grey-wolf-predation-on-livestock-in-relation-to-prey-availability ...
Long-Term Changes in the Diet of Gymnogobius isazafrom Lake Biwa, Japan: Effects of Body Size andEnvironmental Prey AvailabilityJonathan Carlo Briones1., Cheng-Han Tsai2., Takefumi Nakazawa2,4*, Yoichiro Sakai4, Rey
Donne S. Papa5, Chih-hao Hsieh2,3, Noboru Okuda4
1 Graduate School, University of Santo Tomas, Manila, Philippines, 2 Institute of Oceanography, National Taiwan University, Taipei, Taiwan, 3 Institute of Ecology and
Evolutionary Biology, National Taiwan University, Taipei, Taiwan, 4 Center for Ecological Research, Kyoto University, Otsu, Japan, 5 Department of Biological Sciences and
Research Center for the Natural and Applied Sciences, University of Santo Tomas, Manila, Philippines
Abstract
Body size and environmental prey availability are both key factors determining feeding habits of gape-limited fish predators.However, our understanding of their interactive or relative effects is still limited. In this study, we performed quantitativedietary analysis of different body sizes of goby (Gymnogobius isaza) specimens collected from Lake Biwa between 1962 and2004. First, we report that the diet was composed mainly of zooplankton (cladocerans and copepods) before the 1980s, andthereafter, shifted to zoobenthos (gammarids). This foraging shift coincided with, and thus can be linked to, knownhistorical events in the lake at that time: decrease in zooplankton abundance with the alleviation of eutrophication, increasein fish body size resulting from fish population collapse, and increase in gammarid abundance due to reduced fishpredation pressure. Supporting this view, our data analyses revealed how the long-term changes in the diet compositionwould be co-mediated by changes in fish body size and environmental prey availability. Specifically, while zoobenthosabundance strongly affected the fish diet composition, larger (smaller) fish preferred zoobenthos (zooplankton).Furthermore, the body size effects were stronger than those of prey availability. These results provide the best long-term evidence that fish feeding habits vary over decades with its body size and prey community due to anthropogenicdisturbances.
Citation: Briones JC, Tsai C-H, Nakazawa T, Sakai Y, Papa RDS, et al. (2012) Long-Term Changes in the Diet of Gymnogobius isaza from Lake Biwa, Japan: Effects ofBody Size and Environmental Prey Availability. PLoS ONE 7(12): e53167. doi:10.1371/journal.pone.0053167
Editor: Konstantinos I. Stergiou, Aristotle University of Thessaloniki, Greece
Received September 4, 2012; Accepted November 26, 2012; Published December 28, 2012
Copyright: � 2012 Briones et al. This is an open-access article distributed under the terms of the Creative Commons Attribution License, which permitsunrestricted use, distribution, and reproduction in any medium, provided the original author and source are credited.
Funding: This research was supported by a joint program between the Institute of Oceanography, National Taiwan University and the Research Center for theNatural and Applied Sciences, University of Santo Tomas. TN was supported by the Japan Society for the Promotion of Science Research Fellowship for YoungScientists (2103033) and Kurita Water and Environment Foundation (23299). CH was supported by a grant for Frontier and Innovative Research of National TaiwanUniversity and National Science Council of Taiwan. NO was supported by the Environment Research and Technology Development Fund (S-9-4) of the Ministry ofthe Environment of Japan. The funders had no role in study design, data collection and analysis, decision to publish, or preparation of the manuscript.
Competing Interests: The authors have declared that no competing interests exist.
* E-mail: [email protected]
. These authors contributed equally to this work.
Introduction
Fish predation plays a key role in controlling structure and
dynamics of aquatic food webs [1], [2], [3]. Dietary studies using
stomach content analysis have long been used to reveal aspects of
fish feeding habits and to understand aquatic food webs [4], [5],
[6], [7], [8]. For example, investigation of the relationship between
fish diets and environmental prey availability or system produc-
tivity has helped characterize bottom-up processes regulating
energy flows from lower to higher trophic levels [9], [10], [11]. In
addition, dietary analyses also indicate how fish select food items
among diverse types of potential prey [12], [13]. In particular, fish
often exhibit marked ontogenetic changes in diet, which is
typically caused by gape-limited feeding [14], [15]. As such, fish
can have flexible (i.e., temporally variable) feeding habits
depending on their body size and prey availability. Scrutinizing
such trophic flexibility and identifying its abiotic and biotic
determinants are crucial for understanding aquatic food webs and
for ultimately predicting ecosystem responses to environmental
changes due to anthropogenic disturbances.
Although what fish eat and what determines it have long been
central subjects of aquatic ecology [2], [5], [6], our understanding
of the fish feeding habits is still limited. Many researchers have
reported temporal changes in fish feeding habits in both freshwater
and marine systems, and most of these studies have shown that fish
feeding habits are highly associated with environmental prey
availability (e.g., [10], [16], [17]) or fish body size (e.g., [18], [19],
[20]). In general, however, the effects of prey availability have
been tested with long-term data without accounting for intraspe-
cific fish body size variations [10], [16], [17], while the effects of
fish body size have been tested with short-term or snapshot data
focusing on ontogenetic diet shifts without considering the possible
effects of environmental prey variability [18], [19], [20]. There-
fore, to date, long-term stomach content data analyzed in relation
to changes in both fish body size and environmental prey
availability have been very limited, and their interactive or relative
effects on fish feeding habits are still poorly understood. This is
PLOS ONE | www.plosone.org 1 December 2012 | Volume 7 | Issue 12 | e53167
especially true and important for freshwater fish, considering the
facts that there is a research bias towards marine species in fish
feeding ecology [21] and that freshwater ecosystems are highly
vulnerable to anthropogenic disturbances [22], [23].
In the present study, we examine long-term (spanning more
than 40 years) changes in the diet composition of Gymnogobius isaza
(Tanaka 1916) by performing extensive and quantitative dietary
analyses using archival fish specimens that have been collected
from Lake Biwa, Japan for over four decades (1962–2004). Lake
Biwa (35u209N 136u109E) is the largest lake in Japan with an area
of 670 km2 and a maximum depth of 104 m. Organisms living in
Lake Biwa have been subject to various ecosystem disturbances
during the latter half of the 20th century. The lake was originally
oligotrophic but became eutrophic in the 1960s because of
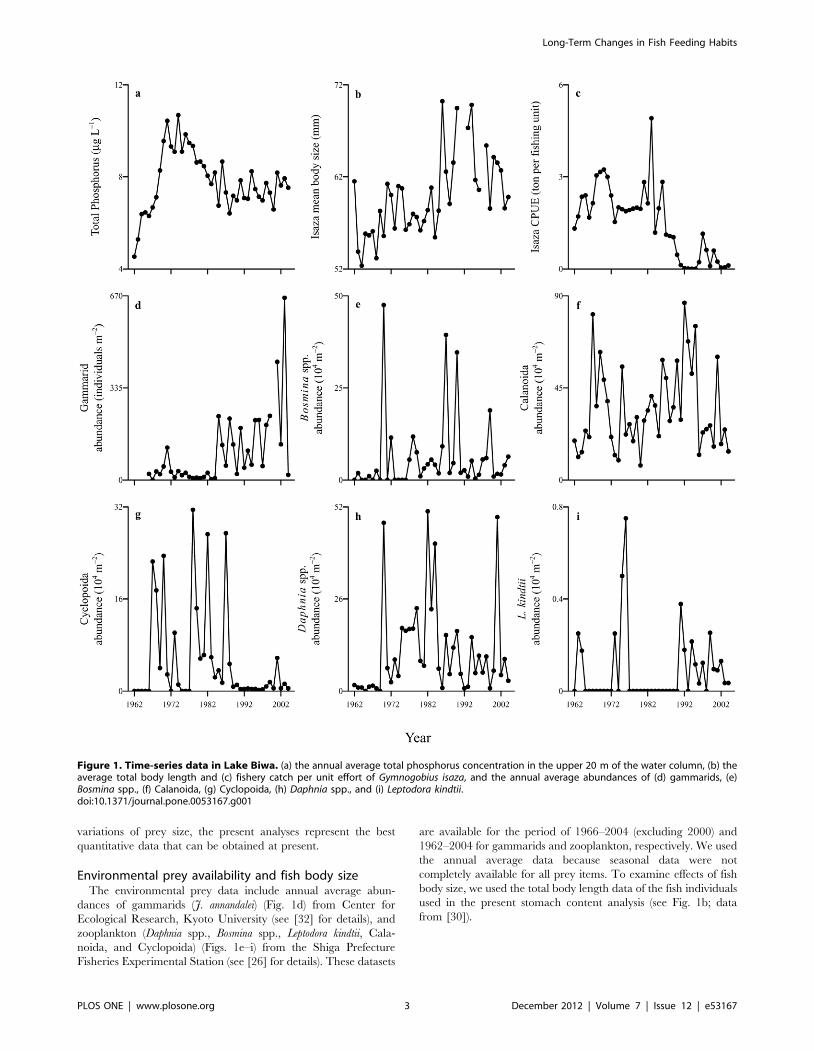
increased nutrient loading (Fig. 1a; data from [24]). Regulations
on nutrient discharge into the lake were enforced by the local
government in 1980, after which eutrophication became progres-
sively alleviated, and the lake finally stabilized in a mesotrophic
state after the mid-1980s [24]. During the period of eutrophica-
tion, zooplankton, one of the main prey of G. isaza [25], increased
and maintained elevated levels of abundance during the 1970s,
and thereafter, their abundance progressively decreased (Figs. 1e–
i; data from [26]; also see [27]). Another significant disturbance
was the invasion of exotic predatory fish, such as bluegill (Lepomis
macrochirus) and largemouth bass (Micropterus salmoides), in the
1960s–1970s. Their populations explosively expanded in the
1980s–1990s, and reduced some fish species to a threatened or
endangered status [28]. In addition, similar to many other lakes in
the world, Lake Biwa has experienced warming during the past
several decades, which has also influenced the plankton commu-
nity of the lake [24], [26]. Facing these ecosystem disturbances, the
G. isaza population suddenly collapsed in the 1980s (Fig. 1c; data
from [29]), although the detailed mechanisms remain unclear.
Notably, this population decline dramatically increased the mean
body size of survived fish through negative density dependency
(Fig. 1b; data from [30]; also see [31]). At the same time,
gammarids (Jesogammarus annandalei), another common prey of G.
isaza [25], suddenly increased in population density through
release from top-down regulation by G. isaza (Fig. 1d; also see
[32]).
Long-term changes in the feeding habits of G. isaza have been
the subject of previous research due to its unique characteristics
and potential ecological importance. G. isaza is a freshwater goby
endemic to Lake Biwa. G. isaza migrates from the pelagic to the
littoral zone to breed during spring. The hatched larvae disperse
offshore to grow from summer to winter, reaching maturity in the
next spring [33]. They are usually annual and die after spawning,
with some fish surviving to the second year. Intriguingly, G. isaza
has adapted to a pelagic habitat with its strong swimming ability,
whereas most gobiid fish are benthic. As a result of this strong
swimming ability, this species plays important roles in the lake
ecosystem as a keystone predator by feeding on pelagic
zooplankton and benthic gammarid amphipods [25], [32], thereby
coupling the pelagic and benthic food webs of the lake. Through
stomach content analysis, Nakanishi and Nagoshi [25] reported
that G. isaza fed mainly on zooplankton and gammarids in the
1960s. Their evaluation, however, was based on frequency of
occurrence (i.e., presence/absence), which is a qualitative index
that ignores numerical and weight composition of prey items in the
diet. More recently, Ogawa et al. [34] and Nakazawa et al. [30]
conducted stable isotope analysis of long-term specimens of G.
isaza collected since the 1960s. Their stable isotope analyses
provided useful information on the fish trophic dynamics.
However, how the feeding habits of G. isaza have varied over
the past decades remains unclear due to the lack of quantitative
and direct evaluation of stomach contents.
In this study, our primary aim is to test the hypothesis that long-
term variations in the diet composition of G. isaza would have been
co-mediated by changes in both fish body size and environmental
prey availability. We first provide .40-year time-series data of the
diet composition of different body sizes of archived G. isaza
specimens. We then investigate how the fish diet composition has
been associated with temporal changes in environmental prey
availability and fish body size by assessing prey selectivity, size-
dependent feeding habits, and their combined effects. We also
examine effects of eutrophication and fish body size on the diet
composition. This additional analysis is motivated by the fact that
long-term data on environmental prey availability are often
unavailable in studies of fish feeding habits (unlike our case), and
may help illustrate whether the use of lake trophic status data can
be a good alternative in such cases.
Materials and Methods
Ethics statementAll scientific procedures were validated by the ethics committee
of Center for Ecological Research, Kyoto University, and were
conducted according to its guidelines and permits. Specimens of G.
isaza collected from 1962 to 2004 during winter (mainly
December) by commercial trawling (excluding 1991, 1992, and
1997 because of low abundance) were used for this study. The
sampling scheme (i.e., location, depth, timing, and method) did
not substantially change over time, and thus sampling bias is not a
concern. Specimens were initially fixed in 10% formalin and
subsequently preserved in 70% ethanol (see [34] for details). In the
previous stable isotope study, Nakazawa et al. [30] analyzed 20
specimens per year selected in a manner representative of the body
size range of each sampling year. For the present analysis, we used
the same fish samples. The sample size might be small, yet it was
because we cannot analyze many valuable historical specimens.
Fish dietWe examined stomach contents of a total of 800 fish individuals
(total body length ranging from 33 to 91 mm), among which 36
(4.5%) fish specimens had empty stomachs. We identified prey
taxa and quantified these prey items per stomach by counting their
undigested body parts under a compound microscope using a
Sedgewick Rafter counting chamber. We found in this process that
17 (c.a. 2.1%) samples had only unidentifiable materials. These
samples cannot be included in the following data analyses of diet
composition, and we treated them as having empty stomachs for
notational convenience. In addition, to estimate the prey biomass
per stomach, we calculated the product of numerical count and
average dry weight of each prey item. The average dry weight of
each prey item was estimated by weighing all undigested
individuals in bulk over the research period (after desiccation at
60uC for 24 hours) and dividing by the number of individuals. We
adopted this approach because an exact evaluation of prey
biomass was not possible due to digestion and mixture. Inter-
annual variations of prey individual weight therefore could not be
taken into account in the biomass evaluation; however, it does not
matter to the major conclusions we draw. For small prey (Bosmina
spp. and nauplii), length–weight relationships were used to
estimate individual weight [35], because direct weight measure-
ments were not possible. Although we recognize potential biases
associated with our sampling and analytical methods or other
factors such as prey-specific digestion rates and inter-annual
Long-Term Changes in Fish Feeding Habits
PLOS ONE | www.plosone.org 2 December 2012 | Volume 7 | Issue 12 | e53167
variations of prey size, the present analyses represent the best
quantitative data that can be obtained at present.
Environmental prey availability and fish body sizeThe environmental prey data include annual average abun-
dances of gammarids (J. annandalei) (Fig. 1d) from Center for
Ecological Research, Kyoto University (see [32] for details), and
zooplankton (Daphnia spp., Bosmina spp., Leptodora kindtii, Cala-
noida, and Cyclopoida) (Figs. 1e–i) from the Shiga Prefecture
Fisheries Experimental Station (see [26] for details). These datasets
are available for the period of 1966–2004 (excluding 2000) and
1962–2004 for gammarids and zooplankton, respectively. We used
the annual average data because seasonal data were not
completely available for all prey items. To examine effects of fish
body size, we used the total body length data of the fish individuals
used in the present stomach content analysis (see Fig. 1b; data
from [30]).
Figure 1. Time-series data in Lake Biwa. (a) the annual average total phosphorus concentration in the upper 20 m of the water column, (b) theaverage total body length and (c) fishery catch per unit effort of Gymnogobius isaza, and the annual average abundances of (d) gammarids, (e)Bosmina spp., (f) Calanoida, (g) Cyclopoida, (h) Daphnia spp., and (i) Leptodora kindtii.doi:10.1371/journal.pone.0053167.g001
Long-Term Changes in Fish Feeding Habits
PLOS ONE | www.plosone.org 3 December 2012 | Volume 7 | Issue 12 | e53167
Data analysisWe evaluated temporal changes in three conventional indices of
diet composition [36]: (i) frequency of occurrence (%F), which is
the proportion of non-empty stomachs containing a particular
prey item to all stomachs for each sampling year; (ii) numerical
composition (%N), which is the proportion of the total numerical
count of a particular prey item to total prey count among all fish
stomachs in each year; and (iii) weight composition (%W), which is
the proportion of biomass of a particular prey item to total prey
biomass among all fish stomachs in each year. To analyze long-
term trends of the diet composition, we calculated cumulative z-
scores of the indices %N and %W for each prey item. The
cumulative z-score analysis can be used to visually characterize the
years with predominantly positive or negative anomalies and
reveal the timing of trend initiation, although the timing cannot be
tested statistically [17].
Using the diet composition data, we examined how the long-
term variations of the fish feeding habits were affected by changes
in environmental prey availability and fish body size. To carry out
the data analyses, we focused on numerical rather than biomass
data because feeding events occur at the individual level. Note also
that most copepodites found in the diet were Calanoida, and thus,
we aggregated Calanoida and copepodites into a single category of
‘‘Calanoida’’. First, we compared the percentage of prey in the
diet and in the environment (which hereafter referred to as
‘‘%prey in diet’’ and ‘‘%prey in environment,’’ respectively). In
this analysis, we considered only the relative abundances (%N) of
gammarids and zooplankton (Daphnia spp., Bosmina spp., L. kindtii,
Calanoida, and Cyclopoida). We ignore other prey items (e.g.,
shrimps and juvenile fish) because no data are available on their
Table 1. Overall diet composition in terms of frequency ofoccurrence (%F), numerical composition (%N), and weightcomposition (%W).
Prey items % F % N % WTotalcounts
Average weight(mg)
Zooplankton
Bosmina spp. 7.1 4.3 0.1 296 0.007(60.016)
Daphnia spp. 57.1 58.1 13.0 3963 0.082(60.742)
Leptodora kindtii 7.6 1.6 0.5 112 0.103(60.165)
Calanoida 12.1 3.0 3.1 207 0.377(60.816)
Cyclopoida 21.8 5.7 5.2 385 0.337(61.091)
Copepodite 12.5 2.5 1.8 172 0.260(60.156)
Nauplii 3.3 0.4 ,0.01 27 0.0007(60.0007)
Zoobenthos
Oligochaete worm 3.6 1.3 0.4 86 0.111(61.013)
Chironomid larvae 12.0 2.8 2.4 190 0.313(60.761)
Gammarids 66.3 18.9 55.7 1291 1.075(67.727)
Shrimps 4.6 0.5 10.3 37 6.954(69.809)
Juvenile fish 6.0 0.8 7.6 51 3.700(62.546)
The total individual counts and average individual dry weight (6 standarddeviation) during the entire research period is also listed for each prey item.doi:10.1371/journal.pone.0053167.t001
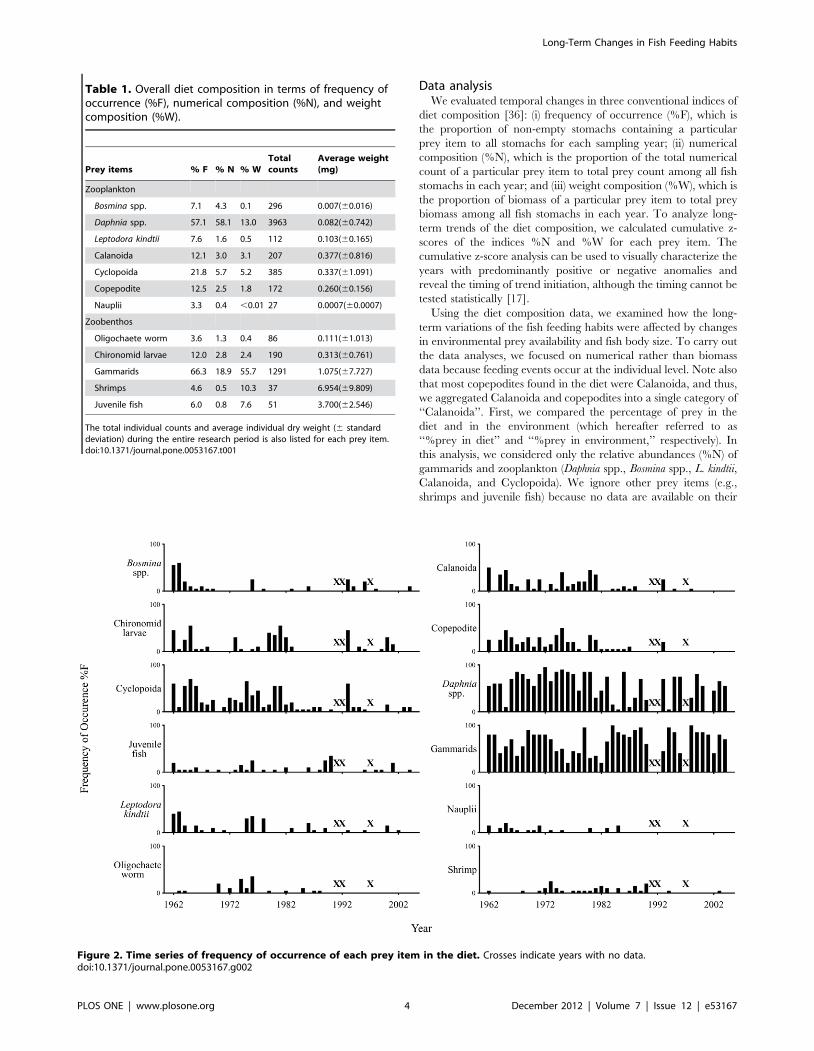
Figure 2. Time series of frequency of occurrence of each prey item in the diet. Crosses indicate years with no data.doi:10.1371/journal.pone.0053167.g002
Long-Term Changes in Fish Feeding Habits
PLOS ONE | www.plosone.org 4 December 2012 | Volume 7 | Issue 12 | e53167
environmental abundances; however, their overall contributions to
the fish diet composition were small, and our conclusions would
not be qualitatively changed. Note also that the gammarid
abundance data were unavailable for 1962–1965 and 2000 (see
above), and these five-year data could not be considered.
Furthermore, fish samples with empty stomachs were also
excluded because we are interested in the relative prey preference
and diet composition; as a result, the sample size used in this
analysis was n = 635. Thereafter, we also examined how the long-
term variations of the feeding habits were affected by fish body
size. Here, we used ‘‘prey numerical counts’’ of all prey items in
the diet, so that all fish could be investigated including those with
empty stomachs (i.e., n = 800). Note that the results were
qualitatively the same when %prey in diet was used in this
analysis.
To perform these two analyses, we used a quantile regression
approach. This approach is used when ordinary least square
regression analysis cannot be applied in the limiting cases [37]: for
example, feeding selectivity of fish on different sizes of prey (e.g.,
zooplankton versus shrimps) depends critically on fish body size.
That is, large fish may prefer large prey that typically have higher
nutritious values, while small fish may feed only on small prey due
to their gape limitation. As such, one may expect that the
frequency of large prey items in the diet would increase with fish
body size. However, this assumes that all large fish can find
enough large prey for food. This assumption cannot be met if
environmental availability of large prey is limited. When some
large fish can meet sufficient number of large prey but others
cannot (considering different years with different environmental
conditions), a triangular distribution may occur, in which the
upper limit of frequency of large prey items increases with fish
body size, while the lower limit remains 0. A similar argument may
be applied to small prey items as well. In performing the quantile
regression analysis, we estimated the 0.01, 0.05, 0.25, 0.5, 0.75,
0.95, and 0.99 quantiles, following [38].
In addition to the univariate tests, we also investigated the
combined effects of fish body size and %prey in environment on
%prey in diet, using multiple regression analysis. Note again that
in this analysis only the gammarid and zooplankton data were
used as above (i.e., n = 635). These variables were normalized to
unit mean and variance prior to analyses to show the relative
contribution of each variable [39]. In order to avoid any specific
parametric assumptions, we performed a randomization test (999
times) in assessing the significance of regression coefficients [40].
We did not carry out multivariate quantile regression, because its
methodology and interpretation of the results are still under debate
[38].
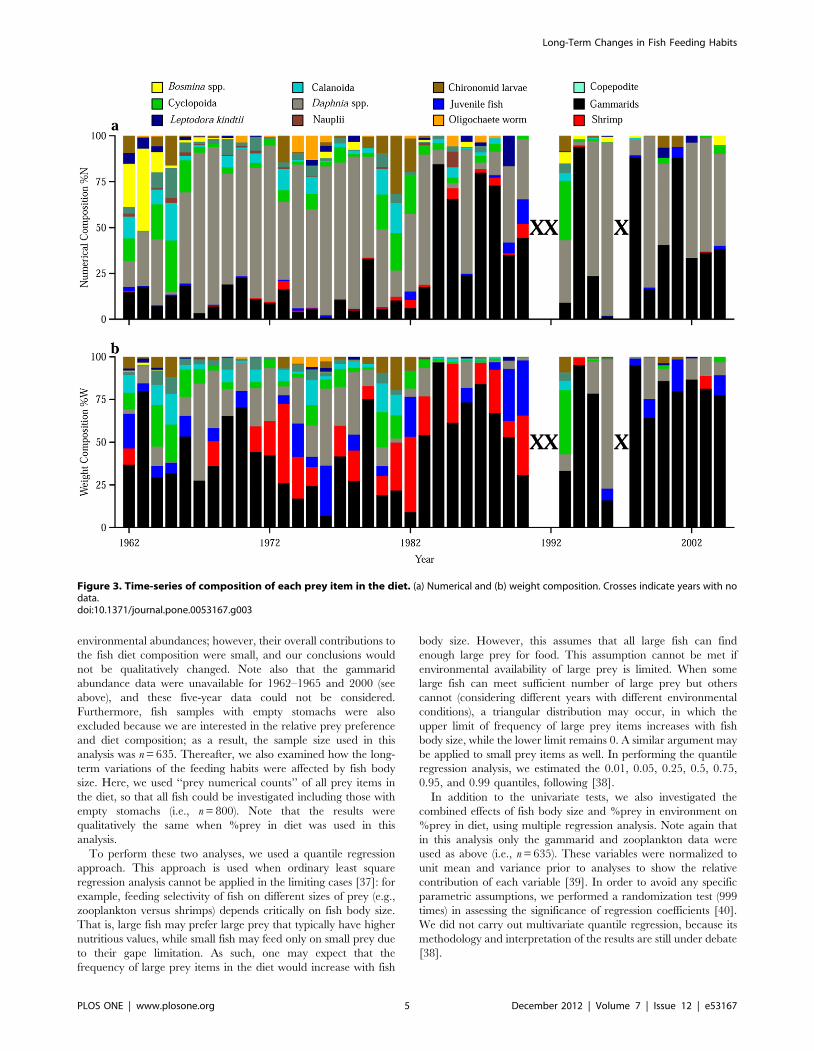
Figure 3. Time-series of composition of each prey item in the diet. (a) Numerical and (b) weight composition. Crosses indicate years with nodata.doi:10.1371/journal.pone.0053167.g003
Long-Term Changes in Fish Feeding Habits
PLOS ONE | www.plosone.org 5 December 2012 | Volume 7 | Issue 12 | e53167
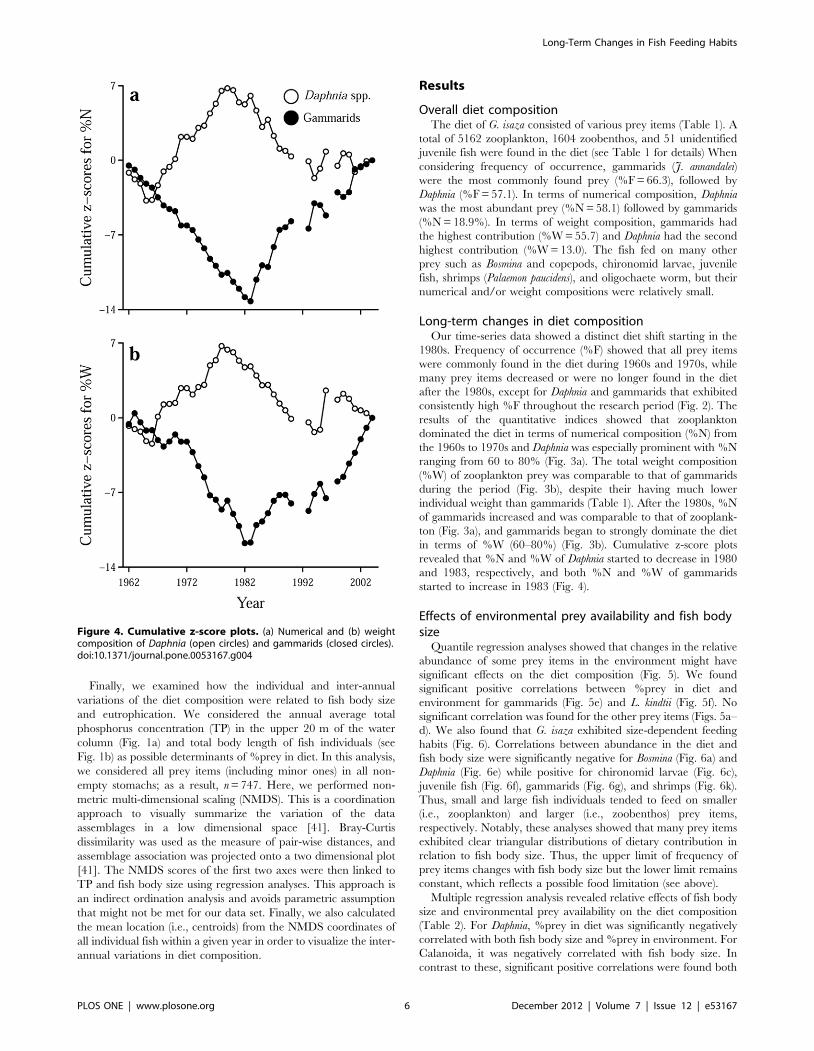
Finally, we examined how the individual and inter-annual
variations of the diet composition were related to fish body size
and eutrophication. We considered the annual average total
phosphorus concentration (TP) in the upper 20 m of the water
column (Fig. 1a) and total body length of fish individuals (see
Fig. 1b) as possible determinants of %prey in diet. In this analysis,
we considered all prey items (including minor ones) in all non-
empty stomachs; as a result, n = 747. Here, we performed non-
metric multi-dimensional scaling (NMDS). This is a coordination
approach to visually summarize the variation of the data
assemblages in a low dimensional space [41]. Bray-Curtis
dissimilarity was used as the measure of pair-wise distances, and
assemblage association was projected onto a two dimensional plot
[41]. The NMDS scores of the first two axes were then linked to
TP and fish body size using regression analyses. This approach is
an indirect ordination analysis and avoids parametric assumption
that might not be met for our data set. Finally, we also calculated
the mean location (i.e., centroids) from the NMDS coordinates of
all individual fish within a given year in order to visualize the inter-
annual variations in diet composition.
Results
Overall diet compositionThe diet of G. isaza consisted of various prey items (Table 1). A
total of 5162 zooplankton, 1604 zoobenthos, and 51 unidentified
juvenile fish were found in the diet (see Table 1 for details) When
considering frequency of occurrence, gammarids (J. annandalei)
were the most commonly found prey (%F = 66.3), followed by
Daphnia (%F = 57.1). In terms of numerical composition, Daphnia
was the most abundant prey (%N = 58.1) followed by gammarids
(%N = 18.9%). In terms of weight composition, gammarids had
the highest contribution (%W = 55.7) and Daphnia had the second
highest contribution (%W = 13.0). The fish fed on many other
prey such as Bosmina and copepods, chironomid larvae, juvenile
fish, shrimps (Palaemon paucidens), and oligochaete worm, but their
numerical and/or weight compositions were relatively small.
Long-term changes in diet compositionOur time-series data showed a distinct diet shift starting in the
1980s. Frequency of occurrence (%F) showed that all prey items
were commonly found in the diet during 1960s and 1970s, while
many prey items decreased or were no longer found in the diet
after the 1980s, except for Daphnia and gammarids that exhibited
consistently high %F throughout the research period (Fig. 2). The
results of the quantitative indices showed that zooplankton
dominated the diet in terms of numerical composition (%N) from
the 1960s to 1970s and Daphnia was especially prominent with %N
ranging from 60 to 80% (Fig. 3a). The total weight composition
(%W) of zooplankton prey was comparable to that of gammarids
during the period (Fig. 3b), despite their having much lower
individual weight than gammarids (Table 1). After the 1980s, %N
of gammarids increased and was comparable to that of zooplank-
ton (Fig. 3a), and gammarids began to strongly dominate the diet
in terms of %W (60–80%) (Fig. 3b). Cumulative z-score plots
revealed that %N and %W of Daphnia started to decrease in 1980
and 1983, respectively, and both %N and %W of gammarids
started to increase in 1983 (Fig. 4).
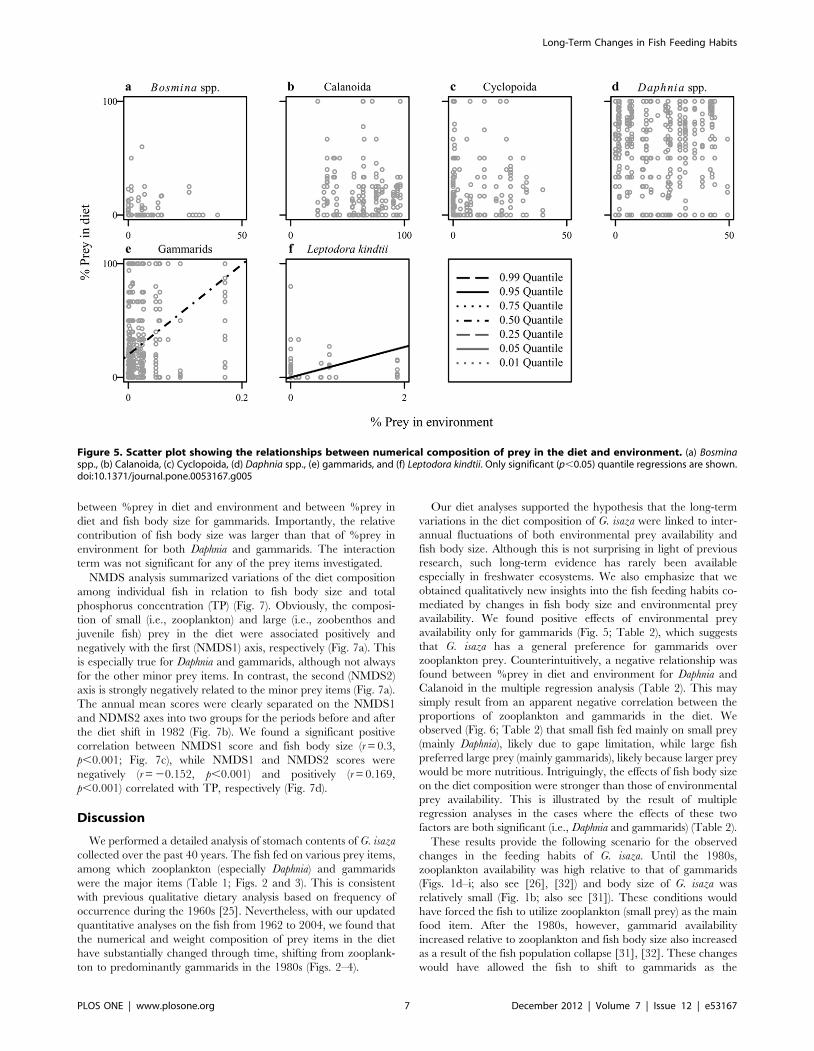
Effects of environmental prey availability and fish bodysize
Quantile regression analyses showed that changes in the relative
abundance of some prey items in the environment might have
significant effects on the diet composition (Fig. 5). We found
significant positive correlations between %prey in diet and
environment for gammarids (Fig. 5e) and L. kindtii (Fig. 5f). No
significant correlation was found for the other prey items (Figs. 5a–
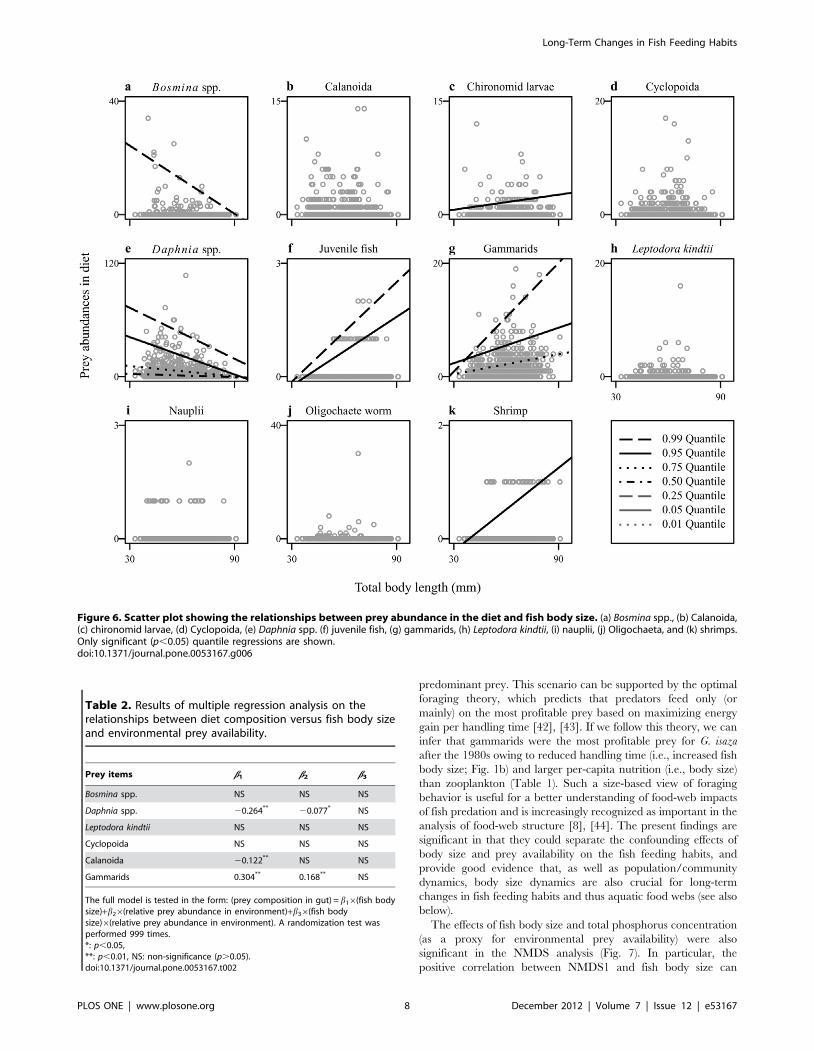
d). We also found that G. isaza exhibited size-dependent feeding
habits (Fig. 6). Correlations between abundance in the diet and
fish body size were significantly negative for Bosmina (Fig. 6a) and
Daphnia (Fig. 6e) while positive for chironomid larvae (Fig. 6c),
juvenile fish (Fig. 6f), gammarids (Fig. 6g), and shrimps (Fig. 6k).
Thus, small and large fish individuals tended to feed on smaller
(i.e., zooplankton) and larger (i.e., zoobenthos) prey items,
respectively. Notably, these analyses showed that many prey items
exhibited clear triangular distributions of dietary contribution in
relation to fish body size. Thus, the upper limit of frequency of
prey items changes with fish body size but the lower limit remains
constant, which reflects a possible food limitation (see above).
Multiple regression analysis revealed relative effects of fish body
size and environmental prey availability on the diet composition
(Table 2). For Daphnia, %prey in diet was significantly negatively
correlated with both fish body size and %prey in environment. For
Calanoida, it was negatively correlated with fish body size. In
contrast to these, significant positive correlations were found both
Figure 4. Cumulative z-score plots. (a) Numerical and (b) weightcomposition of Daphnia (open circles) and gammarids (closed circles).doi:10.1371/journal.pone.0053167.g004
Long-Term Changes in Fish Feeding Habits
PLOS ONE | www.plosone.org 6 December 2012 | Volume 7 | Issue 12 | e53167
between %prey in diet and environment and between %prey in
diet and fish body size for gammarids. Importantly, the relative
contribution of fish body size was larger than that of %prey in
environment for both Daphnia and gammarids. The interaction
term was not significant for any of the prey items investigated.
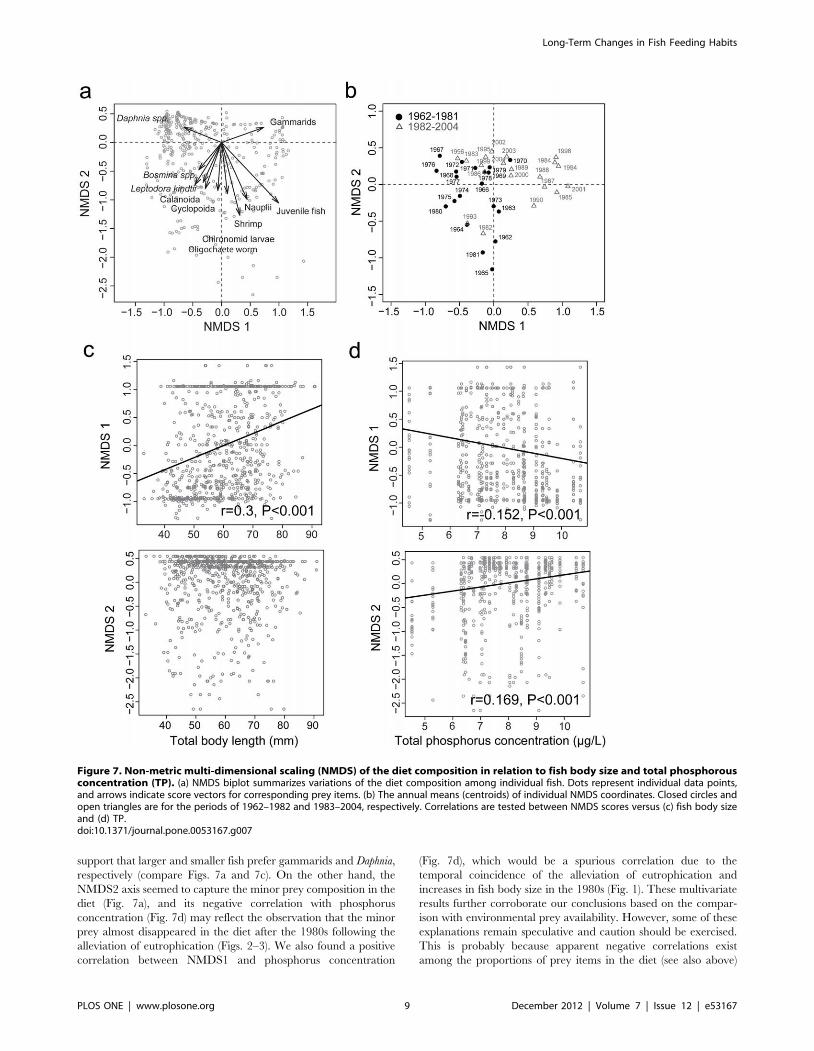
NMDS analysis summarized variations of the diet composition
among individual fish in relation to fish body size and total
phosphorus concentration (TP) (Fig. 7). Obviously, the composi-
tion of small (i.e., zooplankton) and large (i.e., zoobenthos and
juvenile fish) prey in the diet were associated positively and
negatively with the first (NMDS1) axis, respectively (Fig. 7a). This
is especially true for Daphnia and gammarids, although not always
for the other minor prey items. In contrast, the second (NMDS2)
axis is strongly negatively related to the minor prey items (Fig. 7a).
The annual mean scores were clearly separated on the NMDS1
and NDMS2 axes into two groups for the periods before and after
the diet shift in 1982 (Fig. 7b). We found a significant positive
correlation between NMDS1 score and fish body size (r = 0.3,
p,0.001; Fig. 7c), while NMDS1 and NMDS2 scores were
negatively (r = 20.152, p,0.001) and positively (r = 0.169,
p,0.001) correlated with TP, respectively (Fig. 7d).
Discussion
We performed a detailed analysis of stomach contents of G. isaza
collected over the past 40 years. The fish fed on various prey items,
among which zooplankton (especially Daphnia) and gammarids
were the major items (Table 1; Figs. 2 and 3). This is consistent
with previous qualitative dietary analysis based on frequency of
occurrence during the 1960s [25]. Nevertheless, with our updated
quantitative analyses on the fish from 1962 to 2004, we found that
the numerical and weight composition of prey items in the diet
have substantially changed through time, shifting from zooplank-
ton to predominantly gammarids in the 1980s (Figs. 2–4).
Our diet analyses supported the hypothesis that the long-term
variations in the diet composition of G. isaza were linked to inter-
annual fluctuations of both environmental prey availability and
fish body size. Although this is not surprising in light of previous
research, such long-term evidence has rarely been available
especially in freshwater ecosystems. We also emphasize that we
obtained qualitatively new insights into the fish feeding habits co-
mediated by changes in fish body size and environmental prey
availability. We found positive effects of environmental prey
availability only for gammarids (Fig. 5; Table 2), which suggests
that G. isaza has a general preference for gammarids over
zooplankton prey. Counterintuitively, a negative relationship was
found between %prey in diet and environment for Daphnia and
Calanoid in the multiple regression analysis (Table 2). This may
simply result from an apparent negative correlation between the
proportions of zooplankton and gammarids in the diet. We
observed (Fig. 6; Table 2) that small fish fed mainly on small prey
(mainly Daphnia), likely due to gape limitation, while large fish
preferred large prey (mainly gammarids), likely because larger prey
would be more nutritious. Intriguingly, the effects of fish body size
on the diet composition were stronger than those of environmental
prey availability. This is illustrated by the result of multiple
regression analyses in the cases where the effects of these two
factors are both significant (i.e., Daphnia and gammarids) (Table 2).
These results provide the following scenario for the observed
changes in the feeding habits of G. isaza. Until the 1980s,
zooplankton availability was high relative to that of gammarids
(Figs. 1d–i; also see [26], [32]) and body size of G. isaza was
relatively small (Fig. 1b; also see [31]). These conditions would
have forced the fish to utilize zooplankton (small prey) as the main
food item. After the 1980s, however, gammarid availability
increased relative to zooplankton and fish body size also increased
as a result of the fish population collapse [31], [32]. These changes
would have allowed the fish to shift to gammarids as the
Figure 5. Scatter plot showing the relationships between numerical composition of prey in the diet and environment. (a) Bosminaspp., (b) Calanoida, (c) Cyclopoida, (d) Daphnia spp., (e) gammarids, and (f) Leptodora kindtii. Only significant (p,0.05) quantile regressions are shown.doi:10.1371/journal.pone.0053167.g005
Long-Term Changes in Fish Feeding Habits
PLOS ONE | www.plosone.org 7 December 2012 | Volume 7 | Issue 12 | e53167
predominant prey. This scenario can be supported by the optimal
foraging theory, which predicts that predators feed only (or
mainly) on the most profitable prey based on maximizing energy
gain per handling time [42], [43]. If we follow this theory, we can
infer that gammarids were the most profitable prey for G. isaza
after the 1980s owing to reduced handling time (i.e., increased fish
body size; Fig. 1b) and larger per-capita nutrition (i.e., body size)
than zooplankton (Table 1). Such a size-based view of foraging
behavior is useful for a better understanding of food-web impacts
of fish predation and is increasingly recognized as important in the
analysis of food-web structure [8], [44]. The present findings are
significant in that they could separate the confounding effects of
body size and prey availability on the fish feeding habits, and
provide good evidence that, as well as population/community
dynamics, body size dynamics are also crucial for long-term
changes in fish feeding habits and thus aquatic food webs (see also
below).
The effects of fish body size and total phosphorus concentration
(as a proxy for environmental prey availability) were also
significant in the NMDS analysis (Fig. 7). In particular, the
positive correlation between NMDS1 and fish body size can
Figure 6. Scatter plot showing the relationships between prey abundance in the diet and fish body size. (a) Bosmina spp., (b) Calanoida,(c) chironomid larvae, (d) Cyclopoida, (e) Daphnia spp. (f) juvenile fish, (g) gammarids, (h) Leptodora kindtii, (i) nauplii, (j) Oligochaeta, and (k) shrimps.Only significant (p,0.05) quantile regressions are shown.doi:10.1371/journal.pone.0053167.g006
Table 2. Results of multiple regression analysis on therelationships between diet composition versus fish body sizeand environmental prey availability.
Prey items b1 b2 b3
Bosmina spp. NS NS NS
Daphnia spp. 20.264** 20.077* NS
Leptodora kindtii NS NS NS
Cyclopoida NS NS NS
Calanoida 20.122** NS NS
Gammarids 0.304** 0.168** NS
The full model is tested in the form: (prey composition in gut) = b16(fish bodysize)+b26(relative prey abundance in environment)+b36(fish bodysize)6(relative prey abundance in environment). A randomization test wasperformed 999 times.*: p,0.05,**: p,0.01, NS: non-significance (p.0.05).doi:10.1371/journal.pone.0053167.t002
Long-Term Changes in Fish Feeding Habits
PLOS ONE | www.plosone.org 8 December 2012 | Volume 7 | Issue 12 | e53167
support that larger and smaller fish prefer gammarids and Daphnia,
respectively (compare Figs. 7a and 7c). On the other hand, the
NMDS2 axis seemed to capture the minor prey composition in the
diet (Fig. 7a), and its negative correlation with phosphorus
concentration (Fig. 7d) may reflect the observation that the minor
prey almost disappeared in the diet after the 1980s following the
alleviation of eutrophication (Figs. 2–3). We also found a positive
correlation between NMDS1 and phosphorus concentration
(Fig. 7d), which would be a spurious correlation due to the
temporal coincidence of the alleviation of eutrophication and
increases in fish body size in the 1980s (Fig. 1). These multivariate
results further corroborate our conclusions based on the compar-
ison with environmental prey availability. However, some of these
explanations remain speculative and caution should be exercised.
This is probably because apparent negative correlations exist
among the proportions of prey items in the diet (see also above)
Figure 7. Non-metric multi-dimensional scaling (NMDS) of the diet composition in relation to fish body size and total phosphorousconcentration (TP). (a) NMDS biplot summarizes variations of the diet composition among individual fish. Dots represent individual data points,and arrows indicate score vectors for corresponding prey items. (b) The annual means (centroids) of individual NMDS coordinates. Closed circles andopen triangles are for the periods of 1962–1982 and 1983–2004, respectively. Correlations are tested between NMDS scores versus (c) fish body sizeand (d) TP.doi:10.1371/journal.pone.0053167.g007
Long-Term Changes in Fish Feeding Habits
PLOS ONE | www.plosone.org 9 December 2012 | Volume 7 | Issue 12 | e53167
and/or because environmental changes influence the diet com-
position indirectly via complex prey responses (e.g., competition
and predation within the prey community).
In the present study, we showed that G. isaza had consumed
both zooplankton (mainly Daphnia) and zoobenthos (mainly
gammarids) as its major prey and its relative reliance had varied
over time in relation to changes in fish body size and
environmental prey availability (Figs. 2–4). In Lake Biwa,
gammarids (J. annandalei) comprise the largest biomass among
the benthos community [45], and its population dynamics are
largely determined by top-down regulation of G. isaza [32].
Considering these situations, our data have significant implications
in the pelagic-benthic coupling in the lake. The role of the pelagic-
benthic coupling in lake food-web structure and dynamics has
been identified recently and is gaining increasing attention [3],
[46], [47]. However, their research focus has been on how pelagic-
benthic coupling by omnivorous fish predation mediates food-web
responses to environmental changes [48], [49]. Therefore, most
studies have not considered fish body size as a major determinant
of pelagic-benthic coupling (but see [18], [19] for within-year
variations due to ontogenetic niche shifts). Indeed, food-web
models for pelagic-benthic coupling have assumed that the
omnivorous fish has a species-specific (i.e., size-independent) prey
preference [50], [51] (also see [52]). Notably, the present study
suggests that in order to better understand the functional roles of
pelagic-benthic coupling in lake food-web dynamics, not only prey
availability but also fish body size should be considered. These
arguments are generally applicable, because zooplankton and
zoobenthos are distinct in body size and also because fish body size
and prey availability are both likely to fluctuate over time in lake
ecosystems [22].
Finally, we briefly discuss that stomach content analysis has
some advantages over stable isotope analysis especially in the long-
term study of fish feeding habits, although both approaches have
advantages and disadvantages that make them complimentary and
should be used in concert [20]. In previous studies, Ogawa et al.
[34] and Nakazawa et al. [30] examined long-term variations in
nitrogen stable isotope ratios (d15N) of archival specimens of G.
isaza. Their data showed that d15N of the fish was drastically
enriched in the 1960s and 1970s during the eutrophication period.
Ogawa et al. [34] further showed that the isotope signature was
synchronized with a proxy of pelagic primary products extracted
from the chronological sediment core samples. Then, they
concluded that the fish trophic level had remained almost constant
through the latter half of the 20th century. In the present study,
however, we showed that the diet composition of the fish
drastically changed around the 1980s (Figs. 2–4). This apparent
inconsistency can be explained by the fact that in Lake Biwa,
Daphnia and gammarids, the main prey items of G. isaza, are
basically primary consumers feeding on phytoplankton or its
sinking debris, respectively, and they have similar isotope
signatures [53], [54]. As a result, the observed diet shift from
Daphnia to gammarids in the 1980s is detectable only by direct
stomach content analysis (see Fig. S1 in File S1 for preliminary
comparison between estimated d15N of fish individuals based on
stomach contents versus direct stable isotope measurements of the
fish). We should be more aware of the fact that, while stable
isotope studies can provide useful information on fish trophic
dynamics, they alone may not be able to tell us much about
temporal changes in interspecific interactions within a food web
(e.g., pelagic-benthic coupling; see above).
In conclusion, we reported long-term changes in the diet
composition of G. isaza, and our detailed analysis of the diet data
revealed how the long-term variations in the diet composition
would have been co-mediated by changes in both fish body size
and environmental prey availability. These results provide the best
long-term evidence in freshwater ecosystems that fish feeding
habits vary over decades with changes in its body size and prey
community structure due to anthropogenic disturbances such as
eutrophication (oligotrophication) and fish population collapse.
We emphasize that detailed time-series of size-associated diet data,
such as ours, are laborious to collect, yet quite important for more
completely understanding aquatic food webs responding to
ecosystem disturbances.
Supporting Information
File S1
(DOC)
Author Contributions
Conceived and designed the experiments: RDP CHH. Performed the
experiments: JCB CHT. Analyzed the data: JCB CHT. Contributed
reagents/materials/analysis tools: NO YS. Wrote the paper: TN.
References
1. Diehl S (1992) Fish predation and benthic community structure: the role of
omnivory and habitat complexity. Ecology 73: 1646–1661.
2. Carpenter SR, Kitchell JF (1993) The trophic cascade in lakes. Cambridge:
Cambridge University Press.
3. Vander Zanden MJ, Vadeboncoeur Y (2002) Fishes as integrators of benthic and
pelagic food webs in lakes. Ecology 83: 2152–2161.
4. Hyslop EJ (1980) Stomach contents analysis: a review of methods and their
application. J Fish Biol 17: 411–429.
5. Wootton RJ (1990) Ecology of teleost fishes. London: Chapman & Hall.
6. Gerking SD (1994) Feeding ecology of fish. San Diego: Academic Press.
7. Barnes C, Maxwell D, Reuman DC, Jennings S (2010) Global patterns in
predator-prey size relationships reveal size dependency of trophic transfer
efficiency. Ecology 91: 222–232.
8. Nakazawa T, Ushio M, Kondoh M (2011) Scale dependence of predator-prey
mass ratio: determinants and applications. Adv Ecol Res 45: 269–302.
9. Pinnegar JK, Trenkel VM, Tidd AN, Dawson WA, Du Buit MH (2003) Does
diet in Celtic Sea fishes reflect prey availability? J Fish Biol 63: 197–212.
10. Gregersen F, Aass P, Vøllestad LA, L’Abee-Lund JH (2006) Long-term variation
in diet of Arctic charr, Salvelinus alpinus, and brown trout, Salmo trutta: effects of
changes in fish density and food availability. Fish Manag Ecol 13: 243–250.
11. Islam S, Hibino M, Ohta T, Nakayama K, Tanaka M (2006) Long-term
patterns in the diets of Japanese temperate bass Lateolabrax japonicus larvae and
juveniles in Chikugo estuarine nursery ground in Ariake Bay, Japan. Estuar
Coast 29: 519–529.
12. Kohler CC, Ney JJ (1982) A comparison of methods for quantitative analysis of
feeding selection of fishes. Environ Biol Fish 7: 363–368.
13. Papa RD, Pagulayan SRC, Pagulayan AEJ (2008) Zooplanktivory in the
endemic freshwater sardine, Sardinella tawilis (Herre 1927) of Taal Lake, the
Philippines. Zool Stud 47: 535–543.
14. Persson L, Andersson J, Wahlstrom E, Eklov P (1996) Size-specific interactions
in lake systems: predator gape limitation and prey growth rate and mortality.
Ecology 77: 900–911.
15. Post DM (2003) Individual variation in the timing of ontogenetic niche shifts in
largemouth bass. Ecology 84: 1289–1310.
16. Corrigan LJ, Winfield IJ, Hoelzel AR, Lucas MC (2011) Dietary plasticity in
Arctic charr (Salvelinus alpinus) in response to long-term environmental change.
Ecol Freshw Fish 20: 5–13.
17. Winfield IJ, Fletcher JM, James JB (2012) Long-term changes in the diet of pike
(Esox lucius), the top aquatic predator in a changing Windermere. Freshw Biol 57:
373–383.
18. Renones O, Polunin NVC, Goni R (2002) Size related dietary shifts of
Epinephelus marginatus in a western Mediterranean littoral ecosystem: an isotope
and stomach content analysis. J Fish Biol 61: 122–137.
19. Xu J, Zhang M, Xie P (2007) Size-related shifts in reliance on benthic and
pelagic food webs by lake anchovy. Ecoscience 14: 170–177.
20. Davis AM, Blanchette ML, Pusey BJ, Jardine TD Pearson RG (2012) Gut
content and stable isotope analyses provide complementary understanding of
ontogenetic dietary shifts and trophic relationships among fishes in a tropical
river. Freshw Biol 57: 2156–2172.
Long-Term Changes in Fish Feeding Habits
PLOS ONE | www.plosone.org 10 December 2012 | Volume 7 | Issue 12 | e53167
21. Braga RR, Bornatowski H, Vitule JRS (2012) Feeding ecology of fishes: an
overview of worldwide publications. Rev Fish Biol Fish In press.22. Bronmark C, Hansson LA (2005) The biology of lakes and ponds. Oxford:
Oxford University Press.
23. Olden JD, Kennard MJ, Leprieur F, Tedesco PA, Winemiller KO, et al. (2010)Conservation biogeography of freshwater fishes: recent progress and future
challenges. Divers Distrib 16: 496–513.24. Hsieh CH, Ishikawa K, Sakai Y, Ishikawa T, Ichise S, et al. (2010)
Phytoplankton community reorganization driven by eutrophication and
warming in Lake Biwa. Aquat Sci 72: 467–483.25. Nakanishi N, Nagoshi M (1984) Yearly fluctuation of food habits of the isaza,
Chaenogobius isaza, in Lake Biwa. Jap J Limnol 45: 279–288.26. Hsieh CH, Sakai Y, Ban S, Ishikawa K, Ishikawa T, et al. (2011) Eutrophication
and warming effects on long-term variation of zooplankton in Lake Biwa.Biogeosciences 8: 1383–1399.
27. Tsugeki N, Oda H, Urabe J (2003) Fluctuation of the zooplankton community in
Lake Biwa during the 20th century: a paleolimnological analysis. Limnology 4:101–107.
28. Nakai K (1999) Recent, faunal changes in Lake Biwa, with particular referenceto the bass fishing boom in Japan. In: Kawanabe H, Coulter GW, Roosevelt AC
editors. Ancient lakes: their cultural and biological diversity. Ghent: Kenobi
Production. pp. 227–241.29. Shiga Statistics and Information Office (1962–2004) Annual report of the
agriculture, forestry and fisheries statistics of Shiga. Shiga Prefecture (inJapanese)
30. Nakazawa T, Sakai Y, Hsieh CH, Koitabashi T, Tayasu I, et al. (2010) Is therelationship between body-size and trophic niche position time-invariant in a
predatory fish? First stable isotope evidence. PLoS ONE 5: e9120.
31. Nakazawa T, Ishida N, Kato M, Yamamura N (2007) Larger body size withhigher predation rate. Ecol Freshw Fish 16: 362–372.
32. Ishikawa T, Narita T, Urabe J (2004) Long-term changes in the abundance ofJesogammarus annandalei (Tattersall) in Lake Biwa. Limnol Oceanogr 49: 1840–
1847.
33. Nagoshi M (1966) Ecological studies on the population of isaza, Chaenogobius isaza
TANAKA, in Lake Biwa, with special reference to the effects of population
density upon its growth. Res. Popul Ecol 8: 20–36.34. Ogawa N, Koitabashi T, Nakamura T, Oda H, Ohkouchi N, et al. (2001)
Fluctuations of nitrogen isotope ratio of gobiid fish (Isaza) specimens andsediments in Lake Biwa, Japan, during the 20th century. Limnol Oceanogr 46:
1228–1236.
35. Kawabata K, Urabe J (1998) Length-weight relationships of eight freshwaterplanktonic crustacean species in Japan. Freshw Biol 39: 199–205.
36. Cortes E (1997) A critical review of methods of studying fish feeding based onanalysis of stomach contents: Application to elasmobranch fishes. Can J Fish
Aquat Sci 54: 726–738.
37. Cade BS, Noon BR (2003) A gentle introduction to quantile regression for
ecologists. Front Ecol the Environ 1: 412–420.
38. Koenker R (2005) Quantile Regression. Cambridge University Press, Cam-
bridge, UK.
39. Lewis-Beck MS (1980) Applied regression: an introduction. Thousand Oaks:
Sage Publications.
40. Manly BFJ (2006) Randomization, bootstrap and Monte Carlo methods in
biology. Boca Raton: Chapman and Hall/CRC.
41. Legendre P, Legendre L (1998) Numerical Ecology. Elsevier, Amsterdam,
Netherlands.
42. Charnov EL (1976) Optimal foraging: attack strategy of a mantid. Am Nat 110:
141–151.
43. Stephens DW, Krebs JR (1986) Foraging theory. Princeton: Princeton
University Press,
44. Jacob U, Thierry A, Brose U, Arntz WE, Berg S, et al. (2011) The role of body
size in complex food webs: a cold case. Adv Ecol Res 45: 181–223.
45. Ishikawa T, Urabe J (2002) Population dynamics and production of Jesogammarus
annandalei, an endemic amphipod, in Lake Biwa, Japan. Freshw Biol 47: 1935–
1943.
46. Schindler DE, Scheuerell MD (2002) Habitat coupling in lake ecosystems. Oikos
98: 177–189.
47. Vander Zanden MJ, Vadeboncoeur Y, Chandra S (2011) Fish reliance on
littoral–benthic resources and the distribution of primary production in lakes.
Ecosystems 14: 894–903.
48. Jeppesen E, Jensen JP, Jensen C, Faafeng B, Hessen DO, et al. (2003) The
impact of nutrient state and lake depth on top-down control in the pelagic zone
of lakes: a study of 466 lakes from the temperate zone to the arctic. Ecosystems 6:
313–325.
49. Vadeboncoeur Y, Jeppesen E, Vander Zanden MJ, Schierup HH, Christoffersen
K, et al. (2003) From Greenland to Green Lakes: Cultural eutrophication and
the loss of benthic pathways in lakes. Limnol Oceanogr 48: 1408–1418.
50. Vadeboncoeur Y, McCann KS, Vander Zanden MJ, Rasmussen JB (2005)
Effects of multi-chain omnivory on the strength of trophic control in lakes.
Ecosystems 9: 682–693.
51. Rooney N, McCann K, Gellner G, Moore JC (2006) Structural asymmetry and
the stability of diverse food webs. Nature 442: 265–269.
52. Post DM, Conners ME, Goldberg DS (2000) Prey preference by a top predator
and the stability of linked food chains. Ecology 81: 8–14.
53. Yamada Y, Ueda T, Koitabashi T, Wada E (1998) Horizontal and vertical
isotopic model of Lake Biwa ecosystem. Jap J Limnol 59: 409–427.
54. Okuda N, Takeyama T, Komiya T, Kato Y, Okuzaki Y, et al. (2012) A food
web and its long-term dynamics in Lake Biwa: a stable isotope approach. In:
Kawabata H, Nishino M, Maehata M. Lake Biwa: interactions between nature
and people. Amsterdam: Springer Academic. pp. 205–210.
Long-Term Changes in Fish Feeding Habits
PLOS ONE | www.plosone.org 11 December 2012 | Volume 7 | Issue 12 | e53167
Copyright © 2022 FDOKUMEN