Long-term (105) or short-term (103) d13C excursion near the Palaeocene-Eocene transition: evidence...
9
BESEABCH Long-te.rm (10 5 ) or short-term (10 3 ) 8 13 C excursion near the Palaeocene-Eocene transition: evidence from the Tethys Gangyi Lu 1 , Gerta Keller 1 , Thierry Adatte 2 , Nieves Ortiz 1 , Eustaquio Molina 3 1 Department of Geological & Geophysical Sciences, Princeton University, Princeton, N/ 08544, USA, 2 /nstitut de Giologie, 11 rue Emile Argand, 2007 Neucha"iel, Switzerland, 3 Departamento de Geologzá (Palaeontolog1á), Universidad de Zaragoza, E-50009 Zaragoza, Spain ABSTRACT Expanded sedimentary records from the Tethys reveal unique faunal and isotopic changes across the Palaeocene-Eocene (P-E) transition. Unlike in the open oceans, the Tethys exhibits a gradual decrease of 1.5%o in 8 13 C values prior to the rapid 8 13 C excursion. Associated with the 8 13 C excursion is a decrease in calcite burial, increase in detrital content and appearance of a unique planktic foraminiferal assemblage (e.g. compressed acarininids). The existence of a decrease in 8 13 C values in the Tethys suggests that the P-E 8 3 C excursion may have occurred in two steps and overa few hundred thousand years, rather than as one step overa few thousand years as previously suggested. This slower excursion rate is readily explained by changing organic carbon weathering or burial rates and avoids the need of invoking ad hoc scenarios. Terra Nova, 8, 347-355, 1996. INTRODUCTION A remarkable short-tenn global change occurred 54.8 Ma (geomagnetic polarity time-scale of Cande and Kent, 1992) near the Palaeocene-Eocene (P-E) tran- sition. Preliminary studies suggest that this global change took place within a few thousand years (kyr) and }asted less than 200 kyr (Kennett and Stott, 1991 ). It was characterized by a 6-8 ºC wanning in the deep ocean and high-latitude surface ocean as indicated by foraminif- eral ó 18 0 analyses and a major change in the carbon budget as indicated by a negative excursion of 2.5-3o/oo (global average) in carbonate ó 13 C values (Ken- nett and Stott, 1991; Pak and Miller, 1992; Stott, 1992; Koch et al., 1992; Lu and Keller, 1993; Canudo et al., 1995; Bralower et al., 1995; Thomas and Shackleton, 1996; Stott et al., 1996). Associated with these dramatic changes in climate and oceanography, the global ecosystem underwent a sig- ·f) 1996 Blackwell Science Ltd. nificant reorganization marked by ex- tinctions in benthic foraminifera, speciation in land mammals, and pro- liferation of thennophilic species in planktic foraminifera and terrestrial plants (Gingerich, 1986; Thomas, 1990; Wing et al., 1991; Lu and Keller, 1993). Clay mineral compositions suggest a time of exceptionally high precipitation in Antarctica (Robert and Kennett, 1994), but an arid clirnate in the Tethys region (Adatte et al. in prep.), and eolian dust grain size changes suggest a reduction in surface wind intensity which might be related to changes in large-scale atmospheric circulation (Miller et al., 1987; Rea et al., 1990; Hovan and Rea, 1992). Coincident with the ó 13 C excursion, carbonate sedimen- tation decreased drastically across all major ocean basins as well as on continental margins (O'Connell, 1990; Lu and Keller, 1993; Canudo et al., 1995; Thomas and Shackleton, 1996), indicat- ing significant changes in ocean chemistry which might have affected atmospheric C0 2 concentrations. In tenns of rate and magnitude, the thennal and geochemical changes across the P-E transition are unprecedented in the geological record. Sea surface tem- peratures near Antarctica may have reached 20 ºC (Kennett and Stott, 1991), the highest values observed over the last 100 million years. Moreover, the timing and amplitude of the ó 13 C excursion suggests that as muchas 5 billion tonnes of organic carbon was added into active reservoirs (biosphere, atmosphere (lnd ocean) per year, a rate comparable to anthropogenic fossil fuel buming today (Kennett and Stott, 1991; Zachos et al., 1993; Thomas and Shackleton, 1996). Severa} hypotheses ranging from en- hanced hydrothennal activity on the sea floor to the sudden ernission of green- house gases have been proposed as potential causal agents of this unusual global change (Owen and Rea, 1985; Rea et al., 1990; Kennett and Stott, 1990, 1991; Sloan et al., 1992; Lu and Keller, 1993; Eldholrn and Thornas, 1993; Zachos et al., 1993; Thomas and Shackleton, 1996). The Tethys is one of the critica} regions for investigating the potential cause(s) and mechanism(s) of the P-E global change (Kennett and Stott, 1990, 1991). During the P-E transition, the Tethys was a semi-restricted basin surrounded by vast areas of shallow epicontinental seas (Oberhansli and Hsü, 1986; Ober- hansli, 1992). This unique geographical feature suggests that the Tethys region was potentially a major source of wann saline deep water (WSDW, Kennett and Stott, 1990, 1991), a possible driving force for the P-E deep ocean warming. Our current database on the P-E glo- bal change is largely based on deep-sea sections. Although these deep-sea sec- tions have yielded P-E sequences with 347
Transcript of Long-term (105) or short-term (103) d13C excursion near the Palaeocene-Eocene transition: evidence...
~d]]IBIBill BESEABCH
Long-te.rm (105) or short-term (103
) 813C excursion near the Palaeocene-Eocene transition: evidence from the Tethys Gangyi Lu 1
, Gerta Keller1, Thierry Adatte2
, Nieves Ortiz1, Eustaquio Molina3
1Department of Geological & Geophysical Sciences, Princeton University, Princeton, N/ 08544, USA, 2/nstitut de Giologie, 11 rue Emile Argand, 2007 Neucha"iel, Switzerland, 3Departamento de Geologzá (Palaeontolog1á), Universidad de Zaragoza, E-50009 Zaragoza, Spain
ABSTRACT
Expanded sedimentary records from the Tethys reveal unique faunal and isotopic changes across the Palaeocene-Eocene (P-E) transition. Unlike in the open oceans, the Tethys exhibits a gradual decrease of 1.5%o in 813C values prior to the rapid 813C excursion. Associated with the 813C excursion is a decrease in calcite burial, increase in detrital content and appearance of a unique opportuni~tic planktic foraminiferal assemblage (e.g. compressed acarininids). The existence of a ~relude decrease in 813C values in the Tethys suggests that the P-E 8 3C excursion may have occurred in two steps and overa few hundred thousand years, rather than as one step overa few thousand years as previously suggested. This slower excursion rate is readily explained by changing organic carbon weathering or burial rates and avoids the need of invoking ad hoc scenarios.
Terra Nova, 8, 347-355, 1996.
INTRODUCTION
A remarkable short-tenn global change occurred 54.8 Ma (geomagnetic polarity time-scale of Cande and Kent, 1992) near the Palaeocene-Eocene (P-E) transition. Preliminary studies suggest that this global change took place within a few thousand years (kyr) and }asted less than 200 kyr (Kennett and Stott, 1991 ). It was characterized by a 6-8 ºC wanning in the deep ocean and high-latitude surface ocean as indicated by foraminiferal ó180 analyses and a major change in the carbon budget as indicated by a negative excursion of 2.5-3o/oo (global average) in carbonate ó13C values (Kennett and Stott, 1991; Pak and Miller, 1992; Stott, 1992; Koch et al., 1992; Lu and Keller, 1993; Canudo et al., 1995; Bralower et al., 1995; Thomas and Shackleton, 1996; Stott et al., 1996). Associated with these dramatic changes in climate and oceanography, the global ecosystem underwent a sig-
·f) 1996 Blackwell Science Ltd.
nificant reorganization marked by extinctions in benthic foraminifera, speciation in land mammals, and proliferation of thennophilic species in planktic foraminifera and terrestrial plants (Gingerich, 1986; Thomas, 1990; Wing et al., 1991; Lu and Keller, 1993). Clay mineral compositions suggest a time of exceptionally high precipitation in Antarctica (Robert and Kennett, 1994), but an arid clirnate in the Tethys region (Adatte et al. in prep.), and eolian dust grain size changes suggest a reduction in surface wind intensity which might be related to changes in large-scale atmospheric circulation (Miller et al., 1987; Rea et al., 1990; Hovan and Rea, 1992). Coincident with the ó13C excursion, carbonate sedimentation decreased drastically across all major ocean basins as well as on continental margins (O'Connell, 1990; Lu and Keller, 1993; Canudo et al., 1995; Thomas and Shackleton, 1996), indicating significant changes in ocean
chemistry which might have affected atmospheric C02 concentrations.
In tenns of rate and magnitude, the thennal and geochemical changes across the P-E transition are unprecedented in the geological record. Sea surface temperatures near Antarctica may have reached 20 ºC (Kennett and Stott, 1991), the highest values observed over the last 100 million years. Moreover, the timing and amplitude of the ó13C excursion suggests that as muchas 5 billion tonnes of organic carbon was added into active reservoirs (biosphere, atmosphere (lnd ocean) per year, a rate comparable to anthropogenic fossil fuel buming today (Kennett and Stott, 1991; Zachos et al., 1993; Thomas and Shackleton, 1996). Severa} hypotheses ranging from enhanced hydrothennal activity on the sea floor to the sudden ernission of greenhouse gases have been proposed as potential causal agents of this unusual global change (Owen and Rea, 1985; Rea et al., 1990; Kennett and Stott, 1990, 1991; Sloan et al., 1992; Lu and Keller, 1993; Eldholrn and Thornas, 1993; Zachos et al., 1993; Thomas and Shackleton, 1996).
The Tethys is one of the critica} regions for investigating the potential cause(s) and mechanism(s) of the P-E global change (Kennett and Stott, 1990, 1991). During the P-E transition, the Tethys was a semi-restricted basin surrounded by vast areas of shallow epicontinental seas (Oberhansli and Hsü, 1986; Oberhansli, 1992). This unique geographical feature suggests that the Tethys region was potentially a major source of wann saline deep water (WSDW, Kennett and Stott, 1990, 1991), a possible driving force for the P-E deep ocean warming.
Our current database on the P-E global change is largely based on deep-sea sections. Although these deep-sea sections have yielded P-E sequences with
347
excellent foraminiferal preservation and high-quality stable isotope data, the critical clay interval in which the 813C excursion occurred is invariably condensed, ranging from centimetres to a few decimetres. As a result, the nature and tempo of the events is often obscured. Recent investigation of the P-E sections from continental margins of the Tethys (Spain, Tunisia, Israel and Egypt) reveals stratigraphically continuous sequences with sediment accumulation rates several times higher than in the deep-sea, and the critical clay layer reaching 1 to several metres in thickness (Molina et al., 1994; Ortiz, 1994; Speijer, 1994; Canudo et al., 1995; Arenillas and Molina, in press). These expanded sections provide the opportunity for building a high-resolution time-scale and examining in detail the regional climatic, oceanographic and biotic changes across the P-E transition. Herein are reported the results of foraminiieral, stable isotopic and whole rock composition analyses from a newly discovered P-E section at Alamedilla in southem Spain, which appears to be formed in a lower bathyal environment. By conducting high-resolution faunal, isotopic and mineralogic analyses, it was possible to document the characteristics of the P-E events in the deep Tethys basin, correlate these events with the deep-sea records, and reveal the detailed pattem for the onset of the isotopic excursion.
MATERIALS ANO METHODS
The Alamedilla section is located near the village of Alamedilla, in the Province of Granada, Spain, and is geologically in the Sub-betic Zone (Betic Cordillera). It was sampled at 35 cm intervals between biozones P5x and P7 spanning a total of 30 m and 2.5 Myr. Closely spaced samples at 5 cm intervals were examined across the critical interval of global change (13-15 m) in order to determine the sequential occurrence of the benthic foraminiferal extinction, planktic foraminiferal tumover and details of the 813C excursion. For foraminiferal and stable isotopic analyses, sediments were soaked in water and washed through a 63 µm sieve. Stratigraphic ranges and relative abundances of planktic foraminiferal species for each sample were determined from
348
GANGYI LU ET AL.
counts of a random split of about 300 specimens in the > 106 µm size fraction. The planktic foraminiferal zonation i~ this study is based on a revision of the P-zonation of Berggren and Miller (1988) by Lu and Keller (1995). Benthic foraminifera were examined in the > 63 µm size fraction to determine the position of the mass extinction. Oxygen and carbon stable isotope analyses were based on monospecific samples, each containing 30 individuals of Morozovella subbotinae, a surface-dwelling planktic foraminiferal species. In the eight samples below the first stratigraphic appearance of M. subbotinae, a different species, M. aequa, which is similar to M. subbotinae in morphology and habitat (Lu and Keller, 1996), was analysed. Analyses were conducted at the stable isotope geochemistry laboratory at Princeton University using a VG Optima gas source mass spectrometer equipped with a common acid bath. The results were calibrated to the PDB scale with the standard errors of 0.05o/oo for 813C and O.lo/oo for 8180. Bulk rock compositional analyses were conducted at the University of Neuchatel, Switzerland, using a SCINT AG XRD 2000 Diffractometer.
RESULTS
Faunal changes
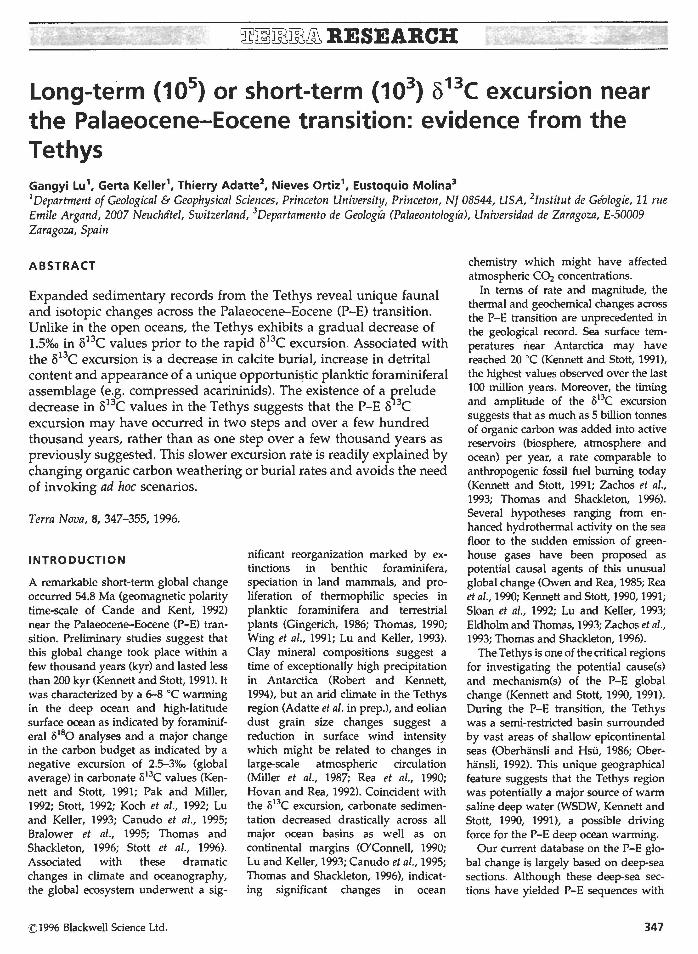
Figure 1 shows a major faunal tumover in planktic foraminifera between 13.60 and 15.00 m as indicated by the drastic increases in relative species turnovcr rates and the relative abundance of compressed acarininids. The relative species tumover ratc is based on the percentage of first and last appearances normalized to sample the resolution, and can be calculated by:
First and last appearances x 100
(Species richness) x (sample spacing)/ (mean sample spadng)
The background turnover rates throughout the entire interval are less than 5%. During the P-E tumover, relative tumover rates increased to as high as 33%. The twin peaks in the species tumover rates coincide with the onset and end of the tumover event (Fig. 1). A pre-P-E faunal change with smaller magnitude (18%) is recorded near the P5x/P6a
biozone boundary. The compressed acarininids are composed of three acarininid species (e.g. A. africana, A. sabaiyaensis and A. berggrenl) that were first described by El-Naggar (1 %6) from the Esna-Idfu region of Egypt near the P-E transition. At Alamedilla, their ranges are confined within the P-E faunal tumover interval where they reached a maximum combined relative abundance of 333 (Fig. 1). Similar species have recently been reported from the equatorial Pacific Site 865 within the isotopic excursion interval (Kelly et al., 1995).
Benthic foraminiferal data indica te that deposition across the P-E transition at Alamedilla occurred in a lower bathyal to abyssal environment. The fauna contains abundant (up to 27%) abyssaminids and many species that have their upper depth limits between 1000 and 2000 m (e.g. Abyssamina poagi, Bulimina velascoensis, Aragonia aragonensis and Tritaxia palaeocenica). The benthic foraminiferal mass extinction was located at 13.45 m (Fig. 1) as marked by the disappearance of Stensioina beccariiformis, among other species. About 53% of the late Palaeocene species survived into the lower Eocene.
Stable isotope changes
Stable isotope measurements were cond ucted on Morozovella subbotinae, a surface-dwelling planktic foraminiferal spedes. The results demonstrate little change in 8180 values across the P-E transition, but a distinct negative excursion in 813C values that peaks in the interval of maximum planktic foraminiferal tumover (Fig. 1). Comparison with the results from other Tethys sections and low-latitude deep-sea sites indicates that the planktic 8180 and 813C pattems observed at Alamedilla represent true signals. Foraminiferal isotope analyses from tropical-subtropical Pacific Sites 47.2, 577 and 865 show no significant changes in planktic 8180 values, but a negative excursion in benthic 8180 values; negative 813C excursions are present in both planktic and benthic foraminifera (Stott, 1992; Pak and Miller, 1992; Bralower et al., 1995). In the Tethys region, benthic isotope analyses were conducted at Caravaca, Spain, by Canudo et al. (1995) which show excursions in both 8180 and 813C values. Thus, the planktic and benthic isotopic pattems
'.'C 1996 Blackwell Science Ltd, Terra Noi1a, 8, 347-355
o13C PALAEOCENE-EOCENE EXCURSION
Faunal, lsotoplc and Sedimentary Changes near the P-E Transltlon, Alamedllla, Spaln
Relative Species Con1)ressed C'.1 3C 1:.1•0 Calc1'te {º'o) Detn'tus {º')
Tumover Rate (%) Acarinlnids (%) o u " 'º
20 30 10 20 30 2 -1.S -2 20 40
Fig. 1. Foraminifera/ fauna/, isotopic and sediment compositional changes across the Palaeocene-Eocene transition at Alamedil/a, Spain . .The relative species turnover rate is based on the percentage of first and last appearances normalized to the sample resolution. Compressed acarininids include species A. africana, A. sabaiyaensis and A. berggreni. Stable isotope values are calibmted to PDB standard with the standard erros of 0.05%0 for b13C and 0.1 for <5
180. Note the correlation between the planktic foraminiferal turnover, benthic foraminiferal extinction, b13C excursion, decrease in ca/cite content and increase in detrita/ content near the P-E transition.
observed in the Tethys region are consistent with those observed from other low-latitude deep-sea sequences.
The b 13e excursion at Alamedilla can be divided into several stages indicating the progressive b ne changes across the P-E transition (Fig. 1 ). Between O m and 6.40 m, planktic dne values are relatively stable at 3.5%0. In the middle of this interval, 5ne values fluctuate near the P5x/P6a biozone boundary, coincident with the pre-P-E faunal change. From 6.40 m to 13.25 m, planktic 5ne values gradually decrease by 1 %o. Following this gradual decrease is the interval of the P-E 5 ne excursion between 13.25 m and 16.05 m. The onset of this excursion is recorded in a 0.70 m interval between 13.25 m and 13.95 m as marked by a rapid decrease of 1.7%0. Between 13.95 m and 14.90 m, planktic o13e values remain at the lowest level (< 1 %0) of the entire observed interval. A gradual recovery begins at 15.05 m and ends at 16.05 m. Above 16.05 m, planktic one values decrease gradually, forming part of the long tenn decrease in oceanic o13C
values that characterizes the late Palaeocene to the early Eocene (Shackleton, 1986, 1987). The beginning of the rapid excursion in planktic b ne values occurred 0.20 m below the benthic foraminiferal extinction and 0.35 m below the onset of the planktic foraminiferal tumover. The pre-excursion gradual decrease in 513e values began well below these faunal changes and has not been observed at other continental margin or deep-sea sites outside the Tethys region.
Whole rock composition
Sediments of the Alamedilla section are composed of calcite, phyllosilicates and detritus. Whole-rock compositional analyses show that calcite content averages 75-80% over the lower 1 O m of the section (Fig. 1). A gradual but fluctuating decrease in calcite content starts at 10.30 m and accelerates at 13.45 m. eoincident with the 5ne excursion and planktic foraminiferal tumover, calcite content drops to as low as 2% and averages 44% between 13.45 m and
©1996 Blackwell Science Ltd, Terra Nova, 8, 347-355
15.00 m. At 15.00 m, calcite content rapidly retums to 75-85% and remains high through the upper portion of the section. Detrital content, measuring the relative abundance of detrital quartz, Kfeldspar and plagiodase, averages 2-4% through most of the section except for the o 13e excursion interval between 13.45 m and 15.00 m (Fig. 1). Within this interval detrital content increases to a high of 12% and averages 9%. ehanges in calcite and detrital contents are compensated by changes in phyllosilicate contents. These changes in sedimentary composition and their association with the o13e excursion, benthic foraminiferal extinction and planktic foraminiferal tumover are similar to the pattems observed at earavaca across the P-E transition (eanudo et al., 1995; Adatte et al., in prep.).
DISCUSSION
Chronostratigraphy
A high-resolution chronostratigraphy is crucial when evaluating P-E changes
349
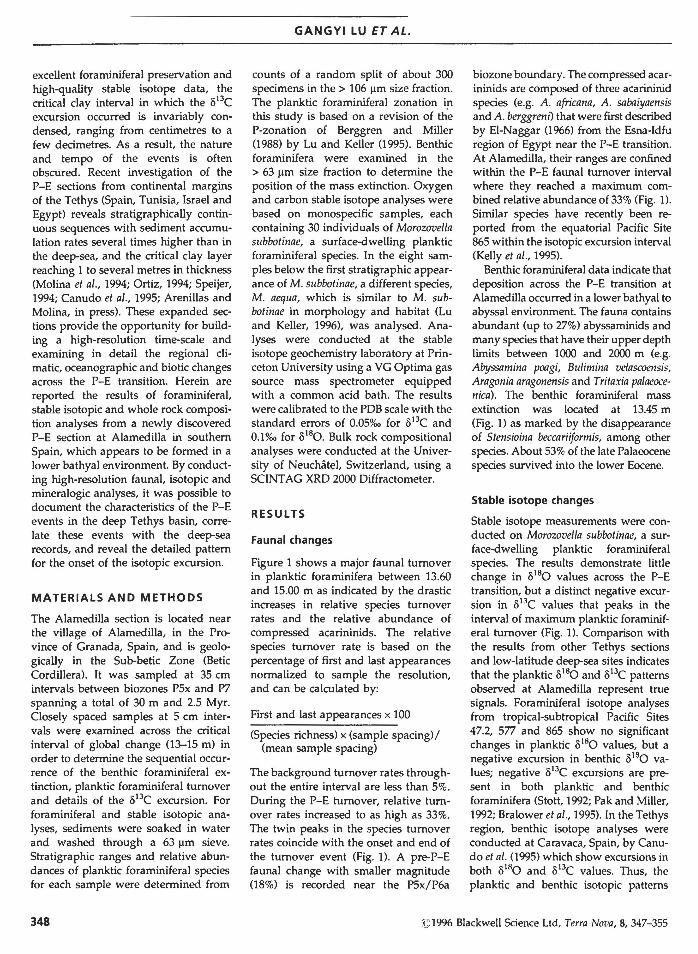
which took place over a few thousand years (Kennett and Stott, 1991 ). Since Chron 24r lasts more than 3 million years across the P-E transition (Berggren et al., 1985; Cande and Kent, 1992), possible changes in sedimentation rates during C24r need to be examined by biostratigraphy and chemostratigraphy. For the Alamedilla section, age models can be developed independently through foraminiferal biostratigraphy and o13C stratigraphy. An age model based on faunal changes and planktic foraminiferal datum events is shown in Fig. 2 with model parametres listed in Table 1. All ages in this model are calibrated to the geomagnetic polarity time-scale (GPTS) of Cande and Kent (1992) based on the discussion by Lu and Keller (1995). Calibration with the GPTS by Berggren et al. (1985) is also shown in Table 1. This age model indicates relatively uniform sedimentation rates of 2.4 cm kyr- 1 for the lower part of the section from the base up to 15.00 m. Above 15.00 m, sedimentation rates drop significantly to 0.7 cm kyr- 1
•
This change in sedimentation rates coincides with a major lithological transition as marked by the sudden increase in calcite content from an average of 44% between 13.45 m and 15.00 m toan average of 78% above 15.00 m (Fig. 1). The main phase of the P-E event is recorded in a 1.55 m interval between 13.45 m and 15.00 m. The onc excursion, however, is recorded overa much more expanded interval between 13.25 m and 16.05 m. This expanded record of the red, clay-rich layer at Alamedilla is also documented by the sequential occurrence of the benthic foraminiferal extinction and the o 13C
GANGYI LU ET AL.
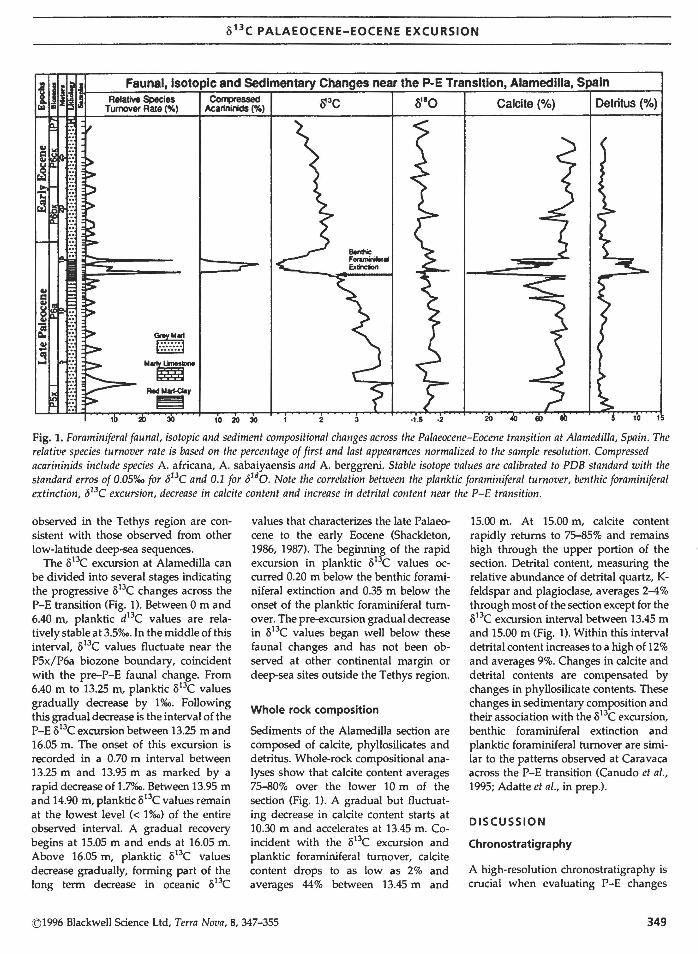
excursion which in the deep-sea and other continental margin sites appear to occur simultaneously (Kennett ai:t.d Stott, 1991; Pak and Miller, 1992; Stott, 1992; Lu and Keller, 1993; Canudo et al., 1995; Thomas and Shackleton, 1996; Bralower et al. 1995). We use the age model in Fig. 2 to calibrate onc values from Alamedilla to the age scale (Fig. 3). Foraminiferal o ne values from ODP Site 690 (one of the most complete deepsea section for this interval, Kennett and Stott, 1991) are calibrated to the age scale based on magnetostratigraphy (Spiess, 1990). Correlation with the equatorial Pacific
tent as indicated by the full range correlation of the o13C excursion at Alamedilla with Sites 690 and 865 (Fig. 3). Below the onc shift, however, inconsistency between foraminiferal and onc chronostratigraf,hies is shown by a prelude decrease in o1 e values prior to the rapid excursion at Alamedilla which is not observed at Site 690 or 865 (Fig. 3).
Expanded or unique record
The prelude decrease in onc values prior to the rapid excursion at Alamedilla posts problems for present
Site 865 is based 52.5-------------------.. on o13C stratigraphy. Comparison of o ne excursion 53.0
pattems between these sections allows us to examine the consistency between foraminiferal and o13C stratigraphies (Fig. 3).
This integrated biostratigra phic and chemostratigra phic a pproach reveals both the validity and potential problems of the age model for the Alamedilla section. Above the rapid o13C shift (13.25 m), foraminiferal and o13C chronostratigraphies are consis-
Ci :::&
53.5
-; 54.0 a <
54.5
55.0
LAD /. lodoen.sis
55.5 ............... ..-.-.-............... - ......................... ..-.........,,....... ......... __ ................ _,....-o 5 10 15 20 25 30
Thlckness (m)
Fig. 2. Age model based on the datum and fauna/ events of foraminifera as listed in Table 1. Absolute ages are calibrated to the geomagnetic polarity time sea/e of Cande and Kent (1992) according to the discussion by Lu and Keller (1995). Note the change in sedimentation rates below and above 15 m.
Table 1 Age model parametres for the Alamedilla section.
Calibration to the GPTS (Ma)• Berggren et al. Cande and Kent Position (m) at
Events (1985) (1992) Error(±) Alanedilla
FAD M. aragoensis 55.67 52.92 0.00 27.70 LAD l. Iodoensis 56.49 53.64 0.09 22.13 LAD M. velascoensis 57.52 54.75 0.29 16.78 Planktic Foram. Tumover 57.54 54.78 0.10 14.30 Benthic Foram. Extinction 57.56 54.80 0.01 13.45 o13C Excursion 57.56 54.80 0.00 13.25 FAD M. subbotinae 57.98 55.26 0.19 2.70
• Absolute ages and errors are calibrated to the geomagnetic polarity time scales by Berggren et al. (1985) and Cande and Kent (1992) based on the discussion by Lu and Keller (1995).
350 :01996 Blackwell Science Ltd, Terra Nova, 8, 347-355
o13 C PALAEOCENE-EOCENE EXCURSION
~-4-------------------.--------------. (Ma)
~.6
~.8 Surface Planktic
SS.O
High Latitude Low Latitude ss.2-+----.---r---..---~--...-----+...,...,.....,...,..,...,....,...,r-r-r-r-r-r-T""T"T""T"T""T".......-........... ........i
~ ~ o 2 3 2 3 4 5
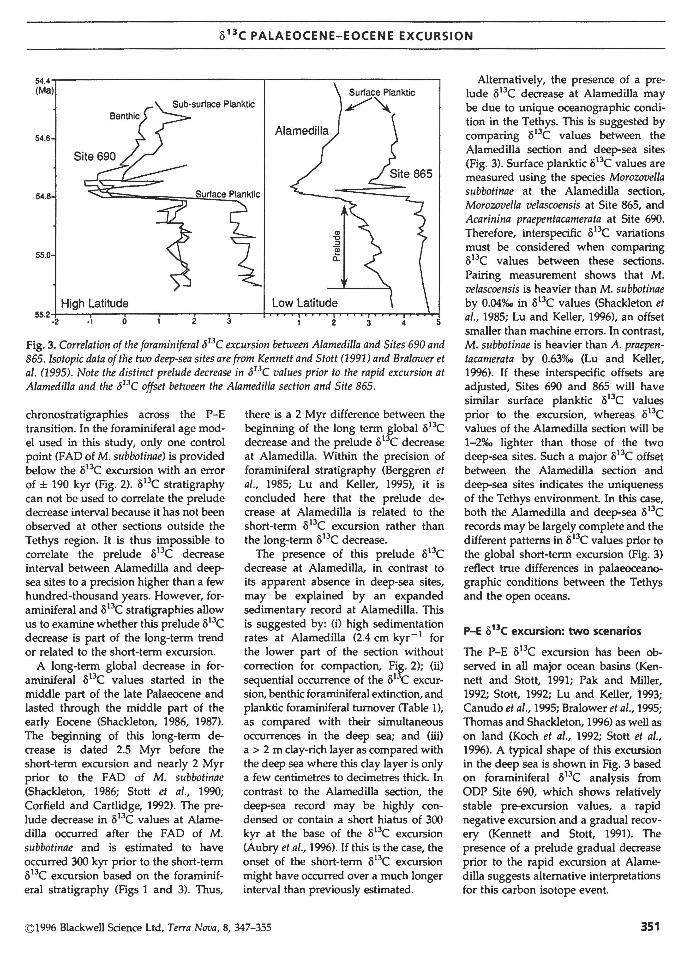
Fig. 3. Correlation of the foraminiferal ó13C excursion between Alamedilla and Sites 690 and 865. Isotopic data of the two deep-sea sites are from Kennett and Stott (1991) and Bralower et al. (1995). Note the distinct prelude decrease in ó13C values prior to the rapid excursion at Alamedilla and the ó13C offset between the Alamedilla section and Site 865.
chronostratigraphies across the P-E transition. In the foraminiferal age model used in this study, only one control point (F AD of M. subbotinae) is provided below the o13C excursion with an error of ± 190 kyr (Fig. 2). o 13C stratigraphy can not be used to correlate the prelude decrease interval because it has not been observed at other sections outside the Tethys region. It is thus impossible to correlate the prelude o13C decrease interval between Alamedilla and deepsea sites to a precision higher than a few hundred-thousand years. However, foraminiferal and o 13C stratigraphies allow us to examine whether this prelude o13C decrease is part of the long-term trend or related to the short-term excursion.
A long-term global decrease in foraminiferal o13C values started in the middle part of the late Palaeocene and lasted through the middle part of the early Eocene (Shackleton, 1986, 1987). The beginning of this long-term decrease is dated 2.5 Myr before the short-term excursion and nearly 2 Myr prior to the FAD of M. subbotinae (Shackleton, 1986; Stott et al., 1990; Corfield and Cartlidge, 1992). The prelude decrease in o13C values at Alamedilla occurred after the F AD of M . subbotinae and is estimated to have occurred 300 kyr prior to the short-term o13C excursion based on the foraminiferal stratigraphy (Figs 1 and 3). Thus,
there is a 2 Myr difference between the beginning of the long term global o 13C decrease and the prelude o 13C decrease at Alamedilla. Within the precision of foraminiferal stratigraphy (Berggren et al., 1985; Lu and Keller, 1995), it is concluded here that the prelude decrease at Alamedilla is related to the short-term o 13C excursion rather than the long-term o13C decrease.
The presence of this prelude o13C decrease at Alamedilla, in contrast to its apparent absence in deep-sea sites, may be explained by an expanded sedimentary record at Alamedilla. This is suggested by: (i) high sedimenta tion rates at Alamedilla (2.4 cm kyr- 1 for the lower part of the section without correction for compaction, Fig. 2); (ii) sequential occurrence of the o13C excursion, benthic foraminiferal extinction, and planktic foraminiferal tumover (Table 1),
as compared with their simultaneous occurrences in the deep sea; and (üi)
a > 2 m clay-rich layer as compared with the deep sea where this clay layer is only a few centirnetres to decimetres thick. In contrast to the Alamedilla section, the deep-sea record may be highly condensed or contain a short hiatus of 300 kyr at the base of the o13C excursion (Aubry et al., 1996). If thic; is the case, the onset of the short-term o 13C excursion might have occurred over a much longer interval than previously estimated.
©1996 Blackwell Science Ltd, Terra Nava, 8, 347-355
Altematively, the presence of a prelude o13C decrease at Alamedilla may be due to unique oceanographic condition in the Tethys. This is suggested by comparing o13C values between the Alamedilla section and deep-sea sites (Fig. 3). Surface planktic o 13C values are measured using the species Morozovel/a subbotinae at the Alamedilla section, Morozovella velascoensis at Site 865, and Acarinina praepentacamerata at Site 690. Therefore, interspecific o13C variations must be considered when comparing o13C values between these sections. Pairing measurement shows that M. velascoensis is heavier than M. subbotinae by 0.04o/oo in o13C values (Shackleton et al., 1985; Lu and Keller, 1996), an offset smaller than machine errors. In contrast, M. subbotinae is heavier than A. praepentacamerata by 0.63o/oo (Lu and Keller, 1996). lf these interspecific offsets are adjusted, Sites 690 and 865 will have similar surface planktic o13C values prior to the excursion, whereas o 13C values of the Alamedilla section will be 1-2%o lighter than those of the two deep-sea sites. Such a major o13C offset between the Alamedilla section and deep-sea sites indicates the uniqueness of the Tethys environment. In this case, both the Alamedilla and deep-sea o 13C records may be largely complete and the different pattems in o 13C values prior to the global short-term excursion (Fig. 3) reflect true differences in palaeoceanogra phic conditions between the Tethys and the open oceans.
P-E o13C excursion: two scenarios
The P-E o13C excursion has been observed in all major ocean basins (Kennett and Stott, 1991; Pak and Miller, 1992; Stott, 1992; Lu and Keller, 1993; Canudo et al., 1995; Bralower et al., 1995; Thomas and Shackleton, 1996) as well as on land (Koch et al., 1992; Stott et al., 1996). A typical shape of this excursion in the deep sea is shown in Fig. 3 based on foraminiferal o13C analysis from ODP Site 690, which shows relatively stable pre-excursion values, a rapid negative excursion anda gradual recovery (Kennett and Stott, 1991). The presence of a prelude gradual decrease prior to the rapid excursion at Alamedilla suggests altemative interpretations for this carbon isotope event.
351
Rapid Excursion Scenario
If both Alamedilla and deep-sea o13e records are largely complete, all previous interpretations about the global P-E o13e excursion remain valid, including: (i) rapid excursion over a few thousand years (Kennett and Stott, 1991; Stott, 1992; Thomas and Shackleton, 1996); and (ii) a magnitude of 2.5-3%0 as global average which may be as large as 4.5-5o/oo regionally (Kennett and Stott, 1991; Stott, 1992;. Pak and Miller, 1992; Lu and Keller, 1993; Bralower et al., 1995; Thomas and Shackleton, 1996). The total magnitude (including the prelude decrease) of the one excursion at Alamedilla is 2.7%o and hence close to the global average. It differs in that the excursion includes two stages, the prelude and the abrupt shift (Fig. 3). During the prelude stage, one values decrease by 1-1.2o/oo over a period of as long as 300 kyr. The prelude decrease is accompanied by decreased calcite concentrations in sediments (Fig. 1). Many regional processes can explain this gradual decrease in one values and calcite concentration, including decreased surface productivity and increased input of organic matter to the Tethys basin. The preh.J.de decrease is followed by a rapid excursion of 1.5-1.7o/oo in o13e values, which is coeval with the global o13e excursion, although at a much reduced magnitude (Fig. 3). This rapid excursion is associated with a mass extinction in benthic foraminifera and a major fatmal turno ver in planktic foraminifera (Fig. 1) that have been observed at many deepsea, as well as near-shore sections (see Lu and Keller, 1995; Thomas and Shackleton, 1996 for reviews). The ocairrence and high relative abundance of the opportunistic planktic foraminiferal species (e.g. compressed acarininids) at Alamedilla and Site 865 suggests a unique oceanic environrnent during the isotopic excursion. Associated with the o ne excursion at Alamedilla is an increase in detrital content (Fig. 1), which suggests changes in ocean currents and/ or surface winds during the P-E transition.
Slow Excursion Scenario
The negative o ne excursion was estimated to have occurred over a few thousand years based on deep-sea re-
352
GANGYI LU ET AL.
cords (Kennett and Stott, 1991; Stótt, 1992; Pak and Miller, 1992; Lu and Keller, 1993; Thomas and Shackleton, 1996). However, if the discrepancy between the o 13e records from Alamedilla and deep sea is the result of differences in sedimentation rates, the timing of the o 13e excursion may have been underestirnated significantly. Foraminiferal biostratigraphy at Alamedilla suggests that the o13c excursion occurred gradually over 300 kyr (Fig. 3). Although this estimate has an error margin of ± 124 kyr (based on the error in the F AD of M. subbotina; Table 1), it represents a significantly longer interval. A slow o 13e excursion over a few hundred thousand years is readily explained by changing organic carbon weathering or burial rates (Berner, 1992; Raymo and Ruddiman, 1992; Selverstone and Gutzler, 1993). In contrast, a rapid o13e excursion of 2-3o/oo over a few thousand years implies a fast release of isotopically light carbon from huge carbon reservoirs that remain an enigma (Kennett and Stott, 1991; Stott, 1992; Zachos et al., 1993; Thomas and Shackleton, 1996).
CONCLUSION
Expanded sedimentary records from Alamedilla, Spain, reveal unique faunal, isotopic and sediment compositional changes across the Palaeocene-Eocene (P-E) transition. Unlike in the open oceans, the Alamedilla section exhibits a gradual decrease of 1%o in o13e values prior to the rapid o13e excursion. Associated with the o13e excursion is a decrease in calcite preservation, increase in detrital content and appearance of sorne unique planktic foraminiferal species (e.g. compressed acarininids). Foraminiferal and o13e stratigraphies suggest that the prelude o13e decrease is related to the short-terrn o 13e event rather than the long-terrn trend. The existence of this prelude decrease suggests that the rapid o13e excursion, currently estimated to have occurred over a few thousand years based on deep-sea records, may have occurred at a much slower rate over a few hundred thousand years. This significantly slower excursion rate can be easily explained by changing organic carbon weathering and/ or burial rates and, thus, avoids the need for ad hoc scenarios.
ACKNOWLEDGEMENTS
We thank D. Schrag for many discussions and for conducting stable isotope measurements in the stable isotope geochemistry laboratory of Princeton University. P. Koch and W. Wei provided important comments and suggestions on an early draft. This study was supported by NSF grant OCE-9021338, Swiss National Fund no. 8220--028367 and post-doctoral fellowship EX92-1721 5112 from the Spanish Ministry of Education and Science.
REFERENCES
Arenillas l. and Molina E. (in press) Bioestratigrafia y evolucion de las asociaciones de foraminiferos planctonicos del transito Paleoceno-Eocens en Alamedilla (Cordilleras Beticas), Rev. Esp. Micropaleont.
Aubry, M.-P., Berggren W. A., Stott L. D. and Sinha A. (1996) The upper Paleocene-lower Eocene stratigraphic record and the Paleocene/Eocene boundary carbon isotope excursion, Spec. Pub/. Geol. Soc. London., 101, 353-380.
Berggren W. A., Kent D. V. and Flynn J. J. (1985) Paleogene geochronology and chronostratigraphy. In: Geochronology and the Geological Recor (ed. by N. J. Snelling). Mem. Geol. Soc. London, 10, 211-260.
Berggren W. A. and Miller K. G. (1988) Paleogene planktonic foraminiferal biostratigraphy and magnetobiostratigraphy, Micropaleontology, 34, 362-380.
Bemer R. A. (1992) A model for atmospheric C02 over Phanerozoic time, Am. /. Sci., 291, 339-376.
Bralower T. J., Zachos J. C., Thomas E., Parrow M., Paul C. K., Kelly D. C., Premoli Silva l., Sliter W. V. and Lohmann K. C. (1995) Late Paleocene to Eocene paleoceanography of the equatorial Pacific Ocean: Stable isotopes recorded at Ocean Drilling Program Site 865, Allison Guyot, Paleoceanography, 10, 841-865.
Brass C. W., Southam J. R. and Peterson W. H. (1982) Warm saline bottom water in the ancient ocean, Nature, 296, 620-623.
Cande S. C. and Kent D. V. (1992) A new geomagnetic polarity time scale for the Late Cretaceous and Cenozoic, /. geophys. Res., 97, 13917-13951.
Canudo J. l., KellerG., Molina E. and Ortiz N. (1995) Planktic foraminiferal tumover and o13C isotopes across the PaleoceneEocene transition at Caravaca and Zumaya, Spain, Palaeogeogr. Pa/aeoc/im. Palaeoeco/., 114, 75-100.
1)1996 Blackwell Science Ltd, Terra Nova, 8, 347-355
813 C PALAEOCENE-EOCENE EXCURSION
Corfield R. M. and Cartlidge J. E. (1992) Oceanographic and climatic implications of the Palaeocene carbon isotope maximum, Terra Nova, 4, 443-455.
El-Naggar Z. R. (1966) Stratigraphy and planktonic forarninifera of the Upper Cretaceous-Lower Tertiary succession in the Esna-Idfu region, Nile Valley, Egypt. In: U.A.R. Britísh Mus. (Nat. Hist.), 81111., London, Geol. Suppl., no. 2.
Eldholm O. and Thomas E. (1993) Environrnental impact of vocanic margin fonnation, Earth Planet. Sci. Lett., 117, 319-329.
Gingerich P. D. (1986) Evolution and the fossil record: patterns, rates, and processes, Can. f. Zoo/., 65, 1053-1060.
Hoven S. A. and Rea D. K. (1992) Paleocene/ Eocene boundary changes in atmospheric
and oceanic circulation: A Southem Hemisphere record, Geology, 20, 15-18.
Kelly D. C., Bralower T. J., Zachos J. C., Thomas E. and Premoli Silva l. (1995) Rapid diversification of tropical Pacific planktonic foramirufera during the late Paleocene thennal maximum, Abstract with Programs, GSA.
Kennett J. P. and Stott L. D. (1990) Proteus and Proto-Oceanus: Paleogene oceans as revealed from Antarctic stable isotopic results, Proc. ODP, Sci. Results, 113, 865-879.
Kennett J. P. and Stott L. D. (1991) Abrupt deep-sea warrning, palaeoceanographic changes and benthic extinctions at the end of the Palaeocene, Nature, 353, 225--229.
Koch P. L., Zachos J. C. and Gingerich P. D. (1992) Correlation between isotope records in marine and continental carbon reservoirs near the Palaeocene/ Eocene boundary, Nature, 358, 319-322.
Lu G. and Keller G. (1993) The PaleoceneEocene transition in the Antarctic Indian Ocean: Inference from planktic foraminifera, Mar. Micropaleont., 21, 101-142.
Lu G. and Keller G. (1995) Planktic forarniniferalfaunal turnovers in the subtropical Pacific during the late Paleocene to early Eocene, f. Foram. Res., 25, 97-116.
Lu G. and Keller G. (1996) Separating ecological assemblages using stable isotope signals: late Paleocene to early Eocene planktic foramirufera, DSDP Site 577, /. Foram. Res., 26, 103-112.
Miller K. G., Janecek T. R., Katz M. E. and Keil D. J. (1987) Abyssal circulation and benthic forarniruferal changes near the Paleocene/Eocene boundary, Paleocea110-graphy, 2, 741-761.
Molina E., Canudo J. l., Martinez-Ruiz F, and Ortiz N. (1994) Integrated stratigra-
phy across the Paleocene/Eocene boyndary at Caravaca, southem Spain, Eclog. geol. Helv., 87, 47-61.
Oberhansli H. (1992) The influence of the Tethys on the bottom waters of the early Tertiary ocean. In: The Antarctic Paleoenvironment: A Perspective on Global Change (ed. by J. P. Kennett). Antarctic Research Series, 56, 167-184.
Oberhansli H. and Hsü K. J. (1986) Paleocene-Eocene paleoceanography. In: Mesozoic and Cenozoíc Oceans, Geodynarnics Series, 15, 85-100.
O'Connell S. B. O. (1990) Variations in upper Cretaceous and Cenozoic calcium carbonate precentages, Maud Rise, Weddell Sea, Antarctica, Proc. ODP, Sci. Results, 113, 971-984.
Ortiz N. (1994) Mass extinction of benthic foraminifera at the Paleocene/Eocene boundary. In: Extinctíon and the Fossil Record (ed. by E. Molina). Cuadernos interdisciplinares, Seminario Interdisciplinar Universidad Zaragoza, 5, 201-218.
Owen R.M. and Rea D. K. (1985) Sea floor hydrothennal activity links climate to tectonics: The Eocene C02 greenhouse, Science, 227, 166-169.
Pak D. K. and Miller K. G. (1992) Paleocene to Eocene benthic foramiruferal isotopes and assemblages: implications for deepwater circulation, Paleoceanography, 7, 405-422.
Raymo M. E. and Ruddiman W. F. (1992) Tectonic forcing of late Cenozoic dimate, Nature, 359, 117-122.
Rea D. K., Zachos J. C., Owen R. M. and Gingerich P. D. (1990) Global changes at the Paleocene-Eocene boundary: dimate and evolutionary consequences of tectonic events, Palaeogeogr. Palaeoclim. Palaeoecol., 79, 117-128.
Robert C. and KennettJ. P. (1994) Antarctic subtropical bumid episode at the Paleocene-Eocene boundary: Clay-mineral evidence, Geolo3y, 22, 211-214.
Selverstone J. and Gutzler D. S. (1993) Post-125 Ma carbon storage associated with continent-continent collision, Geology, 21, 885-888.
Shackleton N. J. (1986) Paleogene stable isotope events, Palaeogeogr. Palaeclim. Palaeoecol., 57, 91-102:
Shackleton N. J. (1987) The carbon isotope record of the Cenozoic: History of organic carbon burial and of oxygen in the ocean and atmosphere. In: Marine Petroleum Source Rocks (ed. by J. Brooks and A. J. Aeet). Spec. Pub/. Geol. Soc. London, 26, 423-434.
Shackleton N. J., Corfield R. M. and Hall
f)1996 Blackwell Science Ltd, Terra Nova, 8, 347-355
M. A. (1985) Stable isotope data and ontogeny of Paleocene planktic Foramirufera, /. Foram. Res., 15, 321-336.
Sloan L. C., Walker J. C. G., Moore, T. C. Jr. Rea D. K. and Zachos J. C. (1992) Possible methane-induced polar warrning in the early Eocene, Nature, 357, 320-322.
Speijer R. P. (1994) Extinction and recovery pattems in benthic foramiruferal paleocommunities across the Cretaceous/Paleogene and Paleocene/Eocene boundaries, PhD thesis, Uruversiteit Utrecht, Geol. Ultraíect., No.124., 191 p.
Spiea V. (1990) Cenozoic magnetostratigraphy of Leg 113 drill sites, Maud Rise, Weddell Sea, Antarctica, Proc. ODP Sci. Results, 113, 261-315.
Stott L. D. (1992) Higher temperatures and lower oceanic PCOi: a clima te enigma at the end of the Paleocene Epoch, Paleoceanography, 7, 395-404.
Stott L. D., Kennett J. P., Shackleton N. J. and Corfield R. M. (1990) The evolution of Antarctic surface waters during the Paleogene: lnferences from the stable isotopic composition of planktonic foraminifers, ODP Leg 113, Proc. ODP, Sci. Results, 113, 849-863.
Stott L. D., Sinha A., Tiry M., Aubry M.P. and Berggren W. A. (1996) The transfer of 12C changes from the ocean to the terrestrial biosphere across the Paleocene/ Eocene boundary: criteria for terrestrial-marine correlations, Spec. Pub/. Geol. Soc. London., 101, 381-400.
Thomas E. (1990) Late Cretaceous through Neogene deep-sea benthic foraminifers (Maud Rise, Weddell Sea, Antarctica), Proc. ODP, Sci. Results, 113, 571-594.
Thomas E. and Shackleton N. J. (1996) The latest Palaeocene benthic foraminiferal extinction and stable isotope anomalies. Spec. Pub/. Geol. Soc. London, 101, 401-441.
Wing S. L., Bown T. M. and Obradovich J. D. (1991) Early Eocene biotic and clima tic change in interior western America, Geology, 19, 1189-1192.
Zachos J. C., Lohmann K. C., Walker J. C. G. and Wise S. W. (1993) Abrupt climate change and transient clima tes during the Paleogene: a marine perspective, /. Geol., 101, 191-213.
Zachos J. C., Stott L. D. and Lohmann K. C. (1994) Evolution of early Cenozoic temperatures, Paleoceanography, 9, 353-387.
Receíved 10 May 1995; revisío11 accepted 27 February 1996.
353
GANGYI LU ET AL.
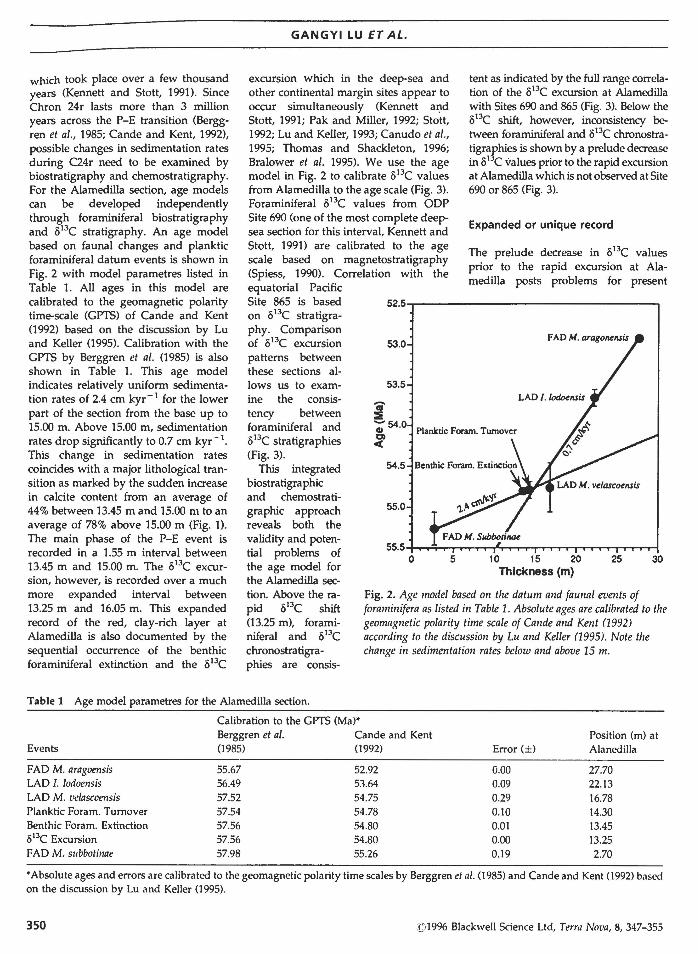
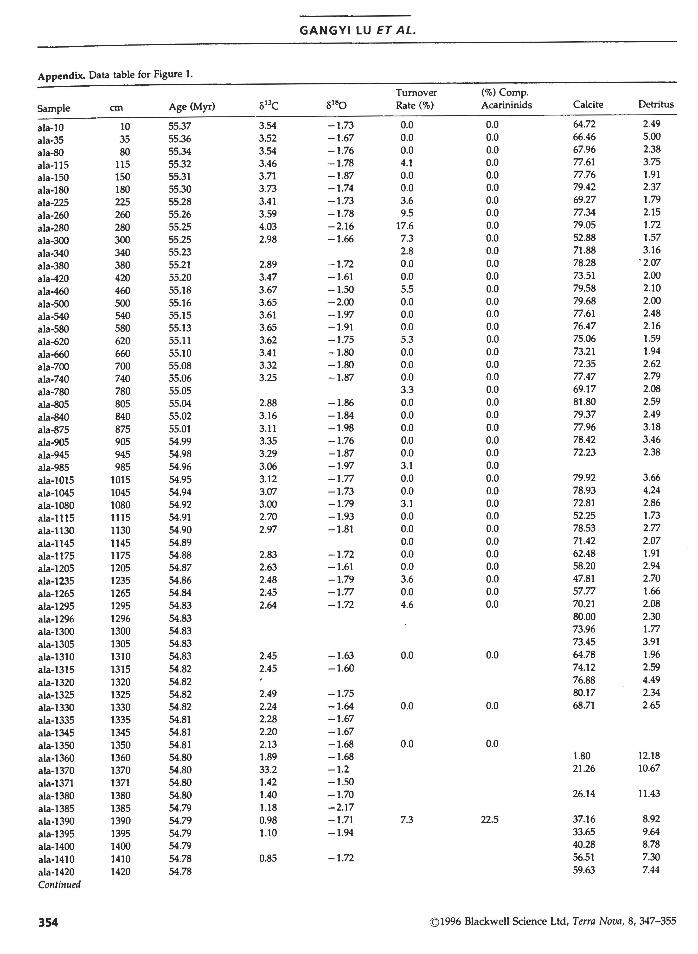
Appendix. Data table for Figure 1.
Tumover (%)Comp.
Sample cm Age (Myr) o13C 0180 Rate (%) Acarininids Calcite Detritus
ala-10 10 55.37 3.54 -1.73 o.o o.o 64.72 2.49
ala-35 35 55.36 3.52 -1.67 o.o o.o 66.46 5.00
ala-80 80 55.34 3.54 -1.76 o.o o.o 67.96 2.38
ala-115 115 55.32 3.46 -1.78 4.1 o.o 77.61 3.75
ala-150 150 55.31 3.71 -1.87 o.o o.o 77.76 1.91
ala-180 180 55.30 3.73 -1.74 o.o o.o 79.42 2.37
ala-225 225 55.28 3.41 -1.73 3.6 o.o 69.27 1.79
ala-260 260 55.26 3.59 -1.78 9.5 o.o 77.34 2.15
ala-280 280 55.25 4.03 -2.16 17.6 o.o 79.05 1.72
ala-300 300 55.25 2.98 -1.66 7.3 o.o 52.88 1.57
ala-340 340 55.23 2.8 o.o 71.88 3.16
ala-380 380 55.21 2.89 -1.72 o.o o.o 78.28 '2.07
ala-420 420 55.20 3.47 -1.61 o.o o.o 73.51 2.00
ala-460 460 5S.18 3.67 -1.50 S.5 o.o 79.58 2.10
ala-500 500 S5.16 3.6S -2.00 o.o o.o 79.68 2.00
ala-540 540 S5.15 3.61 -1.97 o.o o.o 77.61 2.48
ala-580 580 55.13 3.65 -1.91 o.o o.o 76.47 2.16
ala-620 620 55.11 3.62 -1.7S 5.3 o.o 75.06 1.59
ala-660 660 SS.10 3.41 -1.80 o.o o.o 73.21 1.94
ala-700 700 SS.08 3.32 -1.80 o.o o.o 72.35 2.62
ala-740 740 55.06 3.2S -1.87 o.o o.o 77.47 2.79
ala-780 780 SS.OS 3.3 o.o 69.17 2.08
ala-805 805 5S.04 2.88 -1.86 o.o o.o 81 .80 2.59
ala-840 840 SS.02 3.16 -1.84 o.o o.o 79.37 2.49
ala-875 875 S5.01 3.11 -1.98 o.o o.o 77.96 3.18
ala-905 90S 54.99 3.3S -1.76 o.o o.o 78.42 3.46
ala-945 945 54.98 3.29 -1.87 o.o o.o 72.23 2.38
ala-985 985 54.96 3.06 -1.97 3.1 o.o ala-1015 101S 54.95 3.12 -1.77 o.o o.o 79.92 3.66
ala-1045 104S 54.94 3.07 -1.73 o.o o.o 78.93 4.24
ala-1080 1080 54.92 3.00 -1.79 3.1 o.o 72.81 2.86
ala-1115 111S 54.91 2.70 -1.93 o.o o.o 52.2S 1.73
ala-1130 1130 54.90 2.97 -1.81 o.o o.o 78.53 2.77
ala-1145 114S 54.89 o.o o.o 71.42 2.07
ala-1175 1175 54.88 2.83 -1.72 o.o o.o 62.48 1.91
ala-1205 120S 54.87 2.63 -1.61 o.o o.o S8.20 2.94
ala-1235 123S 54.86 2.48 -1.79 3.6 o.o 47.81 2.70
ala-1265 1265 54.84 2.45 -1.77 o.o o.o 57.77 1.66
ala-1295 129S 54.83 2.64 -1.72 4.6 o.o 70.21 2.08
ala-1296 1296 54.83 80.00 2.30
ala-1300 1300 54.83 73.96 1.77
ala-1305 130S 54.83 73.4S 3.91
ala-1310 1310 54.83 2.45 -1.63 o.o o.o 64.78 1.96
ala-1315 1315 54.82 2.45 -1.60 74.12 2.59
ala-1320 1320 54.82 76.88 4.49
ala-1325 132S 54.82 2.49 -1.7S 80.17 2.34
ala-1330 1330 54.82 2.24 -1.64 o.o o.o 68.71 2.65
ala-1335 1335 54.81 2.28 -1.67
ala-1345 1345 54.81 2.20 -1.67
ala-1350 1350 54.81 2.13 -1.68 o.o o.o ala-1360 1360 54.80 1.89 -1.68 1.80 12.18
ala-1370 1370 54.80 33.2 -1.2 21.26 10.67
ala-1371 1371 54.80 1.42 -1.50
ala-1380 1380 54.80 1.40 -1.70 26.14 11.43
ala-1385 138S 54.79 1.18 -2.17
ala-1390 1390 54.79 0.98 -1.71 7.3 22.5 37.16 8.92
ala-1395 139S 54.79 1.10 -1.94 33.6S 9.64
ala-1400 1400 54.79 40.28 8.78
ala-1410 1410 54.78 0.8S -1.72 S6.S1 7.30
ala-1420 1420 54.78 S9.63 7.44
Continued
354 ©1996 Blackwell Science Ltd, Terra Nova, 8, 347-355
o13 C PALAEOCENE-EOCENE EXCURSION
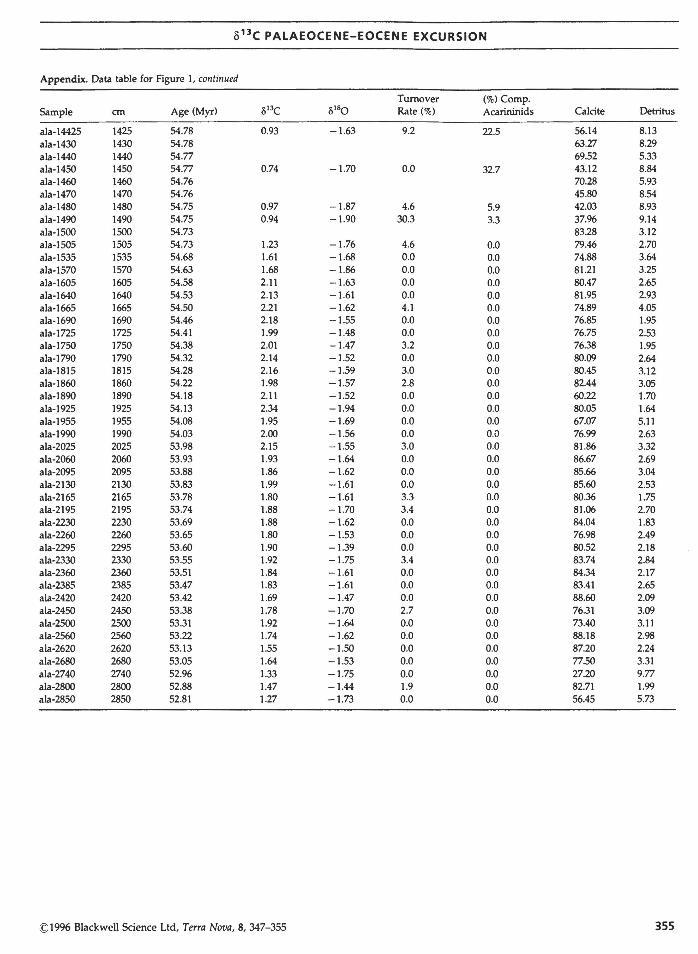
Appendix. Data table for Figure 1, continued
Turnover (%)Comp. Sample cm Age (Myr) o13C º1so Rate (%) Acarininids Calcite Detritus
ala-14425 1425 54.78 0.93 -1 .63 9.2 22.5 56.14 8.13 ala-1430 1430 54.78 63.27 8.29 ala-1440 1440 54.77 69.52 5.33 ala-1450 1450 54.77 0.74 -1.70 o.o 32.7 43.12 8.84 ala-1460 1460 54.76 70.28 5.93 ala-1470 1470 54.76 45.80 8.54 ala-1480 1480 54.75 0.97 -1.87 4.6 5.9 42.03 8.93 ala-1490 1490 54.75 0.94 -1.90 30.3 3.3 37.96 9.14 ala-1500 1500 54.73 83.28 3.12 ala-1505 1505 54.73 1.23 -1.76 4.6 o.o 79.46 2.70 ala-1535 1535 54.68 1.61 -1.68 o.o o.o 74.88 3.64 ala-1570 1570 54.63 1.68 -1.86 o.o o.o 81.21 3.25 ala-1605 1605 54.58 2.11 -1.63 o.o o.o 80.47 2.65 ala-1640 1640 54.53 2.13 -1.61 o.o o.o 81.95 2.93 ala-1665 1665 54.50 2.21 -1.62 4.1 o.o 74.89 4.05 ala-1690 1690 54.46 2.18 -1.55 o.o o.o 76.85 1.95 ala-1n5 1725 54.41 1.99 -1.48 o.o o.o 76.75 2.53 ala-1750 1750 54.38 2.01 -1.47 3.2 o.o 76.38 1.95 ala-1790 1790 54.32 2.14 -1.52 o.o o.o 80.09 2.64 ala-1815 1815 54.28 2.16 -1.59 3.0 o.o 80.45 3.12 ala-1860 1860 54.22 1.98 -1.57 2.8 o.o 82.44 3.05 ala-1890 1890 54.18 2.11 -1.52 o.o o.o 60.22 1.70 ala-1925 1925 54.13 2.34 -1.94 o.o O.O 80.05 1.64 ala-1955 1955 54.08 1.95 -1.69 o.o o.o 67.07 5.11 ala-1990 1990 54.03 2.00 -1 .56 o.o o.o 76.99 2.63 ala-2025 2025 53.98 2.15 -1.55 3.0 o.o 81.86 3.32 ala-2060 2060 53.93 1.93 -1.64 o.o O.O 86.67 2.69 ala-2095 2095 53.88 1.86 -1.62 o.o O.O 85.66 3.04 ala-2130 2130 53.83 1.99 -1.61 o.o O.O 85.60 2.53 ala-2165 2165 53.78 1.80 -1.61 3.3 o.o 80.36 1.75 ala-2195 2195 53.74 1.88 -1.70 3.4 o.o 81.06 2.70 ala-2230 2230 53.69 1.88 -1.62 o.o o.o 84.04 1.83 ala-2260 2260 53.65 1.80 -1.53 o.o o.o 76.98 2.49 ala-2295 2295 53.60 1.90 -1 .39 o.o o.o 80.52 2.18 ala-2330 2330 53.55 1.92 -1.75 3.4 o.o 83.74 2.84 ala-2360 2360 53.51 1.84 -1.61 o.o o.o 84.34 2.17 ala-2385 2385 53.47 1.83 -1 .61 o.o o.o 83.41 2.65 ala-2420 2420 53.42 1.69 -1.47 o.o o.o 88.60 2.09 ala-2450 2450 53.38 1.78 -1.70 2.7 o.o 76.31 3.09 ala-2500 2500 53.31 1.92 -1.64 o.o o.o 73.40 3.11 ala-2560 2560 53.22 1.74 -1 .62 o.o o.o 88.18 2.98 ala-2620 2620 53.13 1.55 -1 .50 o.o o.o 87.20 2.24 ala-2680 2680 53.05 1.64 -1.53 o.o o.o 77.50 3.31 ala-2740 2740 52.96 1.33 -1.75 o.o O.O 27.20 9.77 ala-2800 2800 52.88 1.47 -1.44 1.9 O.O 82.71 1.99 ala-2850 2850 52.81 1.27 -1.73 o.o o.o 56.45 5.73
~1996 Blackwell Science Ltd, Terra Nova, 8, 347-355 355