Nestle Term Paper
42
TERM PAPER ON NESTLE INDIA LIMITED SUBMITTED TO : SUBMITTED BY : MRS. SHELLY ANSHITA GAURI ROLL NO. : RR1003B51 REGD. NO. : 11003325
Transcript of Nestle Term Paper

TERM PAPER ON NESTLE INDIA LIMITED
SUBMITTED TO : SUBMITTED BY:
MRS. SHELLY ANSHITA GAURI
ROLL NO. : RR1003B51
REGD. NO. : 11003325

About company A Nestle India ltd. was established in 1959. And itschairman is Antonio Helio Waszyk. And its secretary is BMurli. Nestle India is a subsidiary of Nestle S.A ofSwitzerland with seven factories and a large number of co-packers.Brands of the company are grouped under four categories, Milk Products& Nutrition, Prepared Dishes & Cooking Aids, Beverages and Chocolates &Confectionery. Nestle has been a cohort in India's growth and has builta very special relationship of trust and commitment with the people ofIndia. The Company's activities in India have facilitated direct andindirect employment and afforded livelihood to about one million peopletogether with farmers, suppliers of packaging materials, services andother goods. Nestle India manufactures products of truly internationalquality under internationally famous brand names and in recent yearsthe company has also introduced products of daily consumption and usesuch as NESTLE Milk, NESTLE SLIM Milk, NESTLE Fresh 'n' Natural Dahiand NESTLE Jeera Raita.
Beginning with its first investment in Moga in 1961,where the Government wanted Nestle to develop the milkeconomy. Progress in Moga required the introduction ofNestle's Agricultural Services to educate, advise andhelp the farmer in a variety of aspects. Nestle'sregular and substantial investments established that itwas here to stay. In 1967, Nestle set up its nextfactory at Choladi (Tamil Nadu) as a pilot plant toprocess the tea grown in the area into soluble tea. The

Nanjangud factory (Karnataka) became operational in theyear 1989. In 1990, the company entered into thechocolate business by introducing Nestle PremiumChocolate. During the period of 1991, the companyentered in JV floated by the parent in collaborationwith BM Khaitan group to set up facilities tomanufacturing a range of Soya based products. TheSamalkha factory (Haryana) was started its operation in1993. Kitkat, the company's worldwide legendary brandchocolate was launched in the year 1995. Nestlecommissioned two factories in Goa at Ponda and Bicholimin the year 1995 and 1997 respectively. Nestle GrowingUp Milk was launched nationally in the year 1999. In April 2000, the company forayed into the Ultra HeatTreated (UHT) liquid milk market. Launched Nestle PureLife bottled water in the year 2001 by the company,within few months, again launched its second waterbrand-San Pellegrino-- in the Indian market. The companyalso made its foray into the iced tea segment. Iced teahas already been soft-launched in Mumbai in twoflavours, one being peach. The company commencedparticipation in this global Nestle initiative in theyear 2003 to create and adapt common business process,permitting adoption of best practices, standardizationof internal and external master data and standardizationof the information systems infrastructure. During theyear 2004, a project has been initiated to upgrade theproduction technology for infant nutrition products atthe Samalkha factory. Nestle India Ltd recognised forits outstanding performance in Exports by the Coffee

Board of India in the Export Awards 2004-05 as the BestExporter of Instant Coffee, Best Exporter to Russia &CIS Countries (coffee) and Best Exporter for Far EastCountries (coffee). The company bestowed the UDYOG RATNAaward by the PHD Chamber of Commerce and Industry torecognise Nestle's significant contribution to theeconomic development of Punjab for the year 2005. A newdepartment -the Channel & Category Sales Development(CCSD) was set up to develop new solutions for thevarious channels and customers and improve theimplementation of commercial plans in the market. The factory in Moga was also conferred the PunjabGovernment's award for ‘Environmental Excellence’. Againrecognised for its outstanding performance in Exports bythe Coffee Board of India in the Export Awards 2005-06as the Second Highest Exporter of Instant Coffee andSecond Highest Exporter of Coffee to the Far Eastcountries. The Company has received the highest coffeeexporter awards from the Coffee Board of India for manyyears. It is also an honour for the company that in asurvey conducted by A.C. Nielsen for CNBC, consumersvoted NESCAFE as the most preferred coffee brand of thenation during 2005-06. Nestle India has commissioned its7th factory at Pant Nagar in Uttrakhand during theperiod 2006 for the purpose of manufacture culinaryproducts with cost of around Rs.100 Crores. During the year 2007, CNBC Asia presented the companywith the India Innovator of the year award. In the year2007, Nestle continued to upgrade its production

capacity, new production lines/technology were put up atthe plants in Pantnagar, Moga, Ponda and Nanjangud. Asin the same year, CRISIL assigned Nestle India a creditrating `AAA' with stable outlook and also in theidentical year 2007, the company's four factories wereawarded the internationally recognised externalcertification ISO 14001 for adherence to environmentalprocesses and OSHAS 18001 for Health and Safety. TheMoga Milk district model has been highly appreciated; itwas started with collection of only 511 kgs of milk from180 farmers, even, now the milk collection is stood upto 1.2 million liters per day from 1,00,000 farmersprosper. The collection agencies are 2400 as of 2007;it's a tremendous growth in this sector of the company.
Nestle India manufactures products of trulyinternational quality under internationally famous brandnames such as NESCAF, MAGGI, MILKYBAR, MILO, KIT KAT,BAR-ONE, MILKMAID and NESTEA. The company continuouslyfocuses its efforts to better understand the changinglifestyles of India and anticipate consumer needs inorder to provide Taste, Nutrition, Health and Wellnessthrough its product offerings. The culture of innovationand renovation within the company and access to theNestle Group's proprietary technology/Brands expertiseand the extensive centralized Research and Developmentfacilities gives it a distinct advantage in theseefforts.

General directors of the nestle India ltd.
Director (Finance & Control)
Shobinder Duggal
1,33,67,000.00
Director Pradip Baijal5,90,000.0
0
DirectorMicheel W O Garrett
4,10,000.00
DirectorRavinder Narain
6,10,000.00
Alternate Director Richard Sykes -Senior Vice President & CS B Murli -Chairman & Managing Director
Antonio Helio Waszyk
1,25,91,000.00
Director Rakesh Mohan -
Non Executive DirectorSwati A Piramal -
Director (Technical)Christian Schmid -

BALANCE SHEET OF NESTLE INDIA Ltd.
(Rs in Crs)
YearDec 09
Dec 08
Dec 07
SOURCES OF FUNDS : Share Capital 96.42 96.42 96.42
Reserves Total 484.8
5376.9
3322.0
1 Equity Share Warrants 0 0 0 Equity Application Money 0 0 0
Total Shareholders Funds581.2
7473.3
5418.4
3 Secured Loans 0 0 2.87 Unsecured Loans 0 0 0 Total Debt 0 0 2.87 Total Liabilities 581.2 473.3 421.3

7 5 APPLICATION OF FUNDS :
Gross Block 1,640
.791,404
.841,179.77
Less : Accumulated Depreciation
744.59
651.54
576.79
Less : Impairment of Assets 0 0.31 1.17
Net Block 896.2752.9
9601.8
1 Lease Adjustment 0 0 0
Capital Work in Progress 79.63109.1
7 73.7
Investments 203.2
6 34.9 94.4 Current Assets, Loans & Advances
Inventories 498.7
4434.9
1401.2
2 Sundry Debtors 64.19 45.59 53.49
Cash and Bank155.5
8193.6
9 37.76
Loans and Advances 138.0
5123.7
6145.3
9
Total Current Assets856.5
6797.9
5637.8
6 Less : Current Liabilities and Provisions
Current Liabilities 587.5
9507.4
6459.9
7
Provisions 834.7
9677.3
2 497.8 Total Current Liabilities
1,422.38
1,184.78
957.77
Net Current Assets
-565.8
2
-386.8
3
-319.9
1 Miscellaneous Expenses not written off 0 0 0 Deferred Tax Assets 46.8 38.91 40.84 Deferred Tax Liability 78.8 75.79 69.54
Net Deferred Tax -32-
36.88 -28.7
Total Assets581.2
7473.3
5 421.3 Contingent Liabilities 0 0 0

PROFIT & LOSS ACCOUNT OF NESTLE INDIA Ltd.
(Rs in Crs)
YearDec 09(12)
Dec 08(12)
Dec 07(12)
INCOME :
Sales Turnover 5,222.
424,471.
063,647.
18 Excise Duty 90.68 143.39 146.53
Net Sales5,131.
744,327.
673,500.
65 Other Income 37.8 33.89 84.48 Stock Adjustments 6.29 31.12 71.01
Total Income5,175.
834,392.
683,656.
14 EXPENDITURE :
Raw Materials 2,073.
251,785.
511,473.
79 Power & Fuel Cost 158.87 159.76 123.94 Employee Cost 432.39 306.92 262.86 Other Manufacturing Expenses 524.8 476.36 380.79 Selling and AdministrationExpenses 868.96 723.32 598.72 Miscellaneous Expenses 87.91 73.99 111.84 Less: Pre-operative Expenses Capitalised 0 0 0
Total Expenditure4,146.
183,525.
862,951.
94
Operating Profit1,029.
65 866.82 704.2 Interest 1.4 1.64 0.85
Gross Profit1,028.
25 865.18 703.35 Depreciation 111.27 92.36 74.74 Profit Before Tax 916.98 772.82 628.61 Tax 265.34 222.31 193.9 Fringe Benefit tax 1.52 8.25 4.21 Deferred Tax -4.88 8.18 16.69 Reported Net Profit 655 534.08 413.81 Extraordinary Items -2.17 -1.91 -13.44 Adjusted Net Profit 657.17 535.99 427.25 Adjst. below Net Profit 0 0 0 P & L Balance brought 100.11 12.52 10.47

forward Statutory Appropriations 0 0 0 Appropriations 612.59 446.49 411.76 P & L Balance carried down 142.52 100.11 12.52 Dividend 467.62 409.77 318.17 Preference Dividend 0 0 0 Equity Dividend % 485 425 330 Earnings Per Share-Unit Curr 59.69 48.17 37.5 Earnings Per Share(Adj)-Unit Curr Book Value-Unit Curr 60.29 49.09 43.4


COMPARATIVE BALANCE SHEET OF NESTLE INDIALtd.
YearDec 09
Dec 08
Absolute
increase ordecrease
Percentage
increase ordecrease Dec 08
Dec07
Absolute
increase ordecrease
Percentage
increase ordecrea
se SOURCES OF FUNDS : Share Capital 96.42 96.42 0 0 96.42 96.42 0 0 Reserves Total
484.85
376.93 107.92 28.63 376.93
322.01 54.92 17.06
Equity Share Warrants 0 0 0 0 0 0 Equity Application Money 0 0 0 0 0 0 Total Shareholders Funds
581.27
473.35 107.92 22.80 473.35
418.43 54.92 13.13
Secured Loans 0 0 0 0 2.87 -2.87 -100 Unsecured Loans 0 0 0 0 0 0 Total Debt 0 0 0 0 2.87 -2.87 -100 Total Liabilities
581.27
473.35 107.92 22.80 473.35 421.3 52.05 12.35
APPLICATION OF FUNDS :
Gross Block1,640.79
1,404.84 235.95 16.80 1,404.84
1,179.77 225.07 19.08
Less : Accumulated Depreciation
744.59
651.54 93.05 14.28 651.54
576.79 74.75 12.96
Less:Impairment of Assets 0 0.31 -0.31 -100 0.31 1.17 -0.86 -73.50
Net Block 896.2752.9
9 143.21 19.02 752.99601.8
1 151.18 25.12 Lease Adjustment 0 0 0 0 0 0 Capital Workin Progress 79.63
109.17 -29.54 -27.06 109.17 73.7 35.47 48.13
Investments203.2
6 34.9 168.36 482.41 34.9 94.4 -59.5 -63.03 Current Assets, Loans& Advances
Inventories 498.7
4434.9
1 63.83 14.68 434.91401.2
2 33.69 8.40 Sundry Debtors 64.19 45.59 18.6 40.80 45.59 53.49 -7.9 -14.77 Cash and Bank
155.58
193.69 -38.11 -19.68 193.69 37.76 155.93 412.95
Loans and Advances
138.05
123.76 14.29 11.55 123.76
145.39 -21.63 -14.88
Total Current Assets
856.56
797.95 58.61 7.35 797.95
637.86 160.09 25.10
Less : Current Liabilities and Provisions Current Liabilities
587.59
507.46 80.13 15.79 507.46
459.97 47.49 10.32
Provisions 834.7
9677.3
2 157.47 23.25 677.32 497.8 179.52 36.06 Total Current Liabilities
1,422.38
1,184.78 237.6 20.05 1,184.78
957.77 227.01 23.70
Net CurrentAssets
-565.8
2
-386.8
3-
178.99 46.27 -386.83
-319.9
1 -66.92 20.92 MiscellaneousExpenses not written off 0 0 0 0 0 0 Deferred Tax Assets 46.8 38.91 7.89 20.28 38.91 40.84 -1.93 -4.73

Deferred Tax Liability 78.8 75.79 3.01 3.97 75.79 69.54 6.25 8.99 Net Deferred Tax -32
-36.88 4.88 -13.23 -36.88 -28.7 -8.18 28.50
Total Assets
581.27
473.35 107.92 22.80 473.35 421.3 52.05 12.35
Contingent Liabilities 0 0 0 0 0 0

COMPARATIVEINCOME STATEMENT OF NESTLE INDIA Ltd.
YearDec
09(12)
Dec08(12)
Absolute
increase ordecrease
Percentageincreaseor
decrease
Dec08(12)
Dec07(12)
Absolute
increase ordecrea
se
Percentageincrease ordecrease
Sales Turnover
5,222.42
4,471.06 751.36 16.80
4,471.06
3,647.18 823.88 22.59
Excise Duty 90.68
143.39 -52.71
-36.76
143.39
146.53 -3.14 -2.14
Net Sales5,131.
744,327.67 804.07 18.58
4,327.67
3,500.65 827.02 23.62
Other Income 37.8 33.89 3.91 11.54 33.89 84.48 -50.59 -59.88 Stock Adjustments 6.29 31.12 -24.83
-79.79 31.12 71.01 -39.89 -56.18
Total Income
5,175.83
4,392.68 783.15 17.83
4,392.68
3,656.14 736.54 20.15
EXPENDITURE : Raw Materials
2,073.25
1,785.51 287.74 16.11
1,785.51
1,473.79 311.72 21.15
Power & Fuel Cost 158.87
159.76 -0.89 -0.56
159.76
123.94 35.82 28.90
Employee Cost 432.39
306.92 125.47 40.88
306.92
262.86 44.06 16.76
Other Manufacturing Expenses 524.8
476.36 48.44 10.17
476.36
380.79 95.57 25.10
Selling andAdministration Expenses 868.96
723.32 145.64 20.13
723.32
598.72 124.60 20.81
Miscellaneous Expenses 87.91 73.99 13.92 18.81 73.99
111.84 -37.85 -33.84
Less: Pre-operative Expenses
0 0 0.00 0 0 0.00

Capitalised Total Expenditure
4,146.18
3,525.86 620.32 17.59
3,525.86
2,951.94 573.92 19.44
Operating Profit
1,029.65
866.82 162.83 18.78
866.82 704.2 162.62 23.09
Interest 1.4 1.64 -0.24-
14.63 1.64 0.85 0.79 92.94 Gross Profit
1,028.25
865.18 163.07 18.85
865.18
703.35 161.83 23.01
Depreciation 111.27 92.36 18.91 20.47 92.36 74.74 17.62 23.58 Profit Before Tax 916.98
772.82 144.16 18.65
772.82
628.61 144.21 22.94
Tax 265.34222.3
1 43.03 19.36222.3
1 193.9 28.41 14.65 Fringe Benefit tax 1.52 8.25 -6.73
-81.58 8.25 4.21 4.04 95.96
Deferred Tax -4.88 8.18 -13.06
-159.6
6 8.18 16.69 -8.51 -50.99 Reported Net Profit 655
534.08 120.92 22.64
534.08
413.81 120.27 29.06
Extraordinary Items -2.17 -1.91 -0.26 13.61 -1.91
-13.44 11.53 -85.79
Adjusted Net Profit 657.17
535.99 121.18 22.61
535.99
427.25 108.74 25.45
Interpretation of comparative income statement
Company sales are increasing so company has increased its stock.
Company income are increasing because company has decreased it expenditure compare to 2008. Because of decrease in expenditure company income are increasing.
Company gross profit are increasing . It means company has decreased its cost of production. Because of decrease in cost of production company gross profit are increasing.
Company net profit are increasing due to increase in sales.

COMMON SIZE OF BALANCE SHEET OF NESTLE INDIA Ltd.
(Rs in Crs)
Amount
(Rs) %
Amount
(Rs) %
Amount
(Rs) %
YearDec-09
Dec08
Dec07
SOURCES OF FUNDS : Share Capital 96.42 16.59 96.42 20.37 96.42 22.89
Reserves Total 484.8
5 83.41376.9
3 376.93322.0
1 76.43 Equity Share Warrants 0 0 0 0 0 0 Equity Application Money 0 0 0 0 0 0
Total Shareholders Funds581.2
7 100473.3
5 100418.4
3 99.32 Secured Loans 0 0 0 0 2.87 0.68 Unsecured Loans 0 0 0 0 0 0 Total Debt 0 0 0 0 2.87 0.68
Total Liabilities581.2
7 100473.3
5 100 421.3 100 APPLICATION OF FUNDS :
Gross Block 1,640
.79 282.281,404.84 296.79
1,179.77 280.03
Less : Accumulated Depreciation
744.59 128.10
651.54 137.64
576.79 136.91
Less:Impairment of Assets 0 0 0.31 0.07 1.17 0.28
Net Block 896.2 154.18752.9
9 159.08601.8
1 142.85 Lease Adjustment 0 0 0 0 0 0
Capital Work in Progress 79.63 13.70109.1
7 23.06 73.7 17.49
Investments 203.2
6 34.97 34.9 7.37 94.4 22.41 Current Assets, Loans & Advances
Inventories 498.7
4 85.80434.9
1 91.88401.2
2 95.23 Sundry Debtors 64.19 11.04 45.59 9.63 53.49 12.70
Cash and Bank155.5
8 26.77193.6
9 40.92 37.76 8.96
Loans and Advances 138.0
5 23.75123.7
6 26.15145.3
9 34.51

Total Current Assets856.5
6 147.36797.9
5 168.58637.8
6 151.40 Less : Current Liabilities and Provisions
Current Liabilities 587.5
9 101.09507.4
6 107.20459.9
7 109.18
Provisions 834.7
9 143.61677.3
2 143.09 497.8 118.16 Total Current Liabilities
1,422.38 244.70
1,184.78 250.30
957.77 227.34
Net Current Assets
-565.8
2 -97.34
-386.8
3 -81.72
-319.9
1 -75.93 Miscellaneous Expenses not written off 0 0 0 0 0 0 Deferred Tax Assets 46.8 8.05 38.91 8.22 40.84 9.69 Deferred Tax Liability 78.8 13.56 75.79 16.01 69.54 16.51
Net Deferred Tax -32 -5.50-
36.88 -7.79 -28.7 -6.81
Total Assets581.2
7 100473.3
5 100 421.3 100 Contingent Liabilities 0 0 0 0 0 0

C0MMON SIZE INCOME STATEMENT OF NESTLE INDIA Ltd.
(Rs in Crs)
Amount
(Rs) %
Amount
(Rs) %
Amount
(Rs) %
Year
Dec09(12)
Dec08(12)
Dec07(12)
INCOME :
Sales Turnover 5,222
.42101.
774,471
.06103.3
13,647
.18104.1
9
Excise Duty 90.68 1.77143.3
9 3.31146.5
3 4.19
Net Sales5,131
.74100.
004,327
.67100.0
03,500
.65100.0
0 Other Income 37.8 0.74 33.89 0.78 84.48 2.41 Stock Adjustments 6.29 0.12 31.12 0.72 71.01 2.03
Total Income5,175
.83100.
864,392
.68101.5
03,656
.14104.4
4 EXPENDITURE :
Raw Materials 2,073
.2540.0
61,785
.51 41.261,473
.79 42.10
Power & Fuel Cost158.8
7 3.10159.7
6 3.69123.9
4 3.54
Employee Cost 432.3
9 8.43306.9
2 7.09262.8
6 7.51 Other Manufacturing Expenses 524.8
10.23
476.36 11.01
380.79 10.88
Selling and Administration Expenses
868.96
16.93
723.32 16.71
598.72 17.10
Miscellaneous Expenses 87.91 1.71 73.99 1.71111.8
4 3.19 Less: Pre-operative ExpensesCapitalised 0 0 0 0 0 0
Total Expenditure4,146
.1880.7
93,525
.86 81.472,951
.94 84.33
Operating Profit1,029
.6520.0
6866.8
2 20.03 704.2 20.12 Interest 1.4 0.03 1.64 0.04 0.85 0.02
Gross Profit1,028
.2520.0
6865.1
8 19.99703.3
5 20.09 Depreciation 111.2 2.17 92.36 2.13 74.74 2.14

7
Profit Before Tax916.9
817.8
7772.8
2 17.86628.6
1 17.96
Tax265.3
4 5.17222.3
1 5.14 193.9 5.54 Fringe Benefit tax 1.52 0.03 8.25 0.19 4.21 0.12
Deferred Tax -4.88-
0.10 8.18 0.19 16.69 0.48
Reported Net Profit 65512.7
6534.0
8 12.34413.8
1 11.82
Extraordinary Items -2.17-
0.04 -1.91 -0.04-
13.44 -0.38
Adjusted Net Profit657.1
712.8
1535.9
9 12.39427.2
5 12.20
Interpretation of comparative balance sheet
Current assets are increasing 58.61(7.31%) except cash and bank are decreasing,All current assets are increasing. Debotors are increasing by 40.79%. it means company can pay its short term liabilties easily.
Company current liabilities are increasing comparison to 2007 so company should try to reduce its current liabilities. Its not satisfactory .
Fixed assets of company are increasing by %.it means company has increased it fixed assets so company can pay it long term liabilities .
Company share capital is not increasing compare to previous year company has not issued new share capital to increase its share capital. But company has increased its reserve fund .It means company are increasing its reserve n surplus fund for future contingency.

Total assets of company are increasing so company has increased it’s capital ,so company can use it to pay its liabilities.
Company investment are increasing it means company has increased its investment and company cash are decreasing it means company used its cash to purchase the new investment or pay short term liabilities.
Company stock are increasing and company sales are also increasing .it means company are increasing its stock for the sales and company debtors are also increasing due to increase in sales of company.

TREND ANALYSIS OF BALANCE SHEET OF NESTLE INDIA Ltd.
(Rs in Crs)
Absolute
Amounts
(Rs.)
TrendPercentage %
Absolute
Amounts
(Rs.)
TrendPercentage %
Absolute
Amounts
(Rs.)
TrendPercentage %
YearDec09
Dec08
Dec07
SOURCES OF FUNDS : Share Capital 96.42 100 96.42 100 96.42 100
Reserves Total 484.85150.569
9 376.93117.055
4 322.01 100 Equity Share Warrants 0 0 0 0 0 100 Equity Application Money 0 0 0 0 0 100
Total Shareholders Funds 581.27138.916
9 473.35113.125
3 418.43 100 Secured Loans 0 0 0 0 2.87 100 Unsecured Loans 0 0 0 0 0 100 Total Debt 0 0 0 0 2.87 100
Total Liabilities 581.27137.970
6 473.35112.354
6 421.3 100 APPLICATION OF FUNDS :
Gross Block 1,640.
79139.077
11,404.
84119.077
41,179.
77 100 Less : Accumulated Depreciation 744.59 129.092 651.54
112.9597 576.79 100
Less:Impairment of Assets 0 0 0.31
26.49573 1.17 100
Net Block 896.2148.917
4 752.99125.120
9 601.81 100 Lease Adjustment 0 0 0 0 0 100
Capital Work in Progress 79.63108.046
1 109.17148.127
5 73.7 100
Investments 203.26215.317
8 34.936.9703
4 94.4 100 Current Assets, Loans & Advances
Inventories 498.74124.305
9 434.91108.396
9 401.22 100 Sundry Debtors 64.19 120.003 45.59 85.2308 53.49 100

7 8
Cash and Bank 155.58412.023
3 193.69512.950
2 37.76 100
Loans and Advances 138.0594.9515
1 123.7685.1227
7 145.39 100
Total Current Assets 856.56134.286
5 797.95 125.098 637.86 100 Less : Current Liabilities and Provisions
Current Liabilities 587.59127.745
3 507.46110.324
6 459.97 100
Provisions 834.79167.695
9 677.32136.062
7 497.8 100 Total Current Liabilities
1,422.38
148.5096
1,184.78
123.7019 957.77 100
Net Current Assets-
565.82176.868
5-
386.83120.918
4-
319.91 100 Miscellaneous Expenses not written off 0 0 0 0 0 100
Deferred Tax Assets 46.8114.593
5 38.9195.2742
4 40.84 100
Deferred Tax Liability 78.8113.316
1 75.79108.987
6 69.54 100
Net Deferred Tax -32111.498
3 -36.88128.501
7 -28.7 100
Total Assets 581.27137.970
6 473.35112.354
6 421.3 100 Contingent Liabilities 0 0 0 0 0 100

TREND ANALYSIS OF INCOME STATEMENT OF NESTLE INDIA Ltd.
(Rs in Crs)
AbsoluteAmounts
(Rs.)
TrendPercentage %
Absolute
Amounts
(Rs.)
TrendPercentage %
Absolute
Amounts
(Rs.)
TrendPercentage %
Year
Dec09(12)
Dec08(12)
Dec07(12)
INCOME :
Sales Turnover 5,222.42 143.19
4,471.06
122.5895
3,647.18 100.00
Excise Duty 90.68 61.88143.3
997.857
09146.5
3 100.00
Net Sales5,131.74 146.59
4,327.67
123.6248
3,500.65 100.00
Other Income 37.8 44.74 33.89 40.116 84.48 100.00
Stock Adjustments 6.29 8.86 31.1243.824
81 71.01 100.00
Total Income5,175.83 141.57
4,392.68
120.1453
3,656.14 100.00
EXPENDITURE : 100.00
Raw Materials 2,073.25 140.67
1,785.51
121.1509
1,473.79 100.00
Power & Fuel Cost158.8
7 128.18159.7
6128.90
11123.9
4 100.00
Employee Cost 432.3
9 164.49306.9
2116.76
18262.8
6 100.00 Other Manufacturing Expenses 524.8 137.82
476.36
125.0978
380.79 100.00
Selling and Administration Expenses
868.96 145.14
723.32
120.8111
598.72 100.00
Miscellaneous Expenses 87.91 78.60 73.9966.157
01111.8
4 100.00 Less: Pre-operative Expenses Capitalised 0 0.00 0 0.00 0 100.00
Total Expenditure4,146.18 140.46
3,525.86
119.4421
2,951.94 100.00
Operating Profit1,029.65 146.22
866.82
123.0929 704.2 100.00

Interest 1.4 164.71 1.64192.94
12 0.85 100.00
Gross Profit1,028.25 146.19
865.18
123.0085
703.35 100.00
Depreciation111.2
7 148.88 92.36123.57
51 74.74 100.00
Profit Before Tax916.9
8 145.87772.8
2122.94
11628.6
1 100.00
Tax265.3
4 136.84222.3
1114.65
19 193.9 100.00
Fringe Benefit tax 1.52 36.10 8.25195.96
2 4.21 100.00
Deferred Tax -4.88 -29.24 8.1849.011
38 16.69 100.00
Reported Net Profit 655 158.29534.0
8129.06
41413.8
1 100.00
Extraordinary Items -2.17 16.15 -1.9114.211
31-
13.44 100.00
Adjusted Net Profit657.1
7 153.81535.9
9125.45
11427.2
5 100.00
Interpretation of trend analysis- Net sales are increasing in both the years in comparison to2007 but stock is also increasing , it means company has increased its sales and stock. Total shareholder funds are increasing in comparison to 2007 by 138.92% in 2009 and 113.12% in 2008 , it means company assets are increasing and liabilities are decreasing. Because of increase in assets company shareholder fund areincreasing.Company net profit is increasing in comparison to 2007 itsprofit is increasing by 121% because company sales are increasing due to increase in sales company profits are alsoincreasing.Company total income is increasing due to increase in sales but company total expenditure are also increasing compare tobase year.Company gross profits are increasing in comparison to 2007.Because company cost of goods sold are decreasing .Company current assets are increasing and current liabilities are also increasing it means company has

increased it current assets but company current liabilities are also increasing so company should decrease it current liabilities.Company stock are increasing in comparison to 2007 it means company has increased it inventory and company sales are also increasing due to increase in sales company has increased its inventory.Company fixed assets are also increasing it means company can easily pay its long term liabilities.
RATIOSLIQUIDITY RATIOS1.Current ratios = Current Assets /Current
LiabilitiesFor year 2008 = 797.95/1184.78 = 0.67:1For year 2009 = 856.56/1422.38 =0.60:1This indicates the extent to which the claims of short–term creditors are covered by assets that are expected to be converted to cash. A Current ratio of about 2:1 is normally regarded as indicating a reasonable level of liquidity . Current ratio of company is 0.67:1 in 2008 and 0.60:1 in 2009, it indicates lack of liquidity and shortage of working capital.
2.Liquid Ratio = Liquid Assets / Current Liabilities Liquid Assets = Current Assets – (stock + prepaid expenses)For year 2008 = 363.04/1184.78

=0.31:1For year 2009 =357.82/1422.38 = 0.25:1
This ratio indicates whether the company is in position to payits current liabilities within a month or immediately. A Liquidratio of about 1:1 is normally regarded as indicating areasonable level of liquidity. Liquid ratio of company is 0.31:1in 2008 and 0.25:1 in 2009, Therefore it can be said thatcompany is not position to meet its liabilities within a month orimmediately.
3.Absolute Liquid Ratio = Absolute Liquid Assets/
Current Liabilities Absolute Liquid Assets = Liquid Assets -(Debtors + B/R ) For year 2008 = 317.45/1184.78 = 0.28:1For year 2009 =293.63/1422.38 =0.21:1
This ratio indicates whether the company is in position to payits current liabilities immediately as soon as possible. AbsoluteLiquid ratio of about 0.5:1 is normally regarded as indicating areasonable level of liquidity.Absolute Liquid ratio of company is0.28:1 in 2008 and 0.21:1 in 2009, Therefore it can be said thatcompany is not position to meet its liabilities within a month orimmediately.
TURNOVER RATIOS1.Stock Turnover Ratio = Cost Of Goods Sold/ Average
Stock
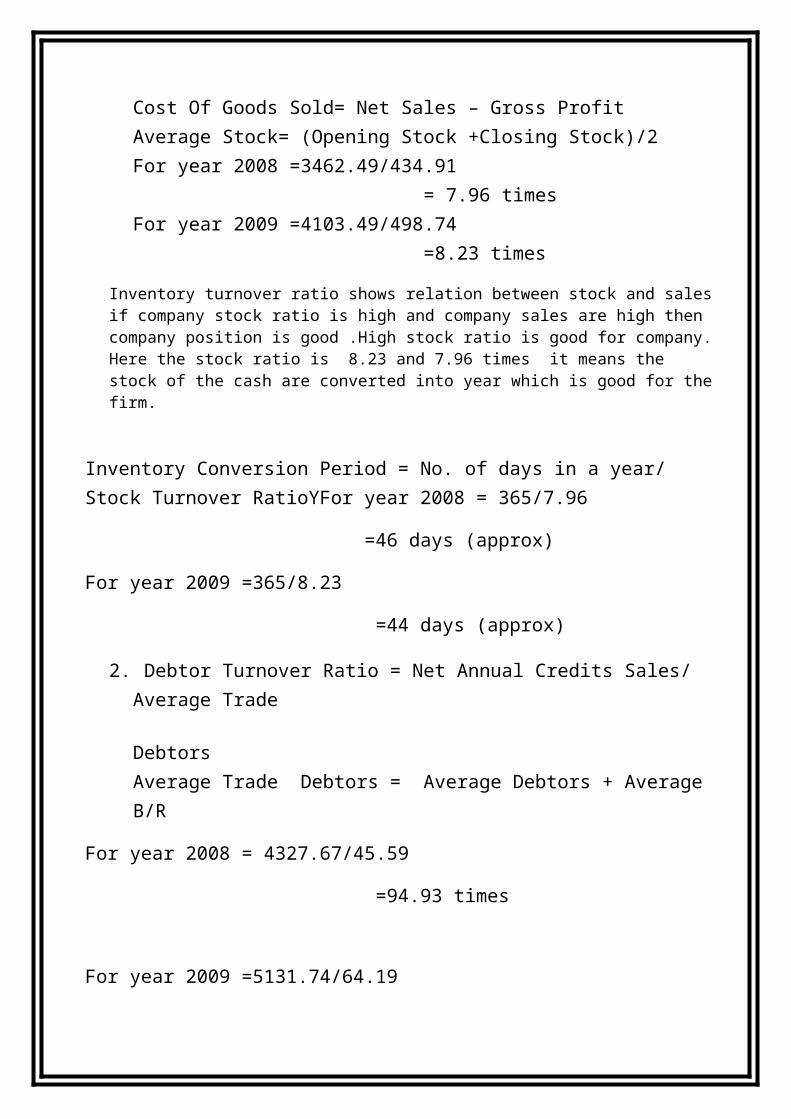
Cost Of Goods Sold= Net Sales – Gross ProfitAverage Stock= (Opening Stock +Closing Stock)/2For year 2008 =3462.49/434.91 = 7.96 timesFor year 2009 =4103.49/498.74 =8.23 times
Inventory turnover ratio shows relation between stock and salesif company stock ratio is high and company sales are high then company position is good .High stock ratio is good for company.Here the stock ratio is 8.23 and 7.96 times it means the stock of the cash are converted into year which is good for thefirm.
Inventory Conversion Period = No. of days in a year/ Stock Turnover RatioYFor year 2008 = 365/7.96
=46 days (approx)
For year 2009 =365/8.23
=44 days (approx)
2. Debtor Turnover Ratio = Net Annual Credits Sales/ Average Trade DebtorsAverage Trade Debtors = Average Debtors + Average B/R
For year 2008 = 4327.67/45.59
=94.93 times
For year 2009 =5131.74/64.19

= 79.95 times
It shows relation between sales receivables that we are able toreceive our amount from debtors very quickly or not. Here the ratio is 79.95 and 94.93 it means in both years company is ableto receive its money very quickly.
Average Collection Period = No. of days in a year/ Debtor Turnover Ratio
For year 2008 = 365/94.93
= 4 days (approx)
For year 2009 = 365/79.95
= 5 days (approx)
3.Working Capital Turnover Ratio = Working Capital/ Cost Of Goods Sold Cost Of Goods Sold= Net Sales – Gross Profit For year 2008 = -386.83/3462.49 = -0.11 times For year 2009 = -565.82 /4103.49 = -0.14 times
SOLVENCY RATIOS1. Debt-Equity Ratio = Debt/Equity
Debt = Long Term Loans, Debentures.

Equity = Equity Share Capital, Preference Share Capital, Reserves and Surplus and accumulated losses.For year 2008 = 0/473.35 = 0For year 2009 = 0/581.27 = 0Debt-Equity Ratio is calculated to assess the ability of firm to meet its long term borrowings. As it can be seen that there is no long term borrowings of the company , therefore financial position from the long term point of view is good.
2. Funded Debt to Total Capitalization = Debt/(Debt +Equity)For year 2008 = 0/473.35 = 0For year 2009 = 0/581.27 = 0Generally, Funded Debt to Total Capitalization ratio of 0.67 : 1 (or 67%) is considered satisfactory. Therefore , it can be conclude that financial position from the long term point of view is good.
3. Proprietary Ratio = Equity/Total AssetsFor year 2008=473.35/473.35 =1:1For year 2009= 581.27/581.27 = 1:1A higher Proprietary Ratio is generally treated as an indicator of sound financial position from long-term point of view, because it means that a large proportion oftotal assets is provided by equity and hence firm is lessdependent on external sources of finance. Therefore, it can be said that company is fully dependent on equity.
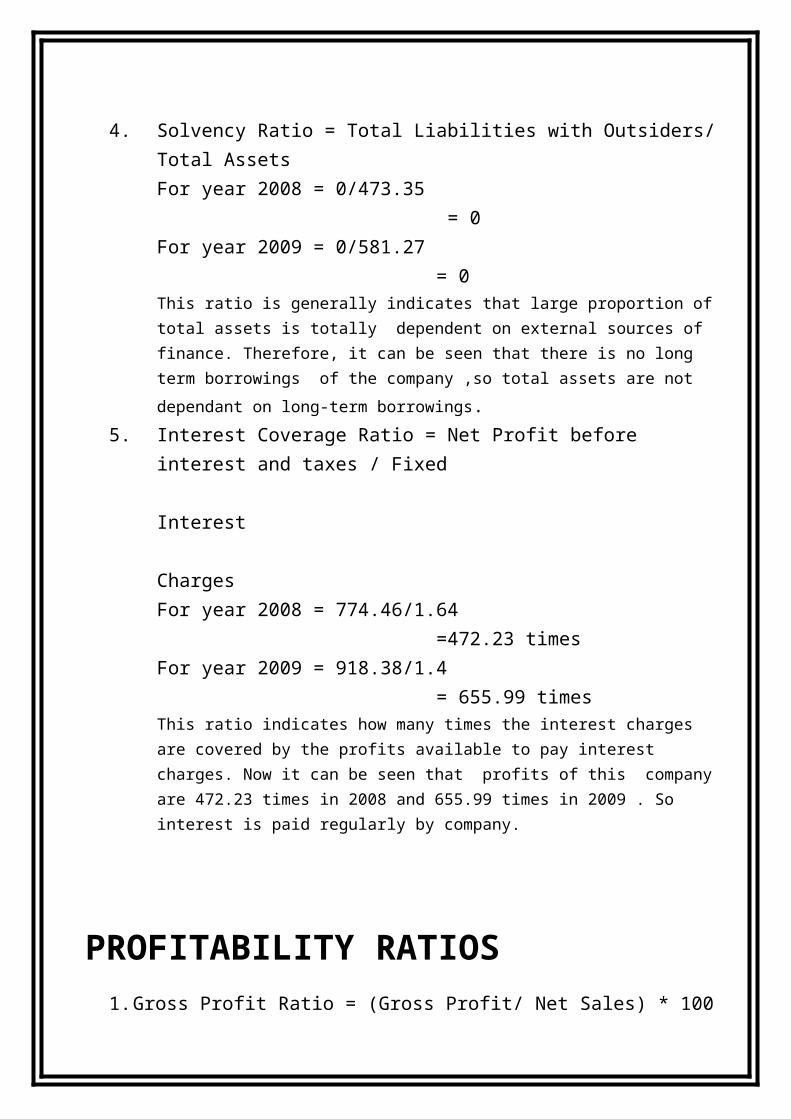
4. Solvency Ratio = Total Liabilities with Outsiders/
Total AssetsFor year 2008 = 0/473.35 = 0For year 2009 = 0/581.27 = 0This ratio is generally indicates that large proportion oftotal assets is totally dependent on external sources of finance. Therefore, it can be seen that there is no long term borrowings of the company ,so total assets are not dependant on long-term borrowings.
5. Interest Coverage Ratio = Net Profit before interest and taxes / Fixed Interest ChargesFor year 2008 = 774.46/1.64 =472.23 timesFor year 2009 = 918.38/1.4 = 655.99 timesThis ratio indicates how many times the interest charges are covered by the profits available to pay interest charges. Now it can be seen that profits of this companyare 472.23 times in 2008 and 655.99 times in 2009 . So interest is paid regularly by company.
PROFITABILITY RATIOS1.Gross Profit Ratio = (Gross Profit/ Net Sales) * 100

For year 2008 = (865.18/4327.67)*100 =19.99% For year 2009 = (1028.25/5131.74)*100 =20.04%
In this ratio high ratio is good but here the ratio is 20.04% and 19.99% which is not satisfactory because the portion of profit in net sales is only 20.04 and 19.99% it means that the firm is not earning much profit from its sales. So company should try to increase its profit and reduce their cost of production.
2.Operating Profit Ratio = (Operating Profit / Net Sales) * 100 For year 2008 = (866.82/4327.67)*100 =20.03% For year 2009 = (1029.65/5131.74)*100 =20.06%In this ratio high ratio is good but here the ratio is 20.03% and 20.06% which is not satisfactory because the portion of profit in net sales is only 20.04% and 20.06% it means that the firm is not earning much profit from its sales. So company should try to increase its profit .
3.Net Profit Ratio =(Net Profit / Net Sales) * 100For year 2008 = (535.99/4327.67)*100 =12.39% For year 2009 = (657.17/5131.74)*100 =12.81%High ratio is better and it measures relation between net profit and net sales but here the ratio is 12.39% and 12.81% which is very less and it is not satisfactory for the company so company should reduce their cost of production to increase their profit.

4.Operating Ratio = (Operating Cost/ Net Sales) * 100 Operating Cost = Cost of Goods Sold+ Operating expenses
For year 2008 = (4736.16/4327.67)*100 =109.44% For year 2009 = (5585.16/5131.74)*100 =108.84%This ratio shows relation between total operating exp. and net sales high ratio is not good for company because high ratio shows high operating exp .here the ratio is 109.44%and 108.84% which is good for company.
5.Expenses Ratio = (Expenses/ Net Sales) * 100For year 2008 = (1273.67/4327.67)*100 =29.43% For year 2009 = (1481.67/5131.74)*100 =28.87%
6.Return on Investment =( Net profit after interest and taxes/total Shareholders Funds)*100For year 2008 = ( 534.08/473.35)*100 =112.83%For year 2009= (655/581.27)*100 =112.68%
This ratio develops the relation between the profit and investment and high ratio is considered good but here the ratio is 112.83% and 112.68% it means company
Profit is good and satisfactory.

CASH FLOW STATEMENT
PARTICULARSDetails(Rs.)
Details(Rs.)
Amounts(Rs.)
Cash from Operating Activities Profit paid during the year 655Add : Non - operating expensesTransfer to general reserve 107.92Depreciation 111.27Interest 1.4Less : Tax -265.34Operating profit before working capital changes 600.2Add : Increase in current liabilitiesIncrease in current liabilities 80.13Increase in provisions 157.47 237.6Less : Increase in current assetsIncrease in inventories 63.83Increase in S. Debtors 18.6Increase in loans and advances 14.29 -96.72Net cash from operating activities (A) 741.08Cash from Investing Activities Purchase of fixed assets -143.21Increase in investment -168.36Net cash from investing activities (B) -311.57 -311.57Cash from Financing ActivitiesDividend -467.62Issue of Share capital 0Net cash from financing activities © -467.62 -467.62Net decrease in cash or cash equivalents -38.11

Cash and cash equivalents at beginning 193.69Cash and cash equivalents at end 155.58

FUND FLOW STATEMENT SCHEDULES OF CHANGES IN WORKING CAPITAL
PARTICULARS 2009 2008
INCREASEIN
WORKINGCAPITAL
DECREASEIN
WORKINGCAPITAL
CURRENT ASSETS
Inventories 498.7
4434.9
1 63.83 Sundry Debtors 64.19 45.59 18.6
Cash and Bank 155.5
8193.6
9 38.11
Loans and Advances 138.0
5123.7
6 14.29
Total Current Assets 856.5
6797.9
5
CURRENT LIABILITIES
Current Liabilities 587.5
9507.4
6 80.13
Provisions 834.7
9677.3
2 157.47
Total Current Liabilities
1,422.38
1,184.78
WORKING CAPITAL
-565.8
2
-386.8
3Net decrease in WorkingCapital 178.99
275.71 275.71
FUNDS FROM OPERATIONS

PARTICULARS
Details
(Rs.)
Amounts
(Rs.)
Profit made during the year
144.16
Add : non fund itemsTransfer to general reserve
107.92
Current year depreciation 93.05
Dividend467.6
2Tax provision 43.03FUNDS FROM OPERATIONS 870.43
FUND FLOW STATEMENT
SOURCES OF FUNDSAMOUNTS(RS.)
APPLICATIONS OF FUNDS
AMOUNTS(RS.)
Funds fromoperations 870.43
Purchase ofinvestments 168.36
Decrease in working capital 178.99
Purchase of Fixedassets 235.95Payment of dividend 409.77Payment of tax 265.34
1,049.4
21,049.4
2
INTERPRETATION OF FUND FLOW STATEMENT

There is Net decrease in working capital by Rs.178.99 crore as shown in schedules of changes in working capital.
There is about Rs. 870.43 crore funds generated from operations by adding non fund items back to profit made during the year.


COST SHEET OF NESTLE INDIA Ltd.
PARTICULARSAMOUNTS(RS.)
AMOUNTS(RS.)
Dec-09 Dec-08
Direct Materials2,073.2
51,785.5
1
PRIME COST
2,073.25
1,785.51
Add : Factory Overheads Power & Fuel Cost 158.87 159.76 Employee Cost 432.39 306.92 Other Manufacturing Expenses 524.8 476.36 Depreciation 111.27 92.36 Tax 265.34 222.31
FACTORY COST/WORK COST 3565.92 3043.22
Add : Selling andAdministration Overheads
Selling and Administration Expenses 868.96 723.32 Miscellaneous Expenses 87.91 73.99 COST OF SALES 4522.79 3840.53 PROFIT 608.95 487.14 SALES
5,131.74
4,327.67
INTERPRETATION OF COST SHEET Prime Cost generated by company is about Rs. 2,073.25 in 2009 and
Rs. 1,785.51
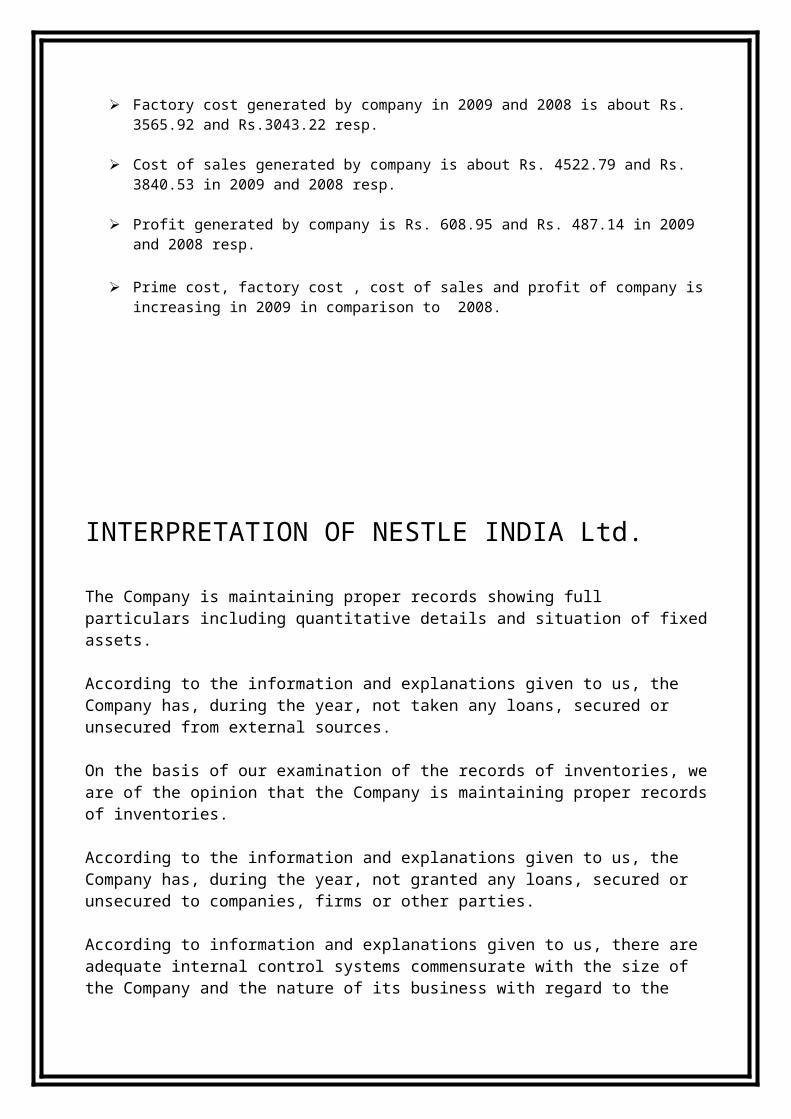
Factory cost generated by company in 2009 and 2008 is about Rs. 3565.92 and Rs.3043.22 resp.
Cost of sales generated by company is about Rs. 4522.79 and Rs. 3840.53 in 2009 and 2008 resp.
Profit generated by company is Rs. 608.95 and Rs. 487.14 in 2009 and 2008 resp.
Prime cost, factory cost , cost of sales and profit of company is increasing in 2009 in comparison to 2008.
INTERPRETATION OF NESTLE INDIA Ltd.
The Company is maintaining proper records showing full particulars including quantitative details and situation of fixedassets.
According to the information and explanations given to us, the Company has, during the year, not taken any loans, secured or unsecured from external sources.
On the basis of our examination of the records of inventories, weare of the opinion that the Company is maintaining proper recordsof inventories.
According to the information and explanations given to us, the Company has, during the year, not granted any loans, secured or unsecured to companies, firms or other parties.
According to information and explanations given to us, there are adequate internal control systems commensurate with the size of the Company and the nature of its business with regard to the

purchase of inventories, fixed assets and with regard to sale of goods.
In our opinion and according to the information and explanations given to us, the Company has not taken any term loans during the year.
![The Grammaticalization of Antipassives [term paper]](https://static.fdokumen.com/doc/165x107/6318b1d6e9c87e0c090fca6f/the-grammaticalization-of-antipassives-term-paper.jpg)