Nestle India
18
13 March 2019 Annual Report Update | Sector: Consumer Nestle India BSE SENSEX S&P CNX CMP: INR10,692 TP: INR11,800 (+10%) Neutral 37,752 11,342 Stock Info Bloomberg NEST IN Equity Shares (m) 96 M.Cap.(INRb)/(USDb) 1030.9 / 14.8 52-Week Range (INR) 11777 / 7628 1, 6, 12 Rel. Per (%) -8/3/27 12M Avg Val (INR M) 771 Free float (%) 37.2 Financials Snapshot (INR b) – CY ending Y/E Dec 2018 2019E 2020E Net Sales 112.9 127.7 144.1 EBITDA 27.3 30.2 35.1 PAT 17.2 19.0 22.4 EPS (INR) 178.6 197.3 232.0 Gr. (%) 27.5 10.5 17.6 BV/Sh (INR) 381.0 386.4 366.5 RoE (%) 48.5 51.4 61.6 RoCE (%) 50.2 53.1 63.5 P/E (x) 59.9 54.2 46.1 P/BV (x) 28.1 27.7 29.2 Shareholding pattern (%) As On Dec-18 Sep-18 Dec-17 Promoter 62.8 62.8 62.8 DII 7.6 8.1 8.2 FII 12.4 12.1 11.8 Others 17.3 17.0 17.2 FII Includes depository receipts Stock Performance (1-year) Double-digit volume growth an evidence of strategic success Ad spend increase and WC days reduction - key positives; Valuations fair Key takeaways from Nestle's (NEST) CY18 annual report: For the first time since CY10, Nestle posted double-digit overall volume growth on a reasonable base (barring CY16 and CY17, when the double-digit volume growth was led by recovery from the 2015 trough after the Maggi crisis). Clear preference for volume growth has also been demonstrated by the third consecutive year of decline in realization growth. Realizations declined by 0.4% in CY18, following a 2.8% decline in CY17 and 10.7% decline in CY16. This compares with realization CAGR of ~14% in the preceding five years, when volumes were extremely tepid. Another clear message of the NEST’s focus on the top line is the absolute ad spend increase of 44.2% in CY18. Ad spend to sales increased by 160bp YoY to 6.9% of domestic sales, the highest level since CY02. Nevertheless, we believe there is room for further increase in A&P to boost sales, given the elevated gross margins in recent years. CY18 gross margin at 59.4% is 530bp higher than CY14 levels (Note that the company does not share volume and ad spend details in its interim results). Net Working Capital (NWC) days’ reduction to -2 days (negative for the first time since CY10) and improving fixed asset turns are great from a ROCE perspective, particularly if dividend payout is increased further. ROCE was already healthy at around 50% in CY18. There is no material change to our EPS forecasts. While the narrative on Nestle is getting consistently better, valuations of 46.1x CY20 leave limited room for upside over the next year. Valuing the company at 49x Mar’21 EPS (in line with 3-year and 5- year average), we get a target price of INR11,800, 10% upside from CMP. Maintain Neutral. Volume growth of 11.5% stronger-than-expected, Maggi and Chocolates segment lead the way While CY16 and CY17 volume growth could be attributed to recovery from the trough of the Maggi crisis (NEST completely emerged out of the crisis only in 2HCY16), 11.1% volume growth in CY18 (we were expecting 8.5%) was a positive surprise. Growth was led by continued strong volumes in the Prepared Dishes (Maggi) portfolio (54% of total volumes and 28% of total sales in CY18), which grew 14.5% YoY. Unlike preceding years, when the rest of the portfolio combined barely grew (between -7% and 3% growth in the preceding five years), CY18 saw a healthy 7.4% growth. Volume growth was particularly impressive in (a) the beverages segment (6% of total volumes and 14% of total sales in CY18), which grew 10.6% YoY (in line) on top of a similar volume growth number in CY17, and (b) the Chocolates & Confectionary segment (9% of total volumes and 12% of total sales in CY18), which witnessed remarkably strong volume growth of 14.7% in CY18 (expected 7%), the highest pace of growth for the category since CY10. Milk & Nutrition (31% of total volumes and 46% of total sales) remains the sole laggard on the volume growth front with 4.8% growth (in line), but even in this case, reported volume growth was at the highest level since CY10. 7,000 8,200 9,400 10,600 11,800 Mar-18 Jun-18 Sep-18 Dec-18 Mar-19 Nestle India Sensex - Rebased Investors are advised to refer through important disclosures made at the last page of the Research Report. Motilal Oswal research is available on www.motilaloswal.com/Institutional-Equities, Bloomberg, Thomson Reuters, Factset and S&P Capital. Krishnan Sambamoorthy – Research Analyst ([email protected]); +91 22 6129 1545 Vishal Punmiya – Research Analyst ([email protected]); +91 22 6129 1547
-
Upload
khangminh22 -
Category
Documents
-
view
0 -
download
0
Transcript of Nestle India

13 March 2019 Annual Report Update | Sector: Consumer
Nestle India
BSE SENSEX S&P CNX CMP: IN R10,692 TP: INR11,800 (+10%) Neutral 37,752 11,342
Stock Info
Bloomberg NEST IN
Equity Shares (m) 96
M.Cap.(INRb)/(USDb) 1030.9 / 14.8
52-Week Range (INR) 11777 / 7628
1, 6, 12 Rel. Per (%) -8/3/27
12M Avg Val (INR M) 771
Free float (%) 37.2
Financials Snapshot (INR b) – CY ending Y/E Dec 2018 2019E 2020E Net Sales 112.9 127.7 144.1 EBITDA 27.3 30.2 35.1 PAT 17.2 19.0 22.4 EPS (INR) 178.6 197.3 232.0 Gr. (%) 27.5 10.5 17.6 BV/Sh (INR) 381.0 386.4 366.5 RoE (%) 48.5 51.4 61.6 RoCE (%) 50.2 53.1 63.5 P/E (x) 59.9 54.2 46.1 P/BV (x) 28.1 27.7 29.2
Shareholding pattern (%)
As On Dec-18 Sep-18 Dec-17
Promoter 62.8 62.8 62.8
DII 7.6 8.1 8.2
FII 12.4 12.1 11.8
Others 17.3 17.0 17.2
FII Includes depository receipts
Stock Performance (1-year)
Double-digit volume growth an evidence of strategic success Ad spend increase and WC days reduction - key positives; Valuations fair
Key takeaways from Nestle's (NEST) CY18 annual report: For the first time since CY10, Nestle posted double-digit overall volume growth on a
reasonable base (barring CY16 and CY17, when the double-digit volume growth wasled by recovery from the 2015 trough after the Maggi crisis).
Clear preference for volume growth has also been demonstrated by the thirdconsecutive year of decline in realization growth. Realizations declined by 0.4% inCY18, following a 2.8% decline in CY17 and 10.7% decline in CY16. This compares withrealization CAGR of ~14% in the preceding five years, when volumes were extremelytepid.
Another clear message of the NEST’s focus on the top line is the absolute ad spendincrease of 44.2% in CY18. Ad spend to sales increased by 160bp YoY to 6.9% ofdomestic sales, the highest level since CY02. Nevertheless, we believe there is roomfor further increase in A&P to boost sales, given the elevated gross margins in recentyears. CY18 gross margin at 59.4% is 530bp higher than CY14 levels (Note that thecompany does not share volume and ad spend details in its interim results).
Net Working Capital (NWC) days’ reduction to -2 days (negative for the first timesince CY10) and improving fixed asset turns are great from a ROCE perspective,particularly if dividend payout is increased further. ROCE was already healthy ataround 50% in CY18.
There is no material change to our EPS forecasts. While the narrative on Nestle isgetting consistently better, valuations of 46.1x CY20 leave limited room for upsideover the next year. Valuing the company at 49x Mar’21 EPS (in line with 3-year and 5-year average), we get a target price of INR11,800, 10% upside from CMP. MaintainNeutral.
Volume growth of 11.5% stronger-than-expected, Maggi and Chocolates segment lead the way While CY16 and CY17 volume growth could be attributed to recovery from the trough of the Maggi crisis (NEST completely emerged out of the crisis only in 2HCY16), 11.1% volume growth in CY18 (we were expecting 8.5%) was a positive surprise. Growth was led by continued strong volumes in the Prepared Dishes (Maggi) portfolio (54% of total volumes and 28% of total sales in CY18), which grew 14.5% YoY. Unlike preceding years, when the rest of the portfolio combined barely grew (between -7% and 3% growth in the preceding five years), CY18 saw a healthy 7.4% growth. Volume growth was particularly impressive in (a) the beverages segment (6% of total volumes and 14% of total sales in CY18), which grew 10.6% YoY (in line) on top of a similar volume growth number in CY17, and (b) the Chocolates & Confectionary segment (9% of total volumes and 12% of total sales in CY18), which witnessed remarkably strong volume growth of 14.7% in CY18 (expected 7%), the highest pace of growth for the category since CY10. Milk & Nutrition (31% of total volumes and 46% of total sales) remains the sole laggard on the volume growth front with 4.8% growth (in line), but even in this case, reported volume growth was at the highest level since CY10.
7,0008,2009,400
10,60011,800
Mar
-18
Jun-
18
Sep-
18
Dec-
18
Mar
-19
Nestle IndiaSensex - Rebased
Investors are advised to refer through important disclosures made at the last page of the Research Report. Motilal Oswal research is available on www.motilaloswal.com/Institutional-Equities, Bloomberg, Thomson Reuters, Factset and S&P Capital.
Krishnan Sambamoorthy – Research Analyst ([email protected]); +91 22 6129 1545 Vishal Punmiya – Research Analyst ([email protected]); +91 22 6129 1547

Nestle India
13 March 2019 2
Well below historical volume levels despite good growth in CY18 Despite the recent strong volume growth, volume in Milk & Nutrition is still 5% lower than CY10 levels, while beverages volume is up barely 2% over CY10 levels. Prepared Dishes’ volume growth is only 24% over CY10 levels and is still ~5% below the pre-Maggi crisis levels of 2014. Confectionary segment volumes in CY18 are still 21% lower than CY10 level. Realization growth being muted is a continued positive A continued bright spot was the weighted average realization growth which had been inordinately high in preceding years was the lowest for many years in CY16 and was flattish in CY17 and now flattish again for CY18. Now this may be a function of low material costs, but it has not dissuaded the company from taking price increases earlier, even at the cost of volumes. This clearly indicates that the overt emphasis on profitability is in the past. Sharp ad spend increase YoY is also encouraging for future growth Ad spends grew sharply by 44.2% YoY to INR7.3b in CY18. On a percentage to domestic sales basis, the increase was by 160bp YoY to 6.9%, the highest level since CY02 levels. Because of Ind-AS adjustments in recent years, ad spend gets understated as promotion spends get knocked off from sales, and thus, ad spend to sales is very impressive from a historical track record. Nevertheless, relative to Consumer peers, particularly given the elevated gross margins in recent years, ad spends to sales still appear low, but is definitely moving in the right direction. Incremental balance sheet efficiencies remarkable, now translating to ROCE growth, payout needs to be increased though While Adjusted PAT/EBITDA has grown 14.2%/18.4% CAGR respectively in the four years ending CY18, cash generation has been strong due to healthy improvements in net working capital (NWC) days and improved fixed asset turns. Operating cash flow/ Free Cash flow has grown 23.2%/25.8% CAGR respectively over this period. NWC days are back to negative levels for the first time since CY10, led by both lower inventory levels and higher creditors. Net cash and cash equivalents have increased very sharply over the past four years from INR12.7b to INR42.7b. If not for dividend payout being range bound between 40-61% over the past four years, ROCE improvement would have been more than the 40-50%. Given the underutilized capacity, capex is unlikely to be significant making the absence of high payout puzzling. Valuation and View There is no material change to our EPS forecasts. While the narrative on Nestle is getting consistently better, valuations of 46.2xCY20 leave limited room for upside over the next year. Valuing the company at 49x Mar’21 EPS (in line with 3-year and 5-year average, we get a target price of INR11,800, a 10% upside. Maintain Neutral.

Nestle India
13 March 2019 3
Exhibit 1: Nestle’s segment-wise performance 2009 2010 2011 2012 2013 2014 2015 2016* 2017 2018
Volume (MT) Milk Products 134,142 144,397 147,984 140,386 138,772 135,591 131,980 128,751 130,796 137,066 Beverages 23,369 26,458 26,692 25,353 27,717 24,673 22,130 22,092 24,423 27,013 Prepared Dishes & Cooking Aids 155,555 193,494 219,041 236,554 245,443 254,553 103,138 176,871 210,427 240,879 Chocolate & Confectionery 44,116 53,483 52,678 47,745 46,718 41,080 33,083 35,289 36,803 42,197 Total 357,182 417,832 446,395 450,038 458,650 455,897 290,331 363,003 402,449 447,155 Volume (as a % of total) Milk Products (MT) 38% 35% 33% 31% 30% 30% 45% 35% 33% 31% Beverages (MT) 7% 6% 6% 6% 6% 5% 8% 6% 6% 6% Prepared Dishes & Cooking Aids (MT) 44% 46% 49% 53% 54% 56% 36% 49% 52% 54% Chocolate & Confectionery 12% 13% 12% 11% 10% 9% 11% 10% 9% 9% Total 100% 100% 100% 100% 100% 100% 100% 100% 100% 100%
Volume Growth (%) Milk Products 13.1% 7.6% 2.5% -5.1% -1.1% -2.3% -2.7% -2.4% 1.6% 4.8% Beverages -3.1% 13.2% 0.9% -5.0% 9.3% -11.0% -10.3% -0.2% 10.6% 10.6% Prepared Dishes & Cooking Aids 21.7% 24.4% 13.2% 8.0% 3.8% 3.7% -59.5% 71.5% 19.0% 14.5% Chocolate & Confectionery 9.7% 21.2% -1.5% -9.4% -2.2% -12.1% -19.5% 6.7% 4.3% 14.7% Total 14.9% 17.0% 6.8% 0.8% 1.9% -0.6% -36.3% 25.0% 10.9% 11.1%
Weighted average volume growth 15.3% 17.5% 7.2% 1.3% 2.0% -0.3% -25.3% 34.6% 11.5% 11.3%
Price (INR/Kg) Milk Products 172 192 226 275 293 337 354 360 368 378 Beverages 344 340 400 443 478 543 604 582 568 564 Prepared Dishes & Cooking Aids 86 89 98 103 110 116 127 131 129 129 Chocolate & Confectionery 175 182 209 245 275 305 336 332 332 332 Total 146 153 172 191 205 222 290 259 252 251
Price Growth (%) Milk Products 5.4% 11.6% 17.8% 21.4% 6.7% 15.0% 4.9% 1.8% 2.4% 2.7% Beverages 3.6% -1.2% 17.8% 10.6% 7.9% 13.7% 11.2% -3.6% -2.4% -0.7% Prepared Dishes & Cooking Aids 4.3% 3.9% 10.3% 4.4% 7.0% 5.8% 9.5% 2.8% -1.8% 0.2% Chocolate & Confectionery 3.5% 4.3% 14.4% 17.3% 12.4% 10.8% 10.1% -1.2% 0.0% 0.0% Total 1.6% 4.4% 12.6% 10.9% 7.2% 8.6% 30.7% -10.7% -2.8% -0.4%
Weighted average price growth 4.6% 6.6% 15.2% 14.6% 7.7% 11.6% 7.3% 0.9% 0.3% 1.2%
Gross Sales (INR m) Milk Products 23,113 27,763 33,510 38,594 40,712 45,752 46,694 46,350 48,196 51,876 Beverages 8,042 8,994 10,684 11,227 13,241 13,398 13,360 12,861 13,870 15,226 Prepared Dishes & Cooking Aids 13,350 17,250 21,545 24,302 26,982 29,613 13,141 23,176 27,071 31,053 Chocolate & Confectionery 7,719 9,759 10,997 11,696 12,864 12,532 11,109 11,709 12,214 14,007 Total 52,224 63,766 76,736 85,819 93,799 101,295 84,304 94,096 101,351 112,162 Gross Sales (as a % of total) Milk Products 44% 44% 44% 45% 43% 45% 55% 49% 48% 46% Beverages 15% 14% 14% 13% 14% 13% 16% 14% 14% 14% Prepared Dishes & Cooking Aids 26% 27% 28% 28% 29% 29% 16% 25% 27% 28% Chocolate & Confectionery 15% 15% 14% 14% 14% 12% 13% 12% 12% 12% Total 100% 100% 100% 100% 100% 100% 100% 100% 100% 100%
Gross Sales Growth (%) Milk Products 19.2% 20.1% 20.7% 15.2% 5.5% 12.4% 2.1% -0.7% 4.0% 7.6% Beverages 0.4% 11.8% 18.8% 5.1% 17.9% 1.2% -0.3% -3.7% 7.8% 9.8% Prepared Dishes & Cooking Aids 26.9% 29.2% 24.9% 12.8% 11.0% 9.7% -55.6% 76.4% 16.8% 14.7% Chocolate & Confectionery 13.6% 26.4% 12.7% 6.4% 10.0% -2.6% -11.4% 5.4% 4.3% 14.7% Total 16.8% 22.1% 20.3% 11.8% 9.3% 8.0% -16.8% 11.6% 7.7% 10.7%
* Slight impact of implementation of Goods and Services Tax (GST) on the CY16 financial statements Source: Company, MOFSL

Nestle India
13 March 2019 4
Domestic volumes grew in double-digits for the third consecutive year Net sales stood at INR112.9b in CY18 compared to INR100.1b in CY17 (growth of
12.8% YoY). Sales growth was the highest since CY11. These growth numberswould have been higher, if not for the impact on realizations as a result of GSTaccounting.
While CY16 and CY17 volume growth could be attributed to recovery from thetrough of the Maggi crisis (NEST completely emerged out of the crisis only in2HCY16), 11.1% volume growth in CY18 was a positive surprise (we wereexpecting 8.5%).
Exhibit 2: Overall tonnage grew 11.1% in CY18…
Source: Company, MOFSL
Exhibit 3: ...leading to gross sales growth of 10.7% YoY
Source: Company, MOFSL
Weighted average realization growth, which had been inordinately high in thepreceding years was flat in CY17 and improved just moderately in CY18 to 1.2%.Now this may be a function of low material costs, but it has not dissuaded thecompany from taking price increases earlier, even at the cost of volumes.
Exhibit 4: Weighted average realization growth up 1.2% in CY18
Source: Company, MOFSL
Export sales were up 6.9% to INR7.1b in CY18. Export proportion of gross salesdeclined 20bp YoY to 6.3% in CY18. Domestic gross sales increased by 10.9% YoYto INR105.1b.
14.9 17.0 6.8
0.8 1.9
(0.6)
(36.3)
25.0
10.9 11.1
CY09
CY10
CY11
CY12
CY13
CY14
CY15
CY16
CY17
CY18
Tonnage growth (%)
1.6 4.4 12.6 10.9 7.2
8.6
30.7
(10.7) (2.8) (0.4)
16.8 22.1 20.3
11.8 9.3 8.0
(16.8)
11.6 7.7 10.7
CY09
CY10
CY11
CY12
CY13
CY14
CY15
CY16
CY17
CY18
Price growth (%) Gross sales growth (%)
(0.2) 7.2 5.9
11.1 8.8 4.6 6.6
15.2 14.6 7.7
11.6 7.3
0.9 0.3 1.2
CY04
CY05
CY06
CY07
CY08
CY09
CY10
CY11
CY12
CY13
CY14
CY15
CY16
CY17
CY18
Weighted average realization growth (%)

Nestle India
13 March 2019 5
Exhibit 5: Domestic sales grew 10.9% YoY in CY18
Source: Company, MOFSL
Exhibit 6: Exports revived a bit after a few tepid years
Source: Company, MOFSL
Exports are carried out to 43 markets with the top-5 being Turkey, Bangladesh,the USA, Canada and Australia. Sales from Nestle India take place to two Nestlefellow subsidiaries in Turkey and Bangladesh (reported in related parttransactions).
Exhibit 7: Volume mix
Source: Company, MOFSL
Exhibit 8: Sales mix
Source: Company, MOFSL
Maggi remains a key volume driver, Non-Maggi sales and volumes reviving NEST does not share detailed segment information in its quarterly results, thus,
its segmental sales and volumes are available only in the Annual Report. Overall volume growth was led by continued strong volumes in the Prepared
Dishes (Maggi) portfolio (54% of total volumes and 28% of total sales in CY18),which grew by 14.5% YoY.
Market share recovery has plateaued at the last reported level of 60%, and isconsiderably lower than the ~80% market share NEST had in earlier years.
Unlike the preceding years, when rest of the portfolio combined barely grew(between -7% and 3% growth in the preceding five years), CY18 saw it grow to ahealthy 7.4%.
Milk & Nutrition (31% of total volumes and 46% of total sales) remains the solelaggard on the volume growth front with 4.8% growth (in line), but even in thiscase, the reported volume growth was at the highest level since CY10 levels.
18.4 23.1 20.8
12.1 7.3 8.4
(17.8)
12.3 8.2 10.9
CY09
CY10
CY11
CY12
CY13
CY14
CY15
CY16
CY17
CY18
Domestic sales growth (%)
(2.9) 6.6
13.0 7.6
47.1
2.9 (1.3) 3.3 0.96.9
CY09
CY10
CY11
CY12
CY13
CY14
CY15
CY16
CY17
CY18
Exports sales growth (%)
37.6 34.6 33.2 31.2 30.3 29.7 45.5 35.5 32.5 30.7
6.5 6.3 6.0 5.6 6.0 5.4 7.6
6.1 6.1 6.0
43.6 46.3 49.1 52.6 53.5 55.8 35.5 48.7 52.3 53.9
12.4 12.8 11.8 10.6 10.2 9.0 11.4 9.7 9.1 9.4
CY09 CY10 CY11 CY12 CY13 CY14 CY15 CY16 CY17 CY18
Milk Products/ Nutrition Beverages
Prepared Dishes Chocolate & Conf.
44.3 43.5 43.7 45.0 43.4 45.2 55.4 49.3 47.6 46.3
15.4 14.1 13.9 13.1 14.1 13.2 15.8
13.7 13.7 13.6
25.6 27.1 28.1 28.3 28.8 29.2 15.6 24.6 26.7 27.7
14.8 15.3 14.3 13.6 13.7 12.4 13.2 12.4 12.1 12.5
CY09 CY10 CY11 CY12 CY13 CY14 CY15 CY16 CY17 CY18
Milk Products/ Nutrition Beverages
Prepared Dishes Chocolate & Conf.

Nestle India
13 March 2019 6
Exhibit 9: Milk Products and Nutrition performance
Source: Company, MOFSL
Exhibit 10: Prepared dishes & Cooking aids performance
Source: Company, MOFSL
The other two non-Maggi segments — beverages and Chocolate &Confectionary have started reporting strong numbers, CY18 onwards.
Volume growth was particularly impressive in the beverages segment (6% oftotal volumes and 14% of total sales in CY18), which grew by 10.6% YoY (in line)on top of a similar volume growth number in CY17.
The Chocolates & Confectionary segment (9% of total volumes and 12% of totalsales in CY18) witnessed remarkably strong volume growth of 14.7% in CY18(expected 7%), the highest pace of growth for the category since CY10.
Exhibit 11: Powdered and Liquid Beverages performance
Source: Company, MOFSL
Exhibit 12: Confectionery performance
Source: Company, MOFSL
Exhibit 13: Non-Maggi portfolio has revived in recent years
Source: Company, MOFSL
13.1 7.6
2.5 (5.1) (1.1) (2.3) (2.7) (2.4) 1.6 4.8
5.4 11.6 17.8 21.4
6.7 15.0
4.9 1.8 2.4
2.7 19.2 20.1 20.7
15.2
5.5
12.4
2.1 (0.7)
4.0 7.6
CY09 CY10 CY11 CY12 CY13 CY14 CY15 CY16 CY17 CY18
Volume Growth (%) Price Growth (%) Sales Growth (%)
26.9 29.2 24.9 12.8 11.0 9.7
(55.6)
76.4
16.8 14.7
CY09 CY10 CY11 CY12 CY13 CY14 CY15 CY16 CY17 CY18
Volume Growth (%) Price Growth (%) Sales Growth (%)
(3.1)
13.2
0.9 (5.0)
9.3
(11.0) (10.3) (0.2)
10.6 10.6
3.6
(1.2)
17.8
10.6 7.9
13.7 11.2
(3.6)
(2.4) (0.7)
0.4
11.8
18.8
5.1
17.9
1.2 (0.3) (3.7)
7.8 9.8
CY09 CY10 CY11 CY12 CY13 CY14 CY15 CY16 CY17 CY18
Volume Growth (%) Price Growth (%) Sales Growth (%)
9.7 21.2
(1.5) (9.4)
(2.2) (12.1)
(19.5)
6.7 4.3 14.7
3.5
4.3
14.4
17.3 12.4 10.8 10.1
(1.2)
0.0
0.0
13.6
26.4
12.7 6.4 10.0
(2.6)
(11.4)
5.4 4.3
14.7
CY09 CY10 CY11 CY12 CY13 CY14 CY15 CY16 CY17 CY18
Volume Growth (%) Price Growth (%) Sales Growth (%)
14.9 17.0 6.8
0.8 1.9 (0.6)
(36.3)
25.0
10.9 11.1
10.2 11.3 1.3
(6.1) (0.1)
(5.6) (7.0) (0.6) 3.2 7.4
CY09
CY10
CY11
CY12
CY13
CY14
CY15
CY16
CY17
CY18
Total Tonnage growth (%) Non-Maggi Tonnage growth (%)

Nestle India
13 March 2019 7
Brand extensions/new launches/product re-launches/introduction of variants Among the most interesting aspect of Nestle in recent years is the pick-up in the
pace of its new launches. CY16, CY17 and CY18 — all witnessed a healthypipeline compared to the past. New launches, however, have slowed down inCY17 and CY18 compared to CY16 levels.
Exhibit 14: New launches/Re-launches/Variants introduced during the year Year CY12 CY13 CY14 CY15 CY16 CY17 CY18
No. of launches
9 6 7 3 19 (39 including variants and re-
launches)
9 (17 including variants and re-
launches)
14 (20 including variants)
1 Nestle Baby & Me NAN PRO 1 Maggi Oats Noodles
Relaunched Maggi Noodles
Maggi Hot Heads 4 variants
Maggi Nutri-licious Noodles : 2
variants
Kitkat duo strawberry variant
2 Cerelac Shishu
Aahar Maggi Hungrooo Nestlé KitKat Senses Milk Munch Nuts Maggi No Onion
No Garlic Masala Maggi Masalas of India : 4 variants
Munch Crunch-O-Nuts
3 Renovation of
Lactogen Maggi Magical
Masala Noodles Nestlé KitKat Senses Dark Cerelac Stage 5 Maggi Hot Heads
Cuppa Noodles
Nestle a+ Grekyo greek yogurts : 3
variants
Nesplus Breakfast cereals-4 variants
4 Renovation of
Cerelac Nestle Munch 4*4 Nestlé KitKat Senses Extra
Smooth
Maggi Cuppa Masala Nan Excella Pro Nescafe Ready-to-
Drink Cans
5 Maggi Healthy
Soups
Nestle Munch convenient share
bag pack
Nestle Masala Buttermilk
Maggi Cuppa Chilly Chow
Nestle Resource High Protein : 3
variants
Maggi Special Masala noodles
6 Nestle Kitkat Dark
Crisp Wafer Fingers
Nestle Alpino Nestle Lassi Maggi Cup-a-
licious Soups 6 variants
Milo Ready-to-Drink beverage
Maggi dip & spread-2 variants
7 Munch Rollz Wafer Tube NAN Lo-Lac Nestle a+ Grekyo 4
variants KITKAT Dessert
Delight
Kitkat Dessert Delight Brownie
Kubes
8 Relaunch of
Nescafe Classic in a unique jar
Nestle Everyday Masala Fusion
Dairy Whitener 6 variants
Milkybar (Re-launch)
Nescafé E-Smart Coffee Machine (all-in-one travel mug and coffee
machine)
9 Sunrise Strong Nescafe RTD 3 variants Milkybar Moosha Maggi Nutri-licious
Baked Noodles
10 Ceregrow Nestle Les
Recettes De l'Atelier
11 Nestle a+ Pro-
grow Nestle Everyday
Chai life-3 variants
12 Renovation of
Cerelac with Iron Nangrow
13 Nescafe Sunrise
Insta-filter Nan Pro with DHA
(Re-launch)
14 Nestea Iced Tea 3
variants Nan Excellapro
(Re-launch) 15 Nescafe Latte 16 Kitkat Duo 17 Nestle Munch Trio 18 Barone Charge 19 New Alpino
Source: Company, MOFSL

Nestle India
13 March 2019 8
New launches was one of the area where management clearly walked-the-talkon its stated intention after the change of guard in Jul’15. Stakeholderinteraction was another. Encouragingly, more recently these have been alliedwith low or no price increases and rise in advertising in recent years. Theemphasis on volume growth focus is clearly becoming more evident unlike inthe past.
Exhibit 15: Financial Overview of Nestle India CY13 % CY14 % CY15 % CY16 % CY17 % CY18 %
Total Revenues 90,619 100.0 98,063 100.0 81,233 100.0 91,593 100.0 99,525 100.0 112,162 100.0 Raw Material Consumed 41,224 45.5 45,240 46.1 34,689 42.7 38,828 42.8 43,269 43.5 45,902 40.9 Gross Profit 49,396 54.5 52,823 53.9 46,544 57.3 52,796 57.6 56,257 56.5 66,260 59.1 Employee Benefit Expense 7,672 8.5 8,706 8.9 9,516 11.7 11,132 12.2 10,577 10.6 11,732 10.5 Other Expenses Power and Fuel 3,854 4.3 3,843 3.9 2,220 2.7 2,328 2.5 2,884 2.9 3,442 3.1 Repairs 962 1.1 1,031 1.1 1,056 1.3 1,213 1.3 1,167 1.2 1,082 1.0 Advertising and Sales Promotion 3,955 4.4 4,455 4.5 5,252 6.5 5,670 6.2 5,060 5.1 7,294 6.5 Freight and Transport 4,374 4.8 4,795 4.9 3,870 4.8 4,556 5.0 4,773 4.8 5,256 4.7 Royalty 3,396 3.7 3,863 3.9 3,342 4.1 3,980 4.3 4,590 4.6 5,419 4.8 Others 5,379 5.9 5,603 5.7 5,343 6.6 5,960 6.5 5,563 5.6 5,472 4.9 EBITDA 19,804 21.9 20,527 20.9 15,946 19.6 17,958 19.6 21,643 21.7 26,564 23.7 Less: Interest Expense 365 142 33 35 919 1,120 Less: Depreciation 3,300 3,375 3,473 3,536 3,423 3,357 Add: Other Income 1,222 1,359 1,621 2,139 2,340 3,350 Profit before Tax (PBT) 17,362 19.1 18,368 18.6 14,062 17.2 16,526 17.9 19,641 19.6 25,437 22.5
Source: Company, MOFSL
Gross and Operating margins Net sales stood at INR112.9b in CY18 growing 12.8% YoY. Material costs on the
other hand, increased at a slower pace of 6.1% YoY leading to gross margins of59.4% in CY18, up 260bp YoY. Gross margin was higher compared to trackrecord of 51-56% levels since the turn of the millennium.
Consumption of raw materials grew only 2.2% YoY. Its proportion to salesdeclined 330bp YoY to 31.9% of net sales. Packing material (6.8% of sales inCY18) contributed 30bp to gross margin expansion. On the other hand, a 32%increase in outside manufacture of goods led to gross margin impact of 30bp,and the change in inventory led to gross margin impact of 50bp.
Exhibit 16: Scenario of benign material likely to change due to increase in milk costs
Source: Company, MOFSL
37.6 36.2 38.5 40.0 40.6 40.3 41.1 40.0 37.8 37.7 38.4 35.9 35.5 36.6 34.1
8.8 8.8 8.5 7.9 8.2 7.5 7.7 7.9 7.6 7.8 7.7 6.8 7.3 7.1 6.8
CY04 CY05 CY06 CY07 CY08 CY09 CY10 CY11 CY12 CY13 CY14 CY15 CY16 CY17 CY18
RMC as a % of net sales Packing Material as a % of net sales

Nestle India
13 March 2019 9
Exhibit 17: Gross margin for CY18 expanded 260bp YoY
Source: Company, MOFSL
Exhibit 18: Employee costs were down 10bp to 10.5%
Source: Company, MOFSL
The company has stopped sharing breakdown of key raw material costs fromCY17 onwards.
Staff costs (including training expense) increased 10.9% YoY to INR11.7b (down10bp to 10.5% of sales) in CY18.
Exhibit 19: Sales per employee has now surpassed earlier peak levels of CY14
Source: Company, MOFSL
Advertisement and Sales promotion costs were up sharply by 44.2% YoY toINR7.3b in CY18. This was after disappointments in the preceding years when adspends had grown by only 1.3% (CY17), in fact, it actually declined by 4.9% inCY16. On a percentage to domestic sales basis, Nestle India’s A&P to salesincreased 160bp YoY to 6.9%.
Exhibit 20: Ad spends grew 160bp to 6.9% in CY18
Source: Company, MOFSL
Exhibit 21: Royalty expenses up 20bp to 4.8%
Source: Company, MOFSL
52.5 51.3 52.2
54.7 54.7 54.1
57.6 57.5 56.8
59.4
CY09
CY10
CY11
CY12
CY13
CY14
CY15
CY16
CY17
CY18
Gross Margin (%)
8.8 7.3 7.6
8.3 8.5 8.9
11.7 10.4 10.6 10.5
CY09
CY10
CY11
CY12
CY13
CY14
CY15
CY16
CY17
CY18
Employee cost (as a % of net sales)
4,983 5,573 6,639 7,008 7,159 7,228 7,495 7,588 7,527 7,604
10.3 11.2 11.3 11.8 12.7 13.6 10.8 12.0 13.2
14.8
CY09
CY10
CY11
CY12
CY13
CY14
CY15
CY16
CY17
CY18
No. of employees (#) Net sales per employee (INR m)
5.5 5.0
4.4 4.4 4.5 4.7
6.7
5.7 5.3
6.9
CY09
CY10
CY11
CY12
CY13
CY14
CY15
CY16
CY17
CY18
A&P (as a % of gross domestic sales)
4.0 4.0 3.8 3.8 3.7 3.9 4.1 4.4 4.6 4.8
CY09
CY10
CY11
CY12
CY13
CY14
CY15
CY16
CY17
CY18
Royalty incldg. taxes (as a % of net sales)

Nestle India
13 March 2019 10
As was indicated by the company earlier, Royalty or general license fees(including withholding tax on general license fees) increased by 20bp to sales inCY18 as well, a 20bp annual increase process that has now ended.
EBITDA margin grew 200bp YoY to at 24.2% YoY in CY18. 260bp increase ongross margins was partly offset by 20bp higher royalty to sales and 160bpincrease in ad spends to sales. Positive contributors to EBITDA margins were the90bp savings on other expenses and 10bp savings on staff costs. AbsoluteEBITDA at INR27.3b increased by 23.0% YoY compared to 12.8% growth in sales.
Exhibit 22: Other operating expenses down sharply by 90bp…
Source: Company, MOFSL
Exhibit 23: ..while EBITDA margins stood at 24.2%; up 200bp
Source: Company, MOFSL
Capex, fixed assets, working capital and cash flows Capex for CY18 stood at INR1.4b with capex to sales down to 1.2%. Depreciation
was INR3.4b for the year. This is the fifth year when depreciation is well aheadof annual capex, leading to reduction in net fixed assets as well for five years in arow.
Exhibit 24: Capex for the year stood at INR1.4b
Source: Company, MOFSL
Exhibit 25: Depreciation as a % EBITDA stood at 12.3% down from 15.4% in CY17
Source: Company, MOFSL
14.2 15.0 15.6 16.1 16.1 15.6 15.4 15.3 14.5 13.6
CY09
CY10
CY11
CY12
CY13
CY14
CY15
CY16
CY17
CY18
Other operating expenses (as a % of net sales)
20.5 20.2 21.0 22.3 22.2 21.3 20.1 22.2 22.2
24.2
CY09
CY10
CY11
CY12
CY13
CY14
CY15
CY16
CY17
CY18
EBITDA Margin (%)
2,06
4
4,83
2
17,2
04
8,47
6
4,26
2
559
944
1,00
0
1,69
3
1,38
0
CY09
CY10
CY11
CY12
CY13
CY14
CY15
CY16
CY17
CY18
Capex (INR m)
1,11
3
1,27
8
1,53
3
2,77
2
3,30
0
3,37
5
3,47
3
3,53
7
3,42
3
3,35
7
10.5 10.1 9.7
14.9 16.3 16.1
21.1 17.4
15.4 12.3
CY09
CY10
CY11
CY12
CY13
CY14
CY15
CY16
CY17
CY18
Depreciation (INR m) Depreciation as a % of EBITDA

Nestle India
13 March 2019 11
Exhibit 26: Capex remains extremely muted
Source: Company, MOFSL
Exhibit 27: Asset turnover increased YoY
Source: Company, MOFSL
Debtor days remained at the historical average of ~3-4 days. Inventory daysreduced by four days YoY to 30 days. Creditor days increased by three days YoYto 36 days. NWC days moved into the negative zone for the first time since2010.
Exhibit 28: Cash Conversion Cycle improved sharply in CY18 Cash Conversion Cycle (on avg. basis) CY09 CY10 CY11 CY12 CY13 CY14 CY15 CY16 CY17 CY18
Inventory Days 33 31 32 33 30 29 37 35 34 30 Add: Trade Receivable Days 4 4 4 4 3 3 4 4 3 3 Less: Trade Payable Days 39 39 30 22 24 25 33 31 33 36 Cash Conversion Cycle (1) (4) 6 15 10 7 8 8 5 (2)
Source: Company, MOFSL
Exhibit 29: Breakup of Inventory days On average basis CY09 CY10 CY11 CY12 CY13 CY14 CY15 CY16 CY17 CY18 Inventory days 33 31 32 32 30 29 37 35 34 30 Raw materials days 10 10 10 9 8 10 12 13 12 10 Packing materials days 1 1 1 1 1 1 1 1 1 1 Work-in-progress days 3 4 4 5 4 3 4 3 4 4 Finished goods & Stock-in-trade days 16 15 15 16 14 14 18 16 15 14 Stores and spares days 2 2 2 2 2 2 2 2 2 2
Source: Company, MOFSL
Operating cash flow/ Free Cash flow has grown 23.2%/25.8% CAGR over thisperiod, led by P&L improvements. NWC days are back to negative levels for thefirst time since CY10, led by lower inventory levels and higher creditors.
Exhibit 30: FCF to sales up YoY
Source: Company, MOFSL
Exhibit 31: Payout ratio has increased but can get better
Source: Company, MOFSL
4.0%
7.7%
23.0
%
10.2
%
4.7%
0.6%
1.2%
1.1%
1.7%
1.2%
CY09
CY10
CY11
CY12
CY13
CY14
CY15
CY16
CY17
CY18
Capex/Sales
5.3
4.6
2.5
2.3
2.5
2.9
2.6
3.1
3.7
4.5
CY09
CY10
CY11
CY12
CY13
CY14
CY15
CY16
CY17
CY18
Sales/Net Fixed Assets (including CWIP)
13.1
%
9.4%
-5.3
%
8.7%
16.2
%
14.9
%
11.7
%
14.9
%
16.3
%
16.8
%
CY09
CY10
CY11
CY12
CY13
CY14
CY15
CY16
CY17
CY18
FCF/Sales
67.0 55.9
45.9 42.5 39.8 48.7
40.5 50.9
61.4 63.3
CY09
CY10
CY11
CY12
CY13
CY14
CY15
CY16
CY17
CY18
Payout (%)
Nestle India
13 March 2019 12
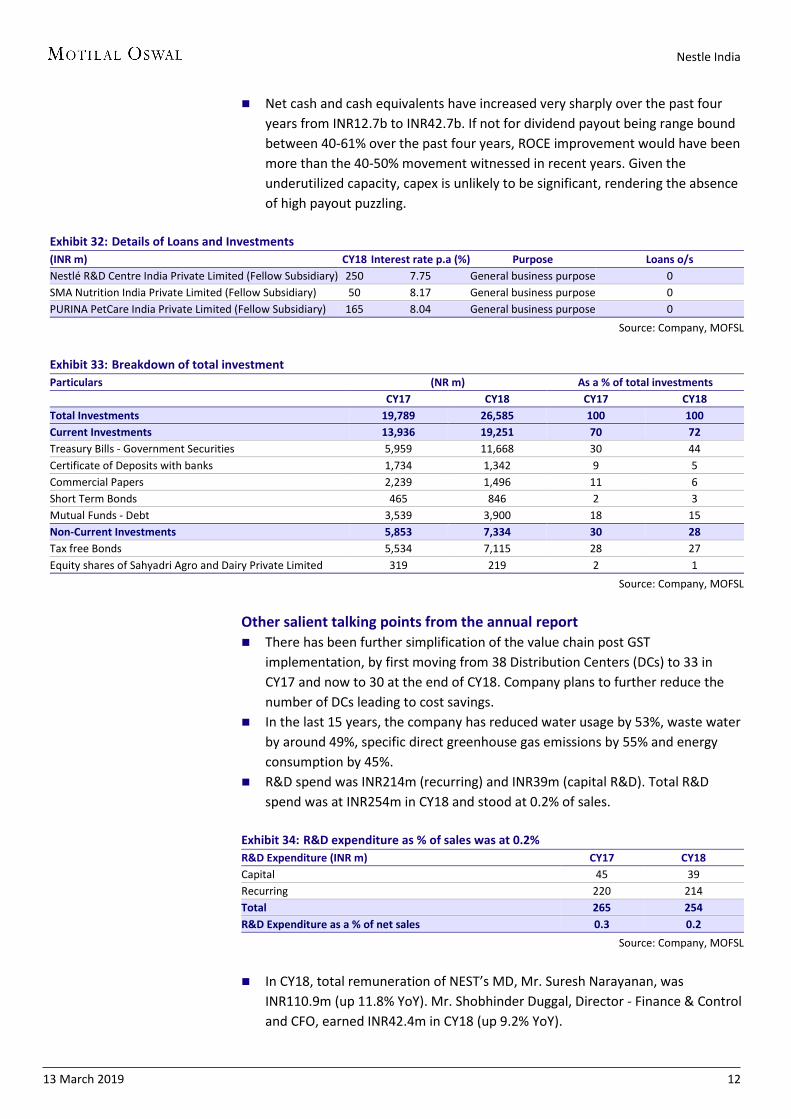
Net cash and cash equivalents have increased very sharply over the past fouryears from INR12.7b to INR42.7b. If not for dividend payout being range boundbetween 40-61% over the past four years, ROCE improvement would have beenmore than the 40-50% movement witnessed in recent years. Given theunderutilized capacity, capex is unlikely to be significant, rendering the absenceof high payout puzzling.
Exhibit 32: Details of Loans and Investments (INR m) CY18 Interest rate p.a (%) Purpose Loans o/s Nestlé R&D Centre India Private Limited (Fellow Subsidiary) 250 7.75 General business purpose 0 SMA Nutrition India Private Limited (Fellow Subsidiary) 50 8.17 General business purpose 0 PURINA PetCare India Private Limited (Fellow Subsidiary) 165 8.04 General business purpose 0
Source: Company, MOFSL
Exhibit 33: Breakdown of total investment Particulars (NR m) As a % of total investments
CY17 CY18 CY17 CY18 Total Investments 19,789 26,585 100 100 Current Investments 13,936 19,251 70 72 Treasury Bills - Government Securities 5,959 11,668 30 44 Certificate of Deposits with banks 1,734 1,342 9 5 Commercial Papers 2,239 1,496 11 6 Short Term Bonds 465 846 2 3 Mutual Funds - Debt 3,539 3,900 18 15 Non-Current Investments 5,853 7,334 30 28 Tax free Bonds 5,534 7,115 28 27 Equity shares of Sahyadri Agro and Dairy Private Limited 319 219 2 1
Source: Company, MOFSL
Other salient talking points from the annual report There has been further simplification of the value chain post GST
implementation, by first moving from 38 Distribution Centers (DCs) to 33 inCY17 and now to 30 at the end of CY18. Company plans to further reduce thenumber of DCs leading to cost savings.
In the last 15 years, the company has reduced water usage by 53%, waste waterby around 49%, specific direct greenhouse gas emissions by 55% and energyconsumption by 45%.
R&D spend was INR214m (recurring) and INR39m (capital R&D). Total R&Dspend was at INR254m in CY18 and stood at 0.2% of sales.
Exhibit 34: R&D expenditure as % of sales was at 0.2% R&D Expenditure (INR m) CY17 CY18 Capital 45 39 Recurring 220 214 Total 265 254 R&D Expenditure as a % of net sales 0.3 0.2
Source: Company, MOFSL
In CY18, total remuneration of NEST’s MD, Mr. Suresh Narayanan, wasINR110.9m (up 11.8% YoY). Mr. Shobhinder Duggal, Director - Finance & Controland CFO, earned INR42.4m in CY18 (up 9.2% YoY).

Nestle India
13 March 2019 13
Exhibit 35: MD’s remuneration increased 11.8% in CY18; median remuneration was at 8.89% Name of Employee Designation Total remuneration (INR m) % increase in remuneration Mr. Suresh Narayanan Chairman and Managing Director 110.9 11.8 Mr. Shobinder Duggal Director - Finance & Control and CFO 42.4 9.2
Source: Company, MOFSL
During the year, the company had earnings from exports of INR7.1b; of this,INR2b were earnings in INR from Nepal and Bhutan, while forex earnings wereat INR5.1bm.
Foreign exchange outgo was INR17.2b, which includes general license fees,imports, dividend paid and travel expenses.
Contingent liabilities and commitments at end-CY18 stood at INR6.6b (exciseduty, custom duty, service tax, sales tax/VAT and income tax) of which thecompany has paid INR367m under protest.
The company met their CSR commitment spends of INR273.4m for CY18.
Valuation and View There is no material change to our EPS forecasts. While the narrative on Nestle is getting consistently better, valuations of 46.2xCY20 leave limited room for an upside over the next year. Valuing the company at 49x Mar’21 EPS (in line with 3-year and 5-year average, we get a target price of INR11,800, 10% upside. Maintain Neutral.
Exhibit 36: Change in numbers have resulted in 1.3%/0.9% cut in CY19/20EPS New Old % Change
INR M 2019E 2020E 2019E 2020E 2019E 2020E
Net Sales 127,741 144,097 127,464 144,708 0.2% -0.4%EBITDA 30,212 35,104 30,571 35,428 -1.2% -0.9%Adjusted PAT 19,022 22,368 19,263 22,576 -1.3% -0.9%
Source: Company, MOFSL
Exhibit 37: Nestle P/E (x)
Source: Company, MOFSL
Exhibit 38: Consumer sector P/E (x)
Source: Company, MOFSL
53.7
42.3
61.8
21.0
51.0
33.6
15.0
30.0
45.0
60.0
75.0
Feb-
09
May
-10
Aug-
11
Nov
-12
Feb-
14
May
-15
Aug-
16
Nov
-17
Feb-
19
P/E (x) Avg (x) Max (x)Min (x) +1SD -1SD
39.4 32.6
46.5
17.5
39.4
25.8
15.0
23.0
31.0
39.0
47.0
55.0
Feb-
09
May
-10
Aug-
11
Nov
-12
Feb-
14
May
-15
Aug-
16
Nov
-17
Feb-
19
P/E (x) Avg (x) Max (x)Min (x) +1SD -1SD

Nestle India
13 March 2019 14
Financials and valuations
Income Statement (INR Million) Y/E December 2015 2016 2017 2018 2019E 2020E 2021E Net Sales 81,753 91,413 100,096 112,923 127,741 144,097 162,205 Change (%) -17.0 11.8 9.5 12.8 13.1 12.8 12.6 Gross Profit 47,064 52,585 56,827 67,020 74,363 84,341 95,401 Margin (%) 57.6 57.5 56.8 59.4 58.2 58.5 58.8 Other Expenditure 30,598 32,284 34,614 39,696 44,151 49,237 54,960 EBITDA 16,466 20,301 22,214 27,324 30,212 35,104 40,441 Change (%) -21.6 23.3 9.4 23.0 10.6 16.2 15.2 Margin (%) 20.1 22.2 22.2 24.2 23.7 24.4 24.9 Depreciation 3,473 3,537 3,423 3,357 3,560 3,725 3,905 Int. and Fin. Ch. 33 909 919 1,120 1,231 1,355 1,490 Other Inc.- Rec. 1,101 1,509 1,769 2,589 2,970 3,360 3,634 PBT 14,062 17,365 19,641 25,437 28,390 33,384 38,679 Change (%) -23.4 23.5 13.1 29.5 11.6 17.6 15.9 Margin (%) 17.2 19.0 19.6 22.5 22.2 23.2 23.8 Tax 2,504 5,440 6,141 8,220 9,369 11,017 12,764 Tax 2,899 5,612 6,492 8,849 9,369 11,017 12,764 Deferred Tax -395 -172 -351 -629 0 0 0 Tax Rate (%) 17.8 31.3 31.3 32.3 33.0 33.0 33.0 Adjusted PAT 11,558 11,924 13,500 17,217 19,022 22,368 25,915 Change (%) -7.3 3.2 13.2 27.5 10.5 17.6 15.9 Margin (%) 14.1 13.0 13.5 15.2 14.9 15.5 16.0 Non-rec. (Exp)/Inc. 5,925 1,911 1,248 1,148 1,148 1,148 1,148 Reported PAT 5,633 10,014 12,252 16,069 17,874 21,220 24,768
Balance Sheet (INR Million) Y/E December 2015 2016 2017 2018 2019E 2020E 2021E Share Capital 964 964 964 964 964 964 964 Reserves 27,214 31,859 33,242 35,773 36,292 34,371 30,212 Net Worth 28,178 32,823 34,206 36,737 37,256 35,335 31,177 Loans 177 332 351 351 351 351 351 Capital Employed 28,356 33,155 34,557 37,089 37,607 35,686 31,528
Gross Block 51,174 30,951 33,584 34,854 36,354 38,154 39,954 Less: Accum. Depn. 22,195 3,650 7,423 10,848 14,408 18,134 22,039 Net Fixed Assets 28,979 27,301 26,162 24,006 21,946 20,020 17,915 Capital WIP 2,308 1,882 942 1,052 1,052 1,052 1,052 Investments 13,249 17,557 19,789 26,585 28,510 30,628 32,957 Current 9,831 12,814 13,936 19,251 21,176 23,294 25,623 Non-current 3,418 4,743 5,853 7,334 7,334 7,334 7,334 Curr. Assets, L&A 16,269 21,365 26,734 29,238 36,160 41,102 44,173 Inventory 8,208 9,401 9,025 9,656 11,111 12,420 13,859 Account Receivables 784 979 890 1,246 1,044 1,177 1,325 Cash and Bank Balance 4,996 8,800 14,574 16,101 20,971 24,046 25,052 Others 2,281 2,185 2,245 2,236 3,034 3,458 3,937 Curr. Liab. and Prov. 30,720 33,396 37,849 43,204 49,473 56,527 63,982 Account Payables 7,435 7,992 9,846 12,404 14,185 16,208 18,120 Other Liabilities 4,659 5,145 4,212 4,578 5,079 5,729 6,450 Provisions 18,625 20,260 23,791 26,222 30,209 34,590 39,412 Net Curr. Assets -14,451 -12,032 -11,115 -13,966 -13,313 -15,426 -19,808Def. Tax Liability -1,729 -1,553 -1,220 -588 -588 -588 -588Appl. of Funds 28,356 33,155 34,558 37,089 37,607 35,686 31,528 E: MOFSL Estimates

Nestle India
13 March 2019 15
Financials and valuations
Ratios Y/E December 2015 2016 2017 2018 2019E 2020E 2021E Basic (INR) EPS 119.9 123.7 140.0 178.6 197.3 232.0 268.8 Cash EPS 155.9 160.4 175.5 213.4 234.2 270.6 309.3 BV/Share 292.2 340.4 354.8 381.0 386.4 366.5 323.3 DPS 48.5 63.0 86.0 113.0 150.0 200.0 250.0 Payout (%) 40.5 50.9 61.4 63.3 76.0 86.2 93.0
Valuation (x) P/E 89.2 86.5 76.4 59.9 54.2 46.1 39.8 Cash P/E 68.6 66.7 60.9 50.1 45.7 39.5 34.6 EV/Sales 12.4 11.0 10.0 8.8 7.7 6.8 6.0 EV/EBITDA 61.5 49.5 44.9 36.2 32.5 27.8 24.1 P/BV 36.6 31.4 30.1 28.1 27.7 29.2 33.1 Dividend Yield (%) 0.5 0.6 0.8 1.1 1.4 1.9 2.3
Return Ratios (%) RoE 40.9 39.1 40.3 48.5 51.4 61.6 77.9 RoCE 40.7 40.8 41.7 50.2 53.1 63.5 80.1 Working Capital Ratios Debtor (Days) 3.4 3.8 3.2 4.1 3.0 3.0 3.0 Asset Turnover (x) 2.7 2.8 2.8 3.1 3.4 3.9 4.7
Leverage Ratio Debt/Equity (x) 0.0 0.0 0.0 0.0 0.0 0.0 0.0
Cash Flow Statement (INR Million) Y/E December 2015 2016 2017 2018 2019E 2020E 2021E OP/(loss) before Tax 8,136 15,454 18,393 24,290 26,651 31,379 36,535 Int./Div. Received 756 1,378 1,353 2,477 2,970 3,360 3,634 Depn. and Amort. 3,673 3,537 3,423 3,357 3,560 3,725 3,905 Interest Paid 33 35 7 41 1,231 1,355 1,490 Direct Taxes Paid 3,422 5,029 6,041 8,813 9,369 11,017 12,764 Incr in WC 3,316 2,040 3,750 4,128 4,217 5,188 5,388 CF from Operations 10,981 14,659 18,178 20,525 23,321 27,270 30,920
Others -3,594 -1,538 639 -2,592 3,561 4,218 4,631 Incr in FA 1,493 1,133 1,959 1,628 1,500 1,800 1,800 Free Cash Flow 9,488 13,526 16,219 18,897 21,821 25,470 29,120 Pur of Investments 373 1,528 1,118 1,604 1,925 2,118 2,329 CF from Invest. -5,461 -4,199 -2,438 -5,824 136 300 502
Incr in Debt -32 4 0 0 0 0 0 Dividend Paid 4,098 5,640 8,292 10,895 17,356 23,141 28,926 Others -854 -1,020 -1,674 -2,279 -1,231 -1,355 -1,490CF from Fin. Activity -4,983 -6,656 -9,966 -13,174 -18,587 -24,495 -30,416
Incr/Decr of Cash 537 3,805 5,774 1,526 4,870 3,075 1,006 Add: Opening Balance 4,458 4,996 8,800 14,574 16,101 20,971 24,046 Closing Balance 4,996 8,800 14,574 16,101 20,971 24,046 25,052 E: MOFSL Estimates

Nestle India
13 March 2019 16
N O T E S
Nestle India
13 March 2019 17
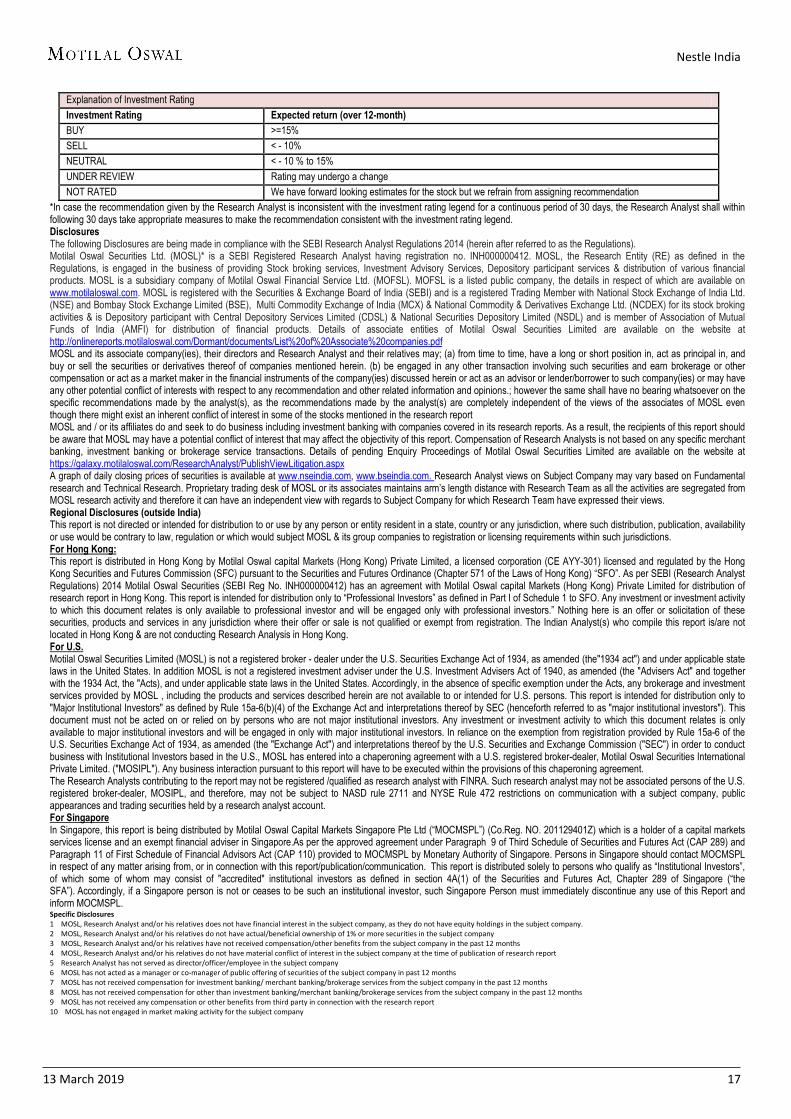
Explanation of Investment Rating Investment Rating Expected return (over 12-month) BUY >=15% SELL < - 10%NEUTRAL < - 10 % to 15%UNDER REVIEW Rating may undergo a change NOT RATED We have forward looking estimates for the stock but we refrain from assigning recommendation
*In case the recommendation given by the Research Analyst is inconsistent with the investment rating legend for a continuous period of 30 days, the Research Analyst shall within following 30 days take appropriate measures to make the recommendation consistent with the investment rating legend. Disclosures The following Disclosures are being made in compliance with the SEBI Research Analyst Regulations 2014 (herein after referred to as the Regulations). Motilal Oswal Securities Ltd. (MOSL)* is a SEBI Registered Research Analyst having registration no. INH000000412. MOSL, the Research Entity (RE) as defined in theRegulations, is engaged in the business of providing Stock broking services, Investment Advisory Services, Depository participant services & distribution of various financialproducts. MOSL is a subsidiary company of Motilal Oswal Financial Service Ltd. (MOFSL). MOFSL is a listed public company, the details in respect of which are available onwww.motilaloswal.com. MOSL is registered with the Securities & Exchange Board of India (SEBI) and is a registered Trading Member with National Stock Exchange of India Ltd.(NSE) and Bombay Stock Exchange Limited (BSE), Multi Commodity Exchange of India (MCX) & National Commodity & Derivatives Exchange Ltd. (NCDEX) for its stock brokingactivities & is Depository participant with Central Depository Services Limited (CDSL) & National Securities Depository Limited (NSDL) and is member of Association of MutualFunds of India (AMFI) for distribution of financial products. Details of associate entities of Motilal Oswal Securities Limited are available on the website athttp://onlinereports.motilaloswal.com/Dormant/documents/List%20of%20Associate%20companies.pdf MOSL and its associate company(ies), their directors and Research Analyst and their relatives may; (a) from time to time, have a long or short position in, act as principal in, andbuy or sell the securities or derivatives thereof of companies mentioned herein. (b) be engaged in any other transaction involving such securities and earn brokerage or othercompensation or act as a market maker in the financial instruments of the company(ies) discussed herein or act as an advisor or lender/borrower to such company(ies) or may have any other potential conflict of interests with respect to any recommendation and other related information and opinions.; however the same shall have no bearing whatsoever on the specific recommendations made by the analyst(s), as the recommendations made by the analyst(s) are completely independent of the views of the associates of MOSL eventhough there might exist an inherent conflict of interest in some of the stocks mentioned in the research report MOSL and / or its affiliates do and seek to do business including investment banking with companies covered in its research reports. As a result, the recipients of this report should be aware that MOSL may have a potential conflict of interest that may affect the objectivity of this report. Compensation of Research Analysts is not based on any specific merchant banking, investment banking or brokerage service transactions. Details of pending Enquiry Proceedings of Motilal Oswal Securities Limited are available on the website athttps://galaxy.motilaloswal.com/ResearchAnalyst/PublishViewLitigation.aspx A graph of daily closing prices of securities is available at www.nseindia.com, www.bseindia.com. Research Analyst views on Subject Company may vary based on Fundamentalresearch and Technical Research. Proprietary trading desk of MOSL or its associates maintains arm’s length distance with Research Team as all the activities are segregated from MOSL research activity and therefore it can have an independent view with regards to Subject Company for which Research Team have expressed their views. Regional Disclosures (outside India) This report is not directed or intended for distribution to or use by any person or entity resident in a state, country or any jurisdiction, where such distribution, publication, availability or use would be contrary to law, regulation or which would subject MOSL & its group companies to registration or licensing requirements within such jurisdictions. For Hong Kong: This report is distributed in Hong Kong by Motilal Oswal capital Markets (Hong Kong) Private Limited, a licensed corporation (CE AYY-301) licensed and regulated by the HongKong Securities and Futures Commission (SFC) pursuant to the Securities and Futures Ordinance (Chapter 571 of the Laws of Hong Kong) “SFO”. As per SEBI (Research AnalystRegulations) 2014 Motilal Oswal Securities (SEBI Reg No. INH000000412) has an agreement with Motilal Oswal capital Markets (Hong Kong) Private Limited for distribution ofresearch report in Hong Kong. This report is intended for distribution only to “Professional Investors” as defined in Part I of Schedule 1 to SFO. Any investment or investment activity to which this document relates is only available to professional investor and will be engaged only with professional investors.” Nothing here is an offer or solicitation of thesesecurities, products and services in any jurisdiction where their offer or sale is not qualified or exempt from registration. The Indian Analyst(s) who compile this report is/are notlocated in Hong Kong & are not conducting Research Analysis in Hong Kong. For U.S. Motilal Oswal Securities Limited (MOSL) is not a registered broker - dealer under the U.S. Securities Exchange Act of 1934, as amended (the"1934 act") and under applicable state laws in the United States. In addition MOSL is not a registered investment adviser under the U.S. Investment Advisers Act of 1940, as amended (the "Advisers Act" and togetherwith the 1934 Act, the "Acts), and under applicable state laws in the United States. Accordingly, in the absence of specific exemption under the Acts, any brokerage and investment services provided by MOSL , including the products and services described herein are not available to or intended for U.S. persons. This report is intended for distribution only to"Major Institutional Investors" as defined by Rule 15a-6(b)(4) of the Exchange Act and interpretations thereof by SEC (henceforth referred to as "major institutional investors"). This document must not be acted on or relied on by persons who are not major institutional investors. Any investment or investment activity to which this document relates is onlyavailable to major institutional investors and will be engaged in only with major institutional investors. In reliance on the exemption from registration provided by Rule 15a-6 of theU.S. Securities Exchange Act of 1934, as amended (the "Exchange Act") and interpretations thereof by the U.S. Securities and Exchange Commission ("SEC") in order to conductbusiness with Institutional Investors based in the U.S., MOSL has entered into a chaperoning agreement with a U.S. registered broker-dealer, Motilal Oswal Securities International Private Limited. ("MOSIPL"). Any business interaction pursuant to this report will have to be executed within the provisions of this chaperoning agreement. The Research Analysts contributing to the report may not be registered /qualified as research analyst with FINRA. Such research analyst may not be associated persons of the U.S. registered broker-dealer, MOSIPL, and therefore, may not be subject to NASD rule 2711 and NYSE Rule 472 restrictions on communication with a subject company, publicappearances and trading securities held by a research analyst account. For Singapore In Singapore, this report is being distributed by Motilal Oswal Capital Markets Singapore Pte Ltd (“MOCMSPL”) (Co.Reg. NO. 201129401Z) which is a holder of a capital markets services license and an exempt financial adviser in Singapore.As per the approved agreement under Paragraph 9 of Third Schedule of Securities and Futures Act (CAP 289) and Paragraph 11 of First Schedule of Financial Advisors Act (CAP 110) provided to MOCMSPL by Monetary Authority of Singapore. Persons in Singapore should contact MOCMSPL in respect of any matter arising from, or in connection with this report/publication/communication. This report is distributed solely to persons who qualify as “Institutional Investors”,of which some of whom may consist of "accredited" institutional investors as defined in section 4A(1) of the Securities and Futures Act, Chapter 289 of Singapore (“theSFA”). Accordingly, if a Singapore person is not or ceases to be such an institutional investor, such Singapore Person must immediately discontinue any use of this Report andinform MOCMSPL. Specific Disclosures 1 MOSL, Research Analyst and/or his relatives does not have financial interest in the subject company, as they do not have equity holdings in the subject company. 2 MOSL, Research Analyst and/or his relatives do not have actual/beneficial ownership of 1% or more securities in the subject company 3 MOSL, Research Analyst and/or his relatives have not received compensation/other benefits from the subject company in the past 12 months 4 MOSL, Research Analyst and/or his relatives do not have material conflict of interest in the subject company at the time of publication of research report 5 Research Analyst has not served as director/officer/employee in the subject company 6 MOSL has not acted as a manager or co-manager of public offering of securities of the subject company in past 12 months 7 MOSL has not received compensation for investment banking/ merchant banking/brokerage services from the subject company in the past 12 months 8 MOSL has not received compensation for other than investment banking/merchant banking/brokerage services from the subject company in the past 12 months 9 MOSL has not received any compensation or other benefits from third party in connection with the research report 10 MOSL has not engaged in market making activity for the subject company **************************************************************** ****************************************************************

Nestle India
13 March 2019 18
The associates of MOSL may have: - financial interest in the subject company - actual/beneficial ownership of 1% or more securities in the subject company - received compensation/other benefits from the subject company in the past 12 months - other potential conflict of interests with respect to any recommendation and other related information and opinions.; however the same shall have no bearing whatsoever on the
specific recommendations made by the analyst(s), as the recommendations made by the analyst(s) are completely independent of the views of the associates of MOSL even though there might exist an inherent conflict of interest in some of the stocks mentioned in the research report.
- acted as a manager or co-manager of public offering of securities of the subject company in past 12 months - be engaged in any other transaction involving such securities and earn brokerage or other compensation or act as a market maker in the financial instruments of the
company(ies) discussed herein or act as an advisor or lender/borrower to such company(ies) - received compensation from the subject company in the past 12 months for investment banking / merchant banking / brokerage services or from other than said services.
The associates of MOSL has not received any compensation or other benefits from third party in connection with the research report Above disclosures include beneficial holdings lying in demat account of MOSL which are opened for proprietary investments only. While calculating beneficial holdings, It does not consider demat accounts which are opened in name of MOSL for other purposes (i.e holding client securities, collaterals, error trades etc.). MOSL also earns DP income from clients which are not considered in above disclosures. Analyst Certification The views expressed in this research report accurately reflect the personal views of the analyst(s) about the subject securities or issues, and no part of the compensation of the research analyst(s) was, is, or will be directly or indirectly related to the specific recommendations and views expressed by research analyst(s) in this report. Terms & Conditions: This report has been prepared by MOSL and is meant for sole use by the recipient and not for circulation. The report and information contained herein is strictly confidential and may not be altered in any way, transmitted to, copied or distributed, in part or in whole, to any other person or to the media or reproduced in any form, without prior written consent of MOSL. The report is based on the facts, figures and information that are considered true, correct, reliable and accurate. The intent of this report is not recommendatory in nature. The information is obtained from publicly available media or other sources believed to be reliable. Such information has not been independently verified and no guaranty, representation of warranty, express or implied, is made as to its accuracy, completeness or correctness. All such information and opinions are subject to change without notice. The report is prepared solely for informational purpose and does not constitute an offer document or solicitation of offer to buy or sell or subscribe for securities or other financial instruments for the clients. Though disseminated to all the customers simultaneously, not all customers may receive this report at the same time. MOSL will not treat recipients as customers by virtue of their receiving this report. Disclaimer: The report and information contained herein is strictly confidential and meant solely for the selected recipient and may not be altered in any way, transmitted to, copied or distributed, in part or in whole, to any other person or to the media or reproduced in any form, without prior written consent. This report and information herein is solely for informational purpose and may not be used or considered as an offer document or solicitation of offer to buy or sell or subscribe for securities or other financial instruments. Nothing in this report constitutes investment, legal, accounting and tax advice or a representation that any investment or strategy is suitable or appropriate to your specific circumstances. The securities discussed and opinions expressed in this report may not be suitable for all investors, who must make their own investment decisions, based on their own investment objectives, financial positions and needs of specific recipient. This may not be taken in substitution for the exercise of independent judgment by any recipient. Each recipient of this document should make such investigations as it deems necessary to arrive at an independent evaluation of an investment in the securities of companies referred to in this document (including the merits and risks involved), and should consult its own advisors to determine the merits and risks of such an investment. The investment discussed or views expressed may not be suitable for all investors. Certain transactions -including those involving futures, options, another derivative products as well as non-investment grade securities - involve substantial risk and are not suitable for all investors. No representation or warranty, express or implied, is made as to the accuracy, completeness or fairness of the information and opinions contained in this document. The Disclosures of Interest Statement incorporated in this document is provided solely to enhance the transparency and should not be treated as endorsement of the views expressed in the report. This information is subject to change without any prior notice. The Company reserves the right to make modifications and alternations to this statement as may be required from time to time without any prior approval. MOSL, its associates, their directors and the employees may from time to time, effect or have effected an own account transaction in, or deal as principal or agent in or for the securities mentioned in this document. They may perform or seek to perform investment banking or other services for, or solicit investment banking or other business from, any company referred to in this report. Each of these entities functions as a separate, distinct and independent of each other. The recipient should take this into account before interpreting the document. This report has been prepared on the basis of information that is already available in publicly accessible media or developed through analysis of MOSL. The views expressed are those of the analyst, and the Company may or may not subscribe to all the views expressed therein. This document is being supplied to you solely for your information and may not be reproduced, redistributed or passed on, directly or indirectly, to any other person or published, copied, in whole or in part, for any purpose. This report is not directed or intended for distribution to, or use by, any person or entity who is a citizen or resident of or located in any locality, state, country or other jurisdiction, where such distribution, publication, availability or use would be contrary to law, regulation or which would subject MOSL to any registration or licensing requirement within such jurisdiction. The securities described herein may or may not be eligible for sale in all jurisdictions or to certain category of investors. Persons in whose possession this document may come are required to inform themselves of and to observe such restriction. Neither the Firm, not its directors, employees, agents or representatives shall be liable for any damages whether direct or indirect, incidental, special or consequential including lost revenue or lost profits that may arise from or in connection with the use of the information. The person accessing this information specifically agrees to exempt MOSL or any of its affiliates or employees from, any and all responsibility/liability arising from such misuse and agrees not to hold MOSL or any of its affiliates or employees responsible for any such misuse and further agrees to hold MOSL or any of its affiliates or employees free and harmless from all losses, costs, damages, expenses that may be suffered by the person accessing this information due to any errors and delays. Registered Office Address: Motilal Oswal Tower, Rahimtullah Sayani Road, Opposite Parel ST Depot, Prabhadevi, Mumbai-400025; Tel No.: 022-3980 4263; www.motilaloswal.com. Correspondence Address: Palm Spring Centre, 2nd Floor, Palm Court Complex, New Link Road, Malad (West), Mumbai- 400 064. Tel No: 022 3080 1000. Compliance Officer: Neeraj Agarwal, Email Id: [email protected], Contact No.:022-38281085. Registration details: MOSL: SEBI Registration: INZ000158836 (BSE/NSE/MCX/NCDEX); CDSL: IN-DP-16-2015; NSDL: IN-DP-NSDL-152-2000; Research Analyst: INH000000412. AMFI: ARN 17397. Investment Adviser: INA000007100. Motilal Oswal Asset Management Company Ltd. (MOAMC): PMS (Registration No.: INP000000670) offers PMS and Mutual Funds products. Motilal Oswal Wealth Management Ltd. (MOWML): PMS (Registration No.: INP000004409) offers wealth management solutions. *Motilal Oswal Securities Ltd. is a distributor of Mutual Funds, PMS, Fixed Deposit, Bond, NCDs, Insurance and IPO products. *Motilal Oswal Real Estate Investment Advisors II Pvt. Ltd. offers Real Estate products. * Motilal Oswal Private Equity Investment Advisors Pvt. Ltd. offers Private Equity products. * MOSL has been amalgamated with Motilal Oswal Financial Services Limited (MOFSL) w.e.f August 21, 2018 pursuant to order dated July 30, 2018 issued by Hon'ble National Company Law Tribunal, Mumbai Bench. The existing registration no(s) of MOSL would be used until receipt of new MOFSL registration numbers.