Locomotion and proliferation of glioblastoma cells in vitro: statistical evaluation of...
17
arXiv:physics/9902024v2 [physics.bio-ph] 10 Feb 1999 Locomotion and proliferation of glioblastoma cells in vitro: statistical evaluation of videomicroscopic observations Bal´azsHeged˝ us 1 M.Sc., Andr´ asCzir´ok 1 M.Sc., Ilona Fazekas 2 M.D. Ph.D., Tam´ asB´abel 2 M.D., Em´ ıliaMadar´asz 3 M.Sc. Ph.D. & Tam´ as Vicsek 1 M.Sc. Ph.D. University Professor 1 Department of Biological Physics, E¨ otv¨os University, Budapest, Hungary 2 National Institute of Neurosurgery, Budapest, Hungary 3 Institute of Experimental Medicine, Hungarian Academy of Sciences, Budapest, Hungary Corresponding and reprint author: Bal´azsHeged˝ us Department of Biological Physics E¨ otv¨osUniversity H-1117 Budapest P´ azm´anyP´ eter s´ et´any1A Hungary Tel: (36)-1-3722795 Fax: (36)-1-3722757 e-mail: [email protected] Supports: Gedeon Richter Pharmaceutical Company (Richter 216/97/KK) Ministry of Education (FKFP 0203/1997) Hungarian Science Foundation (OTKA T25719, OTKA T019299) Running head: Locomotion and proliferation of glioblastoma cells Key words: glioblastoma, videomicroscopy, cell migration, proliferation I. ABSTRACT Long-term videomicroscopy and computer-aided statistical analysis were used to determine some characteristic parameters of in vitro cell motility and proliferation in three established cell lines derived from human glioblastoma tumors. Migration and proliferation activities were compared among the three cell lines since these are two features of tumor cells that strongly influence the progression of cancer. Cell proliferation in sub-confluent cultures were evaluated by calculating the growth rate of the number of cells and the distribution of the cell-cycle times in a given microscopic field. In these parameters no significant difference was observed among the cell lines regardless to the number of passages. Studies on cell locomotion revealed strong fluctuations in time and exponential distribution of cell velocities. In spite of the fluctuations, both the distribution profile and the average velocity values were reproducibly characteristic to each cell line investigated. The results on these dynamical parameters of cell locomotion were compared to pathological data obtained by traditional methods. The data indicate that the analysis of cell motility provides more specific information and is potentially useful in diagnosis. II. INTRODUCTION In order to provide appropiate methods for the characterization of the large variety of human brain tumors, repro- ducible and quantitative models are needed. Then, one can carry out a characterization of the dynamics of tumor cells providing substantial information supplementing the results of such statical methods as histology or molecular genetics. For example, in vitro studies on the cell cycle and motility of tumor derived cells could provide relevant information for the diagnosis and the estimation of the progression of the cancer. The correlation between tumor 1
-
Upload
meduniwien -
Category
Documents
-
view
1 -
download
0
Transcript of Locomotion and proliferation of glioblastoma cells in vitro: statistical evaluation of...

arX
iv:p
hysi
cs/9
9020
24v2
[ph
ysic
s.bi
o-ph
] 1
0 Fe
b 19
99
Locomotion and proliferation of glioblastoma cells in vitro: statistical evaluation of
videomicroscopic observations
Balazs Hegedus1 M.Sc., Andras Czirok1 M.Sc., Ilona Fazekas2 M.D. Ph.D.,Tamas Babel2 M.D., Emılia Madarasz 3 M.Sc. Ph.D. &Tamas Vicsek1 M.Sc. Ph.D. University Professor
1 Department of Biological Physics, Eotvos University, Budapest, Hungary2 National Institute of Neurosurgery, Budapest, Hungary3 Institute of Experimental Medicine, Hungarian Academy of Sciences, Budapest, Hungary
Corresponding and reprint author: Balazs HegedusDepartment of Biological PhysicsEotvos UniversityH-1117 BudapestPazmany Peter setany 1AHungaryTel: (36)-1-3722795Fax: (36)-1-3722757e-mail: [email protected]
Supports: Gedeon Richter Pharmaceutical Company (Richter 216/97/KK)Ministry of Education (FKFP 0203/1997)Hungarian Science Foundation (OTKA T25719, OTKA T019299)
Running head: Locomotion and proliferation of glioblastoma cells
Key words: glioblastoma, videomicroscopy, cell migration, proliferation
I. ABSTRACT
Long-term videomicroscopy and computer-aided statistical analysis were used to determine some characteristicparameters of in vitro cell motility and proliferation in three established cell lines derived from human glioblastoma
tumors. Migration and proliferation activities were compared among the three cell lines since these are two featuresof tumor cells that strongly influence the progression of cancer.
Cell proliferation in sub-confluent cultures were evaluated by calculating the growth rate of the number of cells andthe distribution of the cell-cycle times in a given microscopic field. In these parameters no significant difference wasobserved among the cell lines regardless to the number of passages.
Studies on cell locomotion revealed strong fluctuations in time and exponential distribution of cell velocities. Inspite of the fluctuations, both the distribution profile and the average velocity values were reproducibly characteristicto each cell line investigated.
The results on these dynamical parameters of cell locomotion were compared to pathological data obtained bytraditional methods. The data indicate that the analysis of cell motility provides more specific information and ispotentially useful in diagnosis.
II. INTRODUCTION
In order to provide appropiate methods for the characterization of the large variety of human brain tumors, repro-ducible and quantitative models are needed. Then, one can carry out a characterization of the dynamics of tumorcells providing substantial information supplementing the results of such statical methods as histology or moleculargenetics. For example, in vitro studies on the cell cycle and motility of tumor derived cells could provide relevantinformation for the diagnosis and the estimation of the progression of the cancer. The correlation between tumor
1

malignancy and increased migration activity of glioma cells had been demonstrated by in vivo and in vitro exper-iments using rat brain xenografts [1,11] or radial dish assays [4,5]. In addition, studies of cell proliferation usingeither proliferation-marker antibodies in tissue sections or flow cytometry of tumor- derived cell cultures have alsodemonstrated that the growth fraction of the specimen often correlates with the malignancy of the tumor [8,10].
In several cases tumor recurrence is originated by a minor subpopulation of highly migratory cells which were notremoved surgically with the bulk tumor. Thus, the detection of such subpopulations and the estimation of theirinfiltration depth is essential for postoperational treatments. However, fluctuations in locomotion or proliferationgenerate difficulties in the characterization of the heterogeneity of a tumor specimen; according to early studies astrong variation is present in the intermitotic times even within a single-cell derived population [18]. Fluctuationsdominate the motility of single cells as well [9,13,7]. The classical methods assaying cell division frequency or cellmotility cannot distinguish between a fluctuating but homogeneous population and an inhomogeneous population,thus their prognostic value is rather limited regarding heterogeneity [10]. To reveal details about heterogeneity andsubpopulations in vitro experiments and careful statistical analyses are required.
Simultaneous and automatized observation of the mitotic and locomotory activity of a large number of cells duringa long time interval can provide a direct way to overcome such difficulties.
We describe here a novel long-term videomicroscopic system together with a computer-aided statistical analysisto quantify the in vitro behavior of cells. With this method we compared three established glioblastoma cell linesderived from three patients. Glioblastoma is a common and highly malignant (WHO Grade IV.) tumor that developsin late adult life and generally located in the cerebral hemispheres. These tumors contain motile and invading cells,frequently causing rapid recurrence after surgical resection [15]. In some cases the migration of these cells lead to theprogress of the disease even without the formation of notable mass effect [19].
While our studies revealed a rather similar proliferation activity in all investigated cell lines, a reproducible andsignificant difference was found in the locomotory activity of the cells. Due to the large number of individually trackedcells the question on the homogeneity of cell motion and proliferation of the cell populations could be also addressed.By appropriate automatization the complete analysis can be completed within 4 or 5 days after processing the surgicalspecimen to one-cell suspension, providing a new tool for diagnostical purposes.
III. MATERIALS AND METHODS
A. Diagnosis of human brain tumors
The surgical specimens were obtained during craniotomies for resection of 3 hemispherical primary brain tumor. Thebigger part of the specimen was evaluated by routine histopathology, including staining with hematoxylin and eosinand immunohistochemical staining for GFAP expression. Specimens were graded according to the WHO classifications[12] at the Histopathological Department of National Institute of Neurosurgery.
B. Establishment of human brain tumor cell lines
Part of the specimen was used for establishing the cell lines. The samples were washed by Minimal EssentialMedium (Sigma) containing gentamycin (Chinoin) and Fungizone (Gibco). After removing the vessels, the sampleswere minced and then triturated with a Pasteur-pipette. The primary tissue was seeded into Leighton culture flaskon Bellco-slide or into Steriline culture flask in Dulbecco’s MEM (Sigma) with 20% FCS (Gibco). According to ourprocedure the cultures are not one-cell derived. The passages were performed with 0.25% trypsin and cells transferredto Greiner tissue culture flasks. Cells were maintained in DMEM (Sigma) with 10% FCS, 40 µg/ml gentamycin and5 µg/ml Fungizone, at 37oC in a humidified 5% CO2 atmosphere. Cells were stored in 10% DMSO (Sigma) DMEMsolution in liquid nitrogen for later use.
C. Immunocytochemical staining for GFAP in the cultures
The cultured cells’ glial origin was indicated by the presence of glial fibrillary acidic protein (GFAP). Cells culturedon slides were fixed with Zamboni-solution for 60 minutes at room temperature. Then incubated as follows: 3 times 10minutes in PBS (Phosphate Buffered Saline), 20 minutes 15% human albumin in PBS (Human), 30 minutes with mouseanti-GFAP antibodies (High Performance, Biogenex) in a humidified chamber, 20 minutes biotin-conjugated anti-mouse immunoglobulin (Multilink Stravigen, Biogenex), 20 minutes peroxidase-conjugated streptavidin (Biogenex).
2

Slides were developed with DAB (2,5 mg DAB+ 5 ml PBS+ 50µl 1% H2O2) under microscopic control. Controlswere performed without the primary antibodies.
D. Long-term videomicroscopy
105 cells, counted in haemocytometer, were plated in 35 mm TC-dishes (Greiner) with 2 ml medium (DMEM(Sigma) with 10% FCS (Gibco)). Cell cultures were kept in a mini-incubator – providing 37oC in a humidified 5%CO2 atmosphere – attached to the powered stage of an inverted phase-contrast microscope (Zeiss Televal-1)(Fig 1).Images of 3-6 neighbouring microscopic fields were taken in every 5 minutes during a 3-day long period, with 10×,20× or 40× objectives using a CCD camera (JVC KY-F30B) connected directly to the frame grabber card (MatroxMeteor, Matrox Electronic Systems LTD, Canada) of a PC (running under LINUX operating system).
E. Cell positions and trajectories
To determine the position (~xi) of the individual cells, the geometrical center of each cell was tracked manually inevery 4th image (i.e., in every 20 minutes in real time). The difference in the location of a given cell was consideredas a migratory segment. Trajectories were constructed from these segments.
F. Duplication time
Using the database of cell positions, the total number of cells in a given microscopic field (n) was determined. Thegrowth of cell number was found to be approximately exponential in each investigated culture, i.e., n ∼ eαt. Basedon a least square-fit of α, the duplication time, τ , was calculated as τ = (ln 2)/α.
G. Cell-cycle time and non-proliferating cells
All cell divisions during the observation period were identified resulting a data base containing the correspondingmother and daughter cells. The cell cycle length (τ0) of a given cell was then determined as the time elapsed betweentwo consecutive cell divisons.
We denote by ν the rate at which non-proliferating cells appear in the culture. It was calculated in two steps.First we determined N , the number of proliferating cells by the criteria that both their birth and subsequent mitosiswas recorded and their birth occured more than 30 hours before the end of the recording. Then N∗, the number ofsuspected non-dividing cells was calculated. These cells were selected using the following criteria: (i) lack of observedmitosis during the entire recording period, and (ii) being tracked for at least 30 hours following their birth. Then, νwas calculated as ν = N∗/(N∗ + N).
Note, that there are two sources of systematic errors in this procedure. On one hand, when calculating N∗, cellsmay be included which do divide, but their cell cycle length is longer than the time period during the culture wasobserved. On the other hand, we did not include in N∗ cells which do not divide, but we could not track them forlonger than 30 hours because they left the field of observation. Taking into account that during a 30-hour periodapproximately 10% of the cells migrated out of the observed area, and (based on the empirical distribution of thecell-cycle times) ≈ 20% of the dividing cells have longer cell cycle than 30h, we estimate the relative error of ν to be10%.
Assuming that after each division a νth portion of daughter cells become unable to further proliferate, the size ofthe cell population (n) after the kth complete set of cell division – denoted as n(kτ0) – is given by
log n(kτ0) ≈ k log 2(1 − ν) + const. (1)
Thus based on this simple calculation, the relation
τ0 log 2 = τ log 2(1 − ν) (2)
is expected to hold among the independently measurable parameters τ ,τ0 and ν.
3
H. Cellular velocities
The velocity, vk(t), of a given cell k was calculated as the translocation of its geometrical center during a giventime interval, ∆t, i.e.,
vk(t) =
∣
∣
∣
∣
~xk(t + ∆t) − ~xk(t)
∆t
∣
∣
∣
∣
. (3)
∆t was chosen to be 1h, since during this time interval the displacement of the cells were typically larger than thecell size, thus the relative error of vk(t) resulting from the tracking procedure was reduced. Nevertheless, during onehour (as our data show) the fluctuations in cell motility were not yet averaged out.
To characterize such a fluctuating quantity as the cell locomotion activity we determined the F (v) cumulativedistribution function. F (v) gives the probability of the event that the velocity of a randomly selected cell at a giventime is less than v. Since the relative error of the small cell displacements is high due to the manual tracking procedure,velocities less than 5 µm/h were discarded in the analyses. The F (v) empirical distribution function was fitted by anexponential distribution [7] as
F (v) = 1 − exp(−v/v0), (4)
where vo is a fitting parameter being equal to the mean velocity if (4) is exact.As another way to characterize the motility of the cells, the empirical average velocity of the culture, V , was
calculated as
V =
∑
k
∑
ivk(ti)
∑
k
∑
iδk(ti)
, (5)
where δk(ti) is 1, if the kth cell is in the visual field in the ti moment, otherwise 0.
IV. RESULTS
A. Histological description of tumors and cell lines
The main features of the cell lines are given in Table 1. The routine histology of the tumor specimens concerningWHO classification revealed glioblastoma. All three sections showed hypercellularity, pleomorphism, vascular prolif-eration and necrosis. The HA and HC specimens (detailed in Table 1) were classified as glioblastoma multiforme. Inthe HB specimen some areas were dominated by multinucleated giant cells and the invasion of lymphoid cells wasobserved. Thus HB was classified as giant cell variant of glioblastoma.
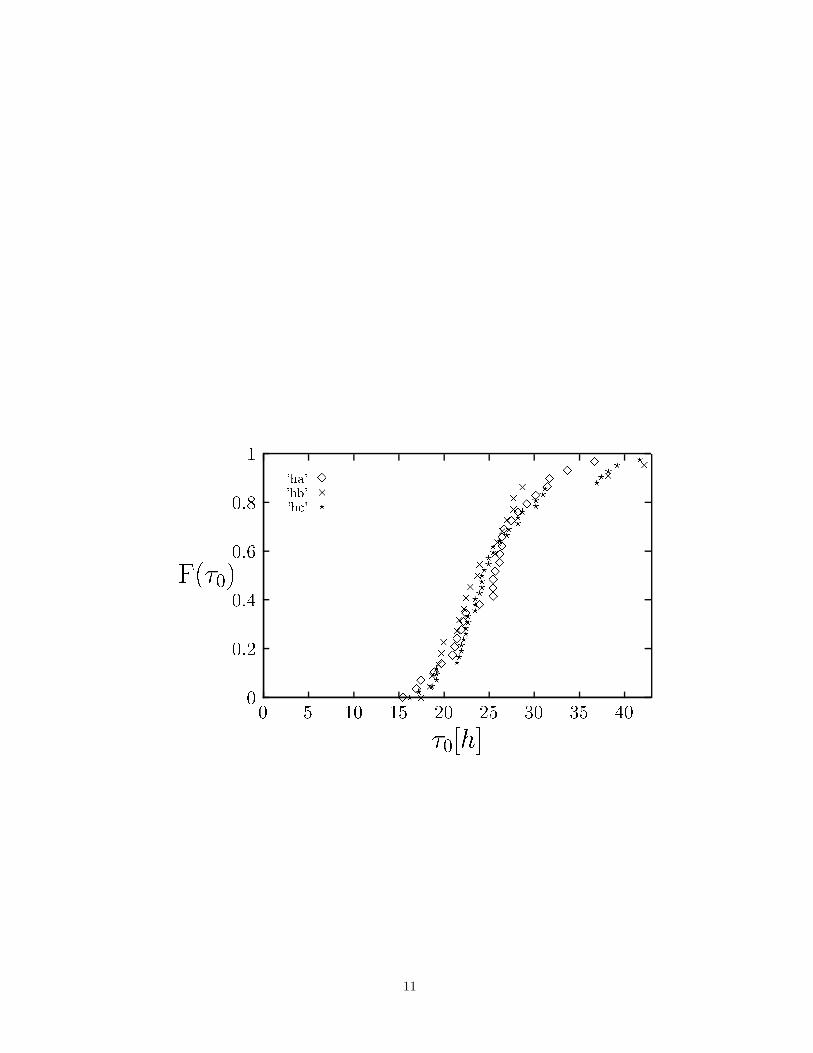
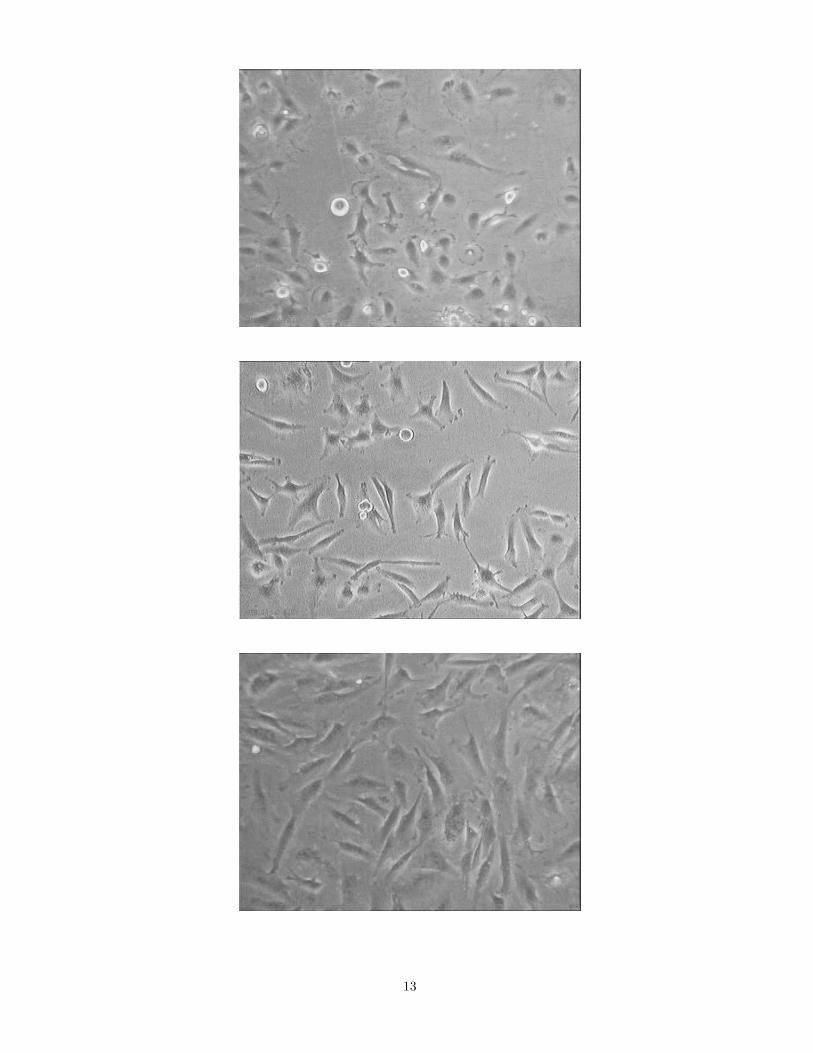
The cultures were morphologically characterized according to Bigner [2]. Usually the HA-derived cells had two orthree processes and the formation of filopodia was quite frequent. The HB culture’s cells were mostly elongated, hadmore processes and the formation of filopodia and lamellipodia with ruffling edges was exceedingly intensive. Bothmorphology was described as fibroblastic. In contrast, even the subconfluent HC cultures showed typical epithelialmorphology with the general absence of cellular processes. The cells formed preferentially a monolayer, though cellscould crawl over each other. During cultivation multinucleated monstrocells were observed in all the three lines. Onthe time-lapse records cell divisions into three daughter cells were also observed occasionally. In most of these casesthe resulting daughter cells seemed to perform normal mitoses later on.
B. Cell proliferation
The number of cells in a given microscopic field grew exponentially after an initial lag phase of 15-20 hours (Fig 2).Based on these data the cell duplication times were determined (Tab 2). No significant differences were found in theduplication time of the various cell lines: each culture could be characterized by τ= 38±4 hour.
The cell number in a given microscopic field changed because of cell divisions and the migration of the cells.According to our observations the net current of migration was approximately zero, so the increase of cell numberwas basically determined by the ratio of dividing cells and the duration of their cell-cycle.
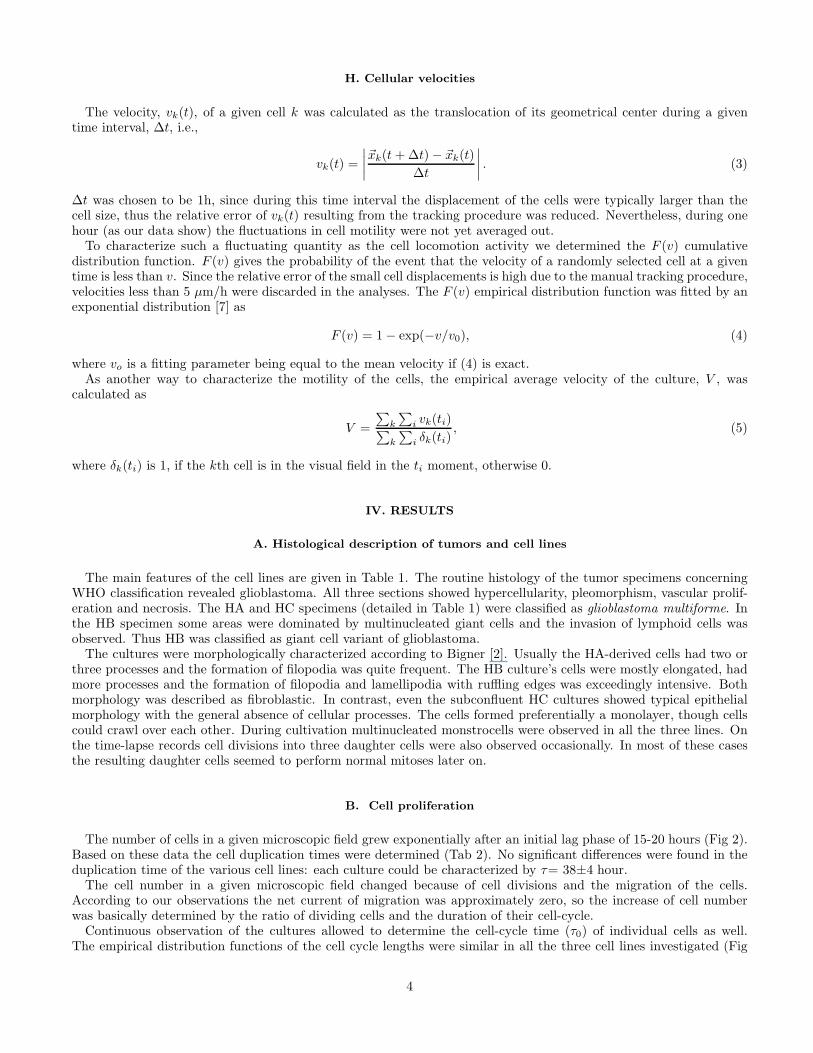
Continuous observation of the cultures allowed to determine the cell-cycle time (τ0) of individual cells as well.The empirical distribution functions of the cell cycle lengths were similar in all the three cell lines investigated (Fig
4

3). In fact, based on this amount of data the distributions could not be distinguished based on a Wilcoxon test(with p<0.05). The average cell-cycle time was found to be 25.6±6.2 hours. The difference between the averagecell-cycle time and the duplication time of the cell population can be explained by the presence of non-dividing cells.The proportion of these cells, ν, was found to be 32 ± 5% (Table 2). According to relation (2) this proportion wasdetermined by average cell-cycle time (τ0) and duplication time (τ) as 34%. Thus, relation (2) holds within error forthe rate of arising of non-proliferating cells, average cell-cycle time (τ0) and duplication time (τ).
To investigate the role of hereditary factors in the determination of cell-cycle time the correlation between parentand daughter cells was studied (Fig 4). The scattering of data indicates uncorrelated variables, it means that theduration of cell-cycle is not influenced by the parent cell’s cell-cycle time.
C. Cell locomotion
The dynamics of cell shape can be qualitatively observed and characterized using the long term time-lapserecords(Fig 5). The videomicroscopic images showed the rich dynamics of the formation of lamellipodia and filopodia.The intensity of ruffling edge formation correlated with the motility of cells [13]. As expected, the epithelial [2] HCcells displayed the lowest motility and the HB cells were more motile than the other fibroblastic [2] HA cell line.
The analysis of the pathways of individual cells revealed that in subconfluent cultures the direction of cell movementis random and disordered (Fig 6a). However, at high cell densities the HB cell line displayed a rather ordered collectivemigration (Fig 6b).
In all of the three cell lines the cell velocities were highly fluctuating as demonstrated in Fig 7.The F (v) cumulative distribution functions are shown in Fig 8. Both the distribution functions and the average
velocities of the culture (V and v0) were different among the three cell lines but within error reproducible for eachindividual cell line (Table 3).
D. Population homogeneity
To understand the relation between velocity distribution function and the homogeneity of locomotory activity ofthe cell population further statistical analysis is required. The velocity distributions described by (4) were foundfor relatively large (≈ 100 cells) populations. On the level of individual cells the exponential behaviour (4) can beinterpreted in two ways: (i) The culture is inhomogeneous, i.e., slower and faster cells can be distinguished on the basesof well preserved phenotypic properties. In this case the exponential F (v) distribution can reflect the ratio of the slowand fast cells in the culture, while the velocity fluctuations of the individual cells can show an arbitrary distribution.(ii) If the culture is homogeneous, then almost all cells exhibit the same distribution of velocity fluctuations, i.e.,Fi(v) ≈ F (v) holds for each cell i, where Fi(v) denotes the velocity distribution function of the cell i. In this scenariothe time-averaged velocity 〈vi(t)〉 of each cell would be the same if we could calculate the time averages over aninfinitely long time. Since the time averages are calculated over a finite time T only, for the distribution of theaverage velocities we can expect a Gamma distribution with a parameter s = T/t0, where the correlation time of theprocess is denoted by t0 [7].
We used the distribution function of the average velocity of individual cells (averaged over the entire observationperiod) to characterize the inhomogeneity within the cell lines. In all cases the average velocity of the cells showed agamma distribution indicating the homogenity of the cell population (Fig. 9.). However, if applying the same kindof analysis on a cell position data base in which cells from different cell lines were mixed, a significant deviation fromthe gamma distribution can be observed (shown in the insert of Fig. 9.).
V. DISCUSSION
The comparison of classical morphological data and the dynamical properties in the three glioblastoma cell lines gavesome unexpected results. In spite of the different origin and different passage-levels of the investigated lines significantalterations in the in vitro proliferating potential were not revealed. Both the cell-cycle time and the percentage ofdividing cells under the same culture conditions were found equal in the three different glioblastoma lines. The cell-cycle time measured in our cultures did not differ from the doubling time of normal primary fibroblasts from humanskin [3]. The variability of the cell-cycle time of individual cells seems to be independent from inheritable factors andmight be best explained by the stochastic activity of the cells.
5

The experimental verification of Eq. (2) suggests that the non-dividing cells did not belong to an initial subpop-ulation in the culture but arose continuously during proliferation. The considerable proportion of these cells mayindicate that defective mitoses are abundant in the cell culture. The cause of this phenomenon can be the geneticalinstability of tumor cells which has been recently demonstrated [3].
Although the in vitro cell motility is a highly stochastic process regarding the direction of the movement or thefluctuation of the velocity of an individual cell, the locomotory activity of the cell lines have some quantitativeproperties that can be interdependent with the morphology of the cultured cells. The cell lines with fibroblasticmorphology performed higher locomotory activity. Reproducible and significant difference was found in the locomotionof the cells among the three investigated glioblastoma cell lines.
The HB case can illustrate that classical studies are not always satisfying in the forecast of the disease course. Inspite of the diagnosis as a giant cell variant, which is commonly known as a less malignant type of glioblastoma, andthe powerful presence of immune response, the tumor was fatally renewed within 4 month. It can be supposed thatthe fast and strong recurrence was due to the highly motile cells that invaded the surrounding tissue and were notremoved surgically.
Our data were obtained on established cell lines after multiple passages, in this way these cultures may not reflectentirely the properties of the cells of the investigated tumors. With similar preparations the evaluation can beperformed on primary cultures with no passages as well. Investigations of in vitro dynamic behavior of primarycell cultures from surgical specimens can complement classical diagnostic methods. Although during culturing aninevitable selection takes place, some of the initial features or even heterogenity of the tumor tissue may be reflectedin the cell cultures. If such analysis can be carried out within a short period of time, it can help to choose the mostappropriate postoperative therapy in each individual case.
VI. ACKNOWLEDGEMENTS
We are indebted to Felıcia Slowik for the diagnosis. We thank Zoltan Csahok and Otto Haiman for the technicalsupport and Antalne Kerekes for the maintainance of the cultures.
[1] Bernstein JJ, Goldberg WJ, Laws ER Jr: Human malignant astrocytoma xenogtrafts migrate in rat brain: a model forcentral nervous system cancer research J Neurosci Res 22:134-143, 1989
[2] Bigner DD et al.: Heterogeneity of Genotypic and Phenotypic Characteristics of Fifteen Permanent Cell Lines Derivedfrom Human Gliomas J Neuropathol Exp Neurol 40: 201-227, 1981
[3] Cahill DP et al.: Mutations of mitotic checkpoint genes in human cancers Nature 392:300-333, 1998[4] Chicoine MR, Silbergeld DL: Assessment of brain tumor cell motility in vivo and in vitro. J Neurosurgery 82: 615-622,
1995[5] Chicoine MR, Silbergeld DL: Mitogens as motogens J Neurooncol 35: 249-257, 1997[6] Chicoine MR, Silbergeld DL: The in vitro motility of human gliomas increases with increasing grade of malignancy. Cancer
75: 2904-9, 1995[7] Czirok A, Schlett K, Madarasz E, Vicsek T: Exponential Distribution of Locomotion Activity in Cell Cultures Phys Rev
Lett 81:3038-3041, 1998[8] Deckert M, Reifenberger G, Wechsler W: Determination of proliferative potential of human brain tumors using the mono-
clonal antibody Ki-67 J Cancer Res Clin Oncol 115:179-188, 1989[9] Dunn GA and Brown AF: A Unified Approach to Analysing Cell Motility J Cell Sci Suppl 8: 81-102, 1987
[10] Hoyt JW, Gown AM, Kim DK, Berger MS: Analysis of proliferative grade in glial neoplasms using antibodies to the Ki-67defined antigen and PCNA in formalin fixed, deparaffinized tissues. J Neurooncol 24:163-169, 1995
[11] Huang P, Allam A, Taghian A: Growth and metastatic behavior of five human glioblastoma compared with nine otherhistological types of human tumor xenografts in SCID mouse. J Neurosurgery 83:308-315, 1995
[12] Kleihues P, Burger PC, Scheithauer BW: Histological Typing of Tumours of the Central Nervous System World Health
Organization, International Histological Classification of Tumours Springer-Verlag: Berlin, Heidelberg, 1993[13] Lauffenburger DA, Horowitz AF: Cell Migration: A Physically Integrated Molecular Process Cell 84:359-369, 1996[14] Muller W, Slowik F, Firsching R, Afra D, Sanker P: Contribution to the problem of giant cell astrocytomas. Neurosurg
Rev 10:213-219, 1987[15] Nazzaro JM, Neuwelt EA: The role of surgery in the management of supratentorial intermediate and high-grade astrocy-
tomas in adults. J Neurosurgery 73:331-344, 1990
6

[16] Onda K, Davis RL, Shibuya M, Wilson CB, Hoshino T: Correlation between the Bromodeoxyuridine Labeling Index andMIB-1 and Ki-67 Proliferating Cell Indices in Cerebral Gliomas. Cancer 74: 1921-1926, 1994
[17] Rutka TJ, Murakami M, Dirks PB: Role of glial filaments in cells and tumors of glial origin: a review. J Neurosurgery
87: 420-430, 1997[18] Shields R: Transition probability and the origin of variation in the cell cycle. Nature 267: 704-707, 1977[19] Silbergeld DL, Rostomily RC, Alvord EC Jr: The cause of death in patients with glioblastoma is multifactoral: clinical
factors and autopsy findings in 117 cases of supratentorial glioblastoma in adults. J Neurooncol 10:179-185, 1991
Figure legends:
FIG. 1. Schematic representation of the long-term videomicroscopy system. The incubator, placed on the inverted micro-scope’s stage, holds the TC-dish. The microscope stage and the adequate cell culture conditions (temperature, atmosphere)are controlled by the computer. The CCD camera’s images are transmitted to the computer, where the digitalized images canbe processed and analysed or recorded on videotape.
FIG. 2. The growth of the normalized cell number in a given visual field. The y-axis is logarithmic, and the actual cellnumbers were normalized by the N0 coefficient of the exponential fit N ∼ N0e
αt. The growth rate is similar in all the cellcultures investigated. The solid line shows the fitted exponential growth with the average duplication time (τ= 38±4).
FIG. 3. The distribution of the cell-cycle time (τ0). The distribution functions obtained from the three cell lines could notbe distinguished statistically. Thus the proliferating cells in any of the investigated cultures divided with the similar cell-cycletime.
FIG. 4. The daughter cells’ cell-cycle time (τ0(d)) versus the parent cells’ cell-cycle time (τ0(p)). The scattering of the datapoints means that the cell-cycle times in the subsequent generations do not correlate.
FIG. 5. Snapshots from the recordings of the various cell lines. Despite the same diagnosis, morphological differences canbe observed. The approximately epithelial morphology of HC (c) cells can be compared to the fibroblastic characteristics ofHA (a) and HB (b) cells. Field of view is 740 µm × 560 µm.
FIG. 6. Cellular trajectories in the HB3 measurement. (a) During the first 24 hours the cells perform a persistent randomwalk. (b) In the second 24 hours, at a higher cell density, the cells show a spatially ordered migration with increased persistencelength. Field of view is 740 µm * 560 µm.
FIG. 7. Cell velocities fluctuate in time. In the figure 3 representative cells’ velocities are plotted vs time for each cell line.For better visualisaton the consecutive curves are shifted vertically by 50µm/h.
FIG. 8. The distribution function G(v) = 1 − F (v) of the cell velocities in the investigated cultures on linear-logarithmicplot. The linearity of the curves indicate that the cell velocities can be described by an exponential distribution. The graphalso shows that G(v) function reproducibly distinguish the three different cell lines.
FIG. 9. Distribution functions of the average velocities of individual cells. The average was calculated over the entiremeasurement period and the functions are normalized by the average velocities of the cultures. The curves are well fittedby the calculated gamma distribution suggesting a phenotypically homogeneous population with respect to the locomotoryactivity. In the inserted graph the mixed curve – data from two different cell lines – shows a significant difference from thecalculated gamma function.
7

TABLE I. The most important data of the cell cultures analyzed
measurement HA1 HA2 HB3 HB4 HC0 HC2
date of 1997 1997 1996 1996 1995 1995operation March March October October February February
age and sex 58 y 58 y 51 y 51 y 61 y 61 yof patient f f m m f f
passage 7 8 45 47 103 107
area ofobserved 1.14 0.41 0.41 1.14 1.14 0.41
field [mm]2
initial cell 55 27 61 110 93 33number
initial cell 48 65 148 96 82 80density [mm]−2
TABLE II. The data on proliferation in the six measurements
measurement HA1 HA2 HB3 HB4 HC0 HC2 average
average cell-cycletime and its standard 24.2 ± 6.6 27.9 ± 5.8 n.a. 24.7 ± 5.9 n. a. 25.9 ± 5.9 25.6 ± 6.2deviation [h]
duplication time[h] 39,6 33,8 42,0 40,77 43.1 33,8 38 ± 4
rate of non-proliferating cells 39% n.a. n.a. 24% n.a. 30% 32 ± 5%
TABLE III. The average velocities in the six measurements
measurement HA1 HA2 HB3 HB4 HC0 HC2
V [µm/h] 11,01 9,19 15,6 18,6 4,2 6,4
v0[µm/h] 11,6 11,1 15,6 17,2 6,5 7,0
error [µm/h] 1,2 1,1 1,6 1,7 0,7 0,7
8

5% CO inflow
2
A/D
CONVERTER
COMPUTER VCR
INTERFACE
OUTPUT
settingfocus
poweredstage
objectivecontrast
phase
CCDcamera
pH
light source
glasselectrode
temperature
INCUBATOR
phase ring
heatingsilica gel
9

1234
0 10 20 30 40 50 60N=N0
t[h]
'ha1''ha2''hb3''hb4''hc0''hc2''�tted'
10
00:20:40:60:81
0 5 10 15 20 25 30 35 40F(�0)
�0[h]
'ha' 3 33333333333333333333333333333
'hb' � ����������������������'hc' ? ??????????????????????????????????????????
11

15202530
15 20 25 30�0(d) [h]
�0(p) [h]3
33
3333333 33 333
33 3333
3
12
13

14

050100150200250300350400450
0 5 10 15 20 25 30 35v[�m/h]
t [h]HA2HB3HC2
15

0:0010:010:11
0 20 40 60 80 100G(v)
v [�m/h]
'ha1''ha2''hb3''hb4''hc0''hc2'
16

00:20:40:60:81
0 0:5 1 1:5 2 2:5F (v=v0)
v=v0
'ha1''ha2''hb3''hb4''hc0''hc2''gamma' 333333333333333333333333333333333333333333333333333333333333333333333333333333
3333333333333333333333333333333333333333333333333333333333333333333333333333333333333333333333333333333333333333333333333333333333333333333333333333333333
3333333333333333333
00:20:40:60:81
0 0:5 1 1:5 2 2:5F (v=v0)
v=v0333333333333333333333333333333333333333333333333333333333333333333333333333333333333333333333333333333333333333
3333333333333333333333333333333333333333333333333333333333333333333333333333333333333333333333333333333333333333333333333333333333333333333
17