Obesity-2014 Obesity & Weight Management Scientific Tracks ...
Upload
independentCategory
view
2download
0
PLEASE SCROLL DOWN FOR ARTICLE
This article was downloaded by: [Canadian Research Knowledge Network]On: 25 May 2011Access details: Access Details: [subscription number 932223628]Publisher RoutledgeInforma Ltd Registered in England and Wales Registered Number: 1072954 Registered office: Mortimer House, 37-41 Mortimer Street, London W1T 3JH, UK
The Professional GeographerPublication details, including instructions for authors and subscription information:http://www.informaworld.com/smpp/title~content=t788352615
Local Data for Obesity Prevention: Using National Data SetsAnwar T. Merchanta; Patrick DeLucab; Mamdouh M. Shubairc; Julie Emilib; Pavlos Kanarogloub
a Arnold School of Public Health, b McMaster University, c University of Northern British Columbia,
First published on: 18 May 2011
To cite this Article Merchant, Anwar T. , DeLuca, Patrick , Shubair, Mamdouh M. , Emili, Julie and Kanaroglou,Pavlos(2011) 'Local Data for Obesity Prevention: Using National Data Sets', The Professional Geographer,, Firstpublished on: 18 May 2011 (iFirst)To link to this Article: DOI: 10.1080/00330124.2011.578538URL: http://dx.doi.org/10.1080/00330124.2011.578538
Full terms and conditions of use: http://www.informaworld.com/terms-and-conditions-of-access.pdf
This article may be used for research, teaching and private study purposes. Any substantial orsystematic reproduction, re-distribution, re-selling, loan or sub-licensing, systematic supply ordistribution in any form to anyone is expressly forbidden.
The publisher does not give any warranty express or implied or make any representation that the contentswill be complete or accurate or up to date. The accuracy of any instructions, formulae and drug dosesshould be independently verified with primary sources. The publisher shall not be liable for any loss,actions, claims, proceedings, demand or costs or damages whatsoever or howsoever caused arising directlyor indirectly in connection with or arising out of the use of this material.

Local Data for Obesity Prevention: Using National Data
Sets
Anwar T. MerchantArnold School of Public Health
Patrick DeLucaMcMaster University
Mamdouh M. ShubairUniversity of Northern British Columbia
Julie Emili and Pavlos KanaroglouMcMaster University
One of the challenges in planning for obesity prevention is the dearth of relevant local data. We analyzeda large nationally representative data set, the Canadian Community Health Survey (CCHS) 2.2, to obtainregional and local distributions of physical activity and diet using statistical and spatial techniques. CCHS2.2 contains information on health status, diet, physical activity, and measured body mass index (BMI),collected from January through December 2004. The total sample size is approximately 35,000; for theHamilton metropolitan area it is approximately 600. The analyses were limited to descriptive statisticsstratified by age group (2–11 years old, 12–17 years old, 18 years and older) and sex. For continuousvariables we computed weighted means, standard errors, and coefficients of variation using the bootstrapmacro (BOOTVARE V3.1.SAS). For spatial analyses we used interpolation with inverse distance weighting.Analyses were conducted at the Research Data Center, McMaster University, using SAS Version 9 andArcGIS 9.2, in compliance with Statistics Canada’s disclosure rules. Children 6 to 11 years old and 12 to17 years old spent 2.6 and 5.8 hours per day, respectively, in sedentary activities. Children 2 to 11 yearsold consumed fruits and vegetables 5.3 times per day; however, 34 percent of that was from fruit juices,and 6 percent was from potatoes. Reported consumption of key nutrients such as fiber and saturated fatvaried by neighborhood. We identified risk factors for obesity in the Hamilton population specific forage groups, sex, and location using a subset of national data. This information can guide programs andpolicies for obesity prevention at the local level. Key Words: Canada, obesity, risk factors, spatial distribution.
The Professional Geographer, 64(1) 2012, pages 1–10 C© Copyright 2012 by Association of American Geographers.Initial submission, April 2009; revised submission, February 2010; final acceptance, April 2010.
Published by Taylor & Francis Group, LLC.
Downloaded By: [Canadian Research Knowledge Network] At: 20:28 25 May 2011

2 Volume 64, Number 1, February 2012
Uno de los retos en la planificacion orientada a prevenir la obesidad es la escasez de datos locales relevantes.Analizamos un gran conjunto de datos nacionalmente representativos, el Estudio Comunitario Canadiense deSalud (CCHS, por la siglaen ingles) 2.2, para obtener las distribuciones regionales y locales de actividad fısicay dieta usando tecnicas estadısticas y espaciales. El CCHS 2.2 contiene informacion sobre estatus de salud,dieta, actividad fısica y la medida del ındice de masa corporal (IMC), datos recogidos de enero a diciembredel 2004. El tamano total de la muestra es aproximadamente de 35.000 unidades; para el area metropolitanade Hamilton es de aproximadamente 600. Los analisis se limitaron a estadısticas descriptivas estratificadaspor grupos de edad (2-11 anos de edad, 12-17 anos de edad, 18 anos y mas de edad) y sexo. Para variablescontinuas computamos medias ponderadas, errores estandar y coeficientes de variacion usando el macrobootstrap (BOOTVARE V3.1.SAS). Para los analisis espaciales utilizamos interpolacion con ponderacioninvertida de la distancia. Los analisis fueron realizados en el Centro de Investigacion de Datos de McMasterUniversity, utilizando la Version 9 de SAS y ArcGIS 9.2, de conformidad con las reglas determinadas porEstadısticas del Canada. Los ninos de 6 a 11 anos de edad y de 12 a 17 anos de edad gastaron 2.6 y 5.8 horaspor dıa, respectivamente, en actividades sedentarias. Los ninos de 2 a 11 anos de edad consumieron frutas yverduras 5.3 veces al dıa; sin embargo, el 34 por ciento de esto estaba representado en jugos de frutas y el 6 porciento en papas. El consumo reportado de nutrientes claves tales como fibra y grasas saturadas variaba segunlos vecindarios. Identificamos factores de riesgo para obesidad en la poblacion de Hamilton, con especificacionde grupos de edad, sexo y localizacion utilizando un subconjunto de datos nacionales. Esta informacion puedeguiar programas y polıticas para la prevencion de la obesidad a nivel local. Palabras clave: Canada, obesidad,factores de riesgo, distribucion espacial.
I nterest in the study of the environmentas a contributing cause of overweight and
obesity arose primarily from a rapid, global risein body weight and a failure of interventionsaimed at altering individual behavior to stemthis trend (Hill and Peters 1998; Swinburn andEgger 2002; Hill et al. 2003). The rationaleis that individual caloric expenditure dependson opportunities for utilitarian or recreationalphysical activity (Riva et al. 2009; Feng et al.2010) and caloric intake depends on food avail-ability and access (Feng et al. 2010). In Westerncountries obesity is more common in poorerthan wealthy communities (Robert and Reither2004; Riva et al. 2009). This difference isattributed in part to higher density of fast foodoutlets per capita (Cummins, McKay, and Mac-intyre 2005) and less access to supermarkets inpoor communities (Rose and Richards 2004),particularly in North America (Cummins andMacintyre 2006). Even though the relationshipbetween the nutritional environment and obe-sity is not consistent (Moore et al. 2009; Fenget al. 2010), there is evidence that food avail-ability and intake vary by place (Moore et al.2008).
One of the challenges in obesity preven-tion planning is the dearth of relevant localdata (Brener et al. 2004). Further, unless thedata were collected with local analysis in mind(Canadian Community Health Survey [CCHS]2005), they are typically coarse in nature, col-lected at provincial or national levels of geog-
raphy. National health surveys are a reliableand valid source of data to monitor nationaland regional disease and risk factor trends,but these surveys provide summary estimatesthat ignore the considerable variation that fac-tors might have over space. Given that dietand physical activity patterns vary not onlyacross communities but also by neighborhoodwithin communities (Brener et al. 2007), sum-mary national- or provincial-level data mightnot be ideal to plan for obesity preventionlocally.
The Canadian Community Health Survey,Cycle 2.2 (CCHS 2.2) is a nationally represen-tative data set compiled by Statistics Canada,with information related to health status, diet,physical activity, measured body mass index(BMI), and health determinants. In addition tothe health data, geographic data were collected,including the postal code of each respondent(CCHS 2005). We analyzed these data usingstatistical and spatial techniques to obtain re-gional and local distributions of determinantsof BMI, physical activity, and diet. Typically,the types of spatial analysis in this arena relateto cluster analysis of obesity (CCHS 2005) oreconometric-type models to help explain obe-sity or obesogenic environments (Blanton et al.2006). The main objective of this article is todemonstrate the analysis and synthesis of lo-cally relevant data for obesity prevention froma large national data set using spatial interpola-tion techniques.
Downloaded By: [Canadian Research Knowledge Network] At: 20:28 25 May 2011

Local Data for Obesity Prevention 3
Data
Study PopulationThe restricted access CCHS 2.2 data are across-sectional, representative sample of Cana-dians (excluding the Territories) collected be-tween January 2004 and January 2005 frompersons aged 2 years and older living in pri-vate dwellings, with 98 percent coverage ofthe target population. The approximate sam-ple size nationally is 35,000; Ontario, whichwas oversampled, has about 11,000 observa-tions; for the Health Region of Central SouthOntario (CSO), which encompasses the CensusDivisions of Brant, Haldimand-Norfolk, Cityof Hamilton, and Niagara, it is approximately1,500; and for the Hamilton Census Metropoli-tan Area (CMA) it is approximately 600 (CCHS2005). It is important to note that part ofHamilton’s CMA, namely, the City of Burling-ton, is located in the Health Region of CentralWest Ontario (CWO). In this analysis we con-sidered all participants living in the HamiltonCMA (including Burlington) and CSO basedon postal code (CCHS 2005). The overall re-sponse rate for the survey was 76.5 percent;for CSO it was 69.1 percent (not available sep-arately for Hamilton). Statistics Canada pro-vided analysis weights for the overall surveyand height and weight measures to minimizenonresponse bias and bootstrap weights to ad-just the variances for the multistage sampling(CCHS 2005). All of the statistical calculationsare presented used these weights.
Physical ActivityCCHS 2.2 measured participation in leisure-time physical activity in all participants 12 yearsand older using a modified version of the Phys-ical Activity Monitor, based on the MinnesotaLeisure-Time Physical Activity Questionnaire(CCHS 2005), and standardized questions forthose 6 to 11 years old. The Physical Ac-tivity Monitor had very good reliability (r =0.90), criterion validity (compared with max-imal oxygen uptake; r = 0.36), and validitywhen compared with physical activity measuredby an alternative questionnaire-based method(r = 0.77; Craig, Russell, and Cameron 2002).The physical activity–related variables derivedfrom the CCHS 2.2 survey for participants12 years and older included (1) average daily
Table 1 Characteristics of populations ofHamilton and Central South Ontario healthregion, weighted percentages
Percent participantsin each categorya
Central SouthHamilton Ontario
Age2–17 years 22.5 20.918+ years 77.5 79.2
SexMale 50.4 50.0
Educationb
< Secondary 6.9 9.0Secondary school 18.1 17.2Other postsecondary
education8.1 9.8
Postsecondary graduate 66.9 64.0Income adequacyc
Lowest income 5.6 6.5Lower middle income 18.5 18.0Upper middle income 31.0 33.1Highest income 34.8 27.2Not stated 10.2 15.2
Smoking categoriesNever smoker 40.4 38.3Former smoker 22.8 21.11–10 cigarettes/day 6.8 5.511–20 cigarettes/day 10.0 11.721+ cigarettes/day 20.0 23.4
aColumn percentage.bHighest level of education obtained by any member ofthe household (not only respondent).cLowest (< $15,000, and 1–2 people in household;< $20,000, and 3–4 people in household; < $30,000,and 5+ people in household); lower middle ($15,000–$29,999, and 1–2 people; $30,000–$39,999, and 3–4people; $30,000–$59,999, and 5+ people); upper mid-dle ($30,000–$59,999, and 1–2 people; $40,000–$79,999,and 3–4 people; $60,000–$79,999, and 5+ people); high-est (≥ $60,000, and 1–2 people; ≥ $80,000, and 3+ peo-ple).
energy expenditure from leisure time activ-ity in metabolic equivalents (METs), (2) av-erage monthly frequency of physical activitylasting over fifteen minutes, and (3) the phys-ical activity index calculated based on the to-tal average daily energy expenditure: inactive if<1.5 METs per day, moderately active if 1.5to 2.9 METs per day, and active if ≥3.0 METsper day (CCHS 2005). For participants 6 to11 years of age physical activity–related vari-ables included time spent in sedentary activi-ties (hours per week) and time spent in physicalactivities (hours per week; 21). For participants12–17 years the included time spent in seden-tary activities (hours per week).
Downloaded By: [Canadian Research Knowledge Network] At: 20:28 25 May 2011
4 Volume 64, Number 1, February 2012
Table 2 Physical activity by age group and sex in Hamilton, 2004–2005, Canadian Community HealthSurvey 2.2
Male Female Both
Age group M SE CV% M SE CV% M SE CV%
6–11 yearsSedentary activity hours/week 2.7 0.3 11.0 2.5 0.2 8.2 2.6 0.2 6.5Physical activity hours/week 13.7 1.1 7.8 12.1 0.8 6.3 12.8 0.6 4.9
12–17 yearsSedentary activity hours/week 6.6 0.4 6.2 5.0 0.4 9.0 5.8 0.3 6.0Sedentary activity excluding readinghours/week
5.9 0.4 7.3 4.2 0.4 10.6 5.1 0.4 6.8
Daily energy expenditure METs/day 4.1 0.6 14.8 3.0 0.5 15.9 3.6 0.4 10.8Monthly frequency of physicalactivity ≥ 15 minutes
35.1 4.5 12.8 34.9 5.9 16.9 35.0 3.4 9.7
18+ yearsDaily energy expenditure METs/day 1.8 0.3 13.7 1.5 0.1 9.0 1.7 0.1 8.5Monthly frequency of physicalactivity ≥ 15 minutes
20.7 2.6 12.7 18.4 1.5 8.0 19.6 1.5 7.7
Note: Variance estimates obtained from bootstrapping; leisure-time physical activity. CV% = coefficient of variationpercent (≤16.6 acceptable); METs = metabolic equivalents.
DietDiet was assessed in all participants 2 years ofage and older (parents or guardian interviewedfor children <6 years) using the computerizedsystem developed by the United States Depart-ment of Agriculture (USDA) called the auto-mated multiple pass method (AMPM; Blantonet al. 2006). This is a computerized 24-hourdietary recall that provides more accurate en-ergy intake estimates than questionnaires insurveys (CCHS 2005). Nutrient estimates were
obtained by multiplying food intake into itscomposition, obtained from the 2001 update ofthe Canadian Nutrient File (Verdier and Beare-Rogers 1984) and summing over all foodsconsumed. To obtain usual intake from thetwenty-four-hour recall we excluded peoplewho said they ate more or less than their usualintake on the day of the recall. Total calories,carbohydrate (g/d), fat (g/d), protein (g/d), fiber(g/d), percentage energy from carbohydrate,percentage energy from protein, percentage fat,
Table 3 Nutrient intake in Hamilton population 18+ years by sex, 2004–2005, Canadian CommunityHealth Survey 2.2
Male Female Both
Nutrition intake M SE CV% M SE CV% M SE CV%
Total calories kcal/day 2250.2 145.0 6.5 1790.8 91.7 5.1 2033.3 78.6 3.9Carbohydrate g/day 249.5 6.1 2.5 234.6 6.8 2.9 242.5 4.6 1.9Protein g/day 81.8 3.1 3.8 87.0 5.2 5.9 84.3 3.1 3.7Total fat g/day 72.5 2.1 2.8 74.4 2.9 3.9 73.4 1.8 2.5Monounsaturated fat g/day 28.5 1.1 4.0 30.0 1.2 4.0 29.2 0.9 3.0Polyunsaturated fat g/day 11.9 1.0 8.0 14.2 1.1 7.5 13.0 0.7 5.3Saturated fat g/day 24.8 1.7 6.8 26.0 1.8 6.9 25.4 1.3 5.3Total fiber g/day 17.6 0.9 4.9 17.7 1.0 5.9 17.7 0.7 3.9% energy from carbohydrates 50.1 1.3 2.5 47.8 1.4 2.9 49.0 0.9 1.9% energy from fat 33.1 1.0 3.1 32.9 1.3 4.1 33.0 0.8 2.5% energy from protein 16.4 0.6 3.7 17.8 1.1 5.9 17.1 0.6 3.7% energy from saturated fat 11.3 0.7 6.3 10.9 0.7 6.8 11.1 0.5 4.8% energy from monounsaturated fat 13.1 0.6 4.4 12.7 0.5 4.0 12.9 0.4 3.0% energy from polyunsaturated fat 5.5 0.4 7.7 6.1 0.5 8.1 5.8 0.3 5.4
Note: CV = coefficient of variance.
Downloaded By: [Canadian Research Knowledge Network] At: 20:28 25 May 2011

Local Data for Obesity Prevention 5
Figure 1 Distribution of fiber intake in the city of Hamilton, <18 years. (Color figure available online.)
percentage energy from monounsaturatedfat, percentage energy from polyunsaturatedfat, and percentage energy from saturated fatwere derived from these data. Intake of fruitjuices, fruit, carrots, other vegetables, greensalad, potatoes, total fruits, and vegetables werederived from items in the main questionnaire(not twenty-four-hour recall) asking about fre-quency of intake. These questions were similarto those appearing in Centers for Disease Con-trol surveillance questionnaires.
Method
Statistical AnalysesAll analyses made use of energy-adjusted intakeestimates (Willett, Howe, and Kushi 1997) ofcarbohydrate, fat, protein, and fiber, and un-adjusted intake to estimate percentage energyfrom carbohydrate, percentage energy fromprotein, percentage fat, percentage energy frommonounsaturated fat, percentage energy from
polyunsaturated fat, and percentage energyfrom saturated fat. The analyses for CSO andthe Hamilton CMA were limited to descrip-tive statistics. Because of sample size concernswe did not examine associations or relation-ships between variables. Rather, we describedthe distribution of these variables stratified byage group (2–11 years, 12–17 years, 18+ years)and sex. For continuous variables we com-puted weighted means, standard errors, and co-efficients of variation using bootstrap macro(BOOTVARE V3.1.SAS). Statistical analyseswere conducted at the Research Data Center,McMaster University, using SAS Version 9 forall descriptive analyses and ArcGIS 9.2 for allspatial analyses. The data are in compliancewith Statistics Canada’s disclosure rules.
Spatial AnalysesInitially, all observations within CSO weregeocoded based on the respondent’s postal code
Downloaded By: [Canadian Research Knowledge Network] At: 20:28 25 May 2011
6 Volume 64, Number 1, February 2012
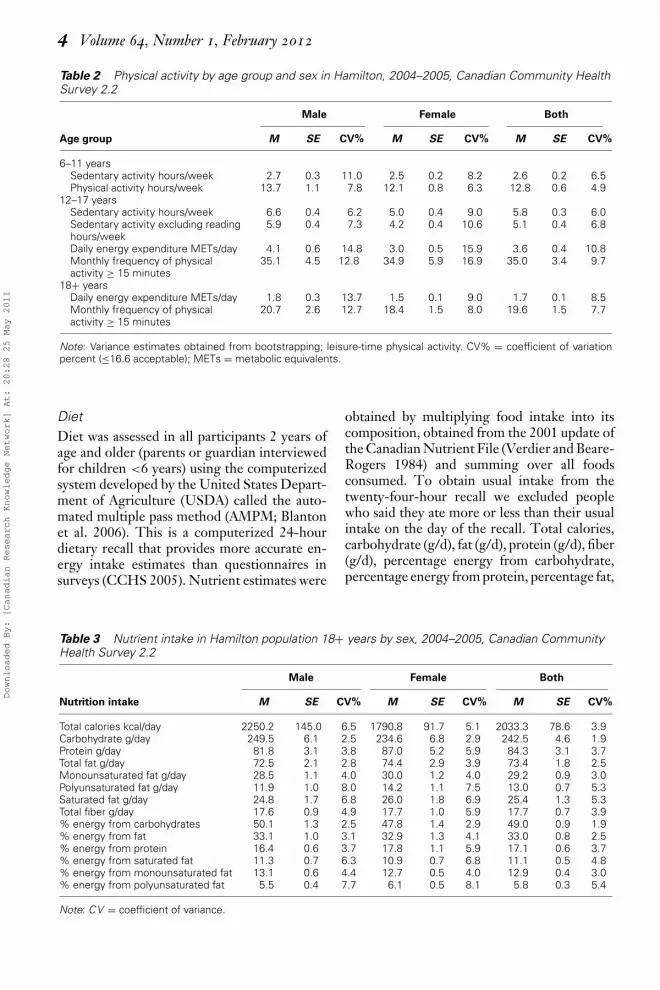
Figure 2 Distribution of percentage energy from saturated fat intake, city of Hamilton, <18 years.(Color figure available online.)
using the 2007 edition of the postal code con-version file (PCCF) from Desktop MappingTechnologies Ltd. Following this, spatial inter-polation techniques were employed to examinethe spatial variability of each attribute. Thesemethods estimate values at unobserved loca-tions based on the values at observed locationsand as a result can highlight broad patternsover geographic space. The method employedin this study was inverse distance weighting,which is effectively a weighted average of po-tentially several points within a user-specifiedneighborhood, where the strength of each ob-servation’s contribution is diminished accord-ing to how far away they are from the point (orgrid cell) to be interpolated. In this instance,each grid cell in the output acts as a target, andthe estimator moves from one grid cell to thenext, estimating values of the attribute basedon the fifteen nearest respondents, thereby en-suring that the confidentiality of the individualrespondents is maintained. This particular ap-
proach is simple and effective with dense data,and it never extrapolates values. In the mod-els employed in this example, an exponent oftwo was used, producing a faster rate of dis-tance decay than a simple linear distance. Tocover as much of the areal extent of Hamiltonas possible and to minimize discontinuities thattypically occur at boundaries, the interpolationwas carried out using all available observationsin CSO and the Hamilton CMA. The resultantraster surface was clipped to show only the cityof Hamilton, given that it is the primary area ofinterest, and any policies would apply only tothe city rather than the CMA.
Results
Characteristics of PopulationApproximately 23 percent of the participantswere 18 years or younger, about half were fe-male, and 67 percent had at least one household
Downloaded By: [Canadian Research Knowledge Network] At: 20:28 25 May 2011

Local Data for Obesity Prevention 7
Figure 3 Breakdown of fruit and vegetable intake frequency, 2 to 11 years, Hamilton, Canadian Com-munity Health Survey 2.2. (Color figure available online.)
member with postsecondary education (Table1). Hamilton and CSO had similar populationcharacteristics (Table 1), but a higher propor-tion of Hamilton residents were in the highestincome adequacy category compared to CSO(35 percent vs. 27 percent; all of Canada = 31percent; see Table 1). The distribution of di-etary and physical activity variables was verysimilar between these groups (data not shown).
Physical ActivityIn general, there appeared to be a trend ofincreasing sedentary activity and decreasingphysical activity across the age groups. Theaverage time spent in sedentary activities forchildren 6 to 11 years old was 2.6 hours perday. This approximately doubled for the 12- to17-year-olds, at 5.8 hours per day (Table 2).The same comparison could not be made forthe 18+ age group, as that information wasnot coded in the CCHS, but a similar pat-tern emerges in the other metrics captured inthe survey. For example, the average daily en-ergy expenditure was 3.6 METs per day and1.7 METs per day in the 12 to 17 year and18+ year age groups, respectively. The aver-
age number of times per month that personsparticipated in any leisure time physical activ-ity lasting more than fifteen minutes was 35.0times among those aged 12 to 17 years and19.6 times among those 18 years and older. Ingeneral males were more active than females(Table 2).
DietThe average nutrient intake in the city canbe found in Table 3. For example, meanintake of total fiber was 17.7 g per day, andthe percentage energy from saturated fat was11.1 g per day. Figures 1 and 2 show the spatial
Table 4 Recommendations for obesityprevention in Hamilton
� Encourage physical activity in all age groups� Decrease sedentary activities in children,
particularly younger children� Specifically encourage physical activity among
teenagers, particularly girls� Promote intake of whole grain, beans, lentils,
fruit, and vegetables� Discourage intake of fruit juice, high-fat dairy, and
red meat� Specifically discourage fruit juice intake in children
Downloaded By: [Canadian Research Knowledge Network] At: 20:28 25 May 2011

8 Volume 64, Number 1, February 2012
distribution of nutrient intake across the city.The areas of the city where fiber intake washigh were the same ones where percentageenergy from saturated fat was low (Figures1 and 2). Coincidentally, these areas tendedto have a higher socioeconomic status. Thenorthern part of the city was not interpolateddue to insufficient observations in the area.
Children 2 to 11 years of age consumed fruitsand vegetables 5.3 times per day; however, 34percent of that was from fruit juices and 6 per-cent from potatoes (Figure 3). The intake fre-quency of fruits and vegetables was 4.44 and4.08, respectively, for the 12 to 17 and 18+ agegroups, respectively.
All results conformed to Statistics Canadadisclosure standards (unweighted cell sizes ≥5 and coefficients of variation ≤16.6 [accept-able] and 16.6–33.3 [marginal]; CCHS 2005).All but one of the estimates in this survey hadcoefficients of variation in the acceptable cat-egory, and the other one was marginal. Thiswas achieved by collapsing categories until thedisclosure rules goals were reached.
Discussion and Conclusions
Risk factors for obesity in Hamilton were un-evenly distributed by age group and sex in asubset of the CCHS 2.2 data. Additionally, wefound that reported intake of fiber and sat-urated fat (associated with obesity risk) wasunevenly distributed by neighborhood. Theseresults are consistent with data from a sur-vey conducted in Hamilton in 2004 and 2005among children (7–13 years old) and their par-ents in two schools in the city (Merchant et al.2007). School A in this study was located in alow-income neighborhood, and School B wasin a high-income neighborhood. Children inSchool A consumed less dark bread, which ishigh in fiber, and more white bread (low infiber) than those in School B (Merchant et al.2007). School A was located in one of the neigh-borhoods identified in this study with low fiberintake, whereas School B was situated in oneof the neighborhoods with high fiber intake(Figure 1).
The main concern about using national datasets at the local level is that the data werecollected with a national or regional goal andthat the sample size is often insufficient to ob-
tain reliable local estimates. In CCHS 2.2 theprovince of Ontario was oversampled so thatthe data were sufficient to obtain reliable esti-mates for the health region (CCHS 2005). Forthis reason we were able to provide a distri-bution of the population characteristics of theCSO Health region for comparison to Hamil-ton. The population characteristics of the lo-cal and regional samples were very similar foralmost all the categories (Table 1), but therewere slightly more people in the highest incomeadequacy category in Hamilton than CSO. Weevaluated its potential impact by statistical ad-justment for income in a sensitivity analysis butthe results were essentially unchanged (resultsnot shown).
The two main strategies to address the con-cern regarding the use of national data sets forlocal levels of geography were first presentingthe data in a more spatially continuous fashion.This was beneficial because it allows for the useof smaller sample sizes, which national data setsmight have on a more local level. By using inter-polation techniques, only a small window thatcan be varied either by distance or number ofneighboring sampling points is evaluated at onetime, reducing the necessity for large samplesrequired to obtain statistical significance. Also,sample size estimations for CCHS are done tobe able to assess prevalence, which is a dichoto-mous variable, whereas for the statistical anal-yses we used variables of interest (fiber intake,for instance) in the continuous form. This ef-fectively reduced the sample size needed to ob-tain reliable estimates.
The second main strategy was not relat-ing variables to any outcome but drawing in-stead on a priori knowledge. Physical activity(Shaw et al. 2006) and intakes of fruits andvegetables, fiber, and saturated fat (Maskarinecet al. 2006) are well-established risk factorsfor overweight and obesity. Here, we assessedthe distribution of these potential risk factorsof overweight and obesity in the Hamiltonpopulation by age group and sex. We aimed forthe data to conform to Statistics Canada disclo-sure standards (unweighted cell sizes ≥ 5 andcoefficients of variation ≤ 16.6 [acceptable] and16.6–33.3 [marginal]). This was achieved bycollapsing categories until the disclosure rulesgoals were reached. We also assessed the distri-bution spatially for many risk factors and dietand nutrition characteristics (only two shown
Downloaded By: [Canadian Research Knowledge Network] At: 20:28 25 May 2011
Local Data for Obesity Prevention 9
for examples). Analyzing the distribution of dis-ease and risk factors over space is a powerfultool in epidemiology that has a long historytracing back to John Snow’s classic cholera out-break investigation in London (Paneth 2004).We suggest using data from a large population-based survey, such as the CCHS 2.2, to obtainspatial distribution of risk factors. The infor-mation from maps obtained from these datacan be combined with information from smallerregional or local surveys to obtain a clearer es-timate of the true situation on the ground. In-formation obtained this way can be a powerfultool to understand local variation of risk fac-tors, which can be valuable for local action. Forexample, we have previously noted that thereis considerable evidence that food availabilityand intake vary by place. In this study we ob-served that spatial distributions of specific di-etary factors varied considerably within the cityof Hamilton (Figures 1 and 2). The informationprovided by these maps was verified by a smallsurvey conducted in Hamilton (Craig, Russell,and Cameron 2002).
These findings were presented to a sub-committee of the Obesity Steering Commit-tee (now the Hamilton Partners for HealthyWeights). The Obesity Steering Committeeconsisted of representatives from communityorganizations in Hamilton that were commit-ted to developing and implementing, throughcollaboration and partnership, a comprehen-sive community-wide strategy to reduce the in-cidence and prevalence of obesity within thecity of Hamilton through the promotion ofhealthy lifestyles. A health promotion com-munication campaign was launched to increaseparents’ awareness of their child’s weight sta-tus to prevent future overweight by assessingcurrent risk factors and was consistent with thefindings. It is possible for other communities inCanada to adopt this model.
The advantages of using data from nationalsurveys to get local information are first thatthe data quality is excellent; second, the dataare a representative sample of the population;third, the data are readily available in usableform; fourth, the marginal cost of data analysisis minimal; and finally, it is possible to makespecific local recommendations using these re-sults (Table 4). These data, however, need to beinterpreted cautiously. The response rate waslower in CSO than the rest of Canada (69.1 per-
cent vs. 76.5 percent). Moreover, about 40 per-cent did not have measured height and weight(CCHS 2005). Statistics Canada providedweights for nonresponse in their calculations,but they would not adjust for differential non-response. This is a potential issue for the entiresurvey, however. Response rates for Hamiltonwere not available, but because the popula-tion characteristics of Hamilton and CSO aresimilar, it alleviates some concerns about differ-ential nonresponse. Generalizing the findingsto the city of Hamilton might be acceptable,but making comparisons with the health regionor other areas might not be so. This methodis generalizable, though, and can be used inother communities, regions, and settings.
Risk factors for obesity vary considerably be-tween neighborhoods, but there are few rep-resentative data for program planning availablelocally (Doak et al. 2006; Merchant et al. 2007).Judiciously using national data sets to describethe distribution of known risk factors at thelocal level by person and place locally can pro-vide policymakers and program planners withuseful information to accurately target obesityprevention. �
Literature Cited
Blanton, C. A., A. J. Moshfegh, D. J. Baer, and M.J. Kretsch. 2006. The USDA automated multiple-pass method accurately estimates group total en-ergy and nutrient intake. Journal of Nutrition136:2594–99.
Brener, N. D., L. Kann, D. Garcia, G. MacDon-ald, F. Ramsey, S. Honeycutt, J. Hawkins, S.Kinchen, and W. A. Harris. 2007. Youth risk be-havior surveillance—Selected steps communities,2005. MMWR Surveillance Summaries 56:1–16.
Brener, N. D., L. Kann, S. A. Kinchen, J. A. Grun-baum, L. Whalen, D. Eaton, J. Hawkins, and J. G.Ross. 2004. Methodology of the youth risk behav-ior surveillance system. MMWR Recommendationsand Reports 53:1–13.
Canadian Community Health Survey 2004. 2005.User guide for the public use microdata file. Ottawa,ON, Canada: Statistics Canada, Health StatisticsDivision.
Craig, C. L., S. J. Russell, and C. Cameron. 2002.Reliability and validity of Canada’s physical activitymonitor for assessing trends. Medicine and Sciencein Sports and Exercise 34:1462–67.
Cummins, S., and S. Macintyre. 2006. Food environ-ments and obesity—Neighbourhood or nation? In-ternational Journal of Epidemiology 35:100–04.
Downloaded By: [Canadian Research Knowledge Network] At: 20:28 25 May 2011

10 Volume 64, Number 1, February 2012
Cummins, S. C., L. McKay, and S. Macintyre. 2005.McDonald’s restaurants and neighborhood depri-vation in Scotland and England. American Journalof Preventive Medicine 29:308–10.
Doak, C. M., T. L. Visscher, C. M. Renders, andJ. C. Seidell. 2006. The prevention of overweightand obesity in children and adolescents: A reviewof interventions and programmes. Obesity Review7:111–36.
Feng, J., T. A. Glass, F. C. Curriero, W. F. Stewart,and B. S. Schwartz. 2010. The built environmentand obesity: A systematic review of the epidemio-logic evidence. Health and Place 16 (2): 175–90.
Hill, J. O., and J. C. Peters. 1998. Environmen-tal contributions to the obesity epidemic. Science280:1371–74.
Hill, J. O., H. R. Wyatt, G. W. Reed, and J. C. Peters.2003. Obesity and the environment: Where do wego from here? Science 299:853–55.
Maskarinec, G, Y. Takata, I. Pagano, L. Carlin, M.T. Goodman, M. L. Le, A. M. Nomura, L. R.Wilkens, and T. N. Kolonel. 2006. Trends and di-etary determinants of overweight and obesity ina multiethnic population. Obesity (Silver Spring)14:717–26.
Merchant, A. T., M. Dehghan, D. Behnke-Cook,and S. S. Anand. 2007. Diet, physical activity,and adiposity in children in poor and rich neigh-borhoods: A cross-sectional comparison. NutritionJournal 6:1.
Moore, L. V., A. V. ez Roux, J. A. Nettleton, andD. R. Jacobs, Jr. 2008. Associations of the localfood environment with diet quality—A compari-son of assessments based on surveys and geographicinformation systems: The multi-ethnic study ofatherosclerosis. American Journal of Epidemiology167:917–24.
Moore, L. V., A. V. ez Roux, J. A. Nettleton, D. R.Jacobs, and M. Franco. 2009. Fast-food consump-tion, diet quality, and neighborhood exposure tofast food: The multi-ethnic study of atherosclero-sis. American Journal of Epidemiology 170:29–36.
Paneth, N. 2004. Assessing the contributions of JohnSnow to epidemiology: 150 years after removalof the broad street pump handle. Epidemiology15:514–16.
Riva, M., S. Curtis, L. Gauvin, and J. Fagg. 2009. Un-raveling the extent of inequalities in health acrossurban and rural areas: Evidence from a nationalsample in England. Social Science Medicine 68:654–63.
Robert, S. A., and E. N. Reither. 2004. A multi-level analysis of race, community disadvantage, andbody mass index among adults in the US. Social Sci-ence Medicine 59:2421–34.
Rose, D., and R. Richards. 2004. Food store accessand household fruit and vegetable use among par-ticipants in the US Food Stamp Program. PublicHealth Nutrition 7:1081–88.
Shaw, K., H. Gennat, P. O’Rourke, and C. Del Mar.2006. Exercise for overweight or obesity. CochraneDatabase System Review CD003817.
Swinburn, B., and G. Egger. 2002. Preventive strate-gies against weight gain and obesity. Obesity Review3:289–301.
Verdier, P., and J. L. Beare-Rogers. 1984. The Cana-dian Nutrient File. Journal of the Canadian DieteticAssociation 45:52–55.
Willett, W. C., G. R. Howe, and L. H. Kushi.Adjustment for total energy intake in epidemio-logic studies. American Journal of Clinical Nutrition65:1220S–28S.
ANWAR T. MERCHANT is Associate Professorand Head of Division of Epidemiology, Departmentof Epidemiology and Biostatistics, Arnold School ofPublic Health, 800 Sumter Street, Columbia, SC29208. E-mail: [email protected] research interests include the study of the de-terminants of overweight and obesity.
PATRICK DELUCA holds two appointments in theSchool of Geography and Earth Sciences at McMas-ter University, 1200 Main St. W., Hamilton, OntarioLN8 3Z5, Canada. E-mail: [email protected] is the Systems Administrator and InstructionalAssistant Centre for Spatial Analysis/GIS Lab and aSessional Lecturer in the School of Geography andEarth Sciences. His research interests focus on re-gional variations in quality of health and health care;air pollution mapping; quantitative methods in geog-raphy and GIS; and business geographics and Inter-net mapping.
MAMDOUH M. SHUBAIR is a Population andPublic Health Epidemiologist (by training) and As-sistant Professor, Health Sciences Programs, Univer-sity of Northern British Columbia, 3333 UniversityWay, Prince George, BC V2N 4Z9, Canada. E-mail:[email protected]. He has expertise in determinantsof overweight/obesity, metabolic syndrome, type 2diabetes, and nutritional epidemiology.
JULIE EMILI is Assistant Professor and Director ofthe Community Medicine Residency Program, De-partment of Clinical Epidemiology and Biostatistics,McMaster University, 1200 Main St. W., Hamilton,ON L8N 3Z5, Canada. E-mail: [email protected] is certified in Family Medicine and CommunityMedicine.
PAVLOS KANAROGLOU is Professor and Direc-tor, School of Geography and Earth Sciences, CanadaResearch Chair in Spatial Analysis, Director, McMas-ter Institute for Transportation and Logistics Mc-Master University, 1200 Main St. W., Hamilton, ONL8N 3Z5, Canada. E-mail: [email protected].
Downloaded By: [Canadian Research Knowledge Network] At: 20:28 25 May 2011
Copyright © 2022 FDOKUMEN