Development of daily gridded rainfall data sets over the Indian ...
23
2021 RR No. 1/2021 CRS RESEARCH REPORT Latha Sridhar Aradhana Kumari Divya Surendran M.R. Badwaik O.P. Sreejith D.S. Pai India Meteorological Department, Pune CLIMATE MONITORING & PREDICTION GROUP OFFICE OF THE HEAD, CLIMATE RESEARCH & SERVICES INDIA METEOROLOGICAL DEPARTMENT SHIVAJINAGAR, PUNE - 411 005 N Development of daily gridded rainfall data sets over the Indian Islands at 1°x1° & 0.25°x0.25° spatial resolutions for the period (1951-2020)
-
Upload
khangminh22 -
Category
Documents
-
view
1 -
download
0
Transcript of Development of daily gridded rainfall data sets over the Indian ...
2021
RR No.
1/2021
CRS RESEARCH REPORT
Latha Sridhar Aradhana Kumari Divya Surendran
M.R. Badwaik
O.P. Sreejith D.S. Pai
India Meteorological Department, Pune
CLIMATE MONITORING & PREDICTION GROUP OFFICE OF THE HEAD, CLIMATE RESEARCH & SERVICES
INDIA METEOROLOGICAL DEPARTMENT SHIVAJINAGAR, PUNE - 411 005
N
Development of daily gridded rainfall data sets over the Indian
Islands at 1°x1° & 0.25°x0.25° spatial resolutions for the period
(1951-2020)
Development of daily gridded rainfall data
sets over the Indian Islands at 1°x1° &
0.25°x0.25° spatial resolutions for the
period (1951-2020)
By
Latha Sridhar, Aradhana Kumari, Divya Surendran, M.R. Badwaik, O.P. Sreejith and D.S. Pai
India Meteorological Department, Pune, India
OFFICE OF THE HEAD, CLIMATE RESEARCH & SERVICES
IMD, PUNE- 411005

Table of Contents
Page Number
Executive Summary 1
Abstract 2
1 Introduction 3
2 Data and Methodology 4
3 Results and discussions 5
3.1 Inter-annual variability and trend of seasonal and annual
rainfall over the Indian Islands 6
3.2 Trends in frequency of extreme rainfall events over the
Indian Islands 7
4 Summary and Conclusions 8
Acknowledgements 9
References 9
Tables and Figures 10
1
Executive Summary
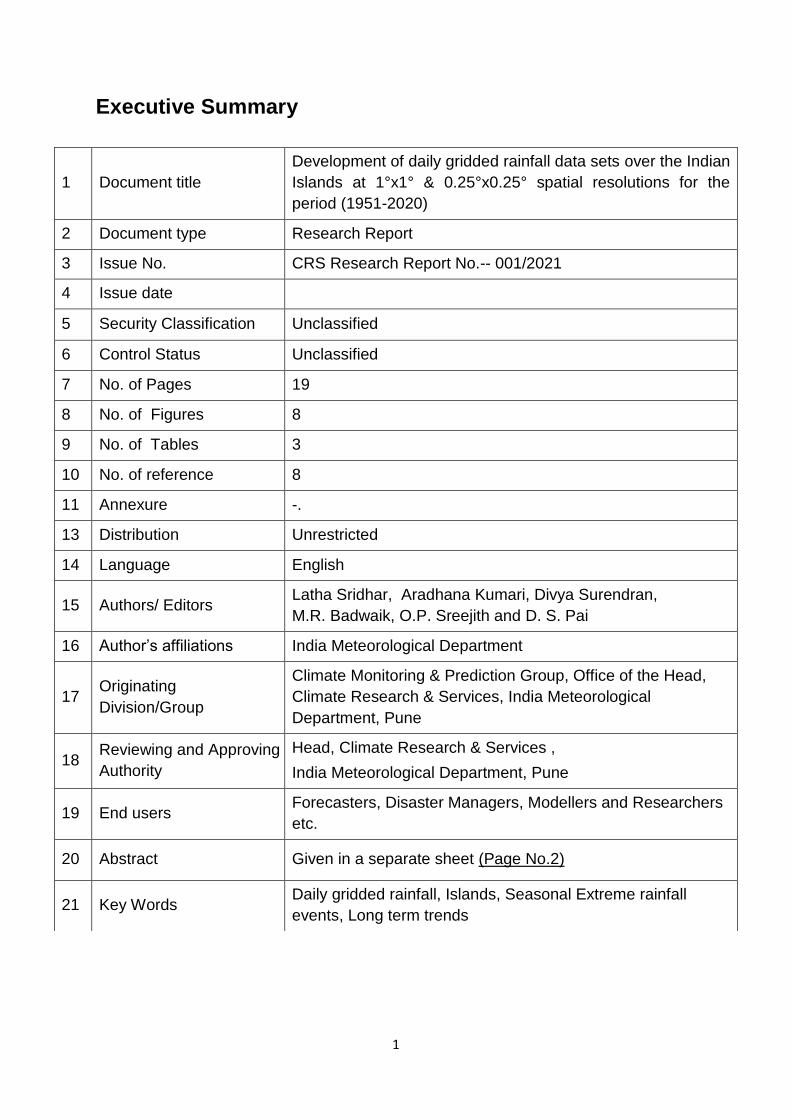
1 Document title
Development of daily gridded rainfall data sets over the Indian
Islands at 1°x1° & 0.25°x0.25° spatial resolutions for the
period (1951-2020)
2 Document type Research Report
3 Issue No. CRS Research Report No.-- 001/2021
4 Issue date
5 Security Classification Unclassified
6 Control Status Unclassified
7 No. of Pages 19
8 No. of Figures 8
9 No. of Tables 3
10 No. of reference 8
11 Annexure -.
13 Distribution Unrestricted
14 Language English
15 Authors/ Editors Latha Sridhar, Aradhana Kumari, Divya Surendran,
M.R. Badwaik, O.P. Sreejith and D. S. Pai
16 Author’s affiliations India Meteorological Department
17 Originating
Division/Group
Climate Monitoring & Prediction Group, Office of the Head,
Climate Research & Services, India Meteorological
Department, Pune
18 Reviewing and Approving
Authority
Head, Climate Research & Services ,
India Meteorological Department, Pune
19 End users Forecasters, Disaster Managers, Modellers and Researchers
etc.
20 Abstract Given in a separate sheet (Page No.2)
21 Key Words Daily gridded rainfall, Islands, Seasonal Extreme rainfall
events, Long term trends
2
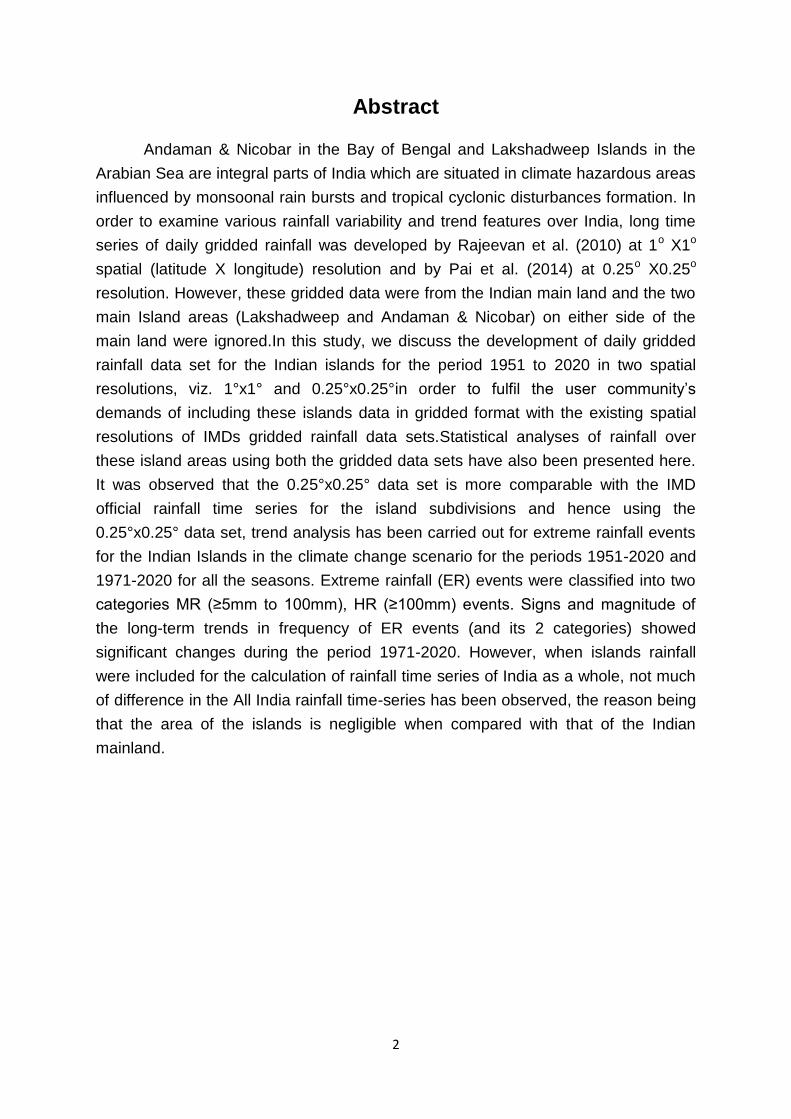
Abstract
Andaman & Nicobar in the Bay of Bengal and Lakshadweep Islands in the
Arabian Sea are integral parts of India which are situated in climate hazardous areas
influenced by monsoonal rain bursts and tropical cyclonic disturbances formation. In
order to examine various rainfall variability and trend features over India, long time
series of daily gridded rainfall was developed by Rajeevan et al. (2010) at 1o X1o
spatial (latitude X longitude) resolution and by Pai et al. (2014) at 0.25o X0.25o
resolution. However, these gridded data were from the Indian main land and the two
main Island areas (Lakshadweep and Andaman & Nicobar) on either side of the
main land were ignored.In this study, we discuss the development of daily gridded
rainfall data set for the Indian islands for the period 1951 to 2020 in two spatial
resolutions, viz. 1°x1° and 0.25°x0.25°in order to fulfil the user community’s
demands of including these islands data in gridded format with the existing spatial
resolutions of IMDs gridded rainfall data sets.Statistical analyses of rainfall over
these island areas using both the gridded data sets have also been presented here.
It was observed that the 0.25°x0.25° data set is more comparable with the IMD
official rainfall time series for the island subdivisions and hence using the
0.25°x0.25° data set, trend analysis has been carried out for extreme rainfall events
for the Indian Islands in the climate change scenario for the periods 1951-2020 and
1971-2020 for all the seasons. Extreme rainfall (ER) events were classified into two
categories MR (≥5mm to 100mm), HR (≥100mm) events. Signs and magnitude of
the long-term trends in frequency of ER events (and its 2 categories) showed
significant changes during the period 1971-2020. However, when islands rainfall
were included for the calculation of rainfall time series of India as a whole, not much
of difference in the All India rainfall time-series has been observed, the reason being
that the area of the islands is negligible when compared with that of the Indian
mainland.
3
1. Introduction
The first daily gridded rainfall data set for the Indian mainland at the spatial
grid of 1°x1° for the period 1951-2003 was initially developed by Rajeevan et al.
(2006) using a fixed network of 1803 rain gauge stations having minimum 90% data
availability during the analysis period. To improve the data quality over northern part
of India, Rajeevan et. al., (2010) reconstructed the data set of Rajeevan et al. (2006)
using a fixed network of 2140 having minimum 90% data availability and the data
period was extended up to 2007. This data set is being widely used by the
researchers worldwide. Pai et al. (2014) developed a daily rainfall data set at the
spatial grid of 0.25° x 0.25° using rainfall from a network of 6955 stations and
compared it with that of Rajeevan et. al., (2006), Rajeevan et. al., (2009), Rajeevan
et. al., (2010) and Yatagai et. al., (2012).
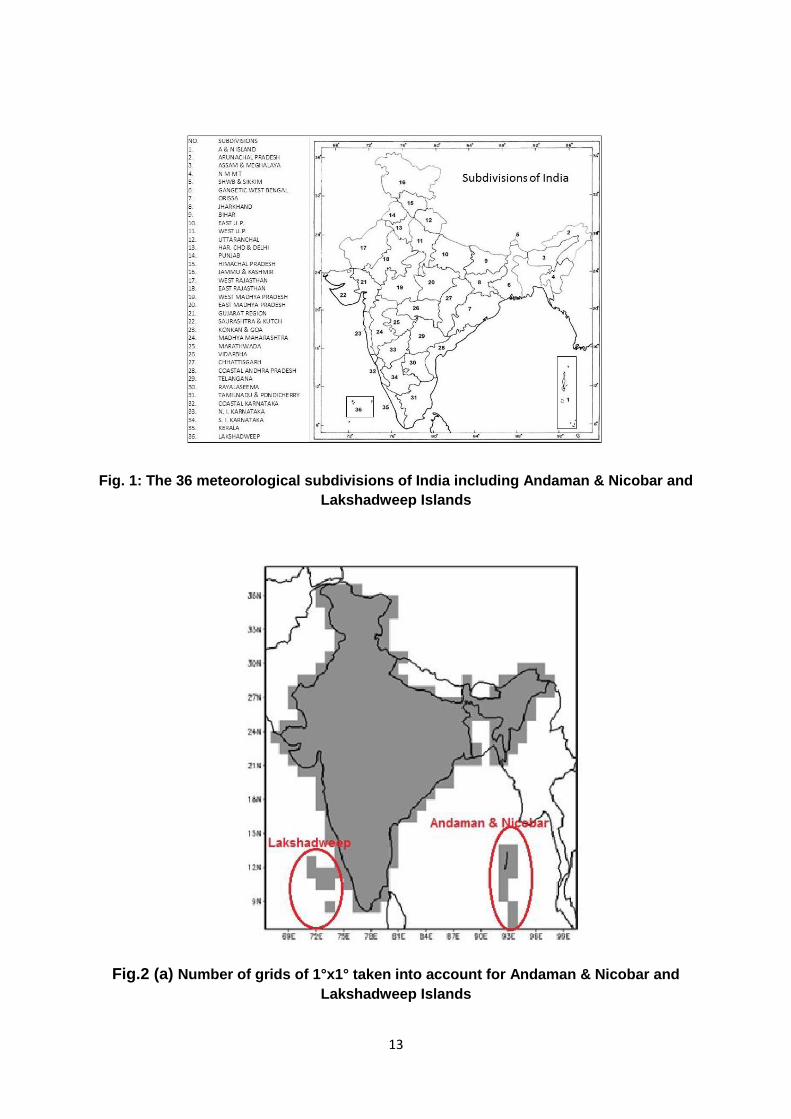
Andaman & Nicobar and Lakshadweep Islands are integral parts of India and
form independent subdivisions out of the 36 meteorological subdivisions of India
(Fig. 1), numbered 1 and 36 respectively. Andaman & Nicobar and Lakshadweep
Islands are situated in climate hazardous areas influenced by monsoonal rain bursts
and tropical cyclonic disturbances formation. The studies related to rainfall over
these islands are important because they are situated in the warm pool tropical
region over which the Inter Tropical Convergence Zone (ITCZ) crosses twice in a
year (May and October–November). Examining trends in the rainfall over warm pool
tropical region are also important for understanding long term change and decadal
variability of the rainfall. Since grids over these islands had been excluded by
Rajeevan et al (2010) & Pai et al. (2014), in the preparation of daily gridded rainfall
data sets, in the present study, daily rainfall gridding has been carried out for these
two island meteorological subdivisions of India, for the period 1951-2020 using a
network of 14 stations (8 over Andaman &Nicobar Islands and 6 over Lakshadweep
islands).
There are limited studies related to variability and trend of rainfall and its
extremes over these two Indian island subdivisions, which lay in the warm pool
tropical region. Kumar et. al (2012) observed a statistically significant decreasing
trend (95 %) for yearly rainfall averaged over the Andaman & Nicobar Islands for a
40-year period of 1961-2000. Sreekesh (2016) examined the rainfall trends over
Amini and Minicoy stations of the Lakshadweep islands for the period 1951-2004
and observed insignificant positive trends of rainfall during JJAS and OND seasons.
4
The main object of the present study is to examine various features of the
rainfall over both the island areas such as climatology, variability at different
temporal scales, extreme rainfall analysis and trends using the gridded rainfall at two
different resolutions (1°x1° and 0.25°x0.25°) developed.
2. Data and Methodology
For developing the daily gridded rainfall data sets of 1°x1° and 0.25°x0.25°
resolutions over the Indian Islands, daily station rainfall data for a fixed network of 14
stations (8 over Andaman & Nicobar scattered across 572 islands and 6 over
Lakshadweep scattered over about 10 inhabited and other small islands) archived at
the National Data Centre, IMD Pune for the period 1951-2016 have been used and
for the period 2017-2020 real-time station rainfall data for these 14 stations have
been used.
Multi-stage quality control of observed rainfall data was carried out before
interpolating station rainfall data into regular grids of 1°x1° and 0.25°x0.25°
Latitudes/Longitudes.
The interpolation method proposed by Shepard (1968) has been used for
interpolating station rainfall data into regular grids including the directional effects
and barriers, as in Rajeevan et. al.,(2006).
One of the additional data set used for this study was the IMD official Rainfall
time series of rainfall over the two island subdivisions during various months,
seasons and annual (1951–2020). IMD official rainfall series contains monthly rainfall
data for the period 1901-2012 from delayed mode computation using all available
stations and 2013-2018 from real time data series (District Rainfall Monitoring
Scheme). District rainfall values have been computed using simple arithmetic mean
of stations values. Met sub-divisions rainfall values have been calculated based on
district area weighted method. This IMD official Rainfall time series has been used
for comparing with 1°x1° and 0.25°x0.25° data sets for the Indian islands.
The area in sq. kms of Lakshadweep islands is about 32.62 and that of
Andaman &Nicobar Islands is 8,249. The number of stations of Andaman & Nicobar
Islands from which data is being received is very less when compared with the areas
of these islands. Also, the total area of the inhabitant and other small islands of
Lakshadweep is lesser than that of the area developed in gridded format. However,
5
to fulfil the user community’s demands the necessity of including the islands data in
gridded format with the existing resolutions of IMDs gridded rainfall data sets has
arisen and hence the rainfall data in gridded format for these two islands have been
prepared in 1°x1° and 0.25°x0.25° resolutions keeping into consideration that at
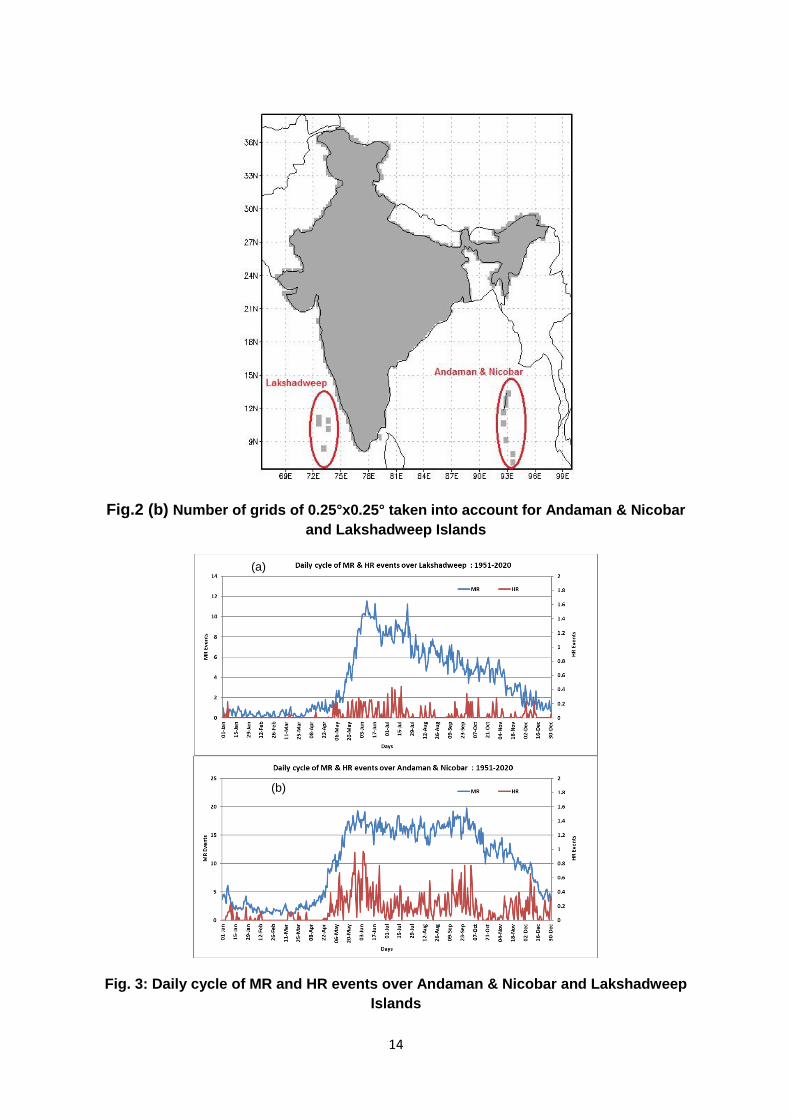
least one representative station falls in one grid.Fig.2a & Fig.2b show the number of
grids of 1°x1° and 0.25°x0.25° resolutions over the Indian Islands marked for
Andaman & Nicobar and Lakshadweep Islands, taken for preparing rainfall data
series. However, for the computation of rainfall time series, the fractional area of land
falling in the respective grids only has been considered avoiding the ocean part.
3. Results and Discussions
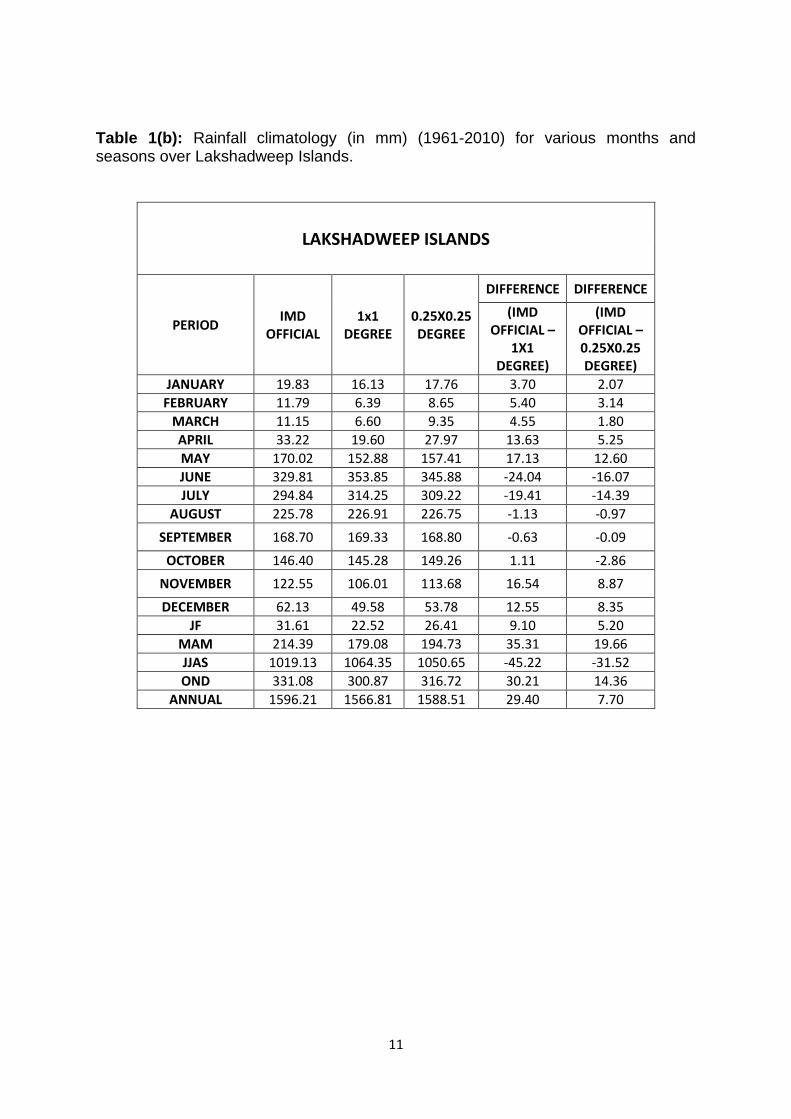
In the present study, comparison of mean rainfall (mm) for the period 1961-
2010 between IMD official data set and the present data sets for Andaman & Nicobar
Islands and Lakshadweep are is shown in Table-1 (a & b). The climatology of rainfall
for all the months and seasons of 0.25°x0.25° data set was more comparable with
IMD official rainfall time series than 1°x1° data set. Hence, for further analysis, the
0.25°x0.25° data set was used.
Over Andaman & Nicobar Islands, the wettest year 2011 received 3824 mm of
rainfall and driest year 1979 received 2084 mm of rainfall. The heaviest grid-point
rainfall recorded in 24 hours is 374 mm on 31st December 1976. Over the
Lakshadweep Islands, the wettest year 1961 received 2435 mm of rainfall and driest
year 1958 received 979 mm of rainfall. The heaviest grid-point rainfall recorded in
24 hours is 297 mm on 15th October 1999.
The seasonal and annual rainfall and the number of respective ER events
over the two island subdivisions were significantly and positively correlated and
major portion (about 98-99%) of rainfall during ER events for annual and all the
seasons over both the islands were received in the form of MR events.
The mean annual cycle in the number of MR & HR events over Andaman &
Nicobar and Lakshadweep Islands are shown in Fig.3 (a) and (b) respectively. It can
be seen from Fig.3 (a) that over Andaman & Nicobar Islands, the maximum MR
events (15-20) occurred between mid-May to mid-October. Mid-April to mid-May and
Mid-October to mid-December, the MR events ranged between 5 and 15, and were
less than 5 during January to mid-April. The HR events were more than 1 during few
days of May & June, and for the other days, mean HR events were less than 1. It
6
can be seen from Fig.3 (b) that over Lakshadweep Islands, the mean MR events
ranged between 0-2 during January to April, increased progressively through May,
ranging between 2-6, thereafter increased to the range of 6-12 during June and July.
The mean MR events decreased gradually and ranged between 4-8 from August to
October and between 0-4 during November and December. The mean HR events
were less than 1 throughout the year.
3.1. Inter-annual variability and trend of seasonal and annual rainfall over the Indian Islands
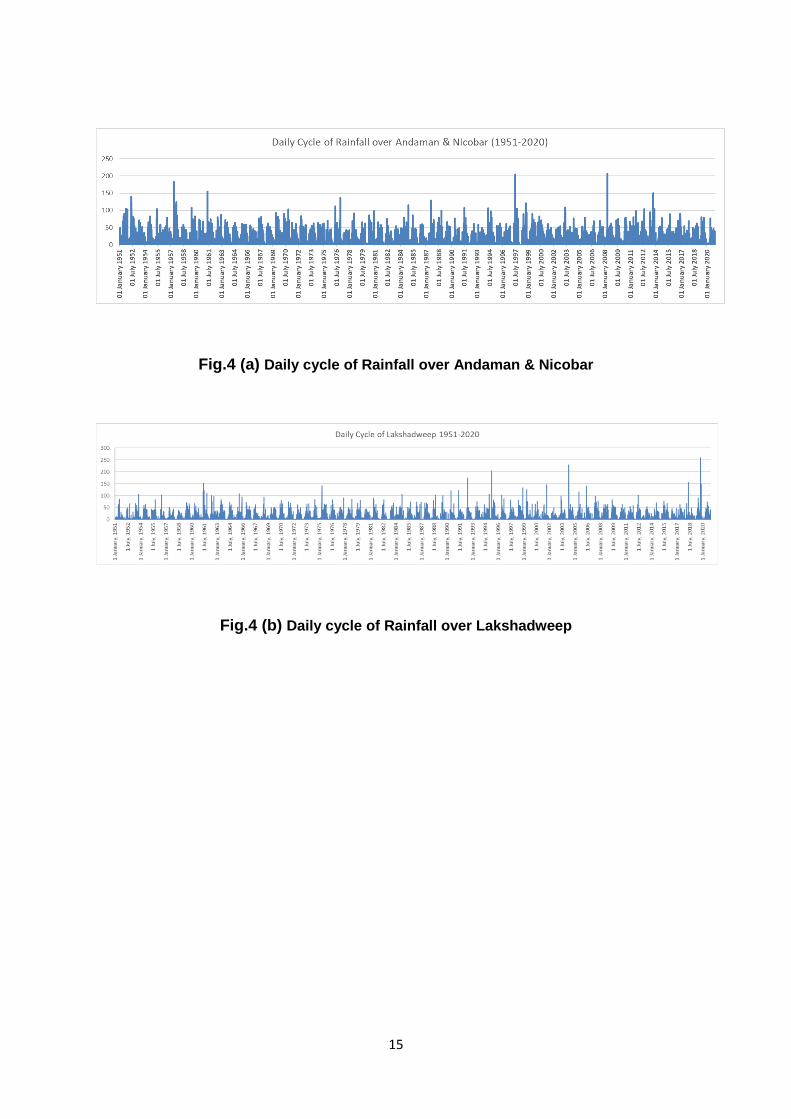
Fig.4a & Fig.4b show the time series of annual cycle of daily rainfall over the
Andaman & Nicobar and Lakshadweep Islands respectively. The daily rainfall over
these islands was computed as the area weighted rainfall over all the grid points
over the respective islands. As seen in the Fig.4a & Fig.4b, both inter-annual and
intra-seasonal variability are present in the daily rainfall series embedded with
extreme rainfall events over the 69-year record. Many times, very heavy rain events
are associated with cyclonic disturbances affecting Andaman & Nicobar and
Lakshadweep Islands. As seen from the Fig.4a, over the Andaman & Nicobar
Islands as a whole, the highest rainfall was observed during the end of April 2008,
owing to Cyclone Nargis. Similarly, Fig.4b shows that owing to Cyclone Maha, during
the end of October 2019, the highest rainfall was observed for the Lakshadweep
Islands as a whole. During July 1997, the peak in the rainfall activity over Andaman
& Nicobar Islands as seen in Fig.4a may be attributed to active MJO phase over
Indian Ocean.
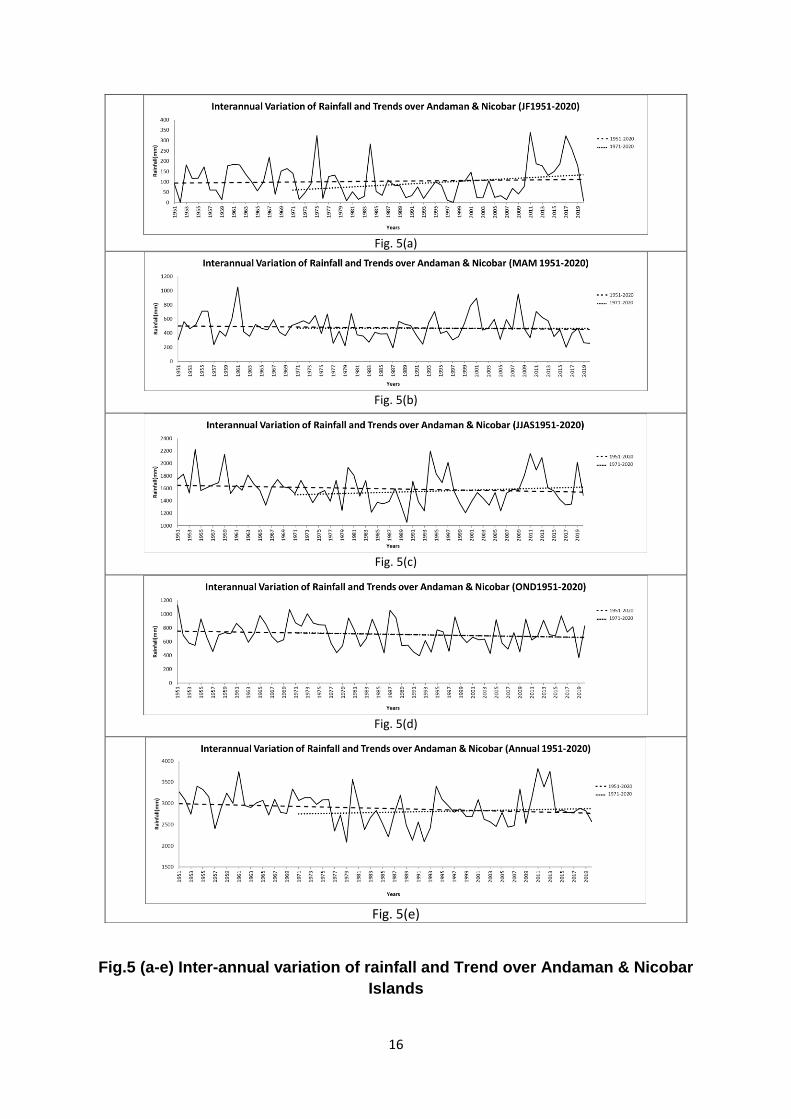
Fig.5 (a-e) show the inter-annual variation of rainfall over Andaman & Nicobar
Islands for the period 1951-2020 with trend lines fitted for the total data period and its
sub-period 1971-2020. From the Fig.5 it can be seen that no trend was observed
during OND season for both the periods, however during MAM season, the sign has
changed from insignificantly negative (1951-2020) to insignificantly positive (1971-
2020). The insignificantly positive trend for JF season during 1951-2020 has
changed to significantly positive (95%, at 17.32 mm/decade) during 1971-2020. The
trend for JJAS and annual rainfall was insignificantly negative during 1951-2020
which have changed to insignificantly positive during 1971-2020.
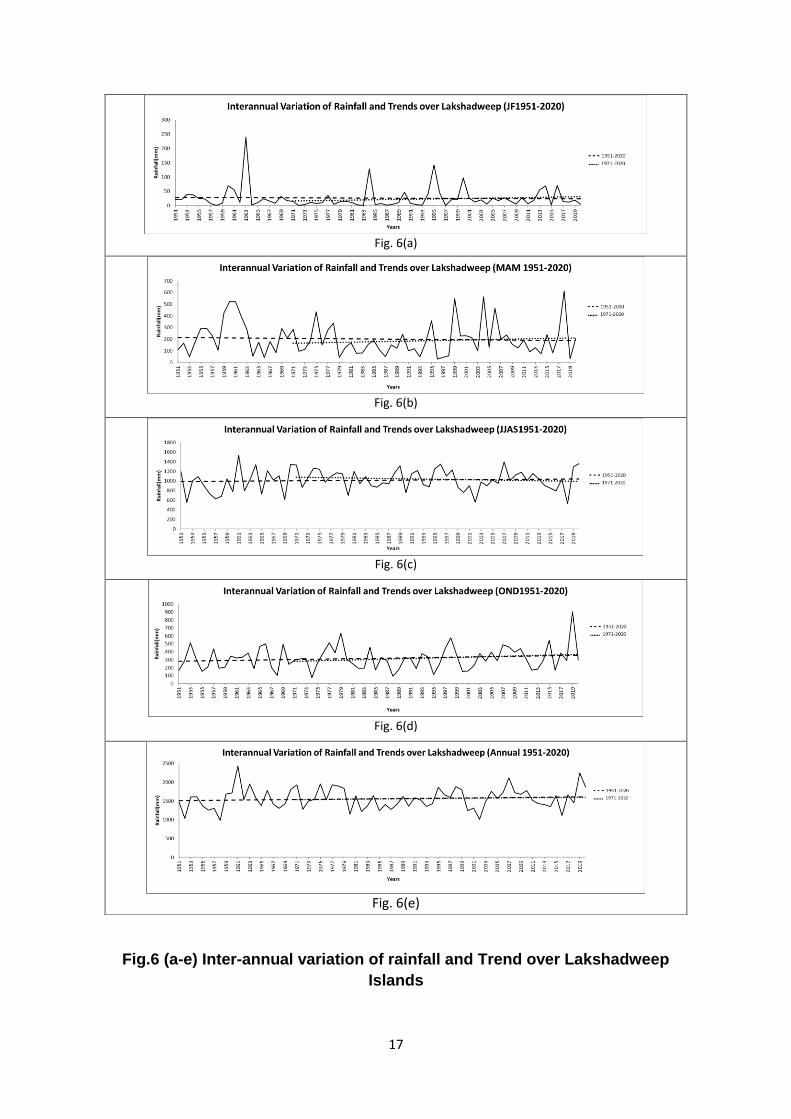
Fig.6 (a-e) show the inter-annual variation of rainfall over Lakshadweep
Islands for the period 1951-2020 with trend lines fitted for the total data period and its
sub-period 1971-2020. From the Fig.6, insignificant positive trend was observed
during JJAS and OND seasons for the entire period of 1951-2020, which is agreeing
7
with Sreekesh (2016) who examined the rainfall trend over Amini and Minicoy
stations of the Lakshadweep islands for the period 1951-2004 and concluded with
similar results. However, during the sub-period 1971-2020, the sign for trend of JJAS
rainfall changed from insignificantly positive to significantly (90%, at -35.72
mm/decade) negative. Also, for JF and MAM seasons, the sign changed from
negative to positive, though statistically insignificant.
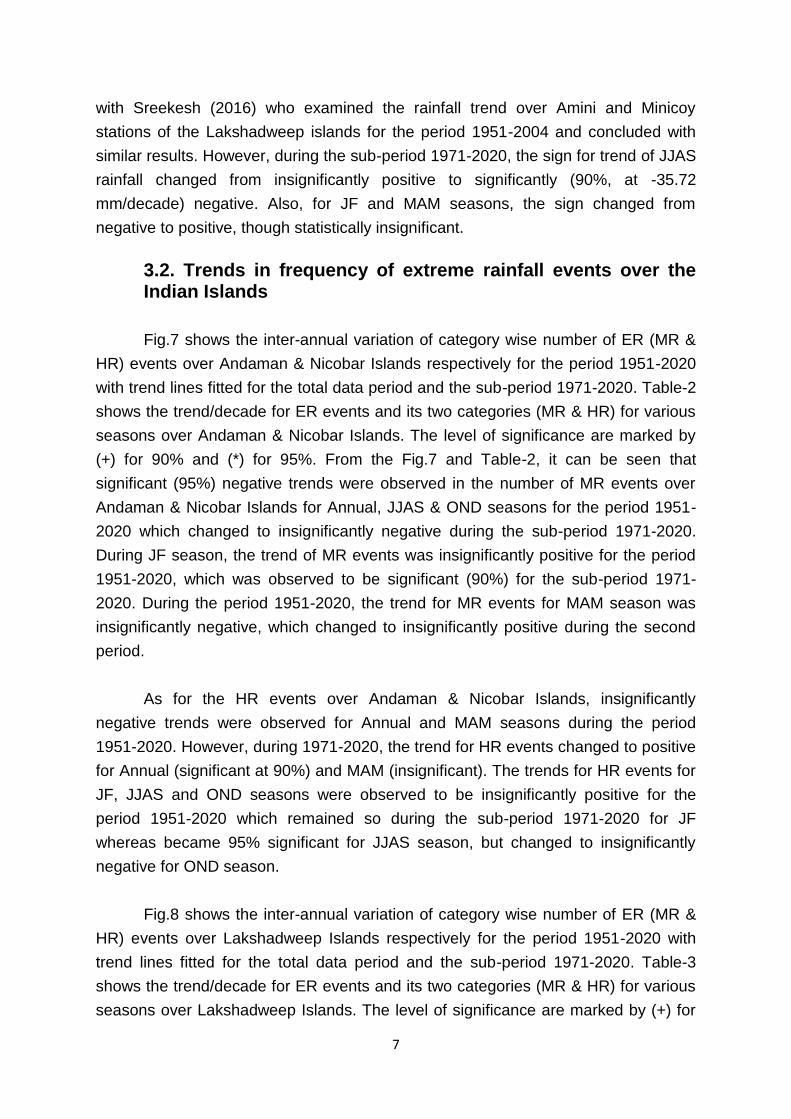
3.2. Trends in frequency of extreme rainfall events over the Indian Islands
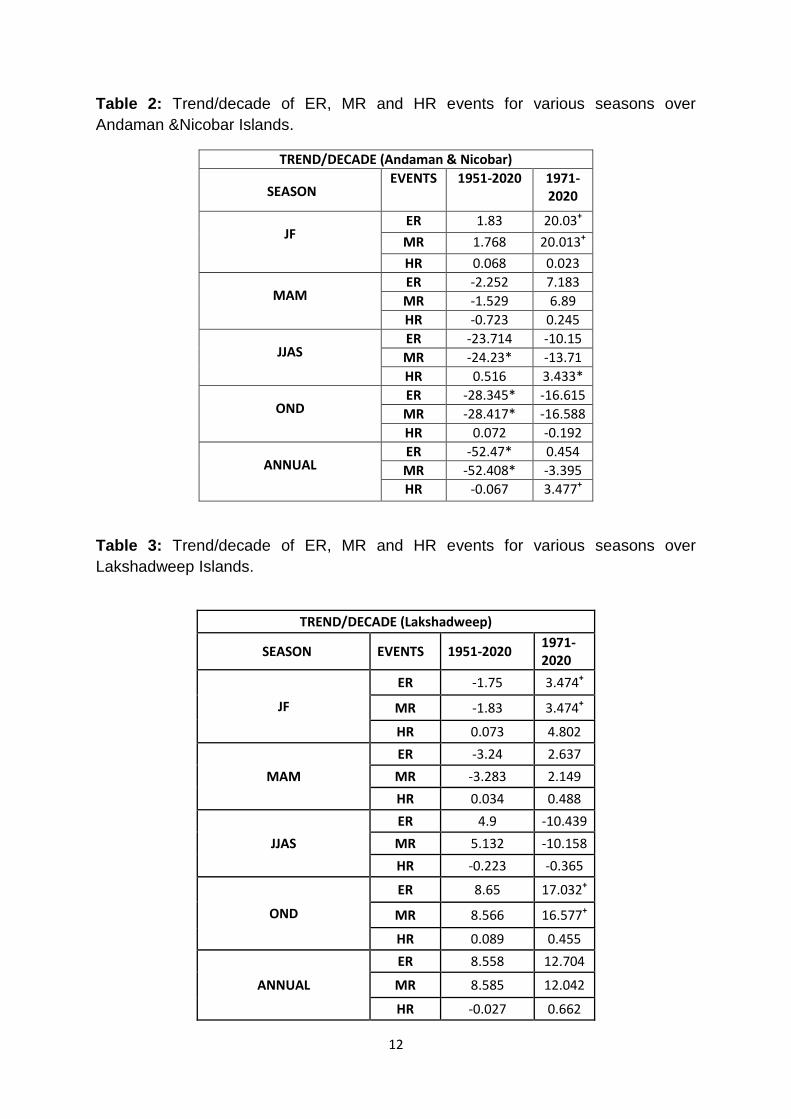
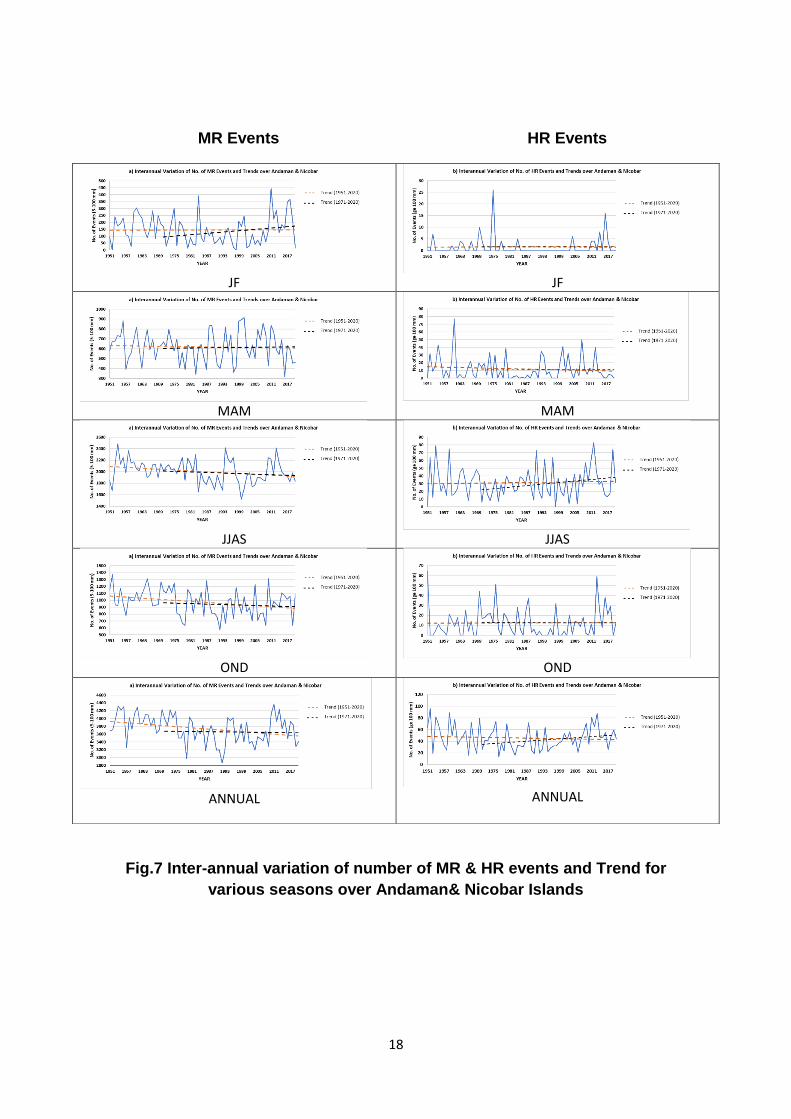
Fig.7 shows the inter-annual variation of category wise number of ER (MR &
HR) events over Andaman & Nicobar Islands respectively for the period 1951-2020
with trend lines fitted for the total data period and the sub-period 1971-2020. Table-2
shows the trend/decade for ER events and its two categories (MR & HR) for various
seasons over Andaman & Nicobar Islands. The level of significance are marked by
(+) for 90% and (*) for 95%. From the Fig.7 and Table-2, it can be seen that
significant (95%) negative trends were observed in the number of MR events over
Andaman & Nicobar Islands for Annual, JJAS & OND seasons for the period 1951-
2020 which changed to insignificantly negative during the sub-period 1971-2020.
During JF season, the trend of MR events was insignificantly positive for the period
1951-2020, which was observed to be significant (90%) for the sub-period 1971-
2020. During the period 1951-2020, the trend for MR events for MAM season was
insignificantly negative, which changed to insignificantly positive during the second
period.
As for the HR events over Andaman & Nicobar Islands, insignificantly
negative trends were observed for Annual and MAM seasons during the period
1951-2020. However, during 1971-2020, the trend for HR events changed to positive
for Annual (significant at 90%) and MAM (insignificant). The trends for HR events for
JF, JJAS and OND seasons were observed to be insignificantly positive for the
period 1951-2020 which remained so during the sub-period 1971-2020 for JF
whereas became 95% significant for JJAS season, but changed to insignificantly
negative for OND season.
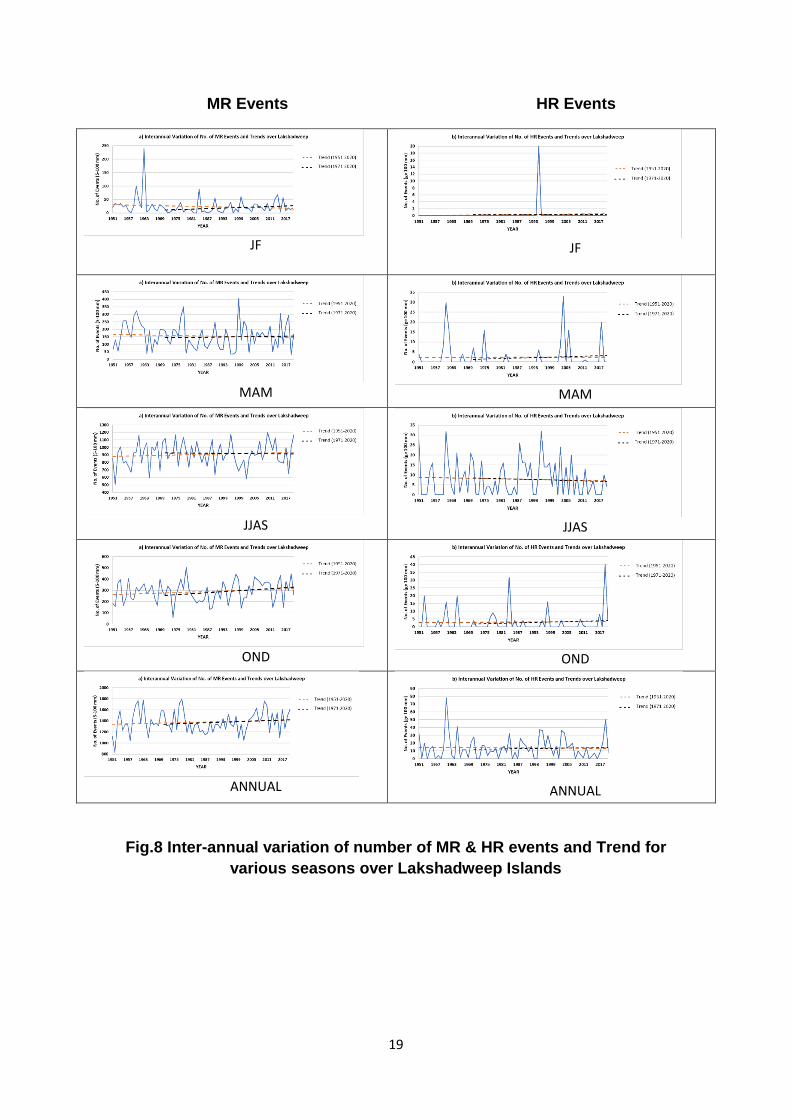
Fig.8 shows the inter-annual variation of category wise number of ER (MR &
HR) events over Lakshadweep Islands respectively for the period 1951-2020 with
trend lines fitted for the total data period and the sub-period 1971-2020. Table-3
shows the trend/decade for ER events and its two categories (MR & HR) for various
seasons over Lakshadweep Islands. The level of significance are marked by (+) for
8
90% and (*) for 95%. From the Fig.8 and Table-3, it can be seen that insignificantly
positive trends were observed in the number of MR events for Annual and OND
seasons during the period 1951-2020. However, during 1971-2020, the trend for MR
events remained positive for Annual (insignificant) and OND (significant at 90%). For
the seasons JF and MAM, trends for MR events were observed to be insignificantly
positive during 1951-2020, changing to positive significant at 90% for JF and
insignificant for MAM during 1971-2020. The observed insignificant positive trend for
MR events during 1951-2020 changed to insignificant negative trend during 1971-
2020.
The HR events over Lakshadweep Islands showed insignificant negative
trends during 1951-2020 for Annual and MAM seasons which became insignificantly
positive for the sub-period 1971-2020. Insignificant negative (positive) trends for HR
events was observed for JJAS (OND) seasons during both the periods and JF
season for both the periods showed no trend in the number of HR events.
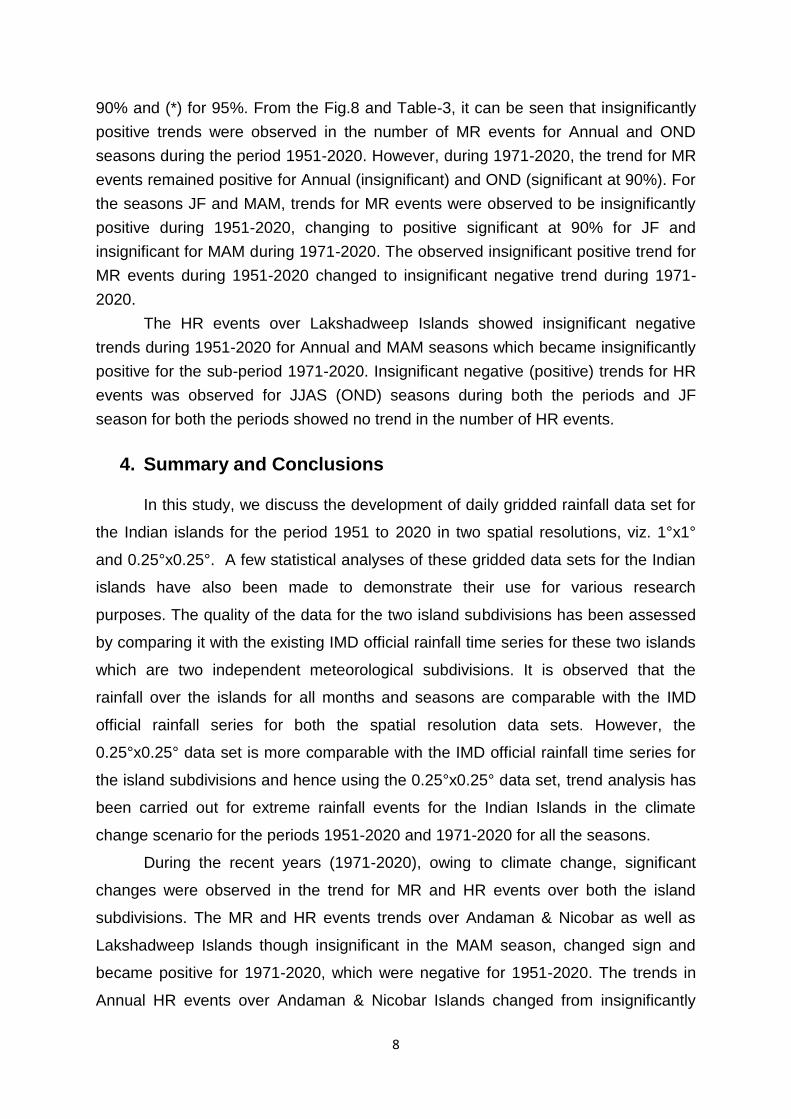
4. Summary and Conclusions
In this study, we discuss the development of daily gridded rainfall data set for
the Indian islands for the period 1951 to 2020 in two spatial resolutions, viz. 1°x1°
and 0.25°x0.25°. A few statistical analyses of these gridded data sets for the Indian
islands have also been made to demonstrate their use for various research
purposes. The quality of the data for the two island subdivisions has been assessed
by comparing it with the existing IMD official rainfall time series for these two islands
which are two independent meteorological subdivisions. It is observed that the
rainfall over the islands for all months and seasons are comparable with the IMD
official rainfall series for both the spatial resolution data sets. However, the
0.25°x0.25° data set is more comparable with the IMD official rainfall time series for
the island subdivisions and hence using the 0.25°x0.25° data set, trend analysis has
been carried out for extreme rainfall events for the Indian Islands in the climate
change scenario for the periods 1951-2020 and 1971-2020 for all the seasons.
During the recent years (1971-2020), owing to climate change, significant
changes were observed in the trend for MR and HR events over both the island
subdivisions. The MR and HR events trends over Andaman & Nicobar as well as
Lakshadweep Islands though insignificant in the MAM season, changed sign and
became positive for 1971-2020, which were negative for 1951-2020. The trends in
Annual HR events over Andaman & Nicobar Islands changed from insignificantly
9
negative during 1951-2020 to significantly positive at 90% during 1971-2020. Over
the Lakshadweep Islands, trends in Annual and OND HR events changed from
insignificantly negative during 1951-2020 to insignificantly positive during 1971-2020.
This study has provided opportunity to make use of observations from island
stations of the country and converting them into gridded spatial resolution format.
Since the rainfall reporting island stations are more or less very consistent on day to
day basis, real time daily preparation of the data is possible. Hence this data can
also be used for important operational services such as onset of Southwest
monsoon over the Indian Islands, and also for more accuracy wherever the rainfall of
India as a whole is taken into consideration, with the rainfall over the two island
subdivisions of the country also included.
Acknowledgements
We express our sincere thanks and gratitude to Dr. M. Mohapatra, DGM, IMD
and Dr. M. Rajeevan, Secretary, MoES and for their encouragement, guidance and
support during various stages of this work. We are also thankful to all the officers
and staff of Climate Monitoring & Prediction Group, IMD Pune for their support.
References
Kumar, N., Yadav, B.P., Tyagi, A. and Jaswal, A.K., 2012. Trend and spatial distribution of rainfall & rainy days over Andaman & Nicobar Islands. Natural hazards, 63(2), pp.575-587.
Pai D. S., Latha Sridhar, Rajeevan M, Sreejith O. P., Satbhai N. S. and Mukhopadhyay B (2014):Development of a new high spatial resolution (0.25° X 0.25°) Long period (1901-2010) daily gridded rainfall data set over India and its comparison with existing data sets over the region. Mausam 65:1, 1-18.
Rajeevan, M., J. Bhate, J.D. Kale and B. Lal, 2006 : A high resolution daily gridded rainfall for the Indian region : analysis of break and active monsoon spells, 2006, Current Science, Vol.91, No.3 pp 296-306.
Rajeevan, M. and Bhate, J., 2009: A high resolution daily gridded rainfall data set (1971-2005) for mesoscale meteorological studies; Current Science, 96, 4, 558 – 562.
Rajeevan M., SulochanaGadgiland JyotiBhate., 2010: Active and break spells of the Indian summer monsoon; Journal of Earth System Science, 119, 3, 229-247.
Shepard D., 1968: A two-dimensional interpolation function for irregularly spaced data; Proc. 1968 ACM Nat. Conf, 517-524.
Sreekesh, S., 2016. Rainfall variation in Lakshadweep Islands, Indian Journal of Geo Marine Sciences Vol. 45 (11), November 2016, pp. 1603-1609.
Yatagai Akiyo, Kenji Kamiguchi, Osamu Arakawa, Atsushi Hamada, Natsuko Yasutomi and Akio Kitoh, 2012: APHRODITE: Constructing a Long-Term Daily Gridded Precipitation Dataset for Asia Based on a Dense Network of Rain Gauges; Bull. Amer. Meteor. Soc., 93, 1401–1415.
10
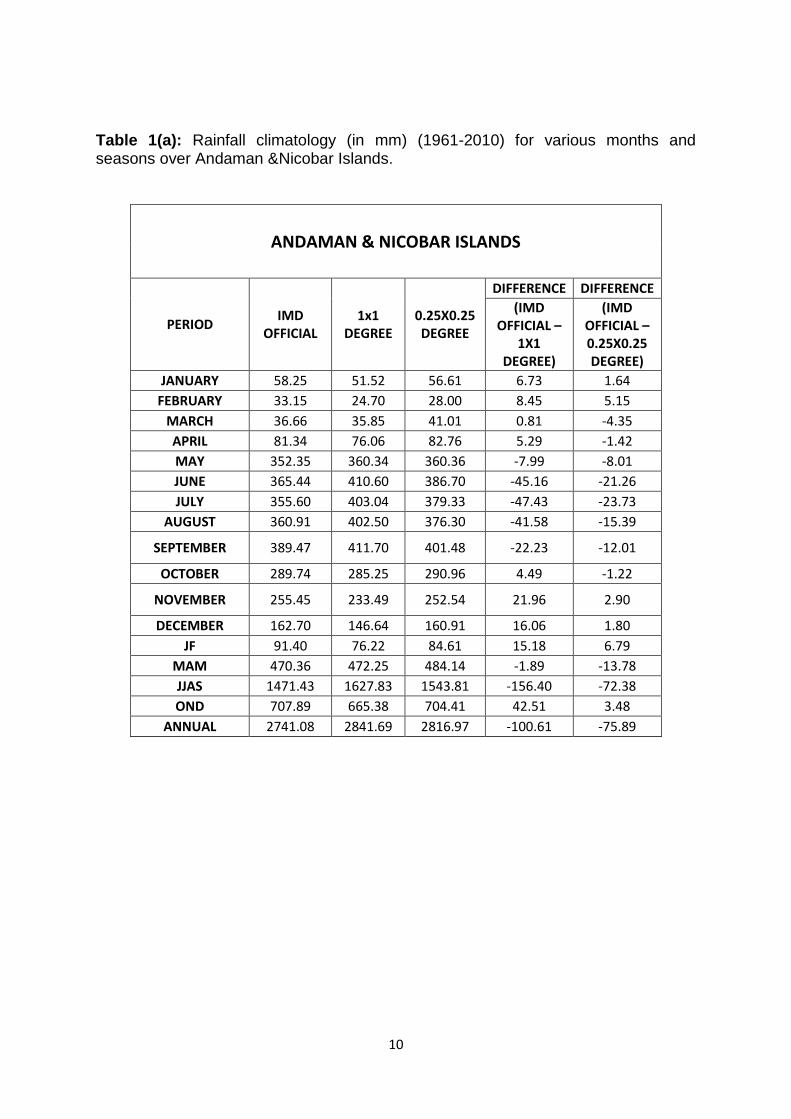
Table 1(a): Rainfall climatology (in mm) (1961-2010) for various months and seasons over Andaman &Nicobar Islands.
ANDAMAN & NICOBAR ISLANDS
PERIOD IMD
OFFICIAL 1x1
DEGREE 0.25X0.25 DEGREE
DIFFERENCE DIFFERENCE
(IMD OFFICIAL –
1X1 DEGREE)
(IMD OFFICIAL – 0.25X0.25 DEGREE)
JANUARY 58.25 51.52 56.61 6.73 1.64
FEBRUARY 33.15 24.70 28.00 8.45 5.15
MARCH 36.66 35.85 41.01 0.81 -4.35
APRIL 81.34 76.06 82.76 5.29 -1.42
MAY 352.35 360.34 360.36 -7.99 -8.01
JUNE 365.44 410.60 386.70 -45.16 -21.26
JULY 355.60 403.04 379.33 -47.43 -23.73
AUGUST 360.91 402.50 376.30 -41.58 -15.39
SEPTEMBER 389.47 411.70 401.48 -22.23 -12.01
OCTOBER 289.74 285.25 290.96 4.49 -1.22
NOVEMBER 255.45 233.49 252.54 21.96 2.90
DECEMBER 162.70 146.64 160.91 16.06 1.80
JF 91.40 76.22 84.61 15.18 6.79
MAM 470.36 472.25 484.14 -1.89 -13.78
JJAS 1471.43 1627.83 1543.81 -156.40 -72.38
OND 707.89 665.38 704.41 42.51 3.48
ANNUAL 2741.08 2841.69 2816.97 -100.61 -75.89
11
Table 1(b): Rainfall climatology (in mm) (1961-2010) for various months and seasons over Lakshadweep Islands.
LAKSHADWEEP ISLANDS
PERIOD IMD
OFFICIAL 1x1
DEGREE 0.25X0.25 DEGREE
DIFFERENCE DIFFERENCE
(IMD OFFICIAL –
1X1 DEGREE)
(IMD OFFICIAL – 0.25X0.25 DEGREE)
JANUARY 19.83 16.13 17.76 3.70 2.07
FEBRUARY 11.79 6.39 8.65 5.40 3.14
MARCH 11.15 6.60 9.35 4.55 1.80
APRIL 33.22 19.60 27.97 13.63 5.25
MAY 170.02 152.88 157.41 17.13 12.60
JUNE 329.81 353.85 345.88 -24.04 -16.07
JULY 294.84 314.25 309.22 -19.41 -14.39
AUGUST 225.78 226.91 226.75 -1.13 -0.97
SEPTEMBER 168.70 169.33 168.80 -0.63 -0.09
OCTOBER 146.40 145.28 149.26 1.11 -2.86
NOVEMBER 122.55 106.01 113.68 16.54 8.87
DECEMBER 62.13 49.58 53.78 12.55 8.35
JF 31.61 22.52 26.41 9.10 5.20
MAM 214.39 179.08 194.73 35.31 19.66
JJAS 1019.13 1064.35 1050.65 -45.22 -31.52
OND 331.08 300.87 316.72 30.21 14.36
ANNUAL 1596.21 1566.81 1588.51 29.40 7.70
12
Table 2: Trend/decade of ER, MR and HR events for various seasons over
Andaman &Nicobar Islands.
TREND/DECADE (Andaman & Nicobar)
SEASON EVENTS 1951-2020 1971-
2020
JF ER 1.83 20.03+
MR 1.768 20.013+
HR 0.068 0.023
MAM ER -2.252 7.183
MR -1.529 6.89
HR -0.723 0.245
JJAS ER -23.714 -10.15
MR -24.23* -13.71
HR 0.516 3.433*
OND ER -28.345* -16.615
MR -28.417* -16.588
HR 0.072 -0.192
ANNUAL ER -52.47* 0.454
MR -52.408* -3.395
HR -0.067 3.477+
Table 3: Trend/decade of ER, MR and HR events for various seasons over
Lakshadweep Islands.
TREND/DECADE (Lakshadweep)
SEASON EVENTS 1951-2020 1971-2020
JF
ER -1.75 3.474+
MR -1.83 3.474+
HR 0.073 4.802
MAM
ER -3.24 2.637
MR -3.283 2.149
HR 0.034 0.488
JJAS
ER 4.9 -10.439
MR 5.132 -10.158
HR -0.223 -0.365
OND
ER 8.65 17.032+
MR 8.566 16.577+
HR 0.089 0.455
ANNUAL
ER 8.558 12.704
MR 8.585 12.042
HR -0.027 0.662
13
Fig. 1: The 36 meteorological subdivisions of India including Andaman & Nicobar and
Lakshadweep Islands
Fig.2 (a) Number of grids of 1°x1° taken into account for Andaman & Nicobar and
Lakshadweep Islands
14
.
Fig.2 (b) Number of grids of 0.25°x0.25° taken into account for Andaman & Nicobar
and Lakshadweep Islands
Fig. 3: Daily cycle of MR and HR events over Andaman & Nicobar and Lakshadweep
Islands
(a)
(b)
15
Fig.4 (a) Daily cycle of Rainfall over Andaman & Nicobar
Fig.4 (b) Daily cycle of Rainfall over Lakshadweep
16
Fig.5 (a-e) Inter-annual variation of rainfall and Trend over Andaman & Nicobar
Islands
Fig. 5(a)
Fig. 5(b)
Fig. 5(c)
Fig. 5(d)
Fig. 5(e)
17
Fig.6 (a-e) Inter-annual variation of rainfall and Trend over Lakshadweep
Islands
Fig. 6(a)
Fig. 6(b)
Fig. 6(c)
Fig. 6(d)
Fig. 6(e)
18
MR Events HR Events
Fig.7 Inter-annual variation of number of MR & HR events and Trend for
various seasons over Andaman& Nicobar Islands
JF
JF
MAM
MAM
JJAS
JJAS
OND
OND
ANNUAL
ANNUAL
19
MR Events HR Events
JF
JF
MAM
MAM
JJAS
JJAS
OND
OND
ANNUAL
ANNUAL
Fig.8 Inter-annual variation of number of MR & HR events and Trend for
various seasons over Lakshadweep Islands

20