Local and Global Correlations between Neurons in the Middle Temporal Area of Primate Visual Cortex
15
Local and Global Correlations between Neurons in the Middle Temporal Area of Primate Visual Cortex Selina S. Solomon 1,2 , Spencer C. Chen 1,2 , John W. Morley 3 and Samuel G. Solomon 1,2,4 1 ARC Centre of Excellence in Vision Science, Sydney, NSW, Australia, 2 Discipline of Physiology, School of Medical Sciences and Bosch Institute, The University of Sydney, Sydney, NSW 2006, Australia, 3 School of Medicine, University of Western Sydney, Campbelltown, NSW 2560, Australia and 4 Department of Experimental Psychology, University College London, WC1P 0AH, UK Address correspondence to Selina S. Solomon, Discipline of Physiology, School of Medical Sciences and Bosch Institute, The University of Sydney, NSW 2006, Australia. Email: [email protected] In humans and other primates, the analysis of visual motion includes populations of neurons in the middle-temporal (MT) area of visual cortex. Motion analysis will be constrained by the structure of neural correlations in these populations. Here, we use multi-elec- trode arrays to measure correlations in anesthetized marmoset, a New World monkey where area MT lies exposed on the cortical surface. We measured correlations in the spike count between pairs of neurons and within populations of neurons, for moving dot fields and moving gratings. Correlations were weaker in area MT than in area V1. The magnitude of correlations in area MT diminished with distance between receptive fields, and difference in preferred direc- tion. Correlations during presentation of moving gratings were stron- ger than those during presentation of moving dot fields, extended further across cortex, and were less dependent on the functional properties of neurons. Analysis of the timescales of correlation sug- gests presence of 2 mechanisms. A local mechanism, associated with near-synchronous spiking activity, is strongest in nearby neurons with similar direction preference and is independent of visual stimulus. A global mechanism, operating over larger spatial scales and longer timescales, is independent of direction preference and is modulated by the type of visual stimulus presented. Keywords: area MT, extrastriate, marmoset, population coding, visual motion Introduction Cortical neurons show variable firing rate, and some of this variability is shared with other neurons. This co-variability, also called “noise correlation”, arises in neurons that share input or are reciprocally connected (Moore et al. 1970; Nowak et al. 1995; Shadlen and Newsome 1998). Knowledge of how noise correlations are distributed is therefore important to understand the circuitry of neuronal populations, and in clari- fying the signals that these populations provide. A productive focus of empirical and theoretical research has been the visual system, where perceptual work has clarified the requirements of population codes, and the receptive field properties of cor- tical neurons are well described. The relationship between per- ceptual decisions and correlated variability has been most thoroughly explored in area middle-temporal (MT) of the primate visual cortex (Newsome et al. 1989; Salzman et al. 1990; Britten et al. 1992)—an extrastriate area that is highly conserved among different primate species and is important in motion vision and the control of eye movements (Newsome and Pare 1988; Priebe and Lisberger 2004; Huang and Lisber- ger 2009). Work in macaque monkey shows that noise correla- tions have marked influence on fine motion discriminations and help yoke the activity of individual neurons to trial-by-trial fluctuations in perceptual judgments about the same stimulus (Zohary et al. 1994; Shadlen and Newsome 1998). The spatial and temporal scales of spike correlations have now been well characterized in the primary visual cortex (V1) of macaque monkey and cat (van Kan et al. 1985; Hata et al. 1991; Nelson et al. 1992; Snider et al. 1998; Reich et al. 2001; Kohn and Smith 2005; Smith and Kohn 2008). Much less is known about extrastriate visual areas. There are good reasons to believe that the spatial and temporal scales of correlations in extrastriate areas may be different from that in V1. First, recep- tive fields in extrastriate areas are usually much larger than those in V1, implying substantial convergence of afferent input. Second, the major feed-forward input to V1 arises in the lateral geniculate nucleus (LGN), but extrastriate areas draw feed-forward input from other cortical areas, including V1, as well as subcortical areas (Weller et al. 1984; Sincich et al. 2004; Born and Bradley 2005; Nassi et al. 2006; Lyon et al. 2010; Warner et al. 2010). Third, indirect comparisons suggest that spike correlations are more pronounced in V1 than in extrastri- ate cortex (Gu et al. 2011; Chen et al. 2013; Liu et al. 2013; Smith and Sommer 2013; Smith et al. 2013). The objective of this study was to establish the spatial and temporal structure of noise correlations in area MT. To do this, we made multi-electrode recordings from area MT of mar- moset, a diurnal New World monkey in which area MT lies exposed on the cortical surface. The functional properties of neurons in the LGN (White et al. 2001; Solomon et al. 2002), V1 (Yu et al. 2010; Cheong et al. 2013), and area MT (Rosa and Elston 1998; Solomon et al. 2011) of marmoset are qualitatively and quantitatively similar to those of Old World macaque monkey. We first characterize the spatial and temporal struc- ture of noise correlations between pairs of single neurons and show its stimulus dependence. We then extend the analysis to estimate noise correlations across populations of neurons. To- gether these analyses suggest 2 distinct mechanisms under- lying noise correlations in area MT—one that is independent of stimulus and prominent over short timescales and one that is slower and stimulus dependent. Comparison of noise correla- tions in area MT and area V1 suggests that processing within area MT reduces noise correlations and contributes to depend- ence on visual stimulus. Materials and Methods Ethical Approval Ten adult marmosets (Callithrix jacchus; 7 males; weight 290–400 g) were obtained from the Australian National Health and Medical Re- search Council (NHMRC) combined breeding facility. Procedures were © The Author 2014. Published by Oxford University Press. All rights reserved. For Permissions, please e-mail: [email protected] Cerebral Cortex doi:10.1093/cercor/bhu111 Cerebral Cortex Advance Access published June 17, 2014 by guest on April 23, 2016 http://cercor.oxfordjournals.org/ Downloaded from
Transcript of Local and Global Correlations between Neurons in the Middle Temporal Area of Primate Visual Cortex
Local and Global Correlations between Neurons in the Middle Temporal Area of PrimateVisual Cortex
Selina S. Solomon1,2, Spencer C. Chen1,2, John W. Morley3 and Samuel G. Solomon1,2,4
1ARC Centre of Excellence in Vision Science, Sydney, NSW, Australia, 2Discipline of Physiology, School of Medical Sciences andBosch Institute, The University of Sydney, Sydney, NSW 2006, Australia, 3School of Medicine, University of Western Sydney,Campbelltown, NSW 2560, Australia and 4Department of Experimental Psychology, University College London, WC1P 0AH, UK
Address correspondence to Selina S. Solomon, Discipline of Physiology, School of Medical Sciences and Bosch Institute, The University of Sydney,NSW 2006, Australia. Email: [email protected]
In humans and other primates, the analysis of visual motion includespopulations of neurons in the middle-temporal (MT) area of visualcortex. Motion analysis will be constrained by the structure ofneural correlations in these populations. Here, we use multi-elec-trode arrays to measure correlations in anesthetized marmoset, aNew World monkey where area MT lies exposed on the corticalsurface. We measured correlations in the spike count between pairsof neurons and within populations of neurons, for moving dot fieldsand moving gratings. Correlations were weaker in area MT than inarea V1. The magnitude of correlations in area MT diminished withdistance between receptive fields, and difference in preferred direc-tion. Correlations during presentation of moving gratings were stron-ger than those during presentation of moving dot fields, extendedfurther across cortex, and were less dependent on the functionalproperties of neurons. Analysis of the timescales of correlation sug-gests presence of 2 mechanisms. A local mechanism, associatedwith near-synchronous spiking activity, is strongest in nearbyneurons with similar direction preference and is independent ofvisual stimulus. A global mechanism, operating over larger spatialscales and longer timescales, is independent of direction preferenceand is modulated by the type of visual stimulus presented.
Keywords: area MT, extrastriate, marmoset, population coding, visual motion
Introduction
Cortical neurons show variable firing rate, and some of thisvariability is shared with other neurons. This co-variability,also called “noise correlation”, arises in neurons that shareinput or are reciprocally connected (Moore et al. 1970; Nowaket al. 1995; Shadlen and Newsome 1998). Knowledge of hownoise correlations are distributed is therefore important tounderstand the circuitry of neuronal populations, and in clari-fying the signals that these populations provide. A productivefocus of empirical and theoretical research has been the visualsystem, where perceptual work has clarified the requirementsof population codes, and the receptive field properties of cor-tical neurons are well described. The relationship between per-ceptual decisions and correlated variability has been mostthoroughly explored in area middle-temporal (MT) of theprimate visual cortex (Newsome et al. 1989; Salzman et al.1990; Britten et al. 1992)—an extrastriate area that is highlyconserved among different primate species and is important inmotion vision and the control of eye movements (Newsomeand Pare 1988; Priebe and Lisberger 2004; Huang and Lisber-ger 2009). Work in macaque monkey shows that noise correla-tions have marked influence on fine motion discriminationsand help yoke the activity of individual neurons to trial-by-trial
fluctuations in perceptual judgments about the same stimulus(Zohary et al. 1994; Shadlen and Newsome 1998).
The spatial and temporal scales of spike correlations havenow been well characterized in the primary visual cortex (V1)of macaque monkey and cat (van Kan et al. 1985; Hata et al.1991; Nelson et al. 1992; Snider et al. 1998; Reich et al. 2001;Kohn and Smith 2005; Smith and Kohn 2008). Much less isknown about extrastriate visual areas. There are good reasonsto believe that the spatial and temporal scales of correlations inextrastriate areas may be different from that in V1. First, recep-tive fields in extrastriate areas are usually much larger thanthose in V1, implying substantial convergence of afferentinput. Second, the major feed-forward input to V1 arises in thelateral geniculate nucleus (LGN), but extrastriate areas drawfeed-forward input from other cortical areas, including V1, aswell as subcortical areas (Weller et al. 1984; Sincich et al. 2004;Born and Bradley 2005; Nassi et al. 2006; Lyon et al. 2010;Warner et al. 2010). Third, indirect comparisons suggest thatspike correlations are more pronounced in V1 than in extrastri-ate cortex (Gu et al. 2011; Chen et al. 2013; Liu et al. 2013;Smith and Sommer 2013; Smith et al. 2013).
The objective of this study was to establish the spatial andtemporal structure of noise correlations in area MT. To do this,we made multi-electrode recordings from area MT of mar-moset, a diurnal New World monkey in which area MT liesexposed on the cortical surface. The functional properties ofneurons in the LGN (White et al. 2001; Solomon et al. 2002),V1 (Yu et al. 2010; Cheong et al. 2013), and area MT (Rosa andElston 1998; Solomon et al. 2011) of marmoset are qualitativelyand quantitatively similar to those of Old World macaquemonkey. We first characterize the spatial and temporal struc-ture of noise correlations between pairs of single neurons andshow its stimulus dependence. We then extend the analysis toestimate noise correlations across populations of neurons. To-gether these analyses suggest 2 distinct mechanisms under-lying noise correlations in area MT—one that is independent ofstimulus and prominent over short timescales and one that isslower and stimulus dependent. Comparison of noise correla-tions in area MT and area V1 suggests that processing withinarea MT reduces noise correlations and contributes to depend-ence on visual stimulus.
Materials and Methods
Ethical ApprovalTen adult marmosets (Callithrix jacchus; 7 males; weight 290–400 g)were obtained from the Australian National Health and Medical Re-search Council (NHMRC) combined breeding facility. Procedures were
© The Author 2014. Published by Oxford University Press. All rights reserved.For Permissions, please e-mail: [email protected]
Cerebral Cortexdoi:10.1093/cercor/bhu111
Cerebral Cortex Advance Access published June 17, 2014 by guest on A
pril 23, 2016http://cercor.oxfordjournals.org/
Dow
nloaded from

approved by Institutional (University of Sydney) Animal Ethics Com-mittee and conform to the Society for Neuroscience and NHMRC pol-icies on the use of animals in neuroscience research.
Experimental PreparationEach animal was initially sedated with an intramuscular (IM) injectionof 12 mg/kg of Alfaxan and 3 mg/kg of Diazepam. We then gave pre-operative IM injections of 0.2 mg/kg of atropine (Pfizer), to reducelung secretions, and dexamethasone (0.3 mg/kg; Maine Pharmaceuti-cals) to reduce inflammation. Subsequent surgery was performedunder supplemental local anesthesia (Lignocaine 2%; Astra Zaneca).A femoral vein was cannulated, the trachea exposed and an endo-tracheal tube inserted, and the animal placed in a stereotaxic frame.Post-surgical anesthesia was maintained by continuous intravenous in-fusion of sufentanil citrate (4–12 µg/kg/h; Sufenta Forte, Janssen Cilag)in physiological solution (sodium lactate, Baxter International) withadded dexamethasone (0.4 mg/kg/h; Mayne Pharma) and Synthamin17 (225 mg/kg/h; Baxter International). The electrocardiogram, elec-troencephalogram (EEG), and SpO2 were monitored continuously.Dominance of low frequencies (1–5 Hz) in the EEG recording, andabsence of EEG changes under noxious stimulus (tail pinch) were usedas the chief sign of an adequate level of anesthesia. At any sign of theanesthesia becoming less effective, the dose of sufentanil citrate wasincreased. Muscular paralysis was then induced and maintained bycontinuous infusion of pancuronium bromide (0.3 mg/kg/h; AstraZaneca). The animal was artificially ventilated, with a 70:30 mix ofN2O and Carbogen, so as to keep end-tidal CO2 near 33 mm Hg. Rectaltemperature was kept near 38°C with the use of a heating blanket. Add-itional antibiotic and anti-inflammatory cover was given daily by IMinjection of 25 mg of Noricillin (Norbrook), and 0.1 mg of dexametha-sone. The pupils were dilated with atropine sulfate, and the corneaswere protected with high-permeability contact lenses that remained inplace for the duration of the experiment. No artificial pupils were used.At the end of the experiment, the animal was euthanized with intraven-ous 500 mg/kg sodium pentobarbitone (Lethobarb; Verbac Australia).The animal was perfused transcardially with 0.9% sodium chloride andthen 4% paraformaldehyde in 0.1 M phosphate buffer, following whichthe brain was removed and post-fixed for 24 h. The tissue was thentransferred to a 30% sucrose solution in 0.1 M phosphate buffer.
RecordingsIn 9 animals, a craniotomy was made over area MT. We identified theposterior tip of the lateral sulcus, then made a series of single-electrodepenetrations anterior and lateral to that location, and used the presenceof directionally tuned multi-unit activity to identify likely location ofarea MT. In 6 animals, a large durotomy was made and extracellular re-cordings were obtained using a 10 × 10 grid of parylene-coated plat-inum iridium microelectrodes (1.5 mm in length, spacing 0.4 mm;Blackrock Microsystems). The array was inserted to a depth of approxi-mately 1 mm using a pneumatic insertion device (Rousche andNormann 1992). The surface curvature of the cortex in and aroundarea MT means that the depth of the electrodes will vary with locationin the cortex. Three of these implants were used to obtain separate re-cordings that have been reported elsewhere (McDonald et al., 2014).In 3 animals that were implanted with the 10 × 10 arrays, coronal sec-tions (50 μm thick) were cut on a freezing microtome, and alternatesections were stained for Nissl substances with cresyl violet, or formyelin with Gallyas silver (Bourne et al. 2007). In these animals, theelectrode tracks reached layers 4–6. We note that because insertion orremoval of the array may extend the electrode tracks beyond the re-cording location, we cannot rule out the possibility that recordingswere obtained from upper layers.
In 3 other animals, we made 12 insertions of an array (NeuroNexus)of 8 laminar probes (spacing 0.2 mm), each of which had 8 iridiumcontact points (spacing 0.2 mm). After making a small durotomy, thelaminar probes were inserted near perpendicular to the corticalsurface, to a depth of approximately 2 mm, until all contact points andthe reference were within cortex. In an additional animal, we used thelaminar probes to make 3 penetrations into V1 across 2 hemispheres;1 in which we recorded from the exposed surface of V1, where
receptive fields are parafoveal, and 2 where we inserted the probesdeeper, toward the calcarine sulcus, to target peripheral V1 receptivefields; in these cases, receptive fields were near the horizontal merid-ian, around 15 degrees eccentricity. Signals from each contact pointwere amplified, bandpass-filtered (0.3–5 kHz), and digitized at a rateof 24 kHz by an RZ2 real-time processor (Tucker-Davis Technologies).Offline-analyses were performed using Matlab (MathWorks, Inc.) andOffline Sorter (Plexon, Inc.).
Visual StimuliVisual stimuli were drawn at 8-bit resolution using commands toOpenGL, by custom software (EXPO; P. Lennie) running on a G5Power Macintosh computer. Stimuli were displayed on a calibratedcathode ray tube monitor (Sony G520, refresh rate 100 Hz, mean lumi-nance 45–55 cd/m2, width 40 cm and height 30 cm). The monitor wasviewed at a distance of 114 cm via a front-silvered mirror (V1 record-ings), or directly at 45 cm (MT recordings). We focused the eyes at theappropriate distance using supplementary lenses, the power of whichwas chosen to optimize the spatial resolution of parvocellular cellsin the dorsal LGN of the thalamus, confirmed by measurements contra-lateral to the recording site. During measurements, 1 eye, usually thecontralateral eye, was occluded.
In 1 stimulus set, white circular dots (Weber contrast 1.0; diameter0.4 degrees) moved across the monitor; outside each dot, the monitorwas held at the mean luminance. Dots were presented at a density of0.3 dots/s/degree and moved with 100% coherence and infinite life-time. The position of each dot at the beginning of a trial was specifiedby a random number generator; the same set of positions was usedon every trial. In another set of stimuli, a large sine-wave grating(Michelson contrast 0.5) drifted within a circular window (MT: diam-eter 30 degrees; V1: diameter 14 degrees) with hard edges; outside thewindow, the luminance was held at the mean value. The spatial fre-quency was 0.2 cycles/degree, and temporal frequency was 4 or 5 Hz,except in 1 array recording from area MT where spatial frequency was0.5 cycles/degree, and temporal frequency was 8 Hz. For both dotfields and gratings, different motion directions (90 degree steps) werepresented in pseudorandom order for 2 s; between trials, the screenwas held at the mean luminance for 2 s. We obtained responses to 100trials of each stimulus.
To estimate the spatial receptive field of each electrode, we mea-sured response to a dot field moving in each of 8 directions (45 degreesteps) at each of 12 positions tiling the stimulus screen. Dot size andspeed, and density of the dot field, were the same as that used above.Each of stimuli in the set, which included a blank screen, was pre-sented in pseudorandom order for 0.50 s; between trials, the screenwas held at the mean luminance for 0.05 s. We obtained responses to20 trials of each stimulus.
Spike-Sorting and Analysis CriteriaWhen inserting the 10 × 10 array, we needed to position the array toensure insertion was normal to the electrodes, and we took care toavoid major blood vessels. The consequence of these constraints is thatnot all electrodes were confined to area MT. We inspected the receptivefield positions and directional-sensitivity of the (multi-unit) recordingsat each electrode of the 10 × 10 array. In all implants, the majority of re-ceptive fields were in the upper quadrant of the visual field. From thetrajectory of receptive field positions (Rosa and Elston 1998), we wereable to identify electrodes that were likely to be within area MT, andothers likely to be in area MTc (a thin area that in our recordings bor-dered much of anterior MT). Of the 96 recording electrodes (4 electro-des are inactive), an average of 63.0% (range 40.6–87.5%) wereclassified as within area MT and 18.9% (range 10.4–33.3%) were classi-fied as within area MTc. For the current analyses, we have includedneurons from electrodes in both regions.
The function findpeaks in the Matlab environment was used to iden-tify candidate waveforms with peak amplitude that exceeded 3 stand-ard deviations (SDs) of the raw signal on the relevant channel.Subsequent classification of these waveforms was made using PlexonOffline Sorter. Single-unit waveforms were manually identified as clus-ters in principal component space. In all putative single-units, we
2 Spike Correlations in Area MT of Marmoset • Solomon et al.
by guest on April 23, 2016
http://cercor.oxfordjournals.org/D
ownloaded from

subsequently found less than 2% of the interspike intervals (ISIs) wereunder 1 ms. The great majority of units (93%) showed less than 1% ofISIs under 1 ms. To quantify the reliability of the spike sorting, we ob-tained the signal-to-noise ratio (SNR) of the spike waveform for eachunit; the amplitude of the mean waveform normalized by twice the SDof the noise in the waveform (Nordhausen et al. 1996; Suner et al.2005; Kelly et al. 2007). The SNRs are summarized in Table 1. Theminimum SNR of units in our sample was 2.35; 2 neurons had SNR of<2.75 (Smith and Kohn 2008). We accepted all the putative single-unitsfor further analysis.
In the following analyses, we only include units where response tothe most effective stimulus direction was at least 1 spike/s greater thanthe maintained discharge, or the least effective direction, whichever wassmaller. This allowed us to include those neurons that were visuallydriven around the maintained discharge. From 6 implantations of the10 × 10 array into area MT, we identified 274 single-units from 8 dot fieldstimulus sets (in 2 animals, we made separate measurements duringstimulation through the contralateral and ipsilateral eye), and 250 single-units from 5 grating stimulus sets, obtained from 4 animals. Of theseunits, 180 (dot fields) and 143 (gratings) passed the response criterion.For these analyses, we will incorporate knowledge of the preferredmotion direction, so we imposed additional criteria to ensure the unitswere direction-selective: the response to the most effective stimulus dir-ection was at least 1.5 times the response to the opposite direction, andat least 1 spike/s greater in magnitude. Imposing this criterion fordirection-selectivity left 151 (dot fields) and 114 (gratings) single-units.
From penetrations of the laminar probes in area MT, we identified137 single-units from 12 dot field stimulus sets, of which 92 passed theresponse criterion. From penetrations of the laminar probes into V1,we identified 69 (3 dot field data sets) and 68 (3 grating data sets)single-units. Of these, 62 and 55 passed the response criterion. Whencomparing results between area MT and area V1, we limit our analysesto recordings from laminar probes. We did not impose additional cri-teria for direction-selectivity because these analyses do not incorporateknowledge of preferred motion direction.
For recordings from the 10 × 10 arrays implanted into area MT, anaverage of 20 neurons (SD 14) in each data set passed all the relevant cri-teria. For laminar probes inserted into area MT, the average was 8neurons (SD 6); for laminar probes inserted into area V1, the average was20 neurons (SD 10). Table 1 summarizes peak response rate, and meanresponse over the 2 s, for the most effective stimulus, in those neuronsthat passed response criterion. For recordings from area MT, we obtained1738 pairs (dot fields) and 1858 pairs (gratings) from the 10 × 10 arrayrecordings, and 483 pairs from the laminar probes. For recordings fromarea V1, we obtained 756 pairs (dot fields) and 557 pairs (gratings).
Estimating Direction PreferenceWe estimated preferred direction from the vector sum of responses toequally spaced motion directions:
R ¼P
k NkeiukPk Nk
ð9Þ
where Nk and uk are the mean spike count and the direction of motionfor the kth direction. We extracted the preferred direction, upref , fromthe angle of the vector R.
Estimating Receptive Field SeparationMulti-unit responses to the matrix of stimuli were subject to singularvalue decomposition (SVD) to obtain the weight given by each elec-trode to each spatial position. We then found the best predictions of atwo-dimensional Gaussian model of the spatial receptive field (usingthe function lsqcurvefit in the Matlab environment). From these fits, weextracted the position and length of the major and minor axes of the el-liptical surface that best described the spatial weights estimated by theSVD. For the current analyses, we define the radius of the receptivefield as the average of the half-width-at-half-height along the major andminor axes. The distance between receptive fields of 2 electrodes is theEuclidean distance between the 2 centers, normalized by the geometricmean of the radii.
Estimating Spike Count Correlation between Pairs of NeuronsThe spike count correlation (rSC) is the Pearson correlation coefficientof the spike counts of 2 units to repeated presentations of the samestimulus: rSC characterizes the co-variation in trial-to-trial responseamplitude ("noise correlations"). The rSC between a pair of neurons isas follows:
rSC ¼ EðN1 � N2Þ � EðN1Þ � EðN2ÞsN1 � sN2
ð1Þ
where N1 and N2 are the spike counts of each neuron, and E and σ are,respectively, the mean and SD of the spike counts. For the current ana-lyses, we also established spike count correlation across all stimuli inthe set. To do this, we first z-scored the spike counts so that responseto each direction had mean of zero and unit variance. The process ofz-scoring makes some terms in equation 1 irrelevant: the denominatortakes on a value of 1, and the means for each neuron are zero. Equation1 therefore reduces to:
rSC ¼ EðZ1Z2Þ ð2Þ
where Z1 and Z2 are the z-scored spike counts of the 2 neurons. Weused equation 2 to characterize spike count correlations during presen-tation of visual stimuli. Very slow fluctuations in for example physio-logical state can induce spike count correlations. In analyses not shown,we dissected the contribution of correlations with time course less than50 s from those with longer time courses, using standard methods (Bairet al. 2001). These analyses showed that correlations with time courseslonger than 50 s contributed less than 10% to our measurements of rSC.We did not explore these slow correlations any further.
To establish any biases in measurement of rSC, we first re-computedrSC after shuffling trials. For data sets obtained from 10 × 10 array im-plants in area MT, this procedure returned mean rSC of 0.0003 (dotfields; standard error of the mean [SEM] 0.0005) and −0.0002 (gratings;SEM 0.0004). The order of stimuli was identical across animals, so toassess possible effects of stimulus sequence, we next estimated rSC forpairs of neurons drawn from different animals: average rSC was 0.0010(dot fields; SEM 0.0002) and 0.0037 (gratings; SEM 0.0003).
To characterize co-variation in maintained discharge rate, we mea-sured spike count over the last 1 s of the blank gray screen betweeneach stimulus presentation and calculated the Pearson’s correlation co-efficient using equation 1. These measurements are unlikely to be
Table 1Isolation quality and response of single-units in area MTand area V1
Area Array Stimulus Number ofneurons
Waveform SNR Mean response Peak response
MT 10 × 10 array Dot field 151 5.22 ± 1.19 (5.01) 3.67 ± 5.50 (2.08) 7.37 ± 9.95 (4.88)MT 10 × 10 array Grating 114 4.62 ± 1.07 (4.40) 2.71 ± 3.74 (1.54) 5.72 ± 6.87 (3.4)MT Laminar probe Dot field 92 4.95 ± 0.71 (4.94) 4.07 ± 5.24 (2.56) 9.44 ± 12.9 (5.55)V1 Laminar probe Dot field 62 4.39 ± 0.74 (4.28) 9.70 ± 8.51 (5.81) 15.62 ± 16.7 (9.46)V1 Laminar probe Gratings 55 4.50 ± 0.82 (4.48) 7.52 ± 9.90 (4.12) 13.4 ± 22.9 (5.96)
Note: All cells show: mean ± SD (median). SNR: signal-to-noise ratio (see Materials and Methods). Response: response magnitude in spikes/s.
Cerebral Cortex 3
by guest on April 23, 2016
http://cercor.oxfordjournals.org/D
ownloaded from

influenced by latent effects from visual stimulation: in separate ana-lyses, we computed rSC separately for period 1–1.5 s and 1.5–2 s afteroffset of visual stimuli. There was no significant difference in rSC forthe 2 time periods (P = 0.32, n = 1738 for measurements between dotfields, P = 0.61, n = 1858 between gratings), and no significant differ-ence for measurements made between presentation of dot fields andpresentation of gratings (P = 0.49). We report measurements from thelast 1 s of the blank gray screen between presentations of gratings.
Single-units isolated from the same electrode are potentially suscep-tible to sorting errors that may in turn inflate or deflate measures ofspike count correlation (Cohen and Kohn 2011). For pairs of neuronsisolated from the same electrode, we therefore measured the depend-ence of rSC on the proportion of ISIs shorter than 1 ms ("ISI violations"),the SNR and the stimulus presented using ANCOVA analysis. This re-vealed that the average proportion of ISI violations across a pair ofneurons explained 3.4% of the variance in the measured rSC (P < 0.001)and that the geometric mean SNR across a pair of neurons explained2.6% of the variance in the measured rSC (P < 0.001). We conclude thatvariations in spike sorting have little effect on the measurements of rSC.
Estimating Cross-CorrelogramsTo characterize the time course of spike correlations, we made cross-correlograms (Bair et al. 2001) between the spike trains (bin width1 ms) of each pair of neurons:
CCG(t) ¼ ð1/MÞPMi¼1
PNt¼1 x
i1ðtÞxi
2ðt þ tÞfðtÞ ffiffiffiffiffiffiffiffiffiffi
l1l2p ð3Þ
where M is the number of trials, N is the number of bins in each trial,xi1ðtÞ and xi
2ðtÞ are spike trains of the 2 neurons on the i-th trial, t is thetime lag, and l1 and l2 are the mean firing rates (spikes/s) of the 2neurons. φ is a triangular function that corrects for the overlap betweenthe 2 spike trains and is given by:
fðtÞ ¼ T � jtj; �T , t , T ð4Þ
where T is the duration of the spike train segments used to computethe cross-correlogram.
For analyses of correlations at all timescales, CCGs were correctedfor stimulus-induced correlations by subtracting an all-way shuffle pre-dictor, approximated by the equation:
CCG(t)shuffle ¼ ð1/MÞPMi¼1
PNt¼1 PSTH
i1ðtÞPSTHi
2ðt þ tÞfðtÞ ffiffiffiffiffiffiffiffiffiffi
l1l2p ð5Þ
where PSTH1 and PSTH2 are the peri-stimulus time histograms (binwidth 1 ms) of the 2 neurons (Bair et al. 2001).
To quantify the magnitude of correlations at different timescales, wecomputed the metric rCCG (Bair et al. 2001; see also Kohn and Smith2005; Smith and Kohn 2008). This is the integral of the shuffle-corrected CCG divided by the geometric mean area of the shuffle-corrected auto-correlograms (ACG) of the 2 neurons:
rCCGðtÞ ¼Pt
t¼�t CCG(t)ffiffiffiffiffiffiffiffiffiffiffiffiffiffiffiffiffiffiffiffiffiffiffiffiffiffiffiffiffiffiffiffiffiffiffiffiffiffiffiffiffiffiffiffiffiffiffiffiffiffiffiffiffiffiffiffiffiffiffiffiffiffiffiffiffiffiffiffiffiPtt¼�t ACG1(t)
� �Ptt¼�t ACG2(t)
q ð6Þ
where
CCGðtÞ ¼ 1M
XM
i¼1
XN
t¼1xi1ðtÞxi
2ðt þ tÞ
� 1M
XM
i¼1
XN
t¼1PSTHi
1ðtÞPSTHi2ðt þ tÞ ð7Þ
ACG(t) ¼ 1M
XM
i¼1
XN
t¼1xi1ðtÞxi
1ðt þ tÞ
� 1M
XM
i¼1
XN
t¼1PSTHi
1ðtÞPSTHi1ðt þ tÞ ð8Þ
To assess the distribution of fast correlations (synchrony), we per-formed a parallel analysis, in which we removed slow temporal
correlations from the CCG using a jitter-correction method (Smith andKohn 2008; Amarasingham et al. 2012). A jitter-correction term was es-timated by resampling the original data sets, such that spike timeswere jittered within a small temporal window (the “jitter window”), asfollows. Each trial was divided into non-overlapping jitter windows.For each trial and each jitter window, spikes in 1 trial were replacedwith a randomly chosen spike from the same jitter window in anothertrial. The correction term was estimated by applying equation (3) tothis resampled data set. This correction term includes correlations at alltimescales longer than the jitter time window, and because it preservesthe shape of the PSTH, it also captures modulations in firing rate dueto the presentation of a stimulus. Jitter-corrected CCGs were computedby subtracting the jitter-correction term from the raw CCGs obtainedvia equation (3). The jitter-corrected CCGs, therefore, capture correla-tions over timescales up to the length of the jitter window (here, 0.05,0.1, 0.2, 0.5 and 1 s).
Estimating Correlations between a Neuron and a Populationof NeuronsWe estimated the correlation of a single neuron with the entire popula-tion of neurons recorded simultaneously, by computing the Pearson’scorrelation coefficient between the spike count of the single neuronand the pooled spike counts of the population of neurons:
r ¼ EðZT � PÞ � EðZTÞ � EðPÞsZT � sP
ð10Þ
where ZT is the spike count of the target neuron z-scored within eachstimulus, P is the pooled z-scored spike count of all other neurons inthe population, and E and σ represent the means and SDs in each case.Two estimates of population response, P, were investigated. In the firstanalysis (“unweighted”), each neuron in a population was given equalweighting, so on each kth trial, the population response Pk is the sumof all z-scored spike counts on that trial:
Pk ¼X
i=TZi;k ð11Þ
In the second analysis (“rSC-weighted”), the z-scored activity of eachneuron was weighted by the measured spike count correlation (rsc, eq. 2)with the target neuron:
Pk ¼X
i=TðrscT ;i � Zi;kÞ ð12Þ
Statistical TestsFor all statistical evaluation of rSC, we performed a Fisher’s r-To-Z trans-formation to stabilize the variance and applied statistical tests to theZ-value. The formula is given by:
Z ¼ 12In
1þ rsc1� rsc
� �ð13Þ
We report actual P-values where the relevant statistical tests returnedP > 0.001; for all P < 0.001, we report the relevant value as P < 0.001.
Non-Linear RegressionWe used the function nlinfit in the Matlab environment to fit ourmodel equations to our data. To assess whether a coefficient was statis-tically significant, we measured the confidence intervals using thefunction nlparci and ensured that these intervals did not overlap withzero.
Results
Our major aim is to characterize the spatial and temporal struc-ture of noise correlations between neurons in area MT andhow these correlations depend on the visual stimulus. To do
4 Spike Correlations in Area MT of Marmoset • Solomon et al.
by guest on April 23, 2016
http://cercor.oxfordjournals.org/D
ownloaded from

this, we measured correlations during maintained activity, andduring presentation of 2 widely used visual stimuli: a driftinggrating and a moving dot field. For both gratings and dotfields, response of neurons in area MT is robust and tuned formotion direction (Fig. 1).
All the measurements we include here are obtained fromwell-isolated single-units. The insets in Figure 1A,B show theaverage extracellular waveforms associated with 2 neurons inarea MT. The waveforms are consistent and well separatedfrom the remaining activity on each electrode. The quality ofspike isolation can be captured by the SNR of the waveform:for the neurons in Figure 1A,B, the ratio was 4.9 and 4.4.Table 1 summarizes the quality of spike isolation across neuronsincluded here.
Correlations between Pairs of NeuronsFigure 2A indicates the structure of the data we have analyzed.A field of white dots moved across a gray background for 2 s,and between stimulus presentations, the monitor screen washeld at the gray background. Each of the 60 rows shows thespiking activity of a single neuron in area MT, with each pointrepresenting a single spike (overlapping points are darker). Ofthe 60 neurons, 46 passed criteria (Materials and Methods,"Spike Sorting and Analysis Criteria") and were accepted forsubsequent analyses. To study the magnitude of correlations,we computed the spike count correlation (rSC), a widely used
measure of trial-by-trial correlation across pairs of neurons. Itscalculation is illustrated in Figure 2B, where the 4 marginalplots compare activity of a pair of neurons, during presentationof dot fields moving in each of 4 motion directions. For eachmotion direction, spike count was measured for each of 100trials and the array of spike counts was transformed intoz-scores. The Pearson’s correlation coefficient, r, was used tocapture the variability in z-scores that was shared by the 2neurons. The total spike count correlation, rSC, is the correl-ation coefficient of z-scores collapsed over all motion direc-tions (Fig. 2B, middle).
Figure 2. Illustrative data set and calculation of spike count correlations. (A) Rasterplot of activity during presentation of a moving dot field, for 60 neurons obtained from1 implantation of a 10 × 10 array into area MT of 1 animal (case MY147). Each rowshows 1 single-unit, and each dot 1 spike from that neuron. Every 4 s a field of whitedots moved over a background of the mean luminance for 2 s. Otherwise, the screenwas held at the mean luminance. Arrows at the top indicate the motion direction ofthe dot field on each trial. (B) Calculation of spike count correlation. Response of eachneuron to each motion direction was transformed into z-scores. The 4 marginal plotscompare the z-scored response for 2 neurons, for each of 4 directions of motion asindicated by the arrows. The associated Pearson’s correlation is shown in each plot.The center plot compares z-scored responses for the same 2 neurons, collapsed overall directions: the associated Pearson’s correlation is the spike count correlation, rSC.
Figure 1. Visual responses of neurons in area MT of marmoset recorded with10 × 10 electrode array. (A) Peri-stimulus time histograms (PSTHs; bin width 10 ms)of response of representative neuron to moving dot fields (20 degree/s; dot diameter0.4 degrees). Dark-filled trace shows average ±1 SEM of response to preferredstimulus over 100 trials. Light-filled trace shows same but for response to the oppositedirection. Inset shows the average ±1 SD of spike waveform of the neuron (filledtrace) and "multi-unit" activity on the same electrode (open trace). SNR of thiswaveform was 4.9. Scale bars are 0.1 ms (abscissa) and 0.1 mV (ordinate). (B)Response of another neuron to drifting gratings (0.2 cycles/degree, 4 Hz). Conventionsas in (A) SNR of this waveform was 4.4. (C) Average response of MT neurons tomoving dot fields (filled symbols; n=114) and moving gratings (open symbols;n=151). Responses are aligned such that the preferred direction is 0 degrees.Horizontal lines show average maintained discharge, obtained during measurementswith dot fields (dashed line) or gratings (solid line). Error bars show ±1 SEM. (D)Average response of MT neurons to moving dot fields and moving gratings, whennormalized to the mean response of each neuron across directions. Neurons andconventions as in (C).
Cerebral Cortex 5
by guest on April 23, 2016
http://cercor.oxfordjournals.org/D
ownloaded from

Spike Count Correlations Decrease with DistanceCorrelated variability in a pair of neurons implies that theyshare common input or are reciprocally connected. Nearbyneurons are more likely to share inputs and connections, so wefirst established how spike count correlation (rSC) depends onthe distance between the electrodes that the 2 neurons wereisolated from. Figure 3A shows mean rSC as a function of cor-tical distance, during presentation of a moving dot field, amoving grating and a gray screen. To estimate rSC for dot fieldsand gratings, we analyzed activity during the 1.0-s period thatfollowed onset of a visual stimulus. To estimate rSC for a grayscreen, we analyzed activity during a 1.0-s period that started 1s after offset of visual stimulus. Figure 3Amakes 2 points. First,rSC declines with distance and appears to be asymptotic forseparations over 1.6 mm (gray screen: P = 0.42; dot fields:P = 0.48; gratings: P = 0.11, ANOVA). Second, rSC is lowerduring presentation of a visual stimulus than during presenta-tion of a gray screen and is lower for dot fields than gratings.For pairs of neurons separated by more than 1.6 mm, mean rSCfor dot fields was 0.029 (SEM 0.002) and that for gratings was0.060 (SEM 0.002). For distances greater than 1.6 mm, meanrSC during presentation of a gray screen was 0.066 if measuredbetween presentations of dot fields and 0.074 if measuredbetween presentations of gratings; these were not significantlydifferent (P = 0.129, Student’s t-test). This global positive rSCdoes not reflect a bias introduced by our analyses and record-ing techniques: mean rSC at large distances was substantiallyhigher than that for artificial pairs (P < 0.001; see Materials andMethods, "Measurements of spike count correlation").
The receptive fields of neurons in area MT are organizedinto a retinotopic map, so distance between electrodes shouldbe closely related to spatial overlap between receptive fields.In separate measurements, we estimated the spatial receptivefield at each electrode. We characterized spatial overlap foreach pair of electrodes as the distance between the centroids ofthe 2 receptive fields, normalized by the average size of the 2receptive fields. This index, which we call RF separation, has a
value of 0 when receptive fields are centered at the same point;a value of 2 indicates 2 receptive fields separated by theiraverage diameter (at half-height), as illustrated by the inset inFigure 3B. Pairs of neurons separated by more than 1.6 mm areunlikely to show substantial receptive field overlap. This sug-gests that the decline in rSC with cortical distance reflectsreduced spatial overlap in receptive fields: a cortical distanceof 1.6 mm is near that where rSC approaches an asymptoticvalue (Fig. 3A).
The above analysis showed that correlation strength dependson the cortical distance between neurons. In separate record-ings, we asked whether distance tangential to the corticalsurface has different impact than distance normal to the cor-tical surface. To establish this, we inserted an array of laminarprobes approximately perpendicular to the cortical surface ofarea MT. We know that the electrodes were approximately per-pendicular because neurons recorded on the same probe(spanning different layers) were more likely to have the samepreferred motion direction, but the preferred directions ofneurons on neighboring probes showed no relationship (notshown). We compared correlations for pairs of neurons re-corded at the same depth (n = 87), and pairs of neurons re-corded in the same column (n = 59). rSC decayed with distancein both cases (not shown) but did not depend on whetherpairs were at the same depth, or in the same column (dotfields: P = 0.21; gray screen: P = 0.14; ANOVA). We concludethat while correlation strength may depend on laminar and col-umnar position, the effect is subtle.
In summary, correlations in area MT decrease with distance:strong correlations are found locally, among neurons whose re-ceptive fields show substantial spatial overlap. These local cor-relations are superimposed on global correlations that mayextend across all of area MT and are reduced in the presence ofa stimulus; this reduction is greater for moving dot fields thanmoving gratings.
Spike Count Correlations Depend on Direction Tuningand Stimulus DirectionWe now show that spike count correlation in area MT candepend on preferred motion direction as well as cortical separ-ation. To capture potential effects at longer timescales, in thefollowing analyses, we compute rSC over the entire 2-s periodof visual stimulation. Figure 4A shows rSC during presentationof moving dot fields, for pairs with similar direction preference(<45 degrees apart) and pairs with very different directionpreference (more than 135 degrees apart). rSC is greater forneurons with similar preferred direction, for cortical distancesup to 1.2 mm. Pairs of neurons with intermediate direction dif-ference had rSC intermediate to these 2 curves (not shown).Figure 4B shows analogous plots during presentation of amoving grating: rSC for gratings shows less dependence on thedirection preference, and the curves differ only for distancesup to 0.4 mm. Estimates of rSC during presentation of a grayscreen showed similar dependence on direction preference fordistances up to 0.4 mm (not shown).
When neurons have very different preferred directions,there is no single motion direction that strongly drives bothneurons. Dependence of spike count correlation on directionpreference may therefore be confounded by differences inspike rate (de la Rocha et al. 2007; Cohen and Kohn 2011). Toaddress this, we estimated rSC for the stimulus direction
Figure 3. Spike count correlation (rSC) decreases with distance. (A) Mean rSC as afunction of the cortical distance between neurons, during responses to a moving dotfield (open circles; n=1738), moving grating (filled black circles; n= 1858), or a grayscreen presented between trials of moving gratings (filled gray circles). Error bars show±1 SEM and are often smaller than the symbols. We were conservative whenisolating single-units and identified 18 (dot fields) or 43 (gratings) pairs of neurons froma single electrode. Values at cortical distances greater than 0 are obtained from anaverage of 253 pairs (range 110–360). (B) Mean receptive field (RF) separationbetween pairs of electrodes (n= 12 528), as a function of cortical distance.Calculation of RF separation is described in Materials and Methods. Inset showsrepresentation of a pair of receptive fields that are circular and equal in diameter, whichtouch but do not overlap.
6 Spike Correlations in Area MT of Marmoset • Solomon et al.
by guest on April 23, 2016
http://cercor.oxfordjournals.org/D
ownloaded from

associated with lowest geometric mean response, for pairs ofneurons with preferred directions less than 45 degrees apart,or more than 135 degrees apart. In this analysis, pairs ofneurons in both groups are poorly driven. For moving dotfields and pairs of neurons separated by up to 1.2 mm, rSC washigher for similarly tuned pairs than for pairs with dissimilartuning (0.10 vs. 0.06; n = 130 and 126, respectively; P = 0.036,one-tailed Students’ t-test). For moving gratings and pairs ofneurons separated by up to 0.4 mm, rSC was also higher forsimilarly tuned pairs (0.14 vs. 0.08; n = 70 and 31, respectively;P = 0.048). These differences remained if we instead examinedstimuli that evoked the lowest response across either of theneurons in the pair (dot fields: P = 0.004, gratings: P < 0.001).
Spike count correlations were nevertheless modulated bystimulus motion direction. To illustrate this, Figure 4C,D showsrSC for pairs of neurons with preferred directions less than 45degrees apart. For clarity, we show correlations during presen-tation of the stimulus direction nearest to the average preferreddirection and the opposite direction; rSC for intermediatestimulus directions was always intermediate to these. rSC ishigher when the stimulus moves in a direction close to thatpreferred by the pair of neurons. For both preferred and non-preferred motion directions, rSC is higher for gratings than dotfields. Responses to the preferred motion direction are natural-ly larger than that to the opposite direction, and the depend-ence of rSC on stimulus motion direction could simply reflectthe dependence on firing rates. We therefore performed an
ANCOVA to assess the dependence of rSC on firing rates of the 2neurons, preferred or opposite stimulus direction, and distancebetween neurons. This analysis revealed that the higher rSC forpreferred motion direction includes a dependence on stimulusdirection in addition to the rate dependence (P < 0.001).
In summary, these analyses show that correlations are stron-ger in pairs of neurons that have similar direction tuning andoverlapping receptive fields. In addition, global correlationsspan similarly and differently tuned neurons and are strongerduring presentation of gratings than dot fields. For both dotfields and gratings, rSC depends on stimulus direction and ishighest for the preferred stimulus.
Modeling of Spike Count CorrelationThe distribution of spike count correlations could be well de-scribed by a model incorporating the distance betweenneurons and the difference in their preferred direction, suchthat:
rSC ¼ A� ðe�distance=aÞð1� b� DprefdirÞ þ offset ð14Þ
where A is gain in correlation, a is cortical space constant (thedistance at which rSC falls by 1/e), b is rate of rSC decay withdifference in preferred direction, and Δprefdir is the differencein the preferred direction between the pair of neurons, indegrees. We used non-linear regression to find the parametersthat best predicted rSC. Cortical distance and difference in pre-ferred direction were significant contributors to rSC (P < 0.05)but not RF separation: this presumably reflects the fact that ourestimates of cortical distance are more precise than our esti-mates of RF separation. The parameter values are provided inTable 2. For pairs of neurons with similar direction preferences(Fig. 4C,D), we repeated the regression, including now thestimulus direction, such that:
rSC ¼ A� ðe�distance=aÞð1� b� DprefdirÞ� c � Dstimdir þ offset
ð15Þ
where c is the rate of rSC decay with relative stimulus direction,and Δstimdir is the direction of the stimulus relative to theaverage preferred direction of the pair of neurons (Table 2).
Timescales of Pair-Wise Correlations
rSC is a measure of correlation strength over the entire durationof the stimulus and does not distinguish between correlationsoccurring at different timescales. In the following, we addressthe temporal structure of correlations over the course of a trial.Our aim is to determine whether correlations arise from
Figure 4. Spike count correlation depends on preferred motion direction and stimulusdirection. (A) Mean rSC during presentation of moving dot fields, for pairs of neuronswith similar direction preference (squares, n=434) and different direction preference(triangles, n= 417). Error bars show ±1 SEM. (B) Mean rSC during presentation of amoving grating (similar direction preference, n= 476; different direction preferencesn=470). Conventions as in (A). (C) Mean rSC during presentation of moving dot fields,for pairs of neurons with similar preferred motion direction (<45 degrees apart;n=434). Open symbols show rSC for the most effective motion direction; closedsymbols show rSC for the least effective motion direction. Error bars show ±1 SEM.(D) Same as (C) but during presentation of a moving grating (n=476). Conventions asin (C).
Table 2Quantitative models of spike count correlations in area MT
Model Stimulus Parameters
Equation 14 A a b offsetDot field 0.21 0.66 0.0058 0.042Grating 0.19 0.47 0.0043 0.083Gray screen 0.32 0.35 0.0037 0.078
Equation 15 A a b c offsetDot field 0.21 0.66 0.0058 0.00017 0.058Grating 0.19 0.47 0.0042 0.00039 0.12
Cerebral Cortex 7
by guest on April 23, 2016
http://cercor.oxfordjournals.org/D
ownloaded from

coordinated neuronal activity that is tightly locked in time (syn-chrony), or slower co-variations. To characterize the timescalesof correlations, we estimated cross-correlograms (CCGs) foreach pair of neurons (see Materials and Methods). In 1 ana-lysis, we computed conventional "shuffle-corrected" CCGs. Wealso computed "jitter-corrected" CCGs, which allow us toisolate correlations arising over shorter timescales.
Correlations at All Timescales Decay with DistanceFigure 5 shows average shuffle-corrected CCGs as a function ofcortical distance, during presentation of a moving dot field, amoving grating, or a gray screen. Proximal pairs of neuronsshow a sharp peak with width 50–100 ms, superimposed on abroader hump with width of several hundred milliseconds.During presentation of dot fields, both the sharp peak andbroad hump disappear at distances greater than 2 mm, but
during presentation of gratings, they remain visible at thelargest distance measured. CCGs obtained during presentationof a gray screen show larger and broader humps, indicatingthat slow correlations are more pronounced. The difference inCCGs obtained during presentation of a gray screen and grat-ings is larger than that expected from the difference in spikecount correlation for these stimuli (rSC; Fig. 3A). This isbecause, following Bair et al. (2001), we present CCGs thathave not been normalized to the ACGs of the constituentneurons. In contrast, rSC is equivalent to the area of the CCG,divided by the average area of the ACGs. Indeed, the ACGs ob-tained during presentations of a gray screen were larger thanthose obtained during presentations of a grating (not shown).We think that the larger ACGs found during presentation of agray screen reflect slow rhythms in maintained activity that aredisrupted during visual stimulation.
To provide a quantitative analysis of the shuffle-correctedCCGs, we computed rCCG (Bair et al. 2001), the integratedstrength of correlation over a particular time window. For anintegrating window of 2 s, rCCG is equivalent to rSC, as bothmetrics measure the strength of correlations occurring over theentire duration of a trial. Figure 5B shows rCCG as a function ofdistance during presentation of a dot field (left panel) orgrating (middle panel), for integration windows of 0.05, 0.5and 2 s. Correlations at all timescales decay with distance.Figure 5B also shows that larger rSC during presentation ofgratings than dot fields primarily reflects correlations overlonger timescales (hundreds of milliseconds); correlations atshorter timescales (0.05 s) are similar for both stimuli. Similar-ly, correlations at timescales less than 0.05 s are similar duringvisual stimulation or presentation of a gray screen: reduced rSCduring visual stimulation primarily reflects reduction in corre-lations over longer timescales.
Sharp peaks around time zero in the average shuffled-corrected CCGs (Fig. 5A) indicate that neurons are likely to firesynchronously. The amplitudes of the shuffled-corrected CCGsat these time lags, however, reflect contributions from bothfast and slow correlations. To isolate correlations at short time-scales, we calculated "jitter-corrected" CCGs, with varying jitterwindows (Materials and Methods). Figure 6A shows the jitter-corrected CCGs as a function of cortical distance, for jitterwindows of 0.05 s (black curves) and 0.5 s (gray curves). Jitterwindows of 0.05 s yield similar CCGs regardless of whetherthe stimulus was a dot field, grating, or gray screen. In eachcase, CCG height decays with distance and peaks disappearbeyond about 1 mm. Jitter windows of 0.5 s, however, yielddifferent pattern of CCGs: peaks in these CCGs also decay withdistance, but while they disappear above 2 mm during presen-tation of moving dot fields or gray screens, they extend at least2.8 mm during presentation of gratings.
In summary, the strength of correlations at short timescales(up to 0.05 s) is similar during presentation of dot fields, grat-ings, and gray screens. Stimulus-dependent noise correlationsare mainly due to correlations that emerge at timescales above0.05 s.
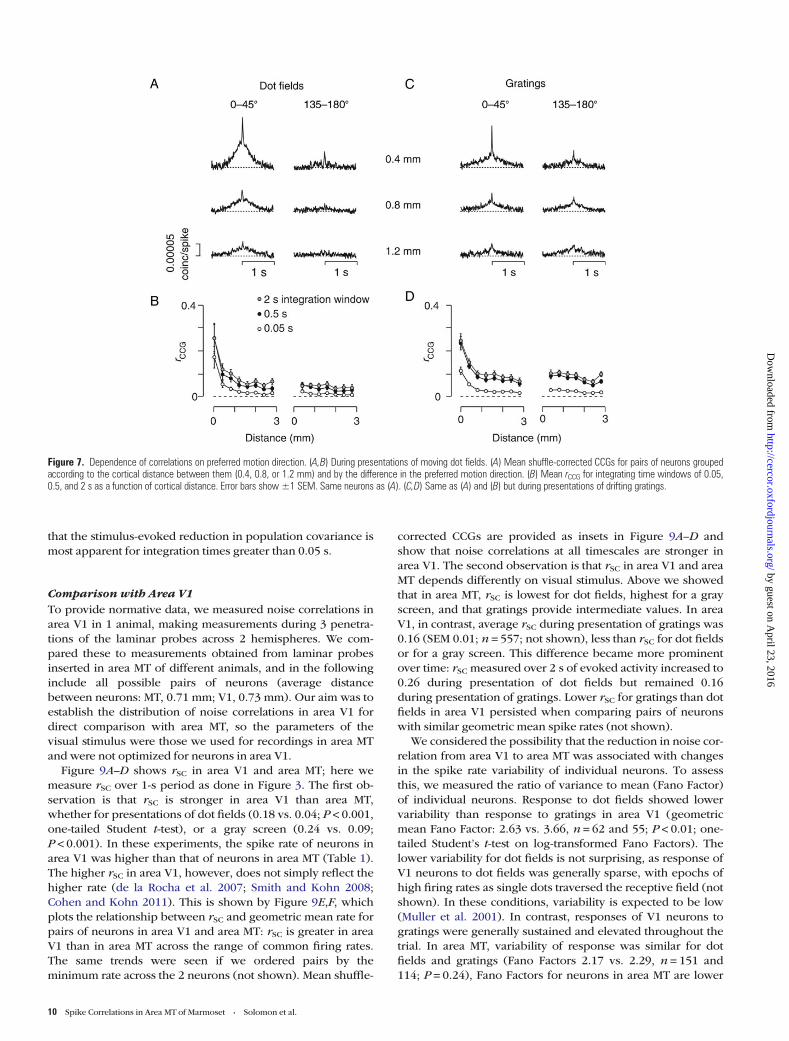
Time Scales of Correlation and Direction PreferencesWe showed above that rSC can depend on preferred motiondirection, at least among nearby neurons. In the following,we establish the timescales over which this dependencearises. Figure 7A shows average shuffle-corrected CCGs for
Figure 5. Correlations at all timescales decay with distance. (A) Shuffle-correctedcross-correlograms (CCGs) as a function of distance. CCGs were computed over 2 sduring presentation of moving dot fields (left, n=1858), or moving gratings (middle,n= 1738). CCGs in the right column were computed over the 1 s of gray screenpresented between successive trials of moving gratings (n=1738). For displaypurposes, CCGs were smoothed with a Gaussian filter (SD 0.005 s). (B) Mean rCCG asa function of distance, for integration windows of 0.05 s (open circles), 0.5 s (blackcircles) or the maximum achievable integration window (gray circles). This was 2 s fordot fields (left) or gratings (middle) and 1 s for the gray screen (right). Same neuronsas (A). Error bars show ±1 SEM.
8 Spike Correlations in Area MT of Marmoset • Solomon et al.
by guest on April 23, 2016
http://cercor.oxfordjournals.org/D
ownloaded from

pairs of neurons with similar and different preferred direc-tion, during presentation of dot fields; similarly tuned pairsshow stronger CCGs, with larger peaks and broad humps.Figure 7B shows that for pairs of neurons with similar preferreddirection, rCCG declines rapidly with distance, at all timescales.In contrast, rCCG is low and shows little distance dependence, inpairs of neurons with different preferred direction. Figure 7C,Dshows similar analyses, but during presentation of gratings.Pairs of neurons with similar preferred direction show strongerCCGs and larger rCCG for distances up to 0.4 mm, as was thecase for rSC.
Analysis of the CCGs made with the jitter-correction methodconfirmed that near-synchronous activity was approximatelytwice as strong in nearby pairs of neurons with similar pre-ferred direction compared with those with different preferreddirections (ANOVA, P = 0.01) but did not depend on whetherthe stimulus was a grating or dot field (P = 0.55). We also com-pared CCGs for each stimulus direction, as a counterpart to theanalyses shown in Figure 4C,D (not shown). The shapes of theCCGs for the most effective and least effective stimulus
directions were very similar, but CCGs for the most effectivestimulus direction were enhanced at all timescales.
Population Covariance
Our analyses have so far considered noise shared betweenpairs of neurons, but even weak pair-wise correlations can beassociated with substantial co-variability in populations ofneurons (Chen et al. 2006). This is partly because the estimatedmagnitude of pair-wise correlations is influenced by independ-ent noise in the activity of individual neurons, and partlybecause pair-wise correlations do not capture many aspects ofhigher-order co-variations among networks of neurons. Toassess how variability is correlated among populations ofneurons, we developed a novel measure that we call “popula-tion covariance” (see Materials and Methods). Population co-variance is the correlation between the trial-by-trial activity of asingle target neuron, and the pooled response of all otherneurons simultaneously recorded; on each trial, the estimate ofpopulation activity is a weighted sum of z-scored activityacross those neurons. This pooled population activity empha-sizes the variability in spiking activity that is shared across apopulation, which is only partially captured in our pair-wisemeasurements of spike count correlation, rSC. In Supplemen-tary Material, we show the mathematical relationship betweenthe population covariance and rSC. As mentioned earlier, ouranalyses are confined to the first 1 s of stimulus-evoked activ-ity, and the last 1 s of maintained activity.
We first measured population covariance when we gaveequal contribution of each neuron to the pool (eq. 11), therebyignoring the identity of the neurons in the comparison popula-tion. Population covariance was on average 0.25 during pres-entation of a gray screen; as for measurements of pair-wisecorrelations, population covariance was reduced during pres-entation of a visual stimulus (Fig. 8A; dot fields: 0.15, gratings:0.22; P < 0.001, one-tailed paired Student t-test). The magni-tude of pair-wise correlations depends on distance betweenneurons and their functional similarity. We incorporated thestructure of pair-wise correlations by weighting the contribu-tion of each neuron to the comparison population by its rSCwith the target neuron (eq. 12). Specifically, the weighting isprovided by the rSC calculated over the entire 1-s analysiswindow. The rSC-weighting naturally refines the estimate ofpopulation activity, as viewed by the target neuron, andthereby increases the estimate of population covariance(Fig. 8B; dot fields: 0.33, grating: 0.38, gray screen: 0.39).These analyses demonstrate that although pair-wise correla-tions in area MT are generally low, covariance within popula-tions of neurons can be substantial.
To establish the temporal structure of population covari-ance, we repeated the analyses above while varying the inte-gration time window over which spike count was measured,with integration times from 0.005 to 1 s. For each integrationtime window, we divided trials into non-overlapping time binsof the appropriate width. For each successive time bin, we cal-culated the z-scored spike count across trials, separately foreach stimulus direction, and thereby accounted for the shapeof the PSTH in each neuron. We then collapsed across all pos-sible time bins to compute the population covariance value foreach integration time window. Figure 8A,B shows that popula-tion covariance increases with integration time window and
Figure 6. Near-synchronous activity is confined to nearby neurons. (A) Meanjitter-corrected CCGs, for jitter windows of 0.05 s (black) and 0.5 s (gray) duringpresentations of moving dot fields (left), moving gratings (middle), or a gray screen(right column). Same neurons as Figure 5A. (B) Mean of area under the jitter-correctedCCGs (±0.01 s), for jitter windows of 0.05 s (open circles) and 0.5 s (filled circles).Same neurons as (A). Error bars show ±1 SEM.
Cerebral Cortex 9
by guest on April 23, 2016
http://cercor.oxfordjournals.org/D
ownloaded from
that the stimulus-evoked reduction in population covariance ismost apparent for integration times greater than 0.05 s.
Comparison with Area V1To provide normative data, we measured noise correlations inarea V1 in 1 animal, making measurements during 3 penetra-tions of the laminar probes across 2 hemispheres. We com-pared these to measurements obtained from laminar probesinserted in area MT of different animals, and in the followinginclude all possible pairs of neurons (average distancebetween neurons: MT, 0.71 mm; V1, 0.73 mm). Our aim was toestablish the distribution of noise correlations in area V1 fordirect comparison with area MT, so the parameters of thevisual stimulus were those we used for recordings in area MTand were not optimized for neurons in area V1.
Figure 9A–D shows rSC in area V1 and area MT; here wemeasure rSC over 1-s period as done in Figure 3. The first ob-servation is that rSC is stronger in area V1 than area MT,whether for presentations of dot fields (0.18 vs. 0.04; P < 0.001,one-tailed Student t-test), or a gray screen (0.24 vs. 0.09;P < 0.001). In these experiments, the spike rate of neurons inarea V1 was higher than that of neurons in area MT (Table 1).The higher rSC in area V1, however, does not simply reflect thehigher rate (de la Rocha et al. 2007; Smith and Kohn 2008;Cohen and Kohn 2011). This is shown by Figure 9E,F, whichplots the relationship between rSC and geometric mean rate forpairs of neurons in area V1 and area MT: rSC is greater in areaV1 than in area MT across the range of common firing rates.The same trends were seen if we ordered pairs by theminimum rate across the 2 neurons (not shown). Mean shuffle-
corrected CCGs are provided as insets in Figure 9A–D andshow that noise correlations at all timescales are stronger inarea V1. The second observation is that rSC in area V1 and areaMT depends differently on visual stimulus. Above we showedthat in area MT, rSC is lowest for dot fields, highest for a grayscreen, and that gratings provide intermediate values. In areaV1, in contrast, average rSC during presentation of gratings was0.16 (SEM 0.01; n = 557; not shown), less than rSC for dot fieldsor for a gray screen. This difference became more prominentover time: rSC measured over 2 s of evoked activity increased to0.26 during presentation of dot fields but remained 0.16during presentation of gratings. Lower rSC for gratings than dotfields in area V1 persisted when comparing pairs of neuronswith similar geometric mean spike rates (not shown).
We considered the possibility that the reduction in noise cor-relation from area V1 to area MT was associated with changesin the spike rate variability of individual neurons. To assessthis, we measured the ratio of variance to mean (Fano Factor)of individual neurons. Response to dot fields showed lowervariability than response to gratings in area V1 (geometricmean Fano Factor: 2.63 vs. 3.66, n = 62 and 55; P < 0.01; one-tailed Student’s t-test on log-transformed Fano Factors). Thelower variability for dot fields is not surprising, as response ofV1 neurons to dot fields was generally sparse, with epochs ofhigh firing rates as single dots traversed the receptive field (notshown). In these conditions, variability is expected to be low(Muller et al. 2001). In contrast, responses of V1 neurons togratings were generally sustained and elevated throughout thetrial. In area MT, variability of response was similar for dotfields and gratings (Fano Factors 2.17 vs. 2.29, n = 151 and114; P = 0.24), Fano Factors for neurons in area MT are lower
Figure 7. Dependence of correlations on preferred motion direction. (A,B) During presentations of moving dot fields. (A) Mean shuffle-corrected CCGs for pairs of neurons groupedaccording to the cortical distance between them (0.4, 0.8, or 1.2 mm) and by the difference in the preferred motion direction. (B) Mean rCCG for integrating time windows of 0.05,0.5, and 2 s as a function of cortical distance. Error bars show ±1 SEM. Same neurons as (A). (C,D) Same as (A) and (B) but during presentations of drifting gratings.
10 Spike Correlations in Area MT of Marmoset • Solomon et al.
by guest on April 23, 2016
http://cercor.oxfordjournals.org/D
ownloaded from
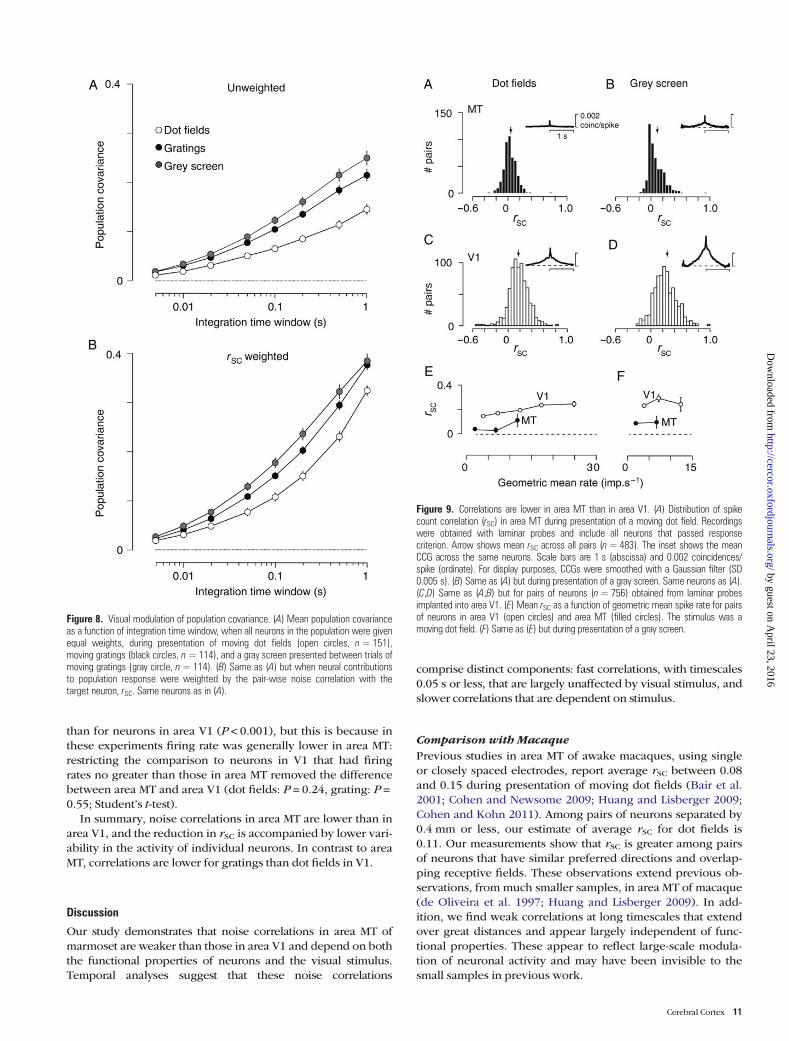
than for neurons in area V1 (P < 0.001), but this is because inthese experiments firing rate was generally lower in area MT:restricting the comparison to neurons in V1 that had firingrates no greater than those in area MT removed the differencebetween area MT and area V1 (dot fields: P = 0.24, grating: P =0.55; Student’s t-test).
In summary, noise correlations in area MT are lower than inarea V1, and the reduction in rSC is accompanied by lower vari-ability in the activity of individual neurons. In contrast to areaMT, correlations are lower for gratings than dot fields in V1.
Discussion
Our study demonstrates that noise correlations in area MT ofmarmoset are weaker than those in area V1 and depend on boththe functional properties of neurons and the visual stimulus.Temporal analyses suggest that these noise correlations
comprise distinct components: fast correlations, with timescales0.05 s or less, that are largely unaffected by visual stimulus, andslower correlations that are dependent on stimulus.
Comparison with MacaquePrevious studies in area MT of awake macaques, using singleor closely spaced electrodes, report average rSC between 0.08and 0.15 during presentation of moving dot fields (Bair et al.2001; Cohen and Newsome 2009; Huang and Lisberger 2009;Cohen and Kohn 2011). Among pairs of neurons separated by0.4 mm or less, our estimate of average rSC for dot fields is0.11. Our measurements show that rSC is greater among pairsof neurons that have similar preferred directions and overlap-ping receptive fields. These observations extend previous ob-servations, from much smaller samples, in area MT of macaque(de Oliveira et al. 1997; Huang and Lisberger 2009). In add-ition, we find weak correlations at long timescales that extendover great distances and appear largely independent of func-tional properties. These appear to reflect large-scale modula-tion of neuronal activity and may have been invisible to thesmall samples in previous work.
Figure 8. Visual modulation of population covariance. (A) Mean population covarianceas a function of integration time window, when all neurons in the population were givenequal weights, during presentation of moving dot fields (open circles, n= 151),moving gratings (black circles, n= 114), and a gray screen presented between trials ofmoving gratings (gray circle, n= 114). (B) Same as (A) but when neural contributionsto population response were weighted by the pair-wise noise correlation with thetarget neuron, rSC. Same neurons as in (A).
Figure 9. Correlations are lower in area MT than in area V1. (A) Distribution of spikecount correlation (rSC) in area MT during presentation of a moving dot field. Recordingswere obtained with laminar probes and include all neurons that passed responsecriterion. Arrow shows mean rSC across all pairs (n=483). The inset shows the meanCCG across the same neurons. Scale bars are 1 s (abscissa) and 0.002 coincidences/spike (ordinate). For display purposes, CCGs were smoothed with a Gaussian filter (SD0.005 s). (B) Same as (A) but during presentation of a gray screen. Same neurons as (A).(C,D) Same as (A,B) but for pairs of neurons (n=756) obtained from laminar probesimplanted into area V1. (E) Mean rSC as a function of geometric mean spike rate for pairsof neurons in area V1 (open circles) and area MT (filled circles). The stimulus was amoving dot field. (F) Same as (E) but during presentation of a gray screen.
Cerebral Cortex 11
by guest on April 23, 2016
http://cercor.oxfordjournals.org/D
ownloaded from

Previous studies in area V1 of macaque report average rSCbetween 0.16 and 0.26, usually measured during presentationof drifting gratings (Reich et al. 2001; Kohn and Smith 2005;Gutnisky and Dragoi 2008; Poort and Roelfsema 2009;Samonds et al. 2009; Rasch et al. 2011; Hansen et al. 2012; butsee Ecker et al. 2010); reviewed by Cohen and Kohn (2011).Among pairs of neurons in area V1, our estimate of average rSCfor gratings is 0.16. Our estimate of rSC for maintained activity(0.24) is lower than that reported in macaque V1 (ca. 0.3;[Kohn and Smith 2005; Smith and Kohn 2008]). The measure-ments in macaque were made during long periods (15–30 min)of uninterrupted gray screen presentations, whereas the mea-surements here were made between presentations of visualstimulation. Intermittent visual stimulation may interrupt cor-tical state and mask slow correlations in spontaneous activity.
In V1, our estimate of rSC during presentation of dot fieldswas higher than that for gratings; we are not aware of any pre-vious measurements of rSC during presentation of dot fields inarea V1. One explanation is that the contrast energy of dotfields is spread across a wide spectrum of spatiotemporal fre-quencies, and dot fields are therefore effectively low-contraststimuli for area V1; in macaque V1, rSC is higher when gratingsare of low contrast (Kohn and Smith 2005). Alternatively,higher rSC during presentation of dot fields may reflect lowerindependent variability of V1 neurons, and indeed the FanoFactors of individual V1 neurons were lower during presenta-tion of dot fields than gratings. Reduction in independent vari-ability may unmask shared variability in the activity of pairs ofneurons. One or both of these factors may underlie the lowerrSC observed for gratings than dots in V1.
Potential Impact of Anesthesia and Array InsertionOur measurements were made during anesthesia, which wasmaintained by sufentanil. Anesthesia may have an impact onthe spatiotemporal structure of correlations. Our measure-ments of rSC in area MT are, however, similar to that reportedfor waking macaque (Zohary et al. 1994; Bair et al. 2001;Cohen and Newsome 2009; Huang and Lisberger 2009). Inaddition, measurements of rSC in V1 of macaque are similarunder sufentanil-anesthesia (Reich et al. 2001; Kohn and Smith2005; Smith and Kohn 2008) and in waking animals (Samondset al. 2009; Hansen et al. 2012); our estimates of rSC in V1 ofmarmoset are similar to that reported for macaque. A secondconcern is that insertion of large electrode arrays, particularlypneumatic insertion of the 10 × 10 array, is associated with dis-turbances to the cortical network. In other experiments notshown, we made measurements from tetrodes in area MT ofmarmoset (Solomon et al. 2011). In that work, we measuredresponse to rapid (duration 0.32 s) serial presentations of dotfields moving in each of 12 directions; the size and speed ofthe dot fields were tailored to the neurons under study. Pairs ofneurons identified in these recordings showed mean rSC of0.12 (SEM 0.02; 99 pairs from 7 animals). We conclude that ourestimates of correlation are unlikely to be distorted by insertionof the recording arrays.
Propagation of Noise Correlations along VisualHierarchyrSC is on average weak in marmoset LGN, particularly in parvo-cellular and magnocellular layers (Cheong et al. 2011); rSC isalso weak in the input layers of macaque area V1 (Hansen et al.
2012; Smith et al. 2013). Throughout most of macaque V1 andV2, however, rSC is on average positive, in the range of 0.1 to0.3, and extends over large distances and across very differentreceptive field preferences (Smith and Kohn 2008; Hansenet al. 2012; Smith et al. 2013). This is in accord with our mea-surements of rSC in V1 of marmoset. Our measurements doshow that pairs of neurons in area MT recorded from the sameelectrode, with the same direction preference, can show rSC ashigh as those measured in V1, but rSC in area MT decaysrapidly with cortical distance and functional dissimilarity. Ourmeasurements therefore agree with meta-analysis of researchin macaque, which suggests that overall rSC in area V1 is higherthan in area MT (Cohen and Kohn 2011). Those studies,however, were conducted under a range of conditions. Oneadvantage of our study is that it allows direct comparison ofcorrelations in the 2 areas: the visual stimuli, recording, ana-lysis and anesthesia were the same for measurements fromboth areas. We cannot rule out the possibility that lower rSC inarea MT reflects an additional effect of anesthesia on networkproperties in area MT, but the parsimonious explanation of ourown measurements and those of others is that correlations areweaker in area MT than in area V1. Sequential reduction innoise correlation may be a general rule in visual cortex: rSC inarea MSTd of macaque, which draws substantial input fromarea MT, is on average low and may be zero (Gu et al. 2011; Liuet al. 2013).
If neurons in area MT simply summed the input of many V1afferents, then rSC in area MT should be higher than in V1. Thisis because summing inputs averages out variability that is notshared: the activity of each neuron in area MT will be domi-nated by the activity that is common among the afferentneurons. The broad spread of rSC throughout area V1 meansthat even if pairs of neurons in area MT drew input from non-overlapping pools of V1 afferents, rSC should still be larger inarea MT than area V1. Why then are correlations generallylower in area MT than area V1? One explanation may be thatadditional feed-forward input to area MT, which arises in areasV2, V3, LGN, and pulvinar (Maunsell and van Essen 1983;Palmer and Rosa 2006), dilutes correlations propagated fromarea V1. Indeed, neurons in area MT can remain visually re-sponsive, and direction-tuned, in the absence of area V1(Rodman et al. 1989; Girard et al. 1992; Rosa et al. 2000). Ifresponse variability in these other areas is not correlated withthat in area V1, then correlations may be lower in area MT thanarea V1.
Additionally, inhibition or suppression within area MT maybe important in reducing correlations that would otherwise beinherited from V1. Co-variation of excitation and inhibitionhelps decorrelate neuronal activity (Graupner and Reyes2013), and it is generally thought that neurons in area MT drawon both excitatory and inhibitory inputs to build receptivefields (Rust et al. 2006). This idea is attractive because thebroad spread of rSC in area V1 introduces redundancy to theactivity of those neurons. It is well established that inhibitionand suppression, through for example center-surround recep-tive fields or gain control mechanisms, can help reduce redun-dancy in sensory signals (Attneave 1954; Barlow 1961;Srinivasan et al. 1982; Schwartz and Simoncelli 2001). In par-ticular, a center-surround receptive field provides an efficientand accurate decoding mechanism in the presence of wide-spread correlated variability (Chen et al. 2006, 2008), such asthat observed in V1.
12 Spike Correlations in Area MT of Marmoset • Solomon et al.
by guest on April 23, 2016
http://cercor.oxfordjournals.org/D
ownloaded from

Stimulus-Dependence of Correlations in Area MTThe primary impact of visual stimulation on correlations in areaMT was a reduction in slow correlations, those with timescaleslonger than 0.05 s. The stimulus-dependent reduction in correla-tions is consistent with the idea that visual stimulation stabilizesneuronal networks (Nowak et al. 1999; Monier et al. 2003; Finnet al. 2007; Smith and Kohn 2008; Kohn et al. 2009; Churchlandet al. 2010), although the mechanism(s) that allow this stabiliza-tion are unclear. In addition, we find that rSC is weaker duringpresentation of dot fields than during presentation of gratings,and more dependent on the similarity of receptive fields. Againthese differences predominantly reflect reduced correlation attimescales above 0.05 s. Lower correlations during presentationof dot fields may have functional implications, as follows. Noisecorrelations among neurons in area MT can account for the vari-ation in speed and direction of smooth pursuit eye movements(Huang and Lisberger 2009). Our observations suggest thatpursuit should be less precise for gratings than for dot fields,consistent with reports that pursuit of narrowband stimuli isless precise than broadband stimuli (Simoncini et al. 2012). Fol-lowing the logic mentioned earlier, lower correlations duringpresentation of dot fields may reflect stronger inhibition or sup-pression in area MT for dot fields than gratings, whether that in-hibition arises from within or outside the classical receptive field(Snowden et al. 1991; Simoncelli and Heeger 1998; Rust et al.2006; Hunter and Born, 2011; Allman et al. 1985; Lui et al. 2007).
Unlike for slower correlations, the distribution and magni-tude of near-synchronous activity, particularly evidenced byanalysis of jitter-corrected CCGs, was similar during presenta-tion of a gray screen, dot fields, and gratings. This suggeststhat near-synchronous activity arises from direct connectivity,either between constituent neurons, or through shared inputs,that is not modified by slower changes in neuronal sensitivity.In addition to this near-synchronous activity, shuffle-correctedCCGs obtained during presentation of drifting gratings showedsharp peaks that persisted across the breadth of area MT.These peaks may reflect presence of high frequency (gamma-band) coherence: preliminary analysis of local field potentialsfrom area MT of marmoset shows increase in gamma-band co-herence during presentation of gratings but not dot fields(Solomon SS and Solomon SG, unpublished observations).This gamma-band coherence may arise in area MT or be propa-gated from area V1 (Bartolo et al. 2011; Jia et al. 2011).
We do not know whether or how feedback to area MT(Maunsell and van Essen 1983) contributes to the spatio-temporal distribution of spike correlations. Nor do we knowwhether feedback from extrastriate areas, including area MT,contributes to long-distance correlations in activity of V1neurons (Smith and Kohn 2008). If feedback from area MTdoes contribute to long-distance correlations in V1, then thosecorrelations may show similar dependence on visual stimulus,and this might be a productive target of future work.
Supplementary MaterialSupplementary material can be found at: http://www.cercor.oxfordjournals.org/.
Funding
This work was supported by National Health & Medical Re-search Council of Australia (NHMRC) Grant 1005427, and bythe ARC Centre of Excellence in Vision Science.
NotesWe thank C. Davey, S.K. Cheong, A. Pietersen, P. Romo, and N. Zeaterfor help in collecting the data and A. Kohn and P.R. Martin for com-ments on previous versions of this manuscript. Conflict of Interest:None declared.
ReferencesAllman J, Miezin F, McGuinness E. 1985. Direction- and velocity-
specific responses from beyond the classical receptive field in themiddle temporal visual area (MT). Perception. 14:105–126.
Amarasingham A, Harrison MT, Hatsopoulos NG, Geman S. 2012. Con-ditional modeling and the jitter method of spike resampling. J Neu-rophysiol. 107:517–531.
Attneave F. 1954. Some informational aspects of visual perception.Psychol Rev. 61:183–193.
Bair W, Zohary E, Newsome WT. 2001. Correlated firing in macaquevisual area MT: time scales and relationship to behavior. J Neurosci.21:1676–1697.
Barlow HB. 1961. Possible principles underlying the transformation ofsensory messages. In: Rosenblith W, editor. Sensory Communica-tion. M.I.T. Press p. 217–234.
Bartolo MJ, Gieselmann MA, Vuksanovic V, Hunter D, Sun L, Chen X,Delicato LS, Thiele A. 2011. Stimulus-induced dissociation of neur-onal firing rates and local field potential gamma power and its rela-tionship to the resonance blood oxygen level-dependent signal inmacaque primary visual cortex. Eur J Neurosci. 34:1857–1870.
Born RT, Bradley DC. 2005. Structure and function of visual area MT.Annu Rev Neurosci. 28:157–189.
Bourne JA, Warner CE, Upton DJ, Rosa MG. 2007. Chemoarchitectureof the middle temporal visual area in the marmoset monkey (Calli-thrix jacchus): laminar distribution of calcium-binding proteins(calbindin, parvalbumin) and nonphosphorylated neurofilament. JComp Neurol. 500:832–849.
Britten KH, Shadlen MN, Newsome WT, Movshon JA. 1992. The ana-lysis of visual motion: a comparison of neuronal and psychophysic-al performance. J Neurosci. 12:4745–4765.
Chen A, Deangelis GC, Angelaki DE. 2013. Functional specializationsof the ventral intraparietal area for multisensory heading discrimin-ation. J Neurosci. 33:3567–3581.
Chen Y, Geisler WS, Seidemann E. 2006. Optimal decoding of corre-lated neural population responses in the primate visual cortex. NatNeurosci. 9:1412–1420.
Chen Y, Geisler WS, Seidemann E. 2008. Optimal temporal decodingof neural population responses in a reaction-time visual detectiontask. J Neurophysiol. 99:1366–1379.
Cheong SK, Tailby C, Martin PR, Levitt JB, Solomon SG. 2011. Slow in-trinsic rhythm in the koniocellular visual pathway. Proc Natl AcadSci USA. 108:14659–14663.
Cheong SK, Tailby C, Solomon SG, Martin PR. 2013. Cortical-like recep-tive fields in the lateral geniculate nucleus of marmoset monkeys.J Neurosci. 33:6864–6876.
Churchland MM, Yu BM, Cunningham JP, Sugrue LP, Cohen MR,Corrado GS, Newsome WT, Clark AM, Hosseini P, Scott BB et al..2010. Stimulus onset quenches neural variability: a widespread cor-tical phenomenon. Nat Neurosci. 13:369–378.
Cohen MR, Kohn A. 2011. Measuring and interpreting neuronal corre-lations. Nat Neurosci. 14:811–819.
Cohen MR, Newsome WT. 2009. Estimates of the contribution of singleneurons to perception depend on timescale and noise correlation.J Neurosci. 29:6635–6648.
de la Rocha J, Doiron B, Shea-Brown E, Josic K, Reyes A. 2007. Correl-ation between neural spike trains increases with firing rate. Nature.448:802–806.
de Oliveira SC, Thiele A, Hoffmann KP. 1997. Synchronization of neur-onal activity during stimulus expectation in a direction discrimin-ation task. J Neurosci. 17:9248–9260.
Ecker AS, Berens P, Tolias AS, Bethge M. 2010. The effect of noise cor-relations in populations of diversely tuned neurons. J Neurosci.31:14272–14283.
Cerebral Cortex 13
by guest on April 23, 2016
http://cercor.oxfordjournals.org/D
ownloaded from

Finn IM, Priebe NJ, Ferster D. 2007. The emergence of contrast-invari-ant orientation tuning in simple cells of cat visual cortex. Neuron.54:137–152.
Girard P, Salin PA, Bullier J. 1992. Response selectivity of neurons inarea MT of the macaque monkey during reversible inactivation ofarea V1. J Neurophysiol. 67:1437–1446.
Graupner M, Reyes AD. 2013. Synaptic input correlations leading tomembrane potential decorrelation of spontaneous activity incortex. J Neurosci. 33:15075–15085.
Gu Y, Liu S, Fetsch CR, Yang Y, Fok S, Sunkara A, DeAngelis GC, Ange-laki DE. 2011. Perceptual learning reduces interneuronal correla-tions in macaque visual cortex. Neuron. 71:750–761.
Gutnisky DA, Dragoi V. 2008. Adaptive coding of visual information inneural populations. Nature. 452:220–224.
Hansen BJ, Chelaru MI, Dragoi V. 2012. Correlated variability inlaminar cortical circuits. Neuron. 76:590–602.
Hata Y, Tsumoto T, Sato H, Tamura H. 1991. Horizontal interactionsbetween visual cortical neurones studied by cross-correlation ana-lysis in the cat. J Physiol. 441:593–614.
Huang X, Lisberger SG. 2009. Noise correlations in cortical area MTand their potential impact on trial-by-trial variation in the directionand speed of smooth-pursuit eye movements. J Neurophysiol.101:3012–3030.
Hunter JN, Born RT. 2011. Stimulus-dependent modulation of suppres-sive influences in MT. J Neurosci. 31:678–686.
Jia X, Smith MA, Kohn A. 2011. Stimulus selectivity and spatial coher-ence of gamma components of the local field potential. J Neurosci.31:9390–9403.
Kelly RC, Smith MA, Samonds JM, Kohn A, Bonds AB, Movshon JA, LeeTS. 2007. Comparison of recordings from microelectrode arraysand single electrodes in the visual cortex. J Neurosci. 27:261–264.
Kohn A, Smith MA. 2005. Stimulus dependence of neuronalcorrelation in primary visual cortex of the macaque. J Neurosci. 25:3661–3673.
Kohn A, Zandvakili A, Smith MA. 2009. Correlations and brain states:from electrophysiology to functional imaging. Curr Opin Neuro-biol. 19:434–438.
Liu S, Gu Y, DeAngelis GC, Angelaki DE. 2013. Choice-related activityand correlated noise in subcortical vestibular neurons. Nat Neuros-ci. 16:89–97.
Lui LL, Bourne JA, Rosa MG. 2007. Spatial summation, end inhibitionand side inhibition in the middle temporal visual area (MT). J Neu-rophysiol. 97:1135–1148.
Lyon DC, Nassi JJ, Callaway EM. 2010. A disynaptic relay from superiorcolliculus to dorsal stream visual cortex in macaque monkey.Neuron. 65:270–279.
Maunsell JH, van Essen DC. 1983. The connections of the middle tem-poral visual area (MT) and their relationship to a cortical hierarchyin the macaque monkey. J Neurosci. 3:2563–2586.
McDonald JS, Clifford CW, Solomon SS, Chen SC, Solomon SG. 2014.Integration and segregation of multiple motion signals by neuronsin area MT of primate. J Neurophysiol. 111:369–378.
Monier C, Chavane F, Baudot P, Graham LJ, Fregnac Y. 2003. Orientationand direction selectivity of synaptic inputs in visual cortical neurons: adiversity of combinations produces spike tuning. Neuron. 37:663–680.
Moore GP, Segundo JP, Perkel DH, Levitan H. 1970. Statistical signs ofsynaptic interaction in neurons. Biophys J. 10:876–900.
Muller JR, Metha AB, Krauskopf J, Lennie P. 2001. Information con-veyed by onset transients in responses of striate cortical neurons. JNeurosci. 21:6978–6990.
Nassi JJ, Lyon DC, Callaway EM. 2006. The parvocellular LGN providesa robust disynaptic input to the visual motion area MT. Neuron.50:319–327.
Nelson JI, Salin PA, Munk MH, Arzi M, Bullier J. 1992. Spatial and tem-poral coherence in cortico-cortical connections: a cross-correlationstudy in areas 17 and 18 in the cat. Vis Neurosci. 9:21–37.
Newsome WT, Britten KH, Movshon JA. 1989. Neuronal correlates of aperceptual decision. Nature. 341:52–54.
Newsome WT, Pare EB. 1988. A selective impairment of motion per-ception following lesions of the middle temporal visual area (MT). JNeurosci. 8:2201–2211.
Nordhausen CT, Maynard EM, Normann RA. 1996. Single unitrecording capabilities of a 100 microelectrode array. Brain Res.726:129–140.
Nowak LG, Munk MH, James AC, Girard P, Bullier J. 1999. Cross-correlation study of the temporal interactions between areas V1 andV2 of the macaque monkey. J Neurophysiol. 81:1057–1074.
Nowak LG, Munk MH, Nelson JI, James AC, Bullier J. 1995. Structuralbasis of cortical synchronization. I. Three types of interhemisphericcoupling. J Neurophysiol. 74:2379–2400.
Palmer SM, Rosa MG. 2006. Quantitative analysis of the corticocorticalprojections to the middle temporal area in the marmoset monkey:evolutionary and functional implications. Cereb Cortex.16:1361–1375.
Poort J, Roelfsema PR. 2009. Noise correlations have little influence onthe coding of selective attention in area V1. Cereb Cortex.19:543–553.
Priebe NJ, Lisberger SG. 2004. Estimating target speed from the popu-lation response in visual area MT. J Neurosci. 24:1907–1916.
Rasch MJ, Schuch K, Logothetis NK, Maass W. 2011. Statistical compari-son of spike responses to natural stimuli in monkey area V1 with si-mulated responses of a detailed laminar network model for a patchof V1. J Neurophysiol. 105:757–778.
Reich DS, Mechler F, Victor JD. 2001. Independent and redundant in-formation in nearby cortical neurons. Science. 294:2566–2568.
Rodman HR, Gross CG, Albright TD. 1989. Afferent basis of visual re-sponse properties in area MT of the macaque. I. Effects of striatecortex removal. J Neurosci. 9:2033–2050.
Rosa MG, Elston GN. 1998. Visuotopic organisation and neuronal re-sponse selectivity for direction of motion in visual areas of thecaudal temporal lobe of the marmoset monkey (Callithrixjacchus): middle temporal area, middle temporal crescent, and sur-rounding cortex. J Comp Neurol. 393:505–527.
Rosa MG, Tweedale R, Elston GN. 2000. Visual responses of neurons inthe middle temporal area of new world monkeys after lesions ofstriate cortex. J Neurosci. 20:5552–5563.
Rousche PJ, Normann RA. 1992. A method for pneumatically insertingan array of penetrating electrodes into cortical tissue. Ann BiomedEng. 20:413–422.
Rust NC, Mante V, Simoncelli EP, Movshon JA. 2006. How MT cellsanalyze the motion of visual patterns. Nat Neurosci. 9:1421–1431.
Salzman CD, Britten KH, Newsome WT. 1990. Cortical microstimula-tion influences perceptual judgements of motion direction. Nature.346:174–177.
Samonds JM, Potetz BR, Lee TS. 2009. Cooperative and competitive in-teractions facilitate stereo computations in macaque primary visualcortex. J Neurosci. 29:15780–15795.
Schwartz O, Simoncelli EP. 2001. Natural signal statistics and sensorygain control. Nat Neurosci. 4:819–825.
Shadlen MN, Newsome WT. 1998. The variable discharge of corticalneurons: implications for connectivity, computation, and informa-tion coding. J Neurosci. 18:3870–3896.
Simoncelli EP, Heeger DJ. 1998. A model of neuronal responses invisual area MT. Vision Res. 38:743–761.
Simoncini C, Perrinet LU, Montagnini A, Mamassian P, Masson GS.2012. More is not always better: adaptive gain control explainsdissociation between perception and action. Nat Neurosci. 15:1596–1603.
Sincich LC, Park KF, Wohlgemuth MJ, Horton JC. 2004. Bypassing V1:a direct geniculate input to area MT. Nat Neurosci. 7:1123–1128.
Smith MA, Jia X, Zandvakili A, Kohn A. 2013. Laminar dependence ofneuronal correlations in visual cortex. J Neurophysiol. 109:940–947.
Smith MA, Kohn A. 2008. Spatial and temporal scales of neuronal cor-relation in primary visual cortex. J Neurosci. 28:12591–12603.
Smith MA, Sommer MA. 2013. Spatial and temporal scales of neuronalcorrelation in visual area V4. J Neurosci. 33:5422–5432.
Snider RK, Kabara JF, Roig BR, Bonds AB. 1998. Burst firing andmodulation of functional connectivity in cat striate cortex. J Neuro-physiol. 80:730–744.
Snowden RJ, Treue S, Erickson RG, Andersen RA. 1991. The responseof area MT and V1 neurons to transparent motion. J Neurosci.11:2768–2785.
14 Spike Correlations in Area MT of Marmoset • Solomon et al.
by guest on April 23, 2016
http://cercor.oxfordjournals.org/D
ownloaded from

Solomon SG, White AJ, Martin PR. 2002. Extraclassical receptive fieldproperties of parvocellular, magnocellular, and koniocellular cellsin the primate lateral geniculate nucleus. J Neurosci. 22:338–349.
Solomon SS, Tailby C, Gharaei S, Camp AJ, Bourne JA, Solomon SG.2011. Visual motion integration by neurons in the middle temporalarea of a New World monkey, the marmoset. J Physiol. 589:5741–5758.
Srinivasan MV, Laughlin SB, Dubs A. 1982. Predictive coding: a freshview of inhibition in the retina. Proc R Soc Lond B Biol Sci. 216:427–459.
Suner S, Fellows MR, Vargas-Irwin C, Nakata GK, Donoghue JP. 2005.Reliability of signals from a chronically implanted, silicon-basedelectrode array in non-human primate primary motor cortex. IEEETrans Neural Syst Rehabil Eng. 13:524–541.
van Kan PL, Scobey RP, Gabor AJ. 1985. Response covariance in catvisual cortex. Exp Brain Res. 60:559–563.
Warner CE, Goldshmit Y, Bourne JA. 2010. Retinal afferents synapsewith relay cells targeting the middle temporal area in the pulvinarand lateral geniculate nuclei. Front Neuroanat. 4:8.
Weller RE, Wall JT, Kaas JH. 1984. Cortical connections of the middletemporal visual area (MT) and the superior temporal cortex in owlmonkeys. J Comp Neurol. 228:81–104.
White AJ, Solomon SG, Martin PR. 2001. Spatial properties of koniocel-lular cells in the lateral geniculate nucleus of the marmoset Calli-thrix jacchus. J Physiol. 533:519–535.
Yu HH, Verma R, Yang Y, Tibballs HA, Lui LL, Reser DH, Rosa MG.2010. Spatial and temporal frequency tuning in striate cortex: func-tional uniformity and specializations related to receptive field ec-centricity. Eur J Neurosci. 31:1043–1062.
Zohary E, Shadlen MN, Newsome WT. 1994. Correlated neuronal dis-charge rate and its implications for psychophysical performance.Nature. 370:140–143.
Cerebral Cortex 15
by guest on April 23, 2016
http://cercor.oxfordjournals.org/D
ownloaded from