Defective excitation-contraction coupling in experimental cardiac hypertrophy and heart failure
Upload
independentCategory
view
0download
0
doi: 10.1152/jn.90968.2008101:350-359, 2009. First published 12 November 2008;J Neurophysiol
Roger M. EnokaDario Farina, Ales Holobar, Marco Gazzoni, Damjan Zazula, Roberto Merletti andDuring Intermittent, Isometric ContractionsAdjustments Differ Among Low-Threshold Motor Units
You might find this additional info useful...
34 articles, 18 of which you can access for free at: This article citeshttp://jn.physiology.org/content/101/1/350.full#ref-list-1
4 other HighWire-hosted articles: This article has been cited by http://jn.physiology.org/content/101/1/350#cited-by
including high resolution figures, can be found at: Updated information and serviceshttp://jn.physiology.org/content/101/1/350.full
can be found at: Journal of Neurophysiology about Additional material and informationhttp://www.the-aps.org/publications/jn
This information is current as of May 31, 2013.
http://www.the-aps.org/. Copyright © 2009 the American Physiological Society. ISSN: 0022-3077, ESSN: 1522-1598. Visit our website attimes a year (monthly) by the American Physiological Society, 9650 Rockville Pike, Bethesda MD 20814-3991.
publishes original articles on the function of the nervous system. It is published 12Journal of Neurophysiology
by guest on May 31, 2013
http://jn.physiology.org/D
ownloaded from
Adjustments Differ Among Low-Threshold Motor Units During Intermittent,Isometric Contractions
Dario Farina,1 Ales Holobar,2,3 Marco Gazzoni,3 Damjan Zazula,2 Roberto Merletti,3 and Roger M. Enoka4
1Center for Sensory-Motor Interaction, Department of Health Science and Technology, Aalborg University, Aalborg, Denmark; 2Facultyof Electrical Engineering and Computer Science, University of Maribor, Maribor, Slovenia; 3Laboratorio di Ingegneria del SistemaNeuromuscolare, Politecnico di Torino, Torino, Italy; and 4Department of Integrative Physiology, University of Colorado at Boulder,Boulder, Colorado
Submitted 27 August 2008; accepted in final form 4 November 2008
Farina D, Holobar A, Gazzoni M, Zazula D, Merletti R, Enoka RM.Adjustments differ among low-threshold motor units during intermittent,isometric contractions. J Neurophysiol 101: 350–359, 2009. First pub-lished November 12, 2008; doi:10.1152/jn.90968.2008. We investigatedthe changes in muscle fiber conduction velocity, recruitment andderecruitment thresholds, and discharge rate of low-threshold motorunits during a series of ramp contractions. The aim was to compare theadjustments in motor unit activity relative to the duration that eachmotor unit was active during the task. Multichannel surface electro-myographic (EMG) signals were recorded from the abductor pollicisbrevis muscle of eight healthy men during 12-s contractions (n � 25)in which the force increased and decreased linearly from 0 to 10% ofthe maximum. The maximal force exhibited a modest decline (8.5 �9.3%; P � 0.05) at the end of the task. The discharge times of 73motor units that were active for 16–98% of the time during the firstfive contractions were identified throughout the task by decompositionof the EMG signals. Action potential conduction velocity decreasedduring the task by a greater amount for motor units that were initiallyactive for �70% of the time compared with that of less active motorunits. Moreover, recruitment and derecruitment thresholds increasedfor these most active motor units, whereas the thresholds decreasedfor the less active motor units. Another 18 motor units were recruitedat an average of 171 � 32 s after the beginning of the task. Therecruitment and derecruitment thresholds of these units decreasedduring the task, but muscle fiber conduction velocity did not change.These results indicate that low-threshold motor units exhibit individ-ual adjustments in muscle fiber conduction velocity and motor neuronactivation that depended on the relative duration of activity duringintermittent contractions.
I N T R O D U C T I O N
A prevailing concept in the study of muscle fatigue is thatthe adjustments exhibited by the motor system depend on thedemands of the task being performed. This concept is known asthe task dependence of muscle fatigue (Enoka and Duchateau2008). According to this scheme, only those physiologicalprocesses that are stressed by the physical activity will bechallenged enough so that they are eventually impaired andcontribute to muscle fatigue. For example, the decline involuntary activation of muscle differs during maximal sus-tained, intermittent, and shortening contractions and thuscontributes differently to the observed muscle fatigue duringthese tasks (Babault et al. 2006; Taylor et al. 2006). Simi-
larly, the type of load supported by a limb during a submaxi-mal isometric contraction influences the rate at which themotor unit pool is recruited and the duration that the contrac-tion can be sustained (Enoka and Duchateau 2008; Maluf andEnoka 2005).
The specificity of the adjustments can also be observedamong the motor units within a single muscle. For example,Carpentier et al. (2001) found differences in the adjustmentsexhibited by motor units in the first dorsal interosseus muscleduring ramp-and-hold contractions to a target force of 50% ofthe maximum. The hold phase of each isometric contractionlasted 10 s and the task was performed until the target forcecould not be reached. Differences were observed betweenmotor units with low (�25% of maximum force) and high(�25%) recruitment thresholds. The low-threshold motor unitsexperienced an increase in mean twitch force, an increase or nochange in recruitment threshold, and a decrease in dischargerate, which contrasted with decreases in twitch force andrecruitment threshold for the high-threshold motor units. Theincrease in twitch force for the low-threshold motor units wasattributed to a change in muscle stiffness during the task,whereas the changes in discharge rate and recruitment thresh-old were likely caused by changes in either the intrinsic motorneuron properties or the afferent feedback from the periphery.
The classification of motor units into low- and high-thresh-old groups by Carpentier et al. (2001) corresponded to theclassical distinction between motor units that are fatigue resis-tant and those that are not (Burke et al. 1973; Kugelberg andEndstrom 1968; Stephens and Usherwood 1977). Despite theterminology, fatigue-resistant motor units can exhibit changesin discharge rate (Mottram et al. 2005), contractility (Nord-strom and Miles 1990), and propagation of the intracellularaction potential (Farina et al. 2004) during prolonged voluntarycontractions and these adjustments depend on the demands ofthe task performed (Mottram et al. 2005). For example, thedecrease in conduction velocity of motor units in hand musclesduring sustained, isometric contractions differs when the motorunits discharge at slightly different rates (Farina et al. 2004).Moreover, the neuromodulatory input that contributes to motorneuron excitability in reduced preparations appears to varywith the duration of activation (Heckman et al. 2008) and mayinfluence motor unit activity during voluntary contractions.Changes in individual motor unit properties during fatiguing
Address for reprint requests and other correspondence: D. Farina, Center forSensory-Motor Interaction (SMI), Department of Health Science and Technol-ogy, Aalborg University, Fredrik Bajers Vej 7 D-3, DK-9220 Aalborg, Den-mark (E-mail: [email protected]).
The costs of publication of this article were defrayed in part by the paymentof page charges. The article must therefore be hereby marked “advertisement”in accordance with 18 U.S.C. Section 1734 solely to indicate this fact.
J Neurophysiol 101: 350–359, 2009.First published November 12, 2008; doi:10.1152/jn.90968.2008.
350 0022-3077/09 $8.00 Copyright © 2009 The American Physiological Society www.jn.org
by guest on May 31, 2013
http://jn.physiology.org/D
ownloaded from

contractions may thus be related to differences in the amount ofactivation experienced by each motor unit during the task.
The hypothesis for the current study was that the duration ofactivity experienced by low-threshold motor units leads todifferent adjustments in both the membrane fiber propertiesand discharge characteristics during a series of intermittentcontractions. The purpose of the study was to examine theassociation between the adjustments exhibited by low-thresh-old motor units (�10% of maximum force) and the relativeproportion of time each unit was active during ramp increasesand decreases in isometric force. Because motor units arerecruited at different thresholds, the ramp increases and de-creases in force implied that the involved motor units wereactive for different proportions of the task. The selected targetforce ensured that all motor units involved were fatigue resis-tant, so that their muscle fibers and motor neurons had similarproperties.
M E T H O D S
Eight healthy men (age, mean � SD: 27.3 � 2.2 yr; height, 1.79 �0.07 m; body mass, 75.2 � 7.4 kg) participated in the experiment. Thelocal ethics committee (Regional Committee, Turin, Italy) approvedthe study and all subjects signed an informed consent form beforeparticipation.
EMG recordings
Surface electromyographic (EMG) signals were detected with atwo-dimensional grid of 61 silver electrodes (1-mm diameter, 3.5-mminterelectrode distance, 13 rows � 5 columns without the four cornerelectrodes; Gazzoni et al. 2005) from the abductor pollicis brevismuscle of the right (dominant) hand. The EMG signals were amplified(LISiN-OT Bioelettronica, Turin, Italy), band-pass filtered (3-dBbandwidth, 10–500 Hz), sampled at 1,650 Hz, and A/D converted on12 bits.
The electrode grid was located with the columns in the direction ofthe muscle fibers and the last row approximately over the end of thedistal tendon. The skin was lightly abraded with abrasive paste(Meditec–Every, Parma, Italy) before the grid was fixed with adhesivetape and a reference electrode was placed at the wrist.
Procedures
A custom-designed brace was used to measure the abduction forceexerted by the thumb (Gazzoni et al. 2005). The subject’s wrist wasfixed in a padded wood support with the head of the proximal thumbphalanx in contact with a load cell (model 8523-50N, Burster, Gerns-bach, Germany). The force signal was amplified (Force Amplifier,MISO-II; LISiN), provided as feedback to the subject on an oscillo-scope, and recorded concurrently with the EMG signals.
The subjects performed three maximal voluntary contractions (MVCs)separated by a 2-min rest prior to the electrode grid being mountedover the abductor pollicis brevis. The highest peak force was used asthe reference MVC for defining submaximal forces. The subject thenpracticed the ramp contractions, which consisted of a linear increasein force from 0 to 10% MVC in 6 s and then a linear decrease from10 to 0% MVC in 6 s. The subject received visual feedback of thetarget force and the force exerted by the thumb. After about 10 min ofpractice with frequent breaks and then 15 min of rest, the subjectperformed the 12-s contraction 25 times without resting betweentrials, which took 5 min. A 5-min isometric contraction of theabductor pollicis brevis muscle at about 5% MVC force has beenshown to evoke detectable changes in the fiber membrane propertiesof low-threshold motor units and the progressive recruitment of motor
units (Farina et al. 2004). The MVC was measured at the end of thetask so that the amount of fatigue (decline in MVC force) associatedwith the task could be estimated.
Decomposition of the surface EMG
Multichannel surface EMG signals were used to detect the dis-charge times of motor units because muscle fiber conduction velocitycan be estimated with these recordings. The multichannel surfaceEMG signals were decomposed with an algorithm that identifies thedischarge times of motor units (Holobar and Zazula 2007). Recruit-ment and derecruitment thresholds for each motor unit were defined asthe force at the times when the motor unit began and stopped,respectively, repetitively discharging action potentials (Enoka 1995).Discharge times separated by �200 ms from the nearest neighborwere excluded from the estimation of recruitment and derecruitmentthresholds to avoid aligning the thresholds with noise-generatedsporadic discharges. Motor units that were continuously active, whichwas rare, were assigned thresholds of 0% MVC force. The dischargerates at recruitment and derecruitment were defined for the motorunits active during the 25 contractions as the average discharge ratesof the first and last six discharges and the peak discharge rate wasdefined as the maximum value obtained from the average rate over sixconsecutive discharges. The discharge rate was averaged over alldischarges during each ramp for the motor units that were recruitedafter the first ramp.
The accuracy of the surface EMG decomposition algorithm hasbeen previously proven theoretically (Farina et al. 2008) and directlydemonstrated with a set of synthetic and experimental signals re-corded during ramp contractions (Holobar and Zazula 2004; A.Holobar, D. Farina, M. Gazzoni, R. Merletti, and D. Zazula, unpub-lished observations). To demonstrate the reliability of the decompo-sition method in the context of the current study, however, surface andintramuscular EMG signals were concurrently recorded in one subjectand the results of the decompositions of the two signals compared.The intramuscular EMG was recorded with a pair of Teflon-coatedstainless steel wires (diameter 0.1 mm; A-M Systems, Carlsborg, WA)inserted with a 25-gauge hypodermic needle in a location approxi-mately 10 mm proximal to the surface electrode grid, in line with thecentral column of the grid. The two wires were cut to expose the crosssection and provided one bipolar signal, which was amplified (Coun-terpoint EMG, Dantec Medical, Copenhagen, Denmark), band-passfiltered (500 Hz to 5 kHz), sampled at 10 kHz concurrently with thesurface EMG, and stored after 12-bit A/D conversion. A validatedmethod was used for the decomposition of the intramuscular EMG(McGill et al. 2005).
The two decomposition techniques identified four common motorunits (Fig. 1) during the series of ramp contractions. Over the courseof the 5-min recording, the two techniques agreed on 96% of thedischarge times for these four motor units. The differences betweenestimates of recruitment and derecruitment thresholds and dischargerates provided by the two decomposition techniques were negligible(Table 1).
Signal analysis
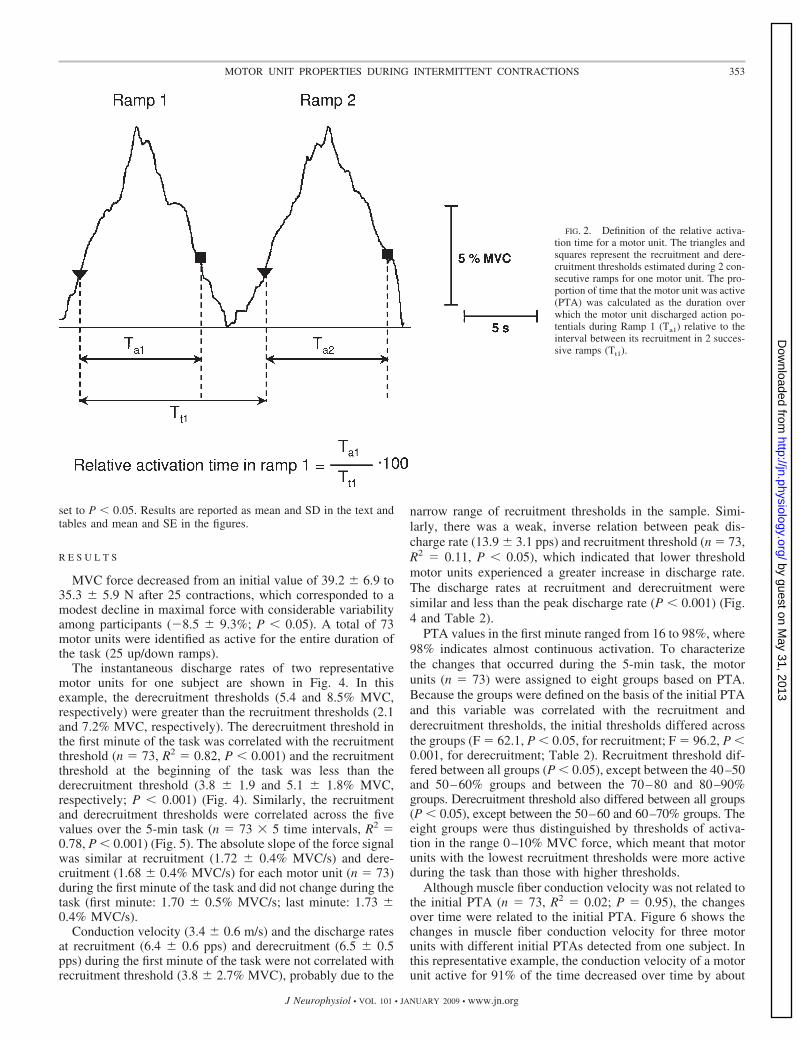
The force signal was low-pass filtered with a fourth-order Butter-worth filter with cutoff frequency 5 Hz. The first derivative (slope) ofthe force signal was computed at the instants of recruitment andderecruitment for each motor unit. The proportion of time that eachmotor unit was active (PTA) during ramp-up and ramp-down con-tractions was expressed as the ratio (%) of the time between recruit-ment and derecruitment of the motor unit relative to the time betweenits recruitment during two consecutive ramps (Fig. 2).
The action potential of each motor unit was obtained by averagingthe multichannel surface EMG signals over all discharges of the motorunit in each ramp (Fig. 3). Muscle fiber conduction velocity was
351MOTOR UNIT PROPERTIES DURING INTERMITTENT CONTRACTIONS
J Neurophysiol • VOL 101 • JANUARY 2009 • www.jn.org
by guest on May 31, 2013
http://jn.physiology.org/D
ownloaded from

estimated for each motor unit from the average action potentials witha multichannel method (Farina et al. 2001, 2002). Three to sixchannels were used to estimate conduction velocity based on thecriterion of a minimal change in shape of the action potential asdetermined by visual selection (Farina et al. 2002). Although musclefiber conduction velocity changes with discharge rate (Stålberg 1966),the magnitude of the change was small in abductor pollicis (�0.5%/pps; Farina et al. 2004) and it was assumed to be negligible in theobserved range of discharge rates.
The dependent variables for the motor units that were active duringall ramp contractions were averaged across five consecutive ramp-upand ramp-down contractions to yield five averages for the 5-min task.The averages were normalized to the value for the initial average. Therate of change across the five averages was estimated with a linearregression (normalized rate of change; %/min).
The motor units that were active during all ramp contractions wereassigned to eight groups on the basis of the average PTA (Fig. 2)during the first minute of the task (initial PTA). The groups consistedof motor units with initial PTAs of 0–30%, 30–40%, 40–50%,
50–60%, 60–70%, 70–80%, 80–90%, and 90–100%. These groupswere chosen to achieve a similar number of motor units in each bin(see RESULTS).
Statistical analysis
Relations between variables extracted from individual motor unitswere investigated with linear correlation analyses. The initial valuesand normalized rates of change of these variables were analyzed witha one-way ANOVA to identify differences among the eight groups ofmotor units defined on the basis of the initial PTA. The absolute valueof the slope of the force signal was analyzed with a two-way ANOVA(direction of change in force � time). When the ANOVA identified asignificant effect, a post hoc Student–Newman–Keuls (SNK) test wasused for pairwise comparisons. A paired Student’s t-test was used tocompare MVC force before and after the task and the variables of themotor units recruited after the beginning of the task during the firstand last ramp contractions in which they were active. Significance was
FIG. 1. Comparison of discharge times identified by decomposition from concurrently recorded intramuscular and surface electromyographic (EMG) signalsduring a 12-s ramp-up and ramp-down contraction. The discharge times of the 4 motor units identified by both techniques are depicted. Motor unit dischargesidentified from only one of the 2 signals (thus without agreement between the 2 techniques) are indicated with a circle.
TABLE 1. Average thresholds and discharge rates at recruitment and derecruitment and peak discharge rate during the first minuteof the task for four motor units identified concurrently with surface and intramuscular EMG decomposition techniques
Motor Unit Recruitment Threshold, %MVC Derecruitment Threshold, %MVC
Discharge Rate, pps
Peak Discharge Rate, ppsAt Recruitment At Derecruitment
1 0.1/0.1 0.8/0.8 7.2/7.3 7.8/7.8 13.0/13.02 2.1/2.1 1.2/1.1 9.0/9.2 6.4/6.2 13.7/13.73 5.7/5.6 6.7/6.6 9.5/9.4 10.1/10.2 14.9/14.94 6.0/6.1 6.2/6.2 9.2/9.2 8.7/8.7 12.0/12.1
Each parameter value is reported twice: surface EMG/intramuscular EMG. The differences between estimates obtained by the two techniques are negligible.See Fig. 1.
352 FARINA, HOLOBAR, GAZZONI, ZAZULA, MERLETTI, AND ENOKA
J Neurophysiol • VOL 101 • JANUARY 2009 • www.jn.org
by guest on May 31, 2013
http://jn.physiology.org/D
ownloaded from
set to P � 0.05. Results are reported as mean and SD in the text andtables and mean and SE in the figures.
R E S U L T S
MVC force decreased from an initial value of 39.2 � 6.9 to35.3 � 5.9 N after 25 contractions, which corresponded to amodest decline in maximal force with considerable variabilityamong participants (�8.5 � 9.3%; P � 0.05). A total of 73motor units were identified as active for the entire duration ofthe task (25 up/down ramps).
The instantaneous discharge rates of two representativemotor units for one subject are shown in Fig. 4. In thisexample, the derecruitment thresholds (5.4 and 8.5% MVC,respectively) were greater than the recruitment thresholds (2.1and 7.2% MVC, respectively). The derecruitment threshold inthe first minute of the task was correlated with the recruitmentthreshold (n � 73, R2 � 0.82, P � 0.001) and the recruitmentthreshold at the beginning of the task was less than thederecruitment threshold (3.8 � 1.9 and 5.1 � 1.8% MVC,respectively; P � 0.001) (Fig. 4). Similarly, the recruitmentand derecruitment thresholds were correlated across the fivevalues over the 5-min task (n � 73 � 5 time intervals, R2 �0.78, P � 0.001) (Fig. 5). The absolute slope of the force signalwas similar at recruitment (1.72 � 0.4% MVC/s) and dere-cruitment (1.68 � 0.4% MVC/s) for each motor unit (n � 73)during the first minute of the task and did not change during thetask (first minute: 1.70 � 0.5% MVC/s; last minute: 1.73 �0.4% MVC/s).
Conduction velocity (3.4 � 0.6 m/s) and the discharge ratesat recruitment (6.4 � 0.6 pps) and derecruitment (6.5 � 0.5pps) during the first minute of the task were not correlated withrecruitment threshold (3.8 � 2.7% MVC), probably due to the
narrow range of recruitment thresholds in the sample. Simi-larly, there was a weak, inverse relation between peak dis-charge rate (13.9 � 3.1 pps) and recruitment threshold (n � 73,R2 � 0.11, P � 0.05), which indicated that lower thresholdmotor units experienced a greater increase in discharge rate.The discharge rates at recruitment and derecruitment weresimilar and less than the peak discharge rate (P � 0.001) (Fig.4 and Table 2).
PTA values in the first minute ranged from 16 to 98%, where98% indicates almost continuous activation. To characterizethe changes that occurred during the 5-min task, the motorunits (n � 73) were assigned to eight groups based on PTA.Because the groups were defined on the basis of the initial PTAand this variable was correlated with the recruitment andderecruitment thresholds, the initial thresholds differed acrossthe groups (F � 62.1, P � 0.05, for recruitment; F � 96.2, P �0.001, for derecruitment; Table 2). Recruitment threshold dif-fered between all groups (P � 0.05), except between the 40–50and 50–60% groups and between the 70–80 and 80–90%groups. Derecruitment threshold also differed between all groups(P � 0.05), except between the 50–60 and 60–70% groups. Theeight groups were thus distinguished by thresholds of activa-tion in the range 0–10% MVC force, which meant that motorunits with the lowest recruitment thresholds were more activeduring the task than those with higher thresholds.
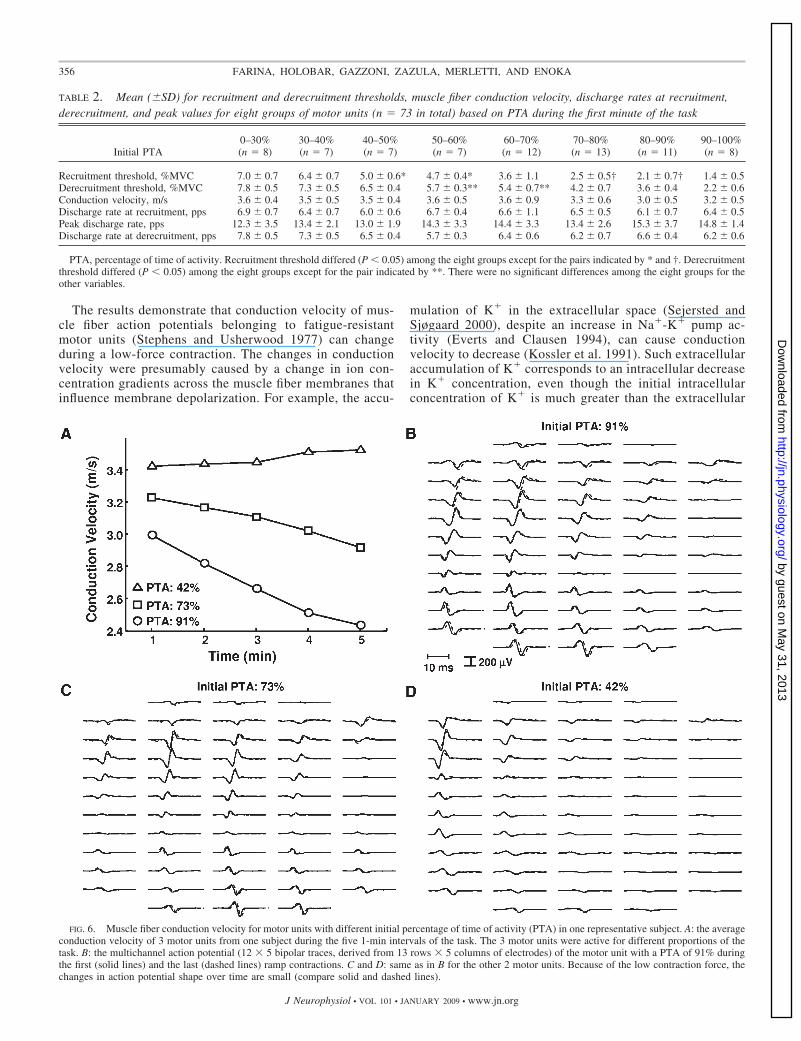
Although muscle fiber conduction velocity was not related tothe initial PTA (n � 73, R2 � 0.02; P � 0.95), the changesover time were related to the initial PTA. Figure 6 shows thechanges in muscle fiber conduction velocity for three motorunits with different initial PTAs detected from one subject. Inthis representative example, the conduction velocity of a motorunit active for 91% of the time decreased over time by about
FIG. 2. Definition of the relative activa-tion time for a motor unit. The triangles andsquares represent the recruitment and dere-cruitment thresholds estimated during 2 con-secutive ramps for one motor unit. The pro-portion of time that the motor unit was active(PTA) was calculated as the duration overwhich the motor unit discharged action po-tentials during Ramp 1 (Ta1) relative to theinterval between its recruitment in 2 succes-sive ramps (Tt1).
353MOTOR UNIT PROPERTIES DURING INTERMITTENT CONTRACTIONS
J Neurophysiol • VOL 101 • JANUARY 2009 • www.jn.org
by guest on May 31, 2013
http://jn.physiology.org/D
ownloaded from

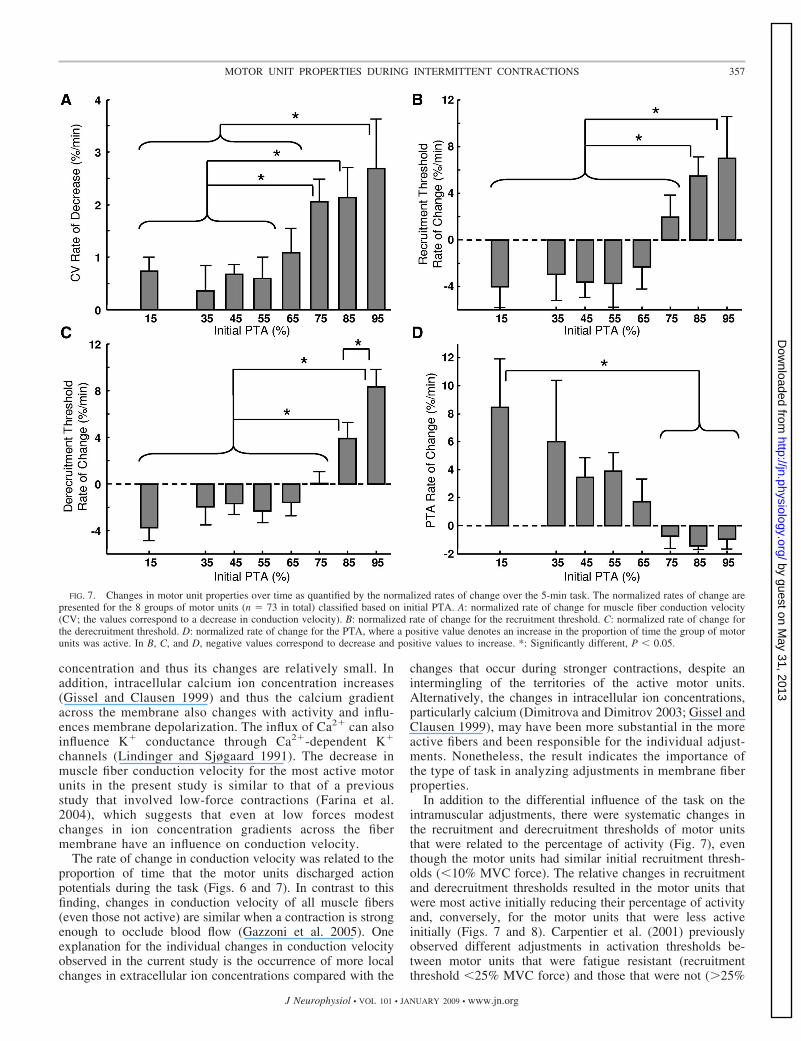
20%, whereas the conduction velocity for the motor unit thatwas active for only 42% of the time did not change substan-tially. As suggested by this example (Fig. 6), the change inconduction velocity for all motor units (n � 73) varied with theinitial PTA (ANOVA: F � 2.4, P � 0.05). Motor units thatwere active for �90% of the task experienced a larger relativedecrease in conduction velocity than motor units that were activefor �70% of the task, and motor units that were active for70–90% of the task exhibited a greater decrease than those activefor �60% of the task (Fig. 7A).
The recruitment threshold of some of the motor unitschanged during the task. Figure 8 shows an example of onemotor unit that slightly increased its recruitment threshold andanother that experienced a decrease in recruitment thresholdduring the same task. The change depended on the initial PTA(ANOVA: F � 3.8, P � 0.01) (Fig. 7B). Motor units active for�70% of the task decreased their recruitment threshold, incontrast to the more active motor units (Fig. 7B). There were
similar differences between groups in the change in derecruit-ment threshold (ANOVA: F � 7.5, P � 0.001). Motor unitswith an initial PTA �80% increased derecruitment threshold(P � 0.05; Fig. 7C), contrary to the other less active units, andthe increase was greater for motor units with an initial PTA�90% than those in the range 80–90% (P � 0.05; Fig. 7C).
Due to the changes in recruitment thresholds, some motorunits experienced a change in PTA during the task (ANOVAon normalized rate of change of PTA: F � 3.3, P � 0.01). PTAdecreased over time for motor units with an initial value�70%, whereas it increased for the other groups (Fig. 7D).Accordingly, PTA at the beginning (first minute) and at the end(fifth minute) of the task was highly correlated (n � 73, R2 �0.77, P � 0.001). The linear regression for PTA at thebeginning and end of the task had slope 0.78 and intercept15.0%, which indicated a larger increase in PTA during thetask for those motor units with smaller initial PTA. For exam-ple, the linear association predicted that a motor unit with
FIG. 3. Extraction of motor unit activity from the surface EMG signals. A: the discharge times of 15 motor units were extracted from the multichannel surfaceEMG signals. The force exerted by the subject is indicated by a thick gray line. B: the multichannel EMG signals detected for a 200-ms interval during the rampcontraction at the force level indicated by the B arrow in A. The multichannel recording consists of 56 bipolar signals, shown in 5 columns and 12 rows. C: EMGsignals as detected at the C arrow in A. D: the action potentials of the 15 motor units in A are shown as detected by the 12 rows of the central column of theelectrode grid. Each trace indicates the average shape of the motor unit action potential during a ramp contraction. Similar averages were derived from the other4 columns of the electrode grid. The entire 2-dimensional representation of the motor unit action potentials was used for signal decomposition. Although theaction potentials in a single column were similar for some motor units, the 2-dimensional representation provided reliable discrimination, as shown previously(Farina et al. 2008).
354 FARINA, HOLOBAR, GAZZONI, ZAZULA, MERLETTI, AND ENOKA
J Neurophysiol • VOL 101 • JANUARY 2009 • www.jn.org
by guest on May 31, 2013
http://jn.physiology.org/D
ownloaded from

initial PTA of 20% would increase its PTA to 30.7% by the endof task, whereas a motor unit with an initial PTA of 95% wouldexperience a decrease to 89.7%. Thus the proportion of timeduring which each motor unit was active during the rampcontractions changed during the task, depending on the initialrelative duration of activity.
The individual changes in recruitment thresholds occasion-ally caused an inversion of recruitment order for pairs of motorunits. For example, motor units 3 and 4 in Fig. 8 changed therelative recruitment order from ramp 2 to ramp 25. How-ever, the inversion in recruitment order was observed inonly eight motor unit pairs in total and these motor units hadrelatively small differences in initial recruitment thresholds(1.8 � 0.5% MVC).
In contrast to the influence of the proportion of activity onrecruitment threshold and muscle fiber conduction velocity, themodest changes in peak discharge rate (0.4 � 4.5%/min) anddischarge rates at recruitment (1.2 � 3.7%/min) and derecruit-ment (�0.6 � 3.3%/min) did not depend on initial PTA andwere not statistically significant.
In addition to the 73 motor units that were identified duringall 25 ramp-up and ramp-down contractions, 18 motor unitswere recruited after the first minute of the task. After the firstdetected discharge of an action potential, which occurred at171 � 32 s (range, 96–236 s) after the beginning of the task,the newly recruited units were active for the remainder of thetask and showed a consistent decrease in recruitment andderecruitment thresholds over time (e.g., motor unit 9 in Fig.8). The recruitment threshold of these motor units (n � 18)decreased from 9.3 � 0.6% MVC force during the first rampcontraction in which they were detected to 8.2 � 1.1% MVCforce in the last ramp (P � 0.05). Derecruitment thresholddecreased similarly from 9.5 � 0.4 to 8.6 � 0.9% MVC force(P � 0.05) from the first to the last activation. Discharge rateand muscle fiber conduction velocity averaged for all dis-charges in each ramp, however, did not change between thefirst and last ramps in which the motor units were active (n �18, average over the first and last ramps, 10.5 � 0.8 pps and3.5 � 0.3 m/s, respectively).
D I S C U S S I O N
Despite the focus on fatigue-resistant motor units during theperformance of a task that produced a modest amount offatigue, the motor units exhibited different adjustments thatdepended on the proportion of the task that they were active.Those units active for a large proportion of the contraction atthe beginning of the task showed greater decreases in musclefiber conduction velocity and increases in recruitment thresh-old. In contrast, less active units experienced a modest changein muscle fiber conduction velocity and a decrease in recruit-ment threshold during the task. As a consequence, the mostactive motor units at the beginning of the task became lessactive by the end of the task, whereas the converse occurred forthe motor units that were less active at the beginning. Thus thelow-threshold motor units in abductor pollicis brevis did notexperience the same adjustments during the fatiguing task. Theadjustments corresponded to the different demands of the taskon each motor unit and indicate specificity of the changes evenamong low-threshold motor units.
Multichannel surface EMG was used to identify the activityof single motor units because it allows concurrent analysis ofmuscle fiber properties (conduction velocity) and the recordingof many motor units. Theoretical and experimental studieshave shown that such recordings provide valid measures ofmotor unit activity at contractions up to moderate force(Farina et al. 2008). The decomposition method used in thecurrent study has been validated on simulated recordings(Holobar and Zazula 2004, 2007) and on concurrent intra-muscular and surface recordings (Holobar et al., unpub-lished observations). Measurements on one subject con-firmed that the approach was appropriate for the currentstudy (Fig. 1 and Table 1).
FIG. 5. Average recruitment and derecruitment thresholds for 73 motorunits identified in 8 subjects at 5 time intervals during the task (n � 73 motorunits � 5 time intervals). Most values lie above the line of identity (dashed)due to the greater derecruitment threshold. Recruitment and derecruitmentthresholds for the 73 motor units in the 5 time instants were correlated (R2 �0.78, P � 0.001).
FIG. 4. Discharge rates for 2 of the motor units identified from one subject.The force is represented by a gray line. The dots correspond to the dischargesof 2 motor units and the y-axis on the right indicates instantaneous dischargerate. The recruitment and derecruitment thresholds were defined as the forcecorresponding to the first and last discharges of each unit, with the exclusionsof discharges at a distance of �200 ms from the nearest neighbor.
355MOTOR UNIT PROPERTIES DURING INTERMITTENT CONTRACTIONS
J Neurophysiol • VOL 101 • JANUARY 2009 • www.jn.org
by guest on May 31, 2013
http://jn.physiology.org/D
ownloaded from
The results demonstrate that conduction velocity of mus-cle fiber action potentials belonging to fatigue-resistantmotor units (Stephens and Usherwood 1977) can changeduring a low-force contraction. The changes in conductionvelocity were presumably caused by a change in ion con-centration gradients across the muscle fiber membranes thatinfluence membrane depolarization. For example, the accu-
mulation of K� in the extracellular space (Sejersted andSjøgaard 2000), despite an increase in Na�-K� pump ac-tivity (Everts and Clausen 1994), can cause conductionvelocity to decrease (Kossler et al. 1991). Such extracellularaccumulation of K� corresponds to an intracellular decreasein K� concentration, even though the initial intracellularconcentration of K� is much greater than the extracellular
TABLE 2. Mean (�SD) for recruitment and derecruitment thresholds, muscle fiber conduction velocity, discharge rates at recruitment,derecruitment, and peak values for eight groups of motor units (n � 73 in total) based on PTA during the first minute of the task
Initial PTA0–30%(n � 8)
30–40%(n � 7)
40–50%(n � 7)
50–60%(n � 7)
60–70%(n � 12)
70–80%(n � 13)
80–90%(n � 11)
90–100%(n � 8)
Recruitment threshold, %MVC 7.0 � 0.7 6.4 � 0.7 5.0 � 0.6* 4.7 � 0.4* 3.6 � 1.1 2.5 � 0.5† 2.1 � 0.7† 1.4 � 0.5Derecruitment threshold, %MVC 7.8 � 0.5 7.3 � 0.5 6.5 � 0.4 5.7 � 0.3** 5.4 � 0.7** 4.2 � 0.7 3.6 � 0.4 2.2 � 0.6Conduction velocity, m/s 3.6 � 0.4 3.5 � 0.5 3.5 � 0.4 3.6 � 0.5 3.6 � 0.9 3.3 � 0.6 3.0 � 0.5 3.2 � 0.5Discharge rate at recruitment, pps 6.9 � 0.7 6.4 � 0.7 6.0 � 0.6 6.7 � 0.4 6.6 � 1.1 6.5 � 0.5 6.1 � 0.7 6.4 � 0.5Peak discharge rate, pps 12.3 � 3.5 13.4 � 2.1 13.0 � 1.9 14.3 � 3.3 14.4 � 3.3 13.4 � 2.6 15.3 � 3.7 14.8 � 1.4Discharge rate at derecruitment, pps 7.8 � 0.5 7.3 � 0.5 6.5 � 0.4 5.7 � 0.3 6.4 � 0.6 6.2 � 0.7 6.6 � 0.4 6.2 � 0.6
PTA, percentage of time of activity. Recruitment threshold differed (P � 0.05) among the eight groups except for the pairs indicated by * and †. Derecruitmentthreshold differed (P � 0.05) among the eight groups except for the pair indicated by **. There were no significant differences among the eight groups for theother variables.
FIG. 6. Muscle fiber conduction velocity for motor units with different initial percentage of time of activity (PTA) in one representative subject. A: the averageconduction velocity of 3 motor units from one subject during the five 1-min intervals of the task. The 3 motor units were active for different proportions of thetask. B: the multichannel action potential (12 � 5 bipolar traces, derived from 13 rows � 5 columns of electrodes) of the motor unit with a PTA of 91% duringthe first (solid lines) and the last (dashed lines) ramp contractions. C and D: same as in B for the other 2 motor units. Because of the low contraction force, thechanges in action potential shape over time are small (compare solid and dashed lines).
356 FARINA, HOLOBAR, GAZZONI, ZAZULA, MERLETTI, AND ENOKA
J Neurophysiol • VOL 101 • JANUARY 2009 • www.jn.org
by guest on May 31, 2013
http://jn.physiology.org/D
ownloaded from
concentration and thus its changes are relatively small. Inaddition, intracellular calcium ion concentration increases(Gissel and Clausen 1999) and thus the calcium gradientacross the membrane also changes with activity and influ-ences membrane depolarization. The influx of Ca2� can alsoinfluence K� conductance through Ca2�-dependent K�
channels (Lindinger and Sjøgaard 1991). The decrease inmuscle fiber conduction velocity for the most active motorunits in the present study is similar to that of a previousstudy that involved low-force contractions (Farina et al.2004), which suggests that even at low forces modestchanges in ion concentration gradients across the fibermembrane have an influence on conduction velocity.
The rate of change in conduction velocity was related to theproportion of time that the motor units discharged actionpotentials during the task (Figs. 6 and 7). In contrast to thisfinding, changes in conduction velocity of all muscle fibers(even those not active) are similar when a contraction is strongenough to occlude blood flow (Gazzoni et al. 2005). Oneexplanation for the individual changes in conduction velocityobserved in the current study is the occurrence of more localchanges in extracellular ion concentrations compared with the
changes that occur during stronger contractions, despite anintermingling of the territories of the active motor units.Alternatively, the changes in intracellular ion concentrations,particularly calcium (Dimitrova and Dimitrov 2003; Gissel andClausen 1999), may have been more substantial in the moreactive fibers and been responsible for the individual adjust-ments. Nonetheless, the result indicates the importance ofthe type of task in analyzing adjustments in membrane fiberproperties.
In addition to the differential influence of the task on theintramuscular adjustments, there were systematic changes inthe recruitment and derecruitment thresholds of motor unitsthat were related to the percentage of activity (Fig. 7), eventhough the motor units had similar initial recruitment thresh-olds (�10% MVC force). The relative changes in recruitmentand derecruitment thresholds resulted in the motor units thatwere most active initially reducing their percentage of activityand, conversely, for the motor units that were less activeinitially (Figs. 7 and 8). Carpentier et al. (2001) previouslyobserved different adjustments in activation thresholds be-tween motor units that were fatigue resistant (recruitmentthreshold �25% MVC force) and those that were not (�25%
FIG. 7. Changes in motor unit properties over time as quantified by the normalized rates of change over the 5-min task. The normalized rates of change arepresented for the 8 groups of motor units (n � 73 in total) classified based on initial PTA. A: normalized rate of change for muscle fiber conduction velocity(CV; the values correspond to a decrease in conduction velocity). B: normalized rate of change for the recruitment threshold. C: normalized rate of change forthe derecruitment threshold. D: normalized rate of change for the PTA, where a positive value denotes an increase in the proportion of time the group of motorunits was active. In B, C, and D, negative values correspond to decrease and positive values to increase. *: Significantly different, P � 0.05.
357MOTOR UNIT PROPERTIES DURING INTERMITTENT CONTRACTIONS
J Neurophysiol • VOL 101 • JANUARY 2009 • www.jn.org
by guest on May 31, 2013
http://jn.physiology.org/D
ownloaded from

MVC force). In the current study, all motor units were likelyfatigue resistant (Stephens and Usherwood 1977) and yet theyexhibited a range of adjustments. Moreover, the changes inrecruitment and derecruitment thresholds observed in the cur-rent study for motor units that were active for �70% of the taskand had recruitment thresholds in the range of 3.6–7.0% MVCforce (Fig. 7 and Table 2) contrasted with those observed byCarpentier et al. (2001) for motor units with recruitmentthreshold in the range 0–25% MVC force. This indicates thatthe motor unit recruitment threshold and motor unit type do notdetermine the specificity of the adjustment.
Carpentier et al. (2001) used ramp-and-hold contractionsthat made it difficult to quantify the proportion of activity,which was thus not associated with the adjustments. Becausethe ramp-up and ramp-down phases each lasted 3 s and thehold phase had a duration of 10 s, however, the high-thresholdmotor units should have been active for a lesser proportion ofeach contraction than the low-threshold units, which is inagreement with the specificity of the adjustments observed inthe current study for motor units with different durations ofactivity. Longer hold phases, such as 50 s at a target torque of20% of maximum, resulted in motor units in vastus lateralisbeing active for similar durations and displaying reasonablysimilar adjustments (Adam and De Luca 2003). Because themotor units analyzed in this study likely received similardescending drive and afferent feedback from the periphery, theindividual adjustments in activation thresholds could be due toindividual changes in the twitch forces expressed by eachmotor unit or in motor neuron excitability. The recruitmentthreshold of a motor unit is not a measure of motor neuronexcitability, but depends on the sum of the forces developed bythe units activated prior to the test unit. When the forcesexerted by the previously activated motor units decrease, therecruitment threshold of the test unit will decrease. Conversely,potentiation of twitch force will increase the force exerted bythe units that are already active and result in an increase in therecruitment threshold of the test unit. Accordingly, Carpentier
et al. (2001) observed an increase in twitch force for lower-threshold motor units and a decrease for higher-threshold unitsthat were accompanied by an increase in threshold for low-threshold units and a decrease for higher-threshold units. Be-cause twitch force was not measured in the current study, it isnot certain whether such a mechanism can explain the oppositechanges in recruitment threshold for the most and least activelow-threshold motor units in the current study.
Alternatively, the excitability of the motor neurons mayhave changed differently depending on the duration of motorunit activation and have caused the individual adjustments inactivation thresholds. The extrinsic synaptic input needed torecruit a motor neuron may change during a fatiguing contrac-tion. Over short time intervals of motor unit activity, persistentinward currents in the dendrites may reduce the current re-quired from extrinsic synaptic sources to reach recruitmentthreshold (Fuglevand et al. 2006; Gorassini et al. 2002; Heck-man et al. 2005; Nordstrom et al. 2007). Longer intervals ofmotor unit activity, however, may elicit slow inactivation ofCa2� and Na� persistent inward currents that conversely in-crease the synaptic current required to reach threshold (Heck-man et al. 2005). Additionally, slow inactivation of Na�
channels and a slowing of the transmembrane Na�-K� pumpactivity may increase the recruitment threshold (Miles et al.2005; Vilin and Ruben 2001). Because these mechanismsdepend on the duration of activation and are particularlyrelevant in low-threshold motor neurons (Heckman et al. 2005), theymay have contributed to the differential adjustments in motorunit activity observed in the current study.
The individual adjustments in motor unit activity occurredduring a progressive increase of the central drive to the motorneuron pool, as evidenced by the additional recruitment ofmotor units during the current task and as observed previously(Farina et al. 2004). The motor units that were recruited afterthe first minute of the task exhibited a progressive decrease inactivation thresholds and did not change either muscle fiberconduction velocity or discharge rate due to the relatively
FIG. 8. Discharge times of motor units identified from one subject during 3 ramp-up contractions (ramps 2, 14, and 25). The changes in recruitment thresholdsare illustrated for 2 motor units. The first motor unit (initial PTA � 94%) slightly increased its recruitment threshold (open triangles) over time, whereas thesecond (initial PTA � 42%) decreased its threshold (filled triangles). Motor unit 9 was first recruited in ramp 14.
358 FARINA, HOLOBAR, GAZZONI, ZAZULA, MERLETTI, AND ENOKA
J Neurophysiol • VOL 101 • JANUARY 2009 • www.jn.org
by guest on May 31, 2013
http://jn.physiology.org/D
ownloaded from
shorter duration of activation. These adjustments were consis-tent with those observed for the motor units that were lessactive during the first minute of the task.
In summary, low-threshold motor units in abductor pollicisbrevis exhibited different adjustments during a fatiguing con-traction that depended on the relative duration that each motorunit was active during the task. Motor units that were initiallyactive for most of the task displayed a larger decrease inmuscle fiber conduction velocity and an increase in recruitmentand derecruitment thresholds, whereas less active and newlyrecruited motor units experienced decreases in recruitment andderecruitment thresholds and less or no decrease in conductionvelocity. The results indicate that the relative duration ofactivity evoked differential adjustments in a homogeneousgroup of motor units during intermittent, isometric contrac-tions.
G R A N T S
This research was supported by the European CyberManS Project Grant16712 to R. Merletti and D. Farina, by Marie Curie Intra-European FellowshipDE MUSE 023537 (within the 6th European Community Framework Pro-gramme) to A. Holobar, by Danish Technical Research Council Grant CEN26-04-0100 to D. Farina, and by National Institute of Neurological Disordersand Stroke Grant NS-43275 to R. M. Enoka.
R E F E R E N C E S
Adam A, De Luca CJ. Recruitment order of motor units in human vastuslateralis muscle is maintained during fatiguing contractions. J Neurophysiol90: 2919–2927, 2003.
Babault N, Desbrosses K, Fabre MS, Michaut A, Pousson M. Neuromus-cular fatigue development during maximal concentric and isometric kneeextensions. J Appl Physiol 100: 780–785, 2006.
Burke RE, Levine DN, Tsairis P, Zajac FE 3rd. Physiological types andhistochemical profiles in motor units of the cat gastrocnemius. J Physiol234: 723–748, 1973.
Carpentier A, Duchateau J, Hainaut K. Motor unit behaviour and contractilechanges during fatigue in the human first dorsal interosseus. J Physiol 534:903–912, 2001.
Dimitrova NA, Dimitrov GV. Interpretation of EMG changes with fatigue:facts, pitfalls, and fallacies. J Electromyogr Kinesiol 13: 13–36, 2003.
Enoka RM. Morphological features and activation patterns of motor units.J Clin Neurophysiol 12: 538–559, 1995.
Enoka RM, Duchateau J. Muscle fatigue: what, why and how it influencesmuscle function. J Physiol 586: 11–23, 2008.
Everts ME, Clausen T. Excitation-induced activation of the Na�-K� pump inrat skeletal muscle. Am J Physiol Cell Physiol 266: C925–C934, 1994.
Farina D, Arendt-Nielsen L, Merletti R, Graven-Nielsen T. Assessment ofsingle motor unit conduction velocity during sustained contractions of thetibialis anterior muscle with advanced spike triggered averaging. J NeurosciMethods 115: 1–12, 2002.
Farina D, Gazzoni M, Camelia F. Low-threshold motor unit membraneproperties vary with contraction intensity during sustained activation withsurface EMG visual feedback. J Appl Physiol 96: 1505–1515, 2004.
Farina D, Muhammad W, Fortunato E, Meste O, Merletti R, Rix H.Estimation of single motor unit conduction velocity from surface electro-myogram signals detected with linear electrode arrays. Med Biol EngComput 39: 225–236, 2001.
Farina D, Negro F, Gazzoni M, Enoka RM. Detecting the unique represen-tation of motor-unit action potentials in the surface electromyogram, J Neu-rophysiol 100: 1223–1233, 2008.
Fuglevand AJ, Dutoit AP, Johns RK, Keen DA. Evaluation of plateau-potential-mediated “warm up” in human motor units. J Physiol 571: 683–693, 2006.
Gazzoni M, Camelia F, Farina D. Conduction velocity of quiescent musclefibers decreases during sustained contraction. J Neurophysiol 94: 387–394,2005.
Gissel H, Clausen T. Excitation-induced Ca2� uptake in rat skeletal muscle.Am J Physiol Regul Integr Comp Physiol 45: R331–R339, 1999.
Gorassini M, Yang JF, Siu M, Bennett DJ. Intrinsic activation of humanmotoneurons: reduction of motor unit recruitment thresholds by repeatedcontractions. J Neurophysiol 87: 1859–1866, 2002.
Heckman CJ, Gorassini MA, Bennett DJ. Persistent inward currents inmotoneuron dendrites: implications for motor output. Muscle Nerve 31:135–156, 2005.
Heckman CJ, Johnson M, Mottram C, Schuster J. Persistent inwardcurrents in spinal motoneurons and their influence on human motoneuronfiring patterns. Neuroscientist 14: 264–275, 2008.
Holobar A, Zazula D. Correlation-based decomposition of surface electro-myograms at low contraction forces. Med Biol Eng Comput 42: 487–495,2004.
Holobar A, Zazula D. Multichannel blind source separation using convolutionkernel compensation. IEEE Trans Signal Process 55: 4487–4496, 2007.
Kossler F, Lange F, Caffier G, Kuchler G. External potassium and actionpotential propagation in rat fast and slow twitch muscles. Gen PhysiolBiophys 10: 485–498, 1991.
Kugelberg E, Edstrom L. Differential histochemical effects of muscle con-tractions on phosphorylase and glycogen in various types of fibres. J NeurolNeurosurg Psychiatry 31: 415–423, 1968.
Lindinger MI, Sjøgaard G. Potassium regulation during exercise and recov-ery. Sports Med 11: 382–401, 1991.
Maluf KS, Enoka RM. Task failure during fatiguing contractions performedby humans. J Appl Physiol 99: 389–396, 2005.
McGill KC, Lateva ZC, Marateb HR. EMGLAB: an interactive EMGdecomposition program. J Neurosci Methods 149: 121–133, 2005.
Miles GB, Dai Y, Brownstone RM. Mechanisms underlying the early phaseof spike frequency adaptation in mouse spinal motoneurons. J Physiol 566:519–532, 2005.
Mottram CJ, Jakobi JM, Semmler JG, Enoka RM. Motor-unit activitydiffers with load type during a fatiguing contraction. J Neurophysiol 93:1381–1392, 2005.
Nordstrom MA, Gorman RB, Laouris Y, Spielmann JM, Stuart DG. Doesmotoneuron adaptation contribute to muscle fatigue? Muscle Nerve 35:135–158, 2007.
Nordstrom MA, Miles TS. Fatigue of single motor units in human masseter.J Appl Physiol 68: 26–34, 1990.
Sejersted OM, Sjøgaard G. Dynamics and consequences of potassium shiftsin skeletal muscle and heart during exercise. Physiol Rev 80: 1411–1481,2000.
Stålberg E. Propagation velocity in human muscle fibers in situ. Acta PhysiolScand 287: 1–112, 1966.
Stephens JA, Usherwood TP. The mechanical properties of human motorunits with special reference to their fatiguability and recruitment threshold.Brain Res 125: 91–97, 1977.
Taylor JL, Todd G, Gandevia SC. Evidence for a supraspinal contribution tohuman muscle fatigue. Clin Exp Pharmacol Physiol 33: 400–405, 2006.
Vilin YY, Ruben PC. Slow inactivation in voltage-gated sodium channels:molecular substrates and contributions to channelopathies. Cell BiochemBiophys 35: 171–190, 2001.
359MOTOR UNIT PROPERTIES DURING INTERMITTENT CONTRACTIONS
J Neurophysiol • VOL 101 • JANUARY 2009 • www.jn.org
by guest on May 31, 2013
http://jn.physiology.org/D
ownloaded from
Copyright © 2022 FDOKUMEN