Lithofacies supported granulometric analysis of the Middle Siwalik Subgroup of Mohand area,...
23
469 Lithofacies supported granulometric analysis of the Middle Siwalik Subgroup of Mohand area, North-Western Himalaya, India: A palaeoenvironmental application REKHA RANI 1 , U. K. SHUKLA 2 *, OMNATH SAHA 3 and M. K. PANDEY 4 1 GSI Residential complex, Faridabad, India 2 *Centre of Advanced Study in Geology, Banaras Hindu University, Varanasi-221005, India 3 GSI Residential complex, Agartala, India 4 Department of Geography, Banaras Hindu University, Varanasi-221005, India *Email : [email protected] Abstract A detailed grain size analysis of 27 samples of sandstones supported by lithofacies of the 400 m thick Middle Siwalik Subgroup, north-western Himalaya, India, was done to understand the dynamics of sedimentation. Lithofacies supports sedimentation in a wide foreland basin setting by migrating river channels flowing along the SW palaeoslopes and carrying sediment loads from the Himalaya. Though, some of the rivers seem to have deposited calcrete conglomerates reworking preexisting foreland basin sediments. The increased sandstone body thickness and grain size in the upper levels of the succession imply sedimentation under progressively humid climatic conditions coupled with enhanced tectonics at the source. Grain size analysis shows that most of the sandstone samples are in the size range of fine-grained sandstones, and only a few are in medium and very fine grained categories. In general, sediments are moderately well sorted, positively to negatively skewed and mainly leptokurtic to mesokurtic suggesting deposition under fluctuating energy conditions in different geomorphic domains within a fluvial setting. Bivariate plots combining the textural parameters also imply continental sedimentation for the Middle Siwalik Subgroup of the study area. Cumulative curves and C-M plot suggest sedimentation transport mainly by saltation and bottom suspension processes under varying energy conditions in aggrading channels. Key words: Middle Siwalik, Lithofacies, Granulometric analysis, Sediemt transport, Depositional environment INTRODUCTION The Siwalik Group represents synorogenic sedimentation in Himalayan Foreland Basin System that was formed in response to thrust sheet accumulation in the Himalaya during India-Asia collision. The Siwalik succession is 6-8 km thick and is exposed from MEMOIR OF THE GEOLOGICAL SOCIETY OF INDIA No. 77, 2011, ISBN: 978-81-907636-2-2, pp. 469-491
Transcript of Lithofacies supported granulometric analysis of the Middle Siwalik Subgroup of Mohand area,...

469
Lithofacies supported granulometric analysis of the Middle SiwalikSubgroup of Mohand area, North-Western Himalaya, India:
A palaeoenvironmental application
REKHA RANI1, U. K. SHUKLA2*, OMNATH SAHA3
and M. K. PANDEY4
1GSI Residential complex, Faridabad, India2*Centre of Advanced Study in Geology, Banaras Hindu University, Varanasi-221005, India
3GSI Residential complex, Agartala, India4Department of Geography, Banaras Hindu University, Varanasi-221005, India
*Email : [email protected]
Abstract
A detailed grain size analysis of 27 samples of sandstones supported by lithofacies of the400 m thick Middle Siwalik Subgroup, north-western Himalaya, India, was done to understandthe dynamics of sedimentation. Lithofacies supports sedimentation in a wide foreland basinsetting by migrating river channels flowing along the SW palaeoslopes and carrying sedimentloads from the Himalaya. Though, some of the rivers seem to have deposited calcreteconglomerates reworking preexisting foreland basin sediments. The increased sandstone bodythickness and grain size in the upper levels of the succession imply sedimentation underprogressively humid climatic conditions coupled with enhanced tectonics at the source. Grainsize analysis shows that most of the sandstone samples are in the size range of fine-grainedsandstones, and only a few are in medium and very fine grained categories. In general, sedimentsare moderately well sorted, positively to negatively skewed and mainly leptokurtic to mesokurticsuggesting deposition under fluctuating energy conditions in different geomorphic domainswithin a fluvial setting. Bivariate plots combining the textural parameters also imply continentalsedimentation for the Middle Siwalik Subgroup of the study area. Cumulative curves and C-Mplot suggest sedimentation transport mainly by saltation and bottom suspension processesunder varying energy conditions in aggrading channels.
Key words: Middle Siwalik, Lithofacies, Granulometric analysis, Sediemt transport, Depositionalenvironment
INTRODUCTION
The Siwalik Group represents synorogenic sedimentation in Himalayan ForelandBasin System that was formed in response to thrust sheet accumulation in the Himalayaduring India-Asia collision. The Siwalik succession is 6-8 km thick and is exposed from
MEMOIR OF THE GEOLOGICAL SOCIETY OF INDIANo. 77, 2011, ISBN: 978-81-907636-2-2, pp. 469-491

470
east to west all along the length of Himalaya. Spanning between Middle Miocene to MiddlePleistocene, the Siwalik succession is traditionally divided into Lower, Middle and UpperSiwalik Subgroups (Pilgrim, 1910). Recently Oil & Natural Gas Commission (ONGC)also classified the Siwaliks into three zones- Upper, Middle and Lower Siwalik on thebasis of heavy mineral assemblages (cf. Prakash and Bajpai 1971). The Lower and MiddleSiwaliks are sandstone dominated while Upper Siwalik is a conglomeratic succession.Present study relates to the Middle Siwalik Subgroup of Mohand area, north-westernHimalaya.
Fig.1. Geological map of the study area shows three major subdivisions of Siwalik belt and thestudied river sections staring from Mohan Rao River section in the east to Mohand Rao section inthe middle to Sakumbari Devi section in the west (modified after Karunakaran and Ranga Rao,1976; Valdiya, 1980; Kumar et al. 2004). B) Inset on the upper left corner shows the location ofstudy is in Dehradun Valley bounded by Ganga River in east and Yamuna River in the west. C) TheHimalayan Frontal fault separates the Siwalik belt from the Indo-Gangetic Plain.
Located on the southern flank of the Dehra Dun Valley between Yamuna and Ganga Riversaround Mohand Village, the study area comprises the Middle and Upper Siwalik rocksforming an anticlinal structure also known as Mohand Anticline. In the study area, the
REKHA RANI, U. K. SHUKLA, OMNATH SAHA AND M. K. PANDEY

471
Middle Siwalik Subgroup is palaeomagnetically dated between 10-5 Ma and correlated toNagri Formation of type area in Potwar Plateau of Pakistan Siwalik (Sangode and Kumar2004; Tandon, 1991). The studied section exposed along Mohan Rao River channel is 400m thick and probably corresponds to the upper part of dated Mahand Rao section (Sangodeet al 1999; Sangode and Kumar 2004) (Fig. 2).
Fig.2. Litholog of Mohan Rao (=River) section showing lithofacies, primary physical structures,grain-size and palaeocurrent trends. Location of sampling sites for S1 to S27 are in the litholog isalso shown. Measured section shows increasing upward grain-size and concurrent increase of sandbody thickness grading to gravelly Upper Siwalik. At the outcrop level, palaeocurrent trends arequite variable, but the rose diagram indicates bimodal palaeocurrent pattern and mean current directedto SW.
The Middle Siwalik Subgroup of Mohand area is rather well studied in terms ofmagnetostratigraphy, magnetic fabric on channel sands and rock magnetic ratios of pedogenic
LITHOFACIES SUPPORTED GRANULOMETRIC ANALYSIS OF THE MIDDLE SIWALIKSUBGROUP OF MOHAND AREA, NORTH-WESTERN HIMALAYA, INDIA:
A PALAEOENVIRONMENTAL APPLICATION

472
horizons Kumar and Nanda, 1989; Kumar and Ghosh, 1994; Kumar et al. 2004; Sangode etal. 1999, 2001). However, detailed facies analysis, sand body architecture, palaeocurrent,trace fossil studies, and systematic grain-size analysis of the Middle Siwalik Subgroup arestill awaited and need further attention. Present study is focused on sedimentological detailsusing major lithofacies and detailed grain size analysis to understand the processes ofsedimentation. For this purpose, three sections exposed along Shakumbri Devi Rao,Khajnawar Rao and Mohan Rao River sections are studied for sedimentological details(Fig.1). For detailed grain size analysis, the Mohan Rao River section is lithologged andsystematically sampled from lower to upper stratigraphic levels preferably from sandstonehorizons (Fig. 2). Delineation of major lithofacies and their vertical disposition helpeddecipher the geomorphic domains of sedimentation within the fluvial setting. Grain-sizedata are interpreted in conjunction with lithofacies and palaeocurrent to understand therelevance of different textural parameters in case of the Middle Siwalik Subgroup of Mohandarea.
MATERIAL AND METHODS
Based on field parameters such as grain size, primary physical structures, geometryof lithounits, palaeocurrent pattern and bioturbation structures, five major lithofaciesassociations, comprising a number of constituent lithofacies, have been identified anddescribed here in brief. For the grain-size analysis, 27 representative samples avoidingweathered horizons were collected from the sandstone units to characterize the MiddleSiwalik succession exposed in Mohan Rao River section. Fig. 2 presents all the 27 samplinglocations in the studied section. The samples were analyzed using sieve analysis (Ingram1971), and the statistical parameters are calculated following Folk and Ward (1957).Collected samples were crushed and soaked in dilute HCl (40%) for 3 days to removecarbonate content present in the form of minute calcrete globules. Samples were washed bywater and then dried in oven at temperatures of 300°C. Dried samples were weighed afterthe removal of impurities. Sieves are arranged at ¼ phi intervals from top to bottom byincreasing ASTM (American Society for Testing and Materials) sieve mesh numbers 8, 10,12, 14, 16, 18, 25, 30, 35, 40, 45, 50, 60, 70, 80, 100, 120, 140, 170, 200, 230, 270, 325 and400. Forty grams of each sample was placed on the uppermost sieve in a set of stackedsieves and shaken in the Retsch vibrating machine for 20 minutes. After shaking the remainingfraction in each mesh is collected and weighed. Data obtained was tabulated for extractingthe weight percentage which was converted into cumulative percentage for preparing thecumulative and frequency curves.
LITHOFACIES ANALYSIS
In the Mohand area, the Middle Siwalik and Upper subgroups are well exposed. Inthe upper levels, sandstone dominated the Middle Siwalik becomes gravelly andsystematically grades to the overlying conglomeratic Upper Siwalik Subgroup. The section
REKHA RANI, U. K. SHUKLA, OMNATH SAHA AND M. K. PANDEY

473
is comprised of tens of meter thick sandstones and mudstones which are often calcareousand interbedded with calcrete conglomerate units. The sandstones are fine to mediumgrained, multistoried, gray to buff in color and profusely cross-bedded. Mudstone units aregray to brownish black and red coloured showing mottling and nodular appearance.
Fig. 3. (A) Multistoried and cross-bedded sandstone association developed in the Mohan Rao Riversection. Three sandstone bodies (1, 3 and 3) are separated by lensoidal grey mudstone units offloodplain origin (marked by arrows). The upper most sand body in itself is a multistoried complexhaving erosionally superimposed stories a, b and c; height of the person is 175 cm. (B) Bedded,mottled, parallel and ripple cross-laminated and sparingly calcretzed siltstone association representinglevee deposits in Mohand Rao section; scale, pencil length 15 cm.
LITHOFACIES SUPPORTED GRANULOMETRIC ANALYSIS OF THE MIDDLE SIWALIKSUBGROUP OF MOHAND AREA, NORTH-WESTERN HIMALAYA, INDIA:
A PALAEOENVIRONMENTAL APPLICATION

474
The Middle Siwalik Subgroup of the study area shows intense vertical and lateralfacies changes in terms of frequency and overall development (Figs. 2 and 3). In differentsections, following five lithofacies associations are identified. These lithofacies are: (i)sandstone association, (ii) siltstone association, (iii) calcrete conglomerate association,
Fig. 3. (C) Photograph showing multistoried calcrete conglomerate association made up of laterallyshifting sheet like stories composed of lensoidal beds in Sakumbari Devi section; scale, height of theperson 175 cm. (D) Close up of calcrete conglomerate units showing angular to sub-rounded calcreteand mudstone clasts (mostly 2-5 cm sized) suspended in sandy matrix; scale, hammer length 29 cm.(E) Close up of floodplain mudstone deposit showing pink and green mottled on brownish background in Mohand Rao section; scale, hammer length 32 cm. (F) Photograph showing verticalassociation of channel sandstone, siltsty levee, muddy floodplain and red colored silt-mudstonevalley fill deposits forming fining upwards (FU) fluvial cycle in Sakumbari Devi section; scale,height of the person is 160 cm.
REKHA RANI, U. K. SHUKLA, OMNATH SAHA AND M. K. PANDEY

475
(iv) mudstone association and (v) mottled silt-mudstone association. Each facies associationrepresenting sedimentation in specific geomorphic setting is consisted of a number oflithofacies deposited under varying hydrodynamic conditions. A brief description oflithofacies associations is given below.
Sandstone association
This association is characterized by multistoried fine to medium-grained sandstonebodies. Sandstone bodies vary in thickness from 4 m to 60 m (rarely up to 100 m, see Fig.2) and are small to large-scale cross-bedded (Fig. 3A). They have erosional lower contactsoften marked by dcm to meter thick basal lag deposits made up of reworked calcrete, mudballs and rock fragments. Erosional relief is generally in meter scale.
In case of thicker sandstone bodies (more than 15 m thick), generally 3 to 6 stories,each of 2-5 m thick, erosionally superimpose from different directions to generate amultistoried complex (Fig. 3A). In contrast, thinner sandstone bodies (4 - 10 m thick)show laterally shifting stories (2 - 3 m thick) having erosional contacts and often markedby lensoidal mudstone units of limited lateral extent. From bottom to top of the individualstories, a number of lithofacies are discernible. Important lithofacies are planar- and- troughcross-bedded sandstone, low-angle horizontally bedded sandstone, parallel laminatedsandstone, ripple cross-laminated sandstone and mottled sandstone. Based on large-scalecross-bedding, palaeocurrent is directed to SW (Fig. 2). These sandstones are subjected todetailed grain-size analysis described in the following section.
Siltstone association
Siltstone association is 3 - 5 m thick and is made up of 7 - 15 cm thick lensoidalinterbeds of siltstone and silt-rich mudstones. This association gradationally follows thesandstone association, and gradationally merges with the overlying mudstone association(Fig. 3B, F). This association has overall sheet like geometries and show development ofmostly small-scale to rarely large-scale primary sedimentary structures including ripplecross-lamination, climbing ripple cross-lamination, parallel lamination, scour fill structures,and load structures. Well preserved mostly vertical and inclined, actively and passivelyfilled animal burrows and plant traces including root casts are fairly common in mudstoneinterbeds. Occasionally, up to a meter thick fine-grained channelized and lensoidal finegrained sandstone units having solitary large-scale cross-beds (5 - 7cm thick) are alsoincorporated. This association can be identified into ripple-parallel laminated siltstone,mottled mudstone and large-scale cross-bedded silty fine grained sandstone lithofacies.
Calcrete conglomerate association
This association is encountered in the lower stratigraphic levels in the Shakumbri DeviRao section; though, lensoid units of calcrete conglomerates are present at the erosionalbases of sandstone bodies as basal lags through out the Middle Siwalik Subgroup in thestudy area. In general, calcrete conglomerate units are 20 cm – 5 m thick (Fig. 3C), singleand multistoried, erosionally based and large-scale (mostly 8-30 cm thick) planar cross-
LITHOFACIES SUPPORTED GRANULOMETRIC ANALYSIS OF THE MIDDLE SIWALIKSUBGROUP OF MOHAND AREA, NORTH-WESTERN HIMALAYA, INDIA:
A PALAEOENVIRONMENTAL APPLICATION

476
bedded. They are made up of calcrete nodules and mud balls of mm to a few cm in size andsub-angular to round in shape. They are clast- to- matrix-supported (Fig. 3D). In case ofmatrix-supported units, angular mudstone clasts and calcretes are suspended in sandy matrixshowing crude imbrications. Conglomerates show normal as well as reverse grading andmay laterally grade into gravelly medium to coarse-grained sandstones. The cross-beddedconglomerate units often have the sandy interbeds showing parallel lamination, ripple cross-lamination and rarely large-scale cross-beds. Laterally accreted (LA elements) conglomerateunits are more common than the units showing amalgamation of unit bars from differentdirections (Fig. 3C). This association can be identified in to clast-supported calcreteconglomerate, matrix-supported calcrete conglomerate, graded calcrete conglomerate andcross-bedded conglomeratic sandstone lithofacies.
Mudstone association
The mudstone units are 2-5 m (rarely 10 m) thick, grey to black in color and lensoidin geometry (Fig. 3A). Stratigraphically, it gradationally follows both the sandstone andsiltstone associations (Figs. 3A, F). It shows preserved organic content, wood logs, leafimpressions and a variety of animal and plant traces. These units often contain pink andgreenish grey mottles on yellowish brown back ground (Fig. 3E). At places where siltcontent increases, small ripples and lamination is also developed. Occasionally up to ameter thick erosionally based and ripple cross-laminated sandy siltstone units of limitedlateral extent are also present. This association can be identified in to carbonaceousmudstone, mottled mudstone, and rippled siltstone lithofacies.
Mottled silt-mudstone association
This association is multicolored with various shades of green, gray, yellow, red,maroon and a mixture of different colours. Such units are mostly 2-4 m thick (rarely up to16 m thick) and laterally persistent (valley fill deposit in Fig. 3F). It may contain dcm thicklensoidal sandy beds having sharp erosional bases. Because of intense mottling, they aredevoid of primary sedimentary structures. Spheroidal nodular structures, cracks filled withcalcite, calcrete and ferruginous nodules and rhyzocretes are common features developedin these units. This association follows the sandstone association and the mudstoneassociation mostly with a gradational transition (Fig. 3F). The association can be identifiedin to mottled silt-mudstone, calcretized mudstone and laminated silty sandstone lithofacies.
GRANULOMETRIC ANALYSIS
Granulometric analysis is a classical tool and provides additional informationregarding sediment transport, energy conditions and depositional environment (cf. Udden1914; Wentworth 1929; Otto 1939; Keller 1949; Inman and Chamberlein 1955; Srivastavaand Mankar 2009). Various textural parameters such as graphic mean, standard deviation(sorting), skewness and kurtosis have environmental significance and are useful forunderstanding synsedimentary hydrodynamic factors of transportation and deposition in abasin (Folk and Ward 1957: Friedman 1961; Friedman 1979; Doeglas 1964; Passega 1957,1964; Srivastava and Mankar 2009; Vijaya Lakshmi et al. 2010).
REKHA RANI, U. K. SHUKLA, OMNATH SAHA AND M. K. PANDEY

477
Being a classical tool used for many decades to understand transport behaviourand size-sorting processes of sediments in numerous environments, the granulometricanalysis proposed by Folk and Ward (1957) and others have been widely discussed fortheir merits and demerits (Sun et al. 2002; Flemming 2007; Molinaroli et al. 2009). Whencompared with the gain size distribution results, however, obtained from new techniques(e.g. sieving, laser absorption and diffraction, settling velocity measurements), it is realizedthat though the methods described by earlier workers (Krumbein and Pettijohn 1938; Folkand Ward 1957) are not foolproof and rely heavily on the validity of the assumptions onwhich they are based, yet may serve as a potential tool for evaluating sediment charactersduring the processes of transportation and sedimentation if sampling is done objectivelyand integrated with meticulous field observation of the rocks (Kalicki 2000; Allena andHaslettb 2006; Bartholdy et al. 2007).
Frequency and Cumulative curves
Frequency curves drawn on arithmetic graph paper ordinates show distribution ofparticle size and they are good indicators of frequency distribution of the sedimentpopulations. Maximum samples (18 samples) are fine grained sand and some are very fine(2 samples) to medium grained (7 samples) sand (Fig. 4a, b; Table 1). The analyzed sandstonesamples show unimodal (13 samples), bimodal (9 samples) and polymodal (3 samples)nature of the curve. Therefore the results show that most of the samples are fine-grainedand unimodal. Cumulative curves are plotted on the arithmetic scale with the combinationof cumulative weight percentage at the Y- axes and phi values at the X-axes. These curvesprovide grain size information values of phi (ô), which is used in mathematical calculationsof statistical parameters (graphic mean, graphic standard deviation, graphic skewness andgraphic kurtosis) proposed by Folk and Ward (1957). When plotted on the arithmetic scale,cumulative curves typically show the S-shape trend. The slope of central portion of thecurve indicates sorting of the sample; if there is very gentle slope, it indicates poor sortingand very steep slope means good sorting. The analyzed samples have the S-type slope (Fig.4c, d). Most of the samples (17 samples) forming 63% population of the collected samplesare well sorted to moderately well sorted. Remaining 7 samples (22%) are moderatelysorted, 1 sample each poorly sorted (S-26) and very poorly sorted (S-5) and 2 samples verywell sorted (S-6 and S-10).
Textural parameters
Different textural parameters are determined graphically through cumulative curvesby reading the values of phi of Ö1, Ö5, Ö16, Ö25, Ö50, Ö75, Ö84, and Ö95. A number offormulae have been proposed by different workers to calculate four main statisticalparameters viz. graphic mean (Mz), graphic standard deviation (ó1), graphic skewness (SK)and graphic kurtosis (KA) (Wentworth 1929; Krumbein and Pettijohn 1938; Friedman 1961,62, 67; Sahu 1964). However, the formulae given by Folk and Ward (1957) including 90%of the curve are most suitable and used in the present work to calculate following statisticalparameters. These parameters are effective tools for the interpretation of sedimentaryprocesses operative in depositional environments (Le Roux and Rojas 2002; Sun et al.2002; Flemming 2007; Bartholdy et al. 2007; Vijaya Lakshmi et al. 2010).
LITHOFACIES SUPPORTED GRANULOMETRIC ANALYSIS OF THE MIDDLE SIWALIKSUBGROUP OF MOHAND AREA, NORTH-WESTERN HIMALAYA, INDIA:
A PALAEOENVIRONMENTAL APPLICATION

478
Graphic Mean (Mz)
The graphic mean is the average particle size of the sediment and is calculated bythe formula Ö16 + Ö50 + Ö84 / 3. Out of analyzed samples, about 67% samples are finegrained (2.05 - 2.93Ö), 26% medium grained (2.0 - 1.56 Ö) and 7% (samples, S-15, S-1),very fine grained (3.03 - 3.07Ö). So, the majority of the samples are fine sand sized withaverage value of 2.27 Ö (Table 1).
Graphic Standard Deviation
Graphic standard deviation (ó1) is calculated by the formula Ö84 – Ö16 / 4 + Ö95 –Ö5 / 6.6, and it measures the sorting or uniformity of the grains and indicates the state of theenergy conditions prevailing during transport and in the basin of deposition. Out of analyzedsamples, 44% samples moderately well sorted (ó1 = 0.52 - 0.65), about 22% are moderatelysorted (ó1 = 0.75 - 0.84), 19% well sorted (ó1 = 0.41 - 0.50), and 7% (sample, S-6) very wellsorted (ó1=0.29). Remaining two samples, S-26 and S-5, each representing 4% of thesamples, are respectively poorly sorted (ó1 = 1.63) and very poorly sorted (ó1 = 2.68) (Table1).
Fig. 4. Frequency (a, b) and cumulative (c, d) curves drawn on arithmetic paper show grain-sizetrends of analyzed samples of sandstones of Middle Siwalik in Mohan Rao River section of DehraDun Valley.
REKHA RANI, U. K. SHUKLA, OMNATH SAHA AND M. K. PANDEY

479
Table 1: Results of the Textural Parameters of the analyzed sandstone samples of Middle Siwalik ofMohan Rao River section. Mz = Graphic Meane, ó1 = Standard Deviation, sk = Skewness, Ka =Kurtosis, C = One percentile values, M = Median values.
Sample no.
Ф95 Ф 84 Ф 75 Ф50 Ф25 Ф16 Ф5 Ф1 (Mz) in φ
(σ1) (Sk) (Ka) C in micron
M in micron
S -1 4 3.8 3.6 3.3 2.9 2.1 1.2 0.7 3.067 0.849 -0.456 1.639 700 3300 S-2 3.5 3 2.8 2.45 2.15 1.9 1.6 1.1 2.45 0.562 -0.21 2.923 1100 2450 S-3 2.6 2.3 2.1 1.75 1.4 1.3 0.9 0.65 1.783 0.507 0.05 0.995 650 1750 S-4 3.4 2.9 2.55 2 1.7 1.6 1.3 1 2.167 0.635 0.375 0.906 1000 2000 S-5 3.1 2.7 2.5 2.15 1.7 1.4 0.9 0.8 2.083 2.683 -0.145 1.127 800 2150 S-6 2.2 1.9 1.8 1.7 1.3 1.1 0.9 1.1 1.566 0.296 -0.365 1.065 1100 1700 S-7 3.5 3.1 2.9 2.5 1.99 1.7 1.2 1.15 2.434 0.699 -0.136 1.036 1150 2500 S-8 3 2.6 2.4 2.1 1.9 1.8 1.6 1.45 2.167 0.412 0.268 1.148 1450 2100 S-9 3.9 3.4 3.2 2.9 2.7 2.5 1.9 1.35 2.933 0.528 0.055 1.639 1350 2900 S-10 3.4 3.1 3 2.8 2.7 2.6 2.3 -1.1 2.833 0.291 0.145 1.502 100 2800 S-11 3.6 3 2.8 2.4 2.2 2 1.8 0.1 2.467 0.522 0.267 1.229 100 2400 S-12 3.5 2.9 2.6 2 1.6 1.4 1 1.4 2.1 0.754 1.1 1.024 1400 2000 S-13 3.3 2.85 2.3 1.9 1.6 1.4 1.1 0.7 2.05 0.695 1.44 1.78 700 1900 S-14 3.35 2.8 2.5 2.1 1.8 1.7 1.4 0.8 2.2 0.563 -2.01 1.11 800 2100 S-15 3.8 3.4 3.25 3 2.8 2.7 2.2 1.1 3.03 0.417 0.071 1.46 1100 3000 S-16 3.3 3.1 3 2.7 2.4 2.2 1.9 1.05 2.66 0.429 -0.11 0.922 1050 2700 S-17 3 2.85 2.7 2.3 1.9 1.8 1.4 1.65 2.31 0.497 -0.024 0.794 1650 2300 S-18 3.25 2.8 2.65 2.3 1.9 1.7 0.9 1 2.26 0.631 -0.523 1.284 1000 2300 S-19 3.5 3.05 2.9 2.6 2.3 2.1 1.6 0.25 2.58 0.524 -0.052 1.29 250 2600 S-20 3.8 3.1 2.85 2.45 2.15 2 1.7 0.3 2.52 0.585 0.248 1.2 300 2450 S-21 3.5 2.9 2.2 1.8 1.4 1.2 0.8 1.2 1.96 0.834 0.276 1.38 1200 1800 S-22 3.7 2.85 2.45 1.9 1.6 1.45 1 0.4 2 0.75 0.34 1.3 400 1900 S-23 3.35 2.9 2.65 2.15 1.8 1.6 1.1 0.7 2.2 0.658 0.12 1.06 700 2150 S-24 3.1 2.5 2.1 1.5 1 0.8 0.5 0.5 1.6 0.819 0.115 0.969 500 1500 S-25 3.3 2.8 2.6 2.1 1.7 1.6 1.3 0.95 2.167 0.603 0.183 0.91 000 2100 S-26 3.2 2.8 2.5 1.9 1.5 1.3 0.8 0.4 2 1.631 0.142 0.983 950 1900 S-27 3.2 2.65 2.3 1.6 1.2 0.95 0.6 0.2 1.733 0.819 0.232 0.968 400 1600
Average 2.24 2.27 0.71 0.05 1.25
Graphic Skewness
Skewness (Sk1) measures the degree of asymmetry in the frequency curves in termsof domination of fine or coarse-grained fractions. It has been calculated by formula Ö84 +Ö16 – 2 Ö50 / 2(Ö84 – Ö16) + Ö5 + Ö95 – 2Ö50 / 2(Ö95- Ö5). The analyzed samples of sandstonesshow that 37% samples are positively skewed (Sk1 = 0.11 to 0.27), 19% negatively skewed(Sk1 = -0.11 to -2.01), 11% samples (S-1, S-18 and S-6) strongly negatively skewed (Sk1 = -0.52, -0.45 and -0.36 respectively), 19% strongly positively skewed (Sk1 = 0.34 to 1.44) andremaining 14% samples (S-3 and S-9) are near symmetrical (Sk1 = 0.05). Data shows thatmaximum samples are positively skewed ranging in Skewness values from 0.11 to 0.27denoting domination of finer material in the tail (Table 1). Though, sizable number ofsamples are negatively skewed with SK1 values varying between -0.11 to -2.01 indicatingdomination of coarser material in the tail.
Graphic Kurtosis
According to Cadigan (1961), Kurtosis (KG) is the measure of peakedness of thefrequency curve. It is calculated by formula Ö95 – Ö5 / 2.44 (Ö75 – Ö25). Kurtosis is aquantitative measure of shape of the frequency curve, and ratio between the sorting in thetail and central portion of the curve. Accordingly, if central portion is better sorted than thetail, the curve is said to be leptokurtic (excessively peaked), but if tail is better sorted than
LITHOFACIES SUPPORTED GRANULOMETRIC ANALYSIS OF THE MIDDLE SIWALIKSUBGROUP OF MOHAND AREA, NORTH-WESTERN HIMALAYA, INDIA:
A PALAEOENVIRONMENTAL APPLICATION
480
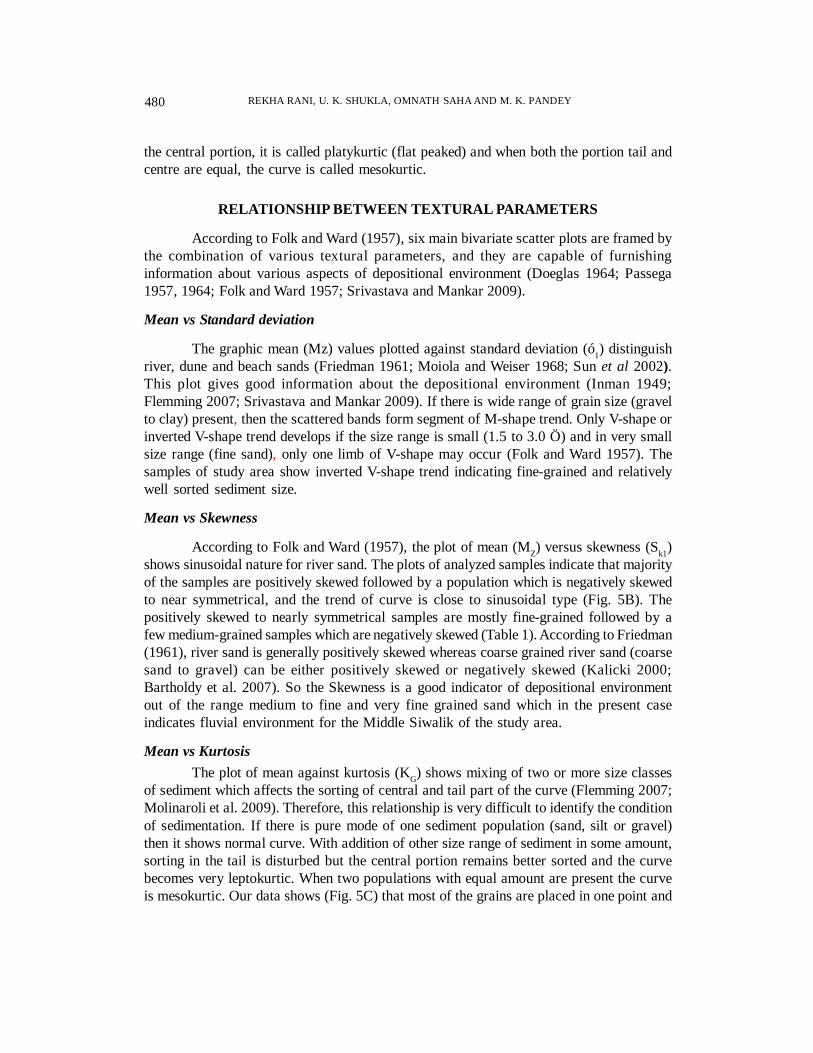
the central portion, it is called platykurtic (flat peaked) and when both the portion tail andcentre are equal, the curve is called mesokurtic.
RELATIONSHIP BETWEEN TEXTURAL PARAMETERS
According to Folk and Ward (1957), six main bivariate scatter plots are framed bythe combination of various textural parameters, and they are capable of furnishinginformation about various aspects of depositional environment (Doeglas 1964; Passega1957, 1964; Folk and Ward 1957; Srivastava and Mankar 2009).
Mean vs Standard deviation
The graphic mean (Mz) values plotted against standard deviation (ó1) distinguishriver, dune and beach sands (Friedman 1961; Moiola and Weiser 1968; Sun et al 2002).This plot gives good information about the depositional environment (Inman 1949;Flemming 2007; Srivastava and Mankar 2009). If there is wide range of grain size (gravelto clay) present, then the scattered bands form segment of M-shape trend. Only V-shape orinverted V-shape trend develops if the size range is small (1.5 to 3.0 Ö) and in very smallsize range (fine sand), only one limb of V-shape may occur (Folk and Ward 1957). Thesamples of study area show inverted V-shape trend indicating fine-grained and relativelywell sorted sediment size.
Mean vs Skewness
According to Folk and Ward (1957), the plot of mean (MZ) versus skewness (Sk1)shows sinusoidal nature for river sand. The plots of analyzed samples indicate that majorityof the samples are positively skewed followed by a population which is negatively skewedto near symmetrical, and the trend of curve is close to sinusoidal type (Fig. 5B). Thepositively skewed to nearly symmetrical samples are mostly fine-grained followed by afew medium-grained samples which are negatively skewed (Table 1). According to Friedman(1961), river sand is generally positively skewed whereas coarse grained river sand (coarsesand to gravel) can be either positively skewed or negatively skewed (Kalicki 2000;Bartholdy et al. 2007). So the Skewness is a good indicator of depositional environmentout of the range medium to fine and very fine grained sand which in the present caseindicates fluvial environment for the Middle Siwalik of the study area.
Mean vs KurtosisThe plot of mean against kurtosis (KG) shows mixing of two or more size classes
of sediment which affects the sorting of central and tail part of the curve (Flemming 2007;Molinaroli et al. 2009). Therefore, this relationship is very difficult to identify the conditionof sedimentation. If there is pure mode of one sediment population (sand, silt or gravel)then it shows normal curve. With addition of other size range of sediment in some amount,sorting in the tail is disturbed but the central portion remains better sorted and the curvebecomes very leptokurtic. When two populations with equal amount are present the curveis mesokurtic. Our data shows (Fig. 5C) that most of the grains are placed in one point and
REKHA RANI, U. K. SHUKLA, OMNATH SAHA AND M. K. PANDEY

481
the shape of curve is inverted V type. Though, trend of analyzed samples is leptokurtic tomesokurtic with some platykurtic trends (Fig. 5C). Leptokurtic sediments are fine-grainedto very fine-grained, and platykurtic to mesokurtic are fine to medium grained (Table 1).
Fig. 5. Bivariant scatter plots of analyzed samples drawn on model plots proposed by Folk and Ward(1957) in the Siwalik Subgroup in the Mohan Rao River section. (A) Mean Size vs Standard Deviation,(B) Mean Size vs Skewness, (C) Mean Size vs Kurtosis, (D) Skewness vs Standard Deviation, (E)Standard Deviation vs Kurtosis and (F) Skewness vs Kurtosis.
Skewness vs Standard deviation
The combination between skewness (Sk1) and standard deviation (ó1) helps todifferentiate river sediments from beach sediments (Friedman 1961, 1967; Sun et al. 2002;Flemming 2007). Symmetrical curve may be obtained when unimodal sediment populationwith good sorting or equal mixture of two modes with poor sorting are present. Verynegatively skewed values are obtained when coarser size range dominates over finersediments. The plot of analyzed samples form a ring in a particular area indicating unimodalnature of sediment population (cf. Folk and Ward 1957), and those grains are moderatelywell sorted to moderately sorted and positively skewed to negatively skewed. However,
LITHOFACIES SUPPORTED GRANULOMETRIC ANALYSIS OF THE MIDDLE SIWALIKSUBGROUP OF MOHAND AREA, NORTH-WESTERN HIMALAYA, INDIA:
A PALAEOENVIRONMENTAL APPLICATION

482
five samples are scattered away from the cluster (Fig. 5D) which implies mixing of twosize classes of a single mode.
Standard deviation vs Kurtosis
The relation between standard deviation (ó1) and kurtosis (KG) shows that maximumsamples of sand are in leptokurtic range and some are mesokurtic, and grains are moderatelywell sorted to well sorted (Fig. 5E). The highest value of kurtosis (leptokurtic) is achievedwhen one mode of sediment present is subordinate and sediment population moderatelysorted (Sun et al. 2002; Flemming 2007).
Skewness vs Kurtosis
This plot between skewness (Sk1) and kurtosis (KG) has been proposed to distinguishbeach, dune and eolian sands (Mason and Folk 1958; Kalicki 2000; Sun et al. 2002; Allenaand Haslettb 2006; Flemming 2007; Molinaroli et al. 2009). This plot mainly depends onthe quantity of two modes. By the combination of these parameters, a regular path occurs.Generally pure sand mode gives normal curve, whereas by the addition of other modes(gravel) it is disturbed (Folk and Ward 1957). However, if fine material is in excess, thecurve moves in positively skewed leptokurtic region. In the present study, the data indicatein mesokurtic, leptokurtic to very leptokurtic range, with positively skewed to negativelyskewed character which indicates sand with fewer amounts of fine-grained silt and clay(Fig. 5F). This combination differentiates it from beach and dune sediments and places itas river deposits (Friedman 1967; Srivastava and Mankar 2009).
SIGNIFICANCE OF GRANULOMETRUC ANALYSIS
It is well known that the Middle Siwalik had been deposited in the HimalayanForeland Basin setting by fluvial processes (Prakash et al. 1980; Raiverman et al. 1983;Willis 1993; Zaleha 1997; Sharma et al. 2000; Shukla et al. 2009). However, in the presentstudy grain size parameters have been used to evaluate different aspects of sedimentationin river channels under the fluvial setting and also the applicability of granulometric analysisin the Middle Siwalik Subgroup. Textural parameters and the bivariate scatter plots proposedby different workers (Folk and Ward 1957; Friedman 1979; Moiola and Weiser 1968)have indicated that the Middle Siwalik Subgroup of Mohan Rao section represents fluvialsedimentation, though complexity of transportation and depositional processes haveimparted varied sediment characters to the rocks (Figs. 4, 5 and 6). The plot between meansizes vs standard deviation, standard deviation against skewness and kurtosis vs skewnessare effective tools to differentiate between beach and river sands (Sun et al. 2002; Flemming2007; Srivastava and Mankar 2009). These three plots show that fine-grained sandstonesshowing relatively better sorting and positive skewess represent fluvial environment in abasin of wide aerial extent for the Middle Siwalik of Mohan Rao section (Fig. 6).
The frequency curves and the graphic mean (MZ) values show that sedimentpopulation of the studied samples is mostly fine-grained and unimodal along with a fewsamples having medium sand size and mixed character (Fig. 4a, b; Table 1). The skewness
REKHA RANI, U. K. SHUKLA, OMNATH SAHA AND M. K. PANDEY

483
Fig. 6. Bivariate plots (a-c) proposed by Folk and Ward (1957) characterizing the depositionalenvironment of the Middle Siwalik of Mohan Rao River section as river deposits.
also indicates the source of the sediment (Sun et al. 2002; Flemming 2007), and the shapeof the resulting curve varies according to skewness which in turn is dependent upon thetype of material present. If single source sediment is present, then the curve is fairly normal,whereas with multiple source sediment the curve shows marked skewness. When sedimentconsists of dominantly one end member with small amount of other member they showextremely skewed conditions. Our data indicate that most of the samples are fine-grainedsand positively skewed which is mostly the characteristic of fluvial deposits (Friedman1978; Sun et al. 2002; Flemming 2007) (Table 1). Generally, river born sediments areconsidered to show poor sorting and the values of standard deviation (ó1) for river sedimentsmay range from 1.30 to 1.40 Ö (Friedman 1978; Wolman 1978). In our study most of thesamples however, show moderately better sorting having lower values of standard deviation(Fig. 4c, d; Table 1). Dominantly mesokurtic to leptokurtic and rarely platykurtic behaviourof the sediments also imply improved sorting of the sediments (Folk and Ward, 1957;Flemming 2007; Molinaroli et al. 2009). Relatively better sorting of the sediments in thechannel sandstones might be due to high energy and prolonged transport within a wideforeland basin setting of the Middle Siwalik times. However, the mixed character of somesediment samples would have been due to sediment contribution from tributaries to the
LITHOFACIES SUPPORTED GRANULOMETRIC ANALYSIS OF THE MIDDLE SIWALIKSUBGROUP OF MOHAND AREA, NORTH-WESTERN HIMALAYA, INDIA:
A PALAEOENVIRONMENTAL APPLICATION

484
main channels and/or due to high rate of sedimentation in aggrading channel (Flemming2007; Molinaroli et al. 2009).
Fig. 7. Log probability plots (A-D) of the analyzed samples showing mode of transportation ofsediments by traction, suspension and saltation processes.
Cumulative probability curves are drawn on log probability paper in which, at theY-axis is plotted the cumulative frequency percentage and on the X-axis, the phi value(Fig. 7). These plots indicate the mode of transportation of sediment grains within adepositional medium (Visher 1969; Srivastava and Mankar 2009). These plots indicatetwo or three straight line segments rather than a single straight line. Each segment of thecurve is interpreted to show different sub populations of grain that were transportedsimultaneously but by different ways i.e. suspension, saltation and as traction bed load. Allthe 27 samples plotted in log probability paper indicate that most of the sediments aretransported mainly by saltation-traction and suspension mode (Fig. 7A-D). These plotsalso indicate sorting of the sediment where most of the grains are moderately well sortedprobably due prolonged transport and winnowing processes (Bartholdt et al. 2007;Bartholomae et al. 2007; Vijaya Lakshmi et al. 2010).
To interpret conditions of sediment transport, in addition to cumulative probabilitycurves, we also tried the method described by Passega (1964, 1977) who interpreted grainsize data using C-M plots. This plot is drawn by the combination of coarsest grain in thedeposit C (one percentile value) in microns and M (median) in microns on double log
REKHA RANI, U. K. SHUKLA, OMNATH SAHA AND M. K. PANDEY

485
probability paper (Fig. 8). In general the particle size of clastic sediment defines the hy-draulic energy condition of the environment (Kalicki 2000; Le Roux and Rojas 2002;Molinaroli et al. 2009). Coarser grains are transported and deposited by energetic, fastermoving currents than the finer grains of the sediments. Thus grain size clearly indicatesdistance of transport from the source and energy condition of transporting medium. How-ever, the upper size limits of grains carried in suspension or saltation are related to thepower of the transporting medium. Such limitations do not affect the fine size in transport(Friedman 1961; Kalicki 2000; Le Roux and Rojas 2002). Our samples mostly indicatesuspension of grain in different mode such as, transportation as graded suspension, bottomsuspension and rolling (Fig. 8). Results are similar to what have been shown by the cumu-lative probability curves (Fig. 7). As indicated by grain size constitution and mostly as bedload sedimentation, the current energy in the channels during normal conditions of deposi-tion would have been low to medium ranging from 20-100 cm/sec.
Fig. 8. C-M plot indicates the position of analyzed samples of the Middle Siwalik of the study area inthe standard model of Pasega (1957, 1964) indicating graded suspension as the dominant processresponsible for sediment transport in the channels.
DISCUSSION
Major lithofacies constitution, geometry of lithounits and their mutual associationalong with grain-size parameters suggest that the Middle Siwalik of the study area wasdeposited purely under continental setting by river channels and related overbank areas(Figs. 2; 3F). Sandstone facies association showing erosionally based multistoried and
LITHOFACIES SUPPORTED GRANULOMETRIC ANALYSIS OF THE MIDDLE SIWALIKSUBGROUP OF MOHAND AREA, NORTH-WESTERN HIMALAYA, INDIA:
A PALAEOENVIRONMENTAL APPLICATION

486
small to large-scale cross-bedded sandstone bodies represent sedimentation as channel bardeposits (Bridge, 1993; Miall, 1996; Shukla et al. 2001; Shukla et al. 2009) (Figs. 2; 3A).Having gradational contacts with the underlying sandstones, the siltstone facies associationis characterized by mostly small-scale features and mudstone interbeds representing leveesedimentation (Stewart 1983; Ricken et al. 1998; Shukla and Singh 2004) (Fig. 3B). It issucceeded by the mudstone association of the flood plain origin (Kraus and Gwinn 1997;Shukla et al. 2009). Containing animal and plant traces and preserved organic matter, themudstones suggest that flood plains were vegetated and inhabited by animals (Fig. 3E).Near the top of the mudstones, variously colored and mottled silt-mudstone facies associationoccurs to represent valley fill deposits (Singh et al. 1997; Kraus and Gwinn 1997) (Fig.3F). This association develops when river channels are either filled or laterally shift due tolateral migration and avulsion processes. Thickly developed amalgamating multistoriedsandstone bodies, variable outcrop level palaeocurrent trends and subordinate presence offine-grained lithofacies suggest that palaeochannels were mostly braided type. They werefreely migrating and eroding intervening muddy floodplain deposits (Bridge 1985; Shuklaet al. 1999; Nichols and Fisher 2007; Shukla et al. 2009) (Figs. 2; 3A). Whereas, smallermeandering channels with laterally shifting stories had well developed levees flanked byvegetated floodplain areas (Shukla and Singh 2004; Shukla et al. 2009). Mean direction ofpalaeocurrent for the Mohan Rao section suggests south-westerly palaeoslope (2120) ofthe basin of deposition (Fig. 2).
The Middle Siwalik Subgroup of the study area also shows calcrete conglomeratesorganized in the form of a few meter thick laterally shifting multistoried complexes mostlyoccurring at the lower levels of the succession (Fig. 3C-D). As indicated by sub-angular torounded a few cm sized reworked calcrete forming large-scale cross-beds, it seems that inthe beginning of Middle Siwalik sedimentation, some smaller rivers were meandering andflowing across the surfaces having extensive calcrete development (Singh et al. 1999;Shukla 2009). The major rivers having high increased water budget carried sedimentsdirectly from the Himalayan orogen.
Grain size analysis of 27 samples from the Middle Siwalik Subgroup of MohanRao River section corroborates the view of facies analysis and identifies the succession asfluvial deposits. The succession is made up of mostly fine-grained (rarely medium-grained)sandstones (Figs. 2, 4; Table 1). Textural parameters and their combination of bivariateplots show mostly unimodal, relatively well sorted, positively to negatively skewed andleptokurtic to mesokurtic nature of the sediments, suggesting sedimentation under differentset of conditions of transportation and deposition (Sun et al. 2002; Flemming 2007;Molinaroli et al. 2009; Kalicki 2000; Allena and Haslettb 2006; Bartholdy et al. 2007)(Figs. 5-7; Table 1). Cumulative curves and C-M plots indicate transportation of sedimentmainly by bed load and suspension processes (Fig. 8). These results also suggest that duringsedimentation, energy conditions were variable and quickly fluctuating. Based on sedimentcharacter, similar deductions have been made for the Middle Siwalik rocks of differentregions (Kumar and Nanda 1989; Zaleha 1997; Sharma et al. 2000).
REKHA RANI, U. K. SHUKLA, OMNATH SAHA AND M. K. PANDEY

487
Dominantly unimodal nature of grain-size population may imply sediment supplyfrom a single source by rivers of comparable strength (Sun et al. 2002; Flemming 2007).The whole of the Middle Siwalik Subgroup is made up of micaceous gray to buff colouredsand containing quartz, appreciable amount of feldspars, lithic grains and dark colouredferromagnesian minerals (Prakash et al. 1980; Raiverman et al. 1983; Ranjan and Banerjee2009). This mineralogical composition and SW directed papaleocurrent suggest supplyfrom Himalaya forming mountain hinterland during the Middle Siwalik sedimentation(Willis 1993; Zaleha 1997). Better sorting would have been achieved during a prolongedtransport from Himalayan Hinterland to Siwalik Foreland Basin located in the south andconsidered to have been fully evolved covering thousands square kilometer area by thetime of Middle Siwalik sedimentation (Willis 1993; Zaleha 1997; Sharma et al. 2000).
Nevertheless, in some samples, variation of grain size from very fine-grained(samples, S-1, S-15) to medium grained (samples, S-3, S-6, S-21, S-26 and S-27) sand,poor sorting (samples, S-5, S-26), platykurtic nature (samples, S-4, S-17) and stronglynegatively skewed (sample, S-1) to strongly positively skewed character (samples, S-12,S-13) may be due to different reasons (Table 1). In the study, almost all the medium grainedsamples are from the lower parts of the thickly developed sandstone bodies (more than 15m thick) incorporating basal lag deposits. They show poor sorting (S-26) similar to upperparts of the individual stories which is fine-grained (S-5) sand (Fig. 2, Table 1). Very finegrained samples have been taken from the top of the sand bodies, and based on lithofacies;these units are interpreted as upper bar-levee deposits. It implies that both bottom and topsediments are ill sorted than the main body of the channel deposits. Most of the fine-grained sandstone samples taken from the upper stories of sandstone complexes areplatykurtic and positively skewed (Fig. 2; Table 1). Grain-size data shows that individualsandstone body complexes have upward fining in grain-size, and that levee deposits arefiner grained than the channel sandstones. Therefore, variation in grain size parameters ismainly related to depositional dynamics of different geomorphic domains of sedimentationwithin a river valley (Sun et al. 2002; Flemming 2007; Molinaroli et al. 2009; Kalicki2000; Allena and Haslettb 2006; Bartholdy et al. 2007). However, in a wider context on abasin scale, it may be related to sediment transport by rivers catering different catchmentswithin the source terrain having contrasting geo-tectonic settings; or, it may be due tocannibalization of pre-existing foreland basin sediments, as being done today by smalleralluvium fed rivers of modern Indo-Gangetic foreland basin carrying mixed sediment loads.
As evidenced by upward increase in sandstone body thickness and the grain-size,the Middle Siwalik Subgroup of Mohan Rao River section shows overall upward coarseningcharacter (Fig. 2). Towards the top of the succession near the transition to the Upper Siwaliks,sandstones become gravelly and coarse-grained. Such a grain-size distribution suggestsprogressively humid climatic conditions during the Middle Siwalik sedimentation incombination to enhanced tectonics at the source (cf. Willis 1993; Zaleha 1997).
This study tends to demonstrate that grain-size distribution and resulting texturalparameters are greatly influenced by the dynamics of the depositional domains within a
LITHOFACIES SUPPORTED GRANULOMETRIC ANALYSIS OF THE MIDDLE SIWALIKSUBGROUP OF MOHAND AREA, NORTH-WESTERN HIMALAYA, INDIA:
A PALAEOENVIRONMENTAL APPLICATION

488
basin of sedimentation. And therefore, sampling should not be done ignoring the lithofaciescharacter, particularly when a temporal change in grain-size is the target. In case of fluvialenvironment, to evaluate spatial variation in grain-size distribution, sand body thicknessand its facies architecture depicting the size and pattern of palaeochannels respectivelyshould be taken into consideration for representative sampling.
ACKNOWLEDGEMENTS
We would like to express our heartily thanks to the Head, Department of Geology,Banaras Hindu University for providing working facilities of the Department. The financialassistance from CSIR- UGC, New Delhi, to Rekha Rani is thankfully acknowledged.
References
ALLEN, J. R. L. and HASLETTB, S. K. (2006) Granulometric characterization and evaluation of annuallybanded mid-Holocene estuarine silts, Welsh Severn Estuary (UK): coastal change, sea level andclimate. Quat. Sci. Rev.,v. 25, pp.1418–1446.
BARTHOLDY, J., CHRISTIANSEN, C. and PEDERSEN, J. B. T. (2007) Comparing spatial grain-size trendsinferred from textural parameters using percentile statistical parameters and those based on the log-hyperbolic method. Sedimentary Geol., v.202, pp.436–452.
BARTHOLOMÄ, A. and FLEMMING, B. W. (2007) Progressive grain-size sorting along an intertidal energygradient. Sedimentary Geol., v.202, pp.464–472.
BRIDGE, J. S. (1985) Palaeochannels inferred from alluvial deposits: a critical evaluation. Jour. Sedim.Petrol. v.55, pp.579–589.
BRIDGE, J. S. (1993) The interaction between channel geometry, water flow, sediment transport and deposition.In: Braided Rivers, Best J L and Bristow C S (ed.) Spl. Publ. Geol. Soc. London, v.75, pp.13–71.
CADIGAN, R. A. (1961) Geological Interpretation of grain size distribution measurements of ColoradoPlateau sedimentary rocks. Jour. Geol., v. 69, pp.121-144.
DOEGLAS , D. J. (1964) Interpretation of the results of mechanical analysis. Jour. Sed. Petrol., v.16, pp.19 -40.
FOLK, R. L. and WARD, W. C. (1957) Brazon river bar- A study in the significance of grain size parameters.Jour. Sed. Petrol. v.27, pp.3-26.
FOLK, R. L. (1971) Longitudanal dunes of the north western edge of the Simpson Desert, Northern territory,Australia, Geomorphology and Grain size relationships. Sedimentology, v.16, pp.5-54.
FRIEDMAN, G. M. (1961) Distinction between dune, beach and river sands from their textural characteristics.Jour. Sed. Petrol. v.31, pp.514-529.
FRIEDMAN, G. M. (1962) On sorting, sorting coefficient and the log-normality of the grain size distributionof sandstone. Jour. Geol. v.70, pp.737-753.
FRIEDMAN, G. M. (1967) Dynamic Process and Statistical parameters compared for size frequency distributionof beach and river sands. Jour. Sed. Petrol. v.37, pp.327-354.
FRIEDMAN, G. M. and SANDERS, J. E. (1978) Principle of sedimentology. Wiley New York.
REKHA RANI, U. K. SHUKLA, OMNATH SAHA AND M. K. PANDEY

489
FRIEDMAN, G. M. (1979) Differences in size distribution of population of particles among sands of variousorigins. Sedimentology, v.26, pp.3-32.
HOUGH, J. L. (1942) Sediments of Cape Cod Bay, Massachusetts. Jour. Sed. Petrol. v.12, pp.10-30.
INMAN, D. L. (1949) Sorting of sediments in the light of fluid mechanism. Jour. Sed. Petrol. v.19, pp.51-70.
INMAN, D. L. and CHAMBERLAIN, T. K. (1955) Particle-size distribution in near shore sediments. In:Hough, spl. publ., v.3, pp.106-129.
INGRAM, R. L. (1971) Sieve analysis, In: Carver R E (Ed.) Procedure in Sedimentary Petrology, WilsonInterscience, pp.49-68.
KALICKI, T. (2000) Grain size of the overbank deposits as carriers of paleogeographical information. Quat.International, v.72, pp.107-114.
KARUNAKARAN, C. and RANGA, R. (1976) Status of exploration for hydrocarbons in the Himalayanregion: contribution to stratigraphy and structure. Geol. Surv. Ind., v.41, pp.1 – 66.
KELLER, W. D. (1949) Size distribution of sand in some dunes, beaches and sandstones. Amer. Assoc. Petrol.Geol. Bull., v.29, pp.215-221.
KRAUS, M. J. and GWINN, B. (1997) Facies and facies architecture of Palaeogene flood plain deposits,Willwood formation, Bighorn Basin, Wyoming, USA. Sedimentary Geol., v.114, pp.33-54.
KRUMBEIN, W. C. and PETTIJOHN, F. J. (1938) Manual of Sedimentary Petrology, Appleton-Century-Coofts Inc. New York, 543p.
KUMAR, R. and NANDA, A. C. (1989) Sedimentology of the Middle Siwalik subgroup of Mohand Area,Dehradun Valley; India. Jour. Geol. Soc. Ind., v.34, pp.597-616.
KUMAR, R. and GHOSH, S. K. (1994) Evolution of Mio-Pleistocene alluvial fan system in Siwalik forelandbasin, Dehradun, India. Him. Geol., v.15, pp.143-159.
KUMAR, R., SANGODE, S. J. and GHOSH, S. K. (2004) Multi storeyed sandstone complex of the Himalayanforeland basin, NW Himalaya, India. Jour. Asian Earth Sci., v.23, pp.407-426.
Le ROUX, J. P. and ROJAS, E. M. (2002) Sediment transport patterns determined from grain size parameters:Overview and state of the art, Sedimentary Geol., v.202, pp.473–488.
MOLINAROLI, E., GUERZONI, S. G., De FALCO, G., SARRETTA, A., CUCCO, A., COMO, S., SIMEONE,S., PERILLI, A. and MAGNI, P. (2009) Relationships between hydrodynamic parameters and grainsize in two contrasting transitional environments: The Lagoons of Venice and Cabras, Italy;Sedimentary Geol., v.219, pp.196–207.
MASON, C. C. and FOLK, R. L. (1958) Differentiation of beach, dune and eolian flat environment by sizeanalysis, Mustang Island, Texas. Jour. Sed. Petrol. v.28, pp.211-226.
MIALL, A. D. (1996) The geology of fluvial deposits. Berlin: Springer-Verlag, 582p.
MOIALA, R. J. and WEISER, D. (1968) Textural parameters and evolution. Jour. Sed. Petrol., v.38, pp.45-53.
NAJMAN, Y. (2006) The detrital record of orogenesis: a review of approaches and techniques used in NicholsG J and Fisher J A 2007 Processes, facies and architecture of fluvial distributary system deposits.Sedimentary Geol., v.195, pp.75–90.
OTTO, G. H. (1939) Modified logarithmic for the mechanical arithmetic probability graph for the interpretationof mechanical analysis of sediment. Jour. Sed. Petrol. v.9, pp. 62-76.
PARKASH, B. and BAJPAI, I. P. (1971) Sedimentary structures and Palaeocurrent of the Siwaliks exposedbetween the Ganges and Jamuna rivers. Roorkee Univ. Res. Jour., v.12, pp.13-24.
LITHOFACIES SUPPORTED GRANULOMETRIC ANALYSIS OF THE MIDDLE SIWALIKSUBGROUP OF MOHAND AREA, NORTH-WESTERN HIMALAYA, INDIA:
A PALAEOENVIRONMENTAL APPLICATION

490
PRAKASH, B., SHARMA, R. P. and ROY, A. K. (1980) The Siwalik group (Molasse) – Sediments shed bycollision of continental Plates. Sedimentary Geol., v. 25, pp.127-159.
PASSEGA, R. (1957) Texture as a characteristic of clastic deposition. Amer. Assoc. Petrol. Geol., v.41, pp.1952-1984.
PASSEGA, R. (1964) Grain Size representation by C-M pattern as a geological tool. Jour. Sed. Petrol., v.34,pp.830-847.
PASSEGA, R. (1977) Significance of C-M diagrams of sediments deposited by suspension. Sedimentology,v. 24, pp.723-733.
PILGRIM, G. E. (1910) Preliminary notes on a revised classification of the Tertiary freshwater deposits ofIndian. Rec. Geo. Surv. Ind., v.40, pp.185-188.
RANJAN, N and BANERJEE, D. M. (2009) Central Himalayan crystallines as the primary source for thesandstone–mudstone suites of the Siwalik Group: New geochemical evidence. Gond. Res., v.16,pp.687-696.
RAIVERMAN, V., KUNTE, S. V. and MUKHERJEE, A. (1983) Basin geometry, Cenozoic sedimentationand hydrocarbon prospects in north western Himalaya and Indo- Gangatic plains. Petrol. Asia Jour.,v.6, pp.67-92.
RICKEN, W., AIGNER, T. and JACOBSEN, B. (1998) Levee-crevasse deposits from the GermanSchilfsandstein. N. Jb. Geol. Paläontol. Abh., pp.77-94.
SAHU, B. K. (1964) Significance of size-distribution statistics in the interpretation of depositional environment.Res. Bull., M.S. Punjab Uni., v.15, pp.213-219.
SANGODE, S. J., KUMAR, R. and GHOSH, S. K. (1999) Palaeomagnetic and rock magnetic perspectives onthe post Collisional continental sediments of the Himalaya, In: The Indian Subcontinent andGondwana: A palaeomagnetic and rock magneyic perspective (ed.) Krishna T R and Piper J D A(ed.), Mem. Geol. Soc. Ind., v.44, pp.221-248.
SANGODE, S. J., KUMAR, R. and GHOSH, S. K. (2001) Application of magnetic fabric studies in an ancientfluvial sequence of NW Himalya. Curr. Sci. v.81, pp.66-71.
SANGODE, S. J. and KUMAR, R. (2004) Magnetostratigraphi correlation of the Late Cenozoic fluvialsequences from the NW Himalaya, India, Curr. Sci. v.84, pp.1014– 1023.
SHARMA, M., SHARMA, S., SHUKLA, U. K. and SINGH, I. B. (2000) Sandstone body architecture andstratigraphic trends in the Middle Siwalik succession of Jammu area, India. Jour. Asian Earth Sci.v.20, pp.817-828.
SINGH, I. B., SHUKLA, U. K. and SRIVASTAVA, P. (1997) Point bar complex of an exhumed channel inupland interfluve of the Ganga Plain, India. Jour. Geol. Soc. Ind., v.51, pp.315–322.
SHUKLA, U. K., SINGH, I. B., SRIVASTAVA, P. and SINGH, D. S. (1999) Palaeocurrent patterns in braidand point bar deposits: examples from Ganga River, India. Jour. Sed. Res. v.69, pp.992–1002.
SHUKLA, U. K., SINGH, I. B., SHARMA, M. and SHARMA, S. (2001) A model of alluvial megafansedimentation: Ganga Megafan. Sedimentary Geol., v.144, pp.243–262.
SHUKLA, U. K. and SINGH, I. B (2004) Signatures of palaeofloods in sandbar-levee deposits of GangaPlain, India. Jour. Geol. Soc. Ind. v.64, pp.455–460.
SHUKLA, U. K. (2009) Sedimentation model of gravel-dominated alluvial piedmont fan, Ganga Plain, India.Inter. Jour. of Earth Sci., v.98, pp.443–459.
SHUKLA, U. K., BORA, D. S. and SINGH, C. K. (2009) Geomorphic positioning and Depositional dynamicsof River systems in Lower Siwalik Basin, Kumaun Himalaya, India. Jour. Geol. Soc. Ind., v.73, pp.335-354.
REKHA RANI, U. K. SHUKLA, OMNATH SAHA AND M. K. PANDEY

491
SINGH, I. B., SRIVASTAV, P., SHARMA, S., SHARMA, M., SINGH, D. S., RAJAGOPALAN, G. andSHUKLA, U. K. (1999) Upland Interfluve (Doab) deposition: An alternative model to muddyoverbank deposits Facies. v.40, pp.197-210.
SRIVASTAV, A. K. and MANKAR, S. R. (2009) Grain Size Analysis and depositional pattern of UpperGondwana sediments (early Crataceous) of Salbardi area,distt. Amravati, Maharashtra and Betul,Madhya Pradesh. Jour. Geol. Soc. Ind., v.73, pp.393 - 404.
STEWART, D. J. (1983) Possible suspended-load channel deposits from the Wealden Group (Lower Cretaceous)of southern England; In: Modern and ancient fluvial systems (ed.) Collinson, J. D. and Lewin, J,Spl. Publ. Int. Assoc. Sediment. v.6, pp.369–384.
SUN, D., BLOEMENDAL, J., REA, D. K., VANDENBERGHE, J., JIANG, F., AN, Z. and SU, R. (2002)Grain-size distribution function of polymodal sediments in hydraulic and aeolian environments, andnumerical partitioning of the sedimentary components; Sedim. Geology, v.152, pp.263–277.
TANDON, S. K. (1991) The Himalayan foreland: Focus on Siwalik Basin; In: Sedimentary Basin of India:Tectonic Context (ed.) Tandon, S. K., Pant, C. C. and Casshyap, S. M., Gyanodaya Prakashan,Nainital, pp.171-201.
UDDEN, J. A. (1914) Mechanical composition of clastic sediments. Geol. Soc. Amer. Bull. v.25, pp.655-744.
VIJAYALAKSHMI, C. S., SRINIVASAN, P., MURTHY, S. G. N.,TRIVEDI, D. and NAIR, R. R. (2010)Granularity and textural analysis as a proxy for extreme wave events in southeast coast of India.Jour. Earth Syst. Sci. v.119, pp.297–305.
VISHER, G. S. (1969) Grain Size distribution and depositional process. Jour. Sed. Petrol., v.39, pp.1074-1106.
WADHAWAN, S. K. (1996) Textural attributes of recent eolian deposits in different sub-basins of the TharValdiya K S 1980 Stratigraphic scheme of the sedimentary units of the Kumaun Lesser Himalaya;In: Stratigraphy and Correlations of Lesser Himalayan Formation (ed.) Valdiya, K. S. and Bhatia, S.B., Hindustan Publ. Corp., Delhi, pp.1-48.
WENTWORTH, C. K. (1929) Method of computing mechanical composition type in sediments. Bull. Amer.Geo. Soc., v.40, pp.771-790.
WILLIS, B. J. (1993) Ancient river system in the Himalayan Foredeep, Chinji village area, northern Pakistan.Jour. Sediment. Geol., v.88, pp.1-76.
WOLMAN, M. G. (1978) Alluvium; In: Encyclopedia of earth Sciences VI: The encyclopedia of sedimentology(ed.) Fairbridge, R. W. and Bourgeois, J., Dowden, Hutchinson and Ross Stroudsburg. pp.11-13.
ZALEHA, M. J. (1997) Intra-and extrabasinal controls on fluvial deposition in the Miocene Indo-Gangetic
foreland basin, northern Pakistan. Sedimentology, v.44, pp.369-390.
LITHOFACIES SUPPORTED GRANULOMETRIC ANALYSIS OF THE MIDDLE SIWALIKSUBGROUP OF MOHAND AREA, NORTH-WESTERN HIMALAYA, INDIA:
A PALAEOENVIRONMENTAL APPLICATION