Literacy learning and geography education
96
Edited by Gary S. Elbow, David J. Rutherford and Christopher Shearer Geographic Literacy in the United States: Challenges and Opportunities in the NCLB Era The National Council for Geographic Education supports the teaching and learning of themes, concepts, and skills in geography at all levels of instruction. www.ncge.org
Transcript of Literacy learning and geography education
Edited by Gary S. Elbow, David J. Rutherford and Christopher Shearer
Geographic Literacy in the United States:
Challenges and Opportunities in the
NCLB Era
The National Council for Geographic Education supports the teaching and learning of themes, concepts, and skills in geography at all levels of instruction.
www.ncge.org
i
Geographic Literacy in the United States: Challenges and Opportunities in the NCLB Era Copyright ©2011 by the National Council for Geographic Education No part of this book may be reproduced or transmitted in any form by any means, electronic or mechanical, including photocopying, recording, or by any information storage or retrieval system without written permission of the publisher. For information about this title please contact: National Council for Geographic Education 1145 17th Street, NW Room 7620 Washington, DC 20036 www.ncge.org ISBN: 978-0-9818-3243-2
ii
A NATIONAL COUNCIL FOR GEOGRAPHIC EDUCATION
PUBLICATION
Geographic Literacy in the United States: Challenges and Opportunities in the
NCLB Era
Edited by Gary S. Elbow, David J. Rutherford
and Christopher Shearer
The National Council for Geographic Education supports the teaching and learning of themes, concepts, and skills in geography at all levels of instruction.
www.ncge.org
The National Council for Geographic Education supports the teaching and learning of themes, concepts, and skills in geography at all levels of instruction.
www.ncge.org
iii
Gary S. Elbow is Professor of Geography and Honors Studies and Associate Vice Provost for Academic Affairs at Texas Tech University. His research focuses on Latin American human geog-raphy. Elbow is author or co-author of seven geography or social studies textbooks at levels from 4th grade through college. He is a recipient of the Preston E. James Eminent Latin Ameri-canist Career Award from the Conference of Latin American-ist Geographers and the Nation-al Council for Geographic Edu-cation George J. Miller Award for Distinguished Service. David J. Rutherford, Ph.D. is Assistant Professor of Geog-raphy in the Department of Public Policy Leadership at the University of Mississippi. He is also Director of the Mississippi Geographic Alliance. Drawing from a broad background in physical and human geography and in education, his current research in geography educa-tion focuses on both the K-12 and university levels. Christopher Shearer is a Pro- gram Officer for Education at the William and Flora Hewlett Foundation. For over a decade he directed grant-making at the National Geographic Society’s Education Foundation and ser-ved on the boards of the Geo-graphy Education National Im-plementation Project (GENIP) and Canadian Council for Geo-graphic Education. He speaks and writes regularly on K-12 education reform and grant-making.
Preface Gary S. Elbow, David J. Rutherford and Christopher Shearer
The papers in this collection provide a valuable retrospective view of the substantial effort made by geographers to engage issues that have inhibited the development of geographic education (geoliteracy) in the United States over the past few decades. In particular, the 15 essays included here summarize the status of geographic education in the middle of the 2001-2010 decade. As such, they provide the reader with summaries of the results of assessment, innovation in curriculum, and development programs in geographic education; the results are impressive. However, they also make clear that there is still a long way to go before geoliteracy in the United States reaches parity with other developed countries in Europe and Asia. The essays on geoliteracy research sponsored by the National Geographic Society in 1988 and 2002 also reveal that all the countries surveyed have considerable room for improvement to attain satisfactory levels of geographic knowledge.
The impact of the Geographic Alliance Networks, part of an extensive program to improve geographic education supported by the National Geographic Society beginning in the 1980s is apparent. So also are the innovative cross-disciplinary programs developed by the Arizona Geographic Alliance, one of the state-based alliances that emerged from the NGS Alliance initiative. Several of the papers deal with professional development, which was a major thrust of the NGS Alliance program.
Many of the papers refer in one context or another to the No Child Left Behind Act, which has brought profound change to public educa-tion in the United States. As Rutherford and Shearer note in their Executive Summary, the impact of NCLB on geography is mixed. On one hand, the inclusion of geography as one of the core disciplines is formal recognition of the importance politicians and educational plan-ners place on geography education. However, that geography was the only core discipline not to receive funding under NCLB may also be interpreted as signaling the lack of appreciation for the role geography should play in public education. Calls for geographers to become more involved in public policy debates on education funding are still timely, although the political climate for funding public education has clearly changed in important ways since the papers in this collection were written.
Finally, we would like to comment on our roles as editors. This has been a collective effort, although it was carried out in discrete stages.
ii
Rutherford and Shearer developed the concept for this collection of essays, contacted potential authors and worked with them to define their topics. Without their vision and familiarity with current research on geographic education in the United States, this collection would not have been possible.
Rutherford began the review and editing process for the essays and worked with authors to develop
tables and figures. He also helped authors in the early stages of essay development to clearly define their topics.
Elbow came late to the project, having been asked to handle final editing, formatting of the essays and other details required to bring the project to a successful conclusion.
iii
Joseph Kerski serves as Educa-tion Manager on the Education Team for Environmental Sys-tems Research Institute (Esri) in Colorado USA, having served 20 years as Geographer at the USGS and at the US Census Bureau. He has taught as ad-junct instructor at the university and K-12 levels and holds three degrees in Geography. Pas-sionate about all aspects of spatial learning, he seeks and fosters educational partner-ships, promotes GIS in educa-tion and society through curri-culum development and profess-sional development, and con-ducts research in the effective-ness and implementation of GIS technologies in formal and in-formal educational settings. Daniel Edelson is Vice President for Education at the National Geographic Society and Executive Director of the National GeographicEducation Foundation. He received a Ph.D. in computer science from Northwestern University and a B.S. in engineering sciences from Yale University. He has written extensively on motivation, classroom teaching and learning and related topics. Edelson has dedicated his career to improving young people’s understanding of the world they live in and their role in determining its future.
Foreword
Joseph Kerski and Daniel Edelson
Imagine a world where people regularly made decisions without
considering geography. Local businesses would site retail outlets without taking into account such things as zoning and neighborhood demographics. Farmers would plant crops without considering soil types. Planners would lay out transportation routes without considering historical and future trade patterns. Policymakers would disregard the distribution of natural resources, culture, and climate. This would be a sadly inefficient world at best, or a frightening one at worst. But is it also a story that seems a bit too familiar? Do many decisions appear to be made without consideration for culture, demographics, natural hazards, human impact, or biodiversity? If the above scenarios sound similar to what occurs in our world today, could it be because decision-makers were not provided with a firm grounding in geography in their primary, secondary, and postsecondary education?
One reason most college graduates are not given a firm grounding in geography education is that the nature and importance of geographic literacy are not widely understood. Because geographic literacy is not well understood, it is not well supported, not well funded, nor is it well embedded throughout formal education in the United States. This collection of essays seeks to shed light on geographic literacy from a variety of perspectives and provide common ground for curriculum development and research.
As the essays that follow make clear, geographic literacy rests on three pillars. The first pillar is rich and deep content understanding in topics that include human settlement, patterns of economic interaction, cultural mosaics, agriculture, natural resources, ecoregions, and land use. The second pillar is a set of skills that include cartography, geographic information analysis, remote sensing, and spatial statistics. The third pillar is a way of thinking about the world that includes the perspective of scale, change, relationships, interconnected spatial and temporal patterns, and sustainability.
As the subtitle indicates, this collection not only outlines what geographic literacy is, but identifies some key challenges to strengthening it in our country. Challenges in funding and support are not unique to geography, but they are greater because of the fact that geography is the only core academic subject identified in the No Child Left Behind Act that lacks a Federal program of funding to improve teaching. Geographic education has long been neglected in the U.S., and this has very real consequences that range from social, economic, and political policy to the lack of qualified workers who understand the use of geographic information systems and other geotechnologies. The essays in this collection also suggest opportunities and promising direc-
iv
tions for achieving geographic literacy through improvements in geographic education.
As these pages make clear, non-profits, private industry, government agencies, and educators from both formal and informal institutions at all levels have worked tirelessly to strengthen and support the role of geography in education and in society. However, the problems faced by our 21st Century world—from climate change, water quality and availability, natural hazards, energy, urbanization, ethnic conflict, to human health—mandate that change needs to happen more quickly. Each of
these problems is geographic in nature. Addressing them will require analysts and decision-makers who have mastered the three pillars of geographic literacy, content, skills, and ways of thinking. Geography is not just an important part of the curriculum. It is critically needed throughout society to navigate the rapidly changing 21st century world. Change will take a much greater, smarter, and sustained effort from each of us in the geography education community. What will you do to advance geography education?
v
TABLE OF CONTENTS
Editors‟ Preface i Gary S. Elbow, David J. Rutherford, Christopher Shearer Foreword iii Joseph Kerski and Daniel Edelson Table of Contents v Introduction and Executive Summary 1 David J. Rutherford and Christopher Shearer National Geographic Society—Roper 2002 Global Geographic Literacy Survey 6 Donna Schoeller Sprague and Nicolas Boyon No Child Left Behind and Its Implications for Geography Education 11 Ryan Daley Effects of the No Child Left Behind Act: Educator Perspectives 16 Susan White Frazier Status of Geography Curricula and Assessment in the States 20 Zachary A. Moore Ensuring Rigorous Geography Content in the K-12 Curriculum: 25 Standards Implementation in the States David J. Rutherford and Richard G. Boehm National Geographic Society Alliance Study 33 Kerry S. Englert and Zoe A. Barley Can Professional Development Enhance Student Achievement and Prove It? 38 Results of the 1999-2003 Michigan Achievement Project Michael Libbee, Marty Mater and Larry Schaftenaar Effectiveness of Teaching Pedagogical Content Knowledge Through 45 Summer Geography Institutes Todd W. Kenreich Literacy Learning and Geography Education 51 Elizabeth R. Hinde, Sharon E. Osborn Popp, Gale Olp Ekiss and Ronald I. Dorn Mathematics Learning and Geography Education 57 Gale Olp Ekiss, Ronald I. Dorn, Elizabeth R. Hinde, John Douglass and Barbara Trapido-Lurie The Implementation and Effectiveness of Geographic Information Systems 63 Technology and Methods in Secondary Education Joseph Kerski
vi
Physical Science in Geography Education: Connections and Opportunities 68 Keith R. Mountain and David A. Howarth The Growth of Advanced Placement Human Geography and Its Impact on 73 the Discipline of Geography David A. Lanegran Assessment as Art, Assessment as Science: Classroom and High-Stakes 78 Measurement in Geography Scott L. Walker The What and Why of Geography 83 Charles F. Gritzner
1
David J. Rutherford, Ph.D. is Assistant Professor of Geog-raphy in the Department of Public Policy Leadership at the University of Mississippi. He is also Director of the Mississippi Geographic Alliance. Drawing from a broad background in physical and human geography and in education, his current research in geography educa-tion focuses on both the K-12 and university levels. Christopher Shearer is a Pro- gram Officer for Education at the William and Flora Hewlett Foundation. For over a decade he directed grant-making at the National Geographic Society’s Education Foundation and ser-ved on the boards of the Geo-graphy Education National Im-plementation Project (GENIP) and Canadian Council for Geo-graphic Education. He speaks and writes regularly on K-12 education reform and grant-making.
Introduction and Executive Summary David J. Rutherford and Christopher Shearer
Our elected leaders—whether the president, the governors, or state and federal legislators—cannot thump on the table demanding more accountability from teachers while failing to provide teachers with the means to bring about improvement. Leadership has several aspects. One involves formulating a vision and making demands. Another involves providing assistance to help people meet those demands. We will not improve our public schools and raise student achievement without both kinds of leadership.1
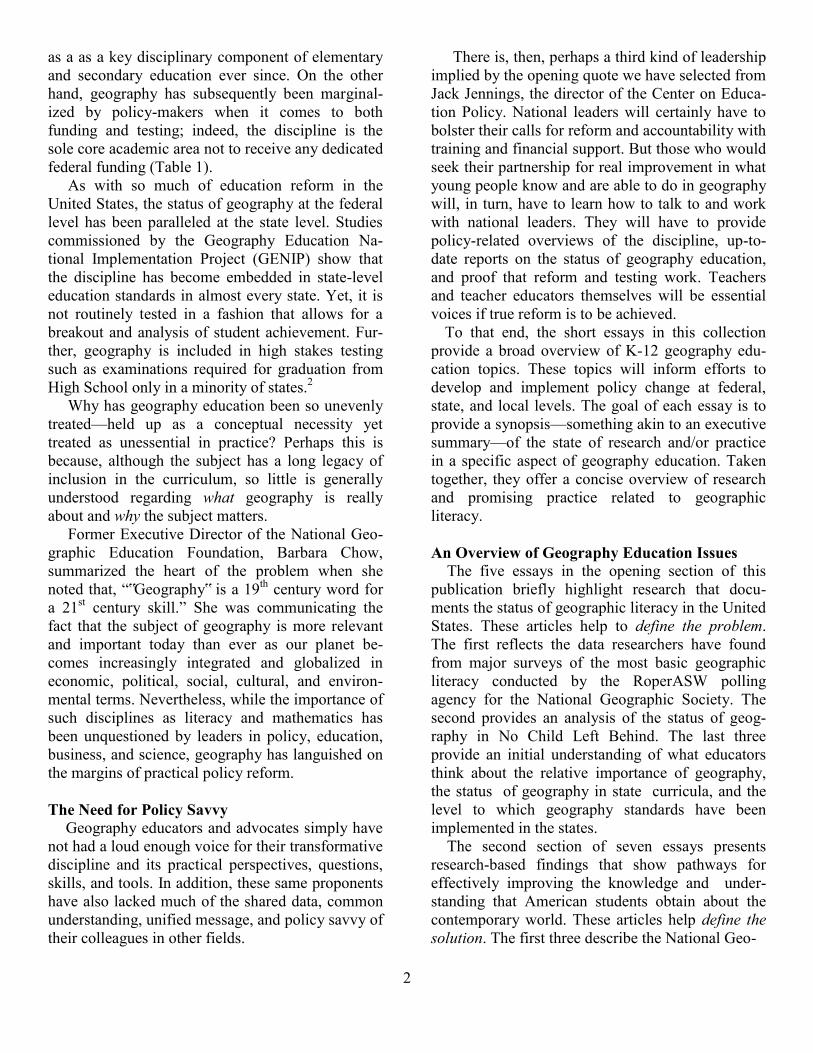
Over the course of working together on national reform in geography education, we were struck by the convergence of two important facts. First, educators themselves provide a real and compelling voice for edu-cational improvement. Second, little information is easily available to support advocates for advancing the status of geography education in federal, state, and local policy and practice. We also agreed that the National Council for Geographic Education (NCGE) would be a uniquely valuable leader in providing educators with the background and data they might want in order to become more familiar with the status of geography education policy, to better understand the need for being policy savvy, and to learn about the key issues in current discus-sions on reform and improvement. Consequently, in order to advance these goals, we approached NCGE with the idea to produce this collection. We believe that the remarkable changes in the world today are throwing into high relief the need for geographic skills and knowledge at the personal, national, and international levels. Likewise, we believe that better schooling is essential to meeting needs, solving challenges, and protecting and enjoying our interconnected planet. In other words, contemporary global issues and trends are making it quite urgent to develop “geoliteracy” among US citizens, and thus quite urgent to pro-duce significant improvement in the scale of geography teaching and learning. We have, therefore, asked a number of the nation‟s leaders in geography education to contribute to this publication in order to provide educators, policy-makers and others with essays that begin to define the problem, the solution, and the future of geography education. The Status of Geography in Education Reform For the geography educator, standards-based education—and the No Child Left Behind Act in particular—have been a mixed blessing. On one hand, it has put geography on the map in education reform. After several frustrating decades of decline on the U.S. education landscape, geography was highlighted as one of the original so-called “core aca-demic disciplines” put forth by the nation‟s governors at their seminal Charlottesville, VA education summit in 1989, and it has been included
2
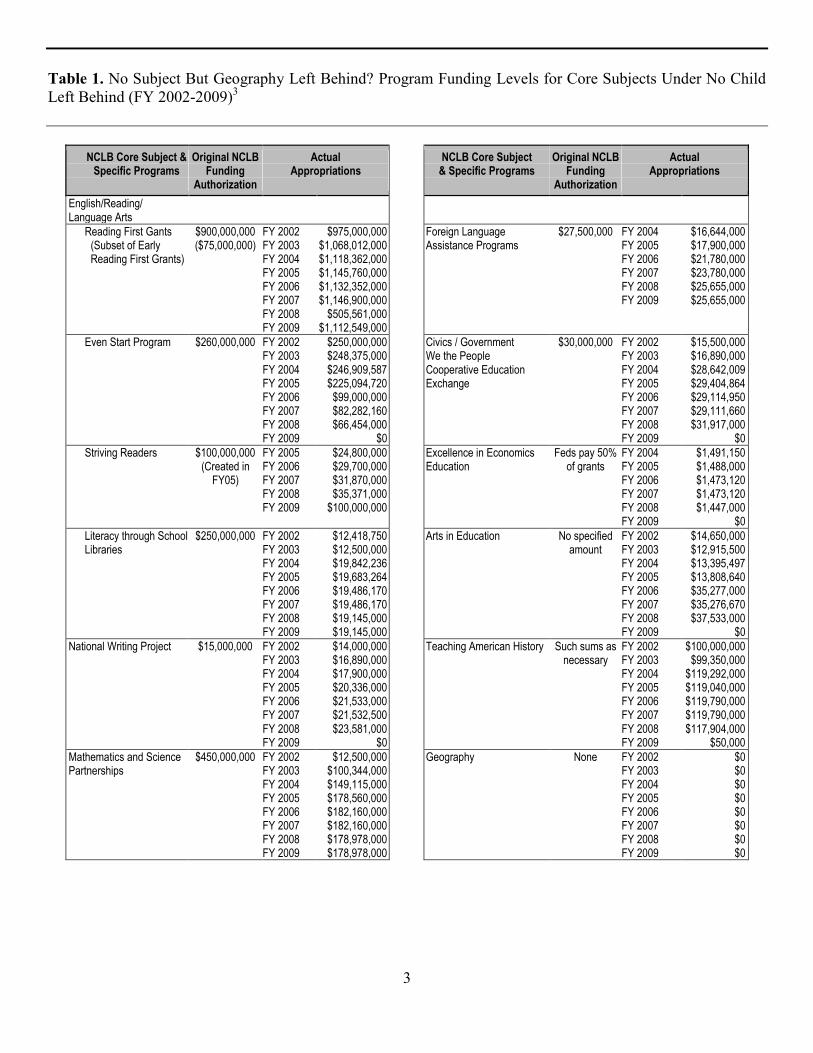
as a as a key disciplinary component of elementary and secondary education ever since. On the other hand, geography has subsequently been marginal-ized by policy-makers when it comes to both funding and testing; indeed, the discipline is the sole core academic area not to receive any dedicated federal funding (Table 1). As with so much of education reform in the United States, the status of geography at the federal level has been paralleled at the state level. Studies commissioned by the Geography Education Na-tional Implementation Project (GENIP) show that the discipline has become embedded in state-level education standards in almost every state. Yet, it is not routinely tested in a fashion that allows for a breakout and analysis of student achievement. Fur-ther, geography is included in high stakes testing such as examinations required for graduation from High School only in a minority of states.2 Why has geography education been so unevenly treated—held up as a conceptual necessity yet treated as unessential in practice? Perhaps this is because, although the subject has a long legacy of inclusion in the curriculum, so little is generally understood regarding what geography is really about and why the subject matters. Former Executive Director of the National Geo-graphic Education Foundation, Barbara Chow, summarized the heart of the problem when she noted that, “‟Geography‟ is a 19th century word for a 21st century skill.” She was communicating the fact that the subject of geography is more relevant and important today than ever as our planet be-comes increasingly integrated and globalized in economic, political, social, cultural, and environ-mental terms. Nevertheless, while the importance of such disciplines as literacy and mathematics has been unquestioned by leaders in policy, education, business, and science, geography has languished on the margins of practical policy reform. The Need for Policy Savvy
Geography educators and advocates simply have not had a loud enough voice for their transformative discipline and its practical perspectives, questions, skills, and tools. In addition, these same proponents have also lacked much of the shared data, common understanding, unified message, and policy savvy of their colleagues in other fields.
There is, then, perhaps a third kind of leadership implied by the opening quote we have selected from Jack Jennings, the director of the Center on Educa-tion Policy. National leaders will certainly have to bolster their calls for reform and accountability with training and financial support. But those who would seek their partnership for real improvement in what young people know and are able to do in geography will, in turn, have to learn how to talk to and work with national leaders. They will have to provide policy-related overviews of the discipline, up-to-date reports on the status of geography education, and proof that reform and testing work. Teachers and teacher educators themselves will be essential voices if true reform is to be achieved.
To that end, the short essays in this collection provide a broad overview of K-12 geography edu-cation topics. These topics will inform efforts to develop and implement policy change at federal, state, and local levels. The goal of each essay is to provide a synopsis—something akin to an executive summary—of the state of research and/or practice in a specific aspect of geography education. Taken together, they offer a concise overview of research and promising practice related to geographic literacy. An Overview of Geography Education Issues The five essays in the opening section of this publication briefly highlight research that docu-ments the status of geographic literacy in the United States. These articles help to define the problem. The first reflects the data researchers have found from major surveys of the most basic geographic literacy conducted by the RoperASW polling agency for the National Geographic Society. The second provides an analysis of the status of geog-raphy in No Child Left Behind. The last three provide an initial understanding of what educators think about the relative importance of geography, the status of geography in state curricula, and the level to which geography standards have been implemented in the states. The second section of seven essays presents research-based findings that show pathways for effectively improving the knowledge and under- standing that American students obtain about the contemporary world. These articles help define the solution. The first three describe the National Geo-
3
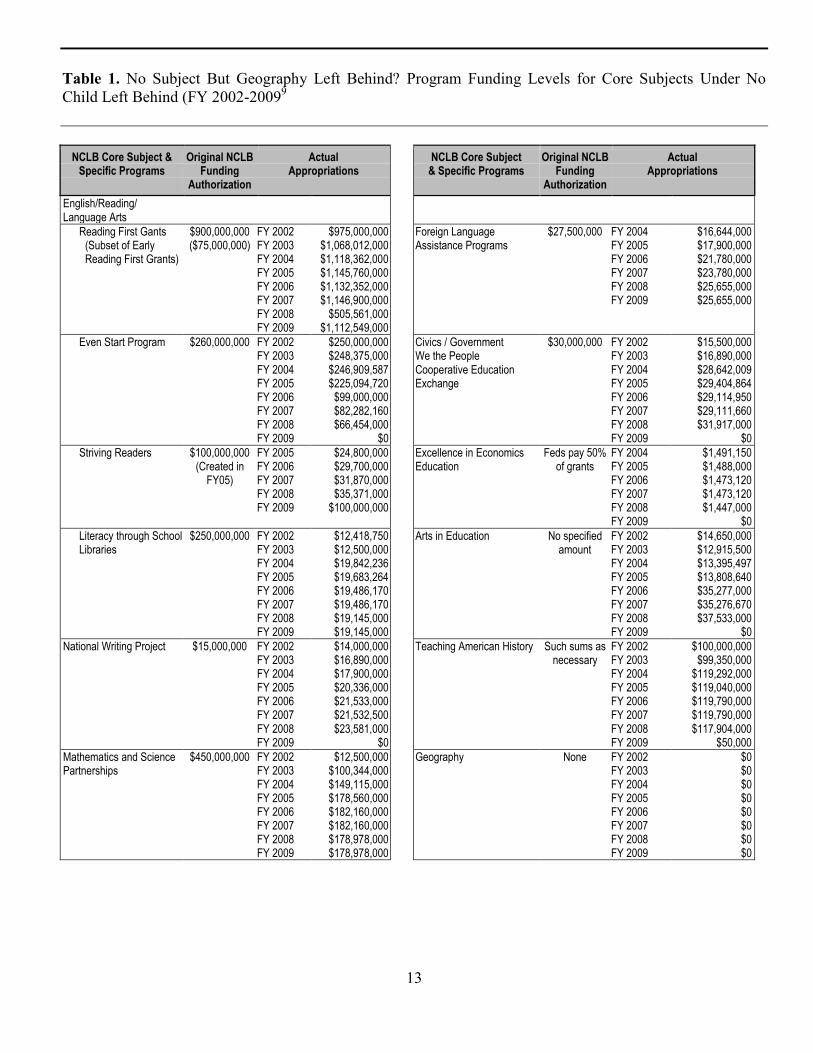
Table 1. No Subject But Geography Left Behind? Program Funding Levels for Core Subjects Under No Child Left Behind (FY 2002-2009)3
NCLB Core Subject &
Specific Programs
Original NCLB Funding
Authorization
Actual Appropriations
NCLB Core Subject & Specific Programs
Original NCLB Funding
Authorization
Actual Appropriations
English/Reading/ Language Arts
Reading First Gants (Subset of Early Reading First Grants)
$900,000,000 ($75,000,000)
FY 2002 FY 2003 FY 2004 FY 2005 FY 2006 FY 2007 FY 2008 FY 2009
$975,000,000 $1,068,012,000 $1,118,362,000 $1,145,760,000 $1,132,352,000 $1,146,900,000
$505,561,000 $1,112,549,000
Foreign Language Assistance Programs
$27,500,000 FY 2004 FY 2005 FY 2006 FY 2007 FY 2008 FY 2009
$16,644,000 $17,900,000 $21,780,000 $23,780,000 $25,655,000 $25,655,000
Even Start Program $260,000,000 FY 2002 FY 2003 FY 2004 FY 2005 FY 2006 FY 2007 FY 2008 FY 2009
$250,000,000 $248,375,000 $246,909,587 $225,094,720 $99,000,000 $82,282,160 $66,454,000
$0
Civics / Government We the People Cooperative Education Exchange
$30,000,000 FY 2002 FY 2003 FY 2004 FY 2005 FY 2006 FY 2007 FY 2008 FY 2009
$15,500,000 $16,890,000 $28,642,009 $29,404,864 $29,114,950 $29,111,660 $31,917,000
$0
Striving Readers $100,000,000 (Created in
FY05)
FY 2005 FY 2006 FY 2007 FY 2008 FY 2009
$24,800,000 $29,700,000 $31,870,000 $35,371,000
$100,000,000
Excellence in Economics Education
Feds pay 50% of grants
FY 2004 FY 2005 FY 2006 FY 2007 FY 2008 FY 2009
$1,491,150 $1,488,000 $1,473,120 $1,473,120 $1,447,000
$0
Literacy through School Libraries
$250,000,000 FY 2002 FY 2003 FY 2004 FY 2005 FY 2006 FY 2007 FY 2008 FY 2009
$12,418,750 $12,500,000 $19,842,236 $19,683,264 $19,486,170 $19,486,170 $19,145,000 $19,145,000
Arts in Education No specified amount
FY 2002 FY 2003 FY 2004 FY 2005 FY 2006 FY 2007 FY 2008 FY 2009
$14,650,000 $12,915,500 $13,395,497 $13,808,640 $35,277,000 $35,276,670 $37,533,000
$0
National Writing Project $15,000,000 FY 2002 FY 2003 FY 2004 FY 2005 FY 2006 FY 2007 FY 2008 FY 2009
$14,000,000 $16,890,000 $17,900,000 $20,336,000 $21,533,000 $21,532,500 $23,581,000
$0
Teaching American History Such sums as necessary
FY 2002 FY 2003 FY 2004 FY 2005 FY 2006 FY 2007 FY 2008 FY 2009
$100,000,000 $99,350,000
$119,292,000 $119,040,000 $119,790,000 $119,790,000 $117,904,000
$50,000
Mathematics and Science Partnerships
$450,000,000 FY 2002 FY 2003 FY 2004 FY 2005 FY 2006 FY 2007 FY 2008 FY 2009
$12,500,000 $100,344,000 $149,115,000 $178,560,000 $182,160,000 $182,160,000 $178,978,000 $178,978,000
Geography None FY 2002 FY 2003 FY 2004 FY 2005 FY 2006 FY 2007 FY 2008 FY 2009
$0 $0 $0 $0 $0 $0 $0 $0
4
graphic Society‟s Alliance Network, whose activ-ities have been demonstrated to improve student achievement as an outcome of preparing highly effective, professional geography teachers.
The next two articles report on related programs that integrate mathematics and reading with the teaching of geography. These programs maximize classroom instructional time by incorporating geog-raphy into the teaching of these other subjects and, in addition, provide significant improvement in student achievement in both reading and mathe-matics. The final essays in this section reinforce the findings of the earlier studies—that geography can contribute to education in other subjects while simultaneously improving student knowledge about the contemporary world. These articles highlight educational applications of Geographic Information Systems (GIS) that are increasingly important throughout government and business, and they describe important roles that geography can play in various aspects of science and environmental education. Finally, this publication concludes with a set of three essays on promising directions for improving geography education. These articles help define the future. The first addresses the powerful role the AP Human Geography course and exam can play in exposing students to robust and engaging geo-graphic inquiry prior to college and reestablishing the discipline as a prestigious field of study. The second reveals the role of assessment in advancing geography. The final essay briefly outlines the nature of geography as a subject that teaches about the peoples, places, and environments of the world, and it describes the crucial relevance of geography for understanding the rapidly changing contempo-rary world and steering through it as individuals, as communities, and as a nation. The Case for Urgency It may seem far-fetched to a busy K-12 teacher, administrator, or academic that a familiarity with policy issues is important, much less essential. It is our contention, however, that the field simply requires that educators and practitioners be able to see and convey the urgency of geography education in today‟s educational system. It is difficult to overstate the importance and relevance of geography as a school subject in our increasingly interconnected and globalizing world
in which the connections and interactions among people, places, and environments continue to ex-pand and multiply.4
Geography provides the primary and sometimes the only means by which we systematically educate young people about the present-day world in which economic competition, cultural diversity, and technological innovations spread quickly through telecommunications and transportation networks to reach ever more deeply into American society. In the past, understanding of these global influences may have been essential only for the leaders of business and government but today such geographic understanding has become indispensable for all Americans for two important reasons. First is the pragmatic reality that the life and livelihood of every American are increasingly influenced and affected by ubiquitous global forces that we must more fully understand in order to foster personal and national security and success. Second is the ethical consideration that as citizens of a wealthy, free-market, democratic country we should be more aware of how the choices and decisions we all make have far-reaching effects around our shared world.
Geography is the only school subject that has an explicit focus on understanding the myriad, inter-related dynamics of the twenty-first century world. And yet, tragically, the subject struggles for a secure place in the K-12 curriculum during a time when it is perhaps needed the most. As a result, the knowledge of geography that Americans possess is demonstrably poorer and weaker than that of citi-zens of other countries.
This is not a minor concern, the complaint of a few disciplinary zealots or an apologia for geo-graphic trivia. The planet is in many respects at a real crossroads. There is a window of opportunity for the next generation to make thoughtful and sustainable decisions regarding the environment and diversity and to use increasingly powerful geo-graphical tools to ask and answer the questions necessary to achieve successful economic and cultural cooperation. Further, we should not lose sight of the simple but powerful fact that geographic literacy allows people to better understand and appreciate the beauty and complexity of Earth and to enjoy and fully participate in the environmental and cultural mosaics of our planet.
We hope that you will enjoy this special pub-lication of the National Council for Geographic
5
Education. Moreover, and perhaps more impor-tantly, we hope that it will prove useful to you as you consider the policy implications of improving geography education in your school, district, state, and the nation.
Notes 1Jennings, J. 2002. Stricter Federal Demands, Bigger State Role: What To Expect From The No Child Left Behind Act, Washington, DC: Center for Education Policy, available at: http://www.cep-dc.org/index.cfm?DocumentSubTopicID=25, (last accessed March 21, 2011).
2Wdowiarz, J. 2005. Status of Geography in High School Graduation Requirements and Exit Exams. Washington DC: Geography Education National Implementation Project. 3U.S. Department of Education. 2005. Programs proposed for elimination arts in education. Fiscal Year 2006 Budget Summary. Washington, DC: U.S. Department of Education. Available at http://www2. ed.gov/about/overview/budget/ budget06/summary/edlite-section3.html#arts (last accessed February 25, 2011).
3Programs proposed for elimination math and science part-nerships: Fiscal Year 2006 Budget Summary. Washington
DC: U.S. Department of Education. Available from http://www.ed.gov/about/overview/budget/budget06/summary/edlite-section2a.html#mathsci (last accessed February 25, 2011). Additional budget information received from the following websites: http://www.ed.gov/about/overview/ budget/budget05/summary/edlite-section1.html (last acces-sed February 25, 2011 http://www.ed.gov/about/overview/ budget/budget06/summary/edlite-section1.html (last Acces-sed February 25, 2011).
4Johnston, R.J., P.J. Taylor and M.J. Watts (editors).1995. Geographies of Global Change: Remapping the World in the Late Twentieth Century. Oxford, UK: Blackwell.
5For background on both the pragmatic and ethical reasons for geographic understanding see: Research and Policy Committee of the Committee for Economic Development. 2006. Education for Global Leadership: The Importance of International Studies and Foreign Language Education for U.S. Economic and National Security. Washington DC: Committee for Economic Development, and The Secretary‟s Commission on Achieving Necessary Skills (SCANS). 1992. Learning a Living: A Blueprint for High Performance. Washington DC: U.S. Department of Labor. Available at http://wdr.doleta.gov/SCANS/lal/lal.pdf (last accessed April 20, 2011).
6
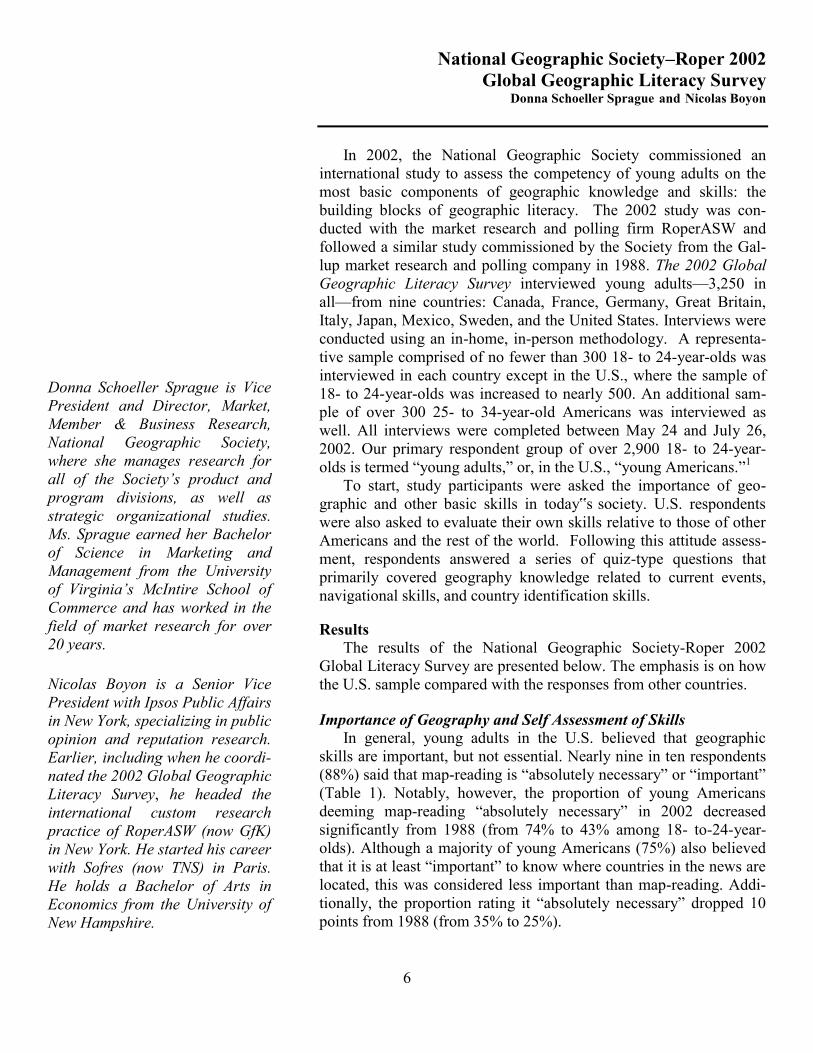
Donna Schoeller Sprague is Vice President and Director, Market, Member & Business Research, National Geographic Society, where she manages research for all of the Society’s product and program divisions, as well as strategic organizational studies. Ms. Sprague earned her Bachelor of Science in Marketing and Management from the University of Virginia’s McIntire School of Commerce and has worked in the field of market research for over 20 years. Nicolas Boyon is a Senior Vice President with Ipsos Public Affairs in New York, specializing in public opinion and reputation research. Earlier, including when he coordi-nated the 2002 Global Geographic Literacy Survey, he headed the international custom research practice of RoperASW (now GfK) in New York. He started his career with Sofres (now TNS) in Paris. He holds a Bachelor of Arts in Economics from the University of New Hampshire.
National Geographic Society–Roper 2002 Global Geographic Literacy Survey
Donna Schoeller Sprague and Nicolas Boyon
In 2002, the National Geographic Society commissioned an
international study to assess the competency of young adults on the most basic components of geographic knowledge and skills: the building blocks of geographic literacy. The 2002 study was con-ducted with the market research and polling firm RoperASW and followed a similar study commissioned by the Society from the Gal-lup market research and polling company in 1988. The 2002 Global Geographic Literacy Survey interviewed young adults—3,250 in all—from nine countries: Canada, France, Germany, Great Britain, Italy, Japan, Mexico, Sweden, and the United States. Interviews were conducted using an in-home, in-person methodology. A representa-tive sample comprised of no fewer than 300 18- to 24-year-olds was interviewed in each country except in the U.S., where the sample of 18- to 24-year-olds was increased to nearly 500. An additional sam-ple of over 300 25- to 34-year-old Americans was interviewed as well. All interviews were completed between May 24 and July 26, 2002. Our primary respondent group of over 2,900 18- to 24-year-olds is termed “young adults,” or, in the U.S., “young Americans.”1
To start, study participants were asked the importance of geo-graphic and other basic skills in today‟s society. U.S. respondents were also asked to evaluate their own skills relative to those of other Americans and the rest of the world. Following this attitude assess-ment, respondents answered a series of quiz-type questions that primarily covered geography knowledge related to current events, navigational skills, and country identification skills.
Results
The results of the National Geographic Society-Roper 2002 Global Literacy Survey are presented below. The emphasis is on how the U.S. sample compared with the responses from other countries.
Importance of Geography and Self Assessment of Skills
In general, young adults in the U.S. believed that geographic skills are important, but not essential. Nearly nine in ten respondents (88%) said that map-reading is “absolutely necessary” or “important” (Table 1). Notably, however, the proportion of young Americans deeming map-reading “absolutely necessary” in 2002 decreased significantly from 1988 (from 74% to 43% among 18- to-24-year-olds). Although a majority of young Americans (75%) also believed that it is at least “important” to know where countries in the news are located, this was considered less important than map-reading. Addi-tionally, the proportion rating it “absolutely necessary” dropped 10 points from 1988 (from 35% to 25%).
7
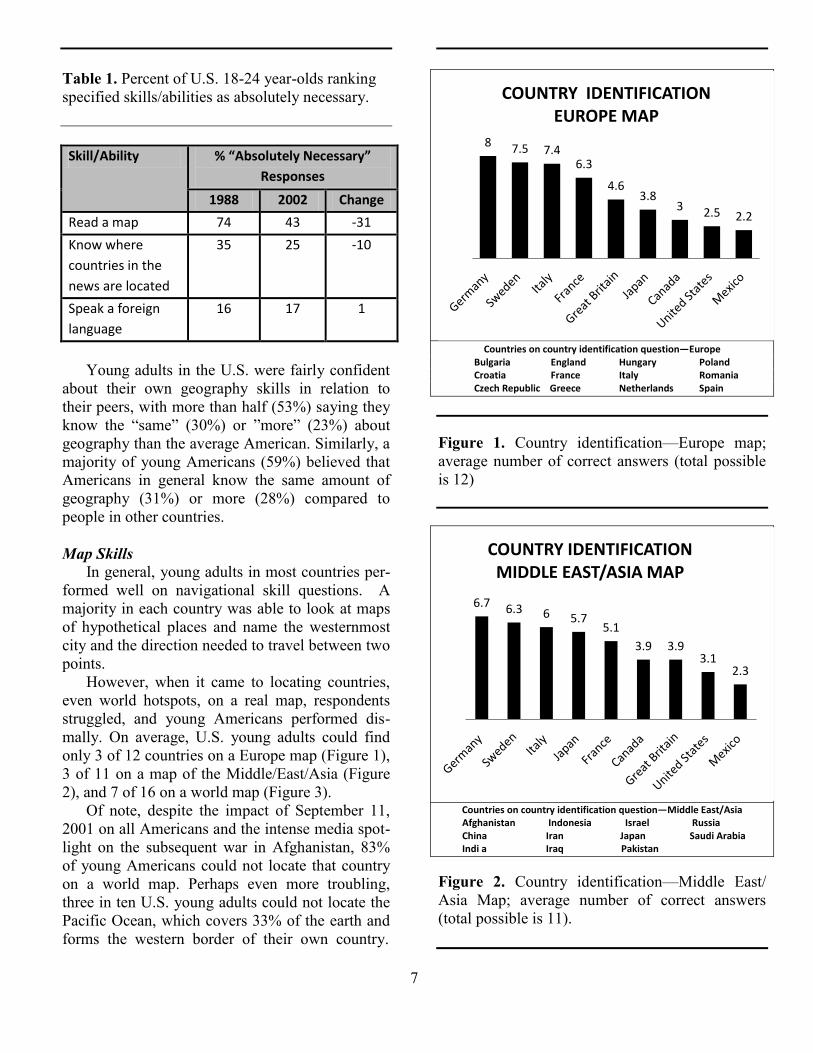
Table 1. Percent of U.S. 18-24 year-olds ranking specified skills/abilities as absolutely necessary. Skill/Ability % “Absolutely Necessary”
Responses
1988 2002 Change
Read a map 74 43 -31
Know where
countries in the
news are located
35 25 -10
Speak a foreign
language
16 17 1
Young adults in the U.S. were fairly confident
about their own geography skills in relation to their peers, with more than half (53%) saying they know the “same” (30%) or ”more” (23%) about geography than the average American. Similarly, a majority of young Americans (59%) believed that Americans in general know the same amount of geography (31%) or more (28%) compared to people in other countries. Map Skills
In general, young adults in most countries per-formed well on navigational skill questions. A majority in each country was able to look at maps of hypothetical places and name the westernmost city and the direction needed to travel between two points.
However, when it came to locating countries, even world hotspots, on a real map, respondents struggled, and young Americans performed dis-mally. On average, U.S. young adults could find only 3 of 12 countries on a Europe map (Figure 1), 3 of 11 on a map of the Middle/East/Asia (Figure 2), and 7 of 16 on a world map (Figure 3).
Of note, despite the impact of September 11, 2001 on all Americans and the intense media spot-light on the subsequent war in Afghanistan, 83% of young Americans could not locate that country on a world map. Perhaps even more troubling, three in ten U.S. young adults could not locate the Pacific Ocean, which covers 33% of the earth and forms the western border of their own country.
Countries on country identification question—Europe
Bulgaria England Hungary Poland Croatia France Italy Romania Czech Republic Greece Netherlands Spain Figure 1. Country identification—Europe map; average number of correct answers (total possible is 12)
Countries on country identification question—Middle East/Asia
Afghanistan Indonesia Israel Russia China Iran Japan Saudi Arabia Indi a Iraq Pakistan
Figure 2. Country identification—Middle East/ Asia Map; average number of correct answers (total possible is 11).
8 7.5 7.4 6.3
4.6 3.8
3 2.5 2.2
COUNTRY IDENTIFICATION EUROPE MAP
6.7 6.3 6 5.7 5.1
3.9 3.9 3.1
2.3
COUNTRY IDENTIFICATION MIDDLE EAST/ASIA MAP
8
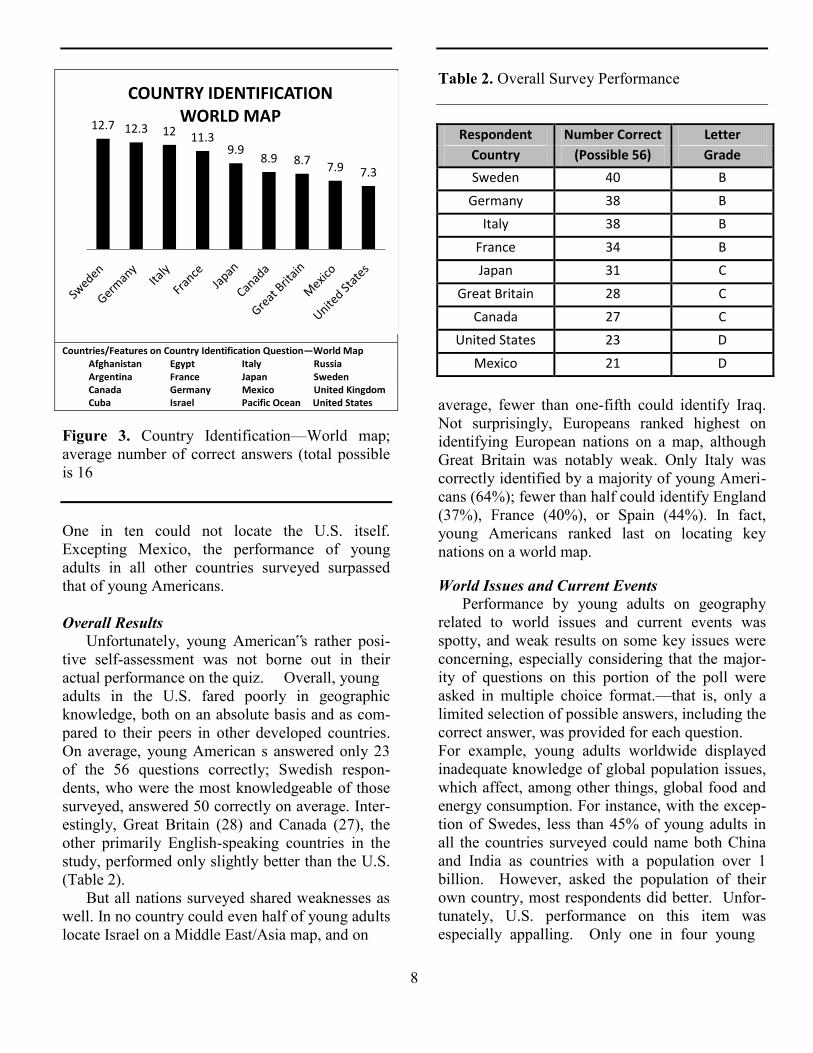
Countries/Features on Country Identification Question—World Map Afghanistan Egypt Italy Russia Argentina France Japan Sweden
Canada Germany Mexico United Kingdom Cuba Israel Pacific Ocean United States
Figure 3. Country Identification—World map; average number of correct answers (total possible is 16 One in ten could not locate the U.S. itself. Excepting Mexico, the performance of young adults in all other countries surveyed surpassed that of young Americans. Overall Results
Unfortunately, young American‟s rather posi-tive self-assessment was not borne out in their actual performance on the quiz. Overall, young adults in the U.S. fared poorly in geographic knowledge, both on an absolute basis and as com-pared to their peers in other developed countries. On average, young American s answered only 23 of the 56 questions correctly; Swedish respon-dents, who were the most knowledgeable of those surveyed, answered 50 correctly on average. Inter-estingly, Great Britain (28) and Canada (27), the other primarily English-speaking countries in the study, performed only slightly better than the U.S. (Table 2).
But all nations surveyed shared weaknesses as well. In no country could even half of young adults locate Israel on a Middle East/Asia map, and on
Table 2. Overall Survey Performance
Respondent Number Correct Letter
Country (Possible 56) Grade
Sweden 40 B
Germany 38 B
Italy 38 B
France 34 B
Japan 31 C
Great Britain 28 C
Canada 27 C
United States 23 D
Mexico 21 D
average, fewer than one-fifth could identify Iraq. Not surprisingly, Europeans ranked highest on identifying European nations on a map, although Great Britain was notably weak. Only Italy was correctly identified by a majority of young Ameri-cans (64%); fewer than half could identify England (37%), France (40%), or Spain (44%). In fact, young Americans ranked last on locating key nations on a world map. World Issues and Current Events
Performance by young adults on geography related to world issues and current events was spotty, and weak results on some key issues were concerning, especially considering that the major-ity of questions on this portion of the poll were asked in multiple choice format.—that is, only a limited selection of possible answers, including the correct answer, was provided for each question. For example, young adults worldwide displayed inadequate knowledge of global population issues, which affect, among other things, global food and energy consumption. For instance, with the excep-tion of Swedes, less than 45% of young adults in all the countries surveyed could name both China and India as countries with a population over 1 billion. However, asked the population of their own country, most respondents did better. Unfor-tunately, U.S. performance on this item was especially appalling. Only one in four young
12.7 12.3 12 11.3 9.9
8.9 8.7 7.9 7.3
COUNTRY IDENTIFICATION WORLD MAP
9
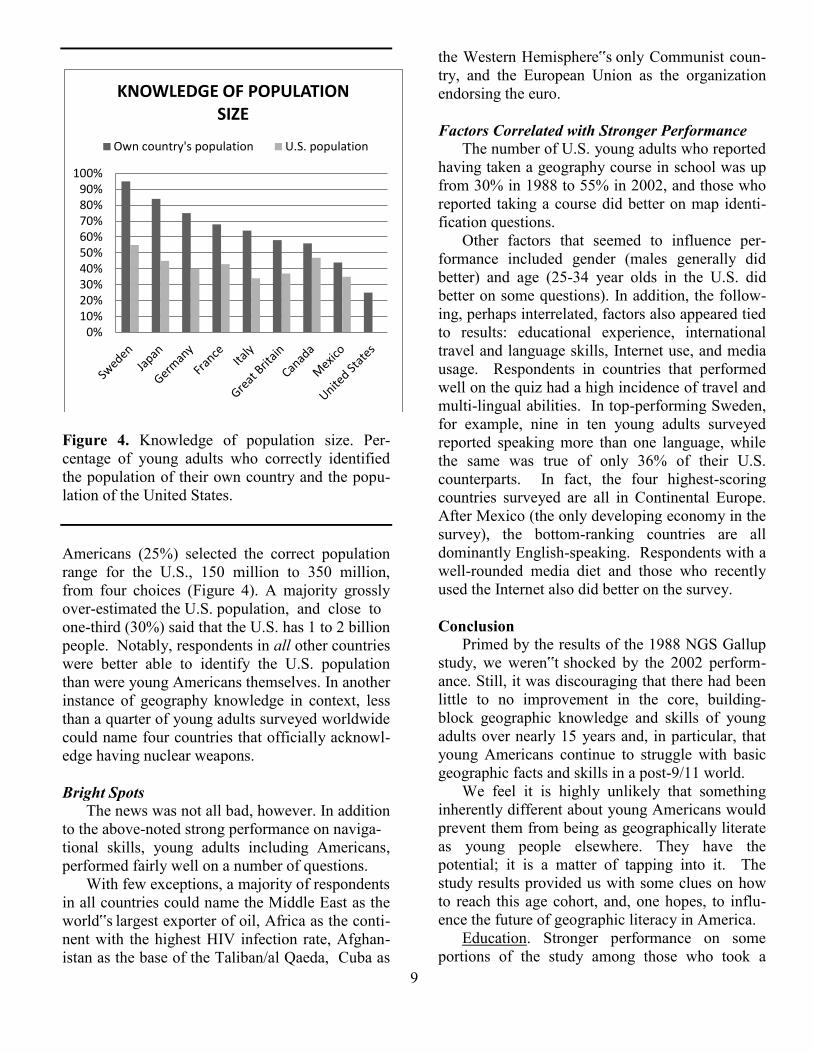
Figure 4. Knowledge of population size. Per-centage of young adults who correctly identified the population of their own country and the popu-lation of the United States.
Americans (25%) selected the correct population range for the U.S., 150 million to 350 million, from four choices (Figure 4). A majority grossly over-estimated the U.S. population, and close to one-third (30%) said that the U.S. has 1 to 2 billion people. Notably, respondents in all other countries were better able to identify the U.S. population than were young Americans themselves. In another instance of geography knowledge in context, less than a quarter of young adults surveyed worldwide could name four countries that officially acknowl-edge having nuclear weapons.
Bright Spots
The news was not all bad, however. In addition to the above-noted strong performance on naviga- tional skills, young adults including Americans, performed fairly well on a number of questions.
With few exceptions, a majority of respondents in all countries could name the Middle East as the world‟s largest exporter of oil, Africa as the conti-nent with the highest HIV infection rate, Afghan-istan as the base of the Taliban/al Qaeda, Cuba as
the Western Hemisphere‟s only Communist coun-try, and the European Union as the organization endorsing the euro.
Factors Correlated with Stronger Performance
The number of U.S. young adults who reported having taken a geography course in school was up from 30% in 1988 to 55% in 2002, and those who reported taking a course did better on map identi-fication questions.
Other factors that seemed to influence per-formance included gender (males generally did better) and age (25-34 year olds in the U.S. did better on some questions). In addition, the follow-ing, perhaps interrelated, factors also appeared tied to results: educational experience, international travel and language skills, Internet use, and media usage. Respondents in countries that performed well on the quiz had a high incidence of travel and multi-lingual abilities. In top-performing Sweden, for example, nine in ten young adults surveyed reported speaking more than one language, while the same was true of only 36% of their U.S. counterparts. In fact, the four highest-scoring countries surveyed are all in Continental Europe. After Mexico (the only developing economy in the survey), the bottom-ranking countries are all dominantly English-speaking. Respondents with a well-rounded media diet and those who recently used the Internet also did better on the survey.
Conclusion
Primed by the results of the 1988 NGS Gallup study, we weren‟t shocked by the 2002 perform-ance. Still, it was discouraging that there had been little to no improvement in the core, building-block geographic knowledge and skills of young adults over nearly 15 years and, in particular, that young Americans continue to struggle with basic geographic facts and skills in a post-9/11 world.
We feel it is highly unlikely that something inherently different about young Americans would prevent them from being as geographically literate as young people elsewhere. They have the potential; it is a matter of tapping into it. The study results provided us with some clues on how to reach this age cohort, and, one hopes, to influ-ence the future of geographic literacy in America.
Education. Stronger performance on some portions of the study among those who took a
0%10%20%30%40%50%60%70%80%90%
100%
KNOWLEDGE OF POPULATION SIZE
Own country's population U.S. population
10
geography class in school supports efforts to make geography an essential part of school curricula via proper funding, teacher training, and the develop-ment of effective classroom materials.
Media/Internet. Although TV dominated as the source for current events news in all counties sur-eyed, young adults outside the U.S. were more likely to round out their media intake with print, radio, and the Internet. Countries with a more well-rounded media diet generally did better on the quiz, as did those who recently accessed the Inter-net. Americans, particularly young ones, showed considerable technology savvy and high web pene-tration, but their media consumption was driven more by a desire for entertainment than education. These results suggest that there is an opportunity to engage young Americans with entertaining and interactive information that will provide them with more geographic context about the world in which they live.
Travel and language skills. In comparison to those in the best-performing countries, the over-whelming majority of young Americans surveyed spoke only one language, and had not been outside of their country of residence in the past three years. Although geographical factors are clearly at play here—for example, inter-country travel is easier in Europe than in large countries such as the U.S. and Canada—it is worth exploring how changes in lan-guage skill requirements or increased opportunities for international travel might influence the geog-raphy skills and knowledge of young Americans.
Relevance. Finally, young Americans paid attention to information that is most relevant to their lives, as did young people of other ages and nationalities surveyed. They did fairly well, for example, on survey questions related to weather,
oil, and AIDS, and on one related to pop culture (correctly placing in the South Pacific the filming location for a “Survivor” TV series that had been aired recently before the study). This information suggests a need to serve up geography, whether via formal education or entertainment-related outlets, in a way that highlights its importance to the everyday life of young people.
In recognition that the keys to geographic liter-acy lie not only in education, but in using media and other outlets to engage young people, the National Geographic Society convened an inter-national coalition of policy-makers and business leaders in response to the survey results. The coali-tion recommended initiatives that can be taken by educators, the media, policy-makers, business leaders, parents, and children to fight geographic ignorance and apathy among young people and encourage interest in world affairs. Emerging from this coalition and additional research was the My Wonderful World public engagement campaign that was launched in May 2006.2
Notes 1A full description of the sampling methodology and procedures, copies of the questionnaires used in the study, and detailed results for the map locator questions are available in the full report, NGEF-Roper (National Geographic Education Foundation and Roper ASW). National Geographic—Roper 2002 global geographic liter-acy survey. Report by RoperASW to National Geographic Society 2002. Available at http://www.nationalgeographic. com/geosurvey2002/download/RoperSurvey.pdf (last acces-sed April 15, 2011).
2See http://207.24.89.238/ for information on the My Won-derful World campaign (last Accessed April 15, 2011).
11
Ryan Daley has a Bachelor’s degree in geography from the University of Colorado and a Master’s degree from the Uni-versity of California, Los Angel-es. His academic interests fo-cused around electoral geog-raphy in the United States. He is currently employed as an an-alyst at the National Renewable Energy Laboratory in Golden, Colorado.
No Child Left Behind and Its Implications for Geography Education
Ryan Daley
The No Child Left Behind Act (NCLB), signed into law in
January 2002 by President George W. Bush, is the most recent reauthorization of the Elementary and Secondary Education Act of 1965.1 Response to this monumental legislation has been mixed, but the vast reforms of the act had many implications for geography education. That NCLB included geography as a “core academic subject” and required all geography teachers to be highly qualified by 2005-2006 speaks to over two decades of progress for the discipline. While other subjects may have had more clearly defined programs and avenues of funding, the requirements of NCLB together with many other potential funding and programmatic opportunities aided the advancement of geography education.
Inclusion of geography as a core academic subject resulted, in part, from disheartening results in a 1988 poll by the Gallup Organi-zation that exposed strikingly low levels of geographic literacy among Americans.2 This poll alarmed the geography community and helped trigger a movement to improve geography education that continues to this day. As a result, in the 1980‟s the National Geo-graphic Society (NGS) established a national network of geography alliances that have as their collective goal the improvement of geography education in the nation‟s schools. In 1989, during an historic education summit, President George H. W. Bush and state governors included geography as one of five “core subjects” in the National Education Goals. Subsequently, in 1994 awards by the U.S. Department of Education for the development of high academic standards prompted six states to adopt geography standards. Since 1994 and the publication of Geography for Life: National Geography Standards 1994 by the National Geographic Society3 all states except Iowa and Rhode Island have established such standards.4 The effects of NCLB are the focus of this paper.
Brief Overview of No Child Left Behind
Hoping to fuel an unprecedentedly important federal role in the U.S. education system, the No Child Left Behind Act obligated all states to follow particular guidelines for testing and accountability in an attempt to raise the achievement level of all students. NCLB required that assessments be aligned with state academic standards and administered a minimum of three times between grades 3-12. Test results were intended to pinpoint the specific academic needs of students and to hold educators accountable for student progress. Emphasis was placed on raising student scores to benchmarks set by each state in mathematics and reading and on closing the achievement gaps between under-privileged racial, ethnic and income groups and
12
other students. Related changes in the distribution of Title I funds were also made. Special provisions allowed the U.S. Department of Education to channel funds directly to poorer school districts to serve under-privileged students with such programs as The Teacher Quality initiative and The Reading First Program.5
One of the more ambitious requirements of NCLB was that supported programs, particularly in mathematics and reading, be the product of “sci-entifically based research.” The act defines this as research that uses “rigorous, systematic, and ob-jective procedures to obtain reliable programs and valid knowledge relevant to education activities and programs” or research that is “accepted by a peer-reviewed journal or approved by a panel of independent experts through a comparably rigo-rous, objective, and scientific review.”
Perhaps one of the most difficult aspects of NCLB for schools nationwide was the requirement that all teachers of core academic subjects be “highly qualified.” Teachers in core subjects were mandated to meet this requirement by the end of the 2005-2006 school year, yet even as late as 2007, schools across the country were struggling to identify precisely what criteria should define “highly qualified,” and were having difficulty staf-fing high-poverty schools with qualified teachers.6 For their compliance with these federal demands, state and local education agencies were afforded greater flexibility in spending their federal funds. However, the act placed explicit importance on showing “adequate yearly progress” (AYP), mean-ing that education funding is tied to measurable levels of achievement.7
Standing of Geography within No Child Left Behind
Building on the 1989 Governor‟s Summit, the “core academic subjects” as defined by NCLB include English, reading or language arts, mathe-matics, science, foreign language, civics and government, economics, arts, history, and geog-raphy. However, under NCLB, English, reading and language arts, science, and mathematics are the only subjects for which states were required to establish academic standards as well as assess-ments to gauge the progress of students. Standards and assessments in all other subjects are optional.
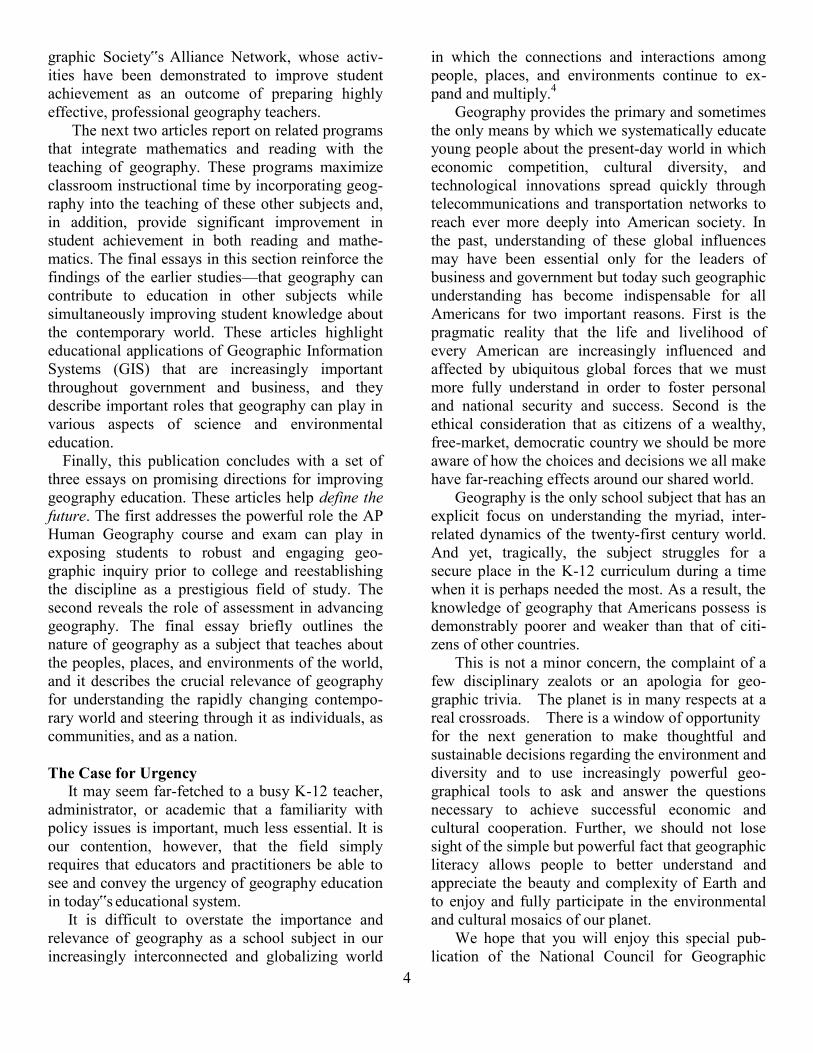
Because of the emphasis on such assessments as measures of student progress and school perform-ance, and the reliance on test results to determine funding, some state and local education agencies were effectively forced to concentrate mainly on assessments in the required subjects. The effect has been to marginalize programs that have a less prominent role in the legislation. This is especially the case with geography, which not only lacked a federal mandate to be tested, but is also the only core academic subject that has no specific pro-grammatic requirements or authorization for federal funding within NCLB. Consequently, Con-gress annually appropriates funding for all core subjects except geography (Table 1). Opportunities for Geography Education
The weak funding position of geography in NCLB leaves the discipline with relatively few di-rect options to advance geography education for elementary and secondary students. Nonetheless, with geography listed as a core academic subject schools must place some level of priority on the improvement of student academic achievement in the subject and on provision of highly qualified geography teachers8. Herein lies perhaps the best short-term opportunity for geography educators. NCLB generally provides funding for partnerships with public schools and institutions of higher edu-cation to maintain and ensure teacher quality. Certification of highly qualified veteran teachers rests largely on the shoulders of local education agencies; ensuring the qualifications of new in-structors is primarily the responsibility of teacher training institutions. Geography education could secure meaningful funding through partnerships with these institutions. Table 2 highlights some of the most promising avenues to improve geography education and also lists several NCLB programs through which funding is possible, including pro-grams for highly qualified teachers.
State assessments also show promising oppor-tunities. As of 2002, only twenty-seven states included a geography component in their examina-tions. Maintaining this presence and adding similar test sections in other states can be subsidized through NCLB funded partnerships with state and local education agencies for the development and maintenance of assessments. As the saying goes,
13
Table 1. No Subject But Geography Left Behind? Program Funding Levels for Core Subjects Under No Child Left Behind (FY 2002-20099
NCLB Core Subject & Specific Programs
Original NCLB Funding
Authorization
Actual Appropriations
NCLB Core Subject & Specific Programs
Original NCLB Funding
Authorization
Actual Appropriations
English/Reading/ Language Arts
Reading First Gants (Subset of Early Reading First Grants)
$900,000,000 ($75,000,000)
FY 2002 FY 2003 FY 2004 FY 2005 FY 2006 FY 2007 FY 2008 FY 2009
$975,000,000 $1,068,012,000 $1,118,362,000 $1,145,760,000 $1,132,352,000 $1,146,900,000
$505,561,000 $1,112,549,000
Foreign Language Assistance Programs
$27,500,000 FY 2004 FY 2005 FY 2006 FY 2007 FY 2008 FY 2009
$16,644,000 $17,900,000 $21,780,000 $23,780,000 $25,655,000 $25,655,000
Even Start Program $260,000,000 FY 2002 FY 2003 FY 2004 FY 2005 FY 2006 FY 2007 FY 2008 FY 2009
$250,000,000 $248,375,000 $246,909,587 $225,094,720 $99,000,000 $82,282,160 $66,454,000
$0
Civics / Government We the People Cooperative Education Exchange
$30,000,000 FY 2002 FY 2003 FY 2004 FY 2005 FY 2006 FY 2007 FY 2008 FY 2009
$15,500,000 $16,890,000 $28,642,009 $29,404,864 $29,114,950 $29,111,660 $31,917,000
$0
Striving Readers $100,000,000 (Created in
FY05)
FY 2005 FY 2006 FY 2007 FY 2008 FY 2009
$24,800,000 $29,700,000 $31,870,000 $35,371,000
$100,000,000
Excellence in Economics Education
Feds pay 50% of grants
FY 2004 FY 2005 FY 2006 FY 2007 FY 2008 FY 2009
$1,491,150 $1,488,000 $1,473,120 $1,473,120 $1,447,000
$0
Literacy through School Libraries
$250,000,000 FY 2002 FY 2003 FY 2004 FY 2005 FY 2006 FY 2007 FY 2008 FY 2009
$12,418,750 $12,500,000 $19,842,236 $19,683,264 $19,486,170 $19,486,170 $19,145,000 $19,145,000
Arts in Education No specified amount
FY 2002 FY 2003 FY 2004 FY 2005 FY 2006 FY 2007 FY 2008 FY 2009
$14,650,000 $12,915,500 $13,395,497 $13,808,640 $35,277,000 $35,276,670 $37,533,000
$0
National Writing Project $15,000,000 FY 2002 FY 2003 FY 2004 FY 2005 FY 2006 FY 2007 FY 2008 FY 2009
$14,000,000 $16,890,000 $17,900,000 $20,336,000 $21,533,000 $21,532,500 $23,581,000
$0
Teaching American History Such sums as necessary
FY 2002 FY 2003 FY 2004 FY 2005 FY 2006 FY 2007 FY 2008 FY 2009
$100,000,000 $99,350,000
$119,292,000 $119,040,000 $119,790,000 $119,790,000 $117,904,000
$50,000
Mathematics and Science Partnerships
$450,000,000 FY 2002 FY 2003 FY 2004 FY 2005 FY 2006 FY 2007 FY 2008 FY 2009
$12,500,000 $100,344,000 $149,115,000 $178,560,000 $182,160,000 $182,160,000 $178,978,000 $178,978,000
Geography None FY 2002 FY 2003 FY 2004 FY 2005 FY 2006 FY 2007 FY 2008 FY 2009
$0 $0 $0 $0 $0 $0 $0 $0
14
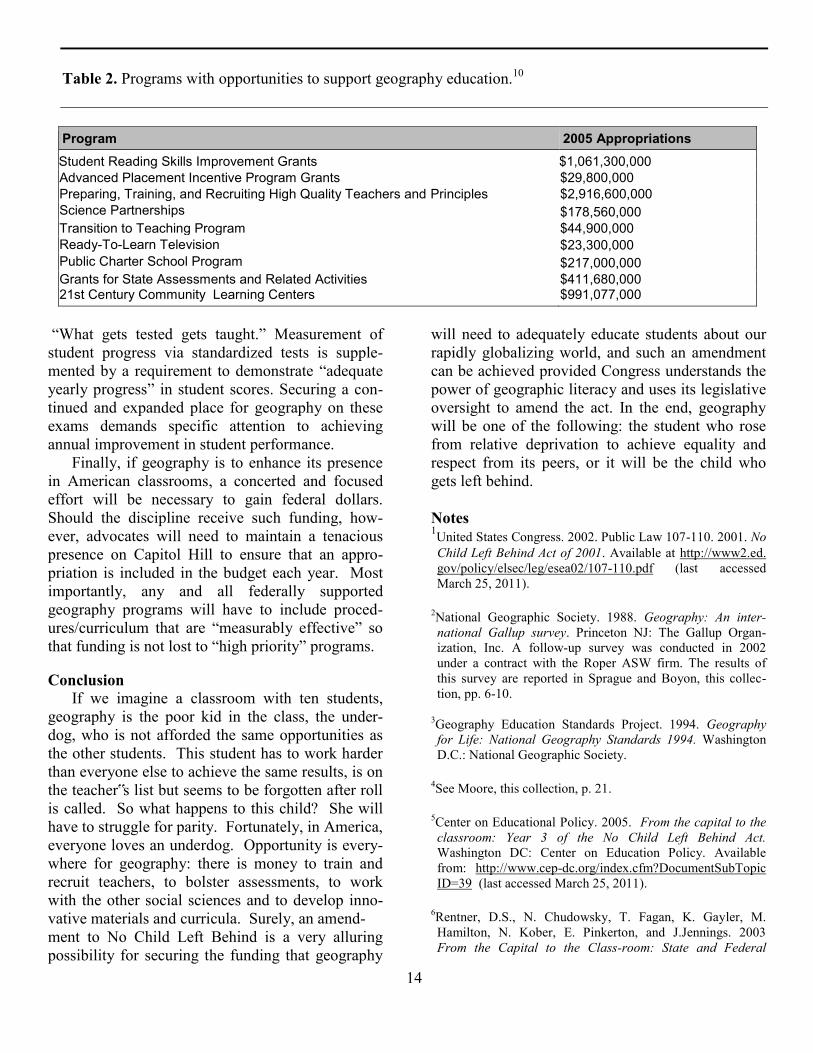
Table 2. Programs with opportunities to support geography education.10
Program 2005 Appropriations Student Reading Skills Improvement Grants $1,061,300,000 Advanced Placement Incentive Program Grants $29,800,000 Preparing, Training, and Recruiting High Quality Teachers and Principles $2,916,600,000 Science Partnerships $178,560,000 Transition to Teaching Program $44,900,000 Ready-To-Learn Television $23,300,000 Public Charter School Program $217,000,000 Grants for State Assessments and Related Activities $411,680,000 21st Century Community Learning Centers $991,077,000
“What gets tested gets taught.” Measurement of student progress via standardized tests is supple-mented by a requirement to demonstrate “adequate yearly progress” in student scores. Securing a con-tinued and expanded place for geography on these exams demands specific attention to achieving annual improvement in student performance.
Finally, if geography is to enhance its presence in American classrooms, a concerted and focused effort will be necessary to gain federal dollars. Should the discipline receive such funding, how-ever, advocates will need to maintain a tenacious presence on Capitol Hill to ensure that an appro-priation is included in the budget each year. Most importantly, any and all federally supported geography programs will have to include proced-ures/curriculum that are “measurably effective” so that funding is not lost to “high priority” programs. Conclusion
If we imagine a classroom with ten students, geography is the poor kid in the class, the under-dog, who is not afforded the same opportunities as the other students. This student has to work harder than everyone else to achieve the same results, is on the teacher‟s list but seems to be forgotten after roll is called. So what happens to this child? She will have to struggle for parity. Fortunately, in America, everyone loves an underdog. Opportunity is every-where for geography: there is money to train and recruit teachers, to bolster assessments, to work with the other social sciences and to develop inno-vative materials and curricula. Surely, an amend- ment to No Child Left Behind is a very alluring possibility for securing the funding that geography
will need to adequately educate students about our rapidly globalizing world, and such an amendment can be achieved provided Congress understands the power of geographic literacy and uses its legislative oversight to amend the act. In the end, geography will be one of the following: the student who rose from relative deprivation to achieve equality and respect from its peers, or it will be the child who gets left behind.
Notes 1United States Congress. 2002. Public Law 107-110. 2001. No Child Left Behind Act of 2001. Available at http://www2.ed. gov/policy/elsec/leg/esea02/107-110.pdf (last accessed March 25, 2011).
2National Geographic Society. 1988. Geography: An inter-national Gallup survey. Princeton NJ: The Gallup Organ-ization, Inc. A follow-up survey was conducted in 2002 under a contract with the Roper ASW firm. The results of this survey are reported in Sprague and Boyon, this collec-tion, pp. 6-10.
3Geography Education Standards Project. 1994. Geography for Life: National Geography Standards 1994. Washington D.C.: National Geographic Society.
4See Moore, this collection, p. 21. 5Center on Educational Policy. 2005. From the capital to the classroom: Year 3 of the No Child Left Behind Act. Washington DC: Center on Education Policy. Available from: http://www.cep-dc.org/index.cfm?DocumentSubTopic ID=39 (last accessed March 25, 2011).
6Rentner, D.S., N. Chudowsky, T. Fagan, K. Gayler, M. Hamilton, N. Kober, E. Pinkerton, and J.Jennings. 2003 From the Capital to the Class-room: State and Federal
15
Efforts to Implement the No Child Left Behind Act. Washington DC: Center on Education Policy. 2003. Available at http://www.cep-dc.org/index.cfm?Document SubTopicID=41 (last accessed March 25, 2011), and McMurrer, J. 2007. Implementing the No Child Left Behind
Teacher Requirements. Washington, DC: Center on Educa-tion Policy. Available from http://www.cep-dc.org/display Document.cfm?DocumentID=311 (last accessed March 25, 2011).
7U.S. Department of Education. 2004. The Facts About… Making Gains Every Year. Washington DC: U.S. Department of Education. Available at http://www.ed.gov/nclb/ accountability/ayp/yearly.html (last accessed March 25, 2011).
8U.S. Department of Education. 2005. Programs proposed for elimination arts in education. Fiscal Year 2006 Budget Summary. Washington, DC: U.S. Department of Education. Available at http://www2.ed.gov/about/overview/budget/ budget06/summary/edlite-section3.html#arts (last accessed March 25, 2011), and U.S. Department of Education. 2005. Programs proposed for elimination math and science partnerships: Fiscal Year 2006. Budget Summary. Washington DC: U.S. Department of Education. Available from http://www.ed.gov/about/overview/budget/budget06/
summary/edlite-section2a.html#mathsci (last accessed March 25, 2011). Additional budget information received from the following websites: http://www.ed.gov/about/moverview/ budget/budget05/summary/edlite-section1.html (last accessed February 25, 2011). http://www.ed.gov/about/ overview/ budget/budget06/summary/edlitesection1.html (last Accessed February 25, 2011).
9The “highly qualified” designation requires that teachers be fully licensed and have an undergraduate degree in subjects they teach, or an alternative certification may be achieved though subject matter tests developed by each state.
10For more detailed information regarding the information contained in Table 2, see Ryan Daley. 2001. No geographer left behind: A policy guide to geography education and the No Child Left Behind Act of 2001. College Station TX: Geography Education National Implementation Project. Available at http://genip.tamu.edu/index.htm (last accessed March 25, 2011); and Ryan Daley. 2001. No geographer left behind: An educator’ guide to geography education and the No Child Left Behind Act of 2001. College Station TX: Geography Education National Implementation Project. Available at http://genip.tamu.edu/index.htm (last accessed March 25, 2011).
16
Susan White Frazier is Re-search Manager , Market Mem-ber and Business Research at National Geographic Society.
Effects of the No Child Left Behind Act: Educator Perspectives
Susan White Frazier
This paper reports the results of a survey conducted by the National Geographic Society that obtained the perceptions of public school edu-cators about the effects of the No Child Left Behind Act (NCLB) upon geography education. The survey was conducted a little over two years after NCLB had been passed into law and assessed the impact that NCLB implementation was having on geography education, with a spe-cial focus on the emerging challenges to improving geographic literacy.
Methods and Respondents
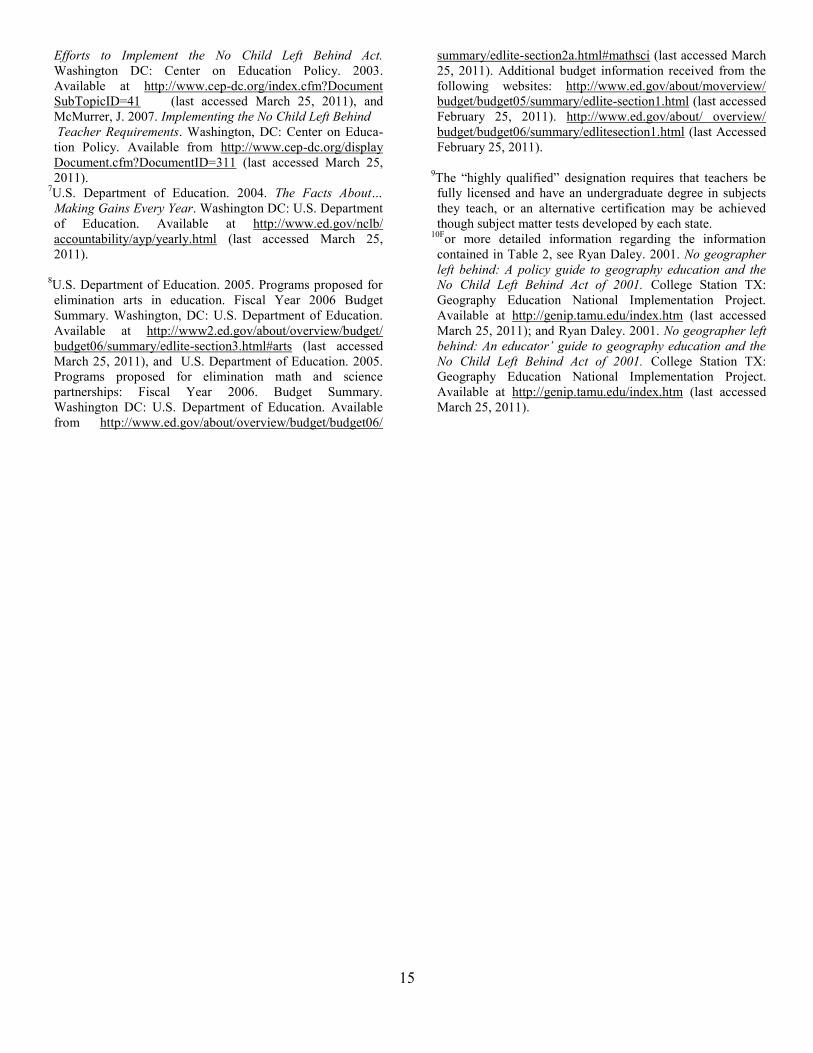
A survey was mailed on February 17, 2004 to a sample of 4,500 social studies teachers, principals, and curriculum coordinators in grades K-12. National Geographic purchased lists from Market Data Retrieval1 a leading list provider in the education market. The total number of returned surveys was 561, amounting to an overall response rate of 13% (Table 1).2 Most respondents identified themselves as classroom teachers (77%). Nearly four-fifths of the respondents work primarily with middle school/junior high school or high school students (elementary 16%; middle/junior high school 42%; high school 34%). Respondents to this survey had a generally long tenure in education, with more than four in ten working in education for more than 20 years and just 12 percent working in the field for five years or less. Table 1. No Child Left Behind survey sample composition
Educator Category Total
mailed Total
returned Response
rate
K-12 social studies teachers 2,500 396 16% K-12 principals 1,000 66 7% K-12 curriculum coordinators/ department chairs
1,000 99 10%
Total 4,500 561 13%
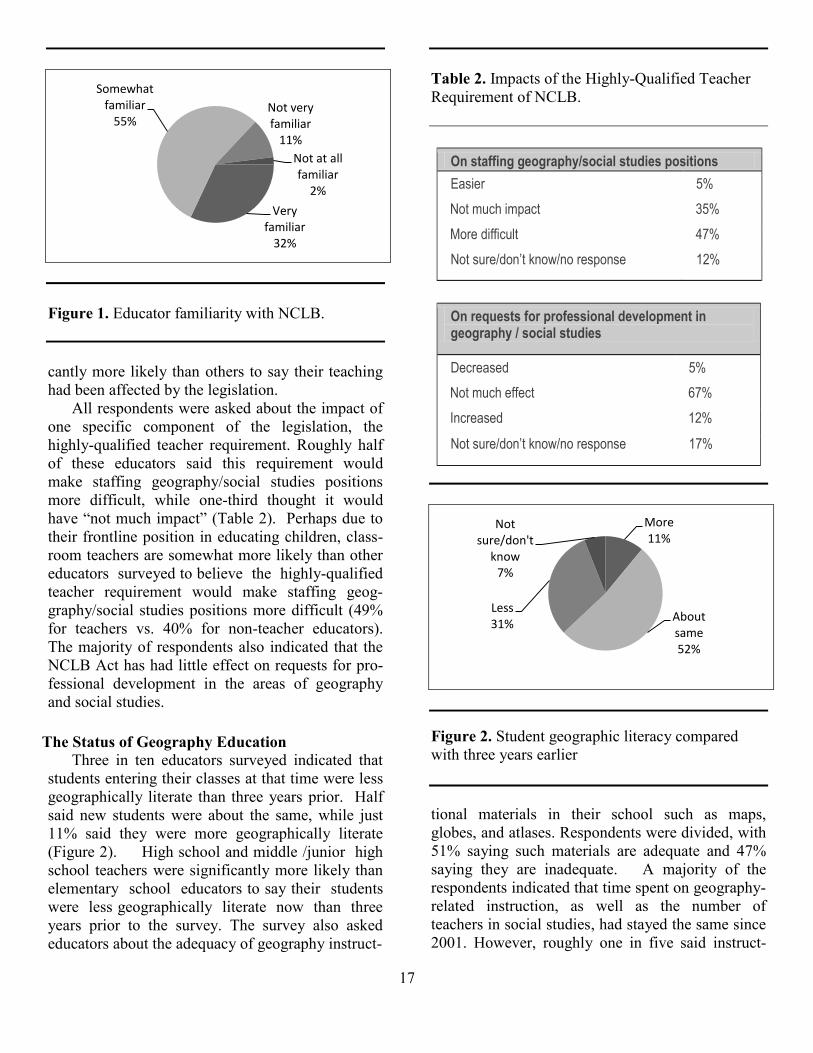
Overall Perceptions Most of the educators surveyed indicated they were at least
somewhat familiar with NCLB, with one-third saying they are “very familiar” with it, and only two percent saying they were “not at all familiar” with it (Figure 1). Looking just at classroom teachers and the impact of NCLB on their teaching, four in ten said that since 2001 “more of my teaching is focused on meeting NCLB‟s priorities” (40%). The remainder of classroom teachers (59%) indicated that their teaching “has not changed significantly based on NCLB‟s priorities.” Those who considered themselves “very familiar” with the Act were signifi-
17
Figure 1. Educator familiarity with NCLB.
cantly more likely than others to say their teaching had been affected by the legislation.
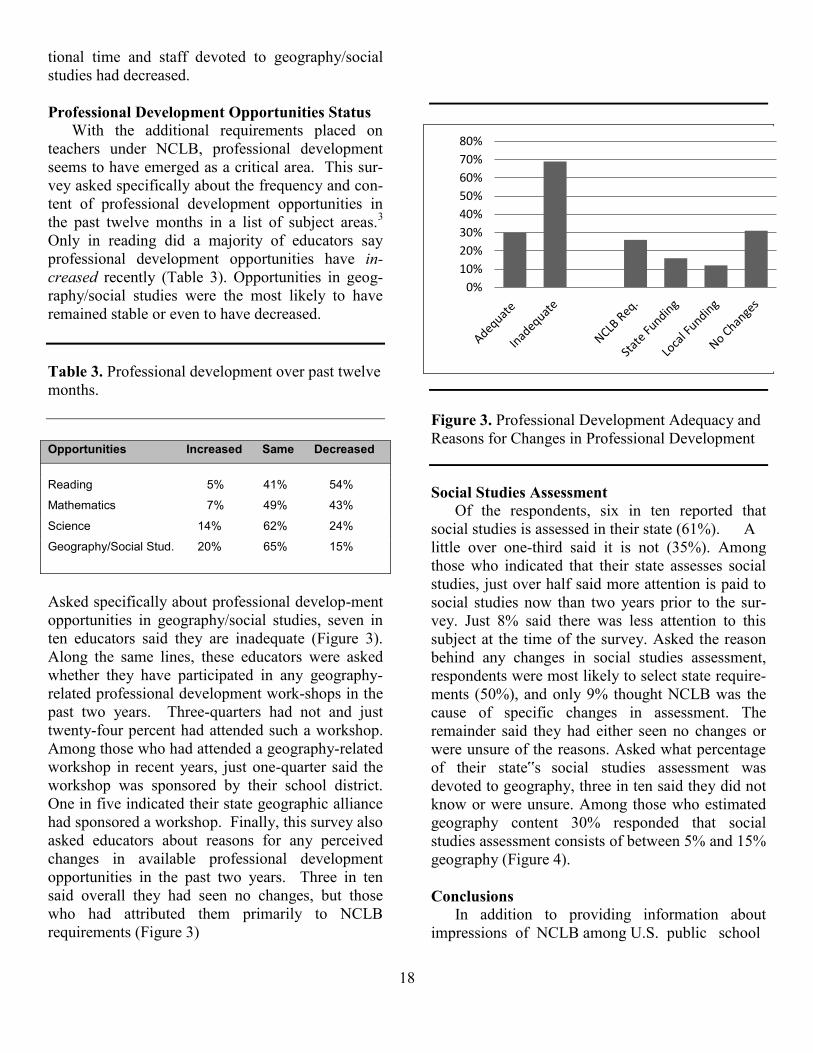
All respondents were asked about the impact of one specific component of the legislation, the highly-qualified teacher requirement. Roughly half of these educators said this requirement would make staffing geography/social studies positions more difficult, while one-third thought it would have “not much impact” (Table 2). Perhaps due to their frontline position in educating children, class- room teachers are somewhat more likely than other educators surveyed to believe the highly-qualified teacher requirement would make staffing geog-graphy/social studies positions more difficult (49% for teachers vs. 40% for non-teacher educators). The majority of respondents also indicated that the NCLB Act has had little effect on requests for pro-fessional development in the areas of geography and social studies.
The Status of Geography Education
Three in ten educators surveyed indicated that students entering their classes at that time were less geographically literate than three years prior. Half said new students were about the same, while just 11% said they were more geographically literate (Figure 2). High school and middle /junior high school teachers were significantly more likely than elementary school educators to say their students were less geographically literate now than three years prior to the survey. The survey also asked educators about the adequacy of geography instruct-
Table 2. Impacts of the Highly-Qualified Teacher Requirement of NCLB.
On staffing geography/social studies positions
Easier 5%
Not much impact 35%
More difficult 47%
Not sure/don’t know/no response 12%
On requests for professional development in geography / social studies
Decreased 5%
Not much effect 67%
Increased 12%
Not sure/don’t know/no response 17%
Figure 2. Student geographic literacy compared with three years earlier
tional materials in their school such as maps, globes, and atlases. Respondents were divided, with 51% saying such materials are adequate and 47% saying they are inadequate. A majority of the respondents indicated that time spent on geography-related instruction, as well as the number of teachers in social studies, had stayed the same since 2001. However, roughly one in five said instruct-
Very familiar
32%
Somewhat familiar
55% Not very familiar
11%
Not at all familiar
2%
More 11%
About same 52%
Less 31%
Not sure/don't
know 7%
18
tional time and staff devoted to geography/social studies had decreased. Professional Development Opportunities Status
With the additional requirements placed on teachers under NCLB, professional development seems to have emerged as a critical area. This sur- vey asked specifically about the frequency and con-tent of professional development opportunities in the past twelve months in a list of subject areas.3
Only in reading did a majority of educators say professional development opportunities have in-creased recently (Table 3). Opportunities in geog-raphy/social studies were the most likely to have remained stable or even to have decreased.
Table 3. Professional development over past twelve months.
Opportunities Increased Same Decreased
Reading 5% 41% 54%
Mathematics 7% 49% 43%
Science 14% 62% 24%
Geography/Social Stud. 20% 65% 15%
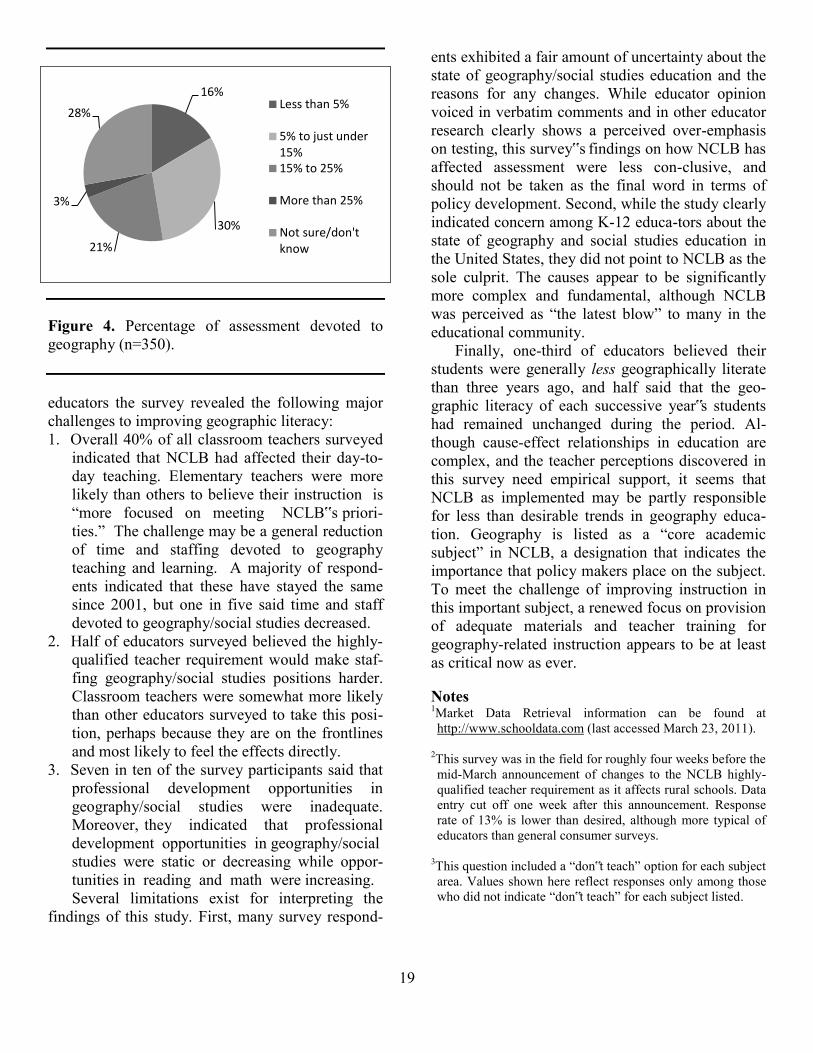
Asked specifically about professional develop-ment opportunities in geography/social studies, seven in ten educators said they are inadequate (Figure 3). Along the same lines, these educators were asked whether they have participated in any geography-related professional development work-shops in the past two years. Three-quarters had not and just twenty-four percent had attended such a workshop. Among those who had attended a geography-related workshop in recent years, just one-quarter said the workshop was sponsored by their school district. One in five indicated their state geographic alliance had sponsored a workshop. Finally, this survey also asked educators about reasons for any perceived changes in available professional development opportunities in the past two years. Three in ten said overall they had seen no changes, but those who had attributed them primarily to NCLB requirements (Figure 3)
Figure 3. Professional Development Adequacy and Reasons for Changes in Professional Development
Social Studies Assessment Of the respondents, six in ten reported that
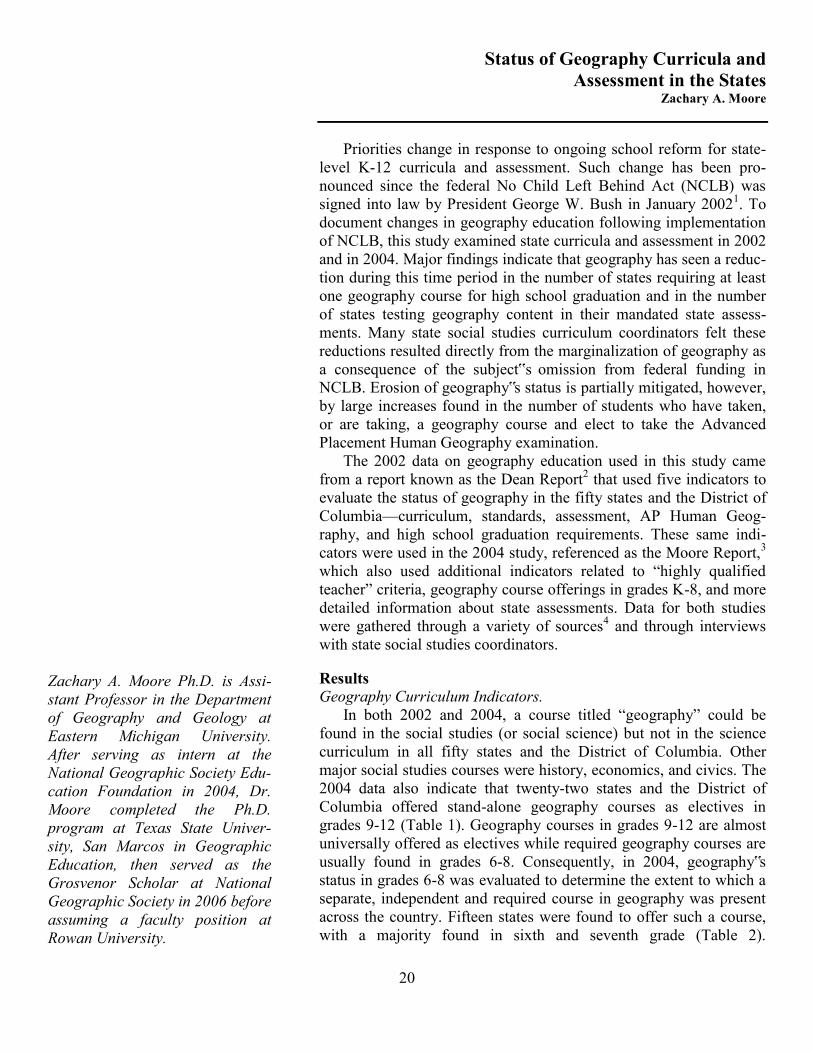
social studies is assessed in their state (61%). A little over one-third said it is not (35%). Among those who indicated that their state assesses social studies, just over half said more attention is paid to social studies now than two years prior to the sur-vey. Just 8% said there was less attention to this subject at the time of the survey. Asked the reason behind any changes in social studies assessment, respondents were most likely to select state require-ments (50%), and only 9% thought NCLB was the cause of specific changes in assessment. The remainder said they had either seen no changes or were unsure of the reasons. Asked what percentage of their state‟s social studies assessment was devoted to geography, three in ten said they did not know or were unsure. Among those who estimated geography content 30% responded that social studies assessment consists of between 5% and 15% geography (Figure 4). Conclusions
In addition to providing information about impressions of NCLB among U.S. public school
0%
10%
20%
30%
40%
50%
60%
70%
80%
19
Figure 4. Percentage of assessment devoted to geography (n=350). educators the survey revealed the following major challenges to improving geographic literacy: 1. Overall 40% of all classroom teachers surveyed
indicated that NCLB had affected their day-to-day teaching. Elementary teachers were more likely than others to believe their instruction is “more focused on meeting NCLB‟s priori-ties.” The challenge may be a general reduction of time and staffing devoted to geography teaching and learning. A majority of respond-ents indicated that these have stayed the same since 2001, but one in five said time and staff devoted to geography/social studies decreased.
2. Half of educators surveyed believed the highly-qualified teacher requirement would make staf-fing geography/social studies positions harder. Classroom teachers were somewhat more likely than other educators surveyed to take this posi-tion, perhaps because they are on the frontlines and most likely to feel the effects directly.
3. Seven in ten of the survey participants said that professional development opportunities in geography/social studies were inadequate. Moreover, they indicated that professional development opportunities in geography/social
studies were static or decreasing while oppor-tunities in reading and math were increasing. Several limitations exist for interpreting the
findings of this study. First, many survey respond-
ents exhibited a fair amount of uncertainty about the state of geography/social studies education and the reasons for any changes. While educator opinion voiced in verbatim comments and in other educator research clearly shows a perceived over-emphasis on testing, this survey‟s findings on how NCLB has affected assessment were less con-clusive, and should not be taken as the final word in terms of policy development. Second, while the study clearly indicated concern among K-12 educa-tors about the state of geography and social studies education in the United States, they did not point to NCLB as the sole culprit. The causes appear to be significantly more complex and fundamental, although NCLB was perceived as “the latest blow” to many in the educational community.
Finally, one-third of educators believed their students were generally less geographically literate than three years ago, and half said that the geo-graphic literacy of each successive year‟s students had remained unchanged during the period. Al-though cause-effect relationships in education are complex, and the teacher perceptions discovered in this survey need empirical support, it seems that NCLB as implemented may be partly responsible for less than desirable trends in geography educa-tion. Geography is listed as a “core academic subject” in NCLB, a designation that indicates the importance that policy makers place on the subject. To meet the challenge of improving instruction in this important subject, a renewed focus on provision of adequate materials and teacher training for geography-related instruction appears to be at least as critical now as ever.
Notes 1Market Data Retrieval information can be found at http://www.schooldata.com (last accessed March 23, 2011).
2This survey was in the field for roughly four weeks before the mid-March announcement of changes to the NCLB highly-qualified teacher requirement as it affects rural schools. Data entry cut off one week after this announcement. Response rate of 13% is lower than desired, although more typical of educators than general consumer surveys.
3This question included a “don‟t teach” option for each subject area. Values shown here reflect responses only among those who did not indicate “don‟t teach” for each subject listed.
16%
30%
21%
3%
28% Less than 5%
5% to just under15%15% to 25%
More than 25%
Not sure/don'tknow
20
Zachary A. Moore Ph.D. is Assi-stant Professor in the Department of Geography and Geology at Eastern Michigan University. After serving as intern at the National Geographic Society Edu-cation Foundation in 2004, Dr. Moore completed the Ph.D. program at Texas State Univer-sity, San Marcos in Geographic Education, then served as the Grosvenor Scholar at National Geographic Society in 2006 before assuming a faculty position at Rowan University.
Status of Geography Curricula and Assessment in the States
Zachary A. Moore
Priorities change in response to ongoing school reform for state-
level K-12 curricula and assessment. Such change has been pro-nounced since the federal No Child Left Behind Act (NCLB) was signed into law by President George W. Bush in January 20021. To document changes in geography education following implementation of NCLB, this study examined state curricula and assessment in 2002 and in 2004. Major findings indicate that geography has seen a reduc-tion during this time period in the number of states requiring at least one geography course for high school graduation and in the number of states testing geography content in their mandated state assess-ments. Many state social studies curriculum coordinators felt these reductions resulted directly from the marginalization of geography as a consequence of the subject‟s omission from federal funding in NCLB. Erosion of geography‟s status is partially mitigated, however, by large increases found in the number of students who have taken, or are taking, a geography course and elect to take the Advanced Placement Human Geography examination.
The 2002 data on geography education used in this study came from a report known as the Dean Report2 that used five indicators to evaluate the status of geography in the fifty states and the District of Columbia—curriculum, standards, assessment, AP Human Geog-raphy, and high school graduation requirements. These same indi-cators were used in the 2004 study, referenced as the Moore Report,3 which also used additional indicators related to “highly qualified teacher” criteria, geography course offerings in grades K-8, and more detailed information about state assessments. Data for both studies were gathered through a variety of sources4 and through interviews with state social studies coordinators.
Results Geography Curriculum Indicators.
In both 2002 and 2004, a course titled “geography” could be found in the social studies (or social science) but not in the science curriculum in all fifty states and the District of Columbia. Other major social studies courses were history, economics, and civics. The 2004 data also indicate that twenty-two states and the District of Columbia offered stand-alone geography courses as electives in grades 9-12 (Table 1). Geography courses in grades 9-12 are almost universally offered as electives while required geography courses are usually found in grades 6-8. Consequently, in 2004, geography‟s status in grades 6-8 was evaluated to determine the extent to which a separate, independent and required course in geography was present across the country. Fifteen states were found to offer such a course, with a majority found in sixth and seventh grade (Table 2).
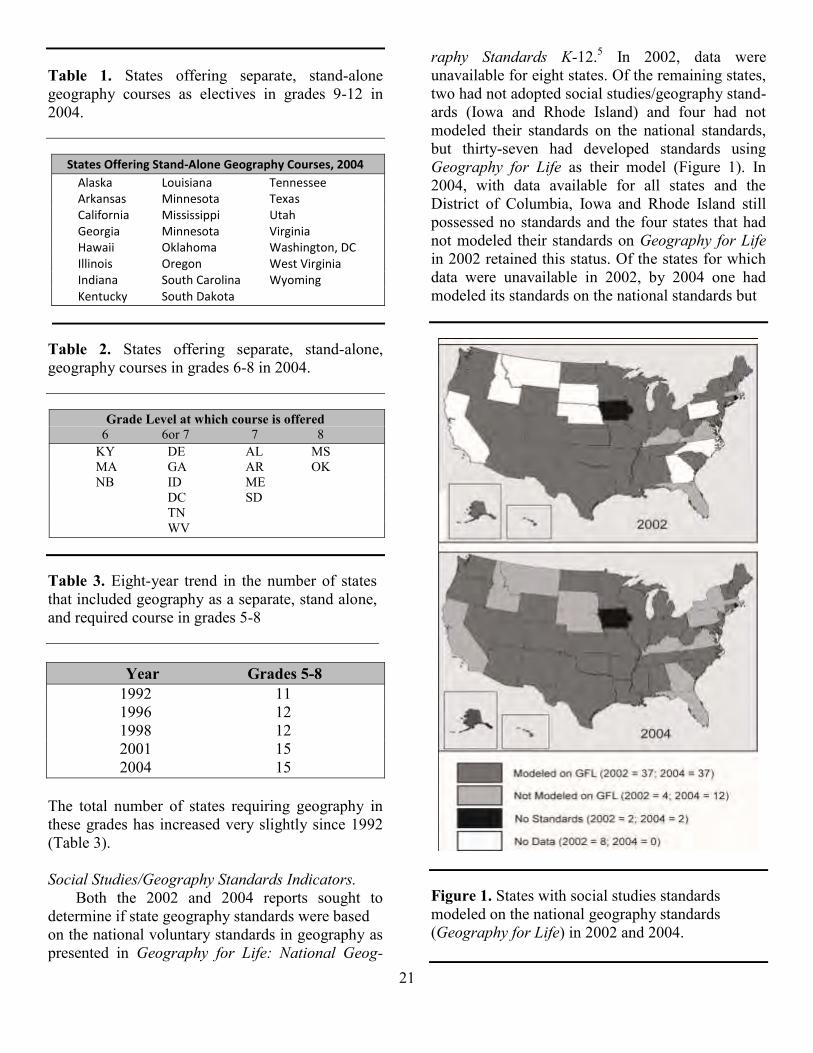
21
Table 1. States offering separate, stand-alone geography courses as electives in grades 9-12 in 2004.
States Offering Stand-Alone Geography Courses, 2004
Alaska Louisiana Tennessee Arkansas Minnesota Texas California Mississippi Utah Georgia Minnesota Virginia Hawaii Oklahoma Washington, DC Illinois Oregon West Virginia Indiana South Carolina Wyoming Kentucky South Dakota
Table 2. States offering separate, stand-alone, geography courses in grades 6-8 in 2004.
Grade Level at which course is offered
6 6or 7 7 8 KY DE AL MS MA GA AR OK NB ID ME
DC SD TN WV
Table 3. Eight-year trend in the number of states that included geography as a separate, stand alone, and required course in grades 5-8
Year Grades 5-8 1992 11 1996 12 1998 12 2001 15 2004 15
The total number of states requiring geography in these grades has increased very slightly since 1992 (Table 3). Social Studies/Geography Standards Indicators.
Both the 2002 and 2004 reports sought to determine if state geography standards were based on the national voluntary standards in geography as presented in Geography for Life: National Geog-
raphy Standards K-12.5 In 2002, data were unavailable for eight states. Of the remaining states, two had not adopted social studies/geography stand-ards (Iowa and Rhode Island) and four had not modeled their standards on the national standards, but thirty-seven had developed standards using Geography for Life as their model (Figure 1). In 2004, with data available for all states and the District of Columbia, Iowa and Rhode Island still possessed no standards and the four states that had not modeled their standards on Geography for Life in 2002 retained this status. Of the states for which data were unavailable in 2002, by 2004 one had modeled its standards on the national standards but
Figure 1. States with social studies standards modeled on the national geography standards (Geography for Life) in 2002 and 2004.
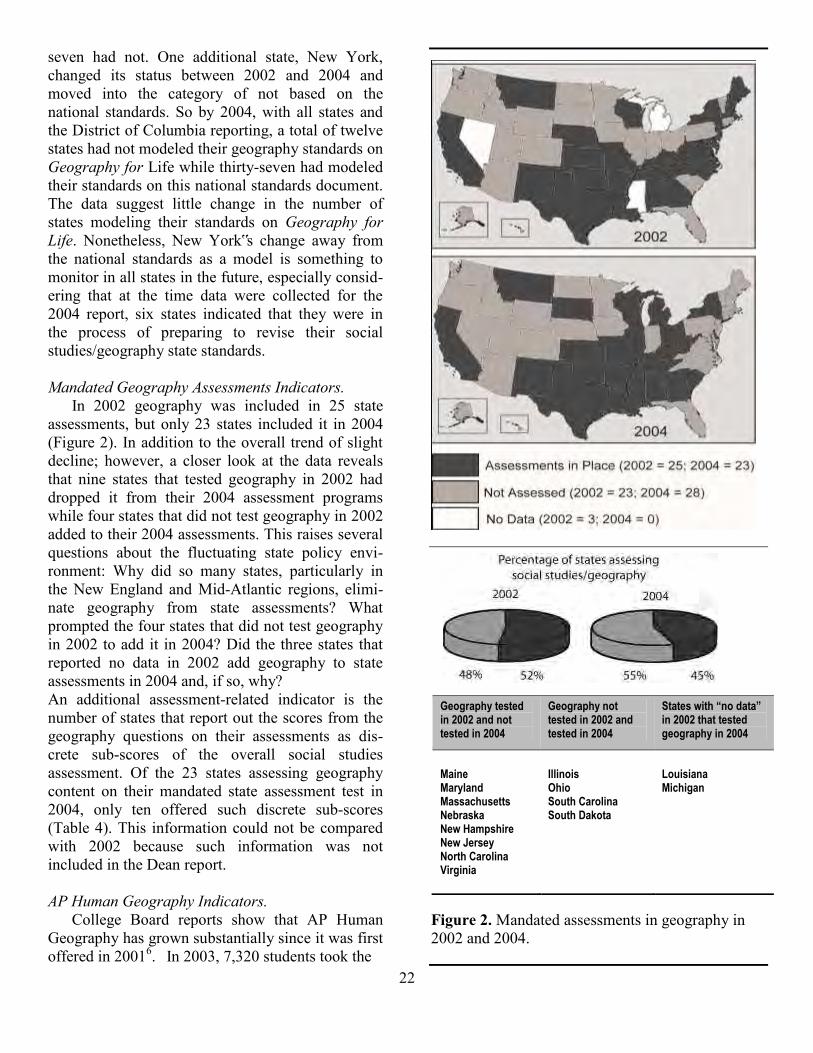
22
seven had not. One additional state, New York, changed its status between 2002 and 2004 and moved into the category of not based on the national standards. So by 2004, with all states and the District of Columbia reporting, a total of twelve states had not modeled their geography standards on Geography for Life while thirty-seven had modeled their standards on this national standards document. The data suggest little change in the number of states modeling their standards on Geography for Life. Nonetheless, New York‟s change away from the national standards as a model is something to monitor in all states in the future, especially consid-ering that at the time data were collected for the 2004 report, six states indicated that they were in the process of preparing to revise their social studies/geography state standards.
Mandated Geography Assessments Indicators.
In 2002 geography was included in 25 state assessments, but only 23 states included it in 2004 (Figure 2). In addition to the overall trend of slight decline; however, a closer look at the data reveals that nine states that tested geography in 2002 had dropped it from their 2004 assessment programs while four states that did not test geography in 2002 added to their 2004 assessments. This raises several questions about the fluctuating state policy envi-ronment: Why did so many states, particularly in the New England and Mid-Atlantic regions, elimi-nate geography from state assessments? What prompted the four states that did not test geography in 2002 to add it in 2004? Did the three states that reported no data in 2002 add geography to state assessments in 2004 and, if so, why? An additional assessment-related indicator is the number of states that report out the scores from the geography questions on their assessments as dis-crete sub-scores of the overall social studies assessment. Of the 23 states assessing geography content on their mandated state assessment test in 2004, only ten offered such discrete sub-scores (Table 4). This information could not be compared with 2002 because such information was not included in the Dean report. AP Human Geography Indicators.
College Board reports show that AP Human Geography has grown substantially since it was first offered in 20016. In 2003, 7,320 students took the
Figure 2. Mandated assessments in geography in 2002 and 2004.
Geography tested in 2002 and not tested in 2004
Geography not tested in 2002 and tested in 2004
States with “no data” in 2002 that tested geography in 2004
Maine Maryland Massachusetts Nebraska New Hampshire New Jersey North Carolina Virginia
Illinois Ohio South Carolina South Dakota
Louisiana Michigan
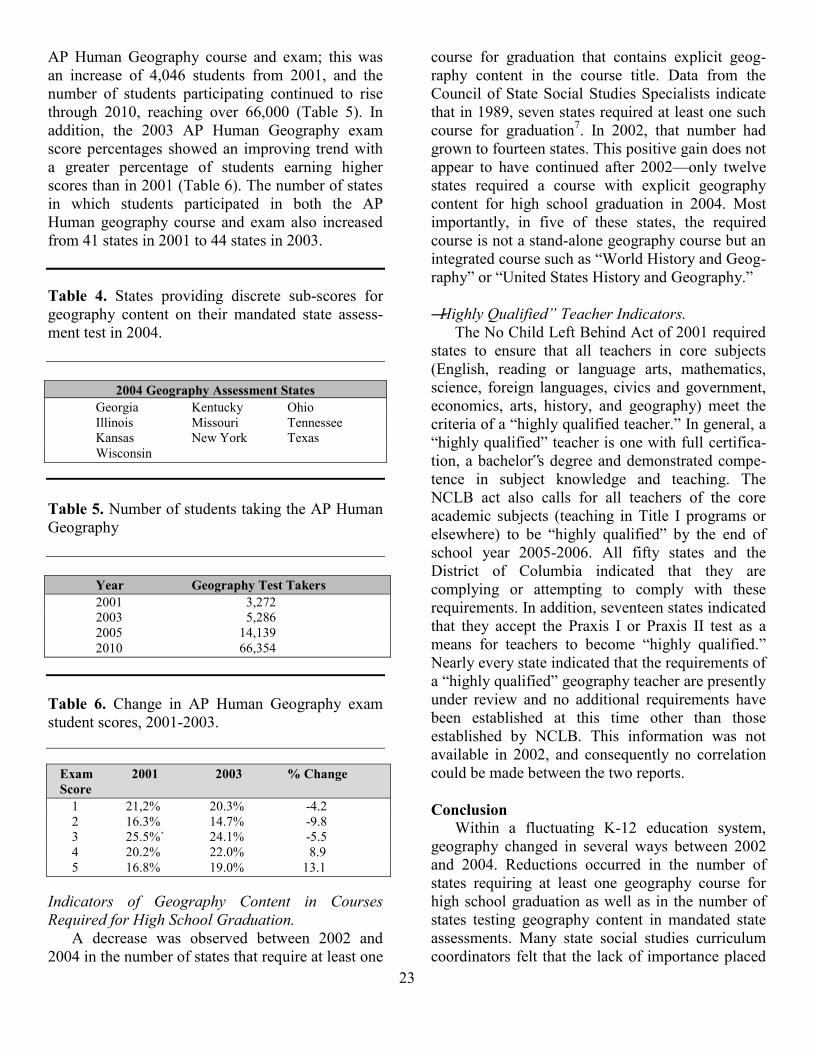
23
AP Human Geography course and exam; this was an increase of 4,046 students from 2001, and the number of students participating continued to rise through 2010, reaching over 66,000 (Table 5). In addition, the 2003 AP Human Geography exam score percentages showed an improving trend with a greater percentage of students earning higher scores than in 2001 (Table 6). The number of states in which students participated in both the AP Human geography course and exam also increased from 41 states in 2001 to 44 states in 2003. Table 4. States providing discrete sub-scores for geography content on their mandated state assess-ment test in 2004.
2004 Geography Assessment States
Georgia Kentucky Ohio Illinois Missouri Tennessee
Kansas New York Texas Wisconsin
Table 5. Number of students taking the AP Human Geography Year Geography Test Takers 2001 3,272 2003 5,286 2005 14,139 2010 66,354 Table 6. Change in AP Human Geography exam student scores, 2001-2003. Exam 2001 2003 % Change Score 1 21,2% 20.3% -4.2 2 16.3% 14.7% -9.8 3 25.5%` 24.1% -5.5 4 20.2% 22.0% 8.9 5 16.8% 19.0% 13.1
Indicators of Geography Content in Courses Required for High School Graduation.
A decrease was observed between 2002 and 2004 in the number of states that require at least one
course for graduation that contains explicit geog-raphy content in the course title. Data from the Council of State Social Studies Specialists indicate that in 1989, seven states required at least one such course for graduation7. In 2002, that number had grown to fourteen states. This positive gain does not appear to have continued after 2002—only twelve states required a course with explicit geography content for high school graduation in 2004. Most importantly, in five of these states, the required course is not a stand-alone geography course but an integrated course such as “World History and Geog-raphy” or “United States History and Geography.”
―Highly Qualified‖ Teacher Indicators.
The No Child Left Behind Act of 2001 required states to ensure that all teachers in core subjects (English, reading or language arts, mathematics, science, foreign languages, civics and government, economics, arts, history, and geography) meet the criteria of a “highly qualified teacher.” In general, a “highly qualified” teacher is one with full certifica-tion, a bachelor‟s degree and demonstrated compe-tence in subject knowledge and teaching. The NCLB act also calls for all teachers of the core academic subjects (teaching in Title I programs or elsewhere) to be “highly qualified” by the end of school year 2005-2006. All fifty states and the District of Columbia indicated that they are complying or attempting to comply with these requirements. In addition, seventeen states indicated that they accept the Praxis I or Praxis II test as a means for teachers to become “highly qualified.” Nearly every state indicated that the requirements of a “highly qualified” geography teacher are presently under review and no additional requirements have been established at this time other than those established by NCLB. This information was not available in 2002, and consequently no correlation could be made between the two reports.
Conclusion
Within a fluctuating K-12 education system, geography changed in several ways between 2002 and 2004. Reductions occurred in the number of states requiring at least one geography course for high school graduation as well as in the number of states testing geography content in mandated state assessments. Many state social studies curriculum coordinators felt that the lack of importance placed
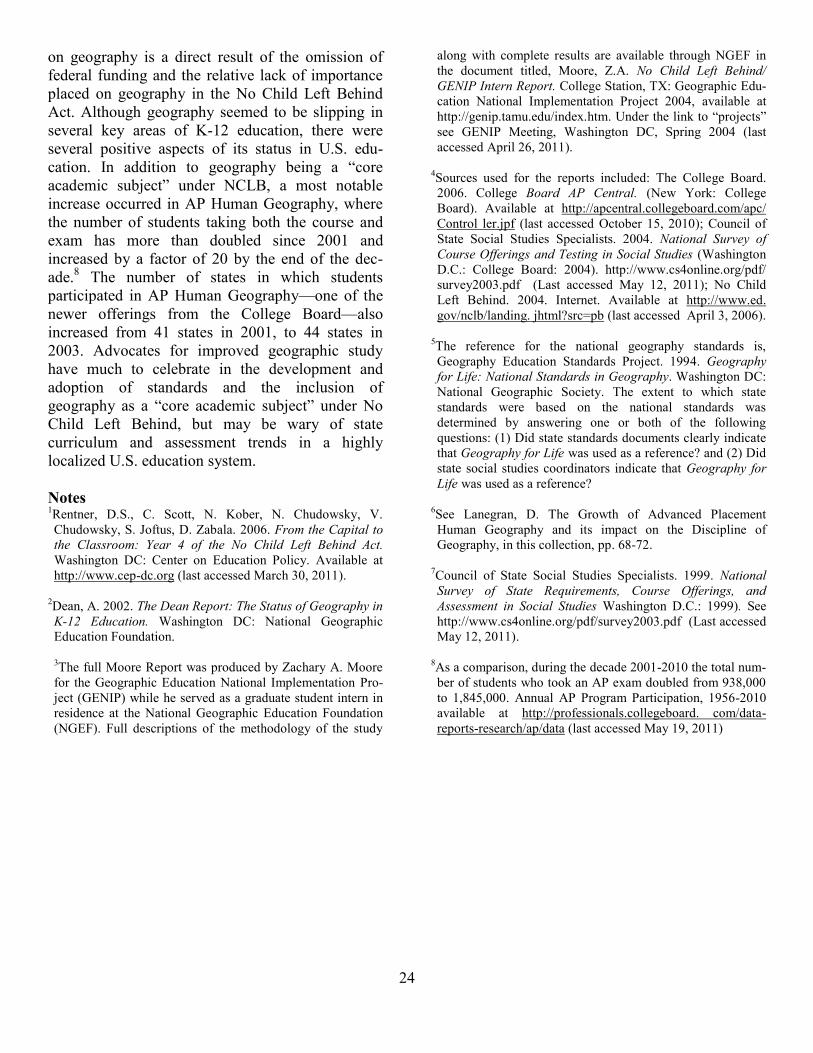
24
on geography is a direct result of the omission of federal funding and the relative lack of importance placed on geography in the No Child Left Behind Act. Although geography seemed to be slipping in several key areas of K-12 education, there were several positive aspects of its status in U.S. edu-cation. In addition to geography being a “core academic subject” under NCLB, a most notable increase occurred in AP Human Geography, where the number of students taking both the course and exam has more than doubled since 2001 and increased by a factor of 20 by the end of the dec-ade.8 The number of states in which students participated in AP Human Geography—one of the newer offerings from the College Board—also increased from 41 states in 2001, to 44 states in 2003. Advocates for improved geographic study have much to celebrate in the development and adoption of standards and the inclusion of geography as a “core academic subject” under No Child Left Behind, but may be wary of state curriculum and assessment trends in a highly localized U.S. education system.
Notes 1Rentner, D.S., C. Scott, N. Kober, N. Chudowsky, V. Chudowsky, S. Joftus, D. Zabala. 2006. From the Capital to the Classroom: Year 4 of the No Child Left Behind Act. Washington DC: Center on Education Policy. Available at http://www.cep-dc.org (last accessed March 30, 2011).
2Dean, A. 2002. The Dean Report: The Status of Geography in K-12 Education. Washington DC: National Geographic Education Foundation.
3The full Moore Report was produced by Zachary A. Moore for the Geographic Education National Implementation Pro-ject (GENIP) while he served as a graduate student intern in residence at the National Geographic Education Foundation (NGEF). Full descriptions of the methodology of the study
along with complete results are available through NGEF in the document titled, Moore, Z.A. No Child Left Behind/ GENIP Intern Report. College Station, TX: Geographic Edu-cation National Implementation Project 2004, available at http://genip.tamu.edu/index.htm. Under the link to “projects” see GENIP Meeting, Washington DC, Spring 2004 (last accessed April 26, 2011).
4Sources used for the reports included: The College Board. 2006. College Board AP Central. (New York: College Board). Available at http://apcentral.collegeboard.com/apc/ Control ler.jpf (last accessed October 15, 2010); Council of State Social Studies Specialists. 2004. National Survey of Course Offerings and Testing in Social Studies (Washington D.C.: College Board: 2004). http://www.cs4online.org/pdf/ survey2003.pdf (Last accessed May 12, 2011); No Child Left Behind. 2004. Internet. Available at http://www.ed. gov/nclb/landing. jhtml?src=pb (last accessed April 3, 2006).
5The reference for the national geography standards is, Geography Education Standards Project. 1994. Geography for Life: National Standards in Geography. Washington DC: National Geographic Society. The extent to which state standards were based on the national standards was determined by answering one or both of the following questions: (1) Did state standards documents clearly indicate that Geography for Life was used as a reference? and (2) Did state social studies coordinators indicate that Geography for Life was used as a reference?
6See Lanegran, D. The Growth of Advanced Placement Human Geography and its impact on the Discipline of Geography, in this collection, pp. 68-72.
7Council of State Social Studies Specialists. 1999. National Survey of State Requirements, Course Offerings, and Assessment in Social Studies Washington D.C.: 1999). See http://www.cs4online.org/pdf/survey2003.pdf (Last accessed May 12, 2011).
8As a comparison, during the decade 2001-2010 the total num-ber of students who took an AP exam doubled from 938,000 to 1,845,000. Annual AP Program Participation, 1956-2010 available at http://professionals.collegeboard. com/data-reports-research/ap/data (last accessed May 19, 2011)
25
David J. Rutherford is Assistant Professor of Geography in the Department of Public Policy Lead-ership at the University of Missi-ssippi. He is also Director of the Mississippi Geographic Alliance. Drawing from a broad background in physical and human geography and in education, his current re-search in geography education focuses on both the K-12 and uni-versity levels. Richard G. Boehm holds the Jesse H. Jones Distinguished Chair in Geographic Education at Texas State University–San Marcos. He is also the Director of the Gilbert M. Grosvenor Center for Geographic Education and Co-coordinator of the Texas Alliance for Geographic Education. In addition, Dr. Boehm is the Executive Editor of the scholarly journal Research in Geographic Education, and he has authored several best selling geography and social studies books for grades K-12.
Ensuring Rigorous Geography Content in the K-12 Curriculum: Standards Implementation in the States1
David J. Rutherford and Richard G. Boehm
In a cover letter for the 2002 No Child Left Behind Act (NCLB),
then Secretary of Education Rod Paige wrote, “[t]his historic reform [NCLB] gives states and school districts unprecedented flexibility in how they spend their education dollars in return for setting stand-ards for student achievement and holding students and educators accountable for results.”2 This focus on standards as the basis for education built upon the movement to develop and implement standards that began in the early 1990‟s and has been so widely accepted by school officials, teachers, parents, and politicians that today, virtually every state and/or local school district has adopted a standards-based education system.3
But, while the focus of the federal government has been on the presence of national standards and school accountability for their achievement by students, inadequate attention has been paid to helping the states ensure that their standards reflect the high quality subject matter that has been identified by discipline specialists. It makes little sense for states to be held accountable for student achievement of standards when students fail to master content and skills. And yet, implementation of such high-quality standards by the states has faced continued challenges. A research study pub-lished in 2000 titled The State of State Standards graded the extent to which national standards had made their way into state curric-ulum frameworks.4 For the five “core subject areas” of history, science, math, English, and geography there were far more “F‟s” and “D‟s” than “A‟s” and “B‟s,” and for geography, seven states got “A” but 14 got “F.” Although more recent literature suggests that the states may be doing a little better today, as we look back over fifteen years since the beginning of the standards movement, it is apparent that there have been lots of roadblocks and controversy.
National standards for geography were published in 1994 by the National Geographic Society under the title Geography for Life5 (Table 1), and during the following ten years the geography educa-tion community worked diligently to incorporate the standards into state curricula. However, as the research cited above illustrates, these national geography standards have not penetrated state stand-ards to the extent the disciplinary experts who prepared them had hoped. Consequently, research was conducted that produced five major recommendations for more complete implementation of the geography standards at the state level (Table 2).6
Recommendations
The first and foremost recommendation is that standards documents should emphasize alignment across four separate but integrally related components. They should begin with a simple, but
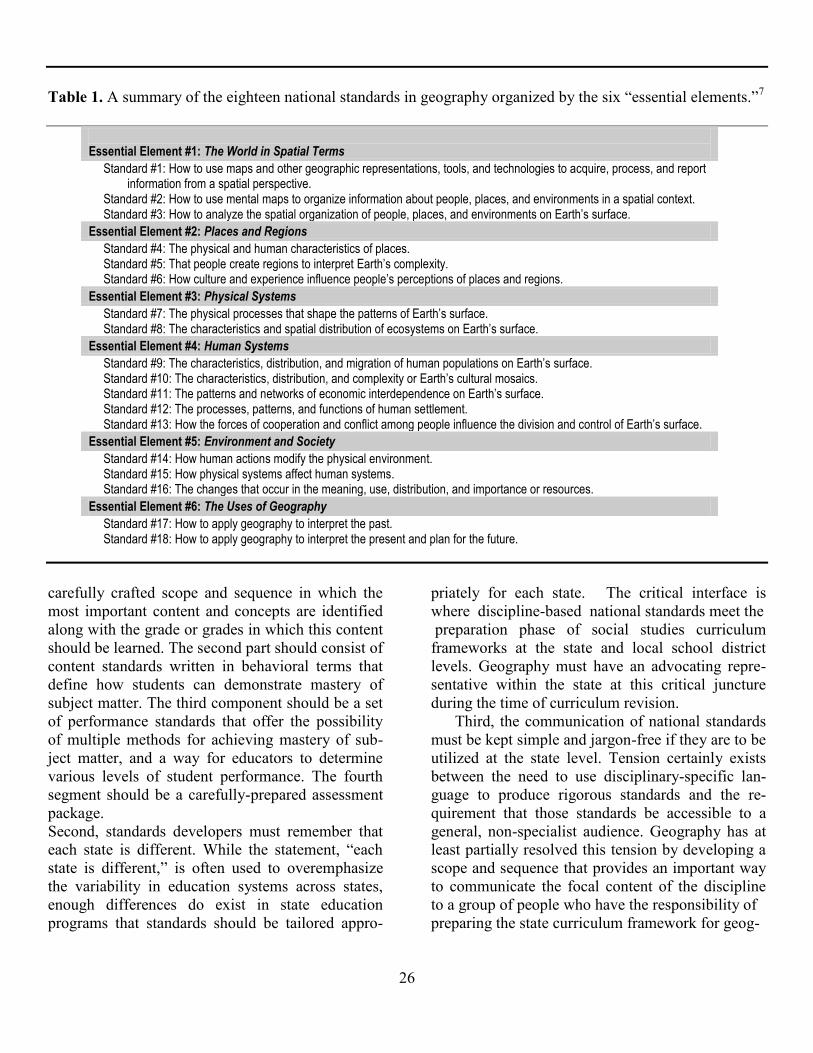
26
Table 1. A summary of the eighteen national standards in geography organized by the six “essential elements.”7
Essential Element #1: The World in Spatial Terms
Standard #1: How to use maps and other geographic representations, tools, and technologies to acquire, process, and report information from a spatial perspective.
Standard #2: How to use mental maps to organize information about people, places, and environments in a spatial context. Standard #3: How to analyze the spatial organization of people, places, and environments on Earth’s surface.
Essential Element #2: Places and Regions
Standard #4: The physical and human characteristics of places. Standard #5: That people create regions to interpret Earth’s complexity. Standard #6: How culture and experience influence people’s perceptions of places and regions.
Essential Element #3: Physical Systems
Standard #7: The physical processes that shape the patterns of Earth’s surface. Standard #8: The characteristics and spatial distribution of ecosystems on Earth’s surface.
Essential Element #4: Human Systems
Standard #9: The characteristics, distribution, and migration of human populations on Earth’s surface. Standard #10: The characteristics, distribution, and complexity or Earth’s cultural mosaics. Standard #11: The patterns and networks of economic interdependence on Earth’s surface. Standard #12: The processes, patterns, and functions of human settlement. Standard #13: How the forces of cooperation and conflict among people influence the division and control of Earth’s surface.
Essential Element #5: Environment and Society
Standard #14: How human actions modify the physical environment. Standard #15: How physical systems affect human systems. Standard #16: The changes that occur in the meaning, use, distribution, and importance or resources.
Essential Element #6: The Uses of Geography
Standard #17: How to apply geography to interpret the past. Standard #18: How to apply geography to interpret the present and plan for the future.
carefully crafted scope and sequence in which the most important content and concepts are identified along with the grade or grades in which this content should be learned. The second part should consist of content standards written in behavioral terms that define how students can demonstrate mastery of subject matter. The third component should be a set of performance standards that offer the possibility of multiple methods for achieving mastery of sub-ject matter, and a way for educators to determine various levels of student performance. The fourth segment should be a carefully-prepared assessment package. Second, standards developers must remember that each state is different. While the statement, “each state is different,” is often used to overemphasize the variability in education systems across states, enough differences do exist in state education programs that standards should be tailored appro-
priately for each state. The critical interface is where discipline-based national standards meet the preparation phase of social studies curriculum frameworks at the state and local school district levels. Geography must have an advocating repre-sentative within the state at this critical juncture during the time of curriculum revision.
Third, the communication of national standards must be kept simple and jargon-free if they are to be utilized at the state level. Tension certainly exists between the need to use disciplinary-specific lan-guage to produce rigorous standards and the re-quirement that those standards be accessible to a general, non-specialist audience. Geography has at least partially resolved this tension by developing a scope and sequence that provides an important way to communicate the focal content of the discipline to a group of people who have the responsibility of preparing the state curriculum framework for geog-
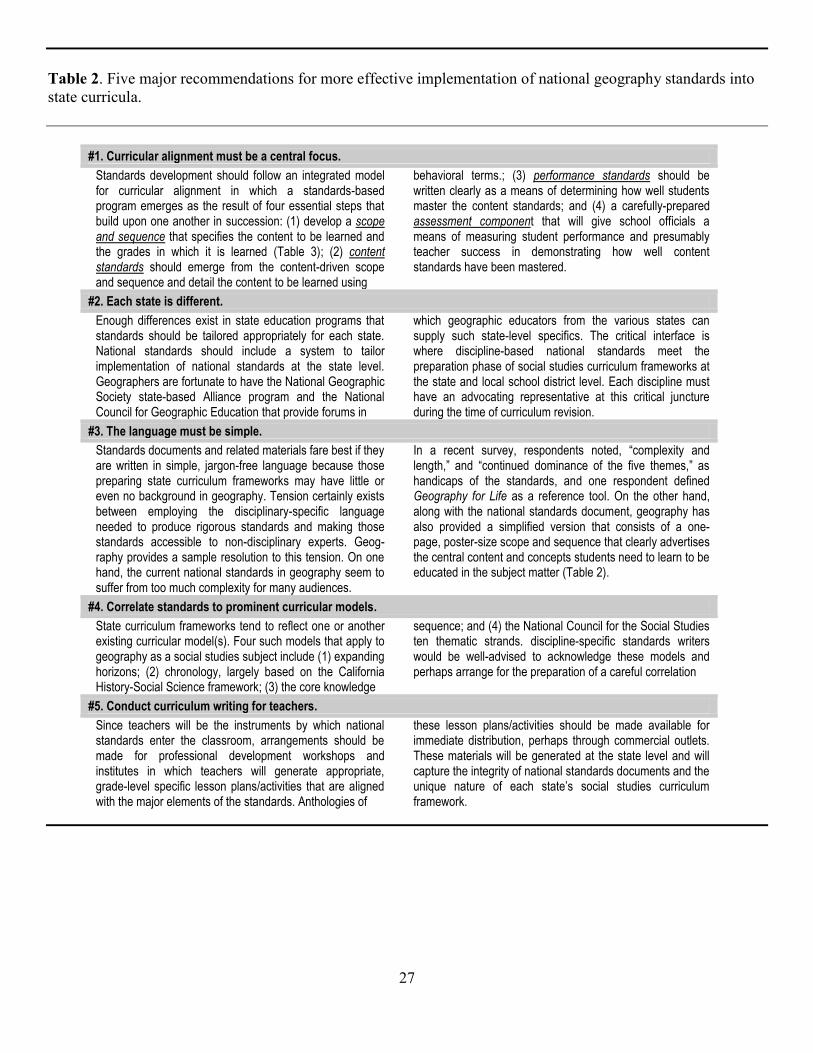
27
Table 2. Five major recommendations for more effective implementation of national geography standards into state curricula.
#1. Curricular alignment must be a central focus.
Standards development should follow an integrated model for curricular alignment in which a standards-based program emerges as the result of four essential steps that build upon one another in succession: (1) develop a scope and sequence that specifies the content to be learned and the grades in which it is learned (Table 3); (2) content standards should emerge from the content-driven scope and sequence and detail the content to be learned using
behavioral terms.; (3) performance standards should be written clearly as a means of determining how well students master the content standards; and (4) a carefully-prepared assessment component that will give school officials a means of measuring student performance and presumably teacher success in demonstrating how well content standards have been mastered.
#2. Each state is different.
Enough differences exist in state education programs that standards should be tailored appropriately for each state. National standards should include a system to tailor implementation of national standards at the state level. Geographers are fortunate to have the National Geographic Society state-based Alliance program and the National Council for Geographic Education that provide forums in
which geographic educators from the various states can supply such state-level specifics. The critical interface is where discipline-based national standards meet the preparation phase of social studies curriculum frameworks at the state and local school district level. Each discipline must have an advocating representative at this critical juncture during the time of curriculum revision.
#3. The language must be simple.
Standards documents and related materials fare best if they are written in simple, jargon-free language because those preparing state curriculum frameworks may have little or even no background in geography. Tension certainly exists between employing the disciplinary-specific language needed to produce rigorous standards and making those standards accessible to non-disciplinary experts. Geog-raphy provides a sample resolution to this tension. On one hand, the current national standards in geography seem to suffer from too much complexity for many audiences.
In a recent survey, respondents noted, “complexity and length,” and “continued dominance of the five themes,” as handicaps of the standards, and one respondent defined Geography for Life as a reference tool. On the other hand, along with the national standards document, geography has also provided a simplified version that consists of a one-page, poster-size scope and sequence that clearly advertises the central content and concepts students need to learn to be educated in the subject matter (Table 2).
#4. Correlate standards to prominent curricular models.
State curriculum frameworks tend to reflect one or another existing curricular model(s). Four such models that apply to geography as a social studies subject include (1) expanding horizons; (2) chronology, largely based on the California History-Social Science framework; (3) the core knowledge
sequence; and (4) the National Council for the Social Studies ten thematic strands. discipline-specific standards writers would be well-advised to acknowledge these models and perhaps arrange for the preparation of a careful correlation
#5. Conduct curriculum writing for teachers.
Since teachers will be the instruments by which national standards enter the classroom, arrangements should be made for professional development workshops and institutes in which teachers will generate appropriate, grade-level specific lesson plans/activities that are aligned with the major elements of the standards. Anthologies of
these lesson plans/activities should be made available for immediate distribution, perhaps through commercial outlets. These materials will be generated at the state level and will capture the integrity of national standards documents and the unique nature of each state’s social studies curriculum framework.
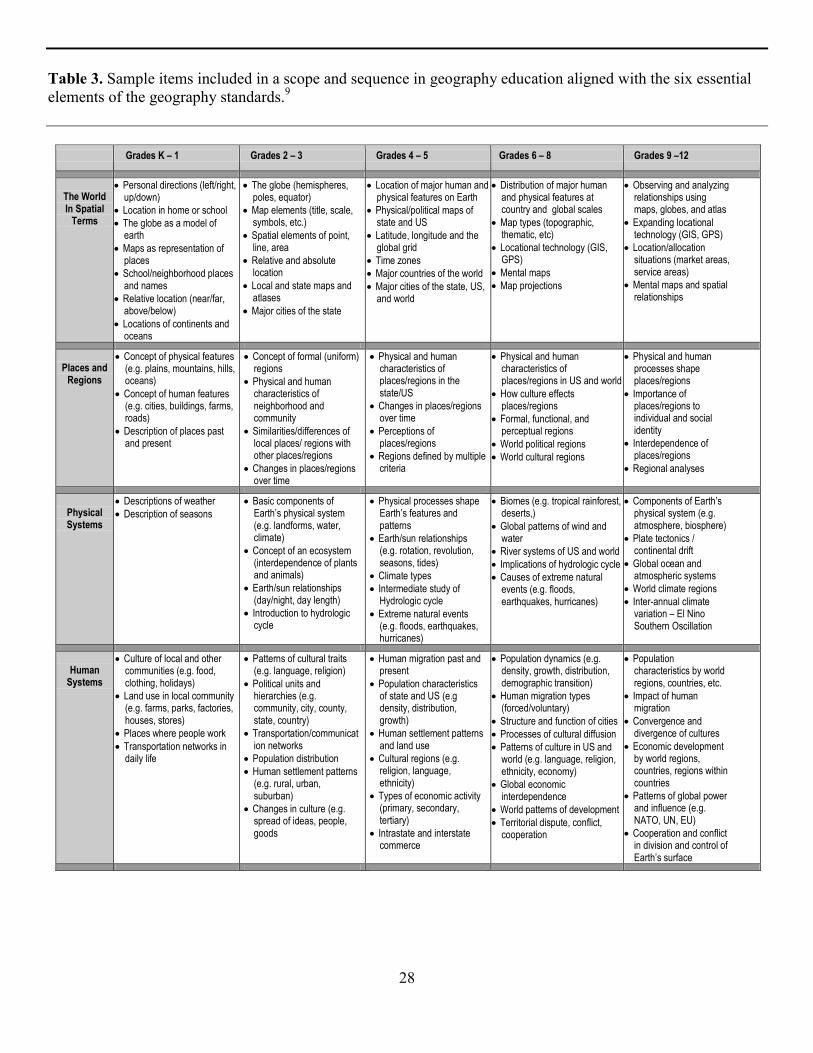
28
Table 3. Sample items included in a scope and sequence in geography education aligned with the six essential elements of the geography standards.9
Grades K – 1 Grades 2 – 3 Grades 4 – 5 Grades 6 – 8 Grades 9 –12
The World In Spatial
Terms
Personal directions (left/right, up/down)
Location in home or school
The globe as a model of earth
Maps as representation of places
School/neighborhood places and names
Relative location (near/far, above/below)
Locations of continents and oceans
The globe (hemispheres, poles, equator)
Map elements (title, scale, symbols, etc.)
Spatial elements of point, line, area
Relative and absolute location
Local and state maps and atlases
Major cities of the state
Location of major human and physical features on Earth
Physical/political maps of state and US
Latitude, longitude and the global grid
Time zones
Major countries of the world
Major cities of the state, US, and world
Distribution of major human and physical features at country and global scales
Map types (topographic, thematic, etc)
Locational technology (GIS, GPS)
Mental maps
Map projections
Observing and analyzing relationships using maps, globes, and atlas
Expanding locational technology (GIS, GPS)
Location/allocation situations (market areas, service areas)
Mental maps and spatial relationships
Places and
Regions
Concept of physical features (e.g. plains, mountains, hills, oceans)
Concept of human features (e.g. cities, buildings, farms, roads)
Description of places past and present
Concept of formal (uniform) regions
Physical and human characteristics of neighborhood and community
Similarities/differences of local places/ regions with other places/regions
Changes in places/regions over time
Physical and human characteristics of places/regions in the state/US
Changes in places/regions over time
Perceptions of places/regions
Regions defined by multiple criteria
Physical and human characteristics of places/regions in US and world
How culture effects places/regions
Formal, functional, and perceptual regions
World political regions
World cultural regions
Physical and human processes shape places/regions
Importance of places/regions to individual and social identity
Interdependence of places/regions
Regional analyses
Physical Systems
Descriptions of weather
Description of seasons
Basic components of Earth’s physical system (e.g. landforms, water, climate)
Concept of an ecosystem (interdependence of plants and animals)
Earth/sun relationships (day/night, day length)
Introduction to hydrologic cycle
Physical processes shape Earth’s features and patterns
Earth/sun relationships (e.g. rotation, revolution, seasons, tides)
Climate types
Intermediate study of Hydrologic cycle
Extreme natural events (e.g. floods, earthquakes, hurricanes)
Biomes (e.g. tropical rainforest, deserts,)
Global patterns of wind and water
River systems of US and world
Implications of hydrologic cycle
Causes of extreme natural events (e.g. floods, earthquakes, hurricanes)
Components of Earth’s physical system (e.g. atmosphere, biosphere)
Plate tectonics / continental drift
Global ocean and atmospheric systems
World climate regions
Inter-annual climate variation – El Nino Southern Oscillation
Human
Systems
Culture of local and other communities (e.g. food, clothing, holidays)
Land use in local community (e.g. farms, parks, factories, houses, stores)
Places where people work
Transportation networks in daily life
Patterns of cultural traits (e.g. language, religion)
Political units and hierarchies (e.g. community, city, county, state, country)
Transportation/communication networks
Population distribution
Human settlement patterns (e.g. rural, urban, suburban)
Changes in culture (e.g. spread of ideas, people, goods
Human migration past and present
Population characteristics of state and US (e.g density, distribution, growth)
Human settlement patterns and land use
Cultural regions (e.g. religion, language, ethnicity)
Types of economic activity (primary, secondary, tertiary)
Intrastate and interstate commerce
Population dynamics (e.g. density, growth, distribution, demographic transition)
Human migration types (forced/voluntary)
Structure and function of cities
Processes of cultural diffusion
Patterns of culture in US and world (e.g. language, religion, ethnicity, economy)
Global economic interdependence
World patterns of development
Territorial dispute, conflict, cooperation
Population characteristics by world regions, countries, etc.
Impact of human migration
Convergence and divergence of cultures
Economic development by world regions, countries, regions within countries
Patterns of global power and influence (e.g. NATO, UN, EU)
Cooperation and conflict in division and control of Earth’s surface
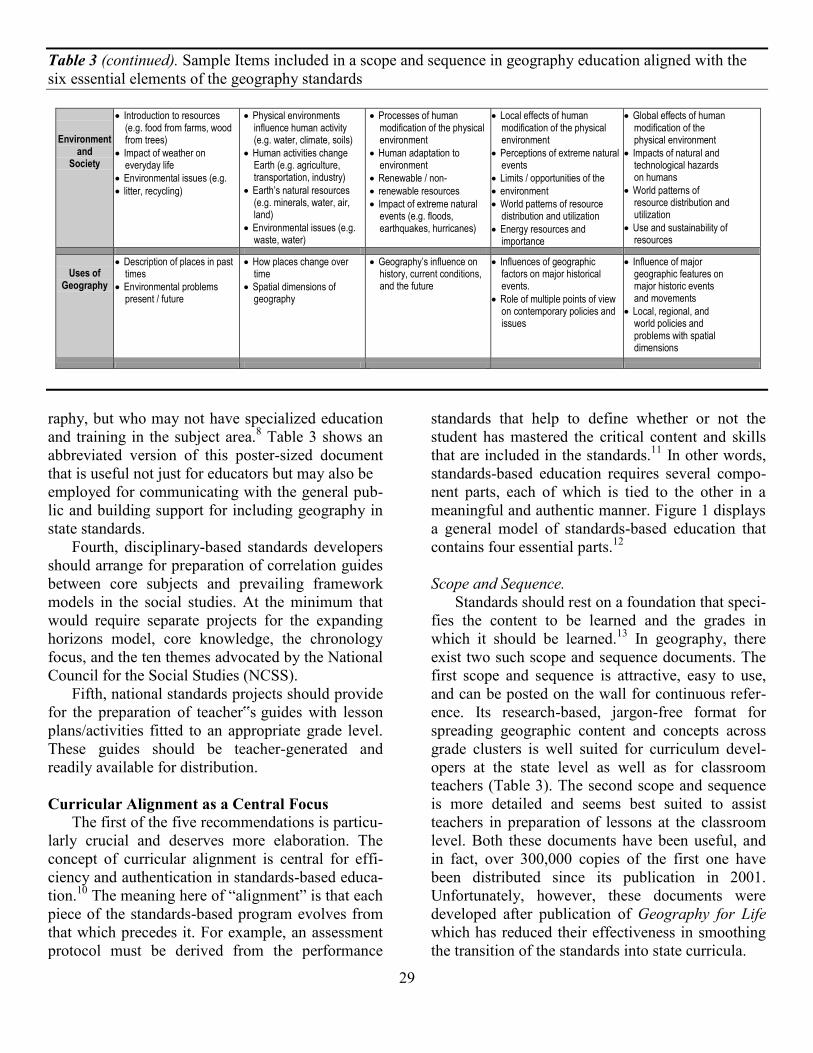
29
Table 3 (continued). Sample Items included in a scope and sequence in geography education aligned with the six essential elements of the geography standards
Environment and
Society
Introduction to resources (e.g. food from farms, wood from trees)
Impact of weather on everyday life
Environmental issues (e.g.
litter, recycling)
Physical environments influence human activity (e.g. water, climate, soils)
Human activities change Earth (e.g. agriculture, transportation, industry)
Earth’s natural resources (e.g. minerals, water, air, land)
Environmental issues (e.g. waste, water)
Processes of human modification of the physical environment
Human adaptation to environment
Renewable / non-
renewable resources
Impact of extreme natural events (e.g. floods, earthquakes, hurricanes)
Local effects of human modification of the physical environment
Perceptions of extreme natural events
Limits / opportunities of the
environment
World patterns of resource distribution and utilization
Energy resources and importance
Global effects of human modification of the physical environment
Impacts of natural and technological hazards on humans
World patterns of resource distribution and utilization
Use and sustainability of resources
Uses of
Geography
Description of places in past times
Environmental problems present / future
How places change over time
Spatial dimensions of geography
Geography’s influence on history, current conditions, and the future
Influences of geographic factors on major historical events.
Role of multiple points of view on contemporary policies and issues
Influence of major geographic features on major historic events and movements
Local, regional, and world policies and problems with spatial dimensions
raphy, but who may not have specialized education and training in the subject area.8 Table 3 shows an abbreviated version of this poster-sized document that is useful not just for educators but may also be employed for communicating with the general pub-lic and building support for including geography in state standards.
Fourth, disciplinary-based standards developers should arrange for preparation of correlation guides between core subjects and prevailing framework models in the social studies. At the minimum that would require separate projects for the expanding horizons model, core knowledge, the chronology focus, and the ten themes advocated by the National Council for the Social Studies (NCSS).
Fifth, national standards projects should provide for the preparation of teacher‟s guides with lesson plans/activities fitted to an appropriate grade level. These guides should be teacher-generated and readily available for distribution. Curricular Alignment as a Central Focus
The first of the five recommendations is particu-larly crucial and deserves more elaboration. The concept of curricular alignment is central for effi-ciency and authentication in standards-based educa-tion.10 The meaning here of “alignment” is that each piece of the standards-based program evolves from that which precedes it. For example, an assessment protocol must be derived from the performance
standards that help to define whether or not the student has mastered the critical content and skills that are included in the standards.11 In other words, standards-based education requires several compo-nent parts, each of which is tied to the other in a meaningful and authentic manner. Figure 1 displays a general model of standards-based education that contains four essential parts.12
Scope and Sequence.
Standards should rest on a foundation that speci-fies the content to be learned and the grades in which it should be learned.13 In geography, there exist two such scope and sequence documents. The first scope and sequence is attractive, easy to use, and can be posted on the wall for continuous refer-ence. Its research-based, jargon-free format for spreading geographic content and concepts across grade clusters is well suited for curriculum devel-opers at the state level as well as for classroom teachers (Table 3). The second scope and sequence is more detailed and seems best suited to assist teachers in preparation of lessons at the classroom level. Both these documents have been useful, and in fact, over 300,000 copies of the first one have been distributed since its publication in 2001. Unfortunately, however, these documents were developed after publication of Geography for Life which has reduced their effectiveness in smoothing the transition of the standards into state curricula.
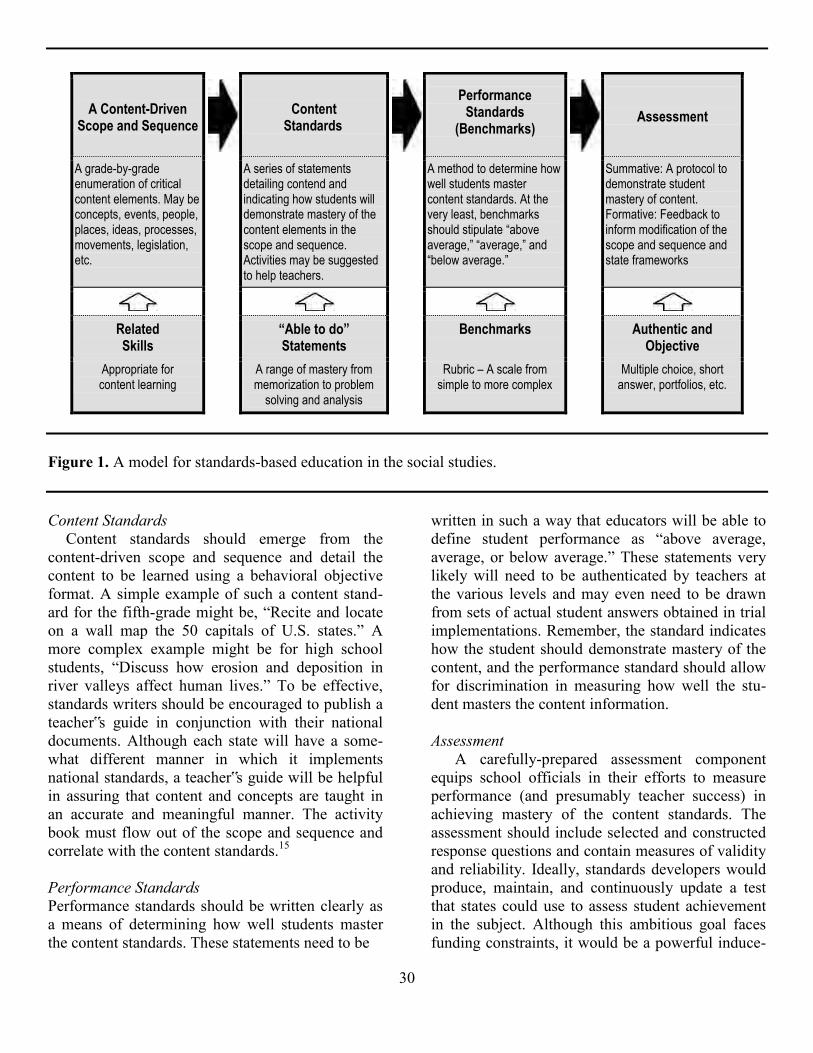
30
A Content-Driven
Scope and Sequence
Content
Standards
Performance Standards
(Benchmarks)
Assessment
A grade-by-grade enumeration of critical content elements. May be concepts, events, people, places, ideas, processes, movements, legislation, etc.
A series of statements detailing contend and indicating how students will demonstrate mastery of the content elements in the scope and sequence. Activities may be suggested to help teachers.
A method to determine how well students master content standards. At the very least, benchmarks should stipulate “above average,” “average,” and “below average.”
Summative: A protocol to demonstrate student mastery of content. Formative: Feedback to inform modification of the scope and sequence and state frameworks
Related Skills
“Able to do” Statements
Benchmarks Authentic and Objective
Appropriate for content learning
A range of mastery from memorization to problem
solving and analysis
Rubric – A scale from simple to more complex
Multiple choice, short answer, portfolios, etc.
Figure 1. A model for standards-based education in the social studies.
Content Standards Content standards should emerge from the
content-driven scope and sequence and detail the content to be learned using a behavioral objective format. A simple example of such a content stand-ard for the fifth-grade might be, “Recite and locate on a wall map the 50 capitals of U.S. states.” A more complex example might be for high school students, “Discuss how erosion and deposition in river valleys affect human lives.” To be effective, standards writers should be encouraged to publish a teacher‟s guide in conjunction with their national documents. Although each state will have a some-what different manner in which it implements national standards, a teacher‟s guide will be helpful in assuring that content and concepts are taught in an accurate and meaningful manner. The activity book must flow out of the scope and sequence and correlate with the content standards.15 Performance Standards Performance standards should be written clearly as a means of determining how well students master the content standards. These statements need to be
written in such a way that educators will be able to define student performance as “above average, average, or below average.” These statements very likely will need to be authenticated by teachers at the various levels and may even need to be drawn from sets of actual student answers obtained in trial implementations. Remember, the standard indicates how the student should demonstrate mastery of the content, and the performance standard should allow for discrimination in measuring how well the stu-dent masters the content information. Assessment
A carefully-prepared assessment component equips school officials in their efforts to measure performance (and presumably teacher success) in achieving mastery of the content standards. The assessment should include selected and constructed response questions and contain measures of validity and reliability. Ideally, standards developers would produce, maintain, and continuously update a test that states could use to assess student achievement in the subject. Although this ambitious goal faces funding constraints, it would be a powerful induce-
31
ment to states to adopt the national standards as written. At a minimum, however, standards devel-opers should produce sample test questions for all content standards so that states will have a guide for development of their own assessments or choice of off-the-shelf tests to employ.
Skills
Appropriate skills are an integral part of standards-based education. While standards initially focus on content, students are soon asked to demon-strate mastery. Such mastery at a low educational level might be satisfied by rote memory and an end-less stream of parroted facts, locations, events, and people. Higher-level mastery requires students to problem-solve in a constructivist educational envi-ronment, along with analysis and application to a real world setting. Such performance requires an increasingly sophisticated skill set as the student passes through the grades. In the world of geog-raphy, an elementary student may be asked to “read” a map; at the intermediate level, the student may be asked to understand the patterns, distri-bution, and interaction shown on the map and draw conclusions; and at the advanced level, students might be asked to construct a map or maps to show correlations of spatial data in order to answer ques-tions about societal issues with geographic dimen-sions. Standards writers need to identify appropriate skills at various grade levels that will assist students in developing the capability of authentic learning while demonstrating their mastery of the required standards.
Conclusion
Standards-based education has spread perva-sively across K-12 education in the United States, and this educational trend seems likely to endure. However, maximizing the benefits of standards-based-education requires that strong and rigorous subject matter content becomes infused across the curricula that states adopt. Clearly, disciplinary experts are best equipped to specify the content that should be present in standards but such work merely marks the beginning of the task. Continued efforts as outlined in this paper need to be engaged to ensure that those rigorous content standards are implemented by the states and subsequently learned by students.
Notes 1This essay is based in large part on the following article: Rutherford, D.J. and R.G. Boehm. 2004. Round Two: Implementation of the National Standards in Geography. The Social Studies 95(6):231-38.
2United States Department of Education, Office of Elementary and Secondary Education. 2002. No Child Left Behind Act Desktop Reference. Washington DC., page vii, emphasis added.
3Tucker, M.S., and J.B. Codding. 1998. Standards for our schools. San Francisco CA: Josey-Bass. Marran, J. 2001. Standards-directed education: The good, the bad, and the ugly. Journal of Geography 100(6):271-72.
4Finn, C.E., and M.J. Petrelli. 2000. The State of the State Standards 2000. Washington DC: Thomas B. Fordham Foundation.
5Geography Education Standards Project. 1994. Geography for life: National Geography Standards 1994. Washington D.C.: National Geographic Research and Exploration.
6The work upon which this paper is based proceeded over two years in three ways, First, data were collected in a series of open hearings held by James Marran, representing the Geographic Education National Implementation Project (GENIP), at various annual meetings including meetings of the National Council for the Social Studies (NCSS) and the National Council for Geographic Education (NCGE). For an account of Marran‟s work see Assessing Geography for Life: National Geography Standards 1994. College Station, TX: Geographic Education National Implementation Project. Available at http://genip.tamu.edu/index.htm (under Wash-ington DC meeting, November 2003) (last accessed April 26, 2011). Second, the standards implementation process in geography was analyzed in two Ph.D.-level seminars in geographic education at Texas State University at San Marcos. In these seminars, advanced students were asked to do three things: (1) assess how well national standards in geography had been integrated into state social studies curriculum frameworks; (2) identify problems or barriers to implementation; and (3) construct strategies to overcome these problems or barriers, and, in some cases, to prepare prototype materials. Third, knowledgeable experts in six states were asked to research and write the story of geog-raphy standards implementation in their respective states. They were asked to organize their writing as answers to questions that would explain (1) the ways that national standards were received at the state level, (2) the chief barriers to implementation, and (3) how standards writers in the future might be able to ease the implementation process and thus make national standards claim a higher level of utility while achieving the goal of helping schools and teachers educate and guide all students to the best content and skills available in the subject area.
7Op Cit. Geography Education Standards Project. 1994.
32
8Grosvenor Center for Geographic Education. 2001. Path Toward World Literacy: A Scope and Sequence in Geographic Education K-12. Washington DC: National Geographic Society Education Foundation.
9This table represents a sampling of the content items in the scope and sequence titled Path Toward World Literacy: A Scope and Sequence in Geographic Education K-12. This scope and sequence takes the form of a poster-sized document that can be posted or spread on a desk for easy and regular reference.
10English, F. 2000. Deciding what to teach and test. Thousand Oaks, CA: Corwin Press Inc., a Sage Publications Company.
11Bettis, N. 2000. Assessment issues in geographic education for the twenty-first century. Journal of Geography 100(4): 172-74.
12This model is not significantly different from a variety of other models displayed in the educational literature. See M.
Kenney 1998. How to develop performance assessments in social studies. Denver, CO: Colorado Department of Educa-tion, and Libbee., M. 2001. Assessment as a diagnostic tool. Journal of Geography 100(4): 175-78
13Hume, S., and R.G. Boehm. 1999. A rationale and model for a scope and sequence in geographic education, grades K-12. The Social Studies 63(2):16-21.
14The two scope and sequence documents are Grosvenor Center for Geographic Education. 2001. Path Toward World Literacy: A Scope and Sequence in Geographic Education K-12. Washington, DC: National Geographic Society Education Foundation, and Vender, J. 2002. Teaching to the Standards: A K-12 Scope and Sequence in Geography. College Station, TX: Geographic Education National Implementation Project.
15An example of such a guide can be found in Grosvenor Center for Geographic Education. 2001. Path Toward World Literacy: A Standards-Based Guide to K-12 Geography. Washington DC: National Geographic Society.
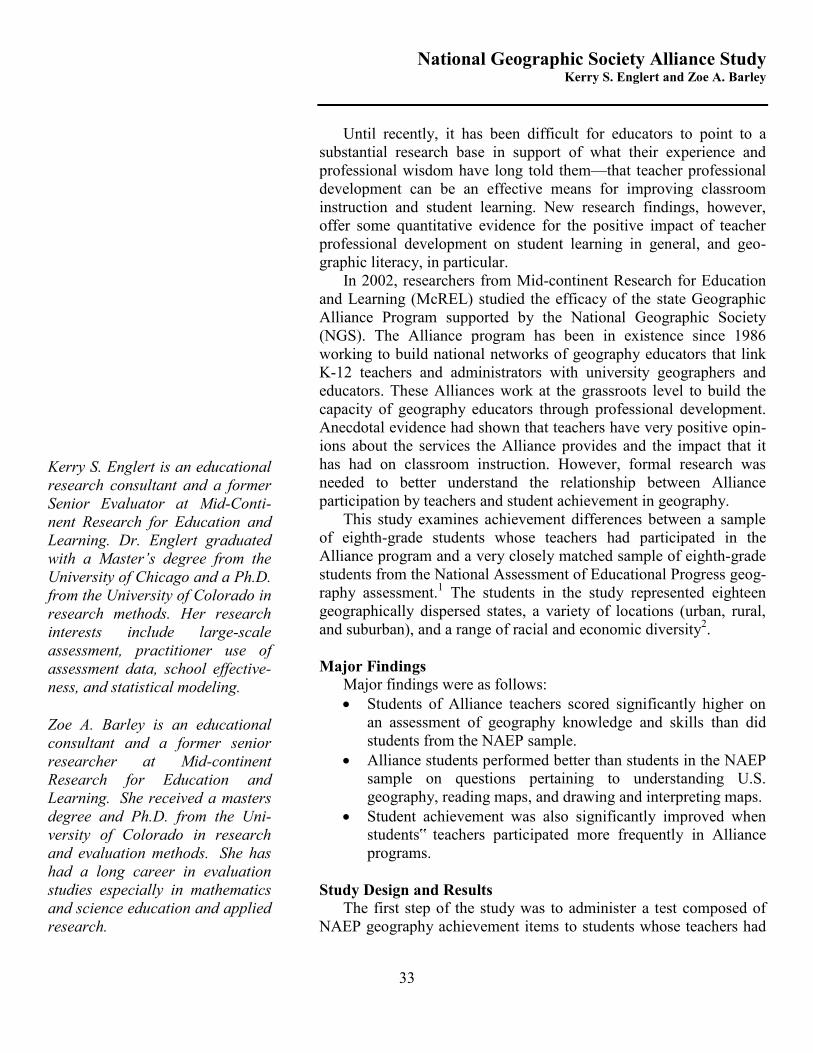
33
Kerry S. Englert is an educational research consultant and a former Senior Evaluator at Mid-Conti-nent Research for Education and Learning. Dr. Englert graduated with a Master’s degree from the University of Chicago and a Ph.D. from the University of Colorado in research methods. Her research interests include large-scale assessment, practitioner use of assessment data, school effective-ness, and statistical modeling. Zoe A. Barley is an educational consultant and a former senior researcher at Mid-continent Research for Education and Learning. She received a masters degree and Ph.D. from the Uni-versity of Colorado in research and evaluation methods. She has had a long career in evaluation studies especially in mathematics and science education and applied research.
National Geographic Society Alliance Study Kerry S. Englert and Zoe A. Barley
Until recently, it has been difficult for educators to point to a substantial research base in support of what their experience and professional wisdom have long told them—that teacher professional development can be an effective means for improving classroom instruction and student learning. New research findings, however, offer some quantitative evidence for the positive impact of teacher professional development on student learning in general, and geo-graphic literacy, in particular.
In 2002, researchers from Mid-continent Research for Education and Learning (McREL) studied the efficacy of the state Geographic Alliance Program supported by the National Geographic Society (NGS). The Alliance program has been in existence since 1986 working to build national networks of geography educators that link K-12 teachers and administrators with university geographers and educators. These Alliances work at the grassroots level to build the capacity of geography educators through professional development. Anecdotal evidence had shown that teachers have very positive opin-ions about the services the Alliance provides and the impact that it has had on classroom instruction. However, formal research was needed to better understand the relationship between Alliance participation by teachers and student achievement in geography.
This study examines achievement differences between a sample of eighth-grade students whose teachers had participated in the Alliance program and a very closely matched sample of eighth-grade students from the National Assessment of Educational Progress geog-raphy assessment.1 The students in the study represented eighteen geographically dispersed states, a variety of locations (urban, rural, and suburban), and a range of racial and economic diversity2.
Major Findings
Major findings were as follows: Students of Alliance teachers scored significantly higher on
an assessment of geography knowledge and skills than did students from the NAEP sample.
Alliance students performed better than students in the NAEP sample on questions pertaining to understanding U.S. geography, reading maps, and drawing and interpreting maps.
Student achievement was also significantly improved when students‟ teachers participated more frequently in Alliance programs.
Study Design and Results
The first step of the study was to administer a test composed of NAEP geography achievement items to students whose teachers had
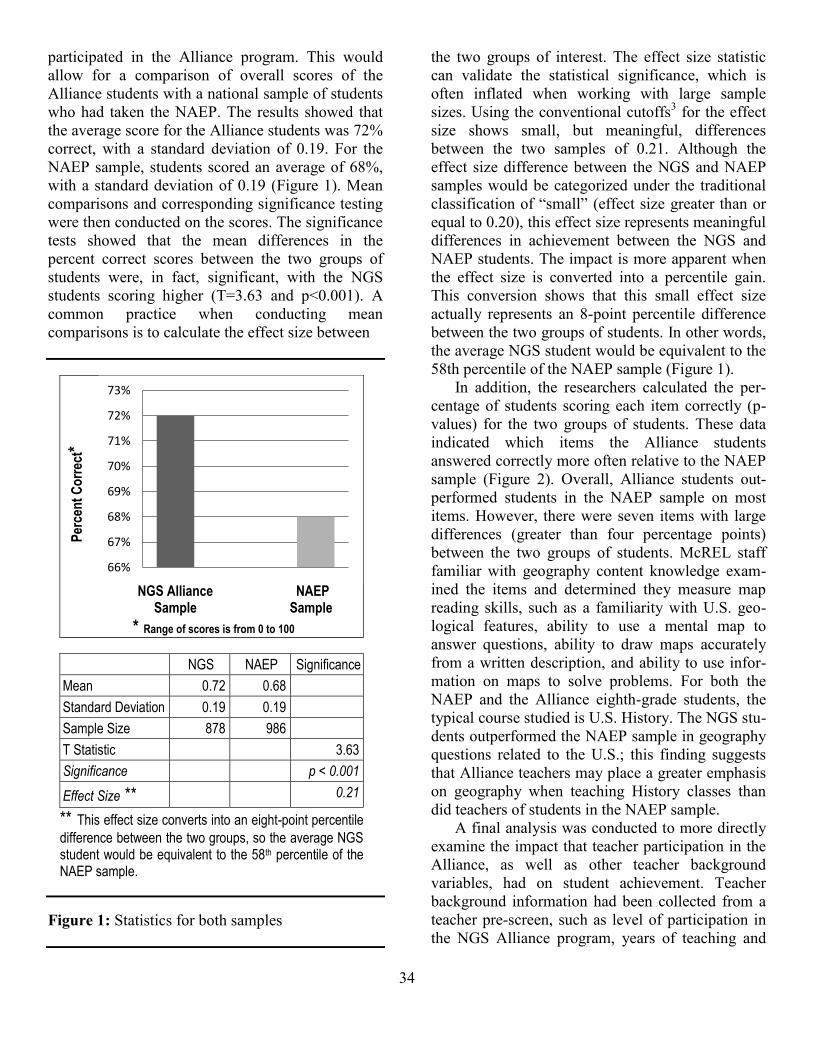
34
participated in the Alliance program. This would allow for a comparison of overall scores of the Alliance students with a national sample of students who had taken the NAEP. The results showed that the average score for the Alliance students was 72% correct, with a standard deviation of 0.19. For the NAEP sample, students scored an average of 68%, with a standard deviation of 0.19 (Figure 1). Mean comparisons and corresponding significance testing were then conducted on the scores. The significance tests showed that the mean differences in the percent correct scores between the two groups of students were, in fact, significant, with the NGS students scoring higher (T=3.63 and p<0.001). A common practice when conducting mean comparisons is to calculate the effect size between
NGS Alliance
Sample NAEP Sample
* Range of scores is from 0 to 100
NGS NAEP Significance
Mean 0.72 0.68
Standard Deviation 0.19 0.19
Sample Size 878 986
T Statistic 3.63
Significance p < 0.001
Effect Size ** 0.21
** This effect size converts into an eight-point percentile
difference between the two groups, so the average NGS student would be equivalent to the 58th percentile of the NAEP sample.
Figure 1: Statistics for both samples
the two groups of interest. The effect size statistic can validate the statistical significance, which is often inflated when working with large sample sizes. Using the conventional cutoffs3 for the effect size shows small, but meaningful, differences between the two samples of 0.21. Although the effect size difference between the NGS and NAEP samples would be categorized under the traditional classification of “small” (effect size greater than or equal to 0.20), this effect size represents meaningful differences in achievement between the NGS and NAEP students. The impact is more apparent when the effect size is converted into a percentile gain. This conversion shows that this small effect size actually represents an 8-point percentile difference between the two groups of students. In other words, the average NGS student would be equivalent to the 58th percentile of the NAEP sample (Figure 1).
In addition, the researchers calculated the per-centage of students scoring each item correctly (p-values) for the two groups of students. These data indicated which items the Alliance students answered correctly more often relative to the NAEP sample (Figure 2). Overall, Alliance students out-performed students in the NAEP sample on most items. However, there were seven items with large differences (greater than four percentage points) between the two groups of students. McREL staff familiar with geography content knowledge exam-ined the items and determined they measure map reading skills, such as a familiarity with U.S. geo-logical features, ability to use a mental map to answer questions, ability to draw maps accurately from a written description, and ability to use infor-mation on maps to solve problems. For both the NAEP and the Alliance eighth-grade students, the typical course studied is U.S. History. The NGS stu-dents outperformed the NAEP sample in geography questions related to the U.S.; this finding suggests that Alliance teachers may place a greater emphasis on geography when teaching History classes than did teachers of students in the NAEP sample.
A final analysis was conducted to more directly examine the impact that teacher participation in the Alliance, as well as other teacher background variables, had on student achievement. Teacher background information had been collected from a teacher pre-screen, such as level of participation in the NGS Alliance program, years of teaching and
66%
67%
68%
69%
70%
71%
72%
73%
Per
cen
t C
orr
ect*
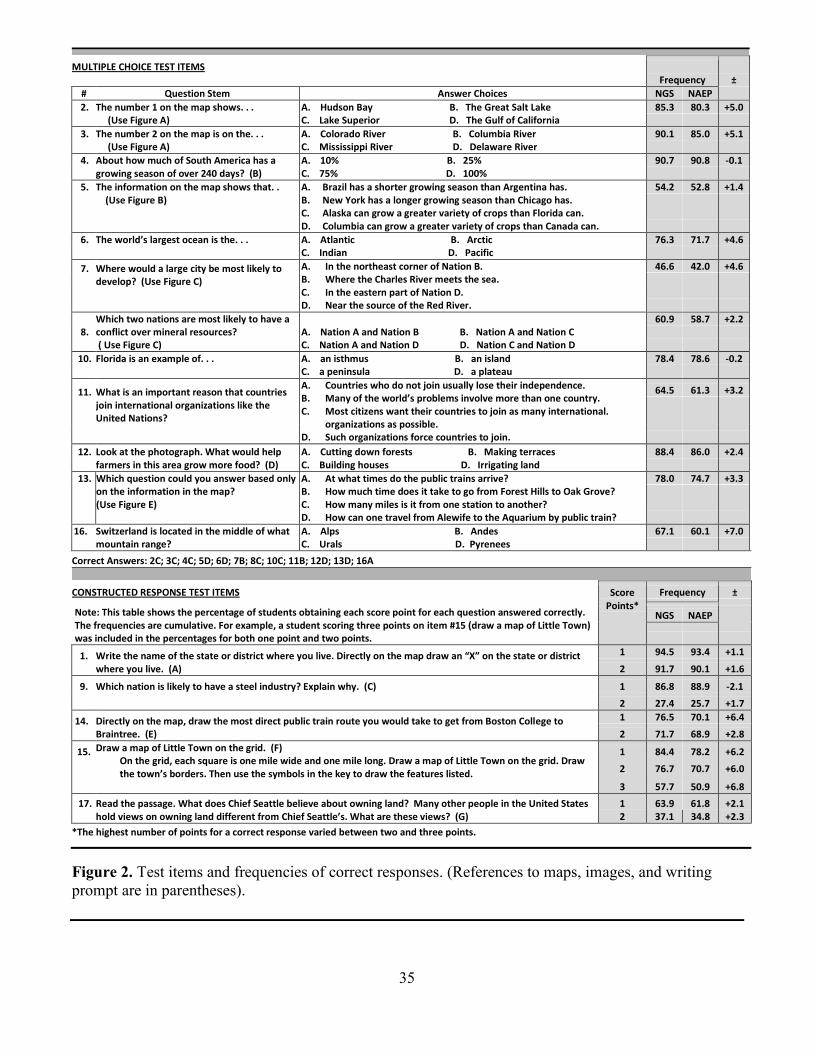
35
MULTIPLE CHOICE TEST ITEMS
Frequency ±
# Question Stem Answer Choices NGS NAEP
2. The number 1 on the map shows. . . A. Hudson Bay B. The Great Salt Lake C. Lake Superior D. The Gulf of California
85.3 80.3 +5.0 (Use Figure A)
3. The number 2 on the map is on the. . . A. Colorado River B. Columbia River C. Mississippi River D. Delaware River
90.1 85.0 +5.1 (Use Figure A)
4.
About how much of South America has a growing season of over 240 days? (B)
A. 10% B. 25% C. 75% D. 100%
90.7 90.8 -0.1
5.
The information on the map shows that. . (Use Figure B)
A. Brazil has a shorter growing season than Argentina has. B. New York has a longer growing season than Chicago has. C. Alaska can grow a greater variety of crops than Florida can. D. Columbia can grow a greater variety of crops than Canada can.
54.2 52.8 +1.4
6. The world’s largest ocean is the. . . A. Atlantic B. Arctic C. Indian D. Pacific
76.3 71.7 +4.6
7.
Where would a large city be most likely to develop? (Use Figure C)
A. In the northeast corner of Nation B. B. Where the Charles River meets the sea. C. In the eastern part of Nation D. D. Near the source of the Red River.
46.6 42.0 +4.6
8.
Which two nations are most likely to have a conflict over mineral resources? ( Use Figure C)
A. Nation A and Nation B B. Nation A and Nation C C. Nation A and Nation D D. Nation C and Nation D
60.9 58.7 +2.2
10. Florida is an example of. . . A. an isthmus B. an island C. a peninsula D. a plateau
78.4 78.6 -0.2
11.
What is an important reason that countries join international organizations like the United Nations?
A. Countries who do not join usually lose their independence. B. Many of the world’s problems involve more than one country. C. Most citizens want their countries to join as many international.
organizations as possible. D. Such organizations force countries to join.
64.5 61.3 +3.2
12.
Look at the photograph. What would help farmers in this area grow more food? (D)
A. Cutting down forests B. Making terraces C. Building houses D. Irrigating land
88.4 86.0 +2.4
13. Which question could you answer based only on the information in the map? (Use Figure E)
A. At what times do the public trains arrive? B. How much time does it take to go from Forest Hills to Oak Grove? C. How many miles is it from one station to another? D. How can one travel from Alewife to the Aquarium by public train?
78.0 74.7 +3.3
16.
Switzerland is located in the middle of what mountain range?
A. Alps B. Andes C. Urals D. Pyrenees
67.1 60.1 +7.0
Correct Answers: 2C; 3C; 4C; 5D; 6D; 7B; 8C; 10C; 11B; 12D; 13D; 16A
CONSTRUCTED RESPONSE TEST ITEMS Score Points*
Frequency ±
Note: This table shows the percentage of students obtaining each score point for each question answered correctly. The frequencies are cumulative. For example, a student scoring three points on item #15 (draw a map of Little Town) was included in the percentages for both one point and two points.
NGS NAEP
1.
Write the name of the state or district where you live. Directly on the map draw an “X” on the state or district where you live. (A)
1 94.5 93.4 +1.1
2 91.7 90.1 +1.6
9. Which nation is likely to have a steel industry? Explain why. (C) 1 86.8 88.9 -2.1
2 27.4 25.7 +1.7
14.
Directly on the map, draw the most direct public train route you would take to get from Boston College to Braintree. (E)
1 76.5 70.1 +6.4
2 71.7 68.9 +2.8
15. Draw a map of Little Town on the grid. (F) On the grid, each square is one mile wide and one mile long. Draw a map of Little Town on the grid. Draw the town’s borders. Then use the symbols in the key to draw the features listed.
1 84.4 78.2 +6.2
2 76.7 70.7 +6.0
3 57.7 50.9 +6.8
17.
Read the passage. What does Chief Seattle believe about owning land? Many other people in the United States hold views on owning land different from Chief Seattle’s. What are these views? (G)
1 63.9 61.8 +2.1 2 37.1 34.8 +2.3
*The highest number of points for a correct response varied between two and three points.
Figure 2. Test items and frequencies of correct responses. (References to maps, images, and writing prompt are in parentheses).
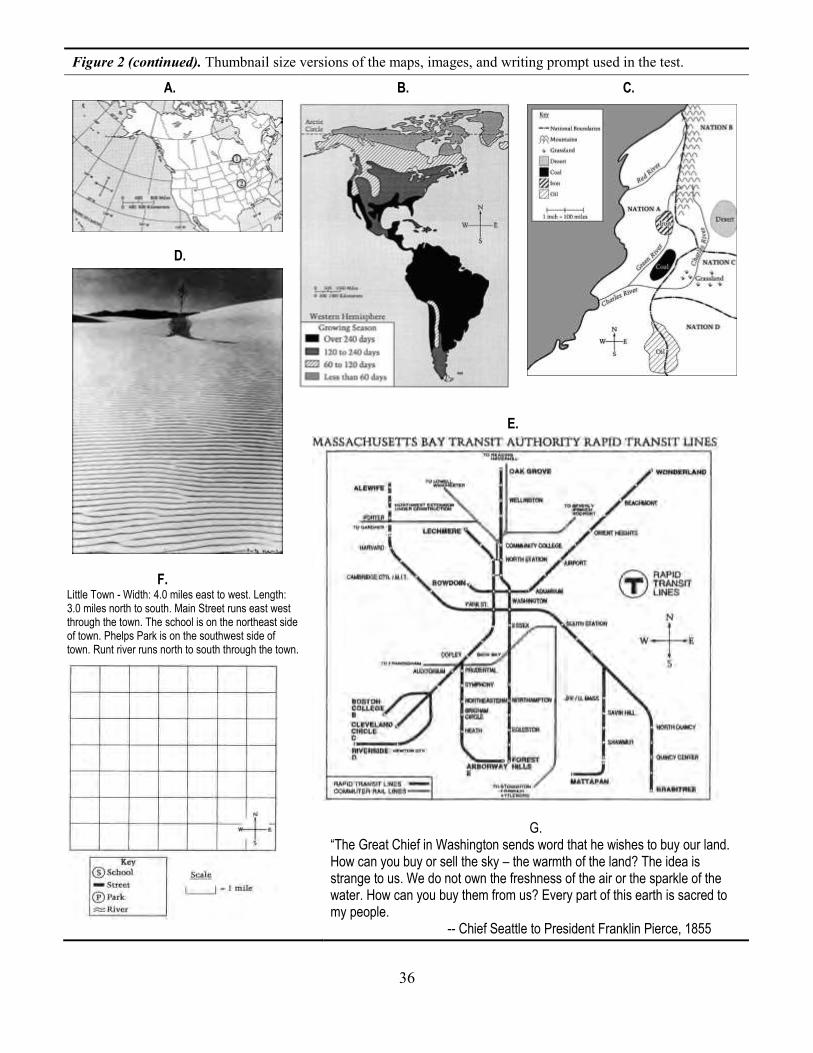
36
Figure 2 (continued). Thumbnail size versions of the maps, images, and writing prompt used in the test.
A. D.
F. Little Town - Width: 4.0 miles east to west. Length: 3.0 miles north to south. Main Street runs east west through the town. The school is on the northeast side of town. Phelps Park is on the southwest side of town. Runt river runs north to south through the town.
B. C. F. E.
G. “The Great Chief in Washington sends word that he wishes to buy our land. How can you buy or sell the sky – the warmth of the land? The idea is strange to us. We do not own the freshness of the air or the sparkle of the water. How can you buy them from us? Every part of this earth is sacred to my people. -- Chief Seattle to President Franklin Pierce, 1855
37
hours of general professional development. These variables were merged with student scores and a regression analysis was run to determine of these variables predicted achievement. The results showed a correlation between many of the variables but the only variable that significantly predicted achievement (F=8.69, p<0.01) was the number of times a teacher had attended the Alliance summer training institutes. This finding indicates that there is a positive relationship between how often a teacher participates in the summer programs and the achievement of her/his students.
Summary
The overall results of this study show meaningful and statistically significant differences in achievement between the students of teachers who participated in the Alliance professional development and the sample of students extracted from the NAEP data. These data are particularly meaningful given that the sample of students in the study was statistically matched to the NAEP sample. The item-level analyses support the overall finding that Alliance students outperformed the students in the NAEP sample. These results also indicate that Alliance students tended to do better
on items that are typically taught in the eighth-grade social studies curriculum. Furthermore, the anal-yses suggest that the frequency of teacher parti-cipation in the NGS Summer Institutes has a positive impact on student scores. In sum, our results indicate that, overall, the Alliance program is having a positive impact on student achievement in geography, which translates statistically into an eight percentile difference in achievement. Notes 1Effect sizes categorized as small are 0.20-0.49. Effect sizes categorized as medium are 0.50-0.79 and large are greater than .80. See Jacob Cohen, Statistical Power for the Behavioral Sciences (2nd ed. (Hillsdale, NJ: Erlbaum 1988)
2The full report from this study is available at the Mid-continent Center for Research and Learning Web site at http://www.mcrel.org/PDF/instruction/4007RR_NGS_Alliance_Study.pdf (last accessed May 12, 2011). Results of this study were also published as a peer reviewed article, Englert, K., and Z. Barley. 2003. “National Geographic Society Alliance Study.” Journal of Geography 102 no. 2: 80-89.
3Effect sizes categorized as small are 0.20-0.49. Effect sizes categorized as medium are 0.50-0.79 and large are greater than .80. See Cohen, J. 1988. Statistical Power for the Behavioral Sciences. 2nd ed. Hillsdale, NJ: Erlbaum.
38
Michael J. Libbee is a professor in the Department of Geography at Central Michigan University and Co-coordinator of the Michigan Geographic Alliance. His interests include geographic education, teacher preparation, and human geography. Marty Mater is the Teacher Consultant in Residence for the Michigan Geographic Alliance. She has been a Teacher Consultant since 1990, and has 24 years of elementary teaching experience, including 18 years teaching 4th grade Michigan Studies. Larry Shaftenaar is retired but serves as a board member of the Michigan Educational Research Association
Can Professional Development Enhance Student Achievement, and Prove It? Results of the 1999-2003 Michigan Achievement Project
Michael Libbee, Marty Mater, and Larry Schaftenaar
Over the past fifteen years, most states developed content standards focused on core disciplines, and many experimented with moderate- to high-stakes assessments.1 The purpose of developing content standards and assessments was to enhance student achievement,2 and the problem rapidly became how best to support teachers and students to meet the high standards reflected on state assessments.3
Since its inception in 1989, the Michigan Geographic Alliance has pursued the goal of using geography to improve the education of Michigan students. In the late 1990s, the Alliance was deeply involved in develop-ment of Michigan content standards and the design of the social studies component of the Michigan statewide assessment program, the Michigan Education Assessment Program (MEAP). The Alliance developed the Michigan Achievement Project (MAP) to help support teachers and stu-dents in meeting these high standards. The core question of the MAP project was, “Is it possible to provide an educationally valid, cost-effective testing, training, and feedback service for teachers that helps enhance stu-dent achievement in core social studies disciplines and prove its effective-ness as measured by an independent statewide assessment?” This paper reports the results of the efforts undertaken during the Michigan Achieve-ment Project (MAP) to answer this question.4
Context, Goals, and Implementation of the Michigan Achievement Project
The Social Studies MEAP was based directly on the Michigan social studies content standards developed in the late 1990s.5 First administered in January, 1999, the Social Studies MEAP seemed likely to have four problems that are often associated with statewide assessment programs:
Timing: Although assessments provide information about student achievement, teachers typically do not receive feedback until after the end of the school year, and as a result, have little useful information about the skills of individual students before the state test, and virtually no chance to use assessment data to modify their instruction and evaluate improvement within a school year
Diagnostic Utility: Students often have limited knowledge of what is being assessed, are given minimal practice on assessable tasks, receive only fairly global feedback, and have very little chance to self-evaluate and improve their responses.
Professional Development: Workshops are the primary means of providing teachers with information in advance of assessment, but work-shops are often have mixed quality and relevance and almost never link to information about students in teachers current classes. In addition, there is not much information about which workshops enhanced student achieve-ment, a necessary component of professional development1
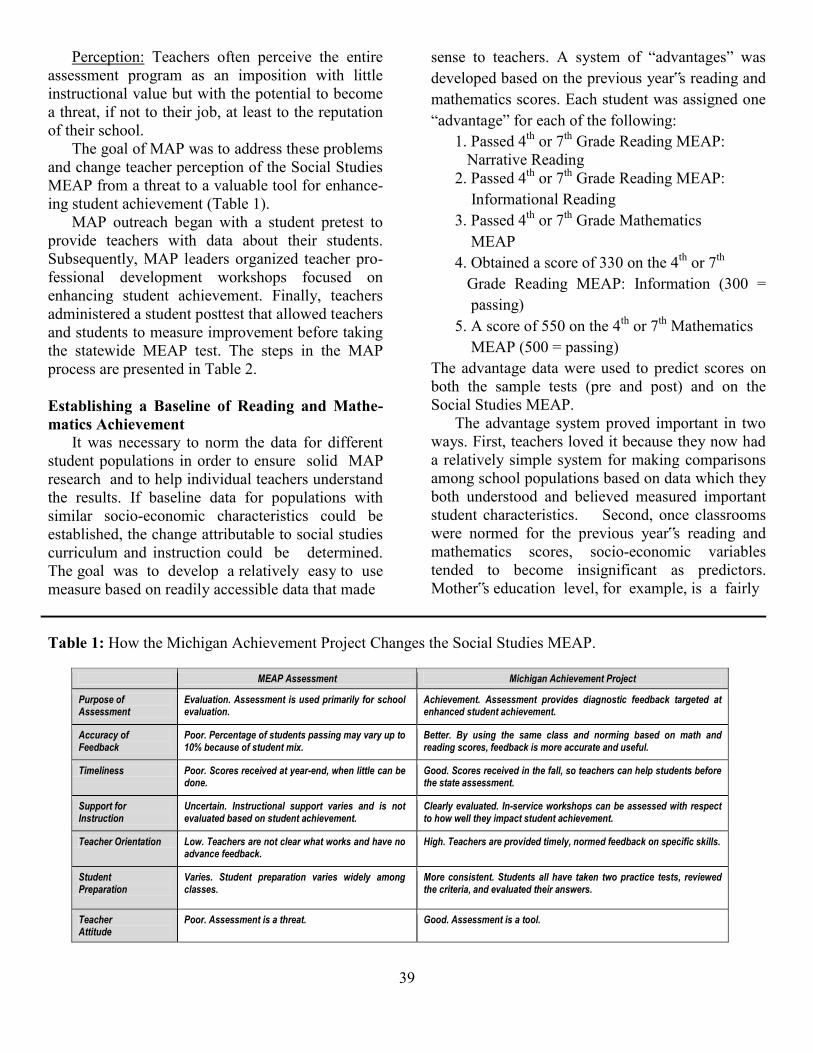
39
Perception: Teachers often perceive the entire assessment program as an imposition with little instructional value but with the potential to become a threat, if not to their job, at least to the reputation of their school.
The goal of MAP was to address these problems and change teacher perception of the Social Studies MEAP from a threat to a valuable tool for enhance-ing student achievement (Table 1).
MAP outreach began with a student pretest to provide teachers with data about their students. Subsequently, MAP leaders organized teacher pro-fessional development workshops focused on enhancing student achievement. Finally, teachers administered a student posttest that allowed teachers and students to measure improvement before taking the statewide MEAP test. The steps in the MAP process are presented in Table 2. Establishing a Baseline of Reading and Mathe-matics Achievement
It was necessary to norm the data for different student populations in order to ensure solid MAP research and to help individual teachers understand the results. If baseline data for populations with similar socio-economic characteristics could be established, the change attributable to social studies curriculum and instruction could be determined. The goal was to develop a relatively easy to use measure based on readily accessible data that made
sense to teachers. A system of “advantages” was developed based on the previous year‟s reading and mathematics scores. Each student was assigned one “advantage” for each of the following: 1. Passed 4th or 7th Grade Reading MEAP: Narrative Reading 2. Passed 4th or 7th Grade Reading MEAP: Informational Reading 3. Passed 4th or 7th Grade Mathematics MEAP 4. Obtained a score of 330 on the 4th or 7th Grade Reading MEAP: Information (300 = passing) 5. A score of 550 on the 4th or 7th Mathematics MEAP (500 = passing) The advantage data were used to predict scores on both the sample tests (pre and post) and on the Social Studies MEAP.
The advantage system proved important in two ways. First, teachers loved it because they now had a relatively simple system for making comparisons among school populations based on data which they both understood and believed measured important student characteristics. Second, once classrooms were normed for the previous year‟s reading and mathematics scores, socio-economic variables tended to become insignificant as predictors. Mother‟s education level, for example, is a fairly
Table 1: How the Michigan Achievement Project Changes the Social Studies MEAP.
MEAP Assessment Michigan Achievement Project
Purpose of Assessment
Evaluation. Assessment is used primarily for school evaluation.
Achievement. Assessment provides diagnostic feedback targeted at enhanced student achievement.
Accuracy of Feedback
Poor. Percentage of students passing may vary up to 10% because of student mix.
Better. By using the same class and norming based on math and reading scores, feedback is more accurate and useful.
Timeliness Poor. Scores received at year-end, when little can be done.
Good. Scores received in the fall, so teachers can help students before the state assessment.
Support for Instruction
Uncertain. Instructional support varies and is not evaluated based on student achievement.
Clearly evaluated. In-service workshops can be assessed with respect to how well they impact student achievement.
Teacher Orientation Low. Teachers are not clear what works and have no advance feedback.
High. Teachers are provided timely, normed feedback on specific skills.
Student Preparation
Varies. Student preparation varies widely among classes.
More consistent. Students all have taken two practice tests, reviewed the criteria, and evaluated their answers.
Teacher Attitude
Poor. Assessment is a threat. Good. Assessment is a tool.
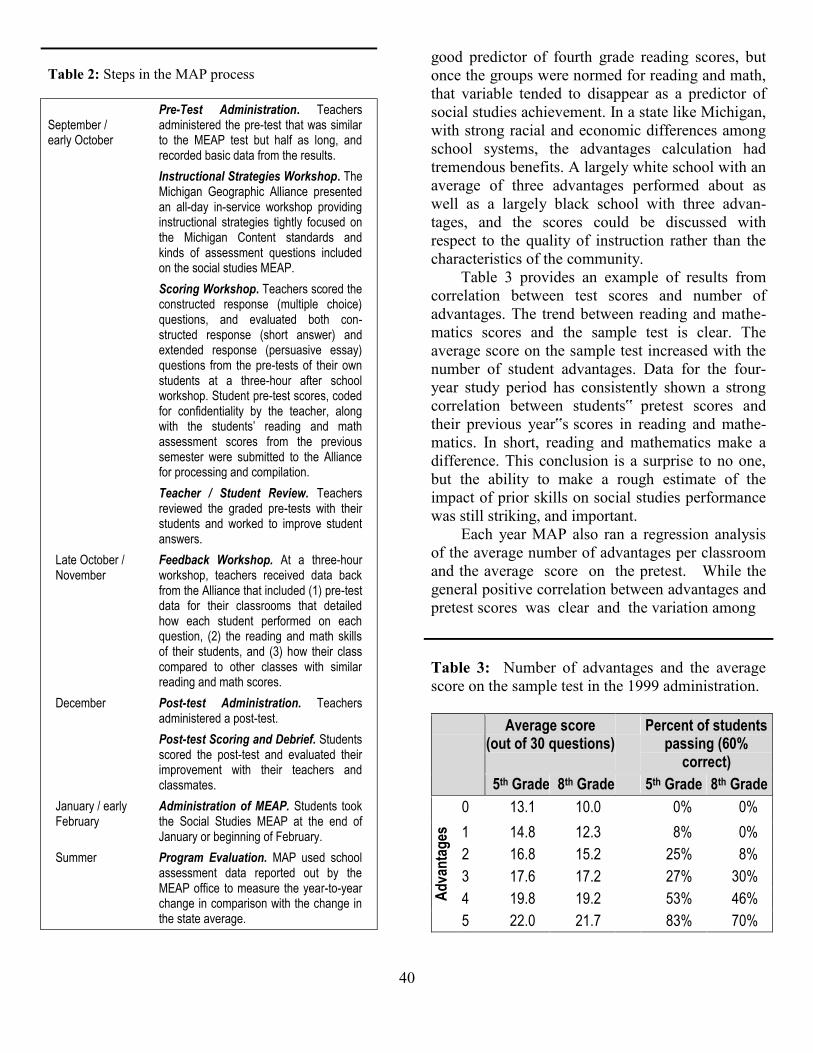
40
Table 2: Steps in the MAP process
September / early October
Pre-Test Administration. Teachers administered the pre-test that was similar to the MEAP test but half as long, and recorded basic data from the results.
Instructional Strategies Workshop. The Michigan Geographic Alliance presented an all-day in-service workshop providing instructional strategies tightly focused on the Michigan Content standards and kinds of assessment questions included on the social studies MEAP.
Scoring Workshop. Teachers scored the constructed response (multiple choice) questions, and evaluated both con-structed response (short answer) and extended response (persuasive essay) questions from the pre-tests of their own students at a three-hour after school workshop. Student pre-test scores, coded for confidentiality by the teacher, along with the students’ reading and math assessment scores from the previous semester were submitted to the Alliance for processing and compilation.
Teacher / Student Review. Teachers reviewed the graded pre-tests with their students and worked to improve student answers.
Late October / November
Feedback Workshop. At a three-hour workshop, teachers received data back from the Alliance that included (1) pre-test data for their classrooms that detailed how each student performed on each question, (2) the reading and math skills of their students, and (3) how their class compared to other classes with similar reading and math scores.
December Post-test Administration. Teachers administered a post-test.
Post-test Scoring and Debrief. Students scored the post-test and evaluated their improvement with their teachers and classmates.
January / early February
Administration of MEAP. Students took the Social Studies MEAP at the end of January or beginning of February.
Summer
Program Evaluation. MAP used school assessment data reported out by the MEAP office to measure the year-to-year change in comparison with the change in the state average.
good predictor of fourth grade reading scores, but once the groups were normed for reading and math, that variable tended to disappear as a predictor of social studies achievement. In a state like Michigan, with strong racial and economic differences among school systems, the advantages calculation had tremendous benefits. A largely white school with an average of three advantages performed about as well as a largely black school with three advan-tages, and the scores could be discussed with respect to the quality of instruction rather than the characteristics of the community.
Table 3 provides an example of results from correlation between test scores and number of advantages. The trend between reading and mathe-matics scores and the sample test is clear. The average score on the sample test increased with the number of student advantages. Data for the four-year study period has consistently shown a strong correlation between students‟ pretest scores and their previous year‟s scores in reading and mathe-matics. In short, reading and mathematics make a difference. This conclusion is a surprise to no one, but the ability to make a rough estimate of the impact of prior skills on social studies performance was still striking, and important.
Each year MAP also ran a regression analysis of the average number of advantages per classroom and the average score on the pretest. While the general positive correlation between advantages and pretest scores was clear and the variation among Table 3: Number of advantages and the average score on the sample test in the 1999 administration. Average score
(out of 30 questions) Percent of students
passing (60% correct)
5th Grade 8th Grade 5th Grade 8th Grade
Ad
van
tag
es
0 13.1 10.0 0% 0%
1 14.8 12.3 8% 0%
2 16.8 15.2 25% 8%
3 17.6 17.2 27% 30%
4 19.8 19.2 53% 46%
5 22.0 21.7 83% 70%
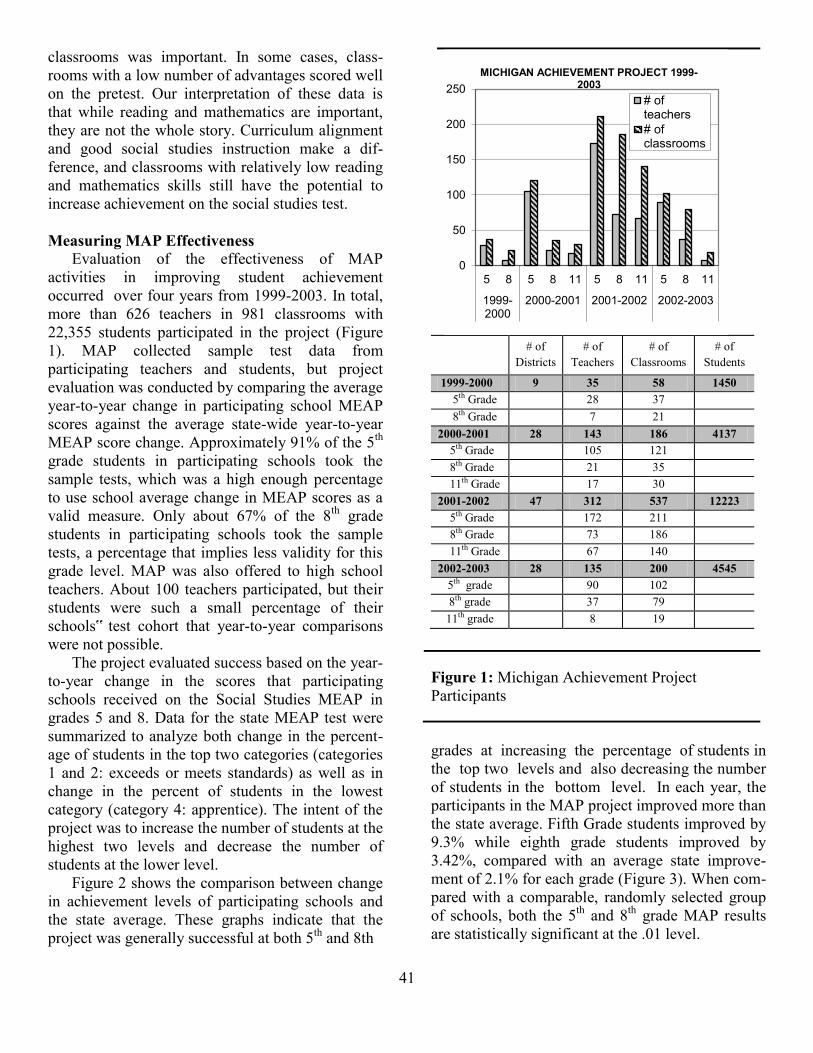
41
classrooms was important. In some cases, class-rooms with a low number of advantages scored well on the pretest. Our interpretation of these data is that while reading and mathematics are important, they are not the whole story. Curriculum alignment and good social studies instruction make a dif-ference, and classrooms with relatively low reading and mathematics skills still have the potential to increase achievement on the social studies test. Measuring MAP Effectiveness
Evaluation of the effectiveness of MAP activities in improving student achievement occurred over four years from 1999-2003. In total, more than 626 teachers in 981 classrooms with 22,355 students participated in the project (Figure 1). MAP collected sample test data from participating teachers and students, but project evaluation was conducted by comparing the average year-to-year change in participating school MEAP scores against the average state-wide year-to-year MEAP score change. Approximately 91% of the 5th grade students in participating schools took the sample tests, which was a high enough percentage to use school average change in MEAP scores as a valid measure. Only about 67% of the 8th grade students in participating schools took the sample tests, a percentage that implies less validity for this grade level. MAP was also offered to high school teachers. About 100 teachers participated, but their students were such a small percentage of their schools‟ test cohort that year-to-year comparisons were not possible.
The project evaluated success based on the year-to-year change in the scores that participating schools received on the Social Studies MEAP in grades 5 and 8. Data for the state MEAP test were summarized to analyze both change in the percent-age of students in the top two categories (categories 1 and 2: exceeds or meets standards) as well as in change in the percent of students in the lowest category (category 4: apprentice). The intent of the project was to increase the number of students at the highest two levels and decrease the number of students at the lower level.
Figure 2 shows the comparison between change in achievement levels of participating schools and the state average. These graphs indicate that the project was generally successful at both 5th and 8th
# of
Districts # of
Teachers # of
Classrooms # of
Students
1999-2000 9 35 58 1450 5th Grade 28 37 8th Grade 7 21 2000-2001 28 143 186 4137 5th Grade 105 121 8th Grade 21 35 11th Grade 17 30 2001-2002 47 312 537 12223 5th Grade 172 211 8th Grade 73 186 11th Grade 67 140 2002-2003 28 135 200 4545
5th grade 90 102 8th grade 37 79
11th grade 8 19
Figure 1: Michigan Achievement Project Participants
grades at increasing the percentage of students in the top two levels and also decreasing the number of students in the bottom level. In each year, the participants in the MAP project improved more than the state average. Fifth Grade students improved by 9.3% while eighth grade students improved by 3.42%, compared with an average state improve-ment of 2.1% for each grade (Figure 3). When com-pared with a comparable, randomly selected group of schools, both the 5th and 8th grade MAP results are statistically significant at the .01 level.
0
50
100
150
200
250
5 8 5 8 11 5 8 11 5 8 11
1999-2000
2000-2001 2001-2002 2002-2003
MICHIGAN ACHIEVEMENT PROJECT 1999-2003
# ofteachers# ofclassrooms
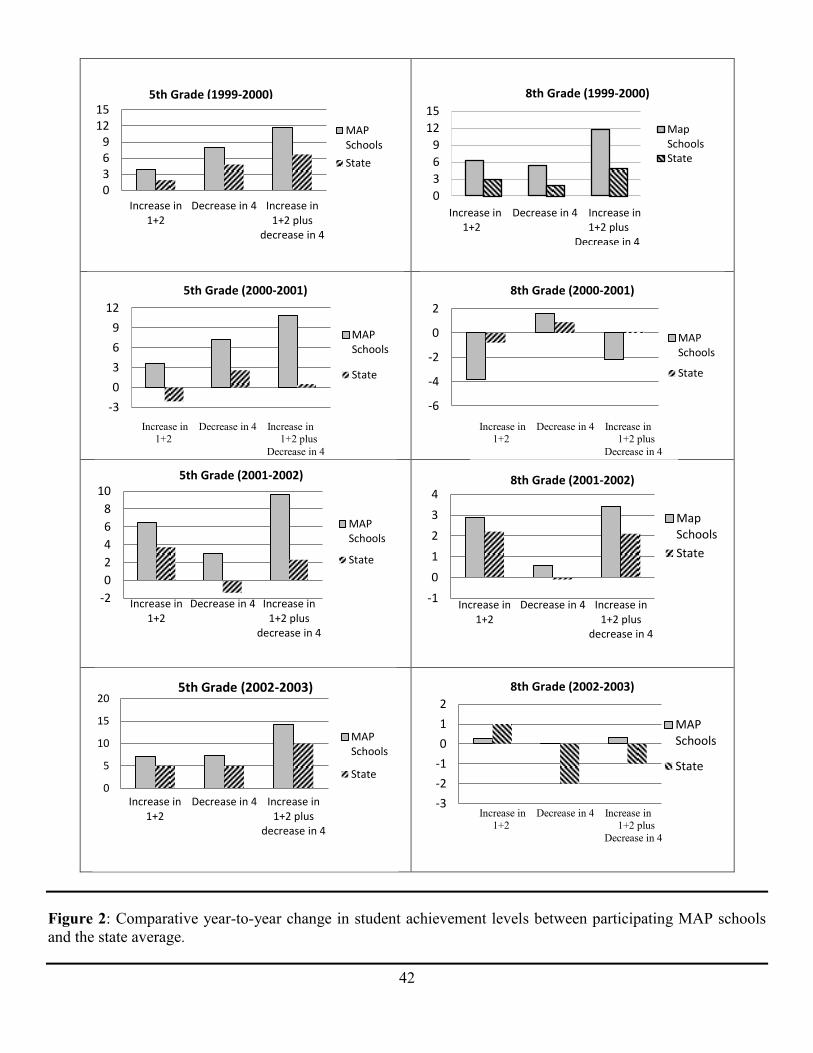
42
Figure 2: Comparative year-to-year change in student achievement levels between participating MAP schools and the state average.
0369
1215
Increase in1+2
Decrease in 4 Increase in1+2 plus
decrease in 4
MAPSchools
State
5th Grade (1999-2000)
0
3
6
9
12
15
8th Grade (1999-2000)
Map Schools State
-3
0
3
6
9
12
5th Grade (2000-2001)
MAPSchools
State
-6
-4
-2
0
2
8th Grade (2000-2001)
MAPSchools
State
-2
0
2
4
6
8
10
Increase in1+2
Decrease in 4 Increase in1+2 plus
decrease in 4
5th Grade (2001-2002)
MAPSchools
State
-1
0
1
2
3
4
Increase in1+2
Decrease in 4 Increase in1+2 plus
decrease in 4
8th Grade (2001-2002)
MapSchools
State
0
5
10
15
20
Increase in1+2
Decrease in 4 Increase in1+2 plus
decrease in 4
5th Grade (2002-2003)
MAPSchools
State
-3
-2
-1
0
1
2
8th Grade (2002-2003)
MAPSchools
State
Increase in Decrease in 4 Increase in 1+2 1+2 plus Decrease in 4
Increase in Decrease in 4 Increase in 1+2 1+2 plus Decrease in 4
Increase in Decrease in 4 Increase in 1+2 1+2 plus Decrease in 4
Increase in Decrease in 4 Increase in 1+2 1+2 plus Decrease in 4
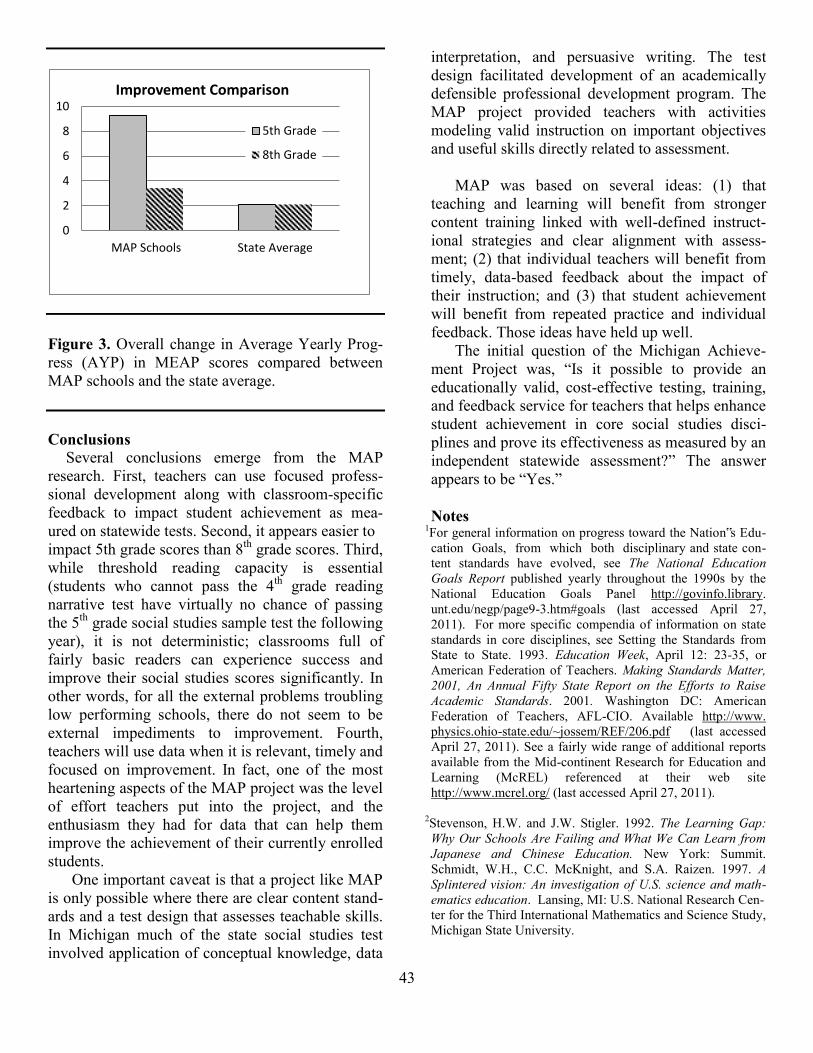
43
Figure 3. Overall change in Average Yearly Prog-ress (AYP) in MEAP scores compared between MAP schools and the state average. Conclusions
Several conclusions emerge from the MAP research. First, teachers can use focused profess-sional development along with classroom-specific feedback to impact student achievement as mea-ured on statewide tests. Second, it appears easier to impact 5th grade scores than 8th grade scores. Third, while threshold reading capacity is essential (students who cannot pass the 4th grade reading narrative test have virtually no chance of passing the 5th grade social studies sample test the following year), it is not deterministic; classrooms full of fairly basic readers can experience success and improve their social studies scores significantly. In other words, for all the external problems troubling low performing schools, there do not seem to be external impediments to improvement. Fourth, teachers will use data when it is relevant, timely and focused on improvement. In fact, one of the most heartening aspects of the MAP project was the level of effort teachers put into the project, and the enthusiasm they had for data that can help them improve the achievement of their currently enrolled students.
One important caveat is that a project like MAP is only possible where there are clear content stand-ards and a test design that assesses teachable skills. In Michigan much of the state social studies test involved application of conceptual knowledge, data
interpretation, and persuasive writing. The test design facilitated development of an academically defensible professional development program. The MAP project provided teachers with activities modeling valid instruction on important objectives and useful skills directly related to assessment.
MAP was based on several ideas: (1) that
teaching and learning will benefit from stronger content training linked with well-defined instruct-ional strategies and clear alignment with assess-ment; (2) that individual teachers will benefit from timely, data-based feedback about the impact of their instruction; and (3) that student achievement will benefit from repeated practice and individual feedback. Those ideas have held up well.
The initial question of the Michigan Achieve-ment Project was, “Is it possible to provide an educationally valid, cost-effective testing, training, and feedback service for teachers that helps enhance student achievement in core social studies disci-plines and prove its effectiveness as measured by an independent statewide assessment?” The answer appears to be “Yes.” Notes
1For general information on progress toward the Nation‟s Edu-cation Goals, from which both disciplinary and state con-tent standards have evolved, see The National Education Goals Report published yearly throughout the 1990s by the National Education Goals Panel http://govinfo.library. unt.edu/negp/page9-3.htm#goals (last accessed April 27, 2011). For more specific compendia of information on state standards in core disciplines, see Setting the Standards from State to State. 1993. Education Week, April 12: 23-35, or American Federation of Teachers. Making Standards Matter, 2001, An Annual Fifty State Report on the Efforts to Raise Academic Standards. 2001. Washington DC: American Federation of Teachers, AFL-CIO. Available http://www. physics.ohio-state.edu/~jossem/REF/206.pdf (last accessed April 27, 2011). See a fairly wide range of additional reports available from the Mid-continent Research for Education and Learning (McREL) referenced at their web site http://www.mcrel.org/ (last accessed April 27, 2011).
2Stevenson, H.W. and J.W. Stigler. 1992. The Learning Gap: Why Our Schools Are Failing and What We Can Learn from Japanese and Chinese Education. New York: Summit. Schmidt, W.H., C.C. McKnight, and S.A. Raizen. 1997. A Splintered vision: An investigation of U.S. science and math-ematics education. Lansing, MI: U.S. National Research Cen-
ter for the Third International Mathematics and Science Study, Michigan State University.
0
2
4
6
8
10
MAP Schools State Average
Improvement Comparison
5th Grade
8th Grade
44
3Business Roundtable. 1992. The Essential Components of a Successful Education System: Putting Theory Into Practice. Washington D.C.: The Business Roundtable; Rigdon, M. 1997. Accountability and school performance: Implications for restructuring schools. Harvard Education Review 67(1): 41-74.
4The Michigan Achievement Project (MAP) was sponsored by the National Geographic Society Education Foundation and the Michigan Department of Education with Eisenhower Professional Development support, and administered by the Michigan Geographic Alliance. Workshops were provided by
Michigan Geographic Alliance Teacher Consultants and by the two Alliance co-coordinators.
5The social studies MEAP can be accessed at http://www.michigan.gov/mde/0,1607,7-140-22709_31168---,00.html (last accessed April 27, 2011).
6United States Department of Education. ND. Building bridges: The mission and principles of professional develop-ment. Washington DC: United States Department of Education (no date). Available at http://www.ed.gov/G2K/ bridge.html (last accessed April 27, 2011).
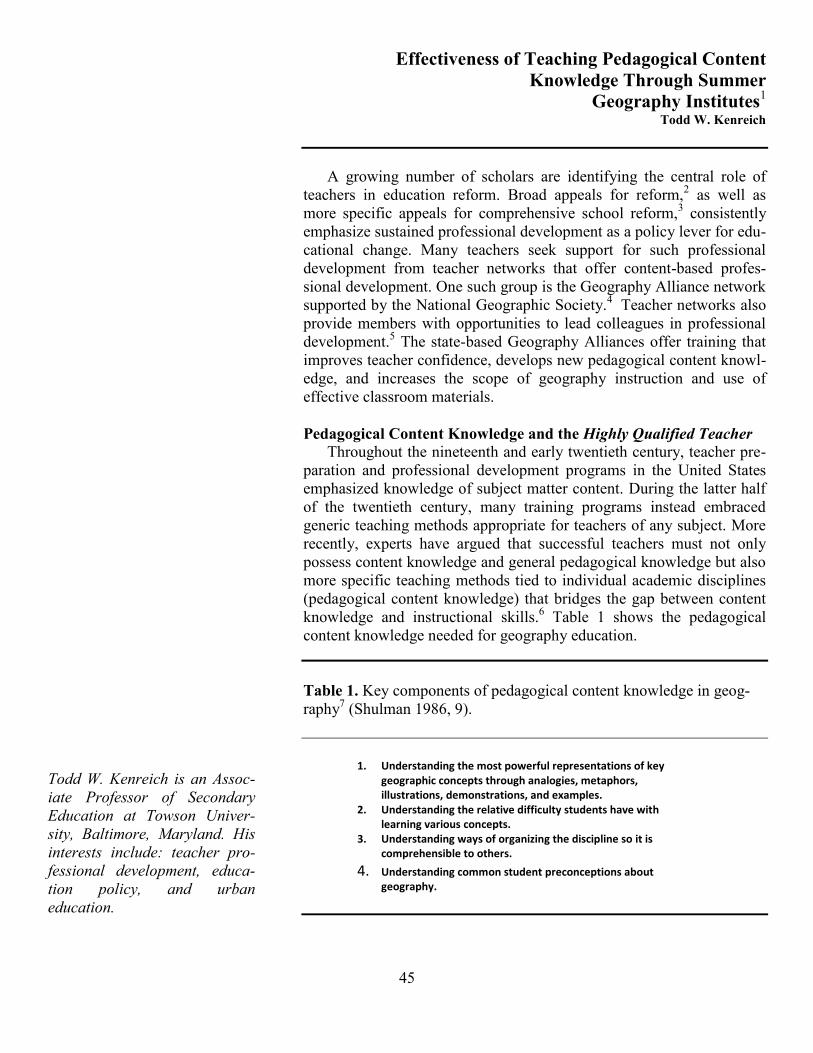
45
Todd W. Kenreich is an Assoc-iate Professor of Secondary Education at Towson Univer-sity, Baltimore, Maryland. His interests include: teacher pro-fessional development, educa-tion policy, and urban education.
Effectiveness of Teaching Pedagogical Content Knowledge Through Summer
Geography Institutes1 Todd W. Kenreich
A growing number of scholars are identifying the central role of
teachers in education reform. Broad appeals for reform,2 as well as more specific appeals for comprehensive school reform,3 consistently emphasize sustained professional development as a policy lever for edu-cational change. Many teachers seek support for such professional development from teacher networks that offer content-based profes-sional development. One such group is the Geography Alliance network supported by the National Geographic Society.4 Teacher networks also provide members with opportunities to lead colleagues in professional development.5 The state-based Geography Alliances offer training that improves teacher confidence, develops new pedagogical content knowl-edge, and increases the scope of geography instruction and use of effective classroom materials. Pedagogical Content Knowledge and the Highly Qualified Teacher
Throughout the nineteenth and early twentieth century, teacher pre-paration and professional development programs in the United States emphasized knowledge of subject matter content. During the latter half of the twentieth century, many training programs instead embraced generic teaching methods appropriate for teachers of any subject. More recently, experts have argued that successful teachers must not only possess content knowledge and general pedagogical knowledge but also more specific teaching methods tied to individual academic disciplines (pedagogical content knowledge) that bridges the gap between content knowledge and instructional skills.6 Table 1 shows the pedagogical content knowledge needed for geography education. Table 1. Key components of pedagogical content knowledge in geog-raphy7 (Shulman 1986, 9).
1. Understanding the most powerful representations of key geographic concepts through analogies, metaphors, illustrations, demonstrations, and examples.
2. Understanding the relative difficulty students have with learning various concepts.
3. Understanding ways of organizing the discipline so it is comprehensible to others.
4. Understanding common student preconceptions about geography.
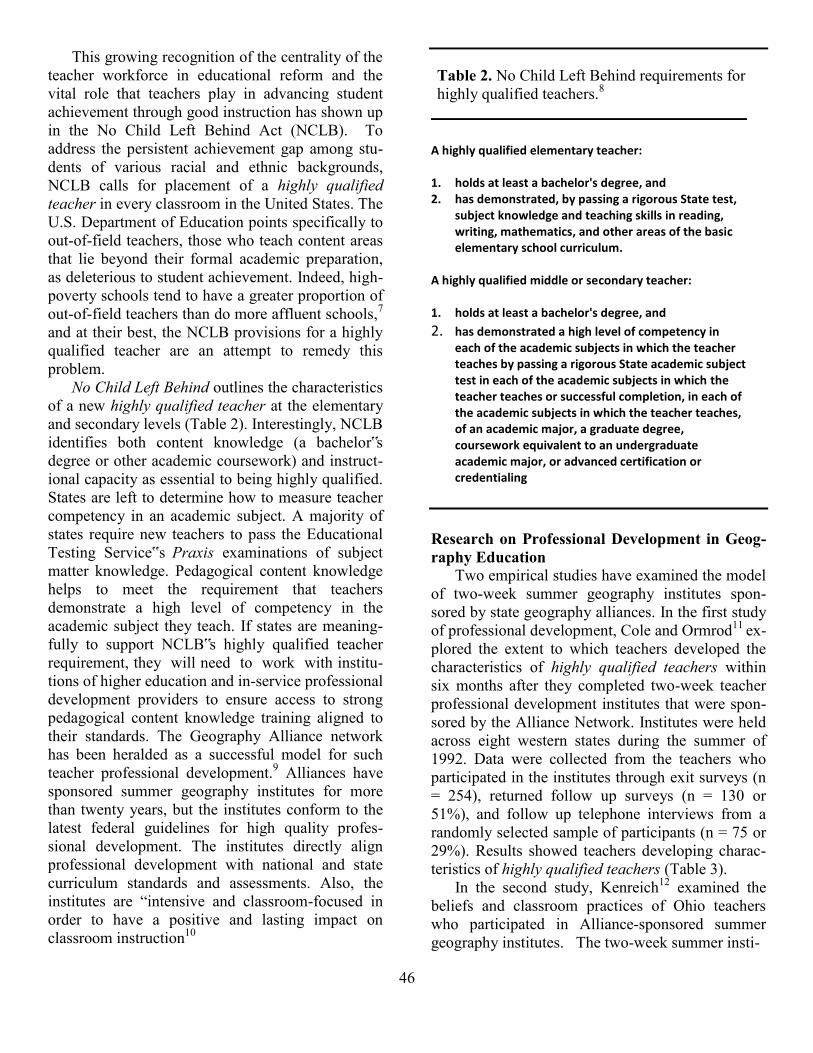
46
This growing recognition of the centrality of the teacher workforce in educational reform and the vital role that teachers play in advancing student achievement through good instruction has shown up in the No Child Left Behind Act (NCLB). To address the persistent achievement gap among stu-dents of various racial and ethnic backgrounds, NCLB calls for placement of a highly qualified teacher in every classroom in the United States. The U.S. Department of Education points specifically to out-of-field teachers, those who teach content areas that lie beyond their formal academic preparation, as deleterious to student achievement. Indeed, high-poverty schools tend to have a greater proportion of out-of-field teachers than do more affluent schools,7 and at their best, the NCLB provisions for a highly qualified teacher are an attempt to remedy this problem. No Child Left Behind outlines the characteristics of a new highly qualified teacher at the elementary and secondary levels (Table 2). Interestingly, NCLB identifies both content knowledge (a bachelor‟s degree or other academic coursework) and instruct-ional capacity as essential to being highly qualified. States are left to determine how to measure teacher competency in an academic subject. A majority of states require new teachers to pass the Educational Testing Service‟s Praxis examinations of subject matter knowledge. Pedagogical content knowledge helps to meet the requirement that teachers demonstrate a high level of competency in the academic subject they teach. If states are meaning-fully to support NCLB‟s highly qualified teacher requirement, they will need to work with institu- tions of higher education and in-service professional development providers to ensure access to strong pedagogical content knowledge training aligned to their standards. The Geography Alliance network has been heralded as a successful model for such teacher professional development.9 Alliances have sponsored summer geography institutes for more than twenty years, but the institutes conform to the latest federal guidelines for high quality profes-sional development. The institutes directly align professional development with national and state curriculum standards and assessments. Also, the institutes are “intensive and classroom-focused in order to have a positive and lasting impact on classroom instruction10
Table 2. No Child Left Behind requirements for highly qualified teachers.8
A highly qualified elementary teacher: 1. holds at least a bachelor's degree, and 2. has demonstrated, by passing a rigorous State test,
subject knowledge and teaching skills in reading, writing, mathematics, and other areas of the basic elementary school curriculum.
A highly qualified middle or secondary teacher: 1. holds at least a bachelor's degree, and
2. has demonstrated a high level of competency in each of the academic subjects in which the teacher teaches by passing a rigorous State academic subject test in each of the academic subjects in which the teacher teaches or successful completion, in each of the academic subjects in which the teacher teaches, of an academic major, a graduate degree, coursework equivalent to an undergraduate academic major, or advanced certification or credentialing
Research on Professional Development in Geog-raphy Education
Two empirical studies have examined the model of two-week summer geography institutes spon-sored by state geography alliances. In the first study of professional development, Cole and Ormrod11 ex-plored the extent to which teachers developed the characteristics of highly qualified teachers within six months after they completed two-week teacher professional development institutes that were spon-sored by the Alliance Network. Institutes were held across eight western states during the summer of 1992. Data were collected from the teachers who participated in the institutes through exit surveys (n = 254), returned follow up surveys (n = 130 or 51%), and follow up telephone interviews from a randomly selected sample of participants (n = 75 or 29%). Results showed teachers developing charac-teristics of highly qualified teachers (Table 3).
In the second study, Kenreich12 examined the beliefs and classroom practices of Ohio teachers who participated in Alliance-sponsored summer geography institutes. The two-week summer insti-
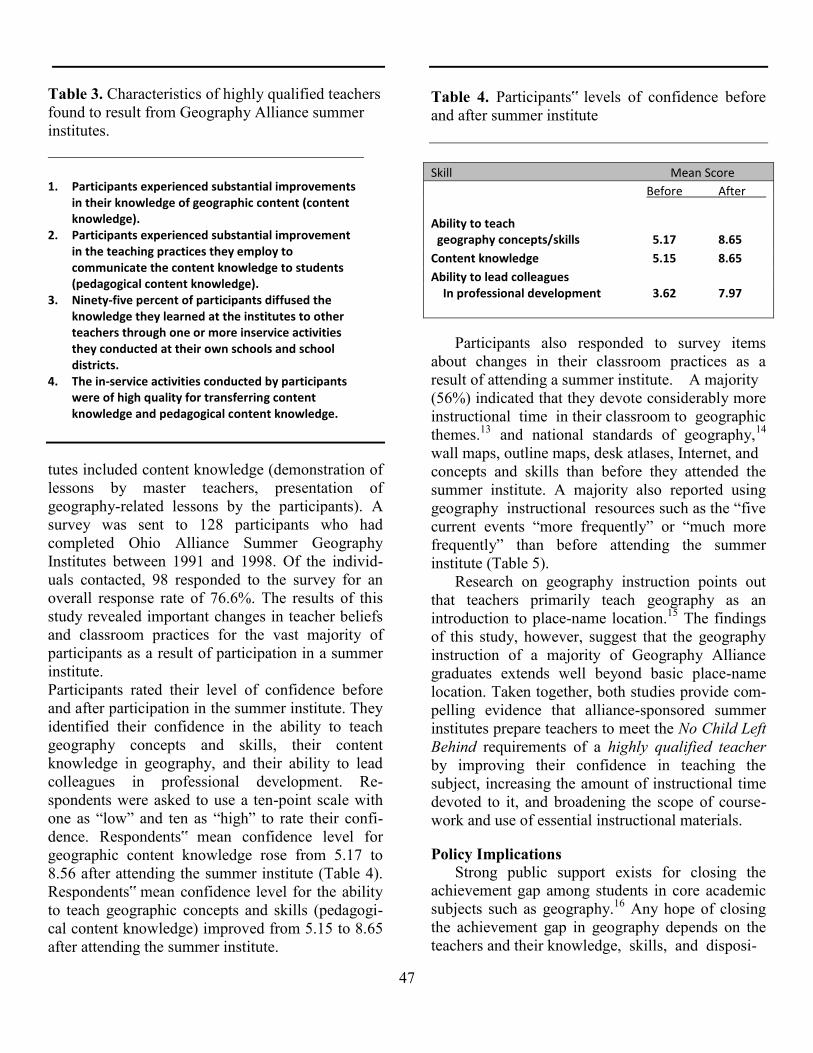
47
Table 3. Characteristics of highly qualified teachers found to result from Geography Alliance summer institutes.
1. Participants experienced substantial improvements
in their knowledge of geographic content (content knowledge).
2. Participants experienced substantial improvement in the teaching practices they employ to communicate the content knowledge to students (pedagogical content knowledge).
3. Ninety-five percent of participants diffused the knowledge they learned at the institutes to other teachers through one or more inservice activities they conducted at their own schools and school districts.
4. The in-service activities conducted by participants were of high quality for transferring content knowledge and pedagogical content knowledge.
tutes included content knowledge (demonstration of lessons by master teachers, presentation of geography-related lessons by the participants). A survey was sent to 128 participants who had completed Ohio Alliance Summer Geography Institutes between 1991 and 1998. Of the individ-uals contacted, 98 responded to the survey for an overall response rate of 76.6%. The results of this study revealed important changes in teacher beliefs and classroom practices for the vast majority of participants as a result of participation in a summer institute. Participants rated their level of confidence before and after participation in the summer institute. They identified their confidence in the ability to teach geography concepts and skills, their content knowledge in geography, and their ability to lead colleagues in professional development. Re-spondents were asked to use a ten-point scale with one as “low” and ten as “high” to rate their confi-dence. Respondents‟ mean confidence level for geographic content knowledge rose from 5.17 to 8.56 after attending the summer institute (Table 4). Respondents‟ mean confidence level for the ability to teach geographic concepts and skills (pedagogi-cal content knowledge) improved from 5.15 to 8.65 after attending the summer institute.
Table 4. Participants‟ levels of confidence before and after summer institute Skill Mean Score
Before After Ability to teach geography concepts/skills 5.17 8.65
Content knowledge 5.15 8.65
Ability to lead colleagues In professional development 3.62 7.97
Participants also responded to survey items
about changes in their classroom practices as a result of attending a summer institute. A majority (56%) indicated that they devote considerably more instructional time in their classroom to geographic themes.13 and national standards of geography,14 wall maps, outline maps, desk atlases, Internet, and concepts and skills than before they attended the summer institute. A majority also reported using geography instructional resources such as the “five current events “more frequently” or “much more frequently” than before attending the summer institute (Table 5).
Research on geography instruction points out that teachers primarily teach geography as an introduction to place-name location.15 The findings of this study, however, suggest that the geography instruction of a majority of Geography Alliance graduates extends well beyond basic place-name location. Taken together, both studies provide com-pelling evidence that alliance-sponsored summer institutes prepare teachers to meet the No Child Left Behind requirements of a highly qualified teacher by improving their confidence in teaching the subject, increasing the amount of instructional time devoted to it, and broadening the scope of course-work and use of essential instructional materials. Policy Implications
Strong public support exists for closing the achievement gap among students in core academic subjects such as geography.16 Any hope of closing the achievement gap in geography depends on the teachers and their knowledge, skills, and disposi-
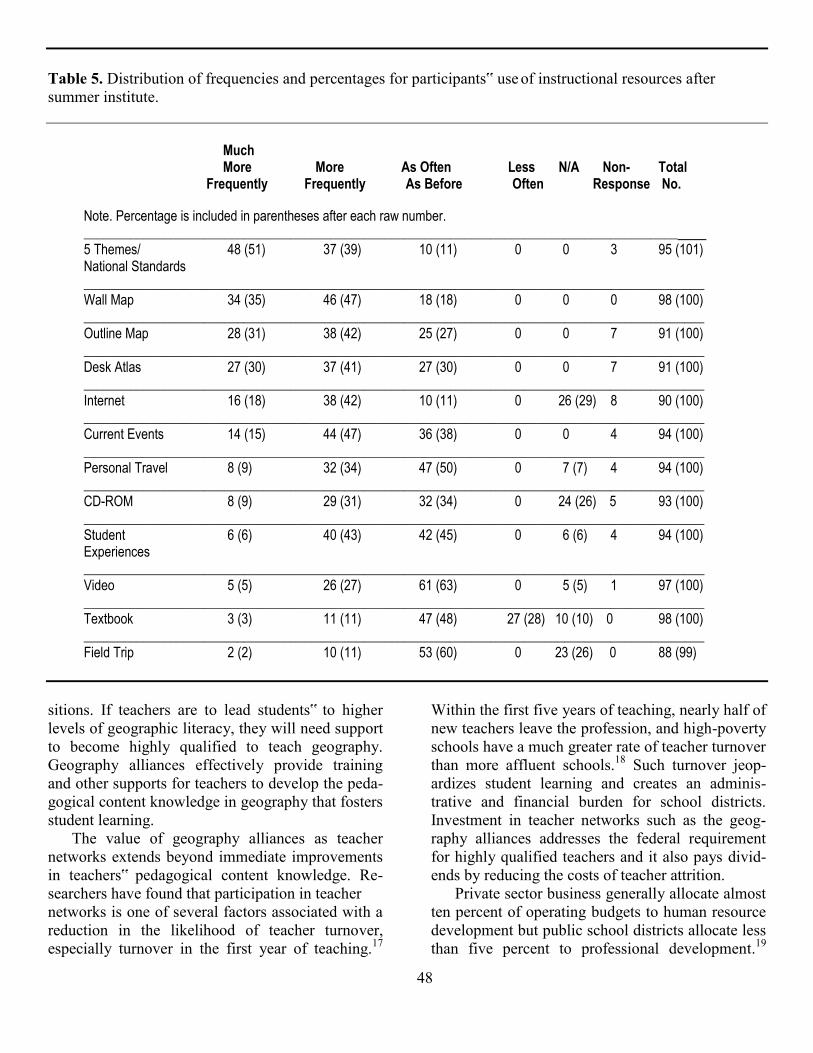
48
Table 5. Distribution of frequencies and percentages for participants‟ use of instructional resources after summer institute.
Much More More As Often Less N/A Non- Total Frequently Frequently As Before Often Response No. Note. Percentage is included in parentheses after each raw number. _________________________________________________________________________________________ 5 Themes/ 48 (51) 37 (39) 10 (11) 0 0 3 95 (101) National Standards _____________________________________________________________________________________________ Wall Map 34 (35) 46 (47) 18 (18) 0 0 0 98 (100) _____________________________________________________________________________________________ Outline Map 28 (31) 38 (42) 25 (27) 0 0 7 91 (100) _____________________________________________________________________________________________ Desk Atlas 27 (30) 37 (41) 27 (30) 0 0 7 91 (100) _____________________________________________________________________________________________ Internet 16 (18) 38 (42) 10 (11) 0 26 (29) 8 90 (100) _____________________________________________________________________________________________ Current Events 14 (15) 44 (47) 36 (38) 0 0 4 94 (100) _____________________________________________________________________________________________ Personal Travel 8 (9) 32 (34) 47 (50) 0 7 (7) 4 94 (100) _____________________________________________________________________________________________ CD-ROM 8 (9) 29 (31) 32 (34) 0 24 (26) 5 93 (100) _____________________________________________________________________________________________ Student 6 (6) 40 (43) 42 (45) 0 6 (6) 4 94 (100) Experiences _____________________________________________________________________________________________ Video 5 (5) 26 (27) 61 (63) 0 5 (5) 1 97 (100) _____________________________________________________________________________________________ Textbook 3 (3) 11 (11) 47 (48) 27 (28) 10 (10) 0 98 (100) _____________________________________________________________________________________________ Field Trip 2 (2) 10 (11) 53 (60) 0 23 (26) 0 88 (99)
sitions. If teachers are to lead students‟ to higher levels of geographic literacy, they will need support to become highly qualified to teach geography. Geography alliances effectively provide training and other supports for teachers to develop the peda-gogical content knowledge in geography that fosters student learning.
The value of geography alliances as teacher networks extends beyond immediate improvements in teachers‟ pedagogical content knowledge. Re-searchers have found that participation in teacher networks is one of several factors associated with a reduction in the likelihood of teacher turnover, especially turnover in the first year of teaching.17
Within the first five years of teaching, nearly half of new teachers leave the profession, and high-poverty schools have a much greater rate of teacher turnover than more affluent schools.18 Such turnover jeop-ardizes student learning and creates an adminis-trative and financial burden for school districts. Investment in teacher networks such as the geog-raphy alliances addresses the federal requirement for highly qualified teachers and it also pays divid-ends by reducing the costs of teacher attrition. Private sector business generally allocate almost ten percent of operating budgets to human resource development but public school districts allocate less than five percent to professional development.19
49
Effective professional development for teachers requires additional time20 and funding. 21 In an era of fiscal belt-tightening, policy-makers and public officials must carefully weigh spending priority op-tions as they seek to support and enforce improved teacher quality. Geography Alliances merit the attention and support of public officials at local, state, and national levels when setting those priorities. Geography Alliances are a vibrant teacher network that sustains professional development over time, and Alliances have an established record of delivering professional development that im-proves teachers‟ pedagogical content knowledge and promotes students‟ geographic literacy. Notes 1This essay emerges from a longer previously published article, Kenreich .T.W. 2004. Beliefs, Classroom Practices, and Professional Development Activities of Teacher Con-sultants. Journal of Geography 103(4):153-60.
2Corcoran, T.C. 1995. Transforming professional development for teachers: A guide for state policy-makers. Washington, DC: National Governors‟ Association; Darling-Hammond, L. and M.W. McLaughlin. 1995. Policies that support professional development in an era of reform. Phi Delta Kappan 76(8):597-604; Fullan. M. 1991. The new meaning of educational change. New York: Teachers College Press; The Holmes Group. 1990. Principles for the design of professional development schools East Lansing, MI; Little, J.W. 1993. Professional development in a climate of educational reform. Educational Evaluation and Policy Analysis 15(2):129-51; National Commission on Teaching and America‟s Future. 1996. What matters most: Teachers for America’s future. Available at http://www.teaching-point.net/Exhibit%20A/What%20Matters%20Most%20Exec %20Summary.pdf (last accessed April 27, 2011); Smith, M.S. and J. O‟Day. 1991. Systemic school reform. In S. Fuhrman and B. Malen, eds. The Politics of Curriculum and Testing. pp. 233-68. Bristol, PA: Falmer Press.
3Comer, J.P. 1996. Rallying the whole village: The Comer process for reforming education. New York: Teacher College Press; Slavin, R.E., N.A. Madden, L.J. Dolan, and B.A. Wasik. 1996. Every child, every school: Success for all. Newbury Park, CA: Corwin.
4Knapp. M.S. 2004. Professional development as a policy pathway. In Review of Research in Education 27, ed. R. E. Floden, pp. 109-57. Washington, DC: American Educational Research Association.
5Lieberman, A. and M. Grolnick. 1996. Networks and reform in American education. Teachers College Record 98(1):7-45.
6Shulman, L,S. 1986. Those who understand: Knowledge growth in teaching. Educational Researcher 15:4-14.
7Ingersoll, R. 2002. Out-of-field teaching, educational inequality, and the organization of schools: An exploratory analysis. Seattle: Center for the Study of Teaching and Policy.
8United States Department of Education. 2004. Improving teacher quality state grants Title 2, Part A. Washington, DC. Available at http://www.ed. gov/programs/teacherqual/ guidance.doc (last accessed April 27, 2011).
9Binko, J.B., G.A. Neubert, and M. Madden. 1997. Writing and geography provide lessons for other disciplines. Journal of Staff Development 18(4):11-15; Rutherford, D.J. 2005. What works in geography education Washington, DC: National Geographic Education Foundation. Thiesen, R. 2000. National council for the social studies notebook: 43rd annual meeting of the house of delegates. Social Education 64(4):241-54.
10 U.S. Congress, 2001. Section 9101[34] No Child Left Behind Act of 2001. (Washington, DC: Government Printing Office.. Available at http://www.ed.gov/policy/elsec/leg/ esea02/index.html (last accessed April 27, 2011).
11Cole, D.B., and J.E. Ormrod. 19 95.Effectiveness of teaching pedagogical content knowledge through summer geography institutes. Journal of Geography 47(1):427-33.
12Kenreich, T.W. 2004. Beliefs, classroom practices, and professional development activities of teacher consultants. Journal of Geography 103(4):153-60.
13Joint Commission on Geography Education. 1984. Guide-lines for Geography Education. (Washington DC and Indiana PA: The Association of American Geographers and the National Council for Geographic Education.
14Geography Education Standards Project. 1994. Geography for life: National geography standards. Washington, DC: National Geographic Research and Exploration.
15J. Cirrincione, J., and R. T. Farrell. 1998. The status of geography in middle/junior and senior high schools. In Strengthening Geography in the Social Studies, ed. S. J. Natoli, pp. 11-21. Washington, DC: National Council for the Social Studies; Thornton, S.J., and R.N. Wenger. 1990. Geography curriculum and instruction in three fourth-grade classrooms. Elementary School Journal 90:515-31.
16Rose, L.C., and A.M. Gallup. 2005. The 37th annual Phi Delta Kappa/Gallup poll of the public‟s attitudes toward the public schools. Phi Delta Kappan 87(1):41-57. Available at http://www.uscharterschools.org/cs/r/view/uscs_rs/2059 (last accessed April 27, 2011).
17Smith, T.M., and R.M. Ingersoll. 2004. What are the effects of induction and mentoring on beginning teacher turnover? American Educational Research Journal 41(3):681-714.
50
18Ingersoll, R. 2001. Teacher turnover and teacher shortages: An organizational analysis. American Educational Research Journal 38(3):499-534.
19United States Department of Education. 1996. Building knowledge for a nation of learners. U.S. Department of Education: Washington, DC.
20National Commission on Time and Learning. 1994. Prisoners of time. National Commission on Time and Learning: Washington, DC:
21National Commission on Time and Learning. 2003. No dream denied: A pledge to America’s children. New York: Available at http://www.nctaf.org/documents/no-dream-denied_summary_report.pdf (last accessed April 7 2011); United States Department of Education 1996. Building knowledge for a nation of learners. United States Department of Education: Washington, DC.
51
Elizabeth Hinde is an Associate Professor and Director of Teacher Preparation at Arizona State University's Mary Lou Fulton Teachers College. Prior to\entering higher education, she taught elementary school for 20 years in Mesa, AZ. Sharon E. Osborn Popp is an Assistant Professor of Assess-ment and Evaluation in the Col-lege of Teacher Education and Leadership at Arizona State University. Her research focus is applied psychometrics. Gale Olp Ekiss has been the Co-Coordinator of the Arizona Geographic Alliance since July 2001. Gale retired from Mesa Public Schools after 28 years of teaching junior high social studies. Since her retirement, Gale has been the manager for GeoLiteracy and GeoMath pro-jects and other Alliance pro-grams and activities. Ronald I. Dorn is a Professor of Geography at Arizona State University. He has A.B. and M.A. degrees in Geography from U.C. Berkeley and a Ph.D. in Geography from UCLA. A co-coordinator of the Arizona Geographic Alliance, his main research focus rests in the geography of rock decay as a way of understanding and conserving rock art.
Literacy Learning and Geography Education
Elizabeth Hinde, Sharon E. Osborn Popp, Gale Olp Ekiss, and Ronald I. Dorn
Elementary teachers often decry the lack of time they are afforded for teaching anything other than tested subjects. Regarding geography, they cite mandates of the No Child Left Behind act (NCLB) that do not include geography education, along with testing pressures applied by administrators.1 In addition to these demands on classroom time, Marzano calculates an average of 200 standards and 3093 benchmarks across 14 different content areas that teachers are expected to teach in an average school year.2 He further estimates that teachers would need approximately 15,465 hours to adequately address the content articu-lated in those standards, but that teachers possess no more than 9,042 hours of actual instructional time in a typical school year. Obviously, it is not viable for teachers to address all mandated standards in the course of one school year.
Geography instruction at the elementary level is one area of the curriculum being curtailed, and, Jeannine Kuropatkin, a seventh grade teacher from Mesa, Arizona wanted something done about it. She told the coordinators of the Arizona Geographic Alliance (AzGA) of her fear that the push for language arts and mathematics standards and test-based reform was eliminating the teaching of geography in the elemen-tary grades. This junior high school teacher worried that she would need to teach elementary concepts that her students had not learned in the earlier grades, as well as the higher level concepts that middle school social studies standards mandate. Her fears were real. Anecdotal reports as well as research literature conclude that social studies in the elemen-tary schools is in trouble and that there are significant decreases in instructional time given to social studies, civics, and geography in K-5 classrooms across the country.3
In 2000, the AzGA began development of a curriculum based on the Arizona content standards that would integrate the subject areas of read-ing, writing, and geography in K-8 classrooms. They called the curriculum GeoLiteracy. With financial support from the National Geo-graphic Society Education Foundation (NGEF), matched by support from Arizona State University and funds from the Arizona Department of Education, the AzGA assembled a group of teachers from around the state to design the lesson plans. The result was a CD and a website that contains eighty-five integrated lesson plans, assessments, and supple-mental materials for K-8 teachers.
Designing, creating, and implementing eighty-five lesson plans involved twenty-six teacher-writers, two Alliance coordinators (one in charge of project management and the other in charge of technology), an editor, an assessment specialist, a website designer, an administrative assistant, a student assistant, and over one hundred teachers who volun-teered to pilot the lessons before the final edit.
52
The Arizona GeoLiteracy Project’s Evolution One emphasis of the GeoLiteracy Project is that
classroom teachers actually wrote the lessons. They were teacher consultants (TC) with AzGA and National Board Certified Teachers from Arizona. Lesson writers were arranged into teams according to grade level: K-3, 4-5, 6-8. Each team was assigned a team leader who ensured that the state language arts and geography standards were being addressed and who was also responsible for moti-vating the teachers to complete their lessons in a timely manner. All the teachers were trained by an assessment specialist on how to create tests that mirror standardized assessments and measure the state standards each lesson addresses. Team mem-bers were also trained to input the lessons onto a specially created interactive Web site which enabled teachers to work from their home or classroom. Each section of the lesson plans was posted to the website so that the project manager, the team leaders, and the editor could access them to make any necessary changes.
The next step involved editorial review and content review. Team leaders and Alliance coordi-nators reviewed lessons and consulted with various experts to ensure content accuracy (e.g., a professor of religious studies advised the writers on lessons involving religion; geography and history experts checked facts on many lessons).
When the first lesson drafts were completed in spring of 2001, Kindergarten through eighth grade teachers from twenty different school districts in Arizona piloted their use. As a result, some lessons were scrapped, but most were revised to provide clearer directions and supplemental materials to make them more student-friendly (i.e., animations, maps, or graphic organizers).
Finally, the lessons, worksheets, assessments and supplemental materials (including copyright free maps, pictures, student samples, and video clips) were published in CD format. Within two years of completion, the AzGA conducted ten teacher workshops for interested teachers and school districts in underserved areas. As of 2005, over 40 workshops/conferences had been presented in Arizona, Michigan, Maryland, Illinois, North Carolina, Pennsylvania, Utah, Oklahoma, North Dakota, and Kansas—not including presentations for pre-service teachers in their college classes. Overall, 2,171 Arizona teachers had been impacted
by GeoLiteracy workshops. Assuming a conserve-ative ratio of 25 students per elementary teacher and 125 students per middle school teacher, some 128,000 Arizona students were impacted by Geo-Literacy lessons.
Since development of the original program, two major innovations have taken place, both supported by the Model Grant Program of the National Geo-graphic Society Education Foundation. First, each lesson was revised to help meet the needs of English Language Learners (ELLs). Methods and materials known to be beneficial for English learners are now included in each lesson. Second, a completely online virtual workshop demonstrating how to teach and adapt lessons for ELLs was devel-oped. Furthermore, a subsequent national study revealed that the GeoLiteracy program adapted for ELLs significantly improves their reading achieve-ment in grades 3-5 and 7-8. This study mirrors find-ings of a national study that was conducted on the original GeoLiteracy program, described below. GeoLiteracy Lessons4
Table 1 provides a sampling of lessons from each grade level, and Figure 1 overviews a sample GeoLiteracy lesson plan. In the sample lesson, students are introduced to the human features of various cultures through the use of an engaging book describing famous walls around the world. Specific literacy instruction is also included. Al-though the lesson meets standards for primary age students, teachers of upper elementary grades have found this to be a valuable lesson for their students as well. GeoLiteracy Research5
In 2004 Arizona State University (ASU) received a grant from the NGEF to conduct an eval-uation of the effectiveness of GeoLiteracy instruct-tion on the reading achievement of elementary and middle school students. In collaboration with AzGA and the Michigan Geographic Alliance, the ASU College of Teacher Education and Leadership (now named the Mary Lou Fulton Teachers College) conducted this evaluation across multiple school settings in Arizona and Michigan.
The evaluation employed a comparison group/ intervention group research design to test and com-pare student achievement in reading comprehension reliability. The tests assess reading comprehension
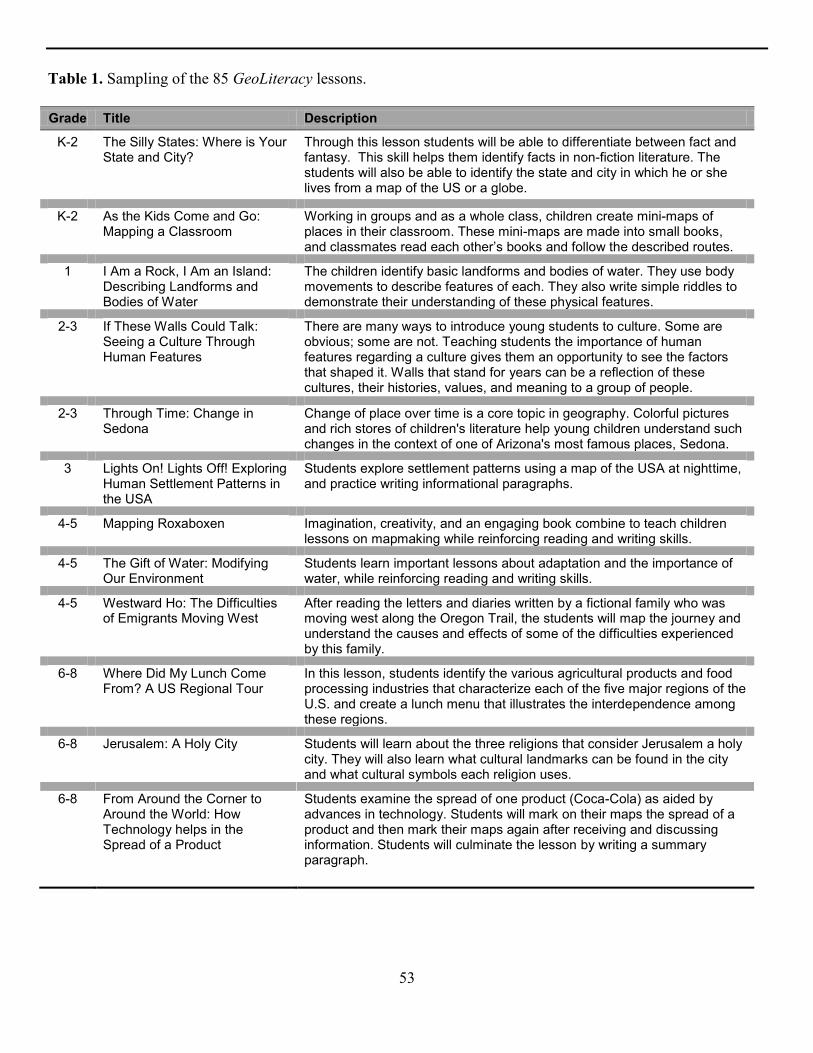
53
Table 1. Sampling of the 85 GeoLiteracy lessons.
Grade Title Description
K-2 The Silly States: Where is Your State and City?
Through this lesson students will be able to differentiate between fact and fantasy. This skill helps them identify facts in non-fiction literature. The students will also be able to identify the state and city in which he or she lives from a map of the US or a globe.
K-2 As the Kids Come and Go: Mapping a Classroom
Working in groups and as a whole class, children create mini-maps of places in their classroom. These mini-maps are made into small books, and classmates read each other’s books and follow the described routes.
1 I Am a Rock, I Am an Island: Describing Landforms and Bodies of Water
The children identify basic landforms and bodies of water. They use body movements to describe features of each. They also write simple riddles to demonstrate their understanding of these physical features.
2-3 If These Walls Could Talk: Seeing a Culture Through Human Features
There are many ways to introduce young students to culture. Some are obvious; some are not. Teaching students the importance of human features regarding a culture gives them an opportunity to see the factors that shaped it. Walls that stand for years can be a reflection of these cultures, their histories, values, and meaning to a group of people.
2-3 Through Time: Change in Sedona
Change of place over time is a core topic in geography. Colorful pictures and rich stores of children's literature help young children understand such changes in the context of one of Arizona's most famous places, Sedona.
3 Lights On! Lights Off! Exploring Human Settlement Patterns in the USA
Students explore settlement patterns using a map of the USA at nighttime, and practice writing informational paragraphs.
4-5 Mapping Roxaboxen Imagination, creativity, and an engaging book combine to teach children lessons on mapmaking while reinforcing reading and writing skills.
4-5 The Gift of Water: Modifying Our Environment
Students learn important lessons about adaptation and the importance of water, while reinforcing reading and writing skills.
4-5 Westward Ho: The Difficulties of Emigrants Moving West
After reading the letters and diaries written by a fictional family who was moving west along the Oregon Trail, the students will map the journey and understand the causes and effects of some of the difficulties experienced by this family.
6-8 Where Did My Lunch Come From? A US Regional Tour
In this lesson, students identify the various agricultural products and food processing industries that characterize each of the five major regions of the U.S. and create a lunch menu that illustrates the interdependence among these regions.
6-8 Jerusalem: A Holy City Students will learn about the three religions that consider Jerusalem a holy city. They will also learn what cultural landmarks can be found in the city and what cultural symbols each religion uses.
6-8 From Around the Corner to Around the World: How Technology helps in the Spread of a Product
Students examine the spread of one product (Coca-Cola) as aided by advances in technology. Students will mark on their maps the spread of a product and then mark their maps again after receiving and discussing information. Students will culminate the lesson by writing a summary paragraph.
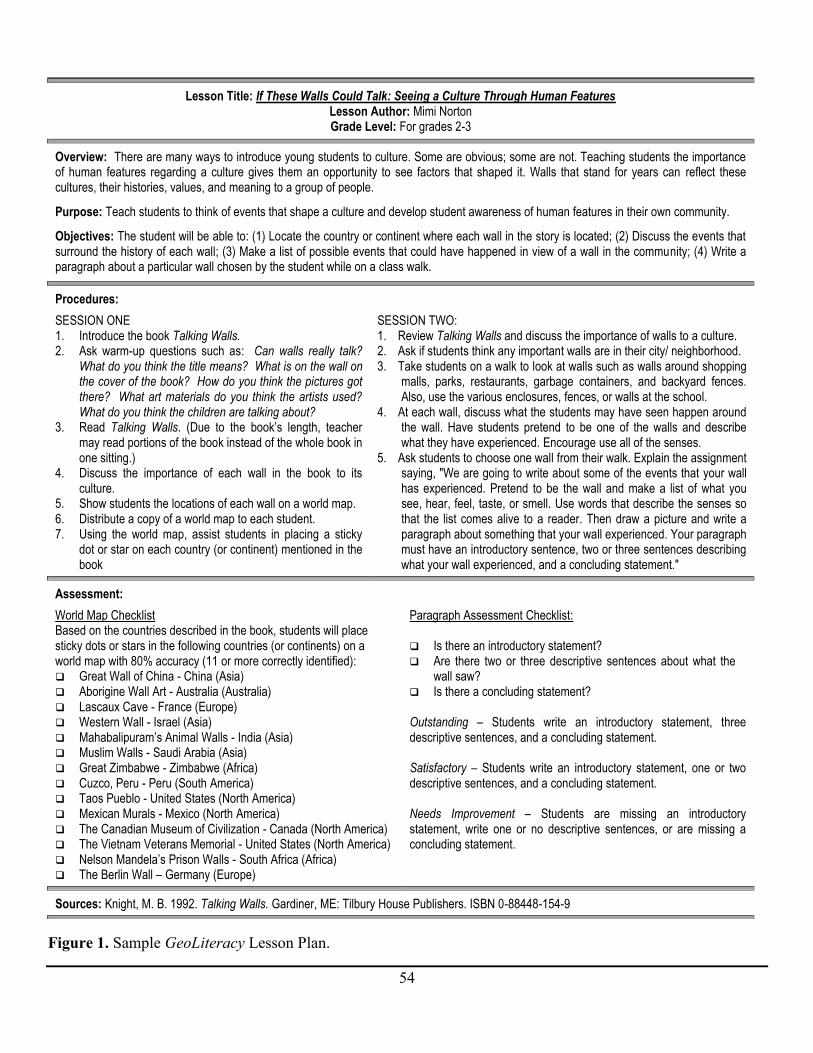
54
Figure 1. Sample GeoLiteracy Lesson Plan.
Lesson Title: If These Walls Could Talk: Seeing a Culture Through Human Features Lesson Author: Mimi Norton Grade Level: For grades 2-3
Overview: There are many ways to introduce young students to culture. Some are obvious; some are not. Teaching students the importance of human features regarding a culture gives them an opportunity to see factors that shaped it. Walls that stand for years can reflect these cultures, their histories, values, and meaning to a group of people.
Purpose: Teach students to think of events that shape a culture and develop student awareness of human features in their own community.
Objectives: The student will be able to: (1) Locate the country or continent where each wall in the story is located; (2) Discuss the events that surround the history of each wall; (3) Make a list of possible events that could have happened in view of a wall in the community; (4) Write a paragraph about a particular wall chosen by the student while on a class walk.
Procedures:
SESSION ONE 1. Introduce the book Talking Walls. 2. Ask warm-up questions such as: Can walls really talk?
What do you think the title means? What is on the wall on the cover of the book? How do you think the pictures got there? What art materials do you think the artists used? What do you think the children are talking about?
3. Read Talking Walls. (Due to the book’s length, teacher may read portions of the book instead of the whole book in one sitting.)
4. Discuss the importance of each wall in the book to its culture.
5. Show students the locations of each wall on a world map. 6. Distribute a copy of a world map to each student. 7. Using the world map, assist students in placing a sticky
dot or star on each country (or continent) mentioned in the book
SESSION TWO: 1. Review Talking Walls and discuss the importance of walls to a culture. 2. Ask if students think any important walls are in their city/ neighborhood. 3. Take students on a walk to look at walls such as walls around shopping
malls, parks, restaurants, garbage containers, and backyard fences. Also, use the various enclosures, fences, or walls at the school.
4. At each wall, discuss what the students may have seen happen around the wall. Have students pretend to be one of the walls and describe what they have experienced. Encourage use all of the senses.
5. Ask students to choose one wall from their walk. Explain the assignment saying, "We are going to write about some of the events that your wall has experienced. Pretend to be the wall and make a list of what you see, hear, feel, taste, or smell. Use words that describe the senses so that the list comes alive to a reader. Then draw a picture and write a paragraph about something that your wall experienced. Your paragraph must have an introductory sentence, two or three sentences describing what your wall experienced, and a concluding statement."
Assessment:
World Map Checklist Based on the countries described in the book, students will place sticky dots or stars in the following countries (or continents) on a world map with 80% accuracy (11 or more correctly identified): Great Wall of China - China (Asia) Aborigine Wall Art - Australia (Australia) Lascaux Cave - France (Europe) Western Wall - Israel (Asia) Mahabalipuram’s Animal Walls - India (Asia) Muslim Walls - Saudi Arabia (Asia) Great Zimbabwe - Zimbabwe (Africa) Cuzco, Peru - Peru (South America) Taos Pueblo - United States (North America) Mexican Murals - Mexico (North America) The Canadian Museum of Civilization - Canada (North America) The Vietnam Veterans Memorial - United States (North America) Nelson Mandela’s Prison Walls - South Africa (Africa) The Berlin Wall – Germany (Europe)
Paragraph Assessment Checklist: Is there an introductory statement? Are there two or three descriptive sentences about what the
wall saw? Is there a concluding statement? Outstanding – Students write an introductory statement, three descriptive sentences, and a concluding statement. Satisfactory – Students write an introductory statement, one or two descriptive sentences, and a concluding statement. Needs Improvement – Students are missing an introductory statement, write one or no descriptive sentences, or are missing a concluding statement.
Sources: Knight, M. B. 1992. Talking Walls. Gardiner, ME: Tilbury House Publishers. ISBN 0-88448-154-9
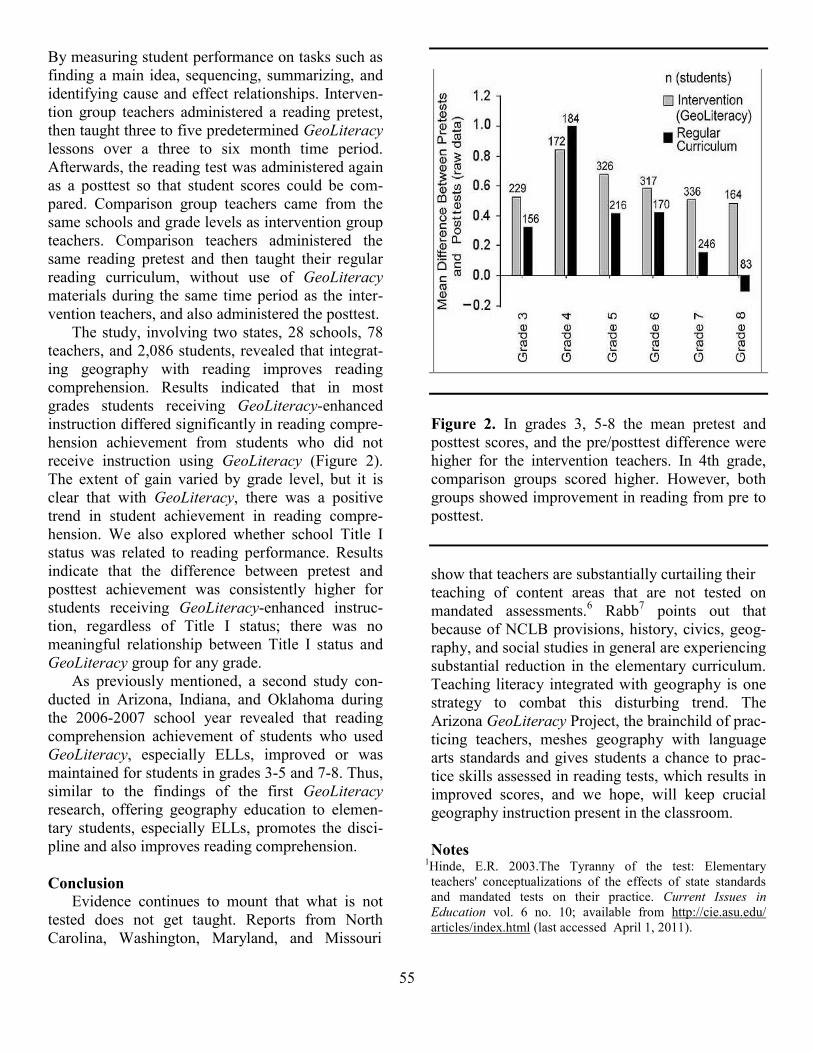
55
By measuring student performance on tasks such as finding a main idea, sequencing, summarizing, and identifying cause and effect relationships. Interven-tion group teachers administered a reading pretest, then taught three to five predetermined GeoLiteracy lessons over a three to six month time period. Afterwards, the reading test was administered again as a posttest so that student scores could be com-pared. Comparison group teachers came from the same schools and grade levels as intervention group teachers. Comparison teachers administered the same reading pretest and then taught their regular reading curriculum, without use of GeoLiteracy materials during the same time period as the inter-vention teachers, and also administered the posttest.
The study, involving two states, 28 schools, 78 teachers, and 2,086 students, revealed that integrat-ing geography with reading improves reading comprehension. Results indicated that in most grades students receiving GeoLiteracy-enhanced instruction differed significantly in reading compre-hension achievement from students who did not receive instruction using GeoLiteracy (Figure 2). The extent of gain varied by grade level, but it is clear that with GeoLiteracy, there was a positive trend in student achievement in reading compre-hension. We also explored whether school Title I status was related to reading performance. Results indicate that the difference between pretest and posttest achievement was consistently higher for students receiving GeoLiteracy-enhanced instruc-tion, regardless of Title I status; there was no meaningful relationship between Title I status and GeoLiteracy group for any grade.
As previously mentioned, a second study con-ducted in Arizona, Indiana, and Oklahoma during the 2006-2007 school year revealed that reading comprehension achievement of students who used GeoLiteracy, especially ELLs, improved or was maintained for students in grades 3-5 and 7-8. Thus, similar to the findings of the first GeoLiteracy research, offering geography education to elemen-tary students, especially ELLs, promotes the disci-pline and also improves reading comprehension. Conclusion
Evidence continues to mount that what is not tested does not get taught. Reports from North Carolina, Washington, Maryland, and Missouri
Figure 2. In grades 3, 5-8 the mean pretest and posttest scores, and the pre/posttest difference were higher for the intervention teachers. In 4th grade, comparison groups scored higher. However, both groups showed improvement in reading from pre to posttest. show that teachers are substantially curtailing their teaching of content areas that are not tested on mandated assessments.6 Rabb7 points out that because of NCLB provisions, history, civics, geog-raphy, and social studies in general are experiencing substantial reduction in the elementary curriculum. Teaching literacy integrated with geography is one strategy to combat this disturbing trend. The Arizona GeoLiteracy Project, the brainchild of prac-ticing teachers, meshes geography with language arts standards and gives students a chance to prac-tice skills assessed in reading tests, which results in improved scores, and we hope, will keep crucial geography instruction present in the classroom. Notes
1Hinde, E.R. 2003.The Tyranny of the test: Elementary teachers' conceptualizations of the effects of state standards and mandated tests on their practice. Current Issues in Education vol. 6 no. 10; available from http://cie.asu.edu/ articles/index.html (last accessed April 1, 2011).
56
2Marzano, R.J. 2003. What works in schools: Translating research into action. Alexandria, Virginia: Association for Supervision and Curriculum Development.
3von Zastrow, C. and H. Janc, 2004. Academic atrophy: The condition of the liberal arts in America’s public schools. Washington, DC: Council for Basic Education.
4For more detailed information about GeoLiteracy, Geoliteracy for English Language Learners, or the Virtual Trainings for ELL Adaptations to GeoLiteracy contact the Arizona Geo-graphic Alliance at [email protected] or 480-965-5361, or explore the project home pages at http://alliance.la.asu.edu/ geoliteracy/general.html (last accessed April 28, 2011).
5For more information see Hinde, E.R., S.E. Osborn Popp,R.I. Dorn, G.O. Ekiss, M. Mater, C.B.Smith, and M. Libbee. 2007. “The integration of literacy and geography: The Arizona GeoLiteracy program's effect on reading comprehension.” Theory and Research in Social Education 35:343-65. Addi-
tional research can be found in Hinde, E. R., S. E. Popp, M.
Jimenez-Silva. and R.I. Dorn. 2011. Linking Geography to Reading and English Language Learners‟ Achievement in U.S. Elementary and Middle School Classrooms. Inter-national Research in Geographical & Environmental Educa-tion: 20(1):49-63.
6In North Carolina see Jones, M.G., B.D. Jones, B. Hardin, L. Chapman, T. Yarbrough, and M. Davis. 1999. The impact of high-stakes testing on teachers and students in North Carolina, Phi Delta Kappan 81 no. 3: 199-203. In Washington see Bach, D. 2004. Standards-based focus to schooling gets a failing grade, Seattle Post-Intelligencer, March 4. In Maryland see Perlstein, L. 2004. School pushes reading, writing, reform: Sciences shelved in effort to boost students to „no child‟ standards, Washington Post, May 31. In Missouri see Smith, D.A. 2005. Social studies get short shrift, Kansas City Star, January 21.
7Theodore K. Rabb, “NCLB: Leaving history behind?” History Matters 16 no. 8 (2004):1.
57
Gale Olp Ekiss has been the Co-Coordinator of the Arizona Geographic Alliance since July 2001, and she manages Geo-Literacy (with ELL adaptations) and GeoMath projects. Her current project unites the con-tent and skills of history and geography into GeoHistory. Ronald I. Dorn is a Professor of Geographical Sciences and Ur-ban Planning at Arizona State University. He has A.B. and M.A. degrees in Geography from U.C. Berkeley and a Ph.D. in Geography from UCLA. He is co-coordinator of the Ari-zona Geographic Alliance. Elizabeth Hinde is Associate Professor and Director of Teacher Preparation at Arizona State University's Mary Lou Fulton Teachers College. Prior to entering higher education, she taught elementary school for 20 years in Mesa, AZ. John Douglass is an Instructor at Paradise Valley Community College, He has a Ph.D. in Geography from Arizona State University and has worked with K-12 teachers in science educa-tion since 2000. Barbara Trapido-Lurie is a Re-search Professional in the School of Geographical Sci-ences and Urban Planning at Arizona State University, where she works in cartography teach-ing and applications. She has participated in map develop-ment for the Arizona Geo-graphic Alliance since its incep-tion in 1992. She has an M.A. in Geography from the Univer-sity of Hawaii.
Mathematics Learning and Geography Education Gale Olp Ekiss, Ronald I. Dorn, Elizabeth R. Hinde,
John Douglass, and Barbara Trapido-Lurie
In 2002, Arizona teachers saw geography being increasingly mar-
ginalized as reading, writing and math requirements grew. For example, 22.5 % of Arizona 8th graders were required to score at the proficient level or higher on state mathematics tests in 2004-05, up from 7 % in the 2003-04 academic year.1 Facing the loss of geography teaching time due to the pressures of a testing system that emphasized mathematics, reading and writing,2 teachers of the Arizona Geographic Alliance (AzGA) agreed at their 2002 Annual Conference of Teacher Consult-ants on the need to develop a GeoMath curriculum package linking the teaching and learning of geography and mathematics in grades K-8.3
The GeoMath program was built on the finding that geography inherently integrates mathematics with many areas of its study,4 not just the mapping sciences5 This is borne out by analysis of the voluntary national standards for geography.6 All essential elements of these standards explore number sense, as do many leading geography lesson packages such as Mission Geography,7 Activities and Readings in the Geography of the United States (ARGUS), and Activities and Readings of the Geography of the World (ARGWorld). Similarly, mathematics innovators consistently seek authentic examples to enrich conceptual understanding.8
A natural question is why a full curriculum package had not been developed to exploit a mathematics-geography linkage. The answer likely includes a number of obstacles such as: (1) convincing elemen-tary educators that key mathematics skills can be learned using elements other than the mathematics textbook; (2) convincing administrators that mathematics scores can be improved by using cross-curricular materials in addition to core mathematics instruction; (3) pressures on teachers to teach only those mathematical concepts and skills directly tested on mandated assessments; and (4) the open secret that those attracted to elementary school teaching are the most likely to be poorly trained in mathematics, often translating into a phobia of mathematics for their students.9
GeoMath Materials
The GeoMath project produced a CD-based lesson package of more than eighty lessons with student assessments with math items that mir-ror the style of the required high stakes test.10 All of the twenty-eight lesson authors (a mix of AzGA teacher consultants, National Board Certified Teachers, and members of the National Council of Teachers of Mathematics) integrated geography lessons with tested mathematics skills based on state standards, many of which reflect the six essential elements of the National Geography Standards. Table 1 provides a sampling of the teacher-produced lessons.
Users access the GeoMath program through any Internet browser and a PDF reader such as Adobe Acrobat. Figure 1 illustrates the first
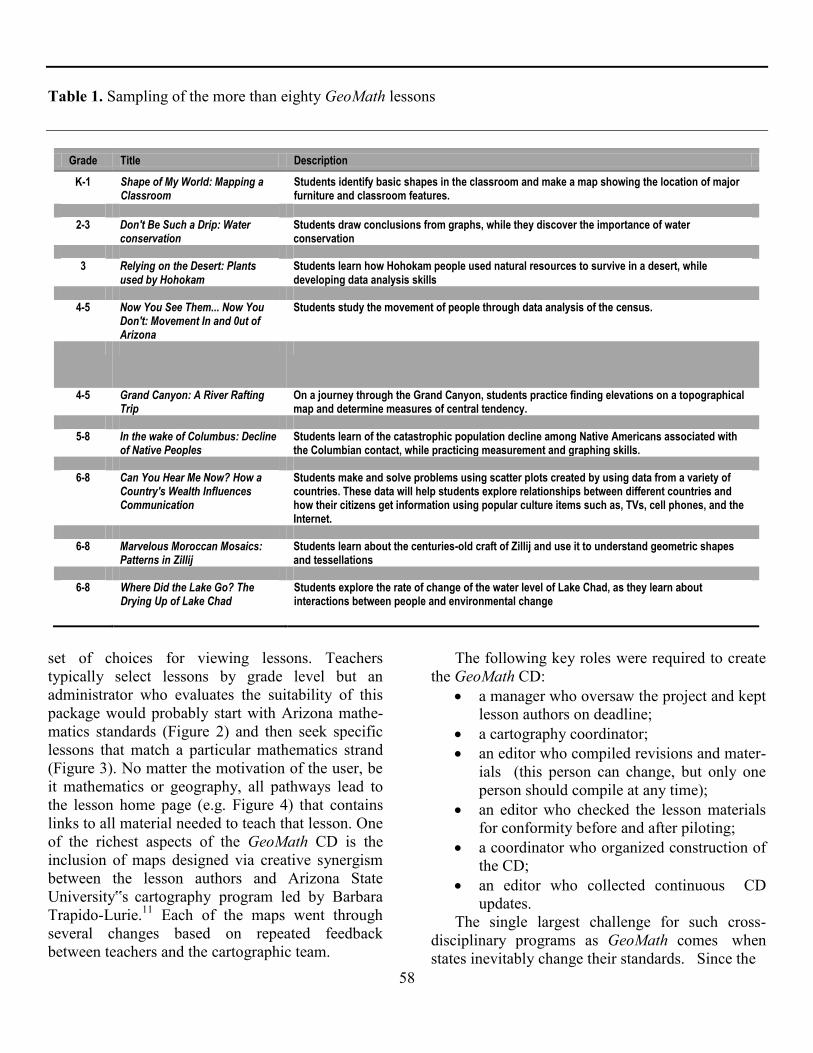
58
Table 1. Sampling of the more than eighty GeoMath lessons
Grade Title Description
K-1 Shape of My World: Mapping a Classroom
Students identify basic shapes in the classroom and make a map showing the location of major furniture and classroom features.
2-3 Don't Be Such a Drip: Water
conservation Students draw conclusions from graphs, while they discover the importance of water conservation
3 Relying on the Desert: Plants
used by Hohokam Students learn how Hohokam people used natural resources to survive in a desert, while developing data analysis skills
4-5 Now You See Them... Now You
Don't: Movement In and 0ut of Arizona
Students study the movement of people through data analysis of the census.
4-5 Grand Canyon: A River Rafting Trip
On a journey through the Grand Canyon, students practice finding elevations on a topographical map and determine measures of central tendency.
5-8 In the wake of Columbus: Decline
of Native Peoples Students learn of the catastrophic population decline among Native Americans associated with the Columbian contact, while practicing measurement and graphing skills.
6-8 Can You Hear Me Now? How a
Country's Wealth Influences Communication
Students make and solve problems using scatter plots created by using data from a variety of countries. These data will help students explore relationships between different countries and how their citizens get information using popular culture items such as, TVs, cell phones, and the Internet.
6-8 Marvelous Moroccan Mosaics:
Patterns in Zillij Students learn about the centuries-old craft of Zillij and use it to understand geometric shapes and tessellations
6-8
Where Did the Lake Go? The Drying Up of Lake Chad
Students explore the rate of change of the water level of Lake Chad, as they learn about interactions between people and environmental change
set of choices for viewing lessons. Teachers typically select lessons by grade level but an administrator who evaluates the suitability of this package would probably start with Arizona mathe-matics standards (Figure 2) and then seek specific lessons that match a particular mathematics strand (Figure 3). No matter the motivation of the user, be it mathematics or geography, all pathways lead to the lesson home page (e.g. Figure 4) that contains links to all material needed to teach that lesson. One of the richest aspects of the GeoMath CD is the inclusion of maps designed via creative synergism between the lesson authors and Arizona State University‟s cartography program led by Barbara Trapido-Lurie.11 Each of the maps went through several changes based on repeated feedback between teachers and the cartographic team.
The following key roles were required to create the GeoMath CD:
a manager who oversaw the project and kept lesson authors on deadline;
a cartography coordinator; an editor who compiled revisions and mater-
ials (this person can change, but only one person should compile at any time);
an editor who checked the lesson materials for conformity before and after piloting;
a coordinator who organized construction of the CD;
an editor who collected continuous CD updates.
The single largest challenge for such cross-disciplinary programs as GeoMath comes when states inevitably change their standards. Since the
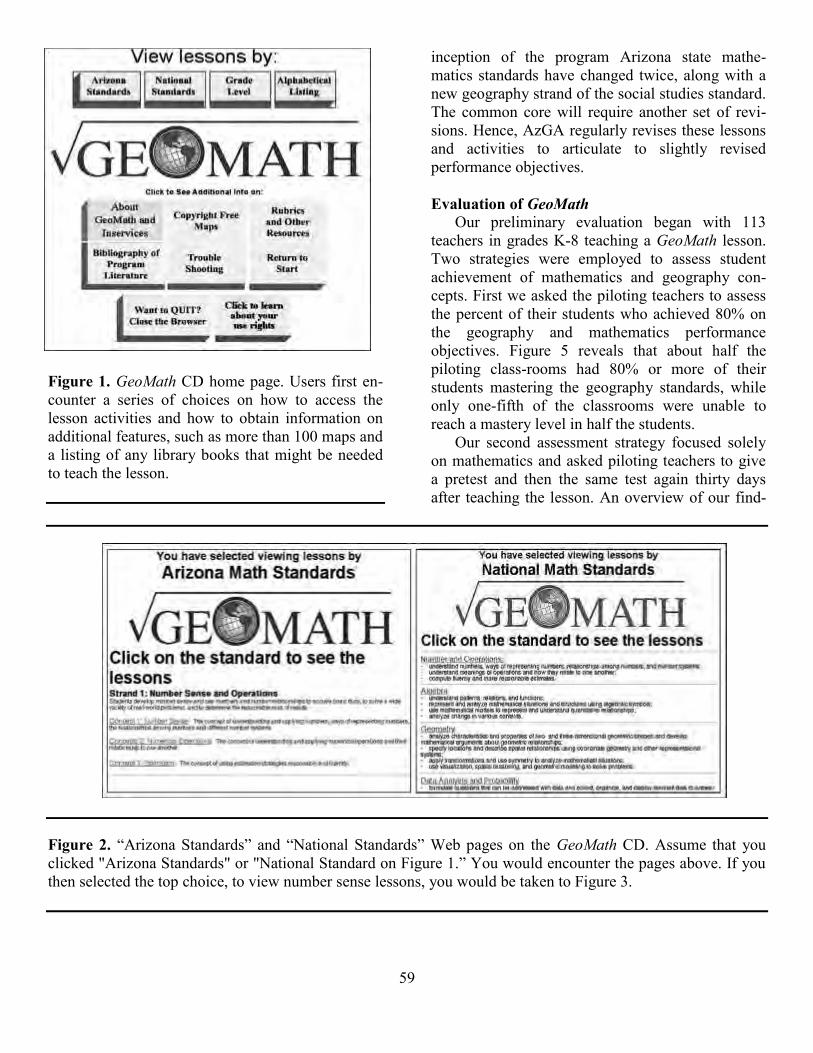
59
Figure 1. GeoMath CD home page. Users first en-counter a series of choices on how to access the lesson activities and how to obtain information on additional features, such as more than 100 maps and a listing of any library books that might be needed to teach the lesson.
inception of the program Arizona state mathe- matics standards have changed twice, along with a new geography strand of the social studies standard. The common core will require another set of revi-sions. Hence, AzGA regularly revises these lessons and activities to articulate to slightly revised performance objectives.
Evaluation of GeoMath
Our preliminary evaluation began with 113 teachers in grades K-8 teaching a GeoMath lesson. Two strategies were employed to assess student achievement of mathematics and geography con-cepts. First we asked the piloting teachers to assess the percent of their students who achieved 80% on the geography and mathematics performance objectives. Figure 5 reveals that about half the piloting class-rooms had 80% or more of their students mastering the geography standards, while only one-fifth of the classrooms were unable to reach a mastery level in half the students.
Our second assessment strategy focused solely on mathematics and asked piloting teachers to give a pretest and then the same test again thirty days after teaching the lesson. An overview of our find-
Figure 2. “Arizona Standards” and “National Standards” Web pages on the GeoMath CD. Assume that you clicked "Arizona Standards" or "National Standard on Figure 1.” You would encounter the pages above. If you then selected the top choice, to view number sense lessons, you would be taken to Figure 3.
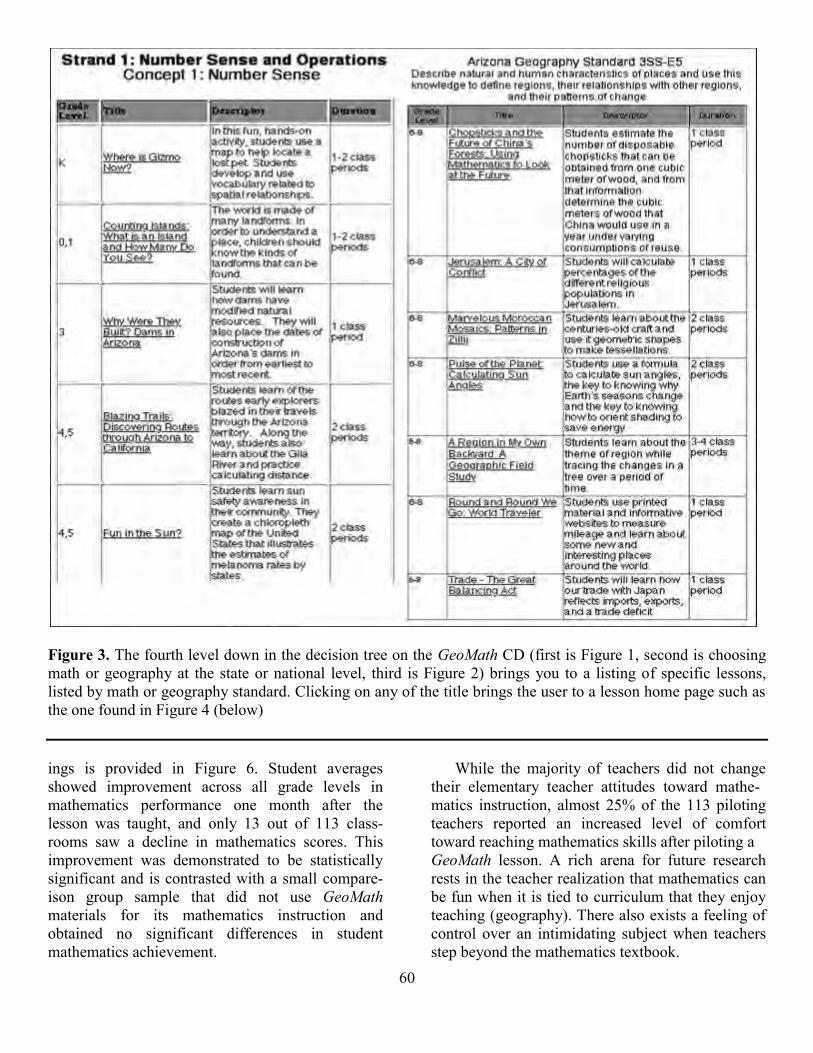
60
Figure 3. The fourth level down in the decision tree on the GeoMath CD (first is Figure 1, second is choosing math or geography at the state or national level, third is Figure 2) brings you to a listing of specific lessons, listed by math or geography standard. Clicking on any of the title brings the user to a lesson home page such as the one found in Figure 4 (below) ings is provided in Figure 6. Student averages showed improvement across all grade levels in mathematics performance one month after the lesson was taught, and only 13 out of 113 class-rooms saw a decline in mathematics scores. This improvement was demonstrated to be statistically significant and is contrasted with a small compare-ison group sample that did not use GeoMath materials for its mathematics instruction and obtained no significant differences in student mathematics achievement.
While the majority of teachers did not change
their elementary teacher attitudes toward mathe- matics instruction, almost 25% of the 113 piloting teachers reported an increased level of comfort toward reaching mathematics skills after piloting a GeoMath lesson. A rich arena for future research rests in the teacher realization that mathematics can be fun when it is tied to curriculum that they enjoy teaching (geography). There also exists a feeling of control over an intimidating subject when teachers step beyond the mathematics textbook.
61
Figure 4. Lesson “home pages” on the GeoMath CD. Each lesson has its own "home page" that provides links to print out all materials needed to teach the lesson. Each of the links brings up a PDF file. Early elementary lessons tend to contain just the teacher instructions and perhaps student worksheets and examples, while middle school lessons tend to be richer in geography content and contain more material options for the teacher. Conclusion
In an effort to incorporate geography instruction into academic subjects with mandatory assessments under No Child Left Behind, the Teacher Consult-ants of the Arizona Geographic Alliance developed a plan to convince administrators of the value of geography in preparing for the high-stakes mathematics testing by creating a package of GeoMath lessons. The lessons have assessments that prepare students for the mathematics test and also help them learn geography. They were piloted in more than a hundred K-8 classrooms across Ariz-
Figure 5. Percent of students by math classroom that mastered geography material as defined by a score of 80% or higher on assessments of geog-raphy achievement.
Figure 6. Average improvement in math achieve-ment from pre-test to post-test for the intervention group that received instruction using GeoMath materials. These results are statistically significant (R2 = 0.34, p < 0.001).
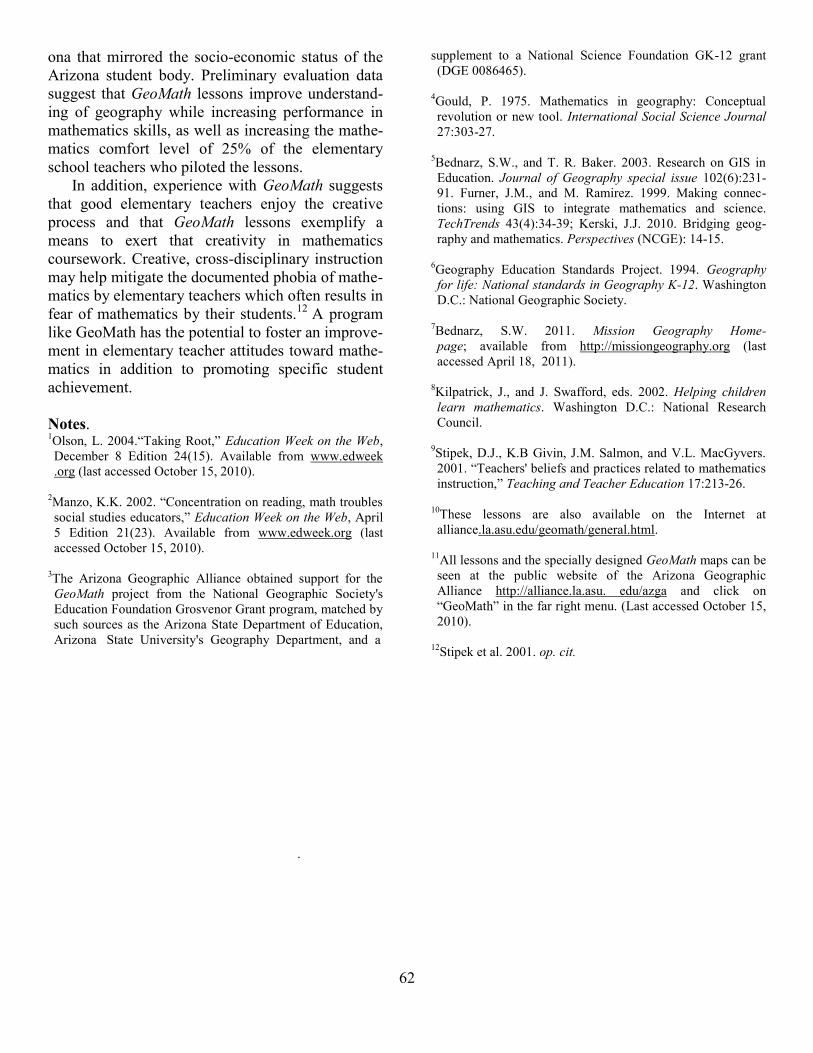
62
ona that mirrored the socio-economic status of the Arizona student body. Preliminary evaluation data suggest that GeoMath lessons improve understand-ing of geography while increasing performance in mathematics skills, as well as increasing the mathe-matics comfort level of 25% of the elementary school teachers who piloted the lessons.
In addition, experience with GeoMath suggests that good elementary teachers enjoy the creative process and that GeoMath lessons exemplify a means to exert that creativity in mathematics coursework. Creative, cross-disciplinary instruction may help mitigate the documented phobia of mathe-matics by elementary teachers which often results in fear of mathematics by their students.12 A program like GeoMath has the potential to foster an improve-ment in elementary teacher attitudes toward mathe-matics in addition to promoting specific student achievement. Notes. 1Olson, L. 2004.“Taking Root,” Education Week on the Web, December 8 Edition 24(15). Available from www.edweek .org (last accessed October 15, 2010).
2Manzo, K.K. 2002. “Concentration on reading, math troubles social studies educators,” Education Week on the Web, April 5 Edition 21(23). Available from www.edweek.org (last accessed October 15, 2010).
3The Arizona Geographic Alliance obtained support for the GeoMath project from the National Geographic Society's Education Foundation Grosvenor Grant program, matched by such sources as the Arizona State Department of Education, Arizona State University's Geography Department, and a
supplement to a National Science Foundation GK-12 grant (DGE 0086465).
4Gould, P. 1975. Mathematics in geography: Conceptual revolution or new tool. International Social Science Journal 27:303-27.
5Bednarz, S.W., and T. R. Baker. 2003. Research on GIS in Education. Journal of Geography special issue 102(6):231-91. Furner, J.M., and M. Ramirez. 1999. Making connec-tions: using GIS to integrate mathematics and science. TechTrends 43(4):34-39; Kerski, J.J. 2010. Bridging geog-raphy and mathematics. Perspectives (NCGE): 14-15.
6Geography Education Standards Project. 1994. Geography for life: National standards in Geography K-12. Washington D.C.: National Geographic Society.
7Bednarz, S.W. 2011. Mission Geography Home- page; available from http://missiongeography.org (last accessed April 18, 2011).
8Kilpatrick, J., and J. Swafford, eds. 2002. Helping children learn mathematics. Washington D.C.: National Research Council.
9Stipek, D.J., K.B Givin, J.M. Salmon, and V.L. MacGyvers. 2001. “Teachers' beliefs and practices related to mathematics instruction,” Teaching and Teacher Education 17:213-26.
10These lessons are also available on the Internet at alliance.la.asu.edu/geomath/general.html.
11All lessons and the specially designed GeoMath maps can be seen at the public website of the Arizona Geographic Alliance http://alliance.la.asu. edu/azga and click on “GeoMath” in the far right menu. (Last accessed October 15, 2010).
12Stipek et al. 2001. op. cit.
.
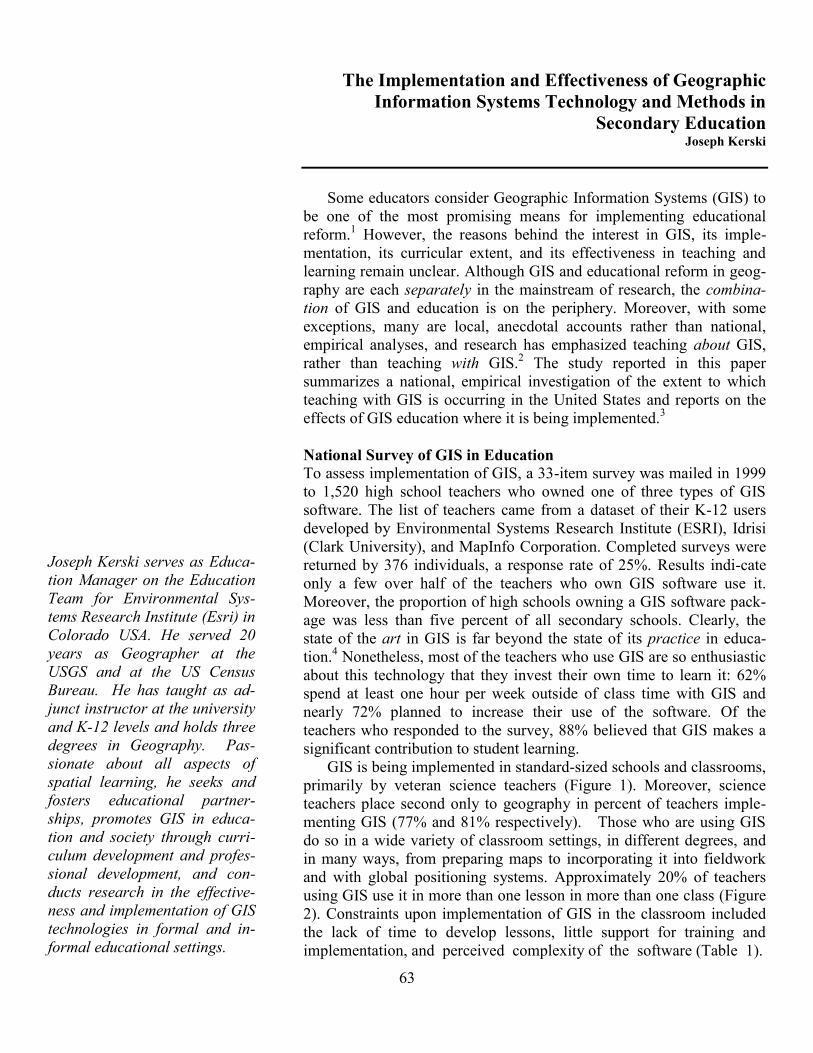
63
Joseph Kerski serves as Educa-tion Manager on the Education Team for Environmental Sys-tems Research Institute (Esri) in Colorado USA. He served 20 years as Geographer at the USGS and at the US Census Bureau. He has taught as ad-junct instructor at the university and K-12 levels and holds three degrees in Geography. Pas-sionate about all aspects of spatial learning, he seeks and fosters educational partner-ships, promotes GIS in educa-tion and society through curri-culum development and profes-sional development, and con-ducts research in the effective-ness and implementation of GIS technologies in formal and in-formal educational settings.
The Implementation and Effectiveness of Geographic
Information Systems Technology and Methods in Secondary Education
Joseph Kerski
Some educators consider Geographic Information Systems (GIS) to
be one of the most promising means for implementing educational reform.1 However, the reasons behind the interest in GIS, its imple-mentation, its curricular extent, and its effectiveness in teaching and learning remain unclear. Although GIS and educational reform in geog-raphy are each separately in the mainstream of research, the combina-tion of GIS and education is on the periphery. Moreover, with some exceptions, many are local, anecdotal accounts rather than national, empirical analyses, and research has emphasized teaching about GIS, rather than teaching with GIS.2 The study reported in this paper summarizes a national, empirical investigation of the extent to which teaching with GIS is occurring in the United States and reports on the effects of GIS education where it is being implemented.3
National Survey of GIS in Education To assess implementation of GIS, a 33-item survey was mailed in 1999 to 1,520 high school teachers who owned one of three types of GIS software. The list of teachers came from a dataset of their K-12 users developed by Environmental Systems Research Institute (ESRI), Idrisi (Clark University), and MapInfo Corporation. Completed surveys were returned by 376 individuals, a response rate of 25%. Results indi-cate only a few over half of the teachers who own GIS software use it. Moreover, the proportion of high schools owning a GIS software pack-age was less than five percent of all secondary schools. Clearly, the state of the art in GIS is far beyond the state of its practice in educa-tion.4 Nonetheless, most of the teachers who use GIS are so enthusiastic about this technology that they invest their own time to learn it: 62% spend at least one hour per week outside of class time with GIS and nearly 72% planned to increase their use of the software. Of the teachers who responded to the survey, 88% believed that GIS makes a significant contribution to student learning.
GIS is being implemented in standard-sized schools and classrooms, primarily by veteran science teachers (Figure 1). Moreover, science teachers place second only to geography in percent of teachers imple-menting GIS (77% and 81% respectively). Those who are using GIS do so in a wide variety of classroom settings, in different degrees, and in many ways, from preparing maps to incorporating it into fieldwork and with global positioning systems. Approximately 20% of teachers using GIS use it in more than one lesson in more than one class (Figure 2). Constraints upon implementation of GIS in the classroom included the lack of time to develop lessons, little support for training and implementation, and perceived complexity of the software (Table 1).
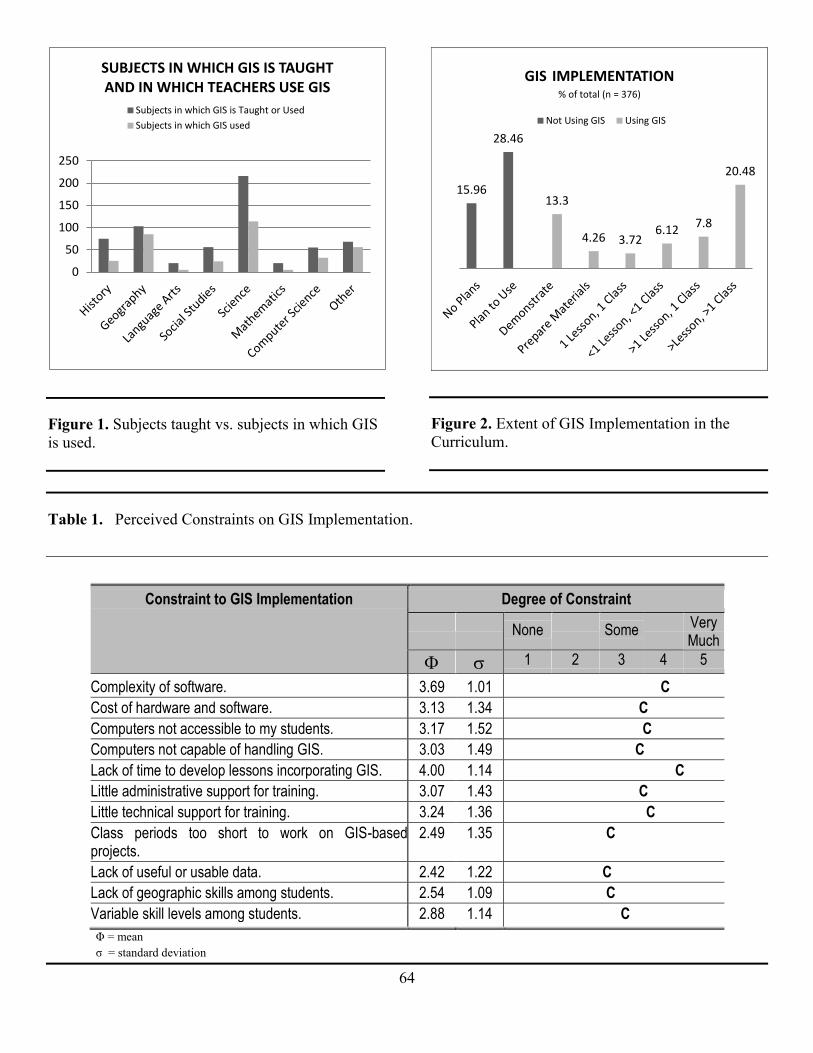
64
Figure 1. Subjects taught vs. subjects in which GIS is used.
Figure 2. Extent of GIS Implementation in the Curriculum.
Table 1. Perceived Constraints on GIS Implementation.
Constraint to GIS Implementation Degree of Constraint
None
Some Very
Much
1 2 3 4 5
Complexity of software. 3.69 1.01 C
Cost of hardware and software. 3.13 1.34 C
Computers not accessible to my students. 3.17 1.52 C
Computers not capable of handling GIS. 3.03 1.49 C
Lack of time to develop lessons incorporating GIS. 4.00 1.14 C
Little administrative support for training. 3.07 1.43 C
Little technical support for training. 3.24 1.36 C
Class periods too short to work on GIS-based projects.
2.49 1.35 C
Lack of useful or usable data. 2.42 1.22 C
Lack of geographic skills among students. 2.54 1.09 C
Variable skill levels among students. 2.88 1.14 C
Φ = mean σ = standard deviation
0
50
100
150
200
250
SUBJECTS IN WHICH GIS IS TAUGHT AND IN WHICH TEACHERS USE GIS
Subjects in which GIS is Taught or Used
Subjects in which GIS used
15.96
28.46
13.3
4.26 3.72 6.12
7.8
20.48
GIS IMPLEMENTATION % of total (n = 376)
Not Using GIS Using GIS
65
The perceived benefits of GIS are that it enhances learning, helps integration of different subjects, and provides an exploratory tool for data as well as real-world relevance (Table 2). Table 2 also reveals a constraint on GIS implementation—the belief of many teachers that GIS cannot help them teach con-tent standards.
Multiple regression analysis explained that about one-third of GIS use resulted from the amount of training, the length of a teacher‟s career, the number of teachers using GIS in the school, the amount of technical support, and the number of conferences attended (Table 3). The number of teachers using GIS in a school had the highest t value, indicating the most confidence that this vari-able affects the amount of GIS use in a school more than any other. Time spent in GIS training was the next most influential variable. Consequently, train-ing programs are critical to implementation of GIS in schools and institutionalization seems most likely if teams of teachers from the same school are trained at the same time.
Effectiveness Experiments and Case Studies
I personally have been troubled with the question of whether students are learning geographic inquiry strategies or merely learning to use a very powerful tool without much thinking about the underlying ques-tions under consideration.-Teacher response With this question in mind, the research sup-
plemented the survey data with experiments and case studies in three public high schools in Colo-rado. Twelve geography lessons were created, each with a GIS-based version and a traditional version. Experimental groups were sections of a geography course in which students used GIS, and control groups were other sections in the same course in which students used paper maps and texts to complete the same lessons. Pretests and posttests consisted of standardized tests and a spatial analysis test that assessed knowledge of geography content and geographic skills as defined by scoring guides based on the national geography standards.5 Anal- yses were conducted using inferential statistics on individual classes, between classes, in each school, and between schools.6 GIS made a difference in test
scores for those using it. Only four out of nine tests showed statistically significant differences, and in all four, students using GIS scored significantly higher than their counterparts who were using traditional methods. Students using GIS showed improved learning of geographic content, could better describe reasons for human and physical patterns, showed higher-order analytical and synthetic thinking, and had better knowledge of the absolute and relative locations of places. Average and below-average students improved more with GIS than did above-average students.
Case studies were employed to more fully understand the effect of implementing GIS in the classroom. Case studies involved personal inter-views with teachers and students, written and oral end-of-semester surveys, and participant observa-tion over an entire academic year, all obtained from the three Colorado high schools. Results indicated:
GIS education requires the manipulation of graphics, charts, maps, and data, and pro-vides a fuller practice of computer tools than other software.
Students wrestled with data relevance and data quality, identifying relationships and drawing interpretations.
Although the computer lab manager's involve-ment was critical, computer issues were second-ary to time required to create lessons and man-age data, the structure of the school day, school politics, and spatial thinking. GIS increased student motivation, altered communication patterns, stimulated visual learners, and reached students who are not traditional learners. The inquiry-oriented learning that GIS
fosters required teachers and students to tolerate uncertainty, take risks, and change traditional roles. Most students were uncom-fortable with this problem-solving style of learning, although GIS matched the teachers‟ constructivist teaching style.
Most students lacked a spatial perspective. GIS increased teachers' ties to the surround-
ing community and to their own profession.
Summary and Conclusions Research results supported six of the research
hypotheses:
66
1. Social, educational, and political factors are more important influences on implementing GIS technology in education than techno-logical factors.
2. Implementing GIS tools in high school cur-ricula fundamentally alters the manner of teaching in the classroom; teachers who favor the analytical, problem-solving style using a variety of media are attracted to GIS.
3. Implementing GIS alters the manner of learning as students grapple with the same issues and use the same tools as those in government and industry.
4. Although their teaching philosophy and style usually did not change, instructional methods that teachers use with GIS are more closely aligned with the tenets of modern educational reform (e.g. construc-tivism, teacher as facilitator of knowledge) than methods the teachers used before the introduction of GIS.
5. GIS is implemented in the secondary curriculum primarily through the efforts of individual teachers rather than via a sys-tematic educational agenda.
6. More professional development and contact with the local community is associated with teachers using GIS than teachers who do not use GIS.
Perhaps surprisingly, the introduction of GIS did not consistently increase the geographic skills of secondary-school students to a greater extent than did the same lessons that did not include GIS. The use of GIS did, however, strengthen the learning of traditional place-name geographic skills and knowl-edge, and the finding that GIS benefits below-average students implies that it should not be con-fined to the best students.
Teaching with GIS relies on single teachers to act as the driving force, but most teachers in the survey have not even reached the minimal stage of “awareness” in Binko's four stages of teacher learning.7 To improve teacher awareness of why and how to use GIS in the classroom, preservice education should include technology, geography, and GIS. Teachers should be taught with GIS as they will teach their students using real world prob-lems to experience how this model of learning works.8 Bednarz and Audet went so far as to state
that "until consensus is reached that GIS has a role, then we will continue to see a directionless patch-work of [teacher training] programs.”9 Without a preservice component, GIS implementation will be confined largely to slow-diffusing in-service train-ing. This is especially true in geography taught in the social studies curriculum where teachers have less computer access and training and their training is less constructivist in nature than their science teacher counterparts. Preservice and in-service training for geography teachers needs to be strengthened so that geography teachers feel confi-dent that they can employ open-ended tools.
The geographic perspective is in increasingly high demand partly because of the success that GIS has in solving problems throughout the world. Teaching with GIS could be used as a primary method of integrating geographic thinking into other disciplines. Perhaps the approach to GIS should not be, "How can we get GIS into the curriculum?" but "How can GIS help meet cur-ricular goals?" This study found GIS not to be just a technology, but also a method. The methods that GIS uses make it an attractive option to those advo-cating educational reform. These same methods, more than the tools, make GIS difficult to imple-ment. GIS allows students to do geographic and scientific analysis, not just read about what others have done.
Notes 1Barstow, D.. 1994. An introduction to GIS in education. In First National Conference on the Educational Applications of Geographic Information Systems (EdGIS) Conference Report, edited by Barstow, D.M. D. Gerrard and P.M. Kapisovsky. TERC: Cambridge, MA.
2Examples of the anecdotal accounts include: Ramirez, M. 1996. A driving force in technology education: Geographic information systems. TechTrends 41(2):34-36; McGarigle, B. 1997. High school students win national awards with GIS. Government Technology 9(7):1, 48; Walker, M., J Casper, F. Hissong, and E. Rieben. 2000. GIS: A new way to see. Science and Children 37(4):33-40. A rare exception to the anecdotal accounts is Bednarz, S.W. 2004. Geographic information systems: A tool to support geography and environmental education? GeoJournal 60:191-99. A discussion regarding the difference between teaching about GIS and teaching with GIS is found in Sui, D.Z. 1995. A pedagogic framework to link GIS to the intellectual core of geography. Journal of Geography 94(6):578-91.
3A full report of the study summarized in this paper can be found in Kerski, J. J. 2003. The implementation and effec-
67
tiveness of geographic information systems technology and methods in secondary education. Journal of Geography 102(3):128-37. A follow-up study focusing on educators involved in GIS professional development institutes was conducted and published as: Baker, T.R., A.M. Palmer, and J. Kerski. 2009. A national survey to examine teacher pro-fesssional development and implementation of desktop GIS. Journal of Geography 108:174-85.
4Means, B., ed. 1994. Technology and Education Reform: The Reality Behind the Promise. San Francisco: Jossey-Bass.
5Geography Education Standards Project. 1994. Geography for Life: National Geography Standards. Washington, DC: National Geographic Research and Exploration .
6Two-sample t-tests with equal variances were conducted on the standardized and the spatial analysis tests, and pretest scores were compared to posttest scores via paired t-tests to
determine the amount of change over the semester and between each group. Lesson scores were analyzed with a
two-sample t-test, with ANOVAs and t-tests for gender differences. Linear and non-linear regression models tested the relationship between GIS and the difference in test scores from the beginning ot the end of the semester.
7The four stages of teacher learning are found in Binko, J.B. 1989. Spreading the Word about Geography: A Guide for Teacher-Consultants in Geography Education. Washington, DC: National Geographic Society. The four stages are (1) awareness, (2) understanding, (3) application, and (4) implementation.
8Bednarz, S.W. 1999. Impact and success: Evaluating a GIS training institute. Proceedings, 19th Annual ESRI User Con-ference. San Diego, California.. Available at http://gis.esri .com/library/userconf/proc99/proceed/papers/pap895/p895.htm (last accessed March 27, 2011).
9See page 66 in Bednarz, S.W. and R.H. Audet. 1999. The status of GIS technology in teacher preparation programs. Journal of Geography 98(2):60-67.
68
Keith R. Mountain is Associate Professor and Chair of the Department of Geography and Geosciences at the University of Louisville. David A. Howarth is Professor of Geography and Geosciences at the University of Louisville
Physical Science in Geography Education: Connections and Opportunities
Keith R. Mountain and David A. Howarth
One may attend a conference of superintendents and teachers before whom geography is a subject for discus-sion . . . and yet hardly a suggestion may be made as to the effect that teachers of geography should be better taught, and still less intimation offered that geography itself is in need of a more mature development as a scientific study.1
The above statement made by William Morris Davis in the early
20th century still rings true in the PreK-12 educational setting of the 21st century. Even with the many educational reforms implemented at national, state and local levels, teachers are not adequately prepared to teach geography and the discipline strives for recognition as a sci-entific area of study. This position may have evolved from the highly integrative nature of the discipline that includes both social and phys-ical sciences along with the humanities, but whatever the cause, one result is that the content of geography has become fragmented and subsumed within other content areas in PreK-12 education.
While much geography content justifiably resides as a core ele-ment within social studies curricula, the role of geography as a central component of science curricula remains largely unrecognized and undervalued.2 Discussions about the nature of science notwith-standing, geography and geographic thinking clearly revolve around inductive and deductive reasoning, critical thinking, and open embrace of all processes and techniques that define the scientific method.3 This paper briefly describes the connections between geography and the physical sciences and proposes a crucial role that geography can play as an integrative approach to the teaching and learning of science in PreK-12 education.
Science Standards and the Position of Geography
With the publication in 1994 of Geography for Life,4 the national standards for geography in K-12 education, proponents leveraged geography into a unique position by taking the initiative to ground the discipline in both definition and content as well as to identify performance requirements for various grade levels. This approach led to widespread and even verbatim inclusion of the geography stand-ards in many state social studies standards, assessments, and performance protocols for both teachers and students. Curiously, however, state standards in the physical sciences were not similarly impacted by Geography for Life.5 This failure of geography standards to impact state science standards occurred in spite of the National Science Education Standards6 that possess wording highly correlated with the geography standards and that demonstrate many opportu-nities for the recognition and inclusion of geography in science
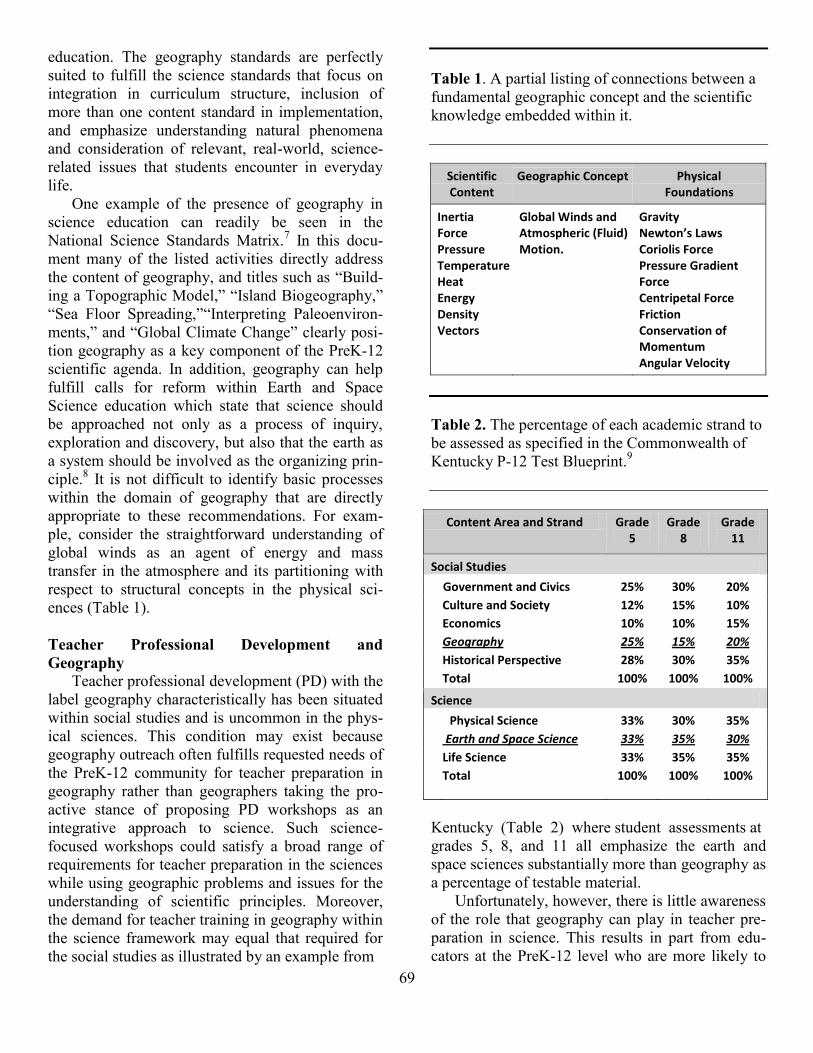
69
education. The geography standards are perfectly suited to fulfill the science standards that focus on integration in curriculum structure, inclusion of more than one content standard in implementation, and emphasize understanding natural phenomena and consideration of relevant, real-world, science-related issues that students encounter in everyday life.
One example of the presence of geography in science education can readily be seen in the National Science Standards Matrix.7 In this docu-ment many of the listed activities directly address the content of geography, and titles such as “Build-ing a Topographic Model,” “Island Biogeography,” “Sea Floor Spreading,”“Interpreting Paleoenviron-ments,” and “Global Climate Change” clearly posi-tion geography as a key component of the PreK-12 scientific agenda. In addition, geography can help fulfill calls for reform within Earth and Space Science education which state that science should be approached not only as a process of inquiry, exploration and discovery, but also that the earth as a system should be involved as the organizing prin-ciple.8 It is not difficult to identify basic processes within the domain of geography that are directly appropriate to these recommendations. For exam-ple, consider the straightforward understanding of global winds as an agent of energy and mass transfer in the atmosphere and its partitioning with respect to structural concepts in the physical sci-ences (Table 1).
Teacher Professional Development and Geography
Teacher professional development (PD) with the label geography characteristically has been situated within social studies and is uncommon in the phys- ical sciences. This condition may exist because geography outreach often fulfills requested needs of the PreK-12 community for teacher preparation in geography rather than geographers taking the pro-active stance of proposing PD workshops as an integrative approach to science. Such science-focused workshops could satisfy a broad range of requirements for teacher preparation in the sciences while using geographic problems and issues for the understanding of scientific principles. Moreover, the demand for teacher training in geography within the science framework may equal that required for the social studies as illustrated by an example from
Table 1. A partial listing of connections between a fundamental geographic concept and the scientific knowledge embedded within it.
Scientific Content
Geographic Concept Physical Foundations
Inertia Force Pressure Temperature Heat Energy Density Vectors
Global Winds and Atmospheric (Fluid) Motion.
Gravity Newton’s Laws Coriolis Force Pressure Gradient Force Centripetal Force Friction Conservation of Momentum Angular Velocity
Table 2. The percentage of each academic strand to be assessed as specified in the Commonwealth of Kentucky P-12 Test Blueprint.9
Content Area and Strand Grade 5
Grade 8
Grade 11
Social Studies
Government and Civics 25% 30% 20%
Culture and Society 12% 15% 10%
Economics 10% 10% 15%
Geography 25% 15% 20%
Historical Perspective 28% 30% 35%
Total 100% 100% 100%
Science
Physical Science 33% 30% 35%
Earth and Space Science 33% 35% 30%
Life Science 33% 35% 35%
Total 100% 100% 100%
Kentucky (Table 2) where student assessments at grades 5, 8, and 11 all emphasize the earth and space sciences substantially more than geography as a percentage of testable material.
Unfortunately, however, there is little awareness of the role that geography can play in teacher pre-paration in science. This results in part from edu-cators at the PreK-12 level who are more likely to
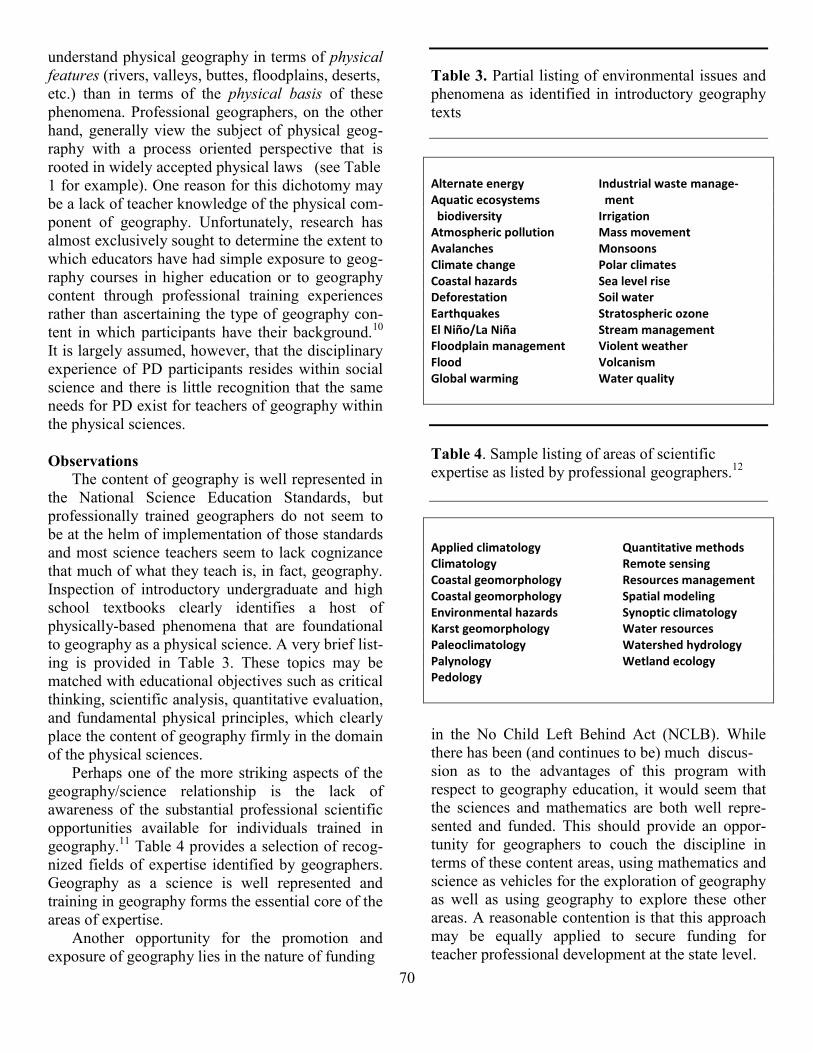
70
understand physical geography in terms of physical features (rivers, valleys, buttes, floodplains, deserts, etc.) than in terms of the physical basis of these phenomena. Professional geographers, on the other hand, generally view the subject of physical geog- raphy with a process oriented perspective that is rooted in widely accepted physical laws (see Table 1 for example). One reason for this dichotomy may be a lack of teacher knowledge of the physical com-ponent of geography. Unfortunately, research has almost exclusively sought to determine the extent to which educators have had simple exposure to geog-raphy courses in higher education or to geography content through professional training experiences rather than ascertaining the type of geography con-tent in which participants have their background.10 It is largely assumed, however, that the disciplinary experience of PD participants resides within social science and there is little recognition that the same needs for PD exist for teachers of geography within the physical sciences. Observations
The content of geography is well represented in the National Science Education Standards, but professionally trained geographers do not seem to be at the helm of implementation of those standards and most science teachers seem to lack cognizance that much of what they teach is, in fact, geography. Inspection of introductory undergraduate and high school textbooks clearly identifies a host of physically-based phenomena that are foundational to geography as a physical science. A very brief list-ing is provided in Table 3. These topics may be matched with educational objectives such as critical thinking, scientific analysis, quantitative evaluation, and fundamental physical principles, which clearly place the content of geography firmly in the domain of the physical sciences.
Perhaps one of the more striking aspects of the geography/science relationship is the lack of awareness of the substantial professional scientific opportunities available for individuals trained in geography.11 Table 4 provides a selection of recog-nized fields of expertise identified by geographers. Geography as a science is well represented and training in geography forms the essential core of the areas of expertise.
Another opportunity for the promotion and exposure of geography lies in the nature of funding
Table 3. Partial listing of environmental issues and phenomena as identified in introductory geography texts Alternate energy Industrial waste manage- Aquatic ecosystems ment biodiversity Irrigation Atmospheric pollution Mass movement Avalanches Monsoons Climate change Polar climates Coastal hazards Sea level rise Deforestation Soil water Earthquakes Stratospheric ozone El Niño/La Niña Stream management Floodplain management Violent weather Flood Volcanism Global warming Water quality
Table 4. Sample listing of areas of scientific expertise as listed by professional geographers.12
Applied climatology Quantitative methods Climatology Remote sensing Coastal geomorphology Resources management Coastal geomorphology Spatial modeling Environmental hazards Synoptic climatology Karst geomorphology Water resources Paleoclimatology Watershed hydrology Palynology Wetland ecology Pedology
in the No Child Left Behind Act (NCLB). While there has been (and continues to be) much discus- sion as to the advantages of this program with respect to geography education, it would seem that the sciences and mathematics are both well repre-sented and funded. This should provide an oppor-tunity for geographers to couch the discipline in terms of these content areas, using mathematics and science as vehicles for the exploration of geography as well as using geography to explore these other areas. A reasonable contention is that this approach may be equally applied to secure funding for teacher professional development at the state level.
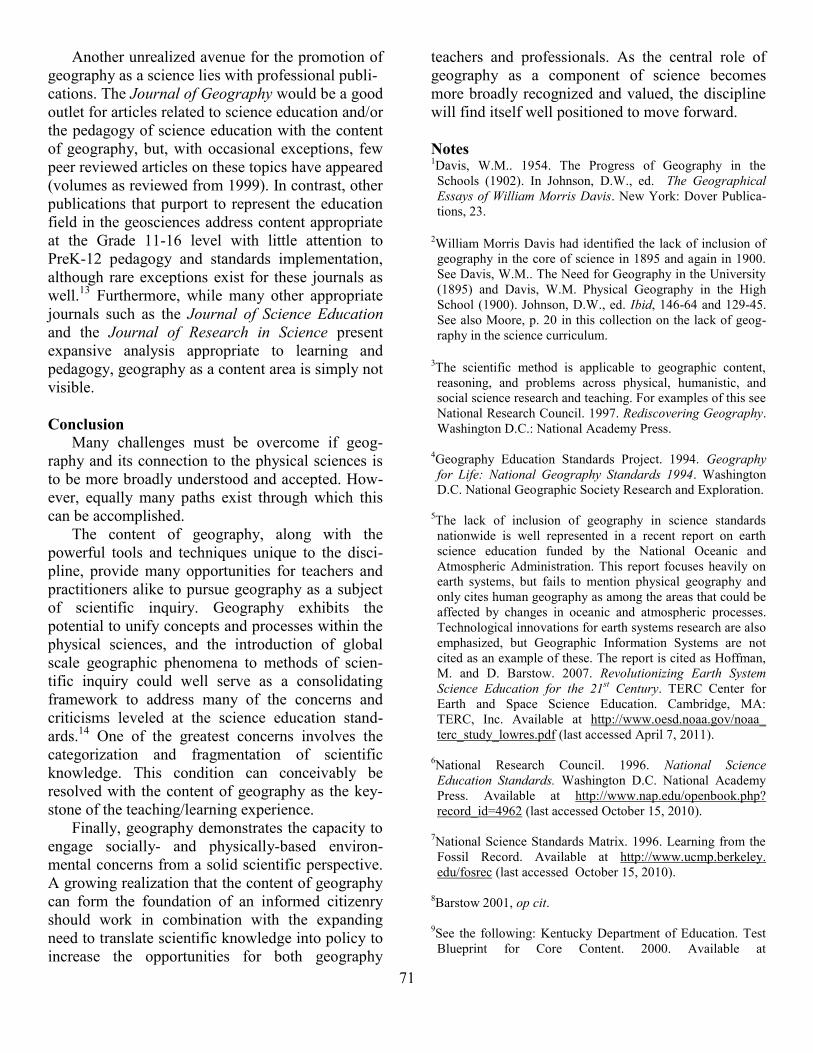
71
Another unrealized avenue for the promotion of geography as a science lies with professional publi- cations. The Journal of Geography would be a good outlet for articles related to science education and/or the pedagogy of science education with the content of geography, but, with occasional exceptions, few peer reviewed articles on these topics have appeared (volumes as reviewed from 1999). In contrast, other publications that purport to represent the education field in the geosciences address content appropriate at the Grade 11-16 level with little attention to PreK-12 pedagogy and standards implementation, although rare exceptions exist for these journals as well.13 Furthermore, while many other appropriate journals such as the Journal of Science Education and the Journal of Research in Science present expansive analysis appropriate to learning and pedagogy, geography as a content area is simply not visible. Conclusion
Many challenges must be overcome if geog-raphy and its connection to the physical sciences is to be more broadly understood and accepted. How-ever, equally many paths exist through which this can be accomplished.
The content of geography, along with the powerful tools and techniques unique to the disci-pline, provide many opportunities for teachers and practitioners alike to pursue geography as a subject of scientific inquiry. Geography exhibits the potential to unify concepts and processes within the physical sciences, and the introduction of global scale geographic phenomena to methods of scien-tific inquiry could well serve as a consolidating framework to address many of the concerns and criticisms leveled at the science education stand-ards.14 One of the greatest concerns involves the categorization and fragmentation of scientific knowledge. This condition can conceivably be resolved with the content of geography as the key-stone of the teaching/learning experience.
Finally, geography demonstrates the capacity to engage socially- and physically-based environ-mental concerns from a solid scientific perspective. A growing realization that the content of geography can form the foundation of an informed citizenry should work in combination with the expanding need to translate scientific knowledge into policy to increase the opportunities for both geography
teachers and professionals. As the central role of geography as a component of science becomes more broadly recognized and valued, the discipline will find itself well positioned to move forward. Notes 1Davis, W.M.. 1954. The Progress of Geography in the Schools (1902). In Johnson, D.W., ed. The Geographical Essays of William Morris Davis. New York: Dover Publica-tions, 23.
2William Morris Davis had identified the lack of inclusion of geography in the core of science in 1895 and again in 1900. See Davis, W.M.. The Need for Geography in the University (1895) and Davis, W.M. Physical Geography in the High School (1900). Johnson, D.W., ed. Ibid, 146-64 and 129-45. See also Moore, p. 20 in this collection on the lack of geog-raphy in the science curriculum.
3The scientific method is applicable to geographic content, reasoning, and problems across physical, humanistic, and social science research and teaching. For examples of this see National Research Council. 1997. Rediscovering Geography. Washington D.C.: National Academy Press.
4Geography Education Standards Project. 1994. Geography for Life: National Geography Standards 1994. Washington D.C. National Geographic Society Research and Exploration.
5The lack of inclusion of geography in science standards nationwide is well represented in a recent report on earth science education funded by the National Oceanic and Atmospheric Administration. This report focuses heavily on earth systems, but fails to mention physical geography and only cites human geography as among the areas that could be affected by changes in oceanic and atmospheric processes. Technological innovations for earth systems research are also emphasized, but Geographic Information Systems are not cited as an example of these. The report is cited as Hoffman, M. and D. Barstow. 2007. Revolutionizing Earth System Science Education for the 21st Century. TERC Center for Earth and Space Science Education. Cambridge, MA: TERC, Inc. Available at http://www.oesd.noaa.gov/noaa_ terc_study_lowres.pdf (last accessed April 7, 2011).
6National Research Council. 1996. National Science Education Standards. Washington D.C. National Academy Press. Available at http://www.nap.edu/openbook.php? record_id=4962 (last accessed October 15, 2010).
7National Science Standards Matrix. 1996. Learning from the Fossil Record. Available at http://www.ucmp.berkeley. edu/fosrec (last accessed October 15, 2010).
8Barstow 2001, op cit. 9See the following: Kentucky Department of Education. Test Blueprint for Core Content. 2000. Available at
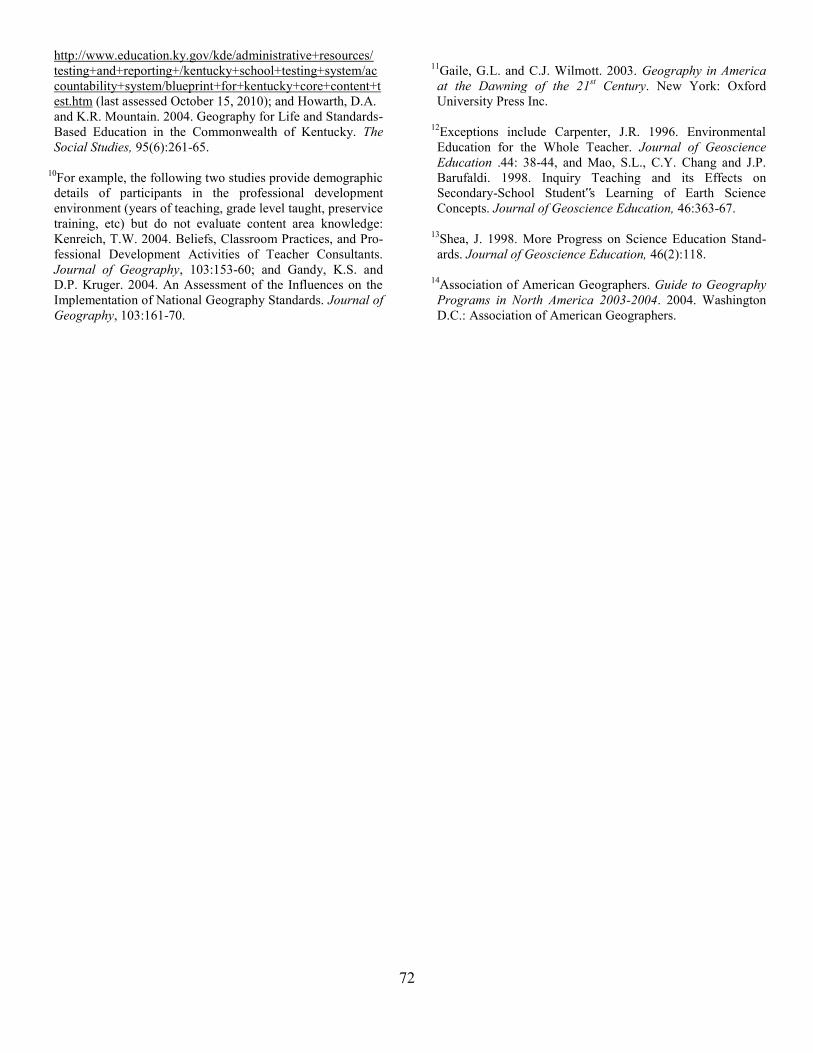
72
http://www.education.ky.gov/kde/administrative+resources/ testing+and+reporting+/kentucky+school+testing+system/accountability+system/blueprint+for+kentucky+core+content+test.htm (last assessed October 15, 2010); and Howarth, D.A.
and K.R. Mountain. 2004. Geography for Life and Standards-Based Education in the Commonwealth of Kentucky. The Social Studies, 95(6):261-65.
10For example, the following two studies provide demographic details of participants in the professional development environment (years of teaching, grade level taught, preservice training, etc) but do not evaluate content area knowledge: Kenreich, T.W. 2004. Beliefs, Classroom Practices, and Pro-fessional Development Activities of Teacher Consultants. Journal of Geography, 103:153-60; and Gandy, K.S. and D.P. Kruger. 2004. An Assessment of the Influences on the Implementation of National Geography Standards. Journal of Geography, 103:161-70.
11Gaile, G.L. and C.J. Wilmott. 2003. Geography in America at the Dawning of the 21st Century. New York: Oxford University Press Inc.
12Exceptions include Carpenter, J.R. 1996. Environmental Education for the Whole Teacher. Journal of Geoscience Education .44: 38-44, and Mao, S.L., C.Y. Chang and J.P. Barufaldi. 1998. Inquiry Teaching and its Effects on Secondary-School Student‟s Learning of Earth Science Concepts. Journal of Geoscience Education, 46:363-67.
13Shea, J. 1998. More Progress on Science Education Stand-ards. Journal of Geoscience Education, 46(2):118.
14Association of American Geographers. Guide to Geography Programs in North America 2003-2004. 2004. Washington D.C.: Association of American Geographers.
73
David A. Lanegran holds the John S. Holl Distinguished Chair of Geography at Mac-alester College where he teaches courses in Human and Urban Geography. He served the National Council for Geo-graphic Education in various capacities including President in 1998. He was a Member and Chair of the Advanced Place-ment Human Geography Test Development committee from 1996 to 2003, and served as a reader of the Advanced Place-ment Exams from 2001 to 2008 and is currently the Chief Reader of the APHG Exam. He is the Coordinator of the Minnesota Alliance for Geo-graphic Education
The Growth of Advanced Placement Human Geography and its Impact on the Discipline of Geography
David A. Lanegran
After nearly a decade of lobbying by James Marran of the National
Council for Geographic Education (NCGE), and a significant push by Bob Dulli of the National Geographic Society (NGS), in 1996 the Col-lege Board agreed to establish a task force to develop an Advanced Placement Human Geography (APHG) test. This was a momentous step forward for the discipline of geography because the College Board endorsement signaled that geography was indeed an important subject and worthy of the attention of the most academically-oriented high school students and faculty.
Many geography educators believed that it was necessary to get APHG established in high schools to complete the reform movement begun in the 1980s. It was argued that unless the discipline was vali-dated as worthy of AP standing, geography in the lower grades would be eroded away. Furthermore a well-constructed human geography course would enhance the high school curriculum by presenting multi-cultural perspectives, promoting global awareness and allowing applica-tions on the local level. In addition, the wide-ranging and concerted AP affirmative action program would help to increase diversity in geography.1 Nature and Expansion of the Geography Exam Although the Advanced Placement program does not produce texts or curriculum per se, any test developed must reflect an underlying con-sensus on what should be covered in an introductory geography course. There are several reasons why the AP Geography task force that devel-oped the content determined that the test would be based on human geography rather than physical geography, world regional geography or a general introduction to geography. This decision was based on the following arguments. (1) Physical geography was thought to be too similar in content to the existing environmental science exam. (2) World regional geography was rejected because the task force felt it necessary to distinguish the high school course from the commonly taught middle school course on world regional geography. (3) The introduction to geography model was not selected because it is a less frequently taught college course than human geography.
As part of the development process, a curriculum survey was pro-duced and distributed to college level human geography instructors to determine the overall content of such a course. The task force used the survey results along with careful examination of the common themes of the half dozen most widely used human geography textbooks to create the course purpose and outline. The course purpose was specified as follows:
The purpose of the AP course in Human Geography is to introduce the students to the systematic study of patterns and processes that have shaped human understanding, use, and
74
alteration of Earth‟s surface. Students em-ploy spatial concepts and landscape analysis to analyze human social organization and its environmental consequences. They also learn about the methods and tools geog-raphers use in their science and practice.2
The course outline is divided into seven sections, six topical areas (Table 1) and one additional topic on the nature of geography including the concepts, perspectives, skills and history of the discipline. These topics should be studied using five college level goals (Table 2) that build on the National Geography Standards,3 and the course material suggests that instructors infuse the concepts and skills of geography into their teaching of the six topical components. The test is also designed in an integrative fashion with most questions covering two or more topics. The students‟ breadth of knowl- edge is tested with a set of objective questions in the first part of the test that cover each section of the course outline. These items are rigorously evaluated and field-tested before they are added to the pool of potential test questions. The second part of the test consists of three free-response questions that asses the students‟ deep knowledge and their ability to analyze situations with a geographical perspective. The entire exam takes two hours and fifteen min-utes to complete.
The number of students taking the exam has grown rapidly since it was first administered in spring of 2001 and over 66,000 tests were read in Spring 2010 (Table 3). This number places geog-raphy in the range of other social science courses such as micro and macroeconomics. Because the lab sciences, English and history courses are required in high schools they have a greater pool of candidates from which to draw, and we cannot expect the APHG test numbers to equal their magnitudes Impact of Exam on the Discipline of Geography
The development of the APHG project has begun to change the pedagogic development of our discipline in several exciting ways. Because the AP process calls for constant and thorough syllabus design and redesign together with a rigorous and constant monitoring of quality and relevance of the assessments used, APHG provides high school and college level geographic educators with a model for effective teaching. In the development of the items for the exams and during the annual reading of the
exams, geographers from high schools and colleges have come together to share their classroom and research experiences and consider the development of the human geography course. It is one of the very few times that geographers assemble to discuss, describe and assess the common core of the disci-pline rather than the subspecialties. At the readings the assembled geography teachers share their views on what elements of geography should be covered in an introductory course and what elements are more properly parts of the advanced classes on subspecialties of the discipline. This contrasts with the specialized presentations and discussions that are typical of sessions at the annual meetings of the professional geographic associations.
Scoring of tens of thousands of essay responses during the annual reading takes dedication and geo-graphical esprit. In addition, the variety of answers provided to the questions by the students affords feedback to the teachers and professors at the read-ing. The knowledge gained allows for enhancement of individual courses and subsequent revitalization of geography. Geographers involved in APHG take satisfaction in the manner in which the course has improved the quality of instruction at the secondary and tertiary levels. The relevance of the course to students‟ lives, supported with connections to bodies of geographic research, builds the credibility of our discipline.
The continuation and enhancement of a social science-based APHG will demand the attention and direct support of the entire geographic community. Because we are in the early phases of the diffusion of the test there are not many suitable supplemental materials available for teacher use. College Board has created a web site with links to useful sites for lessons, materials and ideas. In addition, a special double edition of the Journal of Geography was published in 2000 that explains the topics and the course outline in some detail.8 In 2004, three books were published by the National Council for Geo-graphic Education (NCGE) that are of use to APHG teachers.9 But these do not compare with the wealth of texts and background material available in other disciplines. We have also created a special interest network within the NCGE for AP teachers and there is a listserv for teachers.
The most vexing constraint on the expansion of APHG is the modest number of geography-trained high school teachers. This, combined with even
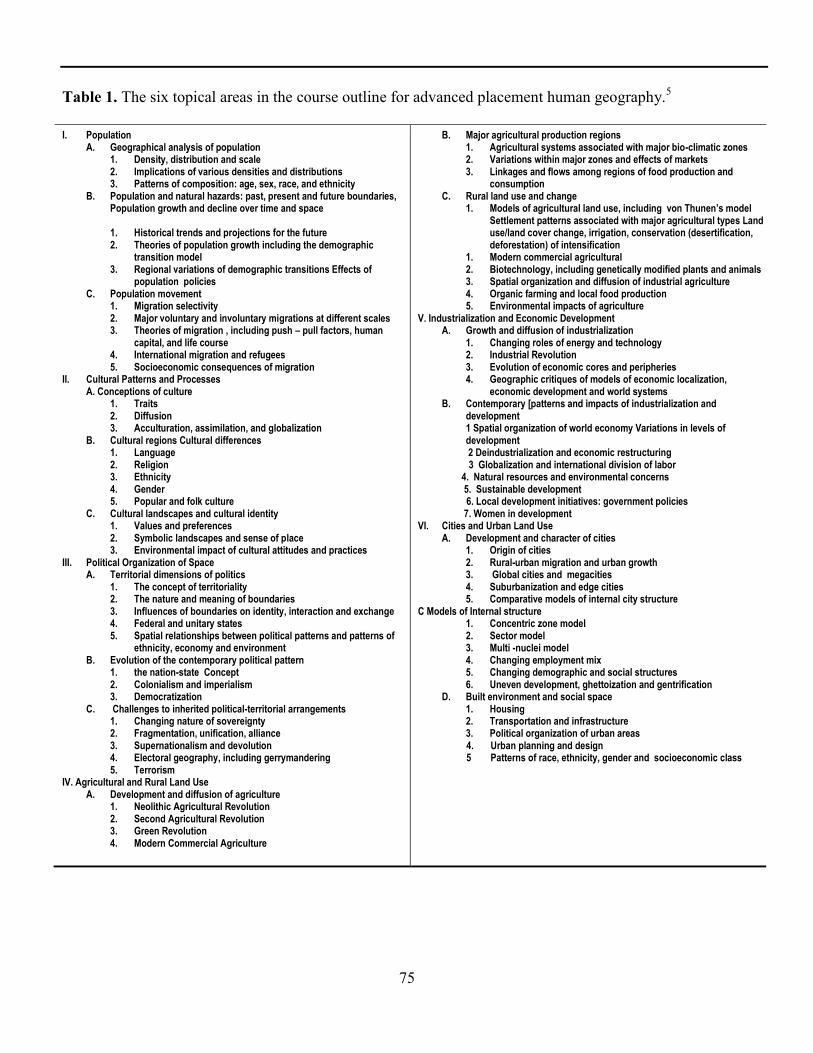
75
Table 1. The six topical areas in the course outline for advanced placement human geography.5 I. Population
A. Geographical analysis of population 1. Density, distribution and scale 2. Implications of various densities and distributions 3. Patterns of composition: age, sex, race, and ethnicity
B. Population and natural hazards: past, present and future boundaries, Population growth and decline over time and space
1. Historical trends and projections for the future 2. Theories of population growth including the demographic
transition model 3. Regional variations of demographic transitions Effects of
population policies C. Population movement
1. Migration selectivity 2. Major voluntary and involuntary migrations at different scales 3. Theories of migration , including push – pull factors, human
capital, and life course 4. International migration and refugees 5. Socioeconomic consequences of migration
II. Cultural Patterns and Processes A. Conceptions of culture
1. Traits 2. Diffusion 3. Acculturation, assimilation, and globalization
B. Cultural regions Cultural differences 1. Language 2. Religion 3. Ethnicity 4. Gender 5. Popular and folk culture
C. Cultural landscapes and cultural identity 1. Values and preferences 2. Symbolic landscapes and sense of place 3. Environmental impact of cultural attitudes and practices
III. Political Organization of Space A. Territorial dimensions of politics
1. The concept of territoriality 2. The nature and meaning of boundaries 3. Influences of boundaries on identity, interaction and exchange 4. Federal and unitary states 5. Spatial relationships between political patterns and patterns of
ethnicity, economy and environment B. Evolution of the contemporary political pattern
1. the nation-state Concept 2. Colonialism and imperialism 3. Democratization
C. Challenges to inherited political-territorial arrangements 1. Changing nature of sovereignty 2. Fragmentation, unification, alliance 3. Supernationalism and devolution 4. Electoral geography, including gerrymandering 5. Terrorism
IV. Agricultural and Rural Land Use A. Development and diffusion of agriculture
1. Neolithic Agricultural Revolution 2. Second Agricultural Revolution 3. Green Revolution 4. Modern Commercial Agriculture
B. Major agricultural production regions 1. Agricultural systems associated with major bio-climatic zones 2. Variations within major zones and effects of markets 3. Linkages and flows among regions of food production and
consumption C. Rural land use and change
1. Models of agricultural land use, including von Thunen’s model Settlement patterns associated with major agricultural types Land use/land cover change, irrigation, conservation (desertification, deforestation) of intensification
1. Modern commercial agricultural 2. Biotechnology, including genetically modified plants and animals 3. Spatial organization and diffusion of industrial agriculture 4. Organic farming and local food production 5. Environmental impacts of agriculture
V. Industrialization and Economic Development A. Growth and diffusion of industrialization
1. Changing roles of energy and technology 2. Industrial Revolution 3. Evolution of economic cores and peripheries 4. Geographic critiques of models of economic localization,
economic development and world systems B. Contemporary [patterns and impacts of industrialization and
development 1 Spatial organization of world economy Variations in levels of development 2 Deindustrialization and economic restructuring
3 Globalization and international division of labor 4. Natural resources and environmental concerns 5. Sustainable development 6. Local development initiatives: government policies 7. Women in development VI. Cities and Urban Land Use
A. Development and character of cities 1. Origin of cities 2. Rural-urban migration and urban growth 3. Global cities and megacities 4. Suburbanization and edge cities 5. Comparative models of internal city structure
C Models of Internal structure 1. Concentric zone model 2. Sector model 3. Multi -nuclei model 4. Changing employment mix 5. Changing demographic and social structures 6. Uneven development, ghettoization and gentrification
D. Built environment and social space 1. Housing 2. Transportation and infrastructure 3. Political organization of urban areas
4. Urban planning and design 5 Patterns of race, ethnicity, gender and socioeconomic class
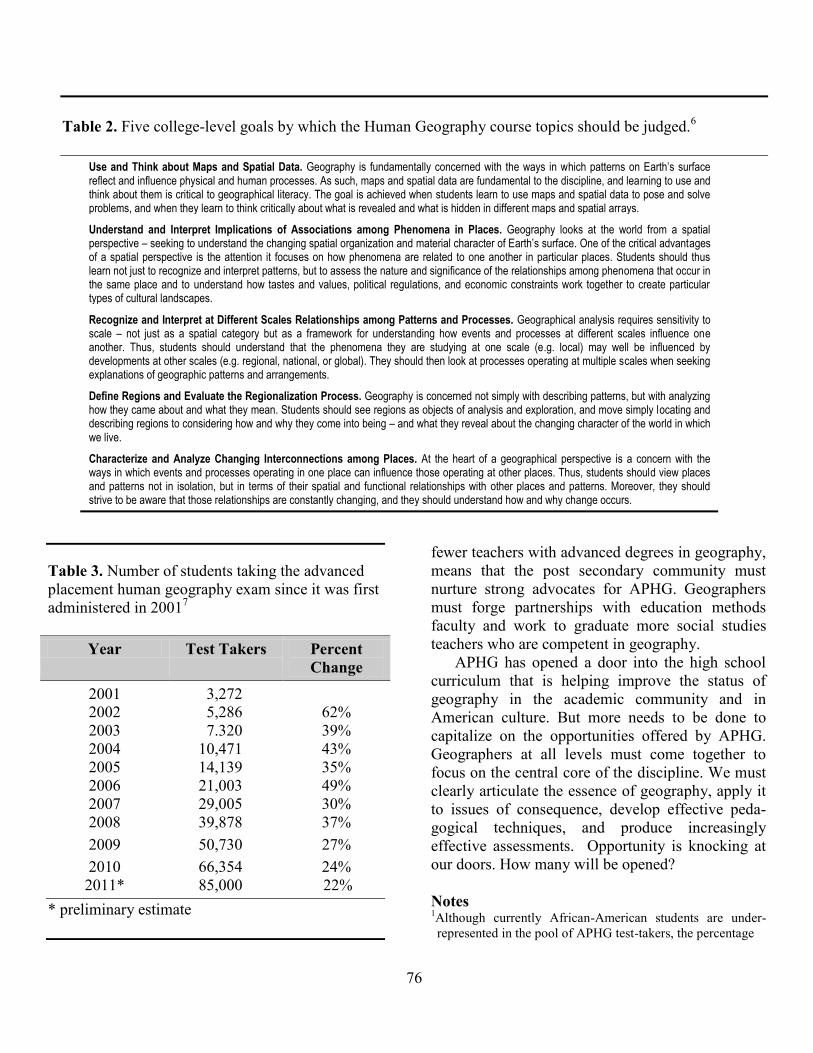
76
Table 2. Five college-level goals by which the Human Geography course topics should be judged.6
Use and Think about Maps and Spatial Data. Geography is fundamentally concerned with the ways in which patterns on Earth’s surface reflect and influence physical and human processes. As such, maps and spatial data are fundamental to the discipline, and learning to use and think about them is critical to geographical literacy. The goal is achieved when students learn to use maps and spatial data to pose and solve problems, and when they learn to think critically about what is revealed and what is hidden in different maps and spatial arrays.
Understand and Interpret Implications of Associations among Phenomena in Places. Geography looks at the world from a spatial perspective – seeking to understand the changing spatial organization and material character of Earth’s surface. One of the critical advantages of a spatial perspective is the attention it focuses on how phenomena are related to one another in particular places. Students should thus learn not just to recognize and interpret patterns, but to assess the nature and significance of the relationships among phenomena that occur in the same place and to understand how tastes and values, political regulations, and economic constraints work together to create particular types of cultural landscapes.
Recognize and Interpret at Different Scales Relationships among Patterns and Processes. Geographical analysis requires sensitivity to scale – not just as a spatial category but as a framework for understanding how events and processes at different scales influence one another. Thus, students should understand that the phenomena they are studying at one scale (e.g. local) may well be influenced by developments at other scales (e.g. regional, national, or global). They should then look at processes operating at multiple scales when seeking explanations of geographic patterns and arrangements.
Define Regions and Evaluate the Regionalization Process. Geography is concerned not simply with describing patterns, but with analyzing how they came about and what they mean. Students should see regions as objects of analysis and exploration, and move simply locating and describing regions to considering how and why they come into being – and what they reveal about the changing character of the world in which we live.
Characterize and Analyze Changing Interconnections among Places. At the heart of a geographical perspective is a concern with the ways in which events and processes operating in one place can influence those operating at other places. Thus, students should view places and patterns not in isolation, but in terms of their spatial and functional relationships with other places and patterns. Moreover, they should strive to be aware that those relationships are constantly changing, and they should understand how and why change occurs.
Table 3. Number of students taking the advanced placement human geography exam since it was first administered in 20017
Year Test Takers Percent Change
2001 3,272 2002 5,286 62% 2003 7.320 39% 2004 10,471 43% 2005 14,139 35% 2006 21,003 49% 2007 29,005 30% 2008 39,878 37% 2009 50,730 27% 2010 2011*
66,354 85,000
24% 22%
* preliminary estimate
fewer teachers with advanced degrees in geography, means that the post secondary community must nurture strong advocates for APHG. Geographers must forge partnerships with education methods faculty and work to graduate more social studies teachers who are competent in geography.
APHG has opened a door into the high school curriculum that is helping improve the status of geography in the academic community and in American culture. But more needs to be done to capitalize on the opportunities offered by APHG. Geographers at all levels must come together to focus on the central core of the discipline. We must clearly articulate the essence of geography, apply it to issues of consequence, develop effective peda-gogical techniques, and produce increasingly effective assessments. Opportunity is knocking at our doors. How many will be opened?
Notes 1Although currently African-American students are under-represented in the pool of APHG test-takers, the percentage
77
of both Latino and Asian/Asian-American students taking the test exceeds their overall share of the population. This is especially important because APHG is the only program actively recruiting minority high school students into college level geography. See Bailey, A. 2003. “Recruiting and preparing students for university geography: advanced Placement Human Geography,” Journal of Geography in Higher Education 2711:7-15.
2College Board, 2005. Human geography course description.” Princeton, NJ: Author, 2005. Available at http://www. collegeboard.com/student/testing/ap/sub_humangeo.html?humangeo (last accessed October 15, 2010).
3Geography Education Standards Project 1994. Geography for life: National Geography Standards 1994. Washington DC: National Geographic Research and Exploration.
4Murphy, A. B. 2000. “Teaching Advanced Place-ment Human Geography: Introduction.” Journal of Geography 99 no. 3/4:.93-96.
5 AP Human Geography Workshop Handbook 2009-2010 College Board New York New York 2009.
6Table 1 was developed following A. B. Murphy, op cit. 7College Board, op cit.. 8Figures presented by Barbara Hildebrandt during a session titled AP Human Geography Workshop at the annual meeting of the National Council for Geographic Education in Birmingham AL, October 13, 2005.
78
Scott L. Walker, ScEdD has an extensive background in teacher education, education technology, geography education, and inter-national education development. His research interests are in psychosocial learning environ-ments, student affective traits, teacher professional development, and transformative learning in community college geography. Dr. Walker coordinates the Geog-raphy and International Studies programs at Northwest Vista Col-lege, in San Antonio, Texas.
Assessment as Art, Assessment as Science: Classroom and High-Stakes Measurement
in Geographic Education Scott L. Walker
The issue of assessment in education has led to frequent discus-sions and strong debates. This situation is not likely to change in the near future. At the 2000 National Council for Geographic Education meeting in Chicago several NCGE leaders spoke about directions for geography education, and Norman Bettis addressed the issue of assessment. In a paper on the topic published after the conference, Bettis summarized “the most pressing assessment issues facing us” into seven overarching themes: (1) alignment between curriculum and assessment, (2) training educators to perform tasks connected with standards-based accountability, (3) teacher time to implement standards-based accountability systems, (4) changes in geography standards-based systems to enhance learning, (5) inappropriate uses of assessment, (6) application of high-stakes testing in making decisions about students‟ progress, and (7) use of technology in delivering assessment.1
The importance of these issues continues today and is reflected in numerous popular and consumer media reports. One example from Houston provides a useful illustration of how assessment results may be misinterpreted. A newspaper reported that SAT scores in the Houston Independent School District were below state and national averages and a large achievement gap existed between minority students and others, in part because of the school system. School board members interviewed by the reporter either jumped to the defense of their district or admitted that the district‟s education programs needed improvement.2 What no one recognized, or at least what was not reported, is that the SAT is a college aptitude test—a self-selected, norm-referenced exam specifically designed to predict future learning in colleges and universities. It is not, as portrayed in the newspaper, a domain-referenced test of student achievement that indicates students‟ learning in a given school system. Furthermore, the College Board clearly publicizes that SAT scores are not valid for ranking or comparing educational programs or teachers. In fact, the Board states that SAT scores “do not reflect the educational attain-ment of all students in a school, district or state.” 3 Clearly, a number of Bettis‟s themes are evident in this example.
Distinctions in Assessment
To advance the assessment discussion some critical distinctions must be made between the art and the science of assessment. The science of learning is conducted by cognitive scientists such as psychologists, neuroscientists and educational psychologists, who develop learning strategies that can be incorporated into teaching practices such as assessment. Other scientists, referred to as psycho-
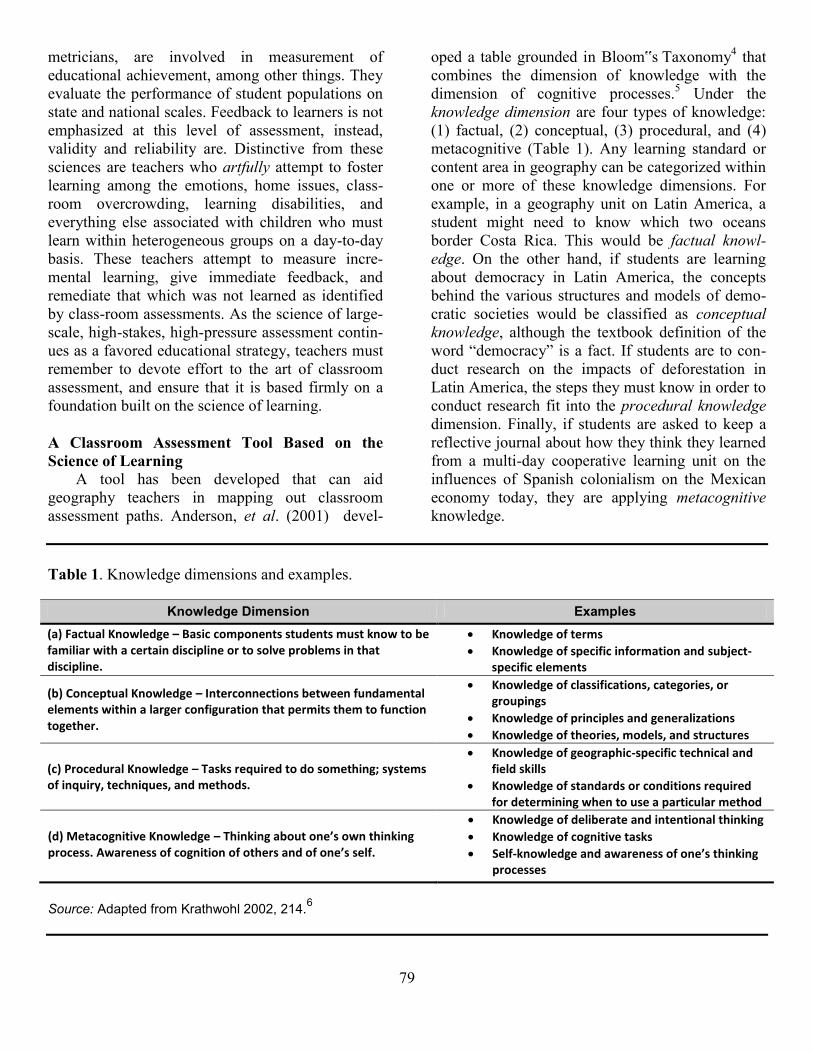
79
metricians, are involved in measurement of educational achievement, among other things. They evaluate the performance of student populations on state and national scales. Feedback to learners is not emphasized at this level of assessment, instead, validity and reliability are. Distinctive from these sciences are teachers who artfully attempt to foster learning among the emotions, home issues, class-room overcrowding, learning disabilities, and everything else associated with children who must learn within heterogeneous groups on a day-to-day basis. These teachers attempt to measure incre-mental learning, give immediate feedback, and remediate that which was not learned as identified by class-room assessments. As the science of large-scale, high-stakes, high-pressure assessment contin-ues as a favored educational strategy, teachers must remember to devote effort to the art of classroom assessment, and ensure that it is based firmly on a foundation built on the science of learning.
A Classroom Assessment Tool Based on the Science of Learning
A tool has been developed that can aid geography teachers in mapping out classroom assessment paths. Anderson, et al. (2001) devel-
oped a table grounded in Bloom‟s Taxonomy4 that combines the dimension of knowledge with the dimension of cognitive processes.5 Under the knowledge dimension are four types of knowledge: (1) factual, (2) conceptual, (3) procedural, and (4) metacognitive (Table 1). Any learning standard or content area in geography can be categorized within one or more of these knowledge dimensions. For example, in a geography unit on Latin America, a student might need to know which two oceans border Costa Rica. This would be factual knowl-edge. On the other hand, if students are learning about democracy in Latin America, the concepts behind the various structures and models of demo-cratic societies would be classified as conceptual knowledge, although the textbook definition of the word “democracy” is a fact. If students are to con-duct research on the impacts of deforestation in Latin America, the steps they must know in order to conduct research fit into the procedural knowledge dimension. Finally, if students are asked to keep a reflective journal about how they think they learned from a multi-day cooperative learning unit on the influences of Spanish colonialism on the Mexican economy today, they are applying metacognitive knowledge.
Table 1. Knowledge dimensions and examples.
Knowledge Dimension Examples (a) Factual Knowledge – Basic components students must know to be familiar with a certain discipline or to solve problems in that discipline.
Knowledge of terms
Knowledge of specific information and subject-specific elements
(b) Conceptual Knowledge – Interconnections between fundamental elements within a larger configuration that permits them to function together.
Knowledge of classifications, categories, or groupings
Knowledge of principles and generalizations
Knowledge of theories, models, and structures
(c) Procedural Knowledge – Tasks required to do something; systems of inquiry, techniques, and methods.
Knowledge of geographic-specific technical and field skills
Knowledge of standards or conditions required for determining when to use a particular method
(d) Metacognitive Knowledge – Thinking about one’s own thinking process. Awareness of cognition of others and of one’s self.
Knowledge of deliberate and intentional thinking
Knowledge of cognitive tasks
Self-knowledge and awareness of one’s thinking processes
Source: Adapted from Krathwohl 2002, 214.6
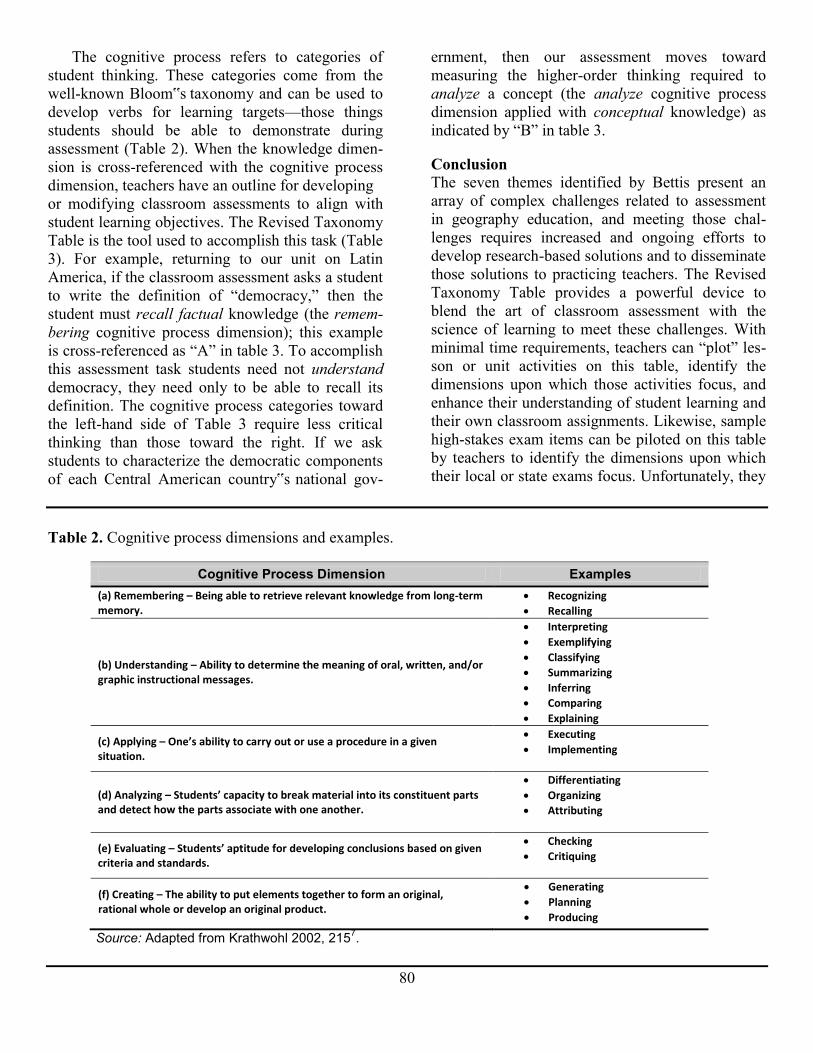
80
The cognitive process refers to categories of student thinking. These categories come from the well-known Bloom‟s taxonomy and can be used to develop verbs for learning targets—those things students should be able to demonstrate during assessment (Table 2). When the knowledge dimen-sion is cross-referenced with the cognitive process dimension, teachers have an outline for developing or modifying classroom assessments to align with student learning objectives. The Revised Taxonomy Table is the tool used to accomplish this task (Table 3). For example, returning to our unit on Latin America, if the classroom assessment asks a student to write the definition of “democracy,” then the student must recall factual knowledge (the remem-bering cognitive process dimension); this example is cross-referenced as “A” in table 3. To accomplish this assessment task students need not understand democracy, they need only to be able to recall its definition. The cognitive process categories toward the left-hand side of Table 3 require less critical thinking than those toward the right. If we ask students to characterize the democratic components of each Central American country‟s national gov-
ernment, then our assessment moves toward measuring the higher-order thinking required to analyze a concept (the analyze cognitive process dimension applied with conceptual knowledge) as indicated by “B” in table 3. Conclusion The seven themes identified by Bettis present an array of complex challenges related to assessment in geography education, and meeting those chal-lenges requires increased and ongoing efforts to develop research-based solutions and to disseminate those solutions to practicing teachers. The Revised Taxonomy Table provides a powerful device to blend the art of classroom assessment with the science of learning to meet these challenges. With minimal time requirements, teachers can “plot” les-son or unit activities on this table, identify the dimensions upon which those activities focus, and enhance their understanding of student learning and their own classroom assignments. Likewise, sample high-stakes exam items can be piloted on this table by teachers to identify the dimensions upon which their local or state exams focus. Unfortunately, they
Table 2. Cognitive process dimensions and examples.
Cognitive Process Dimension Examples (a) Remembering – Being able to retrieve relevant knowledge from long-term memory.
Recognizing
Recalling
(b) Understanding – Ability to determine the meaning of oral, written, and/or graphic instructional messages.
Interpreting
Exemplifying
Classifying
Summarizing
Inferring
Comparing
Explaining
(c) Applying – One’s ability to carry out or use a procedure in a given situation.
Executing
Implementing
(d) Analyzing – Students’ capacity to break material into its constituent parts and detect how the parts associate with one another.
Differentiating
Organizing
Attributing
(e) Evaluating – Students’ aptitude for developing conclusions based on given criteria and standards.
Checking
Critiquing
(f) Creating – The ability to put elements together to form an original, rational whole or develop an original product.
Generating
Planning
Producing
Source: Adapted from Krathwohl 2002, 2157.
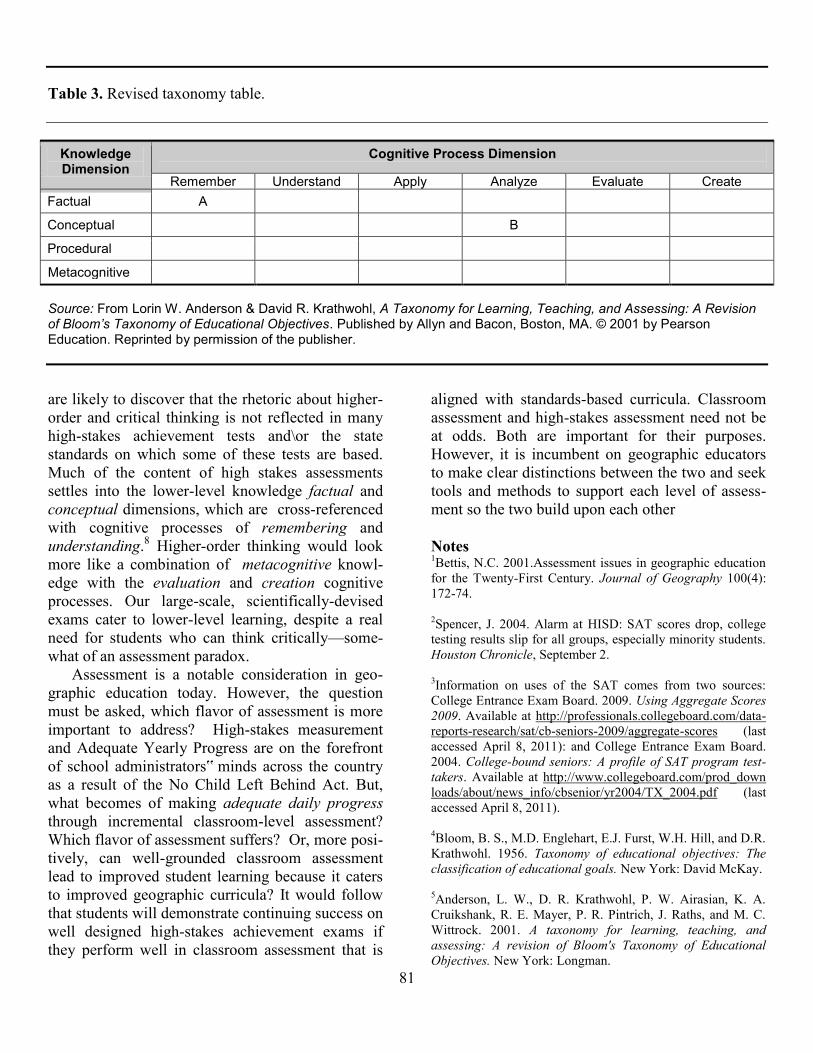
81
Table 3. Revised taxonomy table.
Knowledge Dimension
Cognitive Process Dimension
Remember Understand Apply Analyze Evaluate Create Factual A
Conceptual B
Procedural
Metacognitive Source: From Lorin W. Anderson & David R. Krathwohl, A Taxonomy for Learning, Teaching, and Assessing: A Revision of Bloom’s Taxonomy of Educational Objectives. Published by Allyn and Bacon, Boston, MA. © 2001 by Pearson Education. Reprinted by permission of the publisher.
are likely to discover that the rhetoric about higher-order and critical thinking is not reflected in many high-stakes achievement tests and\or the state standards on which some of these tests are based. Much of the content of high stakes assessments settles into the lower-level knowledge factual and conceptual dimensions, which are cross-referenced with cognitive processes of remembering and understanding.8 Higher-order thinking would look more like a combination of metacognitive knowl-edge with the evaluation and creation cognitive processes. Our large-scale, scientifically-devised exams cater to lower-level learning, despite a real need for students who can think critically—some-what of an assessment paradox.
Assessment is a notable consideration in geo-graphic education today. However, the question must be asked, which flavor of assessment is more important to address? High-stakes measurement and Adequate Yearly Progress are on the forefront of school administrators‟ minds across the country as a result of the No Child Left Behind Act. But, what becomes of making adequate daily progress through incremental classroom-level assessment? Which flavor of assessment suffers? Or, more posi-tively, can well-grounded classroom assessment lead to improved student learning because it caters to improved geographic curricula? It would follow that students will demonstrate continuing success on well designed high-stakes achievement exams if they perform well in classroom assessment that is
aligned with standards-based curricula. Classroom assessment and high-stakes assessment need not be at odds. Both are important for their purposes. However, it is incumbent on geographic educators to make clear distinctions between the two and seek tools and methods to support each level of assess-ment so the two build upon each other
Notes 1Bettis, N.C. 2001.Assessment issues in geographic education for the Twenty-First Century. Journal of Geography 100(4): 172-74. 2Spencer, J. 2004. Alarm at HISD: SAT scores drop, college testing results slip for all groups, especially minority students. Houston Chronicle, September 2. 3Information on uses of the SAT comes from two sources: College Entrance Exam Board. 2009. Using Aggregate Scores 2009. Available at http://professionals.collegeboard.com/data-reports-research/sat/cb-seniors-2009/aggregate-scores (last accessed April 8, 2011): and College Entrance Exam Board. 2004. College-bound seniors: A profile of SAT program test-takers. Available at http://www.collegeboard.com/prod_down loads/about/news_info/cbsenior/yr2004/TX_2004.pdf (last accessed April 8, 2011). 4Bloom, B. S., M.D. Englehart, E.J. Furst, W.H. Hill, and D.R. Krathwohl. 1956. Taxonomy of educational objectives: The classification of educational goals. New York: David McKay. 5Anderson, L. W., D. R. Krathwohl, P. W. Airasian, K. A. Cruikshank, R. E. Mayer, P. R. Pintrich, J. Raths, and M. C. Wittrock. 2001. A taxonomy for learning, teaching, and assessing: A revision of Bloom's Taxonomy of Educational Objectives. New York: Longman.

82
6Krathwohl, D.R. 2002. A revision of Bloom‟s taxonomy: An overview. Theory into Practice 41(4):212-19. 7Ibid.
8Walker, S. L. 2007. Early instruction in geography: An exploration in the ecology of kindergarten and first grade geography education. Journal of Geography 106(3):123-31.
83
Charles F. ―Fritz‖ Gritzner is Distinguished Professor Emeritus of Geography at South Dakota State University in Brookings. Dr. Gritzner has served as both Pres-ident and Executive Director of the National Council for Geo-graphic Education (NCGE) and has received the Council’s highest honor, the George J. Miller Award for Distinguished Service to Geo-graphic Education, as well as numerous other national teaching, service, and research recognitions from the NCGE, the Association of American Geographers, and other organizations
The What and Why of Geography1 Charles F. Gritzner
What Is Geography?
Defining geography is no easy task. Indeed, few fields of study seem to be more fuzzy in the minds of laymen and educators alike. Many people confuse geography with geology; after all, both sciences share a common interest in geo (Earth) and the distinction between graphy (Greek: to write about, or describe) and logy (Greek: to dis-course, or speak about; science) seems rather insignificant! Some believe that geographers are people who travel to exotic places, take great photographs, and publish accounts of their adventures in National Geographic Magazine. Still others associate geography with laborious and sterile memorization of states, capitals, the length of rivers and height of mountains, and leading products of the world‟s countries—a sterile exercise that contributes to a “load on the memory, rather than a light in the mind.” Perhaps the most commonly held perception about geographers is our fascination with maps and what they can tell us about places.
To the trained geographer, all but the last of the foregoing per-ceptions seem rather strange! After all, as a recognized body of knowledge and as a unique methodology applied to the study of Earth‟s varied physical and human features and conditions, geog-raphy is hardly the “new kid on the block.” In fact, geography is the most ancient of the existing sciences! Its origin is traced to ancient Greek Cosmography (The comprehensive study of Earth and the Cosmos), and the term geography (first used by the Greek scholar Eratosthenes ca. 200 BC) has been around for more than 2,200 years!
Actually, there are many definitions of geography (Over the years, I have catalogued more than 100 of them). Whereas geog-raphers may not always agree on a single definition of their field of study, a considerable amount of agreement exists within our com-munity concerning the fundamental nature of this unique discipline. Most simply stated, geographers seek to understand “What is where, why (is it) there, and why (should we) care?” in regard to the varied physical and human features appearing on Earth‟s surface. Applica-tion of this unique geographic (spatial) method helps one better understand the complex and seemingly bewildering distribution of Earth‟s features, conditions, interrelationships, distributions, and patterns.
A key to understanding the nature of geography rests in the realization that the science is based not on what geographers study but on how we organize and analyze information pertaining to any of Earth‟s physical or cultural features. Geography is a correlative, integrative, holistic science. In an age of increasing scientific com-partmentalization, geography provides a bridge of understanding that links otherwise fragmented information from the natural and social sciences, the arts and humanities and history. It presents information from the natural and social sciences, the arts and humanities, and his-
84
tory. It presents information in a spatial (location and distribution) organizational framework. The geographic approach is a methodology, a unique way of organizing and analyzing information—information pertaining literally to anything that can be identified, located, mapped, and analyzed in terms of its spatial location and distribution.2
One of the most fundamental assumptions of geographic study is that once a particular feature, or set of features, is spatially depicted (mapped), the resulting pattern(s) can be explained by identifying and analyzing various processes and interrelation-ships, which, functioning through time and space, have contributed to their occurrence. Obvious examples include the relationship that exists between a particular type of climate and its associ-ated vegetation, animal life, water features, soil, landforms, and land use potential. In human geog-raphy examples are evident in the relationship between a culture and its associated economic activity, technology, belief and communication sys-tems, social customs and governance, diet, percep-tions, and landscape imprint.
Geographers study Earth‟s features in a variety of ways when organizing, analyzing, and presenting information—be it on a local, regional, or global scale. The most commonly employed traditions are: (1) spatial analysis, in which selected features are studied in the context of their location, spatial ar-rangement or pattern, and their relationship to other features, (2) culture-environment relationships (cultural ecology), which focus upon cultural per-ceptions of and adaptation to environmental condi-tions, including resource potentials and use, and environmental change, (3) the cultural landscape approach, in which human activities are studied in space and time for the purpose of better under-standing the human imprint on Earth‟s surface, and (4) the regional concept, which is used in iden-tifying, describing, and explaining patterns of relative homogeneity on Earth‟s surface. Consider-able overlap exists between and among the four traditions. In teaching, geographic information can be integrated using five concepts or themes: location (position on Earth‟s surface), place (physical and human features and conditions), interaction (the ways in which humans culturally adapt to, use, and change Earth‟s natural environ-ments), movement (uneven flow of natural elements,
people, materials, and ideas), and region (areas in which one or more conditions are similar).
Regardless of the particular traditions or themes employed in geographic study, an historical (tem-poral) dimension is essential. Only by understand-ing past events, processes, interrelationships, and patterns can one fully understand those agents that have contributed to the evolution of contemporary features, conditions, and distributions. “The pre-sent,” as the late geographer Erhard Rostlund so eloquently noted, “is the fruit of the past and contains the seeds of the future.”
Might the foregoing information explain the prominence of geography in the curriculum of nearly all countries within the developed world, and in many others as well? Might it also explain, at least in part, why geography has languished in the American curriculum? Where, after all, can a “place” be found for a science claiming to be both physical and cultural, as well as both spatial and temporal, in a rigid curriculum employing a stultify-ing and unrealistic “pigeon hole” approach to the organization and compartmentalization of knowl-edge? Few educators fail to recognize the import-ance of history‟s temporal (when?) perspective; why is it, then, that so few educators and other Americans seem capable of grasping the vital importance of geography‟s spatial (where?) pers-pective? All things that occurred sometime, after all, also occur(red) someplace. Finally, geography is a dynamic science. It has been called “Learning for living.”
Few sciences can offer a more immediate or direct benefit in terms of daily living as a member of an increasingly diverse, complex, often conflict-ing, and increasingly confusing world. In addition to its intrinsic values, today geography offers a world of vocational opportunities in a broad variety of fields including government, business, education, and private enterprise.
Why Geography?
Never has a nation possessed more information or been in command of more sophisticated means of acquiring, disseminating, and analyzing data than do contemporary Americans. GPS, GIS, the Inter-net, satellite imagery . . . the list goes on and on. Yet given these potential means of enhancing our geographic awareness and global understanding,
85
most Americans—living in a Global Age—continue to possess little more than a Stone Age awareness of the world in which we live and upon which we increasingly depend for our very survival.
To individuals lacking a well-developed "mental map" of Earth‟s surface, with its varied mosaic of physical and human conditions, our planet must appear as a vague, fragmented, and incredibly con-fusing hodgepodge of meaningless phenomena randomly scattered on an all but bare tabula rasa. Theirs is a world inhabited by faceless peoples whose cultures lack a proud heritage, bonding insti-tutions and customs, feelings and values, tools and technologies, and essential dimensions of space and time. Places, to the geographic illiterate, are mean-ingless in terms of those unique physical and human features that give each spot on Earth‟s surface its own distinctive character. And the clustering of places by the location and distribution of similar features into regions holds little if any meaning or relevance to those who are unaware of their nature and importance. Their world is composed of vaguely imaged physical features and environ-mental systems for which they lack appropriate terminology, valid mental images, or understanding of causative agents or processes. Those who are ignorant of basic geographic principles also have little knowledge of environmental potentials and limitations. How can they possibly be expected to make enlightened decisions relating to the use and sustainability of our finite global natural endow-ment?
To persons with a blank mental map, temporal events occurred in a spatial vacuum in which his-tory and geography are unlinked in space and time. Such individuals, although constantly confronted by critical problems and issues, sadly lack reasoned criteria on which to base rational analyses, judg-ments, or attempts at resolution. To the geographi-cally unaware, human differences often appear to be threatening and can constitute the basis for feelings of prejudice and acts of discrimination. Such indi-viduals are prisoners of their own ignorance and provincialism. How poorly equipped they are to assume meaningful citizenship in the increasingly intradependent global community!
It stands as a rather sad and somewhat inexplic-able indictment of this country's public priority and educational system that among the world's educated industrial societies, Americans rank among the least
literate in geographic knowledge and, perhaps worse, in curiosity. Examples of geographic illiter-acy are numerous. So are the increasingly apparent, appalling, and often damaging consequences—be they social, economic, political, military, or envi-ronmental—of our failure to provide citizens with adequate geographic instruction.
In most countries of the Western urban-industrial world (and in many Less Developed Countries as well), geography constitutes the "core" of the social science curriculum. The United States is unique among these nations in relegating geography to a relatively minor role in both the elementary and secondary curriculum. Consider-able progress has been made in terms of enhancing the position of geography in the curriculum during recent years, particularly through the various initi-atives of the National Geographic Society. It remains a sad and somewhat shocking indictment of our educational priorities, however, that most of the world's educated people are much better informed about the world (and often about the United States!) than are the majority of our own citizens.
In an increasingly complex, troubled, and closely intertwined global community of cultures and nations, Americans simply do not know much about our global neighbors (or, for that matter, even about ourselves in a geographic sense). We have little understanding of or feeling for distant lands and peoples. We are largely ignorant of their resources, capabilities, and attainments. And we are ignorant of their cultural similarities and differ-ences, of their hopes and dreams, and of their problems and needs. Perhaps of greatest import-ance, we fail to understand how important they have become to us and we are to them. How can Americans expect to maintain a position of leadership, strength, and respect within a world of nations about which we know—and seemingly care—so little?
Now, more than ever, citizens can ill-afford to remain ignorant of the world about us. The com-pression of time and space resulting from the technological "explosion" has placed even our most remote neighbors at our very doorstep. It is essen-tial that all Americans understand and appreciate their role and responsibility in an increasingly complex global community. Each of us must be aware of Earth‟s fundamental physical and cultural patterns; of its key locations, distributions, patterns,
86
and divisions; and of its primary linkages, move-ments, networks, and systems. We also must under-stand our planet‟s basic areas of resource and commodity production and consumption, its major spatial interrelationships, and—as events of 9/11 and our efforts in the Middle East have made abun-dantly clear—conflicts and their importance. A populace that remains largely ignorant of funda-mental geographic knowledge surely limits the ability of a nation to function well and compete suc-cessfully within the global community.
Is it not time to ensure that all students—kin-dergarten through college—be given the key to world understanding that a rigorous geography curriculum can provide? Few people question the need for history education; why, then, do so many question the importance of geography? History is but a recording of past geographies; if we live a “good geography,” we shall leave a good history. Geography is the ancient and time-honored field of study that can best provide the essential knowledge
needed to ensure that our citizens are prepared to assume responsible and enlightened leadership in the complex and demanding global community.
T. S. Eliot wrote, "We shall not cease from exploration, and the end of all our exploring will be to arrive where we started and to know the place for the first time." Today, we certainly must think globally and act locally. By better knowing the world about us, we come to better know ourselves whether at home, or as members of the global community.
Notes 1 This essay draws from various published essays by the author, including: Gritzner, C.F. 2002. What Is Where, Why There, and Why Care? Journal of Geography 101(1):38-40; and Gritzner C.F. 2003. Why Geography? Journal of Geog-raphy 102(2):90-91. 2History, too, is a methodology that can easily be contrasted with geography. Geographers ask ―what, where, and why?‖ whereas historians ask ―what, when, and why?‖

87