Language, literacy, and learning in STEM education: Research methods and perspectives from applied...
21
is is a contribution from Language, Literacy, and Learning in STEM Education. Research Methods and Perspectives from Applied Linguistics. Edited by Mary Jane Curry and David I. Hanauer. © . John Benjamins Publishing Company is electronic le may not be altered in any way. e author(s) of this article is/are permitted to use this PDF le to generate printed copies to be used by way of oprints, for their personal use only. Permission is granted by the publishers to post this le on a closed server which is accessible to members (students and sta ) only of the author’s/s’ institute, it is not permitted to post this PDF on the open internet. For any other use of this material prior written permission should be obtained from the publishers or through the Copyright Clearance Center (for USA: www.copyright.com). Please contact [email protected] or consult our website: www.benjamins.com Tables of Contents, abstracts and guidelines are available at www.benjamins.com John Benjamins Publishing Company
Transcript of Language, literacy, and learning in STEM education: Research methods and perspectives from applied...

!is is a contribution from Language, Literacy, and Learning in STEM Education. Research Methods and Perspectives from Applied Linguistics. Edited by Mary Jane Curry and David I. Hanauer.© "#$%. John Benjamins Publishing Company
!is electronic &le may not be altered in any way.!e author(s) of this article is/are permitted to use this PDF &le to generate printed copies to be used by way of o'prints, for their personal use only.Permission is granted by the publishers to post this &le on a closed server which is accessible to members (students and sta') only of the author’s/s’ institute, it is not permitted to post this PDF on the open internet.For any other use of this material prior written permission should be obtained from the publishers or through the Copyright Clearance Center (for USA: www.copyright.com). Please contact [email protected] or consult our website: www.benjamins.com
Tables of Contents, abstracts and guidelines are available at www.benjamins.com
John Benjamins Publishing Company

© !"#$. John Benjamins Publishing CompanyAll rights reserved
chapter 6
Graphics and invention in academic engineers’ writing for publication
Mary Jane CurryUniversity of Rochester
)is chapter explores how academic engineers write for publication, focusing on “invention” – that is, moments when writers identify the research results they want to present and decide on the arguments they want to make in an article. A key *nding presented is that beyond the well-documented role of graphics in displaying research results, graphics also play a crucial heuristic role in invention. )is *nding emerged from an ethnographic study of three engineering research groups, which entailed the analysis of a range of qualitative data to o+er perspectives on the experiences of academic engineers writing for publication. Drawing on this research, the chapter documents that in developing texts for publication, engineers o,en begin with the graphic results of data analysis to identify *ndings and begin to cra, arguments. Further, in research group and informal meetings, engineers invoke the notion of storytelling through graphics as they socialize their group members into the practices of research dissemination via posters and articles.
Introduction
A chief feature of communications practices in the *eld of engineering is multi-modality, as Mathison (2000) notes: “an engineer’s way of knowing involves mul-tiple symbol systems, some of which are verbal and some of which are numerical and visual” (p. 75; see also Amare & Manning 2007; Archer 2006; Selzer 1983). Research has identi*ed the recursive interplay between text and graphics in the communication of engineering knowledge by undergraduate students (Archer 2006) and engineers in the workplace (Hutto 2007; Lloyd 2000). In presenting new knowledge, “visual representations of data are the work horses of argument,” as Poe, Lerner, and Craig (2010, p. 115) claim in their overview of graphics and the scienti*c research article. Graphics therefore appear to be integral to the con-struction of knowledge and its communication across a range of contexts in which
© !"#$. John Benjamins Publishing CompanyAll rights reserved
!! Mary Jane Curry
engineering texts are produced. )is chapter focuses on the heuristic role that graphics play in invention in the professional writing practices of academic engi-neers. Addressing the need for more empirical understandings of how scientists and engineers write, it presents *ndings from a three-year ethnographic study of the research dissemination practices of academic engineers (faculty members and their research group members), as they write professional genres such as confer-ence papers/posters and journal articles. Ethnographic research can provide a window onto engineers’ actual writing practices, enabling us to document prac-tices and the perspectives of writers. Because it adopts an insiders’ or “emic” per-spective on particular social practices, ethnographic research enables an analysis of engineers’ writing practices in terms of their meaning for both writers and the construction of disciplinary knowledge.
In this chapter I argue that (a) engineers o,en envision and construct the argu-ment of a paper through the graphics (visuals such as tables, *gures, and plots) that they generate in data analysis – thus in their writing visuals play a more central role than simply as illustrations for previously determined research *ndings and argu-ments; (b) the work of constructing *ndings and articulating arguments in text is a social, rather than an individual, practice; and (c) engineering faculty mem-bers use the metaphor of storytelling to conceptualize the development of a paper’s argument and to persuade their readers. Faculty members draw on this storytelling metaphor to advise post-doctoral fellows, graduate students, undergraduates, and technicians working on speci*c projects as well as writing more generally.
)e chapter *rst reviews the literature on multimodality and academic writing, then discusses the theoretical framework of academic writing as a predominantly social rather than individual practice (Curry 2003; Lea & Street 2006; Lillis & Scott 2007). I link this theoretical stance to the social turn in understandings of the rhe-torical notion of invention (Lauer 2004; LaFevre 1987). A,er describing the three-year ethnographic study of engineering research groups, I present my *ndings about graphics and invention. I conclude with a discussion of the value of ethno-graphic research for understanding what goes on in the professional communica-tion practices of engineering faculty members and students. )ese *ndings have implications for teaching and advising students and early career scholars about cru-cial communication practices in engineering, and by extension, other STEM *elds.
!eoretical framework: Engineering writing as multimodal social practice
Social practices are repeated patterns of activity aimed at particular purposes, such as, here, publishing and presenting academic research (Wenger 1998). A social practice perspective takes account of the range of activities comprising a practice
© !"#$. John Benjamins Publishing CompanyAll rights reserved
Chapter 6. Graphics and invention in academic engineers’ writing !"
and considers how people learn the practice. It posits that learning occurs through increasing participation in valued practices, o,en under the guidance of more expert members (Barton & Tusting 2005). A social practice perspective helps with understanding how students, for example, gain access to academic knowledge-making practices (Lillis 2001). In the present study, learning academic publishing practices involves interactions among students, post-doctoral fellows, and faculty research group leaders. It illustrates what Lea and Street (2006) describe as an aca-demic socialization model, in which learners are seen to participate in “the ways of talking, writing, thinking, and using literacy that typify members of a disciplinary or subject area community” (p. 368).
Scholars concerned with learning about the communication practices of aca-demic disciplines have focused on novices producing writing that meets speci*c genre expectations in educational and workplace settings (e.g. Li 2002, 2005; Poe et al. 2010; Winsor 1992). In the *eld of composition studies, a predominant focus on the individual student has reinforced the notion that invention is a stage of writing that takes place before writing (as in ‘pre-writing’ in the process approach to writing) as well as being an individual practice (Bawarshi 2003). Invention, according to a summary by Odell and Swersey (2003, p. 40), was “for Aristotle, the discovery of persuasive arguments; for modern rhetoric, the formulation and artic-ulation of ideas” – or the “discovery and creation models” of invention (Hawhee 2002, p. 17). Instead, Hawhee proposes the notion of “invention-in-the-middle,” which connects to social practice theories by acknowledging that generating ideas and developing arguments occur in social encounters. )ese encounters include the collaborative writing that characterizes engineering (Gimenez & )ondhlana 2012; Winsor 1994) and indeed encounters taking place in an “individual” writer’s head, as writers are always knowingly or unknowingly responding to the voices of others (Bakhtin 1986; LaFevre 1987; Lillis 2003).
Problematizing notions of the nature of engineering writing itself, Winsor (1992) argues that research data per se – represented as tables, *gures, charts, and other graphics – in fact constitute a form of writing. In Winsor’s study, “the engi-neer actually worked very hard to make these written traces [of research activity] appear” in his text (p. 342). She advocates that researchers move beyond “the insis-tence on the presence of words [that] comes from the deeply ingrained idea that writing is recorded speech” (p. 342; see also Winsor 1994). )is perspective aligns with research pinpointing academic knowledge as increasingly being constructed and presented through a range of modalities (Bezemer & Kress 2008; Hanauer 2006). For example, in ethnographically studying the “linguistic landscape” of a microbiology laboratory, Hanauer (2009) documents how scientists and students graphically represented the knowledge they were constructing in the laboratory and used such representations (e.g. conference posters) as learning tools. Likewise,
© !"#$. John Benjamins Publishing CompanyAll rights reserved
"# Mary Jane Curry
Dicks, Flewitt, Lancaster and Pahl (2011) argue for the value of ethnography in studying multimodality, claiming that “any instance of literacy is in fact a multi-modal ‘event’” (p. 230). Nevertheless, considerations of multimodality have o,en been downplayed in relation to the written word, as I discuss next.
Research on writing for publication in science and engineering
While some of the literature on scientists writing for publication (e.g. Bazerman 1988; Knorr-Cetina 1981; Latour & Woolgar 1979) makes passing note of the graphic display of research *ndings, most researchers do not closely examine its role.1 However, in a rare study of the interactions among scientists as they write for publication, Rymer (1988) documents how nine “esteemed” biochemists write articles. Among her *ndings, she points to the generative role of graphics:
Some invention procedures – using graphs, tables of data, and the author’s own previous papers as planning devices – characterize all the [scientists’] practices. Typically, *gures and tables of the data … function as visual aids to invention and as organizing points during planning and dra,ing. (p. 220)
In contrast to Rymer’s apparent assumption that graphical representations of data have a function in invention, the literature on scientists learning to write for pub-lication concentrates on the social practices of writing. For instance, Blakeslee’s (1997) study of collaboration among a physics graduate student, post-doctoral fel-low, and faculty member in a research group describes the student dra,ing his *rst article. Although she discusses the visual display of information, it is only mentioned as embedded in a data extract about how the student approaches the presentation of “information appropriate for their auditors.” )e student recounts:
When I say what kind of results, I mean what kind of *gures – like all these tables I have to get rid of [in the revision]. Now I have to decide what to put instead. I’ll base my decision on results on which ones actually show that one method is better than another. (p. 146)
Here again, however, graphics receive only -eeting attention. In engineering spe-ci*cally, the literature on writing for publication has mainly analyzed published texts and genres (e.g. Koutsantoni 2006; Luzon 2005; Shehzad 2006) or described and evaluated workshops and other instructional activities (Alford & Stubble*eld
$. In fact, none of the 40 studies that Swales (1990) includes in Table 3, ‘Overview of the Textual Studies of the English RA [Research Article]’, focuses on the role of graphics; article structure is the primary concern of many researchers.

© !"#$. John Benjamins Publishing CompanyAll rights reserved
Chapter 6. Graphics and invention in academic engineers’ writing "$
2002; Leydens & Olds 2007). Of the few investigations of professional engineers’ writing practices, Shaw’s (2010) study of the research report as deployed in the dis-tinct but related domains of academia and industry demonstrates the relationship of context, purpose, and expertise in writing for di+erent audiences. In a recent study of engineers writing for publication, Chiu (2011) focuses on two early career Taiwanese scholars. One of them, a mechanical engineer, Eric, “wrote the *rst dra, only a,er organizing experiment data and discussing the major *ndings with his advisor and lab mates. … Eric negotiated with his data and tried hard to *nd a perspective by which to present his claims” (p. 472). Perhaps in foregrounding scholars’ use of English as an additional language, this article presents *ndings about their “extensive reading and textual borrowing strategies” (p. 472) but does not explore the role of graphics. Overall, then, much of the literature on writing science and engineering journal articles mentions graphics only incidentally, with little sustained exploration of its role in writing. However, as Graves (2005) cau-tions in discussing scholarly publications:
the process of creating the knowledge presented in academic articles is complex and multifaceted, suggesting that conclusions about a particular academic discipline that use as their evidence only the product – the written and published article – do not represent the whole story especially if claims about process are extrapolated from the written text. (p. 255)
)e paucity of research on the practices of academic engineers writing for publica-tion was one prompt for the present study, which I turn to next.
Methodology of the larger study
)is paper comes from a larger study, “Publishing Engineering Writing” (PEW), whose primary research question was: “In what experiences or activities do engi-neering faculty members, post-doctoral research fellows, and students engage in writing for research publication?” In this chapter I address two sub-questions:
– What are the professional writing practices of academic engineers? – How do engineering students and post-doctoral research fellows learn the
practices of writing for publication?
Ethnographic methodology o+ers an approach to understanding the lived experi-ences of writers in terms of their practices over time (Kress 2011; Lillis 2008). Eth-nographic methods of data collection include participant observation of speci*c contexts; video- and audio-taping of speci*c events; conducting focus groups; and holding individual interviews. To study the practices of writing for publication,

© !"#$. John Benjamins Publishing CompanyAll rights reserved
"% Mary Jane Curry
the PEW study adopts the “text-ethnographic” methodology developed to explore writing for publication within speci*c contexts of production (Lillis & Curry 2006, 2010). Text-ethnographic methods include the collection of texts written for publication as well as other relevant documents including participants’ corre-spondence with journal gatekeepers. Analytic methods used in text-ethnographic methodology follow the principles of modi*ed grounded theory (Charmaz 2006). )is approach involves multiple readings of interview/meeting transcripts, *eld notes, and documentary data in order to create codes, categories and themes that signal speci*c research *ndings. Researchers then validate the analytic *ndings partly by means of member checking, that is, presenting preliminary *ndings to research participants for feedback.
Study setting and participants
)e PEW study took place over three years at a U.S. engineering school with 81 tenure-track faculty members. )e three faculty members and research groups that participated were representative of the school in terms of gender, race, and national/ethnic origin. However, they came from only two sub-disciplines, albeit large departments: electrical and computing engineering and biomedical engi-neering. Table 6.1 shows the composition of each research group (names are pseudonyms).
Table 6.1. Participants in the PEW study research groups
Research group
Head Members Gender Countries of origin
A Professor Arthur, a white, male, distinguished full professor and department chair
13 students and post-doctoral research fellows
3 women10 men
United States, East Asia, South Asia, central Europe
B Professor Brown, a white, male, full professor and former department chair
six students and post-doctoral fellows
1 woman5 men
United States, East Asia, central Europe
C Professor Courts, a white, female associate professor (also collaborating with two faculty colleagues, one at this university and one at another institution)
six students, one post-doctoral research fellow, three technical sta+ members
5 women5 men
United States, East Asia, South Asia
Data collection consisted of audio- and video-recorded focus groups with various sub-groups (female faculty, female undergraduates, users of English as an additional language); 47 audio- and video-recorded individual semi-structured interviews with the participants; more than 100 audio and/or video recorded
© !"#$. John Benjamins Publishing CompanyAll rights reserved
Chapter 6. Graphics and invention in academic engineers’ writing "&
participant observations, with attendant *eld notes made of formal and informal meetings including Professor Courts’s weekly meeting; and multiple dra,s of more than 50 texts written for presentation and publication.2 Interviews and selected meeting recordings were transcribed and data were analyzed using modi*ed grounded theory, as described above. Various data sources were transcribed and coded by me and members of my research team over the three years of data col-lection and two subsequent years of analysis. Using emerging codes and themes, data were coded independently by research assistants. Resulting analyses were compared, then codes and themes adjusted and reapplied to coded and new data. Ethnography enables us to triangulate emerging understandings of participants’ practices by drawing on complementary data sources. In this case, triangulation allowed us to compare participants’ self-reports with descriptions of these prac-tices from their collaborators and the researcher team’s documentation of prac-tices. Dra,s of this paper have been shared with participants, who con*rmed our analyses of their experiences and practices.
Findings: Graphics as invention in writing for publication
As mentioned, two key and related *ndings from the ethnographic study are that (a) graphics function as invention heuristics in the professional writing of academic engineers and (b) academic engineers convey these practices to those working with them either implicitly through shared practices or explicitly in dis-cussion, o,en invoking the notion of storytelling. In this section, I use extracts from individual and focus group interviews to construct an overview of the fac-ulty members’ practices in directing their research groups’ writing activities. )en, drawing on observational data and recordings as well as interview data, I describe a meeting that Professor Courts held in order to begin conceptualizing a paper.
As noted, the three engineering faculty members were highly successful, con-ducting and publishing research in their sub-disciplines that was funded by large grants and supporting a number of Ph.D. students and post-doctoral fellows. An important writing and teaching practice shared by the engineering faculty mem-bers was to assign to group members the initial dra,ing of papers and conference posters, to which the faculty members then responded. However, the majority of
%. My gratitude to research assistants Hairong Shang, Hee-Jeong Oh, Nan Zhang, Rachel Cha!ee, Farzana Hafsa, and Qiao Li for support in data collection, management, and analysis over the life of the project. "anks also go to my doctoral student group, which read an earlier dra# of this paper, as well as to Julio Gimenez, David Hanauer, and Fredricka Stoller for their suggestions. Earlier versions of this paper were presented at conferences of the Canadian Asso-ciation of Applied Linguistics (2009) and the Symposium on Second Language Writing (2010).

© !"#$. John Benjamins Publishing CompanyAll rights reserved
"' Mary Jane Curry
their other practices for engaging group members in preparing conference post-ers and writing articles di+ered, which a+ected my own research team’s access to observing their practices. For example, Professor Arthur rarely held meetings with his entire group, which was the largest of the participating groups; rather, he moved multiple projects forward simultaneously in small and o,en quickly scheduled meetings, impromptu hallway conversations, and through email. Pro-fessor Brown generally followed similar practices. )us it was di.cult to be on site when interactions related to writing took place in these professors’ groups. In con-trast, in the second year of the study, Professor Courts initiated an ongoing weekly writing meeting with graduate and undergraduate students, a post-doctoral fel-low, and technical sta+ members and invited me to research the group’s activities. Although Professor Courts also met outside of scheduled meetings with smaller groups or individuals working on speci*c papers, these smaller groups would also bring dra,s of these papers to the whole group for peer review and discussion. We were able to observe these scheduled meetings because Professor Courts diligently noti*ed us about them and included me on emails to her group and sub-groups.
In terms of this chapter’s focus on graphics, the importance of graphics in the faculty members’ writing practices emerged as a strong theme in the data analysis, as illustrated in comments made by Professor Arthur:
I like pictures and !gures. … You put the text a"er the !gures. )is is … actually how we write the paper. We visualize the set of pictures, the story that we tell, and then we put the text around it. )at’s how … [but it] never works the other way around. Because especially if you write a short paper, you have to get to the point immediately and you have to tell a story, because people have no patience in my *eld. (Interview; emphasis added)
Professor Arthur’s comments point to the role of graphics as invention heuristics and in structuring the argument of the paper, which he calls “the story.” )ese comments also highlight his well-developed sense of his audience as busy col-leagues – “people [who] have no patience” – and whose lack of time adds pressure for publications to get to the point quickly. Students in Professor Arthur’s group corroborated his description of these practices. Yuan, an international Ph.D. stu-dent, explained their practice:
What we [students] do is discuss with [Professor Arthur] about the possibility of writing a paper. I will show him those graphs, those results I have, some experimental results, some theoretical results. And he will comment on it. And then he will say, ‘Okay, this is a good paper. You should write it.’ (Interview; emphasis added)
Yuan’s comments underscore how the visual presentation of research results (“those graphs”) contributes to the research group determines whether such results might be publishable.
© !"#$. John Benjamins Publishing CompanyAll rights reserved
Chapter 6. Graphics and invention in academic engineers’ writing "(
Turning to Professor Brown, his summary of his typical way of working with a research group member on a paper follows the stages suggested by many writing teachers – outline, dra,, revision:
Generally in the meetings with the student, when we mutually agree that there is something worth writing up, then I will ask them to write an outline *rst. We will sit down with the outline and then we edit that, and then *gure out the content, the -ow of the paper. And then I will make them write a *rst dra, and then work on that. I try to get them to do all the writing. I make small changes, but it varies. We will discuss the paper and the structure, what would be in it. (Interview)
Any mention of the role of graphics in identifying “something worth writing up” seems notably absent from Professor Brown’s description of the writing process he follows and promulgates. However, data from his group members reveals that the advice he imparts to them – and what they actually do – is to begin writing a paper by creating and contemplating visuals that display research results. For instance, Natalia, an international post-doctoral fellow, believes that Professor Brown:
has a better [approach than mine], I tried it a couple of times and you just jot down *gures and then you write the captions and describe what’s on the *gure like in a text…. To write a paper, that’s the process where you put those *gures and you describe what you did and you put in the references. (Interview)
Likewise, one of Professor Brown’s international Ph.D. students, Christopher, reports the advice he received to pursue these writing practices:
When we *nd results that are pretty interesting, we look at the results and work in a kind of backwards way to say, we will put the interesting things that we have discovered and then back it up, support with our *ndings and our data. One interesting thing Professor Brown said when we were *rst writing together, he said, “Don’t think of how to write it, just put the pictures, images that you think are interesting and then write about it.” (Focus group interview)
)us in practice, Professor Brown shares Professor Arthur’s perspective on how graphics function as invention heuristics in writing; the fact that he does not explicitly identify how graphics function in his writing and supporting research group members may re-ect a conventional sense of what writing practices con-sist of, as Winsor (1992), discussed above, identi*es. )e data extracts included in this section point to the nuanced understandings that research group mem-bers have gained about the practices and advice given by professors Arthur and Brown.
In discussing her writing practices, rather than summarize them as did her colleagues, Professor Courts articulated that she and her group members follow a
© !"#$. John Benjamins Publishing CompanyAll rights reserved
") Mary Jane Curry
routine of beginning an academic paper by creating an outline and using it to sup-port student writing. Nonetheless, she lamented:
some of the students don’t want to outline anything… Some of them just want to start writing. Or the *rst [dra,] they give you they’ve really written it all out and so it is harder. But I have [an international] post-doc right now and his language skill is not very strong. So I really force him to do outlines. So we start from scratch.
Although Professor Courts’s comments suggest that she follows the process approach to writing in which outlining is a pre-writing technique, the ethno-graphic data show that the outlines created in her research group in fact involve graphical representations of research results. As her post-doctoral research fellow, Ali, recalled:
Usually we have to make an outline, what to include and what not … )e *rst paper that I actually wrote in this lab, you make an outline what kind of !gures we should show, or just the results section … what are the key *gures they should show. Once you know these are the results you want to show, then you can come back to the introduction. (Interview, emphasis added)
)e term “outline,” therefore, suggests a type of multimodality that writing teach-ers – and academic engineers who are not writing specialists – may not recognize. )is possibility is not surprising given that tacit knowledge about a social prac-tice is not always available for expert practitioners to articulate, whether to their students or researchers (Nathan & Petrosino 2003). To explore these practices in more depth, I next describe the use of the analytic method of “text history” ( Lillis & Curry 2006) to present a *ne-grained rendering of the function of graphics as invention heuristics. Text histories draw on the range of qualitative data listed above to trace the development of a particular text over time, an approach par-ticularly suited to the long time frames involved in the development of academic texts for publication.
Text history: Launching a research article
)is partial3 text history4 is based on recorded participant observations, *eld notes, PowerPoint presentation slides, and one dra, of an article for publication. I draw on these data to describe how Professor Courts and her group began to
&. "is text history is partial because Professor Courts and her collaborators put this paper on hold to write other papers during the data collection period.
'. To protect the anonymity of participants in the study, details of the data that might disclose their research areas are omitted and replaced with ellipses or [X], [Y], etc.

© !"#$. John Benjamins Publishing CompanyAll rights reserved
Chapter 6. Graphics and invention in academic engineers’ writing "*
conceptualize an article in a one-hour meeting with her post-doctoral fellow, Ali, one of her technicians, Kathy, and an undergraduate, Nathan. Before the meeting began, Professor Courts had identi*ed the target journal for the article, which she considers the top journal in her *eld, and had provisionally decided that the results the group was about to discuss would be publishable in this journal.
Professor Courts begins the meeting by noting, “I’ve got a lot of *gures and things and I looked up the guidelines in [the journal] to see if we’re going to shoot for that [journal], which seems worth doing.” She then reads aloud an extract from the journal’s website, which she had pasted into the dra, document:
An article is a substantial novel research study, with a complex story o,en involving several techniques or approaches. )e main text (excluding abstract, Methods, references and *gure legends) is 2,000–4,000 words. … Articles have no more than 8 display items (*gures and/or tables). An introduction (without heading) is followed by sections headed Results, Discussion and Methods. … (Extract from Paper Dra, 1, boldface emphasis original)
Addressing the group, Professor Courts comments,
I was just starting to remember the results we’ve got and of course some of them we’re still pulling together the *gures for. But we could map out what *gures we want to include. I think that’s a good way to start. One thing I just did was to run the [X] analysis program, but I think it’s easier to look at this PowerPoint™ from a talk I gave in Munich last year.
She then begins to project the 25 slides of her conference presentation, of which 13 either included or entirely comprised visuals. )is move itself illustrates the multimodal nature of the process of invention in this conversation: She is using a Microso, Word™ document in for the article dra, and slides from a Power-Point™ presentation which include the data output in the form of graphs. Professor Courts continues:
)is is just to remind us what *gures we’ve got. And the general story to remember is that [summary of the research results from a former Ph.D. student in her group that underpin this study]. … Most papers in the literature would argue that [X] and you can argue that [Y] … that’s what we’ve got to shore up, is the [Y] analysis. … So as we go through these *gures it is useful to see, one *gure might be the apparatus, I don’t know how critical it is to have that in this paper. (Recorded observation transcript; emphasis added)
Ali, the post-doc, then points out that because they used a commercially produced apparatus in doing the research, a description should already be publically avail-able. Kathy, the technician, wonders if Professor Courts’s laboratory had previ-ously published a paper with a description of the apparatus, to which the present paper could refer.

© !"#$. John Benjamins Publishing CompanyAll rights reserved
"! Mary Jane Curry
Professor Courts: Not exactly. But it’s an optional *gure, it might make it easier for people to see. A picture is worth a kilo-word, so if we include it, it would make the Methods longer, but the Methods are not included in the word count, right? It makes the Methods longer if you don’t have the *gure so I guess it’s just a trade. (Recorded observation)
Here Professor Courts points to the tension created between the requirements of the target journal – limiting authors to eight “display items (*gures/tables)” and word limits for certain sections of the article – and the need for rigor in the Methods section that would be established in part by describing the apparatus – whether in words or visuals. As the discussion moves on to which types of results to include from experiments with two types of subjects, Professor Courts advo-cates including both sets:
Professor Courts: It *ts better into this mold of multiple techniques.Ali: Complex story?Professor Courts: [chuckling] Complex story. (Recorded observation, emphasis added)
While neither of these participants elaborates here, Professor Courts’s laugh sug-gests that the story metaphor that Ali introduces is part of an ongoing conversa-tion in her group (which my ethnographic data verify). Next she presents the slide shown in Figure 6.1, saying, “)is is one of the results for [X].”
Modulation transfer function - Noise–30
–25
–20
–15
–10
–5
04 8 16 32
Modulation frequency (Hz)
Thre
shol
d (2
0 lo
g 10m
)
64 128 256
Results - Behavior
H1H2H3R10R11R13R15R17
Figure 6.1. Experimental results from Professor Courts’s research group
)e group embarks on a cost-bene*t analysis of paying the journal to include the graphic in color. Here the main considerations are the pragmatic in terms

© !"#$. John Benjamins Publishing CompanyAll rights reserved
Chapter 6. Graphics and invention in academic engineers’ writing ""
of cost and how color might be reproduced in photocopies or computer print-o+s of an article. Of interest here is how important the subject of the graphics in the proposed article remains, in terms of the group’s shared understanding of the value that appropriately presented graphics add to the paper even as future reproductions.
When Professor Courts projects the second results slide, a discussion ensues about whether to include the down arrows (visible just above 4, 8, and 16 on the x-axis in Figure 6.2) that represent subjects’ performance on an experiment. When Kathy queries whether it is necessary to include the down arrows, Ali suggests that the *gure legend could explain their signi*cance. Professor Courts proposes writing a description of the results and their signi*cance and removing the down arrows, then immediately counters this possibility, saying that remov-ing the down arrows might cause readers to miss the point. Here again what might appear to be minutiae in terms of choices about visual presentation take on signi*cance in relation to the argument to be made and how readers might receive it. Professor Courts mentions relevant results from a recently published article, concluding, “Maybe it’s worth playing around with the down arrows.”
Modulation transfer function - TONE–30
–25
–20
–15
–10
–5
04 8 16 32
Modulation frequency (Hz)
Thre
shol
d (2
0 lo
g 10m
)
64 128 256
Results - Behavior
H1H2H3R10R11R13R15R17
Figure 6.2. Experimental results using down arrows
)ese data extracts and illustrative *gures show how a *ve-minute conver-sation about what might seem a trivial notation – the down arrow – prompts the group’s discussion about presenting a key argument in the paper. In addi-tion, in mentioning a related recent article, Professor Courts steers the group’s thinking about research results such that they cra, their argument to contribute to the “conversations of the discipline” (Bazerman 1980; see also Shaw 2010).

© !"#$. John Benjamins Publishing CompanyAll rights reserved
$## Mary Jane Curry
Invention in relation to writing an engineering article for publication therefore involves considerations of audience (here both the speci*c target journal and the end-user who will interact with color or black-and-white versions of the published article), how the graphics are constructed (decisions about whether to include the down arrows in Figure 6.2), and the larger research conversations taking place.
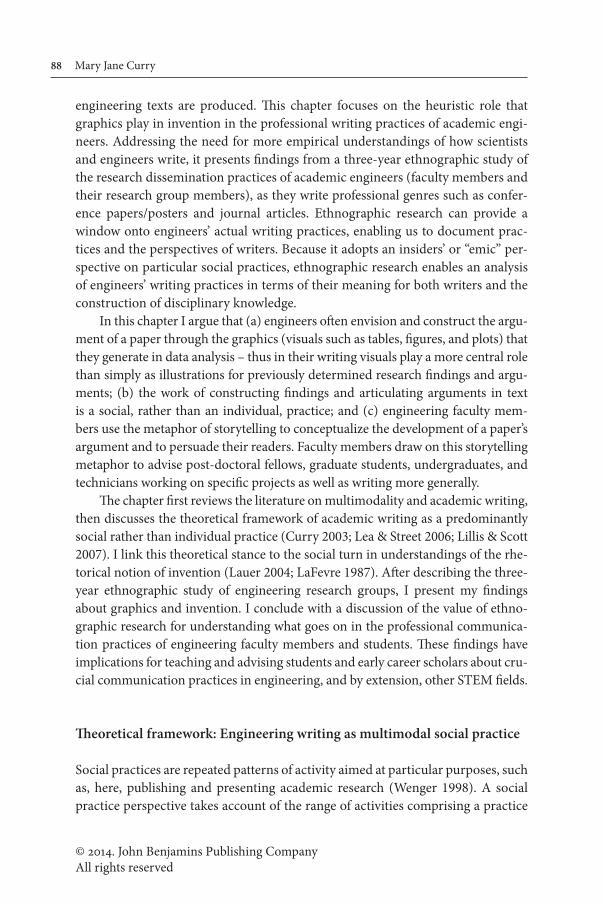
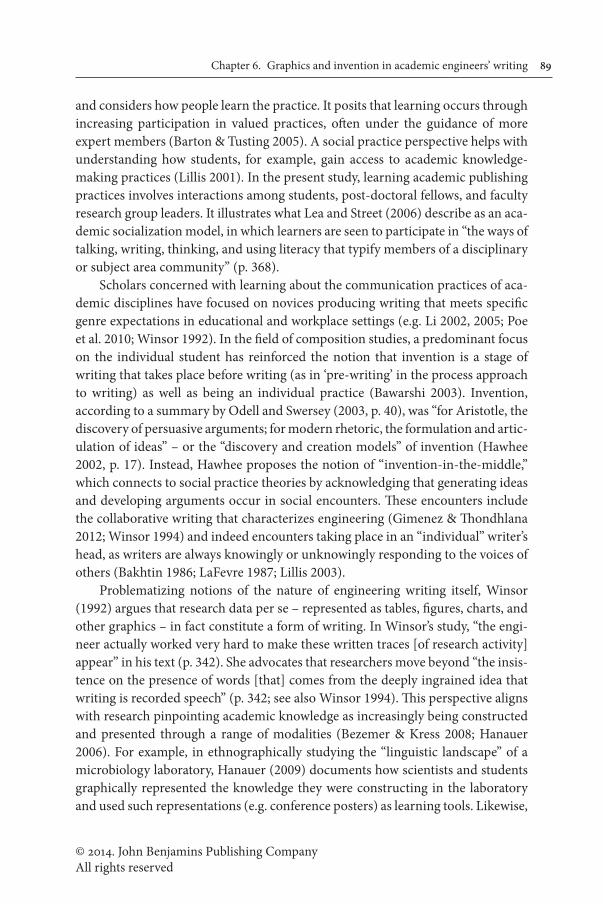
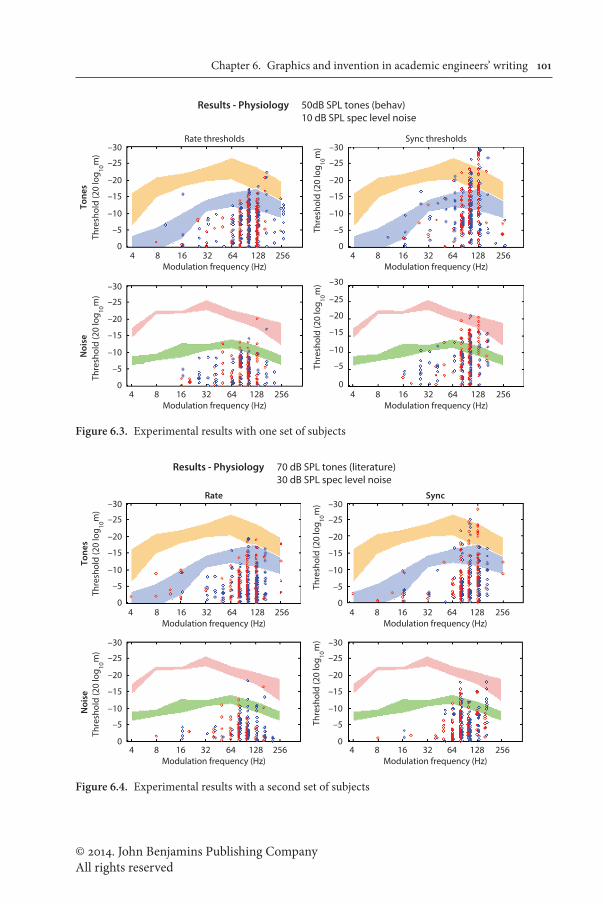
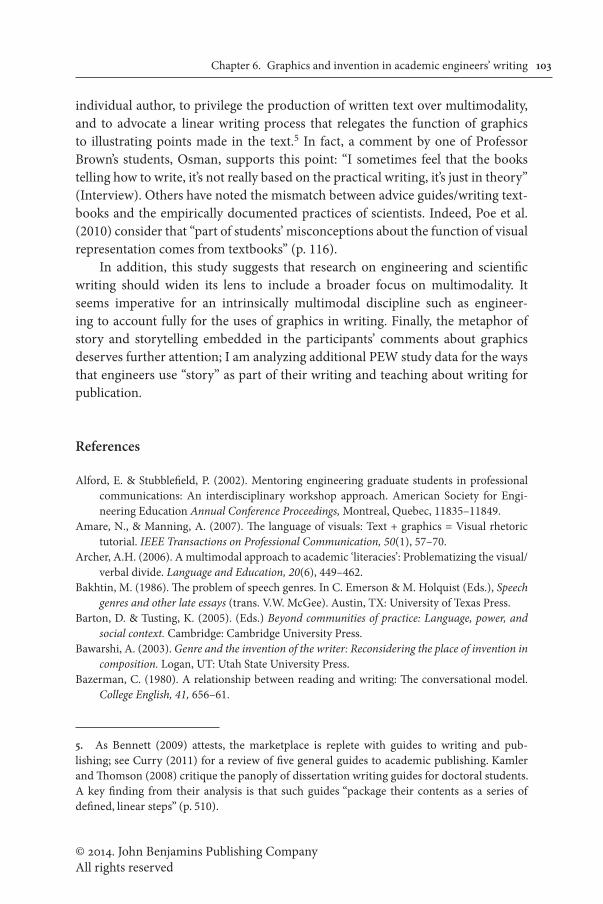
As the meeting continues, Professor Courts recaps the functions of Figures 6.1 and 6.2: “)ese two plots summarize all the behavior [data]. So at least it’s concise.” When she shows her subsequent PowerPoint slides, Nathan suggests combining the slides shown in Figures 6.3 and 6.4 to introduce the second set of data from which the results come.
Contemplating the results displayed on these two slides, Professor Courts comments,
#is story is a little di+erent than the poster, which was earlier. In the poster, the [X] thresholds weren’t good and maybe we were goo*ng somehow when we were calculating because when we went back last summer they were *ne. … We’ll repeat all these. )ese are the plots that we need to do, the newly clustered data. So this story is pretty simple. It’s just a matter of describing. Now … we’re only showing [X]; there’s a whole lot that fall o+ the bottom. We have to describe the fact that that’s true and actually give numbers. (Recorded observation; emphasis added)
Here the metaphor of story is interwoven in the discussion about articulating the paper’s argument about the results. As the meeting continues, Professor Courts records the group’s ideas for the paper on the word-processed document on her laptop. Although space does not permit a full explication of the hour-long meeting, these examples show the central role of graphics in the concep-tualization of this article: deciding which results to argue for, how many visuals would be needed to convey the argument (the results), and the speci*c form the graphics should take. )is text history also documents how identifying research results can take place over long spans of time, as group members considered the slides that Professor Courts presented a year earlier to be provisional in the process of writing the article and assumed that they would need to revisit and re*ne their experimental and communication tasks. Indeed, she mentions that the slides showed slightly di+erent results than did an even earlier poster pre-senting research results. )e text history also reinforces understandings of the collaborative nature of writing for publication in STEM, a process beginning with the collaborative invention of research results through the heuristic of the data graphics.
© !"#$. John Benjamins Publishing CompanyAll rights reserved
Chapter 6. Graphics and invention in academic engineers’ writing $#$
Sync thresholdsRate thresholds
Tone
sN
oise
Thre
shol
d (2
0 lo
g 10m
)
–30
–25
–20
–15
–10
–5
0
Thre
shol
d (2
0 lo
g 10m
)
–30
–25
–20
–15
–10
–5
0
Thre
shol
d (2
0 lo
g 10m
) –30
–25
–20
–15
–10
–5
0
Thre
shol
d (2
0 lo
g 10m
) –30
–25
–20
–15
–10
–5
0
4 8 16 32 64 128 256
8 16 32Modulation frequency (Hz)
64 128 256 4 8 16 32Modulation frequency (Hz)
64 128 256
8 16 32Modulation frequency (Hz)
64 128 256Modulation frequency (Hz)
4
4
50dB SPL tones (behav)10 dB SPL spec level noise
Results - Physiology
Figure 6.3. Experimental results with one set of subjects
Sync
Tone
sN
oise
Thre
shol
d (2
0 lo
g 10m
)
–30
–25
–20
–15
–10
–5
0
Thre
shol
d (2
0 lo
g 10m
)
–30
–25
–20
–15
–10
–5
0
Thre
shol
d (2
0 lo
g 10m
) –30
–25
–20
–15
–10
–5
0
Thre
shol
d (2
0 lo
g 10m
) –30
–25
–20
–15
–10
–5
0
4 8 16
Rate
32 64 128 256
8 16 32Modulation frequency (Hz)
64 128 256 4 8 16 32Modulation frequency (Hz)
64 128 256
8 16 32Modulation frequency (Hz)
64 128 256Modulation frequency (Hz)
4
4
70 dB SPL tones (literature)30 dB SPL spec level noise
Results - Physiology
Figure 6.4. Experimental results with a second set of subjects

© !"#$. John Benjamins Publishing CompanyAll rights reserved
$#% Mary Jane Curry
Discussion and implications
)is chapter has documented the heuristic role of graphics in the writing of aca-demic engineering research papers; in contrast to having merely ancillary and illus-trative functions, graphics act as invention devices that enable engineers to map out arguments to put forward in research dissemination, o,en conceptualized as a “story.” Participants both articulated and enacted these practices in the three years during which the ethnographic study took place. Ethnographic research allowed the documentation of a range of practices and participants’ perspectives in order to arrive at these *ndings. )ey suggest that academic engineers do not reserve their consideration of the graphical display of research results for the *nal stages of writing, but rather begin with the visuals. )ese *ndings lend support to Winsor’s (1992, 1994) argument for the revision of conceptions of scienti*c/technical writ-ing that divorce text and visuals. Indeed, both engineers’ writing processes and their informal teaching practices manifest a clearly multimodal nature. In various ways, the faculty members in this study articulated or enacted this understand-ing with the members of their research groups and with smaller teams writing research publications – even if they did not include them in their descriptions of their writing practices.
)ese *ndings have implications for understanding and sharing the social practices of writing for publication in academic engineering, and by extension, in other STEM disciplines. For writing instructors as well as disciplinary faculty members working with students on writing projects, these *ndings suggest the value of considering the role of graphics in text production not only as illustrations but also as heuristics for invention in identifying research *ndings and shaping rhetorical arguments. Along these lines, Poe et al. (2010) provide an example of an MIT faculty member, Dennis Freeman, who teaches physiology students to use a storyboarding technique that includes these three concepts:
1. Data driven scienti*c research. Organize and locate trends in data before beginning to write the supporting text. 2. Each *gure in a report tells its own story. Design *gures that make the point that you want to make. 3. In sum, the *gures in a report tell the narrative of the research. Consider if the data make a logical sequence from one *gure to the next *gure. (p. 118)
Based on the literature, Freeman’s example represents a rare articulation of such a strategy, but one that aligns well with the *ndings presented here.
Another implication of this study is to support the suggestion that writ-ing guides and other materials on research dissemination should be grounded in empirical evidence about engineers’ actual writing practices (Curry & Lillis 2010, 2013; Harwood 2005). Such guides tend to work from an assumption of an
© !"#$. John Benjamins Publishing CompanyAll rights reserved
Chapter 6. Graphics and invention in academic engineers’ writing $#&
individual author, to privilege the production of written text over multimodality, and to advocate a linear writing process that relegates the function of graphics to illustrating points made in the text.5 In fact, a comment by one of Professor Brown’s students, Osman, supports this point: “I sometimes feel that the books telling how to write, it’s not really based on the practical writing, it’s just in theory” (Interview). Others have noted the mismatch between advice guides/writing text-books and the empirically documented practices of scientists. Indeed, Poe et al. (2010) consider that “part of students’ misconceptions about the function of visual representation comes from textbooks” (p. 116).
In addition, this study suggests that research on engineering and scienti*c writing should widen its lens to include a broader focus on multimodality. It seems imperative for an intrinsically multimodal discipline such as engineer-ing to account fully for the uses of graphics in writing. Finally, the metaphor of story and storytelling embedded in the participants’ comments about graphics deserves further attention; I am analyzing additional PEW study data for the ways that engineers use “story” as part of their writing and teaching about writing for publication.
References
Alford, E. & Stubble*eld, P. (2002). Mentoring engineering graduate students in professional communications: An interdisciplinary workshop approach. American Society for Engi-neering Education Annual Conference Proceedings, Montreal, Quebec, 11835–11849.
Amare, N., & Manning, A. (2007). )e language of visuals: Text + graphics = Visual rhetoric tutorial. IEEE Transactions on Professional Communication, 50(1), 57–70.
Archer, A.H. (2006). A multimodal approach to academic ‘literacies’: Problematizing the visual/verbal divide. Language and Education, 20(6), 449–462.
Bakhtin, M. (1986). )e problem of speech genres. In C. Emerson & M. Holquist (Eds.), Speech genres and other late essays (trans. V.W. McGee). Austin, TX: University of Texas Press.
Barton, D. & Tusting, K. (2005). (Eds.) Beyond communities of practice: Language, power, and social context. Cambridge: Cambridge University Press.
Bawarshi, A. (2003). Genre and the invention of the writer: Reconsidering the place of invention in composition. Logan, UT: Utah State University Press.
Bazerman, C. (1980). A relationship between reading and writing: )e conversational model. College English, 41, 656–61.
(. As Bennett (2009) attests, the marketplace is replete with guides to writing and pub-lishing; see Curry (2011) for a review of five general guides to academic publishing. Kamler and "omson (2008) critique the panoply of dissertation writing guides for doctoral students. A key finding from their analysis is that such guides “package their contents as a series of defined, linear steps” (p. 510).

© !"#$. John Benjamins Publishing CompanyAll rights reserved
$#' Mary Jane Curry
Bazerman, C. (1988). Shaping written knowledge: #e genre and activity of the experimental article in science. Madison, WI: )e University of Wisconsin Press.
Bennett, K. (2009). English academic style manuals: A survey. Journal of English for Academic Purposes, 8, 43–54.
Bezemer, J. & Kress, G. (2008). Writing in multimodal texts: A social semiotic account of designs for learning. Written Communication, 25(2), 166–195.
Blakeslee, A. (1997). Activity, context, interaction, and authority: Learning to write scienti*c papers in situ. Journal of Business and Technical Communication, 11(2), 125–169.
Charmaz, K. (2006). Constructing grounded theory: A practical guide through qualitative analysis. )ousand Oaks, CA: Sage.
Chiu, Y.-H. (2011). Exploring non-native science scholars’ perspectives of writing for publica-tion in English. #e Asia-Paci!c Education Researcher, 20(3), 469–476.
Curry, M.J. (2003). Skills, access, and “basic writing”: A community college case study from the United States. Studies in the Education of Adults, 35(1), 5–18.
Curry, M.J. (2011). “Where there is no laundry”: Review of *ve books on writing for publication. Journal of English for Academic Purposes, 20, 1–4. doi:10.1016/j.jeap.2010.09.003
Curry, M.J. (2014). Graphics as invention heuristics in writing for publication by academic engi-neers. In M. J. Curry & D. Hanauer, (Eds.), Language, literacy, and learning in STEM Educa-tion: Research methods and perspectives from applied linguistics (pp. 87–106). Amsterdam: John Benjamins.
Curry, M.J. & Lillis, T. (2010). Making academic publishing practices visible: Designing research-based heuristics to support English-medium text production. In N. Harwood (Ed.), Language teaching materials: #eory and practice (pp. 322–345). Cambridge: Cambridge University Press.
Curry, M.J. & Lillis, T. (2013). A scholar’s guide to getting published in English: Critical choices and practical strategies. Bristol, UK: Multilingual Matters.
Dicks, B., Flewitt, R., Lancaster, L. & Pahl, K. (2011). Multimodality and ethnography: Working at the intersection. Qualitative Research, 11, 227–237.
Gimenez, J. & )ondhlana, J. (2012). Collaborative writing in engineering: Perspectives from research and implications for undergraduate education. European Journal of Engineering Education, 37(5), 471–487.
Graves, H. (2005). Rhetoric in(to) science: Style as invention in inquiry. Cresskill, NJ: Hampton Press.
Hanauer, D. (2006). Scienti!c discourse: Multimodality in the science classroom. London: Continuum.
Hanauer, D. (2009). Science and the linguistic landscape: A genre analysis of representational wall space in a microbiology laboratory. In E. Shohamy & D. Gorter (Eds.), Linguistic land-scape: Expanding the scenery (pp. 287–301). New York, NY: Routledge.
Harwood, N. (2005). What do we want EAP teaching materials for? Journal of English for Academic Purposes, 4, 149–161.
Hawhee, D. (2002). Kairotic encounters. In J. M. Atwill & J. M. Lauer (Eds.), Perspectives on rhetorical invention (pp. 16–35). Knoxville, TN: University of Tennessee Press.
Hutto, D. (2007). Graphics and invention in engineering writing. Technical Communication, 54(1), 88–98.
Kamler, B. & )omson, P. (2008). )e failure of dissertation advice books: Toward alternative pedagogies for doctoral writing. Educational Researcher, 37(8), 507–514.
© !"#$. John Benjamins Publishing CompanyAll rights reserved
Chapter 6. Graphics and invention in academic engineers’ writing $#(
Knorr-Cetina, K. (1981). #e manufacture of knowledge: An essay on the constructivist and con-textual nature of science. Oxford: Pergamon Press.
Koutsantoni, D. (2006). Rhetorical strategies in engineering research articles and research theses: Advanced academic literacy and relations of power. Journal of English for Academic Purposes, 5(1), 19–36.
Kress, G. (2011). ‘Partnerships in research’: Multimodality and ethnography. Qualitative Research, 11: 239–260.
LaFevre, K. (1987). Invention as a social act. Carbondale, IL: Southern Illinois University Press.Latour, B. & Woolgar, S. (1979). Laboratory life: #e social construction of scienti!c facts. Beverly
Hills, CA: Sage.Lauer, J. (2004). Invention in rhetoric and composition. West Lafayette, IN: Parlor Press.Lea, M. & Street, B.V. (2006). Student writing in higher education: an academic literacies
approach. Studies in Higher Education, 23(2): 157–72.Leydens, J. & Olds, B. (2007). Publishing in scienti*c and engineering contexts: A course for
graduate students. IEEE Transactions on Professional Communication, 50(1), 45–56.Li, Y.Y. (2002). Writing for international publication: )e perceptions of Chinese doctoral
researchers. Asian Journal of English Language Teaching, 12, 179–193.Li, Y.Y. (2005). Multidimensional enculturation: )e case of an EFL Chinese doctoral student.
Journal of Asian Paci!c Communications, 15(1), 153–170.Lillis, T. (2001). Student writing: Access, regulation and desire. London: Routledge.Lillis, T. (2003). An ‘academic literacies’ approach to student writing in higher education:
Drawing on Bakhtin to move from critique to design. Language and Education, 17(3), 192–207.
Lillis, T. (2008). Ethnography as method, methodology, and “deep theorizing”: Closing the gap between text and context in academic writing research. Written Communication, 25(3), 353–388.
Lillis, T.M. & Curry, M.J. (2006). Professional academic writing by multilingual scholars: interactions with literacy brokers in the production of English-medium texts. Written Communication, 23(1), 3–35.
Lillis, T.M. & Curry, M.J. (2010). Academic writing in a global context: #e politics and practices of publishing in English. London: Routledge.
Lillis, T. & Scott, M. (2007). De*ning academic literacies research: issues of epistemology, ideol-ogy and strategy. Journal of Applied Linguistics, 4(1), 5–32.
Lloyd, P. (2000). Storytelling and the development of discourse in the engineering design process. Design Studies, 21, 357–373.
Luzon, M.J. (2005). Genre analysis in technical communication. IEEE Explore, 285–295.Mathison, M. (2000). “I don’t have to argue my design – the visual speaks for itself ”: A case
study of mediated activity in an introductory mechanical engineering course. In S. Mitchell & R. Andrew (Eds.), Learning to argue in higher education (pp. 74–84). Portsmouth, NH: Boynton/Cook.
Nathan, M. & Petrosino, A. (2003). Expert blind spot among preservice teachers. American Educational Research Journal, 40, 905–928.
Odell, L. & Swersey, B. (2003). Reinventing invention: Writing across the curriculum without WAC. Language & Learning across the Disciplines, 6(3): 38–53.
Poe, M., Lerner, N., & Craig, J. (2010). Learning to communicate in science and engineering: Case studies from MIT. Cambridge, MA: )e MIT Press.

© !"#$. John Benjamins Publishing CompanyAll rights reserved
$#) Mary Jane Curry
Rymer, J. (1988). Scienti*c composing processes: How eminent scientists write journal articles. In D. A. Joli+e (Ed.), Writing in academic disciplines (pp. 211–250). Norwood, NJ: Ablex.
Selzer, J. (1983). )e composing processes of an engineer. College Composition and Communica-tion, 34(2), 178–187.
Shaw, P. (2010). Research reports in academic and industrial research. In M. F. Ruiz-Garrido, J.C. Palmer-Silveira & I. Fortanet-Gómez (Eds.), English for professional and academic pur-poses (pp. 73–87). Amsterdam: Rodopi.
Shehzad, W. (2006). How to end an introduction in a computer science article: A corpus-based approach. In E. Fitzpatrick (Ed.) Language and computers, corpus linguistics beyond the word: Corpus linguistics from phrase to discourse (pp. 227–241). Amsterdam: Rodopi.
Swales, J. (1990). Genre analysis: English in academic and research settings. Cambridge: Cambridge University Press.
Wenger, E. (1998). Communities of practice: Learning, meaning, and identity. Cambridge: Cambridge University Press.
Winsor, D. (1992). What counts as writing? An argument from engineers’ practice. Journal of Advanced Composition, 12(2), 337–347.
Winsor, D. (1994). Invention and writing in technical work: Representing the object. Written Communication, 11(2), 227–250.