Liquidity Impact on the Municipal Bond Market - MSRB
24
Municipal Bond ETFs: Liquidity Impact on the Municipal Bond Market APRIL 2018 Simon Z. Wu and Meghan Burns Municipal Securities Rulemaking Board
-
Upload
khangminh22 -
Category
Documents
-
view
0 -
download
0
Transcript of Liquidity Impact on the Municipal Bond Market - MSRB

Municipal Bond ETFs: Liquidity Impact on the Municipal Bond Market
APRIL 2018
Simon Z. Wu and Meghan Burns Municipal Securities Rulemaking Board

© 2018 Municipal Securities Rulemaking Board 2msrb.org
APRIL 2018 Municipal Bond ETFs: Liquidity Impact on the Municipal Bond Market
Abstract1
As exchange-traded funds (ETFs) grow in popularity, it becomes increasingly important to understand the relationship between these funds and the corresponding markets for individual securities. Recent academic research into the corporate bond market has identified an inverse relationship between ETF growth and liquidity of the underlying bonds. Since bond ETFs, and specifically municipal bond ETFs, have experienced material growth in recent years, staff of the Municipal Securities Rulemaking Board (MSRB), which oversees the municipal securities market and studies market structure issues, set out to explore the nature of the relationship between municipal bond ETFs and the liquidity of the municipal bond secondary market.2 The findings of this analysis indicate that there is no statistical relationship between the growth of ETFs and municipal bond market liquidity so far. However, there is opportunity for future research, particularly given the dynamic nature of the financial markets. The purpose of this report is twofold: 1) to provide market participants and other stakeholders with additional perspective on municipal bond ETFs and the corresponding municipal bond market and 2) to promote further research on this topic, such as examining whether the liquidity impact on those municipal bonds contained in ETFs differs from the impact (or lack thereof) on bonds that are not incorporated into ETFs.
1 The views expressed in the working papers are those of the author(s) and do not necessarily reflect the views and positions of the MSRB.
2 It should be noted that the MSRB does not have any regulatory jurisdiction over ETFs.
CONTENTS
3 Introduction
4 Brief History of ETFs
11 Recent Emerging Issues
14 Municipal Bond ETFs — Analysis of Liquidity Impact
19 Conclusions
20 References
21 Appendix A — About the Authors
22 Appendix B — Top 40 Municipal Bond ETFs as of March 2018

© 2018 Municipal Securities Rulemaking Board 3msrb.org
APRIL 2018 Municipal Bond ETFs: Liquidity Impact on the Municipal Bond Market
I. Introduction
The growth of exchange-traded funds (“ETFs” or “funds”) has been robust in the past 20 years, with overall ETF assets increasing at a rate of 36.3 percent annually between 1997 and 2016.3 Relative latecomers to the market, fixed-income ETF products expanded at an annual growth rate of 35.5 percent between 2006 and 2016.4 Increasingly, financial regulators, economists, policymakers and market practitioners are considering how the growth of ETFs might have an impact on the underlying securities that comprise individual ETFs as well as on the municipal bond market as a whole. Although ETFs trade independently, they are intrinsically related to the underlying securities.
An ETF is a tradable security that tracks equity or bond indices, commodities, currencies or actively managed assets.5 Like mutual funds, ETFs own the underlying assets and can create and redeem shares daily. Unlike mutual funds, investors in ETFs can trade in and out of positions throughout the day because ETFs trade like a stock on an exchange, which makes them attractive to investors who want to be able to react to market movements in real time. Regardless of the product structure, all ETF products are subject to regulation by the Securities and Exchange Commission (SEC) under the Securities Act of 1933 and the Securities Exchange Act of 1934. ETFs organized as investment companies must also comply with certain requirements of the Investment Company Act of 1940 under the jurisdiction of the SEC.6
For many fixed-income ETFs, because the underlying securities tend to be less liquid than the ETFs themselves, there has been a view that the so-called “liquidity mismatch” would negatively affect the price-tracking ability of those fixed-income ETF products.7 If this is true, there is a possibility that the mismatch in liquidity could be exacerbated as the size of ETF assets and the number of ETF products grow. Recent research on equity and corporate bond ETFs indeed shows declining market efficiency and hampered liquidity for underlying component securities accompanying increases in ETF ownership. This report examines whether a similar relationship might exist between municipal bond ETFs and the overall municipal bond secondary market.
This report focuses mainly on the liquidity impact of municipal bond ETFs on municipal securities. Section II summarizes the evolving history of ETF products, including municipal bond ETFs. Section III discusses emerging issues impacting all ETFs. Section IV details the liquidity impact analysis, including hypotheses, a short literature review, data, methodology and empirical findings. Finally, Section V concludes with considerations for future research as market conditions evolve.
3 Based on the data from Investment Company Institute (ICI). For the most up-to-date figures about the fund industry, please visit www.ici.org/research/stats.
4 Ibid.5 See Antoniewicz, Rochelle and Jane Heinrichs, “Understanding Exchange-Traded Funds: How ETFs Work,”
Investment Company Institute (ICI) Research Perspective, Vol. 20, No. 5, September 2014.6 The funds that are not registered under the Investment Company Act of 1940 primarily invest in commodities,
currencies and futures.7 See Weinberg, Ari, “SEC Raises Concerns About Bond ETFs,” Wall Street Journal, February 7, 2016.

© 2018 Municipal Securities Rulemaking Board 4msrb.org
APRIL 2018 Municipal Bond ETFs: Liquidity Impact on the Municipal Bond Market
II. Brief History of ETFs
The first ETF created in the United States was the SPDR S&P 500 Trust (ticker symbol “SPY”). It was designed to track the S&P 500 stock market index and was launched on January 22, 1993 by State Street Global Advisors. By comparison, it was not until July 2002 that iShares (formerly owned by Barclays Global Investors but now owned by BlackRock, Inc.) established the first fixed-income ETFs. These funds were based on United States Treasury bonds and corporate bonds, including the iShares US Treasury Bond ETF (ticker symbol “GOVT”) and the iShares iBoxx $ Investment Grade Corporate Bond (ticker symbol “LQD”). The first municipal bond ETF, iShares National Muni Bond ETF (ticker symbol “MUB”), was formed in September 2007. It remains the largest municipal ETF by net assets to date.8
Chart 1. Total Net Assets — Mutual Funds, Closed-End Funds and ETFs
0
5000
10000
15000
20000
ETFsClosed-End FundsMutual Funds
0
5,000
10,000
15,000
20,000
ETFsClosed-End FundsMutual Funds
1997 ’99 2000’98 ’01 ’02 ’03 ’04 ’05 ’07 ’09 ’11 ’13 ’15’06 ’08 ’10 ’12 ’14 ’16
In B
illio
ns o
f D
olla
rs
Source: MSRB analysis with data obtained from the ICI. For the most up-to-date figures about the fund industry, please visit www.ici.org/research/stats.
Total net assets for all ETFs have grown significantly since the first ETF was founded in the 1990s. Chart 1 shows that by the end of 2016, total net assets for ETFs exceeded $2.5 trillion, over 360 times the size of the ETF market in 1997, according to the Investment Company Institute (ICI). By comparison, while total net assets for mutual funds, at $16.3 trillion in 2016, were considerably larger than ETFs, they were less than four times their market size in 1997. Total net assets for closed-end funds grew modestly over the same period, to less than double the size in 1997.
8 For the top municipal bond ETFs by net assets as of December 2017, please refer to Appendix B.

© 2018 Municipal Securities Rulemaking Board 5msrb.org
APRIL 2018 Municipal Bond ETFs: Liquidity Impact on the Municipal Bond Market
As of the beginning of 2017, there were over 1,700 ETF products in the United States.9 While almost all ETFs are passively managed, tracking existing indices or benchmarks, about 1 percent of ETFs are intended to track an actively managed investment pool.10 Like mutual funds, ETFs have a variety of investment objectives, which include funds that track equity indices, bond indices, commodities, currencies and futures. Chart 2 presents a breakdown of ETFs by investment objectives as of the end of 2016, with fixed-income ETFs comprising 17 percent of all ETFs by net asset value.
Chart 2. ETF Net Assets by Investment Objective (2016)
Bond
Commodities
Global/International EquityDomestic Equity
BondCommoditiesGlobal/International EquityDomestic Equity
17%
Source: MSRB analysis with data obtained from the ICI. For the most up-to-date figures about the fund industry, go to www.ici.org/research/stats.
Among fixed-income ETFs in the United States, only about 6 percent of bond ETF assets are invested in municipal bonds, as illustrated in Chart 3. By contrast, domestic corporate investment-grade bond ETFs and high-yield bond ETFs dominate the universe of fixed-income ETFs, totaling 65 percent of all bond ETFs assets between the two categories. The remaining fixed-income ETFs consist of United States government bonds (treasury securities, U.S. agency securities, etc.) and international-based bonds, such as sovereign debt.
9 2017 ICI Factbook.10 See Cinthia Murphy, “When, If Ever, Will Active ETFs Take Off?” http://www.etf.com/sections/features-and-news/
when-if-ever-will-active-etfs-take?nopaging=1, July 7, 2015.

© 2018 Municipal Securities Rulemaking Board 6msrb.org
APRIL 2018 Municipal Bond ETFs: Liquidity Impact on the Municipal Bond Market
Chart 3. Breakdown of Bond ETFs (2016)11
Municipal
International
High Yield
Corporate
Government
InternationalHigh YieldCorporateMunicipalGovernment
6%
Source: MSRB analysis with data obtained from the ICI.
a. Growth of Municipal Bond ETFs
Table 1. Growth Rate of Bond ETFs
Type of ETFs Growth Rate 2008–2016
Municipal 35.4%
Government 16.5%
Corporate 32.6%
High Yield 47.5%
International 45.8%
All Bond ETFs 28.6%
Source: MSRB analysis with data obtained from the ICI. For the most up-to-date figures about the fund industry, please visit www.ici.org/research/stats.
Table 1 shows the growth rate of different types of bond ETFs from 2008 to 2016. Compared to corporate bond and government bond ETFs, municipal bond ETFs are relatively new to the landscape, making up about one percent of all ETF assets. However, their growth rate of 35.4 percent annually from 2008 through 2016 has outpaced the average growth among all fixed-income ETFs, as well as the corresponding municipal bond market given that the total
11 Per ICI, mortgage-backed securities ETFs are included in the domestic government bond funds.

© 2018 Municipal Securities Rulemaking Board 7msrb.org
APRIL 2018 Municipal Bond ETFs: Liquidity Impact on the Municipal Bond Market
amount of municipal bonds outstanding has been relatively steady in recent years.12 By the end of 2016, the ratio of municipal bond ETFs to municipal bonds outstanding was about 0.7 percent, as illustrated in Chart 4 and Chart 5. The ratio is also 0.7 percent for Treasury ETFs. By comparison, the ratio is 2.6 percent for corporate bond ETFs, and 6.8 percent for all U.S. equity ETFs. While the ETF component is still a tiny fraction of the municipal bond market, its relative growth rate is worth noting; should municipal bond ETFs continue to grow, further research may be warranted.
Chart 4. Total Municipal Market (In Billions)
3,500
3,600
3,700
3,800
3,900
4,000
Municipal ETF AssetsTotal Municipal Debt
3500
3600
3700
3800
3900
4000
Municipal ETF AssetTotal Municipal Debt
2007 2008 2009 2010 2011 2012 2013 2014 2015 2016 2017Q1
Source: MSRB analysis with data obtained from the Federal Reserve Flow of Funds and the ICI. For the most up-to-date figures about the fund industry, please visit www.ici.org/research/stats.
12 The total dollar amount of municipal bonds outstanding has been stable between 2008 and 2016, fluctuating between $3.66 and $3.94 trillion during the period. See the Federal Reserve Flow of Funds quarterly report.

© 2018 Municipal Securities Rulemaking Board 8msrb.org
APRIL 2018 Municipal Bond ETFs: Liquidity Impact on the Municipal Bond Market
Chart 5. Growth of Municipal Bond ETFs Relative to Municipal Debt Outstanding
$0
$5
$10
$15
$20
$25
$30
$35
0.0%
0.1%
0.2%
0.3%
0.4%
0.5%
0.6%
0.7%
Municipal ETF Asset Ratio of Muni ETF to Total Muni Debt
0
5
10
15
20
25
30
Municipal ETF Asset
0.0
0.1
0.2
0.3
0.4
0.5
0.6
0.7
Ratio of Muni ETF to Total Muni Debt
2007 2008 2009 2010 2011 2012 2013 2014 2015 2016 2017Q1
In B
illio
ns
Source: MSRB analysis with data obtained from the Federal Research Flow of Funds and the ICI. For the most up-to-date figures about the fund industry, please visit www.ici.org/research/stats.
Further, since other ETF products grew over a much longer period, it is likely that the high growth rate of ETF municipal bond assets will continue for the near term.13 Any potential impact on the municipal bond market because of the growth of municipal bond ETFs may change over time, as the ETF market continues to evolve. In addition, as of 2017, the top municipal bond ETFs listed in Appendix B average over 5 million shares traded per day in the secondary market, or about $250 million-dollar value of trades.14
In terms of ETF issuance providers, or administrators of ETFs, the ETF market has become highly concentrated in recent years, with 82.3 percent of all ETF products administered by the top three fund issuers by assets.15 This concentration of issuers is also manifested in the municipal bond ETF market, where seven out of the top 10 municipal bond ETFs by assets are issued by one of the above top three issuers (see Appendix B). While the whole ETF industry is still in growth mode, the concentration of issuance among a few top issuers has been stable in the last few years.
13 For example, according to BlackRock, Inc., ETFs’ aggregate ownership share of three popular U.S. equity indices — the S&P 500, the Russell 1000 and the Russell 2000 — has risen from around 1 percent to between 7–12 percent over the period from 2000 to 2016.
14 Calculated using data from ETF.com. The growth rate of municipal bond ETF trading volume has been impressive as well; for example, the largest municipal bond ETF by assets, iShares National Muni Bond ETF (MUB), has witnessed a 28 percent annualized growth in trading volume since its introduction in September 2007.
15 See http://www.etf.com/sections/etf-league-tables/etf-league-table-2017-08-30?nopaging=1 “ETF League Table as of August 31, 2017.” The next two largest issuers have about 7 percent of the total market share, so that the top five issuers together have nearly 90 percent of the market share.

© 2018 Municipal Securities Rulemaking Board 9msrb.org
APRIL 2018 Municipal Bond ETFs: Liquidity Impact on the Municipal Bond Market
b. Mechanism of ETF Trading and Pricing
Close tracking of a portfolio’s net asset value (NAV) by a corresponding ETF’s price is important for investors, since deviation from the NAV can result in investors purchasing a financial product whose value is different than what investors reasonably believe.16 The price deviation between an ETF and its corresponding fund portfolio’s NAV, however, could be the result of either ETF mispricing, slow price discovery of underlying individual bonds in the portfolio, or both.
The supply, demand and pricing of ETF shares are controlled by a unique creation/redemption process.17 Only authorized participants, or APs, can participate in the process directly with issuers of ETFs.18 In the case when there is a price deviation between ETFs and the NAV of their underlying securities, authorized participants create or redeem ETF shares as a way of arbitraging for profit making. The arbitraging activities precipitate the price adjustment for ETFs and/or underlying securities so that ETF prices align with the NAV.19
For example, if the price of an ETF deviates significantly from its NAV such that ETF shares trade at a premium, as illustrated in Chart 6, the following steps take place in the market:
1. Authorized participants buy a basket of underlying securities in the open market;
2. Authorized participants redeem the securities for creation units (ETF shares) with the issuer trust as an in-kind exchange;20
3. Authorized participants then sell the ETF shares to the market for a profit; and
4. By buying underlying securities and selling ETF shares, the arbitraging process reduces or eliminates the premium.
16 Information about an ETF’s historical price deviation (premiums and discounts) can be found either in the ETF’s full prospectus or on its website. In addition, ETFs are subject to specific regulatory reporting requirements and disclosure obligations relating to investment objectives, risks, expenses and other information in their registration statements and periodic reports. See https://www.sec.gov/investor/alerts/etfs.pdf.
17 Antoniewicz and Heinrichs, “Understanding Exchange-Traded Funds.” ICI Research Perspective, Vol. 20, No. 5, September 2014.
18 While only broker-dealers typically are registered as an authorized participant for each fund, other investors such as institutional investors could participate in the creation/redemption process indirectly through their broker-dealers who are registered as an authorized participant.
19 The process of price adjustment may take anywhere from a few hours to days, depending on individual ETF’s characteristics, such the liquidity of the ETF and its underlying securities, as well as the number of active authorized participants for the ETF.
20 Each creation/redemption unit typically has at least 50,000 ETF shares. In addition, in-kind exchange transactions between authorized participants and issuers are not reported to the MSRB.

© 2018 Municipal Securities Rulemaking Board 10msrb.org
APRIL 2018 Municipal Bond ETFs: Liquidity Impact on the Municipal Bond Market
Chart 6. Illustration of ETF Share Creation Process
Note: The creation basket represents a specific list of securities, cash, and/or other assets.
Conversely, when the price of an ETF trades at a discount to its NAV, authorized participants buy ETF shares on the open market, exchange ETF shares in creation units with the trust for underlying securities, then sell underlying securities in the secondary market. By buying ETF shares and selling underlying securities, the arbitrage process minimizes the discount. However, it should be noted that the redemption process for authorized participants in municipal bond ETFs could be slightly different from the creation process because the trading mechanism for selling municipal bonds (redemption) differs from the trading mechanism for purchasing municipal bonds (creation).21
Most authorized participants contribute to the creation or redemption of ETF shares on the primary market and provide liquidity for ETF shares on the secondary market as market makers. ETFs generally have more than one registered authorized participant, with large ETFs having as many as several dozen authorized participants. However, not every registered authorized participant joins in the creation or redemption process on any given day. In fact, most of them do not participate regularly.22 This is because each individual authorized participant decides whether or not to participate in creation or redemption based on the level of profitability from arbitrage that they anticipate.23
21 When purchasing municipal bonds, traders can usually “lift” existing live offer quotes on a variety of trading venues. On the other hand, when selling municipal bonds, bid quotes are not usually displayed; therefore, traders would most likely have to solicit bid quotes via dissemination of requests.
22 See Antoniewicz, Rochelle and Jane Heinrichs, “The Role and Activities of Authorized Participants of Exchange-Traded Funds,” Investment Company Institute, March 2015.
23 Please refer to Antoniewicz and Heinrichs, “Understanding Exchange-Traded Funds” and Antoniewicz and Heinrichs, “Activites of Authorized Participants” for more information.
Secondary Market
Sell ETF Shares to Clients
Sell ETF Shares on an Exchange to Other Market
Participants
Fund or Trust
Primary Market
Creation Basket
One Creation Unit (e.g., 150,000
Shares of an ETF)
Authorized Participants
Buy Underlying Assets
from Open Market

© 2018 Municipal Securities Rulemaking Board 11msrb.org
APRIL 2018 Municipal Bond ETFs: Liquidity Impact on the Municipal Bond Market
III. Recent Emerging Issues
ETFs should more closely track the underlying NAV than closed-end funds by design, since shares can be freely created or redeemed to meet the demand.24 However, there has been concern among regulators that ETF prices could become dislocated from the NAV under certain circumstances, such as during a market “stress” period. Both former SEC Chairman Mary Jo White and current SEC Commissioners Michael Piwowar and Kara Stein mentioned the risks inherent to ETF products in recent years.25 Although the average end-of-the-day deviation from the NAV for ETFs that track most domestic equity indices is less than 0.05 percent, and almost never exceeds 1 percent,26 deviations can be more significant for certain bond ETFs, as well as those ETFs that track foreign indices, because liquidity constraints on the underlying assets make arbitrage more difficult. In other words, liquidity mismatch between ETF products and the underlying securities may result in more severe deviations from NAV.27 In addition, during a period with high market volatility, price deviation between ETFs and portfolio NAV can be exacerbated, certainly for fixed-income ETFs but even for some equity ETFs.
As mentioned above, price deviation between an ETF and its corresponding fund portfolio’s NAV could be the result of either ETF mispricing, slow-moving price discovery for individual bonds in the portfolio, or both.
a. Liquidity Mismatch Between ETFs and Underlying Bonds
Many fixed-income ETFs, especially municipal bond ETFs, are more liquid than their underlying securities since the ETF products trade much more frequently in the secondary market on average than individual over-the-counter bonds.28 This scenario is defined as liquidity mismatch between funds and underlying securities in the funds.29
Essentially, investors can trade ETFs throughout the day, but some of the underlying assets can be difficult to trade due to illiquidity; as a result, there may be a lag in pricing of those potentially less liquid bonds. This could cause a deviation between ETF prices and the NAV, as authorized participants would not be able to arbitrage easily to narrow the gap between
24 See Engle, Robert and Debojyoti Sarkar, “Premiums-Discounts and Exchange Traded Funds,” The Journal of Derivatives, Summer 2006.
25 See Chairman Mary Jo White’s address to the Investment Company Institute 2016 General Meeting, Commissioner Michael Piwowar’s address to the SEC-New York University dialogue on September 8, 2017 and Commissioner Kara Stein’s remarks at the 2016 SEC Speaks.
26 See Engle and Sarkar, “Premiums-Discount.”27 For example, for fund portfolios containing less frequently traded securities, priced based on valuation models
rather than trades. During a market stress period, there could be an increased uncertainty about the accuracy of the NAV.
28 See Weinberg, Ari, “SEC Raises Concerns About Bond ETFs,” the Wall Street Journal, February 7, 2016. 29 Similar liquidity risk also exists in other open-end funds, such as mutual funds. See the Final Rule of the SEC’s
Investment Company Liquidity Risk Management Programs (https://www.sec.gov/rules/final/2016/33-10233.pdf), October 13, 2016. Mutual funds may also incur costs due to illiquidity of securities in the funds when inflows and outflows of investment money force trading of illiquid bonds in the portfolios. Those costs, however, are shared by all investors of a mutual fund based upon the NAV calculation, not just by investors who purchase or redeem shares from the fund. By comparison, the costs of trading of illiquid securities in an ETF are borne solely by an authorized participant but not by the ETF itself or investors in the ETF.

© 2018 Municipal Securities Rulemaking Board 12msrb.org
APRIL 2018 Municipal Bond ETFs: Liquidity Impact on the Municipal Bond Market
the two values. The perception that bond market liquidity has declined in recent years due to financial reform and dealers’ retreat from bond dealing has further elevated concern over this liquidity mismatch especially for those ETFs with many hard-to-trade securities.30
b. Price Deviation on a Flash Crash Day
On Monday, August 24, 2015, a confluence of market factors caused significant ETF price dislocation, especially for some of the large equity ETFs. The stock market had undergone a four-day slide the previous week and international markets continued to drop early that morning. Surprisingly, the largest price deviations on that day occurred in ETFs owning large-cap domestic stocks rather than those owning illiquid stocks, bonds and other financial instruments, with one ETF tracking the S&P 500 equity index had over 30 percent price dislocation at one point during the day.31 Several causes of the dislocation in the market have since been identified, and nearly all of them relate to market structure issues, including lack of transparency at the opening bell, a widened bid-ask spread and thinning liquidity.32 Halted trading enforced by the listing exchanges for both ETFs and underlying securities exacerbated the problem by preventing authorized participants from engaging in arbitrage to restore the balance.
Similar price misalignment has also occurred for bond ETFs in the past.33 As the growth in ETF assets outpaces the growth in municipal bond debt outstanding, it has become more important to understand the interaction between liquidity, market structure and pricing impact of ETFs on underlying municipal securities.
c. Volatility from Creation and Redemption Process Due to Market Structure
For many fixed-income ETFs, creation/redemption of ETF shares occurs only once a day, whereas for many equity ETFs creation and redemption is a continuous process throughout a trading day.
An example highlights the challenges with this system: a fixed-income ETF has a cutoff time of 3:00 p.m. for authorized participants to submit a basket of securities to fund issuers in exchange for ETF share creation. As a result, there is a competing demand for the underlying securities by authorized participants right before the cutoff time to complete a basket.34 This competition is likely to drive the prices of underlying securities higher than necessary,
30 Weinberg, “SEC Raises Concerns.”31 For the three ETFs that track the value of the S&P 500 Index on that day, the SPDR S&P 500 ETF Trust (SPY) was
down as much as 7.8 percent the iShares Core S&P 500 ETF (IVV) was down 26 percent and the Guggenheim S&P 500 Equity Weight ETF (RSP) was down 42.7 percent while the S&P 500 Index itself was only down 5.3 percent during the day.
32 See Gerig, Austin and Keegan Murphy, “The Determinants of ETF Trading Pauses on August 24th, 2015,” working paper, SEC Division of Economic and Risk Analysis, February 2016.
33 See Jackson, Gavin, “Pricing Mismatch Worries Hit ETFs,” Financial Times, January 5, 2016. As another example, MUB, the largest municipal bond ETF by assets, was discounted by 2.9 percent on June 21, 2013 and priced at a 4 percent premium on February 13, 2012, relative to the S&P National Municipal AMT-Free index it seeks to track.
34 Authorized participants may prefer waiting until closer to the deadline before completing a basket of securities, as the market fluctuates throughout a trading day and it is harder to gauge the profitability of the arbitrage earlier in the day.
© 2018 Municipal Securities Rulemaking Board 13msrb.org
APRIL 2018 Municipal Bond ETFs: Liquidity Impact on the Municipal Bond Market
especially for illiquid securities, affecting the accuracy of the NAV.35 Any price deviation, however temporary, has the potential to harm some investors and market participants, as investors may purchase a security at a price higher than its true value. Conversely, in the case when authorized participants redeem ETF shares for underlying securities at the cutoff time, there is a rush of selloff for the illiquid underlying securities after the cutoff time, driving the prices of underlying securities lower than they otherwise would have been. A volatile trading period could exacerbate the problem of selling municipal bonds when liquidity tends to vanish. For the municipal bond market, unlike the offer side of the market where there may be live offer quotes disseminated to the market, generally there are no live bid quotes displayed on trading venues, and bids would have to be specifically requested by a seller; during a stress period, regular liquidity providers may not want to supply a bid in response to a request.
Finally, in certain situations, authorized participants react to price deviation by “overdoing” the amount of creation/redemption baskets, thereby prolonging ETF price volatility. For example, there is a price gap of 2 percent between an ETF and its NAV, and a creation/redemption amount of, say $3,000,000, would be sufficient to bridge the gap; instead, competing authorized participants commit more than $3,000,000 during the arbitrage process, therefore they could overshoot the price target, swinging the price deviation from one direction to the other.
35 See Malamud, Semyon, “A Dynamic Equilibrium Model of ETFs,” Swiss Finance Institute Research Paper No. 15-37, September 17, 2015.

© 2018 Municipal Securities Rulemaking Board 14msrb.org
APRIL 2018 Municipal Bond ETFs: Liquidity Impact on the Municipal Bond Market
IV. Municipal Bond ETFs — Analysis of Liquidity Impact
a. Overview of Municipal Bond Market
Municipal securities are issued by states, political subdivisions of a state (counties, cities, towns) and agencies, authorities or instrumentalities to finance public-purpose projects, including roads, airports, hospitals, schools, and water and sewer systems. Municipal securities include municipal bonds, notes and other financial instruments.
A distinguishing characteristic of most municipal securities is that the interest paid on the securities is exempt from federal income tax and typically from local jurisdiction income tax. Hence, municipal bonds often are referred to as tax-exempt bonds. In addition, shorting municipal bonds can be cost-prohibitive for various reasons, including tax regulation promulgated by the Internal Revenue Service.36
b. Liquidity Impact Hypotheses and Literature Review
For fixed-income ETFs, the consensus is that ETFs noticeably alter the bond investment universe by providing intra-day pricing previously unavailable from major bond indices.37 However, recent research papers on equity and corporate bond ETFs (see below) have shown that an increase in ETF ownership is accompanied by a decline in market efficiency and have demonstrated that this dampens liquidity for the underlying component securities. This research has not yet addressed the impact of ETFs on the municipal bond market.
Academic literature has illustrated two main theories on how the growth of ETF holdings can affect the underlying securities’ liquidity. ETFs could increase the liquidity of the underlying securities through ETFs’ direct participation in the bond market or, as theories predict, by increasing opportunities for arbitrage. Conversely, if ETFs offer a low transaction cost alternative with more intra-day price transparency, non-informed investors may migrate from the underlying market to ETFs, leaving a higher proportion of informed investors in the underlying market, and thus potentially reducing liquidity.38
To date, most of the empirical evidence illustrates a negative relationship between ETF holdings and the liquidity of underlying securities, primarily in the corporate bond and equity space. Dannhauser (2016) showed that the growth of corporate bond ETF activities reduces investment-grade corporate bond liquidity but does not affect high-yield bond liquidity.39 Pang and Zeng (2017) found evidence of a liquidity mismatch in the corporate bond ETF market, and that this mismatch can reduce market efficiency and increase ETF mispricing.
36 Most municipal securities have tax-exempt status; as a result, short positioning municipal securities is rare because the Internal Revenue Service does not allow both a borrower and lender of a municipal security to claim a tax exemption.
37 See Tucker, Matthew and Stephen Laipply, “Fixed Income ETFs and the Corporate Bond Liquidity Challenge,” iShares BlackRock, 2015, and “Bond Market Price Discovery: Clarity Through the Lens of an Exchange,” The Journal of Portfolio Management, Winter 2013.
38 See Dannhauser, Caitlin Dillon, “The Impact of Innovation: Evidence from Corporate Bond ETFs,” working paper, September 2016. Informed investors buy and sell based on the belief that they can predict the direction of the price movement, as opposed to non-informed investors who do not trade based on information.
39 On the positive impact side, Dannhauser (2016) found ETF ownership has a significant and long-term positive valuation impact on the underlying high yield and investment grade bonds.

© 2018 Municipal Securities Rulemaking Board 15msrb.org
APRIL 2018 Municipal Bond ETFs: Liquidity Impact on the Municipal Bond Market
For research in the equity-backed ETF products, Hamm (2014) and Israeli, Lee, and Sridharan (2016) also found a negative relationship between ETF holdings and the liquidity of underlying stocks, corroborating the results from Dannhauser’s corporate bond ETF study. Conversely, an earlier paper by Hedge and McDermott (2004) found decreased transaction costs for Dow Jones 30 stocks following the introduction of the SPDR® Dow Jones® Industrial Average ETF (commonly referred to as “Diamond” ETF).
The potential usage of municipal bond ETFs as an additional tool for arbitraging purposes could be an important factor. Generally, municipal bonds themselves may not be as liquid as other securities such as equities, treasury securities and some corporate bonds. Therefore, there are likely more instances where prices of municipal bonds are slow to adjust to market environment, thus creating more opportunities for arbitraging by participants in the secondary market. The existence of ETFs could also provide incentives for market participants to trade more municipal bonds as the pricing linkage between the two products provides further prospects for profit-seeking trades. Consequently, based on this unique aspect of municipal bonds, there is a possibility that the impact of ETF growth on municipal bond liquidity could differ from their impact on corporate bond liquidity. In other words, ETFs may not negatively affect the municipal bond market liquidity.
Although price discovery is not the focus of this report, some industry participants believe that bond ETFs could lead price discovery in the underlying securities due to the ETFs’ superior liquidity. Recent academic and industry research into the corporate bond market has supported this notion. For example, Tucker and Laipply (2013) found that not only does the ETF price move in line with the bond market over time, it appears to absorb price information more rapidly. As a result, price movements in fixed-income ETFs can often lead price movements in individual bonds and market indices. However, no similar research has been performed for the municipal bond market; given the differences between municipal bonds and corporate bonds, it is not clear whether the same conclusion could be drawn from the municipal bond market.40
c. Data and Methodology
MSRB staff has conducted an empirical analysis by using a regression model to test, on an aggregate level, whether the growth of total municipal bond ETF net assets over the period from September 2007 through August 2017 has had an impact on municipal bond secondary market trading volume, which is used as a proxy for market liquidity.41 The model incorporates data on a monthly basis,42 and in addition to examining the effect of ETF total asset value, it controls for other factors that may contribute to monthly trading volume
40 The major differences in characteristics between municipal bonds and corporate bonds include number of issuers, number of securities (CUSIPs), size of issuance, maturity structure and optionality, among others.
41 Another measure of liquidity that could be considered is turnover ratio, which can be calculated as a ratio of trading volume over the total amount of bonds outstanding. However, the total municipal bond outstanding data are available only on a quarterly but not monthly basis, which is the frequency adopted in the regression model. Also, during the relevant period, the amount of outstanding municipal bonds had been steady; therefore, the fluctuation of the turnover ratio is likely not too different from the fluctuation of the trading volume. In addition, transaction costs such as the spread for investor trades could also be a measure of liquidity; however, in the municipal bond market, transaction costs may reflect other factors in addition to liquidity, such as market transparency and technology advancement.
42 This report hypothesizes that many potential impacts on trading volume are short-lived, therefore the methodology uses the monthly frequency for the regression model given the availability of data series frequencies.

© 2018 Municipal Securities Rulemaking Board 16msrb.org
APRIL 2018 Municipal Bond ETFs: Liquidity Impact on the Municipal Bond Market
fluctuation, such as mutual fund total asset value, municipal bond market volatility, municipal bond market price return43 and municipal bond new issuance volume.
The regression model is specified as follows:44
𝑀𝑀𝑀𝑀𝑀𝑀𝑀𝑀𝑀𝑀𝑀𝑀𝑀𝑀𝑀𝑀𝑀𝑀𝐵𝐵𝐵𝐵𝑀𝑀𝐵𝐵𝑇𝑇𝑇𝑇𝑀𝑀𝐵𝐵𝑀𝑀𝑀𝑀𝑇𝑇𝑉𝑉𝐵𝐵𝑀𝑀𝑀𝑀𝑉𝑉𝑉𝑉3= 𝛼𝛼 + 𝛽𝛽8𝐸𝐸𝑇𝑇𝐸𝐸𝑇𝑇𝐵𝐵𝑇𝑇𝑀𝑀𝑀𝑀𝐴𝐴𝐴𝐴𝐴𝐴𝑉𝑉𝑇𝑇𝑉𝑉𝑀𝑀𝑀𝑀𝑀𝑀𝑉𝑉3>8 + 𝛽𝛽?𝑀𝑀𝑀𝑀𝑇𝑇𝑀𝑀𝑀𝑀𝑀𝑀𝐸𝐸𝑀𝑀𝑀𝑀𝐵𝐵𝑇𝑇𝐵𝐵𝑇𝑇𝑀𝑀𝑀𝑀𝐴𝐴𝐴𝐴𝐴𝐴𝑉𝑉𝑇𝑇𝑉𝑉𝑀𝑀𝑀𝑀𝑀𝑀𝑉𝑉3>8+ 𝛽𝛽@𝑀𝑀𝑀𝑀𝑀𝑀𝑀𝑀𝑀𝑀𝑀𝑀𝑀𝑀𝑀𝑀𝑀𝑀𝐵𝐵𝐵𝐵𝑀𝑀𝐵𝐵𝑇𝑇𝑇𝑇𝑀𝑀𝐵𝐵𝑀𝑀𝑀𝑀𝑇𝑇𝑉𝑉𝐵𝐵𝑀𝑀𝑀𝑀𝑉𝑉𝑉𝑉3>8 + 𝛽𝛽A𝑀𝑀𝑀𝑀𝑀𝑀𝑀𝑀𝑀𝑀𝑀𝑀𝑀𝑀𝑀𝑀𝑀𝑀𝐵𝐵𝐵𝐵𝑀𝑀𝐵𝐵𝑉𝑉𝐵𝐵𝑀𝑀𝑀𝑀𝑇𝑇𝑀𝑀𝑀𝑀𝑀𝑀𝑇𝑇𝑉𝑉3+ 𝛽𝛽C𝑀𝑀𝑀𝑀𝑀𝑀𝑀𝑀𝑀𝑀𝑀𝑀𝑀𝑀𝑀𝑀𝑀𝑀𝐵𝐵𝐵𝐵𝑀𝑀𝐵𝐵𝑅𝑅𝑉𝑉𝑇𝑇𝑀𝑀𝑇𝑇𝑀𝑀3 + 𝛽𝛽E𝑀𝑀𝑀𝑀𝑀𝑀𝑀𝑀𝑀𝑀𝑀𝑀𝑀𝑀𝑀𝑀𝑀𝑀𝐵𝐵𝐵𝐵𝑀𝑀𝐵𝐵𝑅𝑅𝑉𝑉𝑇𝑇𝑀𝑀𝑇𝑇𝑀𝑀3>8+ 𝛽𝛽F𝑀𝑀𝑀𝑀𝑀𝑀𝑀𝑀𝑀𝑀𝑀𝑀𝑀𝑀𝑀𝑀𝑀𝑀𝐵𝐵𝐵𝐵𝑀𝑀𝐵𝐵𝑁𝑁𝑉𝑉𝑁𝑁𝐼𝐼𝐴𝐴𝐴𝐴𝑀𝑀𝑀𝑀𝑀𝑀𝑀𝑀𝑉𝑉3 + 𝛽𝛽J𝑀𝑀𝑀𝑀𝑀𝑀𝑀𝑀𝑀𝑀𝑀𝑀𝑀𝑀𝑀𝑀𝑀𝑀𝐵𝐵𝐵𝐵𝑀𝑀𝐵𝐵𝑁𝑁𝑉𝑉𝑁𝑁𝐼𝐼𝐴𝐴𝐴𝐴𝑀𝑀𝑀𝑀𝑀𝑀𝑀𝑀𝑉𝑉3>8 + 𝜀𝜀3
where all variables are specified in percentage change.45 Par value is used for calculating monthly municipal bond trading volume.46 The model tests for statistical significance and, if significant, measures the percentage of variation in municipal bond volume that is explained by the growth of ETF total asset value, with all the other factors used as control variables in the regression.47 Essentially, the model tests whether one month’s change in ETF total asset value affects the following month’s municipal bond trading volume. The test result should fall into one of the three categories:
1) Statistically significant and positive, which means that the growth of municipal bond ETFs leads to more underlying bond trading volume;
2) Statistically significant and negative, which means that the growth of municipal bond ETFs depresses the underlying municipal bond trading volume; and
3) No statistical significance, which means that the growth of municipal bond ETFs does not affect the underlying municipal bond trading volume.
The data was gathered from the following sources: The MSRB’s Real-Time Transaction Reporting System (RTRS) and primary market new issuance, ICI, Bloomberg and S&P Dow Jones Indices.
d. Empirical Findings
The regression analysis shows that, on an aggregate basis to date, there is no evidence of deterioration in municipal securities’ liquidity. All else being equal, the growth of municipal bond ETF net asset value over the period from September 2007 through August 2017 did not have an impact on the overall municipal bond trading volume.48 It should be noted that less than 1 percent of all municipal securities-related investments are in ETFs to date (compared to nearly 3 percent for corporate bonds and 7 percent for equity). As the ETF market continues to grow, impact on municipal bond market liquidity could change over time. Furthermore, except for a few short periods, the market has not experienced a dramatic and sustained rising interest rate environment during this timeframe, and the result may be different in a fixed-income “bear” market. Table 2 provides a summary of the regression results.
43 Price return is calculated as the month-over-month percentage change on the S&P National Municipal Bond Index.
44 Staff performed some robustness tests for multicollinearity of independent variables in the regression.45 The report uses the natural log difference as a proxy for percentage difference for all variables in the equation.46 Staff also calculated market value (transaction price*volume) as a measure for municipal bond trading volume,
and the results do not differ significantly from the measure using par value.47 Control variables themselves are not of primary interest to the analysis. In addition, including a trend term to
capture any trend in the municipal bond trading volume does not change the results for all the other variables. 48 The parameter tested in the model above is statistically insignificant.

© 2018 Municipal Securities Rulemaking Board 17msrb.org
APRIL 2018 Municipal Bond ETFs: Liquidity Impact on the Municipal Bond Market
Table 2. Regression Model — Impact on Municipal Bond Trading Volume
ETF Total Asset Value (One-Month Lag)
Mutual Fund Total Asset Value (One-Month Lag)
Municipal Bond
Trading Volume (One-Month Lag)
Municipal Bond
Market Volatility
Municipal Bond
Market Return
Municipal Bond
Market Return (One-Month Lag)
New Issuance
New Issuance
(One-Month Lag)
Statistical Significance at 5% Confidence Level?
No Yes Yes Yes No No No No
If Statistically Significant, Positive or Negative Impact
Positive Negative Positive
Impact on Municipal Bond Trading Volume — for Every 10% Increase in Each Variable
27.9% -3.2% 0.7%
Source: MSRB analysis, with data obtained MSRB, Bloomberg, S&P Dow Jones Indices and the ICI. For the most up-to-date figures about the fund industry, please visit www.ici.org/research/stats.
Outside the variable ETF total asset value, three control variables are found to have statistically significant impact on municipal bond trading volume:
• Lagged municipal bond mutual fund total asset value, where there is a positive impact on municipal bond trading volume from a growing mutual fund ownership;
• Lagged municipal bond trading volume, where a prior month’s trading volume increase would decrease the next month’s trading volume; and
• Contemporaneous municipal bond market volatility, where a month with high volatility has a positive impact on the same month’s trading volume.
Most of the findings for control variables are expected. For example, when compared to the undetermined impact of ETF ownership on overall volume, the positive impact of mutual fund ownership could be attributed to the fact that open-end mutual funds have a very different operation mechanism from ETFs where inflows and outflows of investment money directly result in purchasing or selling of securities in a fund portfolio. In addition, most mutual funds are actively managed funds whereas a vast majority of the ETFs are passive investments. Since actively managed funds by definition have higher turnover of securities in the portfolio than passively managed funds, this result is unsurprising. Similarly, municipal bond market price return does not have a statistically significant impact on trading volume, whether the variable is specified in a one-month lag or contemporaneously. This result is different from the equity market, where bull markets tend to encourage more trading volume

© 2018 Municipal Securities Rulemaking Board 18msrb.org
APRIL 2018 Municipal Bond ETFs: Liquidity Impact on the Municipal Bond Market
and a prolonged bear market tends to depress trading volume, but nevertheless is not surprising, given that bond investors tend to focus on coupon payments and yields in the municipal bond market rather than bond price fluctuation.49 Furthermore, market volatility is widely known to precipitate trading activity, as validated by the regression analysis statistically.
While it is widely known that individual municipal bonds trade more when newly issued and that the trading volume tends to decline as the bonds move further away from the issuance date, the regression analysis implies that this new issuance impact on aggregate municipal bond trading volume is either short-lived or negligible.50 Even within the same month of issuance, new issue volume does not have a statistically significant impact on overall secondary market trading volume.
On the other hand, it is interesting that when municipal bond trading volume increases in a given month, the following month’s trading volume would reverse the trend and decrease (and vice versa), suggesting that there is no volume “pile-on” effect in the municipal bond market. All else equal, the volume change is temporal and is partially offset in the following month.
e. Potential Future Research
More research is warranted in this area to draw firmer conclusions. In addition, any potential impact on the municipal bond market because of the growth of municipal bond ETFs may change over time as the ETF market continues to evolve. Also, the impact may be different during periods of extreme market volatility.
Since this analysis focuses on aggregate municipal bond data, one area of potential future research is to examine actual bond-level liquidity. For example, it would be a more precise measure of the ETF impact on underlying municipal bond liquidity if the methodology could segregate municipal bonds held in ETFs from those municipal bonds not held in ETFs, and then compare the liquidity impact differential over time for two groups of municipal bonds.
In addition, like the Tucker and Laipply (2013) study referenced earlier that examines the impact of fixed-income ETFs on price discovery, future research can also examine whether municipal bond ETFs are indeed a better asset for price discovery than the underlying bond portfolio, which the ETFs are supposed to mimic. This should result in price information more immediately reflected in ETF prices than in either index values or in prices of the underlying securities.
Finally, like the Dannhauser (2016) paper, a study could be conducted to test for a valuation effect from ETF ownership, and whether municipal bond ETF ownership also has positive impact on underlying bond valuation relative to a benchmark.
49 Some may argue that fixed-income investors may even pay more attention to bond yields than prices, where a higher yield environment may encourage more participation from the buy-and-hold investors, and vice versa.
50 Typically, over 85 percent of new issuance volume is directly placed by underwriters with institutional and retail investors, who tend to have a buy-and-hold investment strategy in the municipal bond market. The other 15 percent of new issuance volume is placed with other dealers, who may elect to resell into the secondary market. Therefore, only a small portion of new issuance volume has the potential to be traded immediately in the secondary market.

© 2018 Municipal Securities Rulemaking Board 19msrb.org
APRIL 2018 Municipal Bond ETFs: Liquidity Impact on the Municipal Bond Market
V. Conclusions
The growth of the municipal bond and other fixed-income ETF markets offers a new tool for investors and market participants, beyond that which can be accessed directly in the over-the-counter bond market. However, it should be noted that the ETF structure itself remains dependent on the liquidity of the underlying bond market.
The value at which ETFs trade should be reflective of the value of the underlying bonds held within the ETF; if a value discrepancy between the ETF and its underlying bond portfolio develops, market participants can trade one versus the other to take advantage of the arbitrage opportunity. This mechanism, however, is premised upon a functioning over-the-counter bond market that can be utilized by arbitrageurs to buy and sell the underlying securities. As others have shown, if the underlying bond market liquidity becomes impaired then the ETF creation/redemption process would be hampered as well.51 While ETFs can provide liquidity enhancement for the bond market overall, they remain structurally dependent upon the same bond market for their creation and redemption process.
The empirical findings discussed in this report do not show any evidence of deterioration of municipal bond liquidity because of the recent rapid growth of municipal bond ETFs. As the ETF market continues to grow, however, the liquidity impact on the municipal bond market could change. In addition, as noted above, since the advent of municipal bond ETFs in September 2007, the market has not witnessed a sustained dramatic rising interest rate environment, which would result in a bear market for bonds. Therefore, how fixed-income ETFs behave in a bear-market period is still unknown and untested.
Regardless of the ultimate impact on the corresponding markets for individual securities, improving liquidity for the municipal bond market is essential for keeping both markets well-functioning and for providing both investors and municipal entities more efficient avenues to access the capital markets.
For question about this report, please contact Simon Wu, MSRB Chief Economist (202-838-1385; [email protected]), or Meghan Burns, Market Structure Specialist/Economic Researcher (202-838-1320; [email protected]).
51 See Tucker, Matthew and Stephen Laipply, “Fixed Income ETFs and the Corporate Bond Liquidity Challenge,” iShares BlackRock. In such a scenario the ETF would mechanically begin to function more like a closed-end fund, which is unable to grow or shrink in size in order to balance supply and demand.

© 2018 Municipal Securities Rulemaking Board 20msrb.org
APRIL 2018 Municipal Bond ETFs: Liquidity Impact on the Municipal Bond Market
References
Antoniewicz, Rochelle and Jane Heinrichs, “Understanding Exchange-Traded Funds: How ETFs Work,” Investment Company Institute (ICI) Research Perspective, Vol. 20, No. 5, September 2014.
Antoniewicz, Rochelle and Jane Heinrichs, “The Role and Activities of Authorized Participants of Exchange-Traded Funds,” Investment Company Institute, March 2015.
Dannhauser, Caitlin Dillon, “The Impact of Innovation: Evidence from Corporate Bond ETFs,” Working Paper, September 2016.
Engle, Robert and Debojyoti Sarkar, “Premiums-Discounts and Exchange Traded Funds,” The Journal of Derivatives, Summer 2006.
Gerig, Austin and Keegan Murphy, “The Determinants of ETF Trading Pauses on August 24th, 2015,” working paper, Division of Economic and Risk Analysis, the Securities and Exchange Commission, February 2016.
Hamm, Sophia J.W., “The Effect of ETFs on Stock Liquidity,” working paper, April 2014.
Hedge, Shantaram and John B. McDermott, “The Market Liquidity of DIAMONDS, Q’s, and Their Underlying Stocks,” Journal of Banking and Finance 28, 1043 – 1067, 2004.
Israeli, Doran, M.C. Lee, Charles and Suhas A. Sridharan, “Is There a Dark Side to Exchange Traded Funds? An Information Perspective,” Review of Accounting Studies, forthcoming.
Jackson, Gavin, “Pricing Mismatch Worries Hit ETFs,” Financial Times, January 5, 2016.
Malamud, Semyon, “A Dynamic Equilibrium Model of ETFs,” Swiss Finance Institute Research Paper No. 15-37, September 17, 2015.
Pan, Kevin and Yao Zeng, “ETF Arbitrage under Liquidity Mismatch,” working paper, February 2017.
Tucker, Matthew and Stephen Laipply, “Bond Market Price Discovery: Clarity Through the Lens of an Exchange,” The Journal of Portfolio Management, Winter 2013.
Tucker, Matthew and Stephen Laipply, “Fixed Income ETFs and the Corporate Bond Liquidity Challenge,” iShares BlackRock, 2015.
Weinberg, Ari, “SEC Raises Concerns About Bond ETFs,” Wall Street Journal, February 7, 2016.

© 2018 Municipal Securities Rulemaking Board 21msrb.org
APRIL 2018 Municipal Bond ETFs: Liquidity Impact on the Municipal Bond Market
Appendix A — About the Authors
Simon Wu, Ph.D., Chief Economist — Mr. Wu is the Chief Economist for the Municipal Securities Rulemaking Board. With nearly two decades of experience applying economic expertise to securities policymaking and regulation, Mr. Wu oversees economic analysis of MSRB rulemaking and municipal market transparency initiatives, and leads related statistical, econometric and financial economic analysis. Before joining the MSRB’s Market Structure department, Mr. Wu served as a financial economic expert on securities trading, market structure, best execution, investment management and financial institution risk management at several economic consulting firms. Mr. Wu also served as Chief Economist at the Federal Housing Finance Agency (FHFA), Office of Inspector General, where he was involved in regulatory oversight on mortgage-backed securities issuance and trading, capital market risk management and unsecured lending by banks. He began his career as senior economist at the Financial Industry Regulatory Authority (FINRA) where he led economic studies in support of securities rule proposals and policy impact analysis. Mr. Wu has a doctorate and master’s degree in economics from Vanderbilt University and a bachelor’s degree in economics from Belmont University.
Meghan Burns, Market Structure Specialist/Economic Researcher — Ms. Burns is Economic Researcher and Market Structure Specialist at the Municipal Securities Rulemaking Board where she works on cost benefit analysis for rulemaking and financial market research for market structure-related issues. She has a bachelor’s degree from the College of William & Mary and is completing her master’s in business administration at Georgetown University.
© 2018 Municipal Securities Rulemaking Board 22msrb.org
APRIL 2018 Municipal Bond ETFs: Liquidity Impact on the Municipal Bond Market
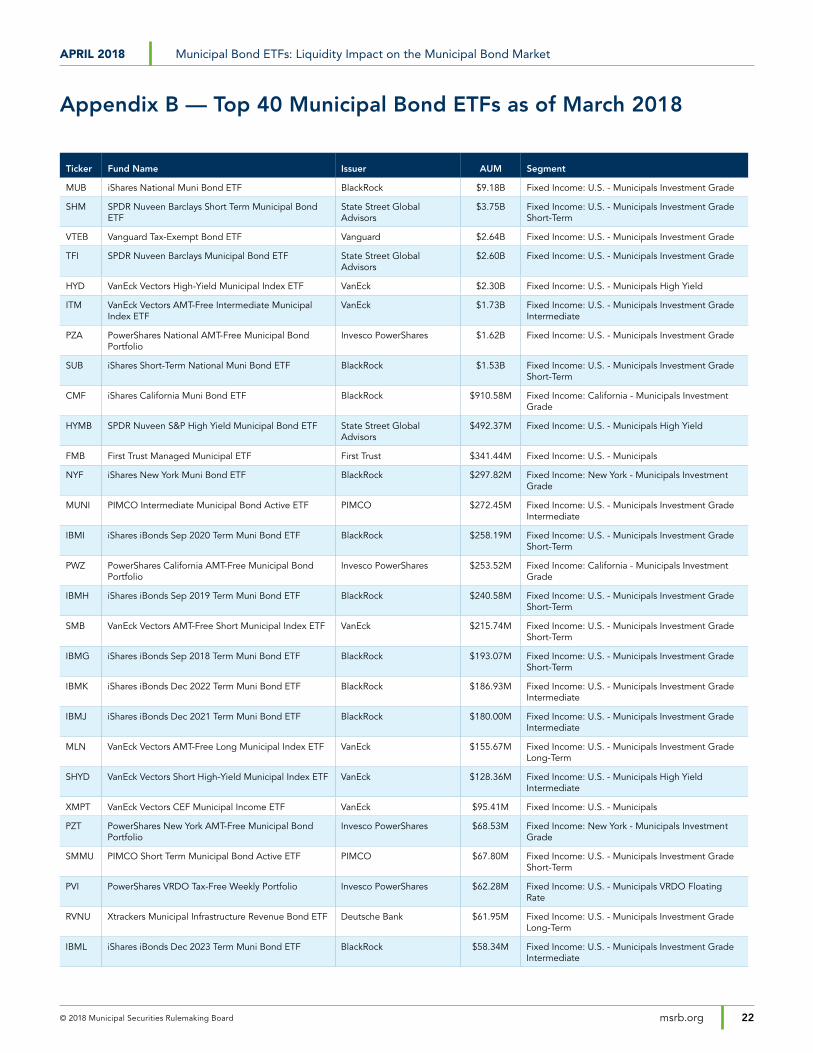
Appendix B — Top 40 Municipal Bond ETFs as of March 2018
Ticker Fund Name Issuer AUM Segment
MUB iShares National Muni Bond ETF BlackRock $9.18B Fixed Income: U.S. - Municipals Investment Grade
SHM SPDR Nuveen Barclays Short Term Municipal Bond ETF
State Street Global Advisors
$3.75B Fixed Income: U.S. - Municipals Investment Grade Short-Term
VTEB Vanguard Tax-Exempt Bond ETF Vanguard $2.64B Fixed Income: U.S. - Municipals Investment Grade
TFI SPDR Nuveen Barclays Municipal Bond ETF State Street Global Advisors
$2.60B Fixed Income: U.S. - Municipals Investment Grade
HYD VanEck Vectors High-Yield Municipal Index ETF VanEck $2.30B Fixed Income: U.S. - Municipals High Yield
ITM VanEck Vectors AMT-Free Intermediate Municipal Index ETF
VanEck $1.73B Fixed Income: U.S. - Municipals Investment Grade Intermediate
PZA PowerShares National AMT-Free Municipal Bond Portfolio
Invesco PowerShares $1.62B Fixed Income: U.S. - Municipals Investment Grade
SUB iShares Short-Term National Muni Bond ETF BlackRock $1.53B Fixed Income: U.S. - Municipals Investment Grade Short-Term
CMF iShares California Muni Bond ETF BlackRock $910.58M Fixed Income: California - Municipals Investment Grade
HYMB SPDR Nuveen S&P High Yield Municipal Bond ETF State Street Global Advisors
$492.37M Fixed Income: U.S. - Municipals High Yield
FMB First Trust Managed Municipal ETF First Trust $341.44M Fixed Income: U.S. - Municipals
NYF iShares New York Muni Bond ETF BlackRock $297.82M Fixed Income: New York - Municipals Investment Grade
MUNI PIMCO Intermediate Municipal Bond Active ETF PIMCO $272.45M Fixed Income: U.S. - Municipals Investment Grade Intermediate
IBMI iShares iBonds Sep 2020 Term Muni Bond ETF BlackRock $258.19M Fixed Income: U.S. - Municipals Investment Grade Short-Term
PWZ PowerShares California AMT-Free Municipal Bond Portfolio
Invesco PowerShares $253.52M Fixed Income: California - Municipals Investment Grade
IBMH iShares iBonds Sep 2019 Term Muni Bond ETF BlackRock $240.58M Fixed Income: U.S. - Municipals Investment Grade Short-Term
SMB VanEck Vectors AMT-Free Short Municipal Index ETF VanEck $215.74M Fixed Income: U.S. - Municipals Investment Grade Short-Term
IBMG iShares iBonds Sep 2018 Term Muni Bond ETF BlackRock $193.07M Fixed Income: U.S. - Municipals Investment Grade Short-Term
IBMK iShares iBonds Dec 2022 Term Muni Bond ETF BlackRock $186.93M Fixed Income: U.S. - Municipals Investment Grade Intermediate
IBMJ iShares iBonds Dec 2021 Term Muni Bond ETF BlackRock $180.00M Fixed Income: U.S. - Municipals Investment Grade Intermediate
MLN VanEck Vectors AMT-Free Long Municipal Index ETF VanEck $155.67M Fixed Income: U.S. - Municipals Investment Grade Long-Term
SHYD VanEck Vectors Short High-Yield Municipal Index ETF VanEck $128.36M Fixed Income: U.S. - Municipals High Yield Intermediate
XMPT VanEck Vectors CEF Municipal Income ETF VanEck $95.41M Fixed Income: U.S. - Municipals
PZT PowerShares New York AMT-Free Municipal Bond Portfolio
Invesco PowerShares $68.53M Fixed Income: New York - Municipals Investment Grade
SMMU PIMCO Short Term Municipal Bond Active ETF PIMCO $67.80M Fixed Income: U.S. - Municipals Investment Grade Short-Term
PVI PowerShares VRDO Tax-Free Weekly Portfolio Invesco PowerShares $62.28M Fixed Income: U.S. - Municipals VRDO Floating Rate
RVNU Xtrackers Municipal Infrastructure Revenue Bond ETF Deutsche Bank $61.95M Fixed Income: U.S. - Municipals Investment Grade Long-Term
IBML iShares iBonds Dec 2023 Term Muni Bond ETF BlackRock $58.34M Fixed Income: U.S. - Municipals Investment Grade Intermediate

© 2018 Municipal Securities Rulemaking Board 23msrb.org
APRIL 2018 Municipal Bond ETFs: Liquidity Impact on the Municipal Bond Market
Ticker Fund Name Issuer AUM Segment
MEAR iShares Short Maturity Municipal Bond ETF BlackRock $54.80M Fixed Income: U.S. - Municipals Investment Grade Short-Term
MMIT IQ MacKay Shields Municipal Intermediate ETF IndexIQ $29.73M Fixed Income: U.S. - Municipals Investment Grade Intermediate
FMHI First Trust Municipal High Income ETF First Trust $22.49M Fixed Income: U.S. - Municipals
CUMB Virtus Cumberland Municipal Bond ETF Virtus $14.93M Fixed Income: U.S. - Municipals Investment Grade
MMIN IQ MacKay Shields Municipal Insured ETF IndexIQ $14.87M Fixed Income: U.S. - Municipals Investment Grade
PRB VanEck Vectors Pre-Refunded Municipal Index ETF VanEck $14.58M Fixed Income: U.S. - Municipals Investment Grade
MCEF First Trust Municipal CEF Income Opportunity ETF First Trust $13.34M Fixed Income: U.S. - Municipals
HMOP Hartford Municipal Opportunities ETF Hartford $11.87M Fixed Income: U.S. - Municipals
FCAL First Trust California Municipal High Income ETF First Trust $10.01M Fixed Income: California - Municipals
FLMI Franklin Liberty Intermediate Municipal Opportunities ETF
Franklin Templeton Investments
$7.32M Fixed Income: U.S. - Municipals Intermediate
FLMB Franklin Liberty Municipal Bond ETF Franklin Templeton Investments
$7.30M Fixed Income: U.S. - Municipals Investment Grade Long-Term
IBMM iShares iBonds Dec 2024 Term Muni Bond ETF BlackRock $2.50M Fixed Income: U.S. - Municipals Investment Grade Intermediate
Source: ETF.com
C O R P O R A T E O F F I C E
Municipal Securities Rulemaking Board1300 I Street NW, Suite 1000Washington, DC 20005202-838-1500
M S R B S U P P O R T
202-838-1330O N L I N E
msrb.orgemma.msrb.orgTwitter: @MSRB_News
ABOUT THE MSRB
The MSRB protects investors, state and local governments and other municipal entities, and the public interest by promoting a fair and efficient municipal securities market. The MSRB fulfills this mission by regulating the municipal securities firms, banks and municipal advisors that engage in municipal securities and advisory activities. To further protect market participants, the MSRB provides market transparency through its Electronic Municipal Market Access (EMMA®) website, the official repository for information on all municipal bonds. The MSRB also serves as an objective resource on the municipal market, conducts extensive education and outreach to market stakeholders, and provides market leadership on key issues. The MSRB is a Congressionally-chartered, self-regulatory organization governed by a 21-member board of directors that has a majority of public members, in addition to representatives of regulated entities. The MSRB is subject to oversight by the Securities and Exchange Commission.