Justification and Implication of Macroeconomic Management ...
Upload
khangminh22Category
view
4download
0
189189
ISSN 1518-3548
Linking Financial and Macroeconomic Factors to Credit RiskIndicators of Brazilian Banks
Marcos Souto, Benjamin M. Tabakand Francisco Vazquez
July, 2009
Working Paper Series

ISSN 1518-3548 CGC 00.038.166/0001-05
Working Paper Series Brasília n. 189 Jul. 2009 p. 1-46

Working Paper Series Edited by Research Department (Depep) – E-mail: [email protected] Editor: Benjamin Miranda Tabak – E-mail: [email protected] Editorial Assistent: Jane Sofia Moita – E-mail: [email protected] Head of Research Department: Carlos Hamilton Vasconcelos Araújo – E-mail: [email protected] The Banco Central do Brasil Working Papers are all evaluated in double blind referee process. Reproduction is permitted only if source is stated as follows: Working Paper n. 189. Authorized by Mário Mesquita, Deputy Governor for Economic Policy. General Control of Publications Banco Central do Brasil
Secre/Surel/Dimep
SBS – Quadra 3 – Bloco B – Edifício-Sede – 1º andar
Caixa Postal 8.670
70074-900 Brasília – DF – Brazil
Phones: +55 (61) 3414-3710 and 3414-3567
Fax: +55 (61) 3414-3626
E-mail: [email protected]
The views expressed in this work are those of the authors and do not necessarily reflect those of the Banco Central or its members. Although these Working Papers often represent preliminary work, citation of source is required when used or reproduced. As opiniões expressas neste trabalho são exclusivamente do(s) autor(es) e não refletem, necessariamente, a visão do Banco Central do Brasil. Ainda que este artigo represente trabalho preliminar, é requerida a citação da fonte, mesmo quando reproduzido parcialmente. Consumer Complaints and Public Enquiries Center Banco Central do Brasil
Secre/Surel/Diate
SBS – Quadra 3 – Bloco B – Edifício-Sede – 2º subsolo
70074-900 Brasília – DF – Brazil
Fax: +55 (61) 3414-2553
Internet: http//www.bcb.gov.br/?english

3
Linking Financial and Macroeconomic Factors to Credit Risk Indicators of Brazilian Banks*
Marcos Souto** Benjamin M. Tabak*** Francisco Vazquez****
The Working Papers should not be reported as representing the views of the Banco Central do Brasil. The views expressed in the papers are those of the author(s) and do
not necessarily reflect those of the Banco Central do Brasil.
Abstract This study constructs a set of credit risk indicators for 39 Brazilian banks, using the Merton framework and balance sheet information on the banks’ total assets and liabilities. Despite the simplifying assumptions, the methodology captures well several stylized facts in the recent history of Brazil. In particular, it identifies deterioration in the credit risk indicators of the banking sector, following the crisis in the early 2000s. The risk indicators were regressed against a number of macro-financial variables at both individual and systemic level, showing that an increase in the system EDF, interest rates, and CDS spreads will lead to a deterioration of the individual expected default probability. Keywords: structural models, credit risk indicators, stress tests, macro-financial links. JEL Classification: G21, G33
* The opinions expressed in this paper are those of the authors and do not necessarily reflect those of the Central Bank of Brazil or the IMF. Benjamin M. Tabak gratefully acknowledges financial support from CNPQ Foundation. The authors thank the comments made by participants of the Workshop on Financial Stability sponsored by the Banco Central do Brasil and the 2008 Australasian Banking and Finance Conference. ** International Monetary Fund, MCM. *** Banco Central do Brasil: Research Department. Universidade Católica de Brasília. E-mail: [email protected] **** International Monetary Fund.
4
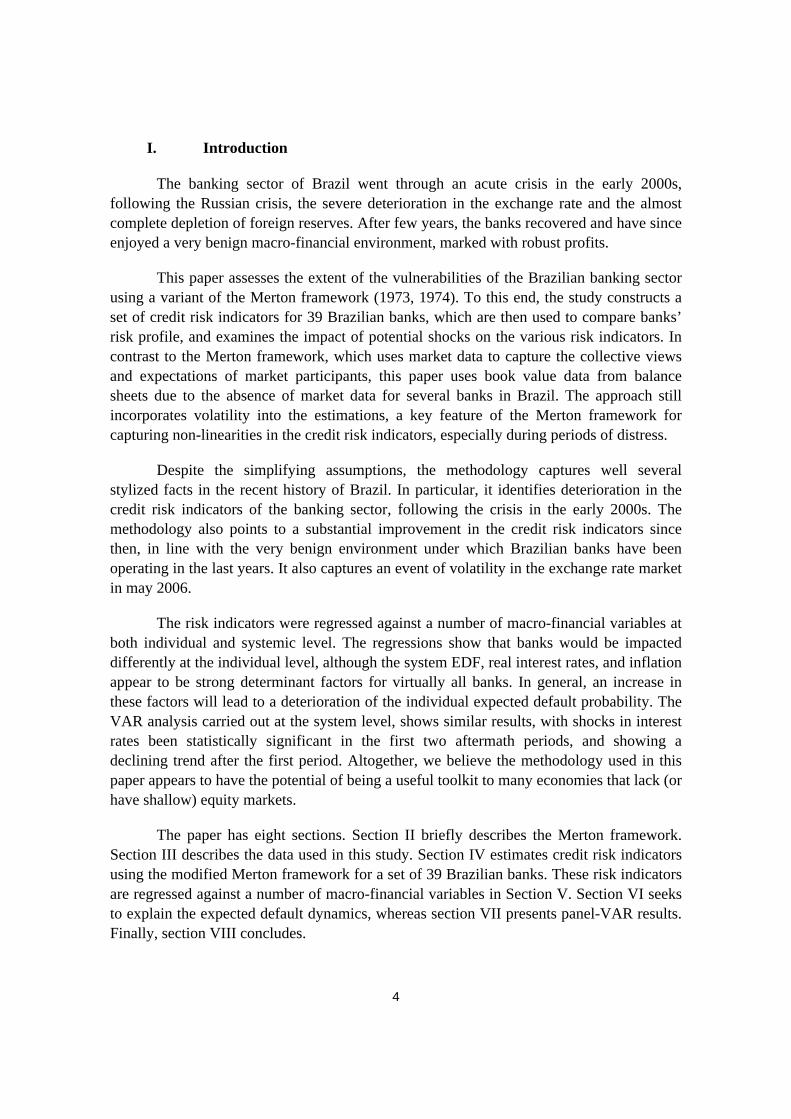
I. Introduction
The banking sector of Brazil went through an acute crisis in the early 2000s, following the Russian crisis, the severe deterioration in the exchange rate and the almost complete depletion of foreign reserves. After few years, the banks recovered and have since enjoyed a very benign macro-financial environment, marked with robust profits.
This paper assesses the extent of the vulnerabilities of the Brazilian banking sector using a variant of the Merton framework (1973, 1974). To this end, the study constructs a set of credit risk indicators for 39 Brazilian banks, which are then used to compare banks’ risk profile, and examines the impact of potential shocks on the various risk indicators. In contrast to the Merton framework, which uses market data to capture the collective views and expectations of market participants, this paper uses book value data from balance sheets due to the absence of market data for several banks in Brazil. The approach still incorporates volatility into the estimations, a key feature of the Merton framework for capturing non-linearities in the credit risk indicators, especially during periods of distress.
Despite the simplifying assumptions, the methodology captures well several stylized facts in the recent history of Brazil. In particular, it identifies deterioration in the credit risk indicators of the banking sector, following the crisis in the early 2000s. The methodology also points to a substantial improvement in the credit risk indicators since then, in line with the very benign environment under which Brazilian banks have been operating in the last years. It also captures an event of volatility in the exchange rate market in may 2006.
The risk indicators were regressed against a number of macro-financial variables at both individual and systemic level. The regressions show that banks would be impacted differently at the individual level, although the system EDF, real interest rates, and inflation appear to be strong determinant factors for virtually all banks. In general, an increase in these factors will lead to a deterioration of the individual expected default probability. The VAR analysis carried out at the system level, shows similar results, with shocks in interest rates been statistically significant in the first two aftermath periods, and showing a declining trend after the first period. Altogether, we believe the methodology used in this paper appears to have the potential of being a useful toolkit to many economies that lack (or have shallow) equity markets.
The paper has eight sections. Section II briefly describes the Merton framework. Section III describes the data used in this study. Section IV estimates credit risk indicators using the modified Merton framework for a set of 39 Brazilian banks. These risk indicators are regressed against a number of macro-financial variables in Section V. Section VI seeks to explain the expected default dynamics, whereas section VII presents panel-VAR results. Finally, section VIII concludes.

5
II. A Structural Model for Estimating Credit Risk Indicators
We utilize the Merton (1973, 1974) framework to estimate expected default probabilities for a set of Brazilian banks. The Merton framework combines liability-related balance sheet information with commonly used risk measurement tools to construct marked-to-market overall balance sheets with a view to identify and quantify credit risk. It relies on observable market information about the value and volatility of liabilities (and equity) to derive the value of non-observable quantities, such as the asset value and corresponding volatility. This information is then combined to estimate risk indicators, such as the distance-to-distress, default probability and credit spreads.
The Merton framework offers some distinct advantages over other vulnerability analyses†. First, the Merton framework takes balance sheet information and combines it with current and forward-looking financial market prices to compute risk-adjusted marked-to-market balance sheets. It thus incorporates the collective views of all market participants, as all the relevant information is priced into the firm’s equity. Second, the Merton framework distinguishes itself from other vulnerability analyses in that it incorporates market volatility when estimating credit risk. Volatility is crucial in capturing nonlinear changes in risk, especially during times of stress when small shocks can gain momentum and trigger systemic repercussions.
The basic idea of the Merton framework is to model a firm’s balance sheet by grouping the main accounts into assets, liabilities and ‘equity’. Merton shows how a firm’s equity can be modeled as a (junior) contingent claim on the residual value of its assets. In the event of default, equity holders receive nothing if the firm’s assets are all consumed to pay the senior stakeholders (e.g. debt holders); otherwise equity holders receive the difference between the value of assets and debt. Under this framework, the equity of the firm can be seen as a call option on the residual value of the firm’s assets. From Black and Scholes (1973):
1 2( ) ( )rTE VN d DBe N d−= − , (1)
where V is the implied value of asset, DB is the value of the distress barrier, r is the
(constant) risk-free interest rate, T is the maturity of the option, and 1
d and 2
d are defined
as:
† See Gapen et al. (2004, 2005) and Dale and Jones (2006) for examples of application of the Merton framework to government, banking, and corporate sectors’ balance sheets.

6
22
1
11 ln exp ln( )ln22
VV
V V
V V r T DBr TDB
dT T
σσ
σ σ
⎛ ⎞⎛ ⎞⎛ ⎞⎛ ⎞ ⎛ ⎞ + −+ + ⎜ ⎟⎜ ⎟⎜ ⎟⎜ ⎟ ⎜ ⎟ ⎝ ⎠⎝ ⎠⎝ ⎠ ⎝ ⎠ ⎝ ⎠= = , (2)
and
22
2
11 ln exp ln( )ln22
VV
V V
V V r T DBr TDB
dT T
σσ
σ σ
⎛ ⎞⎛ ⎞⎛ ⎞⎛ ⎞ ⎛ ⎞ − −+ − ⎜ ⎟⎜ ⎟⎜ ⎟⎜ ⎟ ⎜ ⎟ ⎝ ⎠⎝ ⎠⎝ ⎠ ⎝ ⎠ ⎝ ⎠= = , (3)
with Vσ being the implied value of asset volatility.
Also, using Ito’s lemma and the definition of variance, it is easy to show that:
1( )E V V
E V VN d
V E Eσ σ σ∂= =
∂, (4)
where E is the value of equity and Eσ is the volatility of equity.
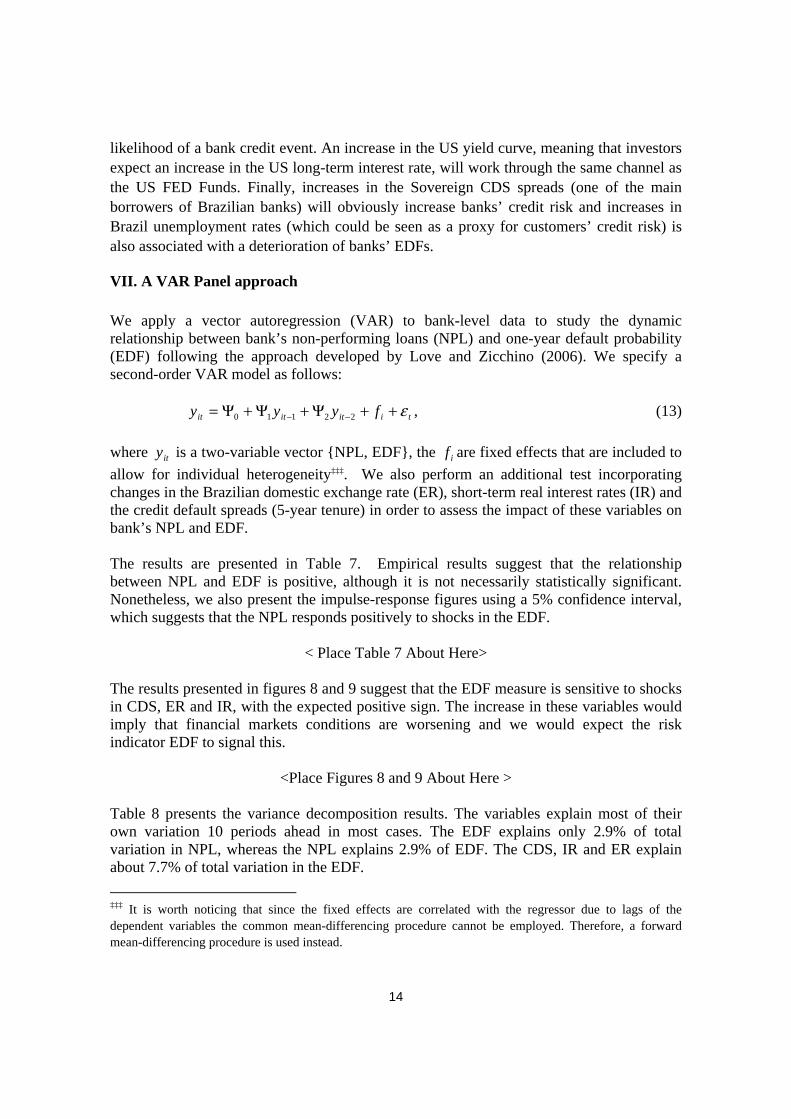
This framework enables a rich characterization of a firm’s (or sovereign’s) balance sheet and the derivation of a series of credit risk indicators, in particular the distance to distress, the default probability, and credit spreads. Overall, with information on the market value and volatility of equity and the book value of liabilities, it is possible to estimate the implied value for assets and assets volatility, by solving a system of equations comprised by equations (1) and (4) (See figure 1).
<Place Figure 1 About Here>
Souto (2008b) shows how to solve numerically this system and shows that the numerical solution of the system converges to a unique par of values. After determining the distress barrier, the firm is assumed to default whenever the values of its implied assets fall below this distress barrier. We follow Moody’s-KMV and define the distress barrier as:
DB STD LTDα= + ⋅ ‡, (5)
where STD represents the short-term liabilities (maturity ≤ 1 year), LTD represents the long-term liabilities (maturity > 1 year), and α is a parameter between 0 and 1 (usually around 0.5)§.
‡ Usually this expression also incorporates one-year interest payments. To compensate for that, we use
0.7α = , slightly larger than the value used by Moody’s.

7
We can also estimate:
(1) Distance to distress ( 2D D ): which gives the number of standard deviations that the asset value is away from the distress barrier ( D ):
( ) 21ln ln( )
22
V r T DD D
T
σ
σ
⎛ ⎞+ − −⎜ ⎟⎝ ⎠= . (6)
(2) Risk neutral default probability ( RNDP ):
( 2 )RNDP N D D= − . (7)
(3) Credit default spread ( spread ):
1 2
1ln ( ) ( )
rt
Vspread N d N d
t De−
− ⎛ ⎞= +⎜ ⎟⎝ ⎠
. (8)
III. The Data III.1. Banking Data
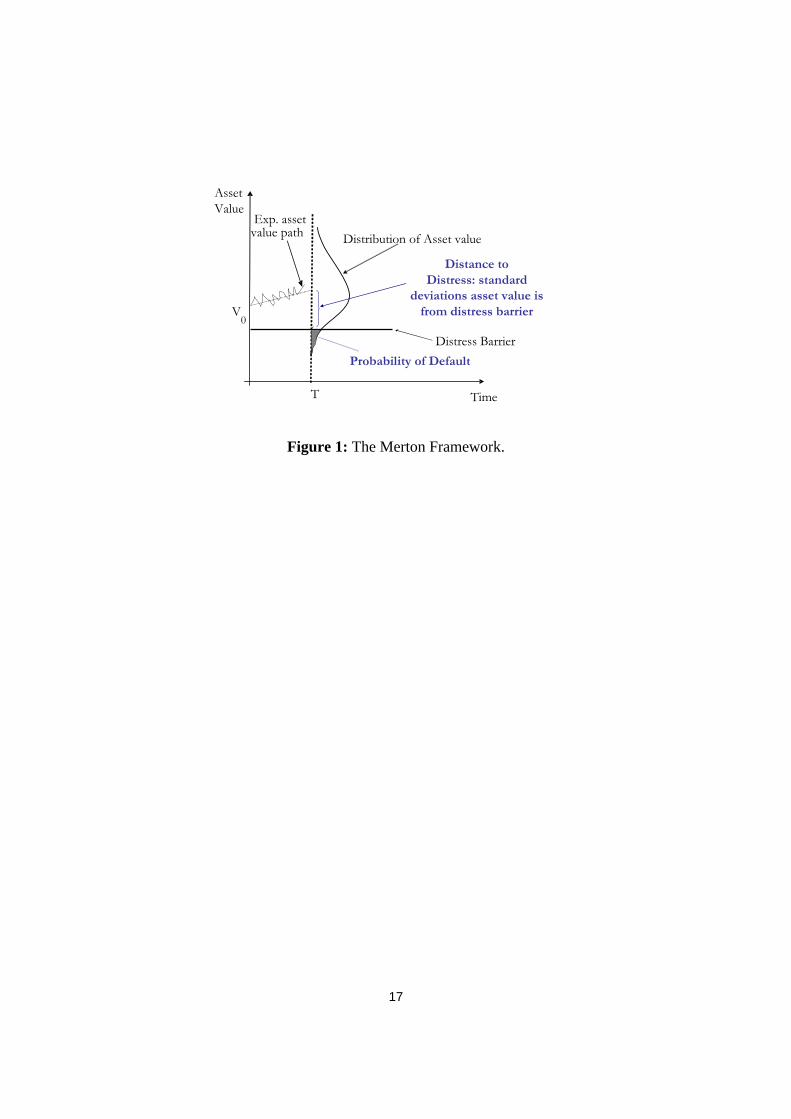
We have collected monthly book value data** for a sample of 39 banks, including some of the largest banks, going back to January of 2001††. These banks represent 72.9 percent of total assets for the banking system (Table 1). Our sample includes government (11), domestic private (17), and foreign private banks (11). Foreign private banks are defined as those with at least 50 percent of foreign ownership. Otherwise, they are classified as domestic private banks. This data is available in the Central Bank of Brazil website.
<Place Table 1 About Here>
§ Moody’s utilizes α in the range 0.5-0.6, based on the calibration of their model, so as to match model and historical probabilities of default. We use 0.7α = , to compensate for the lack of information on 1-year interest rate expenses.
** For each individual bank, we have information on total assets, short-term liabilities, long-term liabilities, total loans and credits, non-performing loans (NPL) as percentage of total loans, and return on equity (ROE).
†† The balance sheet data used in this study was adjusted to account for banks’ operations that were ‘double-counted’. This data is available starting only in January 2001.

8
Few of these banks trade equity frequently in the Brazilian stock exchange and for them we can estimate credit risk indicators using equity market data. In addition, there is also data available on the expected default probability for some banks, as estimated by Moody’s-KMV and available in their database. III.2. Macro-financial variables
To construct the regression model linking the credit risk indicator to macro-financial factors, we have selected a number of variables that could describe the main dynamics recently observed in both global and domestic markets. We adapted some of the suggested factors from Gray and Walsh (2008) to the Brazilian reality. We list these factors in Table 2 below, along with their source and their definitions. All variables are available at least at a monthly frequency, and most cover the same period as for the banking data, with exception of the time series for USD interest rates in Brazil (known as Cupom Cambial), since this time series have a shorter time span.
<Place Table 2 About Here>
IV. Estimating Default Probabilities for Brazilian Banks
We use the structural Merton framework as outlined in Section 2, to estimate expected default probabilities for Brazilian banks. In the case of Brazil, market data is not available for several banks and it is thus not possible to obtain marked-to-market risk indicators for them. However, it is still possible to incorporate volatility, using book value data, into the estimation of credit risk indicators. As mentioned above, factoring in volatility makes it possible to capture non-linearities that are important particularly when a company or bank enters a period of distress. While losing the ‘collective view’ feature that characterizes the Merton framework, book value balance sheet data still possesses relevant information.
In this context, estimating risk indicators using book value balance sheet data, it is not necessary to estimate expressions (2) and (3) (to obtain implied value of assets and assets volatility). Instead, the book value of assets and volatility of assets are used to estimate the risk indicators in expressions (6) – (8). To estimate the volatility for the book value of total assets, we use the definition for downside risk volatility, which places greater weight to negative shocks than to positive shocks, as in the formula below:
( )∑=
−−=N
ttt VVMin
1
21 0),ln()ln(σ , (9)
where ( )⋅⋅⋅Min is the minimum function.

9
The intuition for this choice for volatility modeling relies on the fact that usually the negative shocks are the source of concern, rather than the positive ones. It has also helped to deal with many cases where the volatility was rather a reflex of a steady growth. In the particular case of this study, this measure of volatility has helped us obtain reasonable estimates for default probabilities, consistent with the main stylized facts observed in the recent history of Brazil.
All book value information was converted to US dollars and we use a Brazilian short-term interest rate, in US Dollars (the “cupom cambial”)‡‡, to estimate the expected default probability. We used Dollar denominated values in order to be able to contrast our results with the Moody’s-KMV results. In figures 2 and 3 below, we present the expected default probability aggregated (by total assets) for the system and for groups of banks (government, domestic private, and foreign private banks) and few comments are in place. First, despite the fact that it uses only book value data, the estimated EDFs capture the main events of recent history in Brazil reasonably well. For example, the high (but decreasing) EDFs in the beginning of 2003 reflect the end of the period crisis that shaked the Brazilian banking system in the early 2000’s. Then, more recently (April 2006), an episode of volatility in the foreign exchange market again provokes deterioration in the banks’ credit risk profile, having affected the government banks more acutely. Second, in general, private domestic banks perform better than government and private foreign banks. Government banks perform the worse, in general. This is also consistent with the observed stylized facts, with domestic private banks presenting to his stakeholders very profitable results (more profitable than foreign banks). Finally, after the crisis in the early 2000’s, Brazilian banks credit risk profile improved significantly (perhaps easier to be seen in Figure 4 below), reflecting the very benign environment under which they have been operating since then.
<Place Figures 2 and 3 About Here>
IV.1. One Interesting Case: Recent Failure of a Large Sized Bank
Established in 1969 as a small investment fund this bank became a commercial bank in 1989 and continued to grow steadily until 2004, to become the eighth largest private domestic bank in Brazil, managing over USD 6 Billions in assets. However, the Central Bank of Brazil placed this bank in a monitoring list in late 2002, declaring the fragility of the bank’s capital structure to be ‘fragile’. In late 2003, both Standard and Poor’s and Fitch, downgraded this bank ratings, reflecting deterioration in its credit portfolio and inadequate loan provisioning. In mid 2004 the bank suffered a bank run that eventually lead the bank to be intervened in November 2004.
‡‡ The “cupom cambial” is defined as the sum i*+φ, where i* is the foreign interest rate (e.g. Libor), and φ is a risk premium (assuming that the uncovered interst rate parity holds).

10
Figures 4 and 5 below present the evolution of the estimated default frequency for the bank during the period of March 2002 to November 2004, as well as the evolution of the bank’s total assets volatility and distance-to-distress. Figure 4 shows an acute deterioration of the EDF in May, 2004, which continue to deteriorate until achieving a maximum point in June 2006. After that, EDF bounced around high levels until September 2009. The deterioration in EDF was mainly associated with an increase in asset volatility (Figure 5) stemming from the bank run in mid 2004. Despite the early warnings made by the Central Bank of Brazil, the estimated EDF is consistent with a number of credit reports by rating agencies that highlighted the relative good performance of this bank as late as April/May 2004. The results also highlight the usefulness of this tool for off-site supervision applications, as the methodology captures the deterioration in the credit risk indicator few months before the BCB intervention took place..
<Place Figures 4 and 5 About Here>
V. Book vs. Market Data: Some Important Stylized Facts
In this section we compare the EDF for the three largest banks in Brazil estimated using book value information, as laid out in Section II above, with the EDFs estimated by Moody’s-KMV, using market value data. We focus on these three largest banks because their stocks are fairly liquid. In Figure 6, we plot the weighted average EDF (by total assets) for the two cases and few comments are in order. First, there is a high degree of correlation between the two series (72.7%) and they both seem to capture the main peaks and valleys in the recent history in Brazil. This is a fairly high degree of correlation particularly considering that the market EDF imbeds other information in addition to what is in the financial statements. This is a very important point, as both market and book EDFs capture the main trends in the EDFs. When there is no reliable market data (or no market data at all), it is crucial to know that book EDF can work as a very good proxy for market EDF. This may also represent the fact that banks’ financial statements are probably the most important piece of information when forming market expectations about the likelihood of banks’ default. Second, the book EDF is considerably higher than the EDF. In the particular case of these three large banks, book value EDF is about 9 times bigger than the market EDF§§. This is a result of the total assets (book) volatility, which is significantly larger than the implied market asset volatility. Despite the observed book total assets fluctuations, the market still considers these banks to be fairly stable and equity volatility is not so high.
<Place Figure 6 About Here>
A second interesting question is whether the credit risk indicators (book or market EDFs) could be any useful in forecasting NPLs and/or vice-versa. That is, whether the banks’ credit risk deteriorates in expectation for a deterioration in the borrowers’ credit
§§ For this purpose, we estimated the regression
, ,Book t Market t tEDF EDFβ ε= ⋅ + , producing 8.90β = ,
significantly different than zero (t-stat=8.18), Adj.-R2=53.9% and F-stat=66.9.

11
profile, or the other way around. We tried to address this question by running a 2-lag VAR, comprised by book and market EDF and NPL***. Results are presented in Table 3. The only statistically significant Granger causality is from NPL to log(EDFM). Interestingly, there is no statistical significant Granger causality from NPL to log(EDFB), which may be only indicating that a deterioration in Borrowers’ credit quality (increase in borrowers’ default) does not necessarily leads to a deterioration in the banks’ credit risk (increase in the likelihood that the bank will default), particularly at the low levels of NPLs observed in these three large banks. There is no Granger causality from log(EDFM) to log(EDFB) or vice-versa and there seems to be no dominance of log(EDFM) over log(EDFB) or vice-versa, as far as forecasting capability is concerned.
<Place Table 3 About Here>
VI. Explaining the EDF Dynamics
In this section we try to establish a relationship between the expected default probabilities to a number of macro-financial variables, in an effort to construct a framework that can be used for stress testing. We start with simple OLS regressions at the individual bank level and then we move to a structural VAR, applied to the aggregated risk indicator and to a panel, including the available data for all banks in our sample. To avoid problems with unit root, we used the first difference for the variables.
VI.1. Individual Banks
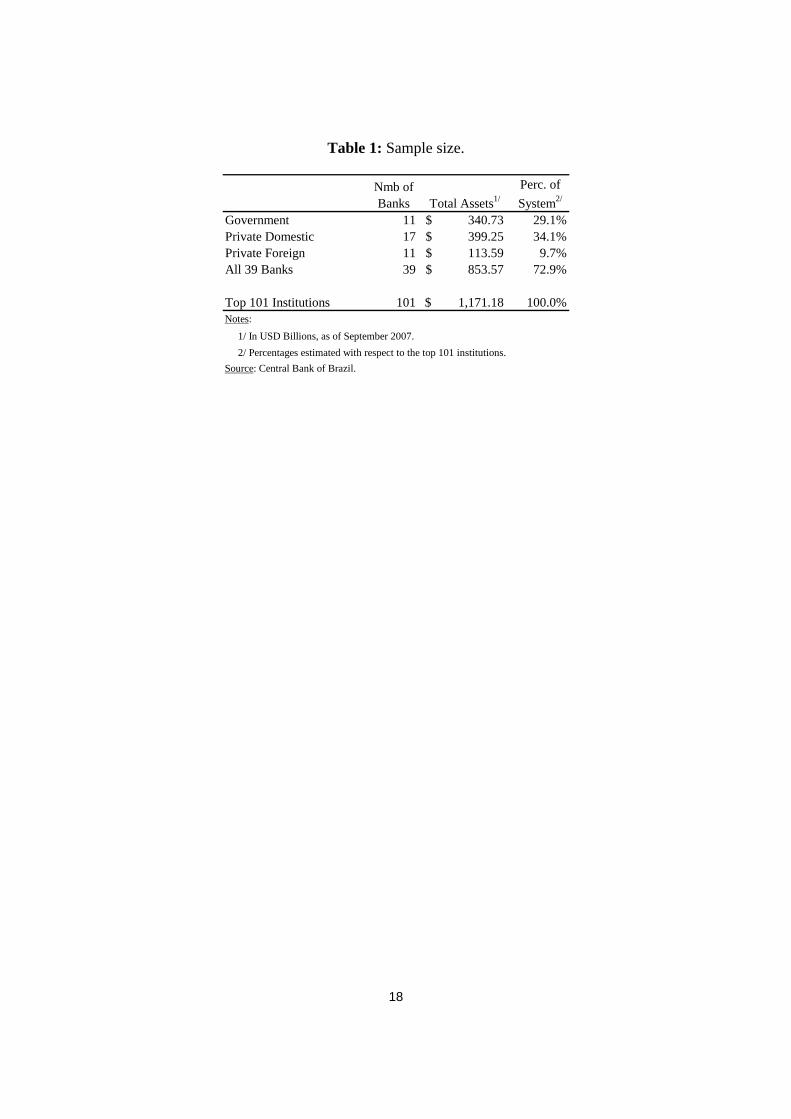
To identify the main drivers for individual banks expected default probabilities, we utilize simple OLS stepwise regressions:
it i i it itEDF Xα β ε= + ⋅ +�
, (10)
where itEDF is the time series of expected default frequency for the bank i , iα is the
constant term, iβ�
is the vector of coefficients for the variables itX , itX is the set of macro
and financial variables (some of them bank-specific, such as NPLs), and itε is the bank-
specific time series of residuals.
We used a backward elimination, which involves starting with all candidate variables (as in Table 2) and then eliminating the ones whose coefficient’s significant level is higher than 10%. So, each bank may end up with a different set of covariates, itX .
Results for this analysis are presented in Table 4.
*** We use the model
1 1 2 2t t t tX X Xα β β ξ− −= + ⋅ + ⋅ +
� �
, where { }book marketEDF , EDF , NPL
tX =

12
<Place Table 4 About Here>
Several points are worth highlighting in Table 4. First, the individual banks EDFs are explained by different factors, which can be due to their diverse portfolio composition, maturity structure, and risk exposures. Second, the simple OLS regressions also had reasonably good fits, with Adjusted R2 ranging from 38 percent to 84.6 percent, while the F-Statistics was significant at the 1 percent level for all banks. Finally, despite the diversity of the explanatory variables in each bank regression, there were a few common factors to most of them.
The system expected default probability was significant for all banks with the exception of bank 9. The positive sign indicates that an increase in the system probability of default also induces an increase in the individual bank probability of default, which is quite intuitive and stresses the importance of examining a systemic risk event. The short-term nominal domestic interest rate was also significant for several banks, with two counterbalancing factors. In general, the negative sign could be taken as an evidence that diminishing the domestic interest rate may have a significant impact on banks interest income (over which Brazilian banks rely heavily), and thus increasing the individual bank probability of default. However, for banks 1, 7, 9 and 10, the positive sign is evidencing the increase in credit risk from the borrowers, with the increase in interest rate, provoking an increase in the individual banks probability of default. Finally, inflation (12-month expected inflation) was very significant for four banks, with a positive sign for three of them, indicating that a surge in inflation will impose additional burden to borrowers, increasing their credit risk and the associated banks’ probability of default. VI.2. Aggregated Banks
In addition to the simple OLS for individual banks, we also investigate the impact of variables over the entire sample, using aggregated data. The idea is to identify the main risk drivers that could have adverse effect over the entire system. For this exercise, we use a structural VAR, as we are also interested in visualizing the reaction functions to shocks in the main factors. To determine which variables to utilize, we run a stepwise OLS regression over the aggregated data (as in Equation (10) above) and find that short-term and long-term domestic real interest rate are the most significant factors. Next, we estimate the VAR with two lags only (because of the number of available data – 44 observations):
1 1 2 2t t t tX X X uα β β− −= + ⋅ + ⋅ +� �
, (11)
The results are presented in Table 5. In general, we obtained good fits with two-lags VAR: the adjusted R2 was reasonably high (68.4 percent). Increases in the first lag values for 5-years CDS spreads and interest rates are associated with an increase in the contemporaneous system EDF, while decreases in expected inflation and the Brazilian broad market index are also associated with an increase in the system EDF. Additional tests

13
show that VAR residuals are normal (Jarque-Bera test) and have no autocorrelation (Lagrange-multiplier test), and that the VAR satisfies the stability conditions (Eigenvalue stability condition)†††. Despite their large margins, the first two periods of the impulse reaction functions (Figure 7) are significant at the 95 percent confidence level for 5-years CDS spreads and SELIC, and indicate that a positive shock in interest rates and CDS spreads would be provoke a spike in the system EDF (in the first period), followed by a gradual decrease in EDF, as the system accommodates the shocks and makes the appropriate adjustments in their portfolios.
<Place Table 5 and Figure 7 About Here>
VI.2. Panel Regression
In order to benefit from all the available information, which included bank level data, with monthly frequency, to assess the impact of macroeconomic variables on the EDFs, and considering that we have an unbalanced panel, we employ the following panel regression specification:
it it tEDF Xα β υ= + ⋅ +�
, (12)
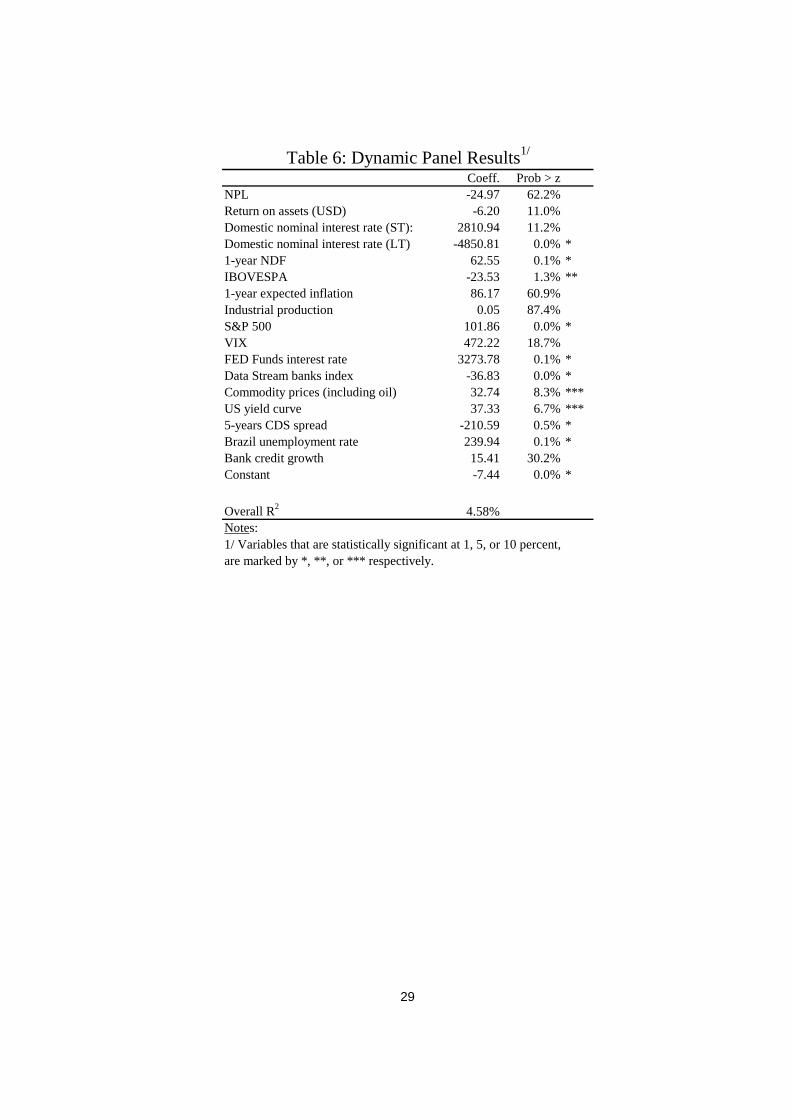
The results are presented in Table 6 and few comments are in order. Only long-term domestic nominal interest rate, 1-year NDF, S&P 500 index, FED Funds interest rate, Banks index, CDS spreads and unemployment rate are statistically significant at 1 % level. At 5 % level there is the IBOVESPA index, and at 10% there are commodity prices (including oil) and the US yield curve. The signs are generally consistent with our expectations. A decrease in interest rate will reduce banks interest income, which is fairly large in the case of Brazilian banks. The deterioration in the Brazilian equity index (IBOVESPA), indicates an increase in borrowers’ credit risk, which leads to an increase in banks’ credit risk. An increase in the US S&P 500 index, may divert foreign investors’ capital, leading to a drop in the IBOVESPA and, consequently, an increase in the banks’ EDF, through the same channel we have just explained above. An increase in the US interest rate is generally associated with a Brazilian currency depreciation, which increases borrowers’ and banks’ exposures to foreign currency risk.
< Place Table 6 About Here>
The sign in the banks’ index works in through the very same channel as the sign for IBOVESPA. Increases in commodity prices impose inflationary pressures on customers’ and corporations budgets, making them more prone to credit risk and increasing the
††† Test results can be provided upon request.
14
likelihood of a bank credit event. An increase in the US yield curve, meaning that investors expect an increase in the US long-term interest rate, will work through the same channel as the US FED Funds. Finally, increases in the Sovereign CDS spreads (one of the main borrowers of Brazilian banks) will obviously increase banks’ credit risk and increases in Brazil unemployment rates (which could be seen as a proxy for customers’ credit risk) is also associated with a deterioration of banks’ EDFs.
VII. A VAR Panel approach We apply a vector autoregression (VAR) to bank-level data to study the dynamic relationship between bank’s non-performing loans (NPL) and one-year default probability (EDF) following the approach developed by Love and Zicchino (2006). We specify a second-order VAR model as follows:
tiititit fyyy ε++Ψ+Ψ+Ψ= −− 22110 , (13)
where ity is a two-variable vector {NPL, EDF}, the if are fixed effects that are included to
allow for individual heterogeneity‡‡‡. We also perform an additional test incorporating changes in the Brazilian domestic exchange rate (ER), short-term real interest rates (IR) and the credit default spreads (5-year tenure) in order to assess the impact of these variables on bank’s NPL and EDF. The results are presented in Table 7. Empirical results suggest that the relationship between NPL and EDF is positive, although it is not necessarily statistically significant. Nonetheless, we also present the impulse-response figures using a 5% confidence interval, which suggests that the NPL responds positively to shocks in the EDF.
< Place Table 7 About Here> The results presented in figures 8 and 9 suggest that the EDF measure is sensitive to shocks in CDS, ER and IR, with the expected positive sign. The increase in these variables would imply that financial markets conditions are worsening and we would expect the risk indicator EDF to signal this.
<Place Figures 8 and 9 About Here > Table 8 presents the variance decomposition results. The variables explain most of their own variation 10 periods ahead in most cases. The EDF explains only 2.9% of total variation in NPL, whereas the NPL explains 2.9% of EDF. The CDS, IR and ER explain about 7.7% of total variation in the EDF.
‡‡‡ It is worth noticing that since the fixed effects are correlated with the regressor due to lags of the dependent variables the common mean-differencing procedure cannot be employed. Therefore, a forward mean-differencing procedure is used instead.

15
< Place Table 8 About Here> VIII. Conclusion
The results of a modified Merton framework, applied to the case of the Brazilian banking system, appear to be promising for countries without liquid equity markets. While the methodology is based on balance sheet information, and not on market valuations, the estimated asset volatility and default probability time series seem quite sensible. In particular, they track well the deteriorated credit condition of the system after the crisis in the early 2000s. In addition, the framework proves useful to simulate the effects of possible changes in macroeconomic conditions to individual banks and to the banking system. More specifically, it improves upon conventional portfolio stress tests that rely only on asset and liability levels by incorporating explicitly volatility into the analysis.
There are many directions to which this paper can be extended This would provide a far richer laboratory for analyzing the dynamics of the banks EDFs. It would be useful to explore further the relationships between book and market indicators. It would also be interesting to investigate the reverse causality, that is, the impact on the real sector from a shock in the credit risk indicator.

16
References
Black, F. and M. Scholes, 1973, The pricing of options and corporate liabilities, Journal of Political Economy, 81, 637-659.
Gapen, Michael T., Dale F. Gray, Cheng Hoon Lim, and Yingbin Xiao, 2005, Measuring and Analyzing Sovereign Risk with Contingent Claims, IMF Working Paper No. 05/155, August (Washington: International Monetary Fund).
Gapen, Michael T., Dale F. Gray, Yingbin Xiao, and Cheng Hoon Lim, 2004, The Contingent Claims Approach to Corporate Vulnerability Analysis: Estimating Default Risk and Economy-wide Risk Transfer, IMF Working Paper No. 04/121, July (Washington: International Monetary Fund).
Gray, D., and J. P. Walsh, 2008, “Factor Model for Stress-testing with a Contingent Claims Model of the Chilean Banking System,” IMF Working Paper xxx/08, forthcoming.
Merton, Robert C., 1973,. “Theory of Rational Option Pricing,” Bell Journal of Economics and Management Science, Vol. 4: 141–83.
Merton, Robert C., 1974, “On the Pricing of Corporate Debt: The Risk Structure of Interest Rates,” Journal of Finance, vol. 29 (May), pp. 449-70.
Merton, Robert C., 1977, “An Analytic Derivation of the Cost of Loan Guarantees and Deposit Insurance: An Application of Modern Option Pricing Theory,” Journal of Banking and Finance, Vol. 1: 3–11.
Souto, M. R., 2008a, “Has the Uruguayan Financial System Become More Resilient to Shocks? An Analysis Adapting the Merton Framework to a Country Without Equity Market Data,” IMF Occasional Paper, forthcoming.
Souto, M. R., 2008b, “On the Unique Solution of the Merton Framework Equations,” IMF manuscript.
17
Asset
ValueExp. asset
Distribution of Asset valuevalue path
Distress Barrier
V0
Time
Probability of Default
T
Distance to
Distress: standard
deviations asset value is
from distress barrier
Figure 1: The Merton Framework.
18
Table 1: Sample size.
Nmb of Banks Total Assets1/
Perc. of
System2/
Government 11 340.73$ 29.1%Private Domestic 17 399.25$ 34.1%Private Foreign 11 113.59$ 9.7%All 39 Banks 39 853.57$ 72.9%
Top 101 Institutions 101 1,171.18$ 100.0%Notes:
1/ In USD Billions, as of September 2007.
2/ Percentages estimated with respect to the top 101 institutions.
Source: Central Bank of Brazil.

19
Table 2: Macro-financial variables.
Variable Description SourceBnkCrGr Bank credit growth Authors' calculationNPL Non performing loans, as percentage of total loans Central Bank of BrazilRet(TA - US$) Return on total assets (continuously compounded) Central Bank of BrazilBank_EDF Bank's expected default frequency Central Bank of BrazilEDF System's expected default frequency Central Bank of BrazilSELIC Brazilian broad equity index (IBOVESPA) Data StreamJ1Y One-year domestic nominal interest rate Data StreamEXPINF12m 1-yr expected inflation Central Bank of BrazilIBOV Brazil broad equity index Central Bank of BrazilNDF12m 1-yr non-deliverable forward exchange rate Data Stream
IP Industrial production indexBrazilian Institute of Applied Economic Research (IPEA)
SP500 Brazil broad equity index Data StreamCPI Inflation price index 2 Central Bank of BrazilVIX US market volatility index Data StreamFEDFUNDS Federal funds short term nominal interest rate Data StreamDS_Banks Data Stream equity index for banks Data StreamUS YC US yield curve (30-yrs minus 3-months zero coupom rates Bloomberg and authors' calculationCommPr1 Commodity prices (including petroleum) International Financial Statistics - IMCBRZ1U5 5-year CDS spreads BloombergBRUN%TOTR Brazil unemployment rate Data StreamCreditGr system credit growth Central Bank of Brazil

20
0.0%
2.0%
4.0%
6.0%
8.0%
10.0%
12.0%
14.0%
16.0%
2003
04
2003
07
2003
10
2004
01
2004
04
2004
07
2004
10
2005
01
2005
04
2005
07
2005
10
2006
01
2006
04
2006
07
2006
10
2007
01
2007
04
2007
07
Source: Authors’ estimation.
Figure 2: Aggregated EDF for all banks.

21
0.0%
5.0%
10.0%
15.0%
20.0%
25.0%
2003
04
2003
07
2003
10
2004
01
2004
04
2004
07
2004
10
2005
01
2005
04
2005
07
2005
10
2006
01
2006
04
2006
07
2006
10
2007
01
2007
04
2007
07
EDF_Gov. EDF_Priv. D. EDF_Priv. F. EDF_All
Source: Authors’ estimation.
Figure 3: Aggregated EDFs by ownership.

22
0.00%
2.00%
4.00%
6.00%
8.00%
10.00%
12.00%
14.00%
2003
04
2003
06
2003
08
2003
10
2003
12
2004
02
2004
04
2004
06
2004
08
Boo
k V
alue
1-Y
r E
DF
.
Figure 4: Estimated EDF for a large Brazilian bank.
May 2004

23
0.17
0.18
0.19
0.20
0.21
0.22
0.23
0.24
0.25
200304 200308 200312 200404 200408
0.18
0.18
0.19
0.19
0.20
0.20
0.21
0.21
0.22
0.22
0.23
0.23
(TA -DB)/TA TA Volatility
Figure 5: Distance to Distress and TA Volatility for a large Brazilian bank.
(TA - DB)/TA Right Axis
TA Volatility Left Axis

24
0.00%
0.10%
0.20%
0.30%
0.40%
0.50%
0.60%
0.70%
4/30
/200
3
9/30
/200
3
2/29
/200
4
7/31
/200
4
12/3
1/20
04
5/31
/200
5
10/3
1/20
05
3/31
/200
6
8/31
/200
6
1/31
/200
7
6/29
/200
7
0.00%
2.00%
4.00%
6.00%
8.00%
10.00%
12.00%
14.00%
Market EDF Book EDF
Source: Moody’s-KMV and authors’ estimation.
Figure 6: Book vs. Market EDF for the 3 Largest Brazilian Banks.
Market EDF Left axis
Book EDF Right axis

25
Dependent Independent χ2 Prob > χ2
NPL Log(EDFM) 7.10 2.9%
NPL Log(EDFB) 0.53 76.9%
Log(EDFM) NPL 1.41 49.3%
Log(EDFM) Log(EDFB) 2.76 25.2%
Log(EDFB) NPL 1.18 55.4%
Log(EDFB) Log(EDFM) 0.95 62.3%
Table 3: Granger tests
26
Bank1 Bank2 Bank3 Bank4 Bank5 Bank6 Bank7 Bank8 Bank9 Bank10ConstantBank credit growthNPLReturn on total assets -0.07 ** -0.03 **
System EDF 1.53 * 0.64 * 0.61 * 0.13 * 0.25 * 1.76 * 1.20 * 0.35 * 3.20 *
Domestic nominal int. rate (ST) 6.13 * -1.60 * 5.92 * -7.10 *
Domestic nominal int. rate (LT) -13.13 * -6.77 ** 2.93 ** 11.57 *
1-year expected inflation 0.27 * 0.16 ** 0.17 * -0.91 **
Brazil equity index -0.13 * 0.03 * 0.03 ** 0.03 *
NDF 1 Y 0.08 ** -0.03 **
Industrial produtionS&P 500 -0.06 * -0.08 * -0.04 * -0.05 ** 0.25 **
VIX -6.85 * -0.92 *** -0.41 ** 4.46 **
FED Funds int. rate 2.17 ***
Brazilian banks equity index 0.01 ** 0.01 * 0.04 *** -0.06 ***
US yield curve 0.57 *** -0.41 *** -3.02 * 0.95 ***
Commodity prices5-yrs CDS spread 0.03 *** 0.15 * 0.10 * -0.27 ***
Brazil unemployment rate -0.96 **
System credit growthUS CPI 1.74 ***
Brazilian IPCA -0.21 *** 0.45 **
Adj R-squared 50.6% 81.7% 74.8% 60.0% 58.3% 69.2% 84.6% 38.0% 55.8% 73.6%F Stat. 11.09 * 44.97 * 41.86 * 21.78 * 25.15 * 32.04 * 76.9 * 9.45 * 15.50 * 28.42 *
Note:1/ Variables that are statistically significant at 1, 5, or 10 percent, are marked by *, **, or *** respectively.
Table 4A: Stepwise OLS regressions.1/

27
Variables CoefficientStandard Error z Prob(>z)
log(EDF): Lag 1 0.58 0.16 3.63 0.0% Lag 2 0.09 0.16 0.56 57.8%
5-yrs CDS spreads: Lag 1 4.93 16.69 0.3 76.8% Lag 2 -15.04 12.89 -1.17 24.3%
1-yr expected inflation Lag 1 -15.32 36.52 -0.42 67.5% Lag 2 -12.08 34.57 -0.35 72.7%
Brazil equity index: Lag 1 -1.19 1.67 -0.72 47.4% Lag 2 -2.72 1.60 -1.7 8.9%
Domestic nominal interest rate (ST): Lag 1 551.20 428.49 1.29 19.8% Lag 2 -327.69 391.83 -0.84 40.3%
Domestic nominal interest rate (LT) Lag 1 176.35 227.70 0.77 43.9% Lag 2 36.38 234.95 0.15 87.7%
Constant -1.23 0.42 -2.94 0.3%
Adjusted R2 68.4%
Table 5: Aggregated Data VAR

28
-.2
0
.2
.4
-.2
0
.2
.4
0 2 4 6 8
0 2 4 6 8 0 2 4 6 8
Impulse: 5-yrs CDS spread Impulse: 1-yr expect inflation Impulse: IBOVEPA
order1, J1Y, log_edf order1, SELIC, log_edf
95% Confidence Interval
Impulse Reaction Functions
Figure 7: Impulse reaction functions for the VAR
29
Coeff. Prob > zNPL -24.97 62.2%Return on assets (USD) -6.20 11.0%Domestic nominal interest rate (ST): 2810.94 11.2%Domestic nominal interest rate (LT) -4850.81 0.0% *1-year NDF 62.55 0.1% *IBOVESPA -23.53 1.3% **1-year expected inflation 86.17 60.9%Industrial production 0.05 87.4%S&P 500 101.86 0.0% *VIX 472.22 18.7%FED Funds interest rate 3273.78 0.1% *Data Stream banks index -36.83 0.0% *Commodity prices (including oil) 32.74 8.3% ***US yield curve 37.33 6.7% ***5-years CDS spread -210.59 0.5% *Brazil unemployment rate 239.94 0.1% *Bank credit growth 15.41 30.2%Constant -7.44 0.0% *
Overall R2 4.58%Notes: 1/ Variables that are statistically significant at 1, 5, or 10 percent, are marked by *, **, or *** respectively.
Table 6: Dynamic Panel Results1/

30
Table 7: Panel-VAR results. Response to NPL t EDF t Panel A: 2-var model NPL t-1 0.68 0.36 (3.09) (1.77) EDF t-1 0.02 0.13 (1.10) (1.75) Panel B: 5-var model NPL t-1 0.65 0.15 (2.79) (1.03) EDF t-1 0.03 0.12 (1.30) (1.64) CDS t-1 0.01 0.12 (0.20) (1.56) IR t-1 0.03 0.11 (1.49) (1.18) ER t-1 0.00 0.14 (0.13) (3.29)

31
Impulse-responses for 1 lag VAR of npl EDF1YR
Errors are 5% on each side generated by Monte-Carlo with 1000 reps
response of npl to npl shocks
(p 5) npl npl (p 95) npl
0 60.0000
0.0168
response of npl to EDF1YR shocks
(p 5) EDF1YR EDF1YR (p 95) EDF1YR
0 6-0.0004
0.0031
response of EDF1YR to npl shocks
(p 5) npl npl (p 95) npl
0 60.0000
0.0080
response of EDF1YR to EDF1YR shocks
(p 5) EDF1YR EDF1YR (p 95) EDF1YR
0 6-0.0000
0.0444
Figure 8. Impulse-responses in a 2-VAR model (EDF x NPL).

32
Impulse-responses for 1 lag VAR of npl EDF1YR CDS IR ER
Errors are 5% on each side generated by Monte-Carlo with 1000 reps
response of npl to npl shocks
(p 5) npl npl (p 95) npl
0 60.0000
0.0137
response of npl to EDF1YR shocks
(p 5) EDF1YR EDF1YR (p 95) EDF1YR
0 6-0.0002
0.0027
response of npl to CDS shocks
(p 5) CDS CDS (p 95) CDS
0 6-0.0010
0.0017
response of npl to IR shocks
(p 5) IR IR (p 95) IR
0 6-0.0000
0.0016
response of npl to ER shocks
(p 5) ER ER (p 95) ER
0 6-0.0006
0.0007
response of EDF1YR to npl shocks
(p 5) npl npl (p 95) npl
0 6-0.0010
0.0058
response of EDF1YR to EDF1YR shocks
(p 5) EDF1YR EDF1YR (p 95) EDF1YR
0 6-0.0009
0.0431
response of EDF1YR to CDS shocks
(p 5) CDS CDS (p 95) CDS
0 6-0.0029
0.0109
response of EDF1YR to IR shocks
(p 5) IR IR (p 95) IR
0 6-0.0008
0.0056
response of EDF1YR to ER shocks
(p 5) ER ER (p 95) ER
0 6-0.0050
0.0081
response of CDS to npl shocks
(p 5) npl npl (p 95) npl
0 6-0.0033
0.0034
response of CDS to EDF1YR shocks
(p 5) EDF1YR EDF1YR (p 95) EDF1YR
0 6-0.0071
0.0046
response of CDS to CDS shocks
(p 5) CDS CDS (p 95) CDS
0 6-0.0022
0.0253
response of CDS to IR shocks
(p 5) IR IR (p 95) IR
0 6-0.0027
0.0024
response of CDS to ER shocks
(p 5) ER ER (p 95) ER
0 6-0.0105
0.0006
response of IR to npl shocks
(p 5) npl npl (p 95) npl
0 6-0.0017
0.0028
response of IR to EDF1YR shocks
(p 5) EDF1YR EDF1YR (p 95) EDF1YR
0 60.0000
0.0080
response of IR to CDS shocks
(p 5) CDS CDS (p 95) CDS
0 6-0.0092
0.0000
response of IR to IR shocks
(p 5) IR IR (p 95) IR
0 60.0000
0.0143
response of IR to ER shocks
(p 5) ER ER (p 95) ER
0 6-0.0011
0.0040
response of ER to npl shocks
(p 5) npl npl (p 95) npl
0 6-0.0035
0.0080
response of ER to EDF1YR shocks
(p 5) EDF1YR EDF1YR (p 95) EDF1YR
0 6-0.0043
0.0146
response of ER to CDS shocks
(p 5) CDS CDS (p 95) CDS
0 6-0.0081
0.0419
response of ER to IR shocks
(p 5) IR IR (p 95) IR
0 6-0.0038
0.0146
response of ER to ER shocks
(p 5) ER ER (p 95) ER
0 6-0.0248
0.0398
Figure 9. Impulse-responses in a 5-VAR model.

33
Table 8. Variance Decomposition
S NPL EDF CDS IR ER Panel A: 2-var model
NPL 10 99.0% 1.0% EDF 10 2.9% 97.1%
Panel B: 5-var model
NPL 10 95.6% 2.2% 0.3% 1.8% 0.1% EDF 10 1.3% 91.0% 4.1% 1.4% 2.2% CDS 10 1.6% 7.0% 78.5% 1.9% 11.0% IR 10 0.8% 17.1% 19.6% 60.1% 2.4% ER 10 0.9% 4.0% 41.0% 5.6% 48.5%

34
Banco Central do Brasil
Trabalhos para Discussão Os Trabalhos para Discussão podem ser acessados na internet, no formato PDF,
no endereço: http://www.bc.gov.br
Working Paper Series
Working Papers in PDF format can be downloaded from: http://www.bc.gov.br
1 Implementing Inflation Targeting in Brazil
Joel Bogdanski, Alexandre Antonio Tombini and Sérgio Ribeiro da Costa Werlang
Jul/2000
2 Política Monetária e Supervisão do Sistema Financeiro Nacional no Banco Central do Brasil Eduardo Lundberg Monetary Policy and Banking Supervision Functions on the Central Bank Eduardo Lundberg
Jul/2000
Jul/2000
3 Private Sector Participation: a Theoretical Justification of the Brazilian Position Sérgio Ribeiro da Costa Werlang
Jul/2000
4 An Information Theory Approach to the Aggregation of Log-Linear Models Pedro H. Albuquerque
Jul/2000
5 The Pass-Through from Depreciation to Inflation: a Panel Study Ilan Goldfajn and Sérgio Ribeiro da Costa Werlang
Jul/2000
6 Optimal Interest Rate Rules in Inflation Targeting Frameworks José Alvaro Rodrigues Neto, Fabio Araújo and Marta Baltar J. Moreira
Jul/2000
7 Leading Indicators of Inflation for Brazil Marcelle Chauvet
Sep/2000
8 The Correlation Matrix of the Brazilian Central Bank’s Standard Model for Interest Rate Market Risk José Alvaro Rodrigues Neto
Sep/2000
9 Estimating Exchange Market Pressure and Intervention Activity Emanuel-Werner Kohlscheen
Nov/2000
10 Análise do Financiamento Externo a uma Pequena Economia Aplicação da Teoria do Prêmio Monetário ao Caso Brasileiro: 1991–1998 Carlos Hamilton Vasconcelos Araújo e Renato Galvão Flôres Júnior
Mar/2001
11 A Note on the Efficient Estimation of Inflation in Brazil Michael F. Bryan and Stephen G. Cecchetti
Mar/2001
12 A Test of Competition in Brazilian Banking Márcio I. Nakane
Mar/2001

35
13 Modelos de Previsão de Insolvência Bancária no Brasil Marcio Magalhães Janot
Mar/2001
14 Evaluating Core Inflation Measures for Brazil Francisco Marcos Rodrigues Figueiredo
Mar/2001
15 Is It Worth Tracking Dollar/Real Implied Volatility? Sandro Canesso de Andrade and Benjamin Miranda Tabak
Mar/2001
16 Avaliação das Projeções do Modelo Estrutural do Banco Central do Brasil para a Taxa de Variação do IPCA Sergio Afonso Lago Alves Evaluation of the Central Bank of Brazil Structural Model’s Inflation Forecasts in an Inflation Targeting Framework Sergio Afonso Lago Alves
Mar/2001
Jul/2001
17 Estimando o Produto Potencial Brasileiro: uma Abordagem de Função de Produção Tito Nícias Teixeira da Silva Filho Estimating Brazilian Potential Output: a Production Function Approach Tito Nícias Teixeira da Silva Filho
Abr/2001
Aug/2002
18 A Simple Model for Inflation Targeting in Brazil Paulo Springer de Freitas and Marcelo Kfoury Muinhos
Apr/2001
19 Uncovered Interest Parity with Fundamentals: a Brazilian Exchange Rate Forecast Model Marcelo Kfoury Muinhos, Paulo Springer de Freitas and Fabio Araújo
May/2001
20 Credit Channel without the LM Curve Victorio Y. T. Chu and Márcio I. Nakane
May/2001
21 Os Impactos Econômicos da CPMF: Teoria e Evidência Pedro H. Albuquerque
Jun/2001
22 Decentralized Portfolio Management Paulo Coutinho and Benjamin Miranda Tabak
Jun/2001
23 Os Efeitos da CPMF sobre a Intermediação Financeira Sérgio Mikio Koyama e Márcio I. Nakane
Jul/2001
24 Inflation Targeting in Brazil: Shocks, Backward-Looking Prices, and IMF Conditionality Joel Bogdanski, Paulo Springer de Freitas, Ilan Goldfajn and Alexandre Antonio Tombini
Aug/2001
25 Inflation Targeting in Brazil: Reviewing Two Years of Monetary Policy 1999/00 Pedro Fachada
Aug/2001
26 Inflation Targeting in an Open Financially Integrated Emerging Economy: the Case of Brazil Marcelo Kfoury Muinhos
Aug/2001
27
Complementaridade e Fungibilidade dos Fluxos de Capitais Internacionais Carlos Hamilton Vasconcelos Araújo e Renato Galvão Flôres Júnior
Set/2001

36
28
Regras Monetárias e Dinâmica Macroeconômica no Brasil: uma Abordagem de Expectativas Racionais Marco Antonio Bonomo e Ricardo D. Brito
Nov/2001
29 Using a Money Demand Model to Evaluate Monetary Policies in Brazil Pedro H. Albuquerque and Solange Gouvêa
Nov/2001
30 Testing the Expectations Hypothesis in the Brazilian Term Structure of Interest Rates Benjamin Miranda Tabak and Sandro Canesso de Andrade
Nov/2001
31 Algumas Considerações sobre a Sazonalidade no IPCA Francisco Marcos R. Figueiredo e Roberta Blass Staub
Nov/2001
32 Crises Cambiais e Ataques Especulativos no Brasil Mauro Costa Miranda
Nov/2001
33 Monetary Policy and Inflation in Brazil (1975-2000): a VAR Estimation André Minella
Nov/2001
34 Constrained Discretion and Collective Action Problems: Reflections on the Resolution of International Financial Crises Arminio Fraga and Daniel Luiz Gleizer
Nov/2001
35 Uma Definição Operacional de Estabilidade de Preços Tito Nícias Teixeira da Silva Filho
Dez/2001
36 Can Emerging Markets Float? Should They Inflation Target? Barry Eichengreen
Feb/2002
37 Monetary Policy in Brazil: Remarks on the Inflation Targeting Regime, Public Debt Management and Open Market Operations Luiz Fernando Figueiredo, Pedro Fachada and Sérgio Goldenstein
Mar/2002
38 Volatilidade Implícita e Antecipação de Eventos de Stress: um Teste para o Mercado Brasileiro Frederico Pechir Gomes
Mar/2002
39 Opções sobre Dólar Comercial e Expectativas a Respeito do Comportamento da Taxa de Câmbio Paulo Castor de Castro
Mar/2002
40 Speculative Attacks on Debts, Dollarization and Optimum Currency Areas Aloisio Araujo and Márcia Leon
Apr/2002
41 Mudanças de Regime no Câmbio Brasileiro Carlos Hamilton V. Araújo e Getúlio B. da Silveira Filho
Jun/2002
42 Modelo Estrutural com Setor Externo: Endogenização do Prêmio de Risco e do Câmbio Marcelo Kfoury Muinhos, Sérgio Afonso Lago Alves e Gil Riella
Jun/2002
43 The Effects of the Brazilian ADRs Program on Domestic Market Efficiency Benjamin Miranda Tabak and Eduardo José Araújo Lima
Jun/2002

37
44 Estrutura Competitiva, Produtividade Industrial e Liberação Comercial no Brasil Pedro Cavalcanti Ferreira e Osmani Teixeira de Carvalho Guillén
Jun/2002
45 Optimal Monetary Policy, Gains from Commitment, and Inflation Persistence André Minella
Aug/2002
46 The Determinants of Bank Interest Spread in Brazil Tarsila Segalla Afanasieff, Priscilla Maria Villa Lhacer and Márcio I. Nakane
Aug/2002
47 Indicadores Derivados de Agregados Monetários Fernando de Aquino Fonseca Neto e José Albuquerque Júnior
Set/2002
48 Should Government Smooth Exchange Rate Risk? Ilan Goldfajn and Marcos Antonio Silveira
Sep/2002
49 Desenvolvimento do Sistema Financeiro e Crescimento Econômico no Brasil: Evidências de Causalidade Orlando Carneiro de Matos
Set/2002
50 Macroeconomic Coordination and Inflation Targeting in a Two-Country Model Eui Jung Chang, Marcelo Kfoury Muinhos and Joanílio Rodolpho Teixeira
Sep/2002
51 Credit Channel with Sovereign Credit Risk: an Empirical Test Victorio Yi Tson Chu
Sep/2002
52 Generalized Hyperbolic Distributions and Brazilian Data José Fajardo and Aquiles Farias
Sep/2002
53 Inflation Targeting in Brazil: Lessons and Challenges André Minella, Paulo Springer de Freitas, Ilan Goldfajn and Marcelo Kfoury Muinhos
Nov/2002
54 Stock Returns and Volatility Benjamin Miranda Tabak and Solange Maria Guerra
Nov/2002
55 Componentes de Curto e Longo Prazo das Taxas de Juros no Brasil Carlos Hamilton Vasconcelos Araújo e Osmani Teixeira de Carvalho de Guillén
Nov/2002
56 Causality and Cointegration in Stock Markets: the Case of Latin America Benjamin Miranda Tabak and Eduardo José Araújo Lima
Dec/2002
57 As Leis de Falência: uma Abordagem Econômica Aloisio Araujo
Dez/2002
58 The Random Walk Hypothesis and the Behavior of Foreign Capital Portfolio Flows: the Brazilian Stock Market Case Benjamin Miranda Tabak
Dec/2002
59 Os Preços Administrados e a Inflação no Brasil Francisco Marcos R. Figueiredo e Thaís Porto Ferreira
Dez/2002
60 Delegated Portfolio Management Paulo Coutinho and Benjamin Miranda Tabak
Dec/2002

38
61 O Uso de Dados de Alta Freqüência na Estimação da Volatilidade e do Valor em Risco para o Ibovespa João Maurício de Souza Moreira e Eduardo Facó Lemgruber
Dez/2002
62 Taxa de Juros e Concentração Bancária no Brasil Eduardo Kiyoshi Tonooka e Sérgio Mikio Koyama
Fev/2003
63 Optimal Monetary Rules: the Case of Brazil Charles Lima de Almeida, Marco Aurélio Peres, Geraldo da Silva e Souza and Benjamin Miranda Tabak
Feb/2003
64 Medium-Size Macroeconomic Model for the Brazilian Economy Marcelo Kfoury Muinhos and Sergio Afonso Lago Alves
Feb/2003
65 On the Information Content of Oil Future Prices Benjamin Miranda Tabak
Feb/2003
66 A Taxa de Juros de Equilíbrio: uma Abordagem Múltipla Pedro Calhman de Miranda e Marcelo Kfoury Muinhos
Fev/2003
67 Avaliação de Métodos de Cálculo de Exigência de Capital para Risco de Mercado de Carteiras de Ações no Brasil Gustavo S. Araújo, João Maurício S. Moreira e Ricardo S. Maia Clemente
Fev/2003
68 Real Balances in the Utility Function: Evidence for Brazil Leonardo Soriano de Alencar and Márcio I. Nakane
Feb/2003
69 r-filters: a Hodrick-Prescott Filter Generalization Fabio Araújo, Marta Baltar Moreira Areosa and José Alvaro Rodrigues Neto
Feb/2003
70 Monetary Policy Surprises and the Brazilian Term Structure of Interest Rates Benjamin Miranda Tabak
Feb/2003
71 On Shadow-Prices of Banks in Real-Time Gross Settlement Systems Rodrigo Penaloza
Apr/2003
72 O Prêmio pela Maturidade na Estrutura a Termo das Taxas de Juros Brasileiras Ricardo Dias de Oliveira Brito, Angelo J. Mont'Alverne Duarte e Osmani Teixeira de C. Guillen
Maio/2003
73 Análise de Componentes Principais de Dados Funcionais – uma Aplicação às Estruturas a Termo de Taxas de Juros Getúlio Borges da Silveira e Octavio Bessada
Maio/2003
74 Aplicação do Modelo de Black, Derman & Toy à Precificação de Opções Sobre Títulos de Renda Fixa
Octavio Manuel Bessada Lion, Carlos Alberto Nunes Cosenza e César das Neves
Maio/2003
75 Brazil’s Financial System: Resilience to Shocks, no Currency Substitution, but Struggling to Promote Growth Ilan Goldfajn, Katherine Hennings and Helio Mori
Jun/2003

39
76 Inflation Targeting in Emerging Market Economies Arminio Fraga, Ilan Goldfajn and André Minella
Jun/2003
77 Inflation Targeting in Brazil: Constructing Credibility under Exchange Rate Volatility André Minella, Paulo Springer de Freitas, Ilan Goldfajn and Marcelo Kfoury Muinhos
Jul/2003
78 Contornando os Pressupostos de Black & Scholes: Aplicação do Modelo de Precificação de Opções de Duan no Mercado Brasileiro Gustavo Silva Araújo, Claudio Henrique da Silveira Barbedo, Antonio Carlos Figueiredo, Eduardo Facó Lemgruber
Out/2003
79 Inclusão do Decaimento Temporal na Metodologia Delta-Gama para o Cálculo do VaR de Carteiras Compradas em Opções no Brasil Claudio Henrique da Silveira Barbedo, Gustavo Silva Araújo, Eduardo Facó Lemgruber
Out/2003
80 Diferenças e Semelhanças entre Países da América Latina: uma Análise de Markov Switching para os Ciclos Econômicos de Brasil e Argentina Arnildo da Silva Correa
Out/2003
81 Bank Competition, Agency Costs and the Performance of the Monetary Policy Leonardo Soriano de Alencar and Márcio I. Nakane
Jan/2004
82 Carteiras de Opções: Avaliação de Metodologias de Exigência de Capital no Mercado Brasileiro Cláudio Henrique da Silveira Barbedo e Gustavo Silva Araújo
Mar/2004
83 Does Inflation Targeting Reduce Inflation? An Analysis for the OECD Industrial Countries Thomas Y. Wu
May/2004
84 Speculative Attacks on Debts and Optimum Currency Area: a Welfare Analysis Aloisio Araujo and Marcia Leon
May/2004
85 Risk Premia for Emerging Markets Bonds: Evidence from Brazilian Government Debt, 1996-2002 André Soares Loureiro and Fernando de Holanda Barbosa
May/2004
86 Identificação do Fator Estocástico de Descontos e Algumas Implicações sobre Testes de Modelos de Consumo Fabio Araujo e João Victor Issler
Maio/2004
87 Mercado de Crédito: uma Análise Econométrica dos Volumes de Crédito Total e Habitacional no Brasil Ana Carla Abrão Costa
Dez/2004
88 Ciclos Internacionais de Negócios: uma Análise de Mudança de Regime Markoviano para Brasil, Argentina e Estados Unidos Arnildo da Silva Correa e Ronald Otto Hillbrecht
Dez/2004
89 O Mercado de Hedge Cambial no Brasil: Reação das Instituições Financeiras a Intervenções do Banco Central Fernando N. de Oliveira
Dez/2004

40
90 Bank Privatization and Productivity: Evidence for Brazil Márcio I. Nakane and Daniela B. Weintraub
Dec/2004
91 Credit Risk Measurement and the Regulation of Bank Capital and Provision Requirements in Brazil – a Corporate Analysis Ricardo Schechtman, Valéria Salomão Garcia, Sergio Mikio Koyama and Guilherme Cronemberger Parente
Dec/2004
92
Steady-State Analysis of an Open Economy General Equilibrium Model for Brazil Mirta Noemi Sataka Bugarin, Roberto de Goes Ellery Jr., Victor Gomes Silva, Marcelo Kfoury Muinhos
Apr/2005
93 Avaliação de Modelos de Cálculo de Exigência de Capital para Risco Cambial Claudio H. da S. Barbedo, Gustavo S. Araújo, João Maurício S. Moreira e Ricardo S. Maia Clemente
Abr/2005
94 Simulação Histórica Filtrada: Incorporação da Volatilidade ao Modelo Histórico de Cálculo de Risco para Ativos Não-Lineares Claudio Henrique da Silveira Barbedo, Gustavo Silva Araújo e Eduardo Facó Lemgruber
Abr/2005
95 Comment on Market Discipline and Monetary Policy by Carl Walsh Maurício S. Bugarin and Fábia A. de Carvalho
Apr/2005
96 O que É Estratégia: uma Abordagem Multiparadigmática para a Disciplina Anthero de Moraes Meirelles
Ago/2005
97 Finance and the Business Cycle: a Kalman Filter Approach with Markov Switching Ryan A. Compton and Jose Ricardo da Costa e Silva
Aug/2005
98 Capital Flows Cycle: Stylized Facts and Empirical Evidences for Emerging Market Economies Helio Mori e Marcelo Kfoury Muinhos
Aug/2005
99 Adequação das Medidas de Valor em Risco na Formulação da Exigência de Capital para Estratégias de Opções no Mercado Brasileiro Gustavo Silva Araújo, Claudio Henrique da Silveira Barbedo,e Eduardo Facó Lemgruber
Set/2005
100 Targets and Inflation Dynamics Sergio A. L. Alves and Waldyr D. Areosa
Oct/2005
101 Comparing Equilibrium Real Interest Rates: Different Approaches to Measure Brazilian Rates Marcelo Kfoury Muinhos and Márcio I. Nakane
Mar/2006
102 Judicial Risk and Credit Market Performance: Micro Evidence from Brazilian Payroll Loans Ana Carla A. Costa and João M. P. de Mello
Apr/2006
103 The Effect of Adverse Supply Shocks on Monetary Policy and Output Maria da Glória D. S. Araújo, Mirta Bugarin, Marcelo Kfoury Muinhos and Jose Ricardo C. Silva
Apr/2006

41
104 Extração de Informação de Opções Cambiais no Brasil Eui Jung Chang e Benjamin Miranda Tabak
Abr/2006
105 Representing Roommate’s Preferences with Symmetric Utilities José Alvaro Rodrigues Neto
Apr/2006
106 Testing Nonlinearities Between Brazilian Exchange Rates and Inflation Volatilities Cristiane R. Albuquerque and Marcelo Portugal
May/2006
107 Demand for Bank Services and Market Power in Brazilian Banking Márcio I. Nakane, Leonardo S. Alencar and Fabio Kanczuk
Jun/2006
108 O Efeito da Consignação em Folha nas Taxas de Juros dos Empréstimos Pessoais Eduardo A. S. Rodrigues, Victorio Chu, Leonardo S. Alencar e Tony Takeda
Jun/2006
109 The Recent Brazilian Disinflation Process and Costs Alexandre A. Tombini and Sergio A. Lago Alves
Jun/2006
110 Fatores de Risco e o Spread Bancário no Brasil Fernando G. Bignotto e Eduardo Augusto de Souza Rodrigues
Jul/2006
111 Avaliação de Modelos de Exigência de Capital para Risco de Mercado do Cupom Cambial Alan Cosme Rodrigues da Silva, João Maurício de Souza Moreira e Myrian Beatriz Eiras das Neves
Jul/2006
112 Interdependence and Contagion: an Analysis of Information Transmission in Latin America's Stock Markets Angelo Marsiglia Fasolo
Jul/2006
113 Investigação da Memória de Longo Prazo da Taxa de Câmbio no Brasil Sergio Rubens Stancato de Souza, Benjamin Miranda Tabak e Daniel O. Cajueiro
Ago/2006
114 The Inequality Channel of Monetary Transmission Marta Areosa and Waldyr Areosa
Aug/2006
115 Myopic Loss Aversion and House-Money Effect Overseas: an Experimental Approach José L. B. Fernandes, Juan Ignacio Peña and Benjamin M. Tabak
Sep/2006
116 Out-Of-The-Money Monte Carlo Simulation Option Pricing: the Join Use of Importance Sampling and Descriptive Sampling Jaqueline Terra Moura Marins, Eduardo Saliby and Joséte Florencio dos Santos
Sep/2006
117 An Analysis of Off-Site Supervision of Banks’ Profitability, Risk and Capital Adequacy: a Portfolio Simulation Approach Applied to Brazilian Banks Theodore M. Barnhill, Marcos R. Souto and Benjamin M. Tabak
Sep/2006
118 Contagion, Bankruptcy and Social Welfare Analysis in a Financial Economy with Risk Regulation Constraint Aloísio P. Araújo and José Valentim M. Vicente
Oct/2006

42
119 A Central de Risco de Crédito no Brasil: uma Análise de Utilidade de Informação Ricardo Schechtman
Out/2006
120 Forecasting Interest Rates: an Application for Brazil Eduardo J. A. Lima, Felipe Luduvice and Benjamin M. Tabak
Oct/2006
121 The Role of Consumer’s Risk Aversion on Price Rigidity Sergio A. Lago Alves and Mirta N. S. Bugarin
Nov/2006
122 Nonlinear Mechanisms of the Exchange Rate Pass-Through: a Phillips Curve Model With Threshold for Brazil Arnildo da Silva Correa and André Minella
Nov/2006
123 A Neoclassical Analysis of the Brazilian “Lost-Decades” Flávia Mourão Graminho
Nov/2006
124 The Dynamic Relations between Stock Prices and Exchange Rates: Evidence for Brazil Benjamin M. Tabak
Nov/2006
125 Herding Behavior by Equity Foreign Investors on Emerging Markets Barbara Alemanni and José Renato Haas Ornelas
Dec/2006
126 Risk Premium: Insights over the Threshold José L. B. Fernandes, Augusto Hasman and Juan Ignacio Peña
Dec/2006
127 Uma Investigação Baseada em Reamostragem sobre Requerimentos de Capital para Risco de Crédito no Brasil Ricardo Schechtman
Dec/2006
128 Term Structure Movements Implicit in Option Prices Caio Ibsen R. Almeida and José Valentim M. Vicente
Dec/2006
129 Brazil: Taming Inflation Expectations Afonso S. Bevilaqua, Mário Mesquita and André Minella
Jan/2007
130 The Role of Banks in the Brazilian Interbank Market: Does Bank Type Matter? Daniel O. Cajueiro and Benjamin M. Tabak
Jan/2007
131 Long-Range Dependence in Exchange Rates: the Case of the European Monetary System Sergio Rubens Stancato de Souza, Benjamin M. Tabak and Daniel O. Cajueiro
Mar/2007
132 Credit Risk Monte Carlo Simulation Using Simplified Creditmetrics’ Model: the Joint Use of Importance Sampling and Descriptive Sampling Jaqueline Terra Moura Marins and Eduardo Saliby
Mar/2007
133 A New Proposal for Collection and Generation of Information on Financial Institutions’ Risk: the Case of Derivatives Gilneu F. A. Vivan and Benjamin M. Tabak
Mar/2007
134 Amostragem Descritiva no Apreçamento de Opções Européias através de Simulação Monte Carlo: o Efeito da Dimensionalidade e da Probabilidade de Exercício no Ganho de Precisão Eduardo Saliby, Sergio Luiz Medeiros Proença de Gouvêa e Jaqueline Terra Moura Marins
Abr/2007

43
135 Evaluation of Default Risk for the Brazilian Banking Sector Marcelo Y. Takami and Benjamin M. Tabak
May/2007
136 Identifying Volatility Risk Premium from Fixed Income Asian Options Caio Ibsen R. Almeida and José Valentim M. Vicente
May/2007
137 Monetary Policy Design under Competing Models of Inflation Persistence Solange Gouvea e Abhijit Sen Gupta
May/2007
138 Forecasting Exchange Rate Density Using Parametric Models: the Case of Brazil Marcos M. Abe, Eui J. Chang and Benjamin M. Tabak
May/2007
139 Selection of Optimal Lag Length inCointegrated VAR Models with Weak Form of Common Cyclical Features Carlos Enrique Carrasco Gutiérrez, Reinaldo Castro Souza and Osmani Teixeira de Carvalho Guillén
Jun/2007
140 Inflation Targeting, Credibility and Confidence Crises Rafael Santos and Aloísio Araújo
Aug/2007
141 Forecasting Bonds Yields in the Brazilian Fixed income Market Jose Vicente and Benjamin M. Tabak
Aug/2007
142 Crises Análise da Coerência de Medidas de Risco no Mercado Brasileiro de Ações e Desenvolvimento de uma Metodologia Híbrida para o Expected Shortfall Alan Cosme Rodrigues da Silva, Eduardo Facó Lemgruber, José Alberto Rebello Baranowski e Renato da Silva Carvalho
Ago/2007
143 Price Rigidity in Brazil: Evidence from CPI Micro Data Solange Gouvea
Sep/2007
144 The Effect of Bid-Ask Prices on Brazilian Options Implied Volatility: a Case Study of Telemar Call Options Claudio Henrique da Silveira Barbedo and Eduardo Facó Lemgruber
Oct/2007
145 The Stability-Concentration Relationship in the Brazilian Banking System Benjamin Miranda Tabak, Solange Maria Guerra, Eduardo José Araújo Lima and Eui Jung Chang
Oct/2007
146 Movimentos da Estrutura a Termo e Critérios de Minimização do Erro de Previsão em um Modelo Paramétrico Exponencial Caio Almeida, Romeu Gomes, André Leite e José Vicente
Out/2007
147 Explaining Bank Failures in Brazil: Micro, Macro and Contagion Effects (1994-1998) Adriana Soares Sales and Maria Eduarda Tannuri-Pianto
Oct/2007
148 Um Modelo de Fatores Latentes com Variáveis Macroeconômicas para a Curva de Cupom Cambial Felipe Pinheiro, Caio Almeida e José Vicente
Out/2007
149 Joint Validation of Credit Rating PDs under Default Correlation Ricardo Schechtman
Oct/2007

44
150 A Probabilistic Approach for Assessing the Significance of Contextual Variables in Nonparametric Frontier Models: an Application for Brazilian Banks Roberta Blass Staub and Geraldo da Silva e Souza
Oct/2007
151 Building Confidence Intervals with Block Bootstraps for the Variance Ratio Test of Predictability
Nov/2007
Eduardo José Araújo Lima and Benjamin Miranda Tabak
152 Demand for Foreign Exchange Derivatives in Brazil: Hedge or Speculation? Fernando N. de Oliveira and Walter Novaes
Dec/2007
153 Aplicação da Amostragem por Importância à Simulação de Opções Asiáticas Fora do Dinheiro Jaqueline Terra Moura Marins
Dez/2007
154 Identification of Monetary Policy Shocks in the Brazilian Market for Bank Reserves Adriana Soares Sales and Maria Tannuri-Pianto
Dec/2007
155 Does Curvature Enhance Forecasting? Caio Almeida, Romeu Gomes, André Leite and José Vicente
Dec/2007
156 Escolha do Banco e Demanda por Empréstimos: um Modelo de Decisão em Duas Etapas Aplicado para o Brasil Sérgio Mikio Koyama e Márcio I. Nakane
Dez/2007
157 Is the Investment-Uncertainty Link Really Elusive? The Harmful Effects of Inflation Uncertainty in Brazil Tito Nícias Teixeira da Silva Filho
Jan/2008
158 Characterizing the Brazilian Term Structure of Interest Rates Osmani T. Guillen and Benjamin M. Tabak
Feb/2008
159 Behavior and Effects of Equity Foreign Investors on Emerging Markets Barbara Alemanni and José Renato Haas Ornelas
Feb/2008
160 The Incidence of Reserve Requirements in Brazil: Do Bank Stockholders Share the Burden? Fábia A. de Carvalho and Cyntia F. Azevedo
Feb/2008
161 Evaluating Value-at-Risk Models via Quantile Regressions Wagner P. Gaglianone, Luiz Renato Lima and Oliver Linton
Feb/2008
162 Balance Sheet Effects in Currency Crises: Evidence from Brazil Marcio M. Janot, Márcio G. P. Garcia and Walter Novaes
Apr/2008
163 Searching for the Natural Rate of Unemployment in a Large Relative Price Shocks’ Economy: the Brazilian Case Tito Nícias Teixeira da Silva Filho
May/2008
164 Foreign Banks’ Entry and Departure: the recent Brazilian experience (1996-2006) Pedro Fachada
Jun/2008
165 Avaliação de Opções de Troca e Opções de Spread Européias e Americanas Giuliano Carrozza Uzêda Iorio de Souza, Carlos Patrício Samanez e Gustavo Santos Raposo
Jul/2008

45
166 Testing Hyperinflation Theories Using the Inflation Tax Curve: a case study Fernando de Holanda Barbosa and Tito Nícias Teixeira da Silva Filho
Jul/2008
167 O Poder Discriminante das Operações de Crédito das Instituições Financeiras Brasileiras Clodoaldo Aparecido Annibal
Jul/2008
168 An Integrated Model for Liquidity Management and Short-Term Asset Allocation in Commercial Banks Wenersamy Ramos de Alcântara
Jul/2008
169 Mensuração do Risco Sistêmico no Setor Bancário com Variáveis Contábeis e Econômicas Lucio Rodrigues Capelletto, Eliseu Martins e Luiz João Corrar
Jul/2008
170 Política de Fechamento de Bancos com Regulador Não-Benevolente: Resumo e Aplicação Adriana Soares Sales
Jul/2008
171 Modelos para a Utilização das Operações de Redesconto pelos Bancos com Carteira Comercial no Brasil Sérgio Mikio Koyama e Márcio Issao Nakane
Ago/2008
172 Combining Hodrick-Prescott Filtering with a Production Function Approach to Estimate Output Gap Marta Areosa
Aug/2008
173 Exchange Rate Dynamics and the Relationship between the Random Walk Hypothesis and Official Interventions Eduardo José Araújo Lima and Benjamin Miranda Tabak
Aug/2008
174 Foreign Exchange Market Volatility Information: an investigation of real-dollar exchange rate Frederico Pechir Gomes, Marcelo Yoshio Takami and Vinicius Ratton Brandi
Aug/2008
175 Evaluating Asset Pricing Models in a Fama-French Framework Carlos Enrique Carrasco Gutierrez and Wagner Piazza Gaglianone
Dec/2008
176 Fiat Money and the Value of Binding Portfolio Constraints Mário R. Páscoa, Myrian Petrassi and Juan Pablo Torres-Martínez
Dec/2008
177 Preference for Flexibility and Bayesian Updating Gil Riella
Dec/2008
178 An Econometric Contribution to the Intertemporal Approach of the Current Account Wagner Piazza Gaglianone and João Victor Issler
Dec/2008
179 Are Interest Rate Options Important for the Assessment of Interest Rate Risk? Caio Almeida and José Vicente
Dec/2008
180 A Class of Incomplete and Ambiguity Averse Preferences Leandro Nascimento and Gil Riella
Dec/2008
181 Monetary Channels in Brazil through the Lens of a Semi-Structural Model André Minella and Nelson F. Souza-Sobrinho
Apr/2009

46
182 Avaliação de Opções Americanas com Barreiras Monitoradas de Forma Discreta Giuliano Carrozza Uzêda Iorio de Souza e Carlos Patrício Samanez
Abr/2009
183 Ganhos da Globalização do Capital Acionário em Crises Cambiais Marcio Janot e Walter Novaes
Abr/2009
184 Behavior Finance and Estimation Risk in Stochastic Portfolio Optimization José Luiz Barros Fernandes, Juan Ignacio Peña and Benjamin Miranda Tabak
Apr/2009
185 Market Forecasts in Brazil: performance and determinants Fabia A. de Carvalho and André Minella
Apr/2009
186 Previsão da Curva de Juros: um modelo estatístico com variáveis macroeconômicas André Luís Leite, Romeu Braz Pereira Gomes Filho e José Valentim Machado Vicente
Maio/2009
187 The Influence of Collateral on Capital Requirements in the Brazilian Financial System: an approach through historical average and logistic regression on probability of default Alan Cosme Rodrigues da Silva, Antônio Carlos Magalhães da Silva, Jaqueline Terra Moura Marins, Myrian Beatriz Eiras da Neves and Giovani Antonio Silva Brito
Jun/2009
188 Pricing Asian Interest Rate Options with a Three-Factor HJM Model Claudio Henrique da Silveira Barbedo, José Valentim Machado Vicente and Octávio Manuel Bessada Lion
Jun/2009
Copyright © 2022 FDOKUMEN