Linking air and water transport in intact soils to macropore characteristics inferred from X-ray...
12
Linking air and water transport in intact soils to macropore characteristics inferred from X-ray computed tomography Sheela Katuwal a, ⁎, Trine Norgaard a , Per Moldrup b , Mathieu Lamandé a , Dorthe Wildenschild c , Lis W. de Jonge a a Aarhus University, Department of Agroecology, Blichers Allé 20, DK-8830 Tjele, Denmark b Aalborg University, Department of Civil Engineering, Sohngaardsholmsvej 57, DK-9000, Aalborg, Denmark c Oregon State University, School of Chemical, Biological, and Environmental Engineering, 103 Gleeson Hall, Corvallis, OR 97331-2702, USA abstract article info Article history: Received 13 March 2013 Received in revised form 9 August 2014 Accepted 15 August 2014 Available online xxxx Keywords: Macropores Limiting-section macroporosity X-ray computed tomography Air permeability 5% tracer arrival time Soil macropores largely control fluid and solute transport, making visualization and quantification of macropore characteristics essential for better understanding and predicting soil hydrogeochemical functions. In this study, seventeen large (19 × 20 cm) intact soil cores taken across a loamy field site (Silstrup, Denmark) were scanned at in-situ sampling conditions (~field capacity) at a relatively coarse resolution (500 μm) by medical X-ray com- puted tomography (CT). In the image analyses, artifacts related to the presence of rocks were identified and re- moved before linking CT-derived pore parameters to measured fluid transport parameters. After CT scanning, soil cores were saturated and drained at −20 hPa soil–water potential, leaving only pores N 150 μm air-filled. Air per- meability (k a20 ) and air-filled porosity (ε 20 ) were measured to evaluate gas transport behavior in macropore net- works under these conditions. Finally, tracer transport experiments at a constant, high flow rate (10 mm h −1 ) were carried out, and the arrival time for 5% of the applied tracer (T 5% ) was used as an index for the magnitude of water transport in macropores. Although X-ray CT scanning only identified 5–25% of the total air-filled pore network at −20 hPa, CT-derived macroporosity (average for whole column) and macroporosity for the limiting-quarter section of each column were highly correlated to both k a20 and T 5% (R 2 from 0.6 to 0.8). The CT-inferred limiting depth for soil–gas transport was typically located at 90–165 mm depth, and likely a result of soil management history. Results suggest that the functional macropore network for fluid transport was well quantified by rapid, coarse-resolution X-ray CT scanning. Linking rapid X-ray CT scanning with classical fluid transport measurements on large intact columns thus proves highly useful for characterizing soil macropore functions and in perspective may prove to be useful in predicting field-scale variations in gas, water, and chemical transport. © 2014 Elsevier B.V. All rights reserved. 1. Introduction Macropores – earthworm burrows, root channels, fissures and interaggregate voids – represent only a small fraction of the total poros- ity in soil, but play a central role in many physical processes like fluid flow and solute transport. Consequently, a good understanding of the determinism of macropores in space and time, and of the physical pro- cesses associated with the presence and the geometry of macropores is needed to maintain acceptable crop yield and to prevent environmental pollution. As emphasized by Jarvis (2007) and references therein, rapid flow and solute transport through macropores have been extensively explored by soil scientists during the last few decades. Macropores have been described through functional soil properties such as water re- tention, air permeability, gas diffusivity, and saturated and unsaturated hydraulic conductivity (Ball, 1981; Blackwell et al., 1990; Granovsky and McCoy, 1997), and by performing tracer experiments in the field or for soil cores in the lab (Deeks et al., 2008; Ersahin et al., 2002; Kjaergaard et al., 2004). In such studies, models for fluid mechanics in porous media helped in assessing the size distribution and the (likely) shape of the macropores. These studies are very useful, however, all these methods to quantify macropores are based on model assumptions (e.g. the capillary model). A number of studies based on image analysis of two-dimensional sections of soil prepared by impregnation tech- niques have been conducted to describe macropore characteristics (e.g. Droogers et al., 1998; Singh et al., 1991; Velde et al., 1996). Though some macropore properties can be adequately assessed using sections at different depths, many three-dimensional properties cannot be pre- dicted precisely with these two-dimensional sections (Moreau et al., 1999). Imaging in three-dimensions and making geometrical measure- ments of macropores have been successfully carried out using imaging techniques like X-ray computed tomography (e.g. Luo et al., 2010a; Munkholm et al., 2012; Perret et al., 1999), a non-invasive and a Geoderma 237–238 (2015) 9–20 ⁎ Corresponding author. E-mail address: [email protected] (S. Katuwal). http://dx.doi.org/10.1016/j.geoderma.2014.08.006 0016-7061/© 2014 Elsevier B.V. All rights reserved. Contents lists available at ScienceDirect Geoderma journal homepage: www.elsevier.com/locate/geoderma
-
Upload
independent -
Category
Documents
-
view
4 -
download
0
Transcript of Linking air and water transport in intact soils to macropore characteristics inferred from X-ray...

Geoderma 237–238 (2015) 9–20
Contents lists available at ScienceDirect
Geoderma
j ourna l homepage: www.e lsev ie r .com/ locate /geoderma
Linking air and water transport in intact soils to macroporecharacteristics inferred from X-ray computed tomography
Sheela Katuwal a,⁎, Trine Norgaard a, Per Moldrup b, Mathieu Lamandé a,Dorthe Wildenschild c, Lis W. de Jonge a
a Aarhus University, Department of Agroecology, Blichers Allé 20, DK-8830 Tjele, Denmarkb Aalborg University, Department of Civil Engineering, Sohngaardsholmsvej 57, DK-9000, Aalborg, Denmarkc Oregon State University, School of Chemical, Biological, and Environmental Engineering, 103 Gleeson Hall, Corvallis, OR 97331-2702, USA
⁎ Corresponding author.E-mail address: [email protected] (S. Katuwal
http://dx.doi.org/10.1016/j.geoderma.2014.08.0060016-7061/© 2014 Elsevier B.V. All rights reserved.
a b s t r a c t
a r t i c l e i n f oArticle history:Received 13 March 2013Received in revised form 9 August 2014Accepted 15 August 2014Available online xxxx
Keywords:MacroporesLimiting-section macroporosityX-ray computed tomographyAir permeability5% tracer arrival time
Soil macropores largely control fluid and solute transport, making visualization and quantification of macroporecharacteristics essential for better understanding and predicting soil hydrogeochemical functions. In this study,seventeen large (19 × 20 cm) intact soil cores taken across a loamy field site (Silstrup, Denmark) were scannedat in-situ sampling conditions (~field capacity) at a relatively coarse resolution (500 μm) bymedical X-ray com-puted tomography (CT). In the image analyses, artifacts related to the presence of rocks were identified and re-moved before linking CT-derived pore parameters tomeasuredfluid transport parameters. After CT scanning, soilcoreswere saturated and drained at−20hPa soil–water potential, leaving only pores N 150 μmair-filled. Air per-meability (ka20) and air-filled porosity (ε20) weremeasured to evaluate gas transport behavior inmacropore net-works under these conditions. Finally, tracer transport experiments at a constant, high flow rate (10 mm h−1)were carried out, and the arrival time for 5% of the applied tracer (T5%) was used as an index for the magnitudeof water transport in macropores. Although X-ray CT scanning only identified 5–25% of the total air-filled porenetwork at −20 hPa, CT-derived macroporosity (average for whole column) and macroporosity for thelimiting-quarter section of each column were highly correlated to both ka20 and T5% (R2 from 0.6 to 0.8). TheCT-inferred limiting depth for soil–gas transport was typically located at 90–165 mm depth, and likely a resultof soil management history. Results suggest that the functional macropore network for fluid transport waswell quantified by rapid, coarse-resolution X-ray CT scanning. Linking rapid X-ray CT scanning with classicalfluid transportmeasurements on large intact columns thus proves highly useful for characterizing soilmacroporefunctions and inperspectivemay prove to be useful in predictingfield-scale variations in gas,water, and chemicaltransport.
© 2014 Elsevier B.V. All rights reserved.
1. Introduction
Macropores – earthworm burrows, root channels, fissures andinteraggregate voids – represent only a small fraction of the total poros-ity in soil, but play a central role in many physical processes like fluidflow and solute transport. Consequently, a good understanding of thedeterminism of macropores in space and time, and of the physical pro-cesses associated with the presence and the geometry of macropores isneeded tomaintain acceptable crop yield and to prevent environmentalpollution. As emphasized by Jarvis (2007) and references therein, rapidflow and solute transport through macropores have been extensivelyexplored by soil scientists during the last few decades. Macroporeshave been described through functional soil properties such aswater re-tention, air permeability, gas diffusivity, and saturated and unsaturatedhydraulic conductivity (Ball, 1981; Blackwell et al., 1990; Granovsky
).
and McCoy, 1997), and by performing tracer experiments in the fieldor for soil cores in the lab (Deeks et al., 2008; Ersahin et al., 2002;Kjaergaard et al., 2004). In such studies, models for fluid mechanics inporous media helped in assessing the size distribution and the (likely)shape of the macropores. These studies are very useful, however, allthesemethods to quantifymacropores are based onmodel assumptions(e.g. the capillary model). A number of studies based on image analysisof two-dimensional sections of soil prepared by impregnation tech-niques have been conducted to describe macropore characteristics(e.g. Droogers et al., 1998; Singh et al., 1991; Velde et al., 1996). Thoughsome macropore properties can be adequately assessed using sectionsat different depths, many three-dimensional properties cannot be pre-dicted precisely with these two-dimensional sections (Moreau et al.,1999).
Imaging in three-dimensions and making geometrical measure-ments of macropores have been successfully carried out using imagingtechniques like X-ray computed tomography (e.g. Luo et al., 2010a;Munkholm et al., 2012; Perret et al., 1999), a non-invasive and a
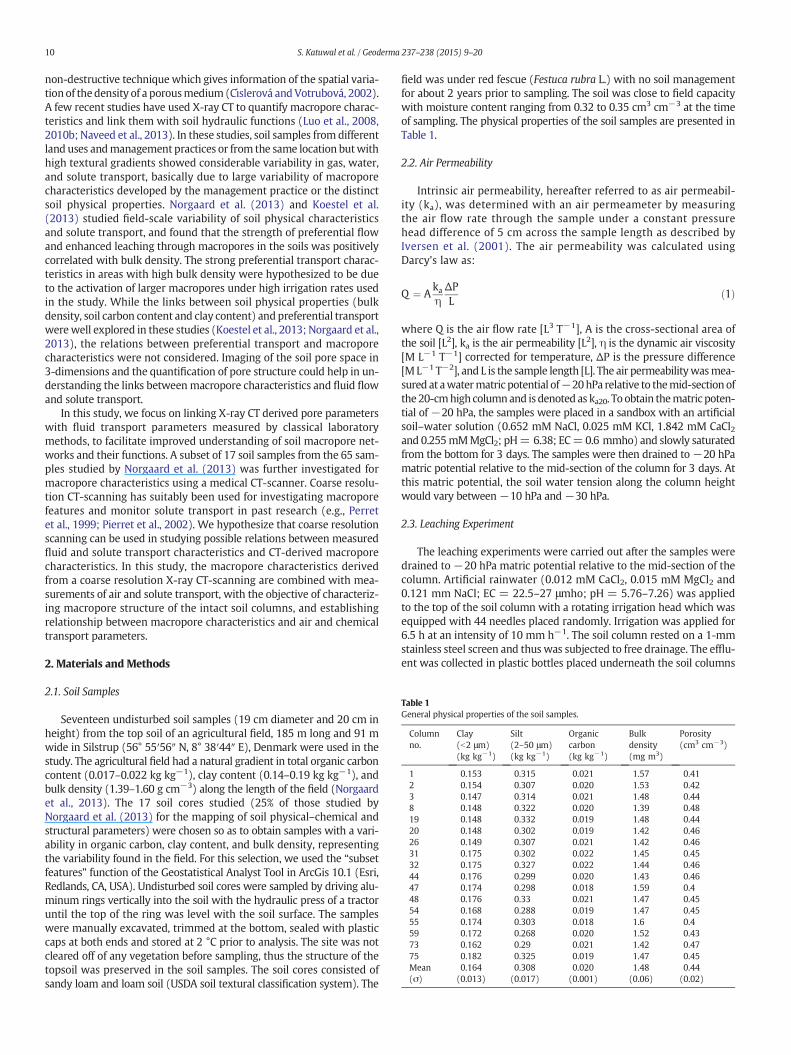
Table 1General physical properties of the soil samples.
Columnno.
Clay(b2 μm)(kg kg−1)
Silt(2–50 μm)(kg kg−1)
Organiccarbon(kg kg−1)
Bulkdensity(mg m3)
Porosity(cm3 cm−3)
1 0.153 0.315 0.021 1.57 0.412 0.154 0.307 0.020 1.53 0.423 0.147 0.314 0.021 1.48 0.448 0.148 0.322 0.020 1.39 0.4819 0.148 0.332 0.019 1.48 0.4420 0.148 0.302 0.019 1.42 0.4626 0.149 0.307 0.021 1.42 0.4631 0.175 0.302 0.022 1.45 0.4532 0.175 0.327 0.022 1.44 0.4644 0.176 0.299 0.020 1.43 0.4647 0.174 0.298 0.018 1.59 0.448 0.176 0.33 0.021 1.47 0.4554 0.168 0.288 0.019 1.47 0.4555 0.174 0.303 0.018 1.6 0.459 0.172 0.268 0.020 1.52 0.4373 0.162 0.29 0.021 1.42 0.4775 0.182 0.325 0.019 1.47 0.45Mean 0.164 0.308 0.020 1.48 0.44(σ) (0.013) (0.017) (0.001) (0.06) (0.02)
10 S. Katuwal et al. / Geoderma 237–238 (2015) 9–20
non-destructive technique which gives information of the spatial varia-tion of thedensity of a porousmedium (Cı́slerová andVotrubová, 2002).A few recent studies have used X-ray CT to quantify macropore charac-teristics and link them with soil hydraulic functions (Luo et al., 2008,2010b; Naveed et al., 2013). In these studies, soil samples from differentland uses andmanagement practices or from the same location butwithhigh textural gradients showed considerable variability in gas, water,and solute transport, basically due to large variability of macroporecharacteristics developed by the management practice or the distinctsoil physical properties. Norgaard et al. (2013) and Koestel et al.(2013) studied field-scale variability of soil physical characteristicsand solute transport, and found that the strength of preferential flowand enhanced leaching through macropores in the soils was positivelycorrelated with bulk density. The strong preferential transport charac-teristics in areas with high bulk density were hypothesized to be dueto the activation of larger macropores under high irrigation rates usedin the study. While the links between soil physical properties (bulkdensity, soil carbon content and clay content) and preferential transportwerewell explored in these studies (Koestel et al., 2013; Norgaard et al.,2013), the relations between preferential transport and macroporecharacteristics were not considered. Imaging of the soil pore space in3-dimensions and the quantification of pore structure could help in un-derstanding the links betweenmacropore characteristics and fluid flowand solute transport.
In this study, we focus on linking X-ray CT derived pore parameterswith fluid transport parameters measured by classical laboratorymethods, to facilitate improved understanding of soil macropore net-works and their functions. A subset of 17 soil samples from the 65 sam-ples studied by Norgaard et al. (2013) was further investigated formacropore characteristics using a medical CT-scanner. Coarse resolu-tion CT-scanning has suitably been used for investigating macroporefeatures and monitor solute transport in past research (e.g., Perretet al., 1999; Pierret et al., 2002). We hypothesize that coarse resolutionscanning can be used in studying possible relations between measuredfluid and solute transport characteristics and CT-derived macroporecharacteristics. In this study, the macropore characteristics derivedfrom a coarse resolution X-ray CT-scanning are combined with mea-surements of air and solute transport, with the objective of characteriz-ing macropore structure of the intact soil columns, and establishingrelationship between macropore characteristics and air and chemicaltransport parameters.
2. Materials and Methods
2.1. Soil Samples
Seventeen undisturbed soil samples (19 cm diameter and 20 cm inheight) from the top soil of an agricultural field, 185 m long and 91 mwide in Silstrup (56° 55′56″ N, 8° 38′44″ E), Denmark were used in thestudy. The agricultural field had a natural gradient in total organic carboncontent (0.017–0.022 kg kg−1), clay content (0.14–0.19 kg kg−1), andbulk density (1.39–1.60 g cm−3) along the length of the field (Norgaardet al., 2013). The 17 soil cores studied (25% of those studied byNorgaard et al. (2013) for the mapping of soil physical–chemical andstructural parameters) were chosen so as to obtain samples with a vari-ability in organic carbon, clay content, and bulk density, representingthe variability found in the field. For this selection, we used the “subsetfeatures” function of the Geostatistical Analyst Tool in ArcGis 10.1 (Esri,Redlands, CA, USA). Undisturbed soil cores were sampled by driving alu-minum rings vertically into the soil with the hydraulic press of a tractoruntil the top of the ring was level with the soil surface. The sampleswere manually excavated, trimmed at the bottom, sealed with plasticcaps at both ends and stored at 2 °C prior to analysis. The site was notcleared off of any vegetation before sampling, thus the structure of thetopsoil was preserved in the soil samples. The soil cores consisted ofsandy loam and loam soil (USDA soil textural classification system). The
field was under red fescue (Festuca rubra L.) with no soil managementfor about 2 years prior to sampling. The soil was close to field capacitywith moisture content ranging from 0.32 to 0.35 cm3 cm−3 at the timeof sampling. The physical properties of the soil samples are presented inTable 1.
2.2. Air Permeability
Intrinsic air permeability, hereafter referred to as air permeabil-ity (ka), was determined with an air permeameter by measuringthe air flow rate through the sample under a constant pressurehead difference of 5 cm across the sample length as described byIversen et al. (2001). The air permeability was calculated usingDarcy's law as:
Q ¼ AkaηΔPL
ð1Þ
where Q is the air flow rate [L3 T−1], A is the cross-sectional area ofthe soil [L2], ka is the air permeability [L2], η is the dynamic air viscosity[M L−1 T−1] corrected for temperature, ΔP is the pressure difference[ML−1 T−2], and L is the sample length [L]. The air permeabilitywasmea-sured at awatermatric potential of−20hPa relative to themid-section ofthe 20-cmhigh columnand is denoted as ka20. To obtain thematric poten-tial of −20 hPa, the samples were placed in a sandbox with an artificialsoil–water solution (0.652 mM NaCl, 0.025 mM KCl, 1.842 mM CaCl2and 0.255mMMgCl2; pH= 6.38; EC=0.6 mmho) and slowly saturatedfrom the bottom for 3 days. The samples were then drained to−20 hPamatric potential relative to the mid-section of the column for 3 days. Atthis matric potential, the soil water tension along the column heightwould vary between−10 hPa and−30 hPa.
2.3. Leaching Experiment
The leaching experiments were carried out after the samples weredrained to −20 hPa matric potential relative to the mid-section of thecolumn. Artificial rainwater (0.012 mM CaCl2, 0.015 mM MgCl2 and0.121 mm NaCl; EC = 22.5–27 μmho; pH = 5.76–7.26) was appliedto the top of the soil column with a rotating irrigation head which wasequipped with 44 needles placed randomly. Irrigation was applied for6.5 h at an intensity of 10 mm h−1. The soil column rested on a 1-mmstainless steel screen and thus was subjected to free drainage. The efflu-ent was collected in plastic bottles placed underneath the soil columns

11S. Katuwal et al. / Geoderma 237–238 (2015) 9–20
through a funnel. Sampleswere collected every 10min for thefirst 1.5 h,every 15 min for 3 h and then every 30 min for 2 h. When the flow ratewas steady, a solution of radioactive conservative tracer, (tritium solu-tion, 3H2O), applied at the same intensity as rainwater, replaced rainwa-ter for 10 min. The effluent was analyzed for tritium activity and 5%tracer arrival time (defined as the total time taken to recover 5% of theapplied tritium in the outflow), was calculated.
The samples were weighed before saturation i.e., at in-situ moisturecondition, and after drainage. Finally, after the leaching experiments,the soil samples were oven dried to get the dry bulk density of eachsample. The total soil porosity was estimated from the measured soilbulk density and a particle density of 2.65 g cm−3. Air-filled porosityat −20 hPa matric potential also referred to as air-filled porosity wascalculated as the difference between the total porosity and volumetricsoil–water content at that potential.
2.4. Image Acquisition and Processing
The soil samples, at in-situ soil moisture conditions, werescanned with a medical scanner, Siemens Biograph 64 True Point(Siemens AG, Erlangen, Germany) at the PET Center (Aarhus Univer-sity Hospital). The soil columns were placed horizontally on thebench, and spiral scanning performed using a voltage of 120 kV, an expo-sure of 740 mAs and an X-ray tube current of 333 mA. The scanningproduced images with a slice thickness of 0.6 mmwith 512 × 512 pixelsper slice for the field of view of 220 × 220 mm, thus producing voxelswith a resolution of 0.43 × 0.43 × 0.6 mm in the reconstructed image.
Fig. 1. (a) Gray scale intensity histogram (top figure) with the thresholding method (bottom figsoil samplewith intensity histogram in the left; (c) gray scale imagewith the segmentedpores sreferred to the web version of this article.)
The imageswere 16-bit (DICOM format) inwhich the voxel values repre-sented the linear attenuation coefficient in Hounsfield units (HU). Werefer to Wildenschild et al. (2002) for the basic principles of X-ray com-puted tomography (CT).
The images in DICOM format were processed and analyzed usingeither AVIZO Fire® 6.3 (http://www.vsg3d.com/avizo/fire) or the free-ware software program ImageJ, version 1.46a (Abramoff et al., 2004).A Gaussian filter (3 × 3 × 3 kernel size) was used to reduce the noisein the image. The images were cropped to a region of interest (ROI) of180 mm diameter and a height of 170 mm to avoid artifacts due tothe uneven top of the soil sample. Thresholding based on the intensityhistogram of the entire sample as described by Lamandé et al. (2013)was used to segment macropores. Briefly described, the thresholdvalue was obtained from the intensity histogram of the image by fittinga parabola between the Hounsfield unit of about−900HU, correspond-ing to the peak for air, and HU of about −300, adjusting this range foreach sample, to obtain a parabolawhichwould best represent the histo-gram in that range (Fig. 1). The minimum point in the parabola wasused as the threshold value for segmenting the pores. Since soil proper-ties and the moisture content varied among the samples, differentthreshold values were obtained for different samples which rangedfrom−700 to−550 HU. In the binary image obtained from segmenta-tion, featureswithminimumFeret's diameter b 1.2mm(width less than2 voxels), were removed to avoid classification of noise as pores in fur-ther analysis (Lamandé et al., 2013; Munkholm et al., 2012). Thus, thepores quantified were those larger than about 1.2 mm in diameterwhich are referred to as macropores in this study. Macropores have
ure), (b) gray scale image, where dark areas in the image represent the pore spaces of thehown in red. (For interpretation of the references to color in thisfigure legend, the reader is

Fig. 3. Macroporosity from CT-scans with and without artifacts. The circled samples arethose with a large difference in macroporosity values with and without artifacts and arenot included in developing the regression between macroporosity with and withoutartifacts.
12 S. Katuwal et al. / Geoderma 237–238 (2015) 9–20
been defined variously in the past researches, for example; as poreslarger than 1 mm (Luxmoore, 1981), larger than about 0.3–0.5 mm(Jarvis, 2007) and pores larger than 3 mm (Germann and Beven,1981). In this study, pores ≥ 1.2 mmwere considered as macropores.
2.5. Removal of Artifacts
The CT-images of the samples provided the opportunity to look intoeach of the soil samples. Examination of the scanned images revealedthat some artifacts had developed during sample coring, especiallywhen a rockwas present at theperimeter of the sample andwas pusheddown by the cylinder during sampling, creating an artificial pore (arti-fact) above the rock (Fig. 2). The artifacts had some common features;they were close to the cylinder wall, differed from the cylindricalshape of a natural macropore, and the majority of them were isolated.Thus, they could be manually selected and removed from the binaryimage. However, those rock artifacts which were not isolated butconnected to other visible macropores or to the top or bottom were notremoved as their removal would also remove the natural macropores inthe samples.
Exclusion of the rock artifacts resulted in a reduction inmacroporosityvalues for the samples by 7 to 70%. But the overall trend inmacroporositywas not affected by the removal of the artifacts as shown by the highcorrelation between macroporosity with and without artifacts (R2
value of 0.82, excluding samples #31 and #48) in Fig. 3. Macroporosity(cm3 cm−3), here, refers to the ratio of the total volume of all macroporesquantified using X-ray CT-scanning to the volume of the ROI. Except fortwo samples #31 and #48 (circled in Fig. 3) which had a large differencein the two macroporosity values, the CT-derived macroporosity withoutartifacts for all the samples was less than that with artifacts byabout 0.0032 cm3 cm−3. In the sections hereafter we refer to macro-porosity derived from X-ray CT and after removing artifacts as “CT-derived macroporosity” or simply “macroporosity” and the associatedmacropores as simply “macropores” unless stated.
2.6. Derivation of Macropore Characteristics From the CT Scans
In addition to macroporosity, macroporosity variation with soildepth, macroporosity of the limiting quarter section, macropore densi-ty, macropore length density, branch density, macropore node density,average tortuosity and connectivity of the macropores (described laterin the section) were analyzed for each sample obtained (after theremoval of the artifacts). The variation in macroporosity with depthwas analyzed by calculating the macroporosity value for each slice(0.6 mm) of the binary image of each sample. Macroporosity of the lim-iting quarter sectionwas obtained as themacroporosity of the section inthe samplewith thickness equal to one-fourth of the total sample heightthat had the lowest volume of CT-derived macropores. This wasachieved by cropping the ROI to 25% of its thickness starting from the
Fig. 2. Gray scale image of a vertical slice of a soil column with artifacts created duringsample coring due to scour of rocks caused by the cylindrical sampling rings. Dark areasin the image represent the pore spaces, gray areas are the soil matrix with brighter colorbeing the denser fractions of the soil matrix.
top, then consequently a slice downward until the lower quarter of theROI was obtained and calculating themacroporosity for each quarter sec-tion. The lowest value of macroporosity provided the macroporosity ofthe limiting quarter section. Macropore density (cm−3) was calculatedas the number of macropores per unit volume of soil.
Macropore branch density, macropore node density, macroporelength density, and the average tortuosity were derived from skeletonsof the macropores which were generated using the Skeletonize 3Dplugin (Doube et al., 2010) in the software ImageJ. The skeletons werethen analyzed using the Analyze Skeleton plugin (Doube et al., 2010).Skeletons of macropores are the representation of the centerline ofmacropores with a thickness of one voxel. Macropore branch densitywas calculated as the total number of all branches/segments (includingthe isolatedmacropores) in the ROI. Node density, which can be used toquantify the inter-connectivity of macropores (Luo et al., 2010a), wascalculated as the sum of the number of nodes (intersections where atleast two pore branches connect) in all macropores per unit volume ofsoil considered (cm−3). Macropore length density was calculated asthe sum of actual lengths of all macropores per unit volume of soil with-in the ROI (cm cm−3). The average tortuosity for each sample was ob-tained as the ratio of the total actual lengths of all macropores to thesum of the shortest distance between two ends for all the macropores.
The average size of a macropore (mean diameter) was obtainedusing the Thickness plugin (Dougherty and Kunzelmann, 2007;Hildebrand and Rüegsegger, 1997) in the Particle Analyzer plugin inImageJ. The plugin is based on the calculation of the local thickness ata point in the structure, which is the diameter of the largest sphere con-taining the point and fitting completely within the structure. The aver-age size of a macropore is then the volume-based local thickness ofthe structure (Hildebrand and Rüegsegger, 1997). The plugin has beendesigned for images with isotropic voxels. However, we found theplugin to function equally good for images with anisotropic voxels too,with the anisotropy in z-direction. This was checked by calculatingmanually the average size for artificial pores of different radii alongthe pore length generated in ImageJ and applying the plugin.
The connectivity of the macropores in each sample was calculatedusing Euler–Poincaré characteristic (or Euler number), one of theMinkowski functionals and a topological measure used for describingthe connectivity of spatial structures (Arns et al., 2002; Vogel andRoth, 2001; Vogel et al., 2010). In 3-dimensions, the Euler number

13S. Katuwal et al. / Geoderma 237–238 (2015) 9–20
(χ, chi) is calculated as the number of isolated pores (N) minus thenumber of redundant connections or loops (C) within the pore spaceoften referred to as connectivity or genus plus the number of completelyenclosed cavities (H) in a volume of soil considered (Vogel, 1997; Vogeland Roth, 2001), i.e., χ = N − C + H. From the 3D binary image, theEuler number of a pore network was calculated using the Particle Ana-lyzer plugin in ImageJ.
2.7. Statistical Analysis
All the statistical analyses were performed using the R program (Rversion 2.14.1). The Shapiro–Wilk normality test was used to test thenormality of the distribution of macropore characteristics, soil physicalcharacteristics, air permeability and 5% arrival time. Pearson's correla-tion coefficient (r) was used to test the correlation between the differentmacropore characteristics, and between soil properties and macroporecharacteristics. Simple linear regressions (using the “lm” option in R forfitting linear models) were used to correlate macropore characteristicsto air permeability and 5% tracer arrival time. The slope and intercept ofthe linear fits were checked if they differed significantly (p b 0.01) from0 and linear regressions with zero intercept were drawn when the inter-cept did not differ significantly from 0.
3. Results and Discussion
3.1. Macropore Characteristics
Macropores quantified in all the samples were reconstructed forvisualization but only selected examples are shown in Fig. 4, with thevalue of macroporosity in parenthesis. Biopores (earthworm burrowsor root channels), large tubular pores and mostly vertically oriented,could easily be identified in most of the samples, but in this study noeffort has been done towards differentiating and quantifying the
Fig. 4. 3D reconstruction of macropores in the soil samples, the samples are arranged accordingfor the sample.
visualized pores based on their types. Variousmacropore characteristicsquantified via CT-scanning samples are shown in Table 2. Macroporedensity, the number of CT-derived macropore networks per unit vol-ume, ranged from about 0.70 to 3.69 (×105 networks m−3) and theCT-derived macroporosity (without artifacts) ranged between 0.0038and 0.0166 cm3 cm−3 with an average macropore volume for the sam-ples ranging from14.3 to 54.2mm3. Similar to Luo et al. (2010b), we ob-served positive correlation of macroporosity with macropore density(r = 0.80) (Table 3), whereas Perret et al. (1999) observed averagemacropore volume to be a better indicator ofmacroporosity in soil com-pared to macropore density. We also observed a high positive correla-tion (r = 0.92) between the density of branched and unbranchedmacropore networks and the density of unbranched networks in thesamples were 3.7 to 5.8 times the density of branched networks. Thehigher density of branched and unbranchedmacropores in the columnswith higher macroporosity suggests that the probability of macroporesbeing interconnected with each other because of bridging withmacropores b 1.2 mm (that could not be visualized in the study) in-creases as macroporosity increases. Since the information on branchingof macropores could be obtained only after skeletonization of themacropores, the information on the volumes of branched and un-branched macropores could not be generated.
The total surface area density of macropores ranged from 5.23 to26.90m2 m−3 and the total length density of the samples was between0.71 and 3.91 km m−3. Since volume and surface area are functions ofmacropore diameter and length, the high positive correlation of totallength density with macroporosity (r = 0.94) and surface area density(r = 0.97) was expected. Macropore node density of the soil samplesranged from 0.38 × 10⁵ to 2.38× 10⁵ nodesm−3 andmacropore branchdensity ranged from1.29 × 105 to 7.02× 10⁵ branchesm−3. Despite thelarge variation in most of the macropore characteristics, the tortuosityof the samples varied within a close range of 1.23 to 1.28 with an aver-age tortuosity value of 1.25 (σ = 0.01). This is likely because the
to decreasingmacroporosity. Values in parentheses denote themacroporosity (cm3 cm−3)
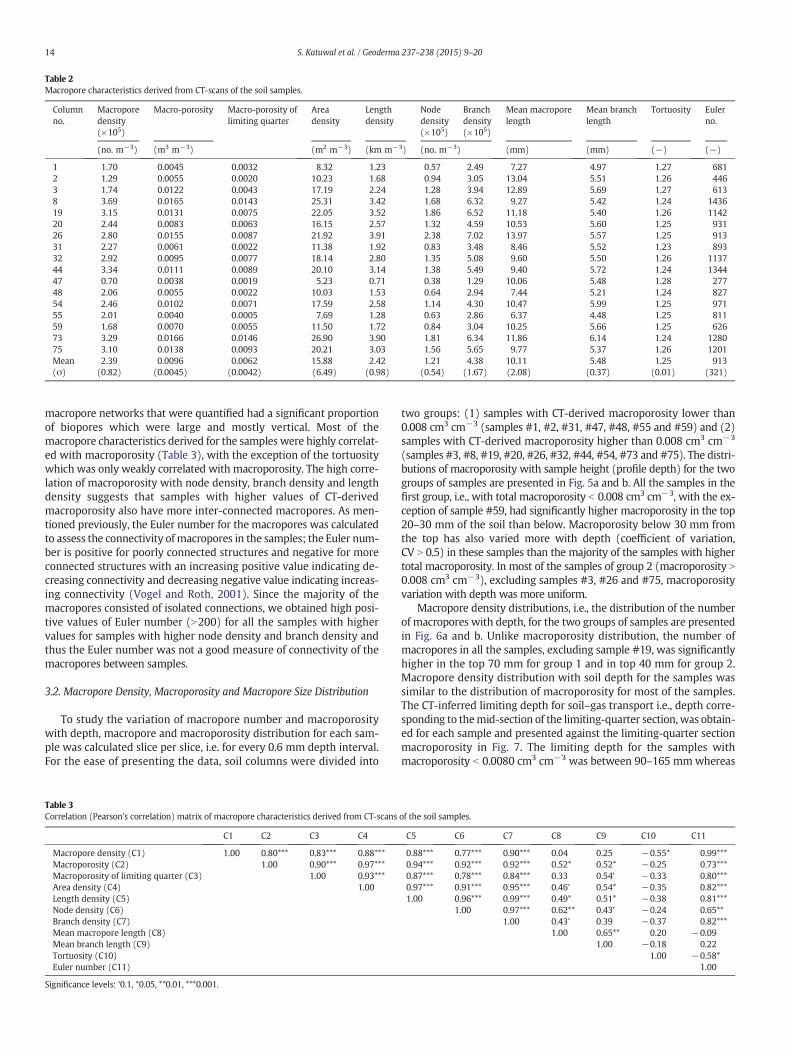
Table 2Macropore characteristics derived from CT-scans of the soil samples.
Columnno.
Macroporedensity(×105)
Macro-porosity Macro-porosity oflimiting quarter
Areadensity
Lengthdensity
Nodedensity(×105)
Branchdensity(×105)
Mean macroporelength
Mean branchlength
Tortuosity Eulerno.
(no. m−3) (m3 m−3) (m2 m−3) (km m−3) (no. m−3) (mm) (mm) (−) (−)
1 1.70 0.0045 0.0032 8.32 1.23 0.57 2.49 7.27 4.97 1.27 6812 1.29 0.0055 0.0020 10.23 1.68 0.94 3.05 13.04 5.51 1.26 4463 1.74 0.0122 0.0043 17.19 2.24 1.28 3.94 12.89 5.69 1.27 6138 3.69 0.0165 0.0143 25.31 3.42 1.68 6.32 9.27 5.42 1.24 143619 3.15 0.0131 0.0075 22.05 3.52 1.86 6.52 11.18 5.40 1.26 114220 2.44 0.0083 0.0063 16.15 2.57 1.32 4.59 10.53 5.60 1.25 93126 2.80 0.0155 0.0087 21.92 3.91 2.38 7.02 13.97 5.57 1.25 91331 2.27 0.0061 0.0022 11.38 1.92 0.83 3.48 8.46 5.52 1.23 89332 2.92 0.0095 0.0077 18.14 2.80 1.35 5.08 9.60 5.50 1.26 113744 3.34 0.0111 0.0089 20.10 3.14 1.38 5.49 9.40 5.72 1.24 134447 0.70 0.0038 0.0019 5.23 0.71 0.38 1.29 10.06 5.48 1.28 27748 2.06 0.0055 0.0022 10.03 1.53 0.64 2.94 7.44 5.21 1.24 82754 2.46 0.0102 0.0071 17.59 2.58 1.14 4.30 10.47 5.99 1.25 97155 2.01 0.0040 0.0005 7.69 1.28 0.63 2.86 6.37 4.48 1.25 81159 1.68 0.0070 0.0055 11.50 1.72 0.84 3.04 10.25 5.66 1.25 62673 3.29 0.0166 0.0146 26.90 3.90 1.81 6.34 11.86 6.14 1.24 128075 3.10 0.0138 0.0093 20.21 3.03 1.56 5.65 9.77 5.37 1.26 1201Mean 2.39 0.0096 0.0062 15.88 2.42 1.21 4.38 10.11 5.48 1.25 913(σ) (0.82) (0.0045) (0.0042) (6.49) (0.98) (0.54) (1.67) (2.08) (0.37) (0.01) (321)
14 S. Katuwal et al. / Geoderma 237–238 (2015) 9–20
macropore networks that were quantified had a significant proportionof biopores which were large and mostly vertical. Most of themacropore characteristics derived for the samples were highly correlat-ed with macroporosity (Table 3), with the exception of the tortuositywhich was only weakly correlated with macroporosity. The high corre-lation of macroporosity with node density, branch density and lengthdensity suggests that samples with higher values of CT-derivedmacroporosity also have more inter-connected macropores. As men-tioned previously, the Euler number for the macropores was calculatedto assess the connectivity of macropores in the samples; the Euler num-ber is positive for poorly connected structures and negative for moreconnected structures with an increasing positive value indicating de-creasing connectivity and decreasing negative value indicating increas-ing connectivity (Vogel and Roth, 2001). Since the majority of themacropores consisted of isolated connections, we obtained high posi-tive values of Euler number (N200) for all the samples with highervalues for samples with higher node density and branch density andthus the Euler number was not a good measure of connectivity of themacropores between samples.
3.2. Macropore Density, Macroporosity and Macropore Size Distribution
To study the variation of macropore number and macroporositywith depth, macropore and macroporosity distribution for each sam-ple was calculated slice per slice, i.e. for every 0.6 mm depth interval.For the ease of presenting the data, soil columns were divided into
Table 3Correlation (Pearson's correlation) matrix of macropore characteristics derived from CT-scans
C1 C2 C3 C4
Macropore density (C1) 1.00 0.80*** 0.83*** 0.88***Macroporosity (C2) 1.00 0.90*** 0.97***Macroporosity of limiting quarter (C3) 1.00 0.93***Area density (C4) 1.00Length density (C5)Node density (C6)Branch density (C7)Mean macropore length (C8)Mean branch length (C9)Tortuosity (C10)Euler number (C11)
Significance levels: ‘0.1, *0.05, **0.01, ***0.001.
two groups: (1) samples with CT-derived macroporosity lower than0.008 cm3 cm−3 (samples #1, #2, #31, #47, #48, #55 and #59) and (2)samples with CT-derived macroporosity higher than 0.008 cm3 cm−3
(samples #3, #8, #19, #20, #26, #32, #44, #54, #73 and #75). The distri-butions of macroporosity with sample height (profile depth) for the twogroups of samples are presented in Fig. 5a and b. All the samples in thefirst group, i.e., with total macroporosity b 0.008 cm3 cm−3, with the ex-ception of sample #59, had significantly higher macroporosity in the top20–30 mm of the soil than below. Macroporosity below 30 mm fromthe top has also varied more with depth (coefficient of variation,CV N 0.5) in these samples than the majority of the samples with highertotal macroporosity. In most of the samples of group 2 (macroporosity N
0.008 cm3 cm−3), excluding samples #3, #26 and #75, macroporosityvariation with depth was more uniform.
Macropore density distributions, i.e., the distribution of the numberof macropores with depth, for the two groups of samples are presentedin Fig. 6a and b. Unlike macroporosity distribution, the number ofmacropores in all the samples, excluding sample #19, was significantlyhigher in the top 70 mm for group 1 and in top 40 mm for group 2.Macropore density distribution with soil depth for the samples wassimilar to the distribution of macroporosity for most of the samples.The CT-inferred limiting depth for soil–gas transport i.e., depth corre-sponding to themid-section of the limiting-quarter section,was obtain-ed for each sample and presented against the limiting-quarter sectionmacroporosity in Fig. 7. The limiting depth for the samples withmacroporosity b 0.0080 cm3 cm−3 was between 90–165 mmwhereas
of the soil samples.
C5 C6 C7 C8 C9 C10 C11
0.88*** 0.77*** 0.90*** 0.04 0.25 −0.55* 0.99***0.94*** 0.92*** 0.92*** 0.52* 0.52* −0.25 0.73***0.87*** 0.78*** 0.84*** 0.33 0.54’ −0.33 0.80***0.97*** 0.91*** 0.95*** 0.46’ 0.54* −0.35 0.82***1.00 0.96*** 0.99*** 0.49* 0.51* −0.38 0.81***
1.00 0.97*** 0.62** 0.43’ −0.24 0.65**1.00 0.43’ 0.39 −0.37 0.82***
1.00 0.65** 0.20 −0.091.00 −0.18 0.22
1.00 −0.58*1.00
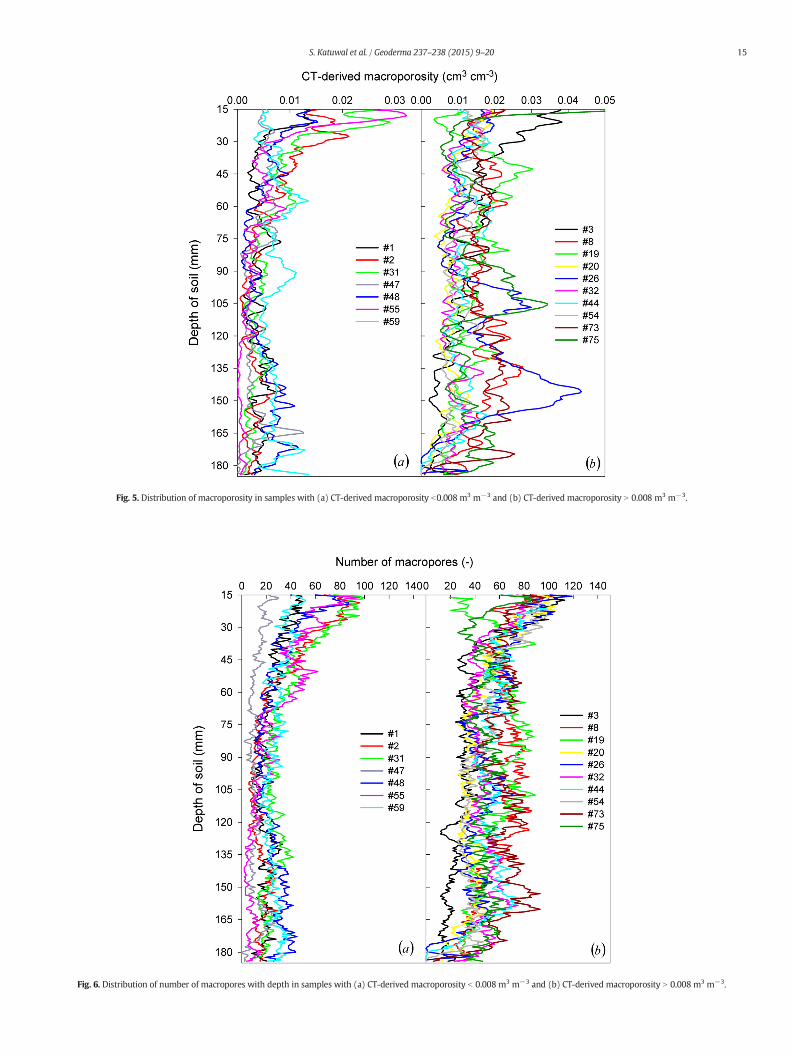
Fig. 5. Distribution of macroporosity in samples with (a) CT-derived macroporosity b0.008 m3 m−3 and (b) CT-derived macroporosity N 0.008 m3 m−3.
Fig. 6. Distribution of number of macropores with depth in samples with (a) CT-derived macroporosity b 0.008 m3 m−3 and (b) CT-derived macroporosity N 0.008 m3 m−3.
15S. Katuwal et al. / Geoderma 237–238 (2015) 9–20
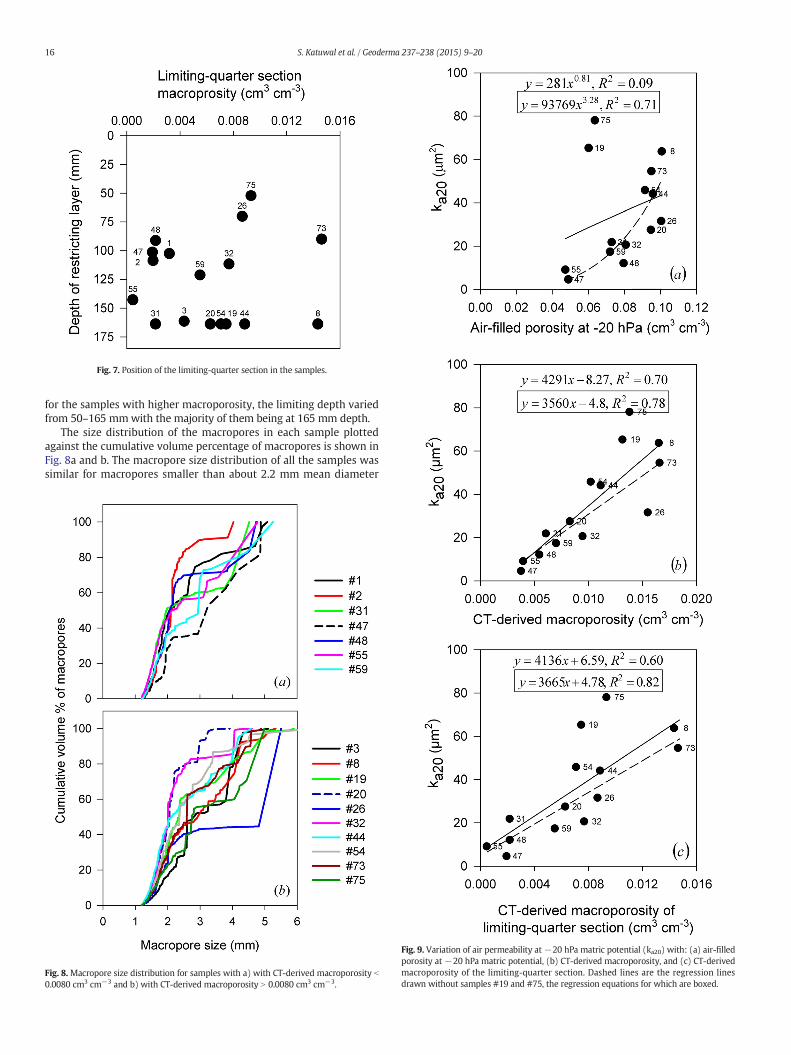
Fig. 7. Position of the limiting-quarter section in the samples.
16 S. Katuwal et al. / Geoderma 237–238 (2015) 9–20
for the samples with higher macroporosity, the limiting depth variedfrom 50–165 mmwith the majority of them being at 165 mm depth.
The size distribution of the macropores in each sample plottedagainst the cumulative volume percentage of macropores is shown inFig. 8a and b. The macropore size distribution of all the samples wassimilar for macropores smaller than about 2.2 mm mean diameter
Fig. 8. Macropore size distribution for samples with a) with CT-derived macroporosity b
0.0080 cm3 cm−3 and b) with CT-derived macroporosity N 0.0080 cm3 cm−3.
Fig. 9. Variation of air permeability at−20 hPa matric potential (ka20) with: (a) air-filledporosity at −20 hPa matric potential, (b) CT-derived macroporosity, and (c) CT-derivedmacroporosity of the limiting-quarter section. Dashed lines are the regression linesdrawn without samples #19 and #75, the regression equations for which are boxed.

Fig. 10. Breakthrough curves for the samples with CT-derived macroporosity(a) b0.008 cm3 cm−3 and (b) N0.008 cm3 cm−3.
17S. Katuwal et al. / Geoderma 237–238 (2015) 9–20
with a linear increase in macropore size with macropore volume. In themajority of samples with lower macroporosity (b0.0080 cm3 cm−3,Fig. 9a), about 50% of the macropore volume was comprised ofmacropores with average size smaller than 2.2 mm. In the sampleswith higher macroporosity (N0.0080 cm3 cm−3, Fig. 8b), there was alarger variation in the proportion of themacroporeswith diameter larg-er than 2.2 mm among the samples than in the samples with lowermacroporosity.
3.3. Relationship of Air Permeability With Macropore Characteristics
The air permeability measured at −20 hPa (ka20) matric potentialrelative to the mid-section of the column varied from 4.66 to78.10 μm2 in the samples. The air permeability values do not includethose for samples #1, #2 and #3, as the air permeability measurementsfor those samples were not carried out at−20 hPa. According to capil-lary law, pores larger than 0.145 mm are expected to drain at a matricpotential of −20 hPa. Presented in Fig. 9a–c are ka20 plotted againstair-filled porosity at −20 hPa (ε20), CT-derived macroporosity, andmacroporosity of the limiting-quarter section, respectively. Regressionlines and regression equations are also shown for each plot, with andwithout two possible outliers (samples #19 and #75). We observed ahigh positive correlation between air permeability and air-filled poros-ity at−20 hPa (without the outliers) and the relationship was best ex-plained by a power function, as presented in Fig. 9a. The result is similarto models used for predicting air permeability (e.g., McCarthy andBrown, 1992; Moldrup et al., 1998; Poulsen et al., 2007) that are basedon an exponential (power function) relationship between air perme-ability and air-filled porosity. We also observe that in the sampleswith large air-filled porosity at −20 hPa (samples #8, #20, #26, #44,#54 and #73) there exists a large variation in air permeability(23.5–63.8 μm2) for a narrow range of air-filled porosity (0.095–0.101 cm3 cm−3). Air permeability of soils is largely dependent onpore size distribution (especially on the proportion of larger pores), tor-tuosity and connectivity of air-filled pore space (Kawamoto et al., 2006;Moldrup et al., 2001; Tuli and Hopmans, 2004). We therefore concludethat the variability in air permeability in these samples (samples #8,#20, #26, #44, #54 and #73) is due to the large variation in volume ofmacropores (N1.2 mm) and the interconnectivity (as indicated bybranch density and node density) of the macropores present in thesesamples. Additionally, the proportion of larger macropores (N2.2 mm)was higher in the samples (Fig. 9b), with higher macroporosity. Wealso observed a strong positive correlation (r = 0.90) between theratio of CT-derived macroporosity and εa (the volume fraction of air-filled pores occupied bymacropores N1.2mm) and ka20. The high air per-meability associated with samples #19 and #75 could be due to higherproportion of macropores N 1.2 mm in these samples. In sample #75,about 40% of the macropore volume consisted of macropores N 4 mm inmean diameter which might have resulted in the high air permeabilityin the sample.
Since the macroporosity varied with sample height and the highestmacroporosity was observed in the top 15–20mm for most of the sam-ples (Fig. 5a and b), the macroporosity of the limiting-quarter sectionwas calculated for each sample and correlated with air permeabilitymeasured at −20 hPa matric potential (Fig. 9c). The limiting-quartersection represents the section in the soil column with the lowest vol-ume of macropores which could therefore act as a restricting layer forthe percolation of air through the pores. Since the macroporosity distri-bution below the top 20mmof sample heightwas quite uniform for themajority of the samples, there was a strong correlation (r = 0.91)between macroporosity of the limiting-quarter section and the totalmacroporosity. Thus, the relationship between macroporosity ofthe limiting-quarter section and air-permeability was similar to thatbetween the total macroporosity and air permeability. Macroporosityof the limiting-quarter section could be a more useful parameterfor studying air-permeability in samples where the macroporosity
distribution with depth is more variable; for instance, for sample #26the lower air-permeability could be explained by the lowmacroporosityof the limiting layer despite its high air-filled porosity and CT-derivedmacroporosity. Similar results were obtained by Naveed et al. (2013)who found macroporosity of the limiting-quarter section to be a betterpredictor of air permeability (R2 = 0.93) than air-filled porosity(R2 = 0.64). Our study also supports the findings of Granovsky andMcCoy (1997) who highlighted the importance of descriptions of theavailable pore spaces and active parts of these pore spaces for character-ization of the variability of hydraulic properties of soil among differentlocations. However, it is more important to describe the macroporecharacteristics in the restricting sections in the soil.
3.4. 5% Arrival Time, CT-Derived Macroporosity and MacroporeCharacteristics
The tracer breakthrough curves for the samples are presented inFig. 10a and b. Distinct early peaks with long tails in the breakthroughcurves, typical for preferentialflow throughmacropores, were observedin the samples with macroporosity b 0.0080 cm3 cm−3. In the sampleswith highermacroporosity, the peak in the breakthrough curvewas flat-ter and more delayed, suggesting more exchange of the tracer with thesoil matrix, than in samples with lower macroporosity. Only 51–62% ofthe applied tracer could be recovered in the outflow by the end of the ex-periment (about 5.5 h) in the samples with highermacroporosity where-as the amount recovered in the samples with lower macroporosity wasbetween 70 and 99%. We use 5% tracer arrival time (the time taken for5% of the total applied tracer to get collected in the outflow) for compar-ing the flow behavior of the samples as this is the most robust parameterand shape measure describing preferential flow in soils (Koestel et al.,2011). Similar to air permeability, there was a large variation in 5% tracer
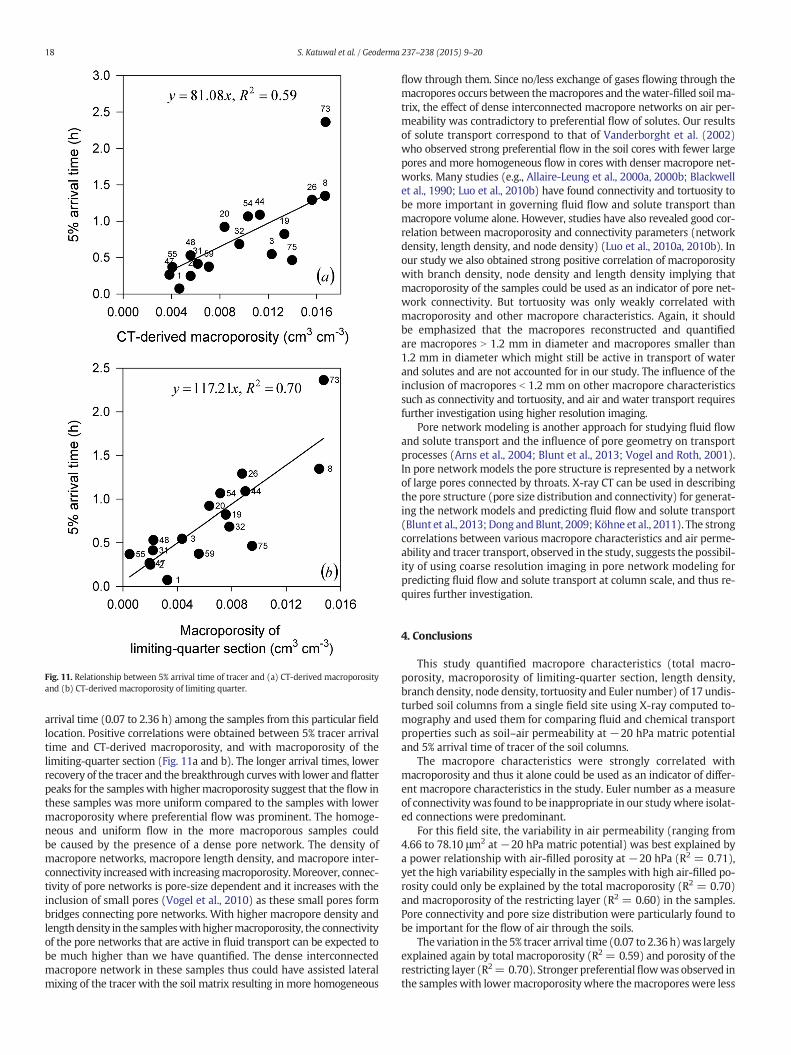
Fig. 11. Relationship between 5% arrival time of tracer and (a) CT-derived macroporosityand (b) CT-derived macroporosity of limiting quarter.
18 S. Katuwal et al. / Geoderma 237–238 (2015) 9–20
arrival time (0.07 to 2.36 h) among the samples from this particular fieldlocation. Positive correlations were obtained between 5% tracer arrivaltime and CT-derived macroporosity, and with macroporosity of thelimiting-quarter section (Fig. 11a and b). The longer arrival times, lowerrecovery of the tracer and the breakthrough curveswith lower and flatterpeaks for the samples with highermacroporosity suggest that the flow inthese samples was more uniform compared to the samples with lowermacroporosity where preferential flow was prominent. The homoge-neous and uniform flow in the more macroporous samples couldbe caused by the presence of a dense pore network. The density ofmacropore networks, macropore length density, and macropore inter-connectivity increasedwith increasingmacroporosity.Moreover, connec-tivity of pore networks is pore-size dependent and it increases with theinclusion of small pores (Vogel et al., 2010) as these small pores formbridges connecting pore networks. With higher macropore density andlengthdensity in the sampleswithhighermacroporosity, the connectivityof the pore networks that are active in fluid transport can be expected tobe much higher than we have quantified. The dense interconnectedmacropore network in these samples thus could have assisted lateralmixing of the tracer with the soil matrix resulting in more homogeneous
flow through them. Since no/less exchange of gases flowing through themacropores occurs between themacropores and thewater-filled soilma-trix, the effect of dense interconnected macropore networks on air per-meability was contradictory to preferential flow of solutes. Our resultsof solute transport correspond to that of Vanderborght et al. (2002)who observed strong preferential flow in the soil cores with fewer largepores and more homogeneous flow in cores with denser macropore net-works. Many studies (e.g., Allaire-Leung et al., 2000a, 2000b; Blackwellet al., 1990; Luo et al., 2010b) have found connectivity and tortuosity tobe more important in governing fluid flow and solute transport thanmacropore volume alone. However, studies have also revealed good cor-relation between macroporosity and connectivity parameters (networkdensity, length density, and node density) (Luo et al., 2010a, 2010b). Inour study we also obtained strong positive correlation of macroporositywith branch density, node density and length density implying thatmacroporosity of the samples could be used as an indicator of pore net-work connectivity. But tortuosity was only weakly correlated withmacroporosity and other macropore characteristics. Again, it shouldbe emphasized that the macropores reconstructed and quantifiedare macropores N 1.2 mm in diameter and macropores smaller than1.2 mm in diameter which might still be active in transport of waterand solutes and are not accounted for in our study. The influence of theinclusion of macropores b 1.2 mm on other macropore characteristicssuch as connectivity and tortuosity, and air and water transport requiresfurther investigation using higher resolution imaging.
Pore network modeling is another approach for studying fluid flowand solute transport and the influence of pore geometry on transportprocesses (Arns et al., 2004; Blunt et al., 2013; Vogel and Roth, 2001).In pore network models the pore structure is represented by a networkof large pores connected by throats. X-ray CT can be used in describingthe pore structure (pore size distribution and connectivity) for generat-ing the network models and predicting fluid flow and solute transport(Blunt et al., 2013; Dong andBlunt, 2009; Köhne et al., 2011). The strongcorrelations between various macropore characteristics and air perme-ability and tracer transport, observed in the study, suggests the possibil-ity of using coarse resolution imaging in pore network modeling forpredicting fluid flow and solute transport at column scale, and thus re-quires further investigation.
4. Conclusions
This study quantified macropore characteristics (total macro-porosity, macroporosity of limiting-quarter section, length density,branch density, node density, tortuosity and Euler number) of 17 undis-turbed soil columns from a single field site using X-ray computed to-mography and used them for comparing fluid and chemical transportproperties such as soil–air permeability at −20 hPa matric potentialand 5% arrival time of tracer of the soil columns.
The macropore characteristics were strongly correlated withmacroporosity and thus it alone could be used as an indicator of differ-ent macropore characteristics in the study. Euler number as a measureof connectivity was found to be inappropriate in our studywhere isolat-ed connections were predominant.
For this field site, the variability in air permeability (ranging from4.66 to 78.10 μm2 at −20 hPa matric potential) was best explained bya power relationship with air-filled porosity at −20 hPa (R2 = 0.71),yet the high variability especially in the samples with high air-filled po-rosity could only be explained by the total macroporosity (R2 = 0.70)and macroporosity of the restricting layer (R2 = 0.60) in the samples.Pore connectivity and pore size distribution were particularly found tobe important for the flow of air through the soils.
The variation in the 5% tracer arrival time (0.07 to 2.36 h)was largelyexplained again by total macroporosity (R2 = 0.59) and porosity of therestricting layer (R2= 0.70). Stronger preferentialflowwas observed inthe samples with lowermacroporositywhere themacropores were less
19S. Katuwal et al. / Geoderma 237–238 (2015) 9–20
dense and less inter-connected whereas in samples with higher macro-porosity the flow was more homogeneous.
In perspective, the results from this study suggest that it is more im-portant to quantify the active conducting parts and the restricting partsof the porous network than to quantify the total available pore networkin relation to air, water and solute transport through soils. This studyhighlighted that quantification of pore characteristics such as pore con-nectivity is one of the key variables needed to understand the flow andtransport behavior of soils and also that there is a strong need for stan-dard procedures for deriving and quantifying these macropore charac-teristics. Additionally, the influence of macropores b 1.2 mm, whichcould not be visualized and quantified in our study, onmacropore char-acteristics (e.g. by linking non-adjoining macropores) and on air andwater transport properties calls for further investigation using higherresolution imaging.
Acknowledgments
This study was performed under the large framework of the project“Soil Infrastructure, Interfaces, and Translocation Processes in InnerSpace (Soil-it-is)” financed by the Danish Research Council for Tech-nology and Production Sciences (Grant number: 274-06-0288). The au-thors wish to thank Anders Lindblad Vendelboe, Aarhus University andSøren Baarsgaard Hansen, The PET-Center, Aarhus University Hospitalfor the technical support in scanning the soil samples.
References
Abramoff, M.D., Magalhaes, P.J., Ram, S.J., 2004. Image Processing with ImageJ. Biophoton.Int. 11 (7), 36–42.
Allaire-Leung, S.E., Gupta, S.C., Moncrief, J.F., 2000a.Water and solute movement in soil asinfluenced by macropore characteristics: 1. Macropore continuity. J. Contam. Hydrol.41 (3–4), 283–301. http://dx.doi.org/10.1016/s0169-7722(99)00079-0.
Allaire-Leung, S.E., Gupta, S.C., Moncrief, J.F., 2000b. Water and solute movement in soil asinfluenced by macropore characteristics: 2. Macropore tortuosity. J. Contam. Hydrol.41 (3–4), 303–315. http://dx.doi.org/10.1016/s0169-7722(99)00074-1.
Arns, C., Knackstedt, M., Mecke, K., 2002. Characterising the morphology of disorderedmaterials. In: Mecke, K., Stoyan, D. (Eds.), Morphology of Condensed Matter. vol.600. Springer, Berlin Heidelberg, pp. 37–74.
Arns, J.-Y., Robins, V., Sheppard, A., Sok, R., Pinczewski, W.V., Knackstedt, M., 2004. Effectof network topology on relative permeability. Transp. Porous Media 55 (1), 21–46.http://dx.doi.org/10.1023/B:TIPM.0000007252.68488.43.
Ball, B.C., 1981. Pore characteristics of soils from two cultivation experiments as shown bygas diffusivities and permeabilities and air-filled porosities. J. Soil Sci. 32 (4),483–498. http://dx.doi.org/10.1111/j.1365-2389.1981.tb01724.x.
Blackwell, P.S., Ringrose-Voase, A.J., Jayawardane, N.S., Olsson, K.A., McKenzie, D.C.,Mason, W.K., 1990. The use of air-filled porosity and intrinsic permeability to air tocharacterize structure of macropore space and saturated hydraulic conductivity ofclay soils. J. Soil Sci. 41 (2), 215–228. http://dx.doi.org/10.1111/j.1365-2389.1990.tb00058.x.
Blunt, M.J., Bijeljic, B., Dong, H., Gharbi, O., Iglauer, S., Mostaghimi, P., Paluszny, A.,Pentland, C., 2013. Pore-scale imaging and modelling. Adv. Water Resour. 51,197–216. http://dx.doi.org/10.1016/j.advwatres.2012.03.003 (0).
Cı́slerová, M., Votrubová, J., 2002. CT derived porosity distribution and flow domains. J.Hydrol. 267 (3–4), 186–200. http://dx.doi.org/10.1016/s0022-1694(02)00149-x.
Deeks, L.K., Bengough, A.G., Stutter, M.I., Young, I.M., Zhang, X.X., 2008. Characterisation offlow paths and saturated conductivity in a soil block in relation to chloride break-through. J. Hydrol. 348 (3–4), 431–441. http://dx.doi.org/10.1016/j.jhydrol.2007.10.025.
Dong, H., Blunt, M.J., 2009. Pore–network extraction from micro-computerized-tomography images. Phys. Rev. E. 80 (3), 036307.
Doube, M., Kłosowski, M.M., Arganda-Carreras, I., Cordelières, F.P., Dougherty, R.P.,Jackson, J.S., Schmid, B., Hutchinson, J.R., Shefelbine, S.J., 2010. BoneJ: free and exten-sible bone image analysis in ImageJ. Bone 47 (6), 1076–1079. http://dx.doi.org/10.1016/j.bone.2010.08.023.
Dougherty, R., Kunzelmann, K.-H., 2007. Computing local thickness of 3D structures withImageJ. Microsc. Microanal. 13 (Suppl. S02), 1678–1679. http://dx.doi.org/10.1017/S1431927607074430.
Droogers, P., Stein, A., Bouma, J., de Boer, G., 1998. Parameters for describing soilmacroporosity derived from staining patterns. Geoderma 83 (3–4), 293–308.http://dx.doi.org/10.1016/s0016-7061(98)00005-6.
Ersahin, S., Papendick, R.I., Smith, J.L., Keller, C.K., Manoranjan, V.S., 2002. Macroporetransport of bromide as influenced by soil structure differences. Geoderma 108(3–4), 207–223. http://dx.doi.org/10.1016/s0016-7061(02)00131-3.
Germann, P., Beven, K., 1981. Water flow in soil macropores I. An experimental approach.J. Soil Sci. 32 (1), 1–13. http://dx.doi.org/10.1111/j.1365-2389.1981.tb01681.x.
Granovsky, A.V., McCoy, E.L., 1997. Air flow measurements to describe field variation in po-rosity and permeability of soil macropores. Soil Sci. Soc. Am. J. 61 (6), 1569–1576. http://dx.doi.org/10.2136/sssaj1997.03615995006100060005x.
Hildebrand, T., Rüegsegger, P., 1997. A new method for the model-independent assess-ment of thickness in three-dimensional images. J. Microsc. 185 (1), 67–75. http://dx.doi.org/10.1046/j.1365-2818.1997.1340694.x.
Iversen, B.V., Schjønning, P., Poulsen, T.G., Moldrup, P., 2001. In situ, on-site and laboratorymeasurements of soil air permeability: boundary conditions and measurement scale.Soil Sci. 166 (2), 97–106.
Jarvis, N.J., 2007. A review of non-equilibrium water flow and solute transport in soilmacropores: principles, controlling factors and consequences for water quality. Eur.J. Soil Sci. 58 (3), 523–546. http://dx.doi.org/10.1111/j.1365-2389.2007.00915.x.
Kawamoto, K., Moldrup, P., Schjonning, P., Iversen, B.V., Komatsu, T., Rolston, D.E., 2006.Gas transport parameters in the vadose zone: development and tests of power–lawmodels for air permeability. Vadose Zone J. 5 (4), 1205–1215. http://dx.doi.org/10.2136/vzj2006.0030.
Kjaergaard, C., Poulsen, T.G., Moldrup, P., de Jonge, L.W., 2004. Colloid mobilization andtransport in undisturbed soil columns. I. Pore structure characterization and tritiumtransport. Vadose Zone J. 3 (2), 413–423. http://dx.doi.org/10.2136/vzj2004.0413.
Koestel, J.K., Moeys, J., Jarvis, N.J., 2011. Evaluation of nonparametric shape measures forsolute breakthrough curves. Vadose Zone J. 10 (4), 1261–1275. http://dx.doi.org/10.2136/vzj2011.0010.
Koestel, J.K., Norgaard, T., Luong, N.M., Vendelboe, A.L., Moldrup, P., Jarvis, N.J., Lamandé, M.,Iversen, B.V., de Jonge, L.W., 2013. Links between soil properties and steady-state solutetransport through cultivated topsoil at the field scale. Water Resour. Res. 49, 1–19.http://dx.doi.org/10.1002/wrcr.20079.
Köhne, J.M., Schlüter, S., Vogel, H.-J., 2011. Predicting solute transport in structured soilusing pore network models. Vadose Zone J. 10 (3), 1082–1096. http://dx.doi.org/10.2136/vzj2010.0158.
Lamandé, M., Wildenschild, D., Berisso, F.E., Garbout, A., Marsh, M., Moldrup, P., Keller, T.,Hansen, S.B., de Jonge, L.W., Schjønning, P., 2013. X-ray CT and laboratory measure-ments on glacial till subsoil cores: assessment of inherent and compaction-affectedsoil structure characteristics. Soil Sci. 178 (7), 359–368. http://dx.doi.org/10.1097/SS.0b013e3182a79e1a.
Luo, L., Lin, H., Halleck, P., 2008. Quantifying soil structure and preferential flow in intactsoil using X-ray computed tomography. Soil Sci. Soc. Am. J. 72 (4), 1058–1069. http://dx.doi.org/10.2136/sssaj2007.0179.
Luo, L., Lin, H., Li, S., 2010a. Quantification of 3-D soil macropore networks in different soiltypes and land uses using computed tomography. J. Hydrol. 393 (1–2), 53–64. http://dx.doi.org/10.1016/j.jhydrol.2010.03.031.
Luo, L., Lin, H., Schmidt, J., 2010b. Quantitative relationships between soil macropore char-acteristics and preferential flow and transport. Soil Sci. Soc. Am. J. 74 (6), 1929–1937.http://dx.doi.org/10.2136/sssaj2010.0062.
Luxmoore, R.J., 1981. Micro-, meso-, and macroporosity of soil. Soil Sci. Soc. Am. J. 45 (3),671–672. http://dx.doi.org/10.2136/sssaj1981.03615995004500030051x.
McCarthy, K.P., Brown, K.W., 1992. Soil gas permeability as influenced by soil gas-filledporosity. Soil Sci. Soc. Am. J. 56 (4), 997–1003. http://dx.doi.org/10.2136/sssaj1992.03615995005600040001x.
Moldrup, P., Poulsen, T.G., Schjønning, P., Olesen, T., Yamaguchi, T., 1998. Gas permeability inundisturbed soils: measurements and predictive models. Soil Sci. 163 (3), 180–189.
Moldrup, P., Olesen, T., Komatsu, T., Schjønning, P., Rolston, D.E., 2001. Tortuosity, diffu-sivity, and permeability in the soil liquid and gaseous phases. Soil Sci. Soc. Am. J. 65(3), 613–623. http://dx.doi.org/10.2136/sssaj2001.653613x.
Moreau, E., Velde, B., Terribile, F., 1999. Comparison of 2D and 3D images of fractures in aVertisol. Geoderma 92 (1–2), 55–72. http://dx.doi.org/10.1016/s0016-7061(99)00025-7.
Munkholm, L.J., Heck, R.J., Deen, B., 2012. Soil pore characteristics assessed from X-raymicro-CT derived images and correlations to soil friability. Geoderma 181–182,22–29. http://dx.doi.org/10.1016/j.geoderma.2012.02.024.
Naveed, M., Moldrup, P., Arthur, E., Wildenschild, D., Eden, M., Lamandé, M., Vogel, H.-J.,de Jonge, L.W., 2013. Revealing soil structure and functional macroporosity alonga clay gradient using X-ray computed tomography. Soil Sci. Soc. Am. J. 77 (2),403–411. http://dx.doi.org/10.2136/sssaj2012.0134.
Norgaard, T., Moldrup, P., Olsen, P., Vendelboe, A.L., Iversen, B.V., Greve, M.H., Kjaer, J., deJonge, L.W., 2013. Comparative mapping of soil physical–chemical and structuralparameters at field scale to identify zones of enhanced leaching risk. J. Environ.Qual. 42 (1), 271–283. http://dx.doi.org/10.2134/jeq2012.0105.
Perret, J., Prasher, S.O., Kantzas, A., Langford, C., 1999. Three-dimensional quantification ofmacropore networks in undisturbed soil cores. Soil Sci. Soc. Am. J. 63 (6), 1530–1543.http://dx.doi.org/10.2136/sssaj1999.6361530x.
Pierret, A., Capowiez, Y., Belzunces, L., Moran, C.J., 2002. 3D reconstruction and quantifica-tion of macropores using X-ray computed tomography and image analysis.Geoderma 106 (3–4), 247–271. http://dx.doi.org/10.1016/s0016-7061(01)00127-6.
Poulsen, T.G., Moldrup, P., Thorbjorn, A., Schjonning, P., 2007. Predicting air permeabilityin undisturbed, subsurface sandy soils from air-filled porosity. J. Environ. Eng. 133(10), 995–1001.
Singh, P., Kanwar, R.S., Thompson, M.L., 1991.Macropore characterization for 2 tillage sys-tems using resin-impregnation technique. Soil Sci. Soc. Am. J. 55 (6), 1674–1679.
Tuli, A., Hopmans, J.W., 2004. Effect of degree of fluid saturation on transport coefficientsin disturbed soils. Eur. J. Soil Sci. 55 (1), 147–164. http://dx.doi.org/10.1046/j.1365-2389.2003.00551.x.
Vanderborght, J., Gähwiller, P., Flühler, H., 2002. Identification of transport processes insoil cores using fluorescent tracers. Soil Sci. Soc. Am. J. 66 (3), 774–787. http://dx.doi.org/10.2136/sssaj2002.7740.
Velde, B., Moreau, E., Terribile, F., 1996. Pore networks in an Italian Vertisol: quantitativecharacterisation by two dimensional image analysis. Geoderma 72 (3–4), 271–285.http://dx.doi.org/10.1016/0016-7061(96)00033-x.

20 S. Katuwal et al. / Geoderma 237–238 (2015) 9–20
Vogel, H.J., 1997. Morphological determination of pore connectivity as a function of poresize using serial sections. Eur. J. Soil Sci. 48 (3), 365–377. http://dx.doi.org/10.1111/j.1365-2389.1997.tb00203.x.
Vogel, H.J., Roth, K., 2001. Quantitative morphology and network representation of soilpore structure. Adv. Water Resour. 24 (3), 233–242. http://dx.doi.org/10.1016/s0309-1708(00)00055-5.
Vogel, H.J., Weller, U., Schluter, S., 2010. Quantification of soil structure based onMinkowski functions. Comput. Geosci. 36 (10), 1236–1245. http://dx.doi.org/10.1016/j.cageo.2010.03.007.
Wildenschild, D., Vaz, C.M.P., Rivers, M.L., Rikard, D., Christensen, B.S.B., 2002. Using X-raycomputed tomography in hydrology: systems, resolutions, and limitations. J. Hydrol.267 (3–4), 285–297. http://dx.doi.org/10.1016/s0022-1694(02)00157-9.