Lignocellulose-Based Superabsorbent Polymer Gel ... - MDPI
19
polymers Article Lignocellulose-Based Superabsorbent Polymer Gel Crosslinked with Magnesium Aluminum Silicate for Highly Removal of Zn (II) from Aqueous Solution Yuhong An 1,† , Wanqi Zhang 1,† , Hui Liu 1 , Yuan Zhong 1 , Zichu Hu 2 , Yali Shao 1 , Zhangjing Chen 3 , Yukun Ren 4 , Boyun Wang 2 , Sunguo Wang 5 , Xiaotao Zhang 2,6, * and Ximing Wang 1,6, * Citation: An, Y.; Zhang, W.; Liu, H.; Zhong, Y.; Hu, Z.; Shao, Y.; Chen, Z.; Ren, Y.; Wang, B.; Wang, S.; et al. Lignocellulose-Based Superabsorbent Polymer Gel Crosslinked with Magnesium Aluminum Silicate for Highly Removal of Zn (II) from Aqueous Solution. Polymers 2021, 13, 4161. https://doi.org/10.3390/ polym13234161 Academic Editor: Antonio Pizzi Received: 9 November 2021 Accepted: 25 November 2021 Published: 28 November 2021 Publisher’s Note: MDPI stays neutral with regard to jurisdictional claims in published maps and institutional affil- iations. Copyright: © 2021 by the authors. Licensee MDPI, Basel, Switzerland. This article is an open access article distributed under the terms and conditions of the Creative Commons Attribution (CC BY) license (https:// creativecommons.org/licenses/by/ 4.0/). 1 College of Material Science and Art Design, Inner Mongolia Agricultural University, Hohhot 010018, China; [email protected] (Y.A.); [email protected] (W.Z.); [email protected] (H.L.); [email protected] (Y.Z.); [email protected] (Y.S.) 2 College of Science, Inner Mongolia Agricultural University, Hohhot 010018, China; [email protected] (Z.H.); [email protected] (B.W.) 3 Department of Sustainable Biomaterials, Virginia Polytechnic Institute and State University, Blacksburg, VA 24060, USA; [email protected] 4 Bioimaging Research, Sanofi Global R&D, Framingham, MA 01702, USA; yukun.ren@sanofi.com 5 Sungro Bioresource & Bioenergy Technologies Corp., Edmonton, AL T6R3J6, Canada; [email protected] 6 Inner Mongolia Key Laboratory of Sandy Shrubs Fibrosis and Energy Development and Utilization, Hohhot 010018, China * Correspondence: [email protected] (X.Z.); [email protected] (X.W.) † Contributed equally to this paper. Abstract: Lignocellulose (LCE) was ultrasonically treated and intercalated into magnesium aluminum silicate (MOT) clay to prepare a nano-lignocellulose magnesium aluminum silicate polymer gel (nano- LCE-MOT) for the removal of Zn (II) from aqueous solution. The product was characterised using nitrogen adsorption/desorption isotherm measurements, Fourier-transform infrared spectroscopy, scanning electron microscopy and energy-dispersive X-ray spectroscopy. The conditions for the adsorption of Zn (II) on nano-LCE-MOT were screened, and adsorption kinetics and isotherm model analysis were carried out to explore the adsorption mechanism and achieve the optimal adsorption of Zn (II). Optimal adsorption was achieved at an initial Zn (II) concentration of 800 mg/L at 60 ◦ C in 160 min at a pH of 4.52. The adsorption kinetics were explored using a pseudo-second-order model, with the isotherm adsorption equilibrium found to conform to the Langmuir model. The maximum adsorption capacity of the nano-LCE-MOT polymer gel toward Zn (II) is 513.48 mg/g. The materials with adsorbed Zn (II) were desorbed using different media, with HCl found to be the most ideal medium to desorb Zn (II). The optimal desorption of Zn (II) was achieved in 0.08 mol/L HCl solution at 65 ◦ C in 60 min. Under these conditions, Zn (II) was almost completely desorbed from the adsorbents, with the adsorption effect after cycling being slightly different from that of the initial adsorption. Keywords: nano-lignocellulose; magnesium aluminum silicate; intercalation; adsorption; Zn (II) 1. Introduction Heavy metals that are released into the environment tend to persist indefinitely, circulate and eventually accumulate throughout the food chain, posing a serious threat to the environ- ment, animals and humans [1–3]. Even at relatively low concentrations, heavy metals are toxic to aquatic flora and fauna, and in some of these organisms they are assimilated, stored and concentrated. In the presence of zinc sulphides, carbonates, silicates, and oxides are formed in Nature. The presence of Zn (II) at pH < 7 is negligible, but at pH > 7 it is present in different forms. Zn (II) is discharged in the wastewater of the waste streams of metal, chemical and pulp Polymers 2021, 13, 4161. https://doi.org/10.3390/polym13234161 https://www.mdpi.com/journal/polymers
-
Upload
khangminh22 -
Category
Documents
-
view
4 -
download
0
Transcript of Lignocellulose-Based Superabsorbent Polymer Gel ... - MDPI
polymers
Article
Lignocellulose-Based Superabsorbent Polymer Gel Crosslinkedwith Magnesium Aluminum Silicate for Highly Removal of Zn(II) from Aqueous Solution
Yuhong An 1,†, Wanqi Zhang 1,†, Hui Liu 1, Yuan Zhong 1, Zichu Hu 2, Yali Shao 1, Zhangjing Chen 3, Yukun Ren 4,Boyun Wang 2, Sunguo Wang 5, Xiaotao Zhang 2,6,* and Ximing Wang 1,6,*
�����������������
Citation: An, Y.; Zhang, W.; Liu, H.;
Zhong, Y.; Hu, Z.; Shao, Y.; Chen, Z.;
Ren, Y.; Wang, B.; Wang, S.; et al.
Lignocellulose-Based Superabsorbent
Polymer Gel Crosslinked with
Magnesium Aluminum Silicate for
Highly Removal of Zn (II) from
Aqueous Solution. Polymers 2021, 13,
4161. https://doi.org/10.3390/
polym13234161
Academic Editor: Antonio Pizzi
Received: 9 November 2021
Accepted: 25 November 2021
Published: 28 November 2021
Publisher’s Note: MDPI stays neutral
with regard to jurisdictional claims in
published maps and institutional affil-
iations.
Copyright: © 2021 by the authors.
Licensee MDPI, Basel, Switzerland.
This article is an open access article
distributed under the terms and
conditions of the Creative Commons
Attribution (CC BY) license (https://
creativecommons.org/licenses/by/
4.0/).
1 College of Material Science and Art Design, Inner Mongolia Agricultural University, Hohhot 010018, China;[email protected] (Y.A.); [email protected] (W.Z.);[email protected] (H.L.); [email protected] (Y.Z.);[email protected] (Y.S.)
2 College of Science, Inner Mongolia Agricultural University, Hohhot 010018, China;[email protected] (Z.H.); [email protected] (B.W.)
3 Department of Sustainable Biomaterials, Virginia Polytechnic Institute and State University,Blacksburg, VA 24060, USA; [email protected]
4 Bioimaging Research, Sanofi Global R&D, Framingham, MA 01702, USA; [email protected] Sungro Bioresource & Bioenergy Technologies Corp., Edmonton, AL T6R3J6, Canada;
[email protected] Inner Mongolia Key Laboratory of Sandy Shrubs Fibrosis and Energy Development and Utilization,
Hohhot 010018, China* Correspondence: [email protected] (X.Z.); [email protected] (X.W.)† Contributed equally to this paper.
Abstract: Lignocellulose (LCE) was ultrasonically treated and intercalated into magnesium aluminumsilicate (MOT) clay to prepare a nano-lignocellulose magnesium aluminum silicate polymer gel (nano-LCE-MOT) for the removal of Zn (II) from aqueous solution. The product was characterised usingnitrogen adsorption/desorption isotherm measurements, Fourier-transform infrared spectroscopy,scanning electron microscopy and energy-dispersive X-ray spectroscopy. The conditions for theadsorption of Zn (II) on nano-LCE-MOT were screened, and adsorption kinetics and isotherm modelanalysis were carried out to explore the adsorption mechanism and achieve the optimal adsorptionof Zn (II). Optimal adsorption was achieved at an initial Zn (II) concentration of 800 mg/L at 60 ◦Cin 160 min at a pH of 4.52. The adsorption kinetics were explored using a pseudo-second-ordermodel, with the isotherm adsorption equilibrium found to conform to the Langmuir model. Themaximum adsorption capacity of the nano-LCE-MOT polymer gel toward Zn (II) is 513.48 mg/g.The materials with adsorbed Zn (II) were desorbed using different media, with HCl found to be themost ideal medium to desorb Zn (II). The optimal desorption of Zn (II) was achieved in 0.08 mol/LHCl solution at 65 ◦C in 60 min. Under these conditions, Zn (II) was almost completely desorbedfrom the adsorbents, with the adsorption effect after cycling being slightly different from that of theinitial adsorption.
Keywords: nano-lignocellulose; magnesium aluminum silicate; intercalation; adsorption; Zn (II)
1. Introduction
Heavy metals that are released into the environment tend to persist indefinitely, circulateand eventually accumulate throughout the food chain, posing a serious threat to the environ-ment, animals and humans [1–3]. Even at relatively low concentrations, heavy metals are toxicto aquatic flora and fauna, and in some of these organisms they are assimilated, stored andconcentrated. In the presence of zinc sulphides, carbonates, silicates, and oxides are formed inNature. The presence of Zn (II) at pH < 7 is negligible, but at pH > 7 it is present in differentforms. Zn (II) is discharged in the wastewater of the waste streams of metal, chemical and pulp
Polymers 2021, 13, 4161. https://doi.org/10.3390/polym13234161 https://www.mdpi.com/journal/polymers
Polymers 2021, 13, 4161 2 of 19
and paper processes, from galvanised steel plant lines, plant zinc and brass metal processes,Zn (II) and brass plating and processes such as viscose rayon fibre production. The WorldHealth Organization recommends a maximum acceptable zinc concentration limit in waterof 5.0 mg L−1 [4]. Zn (II) plays a regulatory role in the immune system of the human body,maintaining normal physiological functions in adults, promoting the normal development ofchildren, and promoting the healing of ulcers. It is often used to treat children with anorexia,malnutrition and slow growth, and can also be used to treat hair loss, rashes, mouth ulcersand gastritis. An excess intake of Zn (II) can cause astringency, thirst, a tight chest, dry cough,headaches, dizziness, high fever and chills, among other symptoms. Zn (II) dust is irritatingto the eyes and when orally ingested affects the gastrointestinal tract. With this in mind, thereare many treatment technologies available to purify water and wastewater contaminated withsuch heavy metals. The most common methods for removing metal ions from wastewaterinclude chemical precipitation [5,6], extraction [7], redox [8], dialysis [9], electrodialysis [10],electrolytic extraction [11], reverse osmosis [12,13], ion exchange [14,15], adsorption [16–20],ion flotation [21], stripping [22], coagulation flocculation [23], precipitation [24,25] and chela-tion [26]. Among them, adsorption is widely used as an environmentally friendly method,especially for metal ions that cannot be removed using other techniques. Selective adsorptioncan also be carried out using biomass materials, such as inorganic clay, activated carbon orpolymer resins.
Lignocellulose (LCE) is widely used as a natural biodegradable raw material in thepreparation of various biomass absorbent [27]. As the most abundant renewable resourcein nature, LCE is widely used in the research and development of new materials, not onlybecause it is cheap and easy to obtain, but more importantly, because it contains lignin,cellulose and hemicellulose. These three components have different properties and can thusbe used to change the properties of other materials, whether isolated or used directly [28].The cellulose, lignin and hemicellulose in LCE are tightly entangled, which results in LCEhaving a high molecular weight and being difficult to combine with other materials [29,30].To reduce the molecular weight of LCE and free up functional groups to facilitate thereaction of LCE with other materials, chemical [31] and mechanical methods [32–34], aswell as a combination of the two, have been employed.
Magnesium aluminum silicate (MOT), the most common layered silicate, is commonlyused to prepare absorbents due to its high cation exchange capacity (CEC), surface area,surface reactivity, adsorption performance and low cost [35,36]. MOT has a nanoscaleflat sheet layer structure, with this special structure leading to the sheets of MOT beingpermanently negatively charged, meaning that it exhibits strong exchangeability andadsorption toward positively charged metal cations. The sheet bonding strength of MOTis very weak; thus, it is highly likely that its sheet layers are translated or even peel off,meaning that MOT also exhibits intercalation properties. However, the adsorption capacityof MOT is insufficient, meaning that it cannot be used in large-scale applications. To formMOT absorbent, a monomer or polymer is inserted into the sheet structure of MOT tobreak its sheet structure. Therefore, to increase its adsorption capacity for Zn (II) cations,MOT can be reacted with nanosized LCE (nano-LCE) to form a polymer gel adsorbentvia the attachment of the absorptive functional groups of nano-LCE to the structure ofthe MOT. Lignocellulose has a large number of hydroxyl groups on its surface, and itsfibres are tightly bound via hydrogen bonding, meaning that it exhibits strong polarityand water absorption. The hydrophilic polarity of the lignocellulose surface means that itadsorbs moisture and dissolved substances from water. When a polymer gel is formed fromnano-LCE and MOT, nano-LCE is dispersed in the MOT layers, wherein a large numberof intermolecular amino bonds are formed between the hydroxyl groups of MOT and thehydroxyl groups of the nano-LCE between the sheets, enhancing the forces between thefibres to form a structurally stable polymer gel material. In this polymer gel, the adsorptionperformance and the electronegativity of MOT increase the overall adsorption capacitytoward Zn (II) cations. Compare with the same type of clay mineral polymer compositematerial [37–39]. This paper uses dissolution and ultrasonic cavitation effects to disperse
Polymers 2021, 13, 4161 3 of 19
the LCE, and then insert the dispersed nano-LCE between the magnesium-aluminumsilicate clay sheets to re-polymerize the layers to form a stable Three-dimensional networkstructure similar to that of wood cell walls. Structure to obtain a super absorbent polymergel with high specific surface area and multiple adsorption sites.
2. Materials and Methods2.1. Materials
Zinc oxide (ZnO, analytical grade reagent, AR) was purchased from SinopharmChemical Reagent Co., Ltd. (Beijing, China). Sulfuric acid (H2SO4, AR) was purchasedfrom Sinopharm Chemical Reagent Co., Ltd. (Beijing, China). Sodium hydroxide (NaOH,AR) was purchased from Tianjin Fengchuan Chemical Reagent Co., Ltd. (Tianjin, China).MOT (CEC of 100 meq·100 g−1) was produced by Zhejiang Fenghong Clay Chemical Co.,Ltd. (Huzhou, China). LCE (SAM-100) was produced by Beijing Huaduo Biotech, Ltd.(Beijing, China). All solutions used in the experiments were prepared using distilled water.
2.2. Preparation of the LCE-MOT Polymer Gel
LCE (0.5 g) was weighed into a 50 mL conical flask containing a 25% solution ofNaOH (15 mL), which was then placed in a temperature-controlled magnetic stirrer (HJ-6,Changzhou Guohua Instrument Co., Ltd., Changzhou, China) The mixture was then stirredat 50 ◦C for 30 min to fully expose the LCE to NaOH. Then, MOT (0.5 g) was placed in a50 mL beaker, to which 15 mL of deionised water was added, and the mixture was stirredat room temperature (23–27 ◦C) for 30 min. When the MOT was sufficiently dispersed inthe deionised water it was assumed that MOT and LCE were mixed, and the resultantmixture was stirred on a temperature-controlled magnetic stirrer at 50 ◦C for 4 h. After thistime, the product was washed with deionised water until pH 7 was reached, then dried at85 ◦C for 4 h (DZF-6210, Shanghai Yiheng Scientific Instrument Co., Ltd., Shanghai, China),before being pulverised into a powder, and sieved through a 200-size mesh.
2.3. Preparation of Nano-LCE
A 20 wt.% solution of NaOH (250 mL) was prepared and poured into a 250 mL beaker.Then, to this, LCE (0.5 g) was gradually added, and the mixture was slowly stirred with aglass rod until a suspension was formed. The stirred suspension was placed in a SM-1200Dultrasonic cell pulveriser (Nanjing Shunma Co., Ltd., Nanjing, China) and treated at 1080 Wfor 150 min, before being removed and centrifuged to obtain the target nano-LCE material.
2.4. Preparation of the Nano-LCE-MOT Polymer Gel
The prepared nano-LCE was centrifuged and re-dispersed in a 25% solution of NaOH(15 mL) and added to a 50 mL Erlenmeyer flask. Then, the same experimental conditionsused in the preparation of the LCE-MOT polymer gel were used to prepare the nano-LCE-MOT polymer gel. After the preparation was completed, the product was freeze-dried andused for subsequent adsorption experiments.
2.5. Adsorption Experiments
A Zn (II) ion solution (100 mL) was prepared for adsorption and added to a 250 mLmilled Erlenmeyer flask. Hydrochloric acid (HCl) or NaOH (0.1 mol/L) was then used toadjust the pH of the solution to the experimental target value. The adsorbent (0.05 g of theLCE-MOT polymer gel or nano-LCE-MOT polymer gel) was added to the ionic solution,and the flask was then sealed with a glass stopper and placed in a thermostatic shaker(TED, Tianjin Taisite Instrument Co., Ltd., Tianjin China). The adsorption temperatureand time were set to complete the adsorption experiments at a constant speed of 120 rpm.After the adsorption process was completed, the resultant mixture was centrifuged at3000 rpm for 7 min. The Zn (II) concentration of the supernatant was measured using thexylenol orange complex colorimetric method, and the colourised Zn (II) ion solution wasthen passed through a dual-beam ultraviolet–visible spectrophotometer (TU-1901, Beijing
Polymers 2021, 13, 4161 4 of 19
General Analysis General Instruments Co., Ltd., Beijing, China) to measure the absorbanceof the Zn (II) complex. A linear regression equation (y = 0.3297 x + 0.409, R2 = 0.9998) wasthen used to determine the concentration of the Zn (II) solution and the amount of Zn (II)adsorbed on the adsorbent. Taking experimental errors and averages into account, threeindependent replicate experiments confirmed that the Zn (II) removal was reproducibleunder the same conditions. The amount of metal adsorbed (qt) at equilibrium at time t wascalculated using Equation (1):
qt =(C0 − Ct)× V0
m0(1)
where qt (mg/g) is the capacity of the adsorption at time t; C0 and Ct (mg/L) are the initialconcentration and concentration of Zn (II) at time t, respectively; V0 (L) is the volume ofthe Zn (II) ion solution and m0 (g) is the mass of the adsorbent.
2.6. Desorption Experiments
HCl, HNO3, H2SO4 and NaOH solutions used as desorption reagents were preparedat different concentrations. Saturated adsorbent (0.05 g) was weighed into a 250 mL conicalflask, to which 50 mL of the desorption reagents were added, and ultrasonic desorptionwas carried out for a certain time at a certain temperature until desorption equilibriumwas reached. The suspension was then centrifuged, and the metal ion concentration in thesupernatant of each desorption experiment was tested using the previously mentionedmethod. The desorption experiments were conducted three times in the same manner, andthe desorption capacity at equilibrium (qt,2) was calculated using the following equation:
qt,2 =Ct,2 × V2
m2(2)
where qt,2 (mg/g) is the amount of Zn (II) desorbed at desorption time t (min); Ct,2 (mg/L)is the concentration of each metal ion in solution at time t (min); V2 (mL) is the volumeof the desorption agents and m2 (g) is the final mass of the adsorbents after release of themetal ions.
Adsorption/desorption cycling tests were carried out to investigate the reusability ofthe nano-LCE-MOT and LCE-MOT. The nano-LCE-MOT and LCE-MOT were washed untilthey were restored to their original states after the first batch of adsorption experimentsand were then used in the subsequent adsorption experiments. The regenerated nano-LCE-MOT and LCE-MOT were then used in three consecutive cycles under identical conditionsand the residual Zn (II) in solution after each adsorption/desorption cycle was measuredusing the previously mentioned method, and the adsorption/desorption capacity wascalculated using the above equations.
3. Results3.1. Characterisation of the Materials
The physicochemical properties of the nano-LCE-MOT polymer gel were investigatedusing different characterisation techniques. The specific surface area, pore structure andpore size of nano-LCE-MOT were measured from nitrogen (N2) adsorption–desorptionisotherms at −77 ◦C using an ASAP 2020 surface area analyser (Micromeritics, South Bend,IN, USA). The specific surface area was measured using the Langmuir and Brunauer–Emmet–Teller (BET) methods. Chemical characterisation of the functional groups ofTL and TLM was carried out using a spectrophotometer (Thermo Nicolet corporation,Madison, WI, USA) over a scan range of 4000–400 cm−1. The powder X-ray diffraction(PXRD) pattern of the TLM was recorded using a diffractometer (X’pero PRO, Armelo, TheNetherlands) equipped with a Kα radiation source in the 2θ angle range of 2–15◦, operatedat 40 kV and 30 mA. Scanning electron microscopy (SEM) of TLM was performed usingHITACHI S-4800 (Tokyo, Japan) and S-3400/N Oxford-XMasN (HORIBA, Kyoto, Japan)
Polymers 2021, 13, 4161 5 of 19
microscopes. Meanwhile, transmission electron microscopy (TEM, JEM-2010, JEOL, Tokyo,Japan) was carried out at 75–100 kV to investigate the morphology and structure of TLM.
3.1.1. N2 Adsorption–Desorption Isotherms of the Nano-LCE-MOT Polymer Gel
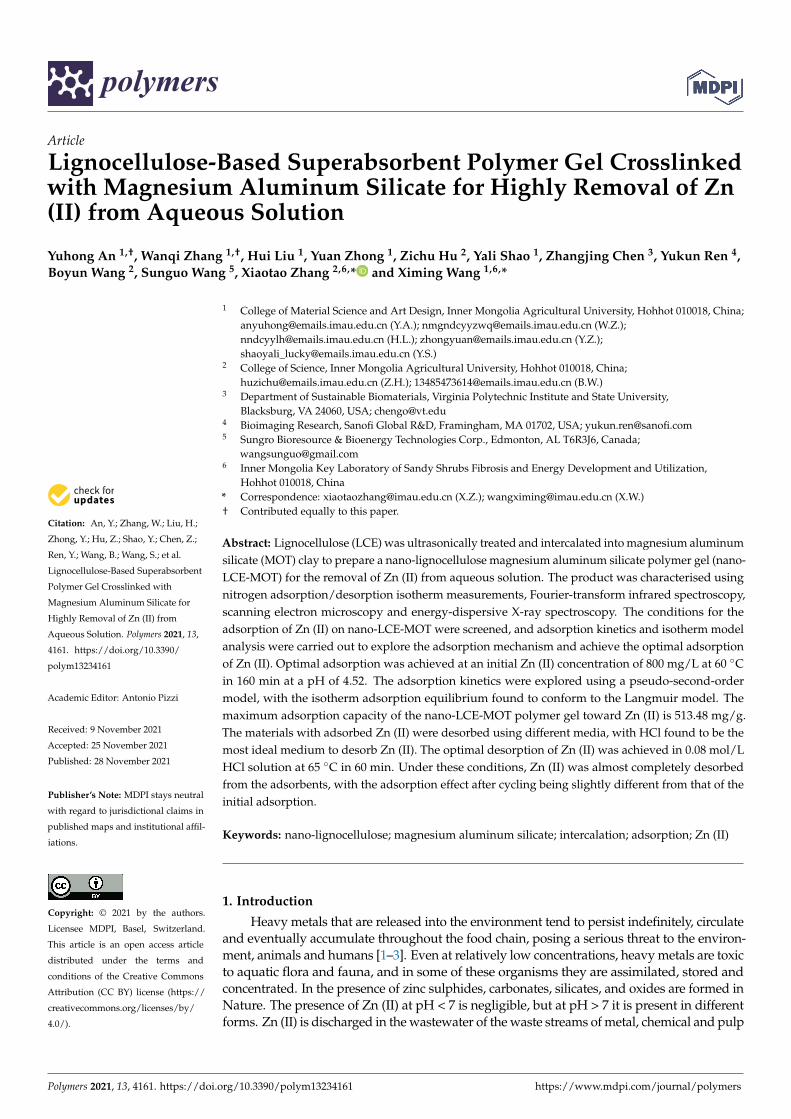
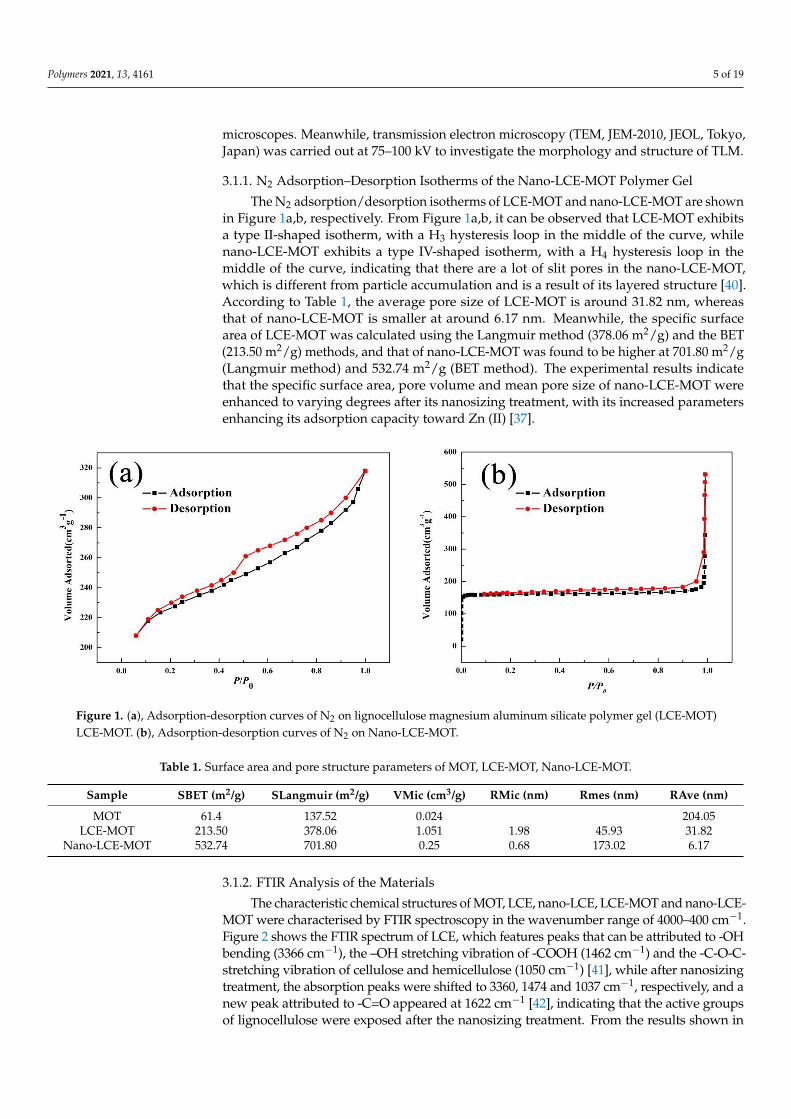
The N2 adsorption/desorption isotherms of LCE-MOT and nano-LCE-MOT are shownin Figure 1a,b, respectively. From Figure 1a,b, it can be observed that LCE-MOT exhibitsa type II-shaped isotherm, with a H3 hysteresis loop in the middle of the curve, whilenano-LCE-MOT exhibits a type IV-shaped isotherm, with a H4 hysteresis loop in themiddle of the curve, indicating that there are a lot of slit pores in the nano-LCE-MOT,which is different from particle accumulation and is a result of its layered structure [40].According to Table 1, the average pore size of LCE-MOT is around 31.82 nm, whereasthat of nano-LCE-MOT is smaller at around 6.17 nm. Meanwhile, the specific surfacearea of LCE-MOT was calculated using the Langmuir method (378.06 m2/g) and the BET(213.50 m2/g) methods, and that of nano-LCE-MOT was found to be higher at 701.80 m2/g(Langmuir method) and 532.74 m2/g (BET method). The experimental results indicatethat the specific surface area, pore volume and mean pore size of nano-LCE-MOT wereenhanced to varying degrees after its nanosizing treatment, with its increased parametersenhancing its adsorption capacity toward Zn (II) [37].
Polymers 2021, 13, x FOR PEER REVIEW 5 of 19
Bend IN, USA). The specific surface area was measured using the Langmuir and
Brunauer–Emmet–Teller (BET) methods. Chemical characterisation of the functional
groups of TL and TLM was carried out using a spectrophotometer (Thermo Nicolet cor-
poration, Madison, WI, USA) over a scan range of 4000–400 cm−1. The powder X-ray dif-
fraction (PXRD) pattern of the TLM was recorded using a diffractometer (X’pero PRO,
Armelo, The Netherlands) equipped with a Kα radiation source in the 2θ angle range of
2°–15°, operated at 40 kV and 30 mA. Scanning electron microscopy (SEM) of TLM was
performed using HITACHI S-4800 (Tokyo, Japan) and S-3400/N Oxford-XMasN
(HORIBA, Kyoto, Japan) microscopes. Meanwhile, transmission electron microscopy
(TEM, JEM-2010, JEOL, Tokyo, Japan) was carried out at 75–100 kV to investigate the mor-
phology and structure of TLM.
3.1.1. N2 Adsorption–Desorption Isotherms of the Nano-LCE-MOT Polymer Gel
The N2 adsorption/desorption isotherms of LCE-MOT and nano-LCE-MOT are
shown in Figure 1a,b, respectively. From Figure 1a,b, it can be observed that LCE-MOT
exhibits a type II-shaped isotherm, with a H3 hysteresis loop in the middle of the curve,
while nano-LCE-MOT exhibits a type IV-shaped isotherm, with a H4 hysteresis loop in the
middle of the curve, indicating that there are a lot of slit pores in the nano-LCE-MOT,
which is different from particle accumulation and is a result of its layered structure [40].
According to Table 1, the average pore size of LCE-MOT is around 31.82 nm, whereas that
of nano-LCE-MOT is smaller at around 6.17 nm. Meanwhile, the specific surface area of
LCE-MOT was calculated using the Langmuir method (378.06 m2/g) and the BET (213.50
m2/g) methods, and that of nano-LCE-MOT was found to be higher at 701.80 m2/g (Lang-
muir method) and 532.74 m2/g (BET method). The experimental results indicate that the
specific surface area, pore volume and mean pore size of nano-LCE-MOT were enhanced
to varying degrees after its nanosizing treatment, with its increased parameters enhancing
its adsorption capacity toward Zn (II) [37].
Figure 1. (a), Adsorption-desorption curves of N2 on lignocellulose magnesium aluminum silicate polymer gel (LCE-MOT)
LCE-MOT. (b), Adsorption-desorption curves of N2 on Nano-LCE-MOT.
Table 1. Surface area and pore structure parameters of MOT, LCE-MOT, Nano-LCE-MOT.
Sample SBET (m2/g) SLangmuir
(m2/g) VMic (cm3/g)
RMic
(nm)
Rmes
(nm)
RAve
(nm)
MOT 61.4 137.52 0.024 204.05
LCE-MOT 213.50 378.06 1.051 1.98 45.93 31.82
Nano-LCE-MOT 532.74 701.80 0.25 0.68 173.02 6.17
Figure 1. (a), Adsorption-desorption curves of N2 on lignocellulose magnesium aluminum silicate polymer gel (LCE-MOT)LCE-MOT. (b), Adsorption-desorption curves of N2 on Nano-LCE-MOT.
Table 1. Surface area and pore structure parameters of MOT, LCE-MOT, Nano-LCE-MOT.
Sample SBET (m2/g) SLangmuir (m2/g) VMic (cm3/g) RMic (nm) Rmes (nm) RAve (nm)
MOT 61.4 137.52 0.024 204.05LCE-MOT 213.50 378.06 1.051 1.98 45.93 31.82
Nano-LCE-MOT 532.74 701.80 0.25 0.68 173.02 6.17
3.1.2. FTIR Analysis of the Materials
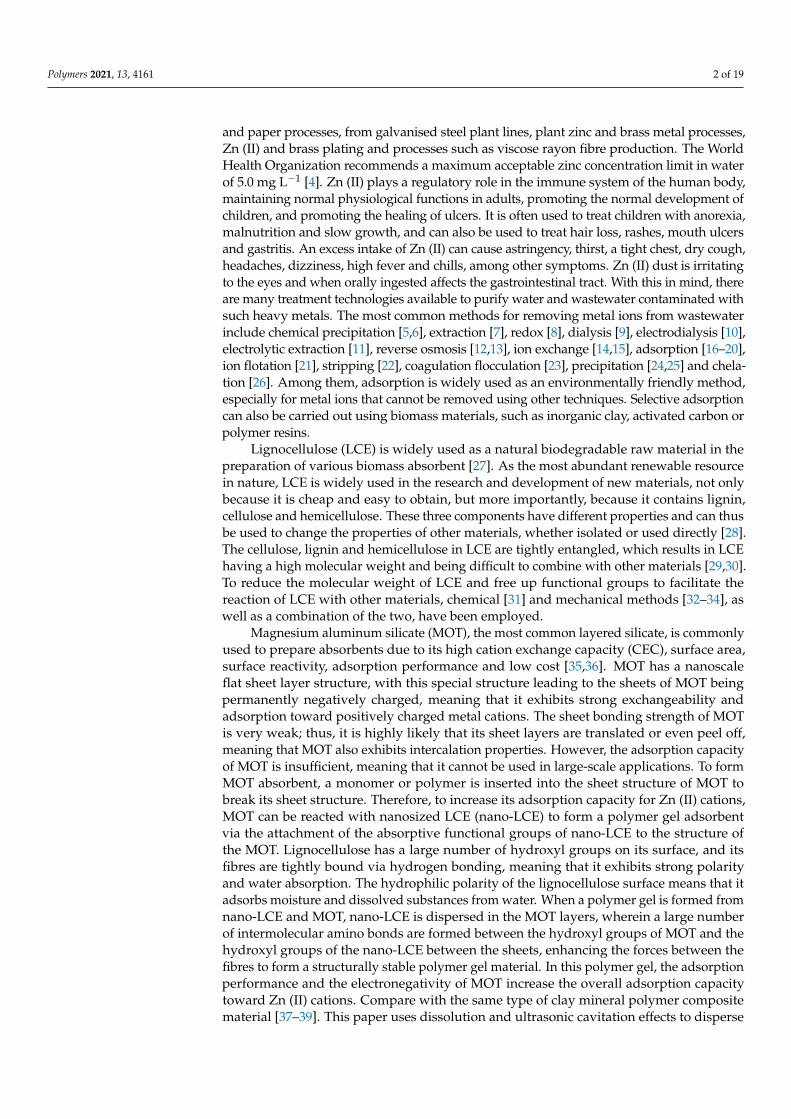
The characteristic chemical structures of MOT, LCE, nano-LCE, LCE-MOT and nano-LCE-MOT were characterised by FTIR spectroscopy in the wavenumber range of 4000–400 cm−1.Figure 2 shows the FTIR spectrum of LCE, which features peaks that can be attributed to -OHbending (3366 cm−1), the –OH stretching vibration of -COOH (1462 cm−1) and the -C-O-C-stretching vibration of cellulose and hemicellulose (1050 cm−1) [41], while after nanosizingtreatment, the absorption peaks were shifted to 3360, 1474 and 1037 cm−1, respectively, and anew peak attributed to -C=O appeared at 1622 cm−1 [42], indicating that the active groupsof lignocellulose were exposed after the nanosizing treatment. From the results shown in

Polymers 2021, 13, 4161 6 of 19
Figure 2, it is inferred that the nanosizing treatment of LCE does not change its chemicalstructure, it only reduces its size to nanosized, thus enhancing its adsorption capacity towardZn (II) from effluent.
Polymers 2021, 13, x FOR PEER REVIEW 6 of 19
3.1.2. FTIR Analysis of the Materials
The characteristic chemical structures of MOT, LCE, nano-LCE, LCE-MOT and nano-
LCE-MOT were characterised by FTIR spectroscopy in the wavenumber range of 4000–
400 cm−1. Figure 2 shows the FTIR spectrum of LCE, which features peaks that can be
attributed to -OH bending (3366 cm−1), the –OH stretching vibration of -COOH (1462 cm−1)
and the -C-O-C- stretching vibration of cellulose and hemicellulose (1050 cm−1) [41], while
after nanosizing treatment, the absorption peaks were shifted to 3360, 1474 and 1037 cm−1,
respectively, and a new peak attributed to -C=O appeared at 1622 cm−1 [42], indicating that
the active groups of lignocellulose were exposed after the nanosizing treatment. From the
results shown in Figure 2, it is inferred that the nanosizing treatment of LCE does not
change its chemical structure, it only reduces its size to nanosized, thus enhancing its ad-
sorption capacity toward Zn (II) from effluent.
Figure 2. FTIR spectra of MOT, LCE, Nano-LCE, LCE-MOT, Nano-LCE-MOT.
Upon the intercalation of LCE and nano-LCE into the interlayers of MOT, the peak
of -OH (3406 cm−1) shifted to a higher wavenumber of 3468 cm−1 for LCE-MOT and 3438
cm−1 for nano-LCE-MOT, and the carbonyl -OH absorption peak shifted to 1464 and 1456
cm−1, respectively. The telescopic vibration adsorption peaks at 909 and 786 cm−1 can be
attributed to -Al-O-H and -Si-O in in the structure of MOT, respectively, and they were
clearly abated, as is evident from the spectra of LCE-MOT and nano-LCE-MOT [43]. As
shown in the FTIR spectra, LCE and nano-LCE intercalate into the interlayers of MOT,
and there are many different types of adsorption sites on the surface of LCE-MOT and
nano-LCE-MOT, such as -Al-O, -Si-O, -C-O-C-, -C=O and -OH, which enhance their ca-
pacity to adsorb heavy metals [44].
3.1.3. PXRD Analysis of the Materials
As shown in Figure 3, the PXRD pattern of MOT exhibits a characteristic diffraction
peak at 5.92°, which indicates that it maintains a relatively complete crystal structure and
Figure 2. FTIR spectra of MOT, LCE, Nano-LCE, LCE-MOT, Nano-LCE-MOT.
Upon the intercalation of LCE and nano-LCE into the interlayers of MOT, the peakof -OH (3406 cm−1) shifted to a higher wavenumber of 3468 cm−1 for LCE-MOT and3438 cm−1 for nano-LCE-MOT, and the carbonyl -OH absorption peak shifted to 1464 and1456 cm−1, respectively. The telescopic vibration adsorption peaks at 909 and 786 cm−1 canbe attributed to -Al-O-H and -Si-O in in the structure of MOT, respectively, and they wereclearly abated, as is evident from the spectra of LCE-MOT and nano-LCE-MOT [43]. Asshown in the FTIR spectra, LCE and nano-LCE intercalate into the interlayers of MOT, andthere are many different types of adsorption sites on the surface of LCE-MOT and nano-LCE-MOT, such as -Al-O, -Si-O, -C-O-C-, -C=O and -OH, which enhance their capacity toadsorb heavy metals [44].
3.1.3. PXRD Analysis of the Materials
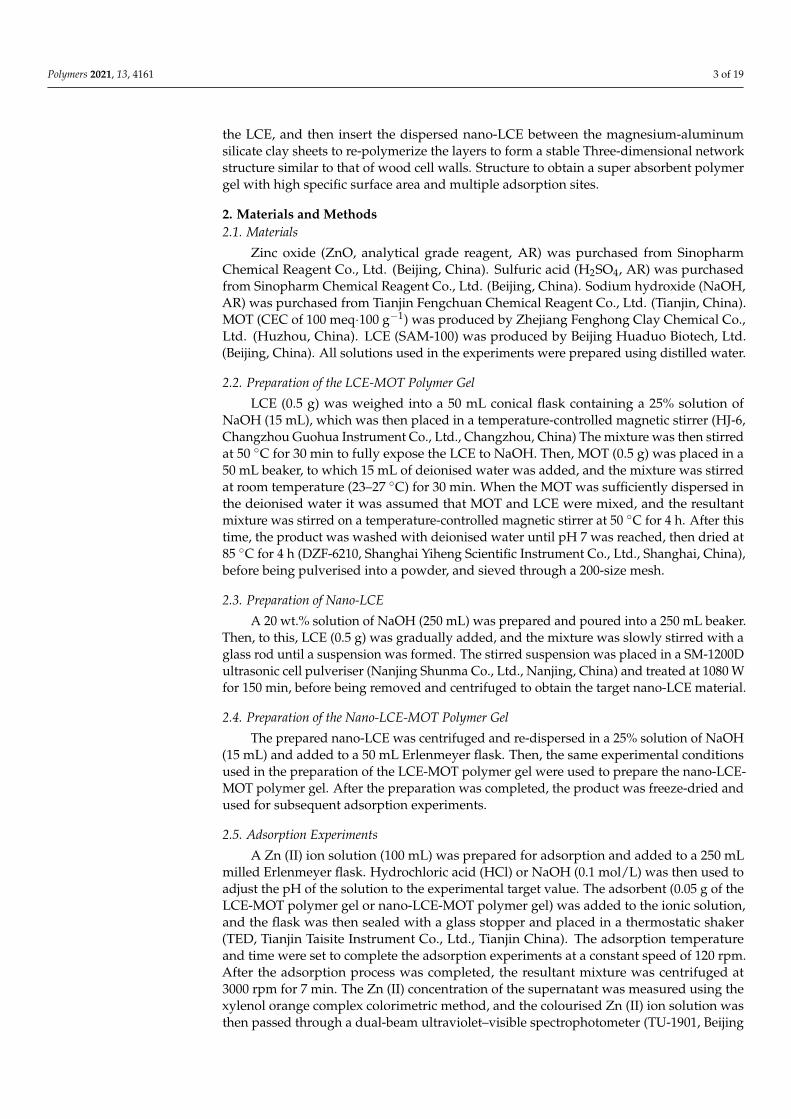
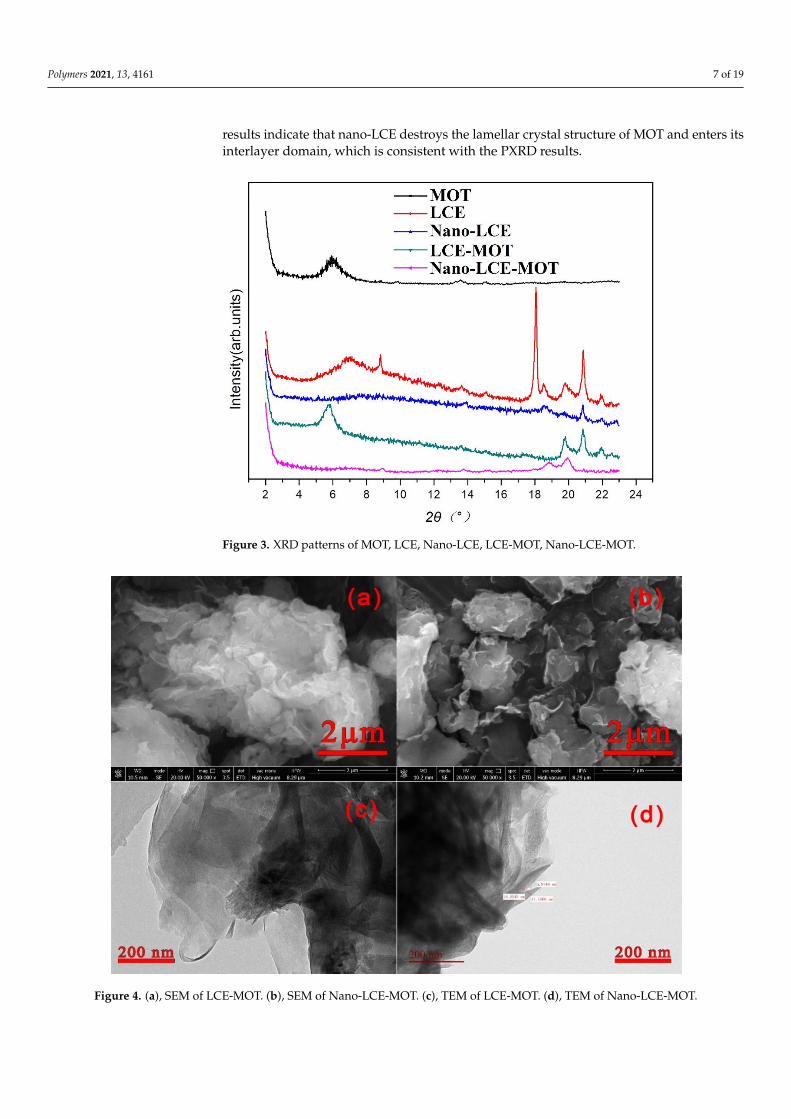
As shown in Figure 3, the PXRD pattern of MOT exhibits a characteristic diffraction peakat 5.92◦, which indicates that it maintains a relatively complete crystal structure and has atypical nanomaterial structure [45]. After the intercalation reaction of MOT with LCE andnano-LCE, the characteristic diffraction peak of MOT disappeared, indicating that the layeredstructure of MOT is destroyed during the intercalation process as LCE and nano-LCE enterinto the layers of MOT, forming an intercalation stripped nanostructure. Apparently, in theintercalation process, nano-LCE inflicts greater damage on the layered structure of the MOT,so the specific surface area of nano-LCE-MOT is higher than LCE-MOT.
3.1.4. SEM Analysis of Nano-LCE-MOT and LCE-MOT
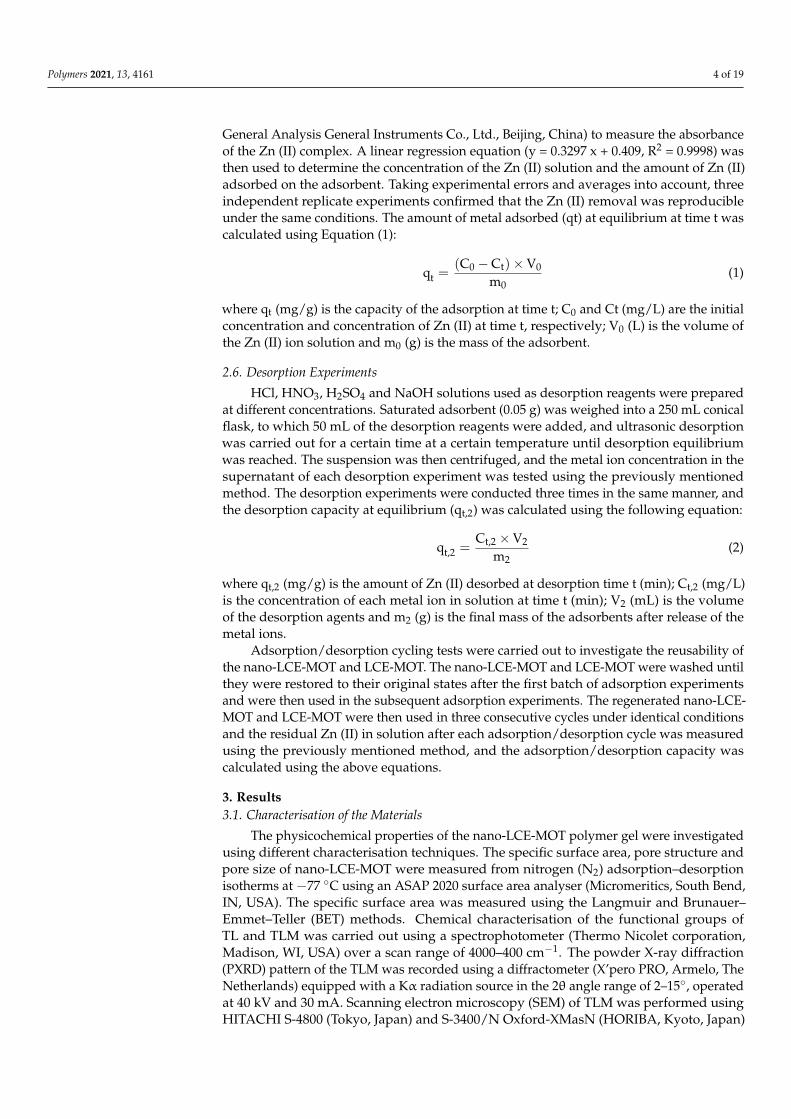
To further investigate the microstructures of LCE-MOT and nano-LCE-MOT, theirintercalation and exfoliation were analysed, and their surface morphologies were observedby SEM. It can be seen from Figures 2 and 4a that the surfaces of LCE-MOT and nano-LCE-MOT are very rough and dispersed, and their lamellar structures exhibit curly shapes. The
Polymers 2021, 13, 4161 7 of 19
results indicate that nano-LCE destroys the lamellar crystal structure of MOT and enters itsinterlayer domain, which is consistent with the PXRD results.
Polymers 2021, 13, x FOR PEER REVIEW 7 of 19
has a typical nanomaterial structure [45]. After the intercalation reaction of MOT with LCE
and nano-LCE, the characteristic diffraction peak of MOT disappeared, indicating that the
layered structure of MOT is destroyed during the intercalation process as LCE and nano-
LCE enter into the layers of MOT, forming an intercalation stripped nanostructure. Ap-
parently, in the intercalation process, nano-LCE inflicts greater damage on the layered
structure of the MOT, so the specific surface area of nano-LCE-MOT is higher than LCE-
MOT.
Figure 3. XRD patterns of MOT, LCE, Nano-LCE, LCE-MOT, Nano-LCE-MOT.
3.1.4. SEM Analysis of Nano-LCE-MOT and LCE-MOT
To further investigate the microstructures of LCE-MOT and nano-LCE-MOT, their
intercalation and exfoliation were analysed, and their surface morphologies were ob-
served by SEM. It can be seen from Figures 4a and 2b that the surfaces of LCE-MOT and
nano-LCE-MOT are very rough and dispersed, and their lamellar structures exhibit curly
shapes. The results indicate that nano-LCE destroys the lamellar crystal structure of MOT
and enters its interlayer domain, which is consistent with the PXRD results.
3.1.5. TEM Analysis of Nano-LCE-MOT and LCE-MOT
The morphologies and structures of LCE-MOT and nano-LCE-MOT were investi-
gated using TEM. From the results, it can be seen that LCE and nano-LCE intercalate into
the MOT layers and destroy the MOT structure. In Figure 4c,d, the shaded part is the
lamellar structure of MOT, and the black rods are LCE (c) and nano-LCE (d). As the par-
ticle size of nano-LCE is smaller than that of LCE, it more easily enters into the MOT la-
mellae, which means that the black area in Figure 4d is more obvious than that in Figure
4c, so the specific surface area of nano-LCE-MOT is the highest of the polymer gel mate-
rials, and there are more active adsorption sites for the adsorption of heavy metals. Thus,
the MOT lamellar crystals are stretched or stripped to form intercalation stripped materi-
als.
Figure 3. XRD patterns of MOT, LCE, Nano-LCE, LCE-MOT, Nano-LCE-MOT.Polymers 2021, 13, x FOR PEER REVIEW 8 of 19
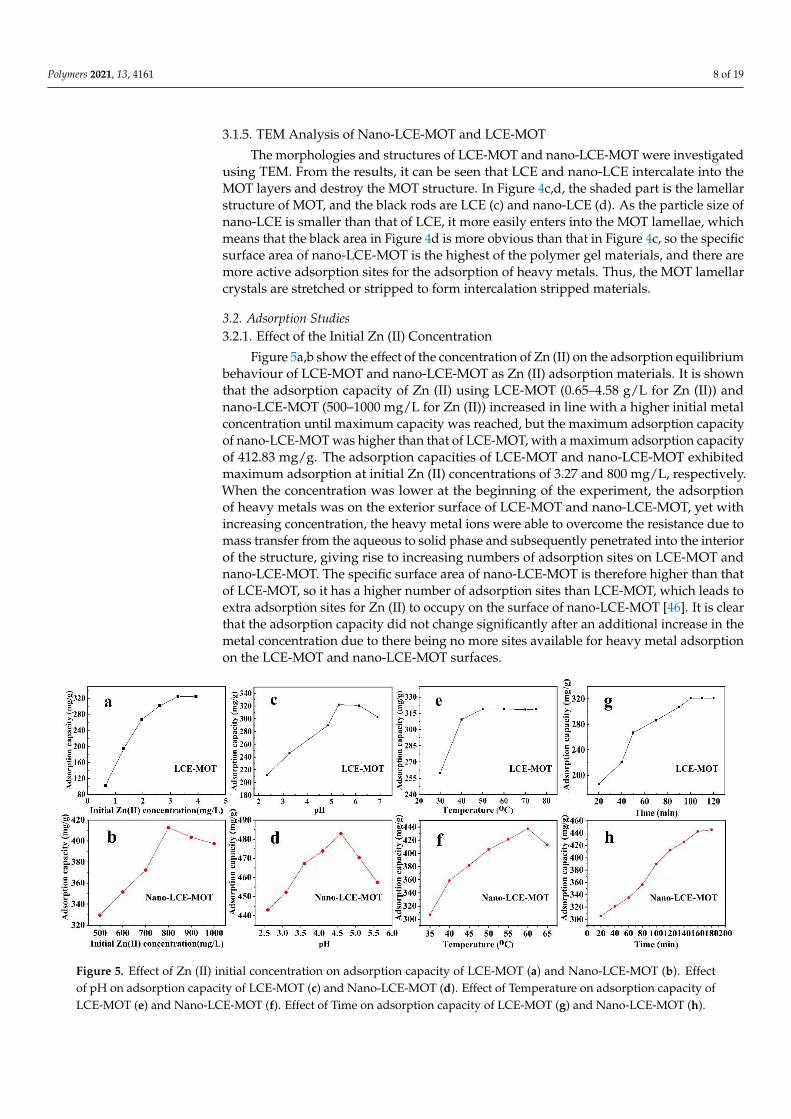
Figure 4. (a), SEM of LCE-MOT. (b), SEM of Nano-LCE-MOT. (c), TEM of LCE-MOT. (d), TEM of Nano-LCE-MOT.
3.2. Adsorption Studies
3.2.1. Effect of the Initial Zn (II) Concentration
Figure 5a,b show the effect of the concentration of Zn (II) on the adsorption equilib-
rium behaviour of LCE-MOT and nano-LCE-MOT as Zn (II) adsorption materials. It is
shown that the adsorption capacity of Zn (II) using LCE-MOT (0.65–4.58 g/L for Zn (II))
and nano-LCE-MOT (500–1000 mg/L for Zn (II)) increased in line with a higher initial
metal concentration until maximum capacity was reached, but the maximum adsorption
capacity of nano-LCE-MOT was higher than that of LCE-MOT, with a maximum adsorp-
tion capacity of 412.83 mg/g. The adsorption capacities of LCE-MOT and nano-LCE-MOT
exhibited maximum adsorption at initial Zn (II) concentrations of 3.27 and 800 mg/L, re-
spectively. When the concentration was lower at the beginning of the experiment, the ad-
sorption of heavy metals was on the exterior surface of LCE-MOT and nano-LCE-MOT,
yet with increasing concentration, the heavy metal ions were able to overcome the re-
sistance due to mass transfer from the aqueous to solid phase and subsequently pene-
trated into the interior of the structure, giving rise to increasing numbers of adsorption
sites on LCE-MOT and nano-LCE-MOT. The specific surface area of nano-LCE-MOT is
therefore higher than that of LCE-MOT, so it has a higher number of adsorption sites than
LCE-MOT, which leads to extra adsorption sites for Zn (II) to occupy on the surface of
nano-LCE-MOT [46]. It is clear that the adsorption capacity did not change significantly
after an additional increase in the metal concentration due to there being no more sites
available for heavy metal adsorption on the LCE-MOT and nano-LCE-MOT surfaces.
3.2.2. Effect of pH
Figure 5c,d show the effects of the starting pH of the solution on the adsorption of
Zn (II). As noted from the figures, the pH has a marked impact on the adsorption process
of LCE-MOT and nano-LCE-MOT toward Zn (II). The adsorption capacities of Zn (II) were
Figure 4. (a), SEM of LCE-MOT. (b), SEM of Nano-LCE-MOT. (c), TEM of LCE-MOT. (d), TEM of Nano-LCE-MOT.
Polymers 2021, 13, 4161 8 of 19
3.1.5. TEM Analysis of Nano-LCE-MOT and LCE-MOT
The morphologies and structures of LCE-MOT and nano-LCE-MOT were investigatedusing TEM. From the results, it can be seen that LCE and nano-LCE intercalate into theMOT layers and destroy the MOT structure. In Figure 4c,d, the shaded part is the lamellarstructure of MOT, and the black rods are LCE (c) and nano-LCE (d). As the particle size ofnano-LCE is smaller than that of LCE, it more easily enters into the MOT lamellae, whichmeans that the black area in Figure 4d is more obvious than that in Figure 4c, so the specificsurface area of nano-LCE-MOT is the highest of the polymer gel materials, and there aremore active adsorption sites for the adsorption of heavy metals. Thus, the MOT lamellarcrystals are stretched or stripped to form intercalation stripped materials.
3.2. Adsorption Studies3.2.1. Effect of the Initial Zn (II) Concentration
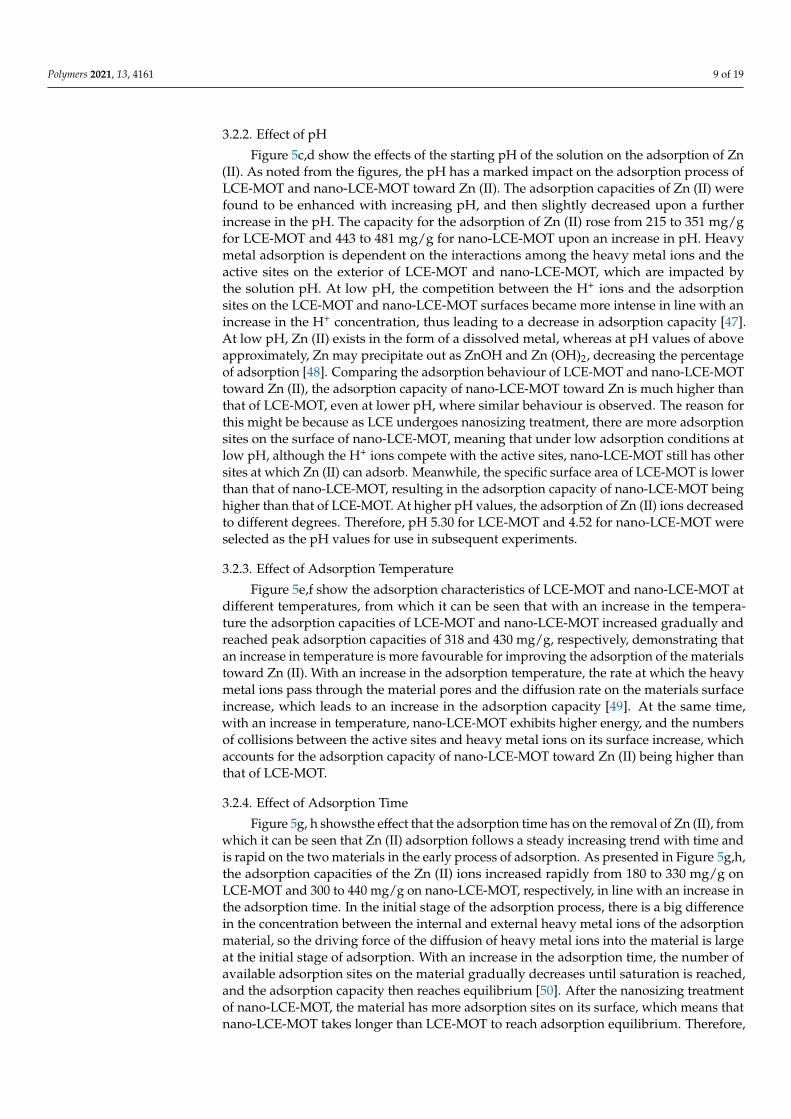
Figure 5a,b show the effect of the concentration of Zn (II) on the adsorption equilibriumbehaviour of LCE-MOT and nano-LCE-MOT as Zn (II) adsorption materials. It is shownthat the adsorption capacity of Zn (II) using LCE-MOT (0.65–4.58 g/L for Zn (II)) andnano-LCE-MOT (500–1000 mg/L for Zn (II)) increased in line with a higher initial metalconcentration until maximum capacity was reached, but the maximum adsorption capacityof nano-LCE-MOT was higher than that of LCE-MOT, with a maximum adsorption capacityof 412.83 mg/g. The adsorption capacities of LCE-MOT and nano-LCE-MOT exhibitedmaximum adsorption at initial Zn (II) concentrations of 3.27 and 800 mg/L, respectively.When the concentration was lower at the beginning of the experiment, the adsorptionof heavy metals was on the exterior surface of LCE-MOT and nano-LCE-MOT, yet withincreasing concentration, the heavy metal ions were able to overcome the resistance due tomass transfer from the aqueous to solid phase and subsequently penetrated into the interiorof the structure, giving rise to increasing numbers of adsorption sites on LCE-MOT andnano-LCE-MOT. The specific surface area of nano-LCE-MOT is therefore higher than thatof LCE-MOT, so it has a higher number of adsorption sites than LCE-MOT, which leads toextra adsorption sites for Zn (II) to occupy on the surface of nano-LCE-MOT [46]. It is clearthat the adsorption capacity did not change significantly after an additional increase in themetal concentration due to there being no more sites available for heavy metal adsorptionon the LCE-MOT and nano-LCE-MOT surfaces.
Polymers 2021, 13, x FOR PEER REVIEW 9 of 19
found to be enhanced with increasing pH, and then slightly decreased upon a further in-
crease in the pH. The capacity for the adsorption of Zn (II) rose from 215 to 351 mg/g for
LCE-MOT and 443 to 481 mg/g for nano-LCE-MOT upon an increase in pH. Heavy metal
adsorption is dependent on the interactions among the heavy metal ions and the active
sites on the exterior of LCE-MOT and nano-LCE-MOT, which are impacted by the solution
pH. At low pH, the competition between the H+ ions and the adsorption sites on the LCE-
MOT and nano-LCE-MOT surfaces became more intense in line with an increase in the H+
concentration, thus leading to a decrease in adsorption capacity [47]. At low pH, Zn (II)
exists in the form of a dissolved metal, whereas at pH values of above approximately, Zn
may precipitate out as ZnOH and Zn (OH)2, decreasing the percentage of adsorption [48].
Comparing the adsorption behaviour of LCE-MOT and nano-LCE-MOT toward Zn (II),
the adsorption capacity of nano-LCE-MOT toward Zn is much higher than that of LCE-
MOT, even at lower pH, where similar behaviour is observed. The reason for this might
be because as LCE undergoes nanosizing treatment, there are more adsorption sites on
the surface of nano-LCE-MOT, meaning that under low adsorption conditions at low pH,
although the H+ ions compete with the active sites, nano-LCE-MOT still has other sites at
which Zn (II) can adsorb. Meanwhile, the specific surface area of LCE-MOT is lower than
that of nano-LCE-MOT, resulting in the adsorption capacity of nano-LCE-MOT being
higher than that of LCE-MOT. At higher pH values, the adsorption of Zn (II) ions de-
creased to different degrees. Therefore, pH 5.30 for LCE-MOT and 4.52 for nano-LCE-
MOT were selected as the pH values for use in subsequent experiments.
Figure 5. Effect of Zn (II) initial concentration on adsorption capacity of LCE-MOT (a) and Nano-LCE-MOT (b). Effect of
pH on adsorption capacity of LCE-MOT (c) and Nano-LCE-MOT (d). Effect of Temperature on adsorption capacity of
LCE-MOT (e) and Nano-LCE-MOT (f). Effect of Time on adsorption capacity of LCE-MOT (g) and Nano-LCE-MOT (h).
3.2.3. Effect of Adsorption Temperature
Figure 5e,f show the adsorption characteristics of LCE-MOT and nano-LCE-MOT at
different temperatures, from which it can be seen that with an increase in the temperature
the adsorption capacities of LCE-MOT and nano-LCE-MOT increased gradually and
reached peak adsorption capacities of 318 and 430 mg/g, respectively, demonstrating that
an increase in temperature is more favourable for improving the adsorption of the mate-
rials toward Zn (II). With an increase in the adsorption temperature, the rate at which the
heavy metal ions pass through the material pores and the diffusion rate on the materials
surface increase, which leads to an increase in the adsorption capacity [49]. At the same
time, with an increase in temperature, nano-LCE-MOT exhibits higher energy, and the
numbers of collisions between the active sites and heavy metal ions on its surface increase,
Figure 5. Effect of Zn (II) initial concentration on adsorption capacity of LCE-MOT (a) and Nano-LCE-MOT (b). Effectof pH on adsorption capacity of LCE-MOT (c) and Nano-LCE-MOT (d). Effect of Temperature on adsorption capacity ofLCE-MOT (e) and Nano-LCE-MOT (f). Effect of Time on adsorption capacity of LCE-MOT (g) and Nano-LCE-MOT (h).
Polymers 2021, 13, 4161 9 of 19
3.2.2. Effect of pH
Figure 5c,d show the effects of the starting pH of the solution on the adsorption of Zn(II). As noted from the figures, the pH has a marked impact on the adsorption process ofLCE-MOT and nano-LCE-MOT toward Zn (II). The adsorption capacities of Zn (II) werefound to be enhanced with increasing pH, and then slightly decreased upon a furtherincrease in the pH. The capacity for the adsorption of Zn (II) rose from 215 to 351 mg/gfor LCE-MOT and 443 to 481 mg/g for nano-LCE-MOT upon an increase in pH. Heavymetal adsorption is dependent on the interactions among the heavy metal ions and theactive sites on the exterior of LCE-MOT and nano-LCE-MOT, which are impacted bythe solution pH. At low pH, the competition between the H+ ions and the adsorptionsites on the LCE-MOT and nano-LCE-MOT surfaces became more intense in line with anincrease in the H+ concentration, thus leading to a decrease in adsorption capacity [47].At low pH, Zn (II) exists in the form of a dissolved metal, whereas at pH values of aboveapproximately, Zn may precipitate out as ZnOH and Zn (OH)2, decreasing the percentageof adsorption [48]. Comparing the adsorption behaviour of LCE-MOT and nano-LCE-MOTtoward Zn (II), the adsorption capacity of nano-LCE-MOT toward Zn is much higher thanthat of LCE-MOT, even at lower pH, where similar behaviour is observed. The reason forthis might be because as LCE undergoes nanosizing treatment, there are more adsorptionsites on the surface of nano-LCE-MOT, meaning that under low adsorption conditions atlow pH, although the H+ ions compete with the active sites, nano-LCE-MOT still has othersites at which Zn (II) can adsorb. Meanwhile, the specific surface area of LCE-MOT is lowerthan that of nano-LCE-MOT, resulting in the adsorption capacity of nano-LCE-MOT beinghigher than that of LCE-MOT. At higher pH values, the adsorption of Zn (II) ions decreasedto different degrees. Therefore, pH 5.30 for LCE-MOT and 4.52 for nano-LCE-MOT wereselected as the pH values for use in subsequent experiments.
3.2.3. Effect of Adsorption Temperature
Figure 5e,f show the adsorption characteristics of LCE-MOT and nano-LCE-MOT atdifferent temperatures, from which it can be seen that with an increase in the tempera-ture the adsorption capacities of LCE-MOT and nano-LCE-MOT increased gradually andreached peak adsorption capacities of 318 and 430 mg/g, respectively, demonstrating thatan increase in temperature is more favourable for improving the adsorption of the materialstoward Zn (II). With an increase in the adsorption temperature, the rate at which the heavymetal ions pass through the material pores and the diffusion rate on the materials surfaceincrease, which leads to an increase in the adsorption capacity [49]. At the same time,with an increase in temperature, nano-LCE-MOT exhibits higher energy, and the numbersof collisions between the active sites and heavy metal ions on its surface increase, whichaccounts for the adsorption capacity of nano-LCE-MOT toward Zn (II) being higher thanthat of LCE-MOT.
3.2.4. Effect of Adsorption Time
Figure 5g, h showsthe effect that the adsorption time has on the removal of Zn (II), fromwhich it can be seen that Zn (II) adsorption follows a steady increasing trend with time andis rapid on the two materials in the early process of adsorption. As presented in Figure 5g,h,the adsorption capacities of the Zn (II) ions increased rapidly from 180 to 330 mg/g onLCE-MOT and 300 to 440 mg/g on nano-LCE-MOT, respectively, in line with an increase inthe adsorption time. In the initial stage of the adsorption process, there is a big differencein the concentration between the internal and external heavy metal ions of the adsorptionmaterial, so the driving force of the diffusion of heavy metal ions into the material is largeat the initial stage of adsorption. With an increase in the adsorption time, the number ofavailable adsorption sites on the material gradually decreases until saturation is reached,and the adsorption capacity then reaches equilibrium [50]. After the nanosizing treatmentof nano-LCE-MOT, the material has more adsorption sites on its surface, which means thatnano-LCE-MOT takes longer than LCE-MOT to reach adsorption equilibrium. Therefore,
Polymers 2021, 13, 4161 10 of 19
the adsorption capacity of nano-LCE-MOT is higher than LCE-MOT toward Zn (II), andthe time taken to reach adsorption equilibrium is slightly longer.
3.2.5. Adsorption Kinetics and Mechanism
Prediction of the adsorption rates provides important information regarding adsorp-tion mechanisms. To this aim, to evaluate the adsorption mechanisms of nano-LCE-MOTand LCE-MOT, the experimental data at various adsorption times corresponding to thechanges in adsorption capacity were fitted using pseudo-first order (Equation (3)) andpseudo-second order (Equation (4)) models:
ln(qet − qt
)= ln qet − k1t (3)
tqt
=t
qe+
1k2q2
e(4)
where qe and qt are the amounts of heavy metal ions adsorbed (mg/g) at equilibriumand at time t (min), respectively; k1 (min−1) is the pseudo-first-order rate constant and k2[g·(mg/min) −1] is the rate constant of the pseudo-second-order adsorption kinetic equation.
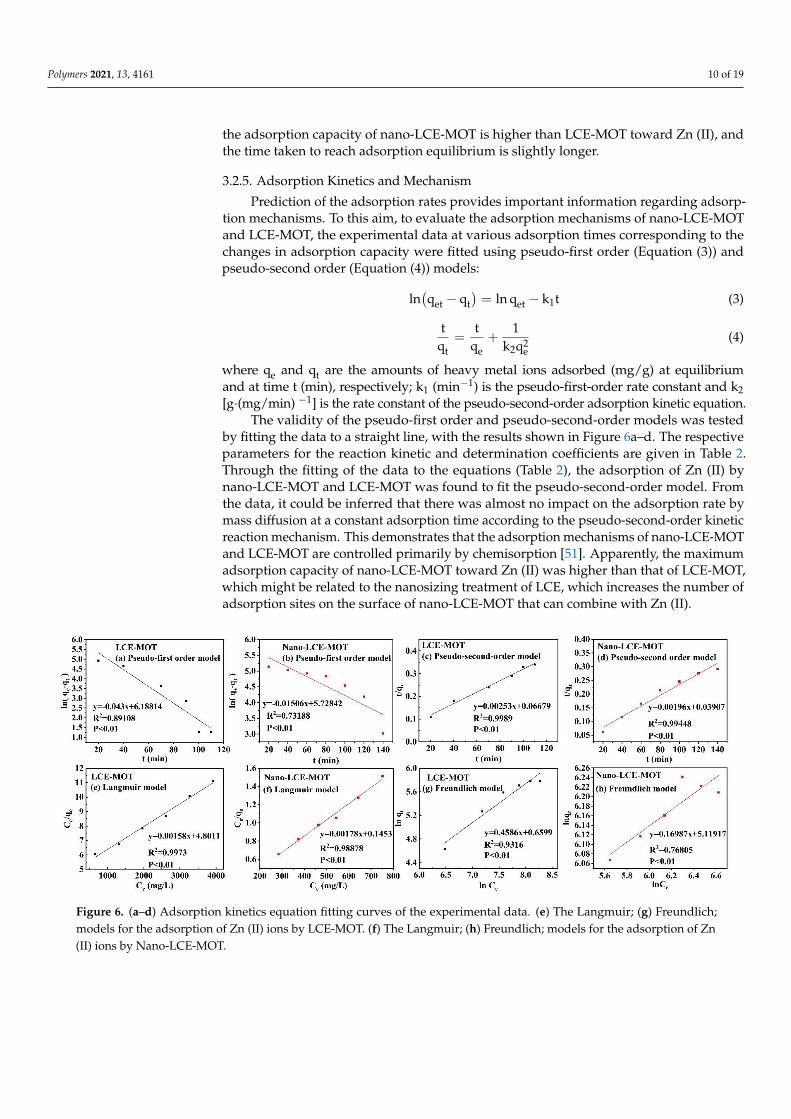
The validity of the pseudo-first order and pseudo-second-order models was testedby fitting the data to a straight line, with the results shown in Figure 6a–d. The respectiveparameters for the reaction kinetic and determination coefficients are given in Table 2.Through the fitting of the data to the equations (Table 2), the adsorption of Zn (II) bynano-LCE-MOT and LCE-MOT was found to fit the pseudo-second-order model. Fromthe data, it could be inferred that there was almost no impact on the adsorption rate bymass diffusion at a constant adsorption time according to the pseudo-second-order kineticreaction mechanism. This demonstrates that the adsorption mechanisms of nano-LCE-MOTand LCE-MOT are controlled primarily by chemisorption [51]. Apparently, the maximumadsorption capacity of nano-LCE-MOT toward Zn (II) was higher than that of LCE-MOT,which might be related to the nanosizing treatment of LCE, which increases the number ofadsorption sites on the surface of nano-LCE-MOT that can combine with Zn (II).
Polymers 2021, 13, x FOR PEER REVIEW 11 of 19
Figure 6. (a–d) Adsorption kinetics equation fitting curves of the experimental data. (e) The Langmuir; (g) Freundlich;
models for the adsorption of Zn (II) ions by LCE-MOT. (f) The Langmuir; (h) Freundlich; models for the adsorption of Zn
(II) ions by Nano-LCE-MOT.
Table 2. R2 and constant values for the different adsorption kinetics models of Zn (II) for Nano-LCE-
MOT and LCE-MOT.
Materials Parameters Pseudo-First Order Pseudo-Second Order
LCE-MOT
R2 0.8912 0.9989
Constants k1 0.0045 min−1 k2 0.2876 min−1
qe 297.01 mg/g qe 327.11 mg/g
Nano-LCE-MOT
R2 0.7319 0.9945
Constants k1 0.015 min−1 k2 0.000098 min−1
qe 541.10 mg/g qe 510.20 mg/g
3.2.6. Adsorption Modelling
To better understand the ion adsorption processes that occur on nano-LCE-MOT and
LCE-MOT, the Langmuir (Equation (5)) and Freundlich (Equation (6)) isotherms were ap-
plied to fit the adsorption equilibrium data obtained from the batch adsorption experi-
ments. Figure 6e–h shows the fitting of the data to the isotherms, and the correlation co-
efficient values, among other parameters, are presented in Table 3. From the results, the
Langmuir model was found to be more suitable than the Freundlich model. The Langmuir
model makes the assumption that the adsorption in the monolayer of the adsorbent takes
place when the adsorbent has a uniform exterior structure, in which the binding sites have
identical affinity toward adsorption and there is zero interaction among the adsorbent
binding sites. According to the intrinsic features of the Langmuir model, it was revealed
that the adsorption of Zn (II) by nano-LCE-MOT and LCE-MOT was confined to the mon-
olayers created between the adsorbents and heavy metals, with zero additional same-
plane interactions on the surface of the adsorbent by the adsorbate, in a multilayer cover-
age fashion [52]. The maximum theoretical adsorption capacities of nano-LCE-MOT and
LCE-MOT at their optimal temperatures were found to be 326.08 and 561.80 mg/g, respec-
tively, as shown in Table 3. Meanwhile, as also shown in Table 3, compared with the pre-
viously reported adsorbents, nano-LCE-MOT and LCE-MOT exhibit higher adsorption
capacity toward Zn (II), which illustrates that nano-LCE-MOT and LCE-MOT are excel-
lent adsorbents for the adsorption of Zn (II) from aqueous media. However, maximum
adsorption capacity of nano-LCE-MOT is higher than that of LCE-MOT, which proves
Figure 6. (a–d) Adsorption kinetics equation fitting curves of the experimental data. (e) The Langmuir; (g) Freundlich;models for the adsorption of Zn (II) ions by LCE-MOT. (f) The Langmuir; (h) Freundlich; models for the adsorption of Zn(II) ions by Nano-LCE-MOT.
Polymers 2021, 13, 4161 11 of 19
Table 2. R2 and constant values for the different adsorption kinetics models of Zn (II) for Nano-LCE-MOT and LCE-MOT.
Materials Parameters Pseudo-First Order Pseudo-Second Order
LCE-MOT
R2 0.8912 0.9989
Constantsk1 0.0045 min−1 k2 0.2876 min−1
qe 297.01 mg/g qe 327.11 mg/g
Nano-LCE-MOT
R2 0.7319 0.9945
Constantsk1 0.015 min−1 k2 0.000098 min−1
qe 541.10 mg/g qe 510.20 mg/g
3.2.6. Adsorption Modelling
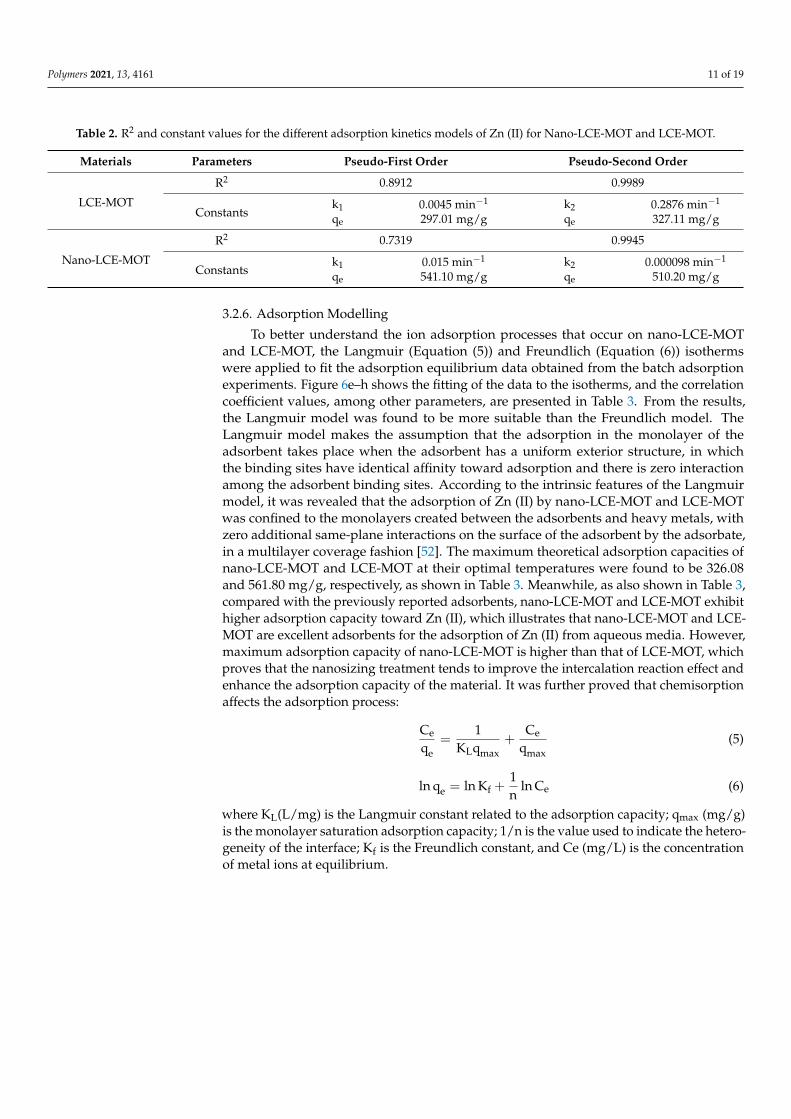
To better understand the ion adsorption processes that occur on nano-LCE-MOTand LCE-MOT, the Langmuir (Equation (5)) and Freundlich (Equation (6)) isothermswere applied to fit the adsorption equilibrium data obtained from the batch adsorptionexperiments. Figure 6e–h shows the fitting of the data to the isotherms, and the correlationcoefficient values, among other parameters, are presented in Table 3. From the results,the Langmuir model was found to be more suitable than the Freundlich model. TheLangmuir model makes the assumption that the adsorption in the monolayer of theadsorbent takes place when the adsorbent has a uniform exterior structure, in whichthe binding sites have identical affinity toward adsorption and there is zero interactionamong the adsorbent binding sites. According to the intrinsic features of the Langmuirmodel, it was revealed that the adsorption of Zn (II) by nano-LCE-MOT and LCE-MOTwas confined to the monolayers created between the adsorbents and heavy metals, withzero additional same-plane interactions on the surface of the adsorbent by the adsorbate,in a multilayer coverage fashion [52]. The maximum theoretical adsorption capacities ofnano-LCE-MOT and LCE-MOT at their optimal temperatures were found to be 326.08and 561.80 mg/g, respectively, as shown in Table 3. Meanwhile, as also shown in Table 3,compared with the previously reported adsorbents, nano-LCE-MOT and LCE-MOT exhibithigher adsorption capacity toward Zn (II), which illustrates that nano-LCE-MOT and LCE-MOT are excellent adsorbents for the adsorption of Zn (II) from aqueous media. However,maximum adsorption capacity of nano-LCE-MOT is higher than that of LCE-MOT, whichproves that the nanosizing treatment tends to improve the intercalation reaction effect andenhance the adsorption capacity of the material. It was further proved that chemisorptionaffects the adsorption process:
Ce
qe=
1KLqmax
+Ce
qmax(5)
ln qe = ln Kf +1n
ln Ce (6)
where KL(L/mg) is the Langmuir constant related to the adsorption capacity; qmax (mg/g)is the monolayer saturation adsorption capacity; 1/n is the value used to indicate the hetero-geneity of the interface; Kf is the Freundlich constant, and Ce (mg/L) is the concentrationof metal ions at equilibrium.
Polymers 2021, 13, 4161 12 of 19
Table 3. R2 and constant values for the different adsorption isotherm models of Zn (II) for Nano-LCE-MOT and LCE-MOT.
Materials Parameters Langmuir Freundlich
LCE-MOT
R2 0.9973 0.9316
ConstantsKL 0.0311 L/mg Kf 69.11 L/mg
qmax 326.08 mg/g 1/n 0.135
Nano-LCE-MOT
R2 0.9888 0.7681
ConstantsKL 0.0012 L/mg Kf 167.28 L/mg
qmax 561.80 mg/g 1/n 0.1699
3.3. Desorption and Regeneration Studies3.3.1. Effects of Various Desorption Reagents
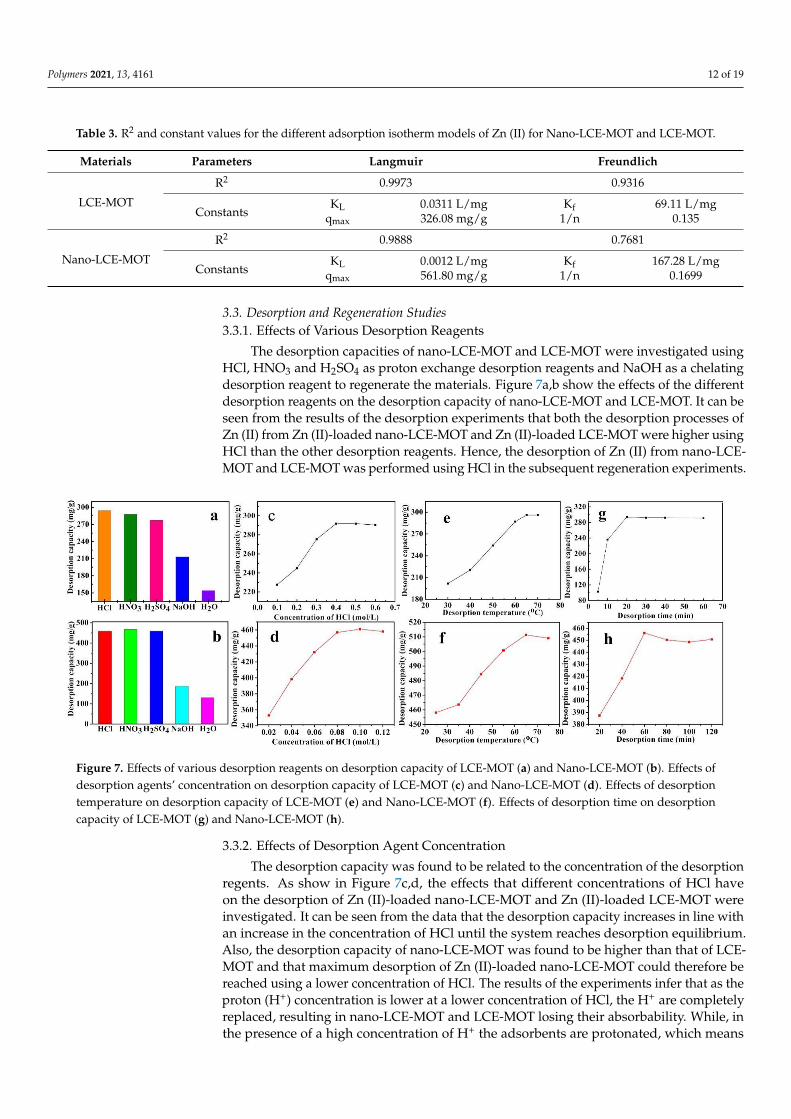
The desorption capacities of nano-LCE-MOT and LCE-MOT were investigated usingHCl, HNO3 and H2SO4 as proton exchange desorption reagents and NaOH as a chelatingdesorption reagent to regenerate the materials. Figure 7a,b show the effects of the differentdesorption reagents on the desorption capacity of nano-LCE-MOT and LCE-MOT. It can beseen from the results of the desorption experiments that both the desorption processes ofZn (II) from Zn (II)-loaded nano-LCE-MOT and Zn (II)-loaded LCE-MOT were higher usingHCl than the other desorption reagents. Hence, the desorption of Zn (II) from nano-LCE-MOT and LCE-MOT was performed using HCl in the subsequent regeneration experiments.
Polymers 2021, 13, x FOR PEER REVIEW 13 of 19
3.3.3. Effects of Desorption Temperature
As shown in Figure 7e,f, the desorption capacities of the absorbents increased in line
with the temperature, which might be a result of more H+ ion activity at higher tempera-
ture, meaning that the H+ compete with Zn (II) on the surface of Zn (II)-loaded nano-LCE-
MOT and Zn (II)-loaded LCE-MOT, thus leading to an increase in the desorption rate.
While, upon a further increase in the temperature, the active sites might be destroyed if
the temperature is too high [53], hence leading to a slight decrease in the desorption ca-
pacities of Zn (II)-loaded nano-LCE-MOT and Zn (II)-loaded LCE-MOT.
3.3.4. Effects of Desorption Time
As shown in Figure 7g,h, the best desorption times of nano-LCE-MOT and LCE-MOT
were 60 and 20 min, respectively. With an increase in the desorption time, the desorption
capacity first increased and then decreased. In the initial stage of desorption, H+ gradually
replaces the Zn (II) adsorbed on the material, therefore meaning that there is a gradual
increase in the adsorption capacity. After a certain adsorption time, the material continues
to adsorb Zn (II), so as to reach adsorption–desorption equilibrium.
Figure 7. Effects of various desorption reagents on desorption capacity of LCE-MOT (a) and Nano-LCE-MOT (b). Effects
of desorption agents’ concentration on desorption capacity of LCE-MOT (c) and Nano-LCE-MOT (d). Effects of desorption
temperature on desorption capacity of LCE-MOT (e) and Nano-LCE-MOT (f). Effects of desorption time on desorption
capacity of LCE-MOT (g) and Nano-LCE-MOT (h).
3.3.5. Regeneration and Reuse
The recovery of heavy metals adsorbed on the nano-LCE-MOT and LCE-MOT sur-
faces is of great significance toward improving the economy of nano-LCE-MOT and LCE-
MOT. Table 4 shows the data on the reusability of nano-LCE-MOT and LCE-MOT inves-
tigated over three adsorption/desorption cycles. The adsorption capacities of nano-LCE-
MOT and LCE-MOT were observed to decrease gradually with the number of cycles,
which might be because the adsorption sites on the surfaces of nano-LCE-MOT and LCE-
MOT were destroyed at low pH during the regeneration cycles. The results show that
nano-LCE-MOT could be recycled up to three times for the adsorption of Zn (II) with very
little loss in efficiency, while LCE-MOT could be recycled twice, proving that the nanosiz-
ing treatment enhances the reusability of the adsorbent.
Figure 7. Effects of various desorption reagents on desorption capacity of LCE-MOT (a) and Nano-LCE-MOT (b). Effects ofdesorption agents’ concentration on desorption capacity of LCE-MOT (c) and Nano-LCE-MOT (d). Effects of desorptiontemperature on desorption capacity of LCE-MOT (e) and Nano-LCE-MOT (f). Effects of desorption time on desorptioncapacity of LCE-MOT (g) and Nano-LCE-MOT (h).
3.3.2. Effects of Desorption Agent Concentration
The desorption capacity was found to be related to the concentration of the desorptionregents. As show in Figure 7c,d, the effects that different concentrations of HCl haveon the desorption of Zn (II)-loaded nano-LCE-MOT and Zn (II)-loaded LCE-MOT wereinvestigated. It can be seen from the data that the desorption capacity increases in line withan increase in the concentration of HCl until the system reaches desorption equilibrium.Also, the desorption capacity of nano-LCE-MOT was found to be higher than that of LCE-MOT and that maximum desorption of Zn (II)-loaded nano-LCE-MOT could therefore bereached using a lower concentration of HCl. The results of the experiments infer that as theproton (H+) concentration is lower at a lower concentration of HCl, the H+ are completelyreplaced, resulting in nano-LCE-MOT and LCE-MOT losing their absorbability. While, inthe presence of a high concentration of H+ the adsorbents are protonated, which means
Polymers 2021, 13, 4161 13 of 19
that the adsorption site for Zn (II) are occupied by H+, meaning that there are no increasesin the desorption capacities of Zn (II)-loaded nano-LCE-MOT and Zn (II)-loaded LCE-MOT.The maximum desorption values of Zn (II)-loaded nano-LCE-MOT and Zn (II)-loadedLCE-MOT reached 456.81 and 291.88 mg/g for Zn (II) at HCl concentrations of 0.08 and0.4 mol/L, respectively.
3.3.3. Effects of Desorption Temperature
As shown in Figure 7e,f, the desorption capacities of the absorbents increased inline with the temperature, which might be a result of more H+ ion activity at highertemperature, meaning that the H+ compete with Zn (II) on the surface of Zn (II)-loadednano-LCE-MOT and Zn (II)-loaded LCE-MOT, thus leading to an increase in the desorptionrate. While, upon a further increase in the temperature, the active sites might be destroyedif the temperature is too high [53], hence leading to a slight decrease in the desorptioncapacities of Zn (II)-loaded nano-LCE-MOT and Zn (II)-loaded LCE-MOT.
3.3.4. Effects of Desorption Time
As shown in Figure 7g,h, the best desorption times of nano-LCE-MOT and LCE-MOTwere 60 and 20 min, respectively. With an increase in the desorption time, the desorptioncapacity first increased and then decreased. In the initial stage of desorption, H+ graduallyreplaces the Zn (II) adsorbed on the material, therefore meaning that there is a gradualincrease in the adsorption capacity. After a certain adsorption time, the material continuesto adsorb Zn (II), so as to reach adsorption–desorption equilibrium.
3.3.5. Regeneration and Reuse
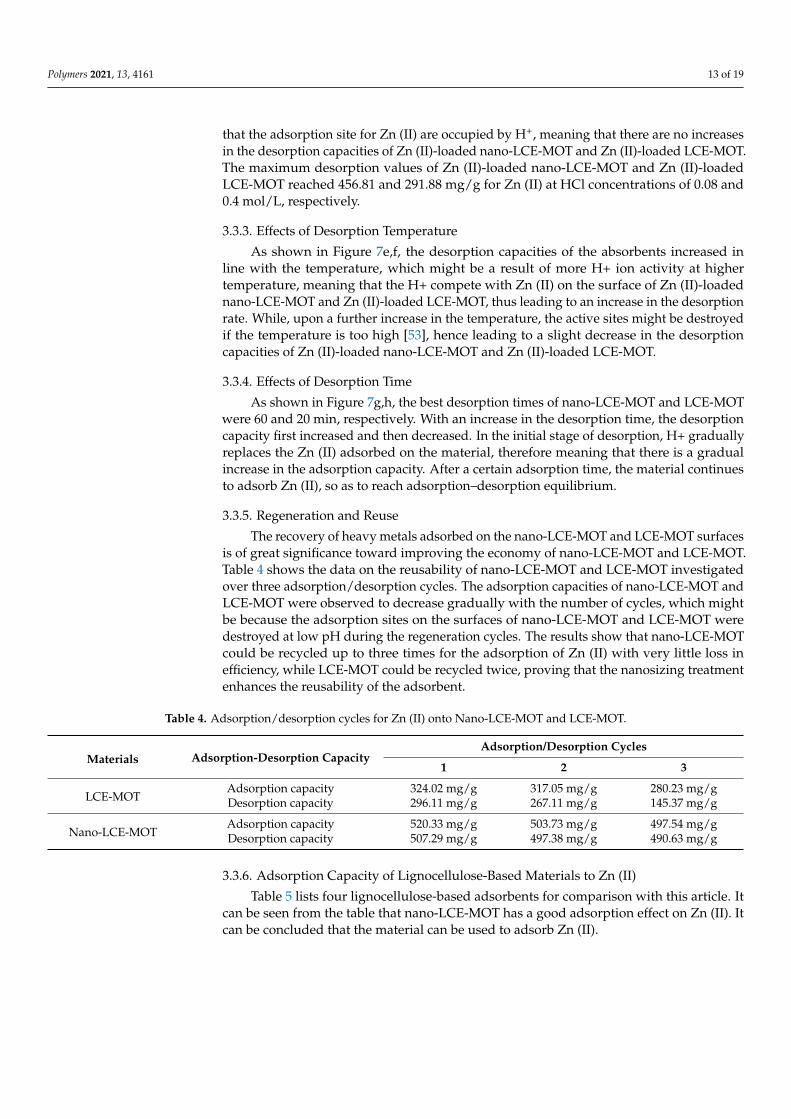
The recovery of heavy metals adsorbed on the nano-LCE-MOT and LCE-MOT surfacesis of great significance toward improving the economy of nano-LCE-MOT and LCE-MOT.Table 4 shows the data on the reusability of nano-LCE-MOT and LCE-MOT investigatedover three adsorption/desorption cycles. The adsorption capacities of nano-LCE-MOT andLCE-MOT were observed to decrease gradually with the number of cycles, which mightbe because the adsorption sites on the surfaces of nano-LCE-MOT and LCE-MOT weredestroyed at low pH during the regeneration cycles. The results show that nano-LCE-MOTcould be recycled up to three times for the adsorption of Zn (II) with very little loss inefficiency, while LCE-MOT could be recycled twice, proving that the nanosizing treatmentenhances the reusability of the adsorbent.
Table 4. Adsorption/desorption cycles for Zn (II) onto Nano-LCE-MOT and LCE-MOT.
Materials Adsorption-Desorption CapacityAdsorption/Desorption Cycles
1 2 3
LCE-MOTAdsorption capacity 324.02 mg/g 317.05 mg/g 280.23 mg/gDesorption capacity 296.11 mg/g 267.11 mg/g 145.37 mg/g
Nano-LCE-MOTAdsorption capacity 520.33 mg/g 503.73 mg/g 497.54 mg/gDesorption capacity 507.29 mg/g 497.38 mg/g 490.63 mg/g
3.3.6. Adsorption Capacity of Lignocellulose-Based Materials to Zn (II)
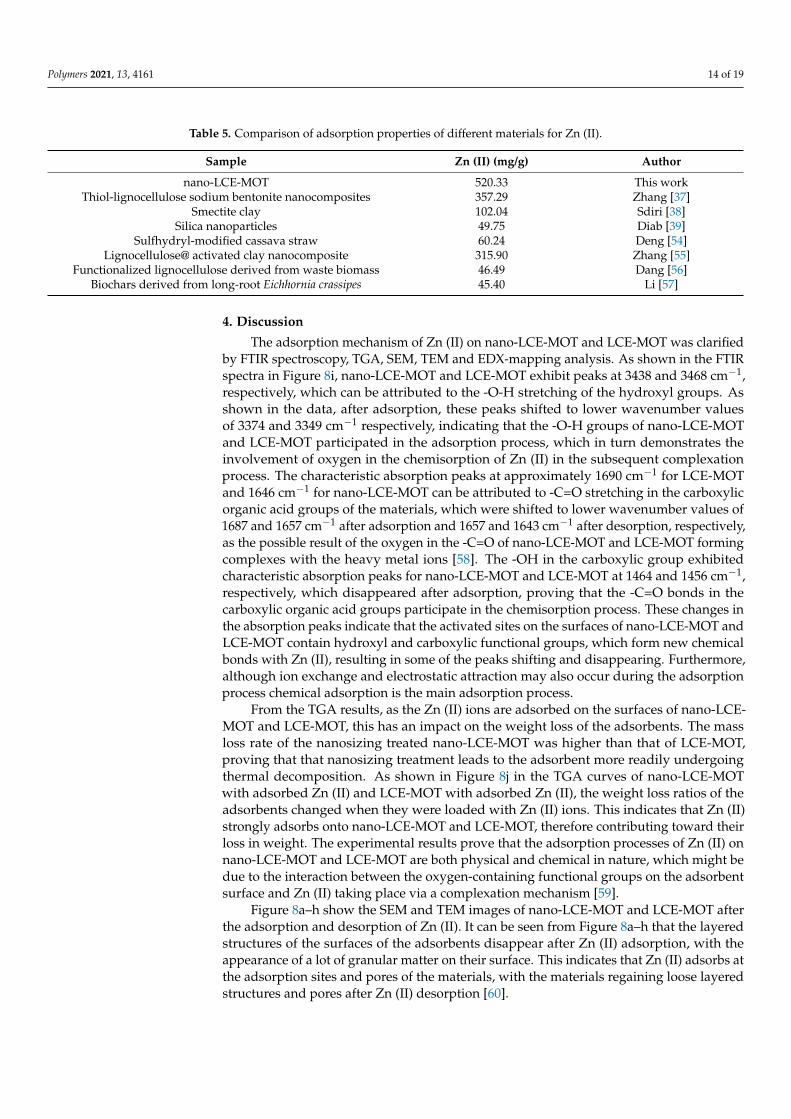
Table 5 lists four lignocellulose-based adsorbents for comparison with this article. Itcan be seen from the table that nano-LCE-MOT has a good adsorption effect on Zn (II). Itcan be concluded that the material can be used to adsorb Zn (II).
Polymers 2021, 13, 4161 14 of 19
Table 5. Comparison of adsorption properties of different materials for Zn (II).
Sample Zn (II) (mg/g) Author
nano-LCE-MOT 520.33 This workThiol-lignocellulose sodium bentonite nanocomposites 357.29 Zhang [37]
Smectite clay 102.04 Sdiri [38]Silica nanoparticles 49.75 Diab [39]
Sulfhydryl-modified cassava straw 60.24 Deng [54]Lignocellulose@ activated clay nanocomposite 315.90 Zhang [55]
Functionalized lignocellulose derived from waste biomass 46.49 Dang [56]Biochars derived from long-root Eichhornia crassipes 45.40 Li [57]
4. Discussion
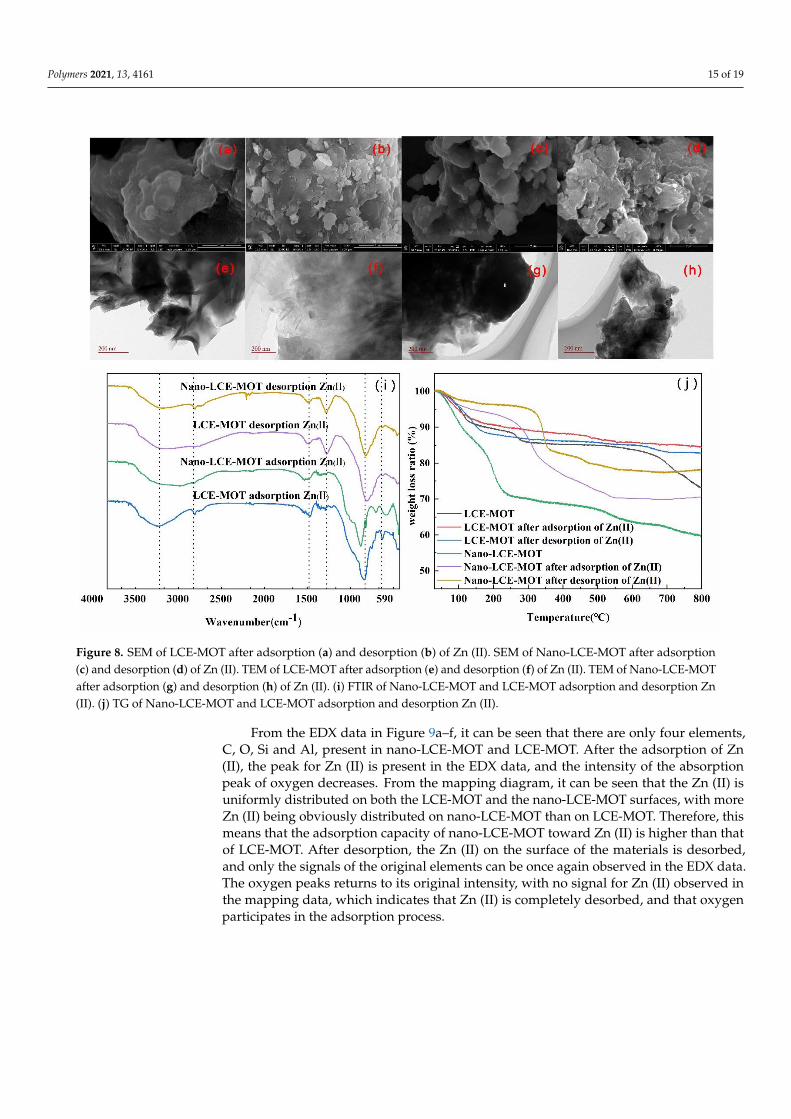
The adsorption mechanism of Zn (II) on nano-LCE-MOT and LCE-MOT was clarifiedby FTIR spectroscopy, TGA, SEM, TEM and EDX-mapping analysis. As shown in the FTIRspectra in Figure 8i, nano-LCE-MOT and LCE-MOT exhibit peaks at 3438 and 3468 cm−1,respectively, which can be attributed to the -O-H stretching of the hydroxyl groups. Asshown in the data, after adsorption, these peaks shifted to lower wavenumber valuesof 3374 and 3349 cm−1 respectively, indicating that the -O-H groups of nano-LCE-MOTand LCE-MOT participated in the adsorption process, which in turn demonstrates theinvolvement of oxygen in the chemisorption of Zn (II) in the subsequent complexationprocess. The characteristic absorption peaks at approximately 1690 cm−1 for LCE-MOTand 1646 cm−1 for nano-LCE-MOT can be attributed to -C=O stretching in the carboxylicorganic acid groups of the materials, which were shifted to lower wavenumber values of1687 and 1657 cm−1 after adsorption and 1657 and 1643 cm−1 after desorption, respectively,as the possible result of the oxygen in the -C=O of nano-LCE-MOT and LCE-MOT formingcomplexes with the heavy metal ions [58]. The -OH in the carboxylic group exhibitedcharacteristic absorption peaks for nano-LCE-MOT and LCE-MOT at 1464 and 1456 cm−1,respectively, which disappeared after adsorption, proving that the -C=O bonds in thecarboxylic organic acid groups participate in the chemisorption process. These changes inthe absorption peaks indicate that the activated sites on the surfaces of nano-LCE-MOT andLCE-MOT contain hydroxyl and carboxylic functional groups, which form new chemicalbonds with Zn (II), resulting in some of the peaks shifting and disappearing. Furthermore,although ion exchange and electrostatic attraction may also occur during the adsorptionprocess chemical adsorption is the main adsorption process.
From the TGA results, as the Zn (II) ions are adsorbed on the surfaces of nano-LCE-MOT and LCE-MOT, this has an impact on the weight loss of the adsorbents. The massloss rate of the nanosizing treated nano-LCE-MOT was higher than that of LCE-MOT,proving that that nanosizing treatment leads to the adsorbent more readily undergoingthermal decomposition. As shown in Figure 8j in the TGA curves of nano-LCE-MOTwith adsorbed Zn (II) and LCE-MOT with adsorbed Zn (II), the weight loss ratios of theadsorbents changed when they were loaded with Zn (II) ions. This indicates that Zn (II)strongly adsorbs onto nano-LCE-MOT and LCE-MOT, therefore contributing toward theirloss in weight. The experimental results prove that the adsorption processes of Zn (II) onnano-LCE-MOT and LCE-MOT are both physical and chemical in nature, which might bedue to the interaction between the oxygen-containing functional groups on the adsorbentsurface and Zn (II) taking place via a complexation mechanism [59].
Figure 8a–h show the SEM and TEM images of nano-LCE-MOT and LCE-MOT afterthe adsorption and desorption of Zn (II). It can be seen from Figure 8a–h that the layeredstructures of the surfaces of the adsorbents disappear after Zn (II) adsorption, with theappearance of a lot of granular matter on their surface. This indicates that Zn (II) adsorbs atthe adsorption sites and pores of the materials, with the materials regaining loose layeredstructures and pores after Zn (II) desorption [60].
Polymers 2021, 13, 4161 15 of 19Polymers 2021, 13, x FOR PEER REVIEW 15 of 19
Figure 8. SEM of LCE-MOT after adsorption (a) and desorption (b) of Zn (II). SEM of Nano-LCE-MOT after adsorption (c)
and desorption (d) of Zn (II). TEM of LCE-MOT after adsorption (e) and desorption (b) of Zn (II). TEM of Nano-LCE-MOT
after adsorption (a) and desorption (b) of Zn (II). (i) FTIR of Nano-LCE-MOT and LCE-MOT adsorption and desorption
Zn (II). (g) TG of Nano-LCE-MOT and LCE-MOT adsorption and desorption Zn (II).
From the TGA results, as the Zn (II) ions are adsorbed on the surfaces of nano-LCE-
MOT and LCE-MOT, this has an impact on the weight loss of the adsorbents. The mass
loss rate of the nanosizing treated nano-LCE-MOT was higher than that of LCE-MOT,
proving that that nanosizing treatment leads to the adsorbent more readily undergoing
thermal decomposition. As shown in Figure 8j in the TGA curves of nano-LCE-MOT with
adsorbed Zn (II) and LCE-MOT with adsorbed Zn (II), the weight loss ratios of the adsor-
bents changed when they were loaded with Zn (II) ions. This indicates that Zn (II) strongly
adsorbs onto nano-LCE-MOT and LCE-MOT, therefore contributing toward their loss in
weight. The experimental results prove that the adsorption processes of Zn (II) on nano-
LCE-MOT and LCE-MOT are both physical and chemical in nature, which might be due
to the interaction between the oxygen-containing functional groups on the adsorbent sur-
face and Zn (II) taking place via a complexation mechanism [59].
Figure 8a–h show the SEM and TEM images of nano-LCE-MOT and LCE-MOT after
the adsorption and desorption of Zn (II). It can be seen from Figure 8a–h that the layered
structures of the surfaces of the adsorbents disappear after Zn (II) adsorption, with the
appearance of a lot of granular matter on their surface. This indicates that Zn (II) adsorbs
at the adsorption sites and pores of the materials, with the materials regaining loose lay-
ered structures and pores after Zn (II) desorption [60].
Figure 8. SEM of LCE-MOT after adsorption (a) and desorption (b) of Zn (II). SEM of Nano-LCE-MOT after adsorption(c) and desorption (d) of Zn (II). TEM of LCE-MOT after adsorption (e) and desorption (f) of Zn (II). TEM of Nano-LCE-MOTafter adsorption (g) and desorption (h) of Zn (II). (i) FTIR of Nano-LCE-MOT and LCE-MOT adsorption and desorption Zn(II). (j) TG of Nano-LCE-MOT and LCE-MOT adsorption and desorption Zn (II).
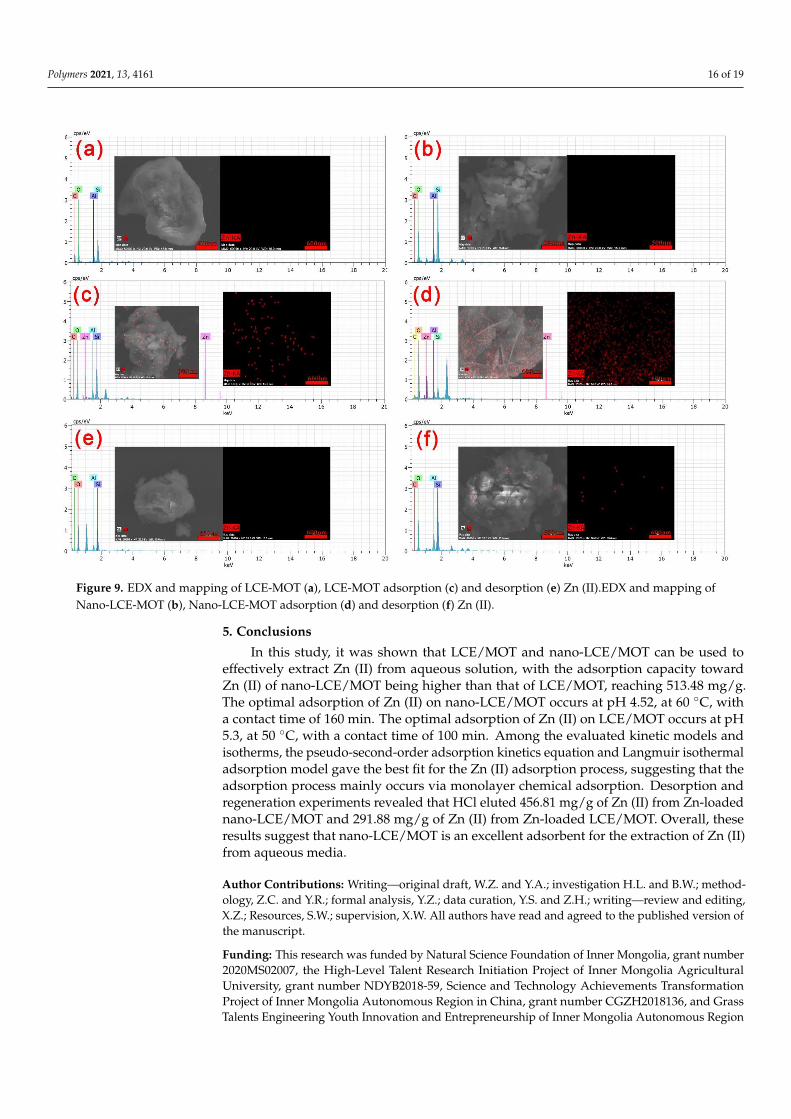
From the EDX data in Figure 9a–f, it can be seen that there are only four elements,C, O, Si and Al, present in nano-LCE-MOT and LCE-MOT. After the adsorption of Zn(II), the peak for Zn (II) is present in the EDX data, and the intensity of the absorptionpeak of oxygen decreases. From the mapping diagram, it can be seen that the Zn (II) isuniformly distributed on both the LCE-MOT and the nano-LCE-MOT surfaces, with moreZn (II) being obviously distributed on nano-LCE-MOT than on LCE-MOT. Therefore, thismeans that the adsorption capacity of nano-LCE-MOT toward Zn (II) is higher than thatof LCE-MOT. After desorption, the Zn (II) on the surface of the materials is desorbed,and only the signals of the original elements can be once again observed in the EDX data.The oxygen peaks returns to its original intensity, with no signal for Zn (II) observed inthe mapping data, which indicates that Zn (II) is completely desorbed, and that oxygenparticipates in the adsorption process.
Polymers 2021, 13, 4161 16 of 19
Polymers 2021, 13, x FOR PEER REVIEW 16 of 19
From the EDX data in Figure 9a–f, it can be seen that there are only four elements, C,
O, Si and Al, present in nano-LCE-MOT and LCE-MOT. After the adsorption of Zn (II),
the peak for Zn (II) is present in the EDX data, and the intensity of the absorption peak of
oxygen decreases. From the mapping diagram, it can be seen that the Zn (II) is uniformly
distributed on both the LCE-MOT and the nano-LCE-MOT surfaces, with more Zn (II)
being obviously distributed on nano-LCE-MOT than on LCE-MOT. Therefore, this means
that the adsorption capacity of nano-LCE-MOT toward Zn (II) is higher than that of LCE-
MOT. After desorption, the Zn (II) on the surface of the materials is desorbed, and only
the signals of the original elements can be once again observed in the EDX data. The oxy-
gen peaks returns to its original intensity, with no signal for Zn (II) observed in the map-
ping data, which indicates that Zn (II) is completely desorbed, and that oxygen partici-
pates in the adsorption process.
Figure 9. EDX and mapping of LCE-MOT (a), LCE-MOT adsorption (c) and desorption (e) Zn (II).EDX and mapping of
Nano-LCE-MOT (b), Nano-LCE-MOT adsorption (d) and desorption (f) Zn (II).
5. Conclusions
In this study, it was shown that LCE/MOT and nano-LCE/MOT can be used to effec-
tively extract Zn (II) from aqueous solution, with the adsorption capacity toward Zn (II)
of nano-LCE/MOT being higher than that of LCE/MOT, reaching 513.48 mg/g. The opti-
mal adsorption of Zn (II) on nano-LCE/MOT occurs at pH 4.52, at 60 °C, with a contact
time of 160 min. The optimal adsorption of Zn (II) on LCE/MOT occurs at pH 5.3, at 50 °C,
with a contact time of 100 min. Among the evaluated kinetic models and isotherms, the
pseudo-second-order adsorption kinetics equation and Langmuir isothermal adsorption
model gave the best fit for the Zn (II) adsorption process, suggesting that the adsorption
process mainly occurs via monolayer chemical adsorption. Desorption and regeneration
Figure 9. EDX and mapping of LCE-MOT (a), LCE-MOT adsorption (c) and desorption (e) Zn (II).EDX and mapping ofNano-LCE-MOT (b), Nano-LCE-MOT adsorption (d) and desorption (f) Zn (II).
5. Conclusions
In this study, it was shown that LCE/MOT and nano-LCE/MOT can be used toeffectively extract Zn (II) from aqueous solution, with the adsorption capacity towardZn (II) of nano-LCE/MOT being higher than that of LCE/MOT, reaching 513.48 mg/g.The optimal adsorption of Zn (II) on nano-LCE/MOT occurs at pH 4.52, at 60 ◦C, witha contact time of 160 min. The optimal adsorption of Zn (II) on LCE/MOT occurs at pH5.3, at 50 ◦C, with a contact time of 100 min. Among the evaluated kinetic models andisotherms, the pseudo-second-order adsorption kinetics equation and Langmuir isothermaladsorption model gave the best fit for the Zn (II) adsorption process, suggesting that theadsorption process mainly occurs via monolayer chemical adsorption. Desorption andregeneration experiments revealed that HCl eluted 456.81 mg/g of Zn (II) from Zn-loadednano-LCE/MOT and 291.88 mg/g of Zn (II) from Zn-loaded LCE/MOT. Overall, theseresults suggest that nano-LCE/MOT is an excellent adsorbent for the extraction of Zn (II)from aqueous media.
Author Contributions: Writing—original draft, W.Z. and Y.A.; investigation H.L. and B.W.; method-ology, Z.C. and Y.R.; formal analysis, Y.Z.; data curation, Y.S. and Z.H.; writing—review and editing,X.Z.; Resources, S.W.; supervision, X.W. All authors have read and agreed to the published version ofthe manuscript.
Funding: This research was funded by Natural Science Foundation of Inner Mongolia, grant number2020MS02007, the High-Level Talent Research Initiation Project of Inner Mongolia AgriculturalUniversity, grant number NDYB2018-59, Science and Technology Achievements TransformationProject of Inner Mongolia Autonomous Region in China, grant number CGZH2018136, and GrassTalents Engineering Youth Innovation and Entrepreneurship of Inner Mongolia Autonomous Region
Polymers 2021, 13, 4161 17 of 19
in China grant number Q2017053,Inner Mongolia Autonomous Region Postgraduate Research andInnovation Funding Project,BZ2020055.
Institutional Review Board Statement: Not applicable.
Informed Consent Statement: Not applicable.
Data Availability Statement: The data presented in this study are available on request from thecorresponding author.
Acknowledgments: The experimental part of this work was supported by Inner Mongolia KeyLaboratory of Sandy Shrubs Fibrosis and Energy Development and Utilization.
Conflicts of Interest: The authors declare that there is no conflict of interests regarding the publicationof this paper.
References1. Volesky, B.; Holan, Z.R. Biosorption of heavy metals. Biotechnol. Prog. 1995, 11, 235–250. [CrossRef]2. Wang, J.; Chen, C. Biosorbents for heavy metals removal and their future. Biotechnol. Adv. 2009, 27, 195–226. [CrossRef] [PubMed]3. Bano, A.; Hussain, J.; Akbar, A.; Mehmood, K.; Anwar, M.; Hasni, M.S.; Ullah, S.; Sajid, S.; Ali, I. Biosorption of heavy metals by
obligate halophilic fungi. Chemosphere 2018, 199, 218–222. [CrossRef]4. Mohan, D.; Singh, K.P. Single- and multi-component adsorption of cadmium and zinc using activated carbon derived from
bagasse—an agricultural waste. Water Res. 2002, 36, 2304–2318. [CrossRef]5. Kongsricharoern, N.; Polprasert, C. Chromium removal by a bipolar electro-chemical precipitation process. Water Sci. Technol.
1996, 34, 109–116. [CrossRef]6. Zhang, Z.; Zheng, H.; Sun, Y.; Zhao, C.; Zhou, Y.; Tang, X.; Zhao, C. A combined process of chemical precipitation and flocculation
for treating phosphating wastewater. Desalination Water Treat. 2016, 57, 25520–25531. [CrossRef]7. Chukwu, U.J.; Uzoukwu, B.A. Synergistic extraction of Zn2+ from aqueous buffer medium of chloride ions into 1- Phenyl -3-
Methyl -4- trichloro acetyl pyrazolone -5 in benzene and hexane. Recent Patents Mater. Sci. 2010, 3, 2. [CrossRef]8. Tang, W.; Zeng, G.; Gong, J.; Liang, J.; Xu, P.; Zhang, C.; Huang, B. Impact of humic/fulvic acid on the removal of heavy metals
from aqueous solutions using nanomaterials: A review. Sci. Total Environ. 2014, 468, 1014–1027. [CrossRef] [PubMed]9. Cherif, A.T.; Elmidaoui, A.; Gavach, C. Separation of Ag+, Zn2+ and Cu2+ ions by electrodialysis with monovalent cation specific
membrane and EDTA. J. Membr. Sci. 1993, 76, 39–49. [CrossRef]10. Cherif, A.T.; Gavach, C.; Molenat, J.; Elmidaoui, A. Transport and separation of Ag + and Zn 2+ by donnan dialysis through a
monovalent cation selective membrane. Talanta 1998, 46, 1605–1611. [CrossRef]11. Pociecha, M.; Kastelec, D.; Lestan, D. Electrochemical EDTA recycling after soil washing of Pb, Zn and Cd contaminated soil. J.
Hazard. Mater. 2011, 192, 714–721. [CrossRef] [PubMed]12. Ipek, U. Removal of Ni (II) and Zn (II) from an aqueous solutionby reverse osmosis. Desalination 2005, 174, 161–169. [CrossRef]13. Ujang, Z.; Anderson, G.K. Application of low-pressure reverse osmosis membrane for Zn2+ and Cu2+ removal from wastewater.
Water Sci. Technol. 1996, 34, 247–253. [CrossRef]14. Franco, P.E.; Veit, M.T.; Borba, C.E.; da Cunha Gonçalves, G.; Fagundes-Klen, M.R.; Bergamasco, R.; da Silva, E.A.; Suzaki, P.Y.R.
Nickel (II) and zinc (II) removal using Amberlite IR-120 resin: Ion exchange equilibrium and kinetics. Chem. Eng. J. 2013, 221,426–435. [CrossRef]
15. Ostroski, I.C.; Barros, M.A.S.D.; Silva, E.A.; Dantas, J.H.; Arroyo, P.A.; Lima, O.C.M. A comparative study for the ion exchange ofFe (III) and Zn (II) on zeolite NaY. J. Hazard. Mater. 2009, 161, 1404–1412. [CrossRef] [PubMed]
16. Bhattacharya, A.K.; Mandal, S.N.; Das, S.K. Adsorption of Zn (II) from aqueous solution by using different adsorbents. Chem.Eng. J. 2006, 123, 43–51. [CrossRef]
17. Bereket, G.; Arog, A.Z.; Özel, M.Z. Removal of Pb (II), Cd (II), Cu (II), and Zn (II) from Aqueous Solutions by Adsorption onBentonite. J. Colloid Interface Sci. 1997, 187, 338–343. [CrossRef] [PubMed]
18. Kubilay, S.; Gürkan, R.; Savran, A.; Sahan, T. Removal of Cu (II), Zn (II) and Co (II) ions from aqueous solutions by adsorptiononto natural bentonite. Adsorption 2007, 13, 41–51. [CrossRef]
19. Juang, R.; Shao, H. Effect of pH on competitive adsorption of Cu(II), Ni(II), and Zn (II) from water onto chitosan beads. Adsorption2002, 8, 71–78. [CrossRef]
20. Pranata Putra, W.; Kamari, A.; Najiah Mohd Yusoff, S.; Fauziah Ishak, C.; Mohamed, A.; Hashim, N.; Md Isa, I. Biosorption of Cu(II), Pb (II) and Zn (II) ions from aqueous solutions using selected waste materials: Adsorption and characterisation studies. J.Encapsulation Adsorpt. Sci. 2014, 4, 25–35. [CrossRef]
21. Hoseinian, F.S.; Irannajad, M.; Nooshabadi, A.J. Ion flotation for removal of Ni (II) and Zn (II) ions from wastewaters. Int. J. Miner.Process. 2015, 143, 131–137. [CrossRef]
22. Matarese Palmieri, R.; Pera, L.L.; Di Bella, G.; Dugo, G. Simultaneous determination of Cd (II), Cu (II), Pb (II) and Zn (II) byderivative stripping chronopotentiometry in Pittosporum tobira leaves: A measurement of local atmospheric pollution in Messina(Sicily, Italy). Chemosphere 2005, 59, 1161–1168. [CrossRef]
Polymers 2021, 13, 4161 18 of 19
23. Pang, F.M.; Kumar, P.; Teng, T.T.; Mohd Omar, A.K.; Wasewar, K.L. Removal of lead, zinc and iron by coagulation–flocculation. J.Taiwan Inst. Chem. Eng. 2011, 42, 809–815. [CrossRef]
24. Alvarez, M.T.; Crespo, C.; Mattiasson, B. Precipitation of Zn (II), Cu (II) and Pb (II) at bench-scale using biogenic hydrogen sulfidefrom the utilization of volatile fatty acids. Chemosphere 2007, 66, 1677–1683. [CrossRef]
25. Trainor, T.P.; Brown, G.E.; Parks, G.A. Adsorption and precipitation of aqueous Zn (II) on alumina powders. J. Colloid Interface Sci.2000, 231, 359–372. [CrossRef] [PubMed]
26. Guan, B.; Ni, W.; Wu, Z.; Lai, Y. Removal of Mn (II) and Zn (II) ions from flue gas desulfurization wastewater with water-solublechitosan. Sep. Purif. Technol. 2009, 65, 269–274. [CrossRef]
27. Alqadami, A.A.; Naushad, M.; Abdalla, M.A.; Ahamad, T.; Abdullah Alothman, Z.; Alshehri, S.M. Synthesis and characterizationof Fe3O4@TSC nanocomposite: Highly efficient removal of toxic metal ions from aqueous medium. RSC Adv. 2016, 6, 22679–22689.[CrossRef]
28. Li, S.; Song, X. Study on the preparation and production factors of a direct lignocellulose biomass fuel cell. J. Electroanal. Chem.2018, 810, 55–61. [CrossRef]
29. Guerra, A.; Filpponen, I.; Lucia, L.A.; Argyropoulos, D.S. Comparative Evaluation of three lignin isolation protocols for variouswood species. J. Agric. Food Chem. 2006, 54, 9696–9705. [CrossRef]
30. Doherty, W.O.S.; Mousavioun, P.; Fellows, C.M. Value-adding to cellulosic ethanol: Lignin polymers. Ind. Crop. Prod. 2011, 33,259–276. [CrossRef]
31. Saha, P.; Manna, S.; Chowdhury, S.R.; Sen, R.; Roy, D.; Adhikari, B. Enhancement of tensile strength of lignocellulosic jute fibersby alkali-steam treatment. Bioresour. Technol. 2010, 101, 3182–3187. [CrossRef]
32. Mak, K.F.; Lee, C.; Hone, J.; Shan, J.; Heinz, T.F. Atomically ThinMoS2: A new direct-gap semiconductor. Phys. Rev. Lett. 2010,105, 136805. [CrossRef]
33. Uetani, K.; Yano, H. Nano fibrillation of Wood Pulp Using a High-Speed Blender. Biomacromolecules 2010, 12, 348–353. [CrossRef]34. Malainine, M.E.; Mahrouz, M.; Dufresne, A. Thermoplastic nanocomposites based on cellulose microfibrils from Opuntia
Ficus-indica parenchyma cell. Compos. Sci. Technol. 2005, 65, 1520–1526. [CrossRef]35. Sinha Ray, S.; Okamoto, M. Polymer/layered silicate nanocomposites: A review from preparation to processing. Prog. Polym. Sci.
2003, 28, 1539–1641. [CrossRef]36. Pavlidou, S.; Papaspyrides, C.D. A review on polymer–layered silicate nanocomposites. Prog. Polym. Sci. 2008, 33, 1119–1198.
[CrossRef]37. Zhang, W.; An, Y.; Li, S.; Liu, Z.; Chen, Z.; Ren, Y.; Wang, S.; Zhang, X.; Wang, X. Enhanced heavy metal removal from an aqueous
environment using an eco-friendly and sustainable adsorbent. Sci. Rep. 2020, 10, 16453. [CrossRef] [PubMed]38. Sdiri, A.T.; Higashi, T.; Jamoussi, F. Adsorption of copper and zinc onto natural clay in single and binary systems. Int. J. Environ.
Sci. Technol. 2014, 11, 1081–1092. [CrossRef]39. Diab, M.A.; Attia, N.F.; Attia, S.; El-Shahat, M.F. Green synthesis of cost-effective and efficient nano adsorbents based on zero-
and two-dimensional nanomaterials for Zn2+ and Cr3+ removal from aqueous solutions. Synth. Met. 2020, 265, 116411. [CrossRef]40. Sing, K.S.W.; Williams, R.T. Physisorption Hysteresis Loops and the Characterization of Nano porous Materials. Adsorpt. Sci.
Technol. 2004, 22, 773–782. [CrossRef]41. Xu, J.K.; Zhou, P.F.; Dai, L.; Gui, Y.; Yuan, L.; Shen, X.J.; Zhang, C.T.; Huo, K.F. A scalable waste-free biorefinery inspires revenue
from holistic lignocellulose valorization. Green Chem. 2021, 23, 6008–6019. [CrossRef]42. Zhang, W.; Duo, H.; Li, S.; An, Y.; Chen, Z.; Liu, Z.; Ren, Y.; Wang, S.; Zhang, X.; Wang, X. An overview of the recent advances in
functionalization biomass adsorbents for toxic metals removal. Colloid Interface Sci. Commun. 2020, 38, 100308. [CrossRef]43. Zhang, X.; Wang, X.; Chen, Z. A novel nanocomposite as an efficient adsorbent for the rapid adsorption of Ni (II) from aqueous
solution. Materials 2017, 10, 1124. [CrossRef]44. An, Y.; Zhang, X.; Wang, X.; Chen, Z.; Wu, X. Nano@lignocellulose intercalated montmorillonite as adsorbent for effective Mn (II)
removal from aqueous solution. Sci. Rep. 2018, 8, 10863. [CrossRef]45. Wang, Y.; Wang, R.; Lin, N.; Wang, Y.; Zhang, X. Highly efficient microwave-assisted Fenton degradation bisphenol A using iron
oxide modified double perovskite intercalated montmorillonite composite nanomaterial as catalyst. J. Colloid Interface Sci. 2021,594, 446–459. [CrossRef]
46. Pei, X.; Gan, L.; Tong, Z.; Gao, H.; Meng, S.; Zhang, W.; Wang, P.; Chen, Y. Robust cellulose-based composite adsorption membranefor heavy metal removal. J. Hazard. Mater. 2020, 406, 124746. [CrossRef]
47. Yousefi, N.; Jones, M.; Bismarck Mautner, A. Fungal chitin-glucan nanopapers with heavy metal adsorption properties forultrafiltration of organic solvents and water. Carbohydr. Polym. 2020, 253, 117273. [CrossRef] [PubMed]
48. Boughrara, L.; Sebba, F.Z.; Sebti, H.; Choukchou-Braham, E.; Bounaceur, B.; Kada, S.O.; Zaoui, F. Removal of Zn (II) and Ni (II)heavy metal ions by new alginic acid-ester derivatives materials. Carbohydr. Polym. 2021, 272, 118439. [CrossRef] [PubMed]
49. Liu, S.; Xie, Z.; Zhu, Y.; Zhu, Y.; Jiang, Y.; Wang, Y.; Gao, H. Adsorption characteristics of modified rice straw biochar for Zn andin-situ remediation of Zn contaminated soil. Environ. Technol. Innov. 2021, 22, 101388. [CrossRef]
50. He, X.; Zhang, T.; Xue, Q.; Zhou, Y.; Wang, H.; Bolan, N.S.; Jiang, R.; Tsang, D.C. Enhanced adsorption of Cu (II) and Zn (II) fromaqueous solution by polyethyleneimine modified straw hydrochar. Sci. Total Environ. 2021, 778, 146116. [CrossRef] [PubMed]
Polymers 2021, 13, 4161 19 of 19
51. Ighalo, J.O.; Arowoyele, L.T.; Ogunniyi, S.; Adeyanju, C.A.; Oladipo-Emmanuel, F.M.; Belgore, O.R.; Omisore, M.O.; Adeniyi, A.G.Recent innovations in chemical engineering (formerly recent patents on chemical engineering). Bentham Sci. 2021, 14, 148–159.[CrossRef]
52. Xu, Z.; Lin, Y.; Lin, Y.; Yang, D.; Zheng, H. Adsorption behaviors of paper mill sludge biochar to remove Cu, Zn and As inwastewater. Environ. Technol. Innov. 2021, 23, 101616. [CrossRef]
53. Wang, Z.; Li, T.; Liu, D.; Fu, Q.; Hou, R.; Li, Q.; Cui, S.; Li, M. Research on the adsorption mechanism of Cu and Zn by biocharunder freeze-thaw conditions. Sci. Total Environ. 2021, 774, 145194. [CrossRef]
54. Deng, H.; Li, Y.F.; Kang, C.Y.; Yan, L.; Li, S.; Li, S. Adsorption characteristics of Cu (II) and Zn (II) in water on sulfhydryl modifiedcassava straw. Water Treat. Technol. 2021, 47, 22–27. [CrossRef]
55. Zhang, X.; Hao, Y.; Chen, Z.; An, Y.; Zhang, W.; Wang, X. Lignocellulose @activated clay nanocomposite with hierarchicalnanostructure enhancing the removal of aqueous Zn (II). Polymers 2019, 11, 1710. [CrossRef] [PubMed]
56. Dang, J.; Wang, H.; Wang, C. Adsorption of toxic zinc by functionalized lignocellulose derived from waste biomass: Kinetics,isotherms and thermodynamics. Sustainability 2021, 13, 10673. [CrossRef]
57. Li, Q.; Tang, L.; Hu, J.; Jiang, M.; Shi, X.; Zhang, T.; Li, Y.; Pan, X. Removal of toxic metals from aqueous solution by biochar’sderived from long-root Eichhornia crassipes. R. Soc. Open Sci. 2018, 5, 180966. [CrossRef]
58. Kayranli, B.; Gok, O.; Yilmaz, T.; Gok, G.; Celebi, H.; Seckin, I.Y.; Kalat, D. Zinc removal mechanisms with recycled lignocellulose:From fruit residual to biosorbent then soil conditioner. Water Air Soil Pollut. 2021, 232, 8. [CrossRef]
59. Ahmad, S.Z.N.; Wan, S.; Wan, N.; Ismail, A.F.; Yusof, N.; Mohd, Y.; Mohd, Z.; Aziz, F. Adsorptive removal of heavy metalions using graphene-based nanomaterials: Toxicity, roles of functional groups and mechanisms. Chemosphere 2020, 248, 126008.[CrossRef] [PubMed]
60. AnÐukic, A.B.; Kumric, K.; Vukelic, N.S.; Dimitrijevic, M.; Bašcarevic, Z.D.; Kurko, S.; Matovic, L. Simultaneous removal ofPb2+, Cu2+, Zn2+ and Cd2+ from highly acidic solutions using mechanochemically synthesized montmorillonite–kaolinite/TiO2composite. Appl. Clay Sci. 2015, 103, 20–27. [CrossRef]