
Light Harvesting by Dye Linked Conducting Polymers - OSTI ...
246
Ris0-PhD-26(EN) Light Harvesting by Dye Linked Conducting Polymers Kim Troensegaard Nielsen Ris0 National Laboratory Roskilde Denmark June 2006
-
Upload
khangminh22 -
Category
Documents
-
view
0 -
download
0
Transcript of Light Harvesting by Dye Linked Conducting Polymers - OSTI ...
Ris0-PhD-26(EN)
Light Harvesting by Dye Linked Conducting Polymers
Kim Troensegaard Nielsen
Ris0 National Laboratory Roskilde Denmark
June 2006

Author: Kim Troensegaard NielsenTitle: Light Harvesting by Dye Linked Conducting Polymers Department: The Danish Polymer Centre
This thesis is submitted in partial fulfilment of the requirements for the Ph D. degree at Department of Chemistry, Technical University of Demnark Abstract (max. 2000 char.):The fact that the fossil fuel is finite and that the detrimental long-tenn effects of letting C02 into our atmosphere exist, have created an enormous interest in developing new, cheap, renewable and less polluting energy resources. One of the most obvious abundant sources of energy in the solar system is the sun. Unfortunately the well developed silicon solar cells are very costly to produce. In an attempt to produce cheap and flexible solar cells, plastic solar cells have received a lot of attention in the last decades. There are still a lot of parameters to optimize if the plastic solar cell shall be able to compete with the silicon solar cells. One of the parameters is to ensure a high degree of charge carrier separation. Charge carrier separation can only happen at heterojunctions, which cover for example the interfaces between the polymers and the electrodes or the interface between an n- conductor and a pconductor. The facts that the charge carrier separation only happens at the heterojunctions limits the thickness of the active layer in solar cells and thereby the effectiveness of the solar cells.
In this project the charge carrier separation is attempted optimized by making plastic solar cells with a molecular heterojunction. The molecular heterojunction has been obtained by synthesizing a three domain super molecular assembly tenned NPN. NPN consists of two poly [ l-(2,5- dioctyltolanyljethynylene] chains (N-domains) coupled to the [10,20- bis(3,5-bisferf- buty lphenyl] -5,15 -dibromoporphinato] zinc(II) (P-domain).
It is shown that the N domains in NPN work as effective light harvesting antennas for the P domain and effectively transfer electrically generated excitons in the N domain to the P domain. Unfortunately the P domain does not separate the charge carriers but instead works as a charge carrier trap. This results in a performance of solar cells made of NPN that is much lower than the performance of solar cells made of pure poly [1 -(2,5- dioctyltolanyl)- ethynylene], Nn. On the other hand light emitting diodes, LEDs, made of Nn and NPN works very well. The LEDs made of Nn emits greenish blue light while LEDs made of NPN emits light in the near- infrared region.
During the synthesis of Nn and NPN it was found that remnants of the palladium catalysts caused problems in the control of the polymers and further made the resistance in the solar cells and LEDs so low that they did not work. A large effort has been made during the project to develop a method to remove remnants of metal catalysts from organic compounds and in particular polymers so that functional solar cells and LEDs could be made. It was succeeded to find a very effective method to remove remnants of metal catalysts from organic compounds by the discovery of the fact that azothiofonnamides are capable of dissolving metal nanoparticles by forming electron transfer complexes. Even metal wires of some metals can be dissolved by the azothiofonnamides within a reasonable time range.
Copyright © Kim Troensegaard Nielsen, 2006, Second edition.
Ris0-PhD-26(EN) June 2006
ISBN 87-550-3530-2
Contract no.:
Group's own reg. no.:
Sponsorship:
Cover :
Pages: 236Tables:References:
Riso National Laboratory Information Service Department P.O.Box 49 DK-4000 Roskilde DenmarkTelephone +45 46774004 biblMrisoe.dk Fax +45 46774013 www.risoe.dk

Table of Contents
Table of Contents...........................................................................................................................iiiPreface..............................................................................................................................................vAbstract...........................................................................................................................................ixDansk Resume................................................................................................................................ xiList of Abbreviations.................................................................................................................. xiii1 Introduction............................................................................................................................... 1
1.1 The choice of system...........................................................................................................62 Plastic Solar Cells......................................................................................................................9
2.1 Inorganic photovoltaic devices.......................................................................................... 92.1.1 Schottky junction, ohmic contact and p-n junction.............................................. 112.1.2 p-n junction solar cells..............................................................................................14
2.2 Polymer organic photovoltaics........................................................................................ 162.2.1 The MIM-model........................................................................................................17
2.2.1.1 Short-circuit condition..........................................................................................172.2.1.2 Open-circuit condition..........................................................................................172.2.1.3 Forward bias...........................................................................................................192.2.1.4 Reverse bias............................................................................................................ 19
2.2.2 Key parameteres........................................................................................................192.2.2.1 The efficiency (nf............................................................................................... 192.2.2.2 The open-circuit voltage (Voc)........................................................................... 192.2.2.3 The short-circuit current (Isc)............................................................................. 202.2.2.4 The fill factor (FF)...............................................................................................20
2.3 The device construction in this project........................................................................... 223 Sonogashira.............................................................................................................................. 25
3.1.1 The reaction mechanism.......................................................................................... 253.1.2 By-products............................................................................................................... 273.1.3 Reaction conditions..................................................................................................27
3.1.3.1 The reaction temperature.....................................................................................283.1.3.2 The base................................................................................................................. 283.1.3.3 The catalyst............................................................................................................29
3.2 CTS cross coupling.............................................................................................................314 The Monomer Unit..................................................................................................................335 Monodisperse Oligomers....................................................................................................... 416 The Polymers........................................................................................................................... 517 The Palladium Saga.................................................................................................................59
7.1 Diethylammonium DiethyldithioCarbamate (DDC).................................................... 617.2 The azothi oformami des.................................................................................................... 62
7.2.1 Analytic tool...............................................................................................................657.2.2 Test of L1 and L2..................................................................................................... 667.2.3 Structural determination.......................................................................................... 67
7.3 Conclusion..........................................................................................................................698 Crystallization..........................................................................................................................739 Characterization......................................................................................................................81
iii

9.1 The electronic levels of Nn............................................................................................... 819.2 Charge carrier mobilities in Nn........................................................................................839.3 UV-Vis characterization...................................................................................................859.4 Fluorescence characterization..........................................................................................889.5 LED devices....................................................................................................................... 949.6 POPV devices .................................................................................................................. 96
10 Conclusion............................................................................................................................10111 A Tellurium Story............................................................................................................... 103
11.1 Introduction.......................................................................................................................10311.2 Pyroelectricity.................................................................................................................. 10411.3 4,7-dimethoxybenzo[c]tellurophene............................................................................. 105
12 Appendix A...........................................................................................................................11112.1 Pd(PPhg)4 catalyst............................................................................................................ 11112.2 PdCl2(PPh3)2 catalyst...................................................................................................... 11112.3 2,5-dioctylbenzene (1).................................................................................................... 11212.4 1-(4-bromophenyl)-2-trimethylsilylacetylene (6)....................................................... 11312.5 1-(4-iodophenyl)-2-trimethylsilylacetylene (7)...........................................................11412.6 4-(2-trimethylsilylethynyl)benzoic acid........................................................................11512.7 The Cs salt.........................................................................................................................11612.8 Coupling of the Cs salt to the resin............................................................................... 11612.9 Coupling of the iodomonomer to the anchor unit....................................................... 11612.10 The deprotection of the anchored unit..................................................................... 11712.11 Cleaving of the anchored unit..................................................................................117
13 Appendix B...........................................................................................................................11913.1 The list of publications.....................................................................................................119
iv

Preface
Preface
This thesis presents the main results of my work carried out at The Danish Polymer Centre, Riso National Laboratory and Department of Chemistry, Technical University of Denmark (DTU) in the period from May 2003 to June 2006. The work has been carried out under supervision of Senior Scientist Frederik C. Krebs (Riso) and Associated Professor Pernille Harris (DTU) and was financed by STVF. The thesis is submitted to The Faculty of Chemistry and Biotechnology, Technical University of Denmark, in order to obtain the academic degree of Doctor of Philoshophy, Ph D.
The thesis is divided into three main parts. Part one (chapter 1-3) is introductory chapters, which deals with a short introduction to the different aspects in making solar cells of plastic and gives the status of the research in plastic solar cells. Furthermore the objectives of the Ph D. project are given and discussed (chapter 1). Chapter 2 and 3 in part one are two theory chapters. The first theory chapter deals with a short introduction to how both inorganic and organic solar cells work (chapter 2), while the second theory chapter describe the Sonogashira cross coupling reaction (chapter 3), which is the main reaction type used in this thesis.
Part two describes the major part of my work, and deals with the synthesis of the monomer unit (chapter 4), problems during synthesis of monodisperse oligomers (chapter 5), the synthesis of the polymers (chapter 6), problems with remnants of the palladium catalysts in the polymers and the development of a method to remove palladium from organic samples (chapter 7), attempts to crystallize mono disperse oligomers (chapter 8), the characterization of the polymers and light emitting devices and solar cells made from the synthesized polymers (chapter 9) and a summery of the main results (chapter 10).
Part three describes my contribution to a project concerning an unusually stable tellurium compound showing pyroelectric properties. The work was carried out in collaboration with people from Copenhagen University.
At the end of the thesis two appendixes are presented. Appendix A describes the experimental work that has not been published and Appendix B contains copies of published work, which I have contributed to. The work carried out by me has altogether contributed to six papers, one patent, one proceeding and one poster.
There are lots of people I would like to thank for their help and interest in my work during the project.
In particular I would like to thank Frederik C. Krebs for his supervision, drive and forever and ever showing optimism, and interest in my work. It has been a true pleasure to work with Frederik and his always high optimism and enthusiasm have been very catching. I would also like to thank Mikkel Jorgensen for his action as a kind of assistant supervisor always ready to answer my questions, when Frederik has been impossible to reach because of his many activities. I am deeply grateful for that.
v

Preface
Special thanks to Ole Hagemann, Jan Alstrup, Holger Spanggaard, Klaus Bechgaard, Kion Norrman, Lotte Nielsen, Ole Kristoffersen, Birgit Jensen, Lizette Bruun and Eva Bundgaard. Ole is the most skilled technician in organic chemistry I have ever met, and I have received a lot of benefit from his great knowledge concerning practical organic chemistry. Furthermore he has been a god friend and the fact that our sons have been in the same day nursery has given us a lot of things to talk about. Jan is like Ole a very skilled technician and has helped me producing devices and has always been ready to give guided tours to the production line for plastic solar cells, when I have visits from different High schools in Denmark or Sweden. Holger has been a great laboratory mate and have taught me how to use the fluorescence spectrophotometer. The great collaboration with Holger has lead to two papers, one proceeding and one poster. Klaus is my former head of department and is now full professor at Copenhagen University. Furthermore he has been supervisor for both Frederik and Mikkel, and he has an impressive knowledge of both inorganic and organic chemistry. I would like to thank Klaus for the excellent collaboration in order to remove remnants of palladium and other metal catalyst for our compounds, which have lead to three papers and one patent. Kion is the third senior scientist in the solar cell group at the department, and I will like to thank him for his always good mood, which always spreads happiness around him to the rest of us. His different funny emails have lead to many funny conversations. Thanks for that Kion. Lotte is like Ole and Jan a skilled technician and I will like to thank her for always having time to answer question concerning the department's analytic SEC equipments and to teaching me how to use the MALDI-TOF spectrometer. Ole K. and Birgit is the infrastructure of the department, without them nothing would be possible. They have made it a true pleasure to be organic synthetic chemist in this department by taking care of all the dirty dishes, the purchasing of chemicals, helping with mounting of new equipment etc. Lizette has been a good friend, and we have enjoyed many hard working hours at the spinning lectures in the fitness center, but all her cakes and her ice cream system have resulted in that my shape stays the same. Eva shall have a lot of thanks for always being joyful and being able to coop with all the guy talk at lunch.
I would also thank the rest of the solar cell group for good collaboration and a nice solidarity. Further I would like to thank the rest of the people in the polymer centre for being good colleagues.
From DTU I would like to thank the technicians Lise Lotte Berring and Astrid Schoneberg for helping me to choose the right crystals and to use the SMART system and Pernille Harris for her supervision, and her optimism with regard to growing crystals of the monodisperse oligomers. Further I will like to thank Pernille for teaching me in the use of the SMART and how to use the X-ray software, always having time for me, making sure that the paperwork was done in time. Unfortunately the project did not lead to much structure solving as anticipated in the beginning because I was unable to grow crystals of the monodisperse oligomers, but at least we succeeded in solving the crystal structures of the electron transfer complexes, which lead to one structure paper.
From the University of Roskilde I will like to thank my former supervisor professor Poul Erik Hansen for the many discussions concerning the unusually broad lines in the NMR spectra of the electron transfer complexes and for providing the 600 MHz NMR spectrophotometer to my disposal. Furthermore I will like to thank Bjarke Hansen for the proofreading of this thesis.
vi

Preface
Last but not least I will thank my family and particular my wife Bettina for her unusual understanding, when I have been coming home late from work and for her always continuing support.
I therefore dedicate this work to her and my two children Lukas and Laika.
vii

viii

Abstract
Abstract
The fact that the fossil fuel is finite and that the detrimental long-term effects of letting C02 into our atmosphere exist, have created an enormous interest in developing new, cheap, renewable and less polluting energy resources. One of the most obvious abundant sources of energy in the solar system is the sun. Unfortunately the well developed silicon solar cells are very costly to produce. In an attempt to produce cheap and flexible solar cells, plastic solar cells have received a lot of attention in the last decades. There are still a lot of parameters to optimize if the plastic solar cell shall be able to compete with the silicon solar cells. One of the parameters is to ensure a high degree of charge carrier separation. Charge carrier separation can only happen at heterojunctions, which cover for example the interfaces between the polymers and the electrodes or the interface between an n-conductor and a p- conductor. The facts that the charge carrier separation only happens at the heterojunctions limits the thickness of the active layer in solar cells and thereby the effectiveness of the solar cells.
In this project the charge carrier separation is attempted optimized by making plastic solar cells with a molecular heterojunction. The molecular heterojunction has been obtained by synthesizing a three domain super molecular assembly termed NPN. NPN consists of two poly[l-(2,5-dioctyltolanyl)ethynylene] chains (N-domains) coupled to the [10,20-bis(3,5-bis- fe/T-butylphenyl]-5,15-dibromoporphinato]zinc(II) (P-domain).
The synthesized molecular heterojunction, NPN.
It is shown that the N domains in NPN work as effective light harvesting antennas for the P domain and effectively transfer electrically generated excitons in the N domain to the P domain. Unfortunately the P domain does not separate the charge carriers but instead works as a charge carrier trap. This results in a performance of solar cells made of NPN that is much lower than the performance of solar cells made of pure poly[l-(2,5-dioctyltolanyl)- ethynylene], N„. On the other hand light emitting diodes, LEDs, made of N„ and NPN works very well. The LEDs made of N„ emits greenish blue light while LEDs made of NPN emits light in the near-infrared region.
During the synthesis of N„ and NPN it was found that remnants of the palladium catalysts caused problems in the control of the polymers and further made the resistance in the solar cells and LEDs so low that they did not work. A large effort has been made during the project to develop a method to remove remnants of metal catalysts from organic compounds and in
IX

Abstract
particular polymers so that functional solar cells and LEDs could be made. It was succeeded to find a very effective method to remove remnants of metal catalysts from organic compounds by the discovery of the fact that azothioformamides are capable of dissolving metal nanoparticles by forming electron transfer complexes. Even metal wires of some metals can be dissolved by the azothioformamides within a reasonable time range.
x

Dansk Resume
Dansk Resume
Da masngden af fossilt brasndstof er begrasnset, og da der er pavist skadelige langtidseffekter ved udledning af CO2 i atmosferen, er der opstaet en enorm interesse i at fremstille nye, billige, mindre forurenende og vedvarende energikilder. En af de mest abenlyse vedvarende energikilder i vores sol system, er solen. Desvasrre er silicium-baserede solceller med fornuftig levetid og effektivitet meget dyre at producere. I forsog pa at fremstille billige og fleksible solceller bar specielt solceller lavet af plastik fact stor opmasrksomhed i nyere tid. Der er stadig mange parametre, der skal optimeres, hvis plastiksolcellerne skal vasre i stand til at konkurrere med silicium-baserede solceller. En af parametrene er at sikre separation af dannede ladningsbasrere. Separationen af ladningsbasrereme kan kun ske nasr graenseflader mellem f.eks. polymerer og elektroder eller gramseflader imellem en n-leder og en p-leder. Dette begrasnser, hvor tykt det aktive lag i solceller kan vasre, og dermed effektiviteten af solcellerne.
I dette projekt bar jeg forsogt at optimere ladningsbaerereseparationen ved at lave plastiksolceller, der indeholder en molekylasr grasnseflade. Den molekylasre grasnseflade er lavet ved at syntetisere et tre-domasne supermolekyle navngivet NPN. NPN bestar af to poly[l-(2,5-dioctyltolanyl)ethynylen] kasder (N-domasner) koblet til [10,20-bis(3,5-bis-te/^- butylphenyl]-5,15-dibromoporphinato]zink(II) (P-domasnet).
c—
N
w
Nv JDen syntetiserede molekylaere heterojunction, NPN.
I afhandlingen vises det, at N-domaenerne i NPN virker som meget effektive lyshostende antenner for P-domasnet og effektivt overforer excitoner fra N-domaenerne til P-domaenet. Desvaerre separerer P-domaenet ikke ladningsbaererne, men virker i stedet som en ladningsbaerefaelde. Dette resulterer i at ydeevnen for solceller lavet af NPN er meget lavere end ydeevnen for solceller lavet af den rene poly[ 1 -(2,5-dioctyltolany 1 )ethyny 1 en], N„. Pa den anden side virker lysdioder lavet af bade NPN og N„ rigtig godt. Lysdioder lavet af N„ udsender blagront lys, mens lysdioder lavet af NPN udsender lys i den naer infrarode region.
Under syntesen af N„ og NPN observerede jeg, at rester af palladiumkatalysatoren gav problemer med at kontrollere polymereme og yderligere blev modstanden i solcellerne og lysdioderne sa lav, at de ikke virkede. En stor del af projektet er gaet til at udvikle en metode til fjemelse af rester af metalkatalysatorer fra savel sma organ!ske forbindelser som polymerer. Isaer bar det v as ret vigtigt at fa ljemet katalysator rester fra polymereme, sa funktionelle solceller og lysdioder bar kunnet fremstilles. Den store arbejdsindsats bar firugt, og det lykkedes at finde en meget effektiv metode til ljemelse af rester af metalkatalysatorer
xi

Dansk Resume
fra organiske forbindelser ved opdagelsen af azothioformamidernes evne til at opl0se metal nanopartikler under dannelse af el ektronoverf0rel se s komplekser. Selv metal trade af visse metaller kan blive opl0st af azothioformamiderne inden for en rimelig tidsramme.
Xii

List of Abbreviations
List of Abbreviations
DDC
Ef
Eg
FF
Io
Jdark
Imax
IP
Jph
IPV
ISC
Isc
ITO
LED
MOPV
M*
OPV
OSC
PCBM
PD
PEDOT:PSS
Pin
POPV
P out
PPE
PPV
PR-TRMC
PV
Rserial
Rshunt
SEC
TB
Diethylammonium diethyldithiocarbamate
Fermi level
Band gap
Fill factor
The dark saturation current
The dark current
The current at the maximum power point
Ionization potential
The photo current
Inorganic photovoltaic
Inorganic semiconductor
The short-circuit current
Indium tin oxide
Light emitting diode
Molecular organic photovoltaic
Molecular weight
Organic photovoltaic
organic semiconductor
[6,6]-phenyl C6i butyric acid methyl ester
Polydispersity
Poly(ethylene dioxythiophene) doped with polystyrene sulphonic acid
The power input
Polymer organic photovoltaic
The power output
Poly(phenylene ethynylene)
Poly(phenylene vinylene)
Pulse radiolysis time-resolved microwave conductivity
Photovoltaic
Serial resistance
Shunt resistance
Size exclusion chromatography
Through bond
xiii

TBAF Tetrabutylammonium fluoride
TS Through space
UPS Ultra photoelectron spectroscopy
Vmax The voltage at the maximum power point
Voc The open-circuit voltage
tfeff The efficiency
0 Workfunction
Xs Electron affinity
List of Abbreviations
xiv

Introduction
c t i o n
The recognition that the supply of fossil fuel is finite and the detrimental long-term effects of letting CO2 into our atmosphere are the seeds for a great motivation to develop new, cheap, renewable and less polluting energy resources. Obvious alternatives to the fossil fuel today are nuclear power, wind energy, water energy and sun energy. Nuclear power plants deliver very cheap and renewable energy, but unfortunately it is not a potential energy source in many countries for political reasons owed to the fear of security and health risk. The interest in wind energy is growing, and e g. in Denmark nearly 20 %, of the total annual electricity consumption is covered by windmills.1 Windmills however are not particularly beautiful, cannot be placed anywhere, and need maintenance. Water energy is cheap and renewable but in general requires rivers, which we do not have in e g. Denmark. Solar energy is renewable, it is ubiquitous and solar cells can be placed everywhere, even in a satellite, but unfortunately the conventional solar cells on the market are very expensive. Even though the photovoltaic (PV) effect was discovered in 1839 by Edmond Becquerel2 and the first crystalline silicon PV device was developed in 1954 at Bell Laboratories3 it has not yet been possible to get the price pr. watt down, so that it can influence the energy production markets significantly. The reason for the high power prize is that the cells are made of inorganic semiconductors (ISC) such as silicon (Si) and Gallium Arsenide (GaAs), which need very high production temperatures and therefore are expensive to produce. For instance metallic Si is produced by reduction of quartz (SiCE). The reduction is performed with coke at 4000 °C and the product is about 98 % pure Si. Further purification is then typically achieved by reaction with hydrogen chloride to form trichlorosilane (SiHCk), which is purified by fractional distillation and finally reduced to Si by hydrogen.4 More than fifty years of research since the development of the first silicon solar cell has lead to a world PV module production of 560.27 MW in 2002, with a power cost of ~$4/W.5 The energy produced by PV therefore counts for less than 0.1 % of the total world energy production.6 If the progress of the prizes for the conventional solar cells continue to decrease with the same rate as now, the best estimates of the power cost in 2014 would be 1.4 $/W, which is still too high.5A very promising and interesting alternative to the conventional inorganic solar cells are solar cells based on organic semiconductors (OSC). OSC is a unique class of materials, which already have shown potential applications in several types of optoelectronic devices. Compared with ISC, OSC show some very interesting advantages: They are very cheap in production and can be produced near room temperature, the purification is easy and cheap, the organic photovoltaic (OPV) devices can be made flexible, they are lightweight and can be incorporated in e g. clothes.6'7'8 It should be noted that the disadvantages of OPV compared to inorganic photovoltaic (IPV) devices are the performance and the lifetime. The power conversion efficiencies for single crystal silicon cells are as high as 24 % and 32.5 % for a multijunction GaAs solar cell, while the best organic solar cells have power conversion efficiencies around 4-5 %7'918 Concerning the lifetime the IPV devices are extremely stable and have a lifetime of more than 25 years, while the estimated lifetime of the most stable OPV devices is only a few years.10 In this context it should be mentioned that the OPV
I n t r 0 d1
1

Introduction
devices with longer lifetime are not the same OPV devices with power conversion efficiencies of > 3 %.In summary, if either the IPV or the OPV devices shall be able to break through to the energy market and not only be limited to a niche market, they have to fulfil three parameters: Long lifetime, good power conversion efficiency and low cost. Brabec has visualized this by the critical triangle (see Figure l).11 As mentioned above and as seen in Figure 1 neither the IPV nor the OPV devices fulfil all three parameters.
Figure 1. The Brabec critical triangle for photovoltaics. If a Photovoltaic is going to be a success on the energy market, it has to fulfill all three requirements: Lifetime, efficiency and low cost. On the figure the current achievement of IPV and OPV devices is circled. The IPV devices have good power conversion efficiency and a long lifetime, but are very expensive; the OPV devices have very low cost, but moderately low power conversion efficiency and relatively short lifetime.
The basis of this thesis is the OPV devices, which can be divided into two main groups, distinguished by the type of material and fabrication methods: Molecular organic photovoltaics and polymer organic photovoltaics (plastic solar cells).7The molecular organic photovoltaics (MOPV) are inspired by the photosynthesis in plants and consist of molecular dyes that are macrocyclic molecules like chlorophyll (Chart 1 show structures of some of the small molecules, which are often used in MOP Vs). In MOPV devices the active layer is sublimed under vacuum onto the electrodes. The most efficient solar cells have an active layer, which consists of an organic heterojunction between hole (p- type) and electron (n-type) transporting organic materials. Examples of p type materials are: Metal-phthalocyanines (MPc), metal-5,10,15,20-tetraphenylporphyrins (MTpp), merocyanine dyes; and n-types are: 3,4,9,10-perylene tetracarboxylic-bis-benzimidazole (PTCBI), metal- 5, 10,15,20-tetra(4-pyridyl)porphyrin and fullerenes (see Chart l).7'12The breakthrough of the MOP Vs was in 1986, where Tang reported a MOPV device with a power conversion efficiency of 1 %.13 The device was a bilayer, where CuPc was employed as the p-conductor and the n-conductor was PTCBI. Recently, the Princeton group has produced MOPV cells with a power conversion efficiency of 5 %.14 This was achieved by doping CuPc with Ceo and optimizing the morphology of the heterojunction between Ceo doped CuPc and PCTBI.The polymer organic photovoltaics (POPV) consist of conjugated polymers sandwiched between two different electrodes. One of the biggest advantages of the POPV devices is that the polymers give the opportunity to prepare devices by solution processing which is very cheap and easy, so it might lead to cheap preparation of large area devices. Solution
2

Introduction
processing includes methods like spin coating, screen or inkjet printing and even roll-to-roll processing.15In Chart 2 examples of different types of conjugated polymer used in POPV devices are shown. Before the POPV devices can become the success many people hope for and before the industry will be interested in producing them, solutions to two common problems are needed. The two problems are the stability and the power conversion efficiencies of the POPV devices.Regarding the stability or the lifetime of POPV devices, it is not necessary that the devices has the same long lifetime as the IPV devices, because they are much cheaper and can therefore be replaced many times and still be an economically favoured choice compared to the IPV devices. On the other hand before devices for durable applications are interesting, they need a shelf lifetime of several years and an operational lifetime of tens of thousands of hours.16
Chlorophyll a
N—M—N
N—M—N
Merocyanine dye
Chart 1. Examples of some dye molecules used for MOPV devices.
3

Introduction
Chart 2. Commonly used conjugated polymers in POPV devices, (a) polyacetylene, (b) poly(p- phenylene vinylene) (PPV), (c) poly(/>phcnylcnc cyano vinylene) (CN-PPV), (d) poly(p (2-methoxy- 5-(2',4'-dimethylpentyloxy))phenylene vinylene) (MDMO-PPV), (e) poly(/;-phenylene ethynylene) and (f) poly(3-alkyl-thiophene) (P3AT).
Krebs et al. have recently solved the lifetime problem very elegantly.10 They have used ester groups as side groups on the polymer backbones. The side groups give the opportunity for solution processing, and can here after be removed by thermal cleaving.17 In this way they obtain an active layer in the POPV devices, which is very rigid, hard and insoluble. The diffusion of the oxygen and ions from the electrodes through the active layer is slowed down and in that way prevented from destroying the devices. Thus they have obtained devices, which have shelf-lifetimes as well as operational lifetimes of more than 2 years under the exclusion of water and oxygen. Unfortunately the power conversion efficiencies are only 0.167 %. A big challenge lies in combining this knowledge of lifetime with the knowledge of polymers with good power conversion efficiency. This challenge leads us to the other main problem: The power conversion efficiency.
6e+18Absorption of an oligo-PV derivat
------- NREL Standard AM 1.5------- Rise AM 1.55e+18
4e+18
3e+18
o 2e+18
le+18
Wavelength [nm]
Figure 2. The photon flux of the AM 1.5 sun simulators used at Rise and of the National Renewable Energy Laboratory (NREL) standard AM 1.5 compared with the absorption of a typically oligo Phenylene Vinylene derivate (o/zgo-PV). The AM (Air Mass) 1.5 spectra represent the terrestrial solar spectrum when the sun's position vector is placed 48.3° away from its perpendicular position, which correspond to the situation in Denmark.
4

Introduction
The power conversion efficiency of the best POPV devices is about 4.4 %,18 which is still far from the efficiencies of the IPV devices. There are several reasons for the small power conversion efficiencies of the POPV devices. Some obvious reasons are:• There is not a perfect match between the solar spectrum and the optical absorption bands of
the polymers. The maximum spectral flux of the sun (AM1.5) is between 550 and 900 nm (see Figure 2), where the majority of known conjugated polymer absorb below 500 nm. Polymers with low band gap are therefore needed to absorb the red photons.5, 19,20
• One of the most fundamental differences between IPV and OPV devices is that in IPV devices light absorption leads directly to the formation of free electron-hole pairs, where the electron and the hole will be driven to the respective electrodes by the built in field.21,22 In OPV devices the light absorption leads to formation of excitons, which can be considered as a electrically neutral tightly electrostatically bound electron-hole pair or as a mobile excited state. The binding energy of the excitons is in the order of several tenths of an electron volt,7 and a typical value is 0.25 eV.23 This means that the built in field generated from the use of electrodes with different workfunctions is insufficient to dissociate the excitons into free charge carriers (electrons and holes),7 and the dissociation can therefore only happen at a heterointerface e.g. at the electrodes.
• The low charge carrier mobilities in polymer semiconductors is limiting the thickness of the active layer, because the photo generated excitons have to be transported by diffusion within their lifetime to a heterointerface (e.g. the interface between the electrodes and the active layer) to dissociate into free charge carriers. The diffusion length of an exciton in polymer semiconductors is typically in the order of 10 nm. This means that the exciton can travel 10 nm before it recombines and decays to the ground state.5
• A better understanding of the charge transport across different interfaces, can lead to an optimisation of the cells by reducing e.g. the contact resistance.5 Brabec et al. have recently shown that the insertion of a thin layer of LiF under e.g. the negative aluminium electrode enhances the efficiency by more than 20 %.24
It can be concluded that lots of areas need to be investigated with an overall performance enhancement of the POPV devices in mind. It is unrealistic to believe that all the mentioned problems can be considered in this thesis. I have therefore decided to limit the topic of this thesis to an optimisation of the power conversion efficiency in POPV devices through a more effective dissociation of the photo generated excitons.As already mentioned in the list above the only place a photo generated exciton can dissociate in a POPV device consisting of a single conjugated polymer sandwiched between to different electrodes, is at the heterointerface between the electrodes and the polymer. The short diffusion length of the excitons therefore limits the thickness of the polymer layer used to generate free charge carriers and thereby also limits the quantity of photo generated current in the devices. Several attempts have been made to optimize the amount of dissociated excitons, and common for these attempts are the application of doping the polymer with either molecules or polymers having a higher electron affinity and electron transport than the pure polymer. The most successful attempts have employed mixing the polymer with fullerene derivatives (e.g. [6,6]-phenyl C61 butyric acid methyl ester (PCBM)) and hereby make a bulk heterojunction, by which power conversion efficiencies above 4 % have been achieved.18,25,26 The use of fullerenes results in an ultra fast metastable photoinduced electron transfer through space (TS) from the polymer to the fullerene with a larger electron affinity.27,28 As a transfer process through space is involved, the rate constant of the TS electron transfer process depend
5

Introduction
on the distance between the donor and the acceptor molecule. To maximize the area of the heterojunction it is required that the PCBM and the polymer are mixed very well. To avoid phase separation or large domain size upon the mixing of the acceptor and the donor molecules, a molecular heterojunction can be designed. In molecular heterojunctions the donor and the acceptor molecules are covalently bound together, which will ensure that the area of the heterojunction is maximized. Nierengarten et al.29 Peeters et al.30 and van Hal et al.31 were among the first who in 1999 and in 2000 investigated charge separation in phenylene vinylene and thiophene oligomers covalently linked to fullerene. They both discovered that the length of the conjugated oligomers determined whether they observed an energy transfer to the fullerene from the oligomers or a charge separation (electron transfer). The critical length of the oligomers was between 3 and 4 units. The longer oligomers favour the electron transfer, while the shorter oligomers favour the energy transfer. Other molecular heterojunctions, where polymers or oligomers have been covalently bound to dyes have been investigated by Krebs et al. and Li et al. Krebs et al. have investigated 4-aza-4-(4'-(poly- 2',5'-dioctyl-4,4"-terphenylene-1-cyanovinylene-2-yl)biphen-4-yl)-8,12-dioxa-4,8,12,12c- tetrahydrodibenzo[cd,mn]pyrenium tetrafluoroborate (JA-assembly)32,33 and 10,20,diphenyl- 5,15-bis(4-(poly-2',5'-dioctyl-4,4''-terphenylene-1-cyanovinylene-2-yl)phenyl)porphyrin (JPJ-assembly)34 and Li et al. have investigated porphyrins with four monodisperse oligo fluorine arms (PF4 assembly).35 Common for the three investigations is the observation of an effective energy transfer from the polymers or the oligomers to the dye molecules. Further Krebs et al. observed a 100-fold increase in magnitude of the short circuit current in PV devices of the JA-assembly compared to the PV devices of the pure J domain (the poly terpehnylenecyanovinylene).33
Inspired by the work of Krebs et al.1 the aims of the present work are the following:• To synthesise new molecular heterojunctions consisting of super molecular
assemblies, where conjugated polymers are covalently bound to a dye molecule.• To characterise the structural end electrical properties of the super molecular
assemblies and the pure polymers.• Testing the assemblies and the pure polymers properties as a light harvesting
system.• Testing PV devices made from the synthesised assemblies and polymers.
1.1 The choice of systemTo have the best foundation for comparison with results from the literature,34,35 it was decided to use porphyrin as the dye. The polymer backbone was chosen to be poly(phenylene ethynylene)s. The reason for the choice of the triple bonds in the polymer backbone was to ensure very stiff polymer chains compared to the PPVs in the study of Krebs et al34 The stiff polymer chain may reduce a potential torsion angle out of plane between the polymer and the dye and a potential torsion angle out of plane between the individual monomer units in the polymer chain (see Figure 3 for illustration of the torsion angles). The reduction of possible distortions of the backbone could open up for an increased conjugation and an increased charge carrier mobility, which hopefully can lead to an increased energy transfer from the polymer chains to the dye molecule.
1 The work of Li et al. was not published, when this study was started.
6

Introduction
Figure 3. The chosen NPN super molecular assembly, which is a three-domain structure. Possible torsion angles is marked with arrows.
To obtain solubility of the polymer it was decided to incorporate two alkyl groups on the polymer backbone,36 but only on every second phenyl ring to minimize the distortion effect of the alkyl groups on the backbone.37 The chosen super molecular assembly is illustrated in Figure 3, where the poly[l-(2,5-dioctyltolanyl)ethynylene] constitute the N-domains and the [10,20-bis(3,5-bis-fe7T-butylphenyl]-5,15-dibromoporphinato]zinc(II) constitute the P- domain.
Another reason to choose the poly(phenylene ethynylene) as the polymer backbone of the system is that it can be synthesised by the Sonogashira cross-coupling reaction,38 which in theory gives the possibility to stepwise synthesise monodisperse oligomers. Hence it is possible to investigate the influence of the length of the polymer chains on the properties of the NPN assembly. Furthermore, the combination of the stiff monomer unit and the possibility to synthesise monodisperse oligomers, makes it probable that crystallisation of the oligomers could be achieved allowing for an investigation of the crystal structure of the oligomers.
References
1 Krebs, F. C.,Naturens Verden, 2003, 10, 26-40.2 (A) Becquerel, A. E., Compt. Rend. Acad. Sci., 1839, 9, 145-149.
(B) Becquerel, A. E., Compt. Rend. Acad. Sci., 1839, 9, 561-567.3 Chapin, D. M.; Fuller, G. L. and Pearson, G. L., J. Appl. Rhys., 1954, 25, 676-677.4 Tsubomura, H. and Kobayashi, H , Critical Reviews in Solid State and Materials Sciences, 1993,18,
261-326.5 Shaheen, S. E.; Ginley, D. S. and Jabbour, G. E., MRS Bulletin, 2005, 30, 10-15.6 Spanggaard, H. and Krebs, F. C , Sol. Energy Mater. Sol. Cells., 2004, 83, 125-146.7 Lane, P. A. and Kafafi, Z. H , Organic Photovoltaics - Mechanisms, Materials, and Devices, 2005,
chapter 4, Editors: Sun, S. S. and Saricifci, N. S., Taylor & Francis Group, EEC, Boca Raton.8 http://www.risoe.dk/solarcells/element-ary.htm
7
Introduction
9 Hepp, A. F., Bailey, S. G. and Raffaelle, R. P., Organic Photovoltaics - Mechanisms, Materials, and Devices, 2005, chapter 2, Editors: Sun, S. S. and Saricifci, N. S., Taylor & Francis Group, LLC, Boca Raton.
10 Krebs, F. C. and Spanggaard, H., Chem. Mater., 2005, 17, 5235-5237.11 Brabec, C. J., Sol. Energy Mater. Sol. Cells., 2004, 83, 273-292.12 Wohrle, D. and Meissner, D., Adv. Mater., 1991, 3, 129-138.13 Tang, C., Appl. Phys. Lett., 1986, 48, 183-185.14 Forrest, S. R., MRS Bulletin, 2005, 30, 28-32.15 Muller, C. D.; Falcou, A. ; Reckefuss, N.; Rojahn, M.; Wiederhirn, V.; Rudati, P.; Frohne, H.;
Nuyken, O.; Becker, H. and Meerholz, K., Nature, 2003, 421, 829-833.16 Brabec, C. J; Sariciftci, N. S. and Hummelen, J. C., Adv. Funct. Mater., 2001, 11, 15-26.17 Liu, J.; Kadnikova, E. N.; Liu, Y.; Mcehee, M. D. and Frechet, J. M., J. Am. Chem. Soc., 2004, 126,
9486-9487.18 Li, G.; Shotriya, V.; Huang, J.; Yao, Y.; Moriarty, T.; Emery, K. and Yang, Y., Nature Materials,
2005, 4, 864-868.19 Sariciftci, N. S., Materialstoday, 2004, 36-40.20 Schilinsky, P.; Asawapirom, U.; Scherf, U.; Biele, M. and Brabec, C. J., Chem. Mater., 2005, 17,
2175-2180.21 Tsubomura, H. and Kobayashi, H., Critical Reviews in Solid State and Materials Sciences, 1993, 18,
261-326.22 Sze, S. M., Physics of Semiconductor Devices, 2003, chapter 14, John Wiley & Sons, New York.23 Gregg, B. A. and Hanna, M. C., J. Appl. Phys., 2003, 93, 3605-3614.24 Brabec, C. J.; Shaheen, S. E.; Winder, C. and Sariciftci, N. S., Appl. Phys. Lett., 2002, 80, 1288
1290.25 Wienk, M. M.; Kroon, J. M.; Verhees, W. J. H.; Knol, J.; Hummelen, J. C.; van Hal, P. A. and
Janssen, R. A. J., Angew. Chem. Int. Ed., 2003, 42, 3371-3375.26 Svensson, M.; Zhang, F.; Veenstra, S. C.; Verhees, V. J. H.; Hummelen, J. C.; Kroon, J. M.,
Inganas, O. and Andersson, M. R., Adv. Mater., 2003, 15, 988-991.27 Sariciftci, N. S.; Smilowitz, L.; Heeger, A. J. and Wudl, F., Science, 1992, 258, 1474-1476.28 Hoppe, H. and Sariciftci, N. S., Organic Photovoltaics - Mechanisms, Materials, and Devices,
2005, chapter 9, Editors: Sun, S. S. and Saricifci, N. S., Taylor & Francis Group, LLC, Boca Raton.29 Nierengarten, J. F.; Eckert, J. F.; Nicoud, J. F.; Ouali, L.; Krasnikov, V. and Hadziioannou, G.,
Chem. Commun., 1999, 617-618.30 Peeters, E.; van Hal, O. A.; Knol, J.; Brabec, C. J.; Sariciftci, N. S.; Hummelen, J. C. and Janssen,
R. A. J., J. Phys. Chem. B, 2000, 104, 10174-10190.31 Van Hal, P. A.; Knol, J.; Langeveld-Voss, B. M. W.; Meskers, S. C. J.; Hummelen, J. C. and
Janssen, R. A. J., J. Phys. Chem. A, 2000, 104, 5974-5988.32 Krebs, F. C.; Spanggard, H.; Rozlosnik, N.; Larsen, N. B. and Jorgensen, M., Langmuir, 2003, 19,
7873-7880.33 Krebs, F. C., Sol. Energy Mater. Sol. Cells., 2003, 80, 257-264.34 Krebs, F. C.; Hagemann, O. and Spanggard, H., J. Org. Chem., 2003, 68, 2463-2466.35 Li, B.; Li, J.; Fu, Y. and Bo, Z., J. Am. Chem. Soc., 2004, 126, 3430-3431.36 Wong, M. S.; Zhong, H. L.; Shek, M. F.; Chow, K. H.; Tao, Y. and D’lorio, M., J. Mater. Chem.,
2000, 10, 1805-1810.37 Gill, R. E.; van Hutten, P. F.; Meetsma, A. and Hadziioannou, G., Chem. Mater., 1996, 8, 1341
1346.38 Sonogashira, K; Thoda, Y. and Hagihara, N., Tetrahedron Lett., 1975, 50, 4467-4470.
8

Plastic Solar Cells
Plastic Cells
The conversion of light into electricity can in principle be divided into the following four steps: Light absorption, generation of an electron hole pair, separation of the electron hole pair into free charge carriers and transport of the free charge carriers to the respective electrodes. In Solar cells (photovoltaic devices), whether it is polymer organic photovoltaics (POPV) or inorganic photovoltaics (IPV), the light absorption takes place in semi conducting materials sandwiched between two electrodes. The absorption of light results in excitation of electrons from the valence bands to the conduction band, but to achieve separation of the electron from the hole an electric field stronger than the columbic forces between the electrons and the holes is needed. It is only at the interface, also called contact junction, between the semiconductors and the electrodes or the interface between two semiconductors with different workfunctions such electrical fields are found. The excitation of electrons and the following charge separation in crystalline inorganic semiconductors is well described by the use of energy band formalism.1'2 These processes are in the case of polymeric organic semiconductors not so well described as in the case of the inorganic semiconductors. This is due to both the fact that there has been more research in inorganic semiconductors than organic semiconductors and because the polymeric organic semiconductors miss the three- dimensional crystal lattice. The system of polymeric organic semiconductors is very complex, because of the lack of crystal lattice, which means that the classical energy band formalism cannot be used to describe the solid-state properties satisfactory. In the absence of a better alternative the classical energy formalism is often used as a very rough approximation to give a qualitative description of the fundamental processes in the polymer organic semiconductors. The charge carrier mobilities in the polymeric organic semiconductors are generally several orders of magnitude lower than in the traditional inorganic semiconductors and the light absorption does not lead to generation of free electron hole pairs but instead of excitons as mentioned in the introduction.
In this chapter I will briefly describe how the classical energy band formalisms are used to describe the fundamental processes in POPV. Furthermore, I will describe the device structures and the electrical characteristics of these.
2.1 Inorganic photovoltaic devicesFrom solid-state physics it is known that all solid materials can be divided roughly into three groups, according to the energy gap size between the two electronic bands: The valence band and the conduction band. The three groups are conductors, semiconductors and insulators. In the case of conductors the two electronic bands are so close that they practically form a continuum. The semiconductors and the insulators are both characterised by an energy gap between the two bands, also called the band gap (Eg). The difference between the semiconductors and the insulators is the magnitude of the band gap. Normally it is presumed that materials with a band gap below 2 eV are semiconductors and materials with a band gab above this value are insulators (see Figure 4).2
9

Plastic Solar Cells
Figure 4. Solid materials can be divided into three groups according to the size of their band gap between the conduction band and valence band. The three groups are conductors (no band gap), semiconductors (band gap lower than 2 eV) and insulators (band gap higher than 2 eV).
The distribution of electrons in the various energy levels is given by the Fermi-Dirac distribution:
/(f)1
1 + exp e-ef)kT )
(2.1)
In the Fermi-Dirac distribution EF is the Fermi level. From equation (2.1) it can be seen that if E=Ef , then f(E)=0.5, which means the probability that the concerned energy level is occupied is 50 %. If E<Ef the particular energy level is more likely to be occupied than unoccupied and if E>Ef then the particular energy level is more likely to be unoccupied than occupied. For intrinsic semiconductors with no impurities and at ordinary temperatures the Fermi level lies in the middle of the band gap between the valence and the conduction band (see Figure 5).2-3
By doping an intrinsic semiconductor with impurities consisting of e g. elements from an adjacent group in the periodic table new energy levels are introduced near the band edges. In the case of elements from a higher main group, the impurities have more electrons than can be fitted into the stable structure of the semiconductors. These electrons are therefore more loosely bound and their energy levels (donor levels) are near the bottom of the conduction band. Due to the small energy difference between the energy levels of these electrons and the conduction band, part of these electrons will be excited into the conduction band by the thermal energy. Consequently, the Fermi level in the doped semiconductor will move closer to the conduction band (the Fermi level at low temperature in doped semiconductor will lie approximately in the middle between the energy of the donor levels and energy of the conduction band) (see Figure 5).3 This type of doped semiconductors is called n-type, because they have excess of negative charge carriers.
10

Plastic Solar Cells
In the case of doping a semiconductor with atoms from a lower main group, the impurities have fewer electrons than is needed for the stable structure. Therefore it does not require much energy for electrons from neighbour atoms to occupy these empty positions (acceptor levels) and form covalent bonds. The energy of the acceptor levels is therefore near the valence band edge. At room temperature the acceptor levels will be partly filled by thermal excitated electrons from the valence band. Consequently, the Fermi level in this doped semiconductor will move closer to the valence band (the Fermi level at low temperature will approximately be in the middle between energy of the acceptor levels and energy of the valence band) (see Figure 5).3 This type of doped semiconductor is called p-type, because they have excess of positive charge carriers.Energy
AVacuum level
Conduction band
Valence band
Undopedsemiconductor
n-typesemiconductor
p-typesemiconductor
O - electron O = hole
Figure 5. The band diagrams for the three types of semiconductors: The undoped, the n-type and the p-type. It can be seen how doping change the position of the Fermi level of the semiconductor. Furthermore an illustration of the definition of the workfunction is given.
An important parameter for materials is the workfunction, which by definition is the energy difference between the vacuum level and the Fermi level (see Figure 5). The workfunction is denoted <f>m and <f>s for the metal and the semiconductors respectively.
2.1.1 Schottky junction, ohmic contact and p-n junctionIf two materials with different workfunctions are brought into contact the Fermi levels of both materials will coincide at thermal equilibrium. This happens because free carriers in the material with the lower workfunction transfer to the material with the higher workfunction. In this way an electronic double layer is formed at the interface between the two materials, and as a consequence of this, the Fermi level in the material with the lower workfunction will be lowered by an amount equal to the difference between the two workfunctions (relative to the Fermi level in the materials with the high workfunction). If both materials are metals, the electronic double layer, where the charge separation happens, is only few A thick, due to the large free carrier density (normally >1022 per cm3) (see Figure 6).2
In the case of semiconductors, where the free carrier density is normally <1018 per cm3, free carriers from the bulk area are needed to be transferred to the interface to align the Fermi levels of the two materials. In this case the electronic layer is much thicker (pm-scale), and
11

Plastic Solar Cells
this layer is also called the depletion layer or the space charge layer, because it contains net positive charges or negative charges from ionized donors or acceptors.2
Vacuum level
Metal 1 Metal 2 Metal 1 Metal 2
No contact Contact
Figure 6. A band diagram for a metal metal contact.2
If we consider the case where e g. an n-type semiconductor is brought into ideal contact (in absence of surface states) with a metal with higher workfunction, we will observe that electrons from the semiconductors conduction band are transferred into the metal to line up the Fermi levels. A negative charge is therefore built up at the surface of the metal. In the semiconductor an equal positive charge must be built up, but due to the low free carrier density in the semiconductors compared to the metal, this positive charge is distributed over the entire depletion layer. Consequently a parabolic potential gradient would be built up in the depletion layer and the bands of the semiconductors would be bended as illustrated in Figure 7. This form of energy barrier is called a Schottky barrier.2"4
Vacuum level
Conduction band
________ Ec
Valence band
Metaln-type
semiconductor
No contact
Conduction band
Valence bandn-type
semiconductorMetal
Contact
Figure 7. A band diagram of the Schottky junction between a metal and a n-type semiconductor
12

Plastic Solar Cells
The magnitude of the band bending in equilibrium, eVb, is also called the contact potential and it is given by:
=A, -A (2 2)
The contact potential is the energy barrier of the flow of electrons from the semiconductor conduction band to the metal. The magnitude of the Schottky barrier for the n-type semiconductors, <f>n, which is the barrier of the flow of electrons from the metal to the semiconductors, is given by:
& =&,-%, (2 3)
where is the electron affinity of the semiconductor.
For p-type semiconductors the Schottky barrier, (pp, is given by:
(2-4)
In the cases above it was assumed that <j>m > ^ for the n-type semiconductors (<f>m <<f>s in the case of the p-type), but in the case where <j>m < <j>s for the n-type, electrons will now be transferred from the metal to the semiconductors to line up the Fermi levels. Because of the high free carrier density in the metal and because there is a lot of room for these electrons in the conduction band of the semiconductors, the electronic double layer will be very thin. This layer is so thin that charge carriers easily can tunnel through it from both sides. This type of contact is called an “ohmic contact” (see Figure 8).2-4
Vacuum level
X;
Conduction band
Valence band
n-typesemiconductor
No contact
Conduction bandf
++++ -+ ~
(
Valence band
Metal n-typesemiconductor
Contact
Figure 8. A band diagram of the ohmic contact between a metal and a n-type semiconductor(&, <&) "
Focusing on the case where a n-type and a p-type semiconductor is brought into contact, we will observe that electrons from the conduction band in the n-type semiconductor (the semiconductor with the lower workfunction) will diffuse into the valence band of the p-type (the semiconductor with the higher workfunction) until the Fermi levels of the two semiconductors coincide (see Figure 9).
13

Plastic Solar Cells
Vacuum level
Conductionband
Valence band
p-typesemiconductor
Conductionband
Conductionband
Conduction ■—band ' + ++
Valence band Valence band
n-typesemiconductor
n-typesemiconductor
p-typesemiconductor
No contact Contact
Figure 9. A band diagram of a p-n junction.2
Due too the lower free carrier density in the n-type semiconductor and the low number of unoccupied places in the valence band of the p-type semiconductor a parabolic potential will arise in the depletion layer of both semiconductors.
2.1.2 p-n junction solar cellsAt thermal equilibrium a built-in potential will be present in the depletion layer as described above and illustrated in Figure 9, and therefore there will be an electrical field in the depletion layer with direction from the n-type to the p-type semiconductor. This means that if an electron from the conduction band of the n-type semiconductor tries to diffuse in to the depletion layer it will be repelled back to the n-type semiconductor by the electrical field. On the other hand a hole in the valence band of the p-type semiconductor will be repelled back to the p-type semiconductor if it tries to diffuse in to the depletion band. At room temperature in dark, electron hole pairs will be generated in both semiconductors, and if they are generated in or near the depletion layer, the electrical field will separate them and the electrons will be accumulated in the n-type semiconductor, while the holes will be accumulated in the p-type semiconductors. This will lead to a net electrical current from the n-type to the p-type semiconductor. The accumulation of electrons and holes in the n-type and p-type semiconductors respectively will lead to a decrease of the band bending. This decrease will allow for electrons from the conduction band of the n-type semiconductors to diffuse into the valence band of the p-type semiconductor, and the opposite is the case for the hole in the valence band of the p-type semiconductor. Hence an electrical current is generated in the opposite direction of the current due to the separation of generated electron hole pairs near the depletion layer. At thermal equilibrium these two currents will outbalance each other. The first type of current will hardly depend on the magnitude of the band bending while the second type of current will depend highly on the magnitude of the band bending. The sum of these two types of current is called the dark current, I dark, and can be expressed by2:
I dark f) «P|f !-! (25)
In equation (2.5) the first term represents the second type of current while the second term represents the first type of current. I0 is called the dark saturation current and represent the current flowing under high reverse bias. In Figure 10 the I dark is shown as a function of the
14

Plastic Solar Cells
applied bias for a Si solar cell from a garden lamp. It can be seen that p-n junction is showing rectifying behaviour and therefore works like a diode.Under illumination the generation of electron hole pairs near the depletion layer will increase and give an additional contribution called the photo current, Iph. The total current under illumination is given by the sum of the photo current and the dark current (see Figure 10):
1 ^ ph + 1dark ̂ph exp| f1 (2.6)
Under open-circuit conditions the accumulation of electrons and holes in the n-type and p-type semiconductors respectively will flatten the band bending out so the dark current and the photo current will cancel out. No total net current will be running in the solar cell. The open-circuit photovoltage, Voc, is therefore given by:
Voc = — lne
(Iph_
V Io(2.7)
Under short-circuit conditions the accumulated electrons and holes in the n-type and p-type semiconductors will be transferred through the electrical circuit to the electrodes and no photovoltage will be produced. In this case the band bending is at maximum and therefore the photocurrent will be at maximum. The short-circuit current, Isc, will be equal to the photo current:
ISC = I ph (2.8)
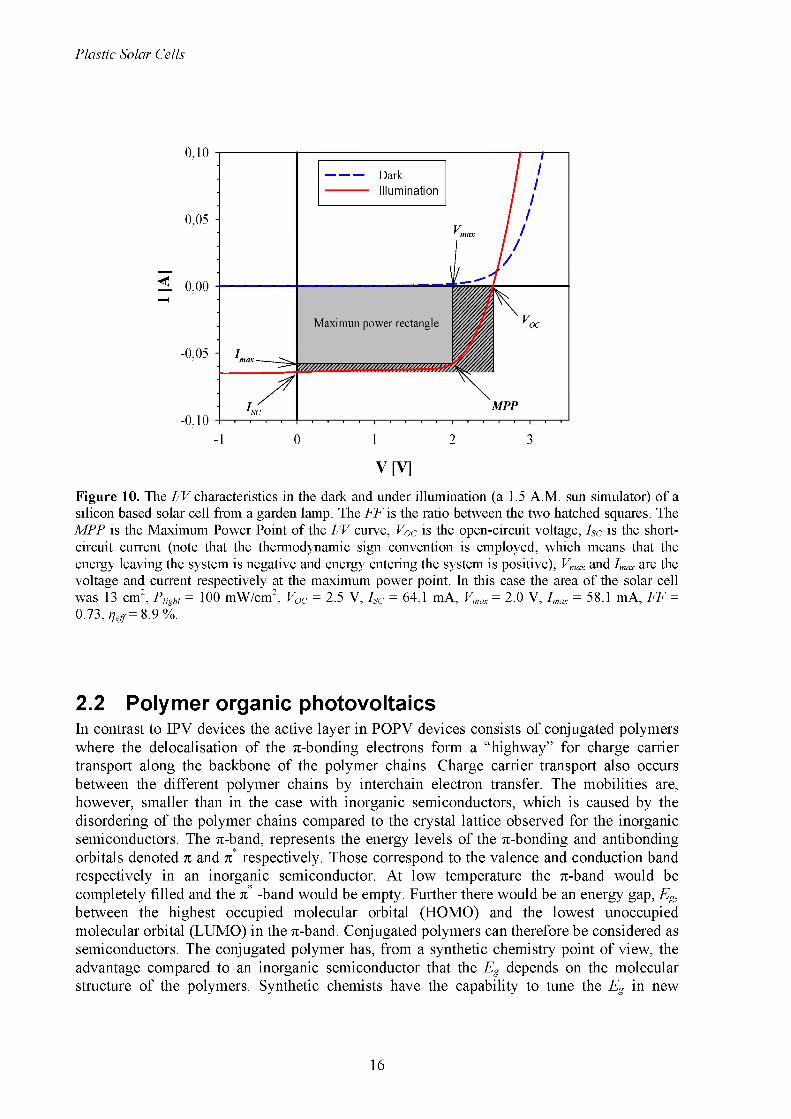
The diode property of solar cells is described by the fill factor, FF. The FF is the ratio between the maximum power output from the solar cell (the maximum power point of the I/V curve in the 4th quadrant) and the maximum theoretical power output if the solar cell was an ideal diode (the product of Voc and Isc):
V IFF = max max (2 9)VI V ' ’^OC^SC
Where Vmax and Imax is the voltage and the current respectively at the maximum power point.
One of the most interesting values of a solar cell is the efficiency, which is given as the ratio between the power output, Pout, of the cell and the power input, Pin, from the sun, Plight-
1 out
Pin
VmaxImax VOCISCFF
Plight Pight
(2.10)
15
Plastic Solar Cells
DarkIllumination
ZZ 0,00
Maximun power rectangle
-0,05 - 7
MPP
Figure 10. The I/V characteristics in the dark and under illumination (a 1.5 A.M. sun simulator) of a silicon based solar cell from a garden lamp. The FF is the ratio between the two hatched squares. The MPP is the Maximum Power Point of the I/V curve, Voc is the open-circuit voltage, ISc is the short- circuit current (note that the thermodynamic sign convention is employed, which means that the energy leaving the system is negative and energy entering the system is positive), Vmax and Imax are the voltage and current respectively at the maximum power point. In this case the area of the solar cell was 13 cm2, P,ight = 100 mW/cm2, Voc = 2.5 V, Isc = 64.1 mA, Vmax = 2.0 V, Imax = 58.1 mA, FF = 0.73, t]eff = 8.9 %.
2.2 Polymer organic photovoltaicsIn contrast to IPV devices the active layer in POPV devices consists of conjugated polymers where the delocalisation of the Tt-bonding electrons form a “highway” for charge carrier transport along the backbone of the polymer chains. Charge carrier transport also occurs between the different polymer chains by interchain electron transfer. The mobilities are, however, smaller than in the case with inorganic semiconductors, which is caused by the disordering of the polymer chains compared to the crystal lattice observed for the inorganic semiconductors. The Tt-band, represents the energy levels of the Tt-bonding and antibonding orbitals denoted Tt and Tt respectively. Those correspond to the valence and conduction band respectively in an inorganic semiconductor. At low temperature the Tt-band would be completely filled and the Tt* -band would be empty. Further there would be an energy gap, Eg, between the highest occupied molecular orbital (HOMO) and the lowest unoccupied molecular orbital (LUMO) in the Tt-band. Conjugated polymers can therefore be considered as semiconductors. The conjugated polymer has, from a synthetic chemistry point of view, the advantage compared to an inorganic semiconductor that the Eg depends on the molecular structure of the polymers. Synthetic chemists have the capability to tune the Eg in new
16

Plastic Solar Cells
polymers to a desired level, and thereby determine in which region of the sun light absorption take places or in the case of light emitting diodes, the colour of the emitted light.5 Light absorption in POPV devices, as mentioned in the introduction, does not lead directly to free charge carriers, but instead to neutral excitons (mobile excited states), which to first order are unaffected by electric fields. This means that the generated excitons by diffusion have to be transported to a heterointerface, where a dissociation of the excitons into a free electron in one material and a free hole in the other material can take place. When the excitons are dissociated the free carriers can be transported to their respective electrodes by the built in potential produced by the electrodes with asymmetrical workfunctions. Due to the very low mobility of the excitons in the polymer layer the energy conversion efficiencies for POPV devices made of pure conjugated polymers are very low, typically between 10-3-10-1 %.6,8,9,10
In order to optimise the POPV devices and to understand their mechanism function, a good model of the devices is useful. The model has to describe how device properties such as the ISC, Voc, FF and qeff depend on the fundamental properties such as the workfunctions, the charge carrier mobilities, the band gap of the polymers, electron affinities etc.
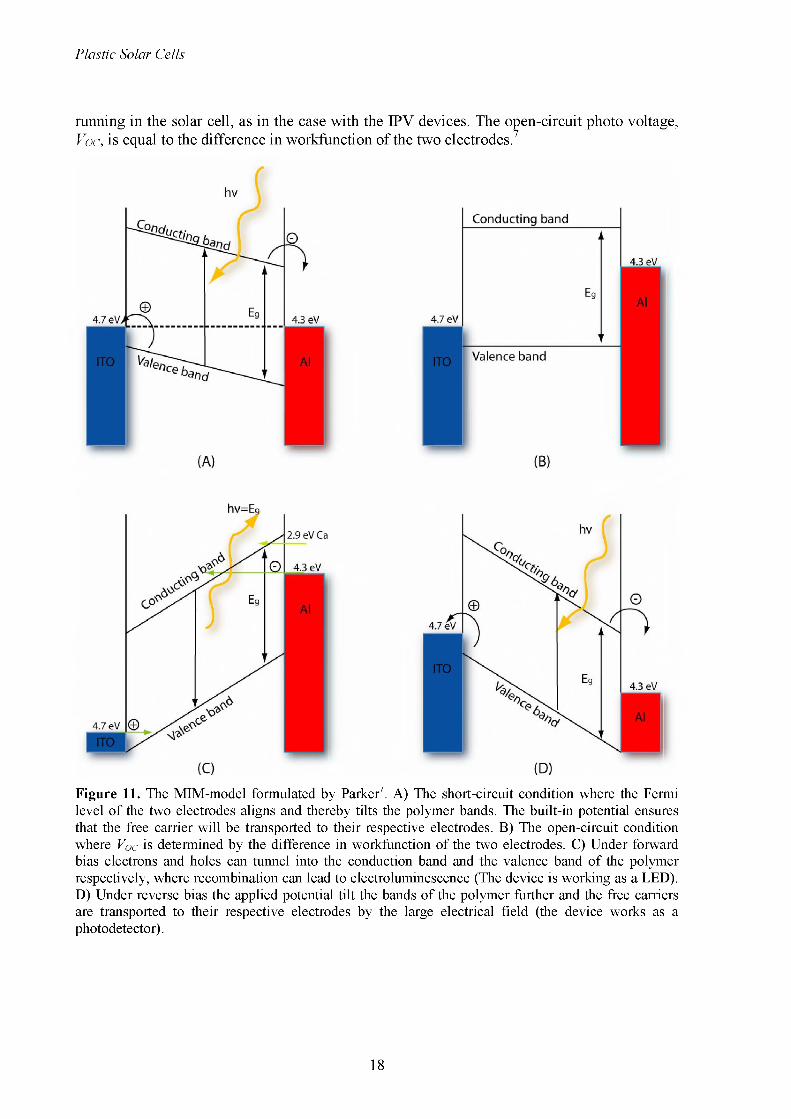
2.2.1 The MIM-modelThe simplest POPV device consists of a polymer layer sandwiched between two metal electrodes with asymmetrical workfunction. This setup is clearly explained by the MIM- model (Metal-Insulator-Metal) originally developed by Parker for polymer based diodes.7 The MIM-model is based on the assumption that the free carrier concentration in the polymers in dark is very low, hence it can be assumed to be an insulator. This has the consequence that the band bending at the metal-polymer interface when applying an electrical field would be very small. The model can therefore be regarded as a rigid band model contra the case of e.g. a Schottky junction (Figure 7). The POPV device can now be viewed in the following four situations: Short circuit condition (zero bias), open circuit condition, under forward bias and under reverse bias.
2.2.1.1 Short-circuit conditionUnder short-circuit conditions the Fermi level of the two electrodes will align because of the difference in workfunction, and give rise to a constant electrical field across the polymer layer, which will tilt the polymer bands as illustrated in Figure 11A. Under illumination any generated free charge carriers will experience a driving force from the field such, that electrons will be transported to the electrode with the low workfunction while the holes would be transported to the electrodes with the high workfunction; the devices will exhibit a considerable photocurrent.8 In this connection two things have to be pointed out. First, when free charge carriers are generated under illumination, the polymer can no longer be assumed to be an insulator, and there will be some band bending near the metal-polymer interfaces. Second, light absorption in POPV devices, as mentioned, lead to neutral excitons and not to free charge carriers.9,10
2.2.1.2 Open-circuit conditionUnder open-circuit condition (also called flat band condition) and illumination electrons and holes will accumulate on the interface at the low and high workfunction electrodes, respectively (see Figure 11B). This accumulation will flatten the band bending so the dark current and the photo current would be equal; this means that no total net current will be
17
Plastic Solar Cells
running in the solar cell, as in the case with the IPV devices. The open-circuit photo voltage, Voc, is equal to the difference in workfunction of the two electrodes.7
4.3 eV
4.7 eV
4.7 eV
4.3 eV
Figure 11. The MIM-model formulated by Parker7. A) The short-circuit condition where the Fermi level of the two electrodes aligns and thereby tilts the polymer bands. The built-in potential ensures that the free carrier will be transported to their respective electrodes. B) The open-circuit condition where Voc is determined by the difference in workfunction of the two electrodes. C) Under forward bias electrons and holes can tunnel into the conduction band and the valence band of the polymer respectively, where recombination can lead to electroluminescence (The device is working as a LED). D) Under reverse bias the applied potential tilt the bands of the polymer further and the free carriers are transported to their respective electrodes by the large electrical field (the device works as a photodetector).
18

Plastic Solar Cells
2.2.1.3 Forward biasUnder forward bias (the POPV devices work like a diode) the applied electrical field will tilt the polymer bands, and two barriers arise; one caused by the energy difference between the HOMO level for the polymer and the workfunction of the anode (the electrode with the high workfunction) and the other caused by the energy difference between the LUMO level of the polymer and the workfunction of the cathode (the electrode with the low workfunction) (see Figure 11C). When the electrical field increase the barriers will be easier to overcome and eventually the holes from the high workfunction electrode and electrons from the low workfunction electrode will be able to tunnel into the polymer film.7,11 If the electrons and holes are capable of recombining, electroluminescence can be observed, and a light emitting diode (LED) is made. The I/V characteristics are determined by the lower of the two barriers, which often is the barrier between the HOMO level of the polymer and the anode, while the device efficiency is determined by the higher barrier, which often is the barrier between the LUMO level of the polymer and the cathode. Changing the anode electrode to e.g. an electrode with a lower workfunction (but not lower than the cathode) will increase the lower barrier height and thereby increase the operating voltage of the diode (the voltage where holes can tunnel into the polymer film), since the polymer bands have to be tilted further before the holes are able to tunnel into the polymer film. Hence the best devices are obtained when the anode workfunction is matched with the HOMO level of the polymer in such a way that it is equal to or lower than the HOMO level, and when the cathode workfunction is matched with the LUMO level of the polymer. The turn-on voltage of the POPV devices is the voltage required to achieve flat-band condition, which is equal to the band gap of the polymer minus the two barrier offsets. Thus, the turn-on voltage only depends on the band gap of the polymer and the workfunction of the electrodes.7
2.2.1.4 Reverse biasUnder reverse bias the POPV devices exhibit a strong photo response caused by the strong external field, which very efficiently transport the hole to the high workfunction electrode and the electrons to the low workfunction electrode (see Figure 11D). In this way the POPV devices can be used as a photodetector.8
2.2.2 Key parameteresThe key parameters to describe the POPV-devices is similar to the IPV devices: qef, ISC, VOC, and FF .
2.2.2.1 The efficiency (neff)The efficiency, neff, is the most essential parameter for solar cells, which, as in the case of IPV devices, is determined by equation (2.10).
Typically values for single layer POPV devices are between 10"3 to 10-1 %,8 while bulk heterojunction POPV devices have shown efficiencies up to 4.4 %.12
2.2.2.2 The open-circuit voltage (Voc)The open-circuit voltage, VOC, is the maximum voltage the device can produce. The VoC for POPV devices is higher than for inorganic cells and is typically between 0.4 and 1.5 V.13 In the case of single layer POPV devices that has be described by the MIM-model, the built-in potential can be estimated by the VoC, and therefore the VoC influences properties such as the
19

Plastic Solar Cells
charge dissociation, charge transport and charge collection in the devices. In the case where the MIM-model is valid, the VoC is estimated as the difference between the workfunction of the two electrodes. In cases where the POPV devices consist of blended polymer and fullerene (bulk heterojunction solar cells) the MIM-model cannot satisfactorily explain the observed VoC, which is higher than the difference between the workfunction of the two electrodes. The typical value of VOC for ITO/polymer-fullerene blend/Al devices range from 0.5 V for P3HT and 0.8 V for PPV and up, which is in contrast to the 0.4 V predicted by the MIM-model.6 The origin of the VOC for the bulk heterojunction solar cells is not fully understood yet, while Brabec et a/14,15 have shown that the value of the VOC correlate directly with the acceptor strength of the fullerenes, and depends only very little on the workfunction of the cathode material.
2.2.2.3 The short-circuit current (ISC)The short-circuit current, ISC, is the current running in the device under illumination and no applied bias, and therefore it represents the maximum possible current. The magnitude of ISC depends on the efficiency of the charge separation, the mobility and the lifetime of the charge carriers in the active layer and the intensity of the illumination. In order to optimize ISC a fullerene is often blended into the polymer matrix to optimize the interface area, where charge separation can take place. Further it has been shown that the polymer matrix transports the holes and the fullerene molecules transport the electrons. Along the polymer chains the transport of the holes is fast while between the individual chains the transport is nearly 5 times slower. The fullerene molecules transport the electrons by a hopping process between the individual fullerene molecules, and therefore an optimal performance requires that the fullerenes are packed close together.6 Illumination under AM 1.5 conditions the gives an observed magnitude of ISC is in the range of 0.2 to 10 mA/cm2.13
2.2.2.4 The fill factor (FF)The fill factor, FF, which describes the diode properties of the POPV devices, is, like in the case of IPV devices, determined by equation (2.9).FF depends largely on two parameters: The presence of current leakage e.g. due to small holes in the polymer layer and ohmic contacts between the polymer layer and the electrodes. To gain insight in the FF dependence on the two parameters, an equivalent electrical circuit of a POPV device can be drawn at (see Figure 12). In the equivalent electrical circuit the current leakage is modelled as a small parallel shunt resistance, RShunt, while the ohmic contacts are modelled as a large serial resistance, RSeriai, which also includes the bulk resistance and the circuit resistance. If the shunt resistance is very low, which means a large current leakage, the FF will be low and the devices will act as an ohmic resistance, which will result in a straight line in the I/V characteristic of the devices (see Figure 13). In order to increase the shunt resistance it is very common to spin coat a layer of the hole conductor PEDOT:PSS (Poly(Ethylene DioxyThiophene doped with PolyStyrene Sulphonic acid) on top of the anode electrode. This gives a barrier layer with a conductivity of « 10-3 S/cm, which increase the shunt resistance and prevents shorts between the two electrodes as a consequence of holes in the polymer layer.
20

Plastic Solar Cells
i
Shunt Diode
Figure 12. The equivalent electrical circuit for a POPV device. Rsinmt is the total shunt in the devices, R,sc,ci represent the ohmic contacts, the bulk resistivity, the circuit resistivity and represent the photo generated current.
-0.03 -DarkIllumination
Figure 13. The I/V characteristic in dark and under illumination (a 1.5 A.M. sun simulator) of a bulkheterojunction POPV device made from P3HT (Poly-3-HexylThiophene), PCBM fullerene and having the ITO and A1 electrodes. In this case the area of the solar cell was 10 cm2, Phght = 100mW/cm2, Voc = 0.4 V, Isc = 5.8 mA, Vmax = 0.15 V, Imax = 2.8 mA, FF = 0.18, //e// = 0.1 %. It can be seen that the shunt resistivity is very low, which implied that when a large bias is applied an ohmic behaviour is observed (a straight line in the PVcharacteristic).
21
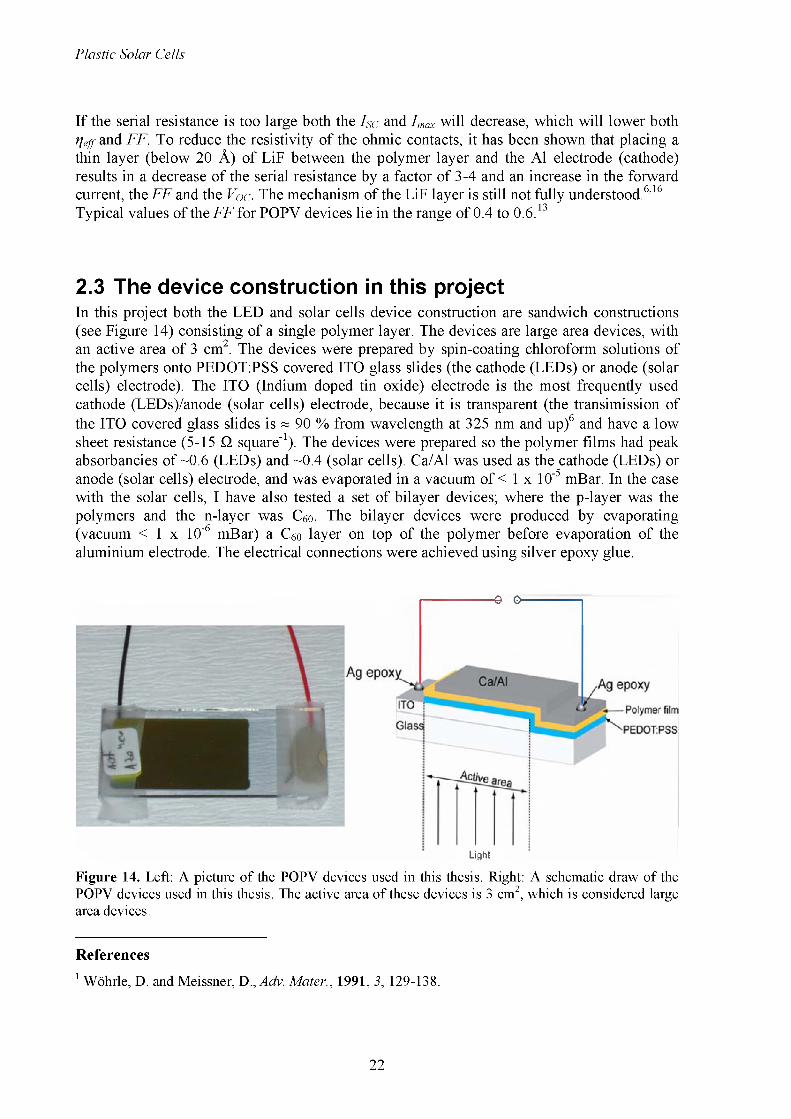
Plastic Solar Cells
If the serial resistance is too large both the Isc and Imax will decrease, which will lower both r/eff and FF. To reduce the resistivity of the ohmic contacts, it has been shown that placing a thin layer (below 20 A) of LiF between the polymer layer and the A1 electrode (cathode) results in a decrease of the serial resistance by a factor of 3-4 and an increase in the forward current, the FF and the Voc■ The mechanism of the LiF layer is still not fully understood.6'16 Typical values of the FF for POPV devices lie in the range of 0.4 to 0.6.13
2.3 The device construction in this projectIn this project both the LED and solar cells device construction are sandwich constructions (see Figure 14) consisting of a single polymer layer. The devices are large area devices, with an active area of 3 cm2. The devices were prepared by spin-coating chloroform solutions of the polymers onto PEDOT:PSS covered ITO glass slides (the cathode (LEDs) or anode (solar cells) electrode). The ITO (Indium doped tin oxide) electrode is the most frequently used cathode (LEDs)Zanode (solar cells) electrode, because it is transparent (the transimission of the ITO covered glass slides is « 90 % from wavelength at 325 nm and up)6 and have a low sheet resistance (5-15 Q square'1). The devices were prepared so the polymer films had peak absorbancies of ~0.6 (LEDs) and ~0.4 (solar cells). Ca/Al was used as the cathode (LEDs) or anode (solar cells) electrode, and was evaporated in a vacuum of < 1 x 10"5 mBar. In the case with the solar cells, I have also tested a set of bilayer devices; where the p-layer was the polymers and the n-layer was Ceo- The bilayer devices were produced by evaporating (vacuum < 1 x 10'6 mBar) a Ceo layer on top of the polymer before evaporation of the aluminium electrode. The electrical connections were achieved using silver epoxy glue.
■q e>
Light
Figure 14. Left: A picture of the POPV devices used in this thesis. Right: A schematic draw of the POPV devices used in this thesis. The active area of these devices is 3 cm2, which is considered large area devices.
References
1 Wohrle, D. and Meissner, D,,Adv. Mater., 1991, 3, 129-138.
22

Plastic Solar Cells
2 Tsubomura, H. and Kobayashi, H., Critical Reviews in Solid State and Materials Sciences, 18(3), 261-326, 1993.
3 Smith, R. A., Semiconductors, second edition 1978, chapter 4, Cambrigde University Press, Cambridge.
4 Sze, S. M., Physics of Semiconductor Devices, 1981, chapter 5, John Wiley & Sons, USA.5 Heeger, A. J., Rev. Mod. Phys., 2001, 73, 681-700.6 Brabec, C. J., Solar Energy Materials & Solar Cells, 2004, 83, 273.292.7 Parker, I. D., J. Appl. Phys., 1994, 75, 1656-1666.8 Brabec, C. J., Sariciftci, N. S. and Hummelen, J. C., Adv. Funct. Mater., 2001, 11, 15-26.9 Gregg, B. A. and Hanna, M. C., J. Appl. Phys., 2003, 93, 3605-3614.10 Gregg, B. A., J. Phys. Chem. B, 2003, 107, 4688-4698.11 Braun, D. and Heeger, J., Appl. Phys. Lett., 1991, 58, 1982-1984.12 Li, G.; Shrotriya, V.; Huang, J.; Yao, Y.; Moriarty, T.; Emery, K. and Yang, Y., Nature, 2005, 4,
864-868.13 Spanggaard, H. and Krebs, F. C., Solar Energy Materials & Solar Cells, 2004, 83, 125-146.14 Brabec, C. J.; Cravino, A.; Meissner, D.; Sariciftci, N. S.; Fromherz, T.; Rispens, M. T.; Sanches, L.
and Hummelen, J. C., Adv. Funct. Mater., 2001, 11, 374-380.15 Frohne, H.; Shaheen, S. E.; Brabec, C. J.; Muller, D. C.; Sariciftci, N. S. and Meerholz, K., Chem.
Phys. Chem., 2002, 9, 795-799.16 Brabec, C. J.; Shaheen, S. E.; Winder, C. and Sariciftci, N. S., Appl. Phys. Lett., 2002, 80, 1288
1290.
23

24
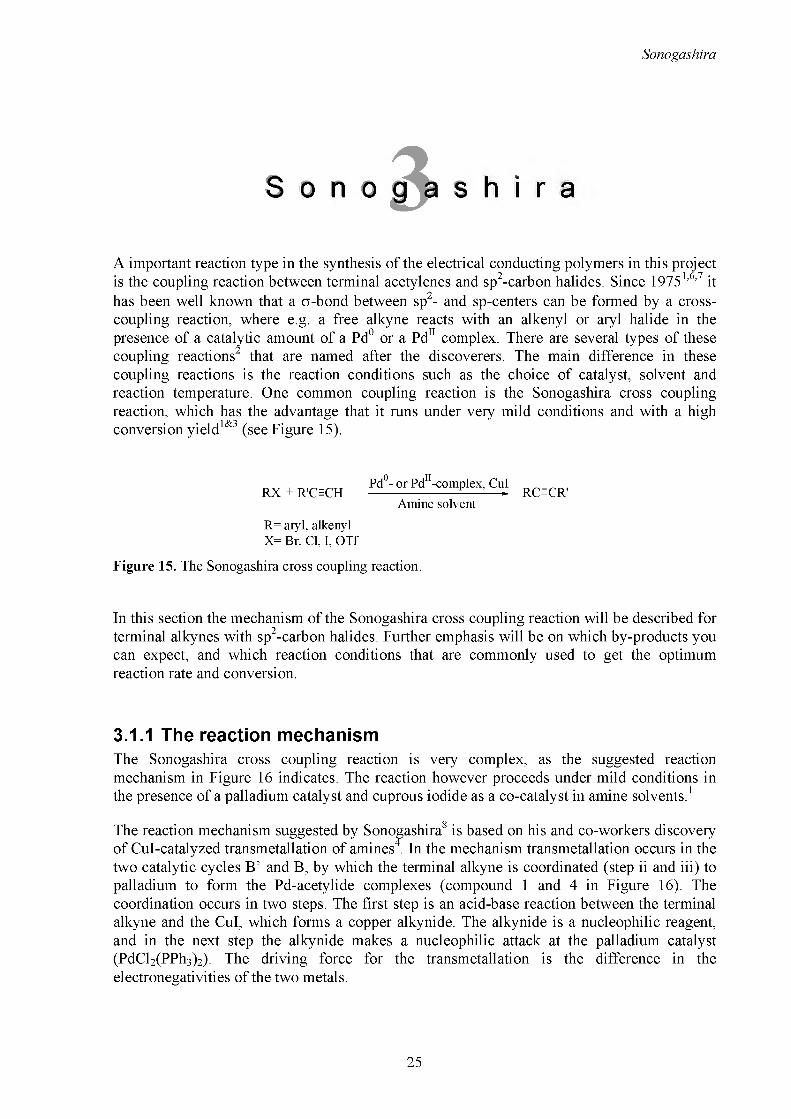
Sonogctshirct
h i r a
A important reaction type in the synthesis of the electrical conducting polymers in this project is the coupling reaction between terminal acetylenes and sp2-carbon halides. Since 19751'6'7 it has been well known that a a-bond between sp2- and sp-centers can be formed by a crosscoupling reaction, where e g. a free alkyne reacts with an alkenyl or aryl halide in the presence of a catalytic amount of a Pd° or a Pd11 complex. There are several types of these coupling reactions2 that are named after the discoverers. The main difference in these coupling reactions is the reaction conditions such as the choice of catalyst, solvent and reaction temperature. One common coupling reaction is the Sonogashira cross coupling reaction, which has the advantage that it runs under very mild conditions and with a high conversion yield163 (see Figure 15).
RX + R'C=CHPd°- or PdH-complex, Cut
Amine solventRC=CR'
R= aryl, alkenyl X= Br, CL I, OTf
Figure 15. The Sonogashira cross coupling reaction.
In this section the mechanism of the Sonogashira cross coupling reaction will be described for terminal alkynes with sp2-carbon halides. Further emphasis will be on which by-products you can expect, and which reaction conditions that are commonly used to get the optimum reaction rate and conversion.
3.1.1 The reaction mechanismThe Sonogashira cross coupling reaction is very complex, as the suggested reaction mechanism in Figure 16 indicates. The reaction however proceeds under mild conditions in the presence of a palladium catalyst and cuprous iodide as a co-catalyst in amine solvents.1
The reaction mechanism suggested by Sonogashira8 is based on his and co-workers discovery of Cul-catalyzed transmetallation of amines4. In the mechanism transmetallation occurs in the two catalytic cycles B’ and B, by which the terminal alkyne is coordinated (step ii and iii) to palladium to form the Pd-acetylide complexes (compound 1 and 4 in Figure 16). The coordination occurs in two steps. The first step is an acid-base reaction between the terminal alkyne and the Cul, which forms a copper alkynide. The alkynide is a nucleophilic reagent, and in the next step the alkynide makes a nucleophilic attack at the palladium catalyst (PdCl2(PPh3)2). The driving force for the transmetallation is the difference in the electronegativities of the two metals.
25

Sonogctshirct
The role of the cycle B’ is to form the catalytically active coordinatively unsaturated 14- electron complex (compound 2 in Figure 16), which is formed by reductive elimination (step iiii) of the Pd-acetylide complex (compound 1). The term reductive elimination does not have the same meaning as the term reduction in organic chemistry. The reductive elimination covers the loss of two one-electron ligands of cis configuration from the Pd center by combining them into one single elimination product. It means that both the coordination number and the formal oxidation state of Pd is reduced to form Pd(0)5. In connection to the formation of compound 2, a by-product in the shape of an equivalent amount of the bis- acetylene compound is formed. The fact that the bis-acetylenes compound forms is supported by Dieck and Heck6. They have observed that an increased amount of the acetylene leads to higher yields. The coordinatively unsaturated Pd-complex is the catalyst for cycle A. By oxidative addition (step i) the alkenyl or the aryl halide is coordinated to the Pd-complex (compound 2) to form the complex 3. Through the other transmetallation cycle (B) (nucleophilic attack by the copper alkynide), the halide is exchanged by the acetylene (step iii), and the complex 4 is formed. Under a reductive elimination (step iiiii) the aryl alkyne or the enyne is cleaved from the Pd complex (compound 4), and the coordinative unsaturated Pd- complex (compound 2) is reformed.7 Without this reductive elimination step, the reaction would stop and the Pd compound would not have any catalytic effect, but react as a stoichiometric compound as in e g. the Grignard reactions.
HX-amine
CuC=CR' HX-amineCycle B
Cycle B"
Cycle A
Figure 16. The reaction mechanism Sonogashira suggested for the coupling reactions between terminal acetylenes and sp2-carbon halides, i) is an oxidative addition step, ii and iii) are transmetallation steps and iiii and iiiii) are reductive elimination steps.8
26

SoMogayA/ra
3.1.2 By-productsThe Sonogashira reaction is popular because it generally works quite well, and many authors have described many applications9 for this reaction type. Unfortunately most of the authors never comment on the fact that it is very hard if at all possible to perform the Sonogashira alkynyl-aryl cross coupling without side reactions. Reported by-products are 1,4- diarylbutadiynes, 1,4-diarylbuta-2-en-1 -ynes and the cyclic trimerization product 1,3,5- triarylbenzene10,11,12,13,14 It should not be a surprise that the Sonogashira reaction have byproducts such as the cyclic trimer because it has been known for more that 50 years that transition metals catalyze the trimerization of alkynes.15
The formation of the three types of by-products is not trivial but it looks like the presence of oxygen and the choice of the catalyst system have a decisive effect on which by-product and the amount in which it is formed. Trumbo and Marvel13 have thus detected between 5 and 20 % of the cyclic trimer 1,3,5-triphenyl benzene when they have synthesized several poly(phenylacetylenes) with different catalysts in the presence of oxygen. They found that Pd(OAc)2 gave the highest yield of the cyclic trimer and that the lowest yield was obtained by employing PdCl2 as the catalyst. Varlemann12 observed all three by-products under the synthesis of tolane from iodobenzene and phenylacetylene by using Pd(OA)2/PPh3/CuI as the catalyst system and NBu4OH as the solvent. When changing the reaction conditions to Pd(OAc)2/PPh3/CuI/TMEDA and NEt3 she only observed the 1,4-diarylbutadiynes in a yield of 4 %. It should be pointed out that Trumbo & Marvel have performed their syntheses at low temperature while Varlemann has done the synthesis in a steel autoclave at high temperature.
The formation of the cyclic trimer by-product has been confirmed by Gevorgyan et al. which in 199716 and 200117 have shown that substituted benzenes can be constructed from enynes and activated alkynes in a [4 + 2] and from terminal alkynes in a [2 + 2 + 2] fashion in the presence of a Pd(0) catalyst. Both reactions proceed under normal Sonogashira conditions without an inert atmosphere.
Crisp & Flynn14 observed in 1993 that even when they used Pd(PPh3)4 as the catalyst in a coupling reaction with less reactive electrophiles such as electron rich arylbromides or triflates, they obtained a by-product in the form of 1,4-diarylbutadiynes, which according to the reaction mechanism for the Sonogashira reaction (see Figure 16) should only be produced if a Pd(II) catalyst was employed. Later they showed that a catalytic amount of both Cu(I) and Pd(0) along with base and oxygen were all required to achieve homocoupling of terminal alkynes. They have thus produced 1,4-diphenylbutadiyne in 82 % yield with a reaction time of 1 day from phenylacetylene with triethylamine as solvent and CuI and Pd(PPh3)4 as the catalytic system in presence of atmospheric air. It is therefore extremely important to keep oxygen away from the reaction.
3.1.3 Reaction conditionsSince the discovery of the Sonogashira cross coupling reaction, a lot of different conditions have been reported. The choice of the right condition depends of the reactivity of the selected halide. The reactivity of the halide is given by the following order: Vinyl iodide « vinyl bromide > aryl iodide > vinyl chloride >> aryl bromide.
In order to choose the right condition several parameters have to be considered. The most obvious ones are: The reaction temperature, the choice of base, the choice of the catalyst, the
27

SoMogayA/ra
ratio between the catalyst and the compounds, the presence or the absence of oxygen and the reaction time.
3.1.3.1 The reaction temperatureThe choice of the right reaction temperature depends on the reactivity of the halide and the boiling point of the solvent. Generally, the less reactive halide, the higher temperature is necessary. E.g. if the halide is a vinyl iodide or aryl iodide the reaction easily runs at room temperature or even at lower temperature, whereas it seems that aryl bromides normally have to be heated to approximate 353 K7"18. Hundertmark et al1 have, however, recently reported a concept (see the Scheme 1), which works for the aryl bromides at room temperature. The catalyst systems consist of palladium with bulky, electron-rich phosphines as ligands. The investigations of Hundertmark et al. show that especially P(t-Bu)3 is a very efficient ligand for the palladium in the Sonogashira reaction at room temperature.
R
+ H = R1
3%Pd(PhCN)2Cl26% P(t-BU)3
2% CuI1.2 equiv HN(/Pr)2dioxaner.t., 0.5-15 h
Scheme 1. Shows the catalytic system for the Sonogashira cross coupling reaction with aryl bromides at r.t. as suggested by Hundertmark et al19.
3.1.3.2 The baseThe reaction rate of the coupling reaction depends highly on the choice of base6. Alami et al.18 have made a thorough investigation on, how the choice of base influences the coupling rate. The investigations are made in both the presence and absence of copper halides (see Scheme 2 and Table 1
I +Pd(PPh3)4 (5%)
^^-R ---------------------Amine, 298 K
R
R=(CH2)2OH
Scheme 2. The coupling reaction in absence of copper halide.
28

Sonogctshirct
Table 1. The yields and reaction times as function of the base and the presence and the absence of Cul obtained by Alarm el a/.18
Amine PKa2
Absence of Cul
Time [h] Isolated yield [%]
Presence of Cul (10 %)
Time [min] Isolated yield [%]
Et3N 11.01 22 0 120 92
/-Pr2NH 10.96 26 2 30 94
Et]NH 10.98 24 0 - -
77-BuNH2 10.77 25 93 - -
Piperidine 11.12 6 96 10 95
pyrrolidine 11.27 2.5 91 10 93
The conclusion that can be drawn from Table 1 is that the two cyclic bases piperidine and pyrrrolidine gives the best yield and the highest reaction rate, but in the presence of Cul only the reaction rate differs for the bases.
These results show that the reaction rates are not only described by the base strength as Brandsma et al.21 and Dieck and Heck6 described. It can be seen that both z-Pr2NH and zz- BuNH2 are weaker bases than Et3N, and both have higher reaction rates than Et3N,
Moreover if we are looking at the pka-values of Et3N and e g. piperidine, which only differ in pka. values by 0.11, it is very hard to believe that this difference would displace the equilibrium in Scheme 3 significantly more towards the right, and thereby produce more of the acetylide. From the reaction mechanism suggested by Sonogashira (Figure 16), the formation of the acetylide is the rate-determining step in the catalytic cycle B.
R = H + Amine . R—=" + H+Amine
Scheme 3. Acid-base equilibrium between an amine and an acetylene compound.
Results from Sanechika et al22 shows that the yield of the reaction depends to a rough approximation on the strength of the bases. The results show that if you choose a weak a base such as pyridine (pKa = 5.25)20 the reaction will not proceed, which is also expected as seen in the light of the reaction mechanism suggested by Sonogashira.Why Et3N does not work as well as e g. piperidine, could be that the ethyl groups are a steric hindrance, which slows the abstraction of the proton from the acetylene.From Table 1 it is seen that the choice of base does not matter, when a copper halide is used as co-catalyst. The reason is probably that the acetylene reacts with Cu+ to form the copper acetylide, which can coordinate with the Pd catalyst. It is well known that 1-alkynes react very well with heavy metal ions (Ag+, Cu+) to form insoluble and often unstable salts.23
3.1.3.3 The catalystGenerally the Pd catalysts may be divided into the following two main groups: The Pd(II) salts and the Pd(0) complexes. There are many different types of Pd catalysts in each group, but commonly used in the Pd(II) group is Pd(PPh3)2Cl2 and Pd(OAc)2, and in the Pd(0) group
29
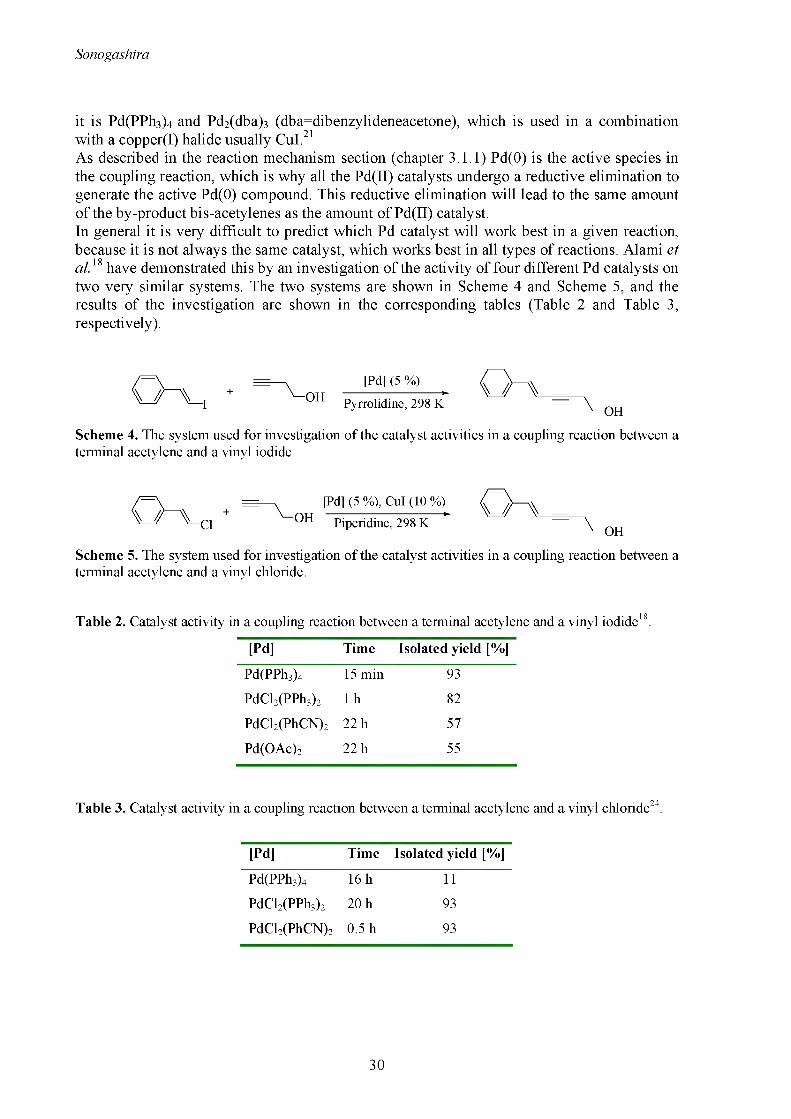
Sonogctshirct
it is Pd(PPh3)4 and Pd2(dba)3 (dba=dibenzylideneacetone), which is used in a combination with a copper(I) halide usually Cul.21As described in the reaction mechanism section (chapter 3.1.1) Pd(0) is the active species in the coupling reaction, which is why all the Pd(II) catalysts undergo a reductive elimination to generate the active Pd(0) compound. This reductive elimination will lead to the same amount of the by-product bis-acetylenes as the amount of Pd(II) catalyst.In general it is very difficult to predict which Pd catalyst will work best in a given reaction, because it is not always the same catalyst, which works best in all types of reactions. Alami et al.18 have demonstrated this by an investigation of the activity of four different Pd catalysts on two very similar systems. The two systems are shown in Scheme 4 and Scheme 5, and the results of the investigation are shown in the corresponding tables (Table 2 and Table 3, respectively).
+[Pd] (5 %)
Pyrrolidine, 298 K
Scheme 4. The system used for investigation of the catalyst activities in a coupling reaction between a terminal acetylene and a vinyl iodide.
[Pd] (5 %), Cut (10 %)
Piperidine, 298 K
Scheme 5. The system used for investigation of the catalyst activities in a coupling reaction between a terminal acetylene and a vinyl chloride.
Table 2. Catalyst activity in a coupling reaction between a terminal acetylene and a vinyl iodide18.
[Pd] Time Isolated yield [%]
Pd(PPh3)4 15 min 93
PdCl2(PPh3)2 lh 82
PdCl2(PhCN)2 22 h 57Pd(OAc)2 22 h 55
Table 3. Catalyst activity in a coupling reaction between a terminal acetylene and a vinyl chloride24.
[Pd] Time Isolated yield [%]
Pd(PPh3)4 16 h 11
PdCl2(PPh3)2 20 h 93
PdCl2(PhCN)2 0.5 h 93
30

Sonogashira
On the basis of the descriptions found in the literature1,5,8,18,21’25 of different types of Sonogashira cross coupling reactions it seems in general not to be so important to choose a specific catalyst. This is because all the catalysts give a high yield with a reaction time less than one day, if the halide is an iodide and a copper halide is used as a co-catalyst. It is common to use either Pd(PPh3)4 or PdCl2(PPh3)2 as catalyst, because they generally work very well, are easy to handle and easy to prepare (see appendix A).
It should be emphasized that the use of both a copper halide as the co-catalysts and additionally triphenylphospine greatly enhance the rate of the coupling reaction, but if too much triphenylposhine is added it slows down the reaction rate and there is a loss in selectivity.^
3.2 CTS cross couplingIn 1998 Crisp, Turner and Stephens developed a new type of Sonogashira cross coupling reaction26 (CTS cross coupling) without copper(I) halide, to try to avoid formation of the homocoupling of terminal alkynes. Instead of the normal co-catalyst CuI they used a combination of ZnCl2 and Nal as co-catalysts (see Scheme 6).
+ HPd(PPh3)4ZnCl2/NaIPiperidine 94 % yield
Scheme 6. The CTS cross coupling between an aryl iodide and terminal acetylene. Note that ZnCl2 is used without drying.
The ZnCl2/NaI co-catalyst system works very well for a coupling reaction between an active aryl halide such as an aryl iodide and a terminal alkyne, and no homocoupled alkyne was detected. Even a coupling reaction with less reactive electrophiles such as an electron rich aryl bromide (see Scheme 7) works very well and only a minimum amount of the homocoupled alkyne is detected.
MeO Br + BuPd(PPh3)4
ZnCl2/NaIPiperidine 86 % yield
Scheme 7. The CTS cross coupling between an aryl bromide and terminal acetylene.
By changing the solvent from piperidine to a combination of DMSO, DBU (1,8- diazabicyclo[5.4.0]undec-7-ene) and NEt3 and changing ZnCl2 to Zn dust the yield can be increased to ~100 % with a minimal amounts of homocoupled alkyne being formed.26
References
1 Sonogashira, K.; Tohda, Y. and Hagihara, N.; Tetrahedron Lett., 1975, 50, 4467.2 Littke, A. F. and Fu, G. C.; Angew. Chem. Int. Ed., 2002, 41, 4176-4211.3 Takahashi, S.; Kuroyama, Y.; Sonogashira, K. and Hagihara, G.; Synthesis, 1980, 627-630.
31

Sonogashira
4 Sonogashira K.; Yatake, Y.; Tohda, Y.; Takahashi, S. and Hagihara. N.; J. C. S. Chem. Comm., 1977, 291-292.
5 Tsuji, J., Palladium reagents and catalysts, 1995, John Wiley & Sons Ltd., Chichester, chapter 1.6 Dieck, H. A. and Heck, F. R.; Journal of Organometallic Chemistry, 1975, 93, 259-263.7 Cassar, L.; Journal of Organometallic Chemistry, 1975, 93, 253-257.8 Sonogashira, K.; Metal-catalyzed Cross-coupling Reactions, chapter 5, edited by Diederich, F. and
Stang, P. J., 1998, Wiley-VCH Verlag, Weinheim.9 A) Ziener, U. and Godt, A., J. Org. Chem. 1997, 62, 6137-6142, B) Hortholary, C. and Coudret, C.,
J. Org. Chem., 2003, 68, 2167-2174, C) Sabourin, E. T. and Onopchenko, A., J. Org. Chem., 1983, 48, 5135-5137, D) Kukula, H.; Veit, S. and Godt, A., Eur. J. Org. Chem., 1999, 277-286, E) Li, J. and Pang, Y., Synthetic Metals, 2003, 10383-10389, F) Jones, L.; Schumm, J. S. and Tour, J. M., J. Org. Chem., 1997, 62, 1388-1410, G) Che, C.-M.; Yu, W.-Y.; Chan, P.-M.; Cheng, W.-C.; Peng, S.- M.; Lau, K.-C. and Li, W.-K., J. Am. Chem. Soc., 2000, 122, 11380-11392.
10 A) Heitz, W., Pure & Appl. Chem., 1995, 67, 1951-1964, B) Kukula, H.; Veit, S. and Godt, A., Eur. J. Org. Chem., 1999, 277-286, C) Li., Y. and Pang, Y., Synthetic Metals, 2003, 10383-10389, and D) Gevorgyan, V.; Radhakrishnan, U.; Takeda, A.; Rubina, M.; Rubin, M. and Yamamoto, Y., J. Org. Chem., 2001, 66, 2835-2841.
11 Heitz, W., Polym. Prepr., 1991, 32, 327-328.12 Varlemann, U.; Thesis, 1992, dem Fachbereich Physikalische Chemie der Philipps-Universitat
Marburg.13 Trumbo, D. L. & Marvel, C. S.; J. Polym. Sci. Part A: Polym. Chem., 1987, 25, 1027-1034.14 Grisp, G. T. and Flynn, B. L., J. Org. Chem., 1993, 58, 6614-6619.15 Reppe, W.; Schlicthing, O.; Klager, K. and Toepel, T., Justus Liebigs Ann. Chem., 1948, 560, 1-7.16 Gevorgyan, V.; Takeda, A. and Yamamoto, Y., J. Am. Chem. Soc., 1997, 119, 11313-11314.17 Gevorgyan, V.; Radhakrishnan, U.; Takeda, A.; Rubina, M.; Rubin, M. and Yamamoto, Y., J. Org.
Chem., 2001, 66, 2835-2841.18 Alami, M.; Ferri, F. and Linstrumelle, G.; Tetrahedron Lett., 1993, 34, 6403-6406.19 Hundertmark, T.; Littke, A. F.; Buchwald, S. L. and Fu, G. C.; Org. Lett., 2000, 2, 1729-1731.20 Handbook of chemistry and physics 54th edition 1973-1974, Chief editor: Robert Erneast, CRC
Press Ohaio.21 Brandsma, L.; Vasilevsky, S. F. and Verkruijsse, H. D.; Application of Transition Metal Catalysts in
Organic Synthesis, 1998, Springer-Verlag Berlin p. 200.22 Sanechika, K.; Yamamoto, T. and Yamamoto, A.; Bull. Chem. Soc. Jpn., 1984, 57, 752.23 Alinger, N. L.; Cava, M. P.; De Jongh, D. C.; Johnson, C. R.; Lebel, N. A. and Stevens, C. L.;
Organic Chemistry, second edition, 1976, Worth Publishers, Inc. New York.24 Alami, M. and Linstrumelle, G., Tetrahedron Lett., 1991, 32, 6109-6112.25 Sonogashira, K. Comprehensive organic synthesis - Selectivity, strategy & efficiency in modern
organic chemistry, 1991, vol. 3, chapter 2.4, editor-in-chief:Trost, B. M., Perganon Press, Oxford, first edition.
26 Crisp, G. T., Turner, P. D. and Stephens, K. A., Journal of Organometallic Chemistry, 1998, 570, 219-224.
32

The Monomer Unit
The Mo m e r Unit
Since the discovery in 19741 of the high electrical conductivity for doped polyacetylene, a large interest in conjugated polymers has followed. Especially the applications for polymer electronic circuits2, light-emitting diodes3 and the polymer solar cells have received considerable attention.4 Concerning the different types of polymers within the application for POPV devices, the poly(p-phenylenevinylene)s (PPVs) are by far the most investigated polymers.6 Recently, focus has been towards the low band gap polymers,5 in order to get a better match with the solar spectrum. Common to most of the conjugated polymers are that they consist of a stiff backbone, which in many cases is linear and can generally be regarded as rigid rods.6 The poly (phenyl eneethy ny 1 ene) s (PPEs), which are the closets relative to PPVs, are due to the triple bonds among the stiffest polymers. The PPEs have a very high degree of linearity if the arenes are para coupled (180° between the bonds of the arenes). The PPEs can be regarded as nearly perfect rigid rods as long as the chains are under 15 nm long or under 20 PE repeating units long. Above this length the PPE chains will behave as wormlike chains.6'7 This high degree of linearity and in addition an extra n bond compared to the PPVs, made me believe that the PPEs would be much more efficient in transferring energy to the dye molecule, than the JA8 and JPJ9 systems of Krebs et al.
In defiance of the close relation to the PPVs, the PPEs have only received very little attention. However it has been demonstrated that the PPEs process fascinating properties such as being: Blue and green Light Emitting Diodes (LEDs),10'11'12'13'14 photoluminescent polarizers,15'16 TNT chemosensory materials,17 exhibit three-dimensional energy migration in solid films,18 and molecular wires.19
One of the attractive properties of the PPE is that they give the possibility of using the Sonogashira cross coupling reaction20 (see chapter 3) for the synthesis of monodisperse oligomers. These can be used as model compounds of the corresponding polymers. Investigations of e g. the influence of the chain length on the energy transfer properties and perhaps the possibility to growth crystals for structural investigations. Some groups have already reported synthesis of mono disperse oligomers of the PPE type.21'22'23'24'25
As mentioned in the introduction, the monomer unit in this project was chosen to be 2,5- dioctyltolany 1 ethyny 1 ene, see Scheme 8. The octyl groups were included to ensure solubility of the polymers, and are only placed on every second phenyl ring to minimize an eventual torsion angle out of plane between the individual phenyl groups. Further it has been shown that larger alkyl groups such as dodecyl groups on every phenyl groups will give rise to a slight distortion from planarity of the backbone of the polymer in the solid state 26 In the solid state, which is the form of the polymer in employed devices, it would be preferred to avoid decrease of conjugation length, which a distortion will cause. Of course it is expected that the backbone of the polymers will differ from planarity in solution, since the barrier of the rotation around the triple bond of an alkyne is less than 1 kcal/mol,6 and the van der Waals forces will ensure that the atoms in the phenyl groups will be as far from each other as possible.
33

The Monomer Unit
ciA)
ci C8H17
1 (84%)
C8Hi7 C8H17
Br-Q)-Br
C8H17
2 (62%)
3 (78%) 4 (95%)
C8H17
Br \ /%^HCaH-iy
5(98%)
y—= TMS + TMS-
B3 (~ 2 %)
V
B) Br ^ ^
C)
82(2-4%)
____ J
Br——TMS
6 (67%) 7 (74%)
CgH-ty CgH-iy B4 (~ 3 %)
10 (81%)
Monomer Unit
9(91%)
Protected monomer unit
Scheme 8. l-iodo-2,5-dioctyl-4’-trimethylsilylethynyltolane (7). (a) (1) Mg, C8H17Br, Et20 (2) NiCMppp, Et20; (b) Br2, I2; (c) (1) n-BuLi, THE, (2) I2; (d) TMS A, Pd(PPh3)2Cl2, Cul, Et3N; (e) K2C03, MeOH, CH2C12. Compounds Bl-B5 were by-products isolated from the reaction mixtures in step d.
The strategy of the synthesis of the monomer unit is shown in Scheme 8. All detailed information can be found in appendix A (compound 1, 6 and 7) and Appendix B paper 1 (2-5 and 8-10). The synthesis descriptions in these two appendixes represent the normal amount of compounds synthesized at one time. All have been performed several times, until 100 g of the protected monomer unit (9) was synthesized. The synthesis involved the commercially available compounds 1,4-dichlorobenzene and 1 -bromo-4-iodobenzene and as such it is a little
34

The Monomer Unit
tedious due to the 10 steps. The synthesis can be divided into three main parts: A, B and C. In part A the key compound 4-bromo-2,5-dioctylphenylethynylene (5) is synthesized, which involves five steps. The five steps is a Grignard reaction, a simple addition of bromine, a bromine-iodine exchange reaction, a Sonogashira cross coupling reaction and finally the removal of the trimethylsilane protective group.
The first two steps are standard reactions and were running smoothly without any trouble. In the third step, which is the bromine-iodine exchange of compound 2 using n-BuLi in THF at 195 K, it was found to be important to ensure that none of the compound 2 crystallized on the side of the flask during the addition to the n-BuLi solution, when this took place it was not able to react with the n-BuLi, and a mixture of compound 2 and 3 was obtained. This mixture is difficult to separate by recrystallization due to co-crystallization. Otherwise the reaction proceeds well. In the fourth step where compound 3 is cross-coupled with TMS A by a Sonogashira cross coupling reaction to form the 1-(4-bromo-2,5-dioctylphenyl)-2- trimethylsilylacetylene (4), it was found to be important that the coupling reaction took place at low temperature to increase the selectivity between iodo versus bromo substitution. Even at 273 K we obtained ~2 % of 1,4-di(trimethylsilylethynyl)-2,5-dioctylbenzene (B1) as byproduct, which were detected by 1H and 13C NMR, GC-MS and MALDI TOF. B1 was difficult to remove, and was able to react further in some of the following steps to produce byproducts such as B5. In this step I also detected 2-4 % of 1,4-bis-trimethylsilylbutadiyne (B2) as by-product, which was expected due to the use of the Pd(PPh3)2Cl2 catalyst (see chapter 3.1.2). B2 was not a problem, because when the TMS group is removed in the second step, the1,3-butadiyne is removed by evaporation. In the last step the TMS group was removed by K2CO3 and the 4-bromo-2,5-dioctylphenylethynylene (5) was obtained.27
In part B the key compound 1-(4-iodophenyl)-2-trimethylsilylacetylene (7) was synthesized in two steps. The first step was a Sonogashira cross coupling reaction similar to step 4 in part A. In this step it was also important to run the reaction at low temperature to reduce the byproduct 1,4-bis(trimethylsilylethynyl)benzene B3. As in part A the by-product B2 was also detected in this step. Fortunately both B2 and B3 could be removed by recrystallization.
In Part C the monomer unit 1-iodo-2,5-dioctyl-4’-ethynyltolane (10) was obtained in three steps. The first step being a Sonogashira cross-coupling reaction between compound 5 and 7 to obtain 1-bromo-2,5-dioctyl-4’-trimethylsilylethynyltolane (8). In this step ~ 3 % 1-bromo-2,5- dioctyl-2’,5’-dioctyl-4-(4’’-trimethylsilylethynylphenyl)ethynyltolane (B4) was detected as a by-product with 1H and 13C NMR and MALDI TOF, which is a result of insufficient iodo bromo selectivity. Furthermore ~1 % of compound 5 was found, which is a result of incomplete reaction ~1 % of 1,4-dioctyl-2,5-bis((4’’-trimethylsilylethynylphenyl)-ethynyl)benzene (B5) was also detected. The presence of B5 is a result of the difficulty in separating B1 from compound 4. The RF values in n-heptane of compound 5, 8, B4 and B5 are 0.58, 0.38, 0.25 and 0.08, so it was possible by flash chromatography to separate 8 from the by-products. The removal of by-products in this step was found to be essential in order to control the later polymerization process. As a consequence the yield of pure compound 8 obtained was low. It should be noted that besides the above mentioned by-products, some minor by-products were also detected, but the amount of these was so small that it was impossible to determine the structures.
The second step was a standard bromine-iodine exchange as described in part A, which ran smoothly. The last step consists of removing the TMS group by K2CO3, which also runs
35

The Monomer Unit
smoothly. This was only done immediately before the monomer unit (10) should be used, to avoid reaction of the reactive terminal ethynylene groups.
Through this synthetic route I successfully produced about 100 g of the protected monomer unit (9). Taught by experience, 100 g of the monomer unit is necessary, if both monodisperse oligomers, polymers, and super molecular structures like NPN is to be synthesized. In Figure 17 and Figure 18 the 1H- and 13C NMR spectra of the protected monomer (9) are shown and in Figure 19 and Figure 20 the 1H- and 13C NMR spectra of the monomer (10) are shown. By comparing the two 1H spectra it can be seen that 9 is characterized by containing the TMS group showed by a singlet around 0.6 ppm while 10 is characterized by the absence of this peak with a peak at around 3.1 ppm due to the ethynylene proton. By comparing the two 13C spectra it can be seen that they only differ in the two carbon atoms in the ethynylene group at which the TMS group in 9 is attached. In compound 9 these two carbon atoms are deshielded by the TMS group and have the chemical shift values of 105.3 and 97.0 ppm, while in 10 the chemical shift values are shifted to 84.0 and 79.6 ppm. NMR therefore offers a fast, easy and effective method to distinguish between these two compounds, and to determine whether a Sonogashira cross coupling reaction has run to completion or not.
ppm (t1)
Figure 17. The 'H-NMR spectrum of 9.
36

The Monomer Unit
ppm (t1)100
Figure 18. The 13C-NMR spectrum of 9.
50
I l|ill
8.0 7.0 6.0 5.0 4.0 3.0 2.0 1.0ppm (t1)
Figure 19. The 1H-NMR spectrum of the monomer 10.
0.0
37
0.86
2 I Ji
t -
0.61
0

The Monomer Unit
100 50ppm (t1)
Figure 20. The 13C-NMR spectrum of the monomer 10.
7
References
1 Chiang, C. K.; Fincher, C. R.; Park, Y. W., Heeger, A. J.; Shirakawa, H.; Louis, E. J.; Gau, S. C. and Macdiarmid, A. G., Physical Review Letters, 1977, 39, 1098-1101.
2 Katz, H. E.; Lovinger, A. J.; Johnson, J.; Kloc, C.; Siegrist, T.; Li, W.; Lin, Y.-Y. and Dodabalapur, A., mature, 2000, 404, 478-481.
3 Burroughes, J. H; Bradley, D. D. C.; Brown, A. R.; Marks, R. N.; Mackay, K.; Friend, R. H.; Burn,P. L. and Holmes, A. B., Nature, 1990, 347, 539-541.
4 Granstrom, M.; Petritsch, K.; Arias, A. C.; Lux, A.; Andersson, M. R. and Fiend, R. H., Nature,1998, 395, 257-260.
5 Bundgaard, E. and Krebs, F. C., Macromolecules, 2006, 39, 2823-2831.Bunz, U. H. F., Chem. Rev., 100, 1605-1644, 2000.Cotts, P. M.; Swager, T. M. and Zhou, Q.,Macromolecules, 1996, 29, 7323-7328.
8 Krebs, F. C., Sol. Energy Mater. Sol. Cells., 2003, 80, 257-264.9 Krebs, F. C.; Hagemann, O. and Spanggard, H., J. Org. Chem., 2003, 68, 2463-2466.10 Weder, C. and Wrighton, M. S., macromolecules, 1996, 29, 5157-5165.11 Montali, A.; Smith, P. and Weder, C., Synth. Met., 97, 123-125, 1998.12 Sato, T.; Jiang, D. L. and Aida, T., J. Am. Chem. Soc., 1999, 121, 10658-10659.13 Pschirer, N. G.; Miteva, T.; Evans, U.; Roberts, R. S.; Marshall, A. R.; Neher, D.; Myrick, M. L. and
Bunz, U. H. F., Chem. Mater., 2001, 13, 2691-2696.14 Schmitz, C.; Posch, P.; Thelakkat, M.; Schmidt, H. W.; Montali, A.; Feldman, K.; Smith, P. and
Weder, C., Adv. Func. Mater., 2001, 11, 41-46.15 Montali, A.; Bastiaansen, C.; Smith, P. and Weder, C., Nature, 1998, 392, 261-264.16 Weder, C.; Sarwa, C.; Montali, A.; Bastiaansen, C. and Smith, P., Science, 1998, 279, 835-837.17 Yang, J. S. and Swager, T. M., J. Am. Chem. Soc., 1998, 120, 11864-11873.18 Levitsky, I. A.; Kim, J. and Swager, T. M., J. Am. Chem. Soc., 1999, 121, 1466-1472.19 Wang, C.; Batsanow, A. S. and Bryce, M. R., J. Org. Chem., 2006, 71, 108-116.2021
Sonogashira, K.; Tohda, Y. and Hagihara, N.; Tetrahedron Lett., 1975, 50, 4467-4470. Ziener, U. and Godt, A., J. Org. Chem., 1997, 62, 6137-6143.
38

The Monomer Unit
22 Kukula, H., Veit, S. and Godt, A., Eur. J. Org. Chem., 1999, 277-289.23 Hsung, R. P., Chidsey, C. E. D. and Sita, L. R., Oranometallics, 1995, 14, 4808-4815.24 Hortholary, C. and Coudret, C., J. Org. Chem., 2003, 68, 2167-2174.25 Jones II, L., Schumm, J. S. and Tour, J. M., J. Org. Chem., 1997, 62, 1388-1410.26 Li, H.; Powell, D. R., Hayashi, R. K. and West, R.,Macromolecules, 1998, 31, 52-58.27 Eaborn, C.; Thompson, A. R.; Walton, D. R. M., J. Chem. Soc., 1967, 1364-1366.
39

40

Monodisperse Oligomers
onodisperseOligomers
Monodisperse oligomers are interesting because they serve as excellent models for their corresponding poly disperse polymers. They can give specific information about electronic, photonic, morphological properties, and how long the oligomers have to be before they act like the poly disperse polymers.1 By synthesizing a series of monodisperse oligomers with different length, the interesting chain dependent properties such as charge carrier mobilities, effective conjugation length, electronic structure and the morphology, can be investigated. Furthermore, characterization of well-defined materials with e g. X-ray diffraction and NMR spectroscopic techniques are easier than of the poly disperse polymers.1
In order to synthesize a series of monodisperse phenyl acetylene terminated oligo(l-(2,5- dioctyltolany 1 )ethyne), I was inspired by Godt et al2 to use the synthetic route illustrated in Scheme 9.
Scheme 9. The synthetic route to monodisperse phenyl acetylene terminated oligo(l-(2,5- dioctyltolanyljethyne). Step 1) Pd(PPh3)4 (2 mol %), Cul (10 mol %) and THF at r.t. Step 2) K2C03 (10 eqv.) and CFFCIVMeOH (1:1) at r.t.
The chosen synthetic route gives the opportunity to synthesize monodisperse oligomers in a stepwise manner with precise molecular length. The synthetic route consists of two steps, and starts with n=0, which means that in the first step phenyl acetylene is coupled with 10 by a Sonogashira cross coupling reaction to produce the phenyl acetylene terminated monomer. This is done to ensure that the oligomers are not capable of homo coupling in further steps. Godt et al. have not used phenyl acetylene to terminate the monomers, but instead started with the bromo monomer to which the iodo monomer was coupled. In doing it this way, they make use of the bromo iodo selectivity in the Sonogashira cross coupling reaction to ensure that the produced monodisperse oligomers do not homo couple. I'm not convinced that the bromo iodo
41

Monodisperse Oligomers
selectivity is strong enough to ensure that none of the oligomers are homo coupled; therefore I decided to terminate them with phenyl acetylene. The synthesis of the phenyl acetylene terminated monomer worked well, which was documented by NMR. It was purified by dry column vacuum chromatography3 using gradient of ^/-heptane/ethyl acetate as eluent to ensure that the first step did not contain remnants of phenyl acetylene or 10, which in later steps could result in poly disperse oligomers or even polymers. In step two the TMS protecting group of the phenyl acetylene terminated monomer was removed by a base (K2CO3 in a 1:1 mixture of methanol and di chi or om ethane). The reaction times of step 1 and 2 were set to two and one day respectively, to ensure that each step in the synthetic cycle was completed before proceeding to the next step. Further, more catalyst was added in step 1 after one day, to ensure that there was active catalyst present in the reaction mixture at all times. The choice of the catalyst was Pd(PPh3)4 because in theory it should not form the 1,4-diarylbutadiynes as a byproduct (see chapter 3.1.2).The idea of the synthetic route was then that it should be carried out by repeating these two steps continuously with only a short aluminium oxide column as the purification method. This way the intention was to e g. synthesize the trimer in 95 % purity, with only minor impurities such as uncoupled monomer, dimer or possible 1,4-diarylbutadiynes from a oxidative homocoupling of the unprotected ethynyl groups. The 95 % pure trimer should then be purified by preparative Size Exclusion Chromatography (SEC).
Mz = 19168 Mz+1 =41925
“ 200
M 150
0 5 10 15 20 25Time [min]
Figure 21. The SEC trace of what should have been the pure trimer. The molecular weight of the trimer is 1441.27 g/mol, and correspond to the highest peak in the middle of the trace (-16.30 min).
Unfortunately when the raw trimer product was analyzed by SEC (see Figure 21) it contained many by-products, and the purity of the trimer was not in the range of 95 %. In the SEC trace in Figure 21 the high peak in the middle (around 14 min.) corresponds to the trimer. The molecular weight of the trimer is 1441 g/mol, and from SEC it can be seen that it is determined to be 2072 g/mol. The reason for this mismatch is, that in SEC it is not the molecular weight that is determined but the hydrodynamic volume. The hydrodynamic
42
Monodisperse Oligomers
volume is then converted to mass by comparing with a calibration curve made by well defined polystyrene standards. The polystyrene standards are flexible randomly coiled polymers diametrically opposed to the PPEs that are rigid rods.4,5 It is therefore obvious that the SEC method will overestimate the molecular weight of PPEs. Tour et al. have made a calibration curve for Mn values of precisely defined oligo(thiophene ethynylene)s and oligo(phenylene ethynylene)s determined by SEC relative to polystyrene standards.1 From the calibration curve it can be seen that the SEC method overestimate the mass of oligo(phenylene ethynylene)s between 50 % and 66 %, when the oligomers has a mass about 1500 g/mol. This result agrees very well with our measurement of the Mn in the case of the trimer, which is 43 % to large. It should be noted that the slope of the calibration curve depends on the actual molecular weight. The dependence of the molecular weight is such that the deviation between the molecular weight determined by SEC and the actual molecular weight increase with the actual molecular weight of the oligomers.From the SEC trace it can be seen that the product contain both by-products with smaller and larger size. The by-products of lower size are most likely uncoupled monomers and dimers and possibly the 1,4-diarylbutadiynes originating from oxidative dimerization of the unprotected monomer or couplings between the unprotected monomer and the unprotected dimer. The by-products with higher mass most likely include the 1,4-diarylbutadiynes originating from homocoupling of the unprotected dimer or a polymerisation of unreacted monomer units.In order to reduce the amount of by-products several different attempts were made. For instance different types of catalysts such as Pd(PPh3)4, Pd(PPh3^Cl2 or Pd2(dba)3, different types of bases such as NEt3 or Piperidine, different types of co-catalysts such as CuI or ZnCl2/NaI (the CTS coupling see chapter 3.2) and changing the reaction time from two days to one week have been attempted but without any significant difference in the amount of byproducts formed. Furthermore it was attempted to boil all the solvent under an argon atmosphere before use, to avoid oxygen which can cause the formation of the 1,4- diarylbutadiynes. No significant difference in the amount of formed by-products was observed in spite of all these trials.
Seen in the light of several months work with lot of different attempts to synthesize the trimer, with a poor yield and highly laborious to purify a reasonable amount of the trimer by SEC, I decided to stop further work of making monodisperse phenyl acetylene terminated oligo(1-(2,5-dioctyltolanyl)ethyne) by this type of synthetic route.
Instead I decided to try to synthesize monodisperse oligomers by using the solid phase synthetic route shown in Scheme 10. The route is inspired by Tour et al.5 All the experimental details can be found in appendix A.
43

Monodisperse Oligomers
o-Os:cl *Csl, DMF
9, Pd(PPh3)4, Cul, NEt3, THF
TBAF, THF
Scheme 10. The chosen solid phase synthetic route to make monodisperse oligomers.
The advantage of this solid phase synthetic route is, that after the monomer units are attached to the resin, they cannot interact with each other and thus cannot form the 1,4- diarylbutadiynes. This means that if the couplings are 100 % head-to-tail coupled, monodisperse oligomers in principle can be obtained without any of the by-products described in chapter 3.1.2. If the couplings proceed in at least 95 % yield in each step, the oligomers can be separated by preparative SEC. A coupling success rate of less than 95 % is not acceptable, it becomes too expensive to separate the different oligomers from each other.
The first step in the solid phase synthesis is to form the anchor unit, which is achieved by the coupling of the Cs salt to Merrifield's resin (chloromethyl polystyrene). In Solid phase synthesis all coupling and purifying (washes) routines take place in a special flask made for solid phase synthesis (see Figure 22).
Monitoring the yield and progress of the reaction are more complicated in solid phase synthesis than in normal solution synthesis. In solid phase syntheses it is not possible to use TEC and other chromatography techniques because the resin is insoluble in the most common solvents. Spectroscopic techniques as e g. solid state NMR and FTIR can be used with success especially for short oligomers, but especially solid state NMR is challenging to use and I have not used this method, but instead used FTIR.
The FTIR techniques have the advantage that in these Sonogashira coupling reactions there are two vibrations in a frequency range where normally there are no other absorptions. These two vibrations are the sp C-R stretch and the sp C = C-R stretch. The frequencies where those vibrations occur depend on the type of radical R attached to the C atoms in the alkynyl groups. Generally, the heavier the R radicals are the higher the frequencies of the vibrations are.
44

Monodisperse Oligomers
Generally, by this technique it is possible to distinguish between the unprotected alkynyl group, the alkynyl group protected with a trimethylsilyl group and the alkynyl groups in the backbone of the oligomers. In other words, when the cross coupling reaction is complete the vibration of the sp C-H and the C = C-H stretch disappears. The stretch from the C = C-R terminals and the backbones C = C of the oligomers should be left.
Figure 22. The equipment for the solid phase synthesis.
Tour et a! 6 have used FTIR to monitor cross coupling reaction for the protected monomer 1- iodo-3-dodecyl-4-[(trimethylsilyl)ethynyl]benzene. They found the terminal alkynyl carbon- hydrogen and the carbon-carbon stretches at 3311 (strong) and 2109 (weak) cm'1 respectively, while the carbon-carbon stretch of the trimethylsilyl-terminated alkyne occur at 2156 (weak) cm'1.
In my system where the deprotected monomer consists of the l-iodo-2,5-dioctyl-4’- ethynyltolane, I observed the terminal alkynyl carbon-hydrogen and the carbon-carbon stretches at 3286 (strong) and 2077 (weak) cm'1 respectively, while the carbon-carbon stretch of the trimethylsilyl-terminated alkyne occurs at 2154 (weak) cm'1. The vibration frequencies of the carbon-carbon stretch for the alkyne groups in the backbone occur at 2211 cm'1 (see Figure 23).
Hence by observation of the different alkynyl stretch vibration intensities, FTIR can be used to monitor whether a given coupling reaction is 100 % completed or e g. only 50 % done.
Both FTIR and solid state NMR have unfortunately the disadvantage that they have a relatively low sensitivity, when they are used for resin analysis.
45

Monodisperse Oligomers
------- Anchor unit
i i i | i i i i i i i i i | i i i i i i i i i | i i i i i i i i i | i i i i i i i i i | i i i ii ii ii | i ii ii
2000 2250 2500 2750 3000 3250 3500 3750 4000
Wavenumbers [cm"*]
Figure 23. The FTIR spectra of the resin with the anchor unit coupled, with the anchor unit and one protected monomer coupled and with the anchor unit and one unprotected monomer coupled.
A more effective method to monitor the coupling reaction is to determine the increase in weight for the resin after each reaction. It is a very slow but very effective method.
The yield after the first coupling reaction can be determined by measuring the increase in weight, AW, of the resin after the reaction and the amount of precipitated silver chloride, ricu from the first coupling reaction.
The yield, T, is given by:
(5.1)
where np is the amount of the product in the final resin, and net is the number of moles of precipitated silver chloride, which is equal to the theoretical moles of free couplings sites.
rip can be determined from the following two conditions:
(52)
where mon, mp and ma is the mass of the coupled OH (from water in the solvents and atmosphere) and product to the resin and the mass of precipitated chloride ions respectively.
By substitution of condition 1 into condition 2 it can be showed that np is given by:
46

Monodisperse Oligomers
np
AW iMOH Mci )nci
Mp — MOH(5.3)
where MOH, Mp and MCi is the molar mass of the coupled OH group, the coupled product and the chlorine.
By substitution of equation (5.3) into (5.1) the following expression for the yield is obtained:
Y = AW — (moh —Mci )nci (5 4)(Mp — MOH )nCI
From the experimental details in appendix A it can be seen that in step 1 AW = 0.425 g and that nci = 9.064 x10"3 mol, which gives a yield of 51 %. This means that 51 % of the free coupling sites are occupied by the anchor unit and all other sites are occupied by OH groups.
Step 2 is a Sonogashira cross coupling reaction where the protected monomer unit (9) is coupled to the anchor unit. The yield in step 2 is given by:
Ynp1
np
(5.5)
Where npi is the amount of 9 coupled to the anchor unit. The weight increase after the coupling reaction is:
AW = mp1 — mH (5.6)
Where mpi is the weight of 9 (minus the weight of an iodine atom) coupled to the resin, where mH is the weight of the hydrogen atoms which are eliminated in the coupling reaction. The npl = nH, because the only way a hydrogen atom can be eliminated is when 9 is coupled to the site, therefore is np] given by:
np1 =AW,
Mp1 — Mh(5.7)
Mpi and MH is the molar mass of 9 (minus the weight of an iodine atom) and a hydrogen atom respectively. By substitution of equation (5.7) and (5.3) into (5.5) following expression for the yield is obtained:
Y =Mp — Moh
AW — (MOH — Mci )nci
AW1Mp1 — Mh
(5.8)
From appendix A it can be seen, that AWi = 0.552 g, when 5.034 g of the resin from step 1 was used. This corresponds to a yield of 50 %. In order to get a higher yield the resin was used again and a new coupling was performed under the same conditions as the first one. In this case the AWi = 0.075 g, which corresponds to a total AWi = 0.627 g and a total yield of 57 %. A third coupling attempt did not lead to any further increase in mass.
In step 3 the TMS protecting groups were removed by treatment with TBAF. In appendix A it can be seen that the mass was reduced by 0.208 g, but should only have been reduced by 0.091 g. I have no explanation for why the mass was reduce so much. I have checked the resin by IR and it shows that it was 100 % deprotected.
47

Monodisperse Oiigomers
In step 4 one more Sonogashira cross coupling reaction was performed to produce the dimer unit. The increase in mass was only 0.464 g in first attempt, 0.068 g in second attempt and 5 mg in third attempt, which give a total mass increase of 0.537 g and corresponds to a yield of 86 %.
In step 5 the dimer was cleaved from the resin by treatment with strong base (NaOH) followed by acidification with HCl. The SEC analysis of the dimer showed unfortunately that there was lots of polymer material in the sample, so no attempt was made to purify the dimer.
The solid phase synthesis was attempted three times and every time there were problems with the coupling yield of less than 95 %, too much loss in mass during the deprotection steps and formation of polymer materials in the cleaving steps.
On the basis of the unsatisfactory coupling yields and problems with the formation of polymer materials together with the immense time consumption in each step, the solid phase synthetic route was dropped as well.From these failed trials aimed at synthesizing monodisperse oligomers a remarkable observation can be made. It seems that the coupling reactions continue after the deprotection steps, which is strange because the catalysts should have been removed or was it? If there are remnants of the catalyst present under the deprotection step, where base is also present, then the environment for a Sonogashira cross coupling reaction is present along with the unprotected and uncoupled monomers. This is especially critical in the case of the solution route, whereas in the solid phase synthesis the uncoupled monomers are washed out. The unprotected and uncoupled monomers will be able to couple with each other to produce long oligomers or polymers. Further it is a possibility that the terminated oligomers will homocouple and form 1,4-diarylbutadiynes. By screening the literature I found that there has only been a sporadic interest to ensure no remnants of the Pd catalysts left in the newly synthesized organic compounds, and that this interest has increased significantly during the course of this project.7'8'9'10'11'12'13'14'15'16'17
I suggest therefore that the problems concerning the synthesis of the monodisperse oligomers in high purity is due to the remnants of Pd in the samples under the deprotection steps. This is supported in the literature by Garret and Prasad14 and Krebs et al.15.
The topic concerning the remnants of Pd in the synthesis organic compounds will be treated in details in chapter 7.
References
1 Tour, J, M., Chem. Rev., 1996, 96, 537-553.2 Ziener, U. and Godt, A., J. Org. Chem., 1997, 62, 6137-6143.3 Pedersen, D. S. and Rosenbohm, C., Synthesis, 2001, 16, 2431-2434.4 Bunz, U. H. F., Chem. Rev., 2000, 100, 1605-1644.5 Jones II, L., Schumm, J. S. and Tour, J. M., J. Org. Chem., 1997, 62, 1388-1410.6 Jones II, L.; Schumm, J. S. and Tour, J. M., J. org. chem., 1997, 62, 1388-1404.7 Schmuckler, G. (Technion Research and Development Foundation Ltd.), DE1533131, 1974
Chem. Abstr. 1969, 71:32590.8 Ferrari, C.; Predieri, G. and Tiripicchio, A., Chem. Mater., 1992, 4, 243-245.9 Rosso, V. W.; Lust, D. A.; Bernot, O. J.; Grosso, J. A.; Modi, S. P.; Rusowicz, A.; Sedergran, T. C.;
Simpson, J. H.; Srivastava, S. K.; Humora, M. J. and Anderson, N. G., Org. Process Res. Dev., 1997, 1, 311-314.
10 Villa, M.; Cannata, V.; Rosi, A. and Allegrini,P. (Zambon Group S.P.A.), WO9851646, 1998
48

Monodisperse Oligomers
Chem. Abstr. 1998, 130:15127.11 Konigsberger, K.; Chen, G.; Wu, R. R.; Girgis, M. J.; Prasad, K.; Repic, O. and Blacklock, T.J.,
Org. Process Res. Dev., 2003, 7, 733-742.12 Manley, P. W.; Acemoglu, M.; Marterer, W. and Pachinger, W., Org. Process Res. Dev., 2003, 7,
436-445.13 Urawa, Y.; Miyazawa, M.; Ozeki, N. and Ogura, K., Org. Process Res. Dev., 2003, 7, 191-195.14 Garret, C. E. and Prasad, K., Adv. Synth. Catal., 2004, 346, 889-900.15 Krebs, F. C.; Nyberg, R. B. and Jorgensen, M., Chem. Mater., 2004, 16, 1313-1318.16 Sellinger, A.; Tamaki, R.; Laine, R. M.; Ueno, K.; Tanabe, H.; Williams, E. and Jabbour, G. E.,
Chem. Commun., 2005, 3700-3702.17 Tristany, M.; Courmarcel, J.; Dieudonne, P.; Moreno-Manas, M.; Pleixats, R.; Rimola, A.; Sodupe,
M. and Villarroya, S., Chem. Mater., 2005, CM051967A.
49

50

The Polymers
The m e r s
The iodine-terminated homopolymer poly[(2,5-dioctyltolanyl)ethynylene], N„, were synthesized by employing a standard Sonogashira cross-coupling as outlined in Scheme 11. All the experimental details can be seen in paper 1 in appendix B. As shown in Scheme 111 have used Pd(PPh3)4 as catalyst instead of Pd(PPh3)2Cl2 to avoid or minimize the formation of the1,4-dibutadiyne by-products (see chapter 3.1.2). In connection to the synthesis of N„ it should be mentioned that attempts to dry the product in a vacuum oven at room temperature gave a darkened product that was no longer soluble in common solvents. This behavior has been observed earlier,1 and is probably a result of cross linking of the polymer chains. Therefore, I always kept the polymer wet with the appropriate solvent. The molecular weight of the polymer was determined by SEC and the results can be seen in Table 4.
c§h17
Pd(?Ph3)4CulPiperidineTHF
10
Scheme 11. The synthetic route of synthesizing of the iodine-terminated homopolymer poly[(2,5- dioctyltolanyl)ethynylene], Nn.2
To synthesize the porphyrin-linked homopolymer, NPN, I have tried two different synthetic routes as shown in Scheme 12 and Scheme 13. Both routes should in theory give a super molecular assembly with the NPN structure. The only way the two different synthetic routes differ is in the way the polymer segment is coupled to the porphyrin unit and thereby the distance from the octyl groups to the porphyrin unit is different. For NPN A, where the distance between the octyl groups and the porphyrin unit is shorter than for NPN B, a decrease in the conjugation length will be expected due to steric effects of the octyl groups.In spite of the expected smaller conjugation length of NPN A compared to NPN B I decided to synthesize NPN A first, as I thought that it would be easier to incorporate the diethynylporphyrin, 11, than the dibromoporphyrin, 12, into the polymer chains because compound 11 was expected to have a higher reactivity towards the individual monomers, 10.
The polymerization of 10 in presence of 11 proceeded smoothly and a green polymer product was obtained. In order to ensure that only one porphyrin unit was incorporated into the polymer backbone and to investigate the chain length dependence on the energy transfer from the polymer backbone to the porphyrin unit, the crude NPN A product was divided into seven fractions by preparative SEC.
51

The Polymers
(Nn-P(Zn)-Nm)NPNA
Scheme 12. The unsuccessful synthetic route to synthesize NPN.2
n+m [-
Scheme 13. The successful synthetic route to synthesize NPN.2
52

The Polymers
The molecular weight of the crude NPN A and the seven fractions were determined by SEC and listed in Table 4. If only one porphyrin unit is sandwiched between two polymer chains, the absorption ratio N/P between the polymer, N, and the porphyrin, P, should increase going from the fraction with lowest molecular weight (fraction 7) to the fraction with highest molecular weight (fraction 1) as a consequence of the longer polymer chains in the fraction with highest molecular weights. In Figure 24 the UV-Vis spectra of the seven fractions are shown.
vV£
ocfi-QC3V N
1.0
0.8
0.6 -
n 0.4 -C3!oZ
0.2
0.0
Fraction 1 Fraction 2 Fraction 3 Fraction 4 Fraction 5 Fraction 6 Fraction 7
300 400 500 600
Wavelength [nm]
700 800
Figure 24. The normalized (according to )vmax) UV-Vis spectra of the seven fractions of NPN A in a CHCf solution. Very little variation of the N/P absorption ratio is observed.2
From the UV-Vis spectra of the seven fractions it can be seen that the zinc porhyrin molecule, whose UV-Vis spectrum is characterized by a Soret band with maximum at around 460-470 nm and the Q-bands between 600 and 700 nm, was successfully incorporated into the polymer backbone. Furthermore, it can be seen that the N/P absorption ratio, astonishingly enough, is roughly constant, which indicate that it is not only NPN A that is produced but also byproducts that consists of more than one porphyrin molecule per polymer chain. The N/P absorption ratio is shown in Table 4. The problem with the synthetic route for NPN A is that the growing chain always exposes an ethynyl group. The free ethynyl groups are known (see chapter 3.1.2) to be capable of undergoing an oxidative homocoupling to form butadiynes, which are the dominating by-products from the Sonogashira cross coupling reaction. The problem with these types of by-products is, that they leave an iodo terminated polymer, which does not represent a termination of chain elongation, instead it allows both monomer and porphyrin units to couple to itself and the polymer chain can continue to grow. The result will be a polymer product with an even distribution of porphyrin molecules, and where the amount of the porphyrin in the polymer backbone largely depends on the initial ratio between the monomer and the porphyrin, and the amount of oxygen present in the reaction mixture. In the light of these arguments it is therefore most likely that the synthetic route in Scheme 12 leads to both the desired NPN structure and a lot of buta-l,3-diyn-l,4-diyl by-products of the type shown in Scheme 14.
53

The Polymers
...NPN-NPN...
Scheme 14. Some of the possible by-products from the Sonogashira cross coupling reaction between 10 and 11. The by-products are due to the homocoupling of ethynyl groups.2
It is possible to get rid of the homocoupling, which is the dominant side reaction by chromatography in small molecules. In the case of polymers the homocoupling will lead to accumulation so that each polymer chain contains several of this type of defect. I have based on the above drawn the conclusion that it is not possible to use the synthetic route in Scheme 12 to synthesize a super molecular assembly like NPN with a high degree of regionregularity and directionality. All further work with NPN A was therefore abandoned.
For NPN B, I assumed that there would only be incorporated one porphyrin molecule in each NPN polymer chain. The reason is that the porphyrin molecule, 12, is bromo terminated in both ends, so that the ethynyl groups on the monomers are coupled to the porphyrin molecule. In this way the growing chain will always be iodo terminated, and therefore not capable of making a homocoupling or a coupling to other porphyrin molecules. On the other hand it is also expected that a considerable amount of the homopolymer would be present, since any homocoupling of the ethynyl groups will lead to homopolymers with iodo termini in both ends of the chain, and therefore are not capable of incorporating the dibromoporphyrin in the chain.The polymerization of 10 in presence of 12 proceeded smoothly and a green polymer product was obtained. The crude NPN B polymer product was fractionated by SEC into eight fractions (see Figure 25 for the SEC trace) and the molecular weight, Mw, was determined to 11546 g/mol with a polydispersity, PD, of 3.46. Note that when a SEC analysis was performed on the crude NPN B and on individual fractions the following day, a very remarkable observation was made. The Mw and the PD were significantly increased, which indicate that a cross-linking between the individual chains took place. To make sure that the cross-linking process was complete before further investigation of the polymer, the crude polymer and the fractions were left standing in CHCf solutions in the hood under the ambient atmosphere to slowly evaporate over a period of three days. The evaporated solids were dissolved in boiling CHCI3 and insoluble parts were filtrated off before they were refractionated by SEC. The new fractions were stable regarding to the Mw and PD and the determined values are listed in Table 4. Fraction 8 was discarded because it consisted of compounds with very low molecular weight. From Table 4 it can be seen that the crude NPN B increase in Mw and PD from 11546 g/mol and 3.46 to 36949 g/mol and 4.09 during the three days, which is surprisingly much.
54

The Polymers
400
- 300
- 200
- 100
010 15 20
Time [min]Figure 25. The SEC trace of the crude NPN B polymer product (right axes) and the 8 fractions (left axes). The UV-signal is monitored at 383 nm, which corresponds to the of the N domain/
OU
rr 60 -!
C3a
£
40 -
20
n -
Fraction 1 Fraction 2 Fraction 3 Fraction 4 Fraction 5 Fraction 6 Fraction 7 Fraction 8 Crude NPN B
In Figure 26 the UV-Vis spectra of the seven fractions dissolved in CHCI3 are shown. It can be seen that the NPN B polymer shows the desired variation of the N/P ratio between the individual fractions, which indicate that I in principle succeeded to incorporate only one porphyrin molecule in the polymer backbone.
Fraction 1/# wl Fraction 2
- Fraction 3
Fraction 4
Fraction 5
Fraction
Fraction 7
3 0.4
500 600Wavelength [nm]
Figure 26. The normalized (according to kmax) UV-Vis spectra of the seven fractions of NPN B in a CHCf solution. It can be seen how the absorption intensity of the porphyrin ('/. = 45 1 nm (Soret band)
55

The Polymers
and X = 520-700 nm (Q band)) compared to the absorption intensity of the N domains varies in the individual fraction and thereby varies as a function of the length of the Nn domains.2
Table 4. Data from the SEC and UV-Vis analyse for all three polymers: Nn, NPN A and NPN B
Compound Mw[g/mol] PDI Absorbance
ratioN/Pratio(UV-Vis)
N/Pratio(SEC)
N„ 92300 2.90NPN A crude 19299 2.12 2.5 8.5Fraction 1 66020 1.18 2.5 8.5Fraction 2 41255 1.16 3 10.0Fraction 3 22175 1.15 2.5 8.5Fraction 4 13058 1.18 2.5 8.5Fraction 5 8373 1.11 2.5 8.5Fraction 6 4727 1.09 2.5 8.5Fraction 7 2839 1.03 2 6.9NPN B crude 36949 4.09 3 10.0 84.6Fraction 1 92275 1.07 6.5 22.2 214.8Fraction 2 60246 1.21 5 17.1 139.0Fraction 3 31612 1.28 4.5 15.4 72.0Fraction 4 14225 1.19 3.5 12.0 31.1Fraction 5 9239 1.24 2.5 8.5 19.4Fraction 6 4074 1.39 2 6.9 7.2Fraction 7 1534 1.17 1.5 5.1 1.5
It should be emphasized that neither SEC nor the UV-Vis analysis give information about the homopolymer content as a result of the oxidative homocoupling of the ethynyl groups. Instead the two methods can give an estimate of the length of the N domains and of the degree of cross linking. From the UV-Vis spectra in Figure 26 it is possible to obtain an average N/P ratio in the NPN B polymer. This is done on the basis of the absorbance ratio between the absorption at X = 390 nm and X = 451 nm, which represent absorption mainly from the N and P (the Soret band) domains, respectively. The absorption ratios for the individual fractions are listed in Table 4. Applying the extinction coefficients for the pure homopolymer N„ and the pure porphyrin molecule 11 an estimate of the N/P ratio can be obtained. The two extinction coefficients were determined to be 8390 = 70000 M'1 cm'1 and 8431 = 240000 M'1 cm'1 respectively.2 The Xmax of the Soret band in NPN B is red-shifted with 20 nm compared to 11 due to the increased conjugation length, which is the reason for the use of the 8431 for the absorption at 451 nm in NPN B. The estimated N/P ratio can be seen in Table 4. From the Mw of the different fractions determined by SEC it is also possible to get an estimate of the N/P ratio, when it is assumed that there is only one porphyrin molecule in each chain and that the molecular weight of the porphyrin unit is 750 g/mol and the weight of the monomer unit is 425 g/mol in the chains. The estimated N/P ratios on basis of the SEC data are also present in Table 4.
2 Note that I used the extinction coefficient of 11 instead of 12 because it looks more like the porphyrin unit that is incorporated into the polymer backbone of NPN B.
56

The Polymers
Comparison of the N/P ratio obtained by UV-Vis with the results from the SEC data a mismatch in both the fractions with low and with high molecular weights is observed. Consider first the low molecular range. In this range the N/P ratio is overestimated by the UV-Vis analysis as a result of the assumption that the extinction coefficient for Nn and P is the same in the polymer and for the isolated molecules. In the low molecular range it is therefore the results from the SEC analysis that are most reliable, while keeping in mind that also the results from the SEC are overestimated due to the mismatch between the hydrodynamic volume of the PS standard and the NPN B. From the data in Table 4 it can be seen that fraction 7 most likely cover the molecules where only one monomer is coupled to the porphyrin. In the range of high molecular weight the mismatch is due to both overestimation of Mw by SEC and to cross-linking of the individually NPN B chains. According to the overestimation of Mw by SEC, Tour et al. have shown that the overestimation highly depends on the size of the molecular assemblies in such way that in the molecular weight range from 600 to 4400 g/mol the overestimation is in the range of 20 to 100 %, with the largest overestimation on the largest molecules.4 But in the case of large polymers with a chain length of more than 20 PPE units, the polymer will no longer act as a perfect rod but begin to act as a wormlike chain,5 and the overestimation of Mw will therefore probably be lower. The cross-linking between the individual polymer chains also contribute significantly to the mismatch since more than one porphyrin molecule will be present in the molecule, and therefore give a too small N/P ratio in the UV-Vis analysis. During the work up the Mw of the crude NPN B was increased about three times, which indicate that in average three polymer chains have been linked together.
Altogether it can be concluded that I, in spite of a lot of unforeseen difficulties, have succeeded to synthesize a three domain super molecular assembly of the desired NPN type, and have furthermore fractionated them into 7 fractions with different length of N domains.
References
1 Solomin, V. A. and Heitz, W., Macromol. Chem. Phys., 1994, 195, 303-314.2 Nielsen, K. T.; Spanggaard, H. and Krebs, F. C., Macromolecules, 2005, 38, 1180-1189.3 Nielsen, K. T.; Spanggaard, H. and Krebs, F. C, Organic Photovoltaics 6. SPIE conference on optics
and photonics: Conference 5938: Organic photovoltaics 6, San Diego, CA (US), 31 Jul - 4 Aug 2005. Kafafi, Z.H.; Lane, P.A. (eds.), (International Society for Optical Engineering, Bellingham, 2005) (SPIEProceedings Series, 5938), 2005, 222-233.
4 Jones II, L.; Schumm, J. S. and Tour, J. M., J. org. chem., 1997, 62, 1388-1405.5 Cotts, P. M.; Swager, T. M. and Zhou, Q.,Macromolecules, 1996, 29, 7323-7328.
57

58
The Palladium Saga
The P a I u m Saga
During the failed attempts to synthesize monodisperse oligomers and during the successful synthesis of the NPN super molecular assembly some remarkable and inexplicable observations were made. In connection to the oligomers, it was observed that it was impossible to control the stepwise synthesis of monodisperse oligomers, and that the results always were a distribution of oligomers and polymer products. The lack of control (the reason for failing) in the synthesis can most likely be tracked to the deprotection step that it failed. Concerning the NPN B polymer, it was observed that the polymer begins to cross-link after work up and purification with SEC. Furthermore it was observed that standard electroactive devices (as described in chapter 2.3), where the active layer consisting of NPN B or N„, had a resistance as low as 30 Q and when a potential was applied the devices short circuit and sparkles from the films as a results of short circuits could be seen. These remarkable observations together with the fact that Krebs et all at the same time had observed Pd remnants in PPV materials synthesized by the Pd catalyzed Heck reaction indicated that there may also be remnants of Pd present in the PPE polymers even after the purification by SEC. An Inductively Coupled Plasma Sector Field Mass Spectrometry (ICP-SFMS) analysis of 0.5 g of the N„ polymer uncovered that it contained 49 ppm (mg/kg) Pd remnants. The real value is actually much higher, because it was impossible to dissolve all the material. Even after three days in aqua regia more than half of the 0.5 g N„ sample was left as an orange sticky material.
The remnants of Pd in the samples can explain the three remarkable observations mentioned above. In the case of the oligomers base is present under the deprotection step and together with the remnants of Pd and oxygen from the filtration steps it provides a breeding ground for the homocoupling of the unprotected oligomers. In the case of the cross-linking of the NPN B polymers, it has been reported in the literature more than 50 years ago that transition metals catalyze the trimerization of alkynes.2 Furthermore in 1997 and 2001 it was shown by Gevorgyan et aid'4 that substituted benzenes can be constructed under Sonogashira crosscoupling conditions without an inert atmosphere from enynes and activated alkynes in a [4 +2] reaction and from terminal alkynes in a [2 + 2 + 2] fashion. In Scheme 15 a possible trimerization process is outlined, showing how two N„ chains, which are not coupled to porphyrins, can form a enyne in presence of Pd(0) catalysts. The enyne can then form the trimerization cross-linking product by reaction with a triple bond in either a N„ or a NPN B chain. In the last case it is obvious that metal in the active layer will lower the resistance and lead to a short circuit of the device.
In order to find a method to remove the Pd remnants from the polymer products and thereby save all the resources that have been put into the work to produce NPN B and N„, the literature has been screened thoroughly. It was found that even though transition metals have been used, as catalysts in the synthesis of new organic compounds, only sporadic attention has been put on remnants of the catalysts in the newly synthesized organic compounds. When the
59

The Palladium Saga
problems of Pd remnants were discovered in this project, it really seemed that removal of e g. Pd remnants from samples was a large forgotten area in the literature; fortunately the interest has increased during the time of this project.1"5"6"7"8"9"10"11"12"13"14"15"16 The reason for this apparent loss of interest concerning the removal e g. of Pd from organic compounds is probably due to the fact that most impurities present at a level below 0.1% do not interfere with characterization techniques like NMR, GC/MS, HPLC, IR, UV-Vis and elemental analysis. However, in compounds used for drugs or electronic applications, the impurity level has to be at a much lower level. In defiance of the lack of literature concerning the removal of Pd from samples, it seems to be common knowledge in the pharmaceutical industry that Pd as a catalyst is not allowed in the two last synthetic steps in synthesis of medical compounds due to the difficulties to remove of Pd remnants.17 To emphasize that the removal of Pd from organic samples is not a simple problem came from Professor Steven Ley from Cambridge University. He claimed at the Knud Lind Larsen symposium in Copenhagen 2004 that he could perform cross coupling reactions with compounds from Sigma Aldrich without any addition of catalyst, because the remnants of palladium in these compounds were present in quantities sufficient for catalysis. It should be emphasized that it is not a trivial problem to remove a noble transition metal from organic compounds and to ensure that the level is under the oral concentration limits and the parenteral concentrations limit for drugs, which in oral cases are 5 and 15 ppm for Pd and Cu respectively and in the parenteral cases are 0.5 and 1.5 ppm for Pd and Cu respectively.14
Pd
NPN
Scheme 15. The possible trimerization process of NPN B observed under Sonogashira cross-coupling conditions.18
60

The Palladium Saga
In this project two model systems of diphenyl acetylene synthesized under normal Sonogashira cross coupling conditions were made (see Scheme 16) one with a Pd catalytic route and one with a Cu catalytic route, to test the ability of different methods to remove just these two metals from the synthesized diphenyl acetylene. It was observed by ICP-SFMS analysis, that even after filtration through a aluminum oxide column and two recrystallization processes in ethanol, the model reaction contained 610 ppm Pd and 1660 ppm Cu respectively (see Table 6). In the literature it is supported that traces of Pd cannot be removed by crystallization7,9,10,19 or by chromatography,9,10 but that methods like distillation9 are needed. With distillation the problem is that not all compounds can withstand high temperatures.
A)
B)
I + ^ /=\ Pd(PPh3)4 (2 mol%)I H Piperidine/THF \—f
I + H—^=-
CuI (5 mol%) =\ 2 PPh3
^ y K2CO3 DMF
69 %
70 %
Scheme 16. The model system used to test for remnants of Pd and Cu respectively after different purifying methods.20
7.1 Diethylammonium DiethyldithioCarbamate (DDC)Based on of the literature screening it was attempted to use diethylammonium diethyldithiocarbamate, DDC (see Scheme 17a), to remove Pd remnants from the polymers, as described by Jones et al.15 in the case of solid-state synthesis. This attempt was done with some success (experimental details and a more thorough discussion about the removal of Pd from the polymers with DDC can be found in paper 1 in appendix B). After the treatment of Nn and NPN B with DDC, the device resistance was increased from 30-50 Q to 0.3-2 MQ and the devices worked without short circuit. The idea with DDC is that it coordinates to Pd like the triple bonds in the alkynes. The coordination is very strong (log K (Pd[DDC]2) = 64.9) and very fast21 and palladium will bind to the DDC instead of to the alkyne groups. DDC and the formed Pd(DDC)2 complex are both soluble in methanol and can be removed by precipitating the polymer mixture containing the DDC and the complex in large amount of methanol. Unfortunately there were some indications that DDC reacted with the polymers. The treatment of the polymers with DDC was performed in following three time intervals: 5 min., 2 hours and 24 hours. With long reaction times dramatic changes in the properties of the polymers were observed. E.g. it was observed that the polymers were difficult to precipitate in methanol, no electroluminescence could be observed, when a potential was applied on standard devices, and significant changes in the UV-Vis spectra were observed (see Figure 27). On the other hand it was impossible to see any changes in NMR and there were no significant changes in the elemental analysis.
The conclusion is, that fast treatment of the polymers with DDC remove the Pd remnants and makes it possible to make standard electroactive devices for LED and POPV application, while a longer treatment time influence the properties of the polymers. However the analysis of the reaction between the polymers and DDC cannot provide a satisfactory explanation for what happens in the reaction between the polymers and DDC.
61

The Palladium Saga
Nn treated with DDC (2 hours). ■
Wavelength [nm]
Figure 27. The UV-Vis spectrum of the Nn polymer before and after the treatment with DDC (2 hours treatments time).18
7.2 The azothioformamidesTo gain knowledge on the effect of DDC on the polymers a lot of resources have been invested in this project to find a better alternative to DDC. This was successfully achieved by the discovery of rV,rV-diethylphenylazothioformamide, LI, and Ar,A-bis(tetraethyleneglycol- monom ethyl ether jphenyl azothi oformami de, L2. Both LI and L2 possess the property of being capable of dissolving nanoparticles of many different transition metals by forming neutral and intensely colored electron transfer complexes (see paper 3, 4, 6 and 7 in appendix B for more detailed information and Scheme 17b-c for the structures).
LI and L2 belong to the group of compounds called azothioformamides, which were subject to a lot of interest during the sixties and early seventies due to properties such as antifungal activity,22 antibiotic activity,23 application as pesticides24 and the property to form electron transfer complexes of the type M-N2S2Z with a large range of transition metals (see Scheme 18).25 LI and L2 both coordinate faster and stronger to the transitions metals than the alkynes. It was observed that LI and L2 were not only capable of dissolving nanoparticles of the transition metals, which is the form the remnants of the metals typically are in, but also metals in form of wires. Especially in the case of copper the process of disintegration was fast and effective (see Figure 28). Nickel and Platinum wire could also be dissolved by LI (it was not tried with L2) but the process here was much slower, while in the case of palladium wire no disintegration was observed. The missing detection of dissolved palladium is probably due to a surface phenomenon, because it has been observed that LI is capable of dissolving palladium black and palladium nanoparticles.
62

The Palladium Saga
DDC
b) / %—N=N—^
L1 k-N=N-
L2
N--O
c)
d)
NzSA\
N
O O O
-O O^/~~~OO
ON
"N/v"
OOO
OO
Complex:
C1 M=Pd C2 M=Pt C3 M=Cu C4 M=Ni
O
O
O
O
N
/AComplex:
C5 M=Pd C6 M=Pt C7 M=Cu C8 M=Ni
Scheme 17.
S
OO
0
0
O
O
O
O
M-NoS 2+
2S2 M-NoS2S2 M-NoS 02S2 M-N2S2S2 M-N2S2S22-e e e e
Scheme 18. An Electron transfer series of five members.26
The structural differences of L1 compared to L2 makes L1 an excellent tool to remove transition metals from polymers, while L2 is a better choice in the case of removing transition metals from small organic molecules. It should be mentioned that the synthesis of L1 has been reported earlier,27 but I have devised a simple one-pot synthesis of L1 (see paper 3 in appendix B for the synthetic details). The synthesis of L2 has not been reported before, and has been developed for the purpose of removal of Pd remnants from small organic molecules (see paper 4 in appendix B for the synthetic details).
63

The Palladium Saga
Figure 28. A copper wire after it has been placed in a concentrated THF solution of LI for just one week. Notice how thin it is in the middle compared to the ends. Further it can be seen that crystals of the formed cis-(di(AjV-diethyl-(2-phenyldiazenyl)thioformamide-KN,K/V2))copper electron transfer complex is growing on the wire ready for e.g. X-ray diffraction measurements or UV-Vis characteristics.2"’26
In the case of LI the procedure to remove transition metals from polymers is very simple and is done by a dissolution and precipitation technique. The polymer product is dissolved in a minimal amount of solvent e.g. chloroform. LI is added and the mixture is stirred over night, whereupon the mixture is precipitated in a lot of methanol and the polymer is collected by filtration (both compound LI and the formed metal complexes are soluble in large amounts of methanol). The dissolution and precipitation technique can be performed again without compound LI to be sure that the filtrate does not contain remnants of compound LI or the complexes.In the case of L2 the procedure to remove transition metals from small molecules is nearly the same as removing transition metals from polymer products with LI. Instead of precipitating the mixture in methanol the mixture was filtered through a short column of silica with a polar solvent such as chloroform. The 7V,Af-bis(tetraethyleneglycolmonomethylether)amine groups in L2 exhibit a strong affinity for silica in polar solvents such as e.g.
Diphenylacetylene
+
Cl
chloroform. This means that both L2 and the complexes with the transition metals are immobile on the columns, whereas small organic molecules will be mobile on the columns (see Figure 29). The pure organic material can therefore be recovered from the filtrate. The N,N- bis(tetraethyleneglycolmonomethylether)amine groups also have the property, that they make L2 water soluble, and L2 can therefore in principle be used to remove transition metals from aqueous solutions. Unfortunately the
Figure 29. A TLC plate of the Pd model system (see Scheme 16) with chloroform as the eluent. The trace to the left is the model system treated with L2, whereas the traces to right is the model system treated with LI. It can be seen that L2 and C3 both are immobile on the silica,
64

The Palladium Saga
distribution coefficient of L2 between water and organic solvents such as chloroform or 1,3- dichlorobenzene is very low, which means that in practice it is impossible to make an extraction of L2 or the complexes from an organic solvent with water. The other way around on the other hand is possible.
7.2.1 Analytic toolA unique feature of both LI and L2 and probably the derivations of N,N- phenylazothioformamide in general is that the formed electron transfer complexes with transition metals unlike the pure ligand has an absorption with a maximum in the range of 800 nm. Because only very few organic materials absorb at this wavelength, they can be used to quantitatively determine the content of the metals in a given organic sample by UV-Vis spectrophotometry. In Figure 30 the UV-Vis spectra of LI and the four complexes Cl, C2, C3 and C4 is shown, and in Table 5 the determined extinction coefficients at kmax for the lowest electronic transition is given. The UV-Vis spectra of L2 and C7 are shown in paper 4 in appendix B. The UV-Vis spectra of C5, C6 and C8 have not been recorded because it turned out that it was very difficult to separate the excess of L2 from the synthesized complexes. Using the combination of LI and UV-Vis spectrophotometry it is possible in case of the Pd and Pt to determine the content of the metals with a detection limit of 0.1 ppm using 50 mg samples. A detection limit of 1 ppb can be obtained, when using larger samples and concentrating the supernatant.
40000
Cl (Pd)h-1 35000 -C2 (Pt)
30000 - C3 (Cu)C4 (Ni)
“ 25000 - : A5 \.j\,.3 20000 :1 V nrV 15000 -
a ioooo
5000 -
Wavelength [nm]
Figure 30. The UV-Vis spectra of LI and the four electron transfer complexes Cl, C2, C3 and C4. The spectra are recorded in chloroform at room temperature. The extinction coefficients are listed in Table 5.20
65

The Palladium Saga
Table 5. The molar extinction coefficients and the Zm;ix values of the first transition for Cl, C2, C3 and C4. The values are determined both in chloroform and THF.20
THFCompound kmax [nm] s [M"1 cm"1]
CHCfkmax [nm] 8 [M"1 cm"1]
Cl 796 8500 801 10300C2 727 26400 731 25400C3 770 3900 768 3400C4 830 1800 830 1800
7.2.2 Test of L1 and L2In order to analyse the ability of LI to remove transition metals from polymers poly(phenylenevinylene) (PPV), poly(phenyleneethynylenes) (PPE) (N„), and poly(alkylthiophene) (PAT) (all three were synthesised with a Pd catalyst) were tested by LI. In order to analyse the abilities of L2, it was tested on the diphenyl acetylene from the model systems in Scheme 16.In the case of L2 the Pd and Cu contents in the model system were first determined by ICP- SFMS and by use of the combination of LI and UV-Vis spectrophotometry. After treatment with L2 and filtration through a pad of silica, the Pd and Cu content in the model system were again determined by ICP-SFMS and by use of LI and UV-Vis spectrophotometry. The results are listed in Table 6. The two different analytical methods give comparable results and have successfully brought the Pd and Cu contents in the model system under the parenteral limit by use of L2.In the cases of LI the content of Pd in the tree polymers was first determined by use of LI and UV-Vis spectrophotometry. After treatment with LI, the content of Pd was again determined by use of LI and UV-Vis spectrophotometry. The results are listed in Table 6. It was not possible to use ICP-SFMS to cross check the Pd content determined by LI, because the polymers cannot be fully dissolved in aqua regia.Also in the cases of the polymers the content of Pd was brought down under the parenteral limit, and more relevantly the resistance of fabricated standard electroactive devices increased by more than a factor 100 and both LED and OPV devices could be prepared after the treatment with LI.Table 6. The Pd and Cu content in model system (Scheme 16) before and after treatment with L2 and the Pd content before and after treatment with LI for the polymer samples of the PPV, PPE and PAT type. Furthermore the resistance of standard electroactive devices made of the three polymers before and after the treatment with LI is presented.20,28
Content of transition metal [ppm] and device resistance [kfi] (3 cm2 device area were used)Model system Before treatment
UV-vis / ICP-SFMSTreated with L2UV-vis / ICP-SFMS
Pd 376/610 <0.1/0.5Cu 1074/ 1660 <0.1/0.1Polymer (Pd) Before treatment
UV-vis / resistanceTreated with LIUV-vis / resistance
PPV 17860/0.1 <0.1/30PPE 268 / 0.03 <0.1/45PAT 4073 / 0.06 <0.1/24
66
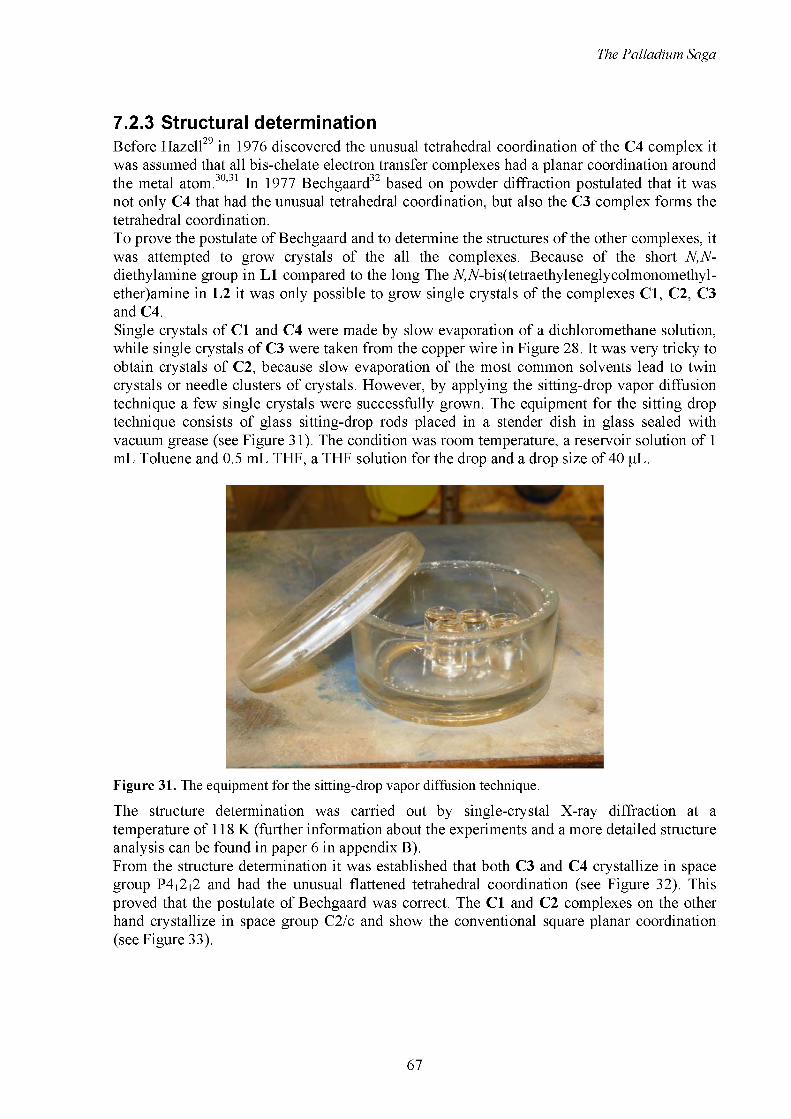
The Palladium Saga
7.2.3 Structural determinationBefore Hazell29 in 1976 discovered the unusual tetrahedral coordination of the C4 complex it was assumed that all bis-chelate electron transfer complexes had a planar coordination around the metal atom.30'31 In 1977 Bechgaard32 based on powder diffraction postulated that it was not only C4 that had the unusual tetrahedral coordination, but also the C3 complex forms the tetrahedral coordination.To prove the postulate of Bechgaard and to determine the structures of the other complexes, it was attempted to grow crystals of the all the complexes. Because of the short N,N- diethylamine group in LI compared to the long The jV,jV-bis(tetraethyleneglycolmonomethyl- ether)amine in L2 it was only possible to grow single crystals of the complexes Cl, C2, C3 and C4.Single crystals of Cl and C4 were made by slow evaporation of a dichloromethane solution, while single crystals of C3 were taken from the copper wire in Figure 28. It was very tricky to obtain crystals of C2, because slow evaporation of the most common solvents lead to twin crystals or needle clusters of crystals. However, by applying the sitting-drop vapor diffusion technique a few single crystals were successfully grown. The equipment for the sitting drop technique consists of glass sitting-drop rods placed in a slender dish in glass sealed with vacuum grease (see Figure 31). The condition was room temperature, a reservoir solution of 1 mL Toluene and 0.5 mL THF, a THF solution for the drop and a drop size of 40 pL.
Figure 31. The equipment for the sitting-drop vapor diffusion technique.
The structure determination was carried out by single-crystal X-ray diffraction at a temperature of 118 K (further information about the experiments and a more detailed structure analysis can be found in paper 6 in appendix B).From the structure determination it was established that both C3 and C4 crystallize in space group P4i2i2 and had the unusual flattened tetrahedral coordination (see Figure 32). This proved that the postulate of Bechgaard was correct. The Cl and C2 complexes on the other hand crystallize in space group C2/c and show the conventional square planar coordination (see Figure 33).
67

The Palladium Saga
Figure 32. The X-ray structure of C3. The structure of C4 is very similar and can be found in paper 6 in appendix B.26
Figure 33. The X-ray structure of Cl. The structure of C2 is very similar and can be found in paper 6 in appendix B.26
Table 7. The key angles [°] for the four complexes. M is the metal ion.
Cl C2 C3 C4
S-M-S 180.00(3) 180.00(2) 123.62(2) 119.50(3)
Nl-M-Nl 180.00(7) 180.00(7) 144.84(7) 144.53(9)
Nl-M-S 82.50(10) 82.11(7) 85.48(4) 85.62(4)
Plane3 0.00(0.16) 0.00(0.10) 71.26 (3) 75.39(3)
Plane-phenylb 51.04(0.13) 52.01(8) 26.55(0.06) 28.08(0.07)
a Angle between ligand planes.
b Angle between ligand plane and phenyl group.
68

The Palladium Saga
Table 8. The key distances (bond lengths) [A] for the four complexes. M is the metal ion.
Cl C2 C3 C4
M-S 2.2929(10) 2.2932(3) 2.2753(4) 2.2085(4)
Cl-S 1.740(4) 1.743(2) 1.7234(15) 1.7226(17)
C1-N2 1.339(5) 1.326(3) 1.3688(18) 1.356(2)
N2-N1 1.339(5) 1.349(3) 1.3226(16) 1.3364(19)
M-Nl 1.994(3) 1.9647(2) 1.9216(12) 1.8732(14)
In Table 7 and Table 8 some selected key angle and distances are listed. From the X-ray structure determination it is also possible to get some information about the electronic configuration of the four complexes. This is done on the basis of the work by Blanchard et air' who have demonstrated that the bond length depends on the given oxidation level of the ligand in complexes with 1-phenyl and 1,4-diphenyl substituted X-methylisothiosemi- carbazides as the ligands. It is possible from the X-ray data to determine the plausible oxidation level of the metal and the ligand in these four complexes. Blanchard et al. have shown that in the case of a Tt-radical anion, (L*)1" the N-N bond is rather short (1.34 ±0.01 A), but if the bond lengths are significantly shorter (1.24 ±0.01 A), then the ligand is regarded as being in its oxidized level, (Lox). From the data in Table 8 it can be seen that the N-N bond lengths in Cl, C2 and C4 complexes all are in the order of 1.34 ± 0.01 A, and therefore it can be rationalized as M(II) complexes with two Tt-radical anion ligands antiferromagnetically coupled, [Pdn(L')2] ,[Ptn(I/)2] and [NiH(I/)2].It is also possible to get information about the delocalization of the tl electron density in the complexes. Blanchard et al. have calculated the values of the following bond lengths N=C, C- S, C-N, N-N to 1.294 A, 1.897 A, 1.342 A and 1.343 A respectively, in the large localized system of (HN-N=C(SH)NH")1". Furthermore, the average C-S and C-N distances in the highly delocalized system of dithiocarbamate are 1.70 and 1.34 A.30 By comparing these bond lengths with the bond lengths in the five-membered ring of the complexes described in this work, a large delocalization of the n electron density over the five-membered ring is suggested.
Concerning the C3 complex, it can be seen that it has a slightly smaller N-N bond length (1.32 A) and a slightly larger C-N bond length compared to the other three complexes. This can be rationalized if it is assumed that the C3 complex consists of Cu(I), one Tt-radical anion ligand and one neutral ligand, [Cu\L')(L)] as proposed by Bechgaard.32 However, which of these two configurations, [CuH(L")2] (antiferromagnetically coupled) or [Cu'(L")(L)], that is the most likely for the C3 (Cu(L)2°) complex, cannot be decided on the X-ray data alone.
7.3 ConclusionAn efficient, fast, very mild and potentially low cost (no expensive chemicals) method to remove remnants of transition metals from both polymer and small molecule products to a limit under 0.1 ppm, has been developed. This opens up the opportunity for the industry to also use palladium catalysts in the last synthetic steps of the synthesis of eg. drugs.
69

The Palladium Saga
Furthermore, the method gives the possibilities to quantitatively determine the content of transition metals at 1 ppb level in a given organic sample. The discovery of the azothioformamide properties have together with Sigma Aldrich's new but highly expensive metal scavenger products34 made remnants of Pd in newly synthesised compounds into a saga. There are just no more excuses to have remnants of Pd or other transition metals in your compounds.It can also be concluded that the coordination of the formed neutral electron complexes depend on the metal and can be either a flattened tetrahedral coordination or a square-planar coordination. Furthermore the formed neutral complexes most likely consist of the metal in oxidization state II and two n-radical anion ligands or of the metal in oxidization state I together with one n-radical anion and one neutral ligand.
References
1 Krebs, F. C.; Nyberg, R. B. and Jorgensen, M., Chem. Mater., 2004, 16, 1313-1318.2 Reppe, W.; Schlicthing, O.; Klager, K. and Toepel, T., Justus Liebigs Ann. Chem., 1948, 560, 1-7.3 Gevorgyan, V.; Takeda, A. and Yamamoto, Y., J. Am. Chem. Soc., 1997, 119, 11313-11314.4 Gevorgyan, V.; Radhakrishnan, U.; Takeda, A. Rubina, M.; Rubin, M. and Yamamoto, Y., J. Org.
Chem., 2001, 66, 2835-2841.5 Schmuckler, G. (Technion Research and Development Foundation Ltd.), DE1533131, 1974 Chem. Abstr. 1969, 71:32590.
6 Ferrari, C.; Predieri, G. and Tiripicchio, A., Chem. Mater., 1992, 4, 243-245.7 Rosso, V. W.; Lust, D. A.; Bernot, O. J.; Grosso, J. A.; Modi, S. P.; Rusowicz, A.; Sedergran, T. C.;
Simpson, J. H.; Srivastava, S. K.; Humora, M. J. and Anderson, N. G., Org. Process Res. Dev.,1997, 1, 311-314.
8 Villa, M.; Cannata, V.; Rosi, A. and Allegrini,P. (Zambon Group S.P.A.), WO9851646, 1998 Chem. Abstr. 1998, 130:15127.
9 Konigsberger, K.; Chen, G.; Wu, R. R.; Girgis, M. J.; Prasad, K.; Repic, O. and Blacklock, T.J., Org. Process Res. Dev., 2003, 7, 733-742.
10 Manley, P. W.; Acemoglu, M.; Marterer, W. and Pachinger, W., Org. Process Res. Dev., 2003, 7, 436-445.
11 Urawa, Y.; Miyazawa, M.; Ozeki, N. and Ogura, K., Org. Process Res. Dev., 2003, 7, 191-195.12 Garret, C. E. and Prasad, K., Adv. Synth. Catal., 2004, 346, 889-900.13 Sellinger, A.; Tamaki, R.; Laine, R. M.; Ueno, K.; Tanabe, H.; Williams, E. and Jabbour, G. E.,
Chem. Commun., 2005, 3700-3702.14 Tristany, M.; Courmarcel, J.; Dieudonne, P.; Moreno-Manas, M.; Pleixats, R.; Rimola, A.; Sodupe,
M. and Villarroya, S., Chem. Mater., 2005, CM051967A.15 Jones II, L.; Schumm, J. S. and Tour, J. M., J. org. chem., 1997, 62, 1388-1404.16 Van Broekhoven, J. and Andrianus, M., European Patent Application 0283092 A1, 1998.17 Private communication with Lizette Bruun (employment at RIS0 and former employment at
Lundbech A/S, Denmark).18 Nielsen, K. T., Spanggaard, H. and Krebs, F. C., Macromolecules, 2005, 38, 1180-1189.19 Chen, C.; Dagneau, P.; Grabowski, E. J. J.; Oballa R.; O’Shea, P.; Prasit, P.; Robichaud, J.; Tillyer,
R. and Wang, X., J. Org. Chem., 2003, 68, 2633-2638.20 Nielsen, K. T.; Bechgaard, K. and Krebs, F. C., Synthesis, 2006, 10, 1639-1644.21 Briscoe, G. B. and Humphries, S., Talanta, 1969, 16, 1403-1419.22 Pluijgers, C. W.; Berg, J.: Sijpesteijn, A. K.: Tempel, A. and Verloop, A , Recueil Trav Chim.. Pays-
Bas, 1968, 87, 833-843.23 Kosower, E. M. and Miyadera, T., J. Med. Chem., 1972, 15, 307-312.24 Sasse, K. and Hammann, I., Ger. Offen DT2145418, 1971.25 Davidson, A.; Edelstein, N.; Holm, R. H. and Maki, A. H., J. Am. Chem. Soc., 1963, 85, 2029-2030.
70

The Palladium Saga
26 Nielsen, K. T.; Harris, P.; Bechgaard, K. and Krebs, F. C., Acta Crys. C, 2006, submitted.27 Jensen, K. A.; Bechgaard, K. and Pedersen, C. T., Acta Chem. Scand., 1972, 26, 2913-2922.28 Nielsen, K. T.; Bechgaard, K. and Krebs, F. C., Macromolecules, 2005, 38, 658-659.29 Hazell, R. G., Acta Chem. Sand. A, 1967, 30, 322-326.30 Eisenbert, R., Prog. Inorg. Chem., 1970, 12, 295-369.31 Bechgaard, K., Acta Chem. Scand. A, 1974, 28, 185-193.32 Bechgaard, K., Acta Chem. Scand. A, 1977, 31, 683-688.33 Blanchard, S., Neese, F., Bothe, E., Bill, E., Weyhermuller, T. and Wieghardt, K., Inorg. Chem.,
2005, 44, 3636-3656.34 Sigma Aldrich, ChemFiles, 2006, 5, 11, 2-4.
71

72

Crystallization
C r y s t z a t i o n
The synthesis of monodisperse oligomers of the PPE type was unsuccessful as mentioned in chapter 5. It has therefore not been possible to make crystals of the PPE and determine the structures by single crystal X-ray diffraction measurement, as I originally set out to do. Instead it has been attempted to grow single crystals of four monodisperse phenylene vinylene oligomers. The oligomers have been synthesized by Jorgensen1 and the structures can be seen in Scheme 19.
Mol. Wt.: 789.05
Scheme 19. The four monodisperse phenylene vinylene oligomers synthesized by Jorgensen.1
73

Crystallization
To ensure that they are all crystalline, before any attempts to grow crystals of the four monodisperse oligomers were done, X-ray powder diffraction patterns were recorded of all four oligomers (see Figure 34 and Figure 35).
Diffractometer:Wavelength(s) (A): 1.54060 Exposure time:
Sample:Collected:
C52H56D6_2_timer
C:\Klm\C52H5606_2_tImer.xyFile:
Remarks: Date:
Sample:Collected:File:
Wavelength (s) (A): 1.54060 Exposure time: C:\Kim\C48H5206S2.xy
Figure 34. The X-ray powder diffraction pattern of Ol (top) and 02 (bottom).
74

Crystallization
Sample:Collected:File:
Wavelength(s) (A): 1,54060 Exposure time: C:\Klm\C51K57N0S.xy
Date:
Diffractometer: wavelength|sl (A): 1.54060 Exposure time: C:\Kiie\C68H7402S3.xy
Figure 35. The X-ray powder diffraction pattern of 03 (top) and 04 (bottom).
From the X-ray diffraction patterns of the oligomers it can be seen that both 02 and 04 are completely amorphous, and no crystals were attempted grown of these two oligomers. Ol and 03 on the other hand contain some level of crystalline order, which is clearer from Figure 36 and Figure 37, where the background subtracted. It looks like the samples of Ol and 03 are micro crystalline.
75

Crystallization
Diffractometer:
wavelength<sl 1*1: 1.54060
Exposure time
sample: cttfHbbObmodify
Collected:File: C.\Klm\C52H5606modHy.xy
Date: Name:
26
Figure 36. The X-ray powder diffraction pattern of Ol, where the background is subtracted. It can be seen that the oligomer contain some degree of crystalline order. The data is recorded over a period of 20 minutes.
10000
8000
3 6000s5
u 4000
2000
0
0 20 40 60 80 100
20Figure 37. The X-ray powder diffraction pattern of 03, where the background is subtracted. It can be seen that the oligomer contain some degree of crystalline order. The data is recorded over a period of 17 hours.
By comparing the diffraction patterns of 03 and Ol it can be seen that they are very similar regarding the positions of the peaks but not intensity of the peaks. In the pattern of 03 (Figure
76

Crystallization
37) peaks one observed at 29 = 6.6°, 10.3°, 18.5°, 21.0°, 23.5°, 28.1° and 42.2°, which corresponds to lattice distances (d-spacings) of 13.5, 8.6, 4.8, 4.2, 3.8, 3.2 and 2.1 A. The quality of the data is however not good enough for unit cell determinations. On the basis of the diffraction pattern of Ol and 03 it was decided to attempt growth of crystals of these two oligomers.
From the literature2"3"4"5 it was found that some o/zgophenylvinylene has been crystallized before (see Scheme 20) and that it has been done by slow evaporation from solvents such as zz-hexane, chloroform or chloroform/zz-hexane mixtures.
Scheme 20. o/z'go-Phenylvinylenes, which have been crystallized previously.
I have tried to crystallize Ol and 03 in solvents such as: zz-hexane, chloroform, toluene, THF, dichloromethane, ethanol, ethyl acetate and a lot of different mixtures of these solvents. Furthermore I have tried to use two different crystallization techniques, which are: Slow evaporation from a flask and the sitting-drop vapor diffusion technique (see figure 31 in chapter 7) but without any luck. Lots of strange and fancy structures were obtained under the different crystallization attempts (see Figure 38 and Figure 39), but none of them gave single crystals or crystals. Only powder patterns could be observed, when the structures were tested in a diffractometer. Not even the structures obtained from 03 (see Figure 39 - right) which in the microscope really looks like crystals with nice sharp edges and shiny surfaces, gave diffraction spots in the diffractometer.
Figure 38. Some of the amorphous/micro crystalline products of Ol obtained by the sitting-drop vapor diffusion techniques.
77

Crystallization
Figure 39. Some of the amorphous/micro crystalline products of 03 obtained by the sitting-drop vapor diffusion techniques.
As a last desperate attempt glass equipment shown in Figure 40 was designed to make it possible to try to crystallize Ol by using stilbene as the solvent. This was inspired by van Hutten et al. who have used a similar method to obtain a single crystal of unsubstituted phenyleneviny 1 ene.6 The idea is that Ol and stilbene (2:100 (w/w)) is placed in the round bottom flask, and the glass equipment is put together. The glass equipment containing the Ol and stilbene is placed in an oven and heated op to 558 K and shaken gently (be careful the equipment is very hot, which the author has learned from bitter experience) until all compounds is in the liquid form and well mixed. The temperature is now lowered down to 518 K and is kept at this temperature until crystals of Ol precipitated (in the case of van Hutten et al. this happened within 2 hours). The precipitated crystals could then be isolated by tipping the equipment (still inside the oven) and filtering of the hot "solvent" through the glass filter. In my case, I waited 6 hours at 518 K for precipitation of crystals but nothing happened. I then decided to try to filter the solvent through the filter to test the equipment. After the filtration the equipment was left to cool down and the round bottom flask was attempted to separate from the part containing the filter. It turned out that the two parts was stuck together, and could not be separated without breaking the equipment. No further attempts to crystallize Ol and 03 were performed.
Figure 40. The glass equipment developed for crystallizing Ol from stilbene.
78
Crystallization
The conclusion is that it was not in my hands possible to grow single crystals or any crystals of the monodisperse oligomers. Why it succeeded for people in the literature to grow crystals of the oligomers in Scheme 20, I do not know. Maybe it is due to fact that the oligomers in Scheme 20 generally are shorter, and in the cases of the long oligomers, there are fewer side groups on the backbone compared to the oligomers I have tried. It is well known that the length and the numbers of the side groups compared to the length of the backbone have a large influence on the packing and crystallizing abilities of molecules.7
References
1 Jorgensen, M. and Krebs, F. C., J. Org. Chem., 2005, 70, 6004-6017.2 Stalmach, U.; Schollmeyer, D. and Meier, H., Chem. Mater., 1999, 11, 2103-2106.3 Gill, R. E.; Hilberer, A.; van Hutten, P. F.; Berentshot, G.; Werts, M- P. L.; Meetsma, A.; Wittmann,
J. G. and Hadziioannou, G., Synth. Met., 1997, 637-638.4 Hohloch, M.; Maichle-Mossmer, C. and Hanack, M., Chem. Mater, 1998, 10,1327-1332.5 Gill, R. E.; van Hutten, P. F.; Meetsma, A. and Hadziioannou, G., Chem. Mater., 1996, 8, 1341
1346.6 Van Hutten, P. F.; Wildeman, J.; Meetsma, A. and Hadziioannou, G., J. Am. Chem. Soc., 1999, 121,
5910-5918.7 Pedersen, W. B., employed at Rise - personal communication.
79

80

Characterization
C h a r a c z a t i o n
In this chapter the characterization of N„ and the NPN polymers is described. The characterization covers the electronic energy levels and the charge carrier motilities of N„, the energy transfer from the N domain to the P domain in the NPN polymer, and tests of LED and POPV devices made of both polymers. All the experimental data concerning the characterizations are presented in paper 1, 2 and 5 in appendix B.
9.1 The electronic levels of NnIn chapter 2.2.1 it was shown that knowledge of the position of the electronic energy levels in the polymers is important because the position of these levels compared to the levels of the electrodes determines the injection barriers into the valence band and the conduction band for holes and electrons respectively. From Ultra Photoelectron Spectroscopy (UPS) experiments1 it is possible to get information on the position of the valence band (EVb) and to determine the ionization potential (IP). In the UPS experiment hard UV photons with an energy of 50 eV from a synchrotron source were used. The UV photons interact with the atoms in the polymer surface by the photoelectric effect, causing electrons from one of the filled energy levels in the polymer to be emitted. The kinetic energies of the emitted electrons are given by equation(9.1).
(9.1)
In equation (9.1) hv is the energy of the UV photons (50 eV). BE is the binding energy of the emitted electrons, which depends on the given atomic orbital. BE can be regarded as the ionization energy of a particular shell for a certain atom. <PS is the workfunction of the spectrophotometer. In the UPS experiment a negative bias of ~9 V is applied on the sample to ensure that electrons are not trapped by the workfunction of the spectrophotometer.
The UPS can therefore give information on the position of the valence band, while it is not possible to get information on the position of the conduction band because of the missing interaction with the unfilled energy levels.
In Figure 41 the recorded UPS spectrum of N„ is shown together with an electronic energy band edge diagram derived from the UPS spectrum.2
The Fermi level, EF, in a thin polymer film placed on a metal substrate has been shown to be determined by the Fermi level of the metal substrate.1 From a clean gold substrate the position of the Fermi level, EF, can be determined by UPS and is given by onset where photoelectrons become detectable. When EF is determined it is used as the zero binding energy reference level (per definition EF is the zero binding energy) (see Figure 41).
81

Characterization
Ep
Onset
Binding Energy [eV]
Fermi (Au)
Filled levels
Figure 41. Left: The UPS spectrum of an over-layer of Nn on a gold substrate with an insert (xlO) showing the onset of photoelectrons. The difference between the Fermi level, EP, and the onset of the photoelectrons represent the injection barrier for holes from the gold substrate into the valence band of Nn. Right: The electronic energy band edge diagram of Nn derived from the UPS spectrum together with a picture of the gold substrate plate (the right comer)/4
It is also possible by UPS to determine the workfunction of gold, @au, from the clean gold substrate. @au is determined as the ionization potential, which simply is the difference between the energy of the UV photons (50 eV) and the numerical value of secondary electron cutoff at high binding energies, BEmax (see equation (9.2)).5
(9-2)
The position of the valence band edge for the polymer material is the difference in kinetic energy of the fastest photoelectrons from the gold substrate compared to the fastest electrons in the thin polymer film on top of the gold substrate. In practice this difference, EFB, is determined as the onset of the photoelectrons towards low binding energies, BEmj„, with reference to the Fermi level of the gold substrate (see Figure 41 and equation (9.3)). The EFVB represents the injection barrier for holes from the metal substrate into the valence band of the polymer.1'5
(9.3)
The difference between the vacuum level of the polymer and the Fermi level of the metal substrate, EFlAC, is given by equation (9.4):
(9.4)
The ionization potential, IP, for the polymer is the sum of EFVB and EF AC (see equation (9.5)), which is also illustrated in Figure 41. The IP is a material constant and is independent of the alignment of the energy level at the interface.1
= (9.5)
The offset of the vacuum levels for a metal substrate with thin polymer film on top is shifted compared to the vacuum level of the pure metal substrate (see equation (9.6)).
82

Characterization
A = (96)
The difference in offsets of the two vacuum levels, A, is probably due to the presence of a dipole layer at the surface because of an orientation of molecules near or at the surface. The size and the direction of the dipole moment can determine whether it is easier or more difficult for electrons to escape the surfaces.5'6
Table 9. The UPS characterization for the Nn polymer on a gold substrate (®Au = 4.7 eV). All the units are eV. The UPS data for the equivalent PPV (also with octyl chains on every second benzene ring) are placed for comparison. It should be mentioned that the data of the PPV are recorded on an Ag substrate plate (®Ag = 4.2 eV) and not An.
Compound efvb E/^ BEmax A IP
Nn 1.5 4.0 46.0 -0.7 5.5PPV7’8 0.70 4.65 45.35 0.45 5.35
From the UPS characterization of N„ (see Table 9) it can be seen that the injection barrier for the holes in the metal substrate to the valence band of N„ is 1.5 eV, which means that a bias of at least 1.5 V needs to be applied, if the injection barrier for holes in a potential device has to be overcome. There is also an injection barrier for electrons from the metal substrate to the conduction band of N„, but this cannot be determined by UPS.
By comparing the UPS data for N„ with the UPS data for the corresponding PPV, it can be seen that the largest difference is between the injection barriers of holes, which is twice as large in N„ compared to the PPV. The fact that the IP and the optical band gap (obtained from the UV-Vis spectra) are nearly the same in both polymers, indicates that the difference in value of Efvb and EFlAC reflects that the Fermi level in N„ is placed closer to the conducting band than in the PPV.
9.2 Charge carrier mobilities in NnThe charge carrier mobility is an important property for conjugated polymers employed for LED and POPV devices. To ensure a high intensity of electroluminescence in LED devices and a good power conversion in POPV devices it is desirable that the carrier mobility is high, because the higher the carrier mobility the more efficient the devices are.
The charge carrier mobility of N„ as determined by use of the Pulse Radiolysis Time- Resolved Microwave Conductivity technique (PR-TRMC). The technique is well described in the literature7'9 and will therefore only be presented very shortly here. PR-TRMC is based on the measurement of the change in the reflected microwave power from a polymer sample influenced by a short pulse of 10 MeV electrons. The high energy electrons create ionisation events whereby electron-hole pairs are formed, leading to a large increase in conductivity. The change in conductivity, A a, has been shown by Warman et al. to be directly related to the change in ratio between the change in the reflected microwave power, AP, and the reflected microwave power before the electron pulse, Pr, see equation (9.7).
f AP)---- =-AAct (9.7)
V ' / max
83

Characterization
The parameter A covers interference effects from the similarity between the dimensions of the sample and the wavelength of the incoming microwaves, and can be calculated from the knowledge of the sample length and the effective dielectric constant.7,9Information on the sum of charge carrier mobilities is related to the change in the conductivity, see equation(9.8).
^Mnin = e( N+ + N_) (9'8)
N is the concentration of the carriers and can be determined from dosimetry, see equation(9.9)
N+ + N =---- (9.9)+ - Ep
D is the measured dose and Ep is the electron-hole pair formation energy, where a value of 25 eV is normally used.7
There is a major advantage and a major disadvantage of this method. The advantage is that you measure the average minimum carrier mobilities and it is done without influence of any electric contacts. The disadvantage is that you can only measure the sum, and it is not possible to distinguish between the electron and the hole mobilities.
From the transient changes in the conductivity the lifetime of the carriers can be determined by a biexponential fit.
In Figure 42 the plot of the electron pulse (duration ~300 ns) and the corresponding dose normalized conductivity transient is shown (normalized after the dose from the pulse).
8e-
6e-
4e-
2e-
2e-6 4e-6 6e-6 8e-6
Time (s)
Figure 42. Above: The 300 ns pulse. Below: The dose normalized radiation induced change in conductivity plotted as a function of time after the pulse. The value at the end of pulse conductivity used for the determination of the sum of the mobilities is read 100 ns post-pulse and is 5* 10-8 s m2 J-1.3
84

Characterization
The determined sum of charge carrier motilities and values of the first half life time are given in Table 10 together with values from different PPVs (see Scheme 21).
Table 10. Comparison of minimum sum of carrier mobilities, Z/4,,,,. and the first half life time, r-,. of Nn and some PPVs.
Polymer [m2 W] % INNn 1.25 x 10'* 10MEH-PPV' 2.00 x 10'G 4ppvu 8.90 x 10-* 528PPV2a 2.32 x 10'G 1PPV3a 1.04 x 10'G 2PPV4a 1.86 x 10'*
TTTT5--------------4
“data from the literature.
MEH-PPVPPV1 (X=H, Y=CgHn)PPV2 (X=H, Y=OC8H17) PPVS (X=F, Y=CgHig) PPV4 (X=F, Y=C8H17)
Scheme 21.
From Table 10 it can be seen that the Z/W generally of similar magnitude, but the value for the PPV1, which only consists of carbon and hydrogen, is somewhat larger than the others. It seems to be the case that electro negative atoms like fluorine and oxygen decrease the mobilities slightly. The significantly larger value of % in PPV1 has been shown most likely to be due the higher purification level.10 It can be seen that the choice of a more rigid system, N„ (containing an extra set of n electrons), have not, as hoped, lead to the increased charge carrier mobility compared to the PPVs. At least the charge carrier mobilities and the half-lives are comparable with the values found in PPVs.
9.3 UV-Vis characterizationThe UV-Vis spectra of N„ have been recorded both in solution and in the solid state (see Figure 43), and the narrow band and sharp absorption edges indicated that the polymer has a rigid linear structure as expected. The form of the bands in both solution and in solid state is similar to similar compounds presented in the literature.11 From the UV-Vis spectra it can also be seen that the optical band gap in solution is 3.0 eV and in the thin film it is 2.8 eV. The Xniax of Nn in solution and solid state is 397 nm and 424 nm respectively, which as expected lies a somewhat above the values of PPEs with electron withdrawing side groups as ester groups and a little under the values of PPEs with electron releasing side groups such as ether
85

Characterization
groups (see Table 11). It can also be seen that Xmaxis red shifted about 27 nm in the solid state compared to the solution state, which is an indication of intermolecular interaction in the solid state.
The UV-Vis spectra of the NPN B fractions have been recorded both in solution and in the solid state (see Figure 26 and Figure 44). It can be seen that in both states all the bands are red shifted as a function of increasing chain length, which is a result of increasing conjugation length indicating that the porphyrin is incorporated in the backbone of a conjugated system. The red shift stops at fraction 4, which from the UV-Vis signal corresponds to the hexamer of the N„ chains. This result is in agreement with the results of Jones et alu who reported studies on oligomers at precise length of the 1,4-phenylene ethynylenes.
Nn thin film
Optical band gap
300 400 500 600 700 800
Wavelength [nm]
Figure 43. The UV-Vis spectra of Nn in solution and in solid state.
As like in the case of N„ the form of the absorption band for NPN B is characterized by being narrow and having sharp absorption edges indicating that NPN B also has a rigid linear structure. The Xmax of NPN B in solution and solid state is 386 nm and 393 nm, respectively. The lower value of Xmax compared to N„ could be a result of the porphyrin working as an electron withdrawing group. The 7 nm red shifting of Xmax in the solid state compared to the solution state indicate moderate intermolecular interaction in the solid state.
The Xniax values for different types of polyphenylene ethynylenes can be found in Table 11.
86

Characterization
FractionFractionFractionFractionFractionFraction
Wavelength [nm]
Figure 44. The UV-Vis spectra of thin spin coated film of the NPN B fractions4
Table 11. Xmax values of selected PPEs in solution and in thin film. The values for the solution are found in THF, except in the case of Nn and NPN B where it was determined in CHC13.
Polymer ^max [nm] , [nm] solution thin film
Nn
NPN B
PPE1
PPE2
PPE3
PPE4
13
397
i 386
388
414
383
408
424
393
452
405
412
87

Characterization
9.4 Fluorescence characterizationThe primary reason for the synthesis of NPN B was to make a molecular heterojunction where dissociation of formed excitons, in the case of POPV devices, or a recombination of charges or excitons under emitting of light, in the case of LED devices, could happen. It is possible to make full colour displays of polymer based LEDs, because all three principle colours: Blue, green and red is possible to obtain. Among the principle colours, green is the most developed concerning brightness and efficiency, while there still is relatively few reports concerning LEDs, which emits light in the near infrared (NIR) region. The reports concerning NIR LEDs can be divided into three groups, which are: Low band gap polymers like poly (thiophenes),15 polymers doped by rare earth metal ions16 and polymer blends where the hosts consist of conjugated polymers with high band gap, which are doped by small red- emitting organic dyes such as porphyrins.17 The polymer blends are the most frequently used method to obtain NIR LEDs and the working mechanism is that the host polymers take care of the charge and exciton transport to the dye molecule, where the excitons decays by emission of NIR light. The exciton transport from the host polymer to the dye molecule occurs through space (TS) normally by a Forster energy transfer process.18 The Forster energy transfer process is a long-range dipole-dipole coupling process, where the transition dipoles of the excited polymer interact with the transition dipoles of the ground-state of the dye molecule.19 The Forster energy transfer process is limited by the fact that it normally only occurs in the distance range of 1 to 50 A20 and that it in addition it requires a good spectral overlap between the emission spectra of the polymer host and the absorption spectra of the dye molecule. Good spectral overlap is far from the general observation.21"22"23"24"25 To overcome the distance range limitation in the polymer blends, the dye molecule can be covalently linked to the polymer as in the case of NPN B, which will ensure that the dye molecules always are well mixed in the polymer host and therefore always are inside the range of 50 A. The covalent link opens furthermore up for the possibility of energy transfer
O/C 0^7 O O
through bonds (TB), ' ' which is promoted by an orbital overlap, do not require spectral overlap and is much faster than the TS transfer process.19'21'22 Figure 45 illustrate the TB transfer process contra the TS transfer process.
Through space transfer Through bond energy transfer
Polymer blendsDye molecules covalent linked to polymer backbones
Figure 45. The energy transfer processes in polymer blends contra molecules like NPN B containing molecular heterojunction.4
In order to characterize and test the efficiency of the energy transfer processes in molecules like NPN B, emission spectrophotometry have proven to be a very useful tool. All experimental details about the fluorescence analysis can be found in paper 1, 2 and 5 in appendix B.
88

Characterization
Solution of N„ and NPN B in chloroform was placed under an UV lamp as a first check to see if Nn and NPN B display fluorescence and to see if there is a difference in their fluorescence, which could indicate an energy transfer from the N domains to the P domain in the NPN B structure. In Figure 46 it can be seen that the displayed fluorescence is deep blue for the two structures, and not so intense in the case of the NPN B, which indicate that an energy transfer from the N domain to the P domain takes place. However the difference is not as significant as anticipated.
Figure 46. The fluorescence of the Nn (right) and the NPN B (left) molecules in solution when placed under an UV lamp.
In Figure 47 the fluorescence spectra of N„ in solution (CHCI3) and in thin film are shown. The form and position of the band is similar to reported values for similar PPEs.11"13"29"30"31"32"33
The fluorescence spectrum of N„ in diluted chloroform solution is characterized by a sharp peak with X,nax = 423 nm and a broader shoulder whit X = 443 nm. By comparing with other dialkyl PPEs29 it can be seen that the peak maximum is in the range of Xma% = 428 to 435 nm and the shoulder is in the range of X = 440 to 450 nm, which is consistent with my observations. By comparing the fluorescence spectrum of N„ in Figure 47 with the absorption spectrum in Figure 43 it can be seen that no mirror imaging is observed, which indicate that the exited state of N„ have a different geometric arrangement of the nuclei than in the ground state. Further it can be seen that the fluorescence spectrum show more fine structure than the absorption spectrum in solution, which is probably due to the benzene rings in the exited state becoming more co-planar. On model compounds of dialkoxy PPEs11 the intensity of the shoulder has been seen to be concentration dependent, which indicate that the shoulder is due to excimer formation. The fluorescence quantum yield for N„ in the chloroform solution is determined to be 0.86 in reference to diphenyl anthracene, DPA. This is somewhat bit low compared to the general value of dialkyl PPEs, which is unity due to the rigid structure, which makes intermolecular dissipation difficult.29 The low value is probably due to the content of small amounts of impurities, which are able to quench the fluorescence. This assumption is supported by the fact that the low half-life times in the PR-TRMC analysis of N„ compared to PPV1 also indicate the presence of small amounts of impurities in N„.
89

Characterization
Abs. porphyrin (film) Emission Nn (film)
Abs. porphyrin (CHC13)
Emission Nn(CElCl3)
Wavelength [nm]
Figure 47. The absorption spectra of the dibromoporphyrin and the fluorescence spectra of Nn in both solid state and in solution. The excitation wavelengths are 397 and 424 nm in the case of solution and solid state respectively.
In the solid state the fluorescence spectrum of N„ is strongly red shifted and is characterized by a broad peak with Xmax= 512 nm and a shoulder at X= 490 nm. In the solid state a lack of the mirror symmetry is also observed, and further the broad unstructured emission centered at Xmax= 512 nm is probably due to excimer formation in the solid state similar to the solution case. The much broader emission band in the solid stated compared to the solution indicate that the formation of excimer clusters is more dominating in the solid state compared to solution.
From Figure 47 it can also be seen that there is a good spectral overlap between the absorption of the porphyrin and the emission of the N„ polymer in both solution and in solid state. This means that both TS and TB energy transfer processes can be involved in energy transfer from the N to the P domain in NPN B.
In Figure 48 the fluorescence spectrum of the dibromoporhyrin in chloroform is shown. The spectrum is consists of two peaks located at 612 and 662 nm. The quantum yield in reference to DP A was determined to be 0.11.
90

Characterization
450 500 550 600 650 700 750 800 850
Wavelength [nm]
Figure 48. The fluorescence spectrum of the dibromoporphyrin in chloroform. The excitation wavelength is 426 nm.
Fraction 1 Fraction 2 Fraction 3 Fraction 4 Fraction 5 Fraction 6 Fraction 7
Wavelength [nm]
Figure 49. Normalized fluorescence spectra of the seven fractions (1-7) of NPN B in degassed chloroform and at a concentration below 10"5 M. The insert shows the porphyrin emission of fractions 2, 4 and 624 The excitation wavelength is 397 nm.
The normalized fluorescence spectra of the seven fractions of NPN B in chloroform are shown in Figure 49. The excitation wavelength is set to X,nax of N„ (397 nm), and from Figure 47 and Figure 48 it can be seen that the emission below 600 nm is mainly due to the N domain and emission above 600 nm is due to the P domain. It can be seen that the emission is
91

Characterization
slightly red shifted as a function of the chain length as expected, but generally there is very little variation in the spectra as a function of the chain length with fraction 6 and 7 as the exceptions probably due to the content of relatively short chain segments. The most interesting and most worrying observation is that there seems to be a very limited energy transfer from the N domain to the P domain in solution. The overall quantum yield from NPN B is around 0.6 and is mainly caused by the N domain. From the measured fluorescence emission and from the assumption that the ratio between the fluorescence rate and the nonradiative decay rates are the same in the NPN B as in the pure porphyrin and N„ compounds a photo balance can be calculated (see Figure 50).
absorption
7000
non radiative ^ processes
Figure 50. The photo balance of the NPN B structure in diluted degassed chloroform solution. The absorption is set to 1000 photons and the fluorescence emission was measured, while the energy transfer and nonradiative decay is calculated from the fluorescence quantum yields of the pure porphyrin and Nn compounds/4
N-200 Q -270 non radiative
processes
-600Fraction 7: ~40
Fraction 1: ~8
fluorescence fluorescence
The only positive result of this photo balance is, that the energy transfer is slightly better than the 10,20-diphenyl-5,15-bis(4-(poly-2',5'-dioctyl-4,4"-terphenylene-l-cy anovinylene-2-yl)- phenyl)porphyrin (JPJ) three domain structure of Krebs et al (see Scheme 22 and Figure 51).^
jpj Scheme 22. The JPJ three domain structure synthesized by Krebs et al.35
92
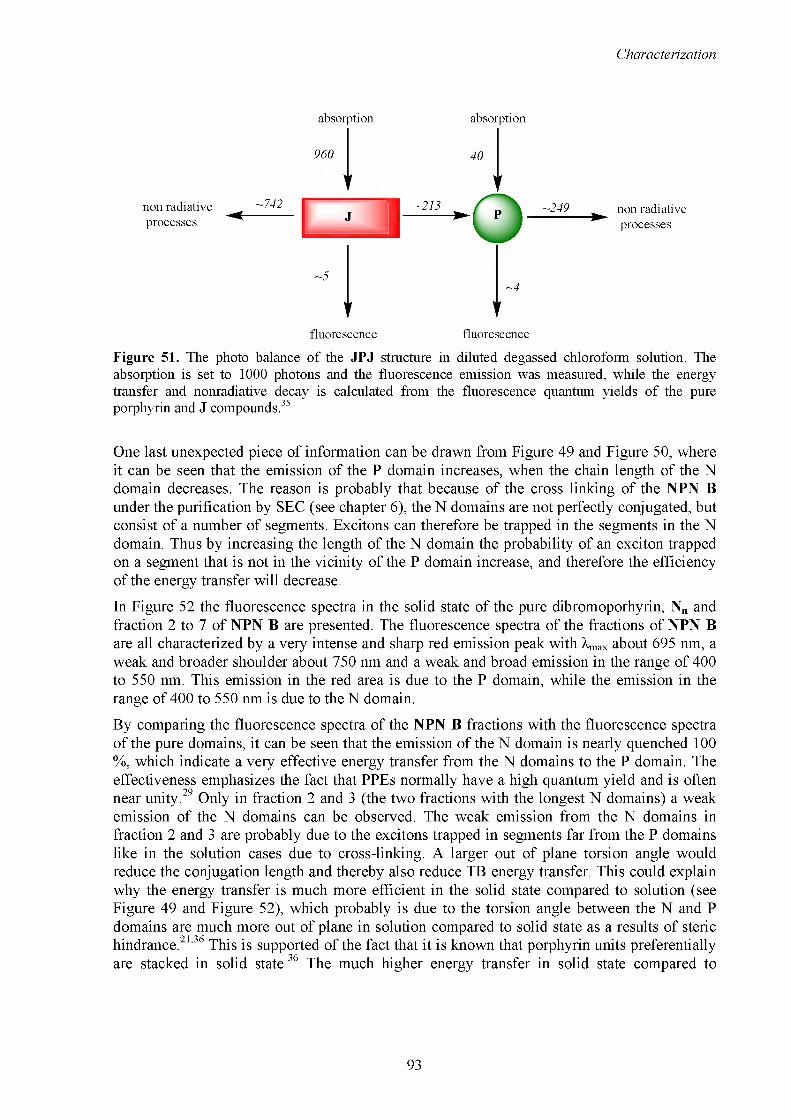
Characterization
non radiative processes
absorption absorption
] -272 -2# non radiative processes
fluorescence fluorescence
Figure 51. The photo balance of the JPJ structure in diluted degassed chloroform solution. The absorption is set to 1000 photons and the fluorescence emission was measured, while the energy transfer and nonradiative decay is calculated from the fluorescence quantum yields of the pure porphyrin and J compounds.35
One last unexpected piece of information can be drawn from Figure 49 and Figure 50, where it can be seen that the emission of the P domain increases, when the chain length of the N domain decreases. The reason is probably that because of the cross linking of the NPN B under the purification by SEC (see chapter 6), the N domains are not perfectly conjugated, but consist of a number of segments. Excitons can therefore be trapped in the segments in the N domain. Thus by increasing the length of the N domain the probability of an exciton trapped on a segment that is not in the vicinity of the P domain increase, and therefore the efficiency of the energy transfer will decrease.
In Figure 52 the fluorescence spectra in the solid state of the pure dibromoporhyrin, N„ and fraction 2 to 7 of NPN B are presented. The fluorescence spectra of the fractions of NPN B are all characterized by a very intense and sharp red emission peak with Vax about 695 nm, a weak and broader shoulder about 750 nm and a weak and broad emission in the range of 400 to 550 nm. This emission in the red area is due to the P domain, while the emission in the range of 400 to 550 nm is due to the N domain.
By comparing the fluorescence spectra of the NPN B fractions with the fluorescence spectra of the pure domains, it can be seen that the emission of the N domain is nearly quenched 100 %, which indicate a very effective energy transfer from the N domains to the P domain. The effectiveness emphasizes the fact that PPEs normally have a high quantum yield and is often near unity.29 Only in fraction 2 and 3 (the two fractions with the longest N domains) a weak emission of the N domains can be observed. The weak emission from the N domains in fraction 2 and 3 are probably due to the excitons trapped in segments far from the P domains like in the solution cases due to cross-linking. A larger out of plane torsion angle would reduce the conjugation length and thereby also reduce TB energy transfer. This could explain why the energy transfer is much more efficient in the solid state compared to solution (see Figure 49 and Figure 52), which probably is due to the torsion angle between the N and P domains are much more out of plane in solution compared to solid state as a results of steric hindrance.2136 This is supported of the fact that it is known that porphyrin units preferentially are stacked in solid state.36 The much higher energy transfer in solid state compared to
93

Characterization
solution is reported for similar systems in the literature,22 35 36 and indicate that TB energy transfer has a large contribution to the overall energy transfer in these domain structures.
5
±X#S3V
500 600
Wavelength [nm]
700
Figure 52. The fluorescence spectra in solid state of the dibromoporphyrin, Nn and fraction 2 to 7 of NPN B.4 The excitation wavelength is 424 nm in the case of Nn and NPN B and 436 nm in the case of the dibromoporphyrin.
9.5 LED devicesSingle-layer LED devices with the configuration as shown in Figure 14 in chapter 2 have been made of N„ and NPN B (further details can be found in paper 2 and 5 in appendix B). Both types of devices had low turn on voltages of 3.3 V. As a comparison the turn on voltages of phenylene ethynylene pentamers,32 2,5-dialkoxy substituted poly(p-phenylene ethynylene) derivates,37 derivates of poly(thiophenes),15 2,5-alkoxy substituted poly(phenylenes)17 and other poly(p-phenylneethynylenes)38 are reported to be 16 V, 8.5-15 V, 1.4-7 V, 4V and 5.5 V, respectively. The devices of N„ and NPN B were during electroluminescence measurements operated at 5.5 V with current densities in the range of 3-8 mA cm'2. The measured electroluminescence spectra are shown in Figure 53.
The electroluminescence of N„ is greenish blue light and consists of a broad peak, which is red shifted -100 nm compared to the fluorescence spectrum (Figure 52). The large red shift indicates that the emission from the N domain is due to a relaxed state. Furthermore, no fine structure is observed as in the case of the fluorescence spectrum. In Figure 54 the band diagram of N„ is shown. It can be seen that there is a large mismatch in energy for the hole injection, which maybe is a limitation factor for the effectiveness of the device.
94

Characterization
Electroluminescence of NPN B Electroluminescence of N
400 500 600 700 800Wavelength [nm]
Figure 53. The electroluminescence spectra of Nn and NPN B
The electroluminescence of NPN B could not be detected visually but measurements revealed that the emission is in the NIR region and that it is very similar to the solid state fluorescence spectrum of NPN B. I interpret this in such a way that the N domains work as very effective antennas, which are capable of transporting electrically generated excitons in the N domain to the P domain where in a photon is emitted as if it was ordinary fluorescence.
-2.9 eV
-3.4 eV
Ca
LUMO
-5.0 eV NnPEDOT:PPS
-6.2 eV
HOMO
Figure 54. The band diagram of Nn. The HOMO and LUMO levels are determined by UPS and UV- Vis spectroscopy and the values of the electrodes are from the litterature.'sy'4"
95

Characterization
9.6 POPV devicesDespite a large and still increasing interest towards the unique photophysical and semiconducting properties of conjugated polymers, I have not been able to find one publication concerning the characteristics of POPV devices where the active layer consist of only a PPE derivative. However, PPE-C60 solar cells have been reported. Furthermore, there are only very few publications concerning the POPV devices with an active layer consisting of polymers in where the monomer is a co-monomer between phenyl ethynylene and electron acceptor compound such as benzothiadiazole (BT)41,42 The missing interest concerning PPEs as the active layer in POPV devices can either mean that no one have discovered the unique properties of PPEs or more likely that the PPEs do not work very well as the active layer in POPV devices. The last is the most probable, which next paragraph will reveal.
POPV devices of Nn and NPN B have been made as described in chapter 2.3 and dark and photo I/V characteristics have been measured (see paper 5 in appendix B for experimental details). The measured I/V characteristics are present in Figure 55 and Figure 56 as linear and logarithmic plots respectively. Data about the fill factor (FF), the power conversion efficiency (nef), the short-circuit current (Isc), the open circuit voltage (Voc) and the maximum power output (Pout) have been obtained as described in chapter 2.2.2 and are presented in. Table 12
From Figure 55 and Figure 56 it can be seen that I succeeded in making a POPV device of Nn, which shown good diode behavior with a rectification ratio of ~35 at bias of ±1 V. Furthermore only a small ohmic contribution is observed at high negative bias, which means that the shunt resistance is large and only a small current leakage is present. Unfortunately the power conversion efficiency of Nn under illumination of white light is lower than the typical value of 0.001 % for single layer POPV devices. Lower values of Isc and Voc than usual for single layer POPV devices are also observed. The lower value of Voc compared to the difference in workfunctions of the two electrodes is probably related to the fast degradation of the polymer caused by oxygen.43 This explanation is supported by the fact that the devices were made under a normal atmosphere containing air, were not encapsulated and had a very short life times (see Figure 57). The low Isc values are probably caused by two things. First, the devices made in this project have an active area of 3 cm2, which is much larger than the typical active area of POPV devices reported in the literature, which is a few mm2.43,44 Research at Riso, Denmark, have shown that it seems to be the general case that there is a large serial resistance present in large area POPV devices, which decrease both Isc and Imax and naturally also both neff and FF. Second, molecular oxygen might have attacked the very sensitive triple bonds in the polymer backbone and thereby have broken some of the conjugation. This will cause some of the charge carriers to be trapped in isolated segments between the broken conjugations, and thereby lead to an increase in the serial resistance.
In conclusion the low value for nejf in Nn is most likely due to the larger mismatch with the solar spectrum compared to PPVs or PATs and to the fact that the sensitive triple bonds very easily are attacked by molecular oxygen or perhaps by the negative metal electrode. The above reasons are probably also the reason, why no one else has reported characterization of POPV devices made of single layer PPEs.
96

Characterization
N„/C„ darkN„/C„ A.M. 1.5NPN B/C„ darkNPN B/Cm A.M. 1.5N/PCBM dark
---- N/PCBM A.M. 1.5
Voltage [V]
Figure 55. The linear dark and photo I/V characteristic of bilayer devices of C6o with Nn and NPN B respectively and blended devices with PCBM and Nn.4
NPN B/C„ darkNPN B/C,n A.M. 1.5N/PCBM dark
---- N /PCBM AM. 1.5
Voltage [V]
Figure 56. The logarithmic dark and photo I/V characteristic of bilayer device of C6o with NPN B and a blended device of PCBM and Nn respectively.
97

Characterization
5.0e-2
4.0e-2
3.0e-2
2.0e-2
Time [h]
Figure 57. The absolute value of Isc as function of the time for the Nn/PCBM device.
Table 12. The summarized I/V characteristics of the POPV devices of Nn and NPN B. The solar simulator have generated AM 1.5 light (-100 mW cm"2) and the active area of the devices was 3 cm24
POPV device Isc InA cm 21 VOC [VI Pout [gW cm 2] FF [%1 }1eff [%]
N„ 2.78 0.19 1.4 x 10"1 26 1 x 10"4
Nn/Ceo 11.3 0.20 7.2 x 10' 32 7 x 10"4
Nn/PCBM 18 3 0.47 2.0 23 2 x 10'2
NPN B 0.16 0.01 5.9x10^ 37 6 x 10'2
NPN B/C6o 6.88 0.14 2.8 x 10 ' 29 3 x 10"4
The low performance of POPV devices made of N„ can be tolerated as long as a significant improvement in performance is observed in the POPV device made of NPN B. Unfortunately it can be seen from Figure 55, Figure 56 and Table 12 that performance of the NPN B POPV devices are even worse than the N„ POPV devices. Even the diode behavior is poorer than the N„ devices. From both the fluorescence and electroluminescence characteristic it is known, that the N domains work as very effective antennas for the P domain. Taking this knowledge into account the poor performance must be due to the fact that either the dissociation of excitons at the P domain is very poor, which means that the molecular heterojunction is not working as intended, or the P domain has difficulties to deliver electrons from dissociated excitons to the electrode or in the case of the bilayer cell to the Ceo layer. In both cases the excitons or the free charge carriers will recombine after the end of their lifetime and e g. emitting light or generating heat. Both explanations indicate why the NPN B POPV devices
98
Characterization
are much poorer than the Nn POPV devices, and why NPN B works as an effective LED. Similar observations have been made by Krebs & Spanggaard45 for a three domain super molecular system, TPT, consisting of the same zinc porphyrin as the P domain and oligo(3- hexylthiophenes) as the T domains. It should be mentioned that Collin et al46 have shown that ruthenium(II) bisterpyridyl complexes covalently linked to zinc porphyrins effectively quenches the fluorescence of the porphyrin, and that this quenching is due to a rapid intramolecular electron transfer process. However both Krebs and Spanggaards and my observation concerning the TPT and NPN B systems show, that more complex systems are needed if effective molecular heterojunctions using porphyrin compounds should be obtained. One possible problem of e.g. the NPN B system is that if excitons are dissociated in the P domain, no good electron conductor is attached to the P domain, and the electrons can have problems reaching the electrodes. A good hole conductor such as a PPV derivative and a good electron conductor such as a fullerene covalently linked to e.g. the ruthenium complex systems of Collin et al. could be a suggestion for a more complex system. This system should make use of the system of Collin et al., which has been proposed to produce free charge carriers, combined with good conductors that are capable of leading the produced free holes and electrons effectively away from the porphyrin unit. The chemistry of this system is however much more complicated, which in the end could be the main problem of these systems. Only time will show.
References
1 Salaneck, W.R.; Logdlund, M.; Fahlman, M.; Grecynski, G. and Kugler, Th.,Mater. Sci. Eng., 2001, R34, 121-146.
2 Waner, C. D.; Riggs, W. M.; Davis, L. E. and Moulder, J. F., Handbook of X-ray photoelectron spectroscopy - A reference book of standard data for use in X-ray photoelectron spectroscopy, Editor: Muilenberg, G.E., Perkin-Elmer Corporation, Eden Prairie, Minnesota, 1979.
3 Nielsen, K. T.; Spanggard, H. and Krebs, F. C., Display, 2004, 25, 231-235.4 Nielsen, K. T.; Spanggaard, H. and Krebs, F. C, Organic Photovoltaics 6. SPIE conference on optics
and photonics: Conference 5938: Organic photovoltaics 6, San Diego, CA (US), 31 Jul - 4 Aug 2005. Kafafi, Z.H.; Lane, P.A. (eds.), (International Society for Optical Engineering, Bellingham, 2005) (SPIEProceedings Series, 5938), 2005, 222-233.
5 Krebs, F. C. and Jorgensen, M., Macromolecules, 2002, 35, 7200-7206.6 Seki, K.; Furuyama, T.; Kawasumi, T.O.; Sakurai, Y.; Ishii, H.; Kajikawa, K.; Ouchi, Y. and
Masuda, T., J. Phys. Chem. B, 1997, 101, 9165-9169.7 Krebs, F. C. and Jorgensen, M.,Macromolecules, 2003, 36, 4374-4384.8 Krebs, F. C. and Jorgensen, M.,Macromolecules - Corrections, 2004, 37, 4740-4740.9 Warman, J. M.; Gelinck, G. H. and de Haas, M. P., J. Phys. Condens. Matter, 2002, 14, 9935-9954.10 Krebs, F. C. and Jorgensen, M., Pol. Bull., 2003, 51, 127-134.11 Li, H.; Powell, D. R.; Hayashi, R. K. and West, R.,Macromolecules, 1998, 31, 52-58.12 Jones II, L.; Schumm, J. S. and Tour, J. M., J. Org. Chem., 1997, 62, 1388-1410.13 Mangel, T.; Eberhardt, A.; Scherf, U.; Bunz, U. H. F. and Muller, K., Macromol. Rapid. Commun.,
1995, 16, 571-580.14 Moroni, M. and Le Moigne, J., Macromolecules, 1994, 27, 562-571.15 Andersson, M. R.; Berggren, M.; Inganas, O.; Gustafsson, G.; Custafsson-Carlberg, J. C.; Selse, D.;
Hjertberg, T. and Wennerstrom, O., Macromolecules, 1995, 28, 7525-7528.16 Tessler, N.; Medvedev, V.; Kazes, M.; Kan, S.; and Banin, U., Science, 2002, 295, 1506-1508.17 Harrison, B. S.; Foley, T. J.; Knefely, A. S.; Mwaura, J. K.; Cunningham, G. B.; Kang, T. S.;
Bouguettaya, M.; Boncella, J. M.; Reynolds, J. S. and Schanze, K. S., Chem. Mater., 2004, 16, 2938-2947.
18 Forster, Th., Discuss. Faraday Soc., 1959, 27, 7-17.
99

Characterization
19 Scholes, G. D.; Chiggino, K. P.; Oliver, A. M. and Paddon-Row, M. N., J. Phys. Chem., 1993, 97, 11871-11876.
20 Speiser, S., Chem. Rev., 1996, 96, 1953-1976.21 Jiao, G. S.; Thoresen, L. H. and Burgess, K., J. Am. Chem. Soc., 2003, 125, 14668-14669.22 Li, N.; Li, Y. and Fu, Z. Bo, J. Am. Chem. Soc., 2004, 126, 3430-3431.23 Dogariu, A.; Gupta, R.; Heeger, A. J. and Wang, H., Synth. Met., 1999, 100, 95-100.24 Webber, S. E., Chem. Rev., 1990, 90, 1469-1482.25 Hsiao, J. S.; Krueger, B. P.; Wagner, R. W.; Johnson, T. E.; Delaney, J. K.; Mauzerall, D. C.;
Fleming, G. R.; Lindsey, K. S.; Bocian, D. F. and Donohoe, R. J., J. Am. Chem. Soc., 1996, 118, 11181-11193.
26 Hoffmann, R.; Imamura, A. and Hehre, W. J., J. Am. Chem. Soc., 1968, 40, 1499-1509.27 Newton, M. D., Chem. Rev., 1991, 91, 767-792.28 Scholes, G. D.; Chiggino, K. P.; Oliver, A. M. and Paddon-Row, M. N., J. Am. Chem. Soc., 1993,
115,4345-4349.29 Bunz, U. H. H., Chem. Rev., 2000, 100, 1605-1644.30 Kukula, H.; Veit, S. and Godt, A., Eur. J. Org. Chem., 1999, 277-286.31 Pizzoferrato, R.; Berliocchi, M.; Di Carlo, A.; Lugli, P.; Venanzi, M.; Micozzi, A.; Ricci, A. and Lo
Sterzo, C.,Macromolecules, 2003, 36, 2215-2223.32 Anderseon, S., Chem. Eur. J., 2001, 7, 21, 4706-4714.33 Weder, C. and Wrighton, M. S.,Macromolecules, 1996, 29, 5157-5165.34 Nielsen, K. T.; Spanggaard, H. and Krebs, F. C., Macromolecules, 2005, 38, 1180-1189.35 Krebs, F. C.; Hagemann, O. and Spanggaard, H., J. Org. Chem., 2003, 68, 2463-2466.36 Jiang, B.; Yang, S. W. and Jones Jr., W. E., Chem. Mater., 1997, 9, 2031-2034.37 Schmitz, C.; P"sch, P.; Thelakkat, M.; Schmidt, H. W.; Montali, A.; Feldman, K.; smith, P. and
Weder, C., Adv. Funct. Mater., 2001, 11, 41-46.38 Pschirer, N. G.; Miteva, T.; Evans, U.; Roberts, R. S.; Marshall, A. R.; Neher, D.; Myrick, M. L. and
Bunz, U. H. F., Chem. Mater., 2001, 13, 2691-2696.39 Montali, A.; Smith, P. and Weder, C., Synthetic metals, 1998, 97, 123-126.40 Wu, S. H.; Shen, C. H.; Chen, J. H.; Hsu, C. C. and Tsiang, R. C. C., J. Polym. Sci. Part A, 2004,
42, 3954-3966.41 Lu, S.; Yang, M.; Luo, J. and Cao, Y., Synthetic Metals, 2004, 140, 199-202.42 Lu, S.; Yang, M.; Luo, J.; Cao, Y. and Bai, F.,Macromol. Chem. Phys., 2005, 206, 664-671.43 Krebs, F. C.; Alstrup, J.; Spanggaard, H.; Larsen, K. and Kold, E., Solar Energy Materials & Solar
Cells, 2004, 83, 293-300.44 Yu, G.; Zhang, C. and Heeger, A. J., Appl. Phys. Lett., 1994, 64, 1540-1542.45 Krebs, F. C. and Spanggard, H., Solar Energy Materials & Solar Cells, 2005, 88, 363-375.46 Collin, J. P.; Harriman, A.; Heitz, V.; Odobel, F. and Sauvage, J. P., J. Am. Chem. Soc., 1994, 116,
5679-5690.
100

Conclusion
Conclusion
In this project the synthesis of a new derivative of a poly(phenylene ethynylene), N„, together with the synthesis of a new three domain super molecular structure consisting of a zinc porphyrin linked conjugated polymer, NPN B, is presented. During the synthesis problems concerning the control of the nature of the polymer were observed, and it was concluded that the problems were caused primarily by two factors: Oxidative dimerization of the ethynylene groups and remnants of Pd catalyst. The problem concerning the remnants of the Pd catalyst has been solved in an elegant and non expensive manner by dissolving the remnants of the Pd catalysts with the VV-diethylphenylazothioformamide through formation of electron transfer complexes. The electron transfer complexes show either an unusually distorted tetrahedral coordination for electron transfer complexes or a more conventional square planar coordination, depending on the metal. The VTV-diethylphenylazothioformamide is not limited to dissolve Pd, as it is shown that N, 7V-di ethyl phenyl azothi oformami de also has the ability to dissolve other transition metals like eg. Pt, Ni and Cu. The uniqueness of N,N- di ethyl phenyl azothi oformami de is furthermore that it gives the possibility to quantitatively analyze the content of a given transition metal by UV-Vis spectroscopy, with a detection limit as low as 10 ppb. To extend the tool box for removal of remnants of transition metals from a given sample, the development of TV, 7V-bis[tetra( ethylene glycol)monomethylether]phenylazo- thioformamide is presented. The TV,TV-bis[tetra(ethylene gly col jmonom ethyl ether] - phenylazothioformamide is specially designed to remove transition metals from samples containing small molecules. The long ethylene glycol monomethyl ether chains give the ligand and the formed electron transfer complexes a very high affinity for silica gel in even polar solvents like chloroform.
Both LED and POPV devices of N„ and NPN B have been prepared and characterized. It was observed that LED devices based on N„ emit greenish blue light while LED devices based on NPN B emit light in the near-infrared region. It is demonstrated that the N domains in NPN B work as very effective antennas for the P domain, and effectively transfer electrically generated excitons in the N domain to the P domain. The performance of the POPV devices based on N„ is however much lower than normally observed for single layer polymer devices sandwiched between two electrodes. It is concluded that the low performance is due to a mismatch with the solar spectrum and the attack of molecular oxygen on the very sensitive triple bonds in the backbone of the polymer. The POPV devices based on the NPN B polymer exhibit even poorer performance than devices based on N„. It is concluded that the poor performance of the POPV devices based on NPN B is due to either a missing dissociation of the excitons in the P domain or problems of delivering free electrons from dissociated excitons in the P domain to the electrodes. The overall conclusion is therefore that a more complex system is needed if a molecular heterojunction is to work efficiently.
101

102

A Tellurium Story!
T e I I u Story
In this chapter I will summarize my contribution to the paper:"Synthesis, Structure and Properties of 4,7-dimethoxybenzo[c]tellurophene, a Molecular Pyroelectric Material" (paper 7 in appendix B). My contribution consisted of the structural characterization as a function of the temperature by X-ray diffraction and the calculation of the pyroelectric coefficient as function of the temperature. The work was done in collaboration with Michael Pittelkow, Theis K. Reenberg, Magnus J. Magnussen, Theis I. Soling and Jorn B. Christensen from University of Copenhagen.
11.1 IntroductionOne of the more remarkable aspects in solid-state chemistry is the connection between the symmetry properties and the electrical properties. The polar axis is responsible for properties such as ferroelectricity and pyroelectricity, and if the point group is non-centrosymmetric properties such as piezoelectricity is a possible.1 Materials with one of these properties have very interesting applications such as capacitors, infrared radiation detectors and transducers for converting mechanical energy to electrical energy (and vice versa), respectively.2
Ferroelectrics have an extremely large permittivity and can retain some residual electrical polarization after an applied potential has been removed. The size of the polarization depends on the size of the applied potential, but has a saturation polarization, Ps, at high field strength. A further property of the ferroelectrics is that applying a potential in the opposite direction can reverse the polarization.2
Piezoelectrics crystals develop electric charges on the opposite crystal faces, when the crystals are applied a mechanical stress. The polarization, P, and the stress, a, are proportional and the proportionality coefficient is called the piezoelectric coefficient, d2:
P = da (11.1)
This property has made piezoelectrics useful, and e g. physicists at Roskilde University have specialized in making rheometric instruments of Piezoelectric materials to measure both bulk and shear modulus of supercooled liquids.3'4
Pyroelectrics are materials where in a change in the spontaneous polarization, P, is observed in connection to a change in temperature, T2
AP = pAT (11.2)
wherep is the pyroelectric coefficient.
Crystals that exhibit one of the above properties have to be non-centrosymmetric. It should be mentioned that it is still a large unsolved problem to predict and control the crystallization of organic molecules to obtain desired symmetry.1 Furthermore, it should also be mentioned that only few organic compounds crystallize in a point group, that has a polar axis.5'6 Therefore it
103

A Tellurium Story
is always interesting when a new organic molecule is found to crystallize in a non- centrosymmetric polar point group, and investigations for possible properties like the ones mentioned above should be carried out.
In the present work the unusually stable tellurium compound: 4,7-dimethoxybenzo- [c]tellurophene has been synthesized (see Figure 58). Single crystal diffraction measurements showed that the compound crystallizes in a non-centrosymmetric polar space group, which means that the compound probably exhibit one or more of the three above mentioned properties. Test for ferroelectricity demands large crystals, which not was easy to grow. Concerning the piezoelectric properties, the crystals are very fragile, which means that even if the compound has piezoelectric properties, it cannot be used as transducers because it cannot withstand the mechanical strain. We have therefore decided not to test for piezoelectric properties. From DSC measurements an exothermic phase transition is observed at about 353 K (see supporting information of paper 7 in appendix B). This phase transition opens up for the possibility of the rare primary pyroelectric effect (will be described in following paragraph), if the compound exhibit pyroelectricity.
C20
C9
Te2
Figure 58. The X-ray structure of 4,7-dimethoxybenzo[c]tellurophene. There are two molecules in the asymmetric unit.7Before testing the pyroelectric effects, a more clarifying explanation of the pyroelectricity is needed.
11.2 PyroelectricityA material is pyroelectric when it shows spontaneous change in polarization when the temperature is changed. The requirement of the polar axis and the non-centrosymmetric symmetry cause crystals that exhibit pyroelectric effects to belong to one of the following 10 out of the 32 possible point groups: Triclinic 1, monoclinic m and 2, orthorhombic mm2, trigonal 3 and 3m, tetragonal 4 and 4mm and hexagonal 6 and 6mm. In point group 1 the polar axis is not determined by symmetry and the vector description of the polar axis therefore has three components for a rectangular coordinate system. In point group m the polar axis lies in the mirror plane and therefore it has only two components. In the other eight point groups the polar axis lies parallel to the unique rotational axis. The unique rotational axis in these point groups corresponds to one of the major crystallographic axes. The vector description of the polar axis therefore has only one component.8
104

A Tellurium Story
The magnitude of the pyroelectric effect is related to the pyroelectric coefficient, which can be divided into three contributions named the primary, secondary and tertiary pyroelectric coefficients. The primary pyroelectric coefficient describes the pyroelectric effect when the shape and volume of the crystal are fixed and the crystal is exposed to a temperature change. It therefore describes the strain-free cases, pS.8 The primary pyroelectric effect covers the change in polarization due to abrupt atomic or molecular movements within the crystal as a function of the temperature. The effect is often observed in connection to or near a phase transition in where a partial or full cancellation of the dipole moments occur as a consequence of e.g. symmetry changes from polar to non-polar point group.7,9 The secondary effect describes the pyroelectric effect when the shape and volume of the crystal are free to change under a uniform change in temperature, which is equivalent to a stress-free case, pT. This means that the secondary effect describe the change in polarization due to thermal expansion. In practice reported pyroelectric effects on crystals is mostly on the pT because this condition is more easily obtained in practice. The tertiary pyroelectric effect is used when crystals experience non-uniform temperature change.8 By ensuring a uniform temperature change in the crystals, the contribution from tertiary effects to the overall pyroelectric effect is eliminated, and the effect will therefore not be commented anymore.
Since the pyroelectric effect is an equilibrium property it is possible to define the pyroelectric coefficient by use of thermodynamics*:
PT (11.3)
wherep, n, T, S, e, T, u, a and E represent the pyroelectric coefficient, the polar axis, constant stress, constant strain, piezoelectric stress coefficient, constant temperature, tensor components, thermal expansion constant and constant electric field. The first term in equation(11.3) represents the primary pyroelectric effect while the second term represents the secondary pyroelectric effect.8,9
11.3 4,7-dimethoxybenzo[c]telluropheneThe X-ray structure of 4,7-dimethoxybenzo[c]tellurophene has been solved at 100 K. The compound crystallizes in the polar non-centrosymmetric space group C2, where the polar axis and the C2 axis lie along the crystallographic b axis. There are two molecules in the asymmetric unit cell. The molecules are planar and from the crystal packing (see Figure 59) it can be seen that all the molecules are arranged around the C2 axis in such a way that the plane of the molecules is tilted with an angle of 48° with respect to the C2 axis.
The crystal packing of the 4,7-dimethoxybenzo[c]tellurophene cause a permanent polarization in the crystal, and in order to investigate the pyroelectric properties and to determine whether the pyroelectric effect is primary or secondary I have investigated the X-ray structure as a function of the temperature. X-ray data have been recorded at the temperatures: 100, 150, 200, 250, 300, 323, 343 and 373 K. The temperature range up to the phase transition at 353 K allowed me to investigate the secondary pyroelectric effect, and the high temperature on the phase transition can give information about a possible primary pyroelectric effect. X-ray data
* The definition of the pyroelectric coefficient by thermodynamics is very lengthy and complicated and it is out with of the scope of this thesis to show this definition, there is therefore referred to the literature8 for a comprehensive description of the definition.
105

A Tellurium Story
were collected successfully in the temperature range up to 343 K but it turns out that when the temperature was increased to 373 K the crystal blackened and its edges became rounded. Furthermore no diffraction was observed when I attempted to record X-ray data. The temperature was then decreased to 343 K but still no diffraction was observed. This indicates that the crystal is possibly not an equilibrium structure, and further polymorphism is not likely to be present since all diffraction disappears after the heating to the high temperature. In the case of the data collection at 343 K I observed that the intensity of the diffraction began to decrease as a function of time, which results in virtually no diffraction observed after 2 hours. Furthermore the crystals very slowly blackened at this temperature also. It therefore seems plausible that the 4,7-dimethoxybenzo[c]tellurophene is not stable at high temperature and looses tellurium, which is collected on the surface of the crystal.
Figure 59. The crystal packing of 4,7-dimethoxybenzo [c]tellurophene at 100 K. Note how the arrangement of the molecules causes a net dipole moment along the crystallographic b axis.7
The solution of the X-ray structure of 4,7-dimethoxybenzo[c]tellurophene was unproblematic at all temperatures except at 323 K, where it was necessary to employ constraints on the molecular geometry as a consequence of the instability of 4,7-dimethoxybenzo[c]tellurophene at high temperature. The constraints consisted of forcing the benzene ring to approach a hexagonal geometry.
In the case of a possible primary pyroelectric effect, it can be concluded that the phase transition at 353 K observed in DSC does not represent a primary pyroelectric effect since; the crystal seems to break down at this transition. Concerning a possible primary pyroelectric effect in the temperature range from 100 K to 323 K, a structural change has to be observed as function of the temperature. The structural changes have to be of the kind that affects the polarization, which only can happen if the molecules move in such a way that the angle between the dipole of the molecules and the C2 axis changes. In Figure 60 the angles between the molecular plane of both molecules in the asymmetric unit cell determined by the least square fit and the C2 axis have been plotted as function of the temperature. It can be seen that the changes in angle are not significant. I therefore conclude that the contribution from a possible primary pyroelectric effect is negligible.
106

A Tellurium St on>
42.5
42.0
g»S- 41.5v
"Sos<
41.0
40.550 100 150 200 250 300 350
T[K]Figure 60. The angle between the plane core of 4,7-dimethoxybenzo[c]tellurophene and the C2 axis as function of the temperature. The large standard deviation on the data at 323 K is due to the instability at high temparture.7
Ea
>
50 100 150 200 250 300 350
T[K|
T[K|vsb T[K| vs volume V=0.3349*T+1867.8818
1980
- 1960
- 1940
- 1920
- 1900
i—'—■—'—■—i—■—'—■—'—i—'—■—'—■—i—■—'—■—'—r
Figure 61. The length of the b axis (left axis) and the size of the volume (right axis) are plotted as a function of the temperature. Furthermore the linear relationship between the volume and the temperature is determined by fitting the experimental data.7
Since secondary pyroelectric effects are solely due to the thermal expansion of the material as a function of temperature, the secondary pyroelectric effect can be estimated by observing the volume of the crystal as a function of the temperature. In Figure 61 the crystallographic b axis
107

A Tellurium Story!
and the volume is plotted as a function of the temperature. It can be seen that there is a change in size of both components as a function of the temperature, which a secondary pyroelectric effect.Since the space group is C2, the molecular dipole, u, is aligned along the crystallographic b axis, and the polarization, P, is given in equation (11.4).
f(T)F(T)
fo)(11.4)
where Z, T and V are the molecular entities per unit cell, the temperature and the volume as function of the temperature. Since the pyroelectric coefficient at constant stress, pJ, is given as the change in polarization with respect to the change in temperature, the following expression for the secondary pyroelectric coefficient is obtained:
dP(T) T dT ~P”~
ciT- +2bT + —-//cos(6>) (H.5)
where ciT2+2bT+b2/a and 6 are the derivatives of the linear thermal expansion with respect to the temperature and the angle between the plane molecular core and the C2 axis.
.10e-6
poT(T) mean
poT(T) calculated12e-6 -
.14e-6 -
,16e-6 -
18e-6 -
20e-6 -
.22e-6
Figure 62. The calculated secondary pyroelectric coefficient as a function of the temperature. In the plot both p„J(T) observed and the p„'(T) mean are shown. The p„'(T) calculated is the secondary pyroelectric effect calculated on basis of equation (11.5) by use of the calculated dipole moments (see paper 7), the thermal expansion from Figure 61 and the angle between the plane molecular core and the C2 axis from Figure 60. The p„'(T) mean is calculated almost as the p„'(T) observed but by use of the mean value of the calculated dipole moments and the mean value of the angle between the plane molecular core and the C2 axis.7
On basis of equation (11.5) and the molecular dipole moment, which can be calculated on basis of the molecular coordinates obtained from the X-ray crystal structures (see paper 7 for
108

A Tellurium Story
further details), it is possible to calculate the secondary pyroelectric coefficient as a function of the temperature. In Figure 62 the calculated secondary pyroelectric coefficient is plotted as a function of the temperature.By comparing with other pyroelectric materials it can be seen that the pyroelectric coefficient is comparable in magnitude with known values for other organic compounds such as phosphangulene, which have a coefficient of 3.2xfQ"6 C m-2 K"1. The magnitude of the pyroelectric coefficient is however nearly a factor 1QQQ smaller than some of the best inorganic pyroelectric materials such as La:SBN.9
References
1 Curtin, D. Y, Paul, I. C., Chem. Rev., 1981, 66, 525-541.2 West, A. R., Basic Solid State Chemistry, 1999, page 361-372, John Wiley & Sons, LTD, Chichester,
England.3 Christensen, T. E. and Olsen, N. B., Rev. Sci. Instr., 1995, 66, 5019-5031.4 Jakobsen, B.; Nielsen, K. T.; Ringgaard, K.; Senderby, S. and Sendergaard, L. R.,Modeller og
maling af shearmoduler for underafkolede vwsker nwr glasfasen, 1999, OB-RUC, Roskilde, Denmark.
5 Mighell, A. D. and Rodgers, J. R., Acta Crystallogr. A, 1980, 36, 321-326.6 Wilson, J. C., Acta Crystallogr. A, 1988, 44, 715-724.7 Pittelkow, M.; Reenberg, T. K.; Nielsen, K. T.; Magnussen, M. J.; Selling, T. I.; Krebs, F. C. and
Christensen, J. B., Angew. Chem. Int. Ed., 2006, accepted.8 Liu, S. T., Landolt-Bornstein, Numerical Data and Functional Relationships in Science and
Technology, Hellwege, K-H., ed., Springer-Verlag: New York, 1979, H/II, 471-494.9 Krebs, F. C.; Larsen, P. S.; Larsen, J.; Jacobsen, C. S.; Boutton, C. and Thorup, N., J. Am. Chem.
Soc., 1997, UP, 1208-1216.
109

110

Appendix A
A p p
12.1 Pd(PPh3)4 catalystThe tetrakispalladium(O) was prepared as described in the literature1. The reaction runs as mentioned below:
2 PdCl2 + 8P(C6H5)3 + 5 NH2NH2 H20 ------- - 2 PD[P(C6H5)3]4+ 4 NH2NH2 HC1 + N2 + 5 H20
In a 500 mL round-bottom three-necked flask palladium dichloride (0.014 mol, 2.53 g) and triphenylphosphine (0.070 mol, 18.69 g) were suspended in dimethyl sulfoxide (170 mL). The flask was equipped with an egg shaped magnetic stirring bar, rubber septum, thermometer and a condenser connected to an argon system with provision made for pressure relief though a silicon oil bubbler. The greenish yellow suspension was heated under stirring until complete solution occured, which was about at 413 K. The heating was then stopped; and the solution was rapidly stirred until the temperature of the solution fell to 403 K. Hydrazine monohydrate (0.056 mol, 2.73 mL) was then added through the septum by a plastic syringe over 1 minute. It is important to cool the solution down to avoid that the hydrazine should decompose in an uncontrolled manner, but the temperature of the solution must not be lower than 403 K, because PdCl2(PPh3)2 will then precipitate. After the addition of the hydrazine, the solution was cooled down to room temperature and the yellow solution was filtered through a glass filter funnel under an argon atmosphere and washed with 100 mL ethanol and 200 mL diethyl ether. Passing a steam of argon over the funnel for 1 hour dried the product. The yield was16.00 g (99 %).
12.2 PdCI2(PPh3)2 catalystThe PdCl2(PPh3)2 catalyst was prepared as described in the literature.1 The reaction is as follow:
DMSOPdCl2 + 2 P(C6H5)3 --------------► PdCl2(PPh3)2
In a 500 mL round-bottom three-necked flask equipped with an egg shaped magnetic stirring bar, thermometer and condenser DMSO (400 mL) was added and flushed with argon for 15 min. Palladium di chloride (0.029 mol, 5.16 g) and triphenylphosphine (0.073 mol, 19.25 g) were added under an argon atmosphere. The suspension was heated to 413 K while stirring. The solution changed colour from cloudy yellow to clear red. The heating and stirring were stopped and the solution was allowed to cool down slowly, while yellow crystals precipitated. The solution was filtered through a glass filter funnel and the crystals were washed with 1 L diethyl ether. The crystals were dried in a vacuum oven. The yield was 19.82 g(97%).
- n d i x A
in

Appendix A
12.3 2,5-dioctylbenzene (1)2,5-dioctylbenzene was prepared by a normal Grignard reaction2.
The reaction runs as showed below:
+ Et2O
Mg (s) + C8H17Br C8H17MgBr
+ NiCl2dppp
2 CgH^^MgBr + Cl Cl+ Et2O
- MgBrClC6H4Cl2
Exact Mass: 145,97 Mol. Wt.: 147,00
C, 49,02; H, 2,74; Cl, 48,23
C8H17 ^ ^ C8H17
C22H38Exact Mass: 302,30 Mol. Wt.: 302,54
C, 87,34; H, 12,66
In a 2000 mL three-necked round-bottom flask filled with argon, Mg (1.06 mol, 25.71 g, 6 % excess) was covered with Et2O (150 mL). Et2O (350 mL) was added drop wise in a mixture with the n-octylbromide (0.99 mol, 191.61 g) under argon atmosphere and over a time period of 2.5 hour. Even though the reaction is exothermic, it was necessary to add some crystals of iodine and heat the solution with a heat gun before the reaction started. After the addition of the halide the solution was stirred in 1 hour under argon atmosphere. Hereafter the catalyst (1.01 g of NiCl2dppp) and a solution of 1,4-dichlorobenzene (0.50 mol, 73.57 g) in Et2O (500 mL) were added to the solution, and the color of the mixture shifted from gray to light green. The solution of dichlorobenzene in Et2O was flushed with argon in 15 minutes before the addition. After the addition the mixture was stirred and refluxed overnight. Next day a lot of solid matter (MgBrCl) had precipitated, so the solution seemed nearly solid, and the color of the solution was shifted from green to brown. The solution was poured into 1.5 L ice water, and the phases were separated by 2 L Et2O. Note that Mg reacts very violently with water. The organic phase was washed three times with water, and dried with MgSO4. After drying, the organic phase was filtered and evaporated to dryness to provide 127.55 g of oil. Yield 84 %. 1H and 13C NMR identified the product as 1,4-dioctylbenzene, and showed that it was clean.1H NMR (250 MHz, CDCf, 300 K, TMS): 5 = 0.87 (6 H, double t), 1.26 (20 H, m), 1.58 (4 H, double q), 2.54 (4 H, double t), 7.05 (4 H, s).13C NMR (63 MHz, CDClg, 300 K, TMS): 5 =14.13, 22.78, 29.41, 29.53, 29.64, 31.69, 32.03, 35.71, 128.26, 140.03.
112

Appendix A
12.4 1-(4-bromophenyl)-2-trimethylsilylacetylene (6)1-(4-bromophenyl)-2-trimethylsilylacetylene was prepared as described in the literature3 with a few exceptions.
The reaction runs as mentioned below:
Br I + ^^TMS
+ Pd(PPh3)2Cl2
+ CuI+ N(CH2CH3)3
------------- - Br- HN(CH2CH3)3I
TMS
C6H4BrIMol. Wt.: 282,90
C5H10S1
Mol. Wt.: 98,22
CnH13BrSi Exact Mass: 252,00
Mol. Wt.: 253,21C, 52,18; H, 5,17; Br, 31,56; Si, 11,09
A 500 mL round-bottom flask was dried with a heat gun and filled with argon. Then a mixture of 1-bromo-4-iodobenzene (82.7 mmol, 23.39 g) and trimethylsilylacetylene ( 82.7 mmol, 8.12 g) was added together with triethylamine (200 mL). The solution was placed in an ice bath and flushed with argon for 30 minutes, before the catalyst Pd(PPh3)2Cl2 (1.16 g, « 2 mol %) and the co-catalyst CuI (1.55 g, « 10 mol %) were added under an argon atmosphere. The mixture was stirred overnight under an argon atmosphere. The colour of the mixture was dark before the addition of the catalyst. After the addition of the catalysts the colour became brownish and cloudy.Next day GC/MS showed that the reaction had stopped and there was still about 9 % of 1- bromo-4-iodobenzene left in the mixture. 9 mole % of trimethylsilylacetylene ( 7.4 mmol, 0.73 g) was therefore added together with a little more catalyst (Pd(PPh3)2Cl2 0,11 g, « 2 mol % and CuI (0.14 g, « 10 mol %), and the mixture was stirred under an argon atmosphere for another 4 hours. At this point GC/MS showed that all of the 1-bromo-4-iodobenzene was converted to 1-(4-bromophenyl)-2-trimethylsilylacetylene. Diethyl ether (150 mL) was added, and the suspension was filtered through a glass filter-funnel (size 3) (triethylammmoniumhydrogen iodide was removed). The filtrate was collected and evaporated to dryness by rotary evaporation. The liquid residue (yellow oil) was dissolved in n-heptane (300 mL) and then purified on an aluminium oxide column. The n-heptane was removed by evaporation, and the product was further purified by recrystallization in 150 mL methanol and washed with cold methanol. 1-(4-bromophenyl)-2-trimethylsilylacetylene was obtained as a white powder in 67 % yield (14.09 g).1H NMR (250 MHz, CDClg, 300 K, TMS): 5 = 0.24 (9 H, s), 7.30 (2H, double t (aa'bb'para- system), 3J = 8.6 Hz, 4J = 2.0 Hz), 7,49 (2H, double t (aa'bb'para-system), 3J = 8.6 Hz, 4J =2.0 Hz).13C NMR (63 MHz, CDClg, 300 K, TMS): 5 =0.00, 95.6, 103.9, 122.1, 122.7, 131.5, 133.4.
Anal. Calcd. for C11H13BrSi: C: 52.18, H: 5.17, N: 0,00. Found: C: 52.03, H: 4.98, N:0,00.
113

Appendix A
12.5 1-(4-iodophenyl)-2-trimethylsilylacetylene (7)The reaction:
Br^O"CnH^BrSi
Exact Mass: 252,00 Mol. Wt.: 253,21
C, 52,18; H, 5,17; Br, 31,56; Si, 11,09
—TMS
+ n-BuLi + THF
- BuBr
Li
+ I2
TMS I TMS
CnH^ISi Exact Mass: 299,98
Mol. Wt.: 300,21C, 44,01; H, 4,36; I, 42,27; Si, 9,36
In a 500 mL conical flask 1-(4-bromophenyl)-2-trimethylsilylacetylene (1.35-10-1 mol, 34.12 g) was dissolved in dry THF (200 mL) under an argon atmosphere. Meanwhile 350 mL THF was cooled to 195 K in a 2000 mL three-necked round-bottom flask. After the THF had reached the temperature of 195 K, n-BuLi (130 mL of a 1.1 M solution in hexane (0.143 mol, ~ 10 % excess) was dissolved in the THF under an argon atmosphere. The dissolution process is very exothermic and the temperature of the solution increased to 233 K. The solution was cooled to 195 K, whereupon the solution of 1-(4-bromophenyl)-2-trimethylsilylacetylene was added drop wise over a period of 2 hours and under an argon atmosphere, so the temperature did not exceed 223 K. After the temperature again was cooled down to 195 K (after about 30 minutes), I2 (0.15 mol (~ 10 % excess), 37.69 g) was added and the temperature of the mixture was allowed to rise to room temperature. The mixture was then treated with petroleum ether (200 mL), and washed with a saturated solution of Na2S2O3-5H2O in water (4-250 mL). The aqueous phase was then washed with diethyl ether (100 mL). The organic phases was collected and dried with MgSO4, whereupon the solvent was removed by evaporation. The yield was 39.42 g of yellow oil. The product was recrystallized in methanol (200 mL) and washed with cold methanol to provide 29.98 g of a white powder. Yield: 74 %.1H NMR (250 MHz, CDClg, 300 K, TMS): 5 = 0.24 (9 H, s), 7.20 (2H, double t (aa'bb'para- system), 3J = 8.4 Hz, 4J = 1.9 Hz), 7,6 (2H, double t (aa'bb'para-system), 3J = 8.4 Hz, 4J = 1.8 Hz).13C NMR (63 MHz, CDClg, 300 K, TMS): 5 =-0.1, 94.4, 95.9, 104.0, 122.6, 133.4, 137.4.
114
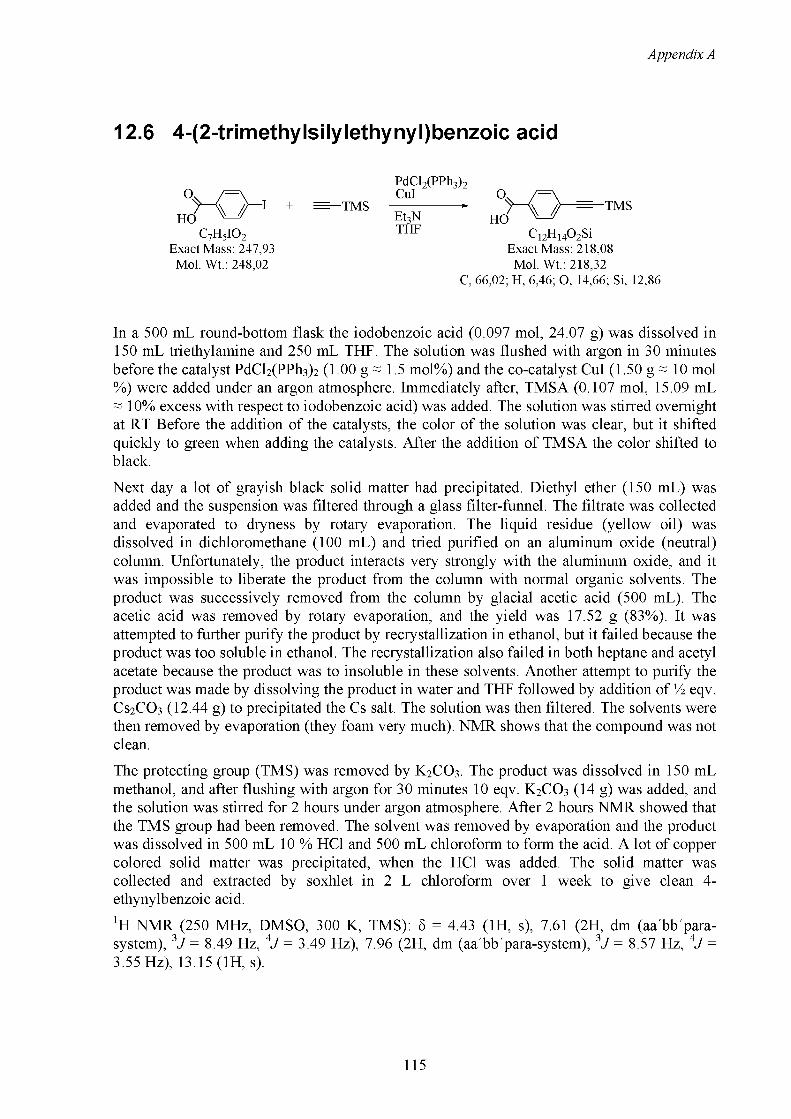
Appendix A
12.6 4-(2-trimethylsilylethynyl)benzoic acid
OHO
C7H5IO2Exact Mass: 247,93
Mol. Wt.: 248,02
+ TMS
Pda2(PPh3)2 CuI 2
Et3NTHF
O
HOTMS
C12H14O2SiExact Mass: 218,08
Mol. Wt.: 218,32C, 66,02; H, 6,46; O, 14,66; Si, 12,86
In a 500 mL round-bottom flask the iodobenzoic acid (0.097 mol, 24.07 g) was dissolved in 150 mL triethylamine and 250 mL THF. The solution was flushed with argon in 30 minutes before the catalyst PdCl2(PPh3)2 (1.00 g ~ 1.5 mol%) and the co-catalyst CuI (1.50 g ~ 10 mol %) were added under an argon atmosphere. Immediately after, TMSA (0.107 mol, 15.09 mL ~ 10% excess with respect to iodobenzoic acid) was added. The solution was stirred overnight at RT Before the addition of the catalysts, the color of the solution was clear, but it shifted quickly to green when adding the catalysts. After the addition of TMSA the color shifted to black.
Next day a lot of grayish black solid matter had precipitated. Diethyl ether (150 mL) was added and the suspension was filtered through a glass filter-funnel. The filtrate was collected and evaporated to dryness by rotary evaporation. The liquid residue (yellow oil) was dissolved in dichloromethane (100 mL) and tried purified on an aluminum oxide (neutral) column. Unfortunately, the product interacts very strongly with the aluminum oxide, and it was impossible to liberate the product from the column with normal organic solvents. The product was successively removed from the column by glacial acetic acid (500 mL). The acetic acid was removed by rotary evaporation, and the yield was 17.52 g (83%). It was attempted to further purify the product by recrystallization in ethanol, but it failed because the product was too soluble in ethanol. The recrystallization also failed in both heptane and acetyl acetate because the product was to insoluble in these solvents. Another attempt to purify the product was made by dissolving the product in water and THF followed by addition of U eqv. Cs2CO3 (12.44 g) to precipitated the Cs salt. The solution was then filtered. The solvents were then removed by evaporation (they foam very much). NMR shows that the compound was not clean.
The protecting group (TMS) was removed by K2CO3. The product was dissolved in 150 mL methanol, and after flushing with argon for 30 minutes 10 eqv. K2CO3 (14 g) was added, and the solution was stirred for 2 hours under argon atmosphere. After 2 hours NMR showed that the TMS group had been removed. The solvent was removed by evaporation and the product was dissolved in 500 mL 10 % HCl and 500 mL chloroform to form the acid. A lot of copper colored solid matter was precipitated, when the HCl was added. The solid matter was collected and extracted by soxhlet in 2 L chloroform over 1 week to give clean 4- ethynylbenzoic acid.1H NMR (250 MHz, DMSO, 300 K, TMS): 5 = 4.43 (1H, s), 7.61 (2H, dm (aa'bb'para- system), 3J = 8.49 Hz, 4J = 3.49 Hz), 7.96 (2H, dm (aa'bb'para-system), 3J = 8.57 Hz, 4J = 3.55 Hz), 13.15 (1H, s).
115

Appendix A
13C NMR (63 MHz, DMSO, 300 K, TMS): 5 = 82.68, 83.40, 125.96, 129.40, 130.86, 131.82,166.56.
Anal. Calcd. for CnHnBrSi: C: 73.97, H: 4.14, N: 0,00. Found: C: 73.61, H: 3.98, N:0,00.
12.7 The Cs saltThe Cs salt of the 4-ethynylbenzoic acid was produced by dissolving 4-ethynylbenzoic acid (10.2 mmol, 1.487 g) and U eqv. Cs2CO3 (1.660 g) in 200 mL ethanol (96 %) and letting it reflux for 2 hours. The solvent was then removed by evaporation, and the salt was then dried in a vacuum oven at 333 K over night. Yield is 2.824 g (98 %).
12.8 Coupling of the Cs salt to the resinThe coupling is made with 10 mmol Cs salt (2.824 g), 10.012 g resin and 1 mmol CsI (0.263 g). All three compounds were mixed in a special flask made for solid phase synthesis, and about 150 mL dried DMF (freshly distilled) was added. The suspension was flushed with argon for 30 minutes and the flask was closed and shaken for one week.
After a week the suspension was washed with 200 mL DMF, then it was shaken by 150 mL DMF for one hour, and then washed with the following series of liquids: 150 mL water, 150 mL ethanol, 150 mL acetone, 150 mL THF and 150 mL diethyl ether.
The resin was then dried in a vacuum oven and weighed. The yield was 10.437 g, which corresponds to AW = 0.425 g.
All the solvents from the washes were collected and evaporated. The residue was then treated with 65 % nitric acid and then treated with a little excess of silver nitrate. The precipitated silver chloride was collected, dried in the vacuum oven and then weighed. The yield was1.299 g.
12.9 Coupling of the iodomonomer to the anchor unitHere the general coupling of an iodomonomer to an anchor unit or to other monomers is described. The description is made on the basis of the coupling of the iodomonomer to the anchor unit.
The resin (5.034 g) and 9 (5 mmol, 3.173 g) were mixed in the flask and 150 mL NEt3 was added. The suspension was flushed with argon for 30 minutes before CuI (10 mol%, 0.094 g) and Pd(PPh3)4 (2 mol%, 0.116 g) were added and the flask was closed and shaken for one week at room temperature.
After a week the suspension was washed with 200 mL DMF, then it was shaked by 150 mL DMF for one hour, and then washed with the following series of liquids: 150 mL water, 150 mL ethanol, 150 mL acetone, 150 mL THF and 150 mL diethyl ether.
The resin was then dried in a vacuum oven and weighed. The yield was 5.586 g, which corresponds to AW = 0.552 g.
116

Appendix A
12.10 The deprotection of the anchored unitHere the general deprotection of the anchored unit is described. The description is made on the basis of the deprotection of the anchored monomer unit.
The resin (5.661 g) was mixed in the flask with 150 mL THF and flushed with argon for 30 minutes before TBAF (tetrabutylammonium fluoride) (~ 10 eqv. (large excess), ~ 3 g) was added and the flask was closed and shaken for two days at room temperature.
The suspension was washed with 200 mL DMF, and then it was shaken by 150 mL DMF for one hour. After this it was washed with the following series of liquids: 150 mL water, 150 mL ethanol, 150 mL acetone, 150 mL THF and 150 mL diethyl ether.
The resin was dried in a vacuum oven and weighted. The yield was 5.453 g, which corresponds to AW = 0.208 g.
12.11 Cleaving of the anchored unitNaOH (~20 eqv. ~ 1 g) was dissolved in 50 mL methanol before 50 mL THF were added. The mixture was flushed with argon in 30 min. before the resin was added. The suspension was stirred and refluxed under an argon atmosphere over night. Next day the temperature of the solution was lowered to RT and 3M hydrochloric acid was added drop wise to acidy the suspension. The suspension was filtered and the organic phase was separated and washed with water three times (50 mL) and dried with magnesium sulphate. The solution was filtered and tested by SEC. SEC unfortunately showed that the product mainly consisted of polymers. Further workup was therefore abandoned.
References
1 Satek, L. C. in Reagents for transition metal complex and organometallic syntheses. Inorganic syntheses, vol 28, p. 107, 1990, John Wiley & Sons, New York, Editor in chief: Angelici, R. J.
2 Brandsma, L.; Vasilevsky, S. F. and Verkruijsse, H.D. Application of Transition Metal Catalysts in Organic Synthesis, 1998, Springer-Verlag, Berlin Heidelberg.
3 Che, C.-M.; Yu, W.-Y.; Chan, P.-M.; Cheng, W.-C.; Peng, S.-M.; Lau, K.-C. and Li, W.-K. J. Am. Chem. Soc. 2000, 722, 11391.
117

118

Appendix B
A p p e i x B
Appendix B contains copies of all the publications pertaining to this work.
13.1 The list of publicationsPaper one:
Nielsen, K. T.; Spanggaard, H. and Krebs, F. C., "Synthesis, Light Harvesting, and Energy Transfer, Properties of a Zinc Porphyrin Linked Poly(phenyleethynylene)", Macromolecules, 2005, 38, 1180-1189.
Paper two:
Nielsen, K. T.; Spanggaard, H. and Krebs, F. C , "Dye linked conjugated homopolymers: using conjugated polymer electroluminescence to optically pump porphyrin-dye emission", Displays, 2004, 25, 231-235.
Paper three:
Nielsen, K. T.; Bechgaard, K. and Krebs, F. C , "Removal of Palladium Nanoparticles from Polymer Materials", Macromolecules, 2005, 38, 658-659.
Paper four:
Nielsen, K. T.; Bechgaard, K. and Krebs, F. C , "Effective Removal and Quantitative Analysis of Pd, Cu, Ni and Pt Catalysts from Small-Molecule Products", Synthesis, 2006, 10, 1639-1644.
Paper five:
Nielsen, K. T.; Spanggaard, H. and Krebs, F. C, "Design of porphyrin- poly phenyl eneethyny 1 ene light harvesting systems", Organic Photovoltaics 6. SPIE conference on optics and photonics: Conference 5938: Organic photovoltaics 6, San Diego, CA (US), 31 Jul - 4 Aug 2005. Kafafi, Z.H.; Lane, P.A. (eds.), (International Society for Optical Engineering, Bellingham, 2005) (SPIE Proceedings Series, 5938), 2005, 222-233.
119

Appendix B
Paper six:
Nielsen, K. T.; Harris, P.; Bechgaard, K. and Krebs, F. C., "A structural study of four complexes of the M-N2S2 type derived from the ligand A,A-diethylphenylazothioformamide and the metals: Palladium, Platinum, Copper and Nickel", Acta Crys. C, 2006, submitted.
Paper seven:
Pittelkow, M.; Reenberg, T. K.; Nielsen, K. T.; Magnussen, M. J.; Selling, T. I.; Krebs, F. C. and Christensen, J. B., "Synthesis, Structure and Properties of 4,7- Dimethoxybenzo[c]tellurophene, a Molecular Pyroelectric Material", Angew. Chem. Int. Ed., 2006, accepted.
Poster:
Nielsen, K. T.; Spanggaard, H. and Krebs, F. C., "Design of porphyrin-polyphenyleneethynylene light harvesting systems",
Patent:
Nielsen, K. T.; Bechgaard, K. and Krebs, F. C., "Complexation of Palladium", P10083GB,2004.
120

Appendix B
1180 Macromolecules 2005, 38, 1180—1189
Synthesis, Light Harvesting, and Energy Transfer Properties of a Zinc Porphyrin Linked Poly(phenyleneethynylene)
Kim T. Nielsen, Holger Spanggaard, and Frederik C. Krebs*The Danish Polymer Centre, RIS0 National Laboratory, P.O. Box 49, DK-4000 Roskilde, Denmark
Received July 23, 2004; Revised Manuscript Received November 15, 2004
ABSTRACT: The synthesis of a zinc porphyrin linked conjugated homopolymer is presented. The synthetic strategy employed a directional polymerization of l-iodo-2,5-dioctyl-4'-ethynyltolane in the presence of [10,20-bis(3,5-bis-tert-butylphenyl]-5,15-diethynylporphinato]zinc(II) (12) or [10,20-bis(3,5-bis-/er<-bu- tylphenyl]-5,15-dibromoporphinato]zinc(II) (10). In the case of 12 the reaction was found to give a polymer product with a constant ratio of zinc porphyrin to incorporated monomer units regardless of the molecular weight. In the case of 10, however, the ratio of zinc porphyrin to incorporated monomer units decreased with increasing molecular weight of the polymer product. The polymer products were separated into fractions using preparative SEC. Studies of the energy transfer properties from the polymer to the zinc porphyrin revealed that there was little energy transfer in solution but quantitative energy transfer in the solid state. The polymer products proved difficult to handle in terms of device construction where a thin polymer film is sandwiched between two electrodes. We found this to be a consequence of the palladium catalysis employed during the polymerization. We finally discuss the issues concerning the problems with remnants from the Pd catalyst in the polymer samples and their removal.
IntroductionSince the discovery in 1974 of doped polyacetylene
showing electrical conductivity,1 there has been a large interest in conjugated polymers and their application for e.g. light-emitting diodes,2 polymer electronic circuits,3 and polymer solar cells.4
Recently, the synthesis of a three-domain (JPJ) and a five-domain (PF4) structure were reported.5’6 The three-domain structure consisted of two homopolymer blocks (J domains) with a porphyrin dye molecule (P domain) in the middle. In this three-domain structure, the J domains were poly(2',5'-dioctyl-4,4"-terphen- ylenecyanovinylene), and the distribution of the individual incorporated monomer units was a broad distribution. The P domain was a 5,10,15,20-tetraphenylpor- phyrin derivative, and there was only one porphyrin molecule in each JPJ unit. In contrast to JPJ the PF4 consisted of four oligofluorene (F domains) linked to a porphyrin dye molecule (P domain). A very interesting property observed for these three-domain and five- domain structures was that both the J and the F domain served as a light-harvesting antenna for the P domain. We decided to investigate and evaluate the use of poly- (phenyleneethynylene)s as the backbone of the lightharvesting polymer chains for the porphyrin dyes and have two alkyl groups on every second phenyl ring to obtain solubility7 and reduce the distortion of the backbone.8
In this paper we present a synthesis of a conjugated homopolymer of the poly(phenyleneethynylene) type. We discuss two different synthetic strategies toward linking the conjugated homopolymer blocks via a zinc porphyrin to give the three-domain structure NPN, as shown in Figure 1.
We present studies of the optical properties of the compounds with a focus on the band gap, the quantum efficiency of the fluorescence, and the lifetimes. These studies were performed on the homopolymer, poly[(2,5-
* Corresponding author: e-mail [email protected].
dioctyltolanyl)ethylene] (N„), on the NPN structure with a broad distribution and on fractions with a narrow distribution prepared by preparative size exclusion chromatography (SEC). Finally, we discuss the problems concerning the use of Pd as a catalyst for the polymerization due to the catalyst remnants contained in the polymer product and provide a solution to this problem in the context of this work.
Experimental Section*H and 13C NMR spectra were recorded on a 250 MHz
Bruker NMR spectrometer at 300 K unless otherwise stated. All spectra were recorded in CDCI3 with TMS as an internal reference. Compound 59 and 1,4-dioctylbenzene10 were prepared according to the procedures described in the literature. Compounds 9-12 were prepared according to the procedures reported by Plater et al.11 with the exception that compound 11 was purified by preparative SEC before deprotection of the TMS groups. Detailed descriptions of synthetic procedures and analytical data for compounds 1, 2, 3, 4, 6, 7, and 8 can be found in the Supporting Information. Electroactive device preparation is described in detail in the Supporting Information.
Liquid Chromatography Methods. The apparatus for the SEC consists of a preparative system with a 3 mL injection loop. The detector is a UV—vis diode array with a spectral resolution of 1 nm. A 16-port switch valve allows for separation into fractions. Two different column systems were used. They consisted of DVB linked polystyrene gel columns comprising a guard column and two gel columns. One system had a 100 A and a 1000 A column in succession, and the other had a 500 A and a 10000 A column in succession. The eluent was chloroform, and the flow rate was 20 mL/min with a pressure of 75 bar. The molecular weight was calculated on the basis of polystyrene standards having molecular weights of 515 000, 127 000, 68 000, 36 300, 19 000, 10 900, 3250, and 1360. In all cases the polydispersity of the standards was smaller than 1.007.
Photophysical Methods. The UV-vis solution spectra were recorded in dry CHCI3 degassed with argon. Emission spectra and lifetimes were recorded in degassed CHCI3. The absorption maximum was kept below 0.07. All emission spectra are corrected. Quantum yields where measured rela-
10.102l/ma048489u CCC: $30.25 © 2005 American Chemical SocietyPublished on Web 01/25/2005
121

Appendix B
Macromolecules, Vol. 38, No. 4, 2005 Zn Porphyrin Linked Poly(phenyleneethynylene) 1181
Figure 1. Three-domain structure of the NPN dye linked homopolymer.
live to DPA.IS The UV-vis solid-state spectra were recorded on spin-coated films of the polymers.
Poly[(2,5-diocty Itolanyl lethynylene] (N„). A 250 mL round-bottom flask was dried using a heat gun and flushed with argon. Compound 8 (1.36 mmol, 0.750 g) was placed in the flask and dissolved in 40 mL of piperidine. The solution was flushed with argon for 30 min before the catalyst Pd (PPhsh (30 mg, =2 mol %) and the cocatalyst Cul (25 mg, %10 mol %) were added under an argon atmosphere. After the addition of the catalyst the mixture was stirred under an argon atmosphere overnight at room temperature. A yellow precipitate quickly formed. The following day the reaction mixture had solidified. Dry THF (50 mL) was added, and the solution was heated to reflux temperature. The precipitate dissolved, and the solution was stirred for another 5 h at reflux. The solution was then poured into 300 mL of methanol, and a yellow precipitate formed. Filtration on a glass filter gave a yellow solid that was washed with both cold methanol and cold diethyl ether and dried on the filter. The wet product was kept for further use. Attempts to dry the product in a vacuum oven at RT gave a darkened product that was no longer soluble in common solvents. This behavior has been observed earlier.18 The total yield based on a completely dried sample was 0.35 g (95%) (the wet product weighed 0.6 g containing 40% w/w solvent and was conveniently stored in this form).'H NMR 6:0.76-0.95 (m. 6H). 1.13-1.50 (m, 20 H). 1.50-1.83 (m. 4H). 2.70-2.90 (m, 4H). 7.31-7.43 (broad s), 7.43-7.60 (broad s) (7.31-7.60, 6H).
Porphyrin Linked Polymer with a Constant Porphy- rin-to-Monomer Ratio (NPN A). A 100 mL round-bottom flask was dried using a heat gun and flushed with argon. Compound 8 (7.24 x 10 4 mol, 0.400 g) and compound 12 (6.26 x 10 5 mol, 0.050 g) were placed in the flask and dissolved in 50/30 mL dry triethylamine/THF. The solution was flushed with argon for 30 min before the catalyst PdtPPhsh (20 mg, =2 mol %) and the cocatalyst Cul (15 mg, %10 mol %) were added under an argon atmosphere. After the addition of the catalyst the mixture was refluxed overnight and was next day poured into 300 mL of methanol. The following day a green precipitate formed that was filtered on a glass filter-funnel. The filter cake was washed with both cold methanol and cold diethyl ether and was dried in the air to give 0.271 g of polymer. »H NMR 6: 0.76-2.18 (m), 2.20 (m) (0.76-2.20, 490 H), 2.81 (broad s, 53 H), 6.80-8.18 (m, 90 H), 8.71-9.06 (m, 4 H), 9.48-9.94 (m, 4 H).
Porphyrin Linked Polymer with One Porphyrin Moiety in Each Polymer Chain (NPN B). A 100 mL round- bottom flask was dried using a heat gun and flushed with argon. Compound 8 (2.19 x 10 ' mol, 1.212 g) and compound 10 (2.12 x 10 < mol, 0.198 g) were placed in the flask and
dissolved in 50/30 mL dry triethylamine/THF. The solution was flushed with argon for 30 min before the catalyst Pd- (PPhj>4 (50 mg, ~2 mol %) and the cocatalyst Cul (40 mg, =10 mol %) were added under an argon atmosphere. After the addition of the catalyst the mixture was refluxed overnight and was poured into 300 mL of methanol. The following day a green precipitate formed that was filtered on a glass filter- funnel. The filter cake was washed with both cold methanol and cold diethyl ether and was dried in the air to give 1.021 g of polymer. ‘H NMR 6: 0.73-1.03 (m, 190 H), 1.03-1.91 (m, 740 H), 2.15 (m, 8 H), 2.32 (m, 9 H), 2.56 (m, 13 H), 2.82 (broad s, 76 H), 6.31-6.61 (m, 14 H), 6.79-8.16 (m, 286 H), 9.01 (m, 4 H), 9.79 (m, 4 H).
Diethylammonium Diethyldithiocarbamate (DDC). DDC was prepared by the method described in the literature for sodium methyltiocarbamate.16 Carbon disulfide (0.15 mol, 11.42 g) was added dropwise to a solution of diethylamine (0.4 mol, 29.25 g) in diethyl ether (350 mL), and after a while small colorless crystals were formed. The material was collected on a filter and washed with copious amounts of diethyl ether and dried in a vacuum oven. The yield was 19.29 (58%); mp 81- 82 "C. ‘H NMR 6: 1.24 (t, 6H. V = 7.3 Hz), 1.37 (t. 6H. V = 7 Hz), 3.15 (q, 4H, V = 7.3 Hz), 4.10 (q, 4H, V = 7 Hz), 8.27 (broad s, 2H). 1SC NMR 6: 12.09, 13.05, 41.70, 48.54. Anal. Calcd for C9H22S2: C, 48.60; H. 9.97; N, 12.60; S, 28.83. Found: C. 48.73; H. 10.17; N, 12.54; S, 28.37.
General Procedure for the Removal of Pd from Polymer Samples Using DDC. The polymer was dissolved in the minimum amount of chloroform. DDC (5 equiv relative to the Pd employed in the catalyst) was added, and the solution was stirred for 5 min. The solution was poured into methanol (10 time the volume of chloroform) and the polymer precipitated. The precipitate was filtered and washed with methanol and diethyl ether.Results and Discussion
Monomer Synthesis. The synthesis of the monomer unit is shown in Scheme 1. The synthesis involves the readily available compounds 1,4-dibromo-2,5-dioctyl- benzene (1) and l-(4-iodophenyl)-2-trimethylsilylacety- lene (TMSA). The first step (Scheme 1A) is a bromine- iodine exchange of compound 1 using zt-BuLi in THF at —78 °C. The bromoiodo compound (2) was cross- coupled with TMSA by Pd/Cu catalysis in the following step to form the l-(4-bromo-2,5-dioctylphenyl)-2-tri- methylsilylacetylene (3). In this step it was found important that the coupling reaction took place at low temperature to increase the selectivity between iodo vs bromo substitution. Even at 273 K we obtained ~2% of
122

Appendix B
1182 Nielsen et al. Macromolecules, Vol. 38, No. 4, 2005
Scheme 1. Synthetic Procedure Leading to the Monomer Unit
1 -Iodo-2,5-dioctyl-4'-trimethylsilylethynyltolane (7)“
C)
Protected monomer» (a) (1) ra-BuLi, THF, (2) I2; (b) TMSA, Pd(PPh3)2Cl2, Cul,
Et3N; (c) K2C03, MeOH, CH2C12. Compounds B1-B4 were side products isolated from the reaction mixtures in step b.
1.4- di(trimethylsilylethynyl)-2,5-dioctylbenzene (Bl) and 2-4% of 1,4-ditrimethylsilylbutadiyne (B2) as byproducts which were detected by 'H and 13C NMR, GC-MS, and MALDI TOP. The TMS group was removed by K2- CO3, and the 4-bromo-2,5-dioctylphenylethynylene (4) was obtained.17 The monomer unit 1-iodo-2,5-dioctyl- 4'-trimethylsilylethynyltolane (7) was then obtained by an additional two-step reaction. The first step being a Sonogashira cross-coupling reaction between compound 4 and l-(4-iodophenyl)-2-trimethylsilylacetylene (5) (Scheme IB) to obtain l-bromo-2,5-dioctyl-4'-trimeth- ylsilylethynyltolane (6). The final step was a standard bromine—iodine exchange.
The Sonogashira reaction for this type of molecules has been described by others13 and generally works quite well. Most authors, however, never comment on the fact that the Sonogashira alkynyl—aryl crosscoupling cannot be performed without significant side reactions. Known byproducts are 1,4-diarylbutadiynes,1.4- diarylbuta-2-en-l-ynes, and the trimerization product 1,3,5-triarylbenzene.18 ~20 Of those byproducts we have only detected butadiynes, and this was in connection with the synthesis of compound 3. With XH and 13C NMR and MALDI TOF we instead detected ~3% l-bromo-2,5-dioctyl-4'-(4"-trimethylsilylethynylphenyl)-
--------Crude product
Time (min)
Figure 2. SEC traces of the crude product when synthesizing 11 using the Sonogashira reaction. The crude product was separated into fractions using preparative SEC, which gave a reasonably pure fraction of the desired product (fraction 2).
ethynyltolane (B3) as a byproduct during the synthesis of compound 6. Furthermore, we found ~1% of compound 4. We believe this to be a result of incomplete reaction. We also detected ~1% of l,4-dioctyl-2,5-bis- ((4'-trimethylsilylethynylphenyl)ethynyl)benzene (B4). The presence of B4 is a result of the difficulty in separating Bl from compound 3. The Rf values in n-heptane of compounds 4, 6, B3, and B4 are 0.58, 0.38, 0.25, and 0.08, so it was possible by flash chromatography to separate 6 from the byproducts. The removal of byproducts in this step was found to be essential in order to control the later polymerization process. As a consequence, compound 6 was obtained in low yield. It should be noted that, besides the above-mentioned byproducts, we have detected some minor byproducts, but the amount of these was so small that we could not determine the structures.
Porphyrin Synthesis. The porphyrin subunit should have a structure that allowed for attachment of the polymer blocks in the 5,15-positions. We chose the synthetic scheme presented by Plater et al.11 due to the possibility of large scale synthesis. The reported procedure allowed for the synthesis of the porphyrin (9) (see Scheme 4) on a 100 g scale of sufficient purity for the synthesis of the zinc dibromoporphyrin (10).
It was possible to obtain 10 in high purity, which we ascribe to the fortuitous low solubility of 10 making the alleviation of byproducts relatively easy. Plater et al. also reported the synthesis of bisethynylporphyrin (12) through Sonogashira coupling of TMSA onto 10 followed by removal of the TMS groups. The synthesis of 12, however, proved very difficult in our hands, and while a product was obtained the analytical data showed that it consisted of oligomers and other impurities. SEC revealed many different components as shown in Figure 2. We decided to purify the crude product by preparative SEC and isolated the purified fraction of 11. The similarity between the XH NMR spectra for the crude fraction and the purified product was striking, and it was virtually impossible to establish the extent of impurities from the XH NMR spectra alone, so a technique like SEC is absolutely needed.
We propose that the large molecular weight impurities are oligomers of 12 to account for the similarities in the 1H NMR spectra and for the fact that the UV spectra of the fractions were very similar and contained the signatures of a zinc porphyrin. The purified fraction containing mainly 11 could be deprotected followed by recrystallization from chloroform, and the product was filtered using a 0.45 /im filter to give pure 12. Similar
123
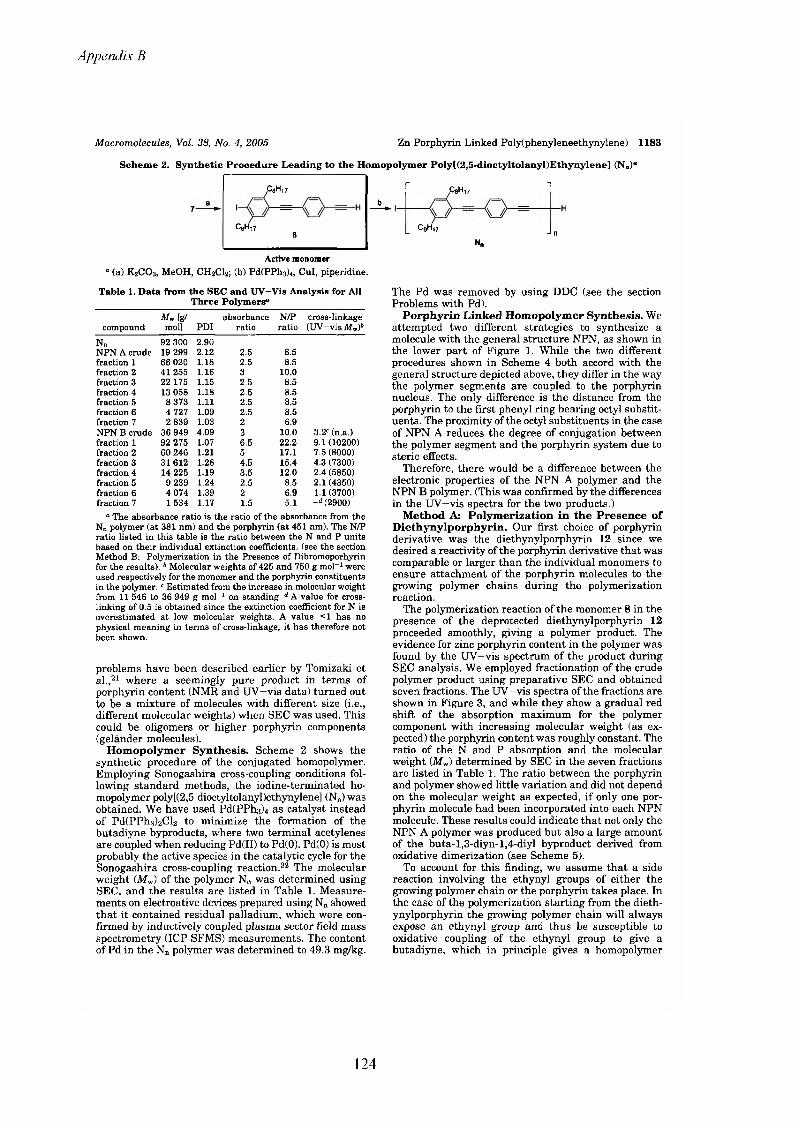
Appendix B
Scheme 2. Synthetic Procedure Leading to the Homopolymer Poly[(2,5-dioctyltolanyl)Ethynylene] (N„)“
Macromolecules, Vol. 38, No. 4, 2005 Zn Porphyrin Linked Poly(phenyleneethynylene) 1183
C8Hi78
Active monomer° (a) K2CO3, MeOH, CH2CI2; (b) Pd(PPh3)4, Cul, piperidine.
Table 1. Data from the SEC and UV-Vis Analysis for All Three Polymers"
compoundAfw [g/
mol] PDIabsorbance
ratioN/Pratio
cross-linkage (UV-vis Afw)4
Nn 92 300 2.90NPN A crude 19 299 2.12 2.5 8.5fraction 1 66 020 1.18 2.5 8.5fraction 2 41 255 1.16 3 10.0fraction 3 22 175 1.15 2.5 8.5fraction 4 13 058 1.18 2.5 8.5fraction 5 8 373 1.11 2.5 8.5fraction 6 4 727 1.09 2.5 8.5fraction 7 2 839 1.03 2 6.9NPN B crude 36 949 4.09 3 10.0 3.2= (n.a.)fraction 1 92 275 1.07 6.5 22.2 9.1(10200)fraction 2 60 246 1.21 5 17.1 7.5 (8000)fraction 3 31 612 1.28 4.5 15.4 4.3 (7300)fraction 4 14 225 1.19 3.5 12.0 2.4 (5850)fraction 5 9 239 1.24 2.5 8.5 2.1 (4350)fraction 6 4 074 1.39 2 6.9 1.1(3700)fraction 7 1 534 1.17 1.5 5.1 -d (2900)
0 The absorbance ratio is the ratio of the absorbance from the Nn polymer (at 381 nm) and the porphyrin (at 451 nm). The N/P ratio listed in this table is the ratio between the N and P units based on their individual extinction coefficients, (see the section Method B: Polymerization in the Presence of Dibromoporhyrin for the results). 4 Molecular weights of 425 and 750 g mol-1 were used respectively for the monomer and the porphyrin constituents in the polymer.* Estimated from the increase in molecular weight from 11 546 to 36 949 g mol-1 on standing. d A value for cross- linking of 0.5 is obtained since the extinction coefficient for N is overestimated at low molecular weights. A value <1 has no physical meaning in terms of cross-linkage; it has therefore not been shown.
problems have been described earlier by Tomizaki et al.,21 where a seemingly pure product in terms of porphyrin content (NMR and UV—vis data) turned out to be a mixture of molecules with different size (i.e., different molecular weights) when SEC was used. This could be oligomers or higher porphyrin components (gelander molecules).
Homopolymer Synthesis. Scheme 2 shows the synthetic procedure of the conjugated homopolymer. Employing Sonogashira cross-coupling conditions following standard methods, the iodine-terminated homopolymer poly[(2,5-dioctyltolanyl)ethynylene] (Nn) was obtained. We have used PdCPPha)* as catalyst instead of PdlPPhalgClg to minimize the formation of the butadiyne byproducts, where two terminal acetylenes are coupled when reducing Pd(II) to Pd(0). Pd(0) is most probably the active species in the catalytic cycle for the Sonogashira cross-coupling reaction.22 The molecular weight (Mw) of the polymer Nn was determined using SEC, and the results are listed in Table 1. Measurements on electroative devices prepared using N„ showed that it contained residual palladium, which were confirmed by inductively coupled plasma sector field mass spectrometry (ICP-SFMS) measurements. The content of Pd in the Nn polymer was determined to 49.3 mg/kg.
CpH.7
C8H)7
N„
The Pd was removed by using DDC (see the section Problems with Pd).
Porphyrin Linked Homopolymer Synthesis. Weattempted two different strategies to synthesize a molecule with the general structure NPN, as shown in the lower part of Figure 1. While the two different procedures shown in Scheme 4 both accord with the general structure depicted above, they differ in the way the polymer segments are coupled to the porphyrin nucleus. The only difference is the distance from the porphyrin to the first phenyl ring bearing octyl substituents. The proximity of the octyl substituents in the case of NPN A reduces the degree of conjugation between the polymer segment and the porphyrin system due to steric effects.
Therefore, there would be a difference between the electronic properties of the NPN A polymer and the NPN B polymer. (This was confirmed by the differences in the UV—vis spectra for the two products.)
Method A: Polymerization in the Presence of Diethynylporphyrin. Our first choice of porphyrin derivative was the diethynylporphyrin 12 since we desired a reactivity of the porphyrin derivative that was comparable or larger than the individual monomers to ensure attachment of the porphyrin molecules to the growing polymer chains during the polymerization reaction.
The polymerization reaction of the monomer 8 in the presence of the deprotected diethynylporphyrin 12
proceeded smoothly, giving a polymer product. The evidence for zinc porphyrin content in the polymer was found by the UV-vis spectrum of the product during SEC analysis. We employed fractionation of the crude polymer product using preparative SEC and obtained seven fractions. The UV-vis spectra of the fractions are shown in Figure 3, and while they show a gradual red shift of the absorption maximum for the polymer component with increasing molecular weight (as expected) the porphyrin content was roughly constant. The ratio of the N and P absorption and the molecular weight (Afw) determined by SEC in the seven fractions are listed in Table 1. The ratio between the porphyrin and polymer showed little variation and did not depend on the molecular weight as expected, if only one porphyrin molecule had been incorporated into each NPN molecule. These results could indicate that not only the NPN A polymer was produced but also a large amount of the buta-l,3-diyn-l,4-diyl byproduct derived from oxidative dimerization (see Scheme 5).
To account for this finding, we assume that a side reaction involving the ethynyl groups of either the growing polymer chain or the porphyrin takes place. In the case of the polymerization starting from the diethynylporphyrin the growing polymer chain will always expose an ethynyl group and thus be susceptible to oxidative coupling of the ethynyl group to give a butadiyne, which in principle gives a homopolymer
124

Appendix B
1184 Nielsen et al. Macromolecules, Vol. 38, No. 4, 2005
Scheme 3. Two Different Synthetic Producers Leading to the Three-Domain Structure NPN"
(N„-P(Zn)-Nm) NPN A
(N„-P(Zn)-NJ NPN B
- (a) Pd(PPh3)4, Cul, EtgN, THF.
segment with a defect in the growth direction such that both polymer termini present iodine atoms. Such an event, however, does not represent a termination of chain elongation as a monomer or another dieth- ynylporphyrin can react at the iodinated chain end
hence continue chain growth. The result is a polymer product with an even distribution of porphyrin molecules with the amount of porphyrin determined largely by the ratio of polymer to monomer in the initial reaction mixture. In conclusion, the synthetic scheme
125

Appendix B
Macromolecules, Vol. 38, No. 4, 2005 Zn Porphyrin Linked Poly( phenyleneethynylene) 1185
Scheme 4. Synthetic Procedure of Compounds 9-12
10
TMSA
Pd(0)
for the incorporation of a single porphyrin molecule between two polymer blocks based on a diethynylpor- phyrin does not work because of the dimerization side reaction that always takes place during the Sonogashira reaction.
From a synthetic point of view, a small molecule product is generally not affected by a small amount of dimerization (of the order of 1—10%) as means of purification are available (i.e., distillation, crystallization). When employing the Sonogashira reaction for polymerization, however, the defects introduced by the side reaction are accumulated in the polymer product and make the applicability of the Sonogashira reaction for polymerization questionable, if a product with a high degree of regioregularity or directionality is required.
Fraction 1 Fraction 2 Fraction 3 Fraction 4 Fraction 5 Fraction 6 Fraction 7
300 400 500 600 700 800
Wavelength [nm]
Figure 3. UV—vis spectra of the seven fractions of the NPN A polymer formed during the polymerization of the monomer 8 in the presence of the diethynyl porphyrin 12. The spectra are normalized according to of the polymer. It can be seen how the absorption of the porphyrin U = 451 nm) does not vary significantly in intensity as a function of the length of the Nn polymers.
Scheme 5. Illustration of Some of the Possible Byproducts from Cross-Coupling of the Monomer
Unit 8 with the Diethynylporphyrin 12
Method B: Polymerization in the Presence of Dibromoporphyrin. In this method we used dibro- moporphyrin, 10, as the source of porphyrin during the polymerization reaction. Seen in light of the finding above, we would expect only one porphyrin molecule to be incorporated in each polymer chain assuming that 10 does not lead to homocoupled byproducts. We would also expect a considerable amount of homopolymer since any dimerization of a pair of ethynyl groups will lead to homopolymers with halogen termini in both ends of the molecule that does not allow for the incorporation of the dibromoporphyrin. From the SEC trace of the crude product it was clear that the synthetic scheme worked in terms of a decreasing porphyrin content with increasing molecular weight. The SEC trace also confirmed the presence of porphyrin in molecules of high molecular weight but revealed nothing about the homopolymer content.
The crude polymer product had a molecular weight (Afw) of 11 546 g/mol and a polydispersity of 3.456. Fractionation of the crude product into seven fractions
126
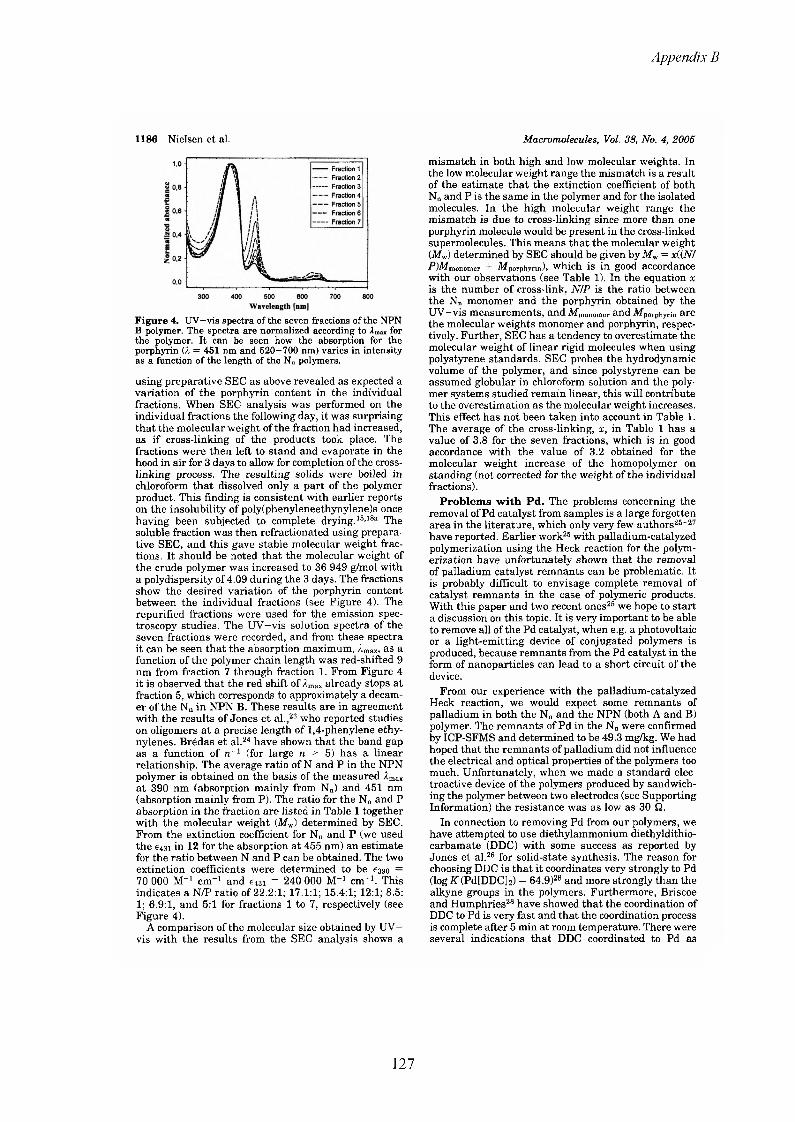
Appendix B
1186 Nielsen et al.
Fraction 1 Fraction 2 Fraction 3 Fraction 4
—— Fraction 6 ------Fraction 7
500 600Wavelength [nm]
Figure 4. UV—vis spectra of the seven fractions of the NPN B polymer. The spectra are normalized according to AmM for the polymer. It can be seen how the absorption for the porphyrin (X = 451 nm and 520—700 nm) varies in intensity as a function of the length of the N„ polymers.
using preparative SEC as above revealed as expected a variation of the porphyrin content in the individual fractions. When SEC analysis was performed on the individual fractions the following day, it was surprising that the molecular weight of the fraction had increased, as if cross-linking of the products took place. The fractions were then left to stand and evaporate in the hood in air for 3 days to allow for completion of the cross- linking process. The resulting solids were boiled in chloroform that dissolved only a part of the polymer product. This finding is consistent with earlier reports on the insolubility of poly(phenyleneethynylene)s once having been subjected to complete drying.15-188 The soluble fraction was then refractionated using preparative SEC, and this gave stable molecular weight fractions. It should be noted that the molecular weight of the crude polymer was increased to 36 949 g/mol with a polydispersity of 4.09 during the 3 days. The fractions show the desired variation of the porphyrin content between the individual fractions (see Figure 4). The repurified fractions were used for the emission spectroscopy studies. The UV—vis solution spectra of the seven fractions were recorded, and from these spectra it can be seen that the absorption maximum, lmax, as a function of the polymer chain length was red-shifted 9 nm from fraction 7 through fraction 1. From Figure 4 it is observed that the red shift of Amax already stops at fraction 5, which corresponds to approximately a decam- er of the Nn in NPN B. These results are in agreement with the results of Jones et al.,23 who reported studies on oligomers at a precise length of 1,4-phenylene ethy- nylenes. Bridas et al.24 have shown that the band gap as a function of n-1 (for large n > 5) has a linear relationship. The average ratio of N and P in the NPN polymer is obtained on the basis of the measured Amax at 390 nm (absorption mainly from N„) and 451 nm (absorption mainly from P). The ratio for the N„ and P absorption in the fraction are listed in Table 1 together with the molecular weight (Mw) determined by SEC. From the extinction coefficient for Nn and P (we used the 6431 in 12 for the absorption at 455 nm) an estimate for the ratio between N and P can be obtained. The two extinction coefficients were determined to be €390 = 70 000 M-' cm"1 and 6431 = 240 000 M-1 cm'1. This indicates a N/P ratio of 22.2:1; 17.1:1; 15.4:1; 12:1; 8.5: 1; 6.9:1, and 5:1 for fractions 1 to 7, respectively (see Figure 4).
A comparison of the molecular size obtained by UV- vis with the results from the SEC analysis shows a
mismatch in both high and low molecular weights. In the low molecular weight range the mismatch is a result of the estimate that the extinction coefficient of both Nn and P is the same in the polymer and for the isolated molecules. In the high molecular weight range the mismatch is due to cross-linking since more than one porphyrin molecule would be present in the cross-linked supermolecules. This means that the molecular weight (Mw) determined by SEC should be given by Mw = x((NI PWmonomer + Afp0rph.vrin), which is in good accordance with our observations (see Table 1). In the equation x is the number of cross-link, N/P is the ratio between the Nn monomer and the porphyrin obtained by the UV-vis measurements, and Mm0nomer and Afporphyrin are the molecular weights monomer and porphyrin, respectively. Further, SEC has a tendency to overestimate the molecular weight of linear rigid molecules when using polystyrene standards. SEC probes the hydrodynamic volume of the polymer, and since polystyrene can be assumed globular in chloroform solution and the polymer systems studied remain linear, this will contribute to the overestimation as the molecular weight increases. This effect has not been taken into account in Table 1. The average of the cross-linking, x, in Table 1 has a value of 3.8 for the seven fractions, which is in good accordance with the value of 3.2 obtained for the molecular weight increase of the homopolymer on standing (not corrected for the weight of the individual fractions).
Problems with Pd. The problems concerning the removal of Pd catalyst from samples is a large forgotten area in the literature, which only very few authors25-27
have reported. Earlier work25 with palladium-catalyzed polymerization using the Heck reaction for the polymerization have unfortunately shown that the removal of palladium catalyst remnants can be problematic. It is probably difficult to envisage complete removal of catalyst remnants in the case of polymeric products. With this paper and two recent ones25 we hope to start a discussion on this topic. It is very important to be able to remove all of the Pd catalyst, when e g. a photovoltaic or a light-emitting device of conjugated polymers is produced, because remnants from the Pd catalyst in the form of nanoparticles can lead to a short circuit of the device.
From our experience with the palladium-catalyzed Heck reaction, we would expect some remnants of palladium in both the Nn and the NPN (both A and B) polymer. The remnants of Pd in the Nn were confirmed by ICP-SFMS and determined to be 49.3 mg/kg. We had hoped that the remnants of palladium did not influence the electrical and optical properties of the polymers too much. Unfortunately, when we made a standard electroactive device of the polymers produced by sandwiching the polymer between two electrodes (see Supporting Information) the resistance was as low as 30 Q.
In connection to removing Pd from our polymers, we have attempted to use diethylammonium diethyldithio- carbamate (DDC) with some success as reported by Jones et al.26 for solid-state synthesis. The reason for choosing DDC is that it coordinates very strongly to Pd (log FT (Pd[DDC]2) = 64.9)28 and more strongly than the alkyne groups in the polymers. Furthermore, Briscoe and Humphries28 have showed that the coordination of DDC to Pd is very fast and that the coordination process is complete after 5 min at room temperature. There were several indications that DDC coordinated to Pd as
Macromolecules, Vol. 38, No. 4, 2005
127

Appendix B
Macromolecules, Vol. 38, No. 4, 2005
Scheme 6. Illustration of a Probable Trimerization Cross-Linkage Process between Two Nn Polymers and
a NPN B Polymer"
PN = porphyrin-N polymer
° The trimerization process is observed under normal So- nogashira cross-coupling conditions.
expected and thereby removed Pd from the polymers. The indications were that the solution shifted color from yellow to dark brown very quickly (in a few seconds) upon addition of DDC. Furthermore, the precipitated polymer product after the treatment with DDC had a lighter yellow color than the crude polymer product; the resistance through a standard electroactive device geometry (produced by sandwiching the polymer between two electrodes) increased from 30—50 Q to 0.3—2 MQ after the treatment with DDC. Our results indicate that DDC very effectively removed or passivated Pd from polymer samples. Unfortunately, there were also some indications that DDC reacted with the polymers. We observed that treatment with DDC, for periods of time longer than 5 min (we attempted 2 and 24 h), led to a dramatic change in some of the properties of the polymers. The polymer became difficult to precipitate from in methanol, and no electroluminescence could be observed when a potential was applied. On the other hand, we had success in removing Pd from the polymer samples without the above-mentioned changes in properties for the polymers, when we used approximately 5 times excess of DDC, compared to the amount of Pd used in the catalyst, and a reaction time between 3 and 5 min. From the UV-vis spectra of the Nn in the solid state (see Supporting Information) it can be seen that
Zn Porphyrin Linked Poly(phenyleneethynylene) 1187
Fraction 1 Fraction 2 Fraction 3 Fraction 4 Fraction 5 Fraction 6 Fraction 7\ 600 650 700
500 600
Wavelength (nm)
Figure 5. Emission spectra of fractions 1-7 of NPN B in degassed chloroform. The excitation wavelength was set to the maximum absorption of the polymer (around 388 nm). Peak absorption was below 0.07 (concentrations below 10~6 M). The inset shows the porphyrin emission of fractions 2, 4, and 6 for comparison.
the optical properties have changed dramatically, when the polymer was treated with DDC for more than 5 min. It should be emphasized that there is little change in the UV—vis spectrum of the polymer, which have been treated with DDC for 5 min compared with the crude polymer. It was not possible to observe the dithiocar- bamoyl groups in the 1H NMR spectra recorded on the DDC treated Nn polymer product. By comparing the fluorescence spectra of the Nn polymer in solid state before and after a long DDC treatment time, it can be seen that there were significant changes (see Supporting Information). The changes cannot however explain why the electroactive devices after long DDC treatment time did not show electroluminescence. The quantum yield of fluorescence is approximately constant; there is however a small blue shift of the emission maximum upon DDC treatment and a shoulder at 415 nm that becomes suppressed.
An elementary analysis of the N„ polymer after a 2 h DDC treatment time shows that the polymer contains C, 84.8%; H, 9.1%; N, 0.5%; and S, <0.1% compared with C, 88.4%; H, 9.5%; N, <0.3%; and S, <0.1% for the untreated Nn polymer. The elementary analysis indicates that it is not the DDC group itself that is added to the polymer, since no S could be detected in the polymer. However, we detected a little increase in the contents of N corresponding to one N atom for every six incorporated monomer units. From the elementary analysis we got an indication that it is an N-containing compound that is attached to the polymer by treatment with DDC. While we cannot provide a solid explanation for the reaction between DDC and the polymer, our photophysical and electroactive device measurements show that DDC treatment changes the properties of the polymer. The NPN B polymer has also been treated with DDC with success; electroluminescent devices of the N„ itself and of NPN B polymer were prepared, and the nature of the electroluminescence has been characterized.29 To decide whether the apparent cross-linkage of the NPN B polymer products could be a result of the content of Pd in the polymers, we performed a search in the literature for a useful model study and found that it has been known for more that 50 years that transition metals catalyze the trimerization of alkynes.30 In 1997 and 2001, it was further shown by Gevorgyan et al.31-32
that substituted benzenes can be constructed from enynes and activated alkynes in a [4 + 2] and from
128

Appendix B
1188 Nielsen et al. Macromolecules, Vol. 38, No. 4, 2005
absorption
1000
O-270 non radiative
processes
Fraction 7: -40
Fraction 1: -8
fluorescence fluorescence
Figure 6. Typical photon balance of the NPN B assembly in dilute degassed chloroform solution. The absorption is arbitrarily set to 1000 photons, and the fluorescence emission was measured. Energy transfer as well as nonradiative decay is calculated from the fluorescence quantum yields of the pure N and P domains. The relative porphyrin emission increases as the N chain length decreases.
terminal alkynes in a [2 + 2 + 2] fashion in the presence of a Pd(0) catalyst. Both reactions proceed under normal Sonogashira conditions without an inert atmosphere. By comparing these model studies of the trimerization of alkynes with the known byproducts18-20 from a Sonogashira cross-coupling reaction, it is most likely that the apparent cross-linkage of our polymer products are formed by a trimerization process. A probable trimerization process could be that two homopolymers N„ with terminal alkynes (that are not coupled to the porphyrins) are forming an enyne in the presence of the Pd(0) catalysts. This enyne can then react with one of the triple bonds in both Nn and NPN B molecules to form the trimerization cross-linkage (see Scheme 6). This can be used to explain how the molecular weight of a polymer fraction can increase when standing and ultimately form an insoluble product with a high degree of cross-linking. To avoid this trimerization cross-linkage of the polymer, it is very important to remove all the catalyst during precipitation of the polymers.
Fluorescence Measurements. We have performed fluorescence measurements on the Nn and the NPN B polymers. In Figure 5 normalized fluorescence spectra of the seven fractions of NPN B are shown. In all cases the excitation wavelength was set to the maximum absorption of the polymer (around 388 nm). The emission below 600 nm is from the N domain, whereas the porphyrin unit emits around 660 nm. The polymer emission from the seven fractions shows little variation. However, fractions 6 and 7, with the shortest N domains, differ somewhat from the remaining fractions: both spectra are more intense at 440 nm. In addition, the spectrum of fraction 7 is blue-shifted 8 nm compared to the remaining spectra, probably due to the relatively short chain segments (oligomers). Another notable feature is that the polymer emission extends more toward long wavelengths as the N domains gets larger as expected. The most interesting difference is that the porphyrin emission seems to gradually increase as the N domain gets shorter (see inset in Figure 5). We interpret this as a consequence of the fact that the whole polymer chain is probably not perfectly conjugated. Hence, the chain will consist of a number of segments. Thus, with increasing polymer length the more likely it becomes that an exciton gets trapped on a segment that is not in the porphyrin vicinity, and the energy transfer efficiency decreases. Since the N domain fluoresces in the spectral area where the P domain absorbs, a Forster type of energy transfer may be involved. Using the same methodology as described earlier, photon balances could be derived for the individual fractions.6'33
Wavelength [nm]
Figure 7. Normalized fluorescence emission from spin-coated films of the N„ polymer (Afw = 92.300 g mol-1) and the NPN B assembly. The polymer emission is almost completely quenched by the porphyrin.
The fluorescence quantum yields for the pure N domain and pure P domain were determined to be 87% and 10.5%, respectively, using DPA as reference.
Assuming that the ratio between the fluorescence rate and the nonradiative decay rates are similar in the NPN B assembly as in the model compounds, a photon balance can be calculated from the measured fluorescence emission. This is shown in Figure 6. The overall quantum yield for the NPN B assembly was in general around 60%, which mainly was caused by the N domain emission. The fluorescence from the P domain was limited compared with the N domain. The relative emission of the P domain was found to increase 5-fold going from fraction 1 to 7. This means that in solution (or in a diluted matrix) the polymer length may be crucial in multidomain light-harvesting systems.
Solid-state studies of NPN B shows that whereas energy transfer is limited in solution, it becomes the main deactivation route of the N domain in the solid phase (see Figure 7); thus, N emission is nearly completely quenched by the porphyrin that emit strongly. Thus, in the solid state the chain length is much less important than in solution with regards to efficient energy transfer. The more efficient energy transfer in the solid state seems to be a general rule for this kind of polymer—dye systems.5,33 The N and P emission are red-shifted by approximately 65 nm compared to the solution spectra. Also, the relative intensity of the N domain and P domain peaks are changed.
The lifetime decay of the pure P domain could be fitted with a single-exponential function, with a decay of 2.4 ns in degassed chloroform. The lifetime decay of the N domain needed a linear combination of two
non radiative processes polymer -300
-600
129

Appendix B
exponential functions to obtain a reasonable fit in degassed chloroform: 259 ps (86%) and 1.6 ps (14%). In the spin-coated film the measured lifetime of the N domain is significantly larger: 1.4 ns (53%) and 2.7 ns (47%). This could be caused by the hampering of some of the deactivation routes that are effective in solution. A side effect is that the exciton has more time to be transferred to a porphyrin unit, and this could be one of the reasons why more efficient energy transfer is observed. Interestingly, the fluorescence lifetime of the porphyrin unit was significantly shorter in the solid state than in solution. The lifetime decay was complex, and a good fit could not be obtained. This is not unexpected since a number of interactions and different local environments are present in the solid NPN B matrix. The average lifetime was approximately 300 ps.
ConclusionsWe have presented the synthesis of a new zinc
porphyrin linked conjugated polymer. We experienced problems in controlling the nature of polymer product and found that it was a result of many factors: oxidative dimerization and cross-linking of the ethynylene groups and palladium remnants from the catalyst. We thoroughly studied products and the reaction by two different synthetic approaches and demonstrated that a polymer product with one porphyrin molecule inserted in each polymer chain could be obtained by choosing the right synthetic approach. We separated the polymer material into fractions using preparative SEC and studied both the cross-linking of the individual fractions and purified them further to finally perform thorough photophysical studies. We showed the light-harvesting properties of the three-domain structure as a function of the chain length of the Nn polymer. This new zinc porphyrin linked homopolymer shows a very effective energy transfer from the polymer to the porphyrin in solid state. Finally, we have identified some problems concerning remnants of Pd from the catalyst in the polymer product, and devise a procedure for the removal of the Pd remnants such that standard electroactive devices could be constructed.
Acknowledgment. The Danish Technical Research Council (STVF) supported this work. We express sincere gratitude to Mette P. Jeppsen, Ole Hagemann, and Jan Alstrup for technical assistance.
Supporting Information Available: General analytical techniques, synthetic procedures, characterization, UV-vis, and fluorescence spectra of the polymer and the DDC-treated polymer, and electroactive device preparation. This material is available free of charge via the Internet at http:// pubs.acs.org.
References and Notes(1) Chiang, C. K.; Fincher, C. R.; Park, Y. W.; Heeger, A. J.;
Shirakawa, H.; Louis, E. J.; Gau, S. C.; Macdiarmid, A. G. Phys. Rev. Lett. 1977, 39, 1098-1101.
(2) Burroughes, J. H.; Bradley, D. D. C.; Brown, A. R.; Marks, R. N.; Mackay, K.; Friend, R. H.; Burn, P. L.; Holmes, A. B. Nature (London) 1990, 347, 539—541.
Macromolecules, Vol. 38, No. 4, 2005
(3) Katz, H. E.; Lovinger, A. J.; Johnson, J.; Kloc, C.; Siegrist, T.; Li, W.; Lin, Y.-Y.; Dodabalapur, A Nature (London) 2000, 404, 478-481.
(4) Granstrom, M.; Petritsch, K.; Arias, A. C.; Lux, A.; Andersson, M. R.; Fiend, R. H. Nature (London) 1998, 395, 257-260.
(5) Krebs, F. C.; Hagemann, O., Spanggaard, H. J. Org. Chem.2003, 68, 2463-2466.
(6) Li, B.; Li, J.; Fu, Y.; Bo, Z. J. Am. Chem. Soc.. 2004, 126, 3430-3431.
(7) Wong, M. S.; Zhong, H. L.; Shek, M. F.; Chow, K. H.; Tao, Y.; D’lorio, M. J. Mater. Chem. 2000, 10, 1805-1810.
(8) Gill, R. E.; van Hutten, P. F.; Meetsma, A.; Hadziioannou, G. Chem. Mater. 1996, 8, 1341-1346.
(9) Yao, Y.; Tour, J. M. J. Org. Chem. 1999, 64, 1968-1971.(10) Pelter, A.; Jenkins, I.; Jones, D. E. Tetrahedron 1997, 53,
10357-10400.(11) Plater, M. J.; Aiken, S.; Bourhill, G. Tetrahedron 2002, 58,
2405-2413.(12) Ware, R. W.; Rothman, W. Chem. Phys. Lett. 1976,39, 449-
453.(13) Ziener, U.; Godt, A J. Org. Chem. 1997, 62, 6137-6142. (b)
Hortholary, C.; Coudret, C. J. Org. Chem. 2003, 68, 2167- 2174. (c) Sabourin, E. T.; Onopchenko, A J. Org. Chem. 1983, 48, 5135-5137. (d) Kukula, H.; Veit, S.; Godt, A. Eur. J. Org. Chem. 1999, 277-286. (e) Li, J.; Pang, Y. Synth. Met. 2003, 10383-10389. (f) Jones, L.; Schumm, J. S.; Tour, J. M. J. Org. Chem. 1997, 62, 1388-1410. (g) Che, C.-M.; Yu, W. Y.; Chan, P.-M.; Cheng, W.-C.; Peng, S.-M.; Lau, K.-C.; Li, W.- K J. Am. Chem. Soc. 2000, 122, 11380-11392.
(14) Brandsma, L.; Vasilevsky, S. F.; Verkruijsse, H. D. Application of Transition Metal Catalysts in Organic Synthesis; Springer-Verlag: Berlin, 1998.
(15) Solomin, V. A.; Heitz, W. Macromol. Chem. Phys. 1994, 195, 303-314.
(16) Klopping, H. L.; van Der Kerk, G. J. M. Recueil 1951, 70, 917-939.
(17) Eabom, C.; Thompson, A. R.; Walton, D. R. M. J. Chem. Soc. 1967, 1364-1366.
(18) (a) Heitz, W. Pure Appl. Chem. 1995, 67, 1951-1964. (b) Kukula, H.; Veit, S.; Godt, A Eur. J. Org. Chem. 1999, 277- 286. (c) Li.; Y.; Pang, Y. Synth. Met. 2003, 10383-10389. (d) Gevorgyan, V.; Radhakrishnan, U.; Takeda, A.; Rubina, M.; Rubin, M.; Yamamoto, Y. J. Org. Chem. 2001,66,2835-2841.
(19) Heitz, W. Polym. Prepr. 1991, 32, 327—328.(20) Trumbo, D. L.; Marvel, C. S. J. Polym. Sci., Part A: Polym.
Chem. 1987, 25, 1027-1034.(21) Tomizaki, K. Y.; Yu, L. H.; Wei, L. Y.; Bocian, D. F.; Lindsey,
J. S. J. Org. Chem. 2003, 68, 8199-8207.(22) Sonogashira, K. In Metal-Catalyzed Cross-Coupling Reac
tions; Diederich, F., Stang, P. J., Eds.; Wiley-VCH Verlag; Weinheim, 1998; Chapter 5.
(23) Jones II, L. R.; Schumm, J. S.; Tour, J. M. J. Org. Chem. 1997, 62, 1388-1410.
(24) Bredas, J, L.; Silbey, R.; Boudreaux, D. S.; Chance, R. R. J. Am. Chem. Soc. 1983, 105, 6555—6559.
(25) (a) Krebs, F. C.; Nyberg, R. B.; Jorgensen, M. Chem. Mater.2004, 16, 1313-1318. (b) Nielsen, K. T.; Bechgaard, K; Krebs, F. C. Macromolecules, in press.
(26) Jones, L.; Schumm, J. S.; Tour, J. M. J. Org. Chem. 1997, 62, 1388-1410.
(27) Van Broekhoven, J.; Adrianus, M. European Patent Application 0283092 Al, 1988.
(28) Briscoe, G. B.; Humphries, S. Talanta 1969, 16, 1403-1419.(29) Nielsen, K. T.; Spanggaard, H.; Krebs, F. C. Displays, in
press.(30) Reppe, W.; Schlicthing, O.; Klager, K; Toepel, T. Justus
Liebigs Ann. Chem. 1948, 560, 1-7.(31) Gevorgyan, V.; Takeda, A.; Yamamoto, Y. J. Am. Chem. Soc.
1997, 119, 11313-11314.(32) Gevorgyan, V.; Radhakrishnan, U.; Takeda, A.; Rubina, M.;
Rubin, M.; Yamamoto, Y. J. Org. Chem. 2001,66, 2835-2841.(33) Krebs, F. C.; Spanggaard, H.; Rozlosnik, N.; Larsen, N. B.;
Jorgensen, M. Langmuir 2003, 19, 7873-7880.
MA048489U
Zn Porphyrin Linked Poly( phenyleneethynylene) 1189
130

Appendix B
Supplementary information
Thin layer chromatography (TLC) was carried out using Merck Silica (Kieselgel) 6OF254 on aluminium sheets and the eluent was n-heptane/1,2-dichlorethane in ratio 5:1 unless otherwise stated. To purify the compounds both flash, short column and preparative liquid chromatography (SEC) was carried out. The column material for the flash column chromatography was Merck Kieselgel 60 (particle size 0.015-0.040 mm) and for the short column chromatography both Aluminium oxid aktiv, neutr., type 507c, korrngr. ~ 150 mesh, 58 A and Kieselgel, korngr. 70-230 mesh, 60 A (both from Aldrich) were used. GC/MS was used to detect compounds with a mass up to 700 g/mol, and MALDI-TOF-MS with a DHB matrix and positive ion detection was used to detect compounds with a larger mass. Both TLC, GC/MS and MALDI-TOF-MS were used to monitor the reactions. All reagents were commercially available and reagent grade.
1,4-dibromo-2,5-dioctylbenzene (1): The following describes a modified procedure compared to the literature1. 1,4-dibromo-2,5-dioctylbenzene was prepared from 1,4- dioctylbenzene by a simple addition reaction of bromine. 1,4-dioctylbenzene (0.42 mol, 127.55 g) was mixed with 0.3 g iodine (acts as a catalyst). The bromine (0.99 mol, 50.8 mL) was added drop wise over a period of 2.5 hour. The reaction is exothermic, and the mixture became warm during the addition of the bromine. The hydrogen bromide gas that evolved was collected in a water trap. After the addition of the bromine, the mixture was stirred overnight. The following day the product had crystallized and was dissolved in dichloromethane (900 mL) and washed with water (4 x 200 mL) and finally with 1M Na2S2O3(aq). The light yellow organic solution was dried using MgSO4, filtered and evaporated to give a light yellow oil (161.0 g). The product was purified by recrystallization from ethanol (2.5 L). Yield: 120.0 g (62%) as colourless crystals. M. p. 321-322 K. 1H NMR (250 MHz, CDCl3, 300K, TMS) 5: 0.88 (doublet of t, 6h), 1.21-1.42 (m, 20H), 1.57 (m, 4H), 2.63 (doublet of t, 4H), 7.35 (s, 2H); 13C NMR (62.9 MHz, CDCl3, 300K, TMS) 5: 14.80, 23.37, 29.92, 30.05, 30.07, 30.51, 32.58, 36.23, 123.77, 134.44, 142.03. Anal. Calcd. for C22H36Br2: C: 57.40: , H: 7.88. Found: C: 57.02, H: 7.86.
General procedure for the bromine-iodine-exchange (2 & 7): This procedure is modified compared to the literature2. THF was cooled to 195 K in a 1-litre three-necked round-bottom flask. After the THF had reached the temperature of 195 K, n-BuLi (typically 10 % excess) was added. The solution was cooled back to 195 K and a solution of the bromo-compound in dry THF was added dropwise over a period of 2.5 hour, at such a rate that the temperature did not exceed 223 K. After the addition the temperature was allowed to reach 195 K, and I2 (10 % excess) was added. The temperature of the mixture was now allowed to reach room temperature and the solution was stirred for 1.5 hour. Light petroleum was added and the mixture was washed with a 1 M solution of Na2S2O3(aq) (3 x 500mL). The organic phase was separated, dried with MgSO4, and the solvent was removed by evaporation. The product was purified further by recrystallization in ethanol or methanol.
1-bromo-2,5-dioctyl-4-iodobenzene (2): The reaction of compound 1 (0.163 mol, 75.04 g) in THF (200 mL) with n-BuLi (160 mL of a 1.1 M solution in hexane, 0.11 mol) and I2 (0.22 mol, 55.85 g) in THF (300 mL) gave, after recrystallization from ethanol (4 L), 65.0 g (78%) of colourless crystals. M. p. 318.5-319 K. 1H NMR (250 MHz, CDCl3, 300K, TMS) 5: 0.88 (doublet of t, 6H), 1.17-1.44 (m, 20H), 1.44-1.65 (m, 4H), 2.61 (doublet of t, 4H), 7.32 (s,
131

Appendix B
1H), 7.61 (s, 1H); 13C NMR (62.9 MHz, CDCl3, 300K, TMS) 5: 14.80, 23.36, 29.92, 30.00,30.06, 30.54, 30.84, 32.57, 36.01, 40.79, 99.51, 125.17, 133.48, 140.99, 142.23, 145.37. Anal.Calcd. for C22H36BrI: C: 52.08 , H: 7.15. Found: C: 52.67 , H: 7.23.
1-iodo-2,5-dioctyl-4’-trimethylsilylethynyltolane (7): The reaction of compound 6 (3.87-10" 1 mol, 22.38 g) in THF (100 mL) with n-BuLi (38.7 mL of a 1.1 M solution in hexane, 0.043 mol) and I2 (0.045 mol, 11.31 g) in THF (200 mL) gave 22.0 g (91 %) of light red oil. The product was used without further purification. 1H NMR (250 MHz, CDCl3, 300K, TMS) 5: 0.25 (s, 9H), 0.77-0.93 (doublet of t, 6H), 1.15-1.47 (m, 20H), 1.47-1.72 (m, 4H), 2.56-2.78 (m, 4H), 7.29 (s, 1H), 7.42 (s, 4H). 7.66 (s, 1H); 13C NMR (62.9 MHz, CDCl3, 300K, TMS) 5: 0.61, 14.80, 23.35, 23.37, 29.95, 30.05, 30.12, 30.22, 30.90, 31.34, 32.58, 34.53, 34.53, 40.90, 90.46, 93.80, 97.02, 101.89, 105.33, 123.17, 123.69, 124.12, 131.88, 132.62, 132.93, 140.22, 143.51, 144.79.
General procedure for Sonogashira cross-coupling (3 and 6). The procedure for the coupling reaction between terminal acetylenes and sp2-carbon halides is the same as described in the literature3,4 with a few modifications. A 500 mL round-bottom flask was dried using a heat gun and flushed with argon. Then a mixture of the terminal acetylene (5 % excess) and the sp2-carbon halide was dissolved in triethylamine (2.5 L per mole halide). After the reagents had dissolved, the solution was flushed with argon for 30 minutes, before the catalyst Pd(PPh3)2Cl2 (« 2 mol %) and the co-catalyst CuI (« 10 mol %) were added under an argon atmosphere. After the addition of the catalyst the mixture was stirred under an argon atmosphere for 9 hours. GC/MS and TLC were used to monitor the reaction. After the 9 hours more catalyst and acetylene were added and the reaction was continued until the TLC showed that the reaction was done. This is important because a mixture of e.g. 1-bromo-4- iodobenzene and 1-(4-bromophenyl)-2-trimithylsilylacetylene were found difficult to separate. When the reaction was complete diethyl ether was added (the same volume as the triethylamine), and the suspension was filtered through a glass filter funnel (triethylaminehydrogeniodide was removed). The filtrate was collected and evaporated to dryness by a rotary evaporation. The liquid residue (usually an oil) was dissolved in n-heptane and then purified on an aluminium oxide column with n-heptane as the eluent. The n-heptane was removed by evaporation to give the product.
1-(4-bromo-2,5-dioctylphenyl)-2-trimethylsilylacetylene (3). Compound 3 was prepared from Compound 2 (3.96-10-2 mol, 20.07g) and trimethylsilylacetylene (4.20-10-2 mol, 4.12 g). The reaction was performed in an ice bath to increase the selectivity between the iodo and the bromo places. The reaction was completed after 9 hours. The yield was 17.95 g (95 %) of clear light yellow oil. 1H NMR (250 MHz, CDCl3, 300K, TMS) 5: 0.25 (s, 9H), 0.80-095 (dt, 6H), 1.15-1.42 (m, 20H), 1.47-1.68 (m, 4H), 2.61 (doublet of t, 4H), 7.26 (s, 1H), 7.33 (s, 1H); 13C NMR (62.9 MHz, CDCl3, 300K, TMS) 5: 0.65, 14.79, 23.37, 29.93, 30.00, 30.10, 30.16, 30.29, 30.58, 31.25, 32.59, 34.80, 36.26, 98.93, 104.01, 122.39, 125.45, 133.43, 134.33, 140.03, 145.35. Anal. Calcd. for C27H45BrSi: C: 67.89, H: 9.5. Found: C: 67.88, H: 9.58.
1-bromo-2,5-dioctyl-4’-trimethylsilylethynyltolane (6). Compound 6 was prepared from compound 4 (2.57-10-3 mol, 1.04 g) and compound 5 (2.60-10-3 mol, 0.78 g). The product was purified on a flash column with n-heptane as eluent. The yield was 0.50 g (34 %) of a light yellow oil. The low yield is caused by the importance in this step to separate the by-product from the main product. From TLC it was known that there were four products, with following Rf values: 0.58, 0.38, 0.25 and 0.08. By 1H and 13C NMR and MALDI TOFF it were
132

Appendix B
determined that the first product mainly consisted of compound 4, the second was compound 6, the third consisted mainly of 1-bromo-2,5-dioctyl-2’,5’-dioctyl-4-(4’’-trimethylsilyl- ethynylphenyl)ethynyltolane (B2), and the fourth of 1,4-dioctyl-2,5-bis((4’’-trimethylsilyl- ethynylphenyl)ethynyl)benzene (B3).
1H NMR (250 MHz, CDClg, 300K, TMS) 5: 0.27 (s, 9H), 0.83-0.97 (doublet of t, 6H), 1.171.47 (m, 20H), 1.53-1.75 (m, 4H), 2.61-2.84 (m, 4H), 7.33 (s, 1H), 7.39 (s, 1H). 7.44 (s, 4H);
NMR (62.9 MHz, CDClg, 300K, TMS) 5: 0.61, 14.78, 23.36, 29.93, 29.95, 30.09, 30.11, 30.14, 30.20, 30.56, 31.29, 32.58, 34.73, 36.29, 90.37, 93.57, 97.02, 105.35, 122.26, 123.70, 124.17, 125.55, 131.86, 132.63, 133.57, 134.13, 140.23, 144.86. Anal. Calcd. for C35HwBrSi: C:72.76, H:8.55. Found: C: 73.14 , H: 8.63.
General procedure for the deprotection of the trimethylsilyl group (4 and 8). Thedeprotection of the trimethylsilyl group was performed as described in the literature3 with minor modifications. In a round-bottom flask the silylated compound was dissolved in a 1:1 dichloromethane:methanol mixture (8 L per mole) and flushed with argon in 30 minutes before potassium carbonate (« 10 equiv) was added under an argon atmosphere. The mixture was stirred at RT and followed by NMR and GC/MS. While shorter reaction times have been reported, the typical reaction time was 1-2 days. At completion the solvent was removed by evaporation. The excess potassium carbonate was eliminated by filtration. The products were used without further purification.
4-bromo-2,5-dioctylphenylacetylene (4). Compound 4 was prepared from compound 3 (6.67-10-2 mol, 31.87 g). Yield 26.60 (98 %) g as a red oil. 1H NMR (250 MHz, CDClg, 300K, TMS) 5: 0.78-0.95 (doublet of t, 6H), 1.16-1.48 (m, 20H), 1.50-1.70 (m, 4H), 2.57-278 (m, 4H), 3.25 (s, 1H), 7.30 (s, 1H), 7.37 (s, 1H); 13C NMR (62.9x MHz, CDClg, 300K, TMS) 5:14.79, 23.37, 29.92, 30.07, 30.09, 30.51, 31.14, 32.58, 34.45, 36.23, 81.55, 82.54, 121.37, 125.81, 133.47, 134.82.
1-iodo-2,5-dioctyl-4’-ethynyltolane (8). Compound 8 was prepared from compound 7 (1.68-10-3 mol, 1.05 g). The yield was 0.750 g (81 %) of a yellow oil. 1H NMR (250 MHz, CDCl3, 300K, TMS) 5: 0.79-0.96 (doublet of t, 6H), 1.14-1.45 (m, 20H), 1.50-1.77 (m, 4H), 2.60-2.79 (m, 4H), 3.18 (s, 1H), 7.30 (s, 1H), 7.46 (s, 4H). 7.68 (s, 1H); 13C NMR (62.9 MHz,CDClg, 300K, TMS) 5: 14.78, 23.38, 29.71, 29.95, 30.06, 30.13, 30.22, 30.92, 31.34, 32.59, 34.54, 40.92, 79.60, 83.97, 90.55, 93.60, 101.95, 122.69, 123.14, 124.60, 131.99, 132.81, 132.96, 140.27, 143.57, 144.85.
Photophysical results from the DDC treatment
133

Appendix B
1,2
Nn-Nn treated with DDC for 5 min.Nn treated with DDC for 2 hours. N„ treated with DDC for 24 hours.
1,0
0,8
n 0,6
0,4
0,2
0,0300 400 500 600 700
Wavelength [nm]
Figure S1: A comparison of the UV-vis spectra for the Nn polymer in solid state as a function of the DDC treatment time. It should be emphasized that for a treatment time in the order of 5 minutes there were no significant changes in the UV-vis spectrum.
134

Appendix B
100Nn treated with DDC (2 hours).
80
60
40
20
400 500 600 700
Wavelength [nm]
Figure S2: The comparison of the fluorescence spectra of the Nn polymer before and after a long DDC treatment time in spincoated films.
Standard electroactive device fabrication
The substrates were 10 Q square-1 ITO slides that had been etched in one end by immersion in a 338 K aqueous solution of HCl(aq) 20% and HNO3(aq) 5% for typically 60 seconds. The etched substrates were cleaned by immersion in isopropanol and subjected to ultrasound for 10 min. After being blown dry in a stream of dry argon, a layer of PEDOT:PSS was applied by spincoating an aqueous solution of PEDOT:PSS (1.3% wt.) containing sorbitol (2% wt.). The substrates were placed in an oven at 373 oC and ramped up to a temperature of 453 K during 1h and kept at 453 K for 1h. Polymer solutions in chloroform at a concentration of 210 mg mL-1 were micro-filtered and spin coated at 1500 rpm onto the substrates. The typical film thicknesses were 50-100 nm as measured by a DEKTAK 3030 and the typical absorbance of the films were 0.25-1.0 absorbance units. The active area of the device was 3 cm2 (20 mm x 15 mm). The aluminium electrode was evaporated onto the device at a pressure of < 5T0-6 mBar. After application of the electrodes the samples were removed from the evaporator chamber, electrical connections were made using conducting silver epoxy glue.
135
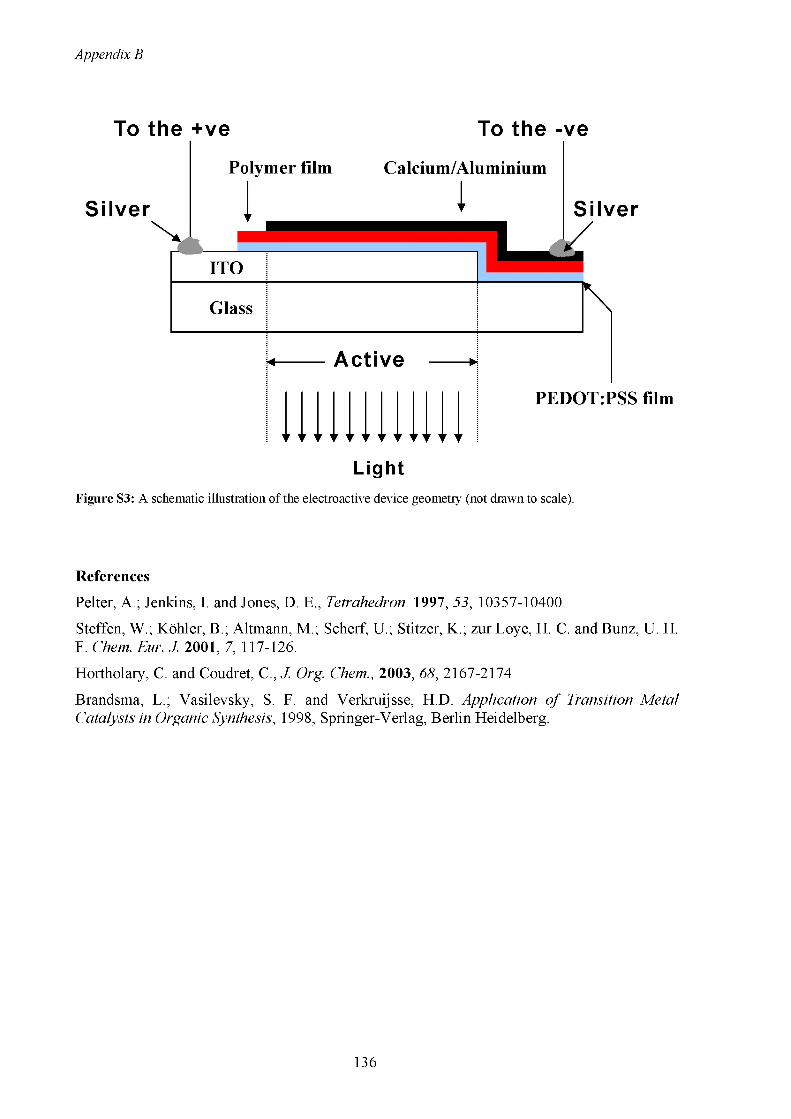
Appendix B
To the +ve To the -ve
◄-------Active -------►
PEDOTrPSS film
LightFigure S3: A schematic illustration of the electroactive device geometry (not drawn to scale).
References
Pelter, A.; Jenkins, I. and Jones, D. E., Tetrahedron. 1997, 53, 10357-10400.
Steffen, W.; Kohler, B.; Altmann, M.; Scherf, U.; Stitzer, K.; zur Loye, H. C. and Bunz, U. H. F. Chem. Eur../. 2001, 7, 117-126.
Hortholary, C. and Coudret, C ,./. Org. Chem., 2003, 68, 2167-2174
Brandsma, L.; Vasilevsky, S. F. and Verkruijsse, HD Application of Transition Metal Catalysts in Organic Synthesis, 1998, Springer-Verlag, Berlin Heidelberg.
136

Appendix B
ELSEVIER
Available online at www.sciencedirect.com —
sc,eNce($DmecT DISPLAYSDisplays 25 (2004) 231 -235
www.elsevier.com/locate/displa
Dye linked conjugated homopolymers: using conjugated polymer electroluminescence to optically pump porphyrin-dye emission
Kim T. Nielsen, Holger Spanggaard, Frederik C. Krebs*RIS0 National Laboratory, The Danish Polymer Centre. P.0, Box 49, Frederiksborgvej 399. DK-4000 Roskilde, Denmark
Available online 18 October 2004
Abstract
Zinc-porphyrin dye molecules were incorporated into the backbone of a conjugated polymer material by a method, which allowed for the incorporation of only one zinc-porphyrin dye molecule into the backbone of each conjugated polymer molecule. The electronic properties of the homopolymer were established using ultraviolet photoelectron spectroscopy (UPS) for the determination of the electronic energy levels and the injection barrier for holes into the valence band. Pulse radiolysis time resolved microwave conductivity (PR-TRMC) was used to determine the sum of charge carrier mobilities. Electroluminescent devices of the homopolymer itself and of the zinc-porphyrin containing polymer were prepared and the nature of the electroluminescence was characterized. The homopolymer segments were found to optically pump the emission of the zinc-porphyrin dye moilies. The homopolymer exhibits blue-green emission and the zinc-porphyrin linked homopolymers emit near-infrared/infrared light. This was demonstrated to be due to electroluminescence pumping of the zinc-porphyrin moieties that were covalently linked to homopolymer material. When only one zinc-porphyrin dye was incorporated into the backbone of each homopolymer molecule complete suppression of homopolymer electroluminescence was observed with exclusive near-infrared emission.© 2004 Elsevier B.V. All rights reserved.
Keywords: Dyc-linked conjugated homopolymers; Zinc-porphyrin dye containing conjugated polymers; Zinc-porphyrin linked polyphenylenccthynylencs; Near-infrared/infrared electroluminescence; Electroluminescence pumping
1. Introduction
Electrical conductivity of doped polyacetylene was shown in 1974 [1]. Since then there has been an increasing activity within the field of conjugated polymers and their application, for e.g. light emitting diodes (LED) [2], polymer electronic circuits |3] and polymer solar cells [4j.
The light emitting diodes got their breakthrough, when Burroughes et al. 12] first published a paper about the preparation and light emitting properties of a green LED made from po ly (//-phenyl enev i n y 1 ene). After this pioneering report there has been a growing interest in polymer- based LED devices |4—11 ], Some of the reasons why there is a large interest in this relatively new discovery compared to conventional inorganic semiconducting devices is due to the potential for low cost, high flexibility and ease of processing |5] of the polymer-based LEDs. Furthermore, it is relatively
* Corresponding author. Tel.: +45 46 77 4799; fax: +45 46 77 4791. E-mail address: [email protected] (F.C. Krebs).
0141-9382/S - see from matter © 2004 Elsevier B.V. All rights reserved, doi: 10.10l6/j.displa.2004.09.019
easy to tune the colour of the light emission by chemical modification [6,8,9],
Reports on polymer-based LEDs with colours from blue to near-infrared (NIR) can be found in the literature [9|. Especially the NIR emitting polymer-based LEDs have attracted a lot of interest in the last couple of years, because they open the possibility for the application of the polymer- based LEDs in telecommunications devices (7,12,13], The reports about these polymer-based NIR LEDs are still relatively few, and most of these reports are concerned with polymers containing rare earth metal ions as dopants 113], low band gap polymers |9] and blends of polymers and small dye molecules [111. In the later case the polymer matrix works as the donor and transfer the energy by a Forster-type energy transfer process to the dye molecules (typically an organometallic complex) [II]. The Forster energy transfer process is energy transfer by long-range dipole-dipole coupling. A conceivable way to optimise the energy transfer from the polymer matrix to the dye molecule could be to covalently link the dye molecule to the backbone
137

Appendix B
232 K.T. Nielsen el al. / Displays 2512004) 231-235
H(Zn>-Domain
N-P(Zn)-N
Fig. 1. An illustration of the three-domain structure for the dye-linked conjugated homopolymer. NPN.
of the polymer. In this way the energy transfer could still happen via the long-range dipole-dipole coupling, but also through the bonds. Recent studies on the light harvesting and energy transfer properties of dye-terminated conjugated polymers and dye-linked conjugated homopolymers have shown that the light energy harvested by the conjugated polymer segment can be transferred to the dye molecule and either be re-emitted as pumped fluorescence or can increase the photovoltaic response when applied as the active material in a polymer photovoltaic set-up 114,15).
In this study we demonstrate the principle of transfer of electroluminescence to a dye molecule that is covalently linked to the conjugated polymer backbone and demonstrate how a blue-green emitting polymer can transfer energy to a zinc-porphyrin dye molecule and give almost exclusively near-infrared light emission. The dye-linked conjugated homopolymer we used in these studies have the three- domain structure, NPN, that can be seen in Fig. 1. The N and P domains consist of poly[(2,5-dioctyl-tolanylene)-ethyny- lene] and [ 10,20-Bis-(3,5-bis-rez7-butylphenyl]-5-15-dibro- moporphinato]zinc(II), respectively.
We also report the electronic properties of the homopolymer by determination of the electronic energy levels, the injection barrier for holes into the valence band, the ionisation potential as determined by ultraviolet photoelectron spectroscopy (UPS) and the sum of charge carrier mobilities for the N polymer as determined by pulse radiolysis time resolved microwave conductivity (PR-TRMC).
2. Experimental
The polymer materials N and NPN were prepared and purified from the contaminant palladium nanoparticles as described previously [16]. Ultraviolet photoelectron spectroscopy [17] was performed using 50 eV photons in a setup and by a procedure described in the literature [18], Carrier mobilities of the homopolymer were measured using
the PR-TRMC technique as described in the literature [l 9] using a set-up described earlier [20]. We employed 10 MeV electrons, pulse lengths of ~ 300 ns and typical pulse doses of 60 Gy. Electroluminescent devices were prepared by spincoating chloroform solutions onto PEDOT:PSS covered ITO slides giving films with peak absorbencies of ~0.6. The metal electrodes were evaporated at a vacuum of < 1 X 10⁻⁵mbar and consisted of a calcium layer (~ 30 nm) covered by an aluminium layer (— 100 nm). The electrical connections were obtained using silver epoxy. Electroluminescence spectra were recorded in a FLS920 from Edinburgh Instruments. The LED devices had turn on voltages of 3.3 V and were during electroluminescence measurements operated at 5.5 V where they drew a typical current of 3-8 mA cm-2.
3. Results and discussion
3.1. Synthesis
Recently we have reported a synthesis of a new homopolymer and a new zinc-porhyrin linked homopolymer [16]. The homopolymer is the iodine terminated poly[(2,5-dioctyl-to!anylene)-ethynylene] (N) (see Scheme I), and the zinc-porphyrin linked homopolymer NPN is the homopolymer N linked to the porphyrin [10,20-Bis-(3,5- bis-/m-butylphenyl]-5-15-dibromoporphinato]zinc(II) (2) (see Scheme 2). N was synthesized by a normal Sonogashira cross-coupling reaction from the 1 -iodo-2,5-diocty 1-4'- ethynyltolane (1).
The synthetic procedure to NPN allowed for the incorporation of only one zinc-porphyrin dye moiety into the conjugated polymer backbone. Once a porphyrin molecule is incorporated the terminal groups are halogen that does not allow further incorporation dibromozineporphyrins.
Both N and NPN were purified from the contaminant palladium nanoparticles by treatment with diethylammo- nium diethyldithiocarbamate (DDC) as described previously [16],
3.2. Ultraviolet photoelectron spectroscopy (UPS)
When preparing electroluminescent devices from conjugated polymer materials an important parameter is the position of the electronic energy levels [17] since the matching of the energy levels to the electrode ultimately
C«H>7
N
Scheme 1. The synthetic procedure of the homopolymer poly|(2,5-dioctyl-tolanylenc)-cthynylcnc] (N). (a) PdtPPhi)* Cut, piperidine.
138

Appendix B
K.T. Nielsen et at. / Displays 25 (2004) 231-235 233
2 dVWNm)NPN
Scheme 2. The synthetic produce leading to the three-domain structure NPN. (b) Pd(PPhj)4, Cul, EljN, THF.
Rp
Binding Energy (eV)
i **‘Xecuum I Aw
*4.
IP
- t
Erv*c
1 ''KrnwU»l
Filled levels
-6
Fig. 2. The UPS spectrum for N with an inset (X 10) showing the onset of pholoelectrons. The distance from the Fermi level. Eg.-, to the onset of photoelectrons (the valence band edge in the material) represent the injection barrier for holes from the substrate into the valence band of the material (left). The electronic band structure derived from the UPS spectrum is also shown (right).
determines the injection barrier for hole carrier injection into the valence band and electron injection into the conduction band during operation. The UPS experiment employs hard UV photons from a synchrotron source. We employed UV photons with an energy of 50 eV that upon interaction with the surface of the polymer material eject a photoelectron from one of the Idled energy levels in the material. For this reason UPS can only reveal information on the filled states in the material under study i.e. the valence band. A second parameter that is obtained is the ionisation potential for the material. The UPS spectrum is shown in Fig. 2.
On the right in Fig. 1 the electronic band structure is shown. The distance from the Fermi level to the valence band edge, £pB, was found to be 1.5 eV and represent the injection barrier for holes into the valence band of the polymer material. The parameters derived from the UPS spectrum are summarized in Table 1.
In terms of electroluminescent devices based on N an injection barrier of 1.5 eV implies that a bias of at least 1.5 V will have to be applied to overcome the injection barrier for holes in the device. There is equally an injection barrier for electrons into the conduction band, but this
cannot be measured by UPS as only filled levels are probed by this method. The sum of the hole and electron injection barriers define the value at which electroluminescence can be observed in principle. There are, however, other factors that come into play since electroluminescent light emission through formation of excitons requires a balanced injection of holes and electrons into the polymer in the device.
3.3. Pulse radiolysis time resolved microwave conductivity (PR-TRMC)
A pre-requisite for function of electroluminescent devices is that the conjugated polymer material is able to transport charge carriers. The charge carrier mobility hinges on many physical parameters such as the organization of the molecules, interface phenomena, impurity levels
Table IData from the photoclcctron spectra for the polymer 1 on a gold substrate (*A„=4.7 cV)
Compound E? £fvac BEmu A IP
N 1.5 4.0 — 46.0 —0.70 5.50
139
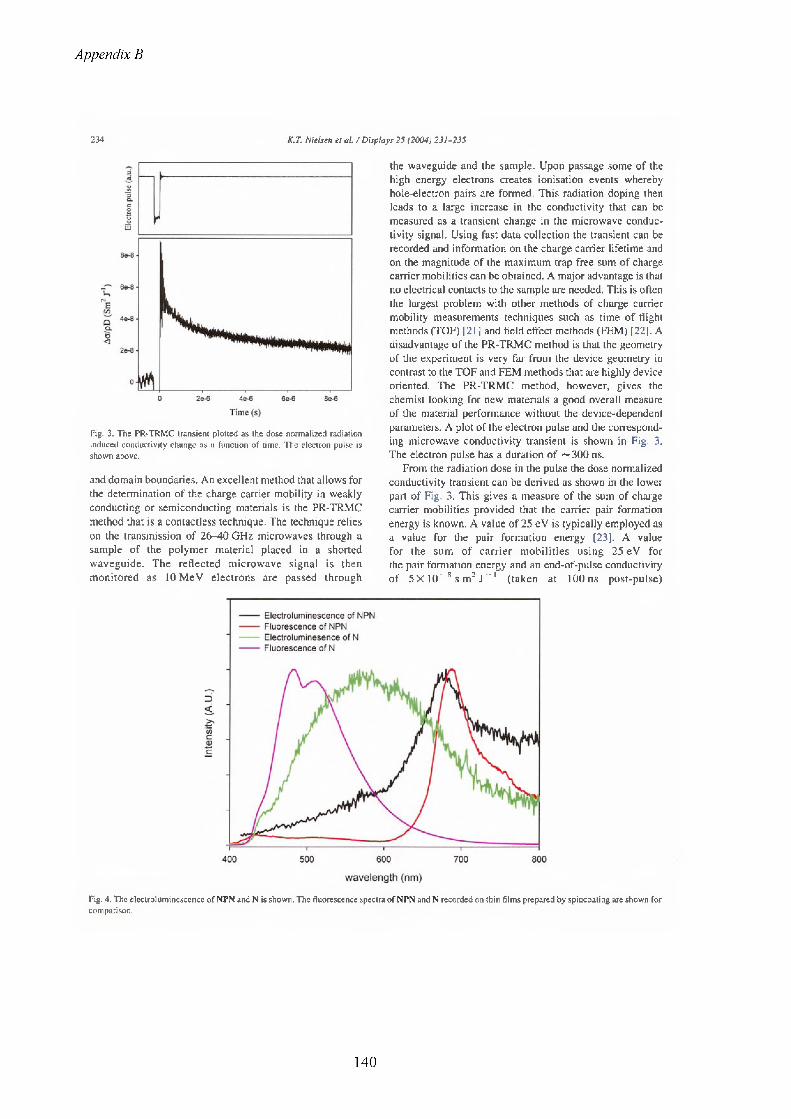
Appendix B
234 K.T. Nielsen el al. Z Displays 25 (2004) 231-235
Time (s)
Fig. 3. The PR-TRMC transient plotted as the dose normalized radiation induced conductivity change as a function of time. The electron pulse is shown above.
and domain boundaries. An excellent method that allows for the determination of the charge carrier mobility in weakly conducting or semiconducting materials is the PR-TRMC method that is a contactless technique. The technique relies on the transmission of 26-40 GHz microwaves through a sample of the polymer material placed in a shorted waveguide. The reflected microwave signal is then monitored as lOMeV electrons are passed through
the waveguide and the sample. Upon passage some of the high energy electrons creates ionisation events whereby hole-electron pairs are formed. This radiation doping then leads to a large increase in the conductivity that can be measured as a transient change in the microwave conductivity signal. Using fast data collection the transient can be recorded and information on the charge carrier lifetime and on the magnitude of the maximum trap free sum of charge carrier mobilities can be obtained. A major advantage is that no electrical contacts to the sample are needed. This is often the largest problem with other methods of charge carrier mobility measurements techniques such as time of flight methods (TOP) [21 ] and field effect methods (FEM) [22]. A disadvantage of the PR-TRMC method is that the geometry of the experiment is very far from the device geometry in contrast to the TOP and FEM methods that are highly device oriented. The PR-TRMC method, however, gives the chemist looking for new materials a good overall measure of the material performance without the device-dependent parameters. A plot of the electron pulse and the corresponding microwave conductivity transient is shown in Fig. 3. The electron pulse has a duration of ~ 300 ns.
From the radiation dose in the pulse the dose normalized conductivity transient can be derived as shown in the lower part of Fig. 3. This gives a measure of the sum of charge carrier mobilities provided that the carrier pair formation energy is known. A value of 25 eV is typically employed as a value for the pair formation energy [23]. A value for the sum of carrier mobilities using 25 eV for the pair formation energy and an end-of-pulse conductivity of 5X 10~8 s m2 J~1 (taken at 100 ns post-pulse)
------ Electroluminescence of NPN------ Fluorescence of NPN------ Electroluminesence of N------ Fluorescence of N
wavelength (nm)
Fig. 4. The electroluminescence of NPN and N is shown. The fluorescence spectra of NPN and N recorded on thin films prepared by spincoating are shown for comparison.
140

Appendix B
K.T. Nielsen el al. / Displays 25 12004) 231-255
gives a sum of charge carrier mobilities, 2/zrain = 1.25 X 10~6m2 V~'s-1 and a first half-life, t1/2~ 10 ns. The value for 2jtmin has not been corrected for the survival probability of the charge carrier pair nor for the differential dose distribution between the conjugated backbone and the alkyl sidechains. This value for the carrier mobility is comparable when compared to values determined earlier for similar compounds [24]. It must be borne in mind that the experimental charge carrier mobilities in an actual device may be much lower due to trapping of carriers at domain boundaries and by impurities.
3.4. Electroluminescence
The electroluminescence of NPN and N along with the fluorescence spectra of spincoated films are shown in Fig. 4. When examining the electroluminescence of the pure N- polymer it is interesting to note that the electroluminescence of the N-domain is red shifted ~ 100 nm compared to the fluorescence spectrum. The electroluminescence is a broad peak whereas the fluorescence exhibits fine structure. The large red shift of the N-domain indicate emission from a relaxed state. The first thing to notice when examining the electroluminescence of NPN is that it is very similar to the solid-state fluorescence spectrum of NPN. We interpret this as the efficient transfer of an electrically generated exciton in the N-domain to the P-domain that then emit a photon as if it was ordinary fluorescence. Electroluminescence is often distinguished by a considerable redshift in emission maximum from its fluorescence maximum as indeed observed here. In the solid state the N-domain effectively transfers its harvested energy to the porphyrin that fluoresce around 700 nm. Comparing the electroluminescence with the fluorescence it is seen that the N-domain also effectively transfers electroluminescence to the P-domain where virtually no emission from the N-domain can be observed.
The porphyrin emission from electroluminescent devices is a broad peak with a maximum that is slightly blue shifted when compared to the fluorescence emission maximum from thin spincoated films that is a much sharper peak.
4. Conclusion
In this paper, we have presented a characterization of the recently synthesized homopolymer N, with respect to its electronic energy levels and its carrier mobilities. We have demonstrated how light emitting devices based on N exhibit blue-green emission. Introduction of a zinc-porphyrin dye into the conjugated backbone of the polymer and subsequent preparation of light emitting devices were shown to emit near-infrared light. We demonstrated that the optical pumping of the zinc-porphyrin moiety arises by excitonic
235
energy transfer from electrically generated excitons in the N-domain to the P-domain.
Acknowledgements
This work was supported by the Danish Technical Research Council (STVF).
References
[1] C.K. Chiang, C.R. Fincher, Y.W. Park. A.J. Hcegcr, H. Shirakawa,E.J. Louis, S.C. Gau, A.G. Macdiarmid, Phys. Rev. Lett. 39 (17) (1977) 1098-1101.
[2] J.H. Burroughcs, D.D.C. Bradley. A R Brown, R.N. Marks, K. Mackay, R.H. Friend, P.L. Bum, A.B. Holmes, Nature 347 (1990)539.
[31 H E. Katz. A.J. Lovinger, J. Johnson, C. Kloc, T. Sicgrist, W. Li, Y- Y. Lin, A. Dodabalapur, Nature 404 (2000) 478-481.
[4] M. Granstrom, K. Pclritsch, A.C. Arias. A. Lux, M R. Andcrsson, R.H. Fiend, Nature 395 (1998) 257-260.
[5] Y.-M. Sun, Polymer 42 (2001) 9495-9504.[6] Z. Yang. I. Sokolik. F.E. Karasz, Macromolccules 26 (1993) 1188-
1190.[7] C.J. Brabec. C. Winder. N.S. Sariciftci. J.C. Hummelcn.
A. Dhanabalan, P.A. van Hal, R A J Janssen, Adv. Fund. Mater. 12 (10) (2002)709-712.
[8] I. Benjamin. E.Z. Faraggi. G. Cohen, H. Chayct, D. Davidov, R. Neumann. Y. Avny, Synth. Met. 84 (1997) 401-402.
[9] M R. Andcrsson. M. Bcrggrcn. O. Inganas. G. Gustafsson,J.C. Custafsson-Carlberg, D. Seise. T. Hjertbcrg. O. Wcnncrstrdm. Macromolccules 28 (1995) 7525-7529.
[10J G. Lwising. S. Tasch, C. Brandstattcr, W. Graupncr, S. Hampel.E. J.W. List. F. Mcghdadi, C. Zcnz, P. Schlichting. U. Rohr. Y. Gccris. U. Scherf, K. Mullen. Synth. Met. 91 (1997) 41-47.
[Ill R Pizzofcrralo. L. Lagonigro, T. Zillcr. A. Di Carlo, R. Paolcssc.F. Mandoj. A. Ricci, C. Lo Sterzo, Chcm. Phys. 300 (2004) 217-225.
[12) J.C. Ostrowski, K. Susurnu, M R Robinson, MJ. Therien.G. C. Bazan, Adv. Mater. 15 (15) (2003) 1296-1300.
[131 N. Tcsslcr, V. Medvedev, M. Kazcs, S. Kan, U. Banin, Science 295 (2002) 1506.
[14] F.C. Krebs. O. Hagcmann. H. Spanggaard. J. Org. Chem. 68 (2003) 2463-2466.
[151 F.C. Krebs, H. Spanggaard, N. Rozlosnik, N.B. Larsen, M. Jorgensen, Langmuir 19 (2003) 7873; F.C. Krebs, Sol. Energy Mater. Sol. Cells 80 (2003) 257-264.
[16] K.T. Nielsen, H. Spanggaard. F.C. Krebs, submitted for publication. F.C. Krebs, R.B. Nybcrg, M. Jorgensen, Chem. Mater. 16(2004) 1313.
[17] W.R. Salaneck, M. Logdlund. M. Fahlman, G. Grcczynski, T. Kuglcr. Mater. Sci. Eng. R34 (2001) 121.
[18] F.C. Krebs. M. Jorgensen, Macromolccules 37 (2004) 3958; F.C. Krebs. M. Jorgensen. Macromolccules 35 (2002) 7200.
[19] J.M. Warman, G.H. Gclinck, M.P. dc Haas, J. Phys. Condcns. Matter 14 (2002) 9935-9954.
[20] F.C. Krebs, M. Jorgensen. Macromolccules 36 (2003) 4374.[21] A M. van dc Craats, L.D.A. Sicbblcs, 1. Blcyl, D. Haarer, Y.A. Berlin,
A.A. Zharikov, J.M. Warman, J. Chem. Phys. B 102 (1998) 9625.[22] B. Wcgcwijs, M.P. dc Haas, D M. de Leeuw, R. Wilson.
H. Sirringhaus, Synth. Met. 101 (1999) 534.[23] G.H. Gclinck. J.M. Warman, J. Phys. Chem. 100(1996) 20035.[24] F.C. Krebs. M. Jorgensen, Pol. Bull. 51 (2003) 127.
141

Appendix B
142

Appendix B
658 Macromolecules 2005, 38, 658—659
Removal of Palladium Nanoparticles from Polymer Materials7
Kim T. Nielsen, Klaus Bechgaard,* and Frederik C. Krebs*The Danish Polymer Centre, RIS0 National Laboratory,P.0, Box 49, DK-4000 Roskilde, Denmark
Received November 17, 2004Revised Manuscript Received December 9, 2004
Palladium catalysis in synthetic organic chemistry has been welcomed as a versatile tool and has made it possible to make complex molecules with many sensitive groups that can be synthesized only under the mild conditions offered by palladium catalysis. The use of palladium in synthetic organic chemistry has led to the development of an arsenal of reaction types that were not possible (or very difficult) without palladium catalysis. The most well-known coupling reactions are Heck,1 Stille,2 Suzuki,3 Negishi,4 and Sonogashira,5 and while many more exist they are variations over the general theme. An often neglected fact is the formation of palladium nanoparticles during the chemical reactions when the catalyst degrades. When the product of the chemical reaction can be purified by distillation (or for small molecules crystallized), it is often possible to obtain a palladium-free product. For large molecules and polymers, however, these means of purification are not available, and a contamination of the product with palladium should always be assumed. The extent to which palladium nanoparticles are withheld in the product depends on how strong the affinity for palladium is. As an example, palladium nanoparticles bind well to conjugated polymers, leading to a product with palladium that cannot be completely removed using current purification techniques. While the contaminant palladium nanoparticles/catalyst to a large extent can be removed, the crude product typically contains palladium nanoparticles/catalyst. The palladium contamination (0.0001-1% w/w) often goes by unnoticed or undetected, as it does not interfere with common analytical techniques (elemental analysis, NMR, etc.). When, however, the electrical properties of the product are important, even the smallest contamination has a detrimental effect on thin film device performance. We recently discovered6 the problem for a polyiphenyle- nevinylene) product prepared by two different routes: an elaborate palladium-free route and a one-step palladium route based on the Heck reaction. The polymer products were identical in most physical - chemical aspects (NMR, UV—vis absorption, etc.), but when electroluminescent devices were made using the polymer product from the palladium route, they were not functional whereas the non-palladium product gave functional devices. The lack of functionality was observed as a very low device resistance and the absence of electroluminescence. We later demonstrated the same problem for poly(phenyleneethynylene)s prepared by a palladium route following Sonogashira conditions.7 We attempted to remove the palladium contamination using
1 A patent application covering this invention has been filed.* Department of Chemistry, University of Copenhagen, DK
2100, Denmark.* Corresponding author: e-mail [email protected].
Scheme 1
2) KOH
2) Atm. 02
Scheme 2
<
AT^V-diethyldithiocarbamate (2) and found that we were able to remove the palladium to a level where device fabrication was possible.7-8 The shortcoming of 2, however, was that prolonged reaction times altered the photophysical properties of the poly(phenyleneethy- nylene) product to an extent where the desired electroluminescence became suppressed. The device resistance, however, remained high.
The efficient chemical removal of palladium nanoparticles/catalyst is not a trivial task if the desired organic product is to be left unaffected, and while 2 provided a partial solution and has been employed successfully for removal of palladium during solid-phase synthesis,9 a new procedure was highly desirable. Various approaches to the removal of heavy metals using N- acylcysteine, polystyrene-based thiuronium salts, or silica particles bearing pendant alkyl groups with terminal thiol functionalities have been reported.10 While they bind palladium efficiently, they do not work well for polymer products since a large proportion of the polymer product is absorbed by the silica or polymer media. A solubilizing agent would thus be more appropriate. Azothioformamides have been reported to dissolve metals like zinc and cadmium in the form of their amalgam and Ni(0) compounds through Ni/COU and Ni(P(0- Etlsh.11,12 We decided to attempt the use of azothioformamides to dissolve palladium nanoparticles/catalyst.
While the synthesis of 1 has been reported,11 we devised a simple one-pot synthesis giving the same yield of 1 as shown in Scheme 1. Compound 1 was shown to efficiently dissolve palladium nanoparticles directly. This could be monitored as a change in color from the light orange color of 1 to a dark brown-green color of 3. It should be emphasized that 1 also dissolves other metals directly (Cu, Ni, Pt), but we focus on the palladium context here. The neutral complex that is formed in the heterogeneous reaction of Pd nanoparticles and 1 is shown in Scheme 2.
Compound 3 is stable in air and readily soluble in most organic solvents such as methanol, chloroform, light petroleum, etc. The synthetic approach of Scheme 1 is general, and many different substituents to the
10.1021/ma047635t CCC: $30.25 © 2005 American Chemical SocietyPublished on Web 01/13/2005
143

Appendix B
Macromolecules, Vol. 38, No. 3, 2005
25000Compound 1 Compound 320000
15000
10000
300 400 500 600 700 800 900 1000
Wavelength (nm)Figure 1. UV—vis spectrum of 1 and 3 in chloroform at room temperature showing their extinction coefficients. Compound 3 shows a moderately strong absorption with a maximum at 801 nm where compound 1 does not absorb, making this technique applicable for the analytical determination of residual palladium content in materials where palladium catalysis has been employed.
azothioformamide skeleton can be envisaged that can encompass different solubility requirements of the derived palladium complexes, making its removal easy in terms of solubility/insolubility. Having demonstrated the successful reaction of 1 with metallic palladium nanoparticles/catalyst it remained to evaluate possible side reactions of 1 with the conjugated polymer product. The most likely reaction between an unsaturation such as vinylene or ethynylene groups is an electrocyclic condensation reaction of the Diels—Alder type. We performed model reactions between 1 and stilbene or tolane in both the presence and absence of palladium. We were not able to demonstrate detectable amounts of the corresponding electrocyclic condensation products (see Supporting Information). The major problem with such side reactions during polymer synthesis is that they are accumulated, and their alleviation is difficult to envisage. The removal of palladium using 1 is thus possible. While the treatment can be performed at elevated temperature, it works best at room temperature and was normally complete within 1 h. The progress of the palladium dissolution could be conveniently followed using simple UV—vis spectroscopy. This has the advantage that the complex exhibits a moderately strong absorption in a wavelength region normally not explored for saturated polymers and rarely for conjugated polymers and organic materials (<797nm,THF
= 8500 M™* 1 11 cm™1, e801nm,chloroform = 10 300 M™1 cm™1). The method presented here can thus be used for preparative work where alleviation of residual palladium catalyst is of interest and for analytical purposes where the palladium content can be determined by simple treatment with 1 followed by UV-vis analysis. In the case where there is an overlap, a correct analytical determination of the palladium content is still possible provided that the UV-vis spectrum of the sample is known and can be accurately subtracted.
We have shown the applicability of 1 for the removal of residual palladium catalyst through 3 that in our case is a complex readily soluble in common organic solvents including methanol commonly used to precipitate polymer materials. Using the method of analysis presented here, it is possible to determine the palladium content with a detection limit of 0.1 ppm (w/w) using 50 mg sample. Employing larger samples and concentration of the supernatant the detection limit can be lowered to 1
ppb (w/w). The results are summarized in Table 1.
Communications to the Editor 659
Table 1. Palladium Content before and after Treatment with 1 for Polymer Samples of the
Poly(phenylenevinylene), Poly(phenyleneethynylene), and Poly(alkylthiophene) Type and the Device
Resistance According to the Device Geometry (See Supporting Information)
Pd content before/after resistance before/afterpolymer (ppm) (kQ)
PPV 17860/<0.1 0.10/30PPE 268/<0.1 0.03/45PAT 4073/<0.1 0.06/24
The polymers employed for the demonstration were prepared by typical palladium routes (see Supporting Information) and cover a broad range of conjugated polymers: poly(phenylenevinylene) (PPV), poly(phen- yleneethynylene)s (PPE), and poly(alkylthiophene) (PAT). While the palladium content depends on the amount of catalyst used and on the conditions of the experiment, the levels observed before treatment are typical. Removal using 1 is efficient, and this is reflected in the device resistance and device function. Electroluminescent and photovoltaic devices could be prepared after palladium removal using this method.
In conclusion, our report describes the efficient removal of the palladium nanoparticle/catalyst contained in polymer materials by a palladium route. We further demonstrate the possibility of a quantitative determination of the palladium nanoparticles/catalyst content at the 1 ppb (w/w) level using simple UV-vis spectrophotometry. It should be emphasized that the method is general and that it can be applied to any sample, small molecule or macromolecular. The only requirement is solubility of the sample.
Acknowledgment. The work was supported by the Danish Technical Research Council (STVF).
Supporting Information Available: Details of the one- pot synthesis to 1, preparation of 3, general procedure for the removal of palladium remnants from conjugated polymer materials, analysis of the palladium content in a conjugated polymer sample at the 0.1 ppm level, the device geometry, and UV-vis in THF. This material is available free of charge via the Internet at http://pubs.acs.org.
References and Notes(1) Dieck, H. A.; Heck, F. R. J. Organomet. Chem. 1975, 93,
259-263.(2) Milstein, D.; Stille, J. K. J. Am. Chem. Soc. 1978, 100, 3636-
3638.(3) Suzuki, A. Acc. Chem. Res. 1982, 15, 178-184.(4) Negishi, E.; King, A. O.; Okukado, N. J. Org. Chem. 1977,
42, 1821-1823.(5) Sonogashira, K.; Tohda, Y.; Hagihara, N. Tetrahedron Lett.
1975, 50, 4467-4470.(6) Krebs, F. C.; Nyberg, R. B.; Jorgensen, M. Chem. Mater.
2004, 16, 1313-1318.(7) Nielsen, K. T.; Spanggaard, H.; Krebs, F. C. Macromolecules,
in press.(8) Nielsen, K. T.; Spanggaard, H.; Krebs, F. C. Displays, in
press.(9) Jones, L.; Schumm, J. S.; Tour, J. M. J. Org. Chem. 1997,
62, 1388-1410.(10) Schmuckler, G. German Patent 15 33 131, 1974. Villa, M.;
Cannata, V.; Rosi, A.; Allegrini, P. International Patent WO 98/51646. Konigsberger, K.; Chen, G.-P.; Wu, R. R.; Girgis, M. J.; Prasad, K.; Repid, O.; Blacklock, T. J. Org. Proc. Res. Dev. 2003, 7, 733-742.
(11) Jensen, K. A.; Bechgaard, K.; Pedersen, C. T. Acta Chem. Scand. 1972, 26, 2913-2922.
(12) Bechgaard, K. Thesis, Copenhagen, 1973.
MA047635T
144

Appendix B
Supporting Information
Removal of palladium nanoparticles from polymer materialsKim T. Nielsen, Klaus Bechgaard and FrederikC. Krebs*The Danish Polymer Centre, R1SO National Laboratory, P.O. Box 49, DK-4000 Roskilde, Denmark.
RECEIVED DATE (automatically inserted by publisher); [email protected]
General information on the properties
Compound 3 was found to exhibit both thermochromic and solvatochromic properties. The UV-vis data reported here thus refer to compound 3 dissolved in THF or chloroform at 25 °C. Compound 1 does not fully dissolve metallic palladium on realistic timescales. It does however dissolve palladium nanoparticles formed during catalysis completely in a short time interval (typically 60 min) as established by ultracentrifugation and following the absorption at 800 nm. Shaking at room temperature overnight was often employed with success. Heating during reaction of 1 with palladium nanoparticles could be employed but room temperature was found to be better. We tested compound 3 as a catalyst in a standard Suzuki reaction between phenylboronic acid and 4-iodoanisole and found no methoxybiphenyl product. We thus conclude that compound 3 is a poor source of palladium during catalysis and that its catalytic activity in palladium catalysed reactions is poor or absent. To ensure that compound 1 does not have any undesirable effect on the polymers, we have evaluated the reactivity of compound 1 and an unsaturation such as vinylene or ethynylene groups. Because 1 has the same unsaturation as 1,4-butadiene, we found that the most likely side reaction would be an electrocyclic condensation reaction of the Diels-Alder type. To test for this type of side reactions, we have made model reactions between 1 and both stilbene and tolane. We did not detect the possible electrocyclic condensation products between respectively stilbene and tolane as shown in scheme SI.
Scheme SI. The possible electrocyclic condensation products between 1 and stilbene or tolane.
The synthetic conditions for the reactions between compound 1 and stilbene or tolane were as follows:
Compound 1 and stilbene: In a 5 mL conical flask compound 1 (2.1 mmol, 0.5g) and stilbene (2.1 mmol, 0.38 g) were mixed and dissolved in xylene (3 mL) and flushed with argon for 5 minutes. The solution was then refluxed for 7 days. Every day a sample was drawn to test for the presence of 4. The
145
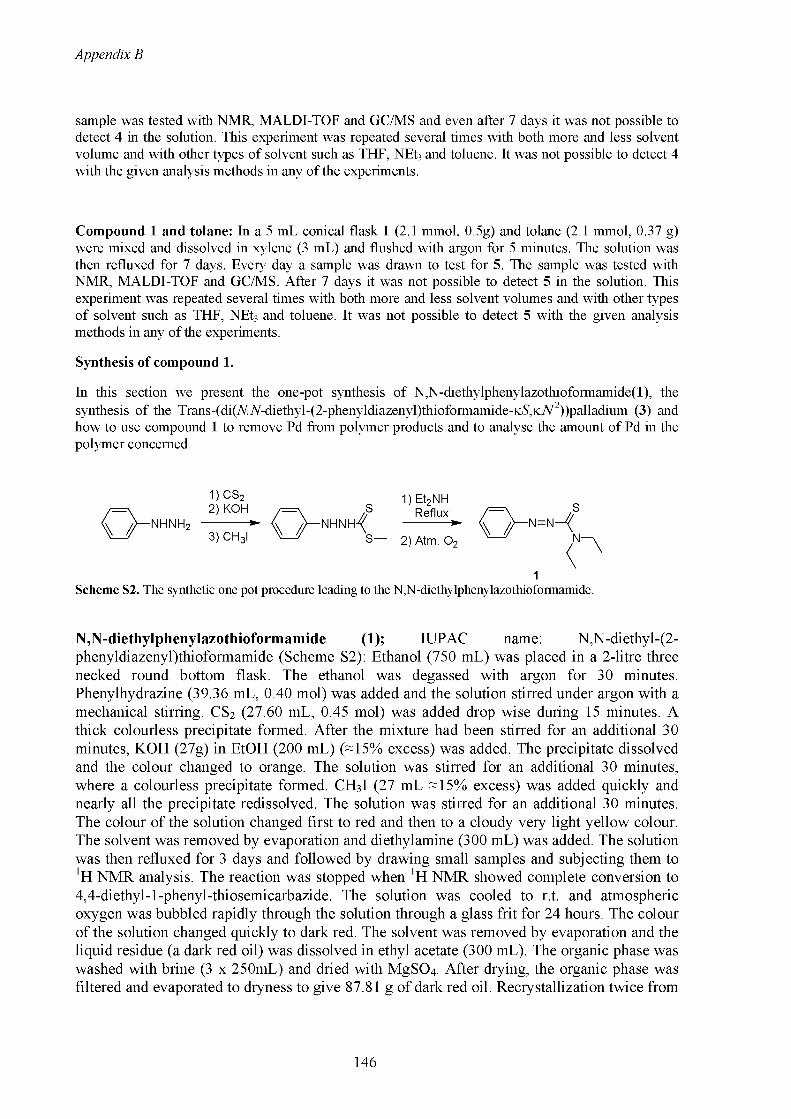
Appendix B
sample was tested with NMR, MALDI-TOF and GC/MS and even after 7 days it was not possible to detect 4 in the solution. This experiment was repeated several times with both more and less solvent volume and with other types of solvent such as THF, NEt3 and toluene. It was not possible to detect 4 with the given analysis methods in any of the experiments.
Compound 1 and tolane: In a 5 mL conical flask 1 (2.1 mmol, 0.5g) and tolane (2.1 mmol, 0.37 g) were mixed and dissolved in xylene (3 mL) and flushed with argon for 5 minutes. The solution was then refluxed for 7 days. Every day a sample was drawn to test for 5. The sample was tested with NMR, MALDI-TOF and GC/Ms. After 7 days it was not possible to detect 5 in the solution. This experiment was repeated several times with both more and less solvent volumes and with other types of solvent such as THF, NEt3 and toluene. It was not possible to detect 5 with the given analysis methods in any of the experiments.
Synthesis of compound 1.
In this section we present the one-pot synthesis of N,N-diethylphenylazothioformamide( 1), the synthesis of the Trans-(di(A^A-diethyl-(2-phenyldiazenyl)thioformamide-KS,,KA^2))palladium (3) and how to use compound 1 to remove Pd from polymer products and to analyse the amount of Pd in the polymer concerned.
NHNH2
1) CS22) KOH y=\
---------4 //3) CH3I xx z/
NHNHS
S
1) Et2NHReflux----------►
2) Atm. O2
SN=N—y
N
1Scheme S2. The synthetic one pot procedure leading to the N,N-diethylphenylazothioformamide.
N,N-diethylphenylazothioformamide (1); IUPAC name: N,N-diethyl-(2-phenyldiazenyl)thioformamide (Scheme S2): Ethanol (750 mL) was placed in a 2-litre three necked round bottom flask. The ethanol was degassed with argon for 30 minutes. Phenylhydrazine (39.36 mL, 0.40 mol) was added and the solution stirred under argon with a mechanical stirring. CS2 (27.60 mL, 0.45 mol) was added drop wise during 15 minutes. A thick colourless precipitate formed. After the mixture had been stirred for an additional 30 minutes, KOH (27g) in EtOH (200 mL) (-15% excess) was added. The precipitate dissolved and the colour changed to orange. The solution was stirred for an additional 30 minutes, where a colourless precipitate formed. CH3I (27 mL -15% excess) was added quickly and nearly all the precipitate redissolved. The solution was stirred for an additional 30 minutes. The colour of the solution changed first to red and then to a cloudy very light yellow colour. The solvent was removed by evaporation and diethylamine (300 mL) was added. The solution was then refluxed for 3 days and followed by drawing small samples and subjecting them to 1H NMR analysis. The reaction was stopped when 1H NMR showed complete conversion to 4,4-diethyl-1-phenyl-thiosemicarbazide. The solution was cooled to r.t. and atmospheric oxygen was bubbled rapidly through the solution through a glass frit for 24 hours. The colour of the solution changed quickly to dark red. The solvent was removed by evaporation and the liquid residue (a dark red oil) was dissolved in ethyl acetate (300 mL). The organic phase was washed with brine (3 x 250mL) and dried with MgSO4. After drying, the organic phase was filtered and evaporated to dryness to give 87.81 g of dark red oil. Recrystallization twice from
146

Appendix B
n-heptane:ethyl acetate/20:1 (3.15 L) gave 1 in 60% yield (53.23 g) as orange crystals. M.p.57.5 oC, DSC.: onset: 54.8 oC, peak: 57.5 oC, AH = 20175.51 J/mol.
Synthesis of 3 from metallic palladium black
0
Scheme S3: The synthetic procedure leading to the Trans-(di(A,A-diethyl-(2-phenyldiazenyl)thioformamide- K^,K^2))palladium (3) complex.
Palladium black contains of nanoparticles but also of larger particles that were not so reactive towards 1 and therefore a longer reaction time was needed.
Trans-(di(A,A-diethyl-(2-Phenyldiazenyl)thioformamide-KA,K.W2))paHadium (3) (Scheme S3):THF (100 mL) was placed in a 250 mL conical flask and degassed with argon. N,N- diethylphenylazothioformamide (1) (1.00 g, 4.21 mmol) and Palladium black (Aldrich) (0.25 g, 2.32 mmol) was added and the solution is refluxed under an argon atmosphere for 7 days. The solution was filtered through a thick (4cm) layer of Celite on a sintered funnel. The filtrate was collected and evaporated to dryness. The residue was purified by dry column vacuum chromatography3 with n- heptane/1,2-dichloroethane in the ratio 10:1 as the eluent. The eluent was removed by slow evaporation to provide dark green crystals. The yield was 164 mg (14 %) of pure compound 3.
Synthesis of 3 from palladium nanoparticles prepared in-situ (Scheme S4):
Scheme S4: An alternative procedure to synthesize the Trans-(di(MA-diethyl-(2-phenyldiazenyl)thioformamide- K^,KA2))palladium (3) complex.
Palladium (II) acetate (268 mg, 1.19 mmol) was dissolved in DMSO (50 mL) and flushed with argon. Under an argon atmosphere phenylhydrazine (74 mg, 0.69 mmol) was added. The colour of thesolution shifted quickly from brownish orange to black. After stirring for 10 minutes compound 1 (680 mg, 2,87 mmol) was added and the solution was refluxed under an argon atmosphere for 1% hour. The solution was then poured into 600 mL water, and was let standing in the hood without an argon
147

Appendix B
atmosphere for IV2 day. The colour of the mixture had changed from very dark brown to dark greenish blue. The mixture was washed four times with 400 mL n-heptane/ethyl acetate mixture (1:1). The entire organic fractions were collected and dried with magnesium sulphate. After filtration the solvent was removed by evaporation. The residue was then purified by dry column vacuum chromatography3 with n-heptane/ethyl acetate as the eluent in the ratio 10:1. The eluent was removed by evaporation to provide dark green powder. The yield was 480 mg (73 %) of compound 3. An analytical sample for determination of the molar extinction coefficient was obtained by an additional dry column chromatography.
'H NMR (250 MHz, CDC13, 300K, TMS, the spectrum is presented in figureS 1) 5: 1.218 (t (3J = 6.9 Hz), 12 H), 4.177 (broad s, 8 H), 6.431 (broad s, 2 H), 6.909 (broad s, 4 H), 7.575 (broad s, 4H). l3C NMR(250 MHz, CDC13, 300K, TMS) 5 : 16.309, 44.819, 123.692, 131.381, 175.869. MALDI-TOF MS [M+FT] = 549 (the isotopic pattern was confirmed); Anal. Calcd. for C22H3nN6PdS2: C:48.13, H:5.51, N:15.31, S: 11.68. Found: C:48.05, H:5.65, N:14.41, S: 11.50.
UV-vis (CHCI3 @ 25 °C): /imax.chloroform = 801 nm,8chloroform = 10300 M'1 cm"1
UV-vis in (THF @ 25 °C): XmaxjHF = 797 nm, s-ihf = 8500 M"1 cm"1 see Fig. S2
7.0 6.0 5.0 4.0 3.0 2.0 1.0 0.0ppm (tl)
Figure SI. The 'H-NMR spectmm of compound 3. The spectmm wasmeasured in CDC13 at 300 K.
148

Appendix B
oE
Wavelength [nm]Figure S2. UV-vis spectrum of 1 and 3 in THF @ 25 oC showing their extinction coefficients. Compound 3 shows a moderately strong absorption with a maximum at 797 nm where compound 1 does not absorb.
General procedure for the removal of Pd from polymer samples by N,N- diethylphenylazothioformamide (1): The polymer was dissolved in THF (no more than necessary, typically 1 ml/20 mg sample) under an argon atmosphere and compound 1 (10 times excess with respect to the amount of Pd in the catalyst used) was added and the solution was stirred between 30 minutes and 1 hour. The mixture can also be refluxed. The polymer was precipitated with methanol (typically 10 times the amount of THF), filtered and washed with methanol. The polymer was redissolved in THF under an argon atmosphere and precipitated with methanol a second time, filtered and washed with methanol. The polymer was then dried in a vacuum oven.
General procedure to analyze the contents of Pd in a polymer sample by N,N- diethylphenylazothioformamide (1): The polymer sample was very precisely weighted out and dissolved in THF (typically 20 mg/ml) under an argon atmosphere. Compound 1 (10 times excess with respect to the amount of Pd in the catalyst) was added and the solution is stirred between 30 minutes and 1 hour. The solvent was evaporated and the solid was redissolved in a precisely known volume of solvent and a UV-vis spectrum of the solution was recorded.
Examples of Pd-catalysed polymerisation to conjugated polymers, Pd analysis and device preparation.
Three types of polymer, PPE1, PPV4 and PAT5 were used in the investigations.
Example 1: Poly[1-(2,5-dioctyl-tolanyl)-ethynylene] (PPE)1. A 100 mL round-bottom flask was dried using a heat gun and flushed with argon. 1-iodo-2,5-dioctyl-4’-ethynyltolane (1.36mmol, 0.750 g) was dissolved in piperidine (40 mL ) and flushed with argon for 30 minutes, before the catalyst Pd(PPh3)4 (* 2 mol %) and the co-catalyst CuI (* 10 mol %) were added under an argon atmosphere. The solution was stirred under an argon atmosphere over night at room temperature. A yellow
149

Appendix B
precipitate quickly formed. The colour of the solution was yellow during the reaction. The following day the reaction mixture had solidified. Dry THF (50 mL) was added and the solution was heated to near reflux temperature. The precipitate dissolved and the solution was stirred for another 5 hours. The solution was then poured into 300 mL methanol and a yellow precipitate formed. The suspension was filtered through a glass filter-funnel. The filter cake was washed with both cold methanol, cold diethyl ether and was sucked as dry as possible. The wet product was kept for further use. Attempts to dry the product in a vacuum at RT gave a darkened product that was no longer soluble in common solvents. This behaviour has been observed2 earlier. The total yield based on a completely dried sample was0.35 g (95%). The wet product that was kept weighed 0.6 g and contained 40% solvent. 'H NMR 5:0.76-0.95 (m, 6H), 1.13-1.50 (m, 20 H), 1.50-1.83 (m, 4H), 2.70-2.90 (m, 4H), 7.31-7.43 (broad s), 7.43-7.60 (broad s) (7.31-7.60, 6H).
Pd-analysis of the PPE polymer The PPE polymer (0.1028 g) was dissolved in 3 mL THF under an argon atmosphere. Compound 1 (0.035 g) was added and the solution was stirred under an argon atmosphere in 1 hour. The solution was diluted to a volume of 5 mL and the UV-vis spectrum was recorded. This gave an absorbance of 0.441 which corresponds to a concentration in 3 of 51.9 qM. The amount of Pd in the polymer was thus 0.259 qmol ~ 27.60 qg Pd in 0.1028 g of polymer. This is equivalent to 268 mg Pd kg-1 or 268 ppm. The result of the Pd determination in the polymer is listed in table 1 in the article.
Example 2: Poly-1,2’’’-(2,5-dioctyl-1,4-phenylene-1’,2’-vinylene-1’’,4’’-phenylene-1’’’,2’’’- vinylene) PPV.4 1,4-Dibromo-2,5-dioctylbenzene (1 g, 2.17 mmol), 1,4-divinylbenzene (0.28 g, 2.17 mmol), triethylamine (10 mL) were mixed in dry THF (50 mL) and the mixture was degassed with argon for 5 min. (PPh3)2PdCl2 (250 mg) was added and the mixture was heated to reflux. After 36 h the mixture was poured into methanol to precipitate the bright yellow product. It was then filtered and dried to give a yellow solid in 85% yield (0.79g). Analytical data as in ref. 4. a mixture of palladium nanoparticles and polymer could be obtained by dissolution of the product in THF followed by ultracentrifugation.
Pd-analysis of the PPV polymer The PPV polymer (0.0577 g) was dissolved in 5 mL THF under an argon atmosphere. Compound 1 (0.035 g) was added and the solution was stirred under an argon atmosphere in 1 hour. The solution is diluted to 50 mL and a sample of 3 mL was drawn and diluted to 20 mL. From this sample the UV-vis spectrum is recorded. This gave an absorbance of 0.247 corresponding to a concentration in 3 of 29 qM. The dilution factor of the 50 mL solution was 6.67 corresponding to a total volume of 333.3 mL. The amount of Pd in the polymer was thus 9.7 qmol ~ 1030 qg Pd in 0.0577 g of polymer. This is equivalent to 17860 mg Pd kg-1 or 17860 ppm. The result of the Pd determination in the polymer is listed in table 1 in the article.
Example 3: Poly-(3-hexylthiophene) PAT.5 DMSO (30mL) and DMF (30mL) was degassed using argon and (PPh3)2PdCl2 (90mg, 0.128 mmol, catalyst) was added and the mixture was heated to 75 oC with stirring. 2-Bromo-3-hexyl-5-trimethylstannylthiophene (1.75g, 4.26 mmol) was added drop wise from a syringe. The colour of the mixture quickly changed to clear yellow and after 1 min. it became cloudy and orange and after another minute it became red/brown and a material started to separate. After 3 days under argon the mixture was a light yellow clear solution with a black precipitate. The mixture was filtered and the solid washed with methanol (5 x 50mL). Drying gave a black solid 0.69g (97%).
Pd-analysis of the PAT polymer The PAT polymer (0.035 g) was dissolved in 5 mL THF under an argon atmosphere. Compound 1 (0.030 g) was added and the solution was stirred under an argon atmosphere in 1 hour. The solution is diluted to 50 mL. From this sample the UV-vis spectrum is recorded. This gave an absorbance of 0.228, which gives a concentration in 3 of 26.8 qM. The amount of Pd in the polymer was thus 1.34 qmol ~ 143 qg Pd in 0.035 g of polymer. This is equivalent to
150
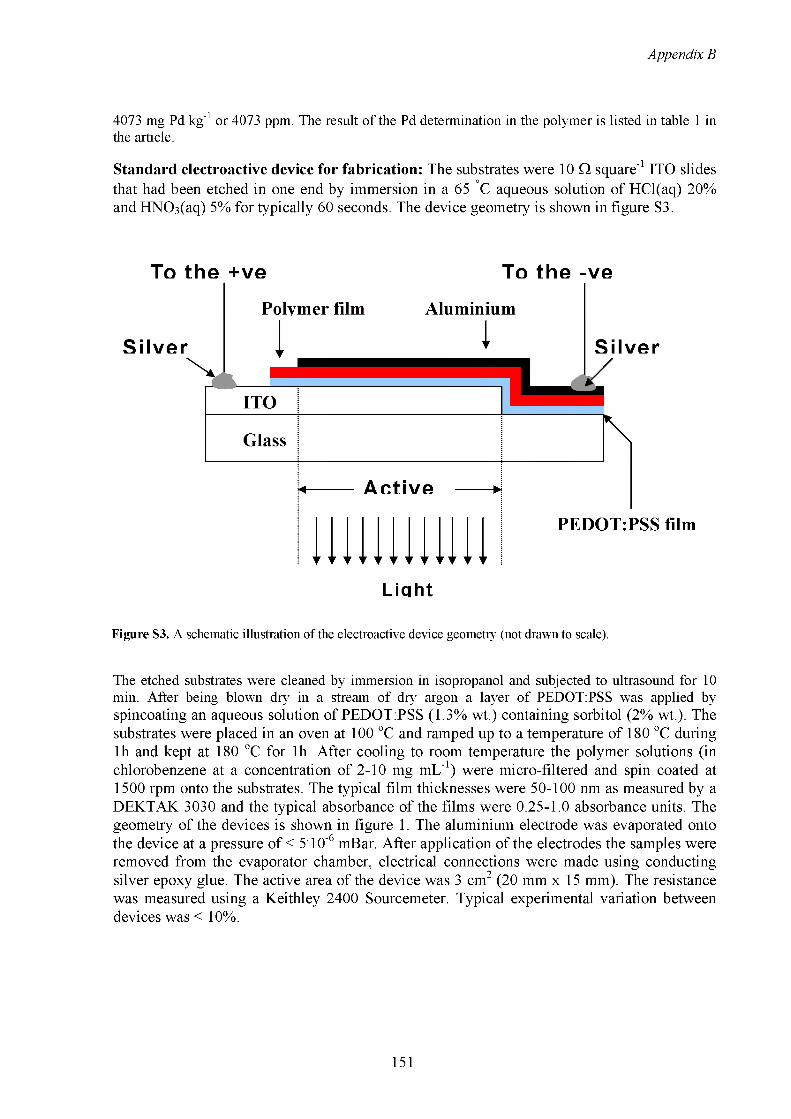
Appendix B
4073 mg Pd kg"1 or 4073 ppm. The result of the Pd determination in the polymer is listed in table 1 in the article.
Standard electroactive device for fabrication: The substrates were 10 O square'1 ITO slides that had been etched in one end by immersion in a 65 C aqueous solution of HCl(aq) 20% and HNOs(aq) 5% for typically 60 seconds. The device geometry is shown in figure S3.
To the +ve To the -ve
Polymer film Aluminium
<------- Active ------- ►
PEDOTrPSS film
Light
Figure S3. A schematic illustration of the electroactive device geometry (not drawn to scale).
The etched substrates were cleaned by immersion in isopropanol and subjected to ultrasound for 10 min. After being blown dry in a stream of dry argon a layer of PEDOTPSS was applied by spincoating an aqueous solution of PEDOT PSS (1.3% wt.) containing sorbitol (2% wt.). The substrates were placed in an oven at 100 °C and ramped up to a temperature of 180 °C during lh and kept at 180 °C for lh. After cooling to room temperature the polymer solutions (in chlorobenzene at a concentration of 2-10 mg mL'1) were micro-filtered and spin coated at 1500 rpm onto the substrates. The typical film thicknesses were 50-100 nm as measured by a DEKTAK 3030 and the typical absorbance of the films were 0.25-1.0 absorbance units. The geometry of the devices is shown in figure 1. The aluminium electrode was evaporated onto the device at a pressure of < 5 10'6 mBar. After application of the electrodes the samples were removed from the evaporator chamber, electrical connections were made using conducting silver epoxy glue. The active area of the device was 3 cm2 (20 mm x 15 mm). The resistance was measured using a Keithley 2400 Sourcemeter. Typical experimental variation between devices was < 10%.
151

Appendix B
References
1) Nielsen, K. T.; Spanggaard, H.; Krebs, F. C. Macromolecules (2004), accepted.
2) Solomin, V. A. and Heitz, W. Macromol. Chem. Phys., 1994, 195, 303-314.
3) Pedersen, D. S.; Rosenbohm, C. Synthesis (2001), 16, 2431-2434.
4) Krebs, F. C.; Jorgensen, M. Macromolecules 2003, 36, 4374-4384; Krebs, F. C.; Nyberg, R. B.; Jorgensen, M. Chem. Mater. (2004), 16, 1313-1318.
5) Iraqi, A.; Barker, G. W. J. Mater. Chem. (1998), 8, 25; Krebs, F. C; Biancardo, M. Sol. En. Mater. Sol. Cells (2004), submitted.
152

Appendix B
Effective Removal and Quantitative Analysis of Pd, Cu, Ni, and Pt Catalysts from Small-Molecule ProductsKim T. Nielsen,*" Klaus Bechgaard,b Frederik C. Krebs"* The Danish Polymer Centre, RJS0 National Laboratory, P.O, Box 49, Roskilde 4000, Denmark
Fax +4546777491; E-mail: [email protected] h Department of Chemistry, University of Copenhagen, Copenhagen 2100, Denmark Received 7 November 2005; revised 9 January 2006
PAPER 1639
Abstract: We demonstrate the ability of V.V (licthylph::nyl azothioforinamide and A'.W-bisllclralethylene glyeol)monomelhyl elherlphenylazolhiofomiamidc ligands to dissolve the four transition metals: palladium, copper, nickel and platinum. The method allows solubilisation and quantitative analysis of the transition-metal content in their bulk metallic forms and as nanopaitides produced during their use as catalysis in Sonogashira coupling reactions.
Key words: palladium, copper, nickel, cross-coupling reaction, catalysis
For more than 100 years organic chemists have been attracted to transition metals, due to the vast number of possibilities that are offered in the field of organic synthesis, e.g. the selective activation of C-H, C—C and C-X bonds (X = good leaving groups such as halides). There has, however been only sporadic interest in ensuring that the amount of transition metals remaining in the newly synthesized organic compounds are at the ppb level.1™14 Organic chemists rarely consider impurities at a level below 0.1 %, because impurities at that level normally do not interfere with characterisation techniques such as NMR, GC-MS, HPLC, 1R, UV-Vis and elemental analysis. The impurity level in organic compounds should, however, be much smaller titan 0.1%, if the compounds are to be used in pharmaceutical or electronic applications.1™3-5™7 In particular, removal of trace amounts of palladium from drugs is a significant problem for the pharmaceutical industry; an aspect that is often neglected in the literature.2-5 6 In this respect it should be mentioned that concentration limits of, for example, Pd and Cu in orally administered drugs should be below 5 ppm and 15 ppm respectively, while the parenteral concentration limits should be I/I0 of the limit for the oral doses.7We have recently demonstrated that palladium impurities of between 268 ppm and 17860 ppm in derivates of polyfphenylene vinylene) (PPV), poly(alkylthiophene) (PAT) and polyfphenylene ethynylene)s (PPE) have a dramatic effect on the electrical properties of thin film devices made from these polymers.12-14 We observed that, as the resistance of the devices (OLEDs) approached short circuit, no electroluminescence could be observed. In this case we found that the palladium remnants could not be
SYNTHESIS 2006, No. 10, pp 1639-1644 Advanced online publication: 27.04.2006 DOl: 10.1055/s-2006-926453: An ID: T15305SS © Georg Thiemc Verlag Stuttgart - New York
removed by normal purification methods such as size-exclusion chromatography (SEC), but that Pd nanoparticles could be dissolved and thereby removed from the polymers by treatment with M/V-diethylphenylazothioforma- mide (1) (Figure la). The contamination level of palladium in these polymers, after such treatment, was lowered to below 0.1 ppm and the resultant thin polymer film devices had high resistance and were electroluminescent.Even though palladium is by far ihe most commonly used transition-metal catalyst15 (used in e.g. Heck.16 Sonogash- ira,n Stille,16 Suzuki1* and Negishi20 cross-coupling reactions), it would be a great advantage if compound 1 also worked for other transition metals. In this paper we focus on four transition me la Is - copper, nickel, palladium and platinum - and demonstrate that 1 also has the ability to dissolve these metals while forming the coordination compounds shown in Figure lb. Furthermore, we present the synthesis of A/.A'-bi.sttetrafethylene glycol) monomethyl etherjphenylazothioformamide (2) (Figure la) designed to extend Ihe use of these iigands lo small- molecule samples and demonstrate that compound 2 can also dissolve the transition metals by forming the coordination compounds shown in Figure 1c.The synthetic route to 2 is shown in Scheme 1 and is described in the experimental section. The most interesting difference between 2 and 1 is that the A\/V-bis[tetra(ethyl- ene glycol) monomethyl etherjamine group in 2 exhibits a strong affinity for silica in polar solvents such as CHClj. When the pure ligand 2 or the complexes 7-10 are filtered through silica gel, with CHCI, as eluent, the materials are immobilised on the columns. This property makes it possible lo remove transition-metal catalysts from samples of small organic molecules in a very easy manner; simple dissolution of die compound in CHCI, together with 2, followed by stirring overnight and subsequent filtration through a pad of silica gel. The organic material can then be recovered from the filtrate. While 2 is water-soluble and, in principle, can be used for removal of metals from aqueous solutions, the distribution coefficient of 2 between water and organic solvents such as CHCI, or 1,2- dichlorobenzene is rather low. This means that, in practice, it is impossible to carry out an extraction of 2, or of its complexes, from an organic solvent into water. Compound 2 can, however, be used to remove catalyst rem-
153
* Thi
s is a
cop
y of t
he a
utho
r’s p
erso
nal r
eprin
t

Appendix B
1640 K. T. Nielsen et al. PAPER
Figure 1
nants from water-soluble compounds by treatment in water followed by removal through extraction into CHC13.
Transition metals are easy to remove from small organic molecules by distillation,1 but compounds are not always able to withstand such relatively harsh conditions and other effective purification techniques are thus needed. It has been shown that neither crystallisation1-2,5,6 nor chromatography1,2 remove traces of palladium catalysts. Here we demonstrate that treatment by 2 is a very mild, efficient and easy way to remove remnants of transition metals from small organic compounds.
To test and demonstrate the affinities of the two azothio- formamides for the four transition metals, we conducted two different types of experiments. In the first type we tested the ability of the two azothioformamide derivatives to dissolve the transition metals in their bulk metallic form. This was performed by placing a piece of metal wire in a concentrated solution of the azothioformamides. The second type of experiment dealt with the ability of the azothioformamides to remove traces of the metals from the products of a typical metal-catalysed reaction. In this type of experiment, the metals would be in the form of nanoparticles, and therefore have a much larger surface area compared to the metallic form in wires. It is therefore expected that the reaction time for dissolution of the nanoparticles would be faster.
The model reaction chosen was of the Sonogashira crosscoupling type,17 since this reaction can be performed either with Pd17 or Cu21 alone as the catalyst, or with Pd as the catalyst and Cu as a co-catalyst. It has also been reported22 that Ni works as a catalyst for this type of reaction, but that reaction did not work satisfactorily in our hands. The two transition metals Pd and Cu do not behave
1) CSj2) KOH
3) CH3I
1)HN[(C2H40)4CH3]2reflux
2) 02 (atmospheric)
O—Scheme 1 The synthetic route used for the preparation of compound 2.
Synthesis 2006, No. 10, 1639-1644 © Thicme Stuttgart • New York
154

Appendix B
PAPER Removal and Analysis of Transition Melals 1641
PdIPPhg), (2 mol%)
Scheme 2 Model systems for metal-catalysed reactions. For comparative studies, we have chosen the synthesis of diphenyl acetylene by a Sonogashira cross-coupling reaction using Pd and Cu.
identically in the Sonogashira reactions, as a consequence we have used different solvent-base pairs for the two model systems (Scheme 2). More details of the model system are to be found in the literature (Pd17 and Cu21) and in the experimental section.
As described earlier,14 the use of 1 to remove palladium, also makes possible the analysis of the palladium content in the samples by UV-Vis spectroscopy, with a detection limit as low as 10 ppb. We demonstrate here that both 1 and 2 have the ability to remove a range of transition metals from an organic sample and furthermore 1 can be used to quantify that content. Note that 1 is designed to remove transition metals from large molecules through precipitation from excess methanol, a solvent in which both 1 and its metal complexes are soluble. Compound 2, on the other hand, is designed to remove transition metals from small organic molecules, which can not be precipitated but where filtration through a short silica column works well.
From the first type of experiments we observed that 1 very effectively dissolves a copper metal wire. Figure 2 shows the results after the copper wire had been immersed in a concentrated TFiF solution of 1 for just one week. Other metals are not dissolved as quickly. Visual inspection of nickel wire under the same conditions showed that, while some of the metal was dissolved, the extent of erosion was significantly less pronounced than that of the copper wire. We could only detect the dissolution of the platinum wire by a UV-Vis analysis of the solution. No solubilisation of the palladium wire was detected; however, we have demonstrated that 1 dissolves both palladium nanoparticles and palladium black, so the inability of this reagent to dissolve this metal seems to be due to a surface phenomenon. From this set of experiments we can conclude that the reactivity of 1 towards the four transition metals increases in the order Pd < Pt < Ni < Cu. Visual inspection of the experiments with compound 2 showed that this compound does not seem to be as effective as 1 in dissolving the metals. This might be due to the steric hindrance of the long tetra(ethylene glycol) monomethyl ether groups, but the trend appears to be the same.To be able to make a quantitative analysis of the transition-metal content in newly synthesised organic compounds as described earlier for palladium,14 we have determined the molar extinction coefficients at Xml, for the four complexes with the ligand 1 in both CHC13 and
THF. The values and the respective Xmax are listed in Table 1.
The UV-Vis spectra for the four complexes are shown in Figure 3. It can be seen that the Xmax increased in the order Pt < Cu < Pd < Ni and the extinction coefficients in the series Ni < Cu < Pd < Pt.
We have also synthesised complexes with 2 as the ligand, however, it turned out that it was very difficult to separate the excess of 2 from the complex of 2 and the transition metal. By examining the UV-vis spectrum of the Cu complex (9) in water and CHC1, (Figure 4), it can be seen that the spectrum in water is characterized by a broad peak with maximum at 657 nm. This peak is not present in the spectrum of the complex in CHC13. The explanation to this peak is probably that the complex is easily oxidized to the CuL,4 complex in aqueous solution. This explanation is supported by the literature23 where the spectrum of the CuL,4 (L = 1) is also characterized by this broad peak.
The content of Pd and Cu in the final product of the model reaction was analysed with 1 and, as can be seen in
Figure 2 Copper wire after one week in a concentrated THF solution of 1. Notice how thin the copper wire is in the middle compared to the ends, and how the crystals of the < n-{ difV.jV-dirthyli 2-plienyldi- azenyl)thijfunnain;dc-k.S',k.V']}copper (5) are growing on the wire.
Table 1 Molar Extinction Coefficients and the Xm„ Values for the Four Complexes
Compd M
THF
(nm) (M' cm ')
CHC1,
(nm)£(M-1 cm"1)
3 Pd 796 8500 801 10300
4 Pt 727 26400 731 25400
5 Cu 770 3900 768 3400
6 Ni 830 1800 830 1800
Synthesis 2006, No. 10, 1639-1644 ©Thieme Stuttgart ■ New York
155

Appendix B
1642 K. T. Nielsen cl al. PAPER
40000
35000
15000 : hi \
300 400 500 000 1000 I UK)Wavelength |nni|
Figure 3 The UV-Vis spectra of the four complexes (compound 3- 6) and the pure ligand W-diethylaminophenylazolhiofonnamide (1). The solvent in this case is CHClj at room temperature. The extinction coefficients are listed in Table 1.
300 400 500 600 700 800 900 1000 1100Wavelength |nm|
Figure 4 The UV-Vis spectra, recorded at room temperature, of the Cu complex (compound 9) and the ligand AUV-bis[tetra(ethylene glycol) monomethyl etherjphenylazothioformamide (2) in both CHClj and water.
Table 2, both metals were still observed even after chromatography and recrystallisation. When the product was then treated with 2 and filtered through a short silica pad, the strong affinity of 2 for silica was observed visually as a colouration of the top layer (Figure 5 illustrates the difference between 1 and 2 in adsorption to silica). Evaporation, followed by NMR and UV-Vis analysis of the filtrate, indicated that only diphenyl acetylene was present, with no trace of the complex or ligand. The absence of metal in the filtrate was confirmed by treatment with 1 followed by UV-Vis analysis (Table 2).
In the case of the determination of the content of Cu in the model system by using 1, it should be mentioned that it was CuL/ instead of CuL, that was observed. The eX696 = 7700 IvL'cnr1 of the CuL,4 from the literature23 was therefore used to determine the content of Cu in the Cu model system.
Oi'pheuyl acetylene .
▼
3
1
1 AFigure 5 A TLC plate of the Pd model system with CMC I, as the eluent. The trace to the left is from the Pd model system treated with2 and the trace to the right is from the Pd model system treated with 1. Notice that both the ligand and the complex are mobile on silica for the system treated with 1, while only diphenyl acetylene is mobile in the system treated with 2.
In order to validate the Pd and Cu content after treatment with 2, we also analysed the samples with inductively coupled plasma sector field mass spectrometry (ICP- SFMS). As the results show (Table 2), both analytical methods gave comparable results for transition-metal content both before and after treatment with 2. Further, it should be emphasised that both analytical methods determined the content of the transition metals after treatment with 2 to be below the parenteral concentration limit for drugs.
Table 2 Transition-Metal Content in the Products of the Model Reaction before and after Treatment with 2 as Determined by UV-Vis Spectroscopy with 1 and ICP-SFMS
Metal UV-Vis (ppm) / ICP-SFMS (ppm)
Before treatment After treatment with 2
Pd 376/610 <0.1/0.5
Cu 1074/1660 <0.1/0.1
In conclusion, we have demonstrated the ability of 1 and 2 to dissolve four transition metals Pd, Pt, Cu and Ni, in a contaminated organic product prepared via metal catalysis. We demonstrated the use of 1 for the analysis and quantitative determination of the content of the four metals in a given organic sample by UV-Vis spectrophotometry. Furthermore we have demonstrated that, unlike 1, the high affinity of 2 for silica enables its use in the facile removal of any of these transition metals from small organic compounds simply by filtration through a short silica pad. It should be emphasised that this method is fast, easy, potentially low-cost (no expensive chemicals) and can be applied to any organic sample, as long the sample is soluble.
ii and 1 'C NMR spectra were recorded on a 250 MHz NMR spectrometer at 300 K unless otherwise staled. All spectra were recorded in CDC1, with TMS as an internal reference. Compound 115 and the four complexes24 (3-6) for the determination of the molar extinction coefficients were prepared according to the procedures described in the literature.
Synthesis 2006, No, 10. 1639-1644 © Thieme Stuttgart ■ New York
156
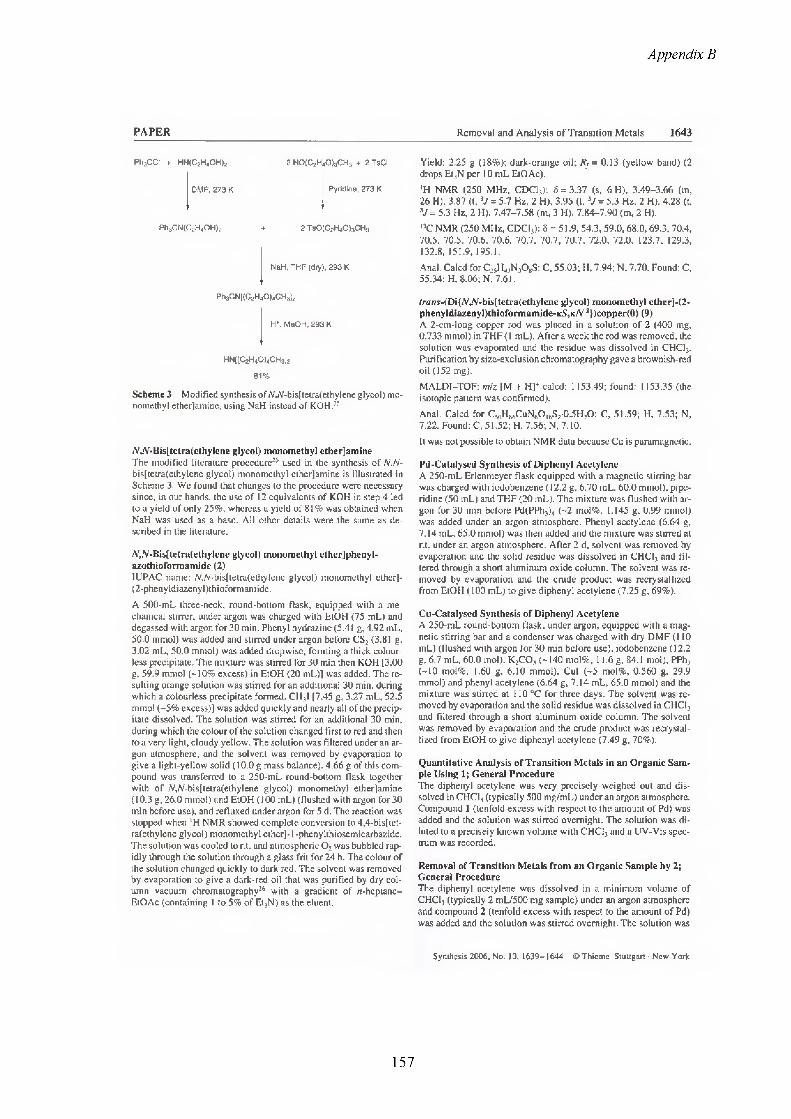
Appendix B
PAPER Removal and Analysis of Transition Metals 1643
Ph3CCI + HN(C2H4OH)2 2 HO(C2H40)3CH3 ♦ 2 TsCI
DMF. 273 K Pyridine. 273 K
Ph3CN(C2H4OH)2 ♦ 2 Ts0(C2H40)3CH3
NaH. THF (dry). 293 K
Yield: 2.25 g (18%); dark-orange oil; Rf = 0.13 (yellow band) (2 drops Et,N per 10 mL EtOAc).
'H NMR (250 MHz, CDC13): 8 = 3.37 (s, 6H), 3.49-3.66 (m, 26 H), 3.87 (t. V = 5.7 Hz, 2 H), 3.95 (t, V = 5.3 Hz, 2 H), 4.28 (t. V = 5.3 Hz, 2 H), 7.47-7.58 (m, 3 H), 7.84-7.90 (m, 2 H).
I3C NMR (250 MHz, CDCI,): 8 = 51.9,54.3,59.0,68.0,69.3,70.4, 70.5, 70.5, 70.6, 70.6, 70.7, 70.7, 70.7, 72.0, 72.0, 123.7, 129.3, 132.8, 151.9, 195.1.
Anal. Calcd for C23H43N,0*S: C, 55.03; H, 7.94; N, 7.70. Found: C, 55.34; H, 8.06; N, 7.61.
Ph3CN[(C2H40)4CH3j2
H*. MeOH. 293 K
HN[(C2H40)4CH3]2
81%
Scheme 3 Modified synthesis of N.A/-bis(tetra(ethylene glycol) mo- nomethyl etherjaminc. using NaH instead of KOH."
NVV-Bis[tctra(ethylcne glycol) monomethyl etherjaminc The modified literature procedure25 used in the synthesis of N.N- bis[tetra(ethylene glycol) monomethyl etherjaminc is illustrated in Scheme 3. We found that changes to the procedure were necessary since, in our hands, the use of 12 equivalents of KOH in step 4 led to a yield of only 25%. whereas a yield of 81% was obtained when NaH was used as a base. All other details were the same as described in the literature.
(V,Af-Bis[tetra(ethylcne glycol) monomethyl etherjphenyl- azothioformamide (2)IUPAC name: A/,/V-bis[tetra(ethylenc glycol) monomethyl etherj- (2-phenyldiazenyl)thioformamidc.
A 500-mL three-neck, round-bottom flask, equipped with a mechanical stirrer, under argon was charged with EtOH (75 mL) and degassed with argon for 30 min. Phenyl hydrazine (5.41 g, 4.92 mL, 50.0 mmol) was added and stirred under argon before CS2 (3.81 g, 3.02 mL, 50.0 mmol) was added dropwise, forming a thick colourless precipitate. The mixture was stirred for 30 min then KOH J3.00 g, 59.9 mmol (-10% excess) in EtOH (20 mL)] was added. The resulting orange solution was stirred for an additional 30 min. during which a colourless precipitate formed. CH3I [7.45 g, 3.27 mL, 52.5 mmol (-5% excess)) was added quickly and nearly all of the precipitate dissolved. The solution was stirred for an additional 30 min, during which the colour of the solution changed first to red and then to a very light, cloudy yellow. The solution was filtered under an argon atmosphere, and the solvent was removed by evaporation to give a light-yellow solid (10.0 g mass balance). 4.66 g of this compound was transferred to a 250-mL round-bottom flask together with of WV-bisJtetrafethylene glycol) monomethyl etherjaminc (10.3 g. 26.0 mmol) and EtOH (100 mL) (flushed with argon for 30 min before use), and refluxed under argon for 5 d. The reaction was stopped when 'H NMR showed complete conversion to 4.4-bis[lel- ra(ethylene glycol) monomethyl ether]-1 -phcnylthioscmicarbazide. The solution was cooled to r.t. and atmospheric Oj was bubbled rapidly through the solution through a glass frit for 24 h. The colour of the solution changed quickly to dark red. The solvent was removed by evaporation to give a dark-red oil that was purified by dry column vacuum chromatography26 with a gradient of n-heptane- EtOAc (containing 1 to 5% of Et3N) as the eluent.
Zrafi$-(Di(A\/V-bis[tetra(ethylene glycol) monomethyl ether]-(2- phenyldiazenyl)thioformamide-K.S,KiV 2})copper(0) (9)A 2-cm-long copper rod was placed in a solution of 2 (400 mg, 0.733 mmol) in THF (1 mL). After a week the rod was removed, the solution was evaporated and the residue was dissolved in CHC13. Purification by size-exclusion chromatography gave a brownish-red oil (152 mg).
MALDI-TOF: m/z [M + HJ* calcd: 1153.49; found: 1153.35 (the isotopic pattern was confirmed).
Anal. Calcd for C50H86CuN6Ol6S2-0.5H2O: C, 51.59; H, 7.53; N, 7.22. Found: C, 51.52; H, 7.56; N, 7.10.
It was not possible to obtain NMR data because Cu is paramagnetic.
Pd-Catalysed Synthesis of Diphenyl Acetylene A 250-mL Erlenmeyer flask equipped with a magnetic stirring bar was charged with iodobenzene (12.2 g. 6.70 mL, 60.0 mmol), piperidine (50 mL) and THF (20 mL). The mixture was flushed with argon for 30 min before Pd(PPh3)4 (-2 mol%, 1.145 g, 0.99 mmol) was added under an argon atmosphere. Phenyl acetylene (6.64 g, 7.14 mL, 65.0 mmol) was then added and the mixture was stirred at r.t. under an argon atmosphere. After 2 d, solvent was removed by evaporation and the solid residue was dissolved in CHC!3 and filtered through a short aluminum oxide column. The solvent was removed by evaporation and the crude product was recrystallized from EtOH (100 mL) to give diphenyl acetylene (7.25 g, 69%).
Cu-Catalyscd Synthesis of Diphenyl Acetylene A 250-mL round-bottom flask, under argon, equipped with a magnetic stirring bar and a condenser was charged with dry DMF (110 mL) (flushed with argon for 30 min before use), iodobenzene (12.2 g, 6.7 mL, 60.0 mol), K2CO, (-140 mol%, 11.6 g, 84.1 mol). PPh, (-10 mol%, 1.60 g, 6.10 mmol). Cul (-5 mol%, 0.560 g, 29.9 mmol) and phenyl acetylene (6.64 g, 7.14 mL, 65.0 mmol) and the mixture was stirred at 110 °C for three days. The solvent was removed by evaporation and the solid residue was dissolved in CHCI, and filtered through a short aluminum oxide column. The solvent was removed by evaporation and the crude product was recrystallized from EtOH to give diphenyl acetylene (7.49 g, 70%).
Quantitative Analysis of Transition Metals in an Organic Sample Using 1; General ProcedureThe diphenyl acetylene was very precisely weighed out and dissolved in CHCI3 (typically 500 mg/mL) under an argon atmosphere. Compound 1 (tenfold excess with respect to the amount of Pd) was added and the solution was stirred overnight. The solution was diluted to a precisely known volume with CHC13 and a UV-Vis spectrum was recorded.
Removal of Transition Metals from an Organic Sample by 2; General ProcedureThe diphenyl acetylene was dissolved in a minimum volume of CHCI3 (typically 2 mL/500 mg sample) under an argon atmosphere and compound 2 (tenfold excess with respect to the amount of Pd) was added and the solution was stirred overnight. The solution was
Synthesis 2006, No. 10, 1639-1644 © Thicmc Stuttgart • New York
157

Appendix B
1644 K. T. Nielsen el al. PAPER
diluted with CHC1, (10 mL) and filtered through a short pad of silica gel. The silica gel was washed with CHCI, (100 mL) and the solvent was then removed by evaporation. The purified diphenyl acetylene was then ready to be tested for transition metals using the method described above.
Acknowledgment
This work was supported by the Danish Technical Research Council (STVF 26-02-0174, STVF 2058-03-0016) and the Danish Strategic Research Council (DSF 2104-04-0030 and DSF 2104-05- 0032).
References
(1) KOnigsberger, K.;Chen,G.; Wu, R. R.;Girgis, M.J.; Prasad, K.; Rcpii, O.; Blacklock, T. J. Org. Process Res. Dev. 2003, 7. 733.
(2) Manley, P. W.; Acemoglu, M.; Marterer, W.; Pachinger, W. Org. Process Res. Dev. 2003, 7,436.
(3) Urawa, Y.; Miyazawa, M.; Ozeki, N.; Ogura, K. Org. Process Res. Dev. 2003, 7, 191.
(4) Ferrari, C.; Prcdieri, G.; Tiripicchio, A. Chem. Mater. 1992,4, 243.
(5) Chen, C.; Dagneau, P.; Grabowski, E. J. J.: Oballa, R.: O'Shea, P.; Prasit, P.; Robichaud, J.; Tillyer, R.; Wang, X. J. Org. Chem. 2003,68, 2633.
(6) Rosso, V. W.; Lust, D. A.; Bernot, O. J.; Grosso, J. A.; Modi,5. P.; Rusowicz, A.; Sedergran, T. C.; Simpson, J. H.; Srivastava, S. K.; Humora, M. J.; Anderson, N. G. Org. Process Res. Dev. 1997, /, 311.
(7) Garret, C. E.; Prasad, K. Adv. Synth. Catal. 2004,346. 889.(8) Schmucklcr, G. (Technion Research and Development
Foundation Ltd.), DEI 533131,1974; Chem. Abstr. 1969, 71, 32590.
Synthesis 2006, No. 10. 1639-1644 © Thieme Stuttgart ■ New York
(9) Villa, M.; Cannata, V.; Rosi, A.; Allegrini, P. (Zambon Group S P A.) WO 9851646,1998; Chem. Abstr. 1998,130, 15127.
(10) Krebs, F. C.; Nyberg, R. B.; Jorgensen, M. Chem. Mater. 2004. 16, 1313.
(11) Sellinger, A.; Tamaki, R.; Laine, R. M.; Ueno, K.; Tanabe, H.; Williams, E.; Jabbour, G. E. Chem. Commun. 2005, 3700.
(12) Nielsen, K. T.; Spanggaard, H.; Krebs, F. C. Macromolecules 2005, 38, 1180.
(13) Nielsen, K. T.; Spanggaard, H.; Krebs, F. C. Displays 2004, 25.231.
(14) Nielsen, K. T.; Bechgaard, K.; Krebs, F. C. Macromolecules 2005,38,658.
(15) Ritleng, V.; Sirlin, C.; Pfeffer, M. Chem. Rev. 2002, 102, 1731.
(16) Dieck, H. A.; Heck, F. R. J. Organomet. Chem. 1975, 93, 259.
(17) Sonogashira, K.; Tohda, Y.; Hagihara, N. Tetrahedron Lett. 1975, 50, 4467.
(18) Milstein, D.; Stille, J. K. J. Am. Chem. Soc. 1978,100, 3636.(19) Suzuki, A. Acc. Chem. Res. 1982, 15, 178.(20) Negishi, E.; King, A. O.; Okukado, N. J. Org. Chem. 1977,
42, 1821.(21) Okuro, K.; Furuune, M.; Enna, M.; Miura, M.; Nomura, M.
J. Org. Chem. 1993, 58,4716.(22) Beletskaya, I. P.; Latyshev, G. V.; Tsvetkov, A. V.;
Lukashev, N. V. Tetrahedron Lett. 2003, 44, 5011.(23) Bechgaard, K. Thesis-, University of Copenhagen: Denmark,
1973.(24) Jensen, K. A.; Bechgaard, K.; Pedersen, C. T. H. Acta Chem.
Scand. 1972,26, 2913.(25) Selve, C.; Ravey, J. C.; Stebe, M.-J.; Moudjahid, C. E.;
Moumni, E. M.; Delpuech, J.-J. Tetrahedron 1991, 47,411.(26) Pedersen, D. S.; Roscnbohm, C. Synthesis 2001, 2431.
158

Appendix B
Design of porphyrin-polyphenyleneethynylene light harvesting systems
Kim T. Nielsen Holger Spanggaard3, Frederik C. Krebs3 3Polymer Solar Cell Initiative, Danish Polymer Centre, Ris0 National Laboratory,
PO Box 49, DK-4000 Roskilde, Denmark.^Department of Chemistry, Technical University of Denmark DTU-207,
DK-2800 Kgs. Lyngby, Denmark
ABSTRACT
The design of light harvesting systems based on zinc-porphyrin linked polyphenyleneethynylene systems is demonstrated through two different synthetic procedures. The use of the Sonogashira cross-coupling reaction was found to be problematic in several aspects and it was only possible for one of the synthetic strategies to incorporate a single porphyrin molecule in each polymer chain. The polymer materials were separated into fractions using preparative SEC and subjected to photophysical studies in both the solution and in the solid state. In the solid state light harvesting by the pendent polyphenyleneethynylene and energy transfer to the zinc-porphyrin was found to be high whereas it was low in solution. This observation was confirmed when making electroactive devices. I/V characteristics were measured on fabricated solar cells of the polymers. Material properties for the native polyphenyleneethynylene were determined using ultra violet photoelectron spectroscopy on thin films and carrier mobility studies were performed using pulse radiolysis time resolved microwave conductivity.
Keywords: Dye-linked conjugated homopolymers, zinc-porphyrin linked polyphenylencthynylenes, near-infrared electroluminescence, energy transfer through bonds, organic based photovoltaics, organic light emitting diodes.
1. INTRODUCTION
The finite supply of fossil fuel is a great motivation to develop new and readily less polluting energy resources. One alternative energy resource to the fossil fuel is the Sun. Unfortunately the current cost of energy (~$4/W) produced by conventional inorganic photovoltaics (PV) or solar cells fabricated form crystalline silicon is still loo high to compete with the fossil fuel or wind energy.1 Lots of work have been afforded to find more inexpensive materials there can replace silicon in the PVs. Since the beginning of the 90s a huge interest for application of organic based photovoltaics (OPV)2 where the silicon is replaced by e.g. polymer has been build up. Like OP Vs, polymer based organic light emitting diodes (OLEDs) have also attracted large scientific and industrial attention due to their very promising applications concerning e.g. flexible large-area flat-panel displays.3 Some of the biggest advantages of polymer based OPVS and OLEDs in comparison to traditional inorganic semi conducting materials are first and foremost the low cost of the materials and the much easier fabrication methods. The traditional inorganic semi conducting components are normally prepared by a series of complicated vacuum techniques, while polymer based OPVs and OLEDs can be prepared by techniques like spin coating, screen or inkjet printing.3 Furthermore, the possibilities to tune the colour of the light emission of the polymer based OLEDs by chemical modifications are nearly unlimited and relatively easy.4"6 The OLEDs can be used for full colour displays because they are able to emit all three principal colours: Blue, green and red. Among these colours green is the most developed concerning brightness and efficiency. The reports on polymer based OLEDs which emits in the near infrared (NIR) region are still relatively few, and include mostly low band gap polymers like poly(thiophenes),6 polymers doped by rare earth metal ions,7 and polymer blends where the hosts are a high band gap conjugated polymer doped with small red-emitting organic dyes such as porphyrins.8 The latter case is the most frequently used and the idea in this case are that the conjugated polymer host both work as charge transporter and take care of the transfer of the excitons formed within it self to the dye molecule. In the dye molecule a decay of the excitations happens while emitting NIR light. The transfer of the excitons to the dye molecule typically occurs through space (TS) normally by a Forster energy transfer process,9 which is a long-range dipole-dipole coupling process
* [email protected]; phone (+45) 46774284; fax (+45) 46774791: www.risoe.dk/solarcells
Organic Photovoltaics VI, edited by Zakya H. Kafafi, Paul A. Lane,Proc. of SPIE Vol. 5938, 59380X, (2005) • 0277-786X/05/$15 • doi: 10.1117/12.613640
Proc. of SPIE Vol. 5938 59380X-1
159

Appendix B
between the transition dipoles of the excited polymer and ground-state dye molecule.10 The rate constant of the Forster energy transfer process, Ic-rfr) is proportional to r6, where r is the distance between the donor and the acceptor. Hence the Forster energy transfer process occur normally only over a range of 1 to 50 A.11The problems with the efficiency of the NIR light-emitting polymer blends are that the energy transfer efficiency among other things depend on how close the donor and acceptor are to each other, which means that it is very important that the polymer and the dye molecules are mixed very thoroughly. Furthermore, it require a good spectral overlap between the emission and the absorption spectra for the polymer and the dye molecules respectively, which is far from the general observation.12-16Recently new NIR light-emitting materials have been produced by linking the dye molecules to the backbones of conjugated polymers by covalent bonds.13'17"19 In this way, it is ensured that the dye molecules are placed close and in a regular fashion with respect to the polymers. The TS energy transfer is therefore optimised, and an eventual aggregate of the dye molecules, which can lead to self-quenching of their fluorescence is prevented.14 Finally the covalent link between the polymer and the dye molecule also opens up for the possibility of energy transfer through bonds (TB)20"22 (see Fig. 1). The TB energy transfer is promoted by an orbital overlap, and is much faster than the TS transfer process.10’12,13 The rate of the energy transfer TB can be tuned, if the dye molecule forms a part of the conjugated polymer backbone.
Through space transfer Through bond energy transfer
Dye molecules covalent linked to polymer backbones
Figure 1: In polymer blends the energy transfer between the polymer and the dye molecules occur by a TS process, which probably is of the Forster type. In the situation where the dye molecules are covalently linked to the polymer, the energy transfer occurs both with the TS process and by a TB process promoted by an orbital overlap.
In relation to light-emitting materials where the dye molecule is covalently linked to the polymer backbone we have recently synthesized17’18 a covalently linked three-domain structure of the type outlined in Fig. 1. The three-domain structure, NPN, consisted of two poly[l-(2.5-dioctyl-tolanyl)-ethynylene] chains (N domains) and a dye molecule in the shape of [10,20-Bis-(3,5-bis-terf-butylphenyl]-5-15-dibromoporphinato]zinc(II) (P domain) (See Scheme 1). In solid state this structure shows a very interesting property. The N domains serves as light-harvesting antenna for the P domain, which then emits the energy in the NIR region. The same property has been reported for two similar domain structures.13’19In this paper we will briefly describe the synthesis of NPN and some of its properties. Furthermore we will focus on how the length of the N domains influences the efficiency of the energy transfer process in the NPN. To control the length of the N domain, we applied two different methods. The first method employed monodisperse phenylacetylene terminated oligo(l-(2,5-dioctyltolanyl)ethyne) of precise molecular length (See Scheme 3 for further details). The oligomers were then coupled to the porphyrin dye molecule by the Sonogashira cross coupling reaction.23 The second method employed the use of Size Exclusion Chromatography (SEC) to make narrow fractions with different molecular weight of NPN, whereby different lengths of the N domains were obtained.
2. EXPERIMENTAL
The compounds polyphenyleneethynylene (N), NPN and l-iodo-2,5-dioctyl-4’-trimethylsilylethynyltolane (protected monomer unit) were prepared and purified from the contaminated palladium nanoparticles as described previously.17 Ultraviolet photoelectron spectroscopy (UPS) and measurements of carrier mobilities of the homopolymer by using the pulse radiolysis time resolved microwave conductivity (PR-TRMC) technique were reported previously.18
Proc. of SPIE Vol. 5938 59380X-2
160

Appendix B
LED and solar cell devices were prepared by spincoating chloroform solutions onto PEDOT:PSS covered ITO slides (the hole-injecting (LEDs) or collecting (solar cells) electrode). The prepared films had peak absorbancies of -0.6 (LEDs) and -0.4 (solar cells). Ca/Al was used as the electron-injecting (LEDs) or collecting (solar cells) electrode, and was evaporated in a vacuum of < 1 x 10⁵ mBar. In the case with the solar cells, sets of bilayer devices were also made. In the bilayer devices a layer of C^o was evaporated (vacuum < 1 x 10⁶ mBar) on top of the polymer before evaporation of the aluminium electrode. The electrical connections were achieved using silver epoxy. Electroluminescence and fluorescence spectra were recorded in a FLS920 from Edinburgh Instruments. I/V characteristics were measured in dark and under a solar simulator generating AM 1.5 light (-lOOmW/cm2) with a Keithley 2400 sourcemeter.The apparatus for the SEC was from Knauer and consists of a preparative system with a 3 mL injection loop. The detector was a UV-vis diode array with a resolution of 1 nm. A 16-port switch valve allows for separation of fractions. Two different column systems were used. They consisted of DVB linked polystyrene gel columns comprising a guard column and two gel columns. One system had a 100 A and a 1000 A column in succession, and the other had a 500 A and a 10000 A column in succession. The eluent was chloroform and the flow rate was 20 mL/min with a pressure of 75 MPa. The molecular weight was calculated on the basis of polystyrene standards having molecular weights of: 515000, 127000, 68000, 36300, 19000, 10900, 3250 and 1360. In all cases the polydispersities of the standards were smaller than 1.007.
3. RESULTS/DISCUSSION
3.1 The synthesis of NPNNPN was synthesized by two different synthetic routes, which are illustrated in scheme 1 and 2. It was concluded that only the synthetic route illustrated in scheme 1 lead to the three domain structure shown in Fig. 1, where only one porhyrin unit is covalent linked in a sandwich between two polymer chains.
Scheme 1: NPN was synthesized by a Sonogashira cross coupling reaction.17
Proc. of SPIE Vol. 5938 59380X-3

Appendix B
Scheme 2: The unsuccessful synthesis of NPN by a Sonogashira cross coupling reaction.17
The problem with the synthetic route illustrated in Scheme 2 is, that the growing chain always expose an ethynyl group, which is capable of undergoing an oxidative coupling to give a butadiyne byproduct. It means that the synthetic route in addition to the desired NPN structure also give a lot of buta-1,3-diy n-1,4-diyl byproducts derived from undesired couplings such as ...NP-PN... and ...NPN-NPN...
Figure 2: The electronic band structure derived from the UPS spectrum. EFVB = 1.5 eV; EFVAC = 4.0 eV; Bemax = -46.0 eV;A = -0.70 eV; IP = 5.50 eV and <hAu = 4.7 eV. In the right comer of the figure the substrate plate is shown.18
The native polyphenyleneethynylene (N) was synthesized by a Sonogashira cross coupling reaction to give information of the carrier mobility, the electronic energy levels and the injection barrier for holes into the valence band of the N domains. The sum of charge carrier mobility was determined by PR-TRMC24"25 and the results were Epmin = 1.25 105 m2 V'1 s'1 and a first half life of xVl ~ 10 ps. The value for has not been corrected for the survival probability charge carrier pair or for the differential dose distribution between the conjugated backbone and the alkyl sidechains.18 The carrier mobility was not as high as hoped, but at least it was comparable to the values determined earlier for similar compounds.26 The electronic energy levels and the injection barrier were determined by UPS,27 which employs hard UV radiation from a synchrotron source. The results of the UPS measurements are listed in Fig. 2.
Proc. of SPIE Vol. 5938 59380X-4

Appendix B
3.2 Synthesis of oligomersTo make monodisperse phenylacetylene terminated oligo( 1 -(2,5-dioctyltolanyl)elhyne) we have employed the synthetic route illustrated in scheme 3. The first step was to couple phenylacetylene with the protected iodo-monomer unit by a Sonogashira cross coupling reaction, which progressed nicely. The second step was removal of the protecting group TMS by a base (e.g. K2C03) followed by a new coupling reaction with the protected iodo-monomer unit to yield the protected dimer. These steps were repeated until the required molecular length was obtained.
CsHlyScheme 3: The stepwise route to synthesize monodisperse phenylacetylene terminated oligo(l-(2.5-dioctyltolanyl)ethyne) of precise molecular length. 1) Pd(PPh3)4 (2 mol %), Cul (10 mol %) and THF at r.t. 2) K2C03 (10 eqv.) and CH2Cl2/MeOH (1:1) at r.t.
The idea was that this cycle should be carried out without any other purification than filtration and a short aluminium oxide column providing e.g. the trimer in 95 % purify with only minor impurities in the form of the dimer, monomer or 1,4-diarylbutadiynes from a oxidative dimerization of the unprotected ethynyl groups. Preparative SEC could then be used to purify the trimer. To be sure that each step in the synthetic cycle was completed before changing to another step, we kept each step running for 2 days. Furthermore we added more catalyst to the coupling reaction after one day, to be sure that there was still active catalyst present in the reaction mixture.
Mp = 2072 Mn = 2321 Mw = 5269 Mz = 19168 Mz+I =41925
Time [min]
Figure 3: The SEC trace of the product, which should have been the pure trimer. The molecule weight of the trimer is 1441.27 g/mol, and correspond to the high peak in the middle of the trace.
Unfortunately the raw trimer product contained many byproducts (see the SEC trace in Fig. 3). In the SEC trace (Fig. 3) the high peak in the middle corresponds to the trimer. It can be seen that there are byproducts at lower mass, which most likely includes the monomer, dimer and 1,4-diarylbutadiynes originated from oxidative dimerization of the unprotected monomer or a combination between the monomer and the dimer. Furthermore there are a lot of byproducts with higher mass, which most likely includes 1,4-diarylbutadiynes originated from oxidative dimerization of the unprotected dimer and trimer or a combination of those, and a polymerisation of unreacted iodo-monomer units. The molecular weight for the trimer derived from SEC is 2072 g/mol even though the molecular weight is only 1441 g/mol. The reason is that it is not the molecular weight that is determined in SEC, but the hydrodynamic volume, which is compared to polystyrene
Proc. of SPIE Vol. 5938 59380X-5
163
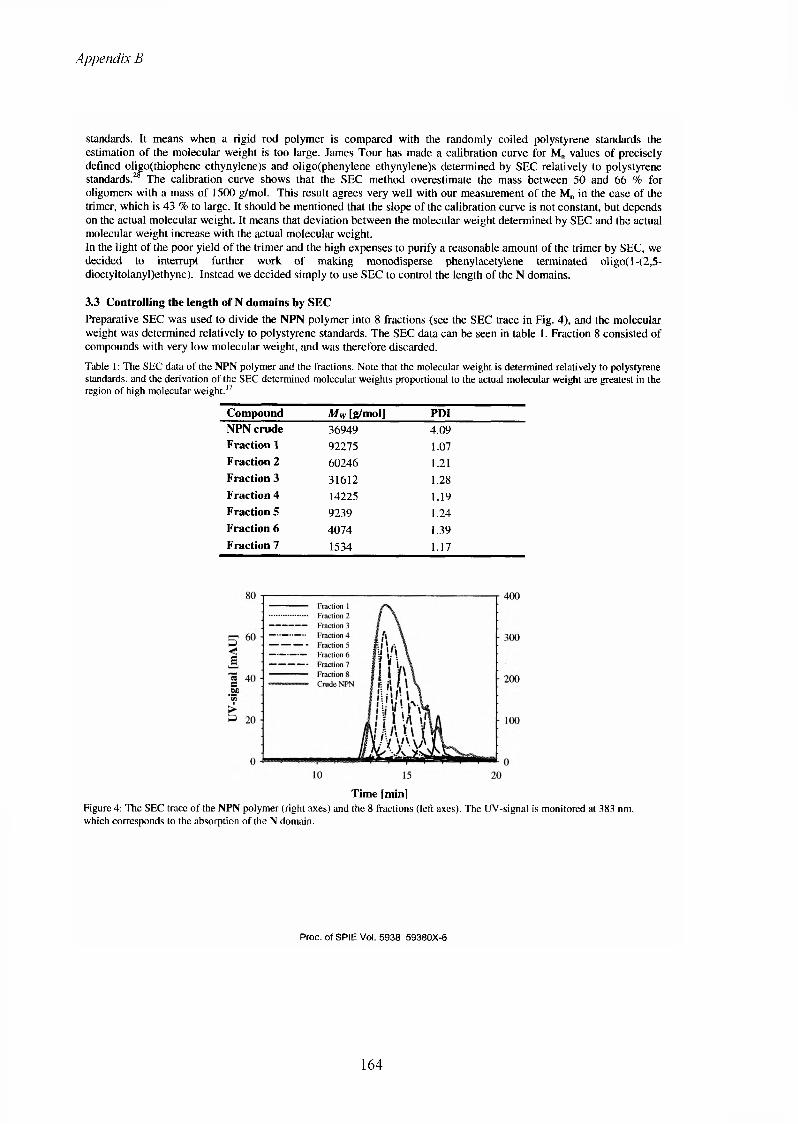
Appendix B
standards. It means when a rigid rod polymer is compared with the randomly coiled polystyrene standards the estimation of the molecular weight is too large. James Tour has made a calibration curve for M„ values of precisely defined oligo(thiophene ethynylene)s and oligo(phenylene ethynylene)s determined by SEC relatively to polystyrene standards.28 The calibration curve shows that the SEC method overestimate the mass between 50 and 66 % for oligomers with a mass of 1500 g/mol. This result agrees very well with our measurement of the M„ in the case of the trimer, which is 43 % to large. It should be mentioned that the slope of the calibration curve is not constant, but depends on the actual molecular weight. It means that deviation between the molecular weight determined by SEC and the actual molecular weight increase with the actual molecular weight.In the light of the poor yield of the trimer and the high expenses to purify a reasonable amount of the trimer by SEC, we decided to interrupt further work of making monodisperse phenylacetylene terminated oligo( 1 -(2,5- dioctyltolanyl)ethyne). Instead we decided simply to use SEC to control the length of the N domains.
3.3 Controlling the length of N domains by SECPreparative SEC was used to divide the NPN polymer into 8 fractions (see the SEC trace in Fig. 4), and the molecular weight was determined relatively to polystyrene standards. The SEC data can be seen in table 1. Fraction 8 consisted of compounds with very low molecular weight, and was therefore discarded.
Table 1: The SEC data of the NPN polymer and the fractions. Note that the molecular weight is determined relatively to polystyrene standards, and the derivation of the SEC determined molecular weights proportional to the actual molecular weight are greatest in the region of high molecular weight.17
Compound Mw [g/mol] PDINPN crude 36949 4.09Fraction 1 92275 1.07Fraction 2 60246 1.21Fraction 3 31612 1.28Fraction 4 14225 1.19Fraction 5 9239 1.24Fraction 6 4074 1.39Fraction 7 1534 1.17
Time [min]Figure 4: The SEC trace of the NPN polymer (right axes) and the 8 fractions (left axes). The UV-signal is monitored at 383 nm, which corresponds to the absorption of the N domain.
Proc. of SPIE Vol. 5938 59380X-6
164

Appendix B
Fraction 1 was not used because the amount of this fraction was very small and furthermore it was not possible to dissolve it again after evaporation, probably due to cross-linking of the polymer chains caused by remnants of the palladium catalysts.17
3.4 Fluorescence and UV-vis measurements in solid stateIn Fig. 5, we present the absorption spectra of the fractions 2 to 7 of the NPN polymer. It can be seen that the Soret band with maximum at around 460-470 nm together with the Q-bands between 600 and 700 nm of the porphyrin decrease in intensity when we are going from the fractions with low molecular weight to the fractions with high molecular weight (fraction 7 to 2). This indicates that we successfully have made NPN polymers with only one porphyrin linked into the polymer backbone', and that we with SEC are able to divide the NPN polymer up into fractions according to the length of the N domains.From Fig. 5 it is also observed that all bands are red shifted with the increased length of the N domains. This indicates that the porphyrin is a part of a conjugated system. It can further be observed that the red shift is stopped at fraction 5, which corresponds to approximately the decamer of the N domains. These results are in agreement with the results of Jones et al.29 who reported studies on oligomers at a precise length of 1,4-phenylene ethynylenes.In Fig. 6, the absorption and the fluorescence spectra of the porphyrin and the native N polymer are presented. It can be seen that there is a full spectral overlap between the absorption of the porphyrin Q-bands and the emission of the native N polymer. Further there is a partial spectral overlap between the absorption of the porphyrin Soret band and the emission of the N polymer. This opens up for the possibilities of a TS energy transfer process.The fluorescence spectra of the fractions (Fig. 7) are all characterized by a very intense and sharp red emission peak at around 695 nm and a weak shoulder at around 750 nm. Furthermore it contains a weak broad emission in the range of 400 to 550 nm from the N domains. By comparing the fluorescence spectra of the NPN fractions with the fluorescence spectrum of the native N polymer, it can be seen, that there is a very effective energy transfer from the N domains to the P domain. Actually it is only in fraction 2 and 3, which corresponds to long N domains, where there is a weak emission from the N domains. When the length of the N domain exceeds the exciton diffusion length the probability of energy transfer to the P domain diminishes and some emission from N is observed.
1.0
I£ 0,8o
2 0.2
0,0300 400 500 600 700 800
Wavelength [nm]Figure 5: The UV-vis spectra of spin-coated thin films of the different NPN fractions. Note that the content of the porphyrin varies in the different fractions as expected.
By comparing the fluorescence spectra of the NPN fraction in thin film with the one in solution from the literature,17 it can be seen that the energy transfer is significantly more effective in the solid state. The difference of the NPN in solid state compared with NPN in solution is probably that the torsion angle between the N and P domains are much larger in solution as a results of a steric hindrance.12 30 This is indicated by the fact that the Soret and the Q-bands are red shifted
' Recently experiments have shown that the N domains in the NPN polymer can be cross-bonded by remnants of the palladium catalyst and oxygen. This would cause NPN strings with more than one porphyrin unit to be incorporated into the polymer backbone.17
Proc. of SPIE Vol. 5938 59380X-7
165

Appendix B
around 20 and 80 nm respectively in the solid stated compared to the solution, whereas the maximum of the N domains absorption only are red shifted around 10 nm. The less red shift in solution compared to solid state is probably due to a decrease in the conjugation length of the system caused by a torsion angle between the P and N domain out of plane. A torsion angle would also reduce the TB energy transfer to the P domain. In solid state it is shown that the porphyrin units are preferentially stacked,30 which forces P into the same plane as the N domains, and thereby allowing a more efficient TB energy transfer. The energy transfer dependence on the torsion angle indicates that it primarily occurs by TB and not by TS. TS energy transfer should not depend on the torsion angle.
— Absorption of the dibromoporphyrin ......... The fluorescence of the native N polymer
Wavelength [nm]
Figure 6: The absorption spectra of the porphyrin and the fluorescence spectra of the native N polymer in solid state.
P<
500 600 700
Wavelength [nm]
Figure 7: The fluorescence spectra of the dibromoporphyrin, the native N polymer and some of the 8 fractions of the NPN polymer in solid state.
3.5 Electroluminescence measurementsThe LED devices for the electroluminescence measurements had turn on voltages of 3.3 V and were during electroluminescence measurements operated at 5.5 V, where they drew a typical current of 3-8 mA cm 2.18 In Fig. 8 the electroluminescence spectra of the native N-polymer and the crude NPN polymer are shown. By comparing the electroluminescence spectrum of the pure N-polymer (Fig. 8) with its fluorescence spectrum (Fig. 7) it can be seen that the electroluminescence of the N-domain is red shifted -100 nm compared to the fluorescence
Proc. of SPIE Vol. 5938 59380X-8
166

Appendix B
spectrum. The large red shift of the N-domain indicates emission from a relaxed state. In contrast to this it can be seen that the electroluminescence ofNPN is very similar to the fluorescence spectrum of the NPN fractions. We interpret this as the N domains works as very effective antennas that transport an electrically generated exciton in the N-domain to the P-domain, which is then emitted as a photon.It should be mentioned that when we first made these LEDs, they all short-circuited. We discovered that it was remnants of the palladium from the catalysts that short-circuited the devices. We removed the palladium remnants with diethylammonium diethyldithiocarbamate with success.18 Later we have discovered that N,N-diethyl-(2- phenyIdiazenyl)-thioformamide (see scheme 4) remove palladium nanoparticles from polymer products much more gently and efficiently.31
——— Electroluminescence of NPN 1 Eleclroluminesence of N
Wavelength [nm]
Figure 8: The electroluminescence spectra of the native N polymer and the NPN crude polymer. Note that in the NPN a complete suppression of the N domains electroluminescence occurs and only exclusive near-infrared emission are observed.18
2 Pd(0)
Scheme 4: We have discovered that N.N-diethyl-(2-phenyldiazenyl)thioformamide can dissolve palladium nanoparticles by forming a complex.31
3.6 IA characteristics of solar cell devicesThe LV characteristics of the solar cells are summarized in Table 2. In Fig. 9 the W curve for the bilayer N and NPN devices are shown. Especially the bilayer N cell shows a good diode behavior with a rectification ratio of -35 at ± IV (in dark). From the W characteristics three observations can be made. Firstly, the best solar cells are obtained with the native N polymer as the active layer and C#, as the electron acceptor layer. From the fluorescence and electroluminescence data we know that the N domains served as effective antennas for the P domain. The poor power conversion efficiencies for the devices with the NPN polymer must therefore be a result of the P domain that is having difficulty in delivering electrons to the electrode or to Cf# in the case of the bilayer cell. Secondly, under the W measurements we observed that the life times of these devices were very short, which is probably due to attack of molecular oxygen on the very sensitive triple bonds in the polymer backbone. Thirdly, the overall performance of the solar cells is very poor.
Proc. of SPIE Vol. 5938 59380X-9
167
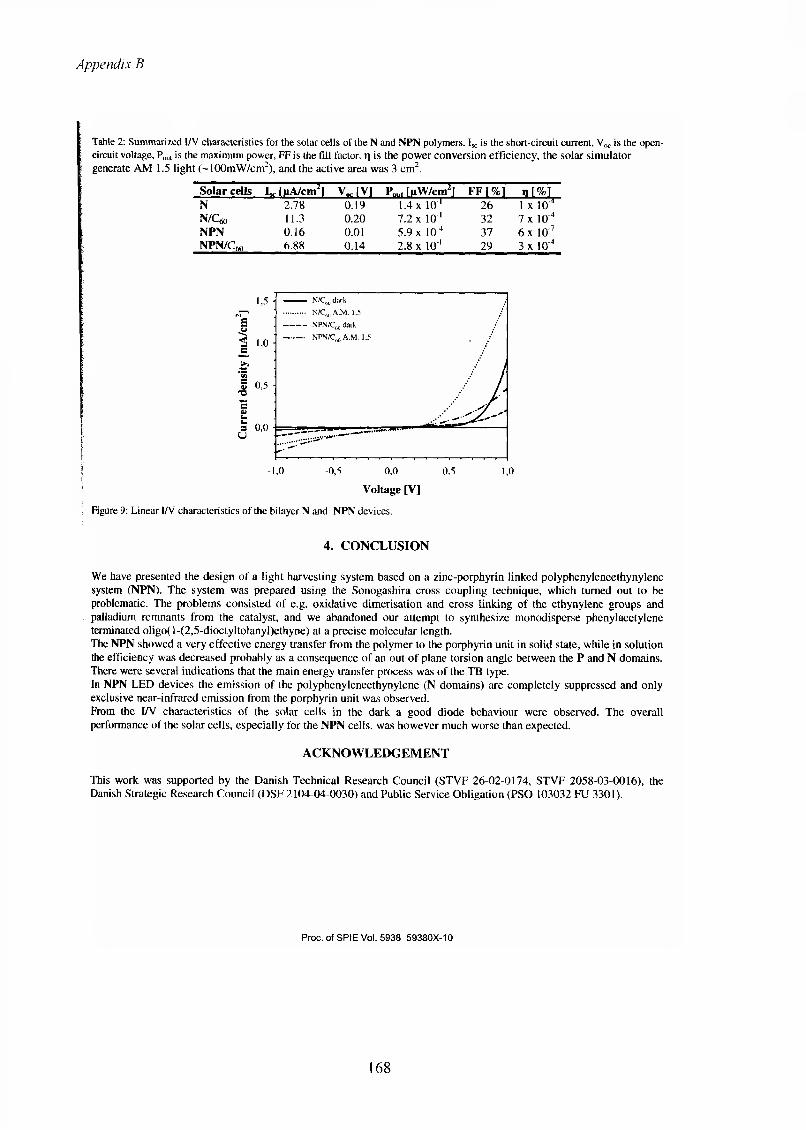
Appendix B
Table 2: Summarized I/V characteristics for the solar cells of the N and NPN polymers. 1%. is the short-circuit current, Vnc is the open- circuit voltage, Pou, is the maximum power, FF is the fill factor, r| is the power conversion efficiency, the solar simulator generate AM 1.5 light (~100mW/cm2), and the active area was 3 cm2.
Solar cells L, [nA/cm2] V«c [V] Pout [gw/cm2] ff r %i n [%],N 2.78 0.19 1.4 x 10 ' 26 1 x 10⁴N/C* 11.3 0.20 7.2 x 10 1 32 7 x 10 4NPN 0.16 0.01 5.9 x 10 4 37 6 x 10⁷NPN/Cm 6.88 0.14 2.8 x 10 ' 29 3 x 10 4
1
Is
1.5
1.0
0,5
s 0,0u
— N/Cgy dark
' ............ N/Cm A.M. 1.5
———— NPN/C^ dark
■ --------- NPN/C61i A.M. 1.5
-1.0 -0,5 0.0
Voltage [V]
Figure 9: Linear I/V characteristics of the bilayer N and NPN devices.
0,5 1,0
4. CONCLUSION
We have presented the design of a light harvesting system based on a zinc-porphyrin linked polyphenyleneethynylene system (NPN). The system was prepared using the Sonogashira cross coupling technique, which turned out to be problematic. The problems consisted of e.g. oxidative dimerisation and cross linking of the ethynylene groups and palladium remnants from the catalyst, and we abandoned our attempt to synthesize monodisperse phenylacetylene terminated oligo( l-(2,5-dioctyltolanyl)ethyne) at a precise molecular length.The NPN showed a very effective energy transfer from the polymer to the porphyrin unit in solid state, while in solution the efficiency was decreased probably as a consequence of an out of plane torsion angle between the P and N domains. There were several indications that the main energy transfer process was of the TB type.In NPN LED devices the emission of the polyphenyleneethynylene (N domains) are completely suppressed and only exclusive near-infrared emission from the porphyrin unit was observed.From the I/V characteristics of the solar cells in the dark a good diode behaviour were observed. The overall performance of the solar cells, especially for the NPN cells, was however much worse than expected.
ACKNOWLEDGEMENT
This work was supported by the Danish Technical Research Council (STVF 26-02-0174, STVF 2058-03-0016), the Danish Strategic Research Council (DSF 2104-04-0030) and Public Service Obligation (PSO 103032 FU 3301).
Proc. of SPIE Vol. 5938 59380X-10
168

Appendix B
REFERENCES
1. S. Shaheen, D. S. Ginley, G. E. Jabbour, “Organic-Based Photovoltaics: Toward Low-Cost Power Generation”, Mrs Bulletin, 30, 10-15, 2005.
2. M. Granstrom, K. Petritsch, A, C. Arias, A. Lux, M. R. Andersson, R. H. Fiend, “Laminated Fabrication of Polymeric Photovoltaic Diodes”, Nature, 395, 257-260, 1998.
3. C. D. Muller, A. Falcou, N. Reckefuss, M. Rojahn, V. Wiederhirn, P. Rudati, H. Frohne, O. Nuyken, H. Becker, K. Meerholz, “Multi-Colour Organic Light-Emitting Displays by Solution Processing", Nature, 421, 829-833,2003.
4. Z. Yang, I. Sokolik, F. E. Karasz, ”A Soluble Blue-Light-Emittting Polymer”, Macromolecules, 26, 1188-1190, 1993.
5. I. Benjamin, E. Z. Faraggi, G. Cohen, H. Chayet, D. Davidov, R. Neumann, Y. Avny, “Newly Synthesized Conjugated Copolymers for Light Emitting Diodes”, Synth. Met., 84, 401-402, 1997.
6. M. R. Andersson, M. Berggren, O. Inganas, G. Gustafsson, J. C. Custafsson-Carlberg, D. Seise, T. Hjertberg, O. Wennerstrom, “Electroluminescence from Substituted Poly(thiophenes): From Blue to Near-Infrared”, Macromolecules, 28, 7525-7529, 1995.
7. N. Tessler, V. Medvedev, M. Razes, S. Kan, U. Banin, "Efficient Near-Infrared Polymer Nanocrystal Light- Emitting Diodes”, Science, 295, 1506-1508, 2002.
8. B. S. Harrison, T. J. Foley, A. S. Knefely, J. K. Mwaura, G. B. Cunningham, T. S. Kang, M. Bouguettaya, J. M. Boncella, J. S. Reynolds, K. S. Schanze, “Near-Infrared Photo- and Electroluminescence of Alkoxy-Substituted Poly(p-phenylene) and Nonconjugated Polymer/Lanthanide Tetraphenylporphyrin Blends”, Chem. Mater., 16, 2938-2947, 2004.
9. Th. Forster, “Energy Transfer with Special Reference to Biological System”, Discuss. Faraday Soc., 27, 7-17, 1959.10. G. D. Scholes, K. P. Ghiggino, A. M. Oliver, M.N. Paddon-Row, “Intramolecular Electronic Energy Transfer
between Rigidly Linked Naphthalene and Anthracene Chromophores”, J. Phys. Chem., 97, 11871-11876, 1993.11. S. Speiser, “Photophysics and Mechanisms of Intramolecular Electronic Energy Transfer in Bichromophoric
Molecular Systems: Solution and Supersonic Jet Studies", Chem. Rev., 96, 1953-1976, 1996.12. G. S. Jiao, L. H. Thoresen, K. Burgess, “Fluorescent, Through-Bond Energy Transfer Cassettes for Labeling
Multiple Biological Molecules in One Experiment”, J. Am. Chem. Soc., 125, 14668-14669, 2003.13. N. Li„ J. Li, Y. Fu, Z. Bo, “Porphyrins with Four Monodisperse Oligofluorene Arms as Efficient Red Light-
Emitting Materials", J. Am. Chem. Soc., 126, 3430-3431, 2004.14. A. Dogariu, R. Gupta, A. J. Heeger, H. Wang, “Time-Resolved Forster Energy Transfer in Polymer Blends". Synth.
Met., 100, 95-100, 1999.15. S. E. Webber, "Photon-Harvesting Polymers", Chem. Rev., 90, 1469-1482, 1990.16. J. S. Hsiao, B. P. Krueger, R. W. Wagner, T. E. Johnson, J. K. Delaney, D. C. Mauzerall, G. R. Fleming, K. S.
Lindsey, D F. Bocian, R. J. Donohoe, “Soluble Synthetic Multiporphyrin Arrays. 2. Photodynamics of Energy- Transfer Process”, J. Am. Chem. Soc., 118, 11181-11193, 1996.
17. K. T. Nielsen, H. Spanggaard, F. C. Krebs, “ Synthesis, Light Harvesting, and Energy Transfer Properties of a Zinc Porphyrin Linked Poly(phenyleneethynylene)”, Macromolecules, 38, 1180-1189, 2005.
18. K. T. Nielsen, H. Spanggaard, F.C. Krebs, “Dye Linked Conjugated Homopolymers: Using Conjugated Polymer Electroluminescence to Optically Pump Porphyrin-Dye Emission”, Displays, 25, 231-235, 2004.
19. F. C. Krebs, O. Hagemann, H. Spanggaard, “Directional Synthesis of a Dye Linked Conducting Homopolymer”, J. Org. Chem., 68, 2463-2466, 2003.
20. R. Hoffmann, A. Imamura, W. J. Hehre, “Benzynes, Dehydroconjugated Molecules, and the Interaction of Orbitals Separated by a Number of Intervening a Bonds", J. Am. Chem. Soc., 40, 1499-1509, 1968.
21. M. D, Newton, “Quantum Chemical Probes of Electron-Transfer Kinetics: The Nature of Donor-Acceptor Interactions”, Chem. Rev., 91, 767-792, 1991.
22. G. D. Scholes, K. P. Ghiggino, A. M. Oliver, M. N. Paddon-Row, “Through-Space and Through-Bond Effects on Excition Interactions in Rigidly Linked Dinaphthyl Molecules”, J. Am. Chem. Soc., 115,4345-4349, 1993.
23. K. Sonogashira, Y. Tohda, N. Hagihara, “A Convenient Synthesis of Acetylenes: Catalytic Substitutions of Acetylenic Hydrogen with Bromoalkenes, Iodoarenes, and Bromopyridines", Tetrahedron Lett., 50, 4467-4470, 1975.
Proc. of SPIE Vol. 5938 59380X-11
169

Appendix B
24. J. M. Warman, G. H. Gelinck, M. P. de Haas, “The Mobility and Relaxation Kinetics of Charge Carriers in Molecular Materials Studied by Means of Pulse-Radiolysis Time-Resolved Microwave Conductivity: Dialkoxy- Substituted Phenylene-vinelylene Polymers", J. Phys. Condens. Matter, 14, 9935-9954, 2002.
25. F. C. Krebs, M. J0rgensen, “High Carrier Mobility in a Series of New Semiconducting PPV-Type Polymers”, Macromolecules, 36, 43744384, 2003.
26. F. C. Krebs, M. Jorgensen, “The Effect of Backbone Fluorination on the Carrier Mobility in Alkoxy and Alkyl Substituted Conducting Polymers of the Poly(phenylenevinylene) Type”, Pol. Bull., 51, 127-134, 2003.
27. W. R. Salaneck, M. Logdlund, M. Fahlman, G. Greczynski, T. Kugler, “The Electronic Structure of Polymer-Metal Interfaces Studied by Ultraviolet Photoelectron Spectroscopy", Mater. Sci. Eng., R34, 121-146, 2001.
28. J. M. Tour, "Conjugated Macromolecules of Precise Length and Constitution. Organic Synthesis for the Construction of Nanoarchitectures”, Chem. Rev., 96, 537-553, 1996.
29. L. R. Jones II, J. S. Schumm, J. M. Tour, "Rapid Solution and Solid Phase Syntheses of 01igo(l,4- phenyleneethynylenejs with Thioester Termini: Molecular Scale Wires with Alligator Clips. Derivation of Iterative Reaction Efficiencies on a Polymer Support”, J. Org. Chem., 62, 1388-1410, 1997.
30. B. Jiang, S. W. Yang, W. E. Jones jr., “Conjugated Porphyrin Polymers: Control of Chromophore Separation by Oligophenylenevinylene Bridges", Chem Mater. Commun., 9, 2031-2034, 1997.
31. K. T. Nielsen, K. Bechgaard, F. C. Krebs, “Removal of Palladium Nanoparticles from Polymer Materials”, Macromolecules Commun., 38, 658-659, 2005.
Proc. of SPIE Vol. 5938 59380X-12
170

Appendix B
PREVIEW (FM) 1
9 Jun 2006
Acta Cryst. (2004). C60, 000-000
A structural study of four complexes of the M—N2S2 type derived from the ligand N, iV-diethylphenylazothioformamide and the metals: Palladium, Platinum, Copper and Nickel.
Kim T. Nielsen,0 Pernille Harris,6 Klaus Bechgaard0 and Frederik C. Krebs'*
aThe Danish Polymer Centre, Ris0 National Laboratory, PO Box 49, DK-4000 Roskilde,
Denmark, Department of Chemistry, Technical University of Denmark, DTU-207, DK-28000
Kgs. Lyngby, Denmark, 6Department of Chemistry, Technical University of Denmark, DTU-
207, DK-28000 Kgs. Lyngby, Denmark, cDepartment of Chemistry, University of Copenhagen,
DK-2100, Copenhagen, Denmark, and d The Danish Polymer Centre, Ris0 National Laboratory,
P.O. Box 49, DK-4000 Roskilde, Denmark. E-mail: [email protected]
Abstract
The four electron transfer complexes: Thzns-(di(N,iV-diethyl- (2-phenyldiazenyl)thioformamide- /cS,/tN2))nickel, <rans-(di(N,TV-diethyl-(2-phenyldiazenyl)thioformamide-KS,KN2))copper, trans-
(di(N,A-diethyl-(2-phenyldiazenyl)thioformamide-zcS,kN2))palladium and trans-(di(N,jV-diethyl-
(2-phenyldiazeny 1)thioformamide-KS, kN2 ))platinum have been crystallized, and their structures
have been determined at low temperature.All the complexes are of the M—N2S2 type. The crystals of both the nickel and the copper
complex belong to the tetragonal system with the symmetry described by the space group P4i2i2.
The molecular symmetry around the central metal atom is tetrahedral, which is unusual for the M—N2S2 electron transfer complexes. The crystals of the palladium and platinum complexes on
the other hand belong to the monoclinic system with the symmetry described by the space group
C2/c. The molecular symmetry around these metal atoms is square planar. It is demonstrated
that the electron density in the ligand planes has a high degree of delocalization. Furthermore,
unusually large line broadening of the XH-NMR spectra was observed and investigated as a
function of temperature for the palladium complex.
Comment
Thiosemicarbazides have been known for more than 100 years (Busch & Bidder, 1904),they can
be transformed to an azothioformamide in a two electron oxidation process (see Fig. 1) (Pyl
et al, 1963). During the sixties and the early seventies research concerning the azothioform-
amides progressed caused by the discovery of antifungal activity (Pluijgers et al., 1968), antibiotic activity (Kosower & Miyadera, 1972), and potential use as pesticides (Basse & Hammann, 1971). They also form electron transfer complexes with many kind of metals analogous to Metal dithiol-
171

Appendix B
PREVIEW (FM) 2
enes (Davidson et al, 1963). Especially Holm and Bechgaard have investigated the structural
and electronic properties of electron transfer complexes series of the type M—(see Fig. 2)
(Holm et al, 1967; Forbes et al, 1971; Jensen et al, 1972; Bechgaard, 1973; Bechgaard, 1974;
Bechgaard, 1977).
Recently, we have discovered that azothioformamides such as N,7V-diethylphenylazothioform-
amide (L) (see Fig. 3) and AT, AI-bis(tetraethyleneglycolmonomethylether)phenylazothioform-
amide have the ability to dissolve palladium and copper nanoparticles (Nielsen et al, 2005;
Nielsen et al, 2006), produced under catalytic reactions e.g. Sonogashira Cross Coupling
reactions (Sonogashira et al., 1975), by forming intensely coloured electron transfer complexes,
Pd(L)2° and Cu(L)g° (see Fig. 3), belonging to the series shown in Fig. 2.
We have demonstrated that this finding can be utilized to quantitatively analyze and remove
remnants of catalyst from organic samples (Nielsen et al, 2005; Nielsen et al, 2006). Remnants
of metal catalysts in organic compounds present a huge problem in the pharmaceutical industry
(Garret & Prasad, 2004). It is therefore promising that the azothioformamides may offer a cheap
and easy way to solve this problem. We therefore believe that the downward tendency of interest
for the azothioformamides during the eighties and nineties will reverse.
In the context of the M(L)2° compounds as electron-transfer complexes, we present here a
structural study of the Pd(L)2°, Pt(L)2°, Ni(L)2° and Cu(L)2° complexes. Before Hazells (1976)
surprising finding of the tetrahedral structure of the Ni(L)2° complex, it was assumed that all bis-
chelate electron transfer complexes showed a planar coordination around the central metal atom
(Bechgaard, 1974; Eisenberg, 1970). Based on powder diffraction, the Cu(L)2° complex was later
assumed to be tetrahedral like the Ni(L)2° complex (Bechgaard, 1977). In this study we reconfirm
both tetrahedral structures, and we also identify the more conventional (square) planar structure
of Pd(L)2° and Pt(L)2° that is usually found for Me-bis-dithiolene-like compounds (Eisenberg,
1970). Forbes et al (1971) have suggested this structure for the N,AT-dimethy lphenylazothioform-
amide Platinum complexes.
For all four M(L)2° complexes the coordination site in L is the sulfur S and the nitrogen N1
(see Fig. 2), so that each metal atom is participating in two five-membered rings.To quantitatively describe the structural conformations of the M(L)2° complexes, and conclude
whether the coordination should be characterized as square-planar or flattened tetrahedral, we
have listed the relevant bond distances and angles in Table 1 to 4. These include the coordination
distance to the central metal atom and the corresponding angles involving the central metal
atom. To describe the overall geometry we have determined the dihedral angle between the
two ligand planes and the dihedral angle between the plane of the phenyl ring and the plane
of the ligand. To shed light on the electronic configuration of the ligand and the metal we
have listed all the bond lengths in the five membered cheleate rings. From Table 1 and 2 it
is seen that both the Ni and Cu complexes adapt the flattened tetrahedral coordination, as
already discovered by Hazell (1976) for the Ni complex. The structures of these two complexes
are shown in Fig. 5. They belong to the tetragonal space group P4i2i2. The in-ring Nl-Me-
S angles are 85.61 (4)°/85.48(4)°, for Ni and Cu respectively, which is below the 109° in a
172

Appendix B
PREVIEW (EM) 3
regular tetrahedron and the N—Me—N angle of 144,55(9)°/144.84(7)°, which is larger than the
109° in a tetrahedral coordination. Furthermore, the dihedral angle between the two planes,
defined by the five atoms in the two five-membered ligand rings, is 75.39 (3)°/71.26(3)°, which
is smaller than the expected 90° for perfect tetrahedral coordination. It should be mentioned
that Hazell determined the dihedral angle in the Ni complex to 70.4°. The difference could be
due to the different data collection temperatures (298 K versus. 118.5 K in the present study).
The dihedral angles between the plane of the phenyl ring and the plane of the ligand (the
five-membered ring) are 28.08(7)°/ 26.55(6)°, respectively, which means that the phenyl ring
is twisted out of plane compared to the five-membered ring. The smaller dihedral angles in the
Cu(L)2° complex compared to the Ni(L)2° complex means, that the Cu(L)2° complex has an even
more flattened tetrahedral coordination than the Ni(L)2° complex. The smaller angle between
the phenyl group and the ligand plane combined with the more flattened coordination imply that
the distance between the two Cll atoms (the two closely spaced atoms in the phenyl groups)
are longer than in the Ni(L)2° complex, 4.522 A to 4.405 A respectively. This indicates that the
intermolecular packing forces are stronger in the Ni(L)2° compared to the Cu(L)2° complex.
The structure determination of the neutral Pd and Pt complexes show that both adapt the more
conventional square planar structure with the metal atom placed on a crystallographic inversion
centre (see Fig. 6). This is in agreement with predictions made by Forbes et al. (1971) based
on a combination of electrochemical, electron paramagnetic resonance and electronic spectral
studies. As seen in Table 1 the key angles N—M—N and S—M—S are both 180°, which by
symmetry are characteristic for square planar coordination. The in-ring Nl—Me—S angles are
82.49(9)/ 82.11 (7)°, for Pd and Pt, respectively. Furthermore, the dihedral angle between the
two ligand planes is exactly 0°. The angles between the phenyl group and the ligand plane are 51.04 (13)°/52.01(8)° for the Pd(L)2° and the Pt(L)2° complexes respectively.
Blanchard et al. (2005) have demonstrated that X-ray crystallography can be used as a tool to
assign the given oxidation level of the ligand. They have shown that for complexes with 1-phenyl
and 1,4-diphenyl substituted S-methylisothiosemicarbazides as the ligands, the bond lengths of
the N—N and C—N bonds are characteristic for the oxidation level of the ligand. E.g. if the N—N
bond is rather short (1.34 ±0.01 A) the ligand can be regarded as a rr-radical anion, (L-)1-, but if
the bond lengths are significantly shorter (1.24 ±0.01 A), then the ligand can be regarded as being on its oxidized level, (Lox). From our data (see Table 1-4) it can be seen that the Ni(L)2°, Pd(L)2°
and Pt(L)2° complexes all have N—N bond lengths of 1.34 ± 0.01 A, and therefore can be
rationalized as M(II) complexes with two rr-radical anion ligands antiferromagnetically coupled,
[Nin(L )2], [Pdn(L )2] and [Ptn(L )2], Blanchard et al. have calculated the value of the following
bond lengths N=C, C—S, C—N, N—N in (HN—N=C(SH)NH')1 ~ to 1.294 A, 1.897 A, 1.342 A and 1.343 A respectively. Furthermore, the average S—C and C—N distances in dithiocarbamate
structures are 1.70 and 1.34 A (Eisenberg, 1970). By comparing these bond lengths with the bond
lengths in the five-membered ring in the ligand described in this work, we find an indication for a large delocalization of the 7r electron density over the five-membered ring. The Cu(L)2° complex
has a slightly smaller N—N bond length (1.32 A) and a slightly larger C—N bond compared with
173
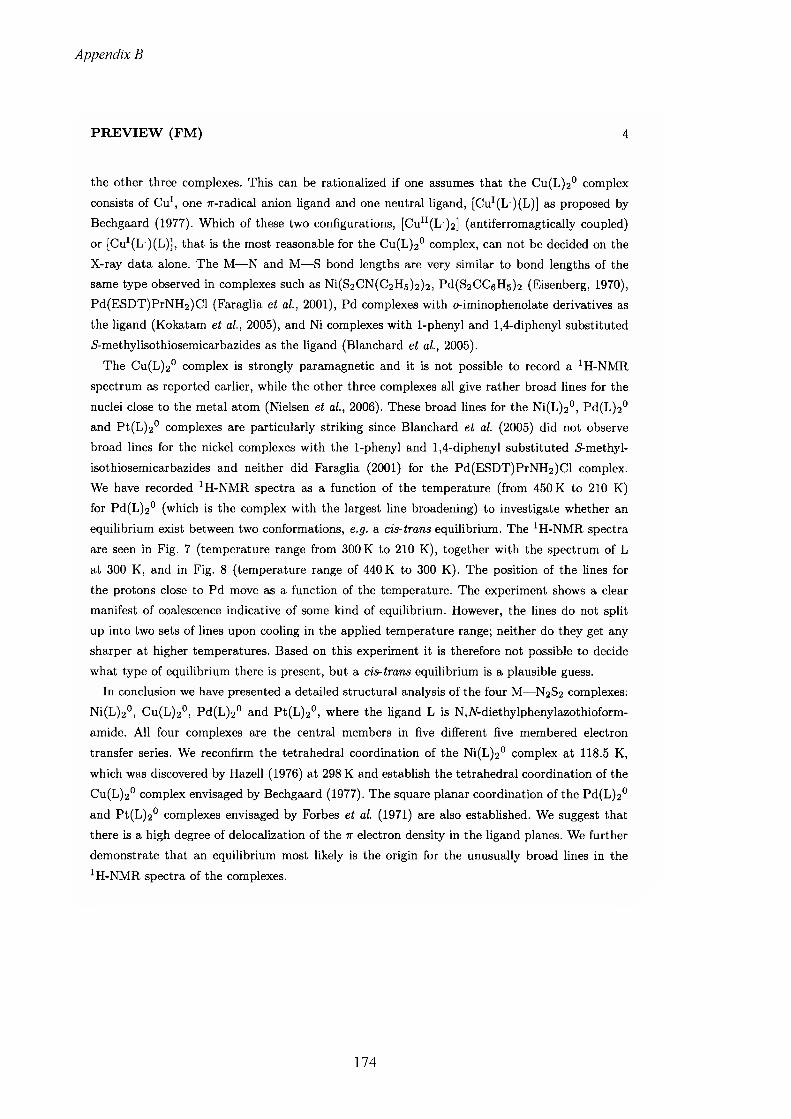
Appendix B
PREVIEW (FM) 4
the other three complexes. This can be rationalized if one assumes that the Cu(L)2° complex consists of Cu1, one rr-radical anion ligand and one neutral ligand, [CuI(L )(L)] as proposed by
Bechgaard (1977). Which of these two configurations, [Cu"(L )2] (antiferromagtically coupled)
or [CuI(L )(L)], that is the most reasonable for the Cu(L)2° complex, can not be decided on the
X-ray data alone. The M—N and M—S bond lengths are very similar to bond lengths of the
same type observed in complexes such as Ni(S2CN(C2H5)2)2, Pd(S2CC6H5)2 (Eisenberg, 1970),
Pd(ESDT)PrNH2)Cl (Faraglia et al., 2001), Pd complexes with o-iminophenolate derivatives as
the ligand (Kokatam et al., 2005), and Ni complexes with 1-phenyl and 1,4-diphenyl substituted
S-methylisothiosemicarbazides as the ligand (Blanchard et al., 2005).
The Cu(L)2° complex is strongly paramagnetic and it is not possible to record a 1H-NMR
spectrum as reported earlier, while the other three complexes all give rather broad lines for the
nuclei close to the metal atom (Nielsen et al., 2006). These broad lines for the Ni(L)2°, Pd(L)2°
and Pt(L)2° complexes are particularly striking since Blanchard et al. (2005) did not observe
broad lines for the nickel complexes with the 1-phenyl and 1,4-diphenyl substituted 5-methyl
isothiosemicarbazides and neither did Faraglia (2001) for the Pd(ESDT)PrNH2)Cl complex. We have recorded 1H-NMR spectra as a function of the temperature (from 450 K to 210 K)
for Pd(L)2° (which is the complex with the largest line broadening) to investigate whether an
equilibrium exist between two conformations, e.g. a cis-trans equilibrium. The 1H-NMR spectra
are seen in Fig. 7 (temperature range from 300 K to 210 K), together with the spectrum of L
at 300 K, and in Fig. 8 (temperature range of 440 K to 300 K). The position of the lines for
the protons close to Pd move as a function of the temperature. The experiment shows a clear
manifest of coalescence indicative of some kind of equilibrium. However, the lines do not split
up into two sets of lines upon cooling in the applied temperature range; neither do they get any
sharper at higher temperatures. Based on this experiment it is therefore not possible to decide
what type of equilibrium there is present, but a cis-trans equilibrium is a plausible guess.
In conclusion we have presented a detailed structural analysis of the four M—N2S2 complexes:
Ni(L)2°, Cu(L)2°, Pd(L)2° and Pt(L)2°, where the ligand L is N,IV-diethylphenylazothioform-
amide. All four complexes are the central members in five different five membered electron
transfer series. We reconfirm the tetrahedral coordination of the Ni(L)2° complex at 118.5 K,
which was discovered by Hazell (1976) at 298 K and establish the tetrahedral coordination of the
Cu(L)2° complex envisaged by Bechgaard (1977). The square planar coordination of the Pd(L)2°
and Pt(L)2° complexes envisaged by Forbes et al. (1971) are also established. We suggest that
there is a high degree of delocalization of the tt electron density in the ligand planes. We further
demonstrate that an equilibrium most likely is the origin for the unusually broad lines in the
1H-NMR spectra of the complexes.
174
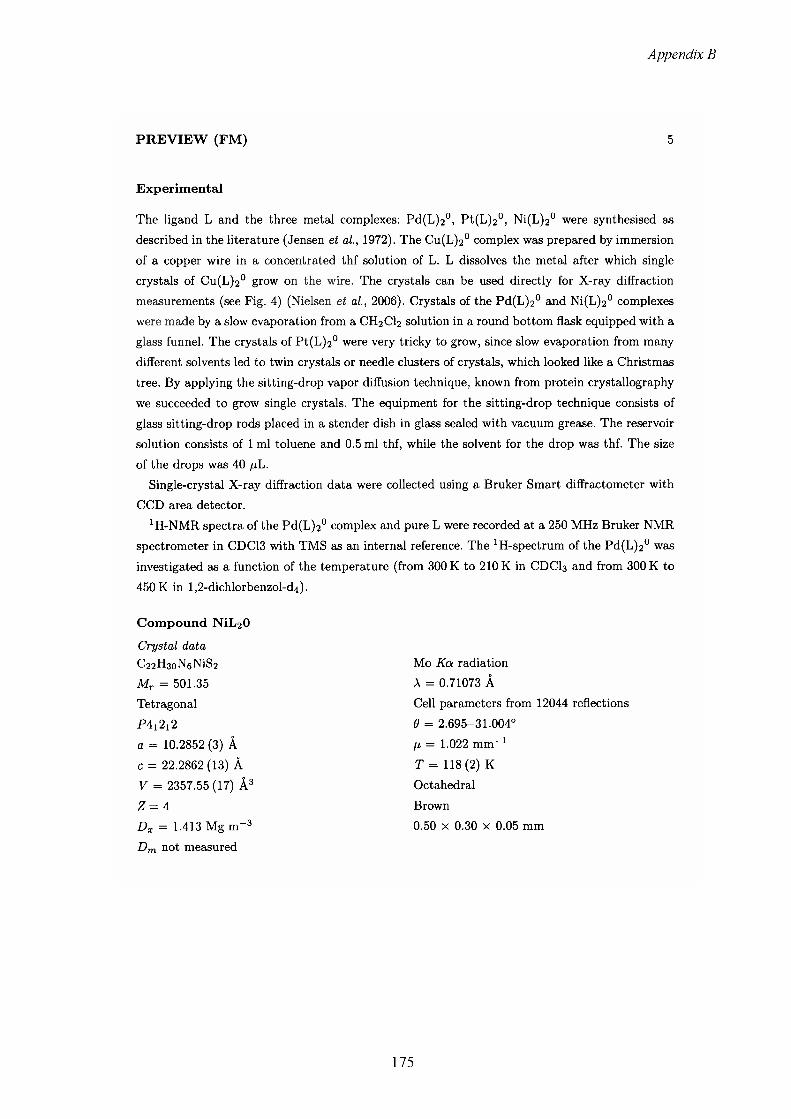
Appendix B
PREVIEW (FM) 5
Experimental
The ligand L and the three metal complexes: Pd(L)2°, Pt(L)2°, Ni(L)2° were synthesised as
described in the literature (Jensen et al., 1972). The Cu(L)2° complex was prepared by immersion
of a copper wire in a concentrated thf solution of L. L dissolves the metal after which single
crystals of Cu(L)2° grow on the wire. The crystals can be used directly for X-ray diffraction
measurements (see Fig. 4) (Nielsen et al., 2006). Crystals of the Pd(L)2° and Ni(L)2° complexes
were made by a slow evaporation from a CH2CI2 solution in a round bottom flask equipped with a
glass funnel. The crystals of Pt(L)2° were very tricky to grow, since slow evaporation from many
different solvents led to twin crystals or needle clusters of crystals, which looked like a Christmas
tree. By applying the sitting-drop vapor diffusion technique, known from protein crystallography
we succeeded to grow single crystals. The equipment for the sitting-drop technique consists of
glass sitting-drop rods placed in a stender dish in glass sealed with vacuum grease. The reservoir
solution consists of 1 ml toluene and 0.5 ml thf, while the solvent for the drop was thf. The size
of the drops was 40 pL.
Single-crystal X-ray diffraction data were collected using a Bruker Smart diffractometer with
CCD area detector.
1H-NMR spectra of the Pd(L)2° complex and pure L were recorded at a 250 MHz Bruker NMR
spectrometer in CDC13 with TMS as an internal reference. The 1H-spectrum of the Pd(L)2° was
investigated as a function of the temperature (from 300 K to 210 K in CDCI3 and from 300 K to
450 K in 1,2-dichlorbenzol-d4).
Compound N1L2O
Crystal data
C22H3oNeNiS2 Mr = 501.35
Tetragonal
P4i2i2a = 10.2852 (3) A
c = 22.2862 (13) A
V = 2357.55 (17) A3
2=4Dx = 1.413 Mg m-3
Dm not measured
Mo Ka radiation
A = 0.71073 A
Cell parameters from 12044 reflections
6 = 2.695-31.004°
fj, = 1.022 mm-1
T = 118(2) K
Octahedral
Brown
0.50 x 0.30 x 0.05 mm
175

Appendix B
PREVIEW (EM) 6
Data collectionCCD area detector diffractometer
Omega scans
Absorption correction:
emperical SADA BS,ver2.03 (Sheldrick,2001)
Tm\n = 0.74, Tmax = 0.96
31608 measured reflections
3630 independent reflections
3436 reflections with
>2sigma(7)
.Rint = 0.0430
Refinement Refinement on F2
RIF* > 2cr(E2)] = 0.0347
wR{F2) = 0.0799
S = 1.174
3630 reflections
141 parameters
H-atom parameters constrained w=l/[cr2{Fo) + (0.0407P)2 + 0.3442P]
where P = (F2 + 2F?)/3
9max = 31.00° h = —13 —> 14
* = —14 —* 14
l = -31 —► 30
every 0 reflections
frequency: 0 min
intensity decay: none
(A/cr)max — 0.001 Apmax = 0.606 e A-3
Apmi„ = -0.262 e A-3
Extinction correction: none
Scattering factors from International Tables
for Crystallography (Vol. C)
Absolute structure: Flack H D (1983), Acta
Cryst. A39, 876-881
Flack parameter = 0.021 (12)
Table 1. Selected geometric parameters (A, °) for NiL^ONi—Nl* 1.8728 (14) Nl—N2 1.3363 (19)
Ni—S' 2.2085 (4) N2—Cl 1.358 (2)
S—Cl 1.7213 (17)N1‘—Ni—Nl 144.55 (9) S*—Ni—S 119.50 (3)
Nl*—Ni—S* 85.61 (4)
Symmetry codes: (i) y,x,—z.
176

Appendix B
PREVIEW (EM) 7
Compound CuL20
Crystal data C22H30CUN6S2
Mr = 506.18
Tetragonal
P4i2j2a = 10.2643 (4) A
c = 22.3519 (13) A
V = 2354.90 (19) A3
Z= 4
£)$ = 1.428 Mg m-3
Dm not measured
Mo Ka radiation
A = 0.71073 A
Cell parameters from 10241 reflections
9 = 2.695-27.956°
fj, = 1.127 mm-1
T = 118 K
Octahedral
Black
0.40 x 0.35 x 0.15 mm
Data collectionCCD area detector diffractometer
Omega scans
Absorption correction:
emperical SADA BS,ver2.03 (Sheldrick,2001)
Tmin = 0.6614, Tm^ = 0.8492
16807 measured reflections
2832 independent reflections
2788 reflections with
>2sigma (I)
Hint = 0.0266
Refinement Refinement on F2
RIP2 > 2cr(P2)] = 0.0237
wR(F2) = 0.0702
S = 1.097
2832 reflections
141 parameters
H-atom parameters constrained w=1/[<72(Fo2) + (0.0000P)2 + 0.1079P]
where P = (F02 + 2Fc2)/3
6»max = 28.01°h = -13 -> 12 k — —13 —> 13 l = -28 —► 28
every 0 reflections
frequency: 0 min
intensity decay: none
(A/u)max = 0.000
Apmax = 0.361 e A-3
Apmin = -0.175 e A-3
Extinction correction: none
Scattering factors from International Tables
for Crystallography (Vol. C)
Absolute structure: Flack H D (1983), Acta
Cryst. A39, 876-881, 1132 Fridel pairs
Flack parameter = 0.012 (9)
Cu—NF
Cu—S'
S—ClN1‘—Cu—N1
N1‘—Cu—S'
Table 2. Selected geometric parameters (A, °) for CuLiO 1.9219 (12) Cl—N2
2.2756 (4) Nl—N2
1.7220 (15)144.83 (7) S'—Cu—S
85.46 (4)
1.3706 (18)
1.3230 (16)
123.60 (2)
177

Appendix B
Symmetry codes: (i) y,x,-z.
Compound PdL20
PREVIEW (FM) 8
Crystal data
C22H3oN6PdS2
Mr = 549.04
Monoclinic
C2/ca = 16.0360 (16) A
b = 12.4564 (13) A
c = 12.3311 (12) AP = 100.952 (2)°V = 2418.3 (4) A3
Z= 4
Dx = 1.508 Mg m-3
Dm not measured
Mo Ka radiation
A = 0.71073 A
Cell parameters from 2763 reflections
0 = 2.520-27.821°
p = 0.962 mm-1
T = 118 K
Plate
Green
0.30 x 0.25 x 0.01 mm
Data collectionCCD area detector diffractometer 9max = 28.00°Omega scans
Absorption correction:
emperical SA DABS,ver2.03 (Sheldrick,2001)
Tmin = 0.7613, Tmax — 0.99028430 measured reflections
2847 independent reflections
2431 reflections with
>2sigma(l)
Rmt = 0.0427
h = -19 -► 21
k = —16 —» 16
l — —9 —► 16
every 0 reflections
frequency: 0 min
intensity decay: none
RefinementRefinement on P2
RIP2 > 2<r(T2)] = 0.0489
wR{F2) = 0.1071
S = 1.156
2847 reflections
w=l/[cr2(Fo) + (0.0364P)2 + 13.3379P]
where P = {F2 + 2F2)/3
(A/or)niax = 0.000
Apmax = 1.476 e A-3Apmin — —2.281 e A 3
142 parameters
H-atom parameters constrained
Extinction correction: none
Scattering factors from International Tables
for Crystallography (Vol. C)
Table 3. Selected geometric parameters (A, °) for PdL^O Pd—NT 1.993 (3) Nl—N2 1.339 (5)
Pd—S 2.2930 (10)
S—Cl 1.741 (4)
N2—Cl 1.340 (5)
178
N2—Cl

Appendix B
180.0 82.49 (9)
x, £ -y, 1-z.
S—Pd—S' 180.00 (3)
PREVIEW (FM)
NP—Pd—N1
Nl—Pd—S
Symmetry codes: (i) ^
Compound PtLgO
Crystal data
CgzHsoNgPtSg Mr = 637.73
Monoclinic
Cg/ca = 15.9317 (7) A b = 12.5300 (5) A
c = 12.3798 (5) A
0 = 100.7550 (10)°V = 2427.90 (17) A3
Z= 4Dx = 1.745 Mg m-3
Dm not measured
Data collection CCD area detector diffractometer
Omega scans
Absorption correction:
emperical 5ADAB5,ver2.03 (Sheldrick,2001)
Tmm = 0.255, Tmax = 0.408
14253 measured reflections
2937 independent reflections
2632 reflections with
>2sigma(i)
Bint = 0.1204
Refinement Refinement on F2
RIF2 > 2a(F2)} = 0.0365
wR(F2) = 0.0977
S = 1.088
2937 reflections
144 parameters
H-atom parameters constrained
Mo Ka radiation
A = 0.71073 ACell parameters from 9821 reflections
9 = 2,516-27.962°
H = 5.973 mm-1
T = 118 K
Plate
Dark green
0.25 x 0.20 x 0.15 mm
0max = 27.98° h — —21 —* 21
k = —16 —+ 16
1= -16-* 16
every 0 reflections
frequency: 0 min
intensity decay: none
■w=l/[<r2(F02) + (0.0604P)2 + 0.0000P] where P = (F2 + 2F2)/3
(A/cr)max = 0.000 Apmax = 3.079 e A-3
Apmin = -4.143 e A-3
Extinction correction: none
Scattering factors from International Tables
for Crystallography (Vol. C)
179

Appendix B
PREVIEW (FM) 10
Table 4. Selected geometric parameters (A, °) for FtTgOPtl—Nl‘ Ptl—SI SI—ClNT—Ptl—N1 Nl—Ptl—SI
1.964 (2)
2.2932 (6)
1.743 (2) 180.0 SI—Ptl—SP
Nl—N2 N2—Cl
1.349 (3)
1.326 (3)
180.000 (17)
82.11 (7)
Symmetry codes: (i) £ - x, £ - y, 1 — z.
?
For NiLgO, data collection: Bruker SMART (Bruker AXS,1998); cell refinement: Bruker SMART
(Broker AXS, 1998): data reduction: Bruker SHELXTL (Sheldrick,2001); program(s) used to
solve structure: Bruker SHELXTL (Sheldrick,2001); program(s) used to refine structure: Bruker
SHELXTL (Sheldrick,2001); molecular graphics: Bruker SHELXTL (Sheldrick,2001); software
used to prepare material for publication: WinGX publication routines (Farrugia, 1999) .
For CuLgO, data collection: Bruker SMART; cell refinement: Bruker SMART; data reduction:
Bruker SHELXTL, program(s) used to solve structure: Bruker SHELXTL; program(s) used to
refine structure: Bruker SHELXTL; molecular graphics: Bruker SHELXTL; software used to
prepare material for publication: WinGX publication routines (Farrugia, 1999) .
For PdLgO, data collection: Bruker SMART; cell refinement: Bruker SMART; data reduction:
Bruker SHELXTL; program(s) used to solve structure: Bruker SHELXTL; program(s) used to
refine structure: Bruker SHELXTL; molecular graphics: Bruker SHELXTL; software used to
prepare material for publication: WinGX publication routines (Farrugia, 1999) .
For PtLgO, data collection: Bruker SMART; cell refinement: Bruker SMART; data reduction:
Bruker SHELXTL; program(s) used to solve structure: Bruker SHELXTL; program(s) used to
refine structure: Bruker SHELXTL; molecular graphics: Bruker SHELXTL; software used to
prepare material for publication: WinGX publication routines (Farrugia, 1999) .
Acknowledgements This work was supported by the Danish Technical Research Council (STVF
26-02-0174, STVF 2058-03-0016), the Danish Strategic Research Council (DSF 2104-04-0030
and DSF 2104-05-0052).
180

Appendix B
PREVIEW (EM) 11
Supplementary data for this paper are available from the IUCr electronic archives (Reference:
PREVIEW). Services for accessing these data are described at the back of the journal.
References
Bachler, V., Olbrich, G., Neese, F. & Wieghardt, K. (2002). Inorg. Chem. 41, 4179-4193.
Bechgaard, K. (1973). thesis, University of Copenhagen, Denmark.
Bechgaard, K. (1974). Acta Chem. Scand. A, 28, 185-193.
Bechgaard, K. (1977). Acta Chem. Scand. A, 31, 683-688.
Blanchard, S., Neese, F., Bothe, E., Bill, E., Weyhermiiller, T. & Wieghardt, K. (2005). Inorg.
Chem. 44, 3636-3656.
Busch, M. & Bidder, H. (1904). Ber. Dtsch. Chem Ges. 29, 843-849.
Davidson, A., Edelstein, N. Holm, R. H. & Maki, A. H. (1963). J. Am. Chem. Soc. 85, 2029-2030.
Eisenberg, R. (1970). Prog. Inorg. Chem. 12, 295-369.
Faraglia, G., Fregona, D., Sitran, S., Giovagnini, L., Marzano, C., Baccichetti, F., Casellato, U. &
Graziani, R. (2001). J. Inorg. Biochem. 83, 31-40.
Forbes, C. E., Gold, A. & Holm, R. H. (1971). Inorg. Chem. 10, 2479-2485.
Garret, C. E. & Prasad, K. (2004). Adv. Synth. Catal. 346, 889-900.
Hampton Research. (2003). Crystallization Research Tools, 13, 206-210.
Hazell, R. G. (1976). Acfo Chem. Scand. A, 30, 322-326.
Holm, R. H, Balch, A. L., Davison, A., Maki, A. H. & Berry, T. E. (1967). J. Am. Chem. Soc. 89,
2866-2874.
Jensen, K. A., Bechgaard, K. & Pedersen, C. TH. (1972). Acta Chem. Scand. 26, 2913-2922.
Kokatam, S., Weyhermiiller, T., Bothe, E., Chaudhuri, P. & Wieghardt, K. (2005). Inorg. Chem.
44, 3709-3717.
Kosower, E. M. & Miyadera, T. (1972). J. Med. Chem. 15, 307-312.
Nielsen, K., Bechgaard, K. & Krebs, F. C. (2005). Macromolecules, 38, 658-659.
Nielsen, K., Bechgaard, K. & Krebs, F. C. (2006). Synthesis, 10, 1639-1644.
Pluijgers, C. W., Berg, J., Sijpesteijn, A. K., Tempel, A. & Verloop, A (1968). Recueil Trav Chim..
Pays-Bas, 87, 833-843.
Pyl, Von Th., Scheel, K. H. & Beyer, H. (1963). J. Prakt. Chem. p. 4. Reihe, 20, 255-262.
Sasse, K. & Hammann, I. (1971). Ger. Offen, DT2145418.
Sonogashira, K., Thoda, Y. & Hagihara, N. (1975). Tetrahedron Lett. 50, 4467-4470.
Fig. 1. Oxidation of thiosemicarbazide (a) to azothioformamide (6).
Fig. 2. Electron transfer series containing five members.
Fig. 3. The structure of [i]N, N[/i]-diethylphenylazothioformamide (L) and the corresponding
electron transfer complexes of the type M—N2S2A
Fig 4. Picture of a crystal of the Cu(L)2° complex growing on a copper wire. The crystal consumes
metallic copper when growing. The wire has been immersed in a concentrated thf solution of L.
181

Appendix B
PREVIEW (FM) 12
Fig. 5. The X-ray structures of the Ni(L)2° complex. The structures are viewed normal to (100).
The structure of the Cu(L)z° complex is similar.
Fig. 6. The X-ray structures of the Pd(L)2° complex. It can be seen that the coordination about
the metal atom is square planar. The structure of the Pt(L)2° complex is similar.
Fig. 7. The XH-NMR of the Pd(L)2° complex as function of the temperature. At the bottom the
temperature is 210 K and at the top 300 K (step of 10 K). Furthermore, the spectrum of pure L
is shown at the top.
Fig. 8. The 1H-NMR of the Pd(L)2° complex as a function of the temperature. At the bottom the
temperature is 300 K and in the top 450 K (step of 50 K).
S SH ,C R 2e" CRN-N VR2 ------------- *- N=N VR2
R1 H R2 -2H+ RiZ R2
(a) (b)
Figure 1.
M-N2S22+ M-N2S2+ M-N2S2° M-N2S2 M-N2S22'
Figure 2.
182
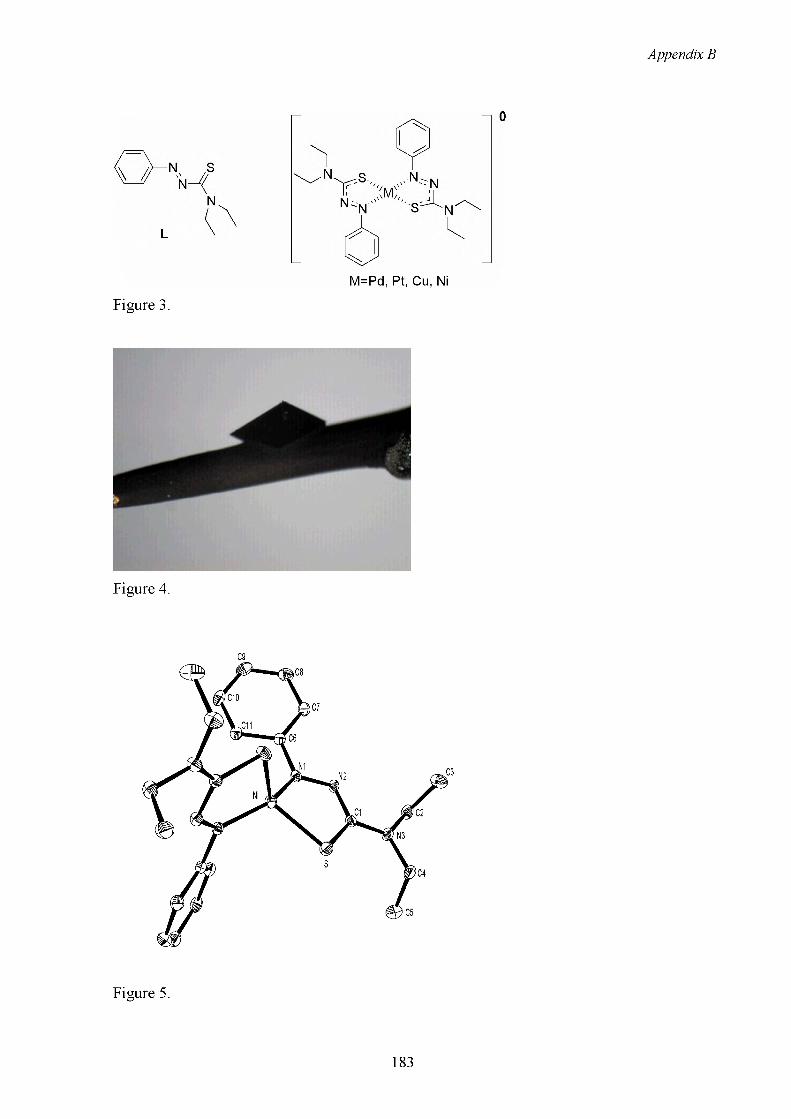
Appendix B
Figure 3.
M=Pd, Pt, Cu, Ni
Figure 4.
C9
Figure 5.
183

Appendix B
Figure 6.
r ■ ■ i ■ ■
Figure 7.
1,2-dichlorbenzene
Figure 8.
184
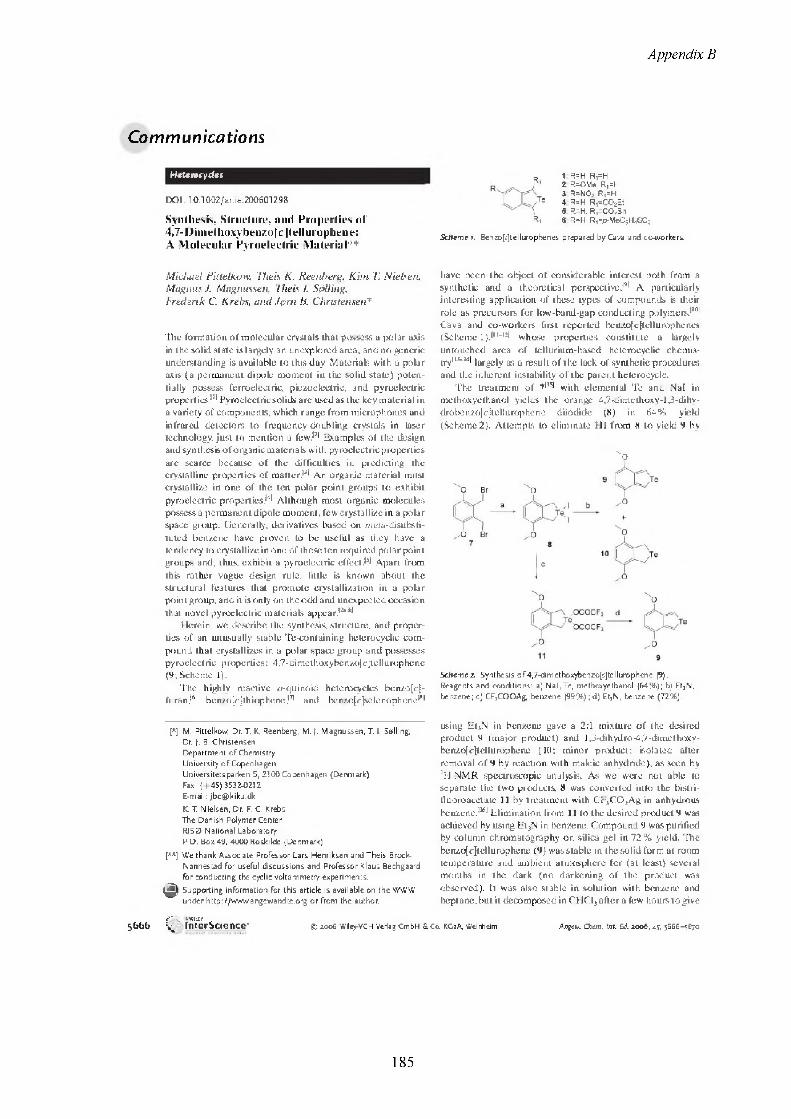
Appendix B
Communications
Hetemcydes
DOI: 10.1002/anie.200601298
Synthesis, Structure, and Properties of 4.7-Diniethoxy benzol cltellurophene:A Molecular Pyroelectric Material**
1 R=H R,=H2 R^OMe R,=H3 R=NO; R,=H4 R-H R,-C02Et5 R=H. R,=COzBn6 R=H R,=p-MeCfiH4S0j
Scheme 1. Benzo[tjtelIurophencs prepared by Cava and co-workers.
Michael Pittelkow, Theis K. Reenherg, Kim T. Nielsen, Magnus J. Magnus sen, Theis /. Spiling,Frederik C. Krebs, anil J&rn B. Christensen*
I he fonnaiion of molecular crystals that possess a polar axis in the solid state is largely an unexplored area, and no generic understanding is available to this day. Materials with a polar axis (a permanent dipole moment in the solid state) potentially possess ferroelectric, piezoelectric, and pyroelectric properties.*1* Pyroelectric solids are used as the key material in a variety of components, which range from microphones and infrared detectors to frequency-doubling crystals in laser technology, just to mention a few.*2* Examples of the design and synthesis of organic materials with pyroelectric properties are scarce because of the difficulties in predicting the crystalline properties of matter.* * An organic material must crystallize in one of the ten polar point groups to exhibit pyroelectric properties.*4* Although most organic molecules possess a permanent dipole moment, few crystallize in a polar space group. Generally, derivatives based on me/ti-disuhsii- tuted benzene have proven to be useful as they have a tendency to crystallize in one of these ten required polar point groups and, thus exhibit a pyroelectric effect.*5* Apart from this rather vague design rule, little is known about the structural features that promote crystallization in a polar point group, and it is only on the odd and unexpected occasion that novel pyroelectric materials appear.*2"**
Herein, we describe the synthesis, structure, and properties of an unusually stable Te-containing heterocyclic compound that crystallizes in a polar space group and possesses pyroelectric properties: 4,7-dimethoxybenzo[c|teIIuri>phene (9; Scheme 1).
The highly reactive o-quinoki heterocycles benzo[c|- furan.*6* benzojc] thiophene,*7* and he n/o[ c |se Ic noph cnc***
[*] M. Pittelkow, Dr. T. K. Reenberg, M. J. Magnussen, T. I. Soiling,Dr. J. B. Christensen Department of Chemistry University of CopenhagenUnivcrsitctsparken 5, 2100 Copenhagen (Denmark)Fax: (+45)3532-0212E-mail: [email protected]
K. T. Nielsen. Dr. F. C. KrebsThe Danish Polymer CenterRIS0 National LaboratoryP.O. Box 49. 4000 Roskilde (Denmark)
[**] We thank Associate Professor Lars Henriksen and Theis Brock- Nannestad for useful discussions and Professor Klaus Bechgaard for conducting the cyclic voltammetry experiments.
|^|) Supporting information for this article is available on the WWW
under http://www.angcwandtc.org or from the author.
__ _ Z"'-. * WILEY5666 \ InterScience- €> 2006 Wley-VCH VeHag GmbH
have been the object of considerable interest both from a synthetic and a theoretical perspective.*9* A particularly interesting application of these types of compounds is their role as precursors for low-band-gap conducting polymers.*10* Cava and co-workers first reported benzo[c|tcllurophcncs (Scheme l),*11"12* whose properties constitute a largely untouched area of tellurium-based heterocyclic chemis- tryl,i‘,4l largely as a result of the lack of synthetic procedures and the inherent instability of the parent heterocycle.
The treatment of 7*15* with elemental Te and Nal in methoxyethanol yields the orange 4,7-dimethoxy-1 J-dihydro be n z<)[ c ]t c II u rop he n e diiodide (8) in 64% yield (Scheme 2). Attempts to eliminate HI from 8 to yield 9 by
^0
Schema. Synthesis of 4,7-dimethoxybenzo[c]tellurophene (9). Reagents and conditions: a) Nal. Te, methoxyethanol (64%); b) Et,N. benzene; c) CF,COOAg. benzene (99%); d) Et,N, benzene (72%).
using EtjN in benzene gave a 2:1 mixture of the desired product 9 (major product) and 1,3-dihydro-4.7-dimethoxy- benzo[c|tellurophene (10: minor product; isolated after removal of 9 by reaction with maleic anhydride), as seen by lH NMR spectroscopic analysis. As we were not able to separate the two products, 8 was converted into the bistri- fluoroacetate 11 by treatment with CF3C02Ag in anhydrous benzene.*16* Elimination from 11 to the desired product 9 was achieved by using Et3N in benzene. Compound 9 was purified by column chromatography on silica gel in 72% yield. The benzo[c|tellurophene (9) was stable in the solid form at room temperature and ambient atmosphere for (at least) several months in the dark (no darkening of the product was observed). It was also stable in solution with benzene and heptane, but it decomposed in CHC13 after a few hours to give
Co. KG a A, Weinheim Angew Chem. Int Ed 2006, 45, 5666-5670
185
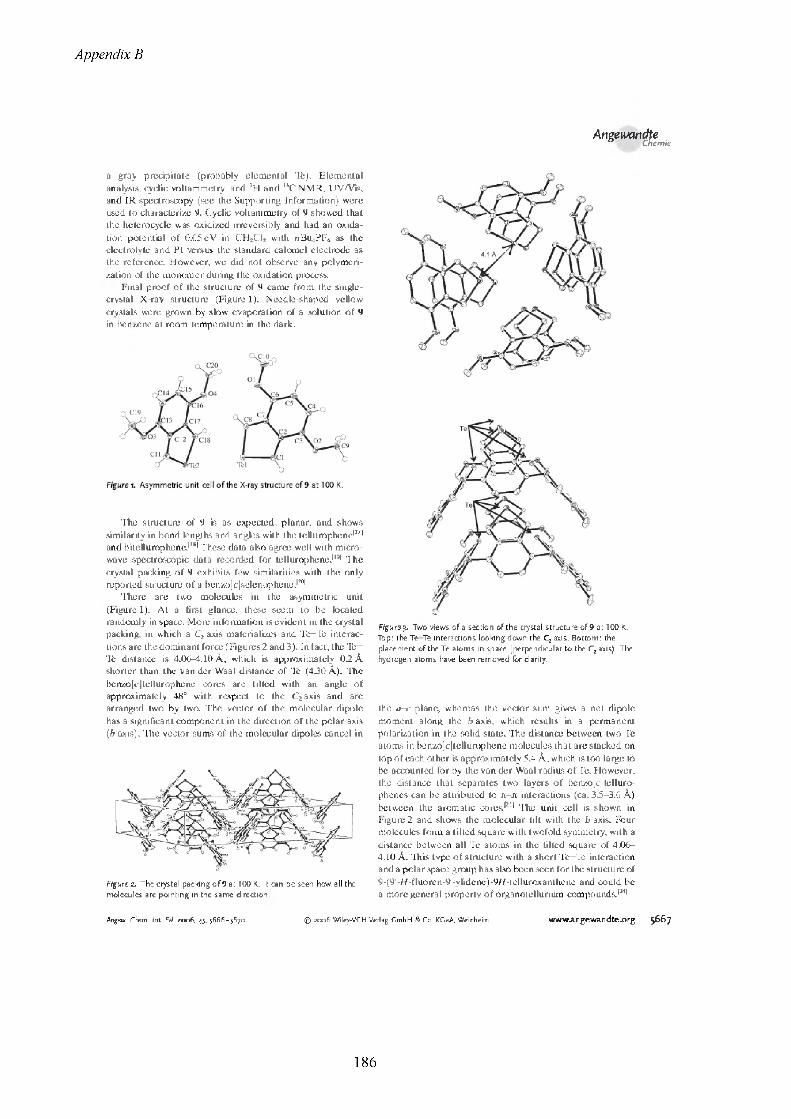
Appendix B
AngewcmdteChemie
a gray precipitate (probably elemental Te). Elemental analysis, cyclic voltammetry, and 'll and l3CNMR, UV/Vis, and IR spectroscopy (see the Supporting Information) were used to characterize 9. Cyclic voltammetry of 9 showed that the heterocycle was oxidized irreversibly and had an oxidation potential of 0.65 eV in CH2CI2 with f*Bu#PF* as the electrolyte and Pt versus the standard calomel electrode as the reference. However, we did not observe any polymerization of the monomer during the oxidation process.
Final proof of the structure of 9 came from the single- crystal X-ray structure (Figure 1). Needle-shaped yellow crystals were grown by slow evaporation of a solution of 9 in benzene at room temperature in the dark.
Figure t Asymmetric unit cell of the X-ray structure of 9 at 100 K.
The structure of 9 is as expected, planar, and shows similarity in bond lengths and angles with the tellurophene*171 and bitellurophcne.*18* These data also agree well with micro- wave spectroscopic data recorded for tellur op he nc.*19* The crystal packing of 9 exhibits few similarities with the only reported structure of a benzo[t (selenophene.*20*
There are two molecules in the asymmetric unit (Figure 1). At a first glance, these seem to be located randomly in space. More information is evident in the crystal packing, in which a Q axis materializes and Te—Te interactions are the dominant force (figures 2 and 3). In fact, the Tele distance is 4.06-4.10 A, which is approximately 02 A shorter than the van der Waal distance of Te (430 A). ’Ihe benzo[c|tellurophene cores are tilted with an angle of approximately 48° with respect to the C2 axis and are arranged two by two. The vector of the molecular dipole has a significant component in the direction of the polar axis (b axis). 'Ihe vector sums of the molecular dipoles cancel in
Figure 2. The crystal packing of 9 at 100 K. It can be seen how all the molecules are pointing in the same direction.
Angav. Chem. Int Ed- 2006. 45. 5666-5670
Figure 3. Two views of a section of the crystal structure of 9 at 100 K. Top: the Te Te interactions looking down the C2 axis. Bottom: the placement of the Te atoms in space (perpendicular to the C3 axis). The hydrogen atoms have been removed for clarity.
the a-c plane, whereas the vector sum gives a net dipole moment along the b axis, which results in a permanent polarization in the solid state. Ihe distance between two Te atoms in benzo[c |te 11 urophene molecules that are stacked on top of each other is approximately 5.4 A. which is too large to be accounted for by the van der Waal radius of Te. However, the distance that separates two layers of benzo[c|telluro- phenes can be attributed to ji-ji interactions (ca. 33-3.6 A) between the aromatic cores.*21* Ihe unit cell is shown in Figure 2 and shows the molecular tilt with the b axis. Four molecules form a tilted square with twofold symmetry, with a distance between all Te atoms in the tilted square of 4.06- 4.10 A. This type of structure with a short Te—Te interaction and a polar space group has also been seen for the structure of 9-(9,-//-fluoren-9’-ylidcne)-9//-telluroxanihene and could be a more general property of organotellurium compounds.*24*
www.angewandte.org 5667© 2006 Wiley-VCH VeHag GmbH & Co. KGaA, Weinheim
186

Appendix B
Communications
The fact that all the be nzo |i ] te 11 urophene molecules point in the same direction in space introduces a permanent polarization into the crystal, thus prompting us to investigate the pyroelectric properties. The pyroelectric effect can be divided into three contributions: primary, secondary, and tertiary effects. The primary effect has origin in abrupt atomic or molecular movements within the crystals as a function of the temperature that leads to changes in the polarization in the material. This behavior is often observed in connection with phase transitions in which the spontaneous polarization either appears, cancels, or changes radically: for example, if the symmetry changes from polar to nonpolar. The secondary effect is due to the change in polarization as a function of the thermal expansion (change of the volume as a function of the temperature) of the unit cell. The tertiary effect is coupled to the piezoelectric properties that pyroelectric materials invariably have. By ensuring homogenous heating of the material and careful design of the detector geometry the tertiary effect can be eliminated from the experiment.
We investigated the X-ray structure as a function of the temperature to determine whether the observed pyroelectric effect is a primary or secondary effect. Therefore, the X-ray diffraction data of 9 were recorded at 100. 150, 200,250, 300, 323, 343, and 373 K. An exothermic phase transition was observed at about 353 K, as shown by differential scanning calorimetry (DSC; see the Supporting Information). Ihe X- ray data could be collected at 343 K. but the crystal blackened and its edges became rounded upon heating to 373 K. No diffraction could be observed when the temperature was k>wered back down to 343 K. Ihis behavior indicates that the observed crystal structure may not be an equilibrium structure. We, however, rule out the possibility of polymorphism as all diffraction disappears after the heating step to 373 K. We observed a decrease in the diffraction intensity as a function of time when collecting data at 343 K, and no diffraction was observed after 2 h. It, therefore, seems plausible that 9 loses tellurium at high temperature.
The structural refinement of 9 was unproblematic at all temperatures, except at 323 K, for which we employed constraints on the molecular geometry by forcing the benzene ring to approach a hexagonal geometry.
If the pyroelectric effect is a primary effect, a structural change as a function of the temperature, which affects the polarization, has to be observed. A change in the polarization can only happen if the angle between the C2 axis and the plane of the molecule changes. We have pkmed the angle between the least squares fitted plane and the C2 axis as a function of the temperature for one of the molecules in the asymmetric unit cell (the same results were obtained for the other molecule in the asymmetric unit; see the Supporting Information). No significant changes were observed which means that a primary pyroelectric effect can be excluded.
In Figure 4. the polar axes of the unit cell and the cell volume is plotted as a function of the temperature, thus clearly indicating a secondary pyroelectric effect.
The secondary pyroelectric effect is solely due to the thermal expans km of the material with temperature. Compound 9 expands when heated, and as the dipoles in the unit
T vs. b
------ V'*0.3349 T ♦ 1867.8818
Figure4. Length of the b axis and the volume of the unit cell as a function of temperature.
cell slay constant the polarization decreases, thus giving the secondary pyroelectric effect as |Eq. (l)|:*a':
ffi-*"-.,-.;*. "I
where P, a1*+2bT+b2/a% T, Z, /r, and 0 are the polarization, the derivatives of the linear thermal expanskm with respect to the temperature, the temperature, the molecular entities per unit cell, the molecular dipole moment, and the angle between the molecular plane and the C2 axis, respectively. The dipole moment of the molecules can be enhanced in the solid state, as reported previously.!^* but this amounts to only minor changes in the overall magnitude of the pyroelectric effect.
I he dipole moments of the single molecules and the unit cells were calculated at the B3LYP/3-21G level of theory using the Gaussian 98 suite of programs.*221 The molecular coordinates from the X-ray crystal structures were used as input, and the results are summarized in fable 1. We observe
Table 1: Calculated dipole moments.^
T [K] ft Pf1 H [D]'=l
100 2.17 15.96150 2.16 14.10200 2.19 12.92250 2.16 13.47300 2.18 12.89323 2.59 15.96
[a] B3LYP/3-21C. [b] Single molecule, [c] Component along the b axis in a single unit cell, the value is equal to the total dipole moment of one unit cell.
that the dipole moment stays relatively constant with temperature, except for when the temperature was raised to near the phase transition.
On the basis of the equation for the thermal expansion (Figure 4) and the calculated dipole moment Viable 1), it becomes possible to calculate the pyroelectric effect as a function of the temperature (Figure 5).
5668 www.angewandte.org © 2006 Wley-VCH Veriag GmbH & Co. KGaA Weinheim Angew. Otem. Int Ed. 2006, 45. 5666-5670
187

Appendix B
AngeivcmdteChemie
-1, l6e-6
-J,20e-6
Figure 5. The calculated secondary pyroelectric coefficient as a function of the temperature. The pz(7) calculated is the secondary pyroelectric coefficient calculated by use of Equation (1), the calculated dipole moments from Table 1, the thermal expansion from Figure 4, and the angle between the molecular plane and the C, axis. The p2(T) mean is the secondary pyroelectric coefficient calculated by use of equation above, the mean value of the calculated dipole moments from Table 1, the thermal expansion from Figure 4, and the mean angle between the molecular plane and the C2 axis.
From the point of view of application, primary pyroelectric materials have the advantage that large effects are seen near the phase transition, and therefore very sensitive detector systems can be designed. Their disadvantage is that the operation of the detector system is limited to temperatures near the phase transition. The application of the secondary pyroelectric effect in a detector system has the advantage that it can work over a large temperature range, and organic systems generally have high merit factors.13*1 11
We are puzzled by the stability of 9 relative to the other known 13-unsubstituted benzo[r|tellurophenes. which decompose upon isolation.111'12* We speculate that the stability of 9 is due to the steric effect that the melhoxy groups in the 4- and 7-positions impose on the 1- and 3-positions of the heterocycle. This steric effect prevents these reactive positions from polymerizing, and we consider this to be a peri effect.*23*
To summarize, we have presented the synthesis and characterization of a stable bcnzo[c)lcllurophcnc derivative, including the first crystal structure of this type of heterocycle. In addition, we observe an unusual stabilizing effect of the electron-don a ling melhoxy substituents in the 4- and 7- posilions The pyroelectric properties of 9 have been investigated, and a secondary effect was found. This discovery suggests that tellurium-containing hetcrocyclcs could be attractive in materials science.
Experimental SectionAll synthetic procedures and characterization data are given in the Supporting Information. Atomic coordinates and further crystallographic details have been deposited with the Cambridge Crystallographic Data Centre, University Chemical Laboratory, Lensfield Road, Cam bridge CB2 IE W. England. CCDC 299607-299612 contain the supplementary crystallographic data for this paper. T hese data
Angev. Chem. Ini Ed. 2006, 45, 5666-5670
can he obtained free of charge from The Cambridge Crystallographic Data Centre via www.ccdc.cam.ac.uk/data_request/cif.
[1J D. Y. CUrtin, I. C Paul, Chem. Rev. 1981. 81,525 - 541.[2] For examples, see: a) S. Matyjasik, Y. V. Shaldin. Phys. Solid
Slate 1997,39,1454-1456; b) F. C. Krebs, R S. Larsen, J. Larsen,C. S. Jacobsen, C. Boulton, N. Thor up,/. Am. Chem. Soc. 1997,119, 1208-1216; c)G. K.H. Madsen, EG. Krebs, B Lebech,F. K. Larsen, Chem. Eur. J. 2000,6,1797-1804; d) A. Faldt, F C.Krebs N. Thor up. /. Chem. Soc. Perkin Trans. 2 1997. 2219- 2227.
[3] a)J. D. Dunitz, A. Gavezzotti, Angew. Chem. 2005.117, 1796- 1819; Angew. Chem. Int. Ed. 2005. 44, 1766-1787; b) “Crystal Design: Structure and Function": G R. Desiraju in Perspectives in Supramolecular Chemistry, Vol. 7, Wiley-VCH, 2003.
[4] S. T. Liu, l.andolt- BOmstein. Numerical Data and Functional Relationships in Science and Technology, Vol. 11/111 (Ed.: K.-H. Hellwege), Springer. New York, 1979. pp. 471 -494.
[5] a) A.D. Mighell, J. R. Rodgers, Ada Crystallogr. Sect. A 1980,36, 321-326; b) J. C Wilson, Acta Crystallogr. Sect A 1988.44,715-724.
[6] For a general review about the synthesis of benzo[c]furans, see:“Science of Synthesis": R G. Steel in Houben-Weyl, Vol. 10 (Ed.:E J. Thomas), Thieme, Stuttgart, 2001, pp. 87-130.
[7] For a general review about the synthesis of benzo[v)thiophenes, see: “Science of Synthesis": J. T. Gilchrist, S.J. Higgins in Houben-Weyl, Vol. 10 (Ed.: E.J. Thomas). Thieme, Stuttgart,200Lpp. 185-210.
[8] For a general review about the synthesis of benzo[c]selenophenes, see: “Science of Synthesis": R J. Murphy in Houben- Weyl, Vol. 10 (Ed.: E.J. Thomas), Thieme, Stuttgart, 2001, pp. 301-205.
[9] “Furans and Their Benzo derivatives": a) F. M. Dean in Comprehensive Heterocyclic Chemistry, Voi 4 (Eds.: A. R.Katritzky, C. V. Rees), Rergamon, Elmsford. 1984 pp. 531- 712; b) W. Friedrichsen, Adv. HeterocycL Chem. 1980,26, 135.
[10] F. Wudl, M. Kobavashi, A. J. Heeger, Z Org. Chem. 1984. 49,3382 - 3384.
[11] EH. Mdrkved, M. V. Lakshmikantham. M. R Cava, Tetrahedron letL 1996, 51,9149-9150.
[12] Z. Huang. M. V. Lakshmikantham, M. Lyon, M. P. Cava,/. Org.Chem. 2000, 65,5413-5415.
[13] a) M. R. Deity, M. B. O'Regan in Tellurium-Containing Heterocycles, Vol. 53, Wiley, New York. 1994; b) “Science of Synthsis":RJ Murphy in Houben-Weyl, VoL 10 (Ed.: EJ. Thomas),Thieme, Stuttgart. 2001, pp. 343-346.
[14] a)N. Petragnani. H. A. Stefani, Tetrahednm 2005. 61, 1613- 1616; b) G. Zeni, D. S. Liidtke. R. B. Panatieri. A. L. Braga,Chem. Rev 2006,106,1032-1076.
[15] J. Eskildsen, T. Christensen, T. K. Reenberg, U. Larsen, J. B. Christensen, Org. Prep. Proced. 2000, 32, 398 - 400.
[16] Preparation of CF3COOAg: J. G. Traynham. J. S. Dehn,/. Org.Chem. 1958, 23,1545 -1546.
[17] Crystal structure of n-tellurophene carboxylic acid: L. Fanfani,A. Nunzi. R F. Zanazzi, A. R. Zanzari, M. A. Pellinghelli. Cryst.St met. Comm. 1972,1, 273 - 278.
[18] Crystal structure of 22 -bitellurophene: T. Otsubo, S. lnoue. H.Nozoe, T. Jigami, F. Ogura, Synth. Met. 1995, 69, 537 - 538.
[19] Microwave spectrum of tellurophene: R. D. Brown. J. G. Crofts,Chem. Phys. 1973,1, 217 - 219.
www.angewandte.org $66 g
Received: April 3, 2006 Published online: July 21, 2006
Keywords: density functional calculations • heterocycles
molecular pyroelectrics • X-ray diffraction
© 2006 Wfley-VCH Veriag GmbH & Co. KG a A Weinheim
188

Appendix B
Commun ica tions
[20] Crystal structure of a benzo[c]selenophene derivative: E. Aqad, M. V. Lakshmikantham. M. P. Cava, G. A. Broker, R. D. Rogers Org. Lett. 2003, 5,2519 - 2521.
[21] C A. Hunter, J. K. M. Sanders J- Am. Chem. Soc. 1000. //2, 5525-5534.
[22] Gaussian08 (Revision A.11.3), J. Frisch, G. W. Trucks H. R Schlegel, G. E Scuseria, M. A. Robb, J. R. Cheeseman, V. G. Zakrzewski, J. A. Montgomery, Jr., R. E. Stratmann, J. G Burant, S. Dapprich, J. M. Mill am. A. D. Daniels, K.N. Kudin, M. G Strain, O. hark as. J. Tomasi, V. Barone, M Cossi, R. Cammi, B. Mennucci, C. Pomelli, G Adamo, S. Clifford, S. J. Ochterski, G. A. Petersson, R Y. Ayala, 0 Gii, K. Morokuma. D. K. Malick, A D. Rabuck, K. Raghavachari, J. B Foresman, J. Goslowski, J. V. Ortiz, B. B. Stefanov, G. Liu, A. Liashenko, R Piskorz. L Knmaromi.R. Gomperts.R. L. MaitiaD. J. Fox.T. Keith, M. A. Al-Laham. G Y. Peng. A. Nanayakkara, G Gonzalez, M. Challacombe, P M. W. Gill, B. Johnson,W. Chen, M. W. Wong. J. L. Andres, M. Head-Gordon, E S. Replogle, J A Pople. Gaussian. Inc., Pittsburgh. PA, 1008.
[23] V. Balasubramanivan. Chem. Rev. 1066, 66,567 -641.[24] A Levy, P U. Biedermann, S. Cohen, 1. Agranat, J. Chem. Soc.
Perkin Tram. 2 2001, 2329 - 2341.
5670 www.angewandte.org <g> 2006 Wley-VCH Verlag GmbH &. Co. KCaA, Weinheim Angew. Chem. Int Ed. 2006, 45, 5666-5670
189

Appendix B
Supporting MaterialSynthesis, Structure and Properties of 4,7-Dimethoxybenzo[c]tellurophene, a Molecular Pyroelectric Material **
Michael Pittelkow, Theis K. Reenberg, Kim T. Nielsen, Magnus J. Magnussen, Theis I. Sailing, Frederik C. Krebs and Jarn B. Christensen *
Table of Contents:Cover page.......................................................................................................S1Table of contents..............................................................................................S2Synthetic procedures................................................................................... S3-S5Uv-vis of compound 9...................................................................................... S6CV of compound 9...........................................................................................S7DSC of compound 9......................................................................................... S8Angle between mean planes vs. temperature..................................................... S9
Synthetic procedures.
2,2-Diiodo-4,7-dimethoxy-2,3-dihydro-benzo[c]tellurophene (8)Bis-bromide (3.0 g, 9.26 mmol) (7), Te (1.18 g, 9.26 mmol) and Nal (11.1 g, 74 mmol) were suspended in 2-methoxyethanol (45 mL) and heated gently to reflux for 2 hours. The reaction mixture was cooled to room temperature and water (50 mL) was added. The orange precipitate was filtered off and washed with water (2x50 mL) and ether (50 mL). The product was dried in vacuum (2 mmHg) at 30°C. This yields the desired product as an orange solid; yield 3.25 g, 64 %. 'H NMR (CDCl3, 300 MHz) 5 6.89 (s, 2H), 4.57 (s, 4H), 3.78 (s, 6H). 13C NMR (CDCb, 75 MHz) 5 152.4, 130.1, 110.2,
[*] Michael Pittelkow Theis K. Reenberg, Magnus J. Magnussen, Dr. Theis I. Soiling, Dr. Jorn B. Christensen.Department of Chemistry, University of Copenhagen, Universitetsparken 5, DK-2100 Copenhagen 0, Denmark.Fax: (+45) 35320212 E-mail: [email protected]
Kim T. Nielsen, Dr. Frederik C. Krebs.The Danish Polymer Center, RIS0 National Laboratory P.O. Box 49, DK-4000Roskilde, Denmark.
[**] We thank Associate Professor Lars Henriksen and Theis Brock-Nannestad for useful discussions and Professor KlausBechgaard for conducting the cyclic voltametry experiments.
190

Appendix B
55.6, 44.0. Mp 230-233°C (decomposition). Anal. Calcd for Ci0H12O2TeI2: C, 22.01; H, 2.22. Found: C, 22.12; H, 1.96. MS (DI) m/z 294 (M-2I+).
4.7- Dimethoxy benzo[c]tellurophene (9)Bis-trifluoroacetate (11) (1.32 g, 2.55 mmol) was dissolved in benzene (80 mL), Et3N (2.58 g, 3.55 mL, 25.5 mmol) was added and the mixture was heated gently to reflux for 1 hour. Water (200 mL) was added and the phases separated. The organic phase was dried over Na2SO4 and evaporated to dryness. The crude was redissolved in CH2Cl2 and purified by dry column vacuum chromatography on silica (heptane/EtOAc mixtures) to yield the benzo[c]tellurophene as a yellow solid. Yield: 0.532 g, 72 %. 1H NMR (CDCl3, 300 MHz) 5 9.50 (t, 2H, JTe.H = 50.1 Hz ), 5.96 (s, 2H), 3.89 (s, 6H). 13C NMR (CDCl3, 75 MHz) 5 148.6, 143.6, 120.1, 97.7, 55.1. Mp 124-126°C (decomposition). IR (KBr, cm-1) 3082 (m). 2982 (m), 2932 (m), 2827 (m), 1621 (s), 1502 (s), 1453 (m), 1445 (m), 1416 (m), 1354 (s), 1256 (s), 1227 (m), 1176 (m), 1135 (m), 1123 (m), 1058 (s), 959 (m), 800 (s), 782 (m), 737 (m), 713 (m). Anal. Calcd for C^H^O^e: C, 41.45; H, 3.48. Found: C, 42.55; H, 3.65. MS (FAB+) m/z: 291.96 (M+H+).
4.7- Dimethoxy-1,3-dihydro-benzo[c]tellurophene (10)Diiodide (8) (1.47 g, 2.69 mmol) was suspended in dry benzene (150 mL) and Et3N (3 mL) was added and the reaction mixture was heated gently to reflux for 1 hour. After cooling the reaction mixture to room temperature it was washed with water (2 x 100 mL), dried (MgSO4) and evaporated to dryness. The resulting yellow solid compound and maleic anhydride (528 mg, 5.39 mmol, 2 eq) was suspended in anhydrous benzene (50 mL) and heated to reflux for 2 hours. The reaction mixture was then evaporated to dryness and purified directly by dry column vacuum chromatography (heptane to EtOAc with 5 % increments). This yields 10 as an off-white solid: 100 mg, 13%. Also a small amount of the highly symmetrical naphthalene compound 12 was isolated and characterized.10: 1H NMR (CDClg) 5 6.55 (s, 2H), 4.42 (s, 4H), 3.72 (s, 6H). 13C NMR(CDCls) 5 152.1, 135.4, 108.8, 55.9, 5.7. GC-MS m/z 294 (130Te). Mp. 91-92°C. Anal. Calcd for CmH^Te: C, 41.16; H, 4.15. Found: C, 41.25; H, 4.01. IR (KBr, cm-1) 2990, 2916, 2827, 1639, 1593, 1557, 1476, 1431, 1410, 1252,1070,943,798,774,717.12: 1H NMR (CDClg) 5 8.88 (s, 2H), 6.99 (s, 2H), 4.01 (s, 6H). 13C NMR (CDClg) 5 163.8, 151.1,129.1, 125.8, 122.7, 108.5, 56.3. GC-MS m/z 258.
Trifluoro-acetic acid 4,7-dimethoxy-2-(2,2,2-trifluoro-acetoxy)-2,3-dihydro-benzo[c]tellurophen-2-yl ester (11)Diiodide (8) (500 mg, 0.916 mmol) and silvertrifluoroacetate (405 mg, 1.833 mmol, 2 eq) was suspended in dry benzene (20 mL) and stirred for 2 hours at room temperature. The reaction mixture was filtered and the filtrate evaporated to dryness to yield the title compound as an off-white solid. Yield 470 mg, 99 %. 1H NMR (CDClg, 300 MHz) 5 6.13 (s, 2H), 4.21 (s, 4H), 3.10 (s, 6H). 13C NMR (CDCl3, 75 MHz) 5 161.9, 152.8, 116.7, 112.9, 110.5, 54.8, 45.2. Mp. 174-175°C (decomposition). Anal. Calcd for C14H12O6F6Te: C, 32.47; H, 2.34. Found: C, 32.69; H, 1.88. MS (DI) m/z 520 (M+).
191

Appendix B
Uv-vis of compound 9 in CH2C12
4,7-Dimethoxy benzo[c]tellurophene
315.5
393.5
wavelength / nm
CV of compound 9
The cyclic voltamogram of 9. The heterocycle was oxidized irreversibly and has an oxidation potential of 0.65 eV in CH2C12 solution using n-Bu4PF6 as tire electrolyte and Pt vs. standard calomel electrode as the reference.
192

Appendix B
DSC of compound 9
DSC for 4,7-dimethoxybenzo[c]telluphene
9000 -
6000 -
3000 -
40 60 80 100
Temperature / °C120 140
Angle between least squares plane in x-structure of 9 and the c2 axis vs. temperature
The angle between the least square plane of 9 and the C2 axes, as a function of the temperature. It can be seen that the angles remain virtually constant over the investigated temperature range.
42.5
42.0 -
41.5 -
41.0 -
40.550 100 150 200 250 300 350
T [K]
193

Appendix B
194

Appendix B
Design of porphyrin-polyphenyleneethynylene light harvesting systemsKim T. Nielsena b. Holger Spanggaard3 and Frederik Krebs3*Polymer Solar Cell Initiative, The Danish Polymer Centre, Rise National Laboratory,
PO Box 49, DK-4000 Roskilde, Denmark. bDepartment of Chemistry. Technical University of Denmark DTU-207,
DK-2800 Kgs. Lyngby. Denmark.
AbstractA zinc-porphyrin linked polyphenylene- ethynylene system were synthesized. It was demonstrated that the polyphenyteneethy- nylene chains works as light harvesting antennas and efficiently could transfer the energy to the porphyrin molecules.
GoalsThe Goals are divided into two main parts:1) To synthesize a three-domain (NPN)
structure consisting of two poiyphenytene- ethynytenes as the N domains and a porphyrin dye molecule as the P domain (see figure 1 and 4).
2) To evaluate the properties of the N domains as a light-harvesting antenna for the P domain.
IntroductionNormally in OPV devices the exciton diffusion length is on the order of 10 nm. which means that the active layers in these devices are very thin. The idea of this work is to synthesize a three-domain structure. NPN. (see figure 1 and 4). which allows a charge separation in the interface between the domains inside the active layer. This opens the possibility to make the active layer thicker and thereby increase the power conversion efficiency.
Figure 1: The three-domain structure NPN.
It was our intention to determine the optimal length of the N domains by making mono- disperse phenylacetytene terminated oligo{1- (2.5-dioctyltolanyi)ethyne) at a precise molecular length by the directional stepwise synthesis illustrated in figure 2.
I J4.—^
Figure 2: The unsuccessful stepwise synthesis of monodisperse okgomers
Unfortunately this failed in our hands caused by the formation of the 1,4-diarylbutadiynes in each coupling step (see figure 3). These
impurities are very difficult to discover by methods like NMR so a technique like Size Exclusion Chromatography (SEC) is absolutely needed.
Time [min]Figure J. The SEC trace of the producfwtwch should have boon the pure Ulmer The moNaMe wwgh# of the tnmer is 1424.27gfmo!
Experimental
Figure 4: NPN was synthesised by a Sonoguhti cross coupling reaction, where PdfPPhj, was used as catalyst •
figure 3: Standard fhm f*n devices were made for electroluminescence measurements after removal of Pdnanoparticles *
Agere & Wo have discovered that NN-db ethyfpheoyte/othiotofme- nwde (U oMdOntty remove Pd nanopartetes from polymer products
furthermore if can tie used tor quantitative analysis of the Pd content See the UV-ve spectra *
figure 7: Uftra vutot Pr**o- otoctron Spectroscopy fUPS> was performed on the native potyphenytenoethy-nyfene fAf) UPS er(moment* employ hard UV radiation horn a synchrotron source The UPS experiments give information of fhe fuied electron states and the tonrsahon potential
Results
Binding Energy |eV]figure •: Left; The UPS speefnm tor the native polyphenyfeneethynyiene The distance from fhe fermr levei. 6, to the onset of photoelectrons (the valence band edge m the mafenah represent the ejection bamer for holes from the substrate into fhe vatonce hand of fhe matenaf Right: The electronic band structure derived from the UPS spectrum l SeV. E,"c « 4 OeV. 8e_, - -46 0eV. d • 4) TOeV. fP ■ i.SOeV and •t’tm * 4 7eV*
Wavelength [nm]figure 9: The otocfrofummescence and the fluoroacence spectra of AfPAf and Af is shown ftofe that the electroluminescence and fhe fluorescence spectra are very sender, which ndkeafe an effewnf transfer of exedons m the N domain to the P domain Thts <S supported by vkluaby no emission from the At domains is observed m the spectra of
ConclusionWe present here the synthesis of a new zineporphyrin linked conjugated polymer. We found that Pd remnants from the catalyst result In cross linking of the ethynylene groups and cause problems when preparing thin film devices. We found that an azothioformamide ligand efficiently remove Pd nanopartides from polymer products.We demonstrated an excitonic energy transfer from electrically generated exdtons in the N- domain to the P-domain.
Acknowledgement
References
www.risoe.dk/solarcells, Tel (+45) 4677 4284, Fax (+45) 4677 4791, [email protected]
195

Appendix B
196
Appendix B
<2*Office $
# INVESTOR IN PEOPLE
FILING RECEIPT
WH Beck Greener & Co 7 Stone Buildings Lincolns Inn London UKWC2A 3SZ
The Patent Office
Concept House Cardiff Road NewportSouth Wales NF10 8QQ
Switchboari; 01633-814000 Mmicorn: 08439 222250DX 722540/41 Cleppa Part 3 http://www.pateat.gov.ulc
Your Ref.: PJS/ALHZP10083GB 27 September 2004
PATENT APPLICATION NUMBER 0421335.1
The Patent Office confirms receipt of a request for grant of a patent, details of which have been recorded as follows :
Filing Date (See Note)
ApplicantsDescription (No. of Sheets)Claims (No. of Sheets)Drawings (No. of Sheets)Abstract (No. of Sheets)Statement of Inventorship (Form 7/77) Request for Search (Form 9/77) Request for Examination (Form 10/77) Priority Documents Translation of Priority Documents Other Attachments Received
: 24-SEP-04
RISO NATIONAL LABORATORY2344+4NoneNoneNoneNoneNoneNoneNone
The application number included in the heading above should be quoted on all correspondence with The Patent Office,
Any queries on this receipt should be addressed to Janine Geran, tel. 01633 814570. All other enquiries should be directed to Central Enquiry Unit, tel. 0845 9 500 505.
Note : The above filing date is provisional and may need to be amended if it is subsequently found during the preliminary examination that the provisions of section 15(1) of the Patents Act 1977 are not met or if the application is re-dated to the date later filed drawings are received.
An Executive Agency of the Department of Trade .and Industry
197

Appendix B
Notice to Applicants
1 The Patents Act 1977 requires the Comptroller to publish the application, including the description and claims, after the expiry of eighteen months from the earliest declared priority date or, where no earlier priority is claimed, from the date of application provided the application has not been withdrawn before completion of the preparations for its publication. The applicant may request publication to take place before the expiry of this period,
2 A request for a preliminary examination and search (with the prescribed fee) must be made within twelve months of the earliest declared priority date or, where no earlier priority is claimed, from the date of the application.
3 Failure to make the request mentioned in 2 above within the twelve month period will result in the application being treated as withdrawn. (This period can be extended by one month upon filing the prescribed fee, or possibly for a longer period at the Comptroller’s discretion also upon filing the prescribed fee - in either case together with Form 52/77).
4 One or more claims and an abstract must also be filed. In the case of an application containing no declared priority date, the period allowed is twelve months from the date of filing the application. For an application which does claim an earlier priority it is twelve months from the earliest declared priority date or one month from the date of the application, whichever is the later.
5 Failure to file documents mentioned in 4 above within the prescribed periods may result in the application being treated as withdrawn.
The information above does not apply to international applications which enter the national phase under Section 89 of the Patents Act 1977. Enquiries on such applications should be addressed to the Patent Office. Tel 01633 814586.
198

Appendix B
Patents Form 1/77 /Jfiv nPatent* Act 1977 | Office 1 §(Rule 16) .JL
/■s®w ww#
Request for grant of a patent(See the notes on the back of this Form* You can also get on explanatory leaflet Grom the Patent OfEce to help you SB in thin form)
The Patent Office
Cardiff Road Newport South Wales NP10 8QQ
1. Your referencePJS/ALH/P10083GB
2. Patent application number(The Patent Office will fill this part lit)
3- Full name, address and postcode of the or of each applicant (underline all surnames)
Patents ADP number (if you know It)
RIS0 NATIONAL LABORATORYBuilding 101Frederiksborgvej 399DK-4000 RoskildeDenmark
If the applicant is a corporate body, give the. country/state of its incorporation Denmark
4. Title of the invention COMPLEXATION OF PALLADIUM
5. Name Of your agent (ifyou have one) W. H. Beck, Greener & Co.
“Address for service’ in the United Kingdom to which all correspondence should be sent(Including the postcode)
W. H. Beck, Greener & Co.7 Stone BuildingsLincoln's InnLondon WC2A 3 SZ
Patents ADP number (tfyou know it) 3230016. Priority: Complete this section if you arc Country Priority application number Date of filing
declaring priority from one or more earlier (ifyou know It) (day/month/year)patent applications, filed in the last 12 months.
7. Divisional, etc: Complete this section only if Number of earlier UK application Date of tilingthis application is a divisional application or (day/month/year)resulted from an entitlement dispute (see note t)
8. Is a Patents Form 7/77 (Statement ofinventorship and of right to grant of a patent) required in support of this request?Answer YES if:a) any applicant named In part 3 is not an inventor, or Yesb) there is an inventor who is not named as an
applicant, ore) any named applicant is a corporate bodyOtherwise answer NO (See note d) Patents Font} 1/77
199

Appendix B
Patents Form 1/77
9 Accompanying documents: A patent application must include a description of die invention.Not counting duplicates, please enter the number of pages of each item accompanying this form:
Continuation sheets of this form
Description 23
Claimfri 4
Abstract
D rawing,'..'; 4
10. If you are also filing any of the following, state how many against each item.
Priority documents
Translations of priority documents
Statement of inventorship and right to grant of a patent (Patents Furm 7m)
Request for a preliminary examinationand search (Patents Form 9/77)
Request for a substantive examination(Patents Form 10/77)
Any other documents (pievc ipccify)
11. I/We request the grant of a patent on the basis of this application.Signature^) y(xJ ■ H • j ^--A—© , Date 24.09.04
12. Name, daytime telephone number ande-mail address, if any, of person to contact in Mrs. Anna L. Halt - (020) 7693 5600 the United Kingdom
WarningAfter an application for a patent has been filed, the Comptroller of the Patent Office will consider whether publication or communication of the invention should be prohibited or restricted under Section 22 of the Patents Act 1977. You will be informed if it is necessary to prohibit or restrict your invention in this way. Furthermore, if you live in the United Kingdom, Section 23 of the Patents Act 1977 stops you from applying fora patent abroad without first getting written permission from the Patent Office unless an application has been filed at least 6 weeks beforehand in the United Kingdom for a patent for the same Invention and cither no direction prohibiting publication or communication has been given, or any such direction has been revoked.
Notesa) If you need help to fill in this form or you have any questions, please contact the Parent Office on 08-159 500505.
b) Write your answers in capital letters using black ink or you may type them.
c) If there is not enough space for all the relevant details on any part of this form, please continue on a separate sheet of paper and write ‘see continuation sheet" in the relevant parl(s). Any continuation sheet should be attached to this form.
d) If you have answered YES in part 8, a Patents Form 7/77 will need to be filed,
c) Once you have filled in the form you must remember to sign and date it.
f) Part 7 should only be completed when a divisional application is being made under section 15(4), or when an application id being made under section 8(3), i 2(A) or 37(f) following an entitlement dispute. By completing pan 7 you are requesting that this application takes the same filing date as an earlier UK application. If you want the new application to have the same priority datc(s) as the earlier UK application, you should also complete pan 6 with the priority details.
Aug 03 Patents Form 1/77
200

Appendix B
P10083US 28.09.04
COMPLEXATION OF PALLADIUM
FIELD OF THE INVENTION5 The present invention relates to applications of the
complexation of palladium atoms or ions by azothioformamide ligands, to a method of synthesizing such ligands, to purified polymers obtainable using such ligands and to electroactive devices comprising such polymers.
10BACKGROUND OF THE INVENTION
There is a need to separate palladium, in particular palladium catalyst, from reaction mixtures and to determine the quantity of palladium present in such mixtures.
15 Palladium is a common catalyst. Examples of reactionsusing palladium catalysts are the Suzuki, Stille,Sonogashira and Heck cross-coupling reactions.
Within the field of medicinal chemistry, it is very important to be able to remove catalyst remnants efficiently
20 from drug products.Since the discovery in 1974 of doped polyacetylene
showing electrical conductivity there has been considerable interest in conjugated polymers and their applications, for example in light emitting diodes, polymer electronic
25 circuits and polymer solar cells. Many different conjugated polymers, for example derivatives of poly-phenylene- ethynylene and poly-phenylvinylene, can conveniently be synthesized using palladium catalysts.
A disadvantage with the use of palladium catalysts when 30 synthesizing conjugated polymers is that palladium
coordinates very well to both double and triple bonds and is therefore difficult to remove from products containing such
1
201

Appendix B
bonds. For polymer products the difficulty in removing the palladium catalyst is increased because polymer molecules tend to become entangled around palladium nanoparticles, making separation by physical means such as centrifugation
5 impossible. Work with palladium catalysed polymerisation using the Heck cross-coupling reaction showed that the removal of palladium catalyst remnants is very difficult.
Using present techniques, it is difficult to achieve complete removal of catalyst remnants in the case of
10 polymeric products.The importance of being able to remove all of the
palladium catalyst is extremely high when the conjugated polymer is to be used in an electrical device, for example a photovoltaic or a light-emitting device, because remaining
15 palladium nanoparticles can lead to a short circuit of the device.
The present inventors have recently showed that a standard electroactive device produced by sandwiching a polymer (chosen from iodine terminated poly[1-(2,5-
20 dioctyltolanyl)ethylene], zinc porphyrin linked poly[1-(2,5- dioctyltolanyl)ethylenes], derivatives of poly- phenylenevinylene and poly-2,5-(3-alkylthiophenes)) between two electrodes contained remnants of palladium catalyst and had a resistance as low as 30 Q for the chosen device
25 geometry (2.1 cm x 1.7 cm = 3.57 cm2) . Furthermore, when a potential was applied it led to a short circuit in some parts of the device.
Previous approaches to separating metal from a mixture have included the use of ligands which complex the metal
30 atoms or ions.
P10083US 28.09.04
2
202

5
10
15
20
25
30
Appendix B
US 4584628 discloses removal of spent catalytic metal from a support by oxidation and complexation with a ligand which is a 1,1-dithiolate, dithiocarbimate or dithiocarbamate salt. The metal may be palladium.
US 4855400 discloses purification of polyketone polymers using a complexing agent for palladium. The complexing agents include phosphines.
EP 1203777 discloses a process for removal of iron and rhodium or platinum group metals from hydrogenated nitrile rubber using an ion-exchange resin having thiourea functional groups.
The present inventors have, with some success, attempted to use diethylammonium diethyldithiocarbamate (DDC) in solution to remove palladium from conjugated polymers as reported by Jones et al. (Jones, L.; Schumm, J.S. and Tour, J. M., J. Org. Chem., 1997, 62, 1388-1410) for solid state synthesis. The use of this compound in complexing metals is also disclosed in US 4584628.
The resistance through the standard electroactive device prepared as described above increased from 30 fi to 0.3-2 Mf2 after treatment with DDC. However, there were indications that DDC reacted with the polymers, possibly with the triple bonds. It was observed that treatment with DDC for periods of time longer than 5 min led to a dramatic change in some of the properties of the polymers. The polymers became soluble in methanol, and no electroluminescence could be observed when a potential was applied. Furthermore, DDC is a powerful nucleophilic reagent, which means that it cannot be used for polymers containing good leaving groups.
Various approaches to the removal of heavy metals using N-acylcysteine, polystyrene based thiuronium salts or silica
P10083US 28.09.04
3
203
Appendix B
PI0083US 28.09.04
particles bearing pendant alkyl groups with terminal thiol functionalities have been reported. While they bind palladium efficiently they do not work well for polymer products since a large proportion of the polymer product is
5 absorbed by the silica or polymer media.There therefore remains a need for effective methods of
separating palladium from reaction mixtures.
SUMMARY OF THE INVENTION10 Surprisingly, the present inventors found that using
azothioformamide complexing agents provided good results.In a first aspect, the present invention provides a
method of separating palladium from a reaction mixture comprising treating the mixture with an azothioformamide
15 complexing agent to form a palladium complex and separating the palladium complex from other components of the reaction mixture.
Optionally, the palladium complex is separated by dissolving the palladium complex in a solvent to form a
20 solution followed by phase separation. Suitable separation techniques which can be applied include precipitation, crystallization, centrifugation, filtration, decanting, adsorption, extraction, run-off of a lower liquid phase or suction of an upper liquid phase. Settling may be necessary
25 before separation takes place.Alternatively, the complexing agent may be an
azothioformamide dimer which forms a solid (polymeric) palladium complex, and the solid palladium complex is separated by phase separation. In this case, the other
30 components of the reaction mixture may be dissolved in a solvent to form a solution before the phase separation. Suitable solvents include ethers, esters, alcohols, ketones,
4
204

5
10
15
20
25
30
Appendix B
alkanes, aromatics, amides and sulfoxides. Examples include pentane, hexane, heptane, methanol, ethanol, propanol, isopropanol, butanol, water, dimethylsulfoxide, N,N- dimethylformamide, tetrahydrofuran, chloroform, dichloromethane, ethyl acetate, acetone, methylethylketone, benzene, toluene, xylene, dimethylacetamide and N- methylpyrrolidone.Preferably, the palladium is in oxidation state 0, more
preferably in elemental form, but it may also be in other oxidation states. It is desirable for the palladium to be in the form of small particles (for example nanoparticles) since these react quickly with the azothioformamide complexing agent. Suitable nanoparticles have a diameter of 1 to 100 nm, preferably 1 to 20 nm, more preferably 1 to 10 nm, for example 1 to 5 nm.Preferably, the other components of the reaction mixture
comprise conjugated polymer or oligomer. Preferred conjugated polymers are optionally substituted poly(phenyleneethynylenej (PPE) poly(phenylenevinylene)(PPV), poly(thiophene), poly(alkylthiophene) (PAT), poly(pyridylvinylene), poly(vinylcarbazole), polyfluorene, polyphenylene and polyarylene. Preferred conjugated oligomers are optionally substitutedoligo(phenyleneethynylene) (PPE) oligo(phenylenevinylene) (PPV), oligo(thiophene), oligo(alkylthiophene) (PAT), oligo(pyridylvinylene), oligo(vinylcarbazole), oligofluorene, oligophenylene and oligoarylene.Preferably, the conjugated polymer or oligomer has a
molecular weight of 200 to 20000000 Da.Preferably, the complexing agent is an azothioformamide of
Formula A:
P10083US 28.09.04
5
205

5
10
15
20
25
30
P10083US 28.09.04
R~Nns*'
R"
Formula A
wherein R, R' and R" are each independently hydrogen or optionally substituted alkyl, cycloalkyl, alkenyl, aryl, ether, ester or amide, or a polymer attached via a linker group or an azothioformamide moiety attached via a linker group.
Suitably, the alkyl groups are Cx to C18 alkyl groups. For example, the alkyl groups may be methyl or ethyl groups. Suitably, the cycloalkyl groups are C3 to Cia cycloalkyl groups. For example, the cycloalkyl groups may be cyclopentyl or cyclohexyl groups. Suitably, the alkenyl groups are C2 to Ci8 alkenyl groups. For example, the alkenyl groups may be ethenyl groups. Suitably, the aryl groups are phenyl groups. Suitably, the ether, ester or amide groups are C2 to Ci8 ether, ester or amide groups.
Suitable linker groups are optionally substituted alkylene, alkenylene, aryl, ether, ester or amide.
Suitably, the alkylene groups are C% to Ci8 alkylene groups. For example, the alkyl groups may be methylene or ethylene groups. Suitably, the alkenylene groups are C2 to Gib alkenylene groups. For example, the alkenylene groups may be ethenylene groups. Suitably, the aryl groups are phenyl groups. Suitably, the ether, ester or amide groups are C2 to Ci8 ether, ester or amide groups.
Where R, R' and/or R" are substituted, fluorine is a preferred substituent.
6
206
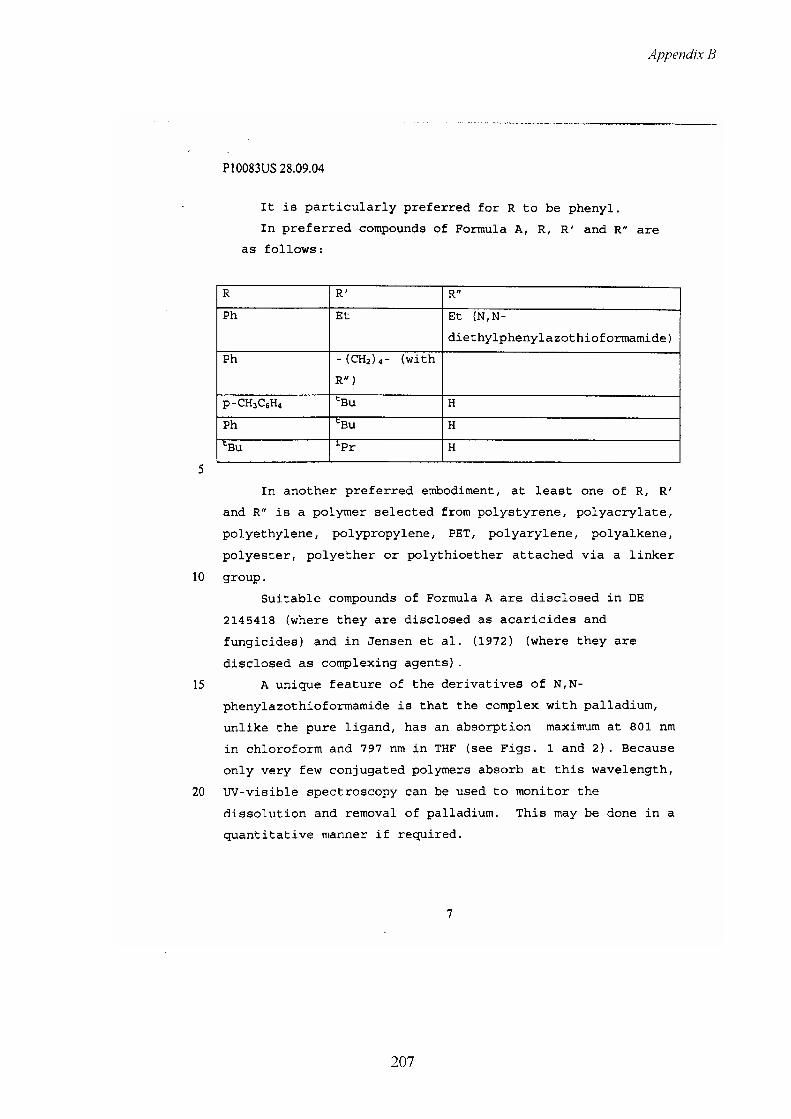
Appendix B
P10083US 28.09.04
It is particularly preferred for R to be phenyl.In preferred compounds of Formula A, R, R' and R" are
as follows:
R R' R"Ph Et Et (N,N-
diethylphenylazothioformamide)Ph - (CH2)4- (with
R")p-CH3C6H4 cBu HPh cBu HcBu ipr H
In another preferred embodiment, at least one of R, R' and R" is a polymer selected from polystyrene, polyacrylate, polyethylene, polypropylene, PET, polyarylene, polyalkene, polyester, polyether or polythioether attached via a linker
10 group.Suitable compounds of Formula A are disclosed in DE
2145418 (where they are disclosed as acaricides and fungicides) and in Jensen et al. (1972) (where they are disclosed as complexing agents).
15 A unique feature of the derivatives of N,N-phenylazothioformamide is that the complex with palladium, unlike the pure ligand, has an absorption maximum at 801 nm in chloroform and 797 nm in THF (see Figs. 1 and 2). Because only very few conjugated polymers absorb at this wavelength,
20 UV-visible spectroscopy can be used to monitor thedissolution and removal of palladium. This may be done in a quantitative manner if required.
7
207

Appendix B
In a second aspect, the present invention provides a method of determining palladium content in a mixture, comprising treating the mixture with an azothioformamide complexing agent to form a palladium complex, dissolving the
5 palladium complex in a solvent to form a solution, andmeasuring the absorbance of the palladium complex solution.
Optionally, phase separation is carried out to separate the palladium complex solution from other components of the mixture before measuring absorbance. However, this is not
10 necessary.Preferably, absorbance is measured at a wavelength in
the range of 770 nm to 830 nm, more preferably at 797 nm or 801 nm.
The high extinction coefficient of the palladium 15 complex in chloroform at 801 nm (~ 10000 M'1 cm"1) coupled
with a sensitivity of 1 mAu for a typical UV-visspectrophotometer gives a detection limit of 500 ppb using 20 mg mL"1 of sample solution. Concentration of the analyte solution easily allows for a detection limit of 1 ppb when
20 using 5g of sample.Any preferred feature described in connection with the
first aspect of the invention can be used in connection with the second aspect of the invention. In particular, the method is particularly useful in determining palladium
25 content in a mixture comprising conjugated polymer.Synthetic routes are known to compounds of Formula A.Jensen et al. discloses formation of N,N-
diethylphenylazothioformamide (Formula A) by quinone oxidation of 4,4-diethyl-l-phenyl-thiosemicarbazide, and
30 discloses oxidation of the complexed thiosemicarbazide using iodine.
P10083US 28.09.04
8
208

5
10
15
20
25
30
In a third aspect, the present invention provides a method of synthesising an azothioformamide of Formula A, comprising the steps of:
a) contacting a hydrazine derivative with carbondisulphideb) contacting the reaction mixture with an aminec) exposing the reaction mixture to elemental oxygen.This method can conveniently be conducted as a one-pot
reaction. The method is general and the substituents can be chosen to obtain the desired solubility of the metal complex in polar or non-polar solvents.
Preferably, the hydrazine derivative is phenylhydrazine.
Preferably, the amine is a secondary amine, for example diethylamine.
Optionally, the amine is a linear or cyclic diamine, preferably a secondary diamine. In this way, azothioformamide dimer ligands may be synthesized. Suitable diamines are EtNH (CH2) i0NHEt and piperazine.
Preferably, in step c) the reaction is exposed to air.Preferably, a further step:d) contacting the reaction mixture with a base and analkyl halideis carried out between steps a) and b).Preferably, the alkyl halide is a methyl halide and/or a
an alkyl iodide. Suitable alkyl halides are methyl iodide, methyl bromide, methyl chloride or ethyl iodide, ethyl bromide or ethyl chloride. The use of a methyl halide means that during reaction with the amine gaseous methanethiol is formed as a by-product and escapes from the reaction mixture. The use of an alkyl iodide is preferred because iodide is a good leaving group.
P10083US 28.09.04
9
209

Appendix B
Preferably, the base is a metal hydroxide, for example potassium hydroxide.
In a fourth aspect, the present invention provides an optionally substituted polyphenyleneethynylene (PPE) polymer
5 having a palladium content of less than 250 ppm. Preferably, the palladium content is less than 10 ppm, more preferably less than 1 ppm. PPE polymers can only be synthesised by a palladium catalysed route, and as explained above no effective purification technique has previously been known.
10 Thus, PPE polymers having a low palladium have not previously been made.
In a fifth aspect, the present invention provides an electroactive device comprising such a polymer.
15 DESCRIPTION OF THE DRAWINGSThe present invention will be further described with
reference to the non-limiting Examples, as illustrated in the Figures, in which:
20 Figure 1 shows the UV-vis spectra of N,N-diethylphenylazothioformamide (compound 1) and the corresponding palladium complex (compound 3) in chloroform. The spectrum is normalized to the maximum absorption, which corresponds to a molar extinction
25 coefficient of 17100 and 29000 (M cm)'1 for N,N-diethylphenylazothioformamide and the complex respectively.
Figure 2 shows the UV-vis spectra of compounds 1 and 330 in THF. Compound 3 shows a moderately strong absorption
with a maximum at 797 nm where compound 1 does not absorb. The maximum absorption corresponds to a molar
10
P10083US 28.09.04
210

Appendix B
P10083US 28.09.04
extinction coefficient of 8500 (M cm)'1 for the complex.
Figure 3 shows the ^-NMR spectrum of compound 3. The 5 spectrum is measured in CDC13 at 300 K.
Figure 4 is a schematic illustration of the electroactive device.
10 DETAILED DESCRIPTION OF THE INVENTIONN,N-diethylphenylazothioformamide (1) Synthesis
15
o ■nhnh2
1) CS22) KOH
3) CH3I
20
25
30
35
1) Et2NH Reflux
2) Atm. 02
Ethanol (750 mL) was placed in a 2 L three-necked round bottom flask. The ethanol was degassed with argon for 30 minutes. Phenylhydrazine (39.36 mL, 0.40 mol) was added and the solution stirred under argon with mechanical stirring. CS2 (27.60 mL, 0.45 mol) was added dropwise over 15 minutes. A thick colourless precipitate formed. After the mixture had been stirred for an additional 30 minutes, KOH (27 g) in EtOH (200 mL) (-15% excess) was added. The precipitate dissolved and the colour changed to orange. The solution was stirred for an additional 30 minutes, where a colourless precipitate formed. CH3I (27 mL -15% excess) was added
11
211

Appendix B
quickly and nearly all the precipitate redissolved. The solution was stirred for an additional 30 minutes. The colour of the solution changed first to red and then to a cloudy very light yellow colour. The solvent was removed by
5 evaporation and diethylamine (300 mL) was added. The solution was then refluxed for 3 days and followed by drawing small samples and subjecting them to 1H NMR analysis. The reaction was stopped when XH NMR showed complete conversion to 4,4-diethyl-1-phenyl-
10 thiosemicarbazide. The solution was cooled to r.t. andatmospheric oxygen was bubbled rapidly through the solution through a glass frit for 24 hours. The colour of the solution changed quickly to dark red. The solvent was now removed by evaporation and the liquid residue (a dark red
15 oil) was dissolved in ethyl acetate (300 mL). The organic phase was then washed with brine (3 x 250mL) and dried with MgS04. After drying, the organic phase was filtered and evaporated to dryness to give 87.81 g of dark red oil. Recrystallization twice from n-heptane:acetylacetate/20 :1
20 (3.15L) gave 1 in 60% yield (53.23 g) as orange crystals.M.p. 57.5 °C, DSC.: onset: 54.8 °C, peak: 57.5 °C, AH = 20175.51 J/mol.
Compound 1 is stable in air and readily soluble in most organic solvents such as methanol, chloroform, light
25 petroleum etc.Compound 1 dissolves palladium metal efficiently (see
below). This can be directly monitored as a change in colour from the light orange colour of 1 to a dark brown green colour.
30 Having demonstrated the successful reaction of 1 withmetallic palladium it remained to evaluate possible side reactions of 1 with conjugated polymer. The most likely
P10083US 28.09.04
12
212

Appendix B
reaction between an unsaturated group such as a vinylene or ethynylene group is an electrocyclic Diels-Alder type condensation reaction, because 1 has the same unsaturation as 1,4-butadiene. Model reactions were performed between 1
5 and stilbene or tolane in both the presence and absence of palladium. No corresponding electrocyclic condensation products 4 and 5 were detected after prolonged reflux under argon in both the presence and absence of palladium catalyst.
P10083US 28.09.04
10
4
5
The synthetic conditions of the reactions of the two models between 1 and stilbene or tolane is as follows:
15
Compound 1 and stilbene: In a 5 mL Erlenmeyer flask compound 1 (2.1 mmol, 0.5g) and stilbene (2.1 mmol, 0.38 g) were dissolved in xylene (3 mL) and flushed with argon for 5 minutes. The solution was then refluxed for 7 days. Every
20 day a sample was drawn to test for 4. The sample was tested with NMR, MALDI-TOF and GC/MS and even after 7 days it was not possible to detect 4 in the solution. This experiment was repeated several times with both more and less solvent and with other solvents including THE, triethylamine and
13
213

Appendix B
P10083US 28.09.04
toluene. It was not possible to detect 4 with the given analysis methods in any of the experiments.
Compound 1 and tolane: In a 5 mL Erlenmeyer flask 1 (2.15 mmol, 0.5g) and tolane (2.1 mmol, 0.37 g) were dissolved in
xylene (3 mL) and flushed with argon for 5 minutes. The solution was then refluxed for 7 days. Every day a sample was drawn to test for 5. The sample was tested with NMR, MALDI-TOF and GC/MS and even after 7 days it was not
10 possible to detect 5 in the solution. This experiment was repeated several times with both more and less solvent and with other solvents including THE, triethylamine and toluene. It was not possible to detect 5 with the given analysis methods in any of the experiments.
15Bis (N,Ndiethylphenylazothiof ormamide-x2S,N)palladium-0 (3)
Synthesis
Pd(0)nanoparticles
3
20 THF (lOOmL) was placed in a 250 mL conical flask anddegassed with argon. N,N-diethylphenylazothioformamide (1) (1.00 g, 4.21 mmol) and Palladium black (Aldrich) (0.25 g, 2.32 mmol) was added and the solution was refluxed under an argon atmosphere for 7 days. The solution was then filtered
25 through a thick (4cm) layer of Celite on a sintered funnel.
14
214

5
10
15
20
25
Appendix B
The filtrate was collected and evaporated to dryness. The residue was then purified by dry column vacuum chromatography with n-heptane/1,2-dichloroethane in the ratio 10:1 as the eluent. The eluent was removed by slow evaporation to provide dark green crystals. The yield was 164 mg (14 %) of pure compound 3.
NMR (250 MHz, CDCl3, 300K, TMS)5: 1.218 (t (3J = 6.9 Hz), 12 H) , 4.177 (broad s, 8 H) , 6.431 (broad s, 2 H) , 6,909 (broad s, 4 H) , 7.575 (broad s, 4H) . 13C NMR (250 MHz, CDC13, 300K, TMS) 5 : 16.309, 44.819, 123.692, 131.381, 175.869.MALDI-TOF MS [M+H+] = 549 (the isotopic pattern wasconfirmed); Anal. Calcd. for C22H3oN6PdS2: C:48.13, H:5.51,N: 15.31, 8:11.68. Found: 0:48.05, H.-5.65, N:14,41, 8:11.50.
Synthesis of 3 from palladium nanoparticles prepared in-sifcu
P10083US 28.09.04
o
Palladium (II) acetate (268 mg, 1.19 mmol) was dissolved in DMSO (50 mL) and flushed with argon. Under an argon atmosphere phenylhydrazine (74 mg, 0.69 mmol) was added. The colour of the solution shifted quickly from brownish orange to black. After stirring for 10 minutes compound 1 (680 mg, 2,87 mmol) was added and the solution was refluxed under an argon atmosphere for 1% hour. The solution was then poured into 600 mL water, and was left standing in the hood without an argon atmosphere for VA day.
15
215

5
10
15
20
25
P10083US 28.09.04
The colour of the mixture had then changed from very dark brown to dark greenish blue. The mixture was washed four times with 400 mL n-heptane/ethyl acetate mixture (1:1) . All organic fractions were collected and dried with magnesium sulphate. After filtration the solvent was removed by evaporation. The residue was purified by dry column vacuum chromatography with n-heptane/ethyl acetate as the eluent in a ratio of 10:1. The eluent was removed by evaporation to provide dark green powder. The yield was 480 mg (73 %) of compound 3. An analytical sample for determination of the molar extinction coefficient was obtained by additional dry column chromatography.3H NMR (250 MHz, CDCl3f 300K, TMS)5: 1.218 (t (3J = 6.9 Hz), 12 H), 4.177 (broad s, 8 H), 6.431 (broad s, 2 H), 6,909 (broad s, 4 H) , 7.575 (broad s, 4H) . 13C NMR(250 MHz, CDC13, 300K, TMS) 5 : 16.309, 44.819, 123.692, 131.381, 175.869. MALDI-TOF MS [M+H+] = 549 (the isotopic pattern was confirmed); Anal. Calcd. for C33H3oNgPdS2: C: 48.13 , H: 5.51,N: 15.31, 8:11.68. Found: C:48.05, H-.5.65, N:14,41, 8:11.50.
Removal of Palladium from Conjugated Polymer
§ r2Pd(0) + R1-N=N-U—N
r3Insoluble
n'N "s-1L-n'R2
IR1 r3Soluble
Polymer synthesised by the method of Krebs et al.(Krebs, F. C. ; Nyberg, R. B. and Jorgensen, M. , Chem.
Mater., 2004, 16, 1313-1318) is dissolved in minimum THF (typically 1 mL/20 mg sample) under an argon atmosphere. 10
times excess of compound 1, compared with the palladium, is
16
216

Appendix B
P10083US 28.09.04
added and the solution is stirred for between 30 minutes and 1 hour, optionally with reflux. The polymer is precipitated in excess methanol (typically 10 times the amount of THF), filtered and washed with more methanol. The polymer is
5 redissolved in THF under an argon atmosphere andprecipitated in methanol, filtered and washed with more methanol. The clean polymer is then dried in a vacuum oven.
Analysis of Palladium content in a Polymer Sample10
The polymer sample is very precisely weighed out and dissolved in THF (typically 20 mg/ml) under an argon atmosphere. Compound 1 (10 times excess with respect to the amount of Pd in the catalyst) is added and the solution is
15 stirred for between 30 minutes and 1 hour.The solvent is evaporated and the residue is dissolved
in a precisely known volume of solvent. A UV-vis spectrum of the solution is recorded. The complex (compound 3) has an absorption maximum at 801 nm in chloroform with an
20 extinction coefficient of 10300 M'1 cm"1. From the UV-vis spectrum the concentration of Pd in the polymer can be calculated.
There is a significant different difference in the UV- vis spectrum extinction coefficient and wavelength of
25 maximum absorption in THF and chloroform.
UV-vis (CHCI3 @ 25 °C) :7-max, chloroform = 801 nm ^chloroform = 10300 M cm UV-vis (THF @ 25 °C) :
30 Xmax.TH? = 797 nm eTHF = 8500 M"1 cm"1
17
217

5
10
15
20
25
30
P10083US 28.09.04
Examples of Palladium-catalysed Polymerisation to form Conjugated polymers
Example 1: Poly[1-(2,5-dioctyl-tolanyl)-ethynylene] (PPE)
A 100 mL round-bottom flask was dried using a heat gun and flushed with argon, l-iodo-2,5-dioctyl-4'-ethynyltolane (1.36-10"3 Mol, 0.750 g) was dissolved in piperidine (40 mL) and flushed with argon for 30 minutes, before the catalyst Pd (PPhs) 4 (« 2 mol %) and the co-catalyst Cul (» 10 mol %) were added under an argon atmosphere. The solution was stirred under an argon atmosphere overnight at room temperature. A yellow precipitate quickly formed. The colour of the solution was yellow during the reaction. The following day the reaction mixture had solidified. Dry THF (50 mL) was added and the solution was heated to near reflux temperature. The precipitate dissolved and the solution was stirred for another 5 hours. The solution was then poured into 300 mL methanol and a yellow precipitate formed. The suspension was filtered through a glass filter-funnel. The filter cake was washed with both cold methanol, cold diethyl ether and was sucked as dry as possible. The wet product was kept for further use. Attempts to dry the product in a vacuum at RT gave a darkened product that was no longer soluble in common solvents. The total yield based on a completely dried sample was 0.35 g (95%). The wet product that was kept weighed 0.6 g and contained 40% solvent. 1H NMR 5: 0.76-0.95 (m, 6H) , 1.13-1.50 (m, 20 H) , 1.50-1.83(m, 4H), 2.70-2.90 (m, 4H), 7.31-7.43 (broad s), 7.43-7.60(broads) (7.31-7.60, 6H) .
18
218

Appendix B
Pd-analysis of the PPE polymers The PPE polymer (0.1028 g) was dissolved in 3 mL THF under an argon atmosphere. Compound 1 (0.035 g) was added and the solution was stirred under an argon atmosphere for 1 hour. The solution was
5 diluted to a volume of 5 mL and the UV-vis spectrum was recorded. This gave an absorbance of 0.441 corresponding to a concentration of 3 of 51.9 faM. The amount of Pd in the polymer was thus 0.259 jimol - 27.60 |xg Pd in 0.1028 g of polymer. This is equivalent to 268 mg Pd kg'1 or 268 ppm.
10
Example 2: Poly-1,2'••-(2,5-dioctyl-l,4-phenylene-l',2'-
vinylene-1'' ,4''-phenylene-1' " , 2''' -vinylene) PPV
l,4-Dibromo-2,5-dioctylbenzene (1 g, 2.17 mmol), 1,4-15 divinylbenzene (0.28 g, 2.17 mmol) and triethylamine (10 mL)
were mixed in dry THF (50 mL) and the mixture was degassed with argon for 5 minutes. (PPh3) 2PdCl2 (250 mg) was added and the mixture was heated to reflux. After 36 h the mixture was poured into methanol to precipitate, the bright yellow
20 product. The mixture was then filtered and dried to give a yellow solid in 85% yield (0.79g).Pd-analysis of the PPV polymer: The PPV polymer (0.0577 g) was dissolved in 5 mL THF under an argon atmosphere.Compound 1 (0.035 g) was added and the solution was stirred
25 under an argon atmosphere for 1 hour. The solution wasdiluted to 50 mL and a sample of 3 mL was drawn and diluted to 20 mL. From this sample the UV-vis spectrum was recorded. This gave an absorbance of 0.247 which corresponds to a concentration of 3 of 29 }iM. The dilution factor of the 50
30 mL solution was 6.67 corresponding to a total volume of333.3 mL. The amount of Pd in the polymer was thus 9.7 jamol
P10083US 28.09.04
19
219

5
10
15
20
25
30
P10083US 28.09.04
~ 1030 fig Pd in 0.0577 g of polymer. This is equivalent to 17860 mg Pd kg"1 or 17860 ppm.
Example 3: Poly-(3-hexylthiophene) PAT.
DMSO (30mL) and DMF (30mL) were degassed using argon and (PPh3)2PdCl2 (90mg, 0.128 mmol, catalyst) was added and the mixture was heated to 75 °C with stirring. 2-Bromo-3- hexyl-5-trimethylstannylthiophene (1.75g, 4.26 mmol) wasadded dropwise from a syringe. The colour of the mixture quickly changed to clear yellow and after 1 minute it became cloudy and orange and after another minute it became red/brown and a material started to separate. After 3 days under argon the mixture was a light yellow clear solution with a black precipitate. The mixture was filtered and the solid washed with methanol (5 x 50mL) . Drying gave a black solid 0.69g (97%) .Pd-analysis of the PAT polymer: The PAT polymer (0.035 g) was dissolved in 5 mL THF under an argon atmosphere.Compound 1 (0.030 g) was added and the solution was stirred under an argon atmosphere for 1 hour. The solution was diluted to 50 mL. From this sample the UV-vis spectrum was recorded. This gave an absorbance of 0.228 which corresponds to a concentration of 3 of 26.8 |iM. The amount of Pd in the polymer was thus 1.34 pmol - 143 pg in 0.035 g of polymer. This is equivalent to 4073 mg Pd kg'1 or 4073 ppm.
Standard electroactive device for fabricationThe substrates are 10 fi square*1 ITO slides which have
been etched at one end by immersion in a 65 °C aqueous solution of HCl(aq) 20% and HN03(aq) 5% for typically 60
20
220
Appendix B
seconds. The etched substrates are cleaned by immersion in isopropanol and subjected to ultrasound for 10 min. After being blown dry in a stream of dry argon a layer of PEDOT:PSS is applied by spin-coating an aqueous solution of
5 PEDOT:PSS (1.3% wt.) containing sorbitol (2% wt.) . The substrates are placed in an oven at 100 °C and the temperature is ramped up to 180 °C over lh and kept at 180 °C for lh. After cooling to room temperature the polymer solutions (in chlorobenzene at a concentration of 2-10 mg
10 mL'1) are micro-filtered and spin coated at 1500 rpm ontothe substrates. The typical film thicknesses are 50-100 nm as measured by a DEKTAK 3030 and the typical absorbance of the films is 0.25-1.0 absorbance units. The geometry of the devices is shown in Fig. 4.
15 The aluminium electrode is evaporated onto the deviceat a pressure of < 5"10'6 mBar. After application of the electrodes the samples are removed from the evaporator chamber and electrical connections are made using conducting silver epoxy glue. The active area of the device is 3 cm2
20 (20 mm x 15 mm) .The resistance is measured using a Keithley 2400
Sourcemeter. Typical experimental variation between devices is < 10%.
P10083US 28.09.04
21
221

Appendix B
P10083US 28.09.04
Polymer Pd content Resistancebefore/after before/after
(ppm) (kO)PPV 17860/>0.1 0.10/30
PPE 268/>0.1 0.03/45PAT 4073/>0.1 0.06/24
10
s sPd(0) + R^*—N——N U—N—N—RiR3 R3
Insoluble
Synthesis of azothioformamide dimers
R3 Ri
t«/TSMNlN'N 's-^ N
R1 R3I
Soluble or insoluble depending on R-groups
CKa
KH S-CH3
ocK.H S-CH3
2) atmospheric oxygen
HN NH
2) atmospheric oxygen
d
1S^N
N
JKK"
NyS
The materials were prepared by a procedure analogous to the one described for N,N-diethylphenylazothioformamide (1) .
The preferred embodiment of the invention has several 15 advantages.
22
222
Appendix B
The derivatives of N, N-phenylazothioformamide coordinate very strongly to palladium like DDC, but unlike DDC they can dissolve metallic palladium. The derivatives of N,N-phenylazothioformamide have the advantage compared to
5 DDC that they do not react with the polymer, but coordinate to and dissolve metallic palladium remnants in the product mixture.
This means that using the N,N-phenylazothioformamide complexing agent, conjugated polymers can be synthesized by
10 a convenient palladium catalysed route and can be purified sufficiently to be used in electroactive devices.
Also, the derivatives of N,N-phenylazothioformamide also have the advantage that they form a complex with palladium which has a distinctive UV absorption maximum in a
15 region where conjugated polymers do not absorb. Thus, the concentration of palladium in a sample of conjugated polymer can be determined without the need to separate the palladium from the conjugated polymer.
P10083US 28.09.04
23
223

Appendix B
P10083US 28.09.04
Claims
1. A method of separating palladium from a reaction mixture comprising treating the mixture with an
5 azothioformamide complexing agent to form a palladiumcomplex and separating the palladium complex from other components of the reaction mixture.
2. A method as claimed in Claim 1, wherein the palladium10 complex is separated by dissolving the palladium
complex in a solvent to form a solution followed by phase separation.
3. A method as claimed in Claim 1, wherein the complexing 15 agent is an azothioformamide dimer which forms solid
palladium complex, and wherein the solid palladiumcomplex is separated by phase separation.
4. A method as claimed in Claim 3, wherein the other 20 components of the reaction mixture are dissolved in a
solvent to form a solution before the phase separation.
5. A method as claimed in Claim 2, wherein the solvent is selected from pentane, hexane, heptane, methanol,
25 ethanol, propanol, isopropanol, butanol, water,dimethylsulfoxide, N,N-dimethylformamide, tetrahydrofuran, chloroform, dichloromethane, ethyl acetate, acetone, methylethylketone, benzene, toluene, xylene, dimethylacetamide and N-methylpyrrolidone.
30
24
224

Appendix B
P10083US 28.09.04
6. A method as claimed in Claim 1, wherein the othercomponents of the reaction mixture comprise conjugated polymer or conjugated oligomer.
5 7. A method as claimed in Claim 1, wherein the palladium isin oxidation state O.
8. A method as claimed in Claim 7, wherein the palladium is in elemental form.
10
9. A method as claimed in Claim 1, wherein the complexing agent is an azothioformamide of Formula A:
15
R"Formula A
wherein R, R' and R' ' are each independently hydrogen or optionally substituted alkyl, cycloalkyl, alkenyl, aryl, ether, ester or amide, or a polymer attached via a linker
20 group or an azothioformamide moiety attached via a linker group.
10. A method as claimed in Claim 9, wherein at least one of R, R' and R" is a polymer selected from
25 polystyrene, polyacrylate, polyethylene, polypropylene, PET, polyarylene, polyalkene, polyester, polyether or polythioether attached via a linker group.
11. A method as claimed in Claim 9, wherein R is phenyl.30
25
225

Appendix B
P10083US 28.09.04
12. A method of determining palladium content in a mixture, comprising treating the mixture with an azothioformamide complexing agent to form a palladium complex, dissolving the palladium complex in a solvent to form a solution,
5 and measuring the absorbance of the palladium complex solution.
10
13. A method as claimed in Claim 12, wherein the palladium complex solution is separated from other phases of the mixture before measuring absorbance.
14. A method as claimed in Claim 12, wherein absorbance is measured at a wavelength of 770 to 830 nm.
15 15. A method as claimed in Claim 14, wherein absorbanceis measured at a wavelength of 801 nm.
16. A method of synthesising an azothioformamide of Formula A, comprising the steps of:
20 a) contacting a hydrazine derivative with carbondisulphideb) contacting the reaction mixture with an aminec) exposing the reaction mixture to oxygen.
25 17. A method as claimed in Claim 16, wherein the amine is adiamine.
18. A method as claimed in Claim 16, wherein in step c) the reaction is exposed to air.
19.A method as claimed in Claim 17, wherein a further step:
26
226

Appendix B
P10083US 28.09.04
d) contacting the reaction mixture with a base and an alkyl halideis carried out between steps a) and b).
20. An optionally substituted polyphenyleneethynylene (PPE) polymer having a palladium content of less than 250 ppm.
21. An optionally substituted PPE polymer as claimed in Claim 20, having a palladium content of less than 10 ppm.
22. An optionally substituted PPE polymer as claimed in Claim 21, having a palladium content of less than 1 ppm.
23. An electroactive device comprising a polymer as claimed in Claim 20.

Appendix B
P10083US 28.09.04
ABSTRACT
COMPLEXATION OF PALLADIUM
5 A method of separating palladium from a reaction mixture comprises treating the mixture with an azothioformamide complexing agent to form a palladium complex and separating the palladium complex from other components of the reaction mixture.
10 A method of determining palladium content in a mixture comprises treating the mixture with an azothioformamide complexing agent to form a palladium complex, dissolving the palladium complex in a solvent to form a solution, and measuring the absorbance of the palladium complex
15 solution.A method of synthesising an azothioformamide comprises the steps of:a) contacting a hydrazine derivative with carbon disulphide
20 b) contacting the reaction mixture with an aminec) exposing the reaction mixture to oxygen.
28
228

Appendix B
1/4
10000 - The pure Ligand In CHCI3 The Pd complex in CHCI3
- 20000
■ 15000 E
■ 10000 ™
4000 ■
- 5000
Wavelength [nm]
Fig. 1
2/4
18000
The pure ligand In THF The Pd complex in THF - 16000
7000 -• 14000
6000 -: 12000 E
ig 5000 -- 10000
4000 -• 8000
3000 ■ 1 6000
2000 - - 4000
1000 - - 2000
Wavelength [nm]
Fig. 2
229

7.57
5
Appendix B
3/4
5
I
ppm(t1)
T '■ r70
Teo
“I* 1 t " r— I ' | T" I r Iff! ; | I I r "( j ' T 1 I I | T50 4.0 3 0 20 10 00
Fig. 3
230

Appendix B
P10083US 28.09.04
4/4
To the +ve terminal
Polymer film
Silver Epoxy
To the -ve terminal
Aluminium
i
Light
Fig. 4
Silver Epoxy
PEDOT:PSS film
32
231

Ris0's research is aimed at solving concrete problems in the society.
Research targets are set through continuous dialogue with business, the political system and researchers.
The effects of our research are sustainable energy supply and new technology for the health sector.
www.risoe.dk