Life Cycle Assessment of Exterior Window Shadings in Residential Buildings in Different Climate...
10
Life cycle assessment of exterior window shadings in residential buildings in different climate zones Hamed Babaizadeh a , Nasim Haghighi b , Somayeh Asadi c, * , Reza Broun d , David Riley c a Stantec Consulting Inc., 500 Main Street, Baton Rouge, LA 70801, USA b Department of Civil & Architectural Engineering, Texas A&M University, Kingsville, TX 78363, USA c Department of Architectural Engineering, The Pennsylvania State University,104 Engineering Unit A, University Park, PA 16802, USA d Department of Civil Engineering, University of Texas at Arlington, Arlington, TX 76019, USA article info Article history: Received 14 January 2015 Received in revised form 10 March 2015 Accepted 17 March 2015 Available online 10 April 2015 Keywords: Life cycle assessment (LCA) Solar shading system Climate zones Life cycle cost (LCC) Sustainable building material Multi-attribute decision analysis abstract Use of exterior shading systems is important to increase energy savings in residential sector, mainly in warmer climates exposed to direct sunlight. These types of shades can keep inside temperatures cooler and consequently reduce cooling loads and costs. This study employs Life Cycle Assessment (LCA) to compare the effects of three different shading materials on building energy consumption and their impacts to the environment within five major climate zones defined by American Society of Heating, Refrigerating and Air-conditioning Engineers (ASHRAE). To achieve this objective, A Life Cycle Inventory (LCI) is used to quantify the energy and emissions of the exterior shading systems during the manufacturing process, in-service and end of life. The Building for Environmental and Economic Sus- tainability (BEES) model and SimaPro 8.0 software (Ecoinvent 3.0 database) were employed to develop the life cycle inventory of the shadings through all life cycle stages. The LCA framework used in this study was based on a life cycle methodology that follows the International Organization for Standardization (ISO) 14040 standard for Life Cycle Assessment and the ASTM standard for Multi-Attribute Decision Analysis. Based on the analysis conducted for wood, aluminum, and polyvinyl chloride (PVC) shadings, it may be concluded that the use of external shadings on residential window panes, in most cases, carries a positive effect on fossil fuel depletion impact, while it increases environmental loads in other environ- mental impact categories. Among the three aforementioned materials, wood and PVC shadings are the most and the least environmentally-friendly materials, respectively. © 2015 Elsevier Ltd. All rights reserved. 1. Introduction Design of sustainable buildings requires the analysis of envi- ronmental performances in every stage of their life cycle. Life Cycle Assessment (LCA) is a technique used to evaluate potential envi- ronmental and economic performances of building envelopes and products throughout their life cycle. Architectural features inten- ded to reduce unwanted heat gain are increasingly utilized to improve building performance but are not commonly scrutinized during project design for their overall environmental impacts. The LCA technique has been widely applied to building components including windows, walls, and roofs and entire buildings. Stazi et al. [1], applied an integrated approach for the optimization of energy and environmental performances of complex building envelopes to an exemplary solar wall system and calculated the environmental performance in terms of energy demand and CO 2 emissions within the manufacturing and use phases. In another study conducted by Mora et al. [2], an integration framework was developed to facili- tate the inclusion of life-cycle considerations in the design process from the outset. Therefore, materials and systems can be selected not only from environmentally friendly resources, but mainly, to match service life performance expectations. The developed framework can be executed iteratively to assess these re- quirements. This framework helps to have a better understanding and modeling of the dynamics of the built environment to which materials, components, and systems are exposed. Babaizadeh and Hassan [3] compared LCAs of a clear float glass window and a similar nano-sized titanium dioxide (TiO 2 ) coated glass window, as a potential substitute for clear glass windows commonly used in residential buildings, to evaluate the ability of the coating * Corresponding author. Tel.: þ1 8148653013. E-mail address: [email protected] (S. Asadi). Contents lists available at ScienceDirect Building and Environment journal homepage: www.elsevier.com/locate/buildenv http://dx.doi.org/10.1016/j.buildenv.2015.03.038 0360-1323/© 2015 Elsevier Ltd. All rights reserved. Building and Environment 90 (2015) 168e177
Transcript of Life Cycle Assessment of Exterior Window Shadings in Residential Buildings in Different Climate...
lable at ScienceDirect
Building and Environment 90 (2015) 168e177
Contents lists avai
Building and Environment
journal homepage: www.elsevier .com/locate/bui ldenv
Life cycle assessment of exterior window shadings in residentialbuildings in different climate zones
Hamed Babaizadeh a, Nasim Haghighi b, Somayeh Asadi c, *, Reza Broun d, David Riley c
a Stantec Consulting Inc., 500 Main Street, Baton Rouge, LA 70801, USAb Department of Civil & Architectural Engineering, Texas A&M University, Kingsville, TX 78363, USAc Department of Architectural Engineering, The Pennsylvania State University, 104 Engineering Unit A, University Park, PA 16802, USAd Department of Civil Engineering, University of Texas at Arlington, Arlington, TX 76019, USA
a r t i c l e i n f o
Article history:Received 14 January 2015Received in revised form10 March 2015Accepted 17 March 2015Available online 10 April 2015
Keywords:Life cycle assessment (LCA)Solar shading systemClimate zonesLife cycle cost (LCC)Sustainable building materialMulti-attribute decision analysis
* Corresponding author. Tel.: þ1 8148653013.E-mail address: [email protected] (S. Asadi).
http://dx.doi.org/10.1016/j.buildenv.2015.03.0380360-1323/© 2015 Elsevier Ltd. All rights reserved.
a b s t r a c t
Use of exterior shading systems is important to increase energy savings in residential sector, mainly inwarmer climates exposed to direct sunlight. These types of shades can keep inside temperatures coolerand consequently reduce cooling loads and costs. This study employs Life Cycle Assessment (LCA) tocompare the effects of three different shading materials on building energy consumption and theirimpacts to the environment within five major climate zones defined by American Society of Heating,Refrigerating and Air-conditioning Engineers (ASHRAE). To achieve this objective, A Life Cycle Inventory(LCI) is used to quantify the energy and emissions of the exterior shading systems during themanufacturing process, in-service and end of life. The Building for Environmental and Economic Sus-tainability (BEES) model and SimaPro 8.0 software (Ecoinvent 3.0 database) were employed to developthe life cycle inventory of the shadings through all life cycle stages. The LCA framework used in this studywas based on a life cycle methodology that follows the International Organization for Standardization(ISO) 14040 standard for Life Cycle Assessment and the ASTM standard for Multi-Attribute DecisionAnalysis. Based on the analysis conducted for wood, aluminum, and polyvinyl chloride (PVC) shadings, itmay be concluded that the use of external shadings on residential window panes, in most cases, carries apositive effect on fossil fuel depletion impact, while it increases environmental loads in other environ-mental impact categories. Among the three aforementioned materials, wood and PVC shadings are themost and the least environmentally-friendly materials, respectively.
© 2015 Elsevier Ltd. All rights reserved.
1. Introduction
Design of sustainable buildings requires the analysis of envi-ronmental performances in every stage of their life cycle. Life CycleAssessment (LCA) is a technique used to evaluate potential envi-ronmental and economic performances of building envelopes andproducts throughout their life cycle. Architectural features inten-ded to reduce unwanted heat gain are increasingly utilized toimprove building performance but are not commonly scrutinizedduring project design for their overall environmental impacts. TheLCA technique has been widely applied to building componentsincluding windows, walls, and roofs and entire buildings. Stazi et al.[1], applied an integrated approach for the optimization of energy
and environmental performances of complex building envelopes toan exemplary solar wall system and calculated the environmentalperformance in terms of energy demand and CO2 emissions withinthe manufacturing and use phases. In another study conducted byMora et al. [2], an integration framework was developed to facili-tate the inclusion of life-cycle considerations in the design processfrom the outset. Therefore, materials and systems can be selectednot only from environmentally friendly resources, but mainly, tomatch service life performance expectations. The developedframework can be executed iteratively to assess these re-quirements. This framework helps to have a better understandingand modeling of the dynamics of the built environment to whichmaterials, components, and systems are exposed. Babaizadeh andHassan [3] compared LCAs of a clear float glass window and asimilar nano-sized titanium dioxide (TiO2) coated glass window, asa potential substitute for clear glass windows commonly used inresidential buildings, to evaluate the ability of the coating

Fig. 1. Energy Information Administration (EIA) climate zones with cities [23,24].
H. Babaizadeh et al. / Building and Environment 90 (2015) 168e177 169
technique in purifying the environment by capturing some of thepollutants in the air. Abeysundra et al. [4] have investigated theenvironmental, economic, and social life cycles of two main con-structionmaterials (i.e. timber and aluminum) used in typical doorsand windows in Sri Lanka. Based on the conducted study, it wasconcluded timber elements are more favorable in environmentaland economic aspects while aluminum performs better in socialterms. In another study conducted by Broun et al., the breakdownof primary energy use and greenhouse has (GHG) emissions ofinsulated concrete form (ICF) and cavity walls, the two most com-mon exterior type walls in the U.K., was investigated to determinethe more environmentally-friendly wall type option to be used inresidential building sector [5]. Life cycle environmental cost char-acteristics of extensive and intensive green roofs versus conven-tional roofs were compared by Kosareo et al. over the life cycle of atypical building to quantify the energy use reduction [6]. Bribianet al. introduced the state-of-the-art regarding the application ofLCA in building sector, providing a list of existing tools, potentialusers, and purposes of LCA in this sector. This simplified LCAmethodology allows global comparisons between the emissionsand the embodied energy of the building materials, in addition tothe energy consumption and its associated emissions at the usephase [7]. Annex 31 was established under the auspices of the In-ternational Energy Agency's (IEA) agreement on energy conserva-tion in buildings and community systems with objective ofpromoting energy efficiency by increasing the use of appropriatetools by practitioners [8]. The building sector constitutes 30e40% ofthe society's total energy demand and 44% of the total material use[9]. Therefore, LCA technique can be used to compare buildingcomponents alternatives and lead building professionals towardsusing more sustainable and environmentally-friendly substitutes.
An essential objective in designing sustainable buildings is todecrease energy consumption over life cycle of building compo-nents with minimum environmental drawbacks [10e13]. Fluctua-tions in outside temperature and solar radiation result in variableinterior façade surface temperatures and transmitted solar gains.Windows are the most important components of the building en-velope in terms of energy use and comfort. Window shadings canplay a major role in indoor air conditioning of the buildingsdepending on their properties, tilt angle and climate [14]. Exteriorshading devices are appropriate systems to protect buildingsagainst extreme solar radiation effectively before it passes throughfenestration glazing. They reduce the overall cooling and heatingloads and lower the peak cooling and heating power, efficientlyreducing the energy consumption and equipment costs for activeair conditioning systems [15]. On the other hand, they can decreasethe visual comfort and increase the energy consumption of artificiallighting. Therefore, a thermal optimization process is required todesign efficient configurations of the shadings. David et al. [16]compared multiple types of exterior shadings such as simpleoverhang, overhang with infinite width, simple overhang withrectangular side fins, and simple overhang with triangular side finsusing different indices and sizes to evaluate their efficiencies. Inanother study conducted by Li and Tsang [17], the impact of fivemain parameters including daylighting designs; shading devices,glaze type, building area, building orientation, and color of externalsurface finishing on the daylighting performance in 35 buildings insubtropical Hong Kong was investigated. Based on the simulatedresults, it was concluded around 20%e25% of total electric lightingenergy could be saved for the studied buildings. Moreover, addi-tional savings in heat rejection and cooling energy could be ob-tained due to less sensible heat gains generated by artificial lightingfittings. A series of measurements and simulations have verified thedistinguished advantages in illumination and building energyconsumption by using external shading devices [18e21]. Exterior
shadings screening the entire glass surface area can reduce directsolar gain by a maximum of 80% [22].
The focus of this study is to conduct a comparing life cycleassessment of windows exterior solar shades. Due to nature ofmaterials and the processes they require to form the final productat the manufacturing companies, the amounts of emissions to theenvironment and depleted resources are different for differentmaterials. Some may produce more greenhouse gases while somemay consume more water and energy during manufacturing andinstallation phases. On the other hand, ASHRAE specificationsmandate specified dimensions and thicknesses for the shadings tominimize heating and cooling loads in the buildings during in-service phase depending on the material type and its heat trans-fer characteristics, geographical conditions, and climate zone. Tak-ing all these main factors into consideration, the requiredproperties and consequently the mass of different shading typesvary. Therefore, the overall resulting environmental inventoriesand consumed/saved energy amounts during life cycle of theshadings vary from one material to another and from one climatezone to another one. Aluminum, wood and PVC are the mostcommon materials can be used in shading systems. Five commonshading configurations in five climate zones defined by ASHRAE arecompared to each other. To achieve this objective, this studycompiled a Life Cycle Inventory (LCI) for quantifying the energy andemissions of the shadings during the manufacturing process andin-service. The Building for Environmental and Economic Sustain-ability (BEES) model (used for LCA of sustainable construction al-ternatives in the United States) and SimaPro 8.0 software wereemployed to develop the LCI of the exterior window shadings. Thelife cycle assessment framework used in this study was based on alife cycle methodology that follows the International Organizationfor Standardization (ISO) 14040 standard for life cycle assessmentand the ASTM standard for Multi-Attribute Decision Analysis(MADA).
2. Methodology and problem formulation
2.1. Climate regions choice
Energy consumption varies greatly from building to buildinglocated in different climatic regions. U.S. Energy InformationAdministration (EIA) categorized the climate regions in the UnitedStates into 5 main categories based on the last 30-year average

Table 1Building location and geometry.
Climate zone Cities Weather condition Latitude Longitude Summer altitude (degrees)
5 FL-Miami Hot-Humid 25.78 80.3 69.254 GA-Atlanta Mixed-Humid 33.66 84.42 63.183 WA-Seattle Marine 47.43 121.8 51.132 IL-Chicago Cold 41.97 87.89 56.031 MN-Duluth Very cold 46.82 92.18 51.66
Fig. 2. External window shading types.
Table 2External shadings dimensions and thicknesses.
City A (m) B (m) C (m) D (m) Thickness (m)
Aluminum Wood PVC
FL-Miami 1.4 0.5 1.2 1.5 0.01 0.1016 0.1GA-Atlanta 1.4 0.7 1.2 1.6 0.01 0.1016 0.1WA-Seattle 1.4 1.1 1.2 1.8 0.01 0.1016 0.1IL-Chicago 1.4 0.9 1.2 1.7 0.01 0.1016 0.1MN-Duluth 1.4 1.1 1.2 1.8 0.01 0.1016 0.1
H. Babaizadeh et al. / Building and Environment 90 (2015) 168e177170
heating degree-days (HDD) and cooling degree days (CDD) asshown in Fig. 1. Five U.S. cities were chosen to represent the majorclimate zones.
They divided the map into five climate zones based on tem-perature, precipitation, and heating and cooling degree days. Thezones are hot-humid (Miami), mixed-humid (Atlanta), marine
Fig. 3. Simulat
(Seattle), cold (Chicago), very cold (Duluth). The geographical in-formation of the representative cities are summarized in Table 1.
2.2. Materials and shading configurations
The most common materials can be used for external solarshadings are aluminum, wood, and PVC. Fig. 2 depicts the commonexternal shading types being used nationwide. Table 2 shows therequired dimensions and thickness for each shading type for a1.2 m � 1.4 mwindow which area based on the ASHRAE standards.
2.3. Building energy simulation
The EnergyPlus 7.2 was used to perform energy simulations andcalculate monthly building energy consumption for each designcase [25]. The Ecotect 5.6 was used to create the building's geom-etry and then it was imported into EnergyPlus for energy
ion steps.

Fig. 4. Typical residential building, (a) floor plan; (b) and (c) 3D model.
H. Babaizadeh et al. / Building and Environment 90 (2015) 168e177 171
consumption simulation. All envelope properties, schedules andequipment (lighting system, HVAC system, etc.) were defined inEnergyPlus. A detailed flowchart for simulation steps is shown inFig. 3.
A typical residential building (see Fig. 4) was selected in thisstudy to assess the effect of various shading designs and materialson total energy consumption in different climate regions in the U.S.The studied building was a one-story detached house with a heightof 3.2 m and a total floor area of 130 m2. The total window to wallratio was 18.87 where the height and width of the windows wereequal to 1.4 m and 1.2 m. The inside temperature was set to 20 and24 �C in winter and summer, respectively. Also, Table 3 shows thetotal heating and cooling energy for the studied residentialbuilding.
2.4. Integrated environmental-economic performance
2.4.1. Environmental performanceA cradle-to-grave environmental LCAwas adopted to determine
the environmental impacts of the shadings in their all life stages
Table 3Total heating and cooling energy (kWh).
Miami Atlanta
Wood PVC Alum. Wood
No Shading 14,779 14,779 14,779 12,855Shading 1 14,226 14,407 14,290 12,636Shading 2 14,235 14,237 14,236 12,525Shading 3 13,911 13,952 13,926 12,388Shading 4 13,675 13,783 13,744 12,318Shading 5 14,004 14,005 14,004 12,426
Chicago
Wood PVC Alu
No Shading 18,929 18,929 18,9Shading 1 18,884 18,934 18,4Shading 2 18,712 18,712 18,7Shading 3 18,680 18,678 18,6Shading 4 18,682 18,684 18,6Shading 5 18,693 18,694 18,6
including raw materials acquisition, product manufacture, trans-portation, installation, operation, and eventually recycling and/orwaste management. This methodology, as shown in Fig. 5, consistsof four major steps, described as follows:
2.4.1.1. Goal and scope definition. Describing the goal and scope isthe very primary step of life cycle assessment. The goal of LCA is toprovide the building community with alternatives for thecommonly used building products in the United States andconvince them to choose environmentally-friendly and cost-effective building materials in construction sector. A combinedenvironmental and economic performance score can lead thebuilding community to pick out the best available constructionmaterial alternatives.
A functional unit for the materials and their alternatives shouldalways be considered for a fair comparison of the substitutes. Thefunctional unit in this analysis for a standard size window in theUnited States assumed to be a unit of shading with dimensions andthicknesses shown in Table 1 being in service for 40 years. Inaddition to functional unit, system boundaries for the analysis are
Seattle
PVC Alum. Wood PVC Alum.
12,855 12,855 12,745 12,745 12,74512,730 12,669 12,564 12,741 12,70912,526 12,526 12,564 12,565 12,56512,402 12,393 12,540 12,536 12,53912,352 12,330 12,545 12,544 12,54412,427 12,426 12,552 12,552 12,552
Duluth
m. Wood PVC Alum.
29 24,431 24,431 24,43114 24,402 24,601 24,62012 24,402 24,402 24,40279 24,552 24,533 24,54683 24,641 24,596 24,62593 24,522 24,522 24,522

Fig. 5. Overall performance steps.
H. Babaizadeh et al. / Building and Environment 90 (2015) 168e177172
defined in this step. The boundary setting consists of major decisioncriteria counting energy and mass consumption.
2.4.1.2. Inventory analysis. The most challenging step of environ-mental LCA is precisely quantifying the inventory flows with inputssuch as raw materials, water and energy, as well as outputs,including air emissions, releases to land and water effluents for aproduct system. Fig. 6 shows the categories BEES model uses togroup data.
Fig. 6. Inventory d
In this study, data were collected from SimaPro 8.0 software(Ecoinvent 3.0 databases) and several other sources (i.e. literature,technical reports, and publications). The software databases (i.e.Ecoinvent 3.0, BUWAL 250, etc.) contain a variety of processes suchas construction materials, transportation, installation, energy andmany others. The collected data used in this step of analysisexclusively represents the U.S. data corresponding to averagetechnologies and not older than 15 years. Also, when data was
ata categories.

Table 4Normalization and weighting factors used in the analysis.
Impact Normalization Weighting
Norm. Values Relative importance
Global warming 25582640.09 29.90Acidification 7800200000.00 3.09Eutrophication 19214.20 6.19Fossil fuel depletion 35309.00 10.31Water intake 529957.75 8.25Criteria air pollutants 19200.00 9.28Human health cancer 151500.03 8.25Human health non cancer 151500.03 5.15Smog 81646.72 4.12Ozone depletion 340.19 2.06Ecological toxicity 274557555.37 7.22Habitat alteration 0.00335 6.19
H. Babaizadeh et al. / Building and Environment 90 (2015) 168e177 173
unavailable and inadequate, assessment was performed based onexpert judgment.
2.4.1.3. Impact assessment. Impact assessment is used as stated bythe ISO series 14040 [26e29] to characterize and normalize the
Table 5First and future costs of shadings.
Shading 1 Shading 2 Shadi
First Future First Future First
(USD) (USD) (USD) (USD) (USD)
Alum. 1176 361 563 173 1100Wood 511 157 278 85 482PVC 510 156 278 85 481
Table 7Environmental performance (Shading 2: Seattle).
Impact Flow Characterization
Alum. Wood PVC
Global warming g CO2 eq 7.72Eþ05 3.17Eþ05 8.36Eþ05Acidification Hþ mmole eq 3.22Eþ05 1.21Eþ05 3.07Eþ05Eutrophication g N eq 3.25Eþ03 1.24Eþ03 2.39Eþ03Fossil fuel depletion MJ surplus �3.12Eþ05 �3.13Eþ05 �3.11Eþ05Water intake Liters 6.06Eþ06 1.31Eþ06 2.12Eþ06Criteria air pollutants microDALYs 1.79Eþ02 6.54Eþ01 1.63Eþ02Human health cancer g C6H6 eq 4.36Eþ03 2.19Eþ03 9.05Eþ03Human health non cancer g C7H7 eq 5.31Eþ06 4.14Eþ06 1.53Eþ07Smog g NOX eq 2.43Eþ03 1.19Eþ03 2.69Eþ03Ozone depletion g CFC-11 eq 1.66E-02 7.76E-03 1.55E-02Ecological toxicity g 2,4-D eq 8.06Eþ03 3.61Eþ03 1.97Eþ04Habitat alteration T&E count 7.02E-11 5.82E-11 6.64E-11
Table 6Environmental performance (Shading 1: Miami).
Impact Flow Characterization
Alum. Wood PVC
Global warming g CO2 eq 8.19Eþ05 3.36Eþ05 8.86Eþ05Acidification Hþ mmole eq 3.42Eþ05 1.28Eþ05 3.25Eþ05Eutrophication g N eq 3.45Eþ03 1.32Eþ03 2.53Eþ03Fossil fuel depletion MJ surplus �8.44Eþ05 �9.55Eþ05 �6.42Eþ05Water intake Liters 6.43Eþ06 1.39Eþ06 2.24Eþ06Criteria air pollutants microDALYs 1.90Eþ02 6.94Eþ01 1.73Eþ02Human health cancer g C6H6 eq 4.62Eþ03 2.32Eþ03 9.60Eþ03Human health non cancer g C7H7 eq 5.64Eþ06 4.39Eþ06 1.62Eþ07Smog g NOX eq 2.57Eþ03 1.26Eþ03 2.85Eþ03Ozone depletion g CFC-11 eq 1.76E-02 8.23E-03 1.64E-02Ecological toxicity g 2,4-D eq 8.55Eþ03 3.83Eþ03 2.09Eþ04Habitat alteration T&E count 7.14E-11 5.87E-11 6.73E-11
environmental impacts. In this step, inventory datawere associatedwith specific environmental impact categories, based on the BEES4.0 model [30]. The BEES model provides the equivalency factorsbased on the research conducted by the U.S. Environmental Pro-tection Agency (U.S. EPA) [31]. BEES model adopts TRACI (Tool forReduction and Assessment of Chemical and other environmentalImpacts) life cycle impact assessment methods developed by theU.S. EPA Office of Research and Development.
For transport from factory to construction site and from con-struction site to landfill/recycle, it was assumed a 16e32 metric tonlorry is used for an average distance of 25 km with a load of 50%because the return trip will be empty. The amount of energy in MJbeing saved due to using the shading over the in-service life of thestudied window is positively incorporated in fossil fuel depletionimpact category. The end of life stage for wood was assumed to be75% landfill and 25% incineration while 100% of aluminum and PVCwere assumed to be recycled. Recycling is effective for both currentand future life cycles. Therefore, the total environmental impactsonly include half of the recycling impacts which correspond to theeffects of recycling in the current life cycle and excluding its effectsfor the next life cycle.
ng 3 Shading 4 Shading 5
Future First Future First Future
(USD) (USD) (USD) (USD) (USD)
337 1636 501 563 173148 685 210 278 85147 684 210 278 85
Normalization Life cycle environmental score
Alum. Wood PVC Alum. Wood PVC
3.02E-02 1.24E-02 3.27E-02 18,650 7080 46,3984.13E-05 1.55E-05 3.93E-051.69E-01 6.47E-02 1.24E-01�8.84Eþ00 �8.86Eþ00 �8.80Eþ001.14Eþ01 2.47Eþ00 3.99Eþ009.32E-03 3.41E-03 8.51E-032.88E-02 1.45E-02 5.97E-023.51Eþ01 2.73Eþ01 1.01Eþ022.97E-02 1.46E-02 3.29E-024.88E-05 2.28E-05 4.55E-052.94E-05 1.31E-05 7.19E-052.10E-08 1.74E-08 1.98E-08
Normalization Life cycle environmental score
Alum. Wood PVC Alum. Wood PVC
3.20E-02 1.31E-02 3.46E-02 4784 �10699 40,0964.38E-05 1.64E-05 4.17E-051.80E-01 6.87E-02 1.32E-01�2.39Eþ01 �2.71Eþ01 �1.82Eþ011.21Eþ01 2.62Eþ00 4.23Eþ009.88E-03 3.61E-03 9.03E-033.05E-02 1.53E-02 6.34E-023.72Eþ01 2.90Eþ01 1.07Eþ023.15E-02 1.55E-02 3.49E-025.17E-05 2.42E-05 4.83E-053.11E-05 1.39E-05 7.63E-052.13E-08 1.75E-08 2.01E-08

Table 8Environmental performance (Shading 3: Duluth).
Impact Flow Characterization Normalization Life cycle environmental score
Alum. Wood PVC Alum. Wood PVC Alum. Wood PVC
Global warming g CO2 eq 1.67Eþ06 6.86Eþ05 1.81Eþ06 6.54E-02 2.68E-02 7.08E-02 65,978 41,247 125,451Acidification Hþ mmole eq 6.99Eþ05 2.61Eþ05 6.64Eþ05 8.96E-05 3.35E-05 8.51E-05Eutrophication g N eq 7.05Eþ03 2.69Eþ03 5.18Eþ03 3.67E-01 1.40E-01 2.69E-01Fossil fuel depletion MJ surplus 2.00Eþ05 2.10Eþ05 1.81Eþ05 5.66Eþ00 5.94Eþ00 5.12Eþ00Water intake Liters 1.31Eþ07 2.83Eþ06 4.58Eþ06 2.48Eþ01 5.35Eþ00 8.65Eþ00Criteria air pollutants microDALYs 3.88Eþ02 1.42Eþ02 3.54Eþ02 2.02E-02 7.38E-03 1.84E-02Human health cancer g C6H6 eq 9.44Eþ03 4.75Eþ03 1.96Eþ04 6.23E-02 3.13E-02 1.29E-01Human health non cancer g C7H7 eq 1.15Eþ07 8.96Eþ06 3.31Eþ07 7.60Eþ01 5.92Eþ01 2.18Eþ02Smog g NOX eq 5.26Eþ03 2.58Eþ03 5.82Eþ03 6.44E-02 3.16E-02 7.13E-02Ozone depletion g CFC-11 eq 3.60E-02 1.68E-02 3.36E-02 1.06E-04 4.94E-05 9.86E-05Ecological toxicity g 2,4-D eq 1.75Eþ04 7.82Eþ03 4.28Eþ04 6.36E-05 2.85E-05 1.56E-04Habitat alteration T&E count 9.30E-11 6.70E-11 8.47E-11 2.78E-08 2.00E-08 2.53E-08
Table 9Environmental performance (Shading 4: Atlanta).
Impact Flow Characterization Normalization Life cycle environmental score
Alum. Wood PVC Alum. Wood PVC Alum. Wood PVC
Global warming g CO2 eq 1.64Eþ06 6.72Eþ05 1.77Eþ06 6.40E-02 2.63E-02 6.93E-02 32,432 7297 92,375Acidification Hþ mmole eq 6.84Eþ05 2.56Eþ05 6.50Eþ05 8.77E-05 3.28E-05 8.34E-05Eutrophication g N eq 6.90Eþ03 2.64Eþ03 5.07Eþ03 3.59E-01 1.37E-01 2.64E-01Fossil fuel depletion MJ surplus �9.06Eþ05 �9.28Eþ05 �8.66Eþ05 �2.57Eþ01 �2.63Eþ01 �2.45Eþ01Water intake Liters 1.29Eþ07 2.78Eþ06 4.49Eþ06 2.43Eþ01 5.24Eþ00 8.47Eþ00Criteria air pollutants microDALYs 3.80Eþ02 1.39Eþ02 3.47Eþ02 1.98E-02 7.22E-03 1.81E-02Human health cancer g C6H6 eq 9.24Eþ03 4.65Eþ03 1.92Eþ04 6.10E-02 3.07E-02 1.27E-01Human health non cancer g C7H7 eq 1.13Eþ07 8.77Eþ06 3.24Eþ07 7.44Eþ01 5.79Eþ01 2.14Eþ02Smog g NOX eq 5.15Eþ03 2.52Eþ03 5.70Eþ03 6.31E-02 3.09E-02 6.98E-02Ozone depletion g CFC-11 eq 3.52E-02 1.65E-02 3.29E-02 1.03E-04 4.84E-05 9.66E-05Ecological toxicity g 2,4-D eq 1.71Eþ04 7.66Eþ03 4.19Eþ04 6.23E-05 2.79E-05 1.53E-04Habitat alteration T&E count 9.22E-11 6.66E-11 8.40E-11 2.75E-08 1.99E-08 2.51E-08
H. Babaizadeh et al. / Building and Environment 90 (2015) 168e177174
The characterized environmental impacts were quantified usingthe widely-used SimaPro 8 software for each shading on a1.4 m � 1.2 mwindow. The quantified environmental impacts werethen normalized according to data corresponding to TRACImethods to the same scale to be expressed in commensurate units.
2.4.1.4. Interpretation. Normalized impacts were synthesized byweighting each impact category by its relative importance tooverall environmental performance. Then, the weighted averageimpact score was computed for each material in each shading torepresent their overall environmental performance.
The environmental impact was weighted as suggested in theBEES model, based on BEES Stakeholder Panel Judgments [30].
Table 10Environmental performance (Shading 5: Chicago).
Impact Flow Characterization
Alum. Wood PVC
Global warming g CO2 eq 6.32Eþ05 2.59Eþ05 6.84Eþ05Acidification Hþ mmole eq 2.64Eþ05 9.86Eþ04 2.51Eþ05Eutrophication g N eq 2.66Eþ03 1.02Eþ03 1.95Eþ03Fossil fuel depletion MJ surplus �4.06Eþ05 �4.07Eþ05 �4.05Eþ05Water intake Liters 4.96Eþ06 1.07Eþ06 1.73Eþ06Criteria air pollutants microDALYs 1.46Eþ02 5.35Eþ01 1.34Eþ02Human health cancer g C6H6 eq 3.57Eþ03 1.79Eþ03 7.41Eþ03Human health non cancer g C7H7 eq 4.35Eþ06 3.38Eþ06 1.25Eþ07Smog g NOX eq 1.99Eþ03 9.73Eþ02 2.20Eþ03Ozone depletion g CFC-11 eq 1.36E-02 6.35E-03 1.27E-02Ecological toxicity g 2,4-D eq 6.59Eþ03 2.95Eþ03 1.62Eþ04Habitat alteration T&E count 6.67E-11 5.68E-11 6.35E-11
Among these 12 weighted factors the BEES model takes intoconsideration in LCA, indoor air quality was omitted in theanalysis of shadings, since use of the product does not affect thiscategory. Relative importance weights were then modified toreflect indoor air quality elimination in these categories: globalwarming (29.9%), acidification (3.1%), eutrophication (6.2%), fossilfuel depletion (10.3%), water intake (8.3%), air pollutants (9.3%),human health cancerous and non-cancerous (8.3% and 5.2%),smog (4.1%), ozone depletion (2.1%), habitat alteration (6.2%), andecological toxicity (7.2%). The score provided by applying therelative importance weights denotes the environmental perfor-mance of the material. A lower score indicates a more sustainableand environmentally-friendly alternative, and a negative score
Normalization Life cycle environmental score
Alum. Wood PVC Alum. Wood PVC
2.47E-02 1.01E-02 2.67E-02 10,849 1385 33,5473.38E-05 1.26E-05 3.22E-051.39E-01 5.30E-02 1.02E-01�1.15Eþ01 �1.15Eþ01 �1.15Eþ019.36Eþ00 2.02Eþ00 3.27Eþ007.62E-03 2.79E-03 6.97E-032.35E-02 1.18E-02 4.89E-022.87Eþ01 2.23Eþ01 8.24Eþ012.43E-02 1.19E-02 2.69E-023.99E-05 1.87E-05 3.73E-052.40E-05 1.08E-05 5.88E-051.99E-08 1.70E-08 1.90E-08
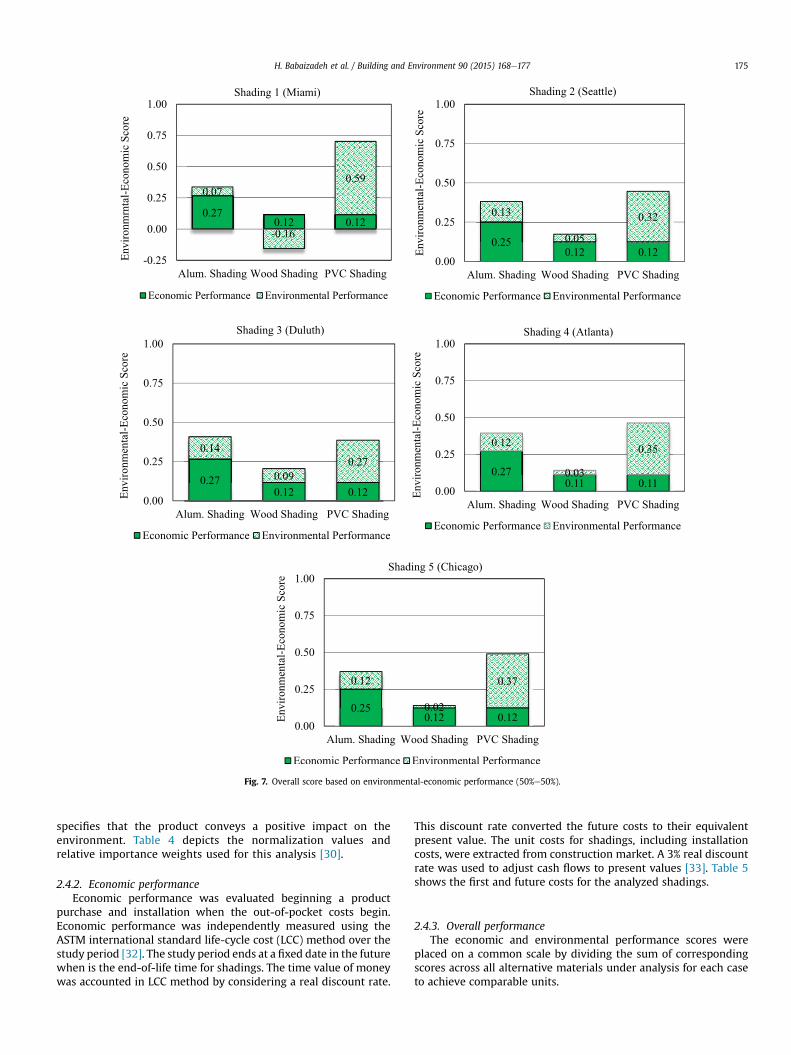
Fig. 7. Overall score based on environmental-economic performance (50%e50%).
H. Babaizadeh et al. / Building and Environment 90 (2015) 168e177 175
specifies that the product conveys a positive impact on theenvironment. Table 4 depicts the normalization values andrelative importance weights used for this analysis [30].
2.4.2. Economic performanceEconomic performance was evaluated beginning a product
purchase and installation when the out-of-pocket costs begin.Economic performance was independently measured using theASTM international standard life-cycle cost (LCC) method over thestudy period [32]. The study period ends at a fixed date in the futurewhen is the end-of-life time for shadings. The time value of moneywas accounted in LCC method by considering a real discount rate.
This discount rate converted the future costs to their equivalentpresent value. The unit costs for shadings, including installationcosts, were extracted from construction market. A 3% real discountrate was used to adjust cash flows to present values [33]. Table 5shows the first and future costs for the analyzed shadings.
2.4.3. Overall performanceThe economic and environmental performance scores were
placed on a common scale by dividing the sum of correspondingscores across all alternative materials under analysis for each caseto achieve comparable units.
H. Babaizadeh et al. / Building and Environment 90 (2015) 168e177176
Ultimately, ASTM standard for Multi-Attribute Decision Analysis(MADA) was used to synthesize the environmental and economicperformance measures into a single overall performance [34e36].For the entire analysis, products were defined and categorizedbased on UNIFORMAT II, the ASTM standard classification for con-struction elements [34].
3. Results and discussions
LCA of five different common shading types in five major cli-mates in the U.S. with three different materials were analyzed.Since the same clear glass (floated) window was used in all modelsfor all cases, its LCA was excluded from the results to represent abetter understating of the effects of the three materials used asshadings. Due to similarity of the results, the environmental per-formances for individual shadings in different climates are shownin Tables 6e10. The results contain the characterized and normal-ized flow quantities for each impact category, and ultimately theweighted and interpreted life cycle environmental score for thesame shading made of different materials.
The most remarkable normalized flow quantities in the studiedcases were the positive effect of the shadings on fossil fuel deple-tion and negative influence on human health (non-cancer) envi-ronmental impact categories. Fossil fuel depletion has a relativeimportance weighting factor as twice as human health (non-can-cer). Hence, in climates with higher solar radiation such as Miami,the better types of shadings can even have positive overall envi-ronmental performance within their life cycles. During in-servicephase, shadings in such climates are capable of decreasing the so-lar gain through façade surface and noticeably reducing the energyrequired for air conditioning. In other climates, the shadings maynot necessary have positive influence on the environment directly,but they can outstandingly diminish the overall negativeperformance.
Fig. 7 shows the overall environmental-economic scores foreach carefully selected shading type. Equal environmental perfor-mance and economic performance weights were considered tocalculate the final score. Smaller scores denote moreenvironmentally-economically efficient materials amongst thealternatives.
Wood shadings have the best environmental, economic andoverall scores in all studied cases. Economically, they are compa-rable to PVC shadings and are cheaper than aluminum shadings.Environmentally, wood shadings are by far the mostenvironmentally-friendly alternative. On the other hand, aluminumshadings have nearly half of the environmental score of PVCshadings conveying their advantage over PVC shadings.
4. Conclusions
This paper investigates the LCA of different types of windowshadings used in the U.S. made of the most common materials inthe market; wood, aluminum, and PVC. The effects of climatevariation on overall cooling and heating conditions for all caseswere also studied in LCA. The results and methods provide guid-ance to decision about the design of shading systems in varioustypes of facilities.
Shading types 2 and 5 are the most efficient types of shadings inalmost all climate zones. The amount of energy saving varies fromone climate to another, but using the solar shading systems arenoticeably more beneficial and extremely recommended in hot-humid (Miami), and mixed-humid (Atlanta) climate zones.
Use of window shadings of any kind for residential windows,more or less, would reduce the total energy consumption forbuildings over their life cycles. This saving of energy will overcome
the amount of fossil fuel depleted and emissions released to land,water, and air while extracting the raw materials, transportation,manufacturing, installation, and recycling phases. A wood shadingunit turned out to be an excellent economic-environmentalfriendly alternative for this mean. Aluminum shading could bethe second best option to reduce the overall environmental im-pacts. To beginwith, it may seemmore costly compared to PVC, butthe overall performance of the material is superior over PVCshading. Furthermore, the reduce air conditioning costs during in-service life of the material will top the costs due to using similarPVC shading within the life cycle of the product.
References
[1] Stazi F, Mastrucci A, Munaf�o P. Life cycle assessment approach for the opti-mization of sustainable building envelopes: an application on solar wall sys-tems. Build Environ 2012;58:278e88.
[2] Mora R, Bitsuamlak G, Horvat M. Integrated life-cycle design of building en-closures. Build Environ 2011;46:1469e79.
[3] Babaizadeh H, Hassan M. Life cycle assessment of nano-sized titanium dioxidecoating on residential windows. Constr Build Mater 2013;40:314e21.
[4] Abeysundra UGY, Babel S, Gheewala S, Sharp A. Environmental, economic andsocial analysis of materials for doors and windows in Sri Lanka. Build Environ2007;42:2141e9.
[5] Broun R, Babaizadeh H, Zakersalehi A, Menzies GF. Integrated life cycle energyand greenhouse gas analysis of exterior wall systems for residential buildings.Sustainability 2014;6:8592e603.
[6] Kosareo L, Robert R. Comparative environmental life cycle assessment ofgreen roofs. Build Environ 2007;42:2606e13.
[7] Bribi�an IZ, Aranda Uson, Scarpellini S. Life cycle assessment in buildings: state-of-the-art and simplified LCA methodology as a complement for buildingcertification. Build Environ 2009;44:2510e20.
[8] Nibel S LT, Knapen M, Boonstra C, Moffat S. Annex 31: energy related envi-ronmental impact of buildings. International Energy Agency.
[9] Erlandsson M, Borg M. Generic LCA e methodology applicable for buildings,constructions and operation services e today practice and developmentneeds. Build Environ 2003;38:919e38.
[10] Fesanghary M, Asadi S, Geem Zong Woo. Design of low-emission and energy-efficient residential buildings using a multi-objective optimization algorithm.Build Environ 2012;49:245e50.
[11] Somayeh Asadi ZWG. Sustainable building design: a review on recent meta-heuristic methods. In: Recent advances in swarm intelligence and evolu-tionary computation. Springer International Publishing; 2015. p. 203e23.
[12] Somayeh Asadi SSA, Mottahedi Mohammad. On the development of multi-linear regression analysis to assess energy consumption in the early stagesof building design. Energy Build 2014;85:246e55.
[13] Asadi S, Geem ZM. Sustainable building design: a review on recent meta-heuristic methods. In: Publishing S.I., editor. Recent advances in swarm in-telligence and evolutionary computation studies in computationalintelligence; 2015. p. 203e23.
[14] Bessoudo M, Tzempelikos A, Atheienitis AK, Zmeureanu R. Indoor thermalenvironmental conditions near glazed facades with shading devices e part I:experiments and building thermal model. Build Environ 2010;45:2506e16.
[15] Moeseke G, Isabella B, Herde AD. Impact of control rules on the efficiency ofshading devices and free cooling for office buildings. Build Environ 2007;42:784e93.
[16] David M, Donn M, Garde F, Lenoir A. Assessment of the thermal and visualefficiency of solar shades. Build Environ 2011;46:1489e96.
[17] Li DHW, Tsang EKW. An analysis of daylighting performance for officebuildings in Hong Kong. Build Environ 2008;43:1446e58.
[18] Kim JT, Kim G. Advanced external shading device to maximize visual and viewperformance. Indoor Built Environ 2010;19:65e72.
[19] Kim G, Lim H, Lim TS, Schaefer L, Kim JT. Comparative advantage of an exteriorshading device in thermal performance for residential buildings. Energy Build2012;46:105e11.
[20] Poirazis H, Blomsterberg A, Wall M. Energy simulations for glazed officebuildings in Sweden. Energy Build 2008;40:1161e70.
[21] Cho J, Yoo C, Kim Y. Viability of exterior shading devices for high-rise resi-dential buildings: case study for cooling energy saving and economic feasi-bility analysis. Energy Build 2014;82:771e85.
[22] Niu J. Some significant environmental issues in high-rise residential buildingdesign in urban areas. Energy Build 2004;36:1259e63.
[23] (EIA) USEIA. Annual energy Outlook. DOE/EIAe03832011.[24] (NOAA) NOaAA. 2012.[25] (DOE) DoE. EnergyPlus Input/Output Reference v6.0. 2011.[26] standardization IOf. ISO/DIS 14040: environmental management e life cycle
assessment e principles and, framework. 1997.[27] Standardization IOf. ISO/DIS 14041: environmental management e life cycle
assessment e goal and scope definition and inventory, analysis. 1997.

H. Babaizadeh et al. / Building and Environment 90 (2015) 168e177 177
[28] Standardization IOf. ISO/DIS 14042: environmental management e life cycleassessment e life cycle, impact assessment. 1998.
[29] Standardization IOf. ISO/DIS 14043: environmental management e life cycleassessment e life cycle, interpretation. 1998.
[30] B L. Building for environmental and economic sustainability (BEES) technicalmanual and user guide. National Institute of Standards and Technology; 2007.
[31] Bare JNG, Pennington D, McKone T. TRACI: the tool for the reduction andassessment of chemical and other environmental impact. J Ind Ecol 2002;6:49e78.
[32] E917-05. Standard practice for measuring life-cycle costs of buildings andbuilding systems ASTM International. In: Standard practice for measuring life-cycle costs of buildings and building systems; 2005. West Conshohocken (PA):ASTM designation E917-05.
[33] Rushing ASKJ, Lippiatt BC.. Energy price indices and discount factors for life-cycle cost analysis. Annual supplement to NIST handbook 135 and NBS spe-cial publication 7092013.
[34] International A. Standard classification for building elements and relatedsitework: UNIFORMAT II. ASTM designation E 1557-97. West Conshohocken(PA). 1997.
[35] International A. Standard practice for applying the analytic hierarchy processto multiattribute decision analysis of investments related to buildings andbuilding systems. ASTM designation E 1765-98. West Conshohocken (PA).1998.
[36] Agency USEP. Toward integrated environmental decision-making. EPA-SAB-EC-00-011. Washington, (DC: United States Environmental Protection Agency,Science Advisory Board; 2000.