Less bang for the buck? Cultural capital and immigrant status effects on kindergarten academic...
27
University of Pennsylvania From the SelectedWorks of Grace Kao 2009 Less Bang for the Buck? Cultural Capital and Immigrant Status Effects on Kindergarten Academic Outcomes Elizabeth Lee, Hamilton College - Clinton Grace Kao, University of Pennsylvania Available at: hp://works.bepress.com/grace_kao/35/
Transcript of Less bang for the buck? Cultural capital and immigrant status effects on kindergarten academic...

University of Pennsylvania
From the SelectedWorks of Grace Kao
2009
Less Bang for the Buck? Cultural Capital andImmigrant Status Effects on KindergartenAcademic OutcomesElizabeth Lee, Hamilton College - ClintonGrace Kao, University of Pennsylvania
Available at: http://works.bepress.com/grace_kao/35/

Less bang for the buck? Cultural capital and immigrant
status effects on kindergarten academic outcomes
Elizabeth M. Lee *, Grace Kao
Department of Sociology, University of Pennsylvania, 3718 Locust Walk, Philadelphia, PA 19104, United States
Available online 25 April 2009
Abstract
Using the Early Childhood Longitudinal Study-Kindergarten Cohort (ECLS-K), a nationally repre-
sentative sample of kindergarteners in 1998–99, we examine how participation in extracurricular activities
varies by race and immigrant status. While all minority children have lower levels of participation, we find
that Asian, Hispanic, and Black children of immigrants are particularly disadvantaged even after accounting
for differences in parent income and educational background. Teachers rate non-White children of
immigrants lower on reading test scores even after controlling for their socioeconomic status and their
test scores. Surprisingly, Asian children of immigrants fare especially badly, in contrast to often-cited
academic successes for this group. Teacher evaluations of reading ability are also correlated with some
forms of extracurricular activity participation, even after adjusting for children’s test scores. Results suggest
modest interaction effects between immigrant status and cultural capital within racial groups. We conclude
that teachers may use evidence of activity participation to signal academic mobility and promise but that
these effects vary by race and immigrant status.
# 2009 Elsevier B.V. All rights reserved.
1. Introduction
The population of children in the United States is increasingly diverse along race, ethnic, and
immigrant lines. Currently, immigrant children account for almost 25% of the school-aged
population, while minority children account for 39% of the population under 18 (O’Hare, 2004).
With the increasing population of children of immigrants in the United States, scholars have
become more interested in their educational attainment (Glick and Hohmann-Marriott, 2007;
Zhou, 1997a). Moreover, researchers examine the extent to which nativity status and race are
associated with these outcomes. Certainly, some differences are attributable to socioeconomic
differences, but socioeconomic status (SES) cannot completely account for the relative
www.elsevier.com/locate/poetic
Available online at www.sciencedirect.com
Poetics 37 (2009) 201–226
* Corresponding author. Tel.: +1 773 573 7312; fax: +1 215 573 2081.
E-mail addresses: [email protected] (E.M. Lee), [email protected] (G. Kao).
0304-422X/$ – see front matter # 2009 Elsevier B.V. All rights reserved.
doi:10.1016/j.poetic.2009.02.001

disadvantage of some minority and immigrant groups or the success of others (Kao and
Thompson, 2003; Zhou, 1997b). While race, ethnic, and immigrant status differences in
educational achievement outcomes have been documented, we still know little about the process
of stratification as students move through their academic careers (Kao and Tienda, 1995; Kao and
Thompson, 2003).
One mechanism for educational attainment is cultural capital. Some qualitative researchers
have argued that teachers expect parents to perform in a manner consistent with White
middle-class values (Lareau, 2000); parents who comply are able to use cultural capital to
improve their children’s prospects in school. With some exceptions, research on cultural
capital is focused on differences across socioeconomic status groups. However, we know very
little about how cultural capital matters in the case of minority and – especially – immigrant
children. It is possible that immigrant and minority parents are less likely to enroll their
children in the kinds of extracurricular activities that Lareau and others argue matter for
building cultural capital. Moreover, while immigrant parents may not expect activities to
affect teachers’ assessments of their children’s academic ability, teachers may in fact use
children’s participation in such organized forums as a sign of parental investment and upward
mobility. One could easily imagine that the import of these differences is more modest and
less important for attainment for school-aged children than for adolescents. If, however,
teachers differentially assess immigrant students due to their cultural participation when they
are very young, it is likely that these differences will increase as children age. In short,
participation in activities in early childhood may set the stage for future educational and
socioeconomic attainment.
There is currently very little knowledge about whether immigrant minority children
participate in activities that build cultural capital, and if these differences affect teacher
perceptions. Our paper examines these two questions. We utilize the Early Childhood
Longitudinal Study-Kindergarten Cohort (ECLS-K), a representative sample of the kindergarten
class of 1998–99 to examine participation in activities that build cultural capital and investigate
how this participation is related to teachers’ assessments of children’s abilities in math and
‘‘literacy and language’’ (henceforth referred to simply as reading) across race-ethnic and
immigration groups.
2. Literature review
2.1. Cultural capital and attainment differences
Educational stratification begins in the earliest years of school (Entwisle and Alexander,
1993). Teachers at this early stage play a key role in determining a child’s attainment trajectory as
they assign children to accelerated or gifted programs or provide positive reinforcement to
students they perceive to be smarter and/or better behaved. This differentiation affects children’s
work habits and other future behavior (Alexander et al., 1993). Grades given at this early stage
affect children’s perceptions of their own abilities, as well as their future test scores and other key
outcomes (Entwisle and Alexander, 1993).
At the aggregate level, these differences may contribute to achievement gaps across race,
immigrant, or socioeconomic categories. Such gaps have been extensively documented. Black
and Hispanic children tend to lag behind Whites, and Asian children do better on average (Kao
and Thompson, 2003). Scholars have also found that children of immigrants (and likewise
immigrants who came to the United States before the age of 13, also known as the 1.5 generation)
E.M. Lee, G. Kao / Poetics 37 (2009) 201–226202

perform better in school than their co-race and co-ethnic peers (Kao and Tienda, 1995; Portes and
Rumbaut, 2001 among others, cited in Waters and Jimenez, 2005).1
A number of scholars have used cultural capital theory (Bourdieu and Passeron, 1977) to
examine questions of attainment gaps across race and SES categories. Various proxies for
cultural capital, such as parents’ education level, have been found to ameliorate differences
between minority and White adolescents (e.g. Kalmijn and Kraaykamp, 1996).2 Likewise,
Dumais finds that participation in certain extracurricular activities increases teacher evaluations
in both math and reading across SES levels (Dumais, 2006a,b). Of particular importance for this
investigation, research has shown that cultural capital has different results by gender and race, i.e.
ascriptive characteristics. DiMaggio (1982) found strong differences in the relationship between
family background and cultural capital outcomes by gender. Kaufman and Gabler (2004) find
that while both boys and girls may reap benefits from cultural capital participation, the type of
activities that carry such benefits may be different by gender. Examining race, Roscigno and
Ainsworth-Darnell (1999) have found that cultural capital may in fact be less efficacious for
Black than White children in terms of advancement. This articulates well with findings in the
sociology of education that indicate that teachers’ biases may affect classroom outcomes, for
example how students are disciplined, or grouped by (perceived) ability (see e.g. Morris, 2005).
There has been little investigation of how cultural capital is utilized by immigrants or children of
immigrants, however. For example, although Perreira et al. (2006) include cultural capital in their
examination of high school completion rates for immigrant and native-born adolescents, their
operationalization of the concept seems closer to social than cultural capital: ‘‘school attachment,
educational aspirations, parental control, and parental closeness’’ (p. 519). Using these somewhat
broad considerations, the authors do find evidence of variation in cultural capital by race/ethnic
group. Specifically, they argue that ‘‘[c]ultural capital and immigrant optimism buffer first
generation Hispanic youth and children of Asian immigrants from the risk of dropping out of high
school. . . [T]he second and third generation children of Hispanic and Black families benefit little, if
at all, from the protective effects of cultural capital and immigrant optimism’’ (p. 533).
Comparisons between children of immigrants and children of native-born parents have
primarily been made based on immigrant group-specific ‘‘cultural characteristics’’ (Zhou, 1997b,
p. 994). This research focuses on attributes such as attitudes towards academic achievement,
social capital and the effects of native language use. For example, Fuligni (1997) finds that
second generation immigrants perceive greater family and community pressure to excel in
school, and also greater peer support for school engagement than those in the third generation.
Similarly, Zhou writes that ‘‘immigrant students who retained strong cultural and family identity
tended to outpace others in school’’ (1997a, p. 80, citing Rumbaut, 1994b, 1996 among others).
Discussion of in-group resources is generally limited to social capital, however, and does not
include what might be called traditional forms of cultural capital (i.e. forms specified by
Bourdieu and subsequent scholars, as discussed below).
As Roscigno and Ainsworth-Darnell note, ‘‘important micropolitical processes that occur in
schools and classrooms and that may have consequences for whether cultural capital and household
educational resources function similarly . . . for Blacks and Whites’’ have not been sufficiently
considered (1999, p. 159). This highlights the interactional aspect of cultural capital: rather than a
E.M. Lee, G. Kao / Poetics 37 (2009) 201–226 203
1 Such achievement is not always consistent across immigrant or ethnic groups (i.e. ‘‘Hispanic,’’ ‘‘Asian’’), however,
with certain nationality or ethnic groups faring better than others within the broader category (Portes and MacLeod,
1999).2 See below for a more complete discussion of the ways cultural capital has been conceptualized and measured.

simple trade of activity or knowledge for esteem or recognition, the capital and its holder are filtered
through the eyes of the gatekeeper. Thus, drawing from research that indicates (a) that teachers may
respond differently to students depending on race, gender, or class; (b) that cultural capital has
inconsistent rewards for students of different races and genders; and (c) that children of immigrants
are likely to differ in terms of social capital from children of native-born parents, we consider here
how cultural capital utilization may differ by immigration status. Specifically, we draw
comparisons between non-White children of immigrants and White children of native-born parents,
as well as with co-race or ethnic peers of native-born parents.
Because there is little existing research, it is difficult to predict with certainty how outcomes
might vary for a wider array of racial groups and/or for children of immigrants. As noted above,
social capital research on immigrants suggests that second generation children are more heavily
involved with networks of co-ethnics/co-nationals (i.e. tighter links to home community than to
school community). This implies that children of immigrants may be less likely to participate in
more traditional ‘‘American’’ extracurricular activities, such as baseball or scouts. On the other
hand, it is possible that the key to gaining cultural capital ‘‘points’’ is the participation itself,
rather than the type of activity in which one participates—i.e. perhaps it is of less importance
whether the activity is scouts or Thai language lessons, it is simply important that the child be
involved in some kind of after-school activity.
2.2. Definitions of cultural capital
Definitions of cultural capital have been wide-ranging and include a vast number of values and
behaviors. Bourdieu’s original presentation of the concept refers to signals of competency in
high-status fields, particularly appreciation of the arts (Bourdieu and Passeron, 1977; see also
DiMaggio, 1982; Dumais, 2006a). Others have defined cultural capital as knowledge about a
wide variety of other areas (for comprehensive discussions, see Lareau and Weininger, 2003;
Lamont and Lareau, 1988). The consistent and crucial aspect throughout these theoretical frames
is the mechanism through which cultural capital is utilized: the display of familiarity with and
competency in valued fields of knowledge facilitates favorable interactions with gatekeepers.
These are rewarded with some form of advancement or advantage. It is important to emphasize
that in order to be effective, cultural capital must be of a form that is recognizable to gatekeepers,
such as teachers (Farkas et al., 1990). Indeed, Lamont and Lareau state that ‘‘[f]or any of these
signals to be considered a form of cultural capital, it needs to be defined as a high-status cultural
signal by a relatively large group of people: the institutionalized or shared quality of these signals
makes them salient as markers’’ (p. 156, emphasis added).
The cultural aspect of cultural capital suggests that only certain kinds of knowledge will be
relevant—not simply high-status culture, as has been argued by many, but culture appropriate to the
context(s). Prudence Carter (2003) has suggested that in fact it may not only be high-status cultural
capital that matters, but rather that the relative value will depend on context. Thus, low-status
cultural knowledge will be of equivalent importance in low-status situations.3 This does not tie in to
the discussion to which cultural capital is usually linked, namely reproduction or attainment
through mobility of high status, but it may better elaborate the actual mechanisms of cultural capital
as a theory. In other words, having high-status cultural capital that is not recognizable to gatekeepers
does not accrue benefits to the holder. Thus, it seems reasonable to hypothesize, as we do here, that
immigrants to this country might not be aware of what does or does not constitute high-status
E.M. Lee, G. Kao / Poetics 37 (2009) 201–226204
3 See also Lamont and Lareau (1988, p. 157) on this point.

knowledge, activities, etc., and might therefore be less able to procure such opportunities for their
children or on their children’s behalves. Alternately, such parents may be more invested in
‘‘cultivating’’ (Lareau, 2002) other formsofknowledgeoractivity more tied to thehome community
which do not function well as mainstream cultural capital (i.e. recognizable to gatekeepers).
Research focused on social capital has indeed found that many immigrant communities involve
children inethno-culture-specificactivities, often outsideof the schoolorbroadercommunity-based
extracurricular activities undertaken by other local children (Zhou, 1997a).
Most discussions of cultural capital focus on older students and achievement later in life, such as
college acceptance (e.g. Gabler and Kaufman, 2006). In studies of younger age groups, attention is
given to parents’ cultural capital and use thereof, rather than on the child’s interactions (e.g. Lareau,
2002; for exceptions see Dumais, 2006a,b). Of course, children’s lives are structured by the location
and decisions of their parents. The literature on cultural capital reviewed above, however, suggests
that in addition to parents’ leveraging of cultural capital, children’s personal interactions with their
teachers – through which cultural capital is exhibited – influence grades and other forms of
evaluation. These evaluations affect a child’s possibility for future education achievement through
grades and through positive or negative reinforcement. This study therefore speaks to two gaps in
the literature on cultural capital: what types of cultural capital – if any – are important to the
evaluation of young children, and how participation in and results from cultural capital-building
activities vary for children of immigrants and different racial or ethnic groups.
Drawing on the works reviewed above, we make two preliminary predictions. First, given the
relatively low understanding of how cultural capital might be accessed and gained from by
immigrants and their children, it is difficult to predict how outcomes might vary. We therefore
expect simply that cultural capital activities matter differently for children whose parents are
immigrants than for those who are native-born. Second, because there is some evidence that race
also plays a role, we examine differences across race-ethnic groups. Here again, there is little
literature examining the effectiveness of cultural capital theory for children of different races or
ethnicities. For example, Roscigno and Ainsworth-Darnell (1999) find different outcomes for
Black as compared with White children, but it is inappropriate to extrapolate their findings to
Hispanic, Asian, or other-race children. It is therefore difficult to predict with confidence how such
variation may occur, but we do expect to find different outcomes from cultural capital for non-White
children. Finally, we consider whether any one of three different proxies for cultural capital – one
focused on art lessons, one focused on museums, and one focused on interaction – has a greater
impact than the other.
3. Methods
Data are drawn from Waves 1, 2, and 4 of the ECLS K-3 database. The ECLS database is a
nationally representative sample of children who began kindergarten in 1998–99, with data from
their parents or guardians, teachers, and school administrators. We use information collected
from parents/guardians and teachers. The total N is 17,565. However, due to non-response,
missing data, or group-specific considerations, the N for our analyses is lower.4
E.M. Lee, G. Kao / Poetics 37 (2009) 201–226 205
4 As shown in Table 1, there are a large number of non-responses for the household income variable—in addition to
those who declined to answer the question, 2869 respondents indicated that they did not know their household income, for
a total of 5130 missing. Since household income is included in all models, this lowers the N for each. Smaller but still
notable figures are also missing from several other variables. Additionally, it should be noted that the N for all group-
specific analyses is dependent upon the sub-population figures for that group (e.g. Hispanic children).

Table 1 presents the measures selected for this study. Teacher assessments of student ability in
math and reading are measured on a 1–5 scale where 1 is low. Each is a composite of multiple
questions from the teacher questionnaire in Wave 2 (spring of kindergarten). The explanatory
measures are selected based on findings from previous research, discussed in greater detail above.
We include the following socio-demographic measures: family income quintile where 1 is lowest
quintile and 5 is highest quintile; parent education, a series of dummy variables for the highest
education level completed by either parent (less than high school, high school only, some college,
and college or beyond); child’s gender (0 for male and 1 for female); and child’s race (Asian,
Black non-Hispanic, Hispanic, other race, and White non-Hispanic). Child’s race and gender are
constant variables, parent education is drawn from Wave 1 (fall of kindergarten), and the
household income variable is from Wave 2 (spring of kindergarten) (Tourangeau et al., 2006). To
expand on existing research, however, we add a variable for mother’s immigration status, US-
born or non-US-born ascertained in Wave 4 (spring of first grade), to supplement child’s race.
This allows us to draw comparisons between children of immigrants and children of native-born
parents within race or ethnic groups.
Three variables measuring child participation in cultural capital-building activities are also
considered: art activities, directed activities and cultural activities, measured in Wave 2 (spring
of kindergarten). These variables are grouped to focus on three aspects of previous research on
cultural capital. Many scholars have focused on participation in activities related to ‘high status’
art knowledge (Dumais, 2006a), and if this kind of cultural capital has an effect we would expect
to see participation in at least one type of art activity result in an increase in the teacher’s
perception of the child’s ability. Arts activities include ‘‘crafts classes or lessons, . . . art classes or
lessons, for example, painting, drawing, sculpturing, . . . drama classes, . . . music lessons, for
example, piano, instrumental music or singing lessons, or dance lessons [or] organized
performing arts programs, such as children’s choirs, dance programs, or theater performances’’
(Tourangeau et al., 2006). For each, the parent or guardian was asked whether the child had ever
participated in one or more of this type of activity.5
In addition, we distinguish between the aforementioned activities from directed activities,
which are activities that require a high degree of interaction with other children and more
importantly with adults in a coordinated fashion. Directed activities include participation in
‘‘organized clubs or recreational programs, like scouts, [or] organized athletic activities, like
basketball, soccer, baseball, or gymnastics’’ (Tourangeau et al., 2006). These variables were
selected to reflect Kaufman and Gabler’s emphasis on ‘‘interactional’’ aspects of cultural capital
(2004, p. 147).6 While Bourdieu (1978) refers to a hierarchy of sports participation in terms of
status, we speculate that the generation of cultural capital from sports (as from Scouts and other
clubs) may result from learning to interact with adults, in addition to or in place of the symbolic
class value of the particular sport. If these types of interaction-heavy activities are important, we
E.M. Lee, G. Kao / Poetics 37 (2009) 201–226206
5 Although measuring whether a child has ‘‘ever’’ participated in a type of activity is imprecise, if anything the model
should underestimate the importance since presumably many children engage such activities over time, not only in a
single instance.6 Although the inclusion of sports activities may seem unorthodox, our intention here is to emphasize the possible
benefits of the interaction, rather than the cultural content. Thus, if the benefits of cultural capital are improved capacity
for interaction with gatekeepers, we would expect to see similar results whether the activity in question is sport or art. As
Bourdieu notes, ‘‘[i]t can be seen, for example, that golf . . . like caviar or foie gras, has a distributional significance (the
meaning which practices derive from their distribution among agents distributed in social classes). . .’’ (1978, p. 836,
italics in original). Following Bourdieu, there have been several examinations of the ways that sports participation may
build cultural capital (see e.g. Warde, 2006).

E.M. Lee, G. Kao / Poetics 37 (2009) 201–226 207
Table 1
Frequencies and definitions of variables.
Variable Measurement N Mean or percent
of population
Teacher assessment (Wave 2)
Math ability 1–5 scale where 1 = low 16,208 3.54
Reading ability 1–5 scale where 1 = low 16,351 3.37
IRT Score (Wave 2)
Math 0–123 where 0 = low 16,717 31.64
Reading 0–154 where 0 = low 16,109 38.84
Race and mother’s immigration status (constant, Wave 4)
Black immigrant 1 = child is Black, mother born outside the United States 151 1.00
Black native-born 1 = child is Black, mother born in the United States 1,784 11.84
Hispanic immigrant 1 = child is Hispanic, mother born outside the United States 1,350 8.96
Hispanic native-born 1 = child is Hispanic, mother born in the United States 1157 7.68
Asian immigrant 1 = child is Asian, mother born outside the United States 668 4.43
Asian native-born 1 = child is Asian, mother born in the United States 129 0.86
Other immigrant 1 = child is other race, mother born outside the United States 161 1.07
Other native-born 1 = child is other race, mother born in the United States 639 4.24
White immigrant 1 = child is White, mother was outside the United States 391 2.59
White native-born 1 = child is White, mother was in the United States 8,639 57.33
Gender (constant)
Female 0 = male, 1 = female 8,494 48.84
Household income (Wave 2)
Lowest income quintile 1 = family’s income is in the lowest quintile 2,479 0.20
Low-income quintile 1 = family’s income is in the lowest quintile 2,480 0.20
Middle-income quintile 1 = family’s income is in the lowest quintile 2,372 0.19
Upper income quintile 1 = family’s income is in the lowest quintile 2,387 0.19
Highest income quintile 1 = family’s income is in the lowest quintile 2,553 0.21
Highest parent education level (Wave 1)
Less than high
school dipl.
1 = highest parent education is less than
high school diploma
1,538 0.10
High school only 1 = highest parent education is a high school diploma 3,797 0.24
Some college 1 = highest parent education is some college 5,310 0.31
College degree or
beyond
1 = highest parent education is college degree or beyond 5,313 0.31
Cultural capital-building activities (Wave 2)
No art activities 1 = child has not done any type of art activities 10,438 0.67
One art activity 1 = child has done one type of art activity 3,091 0.20
Two or more art
activities
1 = child has done at least two types of art activities 1,953 0.13
No directed activities 1 = child has not done any type of directed activities 7,943 0.49
One directed activity 1 = child has done one type of directed activity 6,716 0.42
Two or more directed
activities
1 = child has done at least two types of directed activities 1,413 0.09
No cultural activities 1 = child has not done any type of cultural activities 7,526 0.47
One cultural activity 1 = child has done one type of cultural activity 6,012 0.37
Two or more cultural
activities
1 = child has done at least two types of cultural activities 2,528 0.16

would likewise expect to see an increase in the teacher’s assessment of child’s ability in math and
reading.
Finally, we include a measure for traditional cultural capital measures, comprising visits to
museums and concerts. These are designed to measure the effects of activities most traditionally
considered to provide cultural capital benefits. As above, if these are effective, we would expect
to see that participation in these activities would improve teacher assessments.
All regression results are weighted to adjust for unequal selection probabilities at the school
and child levels, so that our estimates are generalizable to the national population of students in
Kindergarten in the 1998–99 academic year (Tourangeau et al., 2006). Descriptive tables are
unweighted.
4. Descriptive figures
Table 1 shows the composition of the population. The sample is almost 60% White children of
native-born mothers, with the next largest group being Black children of native-born mothers
(12%). Although the other percentages are lower than 10%, the sample is large enough to include
sufficient numbers of children in each cell. (Asian children of native-born mothers and Black and
other-race children of immigrant mothers are particularly poorly represented, so results for these
groups must be treated with caution.) In all, approximately 18% of the samples have mothers
born outside the United States. The sample is almost evenly split between boys and girls, and has
been divided into income quintiles. About one-third of the entire sample have participated in at
least one type of art activity, just over half have participated in at least one type of directed
activity, and 37% have participated in at least one cultural activity.
Table 2 shows the unweighted participation rates in arts, directed, and cultural activities by
group. There are major differences in participation between types of activity, and in some cases,
between groups, with minority children and children of immigrants participating at lower levels
than White children and those with native-born parents.
The majority of children across all groups do not participate in any arts activities whatsoever.
Asian children of native-born mothers are the most likely to participate in at least one activity
(25%), followed by White children of native-born mothers (23%). Asian children of both native
and immigrant mothers (22%), Hispanic children of native-born mothers (21%), and other-race
children of immigrant mothers (21%) are almost equally likely to participate in one art activity as
the comparison group of White children of native-born mothers (23%). Black and Hispanic
children of immigrants, however, are considerably less likely on average to participate in arts
activities. For instance, 86% of immigrant Hispanics and 80% of Black immigrants participate in
no art activities, while 71% of native-born Hispanics and 77% of native-born Blacks do so.
Though there is less difference in arts participation between children of immigrants and children
of native-born parents for Black children, the difference by nativity among Hispanics is
pronounced. It is staggering to note that compared to 64% of native-born Whites, 86% of
Hispanic immigrant children do not participate in any art activity. All differences between White
children of native-born mothers and others are significant at the 0.05 level, and most are
significant at the 0.001 level.
Participation in directed activities is similarly stratified. Greater numbers of children
participate on average in at least one activity, but these results are not consistent across groups.
White children of native-born parents are the most likely to participate in at least one activity,
with only 31% taking part in no directed activity at all. Almost half of White children of native-
born parents (47%) are involved in one activity and a sizeable share (22%) take part in two or
E.M. Lee, G. Kao / Poetics 37 (2009) 201–226208

more activities. In other words, two-thirds of all White children of native-born parents participate
in at least one activity. White children of immigrant parents have a slightly lower participation
rate, and a similar pattern exists for all non-White children of native-born parents, though with
lower rates of participation overall. However, for all non-White groups there are (a) fewer
children participating and (b) much greater discrepancies between children of immigrants and
children of native-born parents compared to White children. For Black, Hispanic, and Asian
children, children of native-born parents are considerably more likely to participate in directed
activities, both in likelihood of participating in any single activity and in participating in two or
more. This discrepancy is greatest for Asian and Hispanic children. As with art activities,
Hispanic children fare the worst in terms of participation. As with arts activity participation,
differences between White children of native-born mothers and others are highly significant, all
at the 0.05 level and most at the 0.001 level.
Finally, participation in cultural activities is less uneven across groups. More children across
the board are likely to have participated in at least one type of cultural activity, with Hispanic
children of immigrant mothers lagging behind. Differences between children of immigrants and
children of native-born mothers are less stark or clear-cut: White, Asian, and other-race children
have similar participation rates regardless of mother’s immigration status. In contrast, Black and
Hispanic children have larger discrepancies between immigrant and non-immigrant parents, but
Black children of native-born parents participate at lower rates than those of immigrant mothers,
with 48% likely to engage in no cultural activities.
Overall, non-White children are less likely to participate in the kinds of extracurricular
activities that many researchers argue improve access to future educational successes. Children
E.M. Lee, G. Kao / Poetics 37 (2009) 201–226 209
Table 2
Proportion of youth participating in arts, directed and cultural activities by race-immigrant groups.
Arts activities Directed activities Cultural activities
None One Two+ None One Two+ None One Two+
Native-born White 0.64 0.23 0.12 0.31 0.47 0.22 0.43 0.41 0.16
(0.48) (0.42) (0.33) (0.46) (0.50) (0.41) (0.50) (0.50) (0.37)
Immigrant White 0.66 0.19 0.15 0.40 0.43 0.17 0.40 0.38 0.22
(0.47) (0.40) (0.35) (0.49) (0.50) (0.37) (0.49) (0.49) (0.42)
Native-born Black 0.77 0.16 0.06 0.55 0.33 0.13 0.48 0.37 0.16
(0.42) (0.37) (0.25) (0.50) (0.47) (0.33) (0.50) (0.48) (0.36)
Immigrant Black 0.80 0.15 0.05 0.69 0.22 0.08 0.39 0.45 0.15
(0.40) (0.36) (0.22) (0.46) (0.42) (0.28) (0.49) (0.50) (0.36)
Native-born Hispanic 0.71 0.21 0.09 0.50 0.38 0.12 0.46 0.38 0.16
(0.46) (0.41) (0.28) (0.50) (0.49) (0.32) (0.50) (0.48) (0.37)
Immigrant Hispanic 0.86 0.10 0.04 0.80 0.17 0.03 0.63 0.27 0.10
(0.34) (0.30) (0.19) (0.40) (0.38) (0.17) (0.48) (0.44) (0.30)
Native-born Asian 0.63 0.25 0.12 0.43 0.39 0.17 0.42 0.38 0.20
(0.49) (0.43) (0.33) (0.50) (0.49) (0.38) (0.50) (0.49) (0.41)
Immigrant Asian 0.66 0.22 0.13 0.70 0.25 0.06 0.46 0.35 0.19
(0.48) (0.41) (0.33) (0.46) (0.43) (0.23) (0.50) (0.48) (0.39)
Native-born other 0.70 0.18 0.12 0.47 0.38 0.14 0.51 0.33 0.16
(0.46) (0.38) (0.33) (0.50) (0.49) (0.35) (0.50) (0.47) (0.37)
Immigrant other 0.67 0.21 0.12 0.58 0.31 0.11 0.54 0.28 0.18
(0.47) (0.41) (0.32) (0.50) (0.46) (0.31) (0.50) (0.45) (0.39)
Standard deviations are in parentheses. All participation rate differences between White children of native-born mothers
and others are significant at the 0.05 level.

of immigrants are in most cases even less likely to participate than co-race or ethnic peers whose
mothers were born in the United States. We now turn to analysis of the relative importance of race
and immigration status in the odds of participation.
5. Analytical results
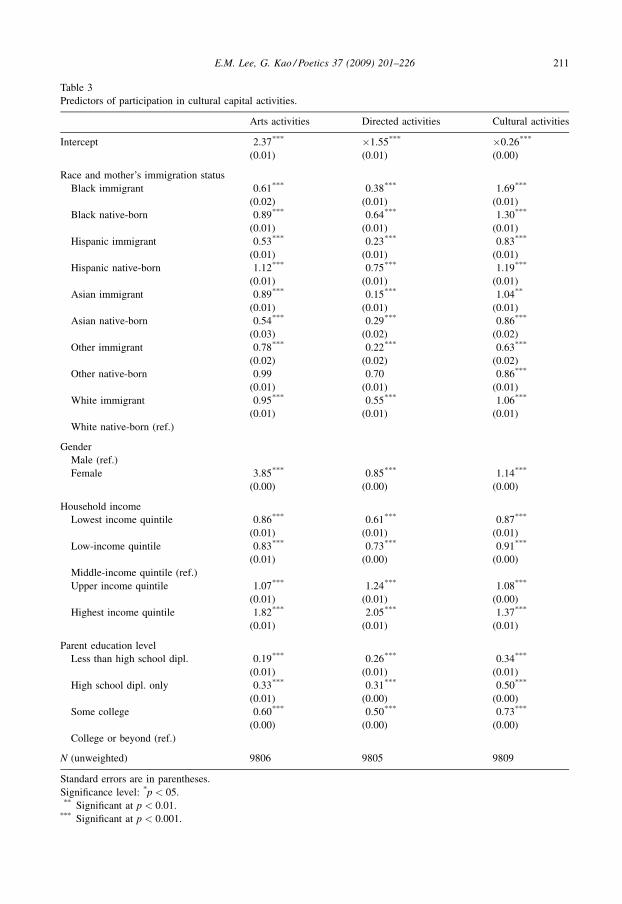
Table 3 shows the results of logistic regression models predicting participation in art and
directed activities based on race/ethnic and immigration variables. For almost all types of
activities, there are pronounced differences in participation rates by mother’s immigration status.
While Hispanic and other-race children of native-born and Asian and other-race children of
immigrant mothers have similar odds of participating in arts activities as White children of
native-born mothers, some children of immigrants have much lower odds than their
corresponding race group or White native-born children. The odds of Black and Hispanic
children with immigrant mothers participating in any art activity are substantially less than those
of White children with native-born mothers (0.61 and 0.53, respectively). This relationship is
reversed for Asian children: children of immigrants have only somewhat lower odds of
participation than the reference group, while children of native-born parents are much less likely
to do so. Children in low-income households and those whose parents have not completed college
have lower odds of participation in arts activities than those in upper income households and
those whose parents have completed college.
The differences in odds of participation in directed activities are more striking and consistent
than those for arts activities. In every race or ethnic category, the odds of immigrants’ children
participating in any directed activity were far lower than their same-race peers of native-born
mothers. For Black, Hispanic, Asian and other-race children the odds of participating in any
directed activity are only 0.15–0.38 those of White children of native-born mothers. In other
words, minority immigrant children are up to six times as likely to not participate in any directed
activity compared to White children of native-born parents. In comparison to their same-race
peers, the odds of participation for children of native-born mothers are one-and-a-half to three
times higher than those of immigrant mothers. As with arts activities, children from low-income
households are considerably less likely and those from upper income households are slightly
more than twice as likely to participate in organized activities, and similar results obtain for
parent education level.
There is less discrepancy by race or immigration status in cultural activity participation.
Black, Asian, and White children of immigrant mothers are more likely than the comparison
group to participate in at least one cultural activity (1.69, 1.04, and 1.06, respectively), as are
Black and Hispanic children of native-born mothers (1.30 and 1.19). Other-race children of
native-born mothers, and Hispanic and Asian children of immigrant mothers are only slightly less
likely to participate, while other-race children of immigrant mothers have by far the lowest odds
of participation (0.63). Race and immigration status thus appear to be weaker predictors of
participation in cultural activities. Odds of participation by household income and parent
education are similar to those in the models for arts and directed activity participation.
Differences between children of immigrants and non-immigrants within race and ethnic
groups are especially important for the discussion at hand. In models not presented here, we used
Black, Hispanic, Asian, and other-race children with native-born mothers as the reference group.
Children of immigrants are considerably less likely to participate in any number of activities than
their peers with native-born mothers, with rare exception (Asian children of immigrants are more
likely to participate in an arts activity than their co-race peers of native-born parents, and Black
E.M. Lee, G. Kao / Poetics 37 (2009) 201–226210
E.M. Lee, G. Kao / Poetics 37 (2009) 201–226 211
Table 3
Predictors of participation in cultural capital activities.
Arts activities Directed activities Cultural activities
Intercept 2.37*** �1.55*** �0.26***
(0.01) (0.01) (0.00)
Race and mother’s immigration status
Black immigrant 0.61*** 0.38*** 1.69***
(0.02) (0.01) (0.01)
Black native-born 0.89*** 0.64*** 1.30***
(0.01) (0.01) (0.01)
Hispanic immigrant 0.53*** 0.23*** 0.83***
(0.01) (0.01) (0.01)
Hispanic native-born 1.12*** 0.75*** 1.19***
(0.01) (0.01) (0.01)
Asian immigrant 0.89*** 0.15*** 1.04**
(0.01) (0.01) (0.01)
Asian native-born 0.54*** 0.29*** 0.86***
(0.03) (0.02) (0.02)
Other immigrant 0.78*** 0.22*** 0.63***
(0.02) (0.02) (0.02)
Other native-born 0.99 0.70 0.86***
(0.01) (0.01) (0.01)
White immigrant 0.95*** 0.55*** 1.06***
(0.01) (0.01) (0.01)
White native-born (ref.)
Gender
Male (ref.)
Female 3.85*** 0.85*** 1.14***
(0.00) (0.00) (0.00)
Household income
Lowest income quintile 0.86*** 0.61*** 0.87***
(0.01) (0.01) (0.01)
Low-income quintile 0.83*** 0.73*** 0.91***
(0.01) (0.00) (0.00)
Middle-income quintile (ref.)
Upper income quintile 1.07*** 1.24*** 1.08***
(0.01) (0.01) (0.00)
Highest income quintile 1.82*** 2.05*** 1.37***
(0.01) (0.01) (0.01)
Parent education level
Less than high school dipl. 0.19*** 0.26*** 0.34***
(0.01) (0.01) (0.01)
High school dipl. only 0.33*** 0.31*** 0.50***
(0.01) (0.00) (0.00)
Some college 0.60*** 0.50*** 0.73***
(0.00) (0.00) (0.00)
College or beyond (ref.)
N (unweighted) 9806 9805 9809
Standard errors are in parentheses.
Significance level: *p < 05.** Significant at p < 0.01.
*** Significant at p < 0.001.

and Asian children of immigrants more likely to participate in a cultural activity than co-race or -
ethnic peers with native-born mothers). Thus, minority immigrant children are particularly
disadvantaged when it comes to participating in directed activities, compared not only White
children but also within race or ethnic categories.
Next, we examine how arts, directed, and cultural activity participation affects teacher
assessments of math and reading ability. Table 4 presents our results for math and reading. Model
1 includes controls for race-immigrant status, gender, highest parent education and household
E.M. Lee, G. Kao / Poetics 37 (2009) 201–226212
Table 4
Coefficients from OLS models predicting teacher assessment of child’s math and reading skills.
Math Reading
Model 1 Model 2 Model 1 Model 2
Intercept 2.38*** 2.37*** 2.02*** 1.97***
(0.03) (0.04) (0.03) (0.03)
Race and mother’s immigration status
Black immigrant 0.01 0.00 �0.16** �0.15*
(0.07) (0.07) (0.06) (0.06)
Black native-born 0.04 0.04 0.00 0.01
(0.03) (0.03) (0.02) (0.02)
Hispanic immigrant �0.05 �0.05 �0.10*** �0.09**
(0.03) (0.03) (0.03) (0.03)
Hispanic native-born �0.06* �0.06* �0.03 �0.02
(0.03) (0.03) (0.02) (0.02)
Asian immigrant �0.04 �0.03 �0.18*** �0.15**
(0.06) (0.06) (0.05) (0.05)
Asian native-born 0.07 0.07 �0.01 0.00
(0.12) (0.12) (0.10) (0.10)
Other immigrant �0.20* �0.19* �0.31*** 0.29***
(0.09) (0.09) (0.08) (0.08)
Other native-born �0.11** �0.10* �0.03 �0.03
(0.04) (0.04) (0.03) (0.03)
White immigrant �0.01 0.03 0.02 0.03
(0.05) (0.05) (0.04) (0.04)
White native-born (ref.)
Gender
Male (ref.)
Female 0.12*** 0.12*** 0.13*** 0.13***
(0.01) (0.02) (0.01) (0.01)
Household income
Lowest income quintile �0.13*** 0.12*** �0.12*** �0.10***
(0.02) (0.03) (0.02) (0.02)
Low-income quintile �0.03 �0.02 0.00 0.01
(0.02) (0.02) (0.02) (0.02)
Middle-income quintile (ref.)
Upper income quintile 0.00 0.01 0.04* 0.04*
(0.02) (0.02) (0.02) (0.02)
Highest income quintile 0.00 �0.01 0.01 0.01
(0.02) (0.03) (0.02) (0.02)
Parent education level
Less than high school dipl. �0.17*** �0.18*** �0.10** �0.09*
(0.04) (0.04) (0.03) (0.03)

income. Model 2 adds cultural capital-building activities to the demographic and test score
variables. To ensure that we are seeing the effect of cultural capital on teacher assessment rather
than simply teacher assessments of actual math and reading performance, we also include
students’ test scores for math and reading in both models. Perhaps students whose parents enroll
them in after-school activities are also those who receive high-test scores, meaning that teachers
are accurate in assessing students’ capacities. This would lend support to a more cognitive model
that argues that gains from such activities simply increase the students’ mental abilities (for
example, arguments that music lessons improve IQ; Schellenberg, 2004).
When we examine race and mother’s immigration status variables in relation to assessment of
math skills as presented in Model 1, it is clear that Hispanic native-born, and other-race immigrant
and native-born children all receive lower teacher assessments than White children of native-born
mothers, after accounting for household income, parent education, and test scores. In addition, girls
are assessed more positively by teachers. Income affects teacher evaluations—students from the
lowest income quintile fare less well than those in the comparison group. Interestingly, this is the
only significant difference between income quintiles, suggesting little if any advantage for children
whose families are in the higher income quintiles. Finally, children whose parents have not
completed high school or who have received only their high school diploma are at a disadvantage in
E.M. Lee, G. Kao / Poetics 37 (2009) 201–226 213
Table 4 (Continued )
Math Reading
Model 1 Model 2 Model 1 Model 2
High school dipl. only �0.07** 0.07** �0.10*** �0.08***
(0.02) (0.02) (0.02) (0.02)
Some college �0.02 �0.02 �0.03 �0.02
(0.02) (0.02) (0.02) (0.02)
College or beyond (ref.)
IRT Test Score 0.04*** 0.04 0.04*** 0.04***
(0.00) (0.00) (0.00) (0.00)
Cultural capital
No art activities (ref.)
One art activity �0.01 �0.01
(0.02) (0.02)
Two+ art activities �0.02 0.02
(0.02) (0.02)
No directed activities (ref.)
One directed activity 0.01 0.05***
(0.02) (0.01)
Two+ directed activities 0.00 0.07**
(0.03) (0.02)
No cultural activities (ref.)
One cultural activity 0.00 0.03*
(0.02) (0.01)
Two+ cultural activities �0.04 0.00
(0.02) (0.02)
Adj. R-squared 0.31 0.32 0.42 0.42
N (unweighted) 9376 8977 9234 8826
Standard errors are in parentheses.* Significant at p < 0.05.
** Significant at p < 0.01.*** Significant at p < 0.001.

assessment, while those who have at least one parent who has completed some college do not show
significant difference from those whose parent has received a college degree.
Our results for reading assessment are similar to those described above, but immigrant
disadvantage relative to their same-race native-born counterparts is more apparent. Other-race
children with immigrant mothers fared the worst, 0.31 points below White children with native-
born mothers. Black, and Hispanic children of immigrant mothers also ranked well below the
reference group, scoring 0.16 and 0.10 points lower respectively than White native-born children.
Asian children of immigrants fared even less well, at 0.18 points below the reference group. Also
as before, income and gender variables have strong effects on teacher evaluations. Girls are
assessed 0.13 points above boys in reading, holding all other factors constant. Lowest income
quintile children are below the comparison group by 0.12, and those in the upper income quintile
are slightly above the reference group. The effect of parent education is also statistically
significant, with children whose parents have not completed any college at a disadvantage.
Model 2 for math and reading adds measures of cultural capital activities (i.e. participation in
arts, directed, and cultural activities). Turning first to math assessments, we see that adding
cultural capital measures affects teacher assessment for students only marginally, and none of the
cultural capital activity measures are themselves significant. There is furthermore little to no
change in the impact of the socio-demographic variables, with only a 0.01 shift in either direction
for any parent education, income quintile, or race and immigration variable. It should also be
noted that the difference between the two scores (i.e. Models 1 and 2) is not significant at the 0.05
level for either math or reading (see Paternoster et al., 1998).
Cultural capital activities are statistically significant in the models for teacher assessments of
reading, however. Participation in art or directed activities increases the teacher’s assessment of a
child’s reading abilities by 0.03 (one cultural activity), 0.05 (one directed activity), 0.07 (two or
more directed activities) points. Both coefficients for directed activities are statistically
significant, as are the coefficients for one cultural activity. Adding these measures to the model
moderates the effect of household income only slightly, reducing from 0.12 to 0.10 the effect of
the lowest income quintile. Similarly, the coefficients for parent education are reduced somewhat
by the inclusion of cultural capital variables. The addition of activity participation also moderates
several of the race–immigration effects somewhat, primarily for Asian and other-race children of
immigrant parents. However, children with immigrant mothers continue to be given lower
evaluations than their peers with native-born mothers, significant across all race-ethnic groups.
These increases in assessment could serve to moderate negative outcomes for children of
immigrants in teacher judgment that remain after accounting for other factors.7 In reading
assessment particularly, children of immigrants appear to be at a disadvantage to their native-born
peers and – especially – to White children of native-born mothers. Black, Hispanic, and particularly
Asian and other-race immigrant children all receive lower teacher assessments for reading ability
after controlling for test scores, household income, parent education, and gender. In math
assessments, immigrant status is less important, with the only significant differences seen in a more
negative assessment for Hispanic native-born and other-race children of immigrant and native-born
parents.
Evaluating the models above, it seems clear that (a) both minority and immigration status are
correlated with lower teacher evaluations, even after accounting for other socio-demographic
E.M. Lee, G. Kao / Poetics 37 (2009) 201–226214
7 It should be noted that in models not shown here, we included a variable for parent language use (i.e. whether parents
speak English or some other language with the child). It was not significant for either math or reading, neither in these
aggregated models nor in subsequent models by ethnic group.

factors and test scores; and (b) participation in cultural capital-building activities can serve to
improve teacher assessment of child ability over and above tested academic ability. We do not yet
know, however, if participation in cultural capital activities matters differently for children of
immigrant parents than for children of native-born parents.
To answer this question, we ran separate models for each race or ethnic group, and included
mother’s immigrant status as an independent variable. We do this to avoid estimating three-way
interactions. Model 1 includes socio-demographic variables only, Model 2 adds cultural capital
activities, and Model 3 adds an interaction term for immigration status by each type of activity.
Looking at Table 5A (math), Model 1, we see that immigration status is not significant for any
E.M. Lee, G. Kao / Poetics 37 (2009) 201–226 215
Table 5A
Coefficients from OLS models predicting teacher assessment of math ability (Whites, Blacks).
White Black
Model 1 Model 2 Model 3 Model 1 Model 2 Model 3
Intercept 2.45*** 2.42*** 2.41*** 2.25*** 2.20*** 2.21***
(0.04) (0.05) (0.05) (0.11) (0.11) (0.12)
Gender
Male (ref.)
Female 0.11*** 0.11*** 0.11*** 0.12** 0.12** 0.12**
(0.02) (0.02) (0.02) (0.04) (0.05) (0.05)
Immigrant status
Child of imm. mother �0.01 0.04 0.06 �0.09 �0.09 �0.12
(0.05) (0.05) (0.09) (0.08) (0.08) (0.16)
Household income
Lowest income �0.11** �0.10** �0.10** �0.11 �0.11 �0.11
(0.03) (0.03) (0.03) (0.07) (0.07) (0.07)
Low income �0.05 �0.04 �0.03 0.14 0.12 0.13
(0.03) (0.03) (0.03) (0.07) (0.08) (0.08)
Middle income (ref.)
Upper income �0.02 �0.01 �0.01 0.13 0.13 0.13
(0.03) (0.03) (0.03) (0.09) (0.09) (0.09)
Highest income 0.00 �0.01 �0.01 �0.05 �0.07 �0.06
(0.03) (0.03) (0.03) (0.10) (0.10) (0.10)
Parent education level
LT high school dipl. �0.19** �0.18** �0.18** �0.18 �0.14 �0.15
(0.06) (0.06) (0.06) (0.10) (0.10) (0.10)
High school dipl. only �0.05 �0.04 �0.04 �0.16* �0.13 �0.14
(0.03) (0.03) (0.03) (0.07) (0.07) (0.08)
Some college �0.02 �0.01 �0.01 �0.09 �0.06 �0.07
(0.02) (0.02) (0.02) (0.06) (0.07) (0.07)
College or beyond (ref.)
IRT Test Score 0.04*** 0.04*** 0.04*** 0.04*** 0.04*** 0.04***
(0.00) (0.00) (0.00) (0.00) (0.00) (0.00)
Cultural capital
No art activities (ref.)
One art activity �0.01 �0.01 0.06 0.05
(0.02) (0.02) (0.06) (0.06)
Two+ art activities 0.03 0.03 �0.14 �0.14
(0.03) (0.03) (0.08) (0.08)

E.M. Lee, G. Kao / Poetics 37 (2009) 201–226216
Table 5A (Continued )
White Black
Model 1 Model 2 Model 3 Model 1 Model 2 Model 3
No directed activities (ref.)
One directed activity 0.01 0.02 0.08 0.08
(0.02) (0.02) (0.05) (0.05)
Two+ directed activities 0.00 0.00 0.08 0.13
(0.03) (0.03) (0.11) (0.12)
No cultural activities (ref.)
One cultural activity 0.04 0.04 0.00 �0.01
(0.02) (0.02) (0.05) (0.05)
Two+ cultural activities �0.05 �0.05 0.04 0.05
(0.03) (0.03) (0.07) (0.07)
Interaction terms
Immigration � one art �0.09 0.08
(0.13) (0.23)
Immigration � two art �0.03 0.05
(0.14) (0.26)
Immigration � one directed �0.10 0.00
(0.10) (0.19)
Immigration � two directed �0.06 �0.33
(0.17) (0.31)
Immigration � one cultural 0.13 0.10
(0.11) (0.18)
Immigration � two cultural �0.02 �0.04
(0.14) (0.23)
Adj. R-squared 0.27 0.28 0.28 0.31 0.30 0.30
N (unweighted) 5996 5696 5696 1010 968 968
Coefficients from OLS models predicting teacher assessment of math ability (Hispanics, Asians and other race)
Hispanic Asian Other
Model
1
Model
2
Model
3
Model
1
Model
2
Model
3
Model
1
Model
2
Model
3
Intercept 2.09*** 2.22*** 2.23*** 2.46*** 2.43*** 2.21*** 2.38*** 2.45*** 2.45***
(0.10) (0.10) (0.11) (0.15) (0.16) (0.19) (0.15) (0.15) (0.16)
Gender
Male (ref.)
Female 0.09* 0.10* 0.10* 0.14* 0.10 0.13 0.17** 0.20*** 0.21***
(0.04) (0.04) (0.04) (0.07) (0.07) (0.07) (0.06) (0.06) (0.06)
Immigrant status
Child of imm. mother 0.04 0.00 0.01 �0.11 �0.09 0.19 �0.13 �0.13 �0.19
(0.04) (0.04) (0.06) (0.08) (0.09) (0.14) (0.08) (0.08) (0.13)
Household income
Lowest income �0.10 �0.11 �0.10 �0.01 0.03 0.03 �0.16 �0.15 �0.14
(0.06) (0.06) (0.06) (0.13) (0.13) (0.13) (0.09) (0.10) (0.10)
Low income �0.08 �0.10 �0.09 0.33** 0.38** 0.33** �0.10 �0.07 �0.07
(0.06) (0.06) (0.06) (0.11) (0.12) (0.11) (0.09) (0.09) (0.09)
Middle income (ref.)
Upper income �0.01 0.02 0.02 0.28** 0.31** 0.32** �0.05 0.00 0.00
(0.07) (0.08) (0.08) (0.10) (0.11) (0.10) (0.11) (0.11) (0.11)
Highest income 0.09 0.11 0.10 0.22* 0.22** 0.21* �0.06 �0.03 �0.03
(0.08) (0.09) (0.09) (0.10) (0.11) (0.11) (0.11) (0.12) (0.12)

E.M. Lee, G. Kao / Poetics 37 (2009) 201–226 217
Table 5A (Continued )
Hispanic Asian Other
Model
1
Model
2
Model
3
Model
1
Model
2
Model
3
Model
1
Model
2
Model
3
Parent education level
LT high school dipl. �0.12 �0.20* �0.21** 0.35* 0.35* 0.35* �0.37** �0.43** �0.43**
(0.08) (0.08) (0.08) (0.16) (0.16) (0.16) (0.13) (0.13) (0.13)
High school dipl. only �0.01 �0.06 �0.08 �0.23 �0.21 �0.14 �0.36*** �0.38*** 0.41***
(0.07) (0.07) (0.07) (0.13) (0.14) (0.14) (0.09) (0.10) (0.10)
Some college 0.01 �0.03 �0.04 0.07 0.06 0.08 �0.16 �0.17 �0.18
(0.06) (0.07) (0.07) (0.09) (0.09) (0.09) (0.08) (0.08) (0.09)
College or beyond (ref.)
IRT Test Score 0.04*** 0.05*** 0.05*** 0.03*** 0.03*** 0.03*** 0.04*** 0.04*** 0.04***
(0.00) (0.00) (0.00) (0.00) (0.00) (0.00) (0.00) (0.00) (0.00)
Cultural capital
No art activities (ref.)
One art activity �0.12* �0.14* 0.10 0.18 0.09 0.15
(0.06) (0.07) (0.09) (0.26) (0.08) (0.09)
Two+ art activities �0.25** �0.22* 0.08 0.36 �0.02 �0.03
(0.08) (0.10) (0.10) (0.21) (0.09) (0.09)
No directed activities (ref.)
One directed activity �0.07 �0.08 �0.01 �0.36* 0.14* 0.15*
(0.05) (0.06) (0.08) (0.16) (0.07) (0.07)
Two+ directed activities �0.01 0.14 0.36 0.18 �0.14 �0.17
(0.09) (0.11) (0.23) (0.31) (0.12) (0.13)
No cultural activities (ref.)
One cultural activity �0.09* �0.12* 0.07 0.55** �0.21** �0.25***
(0.04) (0.06) (0.08) (0.17) (0.06) (0.07)
Two+ cultural activities 0.02 0.12 0.01 0.71** �0.17 �0.22*
(0.06) (0.08) (0.11) (0.25) (0.09) (0.10)
Interaction terms
Immigration � one art 0.01 �0.12 �0.34
(0.12) (0.28) (0.23)
Immigration � two art �0.09 0.37 0.13
(0.16) (0.23) (0.26)
Immigration � one directed 0.09 0.48** �0.08
(0.10) (0.18) (0.20)
Immigration � two directed �0.44* 0.00 0.42
(0.19) (0.47) (0.40)
Immigration � one cultural 0.09 �0.61** 0.22
(0.09) (0.19) (0.18)
Immigration � two cultural �0.23 �0.81** 0.22
(0.13) (0.27) (0.26)
Adj. R-squared 0.31 0.32 0.32 0.28 0.28 0.31 0.36 0.38 0.38
N (unweighted) 1419 1380 1380 408 402 402 543 531 531
Standard errors are in parentheses.* Significant at p < 0.05.
** Significant at p < 0.01.*** Significant at *p < 0.001.

race-ethnic group. The effects of income quintile are inconsistent, with lowest income quintile
reducing teacher assessment for White children, and highest and middle-income quintiles (both
lower and upper) showing significant, strong positive effects for Asian students. For all other
groups, however, there are no significant effects. Parent education level is significant across
groups, with a particularly strong effect for Asian and other-race children. Further, using the
method suggested by Paternoster et al. (1998), only the differences between White and Hispanic
children’s assessment scores are significant at the 0.05 level.
The effect of cultural capital variables in the math model is also quite inconsistent, and
somewhat surprising. In contrast to the models for reading (below), the addition of these variables
does not impact teacher assessment of children from White native-born families. They also do
not seem to benefit Black or Asian children. Hispanic children, however, seem to reap potentially
negative effects from participation, while other-race children see improved assessments from
participation in a single art or directed activity, but negative results from participating in one
cultural activity. Adding cultural capital variables also heightens the effects of income for Asian
children whose households are in the middle income. For White children, the effect of lowest
household income remains significant and virtually unchanged. Likewise, income effects for
other race-ethnic groups remain non-significant. Finally, in this model none of the assessment
scores are significantly different from White children’s.
Not surprisingly, there are few great shifts in Model 3. As in Model 2, none of the assessment
scores for non-White children are significantly different from those of White children. For White,
Black, Hispanic, and other-race children, there are only marginal if any changes in the
coefficients for cultural capital activities or immigration, and none of the interaction terms are
significant. For Asian children, the addition of interaction terms renders several cultural capital
coefficients significant (one directed activity, and one or two cultural activities). Correspond-
ingly, the interaction terms for these activities are also significant and counteract the effects (both
positive and negative) of participation. Thus, while participation in one and two cultural activities
are 0.55 and 0.71, respectively, the interaction terms for immigration and these activities are
�0.61 and �0.81, respectively, while one directed activity is �0.36 and the corresponding
interaction term is 0.48.
Turning to teacher assessments in reading (Table 5B, Model 1), we see very different results.
Every group but other-race children’s scores are significantly different from White children’s at
E.M. Lee, G. Kao / Poetics 37 (2009) 201–226218
Table 5B
Coefficients from OLS models predicting teacher assessment of reading ability (Whites, Blacks).
White Black
Model 1 Model 2 Model 3 Model 1 Model 2 Model 3
Intercept 2.08*** 2.02*** 2.02*** 1.74*** 1.65*** 1.66***
(0.03) (0.04) (0.04) (0.09) (0.09) (0.09)
Gender
Male (ref.)
Female 0.12*** 0.11*** 0.11*** 0.18*** 0.16*** 0.16***
(0.02) (0.02) (0.02) (0.03) (0.04) (0.04)
Immigrant status
Child of imm. mother 0.02 0.03 �0.02 �0.19** �0.20** �0.08
(0.04) (0.04) (0.07) (0.06) (0.06) (0.12)

E.M. Lee, G. Kao / Poetics 37 (2009) 201–226 219
Table 5B (Continued )
White Black
Model 1 Model 2 Model 3 Model 1 Model 2 Model 3
Household income
Lowest income �0.13*** 0.11*** 0.11*** �0.09 �0.10 �0.10
(0.03) (0.03) (0.03) (0.06) (0.06) (0.06)
Low income �0.02 �0.01 �0.01 0.10 0.07 0.06
(0.02) (0.03) (0.03) (0.06) (0.06) (0.06)
Middle income (ref.)
Upper income 0.04 0.04 0.04 0.05 0.03 0.01
(0.02) (0.02) (0.02) (0.07) (0.07) (0.07)
Highest income 0.00 0.01 0.01 �0.05 �0.15 �0.15
(0.02) (0.03) (0.03) (0.08) (0.08) (0.08)
Parent education level
LT high school dipl. 0.21*** 0.17*** 0.17*** �0.06 �0.02 �0.04
(0.05) (0.05) (0.05) (0.08) (0.08) (0.08)
High school dipl. only �0.09*** �0.07** �0.07** �0.07 �0.02 �0.04
(0.02) (0.03) (0.03) (0.06) (0.06) (0.06)
Some college �0.03 �0.02 �0.02 �0.06 �0.04 �0.05
(0.02) (0.02) (0.02) (0.05) (0.05) (0.05)
College or beyond (ref.)
IRT Test Score 0.03*** 0.03*** 0.03*** 0.04*** 0.04*** 0.04***
(0.00) (0.00) (0.00) (0.00) (0.00) (0.00)
Cultural capital
No art activities (ref.)
One art activity 0.00 �0.01 0.01 �0.01
(0.02) (0.02) (0.04) (0.05)
Two+ art activities 0.04 0.04 �0.02 �0.03
(0.03) (0.03) (0.06) (0.06)
No directed activities (ref.)
One directed activity 0.05* 0.05* 0.02 0.04
(0.02) (0.02) (0.04) (0.04)
Two+ directed activities 0.07* 0.07* 0.18* 0.24**
(0.03) (0.03) (0.09) (0.09)
No cultural activities (ref.)
One cultural activity 0.05* 0.05* 0.11** 0.12**
(0.02) (0.02) (0.04) (0.04)
Two+ cultural activities �0.03 �0.03 0.11* 0.09**
(0.02) (0.02) (0.05) (0.05)
Interaction terms
Immigration � one art 0.12 0.18
(0.11) (0.18)
Immigration � two art �0.02 0.07
(0.12) (0.20)
Immigration � one directed 0.00 �0.26
(0.09) (0.14)
Immigration � two directed �0.12 �0.42
(0.14) (0.24)
Immigration � one cultural 0.12 �0.15
(0.10) (0.14)
Immigration � two cultural �0.03 0.12
(0.12) (0.18)

E.M. Lee, G. Kao / Poetics 37 (2009) 201–226220
Table 5B (Continued )
White Black
Model 1 Model 2 Model 3 Model 1 Model 2 Model 3
Adj. R-squared 0.40 0.40 0.40 0.48 0.48 0.48
N (unweighted) 6069 5763 5763 1022 978 978
Coefficients from OLS models predicting teacher assessment of reading ability (Hispanics, Asians, and other race)
Hispanic Asian Other
Model
1
Model
2
Model
3
Model
1
Model
2
Model
3
Model
1
Model
2
Model
3
Intercept 1.66*** 1.67*** 1.70*** 2.37*** 2.30*** 2.43*** 2.15*** 2.09*** 2.10***
(0.09) (0.10) (0.10) (0.13) (0.13) (0.17) (0.13) (0.13) (0.14)
Gender
Male (ref.)
Female 0.08* 0.09* 0.09* 0.20** 0.18** 0.19** 0.27*** 0.29*** 0.29***
(0.04) (0.04) (0.04) (0.06) (0.07) (0.07) (0.05) (0.05) (0.05)
Immigrant status
Child of imm. mother �0.08* �0.09* �0.13* �0.08 �0.06 �0.17 0.26***�0.25** �0.29**
(0.04) (0.04) (0.06) (0.08) (0.08) (0.13) (0.07) (0.08) (0.11)
Household income
Lowest income �0.08 �0.08 �0.07 0.01 0.07 0.05 �0.02 0.04 0.04
(0.06) (0.06) (0.06) (0.12) (0.12) (0.12) (0.08) (0.08) (0.08)
Low income �0.02 �0.01 �0.01 0.25* 0.35** 0.32** 0.09 0.14 0.14
(0.06) (0.06) (0.06) (0.10) (0.10) (0.10) (0.08) (0.08) (0.08)
Middle income (ref.)
Upper income 0.02 0.04 0.03 0.24* 0.26** 0.26** �0.10 �0.04 �0.04
(0.06) (0.07) (0.07) (0.10) (0.10) (0.09) (0.09) (0.10) (0.10)
Highest income 0.09 0.09 0.06 0.30** 0.26** 0.23* 0.01 0.04 0.03
(0.07) (0.07) (0.07) (0.09) (0.10) (0.10) (0.10) (0.10) (0.10)
Parent education level
LT high school dipl. 0.07 0.04 0.04 �0.07 �0.10 �0.08 �0.33** �0.39** �0.39***
(0.07) (0.08) (0.08) (0.15) (0.15) (0.15) (0.12) (0.12) (0.12)
High school dipl. only �0.03 �0.04 �0.06 �0.28* �0.26* �0.25* �0.37***�0.39***�0.40***
(0.06) (0.06) (0.06) (0.12) (0.12) (0.12) (0.08) (0.08) (0.08)
Some college 0.02 0.01 �0.01 0.03 0.02 0.02 �0.17* �0.16* �0.16*
(0.06) (0.06) (0.06) (0.08) (0.08) (0.08) (0.07) (0.07) (0.08)
College or beyond (ref.)
IRT Test Score 0.04*** 0.04*** 0.04*** 0.02*** 0.02*** 0.02*** 0.03*** 0.03*** 0.03***
(0.00) (0.00) (0.00) (0.00) (0.00) (0.00) (0.00) (0.00) (0.00)
Cultural capital
No art activities (ref.)
One art activity �0.12* �0.15* 0.18* �0.26 0.17* 0.19*
(0.05) (0.06) (0.08) (0.24) (0.07) (0.08)
Two+ art activities �0.04 0.10 0.15 0.31 0.00 0.02
(0.07) (0.08) (0.09) (0.19) (0.08) (0.08)
No directed activities (ref.)
One directed activity 0.05 0.03 0.07 �0.25 0.17** 0.16**
(0.04) (0.05) (0.07) (0.15) (0.06) (0.06)
Two+ directed activities 0.12 0.25** 0.34 0.30 �0.15 �0.20
(0.08) (0.09) (0.21) (0.28) (0.10) (0.11)

the 0.05 level. Immigration status has a varied impact across the race and ethnic groups. For
White and Asian children, the term is not significant, indicating no difference between White
children of native-born and immigrant mothers. For Black, Hispanic, and other-race children,
however, the immigration term is significant and negative, indicating that children of immigrants
fare worse in teachers’ assessments of reading ability than children with native-born mothers,
even controlling for academic ability as measured by IRT scores. Compared to their same-race
peers with native-born mothers, other-race children of immigrant mothers fare the worst (�0.26),
while Hispanic children fare the best (�0.08). Strikingly, family income is significant for White
and Asian children, but not for Black, Hispanic, and other-race children. For Whites, the lowest
income quintile is significant and negative, while for Asian children, there is a positive and
significant coefficient for the two middle and the highest income quintiles. Parent education level
is significant only for White, Asian and other-race children, but for Asian children it is only
significant for children whose parents have a high school diploma only while for White and other-
race children it is significant for those who have and have not completed high school.
The effects of immigration status remain in place once cultural capital activities are added
(Table 5B, Model 2). As in the first model, all but other-race children’s scores are significantly
different from White children’s. Black, Hispanic, and other-race children of immigrant mothers
continue to suffer in terms of teacher assessment—the figures and significance levels are virtually
unchanged. We also see that several kinds of cultural capital activity are significant for White
children of native-born parents—participation in any level of directed activity is positive and
E.M. Lee, G. Kao / Poetics 37 (2009) 201–226 221
Table 5B (Continued )
Hispanic Asian Other
Model
1
Model
2
Model
3
Model
1
Model
2
Model
3
Model
1
Model
2
Model
3
No cultural activities (ref.)
One cultural activity �0.05 �0.11* 0.04 0.01 �0.18** �0.18**
(0.04) (0.05) (0.07) (0.15) (0.06) (0.06)
Two+ cultural activities 0.09 0.13 0.01 0.44 �0.18* �0.20*
(0.06) (0.07) (0.09) (0.23) (0.08) (0.08)
Interaction terms
Immigration � one art 0.08 0.48 �0.15
(0.11) (0.25) (0.20)
Immigration � two art �0.42** �0.19 �0.09
(0.14) (0.21) (0.23)
Immigration � one directed 0.14 0.42* 0.08
(0.09) (0.17) (0.18)
Immigration � two directed �0.46** 0.06 0.54
(0.17) (0.43) (0.35)
Immigration � one cultural 0.20* 0.02 0.06
(0.08) (0.17) (0.16)
Immigration � two cultural �0.07 �0.49* 0.12
(0.12) (0.25) (0.23)
Adj. R-squared 0.42 0.43 0.45 0.34 0.36 0.37 0.42 0.45 0.44
N (unweighted) 1184 1145 1145 411 404 404 548 536 536
Standard errors are in parentheses.* Significant at p < 0.05.
** Significant at p < 0.01.*** Significant at p < 0.001.

significant, as is participation in one cultural activity. Participation in arts activities, however, is
not significant. The addition of cultural capital to the model reduces the effect of parent education
and income disadvantages somewhat (from �0.13 to �0.11 for the lowest income quintile, and
�0.21 and �0.09 for less than high school and high school only respectively to �0.17 and
�0.07).
The results are very similar for Black children, for whom participation in two or more directed
and any cultural activities is positive and significant (there were no significant effects in
household income or parent education in the first model, and these remain non-significant in the
second model but are similarly reduced in magnitude). For each other group, however, the effect
of including cultural capital measures is less consistent. Asian and other-race children both see
positive significant effects for participation in one arts activity, and other-race children also see
positive significant results for participation in one directed activity. For Hispanic children,
however, participation in a single arts activity – the only significant effect– results in a lowered
teacher assessment. Similarly, for other-race children, participation in any cultural activity results
in a lowered assessment. Each of these is considerably larger than the effect for White children,
which is significant but only 0.05, while each significant effect for non-White children is greater
than 0.10 (whether positive or negative). Inclusion of these variables also slightly increases the
immigration coefficient for Black and Hispanic children, but reduces it somewhat for other-race
children. Finally, the addition of cultural capital measures to the model impacts the effect of
household income and parent education for Asian and other-race children. For other-race
children, parent education effects are somewhat increased (with the exception of those whose
parents had some college). For Asian children, parent education effects are somewhat reduced,
while lower household income quintile effects are heightened and highest income quintile effects
are reduced.
When the interaction terms for cultural capital and mother’s immigration status are added, we
see that there is virtually no difference for White children. No interaction terms are significant,
and the cultural capital activities remain unchanged. White children thus appear to benefit from
cultural capital activities regardless of mother’s immigration status. Similarly, the interaction
terms for Black and other-race children are not significant (though it is notable that the inclusion
of the interaction terms renders the immigration term no longer significant for Black children). In
each case, the effects and significance levels of cultural capital and immigration coefficients
remain largely the same, with the exception of an increase in magnitude for Black children
participating in two or more directed activities (0.18 in Model 2 and 0.24 in Model 3). Again, this
suggests that these students do not see any effect of cultural capital participation that varies
dependent on mother’s immigration status.
For Hispanic and Asian students, however, we do see significant interaction effects. For
Hispanic children, two additional cultural capital activities become significant when the
interaction between immigration and cultural capital is added—two or more directed activities
(0.25) and one cultural activity (�0.11). Furthermore, three of the interaction terms are
significant: two or more art activities (�0.42), two or more directed activities (�0.46), and one
cultural activity (0.20). This indicates that, indeed, Hispanic children of immigrant mothers
obtain different outcomes for cultural capital participation, distinct even from Hispanic children
whose mothers are US-born. The case is somewhat less clear for Asian children. Although the
immigration and cultural capital variables are not significant (even single art activities, which is
significant in Model 2), two of the interaction terms are significant at the 0.05 level (one directed
and two cultural), suggesting that there may be an interaction effect. As in Model 2, the only
group whose scores are not significantly different from White children’s is other race.
E.M. Lee, G. Kao / Poetics 37 (2009) 201–226222

6. Discussion and conclusion
Although scholars have previously theorized about the forms of immigrant group-specific
social capital that may support school achievement, there has been little discussion of immigrant
use of broadly recognized forms of cultural capital. Since cultural capital must be ‘‘widely
shared’’ (Lamont and Lareau, 1988) to be effective, one might argue that children of immigrants
would be at a disadvantage because their parents would be less likely to know what forms of
cultural capital would be helpful and how to provide such ‘‘cultivation’’ (Lareau, 2002) for their
children. Indeed, the data presented here show that children of immigrant mothers are much less
likely to participate in arts, directed, or cultural activities. Teachers give higher reading
assessments to students who participate in directed and cultural activities, even after controlling
for the effects of parent education, household income, and academic ability, indicating that
cultural capital is associated with educational attainment. Further, these results vary both within
race-ethnic groups and across them, indicating that cultural capital effects are inconsistent by
race or ethnic group. Generally, non-White children and children of immigrants are assessed less
well than White children. Cultural capital participation appears to have a positive and significant
effect for White children’s reading assessment. For non-White children, this is less consistent,
and does not ameliorate disadvantages to immigration status where they exist. Moreover, in the
cases of Hispanic and Asian children of immigrants, there indeed appears to be less benefit to
participation in several cultural capital activities (with the exception of Asian children of
immigrants participating in a single directed activity, which boosts both math and reading
assessments). It must also be noted that in some cases, non-White children appear to be assessed
less well by teachers in both math and reading when participating in cultural capital activities. It
is also notable that Asian children’s assessments for reading (see Table 4) are among the worst,
even after considering parent income and education (i.e. worse than both Black and Hispanic
children), and remain lower than the reference group even once cultural capital activities are
considered (tied with Black children of immigrants, and faring worse than Hispanic children of
immigrants). Indeed, the coefficients for immigration–activity interaction terms for Asian
children are particularly strong.
Clearly, this picture does not match that of the later attainment of Asian Americans who
outpace White peers in high school and in college. Similarly, some studies have found that
some immigrant Black populations have higher educational achievement than native-born
Black children and adolescents (Kasinitz et al., 2004, cited in Waters and Jimenez, 2005). It is
beyond the scope of this paper to speculate what changes over the ensuing school years, but we do
see several possibilities. First, participation in extracurricular activities at greater rates in later
years may allow these adolescents to reap benefits in middle- or high school. Second, access to
other forms of capital (such as social capital as discussed above) may balance lack of
participation to such an extent as to render it moot. Third, it is possible that Asian Americans
benefit from the ‘‘model minority myth’’ in teacher assessment: teachers may attribute positive
behavioral and academic traits to Asian children regardless of extracurricular participation
(Morris, 2005).
While participation in arts, directed, and cultural activities is correlated, each of these is at
times associated with higher teacher evaluations of children’s math and reading ability, with
stronger results for reading assessment. However, our evidence also suggests that directed
activities have a more consistently positive effects than cultural or arts activities. This finding is
consistent with both Lareau’s (2000) and Kaufman and Gabler’s (2004) emphasis on the
interactional nature of cultural capital—to be valuable, cultural capital must be applied, and it
E.M. Lee, G. Kao / Poetics 37 (2009) 201–226 223

must be applied through interaction with the gatekeeper (i.e. the teacher). Thus, activities that
teach children interactional skills would be more likely to boost teacher assessment than those
providing knowledge not necessarily valued in the early years of school, such as drawing or
dance, or experiences for which there may be little outlet for communication, such as visits to a
museum or concert.
We also find that teachers’ subjective evaluations of reading ability of Black, Hispanic, and
Asian immigrant children are more negative even after controlling for SES and children’s test
scores.
These findings suggest that classroom interactions may help to explain discrepancies in
attainment across groups. Although many teacher assessments of a child’s ability are based on
test scores and similar ‘objective’ measures, some portion of a child’s grades are based on ‘‘non-
cognitive’’ factors (Farkas et al., 1990). A number of scholars have suggested that these
subjective measures are formed in student–teacher interactions in the classroom. For example,
Lin et al. (2003) indicate that kindergarten teachers find social aspects of learning, such as ‘‘tells
wants and thoughts, . . . not disruptive of the class, . . . follows directions, . . . and takes turns and
shares,’’ (2003, p. 233) at least as important as academic learning. Farkas et al. (1990) find that
differences in grades across race and ethnic lines may be accounted for by teacher perceptions of
students’ ‘‘work habits’’ (p. 140). They write that ‘‘. . . teacher judgments of student non-
cognitive characteristics are powerful determinants of course grades, even when student
cognitive performance is controlled’’ (p. 140)—in short, regardless of student academic ability as
measured by test scores, teacher assessments are influenced by students’ socio-demographic
characteristics. These studies attest to the importance of classroom interactions, and it is in
precisely these kinds of classroom interactions where children can leverage their own cultural
capital. Although we cannot directly evaluate the importance of the operationalization of cultural
capital in the classroom, our findings support this line of reasoning.
This study has several limitations that make broad extrapolation difficult. First, parents are
asked whether the child has ‘‘ever’’ participated in an activity—we cannot differentiate children
who go to scouts every week from those who have only attended once. We also cannot tell if
interactions with pre-kindergarten caregivers may have affected both extracurricular
participation and math and reading skills. For instance, Magnuson and Waldfogel (2005; see
also Magnuson et al., 2006) find that children from different race backgrounds and immigration
backgrounds receive differing types and quality of pre-K instruction and care—a point well-
worth consideration but beyond the scope of this paper. It is possible that children begin to learn
crucial interactional skills at this very early stage. It is also possible that the length of time lived in
the United States or the child’s own immigration status (i.e. born in the US or abroad) may have
an impact. However, given the already small number of immigrants included in this data set,
further subdivision would make at least some cell sizes too small for adequate analysis.
In sum, we show that participation in cultural capital-building activities varies between White
and minority children, and particularly between children of immigrants and children of native-
born parents, even within racial and ethnic groups. Participation in these activities, and especially
in directed activities that involve high levels of interaction with others, has a strong but
inconsistent impact on teacher evaluations of students’ reading skills, and little positive impact on
assessment of math skills (with the exception of other-race children). None of these differences
can be accounted for entirely by household income, parent education, gender, or students’ tested
academic abilities, suggesting that parent’s immigration status is an important factor in children’s
early school trajectories. Moreover, the effect of cultural capital acquisition varies not only by the
type of activity and arena of assessment (math vs. reading), but also varies by race and ethnic
E.M. Lee, G. Kao / Poetics 37 (2009) 201–226224

group. Moreover, non-White children sometimes see negative effects from participation. Finally,
Asian and Hispanic children of immigrant mothers see additional effects specific to immigration
status for both math and reading assessments. These are almost entirely negative, and in most
cases they counteract any benefits gained by participation in cultural capital activities. Our
findings thus point to yet another mechanism that accounts for the differential educational
experiences of minority and immigrant students: kindergarten teacher evaluations are affected by
children’s extracurricular activities, in which minority and immigrant students are less likely to
participate.
Acknowledgements
The authors gratefully acknowledge support from Russell Sage Foundation, the Spencer
Foundation, and the National Science Foundation. We also thank Kristin Turney, Elizabeth
Vaquera, and two anonymous Poetics reviewers. Finally, we thank Frances Woo and Melissa
Gradilla for clerical assistance.
References
Alexander, Karl, Entwisle, Doris R., Dauber, Susan L., 1993. First-grade classroom behavior: its short- and long-term
consequences for school performance. Child Development 64 (3), 801–814.
Bourdieu, Pierre, 1978. Sport and social class. Social Science Information 17 (6), 819–840.
Bourdieu, Pierre, Passeron, J.C., 1977. Reproduction in Education, Society, and Culture. Sage, London.
Carter, Prudence, 2003. ‘‘Black’’ cultural capital, status positioning, and schooling conflicts for low-income African
American youth. Social Problems 50 (1), 136–155.
DiMaggio, Paul, 1982. Cultural capital and school success: the impact of status culture participation on grades of U.S.
high school students. American Sociological Review 47 (2), 189–201.
Dumais, Susan, 2006a. Early childhood cultural capital, parental habitus, and teachers’ perceptions. Poetics 34, 83–107.
Dumais, Susan, 2006b. Elementary school students’ extracurricular activities: the effects of participation on achievement
and teachers’ evaluations. Sociological Spectrum 26, 117–147.
Entwisle, Doris, Alexander, Karl L., 1993. Entry into school: the beginning school transition and educational stratification
in the United States. Annual Review of Sociology 19, 401–423.
Farkas, George, Grobe, Robert P., Sheehan, Daniel, Shuan, Yuan, 1990. Cultural resources and school success: gender,
ethnicity, and poverty groups within an urban school district. American Sociological Review 55 (1), 127–142.
Fuligni, Andrew J., 1997. The academic achievement of adolescents from immigrant families: the roles of family
background, attitudes, and behavior. Child Development 68 (2), 351–363.
Gabler, Jay, Kaufman, Jason, 2006. Chess, cheerleading, chopin: what gets you into college? Contexts 5 (2) pp. 45–39.
Glick, Jennifer, Hohmann-Marriott, Bryndl, 2007. Academic performance of young children in immigrant families: the
significance of race, ethnicity, and national origins. International Migration Review 41 (2), 371–402.
Kalmijn, Mattijs, Kraaykamp, Gerbert, 1996. Race, cultural capital, and schooling: an analysis of trends in the United
States. Sociology of Education 69 (1), 22–34.
Kao, Grace, Tienda, Marta, 1995. Optimism and achievement: the educational performance of immigrant youth. Social
Science Quarterly 76, 1–19.
Kao, Grace, Thompson, Jennifer S., 2003. Racial and ethnic stratification in educational achievement and attainment.
Annual Review of Sociology 29, 417–442.
Kaufman, Jason, Gabler, Jay, 2004. Cultural capital and the extracurricular activities of girls and boys in the college
attainment process. Poetics 32, 145–168.
Lamont, Michelle, Lareau, Annette, 1988. Cultural capital: allusions, gaps, and glissandos in recent theoretical
developments. Sociological Theory 6 (2), 153–168.
Lareau, Annette, 2002. Invisible inequalities: social class and childrearing in Black families and White families.
American Sociological Review 67 (5), 747–776.
Lareau, Annette, 2000. Home Advantage: Social Class and Parental Intervention in Elementary Education. Rowman &
Littlefield Publishers, Lanham, MD.
E.M. Lee, G. Kao / Poetics 37 (2009) 201–226 225

Lareau, Annette, Weininger, Elliot B., 2003. Cultural capital in education research: a critical assessment. Theory and
Society 32, 567–606.
Lin, Huey-Ling, Lawrence, Frank R., Gorrell, Jeffrey, 2003. Kindergarten teachers’ views of children’s readiness for
school. Early Childhood Research Quarterly 18, 225–237.
Magnusun, Katherine A., Waldfogel, Jane, 2005. Early childhood care and education: effects on ethnic and race gaps in
school readiness. The Future of Children 15 (1), 169–196.
Magnuson, Katherine, Lahaie, Claudia, Waldfogel, Jane, 2006. Preschool and school readiness of children of immigrants.
Social Science Quarterly 87 (s1), 1241–1262.
Morris, Edward, 2005. ‘Tuck in that Shirt!’ Race, class, gender, and discipline in an urban school Sociological
Perspectives 48 (1), 25–48.
O’Hare, W., 2004. Trends in the Well-Being of America’s Children. Population Reference Bureau, Washington, DC.
Paternoster, Raymond, Brame, Robert, Mazerolle, Paul, Piquero, Alexis, 1998. Using the correct statistical test for the
equality of regression coefficients. Criminology 36 (4), 859–866.
Perreira, Krista, Harris, Kathleen Mullan, Lee, Dohoon, 2006. Making it in America: high school completion by
immigrant and native youth. Demography 43 (3), 511–536.
Portes, Alejandro, MacLeod, Dac, 1999. Educating the second generation: determinants of academic achievement among
children of immigrants in the United States. Journal of Ethnic and Migration Studies 25 (3), 373–396.
Roscigno, Vincent, Ainsworth-Darnell, James W., 1999. Race, cultural capital, and educational resources: persistent
inequalities and achievement returns. Sociology of Education 72 (3), 158–178.
Schellenberg, E. Glenn, 2004. Music lessons enhance IQ. Psychological Science 15 (8), 511–514.
Tourangeau, K., Nord, Christine, Le., Thanh, Pollack, Judith M., Atkins-Burnett, Sally, 2006. Early Childhood Long-
itudinal Study, Kindergarten Class of 1998–99 (ECLS-K), Combined User’s Manual for the ECLS-K Fifth-Grade
Data Files and Electronic Codebooks (NCES 2006-032). U.S. Department of Education. National Center for
Education Statistics, Washington, DC.
Waters, Mary C., Jimenez, Tomas R., 2005. Assessing immigrant assimilation: new empirical and theoretical challenges.
Annual Review of Sociology 31, 105–125.
Warde, Alan, 2006. Cultural capital and the place of sport. Cultural Trends 15 (2/3), 107–122.
Zhou, Min, 1997a. Growing up American: the challenge confronting immigrant children and children of immigrants.
Annual Review of Sociology 23, 63–95.
Zhou, Min, 1997b. Segmented assimilation: issues, controversies, and recent research on the new second generation.
International Migration Review 31 (4), 975–1008 (special issue).
Elizabeth M. Lee is a graduate student at University of Pennsylvania’s department of sociology. Her research focuses
both on early academic outcomes and on college life. Her dissertation is a qualitative study of low- and middle-income
students at elite colleges. She is the recipient of a National Science Foundation Graduate Research Fellowship.
Grace Kao is Professor of Sociology and Education at University of Pennsylvania, where she has taught for 12 years. She
received her Ph.D. from The University of Chicago. Her research focuses on race, ethnic, and immigrant differences in
educational outcomes among youth. In addition, she has examined interracial romance and friendship among youth. She
currently serves on the editorial boards of Social Science Research, Social Psychology Quarterly and Social Science
Quarterly. She is Past Board Member of the Association of Asian American Studies and currently serves as a board
member of the Population Association of America. Her research has been supported by NICHD, The Spencer Foundation
and the Russell Sage Foundation.
E.M. Lee, G. Kao / Poetics 37 (2009) 201–226226