Colgate-Palmolive (India) - Nirmal Bang
20
-
Upload
khangminh22 -
Category
Documents
-
view
2 -
download
0
Transcript of Colgate-Palmolive (India) - Nirmal Bang


Please refer to the disclaimer towards the end of the document.
Institutional Equities
Init
iati
ng
Co
vera
ge
Reuters: COLG.BO; Bloomberg: CLGT IN
Colgate-Palmolive (India)
A Reason To Smile While competitive intensity will be high for Colgate-Palmolive (India), or CPIL, in the next couple of quarters, we believe the street fears on further escalation in advertising and promotional (A&P) spending are unlikely to come true. A&P is likely to increase 38% YoY and ~340bps to sales in FY14E over an already high base, resulting in a seven-year low EBITDA margin of 17.5% for the year. In the past 16 years, the A&P to sales ratio has never been higher for CPIL, when not accompanied by sales decline. While absolute A&P expenditure is still expected to grow in double-digits over FY14E-FY16E, we expect the A&P to sales ratio to decline, unlike the Bloomberg consensus view. If CPIL maintains its phenomenal performance of rising market share as well as volume growth, which was witnessed in the past two quarters, despite extreme competition, earnings growth will be sharp. We expect EBITDA margin recovery of ~500bps over FY14E-FY16E from sustained premiumisation, operating leverage due to healthy sales growth and a decline in the A&P to sales ratio. Our EPS forecast is higher than Bloomberg Consensus by 4.7% for FY15E and 15.6% for FY16E. Strong track record, entry barriers: CPIL’s volume growth at close to double-digit YoY for 23 consecutive quarters is not only unparalleled among fast moving consumer goods (FMCG) peers, but it is also sustaining this level, which is remarkable given the sharp slowdown witnessed by FMCG peers. Volume growth is led by strong rural toothpaste demand (low rural penetration of 63%, as per IMRB), CPIL’s rapidly increasing rural reach (the plan to double rural reach in three years is already underway), its dominance at the lower end (market share higher than its overall 56% toothpaste market share), unmatched category development efforts in schools and villages, and the ongoing shift in consumer preference from toothpowder to toothpaste. Other entry barriers are brand power, category development efforts, dedicated focus, and track record in emerging markets. Category premiumisation: The premium segment, which accounts for 11% of CPIL’s sales, is outpacing the growth in overall oral care market. As the average selling price is over 2x the base product, the impact on realization growth and gross margin is tremendous. Healthy volume growth has also emboldened the management to go for relatively higher-than-average price hikes in the past two years, or around 5% annually. A&P spending to sales: The rise in A&P spending to a 12-year high, at 18.9% of sales, in FY14E for CPIL is because of: (1) Launch of Oral-B toothpaste by P&G, (2) Sharp spike in A&P spending by Hindustan Unilever (HUL) in the oral care segment, and (3) Spate of new product launches by CPIL (Colgate Visible White and Colgate Active Salt toothpastes, and Colgate Slim Soft toothbrush). HUL with its 4% overall volume growth, will not be able to go for disproportionately high A&P spending in oral care, which constitutes only ~6% of its total sales. The spate of new launches is unlikely to be repeated and P&G’s A&P spending in oral care so far in FY14E, despite aggression in the wake of Oral-B toothpaste launch, is less than a third of CPIL’s A&P spending. Valuation: CPIL’s valuation at 29.8xFY15E earnings and at 23.5xFY16E earnings is attractive, particularly when strong EPS growth of 65% likely over the next two years is accompanied by high RoE and RoCE of ~90% each and a dividend yield of around 3%. Target valuation at 30xFY16E earnings gives a TP of Rs1,691, up 28% from the CMP.
BUY
Sector: FMCG
CMP: Rs1,324
Target price: Rs1,691
Upside: 28%
Krishnan Sambamoorthy [email protected] +91-22-3926 8033
Saiprasad Prabhu [email protected] +91-22-3926 8172
Key Data
Current Shares O/S (mn) 136.0
Mkt Cap (Rsbn/US$bn) 180.1/2.9
52 Wk H / L (Rs) 1,557/1,190
Daily Vol. (3M NSE Avg.) 77,200
Share holding (%) 1QFY14 2QFY14 3QFY14
Promoter 51.0 51.0 51.0
FII 21.6 20.1 20.4
DII 5.6 6.6 6.5
Corporate 1.2 1.5 1.5
General Public 20.6 20.7 20.7
One-Year Indexed Stock Performance
Price Performance (%)
1 M 6 M 1 Yr
Colgate-Palmolive (I) 0.1 7.6 (2.3)
Nifty Index 6.0 12.7 10.0
Source: Bloomberg
Y/E March (Rsmn) FY12 FY13 FY14E FY15E FY16E
Revenue 26,953 31,654 35,832 41,565 48,215 YoY (%) 17.8 17.4 13.2** 16.0 16.0 EBITDA 5,806 6,584 6,271 8,396 10,945 EBITDA (%) 21.5 20.8 17.5 20.2 22.7 Adj. PAT 4,465 4,968 4,658 6,050 7,670 YoY (%) 10.9 11.3 (6.2) 29.9 26.8 FDEPS (Rs) 32.8 36.5 34.2 44.5 56.4 RoE (%) 109.0 107.4 83.9 88.0 91.5 RoCE (%) 106.6 105.2 81.7 86.2 89.7 Dividend yield (%) 1.9 2.1 2.2 2.6 3.3 P/E (x) 40.3 36.3 38.7 29.8 23.5
Note: ** Net sales in FY14 is expected to be up by ~16% YoY but revenue growth is lower due to low operating income after sale of IT outsourcing business back to the parent. Source: Company, Nirmal Bang Institutional Equities Research
70
80
90
100
110
120
Mar-13 May-13 Jul-13 Sep-13 Nov-13 Jan-14 Mar-14
Colgate-Palmolive (India) NSE CNX NIFTY INDEX
7 March 2014
Institutional Equities
Colgate-Palmolive (India) 2
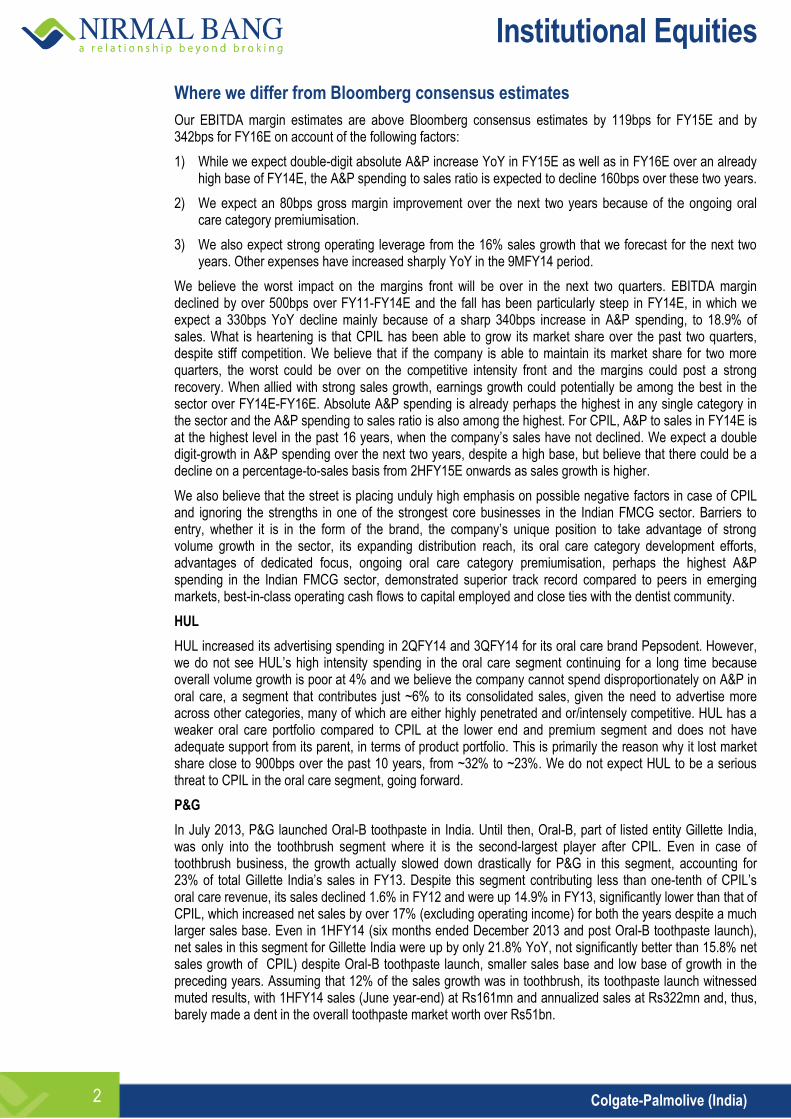
Where we differ from Bloomberg consensus estimates
Our EBITDA margin estimates are above Bloomberg consensus estimates by 119bps for FY15E and by 342bps for FY16E on account of the following factors:
1) While we expect double-digit absolute A&P increase YoY in FY15E as well as in FY16E over an already high base of FY14E, the A&P spending to sales ratio is expected to decline 160bps over these two years.
2) We expect an 80bps gross margin improvement over the next two years because of the ongoing oral care category premiumisation.
3) We also expect strong operating leverage from the 16% sales growth that we forecast for the next two years. Other expenses have increased sharply YoY in the 9MFY14 period.
We believe the worst impact on the margins front will be over in the next two quarters. EBITDA margin declined by over 500bps over FY11-FY14E and the fall has been particularly steep in FY14E, in which we expect a 330bps YoY decline mainly because of a sharp 340bps increase in A&P spending, to 18.9% of sales. What is heartening is that CPIL has been able to grow its market share over the past two quarters, despite stiff competition. We believe that if the company is able to maintain its market share for two more quarters, the worst could be over on the competitive intensity front and the margins could post a strong recovery. When allied with strong sales growth, earnings growth could potentially be among the best in the sector over FY14E-FY16E. Absolute A&P spending is already perhaps the highest in any single category in the sector and the A&P spending to sales ratio is also among the highest. For CPIL, A&P to sales in FY14E is at the highest level in the past 16 years, when the company’s sales have not declined. We expect a double digit-growth in A&P spending over the next two years, despite a high base, but believe that there could be a decline on a percentage-to-sales basis from 2HFY15E onwards as sales growth is higher.
We also believe that the street is placing unduly high emphasis on possible negative factors in case of CPIL and ignoring the strengths in one of the strongest core businesses in the Indian FMCG sector. Barriers to entry, whether it is in the form of the brand, the company’s unique position to take advantage of strong volume growth in the sector, its expanding distribution reach, its oral care category development efforts, advantages of dedicated focus, ongoing oral care category premiumisation, perhaps the highest A&P spending in the Indian FMCG sector, demonstrated superior track record compared to peers in emerging markets, best-in-class operating cash flows to capital employed and close ties with the dentist community.
HUL
HUL increased its advertising spending in 2QFY14 and 3QFY14 for its oral care brand Pepsodent. However, we do not see HUL’s high intensity spending in the oral care segment continuing for a long time because overall volume growth is poor at 4% and we believe the company cannot spend disproportionately on A&P in oral care, a segment that contributes just ~6% to its consolidated sales, given the need to advertise more across other categories, many of which are either highly penetrated and or/intensely competitive. HUL has a weaker oral care portfolio compared to CPIL at the lower end and premium segment and does not have adequate support from its parent, in terms of product portfolio. This is primarily the reason why it lost market share close to 900bps over the past 10 years, from ~32% to ~23%. We do not expect HUL to be a serious threat to CPIL in the oral care segment, going forward.
P&G
In July 2013, P&G launched Oral-B toothpaste in India. Until then, Oral-B, part of listed entity Gillette India, was only into the toothbrush segment where it is the second-largest player after CPIL. Even in case of toothbrush business, the growth actually slowed down drastically for P&G in this segment, accounting for 23% of total Gillette India’s sales in FY13. Despite this segment contributing less than one-tenth of CPIL’s oral care revenue, its sales declined 1.6% in FY12 and were up 14.9% in FY13, significantly lower than that of CPIL, which increased net sales by over 17% (excluding operating income) for both the years despite a much larger sales base. Even in 1HFY14 (six months ended December 2013 and post Oral-B toothpaste launch), net sales in this segment for Gillette India were up by only 21.8% YoY, not significantly better than 15.8% net sales growth of CPIL) despite Oral-B toothpaste launch, smaller sales base and low base of growth in the preceding years. Assuming that 12% of the sales growth was in toothbrush, its toothpaste launch witnessed muted results, with 1HFY14 sales (June year-end) at Rs161mn and annualized sales at Rs322mn and, thus, barely made a dent in the overall toothpaste market worth over Rs51bn.
Institutional Equities
Colgate-Palmolive (India) 3
Now let us look at P&G’s A&P spending in the oral care segment in India. Even assuming that half of the total Gillette India’s A&P spending in 1HFY14 was in oral care, an ambitious assumption to make given the fact that this segment contributed only 24.5% to sales in 1HFY14, advertisement spending on oral care during this period, despite Oral-B toothbrush launch, works out to only Rs925mn in 1HFY14 and Rs1,850mn (annualized). This is only ~27% of CPIL’s A&P spending in FY14E.
P&G’s toothpaste launch in India was expected since the middle of the past decade. In the meantime, CPIL had the time to expand its distribution reach from around 3mn outlets to over 5mn outlets, initiate huge category development efforts, strengthen brand further with sustained advertising, introduce low-priced packs and variants of Cibaca for rural areas and broaden its product portfolio with an entire premium segment range (Colgate Sensitive, Colgate Sensitive Pro Relief, Colgate Plax mouthwash, Colgate Visible White) launch. This led to building more barriers against existing and newer players.
Nevertheless, we believe that P&G, despite its initial lack of success in toothpaste, will be a committed player in the oral care market in the long run. An important point to note is that CPIL, despite its market leadership in toothpaste, has a 56% market share and the remaining 44% is held by companies like HUL, Dabur and some other players who do not have huge entry barriers and have a weaker portfolio. Therefore, HUL, Dabur and others are far more vulnerable to an aggressive P&G, particularly if the former cannot sustain their disproportionate advertisement spending in the oral care segment, going forward. Moreover, the category is also growing as market penetration is lower compared to other large FMCG categories. Apart from CPIL’s strong sales growth, even HUL and Dabur have been reporting double-digit sales growth in the oral care business for the past few quarters. In such a scenario, P&G can increase its market share substantially in the next 10 years, without affecting CPIL.
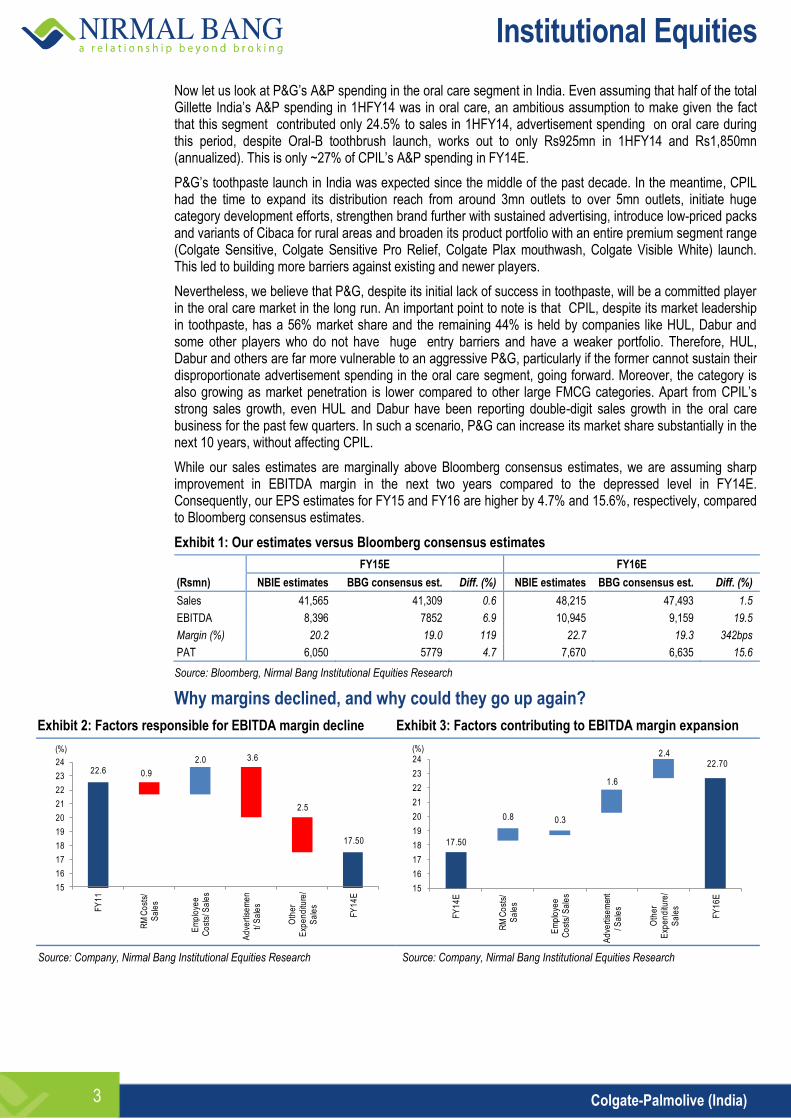
While our sales estimates are marginally above Bloomberg consensus estimates, we are assuming sharp improvement in EBITDA margin in the next two years compared to the depressed level in FY14E. Consequently, our EPS estimates for FY15 and FY16 are higher by 4.7% and 15.6%, respectively, compared to Bloomberg consensus estimates.
Exhibit 1: Our estimates versus Bloomberg consensus estimates
FY15E FY16E
(Rsmn) NBIE estimates BBG consensus est. Diff. (%) NBIE estimates BBG consensus est. Diff. (%)
Sales 41,565 41,309 0.6 48,215 47,493 1.5
EBITDA 8,396 7852 6.9 10,945 9,159 19.5
Margin (%) 20.2 19.0 119 22.7 19.3 342bps
PAT 6,050 5779 4.7 7,670 6,635 15.6
Source: Bloomberg, Nirmal Bang Institutional Equities Research
Why margins declined, and why could they go up again?
Exhibit 2: Factors responsible for EBITDA margin decline Exhibit 3: Factors contributing to EBITDA margin expansion
Source: Company, Nirmal Bang Institutional Equities Research Source: Company, Nirmal Bang Institutional Equities Research
22.6 0.9
2.0 3.6
2.5
17.50
15
16
17
18
19
20
21
22
23
24
FY
11
RM
Co
sts/
S
ale
s
Em
plo
yee
C
ost
s/ S
ale
s
Ad
vert
ise
me
nt/
Sa
les
Oth
er
Exp
en
ditu
re/
Sa
les
FY
14
E
(%)
17.50
0.8 0.3
1.6
2.4 22.70
15
16
17
18
19
20
21
22
23
24
FY
14
E
RM
Co
sts/
S
ale
s
Em
plo
yee
C
ost
s/ S
ale
s
Ad
vert
ise
men
t/ S
ale
s
Oth
er
Exp
en
ditu
re/
Sa
les
FY
16
E
(%)
Institutional Equities
Colgate-Palmolive (India) 4
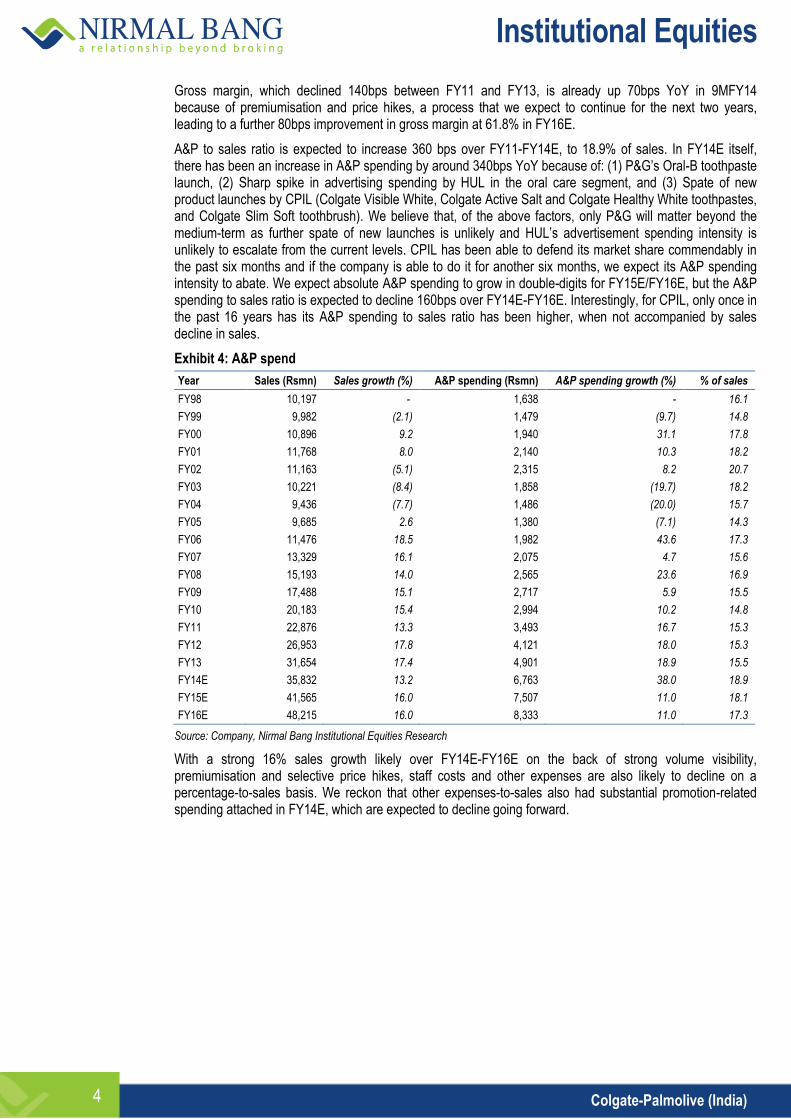
Gross margin, which declined 140bps between FY11 and FY13, is already up 70bps YoY in 9MFY14 because of premiumisation and price hikes, a process that we expect to continue for the next two years, leading to a further 80bps improvement in gross margin at 61.8% in FY16E.
A&P to sales ratio is expected to increase 360 bps over FY11-FY14E, to 18.9% of sales. In FY14E itself, there has been an increase in A&P spending by around 340bps YoY because of: (1) P&G’s Oral-B toothpaste launch, (2) Sharp spike in advertising spending by HUL in the oral care segment, and (3) Spate of new product launches by CPIL (Colgate Visible White, Colgate Active Salt and Colgate Healthy White toothpastes, and Colgate Slim Soft toothbrush). We believe that, of the above factors, only P&G will matter beyond the medium-term as further spate of new launches is unlikely and HUL’s advertisement spending intensity is unlikely to escalate from the current levels. CPIL has been able to defend its market share commendably in the past six months and if the company is able to do it for another six months, we expect its A&P spending intensity to abate. We expect absolute A&P spending to grow in double-digits for FY15E/FY16E, but the A&P spending to sales ratio is expected to decline 160bps over FY14E-FY16E. Interestingly, for CPIL, only once in the past 16 years has its A&P spending to sales ratio has been higher, when not accompanied by sales decline in sales.
Exhibit 4: A&P spend
Year Sales (Rsmn) Sales growth (%) A&P spending (Rsmn) A&P spending growth (%) % of sales
FY98 10,197 - 1,638 - 16.1
FY99 9,982 (2.1) 1,479 (9.7) 14.8
FY00 10,896 9.2 1,940 31.1 17.8
FY01 11,768 8.0 2,140 10.3 18.2
FY02 11,163 (5.1) 2,315 8.2 20.7
FY03 10,221 (8.4) 1,858 (19.7) 18.2
FY04 9,436 (7.7) 1,486 (20.0) 15.7
FY05 9,685 2.6 1,380 (7.1) 14.3
FY06 11,476 18.5 1,982 43.6 17.3
FY07 13,329 16.1 2,075 4.7 15.6
FY08 15,193 14.0 2,565 23.6 16.9
FY09 17,488 15.1 2,717 5.9 15.5
FY10 20,183 15.4 2,994 10.2 14.8
FY11 22,876 13.3 3,493 16.7 15.3
FY12 26,953 17.8 4,121 18.0 15.3
FY13 31,654 17.4 4,901 18.9 15.5
FY14E 35,832 13.2 6,763 38.0 18.9
FY15E 41,565 16.0 7,507 11.0 18.1
FY16E 48,215 16.0 8,333 11.0 17.3
Source: Company, Nirmal Bang Institutional Equities Research
With a strong 16% sales growth likely over FY14E-FY16E on the back of strong volume visibility, premiumisation and selective price hikes, staff costs and other expenses are also likely to decline on a percentage-to-sales basis. We reckon that other expenses-to-sales also had substantial promotion-related spending attached in FY14E, which are expected to decline going forward.
Institutional Equities
Colgate-Palmolive (India) 5
Entry barriers, key advantages
1) Low market penetration
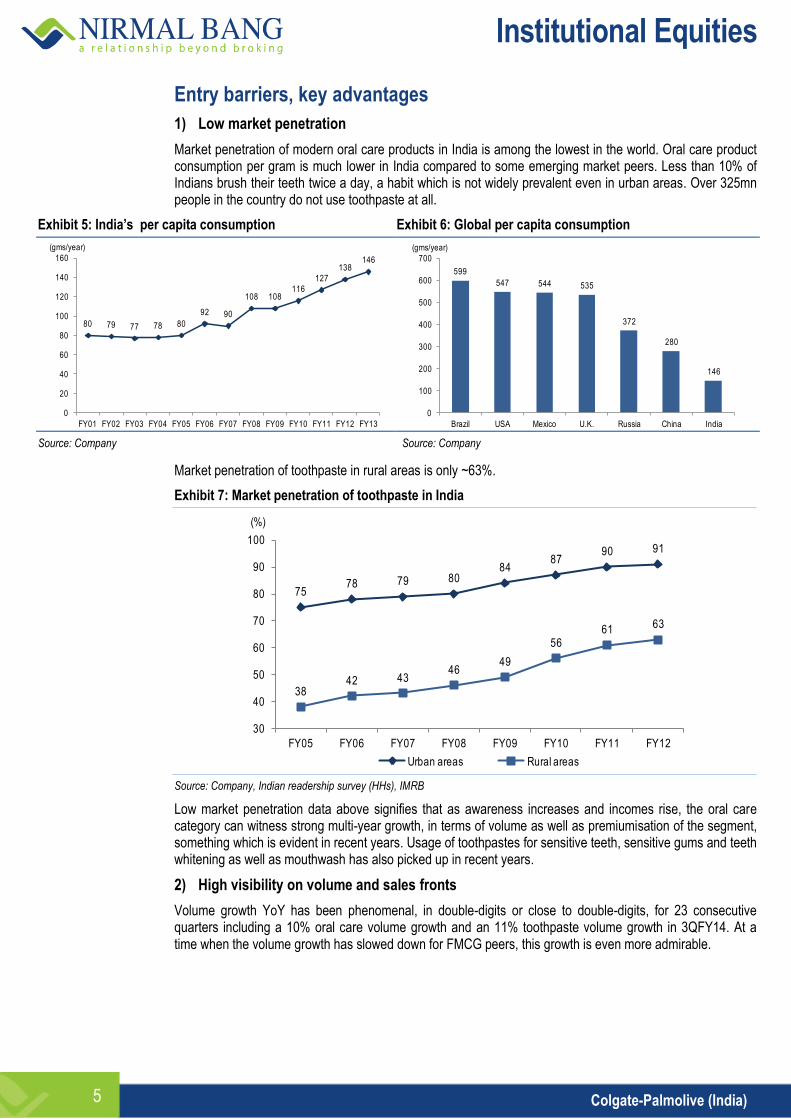
Market penetration of modern oral care products in India is among the lowest in the world. Oral care product consumption per gram is much lower in India compared to some emerging market peers. Less than 10% of Indians brush their teeth twice a day, a habit which is not widely prevalent even in urban areas. Over 325mn people in the country do not use toothpaste at all.
Exhibit 5: India’s per capita consumption Exhibit 6: Global per capita consumption
Source: Company Source: Company
Market penetration of toothpaste in rural areas is only ~63%.
Exhibit 7: Market penetration of toothpaste in India
Source: Company, Indian readership survey (HHs), IMRB
Low market penetration data above signifies that as awareness increases and incomes rise, the oral care category can witness strong multi-year growth, in terms of volume as well as premiumisation of the segment, something which is evident in recent years. Usage of toothpastes for sensitive teeth, sensitive gums and teeth whitening as well as mouthwash has also picked up in recent years.
2) High visibility on volume and sales fronts
Volume growth YoY has been phenomenal, in double-digits or close to double-digits, for 23 consecutive quarters including a 10% oral care volume growth and an 11% toothpaste volume growth in 3QFY14. At a time when the volume growth has slowed down for FMCG peers, this growth is even more admirable.
80 79 77 78 80
92 90
108 108116
127
138146
0
20
40
60
80
100
120
140
160
FY01 FY02 FY03 FY04 FY05 FY06 FY07 FY08 FY09 FY10 FY11 FY12 FY13
(gms/year)
599
547 544 535
372
280
146
0
100
200
300
400
500
600
700
Brazil USA Mexico U.K. Russia China India
(gms/year)
7578 79 80
8487
90 91
3842 43
4649
5661 63
30
40
50
60
70
80
90
100
FY05 FY06 FY07 FY08 FY09 FY10 FY11 FY12
Urban areas Rural areas
(%)
Institutional Equities
Colgate-Palmolive (India) 6
Exhibit 8: Domestic volume growth versus peers
Volume growth (%) 3QFY14 10-quarter average
HUL 4.00 6.90
Dabur 9.00 10.20
Marico 2.00 10.40
CPIL 10.00 10.60
Godrej Consumer - Soaps 6.00 10.00
Emami 1.50 10.60
GSK Consumer 11.00 8.60
P&GHH - Feminine hygiene ~15.00 ~22.00
Source: Company, Nirmal Bang Institutional Equities Research
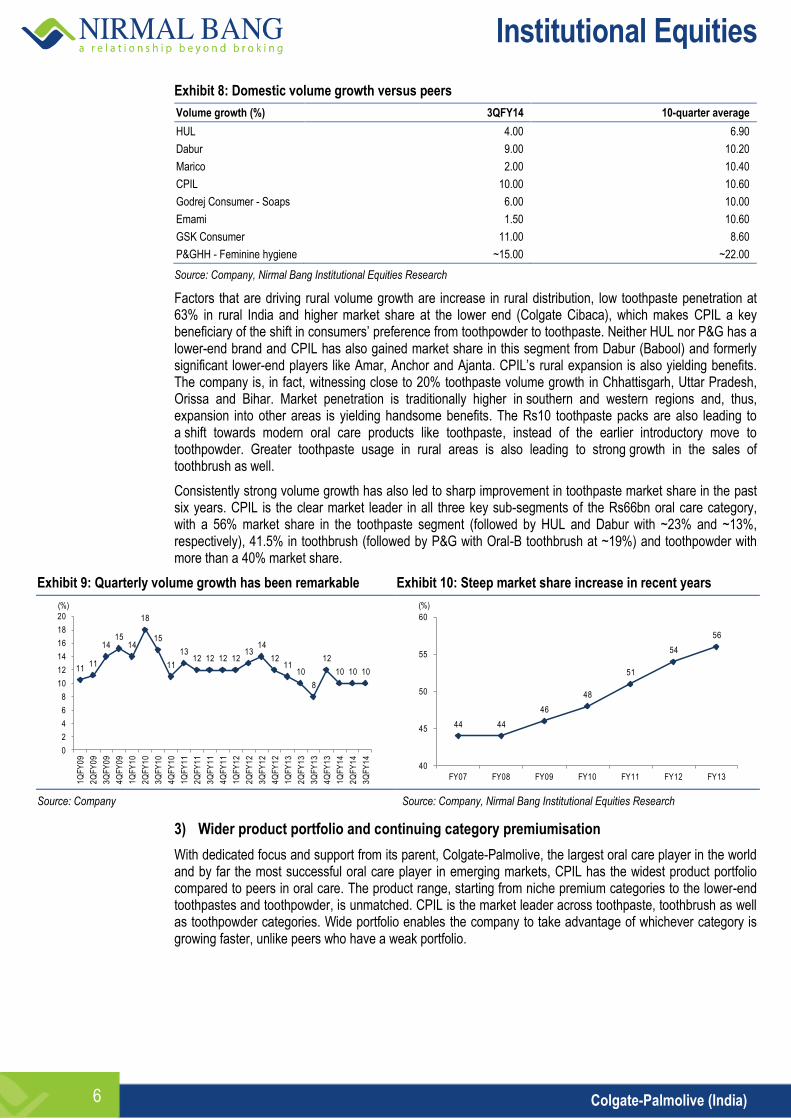
Factors that are driving rural volume growth are increase in rural distribution, low toothpaste penetration at 63% in rural India and higher market share at the lower end (Colgate Cibaca), which makes CPIL a key beneficiary of the shift in consumers’ preference from toothpowder to toothpaste. Neither HUL nor P&G has a lower-end brand and CPIL has also gained market share in this segment from Dabur (Babool) and formerly significant lower-end players like Amar, Anchor and Ajanta. CPIL’s rural expansion is also yielding benefits. The company is, in fact, witnessing close to 20% toothpaste volume growth in Chhattisgarh, Uttar Pradesh, Orissa and Bihar. Market penetration is traditionally higher in southern and western regions and, thus, expansion into other areas is yielding handsome benefits. The Rs10 toothpaste packs are also leading to a shift towards modern oral care products like toothpaste, instead of the earlier introductory move to toothpowder. Greater toothpaste usage in rural areas is also leading to strong growth in the sales of toothbrush as well.
Consistently strong volume growth has also led to sharp improvement in toothpaste market share in the past six years. CPIL is the clear market leader in all three key sub-segments of the Rs66bn oral care category, with a 56% market share in the toothpaste segment (followed by HUL and Dabur with ~23% and ~13%, respectively), 41.5% in toothbrush (followed by P&G with Oral-B toothbrush at ~19%) and toothpowder with more than a 40% market share.
Exhibit 9: Quarterly volume growth has been remarkable Exhibit 10: Steep market share increase in recent years
Source: Company Source: Company, Nirmal Bang Institutional Equities Research
3) Wider product portfolio and continuing category premiumisation
With dedicated focus and support from its parent, Colgate-Palmolive, the largest oral care player in the world and by far the most successful oral care player in emerging markets, CPIL has the widest product portfolio compared to peers in oral care. The product range, starting from niche premium categories to the lower-end toothpastes and toothpowder, is unmatched. CPIL is the market leader across toothpaste, toothbrush as well as toothpowder categories. Wide portfolio enables the company to take advantage of whichever category is growing faster, unlike peers who have a weak portfolio.
1111
1415
14
18
15
11
1312 12 12 12
1314
1211
10
8
12
10 10 10
0
2
4
6
8
10
12
14
16
18
20
1Q
FY
09
2Q
FY
09
3Q
FY
09
4Q
FY
09
1Q
FY
10
2Q
FY
10
3Q
FY
10
4Q
FY
10
1Q
FY
11
2Q
FY
11
3Q
FY
11
4Q
FY
11
1Q
FY
12
2Q
FY
12
3Q
FY
12
4Q
FY
12
1Q
FY
13
2Q
FY
13
3Q
FY
13
4Q
FY
13
1Q
FY
14
2Q
FY
14
3Q
FY
14
(%)
44 44
46
48
51
54
56
40
45
50
55
60
FY07 FY08 FY09 FY10 FY11 FY12 FY13
(%)
Institutional Equities
Colgate-Palmolive (India) 7
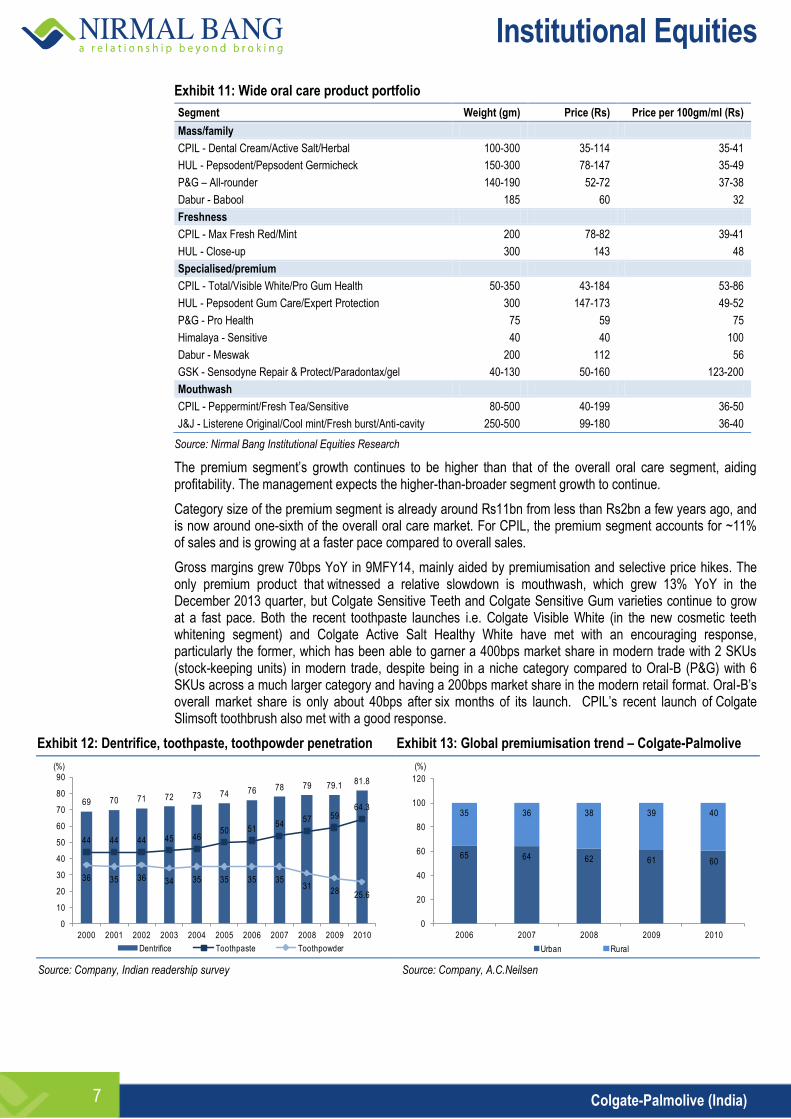
Exhibit 11: Wide oral care product portfolio
Segment Weight (gm) Price (Rs) Price per 100gm/ml (Rs)
Mass/family
CPIL - Dental Cream/Active Salt/Herbal 100-300 35-114 35-41
HUL - Pepsodent/Pepsodent Germicheck 150-300 78-147 35-49
P&G – All-rounder 140-190 52-72 37-38
Dabur - Babool 185 60 32
Freshness
CPIL - Max Fresh Red/Mint 200 78-82 39-41
HUL - Close-up 300 143 48
Specialised/premium
CPIL - Total/Visible White/Pro Gum Health 50-350 43-184 53-86
HUL - Pepsodent Gum Care/Expert Protection 300 147-173 49-52
P&G - Pro Health 75 59 75
Himalaya - Sensitive 40 40 100
Dabur - Meswak 200 112 56
GSK - Sensodyne Repair & Protect/Paradontax/gel 40-130 50-160 123-200
Mouthwash
CPIL - Peppermint/Fresh Tea/Sensitive 80-500 40-199 36-50
J&J - Listerene Original/Cool mint/Fresh burst/Anti-cavity 250-500 99-180 36-40
Source: Nirmal Bang Institutional Equities Research
The premium segment’s growth continues to be higher than that of the overall oral care segment, aiding profitability. The management expects the higher-than-broader segment growth to continue.
Category size of the premium segment is already around Rs11bn from less than Rs2bn a few years ago, and is now around one-sixth of the overall oral care market. For CPIL, the premium segment accounts for ~11% of sales and is growing at a faster pace compared to overall sales.
Gross margins grew 70bps YoY in 9MFY14, mainly aided by premiumisation and selective price hikes. The only premium product that witnessed a relative slowdown is mouthwash, which grew 13% YoY in the December 2013 quarter, but Colgate Sensitive Teeth and Colgate Sensitive Gum varieties continue to grow at a fast pace. Both the recent toothpaste launches i.e. Colgate Visible White (in the new cosmetic teeth whitening segment) and Colgate Active Salt Healthy White have met with an encouraging response, particularly the former, which has been able to garner a 400bps market share in modern trade with 2 SKUs (stock-keeping units) in modern trade, despite being in a niche category compared to Oral-B (P&G) with 6 SKUs across a much larger category and having a 200bps market share in the modern retail format. Oral-B’s overall market share is only about 40bps after six months of its launch. CPIL’s recent launch of Colgate Slimsoft toothbrush also met with a good response.
Exhibit 12: Dentrifice, toothpaste, toothpowder penetration Exhibit 13: Global premiumisation trend – Colgate-Palmolive
Source: Company, Indian readership survey Source: Company, A.C.Neilsen
69 70 71 72 73 74 76 78 79 79.181.8
44 44 44 45 4650 51
5457 59
64.3
36 35 36 34 35 35 35 3531
28 25.6
0
10
20
30
40
50
60
70
80
90
2000 2001 2002 2003 2004 2005 2006 2007 2008 2009 2010
Dentrifice Toothpaste Toothpowder
(%)
65 64 62 61 60
35 36 38 39 40
0
20
40
60
80
100
120
2006 2007 2008 2009 2010
Urban Rural
(%)
Institutional Equities
Colgate-Palmolive (India) 8
Interestingly, the premiumisation in oral care is also being witnessed globally by Colgate-Palmolive and is not just an India phenomenon.
Salience of lower margin toothpowder segment in India is also declining. Despite CPIL’s sales being up 2.4x over the past six years, toothpowder sales actually declined, which means that its proportion to overall sales currently is ~6% compared to ~16% in FY08. Toothpowder users have migrated to toothpaste and CPIL, as a result of its higher market share at the lower end, wide distribution reach (CPIL is actually the second-most widely distributed FMCG product in India), expansion in rural reach, lower unit packs and tremendous category development efforts has been in a position to take advantage of this shift, which is margin accretive. As toothpaste consumption also leads to usage of toothbrush, overall volume growth for CPIL has been healthy during this period.
4) Brand strength and success in emerging markets
Colgate is a byword for the oral care category and its brand strength is phenomenal. The company has a long history in India since the launch in 1937. All its oral care products come under Colgate umbrella brand. Colgate is the only FMCG brand to be rated among the top three brands by The Economic Times’ Brand Equity every year since the inception of its survey. For many of these years including the past three years Colgate has also been rated as the No. 1 brand. Consistently high A&P spending strengthens the brand power.
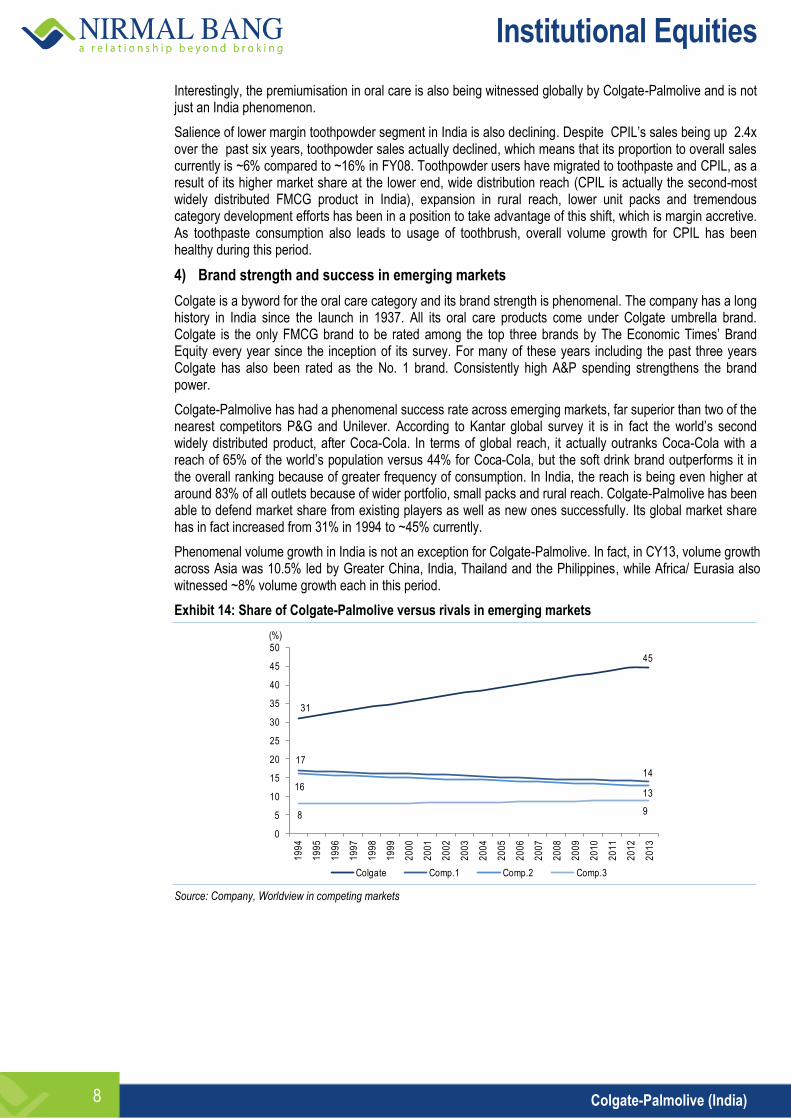
Colgate-Palmolive has had a phenomenal success rate across emerging markets, far superior than two of the nearest competitors P&G and Unilever. According to Kantar global survey it is in fact the world’s second widely distributed product, after Coca-Cola. In terms of global reach, it actually outranks Coca-Cola with a reach of 65% of the world’s population versus 44% for Coca-Cola, but the soft drink brand outperforms it in the overall ranking because of greater frequency of consumption. In India, the reach is being even higher at around 83% of all outlets because of wider portfolio, small packs and rural reach. Colgate-Palmolive has been able to defend market share from existing players as well as new ones successfully. Its global market share has in fact increased from 31% in 1994 to ~45% currently.
Phenomenal volume growth in India is not an exception for Colgate-Palmolive. In fact, in CY13, volume growth across Asia was 10.5% led by Greater China, India, Thailand and the Philippines, while Africa/ Eurasia also witnessed ~8% volume growth each in this period.
Exhibit 14: Share of Colgate-Palmolive versus rivals in emerging markets
Source: Company, Worldview in competing markets
0
5
10
15
20
25
30
35
40
45
50
19
94
19
95
19
96
19
97
19
98
19
99
20
00
20
01
20
02
20
03
20
04
20
05
20
06
20
07
20
08
20
09
20
10
20
11
20
12
20
13
Colgate Comp.1 Comp.2 Comp.3
(%)
31
17
16
8
45
14
13
9
Institutional Equities
Colgate-Palmolive (India) 9
5) Dedicated focus
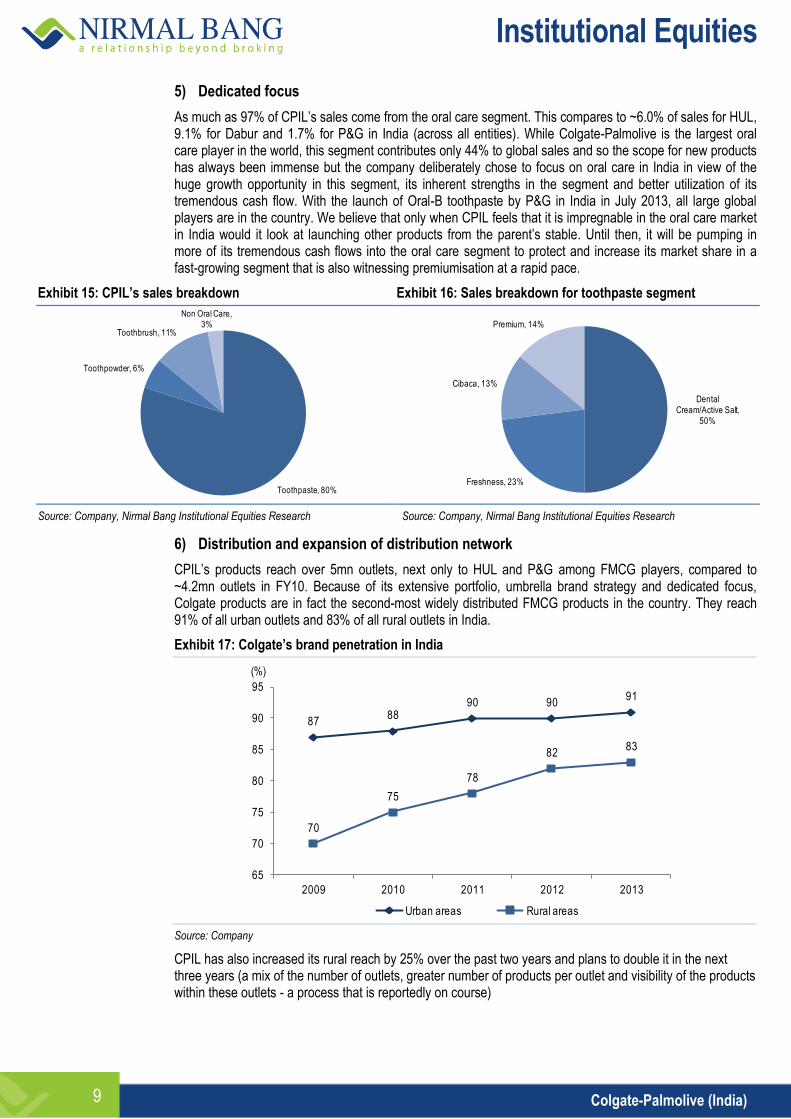
As much as 97% of CPIL’s sales come from the oral care segment. This compares to ~6.0% of sales for HUL, 9.1% for Dabur and 1.7% for P&G in India (across all entities). While Colgate-Palmolive is the largest oral care player in the world, this segment contributes only 44% to global sales and so the scope for new products has always been immense but the company deliberately chose to focus on oral care in India in view of the huge growth opportunity in this segment, its inherent strengths in the segment and better utilization of its tremendous cash flow. With the launch of Oral-B toothpaste by P&G in India in July 2013, all large global players are in the country. We believe that only when CPIL feels that it is impregnable in the oral care market in India would it look at launching other products from the parent’s stable. Until then, it will be pumping in more of its tremendous cash flows into the oral care segment to protect and increase its market share in a fast-growing segment that is also witnessing premiumisation at a rapid pace.
Exhibit 15: CPIL’s sales breakdown Exhibit 16: Sales breakdown for toothpaste segment
Source: Company, Nirmal Bang Institutional Equities Research Source: Company, Nirmal Bang Institutional Equities Research
6) Distribution and expansion of distribution network
CPIL’s products reach over 5mn outlets, next only to HUL and P&G among FMCG players, compared to ~4.2mn outlets in FY10. Because of its extensive portfolio, umbrella brand strategy and dedicated focus, Colgate products are in fact the second-most widely distributed FMCG products in the country. They reach 91% of all urban outlets and 83% of all rural outlets in India.
Exhibit 17: Colgate’s brand penetration in India
Source: Company
CPIL has also increased its rural reach by 25% over the past two years and plans to double it in the next three years (a mix of the number of outlets, greater number of products per outlet and visibility of the products within these outlets - a process that is reportedly on course)
Toothpaste, 80%
Toothpowder, 6%
Toothbrush, 11%
Non Oral Care, 3%
Dental Cream/Active Salt,
50%
Freshness, 23%
Cibaca, 13%
Premium, 14%
8788
90 9091
70
75
78
8283
65
70
75
80
85
90
95
2009 2010 2011 2012 2013
Urban areas Rural areas
(%)
Institutional Equities
Colgate-Palmolive (India) 10
7) Category development efforts
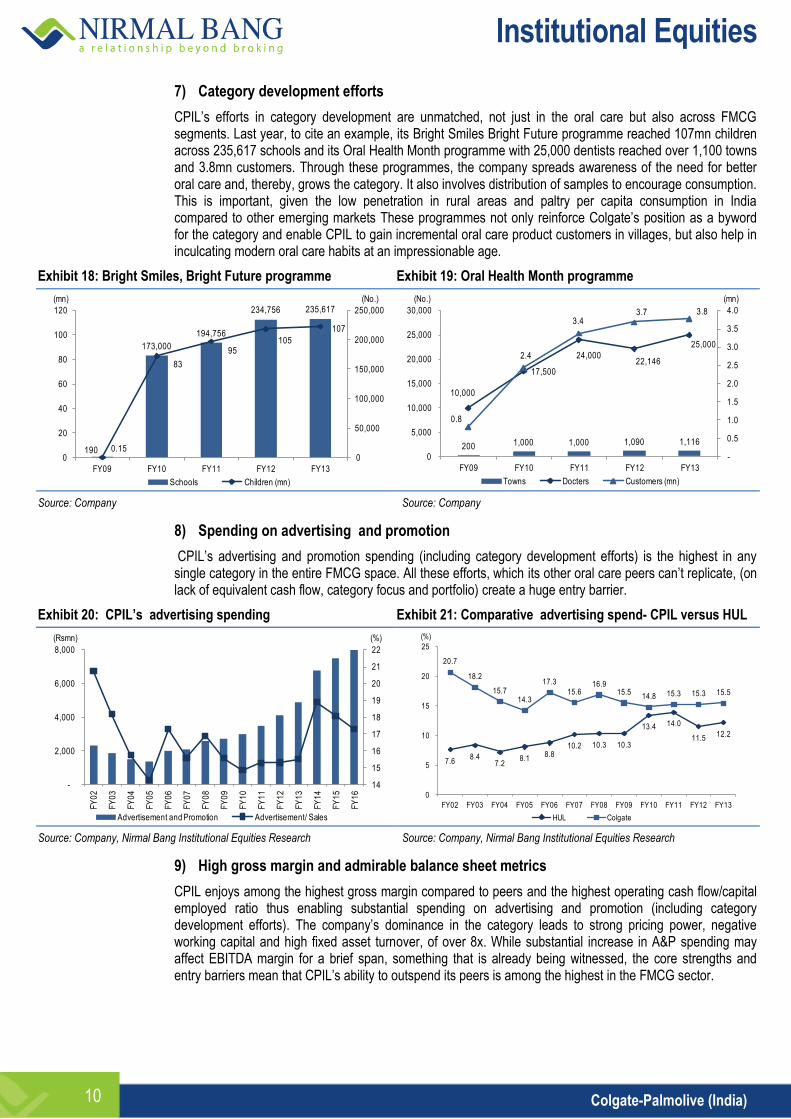
CPIL’s efforts in category development are unmatched, not just in the oral care but also across FMCG segments. Last year, to cite an example, its Bright Smiles Bright Future programme reached 107mn children across 235,617 schools and its Oral Health Month programme with 25,000 dentists reached over 1,100 towns and 3.8mn customers. Through these programmes, the company spreads awareness of the need for better oral care and, thereby, grows the category. It also involves distribution of samples to encourage consumption. This is important, given the low penetration in rural areas and paltry per capita consumption in India compared to other emerging markets These programmes not only reinforce Colgate’s position as a byword for the category and enable CPIL to gain incremental oral care product customers in villages, but also help in inculcating modern oral care habits at an impressionable age.
Exhibit 18: Bright Smiles, Bright Future programme Exhibit 19: Oral Health Month programme
Source: Company Source: Company
8) Spending on advertising and promotion
CPIL’s advertising and promotion spending (including category development efforts) is the highest in any single category in the entire FMCG space. All these efforts, which its other oral care peers can’t replicate, (on lack of equivalent cash flow, category focus and portfolio) create a huge entry barrier.
Exhibit 20: CPIL’s advertising spending Exhibit 21: Comparative advertising spend- CPIL versus HUL
Source: Company, Nirmal Bang Institutional Equities Research Source: Company, Nirmal Bang Institutional Equities Research
9) High gross margin and admirable balance sheet metrics
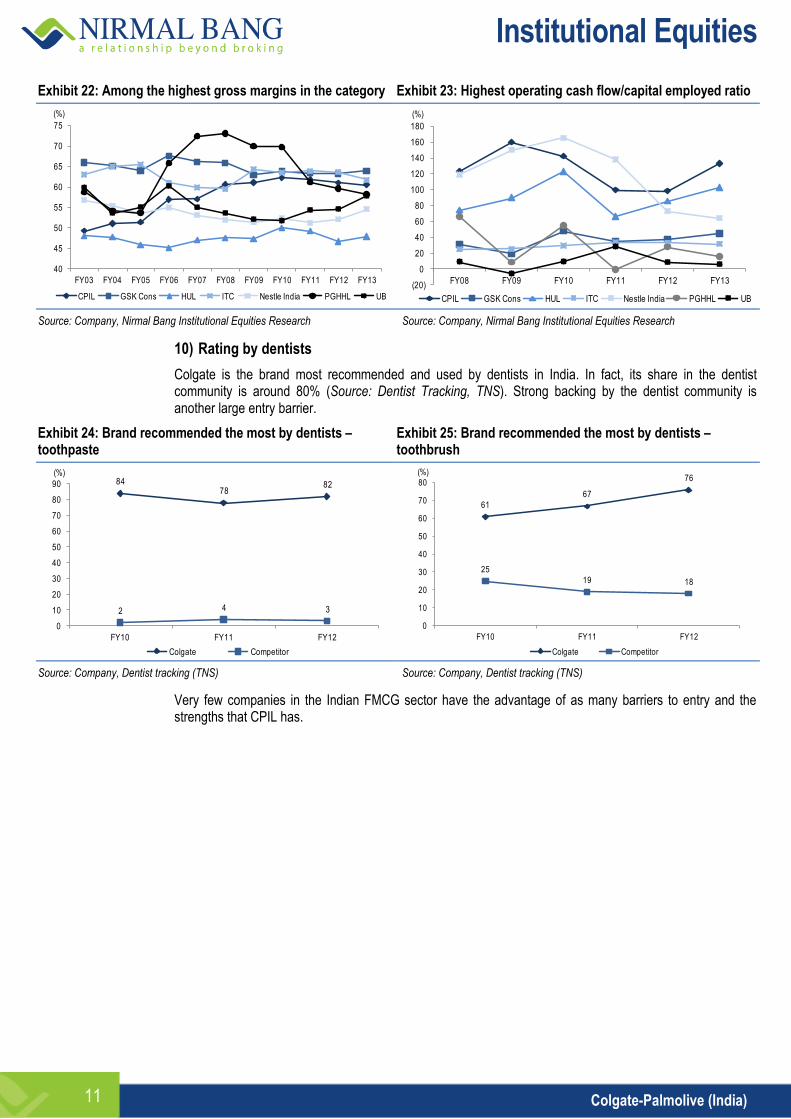
CPIL enjoys among the highest gross margin compared to peers and the highest operating cash flow/capital employed ratio thus enabling substantial spending on advertising and promotion (including category development efforts). The company’s dominance in the category leads to strong pricing power, negative working capital and high fixed asset turnover, of over 8x. While substantial increase in A&P spending may affect EBITDA margin for a brief span, something that is already being witnessed, the core strengths and entry barriers mean that CPIL’s ability to outspend its peers is among the highest in the FMCG sector.
190
173,000
194,756
234,756 235,617
0.15
83
95105
107
0
50,000
100,000
150,000
200,000
250,000
0
20
40
60
80
100
120
FY09 FY10 FY11 FY12 FY13
Schools Children (mn)
(mn) (No.)
200 1,000 1,000 1,090 1,116
10,000
17,500
24,000 22,146
25,000
0.8
2.4
3.4 3.7 3.8
-
0.5
1.0
1.5
2.0
2.5
3.0
3.5
4.0
0
5,000
10,000
15,000
20,000
25,000
30,000
FY09 FY10 FY11 FY12 FY13
Towns Docters Customers (mn)
(No.) (mn)
14
15
16
17
18
19
20
21
22
-
2,000
4,000
6,000
8,000
FY
02
FY
03
FY
04
FY
05
FY
06
FY
07
FY
08
FY
09
FY
10
FY
11
FY
12
FY
13
FY
14
FY
15
FY
16
Advertisement and Promotion Advertisement/ Sales
(Rsmn) (%)
7.6 8.4
7.2 8.1
8.8 10.2 10.3 10.3
13.4 14.0
11.5 12.2
20.7
18.2
15.7 14.3
17.3
15.6 16.9
15.5 14.8 15.3 15.3 15.5
0
5
10
15
20
25
FY02 FY03 FY04 FY05 FY06 FY07 FY08 FY09 FY10 FY11 FY12 FY13
HUL Colgate
(%)
Institutional Equities
Colgate-Palmolive (India) 11
Exhibit 22: Among the highest gross margins in the category Exhibit 23: Highest operating cash flow/capital employed ratio
Source: Company, Nirmal Bang Institutional Equities Research Source: Company, Nirmal Bang Institutional Equities Research
10) Rating by dentists
Colgate is the brand most recommended and used by dentists in India. In fact, its share in the dentist community is around 80% (Source: Dentist Tracking, TNS). Strong backing by the dentist community is another large entry barrier.
Exhibit 24: Brand recommended the most by dentists –toothpaste
Exhibit 25: Brand recommended the most by dentists – toothbrush
Source: Company, Dentist tracking (TNS) Source: Company, Dentist tracking (TNS)
Very few companies in the Indian FMCG sector have the advantage of as many barriers to entry and the strengths that CPIL has.
40
45
50
55
60
65
70
75
FY03 FY04 FY05 FY06 FY07 FY08 FY09 FY10 FY11 FY12 FY13
CPIL GSK Cons HUL ITC Nestle India PGHHL UB
(%)
(20)
0
20
40
60
80
100
120
140
160
180
FY08 FY09 FY10 FY11 FY12 FY13
CPIL GSK Cons HUL ITC Nestle India PGHHL UB
(%)
8478
82
2 4 3
0
10
20
30
40
50
60
70
80
90
FY10 FY11 FY12
Colgate Competitor
(%)
61
67
76
25
19 18
0
10
20
30
40
50
60
70
80
FY10 FY11 FY12
Colgate Competitor
(%)

Institutional Equities
Colgate-Palmolive (India) 12
Financials
Exhibit 26: 3QFY14 and 9MFY14 results
Y/E March (Rsmn) 3QFY13 2QFY14 3QFY14 YoY (%) QoQ (%) 9MFY13 9MFY14 YoY (%)
Net sales 7,838 9,007 8,911 13.7 (1.1) 23,323 26,515 13.7
Net raw material & Purchase of finished goods 3,045 3,621 3,458 13.6 (4.5) 9,280 10,361 11.7
% of sales 38.8 40.2 38.8 - - 39.8 39.1 -
Advertising 999 1,195 1,215 21.6 1.7 2,725 3,423 25.6
% of sales 12.7 13.3 13.6 - - 11.7 12.9 -
Staff costs 631 535 530 (16.1) (1.0) 1,798.3 1,684.0 (6.4)
% of sales 8.1 5.9 5.9 - - 7.7 6.4 -
Other expenses ## 1,664 2,194 2,204 32.4 0.5 4,638 6,425 38.5
% of sales 21.2 24.4 24.7 - - 19.9 24.2 -
Operating Profit 1,499 1,463 1,505 0.4 2.9 4,882 4,621 (5.3)
OPM (%) 19.1 16.2 16.9 - - 20.9 17.4 -
Depreciation 113 117 121 6.4 3.4 324 354 9.3
Other income 117 130 162 38.3 24.7 378 464 22.6
PBT 1,504 1,477 1,547 2.9 4.8 4,936 5,286 7.1
Tax 393 382 418 6.3 9.5 1,200 1,209 0.8
Effective tax rate (%) 26.1 25.8 27.0 - - 24.3 22.9 -
Reported PAT 1,111 1,095 1,129 1.7 3.1 3,736 4,077 9.1
Adjusted PAT 1,111 1,095 1,129 1.7 3.1 3,736 3,522 (5.7)
NPM (%) 14.2 12.2 12.7 - - 16.0 13.3 -
EPS (Rs.) 8.2 8.1 8.3 1.6 3.1 27.5 30.0 9.1
Source: Company, Nirmal Bang Institutional Equities Research
Note: ## other expenses include large promotion spends component
Crucial factors were maintaining market share and that volume growth should not slow down markedly, given the high intensity of the competition. On both those factors, CPIL did very well. Market share in toothpaste was maintained at 56% sequentially, up 150bps YoY and volume growth, at a time when other companies are reporting significant slowdown, stood at 11% in toothpaste and 10% overall.
Net sales in 3QFY14 grew 15.9% YoY and net sales, including operating income, grew 13.7% YoY at Rs8.91bn, 1.3% above Bloomberg consensus estimate. Net sales in 9MFY14 grew 15.5% YoY and net sales, including operating income, grew 13.7% YoY in 9MFY14 at Rs26.24bn. Operating income declined following the sale of information technology outsourcing business to the parent.
Volume growth was not at the cost of gross margins. Gross margin was up 70 bps YoY in 9MFY14 and maintained YoY in 3QFY14 as well, despite a relatively high base. Gross margin improvement was because of the ongoing category premiumisation.
3QFY14 EBITDA at Rs1.51bn was 1.3% above Bloomberg consensus estimate, but YoY EBITDA was flat, primarily because of high advertising and other expenses (likely to have been promotional spending). Because of these two expenditure heads, 9MFY14 EBITDA margin was down 350 bps YoY, despite a 70bps YoY gross margin improvement.
3QFY14 PAT at Rs1.13bn was 0.9% above Bloomberg consensus estimate, but up at only 1.7% of sales owing to operating margin decline YoY. 9MFY14 adjusted PAT was down 5.7% YoY at Rs4.1bn.
CPIL’s earnings growth versus peers
EPS growth was poor over FY11-FY14E because of higher A&P spending and a higher tax rate, which has nearly peaked. As stated earlier, we expect earnings growth to recover sharply from the trough in FY14E in which advertising spending and other expenses rose sharply. FY14E ends a three-year period where EBITDA margin declined by over 500bps. Going forward, strong visibility on sales, consequent strong operating leverage, and decline in advertisement spending to sales will all lead to smart recovery in margins. Consequently, EPS growth of 65% is expected over FY14E-FY16E, easily the highest among peers.

Institutional Equities
Colgate-Palmolive (India) 13
Exhibit 27: Comparative earnings growth
Companies (Rs) FY14E FY15E FY16E Var. (%)
CPIL 34.2 45.4 56.4 65%
P&GHH 78.0 94.5 113.4 45%
HUL 16.9 18.4 20.6 22%
ITC 11.0 12.9 15.0 37%
Nestle India 136.9 159.8 185.1 35%
Britannia Industries 31.8 37.2 44.4 40%
GSK Consumer 144.2 156.5 174.6 21%
Godrej Consumer 22.6 27.8 33.9 50%
Dabur 5.3 6.3 7.3 40%
Marico 7.5 8.6 10.1 35%
Source: Bloomberg, Nirmal Bang Institutional Equities Research
Return ratios and dividend yield demand premium valuation
When a company registers phenomenal EPS growth with highest return on equity, operating cash flow to capital employed and also dividend yield, even on a trailing basis, the target valuation should be high.
Exhibit 28: Return on equity is best in class along with HUL Exhibit 29: Strong balance sheet (operating cash flow/capital employed)
Source: Company ,Bloomberg, Nirmal Bang Institutional Equities Research Source: Company, Nirmal Bang Institutional Equities Research
Exhibit 30: Dividend yield is higher than peers
Source: Company, Bloomberg, Nirmal Bang Institutional Equities Research
0
20
40
60
80
100
120
FY11 FY12 FY13 FY14E FY15E FY16E
CPIL HUL PGHHL GSK Cons
Britannia ITC Nestle India United Breweries
(%)
(20)
0
20
40
60
80
100
120
140
160
180
FY08 FY09 FY10 FY11 FY12 FY13
CPIL GSK Cons HUL ITC Nestle India PGHHL UB
(%)
-
0.5
1.0
1.5
2.0
2.5
3.0
3.5
4.0
FY11 FY12 FY13 FY14E FY15E FY16E
CPIL United Breweries PGHHL HUL
GSK Cons Britannia ITC Nestle India
(%)
Institutional Equities
Colgate-Palmolive (India) 14
Valuation
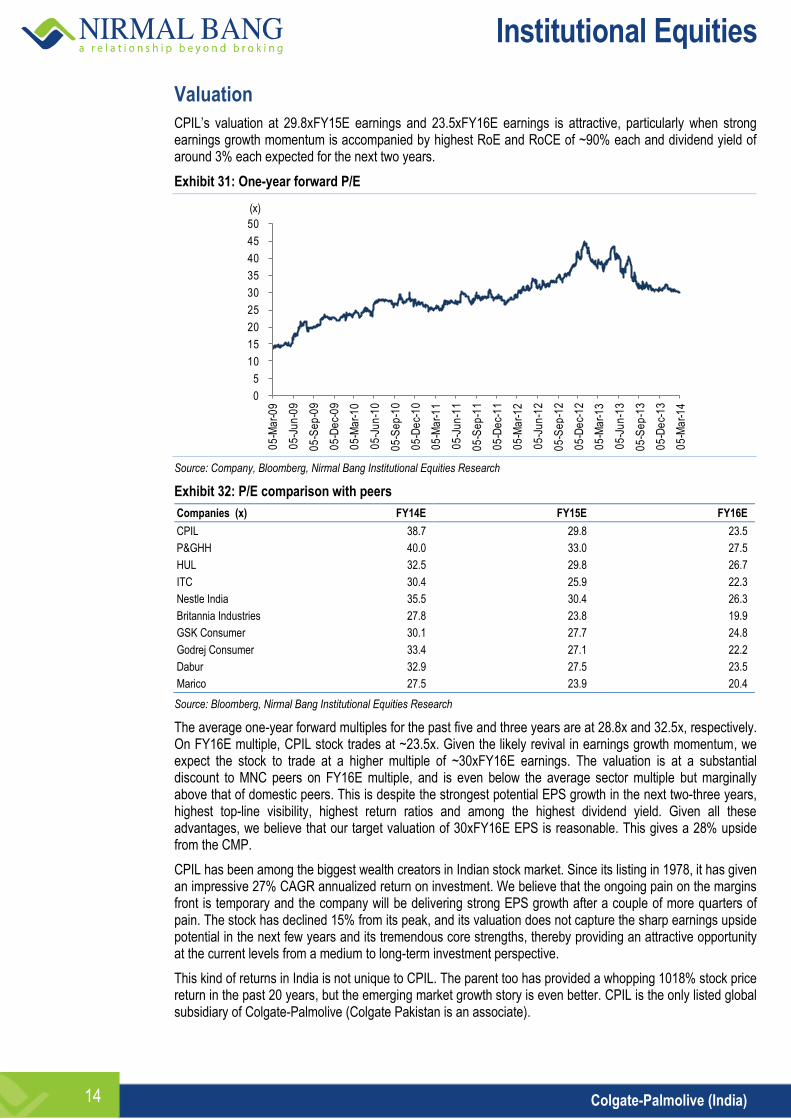
CPIL’s valuation at 29.8xFY15E earnings and 23.5xFY16E earnings is attractive, particularly when strong earnings growth momentum is accompanied by highest RoE and RoCE of ~90% each and dividend yield of around 3% each expected for the next two years.
Exhibit 31: One-year forward P/E
Source: Company, Bloomberg, Nirmal Bang Institutional Equities Research
Exhibit 32: P/E comparison with peers
Companies (x) FY14E FY15E FY16E
CPIL 38.7 29.8 23.5
P&GHH 40.0 33.0 27.5
HUL 32.5 29.8 26.7
ITC 30.4 25.9 22.3
Nestle India 35.5 30.4 26.3
Britannia Industries 27.8 23.8 19.9
GSK Consumer 30.1 27.7 24.8
Godrej Consumer 33.4 27.1 22.2
Dabur 32.9 27.5 23.5
Marico 27.5 23.9 20.4
Source: Bloomberg, Nirmal Bang Institutional Equities Research
The average one-year forward multiples for the past five and three years are at 28.8x and 32.5x, respectively. On FY16E multiple, CPIL stock trades at ~23.5x. Given the likely revival in earnings growth momentum, we expect the stock to trade at a higher multiple of ~30xFY16E earnings. The valuation is at a substantial discount to MNC peers on FY16E multiple, and is even below the average sector multiple but marginally above that of domestic peers. This is despite the strongest potential EPS growth in the next two-three years, highest top-line visibility, highest return ratios and among the highest dividend yield. Given all these advantages, we believe that our target valuation of 30xFY16E EPS is reasonable. This gives a 28% upside from the CMP.
CPIL has been among the biggest wealth creators in Indian stock market. Since its listing in 1978, it has given an impressive 27% CAGR annualized return on investment. We believe that the ongoing pain on the margins front is temporary and the company will be delivering strong EPS growth after a couple of more quarters of pain. The stock has declined 15% from its peak, and its valuation does not capture the sharp earnings upside potential in the next few years and its tremendous core strengths, thereby providing an attractive opportunity at the current levels from a medium to long-term investment perspective.
This kind of returns in India is not unique to CPIL. The parent too has provided a whopping 1018% stock price return in the past 20 years, but the emerging market growth story is even better. CPIL is the only listed global subsidiary of Colgate-Palmolive (Colgate Pakistan is an associate).
0
5
10
15
20
25
30
35
40
45
50
05
-Ma
r-0
9
05
-Ju
n-0
9
05
-Se
p-0
9
05
-De
c-0
9
05
-Ma
r-1
0
05
-Ju
n-1
0
05
-Se
p-1
0
05
-De
c-1
0
05
-Ma
r-1
1
05
-Ju
n-1
1
05
-Se
p-1
1
05
-De
c-1
1
05
-Ma
r-1
2
05
-Ju
n-1
2
05
-Se
p-1
2
05
-De
c-1
2
05
-Ma
r-1
3
05
-Ju
n-1
3
05
-Se
p-1
3
05
-De
c-1
3
05
-Ma
r-1
4
(x)
Institutional Equities
Colgate-Palmolive (India) 15
Non-oral care business
The share of non-oral care revenue for the parent company stands at 54% of sales compared to 3% in case of CPIL. With a reach of over 5mn outlets already and riding piggyback on the tremendous brand franchise of Colgate, we believe that non-oral care could be a huge growth area for CPIL in the long run. The parent has strong global brands including Palmolive, Halo, Axion, Protex, Charmis and Sanex. The non-oral care portfolio is extremely strong. In fact, in the non-oral care category, the parent is No. 1 globally in liquid hand soap, hand dishwashing and household cleaners and No. 2 worldwide in bar soap, liquid body cleansing and fabric conditioners.
We believe the non-oral care segment is definitely on CPIL’s agenda for the long run, but the company wants to focus on the oral care segment in the medium-term, thereby using high advertisement spending and remarkable balance sheet strengths to strengthen its leadership in this fast growing and profitable category.
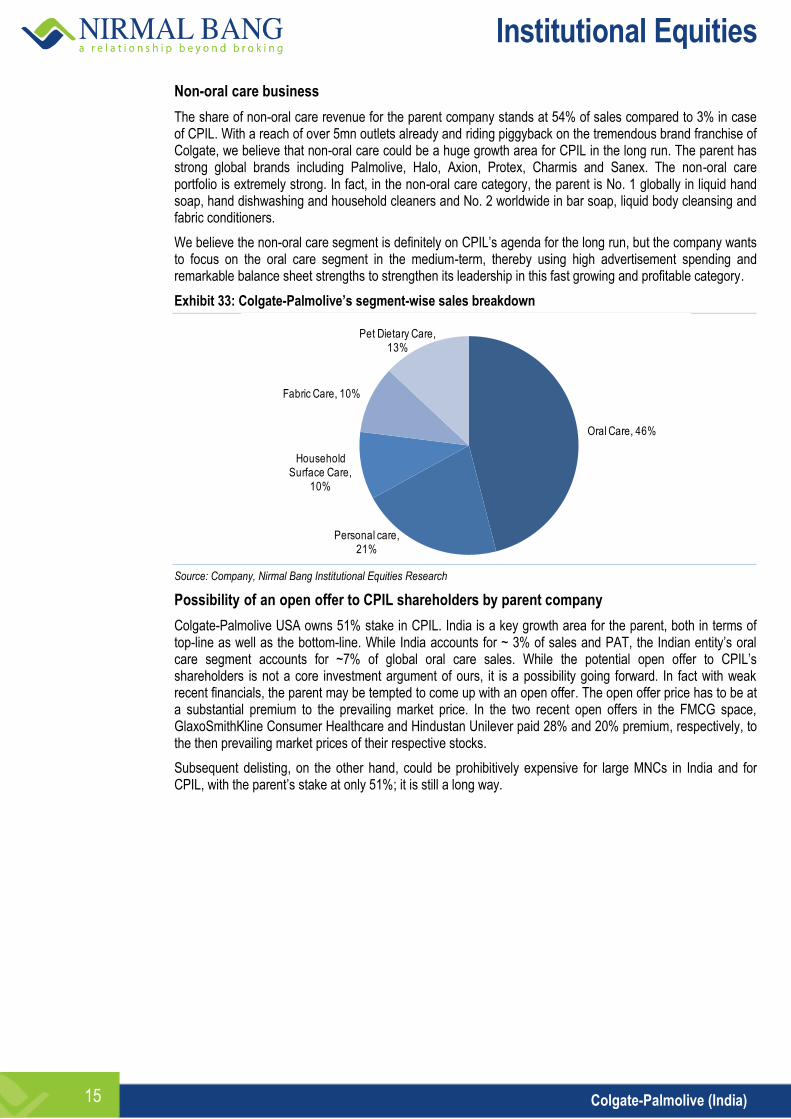
Exhibit 33: Colgate-Palmolive’s segment-wise sales breakdown
Source: Company, Nirmal Bang Institutional Equities Research
Possibility of an open offer to CPIL shareholders by parent company
Colgate-Palmolive USA owns 51% stake in CPIL. India is a key growth area for the parent, both in terms of top-line as well as the bottom-line. While India accounts for ~ 3% of sales and PAT, the Indian entity’s oral care segment accounts for ~7% of global oral care sales. While the potential open offer to CPIL’s shareholders is not a core investment argument of ours, it is a possibility going forward. In fact with weak recent financials, the parent may be tempted to come up with an open offer. The open offer price has to be at a substantial premium to the prevailing market price. In the two recent open offers in the FMCG space, GlaxoSmithKline Consumer Healthcare and Hindustan Unilever paid 28% and 20% premium, respectively, to the then prevailing market prices of their respective stocks.
Subsequent delisting, on the other hand, could be prohibitively expensive for large MNCs in India and for CPIL, with the parent’s stake at only 51%; it is still a long way.
Oral Care, 46%
Personal care, 21%
Household Surface Care,
10%
Fabric Care, 10%
Pet Dietary Care, 13%
Institutional Equities
Colgate-Palmolive (India) 16
Risks to our call
Price war: A risk to our forecasts is a price war in the oral care category. We do not assign a high probability to the same, as the category is growing at a rapid pace, is highly profitable, and also as there are weaker players apart from CPIL with a significant 44% market share. P&G is bleeding at the EBITDA and Net level in India across all three entities in the country put together, and its parent is under pressure to justify spending in emerging markets because the developed markets are slowing down as well. Moreover, Mr. A.G. Lafley, the new global chief executive officer of the company, has already stated publicly that taking on HUL, the market leader in detergents, at the cost of profitability in that segment was a mistake that P&G committed in India.
Exhibit 34: P&G’s India financials
Companies (Rsmn) FY10 FY11 FY12 FY13
P&GHH 9,243 10,032 12,974 16,868
Gillette India 8,525 10,584 12,329 14,377
P&G Home Products 21,042 28,329 39,060 48,265
Total sales of P&G in India 38,809 48,945 64,363 79,510
P&GHH 1,996 1,512 1,813 2,032
Gillette 1,371 862 757 872
P&G Home Products 1,911 (3,336) (3,530) (4,815)
Total PAT of P&G in India 5,278 (962) (960) (1,911)
Source: Company, Nirmal Bang Institutional Equities Research
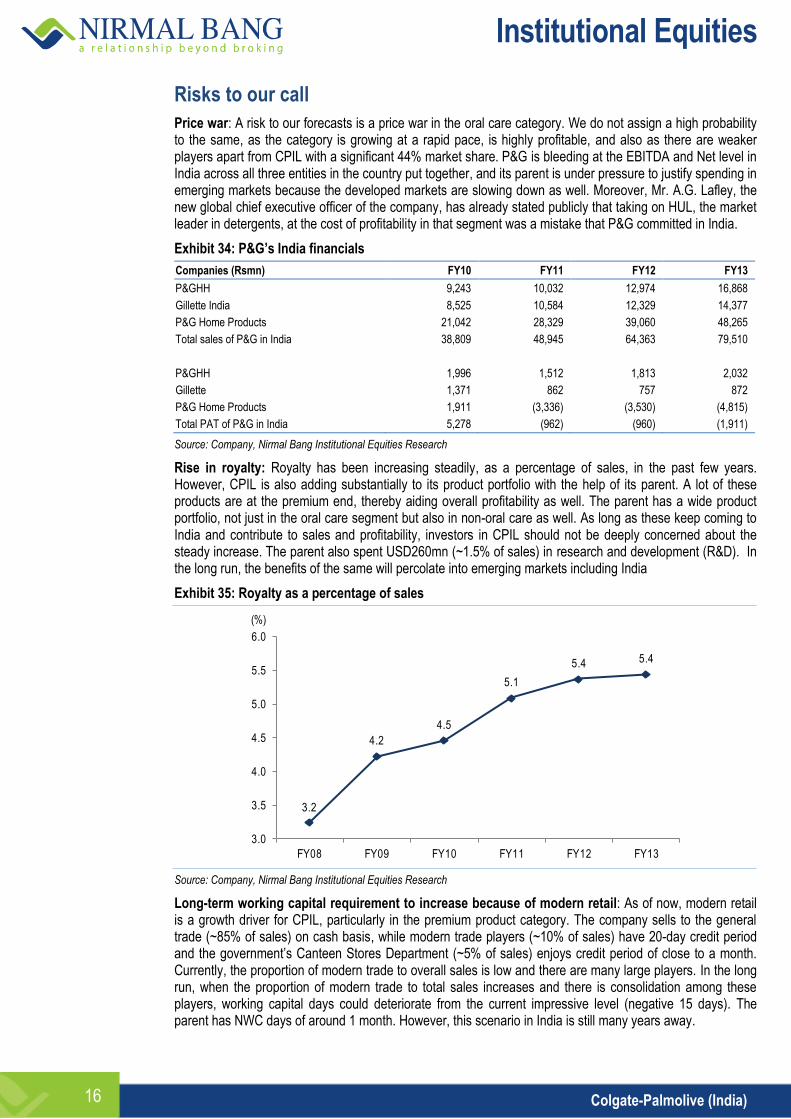
Rise in royalty: Royalty has been increasing steadily, as a percentage of sales, in the past few years. However, CPIL is also adding substantially to its product portfolio with the help of its parent. A lot of these products are at the premium end, thereby aiding overall profitability as well. The parent has a wide product portfolio, not just in the oral care segment but also in non-oral care as well. As long as these keep coming to India and contribute to sales and profitability, investors in CPIL should not be deeply concerned about the steady increase. The parent also spent USD260mn (~1.5% of sales) in research and development (R&D). In the long run, the benefits of the same will percolate into emerging markets including India
Exhibit 35: Royalty as a percentage of sales
Source: Company, Nirmal Bang Institutional Equities Research
Long-term working capital requirement to increase because of modern retail: As of now, modern retail is a growth driver for CPIL, particularly in the premium product category. The company sells to the general trade (~85% of sales) on cash basis, while modern trade players (~10% of sales) have 20-day credit period and the government’s Canteen Stores Department (~5% of sales) enjoys credit period of close to a month. Currently, the proportion of modern trade to overall sales is low and there are many large players. In the long run, when the proportion of modern trade to total sales increases and there is consolidation among these players, working capital days could deteriorate from the current impressive level (negative 15 days). The parent has NWC days of around 1 month. However, this scenario in India is still many years away.
3.2
4.2
4.5
5.1
5.4 5.4
3.0
3.5
4.0
4.5
5.0
5.5
6.0
FY08 FY09 FY10 FY11 FY12 FY13
(%)
Institutional Equities
Colgate-Palmolive (India) 17
Company background
Incorporated in India in 1937, CPIL launched its flagship product, Colgate Dental Cream, in the same year. This was followed in 1948 by the launch of Colgate toothbrush and toothpowder. These were followed in the 1950s by non-oral care products like Palmolive Shaving Cream, Charmis Cold Cream and Halo Shampoo. CPIL offered 60% of its shareholding to the public in 1978, but subsequently its parent increased the stake in the company to 51% in the 1990s, an ownership level that has been maintained since then. In the past 20 years, sales have been up 5.9x and PAT growth has been even better at 7.9x. This resulted in tremendous value creation for the shareholders.
Institutional Equities
Colgate-Palmolive (India) 18
Financials
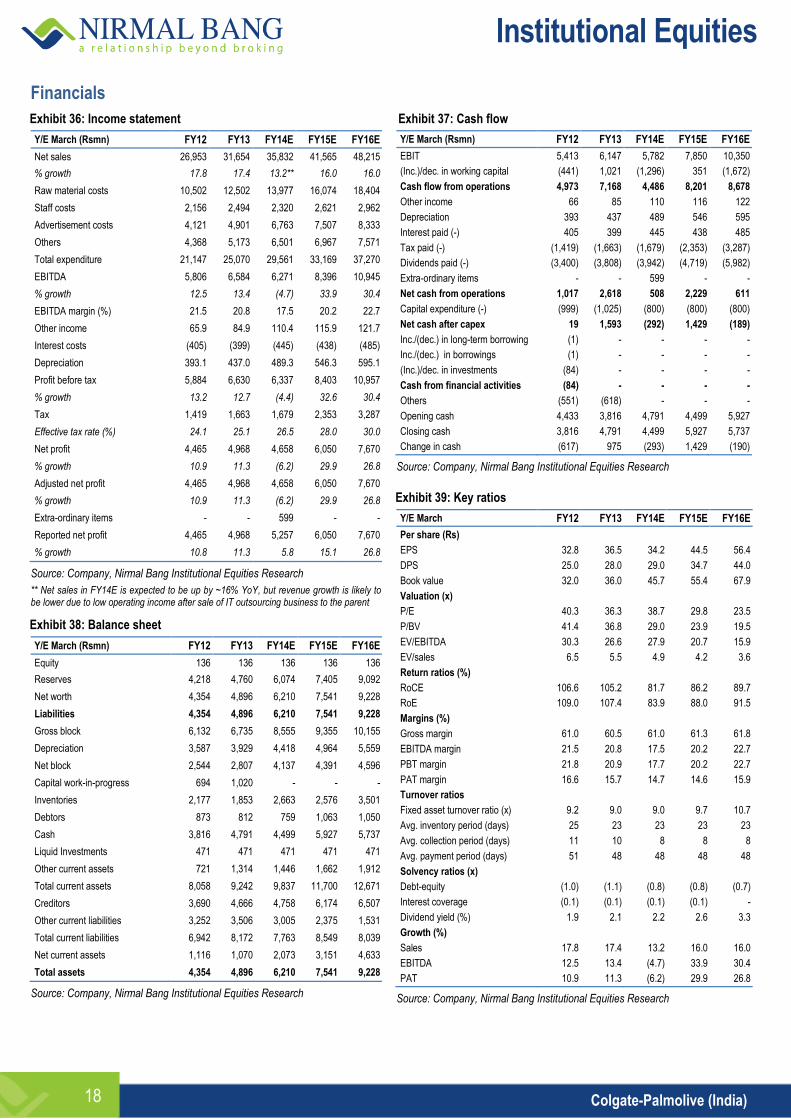
Exhibit 36: Income statement
Y/E March (Rsmn) FY12 FY13 FY14E FY15E FY16E
Net sales 26,953 31,654 35,832 41,565 48,215
% growth 17.8 17.4 13.2** 16.0 16.0
Raw material costs 10,502 12,502 13,977 16,074 18,404
Staff costs 2,156 2,494 2,320 2,621 2,962
Advertisement costs 4,121 4,901 6,763 7,507 8,333
Others 4,368 5,173 6,501 6,967 7,571
Total expenditure 21,147 25,070 29,561 33,169 37,270
EBITDA 5,806 6,584 6,271 8,396 10,945
% growth 12.5 13.4 (4.7) 33.9 30.4
EBITDA margin (%) 21.5 20.8 17.5 20.2 22.7
Other income 65.9 84.9 110.4 115.9 121.7
Interest costs (405) (399) (445) (438) (485)
Depreciation 393.1 437.0 489.3 546.3 595.1
Profit before tax 5,884 6,630 6,337 8,403 10,957
% growth 13.2 12.7 (4.4) 32.6 30.4
Tax 1,419 1,663 1,679 2,353 3,287
Effective tax rate (%) 24.1 25.1 26.5 28.0 30.0
Net profit 4,465 4,968 4,658 6,050 7,670
% growth 10.9 11.3 (6.2) 29.9 26.8
Adjusted net profit 4,465 4,968 4,658 6,050 7,670
% growth 10.9 11.3 (6.2) 29.9 26.8
Extra-ordinary items - - 599 - -
Reported net profit 4,465 4,968 5,257 6,050 7,670
% growth 10.8 11.3 5.8 15.1 26.8
Source: Company, Nirmal Bang Institutional Equities Research
** Net sales in FY14E is expected to be up by ~16% YoY, but revenue growth is likely to be lower due to low operating income after sale of IT outsourcing business to the parent
Exhibit 38: Balance sheet
Y/E March (Rsmn) FY12 FY13 FY14E FY15E FY16E
Equity 136 136 136 136 136
Reserves 4,218 4,760 6,074 7,405 9,092
Net worth 4,354 4,896 6,210 7,541 9,228
Liabilities 4,354 4,896 6,210 7,541 9,228
Gross block 6,132 6,735 8,555 9,355 10,155
Depreciation 3,587 3,929 4,418 4,964 5,559
Net block 2,544 2,807 4,137 4,391 4,596
Capital work-in-progress 694 1,020 - - -
Inventories 2,177 1,853 2,663 2,576 3,501
Debtors 873 812 759 1,063 1,050
Cash 3,816 4,791 4,499 5,927 5,737
Liquid Investments 471 471 471 471 471
Other current assets 721 1,314 1,446 1,662 1,912
Total current assets 8,058 9,242 9,837 11,700 12,671
Creditors 3,690 4,666 4,758 6,174 6,507
Other current liabilities 3,252 3,506 3,005 2,375 1,531
Total current liabilities 6,942 8,172 7,763 8,549 8,039
Net current assets 1,116 1,070 2,073 3,151 4,633
Total assets 4,354 4,896 6,210 7,541 9,228
Source: Company, Nirmal Bang Institutional Equities Research
Exhibit 37: Cash flow
Y/E March (Rsmn) FY12 FY13 FY14E FY15E FY16E
EBIT 5,413 6,147 5,782 7,850 10,350
(Inc.)/dec. in working capital (441) 1,021 (1,296) 351 (1,672)
Cash flow from operations 4,973 7,168 4,486 8,201 8,678
Other income 66 85 110 116 122
Depreciation 393 437 489 546 595
Interest paid (-) 405 399 445 438 485
Tax paid (-) (1,419) (1,663) (1,679) (2,353) (3,287)
Dividends paid (-) (3,400) (3,808) (3,942) (4,719) (5,982)
Extra-ordinary items - - 599 - -
Net cash from operations 1,017 2,618 508 2,229 611
Capital expenditure (-) (999) (1,025) (800) (800) (800)
Net cash after capex 19 1,593 (292) 1,429 (189)
Inc./(dec.) in long-term borrowing (1) - - - -
Inc./(dec.) in borrowings (1) - - - -
(Inc.)/dec. in investments (84) - - - -
Cash from financial activities (84) - - - -
Others (551) (618) - - -
Opening cash 4,433 3,816 4,791 4,499 5,927
Closing cash 3,816 4,791 4,499 5,927 5,737
Change in cash (617) 975 (293) 1,429 (190)
Source: Company, Nirmal Bang Institutional Equities Research
Exhibit 39: Key ratios
Y/E March FY12 FY13 FY14E FY15E FY16E
Per share (Rs)
EPS 32.8 36.5 34.2 44.5 56.4
DPS 25.0 28.0 29.0 34.7 44.0
Book value 32.0 36.0 45.7 55.4 67.9
Valuation (x)
P/E 40.3 36.3 38.7 29.8 23.5
P/BV 41.4 36.8 29.0 23.9 19.5
EV/EBITDA 30.3 26.6 27.9 20.7 15.9
EV/sales 6.5 5.5 4.9 4.2 3.6
Return ratios (%)
RoCE 106.6 105.2 81.7 86.2 89.7
RoE 109.0 107.4 83.9 88.0 91.5
Margins (%)
Gross margin 61.0 60.5 61.0 61.3 61.8
EBITDA margin 21.5 20.8 17.5 20.2 22.7
PBT margin 21.8 20.9 17.7 20.2 22.7
PAT margin 16.6 15.7 14.7 14.6 15.9
Turnover ratios
Fixed asset turnover ratio (x) 9.2 9.0 9.0 9.7 10.7
Avg. inventory period (days) 25 23 23 23 23
Avg. collection period (days) 11 10 8 8 8
Avg. payment period (days) 51 48 48 48 48
Solvency ratios (x)
Debt-equity (1.0) (1.1) (0.8) (0.8) (0.7)
Interest coverage (0.1) (0.1) (0.1) (0.1) -
Dividend yield (%) 1.9 2.1 2.2 2.6 3.3
Growth (%)
Sales 17.8 17.4 13.2 16.0 16.0
EBITDA 12.5 13.4 (4.7) 33.9 30.4
PAT 10.9 11.3 (6.2) 29.9 26.8
Source: Company, Nirmal Bang Institutional Equities Research
Institutional Equities
Colgate-Palmolive (India) 19
Disclaimer
Stock Ratings Absolute Returns
BUY > 15%
HOLD 0-15%
SELL < 0%
This report is published by Nirmal Bang’s Institutional Equities Research desk. Nirmal Bang has other business units with independent research teams separated by Chinese walls, and therefore may, at times, have different or contrary views on stocks and markets. This report is for the personal information of the authorised recipient and is not for public distribution. This should not be reproduced or redistributed to any other person or in any form. This report is for the general information for the clients of Nirmal Bang Equities Pvt. Ltd., a division of Nirmal Bang, and should not be construed as an offer or solicitation of an offer to buy/sell any securities.
We have exercised due diligence in checking the correctness and authenticity of the information contained herein, so far as it relates to current and historical information, but do not guarantee its accuracy or completeness. The opinions expressed are our current opinions as of the date appearing in the material and may be subject to change from time to time without notice.
Nirmal Bang or any persons connected with it do not accept any liability arising from the use of this document or the information contained therein. The recipients of this material should rely on their own judgment and take their own professional advice before acting on this information. Nirmal Bang or any of its connected persons including its directors or subsidiaries or associates or employees or agents shall not be in any way responsible for any loss or damage that may arise to any person/s from any inadvertent error in the information contained, views and opinions expressed in this publication.
‘Access our reports on Bloomberg Type NBIE <GO>’
Team Details:
Name Email Id Direct Line
Rahul Arora CEO [email protected] -
Hemindra Hazari Head of Research [email protected] +91 22 3926 8017 / 18
Dealing
Ravi Jagtiani Dealing Desk [email protected] +91 22 3926 8230, +91 22 6636 8833
Pradeep Kasat Dealing Desk [email protected] +91 22 3926 8100/8101, +91 22 6636 8831
Michael Pillai Dealing Desk [email protected] +91 22 3926 8102/8103, +91 22 6636 8830
Umesh Bharadia Dealing Desk [email protected] +91-22-39268226
Nirmal Bang Equities Pvt. Ltd.
Correspondence Address
B-2, 301/302, Marathon Innova,
Nr. Peninsula Corporate Park
Lower Parel (W), Mumbai-400013.
Board No. : 91 22 3926 8000/1
Fax. : 022 3926 8010