
Least-Squares Interpolation of Fused MR and CT Images in the Wavelet Domain
6
International Journal of Computer Applications (0975 – 8887) Volume 55– No.13, October 2012 1 Least-Squares Interpolation of Fused MR and CT Images in the Wavelet Domain Eman Sultan, Sayed El- Rabaie, and Fathi E. Abd El-Samie Dept. of Electronics & Electrical Comm. Faculty of Electronic Engineering, Menofia University, Menouf, 32952, Egypt Nawal El-Fishawy Dept. of Computer Science & Engineering, Faculty of Electronic Engineering Menofia University, 32952,Egypt Said E. El-Khamy Dept. of Electrical Engineering, Faculty of Engineering, Alexandria University, Egypt ABSTRACT A suggested approach is presented in this paper to obtain high-resolution images from the fusion and then interpolation of Magnetic Resonance (MR) and Computed Tomography (CT) images. MR and CT images are fused with either the Discrete Wavelet Transform (DWT) or the curvelet transform. After that, a least-squares interpolation step is carried out on the wavelet sub-bands of the fusion result. Simulation results show the feasibility of the fusion process to obtain images with more details and the efficiency of interpolation to obtain high-resolution images. General Terms Image processing. Keywords Image interpolation, Image fusion, and Curvelet transform. 1. INTRODUCTION Image fusion is considered as an integration of different source images to produce an image with higher visual quality than the source images. Image fusion is a very important topic for a wide variety of applications [1–5]. It has applications in medical imaging, remote sensing, and digital photographs. It is very important for medical applications, because images of different modalities for the same regions are available, and the fusion of these images will help in obtaining more useful detail information. A further interpolation step on the fused images will be important, if certain regions of them need to be magnified. Medical imaging has become a vital component of a large number of applications including diagnosis, research, and treatment. In order to provide more accurate clinical information for physicians to deal with medical diagnosis and evaluation, multimodality medical images are needed such as X-ray, CT, MR, Magnetic Resonance Angiography (MRA), and Positron Emission Tomography (PET) images [6]. These multimodality medical images usually provide complementary and occasionally conflicting information. For example, the CT image can provide dense structures like bones and implants with less distortion, but it cannot detect physiological changes, while the MR image can provide normal and pathological soft tissues information, but it cannot support the bone information. In this case, only one kind of image may not be sufficient to provide accurate clinical requirements for the physicians. Therefore, the fusion of the multimodal medical images is necessary, and it has become a promising and very challenging research area in recent years [7-10]. The fusion of MR and CT images of the same region or organ would result in an integrated image of much more details. Researchers have made some attempts for the fusion of MR and CT images. Most of these attempts are directed towards the application of the DWT for this purpose [11–13]. Due to the limited capability of the DWT to deal with images with curved structures, the application of the curvelet transform for this purpose gives better results [14]. The application of the curvelet transform for the fusion of MR and CT images, and an efficient implementation of the inverse interpolation techniques to obtain high-resolution versions from the fused images, were presented in [15]. A digital image interpolation method that is performed in the wavelet domain with a least-squares algorithm was presented in [16]. This method estimates wavelet coefficients in the high-frequency sub-images of the estimated high-resolution image from the low-resolution image using a least-squares algorithm. An inverse wavelet transform is then performed for the synthesis of the HR image. This algorithm is based on interpolating each block, separately in an adaptive manner. It considers both the mathematical model by which the image is acquired and the local activity levels of the block to be interpolated, and performs the interpolation in a small number of iterations. In this paper, we present a comparison between the curvelet transform and the wavelet transform for the fusion of MR and CT images, and an efficient implementation of the wavelet- based image interpolation with the least-squares algorithm to obtain high-resolution images from the fusion results. The paper is organized as follows. Section 2 reviews the wavelet fusion technique with concentration on its limitations and also the curvelet fusion technique. In section 3, the least-squares image interpolation algorithm is reviewed. Section 4 introduces the suggested wavelet-based image interpolation method. Section 5 gives the image quality metrics that can be used for quality assessment of fusion and interpolation results. Section 6 gives the experimental fusion and interpolation results. Finally, section 7 gives the concluding remarks. 2. THE IMAGE FUSION TECHNIQUES Several techniques have been presented for image fusion and an overview of these methods is given in [17]. In this paper, we will concentrate on the wavelet and the curvelet fusion techniques.
Transcript of Least-Squares Interpolation of Fused MR and CT Images in the Wavelet Domain

International Journal of Computer Applications (0975 – 8887)
Volume 55– No.13, October 2012
1
Least-Squares Interpolation of Fused MR and CT Images
in the Wavelet Domain
Eman Sultan, Sayed El-Rabaie, and Fathi E. Abd
El-Samie Dept. of Electronics & Electrical
Comm. Faculty of Electronic
Engineering, Menofia University, Menouf,
32952, Egypt
Nawal El-Fishawy Dept. of Computer Science &
Engineering, Faculty of Electronic
Engineering Menofia University,
32952,Egypt
Said E. El-Khamy Dept. of Electrical Engineering,
Faculty of Engineering, Alexandria University, Egypt
ABSTRACT
A suggested approach is presented in this paper to obtain
high-resolution images from the fusion and then interpolation
of Magnetic Resonance (MR) and Computed Tomography
(CT) images. MR and CT images are fused with either the
Discrete Wavelet Transform (DWT) or the curvelet transform.
After that, a least-squares interpolation step is carried out on
the wavelet sub-bands of the fusion result. Simulation results
show the feasibility of the fusion process to obtain images
with more details and the efficiency of interpolation to obtain
high-resolution images.
General Terms
Image processing.
Keywords
Image interpolation, Image fusion, and Curvelet transform.
1. INTRODUCTION Image fusion is considered as an integration of different
source images to produce an image with higher visual quality
than the source images. Image fusion is a very important topic
for a wide variety of applications [1–5]. It has applications in
medical imaging, remote sensing, and digital photographs. It
is very important for medical applications, because images of
different modalities for the same regions are available, and the
fusion of these images will help in obtaining more useful
detail information. A further interpolation step on the fused
images will be important, if certain regions of them need to be
magnified.
Medical imaging has become a vital component of a large
number of applications including diagnosis, research, and
treatment. In order to provide more accurate clinical
information for physicians to deal with medical diagnosis and
evaluation, multimodality medical images are needed such as
X-ray, CT, MR, Magnetic Resonance Angiography (MRA),
and Positron Emission Tomography (PET) images [6]. These
multimodality medical images usually provide
complementary and occasionally conflicting information. For
example, the CT image can provide dense structures like
bones and implants with less distortion, but it cannot detect
physiological changes, while the MR image can provide
normal and pathological soft tissues information, but it cannot
support the bone information. In this case, only one kind of
image may not be sufficient to provide accurate clinical
requirements for the physicians. Therefore, the fusion of the
multimodal medical images is necessary, and it has become a
promising and very challenging research area in recent years
[7-10].
The fusion of MR and CT images of the same region or organ
would result in an integrated image of much more details.
Researchers have made some attempts for the fusion of MR
and CT images. Most of these attempts are directed towards
the application of the DWT for this purpose [11–13]. Due to
the limited capability of the DWT to deal with images with
curved structures, the application of the curvelet transform for
this purpose gives better results [14]. The application of the
curvelet transform for the fusion of MR and CT images, and
an efficient implementation of the inverse interpolation
techniques to obtain high-resolution versions from the fused
images, were presented in [15].
A digital image interpolation method that is performed in the
wavelet domain with a least-squares algorithm was presented
in [16]. This method estimates wavelet coefficients in the
high-frequency sub-images of the estimated high-resolution
image from the low-resolution image using a least-squares
algorithm. An inverse wavelet transform is then performed for
the synthesis of the HR image. This algorithm is based on
interpolating each block, separately in an adaptive manner. It
considers both the mathematical model by which the image is
acquired and the local activity levels of the block to be
interpolated, and performs the interpolation in a small number
of iterations.
In this paper, we present a comparison between the curvelet
transform and the wavelet transform for the fusion of MR and
CT images, and an efficient implementation of the wavelet-
based image interpolation with the least-squares algorithm to
obtain high-resolution images from the fusion results. The
paper is organized as follows. Section 2 reviews the wavelet
fusion technique with concentration on its limitations and also
the curvelet fusion technique. In section 3, the least-squares
image interpolation algorithm is reviewed. Section 4
introduces the suggested wavelet-based image interpolation
method. Section 5 gives the image quality metrics that can be
used for quality assessment of fusion and interpolation results.
Section 6 gives the experimental fusion and interpolation
results. Finally, section 7 gives the concluding remarks.
2. THE IMAGE FUSION TECHNIQUES Several techniques have been presented for image fusion and
an overview of these methods is given in [17]. In this paper,
we will concentrate on the wavelet and the curvelet fusion
techniques.

International Journal of Computer Applications (0975 – 8887)
Volume 55– No.13, October 2012
2
2.1 Discrete Wavelet Image fusion In this sub-section, to better understand the concept and
procedure of the wavelet-based fusion technique, a schematic
diagram is given in Figure 1. In general, the basic idea of
image fusion based on wavelet transform is to perform a
multi-resolution decomposition on each source image. The
coefficients of both the low-frequency band (approximation
band) and high-frequency bands (details bands) of the images
to be fused are then merged with a certain fusion rule as
displayed in the middle block of Figure 1. The widely-used
fusion rule is the maximum selection. This simple rule just
selects the largest absolute value for each wavelet coefficient
at each location from the input images as the coefficient at the
location in the fused image. After that, the fused image is
obtained by performing the Inverse DWT (IDWT) of the
corresponding combined wavelet coefficients. Therefore, as
shown in Figure 1, the detailed fusion steps based on the
wavelet transform can be summarized below:
Step 1. The images to be fused must be registered to assure
that the corresponding pixels are aligned.
Step 2. These images are decomposed into the wavelet
domain.
Step 3. A certain fusion rule is performed to produce the
transform coefficients of the fused image.
Step 4. The fused image is constructed by performing an
inverse wavelet transform based on the combined
transform coefficients from Step 3.
The most frequently used rule is the maximum-
frequency rule, which selects the maximum coefficients from
the wavelet transformed images [13]. Then, the inverse
wavelet transform 1 is computed, and the fused image
),( yxI is reconstructed [5]:
1
1 2( , ) ( ( ( ( , )), ( ( , )))).I x y I x y I x y (1)
Fig 1 Wavelet fusion.
For long curved edges, the wavelet transform has limited
accuracy for edge localization. So, there is an alternative
approach, which has a high accuracy of curve localization
such as the curvelet transform [14].
2.2 Curvelet Image Fusion The DWT has been one of the most famous tools for image
and signal analysis, because of its advantageous property that
helps to localize point singularities in a signal or an image.
One major disadvantage of the DWT in image processing is
that it gives a large number of coefficients in all scales
corresponding to the edges of the image. So, in order to
exactly reconstruct the edges in an image, several
coefficients are required in order to exactly reconstruct the
edges in an image. This makes the DWT inefficient for
handling long curved edges. Recent approaches such as the
ridgelet transform and the curvelet transform are more
efficient in handling long linear and curvilinear singularities
in an image [18–22].
In the curvelet transform, the Additive Wavelet Transform
(AWT) is used instead of the DWT to decompose the image
into different sub-bands called the detail planes and the
approximation plane, and each sub-band of the detail planes is
then partitioned into small tiles. Then, the ridgelet transform
is applied on each tile [23]. In this way, the image edges can
be represented efficiently by the ridgelet transform, because
the image edges will now be almost like small straight lines.
Thus, the curvelet transform is considered as an effectively
extension of the ridgelet transform to detect curved edges. The
algorithm of the curvelet transform can be summarized in the
following steps [18–24]:
1. The image is split up into three sub-bands ∆1, ∆2, ∆3, and
P3 using the AWT, see Figure 2.
2. The sub-bands ∆1, ∆2, and ∆3 are divided into small
blocks called tiles.
3. The discrete ridgelet transform is performed on each tile
of the sub-bands ∆1, ∆2, and ∆3.
P3
C1
P
C2
C3
Fig 2 Curvelet transform.
Figure 3 shows a schematic diagram of the curvelet transform
steps. A detailed description of these steps is presented in the
following sub-sections.
The steps of the curvelet fusion approach of MR and CT
images [14] can be summarized as follows:
1. The MR and the CT images are registered.
2. The AWT is performed to spilt both images into
three sub-bands.
3. Tiling is performed on the sub-bands 1, ∆2, and 3
of each image.
4. The maximum-frequency fusion rule is used for the
fusion of the ridgelet transforms of the tiled sub-
bands.
5. An inverse curvelet transform is performed by the
AWT reconstruction as shown in Figure 4.
6. A post-processing step can be performed by using a
high-pass filter to sharpen the fusion result, if there
is some blurring due to the approximation of the
digital ridgelet transform.
7. These steps are expected to merge the details in
both images into a single image with much more
quality.
Register
ed
obser
vation
s
DWT of Images Fused DWT
Image
(2)
Image
(1)
Max(*)
Fused Image
Additive
Wavelet
Transform Tiling
Tiling
Ridgelet
Transform
on each tile
Tiling Ridgelet
Transform
on each tile
Additive
Wavelet
Transform Tiling
Tiling
Ridgelet
Transform
on each tile
Tiling
Ridgelet
Transform
on each tile
Ridgelet
Transform
on each tile
Additive
Wavelet
Transform Tiling
Tiling
Ridgelet
Transform
on each tile
Tiling
International Journal of Computer Applications (0975 – 8887)
Volume 55– No.13, October 2012
3
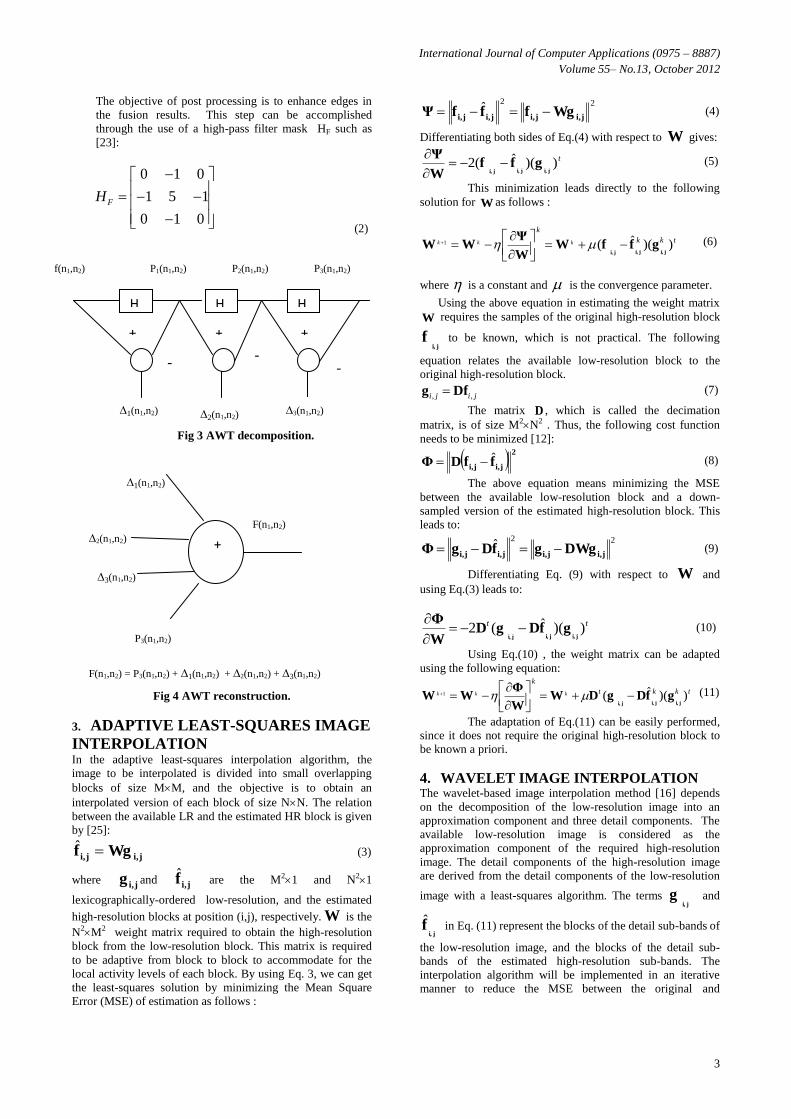
The objective of post processing is to enhance edges in
the fusion results. This step can be accomplished
through the use of a high-pass filter mask HF such as
[23]:
0 1 0
1 5 1
0 1 0
FH
(2)
Fig 3 AWT decomposition.
Fig 4 AWT reconstruction.
3. ADAPTIVE LEAST-SQUARES IMAGE
INTERPOLATION In the adaptive least-squares interpolation algorithm, the
image to be interpolated is divided into small overlapping
blocks of size MM, and the objective is to obtain an
interpolated version of each block of size NN. The relation
between the available LR and the estimated HR block is given
by [25]:
ji,ji, Wgf ˆ (3)
where ji,g and ji,f̂ are the M21 and N21
lexicographically-ordered low-resolution, and the estimated
high-resolution blocks at position (i,j), respectively. W is the
N2M2 weight matrix required to obtain the high-resolution
block from the low-resolution block. This matrix is required
to be adaptive from block to block to accommodate for the
local activity levels of each block. By using Eq. 3, we can get
the least-squares solution by minimizing the Mean Square
Error (MSE) of estimation as follows :
22ˆ
ji,ji,ji,ji, WgfffΨ (4)
Differentiating both sides of Eq.(4) with respect to W gives:
t))(ˆ(2ji,ji,ji,
gffW
Ψ
(5)
This minimization leads directly to the following
solution for W as follows :
tkk
k
kkk ))(ˆ(1
ji,ji,ji,gffW
W
ΨWW
(6)
where is a constant and is the convergence parameter.
Using the above equation in estimating the weight matrix
W requires the samples of the original high-resolution block
ji,f to be known, which is not practical. The following
equation relates the available low-resolution block to the
original high-resolution block.
jiji ,, Dfg (7)
The matrix D , which is called the decimation
matrix, is of size M2N2 . Thus, the following cost function
needs to be minimized [12]:
2
ji,ji, ffDΦ ˆ (8)
The above equation means minimizing the MSE
between the available low-resolution block and a down-
sampled version of the estimated high-resolution block. This
leads to:
22ˆ
ji,ji,ji,ji, DWggfDgΦ (9)
Differentiating Eq. (9) with respect to W and
using Eq.(3) leads to:
tt ))(ˆ(2ji,ji,ji,
gfDgDW
Φ
(10)
Using Eq.(10) , the weight matrix can be adapted
using the following equation:
tkkt
k
kkk ))(ˆ(1
ji,ji,ji,gfDgDW
W
ΦWW
(11)
The adaptation of Eq.(11) can be easily performed,
since it does not require the original high-resolution block to
be known a priori.
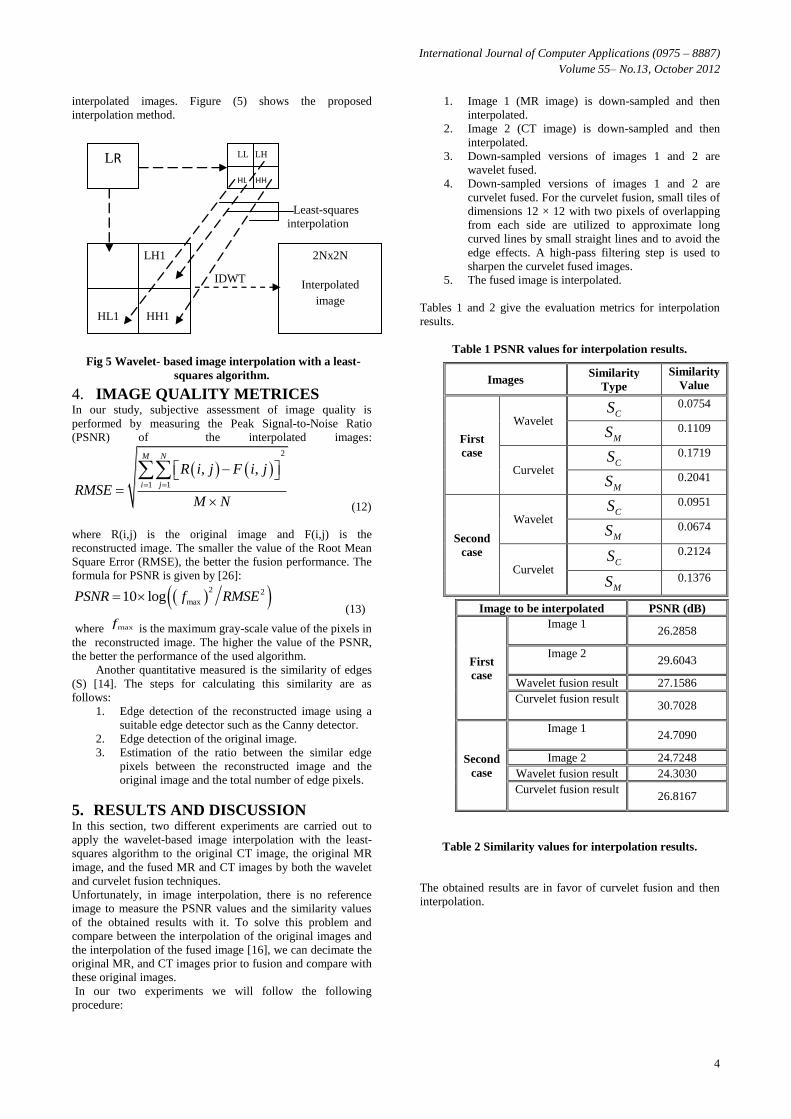
4. WAVELET IMAGE INTERPOLATION The wavelet-based image interpolation method [16] depends
on the decomposition of the low-resolution image into an
approximation component and three detail components. The
available low-resolution image is considered as the
approximation component of the required high-resolution
image. The detail components of the high-resolution image
are derived from the detail components of the low-resolution
image with a least-squares algorithm. The terms ji,
g and
ji,f̂ in Eq. (11) represent the blocks of the detail sub-bands of
the low-resolution image, and the blocks of the detail sub-
bands of the estimated high-resolution sub-bands. The
interpolation algorithm will be implemented in an iterative
manner to reduce the MSE between the original and
∆1(n1,n2) ∆2(n1,n2) ∆3(n1,n2)
+ + +
- -
-
H H
H
f(n1,n2) P1(n1,n2) P2(n1,n2) P3(n1,n2)
F(n1,n2) = P3(n1,n2) + ∆1(n1,n2) + ∆2(n1,n2) + ∆3(n1,n2)
∆3(n1,n2)
P3(n1,n2)
∆2(n1,n2)
∆1(n1,n2)
F(n1,n2)
+
International Journal of Computer Applications (0975 – 8887)
Volume 55– No.13, October 2012
4
interpolated images. Figure (5) shows the proposed
interpolation method.
Least-squares
interpolation
IDWT
Fig 5 Wavelet- based image interpolation with a least-
squares algorithm.
4. IMAGE QUALITY METRICES In our study, subjective assessment of image quality is
performed by measuring the Peak Signal-to-Noise Ratio
(PSNR) of the interpolated images:
2
1 1
, ,M N
i j
R i j F i j
RMSEM N
(12)
where R(i,j) is the original image and F(i,j) is the
reconstructed image. The smaller the value of the Root Mean
Square Error (RMSE), the better the fusion performance. The
formula for PSNR is given by [26]:
2 2
max10 logPSNR f RMSE (13)
where maxf is the maximum gray-scale value of the pixels in
the reconstructed image. The higher the value of the PSNR,
the better the performance of the used algorithm.
Another quantitative measured is the similarity of edges
(S) [14]. The steps for calculating this similarity are as
follows:
1. Edge detection of the reconstructed image using a
suitable edge detector such as the Canny detector.
2. Edge detection of the original image.
3. Estimation of the ratio between the similar edge
pixels between the reconstructed image and the
original image and the total number of edge pixels.
5. RESULTS AND DISCUSSION In this section, two different experiments are carried out to
apply the wavelet-based image interpolation with the least-
squares algorithm to the original CT image, the original MR
image, and the fused MR and CT images by both the wavelet
and curvelet fusion techniques.
Unfortunately, in image interpolation, there is no reference
image to measure the PSNR values and the similarity values
of the obtained results with it. To solve this problem and
compare between the interpolation of the original images and
the interpolation of the fused image [16], we can decimate the
original MR, and CT images prior to fusion and compare with
these original images.
In our two experiments we will follow the following
procedure:
1. Image 1 (MR image) is down-sampled and then
interpolated.
2. Image 2 (CT image) is down-sampled and then
interpolated.
3. Down-sampled versions of images 1 and 2 are
wavelet fused.
4. Down-sampled versions of images 1 and 2 are
curvelet fused. For the curvelet fusion, small tiles of
dimensions 12 × 12 with two pixels of overlapping
from each side are utilized to approximate long
curved lines by small straight lines and to avoid the
edge effects. A high-pass filtering step is used to
sharpen the curvelet fused images.
5. The fused image is interpolated.
Tables 1 and 2 give the evaluation metrics for interpolation
results.
Table 1 PSNR values for interpolation results.
Table 2 Similarity values for interpolation results.
The obtained results are in favor of curvelet fusion and then
interpolation.
Images Similarity
Type
Similarity
Value
First
case
Wavelet CS
0.0754
MS
0.1109
Curvelet CS
0.1719
MS
0.2041
Second
case
Wavelet CS
0.0951
MS
0.0674
Curvelet CS
0.2124
MS
0.1376
Image to be interpolated PSNR (dB)
First
case
Image 1
26.2858
Image 2
29.6043
Wavelet fusion result 27.1586
Curvelet fusion result
30.7028
Second
case
Image 1
24.7090
Image 2 24.7248
Wavelet fusion result 24.3030
Curvelet fusion result
26.8167
LR
mag
e
LH1
HL1 HH1
LL LH
HL HH
2Nx2N
Interpolated
image

International Journal of Computer Applications (0975 – 8887)
Volume 55– No.13, October 2012
5
(a) CT image. (b) M|R image.
(c) Wavelet fusion. (d) Curvelet fusion.
Fig 6 Fusion of MR and CT images for case 1.
(a) Interpolated CT image. (b) Interpolated MR image.
(c) Interpolated wavelet fusion. (d) Post processing of (c)
(e) Interpolated curvelet fusion. (f) Post processing of (e).
Fig 7 Interpolation results.
6. CONCLUSION In this paper, we presented an efficient way to obtain high-
resolution images from the fusion of MR and CT images. The
suggested approach adopts a least-squares strategy to build the
wavelet sub-bands of the required high-resolution image in an
iterative manner. Simulation results show the success of the
proposed approach to obtain images with better resolution,
especially when the curvelet transform is used to merge the
MR and CT images with a final post-processing step.
7. REFRENCES [1] A. Wang, H. J. Sun, and Y. Y. Guan, “The application of
wavelet transform to multi-modality medical image
fusion,” in IEEE International Conference on
Networking, Sensing and Control (IEEE, 2006), pp. 270–
274.
[2] H. Moustafa and S. Rehan, “Applying image fusion
techniques for the detection of hepatic lesions and acute
intra-cerebral hemorrhage,” in ITI 4th International
Conference on Information and Communications
Technology 2006 (IEEE, 2006).
[3] C. Pohl and J. L. van Genderen, “Multisensor image
fusion in remote sensing: concepts, methods and
application,” Int. J. Remote Sens. 19, 823–854 (1998).
[4] A. A. Goshtasby and S. Nikolov, “Image fusion:
advances in the state of the art,” Inf. Fusion 8, 114–118
(2007).
[5] M. Ouendeno, “Image fusion for improved perception,”
Ph.D. dissertation (Florida Institute of Technology,
2007).
[6] F. Maes, D. Vandermeulen, and P. Suetens, “Medical
image registration using mutual information,”
Proceedings of the IEEE, vol. 91, no. 10, pp. 1699–1721,
2003.
[7] V. Barra and J.-Y. Boire, “A general framework for the
fusion of anatomical and functional medical images,”
NeuroImage, vol. 13, no. 3, pp. 410–424, 2001.
[8] Y.-M. Zhu and S. M. Cochoff, “An object-oriented
framework for medical image registration, fusion, and
visualization,” Computer Methods and Programs in
Biomedicine, vol. 82, no. 3, pp. 258–267, 2006.
[9] V. S. Petrovic and C. S. Xydeas, “Gradient-based multi-
resolution image fusion,” IEEE Transactions on Image
Processing, vol. 13, no. 2, pp. 228–237, 2004.
[10] Z. Zhang and R. S. Blum, “A categorization of
multiscale-decomposition-based image fusion schemes
with a performance study for a digital camera
application,” Proceedings of the IEEE, vol. 87, no. 8, pp.
1315–1326, 1999.
[11] S. Udomhunsakul and P. Wongsita, “Feature extraction
in medical MRI images,” in Proceeding of 2004 IEEE
Conference on Cybernetics and
[12] L. Hui Intelligent Systems (IEEE, 2004), Vol. 1, pp.
340–344.., “Multi-sensor imager registration and fusion,”
Ph.D. dissertation (University of California, 1993).
[13] E. Canga, “Image fusion,” M.S. thesis (University of
Bath, 2002).
[14] F. E. Ali, I. M. El-Dokany, A. A. Saad, and F. E. Abd El-
Samie, “Curvelet fusion of MR and CT images,” Prog.
Electromagn.Res. C 3, 215–224 (2008).
[15] F. E. Ali, I. M. El-Dokany, A. A. Saad, and F. E. Abd El-
Samie, “High resolution image acquisition from
magnetic resonance and computed tomography scans
using the curvelet fusion algorithm with inverse

International Journal of Computer Applications (0975 – 8887)
Volume 55– No.13, October 2012
6
interpolation techniques” applied optics, Vol. 49, No. 1,
pp. 114-125, 1 January 2010.
[16] E. A. Soltan, S. El-Rabaie, N. EL-Fishawy, F. E. Abd
El-samie, S. E. Elkhamy, “Wavelet-Based Image
Interpolation with A Least-squares Algorithm”, computer
engineering conference (ICENCO),
10.1109/ICENCO.2010.5720435, 2010, pp. 105-106.
[17] Y. Wang and B. Lohmann, “Multisensor image fusion:
concept, method and applications,” Tech. Rep., Institute
of Automatic Technology, University of Bremen,
Bremen, Germany, 2000.
[18] J. L. Starck, E. Candes, and D. L. Donoho, “The curvelet
transform for image denoising,” IEEE Trans. Image
Process. 11, 670–684 (2002).
[19] G. Y. Chen and B. Kegl, “Image denoising with complex
ridgelets,” Pattern Recogn. 578–585 (2007).
[20] J.-L. Starck, P. Abrial, Y. Moudden, and M. K. Nguyen,
“Wavelets, ridgelets and curvelets on the sphere,”
Astron. Astrophys. 446, 1191–1204 (2006).
[21] F. E. Ali, I. M. El-Dokany, A. A. Saad, and F. E. Abd El-
Samie, “Curvelet fusion of MR and CT images,” Prog.
Electromagn. Res. C 3, 215–224 (2008).
[22] C. Chao and J. Tao, “Study of image magnification based
on curvelet transformation,” in ISPRS Congress Beijing
2008, Proceedings of Commission II, The International
Archives of the Photogrammetry, Remote Sensing, and
Spatial Information Sciences (International Society for
Photogrammetry and Remote Sensing, 2008), Vol. 37-
B2, pp. 289–292.
[23] J. Nunez, X. Otazu, O. Fors, A. Prades, V. Pala, and R.
Arbiol, “Multi-resolution-based image fusion with
additive wavelet decomposition,” IEEE Trans. Geosci.
Remote Sens. 37, 1204–1211 (1999).
[24] B. B. Saevarsson, J. R. Sveinsson, and J. A.
Benediktsson, “Combined wavelet and curvelet
denoising of SAR images,” in IEEE International
Geoscience and Remote Sensing Symposium (IGARSS)
(IEEE, 2004), Vol. 6, pp. 4235–4238.
[25] S. E. El-Khamy, M. M. Hadhoud, M. I. Dessouky, B.
M. Salam, and F. E. Abd El-Samie, “Adaptive Least-
squares Acquisition of HR Images”International Journal
of Information Acquisition (IJIA) , March 2005.
[26] T. Kratochvil and P. Simicek, “Utilization of MATLAB
for picture quality evaluation” ( Institute of Radio
Electronics, Brno University of Technology, 2005).