
Least absolute regression network analysis of the murine osteoblast differentiation network
8
BIOINFORMATICS Least Absolute Regression Network Analysis of the Murine Osteoblast Differentiation Network E.P. van Someren a* , B.L.T. Vaes b , W.T. Steegenga b,d , A.M. Sijbers c , K.J. Dechering c and M.J.T. Reinders a a Department of Mediametics, Delft University of Technology, 2600 GA Delft, The Netherlands, b Department of Applied Biology, University of Nijmegen, Nijmegen, The Netherlands, c N.V. Organon, Target Discovery Unit, Oss, The Netherlands, d Current affiliation: Nutrition, Metabolism and Genomics Group, Division of Human Nutrition, Wageningen University, Wageningen, The Netherlands ABSTRACT Motivation: We propose a reverse engineering scheme to discover genetic regulation from genome-wide transcription data that moni- tors the dynamic transcriptional response after a change in cellular environment. The interaction network is estimated by solving a linear model using simultaneous shrinking of the least absolute weights and the prediction error. Results: The proposed scheme has been applied to the murine C2C12 cell-line stimulated to undergo osteoblast differentiation. Results show that our method discovers genetic interactions that display significant enrichment of co-citation in literature. More detai- led study showed that the inferred network exhibits properties and hypotheses that are consistent with current biological knowledge. Availability: Software is freely available for academic use as a Matlab package, called GENLAB: http://genlab.tudelft.nl/genlab.html Contact: [email protected] Supplementary Information: Additional data, results and figures can be found at http://genlab.tudelft.nl/larna.html 1 INTRODUCTION The development of cells is largely determined by the past and current states of transcription of a relevant set of genes. The tran- scription levels themselves are the result of a complex network of influences exerted by the genes on each other through gene products and signaling pathways. In order to understand any developmental process, it is imperative to unravel the underlying genetic interac- tion network. This understanding might lead to the development of novel (therapeutic) intervention strategies. Although techniques like genome-wide location analysis (Lee et al., 2002) and promo- tor analysis (Tavazoie et al., 1999) may reveal some of the direct transcriptional interactions, the outcome of developmental events is still difficult to explain from sequence information and location data alone. Alternatively, microarray measurements sampled over time pre- sent a global view on transcriptional changes during development and allows to elucidate the regulatory network in a complementary manner, i.e. from transcript data to regulatory influences. Current successful methodologies to infer genetic interactions from microar- ray data, however, have primarily been restricted to the use of * to whom correspondence should be addressed perturbation (e.g. knockout) microarray data (Gardner et al., 2003; Segal et al., 2003; Rung et al., 2002; Pe’er et al., 2001; Hartemink et al., 2001) or learn interactions between representatives of gene clusters (Guthke et al., 2005; Wahde and Hertz, 2001). Here, we present the Least Absolute Regression Network Algo- rithm (LARNA), an efficient and robust method to infer a sparse genetic regulatory network structure from microarray data sampled over time. In our framework, a generative linear model is learned to predict the expression values of a target gene, based on a linear combination of the past expression values of an automatically selec- ted set of genes, denoted as its regulators. The main advantage of our method is the automatic determination of the network structure from the data. We applied our method on a time-course microarray data set of the mouse C2C12 cell-line with and without stimulation to undergo osteoblast differentiation. Results show that LARNA dis- covered genetic interactions that are significantly more co-cited in literature than can be expected by chance. To a large extent LARNA shows higher enrichment of co-citation than hierarchical clustering. This exemplifies the fact that our network inference methodology presents a complementary approach to the more popular clustering methods, by aiming at discovering regulatory behavior instead of functional units. The final network that was discovered presents a global view on the genes and influences involved in driving mesenchymal stem cells into osteoblastic or myoblastic differentiation. The network also poses hypotheses consistent with biological knowledge of which at least two were confirmed by literature study. 2 MATERIALS AND METHODS The complete pre-processing procedure consisted of 1) growing the cell cul- tures, harvesting samples and RNA isolation, 2) hybridisation and read-out of micro-arrays, 3) removing array outliers, 4) array normalisation, 5) gene selection and interpolation. This resulted in a single data set, on which different clustering and regression methods were applied. Each method results in a different network. All networks structures were tested for co- citation enrichment by comparing them to a co-citation network obtained from PubMed. A single regression network was chosen based on co-citation enrichment and its structure was visualized (using clustering results). 2.1 Cell culture and RNA isolation C2C12 murine mesenchymal progenitor cells (obtained from the Ame- rican Type Culture Collection) were maintained in Dulbecco’s modified © The Author (2005). Published by Oxford University Press. All rights reserved. For Permissions, please email: journals.permissions@oxfordjournals.org Bioinformatics Advance Access published December 6, 2005 by guest on June 12, 2013 http://bioinformatics.oxfordjournals.org/ Downloaded from
-
Upload
independent -
Category
Documents
-
view
6 -
download
0
Transcript of Least absolute regression network analysis of the murine osteoblast differentiation network
BIOINFORMATICS
Least Absolute Regression Network Analysis of theMurine Osteoblast Differentiation NetworkE.P. van Someren a∗, B.L.T. Vaes b, W.T. Steegenga b,d, A.M. Sijbers c, K.J.Dechering c and M.J.T. Reinders a
aDepartment of Mediametics, Delft University of Technology, 2600 GA Delft, The Netherlands,bDepartment of Applied Biology, University of Nijmegen, Nijmegen, The Netherlands, cN.V.Organon, Target Discovery Unit, Oss, The Netherlands, dCurrent affiliation: Nutrition, Metabolismand Genomics Group, Division of Human Nutrition, Wageningen University, Wageningen, TheNetherlands
ABSTRACTMotivation: We propose a reverse engineering scheme to discovergenetic regulation from genome-wide transcription data that moni-tors the dynamic transcriptional response after a change in cellularenvironment. The interaction network is estimated by solving a linearmodel using simultaneous shrinking of the least absolute weights andthe prediction error.Results: The proposed scheme has been applied to the murineC2C12 cell-line stimulated to undergo osteoblast differentiation.Results show that our method discovers genetic interactions thatdisplay significant enrichment of co-citation in literature. More detai-led study showed that the inferred network exhibits properties andhypotheses that are consistent with current biological knowledge.Availability: Software is freely available for academic use as a Matlabpackage, called GENLAB: http://genlab.tudelft.nl/genlab.htmlContact: [email protected] Information: Additional data, results and figurescan be found at http://genlab.tudelft.nl/larna.html
1 INTRODUCTIONThe development of cells is largely determined by the past andcurrent states of transcription of a relevant set of genes. The tran-scription levels themselves are the result of a complex network ofinfluences exerted by the genes on each other through gene productsand signaling pathways. In order to understand any developmentalprocess, it is imperative to unravel the underlying genetic interac-tion network. This understanding might lead to the developmentof novel (therapeutic) intervention strategies. Although techniqueslike genome-wide location analysis (Lee et al., 2002) and promo-tor analysis (Tavazoie et al., 1999) may reveal some of the directtranscriptional interactions, the outcome of developmental events isstill difficult to explain from sequence information and location dataalone.
Alternatively, microarray measurements sampled over time pre-sent a global view on transcriptional changes during developmentand allows to elucidate the regulatory network in a complementarymanner, i.e. from transcript data to regulatory influences. Currentsuccessful methodologies to infer genetic interactions from microar-ray data, however, have primarily been restricted to the use of
∗to whom correspondence should be addressed
perturbation (e.g. knockout) microarray data (Gardner et al., 2003;Segal et al., 2003; Rung et al., 2002; Pe’er et al., 2001; Harteminket al., 2001) or learn interactions between representatives of geneclusters (Guthke et al., 2005; Wahde and Hertz, 2001).
Here, we present the Least Absolute Regression Network Algo-rithm (LARNA), an efficient and robust method to infer a sparsegenetic regulatory network structure from microarray data sampledover time. In our framework, a generative linear model is learnedto predict the expression values of a target gene, based on a linearcombination of the past expression values of an automatically selec-ted set of genes, denoted as its regulators. The main advantage ofour method is the automatic determination of the network structurefrom the data. We applied our method on a time-course microarraydata set of the mouse C2C12 cell-line with and without stimulationto undergo osteoblast differentiation. Results show that LARNA dis-covered genetic interactions that are significantly more co-cited inliterature than can be expected by chance. To a large extent LARNAshows higher enrichment of co-citation than hierarchical clustering.This exemplifies the fact that our network inference methodologypresents a complementary approach to the more popular clusteringmethods, by aiming at discovering regulatory behavior instead offunctional units.
The final network that was discovered presents a global view onthe genes and influences involved in driving mesenchymal stem cellsinto osteoblastic or myoblastic differentiation. The network alsoposes hypotheses consistent with biological knowledge of which atleast two were confirmed by literature study.
2 MATERIALS AND METHODSThe complete pre-processing procedure consisted of 1) growing the cell cul-tures, harvesting samples and RNA isolation, 2) hybridisation and read-outof micro-arrays, 3) removing array outliers, 4) array normalisation, 5) geneselection and interpolation. This resulted in a single data set, on whichdifferent clustering and regression methods were applied. Each methodresults in a different network. All networks structures were tested for co-citation enrichment by comparing them to a co-citation network obtainedfrom PubMed. A single regression network was chosen based on co-citationenrichment and its structure was visualized (using clustering results).
2.1 Cell culture and RNA isolationC2C12 murine mesenchymal progenitor cells (obtained from the Ame-rican Type Culture Collection) were maintained in Dulbecco’s modified
© The Author (2005). Published by Oxford University Press. All rights reserved. For Permissions, please email: [email protected]
Bioinformatics Advance Access published December 6, 2005 by guest on June 12, 2013
http://bioinformatics.oxfordjournals.org/
Dow
nloaded from

Someren et al
Eagle’s medium (DMEM) supplemented with 10% newborn calf serum(HyCloner), penicillin (100 U/ml) and streptomycin (100 µg/ml) at 37◦Cin a humidified atmosphere containing 7.5% CO2. For differentiation experi-ments, cells were seeded at a density of 2.0 ·104 cells/cm2 and grown for 24hrs. From this culture, cells were harvested in triplicate and this time pointis denoted as time zero. Subsequently, medium was replaced by DMEMcontaining 5% NCS. One subculture received no treatment and another sub-culture was treated with 500 ng/ml BMP2 (R&D Systems) and 12.5 mMβ-glycerophosphate (Sigma) to induce osteoblast differentiation. Cells weresubsequently harvested from both sub-cultures at one, two, six and ten daysafter time zero. As expected, untreated cells developed into myoblasts, whe-reas the treated cells differentiated into osteoblasts which was confirmedby monitoring cell morphology and marker gene expression as describedpreviously Vaes et al. (2002); de Jong et al. (2004b).
Total RNA was extracted according to an acid guanidium thiocyanate-phenol-chloroform method (TriPurer Isolation Reagent, Boehringer Mann-heim) and RNA concentrations were determined by measuring the absor-bance at 260 nm. Poly(A)+ RNA was prepared from total RNA using theOligotexTM Method (Qiagen). Quantification of poly(A)+ RNA was car-ried out according to the RibogreenTM RNA quantitation assay (MolecularProbes).
2.2 Array hybridisationA microarray dataset was generated from the aforementioned 11 samples.We employed an experimental design based on a common reference sampleas described previously (Churchill, 2002). To this end, Cy5 labelled cDNAwas synthesized from mRNA purified from the cell cultures and hybridizedto Unigene 1 arrays (Incyte Genomics, Mountain View, CA) as describedpreviously (Yue et al., 2001). Cy3 labelled cDNA derived from mouse brainwas used as a control in these hybridisations.
2.3 Data pre-processingTaking the proper pre-preprocessing steps is important as it may heavilyinfluence the outcome. In the supplementary materials, the chosen pre-processing steps and their motivations are described in more detail. Here,we briefly describe the pre-processing steps that were taken.
After read-out, array outlier detection was performed on the arrays. Onearray (24h after treatment) was found to be aberrant and after manually beingconfirmed to be contaminated, it was removed from further analysis.
The common reference approach allowed us to employ the Cy3 intensitiesas a gene-specific way to compensate for array differences. Gene inductionsin time were expressed as a balanced ratio between biological and controlintensities after both were scaled to the initial untreated intensities. Thisresults in the normalised expression value of gene g on array a:
Xag =
Cy5ag Cy3
0g
Cy50g Cy3a
g
− 1 ifCy5a
g Cy30g
Cy50g Cy3a
g
≥ 1
1 −Cy5
0g C3a
g
Cy5ag Cy3
0g
else(1)
Here, Cy5ag denotes the spot intensity in the Cy5 channel of the g-th gene
on the a-th array, whereas Cy50g denotes the Cy5 intensity of the g-th gene,
averaged over the three untreated arrays at time zero. A similar notation isused for Cy3. Using Eq. 1, a normalised gene profile is constant zero if thespot intensities measured in the biological sample show the same deviationfrom its initial intensity level as its corresponding spot in the control sample.
After normalization, a set of significantly expressed genes was selectedbased on whether or not they showed an absolute gene expression value inany of the remaining arrays that exceeds a preset threshold α = 3.052. Thisthreshold was determined by taking the maximal observed absolute geneexpression values of a list of known housekeeping genes.
Having a non-uniform sampling, the data is augmented with a seriesof synthetic microarray results by using linear interpolation between sub-sequent arrays. Using a one-day interval, ∆t = 24h, the final data setresulted in 21 “measurements”, i.e. two series of 10 ”measurements” at days
1, 2, . . . , 10 and one measurement at zero. The choice of ∆t had minoreffect on the overall performance (see supplementary materials).
2.4 Regression networksWe inferred a genetic network by learning a mathematical model to predictfuture gene expression values based on past gene expression values. One ofthe simplest models is a linear genetic network model (D’Haeseleer et al.,1999; Gardner et al., 2003). The linear model assumes that the gene expres-sion level of each gene is the result of a weighted sum of all other geneexpression levels at the previous time-point, or in vector notation:
yq = W · xq + ε q ∈ 1, 2, . . . , Q (2)
Here ε models the error and Q is the number of microarray transition pairs,< xq ,yq >, that are available for learning and are indexed by q. If xq
represents a measurement at time t, e.g. xq = x(t), then yq = x(t + ∆t).The interaction parameter, wij ∈ W, represents the existence (wij 6= 0) orabsence (wij = 0) of a controlling action of regulator gene j on target genei, whether it is activating (wij > 0) or inhibiting (wij < 0), as well as thestrength (|wij |) of the relation. Note that all genes are target genes as wellas possible regulator genes, i.e. i, j ∈ 1, . . . , N . Furthermore, a bias and atreatment node were included in W by adding two artificial inputs to xq thatare treated as if they were normal genes, i.e. a “bias gene” with expressionvalue equal to one for all arrays and a “treatment gene” with zero expressionin untreated and one in treated arrays.
A standard approach to obtain an estimate of the complete set of modelparameters, W, from data, is to minimize the squared error between thepredicted yq and measured yq gene expression levels, i.e.:
W = arg minW
Q∑
q=1
||yq − yq ||2 (3)
However, standard linear algebra techniques will not be sufficient, becausethe number of microarray pairs is far less than the number of selected genes,resulting in a highly under-determined problem. Due to the resulting pro-blems of co-linearity and over-fitting, it is impossible to unambiguouslydetermine the best parameter set for the complete set of regulators and itbecomes essential to constrain the solution space appropriately (Liao et al.,2003).
Restricting the number of regulators follows the biological intuition thatonly a limited number of genes will directly influence a gene’s transcrip-tion during the process under consideration (Guelzim et al., 2002). Even ifthis assumption is violated in some cases, it makes sense to apply Occam’srazor and infer only the most prominent influences when insufficient data isavailable (Hashimoto et al., 2004). Also, to function stably in a stochasticenvironment, the global regulatory system needs to react robustly againstsmall perturbations in the regulatory influences and signalling pathways thatfeed it. Ensuring that the inferred models are robust against noise will the-refore regularize the inference process and direct it towards more plausiblemodels.
We obtained a combination of data-fit, robustness and limited connectivityby augmenting the standard squared error with a penalty term that sums theabsolute values of the weights (van Someren et al., 2003):
WLARNA = arg minW
Q∑
q=1
||yq − yq ||2 + λ
N∑
i=1
N∑
j=1
|wij | (4)
Here, λ provides a trade-off between data-fit versus robustness and limitedconnectivity. Note that robustness implies that small changes in the inputresult in small changes in the output, i.e. ∂yi/∂xj = wij are small. A solu-tion to this equation is, generally, found using only a few iterations of theEM-algorithm (Grandvalet, 1998). In statistical learning, this method is cal-led Least Absolute Shrinkage and Selection Operator (LASSO) (Tibshirani,1994), because it tends to shrink the weights (robustness) such that only afew weights remain non-zero (limited connectivity). As a result, LARNAautomatically selects from among all genes, that set of genes (called regula-tors) that, in combination, provides the best prediction of that gene’s future
2
by guest on June 12, 2013http://bioinform
atics.oxfordjournals.org/D
ownloaded from
LARNA
gene expression levels. The use of LASSO to infer genetic interactions wasfirst introduced in (van Someren et al., 2002) and shown to outperform otheralgorithms on synthetic data.
To test how well our method compares to other approaches, we have alsoimplemented three linear models (i.e. sparse QR (SQR), backward search(B) and forward beamsearch (F)), three non-linear approaches (i.e. DiscreteDynamic Bayesian Network (DDBN), Sigmoidal Gradient Ascent (SGA) andSigmoidal Least Absolute Penalization (SLAP)) and two time-lagged cor-relation based methods (i.e. Correlation Metric Construction (CMC) andSignificant Time-Lagged Correlation (STLC)). SQR is a standard linear alge-bra method based on Gaussian Elimination and QR decomposition thatreturns a (zero-error) matrix that consists completely of zeroes except for Rcolumns which contain non-zero values (R equals the rank of the system). Bis a method that finds sparse network solutions based on a greedy backwardsearch algorithm that for each target gene keeps removing the regulator withthe lowest weight until a given minimal number of regulators, Kmax, isreached or the error becomes non-zero (Weaver et al., 1999). F is a methodthat finds sparse network solutions based on a forward beam-search, withbeam-size K = 5 (van Someren et al., 2001). For each target gene, thismethod starts by checking all single-regulator networks. Then it checks alltwo-regulator networks that can be constructed by adding a regulator to eachof the best K single-regulator networks. This recursively repeats with moreregulators until the prediction error is below a desired level Emax. TheDDBN uses greedy hill-climbing with 100 restarts to find the best structure(with maximal connectivity Kmax) of a dynamic Bayesian network (vanBerlo et al., 2003). Before learning, data was discretized into three geneexpression levels using K-means clustering (as in (Pe’er et al., 2001)). SGAuses 100 restarts of gradient ascent to learn a linear model augmented with asigmoidal dose-response curve (similar to (Weaver et al., 1999; Wahde andHertz, 2001)) and recursively sets the lowest weights to zero until Zmax
non-zeros remain. SLAP is similar to SGA with the addition of the sumof absolute weights to the cost function. STLC first computes a matrix ofthe most significant correlation found between each pair of genes over allpossible time-lags and returns different networks by thresholding the cor-relations in this matrix based on significance. CMC is an implementationof Arkin et al. (1997) which constructs a directed network from a single-linked tree that connects genes that have similar correlation profiles. Such aprofile consists of the correlations to all other genes, individually maximizedfor all possible time-lags. All regression and cluster methods were appliedto the same outlier-removed normalized interpolated data. More detaileddescriptions of all methods can be found in the supplementary materials.
2.5 Co-citation network and enrichmentJenssen (Jenssen et al., 2001) has shown that a co-citation network reflectsbiologically meaningful relationships. One way to validate the networkresults is, therefore, to compare them against a co-citation network. To thisend, a list of gene abbreviations was constructed by extracting symbol nameand synonyms from the gene detail pages of MGI (Blake et al., 2003). Foreach gene abbreviation, PubMed was searched for publications that mentionthis term and a list of identifiers (PMID) referring to these publications wasextracted. A pair is said to be co-cited when there exists at least one paperthat mentions both:
Sij = min(1 , |⋃
s∈k(i)
⋃
t∈k(j)
(ps ∩ pt) |) (5)
Here, k(i) is the list of gene abbreviations of gene i and ps is the list ofPubMed IDs corresponding to term s.
For each network result, the number of true positives was determinedas the number of gene pairs for which the inferred network predicts aninteraction and that are co-cited:
TP = |{ (i, j) | wij 6= 0 ∧ Sij 6= 0 }| (6)
Because TP depends on the connectivity of the co-citation matrix as well ason the connectivity of the inferred matrix, two complementary performancemeasures were computed. Specificity (SP) indicates how often a proposed
interaction concerns genes that are related and is defined as TP divided bythe number of predicted interactions. Sensitivity (SE) indicates how much ofthe ‘ground truth’ is discovered and is defined as TP divided by the numberof pairs that are co-cited.
SP =TP
TP + FPSE =
TP
TP + FN(7)
Here, FP stands for false positives and FN for false negatives.
3 RESULTS
3.1 Clustering and co-expression networksC2C12 cells are myoblasts that form myotubes when cultured underlow serum conditions. Upon treatment with BMP2, the cells diffe-rentiate to an osteoblast phenotype (Vaes et al., 2002). We studiedgene expression at several time points during myoblast and osteo-blast differentiation. Figure 1 shows an overview of the microarraydata. A total of 101 genes (out of the 9596) showed significantchanges in expression with respect to zero under our experimen-tal conditions. To give a meaningful description of the data, thesegenes were grouped by hierarchical clustering into three main clu-sters. Cluster one consists of genes that are down-regulated duringeither osteoblast or myoblast differentiation. This cluster containsmany genes related to control of proliferation (e.g. Plf, Mcm5,Hmga1). See supplementary materials for a complete list of genesymbols, gene names and accession numbers of all genes mentio-ned in this paper. The second cluster visible in Figure 1, consists ofgenes induced during osteoblast differentiation and contains typicalosteoblast markers such as Akp2, Bglap1 and Col1a1. Cluster threeconsists of genes that are induced during myoblast differentiationbut do not change in expression in BMP2-treated cells. Many well-known muscle-related genes, (e.g. Myh1, Tncc, Myom1, Casq1,Ckm) reside in this cluster.
Clustering is known to place functionally related genes into thesame group. The results of the hierarchical clustering could, there-fore, be interpreted as if it represents a network of fully connectedmodules (one module for each cluster) without any connectionsbetween modules. Such a co-expression network is illustrated inFigure 2 for a small subset of genes (chosen arbitrarily just forvisualization purposes).
3.2 Enrichment for co-citation in inferred networksIf the inferred networks express relationships that are biologicallymeaningful, it is expected that these networks also show enrichmentfor co-citation compared to random networks. Therefore, we con-structed a co-citation matrix for the 101 selected genes. This matrixis represented in Figure 3. In this matrix, genes are ordered andgrouped according to the clustering described in Figure 1. We expectthat co-expression networks obtained from clustering will tend toshow a strong enrichment for co-citation and that the co-citationenrichment scores of clustering may serve well as reference perfor-mance. Figure 3 already indicates that large clusters will not showa particulary strong enrichment for co-citation (only the cluster ofosteoblast markers is slightly enriched). Instead, the occurrence ofseveral small white triangles close to the diagonal suggests thatenrichment is stronger for small clusters. Alternatively, we foundthat genes in close hierarchical proximity share similar row andcolumn patterns, indicating that co-expressed genes tend to sharethe same pattern of co-citation with other genes (Chaussabel andSher, 2002).
3
by guest on June 12, 2013http://bioinform
atics.oxfordjournals.org/D
ownloaded from

Someren et al
Fig. 1. Gene expression values from eleven microarrays (columns)of the 101 genes that were significantly differentially expressed(rows) visualized as a heatmap. Black values represent positiveexpression, white values negative expression, whereas gray valuescorrespond the absence of expression (see colorbar at the right).Arrays consist of an untreated triplicate (ZE), an untreated subseries(UN) and a treated subseries (BB). Both subseries were sampled atone (24), two (48), six (144) and ten days (244) after ZE. ArrayBB24 was found to be contaminated and removed from furtheranalysis. The bar to the right of the heatmap indicates the cluste-ring result using hierarchical clustering with the cosine distance andcomplete linkage at a selection of three clusters. Before clusteringand network inference, the triplicate at ZE was averaged and linearinterpolation was used to obtain a virtual data set that is (uniformly)sampled at every day, e.g. expression values at UN72, UN96 andUN120 were obtained by linear interpolation between UN48 andUN144.
A systematic analysis of co-citation enrichment for differentdistance measures, linkage types and cluster sizes using hierarchicalclustering shows that most co-expression networks resulting fromsmall cluster sizes (i.e. a large number of clusters) are significantlyenriched for co-citation. A cosine distance measure and singlelinkage combination was found to score best (See supplementarymaterials). Therefore, we have used this “best-scoring” combina-tion as a method of reference to compare co-citation enrichment ofco-expression networks with regression networks.
Networks derived from clustering of genes show full connecti-vity within clusters (See Figure 2) whereas true genetic networksare likely to be sparsely connected. Furthermore, the clustering
Fig. 2. Illustration of co-expression network between a small arbitrarily cho-sen subset of genes based on the same clustering as was used in Figure 1.There are three clusters, i.e. one cluster of four genes, one cluster of six genesand one cluster of one gene. The corresponding co-expression network con-tains links between all genes in the same cluster, but no links between genesin different clusters. The position of the genes are based on a Sammon pro-jection which places genes closer together when their expression profiles aremore similar.
Fig. 3. Co-citation matrix extracted from PubMed between the 101 selec-ted genes. Because the matrix is symmetric, only the lower triangular part isvisualized. White patches indicate pairs of genes that are co-cited at leastonce, black patches indicate no co-citation. The main diagonal indicateswhether single genes are cited at least once (white) or not at all (black). Theupper triangle visualizes the same clustering result as was used in Figure 1.Pairs of genes that are in the same cluster are indicated by a common color,white patches indicate pairs of genes that are in different clusters. Note thata clustering in N clusters that is strongly enriched in co-citation would showup as N triangular structures below the diagonal that contain more whitepatches than elsewhere.
4
by guest on June 12, 2013http://bioinform
atics.oxfordjournals.org/D
ownloaded from

LARNA
algorithms do not reveal the causal relationships within the gene-tic network. Therefore, we devised a method for Least AbsoluteRegression Network Analysis (LARNA) that can unravel geneticnetwork structure from microarray data sampled in time. LARNAdistinguishes itself from other regression network models as it pro-vides a unique trade-off between data-fit versus robustness andlimited connectivity.
Repeated application of all methods on synthetic data genera-ted using a linear model with random structure shows that HC, F,STLC and LARNA perform on average significantly better than ran-dom, whereas SQR, B and CMC do not or only marginally (Seesupplementary materials).
Because synthetic data may not reflect the actual characteristics ofthe data, Figure 4 shows the performance of LARNA applied to theC2C12 differentiation data and compared to other network models.The specificity of the networks with random connections (Random)indicates that the prior probability of randomly selecting a pair ofco-cited genes is approximately 6% on average with roughly 2%standard deviation. The results show that standard linear approachesthat search for limited connectivity (B, F and SQR) perform signi-ficantly better than random if the inferred networks are sufficientlyconnected (SE > .04). Moreover, in the current setting, recursivelyadding possible regulators (F) seems a more fruitful search strat-egy than recursive elimination (B). The probabilistic and non-linearmodel (DDBN) is able to outperform randomly connected networkstructures, but is very sensitive to its parameter. The need to dis-cretize the data prior to learning in combination with the severelylimited number of samples may have contributed to DDBN’s badperformance. The non-linear SGA does outperform the randomlyconnected structures, but not its linear equivalent (B). More stri-kingly, SLAP is not able to return networks that are significantlybetter than random. Finally, STLC outperforms HC at larger sensiti-vity ranges and performs similarly when returning more sparselyconnected networks. In contrast, CMC (located at 1.6% sensiti-vity) which is also based on time-lagged correlations, but whichwas not originally intended for genetic network reconstruction, per-forms only marginally better than random. All of these methods aimto infer networks of limited connectivity, but they do not providemeasures against noise on the data. LARNA is able to outperformthese methods by incorporating both criteria simultaneously.
3.3 LARNA shows highest enrichment in co-citationThe best overall performance of all network inference methods wasobtained by LARNA, which outperformed the best clustering methodparticularly at intermediate levels of sensitivity and to a lesser extentat high levels of sensitivity. The λ parameter of LARNA determinesthe trade-off between fitting the data versus robustness and limitedconnectivity. When data-fit is less emphasized, the inferred net-works become less sensitive to noise and more sparsely connected,resulting in higher specificity (sometimes at the cost of sensitivity).This pronounced effect is exemplified by LARNA’s performance inFigure 4 around 6.5% sensitivity. While data-fit is relaxed, the sen-sitivity remains approximately 6.5%, but the specificity increasesfrom 15% to almost 32%. Here, LARNA removes unnecessary regu-lators from the network thereby removing a significant number offalse positives.
0 0.02 0.04 0.06 0.08 0.1 0.12 0.14 0.16 0.18 0.20
0.05
0.1
0.15
0.2
0.25
0.3
0.35
0.4
increasing Kmax
Kmax = 1
Emax = .5
increasing Emax
#clusters= 78
increasing#clusters
Kmax=4
Zmax=201
Zmax=200
selected networkλ = 501187
increasing λ
Sensitivity (SE)
Spe
cific
ity (
SP
)
Enrichment for co−citationRandom (Kmax)
SQR
B (Kmax)
F (Emax)
HC (#clusters)
DDBN (Kmax)
SGA (Zmax)
SLAP (Zmax)
CMC
STLC (Zmax)
LARNA (λ)
Fig. 4. The specificity (SP) versus sensitivity (SE) for the network methodswith respect to the co-citation network from Figure 3. Dotted lines depictperformance of random networks plus and minus one standard deviation.Lines with markers depict the performance of network inference methods fordifferent parameter settings (the parameter is depicted in the legend after themethod’s name). Parameter-less methods are depicted with a single marker.The upper-right corner specifies optimal performance. For each method, onesolution is chosen manually as a possible ”best” solution and indicated by anarrow with the corresponding parameter setting.
3.4 Analysis of a single inferred networkTo further illustrate the consistency of the networks inferred byLARNA with current biological expertise, a single network of inte-rest was selected to be analyzed in more detail. Because, the bestsetting of λ cannot be reliably determined from the already limi-ted amount of data (e.g. by cross-validation), we propose to utilizethe literature enrichment scores to select a single network solution.We have selected the LARNA solution that scored best in specificity(32%), while giving sufficiently high sensitivity (6%).
The selected network depicted in Figure 5 is indeed quite sparse,with genes having mostly one or two, but maximally four, regu-lators. Note that the sparseness constraint effects the number ofregulators only, the number of targeted genes can still vary fromnone (e.g. Ogn) to many (e.g. Dcn). Obviously, the position of thegenes within the network is also of importance, i.e. we expect geneswith regulating roles (e.g. Tnnc2) to be network initiators (i.e. influ-encing many but being influenced by few) and known (osteoblast)differentiation markers to be more downstream in the network (e.g.Bglap1).
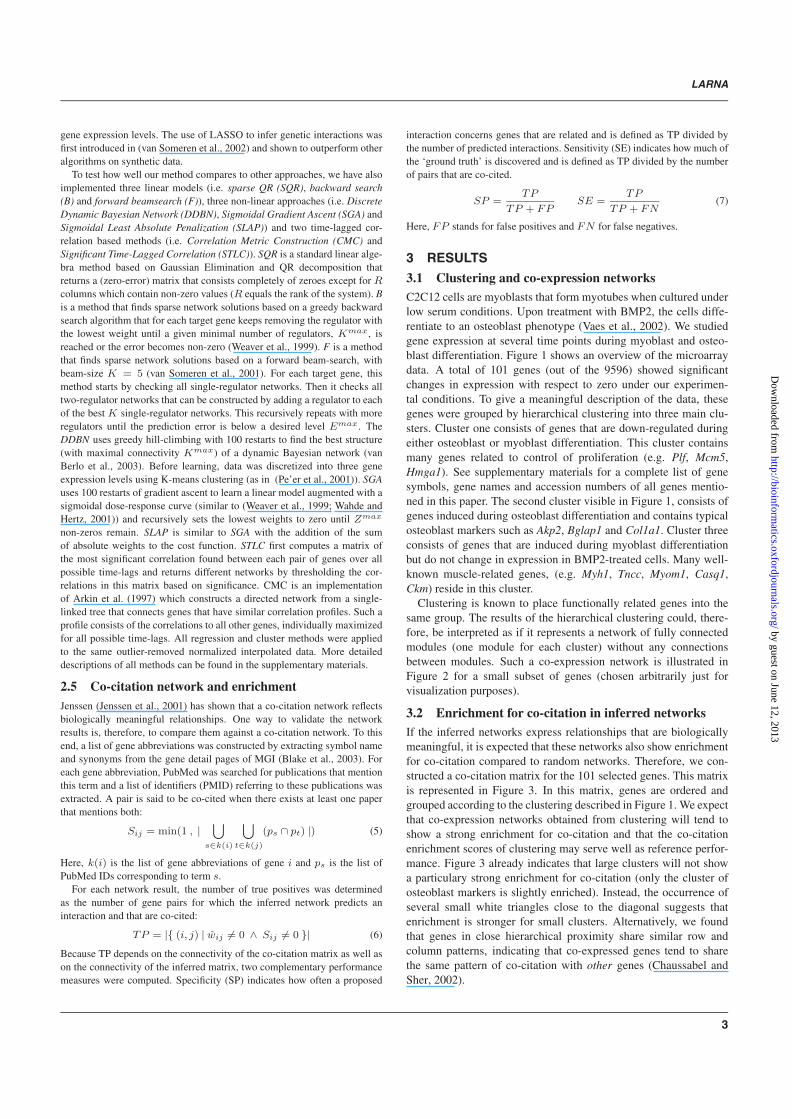
Furthermore, regulatory networks are expected to have a modulararchitecture (Featherstone and Broadie, 2002), consisting of highlyinterconnected modules where inter-module influences are exertedthrough only a few “hub” genes. Indeed, four modules can be recog-nized in the selected network, i.e. 1) the ”muscle development”module (M1) that is related to the normal differentiation of untrea-ted C2C12 precursor cells to myoblasts, containing Tnnc2 as a mainregulator and many muscle-related genes, 2) a module related toproliferation (M2 containing o.a. Mrpplf3, Hmga1 and Igfbp2) regu-lated primarily by proliferin (Plf ), 3) a module with genes related
5
by guest on June 12, 2013http://bioinform
atics.oxfordjournals.org/D
ownloaded from
Someren et al
Fig. 5. Diagram of the network inferred by LARNA. Each node (black box,white edge) represents a set of the genes with the same inferred input and out-put connections. For illustrative purposes, the genes that were not connectedto any other gene were left out of the diagram. Arrows represent an infer-red positive interaction (activation) from a regulating gene to its target(s),where the arrow head ↑ is positioned at the target. Similarly, a directednegative interaction (inhibition) is indicated by a > marker at the target.Self-regulations are not shown. The genes were grouped into four modules(large gray boxes) based on the clustering and known osteoblast differentia-tion phases (see text). Large arrows indicate interaction between modules.Numbers indicate TP per link.
to extra-cellular matrix formation and processing (M3) with deco-rin (Dcn) and periostin (Postn) as main regulators and 4) a moduleof genes related to osteoblast maturation and mineralization (M4containing o.a. Bglap1 and Ogn). To provide a better visualizationof the network structure, we utilized clustering and domain know-ledge to organize the genes into these four modules. These modulescorrespond to the clusters/modules recognized by hierarchical clu-stering and which were depicted in Figure 1. An exception is formedby the osteoblast differentiation module (cluster 2) that we splitinto a matrix formation module (M3) and a mineralisation module(M4) according to the phases that are recognized in the osteoblastdifferentiation process (Franceschi, 1999).
Consistent with a modular structure, connections from onemodule to another are established only through one of the few “hub”genes (i.e. Tnnc2, Plf, Dcn and Postn). Furthermore, these regula-ting influences from one module to another are consistently positiveor negative, i.e. all influences have the same sign. These influences(large arrows in Figure 5) are indicative of the global regulatorybehavior.
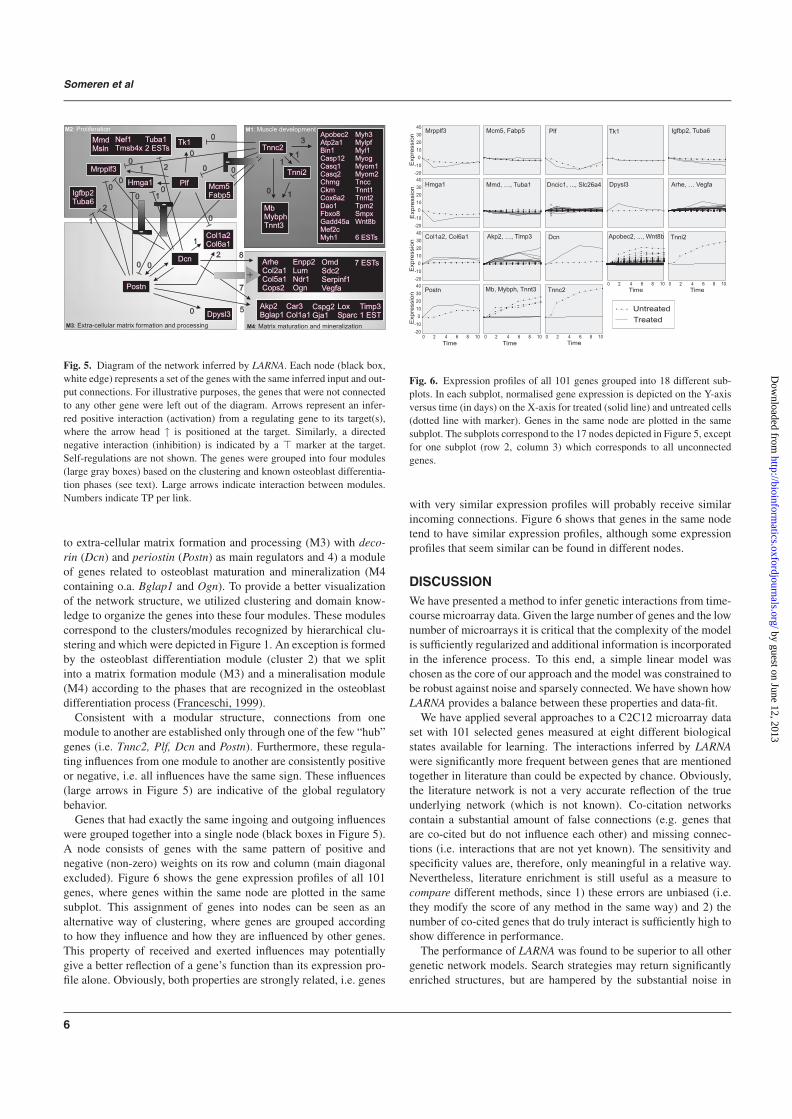
Genes that had exactly the same ingoing and outgoing influenceswere grouped together into a single node (black boxes in Figure 5).A node consists of genes with the same pattern of positive andnegative (non-zero) weights on its row and column (main diagonalexcluded). Figure 6 shows the gene expression profiles of all 101genes, where genes within the same node are plotted in the samesubplot. This assignment of genes into nodes can be seen as analternative way of clustering, where genes are grouped accordingto how they influence and how they are influenced by other genes.This property of received and exerted influences may potentiallygive a better reflection of a gene’s function than its expression pro-file alone. Obviously, both properties are strongly related, i.e. genes
Fig. 6. Expression profiles of all 101 genes grouped into 18 different sub-plots. In each subplot, normalised gene expression is depicted on the Y-axisversus time (in days) on the X-axis for treated (solid line) and untreated cells(dotted line with marker). Genes in the same node are plotted in the samesubplot. The subplots correspond to the 17 nodes depicted in Figure 5, exceptfor one subplot (row 2, column 3) which corresponds to all unconnectedgenes.
with very similar expression profiles will probably receive similarincoming connections. Figure 6 shows that genes in the same nodetend to have similar expression profiles, although some expressionprofiles that seem similar can be found in different nodes.
DISCUSSIONWe have presented a method to infer genetic interactions from time-course microarray data. Given the large number of genes and the lownumber of microarrays it is critical that the complexity of the modelis sufficiently regularized and additional information is incorporatedin the inference process. To this end, a simple linear model waschosen as the core of our approach and the model was constrained tobe robust against noise and sparsely connected. We have shown howLARNA provides a balance between these properties and data-fit.
We have applied several approaches to a C2C12 microarray dataset with 101 selected genes measured at eight different biologicalstates available for learning. The interactions inferred by LARNAwere significantly more frequent between genes that are mentionedtogether in literature than could be expected by chance. Obviously,the literature network is not a very accurate reflection of the trueunderlying network (which is not known). Co-citation networkscontain a substantial amount of false connections (e.g. genes thatare co-cited but do not influence each other) and missing connec-tions (i.e. interactions that are not yet known). The sensitivity andspecificity values are, therefore, only meaningful in a relative way.Nevertheless, literature enrichment is still useful as a measure tocompare different methods, since 1) these errors are unbiased (i.e.they modify the score of any method in the same way) and 2) thenumber of co-cited genes that do truly interact is sufficiently high toshow difference in performance.
The performance of LARNA was found to be superior to all othergenetic network models. Search strategies may return significantlyenriched structures, but are hampered by the substantial noise in
6
by guest on June 12, 2013http://bioinform
atics.oxfordjournals.org/D
ownloaded from
LARNA
the data. Alternatively, the non-linear models may potentially allowfor more realistic model behavior, but they suffer too severely fromunreliably parameter identification, due to the limited number ofmeasurements. To a large extent, LARNA showed a higher enrich-ment of co-citation than could be obtained with the best settingof hierarchical clustering. This makes network inference a validand interesting method to analyze micorarray data in a way thatis complementary to clustering. Whereas clustering obtains groupsof co-regulated genes, network inference goes one step further andunravels the causal relationships between them.
More detailed study showed that many inferred interactions andnetwork properties are consistent with current biological know-ledge and expertise. In our opinion, the selected network seems tocapture the more global inter-relationships corresponding to osteo-blast differentiation, but some important parts are still missing andmany inferred interactions are likely to reflect indirect effects. Thisis exemplified by the fact that the selected network contains onlyone known transcription factor (Hmga1). Furthermore, some well-known regulators of the myogenic and osteogenic pathways aremissing. With respect to the osteogenic regulator Runx2 this isexplained by the fact that the bone-specific transcript is not repre-sented on the array (de Jong et al., 2004a), whereas others did notshow significant expression. Nevertheless, some missing elementsare to be expected of a network that is generated ‘ab initio’ andfrom such an extremely low number of arrays.
It seems, however, that the global inter-relationships betweengenes and modules revealed by the network fit extremely well withcurrent knowledge of differentiation of mesenchymal cells. Diffe-rentiation of mesenchymal cells occurs with a concurrent declinein proliferative capacity (Aubin, 1998; Peng et al., 2004). Accor-dingly, the network shows negative feedback from the muscle andosteoblast differentiation modules to the proliferation module. Inaddition, it reveals negative feedback from the proliferation moduleto the osteoblast differentiation module. This is in line with expe-rimental data that show a mutually exclusive relation between pro-liferation and terminal differentiation of mesenchymal cells (Yinget al., 2003; Marzia et al., 2000).
Within the discovered network, a central role is found for peri-ostin and decorin, both extra-cellular genes involved in cell-matrixinteractions (Horiuchi et al., 1999; Danielson et al., 1997). Theyinitiate the forming of an extra-cellular matrix (Col1a1 and Timp3)and eventually initiate osteoblast maturation genes (Bglap1 andOgn). Such a proposed stimulation of the differentiation processby matrix-cell interactions is in line with published data. Disrup-tion of the decorin gene leads to abnormal collageneous matrixformation (Danielson et al., 1997). Under normal conditions, for-mation of the extracellular matrix drives the differentiation of osteo-blasts. Disruption of the matrix leads to impaired differentiationand an osteopenic phenotype in vivo (Franceschi et al., 1994; Laiet al., 2001; Corsi et al., 2002). The interactions between matrix-associated genes and terminal differentiation markers predicted byour computer-learned network are in good agreement with theseexperimental data.
In conclusion, we presented LARNA, a regression algorithm toinfer sparse genetic networks from microarray data sampled overtime. Interacting gene pairs identified by LARNA are enriched forco-cited genes. In this respect, LARNA outperforms standard net-work inference methods and clustering algorithms. Importantly, twoglobal hypothesis raised by LARNA conform to current biological
knowledge, i.e. 1) osteoblast maturation is induced by extra-cellularmatrix formation and 2) proliferation and differentiation are twomutually exclusive modes of operation. The interactions revealedby LARNA on the current limited set of microarrays are of a glo-bal character and do not reflect all details. Preliminary in-silicostudies support the intuition that samples should be taken more fre-quent at moments when the dynamics of the gene expression signalsincreases (results not shown). The enrichment scores were not sen-sitive to changes in the interpolation interval, but the interval atwhich measurements are obtained as well as the number of diffe-rent treatments will be much more important. Future studies withmore arrays sampled at smaller intervals are likely to provide a net-work map with higher resolution. It would also prove interestingto compare the results of the different regression networks withdifferent publicly available co-citation networks and other globalco-expression networks.
REFERENCESArkin, A., Shen, P., and Ross, J. (1997). A test case of correlation
metric construction of a reaction pathway from measurements.Science, 277:1275–1279.
Aubin, J. (1998). Advances in the osteoblast lineage. Biochemistryand Cell Biology, 76(6):899–910.
Blake, J., Richardson, J., Bult, C., Kadin, J., and Eppig, J. (2003).Mgd: The mouse genome database. Nucleic Acids Research,31:193–195.
Chaussabel, D. and Sher, A. (2002). Mining microarray expressiondata by literature profiling. Genome Biology, 3(10):R55.1–55.16.
Churchill, G. (2002). Fundamentals of experimental design for cdnamicroarrays. Nature Genetics, 32:490–495.
Corsi, A., Xu, T., Chen, X., Boyde, A., Liang, J., Mankani, M.,Sommer, B., Iozzo, R., Eichstetter, I., Robey, P., Bianco, P., andYoung, M. (2002). Phenotypic effects of biglycan deficiency arelinked to collagen fibril abnormalities, are synergized by deco-rin deficiency, and mimic ehlers-danlos-like changes in bone andother connective tissues. Journal of Bone and Mineral Research,17(7):1180–1189.
Danielson, K., Baribault, H., Holmes, D., Graham, H., Kadler, K.,and Iozzo, R. (1997). Targeted disruption of decorin leads toabnormal collagen fibril morphology and skin fragility. Journalof Cell Biology, 136(3):729–743.
de Jong, D., Vaes, B., Dechering, K., Feijen, A., Hendriks, J.,Wehrens, R., Mummery, C., van Zoelen, E., Olijve, W., and Stee-genga, W. (2004a). Identification of novel regulators associatedwith early-phase osteoblast differentiation. Journal of Bone andMineral Research, 19(6):947–958.
de Jong, D. S., Steegenga, W. T., Hendriks, J. M. A., van Zoelen,E. J. J., Olijve, W., and Dechering, K. J. (2004b). Regulationof notch signaling genes during bmp2-induced differentiation ofosteoblast precursor cells. Biochemical and Biophysical ResearchCommunications, 320(1):100–1007.
D’Haeseleer, P., Wen, X., Fuhrman, S., and Somogyi, R. (1999).Linear modeling of mrna expression levels during cns develop-ment and injury. In Pacific Symposium on Biocomputing ’99,volume 4, pages 41–52. World Scientific Publishing Co.
Featherstone, D. and Broadie, K. (2002). Wrestling with pleiotropy:genomic and topological analysis of the yeast gene expressionnetwork. Bioessays, 24(3):267–74.
7
by guest on June 12, 2013http://bioinform
atics.oxfordjournals.org/D
ownloaded from
Someren et al
Franceschi, R. (1999). The developmental control of osteoblast-specific gene expression: role of specific transcription factors andthe extracellular matrix environment. Critical Reviews in OralBiology and Medicine, 10(1):40–57.
Franceschi, R., Iyer, B., and Cui, Y. (1994). Effects of ascorbicacid on collagen matrix formation and osteoblast differentiationin murine mc3t3-e1 cells. Journal of Bone and Mineral Research,9(6):843–854.
Gardner, T., di Bernardo, D., Lorenz, D., and Collins, J. (2003).Inferring genetic networks and identifying compound mode ofaction via expression profiling. Science, 301(5629):102–105.
Grandvalet, Y. (1998). Least absolute shrinkage is equivalent toquadratic penalization. In International Conference on ArtificialNeural Networks (ICANN’98), Skvde, Sweden.
Guelzim, N., Bottani, S., Bourgine, P., and Kepes, F. (2002). Topo-logical and causal structure of the yeast transcriptional regulatorynetwork. Nature Genetics, 31:60–63.
Guthke, R., Moller, U., Hoffmann, M., Thies, F., and Topfer,S. (2005). Dynamic network reconstruction from gene expres-sion data applied to immune response during bacterial infection.Bioinformatics, 21(8):1626–1634.
Hartemink, A. J., Gifford, D. K., Jaakkola, T. S., and Young, R. A.(2001). Using graphical models and genomic expression data tostatistically validate models of genetic regulatory networks. InPacific Symposium on Biocomputing 2001, volume 6, pages 422–433, Hawai. World Scientific Publishing Co.
Hashimoto, R. F., Kim, S., Shmulevich, I., Zhang, W., Bittner,M. L., and Dougherty, E. R. (2004). Growing genetic regulatorynetworks from seed genes. Bioinformatics, 20(8):1241–1247.
Horiuchi, K., Amizuka, N., Takeshita, S., Takamatsu, H., Katsuura,M., Ozawa, H., Toyama, Y., Bonewald, L., and Kudo, A. (1999).Identification and characterization of a novel protein, periostin,with restricted expression to periosteum and periodontal ligamentand increased expression by transforming growth factor beta.Journal of Bone and Mineral Research, 14(7):1239–1249.
Jenssen, T., Laegreid, A., Komorowski, J., and Hovig, E. (2001). Aliterature network of human genes for high-throughput analysisof gene expression. Nature Genetics, 28:21–28.
Lai, C., Chaudhary, L., Fausto, A., Halstead, L., Ory, D., Avioli, L.,and Cheng, S. (2001). Erk is essential for growth, differentiation,integrin expression, and cell function in human osteoblastic cells.Journal of Biological Chemistry, 276(17):14443–14450.
Lee, T. I., Rinaldi, N. J., Robert, F., Odom, D. T., Bar-Joseph, Z.,Gerber, G. K., Hannett, N. M., Harbison, C. T., Thompson, C. M.,Simon, I., Zeitlinger, J., Jennings, E. G., Murray, H. L., Gor-don, D. B., Ren, B., Wyrick, J. J., Tagne, J.-B., Volkert, T. L.,Fraenkel, E., Gifford, D. K., and Young, R. A. (2002). Transcrip-tional regulatory networks in saccharomyces cerevisiae. Science,298(5594):799–804.
Liao, J. C., Boscolo, R., Yang, Y.-L., Tran, L. M., Sabatti, C.,and Roychowdhury, V. P. (2003). Network component analysis:Reconstruction of regulatory signals in biological systems. PNAS,100(26):15522–15527.
Marzia, M., Sims, N., Voit, S., Migliaccio, S., Taranta, A., Ber-nardini, S., Faraggiana, T., Yoneda, T., Mundy, G., Boyce, B.,Baron, R., and Teti, A. (2000). Decreased c-src expression enhan-ces osteoblast differentiation and bone formation. Journal of CellBiology, 151(2):311–320.
Pe’er, D., Regev, A., Elidan, G., and Friedman, N. (2001). Inferringsubnetworks from perturbed expression profiles. Bioinformatics,17(S1):S215–24.
Peng, Y., Kang, Q., Luo, Q., Jiang, W., Si, W., Liu, B. A., Luu,H. H., Park, J. K., Li, X., Luo, J., Montag, A. G., Haydon, R. C.,and He, T.-C. (2004). Inhibitor of dna binding/differentiationhelix-loop-helix proteins mediate bone morphogenetic protein-induced osteoblast differentiation of mesenchymal stem cells. J.Biol. Chem., 279:32941 – 32949.
Rung, J., Schlitt, T., Brazma, A., Freivalds, K., and Vilo, J. (2002).Building and analysing genome-wide gene disruption networks.Bioinformatics, 18(Suppl.2):S202–S210.
Segal, E., Shapira, M., Regev, A., Pe’er, D., Botstein, D., Koller, D.,and Friedman, N. (2003). Module networks: Identifying regula-tory modules and their condition-specific regulators from geneexpression data. Nature Genetics, 34(2):166–176.
Tavazoie, S., Hughes, J., Campbell, M. J., Cho, R., and Church,G. (1999). Systematic determination of genetic network architec-ture. Nature Genetics, 22:281–285.
Tibshirani, R. (1994). Regression selection and shrinkage via thelasso. Technical report.
Vaes, B., Dechering, K., Feijen, A., Hendriks, J., Lefevre, C.,Mummery, C., Olijve, W., van Zoelen, E., and Steegenga, W.(2002). Comprehensive microarray analysis of bone morphoge-netic protein 2-induced osteoblast differentiation resulting in theidentification of novel markers for bone development. Journal ofBone and Mineral Research, 17(12):2106–2118.
van Berlo, R., van Someren, E., and Reinders, M. (2003). Studyingthe conditions for learning dynamic bayesian networks to disco-ver genetic regulatory networks. Simulation: Transactions of thesociety for modeling and simulation, 79(12):689–702.
van Someren, E., Wessels, L., Backer, E., and Reinders, M.(2003). Multi-criterion optimization for genetic network mode-ling. Signal Processing, 83:763–775.
van Someren, E., Wessels, L., Reinders, M., and Backer, E. (2001).Searching for limited connectivity in genetic network models. InProceedings of the Second International Conference on SystemsBiology, pages 222–230, Pasadena, California.
van Someren, E., Wessels, L., Reinders, M., and Backer, E. (2002).Regularization and noise injection for improving genetic net-work models. In Chapter 12 in Computational and StatisticalApproaches to Genomics. Kluwer.
Wahde, M. and Hertz, J. (2001). Modeling genetic regulatory dyna-mics in neural development. Journal of Computational Biology,8(4):429–442.
Weaver, D., Workman, C., and Stormo, G. (1999). Modeling regu-latory networks with weight matrices. In Pacific Symposiumon Biocomputing ’99, volume 4, pages 112–123, Hawai. WorldScientific Publishing Co.
Ying, Q., andI. Chambers, J. N., and Smith, A. (2003). Bmpinduction of id proteins suppresses differentiation and sustainsembryonic stem cell self-renewal in collaboration with stat3. Cell,115(3):281–292.
Yue, H., Eastman, P., Wang, B., Minor, J., Doctolero, M., Nuttall,R. L., Stack, R., Becker, J., Montgomery, J., Vainer, M., andJohnston, R. (2001). An evaluation of the performance of cdnamicroarrays for detecting changes in global mrna expression.Nucleic Acids Research, 29(8):E41–1.
8
by guest on June 12, 2013http://bioinform
atics.oxfordjournals.org/D
ownloaded from