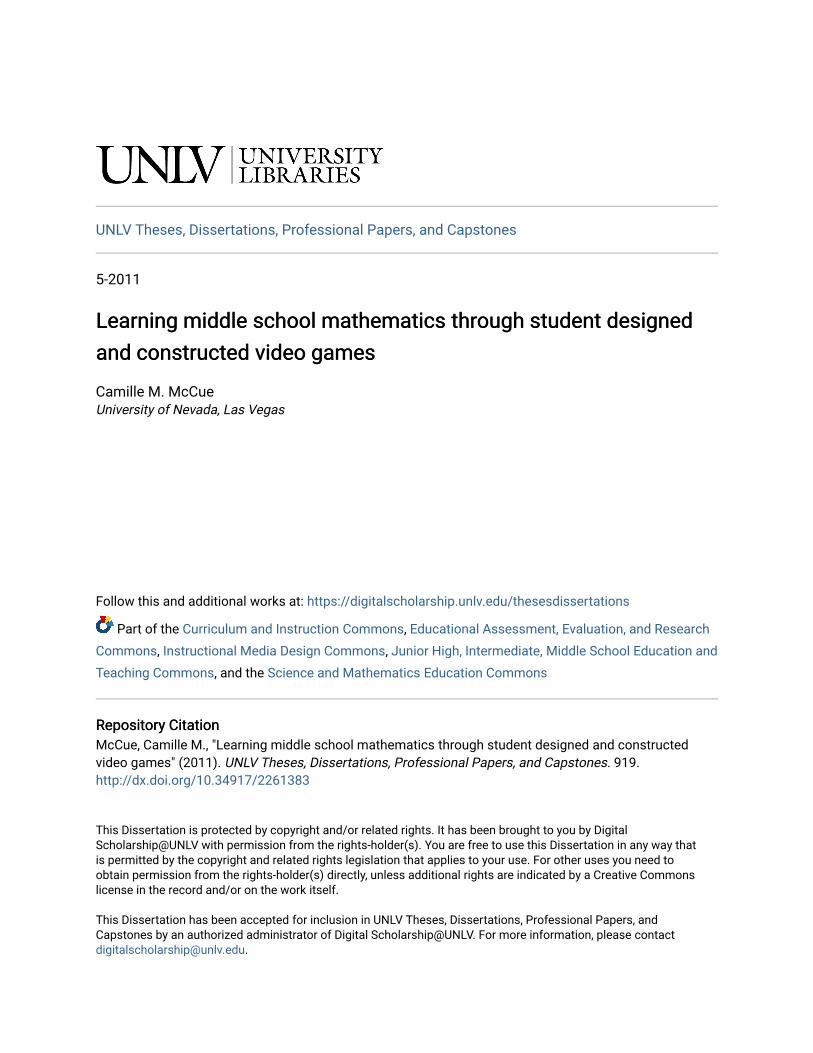
Learning middle school mathematics through student ...
309
UNLV Theses, Dissertations, Professional Papers, and Capstones 5-2011 Learning middle school mathematics through student designed Learning middle school mathematics through student designed and constructed video games and constructed video games Camille M. McCue University of Nevada, Las Vegas Follow this and additional works at: https://digitalscholarship.unlv.edu/thesesdissertations Part of the Curriculum and Instruction Commons, Educational Assessment, Evaluation, and Research Commons, Instructional Media Design Commons, Junior High, Intermediate, Middle School Education and Teaching Commons, and the Science and Mathematics Education Commons Repository Citation Repository Citation McCue, Camille M., "Learning middle school mathematics through student designed and constructed video games" (2011). UNLV Theses, Dissertations, Professional Papers, and Capstones. 919. http://dx.doi.org/10.34917/2261383 This Dissertation is protected by copyright and/or related rights. It has been brought to you by Digital Scholarship@UNLV with permission from the rights-holder(s). You are free to use this Dissertation in any way that is permitted by the copyright and related rights legislation that applies to your use. For other uses you need to obtain permission from the rights-holder(s) directly, unless additional rights are indicated by a Creative Commons license in the record and/or on the work itself. This Dissertation has been accepted for inclusion in UNLV Theses, Dissertations, Professional Papers, and Capstones by an authorized administrator of Digital Scholarship@UNLV. For more information, please contact [email protected].
-
Upload
khangminh22 -
Category
Documents
-
view
0 -
download
0
Transcript of Learning middle school mathematics through student ...
UNLV Theses, Dissertations, Professional Papers, and Capstones
5-2011
Learning middle school mathematics through student designed Learning middle school mathematics through student designed
and constructed video games and constructed video games
Camille M. McCue University of Nevada, Las Vegas
Follow this and additional works at: https://digitalscholarship.unlv.edu/thesesdissertations
Part of the Curriculum and Instruction Commons, Educational Assessment, Evaluation, and Research
Commons, Instructional Media Design Commons, Junior High, Intermediate, Middle School Education and
Teaching Commons, and the Science and Mathematics Education Commons
Repository Citation Repository Citation McCue, Camille M., "Learning middle school mathematics through student designed and constructed video games" (2011). UNLV Theses, Dissertations, Professional Papers, and Capstones. 919. http://dx.doi.org/10.34917/2261383
This Dissertation is protected by copyright and/or related rights. It has been brought to you by Digital Scholarship@UNLV with permission from the rights-holder(s). You are free to use this Dissertation in any way that is permitted by the copyright and related rights legislation that applies to your use. For other uses you need to obtain permission from the rights-holder(s) directly, unless additional rights are indicated by a Creative Commons license in the record and/or on the work itself. This Dissertation has been accepted for inclusion in UNLV Theses, Dissertations, Professional Papers, and Capstones by an authorized administrator of Digital Scholarship@UNLV. For more information, please contact [email protected].

LEARNING MIDDLE SCHOOL MATHEMATICS THROUGH STUDENT
DESIGNED AND CONSTRUCTED VIDEO GAMES
by
Camille Moody McCue
Bachelor of Arts University of Texas, Austin
1988
Master of Arts University of Texas, San Antonio
1993
A dissertation submitted in partial fulfillment of the requirements for the
Doctor of Philosophy in Curriculum & Instruction Department of Curriculum & Instruction
College of Education
Graduate College University of Nevada, Las Vegas
May 2011

Copyright by Camille Moody McCue 2011 All Rights Reserved

ii
THE GRADUATE COLLEGE We recommend the dissertation prepared under our supervision by Camille Moody McCue entitled Learning Middle School Mathematics Through Student Designed and Constructed Video Games be accepted in partial fulfillment of the requirements for the degree of Doctor of Philosophy in Curriculum and Instruction Randall Boone, Committee Chair Kent Crippen, Committee Member PG Schrader, Committee Member David James, Graduate Faculty Representative Ronald Smith, Ph. D., Vice President for Research and Graduate Studies and Dean of the Graduate College May 2011

iii
ABSTRACT
Learning Middle School Mathematics Through Student
Designed and Constructed Video Games
by
Camille Moody McCue
Dr. Randall Boone, Examination Committee Chair Professor of Curriculum and Instruction
University of Nevada, Las Vegas
Mathematics achievement is an area in which American precollege students are
faltering. Emerging research suggests that making mathematics instruction relevant and
applicable in the lives of youth may impact math achievement, especially when it
capitalizes on high-interest technologies such as video games.
Employing a quasi-experimental and descriptive approach, this study examined the
mathematics (i.e., numbers and operations, algebra, geometry, measurement, and
probability) that middle school students employed during their design and construction of
video games. First, it examined the mathematics content learned by 19 sixth and seventh
graders during their analysis, synthesis, and programming of three video game projects
over 7 months. Second, it measured the ability of the student programmers to laterally
transfer mathematics content from the technology context of game production to the
traditional context of paper-and-pencil tests. Third, it evaluated student attitudes toward
mathematics prior to and following video game design and construction. The performance
of student programmers was compared with that of a control group of nonprogrammers on
measures of transfer and affect.

iv
Results indicated that middle grade students successfully identified the events
defining game play (e.g., motion, collisions, and scoring) of three, simple video game
models. They successfully represented video game events in both mathematical and
programming forms by writing and coding (a) boundary conditions using inequalities, (b)
coordinate locations and identification of coordinate convergence, (c) directional
headings, (d) uniform linear motion, (e) variable changes, and (f) probability-based
consequences. They were also successful in writing programming code for their own
functional video games, with a high percentage of relevant mathematics content
incorporated therein. However, while treatment students transferred mathematical
knowledge from the technology to the traditional context, it appeared that, without explicit
bridging, the transfer was no better than comparison students. Treatment students also
demonstrated no significant changes in attitude associated with designing and constructing
video games. This study demonstrated that video game design and construction can be a
viable – although not significantly different – method, cognitively and affectively, of
instructing age-appropriate, standards-based mathematics content.
v
ACKNOWLEDGEMENTS
Thank you to my extraordinary family – Ian, Carson, and Michael – for their
constant love, support, and understanding during this undertaking. Nothing really matters
without you all, so I am grateful that you also believed that my efforts in pursuing a
doctorate were a valuable investment in the future.
Thanks to my parents, Beverly Dempsey-Moody and Dr. Eric Moody, for serving
as role models all my life. Thanks to my friends and colleagues who share the same hope
and enthusiasm for transforming education into something our youth find worthy and
fulfilling.
I would also like to express enormous gratitude to my students who enrolled in
math enrichment and served as the treatment group. This study simply would not have
been possible without your kindness and diligence in helping me execute my research.
And thanks to my outstanding dissertation committee, Dr. Randy Boone, Dr. Kent
Crippen, Dr. PG Schrader, and Dr. Dave James, for your advice, guidance, and
encouragement over the many years it has taken to bring this to fruition.

vi
Dedicated with love to my sons,
Carson McCue and Ian McCue.

vii
TABLE OF CONTENTS
ABSTRACT.........................................................................................................................iii
ACKNOWLEDGEMENTS.................................................................................................. v
DEDICATION.....................................................................................................................vi
LIST OF TABLES.............................................................................................................xiv
LIST OF FIGURES ...........................................................................................................xvi
CHAPTER 1 INTRODUCTION ........................................................................................ 1 Background..................................................................................................................... 1 Video Games............................................................................................................. 1 Video Games and Mathematics ................................................................................ 3 Youth-Oriented Programming Environments........................................................... 4 Selection of Programming Projects .......................................................................... 5 Attitudes Toward Mathematics................................................................................. 6 Conceptual Underpinnings for the Study........................................................................ 6 Recognizing Mathematics Inherent in the Design of Video Games......................... 7 Learning Complex Tasks .......................................................................................... 9 Lateral Transfer of Mathematics............................................................................. 10 Attitudes Toward Math and the Role of Attitude in Achievement in Mathematics........................................................................................................ 12 Statement of the Problem.............................................................................................. 13 Purpose of the Study ..................................................................................................... 15 Research Questions................................................................................................. 15 The mathematics of video game design and construction ................................ 15 The transfer of mathematics ability .................................................................. 16 Attitudes toward mathematics .......................................................................... 16 Hypotheses ............................................................................................................. 16 Hypothesis regarding the mathematics of video game design and construction .................................................................................... 16 Hypothesis regarding the transfer of mathematics ability ................................ 17 Hypothesis regarding attitudes toward mathematics ........................................ 17 Definitions .................................................................................................................... 17
CHAPTER 2 REVIEW OF RELATED LITERATURE.................................................. 21 Introduction................................................................................................................... 21 Literature Addressing the Mathematics of Video Games............................................. 21 Rationale for the Video Game Context................................................................... 22 Theories of Video Game Design and Construction ................................................ 23

viii
Video game design: contributions of James Gee ............................................. 24 Video game construction: contributions of Jeroen van Merriënboer ............... 28 Programming Environment Options for Preteenagers............................................ 31 Focus on Math Instruction in the Video Game Construction Context ................... 36 Literature Relevant to the Transfer of Mathematics Ability......................................... 38 The Significance of Measuring Mathematical Achievement ................................. 39 Mathematics Standards in the Middle Grades ....................................................... 40 Mathematics content standards ........................................................................ 40 Role of the content standards in video game design and construction ............. 42 Mathematics process standards ........................................................................ 42 Role of the process standards in video game design and construction............. 43 Curricula and Instructional Methods in Mathematics............................................. 44 Lateral Transfer from a Related Subject Area to Mathematics .............................. 47 Literature Relevant to Student Affect Associated with Mathematics........................... 53 Definition of Affect ................................................................................................ 54 Instruments for Measuring Affect........................................................................... 55 Historical affective instruments ........................................................................ 55 Criteria for distinguishing quality affective instruments .................................. 56 Attitudes Toward Mathematics Inventory (ATMI) .......................................... 57 Affect and Achievement ......................................................................................... 57 CHAPTER 3 METHODOLOGY ..................................................................................... 60 Research Questions....................................................................................................... 61 Research Design ........................................................................................................... 62 Design Philosophy .................................................................................................. 63 Overview of Quantitative Methods......................................................................... 64 Standardized tests in mathematics .................................................................... 65 Studywide mathematics content tests (pre/post study) ..................................... 65 Checkpoint mathematics content tests (pre/post video game project).............. 65 Event-recognition tallies ................................................................................... 65 Representations scores ...................................................................................... 66 Game model events included............................................................................ 66 Modifications included ..................................................................................... 66 Attitude inventory scores (pre/post treatment) ................................................. 66 Overview of Qualitative Methods........................................................................... 66 Self-reflections (pre/post video game project).................................................. 67 Observations ..................................................................................................... 67 Talk-alouds ....................................................................................................... 67 Evaluation of completed video games .............................................................. 68 Quantitative Methods Regarding Research Question 1a: Video Game Analysis ............................................................................................. 68 Event recognition tallies ................................................................................... 68 Quantitative Methods Regarding Research Question 1b: Video Game Synthesis............................................................................................ 69 Representations scores ...................................................................................... 69

ix
Quantitative Methods Regarding Research Question 1c: Video Game Programming ..................................................................................... 69 Qualitative Methods Regarding Research Question 1: Design and Construction......................................................................................... 70 Self-reflections.................................................................................................. 70 Completed video game files ............................................................................. 71 Observations ..................................................................................................... 71 Talk-alouds ....................................................................................................... 72 Quantitative Methods Regarding Research Question 2: Transfer of Math Content ....................................................................................... 72 Standardized tests ............................................................................................. 72 Studywide mathematics content tests ............................................................... 73 Checkpoint mathematics content tests .............................................................. 74 Quantitative and Qualitative Methods Regarding Research Question 3: Attitudes.................................................................................................................. 74 Attitude scores .................................................................................................. 75 Observations and talk-alouds............................................................................ 76 Study Participants ......................................................................................................... 76 Treatment Group..................................................................................................... 76 Comparison Group.................................................................................................. 76 Non-Random Assignment and Initial Differences.................................................. 77 Setting ........................................................................................................................... 77 Data Collection ............................................................................................................. 79 Sequence of Study Activities .................................................................................. 79 Outset, data-collection ...................................................................................... 80 Treatment period, general overview ................................................................. 80 Treatment period, data collection, pre-analysis ................................................ 81 Treatment period, data collection, analysis ...................................................... 82 Treatment period, data collection, synthesis..................................................... 82 Treatment period, lessons learned from pilot study.......................................... 83 Treatment period, data collection, pre-programming ....................................... 83 Treatment period, data collection, programming.............................................. 84 Treatment period, data collection, post-programming...................................... 85 Close of study, data collection.......................................................................... 85 Study Timeline........................................................................................................ 85 Instruments.................................................................................................................... 86 Instruments, Studywide Mathematics Content Tests (Pre/Post Study) .................. 86 Instruments, Checkpoint Math Content Tests (Pre/Post Study) ............................. 89 Instruments, Student Game Design Journals .......................................................... 89 Instruments, Video Game Files .............................................................................. 90 Instruments, Attitudes Inventory ............................................................................ 91 Mitigating Potential Threats to Validity ....................................................................... 92 Threats to Validity, Role of the Researcher............................................................ 92 Threats to Validity, Sample Selection .................................................................... 94 Threats to Validity, Instruments ............................................................................. 94 Threats to Validity, Maturation and Morbidity ...................................................... 94

x
Data Analysis of Quantitative Measures ...................................................................... 95 Data Analysis of Research Question 1: Event Tallies, Representations, Event Inclusions, Game Modifications ....................................... 96 Data Analysis of Research Question 2: Lateral Transfer of Math Ability ............................................................................ 98 Analysis of lateral transfer of math within the treatment group ....................... 98 Analysis of lateral transfer of math between groups ........................................ 99 Data Analysis of Research Question 3: Attitudes Toward Mathematics............................................................................. 101 CHAPTER 4 RESULTS ................................................................................................. 103 Summary of Research Questions ................................................................................ 103 Question 1, Mathematics of Video Game Design and Construction.................... 103 Question 2, Lateral Transfer of Mathematics Content Knowledge ...................... 103 Question 3, Attitudes Toward Mathematics ......................................................... 104 Initial Differences Between Groups ........................................................................... 104 Comparison by Achievement Test Scores ............................................................ 105 Achievement test scores, descriptive statistics ............................................... 105 Achievement test scores, tests of normality.................................................... 106 Achievement test scores, differences between groups.................................... 107 Comparison by Studywide Content Pre-test Scores ............................................. 107 Studywide content pre-test scores, descriptive statistics ................................ 107 Studywide content pre-test scores, tests of normality..................................... 108 Studywide content pre-test scores, differences between groups..................... 109 Comparison by ATMI Affective Scale Scores ..................................................... 109 Pre-treatment ATMI scores, descriptive statistics .......................................... 110 Pre-treatment ATMI scores, tests of normality .............................................. 111 Pre-treatment ATMI scores, differences between groups .............................. 114 Data Obtained from the Etch-a-Sketch Digital Toy ................................................... 114 Etch-a-Sketch Checkpoint Tests ........................................................................... 115 Etch-a-Sketch Initial Events Tally ........................................................................ 116 Etch-a-Sketch Representations ............................................................................. 119 Etch-a-Sketch representation ratings by type ................................................. 119 Etch-a-Sketch representation ratings by standard........................................... 120 Etch-a-Sketch Initial Reflections and Design Plans ............................................. 120 Statements regarding successes ...................................................................... 121 Statements regarding challenges..................................................................... 121 Statements regarding planned modifications .................................................. 121 Etch-a-Sketch Digital Toy Programming ............................................................. 123 Model events included .................................................................................... 125 Modifications included ................................................................................... 126 Etch-a-Sketch Final Reflections ........................................................................... 127 Statements regarding successes ...................................................................... 127 Statements regarding challenges..................................................................... 128 Statements regarding implemented modifications.......................................... 129 Data Obtained from the Frogger Video Game............................................................ 130

xi
Frogger Checkpoint Tests ..................................................................................... 130 Frogger Initial Events Tally .................................................................................. 131 Frogger Representations ....................................................................................... 133 Frogger representation ratings by type ........................................................... 135 Frogger representation ratings by standard..................................................... 136 Frogger Initial Reflections and Design Plans ....................................................... 137 Statements regarding successes ...................................................................... 137 Statements regarding challenges..................................................................... 138 Statements regarding modifications................................................................ 139 Frogger Video Game Programming ..................................................................... 140 Game model events included.......................................................................... 140 Modifications included ................................................................................... 142 Frogger Final Reflections ..................................................................................... 142 Statements regarding successes ...................................................................... 142 Statements regarding challenges..................................................................... 143 Statements regarding modifications................................................................ 143 Data Obtained from Tamagotchi Virtual Pet Video Game......................................... 145 Tamagotchi Checkpoint Tests .............................................................................. 145 Tamagotchi Initial Events Tally ........................................................................... 147 Tamagotchi Representations................................................................................. 149 Tamagotchi representation ratings by type..................................................... 151 Tamagotchi representation ratings by standard .............................................. 152 Tamagotchi Initial Reflections and Design Plans................................................. 153 Statements regarding successes ...................................................................... 153 Statements regarding challenges..................................................................... 153 Statements regarding modifications................................................................ 154 Tamagotchi Video Game Programming ............................................................... 157 Game model events included.......................................................................... 158 Modifications included ................................................................................... 159 Tamagotchi Final Reflections ............................................................................... 160 Statements regarding successes ...................................................................... 160 Statements regarding challenges..................................................................... 161 Statements regarding modifications................................................................ 161 Studywide Post-test Performance ............................................................................... 167 Studywide Questions Derived from Etch-a-Sketch .............................................. 168 Treatment group performance ........................................................................ 168 Comparison group performance ..................................................................... 169 Treatment vs. comparison group performance ............................................... 170 Studywide Questions Derived from Frogger ........................................................ 171 Treatment group performance ........................................................................ 171 Comparison group performance ..................................................................... 172 Treatment vs. comparison group performance ............................................... 173 Studywide Questions Derived from Tamagotchi.................................................. 174 Treatment group performance ........................................................................ 174 Comparison group performance ..................................................................... 175 Treatment vs. comparison group performance ............................................... 176

xii
Studywide Content Tests, Pre-test-to-Post-test Changes...................................... 177 Treatment group performance ........................................................................ 177 Comparison group performance ..................................................................... 178 Treatment vs. comparison group performance ............................................... 179 Post-treatment ATMI Inventory Outcomes .......................................................... 181 Studywide Pre-treatment-to-Post-treatment ATMI Scores (Within Groups) ....... 182 Studywide Pre-treatment-to-Post-treatment ATMI Scores (Between Groups) .... 184 Other Correlational Relationships .............................................................................. 185 CHAPTER 5 DISCUSSION........................................................................................... 186 Summary of Research Questions ................................................................................ 186 Question 1, Mathematics of Video Game Design and Construction.................... 186 Question 2, Lateral Transfer of Mathematics Content Knowledge ...................... 186 Question 3, Attitudes Toward Mathematics ......................................................... 187 Question 1a – Mathematics of Video Game Design and Construction: Analysis ...................................................................................................................... 187 Analyzing Video Game Events............................................................................. 188 Tallies of Initial Events by Project ....................................................................... 188 Question 1b – Mathematics of Video Game Design and Construction: Synthesis ..................................................................................................................... 189 Synthesizing Representations in Etch-a-Sketch ................................................... 189 Synthesizing Representations in Frogger ............................................................. 190 Synthesizing Representations in Tamagotchi Virtual Pet..................................... 191 Question 1c – Mathematics of Video Game Design and Construction: Programming .............................................................................................................. 192 Programming Etch-a-Sketch................................................................................. 193 Etch-a-Sketch model events............................................................................ 193 Etch-a-Sketch modifications........................................................................... 194 Programming Frogger........................................................................................... 194 Frogger model events...................................................................................... 194 Frogger modifications..................................................................................... 196 Programming Tamagotchi Virtual Pet .................................................................. 196 Tamagotchi model events ............................................................................... 196 Tamagotchi modifications .............................................................................. 197 Support of the Hypothesis Regarding Video Game Design and Construction........... 198 Question 2 – Lateral Transfer of Mathematics Content Knowledge .......................... 198 Question 2a – Lateral Transfer of Mathematics, Within Treatment Group....................................................................................... 199 Lateral transfer by content standard (treatment group) .................................. 199 Lateral transfer by project (treatment group).................................................. 200 Question 2b – Lateral Transfer of Mathematics, Between Groups Comparison ............................................................................... 201 Studywide shifts by raw score ........................................................................ 201 Studywide shifts by mathematics content standards....................................... 202 Support of the Hypothesis Regarding Transfer of Math Content Knowledge ........... 202 Question 3 – Attitudes Toward Mathematics ............................................................. 204

xiii
Question 3a – Attitudes Within the Treatment Group.......................................... 204 Question 3b – Attitudes Between Groups............................................................. 205 Rejection of the Hypothesis Regarding Attitudes Toward Mathematics ................... 206 Conclusions................................................................................................................. 206 Limitations .................................................................................................................. 209 Recommendations for Future Research...................................................................... 212 APPENDICES .................................................................................................................. 214
A. EXAMPLE TREATMENT STUDENT PROFILES........................................... 214 B. STUDYWIDE MATHEMATICS CONTENT TEST ......................................... 218 C. ATTITUDES TOWARD MATHEMATICS INVENTORY (ATMI) ................ 226 D. CHECKPOINT MATHEMATICS TESTS ......................................................... 229 E. EVENTS LIST TEMPLATE............................................................................... 240 F. EXAMPLE REPRESENTATIONS TEMPLATE (ETCH-A-SKETCH) ........... 242 G. REFLECTIONS AND PLANS DESIGN JOURNAL TEMPLATES ................ 245 H. TRANSCRIPT OF CLASS DISCUSSION (ETCH-A-SKETCH)...................... 248 I. TAMAGOTCHI VIDEO GAME MODEL
PROGRAMMING CODE WITH GAPS ............................................................ 258 J. UNLV IRB APPROVALS .................................................................................. 260 K. CONSENT FORMS ............................................................................................ 264
REFERENCES ................................................................................................................. 271 VITA................................................................................................................................. 290

xiv
LIST OF TABLES
Table 1 Example Video Game Events and Associated NCTM Content Standards ....................................................................................... 19 Table 2 Example Event Representations in Tamagotchi Virtual Pet....................... 19 Table 3 Mathematics Achievement Test Scores by Group.................................... 105 Table 4 Tests of Normality: Mathematics Achievement Test Scores by Group........................................................................................ 106 Table 5 Studywide Mathematics Content Pre-test Scores by Group..................... 107 Table 6 Tests of Normality: Studywide Mathematics Content Pre-test Scores by Group........................................................................................ 108 Table 7 ATMI Scales and Maximum Possible Values .......................................... 110 Table 8 Pre-treatment ATMI Inventory Scores by Scale and by Group................ 111 Table 9 Tests of Normality: ATMI Pre-treatment Scores Scores by Scale and by Group .................................................................. 113 Table 10 Etch-a-Sketch Checkpoint Test Performance, Pre-test to Post-test .......... 116 Table 11 Tally of Events Recorded for Etch-a-Sketch Digital Toy Model ............. 117 Table 12 Sample Representations Provided for the Etch-a-Sketch ......................... 118 Table 13 Ratings of All Representations Recorded for Etch-a-Sketch.................... 119 Table 14 Ratings of Mathematical Representations (by Standard) Recorded for the Etch-a-Sketch ............................................................... 120 Table 15 Tally of Etch-a-Sketch Model Events Included in Video Games............. 125 Table 16 Etch-a-Sketch Modifications Constructed ................................................ 126 Table 17 Frogger Checkpoint Test Performance (Pre-test to Post-test) .................. 131 Table 18 Tally of Events Recorded for Frogger Video Game Model During Game Analysis.............................................................................. 132 Table 19 Sample Representations Provided for the Frogger Video Game.............. 135 Table 20 Representations (by Type) Recorded for Frogger .................................... 136 Table 21 Mathematical Representations (by Standard) Recorded for Frogger ....... 137 Table 22 Events from Revised List that were Included in Frogger Video Games............................................................................... 141 Table 23 Frogger Modifications Constructed .......................................................... 142 Table 24 Tamagotchi Checkpoint Test Performance (Pre-test to Post-test)............ 146 Table 25 Tally of Events Recorded for the Tamagotchi Video Game Model During Game Analysis.............................................................................. 148 Table 26 Sample Representations Provided for the Tamagotchi Video Game ....... 150 Table 27 Representations Recorded for Tamagotchi Virtual Pet ............................ 151 Table 28 Mathematical Representations (by Type) Recorded for Tamagotchi Virtual Pet ............................................................................. 152 Table 29 Events from Revised List that were Included in Tamagotchi Video Games ........................................................................ 159 Table 30 Tamagotchi Modifications Constructed.................................................... 160 Table 31 Studywide Content Post-test Scores by Group ......................................... 168 Table 32 Studywide Content, Etch-a-Sketch Subset (Pre-test to Post-test) – Treatment Group ................................................. 169

xv
Table 33 Studywide Content, Etch-a-Sketch Subset (Pre-test to Post-test) – Comparison Group.............................................. 170 Table 34 Studywide Content, Etch-a-Sketch Subset (Pre-test to Post-test) – All Participants.................................................... 171 Table 35 Studywide Content, Frogger Subset (Pre-test to Post-test) – Treatment Group ................................................. 172 Table 36 Studywide Content, Frogger Subset (Pre-test to Post-test) – Comparison Group.............................................. 173 Table 37 Studywide Content, Frogger Subset (Pre-test to Post-test) – All Participants.................................................... 173 Table 38 Studywide Content, Tamagotchi Subset (Pre-test to Post-test) – Treatment Group ................................................. 175 Table 39 Studywide Content, Tamagotchi Subset (Pre-test to Post-test) – Comparison ......................................................... 175 Table 40 Studywide Content, Tamagotchi Subset (Pre-test to Post-test) – All participants .................................................... 176 Table 41 Studywide Content Test (Pre-test to Post-test) – Treatment Group ......... 177 Table 42 Studywide Content Test (Pre-test to Post-test) – Comparison Group ...... 178 Table 43 Studywide Content Test (Pre-test to Post-test) – All Participants ............ 180 Table 44 Within Groups Studywide Content (Pre-test to Post-test) Score .............. 181 Table 45 ATMI Post-treatment Scores by Scale and by Group............................... 182 Table 46 Within Group Studywide ATMI Confidence Pre-treatment to Post-treatment Scores..................................................... 183 Table 47 Within Group Studywide ATMI Value Pre-treatment to Post-treatment Scores..................................................... 183 Table 48 Within Group Studywide ATMI Motivation Pre-treatment to Post-treatment Scores..................................................... 184 Table 49 Within Group Studywide ATMI Enjoyment Pre-treatment to Post-treatment Scores..................................................... 184

xvi
LIST OF FIGURES
Figure 1 Research Questions..................................................................................... 61 Figure 2 Sequence of study activities........................................................................ 79Figure 3 Studywide mathematics content test item addressing coordinate geometry ................................................................................... 87 Figure 4 Studywide mathematics content test item addressing inequality graphing ..................................................................................... 88 Figure 5 Studywide mathematics content test item addressing variable manipulation ................................................................................. 88Figure 6 Etch-a-Sketch digital toy model provided to students .............................. 117 Figure 7 Student sketch showing aesthetic modifications for Etch-a-Sketch ...................................................................................... 122 Figure 8 Student sketch showing mathematical modifications for Etch-a-Sketch ...................................................................................... 123 Figure 9 Etch-a-Sketch featuring aesthetic and mathematical modifications ......... 127 Figure 10 Etch-a-Sketch, with modifications, as constructed by treatment student.................................................................................. 128 Figure 11 Programming code for the penguin object ............................................... 129 Figure 12 Frogger video game model ....................................................................... 132 Figure 13 A Frogger sketch recorded in one student’s Initial Plans ......................... 138 Figure 14 Frogger sketch showing planned design for a “Shark Drop” game................................................................................... 139 Figure 15 Completed “Lumberjack Attack” video game.......................................... 144 Figure 16 Completed “Shark Drop” video game ...................................................... 145 Figure 17 Tamagotchi Virtual Pet video game model .............................................. 147 Figure 18 Design plans for Tinki pet, including variables and aesthetic elements .............................................................................. 155 Figure 19 Planned Tamagotchi with multiple pets, scenes, interacting variables .................................................................................. 156 Figure 20 Alien Tamagotchi Virtual Pet ................................................................... 162 Figure 21 World War II Battle (Tamagotchi Virtual Pet) ......................................... 163 Figure 22 Bunny Tamagotchi.................................................................................... 164 Figure 23 BanMan in the Jungle (Tagmagotchi Virtual Pet) .................................... 165 Figure 24 Fluffo Sheep Tamagotchi Pet ................................................................... 166 Figure 25 Completed Tinki Tamagotchi Pet ............................................................. 167

1
CHAPTER 1
INTRODUCTION
This study addressed the mathematics that middle school students employed
during their production of video games. It examined the mathematics content learned by
6th and 7th graders during the design and construction of three video game projects over
the course of 7 months. The study also examined the ability of the student programmers to
laterally transfer mathematics content learned during programming to the traditional
context of a multiple-choice test. The performance of student programmers was compared
with that of a control group of nonprogrammers on measures of mathematics content and
attitude toward mathematics.
Background
Mathematics achievement has been identified as an area in which American
precollege students are faltering (United States Department of Education, 2009).
Organizations including the National Council of Teachers of Mathematics (NCTM, 2000)
and the White House (White House, 2009) are leading efforts at improvement. Emerging
research has suggested that making mathematics instruction relevant and applicable in the
lives of youth may impact math achievement, especially when it capitalizes on high-
interest technologies such as video games (Kafai, Franke, Ching, & Shih, 1998; Ge,
Thomas, & Greene, 2006; Devlin, 2010).
Video Games
Video games are a regular part of daily life for young people. A 2010 report, "The
Kids and Games: What Boys and Girls are Playing Today," revealed that 91% of preteen

2
boys and 93% of preteen girls play games online (M2 Research, 2010). The widespread
interest of video gaming has resulted in $10.5 billion annual revenue from computer and
video games in the United States (Siwek, 2010), besting film and all other entertainment
venues. Preteens and teens spend more time gaming than on homework (Cummings &
Vanderwater, 2007), and parents and teachers debate whether schools could capitalize on
children’s enthusiasm for video games for an educational purpose (Rice, 2007).
When used to facilitate learning in instructional settings, video games can serve an
educational role. “Educational games and simulations are experiential exercises that
transport learners to another world. There they apply their knowledge, skills, and
strategies in the execution of their assigned roles” (Gredler, 1996, p. 571). Computer-
based educational games can address any academic subject from the liberal and
performing arts to science, technology, engineering, and mathematics (STEM). For
example, a game-based history software title is Muzzy Lane’s Making History, in which
students role play the leaders of nations embroiled in World War II, making political,
economic, and military decisions and interacting with other leaders to shape the direction
of the war. Similarly, an example from the STEM disciplines is Software Kids’ Time
Engineers, which invites students to travel in a time machine to three different eras and
encounter typical engineering problems to be solved, including building pyramids,
irrigating farm land, and operating medieval drawbridges. In general terms video games
have enjoyed little success in education because teachers typically do not see their
educational value (Korzeniowski, 2007). However, some schools are now beginning to
embrace the educational possibilities of video games, asking, “What if, instead of seeing

3
school the way we’ve known it, we saw it for what our children dreamed it might be: a
big, delicious video game?” (Corbett, 2010, p. 2).
Video Games and Mathematics
New attention is being focused on the use of technology-based solutions, including
video games, for a particular instructional discipline deemed in need of substantial
revision, mathematics education. This emphasis may be resulting from increased
awareness of the need to address our nation’s comparatively poor student performance
internationally in mathematics (United States Department of Education, 2009). Data
collected during the most recent Trends in International Mathematics and Science Study
(TIMSS) (Gonzales et al., 2009) and the Program for International Student Assessment
(PISA) study (Fleischman, Hopstock, Pelczar, Shelley, & Xie, 2010), found that 4th and
8th grade students in the United States were being outperformed by peers in many
advanced nations around the world, with that trend extending into high school.
Additionally, the national emphasis on improving mathematics instruction has been
pushed by the rising expectations associated with the Elementary and Secondary
Education Act (US Dept. of Ed., 2010) and its accountability of schools, teachers and
students through mathematics achievement testing in the new millennium.
An analysis by the National Mathematics Advisory Panel of major studies
examining the use of instructional math software concluded that the use of such software
in the classroom “has generally shown positive effects on students’ achievement in
mathematics as compared with instruction that does not incorporate such technologies”
(US Dept. of Ed., 2008, p. 50). Much of the software on which this conclusion was based,
however, focused on training knowledge-level understanding, not higher-order thinking
4
skills. But as new products are developed and research emerges regarding how these
instructional software and video games can most effectively promote learning, the current
emphasis of computer-assisted instruction (CAI) on tutorial and drill activities may
diminish (Squire, 2005).
Looking beyond student engagement in commercially developed math software
products may yield the most productive results. For example, the National Mathematics
Advisory Panel stated that, “studies show that teaching computer programming to students
supports the development of particular mathematical concepts, applications, and problem
solving” (US Dept. of Ed., 2008, p. 50). The Panel went on to note that, “research
indicates that learning to write computer programs improves students’ performance
compared to conventional instruction, with the greatest effects on understanding of
concepts and applications, especially geometric concepts, and weaker effects on
computation” (p. 51). This recommendation suggested that instead of students working as
consumers of pre-made mathematics software, students should also be encouraged to use
math in producing their own products, via computer software design and programming.
As a result of employing math in a programming capacity, lateral transfer (Wright, Rich,
& Leatham, 2010) of mathematics skills may occur from the computer lab to the
mathematics classroom, reaching the overarching goal of boosting mathematics
performance among students.
Youth-Oriented Programming Environments
Numerous programming environments exist for conducting computer-
programming instruction in the precollege setting. For older teens, the selection of a
programming language logically may be tied to the ability to extend experience in the

5
language to university-level and professional programming activities. Flash, C++, and
Java (i.e., the programming language required on the current advanced placement
computer science exam) may be feasible choices at the high school level. But in K-8
schools, these languages are beyond the reach of child and preteen programmers. Instead,
the ubiquitous Logo-based, “turtle” programming languages may provide more suitable,
age-appropriate learning environments (Computer Science Teachers Association, 2006).
Selection of Programming Projects
Additionally, programming projects selected for implementation should be
instructionally do-able and personally relevant to their intended audiences (Milbrandt,
1995; Computer Science Teachers Association, 2006). Do-able is defined as achievable
and within reach of a student’s existing skill set in mathematics and logic, as well as
ability to learn the selected programming language. Personally relevant is defined as
engaging, interesting, and meaningful for the target age group, gender, and cultural
identity. Projects in which students design their own video games and then write computer
code to program the games for use by other students have been demonstrated as
instructionally sound vehicles for teaching both mathematics and programming concepts
(Kafai, 1995). Even the President of the United States recognized the value of encouraging
students to pursue the creation of their own games by announcing a competition that
challenged, “middle schoolers to come up with a video game design that incorporates
STEM concepts and encourages learning in its areas of study” (Mitchell, 2010).

6
Attitudes Toward Mathematics
Finally, the role of attitudes toward mathematics cannot be divorced from
investigations addressing achievement in mathematics. Studies have shown that attitude
towards mathematics is clearly related to achievement in mathematics (Dwyer, 1993).
Dispositions must also be considered within the context of specific technologies used for
instruction. As Squire (2005) pointed out, “while completion rates for online courses
barely reach 50%, gamers spend hundreds of hours mastering games.” Determining
mathematics dispositions of students designing video games may provide insight into
possible motivational routes to mathematics instruction and elevated mathematics
achievement.
Conceptual Underpinnings for the Study
In evaluating the teaching of mathematics through the vehicle of video game
design and construction, four components of this problem must be addressed:
1. Recognizing and describing the mathematics inherent in the design of video
games;
2. Learning complex tasks, specifically the task of computer programming a video
game to create a functional product;
3. Lateral transfer of mathematics from a programming environment to traditional
mathematical problem-solving tasks; and
4. Attitude of students towards mathematics and the role of attitude in achievement
in mathematics.
7
Each component will be discussed briefly according to its own theoretical
framework and in reference to its interconnection with the larger problem. Further, the
problem will focus specifically on the middle school age group.
Recognizing Mathematics Inherent in the Design of Video Games
The ability to “recognize and apply mathematics in contexts outside of
mathematics” defines the Connections principle of the NCTM Principles and Standards
(2000, p. 65). With regard to student design and construction of video games, students
must be able to able to first recognize the mathematics inherent in a game prior to
applying mathematics in the design and coding of their own original game.
Video games may be constructed through the application of multiple mathematical
principles. Foundational knowledge in a breadth of topics – including counting, variable
manipulation, coordinate geometry, conditional logic, and probability – is fundamental to
and recognizing the mathematics of game play. Some examples of how these topics may
be invoked include the following:
1. Counting may be applicable when determining how much time has elapsed or
whether all the dots have been eaten in a Pac-Man game.
2. Variable manipulation may be involved in variety of game play activities, from
decreasing a “lives” variable to adjusting a “health” variable of a game character.
3. Coordinate geometry may be needed to set the boundaries of the drawing pen
in an Etch-a-Sketch digital toy, or to determine whether a collision has occurred in
Asteroids (i.e., when the spaceship and an asteroid share the same coordinates).
4. Conditional logic may be used in a game such as Frogger when determining if
the frog is simultaneously in the stream and on a log – in which case he has not drowned.

8
5. Probability may be employed to produce a random number and provide a
likelihood of obtaining an optimistic, pessimistic, or neutral fortune in a Magic Eight Ball
video game.
In addition to proficiency in the above topics, ability in spatial reasoning is
required in video games that entail movement in a virtual world onscreen. Spatial
reasoning (i.e., mentally manipulating representations of objects) demonstrates the
student’s ability to abstract game characters and interactions in place of their real-world
analogues.
Students who demonstrate ability in spatial reasoning not only are more capable of
recognizing spatial relationships in the video game context, but also have been shown to
be more likely to major in STEM fields in university and ultimately pursue STEM careers
(Wai, Lubinski, & Benbow, 2009).
Recognizing and then representing the mathematics in an existing video game can
be achieved only through the filter of mathematics already known to the student. For
example, a student may recognize two balls in straight-line motion (e.g., one rolling
horizontally with uniform motion and another falling vertically with accelerative motion)
as having speed, but without knowledge of equations addressing gravitational
acceleration, the student may not be able to represent mathematically how the two motions
differ. The degree to which the student is capable of recognizing and representing the
mathematics within a video game is limited by his knowledge of mathematics.
Even with an extensive mathematical skill set, a student still may not easily move
from recognizing the math of a video game to representing it in the code of a
programming language. Establishing a supportive instructional environment can foster the

9
making of such connections in the context of the video game. NCTM standards note that,
“challenging problems encourage students to think about how familiar concepts and
procedures can be applied in new situations. New ideas surface quite naturally as
extensions of previously learned mathematics. With prompting from their teacher,
students routinely ask themselves, ‘How is this problem like what I have done before?
How is it different?’” (NCTM, 2000, p. 274)
Finally, the process of representing the mathematics of a video game may be
achieved through multiple routes (NCTM, 2000). These include the use of (a) word
representations, both oral and written, (b) mathematical symbols and formula
representations, and (c) pseudocode or computer programming code representations.
Representations cannot be provided for a game in its entirety. Instead, representations
define single states of objects or individual events (i.e., interactions between two
characters or an interaction between a character and its environment) within a video game.
The combined effect of multiple object states and events constitutes a complete video
game.
Learning Complex Tasks
From the design perspective, van Merriënboer (1990) viewed the video game as a
complex entity comprised of smaller, component parts. This is because a video game
results from the combined effect of hundreds (or more) objects interacting with each other
and their environment. Playing a video game requires managing and mastering the
component tasks of the game in the short run while simultaneously working purposefully
towards the overarching, complex game goal in the long run. For example, short run tasks
within the game Frogger include jumping through traffic and avoiding collision with
10
vehicles, while the long run task is to move five frogs safely to their lily pad homes.
Knowledge of the complex video game’s components defined by van Merriënboer (1990)
is necessary for describing and ultimately constructing a video game.
From the literary perspective, Gee (2007) suggested that video games employ their
own language and that characterizing a video game requires learning this unique language.
For example, “leveling up” carries both game play and mathematical meaning. From the
game play perspective, the player has successfully lived to confront another round of
obstacles in an environment of increased complexity; and from the mathematical
perspective, the player’s “lives” count exceeds zero, his “health” is increased by an
incremental value, and the “speed” at which he will be able to move is now doubled.
Knowledge of video game vocabulary defined by Gee (2007) is also necessary for
describing and constructing a video game.
Moving students from recognizing to describing and ultimately constructing the
mathematics of a video game must therefore be achieved with consideration both for the
nature of complex tasks and for the language of the game.
Lateral Transfer of Mathematics
Papert (1998) was an early proponent of the idea that students may learn
mathematics effectively not by playing video games, but instead by creating their own
games. Kafai (1995) established the efficacy of this concept, showing that students
building fraction games for peers increased math performance compared with non-game
makers. However, it may be posited that the creation of any game – not just math games –
inherently involves mathematics. Writing programming code to cause a virtual car to
travel with constant motion, a ball to deflect from a paddle, or a score to rise

11
incrementally, requires mathematics. Students, operating as game makers, must invoke
their knowledge of mathematics to create an onscreen world from abstractions born in
their minds.
Unlike experimentation in the messy, real world, operations in a controlled
computer microworld can be controlled and limited by the user. Fadjo, Hallman, Harris,
and Black (2009) defined the experience of physically manipulating an agent designed to
represent a particular object as surrogate embodiment, a mechanism that, “provides a
unique pedagogical opportunity for the instruction of rudimentary arithmetic topics during
video game design and development” (p. 2787). Thus, students building many different
types of video games may ultimately increase their math performance by learning and
applying mathematics in context.
Ferdig and Boyer (2007) also supported the benefits of game making over game
playing, noting that, “one area within the video game arena that has received considerably
less attention is the concept of student development of games. Educators [should] pay
closer attention to student development of video games because it offers design
experiences that can impact classroom learning.”
Because, “systematically pairing a core subject with another, complementary
subject, may lead to greater overall learning in both subjects,” (Wright, Rich, & Leatham,
2010, p. 3529) students creating video games may engage in lateral transfer of math skills
employed in game programming to other mathematical contexts. Thus, lateral transfer of
mathematics learned in the context of video game programming may impact student
mathematical achievement. This lent credence to the acceptability of offering students
opportunities to learn mathematics in settings other than the traditional mathematics

12
classroom and in contexts beyond mathematics itself. Thus, it may be asked whether
students learning mathematics in a video game programming environment are able to
demonstrate similar performance levels on tests of mathematics achievement as students
learning mathematics in a traditional math environment.
Attitudes Toward Math and the Role of Attitude in Achievement in Mathematics
Attitude is a general term expressing the affective dimensions of state of mind and
the prevailing tendency of a person’s emotions, encompassing disposition, motivation,
self-concept and other factors. Attitude is extremely important to academic success or
failure in school, including achievement in mathematics. Tapia and Marsh (2004)
summarized the work of Opachich and Kadijevich (2000) who investigated the role of
attitude towards mathematics in math achievement as follows:
1. “Mathematics achievement is closely related to self-concepts and attitudes
towards mathematics;
2. The effects of mathematics attitude on mathematics achievement is mediated by
self-efficacy;
3. Confidence and self-esteem are linked at higher levels to success in problem-
solving;
4. Confidence of success in a math-related course is a stronger predictor of
choosing math majors than either confidence to solve mathematics problems or to perform
math-related tasks” (p. 12).
Thus, understanding the role of student disposition towards mathematics may be equally
as important as understanding true mathematical ability in evaluating academic success in
math.

13
Because engagement in video games exerts a powerful affective pull on teenage
audiences, exploring student attitude towards mathematics that is learned through video
game creation may provide further insight to student achievement in mathematics.
Statement of the Problem
Mathematics competence in the United States is in crisis. American precollege
students are underperforming peers of industrialized nations trailing 23 countries on
standardized mathematics tests. Such results, “underscore concerns that too few U.S.
students are prepared to become engineers, scientists and physicians, and that the country
might lose ground to competitors” (Glod, 2007, p. A7).
Instructional technologies may prove helpful in mitigating deficiencies in
mathematics among students (US Dept. of Ed., 2008). The National Mathematics
Advisory Panel of the United States Department of Education, “recommends that high-
quality computer assisted instruction (CAI) drill and practice, implemented with fidelity,
be considered as a useful tool in developing students’ automaticity (i.e., fast, accurate, and
effortless performance on computation), freeing working memory so that attention can be
directed to the more complicated aspects of complex tasks” (US Dept. of Ed., 2008, p. 51).
The Panel also recommended that computer programming be considered as an effective
tool (US Dept. of Ed., 2008) in teaching mathematics, especially when programming
languages such as Logo are employed.
While computer programming is not typically included in K-8 curricula, many
high schools do offer advanced placement courses in the subject (Computer Science
Teachers Association, 2006). However, postponing programming instruction past middle

14
school may impact not only technology fluency, but also mathematical literacy. The
National Research Council (1999) stated that a basic understanding of computer science,
including programming, is now an essential component for preparing high school
graduates for life in the 21st Century.
Providing opportunities for students to engage in programming opportunities prior
to high school may, “be best accomplished by adding short modules to existing science,
mathematics, and social studies units” (Computer Science Teachers Association, 2006, pp.
10-11). Because mathematics requires a grasp of computation, algebraic manipulation,
algorithmic thinking, problem solving, and troubleshooting – the same tasks required for
computer programming – teachers may be able to capitalize on the natural connection
between the two disciplines.
Teachers of elementary and middle grades may also find that motivating students
to work on mathematics and programming problems is more effective when students
engage in tasks they find interesting and relevant to their world. An analysis of the TIMSS
assessment found that students who demonstrated positive attitudes towards mathematics
were more likely to perform well in it (Mullis, Martin, Gonzalez, & Chrostowski, 2004;
Mullis, Martin, & Foy, 2008). The popularity of video games, especially among preteens
and young teens may provide fruitful content for engaging this audience – not for game
playing, but for game making. Unlike mundane real-world problems about which students
may care little (e.g., computing sales tax), video games may also appeal to student
interests and provide a motivational impetus for achievement in mathematics.
Thus, as summarized by Squire (2003), “Given the pervasive influence of video
games on American culture, many educators have taken an interest in what the effects

15
these games have on players, and how some of the motivating aspects of video games
might be harnessed” (p. 2). To obtain a measure of these achievement effects and
motivational aspects, a study is proposed in which middle-grade students employ
mathematics and Logo-based programming software to design functional video games.
Evaluating achievement in mathematics and disposition towards mathematics in the
course of the study may provide evidence of whether or not classroom instruction in video
game design correlates with cognitive and affective gains in these domains.
Purpose of the Study
This research studied the efficacy of employing a technology-based, alternative
curriculum to convey middle school mathematics content and foster affective satisfaction
among students. The target audience consisted of preteen and teen youth in middle school.
Research Questions
Three research questions guided this study, addressing the mathematics of video
game design and construction, the transfer of math ability, and disposition toward
mathematics.
The mathematics of video game design and construction. What mathematics
content do middle school students invoke as they design and construct video games? This
question entailed three parts: (a) analysis – What mathematics content do middle school
students invoke as they analyze games? (b) synthesis – What mathematics do middle
school students invoke as they synthesize games? (c) programming – What mathematics
do middle school students invoke as they program games?
16
The transfer of mathematics ability. Using a standards-based multiple-choice
mathematics content test, two questions were posed: (a) Does the performance of middle
school students who engage in video game design and construction (analysis and
synthesis) improve after creating video games? And (b) Does the performance of middle
school students who engage in video game design and construction (analysis and
synthesis) exceed the performance of students of similar math abilities who are not
engaged in creating video games?
Attitudes toward mathematics. Does the attitude of middle school students
towards mathematics improve after designing video games, and how do these dispositions
compare with students who are not engaged in video game design?
By examining the three research questions longitudinally with an audience of
middle school students, insight into the success of employing alternate methods in
teaching and learning mathematics was sought.
Hypotheses
Three hypotheses were posited to address the research questions under
investigation in this study. Each of these question follows.
Hypothesis regarding the mathematics of video game design and construction.
With regard to the first research question, it was hypothesized that middle school students
who engaged in video game design and construction would learn age-appropriate
mathematics concepts (e.g., measurement, geometry and algebra) as prescribed by
standards outlined by the National Council of Teachers of Mathematics. Learning was
measured via (a) evaluations of mathematical events written as students analyzed video

17
games, (b) evaluations of representations written as students synthesized video games, and
(c) evaluation of mathematical standards incorporated in student-produced video games.
Hypothesis regarding the transfer of mathematics ability. With regard to the
second research question, it was hypothesized that (a) that students engaging in video
game design and construction would improve performance, pre-project to post-project, on
a test of standards-based mathematics content ; and (b) that students engaging in video
game design and construction would achieve higher score gains on a studywide test of
standards-based mathematics content than peers of similar mathematics abilities who did
not engage in video game design an construction as compared on pre- and post-treatment
administrations of the test.
Hypothesis regarding attitudes toward mathematics. With regard to the third
research question, it was hypothesized that (a) within the treatment group, attitudes
towards mathematics would increase from pre- to post-treatment measurements; and (b)
that post-treatment attitude scores towards mathematics would be higher for treatment
group students than for comparison group students.
Definitions
Several key terms are used throughout the study. Their definitions follow.
Analysis. “Analysis examines a problem and splits it up into its components”
(Kafai, 1995, p. 7).
Design. “A process of problem-solving. Finding a solution that satisfies the given
conditions,.., involving processes such as planning, search, decision making, reasoning,
and management of mental resources. In the design process, two phases are distinguished:
18
analysis and synthesis. In both analysis and synthesis, designers develop strategies, such
as modularization or generating alternative solutions, when dealing with complex design
tasks” (Kafai, 1995, p. 7).
Digital Toy. Digital toys are similar to video games in terms of appearance and
interaction. However, digital toys differ from video games in that they possess no
overarching goal (Wolf, 2000). Designing and constructing digital toys offers a simplified
entry point for the design and construction of video games. Digital toys, including digital
Etch-a-Sketches, digital Magic 8-Balls, and digital paper dolls, can feature a limited
number of mathematical and programming concepts for their function when compared
with video games. This is due, in part, to the fact that scoring, collision detection, or
boundary recognition are usually not required for digital toys – a digital toy is essentially a
subset of a video game (Gee, 2007). In this study, the Etch-a-Sketch project is
representative of a digital toy, while Frogger and Tamagotchi Virtual Pet are video games.
However, for the purposes of the current study, “video game” typically will be used to
encompass both “video games” and “digital toys” except where otherwise noted.
Elements. Video game elements are visual components of the game play field.
Elements include characters, obstacles, score tallies, and background scenery. Elements
may move and interact (e.g., characters) or remain static (e.g., scenery).
Events. Events are interactions that define game play and cumulatively determine
success or failure of the goals. Events may include moving a character, the collision of
two objects, the collection of an object, and the scoring of a point. Table 1 shows example
game events specified for three video games, along with their associated content standards
defined by the National Council of Teachers of Mathematics (NCTM, 2000).

19
Table 1 Example Video Game Events and Associated NCTM Content Standards
Event representations. Event representations in this research consist of verbal
descriptions (words), mathematical formulations (symbols, logical statements), and
computer programming code or pseudocode. Table 2 shows representations for an
example event pertaining to the Tamagotchi Virtual Pet video game.
Table 2 Example Event Representations in Tamagotchi Virtual Pet
Video game project Video game event Mathematics content standard
Etch-a-Sketch Constrain tool tip from drawing in the red frame
Write inequalities to describe boundaries (algebra)
Frogger Reset frog’s starting coordinates following a collision with an obstacle
Use coordinate geometry (geometry)
Tamagotchi Virtual Pet
Scale dimensions of the Tamagotchi to reflect values of its health/hunger variables
Write algebraic equalities to manipulate variables (algebra and measurement)
Representations Event Mathematical Programming
Feed the Tamagotchi pet to decrease his hunger
If the hunger variable is greater than 1, then subtract 1 from the current value of the hunger.
Put Feed procedure in Feed button to feed if hunger > 0 [sethunger hunger – 1] end

20
Goals. Video game goals are the target benchmarks that the player seeks to
accomplish during game play. A long-run goal, such as hopping a frog through a busy
intersection without incident in Frogger, consists of several short-run goals, such as
avoiding traffic and completing the crossing before time expires.
Synthesis. “Synthesis focuses on bringing all the different parts together to a
solution” (Kafai, 1995, p. 7).
Video game. “An audiovisual entertainment whose content is largely
representational” (Wolf, 2000, p. 2). “Games played on game platforms (such as the Sony
Playstation 2 or 3, the Nintendo Game Cube or Wii, and Microsoft’s Xbox or Xbox 360,
or various handheld devices) and games played on computers” (Gee, 2007, p. 1). In the
current research, Frogger and Tamagotchi Virtual Pet are video games that students design
and construct. Frogger is representative of the dodging genre of video games, while
Tamagotchi Virtual Pet is representative of the artificial life genre (Wolf, 2000).
Video game analysis. Examining an existing video game; analyzing game
components to recognize elements, goals, and events.
Video game construction. Translating representations for game elements and
events into a functional video game. This entailed writing computer programming code.
Video game synthesis. Representing game events in multiple formats, including
both mathematical and programming.

21
CHAPTER 2
REVIEW OF RELATED LITERATURE There is something odd about the way we teach mathematics in our schools. We
teach it as if we expect that our students will never have occasion to make new
mathematics. We do not teach language that way. If we did, students would never
be required to write an original piece of prose or poetry. We would simply require
them to recognize and appreciate the great pieces of language of the past, the
literacy equivalents of the Pythagorean theorem and the law of Cosines. (Schwartz
& Yerushalmy, 1987, p. 293)
Introduction
Learning mathematics through a nontraditional route such as video game
construction is representative of the type of “new mathematics” characterized by Schwartz
and Yerushalmy (1987). In light of the novelty of this nontraditional approach, it is
unsurprising to find only a limited volume of research that directly informs new
investigations addressing video game construction and its correlation with mathematical
achievement and affect. Nonetheless, each research question in the current study can be
examined with regard to theory and previously conducted studies regarding component
facets of each question including the language of video game design, precollege student
programming, the significance of mathematics achievement, mathematics instruction in
nontraditional contexts, transfer of mathematical content and processes, and affect and
achievement in mathematics.

22
Literature Addressing the Mathematics of Video Games
Examining literature relevant to the mathematics of video construction entailed
four components: (a) providing a rationale for the video game context, situating it from
both social and educational perspectives; (b) the theory of video game design and
construction; (c) programming environment options appropriate to the ability of pre-
teenagers; and (d) teaching mathematics via video game construction.
Rationale for the Video Game Context
Video games have emerged as a popular and ubiquitous form of entertainment,
especially among pre-teenagers and young teens. Reception of the video gaming
phenomenon by educators and parents has ranged from embracing this form of tele-
mediated engagement as the next generation of learning to rejecting it as a mindless waste
of time (Johnson, 2005). However, recent research and the success of schools such as the
progressive Quest to Learn (Q2L) secondary institution in New York – with its entire
curriculum built on a serious games and video game development platform – have
strengthened the perspective that gaming holds real educational value (Hsu, 2010).
Learning theorists and educational researchers have posited that participation in
video gaming results in more than simple “increased eye-hand” coordination, contending
that global thinking and complex reasoning skills are acquired by the player-learner (Gee,
2007; McGonigal, 2011). These complex skills emerge not only from video game playing,
but also video game construction, thereby offering a rationale for students to migrate from
game consumers to game producers (Papert, 1998). As one team of game researchers
noted, “with so many children and adolescents playing video games, one might surmise
that the task of creating a game has a sort of ‘universal’ appeal that could be utilized to

23
explore various academic topics through video game design and development” (Fadjo,
Chang, Hong, & Black, 2010, p. 2674).
The announcement by President Obama of a nationwide, video game design
challenge, inviting middle school youth to build and compete their own original games,
further strengthens the emerging perspective that game-building promotes learning in a
way that traditional methods no longer achieve (Mitchell, 2010). New learning
environments are being explored for ways in which video game construction serve
instructional purposes that depart profoundly – and effectively – from textbook and pencil
realms (Kearney, 2004; Kelleher & Pausch, 2005; Maloney, Peppler, Kafai, Resnick, &
Rusk, 2008; Klopfer, Jenkins, & Perry, 2010). The “open-ended learning environment
(OLE)” that fosters student game development is contrasted against the “decontexualized”
environment of the traditional classroom (Ge, Thomas, and Green, 2006), differentiating
the problem-based setting where students learn content to solve the larger problem (i.e.,
create a video game) from the classical setting where mastering content is an end in itself
(Jonassen, 1999).
Video games can address any subject matter, academic and otherwise, and students
constructing their own games can showcase everything from social studies to sports in
their game themes. However, the processes of designing a game concept and ultimately
bringing that concept to fruition requires a very specific skill set predicated on the
underlying theory of video game design and construction.
Theories of Video Game Design and Construction
Constructing a video game requires the complex composition of a virtual world
that presents challenges for players to engage in while there. It is simultaneously a

24
creative, artistic, mathematical, logical, and technological process. With genres ranging
from arcade to adventure (Wolf, 2000), the resulting product can be compellingly fun and
enticing because playing it engages us in ways that go beyond reading a book or even
playing a board game.
Two key researchers, linguist James Paul Gee and experimental psychologist and
instructional technologist Jeroen van Merriënboer have delineated the symbiotic
components associated with video game creation: first, the “design grammar” defining the
microworld aesthetics and game play of a video game; and second, the “complex tasks”
associated with constructing the game in a computer language.
Video game design: contributions of James Gee. Defining video gaming as its
own “semiotic domain,” Gee has examined how, similar to other distinct disciplines
including genetics or opera, gaming possesses its own design grammar, namely its own
content (e.g., facts, theories, and principles) and social practices (Gee, 2007). Mastering a
video game is an exercise in obtaining fluency in gaming design grammar, but acquiring
video game literacy is not an isolated endeavor with relevance only to the confines of the
computer or video game console. In fact, “the principles on which video game design is
based are foundational to the kind of learning that enables children to become innovators
and lifelong learners” (Gee, 2005b, p. 3).
To this end, Gee has enumerated thirty-six such learning principles in What Video
games Have to Teach Us About Learning and Literacy (2007), examining their roles both
with regard to general learning and, more specifically, to gaming. While Gee’s main
interests relate to game playing as opposed to game making, he does argue strongly in
favor of the latter’s constructionist aspect of video gaming: “What is most powerful about

25
video games… is that the consumer (player, learner) is also a producer. They can fairly
easily build extensions and modifications to many games” (Gee, 2003, p. B17). This
production concept can be explored not only in the context of video game modding (i.e.,
creating new or altered content to be shared via the Web) but also in the more extended
context of complete game design by the learner.
Several of Gee’s 36 video game learning principles are especially germane to
mathematical problem solving by students engaged in video game design. For example,
the design principle encompasses the overarching philosophy of why students should be
encouraged to engage in video game design. This principle states that, “learning about and
coming to appreciate design and design principles is core to the learning experience” (Gee,
2007, p. 41). When designing their own video games, learners must analyze existing
games first in order to know what defines the game – what constitutes its elements, goals
and events – before they can advance to game synthesis. Gee’s insider principle
encompasses the constructionist perspective of video game design, stating that “good
learning requires that learners feel like active agents (producers) not just passive recipients
(consumers)” (Gee, 2005a, p. 6). By engaging in active investigation to produce
understanding, students learn the design grammar, including the mathematics of video
game design, and can apply that understanding in the production of something new.
With regard to the process of using a programming language to synthesize working
games on the computer, Gee’s amplification of input principle holds special relevance:
“For a little input, learners get a lot of output” (Gee, 2007, p. 64). Unlike using a
protractor, straightedge and calculator to compute and draw a motion path, learners
constructing a video game with a mindtool such as Logo can quickly test math and physics

26
concepts without getting bogged down in the mechanics of computations and graphical
plots.
Logo is also critical to facilitating learning with regard to Gee’s subset principle,
which states that “Learning even at its start takes place in a (simplified) subset of the real
domain” (Gee, 2007, p. 141). Creating a microworld in Logo affords learners the
opportunity to model precisely such a subset. “The real world is a complex place. Real
scientists do not go out unaided to study it. Models are all simplifications of reality and
initial models are usually ‘fish tanks,’ [that is] simple systems that display the workings of
some major variables” (Gee, 2005a, p. 12). When designing new video games, learners
start small and increase in complexity as they gain competence in the process. However,
starting small does not mean that basic skills are learned in isolation or out of context.
Gee’s bottom-up basic skills principle requires that learners understand how individual
tasks are situated in context of the entire game. “ When learners fail to have a feeling for
the whole system which they are studying, when they fail to see it as a set of complex
interactions and relationships, each fact and isolated element they memorize for their tests
is meaningless” (Gee, 2005a, p. 14).
Gee suggested that these contextualized basic skills must be practiced repeatedly
for the learner to gain fluency and confidence in their use. The concentrated sample
principle advises that, “the learner sees, especially early on, more instances of
fundamental signs and actions than would be the case in a less controlled sample. Learners
get to practice them often and learn them well” (Gee, 2007, p. 142). For example, in the
early stages of video game construction, learners analyze and program repeated instances
of basic motion and heading in simple games devoid of collisions, scoring and other
27
complex constructs. Practicing smaller tasks builds to task fluency that is ultimately
applied to production of the entire game.
To assist learners in building firm foundations in video game design, teachers must
not only provide opportunities for repeated practice of concepts and skills (concentrated
sample principle), but also carefully sequence the acquisition of new concepts and skills.
“The order in which learners confront problems in a problem space is important” (Gee,
2005a, p. 9). This idea embodies the problem-solving principle which states that, “learning
situations are ordered in the early stages so that earlier cases lead to generalizations that
are fruitful for later cases” (Gee, 2007, p. 142). A teacher experienced in video game
design process can provide key guidance in moving the learner along from simple to
related but more complex concepts and skills. “Generalizations are best recognized by
those who already know how to look at the domain, know how the complex variables at
play in the domain relate and interrelate to each other” (Gee, 2005a, p. 10).
Once new concepts and skills are acquired during video game design, learners can
solidify their understanding through practice and then use this new learning in novel
situations, including new games. This embodies Gee’s transfer principle, namely that
“learners are given ample opportunity to practice, and support for, transferring what they
have learned earlier to later problems” (Gee, 2007, p. 142). For example learning to make
a car drive down a road requires the design and coding of straight-line, horizontal motion.
Once secure, the learner can transfer this concept to creating straight-line motion for any
action such a ball rolling or a dog walking.
Bringing a complete video game to fruition, students follow similar paths as one
another in terms of analyzing the game environment and then synthesizing a working
28
program. But these paths need not be identical, bringing Gee’s multiple routes principle to
bear: “There are multiple ways to make progress or move ahead. This allows learners to
make choices, rely on their own strengths and styles of learning and problem-solving”
(Gee, 2007, p. 105). Learners designing games do not have to follow a single path towards
a finished product. Unlike solving a series of mathematics problems on a worksheet,
students designing video games do not always end up with the same answers. For their
game to work, the answers must be correct, just not necessarily identical.
Gee suggested that video gaming and video game construction, “if implemented in
schools, would necessitate significant changes in the structure and nature of formal
schooling as we have long known it, changes that may eventually be inevitable anyway
given modern technologies” (Gee, 2005a). Thus, researching how video gaming and
principles of game making impact student learning – specifically preteen and teen
acquisition of mathematical problem-solving skills – may result in new ways of thinking
about mathematics curriculum and instruction in the middle school.
Video game construction: the contributions of Jeroen van Merriënboer. The
mechanics of video game construction may be modeled on instruction of analogous
complex tasks as described by van Merriënboer. Such instruction, states van Merriënboer
must, “take both human cognitive architecture and multimedia principles into account to
ensure that learners will work in an environment that is goal-effective, efficient, and
appealing” (van Merriënboer & Kester, 2005, p. 72).
Van Merriënboer characterized the learning of complex tasks including
mathematical problem solving and computer programming as hierarchical. To describe
this process, van Merriënboer established the 4C/ID (four component instructional design)

29
model of complex learning. This model, “explicitly aims at the integration of knowledge,
skills and attitudes; the ability to coordinate qualitatively different constituent skills; and
the transfer of what is leaned to daily life or work settings” (van Merriënboer & Kester,
2005, p. 72). The model is designed to provide instruction that avoids bombarding the
learner with excessive information (Sweller, van Merriënboer, & Paas, 1998). Reducing
the cognitive load of learners by focusing their efforts in a scaled-down and well-
controlled model correlates with Gee’s subset principle (2007), the idea that learning
should transpire in a simplified subset of the real domain.
The 4C/ID model describes the composition and sequence of an entire learning
task. Applying the 4C/ID model to video game design and construction, 4C/ID defines the
tasks and sequence via which the teacher guides learners in analyzing, synthesizing, and
programming an entire game. In terms of Gee’s learning principles (2007), 4C/ID invokes
the problem-solving principle by delineating an ordered sequence of individual tasks to be
practiced, mastered and combined to create larger project task.
The 4C/ID is predicated on four components that function as a fluid, yet cohesive
whole during the instructional process. These components follow.
1. Learning tasks component. Each individual learning task represents the lowest
level of decomposition of the entire complex task. Individual learning tasks are grouped
into larger tasks, which are then sequenced to comprise an overarching complex task, such
as constructing a complete a video game. Building fluency in a task progresses from
extensive support from the teacher when learners first encounter a new task to no support
from the teacher once learners are proficient at executing the task independently (van
Merriënboer & Kester, 2005).

30
Complete, worked examples may serve as helpful models for students first
learning a task (Paas & van Merriënboer 1994). For example, a student first attempting to
write programming code to move an object called “racecar” forward by 10 pixels in a
game must be provided a complete programming command (e.g., RACECAR, FD 10) in
order to learn the proper syntax of the language (van Merriënboer & Krammer, 1987).
Completion tasks (which present a problem and a partial solution with gaps which
the learner must complete) are appropriate support tools for students who have achieved a
moderate level of task proficiency following exploration of worked examples. For
example, a student attempting to write programming code to move an object called “frog”
forward by 10 pixels in game could be provided a partial line of programming code (e.g.,
FROG, ? ) with the expectation of completing the missing syntactical information (van
Merriënboer & Krammer, 1987).
2. Supportive information component. The learner is provided context for the
overall task via case studies, systematic approaches to problem solving and cognitive
feedback. This information can be viewed as the theoretical backbone of the overall task.
In the context of video game construction, students would learn tasks (Component
1) in the context of case studies addressing the specific games in which those tasks would
be implemented. For example, students planning to build a Frogger video game could
examine a commercial version of Frogger to evaluate the game play (i.e., analysis).
Discourse between teachers and students regarding the implementation of each task in the
game (problem-solving) would constitute cognitive feedback.
3. Procedural information component. Procedural information is essentially
“how-to” instructions or demonstrations, provided as-needed, and paired with corrective

31
feedback. It provides “algorithmic specification of how to perform those routine aspects”
(van Merriënboer & Kester, 2005, p. 72) of individual learning tasks.
Video game construction requires the development of procedures, groups of
programming commands executed together. Writing such procedures usually requires
how-to guidance in thinking algorithmically about the selection and sequence of this
information.
4. Part-task practice component. Practice takes the form of additional exercises
that help the learner ramp up to automaticity in executing the individual learning tasks.
Learners’ repetitive practice of similar tasks embodies Gee’s concentrated sample
principle of learning (Gee, 2007).
For example, students designing a video game featuring several objects moving in
the playfield will work to set the directional heading and motion for each object. This
repeated process will build automaticity with regard to the specific actions these
commands perform.
Research has shown the 4C/ID model to be effective in training learners to perform
complex tasks ranging from air-traffic control to writing computer programs (van
Merriënboer & Kester, 2005) including the programming of geometrical concepts
(Sweller, van Merriënboer & Pass, 1996). This same model of instructional design may
also prove successful in teaching video game construction to middle schoolers.
Programming Environment Options for Preteenagers
Programming environments are fundamental to the creation of video games. While
graphic design and animation software is vital to creating the imagery and feel of the game
“world,” game action cannot come to life without computer programming code and the

32
underlying mathematics, physics, and logic required to write the code.
Although video gaming, multimedia, and technology as a whole are exploding in
society and the economy, preparation of students in the computing disciplines, including
programming, is actually receding in the K-12 arena. “The point of engaging youth in
computer programming is not to turn them all into hackers or programmers, but because
being engaged in the full range of technology fluencies–including programming–is an
educational right of the 21st Century” (Maloney, Peppler, Kafai, Resnick, & Rusk, 2008,
p. 370 ). Nonetheless, computer science instruction, which includes algorithmic and
computational thinking as well as programming, is not required in K-12 schools. And
schools that do offer computer science courses count them as elective credits, with fewer
than 10 states granting math or science credit for their completion (Wilson, Sudol,
Stephenson, & Stehlik, 2010).
A wide variety of programming languages and environments are available at the
precollege level with little standardization regarding which programming choice is most
appropriate within each age band. To organize the many programming options, Kelleher
and Pausch (2005) created a taxonomy that profiles this diversity of offerings, organizing
languages by their goals. They noted that, in all languages, “to successfully write a
program, users must understand several topics: how to express instructions to the
computer (e.g., syntax), how to organize these instructions [structure] and how the
computer executes these statements” (Kelleher & Pausch, 2005 p. 86). The taxonomy
ranges from environments that simply empower the user (e.g., The Incredible Machine), to
teaching languages that emphasize structure over syntax (e.g., Scratch), and others that
require users to learn both syntax and structure (e.g., MicroWorlds EX).

33
At the high school level, the Java programming language is used on the Advanced
Placement exam (College Board, 2010). At the K-8 level, options including Alice, Scratch,
Terrapin Logo, and Stagecast have emerged as successful tools for teaching computer
programming (Redden, 2007). Newly released environments including GameStar
Mechanic and Scratch are encouraging the next generation to create their own games
(Salen, 2007; Gee, Hayes, Torres, Games, & Squire, 2008; Peppler & Kafai, 2007). Unlike
professional programming languages, most youth-oriented programming environments
offer drag-and-drop interfaces, drop-down menus, interlocking “puzzle piece” commands,
and other friendly adaptations to ease the challenging work of the novice programmer. As
Kelleher and Paucsh (2005) noted, these inviting interfaces create a more accessible
starting point “by simplifying the mechanics of programming, by providing support for
learners, and by providing students with motivation to learn to program” (p. 131).
However, research needs to be conducted regarding the success students experience in
transitioning from programming in these “teaching environments” to programming in
“professional environments” in high school and as post-secondary, adult learners.
One class of programming environments, Logo and its derivatives, offers greater
transparency to the underlying mathematics of programming because it retains more of the
traditional coding interface than other teaching environments. Specifically, MicroWorlds
EX, a modern version of the Logo language originally developed more than 30 years ago
by Seymour Papert at MIT, retains the fidelity of not only teaching programming but
teaching children mathematics – Papert’s fundamental goal. Logo is representative of the
constructionist philosophy of learning in which students construct not only their own

34
ideas, but also physical objects, including computer programs, demonstrative of those
ideas (Papert, 1999).
The Logo environment appears to the learner as a two-dimensional world in which
objects called “turtles” can be placed in the world and manipulated through simple
commands. But what Logo offers the learner is far more powerful. “Children can identify
with the Turtle and are thus able to bring their knowledge about their bodies and how they
move into the work of learning formal [mathematics]” (Papert, 1993, p. 56).
Unlike traditional means of parsing knowledge in a fact-based framework, Logo-
produced microworlds offer learners, “a context for the construction of ‘wrong’ (or, rather,
‘transitional’) theories” (Papert, 1993, p. 56). Learners can create and test models to see
how they perform, then easily adjust model parameters and add new commands to
enhance and extend their creations. As an example, a simple, introductory activity in Logo
involves the construction of familiar geometric figures (e.g., triangles, squares,
pentagons.). The learner gives the turtle iterative commands to generate each regular
polygon, employing trial-and-error to compute the appropriate turning angles – and
eventually deducing the relationship between the number of sides and the turning angle for
each polygon. Although the same activity can be conducted via pencil and paper drawings,
the use of Logo as a mindtool shifts the focus from the mechanics of construction to the
concepts of construction by reducing cognitive load in the learner (Sweller, van
Merriënboer, & Paas, 1998).
In the MicroWorlds EX environment, learners move from writing computer
programs to constructing figures to working in a virtual environment that they can control,
experiment in, and craft models which can be shared with others. While Logo, and more

35
specifically MicroWorlds EX, are not intended to be catch-all solutions for teaching
mathematics and its applications, they do serve as examples of a successful adaptation of
the immersive, learn-by-doing environment espoused by constructionist theorists – one
particularly well-suited to the study of applied mathematics.
In Papert’s view, school mathematics, “often means a lonely, impersonal
experience of manipulating symbols in accordance with rules learned by rote” (Papert,
1975, paragraph 10). Logo was Papert’s attempt to mitigate negative perceptions of math
by providing learners a computer-based microworld that they can control, experiment in,
and share models with others. “Logo programming… is clearly an effective medium for
providing mathematics experiences… when students are able to experiment with
mathematics in varied representations, active involvement becomes the basis for their
understanding. This is particularly true in geometry – and the concept of variable”
(McCoy, 1996, p. 443).
Of the many ways Logo can be explored, Papert said, “my favorite example is
having kids learn enough programming [to make] their own video games. Almost all kids
find this exciting… because video games are important in their world” (Papert, 1996,
paragraph 19). Papert noted that, while game-playing and game-describing are starting
points in fostering mathematical thinking, mindtools like Logo can facilitate learners’
metamorphoses from game consumers to game producers. “When they get the support and
have access to suitable software systems, children’s enthusiasm for playing games easily
gives rise to an enthusiasm for making them, and this in turn leads to more sophisticated
thinking about all aspects of games” (Papert, 1998, paragraph 13).

36
Since the authentic process of making a game requires the learner, working as
game designer and programmer, to set characters in motion (represent velocity), collide
with or capture objects (register coordinate convergence), and record scores (change
variable values), the learner must inevitably employ mathematics in the production of
even the most basic games. “But if you are going to make a serious video game, you are
very likely to run into mathematical problems. For example, if you take a jump, how do
you describe the trajectory? You need a mathematical concept for describing it, a
parabola” (Papert, 1996, paragraph 19). Thus, learners will likely find a natural and real
progression from the application of simple to complex mathematics as they build skills
and extend their abilities in creating ever more robust video games. As a programming
language that may be used to craft simple video games and is easily learned by middle
school students, MicroWorlds EX is a logical choice for the environment to study learner
acquisition of mathematics skills through game building.
Focus on Math Instruction in the Video Game Construction Context
“Most schools use technology to teach content and only few offer opportunities to
learn programming” (Maloney et al., 2008, p. 367). Thus, a considerable body of research
has examined student learning in various school subjects through multimedia technology,
including some addressing serious video games, but only a few studies have looked at
programming per se and even fewer have looked at mathematics instruction as relates to
programming. Now, with national attention focused on the failings of STEM education,
especially mathematics education, (US Dept. of Ed., 2009), further research examining
instruction of mathematics through the closely related programming context is merited.
And of the many projects programming instruction can be employed to create, video

37
games are some of the more personally relevant to students in the preteenage and teenage
age group (Teske & Fristoe, 2010).
Some research conducted on the mathematics students that learn as a result of
programming video games has focused on student development of games that explain or
teach mathematics content. For example, Kafai’s extensive work detailed in Minds In Play
(1995) profiles the construction that preteenage students performed in their creation of
“Fraction-World” Logo games intended to serve as instructional software teaching
fraction concepts to younger peers. Kafai found that students who migrate from playing
games to constructing games, performing both initial design and subsequent software
programming tasks, invoke deep thinking and generate rich, high-level schema in their
production activities.
Ultimately, though, the more relevant mathematics students employ in the
construction of video games may instead be inherent in their design and programming of
any game – arcade games, adventure games and sports games – not just games that
specifically teach mathematics. For example, in a longitudinal study of preteenagers and
teenagers programming animated scenes and games addressing a wide variety of themes,
not specifically “math,” Maloney et al. (2008) found that students demonstrated
significant year-to-year gains in employing the programming concepts of loops, Boolean
logic, variables, random numbers, and conditional statements – all of which have direct
mathematical corollaries. And Fadjo, Chang, Hong & Black (2010) are currently
investigating preteen acquisition of expertise in manipulating conditional statements –
concepts fundamental to mathematical proof – through the “embodied” (i.e., concrete)
approach of Scratch’s puzzle programming tiles.
38
As students design and construct their own games, they access and apply their
mathematical understanding during two distinct phases: analysis and synthesis (Kafai,
1995). By Kafai’s definition, “analysis examines a problem and splits it up into its
components, whereas synthesis focuses on bringing all the different parts together to a
solution” (1995, p. 7). For students to successfully analyze an existing video game and
synthesize their own version of the game in a computer-programming environment, they
must employ both a deep understanding of mathematical problem solving and the ability
to apply their understanding in the game context.
Literature Relevant to the Transfer of Mathematics Ability
Beyond examining whether learners can recognize (analyze), represent
(synthesize), and computer program (construct) mathematics concepts in the production of
a video game, consideration must be given as to whether learners can transfer successful
employment of mathematics in video game construction to other mathematics contexts.
While many other mathematical contexts exist, one such context that has received
significant attention is traditional paper-and-pencil problem solving as measured by
achievement tests (Mullis, Martin, & Foy, 2008).
In considering the process of mathematical transfer, we must first situate (a) the
overall significance of student mathematical achievement; (b) the mathematics standards
of middle school math courses; (c) instructional methods in mathematics; and finally, (d)
the nature of lateral transfer from a related subject area to mathematics.

39
The Significance of Measuring Mathematical Achievement
Precollege student achievement in mathematics is a national concern, impacting
national prosperity and economic health (Rouse, 2010). Government organizations and
educational researchers routinely measure mathematics achievement among precollege
students to gauge the readiness of emerging generations to innovate in science,
technology, engineering, and mathematics (STEM) disciplines.
Results from the 2009 Nation’s Report Card in Mathematics (US Dept. of Ed)
showed that only 39% of American fourth graders and 34% of eighth graders perform at
or above the proficient level (US Dept. of Ed., 2009). Reports including the Third
International Mathematics and Science Study (TIMSS, by Mullis, Martin, & Foy, 2007)
indicated that not only are American children not meeting internal benchmarks, but the
United States is being outperformed by many other industrialized nations as measured on
mathematics achievement tests administered in the middle grades, and further, that our
nation is not improving its performance (Gonzales et al., 2009). “The United States ranks
much worse than most of our economic competitors in the mathematics performance of
high school students. That national slide begins in middle school” (Devlin, 2010).
Because of the red flags signaled by the national downslide in mathematical
performance, and because middle school has been identified as a critical time period when
student learning begins to derail (Gonzales et al., 2009), efforts are underway to improve
mathematics instruction in order to close the achievement gap in the preteen and early teen
years. Such efforts address one or more factors of mathematics instruction believed to be
associated with student achievement, including teacher preparation, instructional
methodology, technology integration, assessment and student disposition.

40
Mathematics Standards in the Middle Grades
Over the past decade, national mathematics education organizations have compiled
keystone documents including Principles and Standards for School Mathematics by the
National Council of Teachers of Mathematics (NCTM, 2000); Adding It Up by the
National Academies (Kilpatrick, Swafford, & Findell, 2001), Foundations for Success
(US Dept. of Ed., 2008), and the Common Core Standards (Common Core State
Standards Initiative, 2010) that outline the body of knowledge and skills that students who
are successful in mathematics know. The documents “reflect research that has identified
the importance of learning with understanding, as opposed to memorizing isolated facts,
and the importance of opportunities to engage in mathematical reasoning and problem
solving” (National Research Council, 2010, p.108).
School curricula and textbooks vying for lucrative, state adoption are typically
written around NCTM’s Principles and Standards (2000), a document that details the
content and processes that students should learn from grades K through 12. These
standards define the mathematics middle schoolers should learn to be prepared for further
mathematical study in high school and beyond, with “ambitious expectations are identified
in algebra and geometry that would stretch the middle-grades program beyond a
preoccupation with number” (NCTM, p. 211).
Mathematics content standards. NCTM content standards describe the
mathematics knowledge students in the middle grades should posses and consist of the
standards that follow.
41
Numbers and operations standard. This standard includes understanding numbers
(their representations and their relative relationships); understanding operations; and
computing and estimating fluently.
Algebra standard. This standard includes understanding patterns, relations and
functions; using algebraic symbols (i.e., variables) to represent and analyze mathematical
situations and structures; using mathematical models to describe quantitative relationships;
and analyzing change.
Geometry standard. This standard includes analyzing properties of two-
dimensional and three-dimensional geometric figures and describing geometrical
relationships in those figures (i.e., the Pythagorean Theorem); specifying spatial locations
and spatial relationships (i.e., parallel and perpendicular lines) via Cartesian coordinates
and other representations; applying transformations and recognizing symmetry; and using
“visualization, spatial reasoning, and geometric modeling to solve problems” (NCTM,
2000, p. 233) including applying geometric ideas in contexts beyond the mathematics
classroom.
Measurement standard. This standard includes understanding measurable
attributes (i.e., angles) as well as measurement units and systems; and selecting and
applying formulas to compute geometric attributes (i.e., using the area formula in a circle
and solving rate of motion questions).
Data analysis and probability standard. This standard includes asking questions to
which data collection and statistical analysis can answer, then inferring and predicting
based on the data; and understanding and applying probability concepts.

42
Role of the content standards in video game design and construction. Each of
the previous content standards plays a role in the context of video game design and
construction. Students require numbers and operations to describe quantities such as
distances in the game environment; computation such as addition and subtraction is
required to increase or decrease quantities in response to game interactions. Algebra
understanding is required to set and manipulate variables. Geometry is necessary to set the
starting position of objects in the play field as well as to create parallel motion of multiple
objects. A grasp of measurement is fundamental to setting the heading of game objects
and determining the area of zones of interaction in which collisions between objects may
occur. Finally, data analysis and probability is needed to understand the relative frequency
with which certain game events may occur as well as introduce a degree of randomness
into object interactions.
Mathematics process standards. NCTM process standards for the middle
grades explain how students should acquire and use mathematical content outlined in the
content standards. The five process standards follow.
Problem-solving standard. Problem solving entails the integration of multiple
math topics while “engaging in a task for which the solution method is not known in
advance,” in contexts that include, “familiar experiences involving students' lives”
(NCTM, 2000, p. 52). As students problem solve, they “engage in larger problems,
perhaps occasionally working for several days on a single problem and its extensions”
(NCTM, 2000, p. 256).
Reasoning and proof. “Students at all grade levels should learn to investigate their
conjectures using concrete materials, calculators and other tools” (NCTM, 2000, p. 57).

43
“Young children's explanations will be in their own language and often will be represented
verbally or with objects. Students can learn to articulate their reasoning by presenting their
thinking to their groups, their classmates, and to others outside the classroom” (NCTM,
2000, p. 57).
Communication. Students should employ oral and written communication to
convey their mathematical thinking and practice using the language of mathematics.
Connections. All students should “recognize and apply mathematics in contexts
outside of mathematics” (NCTM, 2000, p. 274).
Representations standard. All students should exhibit “use of representations to
model physical, social, and mathematical phenomena” (NCTM, 2000, p. 70).
Role of the process standards in video game design and construction. Within
the context of video game design and construction, extensive problem solving is required
as multiple mathematics content topics must be incorporated in the creation of each game,
and each game is a “large problem” that necessitates several days (or more) to solve
(NCTM, 2000). Students constructing video games employ reasoning and proof (Van
Lehn, 1983), using the computer microworld as a visual tool to demonstrate their
conjectures and manifest their ideas for internal and external (peer-to-peer) discussion.
Those discussions exemplify the communications standard (NCTM, 2000). The
representations process standard is employed when students (a) write verbal,
mathematical, and programming code representations during video game synthesis, and
(b) produce their functional game artifact that features a virtual world comprised of
characters and events representing people, objects, behaviors, and events observed in real-
world contexts (NCTM, 2000). Students working to apply mathematics in a programming
44
environment to create the game world are inherently employing the connections standard
by using their math skills in a format that moves beyond the paper-and-pencil problem set
format (Kafai, 1995).
Curricula and Instructional Methods in Mathematics
Conducting studies that control for confounding variables to provide direct
comparisons between diverse curriculum and varied instructional methods have proven
difficult. Thus, consensus does not exist regarding which curriculum and instruction are
most successful in increasing student mathematical achievement (Confrey, 2006). There is
some agreement that part of the problem stems from teaching conducted in the middle
grades, in part due to differences in how middle school math is leveled; in some states
grades five through eight are grouped with elementary levels and in others these grades
are grouped with secondary levels. The National Academies (National Research Council,
2010) have addressed the particular challenge associated with training teachers to instruct
mathematics in the middle grades, noting that, “preparation for middle grades mathematics
teachers varies from place to place, and certification requirements reflect the ambiguous
status of middle school” (p. 103).
While standards (e.g., NCTM’s Principles and Standards, 2000, and the Common
Core State Standards, 2010) guide teachers in knowing what students mathematics content
should learn and how students should proceed when problem-solving in mathematics,
specific methods of mathematics instruction vary widely. The diversity of these methods,
from algorithmic to discovery-based, and from pencil-and-paper to technology-infused,
complicate the instructional landscape. In the end, outcomes of student mathematical

45
achievement may provide some indication of the degree to which various instructional
methods succeed.
For example, the Increasing Course Rigor project, a multistate, collaborative
initiative by the National Governors Association Center for Best Practices and ACT, Inc.
focused on training teachers to use state-of-the-art curriculum units and new instructional
methods that were integrated with a system of assessments to, “prepare more high school
graduates for the demands of higher education and the workplace” (Wakelyn, 2008, p. 1).
In one strand of this initiative, success was measured according to how well geometry
teachers tightened their alignment with mathematics content standards as determined by
the resulting performance of students on the ACT, a standardized, college entrance exam.
Some studies have been tied to specific curriculum offerings from textbook
publishers, but offer insight to empirical practice. For example, Saxon Math mathematics
demonstrated the success of its “incremental, distributed” instructional approach
characterized by a cycle of instruction, practice, and assessment of small chunks of
information (Williams, 1986). However, other researchers examining similar, traditional
approaches found that while children can learn and successfully employ computational
algorithms, they do so without depth of understanding (Brown & Burton, 1978; Van Lehn
1983) and such approaches negatively affect future learning (Hiebert, 1984; Baroody &
Ginsburg, 1986).
Conversely, researchers examining the efficacy of the Everyday Mathematics
program of instruction (the instruction received in daily math courses by participants in
the current study) found that students benefited from learning through this nontraditional
curriculum and instruction. Everyday Mathematics focuses on a cyclical approach,

46
covering a diverse range of topics in each lesson, and cycling back from month-to-month
and year-to-year with increased depth in each topic. Students engaged in Everyday
Mathematics were found to be successful at inventing their own methods for computation
(Kamii & Joseph, 1988; Resnick, Lesgold, & Bill, 1990; Carpenter, Fennema, & Franke,
1992) and these methods bolstered their skills in estimation and mental calculations. Other
field-based findings, though, indicated that the lack of rote drill-and-practice in Everyday
Mathematics reduced student acquisition of automaticity required for executing multi-digit
multiplication and division, and negatively impacted student ability to excel in future
mathematics (Clavel, 2003).
More beneficial to an examination of mathematics instructional methods may be
findings discussed in the research-based, How Students Learn, History, Mathematics, and
Science in the Classroom (Donovan & Bransford, Eds., 2005). How Students Learn
outlines three fundamental principles of learning theory that teachers must invoke in the
instruction of mathematics, regardless of the specific curriculum in place in the classroom.
Principle 1 requires connecting with and building on the prior mathematical
understandings that students bring to the classroom. Principle 2 involves relating the
procedural skills and competences required to do mathematics to an overarching
conceptual framework. Principle 3 aids students in invoking their own metacognitive
strategies when solving mathematics problems.
These principles resonate with Gee’s problem-solving learning principle and van
Merriënboer’s 4C/ID approach to teaching complex skills in that all three describe a cycle
of connecting with prior knowledge, relating within the overarching framework, and
reflecting metacognitively about solution strategies. Thus, the parallel processes

47
demonstrate a natural relationship among game playing, game making and mathematical
problem solving.
Lateral Transfer from a Related Subject Area to Mathematics
A fundamental question to be investigated is whether video game construction
projects in the middle school classroom provide a meaningful context for teachers to
enable learners “to recognize and apply mathematics in contexts outside of mathematics”
(connections standard, NCTM, 2000). Research and theory can inform such engagement;
however, few studies examining the efficacy of the reverse, learning mathematics through
a context (i.e., video game design and construction), have been conducted.
Perkins and Salomon (1987) addressed this concept of learning in a primary field
having spillover into learning in a secondary field. They noted that, “transfer of learning is
a side effect, a fringe benefit: You learn A and find that performance B improves as
well… You learn one video game and note that the reflexes developed there help you with
another similar game” (p. 287). Transfer of learning may be positive or negative
depending upon the degree of “interference effects between the vocabulary and syntax of
the original and new language” (Perkins and Salomon, 1987, p. 287), for example,
between the language of computer programming and the language of mathematics.
Further, transfer may be horizontal (lateral), as in the case of learning computer
programming contributing to learning mathematics; or vertical, as in the case of learning a
task that is a component of a larger task (i.e., learning to subtract contributes to learning
long division). Another aspect of transfer is distance. Near transfer occurs between two
tasks that are similar in character and context (i.e., driving a car and driving a truck), while
far transfer occurs between two tasks that share few common aspects in character and

48
context (i.e., computing probability and playing craps). A final component of transfer is
type, low road and high road. “Low road transfer occurs as the automatic consequence of
varied practice.” (Perkins and Salomon, 1987, p. 288). In contrast, high road transfer takes
place, “through the mindful abstraction and application of principles” (Perkins &
Salomon, 1987, p. 290).
With regard to the current research, learning tasks consist of representing and
constructing video games in three forms: verbal, mathematical, and programming. As
students analyze the structure of provided game models and then construct their own
versions of each game, they move among these three forms, employing a series of near
transfer and far transfer tasks that includes both load road and high road aspects.
Analyzing the mathematics inherent in a video game to enumerate events as verbal
descriptions is a far transfer task as it shares only some common aspects of character and
context with the visual nature of the game. Synthesizing representations in mathematical
and programming forms is also far transfer in terms as it entails translation from verbal to
computational, logic, and code forms. Analysis and synthesis can also be considered low
road because students mostly write events and representations that relate closely to the
examples provided given by the instructor (Perkins & Salomon, 1987). Programming the
mathematics and programming representations into a new video game may include both
near transfer tasks (i.e., that share many common aspects with the representations elicited
in the model game) and far transfer tasks (i.e., that show significant variation or combine
multiple examples ideas from the model) (Perkins & Salomon, 1987). For example, some
programming tasks require repetition or slight variation of a simple piece of code (e.g.,
using the SETH command to set the headings of objects to point different directions in the

49
play field); these tasks are essentially near transfer in nature. Other tasks require an
understanding of multiple tasks variations that result in related but dissimilar code (e.g.,
setting the heading of an object to a random direction following a collision, using a
combination of SETH, RANDOM, and OnTouching code), requiring far transfer
learning. Game programming may also be low road or high road depending on the degree
of deviation students exhibit in creating their games. Students who program a game nearly
identical to the game model, but varying only in aesthetic or slight substantive ways
engage in low-road transfer. Students who choose to deviate from the game model and
create new game features that are not simply aesthetic in nature engage in high-road
transfer. This is because they must apply previously learned principles in a novel fashion,
or possibly learn new principles in order to implement their ideas (Perkins & Salomon,
1987).
Beyond understanding the mathematics that students invoke in analyzing and
synthesizing video games, one goal of the current research is to explore the lateral transfer
of mathematics expertise in the programming context to mathematics expertise in the
traditional context. Singley and Anderson (1989) have shown that through specifically
designed instructional environments and related hands-on projects, learners not only can
acquire new knowledge but they can transfer that knowledge for use in other applications.
Creating a game exemplifies Wilensky’s (1991) notion of concretizing a concept,
specifically transforming mathematical concepts into a physical product. Additionally,
creating a video game requires the additional step of programming code to execute game
play in a computer environment. Fadjo et al., (2010) have termed this idea of concretizing

50
abstract instructions in a physical game program that is manipulable and executable as
embodiment.
With regard to the programming context, van Merriënboer (1990) found that
highly structured programming instruction including worked examples and varied practice
tasks builds not only the successful programming skills in the learner, but also the ability
to transfer these skills to novel situations (van Merriënboer & Kester, 2005). Because
"people construct new knowledge and understandings based on what they already know
and believe" (Bransford, Brown, & Cocking, 1999, p. 10), it is plausible to expect that
some degree of transfer will occur from students exhibiting mathematical understanding in
the design and programming of games to mathematical problem-solving in other familiar
contexts – potentially answering problems on achievement-style math tests.
Klahr and Carver (1988) explored whether children can learn high-level thinking
skills from computer programming and whether these skills transfer to other, similar
environments. They found that learners with extensive experience in Logo effectively
learned to troubleshoot errors in nonprogramming, multistep written solutions. Detecting
and correcting errors, whether “plugging in” a value to check the solution for a variable or
tracing the logic of a geometry proof, are skills necessary in all forms of mathematical
problem solving. Other research showed similar findings, including those by De Corte
(1992) who examined learners’ debugging strategies, problem decomposition, and
construction of external representations, finding that, “the Logo treatment was successful
in achieving transfer, especially to situations that are not too different from the original
learning context” (p. 326).
Fadjo, Chang, Hong, and Black (2010) promoted an approach known as embodied

51
cognition to investigate the processes by which preteen programmers learn one specific
aspect of writing code that possesses strong ties to mathematics, that of conditionals.
Common programming conditional statements, such as “if-then” and “if-then-else” are
often paired with logical connectors (e.g., “and,” “but,” and “or”) to facilitate decision-
making in the program. Similar constructs are also utilized in writing proofs in first-year
geometry courses. Because of the abstract nature of writing conditionals, it is posited that
embodying these programming statements with a physical form (e.g., a puzzle tile in
Scratch) in a video game may more effectively allow students to recognize, “when a
condition is met and when the consequence sequence should be executed” (Fadjo, Chang,
Hong, & Black, p. 2672).
While problem-solving skills will likely grow organically as learners’ experiences
in a programming environment such as Scratch or MicroWorlds EX develop, Littlefield et
al., (1988) emphasized maintaining an instructivist (i.e., teacher-guided) approach during
some phases of Logo instruction to establish the basis for effective skills transfer. He
noted specifically that the instructor must provide, “explicit emphasis on problem-solving
skills, as well as explicit bridging to decontextualize the skills developed and encourage
transfer to other contexts” (p. 133).
Most encouraging that students enhance mathematical understanding through
programming may be Kafai’s findings (1995) that preteens and young teens taught Logo
in a game design context scored higher on rational number concept post-tests than control
groups. The concept tests assessed learners’ understanding of fractions translating among
pictorial, written, and symbolic representations. Additionally, “the Game Design Class
showed a significant increase in their ability to deal with fractions” (p. 266) on a

52
standardized test subsection focused on algorithmic operations, rising from 55% (pre-test)
to 70% (post-test) following Logo intervention.
One limitation associated with studies of Logo’s efficacy in promoting the
acquisition of mathematics concepts and skills is that many studies were conducted in the
late 1970’s, coinciding with the original release of Logo and the initial widespread
adoption of Logo for use on early school computer labs. Little new research has been
conducted on Logo-derivatives during the past decade, although a few studies (Fadjo,
Chang, Hong, & Black, 2010; Maloney, Peppler, Kafai, Resnick, & Rusk, 2008) have
recently revisited this realm through the vehicle of Scratch. Only the work of Kafai and
her colleagues (Kafai, Franke, Ching, & Shih, 1998) looked specifically at learning
mathematics through the MicroWorlds EX interface.
Kelleher and Pausch (2005) emphasized that programming is not an isolated
learning experience but offers students the opportunity “to explore ideas in other subject
areas” (p. 84). Resnick and Silverman (2005) extended this belief, noting that, “When kids
learn to program, it extends the range of what they can design, create, and invent with the
computer. Moreover, it provides them with experience in using and manipulating formal
systems – experience that is important not only in computer science but also in many other
domains from mathematics to grammar to law” (p. 199). But as Teske and Fristoe (2010)
observed, “The shape of this transfer between subject area domains, however, has
remained unexplored and unformulated” (p. 166) including the transfer from doing
mathematics in the context of constructing a video game to doing mathematics in the
traditional paper-and-pencil context. Thus, in summarizing the state of research in the
field of student-programmed video games, it has been observed that, “Taking a design

53
approach to researching games might provide a useful framework for studying games,
which thus far, have lacked a coherent research paradigm” (Squire, 2003, p. 11).
Literature Relevant to Student Affect Associated with Mathematics
In addition to instructional methods, mathematical performance exhibits a
relationship with student attitudes towards mathematics. Understanding how affect,
including attitudes towards participating in instructional activities, math self-efficacy,
enjoyment of mathematics, and other measures correlate with student achievement in
mathematics may better inform educators, curriculum developers, and other decision-
makers regarding instructional alternatives that lead to student success in mathematics.
Although more attention than ever is being directed toward mathematics and mathematics
achievement, little of that attention includes an affective component. As Chamberlin
noted, “unfortunately, dispositions and motivation are the components of education that
are potentially the items most frequently neglected as a result of increased attention to
standardized assessments” (2010, p. 167).
Examining mathematics and affective relationships may be especially important
when considering a diversion from more traditional, instructional environments in favor of
more constructivist, project-based activities such as video game construction, in which
students must invest significant effort to produce a finished product (Blumenfeld et al.,
1991). These types of projects, “can increase student interest because they involve
students in solving authentic problems, in working with others, and in building real
solutions (artifacts). Projects have the potential to enhance deep understanding because
students need to acquire and apply information, concepts and principles, and they have the
potential to improve competence in thinking because students need to formulate plans,
54
track progress and evaluate solutions" (Blumenfeld et al., 1991, pp. 372-373). If students
are more likely to succeed in learning mathematics when engaged in learning activities
they enjoy, then such relationships must be studied and demonstrated to provide
justification for deviation from traditional instructional materials and methods in the
school setting.
Definition of Affect
Affect is a term that encompasses a wide range of aspects characterizing an
individual’s emotional response. Affect includes attitudes, disposition, motivation,
feelings, beliefs, and emotions (Chamberlin, 2010).
The lack of a standard definition for affect has not impacted research efforts in
attempting to measure it within student populations, especially with regard to mathematics
teaching and learning. However, the development of instruments to quantify affect is
predicated on identifying its measurable components. One definition developed by
Anderson and Bourke (2000) incorporated most key components of affect by stating that it
is, “comprised of the sub-components: anxiety, aspiration(s), attitude, interest, locus of
control, self-efficacy, self-esteem, and value” (Chamberlin, 2010, p. 168). External factors
including peer and parental influences, however, are not explicitly included in this
definition.
Each affective component also possesses three characteristics that must be
considered in fully defining it, specifically target, intensity and direction. “The target
refers to the object, activity, or idea towards which the feeling is directed. The intensity
refers to the degree or strength of the feelings. The direction refers to the positive or
negative orientation of feelings” (Chamberlin, 2010, p. 170).

55
Instruments for Measuring Affect
Measuring affect in mathematics requires an instrument that may be administered
or protocol that may be implemented in order to quantify affective components. McLeod
(1994) observed that such instruments were employed as early as the 1960s for the
purpose of determining student attitudes towards a new curriculum that taught
mathematics through science. However, “one major concern of research on attitude was
the quality of the instruments that were being used” (McLeod, 1994, p. 638).
Historical affective instruments. Many of the earliest instruments focused on
single dimensions of affect and provided very narrow windows on the attribute they
intended to study. Representative unidimensional instruments included the Dutton Scale,
which measured students’ feelings toward arithmetic (Dutton, 1954); and the Attitudes
Toward Mathematics survey (Gladstone, Deal, & Drevdahl, 1960). Aikin (1974), was one
of the first researchers to develop a multidimensional attitude survey; his instrument
included both Enjoyment of Mathematics and Value of Mathematics scales, while
Sandman created a six-attribute scale, the Mathematics Attitude Inventory (1980), that
added (a) perception of the mathematics teacher, (b) anxiety toward mathematics, (c) self-
concept in mathematics, and (d) motivation in mathematics to Aiken's two scales. Other
multidimensional scales were developed by Michaels and Forsyth (1977) as well as
Haladyna, Shaughnessy, and Shaughnessy (1983) who created tools for measuring teacher
quality and learning environment variables, proposing that these components were
actually more likely to impact class mentality towards mathematics than individual
attributes. The Trends in International Mathematics and Science Studies (TIMSS) reports
(Mullis, Martin, & Foy, 2007) featured three affective scales consisting of the Index of

56
students’ positive affect toward mathematics (PATM), the index of students valuing
mathematics (SVM), and the index of students’ self-confidence in learning mathematics
(SCM). The Fennema-Sherman Mathematics Attitude Scales (Fennema & Sherman, 1976)
consists of nine instruments: attitude toward success in mathematics scale, confidence in
learning mathematics scale, mathematics anxiety scale, effectance motivation scale in
mathematics, mathematics as a male domain scale, mother scale, father scale, teacher
scale, and mathematics usefulness scale. Although the Fennema-Sherman is one of the
most popular and frequently used sets of measurement scales, Mulhern and Rae (1998)
have argued that the instrument actually addresses fewer factors than it purports to.
Ultimately, Fennema-Sherman may best be used for its measure of four scales, namely
attitude, self-efficacy, motivation, and anxiety (Chamberlin, 2010).
Criteria for distinguishing quality affective instruments. To distinguish quality
affective measurement instruments, Chamberlin (2010) suggested three criteria.
1. Statistical data. Instruments with high validity and reliability coefficients
exceeding 0.80 are considered sound (Nunnaly, 1978).
2. Innovation. Instruments that measure some new aspect of affect are rated as
innovative;
3. Level of usage in the field of mathematics education. Instruments used in
multiple studies and cited in literature reviews possess a high level of use.
One additional practical consideration for an affective instrument intended for students is
that administration time is minimized (Tapia & Marsh, 2004).

57
Attitudes Toward Mathematics Inventory (ATMI). One recently developed
instrument for the purpose of measuring affective factors associated with learning
mathematics that meets the aforementioned criteria is the Attitudes Toward Mathematics
Inventory (ATMI) by Tapia and Marsh (2004). The ATMI is a 40 item-instrument with
demonstrated content validity, reliability and test-retest stability. The ATMI possesses
content validity as it relates each of the 40 question items to the four affective variables of
self-confidence, value, enjoyment, and motivation; it features a strong internal consistency
and reliability of scores (item-to-total correlation) with a Cronbach alpha of 0.97 for the
entire group of 40 items; and its Pearson coefficient for test-retest reliability for the total
scale is 0.89, indicating that scores are stable over time. (Tapia & Marsh, 2004). The
ATMI has been used successfully with elementary, secondary and college audiences
(Fengfeng, 2006, 2007; Marsh, 2005; Moldavan, 2007) and has been employed in recent
years in studies examining mathematics affect and achievement.
Affect and Achievement
Affect and achievement in mathematics are intertwined such that examining either
component in isolation risks failure in obtaining a complete picture of student learning in
mathematics. “Affect is a large piece of why students perform as they do … [it] is
arguably the single greatest factor that impacts the learning process” (Chamberlin, 2010,
p. 169).
Correlations between affect and achievement have been explored in numerous
studies (Burstein, 1992; Reynolds & Walberg, 1992; Randel, Stevenson, & Witruk, 2000;
Sanchez & Sanchez-Rhode, 2003); by the Canadian government (Bussière, Cartwright, &
Knighton, 2004); and by developers of affective measurement instruments such as the

58
ATMI (Tapia and Marsh, 2004). Correlations have also been examined longitudinally via
the regularly administered international TIMMS studies (Mullis, Martin, & Foy, 2008).
Featuring three independent, Likert-response scales, TIMMS has gathered affective data
on precollege students worldwide on indices of students’ positive affect toward
mathematics (PATM); students’ valuing mathematics (SVM); and students’ self-
confidence in learning mathematics (SCM). At both the fourth and eighth grade testing
stages, high achievement in tested mathematics content was associated with more positive
affects, while low achievement scores were associated with more negative affects.
The positive correlation between mathematics achievement and affect also appears
to display some causal directedness as well. A long held perspective that, “student beliefs
and attitudes have the potential to either facilitate or inhibit learning” (Yara, 2009, p. 336)
implies that attitude affects achievement. However, research by Ma & Xu (2004) indicated
that the causal relationship may be the converse – that achievement in mathematics is a
predictor of affect towards mathematics. Their examination of data from the Longitudinal
Study of American Youth (LSAY, 2007) showed that among students in grades 7-12, prior
achievement played a significant role in predicting later attitude, but prior attitude did not
predict later mathematics achievement (Ma & Xu, 2004).
While the results obtained by Ma and Xu (2004) implied that performing poorly in
mathematics leads to negative attitudes towards mathematics, efforts are still being
directed at improving math attitudes as a component of overall mathematical success
among students. In fact, “developing positive attitudes toward mathematics is an important
goal of the mathematics curriculum in many countries” (Mullis, Martin, & Foy, 2008, p.
173). An additional possibility regarding causality between affect and achievement is that

59
the relational is actually cyclical as suggested by Gibbons, Kimmel and O’Shea (1997). In
this case, students’ attitudes may both lead to and stem from achievement in both positive
and negative reinforcing loops. Thus, “those students who do well in a subject generally
have more positive attitudes towards that subject and those who have more positive
attitudes towards a subject tend to perform better in that subject” (Yara, 2009, p. 338).
With regard to examining students’ mathematics affect in conjunction with
mathematics achievement measured during their construction of video games, findings
may provide insight regarding mathematics interest and acquisition both in the short term
and the long term. Not only can such data inform practice regarding alternative routes to
teaching mathematics, but it may also offer insight to the larger challenge of engaging
more youth in STEM-related careers. Hembree (1990) noted that when otherwise capable
students possess negative affect toward mathematics, their resulting avoidance of studying
mathematics reduces career options and deteriorates our nation’s human resource base in
STEM fields. Thus, if learning experiences involving content perceived as high-interest
among preteenagers, specifically video game construction, generate positive affective and
achievement gains in mathematics, the impact may be realized well beyond any one
student or individual classroom.

60
CHAPTER 3
METHODOLOGY
The overarching question for the current study examined whether video game
design and construction by middle school students is an instructionally effective and
affectively satisfying method of teaching age-appropriate, standards-based mathematics
content and processes. In exploring this larger proposition, this study addressed three
different, yet related questions.
The first question involved the mathematics content and processes of video game
construction by students. This question included three parts, namely video game analysis,
video game synthesis and video game construction. Video game analysis focused on the
mathematics that students utilize in recognizing events that occur during game play. Video
game synthesis addressed the mathematics that students utilize in representing events that
occur during game play. Video game construction examined the mathematics that students
employ as they computer program actual games.
The second question sought to determine if the level of mathematical content
knowledge students demonstrated prior to and following video game design and
construction was improved. It also sought to determine whether students engaged in video
game design and construction would achieve higher levels of mathematical content
knowledge than students of similar math abilities who did not engage in video game
design and construction.
The third question sought to go beyond the cognitive aspects of mathematics and
video games by quantifying the affective dimension of middle school students towards
mathematics. Attitudes of students who designed and constructed video games were

61
compared prior to and following project engagement. Additionally, it was queried how
attitudes compared between students who engaged in video game design and construction
and those who did not.
Research Questions
The specific research questions that guided this study follow (see Figure 1).
Figure 1. Research Questions.

62
1. The mathematics of video game design and construction. What mathematics
content do middle school students invoke as they design and construct video games? This
question entailed three parts: (a) analysis – What mathematics content do middle school
students invoke as they analyze games? (b) synthesis – What mathematics do middle
school students invoke as they synthesize games? (c) programming – What mathematics
do middle school students invoke as they program games?
2. Lateral transfer of mathematics ability. Using a standards-based multiple-choice
mathematics content test, how does the performance of middle school students who
engage in video game design and construction (a) change, pre-design and post-
construction of video games? And (b) how does it compare with the performance of
students of similar math abilities who are not engaged in video game design and
construction?
3. Attitudes toward mathematics. How can the attitudes of middle school students
towards mathematics be characterized prior to constructing video games and after
constructing video games, and how do these attitudes compare with students not engaged
in video game design and construction?
Research questions were examined via multiple research methods, including both
quantitative and qualitative analyses.
Research Design
The research study was designed based on a scientific design philosophy. Design
methods included both quantitative and qualitative measurements.

63
Design Philosophy
The National Research Council (National Research Council, 2002), a science and
technology advisory council of the federal government, set forth three guiding questions
with regard to designing and conducting scientific research in education, asking
specifically (a) What is Happening? (b) Is There a Systematic Effect? and (c) Why or How
is it Happening?
Posing research questions, designing research methodologies, and interpreting
findings in accordance with these guiding questions helps ensure relevance of the study to
broader educational issues, replicability of the findings, and implementation of strategies
and interventions judged successful in the educational setting.
With regard to specific mathematics content to be addressed in the middle grades,
the National Council of Teachers of Mathematics (NCTM) provides content standards in
its Principles and Standards for School Mathematics (NCTM, 2000). “Standards are
descriptions of what mathematics instruction should enable students to know and do. They
specify the understanding, knowledge, and skills that students should acquire” (p. 30).
NCTM content standards addressing (a) numbers and operations, (b) algebra, (c)
geometry, (d) measurement, and (e) data analysis and probability prescribe specific
content that students should learn in their mathematics studies in school.
Research questions and the video game design and construction projects developed
to explore those questions were aligned with NCTM (2000) content standards. Alignment
was accomplished by examining grade-appropriate standards, then creating game projects
and mathematics content test questions based only on those standards. This ensured
relevance to examination of student achievement of mathematics in the middle school.

64
This research project followed the NRC research principles and the NCTM
national standards for mathematics content by examining instruction of mathematics in a
context meaningful to students (Midbrandt, 1995). Specifically, the study described the
acquisition and application of mathematics content knowledge through the processes of
video game design and construction (Kafai, 1995). The research also compared the
attitudes between students who constructed video games and students who did not. The
research was designed and executed as a hybrid descriptive and quasi-experimental study.
The quasi-experimental design of the study prevented drawing conclusions
regarding causal effects between video game treatment and student performance in
mathematics ability and disposition. However, the potential for demonstrating
correlational relationships existed, insofar as there was accounting, “for influential
contextual factors within the process of inquiry and in understanding the extent to which
findings can be generalized” (NRC, 2002, p. 80). A review of various paradigms and
achievement measures led to the decision to use both quantitative and qualitative
methodologies in conducting the study. In similar research involving construction of video
games by middle school students, Kafai (1995) suggested an integrated approach featuring
a diversity of research methods, “to compensate for the shortcomings of one methodology
with the strengths of the other” (p. 38). This suggestion was followed in selecting the
research methodologies for the current study.
Overview of Quantitative Methods
Quantitative research methods employ systematic scientific investigation of
properties and phenomena and are useful when numerical descriptions are sought in
explaining revealed relationships. Quantitative methods used in this study included
65
methods used for all study participants and methods used for treatment group students
only. These methods consisted of the following.
Standardized tests in mathematics. The collection and assessment of
standardized test scores. Annual achievement tests that existed for all study participants
were use as the measure of comparison. These tests were used to determine pre-study,
baseline mathematics abilities of the entire study population.
Studywide mathematics content tests (pre/post study). A multiple-choice
mathematics content test designed specifically for this research project was administered
to all study participants pre-treatment and post-treatment. The studywide mathematics
content tests determined pre-treatment and post-treatment mathematics content knowledge
on a specific set of mathematics content standards relevant to the construction of video
games addressed in the study.
Checkpoint mathematics content tests (pre/post video game project). A
multiple-choice mathematics content test designed specifically for each video game
project was administered to treatment group participants pre-analysis and post-
construction of each video game project. Scores on checkpoint mathematics content were
used to determine incremental changes in mathematics content knowledge relevant to the
construction of each specific video game.
Event-recognition tallies. During the analysis phase of each of the three video
games, students were asked to write an initial list of the events they recognized while
examining the game models. A simple count of the number of events recorded by each
treatment group student was tallied for each video game.
66
Representations scores. During the analysis phase of each of the three video
games, a rating of representations written by treatment group students for each event was
established. A rating of -1, 0, or +1 was used to evaluate the depth and accuracy of
mathematical and programming code representations recorded.
Game model events included. During the construction phase of each of the three
video games, students were ask to construct games that included, at a minimum, all events
featured in the game model. Game model event inclusion tallies recorded the number of
events featured in the game model that students incorporated in their own games. While
most events were both mathematical and programming in nature, some events featured
only one type of representation.
Modifications included. During the construction phase of each of the three video
games, students had the option of modifying, enhancing, and adding new events to their
games. Modification inclusion tallies recorded the number of alterations and
amplifications students included in their games as they brought their unique ideas to
fruition.
Attitude inventory scores (pre/post treatment). Attitudes toward mathematics
scores were collected from responses by all study participants on the ATMI attitude
survey. The Likert-scale attitude survey was conducted pre-treatment and post-treatment.
Overview of Qualitative Methods
Interpretation of the collected qualitative data was accomplished within the context
of the specific setting, participants, activities and instruments that comprised the study.
Qualitative data gathered throughout the study elucidated relationships that appeared in
the quantitative data but required further corroboration to acknowledge or eliminate

67
explanations for the results. Such contextual considerations were, “especially critical for
understanding the extent to which theories and finding may be generalizable to other
times, places, and populations” (NRC, 2002, p. 5). Qualitative methods used in this study
were employed only with treatment group students and consisted of the following.
Self-reflections (pre/post video game project). Documented by treatment group
students, self-reflections were generated in the form of written notes and drawings on pre-
formatted reflections and plans templates. Students recorded their self-reflections twice
for each game: first, between the synthesis and construction phase of each game project
(i.e., as Initial Reflections and Design Plans); and second, following game construction
(i.e., as Final Reflections). Self-reflections included students’ perceptions of their
challenges and successes, design graphics of their video games, and comments regarding
modifications or deviations from the game models that students planned and implemented.
Observations. Data was also collected from observations of treatment students
and their work activities that transpired during each class meeting. The researcher
recorded field notes, in the form of observational notes and direct transcriptions of student
statements, to the extent that such recordings did not infringe upon classroom instructional
time. Researcher head notes were recorded in written form immediately following each
class to capture additional nuances of classroom activities. Observation notes were used to
corroborate student-written reflections and video game files.
Talk-alouds. Talk-alouds were conducted at least once per game project,
following final construction of the video game and more frequently as time permitted.
Conducted by the researcher, digital audio recordings (and subsequent written
transcriptions) were made in which individual students talked about their video game

68
construction activities. The intent of the talk-alouds was to obtain additional insight into
students’ mathematical concept understanding during video game design and construction
(Ericsson & Simon, 1993; Patton, 2002). Occasionally, whole room talk-alouds were
recorded to capture the dynamics of social interaction among students as they constructed
their games. Additionally, to situate, “individual students’ progress in a larger context…
case studies [were used] to illuminate the general trends” (Kafai, 1995, p. 38) if the stories
of specific students in the treatment group proved compelling.
Evaluation of completed video games. Completed video games were evaluated
for mathematical and aesthetic elements. Video game elements included those defined by
the basic video game models as well as those added as modifications or deviations from
the game models.
Quantitative Methods Regarding Research Question 1a: Video Game Analysis
A quantitative methodology was appropriate for examining Research Question 1a
which focused on the mathematics of video game analysis. Data from assessment of
student game design journals employed during the analysis phase of each game project
were scored quantitatively to obtain measures of student content knowledge in
mathematics during the analysis phase of each video game. The specific quantitative
measure was event-recognition tallies.
Event-recognition tallies. Following presentation of a game model, treatment
students were asked to make a simple count of identifiable events in the game. For
example, in an Etch-a-Sketch toy, a student might have identified and named an event,
“move the pen tip.” In terms of the four-component/instructional design theory (van
Merriënboer & Kester, 2005), which states that complex tasks can best be taught via

69
carefully sequenced and practiced sub-tasks, this event would be considered a task which
could then be further deconstructed into subtasks including “move the pen tip north,”
“move the pen tip east,” “move the pen tip south,” and, ”move the pen tip west.” Each
listed event counted toward a student’s accumulation total.
Quantitative Methods Regarding Research Question 1b: Video Game Synthesis
A quantitative methodology was appropriate for examining Research Question 1b
which focused on the mathematics of video game synthesis. Data from assessment of
student game design journals employed during the synthesis phase of each game project
were scored quantitatively to obtain measures of student content knowledge in
mathematics during the synthesis phase of each video game. The specific quantitative
measures were representations scores (Miles & Huberman, 1994; Glesne, 2006).
Representations scores. Following the recording of event recognition lists by
treatment group students, the class engaged in a group discussion to complete a revised
events list for the model video game. Students were then asked to synthesize each event on
this revised events list using mathematical (i.e., numbers, symbols and equations) and
computer programming (i.e., code, pseudocode) representations. A scoring matrix (Miles
& Huberman, 1994; Glesne, 2006) rating accuracy and completeness was developed to
quantify student representations of their listed events. See the “Data Analysis” section for
additional details on the scoring matrix.
Quantitative Methods Regarding Research Question 1c: Video Game Programming
Quantitative data was collected during the construction (programming) phase of
each game project. Data consisted of tallies associated with elements of the completed
video games. Tallies were collected to document the number of (a) required game events

70
included in each video game, and (b) mathematical modifications, if any, added to each
game, and (c) aesthetic modifications incorporated in each game.
Qualitative Methods Regarding Research Question 1: Design and Construction
Qualitative data employed during the entire cycle of design and construction (i.e.,
analysis, synthesis, and programming) for each game project was also collected. Artifacts
included (a) initial and final self-reflections documented in student game design journals,
(b) observations, (c) talk-alouds, and (d) completed game files (Kafai, 1995).
Self-reflections. Prior to and following activities associated with the construction
of each project, students were asked to reflect on their plans and progress in producing
their own video games. Design journal pages included prompts to obtain student
reflections on successes and challenges. Design journals also prompted students to address
their personalization of games by reflecting on their modifications and deviations from the
theme and graphics of the model cover story (i.e., the game characters, setting, and
mission) and game play (i.e., events) provided by the researcher. The creative process of
personalization was not only fundamental to the development of new video games, but
frequently rooted in the transfer of mathematical content knowledge from one context to
another. For example, during the construction of the Frogger video game, a student may
have decided to construct interlacing lanes of traffic (in lieu of the standard parallel lanes),
thereby bringing knowledge to bear about perpendicularity in the game playfield. In
contrast, altering only the characters and background scenery with no change to the
underlying mathematics and programming did not constitute a transfer of mathematical
content. Student reflections about these adaptations provided insight about both the

71
mathematical and aesthetic transfer students employed in the production of fully
functional video games.
Completed video game files. Video game files in MicroWorlds EX were saved at
the end of each class and at the end of each completed project. Each computer file was
saved with a filename indicating the date and each student’s unique identification.
Mathematical achievement exhibited by students constructing functional video games in
MicroWorlds EX was corroborated by student reflections in their game journals.
Qualitative relationships between perceived progress (as measured by student reflections
on successes and challenges) and actual progress in game construction were sought.
Additionally, trends in modifying the researcher-provided cover story and events in the
video game model were examined.
Observations. In this study, qualitative data also included observation, “a
fundamental and highly important method in all qualitative inquiry” (Marshall &
Rossman, 2006, p. 99). As the classroom teacher of the math enrichment course, and thus
the direct provider of treatment instruction, the researcher took part in observation
activities during each meeting session as a full participant. Immersion in the computer lab
setting in which students engaged in video game instruction “permit[ted] the researcher to
hear, to see, and to begin to experience reality as the participants do” (Marshall &
Rossman, 2006, p. 100).
Observations of students, the work they conducted and their interpersonal
interactions with peers and the researcher were made during all treatment meetings.
Observations during the treatment phase addressed, “broad areas of interest but without
predetermined categories or strict observational checklists… to discover the recurring
72
patterns of behavior and relationships” (Marshall & Rossman, 2006, p. 99). Four strategies
guided observations, namely that they were conducted, via broad sweep; of nothing in
particular; searching for paradoxes; and searching for problems facing the group (Wolcott,
1981). Observational field notes and researcher-teacher head-notes (Glesne, 2006) were
written immediately following the conclusion of each class.
Talk-alouds. Following the completion of each video game project, the researcher
invited individual students to participate in talk-alouds, discussing their game design and
construction. Talk-alouds preserved the temporal properties of the cognitive process and
offered insight into the steps used by each student in executing the process (Ericsson &
Simon, 1993). Recording and transcriptions of these talk-alouds, in conjunction with
student reflections in the game design journals and saved student game files, provided
further qualitative illumination of quantitative data.
Quantitative Methods Regarding Research Question 2: Transfer of Math Content
Quantitative methods were appropriate for describing (a) initial differences
between study groups, (b) participant achievement in mathematics content knowledge, (c)
achievement comparisons of groups on mathematics content tests, and (d) attitude
comparisons on attitude inventory scales.
Standardized tests. Quantitative measures of baseline mathematical abilities (e.g.,
previously administered standardized math test scores) were used to identify participants
to populate the study. Specifically, students with average scores of 85% or higher were
admitted to the study population (i.e., they were all honors math or skip-grade math
students). Then, students who also enrolled in math enrichment became the treatment
group. The remaining high-performing math students became the comparison group.

73
Limitations regarding the school environment (e.g., scheduling), did not allow for
randomization of treatment and comparison participants. To compensate for this, the
researcher “attempt[ed] to ensure fair comparisons through means other than
randomization, such as by using statistical techniques to adjust for background variables
that may account for differences in the outcome” (National Research Council, 2002, p.
113).
At the outset of the study, statistical tests were performed to determine group
normality and initial differences between the treatment and comparison groups. If initial
differences in baseline mathematics performance or attitude existed, results would not be
easily extensible to broader audiences. For baseline mathematics performance, difference
tests were performed on achievement test scores obtained from the computational
mathematics and quantitative reasoning sections of the norm-referenced Educational
Records Bureau (ERB, 2011) Comprehensive Testing Program (CTP) tests administered
during late Spring 2008. Difference tests were also executed on researcher-developed,
studywide mathematics content tests. For attitude performance, difference tests were
performed on the pre-treatment administration of the Attitude Towards Mathematics
Inventory (ATMI) for both groups. See “Data Analysis” for additional details on statistical
analysis of the tests of initial differences.
Studywide mathematics content tests. Quantitative measures of mathematics
content knowledge, obtained via studywide pre-treatment and post-treatment mathematics
content tests, were obtained for treatment and comparison groups. The use of quantitative
methods to examine mathematics skill exhibited through tests is supported by previous
studies examining the impact of Logo software and its derivatives (Klahr & Carver, 1988;

74
De Corte, 1992; Littlefield el al., 1988) and the specific methods through which
instructional strategies are most effective (Kafai, 1995; Clements & Sarama, 1993).
Because this study sought to investigate the transfer of mathematics skills acquired
from video game design and construction to traditional mathematics achievement tests, the
research tested a correlational hypothesis: that participants programming video games in
MicroWorlds EX would exhibit higher performance levels on a multiple-choice,
standards-based mathematics content test than participants not designing video games.
The studywide mathematics content test was developed by the researcher and consisted of
multiple-choice questions addressing NCTM content standards reflecting with content
required to construct the three video games.
Checkpoint mathematics content tests. Within the treatment group, student
progress in mathematical knowledge was assessed at incremental stages between the start
and end of the treatment period. As treatment group students were engaged in three video
game projects, each project constituted a distinct stage at which mathematical content
knowledge relevant to the specific project could be measured. To this end, game
checkpoint pre-project and post-project content tests of mathematics were administered.
Game checkpoint tests consisted of problems similar to subsets of the studywide
mathematics content test (i.e., those content areas addressing the content required to
construct the game.
Quantitative and Qualitative Methods Regarding Research Question 3: Attitudes
An effective method of gauging student attitude is to conduct an attitude inventory.
In addition to measuring content knowledge changes associated with student design of
video games, this study sought to profile students’ affective changes towards mathematics

75
associated with their design of video games. To this end, a quantitative methodology was
appropriate for measuring and comparing, via Likert scales, the affective disposition of
participants (Dutton and Blum, 1968; Shrigley and Koballa, 1987; Machi and Depool,
2002).
Attitude scores. Existing attitude inventories relevant to mathematics were
examined for possible use. Specifically, an inventory was sought that elicited the types of
information this study intended to discover. The Fennema-Sherman Mathematics Attitude
Scales (Tapia & Marsh, 2004) have been used extensively for measuring math attitudes,
but focused heavily on gender-related themes. Since gender was not a research question
addressed in the proposed study, it was decided that the Fennema-Sherman test was not
appropriate in this venue. Other surveys examined did not possess age-appropriate
phrasing or questions relevant to the experiences of middle school students, male and
female.
It was ultimately decided that the Attitudes Toward Mathematics Instrument
(ATMI) instrument developed by Tapia and Marsh (2000) was the best choice for use with
the study population of the proposed research (See “Instruments”). The ATMI measures
numerous dimensions of student attitudes and have been proven valid through extensive
field-testing. Thus, the ATMI was administered to all study participants before and after
treatment activities. Statistical tests were executed to compare pre-treatment and post-
treatment attitudes within and between groups, and to find relationships between affective
dispositions and cognitive mathematics abilities as demonstrated on studywide content
pre-tests and post-tests.
76
Observations and talk-alouds. Observational notes and notes transcribed during
individual student talk-alouds as well as class discussions conducted by the researcher also
provide clarification of student attitudes towards mathematics and video game design and
construction. The notes were examined for trends within the group and for individuals in
the context of activities undertaken during treatment.
Study Participants
Study participants consisted of 6th and 7th grade students at a private school in Las
Vegas, Nevada. Students ranged in age from 11 to 13 years old.
Treatment Group
The treatment group consisted of 19 students enrolled in an elective math
enrichment course. These students were high performing in math, scoring in the 90th
percentile or better on grade-level achievement tests in computational mathematics and
quantitative reasoning. They represented the top 35% of their grade levels and consisted of
ethnically diverse boys and girls. While only high-performing students were eligible to
enroll in math enrichment, (approximately 50 students total), only a subset of those
eligible chose to take the elective course. Mitigating factors, including scheduling
conflicts, impacted whether students who registered for math enrichment actually enrolled
in the course. Additionally, room capacity limited maximum course enrollment to 20
students. Appendix A presents example profiles of two students in the treatment group.
Comparison Group
The comparison group consisted of 6th and 7th grade students at the participating
school who were high-performing in mathematics (i.e., taking 6th or 7th grade honors

77
math courses) but not enrolled in math enrichment. This high-performing subset of the
general 6th and 7th grade population provided a more equivalent basis for comparison
with the treatment group than the remaining, general population of 6th and 7th graders
who were not enrolled in the math enrichment course. All potential comparison group
students were invited to take part in the proposed study and all consented to do so.
Twenty-four students comprised the comparison group.
Non-Random Assignment and Initial Differences
Achievement test scores in mathematics and quantitative reasoning for the study
population were obtained to provide a quantitative measurement of pre-treatment student
math abilities. Because treatment group and comparison group students were not selected
via random assignment from the larger student population of 6th and 7th graders (or even
the high-performing subset of 6th and 7th graders), it was necessary to acknowledge initial
differences in their baseline mathematics abilities.
Setting
The setting for this investigation was a small, independent day school providing
instruction to approximately 700 students in grades pre-kindergarten through eight.
Located in Las Vegas, Nevada, the school is one of a small number of non-parochial
private schools offering an alternative to public school education provided by the Clark
County School District, the nation’s fifth largest school district. The school admits an
ethnically diverse student population with students possessing above-average academic
abilities and few major learning or physical disabilities. Paying an average tuition of more
than $20,000 annually, parents are of high socio-economic status, including business

78
owners and professionals. No student is classified as an English language learner (ELL)
although some students speak multiple languages including Spanish, French, and
Mandarin. Learning experiences balance collaboration with competitiveness and include
academic disciplines, fine and performing arts, STEM (science, technology, engineering
and mathematics) and health and fitness at all grade levels. Cross-grade collaboration is
encouraged and supported. Teachers are required to possess a minimum of a master’s
degree and 3 years experience before teaching at the school. Many have taught at similar
independent schools around the world. With these parameters in mind, careful
consideration must be given to the generalizability of results to broader populations.
Regarding the physical environment, the study required the use of a school-based
computer lab (Windows PCs were used) with the MicroWorlds EX program installed on
each computer. Researcher access to student files via the school network was required to
obtain copies of student work for future examination. Additional tables and chairs in the
lab served as the seating area for students writing in their design journals and taking
mathematics content tests and attitude inventories.
Many students in the study population have previously used the MicroWorlds EX
software. Informal pilot studies addressing video game construction with students who
had subsequently graduated (McCue, 2009) shaped the development of the current
research. Most students participating in the treatment group and some students in the
comparison group possessed experience using MicroWorlds EX in more traditional Logo
contexts, primarily constructing geometric figures and determining relationships between
polygons and turtle turn angles. However, study participants had not engaged in video
game design and programming activities during previous school semesters.

79
Data Collection
A hybrid descriptive and quasi-experimental design was used to investigate the
relationship between constructing video games and mathematics content knowledge.
Quasi-experimental parallels true experimental design in this case with the exception that
there was no random assignment of groups. One challenge in conducting research in this
format was the inability to shield the student participants from their status as either a
treatment or comparison group participant. Nonetheless, the study attempted to conduct
experimental practice, controlling for extraneous variables to the greatest extent possible
(Gay & Airasian, 2003). In this way, results may be more likely generalizable to settings
beyond the current context.
Sequence of Study Activities
The sequence of study activities was executed during a single school year and is
summarized in Figure 2. The study activities commenced in early November 2008 and
concluded in late May 2009.
Figure 2. Sequence of study activities.
Treatment Group Control Group
Studywide math pre-test and attitude inventory
Digital toy project 1: analysis, synthesis, construction
Video game project 2: analysis, synthesis, construction
Video game project 3: analysis, synthesis, construction
Studywide math post-test and attitude inventory

80
Outset, data collection. At the outset of the study, all participants (i.e., both
treatment and comparison groups) engaged in a studywide pre-test of mathematical
content knowledge. All participants also took a studywide pre-treatment attitude inventory
that measured attitude towards mathematics.
Treatment period, general overview. During a 7-month period, the treatment
group underwent a longitudinal intervention in which three video games were constructed.
For treatment group students, the intervention transpired in addition to their regularly
scheduled, daily mathematics course. The comparison group did not engage in any video
game programming nor special mathematics instruction beyond their regularly scheduled,
daily mathematics course.
The treatment phase was conducted in three segments with one video game project
per segment. The actual time available, in terms of number of 45-minute class periods, for
each project was extremely flexible, with Etch-a-Sketch occupying approximately eight
class periods, Frogger occupying approximately 12 class periods, and Tamagotchi Virtual
Pet occupying approximately 17 class periods. This flexibility allowed as much time as
was needed for students to complete their checkpoint tests, initial and revised event lists,
representations, design journal reflections and plans, and game programming.
For each game project, students in the treatment group followed a specific cycle of
activities: (a) checkpoint mathematics pre-test, (b) game analysis, including interaction
with the game model and listing events, (c) game synthesis, consisting of event
representation, (d) game construction (writing of Initial Reflections and Design Plans in
the design journals, programming in MicroWorlds EX, writing of Final Reflections in the
design journals, and game talk-alouds), and (e) checkpoint mathematics post-test.
81
Video game and digital toy models created by the researcher served as the basis for
each project. Projects analyzed, synthesized and constructed consisted of Etch-a-Sketch,
Frogger, and Tamagotchi Virtual Pet. The mathematics content encompassed by each
game follows.
1. The Etch-a-Sketch digital toy addressed boundary values, inequality statements,
heading, and addition/subtraction as inverse operations.
2. The Frogger video game required the use of Cartesian coordinates, the
equation of a line and the speed equation.
3. The Tamagotchi Virtual Pet video game addressed variable expressions,
variable manipulation and simple probability.
These three projects were selected because they represented mathematics concepts that
were both age-appropriate (NCTM Standards, 2000) and relatively easy to translate to
programming code to construct finished games.
Game production initially required some direct instruction to teach programming
basics including vocabulary, syntax, and logic. The focus however, was not on
programming itself, but on programming code as a mathematical representation and a
route to mathematical problem solving. Milbrandt (1995) stressed the importance of
contextualizing the programming, noting that, “the programming language is of secondary
importance, with emphasis placed on the problem to be solved and the logical steps
required for its solution” (p. 27).
Treatment period, data collection, pre-analysis. Each game project cycle began
with the administration of a short, checkpoint mathematics pre-test relevant to the game to

82
be addressed. The checkpoint tests consisted of seven to ten, multiple-choice mathematics
content problems.
Treatment period, data collection, analysis. The analysis phase then began with
the researcher showing the treatment group the first project model, namely Etch-a-Sketch,
constructed in MicroWorlds EX. Students were able to play with the digital toy on their
computers, but were not able to access the programming code. In this way, operation of
the toy was demonstrated without revealing any underlying mathematics or programming
code.
Treatment group students then began an analysis of play in which they were first
asked to identify toy elements and operation during a group discussion. Students were
asked to work individually as they examined the toy for all events defining the game
action. Definitions and simple examples of events were provided by the researcher in
order to model the expected format for the students. Students then wrote their list of
events in their game design journals. A simple count of events was then tallied to quantify
students’ initial ability to define game play.
Because students frequently missed listing events in the video game, further
identification required to fully describe game play was prompted by the researcher in a
class discussion. Following class consensus on the revised, comprehensive event list, the
researcher provided each student with a copy of the revised events list for their game
design journals.
Treatment period, data collection, synthesis. The revised, comprehensive event
list was formatted in three columns: the first column was the list of events, serving as the
verbal descriptive representation; the second and third columns were blank. During

83
synthesis, students wrote their event representations, using the second column for
mathematical representations, and the third column for programming code representations,
if they knew them. Representations were scored on a matrix that rated the accuracy and
completeness of student responses. These scores further quantified mathematical
understanding during the synthesis phase.
Treatment period, lessons learned from pilot study. The processes of event
analysis and synthesis were previously pilot tested with a small group of students (in fifth
and eighth grades) similar to those of the study treatment group. Pilot students were
shown a game, specifically Frogger, and asked to list four events that they could identify
in the game. Students were then asked to provide verbal descriptive, mathematical and
programming code representations of their events, given relevant examples.
While listing events in the pilot study, some students chose to write mathematical
representations of events closely related to the example event. In 4C/ID terms, these
events were tasks in the same task class (van Merriënboer’s & Kester’s 4C/ID, 2005).
These students produced correct or nearly correct mathematical representations and
programming representations. Other students chose to describe more complex events that
were well differentiated from the example. While these students were capable of writing
mathematical representations, the accuracy of these representations varied. Additionally,
without a translation model, only one student who was already somewhat familiar with
programming in MicroWorlds EX was capable of translating his mathematical
representation into code (with partial accuracy).
Treatment period, data collection, pre-programming. The construction phase
then began, with the researcher inviting treatment group students to plan the appearance of
84
their games in MicroWorlds EX. Students recorded these initial design plans in their game
design journals. The researcher informed them that they could deviate from the original
design of the game model so long as they preserved the general structure of the game play
(i.e., no characters, goals or events were removed, only modified or amplified). Students
wrote descriptions and drew graphics to show their own versions of the game that they
intended to construct (first Etch-a-Sketch, second Frogger, third Tamagotchi Virtual Pet).
Students were also asked to note any new mathematical representations and programming
commands required to implement their plans. They also reflected on their successes and
challenges experienced in analyzing the game models and planning their own versions of
the games. Initial design documents were used to corroborate quantitative data obtained
from the checkpoint pre-test and the event lists and event representations.
Treatment period, data collection, programming. The researcher then led
students into the programming phase of game construction. During this period, students
used their previous analyses and syntheses recorded in their game journals to write
programming code in a MicroWorlds EX game file. Students already recognized that
game play was broken down into component task and subtask problems (i.e., events)
which were more easily solved (i.e., van Merriënboer’s and Kester’s 4C/ID model for the
instruction of complex tasks, 2005). The tasks and subtasks were then ultimately
reassembled to construct the whole game. Worked examples, guided discussion, and peer-
to-peer interaction provided models and support to students in their programming efforts.
At the end of each treatment meeting conducted during game construction,
students were asked to save their game files with a name and date stamp. Following

85
completion of the fully finished game file, students saved their games as “FINAL,” along
with their names in the filename.
As students shared their games and invited one another to play their finished
products, the researcher circulated, making observations and recording candid talk-alouds
to obtain oral reflections by the treatment group students of their work.
Treatment period, data collection, post-programming. Students were asked to
create a Final Reflections page in their game design journals, reflecting on their progress
in programming game events into a functional video game, and noting successes and
challenges they encountered. Students were also asked to sketch their completed games as
well as describe modifications and deviations they made from the original game model.
Post-programming activities closed with the administration of the checkpoint mathematics
post-test (the same instrument as the pre-test) addressing content relevant to the video
game just constructed.
Close of study, data collection. Following the completion of the treatment phase,
all study participants took a studywide post-test of mathematical content (the same
instrument as the pre-test) and completed a post-treatment inventory of mathematics
attitude (the same instrument as the pre-treatment inventory).
Study Timeline
Research activities were conducted during the Fall and Spring semesters (October
2008 to May 2009) of the 2008-2009 academic year.
Three additional meetings (each 45 minutes in duration), were required of all study
group participants to complete the consent process, administer the studywide pre-tests and

86
post-tests of mathematics content, and administer the pre- and post-treatment attitude
inventories measuring student disposition toward mathematics.
Approximately 37 course meetings, each 45 minutes in duration, were conducted
as treatment phase class meetings with students in the math enrichment course. During
these meetings, students engaged in checkpoint pre-tests and post-tests and in video game
project activities consisting of game analysis, game synthesis, and game construction.
Instruments
A range of instruments were employed throughout the study to collect data
regarding student performance in mathematics, programming, and attitude. Descriptions
of specific instruments and their usage in the study follow.
Instruments, Studywide Mathematics Content Tests (Pre/Post Study)
A test of mathematics content (see Appendix B) was administered to all
participants twice during the study, specifically at the commencement of the study as a
pre-test and at the termination of the study as a post-test. The test was constructed by the
researcher and consisted of 20 multiple-choice questions addressing concepts and
processes prescribed by the National Council of Teachers of Mathematics standards
(NCTM, 2000). Specific questions were written to reflect the types of mathematical
content and processes addressed through video game interventions during the treatment
phase of the study. Questions did not directly address programming syntax nor
MicroWorlds EX code. Students were allowed 30 minutes to complete the test at each
administration.

87
Three questions (i.e., problems) on the mathematics content test are discussed to
demonstrate the types of problems students were asked to solve. Test item one (see Figure
3) addressed the “Use coordinate geometry” item of the geometry standard for grades 6-8
(NCTM 2000). Game design activities in Frogger addressed content relevant to this type
of question among students in the treatment group. Item eight (see Figure 4) encompassed
the “Write inequalities to describe boundaries” item of the algebra standard for grades 9-
12 (NCTM 2000). Game design activities featured in the construction of the Etch-a-Sketch
addressed this type of question. Test item eighteen (Figure 5) addressed the “Write
Algebraic expressions to manipulate variables” item of the algebra and measurement
standards for grades 6-8 (NCTM 2000). Treatment group students building Tamagotchi
Virtual Pet explored content relevant to this question type.
Figure 4. Studywide mathematics content test item addressing coordinate geometry.

88
Figure 5. Studywide mathematics content test item addressing inequality graphing.
Figure 5. Studywide mathematics content test item addressing variable manipulation.
Because there were no existing mathematics content tests comprised of the precise
mix of standards-based questions relevant to the video games addressed in the treatment
phase, the researcher developed a studywide mathematics content test specifically for this

89
purpose. Questions were based on NCTM standards (2000) with approximately one-third
of the test addressing questions derived from Etch-a-Sketch, one-third from Frogger and
one-third from Tamagotchi Virtual Pet. Additionally, questions were written in multiple-
choice format and in similar form to questions presented by NCTM for classroom use.
Most questions on the studywide mathematics content test addressed NCTM
standards for grades 6-8. However, because Algebra I is a course now taught in the middle
grades – and a course taken by 7th graders who are high-performing in mathematics as
well as all eighth graders, questions relevant to Algebra I themes were included on the
mathematics content test. NCTM categorizes these Algebra I standards in the grades 9-12
group.Appendix B consists of a complete copy of the studywide mathematics content test.
Instruments, Checkpoint Math Content Tests (Pre/Post Video Game Project)
Checkpoint tests were administered within the treatment group before and after
each video game project. Checkpoint tests consisted of questions similar in format to those
on the studywide mathematics content test. However, only those types of questions
relevant to each of the three video games were included in the checkpoint tests
administered in conjunction with that game. Students were given 15 minutes to complete
each checkpoint test.
Instruments, Student Game Design Journals
Replicating a successful tool employed in Kafai’s video game design research
(1995), treatment students maintained game design journals during game analysis,
synthesis, and construction activities. Game design journals were folders consisting of
pages on which students were asked to record specific information about their game
design and construction activities.

90
Information recorded by students in their game design journals consisted of the
following.
1. During game analysis, an initial list of events defining game play in the game
model.
2. During game synthesis, a table of representations describing each event, written
in verbal (i.e., the revised event list), mathematical, and programming code forms.
3. At the beginning of game construction, a reflections and plans document (i.e.,
(initial reflections and design plans) that included a student’s perception of his or her
successes and challenges in writing events and creating event representations; a labeled
sketch depicting the game environment (background and characters) that the student
planned to create in MicroWorlds EX; and a discussion of any modification the student
intended to implement from the game model.
4. At the end of game construction, a reflections and plans document (i.e., Final
Reflections) that included a student’s perception of his or her successes and challenges
translating written programming code to a functional game file in MicroWorlds EX on the
computer; a labeled sketch depicting the completed game environment (background and
characters) that the student created in MicroWorlds EX; and a discussion of any
modifications the student implemented from the game model.
Instruments, Video Game Files
At the end of each treatment meeting conducted during video game construction,
students saved their work-in-progress game file. Students were asked to save in a format
that included the video game tag, student initials and the date (e.g., EtchWW915 for “Etch
Will Wright November 15”). Students were instructed not to overwrite older versions of

91
game files composed during previous meeting dates, although they frequently did so
accidentally. Ultimately, the final, saved video game for each student served as the artifact
for corroborating other quantitative and qualitative data.
Instruments, Attitudes Inventory
Student attitudes towards mathematics in general and as a function of participation
in the video game design study were measured for study participants. Understanding the
role of student disposition, including attitudes, motivation and other affective facets, is
important in shaping learning activities in which students are truly involved.
Disposition of all study participants was measured via a pre-treatment survey at the
commencement of the study and again via a post-treatment survey (the same instrument)
at the end of the study. Several validated instruments for measuring disposition towards
mathematics were examined, including the popular Fennema-Sherman Mathematics
Attitude Scales (Tapia & Marsh, 2004). However, the Attitude Toward Mathematics
Inventory (ATMI) survey instrument was found to be superior for measuring student
disposition in this study (see Appendix C). Not only has ATMI been proven valid through
repeated research (Tapia & Marsh, 2004), it has also been validated with an audience
nearly identical to the study population – high socioeconomic, middle school students
(Tapia & Marsh, 2000).
The ATMI consisted of 40 items in four categories, addressing (a) confidence, (b)
value, (c) enjoyment, and (d) motivation. Response choices were formatted on a 5-point
Likert scale, consisting of 1: strongly disagree; 2: disagree; 3: neutral; 4: agree; and 5:
strongly agree. Several items were reversed and were given the appropriate value for data
analysis (Tapia & Marsh, 2000).

92
Internal consistency of the ATMI instrument as measured by Cronbach alpha is
.95, the split-half reliability is .83 and the Spearman-Brown reliability is .91.
Additionally, the ATMI instrument mean is 144.54, standard deviation is 24.99 and the
standard error of measurement is 5.42. All items possess item-to-total correlations of .45
or greater, meaning that all items contribute significantly to their categories. Thus, the test
items are homogenous, measuring a single, common trait within each category (Tapia &
Marsh, 2000).
Mitigating Potential Threats to Validity
Measurement of student achievement in technology-infused educational settings
has been a critical research focus for several decades. Since the purpose of school-based
research is to inform education within the school and ultimately to extend findings to the
broader educational community, researcher-teachers must anticipate potential threats to
the validity of results.
Threats to Validity, Role of the Researcher
Researcher-teachers inevitably influence the environment and interactions they
investigate, with the act of observing affecting the phenomenon being observed (Merriam,
1998). The researcher in this study was the enriched mathematics teacher of most 6th
grade treatment participants for 2 years; the enriched mathematics teacher of most 7th
grade treatment participants for 3 years; and the technology teacher of some 7th grade
treatment participants for 1 year. The researcher had previously conducted technology
research addressing gender-based preferences of video games (McCue, 2008) with several
students in the treatment group. Thus, there was a comfort level and familiarity already
established between the researcher and the treatment group.

93
The role of the teacher in fostering educational success is intricately bound up with
other facets of the classroom environment. The National Mathematics Advisory Panel of
the United States Department of Education, in its recently released Foundations For
Success: The Final Report (2008) document, executed a meta-analysis on current
mathematics research to compile a list of findings and recommendations for instruction
and future research. The Report stated that, “The Panel recommends that computer
programming be considered as an effective tool…, for developing specific mathematics
concepts and applications, and mathematical problem solving abilities. Effects are larger if
the computer programming language is designed for learning (e.g., Logo) and if students’
programming is carefully guided by teachers so as to explicitly teach students to achieve
specific mathematical goals (US Dept. of Ed, 2008, p. 52).” Moursund (1997) reinforced
this viewpoint, pointing out that, “Logo and the environments created from it does not
automatically guarantee educational success. While IT-assisted PBL [instructional
technology-assisted project based learning] is an excellent vehicle for implementing a
constructivist theory of teaching and learning a significant contributor to student success is
the teacher’s knowledge and skills” (p. 36). Thus, the role of the classroom teacher in
providing instruction and motivational support to the treatment group students must be
carefully considered. During the course of the study, the researcher-teacher maintained an
active participant role in treatment activities, interacting directly with the students under
investigation (Spradley, 1980). However, because of the constructionist nature of video
game design, the researcher engaged in less of a “direct instructor” role than most
traditional teachers. This de-emphasis of the didactic allowed the researcher to step back
more frequently into the role of observer, taking note of overall student experiences in the

94
game construction process. Care was given to avoid inadvertently skewing or
contaminating outcomes in the treatment group. Ultimately, though, the influence of the
researcher-teacher was not easily dissected from the instructional intervention.
Threats to Validity, Sample Selection
Another potential threat to validity was the problem of selecting samples
representative of the school population at the study site. Because treatment and
comparison group students were the highest-performing mathematics students at the
school, results achieved from studying these groups were not easily extensible to the
greater student body. Beyond the school population, results may not be extensible to
students of similar abilities in other independent-school environments. Generalizations to
typical populations in public school settings may be tenuous at best.
Threats to Validity, Instruments
A key measurement instrument, specifically the studywide mathematics content
test, posed a threat to validity. As the content test was written by the researcher and was
not pilot-tested nor proven valid, its use presented some difficulty in proving that it
measured what it was intended to measure.
Threats to Validity, Maturation and Morbidity
Participant maturation may present a threat to validity as well. Maturation –
changes arising from the natural physical, emotional, and intellectual evolution of subjects
over time – is of special relevance to the 6th and 7th grade audience under consideration.
Because young teens experience significant developmental changes (Rice & Dolgin, 2002;
Slavin, 2000), qualitative observations must attempt to discern whether treatment effects
result from treatment interventions and not personal growth. In this study, maturation also

95
may have resulted from content knowledge development resulting from out-of-class
practice with the relevant mathematics during their regularly scheduled mathematics
classes; or with the MicroWorlds EX software, either at home or during unassigned time
spent in the school computer lab.
Lastly, mortality, the circumstance in which students leave the study, may have
also presented a threat to validity. During this research, no study participant exited the
study. One student left the school during the last month of the school year, but his mother
delivered and administered the post-treatment attitude survey (the only instrument he had
yet to complete) to him and then returned the completed survey to the researcher.
Factors that might have typically threatened validity that did not require
consideration in this study include access to the computer lab facility and the presence of
fundamental technology skills among participants. The researcher was permanently
assigned to the computer lab full-time, during all scheduled classes. Further, students
engaged in weekly technology classes beginning in Kindergarten, with most core teachers
including additional technology activities in academic lessons.
Data Analysis of Quantitative Measures
Descriptive and inferential statistics were used to answer the four research
questions. Descriptive statistics including mean and standard deviation (SD) were
computed to report performance on the following measures.
1. Studywide mathematics content tests.
2. Checkpoint mathematics tests.
3. Tally of initial game play events recorded by students in design journals.

96
4. Ratings of event representations recorded by students in design journals.
5. Likert-scale attitude inventory responses.
Statistical analyses were carried out using the Statistical Product and Service
Solutions (SPSS) software. Means and standard deviations (SDs) were computed for both
preperformance and postperformance on tests and inventories by group. Means and
standard deviations were also computed for tallies of listed game play events and matrix
ratings of event representations. Statistical tests were used to explore relationships within
and between groups as described below. Additionally, the statistical significance of
variables relevant to each research question was computed in SPSS.
Valdez (2004) noted that, for statistical results to prove useful, “most educational
researchers, especially those who have examined large numbers of studies (meta-
analyses), agree that if used appropriately, technology can improve education in the effect-
size range of between 0.30 and 0.40.” Effect size is a numerical way of expressing the
strength or magnitude of a reported relationship. Cohen (1977) extended this benchmark
by providing ranges of effect-size utility, classifying effect sizes of around 0.2 as small,
0.5 as moderate and 0.8 as large. The moderately small sample sizes of N=19 for the
treatment group and N=24 for the comparison group limit the power rating (level of
significance) to .4 with an effect size of .54 (Lenth, 2001).
Data Analysis of Research Question 1: Event Tallies, Representations, Event
Inclusions, and Game Modifications
Within the treatment group, students initiated game analysis by exploring the
operation of a video game model created by the researcher in MicroWorlds EX. Students

97
in the treatment group then developed a list of events defining game play. A simple count
of events was tallied.
Following group discussion led by the researcher, students were given a revised
event list that precisely defined game play for the game model. The events in this revised
list became the verbal representations.
Students then worked to represent each event using mathematical notation and
programming code. Representations were scored using scoring matrices which employed
“+”, “0”, and “–“ codes. Negative (“–1“) codes were scored for representations not
attempted or substantially incorrect. Neutral (“0“) codes were scored for attempts that
included only partially correct or incomplete representations. Positive (“+1“) codes were
recorded for representations which were mostly complete and which contained mostly
correct statements describing the event (Miles & Huberman, 1994; Glesne, 2006).
Patterns of performance exhibited by treatment group students as they progressed
through the analysis phase from the first project, Etch-a-Sketch, to the second project,
Frogger, to the third project, Tamagotchi Virtual Pet, were sought. It was posited that,
during game analysis, students would progress from generating less accurate
representations on Etch-a-Sketch towards more accurate representations in later games.
This shift would be scored as a move from lower scores on representation ratings in Etch-
a-Sketch to higher scores on representations in Frogger and Tamagotchi. Further, a shift
towards more accurate ratings would imply that, as they gained experience, students were
becoming more successful in understanding all necessary mathematics and programming
elements required to bring a functional game to fruition. Mathematically, representation
ratings could range from very negative scores, demonstrating a low level of

98
understanding, to very positive scores, demonstrating a high level of understanding. The
composite score of a student’s entire set of representations equaled the sum of per-event
scores for all events in a given video game.
Once treatment students completed constructing their games, a tally was made for
each student’s completed game to determine how many events from the game model were
included. Finally, a tally of modifications created by each student in their completed
versions of Etch-a-Sketch, Frogger, and Tamagotchi Virtual Pet was performed.
Data Analysis of Research Question 2: Lateral Transfer of Math Ability
Lateral transfer of mathematics ability from the programming context to the
traditional context of multiple-choice tests was conducted in two ways. First, lateral
transfer was examined for treatment group students by project, for each of the three
projects, namely Etch-a-Sketch, Frogger, and Tamagotchi Virtual Pet. Second, lateral
transfer was examined for all study participants at the outset and at the close of the study,
for the purpose of comparing performance between treatment and comparison groups.
Analysis of lateral transfer of math within the treatment group. Prior to and
following each video game construction project, treatment group students completed a
short checkpoint test of mathematics content relevant to the current game. Each
checkpoint test consisted of approximately ten multiple-choice problems. Because
treatment group participants were math enrichment students, samples were not assumed to
be normally distributed. Therefore, simple descriptive and nonparametric statistics of
checkpoint test scores pre- and post-game were employed to examine results.
To determine within group shifts in student performance associated with the
construction of each game, the pre-test to post-test shift for responses to each question

99
item was measured (Roy, 2001, Draugalis & Jackson, 2004; I-TECH, 2008). Three answer
possibilities existed for most questions on the checkpoint content tests: correct (C),
acceptable (Acc), or incorrect (I). An acceptable response was one that indicated that the
student had partial understanding of how to answer the question, but missed a detail in
reaching the completely correct response. Some checkpoint content questions consisted of
only a correct response (C) or an incorrect (I) response.
In scoring the checkpoint content test, the shift by a student from an item response
on the pre-test to an item response on the post-test was measured as follows.
1. Positive change (a shift towards a more correct response).
2. No loss (an acceptable response followed by another acceptable response, or a
correct response followed by another correct response or an acceptable response).
3. No gain (an incorrect response followed by another incorrect response).
4. Negative change (a shift towards an incorrect response).
Percentages of response shifts measured as positive change, no loss, no gain, and negative
change were then reported. The treatment group sample size of N=19 limited the power
rating and effect size statistics computed for checkpoint tests.
Analysis of lateral transfer of math between groups. Opening and closing the
entire study, all study participants completed a 20-item multiple-choice test of
mathematics content relevant to the study content. Because study participants were
selected from honors and math enrichment populations, samples were not assumed to be
normally distributed. Further, samples between comparison and treatment groups were
unpaired and independent. Therefore, simple descriptive and nonparametric statistics of
studywide test scores pre- and post-treatment were employed to examine results.

100
To determine studywide between group shifts in student performance associated
with the treatment intervention, the pre-test to post-test shift for responses to each question
item was measured (Roy, 2001, Draugalis & Jackson, 2004; I-TECH, 2008). For the
studywide mathematics content test, student responses were scored as a correct (C)
response, acceptable response (Acc), or an incorrect (I) response. An acceptable response
was one that indicated that the student had partial understanding of how to answer the
question, but missed a detail in reaching the completely correct response. Some
checkpoint content questions consisted of only a correct response (C) or an incorrect (I)
response. In computing the results of the studywide content test, the shift by a student
from an item response on the pre-test to an item response on the post-test was measured as
positive change (I C), (I Acc), or (Acc C); no loss (C C) or (Acc Acc); no
gain (I I), or negative change (C I), (C Acc), or (Acc I). Percentages of
response shifts measured as positive change, no loss, no gain, and negative change from
the pre-treatment to the post-treatment administrations of the studywide test were then
reported. These results were then examined to determine between-group shifts in student
performance associated with participation in the study.
Additional analysis was also performed by measuring and comparing the pre-
treatment and post-treatment raw scores on the studywide content tests. To evaluate within
group changes that occurred during the course of the study, raw scores earned by students
in each of the treatment and the comparison groups on the studywide content tests were
examined via a Wilcoxon Signed Ranks test. To evaluate between groups changes that
occurred during the course of the study, raw scores earned by each group on the studywide
content tests were examined via a Mann-Whitney U test. Both the Wilcoxon and the
101
Mann-Whitney U are nonparametric statistical tests (two-tailed), appropriate for
examining the data, which was shown not to be normally distributed. The Wilcoxon
Signed Ranks test and the Mann-Whitney U test are analogous to parametric t-tests. A
significance level of .05 was chosen for identifying whether within group changes or
between group differences were significant.
Because members of the treatment and comparison groups were not randomly
assigned, these nonequivalent groups required an “unequal variance” limiter be included
in statistics comparing groups. The total sample size of N=43 students allowed for
descriptive and inferential statistical procedures to be employed with acceptable power
ratings and effect sizes in measuring and interpreting outcomes.
Data Analysis of Research Question 3: Attitudes Toward Mathematics
The ATMI attitude survey in which all study participants engaged at the beginning
and end of the study period produced per-item ordinal scores of 1 through 5 for each of 40
statement items grouped into the four scales of confidence, value, enjoyment, and
motivation. Means and standard deviations for each scale were computed for each of the
treatment (N=19) and comparison (N=24) groups.
To evaluate within group changes that occurred in attitude towards mathematics
during the course of the study, ATMI scores for students in each of the treatment and the
comparison groups were examined via a Wilcoxon Signed Ranks test. To evaluate
between groups changes that occurred in attitude towards mathematics, ATMI scores for
the two groups were compared via a Mann-Whitney U test. Both the Wilcoxon and the
Mann-Whitney U are nonparametric statistical tests (two-tailed), appropriate for
examining the data which was shown not to be normally distributed. The Wilcoxon

102
Signed Ranks test and the Mann-Whitney U test are analogous to parametric t-tests. A
significance level of .05 was chosen for identifying whether within group changes or
between group differences were significant.
Finally inferential statistical tests were employed in an attempt to extract
relationships among student performance on mathematical content tests, performance in
video game event analysis (event scores and representations ratings), and attitude towards
mathematics as measured on the ATMI.
103
CHAPTER 4
RESULTS
This study evaluated the mathematics content learned and attitudes exhibited by
students engaged in the design and construction of video games over several months.
During the study, treatment group students analyzed video games for their mathematical
events; synthesized the mathematics of video game events; and programmed functional
games.
Summary of Research Questions
Three research questions guided this study. The questions addressed learning
mathematics content, transferring mathematics content knowledge, and mathematics
attitude as follows.
Question 1, Mathematics of Video Game Design and Construction
This question entailed three parts: (a) analysis – What mathematics content do
middle school students invoke as they analyze games? (b) synthesis – What mathematics
do middle school students invoke as they synthesize games? (c) programming – What
mathematics do middle school students invoke as they program games?
Question 2, Lateral Transfer of Mathematics Content Knowledge
This question entailed two parts: (a) On a standards-based, multiple-choice
mathematics content test, how does the performance of middle school students change,
pre- and post-design and construction of video games? (b) On a standards-based, multiple-
choice mathematics content test, how does the performance of middle school students who
are engaged in video game design and construction compare with the performance of

104
students of similar math abilities who are not engaged in video game design and
construction?
Question 3, Attitudes Toward Mathematics
This question entailed two parts: (a) How can the attitude of middle school
students towards mathematics be characterized prior to designing and constructing video
games and after designing and constructing video games? (b) How do the attitudes
towards mathematics compare between middle school students who are engaged in video
game design and construction and those who are not engaged in video game design and
construction?
To investigate these questions, 6th and 7th grade middle school students engaged
in designing and constructing three video games using the MicroWorlds EX environment.
Treatment students designed and constructed (a) Etch-a-Sketch (b) Frogger and (c)
Tamagotchi Virtual Pet. They also took mathematics content tests and attitude inventories
pre-treatment and post-treatment. Nineteen treatment group students and twenty-four
comparison group students took part in the study.
Initial Differences Between Groups
At the outset of the study, the treatment and comparison groups were examined for
normality using tests of skewness and kurtosis (Hopkins & Weeks, 1990). Tests were
executed on (a) measures of mathematics performance on standardized tests, (b) measures
of mathematics performance on studywide content pre-tests, and (c) measures of affective
performance on pre-treatment attitude surveys. Criteria defined by Meyers, Gamst, &
Guarino (2006) were employed in determining whether measures exhibited normal

105
distributions. Following tests of normality, groups were compared to determine whether
any initial differences existed.
Comparison by Achievement Test Scores
Groups were compared by performance on achievement test scores. This
measurement was chosen because it provided a standardized basis of comparison for
student mathematical performance, and because it existed for all study participants.
Achievement test scores on quantitative reasoning tests and on numerical tests were
combined to form a composite mathematics achievement test score for each student in the
study.
Achievement test scores, descriptive statistics. Composite mathematics
achievement test scores are shown in Table 3. For the entire study group (N = 43), the
mean composite mathematics achievement test score was 92.5 (SD = 6.0). For students in
the treatment group (N = 19), the mean composite mathematics achievement test score
was 96.1 (SD = 3.1). For students in the comparison group (N = 24), the mean composite
mathematics achievement test score was 89.7 (SD = 6.3).
Table 3
Mathematics Achievement Test Scores by Group
Percentile Scores on Math Achievement Tests Group N Min Max Mean SD Treatment 19 86.5 99.0 96.1 3.1 Comparison 24 76.5 98.5 89.6 6.3 Combined 43 76.5 99.0 92.5 6.0

106
Achievement test scores, tests of normality. Statistical tests of skewness and
kurtosis were conducted on the score data sets to examine whether composite mathematics
achievement test scores earned by students in each of the treatment and comparison
groups were normally distributed. See Table 4 for results of these normality tests.
For the treatment group, data points skewed negatively and the computed
skewness statistic was -1.8 with a standard error of .52. Because the skewness statistic was
more than twice its standard error, the achievement test scores of treatment group
members showed a departure from normal symmetry. Achievement test scores of students
in the treatment group showed a kurtosis of 4.3, more than four times its standard error of
1.0, revealing significantly more clustering than a normal distribution. Thus, on
achievement test scores, the treatment group was not considered normally distributed.
The achievement test scores of the comparison group showed a skewness statistic
of -.70 with a standard error of .47. Kurtosis was computed as -.32 with a standard error
of .92. While the achievement test scores of the comparison group were skewed negatively
and somewhat platykurtic, they did not depart significantly from normality. Since
achievement test scores in the treatment group were not normally distributed, further
statistical exploration of these measures was computed nonparametrically.
Table 4
Tests of Normality: Mathematics Achievement Test Scores by Group
Skewness Kurtosis Group Statistic Std. Error Statistic Std. Error Treatment -1.8 .52 4.3 1.0 Comparison -.70 .47 -.32 .92

107
Achievement test scores, differences between groups. To examine whether
initial differences existed on achievement tests of the treatment and comparison groups,
the Mann-Whitney U statistic was computed. The Mann-Whitney U is appropriate for
nonparametric comparisons of performance between unpaired groups (Blaikie, 2003). On
achievement test measures, the Mann-Whitney U was computed as 68.5 (p < .001)
indicating that, at the outset of the study, treatment and comparison groups showed
differences that were statistically significant.
Comparison by Studywide Content Pre-test Scores
Groups were compared by performance on a researcher-constructed, 20-item,
multiple choice studywide mathematics content pre-test. Question items featured
mathematical topics relevant to the mathematics addressed in the course of constructing
video games in the study.
Studywide content pre-test scores, descriptive statistics. As shown in Table 5,
the mean studywide content pre-test score for the treatment group (N = 19) was 10.2 out
of 20 (SD = 2.7) and the mean studywide pre-test score for the comparison group (N = 24)
was 9.0 out of 20 (SD = 1.9).
Table 5
Studywide Mathematics Content Pre-test Scores by Group
* Range of test was 0 (min) to 20 (max).
Group N Min Max Mean SD Treatment 19 5 15 10.2 2.7 Comparison 24 7 14 9.0 1.9 All participants 43 5 15 9.5 2.3

108
Studywide content pre-test scores, tests of normality. Statistical tests of
skewness and kurtosis were conducted to examine whether studywide content pre-tests
scored by each of the treatment and comparison groups were normally distributed. Results
of these normality tests are shown in Table 6.
Table 6
Tests of Normality: Studywide Mathematics Content Pre-test Scores by Group
For the treatment group, the computed skewness statistic was .09 with a standard
error of .52. Because the skewness statistic very close to 0, the studywide pre-test scores
of treatment group members exhibited nearly normal symmetry. Studywide pre-test scores
of students in the treatment group showed a kurtosis of -.30 with a standard error of 1.0, a
mesokurtic distribution. Thus, on studywide pre-test scores, the treatment group was
considered normally distributed.
The studywide pre-test scores of the comparison group showed a skewness statistic
of 1.1. The skewness statistic was more than twice its standard error (.47) and thus the
studywide pre-test scores of the comparison group did not exhibit normality. Kurtosis was
computed as 1.3 with a standard error of .92. Therefore, the studywide pre-test scores of
the comparison group were skewed positively and slightly leptokurtic, exhibiting a
departure from normality.
Skewness Kurtosis Group Statistic Std. Error Statistic Std. Error Treatment .09 .52 -.30 1.0 Comparison 1.1 .47 1.25 .92 All participants .63 .36 .10 .71

109
The studywide pre-test scores of the entire study group showed a skewness statistic
of 1.1. The skewness statistic was less than twice its standard error (.47). Kurtosis was
computed as .10 with a standard error of .71. Therefore, the studywide pre-test scores of
the group in its entirety exhibited normality.
In summary, studywide pre-test scores of the treatment group exhibited normality,
while studywide pre-test scores of the comparison group were not normally distributed.
Studywide pre-test scores of the entire group exhibited normality Therefore, further
statistical exploration comparing studywide test measures between these groups was
computed nonparametrically.
Studywide content pre-test scores, differences between groups. To examine
whether initial differences existed between studywide pre-tests of the treatment and
comparison groups, the Mann-Whitney U statistic was computed. On studywide pre-test
measures, the Mann-Whitney U was computed as 162.50. This value did not indicate
statistical significance at the p < .05 level. Therefore, based on studywide pre-tests
administered at the outset of the study, treatment and comparison groups showed no
significant statistical differences.
Comparison by ATMI Affective Scale Scores
Groups were compared at the outset of the study by scores on each of the four
scales of the Attitudes Toward Mathematics Inventory (ATMI, Tapia & Marsh, 2004)
affective instrument: confidence, value, enjoyment, and motivation. Each scale consisted
of statements requiring Likert-style responses on a five-point scale from participants, with
several items reversed on each scale. ATMI scales, their respective number of statements,
and their maximum values are shown in Table 7.

110
Table 7 ATMI Scales and Maximum Possible Values
Scale Statements Maximum Value Confidence 15 75 Value 10 50 Enjoyment 10 50 Motivation 5 25
Pre-treatment ATMI scores, descriptive statistics. Table 8 shows the results of
the pre-treatment ATMI attitude inventory for both treatment and comparison groups. The
mean pre-treatment ATMI confidence scale score for the treatment group (N = 19) was
66.0 out of 75 (SD = 5.7) and the mean pre-treatment ATMI confidence scale score for the
comparison group (N = 24) was 58.5 out of 75 (SD = 8.0).
The mean pre-treatment ATMI value scale score for the treatment group (N = 19)
was 47.3 out of 50 (SD = 3.0) and the mean pre-treatment ATMI value scale score for the
comparison group (N = 24) was 43.6 out of 50 (SD = 4.3).
The mean pre-treatment ATMI enjoyment scale score for the treatment group
(N = 19) was 45.8 out of 50 (SD = 5.3) and the mean pre-treatment ATMI enjoyment scale
score for the comparison group (N = 24) was 38.6 out of 50 (SD = 7.7).
The mean pre-treatment ATMI Motivation scale score for the treatment group
(N = 19) was 22.9 out of 25 (SD = 2.7) and the mean pre-treatment ATMI motivation pre-
test scale score for the comparison group (N = 24) was 18.79 out of 25 (SD = 4.1).

111
Table 8 Pre-treatment ATMI Inventory Scores by Scale and by Group
Pre-treatment ATMI scores, tests of normality. Statistical tests of skewness and
kurtosis were conducted to examine whether ATMI scores for each scale were normally
distributed for each of the treatment and comparison groups (see Table 9).
The pre-treatment ATMI confidence scores of the treatment group showed a
skewness statistic of -2.4. The skewness statistic is more than twice its standard error (.52)
and thus the pre-treatment ATMI confidence scores of the treatment group did not exhibit
normality. Kurtosis was computed as 6.7 with a standard error of 1.0. Therefore, the pre-
treatment ATMI confidence scores of the treatment group were skewed negatively and are
leptokurtic, exhibiting a departure from normality.
The pre-treatment ATMI confidence scores of the comparison group showed a
skewness statistic of -.06 with a standard error of .47. Kurtosis was computed as -1.1 with
a standard error of .92. Therefore, the pre-treatment ATMI confidence pre-test scores of
the comparison group exhibited almost no skewness and were only slightly platykurtic,
indicating a distribution that was considered normal.
Scale and group N Min Max Mean SD
ATMI_Confidence – Treatment 19 47 / 75 70 / 75 66.0 / 75 5.7 ATMI_Confidence – Comparison 24 44 / 75 70 / 75 58.5 / 75 8.0 ATMI_Value – Treatment 19 39 / 50 50 / 50 47.3 / 50 3.0 ATMI_Value – Comparison 24 35 / 50 50 / 50 43.6 / 50 4.3 ATMI_Enjoyment – Treatment 19 32 / 50 50 / 50 45.8 / 50 5.3 ATMI_Enjoyment – Comparison 24 17 / 50 48 / 50 38.6 / 50 7.7 ATMI_Motivation – Treatment 19 17 / 25 25 / 25 22.9 / 25 2.7 ATMI_Motivation – Comparison 24 10 / 25 25 / 25 18.8 / 25 4.1

112
The pre-treatment ATMI value scores of the treatment group showed a skewness
statistic of -1.1. The skewness statistic was more than twice its standard error (.52) and
thus the pre-treatment ATMI value scores of the treatment group did not exhibit
normality. Kurtosis was computed as 1.7 with a standard error of 1.0 Therefore, the pre-
treatment ATMI value scores of the treatment group were skewed negatively and slightly
leptokurtic, exhibiting a departure from normality.
The pre-treatment ATMI value scores of the comparison group showed a skewness
statistic of -.48 with a standard error of .42. Kurtosis was computed as -.59 with a standard
error of .92. Therefore, the studywide ATMI value scores of the comparison group
exhibited little skewness and were mostly mesokurtic, indicating a distribution that was
considered normal.
The pre-treatment ATMI enjoyment scale scores of the treatment group showed a
skewness statistic of -1.9. The skewness statistic was more than twice its standard error
(.52) and thus the pre-treatment ATMI enjoyment scores of the treatment group did not
exhibit normality. Kurtosis was computed as 3.0 with a standard error of 1.0. Therefore,
the pre-treatment ATMI enjoyment scores of the treatment group were skewed negatively
and were somewhat leptokurtic, exhibiting a departure from normality.
The pre-treatment ATMI enjoyment scale scores of the comparison group showed
a skewness statistic of -1.2, more than twice the value of its standard error (.47). Thus, the
pre-treatment ATMI enjoyment scores of the comparison group did not exhibit normality.
Kurtosis was computed as 1.3 with a standard error of .92. Therefore, the pre-treatment
ATMI enjoyment scores of the comparison group were both negatively skewed and very
slightly leptokurtic, indicating a distribution that was not considered normal.

113
The pre-treatment ATMI motivation scale scores of the treatment group showed a
skewness statistic of -1.1, more than twice its standard error (.52). Thus, the pre-treatment
ATMI motivation scores of the treatment group did not exhibit normality. Kurtosis was
computed as .03 with a standard error of 1.0. Therefore, the pre-treatment ATMI
motivation scores of the treatment group were skewed negatively and were mesokurtic,
exhibiting a departure from normality.
The pre-treatment ATMI motivation scale scores of the comparison group showed
a skewness statistic of -.19 with a standard error of .47. Kurtosis was computed as -.52
with a standard error of .92. Therefore, the pre-treatment ATMI motivation scores of the
comparison group were both negatively skewed and nearly mesokurtic, indicating a
distribution that was considered normal.
Table 9
Tests of Normality: ATMI Pre-treatment Scores by Scale and by Group
Skewness Kurtosis
Scale and group Statistic Std. Er. Statistic Std. Er. Result
ATMI Confidence – Treatment -2.4 .52 6.7 1.0 not normal ATMI Confidence – Comparison -.06 .47 -1.1 .92 normal ATMI Value – Treatment -1.1 .52 1.7 1.0 not normal ATMI Value – Comparison -.48 .47 -.59 .92 normal ATMI Enjoyment – Treatment -1.9 .52 3.0 1.0 not normal
ATMI Enjoyment – Comparison -1.2 .47 1.3 .92 not normal
ATMI Motivation – Treatment -1.1 .52 .03 1.0 not normal ATMI Motivation – Comparison -.19 .47 -.52 .92 normal

114
For all ATMI scales, pre-treatment scores in the treatment group exhibited a
statistical departure from normality. Pre-treatment scores for all ATMI scales in the
comparison group were normally distributed with the exception of the enjoyment scale.
Therefore, further statistical exploration of ATMI measures between the two groups was
computed nonparametrically.
Pre-treatment ATMI scores, differences between groups. To examine whether
initial differences existed between treatment and comparison groups on pre-treatment
ATMI inventory scores, the Mann-Whitney U statistic was computed. On pre-treatment
ATMI confidence measures, the Mann-Whitney U was computed as 104.5 (p < .01). On
pre-treatment ATMI value measures, the Mann-Whitney U was computed as 107.5
(p < .01). On pre-treatment ATMI enjoyment measures, the Mann-Whitney U was
computed as 76.0 (p < .001). On pre-treatment ATMI Motivation measures, the Mann-
Whitney U was computed as 93.5 (p < .01).
Therefore, based on ATMI attitude inventories administered at the outset of the
study, treatment and comparison groups showed differences that were statistically
significant on all four scales, specifically confidence, value, enjoyment, and motivation.
Data Obtained from the Etch-a-Sketch Digital Toy
The video game design and programming phase of the study commenced
following the administration of studywide content tests and ATMI attitude inventories.
Students worked on a total of three projects, beginning with the Etch-a-Sketch. Strictly
speaking, the Etch-a-Sketch was not a video game, but a digital toy.

115
Etch-a-Sketch Checkpoint Tests At the outset of the Etch-a-Sketch project, a short checkpoint content pre-test
(Appendix D) was administered to the treatment group. The checkpoint content pre-test
consisted of seven multiple choice questions relevant to mathematics content featured in
the Etch-a-Sketch digital toy. Specifically, the checkpoint questions were developed based
on mathematics derived from NCTM content standards, namely the numbers and
operations standard, the algebra standard, or the geometry standard. The same checkpoint
content test was then re-administered to the treatment group as a post-test following the
completion of all Etch-a-Sketch project tasks.
Three answer possibilities existed for most questions on the checkpoint content
test: correct (C), acceptable (Acc), or incorrect (I). An acceptable response was one that
indicated that the student had partial understanding of how to answer the question, but
missed a detail in reaching the completely correct response. Some checkpoint content
questions consisted of only a correct response (C) or an incorrect (I) response.
In scoring the checkpoint content test, the shift by a student from an item response
on the pre-test to an item response on the post-test was measured as follows.
1. Positive change (a shift towards a more correct response).
2. No loss (an acceptable response followed by another acceptable response, or a
correct response followed by another correct response or an acceptable response).
3. No gain (an incorrect response followed by another incorrect response).
4. Negative change (a shift towards an incorrect response).
Performance from pre-test to post-test on the Etch-a-Sketch checkpoint content
tests is shown in Table 10. On the numbers and operations standards, 82% of the

116
responses by treatment students exhibited either a positive change or no loss, while 19%
exhibited either no gain or a negative change. On the algebra standards, 65% of the
responses exhibited either a positive change or no loss; 35% exhibited either no gain or a
negative change. On the geometry standards, 100% of the responses showed either a
positive change or no loss. For all checkpoint content, 80% of the responses showed either
a positive change or no loss, and 20% showed either no gain or negative change.
Table 10
Etch-a-Sketch Checkpoint Test Performance, Pre-test to Post-test
Etch-a-Sketch Initial Events Tally
Following completion of the Etch-a-Sketch checkpoint mathematics pre-test,
students in the treatment group commenced the Etch-a-Sketch digital toy project. As
shown in Figure 6, students were provided an operational game model and given the
opportunity to play individually with the Etch-a-Sketch to explore its appearance and
function. Students were not able to examine any underlying programming code.
As students played with the Etch-a-Sketch model, they were asked to create an
initial events list (see Appendix E) by writing down as many events as they observed.
They were informed that events described any motion, user interaction (buttons or
keyboard), gamefield interaction, object interaction, scoring, or multimedia triggered
Change by Percentage of Responses Standards + Change No Loss No Gain - Change Numbers and operations (Q2, Q3) 21% 61% 11% 8% Algebra (Q5, Q6, Q7) 54% 11% 28% 7% Geometry (Q1, Q4) 8% 92% 0% 0% All content 32% 48% 15% 5%

117
during play. Students were also provided an example event, “L button – press to make the
tool tip move about 5 pixels “left” (west) and leave a trail,” to guide their writing.
Figure 6. Etch-a-Sketch digital toy model provided to students.
Table 11 shows the tally of initial events recorded by students during their
examination of the Etch-a-Sketch digital toy model. Seventeen of nineteen students were
present for the activity. The minimum number of events recorded was 4 and the maximum
was 12. The mean number of events recorded for this game model was 7 (SD = 2.3).
Table 11 Tally of Events Recorded for Etch-a-Sketch Digital Toy Model
Number of Events Recorded N Min Max Mean SD Treatment group students 17 4 12 7 2.3

118
Following the creation of the initial Etch-a-Sketch events list by the treatment
group, students were provided a revised Etch-a-Sketch event list (see Appendix F) by the
researcher. The revised list was comprised of nine events that fully described the Etch-a-
Sketch digital toy. Students discussed the differences between their initial events list and
the revised list to establish a class consensus before proceeding. The rationale for all
treatment students using the same revised list was to ensure consistency in writing
representations for the events during the synthesis phase of design.
Table 12
Sample Representations Provided for the Etch-a-Sketch
Representation Event Mathematical Programming #1 L button – press to make the tool tip move about 5 pixels “left” (west) and draw a trail
Move the tool tip 5 pixels parallel to the x-axis in the direction of negative x with the pen down
PD SETH 270 FD 5
#5 If the tool tip moves left and meets the west red barrier, then the tip bounces back
If the x coordinate of the tool tip exceeds the x coordinate of the left boundary, then undo the action of the button: move the tool tip 5 pixels “backwards” (parallel to the x-axis in the direction of positive x)
In the backpack of the tool tip turtle, at the Rules tab: WHEN THIS XCOR < -142 DO THAT BK 5
#9 When you press the Clear button, the screen erases the drawn lines and the tool tip stays put
Lines are erased. Coordinates of the tool tip remain unchanged.
CLEAN (Freeze Background so that the Etch frame is not erased)
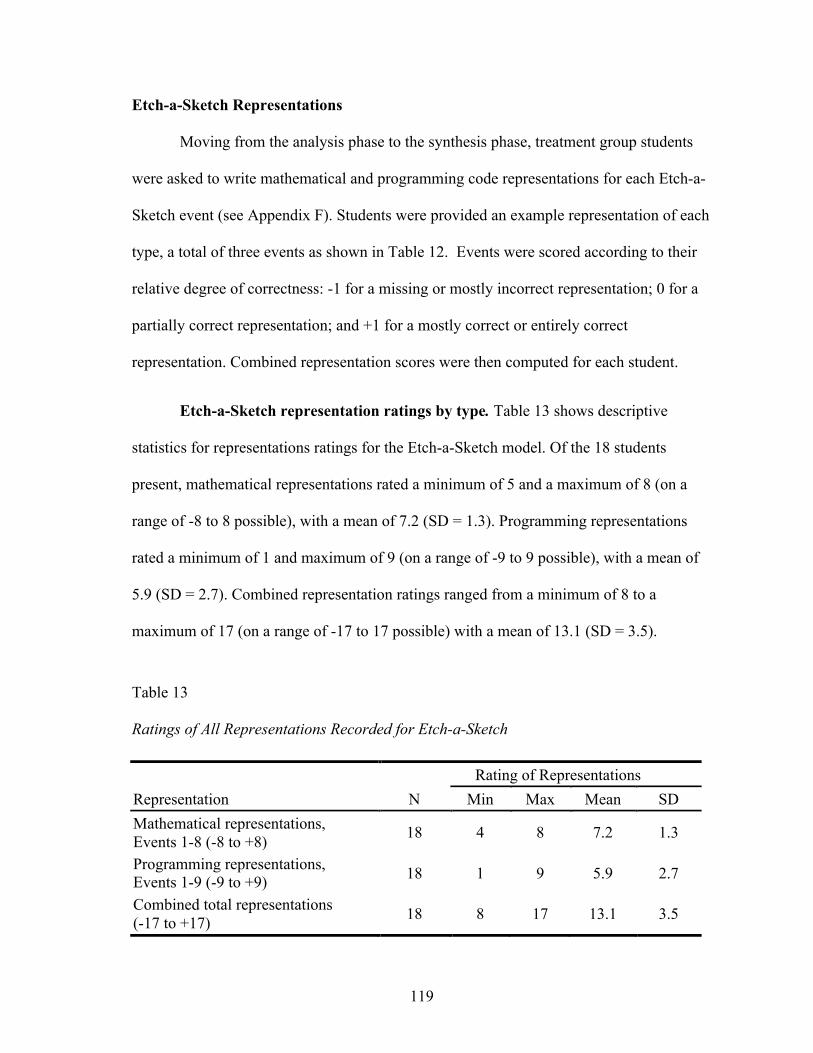
119
Etch-a-Sketch Representations Moving from the analysis phase to the synthesis phase, treatment group students
were asked to write mathematical and programming code representations for each Etch-a-
Sketch event (see Appendix F). Students were provided an example representation of each
type, a total of three events as shown in Table 12. Events were scored according to their
relative degree of correctness: -1 for a missing or mostly incorrect representation; 0 for a
partially correct representation; and +1 for a mostly correct or entirely correct
representation. Combined representation scores were then computed for each student.
Etch-a-Sketch representation ratings by type. Table 13 shows descriptive
statistics for representations ratings for the Etch-a-Sketch model. Of the 18 students
present, mathematical representations rated a minimum of 5 and a maximum of 8 (on a
range of -8 to 8 possible), with a mean of 7.2 (SD = 1.3). Programming representations
rated a minimum of 1 and maximum of 9 (on a range of -9 to 9 possible), with a mean of
5.9 (SD = 2.7). Combined representation ratings ranged from a minimum of 8 to a
maximum of 17 (on a range of -17 to 17 possible) with a mean of 13.1 (SD = 3.5).
Table 13
Ratings of All Representations Recorded for Etch-a-Sketch
Rating of Representations Representation N Min Max Mean SD Mathematical representations, Events 1-8 (-8 to +8) 18 4 8 7.2 1.3
Programming representations, Events 1-9 (-9 to +9) 18 1 9 5.9 2.7
Combined total representations (-17 to +17) 18 8 17 13.1 3.5

120
Etch-a-Sketch representation ratings by standard. Events were then grouped
by NCTM standards to determine ratings by type of mathematical representation recorded
as shown in Table 14. Events 1-4 addressed moving the Etch-a-Sketch drawing tool tip up,
down, left, and right and were categorized as geometry standards. Events 5-8 addressed
using inequalities to set boundary conditions defining the edges of the drawing region and
were categorized as numbers and operations as well as algebra standards (because the x-
coordinate variable, the programming code xcor was employed in writing the
inequality). Event 9 addressed no mathematics content as its function was to erase the
Etch-a-Sketch drawing region, a task strictly programming-oriented in nature.
Table 14
Ratings of Mathematical Representations (by Standard) Recorded for the Etch-a-Sketch.
Etch-a-Sketch Initial Reflections and Design Plans
To gauge an affective facet of student progress in creating the Etch-a-Sketch
digital toys, students were asked to assess their own work prior to and following the
construction of their toys in MicroWorlds EX. Prior to their development of the Etch-a-
Sketch, students were asked to complete an Initial Reflections and Design Plans document
(see Appendix G). The document consisted of an explanatory sentence asking students to
reflect on the events, the mathematical representations, and the programming code they
Ratings Math representation (by Type) N Min (-4) Max (+4) Mean SD Numbers & operations and algebra (Events 5-8) 18 0 4 3.3 1.9
Geometry (Events 1-4) 18 1 4 3.8 .71

121
wrote for their game. Students were then asked to respond to open ended prompts that
asked them to, (a) comment on their successes, (b) comment on their challenges, (c)
sketch the appearance of their planned toy, and (d) describe modifications they planned
from the digital toy model.
Statements regarding successes. In response to the successes prompt, all students
who had been present during the event analysis and representations activities (N=18)
made statements indicating that they experienced success on some aspect of their efforts in
writing events and creating representations for the events. Comments included those
addressing general feelings about the work, such as, “I am very comfortable with this. It
made a lot of sense to me,” and statements more specific to student thinking, including,
“Figuring out the patterns for groups by only needing one of the codes or events.”
Statements regarding challenges. In response to the challenges prompt, 17 of 18
students identified one or more areas with which they experienced difficulty in writing
events or representations. Most statements revealed that students felt challenged by
creating mathematical representations, programming representations, or both. For
example, one student wrote, “My challenges were in the mathematical translation. I am
confused by x core and y core [sic]” and, “I didn't get the programing [sic] code for when
the tip hits the barrier very well.” One student mentioned that listing the events posed
difficulty. Only one individual wrote, “I did not have any challenges.”
Statements regarding planned modifications. In response to the modifications
prompt, all 19 students (including the student who had been absent for event analysis and
representation) provided commentary on how they would change the Etch-a-Sketch digital
toy in order to personalize it. Seven students noted that they would add diagonal buttons,

122
with statements such as, “I will put more buttons on: UR, UL, DL, DR and move some
buttons around.” A few statements, such as, “I would allow users to erase certain spaces as
well as jumping to different positions,” demonstrated student interest in creating rather
unique features in the game. While only three of the boys indicated that they wanted to
change, “the color,” or alter the tool tip, all five girls noted special ways in which they
intended to change the aesthetic appearance of their Etch-a-Sketches, including altering
the color, the background, or the tool tip. One girl wrote, “I don't know if it's possible, but
I would like to make the thing shake when cleared,” and make the tool tip, “a piece [sic]
of candy.” Another girl commented emphatically, "My tool tip will be a duck because
ducks are awesome!” Three students indicated no intent to deviate from the model.
Design sketches revealed planned modifications for the Etch-a-Sketch, and
featured both aesthetic changes (see Figure 7) and mathematical changes (see Figure 8).
Figure 7. Student sketch showing aesthetic modifications for Etch-a-Sketch.

123
Figure 8. Student sketch showing mathematical modifications for Etch-a-Sketch.
Etch-a-Sketch Digital Toy Programming
Following completion of their reflection and plans documents, treatment group
students began constructing their Etch-a-Sketch digital toys. Game construction activities
transpired in a constructivist environment with students working both independently and
collaboratively. For guidance in producing their programming code in MicroWorlds EX,
students referenced the game events and representations they had previously written,
asking for help from the researcher and peers when needed. A typical, quick exchange
among students and the researcher (RSCHR) follows:
RSCHR [in response to question] How do you jump? You could make it forward a bigger amount.
RICHARD Oh – no – I know how to jump. You just go forward without putting pen down!
DAYNE Oh yeah, that’s how you do it! RSCHR I like that. That was smart.

124
Occasional, directive instruction was provided when new tasks required explanation or
an example from the instructor. The following dialogue is a transcript of direct instruction
dialogue between the researcher and the group:
RSCHR [Smiling at class] Everybody! I need your attention on this next part.
Stop what you’re doing. Spin your chairs. I need to see all your faces that way – for the next three minutes. OK. Look up at my screen. This is my drawing tool tip, right. Not nearly as beautiful as yours… I realize that. I’m going to move it to this leftmost barrier. Who knows how I can tell what the coordinates are? [Andrew raises hand.] Andrew?
ANDREW Uh, you open its backpack. RSCHR Open its backpack. How do I open the backpack? ANDREW Right-click and Open Backpack. RSCHR Alright. Now, I’m at the state tab. What are the coordinates right here? JOE Negative 140 and… 8. RSCHR Which part of that is the x part? GROUP Negative 140. RSCHR So if I pick up this guy and move him more this way [horizontally]… RICHARD Oooo, you can do that? RSCHR Yeah, ‘cause he’s unfrozen right now. RICHARD Oh yeah yeah. RSCHR His x-coordinate becomes what? GROUP Negative 171. RSCHR Negative 171. It’s becoming more negative. Right? But what I care
about is this boundary. Now as I move him, if I stay right at this boundary and I move him up and down… do you see that the x-coordinate is staying the same?
GROUP [Quiet agreement] RSCHR What’s happening, though, to the y-coordinate. If I move up, the y-
coordinate becomes more… GROUP Increases. RSCHR More positive or more negative? GROUP [Emphatically] More positive. RSCHR But if I go down, it becomes more… GROUP [Emphatically] Negative. RSCHR Negative. OK, but the x part is staying the same. It’s staying at negative
144. It’s probably the same for you. If you use my frame, it’s probably that if you stick it right at that barrier there, it’s probably negative 144.

125
The entire transcript of the class dialogue during Etch-a-Sketch construction is located in
Appendix H.
Model events included. Students worked on constructing their Etch-a-Sketch
digital toys for approximately three, 45-minute class periods. Minimum construction
requirements were to replicate the form and function of the model they previously
examined. To replicate the model, students were required to construct graphic features,
including drawing a background and adding a tool tip; and events that facilitated and
controlled play. Table 15 lists the events students were required to include in their Etch-a-
Sketch digital toys and the number of students who included each event in their toy.
Table 15 Tally of Etch-a-Sketch Model Events Included in Digital Toys
Event Mathematics
standards
Event type, math or
programming N Number of students who included event
(1) Draw left Geometry both 19 19 (100%) (2) Draw right Geometry both 19 19 (100%) (3) Draw up Geometry both 19 19 (100%) (4) Draw down Geometry both 19 19 (100%)
(5) Left boundary Numbers and operations, algebra both 19 19 (100%)
(6) Right boundary Numbers and operations, algebra both 19 19 (100%)
(7) Top boundary Numbers and operations, algebra both 19 19 (100%)
(8) Bottom boundary Numbers and operations, algebra both 19 19 (100%)
(9) Clear N/A programming 19 19 (100%)

126
Modifications included. Many students chose to deviate from the toy model,
adding modifications they had planned for in their reflections and plans document as well
as new enhancements they devised during the construction process.
Table 16 shows descriptive statistics for modifications added by students in the
construction of their Etch-a-Sketch digital toys. Modifications were categorized by type,
specifically mathematical or aesthetic. For example, adding a diagonal button to allow the
tool tip to draw in the northwest direction was considered a mathematical modification.
Altering the appearance of the tool tip or the background design was considered an
aesthetic modification. Many toys included both aesthetic and mathematical
modifications.
Table 16
Etch-a-Sketch Modifications Constructed
Figure 9 shows a student-made toy that features both types of modifications. The
mean number of mathematical modifications added by students was 4.2 (SD = 2.3); the
mean number of aesthetic modifications added by students was 2.0 (SD = 1.5); and the
mean number of total modifications added was 6.2 (SD = 3.1).
Tally of modifications Modification type N Min Max Mean SD Math 19 0 8 4.2 2.3 Aesthetic 19 0 7 2.0 1.5 Total 19 2 15 6.2 3.1

127
Figure 9. Etch-a-Sketch featuring aesthetic and mathematical modifications.
Etch-a-Sketch Final Reflections Affective dimensions of student progress in creating the Etch-a-Sketch digital toys
were measured post-construction in MicroWorlds EX. Students were asked to assess their
work following the construction of their Etch-a-Sketch toys, via a Final Reflections
document. (Appendix G). The document consisted of an explanatory sentence asking
students to reflect on their successes and challenges in addition to sketching a figure of
their completed toy and describing modifications they ultimately made.
Statements regarding successes. Post-construction, all students were able to
identify successes in constructing their Etch-a-Sketch digital toys. Some remarked simply
that, “It worked,” while others made statements about the areas in which they achieved
success, such as, “I was able to understand the mathematics in programming.” Several

128
students identified specific tasks at which they felt successful, such as, “Changing the tool
tip shape; making diagnol [sic] buttons; making cover page; making tool tip draw.”
Statements regarding challenges. Challenges listed by treatment group students
on their post-construction Final Reflections documents were specific to actual difficulties
encountered in building their Etch-a-Sketch digital toys and debugging until the games
were fully functional. Ten out of the 19 students made remarks describing their difficulty
with setting up the x and y inequalities for the tool tip. Students said that found it
challenging, “putting in the input code for the bondarys [sic] so the tool tip will not go
past the red barrier,” and, “I had trouble understanding the x, y, <, >, stuff.” Two students
noted minor challenges such as freezing the background, and three students stated that
they had no problems at all. Two students expressed general frustration with
programming, stating, “I did not do well with MicroWorlds” and “Bad with computers.”
Figure 10. Etch-a-Sketch, with modifications, as constructed by treatment student.

129
Statements regarding implemented modifications. Students noted their
modifications with all students listing at least one modification (mathematical or aesthetic)
and most students noting two or more modifications. A representative statement from one
student was, “I changed the tool tip to a penguin. When my penguin lands on a purple dot,
it dances. My backround [sic] has penguins on it.” The student’s toy is shown in Figure
10. While the alteration of the tool tip and the penguin frame are aesthetic, the purple dots
serve a different function – the student coded the penguin to responding to touching the
purple color by “dancing,” a mathematical modification that required her writing code in
the OnColor field of the penguin object (see Figure 11). The figure also shows how the
student included all programming of xcor and ycor inequalities to constrain the penguin
tool tip from drawing in the border as shown in the When This Do That field.
Figure 11. Programming code for the penguin object.

130
Data Obtained from the Frogger Video Game
Following completion of the Etch-a-Sketch digital toy, students commenced work
on their second project, Frogger. The Frogger video game was intended to emulate the
arcade game in which the player controls a frog and attempts to move it through traffic to
a goal area on the opposite side of the screen while avoiding collisions with oncoming
vehicles. The goal is to safely reach the opposite side of the screen.
Frogger Checkpoint Tests At the beginning of the Frogger project, a multiple choice checkpoint content pre-
test was administered to the treatment group. The Frogger checkpoint test consisted of 10
multiple-choice questions relevant to mathematics content featured in the Frogger video
game. The Frogger checkpoint questions were developed based on mathematics derived
from NCTM content standards, specifically the algebra standard, the geometry standard,
or the measurement standard. The same Frogger checkpoint content test was then re-
administered to the Treatment group as a post-test after all Frogger video game projects
were completed.
For the Frogger checkpoint content tests, student responses were scored as a
correct (C) response or an incorrect (I) response. In computing the results of the
checkpoint content test, the shift by a student from an item response on the pre-test to an
item response on the post-test was measured as positive change (I C), no loss (C C),
no gain (I I), or negative change (C I). Prior to scoring the checkpoint tests, one
question was omitted because no correct answer was listed among the response choices.
Performance from pre-test to post-test on the Frogger checkpoint content tests is
shown in Table 17. On the algebra and geometry standards, 57% of the responses

131
exhibited either a positive change or no loss, while 43% exhibited no gain or a negative
change. On the Geometry only standards, 51% of the responses exhibited either a positive
change or no loss; 49% showed either no gain or a negative change. On the measurement
standard, 83% of the responses exhibited either a positive change or no loss, with 18%
showing either no gain or a negative change. For all content on the checkpoint test in its
entirety, 64% of the responses demonstrated either a positive change or no loss, and 36%
demonstrated either no gain or negative change.
Table 17 Frogger Checkpoint Test Performance (Pre-test to Post-test)
Frogger Initial Events Tally
After completing the Frogger checkpoint pre-test, treatment group students
commenced the Frogger video game project. Students were shown an operational video
game model (see Figure 12) and invited to play individually with the Frogger game to
explore its function. Underlying game code was not accessible to the students.
As students played with the Frogger video game model, they were asked to create
an initial events list by writing down as many events as they observed. Students were not
Change by Percentage of Students Standards + Change No Loss No Gain - Change Algebra & geometry (Q1, Q2, Q3, Q7) 43% 14% 36% 7%
Geometry only (Q6, Q8, Q9) 26% 25% 40% 9%
Measurement (Q5, Q10, Q11) 23% 60% 9% 9%
All Content 32% 31% 29% 8%

132
provided an example event to guide their writing because they already possessed
experience in writing events for the Etch-a-Sketch digital toy.
Figure 12. Frogger video game model.
Table 18 shows the tally of initial events recorded by students during their
examination of the Frogger video game model. Eighteen of nineteen students were present
for the activity. The minimum number of events recorded was 4 and the maximum was 26.
The mean number of events recorded for this game model was 11 (SD = 5.7).
Table 18 Tally of Events Recorded for Frogger Video Game Model During Game Analysis
Number of Events Recorded N Min Max Mean SD Treatment group students 18 4 26 11 5.7
133
Frogger events recorded by students included varying degrees of specificity.
Events addressing player control of the frog included statements such as, “When right
arrow clicked, Frogger move right,” and “When you press key, frog moves West 10
pxls.” Events addressing the collision between the frog and moving obstacles featured
statements including, “When Frogger hits the bus he ‘splats’,” and “When frog has same
quardenets [sic] as an elephant, motercycle [sic], red car or bus, frog goes to bottom and
splat comes up.”
Many students applied what they had learned from constructing the Etch-a-Sketch
video toy to Frogger. Some of these events fit well, for instance, setting the heading of the
“frog” and moving it incrementally. One student applied his understanding of creating top
and bottom boundary conditions in Etch-a-Sketch to Frogger: he created a top boundary
condition to identify the y-coordinate value defining the entry to the goal area at the top of
the playfield. Other students noted that a bottom boundary condition must have existed to
prevent players from “cheating” by moving down the screen and reappearing in the goal
area at the top. However, a few students wrote misconceived events derived from Etch-a-
Sketch, including left and right boundary conditions. For example, one student wrote
“when frog > x280, frog bounces bk 10 pxls,” a statement constraining the frog from
moving beyond the rightmost border of the playfield. Thus, not all events included in the
event list composed by each student were necessary for the video game to function as
shown in the game model.
Frogger Representations
Following the creation of the initial events recorded by the treatment group for the
Frogger game, students worked collaboratively to create a revised list of 18 events that
134
described the video game in its entirety. They discussed the differences between their
initial events lists and established a class consensus for the revised list. This method of
revising the event list differed from the method employed during the Etch-a-Sketch
project. During Etch-a-Sketch, revision of the event list was directed by the researcher;
during Frogger, it was directed by the students with the researcher serving as a recorder
and mediator.
Some events that were finalized by the treatment group described events not
actually featured in the game model, but deemed necessary by the group. For example, the
model allowed the player to “cheat” by moving the frog backwards into the goal area (i.e.,
circumventing interaction with the obstacles). However, many students felt that players
should be prevented from performing this action. They responded by writing an event that
prevented the backwards cheat.
Treatment group students were then directed to write mathematical and
programming code representations for each Frogger event. Two representations for events
from different task classes were provided to the treatment group as shown in Table 19.
Although students were asked to write their own representations, free form
discussion and idea sharing among students was permitted. Events were then scored for
each student according to their relative degree of correctness: -1 for no attempt at writing a
representation or a mostly incorrect representation; 0 for a partially correct representation;
and +1 for a mostly correct or entirely correct representation. Mathematical, programming
and combined representation scores were then computed for each student in the treatment
group.

135
Table 19 Sample Representations Provided for the Frogger Video Game
Frogger representation ratings by type. Table 20 shows descriptive statistics for
representation ratings recorded by the 17 Treatment students present for the Frogger video
game model. For mathematical representations, the minimum possible score was -16 and
the maximum was 16. Mathematical representations written by students rated a minimum
of 2 and a maximum of 16 with a mean of 11.6 (SD = 4.3). For programming
representations, the minimum possible score was -15 and the maximum was 15.
Programming representations written by students rated a minimum of -2 and maximum of
15, with a mean of 10.4 (SD = 5.6). For mathematics and programming representations
combined, the minimum possible score was -31 and the maximum was 31. Combined
representations written by students rated a minimum of 0 and a maximum of 31 with a
mean of 22.0 (SD = 9.6).
Representation Event Mathematical Programming
#7 One row of traffic (elephants) moves left (W) at constant speed (maybe 10 pixels per second?) This traffic is the slowest of all lanes.
Elephants are moving parallel to x-axis in –x direction. Rate = distance per time = 10 pixels/sec
SETH 270 In the elephant’s ONCLICK field: FD 1 (set to FOREVER)
#12 Frog death: First way for Frogger to die is to hit an obstacle.
Some coordinate on Frogger’s body is the same as some coordinate of an obstacle.
In Frogger’s ONTOUCHING field: ANNOUNCE [SPLAT!] RESET PLAY

136
Table 20 Representations (by Type) Recorded for Frogger
Frogger representation ratings by standard. Frogger events were then grouped
by NCTM content standards to determine ratings by type of mathematical representation
as shown in Table 21. Events 1-6, 12, and 13 were categorized as Geometry
representations. These events consisted of moving the frog in the cardinal directions,
setting his initial starting coordinates, returning him to his starting coordinates following a
collision, and recognizing a collision between the frog and an obstacle. Events 7-11 were
categorized as geometry as well as measurements. These events consisted of setting the
heading and speed of obstacles in the traffic lanes and spacing them for optimum game
play. Events 14, 15, and 18 were categorized as geometry as well as algebra. These events
consisted of constraining playfield boundaries, winning by cheat, and winning legally.
(Events 16 and 17 did not consist of mathematical content.)
Relative Rating of Representations Representation (by type) N Min Max Mean SD Mathematical representations, Events 1-15,18 (min=-16, max=16)
17 2 16 11.6 4.3
Programming representations, Events 1-10, 12-13, 15, 16, 18 (min=-15, max=15)
17 -2 15 10.4 5.6
Combined total representations (min=-31, max=+31) 17 0 31 22.0 9.6

137
Table 21 Mathematical Representations (by Standard) Recorded for Frogger
Frogger Initial Reflections and Design Plans
Treatment group students were asked to assess their work prior to and following
the construction of their video games, for the purpose of measuring an affective
component of their progress. Prior to the development of their Frogger video games,
students completed an Initial Plans document (Appendix G) as they had done for the Etch-
a-Sketch. Students used this document to remark on successes and challenges they had
experienced while writing and representing Frogger events. They also used their
reflections and plans document to sketch plans for their video games and note any
modifications they intended to incorporate.
Statements regarding successes. With regard to their successes, all students who
were present (N=18) made a statement indicating that they had experienced success on
some aspect of their efforts in writing events and crafting representations for the events.
Three students stated that understood “everything,” while others selected more narrow
concepts such as feeling successful at “figuring out cheats.” Two students specifically
Relative Rating of Representations Math Representation (by standard) N Min Max Mean SD Geometry Events 1-6, 12, 13 (min=-8, max=8) 17 1 8 6.0 2.7
Geometry and measurement Events 7-11 (min=-5, max=5) 17 -1 5 3.5 1.9
Geometry and algebra Events 14, 15, 18 (min=-3, max=3) 17 0 3 2.1 1.0

138
stated that they had done well with the mathematical translations, and three mentioned that
were successful with the programming codes.
Statements regarding challenges. In response to the challenges prompt, 16 of 18
students identified at least one area that had challenged them. Four students mentioned
concerns about programming. Another four students noted that they have various
difficulties in planning how obstacles collisions would be handled in the game. The
possibility of a frog-obstacle collision was a new task class for Frogger that differentiated
it from the Etch-a-Sketch. Another student remarked that he was challenged by, “Solving
the constant speed of all moving objects.” This also defined a new task class for Frogger,
objects in constant motion. Three students wrote that they had not encountered challenges
in developing the Frogger events and representations.
Figure 13. A Frogger sketch recorded in one student’s Initial Plans document.
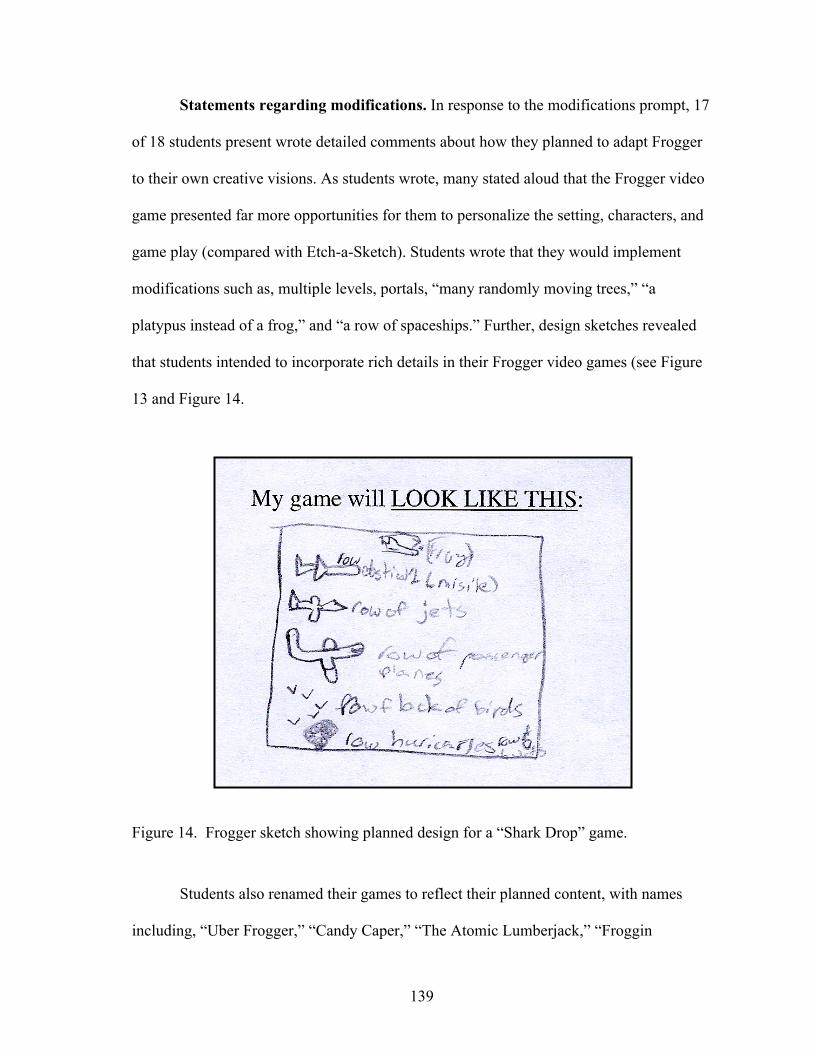
139
Statements regarding modifications. In response to the modifications prompt, 17
of 18 students present wrote detailed comments about how they planned to adapt Frogger
to their own creative visions. As students wrote, many stated aloud that the Frogger video
game presented far more opportunities for them to personalize the setting, characters, and
game play (compared with Etch-a-Sketch). Students wrote that they would implement
modifications such as, multiple levels, portals, “many randomly moving trees,” “a
platypus instead of a frog,” and “a row of spaceships.” Further, design sketches revealed
that students intended to incorporate rich details in their Frogger video games (see Figure
13 and Figure 14.
Figure 14. Frogger sketch showing planned design for a “Shark Drop” game.
Students also renamed their games to reflect their planned content, with names
including, “Uber Frogger,” “Candy Caper,” “The Atomic Lumberjack,” “Froggin

140
Impossible,” and “Platypus Run.” Observations corroborated their enthusiasm for the
progression from the digital toy to the more flexible arcade video game project.
Frogger Video Game Programming
Following completion by the treatment group of the Initial Plans documents,
students began work constructing their Frogger video games. As before, construction
activities transpired in a constructivist environment with students working both
independently and collaboratively. Students used documents from their design journals,
specifically the revised events list and the mathematical and programming code
representations, to assist them in producing their game code. The researcher and peer
members of the class provided help in programming and troubleshooting coding errors as
needed. Rarely was directive instruction required or provided as students found they were
usually able to resolve their own problems or invoke the aid of a friend.
Game model events included. Students worked on constructing their Frogger
video games for approximately seven, 45-minute class periods. Minimum construction
requirements were to replicate the form and function of the video game model they
previously examined. To replicate the game model, students were required to construct
graphic elements, including drawing a traffic scene or other setting for the action, a frog or
other character, and obstacle characters. Students could employ premade backgrounds and
characters available in MicroWorlds EX, or they could create their own artwork. Students
were also required to include events that facilitated and controlled game play. Table 22
lists the events students included, based on the revised event list, in their Frogger video
games, along with the number of students who included each event in their game.

141
Table 22 Events from Revised List that were Included in Frogger Video Games
(a) One student intentionally did not include the north direction of motion. (b) One student intentionally did not include the south direction of motion.
Event Mathematics
standards
Event type, math or
programming N
Number of students who
included event (1) Move frog N Geometry both 19 18a (95%) (2) Move frog E Geometry both 19 19 (100%) (3) Move frog W Geometry both 19 19 (100%) (4) Move frog S Geometry both 19 18b (95%) (5) Set frog starting coordinates; start game Geometry both 19 19 (100%)
(6) Reset after collision Geometry both 19 18 (95%) (7) Traffic row #1 Geometry, measurement both 19 19 (100%) (8) Traffic row #2 Geometry, measurement both 19 19 (100%) (9) Traffic row #3 Geometry, measurement both 19 19 (100%) (10) Traffic row #4 Geometry, measurement both 19 16 (84%) (11) Traffic spacing Geometry, measurement math 19 19 (100%) (12) Collision, frog hits obstacle Geometry both 19 19 (100%)
(13) Collision, obstacle hits frog Geometry both 19 15 (79%)
(14) Playfield boundaries *excluded Geometry, algebra both -- --
(15) Prevent win by cheat (move backwards) Geometry, algebra both 19 5 (23%)
(16) Prevent win by cheat (freeze frog) N/A programming 19 19 (100%)
(17) Prevent win by cheat of holding down arrow keys *excluded
N/A neither -- --
(18) Win Geometry, algebra both 19 19 (100%)
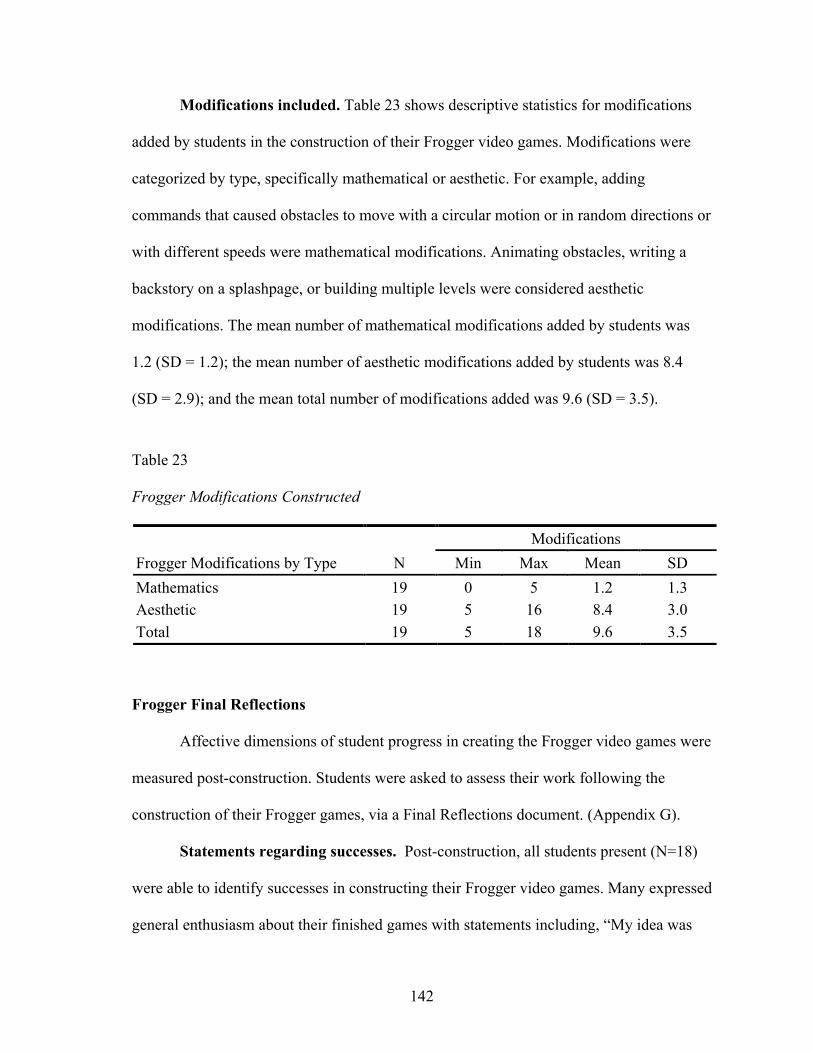
142
Modifications included. Table 23 shows descriptive statistics for modifications
added by students in the construction of their Frogger video games. Modifications were
categorized by type, specifically mathematical or aesthetic. For example, adding
commands that caused obstacles to move with a circular motion or in random directions or
with different speeds were mathematical modifications. Animating obstacles, writing a
backstory on a splashpage, or building multiple levels were considered aesthetic
modifications. The mean number of mathematical modifications added by students was
1.2 (SD = 1.2); the mean number of aesthetic modifications added by students was 8.4
(SD = 2.9); and the mean total number of modifications added was 9.6 (SD = 3.5).
Table 23
Frogger Modifications Constructed
Frogger Final Reflections
Affective dimensions of student progress in creating the Frogger video games were
measured post-construction. Students were asked to assess their work following the
construction of their Frogger games, via a Final Reflections document. (Appendix G).
Statements regarding successes. Post-construction, all students present (N=18)
were able to identify successes in constructing their Frogger video games. Many expressed
general enthusiasm about their finished games with statements including, “My idea was
Modifications Frogger Modifications by Type N Min Max Mean SD Mathematics 19 0 5 1.2 1.3 Aesthetic 19 5 16 8.4 3.0 Total 19 5 18 9.6 3.5

143
really creative,” and “My frogger was adorable!” Others were more specific about the
aesthetics of their games, with one student pointing out that she did well with, “Designing
very cool pages ex: cows on my win page.” Some students mentioned general successes
with programming, specifically, “I really started to enjoy the concepts of microworlds,”
and “I was able to work with the computer better.” Several students noted specific
programming success including, “I programmed each turtle with the hit command,” “The
part I thought was easy was the drive command,” “The rainbow thieves couldn’t hurt each
other,” (due to use of a TOUCHEDTURTLE command) and “my game side scrolls left to
right.”
Statements regarding challenges. Challenges listed by treatment group students
on their post-construction Final Reflections documents identified actual difficulties
encountered in building their Frogger video games and debugging until the games were
fully functional. Eight of the 18 students made remarks describing difficulty with using
the hit command and ensuring that the obstacles were spaced so that they did not run into
each other. In this regard, one boy remarked, “I had trouble placing all the obstacles
perfectly.” Similarly, one of the girls described trouble with, “random hit actions,” and
another noted challenges with, “making sure the obstacles don’t collide.” Seven students
described being challenged by programming, commands, or the drive command.
However, no one stated an overall sense of being challenged by designing and
programming Frogger.
Statements regarding modifications. All students present (N=18) noted several
modifications, both mathematical and aesthetic, in describing how their games departed
from the video game model. A representative statement from a student who created the
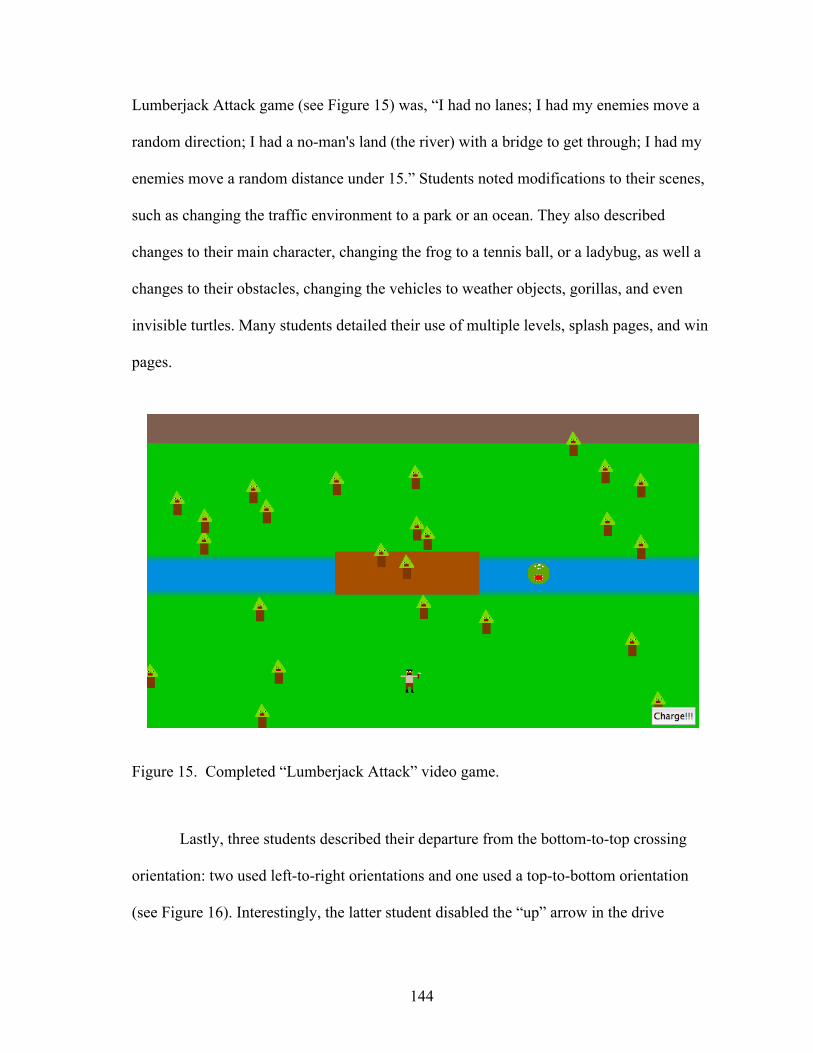
144
Lumberjack Attack game (see Figure 15) was, “I had no lanes; I had my enemies move a
random direction; I had a no-man's land (the river) with a bridge to get through; I had my
enemies move a random distance under 15.” Students noted modifications to their scenes,
such as changing the traffic environment to a park or an ocean. They also described
changes to their main character, changing the frog to a tennis ball, or a ladybug, as well a
changes to their obstacles, changing the vehicles to weather objects, gorillas, and even
invisible turtles. Many students detailed their use of multiple levels, splash pages, and win
pages.
Figure 15. Completed “Lumberjack Attack” video game.
Lastly, three students described their departure from the bottom-to-top crossing
orientation: two used left-to-right orientations and one used a top-to-bottom orientation
(see Figure 16). Interestingly, the latter student disabled the “up” arrow in the drive

145
command to prevent the player from cheating by moving up the playfield and returning at
the bottom in the goal area.
Figure 16. Completed “Shark Drop” video game.
Data Obtained from Tamagotchi Virtual Pet Video Game
Following completion of the Frogger video game, students commenced work on
their third game project, Tamagotchi Virtual Pet (Tamagotchi). Tamagotchi was intended
to emulate the virtual pet toys made popular in Japan, in which the player manages the
“life” of an electronic being. The goal is to keep the Tamagotchi pet alive, by feeding it
when it is hungry, by hugging it when it is sad.
Tamagotchi Checkpoint Tests
At the beginning of the Tamagotchi project, a multiple choice checkpoint content
pre-test was administered to the treatment group. The Tamagotchi checkpoint test

146
consisted of 7 multiple-choice questions relevant to mathematics content featured in the
Tamagotchi video game. The Tamagotchi checkpoint questions were developed based on
mathematics derived from NCTM content standards, specifically the algebra standard, or
the probability standard. The same Tamagotchi checkpoint content test was then re-
administered to the treatment group as a post-test after all Tamagotchi video game projects
were completed.
For the Tamagotchi checkpoint content tests, student responses were scored as a
correct (C) response, and acceptable response (Acc) or an incorrect (I) response. In
computing the results of the checkpoint content test, the shift by a student from an item
response on the pre-test to an item response on the post-test was measured as positive
change (I C, I Acc, or Acc C), no loss (Acc Acc, or C C), no gain (I I),
or negative change (C I, Acc I, or C Acc).
Table 24
Tamagotchi Checkpoint Test Performance (Pre-test to Post-test)
Performance from pre-test to post-test on the Tamagotchi checkpoint content tests
is shown in Table 24. On the algebra standards, 84% of the responses exhibited either a
positive change or no loss, while 16% exhibited no gain or a negative change. On the
Change by Percentage of Responses Standards + Change No Loss No Gain - Change Algebra (Q1, Q2, Q3, Q4, Q6)
15% 70% 8% 7%
Probability (Q5, Q7)
5% 45% 40% 11%
All Content 12% 62% 17% 8%

147
probability standards, 50% of the responses exhibited either a positive change or no loss;
50% showed either no gain or a negative change. For all content on the checkpoint test in
its entirety, 74% of the responses demonstrated either a positive change or no loss, and
26% demonstrated either no gain or negative change.
Tamagotchi Initial Events Tally
Following completion of the Tamagotchi checkpoint pre-test, treatment group
students commenced the Tamagotchi video game project. Students were shown an
operational video game model (Figure 17) and invited to play individually with the
Tamagotchi game to explore its appearance and function. Students were not able to
examine underlying game code.
Figure 17. Tamagotchi Virtual Pet video game model.

148
As students played with the Tamagotchi video game model, they were asked to
write an events list describing the game, as they had done previously for the Etch-a-Sketch
and Frogger games. Students were not provided example events because they already
possessed experience in writing events from the previous two video game projects.
Table 25 shows the tally of events recorded by students during their examination
of the Tamagotchi video game model. Eighteen of nineteen students were present for the
activity. The minimum number of events recorded was 4 and the maximum was 26. The
mean number of events recorded for this game model was 10 (SD = 5.2).
Table 25
Tally of Events Recorded for Tamagotchi Video Game Model During Game Analysis
Tamagotchi events recorded by students included varying degrees of recognition
regarding game events and operation. Most students noticed that pressing the Live button
brought the Tamagotchi pet to life, but did so with varying degrees of mathematical
specificity. For example, one student wrote the event, “Live = pet begins to live (comes
alive),” while another added more specificity with, “press live to reset petstats,” and
another was still more specific, writing, “Live = Pet size 1 / happiness [sic] 20 / hunger
20.” Only some students included in their event lists the change in Tamagotchi pet
variables with the passage of time. One student listed among his events an observation
regarding only one time-controlled variable, happiness, writing, “Every 10 seconds
Number of Events Recorded N Min Max Mean SD Treatment group students 19 4 26 10 5.2

149
happiness – 5.” However, another student noted a more complete, though less specific, set
of trends: “When you wait, his hunger increases,” and “When you wait, his happiness
decreases.” Almost all students correctly commented on the function of the Tamagotchi
button functions in the model video game, namely Feed and Hug. For example, one
student wrote in her event list, “Hug increases happiness,” and “feed decreases hunger and
increases size.” Some students played with the game enough to notice more finely
nuanced details about feeding the Tamagotchi, with comments such as, “when you press
feed and size is 121 the size won’t go up.” Students also noticed the Tamagotchis made
announcements regarding their level of hunger or happiness. An example listed by one
student was, “when hunger is 80 annonce [sic] “Boy I’m hungry!” Many students also
noticed that the Tamagotchis issued announcements when fed or hugged. Towards the end
of their event lists, students wrote events dealing with the conditions for Tamagotchi
death: “When hunger > 100 he dies from hunger.” Only a few students remarked on the
Tamagotchi shape associated with its level of happiness, and almost none noticed that the
Tamagotchi could die of sadness. Almost all students listed a Stop event near the end of
the event lists.
Tamagotchi Representations
Following the tally of events recorded by the treatment group for the Tamagotchi,
students worked collaboratively to create a revised list of 11 events which described the
Tamagotchi video game in its entirety (see Appendix I). They discussed the differences
between their initial events lists and established a class consensus of the revised list. This
method of revising the event list of was student-directed with the researcher serving only
as a recorder and mediator.

150
Students stated that they felt that the events list for the Tamagotchi pet featured
events that were somewhat different from those previously encountered in Etch-a-Sketch
and Frogger. Unlike the directional, motion-based games they had worked with in the first
two games projects, the Tamagotchi pet featured variables whose values changed with
time and whose values could be altered according to button presses by the player. Also,
the Tamagotchi changed shape depending on its emotional state (i.e., its happiness level).
Because the task classes were so different for the Tamagotchi video game, the worked
example representations were especially important models (see Table 26). Following
examination of the example representations, treatment group students were directed to
write mathematical and programming code representations for each Tamagotchi event.
Table 26 Example Representations Provided for the Tamagotchi Video Game
Representations Event Mathematical Programming
#2 Tama becomes hungrier
Hunger variable is increased by a quantity, (i.e., 5 units)
In the tama’s ONTICK field: SETHUNGER HUNGER + 5 Set to 50 “ticks” (tenths of one second)
#3 Feed Tama
If the hunger variable is greater than some minimum value, subtract a quantity (i.e., 5 units) from hunger
In Procedures panel TO FEED IF HUNGER > 0 [SETHUNGER HUNGER - 5] END Place FEED procedure in Instruction field of Feed button

151
Treatment group students were asked to write their own representations for the
Tamagotchi event; however, free form dialogue and sharing between students was
permitted. Events were scored according to their relative degree of correctness: -1 for no
attempt at writing a representation or a mostly incorrect representation; 0 for a partially
correct representation; and +1 for a mostly correct or entirely correct representation.
Combined representation scores were then computed for each treatment student.
Table 27
Representations Recorded for Tamagotchi Virtual Pet
Tamagotchi representation ratings by type. Table 27 shows descriptive statistics
for representation ratings recorded by the 16 Treatment students present for the
Tamagotchi video game model. For mathematical representations, the minimum possible
score was -10 and the maximum was 10. Mathematical representations written by students
rated a minimum of -3 and a maximum of 10 with a mean of 4.8 (SD = 4.5). For
programming representations, the minimum possible score was -11 and the maximum was
11. Programming representations written by students rated a minimum of -5 and
Relative Rating of Representations Representation N Min Max Mean SD Mathematical representations, Events 1, 2, 2a, 2b, 3, 3a, 4, 4a, 5, 5a (min=-10, max=10)
16 -3 10 4.8 4.5
Programming representations, Events 1, 2, 2a, 2b, 3, 3a, 4, 4a, 5, 5a, 6 (min=-11, max=11)
16 -5 11 3.9 4.8
Combined total representations (min=-21, max=+21) 16 -8 21 8.8 8.3

152
maximum of 11, with a mean of 3.9 (SD = 4.8). For mathematics and programming
representations combined, the minimum possible score was -21 and the maximum was 21.
Combined representations written by students rated a minimum of -8 and a maximum of
21 with a mean of 8.8 (SD = 8.3).
Tamagotchi representation ratings by standard. Tamagotchi events were then
grouped by NCTM content standards to determine ratings by type of mathematical
representation as shown in Table 28. Events 1, 2a, 2b, 3, 4a, and 5 were categorized as
algebra representations. These events consisted of setting variable values for the
Tamagotchi pet (e.g., setting the initial values), modifying a variable value (e.g., hugging
the pet, thereby increasing happiness) and making an announcement in response to
variable values (e.g., announcing “I need some attention,” when happiness equals zero).
Table 28
Mathematical Representations (by Type) Recorded for Tamagotchi Virtual Pet
Events 2 and 4 were categorized as algebra and measurement. These events caused
the Tamagotchi pet to get hungrier and to become sadder at a specified time interval.
Events 3a and 5a were categorized as algebra and probability. These events consisted of
Relative Rating of Representations Math Representation (by Type) N Min Max Mean SD Algebra Events 1, 2a, 2b, 3, 4a, and 5 (min=-6, max=6)
16 -2 6 3.4 2.3
Algebra and measurement Events 2 and 4 (min=-2, max=2) 16 -1 2 1.1 1.0
Algebra and probability Events 3a and 5a (min=-2, max=2) 16 -2 2 0.3 1.6

153
making announcements with a predetermined probability when the Tamagotchi was fed or
hugged. (Event 6, the Stop event, did not consist of mathematical content.)
Tamagotchi Initial Reflections and Design Plans
To measure an affective component of student progress, the treatment group was
asked to assess their work prior to and following the construction of their video games.
Before developing their Tamagotchi video games, students completed a reflections and
plans document (see Appendix G) as they had done previously for the Etch-a-Sketch
digital toy and the Frogger video game. Students used this document to remark on
successes and challenges they had experienced while writing and representing Tamagotchi
events. They also used their reflections and plans document to sketch plans for their video
games and note any modifications they intended to incorporate.
Statements regarding successes. With regard to their successes, all students who
were present (N=18) made a statement indicating that they had experienced success on
some aspect of their efforts in writing events and crafting representations for the events.
General statements were made by two students who said that they were successful,
“designing the game,” and one student who felt successful at “everything.” Thirteen
students specifically stated that they were successful in making Tamagotchis, characters,
or the background. One student reflected that he felt had experienced, “growth in
technology,” and a different student mentioned he was successful with the mathematical
translations.
Statements regarding challenges. In response to the challenges prompt, 16 of 18
students identified at least one area that had challenged them. Eight students stated general
concerns about writing programming code. The new task class of using variables to

154
indicate Tamagotchi attributes was challenging for some students. Five students said that
they were challenged by variables, writing statements such as, “Making the variables go
up and down over time is hard,” and “the felings [sic] are challenging for me.” One
student mentioned difficulty with the “mathematic translation.” Only two students wrote
that they had not experienced challenges in developing the Tamagotchi events and
representations.
Statements regarding modifications. In response to the modifications prompt, all
18 students present wrote extensive details about how they planned to alter the
Tamagotchi video game model to personalize the virtual pet. As with Frogger, students
were vocal in brainstorming and expressing their thoughts about how their Tamagotchi
creations would look and function.
All students indicated their intent to draw and name their own Tamagotchi and
situate it in a different scene, such as creating exotic bird in a rainforest or, “a sheep that
lives in a meadow.” Two students wrote that they still wanted to maintain a many aspects
of the game model with statements such as, “I’m using hunger and happiness, but I also
have a heaven button.” Others described plans to maintain similar variable constructs (one
variable that increases and a second variable that decreases over time), but rename the
variables and redesign the pet and scene. This was the case with one student who wrote
that his planned modifications were, “intelligence goes up; wealth goes down; space
background; alien pet.” However, most students described or drew detailed plans (see
Figure 18) that were significantly different from the game model, with many featuring
multiple variables and creative animations. As one girl wrote, “I don’t have a petsize; I

155
made a new variable, dirtiness; I have a bunny instead of a ballon [sic]; I have different
pics come up when I do things like feed it.”
Figure 18. Design plans for Tinki pet, including variables and aesthetic elements.
Other students developed multiple scenes for their Tamagotchis so that the pets
could “live” in different settings. For example, one girl drew three Tamagotchi characters
and two scenes and wrote the variables she planned to employ with her multi-pet video
game, namely, “play; take a bath; swim; sleep; boredom; stinkiness; activeness; health.”
(See Figure 19.)
Half the boys (N=7) in the treatment group wrote plans that included battle,
training, or weapons, with themes ranging from World War II to “Pixelmon” (i.e.,
Pokemon) training. One boy wrote that his modifications consisted of, “Hunger that
increases over time strength from winning battles; Platinum for money; focus that
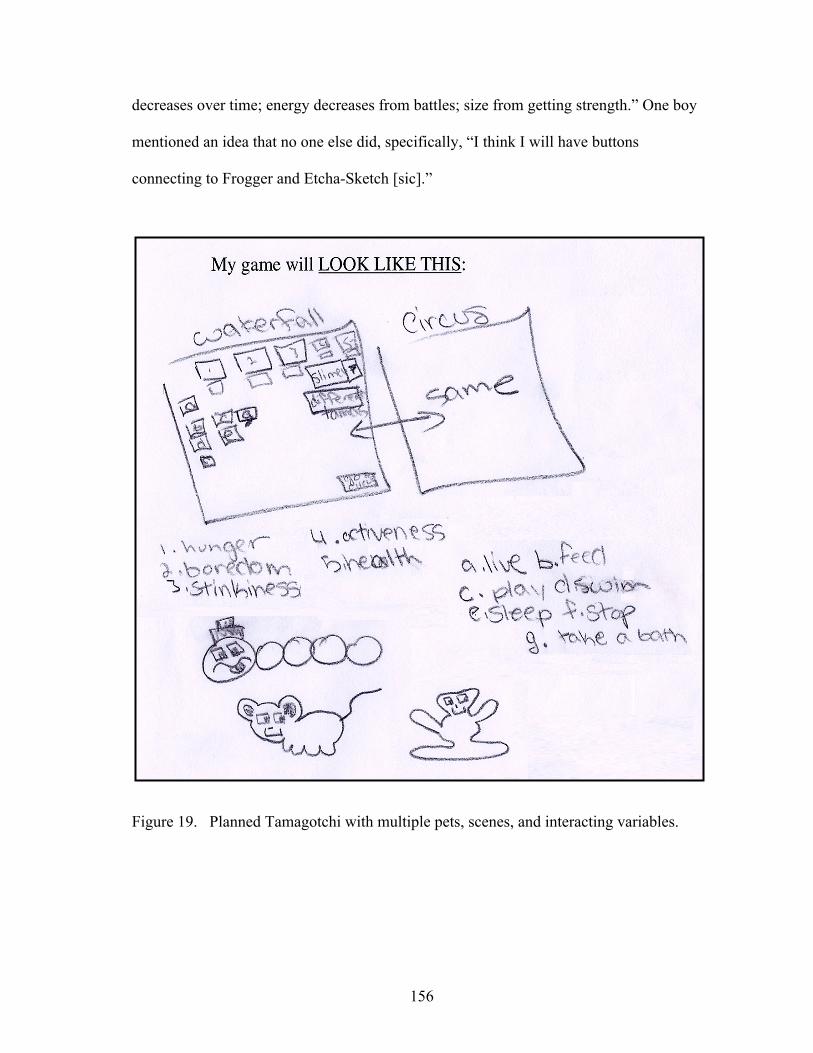
156
decreases over time; energy decreases from battles; size from getting strength.” One boy
mentioned an idea that no one else did, specifically, “I think I will have buttons
connecting to Frogger and Etcha-Sketch [sic].”
Figure 19. Planned Tamagotchi with multiple pets, scenes, and interacting variables.

157
Tamagotchi Video Game Programming Following completion by the treatment group of the reflections and plans
documents, students began work constructing their Tamagotchi video games. Continuing
with the format that had been implemented during the two previous games, video game
construction activities transpired in a constructivist environment with students working
both independently and collaboratively. Students used their events and representations
documents to assist them in producing their game code in MicroWorlds EX.
However, due to the increased complexity of constructing the Tamagotchi pet and
the new variable task classes with which students had no prior experience, students found
that the representations they had written were not sufficiently complete nor supportive in
programming their Tamagotchi pets. To assist students in successfully bridging between
writing representations on paper and programming their games on the computer, the
researcher employed a code completion instructional strategy (van Merriënboer &
Krammer, 1987). The researcher provided the programming code for the Tamagotchi
game model, called Balloonichi, with some complete procedures and some gaps (e.g.,
missing code) where other procedures were needed. The class worked together, with
researcher guidance, to use the code provided as a model for completing the missing code.
(See Appendix I for the Balloonichi game model code completion worksheet.) The code
completion strategy was successful in helping students understand how to program their
Tamagotchi video games.
Treatment group students then resumed programming their Tamagotchi pets, with
the researcher and peer members providing assistance in programming and
158
troubleshooting coding errors as needed. One-on-one troubleshooting was required more
frequently than on previous games, due to the highly customized undertaken by students.
Game model events included. Students worked on constructing their Tamagotchi
video games for approximately twelve, 45-minute class periods. Minimum construction
requirements were to replicate the form and function of the video game model they
previously examined. To replicate the game model, students were required to construct
graphic elements, including drawing a setting for the action and drawing a Tamagotchi
character. Students could employ premade backgrounds and characters available in
MicroWorlds EX, or they could create their own artwork using the built-in drawing tools.
Graphic elements for the Tamagotchi Virtual Pet also included indicators and interaction
buttons. Indicators were text boxes that reported the changing values of the variables they
employed in their video games (e.g., hunger, happiness). Interaction buttons were buttons
that the player could press (e.g., feed, hug) to interact with the Tamagotchi pet and change
the variable values. While the Tamagotchi game model presented two indicators and four
interaction buttons, students were free to modify the model and use any number of
indicators and interaction buttons as they required to construct their design plans.
Finally, students were required to include events that facilitated and controlled
game play. Table 29 lists the events students included, based on the revised event list, in
their Tamagotchi video games, along with the number of students who included each
event in their game.
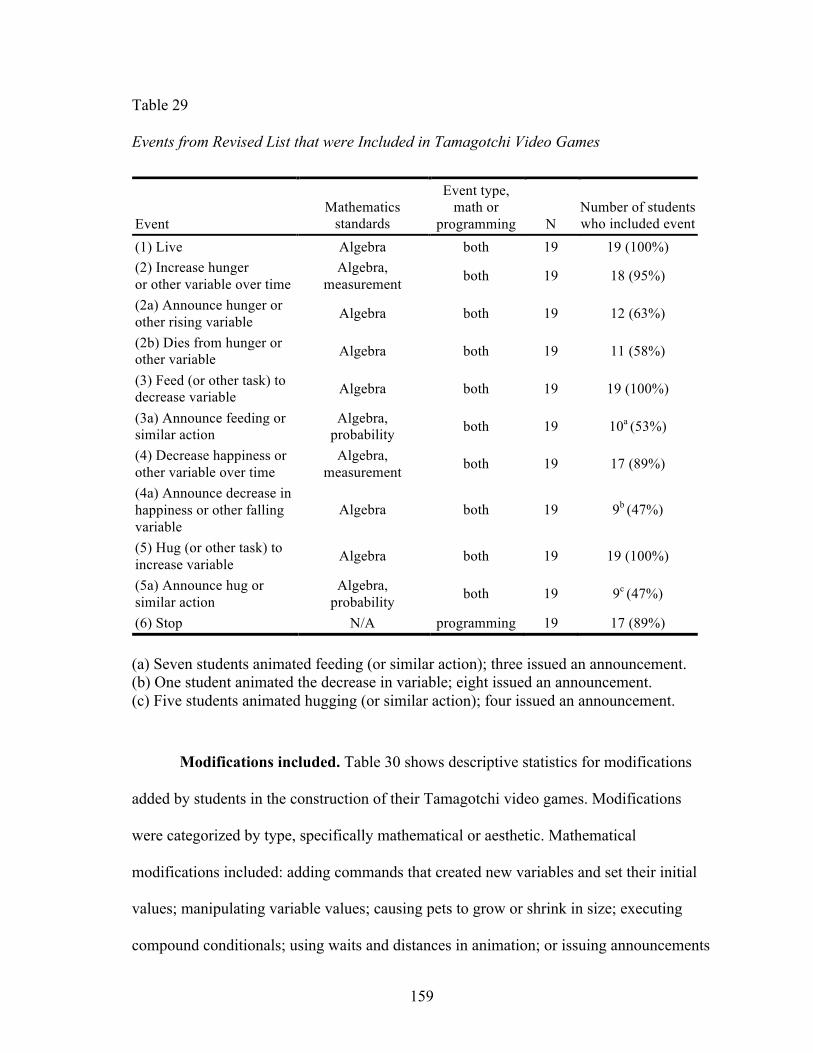
159
Table 29 Events from Revised List that were Included in Tamagotchi Video Games
(a) Seven students animated feeding (or similar action); three issued an announcement. (b) One student animated the decrease in variable; eight issued an announcement. (c) Five students animated hugging (or similar action); four issued an announcement.
Modifications included. Table 30 shows descriptive statistics for modifications
added by students in the construction of their Tamagotchi video games. Modifications
were categorized by type, specifically mathematical or aesthetic. Mathematical
modifications included: adding commands that created new variables and set their initial
values; manipulating variable values; causing pets to grow or shrink in size; executing
compound conditionals; using waits and distances in animation; or issuing announcements
Event Mathematics
standards
Event type, math or
programming N Number of students who included event
(1) Live Algebra both 19 19 (100%) (2) Increase hunger or other variable over time
Algebra, measurement both 19 18 (95%)
(2a) Announce hunger or other rising variable Algebra both 19 12 (63%)
(2b) Dies from hunger or other variable Algebra both 19 11 (58%)
(3) Feed (or other task) to decrease variable Algebra both 19 19 (100%)
(3a) Announce feeding or similar action
Algebra, probability both 19 10a (53%)
(4) Decrease happiness or other variable over time
Algebra, measurement both 19 17 (89%)
(4a) Announce decrease in happiness or other falling variable
Algebra both 19 9b (47%)
(5) Hug (or other task) to increase variable Algebra both 19 19 (100%)
(5a) Announce hug or similar action
Algebra, probability both 19 9c (47%)
(6) Stop N/A programming 19 17 (89%)

160
when equality or inequality conditions were met. Aesthetic modifications included:
animating shape changes; writing a backstory on a splashpage; drawing original character
or scenic graphics; or adding interaction buttons. The mean number of mathematical
modifications added by students was 15 (SD = 12); the mean number of aesthetic
modifications added by students was 20 (SD = 18); and the mean total number of
modifications added was 35 (SD = 27).
Table 30
Tamagotchi Modifications Constructed
Tamagotchi Final Reflections
Qualitative, affective dimensions of student progress in creating the Tamagotchi
video games were measured post-construction. Students were asked to assess their work
following the construction of their Tamagotchi games, via a Final Reflections document.
(See Appendix G).
Statements regarding successes. Post-construction, all students present (N=18)
were able to identify successes in constructing their Tamagotchi games. One of the young
men stated that he succeeded with, “Just about everything,” while another wrote, “My
creativity excelled.” One young woman said simply, “I had fun. I liked being able to
create something.” Two students wrote that they felt successful with programming in
Modifications Tamagotchi Modifications by Type N Min Max Mean SD Mathematics 19 0 38 15 12 Aesthetic 19 1 60 20 18 Total 19 1 80 35 27
161
general, and several others identified specific coding successes including, “making
buttons, making background, changing screens, and most codes.” Some were excited to
share the details of their variables in action, writing statements including, “I successfully
got to ‘lull’ my guy and ‘power’ him up;” and “It was easy for me to set the rating and to
make the ontick work.” Many students also described their work in the aesthetic realm,
noting successes such as, “The design of the feelings of the Tamagotchi,” and “creating
different characters and finishing the animation.” Researcher observations corroborated
students’ self-reported successes as well as their general enthusiasm for creating the final
video game project.
Statements regarding challenges. Challenges listed by treatment group students
(N=18) on their post-construction Final Reflections documents related mostly to
programming. Fifteen of eighteen students present remarked generally on programming
challenges – “I had trouble with the commands” – or specifically on programming
challenges – “I had trouble setting a procedure to change shape.” Only one student
mentioned “not much” in the way of challenges. In general, students wrote fewer
challenges than they had documented for the Etch-a-Sketch and Frogger projects.
Observations corroborated that students were becoming more adept at programming, more
capable of troubleshooting and resolving coding errors, and more capable of adapting their
construction activities to content and skills they already possessed.
Statements regarding modifications. All students present (N=18) were prolific in
noting their many modifications, both mathematical and aesthetic, of the Tamagotchi
Virtual Pet video game. Some noted that they had maintained the general structure of the
Tamagotchi game model, but modified the character and the names of the two variables.

162
One example was the “Alien Tamagotchi Pet” which featured an alien pet in space with
intelligence that increased and wealth that decreased over time (see Figure 20).
Figure 20. Alien Tamagotchi Virtual Pet.
A similar, completed Tamagotchi game that also featured two variables, including
wealth, was set in a snowy mountaintop setting. The treatment student modified the game
model by creating two “turtle” objects – one turtle became a mountain goat Tamagotchi
pet and one turtle became a money pile. Writing code for buttons that affected the goat
and money pile simultaneously, the student reported the state of the pet’s hunger and
wealth numerically through the variable indicators. Additionally, using setsize
commands in the programming code, he caused physical changes to occur during the life
of his pet. For example, the goat grew and the money pile shrank whenever a player
pressed the “Feed” button, because food costs money and induces growth.

163
Another student created a World War II version of the Tamagotchi, noting his
inventive modifications: “I made a splash page. I made different shapes and variables. My
background was different.” As seen in Figure 21, he created a Fear variable that increased
over time, but could be decreased by pressing the Rally Troops button. The student also
created two variables, Ammunition and Soldiers, that decreased over time, but could be
increased by pressing the Reinforcements or Bring in extra ammunition buttons,
respectively. The student was also creative in crafting his Stop button which he renamed
Cease-fire.
Figure 21. World War II Battle (Tamagotchi Virtual Pet).
As shown in Figure 22, one young woman also employed three variables that
changed over time, but she created many additional buttons the player could press to affect
variable values. For her Bunny Tamagotchi, she stated, “I took out petsize and added

164
Dirtiness. On my feed command I had it show a picture of my bunny eating a carrot. I
added dance using the repeat command, also a wash and a mud bath. I also gave it an eat
candy command.” This student also included several announcements that were issued
when variables equaled set values.
Figure 22. Bunny Tamagotchi.
Figure 23, shows the BanMan in the Jungle Tamagotchi, which the student
designed to feature six variables that changed over time and could be changed as a result
of pressing interaction buttons. The student wrote, “I had banananess, energy, age, and
awesomeness rating [as well as petsize and hunger]. I had 11 Tamagotchi shapes. They
showed how many bananas he had.” For his Get a Banana button, the student created a
special procedure employing conditionals: if BanMan possessed zero bananas, pressing
Get a Banana changed his shape so that he held one banana; if BanMan possessed one
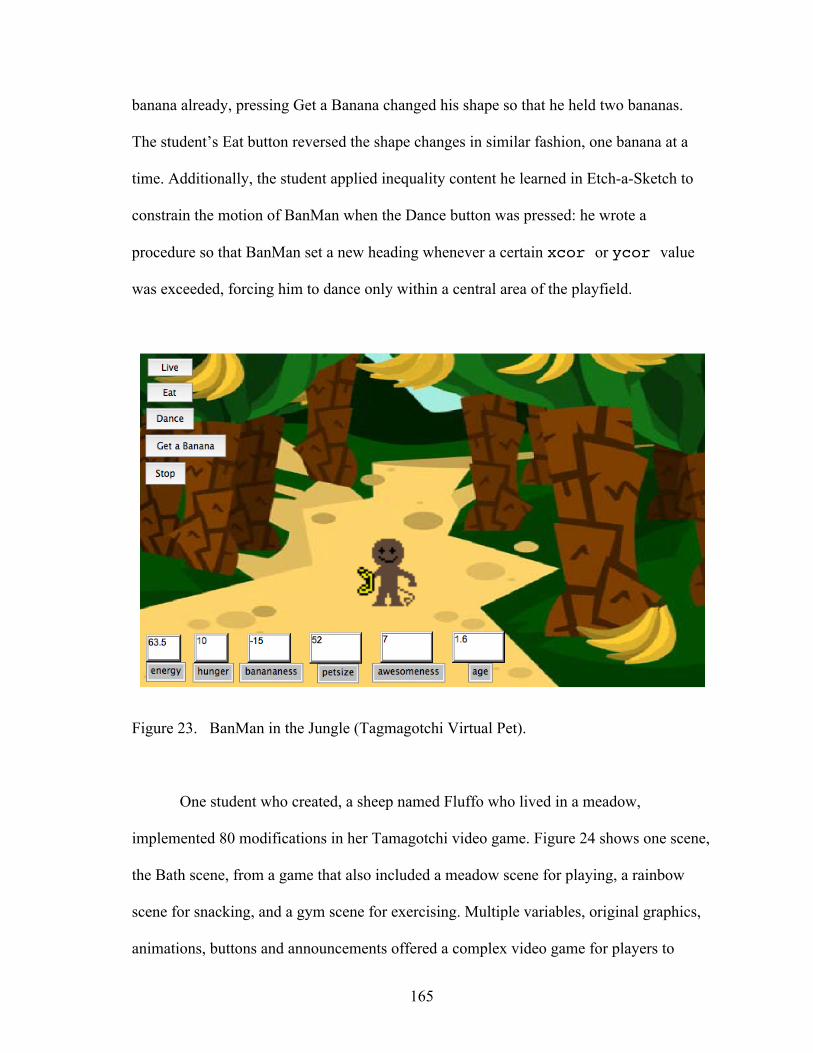
165
banana already, pressing Get a Banana changed his shape so that he held two bananas.
The student’s Eat button reversed the shape changes in similar fashion, one banana at a
time. Additionally, the student applied inequality content he learned in Etch-a-Sketch to
constrain the motion of BanMan when the Dance button was pressed: he wrote a
procedure so that BanMan set a new heading whenever a certain xcor or ycor value
was exceeded, forcing him to dance only within a central area of the playfield.
Figure 23. BanMan in the Jungle (Tagmagotchi Virtual Pet).
One student who created, a sheep named Fluffo who lived in a meadow,
implemented 80 modifications in her Tamagotchi video game. Figure 24 shows one scene,
the Bath scene, from a game that also included a meadow scene for playing, a rainbow
scene for snacking, and a gym scene for exercising. Multiple variables, original graphics,
animations, buttons and announcements offered a complex video game for players to

166
engage in. The student wrote procedures that caused buttons to affect more than one
variable and trigger animations. For instance, Feed Beans caused Fluffo to lose health,
lose happiness, and turn green in the face. Additionally, the student applied the OnColor
command she learned in Frogger to cause Fluffo to bounce when she touched the surface
of a black trampoline in the gym scene.
Figure 24. Fluffo Sheep Tamagotchi Pet.
Finally, one student who stated simply that she modified, ”Everything,” created a
Tamagotchi pet that employed complex animations in which she set shapes, coordinates,
headings, forward motions, and wait times to create a dynamic player experience.
Executing the design plan she previously drew in Figure 18, the student created a Tinki
Tamagotchi that also used drop down boxes and associated procedures to allow for the
selection of fruits to eat and activities for play (see Figure 25).

167
Figure 25. Completed Tinki Tamagotchi Pet.
Studywide Post-test Performance
Following completion of the entire study, all students engaged in a studywide
mathematics content post-test – the same test administered as a pre-test at the outset of the
study. The studywide content tests consisted of 20 questions relevant to the three video
game projects undertaken during the study. Results of the studywide content post-test are
shown in Table 31. Treatment group students scored a mean of 12.7 (SD = 2.3) and
comparison group students scored a mean of 11.0 (SD = 1.9)

168
Table 31 Studywide Content Post-test Scores by Group
* Range of test was 0 (min) to 20 (max).
Studywide Questions Derived from Etch-a-Sketch
A subset of the studywide content questions was derived from content featured in
the Etch-a-Sketch toy. Because all study participants took the studywide content tests, data
were obtained for both treatment group and comparison group participants.
For pre-test to post-test performance, data on the studywide content test was
collected using the same techniques employed for the checkpoint content tests. The shift
by a student from an item response on the pre-test to an item response on the post-test was
measured as either a positive change; no loss; no gain; or negative change.
Treatment group performance. Performance from pre-test to post-test on the
studywide mathematics content addressing Etch-a-Sketch subset questions is shown for
the treatment group in Table 32. On the numbers and operations standards, 100% of the
treatment group responses exhibited either a positive change or no loss. On the geometry
standards, 81% of the treatment group responses exhibited either a positive change or no
loss while 18% showed either no gain or a negative change. On the algebra standards,
44% of the treatment group responses exhibited either a positive change or no loss, while
56% showed either no gain or a negative change. For all Etch-a-Sketch content on the
Group N Min Max Mean SD Treatment 19 9 18 12.7 2.3 Comparison 24 5 15 11.0 1.9 All participants 43 5 18 11.8 2.3

169
studywide content test, 70% of the treatment group responses demonstrated either a
positive change or no loss, and 29% demonstrated either no gain or negative change.
Table 32
Studywide Content, Etch-a-Sketch Subset (Pre-test to Post-test) – Treatment Group
Comparison group performance. Performance from pre-test to post-test on the
studywide content addressing Etch-a-Sketch subset questions is shown for the comparison
group in Table 33. On the numbers and operations standards, 96% of the comparison
group responses exhibited either a positive change or no loss. On the geometry standards,
80% of the comparison group responses exhibited either a positive change or no loss while
18% showed either no gain or a negative change. On the algebra standards, 43% of the
comparison group responses exhibited either a positive change or no loss, while 57%
showed either no gain or a negative change. For all Etch-a-Sketch content on the
studywide test in its entirety, 69% of the comparison group responses demonstrated either
a positive change or no loss, and 32% demonstrated either no gain or negative change.
Change by percentage of treatment responses Etch-a-Sketch standards + Change No Loss No Gain - Change Numbers and operations (Q2, Q3) 21% 79% 0% 0% Geometry (Q1, Q4) 18% 63% 5% 13% Algebra (Q5, Q6, Q7) 28% 16% 51% 5% All content 23% 47% 23% 6%

170
Table 33 Studywide Content, Etch-a-Sketch Subset (Pre-test to Post-test) – Comparison Group
Treatment vs. comparison group performance. Table 34 shows treatment versus
comparison group performance on the studywide mathematics content test with regard to
Etch-a-Sketch subset questions. On the numbers and operations standards, the treatment
group showed positive change or no loss on 100% of the questions, while the comparison
group performed similarly on 96% of the questions. On the geometry standards, the
treatment group showed positive change or no loss on 81% of the questions, while the
comparison group performed similarly on 80% of the questions. On the algebra standards,
the treatment group showed positive change or no loss on 44% of the questions, while the
comparison group performed similarly on 43% of the questions. On all content standards,
the treatment group showed positive change or no loss on 70% of the questions, while the
comparison group performed similarly on 69% of the questions.
Change by percentage of comparison responses Etch-a-Sketch standards + Change No loss No gain - Change Numbers and operations (Q2, Q3) 6% 90% 4% 0% Geometry (Q1, Q4) 15% 65% 4% 17% Algebra (Q5, Q6, Q7) 35% 8% 43% 14% All content 21% 48% 21% 11%

171
Table 34 Studywide Content, Etch-a-Sketch Subset (Pre-test to Post-test) – All Participants
Studywide Questions Derived from Frogger
A subset of the studywide content questions was derived from content featured in
the Frogger game. Because all study participants took the studywide content tests, data
was obtained for both treatment group and comparison group participants. For pre-test to
post-test performance, the shift by a student from an item response on the pre-test to an
item response on the post-test was measured as either a positive change; no loss; no gain;
or negative change.
Treatment group performance. Performance from pre-test to post-test on the
studywide content addressing Frogger subset questions is shown for the treatment group in
Table 35. On the algebra and geometry standards, 23% of the questions answered by the
treatment group either a positive change or no loss, while 77% showed either no gain or a
negative change. On the geometry standards, 57% of the responses exhibited either a
positive change or no loss while 42% showed either no gain or a negative change. On the
measurement standards, 85% of the treatment group questions exhibited either a positive
change or no loss, while 16% showed either no gain or a negative change. For all Frogger
Change by percentage of responses + Change or No loss Etch-a-Sketch standards Treatment Comparison Numbers and operations (Q2, Q3) 100% 96% Geometry (Q1, Q4) 81% 80% Algebra (Q5, Q6, Q7) 44% 43% All content 70% 69%

172
content on the studywide test in its entirety, 54% of the treatment group responses
demonstrated either a positive change or no loss, and 46% demonstrated either no gain or
negative change.
Table 35
Studywide Content, Frogger Subset (Pre-test to Post-test) – Treatment Group
Comparison group performance. Performance from pre-test to post-test on the
studywide content addressing Frogger subset questions is shown for the comparison group
in Table 36. On the algebra and geometry standards, 24% of the questions answered by the
comparison group students exhibited either a positive change or no loss; 76% showed no
gain or negative change. On the geometry standards, 35% of the comparison group
responses exhibited either a positive change or no loss while 65% showed either no gain
or a negative change. On the measurements standards, 80% of the comparison group
responses exhibited either a positive change or no loss, while 20% showed either no gain
or a negative change. For all Frogger content on the checkpoint test in its entirety, 48% of
the comparison group responses demonstrated either a positive change or no loss, and
52% demonstrated either no gain or negative change.
Change by percentage of treatment responses Frogger standards + Change No Loss No Gain - Change Algebra and geometry (Q5, Q6, Q10) 12% 11% 63% 14% Geometry (Q12, Q13) 39% 18% 39% 3% Measurement (Q11, Q14, Q15) 11% 74% 5% 11% All content 18% 36% 36% 10%

173
Table 36 Studywide Content, Frogger Subset (Pre-test to Post-test) – Comparison Group
Treatment vs. comparison group performance. Table 37 shows treatment versus
comparison group performance on the studywide content test with regard to Etch-a-Sketch
subset questions. Only percentages associated with positive change or no loss are shown.
Table 37 Studywide Content, Frogger Subset (Pre-test to Post-test) – All Participants
On the algebra and geometry standards, the treatment group showed positive
change or no loss on 23% of the questions, while the comparison group performed
similarly on 24% of the questions. On the geometry standards, the treatment group showed
Change by percentage of comparison responses Frogger standards + Change No Loss No Gain - Change Algebra and geometry (Q5, Q6, Q10) 17% 7% 68% 8% Geometry (Q12, Q13) 25% 10% 63% 2% Measurement (Q11, Q14, Q15) 26% 54% 7% 13% All content 22% 26% 44% 8%
Change by percentage of responses + Change or No loss Frogger standards Treatment Comparison Algebra and geometry (Q5, Q6, Q10) 23% 24% Geometry (Q12, Q13) 57% 35% Measurement (Q11, Q14, Q15) 85% 80% All content 49% 48%

174
positive change or no loss on 57% of the questions, while the comparison group
performed similarly on 35% of the questions. On the measurement standards, the
treatment group showed positive change or no loss on 85% of the questions, while the
comparison group performed similarly on 80% of the questions. On all content standards,
the treatment group showed positive change or no loss on 49% of the questions, while the
comparison group performed similarly on 48% of the questions.
Studywide Questions Derived from Tamagotchi
A subset of the studywide content questions was derived from content featured in
the Tamagotchi game. Because all study participants took the studywide content tests, data
was obtained for both treatment group and comparison group participants.
For pre-test to post-test performance, the shift by a student from an item response
on the pre-test to an item response on the post-test was measured as either a positive
change; no loss; no gain; or negative change.
Treatment group performance. Performance from pre-test to post-test on the
studywide content addressing Tamagotchi subset questions is shown for the treatment
group in Table 38. On the algebra standards, 79% of the treatment group responses
exhibited either a positive change or no loss, while 21% of the responses showed either no
gain or a negative change. On the probability standards, 61% of the treatment group
responses exhibited either a positive change or no loss while 40% showed either no gain
or a negative change. For all Tamagotchi content on the studywide test, 71% of the
treatment group responses demonstrated either a positive change or no loss, and 28%
demonstrated either no gain or negative change.
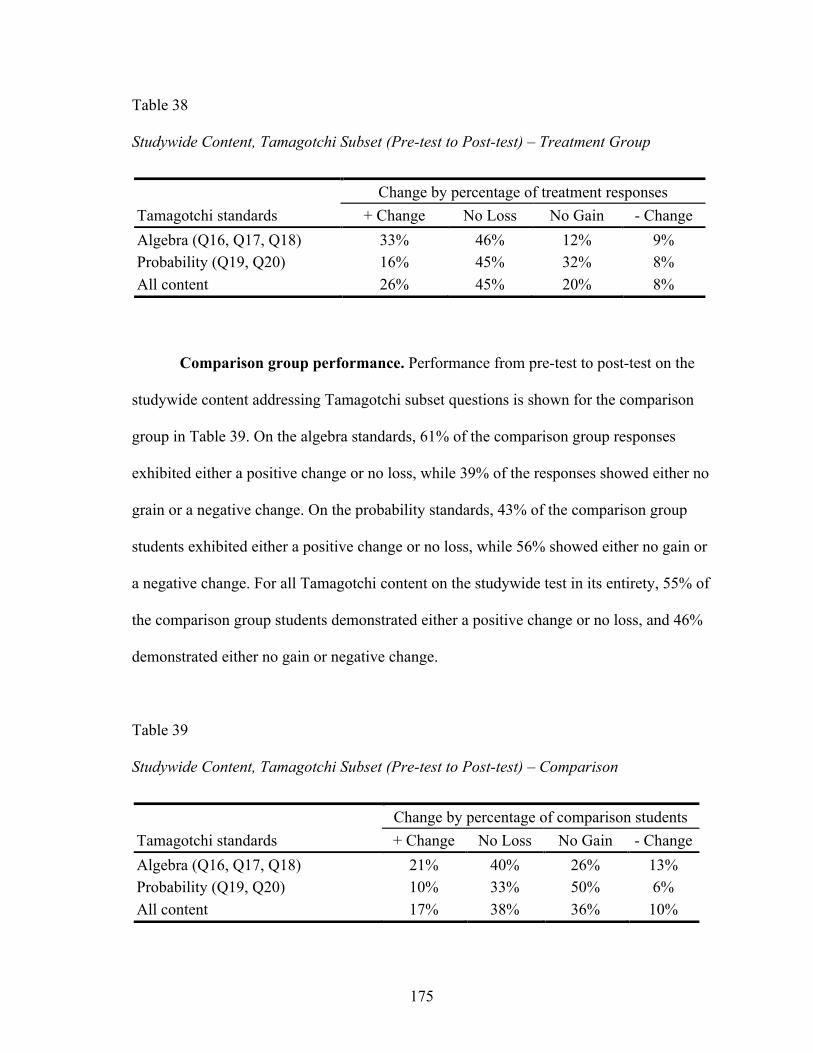
175
Table 38 Studywide Content, Tamagotchi Subset (Pre-test to Post-test) – Treatment Group
Comparison group performance. Performance from pre-test to post-test on the
studywide content addressing Tamagotchi subset questions is shown for the comparison
group in Table 39. On the algebra standards, 61% of the comparison group responses
exhibited either a positive change or no loss, while 39% of the responses showed either no
grain or a negative change. On the probability standards, 43% of the comparison group
students exhibited either a positive change or no loss, while 56% showed either no gain or
a negative change. For all Tamagotchi content on the studywide test in its entirety, 55% of
the comparison group students demonstrated either a positive change or no loss, and 46%
demonstrated either no gain or negative change.
Table 39 Studywide Content, Tamagotchi Subset (Pre-test to Post-test) – Comparison
Change by percentage of treatment responses Tamagotchi standards + Change No Loss No Gain - Change Algebra (Q16, Q17, Q18) 33% 46% 12% 9% Probability (Q19, Q20) 16% 45% 32% 8% All content 26% 45% 20% 8%
Change by percentage of comparison students Tamagotchi standards + Change No Loss No Gain - Change Algebra (Q16, Q17, Q18) 21% 40% 26% 13% Probability (Q19, Q20) 10% 33% 50% 6% All content 17% 38% 36% 10%

176
Treatment vs. comparison group performance. Table 40 shows treatment
versus comparison group performance on the studywide content test with regard to
Tamagotchi subset questions. On the algebra standards, the treatment group showed
positive change or no loss on 79% of the questions, while the comparison group
performed similarly on 61% of the questions. On the geometry standards, the treatment
group showed positive change or no loss on 61% of the questions, while the comparison
group performed similarly on 43% of the questions. On all content standards, the
treatment group showed positive change or no loss on 71% of the questions, while the
comparison group performed similarly on 55% of the questions.
Table 40
Studywide Content, Tamagotchi Subset (Pre-test to Post-test) – All participants
Studywide Content Tests, Pre-test-to-Post-test Changes
All study participants took the studywide content tests so that data was obtained
for both treatment group and comparison group participants. For pre-test to post-test
performance, the shift by a student from an item response on the pre-test to an item
response on the post-test was measured as either a positive change; no loss; no gain; or
negative change.
Change by percentage of participating students + Change or No loss Tamagotchi standards Treatment Comparison Algebra (Q16, Q17, Q18) 79% 61% Probability (Q19, Q20) 61% 43% All content 71% 55%

177
Treatment group performance. Performance by the treatment group from pre-
test to post-test on the studywide content test is shown in Table 41. Question items were
grouped according to NCTM content standard and programming project.
Table 41
Studywide Content Test (Pre-test to Post-test) – Treatment Group
On the numbers and operations standards, 100% of the treatment group responses
showed either a positive change or no loss. On the algebra standards, 62% of the treatment
group responses exhibited either a positive change or no loss while 39% showed either no
gain or a negative change. On the algebra and geometry standards, 23% of the treatment
group responses exhibited either a positive change or no loss, while 77% showed either no
gain or a negative change. On the geometry standards, 70% of the treatment group
responses exhibited either a positive change or no loss, while 30% showed either no gain
or a negative change. On the measurement standards, 85% of the treatment group
responses exhibited either a positive change or no loss, while 16% showed either no gain
or a negative change. On the probability standards, 61% of the treatment group responses
Change by percentage of treatment responses Standards + Change No Loss No Gain - Change Numbers and operations (Etch) 21% 79% 0% 0% Algebra (Etch, Tamagotchi) 31% 31% 32% 7% Algebra and geometry (Frogger) 12% 11% 63% 14% Geometry (Etch, Frogger) 29% 41% 22% 8% Measurement (Frogger) 11% 74% 5% 11% Probability (Tamagotchi) 16% 45% 32% 8% All standards 22% 42% 27% 8%
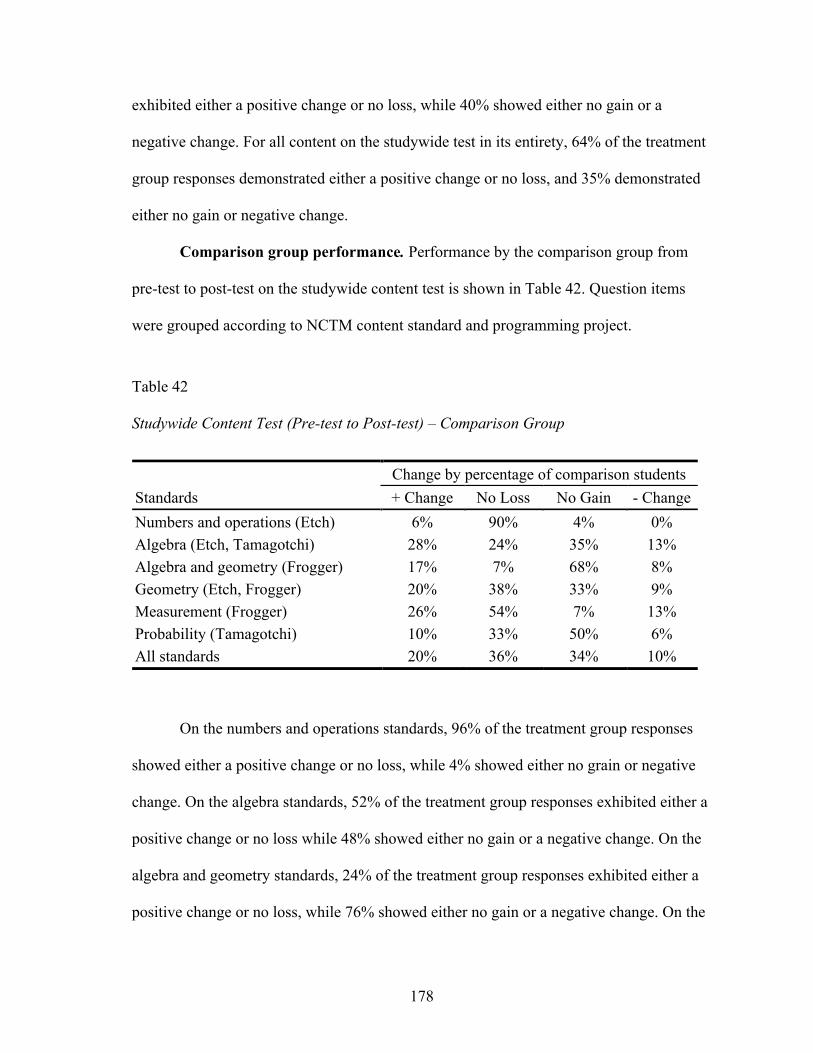
178
exhibited either a positive change or no loss, while 40% showed either no gain or a
negative change. For all content on the studywide test in its entirety, 64% of the treatment
group responses demonstrated either a positive change or no loss, and 35% demonstrated
either no gain or negative change.
Comparison group performance. Performance by the comparison group from
pre-test to post-test on the studywide content test is shown in Table 42. Question items
were grouped according to NCTM content standard and programming project.
Table 42
Studywide Content Test (Pre-test to Post-test) – Comparison Group
On the numbers and operations standards, 96% of the treatment group responses
showed either a positive change or no loss, while 4% showed either no grain or negative
change. On the algebra standards, 52% of the treatment group responses exhibited either a
positive change or no loss while 48% showed either no gain or a negative change. On the
algebra and geometry standards, 24% of the treatment group responses exhibited either a
positive change or no loss, while 76% showed either no gain or a negative change. On the
Change by percentage of comparison students Standards + Change No Loss No Gain - Change Numbers and operations (Etch) 6% 90% 4% 0% Algebra (Etch, Tamagotchi) 28% 24% 35% 13% Algebra and geometry (Frogger) 17% 7% 68% 8% Geometry (Etch, Frogger) 20% 38% 33% 9% Measurement (Frogger) 26% 54% 7% 13% Probability (Tamagotchi) 10% 33% 50% 6% All standards 20% 36% 34% 10%

179
geometry standards, 58% of the treatment group responses exhibited either a positive
change or no loss, while 42% showed either no gain or a negative change. On the
measurement standards, 80% of the treatment group responses exhibited either a positive
change or no loss, while 20% showed either no gain or a negative change. On the
probability standards, 43% of the treatment group responses exhibited either a positive
change or no loss, while 56% showed either no gain or a negative change. For all content
on the studywide test in its entirety, 64% of the treatment group responses demonstrated
either a positive change or no loss, and 35% demonstrated either no gain or negative
change.
Treatment vs. comparison group performance. Table 43 shows treatment versus
comparison group performance on the studywide content test in its entirety. On the
numbers and operations standards, the treatment group showed positive change or no loss
on 100% of the questions, while the comparison group performed similarly on 94% of the
questions. On the algebra standards, the treatment group showed positive change or no
loss on 62% of the questions, while the comparison group performed similarly on 52% of
the questions. On the algebra and geometry standards, the treatment group showed
positive change or no loss on 23% of the questions, while the comparison group
performed similarly on 24% of the questions. On the geometry standards, the treatment
group showed positive change or no loss on 70% of the questions, while the comparison
group performed similarly on 58% of the questions. On the measurement standards, the
treatment group showed positive change or no loss on 85% of the questions, while the
comparison group performed similarly on 80% of the questions. On the measurement
standards, the treatment group showed positive change or no loss on 61% of the questions,

180
while the comparison group performed similarly on 43% of the questions. On all content
standards, the treatment group showed positive change or no loss on 64% of the questions,
while the comparison group performed similarly on 56% of the questions.
Table 43
Studywide Content Test (Pre-test to Post-test) – All Participants
An additional method of viewing changes in pre-test to post-test performance
study participants is to examine the raw scores of both treatment and performance students
at the outset and the end of the study period. As shown in Table 44, the pre-test mean of
the treatment group was 10.2 (out of 20), and the post-test mean of the treatment group
was 12.7. At the outset of the study, some variables for study participants were found to be
normally distributed, while others were not. For consistency, all statistical tests examining
study participants were conducted nonparametrically. The Wilcoxon Signed Ranks test, a
nonparametric t-test used for two paired groups, was used to compare the pre-test-to-post-
test scores for each of the two groups. For the treatment group, the Wilcoxon Z was found
to be -3.1 (p < .01), a statistically significant improvement. For the comparison group, the
Change by percentage of participating students + Change or No loss Standards Treatment Comparison Numbers and operations (Etch) 100% 96% Algebra (Etch, Tamagotchi) 62% 52% Algebra and geometry (Frogger) 23% 24% Geometry (Etch, Frogger) 70% 58% Measurement (Frogger) 85% 80% Probability (Tamagotchi) 61% 43% All standards 64% 56%

181
Wilcoxon Z was found to be -3.6 (p < .001), a statistically significant improvement. For
all participants, the Wilcoxon Z was found to be -4.7 (p < .001), a statistically significant
improvement. The Mann-Whitney U was computed for the between groups pre-post mean
shift and was found to be not statistically significant.
Table 44
Within Groups Studywide Content (Pre-test to Post-test) Scores
Pre-to-Post Comparison Group N
Pre-test Mean*
Post-test Mean*
Pre-Post Mean ∆ Wilcoxon Z Significance
Treatment 19 10.2 12.7 2.5 -3.1 p < .01 Comparison 24 9.0 11.0 2.0 -3.6 p < .001 All participants 43 9.5 11.8 2.3 -4.7 p < .001
* Range of test was 0 (min) to 20 (max).
Post-treatment ATMI Inventory Outcomes
At the completion of the study, all study participants took the ATMI inventory, the
same inventory they completed at the outset of the study. Table 45 shows the post-
treatment ATMI inventory scores by scale for the treatment and comparison groups. For
the post-treatment ATMI confidence scale (max = 75), the treatment group scored a mean
of 65.8 (SD = 5.3) while the comparison group scored a mean of 59.2 (SD = 8.5). For the
post-treatment ATMI value scale (max = 50), the treatment group scored a mean of 46.3
(SD = 4.6) and the comparison group scored a mean of 43.6 (SD = 4.9). For the post-
treatment ATMI enjoyment scale (max = 50), the treatment group scored a mean of 43.4
(SD = 8.0) and the comparison group scored a mean of 38.2 (SD = 6.9). For the post-
treatment ATMI motivation scale (max = 25), the treatment group scored a mean of 21.5

182
(SD = 3.7) and the comparison group scored a mean of 18.6 (SD = 4.3). While ATMI
post-treatment scores were high for all study participants, scores for the treatment group
were higher than scores for the comparison group on all four scales.
Table 45
ATMI Post-treatment Scores by Scale and by Group
Studywide Pre-treatment-to-Post-treatment ATMI Scores (Within Groups)
Tables 46, 47, 48, and 49 show the pre-treatment to post-treatment ATMI
inventory scores by scale and by group. In general, scores for all scales and groups
remained stable during the study, decreasing slightly from pre-treatment to post-treatment.
One exception was that the confidence scale score by comparison group increased slightly
over the course of the study.
Because some pre-treatment ATMI inventory scores exhibited normal distributions
and others did not, nonparametric tests were performed for all ATMI inventory measures
for consistency and ease of comparison. For within group comparisons on all four ATMI
ATMI Post-treatment Scores Scale and group N Min Max Mean SD
ATMI Confidence – Treatment 19 49 / 75 70 / 75 65.8 / 75 5.3 ATMI Confidence – Comparison 24 38 / 75 70 / 75 59.2 / 75 8.5 ATMI Value – Treatment 19 33 / 50 50 / 50 46.3/ 50 4.6 ATMI Value – Comparison 24 32 / 50 50 / 50 43.6/ 50 4.9 ATMI Enjoyment – Treatment 19 28 / 50 50 / 50 43.4 / 50 8.0 ATMI Enjoyment – Comparison 24 22 / 50 49 / 50 38.2 / 50 6.9 ATMI Motivation – Treatment 19 13 / 25 25 / 25 21.5 / 25 3.7 ATMI Motivation – Comparison 24 10 / 25 25 / 25 18.6 / 25 4.3
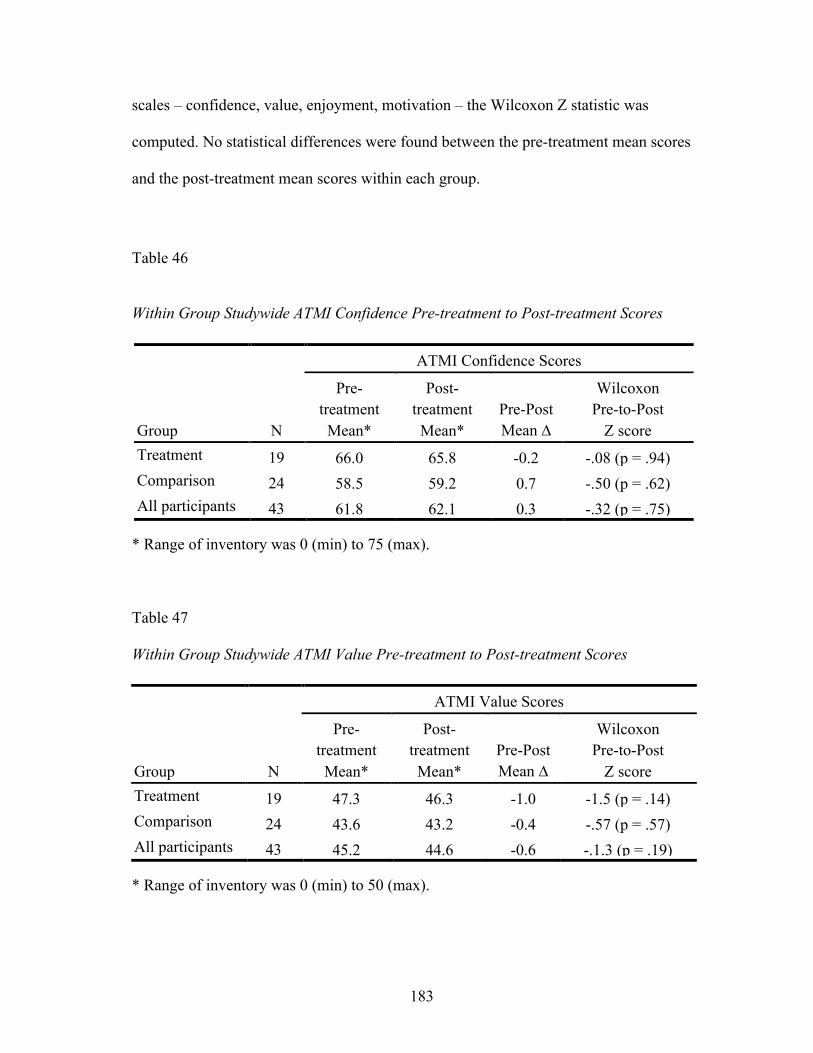
183
scales – confidence, value, enjoyment, motivation – the Wilcoxon Z statistic was
computed. No statistical differences were found between the pre-treatment mean scores
and the post-treatment mean scores within each group.
Table 46
Within Group Studywide ATMI Confidence Pre-treatment to Post-treatment Scores
* Range of inventory was 0 (min) to 75 (max).
Table 47
Within Group Studywide ATMI Value Pre-treatment to Post-treatment Scores
* Range of inventory was 0 (min) to 50 (max).
ATMI Confidence Scores
Group N
Pre-treatment Mean*
Post-treatment Mean*
Pre-Post Mean ∆
Wilcoxon Pre-to-Post
Z score Treatment 19 66.0 65.8 -0.2 -.08 (p = .94) Comparison 24 58.5 59.2 0.7 -.50 (p = .62) All participants 43 61.8 62.1 0.3 -.32 (p = .75)
ATMI Value Scores
Group N
Pre-treatment Mean*
Post-treatment Mean*
Pre-Post Mean ∆
Wilcoxon Pre-to-Post
Z score Treatment 19 47.3 46.3 -1.0 -1.5 (p = .14) Comparison 24 43.6 43.2 -0.4 -.57 (p = .57) All participants 43 45.2 44.6 -0.6 -.1.3 (p = .19)

184
Table 48 Within Group Studywide ATMI Enjoyment Pre-treatment to Post-treatment Scores
* Range of inventory was 0 (min) to 50 (max). Table 49 Within Group Studywide ATMI Motivation Pre-treatment to Post-treatment Scores
* Range of inventory was 0 (min) to 25 (max).
Studywide Pre-treatment-to-Post-treatment ATMI Scores (Between Groups)
For between group comparisons on all four ATMI scales – confidence, value,
enjoyment, motivation – the Mann-Whitney U was computed on the pre-post mean
differences. No statistically significant differences were found between treatment and
comparison groups with regard to their change in scores on any of the four scales.
ATMI Enjoyment Scores
Group N
Pre-treatment Mean*
Post-treatment Mean*
Pre-Post Mean ∆
Wilcoxon Pre-to-Post
Z score Treatment 19 45.8 43.4 -2.4 -1.5 (p = .13) Comparison 24 38.6 38.2 -0.4 -.43 (p = .67) All participants 43 41.8 40.5 -1.3 -1.4 (p = .18)
ATMI Motivation Scores
Group N
Pre-treatment Mean*
Post-treatment Mean*
Pre-Post Mean ∆
Wilcoxon Pre-to-Post
Z score Treatment 19 22.9 21.5 -1.4 -1.8 (p = .08) Comparison 24 18.8 18.6 -0.2 -.02 (p = .98) All participants 43 20.6 19.9 -0.7 -1.1 (p = .29)

185
Other Correlational Relationships
Statistical computations were made to search for other possible relationships
between variables in this study. Only one such relationship was found, specifically, a
gender-related statistical difference that appeared among the young women in the
treatment group. On the ATMI enjoyment scale, girls exhibited a decrease in scores
between pre-treatment and post-treatment that was statistically significant (Mann-Whitney
U = 2.0, p < .05). However, since there were so few girls (N=5) in the treatment group,
further research with a larger study group should be conducted to obtain better data
relevant to this relationship.

186
CHAPTER 5
DISCUSSION
This study evaluated the mathematics content learned and attitudes exhibited by
students engaged in the design and construction of video games over several months. It
emerged from recent research demonstrating the development of complex reasoning and
problem-solving skills (Fadjo, Chang, Hong, & Black, 2010) and mathematics concepts
(Kafai, 1995) by youth engaged in video game design. During the study, treatment group
students analyzed video games for their mathematical events, synthesized the mathematics
of video game events, and programmed functional games.
Summary of Research Questions
Three research questions guided this study. The questions addressed learning
mathematics content, transferring mathematics content knowledge, and mathematics
attitude as follows.
Question 1, Mathematics of Video Game Design and Construction
This question entailed three parts: (a) analysis – What mathematics content do
middle school students invoke as they analyze games? (b) synthesis – What mathematics
do middle school students invoke as they synthesize games? (c) programming – What
mathematics do middle school students invoke as they program games?
Question 2, Lateral Transfer of Mathematics Content Knowledge
This question entailed two parts: (a) On a standards-based, multiple-choice
mathematics content test, how does the performance of middle school students change,
pre- and post-design and construction of video games? (b) On a standards-based, multiple-

187
choice mathematics content test, how does the performance of middle school students who
are engaged in video game design and construction compare with the performance of
students of similar math abilities who are not engaged in video game design and
construction?
Question 3, Attitudes Toward Mathematics
This question entailed two parts: (a) How can the attitude of middle school
students towards mathematics be characterized prior to designing and constructing video
games and after designing and constructing video games? (b) How do the attitudes
towards mathematics compare between middle school students who are engaged in video
game design and construction and those who are not engaged in video game design and
construction?
To investigate these questions, 6th and 7th grade middle school students engaged
in designing and constructing three video games using the MicroWorlds EX environment.
Treatment students designed and constructed (a) an Etch-a-Sketch (b) a Frogger and (c) a
Tamagotchi Virtual Pet. They also took mathematics content tests and attitude inventories
pre-treatment and post-treatment. Nineteen treatment group students and 24 comparison
group students took part in the study.
Question 1a – Mathematics of Video Game Design and Construction: Analysis
During game analysis, treatment group students successfully identified most events
for all three video games as measured by tallies of their initial events. They demonstrated
proficiency in identifying approximately the correct number of mathematical events that
defined each game.

188
Analyzing Video Game Events
For each video game project, treatment group students were asked to analyze the
video game model and generate an initial events list – all mathematical events they
believed defined the complete game. For each treatment student, a tally of all events on
the initial events list was documented.
Following their initial events list, the researcher and class collaborated to generate
a revised events list before proceeding to synthesizing representations. The revised events
list was aggregated and streamlined from individual student events lists, and represented
group consensus of the mathematical events that completely defined the game model.
Treatment students were able to discern most events from the three video game
models. The mean number of events tallied on their initial lists was very close to the
number of events agreed upon for the revised events list.
Tallies of Initial Events by Project
In the Etch-a-Sketch digital toy project, students recorded on their initial events
list a mean number of 7 events (SD = 2.3). The revised events list generated 9 events. For
the Frogger video game project, students recorded on their initial events list a mean
number of 11 events (SD = 5.7). The revised events list generated 18 events, two of which
were not required to make the game. Many students grouped an entire task class together
(e.g., writing “press arrow keys to move the frog”) instead of specifying subtasks (e.g.,
writing “press left arrow key to move frog west”) in their events lists. This
underrepresented the number of initial events recorded by students. Finally, in the
Tamagotchi video game project, students recorded on their initial events lists a mean

189
number of 10 events (SD = 5.2). The revised events list generated 11 events to completely
produce the game.
Question 1b – Mathematics of Video Game Design and Construction: Synthesis
During game synthesis for each video game project, treatment group students
examined their revised events list and wrote representations for each event. Students were
provided example representations for each game and then asked to write both a
mathematical and a programming representation for each event. Mathematical
representations were further categorized by mathematical standard.
Both mathematical and programming representations were then rated with a -1, 0
or 1 based on their degree of accuracy. Treatment group students achieved positive mean
scores in or near the upper quartile of the score range on all mathematical and
programming representations written for the three game projects. However,
representations scores did not rise with increasing experience, but instead decreased
slightly with increasing levels of game complexity and the introduction of new task
classes.
Synthesizing Representations in Etch-a-Sketch
For the Etch-a-Sketch, students demonstrated success in writing both types of
representations, but were more adept in writing mathematical than programming
representations. This may have been due to their inexperience in writing programming
code at the early stages of the study. They produced combined representation scores with a
mean of 13.1 (SD = 3.5) on a possible range of -17 to 17. Their programming
representation scores had a mean of 5.9 (SD = 2.7) on a possible range of -9 to 9.
190
Mathematical representation scores had a mean of 7.2 (SD = 1.3) on a possible range of
-8 to 8.
Deconstructing the Etch-a-Sketch mathematical representations further, students
were very successful in writing mathematical representations for all NCTM standards
relevant to the toy. Upon reflection, most treatment students stated that they felt
challenged by writing representations, mathematical or programming or both. The eight
mathematical events in the game addressed content of the numbers and operations and
algebra standards as well as the geometry standards. Mathematical representations scores
addressing numbers and operations and algebra had a mean of 3.3 (SD = 1.9) on a possible
range of -4 to 4. Mathematical representations scores addressing geometry had a mean of
3.8 (SD = .71) on a possible range of -4 to 4.
Synthesizing Representations in Frogger
For Frogger, students in the treatment group demonstrated some degree of success
in writing both types of representations, and were equally adept in writing mathematical
and programming representations. They produced combined representation scores with a
mean of 10.4 (SD = 5.6) on a possible range of -15 to 15. Upon student reflection,
treatment students stated that their increasing experience made them feel successful
writing representations, but that they were especially challenged by writing programming
code addressing the new task classes in Frogger. Their programming representation scores
had a mean of 5.9 (SD = 2.7) on a possible range of -9 to 9. Their unfamiliarity with
writing programming code addressing collisions (OnTouching), reaching the goal zone
(OnColor), and setting relative speeds of objects (FD and WAIT) reduced their

191
programming representation scores. Mathematical representation scores had a mean of
11.6 (SD = 4.3) on a possible range of -16 to 16.
Deconstructing Frogger mathematical representations further, students were
successful in writing mathematical representations for all standards relevant to the Frogger
game. The 16 mathematical events in the game addressed content of the geometry,
measurement, and algebra standards. Mathematical representations scores addressing
geometry-only standards had a mean of 6.0 (SD = 2.7) on a possible range of -8 to 8.
Mathematical representations scores addressing geometry paired with measurement had a
mean of 3.5 (SD = 1.9) on a possible range of -5 to 5. Mathematical representations scores
addressing geometry paired with algebra had a mean of 2.1 (SD = 1.0) on a possible range
of -3 to 3.
Synthesizing Representations in Tamagotchi Virtual Pet
For the Tamagotchi Virtual Pet, representation scores were in the positive range
and showed that students demonstrated some degree of success in writing both types of
representations. However, scores were closer to the zero point than on previous projects,
implying that students were generally less successful in writing representations for
Tamagotchi pet than for Etch-a-Sketch and Frogger. Early in the Tamagotchi project,
inexperience in working with variables may have affected student ability to write both
mathematical and programming representations for the many variable-related events in
Tamagotchi. Upon student reflection, most treatment students stated that they felt
challenged by writing representations for both mathematics and programming code for the
new task classes addressing variables. However, many students also expressed enthusiasm
about pursuing the new concepts encompassed in the Tamagotchi pet because of the
192
tremendous creative opportunities they presented. Students in the treatment group
produced combined representations scores with a mean of 8.8 (SD = 8.3) on a possible
range of -21 to 21. It is worth noting that the range of total representations scores for the
Tamagotchi project was -8 to 21, indicating a large variation among students in
successfully writing representations. At least one student scored well below the zero point
while another wrote every representation correctly. Programming representations scores
for the Tamagotchi had a mean of 3.9 (SD = 4.8) on a possible range of -11 to 11.
Mathematical representations scores had a mean of 4.8 (SD = 4.5) on a possible range of
-10 to 10.
Deconstructing Tamagotchi representations further, students were somewhat
successful in writing mathematical representations for all standards relevant to the
Tamagotchi game. The 10 mathematical events in the game addressed content of the
algebra, measurement, and probability standards. Mathematical representations scores
addressing algebra-only standards had a mean of 3.4 (SD = 2.3) on a possible range of -6
to 6. Mathematical representations scores addressing algebra paired with measurement had
a mean of 1.1 (SD = 1.0) on a possible range of -2 to 2. Mathematical representations
scores addressing algebra paired with probability had a mean of 0.3 (SD = 1.6) on a
possible range of -2 to 2.
Question 1c – Mathematics of Video Game Design and Construction: Programming
Game construction was the process of transforming the revised events list into
functional programming code resulting in a playable video game. Most treatment group
students successfully included all video game model events from the revised events lists in

193
the construction of their video games. Statements by students who did not include certain
video game model events indicated their intentions to deviate from the model for specific
reasons, as opposed to inability in programming the events.
Treatment group students also had the option of modifying their video games,
altering or adding to the revised list of events when constructing their games. As they
progressed through programming the three game projects, students added increasingly
larger numbers of modifications, both mathematical and aesthetic, as they personalized
their video games.
Programming Etch-a-Sketch
The first of three projects that treatment students programmed was the Etch-a-
Sketch. The Etch-a-Sketch was a computer-based analogue of the physical drawing toy.
Etch-a-Sketch model events. Constructing the Etch-a-Sketch digital toy entailed
nine events agreed upon by treatment group students. These nine events addressed the
following.
1. Geometry standards, consisting of four events for drawing in the four cardinal
directions.
2. Numbers and operations standards along with algebra standards, consisting of
four boundary condition events for constraining the tool tip from drawing in the frame.
3. One programming-only event for cleaning off the drawing (i.e., the Etch-a-
Sketch “shake” feature).
All 19 students (100%) included each of the nine events in their Etch-a-Sketch
toys. This suggested success in learning and applying the geometry, numbers and
operations, and algebra concepts from which the Etch-a-Sketch was constructed. Upon

194
reflection on their Etch-a-Sketch construction activities, more than half the treatment
group (10 out of 19 students) described challenges with programming inequalities to
constrain the tool tip.
Etch-a-Sketch modifications. For the Etch-a-Sketch digital toy, in the reflections
and plans design documents, treatment students wrote of their intent to add mathematical
modifications, such as creating buttons for allowing diagonal drawing; and aesthetic
modifications, such as changing the color of the frame or shape of the tool tip. The mean
number of mathematical modifications created for the Etch-a-Sketch was 4.2 (SD = 2.3),
and the mean number of aesthetic modifications created was 2.0 (SD = 1.5). The mean
number of total modifications created for the Etch-a-Sketch was 6.2 (SD = 3.1). One
student noted difficulty in thinking of new ways to modify the Etch-a-Sketch. However,
considering that the digital toy model consisted of only nine events, it was surprising that
treatment students were able to include, on average, six modifications for their toys.
Programming Frogger
The second of the three projects that treatment students programmed was Frogger.
Frogger was a computer-based analogue of the popular arcade game that challenged
players to safely hop a frog through traffic.
Frogger model events. Constructing the Frogger video game entailed 18 events
agreed upon by treatment group students. During construction, students excluded two
events, deeming them observations more than programmable events. The 16 resulting
events addressed the following.
1. Geometry-only standards, consisting of eight events. Four events enabled
hopping the frog in the four cardinal directions; two events were used for setting the frog’s

195
starting coordinates; and two events were used to identify coordinate convergence during
a collision between a frog and an obstacle. Nearly 100% of the students included all of the
geometry-only events. Students who did not include all of the geometry-only events either
used an alternative programming command to handle collisions or intentionally eliminated
a directional command to prevent the player from moving in certain directions.
2. Geometry and measurement standards consisting of five events for moving the
rows of traffic and keeping traffic obstacles sufficiently spaced apart. Again, nearly 100%
of the students included all geometry and measurement events, although some eliminated
the fourth row of traffic for aesthetic reasons.
3. Geometry and algebra standards consisting of two events, one for reaching the
goal zone to win the game and another for preventing a win via backward cheat (i.e.,
moving the frog backwards into the goal zone without advancing in the forwards
direction). All students included the win event. Only 23% included the prevention of the
backward cheat, an event that required programming an inequality similar to code learned
in Etch-a-Sketch. However, the video game model did not feature this event and some
students said they thought it was more interesting for players if the cheat were allowed.
4. One programming-only event, preventing a cheat by picking up and moving an
unfrozen frog to the goal zone. This event was included by 100% of the students.
Upon reflection on their Frogger construction activities, members of the treatment
group identified challenges with handling the new task class of collisions. But the general
consensus of students was that the construction process was becoming fun, and that they
felt enthusiastic about their emerging skills and the freedom to create their own variations
of the Frogger video game.

196
Frogger modifications. For the Frogger video game, in the reflections and plans
design documents, treatment students wrote of their intent to add mathematical
modifications, such as altering the speed or heading of obstacles; and aesthetic
modifications, such as changing the frog and obstacle shapes, or the game orientation. The
mean number of mathematical modifications created for the Frogger was 1.2 (SD = 1.3),
and the mean number of aesthetic modifications created was 8.4 (SD = 3.0). The mean
number of total modifications created for the Frogger was 9.6 (SD = 3.5). Thus, most
modifications made to Frogger were aesthetic, not mathematical, in nature. However, the
aesthetic modifications caused the finished video game projects to take on vastly different
appearances and game play experiences.
Programming Tamagotchi Virtual Pet
The third of the three projects that treatment students programmed was the
Tamagotchi Virtual Pet. The Tamagotchi was a computer-based analogue of the hand-held
toy requiring players to tend to the needs of a virtual pet.
Tamagotchi model events. Constructing the Tamagotchi video game entailed 11
events agreed upon by treatment group students. The 11 events addressed the following.
1. Algebra-only standards consisted of six events involving setting variables, and
increasing and decreasing their values. Events included bringing the Tamagotchi to life,
feeding (or performing an alternate task) to decrease a variable, and hugging (or
performing an alternate task) to increase a variable. One hundred percent of the students
included these algebra-only events in their Tamagotchi pets. Three other events addressing
algebra-only standards consisted of announcing hunger (or other increasing variable),
dying from hunger (or other variable) and announcing happiness level (or other decreasing

197
variable). For each of these events, only half of the treatment students included the event
in their Tamagotchi pets. Students stated various reasons for not including these model
events in their games, with most reasons being aesthetic in nature. Many students said
they found it annoying for the Tamagotchi to be constantly making announcements; some
also said that they simply didn’t like the idea of the Tamagotchi “dying.”
2. Algebra and measurement standards consisted of two events, one for increasing
hunger (or other variable) over time and one for decreasing happiness (or other variable)
over time. Within the treatment group, 95% of the students included the increasing
variable event and 89% of the students included the decreasing variable event.
3. Algebra and probability standards consisted of two events, announcing feeding
(or similar) and announcing hugging (or similar) with a frequency determined by a
random number. For each of these events, only half of the treatment students included the
event in their Tamagotchi pets. Students had difficulty in working with the programming
code for generating random numbers, which was associated with making announcements.
During discussions with the treatment group, students indicated that their departure
from the Tamagotchi video game model reflected their intent to develop their games in
their own unique ways, not a failure to understand how to replicate the video game model.
Their extensive modifications of the Tamagotchi pet seemed to support these stated
intentions.
Tamagotchi modifications. For the Tamagotchi game, in the reflections and plans
design documents, treatment students wrote of their intent to add mathematical
modifications, such as altering variables and variable interactions; and aesthetic
modifications, such as changing the Tamagotchi shape or animating changes in

198
Tamagotchi appearance. The mean number of mathematical modifications created for the
Tamagotchi was 15 (SD = 12), and the mean number of aesthetic modifications created
was 20 (SD = 18). The mean number of total modifications created for the Tamagotchi
was 35 (SD = 27). Most students made extensive modifications to their Tamagotchis, both
mathematically and aesthetically. Additionally, many students wrote procedures that
caused multiple variables to adjust simultaneously and activate physical changes in the
appearance or behavior of the pet.
Support of the Hypothesis Regarding Video Game Design and Construction
At the outset of the study, it was hypothesized that middle school students who
engaged in video game design would learn age-appropriate math concepts (e.g., algebra,
geometry, and measurement) as prescribed by standards outlined by the National Council
of Teachers of Mathematics (NCTM, 2000). The successful performance of treatment
group students in (a) identifying mathematical events during video game analysis; (b)
writing mathematical and programming representations for events during video game
synthesis; and (c) programming video games featuring both game model events and
extensive modifications (including mathematical) during video game construction,
supported this hypothesis and mirrored outcomes from previous, related studies (Kafai,
1995; McCoy, 1996; Papert, 1996).
Question 2 – Lateral Transfer of Mathematics Content Knowledge
Mathematics content tests were administered during the study to measure the
degree to which lateral transfer of mathematics concepts occurred from the computer-

199
programming context to the traditional paper-and-pencil context. Two types of
mathematics content tests were administered, studywide tests and checkpoint tests.
Three checkpoint tests were administered to treatment group students. Tests were
specific to content of each of the three video game projects and were administered prior to
video game analysis and following video game construction for each video game project.
Each checkpoint test consisted of seven to ten multiple-choice items addressing standards-
based, mathematics content relevant to the three video game projects.
The studywide mathematics test was administered at the outset and close of the
entire study to all participants. The studywide test was a 20-item, standards-based,
multiple-choice mathematics test with questions derived from content featured in the three
video game projects.
Performance of mathematics content tests was evaluated by two methods. The
checkpoint tests were evaluated via score shifts, examining the shift toward a more correct
or more incorrect response on each item. The studywide test was evaluated via raw scores,
with a theoretical minimum of 0 and a theoretical maximum of 20. Additionally, the
subset of studywide test items associated with each video game project was extracted and
the score shifts of these items were also examined.
Question 2a – Lateral Transfer of Mathematics, Within Treatment Group
Lateral transfer of mathematics content knowledge was evaluated for the treatment
group. It was considered with regard to content standards and to each individual video
game project.
Lateral transfer by content standard (treatment group). With regard to
mathematics content standards, treatment students demonstrated better than average score

200
shifts (≥ 50%) on all checkpoint tests and most studywide test items. Students showed
very strong performance (82% checkpoint / 100% studywide) on numbers and operations
standards. They also exhibited strong performance (84% checkpoint / 79% studywide) on
algebra standards addressing variable manipulation; and moderate performance (65%
checkpoint / 44% studywide) on algebra standards addressing inequalities and boundary
conditions. On geometry standards addressing coordinates and directions, they performed
extremely well (100% checkpoint / 81% studywide). On geometry standards addressing
the area of a circle as well as parallel and perpendicular lines, they performed moderately
well (51% checkpoint / 57% studywide). Students struggled (57% checkpoint / 23%
studywide) on combined algebra and geometry standards addressing equations of lines and
the Pythagorean Theorem. On measurement standards addressing rate, students performed
strongly (83% checkpoint / 85% studywide). Finally, on probability standards, students
performed moderately well (50% checkpoint / 61% studywide).
Lateral transfer by project (treatment group). With regard to individual video
game projects, treatment students demonstrated better than average score shifts (≥ 50%)
on checkpoint tests in their entirety and on project-related subsets of the studywide tests.
On the Etch-a-Sketch related tests, treatment students demonstrated either a positive
change or no loss on 80% of the responses on the checkpoint test and 70% of the
responses on the Etch-a-Sketch content of the studywide test. They demonstrated either a
positive change or no loss on 64% of the responses on the Frogger checkpoint test and
54% of the responses on the Frogger content of the studywide test. Finally, treatment
students demonstrated either a positive change or no loss on 74% of the responses on the

201
Tamagotchi checkpoint test and 71% of the responses on the Tamagotchi content of the
studywide test.
Question 2b – Lateral Transfer of Mathematics, Between Groups Comparison
At the outset of the study, it was asked how the performance of middle school
students who engaged in video game construction (treatment group) would compare with
the performance of students of similar math abilities who were not engaged in video game
construction (comparison group). Two types of comparisons were made to answer this
question. The first type of comparison was via mean raw scores of each group on the
studywide pre-test and post-test. Both treatment and comparison groups made statistically
significant raw score gains on pre-to-post administrations of the studywide test. However,
the difference between the score gains of the groups was not statistically significant. The
second type of comparison was via pre-test-to-post-test score shifts on the studywide tests
by group. On the studywide mathematics content tests, the treatment group exhibited
positive gain or no loss on 64% of the responses while the comparison group exhibited
positive gain or no loss on 56% of the responses. In terms of the performance shift
between pre-test and post-test responses on the studywide content test, treatment group
students exhibited greater shifts on all content areas except one. Specifically, the treatment
group exhibited greater shifts than the comparison group on numbers and operations,
algebra-only, geometry-only, measurement, and probability standards. The treatment
group exhibited a nearly equal shift as the comparison group on combined algebra and
geometry standards.
Studywide shifts by raw score. Treatment group students (N=19) scored a mean
of 10.2 on the studywide pre-test and a mean of 12.7 on the post-test, producing a mean

202
shift of 2.5. The Wilcoxon within group change Z value of -3.1 was statistically significant
(p < .01) for treatment students. Comparison group students (N=24) scored a mean of 9.0
on the studywide pre-test and a mean of 11.0 on the post-test, producing a mean shift of
2.0. The Wilcoxon within group change Z value of -3.6 was also statistically significant (p
< .001) for comparison students. The Mann-Whitney U was computed for the between
groups pre-post mean shift and found not to be statistically significant.
Studywide shifts by mathematics content standards. On the numbers and
operations standard, treatment students showed a positive gain or no loss on 100% of the
responses, while the comparison group performed similarly on 96% of the responses. On
the algebra standard, treatment students exhibited positive gain or no loss on 62% of the
responses, while the comparison group performed similarly on 52% of the responses. On
the geometry standards, the shift was 70% (treatment) versus 58% (comparison). On the
measurement standards, the shift was 85% (treatment) versus 80% (comparison). And on
the probability standards, the shift was 61% (treatment) versus 43% (comparison). Only
on the combined algebra and geometry standards did comparison group students slightly
outperform treatment group students, with the treatment students achieving positive gain
or no loss on 23% of the responses, and the comparison students performing similarly on
24% of the responses.
Support of the Hypothesis Regarding Transfer of Math Content Knowledge
At the outset of the study, it was hypothesized that treatment students who engaged
in video game design and construction would improve performance on tests of standards-
based mathematics content. The positive shift (≥ 50%) by treatment group students on all
203
pre-project to post-project checkpoint tests in (a) performance on each mathematics
content standard, and (b) overall performance, supported this hypothesis. Further, the
positive shift in performance (≥ 50%) was replicated on most standards as measured on
the pre-treatment and post-treatment studywide tests. There was variation in how well
performance improvements were retained over time. When comparing the score shifts on
the checkpoint tests with analogous content on the studywide tests, it appeared that the
most-recently learned content was retained best.
It was also hypothesized that students engaging in video game design and
construction would achieve higher score gains on a studywide test of standards-based
mathematics content than peers of similar mathematics abilities who did not engage in
video game design and construction as compared on pre- and post-treatment
administrations of the test. Both the treatment and comparison groups were shown to have
statistically significant positive score shifts, with the treatment group producing a larger
shift (∆ = 2.5) than the comparison group (∆ = 2.0). However, the larger shift of the
treatment group scores was not found to be statistically significant, and thus the
hypothesis was not supported. With regard to content standards, the treatment group
outperformed the comparison group on numbers and operations, algebra, geometry,
measurement, and probability. While the percentage differences between the groups was
not high, it did appear that there was some additional lateral transfer from programming to
the traditional context for these standards. However, there was little difference between
the groups in performance on the combined algebra and geometry content standard. Both
groups exhibited poor performance, and the content conveyed through MicroWorlds EX
programming did not transfer well to the traditional context for this subject matter. As

204
noted by Littlefield et al. (1988), successful transfer of mathematics content from the
programming to the traditional context may require explicit bridging by the teacher.
Question 3 – Attitudes Toward Mathematics
At the outset of the study, it was asked how the attitude of middle school students
toward mathematics could be characterized prior to and after constructing video games,
and how these attitudes would compare with students of similar math abilities who did not
construct games. To answer this question, all study participants completed a 39-item
attitude inventory, the Attitude Towards Mathematics Inventory (ATMI) (Tapia & Marsh,
2004). The ATMI is a valid and reliable, 5-point, Likert-style instrument for measuring
mathematics attitude on four scales, confidence (14 items), value (10 items), enjoyment
(10 items), and motivation (5 items). Because some score distributions exhibited normality
and other did not on the pre-treatment administration of the ATMI, all statistics comparing
ATMI scores were computed nonparametrically.
Approximately 7 months elapsed between ATMI administrations. During this time,
treatment group students engaged in the design and construction of three video games,
while comparison group students engaged in no other study-related activities.
Question 3a – Attitudes Within the Treatment Group
On all four scales of the ATMI, treatment group students exhibited extremely
favorable attitudes toward mathematics. These attitudes held relatively stable during the
course of the study, decreasing only slightly from pre-treatment to post-treatment. The
Wilcoxon Z score indicated no significance in the decreases.

205
Examining treatment group (N=19) attitudes for each scale, the ATMI confidence
scale (max = 75) score showed a mean of 66.0 pre-treatment and 65.8 post-treatment. On
the ATMI value scale (max = 50) the score had a mean of 47.3 pre-treatment and 46.3
post-treatment. On the ATMI enjoyment scale (max = 50), treatment group students
scored a mean of 45.8 pre-treatment and 43.4 post-treatment. The ATMI motivation scale
(max = 25) score showed a mean of 22.9 pre-treatment and 21.5 post-treatment.
Additionally, the positive attitudes measured by the ATMI were corroborated by
(a) favorable comments made by students toward video game design and construction
during the treatment period, (b) student success in creating each video game, and (c) the
time and effort invested in developing extensive modifications for the games.
Question 3b – Attitudes Between Groups
On all four scales of the ATMI, comparison group students exhibited favorable
attitudes toward mathematics, although these attitude scores were slightly lower than those
of the treatment group. Comparison group attitudes held relatively stable during the course
of the study, increasing slightly on the confidence scale and decreasing slightly on all
other scales from pre-treatment to post-treatment. The Wilcoxon Z score indicated no
significance in the attitude changes of the comparison group. Further, the Mann-Whitney
U showed no significant difference in the pre-to-post changes between groups.
On the ATMI confidence scale (max = 70), treatment group students (N=19)
decreased 0.2 pre-treatment to post-treatment, while comparison group students (N=24)
increased 0.7. On the ATMI value scale (max = 50), treatment group students decreased
1.0 pre-treatment to post-treatment, while comparison group students decreased 0.4. On
the ATMI enjoyment scale (max = 50), treatment group students decreased 2.4 pre-
206
treatment to post-treatment, while comparison group students decreased 0.4. On the ATMI
motivation scale (max = 25), treatment group students decreased 1.4 pre-treatment to post-
treatment, while comparison group students decreased 0.2.
Rejection of the Hypothesis Regarding Attitudes Toward Mathematics
At the outset of the study, it was hypothesized that, within the treatment group,
attitudes toward mathematics scores would increase from pre- to post-treatment
measurements. For the treatment group, attitudes scores on all four ATMI scales were
high, both pre-treatment and post-treatment, decreasing slightly between administrations
of the inventory. Wilcoxon Z scores showed the decrease had no statistical significance.
Thus, the hypothesis positing that treatment group disposition scores would rise during the
study was rejected.
Lastly, it was hypothesized that post-treatment attitudes toward mathematics
would be higher for treatment group students than for comparison group students. It was
found that treatment group attitude scores were higher than comparison group scores for
both pre-treatment and post-treatment administrations of the ATMI. However, no
statistically significant differences were found between groups with regard to their
changes in scores on any of the four scales. While the hypothesis was supported, it could
not be concluded that the higher attitude scores of the treatment group were associated
with the treatment intervention.
Conclusions
Based on the quantitative and qualitative data collected and analyzed in this study,
several conclusions can be reached. Conclusions must be qualified with regard to the

207
study participants engaged in this study. Because study participants were of high
mathematics ability and high socioeconomic status, conclusions about their experiences
and their performance may not be generalizable to broader audiences. Further,
consideration must be given to the fact that students in the treatment group chose to
participate in the math enrichment course knowing that they would spend several months
engaged in video game design and construction as part of this study.
1. Middle grade students similar to those in this study can successfully analyze
(identify) the events defining game play in a video game or toy. These students can
recognize mathematics, appropriate to their grade level, that is inherent in the design of
simple video games and toys. Events include motion, collisions, and scoring.
2. Provided worked examples, middle grade students similar to those in this study
can successfully synthesize (represent) video game and toy events in both mathematical
and programming forms. Representations include writing and coding (a) boundary
conditions using inequalities, (b) coordinate locations and identification of coordinate
convergence, (c) directional headings, (d) uniform linear motion, (e) variable changes, and
(f) probability-based consequences.
3. Provided a video game or toy model, middle grades students similar to those in
this study can successfully computer program a similarly functioning game or toy. In
programming their games and toys, they can demonstrate mastery of mathematical content
knowledge acquired through analyzing and synthesizing game or toy events. They can
also customize the game or toy by adding their own aesthetic and mathematical
modifications. Further, they can apply knowledge acquired from previous video game and
toy programming projects in inventive ways during the construction of new projects.

208
4. Middle grades students, similar to those in this study who engaged in the design
and construction of video games and toys, can transfer mathematical knowledge to the
traditional, multiple-choice test format. Because students engaged in this study took both a
traditional math course and a math enrichment course (addressing video game and digital
toy production), it is not possible to attribute the transfer exclusively to the content learned
in the math enrichment course.
Additionally, without explicit bridging by the teacher between instructional
contexts, transfer may not be extensive nor permanent. Additionally, the instruction of
mathematics via video game and toy design and construction may not differ in efficacy
than other instructional methods.
5. Middle grades students similar to those in this study who exhibit favorable
attitudes towards mathematics maintain those attitudes, with no statistically significant
differences, following several months working in the design and construction of video
games. Additionally, students engaged in video game and toy design and construction can
accurately identify successes and challenges when reflecting on their work.
6. Video games and toys are inherently built from multiple mathematics concepts.
Students engaged in the design and construction of video games and toys must employ
these multiple concepts to create their games. Curriculum designers and teachers who
plan to incorporate video game and toy instruction in mathematics courses must plan
carefully to ensure correlation between game and toy projects and math concepts that are
secure or emerging for learners.
In summary, this study demonstrated that curriculum addressing design and
construction of video games and toys can be viable, cognitively and affectively, for

209
instructing age-appropriate, standards-based mathematics content. However, learning may
not be easily transferred to other contexts such as traditional, paper-and-pencil, multiple-
choice tests. Finally, high achievement in mathematics and high socioeconomic status of
the participants may cause these conclusions not to be generalizable to other populations.
Limitations
This study possessed several limitations that must be taken into account when
evaluating its applicability or extensibility to other populations and settings. These
limitations follow.
1. Limited sample sizes. The small number of students in the treatment group
(N=19) and in the comparison group (N=24) make it challenging to draw statistically
sound conclusions that can be generalized.
2. High mathematics achievement of participants. Because study participants
possessed an average achievement test score in mathematics of 92.5%, they were not
representative of typical student populations. Their strength in mathematics content and
problem-solving likely affected their abilities to learn and apply math content in the
programming context.
3. High socioeconomic status (SES) of participants. The high SES status of
participants made them less transient and more consistent in attendance than middle grade
students of lower SES status. There was no morbidity in the study and students were
absent infrequently. This may have allowed for greater instructional consistency than is
typically seen in the middle grades classroom.

210
Additionally, because the students were of high SES, they may have exhibited
other differences from students who were not of high SES. For example, their access to
video games and digital toys, as well as their previous experience with these entertainment
devices, may have been differed when compared with other preteens and teens. Or their
initial disposition towards mathematics may have differed in a way (see Limitation #4)
that could have affected their engagement with the content addressed during video game
and toy design and construction.
4. Favorable attitudes toward mathematics among participants. Because study
participants possessed high attitude scores on all four scales of the ATMI, they were likely
not representative of typical student populations. Because positive attitudes toward math
correlate with high ability in math (Ma & Xu, 2004; LSAY, 2007; Yara, 2009) this factor
may have affected the abilities of the study participants to learn and apply math content in
the programming context.
5. Non-random assignment of groups. Study participants were not randomly
assigned to the treatment and comparison groups. Treatment group students were honors
math students who chose to enroll in math enrichment knowing that they would be
engaged in research addressing the design and construction of video games and digital
toys. Comparison group students were honors math student not simultaneously enrolled in
math enrichment.
6. Differences in number of math courses in which students are enrolled.
Treatment group students were enrolled in two courses, consisting of their regularly
scheduled math course and the elective math enrichment course in which the current
research study was conducted. In contrast, the comparison group students were enrolled

211
only in their regularly scheduled math course. While treatment group students took more
math than their comparison counterparts, the pre-to-post increase in scores on the
studywide math content test were statistically similar for both groups.
7. Initial differences between groups. On achievement test scores, initial
differences existed between treatment and comparison groups. However, no statistically
significant differences existed between initial scores on studywide mathematics pretests.
Thus, although treatment group students may have possessed slightly greater overall
mathematics content knowledge than comparison students, knowledge of mathematics
content that was relevant to the research projects was comparable between groups. Initial
differences also existed between groups with regard to ATMI scores. However, pre-to-
post administrations of the ATMI revealed no statistically significant differences within
groups. Had statistically significant differences existed within a group – indicating a
significant increase or decrease in attitudes occurred during the study – then additional
examination of those attitude scores and reasons for those changes would have required
further investigation.
8. Researcher-created content tests not established as valid and reliable. Because
the studywide and checkpoint mathematics tests had not been validated, they may not
have tested what they intended to test. Validation of the questions would need to be
accomplished via expert examination and revision. Further, additional administrations of
the content tests would be required in order to establish test reliability.
9. Use of a single rater for representation ratings. Representation ratings were
conducted by the researcher only. To improve ratings reliability, multiple raters could be
employed and a measure of inter-rater reliability could be established.

212
Recommendations for Future Research
Results and analyses of the current research raised additional questions that should
be examined in future research. The following recommendations suggest research that
may resolve some of these questions.
1. Examination of replicability of results with different student populations.
Because the study participants in the current research possessed high math ability, high
socioeconomic status, and favorable attitudes toward mathematics, they may not have
been representative of typical student populations. Repeating the treatment interventions
with different student populations may help reveal whether findings are generalizable to
broader, and different, student populations.
2. Examination of concept mastery and transfer of concepts with different video
game and digital toy projects as well as different programming environments. The
selection of programming projects (e.g., Etch-a-Sketch, Frogger, and Tamagotchi Virtual
Pet) was predicated on researcher experience with instructing similar content in pilot
research. However, other programming projects addressing similar or different NCTM
content standards could have been developed and utilized with treatment group students.
Further, alternative programming environments (i.e., Scratch, Kodu, GameMaker) could
have been employed as a vehicle for examining mastery of mathematics concepts and
transfer to the traditional context.
3. Examination of the role of explicit bridging between contexts. The researcher
avoided explicit bridging in this study. For example, there was no attempt to connect the
MicroWorlds EX programming code describing a line with the traditional, algebraic
equation of a line. Without explicit bridging by the teacher between instructional contexts,

213
transfer may not be extensive. This may be especially true for contexts which are
extremely different. Additionally, bridging may also be necessary for achieving more
permanent transfer of concepts with students. While students may be able to deduce
similarities between different contexts in the short term, these understanding may fade
without bridging to clarify meaning. Thus, the role of bridging between the programming
and the traditional context should be further examined.
4. Examination of the degree of correlation associated with transfer from various
curricular models and instructional methods in mathematics. The current research found
that design and construction of video games and digital toys via MicroWorlds EX projects
was a viable method of mathematics instruction. However, study participants did not
participate exclusively in one type of mathematics intervention. All participants took a
traditional math course (typically honors math) while treatment group students also
participated in elective math enrichment in which this research was conducted. Thus, the
mastery of concepts demonstrated by treatment students in designing and constructing
their game and toy projects can be solely attribute to the research intervention. The
question still remains as to whether instruction of mathematics via video game design and
construction differs in efficacy than other instructional methods. Specific methods – with
groups taught math via a single method – should be studied. Further, specific
programming environments should be examined to determine whether differences exist in
their effectiveness in conveying mathematics through programming.

214
APPENDIX A
EXAMPLE TREATMENT STUDENT PROFILES

215
Example Treatment Student Profiles
The treatment group consisted of 5 female and 14 male preteenage and young
teenage students enrolled in math enrichment. Students selected their own pseudonyms to
use while working on research activities associated with this study. Following are two
programmer profiles of students who engaged in video game design and construction and
whose work is featured in this study.
Kandi
Kandi is a 6th-grade young woman enrolled in honors 6th grade mathematics. This
is my third year teaching Kandi in math enrichment. She is the elder of two daughters; her
younger sister is in fifth grade and looks like her twin. Kandi is calm and reserved and
never seems worried about her work. She is warm and successful in making new friends,
but she also possesses a quirky, dry sense of humor that she shares only with those whom
she knows well. Kandi enters numerous academic competitions and has won several
awards for writing, engineering and science. She is happy to win, but does not brag about
her achievements. Kandi usually sits with Katt, another 6th-grade girl in the computer lab,
but is comfortable working with anyone, male or female, or independently. In addition to
being a good student, she is also a strong athlete and an avid Facebook fan. Her parents
are involved in the school and her academics in a positive, supportive fashion.
During the video game study, Kandi was a minimalist in documenting her
successes and challenges. She displayed moderate skill in identifying events and writing
representations. She was quiet in class, but was sufficiently forthright to ask for help when
she reached an impasse. Kandi seemed to appreciate the way MicroWorlds EX provided
feedback, thereby allowing her to try out ideas and troubleshoot her own code.

216
Kandi enjoyed creating her pseudonym, and extended the “candy” theme into her
projects. She seemed to like the fact that she could add color and artistic pizzazz to her
games, which often showcased candy. Her Etch-a-Sketch featured a piece of candy as the
drawing tool tip, and her Frogger involved helping a candy escape girls giving chase in a
candy store. However, her Tamagotchi Virtual Pet, “Tinki,” was provided fruit (not
candy) to eat and playtime activities (i.e., swimming, climbing) to enjoy.
Kandi invested extensive time and attention in developing her game graphics and
programming code, going far beyond the basic video game models. She adapted and
applied ideas from previous games to later games. For example, her Tinki Tamagotchi
included motion commands in which Tinki traipsed across a river and back. This required
Kandi to painstakingly locate and incorporate the coordinates of each stepping-stone into
her “skipping” procedure. She also included a drop-down list and added associated
procedures, which she retrieved from a drawing project she completed in 5th grade, to
allow the player to choose Tinki’s snack. Her finished Tinki Tamagotchi was one of the
most complex games created during the course of the study, and her rich aesthetic and
mathematical talents seemed well matched with the video game making task.
Richard
Richard Timeworth is the self-made moniker of a 6th grade young man currently
taking prealgebra. This is my third year teaching Richard in math enrichment. He is the
younger of two sons; his elder brother Dayne was also in the treatment group. The
brothers got along reasonably well, but generally did not interact in class.
Richard is a small guy with an enormous spirit and a strong work ethic. He has
artistic, scientific and strong mathematical talents that allowed him to make inventive,
217
attractive video games. Richard was always on-task and often volunteered an answer
during group discussions. His strong personality – leaning towards the frenetic – caused
him to feel more emotional about the work than his peers, but his investment and
enthusiasm were impressive. He argued with me (humorously, knowing that I wouldn’t
budge) about including “bullets, blood, and death” in his Frogger game when he knew I
would allow only “paintballs, green goo, and stun.” His completed game showed a forest
setting and a logger (Frogger) attempting to traverse it without being attacked by trees that
moved with random, Brownian-style motion. For his Tamagotchi video game project,
Richard designed an aesthetically appealing World War II battlefield with soldiers and
unusual variables including “Rally Troops.”
Richard was always vocal about discussing and troubleshooting his game. He was
highly vested in writing events and representations, demonstrating a high level of
performance on these tasks, and expressing frustration when he encountered difficulty.
Richard enjoyed sharing his work with me, the class and visiting guests. He was also an
effective ambassador for video game programming among future generations. During a
buddy activity with early childhood students, Richard requested to work with five-year-
old Carson (my own son). Carson possesses basic experience in using MicroWorlds EX
and the partnership produced interesting drawing featuring angled, colored lines all over
the screen with the turtle working in Animate mode. They were all smiles. After class,
Richard said, “I couldn’t remember how to set pen width, but Carson knew how, so he
reminded me!”

218
APPENDIX B
STUDYWIDE MATHEMATICS CONTENT TEST

219
STUDYWIDE MATHEMATICS CONTENT
PRE/POST Test (Circle One)
Student Pseudonym_________________________ Grade Level: __________
Directions: Solve each problem. Select and circle your answer from the choices given below the problem. There is only one best answer for each problem. You have 30 minutes.
Studywide Problem 1: The starting position of a dog is (-220, 0). On each step, the dog moves 30 units. He can walk North, East, South or West. If the dog steps North twice and East twice, what are the coordinates of his ending position? a) (0, 0)
b) (-220, 60)
c) (-160, 60)
d) (60, 60)
e) I don’t know
Studywide Problem 2: Which of the following sequences returns a jogger to her starting position?a) Jog East 2 miles; jog North 2 miles
b) Jog East 2 miles; jog East 2 miles
c) Jog East 2 miles; jog South 2 miles
d) Jog East 2 miles; jog West 2 miles
e) I don’t know
N
Dog starting position
W E (‐220,0)
S

220
Studywide Problem 3: An “undo” button on a calculator performs the inverse of the last operation. What operation “undoes” the operation + 8 ?a) + 0 b) x 0 c) - 8 d) / 8 e) I don’t know
Studywide Problem 4: The North position on a circle is designated as 0 degrees. How many degrees of rotation around the circle coincides with the North position?a) 180 degrees
b) any integer multiple of 180 degrees
c) 360 degrees
d) any integer multiple of 360 degrees
e) I don’t know
Studywide Problem 5: A car is travelling a straight-line path along y = x. At the origin (0, 0), the car makes a 180 degree turn. Along what line is it now travelling?a) y = x
b) y = -x
c) y = 1/x
d) y = -1/x
e) I don’t know
S
(0,0)
N
W E
y = x
Car starting position

221
Studywide Problem 6: A car is travelling a straight-line path along y = x. At the origin (0, 0), the car makes a 90 degree turn. Along what line is it now travelling? a) y = x
b) y = -x
c) y = 1/x
d) y = -1/x
e) I don’t know
Studywide Problem 7: Which of the following graphs shows x > 10?a) b) c) d) e) I don’t know
Studywide Problem 8: Which equation describes the shaded region?a) x > 50
b) x ≥ 50
c) y > 75
d) y ≥ 75
e) I don’t know
(0,0)
N
W E
S
y = x
Car starting position
10‐10 0
10‐10 0
0‐10 10
10‐10 0
N
W E
S
(50,75)

222
Studywide Problem 9: Assume that the shaded region is symmetrical. Which equations describe the shaded region?a) -75 < x < 150 and -75 < y < 150
b) -150 < x < 150 and -75 < y < 75
c) -75 ≤ x ≤ 150 and -75 ≤ y ≤ 150
d) -150 ≤ x ≤ 150 and -75 ≤ y ≤ 75
e) I don’t know
Studywide Problem 10: A ladybug starts at the origin (0, 0). He crawls to the coordinates (-4, 3). What is the straight-line distance between his starting position and his new position?a) 3 units
b) 4 units
c) 5 units
d) 7 units
e) I don’t know
Studywide Problem 11: Speed is equal to distance per time. On a computer screen, an animated car travels at 2 pixels per tenth of a second. Which of the following expressions represents a doubling of the car’s speed?a) 1 pixel per tenth of a second
b) 4 pixels per tenth of a second
c) 1 pixel per second
d) 2 pixels per second
e) I don’t know
N
W E
S
(150,‐75)
(0,0)
N
W E
S
Ladybug starting position
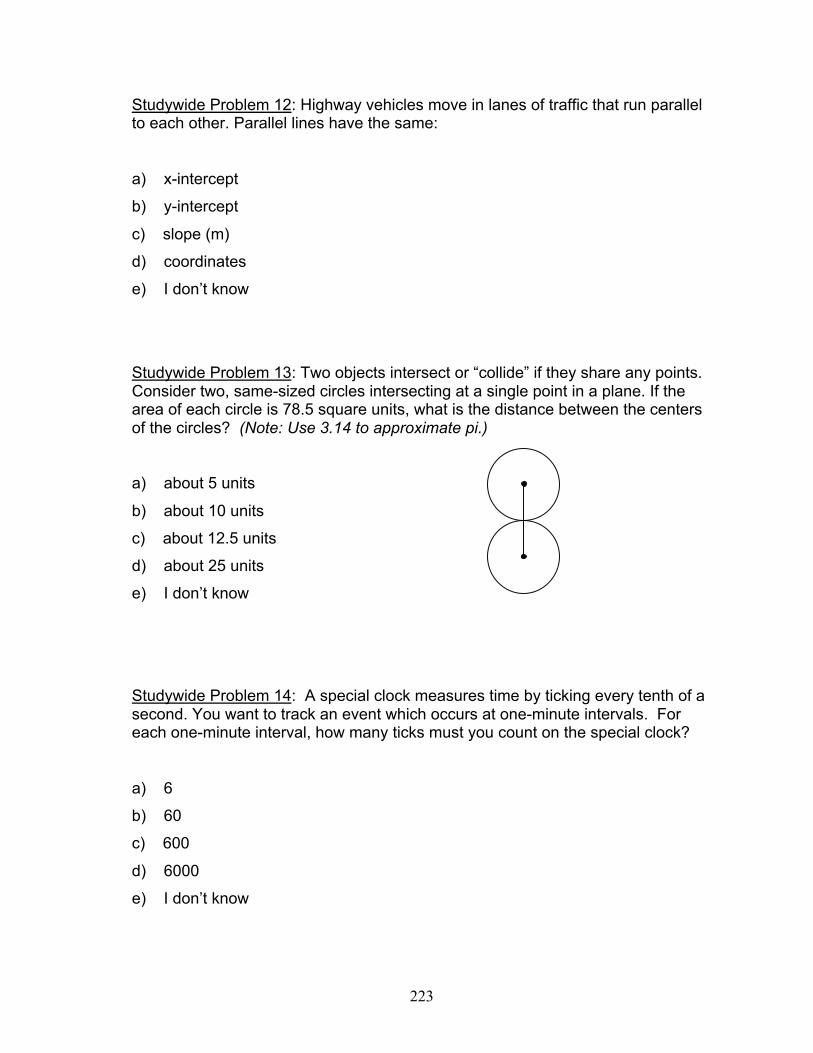
223
Studywide Problem 12: Highway vehicles move in lanes of traffic that run parallel to each other. Parallel lines have the same:a) x-intercept
b) y-intercept
c) slope (m)
d) coordinates
e) I don’t know
Studywide Problem 13: Two objects intersect or “collide” if they share any points. Consider two, same-sized circles intersecting at a single point in a plane. If the area of each circle is 78.5 square units, what is the distance between the centers of the circles? (Note: Use 3.14 to approximate pi.) a) about 5 units
b) about 10 units
c) about 12.5 units
d) about 25 units
e) I don’t know
Studywide Problem 14: A special clock measures time by ticking every tenth of a second. You want to track an event which occurs at one-minute intervals. For each one-minute interval, how many ticks must you count on the special clock?a) 6
b) 60
c) 600
d) 6000
e) I don’t know

224
Studywide Problem 15: A runner executes one of his daily workouts according to the graph below. What could have happened between minutes 14 and 18?a) The runner slowed down
b) The runner sped up
c) The runner ran backwards
d) The runner stopped running
e) I don’t know
Studywide Problem 16: A variable, tennisshoe, gives the number of athletic shoes made at a factory. Tennisshoe equals 1500 after 1 hour; 4500 after 3 hours; and 9000 after 6 hours. What is the predicted value of tennisshoe after 11 hours?a) 9,000
b) 11,000
c) 15,000
d) 16,500
e) I don’t know
Studywide Problem 17: During the evening, the outside air cools down. The value of a variable, airtemp, decreases by 4 degrees Fahrenheit with the passage of 1 hour of time. After one hour, the new value is represented as: airtemp - 4During the morning, the outside air warms. The value of airtemp increases by 5 degrees Fahrenheit with the passage of one hour. The expression that gives the new value of the variable after one hour is…a) airtemp - 4
b) airtemp + 4
c) airtemp - 5
d) airtemp + 5
e) I don’t know
08141830Time (minutes)
Miles

225
Studywide Problem 18: The variable lollipops gives the number of lollipops remaining in the classroom. The lollipops are eaten at the rate of 1 per 5 minutes until they are all gone. Which conditional statement correctly describes the incremental consumption of lollipops?a) decrease the number of lollipops by 1
b) if lollipops > 0 then decrease the number of lollipops by 1
c) if lollipops < 0 then decrease the number of lollipops by 1
d) if lollipops > 1 then decrease the number of lollipops by 1
e) I don’t know
Studywide Problem 19: The variable kenoball is a random number generated between 1 and 80, inclusive. What is the probability that kenoball is a single-digit number?a) 9/80
b) 10/80
c) 9/100
d) 10/100
e) I don’t know
Studywide Problem 20: A restaurant supply company ships several thousand fortune cookies to a take-out diner. Each fortune cookie contains one of 7 randomly-selected fortunes. Three fortunes are optimistic (“Today is your lucky day!”); three fortunes are neutral (“Brush your teeth twice daily”); and one fortune is pessimistic (“Your stocks will nosedive today”). If you select and read three fortune cookies, what is the probability that all the fortunes are positive?a) 3/7
b) 3 x 3/7
c) 3/7 + 3/7 + 3/7
d) 3/7 x 3/7 x 3/7
e) I don’t know

226
APPENDIX C
ATTITUDES TOWARD MATHEMATICS INVENTORY (ATMI)

227

228

229
APPENDIX D
CHECKPOINT MATHEMATICS CONTENT TESTS

230
ETCH-A-SKETCH
PRE/POST Test (Circle One)
Student Pseudonym_________________________ Grade Level: __________
Directions: Solve each problem. Select and circle your answer from the choices given below the problem. There is only one best answer for each problem.You have 15 minutes.
Etch Problem 1: The starting position of a ladybug is (30, 50). On each step, the ladybug moves 20 units. She can walk North, East, South or West. If the ladybug steps East once, South twice and West three times, what are the coordinates of her ending position? a) (0, 0)
b) (-10, -10)
c) (-10, 10)
d) (10, 10)
e) I don’t know
Etch Problem 2: Which of the following sequences returns a bike to its starting position?a) Ride East 2 miles; ride North 2 miles
b) Ride West 2 miles; ride West 2 miles
c) Ride East 2 miles; ride South 2 miles
d) Ride North 2 miles; ride South 2 miles
e) I don’t know
(30,50)
N
W E
S
Ladybug starting position

231
Etch Problem 3: An “undo” button on a calculator performs the inverse of the last operation. What operation “undoes” the operation + 5 ?a) + 5 b) - 5 c) x 0 d) / 5 e) I don’t know
Etch Problem 4: The West position on a circle is designated as 270 degrees. How many degrees of rotation around the circle coincides with the West position?a) 90 degrees
b) any integer multiple of 90 degrees
c) 360 degrees
d) any integer multiple of 360 degrees
e) I don’t know
Etch Problem 5: Which of the following graphs shows x > 12?a) b) c) d) e) I don’t know
0‐12 12
0‐12 12
0‐12 12
0‐12 12
W

232
Etch Problem 6: Which equation describes the shaded region? a) y > 10
b) y ≥ 20
c) x > 10
d) x ≥ 20
e) I don’t know
Etch Problem 7: Assume that the shaded region is symmetrical. Which equations describe the shaded region? a) -80 < x < 80 and -60 < y < 60
b) -80 < x < 60 and -80 < y < 60
c) -80 ≤ x ≤ 80 and -60 ≤ y ≤ 60
d) -80 ≤ x ≤ 60 and -80 ≤ y ≤ 60
e) I don’t know
N
W E
S
(10,20)
N
W E
S
(80,‐60)

233
FROGGER
PRE/POST Test (Circle One)
Student Pseudonym_________________________ Grade Level: __________
Directions: Solve each problem. Select and circle your answer from the choices given below the problem. There is only one best answer for each problem. You have 15 minutes.Frogger Problem 1: A car is traveling a straight-line path with slope 2. The car makes a 180 degree turn. What is the slope of the line along which the car now travels?
a) -2
b) 0
c) 2
d) undefined
e) I don’t know
Frogger Problem 2: A car is travelling a straight-line path along y = x + 1. At (0, 1), the car makes a 180 degree turn. Along what line is it now travelling?
a) y = x + 1
b) y = -x - 1
c) y = 1/x + 1
d) y = -1/x - 1
e) I don’t know
S
N
W
y = x + 1
E (0,1)

234
Frogger Problem 3: A car is traveling a straight-line path with slope 2. The car makes a 90 degree turn. What is the slope of the line along which the car now travels?
a) -2
b) -1/2
c) 1/2
d) 2
e) I don’t know
Frogger Problem 4: A car is travelling a straight-line path along y = x + 1. At (0, 1), the car makes a 90 degree turn. Along what line is it now travelling?
ITEM
REMOVED
Frogger Problem 5: Speed is equal to distance per time. On a computer screen, an animated car travels at 7 pixels per tenth of a second. Which of the following expressions represents a doubling of the car’s speed?a) 7 pixels per tenth of a second
b) 14 pixels per tenth of a second
c) 7 pixels per second
d) 14 pixels per second
e) I don’t know
S
N
W
y = x + 1
E (0,1)
Follows this line after turn

235
Frogger Problem 6: Cars move in lanes of traffic which run parallel to each other.
Parallel lines have the same:
a) x-intercept
b) y-intercept
c) slope (m)
d) coordinates
e) I don’t know
Frogger Problem 7: Perpendicular lines have slopes which:a) add up to 0
b) are equal
c) multiply to 0
d) are negative reciprocals (multiply to -1)
e) I don’t know
Frogger Problem 8: Two objects intersect or “collide” if they share any points. Consider two, same-sized circles intersecting at a single point in a plane. If the area of each circle is 314 square units, what is the distance between the centers of the circles? (Note: Use 3.14 to approximate pi.)
a) about 10 units
b) about 20 units
c) about 40 units
d) about 100 units
e) I don’t know
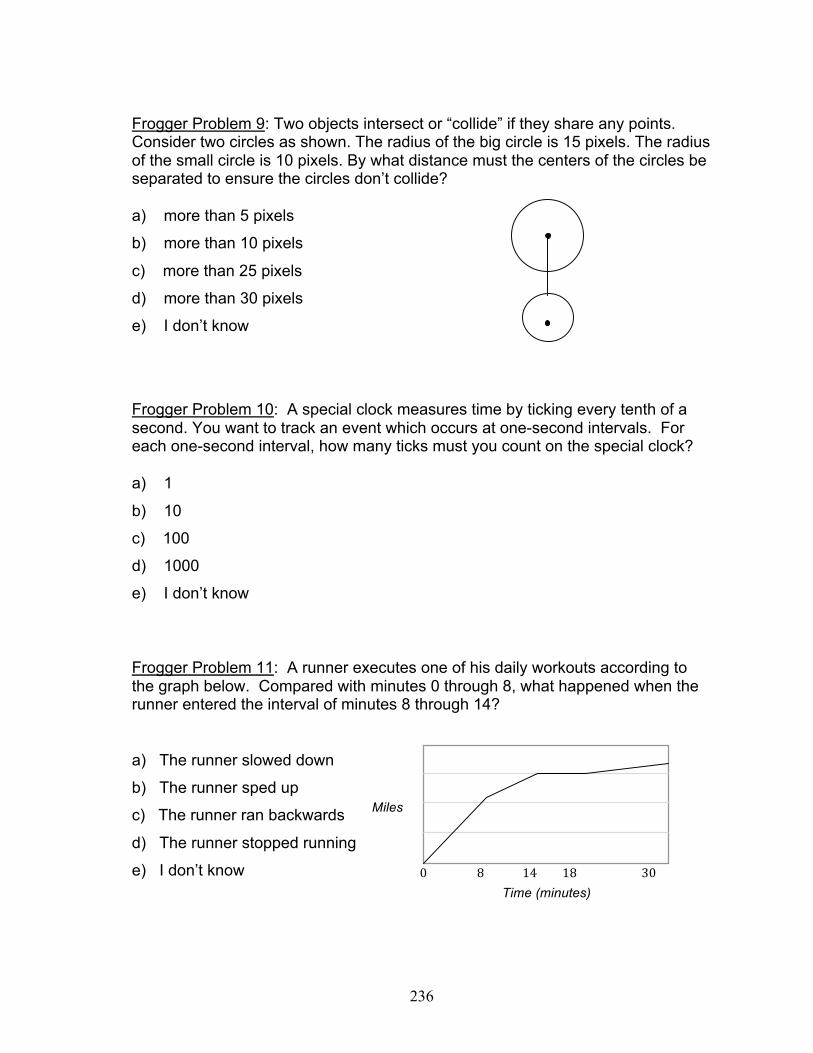
236
Frogger Problem 9: Two objects intersect or “collide” if they share any points. Consider two circles as shown. The radius of the big circle is 15 pixels. The radius of the small circle is 10 pixels. By what distance must the centers of the circles be separated to ensure the circles don’t collide? a) more than 5 pixels
b) more than 10 pixels
c) more than 25 pixels
d) more than 30 pixels
e) I don’t know
Frogger Problem 10: A special clock measures time by ticking every tenth of a second. You want to track an event which occurs at one-second intervals. For each one-second interval, how many ticks must you count on the special clock?a) 1
b) 10
c) 100
d) 1000
e) I don’t know
Frogger Problem 11: A runner executes one of his daily workouts according to the graph below. Compared with minutes 0 through 8, what happened when the runner entered the interval of minutes 8 through 14?a) The runner slowed down
b) The runner sped up
c) The runner ran backwards
d) The runner stopped running
e) I don’t know
08141830Time (minutes)
Miles
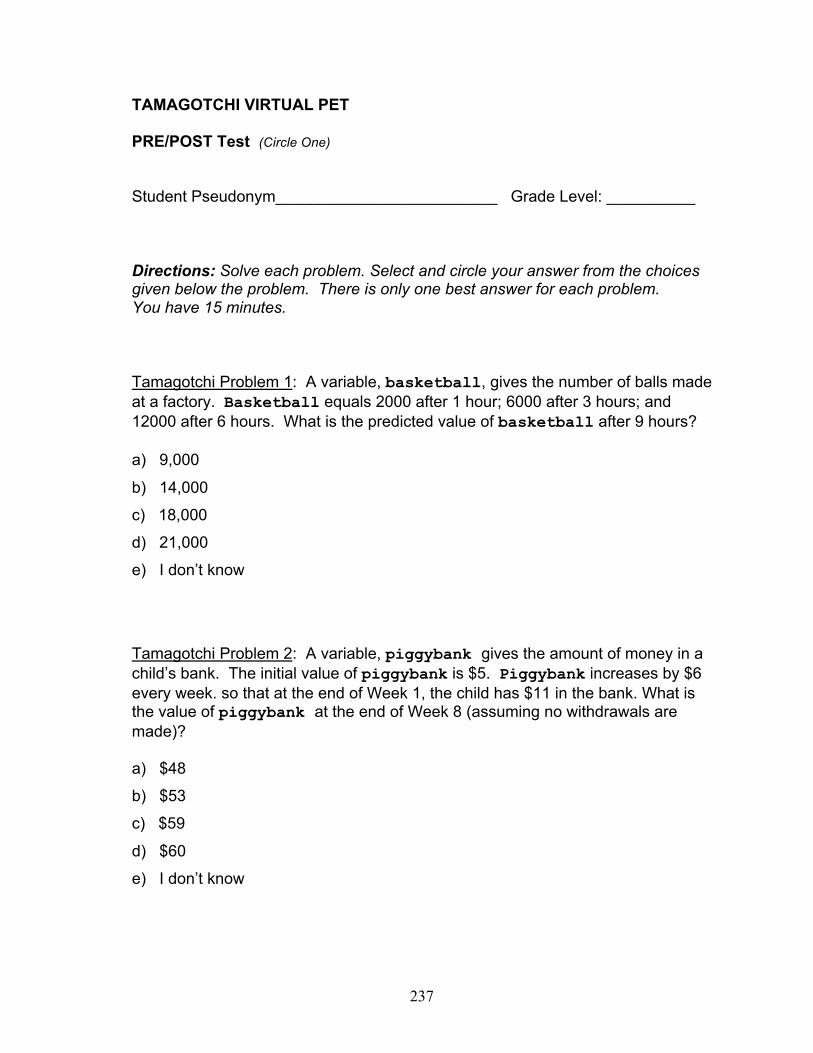
237
TAMAGOTCHI VIRTUAL PET PRE/POST Test (Circle One)
Student Pseudonym_________________________ Grade Level: __________
Directions: Solve each problem. Select and circle your answer from the choices given below the problem. There is only one best answer for each problem. You have 15 minutes.
Tamagotchi Problem 1: A variable, basketball, gives the number of balls made at a factory. Basketball equals 2000 after 1 hour; 6000 after 3 hours; and 12000 after 6 hours. What is the predicted value of basketball after 9 hours?a) 9,000
b) 14,000
c) 18,000
d) 21,000
e) I don’t know
Tamagotchi Problem 2: A variable, piggybank gives the amount of money in a child’s bank. The initial value of piggybank is $5. Piggybank increases by $6 every week. so that at the end of Week 1, the child has $11 in the bank. What is the value of piggybank at the end of Week 8 (assuming no withdrawals are made)?a) $48
b) $53
c) $59
d) $60
e) I don’t know

238
Tamagotchi Problem 3: During the current economic depression, membership at a country club decreases each week. The value of a variable, members, decreases by 3 people with the passage of each week. After one week, the new value is represented as: members - 3Management lowers membership fees to create an incentive for people to join the club. Now, people no longer leave, and the value of members increases by 2 people with the passage of each week. The expression which gives the new value of the variable after one week is…a) members - 2
b) members + 2
c) members - 3
d) members + 3
e) I don’t know
Tamagotchi Problem 4: The variable pancakes gives the number of pancakes remaining at a pancake breakfast. The pancakes are eaten at the rate of 1 per 4 minutes until they are all gone. Which conditional statement correctly describes the incremental consumption of pancakes?a) decrease the number of pancakes by 1
b) if pancakes > 0 then decrease the number of pancakes by 1
c) if pancakes < 0 then decrease the number of pancakes by 1
d) if pancakes > 1 then decrease the number of pancakes by 1
e) I don’t know

239
Tamagotchi Problem 5: The variable dicethrow is a random number generated between 1 and 6, inclusive. What is the probability that dicethrow is greater than 4?a) 0
b) 1/6
c) 2/6
d) 3/6
e) I don’t know
Tamagotchi Problem 6: The value of the variable happiness ranges from 0 to 100 and changes in increments of 5. When happiness = 0, a “dead” message is shown. When happiness < 20, a “sad” message is shown. When happiness > 85, an ”overjoyed” message is shown. No message is shown when happiness possesses other values. When happiness = 20, what message is shown?a) a “dead” message
b) a “sad” message
c) an “overjoyed” message
d) no message
e) I don’t know
Tamagotchi Problem 7: A restaurant supply company ships several thousand fortune cookies to a take-out diner. Each fortune cookie contains one of 10 randomly-selected fortunes. Four fortunes are optimistic (“Today is your lucky day!”); four fortunes are neutral (“Brush your teeth twice daily”); and two fortunes are pessimistic (“Your stocks will nosedive today”). If you select and read three fortune cookies, what is the probability that all the fortunes are positive?a) 4/10
b) 3 x 4/10
c) 4/10 + 4/10 + 4/10
d) 4/10 x 4/10 x 4/10
e) I don’t know

240
APPENDIX E
EVENTS LIST TEMPLATE
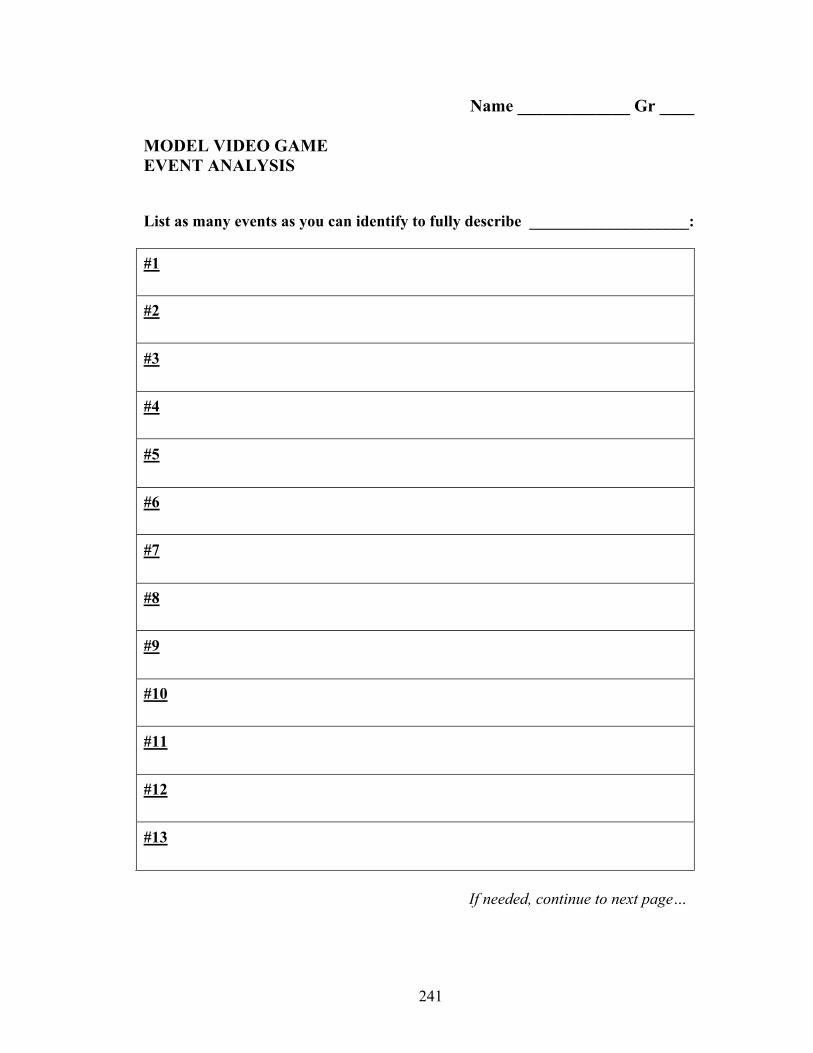
241
Name _____________ Gr ____ MODEL VIDEO GAME EVENT ANALYSIS List as many events as you can identify to fully describe ____________________: #1
#2
#3
#4
#5
#6
#7
#8
#9
#10
#11
#12
#13
If needed, continue to next page…

242
APPENDIX F
REPRESENTATIONS TEMPLATE (ETCH-A-SKETCH)

243

244

245
APPENDIX G
REFLECTIONS AND PLANS DESIGN JOURNAL TEMPLATES
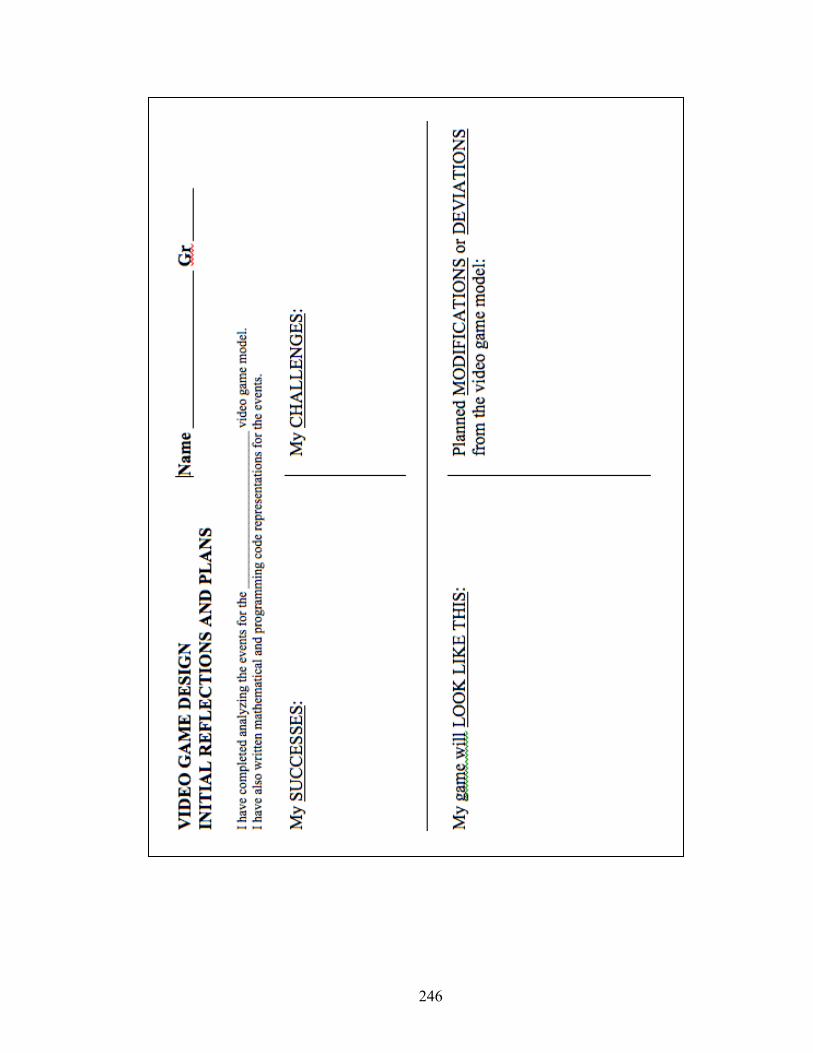
246

247

248
APPENDIX H
TRANSCRIPT OF CLASS DISCUSSION (ETCH-A-SKETCH)

249
Treatment Class Discussion Constructing the Etch-a-Sketch
December 3, 2008 Transcript Trans03Dec2008Part1 0:00 [Background noises of students mimicking Bob voice from
Monsters vs. Aliens] RICHARD Mrs. McCue! RSCHR Yes sir. RICHARD It won’t work, it’s too big. RSCHR OK. Um, we can either try to just erase it, or – let’s go back. Open
up my website and retrieve that same picture again. RICHARD OK. RSCHR ‘Cause then we’ll just slap it right over the top and cover it up. RICHARD [working] RSCHR [To class] Please help each other and talk about it… 1:01 RSCHR [To Katt] Yes ma’am? KATT I hit the clean button and it took away my frame… RSCHR Oh, so what happened, how do you think that happened? You
forgot to do what? KATT I forgot to freeze it but I unfreezed it ‘cause I was gonna draw over
it. I messed up my duck. RSCHR Do you want to go with the red frame again? KATT No, no. RSCHR You can draw it. So here, take your drawing tools. KATT Do I just free draw it? ‘Cause then it’s gonna be all sloppy. RSCHR Well no, because you can use it as a square. So look, let’s say you
fill in the back and you make it pink. KATT Mmm, hmm. RSCHR And then you can use this square and make the inside, uh, yellow.
Or blue. Or this kind of aqua? KATT Aqua! RSCHR OK, so take that, and just draw a square. KATT Cool! RSCHR Isn’t that neat? KATT Can I go back and round the edges? RSCHR Um, I don’t know…. can you do that?... KATT Like if I take a pencil and… RSCHR Yes, yes! Somehow you could that, so you can adjust it… How’s it going?

250
1:48 NICK How do you make that? RSCHR Oh, this was right except you needed the space. So, hold down –
put your finger on the control key. Now, click on that. And then use the dots and stretch it in. There you go… and then you can make it however small you want, OK. Alright, how’s everybody doing?
UKNOWN Good. RSCHR Let me, uh… when you save, remember I need you to save it with a
unique name meaning you need to change the name. Yeah, change the date. So don’t save it over your old file, save it as – what’s today? – save it as NameDec3Etch. Perfect!
2:56 PHIL OK, I need diagonally… RSCHR Ah, yes, sneaky…. You know how to make the buttons, Alexander? ALEX Nooo. RSCHR OK, go to the finger… ALEX The finger? MATITIO [in background] The FINGER… RSCHR Uh-huh. ALEX And click here? RSCHR Anywhere you want, you can always move it. Just click and it’s
going to open up a box. OK, now, um, the Label would be like, left. ALEX OK PHIL [in background] Oh, let’s see uh… RYAN [in background] What’s 40… uh, 125 PHIL it’s 90…., uh, 135, 135, exactly… RSCHR And then the instruction – what do you think the instruction is? First Pen Down, right, PD; and then space, and then let’s turn him
to point the right direction – the boy’s name set heading, SETH, S-E-T-H; space.
ALEX Errrr… RSCHR Uh-huh, that’s right. And then remember, it starts at 0 at the top.
And goes to 90, 180, 270. So left is 270, right. ALEX OK. RSCHR So that just points him, but now we want him to go forward. So FD
space 5. ALEX [nodding] RSCHR So now you can try it. ALEX [clicking button and seeing that it works] RSCHR You see it worked. ALEX OK. RSCHR Perfect!

251
4:16 RSCHR If you want to adjust the size of the button, what you need to do is
hold down the control key and then click on the button and it will give you four sizing dots, and you can adjust the size.
RYAN [in background] Shake, shake, shake shake… RSCHR If you make it too small… UK [inaud] RSCHR Right, so that’s where you may want to use an abbreviation. RICHARD Mrs. McCue… one instruction PD… [inaud] RSCHR OK, so hold down the control key… click on it… stretch it out. RICHARD Oh, I didn’t know I could do that. RSCHR Yeah. RICHARD And it won’t work, though, it won’t let me do the PD. RSCHR Which one? [McCue looking] RICHARD See the Commence Droppings. So then not to do it anymore. RSCHR Oh, well look at what the command is. What is the command on
Commence Droppings? RICHARD PD RSCHR OK, so PD means what? RICHARD Pen Down RSCHR Right. RICHARD Oh! How do I do pen up? RSCHR Make a new button and that’ll be the command. RICHARD What’s it, P-U? RSCHR PU. RICHARD Oh! I get it. RSCHR [chuckles] 5:10 KANDI I did everything and it goes diagonally down and diagonally up. RSCHR You want it to go straight up? KANDI Up, straight up. RSCHR That’s zero. KANDI Oh… RYAN When I finish this, I’m going to bring my flash drive to school so I
can keep it. RSCHR That’ll be awesome. PHIL [to neighbor] Wait! What did I do on the down left that’s messed,
that’s not… oh, PD SETH – it’s not doing anything. RSCHR Good – so you did what? PHIL If forgot the FD part… RSCHR Right, you pointed him, you just didn’t make him go forward.

252
5:46 KATT Wait, um, it’s freezing up. It’s being like weird. Look, I clicked on
that ‘cause I want to put that in the background. Look it won’t do that so it’s being weird.
RSCHR It is being weird. Let’s do this…. Save Project As… OK, we’re gonna change the date…. Close it and just open it back up. Now go…
6:15 ? Look at mine. RSCHR Cooool… he’s a penguin in a cage. JOE Can I change this, the penpoint… RT [Interrupting In background] Mrs. McCue, there’s no… RSCHR [To Joe] Yeah, you can change it to make it look like anything you
want. So go to Shapes…. JOE Since it doesn’t look good, since there’s like lines in the middle. DAYNE [Interrupting In background] Mrs. McCue, look what I did… RSCHR Yeah. Double-click on a shape spot. And now make anything new
that you want and then apply it to the turtle. DAYNE Look what I did. I combined this picture with this picture. RSCHR Very nice. So he looks like he’s in a cage? Is that the idea, or a
box. DAYNE Like I took this one, but then I changed the colors and I put the
penguin there so. RSCHR OK, cool. DAYNE So, I don’t know. I guess he’s like looking through a mirror or
something. RSCHR He’s uh, in a house – looking through a grate. JONIE Mrs. McCue, can you change the color of your buttons? RSCHR Good question. No, unfortunately MicroWorlds is limited. That
would be cool. JONIE Oh… RSCHR The only thing you can do is you can make a turtle look like a
button and draw like a box and make anything you want, but that’s a little more complicated. But yeah, unfortunately you can’t. And you can’t change the text font or anything like that.
7:20 RSCHR Alright, I’m going to give you a couple more minutes, then we’re
going to talk about the constraints so the drawing tip doesn’t go off into the frame. Yes, Matitio.
MATITIO Um, how do you freeze it. When I clicked Clean it all goes away. I had the whole thing and then I clicked Clean and…
RSCHR Right. Any lines that are drawn will go away. MATITIO How do you freeze it? RSCHR So right-click on here…. Um… it’s all frozen.

253
MATITIO Oh, so you can’t write anything? RSCHR No, that part, if you want to write ET on there, then you have to
freeze again. UNKNOWN What’s ET? MATITIO How do you freeze it then. RSCHR So unfreeze and then refreeze it. Unfreeze it, draw what you want
and then refreeze it. MATITIO Oh, all over. RSCHR Sorry. 8:00 [Background noise] RB [In background] You actually want to go all the way around… DRAKE 270 plus 45 is 315! RSCHR There you go! RB Sounds like a good one, yeah. [Background noise] NICK I’m almost done, now all I need is South – no – North, uh… RSCHR Which one are you missing? NICK I’m missing Northwest. RSCHR OK, now. Tell me why you decided to orient the buttons around the
Clean like that. NICK Because it looks better. It looks more neat. RSCHR But how come Southwest is up there and how come Northeast is… NICK Oh, sorry. Yeah, I know. I was messing up a little bit, so… RSCHR No, I’m just curious. Are you choosing to put them in these
positions for a reason? NICK No, not really. RSCHR No? Is Southwest more logical here or here. NICK [pointing correctly] Here, because West is going that way. RSCHR OK, so you’re using it to represent visually where those directions
are. NICK Yeah. RSCHR OK. ---------- End of recording ---------- Trans03Dec2008Part2 0:00 KATT She figured out how to make it curve! RSCHR How did you do that? CHLOE Um, you program a circle and… RSCHR [Gasps] How smart! KATT Awesome! RSCHR You are awesome, that’s cool… taught me something new.
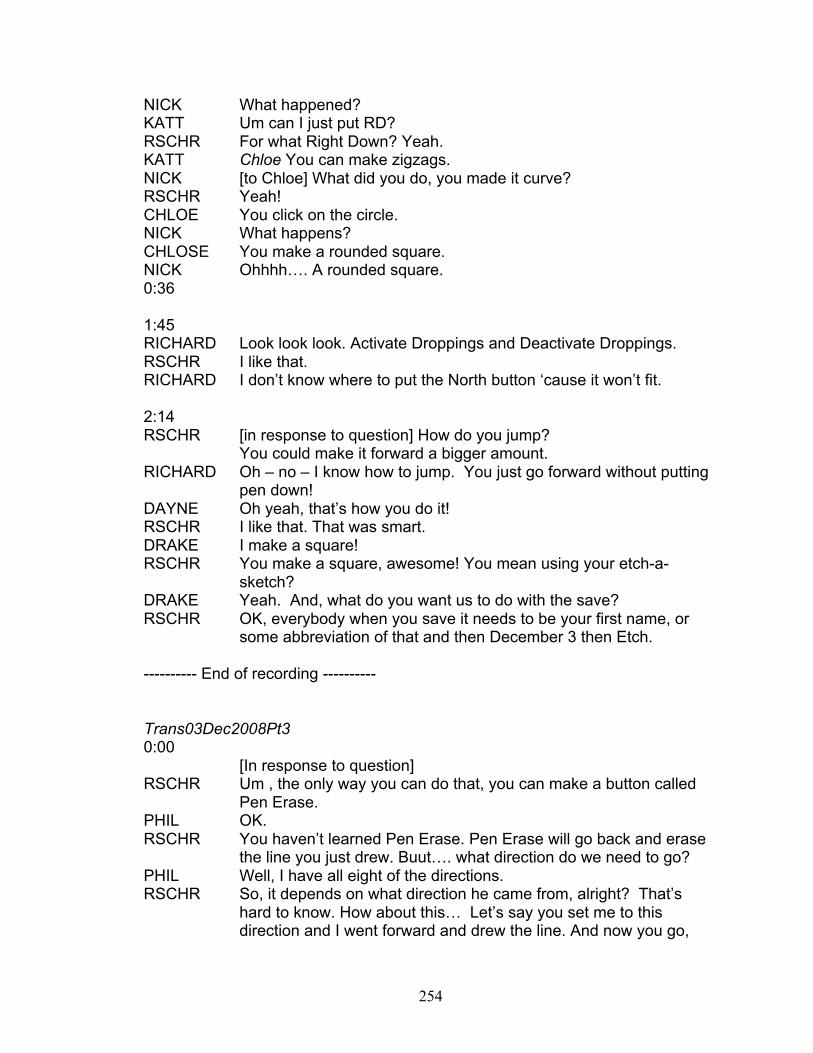
254
NICK What happened? KATT Um can I just put RD? RSCHR For what Right Down? Yeah. KATT Chloe You can make zigzags. NICK [to Chloe] What did you do, you made it curve? RSCHR Yeah! CHLOE You click on the circle. NICK What happens? CHLOSE You make a rounded square. NICK Ohhhh…. A rounded square. 0:36 1:45 RICHARD Look look look. Activate Droppings and Deactivate Droppings. RSCHR I like that. RICHARD I don’t know where to put the North button ‘cause it won’t fit. 2:14 RSCHR [in response to question] How do you jump? You could make it forward a bigger amount. RICHARD Oh – no – I know how to jump. You just go forward without putting
pen down! DAYNE Oh yeah, that’s how you do it! RSCHR I like that. That was smart. DRAKE I make a square! RSCHR You make a square, awesome! You mean using your etch-a-
sketch? DRAKE Yeah. And, what do you want us to do with the save? RSCHR OK, everybody when you save it needs to be your first name, or
some abbreviation of that and then December 3 then Etch. ---------- End of recording ---------- Trans03Dec2008Pt3 0:00
[In response to question] RSCHR Um , the only way you can do that, you can make a button called
Pen Erase. PHIL OK. RSCHR You haven’t learned Pen Erase. Pen Erase will go back and erase
the line you just drew. Buut…. what direction do we need to go? PHIL Well, I have all eight of the directions. RSCHR So, it depends on what direction he came from, alright? That’s
hard to know. How about this… Let’s say you set me to this direction and I went forward and drew the line. And now you go,
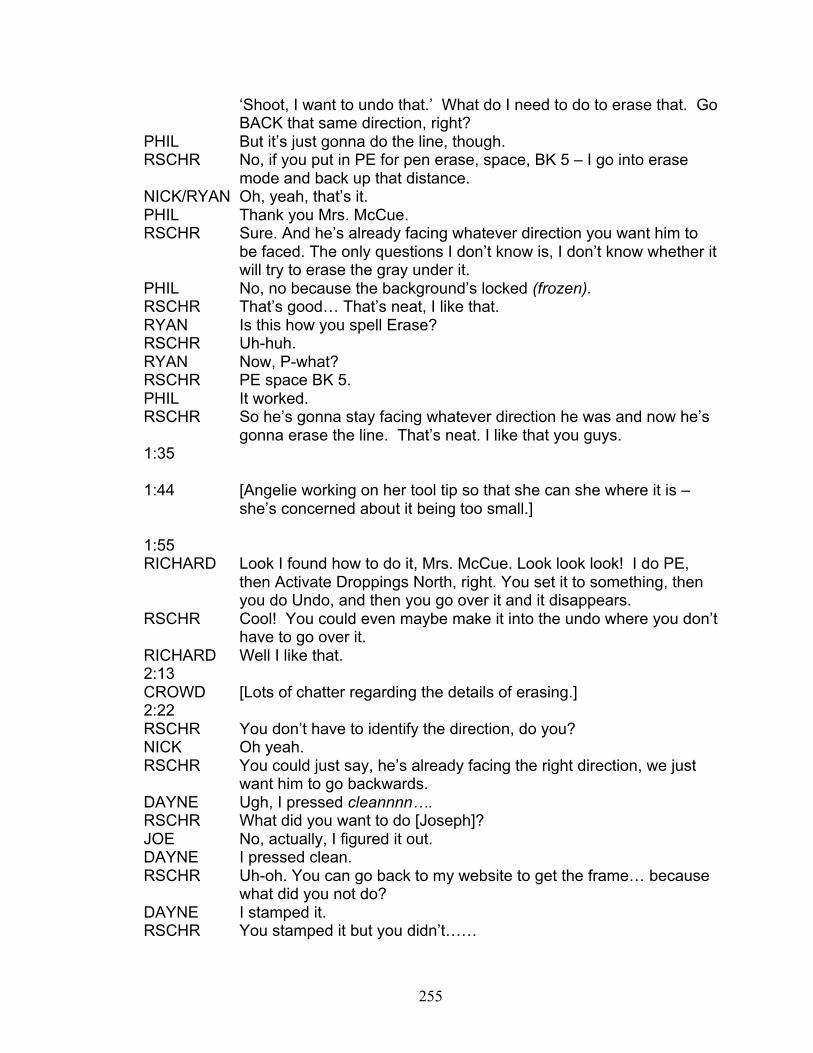
255
‘Shoot, I want to undo that.’ What do I need to do to erase that. Go BACK that same direction, right?
PHIL But it’s just gonna do the line, though. RSCHR No, if you put in PE for pen erase, space, BK 5 – I go into erase
mode and back up that distance. NICK/RYAN Oh, yeah, that’s it. PHIL Thank you Mrs. McCue. RSCHR Sure. And he’s already facing whatever direction you want him to
be faced. The only questions I don’t know is, I don’t know whether it will try to erase the gray under it.
PHIL No, no because the background’s locked (frozen). RSCHR That’s good… That’s neat, I like that. RYAN Is this how you spell Erase? RSCHR Uh-huh. RYAN Now, P-what? RSCHR PE space BK 5. PHIL It worked. RSCHR So he’s gonna stay facing whatever direction he was and now he’s
gonna erase the line. That’s neat. I like that you guys. 1:35 1:44 [Angelie working on her tool tip so that she can she where it is –
she’s concerned about it being too small.] 1:55 RICHARD Look I found how to do it, Mrs. McCue. Look look look! I do PE,
then Activate Droppings North, right. You set it to something, then you do Undo, and then you go over it and it disappears.
RSCHR Cool! You could even maybe make it into the undo where you don’t have to go over it.
RICHARD Well I like that. 2:13 CROWD [Lots of chatter regarding the details of erasing.] 2:22 RSCHR You don’t have to identify the direction, do you? NICK Oh yeah. RSCHR You could just say, he’s already facing the right direction, we just
want him to go backwards. DAYNE Ugh, I pressed cleannnn…. RSCHR What did you want to do [Joseph]? JOE No, actually, I figured it out. DAYNE I pressed clean. RSCHR Uh-oh. You can go back to my website to get the frame… because
what did you not do? DAYNE I stamped it. RSCHR You stamped it but you didn’t……

256
DAYNE What? RSCHR …freeze. DAYNE Oh, you have to freeze it? RSCHR [Laughs] Yeah. [To Randy] OK, I’m going to have them work on
this next step. RB OK. RSCHR [To class] Everybody! I need your attention on this next part. Stop
what you’re doing. Spin your chairs. I need to see all your faces that way – for the next three minutes. All chairs, spin your chairs – spin, spin, turn. OK. Look up at my screen. This is my drawing tool tip, right. Not nearly as beautiful as yours… I realize that. I’m going to move it to this leftmost barrier. Who knows how I can tell what the coordinates are? [Andrew raises hand.] Andrew?
ANDREW Uh, you open its backpack. RSCHR Open its backpack. How do I open the backpack? ANDREW Right-click and Open Backpack. RSCHR Alright. Alright. Now, I’m at the state tab. What are the coordinates
right here? JOE Negative 140 and… 8. RSCHR Which part of that is the x part? GROUP Negative 140. RSCHR So if I pick up this guy and move him more this way [horizontally]… RICHARD Oooo, you can do that? RSCHR Yeah, ‘cause he’s unfrozen right now. RICHARD Oh yeah yeah. RSCHR His x-coordinate becomes what? GROUP Negative 171. RSCHR Negative 171. It’s becoming more negative. Right? But what I care
about is this boundary. Now as I move him, if I stay right at this boundary and I move him up and down… do you see that the x-coordinate is staying the same?
GROUP [Quiet agreement] RSCHR What’s happening, though, to the y-coordinate. If I move up, the y-
coordinate becomes more… GROUP Increases. RSCHR More positive or more negative? GROUP [Emphatically] More positive. RSCHR But if I go down, it becomes more… GROUP [Emphatically] Negative. RSCHR Negative. OK, but the x part is staying the same. It’s staying at
negative 144. It’s probably the same for you. If you use my frame, it’s probably that if you stick it right at that barrier there, it’s probably negative 144.

257
4:40 RSCHR Here’s the challenging part. We’re gonna do it together for this
leftmost barrier and then I want to see if you can extend it to the top, right and bottom. Alright, so if I know that -144 is that barrier, then I’m gonna go over to the Rules tab…. and I’ve actually gotten them written in right here so I’m look just at this one right here…. can you guys see that fairly well? I’m going to read it out, ‘cause it’s fairly small… it says, XCOR… space… less than… negative – and I’m got 142 – so maybe the first time I did this, I was over to the right a couple of pixels; BK… space 5. OK? So what does all that mean?
GROUP [Chatter, many answering] RSCHR Angelie, let me start with you. ANGELIE Um, if you go past negative 140, or 142 pixels… RSCHR Right… ANGELIE um, it will – the rule is it has to go back five pixels. RSCHR Right. So it says, WHEN THIS – when I go more negative than 142
(or -144, whatever my number is) – then the consequence, DO THAT, is BK 5.
---------- End of recording ----------

258
APPENDIX I
TAMAGOTCHI VIDEO GAME MODEL PROGRAMMING CODE WITH GAPS

259

260
APPENDIX J
UNLV IRB APPROVALS

261

262

263

264
APPENDIX K
CONSENT FORMS

265
PARENT PERMISSION FORM
Department of Curriculum and Instruction
TITLE OF STUDY: Middle School Math Skills Development through Student
Produced Video Games
INVESTIGATOR(S): Randall Boone, Ph.D. and Camille McCue, MA
CONTACT PHONE NUMBER: 702-895-3233 (Randall Boone)
or 702-806-8052 (Camille McCue)
Purpose of the Study Your child is invited to participate in a research study. The purpose of this study is to measure the mathematics skills acquired by middle school students as they construct video games. Participants – TREATMENT GROUP Your child is being asked to participate in the study as a member of the treatment group. All math enrichment students taking the “Math Enrichment” course instructed by at The Alexander Dawson School beginning Fall 2008 are potential members of the treatment group. Treatment group participants will analyze the mathematics of video games and construct their own video games. Other students who are not enrolled in math enrichment are being invited to serve as the comparison group. Comparison group students provide pre and post-treatment “standards” against which treatment group math performance and affective disposition can be compared. Procedures If you allow your child to volunteer to participate in this study, work your child produces during the study and observations of your child at work will be included in the study results. Whether you and your child choose to participate in the study, your child will engage in the same learning opportunities as all members of the math enrichment course. Approximately one-half of the math enrichment course work will address learning activities related to the study. During class meetings related to the research study, your child will perform several tasks. Your child will be asked to take a short math pre-test at the start of the Fall semester and take a short math post-test at the end of the Fall semester to measure mathematical knowledge as relates to video game design. The test runs approximately 30 minutes in duration. Additionally, your child will engage in “treatment” activities, analyzing the mathematics of video games and then synthesizing and programming their own video games. The games are specifically chosen for the mathematical problem-solving concepts and tasks they entail. To obtain qualitative data
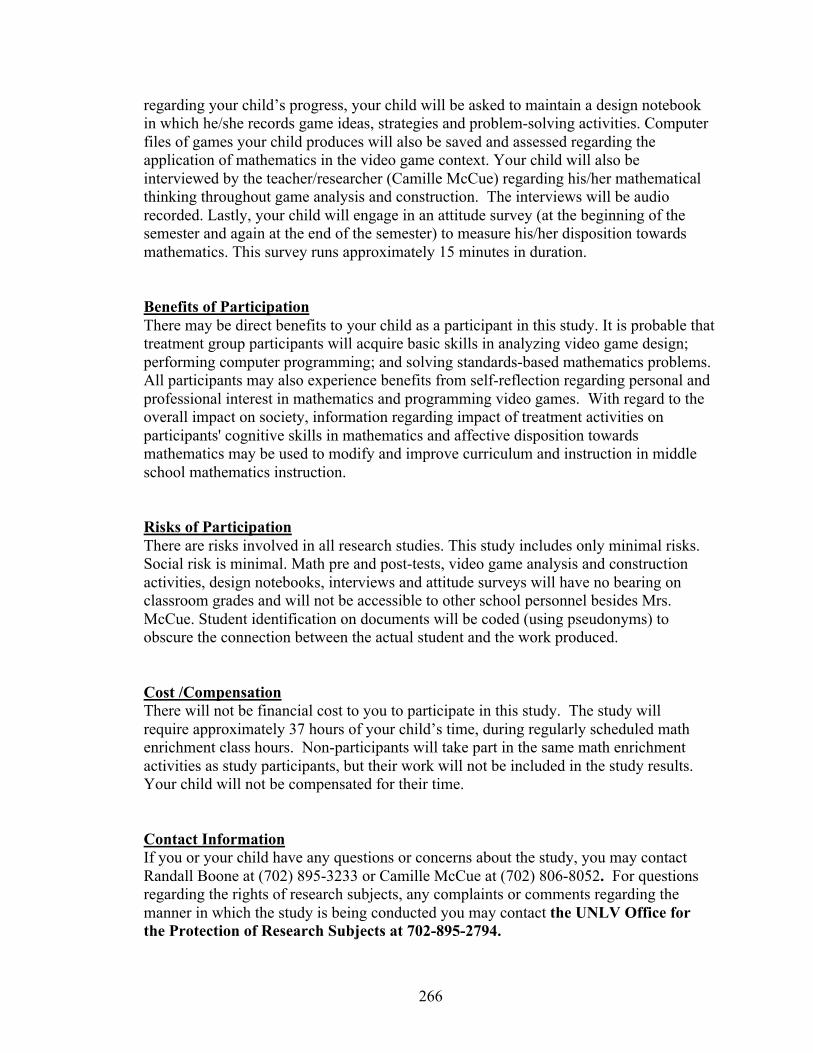
266
regarding your child’s progress, your child will be asked to maintain a design notebook in which he/she records game ideas, strategies and problem-solving activities. Computer files of games your child produces will also be saved and assessed regarding the application of mathematics in the video game context. Your child will also be interviewed by the teacher/researcher (Camille McCue) regarding his/her mathematical thinking throughout game analysis and construction. The interviews will be audio recorded. Lastly, your child will engage in an attitude survey (at the beginning of the semester and again at the end of the semester) to measure his/her disposition towards mathematics. This survey runs approximately 15 minutes in duration. Benefits of Participation There may be direct benefits to your child as a participant in this study. It is probable that treatment group participants will acquire basic skills in analyzing video game design; performing computer programming; and solving standards-based mathematics problems. All participants may also experience benefits from self-reflection regarding personal and professional interest in mathematics and programming video games. With regard to the overall impact on society, information regarding impact of treatment activities on participants' cognitive skills in mathematics and affective disposition towards mathematics may be used to modify and improve curriculum and instruction in middle school mathematics instruction. Risks of Participation There are risks involved in all research studies. This study includes only minimal risks. Social risk is minimal. Math pre and post-tests, video game analysis and construction activities, design notebooks, interviews and attitude surveys will have no bearing on classroom grades and will not be accessible to other school personnel besides Mrs. McCue. Student identification on documents will be coded (using pseudonyms) to obscure the connection between the actual student and the work produced. Cost /Compensation There will not be financial cost to you to participate in this study. The study will require approximately 37 hours of your child’s time, during regularly scheduled math enrichment class hours. Non-participants will take part in the same math enrichment activities as study participants, but their work will not be included in the study results. Your child will not be compensated for their time. Contact Information If you or your child have any questions or concerns about the study, you may contact Randall Boone at (702) 895-3233 or Camille McCue at (702) 806-8052. For questions regarding the rights of research subjects, any complaints or comments regarding the manner in which the study is being conducted you may contact the UNLV Office for the Protection of Research Subjects at 702-895-2794.

267
Voluntary Participation Your child’s participation in this study is voluntary. There is no pressure to participate as your child will engage in the same learning activities regardless of whether you and your child choose to participate in the study. Your child may refuse to participate in this study or in any part of this study. Your child may withdraw at any time without prejudice to your relations with the university. You or your child are encouraged to ask questions about this study at the beginning or any time during the research study. Confidentiality All information gathered in this study will be kept completely confidential. No reference will be made in written or oral materials that could link your child to this study. All records will be stored in a locked facility at UNLV for 3 years after completion of the study. After the storage time, the original, paper documents will be shredded. Electronic data (including digital audio recordings) will be stored as a password-protected file on a password-protected system until completion of publications, then stored to removable media and placed in a secure file cabinet where it will be stored indefinitely. Participant Consent: I have read the above information and agree for my child to participate in this study. I am at least 18 years of age. A copy of this form has been given to me. Signature of Parent Child’s Name (Please print) Parent Name (Please Print) Date I agree to allow my child to be audio taped for the purpose of this research study. Signature of Parent Child’s Name (Please print) Parent Name (Please Print) Date Participant Note: Please do not sign this document if the Approval Stamp is missing or is expired.

268
PARENT PERMISSION FORM
Department of Curriculum and Instruction
TITLE OF STUDY: Middle School Math Skills Development through Student
Produced Video Games
INVESTIGATOR(S): Randall Boone, Ph.D. and Camille McCue, MA
CONTACT PHONE NUMBER: 702-895-3233 (Randall Boone)
or 702-806-8052 (Camille McCue)
Purpose of the Study Your child is invited to participate in a research study. The purpose of this study is to measure the mathematics skills acquired by middle school students as they construct video games. Participants – COMPARISON GROUP Your child is being asked to participate in the study as a member of the comparison group. Comparison group students are high-performing math students (6th and 7th grade students taking “Honors Math”) who are not enrolled in the math enrichment exploratory course (“Math Enrichment”). Math enrichment students comprise the treatment group; they will be programming video games beginning Fall 2008. Comparison group students provide pre and post-treatment “standards” against which treatment group math performance and affective disposition can be compared. Procedures If you allow your child to volunteer to participate in this study, your child will be asked to take a short math pre-test and attitude survey at the start of the Fall semester and again at the end of the semester. The math test runs approximately 30 minutes in duration and the attitude survey runs approximately 15 minutes in duration. Benefits of Participation There may not be direct benefits to your child as a participant in this study. However, it is probable that treatment group participants will acquire basic skills in analyzing video game design; performing computer programming; and solving standards-based mathematics problems. All participants may also experience benefits from self-reflection regarding personal and professional interest in mathematics and programming video games. With regard to the overall impact on society, information regarding impact of treatment activities on participants' cognitive skills in mathematics and affective

269
disposition towards mathematics may be used to modify and improve curriculum and instruction in middle school mathematics instruction. Risks of Participation There are risks involved in all research studies. This study includes only minimal risks. Social risk is minimal. Math pre and post-tests and attitude surveys will have no bearing on classroom grades and will not be accessible to other school personnel besides Mrs. McCue. Student identification on documents will be coded (using pseudonyms). Cost /Compensation There will not be financial cost to you to participate in this study. The study will take 1.5 hours of your child’s time, during the regularly scheduled Honors Math class period. Your child will not be penalized for time missed in the classroom during their participation in the study. Non-participants will engage in the same content tests and attitude surveys, but their results will not be used in the study. Your child will not be compensated for their time. Contact Information If you or your child have any questions or concerns about the study, you may contact Randall Boone at (702) 895-3233 or Camille McCue at (702) 806-8052. For questions regarding the rights of research subjects, any complaints or comments regarding the manner in which the study is being conducted you may contact the UNLV Office for the Protection of Research Subjects at 702-895-2794.
Voluntary Participation Your child’s participation in this study is voluntary. There is no pressure to participate as your child will engage in the same learning activities regardless of whether you and your child choose to participate in the study. Your child may refuse to participate in this study or in any part of this study. Your child may withdraw at any time without prejudice to your relations with the university. You or your child are encouraged to ask questions about this study at the beginning or any time during the research study. Confidentiality All information gathered in this study will be kept completely confidential. No reference will be made in written or oral materials that could link your child to this study. All records will be stored in a locked facility at UNLV for 3 years after completion of the study. After the storage time, the original, paper documents will be shredded. Electronic data will be stored as a password-protected file on a password-protected system until completion of publications, then stored to removable media and placed in a secure file cabinet where it will be stored indefinitely. Participant Consent: I have read the above information and agree to participate in this study. I am at least 18 years of age. A copy of this form has been given to me.

270
Signature of Parent Child’s Name (Please print) Parent Name (Please Print) Date Participant Note: Please do not sign this document if the Approval Stamp is missing or is expired

271
REFERENCES
Aiken, L.R. (1974). Two scales of attitude toward mathematics. Journal for Research in
Mathematics Education, 5, 67-71.
Anderson, L. W., & Bourke, S. F. (2000). Assessing affective characteristics in the
schools. Mahwah, NJ: Erlbaum.
Baroody, A. J., & Ginsburg, H. P. (1986). The relationship between initial meaning and
mechanical knowledge of arithmetic. In J. Hiebert (Ed.), Conceptual and
procedural knowledge: The case of mathematics. Hillsdale, NJ: Erlbaum.
Blaikie, N. (2003). Analyzing Quantitative Data: From Description to Explanation.
London: SAGE.
Blumenfeld, P., Soloway, E., Marx, R., Krajcik, J., Guzdial, M., & Palincsar, A. (1991).
Motivating project-based learning: Sustaining the doing, supporting the learning.
Educational Psychologist, 26 (3 & 4), 369-398.
Bransford, J. D., Brown, A.L., & Cocking, R.R. (Eds). (1999). How people learn: Brain,
mind, experience, and school. Washington, DC: National Academy Press.
Brown, J. S., & Burton, R. R. (1978). Diagnostic models for procedural bugs in basic
mathematical skills. Cognitive Science, 2, 155-192.
Burstein, L. (1992). The analysis of multilevel data in educational research and
evaluation. Review of Research in Education, 8, 158-223.
Bussière, P., Cartwright, F., Knighton, T. (2004). Measuring up – Canadian Results of
the OECD PISA Study: The Performance of Canada’s Youth in Mathematics,
Reading, Science and Problem Solving. Retrieved January 19, 2011 at
http://www.statcan.gc.ca/pub/81-590-x/81-590-x2004001-eng.pdf
272
Carpenter, T. P., Fennema, E., & Franke, M. L. (1992, April). Cognitively guided
instruction: Building the primary mathematics curriculum on children's informal
mathematical knowledge. Paper presented at the annual meeting of the American
Educational Research Association, San Francisco, CA.
Chamberlin, S. (2010). A Review of Instruments Created to Assess Affect in
Mathematics. Journal of Mathematics Education, 3(1), 167-182.
Chouinard, R., & Roy, N. (2008). Changes in high-school students’ competence beliefs,
utility value and achievement goals in mathematics. British Journal of
Educational Psychology, 78, 31-50.
Clavel, M. (2003). How Not to Teach Math. City Journal. Retrieved at http://www.city-
journal.org/html/eon_3_7_03mc.html
Clements, D. H., & Sarama, J. (1993). Research on Logo: effects and efficacy. Journal of
Computing in Childhood Education, 4(4), 263-290.
Cohen, J. (1977). Statistical power analysis for the behavioral sciences (revised edition).
New York: Academic Press.
College Board. (2010). AP Computer Science A. Retrieved at
http://apcentral.collegeboard.com/apc/public/repository/ap-computer-science-
course-description.pdf
Common Core State Standards Initiative. (2010). Common Core State Standards.
Retrieved at http://www.corestandards.org/assets/CCSSI_Math%20Standards.pdf
Computer Science Teachers Association of the Association for Computing Machinery
(ACM). (2006). A Model Curriculum for K-12 Computer Science: Final Report
273
of the ACM K-12 Task Force Curriculum Committee (2nd Ed.). Retrieved at
http://csta.acm.org/Curriculum/sub/CurrFiles/K-12ModelCurr2ndEd.pdf
Confrey, J. (2006). Comparing and Contrasting the NRC Report on Evaluating Curricular
Effectiveness with the What Works Clearinghouse Approach. Educational
Evaluation and Policy Analysis, 28(3) 195–213.
Corbett, S. (2010, September 15). Learning by Playing: Video Games in the Classroom.
The New York Times website. Retrieved at http://www.nytimes.com/2010/09/19/
magazine/19videot.html?_r=1&ref=magazine
Cummings, H.M., & Vandewater, E.A. (2007). Relation of Adolescent Video Game Play
to Time Spent in Other Activities. Archives of Pediatrics and Adolescent
Medicine, 161(7), 684-689.
De Corte, E. (1992). On the Learning and Teaching of Problem-solving Skills in
Mathematics and Logo Programming. Applied Psychology, 41(4), 317–331.
Devlin, K. (2010, May). Serious Games as an Apollo Program for Math Education.
Stanford Magazine. Retrieved at http://seriousgamesmarket.blogspot.com/2010/
05/stanford-mag-serious-games-as-apollo.html
Donovan, M. S., & Bransford, J. D. (Eds.). (2005). How Students Learn History,
Mathematics, and Science in the Classroom. Committee on How People Learn, A
Targeted Report for Teachers. National Research Council of the National
Academies. The National Academies Press: Washington, D.C. Retrieved online at
http://www.nap.edu/openbook.php?isbn=0309074339
Draugalis J.R, & Jackson T.R. (2004). Objective Curricular Evaluation: Applying the
Rasch Model to a Cumulative Examination. American Journal of Pharmaceutical
274
Education, 68(2):article 35, 1-12. Retrieved at http://www.ajpe.org/aj6802/
aj680235/aj680235.pdf
Dutton, W. H., & Blum, M. P. (1968). The measurement of attitudes toward arithmetic
with a Likert-type test. Elementary School Journal, 68, 259-264.
Dwyer, E. E. (1993). Attitude scale construction: A review of the literature. Morristown,
TN: Walters State Community College. (ERIC Document Reproduction Service
No. ED 359201).
Ericsson, K.A., & Simon, H.A. (1993). Protocol Analysis: Verbal Reports as Data.
(revised edition). Cambridge: The MIT Press.
Educational Review Board (ERB) website. (2011). Retrieved online at http://erblearn.org/
Fadjo, C.L., Chang, C.H., Hong, J. & Black, J.B. (2010). An Embodied Approach to the
Instruction of Conditional Logic in Video Game Programming. In Proceedings of
World Conference on Educational Multimedia, Hypermedia and
Telecommunications 2010. (pp. 2672-2679). Chesapeake, VA: AACE.
Fadjo, C.L., Hallman Jr., G., Harris, R. & Black, J.B. (2009). Surrogate Embodiment,
Mathematics Instruction and Video Game Programming. In G. Siemens & C.
Fulford (Eds.). In Proceedings of World Conference on Educational Multimedia,
Hypermedia and Telecommunications 2009 (pp. 2787-2792). Chesapeake, VA:
AACE.
Fengfeng, K. (2006). Classroom goal structures for educational math game application.
In Proceedings of the 7th International Conference on Learning sciences 2006
(pp. 314-320). International Society of the Learning Sciences.

275
Fengfeng, K. (2007). Using computer-based math games as an anchor for cooperative
learning. In Proceedings of the 8th International Conference on Computer
supported collaborative learning 2007. Chinn, C.A., Erkens, G. & Puntambekar,
S. (Eds.) (pp. 357-359). International Society of the Learning Sciences.
Fennema, E. & Sherman, J. A. (1976). Fennema-Sherman Mathematics Attitudes Scales:
Instruments designed to measure attitudes toward the learning of mathematics by
males and females. Catalog of Selected Documents in Psychology, 6(1), 31.
Ferdig, R. E., & Boyer, J. (2007). Can game development impact academic achievement?
T.H.E. Journal. Retrieved at http://www.thejournal.com/articles/21483
Fleischman, H.L., Hopstock, P.J., Pelczar, M.P., Shelley B.E., Xie, H. United States
Department of Education, National Center for Education Statistics. (2010).
Highlights From PISA 2009: Performance of U.S. 15-Year-Old Students in
Reading, Mathematics, and Science Literacy in an International Context.
Retrieved online at http://nces.ed.gov/pubs2011/2011004.pdf
Gay, L.R. & Airasian, P. (2003). Educational research: Competencies for analysis and
application (7th ed.). Upper Saddle River, NJ: Merrill.
Ge, X., Thomas, M. and Greene, B. (2006). Technology-Rich Ethnography for
Examining the Transition to Authentic Problem-Solving in a High School
Computer Programming Class. Journal of Educational Computing Research,
34(4), 319-352.
Gee, J.P. (2003, Sept. 19). The Lessons of Video Games. Chronicle of Higher Education,
50(4), p. B17.

276
Gee, J.P. (2005a). Learning by Design: good video games as learning machines.
Learning, 2(1), 5-16.
Gee, J.P. (2005b, Nov/Dec). The Classroom of Popular Culture: What video games can
teach us about making students want to learn. Harvard Education Letter, 1-4.
Gee, J.P. (2007). What Video Games Have to Teach Us about Literacy and Learning.
New York: Palgrave Macmillan.
Gee, J.P., Hayes, E., Torres, R.J., Games, I.A., Squire, K. (2008) Playing to learn game
design skills in a game context. In Proceedings of the 8th International
Conference for the Learning Sciences 2008 (Vol. 3).
Gibbons, S; Kimmel, H and O’Shea, M. (1997). Changing teacher behaviour through
development: Implementing the teaching and content standards in science. School
Science and Mathematics, 97(6), 302-310.
Gladstone, R., Deal, R., & Drevdahl, J. E (1960). Attitudes toward mathematics. In M.
E. Shaw & J. M. Wright (1967). Scales for the measurement of attitudes. NY:
McGraw Hill. 237-242.
Glesne, C. (2006). Becoming Qualitative Researchers: An Introduction. Boston: Pearson.
Glod, M. (2007, Dec. 5). U.S. Teens Trail Peers Around World on Math-Science Test.
Washington Post Online, p. A07.
Gonzales, P., Williams. T., Jocelyn, L., Roey, S., Kastberg, D., and Brenwald, S. (2009).
Highlights from TIMSS 2007: Mathematics and science achievement of U.S.
fourth- and eight-graders in an international context. Retrieved online at
http://nces.ed.gov/pubs2009/2009001.pdf

277
Gredler, M. E. (1996). Educational games and simulations: A technology in search of a
(research) paradigm. In Johnassen, D. (Ed.) Handbook of Research for
Educational Communications and Technology (pp. 571-582). New York: Simon
& Schuster Macmillan. Retrieved at http://www.questia.com/
PM.qst?a=o&d=104857577
Haladyna, T., Shaughnessy J., and Shaughnessy, J. M. (1983). A Causal Analysis of
Attitude toward Mathematics. Journal for Research in Mathematics Education,
14(1), 19-29. National Council of Teachers of Mathematics. Retrieved at
http://www.jstor.org/stable/748794
Hembree, R. (1990). The nature, effects, and relief of mathematics anxiety. Journal for
Research in Mathematics Education, 21, 33-46.
Hiebert, J. (1984). Children's mathematics learning: The struggle to link form and
understanding. Elementary School Journal, 84, 497-513.
Hildebrand, D. K. (1986). Statistical Thinking for Behavioral Scientists. Boston:
Duxbury.
Hopkins, K.D. and Weeks, D.L. (1990). Tests for Normality and Measures of Skewness
and Kurtosis: Their Place in Research Reporting. Educational and Psychological
Measurement, 50, 717-729.
Hsu, J. (2009, Sept. 16). New York Launches Public School Curriculum Based on
Playing Games. PopSci online. Retrieved at http://www.popsci.com/scitech/
article/2009-09/first-public-school-based-games-set-nyc-debut
International Training and Education Center for Health (I-TECH). (2008). Guidelines for
Pre- and Post-Testing. I-Tech Technical Implementation Guide #2. Retrieved at

278
http://www.go2itech.org/resources/technical-implementation-guides/TIG2.
GuidelinesTesting.pdf/view
Johnson, S. (2005). Everything Bad Is Good For You. New York: Riverhead Books.
Jonassen, D. H. (1999). Designing constructivist learning environments. In C. M.
Reigeluth (Ed.), Instructional design theories and models (Vol. 2): New paradigm
of instructional technology (pp. 215-239). Mahwah, NJ: Lawrence Erlbaum
Associates.
Kafai, Y.B. (1995). Minds in Play: Computer Game Design as a Context for Children's
Learning. Mahwah, NJ: Erlbaum.
Kafai, Y. B., Franke, M., Ching, C., & Shih, J. (1998). Game design as an interactive
learning environment fostering learners’ and teachers’ mathematical inquiry.
International Journal of Computers for Mathematical Learning, 3(2), 149-184.
Kamii, C., & Joseph, L. (1988). Teaching place value and double-column addition.
Arithmetic Teacher, 35 (6), 48-52.
Klopfer, E., Jenkins, H., Perry, J., et al. (2010). Serious Games: Mechanisms and Effects.
U. Ritterfeld, M. Cody, P. Vorderer (Eds.). From Serious Games to Serious
Gaming. Routledge/LEA.
Kearney, P. (2004). Engaging young minds - Using computer game programming to
enhance learning. In L. Cantoni & C. McLoughlin (Eds.). In Proceedings of
World Conference on Educational Multimedia, Hypermedia and
Telecommunications 2004 (pp. 3915-3920). Chesapeake, VA: AACE.

279
Kelleher, C. & Pausch, R. (2005). Lowering the barriers to programming: a taxonomy of
programming environments and languages for novice programmers. ACM
Computing Surveys, 37(2), 88-137.
Kilpatrick, J., Swafford, J., Findell, B. (Eds.). (2001). Adding It Up: Helping Children
Learn Mathematics. National Research Council National Research Council.
Washington, DC: National Academy Press. ISBN-10: 0-309-06995-5.
Klahr, D., & Carver, S.M. (1988) Cognitive objectives in a Logo debugging curriculum:
Instruction, learning, and transfer. Cognitive Psychology, 20, 362-404.
Korzeniowski, P. (2007, March 27). TechNewsWorld. Educational Video Games:
Coming to a Classroom Near You? Retrieved at http://www.technewsworld.com/
story/56516.html?welcome=1219025046
Larsen, R. J. (2009). Affect intensity. In M. R. Leary & R. H. Hoyle (Eds.), Handbook of
individuals differences in social psychology (pp. 241- 254). New York: Guilford.
Lenth, R. V. (2001). Some Practical Guidelines for Effective Sample Size Determination.
The American Statistician, 55, 187-193.
Littlefield, J., Delclos, V., Lever, S., Clayton, K., Bransford, J., & Franks J. (1988).
Learning Logo: Method of teaching, transfer of general skills, and attitudes
toward school and computers. In Teaching and Learning Computer
Programming. Mayer, R.E. (Ed.), 111-135. Hillsdale, NJ: Erlbaum.
Longitudinal Study of American Youth (LSAY). (2007). Retrieved online at
http://www.lsay.org
M2 Research (2010). Kids and Games: What Boys and Girls are Playing Today.
Retrieved at http://www.m2research.com/kids-and-games-report-release.htm

280
Ma, X., and Xu, J. (2004). Determining the Causal Ordering between Attitude Toward
Mathematics and Achievement in Mathematics. American Journal of Education,
110, 256-280.
Machi, M. C., & Depool, R. (2002). Students' Attitudes towards Mathematics and
Computers When Using DERIVE in the Learning of Calculus Concepts.
International Journal of Computer Algebra in Mathematics Education, 9(4), 259-
283.
Maloney, J., Peppler, K., Kafai, Y.B, Resnick, M. and Rusk, N. (2008). Programming by
choice: urban youth learning programming with scratch. In ACM SIGCSE Bulletin
Archive, SIGCSE 2008: Reaching K-12 Students, 40(1), 367-371. ISSN:0097-
8418.
Marsh II, G.E., (2005). Attitudes toward mathematics inventory redux. The Free Library.
Retrieved November 16, 2010 from http://www.thefreelibrary.com/Attitudes
toward mathematics inventory redux-a0138703702
Marshall, C. & Rossman, G.B. (2006). Designing Qualitative Research. Fourth Edition.
Thousand Oakes: Sage Publications.
McCoy, L. P. (1996). Computer-based mathematics learning. Journal of Research on
Computing in Education, 28, 438-460.
McCue, C. (2008). Preteen Programming Literacy via Videogame Construction: Genre
Interests and Gender. In C. Crawford et al. (Eds.), Proceedings of Society for
Information Technology and Teacher Education International Conference 2008,
pp. 1756-1761. Chesapeake, VA: AACE.

281
McCue, C. (2009). Video Games and Mathematical Problem-Solving. Online Journal for
School Mathematics. National Council of Teachers of Mathematics (NCTM).
McGonigal, J. (2011, January 22). Be a Gamer, Save the World. Wall Street Journal
Online. Retrieved February 20, 2011 from http://online.wsj.com/article/
SB10001424052748704590704576092460302990884.html
McLeod, D.B. (1994). Research on Affect and Mathematics Learning in the JRME: 1970
to the Present. Journal for Research in Mathematics Education, 25(6), 637-
647. National Council of Teachers of Mathematics (NCTM). Retrieved
September 15, 2011 at http://www.jstor.org/stable/749576
Merriam, S.B. (1998). Qualitative Research and Case Studies Applications in Education.
San Francisco: Jossey-Bass Publications.
Meyers, L.S., Gamst, G., & Guarino, A.J. (2006). Applied multivariate research: Design
and interpretation. Thousand Oaks, CA: Sage Publication.
Michaels, L. A & Forsyth, R. A. (1977). Construction and validation of an instrument
measuring certain attitudes toward mathematics. Educational and Psychological
Measurement, 37(4), 1043-1049.
Milbrandt, G. (1995). Using Problem Solving to Teach a Programming Language.
Learning and Leading with Technology, 23(2), 27-31.
Miles, M.B., & Huberman, A.M. (1994). Logical Analysis/Matrix Analysis in Qualitative
Data Analysis, 2nd Ed. Newbury Park, CA: Sage.
Mitchell, R. (2010, Sept. 18). Obama launches national STEM game design challenge.
Joystiq website. Retrieved at http://www.joystiq.com/2010/09/18/obama-
launches-national-stem-game-design-challenge/
282
Moldavan, C. C. (2007, January 1). Attitudes toward mathematics of precalculus and
calculus students The Free Library. (2007). Retrieved November 16, 2010 from
http://www.thefreelibrary.com/Attitudes toward mathematics of precalculus and
calculus students-a0163980003
Moursund, D. (2003). Project-Based Learning Using Information Technology (2nd ed.).
Eugene, OR: International Society for Technology in Education. Retrieved
August 15, 2008 from http://www.questia.com/PM.qst?a=o&d=113452687
Mullis, I.V.S., Martin, M.O., & Foy, P. (2008). TIMSS 2007 International Mathematics
Report. Chestnut National Council of Teachers of Mathematics (2000). Principles
and Standards for School Mathematics. Reston, VA: NCTM.
Mullis, I.V.S., Martin, M.O., Gonzalez, E.J., and Chrostowski, S.J., (2004). TIMSS 2003
international mathematics report: Findings from IEA’s Trends in International
Mathematics and Science Study at the Fourth and Eighth Grades. Chestnut Hill,
MA: Boston College.
Mulhern, F. & Rae, G. (1998). Development of a shortened form of the Fennema-
Sherman Mathematics Attitudes Scales. Educational and Psychological
Measurement, 58(2), 295-306.
National Research Council (NRC). (1999). Committee on Information Technology
Literacy. Being Fluent with Information Technology. National Academy Press,
Washington, DC, May 1999. Retrieved at http://www.nap.edu/catalog/6482.html
National Research Council. (2002). Scientific Research in Education. Washington, DC:
National Academy Press.

283
National Research Council. (2010). Committee on the Study of Teacher Preparation
Programs in the United States; Preparing Teachers: Building Evidence for Sound
Policy. National Academy Press. Retrieved online at
http://www.nap.edu/openbook.php?record_id=12882&page=103
Nunnaly, J. (1978). Psychometric theory. New York: McGraw-Hill.
Opachich, O. & Kadijevich, K. (2000). Mathematical self-concept: An operationalization
and its empirical validity. Psihologija, 30(4), 395-412. Retrieved online at
http://www.eurojournals.com/ejsr%2018%201.pdf
Paas, F. G. W. C. & van Merriënboer, J. J. G. (1994). Variability of worked examples and
transfer of geometrical problem-solving skills. Journal of Educational
Psychology, 86(1), 122-134.
Papert, S. (1975, Sept. 16). (Speaker). Some Poetic and Social Criteria for Education
Design. HUMRRO Conference.
Papert, S. (1993). Mindstorms: Children, Computers, and Powerful Ideas. New York:
Basic Books.
Papert, S. (1996). Looking at Technology Through School-Colored Spectacles. Adapted
from a talk delivered by Seymour Papert at the MIT Media Lab, June 4, 1996, at
an event sponsored by The American Prospect Magazine.
Papert, S. (1998). Does Easy Do It? Children, Games, and Learning. Game Developer,
88.
Papert, S. (1999). Ghost in the Machine: Seymour Papert on How Computers
Fundamentally Change the Way Kids Learn. Previously posted on ZineZone.com.

284
Patton, M.Q. (2002). Qualitative evaluation and research methods (3rd ed.) Thousand
Oaks, CA: Sage Publications, Inc.
Perkins, D., & G. Salomon. (1987). Transfer and Teaching Thinking. In Thinking: The
Second International Conference. Perkins, D. N., Lochhead, J., Bishop, J. (Eds.).
pp. 285-303. Hillsdale, N.J. Lawrence Erlbaum Associates.
Randel, B., Stevenson, H.W., & Witruk, E. (2000). Attitudes, Beliefs, and Mathematics
Achievement of German and Japanese High School Students. International
Journal of Behavioral Development, 24, 190-198.
Redden, E. (2007, May 22). Programming with Pictures, Inside Higher Ed. Retrieved at
http://www.insidehighered.com/news/2007/05/22/compsci
Resnick, L. B., Lesgold, S., & Bill, V. (1990). From protoquantities to number sense. A
paper prepared for the Psychology of Mathematics Education Conference, Mexico
City.
Resnick, M. & Silverman, B. (2005). Some reflections on designing construction kits for
kids. In Proceedings of Interaction Design and Children Conference 2005,
Boulder, CO. pp. 117-122.
Reynolds, A.J. and Walberg, H.J. (1992) A Process Model of Mathematics Achievement
and Attitude. Journal for Research in Mathematics Education, 23(4), 306-328.
Rice, J. (2007). New media resistance: Barriers to implementation of computer video
games in the classroom. Journal of Educational Multimedia and Hypermedia,
16(3), 249-261. Chesapeake, VA: AACE.
Rice, F. and Dolgin, K. (2002). The Adolescent: Development, Relationships, and
Culture. Boston, MA: Allyn and Bacon.

285
Rouse, C.E. (2010, July 29). The State of the American Child: The Impact of Federal
Policies on Children. Council of Economic Advisors. Testimony before the
United States Senate, Subcommittee on Children and Families Committee on
Health, Education, Labor and Pensions. Retrieved at http://www.whitehouse.gov/
administration/eop/cea/speeches-testimony/state-of-the-american-child
Roy, H. (2001, August). Use of Web-based Testing of Students as a Method for
Evaluating Courses. Bioscene, 27(3). Retrieved at http://amcbt.indstate.edu/
volume_27/v27-3p3-7.pdf
Salen, K. (2007). Gaming Literacies: A Game Design Study in Action. Journal of
Educational Multimedia and Hypermedia. 16(3), 301 – 322. Chesapeake, VA:
AACE.
Sanchez, F.J.P. & Sanchez-Rhode, M.D. (2003). Relationship between self-concept and
academic achievement in primary students. Electronic Journal of Research in
Educational Psychology, 1(1), 96-120.
Sandman, R. S. (1980). The mathematics attitude inventory: Instrument and user’s
manual. Journal for Research in Mathematics Education, 11(2), 148-149.
Schwartz, J., & Yerushalmy, M. (1987). The Geometric Supposer. Cambridge MA:
Educational Development Center.
Shrigley, R. L., & Koballa, T. R., Jr. (1987). Applying a theoretical framework: A decade
of attitude research in science education. University Park: The Pennsylvania State
University, Department of Curriculum and Instruction.
Singley, M.K., & Anderson, J.R. (1989). Transfer of cognitive skill. Cambridge, MA:
Harvard University Press.

286
Siwek, S. (2010). Video Games in the 21st Century: the 2010 Report. Retrieved at
http://www.theesa.com/facts/pdfs/VideoGames21stCentury_2010.pdf.
Slavin, R. (2000). Educational Psychology: Theory and Practice. 6th Edition, Englewood
Cliffs, New Jersey: Allyn and Bacon.
Spradley, J.P. (1980). Participant Observation. New York: Holt, Rinehart and Winston.
Squire, K. (2003). Unpublished paper. Video Games in Education. Retrieved at
http://www.educationarcade.org/gtt/pubs/IJIS.doc
Squire, K. (2005). Changing the Game: What Happens When Video Games Enter the
Classroom? Innovate Online Journal. 1(6). Retrieved at
http://www.innovateonline.info/index.php?view=article&id=82&action=article
Sweller, J., van Merriënboer, J. J. G., & Paas, F. G. (1998). Cognitive Architecture and
Instructional Design. Educational Psychology Review, 10(3), 251-296.
Tapia, M., & Marsh, G.E. (2000). Aptitudes Towards Mathematics Instrument: An
Investigation with Middle School Students. Paper presented at the Annual
Meeting of the Mid-South Educational Research Association (Bowling Green,
KY, November 15-17, 2000).
Tapia, M., & Marsh, G.E. (2004). An Instrument to Measure Mathematics Attitudes.
Academic Exchange Quarterly, 8(2). Retrieved online at
http://www.rapidintellect.com/AEQweb/cho25344l.htm
Teske, P., and Fristoe, T. (2010). “Let the Players Play!” and other Earnest Remarks
about Videogame Authorship; International Conference on Learning Sciences
Proceedings of the 9th International Conference of the Learning Sciences (Vol.
1). Chicago, IL. pp. 166-173.

287
United States Department of Education, National Mathematics Advisory Panel. (2008).
Foundations For Success: The Final Report Of The National Mathematics
Advisory Panel. Publication number ED004204P. Retrieved at
http://www2.ed.gov/about/bdscomm/list/mathpanel/report/final-report.pdf
United States Department of Education, National Center for Education Statistics. (2009).
The Nation’s Report Card: Mathematics 2009. Retrieved at
http://nces.ed.gov/nationsreportcard/pdf/main2009/2010451.pdf
United States White House (2009, Nov. 23). Office of the Press Secretary. President
Obama Launches "Educate to Innovate" Campaign for Excellence in Science,
Technology, Engineering & Math (Stem) Education. Retrieved at
http://www.whitehouse.gov/the-press-office/president-obama-launches-educate-
innovate-campaign-excellence-science-technology-en
United States Department of Education. (2010). A Blueprint for Reform, The
Reauthorization of the Elementary and Secondary Education Act. Retrieved at
http://www2.ed.gov/policy/elsec/leg/blueprint/blueprint.pdf
Valdez, G. (2004). Technology Leadership: Enhancing positive educational change.
Pathways. Naperville, IL: Learning Point Associates. Retrieved from
http://www.ncrel.org/sdrs/areas/issues/educatrs/leadrshp/le700.htm
Van Lehn, K. (1983). Bugs are not enough: Empirical studies of bugs, impasses and
repairs in procedural skills. Journal of Mathematical Behavior, 3(2), 3-72.
van Merriënboer, J. J. G. (1990). Instructional strategies for teaching computer
programming: Interactions with the cognitive style. Journal of Research on
Computing in Education, 23(1), 45.

288
van Merriënboer, J.J.G, & Kester, L. (2005). The Four-Component Instructional Design
Model: Multimedia Principles in Environments for Complex Learning, 71-93. The
Cambridge Handbook of Multimedia Learning, (Mayer, R.E., Ed.). New York:
Cambridge University Press.
van Merriënboer, J. J. G., & Krammer, H. P. M. (1987). Instructional strategies and
tactics for the design of introductory computer programming courses in high
school. Instructional Science, 16, 251-285.
Wai, J., Lubinski, B., and Benbow, C. (2009). Spatial Ability for STEM Domains:
Aligning over 50 years of Cumulative Psychological Knowledge Solidifies its
Importance. Journal of Educational Psychology, 101(4), 817–835.
Wakelyn, D. (2008). October 28, 2008. Policies to Improve Instruction and Learning in
High School. Retrieved at http://www.nga.org/Files/pdf/
0810IMPROVEINSTRUCTION.PDF
Williams, D. D. (1986). The incremental method of teaching Algebra 1. Kansas City:
University of Missouri.
Wilensky, U. (1991). Abstract Meditations on the Concrete. in Harel, I. and Papert, S.
(Eds.). Constructionism. Norwood NJ: Ablex Publishing Corporation. pp.193-
203.
Wilson, C., Sudol, L.A., Stephenson, C., Stehlik, M. (2010) Running on Empty: The
Failure to Teach K-12 Computer Science in the Digital Age. The Association for
Computing Machinery and The Computer Science Teachers Association.
Retrieved at http://csta.acm.org/Runningonempty/

289
Wolcott, H. (1981). “Confessions of a trained observer.” In The study of schooling,
Popkewitz T.S. & Tabachnick B.R. (Eds.). New York: Praeger.
Wolf, M. J. P. (2000). The Medium of the Video Game. Austin: University of Texas
Press.
Wright, G., Rich, P. & Leatham, K. (2010). Lateral Transfer: Using Programming to
Improve Student Mathematical Comprehension and Ability. In D. Gibson & B.
Dodge (Eds.), Proceedings of Society for Information Technology & Teacher
Education International Conference 2010 (pp. 3529-3532). Chesapeake, VA:
AACE.
Yara, P.O. (2009). Students Attitude Towards Mathematics and Academic Achievement
in Some Selected Secondary Schools in Southwestern Nigeria. European Journal
of Scientific Research, 36(3), 336-341. ISSN 1450-216X. Retrieved at
http://www.eurojournals.com/ejsr.htm

290
VITA
Graduate College University of Nevada, Las Vegas
Camille Moody McCue
Degrees: Bachelor of Arts in Mathematics, 1988 University of Texas, Austin Master of Arts in Curriculum & Instruction, 1993 University of Texas, San Antonio Publications:
McCue, C. (2009). Winning Big Money. National Council of Teachers of Mathematics (NCTM) Mathematics Teaching in the Middle School, 14(6), 330-335. McCue, C. (2009). Video Games and Mathematical Problem-Solving. National Council of Teachers of Mathematics (NCTM) ON-Math Journal, 7(1), 1-6. McCue, C. and James, D. (2008). Future Cities Engineering: Early Engineering Interventions in the Middle Grades. American Society of Engineering Education (ASEE) Advances in Engineering Education Online Journal, 1(2). McCue, C. (2008). Tween Avatars: What do online personas convey about their makers? Society for Information Technology and Teacher Education (SITE) 2008 International Conference Proceedings. Las Vegas, NV. McCue, C. (2008). Tween Programming Literacy via Video Game Construction: Genre Interests and Gender. Society for Information Technology and Teacher Education (SITE) 2008 International Conference Proceedings. Las Vegas, NV. McCue, C. (2003). Shark-Chat: Something’s Swimming in My Desert. Education Satlink. McCue, C., and Solonche, L. (2002). “SAT-Chats: Public Lectures Via Telecommunications.” Education Satlink. McCue, C. (2001). Dreamweaver 4 for Dummies Quick Reference. John Wiley & Sons, Inc. McCue, C. (2000). CliffsNotes Finding What You Want on the Web. John Wiley & Sons, Inc.
291
McCue, C. (1999). CliffsNotes Exploring the Internet with Yahoo! John Wiley & Sons, Inc. McCue, C. (1999). PowerPoint 2000 for Windows for Dummies Quick Reference. John Wiley & Sons, Inc. McCue, C. (1998). PowerPoint 97 for Windows for Dummies Quick Reference. John Wiley & Sons, Inc. Moody, C. (1994). Mission EarthBound Teacher’s Guide. NASA publication EP-308/1-94. Moody, C. (1993). From the Lone Star to the Big Sky. Technological Horizons in Education Journal, 21.
Dissertation Title: Learning Middle School Mathematics Through Student Designed and Constructed Video Games Dissertation Examination Committee: Chairperson, Randall Boone, Ph. D. Committee Member, Kent Crippen, Ph.D. Committee Member, PG Schrader, Ph.D. Graduate Faculty Representative, David James, Ph.D., PE