learning at work in disruptive industries -stilllearning
60
LEARNING AT WORK IN DISRUPTIVE INDUSTRIES - StiLLLearning A Training Needs Analysis October 2021 The European Commission's support for the production of this publication does not constitute an endorsement of the contents, which reflect the views only of the authors, and the Commission cannot be held responsible for any use which may be made of the information contained therein. Intellectual Output 1 Analysis of Learning at Work in Disruptive Industries
-
Upload
khangminh22 -
Category
Documents
-
view
2 -
download
0
Transcript of learning at work in disruptive industries -stilllearning

LEARNING AT WORK IN DISRUPTIVE INDUSTRIES -
StiLLLearning A Training Needs Analysis
October 2021 The European Commission's support for the production of this publication does not constitute an endorsement of the contents, which reflect the views only of the authors, and the Commission cannot be held responsible for any use which may be made of the information contained therein.
Intellectual Output 1 Analysis of
Learning at Work in Disruptive Industries

1
Index
1. Learning in time of disruption ......................................................................................................... 3
2. State of the art ................................................................................................................................ 4
3. Methods .......................................................................................................................................... 7
3.1 Instruments ............................................................................................................................. 7
3.1.1 The StiLLLearning questionnaire ............................................................................................ 7
3.1.2 The StiLLLearning interviews and Delphi ............................................................................... 8
3.2 Sample ........................................................................................................................................... 8
3.2.1 Participants in the questionnaire ........................................................................................... 9
3.2.2 Participants in the interviews .............................................................................................. 10
3.3 Quantitative data analysis .......................................................................................................... 11
3.4 Qualitative data analysis ............................................................................................................. 11
4. Questionnaire results .................................................................................................................... 14
4.1 Individual factors which can support or inhibit learning ............................................................ 15
4.1.1 Self-efficacy .......................................................................................................................... 15
4.1.2 Approaches to learning at work ........................................................................................... 16
4.1.3 Workplace informal learning ............................................................................................... 17
4.1.4 Motivation to attend training .............................................................................................. 19
4.1.5 Acceptance of professional training .................................................................................... 20
4.2 Organizational factors which can support or inhibit learning .................................................... 22
4.2.1 Qualitative job insecurity ..................................................................................................... 22
4.2.2 Workplace climate ............................................................................................................... 23
4.3 Opportunities for learning .......................................................................................................... 24
4.3.1 Formal training opportunity provided at work .................................................................... 24
4.3.2 Training tools at work .......................................................................................................... 25
4.3.3 Self-directed and non-formal training ................................................................................. 27
5. Interviews’ and Delphi results ...................................................................................................... 28
5.1 Disruptions perceived ................................................................................................................. 29
5.2 Skills needed ............................................................................................................................... 33
5.2.1 Transversal skills .................................................................................................................. 33
5.2.2 Digital skills ........................................................................................................................... 35
5.3 Training approaches and digital technologies ............................................................................ 38
5.4 Factors which support or inhibit learning and up-skilling........................................................... 41

2
6. Conclusions and implications for the StiLLLearning project ......................................................... 43
7. References .................................................................................................................................... 45
Appendix A – Further graphs ................................................................................................................ 47
National comparison for disruption and digital skills ....................................................................... 47
Detailed Transversal skills ................................................................................................................. 48
Appendix B – National case studies on qualitative analysis ................................................................. 51
Case Study: Finland ........................................................................................................................... 51
Case Study: Germany ........................................................................................................................ 53
Case Study: Italy ................................................................................................................................ 55
Case Study: Switzerland .................................................................................................................... 57

3
1. Learning in time of disruption
The current paradigm shift we are experiencing is rapidly taking our society toward the so called “Exponential Era”, a moment of human history characterized by a strong disruption: innovations and changes are fast and continuous, and the rapidity of their introduction happens at an exponential rate. Two main trends concern the technological and the socio-economic dimensions:
• Obsolescence processes become increasingly faster: most tools and knowledge age faster and faster, just like habits (consumption patterns, work), thus with an evident impact on obsolescence of methods, knowledge and skills required in the labour market. Technology is innovating the way companies operate; internet can support a local “small” firm to operate worldwide; peer-to-peer markets can blur the separation between consumers and business (Schleicher, 2020), are just few out of many examples.
• Demographic change significantly affects welfare systems, namely social security schemes. Working age relentlessly increases, but in a context that, as previously mentioned, evolves continuously: activities, tasks, competences that are typical for a position are hence exposed to multiple changes during the same period of work of an individual. At the same time, the longer employability phase implies that certain tasks cannot always be performed, due to aging. In both cases, flexibility, resilience to new contexts and objectives, and above all inclination to lifelong learning become more and more important.
As pointed out by Massagli (2017), the debate has been polarized between supporters of current change as the “end of work” and loss of jobs due to technological change (IoT, Industry 4.0, just to mention a few examples). On the other hand, scholars strongly believe in the resourceful ability of mankind to “re-invent” itself, thus putting technology at the service of one’s own creativity. At the same time education and training, in a life-long perspective, become of paramount importance, as highlighted in Figure 1 (Schleicher, 2020): as long as education is able to sustain and guide technological innovations, society can experience prosperity.
Figure 1 Education-Technology dynamics (Schleicher, 2020, inspired by Goldin and Katz)

4
A strong collaboration among stakeholders, namely business and VET ecosystems, can be considered an important condition for a harmonized development (UNEVOC, 2020).
The consequences of this disruption in the labour market have been evident in recent years in several analyses; the impact of the Covid pandemic is just accelerating these transitions (WEF, 2020). In the recent Report on Future of Jobs (2020), the WEF underlines how the pandemic is speeding up the process of job destruction and changes in occupation: 43% of companies are going to reduce workforce; 34% companies declare expanding workforce for technological integrations; and 41% expand contractors for task-specialized works. By 2025, 85 Million people will be displaced by shift towards machines; 97 Million job vacancies will concern new roles (green economy jobs, engineering, cloud computing, AI). The shift to the new normal will include more automation of jobs, an increase of remote work (up to 44% of white collars) and e-commerce; but, due to the pandemic, also a higher need of soft skills: critical thinking, problem solving, but also self-management, resilience, active learning, stress tolerance, flexibility.
In this perspective, reskilling and upskilling become critical: today their importance is recognized by 94% of companies, while in 2018 it was only 65%. Interestingly, while reskilling (mostly informal) is positively considered by employers as also having a return on investment (66%), only 42% employers take part in training activities (WEF, 2020). A new vision on reskilling is necessary to cope with the upcoming challenges mentioned above: to identify the emerging training needs, in order to facilitate the shift from declining to raising jobs; to strengthen technological solutions for encouraging employees in attending reskilling or upskilling activities; to prepare new metrics based on long-term value vision encompassing talent development; to design systemic solutions (involving policy-makers, not only companies) for job transition and life-long learning perspective.
The StiLLLearning project aims at supporting companies and VET organizations to cope with this paradigm shift, by supporting them in identifying training needs and preparing training solutions; this report, as first and introductory deliverable, points out the scientific framework (section 2) of a qualitative and quantitative analysis (section 3) implemented to highlight the current issues related to reskilling and upskilling in this time of disruption (section 4). Some preliminary implications are listed in the conclusions.
2. State of the art
The StiLLLearning project aims at investigating and supporting workplace learning in so-called “disruptive industries”. Cambridge Dictionary defines “disruption” as the action of completely changing the traditional way that an industry or market operates by using new methods or technology. As highlighted by the definition, technological innovations and discontinuities have often been associated as main causes of disruptive processes in industries, since technological discontinuities can be defined as “innovation producing (…) a significant change in the form of products or processes” (Tushman and Anderson, 1986).
Despite the highlighted interdependence between technological discontinuities and disruption, the latter concept indicates a deeper change of the dominant logic within industry, that is the “mind set

5
or a world view or conceptualization of the business and the administrative tools to accomplish goals and make decisions in that business”.
The studies by Sabatier et al., (2012) on the biotechnologies industry show that technological discontinuity is a necessary but not sufficient condition to disrupt dominant logic present in industries. Similarly, Moreau (2013) reported the case of the music industry in which technological discontinuity did not immediately correspond to a consequent disruption in the industry’s dominant logic. These cases brought an overall awareness that technology itself is not sufficient to cause disruption. A Change of the dominant logic involves a qualitative transformation of the relationship among its constituent elements, which are (Phal et al., 2011):
(1) The value context which is the industrial landscape within which opportunities occur for creating and capturing value.
(2) The value creation which refers to the competences and capabilities used by organizations to generate products and services.
(3) The value capture refers to the mechanisms and processes used by organizations to appropriate value through delivering products and services.
Within the StiLLLearning project, we focus on the value creation level. Specifically, the goal of Intellectual Output 1 is to understand which kinds of competences and capabilities are necessary to face disruption within different industrial fields, how employees acquire them, and which strategies employers are adopting to support employees’ learning and development within disruptive scenarios.
We are researching disruptive changes brought by the introduction of industry 4.0 in several economic fields. The studied fields include agriculture, food industries (Eyhorn et al., 2019) to manufactory, like automotive and textile (Bellezza et al., 2018) and services, like tourism.
Dealing with these kinds of disruptive transformations requires considering not only tangible elements (e.g. new technological systems and infrastructure) but also intangible elements, such as professional practices, competences, and skills. The adoption of different industry 4.0 technologies brings along a new division of labour, where workers are expected to shift their work from routine and automatable tasks to tasks that are complementary to machines (Spitz-Oener, 2006). Therefore, employees will be more expected to be equipped not only with digital and technical skills (included but not limited to computational thinking and digital literacy) but also with transversal skills, such as the ability to self-regulate one’s learning during one´s career and the ability to critically interpret information (Weber et al., 2019).
Thus, companies in disruptive industries need to understand how they can support employees in developing these pivotal skills. Learning at the workplace is a complex phenomenon which involves the interaction between individual and organisational levels. These are usually levels informal in nature (Tynjälä, 2008; Clark et al., 2018; Decius et al., 2019). In 2011, Illeris proposed a model which tried to deal with the complexity of learning at the workplace (see Figure 2). In the Illeris model, the individual is placed at the top (on the subjective level) and the environment is placed on the bottom (on the social level).

6
Figure 2 The advanced model of workplace learning (p. 43, Illeris, 2011)
At the individual level, Illeris considers what the workers learn (the learning content) and why a worker learns (the incentive). Incentive is necessary because learning, like any other kinds of mental process, requires a mobilization of energies. Examples or incentives are personal interests and motivations (Fernet et al., 2008). Learning content includes competences, which not only relate to knowledge and skills but also emotional and social attitudes. Learning contents could be acquired through different cognitive processes (Chi, & Wylie, 2014): receiving knowledge (passive), manipulating knowledge (active), generating individually new knowledge (constructive) and co-constructive knowledge with peers (interactive). Moreover, workplace learning is strongly characterized by reflecting on and evaluating one’s work actions and practices (Schon, 1983).
The individual interacts with the social environment through the participation and the activity. Indeed “workplace learning takes place in the encounter between the learning environment of the workplace and the employees’ learning potentials” (p. 29, Illeris, 2011). Employees learning potentials include employees´ occupational self-efficacy (Rigotti et al., 2008), personal approaches to learning at work (Kirby et al., 2003) and workplace informal Learning strategies (Decius et al., 2019).
On the other hand, the workplace learning environment is constituted by two elements: the production and the community. The production element refers to the organisation of work such as the division of labor and workload (Kirby et al., 2003), and the possibility for employees to make decisions and to be autonomous (Kirby et al., 2003). The community element refers to a group of interdependent employees who share common tasks and professional objectives, values and includes opportunities for social interactions with supervisors (Kirby et al., 2003) and colleagues (Billett, 2001).
Illeris (2011) acknowledges that work-related learning not only takes place within the company, but also through external social networks which the employee and the company create by interacting with external clients and/or suppliers (Knight, 2002) and through informal networks. Connectivity with external people and organisations is an important source for transformative learning (Engeström, 2001).
In recent years, research showed that digital technologies could be adopted in learning at the workplace to support different cognitive processes. Digital technology affordances (Bower, 2008; Cattaneo et al., 2015; Aprea & Cattaneo, 2019) such as ubiquity, multimodality and interactivity provided opportunities to transform educational practices giving the learners a more active role

7
through interaction with materials, collaboration with peers and construction of digital knowledge artifacts (Scardamalia & Bereiter, 1994). Emerging opportunities for digital learning include game-based learning, simulations, massive / corporate open online courses, social networks, learning analytics or mobile and augmented applications (Ifenthaler, 2018).
3. Methods
In the frame of reference of the European Commission’s New Skills Agenda, the research goal of IO1 is to analyse and acquire knowledge of learning key competences and field-specific competences at work in disruptive industries. The objective of IO1 research is three-fold:
1) identifying the most relevant key competences, both generic and field-specific, in disruptive industries,
2) understanding which factors facilitate or inhibit employees’ work-based learning,
3) exploring the current methods and practices of learning at work, including the adoption of digital technologies for learning purposes.
To achieve the above-mentioned research objectives, the StiLLLearning project has adopted a multi-method approach: interviews of adult educators, employees and employers were triangulated with quantitative data collection on a larger scale of employees. As the analysis involves multiple countries and different industry sectors, it was investigated if the same key competences are needed across sectors and roles. Whenever it was possible to carry out a comparison, it was also checked if the same key competences are needed in the same sector across countries.
3.1 Instruments
3.1.1 The StiLLLearning questionnaire
The StiLLLearning questionnaire is composed of four main sections including 34 questions (see Table 1 for a description of the StiLLLearning questionnaire structure). The StiLLLearning questionnaire aims at understanding which factors facilitates or inhibit employees’ work-based learning and exploring the current methods and practices of learning at work.
Table 1 Employees questionnaire structure
Questionnaire sections Variables / Scales 1) Basic information - Gender
- Age - Field of industry - Company size - Role - Year of experience - Level of education

8
2) Individual factors which can support or inhibit learning
- Occupational self-efficacy (Rigotti et al., 2008) - Approaches to Learning at Work (Kirby et al., 2003) - Workplace Informal Learning (Decius et al., 2019) - Motivation to attend training (Fernet et al., 2008) - Acceptance of professional training enhanced by web-based
tools (Cheng et al., 2011) 3) Organisational factors which can support or inhibit learning
- Qualitative job insecurity (Van Hootegem & De Witte, 2019) - Workplace Climate (Kirby et al., 2003)
4) Opportunities for learning - Formal training opportunity provided at work - Digital technologies adopted in training activities (Chi et al.,
2014; CIDP, 2020) - Self-directed / non formal learning (Eurostat, 2020)
3.1.2 The StiLLLearning interviews and Delphi
In each country, we interviewed employees, employers, and adult trainers through an interview guide with specular questions for the three roles (see Table 2). The interview questions were built following the theoretical framework provided by Vermersch (2019) which is aimed at supporting the interviewee awareness through a detailed description of personal experiences, actions, and practices. The interviews’ topics 3 and 4 were designed to correspond to the questionnaire’s sections 2, 3 and 4. This allowed us to triangulate the qualitative data with data collected through the questionnaire (Olsen, 2004).
Table 2 Employee, employers, and adult educators interview structure
Topic Examples of questions 1) Disruptions faced in the past and expected in the future
What was/were the biggest transformation/s that you have experienced in your work in the last 5 years? How do you and your company face them?
2) Current and future skills need What kind of is currently needed in your field and your role?
3) Factors which support or inhibit learning at work Can you tell us an episode when you feel you have learned something at work?
4) Training practices adopted by the company Could you please give some examples on learning opportunities provided by your company
Only employers / managers were involved in the second round after the interviews, according to the Delphi methodology (Okoli & Pawlowski, 2004). Based on the interviews’ results, a Ranking Survey was developed. The questionnaire was mainly composed by ranking questions in which participants were asked to prioritize 1) the most important skills in their field; 2) the most important individual and organizational variables to support workplace learning and up-skilling; 3) The most important training practices; 4) The most useful digital technologies to achieve L&D priorities. Answers’ options were based on the results of the interviews.
3.2 Sample

9
3.2.1 Participants in the questionnaire
A total of 187 people had access to the questionnaire, and 139 of them finalized it (M = 69; F = 67; Other = 3; Average age = 42,1 SD = 11,93) (Table 3). Most of them are employed in the Bioeconomy sector (N = 53), followed by Tourism (N = 36) and Textile (N = 13). Beside 64 employees, 22 managers were involved and 37 experts and consultants.
Table 3 Basic information about the participants
Variable Absolute frequency Gender
- Male 69 - Female 67
Role - Employee 64 - Manager 22 - Expert / Consultant / Researcher 37 - HR manager 7 - Apprentice 5 - Adult Educator 1
Age - <= 25 14 - 26-30 17 - 31-35 16 - 36-40 11 - 41-45 20 - 46-50 18 - 51-55 19 - 56-60 17 - > =61 4 - Missing 3
Sector - Tourism 36 - Textile 13 - Bioeconomy 53 - Automotive 4 - Building sector 1 - Other 32
Nation of the workplace - Finland 68 - Germany 11 - Italy 38 - Switzerland 16
The participants included a wide range of representatives of the labor market. In terms of companies, 53% of the sample is employed or collaborates in medium enterprises (50-250 employees); almost 20% operate in small companies with a range of employees between 10 and 50, while only 2% work in microenterprises (less than 10 employees). Finally, 18% of respondents are employed in companies

10
with more than 250 employees; 9% in big companies (more than 500 workers). In terms of respondents, 44% of them have more than a 20-year work experience, while 27% have been working between 10 and 20 years and 21% between 3 and 10 years (total average, 20 years). Focusing on their experience in the company where they are currently employed or collaborating, more than 50% have been working there for less than 10 years; only 12% have more than 20-year experience in their current company (total average, approximately 10 years). The sample also offers a good representation of training skills in companies: half of respondents are currently involved in training apprentices or employees.
In terms of education, most of them gained an ISCED3 level (26%) or ISCED6 (25%); 20% got a Master level (ISCED7), while only 2% got a PhD. ISCED5 is represented by 15% of participants. In almost 6%, participants concluded their education at ISCED2. Overall, more than 60% attended VET courses.
3.2.2 Participants in the interviews
A total of 63 participants (M = 38; F = 25; Average age = 43,2 SD = 11,4) took part in the StiLLLearning interviews (Table 4). The three most represented sectors are Tourism (N = 23), Bioeconomy (N = 16) and Textile (N = 11). The average duration of the interviews was 39 minutes (SD = 13,63).
Table 4 Basic information about the participants to the survey
Variable Absolute frequency Gender
- Male 38 - Female 25
Role - Employer / HR manager 22 - Adult educator 13 - Employee 28
Age - <= 25 3 - 26-30 8 - 31-35 8 - 36-40 8 - 41-45 8 - 46-50 6 - 51-55 8 - 56-60 8 - > =61 2 - Missing 4
Sector - Tourism 23 - Textile 11 - Bioeconomy 16 - Automotive 4 - Building sector 5 - Other 4
Nation of the workplace - Finland 16 - Germany 8

11
- Italy 15 - Switzerland 24
3.3 Quantitative data analysis
The questionnaire was submitted digitally between March and June 2021 to the companies which agreed to take part in the analysis. Employers, directors or HR managers were involved to facilitate the dissemination of the questionnaire throughout their companies, including all levels of employees or consultants.
The original English version was translated into the 4 different languages; answers were collected into a database and analysed cross-nationally to identify the main descriptive statistics elements: the mean, standard deviation and statistical distribution, which are the main indicators. The following development of this research will concentrate on more complex analyses, including national focuses and inferential statistics. The analysis focuses on 139 complete answers, out of a total of 187 people who began filling the online form. In section 4 of this paper results have been highlighted and described.
3.4 Qualitative data analysis
Interviews were analysed following the method of qualitative content analysis. Each interview was audio-recorded and transcribed. The text of the interviews was chunked into a set of units of meaning, defined as “an idea, argument chain or discussion topic” (Strijbos et al., 2006; p. 31). 1303 units of meaning were identified in the 63 interviews (with an average of 20 unities of meaning for each interview). Table 5 describes the distribution of the unities of meaning across sectors, nations, and roles. Most of the unities of meaning comes from tourism (from Italy and Switzerland) followed by bioeconomy (from Finland), textile (from Italy and Switzerland), building sector (Switzerland) and automotive (Germany).
Table 5 Distribution of unity of meaning across sectors, nations, and roles
Absolute frequency Percentage frequency (%)
Sector
- Automotive 49 3,8
- Other 75 5,8
- Building sector 176 13,5
- Textile 237 18,2
- Bioeconomy 352 27,0
- Tourism 414 31,8
Role
- Adult educator 306 23,5
- Employer / HR manager 394 30,2
- Employee 603 46,3

12
Nation of the workplace
- Germany 124 9,5
- Italy 136 10,4
- Finland 352 27,0
- Switzerland 691 53,0
A coding scheme was developed iteratively, based on the same theories presented in understanding and developed directly from the structuring content analysis (Miles & Huberman, 1994).
To guarantee the validity and the reliability of the qualitative analysis, project partners arranged two online meetings. During the first meeting, the partners compared their coding on a small sample of data, discussed divergences and found an agreement on the interpretation of the coding categories. The second meeting was devoted to insert emerging coding categories in the coding scheme and again to compare the interpretation of coding. At the end of the analysis cycles, we had a grid of categories, which we applied to the 1303 unit of meanings (Table 6). Each unit of meaning was coded through a mutually exclusive approach. This means that a unit could be coded with as many categories as appropriate.
The following results were reported:
- the percentage frequency of the codes’ categories, calculated through the ratio between the absolute frequency and the total number of units of meaning (N = 1303);
- the marginal percentage frequency of the codes’ categories, calculated through the ratio between the joint absolute frequency and the number of units of meaning for each mode of the variable of interest for comparison (sectors; nations; roles);
To better interpret the frequency analysis, extracts from the interviews were reported.

13
Table 6 Interviews coding scheme
Categories Codes Definitions
Sources of disruption
Customers / Suppliers needs Change in customers / suppliers’ behaviours, demography, priorities.
Sustainable development Demands for improvements in environmental quality and energy use and efficiency (from customers, policies and so on).
Automation Traditional human-tasks are automatised by introducing different kinds of technologies.
Digitalisation A transformation of business activities by means of digital and information technologies.
Internet of things A change in the complex network of physical objects, sensors, software, and other technologies for the purpose of connecting and exchanging data with other devices and systems. Bridging of the physical and digital world through cyber-physical systems
Digital skills (Carretero et al., 2017)
Using digital equipment / Digital content creation
Selecting and using digital devices; Using the organisational structure of a device and its interfaces; Producing and formatting digital content; Saving digital content in different formats and sorting it into folders and subfolders; Selecting, installing, updating and using software and hardware applications.
Using the Internet / data literacy Using the Internet and making use of online services; Finding information on the Internet; Evaluating information according to its relevance and reliability; Archiving information or adding it to one's favourites.
Communicating through ICT Open and use a mailbox; Manage contacts and send messages; Use the calendar and synchronise it on different devices. Using cloud-based storage system to share materials.
Safety Protecting devices, data and privacy in the digital environment: Knowing copyright and data protection and taking them into account in the digital environment;
Using online services Be able to use online services provided by the government; be able to create digital identities and manage and use them in a functional way; To know the principles behind e-learning platforms and applications (Moodle, Quizlet, Vodeclic, etc.).
Computational thinking Programming: to plan and develop a sequence of understandable instructions for a computing system to develop or modify a digital product (e.g. games, mobile applications, and software).
Fixing technical problems To identify technical problems when operating devices and using digital environments, and to solve them
Transversal / socio-emotional skills (Binkley et al., 2012)
Creativity and innovation Creating new knowledge objects, artefacts, practices Analytical critical thinking Analysing, assessing, producing inferences, meta-reflect on someone’ own thinking
quality Problem solving the skills by which individuals attempt to overcome difficulties, achieve plans that
move them from a starting situation to a desired goal, or reach conclusions Decision making choosing between two or more alternatives, ranging from the relatively clear cut to
the complex Active learning and metacognition the active seeking out of new information, rather than simply being a passive
recipient of a learning experience. Active learners set goals, select strategies, recognize when they understand, and work with others to further learning
Collaboration and teamwork, communicating clearly, actively listening to others, taking responsibility for mistakes, and respecting the diversity of colleagues
Leadership organizing, directing, coordinating, and motivating other efforts toward achieving certain group or organizational goals.
Living in the world / Life skills Personal and social responsibility, flexibility, adaptability, initiative, and self-direction, social and cross-cultural skills
Multi-expert / multi-skilled A need for multiple vocational competences in a profession / vocation Personal factors which impact on WPL and up-skilling
Occupational self-efficacy / actual level of competence (Ellstrom & Kock, 2009)
The competence that a person feels concerning the ability to successfully fulfil the tasks involved in his or her job. The actual level of field competence / knowledge someone has.
Personal organizational / learning approach (Kirby et al., 2003)
1. seek meaning and understanding in learning and competence development; 2. a preference for orderly, accurate, and detailed learning tasks. 3. A tendency to be at “the mercy of the events” in choosing learning opportunities
Use of informal learning strategies at work (Decius et al., 2019)
Trying and applying new ideas, learning through modelling, asking for feedback, asking colleagues about their experiences, reflection on actions and practices
Perception of job insecurity (Van Hootegem, & De Witte, 2019).
Perceived threats of subjectively important aspects of the job, such as deterioration of salary development, career progress, resources, and working conditions.

14
Motivational factors (Fernetet al., 2008)
1. Pleasure or satisfaction derived from learning about something; 2. commitment with companies’ values / sense of ownership; 3. external motivation (requirements from the company); 4. amotivation (do not really know the reasons why to attend a training).
Attitude toward WPL supported by digital technologies (Cheng et al., 2011)
Perceived usefulness of digital technologies for individual and peer learning; intention to use digital technologies for learning and up-skilling.
Organizational factors which impact on WPL and up-skilling
Possibilities for social interaction, guidance and mentoring from supervisors (Kirby et al., 2003) and peers (Billett, 2001)
Supervisors tried to understand and help employees and took their ideas seriously (for example by organizing Staff development interviews). Workers receive instruction from colleagues and others, more or less formalized. Workers participate in meeting for exchange of information, plan and make agreements
Workload (Kirby et al., 2003) Perception of heavy workload Promotion of autonomy (Kirby et al., 2003)
Employees have some control in decision making, over what work to do and how to do it. Employees have possibilities for using their own qualification
Connectivity (Engeström, 2001) Cooperation between workplace and educational institutions, regional players, and other companies
Rewards Economic reward, career opportunities Transversal categories
Inhibit learning – upskilling The personal / organizational factor is mentioned as something which inhibit learning and up-skilling
Support learning - upskilling The personal / organizational factor is mentioned as something which support learning and up-skilling
Internal training planned by the management (Chi & Wylie, 2014)
Traditional / transmissive training model
Attending seminars / webinars with experts; Reading learning materials; Listening / watching videos / podcasts
Model which support individual actions on knowledge
Manipulating knowledge and learning materials interacting through multimedia contents which have “call to actions” (links, short quizzes).
Model which support reflections and metacognition on practice
Job exchange and job rotation; action learning (Kolb, 1984). Actions are followed or anticipated by reflections
Cognitive/individual-constructivism training model
Learners are invited individually to generate or produce additional externalized outputs or products and/or to reflect on their experiences and concrete practices
Interactive / Constructive training model
Co-creation of knowledge products (e.g. project-works) during workshop and or internal events (hackathon, sprint event) through teamwork and group collaboration
No training planned No training is formally planned by the company Digital technologies adopted in planned internal training
Productivity Project management tools (Trello) Teams management tools (Teams; Slack; Discord; Trello); Microsoft Office package
Video tools Tools to edit, create and animate videos (hyper videos); tools to watch videos (Vimeo, YouTube);
Collaboration / Sharing Collaborative writing (wiki); Cloud tools (dropbox, Office 365, Google Drive). Social Media platforms; Interactive board (Padlet). E.g. confluence
Communication Mediated communication tools (forums, email, chats) or synchronous communication (Skype, Adobe connect, Zoom)
Learning content management systems
Learning management systems; Personal profile (ePortfolio);
Content / Knowledge digital tools MOOCs, blogs, OERs repositories, Online Journal and magazine, newsletter Innovative applications AR/ VR simulators; Serious games; chatbots; 3D printing; No digital technologies No digital technologies are adopted in planned internal training Badges / score systems validated display of accomplishment, skill, quality, or interest that can be earned in
any learning environment. Knowledge management systems Any kind of IT system that stores and retrieves knowledge to improve
understanding, collaboration, and process alignment
4. Questionnaire results
The quantitative analysis has been developed focusing on each one of the 34 questions/items included in the questionnaire. The questionnaire, as showed in Table 1, consists of 4 sections: beyond some general information on the participants and their companies (described in section 3.2.1) sections 2, sections 3 and 4 include several dimensions (and sub-dimensions), measured by a different number

15
of items. All items point out how learning happens in companies and the individual and organizational factors facilitating or inhibiting it.
• Section 2: Individual factors which can support or inhibit learning o Occupational self-efficacy: 5 items o Approaches to Learning at Work: 15 items o Workplace Informal Learning: 17 items o Motivation to attend training: 15 items o Acceptance of professional training enhanced by web-based tools: 12 items
• Section 3: Organisational factors which can support or inhibit learning o Qualitative job insecurity: 4 items o Workplace Climate: 14 items
Section 4 on the other hand analyses the opportunities for learning, in company and beyond, trying to also identify tools and methods emerged in participants’ experience, before and after the pandemic
• Opportunities for learning o Formal training opportunity provided at work o Digital technologies adopted in training activities (Chi et al., 2014; CIDP, 2020) o Self-directed / non formal learning (Eurostat, 2020)
Participants were requested to express their opinion using different Likert-scales according to the specific item or, if the case, to select one or more out of a list of potential answers. The following sections present and observe the emerging main results organized per section, dimension and when relevant sub-dimension.
4.1 Individual factors which can support or inhibit learning
4.1.1 Self-efficacy
When looking at the individual factors which may support or inhibit learning in a company, self-efficacy is an important element to analyse (Rigotti et al., 2008). Participants were asked to answer 5 questions through a 6-point Likert scale (1=not at all true; 6=completely true). As pointed out in Table 7, participants declare a high level of occupational self-efficacy, with all means above the value of 5, a relatively low standard deviation (excluding the last two items) and an asymmetrical distribution of answers above 4. The results concerning the attitude towards the potential challenges at work were particularly positive as 61% of respondents felt confident and ready to manage. The same 61% declared that previous work experience prepared them for their occupational future.
Table 7: Main statistics on occupational self-efficacy
Item Mean St. Dev. ≤2 3-4 ≥5 I can remain calm when facing difficulties in my job because I can rely on my abilities. 5,79 1,02 6% 34% 59%
When I am confronted with a problem in my job, I can usually find several solutions. 5,61 1,38 4% 45% 51%
Whatever comes my way in my job, I can usually handle it. 5,80 1,00 5% 33% 61%

16
My past experiences in my job have prepared me well for my occupational future. 5,76 1,07 2% 35% 61%
I meet the goals that I set for myself in my job. 5,16 1,91 3% 44% 51% I feel prepared for most of the demands in my job. 5,44 1,60 5% 37% 57%
4.1.2 Approaches to learning at work
The second dimension analysed in this section concern the respondents’ approaches to learning at work as distinguished into deep, surface-disorganized and surface-rationale (Kirby et al., 2003). Each approach was investigated through a specific selection of items. A 5-point Likert scale was proposed in this case, from 1 (strongly disagree) to 5 (strongly agree), including a “neutral” 3 (neither agree or disagree) and a sixth potential answer in case the item is not applicable to the respondent. All the following tables highlight the main results, aggregating the levels of disagreement (answers 1 and 2) and agreement (answers 4 and 5); answers “6 – not applicable” were minimal.
Table 8 shows results for the first approach, the deep learning scale. Most of the answers concentrate on the highest levels of the scale, determining means higher than 4 in at least three cases. Interesting elements emerge when we focus on those items which imply a personal implication in terms of time and effort to learn and change the work conditions. Only 36% agree to spend their spare time to learn things about their work (and 36% disagree); 54% agree to manage to change those work conditions which are not considered as right, with a mean of 3,56 out of 5.
Table 8 Deep learning scale
Item Mean St. Dev. Disagree Neither Agree The work I am doing in my present job will be good preparation for other jobs I may have in the future. 4,15 1,07 7% 15% 72%
If conditions aren’t right for me at work, I generally manage to do something to change them. 3,56 1,07 17% 26% 54%
In my job one of the main attractions for me is to learn new things. 4,10 0,98 7% 14% 77%
I find that studying for new tasks can often be really exciting and gripping. 4,41 0,91 4% 9% 83%
I spend a good deal of my spare time learning about things related to my work. 2,92 1,20 36% 28% 36%
Surface-disorganized approach which is superficial and characterized by a lack of effective comprehension and higher level of disorganization, was proposed with 5 items. Results (Table 9) seem not to confirm this approach in our sample, with most of the means below 3 and most of the answers concentrated into the “disagree” group of answers. To some extent, the item concerning the preference for a good overview rather than details, can be considered in line with this interpretation.
Table 9 Surface-disorganized scale
Item Mean St. Dev. Disagree Neither Agree At work I find it difficult to organize my time effectively. 2,40 1,07 60% 21% 19%
I prefer to have a good overview rather than focus on details. 3,19 1,03 23% 40% 37%

17
The continual pressure of work—tasks to do, deadlines, and competition—often makes me tense and depressed.
2,76 1,19 45% 27% 27%
Although I generally remember facts and details, I find it difficult to fit them together into an overall picture.
2,17 1,07 67% 22% 8%
I seem to be a bit too ready to jump to conclusions without waiting for all the evidence. 2,71 1,16 51% 23% 25%
A Surface-rationale approach (Table 10) gets higher results than the Surface-disorganized one. In a potential mix of approaches representing our sample, care for details and preference for specific tasks seem to be a more suitable description of respondents’ views. All items have means between 3 and 4, and most of the answers concentrate between 4 and 5 (“agree” cluster).
Table 10 Surface-rationale scale
Item Mean St. Dev. Disagree Neither Agree I generally prefer to tackle each part of a task or problem in order, working out one at a time. 3,61 0,97 14% 23% 62%
I prefer the work I am given to be clearly structured and highly organised. 3,97 0,97 7% 19% 71%
I prefer to follow well tried approaches to problems rather than anything too adventurous. 3,29 1,11 25% 28% 45%
When I learn something new at work I put a lot of effort into memorising important facts. 3,74 1,15 15% 28% 55%
I find it better to start straight away with the details of a new task and build upon overall picture in that way.
3,44 1,25 24% 27% 43%
4.1.3 Workplace informal learning
Workplace informal learning, based on Decius et al. (2019), was investigated throughout 17 different items aggregated in sub-dimensions. In this case, respondents were asked to select on the base of a 4-point Likert scale (1=Totally disagree; 4=Totally agree). The following tables represent the results of the subdimensions showing the mean, the standard deviation and grouping answers 1 and 2 into the “disagree” column, while 3 and 4 into the “agree” column.
The first group of results, showed in Table 11, confirm a high level in respondents’ proactivity. More than 90% of them declare to apply their own ideas to improve and solve tasks at work (means of the first sub-dimension above 3,16 and low standard deviation). In terms of model learning (second sub-dimension), respondents admit they look how others work to improve their work (86%), copying their actions (88%) and to avoid their mistakes (73%).
Table 11 Workplace informal learning
Sub-dimension Item Mean St. Dev. Disagree Agree
Applying own ideas
I try a different method to solve new tasks at work. 3,16 0,66 11% 89%
I try out my own ideas for new tasks. 3,29 0,65 8% 92% I use my own ideas to improve tasks at work. 3,35 0,69 8% 92%
Model learning I look at how others work in the company to improve my work. 3,19 0,73 14% 86%

18
I look at how my colleagues work so I do not make the same mistakes as they do. 2,95 0,78 27% 73%
I try things out at my work, which I have copied from my colleagues. 3,09 0,68 12% 88%
Focusing on the feedback as an informal learning, an indirect feedback is preferred to a direct one, namely asking colleagues about their methods (86%) and their experience (83%), or having tips or hints (84%). The sample is severely divided when it comes to direct feedbacks from colleagues, while only 41% agree to ask their head for an evaluation of their work (Table 12).
Table 12 Feedbacks as informal learning
Sub-dimension Item Mean St. Dev. Disagree Agree
Direct Feedback
I ask my foreman or head how well I have worked. 2,36 0,88 59% 41%
I ask my foreman or head when I am not sure how well I worked. 2,54 0,90 50% 50%
I ask my colleagues when I am not sure how well I worked. 2,45 0,85 51% 49%
Vicarious Feedback
I ask my colleagues about their experience at work. 3,04 0,70 17% 83%
I ask my colleagues about the methods and tricks they use at work. 3,17 0,69 14% 86%
I obtain tips and hints about work from my colleagues. 3,09 0,74 16% 84%
Anticipatory or subsequent reflections are two other sub-dimensions considered as relevant indicators for the workplace informal learning. Table 13 shows that both the sub-dimensions get positive results (all above or around 3 out of 4), while items concerning anticipatory reflections show the highest rates of agreement when it comes to think about how to work the best (mean: 3,40) and what they need to pay attention to (3,33).
Table 13 Reflection
Sub-dimension Item Mean St. Dev. Disagree Agree
Anticipatory reflection
Before starting a new task, I think about how I can do my work best. 3,40 0,65 6% 94%
Before work, I think about how I prepare my workplace. 2,95 0,85 26% 74%
Before starting a new task, I think about the things I need to pay attention to. 3,33 0,66 8% 92%
Subsequent reflection
When I have finished a new task, I think about how well I have worked. 2,78 0,84 32% 68%
When I have finished a new task, I think about what I still could do better next time. 3,14 0,77 21% 79%
When I have finished a new task, I think about the quality of my work. 3,12 0,77 19% 81%
Intrinsic intent to learn seems to represent better the sample, according to respondents (Table 14). 94% of them agree to those items because they can perform better and work faster. On the other hand, extrinsic intent to learn is true only for half the sample, including competition with colleagues or to get their head positively impressed. However, career perspective, as extrinsic intent, is pursued by 87% of the sample.
19
Table 14 Intent to learn
Sub-dimension Item Mean St. Dev. Disagree Agree
Extrinsic intent to learn
I want to learn something new at work for myself because then I can pursue my career at the company.
3,36 0,76 13% 87%
I want to learn something new for myself because then I am better at work than my colleagues.
2,55 0,98 51% 49%
I want to learn something new at work for myself because then my foreman or head is impressed by me.
2,47 0,95 53% 47%
Intrinsic intent to learn
I want to learn something new for myself because then I feel more capable to deal with difficulties at work.
3,50 0,66 6% 94%
I want to learn something new for myself because then I can solve problems at work faster.
3,51 0,63 6% 94%
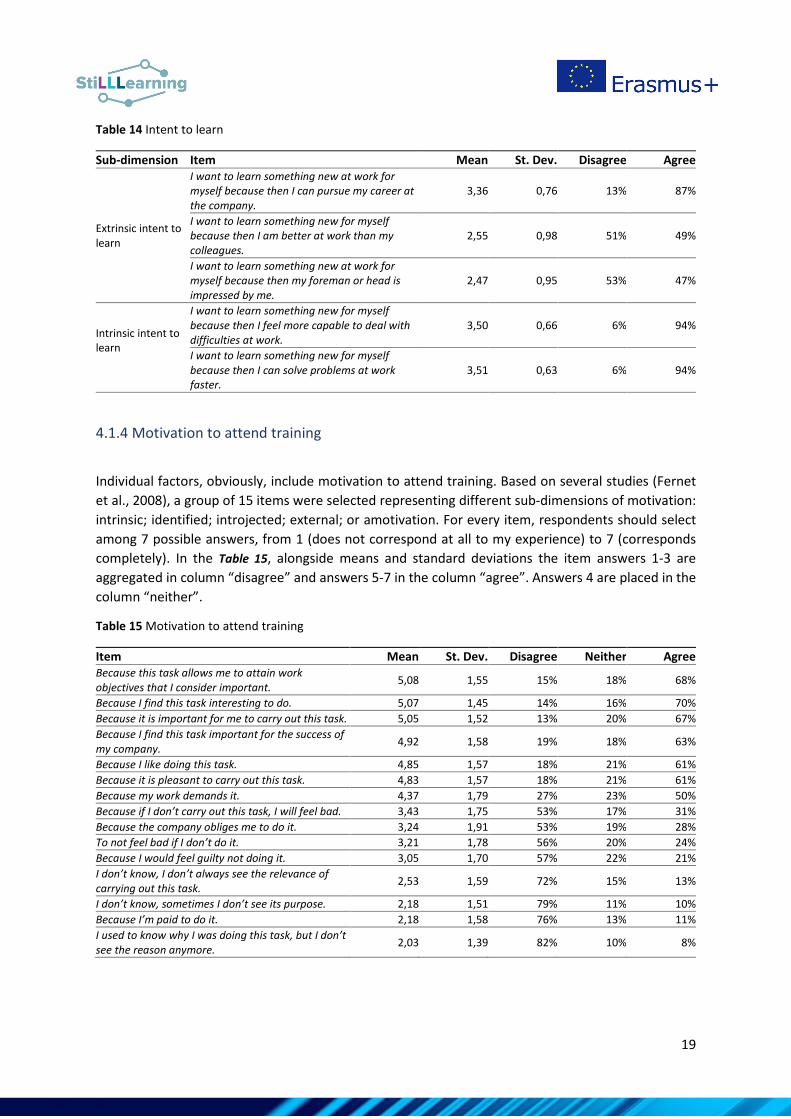
4.1.4 Motivation to attend training
Individual factors, obviously, include motivation to attend training. Based on several studies (Fernet et al., 2008), a group of 15 items were selected representing different sub-dimensions of motivation: intrinsic; identified; introjected; external; or amotivation. For every item, respondents should select among 7 possible answers, from 1 (does not correspond at all to my experience) to 7 (corresponds completely). In the Table 15, alongside means and standard deviations the item answers 1-3 are aggregated in column “disagree” and answers 5-7 in the column “agree”. Answers 4 are placed in the column “neither”.
Table 15 Motivation to attend training
Item Mean St. Dev. Disagree Neither Agree Because this task allows me to attain work objectives that I consider important. 5,08 1,55 15% 18% 68%
Because I find this task interesting to do. 5,07 1,45 14% 16% 70% Because it is important for me to carry out this task. 5,05 1,52 13% 20% 67% Because I find this task important for the success of my company. 4,92 1,58 19% 18% 63%
Because I like doing this task. 4,85 1,57 18% 21% 61% Because it is pleasant to carry out this task. 4,83 1,57 18% 21% 61% Because my work demands it. 4,37 1,79 27% 23% 50% Because if I don’t carry out this task, I will feel bad. 3,43 1,75 53% 17% 31% Because the company obliges me to do it. 3,24 1,91 53% 19% 28% To not feel bad if I don’t do it. 3,21 1,78 56% 20% 24% Because I would feel guilty not doing it. 3,05 1,70 57% 22% 21% I don’t know, I don’t always see the relevance of carrying out this task. 2,53 1,59 72% 15% 13%
I don’t know, sometimes I don’t see its purpose. 2,18 1,51 79% 11% 10% Because I’m paid to do it. 2,18 1,58 76% 13% 11% I used to know why I was doing this task, but I don’t see the reason anymore. 2,03 1,39 82% 10% 8%

20
The first six items in terms of higher mean represent intrinsic and identified motivation, which can be considered a positive result. Similarly, all of the items concerning amotivation concentrate in the bottom of the table with means between 2,03 and 2,53. Items related to external motivation were scored 2,18 (because I’m paid to do it), 3,24 (the company obliges me to do it) and 4,37 (my work demands it), but these last two items also show the highest standard deviations.
4.1.5 Acceptance of professional training
Finally, the questionnaire analyzed to what extent respondents are positively engaged or their potential attitude towards professional training, namely enhanced by digital technologies. Different sub-dimensions have been investigated (Cheng et al., 2011), proposing for each item 7 possible answers, from 1 (does not correspond at all to my experience) to 7 (corresponds completely). As in the previous table, for every item answers 1-3 are aggregated in column “disagree”, answers 5-7 in the column “agree”; answers 4 are in the column “neither”. This question has been related to a previous one (which will be illustrated in section 4.3.1), in order to divide the sample into two different sub-groups: Table 16 collects the answers from those who had a training experience, while Table 17 from those who had not.
Respondents with previous training experience strongly agree in perceiving it as a concrete support in consolidating their knowledge (5,21), enhancing effectiveness (4,86) and identifying gaps and needs (4,64). Generally positive, but with higher standard deviation, respondents are when it comes to the second sub-dimension, concerning the impact of training in enhancing social ties with colleagues, in terms of stronger interaction (4,10), broadening connections (3,93) or even closer relationships (3,69). A climate of teamwork was more easily established, according to 34% (mean 3,89); similarly, no clear trend emerges when professional training is put in relation with the establishment of a norm of cooperation in the company (means: 3,86 and 3,82). However, in terms of intention to use, between 55% and 68% of respondents agree to attend other similar opportunities and to suggest it to their colleagues.
Table 16 Acceptance of training (subsample with previous experience)
Sub-dimension Item Mean St. Dev. Disagree Neither Agree
Perceived Individual Learning Support
Professional training enhanced by digital technologies was helpful for me to construct knowledge in my work context.
5,21 1,21 5% 26% 69%
Professional training enhanced by digital technologies enhanced effectiveness in my work-related learning.
4,86 1,37 15% 27% 58%
Professional training enhanced by digital technologies was helpful for me to identify my knowledge gaps or learning needs.
4,64 1,38 16% 33% 51%
Perceived support for enhancing Social Ties
In my perception, professional training enhanced by digital technologies promoted interaction between my colleagues
4,10 1,55 31% 29% 40%
Professional training enhanced by digital technologies was helpful for broadening 3,93 1,66 32% 34% 34%

21
connections among employees in my company In my perception, professional training enhanced by digital technologies was helpful for closer relationships between my colleagues
3,69 1,58 37% 35% 28%
Perceived support for promoting a Norm Of Cooperation
Professional training enhanced by digital technologies was helpful for formation of a workplace climate of cooperation in work-related learning
3,86 1,54 37% 33% 30%
Professional training enhanced by digital technologies was helpful for formation of a workplace climate of peer mentoring and coaching.
3,82 1,49 36% 32% 32%
Self-developed Professional training enhanced by digital technologies was helpful for formation of a workplace climate of teamwork
3,89 1,54 34% 32% 34%
Intention to Use
Given that I had access to professional training enhanced by digital technologies, I predict that I would attend it.
4,94 1,30 11% 26% 63%
If possible, I would recommend Professional training enhanced by digital technologies to other teammates.
4,77 1,40 14% 31% 55%
Assuming I have access to professional training enhanced by digital technologies, I intend to attend it.
5,17 1,38 10% 22% 68%
For the 20% of the sample with no previous experience, interestingly, all the sub-dimensions related to the acceptance of training get positive results, with a range of means between 3,70 and 4,78, showing a potentially positive attitude (Table 17); however, standard deviations, in this case, are sensibly higher than in table 16.
Table 17 Acceptance of training (subsample with no previous experience)
Sub-dimension Item Mean St. Dev. Disagree Neither Agree
Perceived Individual Learning Support
Professional training enhanced by digital technologies would be helpful for me to construct knowledge in my work context.
4,78 1,55 19% 30% 52%
Professional training enhanced by digital technologies would enhance effectiveness in my work-related learning.
4,37 1,50 22% 33% 44%
Professional training enhanced by digital technologies would be helpful for me to identify my knowledge gaps or learning needs.
4,48 1,53 15% 30% 56%
Perceived support for enhancing Social Ties
In my perception, professional training enhanced by digital technologies can promote interaction between my colleagues
3,93 1,64 41% 22% 37%
Professional training enhanced by digital technologies would be helpful for broadening connections among employees in my company.
4,11 1,58 30% 33% 37%
In my perception, professional training enhanced by digital technologies would 3,70 1,77 41% 30% 30%

22
be helpful for closer relationships between my colleagues
Perceived support for promoting a Norm Of Cooperation
Professional training enhanced by digital technologies would be helpful for formation of a workplace climate of cooperation in work-related learning
3,96 1,60 33% 33% 33%
Professional training enhanced by digital technologies would be helpful for formation of a workplace climate of peer mentoring and coaching.
4,04 1,58 37% 30% 33%
Self-developed
Professional training enhanced by digital technologies would be helpful for formation of a workplace climate of teamwork
4,19 1,57 30% 30% 41%
Intention to Use
Given that I had access to professional training enhanced by digital technologies, I predict that I would attend it.
4,59 1,60 30% 19% 52%
If possible, I would recommend Professional training enhanced by digital technologies to other teammates.
4,37 1,52 33% 19% 48%
Assuming I have access to professional training enhanced by digital technologies, I intend to attend it.
4,59 1,69 22% 26% 52%
4.2 Organizational factors which can support or inhibit learning
4.2.1 Qualitative job insecurity
After the insights on the individual factors which can support or inhibit learning, the third section of the questionnaire focused on the organizational factors. The first dimension to be addressed concerns the qualitative job insecurity (Van Hootegem & De Witte, 2019) perceived by the respondents. A 5-point Lickert scale was proposed in this case for each of the 4 items, from 1 (strongly disagree) to 5 (strongly agree), including a “neutral” 3 (neither agree or disagree). Table 18 highlights the main results, aggregating the levels of disagreement (answers 1 and 2) and agreement (answers 4 and 5). Answers 3 have been placed in the column “neither”.
Table 18 Qualitative job insecurity
Item Mean St. Dev. Disagree Neither Agree I am worried about how my job will look like in the future 2,99 1,17 38% 29% 33%
I think my job will change for the worse 2,53 1,12 53% 26% 20% I feel insecure about the characteristics and conditions of my job in the future 2,71 1,18 48% 24% 28%
Chances are, my job will change in a negative way 2,55 1,05 53% 28% 19%
A slightly positive trend seems to emerge, although the means vary from 2,55 to 2,99. Most of the respondents disagree on the item proposing jobs changing in a negative way or for the worse. Notwithstanding this, uncertainty about the future is recognized by approximately 30% of respondents.

23
4.2.2 Workplace climate
The second dimension we comment concerns the workplace climate (Kirby et al., 2003), through three different sub-dimensions, evaluated with the same Lickert scale just presented (1 to 5). Table 19 shows main results.
Table 19 Workplace climate
Sub-dimension Item Mean St. Dev. Disagree Neither Agree
Workload scale
The workload here is too heavy. 3,40 1,19 22% 36% 38% It sometimes seems to me that my job requires me to do too many different things.
3,21 1,21 32% 26% 41%
In this organisation you’re expected to spend a lot of time learning things on your own.
3,41 1,03 19% 31% 49%
There seems to be too much work to get through here. 3,13 1,27 32% 33% 32%
There’s a lot of pressure on you as an employee here. 3,18 1,27 31% 28% 39%
Choice-independence scale
There is a real opportunity in this organisation for people to choose the particular tasks they work on.
3,31 1,25 26% 26% 45%
The organisation really seems to encourage us to develop our own work-related interests as far as possible.
3,30 1,17 26% 25% 49%
We seem to be given a lot of choice here in the work we have to do. 3,12 1,14 28% 34% 36%
This organisation gives you a chance to go about your work in ways which suit your own way of learning.
3,56 1,04 13% 29% 57%
Employees here have a great deal of choice over how they learn new tasks. 3,23 1,10 26% 34% 39%
Good supervision scale
Most of the supervisors really try hard to get to know employees. 3,49 1,19 19% 28% 53%
Supervisors here make a real effort to understand difficulties employees may be having with their work.
3,51 1,11 18% 28% 55%
The supervisors in this organisation always seem ready to give help and advice on the best way to learn something new.
3,45 1,13 22% 24% 52%
Supervisors in this organisation generally take employees’ ideas and interests seriously.
3,51 1,10 18% 28% 54%
In terms of workload, respondents do not agree or disagree significantly on any item, although 49% agree that there is an expectation, by the company, to significantly invest in upskilling on your own.
Similar lack of a clear trend emerges when it comes to respondents’ independence to express their choices, with the rates of “agreement” generally higher than the others but means between 3,12 and 3,56. The only item registering almost 60% of agreement in respondents’ point of view interestingly

24
concern the perception that companies support and promote flexibility to facilitate learning in the workplace context.
Finally, most of respondents agree on the presence of a good supervision, open to understand employees’ difficulties (55%), taking employees’ ideas and interests seriously (54%), available to get to know employees (53%), and ready to help and support in learning (52%).
4.3 Opportunities for learning
The last section of the questionnaire aims at collecting information about the opportunities for learning both at the workplace and beyond in respondents’ recent experience, with a focus on the digital technologies adopted.
4.3.1 Formal training opportunity provided at work
This area of investigation was two-folded: on one hand, to identify whether respondents had any opportunity of formal training at their workplace; on the other hand, if so, what kind of training setting was adopted. To this extent, two questions were proposed, trying to distinguish between respondents’ experience before and after March 2020, due to the strong impact of pandemic on physical activities.
As shown in Figure 3, formal training is quite common in the companies involved in the project: only 9% of respondents, both before and after the outbreak of the pandemic, have not been proposed any training. At the same time, the most relevant result is the inevitable shift from blended (43% before March 2020) and face-to-face (32%) activities to entirely online training (53% after March 2020). Online activities using digital methods were only 6% before the pandemic, giving an interesting measure of the impact of pandemic in the transformation of training settings and tools. TAs also emerged in the interviews and Delphi (section 5 of this paper), some activities are held face-to-face (12%) or blended (20%), when the personal interaction is considered relevant or in case the training is based on coaching or job shadowing.

25
Figure 3 Formal training opportunities, before and after March 2020
When asked about the source of training, a clear majority declare that their own company (50%) or an institution sponsored by their company has been the provider of training. This confirmsother studies (WEF, 2020) underlining a strong role played by the workplace in employees’ training (Figure 4).
Figure 4 Provider of training
4.3.2 Training tools at work
The third element in the questionnaire consists of a list of different training tools characterizing respondents’ training opportunities. They have been asked to select all the relevant options out of a
9%
43%
32%
6%3%
9%
20%
12%
53%
1%0%
10%
20%
30%
40%
50%
60%
No job-relatedtraining offered
A blend of face-to-face and
online or digitallearning
Entirely face toface
Entirely online orusing digital
methods
Other
Formal training at work
Before March 2020 After March 2020
50%
31%
15%3%
Source of training
My company.
Institutions external to my company promoted / sponsored by my company.
Institutions external to my company that I found on my own.
Other

26
wide list (see Figure 5). No specific tool seems to emerge as more relevant than others: watching videos (19%) and attending webinars (18%) are more common in respondents’ selection, followed by social interaction and collaboration with colleagues (16%), already mentioned previously as an important source of learning. More innovative tools (virtual or augmented reality, reality-based challenges, podcasts) are less frequent and used with less than 6% of respondents.
Figure 5 Training tools in respondents' training opportunities
Focusing on digital tools (Figure 6), the preference for more “traditional” solutions is more evident. Videoconferences (31%) and online learning platforms (29%) represent the most common digital tools; MOOCs, AR and VR solutions, wearable technologies represent, so far, residual solutions. A further development of this research will outline emerging correlation between this element and contextual elements, including company dimension, nationality, role and seniority of respondents.
Figure 6 training digital tools in respondents' training opportunities
1%2%
3%5%
5%6%
6%8%
11%16%
18%19%
0% 2% 4% 6% 8% 10% 12% 14% 16% 18% 20%
OtherListening podcasts.
Designing a job-related project/product.Immersive simulation of professional activities.
Watching animated contents.Quizzes and various forms of assessment.
Solving concrete job-related problems.Interacting with videos (through annotation,…
Reading learning materials.Social interaction and collaboration with colleagues.
Attending webinar / virtual seminars.Watching / listening videos.
Training tools
0%0%0%1%
2%4%
5%5%
6%17%
29%31%
0% 5% 10% 15% 20% 25% 30% 35%
Survey toolInternet tools
Wearable technologiesAugmented reality / Virtual Reality reality…
Game-based applications.Chatbots.
OtherMassive Open Online Courses.
Mobile learning applications.Film / videos / interactive videos /…
Online learning platforms.Video-conference tool
Training digital tools

27
4.3.3 Self-directed and non-formal training
Beside formal training at workplace, the questionnaire eventually analysed other forms of training more based on respondents’ self-initiatives. As represented in Figure 7, most of the respondents have been involved in none or just occasional training opportunities. When it comes to private lessons with a teacher or sport activities with a trainer, the rate of regular attendance increases, respectively to 31% and 36%.
Figure 7 Self-directed training opportunities
On the other hand, when the training tools for these sources of training are investigated, the impact of pandemic emerges, showing a clear general majority for virtual or blended solutions (Figure 8) in all other categories than cultural visits and activities in museums.
45%
51%
60%
51%
54%
28%
13%
9%
26%
33%
28%
36%
31%
23%
13%
0% 20% 40% 60% 80% 100%
Courses / private lessons for personalinterest
Sports courses with the presence of atrainer / teacher
Private lessons with the help of a teacher ora paid tutor
Museum guided visits / workshops withinmuseums
Other course / training activity
Self-directed training
Never Occasionally With a regular attendance

28
Figure 8 Training settings for self-directed training
5. Interviews’ and Delphi results
The distribution of the seven macro-topics is well balanced across the whole corpus of interviews’ codes (see Figure 9). The individual factors (19%) and the transversal skills (16%) are the most mentioned topics, followed by organisational factors (14%) transversal categories (13%), digital skills (12%), and disruption (12%). The topics of training approaches and digital technologies are the least reported (7%).
75%
49%
38%
46%
72%
11%
30%
14%
43%
19%
15%
21%
48%
11%
9%
0% 10% 20% 30% 40% 50% 60% 70% 80% 90% 100%
Courses / private lessons for personal interest
Sports courses with the presence of a trainer /teacher
Private lessons with the help of a teacher or apaid tutor
Museum guided visits / workshops withinmuseums
Other course / training activity
Training setting
Mainly online Mainly in presence Included both online and in presence activities

29
Figure 9 Topics reported in the total corpus of the data. Percentage was calculated by dividing the number of codes for each macro-topic for the total number of codes (N = 3358).
5.1 Disruptions perceived
In the whole corpus of data, the two most mentioned disruptive changes concern digitalisation (13.3%) and customers / suppliers needs (11.4%), followed by sustainable development (2.8) automation (2.6%) and internet of things (1.2%) (see Figure 10).
Figure 10 Disruption reported in the total corpus of data. Percentages were calculated through the ratio between absolute frequency and the total number of unities of meaning (N = 1303)
The most impactful disruptive changes by sector are illustrated in Figure 11. For the building sector and bioeconomy, the customer / supplier need is reported more as a source of disruption (respectively
12 %
12 %
16 %
19 %
14 %
7 %
7 %
13 %
Disruption Digital skills Transversal skills
Individual factors Organisational factors Training approaches
Digital technologies Transversal categories
1,2
2,6
2,8
11,4
13,3
1,0 3,0 5,0 7,0 9,0 11,0 13,0 15,0
Internet of things
Automation
Sustainable development
Customers / Suppliers needs
Digitalisation
% frequency by total of UM
Disruptions reported
Essi Ryymin
The most impactful disruptive changes by sector are illustrated in Figure 11.

30
19.3% and 13.6%) compared to digitalisation (respectively 11.9% and 11.6%), although this difference is more evident in the building sector. Textile and automotive representatives, instead, reported more the digitalisation (respectively 21.1% and 20.4%) compared to the customer / supplier need disruption (respectively 8% and 6.1%). Tourism reported the two most occurring disruptions with the same frequency (9.9%).
For three out of five sectors, the third most reported disruption is related with sustainable development (Automotive = 6.1%; Textile = 4.6%; Building sector = 2.3%), whilst automation is reported as the third most pressing disruption in tourism (3.6%) and bioeconomy (1.7%).
Looking at the qualitative data, digitalisation and customers / suppliers’ needs are usually reported as past or present disruption, whilst sustainability and automation are reported as imminent and future disruption. Thus, the highest occurrence of the former two kinds of disruption compared to the other three could be explained by concrete challenges that companies have already faced.
For example, in the Extract 1 an hotel owner explains that the advent of booking digital platform (digitalisation) was the first kind of disruption he experienced during his career.
Extract 1: “The first big disruptive change in the hotel business was the arrival of Booking.com. I would have to look up exactly when it arrived. This was a tipping point, both a cross and a delight for hoteliers. Already at that time, if you did not have the required skills to adjust the position of your hotel on this important distribution channel… for me it was the beginning of this period of disruption” (Tourism, employer, Switzerland)
On the other hand, an employee from the same hotel, mentioned the topic of the automation only at the end of the interview, when she was asked to think about future transformation in her sector (Extract 2).
Extract 2: “Many will be the changes people will be replaced more and more, i.e. fully automated hotels already exist, it is no longer necessary to have a physical person which does everything ... Most Probably, within small hotels realities it will take years, due to technologies’ costs of implementation ... In a little while people won't be there anymore, machines will give information, pressing the button will be the only task... It may take years to get to the level of our reality, but it will come sooner or later. The change is there already, when you look at the past, there used to be night porters. Now hotels tend to use automatic key systems and entry/exit codes, where porters are not necessary. There is always the tendency to reduce people and try to implement machines then everything goes back.... Maybe a hotel at LAX can work like that: you arrive, you just sleep and then you leave. But where there is still a lot of leisure clientele doing... It will probably take... We're going to get to all these changes like that though” (Tourism, employee, Switzerland).

31
Figure 11 Disruption reported by sector. Percentages were calculated through the ratio between absolute frequency and the total number of unities of meaning for each sector. (Tourism = 414; Textile = 237;
Bioeconomy = 352; Automotive = 49: Building sector = 176)
The salience of the five disruptions seems to change according to the role of the interviewee (Figure 12). For employer / manager and adult educator the main source of disruption is constituted by digitalisation. On the other hand, employees reported slightly more customer / supplier needs as source of disruption. This could be explained by a more direct interaction between employees and customers. On the other hand, employers and managers had to face concrete challenges related to digitalisation (see Extract 3)
Extract 3: “Every kind of digital systems in our branch…data gathering, data analysis. Earlier the decision-making was different, now we need (measured) data and facts, and design operations on this basis, for instance, how to use fields (in farming). We are facing these kinds of changes in large scale now…” (Bioeconomy, employer, Finland)
9,98
13,6
6,1
19,3
3,14,6
1,1
6,1
2,33,6 3,8
1,7 2 1,7
9,9
21,1
11,6
20,4
11,9
1,2 2,1 1,1 2
0,0
5,0
10,0
15,0
20,0
25,0
Tourism Textile Bioeconomy Auotomotive Building sector% fr
eque
ncy
by
tota
l of U
M p
er se
ctor
Customers / Suppliers needs Sustainable development
Automation Digitalisation
Internet of things

32
Figure 12 Disruption reported by role. Percentages were calculated through the ratio between absolute frequency and the total number of unities of meaning for each role (Employer / Manager = 394 Adult educator
= 306 Employee = 603).
To see if the perception of disruption changes across the nation of the workplaces, we compared the Italian and the Swiss interviews with textile and touristic representatives (see Figure 13).
Whilst digitalisation was reported more frequently in the Swiss interviews as a source of disruption (15.3%) in Italy the main source of disruption reported is related with customers / suppliers (14%).
Often, digitalisation related challenges were reported together with other challenges like customer / supplier needs (see Extract 4) and sustainability.
Extract 4: “The digital platforms used today, influence a lot the hotel clients’ expectation. Putting the staff in the position of being a little on camera focus. Everything is now perceived much more, before a mistake could have beeng made without noticing. If you make the first mistake your name can be quickly globalized via TripAdvisor. This means that the entire relationship aspect of the job becomes crazy.” (Tourism, Employee, Italy).
11,4
4,9
14,6
2,8 2,6 2,84,1
1,6 2,2
17,0
8,5
13,3
1,50,7 1,2
0,02,04,06,08,0
10,012,014,016,018,0
Employer / HR manager Adult educator Employee
% fr
eque
ncy
by to
tal o
f UM
per
role
Customers / Suppliers needs Sustainable development
Automation Digitalisation
Internet of things

33
Figure 13 Disruption reported by Italy and Switzerland. The comparison was based only on the two common sectors (textile and tourism). Percentages were calculated through the ratio between absolute frequency and
the total number of unities of meaning for each country. (Italy = 136; Switzerland = 515)
5.2 Skills needed
5.2.1 Transversal skills
The most mentioned transversal skills in the whole corpus of the interviews were collaboration and team work (15.2%) followed by life skills (9.2%) active learning and metacognition (9.1%) critical analytic thinking, (4.5%) multi-expertise, (4.4%), problem solving, (4.2%) leadership, (4.1%), creativity and innovation, (2.6%) and decision making (1.6%) (see Figure 14).
By looking at qualitative data, employers and employees highlighted the difficulty to develop the ability of collaboration and teamwork across departments. This issue has emerged in different sectors included industrial production (see Extract 5) but also tourism and building sector.
Extract 5: “Communicative skills are very important, that is, everything which concerns exchange. You hear quite often that departments only do their own thing, there is a “silo mentality”. They don't consider how to coordinate their own activities with others. So, it is important to communicate with the other stakeholders in the company outside of someone's own department, to ask how things are connected and how processes can be improved”. (Other - industrial production, employee, Germany).
In the Swiss context, in response to the need to improve communication among departments within the hotel, a new diploma “hotel communication clerk” was recently developed, which was often mentioned by hospitality representatives as a key role during the interviews to limit the issues related to a “silo mentality”.
14
8
2,93,9
7,4
2,7
8,8
15,3
2,91,2
02468
1012141618
Italy Switzerland
% fr
eque
ncy
by to
tal o
f UM
per
cou
ntry
Customers / suppliers needs Sustainability
Automation Digitalisation
Internet of things

34
Figure 14 Transversal skills reported in the total corpus of data. Percentage were calculated through the ratio between absolute frequency and the total number of unities of meaning (N = 1303)
The table 20 introduces the most relevant transversal skills of the five sectors (for more details see Figure 24 in the appendix). Collaboration and teamwork are the most reported transversal skill for almost all the sectors, except for bioeconomy where active learning and metacognition has the highest frequency (19.6%). Active learning is the second most occurring transversal skill for automotive (24.5%), and it ranks fourth for building sector (1.7%) and fifth for textile (5.1%). Critical Analytic thinking is the second most reported skill in textile (8.4%) and building sector (4%) and it is fifth place for tourism (4.3%). Life skills is the second most reported skill in Tourism, and it ranks third for bioeconomy (10.5%) and building sectors (2.8%).
Table 20 The five most mentioned transversal skills in the five sectors
Tourism Textile Bioeconomy Automotive Building sector 1st Collaboration and
teamwork (13.5) Collaboration and teamwork (15.2)
Active learning and metacognition (19.6)
Collaboration and teamwork (34.7)
Collaboration and teamwork (20.5)
2nd Life skills (9.4) Critical Analytic Thinking (8.4)
Collaboration and teamwork (12.5)
Active learning and metacognition (24.5)
Critical Analytic Thinking; Leadership (4)
3rd Multi expert (5.3) Life skills (7.6) Life skills (10.5) Leadership; Problem solving (20.4)
Life skills; problem solving (2.8)
4th Problem solving (4.6)
Creativity and innovation (7.2)
Multi expert (5.7) Life skills (18.4) Multi-expert; life; Active learning and metacognition (1.7)
5th Critical Analytic Thinking (4.3)
Active learning and metacognition; Leadership (5.1)
Problem solving (4.5)
Multi-expert (10.2)
Creativity and innovation; Decision making (0.6)
1,6
2,6
4,1
4,2
4,4
4,5
9,1
9,2
15,3
0 2 4 6 8 10 12 14 16 18
Decision-making
Creativity and innovation
Leadership
Problem solving
Multi-expert
Critical Analytic Thinking
Active learning / Metacognition
Life skills
Collaboration and teamwork
% frequency by total of UM

35
Employer, adult educator, and employees reported the same three skills with the highest occurrence: collaboration and teamwork, life skills and active learning (see Table 21, for more details see Figure 26 in the appendix). While collaboration and teamwork take the first place for all the roles, employees reported more active learning (11.6%) than life skills (8.6%). The opposite happened for employers (life skills = 10.2%; active learning = 6.3%) and adult educators (life skills = 9.2%; active learning = 7.8%).
Table 21 The five most mentioned transversal skills in the three roles sectors
Employer / Manager Adult educator Employee 1st Collaboration and teamwork (15.5) Collaboration and teamwork
(12.7) Collaboration and teamwork (16.4)
2nd Life skills (10.2) Life skills (9.2) Active learning and metacognition (11.6)
3rd Active learning and metacognition; Critical Analytic thinking (6.3)
Active learning and metacognition (7.8)
Life skills (8.6)
4th Multi expert (5.3) Critical Analytic Thinking (4.9) Problem solving (5.3) 5th Leadership (5.1) Multi expert (4.6) Leadership (4.5)
A group of employers (N = 8) from the bioeconomy sector (Finland) was involved in the second stage of the Delphi method. The management team unanimously emphasised the importance of leadership skills (7 out of 8 put leadership skills at the 1st place). Active learning and learning skills were considered least important from the options provided themselves in the first round of the Delphi (see Table 22).
Probably, during the interviews, managers and employers were invited to reflect more on their employees desired skills. On the other hand, during the Delphi ranking questionnaire, they focused more on their professional experience, thinking about skills necessary for their work.
Table 22 Ranking of the top six transversal skills according to managers and employers in bioeconomy sector.
1st 2nd 3rd 4th 5th 6th Leadership 87,5% 12,5% 0,0% 0,0% 0,0% 0,0%
Decision-making 0,0% 50,0% 25,0% 0,0% 12,5% 12,5% Life skills 0,0% 12,5% 25,0% 50,0% 0,0% 12,5%
Collaboration and teamwork
0,0% 12,5% 12,5% 37,5% 25,0% 12,5%
Active learning 0,0% 0,0% 12,5% 12,5% 37,5% 37,5% Critical Analytic
thinking 12,5% 12,5% 25,0% 0,0% 25,0% 25,0%
5.2.2 Digital skills
The most mentioned digital skills in the whole corpus of the interviews were using digital equipment (10.7%) followed by communication through ICT (8.3%) and using online services (5.6%), data literacy (4%), computational thinking (1.7%), safety (1%) and fixing technical problems (0.8%) (see Figure 15).
Digital equipment could range from simple productivity tools to more advanced 4.0 technologies, such as 3D printers, as mentioned in the Extract 6
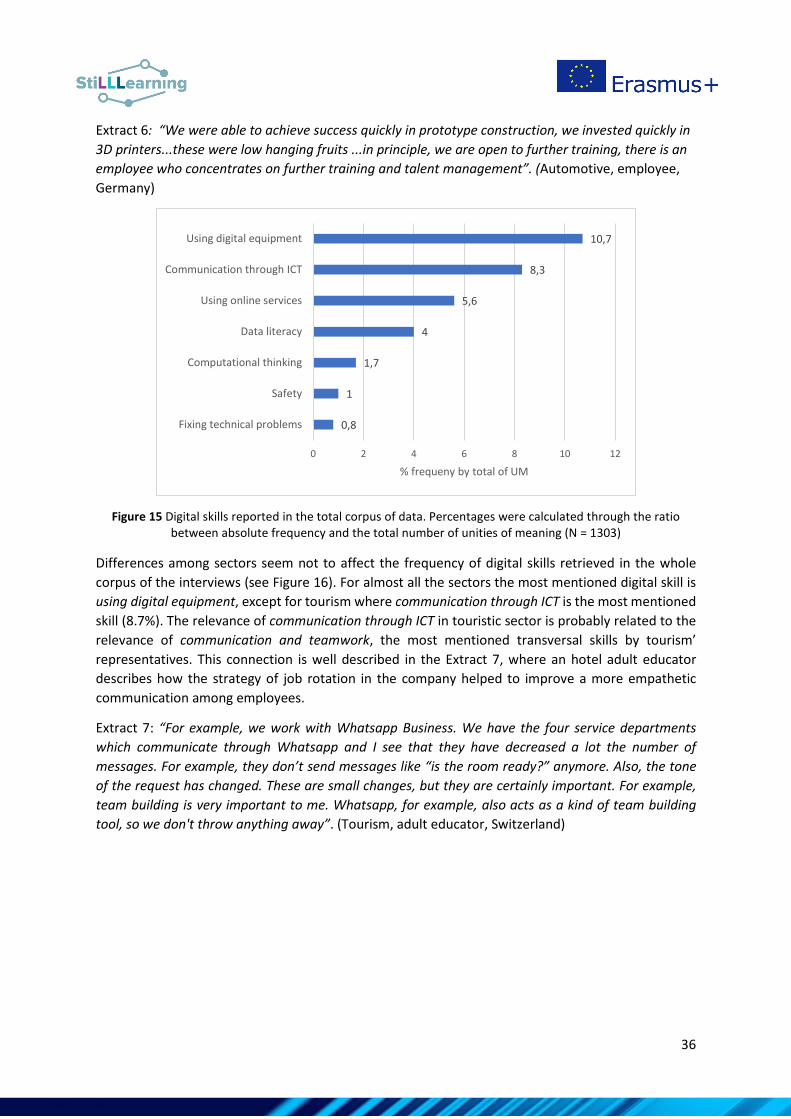
36
Extract 6: “We were able to achieve success quickly in prototype construction, we invested quickly in 3D printers...these were low hanging fruits ...in principle, we are open to further training, there is an employee who concentrates on further training and talent management”. (Automotive, employee, Germany)
Figure 15 Digital skills reported in the total corpus of data. Percentages were calculated through the ratio between absolute frequency and the total number of unities of meaning (N = 1303)
Differences among sectors seem not to affect the frequency of digital skills retrieved in the whole corpus of the interviews (see Figure 16). For almost all the sectors the most mentioned digital skill is using digital equipment, except for tourism where communication through ICT is the most mentioned skill (8.7%). The relevance of communication through ICT in touristic sector is probably related to the relevance of communication and teamwork, the most mentioned transversal skills by tourism’ representatives. This connection is well described in the Extract 7, where an hotel adult educator describes how the strategy of job rotation in the company helped to improve a more empathetic communication among employees.
Extract 7: “For example, we work with Whatsapp Business. We have the four service departments which communicate through Whatsapp and I see that they have decreased a lot the number of messages. For example, they don’t send messages like “is the room ready?” anymore. Also, the tone of the request has changed. These are small changes, but they are certainly important. For example, team building is very important to me. Whatsapp, for example, also acts as a kind of team building tool, so we don't throw anything away”. (Tourism, adult educator, Switzerland)
0,8
1
1,7
4
5,6
8,3
10,7
0 2 4 6 8 10 12
Fixing technical problems
Safety
Computational thinking
Data literacy
Using online services
Communication through ICT
Using digital equipment
% frequeny by total of UM

37
Figure 16 Digital skills reported by sector. Percentages were calculated through the ratio between absolute frequency and the total number of unities of meaning for each sector. (Tourism = 414; Textile = 237;
Bioeconomy = 352; Automotive = 49: Building sector = 176)
The ranking of frequency of the four most reported digital skills do not change across roles (see Figure 17). However, some differences can be retrieved concerning the three less mentioned digital skills. Computational thinking (4.1%) and fixing technical problems (2%) are quietly reported by employers but they are not reported at all by adult educators and poorly reported by employees (respectively 1 and 0.3%). This result highlights a possible gap between employer / manager expectations and adult educator and employee priorities in terms of skills development.
7,7
12,210,5
20,4
10,2
4,12,5
5,7
2,04,0
8,79,7
7,7
4,1
8,5
1,42,5
5,34,2
6,8
4,15,1
0,21,7
4,02,0 1,10,5 1,7
4,1
0,0
5,0
10,0
15,0
20,0
25,0
Tourism Textile Bioeconomy Auotomotive Building sector% fr
eque
ncy
by to
tal o
f UM
per
sect
or
Using digital equipment Data literacy
Communication through ICT Safety
Using online services Computational thinking
Fixing technical problems

38
Figure 17 Digital skills reported by role. Percentage were calculated through the ratio between absolute frequency and the total number of unities of meaning for each role (Employer / Manager = 394 Adult educator
= 306 Employee = 603).
A group of employers (N = 8) from the bioeconomy sector (Finland) were involved in the second stage of the Delphi method.
Results of the ranking stage are in line with the results of the interviews’ content analysis (see Table 23). In accordance with the interview results, using digital equipment is ranked as the most important skill to develop by 6 out of 8 managers / employers. Data literacy and communicating through ICT were assessed second (3 managers / employers) and third (2 managers / employers). Safety is ranked fourth by managers.
Table 23 Ranking of the top four digital skills according to managers and employers in bioeconomy sector
1st 2nd 3rd 4th Using digital equipment 75,0% 12,5% 12,5% 0,0% Data literacy 12,5% 37,5% 25,0% 25,0% Communicating through ICT
12,5% 37,5% 25,0% 25,0%
Safety 0,0% 12,5% 37,5% 50,0%
5.3 Training approaches and digital technologies
The most occurrent training approaches can be classified as transmissive / traditional (7.3%), followed by reflection on practice (4.2%), collaborative constructivism (2.1%), individual constructivism (1.4%) and individual action on knowledge (1.1%) (see Figure 18).
9,1 9,5
12,4
4,3 3,9 3,8
9,1
7,28,3
1,30,7 1
6,6
5,2 5,14,1
12
0,30
2
4
6
8
10
12
14
Employer / HR manager Adult educator Employee
% fr
eque
ncy
by to
tal o
f UM
per
role
Using digital equipment Data literacy
Communication through ICT Safety
Using online services Computational thinking
Fixing technical problems

39
Figure 18 Training approaches reported in the total corpus of data. Percentage were calculated through the ratio between absolute frequency and the total number of unities of meaning (N = 1303)
Companies seem to be aware of the importance of experience learning and reflection on practice and report different kinds of practices (coaching, individual annual interviews). However, according to an employee in the textile sector there is still much room for improvement (see Extract 8) Extract 8: “Perhaps, companies need to create moments in which we stop and analyse what has happened. I mean if there is an important project, you have to achieve the objectives, you work to achieve that objective and certainly learn a lot in the process. The problem is that there is almost always a lack of time to analyse what lessons we have learned from this project, what we have done well, what we have done badly, what we could have done differently. In my opinion, this almost never happens in the company. Instead, it would be invaluable because it would become a company's know-how, not just something that remains within the individual, which would allow them to improve and improve in all future projects”. (Textile, employee, Switzerland) Interestingly, although traditional learning methods were the most mentioned in the interviews, when employers / managers (N = 8) in bioeconomy were explicitly asked to rank the most effective training approaches in the second Delphi round, traditional / transmissive learning is reported by a majority (5 out of 8) as the least effective training method (see Table 24). This highlights a first discrepancy between what companies think about the effectiveness of training methods and what they actually do. Table 24 Ranking of the five most effective training approaches according to managers and employers in bioeconomy sector
1st 2nd 3rd 4th 5th Collaborative constructivism
50,0% 37,5% 0,0% 0,0% 12,5%
Reflection on practice 12,5% 37,5% 0,0% 0,0% 50% Individual action on knowledge
0,0% 0,0% 50,0% 37,5% 12,5%
Traditional / transmissive learning
12,5% 0,0% 12,5% 12,5% 62,5%
1,1
1,4
2,1
4,2
7,3
0 1 2 3 4 5 6 7 8
Individual action on knowledge
Individual constructivism
Collaborative constructivism
Reflection on practice
Traditional learning
% by the total of UM

40
Concerning digital technologies adopted at the workplace (Figure 19), the most mentioned tools are communication (4.4%), followed by productivity (3.8%) and video tools (2.1). The least used technologies are innovative applications (0.7) and badges / score systems (0.2).
Figure 19 Digital technologies reported in the total corpus of data. Percentages were calculated through the ratio between absolute frequency and the total number of unities of meaning (N = 1303)
We were interested to identify to which extent digital technologies were mentioned together with both formal and informal learning practices. We found generally a poor association between the technologies and the training approaches mentioned in the interviews. The strongest co-occurrence emerges between communication tools and traditional learning methods (C = 0.12). Examples are webinars or seminars through online video platforms. Employees reported different experiences about traditional/transmissive distance learning, which increased during the pandemic. For instance, in the Extracts 8 and 9 opposite views emerged concerning the issue of “attention” when attending webinars.
Extract 9 "During these webinars I attended, it was easier for me to take notes. I was much more focused probably because I was in a less formal place. But I remember much more easily the things that I learnt, I listened to, when I was at home, or in a more comfortable place than in presence at work” (Textile, employee, Switzerland)
Extract 10 "Anything within which relationship is required things must be done in presence. The rest, digital is better. I see in practice what happens with the use of technologies. Present training cannot be taken away; the human side is required" (Tourism, employee, Italy).
When employers and managers (N = 8) in bioeconomy were asked to rank digital technologies, they considered more useful to achieve their learning and development priorities. They did not show a strong agreement on any of the tools (see Table 25). Although the management team highlighted sharing experiences and knowledge as the most effective training method (Table 24), collaboration and sharing tools were considered generally less useful than learning content management systems or simple communication tools, such as email or Zoom.
0,2
0,3
0,7
0,9
1,5
1,8
1,8
2,1
3,8
4,4
0 1 2 3 4 5
Badges / score systems
No digital technologies
Innovative applications
Knowledge management systems
Learning content management systems
Collaboration / Sharing
Content / Knowledge digital tools
Video tools
Productivity
Communication
% frequency by the total of UM

41
Table 25 Ranking of the top four digital skills according to managers and employers in bioeconomy sector
1 2 3 4 5 Knowledge management systems
25,0% 25,0% 12,5% 12,5% 25,0%
Learning content management systems
37,5% 25,0% 25,0% 0,0% 12,5%
Content / knowledge digital tools
12,5% 12,5% 25,0% 25,0% 25,0%
Communication tools 25,0% 25,0% 12,5% 25,0% 12,5% Collaboration and sharing tools
0,0% 12,5% 25,0% 37,5% 25,0%
Looking at these results, a second discrepancy emerged between: expectations concerning effective training methods and effective technologies for training and learning.
Employees and managers are generally quite aware about the use of digital technologies to support traditional forms of learning, as shown before. However, companies’ representatives probably need to reflect more about the possibilities to use digital technologies to support the forms of learning they consider more effective. For example, one employee, only at the end of the interview managed to report an example of how his team used a productivity / shared tool (an excel file in Cloud) to support reflection on practice (see Extract 11)
Extract 11: We created an internal file where, for each project or activity, we mark everything that we could have done better. “We have done this thing wrong, we could have done it this way or in the meantime we have decided to do it in a different way”. So, let's put on a file all the actions we've done, the decisions we've made, the assumptions we've made within a project and the changes of programme or purpose. Then, we look at the file ad the end of the project and we set points of improvement for the next one. It helps us a lot. When I re-approach the same project, if it is a recurring project, a similar project, all that we have learned from the previous project does not remain only in the memory, which obviously could be lost, but it remains in an analysis that we do within the team and we apply it. This really allows us to see a progressive improvement in the quality of work. If this were done not only at the level of the individual team, but at the level of the company, perhaps managed by the personnel office in a structured way, and therefore even less artisanal than I can do, I think it would give a taste, a very strong push to that process of informal learning I mentioned before. I don't see much of it even talking to those of the companies, no manager has had similar experiences. I think it would be fundamental, instead. (Textile, employee, Switzerland).
5.4 Factors which support or inhibit learning and up-skilling
In the 32.4% of the total unity of meaning, participants talked about factors which support or inhibit learning. Within this 32.4%, they mostly talked about supportive factors (22%) and less about inhibitor factors (8%). In a few cases, they simultaneously talked about supportive and inhibitor factors (2.4%). Possibilities for social interaction was the organisational factor which mostly supports learning (25.4 %, see Figure 20).

42
Some of the respondents highlighted that support and guidance especially come from colleagues (see Extract 12).
Extract 12: “Well, we always think about these issues together... so there are always certain kind of problems where you feel uncertainty and you look for self-confidence by calling to a friend and asking for help and then you think together of these issues and also vice versa, there are certain strengths which I have more so then, the same persons call me and ask and there are these situations, where you think and solve problems together”. (Bioeconomy, employee, Finland).
The individual ability to adopt informal strategy at work (21.6%) and motivational factors (14%) are the two most mentioned individual factors which support learning. Connectivity (10.7%) is the second most mentioned organisational factor as source for learning (see an example in the Extract 13).
Extract 13: “More companies have joined to co-operate with education. We receive assignments from the world of work (outside of school) and the teams of students develop, as part of their studies, different applications and technical solutions to the companies, for example.” (Bioeconomy, adult educator, Finland).
Figure 20 Factors which support learning. Percentage were calculated through the ratio between absolute frequency of co-occurrence between a factor and the transversal category “support learning” and the total
number of unities of meaning (N = 1303)
According to respondents, the perception of a heavy workload inhibits learning at work (6.6%) as reported in the extract 14.
0,5
1,2
1,7
2,4
4
4,3
5,2
8,1
9,2
9,7
9,9
10,7
14,0
21,6
25,4
0,0 5,0 10,0 15,0 20,0 25,0 30,0
Perception of job insecurity
Workload
Individual action on knowledge
Individual constructivism
Collaborative constructivism
Reward
Reflection on practice
Attitude toward technology in WPL
Occupational self-efficacy
Promotion of autonomy
Traditional training method
Connectivity
Motivational factor
Informal learning strategy at work
Possibilities for social interaction
Organisational factorsIndividual factorsTraining methods

43
Extract 14 “For me it’s a choice between selling (for the customers) or studying. Do I keep machines on, or do I start studying for myself? Now, when the season is on, we have 1000 machines working on the fields and I’m working all daylong and nights, supporting, solving technical problems. It’s a question of people’s living. (Bioeconomy, employer, Finland). We saw that possibilities for social interaction emerge as one of the most important factors supporting informal learning in the workplace. However, in some circumstances (4.3) it can also prove to be a barrier, especially if there is a perception of job insecurity among colleagues (3.1) (see Figure 21). This was reported mainly by employees (see Extract 15). On the other hand, employers rarely mentioned this factor as a possible learning barrier.
Extract 15 "There might be a person who has been working in the company for a longer time than you, and he/she is your supervisor. If you wish to advance in your career, this person could limit you because he/she is in that role for a long time and he/she does not want to share his/her knowledge with you. That's what I've experienced in the past few years" (Employee, building sector, Switzerland).
Figure 21 Factors which inhibit learning. Percentage were calculated through the ratio between absolute frequency of co-occurrence between a factor and the transversal category “inhibit learning” and the total
number of unities of meaning (N = 1303)
6. Conclusions and implications for the StiLLLearning project
Based on the results of this research, some recommendations will guide the following steps of the project. The respondents clearly highlighted key emerging challenges: on one hand the progressive digitalization, on the other hand customers’ rapidly changing needs and habits. Both these elements
0,2
0,2
0,5
0,7
0,9
1,2
1,7
1,9
2,8
3,1
3,6
4,3
6,6
0,0 1,0 2,0 3,0 4,0 5,0 6,0 7,0
Reflection on practice
Reward
No training planned
Connectivity
Occupational self-efficacy
Promotion of autonomy
Informal learning strategy at work
Attitude toward technology in WPL
Traditional training method
Perception of job insecurity
Motivational factor
Possibilities for social interaction
Workload
Organisational factorsIndividual factorsTraining methods

44
are sources of disruption as they have been changing both the methods and the nature of current jobs.
To this extent, the range of skills requested by companies is also changing, making not only training but also upskilling and reskilling a crucial dimension of the future of jobs. Among the others, transversal skills, namely teamwork, life skills and active learning represent a paramount challenge for the involved sectors.
Despite this condition, learning at work is not automatically implemented, nor are innovative training approaches. On the contrary, most companies apply old-fashioned models of training, mainly based on traditional face-to-face sessions, passive learning and minimal application of digital technologies. It is important to reduce the gap between what companies know about the effectiveness of training methods and what they do. Although employers and managers are aware about the adoption of training models based on sharing, interaction and co-construction, interviewees reveal that the current practices are mainly based on the transmissive-traditional training model. It is important to increase the awareness of the use of technologies to support valuable forms of learning. At the same time, companies should discover the opportunities of informal forms of learning included connectivity through the collaboration with external partners like universities, suppliers, even customers.
Due to this analysis, the StiLLLearning project can offer a valuable contribution by preparing companies and HR managers to face current and future disruptions, included sustainable development, automation, and internet of things. It is important to support communication and collaboration skills. Specifically, communication and collaboration across department is considered by employees as a real challenge. In some cases, digital technologies for communication have been adopted to support the communication among departments and reducing issues connected to “silos mentality”. Supporting basic digital skills included using digital equipment and communicating through ICT is an urgent priority. Employees and adult educators should be more aware about employers’ expectations in terms of computational thinking and fixing technical problems.

45
7. References
• Aprea, C., & Cattaneo, A. (2019). Designing Technology-Enhanced Learning Environments in Vocational Education and Training. In The Wiley Handbook of Vocational Education and Training (pp. 373-393). https://doi.org/https://doi.org/10.1002/9781119098713.ch19
• Bellezza, A. & Caggiano, V. & Amenduni, F. (2018). Robotica ed economia: linee guida introduttive. Analysis, 1, 8-17
• Billett, S. (2001). Learning throughout working life: Interdependencies at work. Studies in continuing education, 23(1), 19-35.
• Binkley, M., Erstad, O., Herman, J., Raizen, S., Ripley, M., Miller-Ricci, M., & Rumble, M. (2012). Defining twenty-first century skills. In Assessment and teaching of 21st century skills (pp. 17-66). Springer, Dordrecht.
• Bower, M. (2008). Affordance analysis–matching learning tasks with learning technologies Educational Media International, 45(1), 3-15.
• Carretero, S., Vuorikari, R., & Punie, Y. (2017). The digital competence framework for citizens. Publications Office of the European Union.
• Cattaneo, A., Motta, E., Gurtner J-L. (2015). Evaluating a Mobile and Online System for Apprentices' Learning Documentation in Vocational Education: Usability, Effectiveness and Satisfaction. International Journal of Mobile and Blended Learning (IJMBL), 7(3), 40-58. https://doi.org/10.4018/IJMBL.2015070103
• Cheng, B., Wang, M., Yang, S. J., & Peng, J. (2011). Acceptance of competency-based workplace e-learning systems: Effects of individual and peer learning support. Computers & Education, 57(1), 1317-1333.
• Chi, M. T., & Wylie, R. (2014). The ICAP framework: Linking cognitive engagement to active learning outcomes. Educational psychologist, 49(4), 219-243.
• CIDP (2020) Learning and skills at work 2020 Mind the gap: time for learning in the UK. https://www.cipd.co.uk/Images/learning-skills-work-report-1_tcm18-79434.pdf
• Clark, H., Jassal, P. K., Van Noy, M., & Paek, P. L. (2018). A New Work-and-Learn Framework. In D. Ifenthaler (Ed.), Digital Workplace Learning: Bridging Formal and Informal Learning with Digital Technologies (pp. 23-41). Springer International Publishing. https://doi.org/10.1007/978-3-319-46215-8_3
• Decius, J., Schaper, N., & Seifert, A. (2019). Informal workplace learning: Development and validation of a measure. Human Resource Development Quarterly, 30(4), 495–535.
• Engeström, Y. (2001). Expansive learning at work: Toward an activity theoretical reconceptualization. Journal of education and work, 14(1), 133-156.
• EUROSTAT (2020) Adult Education Survey. https://ec.europa.eu/eurostat/web/education-and-training/methodology
• Eyhorn, F., Muller, A., Reganold, J. P., Frison, E., Herren, H. R., Luttikholt, L., Mueller, A., Sanders, J., Scialabba, N., Seufert, V., & Smith, P. (2019). Sustainability in global agriculture driven by organic farming. Nature Sustainability, 2, 253-255. https://doi.org/10.1038/s41893-019-0266-6
• Fernet, C., Senécal, C., Guay, F., Marsh, H., & Dowson, M. (2008). The work tasks motivation scale for teachers (WTMST). Journal of Career assessment, 16(2), 256-279.
• Hager, P. (2004). The conceptualization and measurement of learning at work. In H. Rainbird, A. Fuller, & A. Munro (Eds.), Workplace learning in context (pp. 242–258). London: Routledge.

46
• Hager, P. (2005, December 12–14). The importance of contextuality in learning. Paper presented at the Researching Work and Learning, RWL04, Conference, Sydney, Australia.
• Ifenthaler, D. (Ed.). (2018). Digital workplace learning: Bridging formal and informal learning with digital technologies. Springer.
• Illeris, K. (2011). The fundamentals of workplace learning: Understanding how people learn in working life. Routledge.
• Knight, L. (2002). Network learning: Exploring learning by interorganizational networks. Human Relations, 55(4), 427–454
• Kirby, J. R., Knapper, C. K., Evans, C. J., Carty, A. E., & Gadula, C. (2003). Approaches to learning at work and workplace climate. International Journal of Training and Development, 7(1), 31-52.
• Miles, M., & Huberman, M. (1994). Qualitative Data Analysis. An Expanded Sourcebook. Sage. • Moreau, F. (2013). The disruptive nature of digitization: the case of the recorded music
industry. International Journal of Arts Management, 15(2). • Okoli, C., & Pawlowski, S. D. (2004). The Delphi method as a research tool: an example, design
considerations and applications. Information & management, 42(1), 15-29. • Olsen, W. (2004). Triangulation in social research: qualitative and quantitative methods can
really be mixed. Developments in sociology, 20, 103-118. • Phaal, R., O'Sullivan, E., Routley, M., Ford, S., & Probert, D. (2011). A framework for mapping
industrial emergence. Technological forecasting and social change, 78(2), 217-230. • Rigotti, T., Schyns, B., Mohr, G. (2008). A short version of the occupational self-efficacy scale:
Structural and construct validity across five countries. Journal of Career Assessment, 16(2), 238–255.
• Sabatier, V., Craig-Kennard, A., & Mangematin, V. (2012). When technological discontinuities and disruptive business models challenge dominant industry logics: Insights from the drugs industry. Technological Forecasting and Social Change, 79(5), 949-962.
• Scardamalia, M., & Bereiter, C. (1994). Computer support for knowledge-building communities. The journal of the learning sciences, 3(3), 265-283.
• Schon, D. A. (1983). The reflective practitioner: How professionals think in action. New York: Basic Books.
• Strijbos, J. W., Martens, R. L., Prins, F. J., & Jochems, W. M. (2006). Content analysis: What are they talking about?. Computers & education, 46(1), 29-48.
• Spitz-Oener, A. (2006). Technical Change, Job Tasks, and Rising Educational Demands: Looking outside the Wage Structure. Journal of Labor Economics, 24(2), 235-270. https://doi.org/10.1086/499972
• Tynjälä, P. (2008). Perspectives into learning at the workplace. Educational research review, 3(2), 130-154.
• Tushman, M. L., & Anderson, P. (1986). Technological discontinuities and organizational environments. Administrative science quarterly, 439-465.
• Van Hootegem, A., & De Witte, H. (2019). Qualitative job insecurity and informal learning: A longitudinal test of occupational self-efficacy and psychological contract breach as mediators. International Journal of Environmental Research and Public Health, 16(10), 1847.
• Vermersch, P. (2019). L'entretien d'explicitation. ESF Sciences humaines. • Weber, K. M., Gudowsky, N., & Aichholzer, G. (2019). Foresight and technology assessment
for the Austrian parliament — Finding new ways of debating the future of industry 4.0. Futures, 109, 240-251. https://doi.org/https://doi.org/10.1016/j.futures.2018.06.018

47
Appendix A – Further graphs
National comparison for disruption and digital skills
Figure 22 Disruption reported by country. Percentage were calculated through the ratio between absolute
frequency and the total number of unities of meaning for each country. (Finland = 352; Germany = 124; Italy = 136; Switzerland = 691)
Figure 23 Digital skills reported by country. Percentage were calculated through the ratio between absolute frequency and the total number of unities of meaning for each country. (Finland = 352; Germany = 124; Italy =
136; Switzerland = 691)
13,6
4,8
14,0
10,9
1,1
3,2 2,9 3,51,7
0,8
7,4
2,5
11,6
16,1
8,8
14,5
1,1 0,8
2,9
0,9
0,02,04,06,08,0
10,012,014,016,018,0
Finland Germany Italy Switzerland% fr
eque
ncy
by to
tal o
f UM
per
nat
ion
Customers / Suppliers needs Sustainable development
Automation Digitalisation
Internet of things
10,5
19,4
11,09,3
5,7
1,62,9 3,8
7,75,6
8,19,1
0,0 0,8
5,1
0,7
6,8 6,5
3,75,2
4,0
0,8 0,7 0,91,7 1,60,7 0,1
0,0
5,0
10,0
15,0
20,0
25,0
Finland Germany Italy Switzerland
% fr
eque
ncy
by to
tal o
f UM
per
nat
ion
Using digital equipment Data literacy Communication through ICT
Safety Using online services Computational thinking
Fixing technical problems

48
Detailed Transversal skills
Figure 24 Transversal skills reported by sector. Percentage were calculated through the ratio between absolute frequency and the total number of unities of meaning for each sector. (Tourism = 414; Textile = 237;
Bioeconomy = 352; Automotive = 49: Building sector
Tourism Textile Bioeconomy Auotomotive Buildingsector
Creativity and innovation 2,7% 7,2% 1,1% 2,0% 0,6%Critical Analytic Thinking 4,3% 8,4% 2,0% 6,1% 4,0%Problem solving 4,6% 2,1% 4,5% 20,4% 2,8%Decision-making 2,9% 2,1% 0,3% 2,0% 0,6%Active learning / Metacognition 3,9% 5,1% 19,6% 24,5% 1,7%Collaboration and teamwork 13,5% 15,2% 12,5% 34,7% 20,5%Leadership 2,9% 5,1% 3,1% 20,4% 4,0%Life skills 9,4% 7,6% 10,5% 18,4% 2,8%Multi-expert 5,3% 2,1% 5,7% 10,2% 1,7%
0,0%
5,0%
10,0%
15,0%
20,0%
25,0%
30,0%
35,0%
40,0%

49
Figure 25 Transversal skills reported by country. Percentage were calculated through the ratio between absolute frequency and the total number of unities of meaning for each country. (Finland = 352; Germany =
124; Italy = 136; Switzerland = 691)
Finland Germany Italy SwitzerlandCreativity and innovation 1,1% 0,8% 7,4% 2,7%Critical Analytic Thinking 2,0% 4,8% 3,7% 5,8%Problem solving 4,5% 8,1% 2,9% 3,6%Decision-making 0,3% 1,6% 2,9% 2,0%Active learning / Metacognition 19,6% 15,3% 10,3% 2,5%Collaboration and teamwork 12,5% 21,8% 10,3% 16,5%Leadership 3,1% 9,7% 3,7% 3,8%Life skills 10,5% 16,9% 17,6% 5,5%Multi-expert 5,7% 5,6% 6,6% 3,0%
0,0%
5,0%
10,0%
15,0%
20,0%
25,0%

50
Figure 26 Transversal skills reported by role. Percentage were calculated through the ratio between absolute frequency and the total number of unities of meaning for each role (Employer / Manager = 394 Adult educator
= 306 Employee = 603).
Employer / HR manager Adult educator EmployeeCreativity and innovation 4,1% 2,0% 2,0%
Critical Analytic Thinking 6,3% 4,9% 3,0%
Problem solving 3,8% 2,6% 5,3%
Decision-making 3,0% 0,7% 1,2%
Active learning / Metacognition 6,3% 7,8% 11,6%
Collaboration and teamwork 15,5% 12,7% 16,4%
Leadership 5,1% 2,3% 4,5%
Life skills 10,2% 9,2% 8,6%
Multi-expert 5,3% 4,6% 3,6%
0,0%
2,0%
4,0%
6,0%
8,0%
10,0%
12,0%
14,0%
16,0%
18,0%

51
Appendix B – National case studies on qualitative analysis
Case Study: Finland
In the Finnish case study, we focused on the bioeconomy industry. Altogether, we carried out 13 interviews with employees from a large company for qualitative data. Nine (9) members of the management board participated in a Delphi survey covering 2 rounds, and 53 employees responded to an online questionnaire. In further, we interviewed three (3) higher education teachers in the field of bioeconomy. In this summary, we briefly introduce some preliminary findings concerning 13 employee interviews. The other research data from the Finnish case will be later reported in peer-reviewed publications. The interviews of employees aimed at recognizing changes in the industry and at work, competences and learning methods, skills and learning processes, and future insights related to the industry of bioeconomy.
Disruptions
The interviewees reported changes in markets and in customers, for instance diminishing number of primary producers. One remarkable disruption on the field was digitalization; the development of IT and data systems, which had impact on both work processes and technology development in the field. In addition, the field of commerce was transforming towards e-commerce. Changes in the operating environment were considered remarkable, including globalization, increased competition, and general insecurity. Sustainability was considered as an evolving trend, and the interviewees reflected its importance from the point of view of trustworthy and responsible company brand. In addition to global trends, also changes in the organization and in the organization of the work were mentioned as disruptive and considered affecting the work. For example, distance work and flexibility in working methods was increasing. At the point in time of the data collection, COVID-19 pandemic had also impacted work - there were no live meetings or events and less possibilities for joint discussions or generating ideas with colleagues.
Learning and competence development
Organized training (formal learning)
The interviewees discussed organized training (formal learning) at their work. Many described that there were an online platform and learning environments available, but the content could be updated or revised to better match the company-specific needs. The interviewees’ learning preferences varied in relation to individual and collaborative learning and digital tools. Some felt that training online could be organized on shorter notice, on smaller subjects and more often. Current training online was mostly lecture-type of training, such as webinars online and less interactive tools and opportunities for social, interactive learning and sharing ideas was available (e.g., polls, quizzes, breakout rooms). Training online was considered to enable individual pace and a more flexible and easy participation in training. Nevertheless, online training was also considered to have some shortcomings: it often lacked a social dimension and a clear separation from everyday work, especially in comparison to face-to-face training organized at work. In general, less training had been organized during the COVID-19 pandemic. One possibility to receive organized training at the company was to participate in education leading to qualifications (e.g., apprenticeship training). The interviewees felt that they were positively encouraged to join in these kinds of education programs.

52
Individual learning activities (informal), “learning by doing”
The interviewees suggested that there were several informal learning opportunities at work. They reported that they learned at work by gaining new tasks and responsibilities and by actively engaging in searching and scanning information (e.g., online platforms, data systems, materials, publications) and, in general, following the developments in the field (e.g., policy developments, regulatory provisions, news, webinars). Using self-reflection and recognizing new competence needs was also an important driver for engaging in self-directed learning activities.
Collaborative, social, and interactive learning activities (informal)
The interviewees emphasized the importance of collaborative, social and interactive learning activities for their continuous learning at work. They told, that they learned from sharing experiences with more experienced colleagues, with the own team and more widely in the working community. They also appreciated the training opportunities and expertise provided by their networks. In future, they wished to obtain more performance feedback from the supervisor, and more informal feedback from supervisors, colleagues, and customers. Overall, feedback was considered important for continuous learning at work.

53
Case Study: Germany
In total, the BNW interviewed 12 people on the subject of learning in the workplace. Of these, two were from human resources development, four from the automotive sector, five from adult education and one from the commercial sector. The average age is 39 years. The average work experience of all persons in total is about 15 years. On average, the interviewees have been working in their current position for about 8 years. The interview guide comprises four major questions. The results of these are summarized below.
The biggest challenge that emerges from the interviews is digitalization. The interviewees report changes to certain work processes due to the introduction of new technologies, the emergence of new forms and methods of work, and changes to internal structures. Also interesting in this context is the reference to the knowledge aspect, which is also influenced by digitalization. For example, certain competencies are changing or new competence requirements are emerging, which are necessary so that employees can continue to perform their tasks fairly. Leadership change, Corona and a change in culture can be identified as further transformation aspects that were mentioned in addition to digitalization and its effects. Since these items are less relevant to answering the research question, the list will be retained as is and will not be continued.
In the next step the employers have been asked about the competencies, which are currently playing an increasingly important role in companies, and will continue to do so in the future. With that it was intended to provide a basis for the follow-up questions in the interview questionnaire. Since a large pool of answers regarding competencies that are expected of employees both now and in the future emerged from the interviews, a summary of those competencies that have been assigned to both categories is provided at this point. Subsequently, the future skills are supplemented by other aspects that the interviewees have assigned exclusively to this area. One important competence relates to the fact that the employees are appropriately trained in their professional areas. Process understanding and thinking can be classified under subject-related competencies. This means that, in the best-case scenario, employees should have knowledge of exactly how work processes are carried out and how different processes are interlinked. In addition, according to the interviewees, it is important that their employees have digital competencies. Digital competencies refer to dealing with current technologies and technology used in the company. In addition, employees should know how to use learning tools and also apply them. Furthermore, soft skills such as punctuality, reliability and teamwork are expected as important competencies from employees. In addition, skills relating to self-organization, self-assessment, initiative and self-reflection are listed. Furthermore, openness and receptiveness to new situations or applications are relevant skills that were also mentioned by the respondents. Finally, independent learning also falls under this area. Independent learning means that employees should regularly inform themselves about events that affect their workplace and continue to educate themselves in order to remain up-to-date. While these competencies are expected of employees both currently and in the future, the following refer exclusively to the Future Skills area.
One important competence is the handling of data. Data handling, data understanding and data security are named here as important future skills by the interviewees. Furthermore, inquisitiveness and curiosity are relevant characteristics that employees should possess. This primarily involves being aware of new developments in the relevant professional areas, being able to recognize and assess the potential of innovative technologies, and generally reflecting on new technological developments.

54
In the course of digitalization, creativity and spontaneity of people are accorded to get greater importance. Creativity is an interesting factor here, since technology takes over monotonous tasks in particular which has little to do with the creativity of employees. It follows that creativity continues to be an important tool that remains solely with the people.
In order to get closer to the question of learning at the workplace, the next step is to ask about supporting and inhibiting factors. Supporting factors are those that facilitate or simplify learning at the workplace. Six aspects emerged from the interviews. These include the creation of a positive working environment in which a positive learning and working atmosphere is generated and a no blame culture is lived. Exchanging ideas with colleagues across departments also makes a positive contribution to learning new things at the workplace. Furthermore, employee motivation plays a very important role in making learning more effective. Learning in communities is also perceived as beneficial by the interviewees. In addition, it is relevant to familiarize employees with the concept of learning and to illustrate what learning looks like in a professional context. The relevance of lifelong learning must also be communicated to employees in a practical manner. Finally, organizational aspects, such as the provision of time and space and the smooth functioning of technology, are crucial for learning at the workplace.
Inhibiting factors, on the other hand, are a corporate culture that consists exclusively of old-fashioned and overly busy business and management staff with little openness to new technologies and ideas. A negative error culture, where employees are afraid to trying out something new, also inhibits learning success in the workplace. Finally, time pressure and stress with available technique, as well as the use of leisure time for learning, are factors that also have a negative impact on learning success at work.
In the last part of the interview, questions were asked about the training opportunities applied within the companies in order to analyse how the companies already enable learning at the workplace. The answers can be divided into four categories. These include internal and external applications such as training courses and workshops. But digital offerings such as webinars, a company wiki or learning platforms such as Elias are also used. What is interesting about this answer is the reference made by several respondents to the fact that digital platforms can only be used to impart theoretical knowledge independent of time and place, while practical knowledge tends to be taught in the company. Finally, self-learning options in the form of blog posts, Internet forums or journals represent options through which employees can further their education independently.

55
Case Study: Italy
The analysis on the Italian context was carried out by a team involving both Cometa Formazione (Stilllearning partner) and the International Academy of Tourism and Hospitality (IATH). While the former is active in IVET at EQF3/4 levels in hospitality, textile and wood sectors, the latter provides its 200 learners with a EQF5 training in tourism, based on a direct involvement of companies in both the training and the governance of the Academy. Interviews, focused on tourism and textile sectors, have involved 15 people, including employers, managers, adult educators and employees. Interviewees’ experience ranges over a wide spectrum, from almost beginners (1 year) to very experienced, with an average value of 20 years and a very different background of levels of qualifications.
Disruptions
Notwithstanding some specific differences between hospitality and textile sectors, the interviewees reported similar views when it comes to their perception of disruptions. The first evidence consists of the inexorable process of digitalization which has been transforming not only the work tools and methods, but also, and mainly, the nature itself of some jobs. Some emerged examples: textile design, easily replicable thanks to internet browsing; or booking and hotel accessing, now basically based on a digital communication through specific apps on customers’ smartphones. An interesting extract from one of the managers reports: “The digital platforms used today influences a lot on clients’ expectations who comes to the hotel. And it put the staff in the position of being a little on camera focus. Everything is perceived more than before, when an error could have passed in silence. Make the first mistake and your name can be globalized via TripAdvisor. This means that all the relationship aspect becomes crazy.”
Also customers’ habits and needs are significantly changing: since Covid-crisis, purchases of textiles did not require anymore a physical observation of the fabric (“Customers first valued the fabrics and then asked for the price. Today they first ask for the price and then what the fabric is made of”); as well as, in tourism, specific health rules, or environment care become essential.
Emerging skills
Based on this analysis of current disruptions, most of the interviews agree on the emerging relevance of transversal skills as the condition to cope with a continuously changing world. Among them, in particular, the ability to be “multitasking” (or multiexpert) is widely recognized as of paramount importance: flexibility, readiness in fulfilling different roles and managing various tasks is considered essential. Also digital skills are relevant and, to some extent, they are more and more perceived now as basic skills, almost a condicio sine qua non for most of the jobs: related to the emergence of digitalization and big data, analytical thinking plays an increasing role in the top competences: once we have many data, it is crucial to understand what they say and identify the right action.
Learning and competence development
The attitude toward learning presents several differences based on the typology of company, the sector, the person.
In general interviewees have a positive personal approach to learning: most of them recognize learning as an essential, even intrinsic part of their work: relational contexts are valued as important factors promoting learning. Collaboration with peers or other internal staff, but also meetings and

56
moments with customers or suppliers can offer an opportunity to learn something new. On the other hand, when it comes to formal training opportunities, intervieewes complain about the difficult condition to balance a demanding workload, with specific constraints on timings, and the rigidity of most of courses’ organization and timelines. In case of overlapping, training is always the less relevant object.
An interesting issue concerns the different approaches to learning played by SMEs and Big companies. The latter, often part of international networks, chains or franchising offer several training opportunities: based on international digital platforms, the staff can (rather freely or after a dialogue with their seniors or employers), choose what topic (from professional to transversal competences) to focus on, to attend the courses self-organizing their time, to be engaged in wide and international settings. On the other hand, SMEs cannot provide their staff with similarly rich opportunities: into these contexts, formal training often leaves the floor to informal training based on daily peer-to-peer collaboration, on-the job training, job shadowing, coaching; also experts can be involved, but mainly in the form of traditional learning courses (physically present and not always online). Personal and autonomous intiatives are usually preferred by interviewees in these cases, while formal training promoted by the company is often perceived as a required step for career advancement.
This final comment, however, has to be mitigated based on a second element of interest emerging from the interviews: while new generations (millennials onwards) are rather positive on learning (growth mindset), older generations (excluding managers) have declared a rather high dissatisfaction on the levels of training they have to attend, privileging a more fixed mindset and a strong extrinsic motivation towards learning.

57
Case Study: Switzerland
In our research we involved employer, employee and managers (N =24) from a hospitality school, a hotel, a building company, and a multinational in the field of textile and fashion in Ticino, that is the Italian-speaking region in Switzerland.
Disruptions
Interviewees from all the fields reported common kinds of disruptions, although they put different emphasis on them. In the hospitality sector one of the main disruptions referred to the past: the advent of booking online services, which created the need of new professional roles and competences. Just as an example, the hotel owner mentions the role of the Revenue Management which needs to be able to make data-driven decisions based on analytics provided by booking platforms. In the hospitality sector, a present and future challenge will concern the higher rate of automation especially in profession related with reception.
Although both employer and employee seemed to be quite aware of this disruption, we did not retrieve a clear strategy on how to deal with it. For instance, the training responsible of the hotel we interviewed, when she was asked to describe how automation will shape the jobs in her sector, reported she is aware of this disruption but she cannot figure out the impact on jobs, occupations, competences and profiles. Textile sector reported different present and future challenges. The two most mentioned are 1. the need to find ways to combine the e-commerce services with physical shops, which can be ascribed to “internet of things” 2. challenges related to sustainability. According to employees in building sector, big B2B online services, such as Alibaba, are strongly shaping customers’ and suppliers’ expectations, in terms of costs and service speed. Especially elder employees perceive a higher pressure to provide a faster service compared to the past.
Skills and new profiles
Not surprisingly, across sectors transversal competences where much more emphasized than technical and field specific competences. Employers reported that transversal competences are more difficult to acquire, as they are strongly based on personal attitudes. It was interesting to see from interviews that new jobs are emerging across sectors, which combine a digital and traditional HR/training functions:
1. In the textile sector, there is the need of a new figure able to correctly manage the communication between the headquarter and the physical shops. According to one of the managers interviewed, this new figure is in the middle between a Human Resource manager and a Digital Marketing expert. He told us they have difficulties to find and select these profiles;
2. In the textile sector and in the hospitality sector, some people talked about adult trainers which are able to communicate like Influencers on Social Media. For instance, the textile company has invested in a big mobile-learning project to train people who work in the physical shops based on short-video lessons. The general manager said to be inspired by the “Tik-Tok” model.
Technology enhanced learning practices

58
During the interviews, different technology enhanced learning practices have emerged. Within digitalized companies, the boundaries between more and less formalized training practices are blurred.
A few transversal topics emerged in relation to the pandemic. The first one is related with the positive attitude toward blended learning as the main training model after the pandemic. We retrieved quite opposite opinion concerning 100% online synchronous learning, from very enthusiastic to strongly skeptical. Nevertheless, employee with a less enthusiastic attitude toward online learning solutions, acknowledge blended learning as positive for workplace learning. In a few cases, participants reported that their attitude toward 100% online learning positively changed during the lockdown period, when they discovered the effectiveness of this solution, also in non-formal courses (e.g. online singing course).
Examples of more formalized strategy are the following:
- In the textile, the company provided a learning platform starting from the March lockdown 2020. This platform did not include only professional courses, but also other kinds of courses (e.g. yoga and theater courses) which are accessible to all the employees. One of the interviewees found that this was a very positive initiative. The employee reported that the pandemic brought a higher accessibility of training opportunities by the textile company for all the employees
- Mobile and video-based learning strategy inspired to some extent by Social Media forms of communication have been recently adopted by the textile company.
- In building sector, formalized forms of online learning consist of webinars to transfer knowledge on new products and materials to employees
- In the touristic sector, only the cook apprentice report to use digital technologies for formalized learning purpose. He mentioned the e-DAP a a mobile learning solution allowing chef apprentices to create one’s recipe book.
Concerning informal learning strategy at work we retrieved the following examples:
- Self-directed learning strategy by employee. In textile, many employee and managers reported they attend webinars and read newsletter daily to be updated; an apprentice from the hotel report to use social media, such as Instagram, to find inspiration for new recipes.
- Reflective practice: One employee at the end of the interview reported an example of how his team used a productivity/shared tool (an excel file in Cloud) to support reflection on practice. He also argues that these kinds of strategies could be better systematized by HR managers.

www.stilllearning.net
#STILLLEARNING_EU #STILLLEARNING
#LEARNINGATWORK #FUTURESKILLS