Laurens School District 55 2011 MSP Evlauation
54
PREPARED FOR LAURENS SCHOOL DISTRICT 55 BY SYSTEM WIDE SOLUTIONS, INC. Malia Howell George W. Appenzeller, MSW Sarah Meadows, MSW Tiffany Powell Jessica Norton October 30, 2011 AN EVALUATION OF THE MATHEMATICS AND SCIENCE PARTNERSHIP GRANT TO LAURENS SC SCHOOL DISTRICT 55 (The STEM Teacher Development Program) March 31, 2011-Sept. 30, 2011
-
Upload
swsolutionsinc -
Category
Documents
-
view
1 -
download
0
Transcript of Laurens School District 55 2011 MSP Evlauation
PREPARED FOR LAURENS SCHOOL DISTRICT 55
BY
SYSTEM WIDE SOLUTIONS, INC.
Malia Howell George W. Appenzeller, MSW
Sarah Meadows, MSW Tiffany Powell Jessica Norton
October 30, 2011
AN EVALUATION
OF THE MATHEMATICS AND SCIENCE PARTNERSHIP GRANT
TO LAURENS SC SCHOOL DISTRICT 55
(The STEM Teacher Development Program)
March 31, 2011-Sept. 30, 2011
Laurens 55 MSP/SWS Inc. October 30, 2011 i
ACKNOWLEDGEMENTS
We gratefully acknowledge the assistance of Laurens County School District 55 personnel who provided information through meetings, emails and discussions. We want to recognize the following individuals who made thoughtful contributions to this report.
Ginny Cartee Jody Penland
Leann Iacuone The teachers and staff of Laurens School District 55
who graciously gave their time for interviews and surveys
Laurens 55 MSP/SWS Inc. October 30, 2011 ii
EXECUTIVE SUMMARY Laurens County (SC) School District 55 received a Mathematics and Science Partnership Grant from the SC Department of Education for the period of March 31, 2011-September 30, 2011, with continuation of the grant possible in future years. The goal of this grant is to improve student achievement in math and science by increasing teacher math and science content knowledge and by improving teacher instructional skills. The STEM concept is based on two process objectives and success is to be measured through ten outcome objectives. The purpose of this evaluation is to provide information which will assist the project staff in meeting the goals of the STEM Teacher Development Project and in assuring the continuing improvement of the project. The evaluation includes both a process evaluation and an outcome evaluation. The design of the process (or formative) evaluation is descriptive-exploratory. The design of the outcome (or summative) evaluation is quasi-experimental. However, since this is the first year of the project, the outcome evaluation will only report baseline data. Laurens District 55 closely followed their implementation plan in spite of a late start caused by funding delays outside of their control. The District was successful in identifying teachers to attend the Summer Institute and the Institute was successful in increasing both the content knowledge and teaching abilities of the participants. The District also provided STEM professional development activities during the summer and into the fall for math and science teaches not involved in the Summer Institute. The members of the comparison group for the evaluation were identified and tested. All other administrative tasks necessary for the grant implementation were carried out successfully. During the first year of the project, only baseline scores are available, and therefore a comparison of the outcomes for the students taught by the experimental group (math and science teachers who take part in the Summer Institute and graduate courses provided by the project) cannot be compared to those of the students of the math and science teachers who do not take part in this professional development. Baseline scores are reported in the evaluation. The teachers who participated in the project have not yet had the opportunity to influence change in the targeted students on the measures established by the grant. Progress toward achieving the outcomes of the grant are presented in the evaluation to establish the change pattern for each measure. The grant was implemented effectively and efficiently. The District staff adapted to the late funding to make sure the project met its objectives for the year. The process indicators were ether met or exceeded and baseline data for the comparison study and outcome measures were obtained. However, the project had established ten outcome measures for the first year. Three of these were met and seven were not met. It is recommended that the District continue its support of the grant and that the improvements to the Summer Institute recommended by key informants on pages 9 and 10 be implemented.
Laurens 55 MSP/SWS Inc. October 30, 2011 iii
TABLE OF CONTENTS ACKNOWLEDGEMENTS ..........................................................................................................I
EXECUTIVE SUMMARY ......................................................................................................... II
TABLE OF CONTENTS ...........................................................................................................III
INTRODUCTION......................................................................................................................... 1 The Purposes and Goal of the Grant......................................................................................................... 1 Purpose and Contents of the Evaluation................................................................................................... 2
Process Evaluation ..............................................................................................................................................2 Outcome Evaluation.............................................................................................................................................2 GPRA Measures...................................................................................................................................................2
METHODOLOGY ....................................................................................................................... 3 Philosophy of the Approach ..................................................................................................................... 3 Evaluation Design..................................................................................................................................... 3 Information System .................................................................................................................................. 3 Process Evaluation.................................................................................................................................... 4 Outcome Evaluation ................................................................................................................................. 4 Phases of the Evaluation........................................................................................................................... 5
Phase 1 – Preparation for Data Gathering..........................................................................................................5 Phase 2 – Gathering and Reviewing Information ................................................................................................5 Phase 3 –Preparation of the Information and Data.............................................................................................6 Phase 4 – Analysis of Information and Data and Development of the Report.....................................................6
Limitations of the Evaluation ................................................................................................................... 6 Organization of the Evaluation................................................................................................................. 7
FINDINGS PART I: PROCESS EVALUATION...................................................................... 8 Introduction .............................................................................................................................................. 8 Teachers Served........................................................................................................................................ 8 Characteristics of Students in the District ................................................................................................ 9 Description of Implementation ................................................................................................................. 9 Teachers’ Reactions to the Summer Institute ......................................................................................... 10 Objective 1: Improve Teacher Content Knowledge Through Participation In Training Provided By The Project..................................................................................................................................................... 14
Math Assessment ................................................................................................................................................14 Science Assessment ............................................................................................................................................16
Objective 2: Improve Teacher Self Efficacy Through Participation In Training Provided By The Project..................................................................................................................................................... 17
FINDINGS PART II: OUTCOME EVALUATION ............................................................... 20 Objective 3: Improved Student Achievement In Mathematics And Science ......................................... 20
FINDINGS PART IV: GOVERNMENT PERFORMANCE AND RESULTS ACT (GPRA)....................................................................................................................................................... 28
GPRA Measure 1: Teacher Content Knowledge.................................................................................... 28 GPRA Measure 2: Students at the Basic Level or Above in State Assessments of Mathematics or Science.................................................................................................................................................... 28 GPRA Measure 3: Students at the Proficient Level or Above in State Assessments of Mathematics or Science.................................................................................................................................................... 29
Laurens 55 MSP/SWS Inc. October 30, 2011 iv
GPRA Measure 4: Experimental or Quasi-Experimental Evaluation Design ........................................ 29 GPRA Measure 5: Scientifically Valid Evaluation Results.................................................................... 29
DISCUSSION .............................................................................................................................. 30 Process Evaluation.................................................................................................................................. 30 Outcome Evaluation ............................................................................................................................... 30
CONCLUSIONS ......................................................................................................................... 31
RECOMMENDATIONS............................................................................................................ 32
APPENDIX ONE: INSTRUMENTS ........................................................................................ 33
APPENDIX TWO: PROFESSIONAL DEVELOPMENT OFFERINGS............................. 47
Laurens 55 MSP/SWS Inc. October 30, 2011 1
INTRODUCTION
The Purposes and Goal of the Grant Laurens County (SC) School District 55 received a Mathematics and Science Partnership Grant from the SC Department of Education for the period of March 31, 2011-September 30, 2011, with continuation of the grant possible in future years. These grants are intended to improve the mathematics and science outcomes for students by improving the abilities of mathematics and science teachers called the STEM Teacher Development Project. The goal of this grant is to improve student achievement in math and science by increasing teacher math and science content knowledge and by improving teacher instructional skills. The STEM concept is based on two process objectives and success is to be measured through ten outcome objectives. The process objectives are:
1. Improve teacher content knowledge through participation in training provided by the Project.
2. Improve teacher self efficacy through participation in training provided by the Project. The outcome objectives are:
1. Decrease in percentage of students in grades 3-5 who score Below Met in Math as measured by the PASS.
2. Increase in percentage of students in grades 3-5 who score Exemplary in Math as measured by the PASS.
3. Decrease in percentage of students in grades 6-8 who score Below Met in Math as measured by the PASS.
4. Increase in percentage of students in grades 6-8 who score Exemplary in Math as measured by the PASS.
5. Increase in percentage of students who earn a passing score on the Mathematics End of Course (EOC) Exam.
6. Decrease in percentage of students in grades 3-5 who score Below Met in Science as measured by the PASS.
7. Increase in percentage of students in grades 3-5 who score Exemplary in Science as measured by the PASS.
8. Decrease in percentage of students in grades 6-8 who score Below Met in Science as measured by the PASS.
9. Increase in percentage of students in grades 6-8 who score Exemplary in Science as measured by the PASS.
10. Increase in percentage of students who earn a passing score on the Science End of Course (EOC) Exam.
The Project is intended to serve all STEM teachers in the District. However, teachers are not required to participate. Teachers from Laurens School District 56, a partner in the grant, were invited to participate in all of the professional development activities. A subset of the STEM
Laurens 55 MSP/SWS Inc. October 30, 2011 2
teachers is receiving more intensive professional development through a Summer Institute and graduate courses. The project potentially could serve all 162 Laurens District 55 teachers and 6,007 students in eleven schools. In addition, the grant seeks to meet the GPRA measures established by the federal government for these grants. These are:
1. GPRA Measure 1: The percentage of teachers who significantly increase their content knowledge in mathematics and science, as reflected in project-level pre-and post- assessments.
2. GPRA Measure 2: The percentage of students in classrooms of MSP teachers who score at the basic level or above in state assessments of mathematics or science.
3. GPRA Measure 3: The percentage of students in classrooms of MSP teachers who score at the proficient level or above in state assessments of mathematics or science.
4. GPRA Measure 4: The percentage of MSP projects that report using experimental or quasi-experimental design for their evaluations.
5. GPRA Measure 5: the percentage of MSP projects that use experimental or quasi experimental design for their evaluations that are conducted successfully and that yield scientifically valid results.
Purpose and Contents of the Evaluation The purpose of the evaluation is to provide information which will assist the project staff in meeting the goals of the STEM Teacher Development Project and in assuring the continuing improvement of the project.
Process Evaluation The process of implementation of the program will be reported on in the evaluation. The areas covered in this section will be the two process objectives, as measured by the performance measures stated in the proposal.
Outcome Evaluation The outcomes of the program will report on the ten outcome objectives, as measured by the performance measures stated in the proposal.
GPRA Measures The GPRA measures will be reported as they are reported in the Federal reporting system, with additional information that may be of help in continuing quality improvement.
Laurens 55 MSP/SWS Inc. October 30, 2011 3
METHODOLOGY
Philosophy of the Approach Using an action research approach, the evaluation is a continuous process with the evaluators providing information to the program, the administrators of the grant, and key staff. The information may then be used to improve the program and is intended to assure success. SWS is conducting both a formative and summative evaluation.
Evaluation Design The design of the process (or formative) evaluation is descriptive-exploratory. The evaluation describes the implementation of the grant during the period being evaluated, what the meaning of that implementation is for the continuation and improvement of the project and what changes may be helpful to the future of the project. The design of the outcome (or summative) evaluation is quasi-experimental. The outcome evaluation first examines changes in state assessments in math and science for all students across the district to determine the overall impact of the project. During the first year of the project, only baseline scores are available, and, therefore, a comparison of the outcomes for the students taught by the experimental group (math and science teachers who take part in the Summer Institute and graduate courses provided by the project) cannot be compared to those of the students of the math and science teachers who do not take part in this professional development. This comparison measure will be available for subsequent years. In the second and third years of the grant, the evaluation will determine the effect of each type of professional development activity offered (Summer Institute, graduate courses, and district-provided mini-courses) by comparing changes in teacher content knowledge, teacher efficacy, and student academic achievement among each group of teachers. During the 2010-2011 grant period, there were 162 teachers in Laurens School District 55 who teach math and/or science. All of these teachers will be included in the evaluation design. Entry into each of the three experimental groups (Summer Institute, graduate courses, and district-provided mini-courses) will be through self-selection. Data on teacher credentials, qualifications, and pre-intervention student academic achievement will be gathered and analyzed to determine baseline equivalence. Furthermore, changes in academic achievement for students in Laurens School District 55 will be compared to changes in academic achievement for students in a comparable school district, Newberry County School District, to determine the overall systemic impact of the project.
Information System The central point for data gathering, storage, initial statistical manipulation and routine reporting is the GEMS® online data system. The GEMS® is a proprietary product of SWS. The GEMS® is designed to provide real time information to track students, personnel, partners, activities, objective fulfillment, testing and surveys, outcomes and similar items. It was modified for this
Laurens 55 MSP/SWS Inc. October 30, 2011 4
project to include data on professional development received and teacher assessments. The system is tracking teacher, partner and student level information. The system produces reports on the students, personnel, processes, inputs, activities and outcomes of the project. The GEMS® reporting is real time and includes descriptive and some inferential statistics.
Process Evaluation
The process evaluation consists of five initial steps: the implementation was divided into its constituent tasks; each task was assigned measurement methods; quantitative data was entered directly into the GEMS® information system described above, and the necessary data elements were included in the system; qualitative data was gathered through interviews, surveys and direct observation; the final step was to determine the findings of the data gathering. The changes in teachers’ abilities attributable to the project are determined using Kirkpatrick’s four level training evaluation model. The model was applied to the summer institute; it could not be applied to the graduate course this year since none occurred. Teachers who choose only to do the required in-district professional development (mini-courses) are being used as a comparison group. Evaluation, professional development and integration of new concepts are determined through immediate reaction sheets (level 1), pre-post content knowledge tests and self-efficacy scales (level 2), semi-annual site visits for observations, group and individual interviews and parent, student and faculty surveys (level 3). Level 4 is being determined by the results in academic outcomes for students.
Outcome Evaluation The Outcome evaluation is based on the outcome measures included as part of the outcome objectives of the project. The changes in the test scores stated in the outcome objectives are determined by comparing the baseline year scores with the project year scores. All scores are entered or imported into the GEMS® system. The outcomes for students of District teachers who participate in Parts 1 and 2 (Summer Institute and graduate courses) of professional development will be compared to the outcomes for students of District teachers who choose to only do the required in-district professional development (mini-courses). Variables that influence knowledge and teacher efficacy will be accounted for through the use of the same pre and post knowledge and teacher efficacy assessments with both groups of teachers. During the first year of the project, only baseline scores are available, and, therefore, a comparison of the outcomes for the students taught by the experimental group (math and science teachers who take part in the Summer Institute and graduate courses provided by the project) cannot be compared to those of the students of the math and science teachers who do not take part in this professional development. In addition, outcomes for the District as a whole will be compared to the outcomes of a nearby school district, Newberry County School District. Newberry SD has agreed to this comparison and is a partner in the project. The comparison will be conducted in the second year of the project.
Laurens 55 MSP/SWS Inc. October 30, 2011 5
Phases of the Evaluation
Phase 1 – Preparation for Data Gathering In this phase, the grant application was reviewed, with a particular emphasis on the goals, objectives, outcomes and activities of the project. The evaluation design of the project was reviewed and questions prepared regarding availability of data, key informants and access to qualitative information. The GEMS® online information system was modified to collect all the necessary information that could be captured in this manner. The evaluators worked with the District to assure appropriate pre and post test instruments, identification of the comparison group members, site visit dates and other technical details. On site interview schedules were prepared. Online forms of pre and post tests were developed. Individuals who enter data into the GEMS® (which includes teachers taking pre and post assessments) were provided with user id’s, passwords and training on using the system. Users only have access to their own data, or, in the case of administrators of the project, to the project’s data. Project administrators do have access to summaries and de-identified records for teacher assessments, but do not have access to view the scores of any individual teachers. The specific instruments chosen for the teacher pre and post knowledge assessment are the PRAXIS II® Middle School Math Practice Test and the PRAXIS II® Middle School Science Practice Test. A copy of the PRAXIS II® Study Guides and Practice Tests was purchased for and distributed to each teacher by the district. The instrument chosen for the measurement of teacher efficacy is the Teacher’s Sense of Efficacy scale. A Site Visit Protocol was also developed, as well as an individual interview form. The teacher efficacy, Site Visit Protocol, and individual interview form may be found in Appendix One.
Phase 2 – Gathering and Reviewing Information Information gathering occurred in four stages. The first stage was to hold a series of meetings and conversations with the project director and other project personnel. In these meetings, the data and other information needs of the project and of the evaluation were addressed and solutions assured. The second stage was to test the instruments and the GEMS® system, then to train personnel who would use the GEMS®. Continuing technical assistance was also arranged. The third stage was to monitor the data being entered into the system, make adjustments as necessary and to provide special reports or feedback to the project. Two site visits were also made to the project during the July 2011-September 2011 period. These were followed up with telephone interviews with members of the project management team. The fourth stage was to access the SC Department of Education database to download the standardized test score data for the district for the period under study. This was followed by a
Laurens 55 MSP/SWS Inc. October 30, 2011 6
final stage of reviewing what information was now in the database for the evaluation of the project and requesting any missing information from the district.
Phase 3 –Preparation of the Information and Data The qualitative information gathered was placed in a single qualitative database for analysis. The quantitative data was exported from GEMS into the Statistical Packages for the Social Sciences (SPSS) for analysis. Tables and Graphs describing the outcomes were developed in Microsoft Excel and exported to Microsoft Word.
Phase 4 – Analysis of Information and Data and Development of the Report In developing the report, the following steps were conducted.
1. The evaluation team achieved consensus on: • What Happened? (Findings of the Study) What activities and actions took place
during the grant period? • So What? (Conclusions of the Study) What meanings do the activities and the
actions have in terms of the goal and objectives of the project and the expressed desires of the participants? To what extent have the aims of the project been achieved? Which activities were most successful? Which could be improved upon?
• Now What? (Recommendations of the Study) What changes and additions does the evaluation team believe might be useful in advancing the goals of the project?
2. The sections of the report were assigned to different team members for drafting and all team members edited the report.
3. The final report includes a description of the grant and its goals and objectives; implementation findings; findings of progress toward the project goals and objectives; a discussion of the findings of the evaluation, including trends and themes; the conclusions; and the recommendations. This resulted in a detailed, written documentation of the progress of the grant and possible implications for the future of similar projects.
Limitations of the Evaluation The project began in April 2011 and teachers received the first part of professional development activities at the end of May 2011. The teachers who participated in professional development during this grant year have not had the chance to influence student achievement for students they taught during the 2010-2011 school year and for whom student achievement data is available. Therefore, the impact of project activities on student achievement cannot be measured and the quasi-experimental design for the outcome evaluation cannot be undertaken during the first year of the evaluation. The data will be available for the 2011-2012 evaluation. The passage rates for End of Course tests for outcome measures is somewhat different between the percentages in the grant proposal and those used for measurement in the evaluation. This was caused by adjustments used in writing the proposal that are not available to the evaluators. The evaluators used the actual, published percentages.
Laurens 55 MSP/SWS Inc. October 30, 2011 7
Organization of the Evaluation The evaluation is organized into six parts.
• The introduction • The methodology • The process findings • The outcome findings • Discussion • Conclusions and recommendations
Laurens 55 MSP/SWS Inc. October 30, 2011 8
FINDINGS PART I: PROCESS EVALUATION
Introduction The process evaluation reports first on the numbers and makeup, to the extent possible, of the teachers and students served by the grant. It then reports on each process objective individually, including progress towards meeting the performance measure for the objective and the progress made towards carrying out the activities included in attempting to meet the objective.
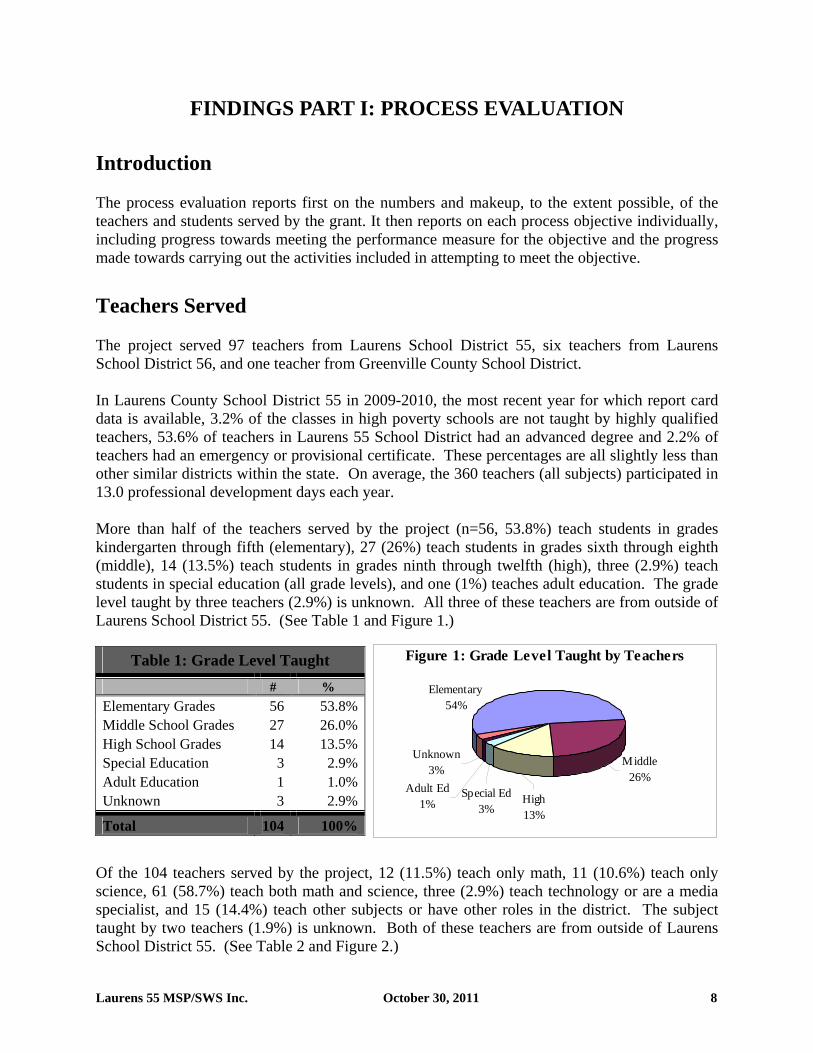
Teachers Served The project served 97 teachers from Laurens School District 55, six teachers from Laurens School District 56, and one teacher from Greenville County School District. In Laurens County School District 55 in 2009-2010, the most recent year for which report card data is available, 3.2% of the classes in high poverty schools are not taught by highly qualified teachers, 53.6% of teachers in Laurens 55 School District had an advanced degree and 2.2% of teachers had an emergency or provisional certificate. These percentages are all slightly less than other similar districts within the state. On average, the 360 teachers (all subjects) participated in 13.0 professional development days each year. More than half of the teachers served by the project (n=56, 53.8%) teach students in grades kindergarten through fifth (elementary), 27 (26%) teach students in grades sixth through eighth (middle), 14 (13.5%) teach students in grades ninth through twelfth (high), three (2.9%) teach students in special education (all grade levels), and one (1%) teaches adult education. The grade level taught by three teachers (2.9%) is unknown. All three of these teachers are from outside of Laurens School District 55. (See Table 1 and Figure 1.)
Table 1: Grade Level Taught # %
Elementary Grades 56 53.8%Middle School Grades 27 26.0%High School Grades 14 13.5%Special Education 3 2.9%Adult Education 1 1.0%Unknown 3 2.9%
Total 104 100%
Of the 104 teachers served by the project, 12 (11.5%) teach only math, 11 (10.6%) teach only science, 61 (58.7%) teach both math and science, three (2.9%) teach technology or are a media specialist, and 15 (14.4%) teach other subjects or have other roles in the district. The subject taught by two teachers (1.9%) is unknown. Both of these teachers are from outside of Laurens School District 55. (See Table 2 and Figure 2.)
Unknown3%
Adult Ed1%
Special Ed3%
High13%
Middle26%
Elementary54%
Figure 1: Grade Level Taught by Teachers

Laurens 55 MSP/SWS Inc. October 30, 2011 9
Table 2: Subjects Taught by Teachers
# %
Mathematics Only 12 11.5%Science Only 11 10.6%Both Math and Science 61 58.7%Media/Technology 3 2.9%Other 15 14.4%Unknown 2 1.9%
Total 104 100%
Characteristics of Students in the District There are approximately 6,007 students enrolled in eleven schools in Laurens 55 School District. Laurens 55 School District has six elementary schools (grades K-5), four middle schools (grades 6-8), and one high school (grades 9-12). The majority of the students in the district (62.6%) are Caucasian, 30.1% are African American, and 6.2% are Hispanic. The majority of the youth (61.7%) receive free or reduced price meals. During the 2009-2010 school year (the most recent year for which data is available), the attendance rate for students was 95.6%, the retention rate was 3.2%, and 6.1% of students were older than usual for their grade. The annual dropout rate was 9.8% and the four year cohort graduation rate was 64.3%.
Description of Implementation The Laurens County STEM Project is designed to provide ongoing professional development opportunities designed to increase teacher subject matter knowledge in science and mathematics and to improve teacher ability to provide standards-based instruction as defined by the SC Math Standards, Common Core Math Standards and SC Science Standards. The targeted teachers are certified to teach elementary education, special education, middle school math or science or high school math or science. Teachers may be classroom teachers as well as instructional coaches and lead teachers. The first step in this professional development was for teachers selected for participation to attend an orientation session designed to heighten teacher awareness of gaps in student achievement and the connection between improved instruction and dropout prevention. During this orientation, the participants were provided with the background on the STEM project, information on integration of STEM strategies to improve instruction and the methods that would be used by the STEM project to achieve its goals. Part of the project is to assist teachers seeking highly qualified status by providing content knowledge instruction in both science and mathematics. There are three specific professional opportunities provided by the project, a Summer Institute, support for participation in a graduate course, and on-going professional development. Since the
0% 10% 20% 30% 40% 50% 60%
Math
Science
Both
Media/Tech
Other
Unknown
Figure 2: Subjects Taught by Teachers
Laurens 55 MSP/SWS Inc. October 30, 2011 10
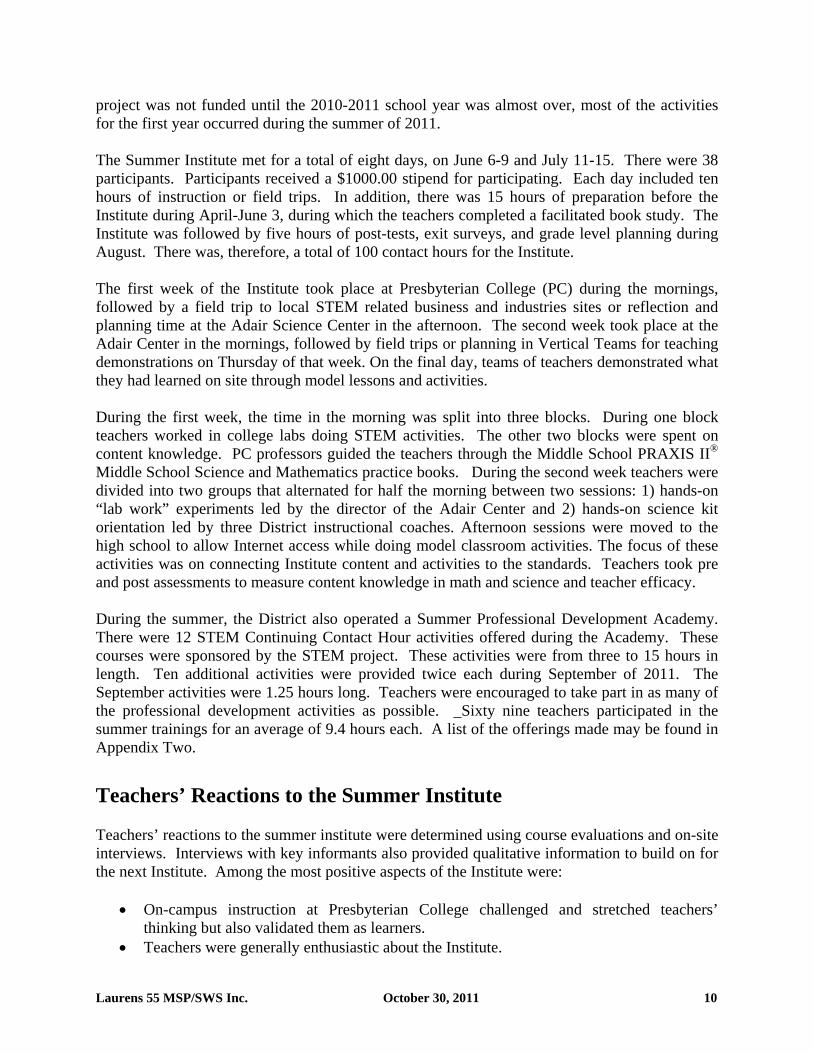
project was not funded until the 2010-2011 school year was almost over, most of the activities for the first year occurred during the summer of 2011. The Summer Institute met for a total of eight days, on June 6-9 and July 11-15. There were 38 participants. Participants received a $1000.00 stipend for participating. Each day included ten hours of instruction or field trips. In addition, there was 15 hours of preparation before the Institute during April-June 3, during which the teachers completed a facilitated book study. The Institute was followed by five hours of post-tests, exit surveys, and grade level planning during August. There was, therefore, a total of 100 contact hours for the Institute. The first week of the Institute took place at Presbyterian College (PC) during the mornings, followed by a field trip to local STEM related business and industries sites or reflection and planning time at the Adair Science Center in the afternoon. The second week took place at the Adair Center in the mornings, followed by field trips or planning in Vertical Teams for teaching demonstrations on Thursday of that week. On the final day, teams of teachers demonstrated what they had learned on site through model lessons and activities. During the first week, the time in the morning was split into three blocks. During one block teachers worked in college labs doing STEM activities. The other two blocks were spent on content knowledge. PC professors guided the teachers through the Middle School PRAXIS II® Middle School Science and Mathematics practice books. During the second week teachers were divided into two groups that alternated for half the morning between two sessions: 1) hands-on “lab work” experiments led by the director of the Adair Center and 2) hands-on science kit orientation led by three District instructional coaches. Afternoon sessions were moved to the high school to allow Internet access while doing model classroom activities. The focus of these activities was on connecting Institute content and activities to the standards. Teachers took pre and post assessments to measure content knowledge in math and science and teacher efficacy. During the summer, the District also operated a Summer Professional Development Academy. There were 12 STEM Continuing Contact Hour activities offered during the Academy. These courses were sponsored by the STEM project. These activities were from three to 15 hours in length. Ten additional activities were provided twice each during September of 2011. The September activities were 1.25 hours long. Teachers were encouraged to take part in as many of the professional development activities as possible. _Sixty nine teachers participated in the summer trainings for an average of 9.4 hours each. A list of the offerings made may be found in Appendix Two.
Teachers’ Reactions to the Summer Institute Teachers’ reactions to the summer institute were determined using course evaluations and on-site interviews. Interviews with key informants also provided qualitative information to build on for the next Institute. Among the most positive aspects of the Institute were:
• On-campus instruction at Presbyterian College challenged and stretched teachers’ thinking but also validated them as learners.
• Teachers were generally enthusiastic about the Institute.
Laurens 55 MSP/SWS Inc. October 30, 2011 11
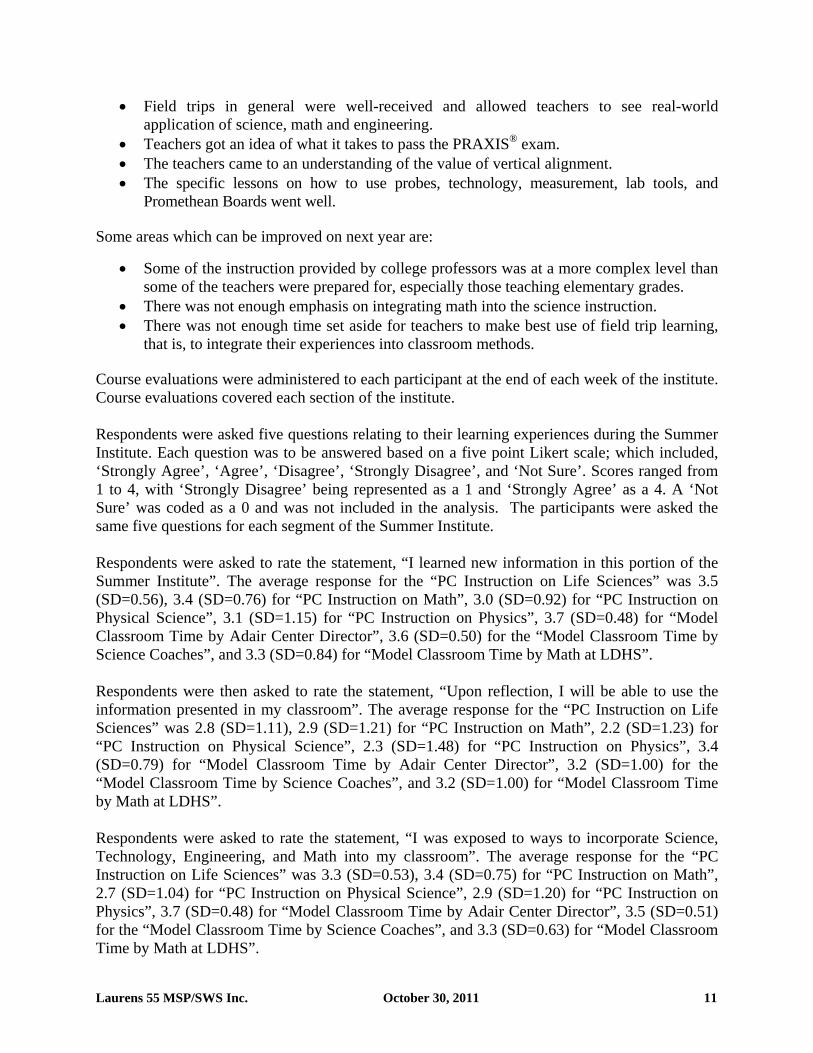
• Field trips in general were well-received and allowed teachers to see real-world application of science, math and engineering.
• Teachers got an idea of what it takes to pass the PRAXIS® exam. • The teachers came to an understanding of the value of vertical alignment. • The specific lessons on how to use probes, technology, measurement, lab tools, and
Promethean Boards went well. Some areas which can be improved on next year are:
• Some of the instruction provided by college professors was at a more complex level than some of the teachers were prepared for, especially those teaching elementary grades.
• There was not enough emphasis on integrating math into the science instruction. • There was not enough time set aside for teachers to make best use of field trip learning,
that is, to integrate their experiences into classroom methods. Course evaluations were administered to each participant at the end of each week of the institute. Course evaluations covered each section of the institute.
Respondents were asked five questions relating to their learning experiences during the Summer Institute. Each question was to be answered based on a five point Likert scale; which included, ‘Strongly Agree’, ‘Agree’, ‘Disagree’, ‘Strongly Disagree’, and ‘Not Sure’. Scores ranged from 1 to 4, with ‘Strongly Disagree’ being represented as a 1 and ‘Strongly Agree’ as a 4. A ‘Not Sure’ was coded as a 0 and was not included in the analysis. The participants were asked the same five questions for each segment of the Summer Institute. Respondents were asked to rate the statement, “I learned new information in this portion of the Summer Institute”. The average response for the “PC Instruction on Life Sciences” was 3.5 (SD=0.56), 3.4 (SD=0.76) for “PC Instruction on Math”, 3.0 (SD=0.92) for “PC Instruction on Physical Science”, 3.1 (SD=1.15) for “PC Instruction on Physics”, 3.7 (SD=0.48) for “Model Classroom Time by Adair Center Director”, 3.6 (SD=0.50) for the “Model Classroom Time by Science Coaches”, and 3.3 (SD=0.84) for “Model Classroom Time by Math at LDHS”. Respondents were then asked to rate the statement, “Upon reflection, I will be able to use the information presented in my classroom”. The average response for the “PC Instruction on Life Sciences” was 2.8 (SD=1.11), 2.9 (SD=1.21) for “PC Instruction on Math”, 2.2 (SD=1.23) for “PC Instruction on Physical Science”, 2.3 (SD=1.48) for “PC Instruction on Physics”, 3.4 (SD=0.79) for “Model Classroom Time by Adair Center Director”, 3.2 (SD=1.00) for the “Model Classroom Time by Science Coaches”, and 3.2 (SD=1.00) for “Model Classroom Time by Math at LDHS”. Respondents were asked to rate the statement, “I was exposed to ways to incorporate Science, Technology, Engineering, and Math into my classroom”. The average response for the “PC Instruction on Life Sciences” was 3.3 (SD=0.53), 3.4 (SD=0.75) for “PC Instruction on Math”, 2.7 (SD=1.04) for “PC Instruction on Physical Science”, 2.9 (SD=1.20) for “PC Instruction on Physics”, 3.7 (SD=0.48) for “Model Classroom Time by Adair Center Director”, 3.5 (SD=0.51) for the “Model Classroom Time by Science Coaches”, and 3.3 (SD=0.63) for “Model Classroom Time by Math at LDHS”.
Laurens 55 MSP/SWS Inc. October 30, 2011 12
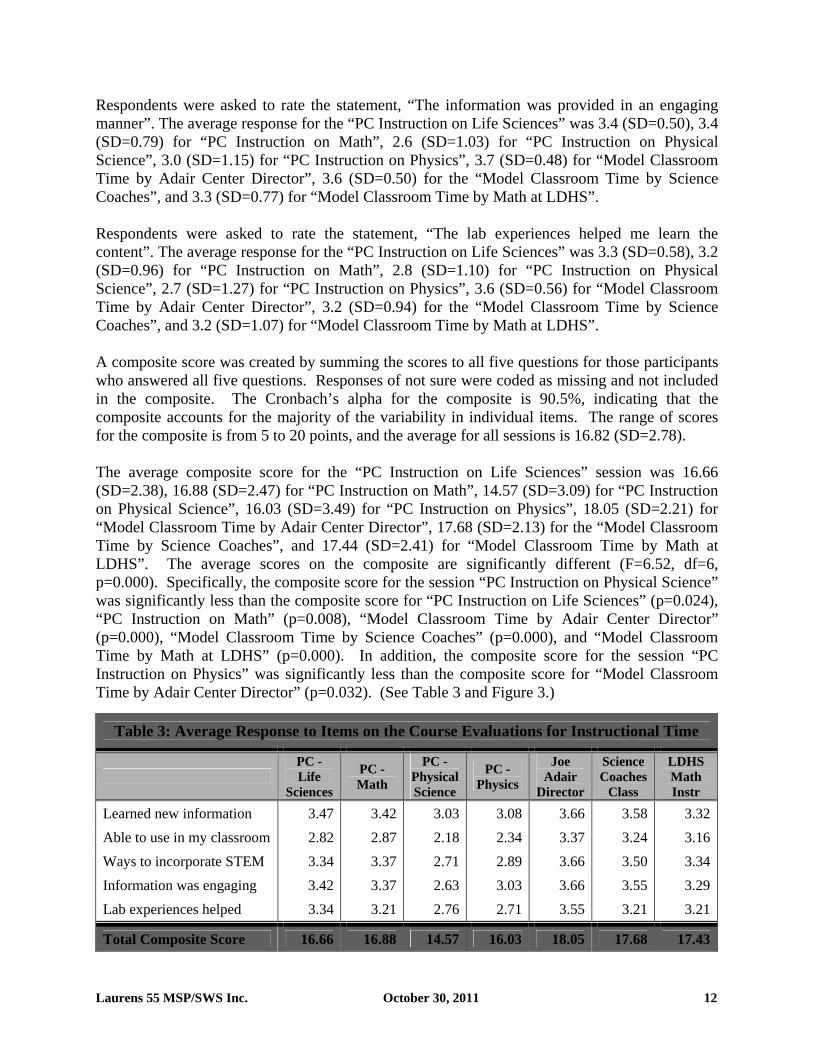
Respondents were asked to rate the statement, “The information was provided in an engaging manner”. The average response for the “PC Instruction on Life Sciences” was 3.4 (SD=0.50), 3.4 (SD=0.79) for “PC Instruction on Math”, 2.6 (SD=1.03) for “PC Instruction on Physical Science”, 3.0 (SD=1.15) for “PC Instruction on Physics”, 3.7 (SD=0.48) for “Model Classroom Time by Adair Center Director”, 3.6 (SD=0.50) for the “Model Classroom Time by Science Coaches”, and 3.3 (SD=0.77) for “Model Classroom Time by Math at LDHS”. Respondents were asked to rate the statement, “The lab experiences helped me learn the content”. The average response for the “PC Instruction on Life Sciences” was 3.3 (SD=0.58), 3.2 (SD=0.96) for “PC Instruction on Math”, 2.8 (SD=1.10) for “PC Instruction on Physical Science”, 2.7 (SD=1.27) for “PC Instruction on Physics”, 3.6 (SD=0.56) for “Model Classroom Time by Adair Center Director”, 3.2 (SD=0.94) for the “Model Classroom Time by Science Coaches”, and 3.2 (SD=1.07) for “Model Classroom Time by Math at LDHS”. A composite score was created by summing the scores to all five questions for those participants who answered all five questions. Responses of not sure were coded as missing and not included in the composite. The Cronbach’s alpha for the composite is 90.5%, indicating that the composite accounts for the majority of the variability in individual items. The range of scores for the composite is from 5 to 20 points, and the average for all sessions is 16.82 (SD=2.78). The average composite score for the “PC Instruction on Life Sciences” session was 16.66 (SD=2.38), 16.88 (SD=2.47) for “PC Instruction on Math”, 14.57 (SD=3.09) for “PC Instruction on Physical Science”, 16.03 (SD=3.49) for “PC Instruction on Physics”, 18.05 (SD=2.21) for “Model Classroom Time by Adair Center Director”, 17.68 (SD=2.13) for the “Model Classroom Time by Science Coaches”, and 17.44 (SD=2.41) for “Model Classroom Time by Math at LDHS”. The average scores on the composite are significantly different (F=6.52, df=6, p=0.000). Specifically, the composite score for the session “PC Instruction on Physical Science” was significantly less than the composite score for “PC Instruction on Life Sciences” (p=0.024), “PC Instruction on Math” (p=0.008), “Model Classroom Time by Adair Center Director” (p=0.000), “Model Classroom Time by Science Coaches” (p=0.000), and “Model Classroom Time by Math at LDHS” (p=0.000). In addition, the composite score for the session “PC Instruction on Physics” was significantly less than the composite score for “Model Classroom Time by Adair Center Director” (p=0.032). (See Table 3 and Figure 3.)
Table 3: Average Response to Items on the Course Evaluations for Instructional Time
PC - Life
Sciences
PC - Math
PC - Physical Science
PC - Physics
Joe Adair
Director
Science Coaches
Class
LDHS Math Instr
Learned new information 3.47 3.42 3.03 3.08 3.66 3.58 3.32Able to use in my classroom 2.82 2.87 2.18 2.34 3.37 3.24 3.16Ways to incorporate STEM 3.34 3.37 2.71 2.89 3.66 3.50 3.34Information was engaging 3.42 3.37 2.63 3.03 3.66 3.55 3.29Lab experiences helped 3.34 3.21 2.76 2.71 3.55 3.21 3.21
Total Composite Score 16.66 16.88 14.57 16.03 18.05 17.68 17.43
Laurens 55 MSP/SWS Inc. October 30, 2011 13
00.5
11.5
22.5
33.5
4
Learned newinformation
Able to use in myclassroom
Ways to incorporateSTEM
Information wasengaging
Lab experiences helped
Figure 3: Average Response to Items on the Course Evaluations for Instructional Time
PC - Life Sciences
PC - Math
PC - Physical Sci.
PC - Physics
Joe Adair Director
Science Coaches
LDHS Math Instr
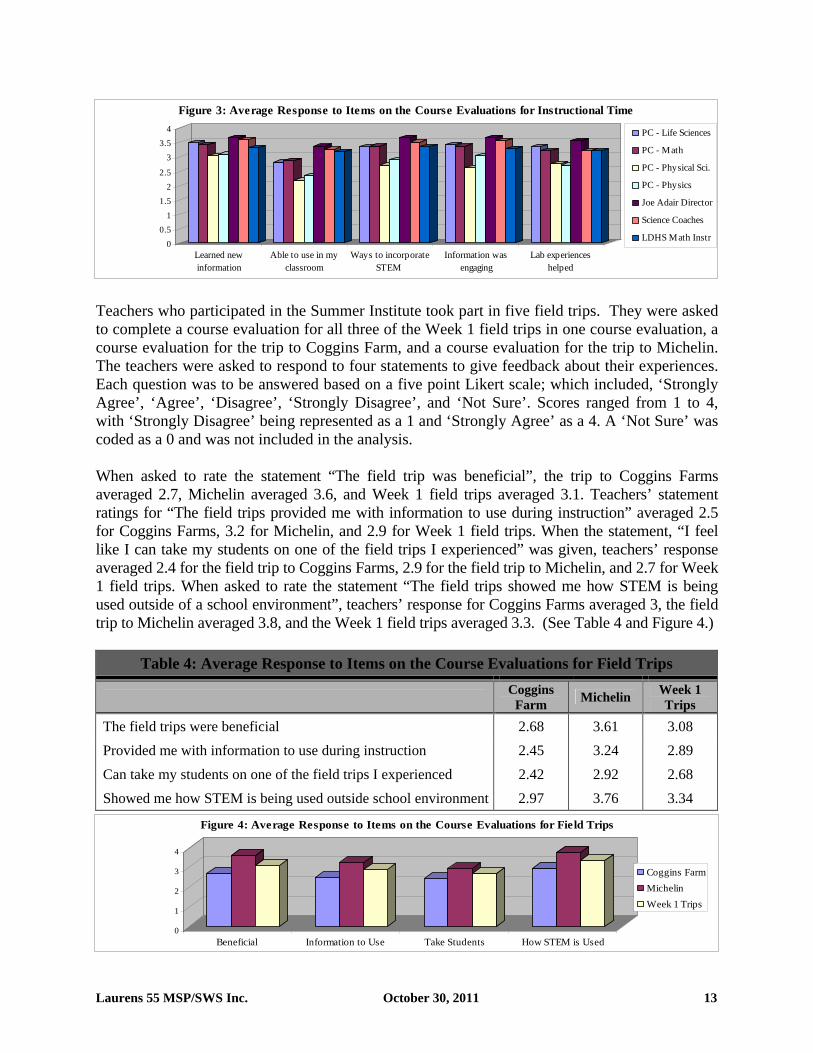
Teachers who participated in the Summer Institute took part in five field trips. They were asked to complete a course evaluation for all three of the Week 1 field trips in one course evaluation, a course evaluation for the trip to Coggins Farm, and a course evaluation for the trip to Michelin. The teachers were asked to respond to four statements to give feedback about their experiences. Each question was to be answered based on a five point Likert scale; which included, ‘Strongly Agree’, ‘Agree’, ‘Disagree’, ‘Strongly Disagree’, and ‘Not Sure’. Scores ranged from 1 to 4, with ‘Strongly Disagree’ being represented as a 1 and ‘Strongly Agree’ as a 4. A ‘Not Sure’ was coded as a 0 and was not included in the analysis. When asked to rate the statement “The field trip was beneficial”, the trip to Coggins Farms averaged 2.7, Michelin averaged 3.6, and Week 1 field trips averaged 3.1. Teachers’ statement ratings for “The field trips provided me with information to use during instruction” averaged 2.5 for Coggins Farms, 3.2 for Michelin, and 2.9 for Week 1 field trips. When the statement, “I feel like I can take my students on one of the field trips I experienced” was given, teachers’ response averaged 2.4 for the field trip to Coggins Farms, 2.9 for the field trip to Michelin, and 2.7 for Week 1 field trips. When asked to rate the statement “The field trips showed me how STEM is being used outside of a school environment”, teachers’ response for Coggins Farms averaged 3, the field trip to Michelin averaged 3.8, and the Week 1 field trips averaged 3.3. (See Table 4 and Figure 4.)
Table 4: Average Response to Items on the Course Evaluations for Field Trips
Coggins Farm Michelin Week 1
Trips
The field trips were beneficial 2.68 3.61 3.08 Provided me with information to use during instruction 2.45 3.24 2.89 Can take my students on one of the field trips I experienced 2.42 2.92 2.68 Showed me how STEM is being used outside school environment 2.97 3.76 3.34
0
1
2
3
4
Beneficial Information to Use Take Students How STEM is Used
Figure 4: Average Response to Items on the Course Evaluations for Field Trips
Coggins FarmMichelinWeek 1 Trips
Laurens 55 MSP/SWS Inc. October 30, 2011 14
The average responses to questions on the reflection and planning sessions in both Week 1 and Week 2 were generally very positive. The average response to all of the questions was slightly more than 3, which means that they generally agree that the amount of time for planning and reflection was appropriate, expectations and assignments were clear, and that the time provided was useful and meaningful to the participants.
Objective 1: Improve Teacher Content Knowledge Through Participation In Training Provided By The Project
The average score for the teachers who participated in the Summer Institute was significantly greater on the post tests than the pre tests on both math and science. The average change was 39% on math and the average change in science was 24%. The STEM project, therefore, exceeded this performance measure.
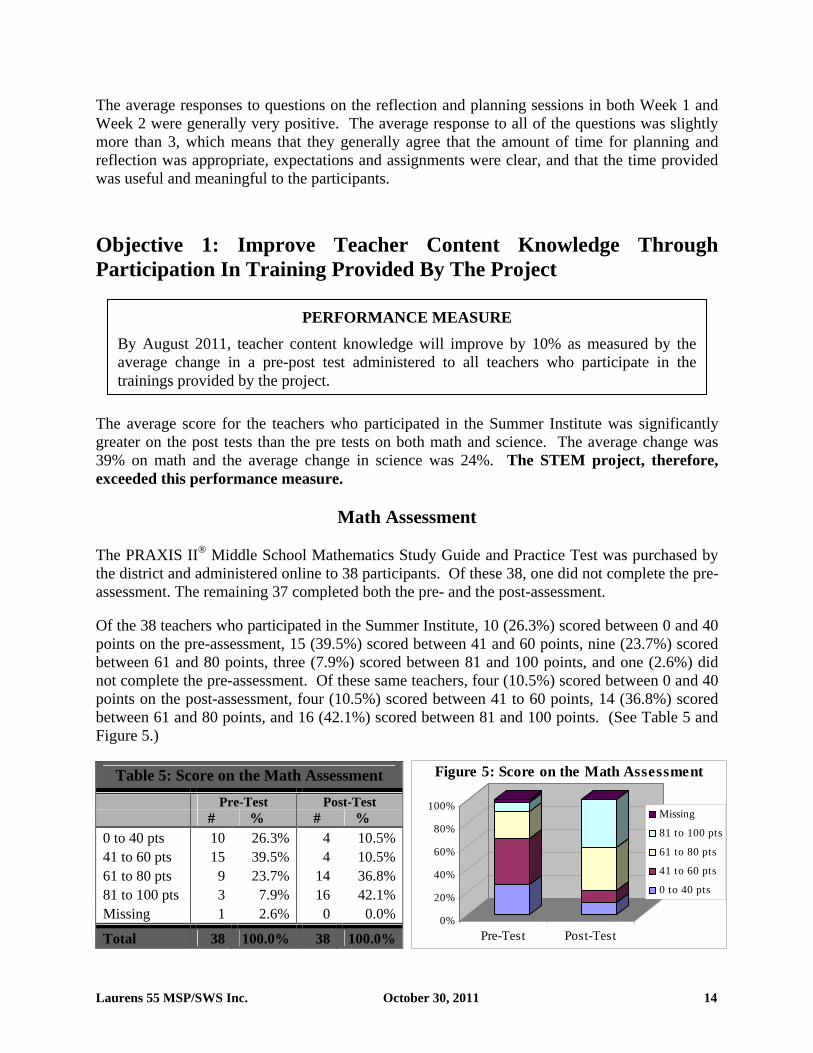
Math Assessment The PRAXIS II® Middle School Mathematics Study Guide and Practice Test was purchased by the district and administered online to 38 participants. Of these 38, one did not complete the pre-assessment. The remaining 37 completed both the pre- and the post-assessment. Of the 38 teachers who participated in the Summer Institute, 10 (26.3%) scored between 0 and 40 points on the pre-assessment, 15 (39.5%) scored between 41 and 60 points, nine (23.7%) scored between 61 and 80 points, three (7.9%) scored between 81 and 100 points, and one (2.6%) did not complete the pre-assessment. Of these same teachers, four (10.5%) scored between 0 and 40 points on the post-assessment, four (10.5%) scored between 41 to 60 points, 14 (36.8%) scored between 61 and 80 points, and 16 (42.1%) scored between 81 and 100 points. (See Table 5 and Figure 5.)
Table 5: Score on the Math Assessment Pre-Test Post-Test # % # %
0 to 40 pts 10 26.3% 4 10.5%41 to 60 pts 15 39.5% 4 10.5%61 to 80 pts 9 23.7% 14 36.8%81 to 100 pts 3 7.9% 16 42.1%Missing 1 2.6% 0 0.0%
Total 38 100.0% 38 100.0%
PERFORMANCE MEASURE By August 2011, teacher content knowledge will improve by 10% as measured by the average change in a pre-post test administered to all teachers who participate in the trainings provided by the project.
0%
20%
40%
60%
80%
100%
Pre-Test Post-Test
Missing
81 to 100 pts
61 to 80 pts
41 to 60 pts
0 to 40 pts
Figure 5: Score on the Math Assessment
Laurens 55 MSP/SWS Inc. October 30, 2011 15
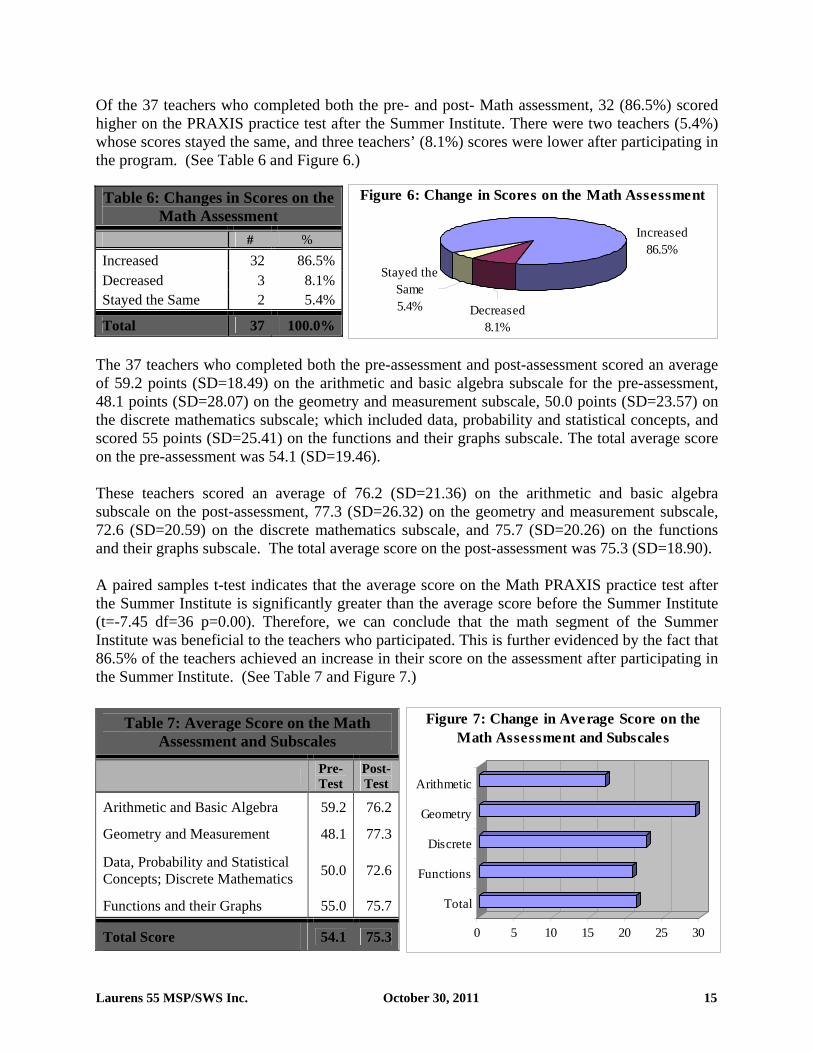
Of the 37 teachers who completed both the pre- and post- Math assessment, 32 (86.5%) scored higher on the PRAXIS practice test after the Summer Institute. There were two teachers (5.4%) whose scores stayed the same, and three teachers’ (8.1%) scores were lower after participating in the program. (See Table 6 and Figure 6.) Table 6: Changes in Scores on the
Math Assessment # %
Increased 32 86.5%Decreased 3 8.1%Stayed the Same 2 5.4%
Total 37 100.0% The 37 teachers who completed both the pre-assessment and post-assessment scored an average of 59.2 points (SD=18.49) on the arithmetic and basic algebra subscale for the pre-assessment, 48.1 points (SD=28.07) on the geometry and measurement subscale, 50.0 points (SD=23.57) on the discrete mathematics subscale; which included data, probability and statistical concepts, and scored 55 points (SD=25.41) on the functions and their graphs subscale. The total average score on the pre-assessment was 54.1 (SD=19.46). These teachers scored an average of 76.2 (SD=21.36) on the arithmetic and basic algebra subscale on the post-assessment, 77.3 (SD=26.32) on the geometry and measurement subscale, 72.6 (SD=20.59) on the discrete mathematics subscale, and 75.7 (SD=20.26) on the functions and their graphs subscale. The total average score on the post-assessment was 75.3 (SD=18.90). A paired samples t-test indicates that the average score on the Math PRAXIS practice test after the Summer Institute is significantly greater than the average score before the Summer Institute (t=-7.45 df=36 p=0.00). Therefore, we can conclude that the math segment of the Summer Institute was beneficial to the teachers who participated. This is further evidenced by the fact that 86.5% of the teachers achieved an increase in their score on the assessment after participating in the Summer Institute. (See Table 7 and Figure 7.)
Table 7: Average Score on the Math Assessment and Subscales
Pre-Test
Post-Test
Arithmetic and Basic Algebra 59.2 76.2
Geometry and Measurement 48.1 77.3
Data, Probability and Statistical Concepts; Discrete Mathematics 50.0 72.6
Functions and their Graphs 55.0 75.7
Total Score 54.1 75.3
Decreased8.1%
Stayed the Same5.4%
Increased86.5%
Figure 6: Change in Scores on the Math Assessment
0 5 10 15 20 25 30
Arithmetic
Geometry
Discrete
Functions
Total
Figure 7: Change in Average Score on the Math Assessment and Subscales
Laurens 55 MSP/SWS Inc. October 30, 2011 16
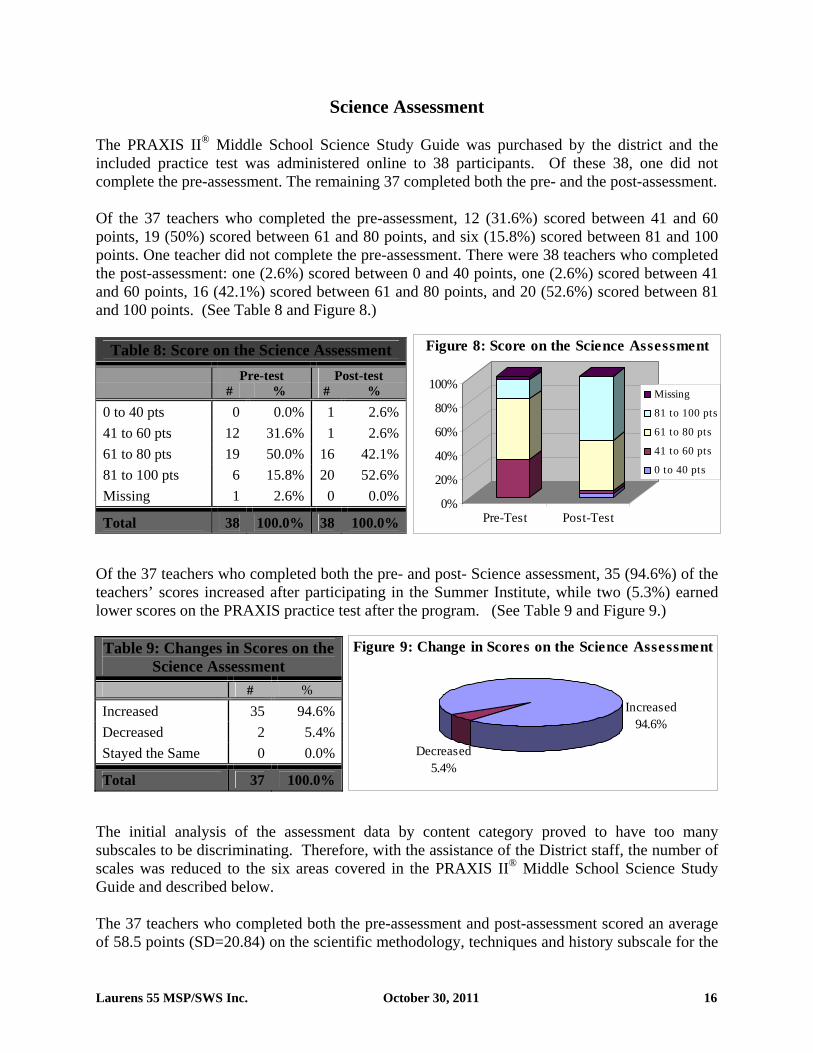
Science Assessment The PRAXIS II® Middle School Science Study Guide was purchased by the district and the included practice test was administered online to 38 participants. Of these 38, one did not complete the pre-assessment. The remaining 37 completed both the pre- and the post-assessment. Of the 37 teachers who completed the pre-assessment, 12 (31.6%) scored between 41 and 60 points, 19 (50%) scored between 61 and 80 points, and six (15.8%) scored between 81 and 100 points. One teacher did not complete the pre-assessment. There were 38 teachers who completed the post-assessment: one (2.6%) scored between 0 and 40 points, one (2.6%) scored between 41 and 60 points, 16 (42.1%) scored between 61 and 80 points, and 20 (52.6%) scored between 81 and 100 points. (See Table 8 and Figure 8.)
Table 8: Score on the Science Assessment Pre-test Post-test # % # %
0 to 40 pts 0 0.0% 1 2.6%41 to 60 pts 12 31.6% 1 2.6%61 to 80 pts 19 50.0% 16 42.1%81 to 100 pts 6 15.8% 20 52.6%Missing 1 2.6% 0 0.0%
Total 38 100.0% 38 100.0% Of the 37 teachers who completed both the pre- and post- Science assessment, 35 (94.6%) of the teachers’ scores increased after participating in the Summer Institute, while two (5.3%) earned lower scores on the PRAXIS practice test after the program. (See Table 9 and Figure 9.) Table 9: Changes in Scores on the
Science Assessment # %
Increased 35 94.6%Decreased 2 5.4%Stayed the Same 0 0.0%
Total 37 100.0% The initial analysis of the assessment data by content category proved to have too many subscales to be discriminating. Therefore, with the assistance of the District staff, the number of scales was reduced to the six areas covered in the PRAXIS II® Middle School Science Study Guide and described below. The 37 teachers who completed both the pre-assessment and post-assessment scored an average of 58.5 points (SD=20.84) on the scientific methodology, techniques and history subscale for the
0%
20%
40%
60%
80%
100%
Pre-Test Post-Test
Missing
81 to 100 pts
61 to 80 pts
41 to 60 pts
0 to 40 pts
Figure 8: Score on the Science Assessment
Decreased5.4%
Increased94.6%
Figure 9: Change in Scores on the Science Assessment
Laurens 55 MSP/SWS Inc. October 30, 2011 17
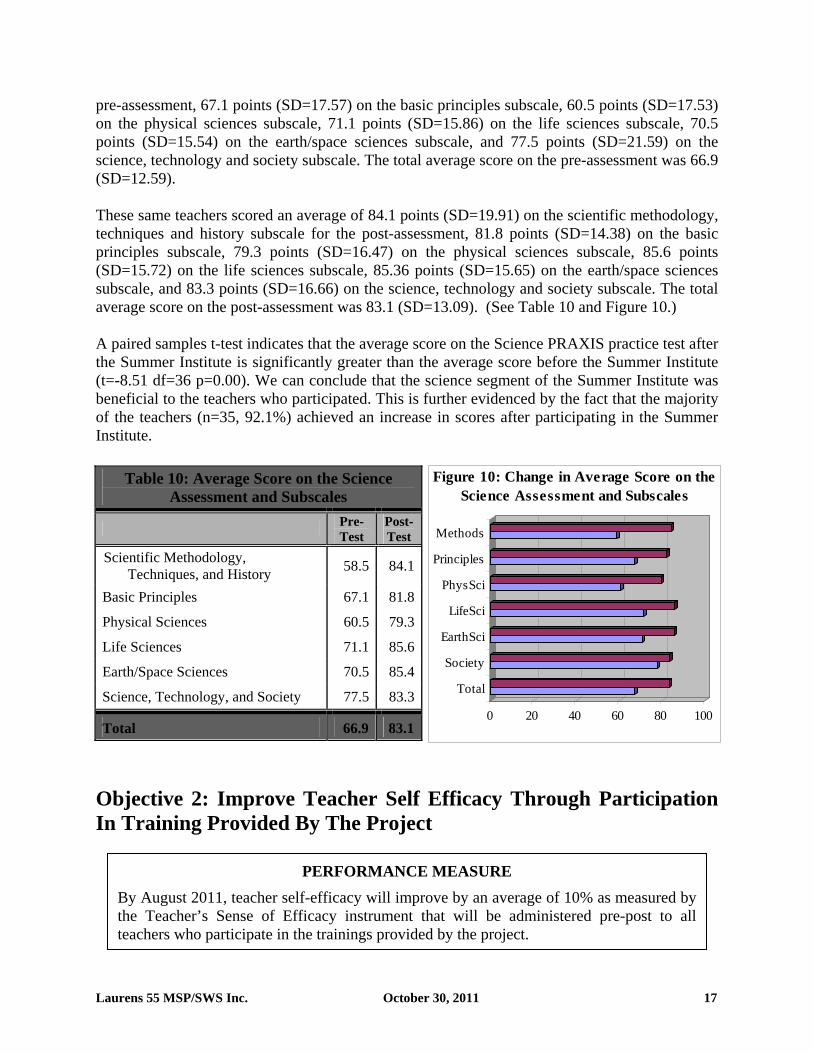
pre-assessment, 67.1 points (SD=17.57) on the basic principles subscale, 60.5 points (SD=17.53) on the physical sciences subscale, 71.1 points (SD=15.86) on the life sciences subscale, 70.5 points (SD=15.54) on the earth/space sciences subscale, and 77.5 points (SD=21.59) on the science, technology and society subscale. The total average score on the pre-assessment was 66.9 (SD=12.59). These same teachers scored an average of 84.1 points (SD=19.91) on the scientific methodology, techniques and history subscale for the post-assessment, 81.8 points (SD=14.38) on the basic principles subscale, 79.3 points (SD=16.47) on the physical sciences subscale, 85.6 points (SD=15.72) on the life sciences subscale, 85.36 points (SD=15.65) on the earth/space sciences subscale, and 83.3 points (SD=16.66) on the science, technology and society subscale. The total average score on the post-assessment was 83.1 (SD=13.09). (See Table 10 and Figure 10.) A paired samples t-test indicates that the average score on the Science PRAXIS practice test after the Summer Institute is significantly greater than the average score before the Summer Institute (t=-8.51 df=36 p=0.00). We can conclude that the science segment of the Summer Institute was beneficial to the teachers who participated. This is further evidenced by the fact that the majority of the teachers (n=35, 92.1%) achieved an increase in scores after participating in the Summer Institute.
Table 10: Average Score on the Science Assessment and Subscales
Pre-Test
Post-Test
Scientific Methodology, Techniques, and History 58.5 84.1
Basic Principles 67.1 81.8
Physical Sciences 60.5 79.3
Life Sciences 71.1 85.6
Earth/Space Sciences 70.5 85.4
Science, Technology, and Society 77.5 83.3
Total 66.9 83.1
Objective 2: Improve Teacher Self Efficacy Through Participation In Training Provided By The Project
PERFORMANCE MEASURE By August 2011, teacher self-efficacy will improve by an average of 10% as measured by the Teacher’s Sense of Efficacy instrument that will be administered pre-post to all teachers who participate in the trainings provided by the project.
0 20 40 60 80 100
Methods
Principles
PhysSci
LifeSci
EarthSci
Society
Total
Figure 10: Change in Average Score on the Science Assessment and Subscales
Laurens 55 MSP/SWS Inc. October 30, 2011 18
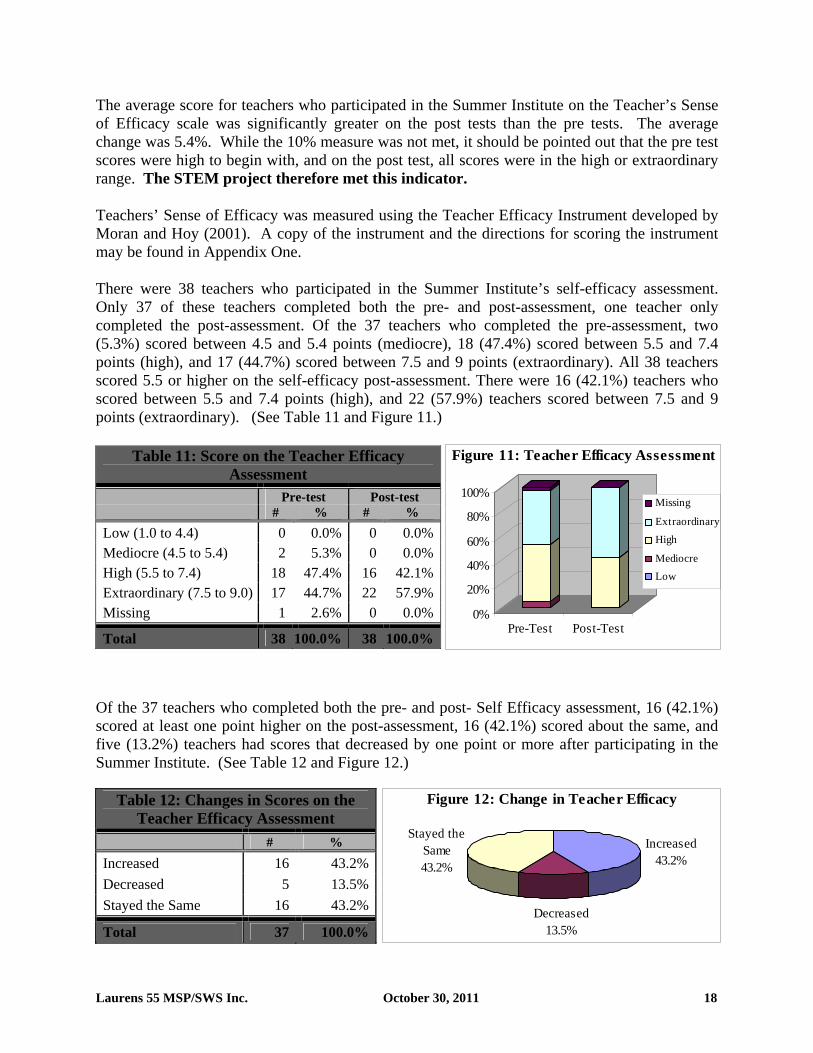
The average score for teachers who participated in the Summer Institute on the Teacher’s Sense of Efficacy scale was significantly greater on the post tests than the pre tests. The average change was 5.4%. While the 10% measure was not met, it should be pointed out that the pre test scores were high to begin with, and on the post test, all scores were in the high or extraordinary range. The STEM project therefore met this indicator. Teachers’ Sense of Efficacy was measured using the Teacher Efficacy Instrument developed by Moran and Hoy (2001). A copy of the instrument and the directions for scoring the instrument may be found in Appendix One. There were 38 teachers who participated in the Summer Institute’s self-efficacy assessment. Only 37 of these teachers completed both the pre- and post-assessment, one teacher only completed the post-assessment. Of the 37 teachers who completed the pre-assessment, two (5.3%) scored between 4.5 and 5.4 points (mediocre), 18 (47.4%) scored between 5.5 and 7.4 points (high), and 17 (44.7%) scored between 7.5 and 9 points (extraordinary). All 38 teachers scored 5.5 or higher on the self-efficacy post-assessment. There were 16 (42.1%) teachers who scored between 5.5 and 7.4 points (high), and 22 (57.9%) teachers scored between 7.5 and 9 points (extraordinary). (See Table 11 and Figure 11.)
Table 11: Score on the Teacher Efficacy Assessment
Pre-test Post-test # % # %
Low (1.0 to 4.4) 0 0.0% 0 0.0%Mediocre (4.5 to 5.4) 2 5.3% 0 0.0%High (5.5 to 7.4) 18 47.4% 16 42.1%Extraordinary (7.5 to 9.0) 17 44.7% 22 57.9%Missing 1 2.6% 0 0.0%
Total 38 100.0% 38 100.0%
Of the 37 teachers who completed both the pre- and post- Self Efficacy assessment, 16 (42.1%) scored at least one point higher on the post-assessment, 16 (42.1%) scored about the same, and five (13.2%) teachers had scores that decreased by one point or more after participating in the Summer Institute. (See Table 12 and Figure 12.)
Table 12: Changes in Scores on the Teacher Efficacy Assessment
# % Increased 16 43.2%Decreased 5 13.5%Stayed the Same 16 43.2%
Total 37 100.0%
0%
20%
40%
60%
80%
100%
Pre-Test Post-Test
Missing
ExtraordinaryHigh
MediocreLow
Figure 11: Teacher Efficacy Assessment
Decreased13.5%
Stayed the Same43.2%
Increased43.2%
Figure 12: Change in Teacher Efficacy
Laurens 55 MSP/SWS Inc. October 30, 2011 19
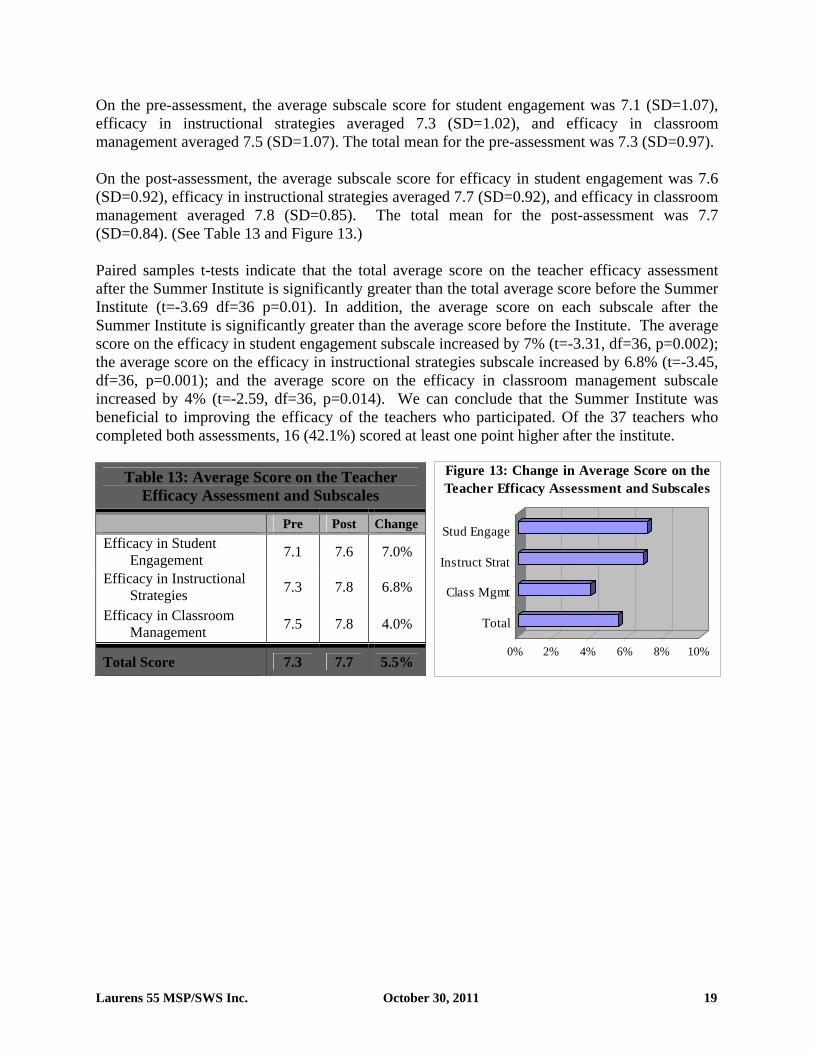
On the pre-assessment, the average subscale score for student engagement was 7.1 (SD=1.07), efficacy in instructional strategies averaged 7.3 (SD=1.02), and efficacy in classroom management averaged 7.5 (SD=1.07). The total mean for the pre-assessment was 7.3 (SD=0.97). On the post-assessment, the average subscale score for efficacy in student engagement was 7.6 (SD=0.92), efficacy in instructional strategies averaged 7.7 (SD=0.92), and efficacy in classroom management averaged 7.8 (SD=0.85). The total mean for the post-assessment was 7.7 (SD=0.84). (See Table 13 and Figure 13.) Paired samples t-tests indicate that the total average score on the teacher efficacy assessment after the Summer Institute is significantly greater than the total average score before the Summer Institute (t=-3.69 df=36 p=0.01). In addition, the average score on each subscale after the Summer Institute is significantly greater than the average score before the Institute. The average score on the efficacy in student engagement subscale increased by 7% (t=-3.31, df=36, p=0.002); the average score on the efficacy in instructional strategies subscale increased by 6.8% (t=-3.45, df=36, p=0.001); and the average score on the efficacy in classroom management subscale increased by 4% (t=-2.59, df=36, p=0.014). We can conclude that the Summer Institute was beneficial to improving the efficacy of the teachers who participated. Of the 37 teachers who completed both assessments, 16 (42.1%) scored at least one point higher after the institute.
Table 13: Average Score on the Teacher Efficacy Assessment and Subscales
Pre Post Change Efficacy in Student
Engagement 7.1 7.6 7.0%
Efficacy in Instructional Strategies 7.3 7.8 6.8%
Efficacy in Classroom Management 7.5 7.8 4.0%
Total Score 7.3 7.7 5.5%
0% 2% 4% 6% 8% 10%
Stud Engage
Instruct Strat
Class Mgmt
Total
Figure 13: Change in Average Score on the Teacher Efficacy Assessment and Subscales
Laurens 55 MSP/SWS Inc. October 30, 2011 20
FINDINGS PART II: OUTCOME EVALUATION As noted previously, the project did not begin providing professional development opportunities to teachers until May of 2011. Therefore, the teachers who participated in the project have not yet had the opportunity to influence change in the targeted students on the measures established by the grant. Progress toward achieving the outcomes of the grant is presented to establish the change pattern for each measure.
Objective 3: Improved Student Achievement In Mathematics And Science
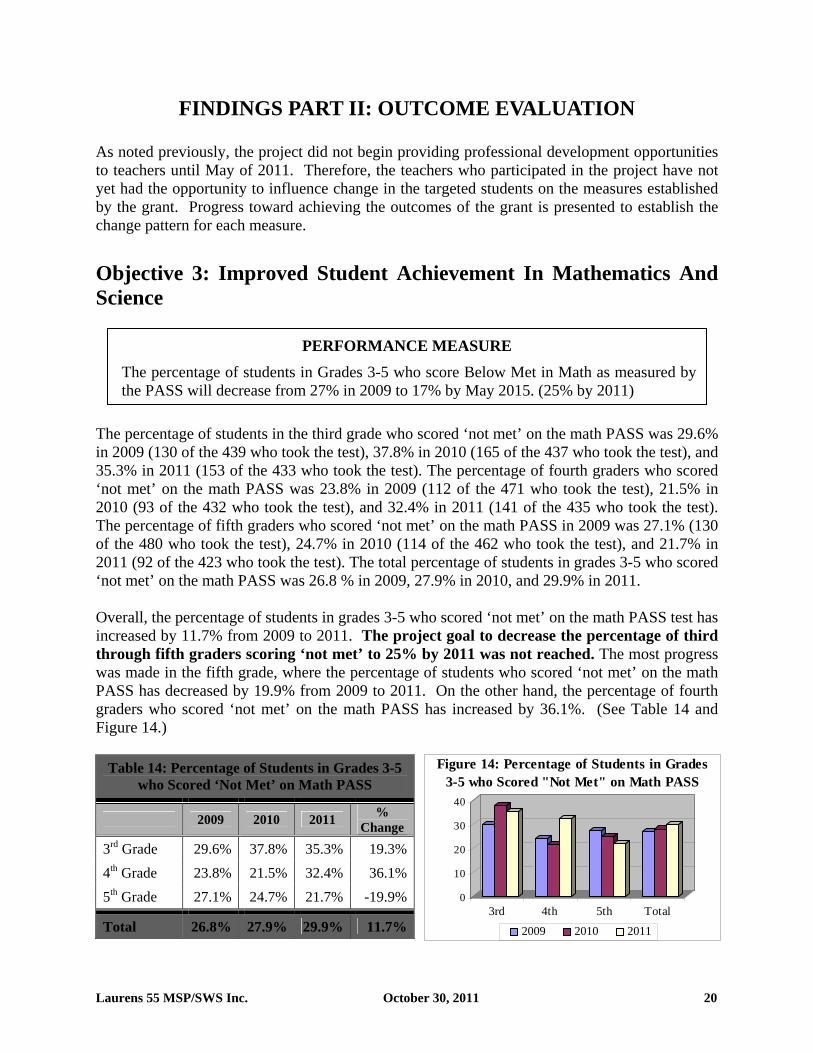
The percentage of students in the third grade who scored ‘not met’ on the math PASS was 29.6% in 2009 (130 of the 439 who took the test), 37.8% in 2010 (165 of the 437 who took the test), and 35.3% in 2011 (153 of the 433 who took the test). The percentage of fourth graders who scored ‘not met’ on the math PASS was 23.8% in 2009 (112 of the 471 who took the test), 21.5% in 2010 (93 of the 432 who took the test), and 32.4% in 2011 (141 of the 435 who took the test). The percentage of fifth graders who scored ‘not met’ on the math PASS in 2009 was 27.1% (130 of the 480 who took the test), 24.7% in 2010 (114 of the 462 who took the test), and 21.7% in 2011 (92 of the 423 who took the test). The total percentage of students in grades 3-5 who scored ‘not met’ on the math PASS was 26.8 % in 2009, 27.9% in 2010, and 29.9% in 2011. Overall, the percentage of students in grades 3-5 who scored ‘not met’ on the math PASS test has increased by 11.7% from 2009 to 2011. The project goal to decrease the percentage of third through fifth graders scoring ‘not met’ to 25% by 2011 was not reached. The most progress was made in the fifth grade, where the percentage of students who scored ‘not met’ on the math PASS has decreased by 19.9% from 2009 to 2011. On the other hand, the percentage of fourth graders who scored ‘not met’ on the math PASS has increased by 36.1%. (See Table 14 and Figure 14.)
Table 14: Percentage of Students in Grades 3-5 who Scored ‘Not Met’ on Math PASS
2009 2010 2011 % Change
3rd Grade 29.6% 37.8% 35.3% 19.3%4th Grade 23.8% 21.5% 32.4% 36.1%5th Grade 27.1% 24.7% 21.7% -19.9%
Total 26.8% 27.9% 29.9% 11.7%
PERFORMANCE MEASURE The percentage of students in Grades 3-5 who score Below Met in Math as measured by the PASS will decrease from 27% in 2009 to 17% by May 2015. (25% by 2011)
0
10
20
30
40
3rd 4th 5th Total
2009 2010 2011
Figure 14: Percentage of Students in Grades 3-5 who Scored "Not Met" on Math PASS
Laurens 55 MSP/SWS Inc. October 30, 2011 21
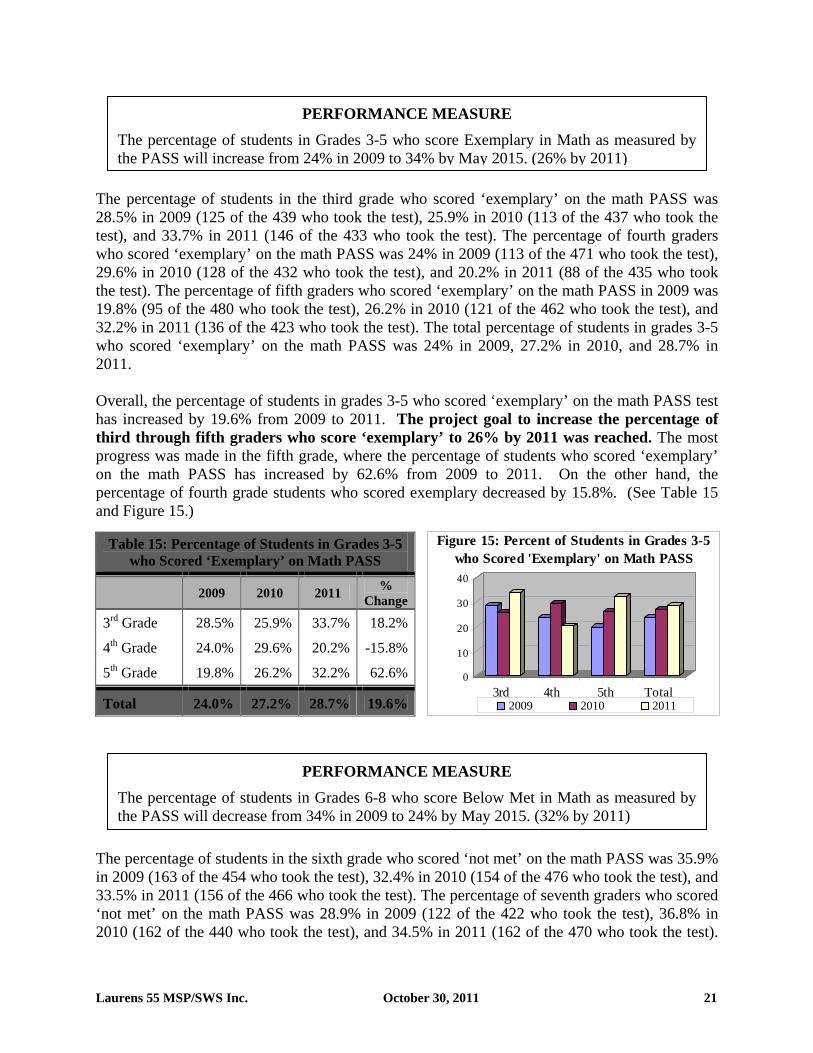
The percentage of students in the third grade who scored ‘exemplary’ on the math PASS was 28.5% in 2009 (125 of the 439 who took the test), 25.9% in 2010 (113 of the 437 who took the test), and 33.7% in 2011 (146 of the 433 who took the test). The percentage of fourth graders who scored ‘exemplary’ on the math PASS was 24% in 2009 (113 of the 471 who took the test), 29.6% in 2010 (128 of the 432 who took the test), and 20.2% in 2011 (88 of the 435 who took the test). The percentage of fifth graders who scored ‘exemplary’ on the math PASS in 2009 was 19.8% (95 of the 480 who took the test), 26.2% in 2010 (121 of the 462 who took the test), and 32.2% in 2011 (136 of the 423 who took the test). The total percentage of students in grades 3-5 who scored ‘exemplary’ on the math PASS was 24% in 2009, 27.2% in 2010, and 28.7% in 2011. Overall, the percentage of students in grades 3-5 who scored ‘exemplary’ on the math PASS test has increased by 19.6% from 2009 to 2011. The project goal to increase the percentage of third through fifth graders who score ‘exemplary’ to 26% by 2011 was reached. The most progress was made in the fifth grade, where the percentage of students who scored ‘exemplary’ on the math PASS has increased by 62.6% from 2009 to 2011. On the other hand, the percentage of fourth grade students who scored exemplary decreased by 15.8%. (See Table 15 and Figure 15.)
Table 15: Percentage of Students in Grades 3-5 who Scored ‘Exemplary’ on Math PASS
2009 2010 2011 % Change
3rd Grade 28.5% 25.9% 33.7% 18.2%
4th Grade 24.0% 29.6% 20.2% -15.8%
5th Grade 19.8% 26.2% 32.2% 62.6%
Total 24.0% 27.2% 28.7% 19.6%
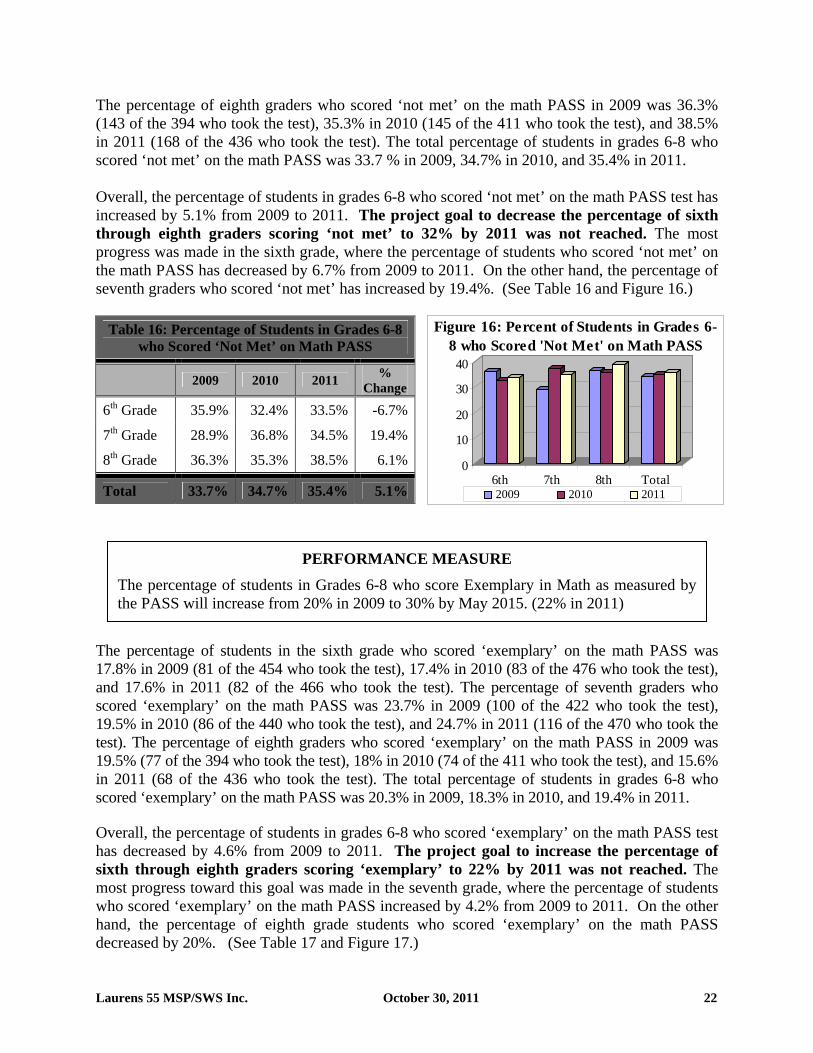
The percentage of students in the sixth grade who scored ‘not met’ on the math PASS was 35.9% in 2009 (163 of the 454 who took the test), 32.4% in 2010 (154 of the 476 who took the test), and 33.5% in 2011 (156 of the 466 who took the test). The percentage of seventh graders who scored ‘not met’ on the math PASS was 28.9% in 2009 (122 of the 422 who took the test), 36.8% in 2010 (162 of the 440 who took the test), and 34.5% in 2011 (162 of the 470 who took the test).
PERFORMANCE MEASURE The percentage of students in Grades 6-8 who score Below Met in Math as measured by the PASS will decrease from 34% in 2009 to 24% by May 2015. (32% by 2011)
PERFORMANCE MEASURE The percentage of students in Grades 3-5 who score Exemplary in Math as measured by the PASS will increase from 24% in 2009 to 34% by May 2015. (26% by 2011)
0
10
20
30
40
3rd 4th 5th Total2009 2010 2011
Figure 15: Percent of Students in Grades 3-5 who Scored 'Exemplary' on Math PASS
Laurens 55 MSP/SWS Inc. October 30, 2011 22
The percentage of eighth graders who scored ‘not met’ on the math PASS in 2009 was 36.3% (143 of the 394 who took the test), 35.3% in 2010 (145 of the 411 who took the test), and 38.5% in 2011 (168 of the 436 who took the test). The total percentage of students in grades 6-8 who scored ‘not met’ on the math PASS was 33.7 % in 2009, 34.7% in 2010, and 35.4% in 2011. Overall, the percentage of students in grades 6-8 who scored ‘not met’ on the math PASS test has increased by 5.1% from 2009 to 2011. The project goal to decrease the percentage of sixth through eighth graders scoring ‘not met’ to 32% by 2011 was not reached. The most progress was made in the sixth grade, where the percentage of students who scored ‘not met’ on the math PASS has decreased by 6.7% from 2009 to 2011. On the other hand, the percentage of seventh graders who scored ‘not met’ has increased by 19.4%. (See Table 16 and Figure 16.)
Table 16: Percentage of Students in Grades 6-8 who Scored ‘Not Met’ on Math PASS
2009 2010 2011 % Change
6th Grade 35.9% 32.4% 33.5% -6.7%
7th Grade 28.9% 36.8% 34.5% 19.4%
8th Grade 36.3% 35.3% 38.5% 6.1%
Total 33.7% 34.7% 35.4% 5.1%
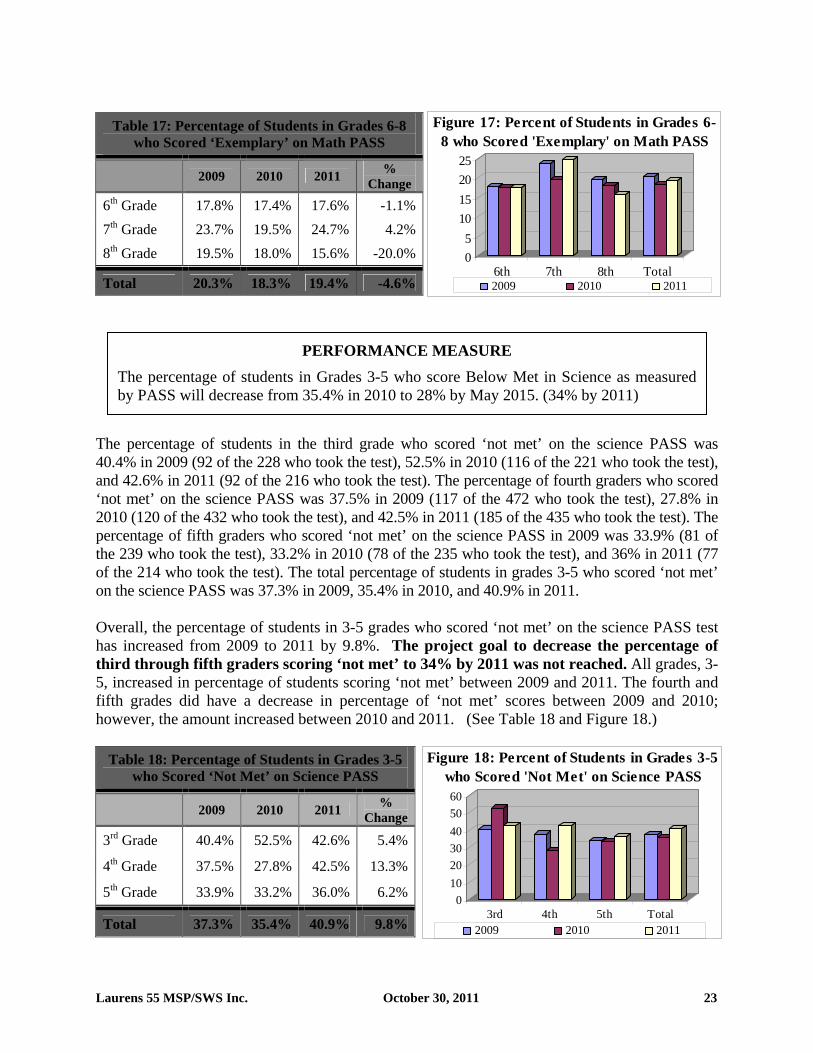
The percentage of students in the sixth grade who scored ‘exemplary’ on the math PASS was 17.8% in 2009 (81 of the 454 who took the test), 17.4% in 2010 (83 of the 476 who took the test), and 17.6% in 2011 (82 of the 466 who took the test). The percentage of seventh graders who scored ‘exemplary’ on the math PASS was 23.7% in 2009 (100 of the 422 who took the test), 19.5% in 2010 (86 of the 440 who took the test), and 24.7% in 2011 (116 of the 470 who took the test). The percentage of eighth graders who scored ‘exemplary’ on the math PASS in 2009 was 19.5% (77 of the 394 who took the test), 18% in 2010 (74 of the 411 who took the test), and 15.6% in 2011 (68 of the 436 who took the test). The total percentage of students in grades 6-8 who scored ‘exemplary’ on the math PASS was 20.3% in 2009, 18.3% in 2010, and 19.4% in 2011. Overall, the percentage of students in grades 6-8 who scored ‘exemplary’ on the math PASS test has decreased by 4.6% from 2009 to 2011. The project goal to increase the percentage of sixth through eighth graders scoring ‘exemplary’ to 22% by 2011 was not reached. The most progress toward this goal was made in the seventh grade, where the percentage of students who scored ‘exemplary’ on the math PASS increased by 4.2% from 2009 to 2011. On the other hand, the percentage of eighth grade students who scored ‘exemplary’ on the math PASS decreased by 20%. (See Table 17 and Figure 17.)
PERFORMANCE MEASURE The percentage of students in Grades 6-8 who score Exemplary in Math as measured by the PASS will increase from 20% in 2009 to 30% by May 2015. (22% in 2011)
0
10
20
30
40
6th 7th 8th Total2009 2010 2011
Figure 16: Percent of Students in Grades 6-8 who Scored 'Not Met' on Math PASS
Laurens 55 MSP/SWS Inc. October 30, 2011 23
The percentage of students in the third grade who scored ‘not met’ on the science PASS was 40.4% in 2009 (92 of the 228 who took the test), 52.5% in 2010 (116 of the 221 who took the test), and 42.6% in 2011 (92 of the 216 who took the test). The percentage of fourth graders who scored ‘not met’ on the science PASS was 37.5% in 2009 (117 of the 472 who took the test), 27.8% in 2010 (120 of the 432 who took the test), and 42.5% in 2011 (185 of the 435 who took the test). The percentage of fifth graders who scored ‘not met’ on the science PASS in 2009 was 33.9% (81 of the 239 who took the test), 33.2% in 2010 (78 of the 235 who took the test), and 36% in 2011 (77 of the 214 who took the test). The total percentage of students in grades 3-5 who scored ‘not met’ on the science PASS was 37.3% in 2009, 35.4% in 2010, and 40.9% in 2011. Overall, the percentage of students in 3-5 grades who scored ‘not met’ on the science PASS test has increased from 2009 to 2011 by 9.8%. The project goal to decrease the percentage of third through fifth graders scoring ‘not met’ to 34% by 2011 was not reached. All grades, 3-5, increased in percentage of students scoring ‘not met’ between 2009 and 2011. The fourth and fifth grades did have a decrease in percentage of ‘not met’ scores between 2009 and 2010; however, the amount increased between 2010 and 2011. (See Table 18 and Figure 18.)
Table 18: Percentage of Students in Grades 3-5 who Scored ‘Not Met’ on Science PASS
2009 2010 2011 % Change
3rd Grade 40.4% 52.5% 42.6% 5.4%
4th Grade 37.5% 27.8% 42.5% 13.3%
5th Grade 33.9% 33.2% 36.0% 6.2%
Total 37.3% 35.4% 40.9% 9.8%
Table 17: Percentage of Students in Grades 6-8 who Scored ‘Exemplary’ on Math PASS
2009 2010 2011 % Change
6th Grade 17.8% 17.4% 17.6% -1.1%7th Grade 23.7% 19.5% 24.7% 4.2%8th Grade 19.5% 18.0% 15.6% -20.0%
Total 20.3% 18.3% 19.4% -4.6%
PERFORMANCE MEASURE The percentage of students in Grades 3-5 who score Below Met in Science as measured by PASS will decrease from 35.4% in 2010 to 28% by May 2015. (34% by 2011)
05
10152025
6th 7th 8th Total2009 2010 2011
Figure 17: Percent of Students in Grades 6-8 who Scored 'Exemplary' on Math PASS
0102030405060
3rd 4th 5th Total2009 2010 2011
Figure 18: Percent of Students in Grades 3-5 who Scored 'Not Met' on Science PASS
Laurens 55 MSP/SWS Inc. October 30, 2011 24
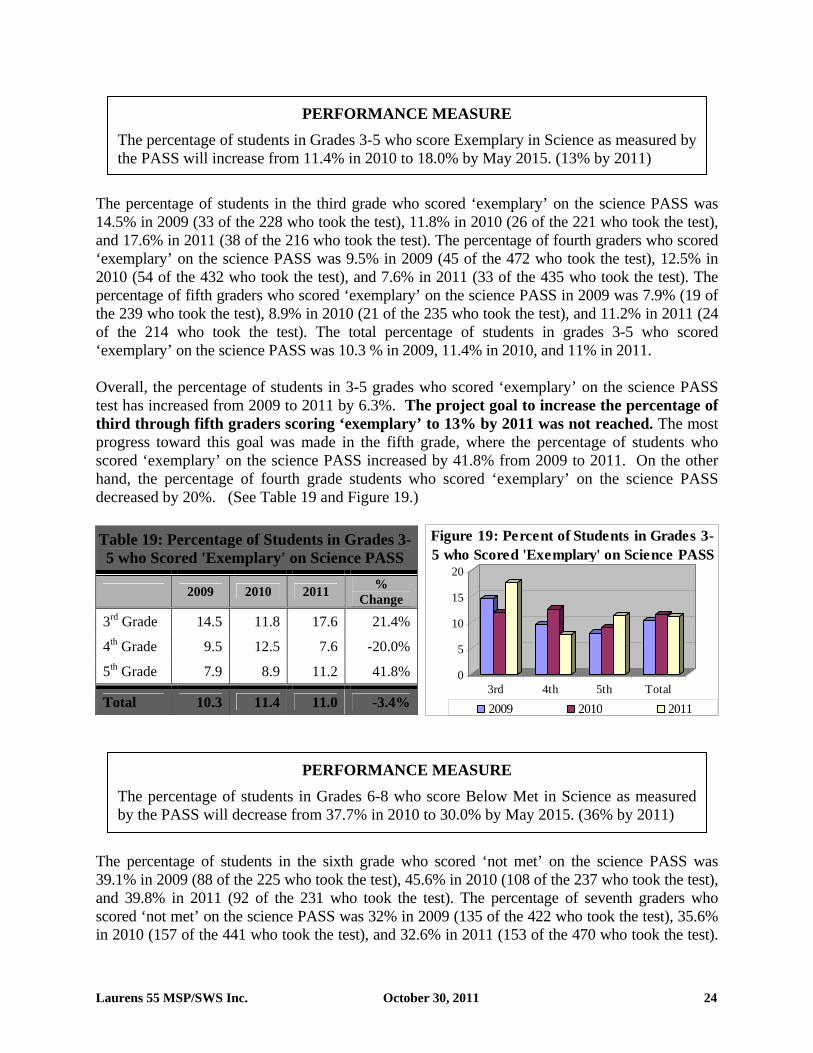
The percentage of students in the third grade who scored ‘exemplary’ on the science PASS was 14.5% in 2009 (33 of the 228 who took the test), 11.8% in 2010 (26 of the 221 who took the test), and 17.6% in 2011 (38 of the 216 who took the test). The percentage of fourth graders who scored ‘exemplary’ on the science PASS was 9.5% in 2009 (45 of the 472 who took the test), 12.5% in 2010 (54 of the 432 who took the test), and 7.6% in 2011 (33 of the 435 who took the test). The percentage of fifth graders who scored ‘exemplary’ on the science PASS in 2009 was 7.9% (19 of the 239 who took the test), 8.9% in 2010 (21 of the 235 who took the test), and 11.2% in 2011 (24 of the 214 who took the test). The total percentage of students in grades 3-5 who scored ‘exemplary’ on the science PASS was 10.3 % in 2009, 11.4% in 2010, and 11% in 2011. Overall, the percentage of students in 3-5 grades who scored ‘exemplary’ on the science PASS test has increased from 2009 to 2011 by 6.3%. The project goal to increase the percentage of third through fifth graders scoring ‘exemplary’ to 13% by 2011 was not reached. The most progress toward this goal was made in the fifth grade, where the percentage of students who scored ‘exemplary’ on the science PASS increased by 41.8% from 2009 to 2011. On the other hand, the percentage of fourth grade students who scored ‘exemplary’ on the science PASS decreased by 20%. (See Table 19 and Figure 19.) Table 19: Percentage of Students in Grades 3-5 who Scored 'Exemplary' on Science PASS
2009 2010 2011 % Change
3rd Grade 14.5 11.8 17.6 21.4%
4th Grade 9.5 12.5 7.6 -20.0%
5th Grade 7.9 8.9 11.2 41.8%
Total 10.3 11.4 11.0 -3.4%
The percentage of students in the sixth grade who scored ‘not met’ on the science PASS was 39.1% in 2009 (88 of the 225 who took the test), 45.6% in 2010 (108 of the 237 who took the test), and 39.8% in 2011 (92 of the 231 who took the test). The percentage of seventh graders who scored ‘not met’ on the science PASS was 32% in 2009 (135 of the 422 who took the test), 35.6% in 2010 (157 of the 441 who took the test), and 32.6% in 2011 (153 of the 470 who took the test).
PERFORMANCE MEASURE The percentage of students in Grades 6-8 who score Below Met in Science as measured by the PASS will decrease from 37.7% in 2010 to 30.0% by May 2015. (36% by 2011)
PERFORMANCE MEASURE The percentage of students in Grades 3-5 who score Exemplary in Science as measured by the PASS will increase from 11.4% in 2010 to 18.0% by May 2015. (13% by 2011)
0
5
10
15
20
3rd 4th 5th Total
2009 2010 2011
Figure 19: Percent of Students in Grades 3-5 who Scored 'Exemplary' on Science PASS
Laurens 55 MSP/SWS Inc. October 30, 2011 25
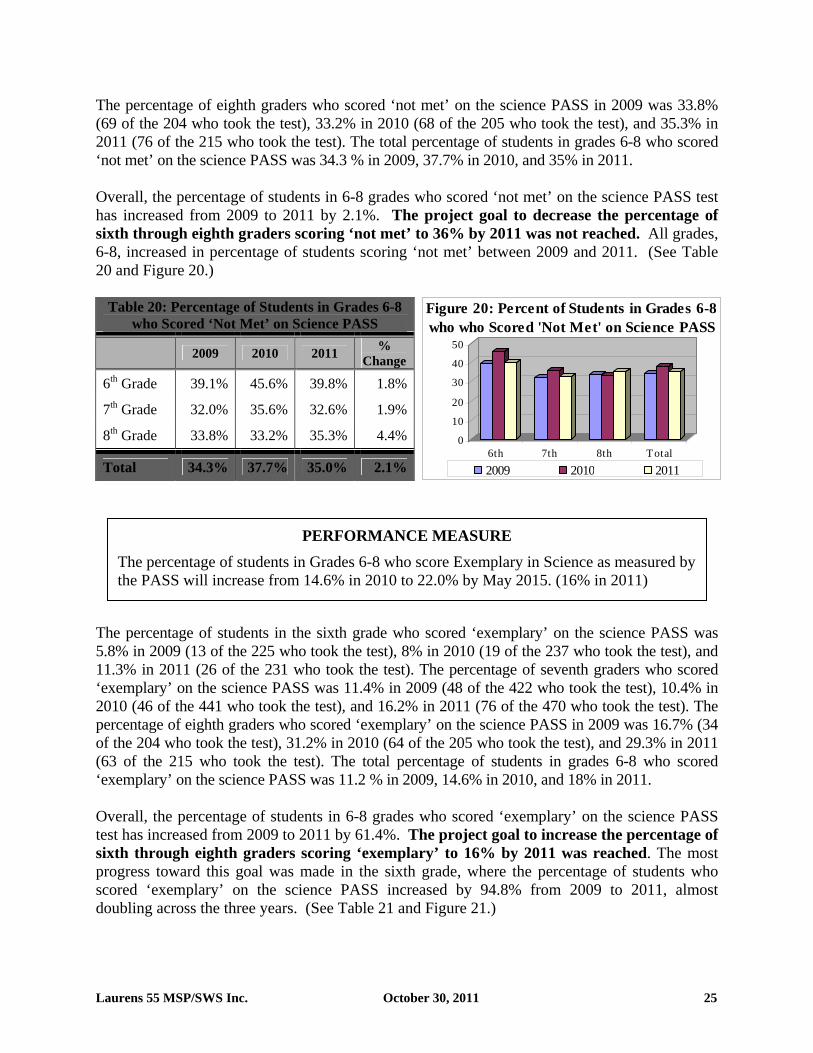
The percentage of eighth graders who scored ‘not met’ on the science PASS in 2009 was 33.8% (69 of the 204 who took the test), 33.2% in 2010 (68 of the 205 who took the test), and 35.3% in 2011 (76 of the 215 who took the test). The total percentage of students in grades 6-8 who scored ‘not met’ on the science PASS was 34.3 % in 2009, 37.7% in 2010, and 35% in 2011. Overall, the percentage of students in 6-8 grades who scored ‘not met’ on the science PASS test has increased from 2009 to 2011 by 2.1%. The project goal to decrease the percentage of sixth through eighth graders scoring ‘not met’ to 36% by 2011 was not reached. All grades, 6-8, increased in percentage of students scoring ‘not met’ between 2009 and 2011. (See Table 20 and Figure 20.)
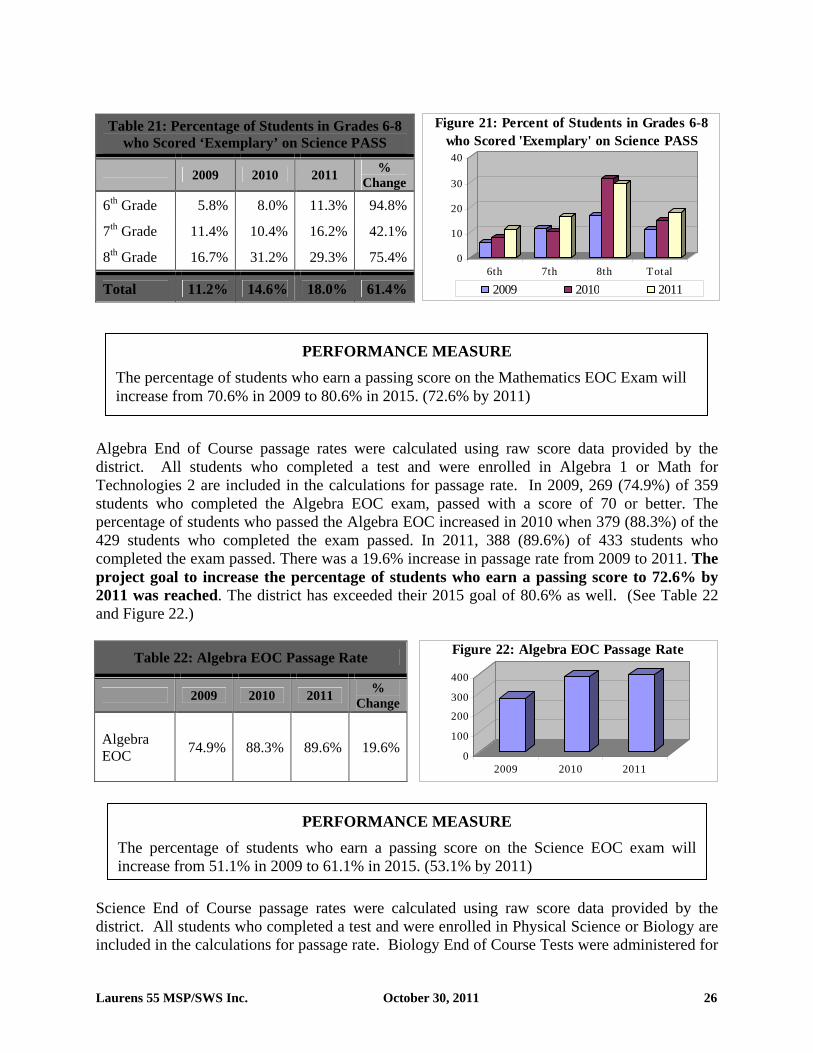
The percentage of students in the sixth grade who scored ‘exemplary’ on the science PASS was 5.8% in 2009 (13 of the 225 who took the test), 8% in 2010 (19 of the 237 who took the test), and 11.3% in 2011 (26 of the 231 who took the test). The percentage of seventh graders who scored ‘exemplary’ on the science PASS was 11.4% in 2009 (48 of the 422 who took the test), 10.4% in 2010 (46 of the 441 who took the test), and 16.2% in 2011 (76 of the 470 who took the test). The percentage of eighth graders who scored ‘exemplary’ on the science PASS in 2009 was 16.7% (34 of the 204 who took the test), 31.2% in 2010 (64 of the 205 who took the test), and 29.3% in 2011 (63 of the 215 who took the test). The total percentage of students in grades 6-8 who scored ‘exemplary’ on the science PASS was 11.2 % in 2009, 14.6% in 2010, and 18% in 2011. Overall, the percentage of students in 6-8 grades who scored ‘exemplary’ on the science PASS test has increased from 2009 to 2011 by 61.4%. The project goal to increase the percentage of sixth through eighth graders scoring ‘exemplary’ to 16% by 2011 was reached. The most progress toward this goal was made in the sixth grade, where the percentage of students who scored ‘exemplary’ on the science PASS increased by 94.8% from 2009 to 2011, almost doubling across the three years. (See Table 21 and Figure 21.)
Table 20: Percentage of Students in Grades 6-8 who Scored ‘Not Met’ on Science PASS
2009 2010 2011 % Change
6th Grade 39.1% 45.6% 39.8% 1.8%
7th Grade 32.0% 35.6% 32.6% 1.9%
8th Grade 33.8% 33.2% 35.3% 4.4%
Total 34.3% 37.7% 35.0% 2.1%
PERFORMANCE MEASURE The percentage of students in Grades 6-8 who score Exemplary in Science as measured by the PASS will increase from 14.6% in 2010 to 22.0% by May 2015. (16% in 2011)
0
10
20
30
40
50
6th 7th 8th Total2009 2010 2011
Figure 20: Percent of Students in Grades 6-8 who who Scored 'Not Met' on Science PASS
Laurens 55 MSP/SWS Inc. October 30, 2011 26
Table 21: Percentage of Students in Grades 6-8
who Scored ‘Exemplary’ on Science PASS
2009 2010 2011 % Change
6th Grade 5.8% 8.0% 11.3% 94.8%
7th Grade 11.4% 10.4% 16.2% 42.1%
8th Grade 16.7% 31.2% 29.3% 75.4%
Total 11.2% 14.6% 18.0% 61.4%
Algebra End of Course passage rates were calculated using raw score data provided by the district. All students who completed a test and were enrolled in Algebra 1 or Math for Technologies 2 are included in the calculations for passage rate. In 2009, 269 (74.9%) of 359 students who completed the Algebra EOC exam, passed with a score of 70 or better. The percentage of students who passed the Algebra EOC increased in 2010 when 379 (88.3%) of the 429 students who completed the exam passed. In 2011, 388 (89.6%) of 433 students who completed the exam passed. There was a 19.6% increase in passage rate from 2009 to 2011. The project goal to increase the percentage of students who earn a passing score to 72.6% by 2011 was reached. The district has exceeded their 2015 goal of 80.6% as well. (See Table 22 and Figure 22.)
Table 22: Algebra EOC Passage Rate
2009 2010 2011 % Change
Algebra EOC 74.9% 88.3% 89.6% 19.6%
Science End of Course passage rates were calculated using raw score data provided by the district. All students who completed a test and were enrolled in Physical Science or Biology are included in the calculations for passage rate. Biology End of Course Tests were administered for
PERFORMANCE MEASURE The percentage of students who earn a passing score on the Science EOC exam will increase from 51.1% in 2009 to 61.1% in 2015. (53.1% by 2011)
PERFORMANCE MEASURE The percentage of students who earn a passing score on the Mathematics EOC Exam will increase from 70.6% in 2009 to 80.6% in 2015. (72.6% by 2011)
0
10
20
30
40
6th 7th 8th Total
2009 2010 2011
Figure 21: Percent of Students in Grades 6-8 who Scored 'Exemplary' on Science PASS
0
100
200
300
400
2009 2010 2011
Figure 22: Algebra EOC Passage Rate
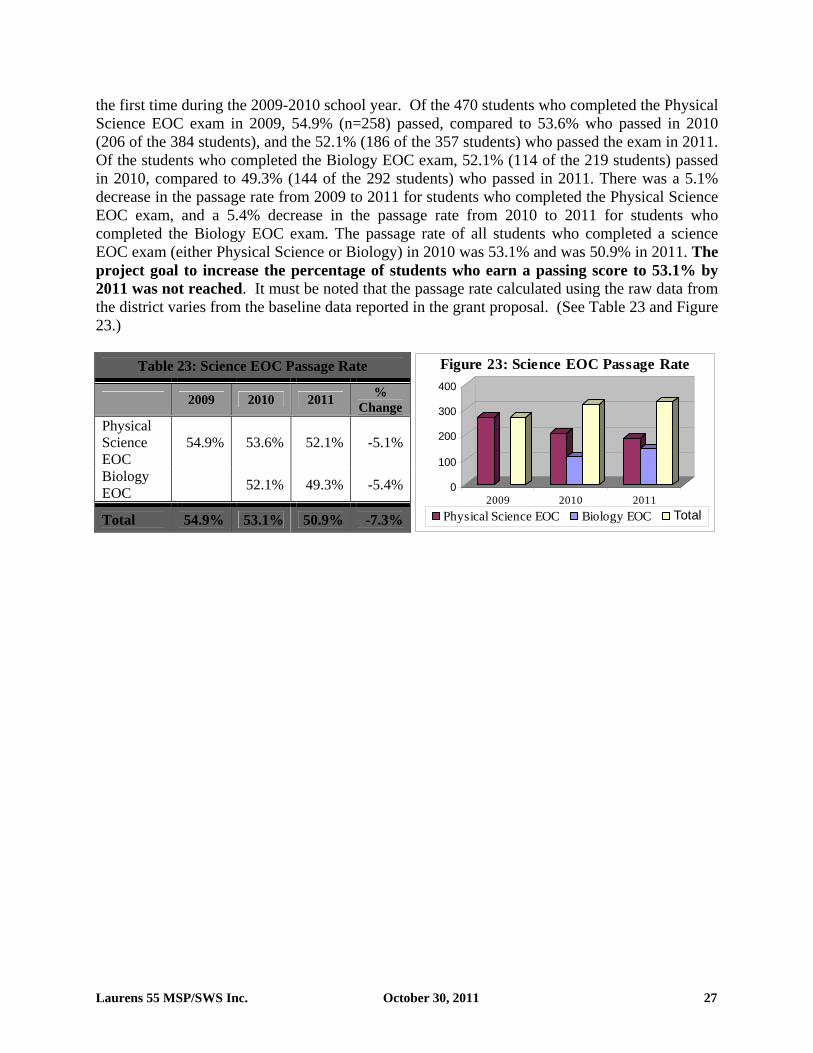
Laurens 55 MSP/SWS Inc. October 30, 2011 27
the first time during the 2009-2010 school year. Of the 470 students who completed the Physical Science EOC exam in 2009, 54.9% (n=258) passed, compared to 53.6% who passed in 2010 (206 of the 384 students), and the 52.1% (186 of the 357 students) who passed the exam in 2011. Of the students who completed the Biology EOC exam, 52.1% (114 of the 219 students) passed in 2010, compared to 49.3% (144 of the 292 students) who passed in 2011. There was a 5.1% decrease in the passage rate from 2009 to 2011 for students who completed the Physical Science EOC exam, and a 5.4% decrease in the passage rate from 2010 to 2011 for students who completed the Biology EOC exam. The passage rate of all students who completed a science EOC exam (either Physical Science or Biology) in 2010 was 53.1% and was 50.9% in 2011. The project goal to increase the percentage of students who earn a passing score to 53.1% by 2011 was not reached. It must be noted that the passage rate calculated using the raw data from the district varies from the baseline data reported in the grant proposal. (See Table 23 and Figure 23.)
Table 23: Science EOC Passage Rate
2009 2010 2011 % Change
Physical Science EOC
54.9% 53.6% 52.1% -5.1%
Biology EOC 52.1% 49.3% -5.4%
Total 54.9% 53.1% 50.9% -7.3%
0
100
200
300
400
2009 2010 2011Physical Science EOC Biology EOC Total
Figure 23: Science EOC Passage Rate
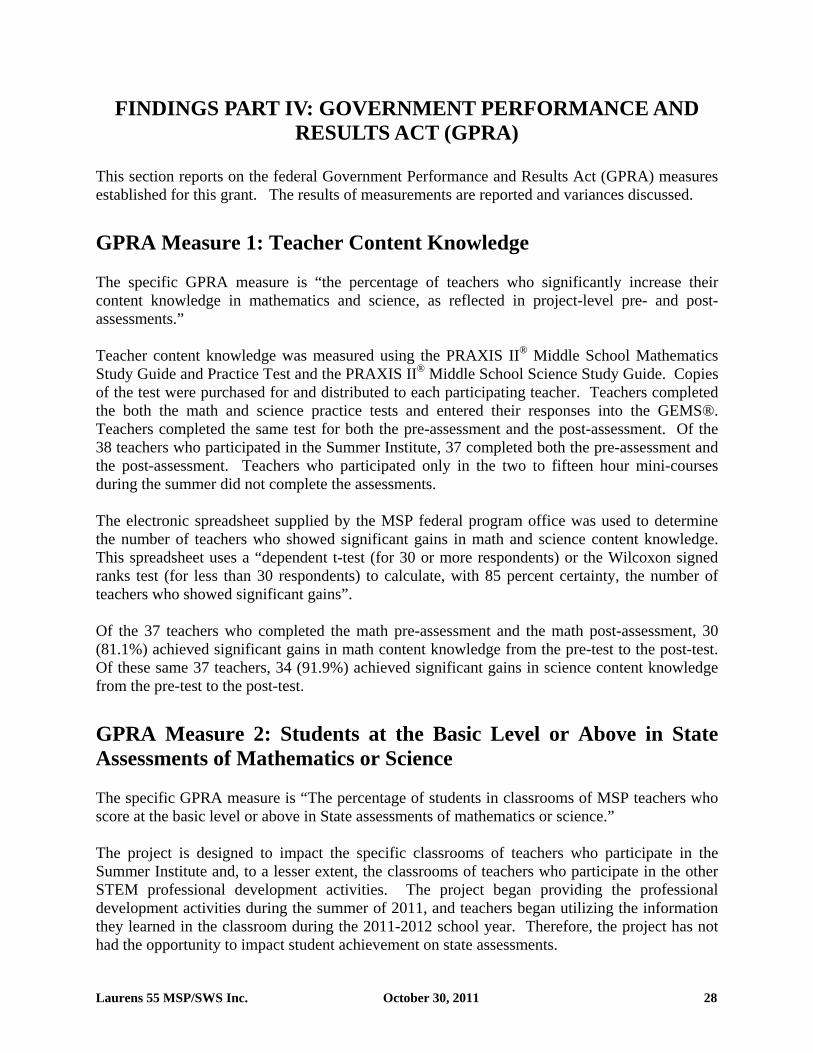
Laurens 55 MSP/SWS Inc. October 30, 2011 28
FINDINGS PART IV: GOVERNMENT PERFORMANCE AND RESULTS ACT (GPRA)
This section reports on the federal Government Performance and Results Act (GPRA) measures established for this grant. The results of measurements are reported and variances discussed.
GPRA Measure 1: Teacher Content Knowledge The specific GPRA measure is “the percentage of teachers who significantly increase their content knowledge in mathematics and science, as reflected in project-level pre- and post-assessments.” Teacher content knowledge was measured using the PRAXIS II® Middle School Mathematics Study Guide and Practice Test and the PRAXIS II® Middle School Science Study Guide. Copies of the test were purchased for and distributed to each participating teacher. Teachers completed the both the math and science practice tests and entered their responses into the GEMS®. Teachers completed the same test for both the pre-assessment and the post-assessment. Of the 38 teachers who participated in the Summer Institute, 37 completed both the pre-assessment and the post-assessment. Teachers who participated only in the two to fifteen hour mini-courses during the summer did not complete the assessments. The electronic spreadsheet supplied by the MSP federal program office was used to determine the number of teachers who showed significant gains in math and science content knowledge. This spreadsheet uses a “dependent t-test (for 30 or more respondents) or the Wilcoxon signed ranks test (for less than 30 respondents) to calculate, with 85 percent certainty, the number of teachers who showed significant gains”. Of the 37 teachers who completed the math pre-assessment and the math post-assessment, 30 (81.1%) achieved significant gains in math content knowledge from the pre-test to the post-test. Of these same 37 teachers, 34 (91.9%) achieved significant gains in science content knowledge from the pre-test to the post-test.
GPRA Measure 2: Students at the Basic Level or Above in State Assessments of Mathematics or Science The specific GPRA measure is “The percentage of students in classrooms of MSP teachers who score at the basic level or above in State assessments of mathematics or science.” The project is designed to impact the specific classrooms of teachers who participate in the Summer Institute and, to a lesser extent, the classrooms of teachers who participate in the other STEM professional development activities. The project began providing the professional development activities during the summer of 2011, and teachers began utilizing the information they learned in the classroom during the 2011-2012 school year. Therefore, the project has not had the opportunity to impact student achievement on state assessments.
Laurens 55 MSP/SWS Inc. October 30, 2011 29
GPRA Measure 3: Students at the Proficient Level or Above in State Assessments of Mathematics or Science The specific GPRA measure is “The percentage of students in classrooms of MSP teachers who score at the proficient level or above in State assessments of mathematics or science.” The project is designed to impact the specific classrooms of teachers who participate in the Summer Institute and, to a lesser extent, the classrooms of teachers who participate in the other STEM professional development activities. The project began providing the professional development activities during the summer of 2011, and teachers began utilizing the information they learned in the classroom during the 2011-2012 school year. Therefore, the project has not had the opportunity to impact student achievement on state assessments.
GPRA Measure 4: Experimental or Quasi-Experimental Evaluation Design The specific GPRA measure is “The percentage of MSP projects that report using experimental or quasi-experimental design for their evaluations.” The design of the outcome evaluation for this project is quasi-experimental. The project began providing the professional development activities during the summer of 2011, and teachers began utilizing the information they learned in the classroom during the 2011-2012 school year. The project did not have the opportunity to impact student achievement on state assessments during the first year of the grant. Therefore, there were no students who are considered to be served during the current grant year and the comparison of outcomes (student achievement) cannot be conducted. Analysis of outcomes for each group of students will be conducted during the 2011-2012 grant year. The second year evaluation will compare changes in teacher content knowledge, teacher efficacy and student achievement among teachers who participated in the 2011 summer institute, teachers who participated in graduate courses, and teachers who participate in only limited breadth “mini-courses” offered by the district.
GPRA Measure 5: Scientifically Valid Evaluation Results The specific GPRA measure is “The percentage of MSP projects that use experimental or quasi experimental design for their evaluations that are conducted successfully and that yield scientifically valid results.” It is the intention of the evaluation team that the quasi-experimental design for years two and three of the grant follow the federal definitions for being scientifically valid. Comparisons will be conducted internally to the project and to the district as well as to a partner district.
Laurens 55 MSP/SWS Inc. October 30, 2011 30
DISCUSSION
Process Evaluation Laurens District 55 closely followed their implementation plan, in spite of a late start caused by funding delays outside of their control. The District was successful in identifying teachers to attend the Summer Institute and the Institute was successful in increasing both the content knowledge and teaching abilities of the participants. The District also provided STEM professional development activities during the summer and into the fall for math and science teachers not involved in the Summer Institute. The members of the comparison group for the evaluation were identified and tested. All other administrative tasks necessary for the grant implementation were carried out successfully.
Outcome Evaluation During the first year of the project, only baseline scores are available, and, therefore, a comparison of the outcomes for the students taught by the experimental group (math and science teachers who take part in the Summer Institute and graduate courses provided by the project) cannot be compared to those of the students of the math and science teachers who do not take part in this professional development. Baseline scores are reported in the evaluation. The teachers who participated in the project have not yet had the opportunity to impact change in the targeted students on the measures established by the grant. Progress toward achieving the outcomes of the grant are presented in the evaluation to establish the change pattern for each measure.
Laurens 55 MSP/SWS Inc. October 30, 2011 31
CONCLUSIONS
1. The grant was implemented effectively and efficiently. The District staff adapted to the
late funding to make sure the project met its objectives for the year.
2. The process indicators were ether met or exceeded.
3. The quasi-experimental design could not be reported on, since this was the first year of the grant, and there was no comparison to be made.
4. The teachers trained in the first year did not have the opportunity to have an impact in the
classroom, since their training occurred in the summer prior to the beginning of the school year. However, the project had established ten outcome measures for the first year. Three of these were met and seven were not met.
5. The number of subscales reported for the PRAXIS Science pre-post test are too
numerous.
Laurens 55 MSP/SWS Inc. October 30, 2011 32
RECOMMENDATIONS
1. The District continue its support of the grant.
2. The improvements to the Summer Institute recommended by key informants on page 9
and 10 be implemented.
3. The number of sub scales reported for the PRAXIS Science pre and post test be reduced.
Laurens 55 MSP/SWS Inc. October 30, 2011 33
APPENDIX ONE: INSTRUMENTS
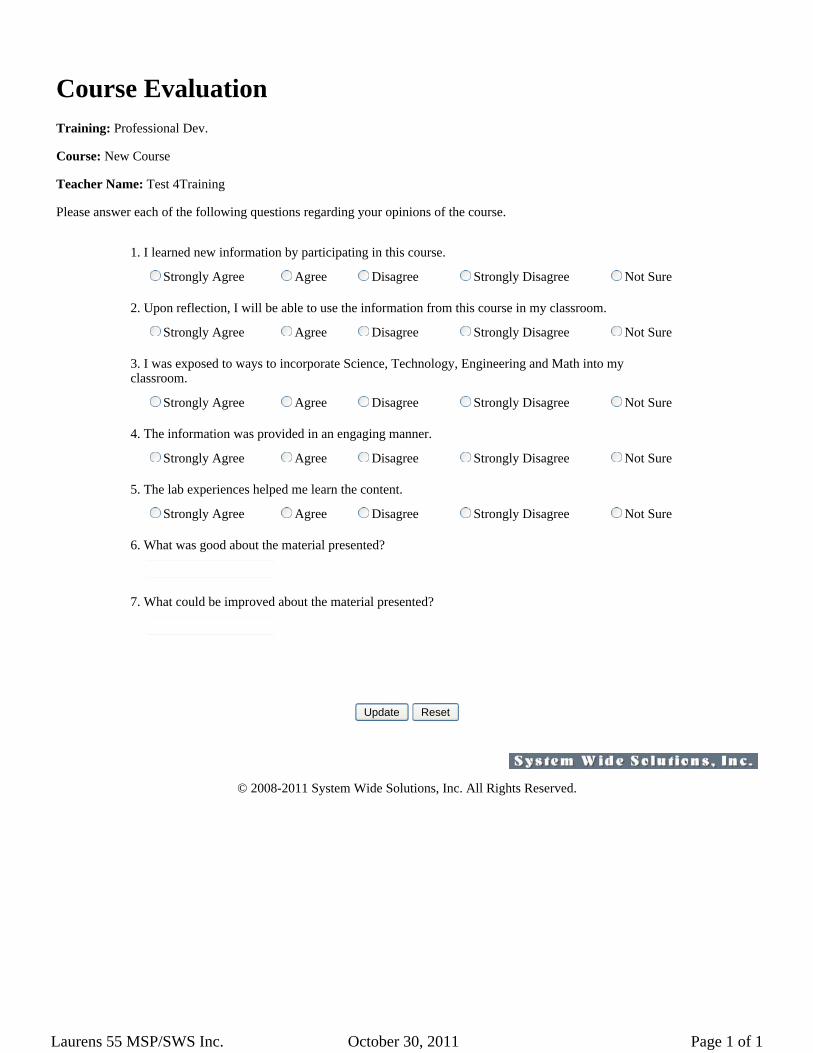
Course EvaluationTraining: Professional Dev.
Course: New Course
Teacher Name: Test 4Training
Please answer each of the following questions regarding your opinions of the course.
1. I learned new information by participating in this course.
Strongly Agree Agree Disagree Strongly Disagree Not Sure
2. Upon reflection, I will be able to use the information from this course in my classroom.
Strongly Agree Agree Disagree Strongly Disagree Not Sure
3. I was exposed to ways to incorporate Science, Technology, Engineering and Math into my classroom.
Strongly Agree Agree Disagree Strongly Disagree Not Sure
4. The information was provided in an engaging manner.
Strongly Agree Agree Disagree Strongly Disagree Not Sure
5. The lab experiences helped me learn the content.
Strongly Agree Agree Disagree Strongly Disagree Not Sure
6. What was good about the material presented?
7. What could be improved about the material presented?
Update Reset
© 2008-2011 System Wide Solutions, Inc. All Rights Reserved.
Laurens 55 MSP/SWS Inc. October 30, 2011 Page 1 of 1
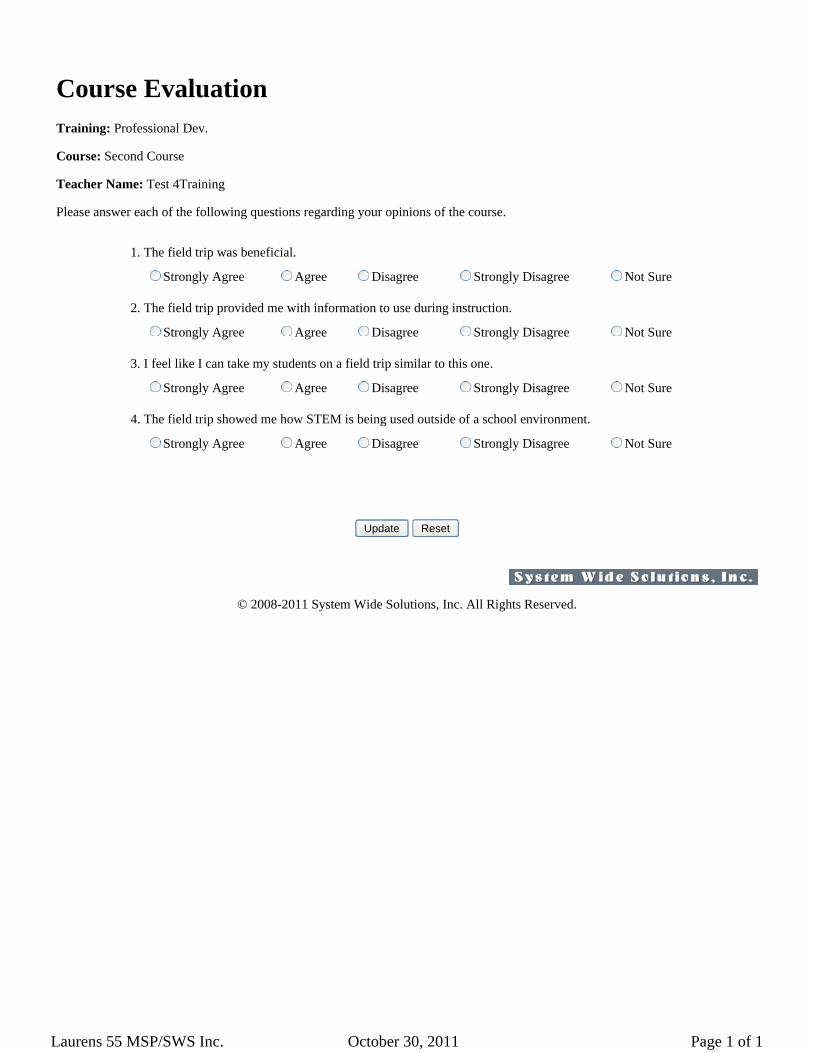
Course EvaluationTraining: Professional Dev.
Course: Second Course
Teacher Name: Test 4Training
Please answer each of the following questions regarding your opinions of the course.
1. The field trip was beneficial.
Strongly Agree Agree Disagree Strongly Disagree Not Sure
2. The field trip provided me with information to use during instruction.
Strongly Agree Agree Disagree Strongly Disagree Not Sure
3. I feel like I can take my students on a field trip similar to this one.
Strongly Agree Agree Disagree Strongly Disagree Not Sure
4. The field trip showed me how STEM is being used outside of a school environment.
Strongly Agree Agree Disagree Strongly Disagree Not Sure
Update Reset
© 2008-2011 System Wide Solutions, Inc. All Rights Reserved.
Laurens 55 MSP/SWS Inc. October 30, 2011 Page 1 of 1
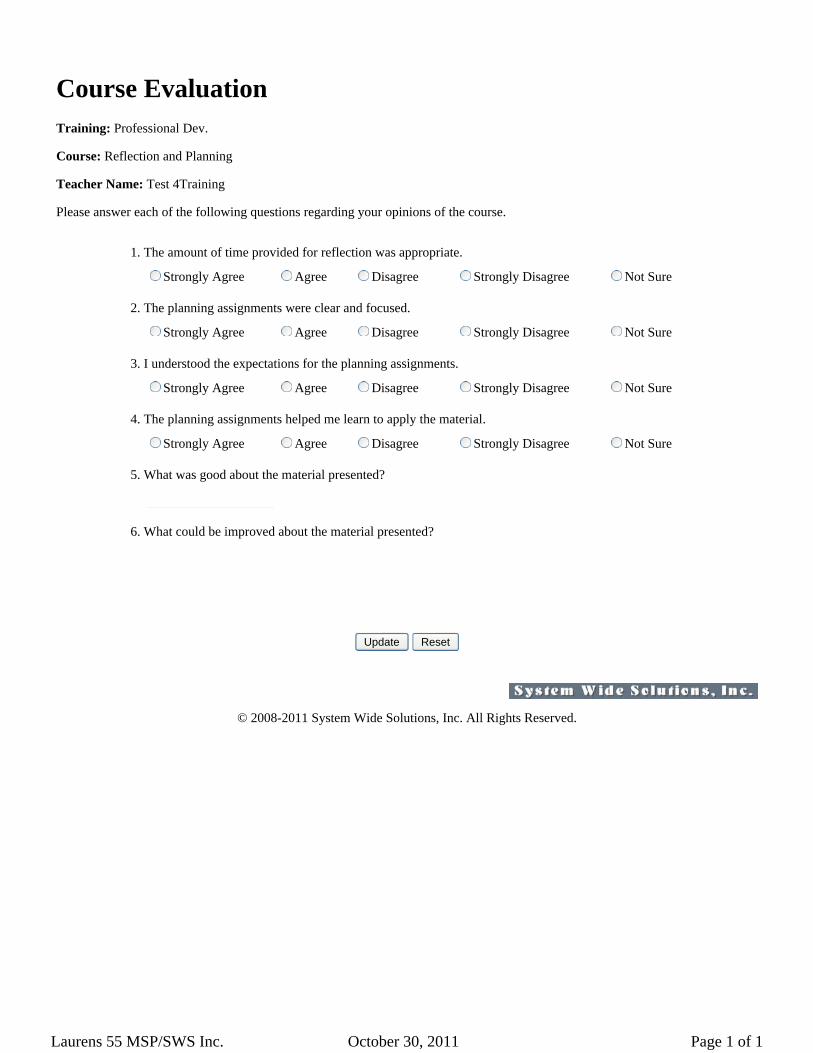
Course EvaluationTraining: Professional Dev.
Course: Reflection and Planning
Teacher Name: Test 4Training
Please answer each of the following questions regarding your opinions of the course.
1. The amount of time provided for reflection was appropriate.
Strongly Agree Agree Disagree Strongly Disagree Not Sure
2. The planning assignments were clear and focused.
Strongly Agree Agree Disagree Strongly Disagree Not Sure
3. I understood the expectations for the planning assignments.
Strongly Agree Agree Disagree Strongly Disagree Not Sure
4. The planning assignments helped me learn to apply the material.
Strongly Agree Agree Disagree Strongly Disagree Not Sure
5. What was good about the material presented?
6. What could be improved about the material presented?
Update Reset
© 2008-2011 System Wide Solutions, Inc. All Rights Reserved.
Laurens 55 MSP/SWS Inc. October 30, 2011 Page 1 of 1
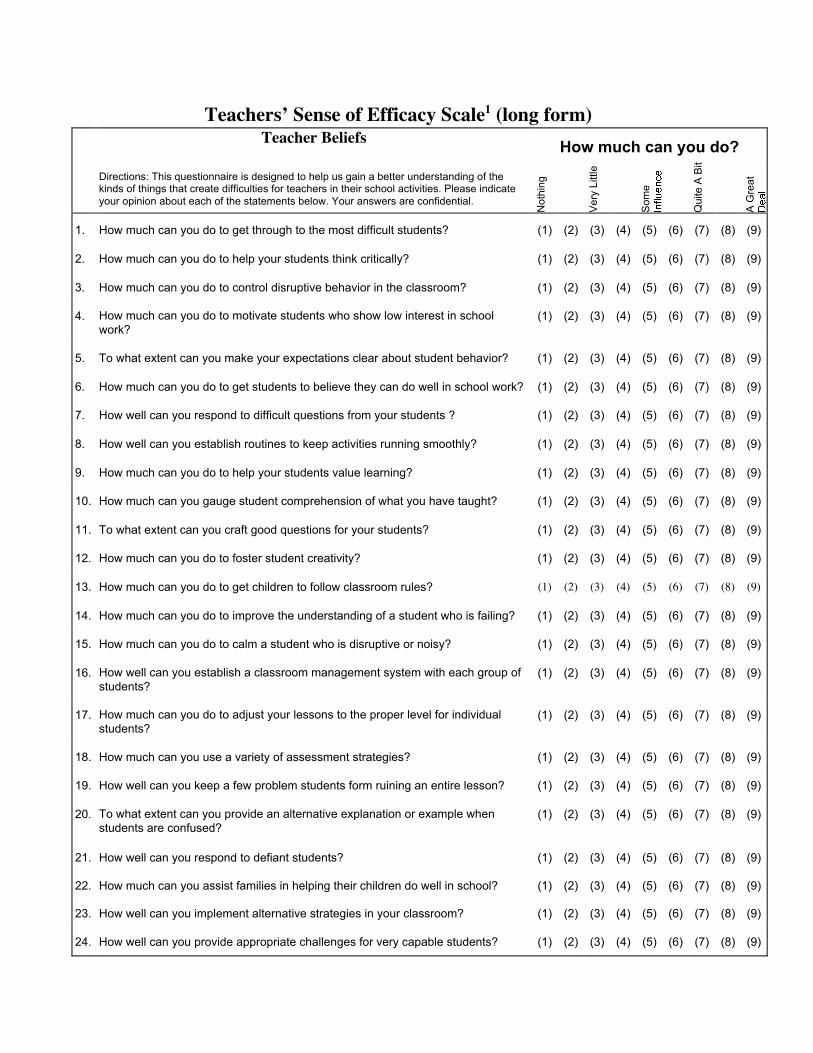
Teachers’ Sense of Efficacy Scale1 (long form)Teacher Beliefs
How much can you do?
Directions: This questionnaire is designed to help us gain a better understanding of thekinds of things that create difficulties for teachers in their school activities. Please indicateyour opinion about each of the statements below. Your answers are confidential.
Not
hing
Ver
y Li
ttle
Som
e
Qui
te A
Bit
A G
reat
1. How much can you do to get through to the most difficult students? (1) (2) (3) (4) (5) (6) (7) (8) (9)
2. How much can you do to help your students think critically? (1) (2) (3) (4) (5) (6) (7) (8) (9)
3. How much can you do to control disruptive behavior in the classroom? (1) (2) (3) (4) (5) (6) (7) (8) (9)
4. How much can you do to motivate students who show low interest in schoolwork?
(1) (2) (3) (4) (5) (6) (7) (8) (9)
5. To what extent can you make your expectations clear about student behavior? (1) (2) (3) (4) (5) (6) (7) (8) (9)
6. How much can you do to get students to believe they can do well in school work? (1) (2) (3) (4) (5) (6) (7) (8) (9)
7. How well can you respond to difficult questions from your students ? (1) (2) (3) (4) (5) (6) (7) (8) (9)
8. How well can you establish routines to keep activities running smoothly? (1) (2) (3) (4) (5) (6) (7) (8) (9)
9. How much can you do to help your students value learning? (1) (2) (3) (4) (5) (6) (7) (8) (9)
10. How much can you gauge student comprehension of what you have taught? (1) (2) (3) (4) (5) (6) (7) (8) (9)
11. To what extent can you craft good questions for your students? (1) (2) (3) (4) (5) (6) (7) (8) (9)
12. How much can you do to foster student creativity? (1) (2) (3) (4) (5) (6) (7) (8) (9)
13. How much can you do to get children to follow classroom rules? (1) (2) (3) (4) (5) (6) (7) (8) (9)
14. How much can you do to improve the understanding of a student who is failing? (1) (2) (3) (4) (5) (6) (7) (8) (9)
15. How much can you do to calm a student who is disruptive or noisy? (1) (2) (3) (4) (5) (6) (7) (8) (9)
16. How well can you establish a classroom management system with each group ofstudents?
(1) (2) (3) (4) (5) (6) (7) (8) (9)
17. How much can you do to adjust your lessons to the proper level for individualstudents?
(1) (2) (3) (4) (5) (6) (7) (8) (9)
18. How much can you use a variety of assessment strategies? (1) (2) (3) (4) (5) (6) (7) (8) (9)
19. How well can you keep a few problem students form ruining an entire lesson? (1) (2) (3) (4) (5) (6) (7) (8) (9)
20. To what extent can you provide an alternative explanation or example whenstudents are confused?
(1) (2) (3) (4) (5) (6) (7) (8) (9)
21. How well can you respond to defiant students? (1) (2) (3) (4) (5) (6) (7) (8) (9)
22. How much can you assist families in helping their children do well in school? (1) (2) (3) (4) (5) (6) (7) (8) (9)
23. How well can you implement alternative strategies in your classroom? (1) (2) (3) (4) (5) (6) (7) (8) (9)
24. How well can you provide appropriate challenges for very capable students? (1) (2) (3) (4) (5) (6) (7) (8) (9)
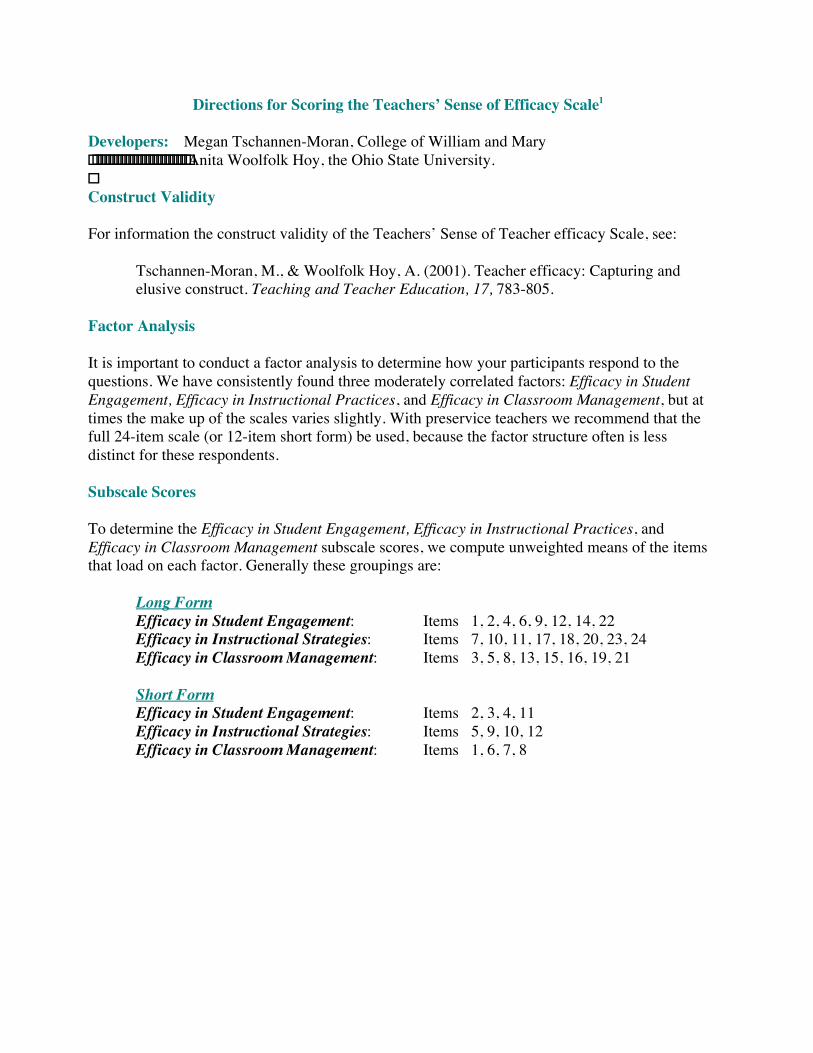
Directions for Scoring the Teachers’ Sense of Efficacy Scale1
Developers: Megan Tschannen-Moran, College of William and Mary!!!!!!!!!!!!!!!!!!!!!!!!!Anita Woolfolk Hoy, the Ohio State University.!Construct Validity
For information the construct validity of the Teachers’ Sense of Teacher efficacy Scale, see:
Tschannen-Moran, M., & Woolfolk Hoy, A. (2001). Teacher efficacy: Capturing andelusive construct. Teaching and Teacher Education, 17, 783-805.
Factor Analysis
It is important to conduct a factor analysis to determine how your participants respond to thequestions. We have consistently found three moderately correlated factors: Efficacy in StudentEngagement, Efficacy in Instructional Practices, and Efficacy in Classroom Management, but attimes the make up of the scales varies slightly. With preservice teachers we recommend that thefull 24-item scale (or 12-item short form) be used, because the factor structure often is lessdistinct for these respondents.
Subscale Scores
To determine the Efficacy in Student Engagement, Efficacy in Instructional Practices, andEfficacy in Classroom Management subscale scores, we compute unweighted means of the itemsthat load on each factor. Generally these groupings are:
Long FormEfficacy in Student Engagement: Items 1, 2, 4, 6, 9, 12, 14, 22Efficacy in Instructional Strategies: Items 7, 10, 11, 17, 18, 20, 23, 24Efficacy in Classroom Management: Items 3, 5, 8, 13, 15, 16, 19, 21
Short FormEfficacy in Student Engagement: Items 2, 3, 4, 11Efficacy in Instructional Strategies: Items 5, 9, 10, 12Efficacy in Classroom Management: Items 1, 6, 7, 8
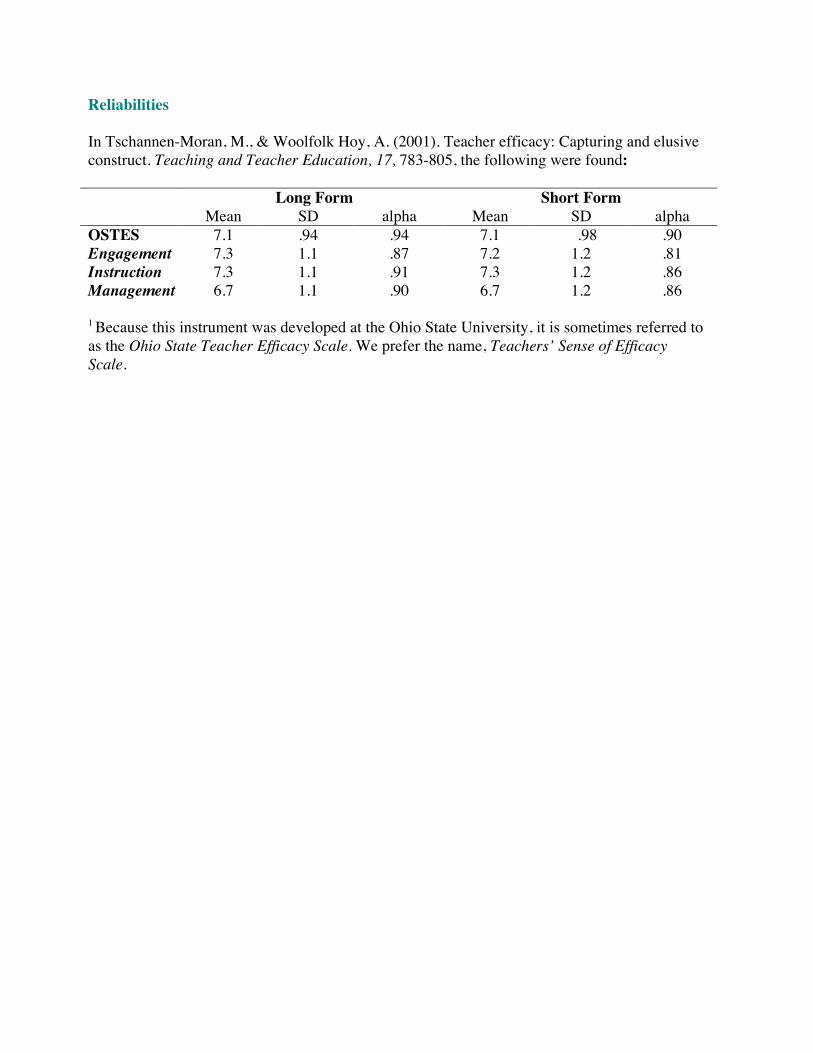
Reliabilities
In Tschannen-Moran, M., & Woolfolk Hoy, A. (2001). Teacher efficacy: Capturing and elusiveconstruct. Teaching and Teacher Education, 17, 783-805, the following were found:
Long Form Short FormMean SD alpha Mean SD alpha
OSTES 7.1 .94 .94 7.1 .98 .90Engagement 7.3 1.1 .87 7.2 1.2 .81Instruction 7.3 1.1 .91 7.3 1.2 .86Management 6.7 1.1 .90 6.7 1.2 .86
1 Because this instrument was developed at the Ohio State University, it is sometimes referred toas the Ohio State Teacher Efficacy Scale. We prefer the name, Teachers’ Sense of EfficacyScale.
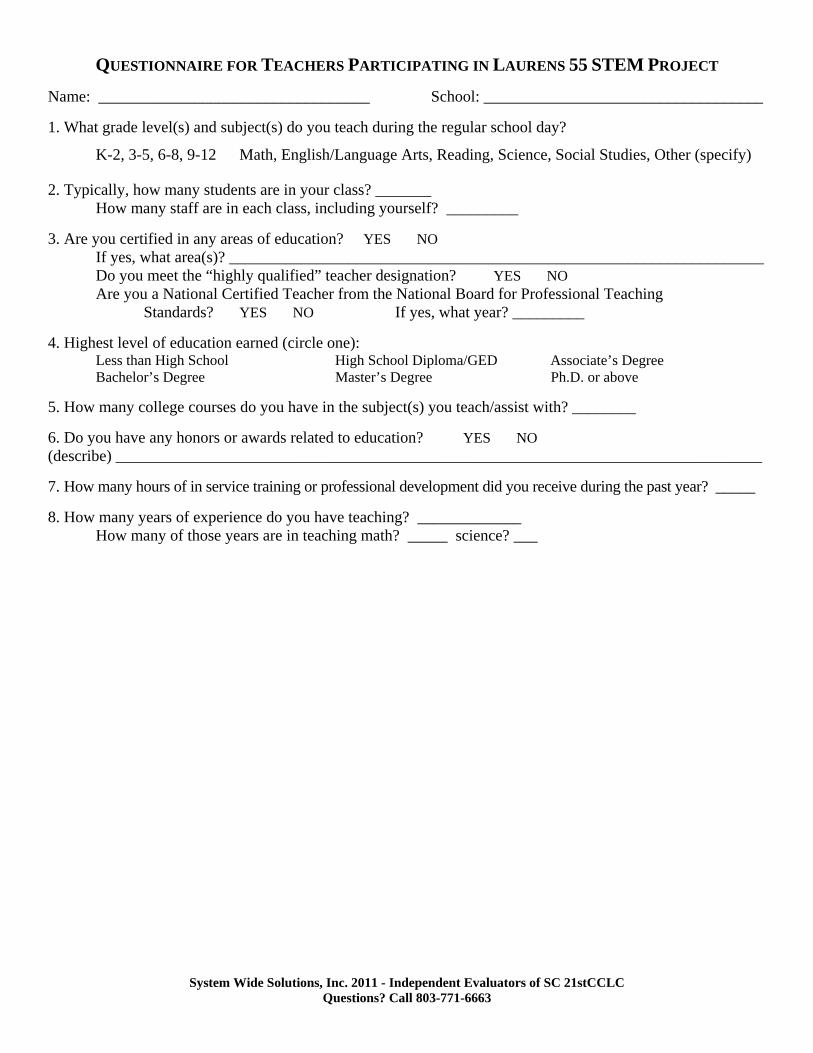
System Wide Solutions, Inc. 2011 - Independent Evaluators of SC 21stCCLC Questions? Call 803-771-6663
QUESTIONNAIRE FOR TEACHERS PARTICIPATING IN LAURENS 55 STEM PROJECT
Name: __________________________________ School: ___________________________________ 1. What grade level(s) and subject(s) do you teach during the regular school day?
K-2, 3-5, 6-8, 9-12 Math, English/Language Arts, Reading, Science, Social Studies, Other (specify)
2. Typically, how many students are in your class? _______ How many staff are in each class, including yourself? _________
3. Are you certified in any areas of education? YES NO
If yes, what area(s)? ___________________________________________________________________ Do you meet the “highly qualified” teacher designation? YES NO Are you a National Certified Teacher from the National Board for Professional Teaching
Standards? YES NO If yes, what year? _________
4. Highest level of education earned (circle one): Less than High School High School Diploma/GED Associate’s Degree Bachelor’s Degree Master’s Degree Ph.D. or above 5. How many college courses do you have in the subject(s) you teach/assist with? ________ 6. Do you have any honors or awards related to education? YES NO (describe) _________________________________________________________________________________ 7. How many hours of in service training or professional development did you receive during the past year? _____ 8. How many years of experience do you have teaching? _____________ How many of those years are in teaching math? _____ science? ___
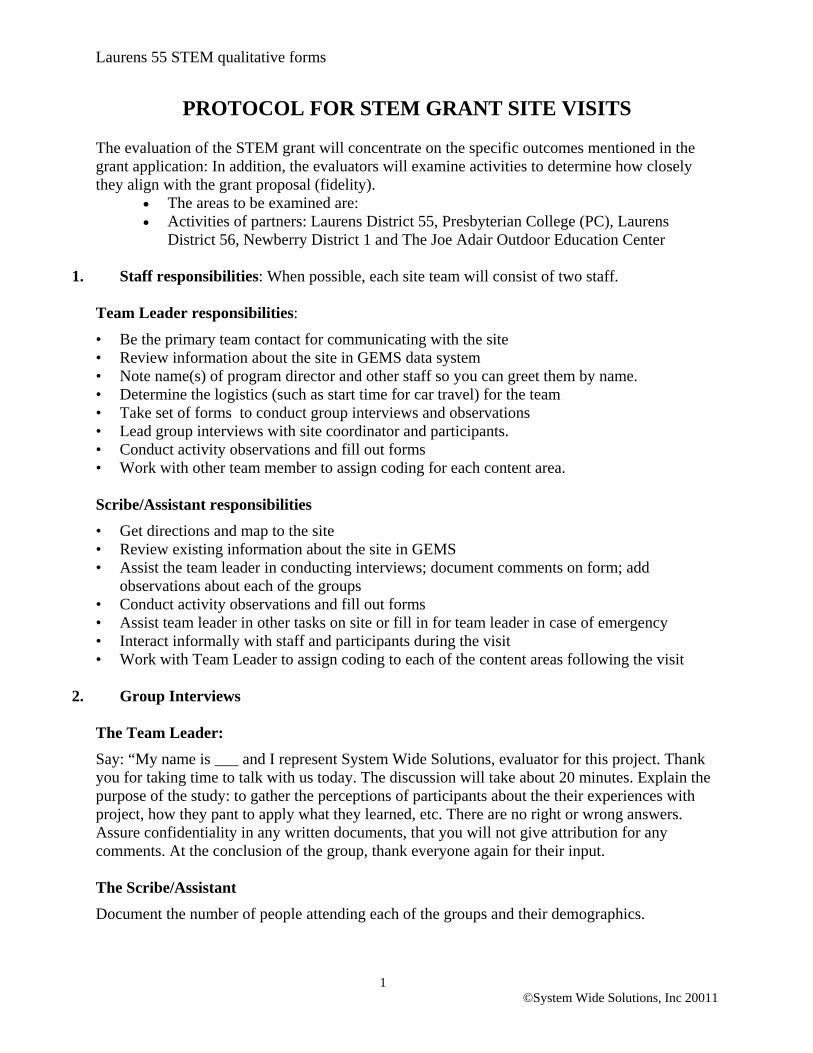
Laurens 55 STEM qualitative forms
PROTOCOL FOR STEM GRANT SITE VISITS
The evaluation of the STEM grant will concentrate on the specific outcomes mentioned in the grant application: In addition, the evaluators will examine activities to determine how closely they align with the grant proposal (fidelity).
• The areas to be examined are: • Activities of partners: Laurens District 55, Presbyterian College (PC), Laurens
District 56, Newberry District 1 and The Joe Adair Outdoor Education Center
1. Staff responsibilities: When possible, each site team will consist of two staff. Team Leader responsibilities:
• Be the primary team contact for communicating with the site • Review information about the site in GEMS data system • Note name(s) of program director and other staff so you can greet them by name. • Determine the logistics (such as start time for car travel) for the team • Take set of forms to conduct group interviews and observations • Lead group interviews with site coordinator and participants. • Conduct activity observations and fill out forms • Work with other team member to assign coding for each content area. Scribe/Assistant responsibilities • Get directions and map to the site • Review existing information about the site in GEMS • Assist the team leader in conducting interviews; document comments on form; add
observations about each of the groups • Conduct activity observations and fill out forms • Assist team leader in other tasks on site or fill in for team leader in case of emergency • Interact informally with staff and participants during the visit • Work with Team Leader to assign coding to each of the content areas following the visit
2. Group Interviews
The Team Leader:
Say: “My name is ___ and I represent System Wide Solutions, evaluator for this project. Thank you for taking time to talk with us today. The discussion will take about 20 minutes. Explain the purpose of the study: to gather the perceptions of participants about the their experiences with project, how they pant to apply what they learned, etc. There are no right or wrong answers. Assure confidentiality in any written documents, that you will not give attribution for any comments. At the conclusion of the group, thank everyone again for their input. The Scribe/Assistant Document the number of people attending each of the groups and their demographics.
1 ©System Wide Solutions, Inc 20011
Laurens 55 STEM qualitative forms
Document participant responses on the form. Note observations about the group process, patterns of communication, nonverbal communication, etc. Give input to the Team Leader after each session and document any summary observations. Make sure that all forms and information are complete before leaving the site.
3. Activity Observation Using the Activity form, each member of the team documents observation of activities that occur at the site.
Coding Qualitative Data
Within 48 hours of site visit, both team members should confer and agree upon a coding for each subject area, according to the coding scale described in the site visit forms. Members enter a single numeric code for each subject area into the qualitative database. In case of disagreement between team members, a third party should arbitrate.
2 ©System Wide Solutions, Inc 20011
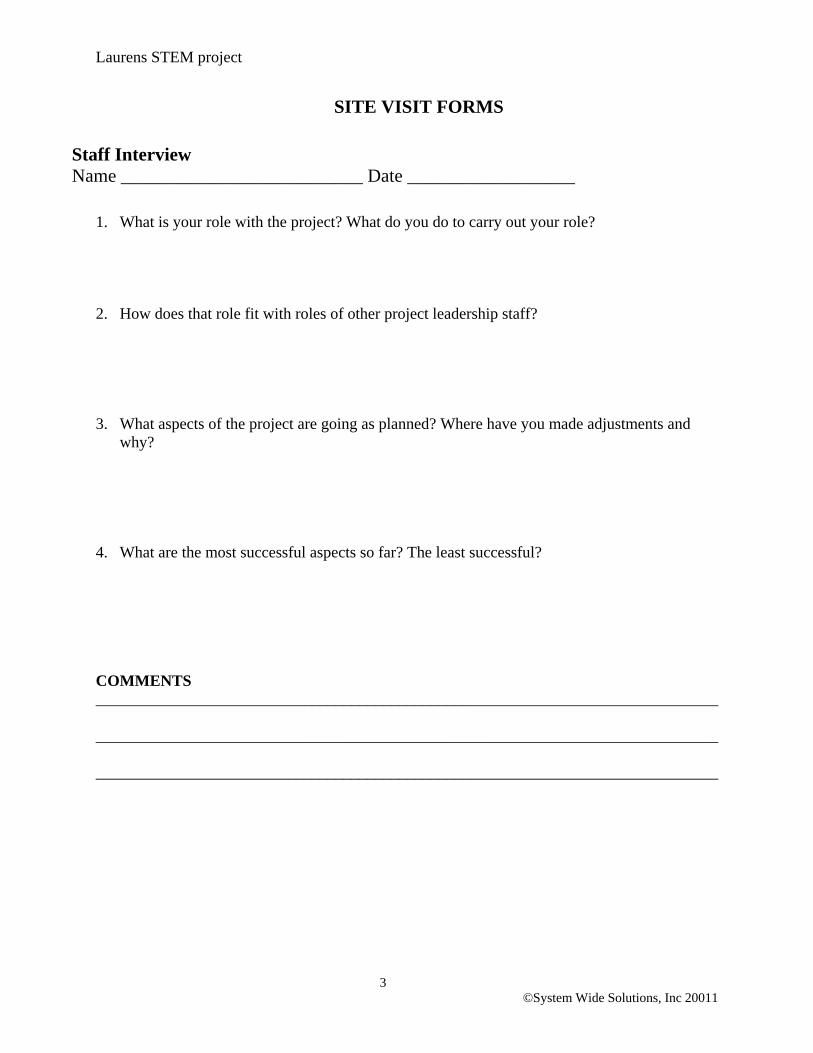
Laurens STEM project
SITE VISIT FORMS
Staff Interview Name __________________________ Date __________________
1. What is your role with the project? What do you do to carry out your role? 2. How does that role fit with roles of other project leadership staff? 3. What aspects of the project are going as planned? Where have you made adjustments and
why? 4. What are the most successful aspects so far? The least successful? COMMENTS ______________________________________________________________________________
______________________________________________________________________________
______________________________________________________________________________
3 ©System Wide Solutions, Inc 20011
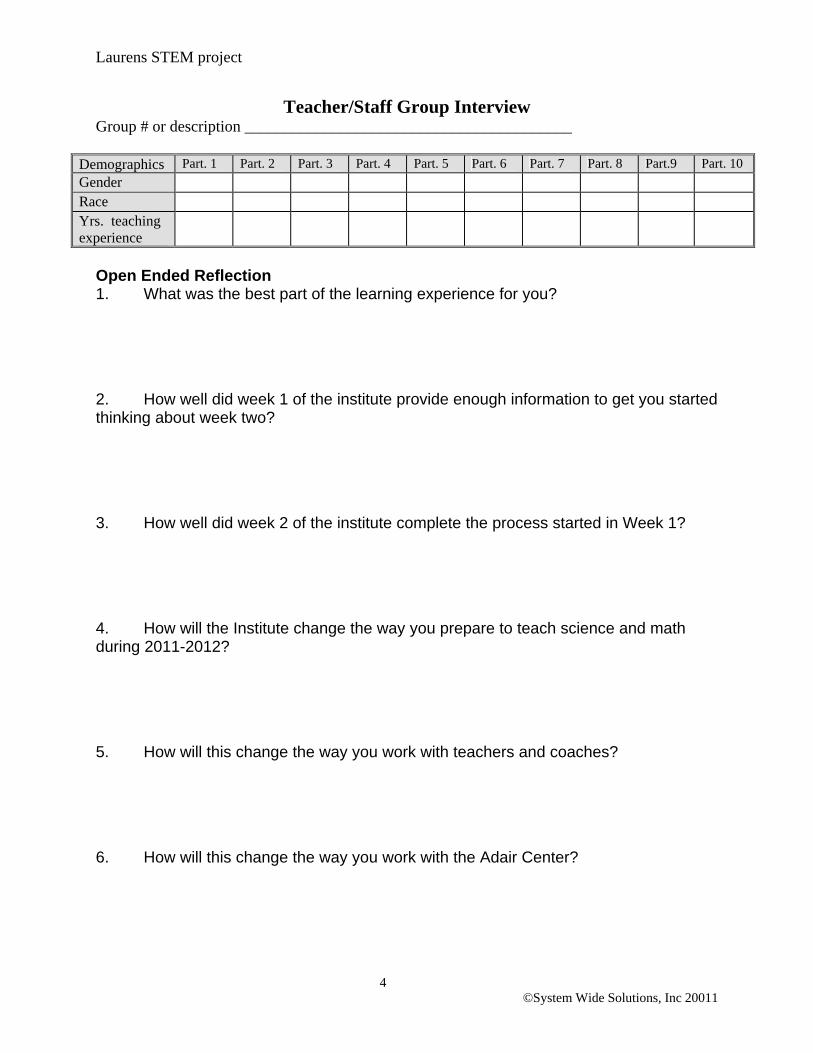
Laurens STEM project
Teacher/Staff Group Interview Group # or description _________________________________________
Demographics Part. 1 Part. 2 Part. 3 Part. 4 Part. 5 Part. 6 Part. 7 Part. 8 Part.9 Part. 10 Gender Race Yrs. teaching experience
Open Ended Reflection 1. What was the best part of the learning experience for you? 2. How well did week 1 of the institute provide enough information to get you started thinking about week two? 3. How well did week 2 of the institute complete the process started in Week 1? 4. How will the Institute change the way you prepare to teach science and math during 2011-2012? 5. How will this change the way you work with teachers and coaches? 6. How will this change the way you work with the Adair Center?
4 ©System Wide Solutions, Inc 20011
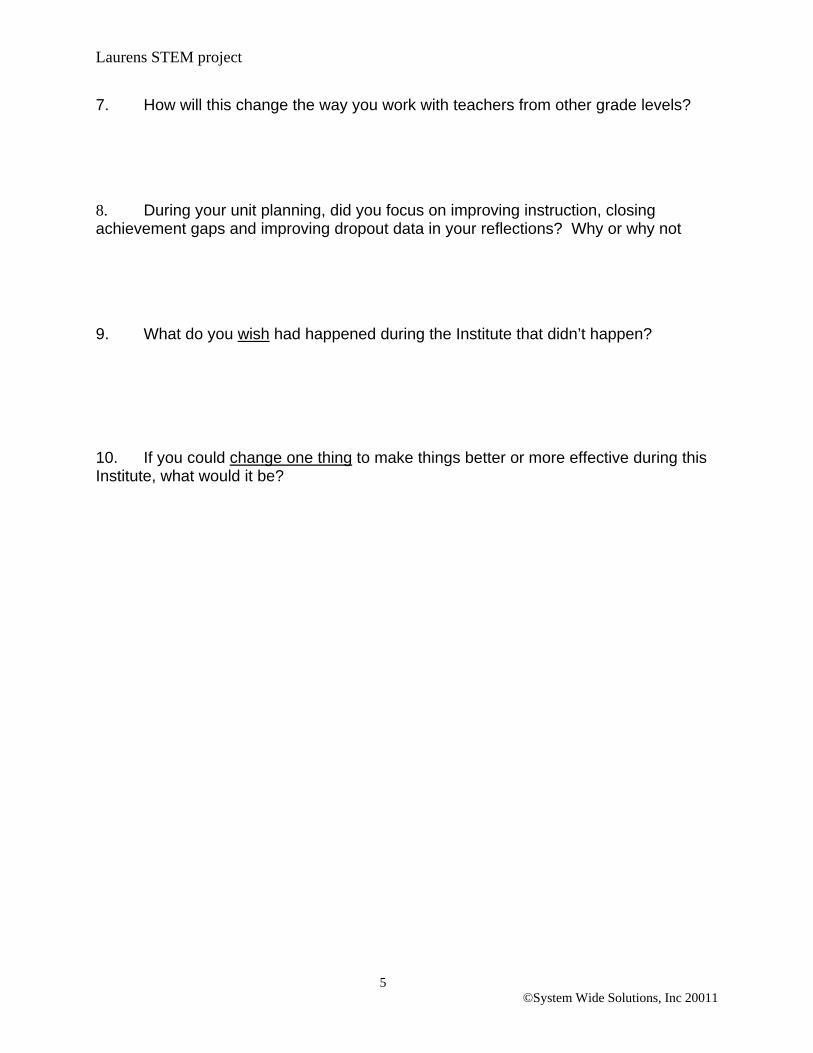
Laurens STEM project
7. How will this change the way you work with teachers from other grade levels? 8. During your unit planning, did you focus on improving instruction, closing achievement gaps and improving dropout data in your reflections? Why or why not 9. What do you wish had happened during the Institute that didn’t happen?
10. If you could change one thing to make things better or more effective during this Institute, what would it be?
5 ©System Wide Solutions, Inc 20011
Laurens STEM project
ACTIVITY OBSERVATION FORM
To observe the activities of the summer programs, carry out the following process.
1. Review the Institute Detailed Schedule Activities file
2. Observe the activities and classes at the program and determine how closely they appear to
follow what was proposed. If unsure about any parts of the programming you observe, ask
questions of the staff and site coordinator.
DESCRIPTION OF THE SUMMARY OF THE PROGRAM’S ACTIVITIES
1. The classes and activities were similar to what was proposed in the following ways:
______________________________________________________________________________
______________________________________________________________________________
______________________________________________________________________________
______________________________________________________________________________
______________________________________________________________________________
______________________________________________________________________________
______________________________________________________________________________
2. The classes and activities were different from what was proposed in the following way:
______________________________________________________________________________
______________________________________________________________________________
______________________________________________________________________________
______________________________________________________________________________
______________________________________________________________________________
______________________________________________________________________________
______________________________________________________________________________
______________________________________________________________________________
______________________________________________________________________________
______________________________________________________________________________
6 ©System Wide Solutions, Inc 20011
Laurens 55 MSP/SWS Inc. October 30, 2011 47
APPENDIX TWO: PROFESSIONAL DEVELOPMENT OFFERINGS

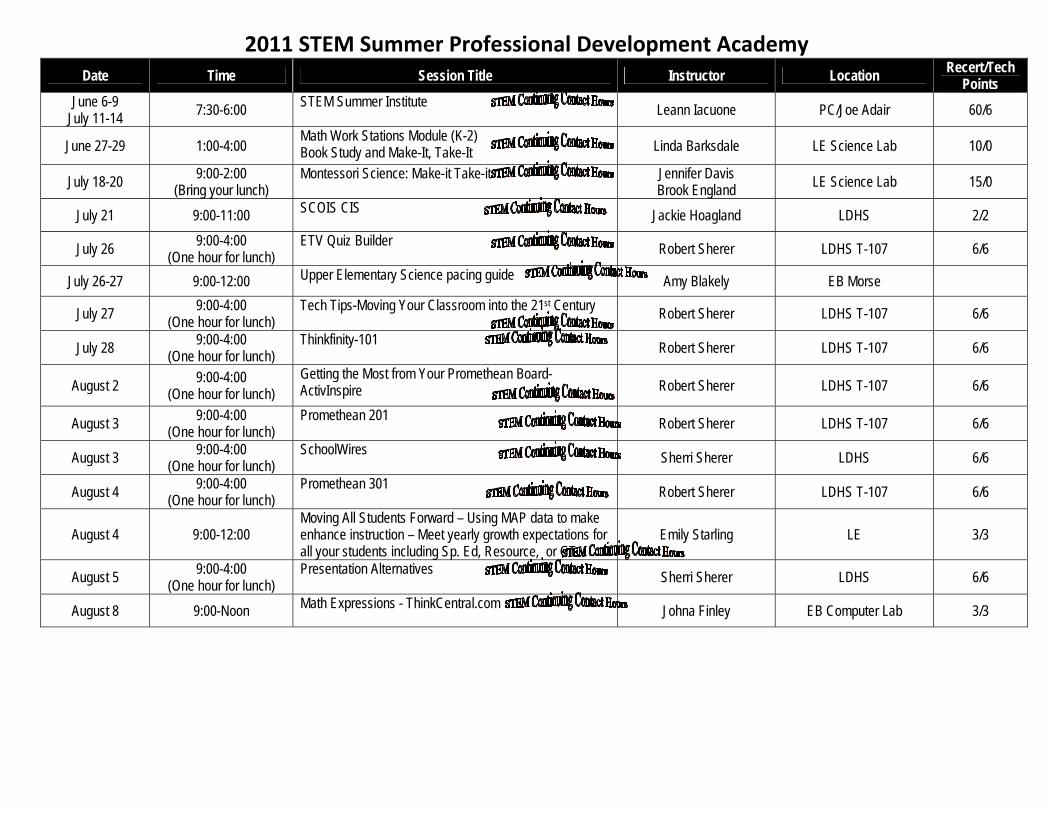
2011 STEM Summer Professional Development Academy Date Time Session Title Instructor Location Recert/Tech
Points June 6-9
July 11-14 7:30-6:00 STEM Summer Institute Leann Iacuone PC/Joe Adair 60/6
June 27-29 1:00-4:00 Math Work Stations Module (K-2) Book Study and Make-It, Take-It Linda Barksdale LE Science Lab 10/0
July 18-20 9:00-2:00 (Bring your lunch)
Montessori Science: Make-it Take-it Jennifer Davis Brook England LE Science Lab 15/0
July 21 9:00-11:00 SCOIS CIS Jackie Hoagland LDHS 2/2
July 26 9:00-4:00 (One hour for lunch)
ETV Quiz Builder Robert Sherer LDHS T-107 6/6
July 26-27 9:00-12:00 Upper Elementary Science pacing guide Amy Blakely EB Morse
July 27 9:00-4:00 (One hour for lunch)
Tech Tips-Moving Your Classroom into the 21st Century Robert Sherer LDHS T-107 6/6
July 28 9:00-4:00 (One hour for lunch)
Thinkfinity-101 Robert Sherer LDHS T-107 6/6
August 2 9:00-4:00 (One hour for lunch)
Getting the Most from Your Promethean Board-ActivInspire Robert Sherer LDHS T-107 6/6
August 3 9:00-4:00 (One hour for lunch)
Promethean 201 Robert Sherer LDHS T-107 6/6
August 3 9:00-4:00 (One hour for lunch)
SchoolWires Sherri Sherer LDHS 6/6
August 4 9:00-4:00 (One hour for lunch)
Promethean 301 Robert Sherer LDHS T-107 6/6
August 4 9:00-12:00 Moving All Students Forward – Using MAP data to make enhance instruction – Meet yearly growth expectations for all your students including Sp. Ed, Resource, or GT
Emily Starling LE 3/3
August 5 9:00-4:00 (One hour for lunch)
Presentation Alternatives Sherri Sherer LDHS 6/6
August 8 9:00-Noon Math Expressions - ThinkCentral.com Johna Finley EB Computer Lab 3/3