Late Quaternary activity of the Feldbiss Fault Zone, Roer Valley Rift System, the Netherlands, based...
21
Late Quaternary activity of the Feldbiss Fault Zone, Roer Valley Rift System, the Netherlands, based on displaced fluvial terrace fragments R.F. Houtgast * , R.T. Van Balen , L.M. Bouwer, G.B.M. Brand , J.M. Brijker Faculteit der Aardwetenschappen, Department of Quaternary Geology and Geomorphology, Vrije Universiteit, de Boelelaan 1085, 1081 HV, Amsterdam, The Netherlands Received 5 November 2001; accepted 19 April 2002 Abstract The Meuse River crosses the Feldbiss Fault Zone, one of the main border fault zones of the Roer Valley Graben in the southern part of the Netherlands. Uplift of the area south of the Feldbiss Fault Zone forced the Meuse River to incise and, as a result, a flight of terraces was formed. Faults of the Feldbiss Fault Zone have displaced the Middle and Late Pleistocene terrace deposits. In this study, an extensive geomorphological survey was carried out to locate the faults of the Feldbiss Fault Zone and to determine the displacement history of terrace deposits.The Feldbiss Fault Zone is characterized by an average displacement rate of 0.041 – 0.047 mm a 1 during the Late Pleistocene. Individual faults show an average displacement rate ranging between 0.010 and 0.034 mm a 1 . The spatial variation in displacement rates along the individual faults reveals a system of overstepping faults. These normal faults developed by reactivation of Paleozoic strike-slip faults.As fault displacements at the bases of the younger terrace deposits are apparently similar to the tops of the adjacent older terrace, the age of these horizons is the same within thousands of years. This implies that the model of terrace development by rapid fluvial incision followed by slow aggradation does apply for this area. D 2002 Elsevier Science B.V. All rights reserved. Keywords: Roer Valley Rift System; Feldbiss Fault Zone; Fault displacement rates; Fluvial terraces; Meuse River; Quaternary 1. Introduction In the southern part of the Netherlands, the Meuse River crosses the Feldbiss Fault Zone. This fault zone forms the boundary between a strongly subsiding Roer Valley Graben, to the north and the uplifting Ardennes and South Limburg Block in the south (Fig. 1). Uplift of the area south of the Feldbiss Fault Zone caused the Meuse river to incise during the Pliocene and the Quaternary and thus forming a flight of terraces (e.g., Pissart, 1974; Zonneveld, 1974; Felder et al., 1989; Van den Berg, 1989; Juvigne ´ and Renard, 1992; Renson et al., 1999; Pissart et al., 1997; Van Balen et al., 2000). Numerous studies have been carried out to detect and quantify large-scale tectonic uplift using terrace stratigraphy (e.g., Antoine et al., 2000; Krzyszkowski et al., 2000; Chen and Liu, 2000). Such a study has 0040-1951/02/$ - see front matter D 2002 Elsevier Science B.V. All rights reserved. PII:S0040-1951(02)00219-6 * Corresponding author. Faculty of Earth Sciences, Vrije Universiteit Amsterdam, De Boelelaan 1085, 1081 HV, Amsterdam, The Netherlands. Tel.: +31-20-44-47392; fax: +31-20-64-62457. E-mail address: [email protected] (R.F. Houtgast). www.elsevier.com/locate/tecto Tectonophysics 352 (2002) 295– 315
-
Upload
independent -
Category
Documents
-
view
3 -
download
0
Transcript of Late Quaternary activity of the Feldbiss Fault Zone, Roer Valley Rift System, the Netherlands, based...
Late Quaternary activity of the Feldbiss Fault Zone,
Roer Valley Rift System, the Netherlands, based on
displaced fluvial terrace fragments
R.F. Houtgast *, R.T. Van Balen , L.M. Bouwer , G.B.M. Brand , J.M. Brijker
Faculteit der Aardwetenschappen, Department of Quaternary Geology and Geomorphology, Vrije Universiteit, de Boelelaan 1085,
1081 HV, Amsterdam, The Netherlands
Received 5 November 2001; accepted 19 April 2002
Abstract
The Meuse River crosses the Feldbiss Fault Zone, one of the main border fault zones of the Roer Valley Graben in the
southern part of the Netherlands. Uplift of the area south of the Feldbiss Fault Zone forced the Meuse River to incise and, as a
result, a flight of terraces was formed. Faults of the Feldbiss Fault Zone have displaced the Middle and Late Pleistocene terrace
deposits. In this study, an extensive geomorphological survey was carried out to locate the faults of the Feldbiss Fault Zone and
to determine the displacement history of terrace deposits.The Feldbiss Fault Zone is characterized by an average displacement
rate of 0.041–0.047 mm a� 1 during the Late Pleistocene. Individual faults show an average displacement rate ranging between
0.010 and 0.034 mm a� 1. The spatial variation in displacement rates along the individual faults reveals a system of
overstepping faults. These normal faults developed by reactivation of Paleozoic strike-slip faults.As fault displacements at the
bases of the younger terrace deposits are apparently similar to the tops of the adjacent older terrace, the age of these horizons is
the same within thousands of years. This implies that the model of terrace development by rapid fluvial incision followed by
slow aggradation does apply for this area.
D 2002 Elsevier Science B.V. All rights reserved.
Keywords: Roer Valley Rift System; Feldbiss Fault Zone; Fault displacement rates; Fluvial terraces; Meuse River; Quaternary
1. Introduction
In the southern part of the Netherlands, the Meuse
River crosses the Feldbiss Fault Zone. This fault zone
forms the boundary between a strongly subsiding Roer
Valley Graben, to the north and the uplifting Ardennes
and South LimburgBlock in the south (Fig. 1). Uplift of
the area south of the Feldbiss Fault Zone caused the
Meuse river to incise during the Pliocene and the
Quaternary and thus forming a flight of terraces (e.g.,
Pissart, 1974; Zonneveld, 1974; Felder et al., 1989; Van
den Berg, 1989; Juvigne and Renard, 1992; Renson et
al., 1999; Pissart et al., 1997; Van Balen et al., 2000).
Numerous studies have been carried out to detect
and quantify large-scale tectonic uplift using terrace
stratigraphy (e.g., Antoine et al., 2000; Krzyszkowski
et al., 2000; Chen and Liu, 2000). Such a study has
0040-1951/02/$ - see front matter D 2002 Elsevier Science B.V. All rights reserved.
PII: S0040 -1951 (02 )00219 -6
* Corresponding author. Faculty of Earth Sciences, Vrije
Universiteit Amsterdam, De Boelelaan 1085, 1081 HV, Amsterdam,
The Netherlands. Tel.: +31-20-44-47392; fax: +31-20-64-62457.
E-mail address: [email protected] (R.F. Houtgast).
www.elsevier.com/locate/tecto
Tectonophysics 352 (2002) 295–315

also been carried out for the Meuse terraces (Van den
Berg, 1996; Van Balen et al., 2000). Alluvial surfaces
have also been used to date movements on individual
faults (e.g., Hou et al., 1998; Li et al., 1999). In this
study, fluvial terraces are used to detect activity along
the Feldbiss Fault Zone.
In the area where the Meuse River crosses the
Feldbiss Fault Zone, several fault scarps dissect the
terrace morphology. These scarps offer the opportu-
nity to identify faults that were active during the Late
Quaternary. The terrace stratigraphy is used to quan-
tify activity along the individual faults. An extensive
geomorphological study combined with an analysis of
borehole data of the Dutch Geological Survey (TNO-
NITG) and geo-electric soundings was carried out.
The objective of this paper is to establish a Late
Quaternary tectonic model for the Feldbiss Fault Zone
in the Sittard area, using the terrace chronostratigra-
phy as time control.
2. Tectonic setting
The Feldbiss Fault Zone is the southern border
fault of the central Graben of the Roer Valley Rift
System (RVRS). The RVRS is an active rift system,
located in the southern part of the Netherlands, the
northeastern part of Belgium and adjacent parts of
Germany (Fig. 1). The RVRS extends from the Dutch
North Sea coast southeastwards into the Lower Rhine
Embayment, which is an integral part of a Cenozoic
mega-rift system crossing western and central Europe
(Ziegler, 1992). The RVRS has a complex Mesozoic
and Cenozoic tectonic history, comprising several
Fig. 1. Tectonic features of the Roer Valley Rift System, the Netherlands.
R.F. Houtgast et al. / Tectonophysics 352 (2002) 295–315296

extensional and inversion phases (Zijerveld et al.,
1992). The current extension phase started during
the Late Oligocene (Geluk et al., 1994).
The Roer Valley Rift System (RVRS) comprises the
Campine and South Limburg Blocks in the south, the
Roer Valley Graben in the center, and the Peel Block
and the Venlo Block in the northeast (Fig. 1). The Roer
ValleyGraben is separated from the adjoining blocks by
the Feldbiss Fault Zone in the southwest and the Peel
Boundary Fault Zone in the northeast, both of which
were active during the Quaternary (e.g., Ahorner, 1962;
Paulissen et al., 1985; Houtgast and Van Balen, 2000).
These fault zones are characterized by a spasmodic
displacement behavior during the Quaternary. In addi-
tion, activity along these fault zones is laterally variable
(Houtgast and Van Balen, 2000).
In the Sittard area (Fig. 2), the Feldbiss Fault Zone
crosses the Meuse terraces almost perpendicularly. The
Fig. 2. Map of South Limburg (The Netherlands). Distribution of terraces (after Van den Berg, 1989) and location of study area.
R.F. Houtgast et al. / Tectonophysics 352 (2002) 295–315 297
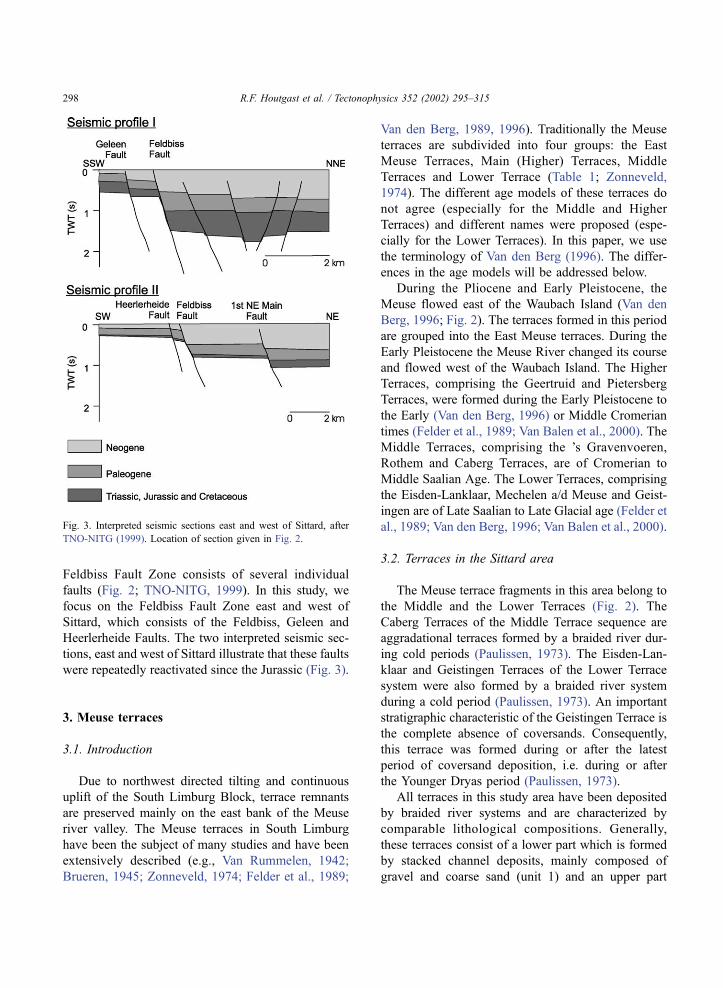
Feldbiss Fault Zone consists of several individual
faults (Fig. 2; TNO-NITG, 1999). In this study, we
focus on the Feldbiss Fault Zone east and west of
Sittard, which consists of the Feldbiss, Geleen and
Heerlerheide Faults. The two interpreted seismic sec-
tions, east and west of Sittard illustrate that these faults
were repeatedly reactivated since the Jurassic (Fig. 3).
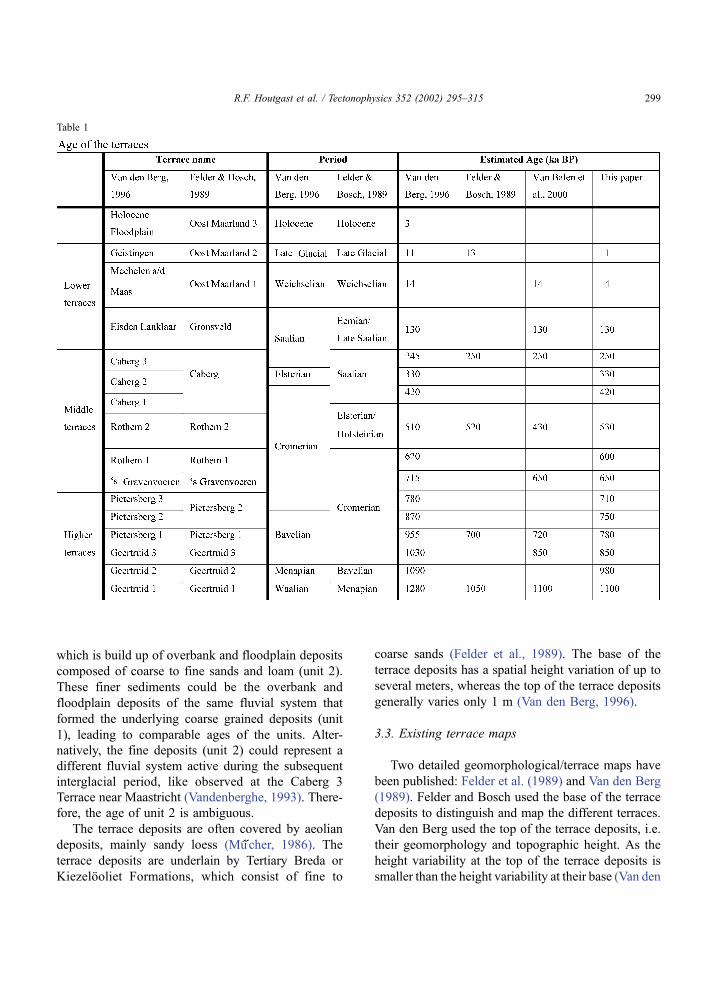
3. Meuse terraces
3.1. Introduction
Due to northwest directed tilting and continuous
uplift of the South Limburg Block, terrace remnants
are preserved mainly on the east bank of the Meuse
river valley. The Meuse terraces in South Limburg
have been the subject of many studies and have been
extensively described (e.g., Van Rummelen, 1942;
Brueren, 1945; Zonneveld, 1974; Felder et al., 1989;
Van den Berg, 1989, 1996). Traditionally the Meuse
terraces are subdivided into four groups: the East
Meuse Terraces, Main (Higher) Terraces, Middle
Terraces and Lower Terrace (Table 1; Zonneveld,
1974). The different age models of these terraces do
not agree (especially for the Middle and Higher
Terraces) and different names were proposed (espe-
cially for the Lower Terraces). In this paper, we use
the terminology of Van den Berg (1996). The differ-
ences in the age models will be addressed below.
During the Pliocene and Early Pleistocene, the
Meuse flowed east of the Waubach Island (Van den
Berg, 1996; Fig. 2). The terraces formed in this period
are grouped into the East Meuse terraces. During the
Early Pleistocene the Meuse River changed its course
and flowed west of the Waubach Island. The Higher
Terraces, comprising the Geertruid and Pietersberg
Terraces, were formed during the Early Pleistocene to
the Early (Van den Berg, 1996) or Middle Cromerian
times (Felder et al., 1989; Van Balen et al., 2000). The
Middle Terraces, comprising the ’s Gravenvoeren,
Rothem and Caberg Terraces, are of Cromerian to
Middle Saalian Age. The Lower Terraces, comprising
the Eisden-Lanklaar, Mechelen a/d Meuse and Geist-
ingen are of Late Saalian to Late Glacial age (Felder et
al., 1989; Van den Berg, 1996; Van Balen et al., 2000).
3.2. Terraces in the Sittard area
The Meuse terrace fragments in this area belong to
the Middle and the Lower Terraces (Fig. 2). The
Caberg Terraces of the Middle Terrace sequence are
aggradational terraces formed by a braided river dur-
ing cold periods (Paulissen, 1973). The Eisden-Lan-
klaar and Geistingen Terraces of the Lower Terrace
system were also formed by a braided river system
during a cold period (Paulissen, 1973). An important
stratigraphic characteristic of the Geistingen Terrace is
the complete absence of coversands. Consequently,
this terrace was formed during or after the latest
period of coversand deposition, i.e. during or after
the Younger Dryas period (Paulissen, 1973).
All terraces in this study area have been deposited
by braided river systems and are characterized by
comparable lithological compositions. Generally,
these terraces consist of a lower part which is formed
by stacked channel deposits, mainly composed of
gravel and coarse sand (unit 1) and an upper part
Fig. 3. Interpreted seismic sections east and west of Sittard, after
TNO-NITG (1999). Location of section given in Fig. 2.
R.F. Houtgast et al. / Tectonophysics 352 (2002) 295–315298
which is build up of overbank and floodplain deposits
composed of coarse to fine sands and loam (unit 2).
These finer sediments could be the overbank and
floodplain deposits of the same fluvial system that
formed the underlying coarse grained deposits (unit
1), leading to comparable ages of the units. Alter-
natively, the fine deposits (unit 2) could represent a
different fluvial system active during the subsequent
interglacial period, like observed at the Caberg 3
Terrace near Maastricht (Vandenberghe, 1993). There-
fore, the age of unit 2 is ambiguous.
The terrace deposits are often covered by aeolian
deposits, mainly sandy loess (Mun cher, 1986). The
terrace deposits are underlain by Tertiary Breda or
Kiezelooliet Formations, which consist of fine to
coarse sands (Felder et al., 1989). The base of the
terrace deposits has a spatial height variation of up to
several meters, whereas the top of the terrace deposits
generally varies only 1 m (Van den Berg, 1996).
3.3. Existing terrace maps
Two detailed geomorphological/terrace maps have
been published: Felder et al. (1989) and Van den Berg
(1989). Felder and Bosch used the base of the terrace
deposits to distinguish and map the different terraces.
Van den Berg used the top of the terrace deposits, i.e.
their geomorphology and topographic height. As the
height variability at the top of the terrace deposits is
smaller than the height variability at their base (Van den
Table 1
R.F. Houtgast et al. / Tectonophysics 352 (2002) 295–315 299
Berg, 1996), mapping the top of the terrace deposits
provides a more accurate picture of the terrace mor-
phology. The Van den Berg terrace division differ-
entiates more terraces in our study area. Therefore, we
prefer the Van den Berg (1989) map to the Felder et al.
(1989) map as a starting point. However, the accuracy
of the terrace borders in the vicinity of the Feldbiss
Fault Zone may be questioned as bending of the terrace
edges may be explained by downfaulting and not so
much by river activity (Fig. 4).
3.4. Age of the terraces
In order to calculate fault displacement rates an age
model for the terraces is required. The age of the
Caberg 3 Terrace (250 ka) has been established by
thermoluminescence and paleontological remains
(Huxtable and Aitken, 1985; Van Kolfschoten et al.,
1993) and is not disputed. For the older terraces, the
age control is less sure. Three different age models for
the terraces have been published (Table 1; Felder et al.,
1989; Van den Berg, 1996; Van Balen et al., 2000).
Felder et al. (1989) based their age model on pollen
data and on correlation to a paleo-temperature curve.
Van den Berg (1996) also used pollen data, correlation
with the paleo-temperature curve and additional local
paleomagnetic measurements. Van Balen et al. (2000)
used data from pollen, regional paleomagnetic meas-
urements and U/Th measurements, as well as a corre-
lation of Meuse and Rhine terraces. The age control of
the latter terraces is better. The different age models
show some discrepancies, particularly for the middle
Pleistocene terraces. The differences are caused by
paleomagnetic data and regional correlations.
The Meuse valley is characterized by flat and wide
terraces its upper part, the Main Terraces, and narrow
terraces in its lower part, the Middle and Lower Terra-
ces. The transition is sharplymarked in themorphology.
The same morphology is also present along the Rhine.
As both rivers are located in the same tectonic and
climatic setting, the morphologic break observed along
theMeuse and Rhine should have the same age. Several
paleomagnetic measurements constrain the age of the
youngest Main Terrace of the Rhine and Meuse, within
and outside the South Limburg area. Therefore, the
basic questions for the terrace age model are: What is
the paleomagnetic signature of the youngest Main
Terrace, and which terrace in the South Limburg area
corresponds to this terrace level? Based on upstream
terrace altitude correlation with the Belgian part of the
Meuse, Van Balen et al. (2000) concluded that the
Pietersberg 1 level is the youngest Main Terrace level.
Although, based on the local morphology, both the
Pietersberg 1 and the Pietersberg 2 Terraces appear to
belong to the last of the Main Terraces (Van den Berg
and Van Hoof, 2001). Thus, Pietersberg 2 is the young-
est Main Terrace. We therefore question the validity of
the date given by Van den Berg (1996) for the age of the
Pietersberg Terrace. Along the Rhine and along the
Meuse upstream of Maastricht, paleomagnetic meas-
urements on the youngest Main Terraces show normal
polarization (seeVanBalen et al., 2000). In addition, the
deposits in the Roer Valley Graben which can be
correlated to the Pietersberg 2 Terrace based on tec-
tono-morphological arguments (Van Balen et al., 2000)
also show normal polarization (van Montfrans, 1971).
The age of this terrace is therefore constrained by the
age of the paleomagnetic Matuyama–Brunhes boun-
dary, which is 0.78 ka. However, the paleomagnetic
data from the Pietersberg 2 level from South Limburg
(Van den Berg, 1996; Van den Berg and Van Hoof,
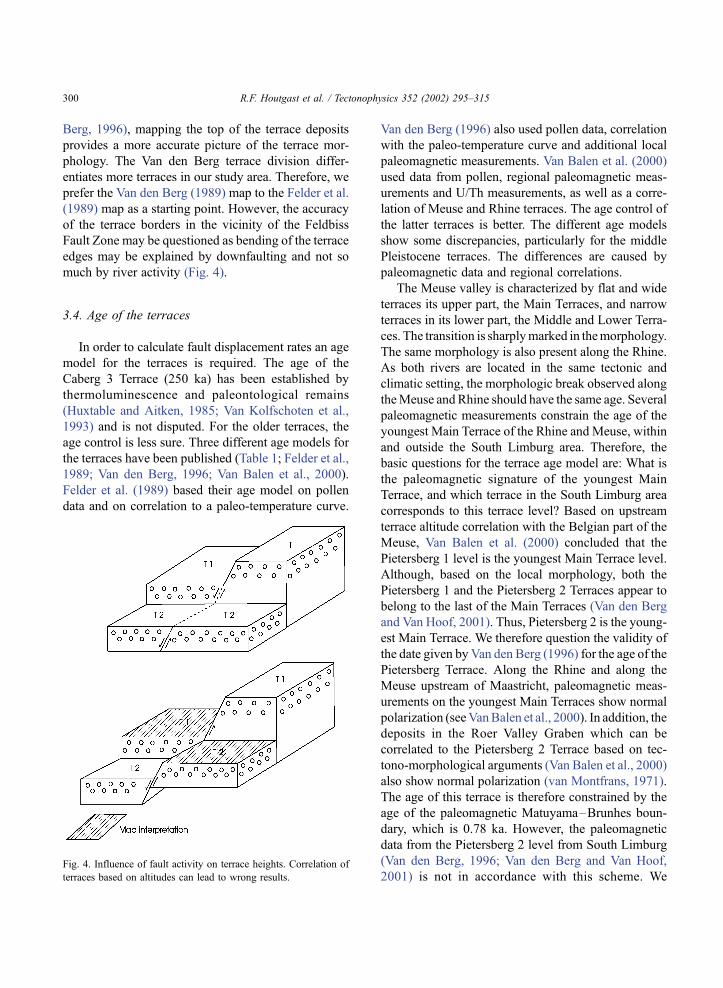
2001) is not in accordance with this scheme. WeFig. 4. Influence of fault activity on terrace heights. Correlation of
terraces based on altitudes can lead to wrong results.
R.F. Houtgast et al. / Tectonophysics 352 (2002) 295–315300
question their validity of their date particularly as the
Pietersberg Terrace correlates with well dated fluvial
deposits in the Roer Valley Graben (Van Balen et al.,
2000). In addition, assuming for it an age close to the
Matuyama–Brunhes boundary results in a more uni-
form distribution of terraces through time, and a
straightforward correlation of terraces with the ocean
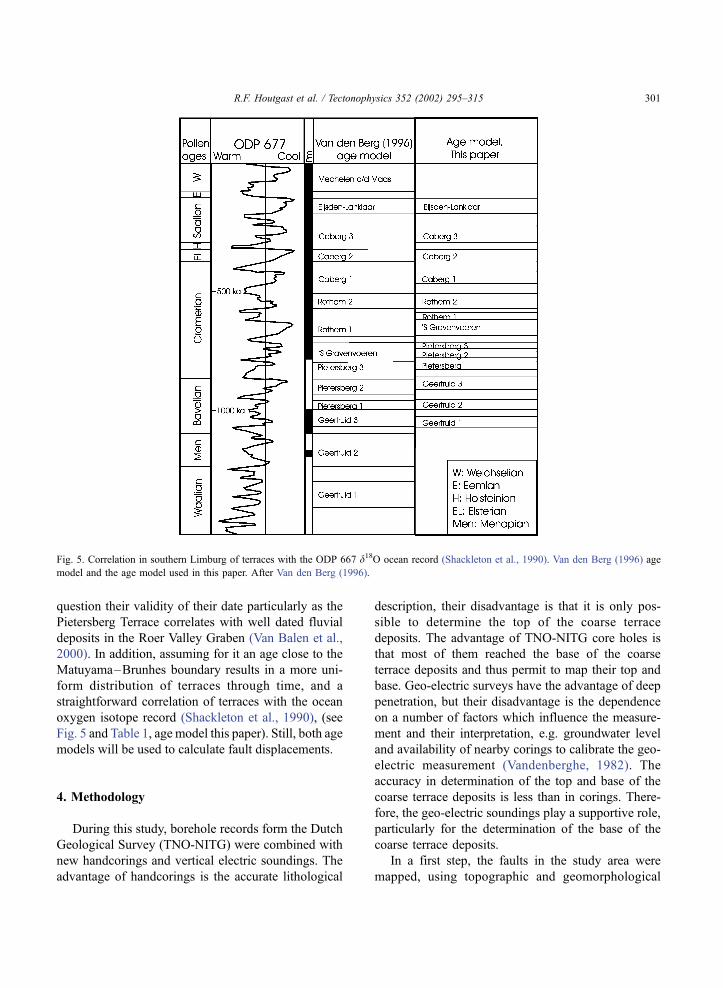
oxygen isotope record (Shackleton et al., 1990), (see
Fig. 5 and Table 1, age model this paper). Still, both age
models will be used to calculate fault displacements.
4. Methodology
During this study, borehole records form the Dutch
Geological Survey (TNO-NITG) were combined with
new handcorings and vertical electric soundings. The
advantage of handcorings is the accurate lithological
description, their disadvantage is that it is only pos-
sible to determine the top of the coarse terrace
deposits. The advantage of TNO-NITG core holes is
that most of them reached the base of the coarse
terrace deposits and thus permit to map their top and
base. Geo-electric surveys have the advantage of deep
penetration, but their disadvantage is the dependence
on a number of factors which influence the measure-
ment and their interpretation, e.g. groundwater level
and availability of nearby corings to calibrate the geo-
electric measurement (Vandenberghe, 1982). The
accuracy in determination of the top and base of the
coarse terrace deposits is less than in corings. There-
fore, the geo-electric soundings play a supportive role,
particularly for the determination of the base of the
coarse terrace deposits.
In a first step, the faults in the study area were
mapped, using topographic and geomorphological
Fig. 5. Correlation in southern Limburg of terraces with the ODP 667 d18O ocean record (Shackleton et al., 1990). Van den Berg (1996) age
model and the age model used in this paper. After Van den Berg (1996).
R.F. Houtgast et al. / Tectonophysics 352 (2002) 295–315 301

maps, field observations and a DTM. Secondly, the
terrace stratigraphy was used to develop an accurate
terrace map for each fault block. Finally, the elevation
of the top and base of each terrace on the different
fault blocks was determined, thus permitting the
calculation of the fault displacements along the indi-
vidual faults.
4.1. Location of the faults in the Sittard area
Various maps showing the location of faults in the
study area have been published (e.g., Felder et al.,
1989; TNO-NITG, 1999; Beerten et al., 1999). In the
field, tectonic scarps are evident as relatively steep
slopes which extent over several kilometers. Based on
a DTM of the area combined with field observations a
new map of the faults was constructed (Fig. 6). The
mapped faults divide the study area, southwest of
Sittard, into four tectonic blocks, namely the area
northeast of the Feldbiss Fault, between the Feldbiss
Fault and the Geleen Fault, between the Geleen Fault
and the Heerlerheide Fault and southwest of the
Heerlerheide Fault. We assume that each fault block
behaves as a tectonic entity. Smaller faults ( < 1 m)
within the individual fault blocks cannot be distin-
guished from natural height variation of 1 m at the top
of the terrace deposits (Van den Berg, 1996). South of
the Heerlerheide Fault, we were unable to collect
enough data because the younger terraces have no
or only small terrace remnants in that area, and
because of built areas. The contribution of the Heer-
lerheide Fault to the total displacement of the Feldbiss
Fault Zone will be addressed in the Discussion sec-
tion. The fault configuration northeast of Sittard (older
terraces) is different from the area west of Sittard
(younger terraces, Fig. 6). East Of Sittard, we divide
the area into three tectonic blocks, namely north of the
NE-Main Fault, between the NE-Main fault and the
Feldbiss Fault and South of the Feldbiss Fault.
4.2. Mapping the terraces
The terrace deposits consists of a coarse grained
lower part (unit 1) and a finer grained upper part (unit 2).
Fig. 6. Detailed map of the terraces and differences with the Van den Berg (1996) map. Dutch reference system coordinates (Rijks Driehoeks
Meting).
R.F. Houtgast et al. / Tectonophysics 352 (2002) 295–315302
The boundary between the sandy Tertiary deposits and
the lower terrace deposits (unit 1) is in most cases easy
to recognize in core holes and geo-electric soundings.
The transition between unit 1 and the overlying finer-
grained unit 2 is also easily recognized in corings. Due
to the gradual transitions, the boundary between the
fine-grained unit 2 and the overlying sandy loess cover
is often difficult to pinpoint in (hand) corings. In this
paper, the base of the terrace deposits refers to the base
of the coarse unit 1, whereas the top of the terrace
deposits refers to top of unit 1.
In order to map the position of the terrace borders
on the individual fault blocks we constructed geo-
logical sections parallel to their bounding NW–SE-
oriented faults (Figs. 7 and 9), applying the following
three criteria: (1) Terrace scarps paralleling the river
Meuse have a clear expression, particularly on the
younger terraces (Geistingen, Eisden-Lanklaar). By
contrast the morphological expression of the older
terraces is less clear due to their masking loess cover
and erosion of the scarps (Zonneveld, 1974). (2)
Abrupt depth changes in the top of unit 1, which
forms a very distinct marker. However, one must
realize that the top unit 1 has often been disrupted
by post depositional gully erosion (Van den Berg,
1996). (3) Abrupt depth changes of the base of unit 1,
which is clearly recognizable in core holes and geo-
electric measurements. However, natural height var-
iations of several meters are evident at the base of unit
1 (Van den Berg, 1996).
5. Results
It is beyond the scope of this paper to discuss the
resulting profiles in detail. However, some features of
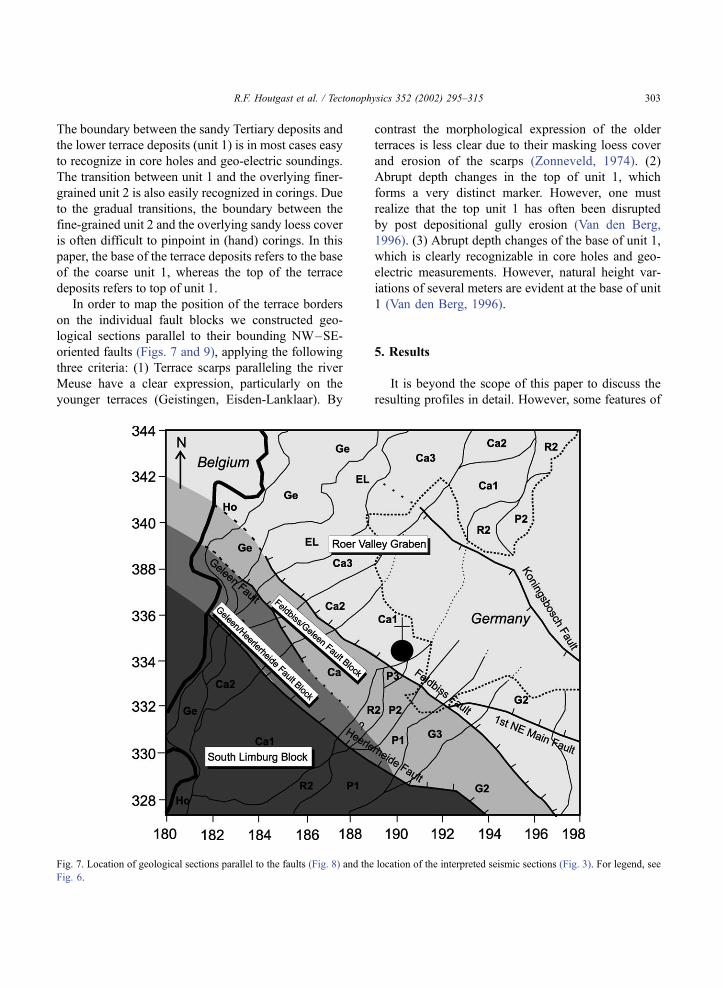
Fig. 7. Location of geological sections parallel to the faults (Fig. 8) and the location of the interpreted seismic sections (Fig. 3). For legend, see
Fig. 6.
R.F. Houtgast et al. / Tectonophysics 352 (2002) 295–315 303
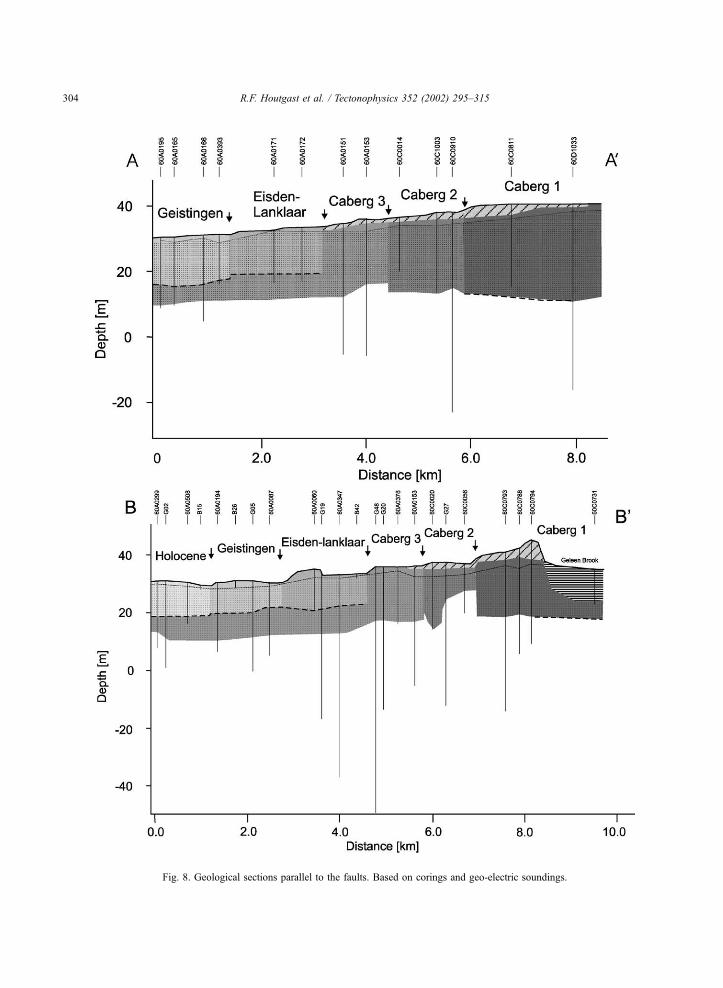
Fig. 8. Geological sections parallel to the faults. Based on corings and geo-electric soundings.
R.F. Houtgast et al. / Tectonophysics 352 (2002) 295–315304
the profiles deserve attention. One prominent feature
is the stacking of terrace deposits in profiles A, B and
C. Older terrace deposits (probably deposits of the
Caberg 3 Terrace) underlie the younger terraces (Hol-
ocene floodplain, Geistingen and Eisden-Lanklaar
Terraces; Beerten et al., 1999). The bases of the coarse
deposits of these terraces are located at about the same
elevation. The profiles are located on different fault
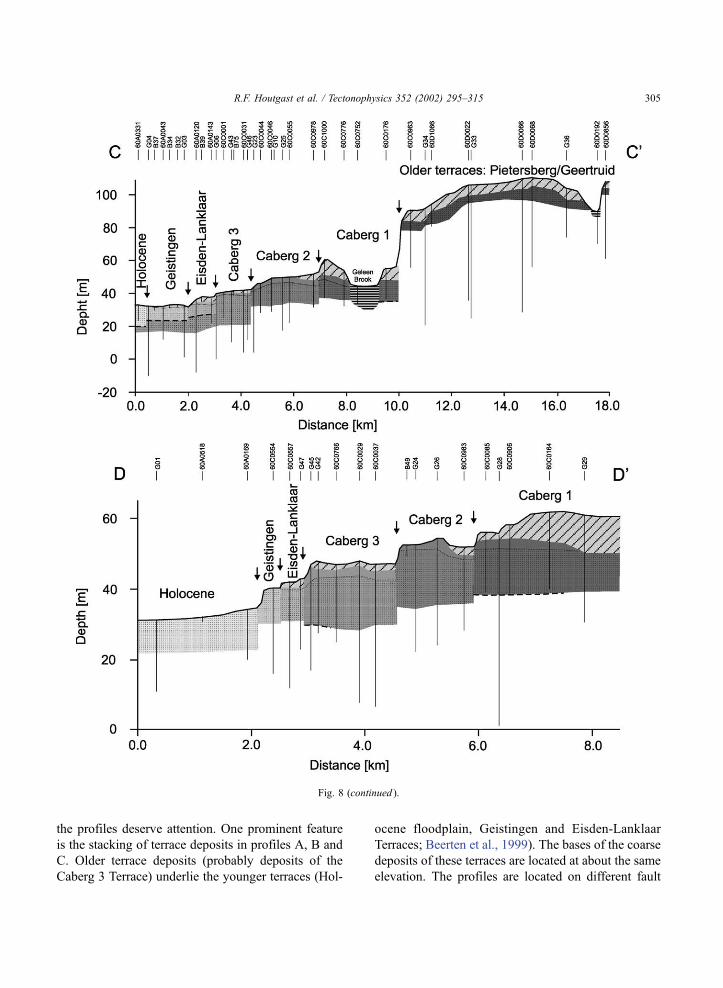
Fig. 8 (continued ).
R.F. Houtgast et al. / Tectonophysics 352 (2002) 295–315 305
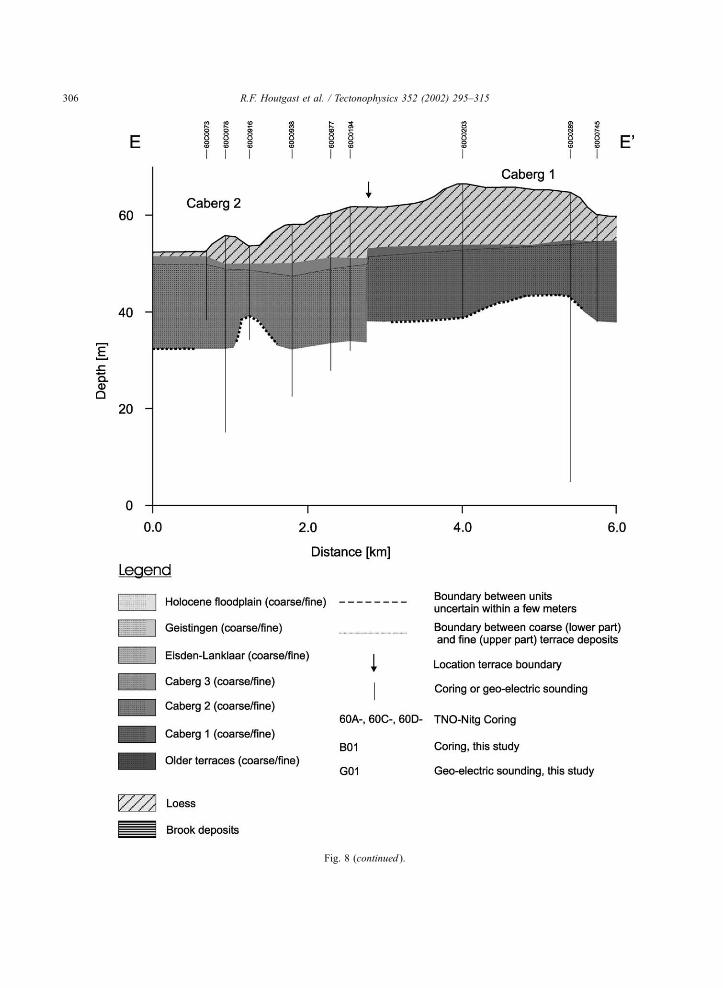
Fig. 8 (continued ).
R.F. Houtgast et al. / Tectonophysics 352 (2002) 295–315306

blocks, with different tectonic regimes (Fig. 7). Pro-
files A and B are located in the Roer Valley Graben,
which is a strong subsiding block. Profiles C and D
are respectively located on the Feldbiss/Geleen Fault
Block and the Geleen/Heerlerheide Fault Block,
which are moderate to minor (with respect to the
Roer Valley Graben) subsiding blocks. Because of
the strong subsiding nature of the Roer Valley Graben
and the moderate subsiding nature of the Feldbiss/
Geleen Fault Block, older terrace deposits underlie the
younger terraces. An additional cause for the decrease
in incision of the younger terraces (Eisden-Lanklaar
and Geistingen Terraces) could be the loss of the
Moselle tributary to the Meuse River during the Late
Saalian (Pissart et al., 1997; Van Balen et al., 2000).
Decreasing the discharge of the Meuse river after the
formation of the Caberg 3 Terrace (Middle Saale) lead
to the preservation of the Caberg 3 Terrace deposits
beneath the younger terrace deposits. This strati-
graphic superposition makes it difficult to establish
the exact position of the boundaries between the
stacked terrace deposits. Section D (Fig. 8) is located
on the Geleen/Heerlerheide Fault Block. Tertiary
deposits underlie all terraces in this profile, stacked
terrace deposits are absent. Section E (Fig. 8) is
located south of the Heerlerheide Fault. In the area
of this profile, the younger terraces are hardly pre-
served.
In section C (Fig. 8), the large height difference
between the Caberg 1 Terrace and the older Terraces
deserves attention. It could possibly be the result of a
N–S-oriented fault. On the geological map of the top
of the pre-Permian (TNO-NITG, 1999), a N–S-ori-
ented fault is situated near this location. However, at
other locations in between the Feldbiss and Geleen
Faults we could not any find evidence for a N–S-
oriented fault that was active during the Quaternary.
Additionally, the inferred displacement of more than
30 m is too large for such a short (1 km) fault
segment, making it the fault with the largest displace-
ment in the area. An alternative explanation is that
during the formation of the Caberg 1 Terrace the river
was able to remove older terrace remnants (Rothem 2,
Rothem 1 and ’s Gravenvoeren) at this location.
The natural height variation of the base of the
terraces is several meters (Van den Berg, 1996). At
Table 2
Average height [m NAP] of the base and top of the terrace deposits on each tectonic block
Terrace North of Feldbiss Fault
Height r N
Between Feldbiss
and Geleen Faults
Between Geleen and
Heerlerheide Faults
South of Heerlerheide
Fault
Height r N Height r N Height r N
Geistingen Top 29.9 0.8 9 31.7 0.6 10 32.4 1.0 7 n.d.
Base 17.6 0.3 2 21.7 0.9 3 26.5 0.4 3 n.d.
Eisden-Lanklaar Top 31.7 0.4 4 34.9 0.7 5 40.0 0.3 5 n.d.
Base 19.2 0.2 2 24.9 1.2 2 34.5 1.2 2 n.d.
Caberg 3 Top 32.9 0.4 5 39.7 0.7 5 46.5 0.6 3 n.d.
Base 17.5 0.5 4 27.0 0.8 4 34.4 1.1 3 n.d.
Caberg 2 Top 34.8 0.5 8 44.2 0.4 4 49.8 0.2 3 n.d.
Base 19.1 1 33.2 0.8 4 38.6 0.6 2 n.d.
Caberg 1 Top 38.6 0.4 5 48.6 0.3 3 53.4 0.1 2 54.7 0.1 3
Base 20.9 0.6 4 38.0 0.6 3 37.3 1 47.3 1
North of NE-main Fault Between Feldbiss
and NE-main Faults
South of Feldbiss Fault
Pietersberg 1 Top 52.5 1 n.d. 95.0 1
Base 49.0 1 n.d. 86.1 1
Geertruid 3 Top n.d. n.d. 98.2 1
Base 48.4 2.7 2 n.d. 96.4 0.4 2
Geertruid 2 Top n.d. 73.2 1.6 3 104.1 1.6 3
Base 39.9 1 66.6 1.8 2 91.8 1.4 5
r= Standard deviation, N =Number of observations, n.d. = no data.
The values given in this table could differ from the results given in the profiles of Fig. 8. In those profiles the terrace heights represent the
elevation at the location of the profile, whereas the values given in this table are calculated with data from the whole fault block.
R.F. Houtgast et al. / Tectonophysics 352 (2002) 295–315 307
several locations along the profiles, the variation is
even larger (e.g., profile B, Caberg 2; profile E,
Caberg 2). This shows that the variation in the base
of the terraces can be as large as 5–8 m. In general,
the terrace heights in the profiles represent the ele-
vation of the base of the terraces at the location of the
profile, whereas the values given in Table 2 are
calculated with data from the whole fault block. Thus,
the values given in Table 2 could differ from the
results as shown in the profiles of Fig. 8.
Additional data (hand corings, TNO-NITG corings
and geo-electric soundings) located outside the pro-
files were used to determine the location of the terrace
borders between the profiles. The new terrace map
differs in several details from the terrace map of Van
den Berg (1989) as indicated in Fig. 6. Most of these
differences occur north of the Feldbiss Fault. South of
the Feldbiss fault, these differences between the two
maps are minimal. The largest discrepancy is the
border between the Geistingen Terrace and Holocene
floodplain. Large parts of the Holocene floodplain are
now interpreted as forming a part of the Geistingen
Terrace. Three arguments support our interpretation.
(1) Difference in morphology between the two terra-
ces. In our interpretation, the Holocene floodplain is
characterized by a clear scroll bar morphology. In the
interpretation of Van den Berg, this distinct morphol-
ogy is attributed to the Geistingen Terrace south of the
Feldbiss Fault. (2) The heights differ between the two
terraces and a scarp occurs between the two terraces.
(3) Analyses of the pollen record of the fill of a
meander scar a few kilometers north of the Feldbiss
Fault revealed a Younger Dryas age (Van Nieuwpoort
and Schokker, 1998), placing the abandonment of this
system before or during the Younger Dryas.
5.1. Height of terrace deposits on the different fault
blocks
Faults divide the area west of Sittard into several
tectonic blocks while the terrace borders subdivide
these blocks into individual terrace sections. The next
step in our analysis was to calculate the average height
of the top and base of the terrace deposits on each
block. Theoretically, all the measurements on a terrace
within one block should approximately yield the same
elevation. However, some natural variations may be
attributed to a depositional height variability of about
1 m at the top of the coarse terrace deposits (Van den
Berg, 1996), and to longitudinal gradients of the
terrace surface. Additional factors are gully erosion
and inaccuracy in the height measurements in corings
and in the determination of the top and base of unit 1
in the corings. We made corrections for the latter (see
below).
Because of the height variability we expect some
of the height measurements to deviate downwards. We
assume that the highest points give the most accurate
representation of the depositional height. Measure-
ments which deviate too much ( > 1 m) from the
average height of each section were rejected. A
distinction should be made between the older terraces
(Pietersberg 1, 2, 3 and Geertruid 1, 2, 3) and the
younger terraces (Caberg 1, 2, 3, Eisden-Lanklaar, and
Geistingen). The older terraces were subjected to
erosion for a much longer time and therefore large
parts of the terrace deposits are missing (Felder et al.,
1989). Therefore, on a number of sections we were
not able to determine the height of the top and/or base
of the coarse terrace deposits. On the younger terra-
ces, a complete stratigraphy is present at most places
and the values are much more reliable. As mentioned
above, the youngest terraces (Eisden-Lanklaar and
Geistingen) are underlain by older terrace deposits
(probably Caberg 3 Terrace deposits, see Fig. 8).
Therefore, values for the base of the unit 1 terrace
deposits on these younger terraces should be regarded
with caution. Table 2 gives the height of the base and
the top of the terrace deposits on each tectonic block
together with the number of reliable observations and
the standard deviation. A distinction was made
between the area west and east of Sittard because of
difference in fault configuration between the two
areas, see Fig. 2.
Beerten et al. (1999) also investigated the height of
the base of several terraces on the Belgian and Dutch
side of the Meuse River, but did not investigate the
height of the top of the terrace deposits. The result of
their investigation is given in Table 3 along with the
results of our study. In most cases the results of both
investigations coincide within a margin of 2 m.
However, they differ significantly on the Geistingen
Terrace in between the Geleen and Feldbiss Faults.
Beerten et al. (1999) used the terrace map of Van den
Berg (1989) in the area of the Geistingen Terrace near
the Feldbiss Fault Zone. This is exactly the area where
R.F. Houtgast et al. / Tectonophysics 352 (2002) 295–315308

the largest adjustments to the Van den Berg terrace
map were made (see Fig. 6). Moreover, Beerten et al.
(1999) regards the area north of the Geleen Fault on
this terrace as one fault block, not intersected by the
Feldbiss Fault. This could lead to different results.
Therefore, we give preference to the results of our
investigation at these specific points.
5.2. Fault displacements
The height difference of the base and top of the unit
1 terrace deposits across a fault is interpreted as
resulting from a displacement along that fault. How-
ever, in order to calculate fault displacements accu-
rately we have to take into account the longitudinal
river gradient of the original terrace surface (Fig. 9).
According to Van den Berg (1996), terrace surfaces
have a gradient of about 0.75 m/km south of the
Feldbiss Fault Zone. The heights of the terrace depos-
its in the middle of adjacent blocks on the same terrace
are approximately 1.2–1.6 km separated from each
other. Therefore, we corrected each height difference
across the faults with 1.0 m for the longitudinal
gradient. In Fig. 10, the displacements of the base
(Fig. 10a) and top (Fig. 10b) of the unit 1 terrace
deposits along the individual faults are presented.
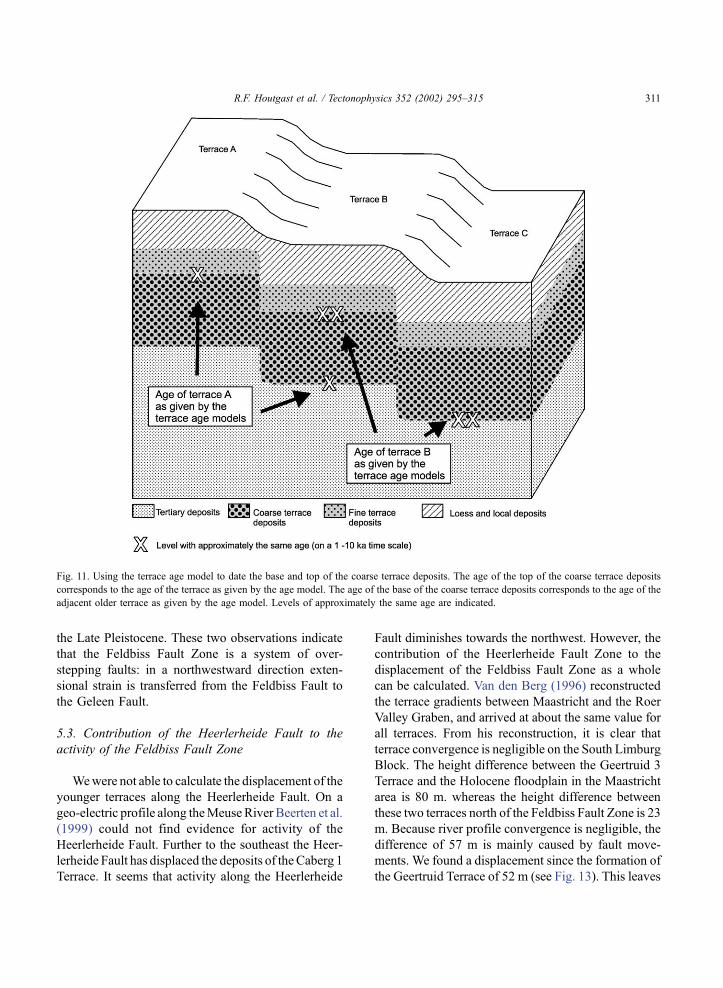
We used two age models to date the fault displace-
ments, the Van den Berg (1996) age model and an
improved Van Balen et al. (2000) age model (Table 1).
To date the displacement of the top of the coarse terrace
deposits we used the age of the terrace as given by the
age models. For dating the displacement of the base of
the coarse terrace deposits, we use the age of the
adjacent older terrace as a maximum age (Fig. 11).
This approach assumes that there is a short time interval
between the formation of two subsequent terraces,
Fig. 9. Relation between height of the tectonic block, fault displacement and fluvial gradient.
Table 3
Comparison between the heights of the base of the terrace deposits on the Dutch side of the Maas River found by Beerten et al. (1999) and this
investigation
Terrace Average heights (m NAP) of the base of the terrace deposits
South of the Geleen Fault Between the Geleen and Feldbiss Faults North of the Feldbiss Fault
This research Beerten et al. This research Beerten et al. This research Beerten et al.
Holocene Floodplain n.d. F 27 n.d. F 16 17.0 F 16
Geistingen 26.5 F 27 21.7 F 27 17.6 < 20
Eisden-Lanklaar 34.5 F 35 24.9 F 27 19.2 < 20
Caberg 3 34.4 F 35 27.0 F 27 17.5 < 20
Caberg 2 38.6 F 40 33.2 F 33 19.1 < 20
n.d. = no data.
R.F. Houtgast et al. / Tectonophysics 352 (2002) 295–315 309

which corresponds to fast river incision followed by
slow aggradation as proposed in models of fluvial
terrace development (e.g., Vandenberghe, 1993).
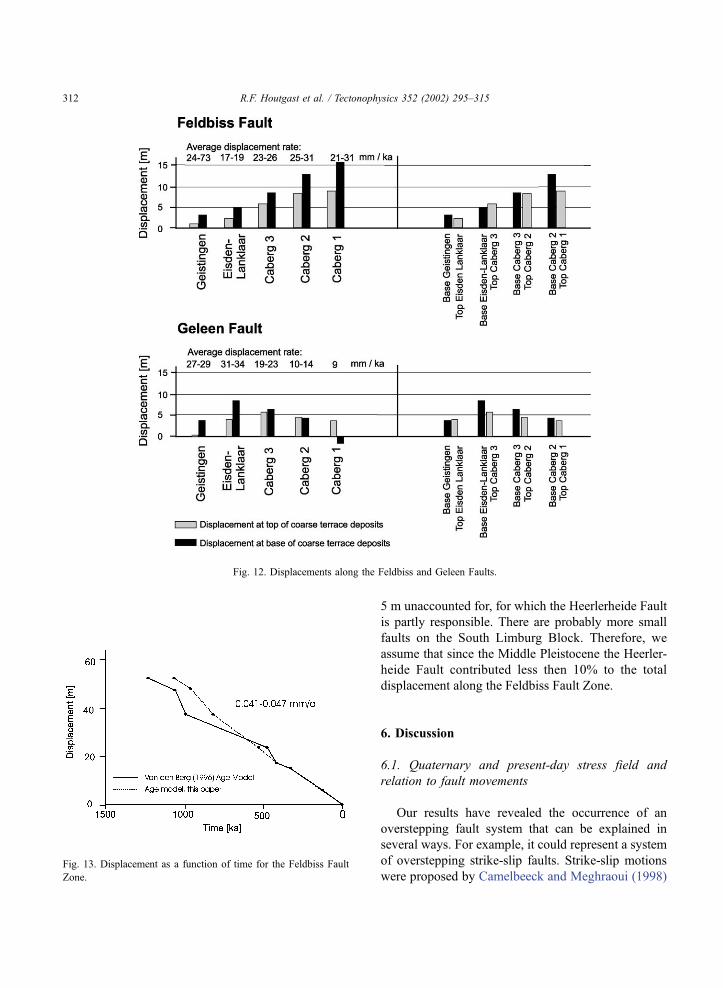
In Fig. 12 (left), the results of our study are
presented as displacements both at the top and the
base of the terrace deposits as a function of location
along the fault, showing the lateral variability in fault
activity along the individual faults (Geleen and Feld-
biss Faults). The average fault displacement rate since
the formation of the terrace is given for the locations
indicated in Fig. 10a and b. It varies between 0.009 and
0.034 mm a� 1 along the Geleen Fault and between
0.017 and 0.031 mm a� 1 along the Feldbiss Fault. We
reject the value of 0.073 mm a � 1, based on the
displacement of the base of the Geistingen Terrace,
as the inaccuracy (several meters, see above) in deter-
mination of the base of the Geistingen Terrace is too
large in comparison with the displacement (0.8 m).
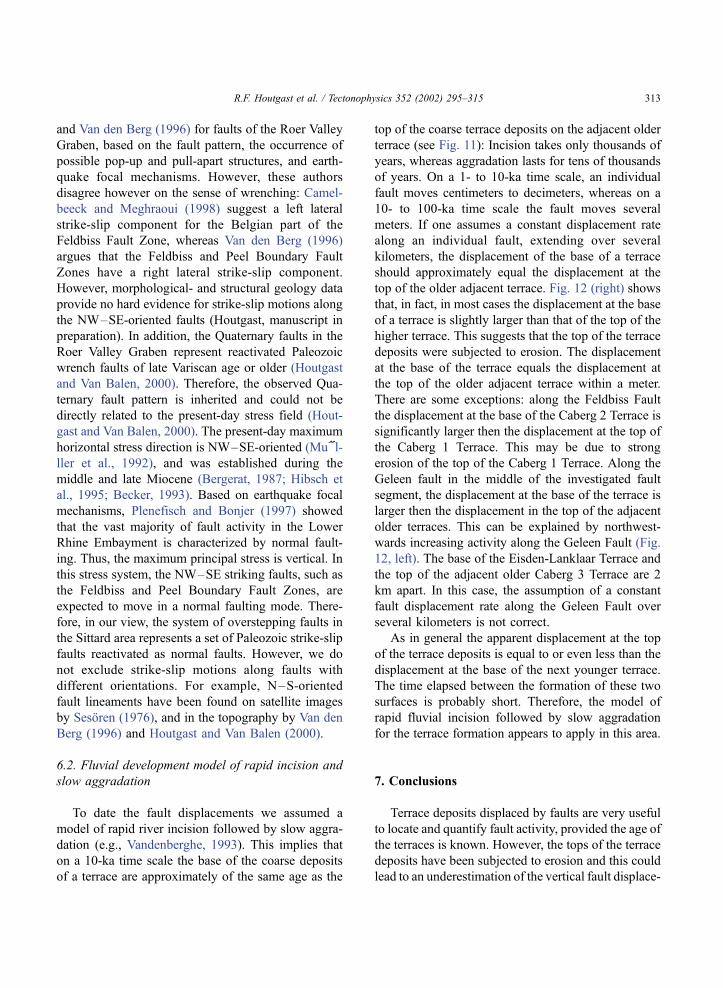
Fig. 13 shows the displacement as a function of
time for the Feldbiss Fault Zone as a whole (Heerler-
heide, Geleen and Feldbiss Faults), using the two age
models. It gives an indication of fault activity for the
Feldbiss Fault Zone from the Middle Pleistocene up to
the present. In Fig. 13, we used the most reliable
measurements, e.g. the displacement at the top of the
terrace deposits for the younger terraces (Geistingen
and Eisden-Lanklaar) and the displacement in the base
of the terrace deposits for the older terraces (Caberg 1,
2 and 3, Pietersberg 1, Geertruid 2 and 3). The
average fault displacement rate since the Middle
Pleistocene for the Feldbiss Fault Zone is 0.041 mm
a� 1, using the Van den Berg (1996) age model and
0.047 mm a� 1, using the improvement of the Van
Balen et al. (2000) age model. These displacement
rates are of the same order of magnitude as displace-
ment rates found by other studies on the Roer Valley
Rift System (Paulissen et al., 1985; Van den Berg,
1996; Camelbeeck and Meghraoui, 1998).
The individual faults show temporal and spatial
variation in fault activity (Fig. 12). However, it is
difficult to separate the temporal and spatial compo-
nents, since the Geleen Fault is only active in the
western part of the study area. This is indicated by the
increase in displacements at both the base and top of
the terrace deposits along this fault towards the north-
west, despite the fact that the terrace deposits become
younger (Fig. 10). This is also clearly evident in the
morphology, as the Geleen Fault looses its morpho-
logical expression southeast of the Caberg 1 terrace.
The displacements along the Feldbiss Fault at both the
base and top of the terrace deposits decrease as
expected whereas the terraces become younger. Yet,
at the Caberg 2 Terrace where the Geleen Fault
becomes active the activity of the Feldbiss Fault
decreases. However, Fig. 13 shows that the total
displacement rate on the Feldbiss Fault Zone is con-
stant at a rate of 0.041 or 0.047 mm a� 1 throughout
Fig. 10. Displacement of the base (a) and top (b) of the terrace
deposits along the individual faults of the Feldbiss Fault Zone. For
legend, see Fig. 6.
R.F. Houtgast et al. / Tectonophysics 352 (2002) 295–315310
the Late Pleistocene. These two observations indicate
that the Feldbiss Fault Zone is a system of over-
stepping faults: in a northwestward direction exten-
sional strain is transferred from the Feldbiss Fault to
the Geleen Fault.
5.3. Contribution of the Heerlerheide Fault to the
activity of the Feldbiss Fault Zone
Wewere not able to calculate the displacement of the
younger terraces along the Heerlerheide Fault. On a
geo-electric profile along theMeuse River Beerten et al.
(1999) could not find evidence for activity of the
Heerlerheide Fault. Further to the southeast the Heer-
lerheide Fault has displaced the deposits of the Caberg 1
Terrace. It seems that activity along the Heerlerheide
Fault diminishes towards the northwest. However, the
contribution of the Heerlerheide Fault Zone to the
displacement of the Feldbiss Fault Zone as a whole
can be calculated. Van den Berg (1996) reconstructed
the terrace gradients between Maastricht and the Roer
Valley Graben, and arrived at about the same value for
all terraces. From his reconstruction, it is clear that
terrace convergence is negligible on the South Limburg
Block. The height difference between the Geertruid 3
Terrace and the Holocene floodplain in the Maastricht
area is 80 m. whereas the height difference between
these two terraces north of the Feldbiss Fault Zone is 23
m. Because river profile convergence is negligible, the
difference of 57 m is mainly caused by fault move-
ments. We found a displacement since the formation of
the Geertruid Terrace of 52 m (see Fig. 13). This leaves
Fig. 11. Using the terrace age model to date the base and top of the coarse terrace deposits. The age of the top of the coarse terrace deposits
corresponds to the age of the terrace as given by the age model. The age of the base of the coarse terrace deposits corresponds to the age of the
adjacent older terrace as given by the age model. Levels of approximately the same age are indicated.
R.F. Houtgast et al. / Tectonophysics 352 (2002) 295–315 311
5 m unaccounted for, for which the Heerlerheide Fault
is partly responsible. There are probably more small
faults on the South Limburg Block. Therefore, we
assume that since the Middle Pleistocene the Heerler-
heide Fault contributed less then 10% to the total
displacement along the Feldbiss Fault Zone.
6. Discussion
6.1. Quaternary and present-day stress field and
relation to fault movements
Our results have revealed the occurrence of an
overstepping fault system that can be explained in
several ways. For example, it could represent a system
of overstepping strike-slip faults. Strike-slip motions
were proposed by Camelbeeck and Meghraoui (1998)
Fig. 12. Displacements along the Feldbiss and Geleen Faults.
Fig. 13. Displacement as a function of time for the Feldbiss Fault
Zone.
R.F. Houtgast et al. / Tectonophysics 352 (2002) 295–315312
and Van den Berg (1996) for faults of the Roer Valley
Graben, based on the fault pattern, the occurrence of
possible pop-up and pull-apart structures, and earth-
quake focal mechanisms. However, these authors
disagree however on the sense of wrenching: Camel-
beeck and Meghraoui (1998) suggest a left lateral
strike-slip component for the Belgian part of the
Feldbiss Fault Zone, whereas Van den Berg (1996)
argues that the Feldbiss and Peel Boundary Fault
Zones have a right lateral strike-slip component.
However, morphological- and structural geology data
provide no hard evidence for strike-slip motions along
the NW–SE-oriented faults (Houtgast, manuscript in
preparation). In addition, the Quaternary faults in the
Roer Valley Graben represent reactivated Paleozoic
wrench faults of late Variscan age or older (Houtgast
and Van Balen, 2000). Therefore, the observed Qua-
ternary fault pattern is inherited and could not be
directly related to the present-day stress field (Hout-
gast and Van Balen, 2000). The present-day maximum
horizontal stress direction is NW–SE-oriented (Mun l-ller et al., 1992), and was established during the
middle and late Miocene (Bergerat, 1987; Hibsch et
al., 1995; Becker, 1993). Based on earthquake focal
mechanisms, Plenefisch and Bonjer (1997) showed
that the vast majority of fault activity in the Lower
Rhine Embayment is characterized by normal fault-
ing. Thus, the maximum principal stress is vertical. In
this stress system, the NW–SE striking faults, such as
the Feldbiss and Peel Boundary Fault Zones, are
expected to move in a normal faulting mode. There-
fore, in our view, the system of overstepping faults in
the Sittard area represents a set of Paleozoic strike-slip
faults reactivated as normal faults. However, we do
not exclude strike-slip motions along faults with
different orientations. For example, N–S-oriented
fault lineaments have been found on satellite images
by Sesoren (1976), and in the topography by Van den
Berg (1996) and Houtgast and Van Balen (2000).
6.2. Fluvial development model of rapid incision and
slow aggradation
To date the fault displacements we assumed a
model of rapid river incision followed by slow aggra-
dation (e.g., Vandenberghe, 1993). This implies that
on a 10-ka time scale the base of the coarse deposits
of a terrace are approximately of the same age as the
top of the coarse terrace deposits on the adjacent older
terrace (see Fig. 11): Incision takes only thousands of
years, whereas aggradation lasts for tens of thousands
of years. On a 1- to 10-ka time scale, an individual
fault moves centimeters to decimeters, whereas on a
10- to 100-ka time scale the fault moves several
meters. If one assumes a constant displacement rate
along an individual fault, extending over several
kilometers, the displacement of the base of a terrace
should approximately equal the displacement at the
top of the older adjacent terrace. Fig. 12 (right) shows
that, in fact, in most cases the displacement at the base
of a terrace is slightly larger than that of the top of the
higher terrace. This suggests that the top of the terrace
deposits were subjected to erosion. The displacement
at the base of the terrace equals the displacement at
the top of the older adjacent terrace within a meter.
There are some exceptions: along the Feldbiss Fault
the displacement at the base of the Caberg 2 Terrace is
significantly larger then the displacement at the top of
the Caberg 1 Terrace. This may be due to strong
erosion of the top of the Caberg 1 Terrace. Along the
Geleen fault in the middle of the investigated fault
segment, the displacement at the base of the terrace is
larger then the displacement in the top of the adjacent
older terraces. This can be explained by northwest-
wards increasing activity along the Geleen Fault (Fig.
12, left). The base of the Eisden-Lanklaar Terrace and
the top of the adjacent older Caberg 3 Terrace are 2
km apart. In this case, the assumption of a constant
fault displacement rate along the Geleen Fault over
several kilometers is not correct.
As in general the apparent displacement at the top
of the terrace deposits is equal to or even less than the
displacement at the base of the next younger terrace.
The time elapsed between the formation of these two
surfaces is probably short. Therefore, the model of
rapid fluvial incision followed by slow aggradation
for the terrace formation appears to apply in this area.
7. Conclusions
Terrace deposits displaced by faults are very useful
to locate and quantify fault activity, provided the age of
the terraces is known. However, the tops of the terrace
deposits have been subjected to erosion and this could
lead to an underestimation of the vertical fault displace-
R.F. Houtgast et al. / Tectonophysics 352 (2002) 295–315 313

ment. Correlation of the top of the terrace deposits
across faults can cause problems. A terrace surface on
the hanging wall will be lower then on the footwall.
However, an older terrace on the hanging wall can have
the same height as a younger terrace on the footwall.
This has to be taken into consideration when terrace
stratigraphy is used to quantify fault activity.
As the bases of the younger terrace deposits have
similar fault displacements as the tops of the older
terraces, the ages of these horizons are apparently
similar within a margin of several thousands of years.
This implies that the duration of the fluvial incision
phase is relatively short compared to the terrace
formation phase.
During the Middle and Late Pleistocene, the Feld-
biss Fault Zone had an average fault displacement rate
of 0.041 or 0.047 mm a� 1, depending on which age
models is used. During the same time period individ-
ual faults of this fault zone (Heerlerheide, Geleen and
Feldbiss Faults) show fault displacement rates varying
between 0.010 and 0.035 mm a � 1. In the area
between Sittard and the Meuse River, the contribution
of the Feldbiss Fault to the total displacement of the
Feldbiss Fault Zone decreases towards the northwest,
whereas in the same direction the contribution of the
Geleen Fault increases. Therefore, this part of the
Feldbiss Fault Zone is a system of overstepping faults.
The overstepping faults are Paleozoic wrench faults,
reactivated as normal faults.
Acknowledgements
The study presented in this paper is a contribution
to the NEESDI (Netherlands Environmental Earth
System Initiative) program, funded by the Netherlands
Organization for Scientific Research (NWO). We
thank Drs. W. Westerhoff of the TNO-NITG for his
cooperation. Prof. Dr. J. Vandenberghe, Dr. C. Kasse,
Dr. F.W. van der Wateren, Drs. P.W. Bogaart and Drs.
V. Bense for their discussions and constructive
criticism.
References
Ahorner, L., 1962. Untersuchungen zur Quartaren Bruchtektonik
der Niederrheinischen Bucht. Eiszeitalter Ggw. 13, 24–105.
Antoine, P., Lautridou, J.P., Laurent, M., 2000. Long-term fluvial
archives in NW France: response of the Seine and Somme rivers
to tectonic movements, climatic variations and sea-level changes.
Geomorphology 33, 183–207.
Becker, A., 1993. An attemp to define a ‘‘neotectonic period’’ for
central and northern Europe. Geol. Rundsch. 82, 67–83.
Beerten, K., Brabers, P., Bosch, P., Gullentops, F., 1999. The pas-
sage of the Feldbiss Bundle through the Maas Valley. Aardkd.
Meded. 9, 153–158.
Bergerat, F., 1987. Stress fields in the European platform at the time
of Africa–Eurasia collision. Tectonics 6 (2), 99–132.
Brueren, J.W.R., 1945. Het terrassenlandschap van Zuid-Limburg.
Meded. - Geol. Sticht., Ser. C VI. (1), 93 pp.
Camelbeeck, T., Meghraoui, M., 1998. Geological and geophysical
evidence for large palaeo-earthquakes with surface faulting in
the Roer Graben (Northwest Europe). Geophys. J. Int. 132,
347–362.
Chen, Y.-G., Liu, T.-K., 2000. Holocene uplift and subsidence along
an active tectonic margin, southwestern Taiwan. Quat. Sci. Rev.
19, 923–930.
Felder, W.M., Bosch, P.W., Bisschops, J.H., 1989. Geologische
kaart van Zuid-Limburg en omgeving, schaal 1:50.000. Afzet-
tingen van de Maas. Rijks Geologische Dienst, Haarlem.
Geluk, M.C., Duin, E.J.Th., Dusar, M., Rijkers, R.H.B., Van den
Berg, M.W., Van Rooijen, P., 1994. Stratigraphy and tectonics of
the Roer Valley Graben. Geol. Mijnbouw 73, 129–141.
Hibsch, C., Jarrige, J.J., Cusginh, E.M., Mercier, J., 1995. Paleo-
stress analysis, a contribution to the understanding of basin
tectonics and geodynamic evolution. Example of the Permian/
Cenozoic tectonics of Great Britain and geodynamic implica-
tions in western Europe. Tectonophysics 252, 103–136.
Hou, J.-J., Han, M.-K., Han, H.-J., 1998. Geomorphological obser-
vations of active faults in the epicentral region of the Huaxian
large earthquake in 1556 in Shaanxi Province, China. J. Struct.
Geol. 20, 549–577.
Houtgast, R.F., Van Balen, R.T., 2000. Neotectonics of the Roer
Valley Rift System, the Netherlands. Global Planet. Change
27, 131–146.
Huxtable, J., Aitken, J., 1985. Thermoluminescence dating results
for the Palaeolithic site Maastricht –Belvedere. Meded. - Rijks
Geol. Dienst 39, 41–44.
Juvigne, E., Renard, F., 1992. Les terrasses de la Meuse de Liege a
Maastricht. Ann. Soc. Geol. Belg. 115, 167–186.
Krzyszkowski, D., Przybylski, B., Badura, J., 2000. The role of
neotectonics and glaciation on terrace formation along the Nysa
Klodzka River in the Sudeten Mountains (southwestern Poland).
Geomorphology 33, 149–166.
Li, Y., Yang, J., Tan, L., Duan, F., 1999. Impact of tectonics on
alluvial landforms in the Hexi Corridor, Northwest China. Geo-
morphology 28, 299–308.
Mun cher, H.J., 1986. Aspects of Loess and Loess-Derived Slope
Deposits: an Experimental and Micromorphological Approach.
Fysisch Geografisch en Bodemkundig Laboratorium, Universi-
teit van Amsterdam, Amsterdam, p. 267.
Mun ller, B., Zoback, M.L., Fuchs, K., Mastin, L., Gregersen, S.,
Pavoni, N., Stephansson, O., Ljunggren, C., 1992. Regional
patterns of tectonic stress in Europe. J. Geophys. 43, 783–803.
Paulissen, E., 1973. De morfologie en de Kwartairstratigrafie van de
R.F. Houtgast et al. / Tectonophysics 352 (2002) 295–315314
Maas vallei in Belgisch Limburg. Verh. K. Acad. Wet. Lett.
Schone Kunsten Belg., Klasse Wet. 35 (127), 1–266.
Paulissen, E., Vandenberghe, J., Gullentops, F., 1985. The Feldbiss
fault in the Maas valley bottom (Limburg, Belgium). Geol.
Mijnbouw 64, 79–87.
Pissart, A., 1974. La Meuse en France et en Belgique. Formation du
basin hydrographique. Les terrasses et leur enseignements. In:
Macar, P. (Ed.), L’Evolution Quaternaire des Basins Fluviaux de
la mer du Nord Merondiale. Centenaire de la Societe Geologi-
que de Belgique, Liege, pp. 105–131.
Pissart, A., Harmand, D., Krook, L., 1997. L’Evolution de la Meuse
de Toul a Maastricht depuis le Miocene: correlations chronolo-
giques et traces des captures de la Meuse Lorraine d’apres les
mineraux denses. Geogr. Phys. Quat. 51, 267–284.
Plenefisch, T., Bonjer, K.-P., 1997. The stress field in the Rhine
Graben area inferred from earthquake focal mechanisms and
estimation of frictional parameters. Tectonophysics 275, 71–97.
Renson, V., Juvigne, E., Cordy, J.-M., 1999. Decouverte en faveur
d’une revision de la chronologie du Quaternaire: la grotte de La
Belle-Roche (Belgique); hypothese nouvelle concernant l’an-
ciennete de l’Homme en Europe du Nord-Ouest. C. R. Acad.
Sci. Paris, Sci. Terre Planeteres/Earth and Planetary Sciences
328, 635–640.
Shackleton, N.J., Berger, A., Peltier, W.R., 1990. An alternative
astronomical calibration of the Lower Pleistocene timescale
based on ODP Site 677. Trans. R. Soc. Edinburgh: Earth Sci.
81, 251–261.
Sesoren, A., 1976. Lineament analysis from ERTS (Landsat) images
of the Netherlands. Geol. Mijnbouw 55, 61–67.
TNO-NITG, 1999. Toelichting bij kaartblad XV Sittard-Maastricht.
Nederlands instituut voor Toegepaste Geowetenschappen TNO,
Utrecht, 127 pp.
Van Balen, R.T., Houtgast, R.F., Van der Wateren, F.M., Van-
denberghe, J., Bogaart, P.W., 2000. Sediment budget and
tectonic evolution of the Meuse catchment in the Ardennes
and the Roer Valley Rift System. Global Planet. Change 27,
113–129.
Van den Berg, M.W., 1989. Geomorfologische Kaart van Nederland
1:50.000 Kaartblad 59 Genk, 60 Sittard, 61 Maastricht, 62 Heer-
len, met toelichting en de Kaart Maasterrassen en Hellingklassen.
Staring Centrum, Wageningen en Rijks Geologische Dienst,
Haarlem, 32 pp.
Van den Berg, M.W., 1996. Fluvial sequences of the Maas, a 10 Ma
record of neotectonics and climate change at various time-
scales. PhD thesis, Universiteit Wageningen, 181 pp.
Van den Berg, M.W., Van Hoof, T., 2001. The Maas terrace se-
quence at Maastricht, SE Netherlands: evidence for 200 m of
late Neogene and Quaternary surface uplift. In: Maddy, D.,
Macklin, M.G., Woodward, J.C. (Eds.), River Basin Sediment
Systems: Archives of Environmental Change. A.A. Balkema
Publishers, Lisse, pp. 45–86.
Van Kolfschoten, T., Roebroeks, W., Vandenberghe, J., 1993. The
Middle and Late Pleistocene sequence at Maastricht–Belvedere:
the type locality of the Belvedere Interglacial. Meded. - Rijks
Geol. Dienst, Niewe Ser. 47, 81–91.
Van Montfrans, H.M., 1971. Paleomagnetic dating in the North Sea
Basin. Thesis, Amsterdam, 133 pp.
Van Nieuwpoort, I.L., Schokker, J., 1998. Rivierevolutie op ver-
schillende tijdschalen. De ontwikkeling van het midden-Lim-
burgse Maasdal vanaf het Cromerien tot heden onder invloed
van klimaat, tektoniek en de mens. Internal report, Faculteit der
Aardwetenschappen, Vrije Universiteit Amsterdam, 107 pp.
Van Rummelen, F.H., 1942. De Maasterrassen van S.-Limburg en
hunne wordingsgeschiedenis, Idem, pp. 85–108.
Vandenberghe, J., 1982. Geo-electric investigations of a fault sys-
tem in Quaternary deposits. Geophys. Prospect. 30, 879–897.
Vandenberghe, J., 1993. River terrace development and its relation
to climate: the Saalian Caberg terrace of the Maas river near
Maastricht (The Netherlands). Meded. - Rijks Geol. Dienst 47,
19–24.
Ziegler, P.A., 1992. European Cenozoic rift system. Tectonophysics
208, 91–111.
Zijerveld, L., Stephenson, R., Cloetingh, S., Duin, E., Van den Berg,
M.W., 1992. Subsidence analysis and modelling of the Roer
Valley Graben (SE Netherlands). Tectonophysics 208, 159–
171.
Zonneveld, J.I.S., 1974. The terraces of the Maas (and Rhine)
downstream of Maastricht. L’Evolution Quartenaire des Bassins
Fluviaux de la Mer du Nord Meridionale. Centenaire de la So-
ciete Geologique de Belgique, Liege, pp. 133–157.
R.F. Houtgast et al. / Tectonophysics 352 (2002) 295–315 315