Fiscal-Food Policies are Likely Misinformed by Biased Price ...
Large-Scale Patterns of Genetic Variation in a Female-Biased Dispersing Passerine: The Importance of Sex-Based AnalysesMonica Guerrini1, Clizia Gennai1¤, Panicos Panayides2, Alan Crabtree3, Inigo Zuberogoitia4,
Alex S. Copland5, Olga Babushkina6, Paolo M. Politi7, Dimitri Giunchi8, Filippo Barbanera1*
1 Department of Biology, Zoology and Anthropology Unit, University of Pisa, Pisa, Italy, 2 Game & Fauna Service, Ministry of Interior, Nicosia, Cyprus, 3 BirdLife Cyprus,
Nicosia, Cyprus, 4 Icarus Environmental Studies, Logrono, Spain, 5 BirdWatch Ireland, Banagher, Ireland, 6 Laboratory of Avian Ecology and Bird Protection, Saint
Petersburg State University, Saint Petersburg, Russian Federation, 7 Orti-Bottagone Nature Reserve, World Wildlife Fund, Piombino, Italy, 8 Department of Biology,
Ethology Unit, University of Pisa, Pisa, Italy
Abstract
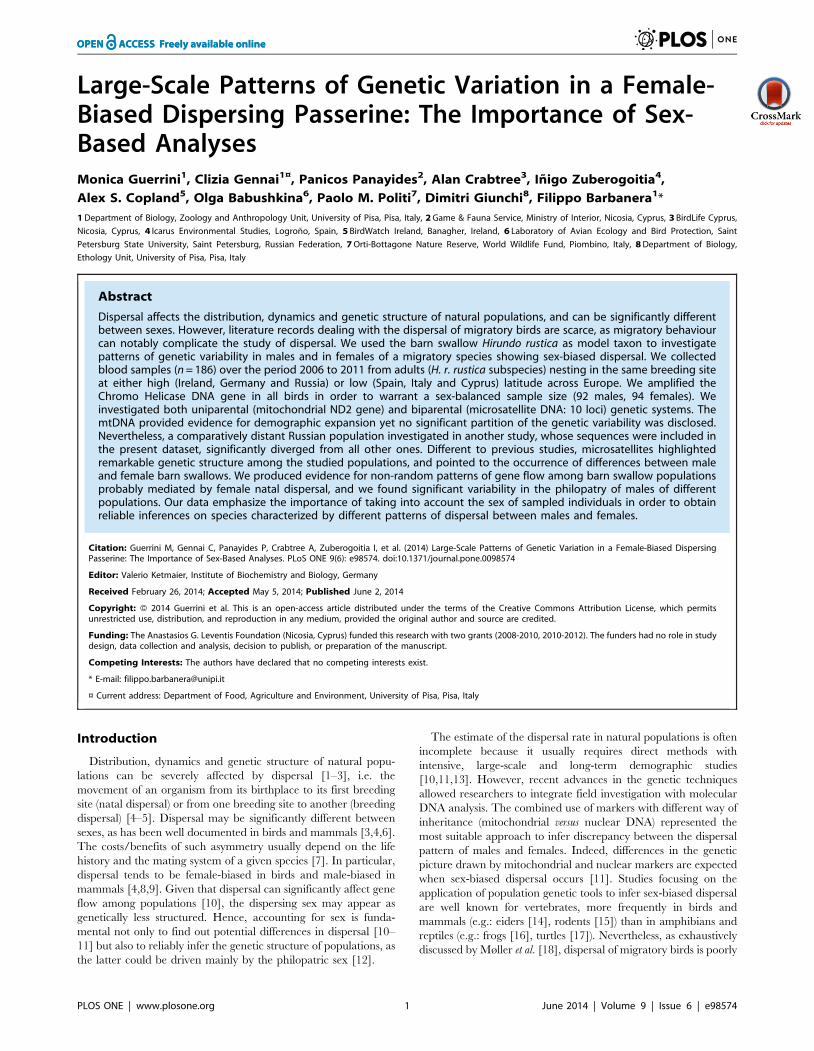
Dispersal affects the distribution, dynamics and genetic structure of natural populations, and can be significantly differentbetween sexes. However, literature records dealing with the dispersal of migratory birds are scarce, as migratory behaviourcan notably complicate the study of dispersal. We used the barn swallow Hirundo rustica as model taxon to investigatepatterns of genetic variability in males and in females of a migratory species showing sex-biased dispersal. We collectedblood samples (n = 186) over the period 2006 to 2011 from adults (H. r. rustica subspecies) nesting in the same breeding siteat either high (Ireland, Germany and Russia) or low (Spain, Italy and Cyprus) latitude across Europe. We amplified theChromo Helicase DNA gene in all birds in order to warrant a sex-balanced sample size (92 males, 94 females). Weinvestigated both uniparental (mitochondrial ND2 gene) and biparental (microsatellite DNA: 10 loci) genetic systems. ThemtDNA provided evidence for demographic expansion yet no significant partition of the genetic variability was disclosed.Nevertheless, a comparatively distant Russian population investigated in another study, whose sequences were included inthe present dataset, significantly diverged from all other ones. Different to previous studies, microsatellites highlightedremarkable genetic structure among the studied populations, and pointed to the occurrence of differences between maleand female barn swallows. We produced evidence for non-random patterns of gene flow among barn swallow populationsprobably mediated by female natal dispersal, and we found significant variability in the philopatry of males of differentpopulations. Our data emphasize the importance of taking into account the sex of sampled individuals in order to obtainreliable inferences on species characterized by different patterns of dispersal between males and females.
Citation: Guerrini M, Gennai C, Panayides P, Crabtree A, Zuberogoitia I, et al. (2014) Large-Scale Patterns of Genetic Variation in a Female-Biased DispersingPasserine: The Importance of Sex-Based Analyses. PLoS ONE 9(6): e98574. doi:10.1371/journal.pone.0098574
Editor: Valerio Ketmaier, Institute of Biochemistry and Biology, Germany
Received February 26, 2014; Accepted May 5, 2014; Published June 2, 2014
Copyright: � 2014 Guerrini et al. This is an open-access article distributed under the terms of the Creative Commons Attribution License, which permitsunrestricted use, distribution, and reproduction in any medium, provided the original author and source are credited.
Funding: The Anastasios G. Leventis Foundation (Nicosia, Cyprus) funded this research with two grants (2008-2010, 2010-2012). The funders had no role in studydesign, data collection and analysis, decision to publish, or preparation of the manuscript.
Competing Interests: The authors have declared that no competing interests exist.
* E-mail: [email protected]
¤ Current address: Department of Food, Agriculture and Environment, University of Pisa, Pisa, Italy
Introduction
Distribution, dynamics and genetic structure of natural popu-
lations can be severely affected by dispersal [1–3], i.e. the
movement of an organism from its birthplace to its first breeding
site (natal dispersal) or from one breeding site to another (breeding
dispersal) [4–5]. Dispersal may be significantly different between
sexes, as has been well documented in birds and mammals [3,4,6].
The costs/benefits of such asymmetry usually depend on the life
history and the mating system of a given species [7]. In particular,
dispersal tends to be female-biased in birds and male-biased in
mammals [4,8,9]. Given that dispersal can significantly affect gene
flow among populations [10], the dispersing sex may appear as
genetically less structured. Hence, accounting for sex is funda-
mental not only to find out potential differences in dispersal [10–
11] but also to reliably infer the genetic structure of populations, as
the latter could be driven mainly by the philopatric sex [12].
The estimate of the dispersal rate in natural populations is often
incomplete because it usually requires direct methods with
intensive, large-scale and long-term demographic studies
[10,11,13]. However, recent advances in the genetic techniques
allowed researchers to integrate field investigation with molecular
DNA analysis. The combined use of markers with different way of
inheritance (mitochondrial versus nuclear DNA) represented the
most suitable approach to infer discrepancy between the dispersal
pattern of males and females. Indeed, differences in the genetic
picture drawn by mitochondrial and nuclear markers are expected
when sex-biased dispersal occurs [11]. Studies focusing on the
application of population genetic tools to infer sex-biased dispersal
are well known for vertebrates, more frequently in birds and
mammals (e.g.: eiders [14], rodents [15]) than in amphibians and
reptiles (e.g.: frogs [16], turtles [17]). Nevertheless, as exhaustively
discussed by Møller et al. [18], dispersal of migratory birds is poorly
PLOS ONE | www.plosone.org 1 June 2014 | Volume 9 | Issue 6 | e98574
studied because routes can greatly complicate the interpretation of
the genetic scenario [19].
The barn swallow Hirundo rustica is a polytypic passerine bird
widely distributed throughout most of the northern hemisphere
[20]. This species is extensively studied with reference to its
morphology and behaviour. For instance, recent studies disclosed
significant patterns of morphological differentiation among Euro-
pean populations in a few characters (ventral coloration, tail
streamers) known to be under sexual selection [21–24]. As far as
the migratory behaviour is concerned, European barn swallows
can be divided in two main groups: one breeds in south-western
Europe and winters in central and western Africa, the other breeds
in northern Europe and winters in southern Africa [25].
Differences in morphological and behavioural traits notwithstand-
ing, the occurrence of some degree of genetic differentiation
among European H. rustica populations has never been proved by
using either mitochondrial or microsatellite DNA markers
[23,24,26]. However, although the barn swallow is a female-
biased dispersal species (males are more philopatric than females,
e.g. [27]), the sex of the investigated individuals has never been
taken into account in any genetic study focusing on this taxon.
In this work we aim at: (i) analysing the genetic variability of
European barn swallow populations over a wide sampling area by
means of markers from both uniparental (mitochondrial DNA:
mtDNA) and biparental (microsatellite DNA) genetic systems; (ii)
testing the consequences of sex-biased dispersal on the population
genetic structure by comparing patterns of variation in a well
balanced sample of males and females. Overall, the barn swallow
represents an excellent model among migratory species to
investigate patterns of genetic variation in males and females.
While lack of genetic structure is expected for the whole sample
size, we predict the occurrence of different genetic pattern between
male and female barn swallows [12,16].
Materials and Methods
Ethics statementThe barn swallow is not an endangered species in all trapping
areas of this study. Samples were obtained in the same place (six
localities) in different years. Adults were trapped with mist-nets.
Samples (one blood droplet) were collected by means of wing
venipuncture (brachial/radial/ulnar vein). Birds were not sedated
and did not suffer any injury: all of them were released 10 min
after blood collection.
We report here below the coordinates of the sampling localities
(see also Table S1) together with the information about the permits
issued for each specific area: (1) Tullynisk, Offaly (Ireland:
53u079N, 07u549W). The licensing authority in Ireland is the
National Parks and Wildlife Service (NPWS), which provided an
annual (renewable) license for the present study (NPWS references
57/2009 and C41/2010). Separately, the capture of birds is also
controlled through the British Trust for Ornithology Ringing
Scheme. All licenses and permits were obtained by, and in the
name of, A.S. Copland (BTO permit number A5115). All samples
were taken from birds at a privately-owned site. Access to this site
was arranged through the regional staff of the NPWS, who also
have contact details for the owner/manager; (2) Itzehoe
(Germany: 53u569N, 09u319E). Samples were collected by S.
Martens, who is ringer at the Institute for Avian Research
‘‘Vogelwarte Helgoland’’. Samples were collected at a private farm
and future permissions should be requested to the owner of the
same; (3) Lake Ladoga (Russian Federation: 60u409N, 32u569E).
Samples were collected by O. Babushkina at the Ladoga
Ornithological Station of the Biological Research Institute of the
Saint Petersburg State University. The Ladoga Ornithological
Station is comprised within the Nizhne-Svirsky State Reserve. All
work at the station adhered to the current legislation of the
Russian Federation and to the institutional guidelines of the State
University of Saint Petersburg. No specific permits were needed to
O. Babushkina. Future permissions should be requested to the
Biological Research Institute of the Saint Petersburg State
University; (4) Gorliz (Spain: 43u249N, 02u579W). Samples were
collected by I. Zuberogoitia. He obtained a license to trap barn
swallows and collect blood samples by the Department of Medio
Ambiente (Diputacion Foral de Bizkaia). The same administration
manages the experimental farm for the selection of cow races
where the sampling was carried out, and all permissions were
obtained in the same site. Future permissions should be requested
to the same Department; (5) Orti-Bottagone Nature Reserve (Italy:
42u579N, 10u359E). Samples were collected by R. Ceccherelli
(veterinary, CRUMA, Leghorn). Land is a private property (oasis)
of World Wildlife Fund (WWF) and future permissions should be
requested to WWF Italy; (6) Polis (Cyprus: 35u029N, 32u259E).
Samples were collected in a government land by A. Crabtree (Vice
Chairman and Ringing Officer of BirdLife Cyprus), who obtained
a specific permit from the competent authority of Cyprus (Game &
Fauna Service, Ministry of Interior, Nicosia). Future permissions
should be requested to the same Ministry.
Biological samplingBlood samples (n = 186) were collected in subsequent years
(2006–2011) from nesting adults (H. r. rustica subspecies) at the
same breeding site in six areas across Europe (Figure 1, Table S1):
Gorliz, Spain (SPA, n = 32); Tullynisk, Ireland (IRE, n = 26); Orti-
Bottagone Nature Reserve, Italy (ITA, n = 33); Itzehoe, Germany
(GER, n = 33); Polis, Cyprus (CYP, n = 32); Lake Ladoga, Russia
(RUS, n = 30). One blood droplet was collected on filter paper
(Whatman, UK) from each bird by wing venipuncture. Each
swallow was ringed and sexed according to a PCR-based assay (see
below).
DNA extractionGenomic DNA was extracted using the Puregene Core Kit-A
(Qiagen, Germany) following the manufacturer’s instructions.
DNA content and purity were determined with an Eppendorf
BioPhotometer (AG Eppendorf, Germany).
SexingChromo Helicase DNA (CHD) gene of ZZ (males) and ZW
(females) sexual chromosomes was amplified with primers L1237
(5’-GAGAAACTGTGCAAAACA-3’) and H1272 (5’-TCCA-
GAATATCTTCTGCTCC-3’) previously tested in other bird
species [28]. PCRs were prepared in 25 mL as in [29] and
performed in a MyCycler thermal cycler (Biorad, USA) with the
following profile: 3 min at 94uC, 30 cycles of 30 s at 94uC, 1 min
at 48uC and 45 s at 72uC, finally 7 min at 72uC. PCR products
were run in a 3.5% agarose gel for 60 min together with positive
controls for male and female individuals. We set-up the PCR-
based procedure by testing 20 barn swallows whose sex (10 males,
10 females) was determined through the inspection of standard
morphological traits [30] by one of us (P.M. Politi).
Mitochondrial DNALaboratory procedure. The entire mtDNA gene codifying
for the second sub-unit of the NADH dehydrogenase (ND2,
1041 bp) was amplified using primers L5216 and H6313 [31].
PCRs (50 mL) were run in a MyCycler thermal cycler (Biorad) as
Genetic Variation in a Sex-Biased Dispersing Passerine
PLOS ONE | www.plosone.org 2 June 2014 | Volume 9 | Issue 6 | e98574

in [29]. PCR products were purified using GenElute PCR Clean-
up Kit (Sigma Aldrich, Italy) and directly sequenced on both DNA
strands using the BigDye Terminator v. 3.1 Cycle Sequencing Kit
on an ABI 3730 DNA automated sequencer (Applied Biosystems,
USA) at Genechron (Rome, Italy). We amplified the ND2 gene in
a subset of samples (10 for each population, n = 60), and we
included in the alignment (CLUSTALX v. 1.81: [32]) 16 sequences
from the GenBank (Russia: Krasnodar Kray, KRD, n = 7 and
Arkhangel’sk Oblast’, MED, n = 9: [33]) (Figure 1, Table S1).
Population genetic inferences. We used DNASP v. 5.1 [34]
to infer the mtDNA haplotypes. A network was constructed using
DNA ALIGNMENT v. 1.3.3.1 (2003–2013 Fluxus Technology, UK)
and the Median Joining method of [35] with NETWORK v. 4.5.1.0
(2004–2009 Fluxus Technology). We used ARLEQUIN v. 3.5.1 [36]
to: (i) calculate the haplotype diversity (h), the nucleotide diversity
(p) and the mean number of pairwise differences (k); (ii) investigate
the partition of the mtDNA diversity (Analysis of the Molecular
Variance, AMOVA) among and within the populations using the
PhiST analogous to Wright’s F-statistics (1000 permutations) [37];
(iii) compute the average genetic distance among populations
(1000 replicates with the TN93 algorithm) [38].
Historical demography. Inferences of historical demogra-
phy were obtained using DNASP and different statistics as described
in [39]. The analysis included (i) males and females plus the
GenBank sequences (n = 60+16 = 76), (ii) only the males (n = 27, no
GenBank entries), and (iii) only the females (n = 33, no GenBank
entries). Ramirez-Soriano et al. [40] investigated the statistical
power of a wide range of statistics computed on DNA
polymorphism data in detecting a sudden population expansion,
a sudden contraction or a bottleneck. They found that the most
powerful tests were those based on haplotype frequencies,
including the FS of Fu [41] and the R2 statistic [42]. In this study,
the significance of the FS and R2 statistics was investigated by
examining the null distribution of 5000 coalescence simulations
using DNASP. Only significant negative FS and positive R2 values
were retained as evidence of population expansion [39]. We also
computed the Tajima’s D [43]. Nevertheless, [42] reported that R2
statistic has a greater power than the Tajima’s D or FS to detect
population expansion when the sample size is small (,10).
Furthermore, the McDonald-Kreitman test [44] as implemented
in DNASP was conducted for the entire dataset to investigate the
deviation from an equal ratio of non-synonymous (Ka) to
synonymous (Ks) fixed substitutions. Specifically for this test we
used two US H. r. erythrogaster samples as outgroup (UWBM 78832
and UWBM 80547 from the University of Washington Burke
Museum of Natural History, Seattle, USA; GenBank accession
codes: HF548593-94).
The Mismatch Distribution (MD) of mtDNA pairwise differ-
ences was also examined using ARLEQUIN (males + females, males
only, females only). The more ragged the shape of the distribution
the closer was the population to a stationary model of constant size
over a long period (raggedness index, r) [45]. The MD test uses the
observed parameters of the expansion to perform coalescent
simulations and to create new estimates of the same parameters.
Departure from a model of sudden expansion was tested for each
population by summing the squared differences (SSD) between
observed and estimated MD [46,47].
Microsatellite DNALaboratory procedure. All samples (n = 186) were investi-
gated at 10 loci of the microsatellite DNA (Short Tandem Repeats,
STR) reported in [48,49]. PCRs (12.5 mL) were performed as in
[50] (Table 1). Gene sizing was carried out at the Research Centre
of Clinical and Molecular Genetics (Pisa, Italy) on an ABI Prism
3730 DNA automated sequencer using GENESCAN (Applied
Biosystems). For the statistical analyses we used either the whole
sample size (n = 186) or males (n = 92) and females (n = 94)
separately.
Genetic variability and relatedness. The discriminatory
power of the whole set of STR loci was evaluated with GIMLET v.
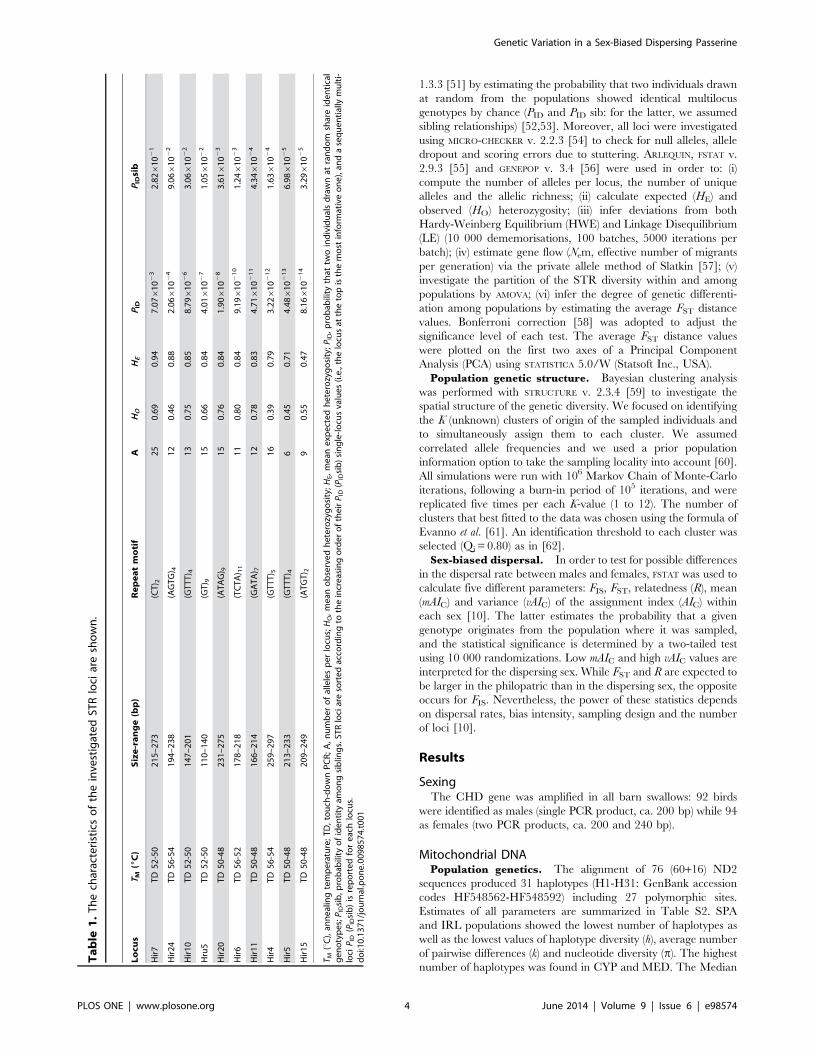
Figure 1. Barn swallow breeding populations sampled in this study. (1): SPA, Spain; (2): IRE, Ireland; (3): ITA, Italy; (4): GER, Germany; (5): CYP,Cyprus; (6): RUS, Russia. Mitochondrial DNA sequences available in the GenBank were obtained from Russian populations of Krasnodar (7, KRD) andMedvedevo (8, MED) (Table S1).doi:10.1371/journal.pone.0098574.g001
Genetic Variation in a Sex-Biased Dispersing Passerine
PLOS ONE | www.plosone.org 3 June 2014 | Volume 9 | Issue 6 | e98574
1.3.3 [51] by estimating the probability that two individuals drawn
at random from the populations showed identical multilocus
genotypes by chance (PID and PID sib: for the latter, we assumed
sibling relationships) [52,53]. Moreover, all loci were investigated
using MICRO-CHECKER v. 2.2.3 [54] to check for null alleles, allele
dropout and scoring errors due to stuttering. ARLEQUIN, FSTAT v.
2.9.3 [55] and GENEPOP v. 3.4 [56] were used in order to: (i)
compute the number of alleles per locus, the number of unique
alleles and the allelic richness; (ii) calculate expected (HE) and
observed (HO) heterozygosity; (iii) infer deviations from both
Hardy-Weinberg Equilibrium (HWE) and Linkage Disequilibrium
(LE) (10 000 dememorisations, 100 batches, 5000 iterations per
batch); (iv) estimate gene flow (Nem, effective number of migrants
per generation) via the private allele method of Slatkin [57]; (v)
investigate the partition of the STR diversity within and among
populations by AMOVA; (vi) infer the degree of genetic differenti-
ation among populations by estimating the average FST distance
values. Bonferroni correction [58] was adopted to adjust the
significance level of each test. The average FST distance values
were plotted on the first two axes of a Principal Component
Analysis (PCA) using STATISTICA 5.0/W (Statsoft Inc., USA).
Population genetic structure. Bayesian clustering analysis
was performed with STRUCTURE v. 2.3.4 [59] to investigate the
spatial structure of the genetic diversity. We focused on identifying
the K (unknown) clusters of origin of the sampled individuals and
to simultaneously assign them to each cluster. We assumed
correlated allele frequencies and we used a prior population
information option to take the sampling locality into account [60].
All simulations were run with 106 Markov Chain of Monte-Carlo
iterations, following a burn-in period of 105 iterations, and were
replicated five times per each K-value (1 to 12). The number of
clusters that best fitted to the data was chosen using the formula of
Evanno et al. [61]. An identification threshold to each cluster was
selected (Qi = 0.80) as in [62].
Sex-biased dispersal. In order to test for possible differences
in the dispersal rate between males and females, FSTAT was used to
calculate five different parameters: FIS, FST, relatedness (R), mean
(mAIC) and variance (vAIC) of the assignment index (AIC) within
each sex [10]. The latter estimates the probability that a given
genotype originates from the population where it was sampled,
and the statistical significance is determined by a two-tailed test
using 10 000 randomizations. Low mAIC and high vAIC values are
interpreted for the dispersing sex. While FST and R are expected to
be larger in the philopatric than in the dispersing sex, the opposite
occurs for FIS. Nevertheless, the power of these statistics depends
on dispersal rates, bias intensity, sampling design and the number
of loci [10].
Results
SexingThe CHD gene was amplified in all barn swallows: 92 birds
were identified as males (single PCR product, ca. 200 bp) while 94
as females (two PCR products, ca. 200 and 240 bp).
Mitochondrial DNAPopulation genetics. The alignment of 76 (60+16) ND2
sequences produced 31 haplotypes (H1-H31: GenBank accession
codes HF548562-HF548592) including 27 polymorphic sites.
Estimates of all parameters are summarized in Table S2. SPA
and IRL populations showed the lowest number of haplotypes as
well as the lowest values of haplotype diversity (h), average number
of pairwise differences (k) and nucleotide diversity (p). The highest
number of haplotypes was found in CYP and MED. The Median
Ta
ble
1.
Th
ech
arac
teri
stic
so
fth
ein
vest
igat
ed
STR
loci
are
sho
wn
.
Lo
cus
TM
( 6C
)S
ize
-ra
ng
e(b
p)
Re
pe
at
mo
tif
AH
OH
EP
IDP
IDsi
b
Hir
7T
D5
2-5
02
15
–2
73
(CT
) 22
50
.69
0.9
47
.076
10
23
2.8
261
02
1
Hir
24
TD
56
-54
19
4–
23
8(A
GT
G) 4
12
0.4
60
.88
2.0
661
02
49
.066
10
22
Hir
10
TD
52
-50
14
7–
20
1(G
TT
T) 4
13
0.7
50
.85
8.7
961
02
63
.066
10
22
Hru
5T
D5
2-5
01
10
–1
40
(GT
) 91
50
.66
0.8
44
.016
10
27
1.0
561
02
2
Hir
20
TD
50
-48
23
1–
27
5(A
TA
G) 9
15
0.7
60
.84
1.9
061
02
83
.616
10
23
Hir
6T
D5
6-5
21
78
–2
18
(TC
TA
) 11
11
0.8
00
.84
9.1
961
02
10
1.2
461
02
3
Hir
11
TD
50
-48
16
6–
21
4(G
AT
A) 7
12
0.7
80
.83
4.7
161
02
11
4.3
461
02
4
Hir
4T
D5
6-5
42
59
–2
97
(GT
TT
) 51
60
.39
0.7
93
.226
10
21
21
.636
10
24
Hir
5T
D5
0-4
82
13
–2
33
(GT
TT
) 46
0.4
50
.71
4.4
861
02
13
6.9
861
02
5
Hir
15
TD
50
-48
20
9–
24
9(A
TG
T) 2
90
.55
0.4
78
.166
10
21
43
.296
10
25
T M(u
C),
ann
eal
ing
tem
pe
ratu
re;
TD
,to
uch
-do
wn
PC
R;
A,
nu
mb
er
of
alle
les
pe
rlo
cus;
HO
,m
ean
ob
serv
ed
he
tero
zyg
osi
ty;
HE,
me
ane
xpe
cte
dh
ete
rozy
go
sity
;P
ID,
pro
bab
ility
that
two
ind
ivid
ual
sd
raw
nat
ran
do
msh
are
ide
nti
cal
ge
no
typ
es;
PID
sib
,pro
bab
ility
of
ide
nti
tyam
on
gsi
blin
gs.
STR
loci
are
sort
ed
acco
rdin
gto
the
incr
eas
ing
ord
er
of
the
irP
ID(P
IDsi
b)
sin
gle
-lo
cus
valu
es
(i.e
.,th
elo
cus
atth
eto
pis
the
mo
stin
form
ativ
eo
ne
),an
da
seq
ue
nti
ally
mu
lti-
loci
PID
(PID
sib
)is
rep
ort
ed
for
eac
hlo
cus.
do
i:10
.13
71
/jo
urn
al.p
on
e.0
09
85
74
.t0
01
Genetic Variation in a Sex-Biased Dispersing Passerine
PLOS ONE | www.plosone.org 4 June 2014 | Volume 9 | Issue 6 | e98574
Joining network showed that all barn swallow populations were
genetically admixed with no noticeable divergence among
haplotypes (Figure 2). In particular, two haplotypes (H1 and H4)
were common to all populations. The 88.4% of the mtDNA
variability was partitioned within populations while the 11.6%
among them (PhiST = 0.131, P,0.001: data not shown). Only
MED significantly diverged from all other populations (PhiST
range: 0.28–0.38, all P,0.001, Table S3). When AMOVA was
performed either without KRD and MED populations or
excluding MED only, we found that the partition of the mtDNA
variability among populations decreased to 1.86% and 1.33%,
respectively (PhiST = 0.02 and 0.01, respectively, P.0.05: data not
shown). Finally, when all the estimated parameters were computed
by including in the analysis males and females separately, all
results matched those produced using the entire dataset (data not
shown).
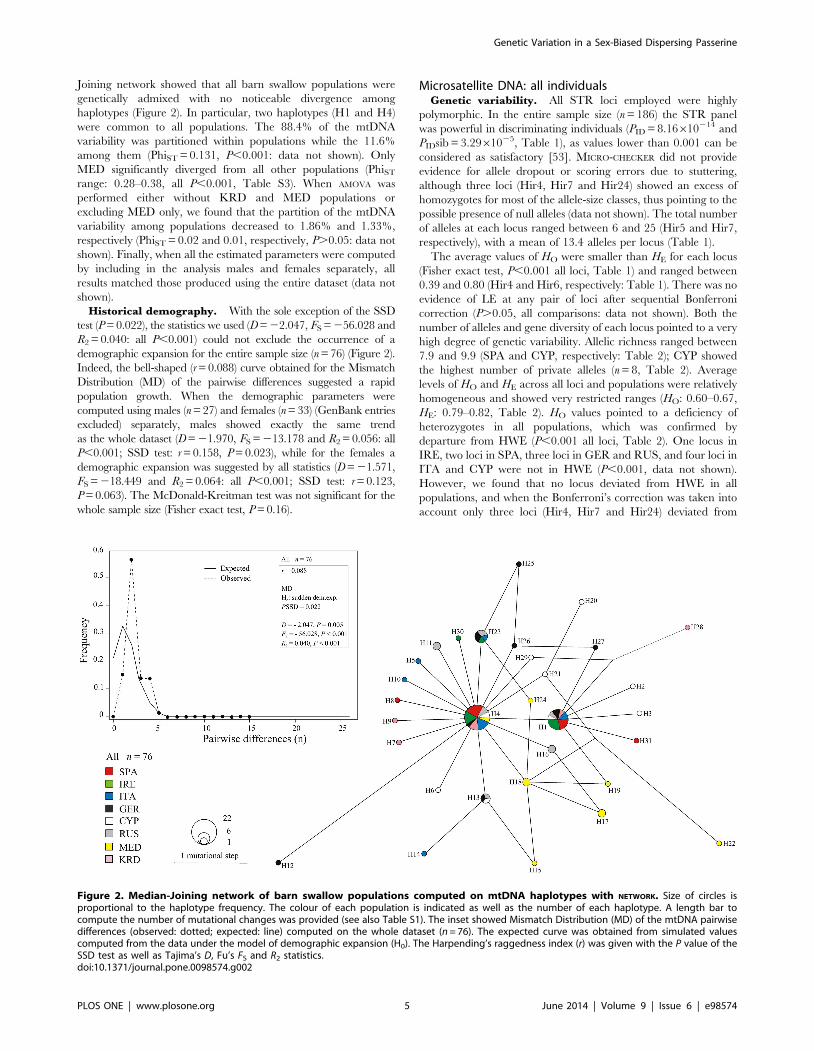
Historical demography. With the sole exception of the SSD
test (P = 0.022), the statistics we used (D = 22.047, FS = 256.028 and
R2 = 0.040: all P,0.001) could not exclude the occurrence of a
demographic expansion for the entire sample size (n = 76) (Figure 2).
Indeed, the bell-shaped (r = 0.088) curve obtained for the Mismatch
Distribution (MD) of the pairwise differences suggested a rapid
population growth. When the demographic parameters were
computed using males (n = 27) and females (n = 33) (GenBank entries
excluded) separately, males showed exactly the same trend
as the whole dataset (D = 21.970, FS = 213.178 and R2 = 0.056: all
P,0.001; SSD test: r = 0.158, P = 0.023), while for the females a
demographic expansion was suggested by all statistics (D = 21.571,
FS = 218.449 and R2 = 0.064: all P,0.001; SSD test: r = 0.123,
P = 0.063). The McDonald-Kreitman test was not significant for the
whole sample size (Fisher exact test, P = 0.16).
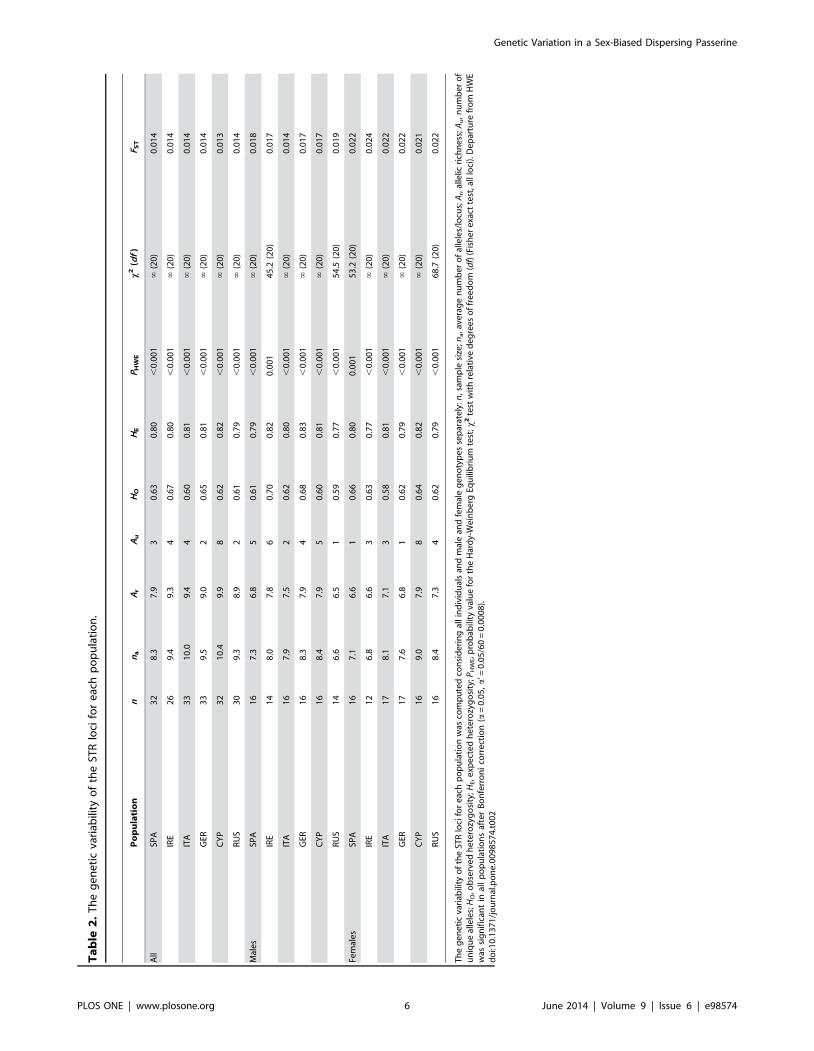
Microsatellite DNA: all individualsGenetic variability. All STR loci employed were highly
polymorphic. In the entire sample size (n = 186) the STR panel
was powerful in discriminating individuals (PID = 8.16610214 and
PIDsib = 3.2961025, Table 1), as values lower than 0.001 can be
considered as satisfactory [53]. MICRO-CHECKER did not provide
evidence for allele dropout or scoring errors due to stuttering,
although three loci (Hir4, Hir7 and Hir24) showed an excess of
homozygotes for most of the allele-size classes, thus pointing to the
possible presence of null alleles (data not shown). The total number
of alleles at each locus ranged between 6 and 25 (Hir5 and Hir7,
respectively), with a mean of 13.4 alleles per locus (Table 1).
The average values of HO were smaller than HE for each locus
(Fisher exact test, P,0.001 all loci, Table 1) and ranged between
0.39 and 0.80 (Hir4 and Hir6, respectively: Table 1). There was no
evidence of LE at any pair of loci after sequential Bonferroni
correction (P.0.05, all comparisons: data not shown). Both the
number of alleles and gene diversity of each locus pointed to a very
high degree of genetic variability. Allelic richness ranged between
7.9 and 9.9 (SPA and CYP, respectively: Table 2); CYP showed
the highest number of private alleles (n = 8, Table 2). Average
levels of HO and HE across all loci and populations were relatively
homogeneous and showed very restricted ranges (HO: 0.60–0.67,
HE: 0.79–0.82, Table 2). HO values pointed to a deficiency of
heterozygotes in all populations, which was confirmed by
departure from HWE (P,0.001 all loci, Table 2). One locus in
IRE, two loci in SPA, three loci in GER and RUS, and four loci in
ITA and CYP were not in HWE (P,0.001, data not shown).
However, we found that no locus deviated from HWE in all
populations, and when the Bonferroni’s correction was taken into
account only three loci (Hir4, Hir7 and Hir24) deviated from
Figure 2. Median-Joining network of barn swallow populations computed on mtDNA haplotypes with NETWORK. Size of circles isproportional to the haplotype frequency. The colour of each population is indicated as well as the number of each haplotype. A length bar tocompute the number of mutational changes was provided (see also Table S1). The inset showed Mismatch Distribution (MD) of the mtDNA pairwisedifferences (observed: dotted; expected: line) computed on the whole dataset (n = 76). The expected curve was obtained from simulated valuescomputed from the data under the model of demographic expansion (H0). The Harpending’s raggedness index (r) was given with the P value of theSSD test as well as Tajima’s D, Fu’s FS and R2 statistics.doi:10.1371/journal.pone.0098574.g002
Genetic Variation in a Sex-Biased Dispersing Passerine
PLOS ONE | www.plosone.org 5 June 2014 | Volume 9 | Issue 6 | e98574
Ta
ble
2.
Th
eg
en
eti
cva
riab
ility
of
the
STR
loci
for
eac
hp
op
ula
tio
n.
Po
pu
lati
on
nn
aA
rA
uH
OH
EP
HW
Ex
2(d
f)
F ST
All
SPA
32
8.3
7.9
30
.63
0.8
0,
0.0
01
‘(2
0)
0.0
14
IRE
26
9.4
9.3
40
.67
0.8
0,
0.0
01
‘(2
0)
0.0
14
ITA
33
10
.09
.44
0.6
00
.81
,0
.00
1‘
(20
)0
.01
4
GER
33
9.5
9.0
20
.65
0.8
1,
0.0
01
‘(2
0)
0.0
14
CY
P3
21
0.4
9.9
80
.62
0.8
2,
0.0
01
‘(2
0)
0.0
13
RU
S3
09
.38
.92
0.6
10
.79
,0
.00
1‘
(20
)0
.01
4
Mal
es
SPA
16
7.3
6.8
50
.61
0.7
9,
0.0
01
‘(2
0)
0.0
18
IRE
14
8.0
7.8
60
.70
0.8
20
.00
14
5.2
(20
)0
.01
7
ITA
16
7.9
7.5
20
.62
0.8
0,
0.0
01
‘(2
0)
0.0
14
GER
16
8.3
7.9
40
.68
0.8
3,
0.0
01
‘(2
0)
0.0
17
CY
P1
68
.47
.95
0.6
00
.81
,0
.00
1‘
(20
)0
.01
7
RU
S1
46
.66
.51
0.5
90
.77
,0
.00
15
4.5
(20
)0
.01
9
Fem
ale
sSP
A1
67
.16
.61
0.6
60
.80
0.0
01
53
.2(2
0)
0.0
22
IRE
12
6.8
6.6
30
.63
0.7
7,
0.0
01
‘(2
0)
0.0
24
ITA
17
8.1
7.1
30
.58
0.8
1,
0.0
01
‘(2
0)
0.0
22
GER
17
7.6
6.8
10
.62
0.7
9,
0.0
01
‘(2
0)
0.0
22
CY
P1
69
.07
.98
0.6
40
.82
,0
.00
1‘
(20
)0
.02
1
RU
S1
68
.47
.34
0.6
20
.79
,0
.00
16
8.7
(20
)0
.02
2
Th
eg
en
eti
cva
riab
ility
of
the
STR
loci
for
eac
hp
op
ula
tio
nw
asco
mp
ute
dco
nsi
de
rin
gal
lin
div
idu
als
and
mal
ean
dfe
mal
eg
en
oty
pe
sse
par
ate
ly:n
,sam
ple
size
;na,a
vera
ge
nu
mb
er
of
alle
les/
locu
s;A
r,al
lelic
rich
ne
ss;A
u,n
um
be
ro
fu
niq
ue
alle
les;
HO
,ob
serv
ed
he
tero
zyg
osi
ty;H
E,e
xpe
cte
dh
ete
rozy
go
sity
;PH
WE,p
rob
abili
tyva
lue
for
the
Har
dy-
We
inb
erg
Equ
ilib
riu
mte
st;x
2te
stw
ith
rela
tive
de
gre
es
of
fre
ed
om
(df)
(Fis
he
re
xact
test
,all
loci
).D
ep
artu
refr
om
HW
Ew
assi
gn
ific
ant
inal
lp
op
ula
tio
ns
afte
rB
on
ferr
on
ico
rre
ctio
n(a
=0
.05
,a
’=0
.05
/60
=0
.00
08
).d
oi:1
0.1
37
1/j
ou
rnal
.po
ne
.00
98
57
4.t
00
2
Genetic Variation in a Sex-Biased Dispersing Passerine
PLOS ONE | www.plosone.org 6 June 2014 | Volume 9 | Issue 6 | e98574
HWE in some populations yet not in all (P,0.001, data not
shown).
We found that 98.6% of the total STR variability was
partitioned within populations and 1.38% among them
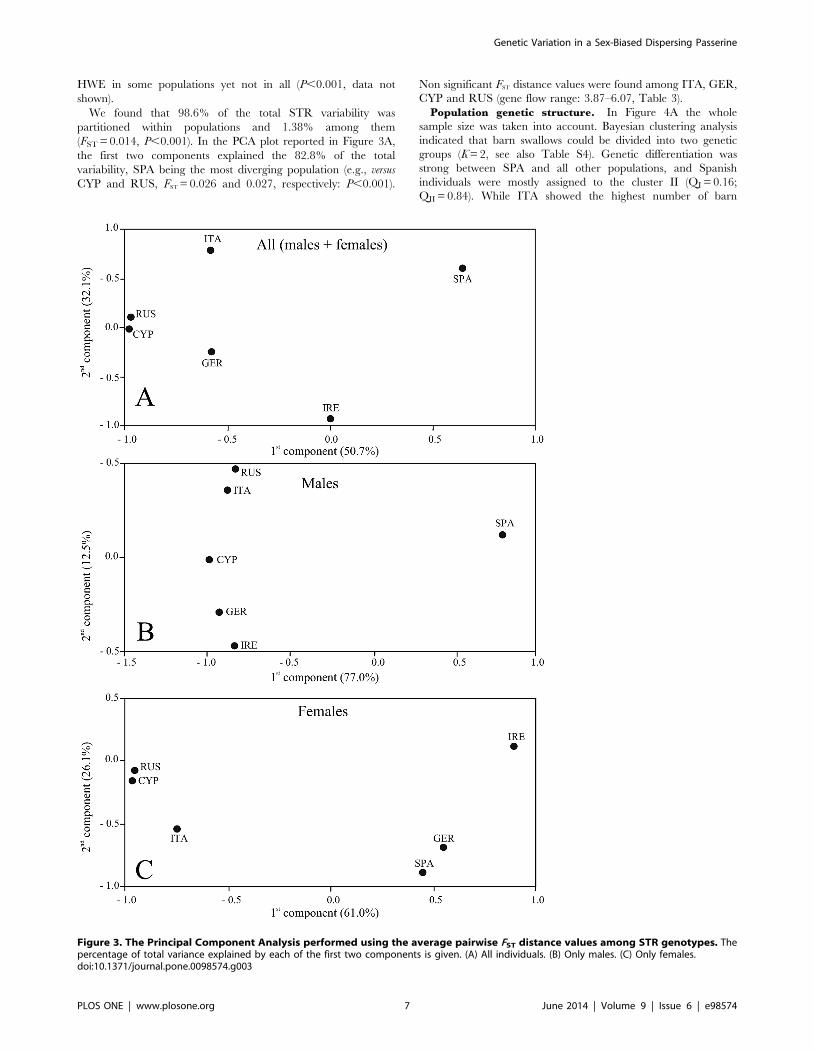
(FST = 0.014, P,0.001). In the PCA plot reported in Figure 3A,
the first two components explained the 82.8% of the total
variability, SPA being the most diverging population (e.g., versus
CYP and RUS, FST = 0.026 and 0.027, respectively: P,0.001).
Non significant FST distance values were found among ITA, GER,
CYP and RUS (gene flow range: 3.87–6.07, Table 3).
Population genetic structure. In Figure 4A the whole
sample size was taken into account. Bayesian clustering analysis
indicated that barn swallows could be divided into two genetic
groups (K = 2, see also Table S4). Genetic differentiation was
strong between SPA and all other populations, and Spanish
individuals were mostly assigned to the cluster II (QI = 0.16;
QII = 0.84). While ITA showed the highest number of barn
Figure 3. The Principal Component Analysis performed using the average pairwise FST distance values among STR genotypes. Thepercentage of total variance explained by each of the first two components is given. (A) All individuals. (B) Only males. (C) Only females.doi:10.1371/journal.pone.0098574.g003
Genetic Variation in a Sex-Biased Dispersing Passerine
PLOS ONE | www.plosone.org 7 June 2014 | Volume 9 | Issue 6 | e98574

Ta
ble
3.
Esti
mat
es
of
po
pu
lati
on
pai
rwis
eg
en
eti
cd
ista
nce
valu
es
(FS
T)
and
nu
mb
er
of
mig
ran
ts(N
em
).
SP
AIR
EIT
AG
ER
CY
PR
US
All
SPA
-3
.24
4.0
53
.01
4.0
92
.96
IRE
0.0
24
**-
4.2
33
.43
3.3
12
.80
ITA
0.0
09
0.0
19
*-
5.4
34
.37
6.0
7
GER
0.0
17
*0
.01
2*
0.0
08
-4
.58
3.8
7
CY
P0
.02
6**
0.0
16
*0
.00
60
.01
0-
4.5
3
RU
S0
.02
7**
0.0
19
*0
.00
50
.01
00
.00
2-
Mal
es
SPA
-2
.89
2.2
22
.57
1.6
92
.59
IRE
0.0
37
*-
2.0
72
.51
1.9
61
.69
ITA
0.0
22
*0
.01
2-
2.0
82
.36
2.9
1
GER
0.0
29
*0
.00
10
.00
1-
3.0
32
.09
CY
P0
.05
0**
0.0
12
0.0
08
0.0
04
-4
.09
RU
S0
.03
9*
0.0
20
0.0
04
0.0
12
0.0
12
-
Fem
ale
sSP
A-
1.6
73
.44
2.5
83
.22
2.3
7
IRE
0.0
21
-1
.79
2.1
83
.05
2.7
5
ITA
0.0
12
0.0
34
*-
3.1
33
.38
2.7
6
GER
0.0
09
0.0
27
*0
.02
5*
-3
.71
3.7
7
CY
P0
.01
90
.03
6*
0.0
08
0.0
29
*-
3.9
5
RU
S0
.03
1*
0.0
48
**0
.01
50
.02
8*
0.0
05
-
Esti
mat
es
of
po
pu
lati
on
pai
rwis
eg
en
eti
cd
ista
nce
(FS
T)
and
nu
mb
er
of
mig
ran
ts(N
em
)w
ere
com
pu
ted
for
all
ind
ivid
ual
s,o
nly
mal
es
and
on
lyfe
mal
es.
Be
low
dia
go
nal
:F S
Tp
airw
ise
dis
tan
ceva
lue
s.A
bo
ved
iag
on
al:
the
eff
ect
ive
nu
mb
er
of
mig
ran
tsp
er
ge
ne
rati
on
(Nem
);*,
P,
0.0
5;
**,
P,
0.0
01
;o
the
rs,
P.
0.0
5.
do
i:10
.13
71
/jo
urn
al.p
on
e.0
09
85
74
.t0
03
Genetic Variation in a Sex-Biased Dispersing Passerine
PLOS ONE | www.plosone.org 8 June 2014 | Volume 9 | Issue 6 | e98574
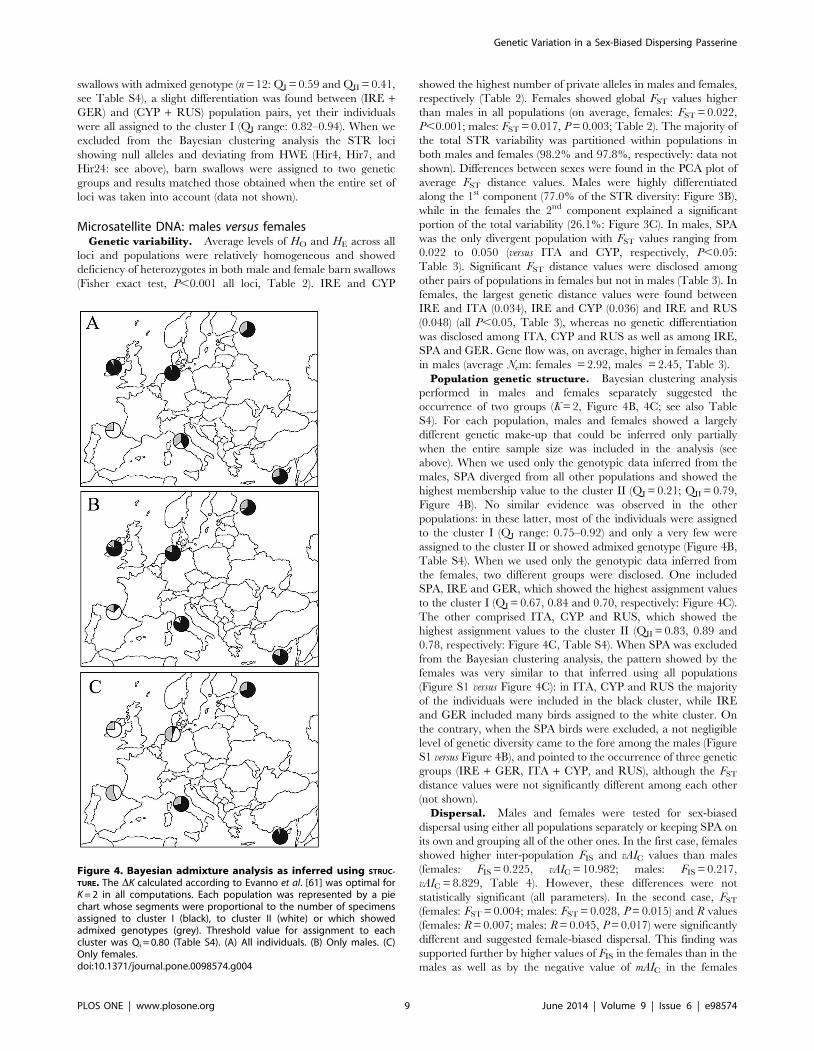
swallows with admixed genotype (n = 12: QI = 0.59 and QII = 0.41,
see Table S4), a slight differentiation was found between (IRE +GER) and (CYP + RUS) population pairs, yet their individuals
were all assigned to the cluster I (QI range: 0.82–0.94). When we
excluded from the Bayesian clustering analysis the STR loci
showing null alleles and deviating from HWE (Hir4, Hir7, and
Hir24: see above), barn swallows were assigned to two genetic
groups and results matched those obtained when the entire set of
loci was taken into account (data not shown).
Microsatellite DNA: males versus femalesGenetic variability. Average levels of HO and HE across all
loci and populations were relatively homogeneous and showed
deficiency of heterozygotes in both male and female barn swallows
(Fisher exact test, P,0.001 all loci, Table 2). IRE and CYP
showed the highest number of private alleles in males and females,
respectively (Table 2). Females showed global FST values higher
than males in all populations (on average, females: FST = 0.022,
P,0.001; males: FST = 0.017, P = 0.003; Table 2). The majority of
the total STR variability was partitioned within populations in
both males and females (98.2% and 97.8%, respectively: data not
shown). Differences between sexes were found in the PCA plot of
average FST distance values. Males were highly differentiated
along the 1st component (77.0% of the STR diversity: Figure 3B),
while in the females the 2nd component explained a significant
portion of the total variability (26.1%: Figure 3C). In males, SPA
was the only divergent population with FST values ranging from
0.022 to 0.050 (versus ITA and CYP, respectively, P,0.05:
Table 3). Significant FST distance values were disclosed among
other pairs of populations in females but not in males (Table 3). In
females, the largest genetic distance values were found between
IRE and ITA (0.034), IRE and CYP (0.036) and IRE and RUS
(0.048) (all P,0.05, Table 3), whereas no genetic differentiation
was disclosed among ITA, CYP and RUS as well as among IRE,
SPA and GER. Gene flow was, on average, higher in females than
in males (average Nem: females = 2.92, males = 2.45, Table 3).
Population genetic structure. Bayesian clustering analysis
performed in males and females separately suggested the
occurrence of two groups (K = 2, Figure 4B, 4C; see also Table
S4). For each population, males and females showed a largely
different genetic make-up that could be inferred only partially
when the entire sample size was included in the analysis (see
above). When we used only the genotypic data inferred from the
males, SPA diverged from all other populations and showed the
highest membership value to the cluster II (QI = 0.21; QII = 0.79,
Figure 4B). No similar evidence was observed in the other
populations: in these latter, most of the individuals were assigned
to the cluster I (QI range: 0.75–0.92) and only a very few were
assigned to the cluster II or showed admixed genotype (Figure 4B,
Table S4). When we used only the genotypic data inferred from
the females, two different groups were disclosed. One included
SPA, IRE and GER, which showed the highest assignment values
to the cluster I (QI = 0.67, 0.84 and 0.70, respectively: Figure 4C).
The other comprised ITA, CYP and RUS, which showed the
highest assignment values to the cluster II (QII = 0.83, 0.89 and
0.78, respectively: Figure 4C, Table S4). When SPA was excluded
from the Bayesian clustering analysis, the pattern showed by the
females was very similar to that inferred using all populations
(Figure S1 versus Figure 4C): in ITA, CYP and RUS the majority
of the individuals were included in the black cluster, while IRE
and GER included many birds assigned to the white cluster. On
the contrary, when the SPA birds were excluded, a not negligible
level of genetic diversity came to the fore among the males (Figure
S1 versus Figure 4B), and pointed to the occurrence of three genetic
groups (IRE + GER, ITA + CYP, and RUS), although the FST
distance values were not significantly different among each other
(not shown).
Dispersal. Males and females were tested for sex-biased
dispersal using either all populations separately or keeping SPA on
its own and grouping all of the other ones. In the first case, females
showed higher inter-population FIS and vAIC values than males
(females: FIS = 0.225, vAIC = 10.982; males: FIS = 0.217,
vAIC = 8.829, Table 4). However, these differences were not
statistically significant (all parameters). In the second case, FST
(females: FST = 0.004; males: FST = 0.028, P = 0.015) and R values
(females: R = 0.007; males: R = 0.045, P = 0.017) were significantly
different and suggested female-biased dispersal. This finding was
supported further by higher values of FIS in the females than in the
males as well as by the negative value of mAIC in the females
Figure 4. Bayesian admixture analysis as inferred using STRUC-
TURE. The DK calculated according to Evanno et al. [61] was optimal forK = 2 in all computations. Each population was represented by a piechart whose segments were proportional to the number of specimensassigned to cluster I (black), to cluster II (white) or which showedadmixed genotypes (grey). Threshold value for assignment to eachcluster was Qi = 0.80 (Table S4). (A) All individuals. (B) Only males. (C)Only females.doi:10.1371/journal.pone.0098574.g004
Genetic Variation in a Sex-Biased Dispersing Passerine
PLOS ONE | www.plosone.org 9 June 2014 | Volume 9 | Issue 6 | e98574

(FIS = 0.234, mAIC = 20.040); however, these differences were not
statistically significant (all parameters, Table 4).
Discussion
There are a few studies focusing on migratory bird species and
relying on the use of molecular DNA markers (e.g., sandhill crane
[63]; black-throated blue warbler [64]; reed warbler [65]). This
likely occurs because species with elevated mobility are expected to
show a higher level of gene flow and a weaker genetic structure
than sedentary ones [66–68]). However, none of these studies
accounted for sex in the genetic analysis. Only Ortego et al. [12]
investigated the correspondence between population genetic
structure and natal dispersal by analyzing males and females
separately but in a non-migratory passerine (Cyanistes caeruleus, blue
tit). On the contrary, studies focusing on other vertebrate species
with sex-biased dispersal and taking into account the sex of
individuals in the genetic analysis are known [16,17,69]. In the
barn swallow, the use of either mitochondrial or microsatellite
DNA pointed to the admixed genetic structure of the European
populations investigated so far [23,24,26], and significant genetic
(mtDNA) distances were found only among barn swallows of
different continents [33]. Nevertheless, in this species, the genetic
pattern of males and females has never been compared.
Mitochondrial DNAThe mtDNA analysis did not suggest any significant structuring
of the genetic variability (Figure 2), as it might be expected in a
species with female-biased dispersal and male philopatry [69]. The
star-like shape of the network, which included two ancestral
haplotypes (H1 and H4), as well as the bell-shaped curve of the
MD were consistent with a recent demographic expansion of
the studied barn swallow populations (Figure 2, Table S2)
[26,33]. Such a scenario was statistically well supported (Fig. 2:
D = 22.047, FS = 256.028 and R2 = 0.040, all P,0.001), with the
SSD statistic (P = 0.022) being an exception. However, although
all tests we employed may be sensitive to unknown structure within
populations, [70] stressed that the SSD statistic was actually the
less powerful. Furthermore, when only the females were analyzed,
a model of expansion was supported also by the SSD statistic
(P = 0.063). Overall, we felt confident in considering that such a
deviation from neutrality was very likely due to demographic
changes rather than selective processes, as the McDonald-Kreit-
man test was not significant in the entire dataset [71]). This result
is in agreement with the relatively recent barn swallow range and
demographic expansion due to the proliferation of human
settlements providing widespread availability of suitable nest sites
[33].
The 11.6% of total mtDNA variability was partitioned among
populations, a value much higher than that (,2%) found by Dor
et al. [24], who analyzed populations of H. r. rustica and H. r.
transitiva (Middle East). However, we feel confident that this result
was due to the divergence of MED, the easternmost and
northernmost population in our sampling scheme. Indeed, when
MED was excluded from the analysis the mtDNA genetic
structure promptly disappeared (Figure 1, Table S3).
Microsatellite DNA: general overviewThe loci of the microsatellite DNA investigated in this study
showed a pattern of variability similar to that reported by [47,48],
with very high degree of polymorphism and low level of
relatedness among the genotyped barn swallows (Table 1).
Microsatellites did not show any evidence of Linkage Disequilib-
rium. However, a significant departure from HWE was found in
all populations due to a deficiency of heterozygotes (Table 2). This
result was possibly caused by either the occurrence of null alleles at
a few STR loci or the Wahlund effect [72], which, in turn, pointed
to sub-structuring due to sourcing from different populations with
different allele frequencies [73]. As discussed by [63], who studied
migratory sandhill cranes (Grus canadensis), a deficiency of
heterozygotes may be common in migratory species when a given
population consists of local and immigrant individuals with
different origin. Overall, departures from HWE would seem also
a deficit intrinsic to the barn swallow, which, however, do not
necessarily affect the result of the genetic analysis. Indeed,
Bayesian procedure does not require perfect equilibria to cluster
individuals, yet it attempts to minimize such departures within
groups [73]. Rodrıguez-Ramilo et al. [74] evaluated the accuracy
of some Bayesian clustering methods when both Hardy-Weinberg
and Linkage Equilibria were not fully respected. They found that
STRUCTURE could reliably determine the correct number of clusters
also for FST values as low as 0.01; hence, we did not exclude any
STR locus from our analysis. Nevertheless, we also showed that
the output of STRUCTURE did not change when Hir4, Hir7 and
Hir24 loci were ruled out (see Results).
Microsatellite DNA: males + females, males only, femalesonly
Santure et al. [23] and Dor et al. [24] investigated H. rustica
including European populations with different morphology and
migratory behaviour. Nevertheless, both mitochondrial and
microsatellite DNA markers did not disclose any significant
Table 4. Sex-biased dispersal tests.
All populations SPA versus all others
Males Females P -value Males Females P -value
FIS 0.217 0.225 0.389 0.217 0.234 0.243
FST 0.011 0.015 0.763 0.028 0.004 0.015*
R 0.017 0.025 0.752 0.045 0.007 0.017*
mAIC 20.052 0.051 0.594 0.041 20.040 0.444
vAIC 8.829 10.982 0.147 15.580 11.110 0.898
FIS, FST, relatedness (R), mean assignment index (mAIC) and variance of mean assignment index (vAIC) were estimated on males and females considering either singlepopulations or by separating Spanish barn swallows from all other ones. Significance (P) (two-tailed test) was assessed using the randomization method of [10]; *, P,
0.05.doi:10.1371/journal.pone.0098574.t004
Genetic Variation in a Sex-Biased Dispersing Passerine
PLOS ONE | www.plosone.org 10 June 2014 | Volume 9 | Issue 6 | e98574
genetic structure. By contrasting an equal number of males and
females from six localities across Europe, we show significantly
more population structure in males than females. This difference
in structure can be explained by dependence of dispersal on sex
(Figure 3, 4; Tables 3, S4). Different from [23], in our study the
pairwise FST computations as well as the PCA and the Bayesian
clustering analysis revealed a genetic picture never before
reported. While we cannot exclude that the discrepancy between
the two studies could be due to the different distribution of the
sampling sites, it should be noted that Santure et al. [23] used a set
of STR markers (6 loci) smaller than that (10 loci) employed in the
present study, and did not provide sex ratio of the investigated
sample. Hence, it seems likely that our analysis has more power to
detect any genetic structuring of populations than that performed
by [23]. Overall, the PCA carried out by using the average
pairwise FST distance values computed among all populations as
well as the Bayesian clustering analysis (males + females), pointed
to the strong divergence between SPA and all other populations
(Figure 3A, 4A, Table 3). This result was even more evident when
we used only the male genotypes (Figure 3B, 4B, Table 3). For
instance, in the Bayesian analysis, most of the SPA individuals
grouped together in the cluster II, whereas the males from all of
the other populations were mainly assigned to the cluster I
(Figure 4B). Balbontın et al. [27] obtained similar results in a field
study. They investigated long-term trends in natal dispersal of
northern (Denmark) and southern (Spain) Europe barn swallow
populations. They found female-biased natal dispersal in both
populations and male philopatry six times higher in the Spanish
than in the Danish population. In our study, the genetic
differentiation showed by the SPA population could be due to a
particularly high rate of natal philopatry of males. We would like
to stress that in the barn swallow the choice of the first breeding
site is crucial, as it can determine where an individual will
reproduce for the rest of its life. Balbontın et al. [27] suggested that
the probability of philopatry, which is related to the fitness in terms
of longevity, may depend on ecological factors related to the
breeding site, although both the livestock farming and the
architecture of rural buildings could also influence the choice
between philopatry and dispersal [75]. Compared to the Spanish
population, the lack of differentiation among all of the other ones
could be due to the lower natal philopatry of their males. These
populations, a mix of resident (philopatric) and immigrant
(dispersing) individuals, showed reciprocal small genetic distances
(Figure 3B, Table 3), and suggested that the barn swallow’s
dispersal behaviour should be regarded as a rather plastic trait
[27]. However, when the SPA population was excluded from the
Bayesian clustering analysis (only males), a not negligible degree of
genetic differentiation was disclosed across Europe (Figure S1
versus Figure 4B). Although this result could seem related to the
occurrence of differences in the migratory routes as we have
suggested for the females (see next paragraph), we feel more
confident in stating that male philopatry in each population is the
primary cause for the population genetic structure we have found.
Genetic structure and migratory behaviour (males versusfemales)
When only the females were taken into account the genetic
scenario was strikingly different compared to that inferred using
the males or the entire sample size. The average FST distance
values (Table 3; with related PCA of Figure 3C) as well as the
Bayesian clustering (Figure 4C) marked out two groups of females:
one (central to western Europe) included SPA, IRE and GER, the
other (central to eastern Europe) comprised ITA, CYP and RUS.
The genetic distance between the two groups was significant
(FST = 0.020, P,0.001, data not shown). Admixed genotypes were
more frequent and gene flow level higher in the females than in the
males (Figure 4, Tables 3, S4), this pointing to a higher dispersal
rate and a lower philopatry of the first group compared to the
second (female-biased dispersal) [4,8,9,27].
When the clustering of the females was considered the
occurrence of a significant latitudinal component could not be
ruled out (e.g., compare SPA versus IRE and CYP versus RUS).
This, in turn, suggested that gene flow among populations could
be partially influenced by the axis of migration. However, the
divergence between ITA and GER also suggests that dispersal
does not strictly occur along a North-South axis. On the other
hand, the genetic differentiation between eastern and western
populations resembles what has been observed for other passerine
species showing a clear migratory divide in central Europe [19,76].
While clear evidences for the existence of a migratory divide do
lack in the barn swallow, ringing data indicate that the autumn
migratory routes of eastern and western populations of this species
are different. Barn swallows from western Europe head for the
Iberian Peninsula, while those of eastern populations travel down
throughout the eastern Mediterranean and the Middle East.
Again, barn swallows from central Europe may travel South
straight across the Mediterranean or south-west to Spain [20].
This pattern of migration roughly parallels the results obtained by
Ambrosini et al. [25] regarding the migratory connectivity in H.
rustica. This analysis, which was carried out on a large dataset of
ringing recoveries, produced weight for the existence of two main
clusters: one includes birds breeding in south-west Europe and
wintering in central Africa, the other comprises birds breeding in
northern and eastern Europe and wintering in southern Africa.
The genetic relationships disclosed in the present study, on one
side, between RUS and CYP and, on the other, between SPA,
GER and IRE, fit to the groups described by [25] and to the main
migratory movements summarized in [20]. Furthermore, mark-
recapture data provided by BirdLife Cyprus (A.C. Author pers.
comm. 2012) also point to a single migration route between RUS
and CYP. Whereas according to Ambrosini et al. [25] ITA should
be separated from the RUS and CYP populations, our results
point to the occurrence of some genetic kinship among the females
of these countries (Figure 4A, Table S4). Overall, this may either
indicate that the pattern of gene flow is only partially related to the
migratory movement or suggest a poorly documented migratory
route that connects central Italy, north-west Russia and Cyprus.
Actually, the geographic area of birds recovered in Italy or ringed
in Italy and recovered abroad is huge and include several eastern
and south-eastern countries (e.g., Turkey and Greece, [77]). These
wide connections, probably due to the position of the Italian
Peninsula in the Mediterranean, should be further investigated by
extending the number of the Italian sampling locations in order to
attempt to disentangle a very complex pattern of gene flow.
When only the males were considered, the very high philopatry
of the Spanish population forced the whole genetic scenario by
isolating the latter against all of the other ones (see previous
paragraph). On the contrary, when the SPA males were excluded,
we disclosed slight differences among the studied populations that
pointed to the occurrence of three groups: (IRE + GER), (ITA +CYP) and RUS (Figure S1). This pattern showed some degree of
correspondence with the female clustering, thus suggesting that the
mechanisms driving the direction of dispersal movements are
probably the same in both sexes. Nevertheless, being aware that
further investigations are needed, we suggest do not over-
interpreting these results.
Genetic Variation in a Sex-Biased Dispersing Passerine
PLOS ONE | www.plosone.org 11 June 2014 | Volume 9 | Issue 6 | e98574
Sex-biased dispersalCases of inconsistency between population structures inferred
from mtDNA or from STR variability are well known. A greater
population differentiation can be detected using nuclear rather
than mitochondrial markers (e.g.: [78,79], this study) but the
opposite may occur as well (e.g.: [71,80]). Although both natal and
breeding dispersal may enable high connectivity among popula-
tions [1,2,5,6], breeding dispersal is virtually absent in the barn
swallow [27]. Hence, sex-biased natal dispersal represents the best
explanation fitting the observed discordance, although tests for the
whole dataset failed to obtain significance for all parameters
(Table 4). However, as stressed by [10], their overall outcome must
be discussed in light of the amount of combined factors that may
affect the statistical power, namely the dispersal rate and the bias
intensity, the sampling design and the number of investigated STR
loci [16,81]. For instance, when the dispersal rate and the sex-bias
are not strong vAIC seems the most powerful test, followed by mAIC
and FST, which work better with less than 20 loci [10]. In this
study, vAIC was higher in the females than in the males, thus
pointing to the occurrence of female-biased dispersal. When the
tests were performed and SPA was separated from all other
populations, R and FST values were significantly lower in the
females than in the males, mAIC value was negative (Table 4) and
FIS value was lower in males than in females, thus suggesting high
philopatry for the Spanish males.
In conclusion, we partially confirmed published data reporting
the lack of a significant partition of diversity using mtDNA
markers, while, in contrast to previous studies, we detected
significant genetic structure by using nuclear DNA markers. The
different scenarios observed between sexes could be explained with
the non-random patterns of gene flow likely mediated by female
natal dispersal and significant variability in male philopatry among
barn swallow populations. Our results emphasize the importance
of taking into account the sex of sampled individuals to obtain
unbiased results on species showing a different pattern of dispersal
between males and females.
Supporting Information
Figure S1 Bayesian admixture analysis as inferredusing STRUCTURE performed excluding the SPA populationin male and female barn swallows. DK was optimal for
K = 2, all computations. Each population was represented by a pie
chart whose segments were proportional to the number of
individuals assigned to cluster I (black), cluster II (white) or which
showed admixed genotypes (grey). Threshold value for assignment
to each cluster was Qi = 0.80.
(DOC)
Table S1 The sample size (n = 186) of this study and themtDNA sequences downloaded from the GenBank
(n = 16). Population (Pop), country, region, locality (latitude/
longitude, Lat/Long), type of tissue, sample size for STR/mtDNA
analysis, and the number of ND2 mtDNA haplotypes are given.
The number of male (M) and female (F) individuals genotyped
with mitochondrial and STR markers was given (unavailable on
line for MED population). GenBank accession codes for KRD and
MED populations are reported in [33].
(DOC)
Table S2 Estimates of mtDNA genetic diversity (aver-agez± SD) as computed for each population and for thewhole dataset. Sites: number of segregating sites.
(DOC)
Table S3 Average mtDNA pairwise distance values(PhiST) as computed among all populations; *, P,0.05;**, P,0.001; others, P.0.05.
(DOC)
Table S4 Proportion of estimated membership of allpopulations to each cluster (QI and QII) as inferred by
STRUCTURE with K = 2 (Figure 4). Computations were per-
formed using: (i) all individuals (n = 186), (ii) males (n = 92) and (iii)
females (n = 94). The number of specimens assigned to the cluster I
(nI) and II (nII) was reported as well as the number of individuals
showing admixed genotype (nmix). The threshold value for
admixed assignment was Qi = 0.80.
(DOC)
Acknowledgments
We are grateful to R. Ceccherelli (CRUMA, Livorno) for the blood
sampling in Orti-Bottagone Nature Reserve (Italy). The authors wish to
thank S. Birks and the University of Washington Burke Museum of Natural
History (Seattle, USA) for the loan of barn swallow tissues (H. r. erythrogaster:
UWBM 78832, UWBM 80547). The authors also wish to thank: I.
Byrkjedal and the Museum of Zoology of the University of Bergen
(Norway); G. Frisk and the Swedish Museum of Natural History of
Stockholm (Sweden); J. Fjeldsa, J.B. Kristensen and the Zoological
Museum of the University of Copenhagen (Denmark). However, samples
obtained from these three museums were investigated at the Cyt-b gene
(partial sequence) and were not included in the present study. The authors
are grateful to R. Ambrosini (Universita degli Studi di Milano Bicocca,
Milan, Italy) for his comments on an early draft of the manuscript, and to
N. Saino (Universita di Milano, Milan, Italy) for suggestions about the
molecular sexing. Comments of two anonymous reviewers as well as of the
Associate Editor improved an earlier draft of the manuscript.
Author Contributions
Conceived and designed the experiments: FB. Performed the experiments:
MG CG FB. Analyzed the data: MG CG FB DG. Contributed reagents/
materials/analysis tools: FB. Wrote the paper: MG DG FB. Biological
sampling: PP AC IZ ASC OB PMP.
References
1. Bohonak AJ (1999) Dispersal, gene flow and population structure. Q Rev Biol74: 21–45.
2. Belliure J, Sorci G, Møller AP, Clobert J (2000) Dispersal distances predict
subspecies richness in birds. J Evolution Biol 13: 480–487.
3. Clobert J, Danchin E, Dhondt AA, Nichols JD (2009) Informed dispersal,
heterogeneity in animal dispersal syndromes and the dynamics of spatiallystructured populations. Ecol Lett 12: 197–209.
4. Greenwood PJ (1980) Mating systems, philopatry and dispersal in birds andmammals. Anim Behav 28: 1140–1162.
5. Paradis E, Baillie, SR, Sutherland WJ, Gregory RD (1998) Patterns of natal and
breeding dispersal in birds. J Anim Ecol 67: 518–536.
6. Clobert J, Danchin E, Dhondt AA, Nichols JD (2001) Dispersal. Oxford
University Press.
7. Perrin N, Mazalov V (2000) Local competition, inbreeding, and the evolution of
sex-biased dispersal. Am Nat 155: 116–127.
8. Greenwood PJ, Harvey PH (1982) The natal and breeding dispersal of birds.
Ann Rev Ecol Syst 13: 1–21.
9. Newton I (2003) The speciation and biogeography of birds. Amsterdam
Academic Press.
10. Goudet J, Perrin N, Waser P (2002) Tests for sex-biased dispersal using bi-
parentally inherited genetic markers. Mol Ecol 11: 1103–1114.
11. Prugnolle F, de Meeus T (2002) Inferring sex-biased dispersal from population
genetic tools: a review. Heredity 88: 161–165.
12. Ortego J, Garcıa-Navas V, Ferrer ES, Sanz JJ (2011) Genetic structure reflects
natal dispersal movements at different spatial scales in the blue tit, Cyanistes
caeruleus. Anim Behav 82: 131–137.
13. Koenig WD, van Vuren D, Hooge PN (1996) Detectability, philopatry and the
evolution of dispersal distances in vertebrates. Trends Ecol Evol 11: 514–518.
Genetic Variation in a Sex-Biased Dispersing Passerine
PLOS ONE | www.plosone.org 12 June 2014 | Volume 9 | Issue 6 | e98574
14. Scribner KT, Petersen MR, Fields RL, Talbot SL, Pearce JM, et al. (2001) Sex-biased gene flow in spectacled eiders (Anatidae): inferences from molecular
markers with contrasting modes of inheritance. Evolution 55: 2105–2115.
15. Le Galliard JF, Remy A, Ims RA, Lambin X (2012) Patterns and processes of
dispersal behaviour in arvicoline rodents. Mol Ecol 21: 505–523.
16. Palo JU, Lesbarreres D, Schmeller DS, Primmer CR, Merila J (2004)
Microsatellite marker data suggest sex-biased dispersal in the common frogRana temporaria. Mol Ecol 13: 2865–2869.
17. Paquette SR, Louis EE Jr, Lapointe FJ (2010) Microsatellite analyses provideevidence of male-biased dispersal in the radiated tortoise Astrochelys radiate
(Chelonia: Testudinidae). J Hered 101: 403–412.
18. Itonaga N, Koppen U, Plath M, Wallschlager D (2010) Breeding dispersal
directions in the white stork (Ciconia ciconia) are affected by spring migrationroutes. J Ethol 28: 393–397.
19. Møller AP, Garamszegi LZ, Peralta-Sanchez J, Soler JJ (2011) Migratory dividesand their consequences for dispersal, population size and parasite-host
interactions. J Evolution Biol 24: 1744–1755.
20. Turner A (2006) The barn swallow. Ed T. and A.D. Poyser, London, UK.
21. Møller AP (1994) Sexual selection and the barn swallow. Oxford UniversityPress.
22. Roff DA, Mousseau T, Møller AP, de Lope F, Saino N (2004) Geographicvariation in the G matrices of wild populations of the barn swallow. Heredity 93:
8–14.
23. Santure AW, Ewen JG, Sicard D, Roff DA, Møller AP (2010) Population
structure in the barn swallow, Hirundo rustica: a comparison between neutralDNA markers and quantitative traits. Biol J Linn Soc 99: 306–314.
24. Dor R, Safran RJ, Vortman Y, Lotem A, McGowan A, et al. (2012) Populationgenetics and morphological comparisons of migratory European (Hirundo rustica
rustica) and sedentary East-Mediterranean (Hirundo rustica transitiva) barn swallows.J Hered 103: 55–63.
25. Ambrosini R, Møller AP, Saino N (2009) A quantitative measure of migratoryconnectivity. J Theor Biol 257: 203–211.
26. Dor R, Safran RJ, Sheldon FH, Winkler DW, Lovette IJ (2010) Phylogeny of thegenus Hirundo and the barn swallow subspecies complex. Mol Phylogenet Evol
56: 409–418.
27. Balbontın J, Møller AP, Hermosell IG, Marzal A, Reviriego M, et al. (2009)
Geographic patterns of natal dispersal in barn swallows Hirundo rustica fromDenmark and Spain. Behav Ecol Sociobiol 63: 1197–1205.
28. Kahn NW, St John J, Quinn TW (1998) Chromosome-specific intron sizedifferences in the avian CHD gene provide a simple and efficient method for
sexing birds. Auk 115: 1074–1078.
29. Barbanera F, Negro JJ, Di Giuseppe G, Bertoncini F, Cappelli F, et al. (2005)
Analysis of the genetic structure of red-legged partridge (Alectoris rufa,Galliformes) populations by means of mitochondrial DNA and RAPD markers:
a study from central Italy. Biol Conserv 122: 275–287.
30. Svensson L (1975) Identification guide to European passerines, 2nd edn.
Naturhistoriska Riksmuseet, Stockholm, Sweden.
31. Sorenson MD, Ast JC, Dimcheff DE, Yuri T, Mindell DP (1999) Primers for a
PCR-based approach to mitochondrial genome sequencing in birds and other
vertebrates. Mol Phylogenet Evol 12: 105–114.
32. Thompson JD, Gibson TJ, Plewniak F, Jeanmougin F, Higgins DG (1997) The
ClustalX windows interface: flexible strategies for multiple sequence alignmentaided by quality analysis tools. Nucleic Acids Res. 24: 4876–4882.
33. Zink RM, Pavlova A, Rohwer S, Drovetski SV (2006) Barn swallows before
barns: population histories and intercontinental colonization. Proc R Soc B 273:
1245–1251.
34. Librado P, Rozas J (2009) DnaSP v5: A software for comprehensive analysis of
DNA polymorphism data. Bioinformatics 25: 1451–1452.
35. Bandelt HJ, Forster P, Rohl A (1999) Median-joining networks for inferring
intraspecific phylogenies. Mol Biol Evol 16: 37–48.
36. Excoffier L, Lischer HEL (2010) Arlequin suite ver 3.5: a new series of programsto perform population genetics analyses under Linux and Windows. Mol Ecol
Resour 10: 564–567.
37. Wright S (1965) The interpretation of population structure by F-statistics with
special regard to systems of mating. Evolution 19: 395–420.
38. Tamura K, Nei M (1993) Estimation of the number of the nucleotide
substitutions in the control region of mitochondrial DNA in humans and
chimpanzees. Mol Biol Evol 10: 512–526.
39. Pilkington MM, Wilder JA, Mendez FL, Cox MP, Woerner A, et al. (2008)
Contrasting signatures of population growth for mitochondrial DNA and Ychromosomes among human populations in Africa. Mol Biol Evol 25: 517–525.
40. Ramırez-Soriano A, Ramos-Onsins SE, Rozas J, Calafell F, Navarro A (2008)
Statistical power analysis of neutrality tests under demographic expansions,
contractions and bottlenecks with recombination. Genetics 179: 555–567.
41. Fu YX (1997) Statistical tests of neutrality of mutations against population
growth, hitchhiking and background selection. Genetics 147: 915–925.
42. Ramos-Onsins SE, Rozas J (2002) Statistical properties of new neutrality tests
against population growth. Mol Biol Evol 19: 2092–2100.
43. Tajima F (1989) A statistical method for testing the neutral mutation hypothesisby DNA polymorphism. Genetics 123: 585–595.
44. McDonald JH, Kreitman M (1991) Adaptive protein evolution at the Adh locusin Drosophila. Nature 351: 652–654.
45. Harpending HC, Sherry ST, Rogers AR, Stoneking M (1993) Genetic structureof ancient human populations. Curr Anthropol 34: 483–496.
46. Schneider S, Excoffier L (1999) Estimation of past demographic parametersfrom the distribution of pairwise differences when the mutation rates vary among
sites: application to human mitochondrial DNA. Genetics 152: 1079–1089.
47. Excoffier L (2004) Patterns of DNA sequence diversity and genetic structure
after a range expansion: lessons from the infinite-island model. Mol Ecol 13:853–864.
48. Primmer CR, Møller AP, Ellegren H (1995) Resolving genetic relationships with
microsatellite markers-a parentage testing system for the swallow Hirundo rustica.Mol Ecol 4: 493–498.
49. Tsyusko OV, Peters MB, Hagen C, Tuberville TD, Mousseau TA, et al. (2007)Microsatellite markers isolated from barn swallows (Hirundo rustica). Mol Ecol
Notes 7: 833–835.
50. Barbanera F, Marchi C, Guerrini M, Panayides P, Sokos C, et al. (2009a)
Genetic structure of Mediterranean chukar (Alectoris chukar, Galliformes)populations: conservation and management implications. Naturwissenschaften
96: 1203–1212.
51. Valiere N (2002) Gimlet: a computer program for analyzing genetic individual
identification data. Mol Ecol Notes 2: 377–379.
52. Peatkau D, Waits L, Clarkson PL, Craighead L, Vyse E, et al. (1998) Variation
in genetic diversity across the range of north American brown bears. Conserv
Biol 12: 418–429.
53. Waits LS, Luikart G, Taberlet P (2001) Estimating the probability of identity
among genotypes in natural populations: cautions and guidelines. Mol Ecol 10:249–256.
54. Van Oosterhout C, Hutchinson WF, Wills DPM, Shipley P (2004) MICRO-CHECKER: software for identifying and correcting genotyping errors in
microsatellite data. Mol Ecol Notes 4: 535–538.
55. Goudet J (2001) FSTAT, a program to estimate and test gene diversities and
fixation indices (Version 2.9.3). http://www.unil.ch/izea/softwares/fstat.html.
56. Raymond M, Rousset F (1995) GENEPOP (version 1.2): population genetics
software for exact tests and ecumenicism. J Hered 86: 248–249.
57. Slatkin M (1985) Gene flow in natural populations. Ann Rev Ecol Syst 16: 393–
430.
58. Hochberg Y (1988) A sharper Bonferroni procedure for multiple tests of
significance. Biometrika 75: 800–802.
59. Pritchard JK, Stephens M, Donnelly P (2000) Inference of population structure
using multilocus genotype data. Genetics 155: 945–959.
60. Hubisz MJ, Falush D, Stephens M, Pritchard JK (2009) Inferring weakpopulation structure with the assistance of sample group information. Mol Ecol
Res 9: 1322–1332.
61. Evanno G, Regnaut S, Goudet J (2005) Detecting the number of clusters of
individuals using the software STRUCTURE: a simulation study. Mol Ecol 14:2611–2620.
62. Vaha JP, Primmer CR (2006) Efficiency of model-based Bayesian methods fordetecting hybrid individuals under different hybridization scenarios and with
different numbers of loci. Mol Ecol 15: 63–72.
63. Jones KL, Krapu GL, Brandt DA, Ashley MV (2005) Population genetic
structure in migratory sandhill cranes and the role of Pleistocene glaciations. Mol
Ecol 14: 2645–2657.
64. Davis LA, Roalson EH, Cornell KL, McClanahan KD, Webster MS (2006)
Genetic divergence and migration patterns in a North American passerine bird:implications for evolution and conservation. Mol Ecol 15: 2141–2152.
65. Prochazka P, Stokke BG, Jensen H, Fainova D, Bellinvia E, et al. (2011) Lowgenetic differentiation among reed warbler Acrocephalus scirpaceus populations
across Europe. J Avian Biol 42: 103–113.
66. Rockwell RF, Barrowclough GF (1987) Gene flow and the genetic structure of
populations. In: Cooke F, Buckley PA, editors. Avian genetics. LondonAcademic Press, pp. 223–255.
67. Arguedas N, Parker PG (2000) Seasonal migration and genetic populationstructure in house wrens. Condor 102: 517–528.
68. Webster MS, Marra PP, Haig SM, Bensch S, Holmes RT (2002) Links between
worlds: unravelling migratory connectivity. Trends Ecol Evol 17: 76–83.
69. Blair ME, Melnick DJ (2012) Genetic evidence for dispersal by both sexes in the
Central American squirrel monkey, Saimiri oerstedii citrinellus. Am J Primatol 74:37–47.
70. Ptak SE, Przeworski M (2002) Evidence for population growth in humans isconfounded by fine-scale population structure. Trends Genet 18: 559–563.
71. Barbanera F, Zuffi MAL, Guerrini M, Gentilli A, Tofanelli S, et al. (2009)Molecular phylogeography of the asp viper Vipera aspis (Linnaeus, 1758) in Italy:
evidence for introgressive hybridization and mitochondrial DNA capture. MolPhylogenet Evol 52: 103–114.
72. Wahlund S (1928) Zusammensetzung von Population und Korrelationserschei-nung vom Standpunkt der Vererbungslehre aus betrachtet. Hereditas 11: 65–
106.
73. Randi E, Tabarroni C, Rimondi S, Lucchini V, Sfougaris A (2003)
Phylogeography of the rock partridge (Alectoris graeca). Mol Ecol 12: 2201–2214.
74. Rodrıguez-Ramilo ST, Toro MA, Fernandez J (2009) Assessing populationgenetic structure via the maximisation of genetic distance. Genet Sel Evol 41: 49.
75. Ambrosini R, Bolzern AM, Canova L, Arieni S, Møller AP, et al. (2002) Thedistribution and colony size of barn swallows in relation to agricultural land use.
J Appl Ecol 39: 524–534.
76. Perez-Tris J, Bensch S, Carbonell R, Helbig A, Tellerıa JL (2004) Historical
diversification of migration patterns in a passerine bird. Evolution 58: 1819–1832.
Genetic Variation in a Sex-Biased Dispersing Passerine
PLOS ONE | www.plosone.org 13 June 2014 | Volume 9 | Issue 6 | e98574
77. Spina F, Volponi S (2008) Atlante della Migrazione degli Uccelli in Italia.
Ministero dell’Ambiente e della Tutela del Territorio e del Mare, IstitutoSuperiore per la Protezione e la Ricerca Ambientale (ISPRA).
78. Piertney SB, MacColl ADC, Bacon PJ, Racey PA, Lambin X, et al. (2000)
Matrilineal genetic structure and female mediated gene flow in red grouse(Lagopus lagopus scoticus): an analysis using mitochondrial DNA. Evolution 54:
279–289.79. Johnson JA, Toepfer JE, Dunn PO (2003) Contrasting patterns of mitochondrial
and microsatellite population structure in fragmented populations of greater
prairie-chickens. Mol Ecol 12: 3335–3347.
80. Borden WC, Stepien CA (2006) Discordant population genetic structuring of
smallmouth bass, Micropterus dolomieu Lacepede, in Lake Erie based on
mitochondrial DNA sequences and nuclear DNA microsatellites. J Great Lakes
Res 32: 242–257.
81. Lampert KP, Rand AS, Mueller UG, Ryan MJ (2003) Fine-scale genetic pattern
and evidence for sex-biased dispersal in the tungara frog, Physalaemus pustulosus.
Mol Ecol 12: 3325–3334.
Genetic Variation in a Sex-Biased Dispersing Passerine
PLOS ONE | www.plosone.org 14 June 2014 | Volume 9 | Issue 6 | e98574
Copyright © 2022 FDOKUMEN