Large-Scale Earthwork Progress Digitalization Practices ...
16
drones Article Large-Scale Earthwork Progress Digitalization Practices Using Series of 3D Models Generated from UAS Images Jin-Woo Cho 1 , Jae-Kang Lee 1, * and Jisoo Park 2 Citation: Cho, J.-W.; Lee, J.-K.; Park, J. Large-Scale Earthwork Progress Digitalization Practices Using Series of 3D Models Generated from UAS Images. Drones 2021, 5, 147. https:// doi.org/10.3390/drones5040147 Academic Editor: Sungjin Kim Received: 11 November 2021 Accepted: 10 December 2021 Published: 12 December 2021 Publisher’s Note: MDPI stays neutral with regard to jurisdictional claims in published maps and institutional affil- iations. Copyright: © 2021 by the authors. Licensee MDPI, Basel, Switzerland. This article is an open access article distributed under the terms and conditions of the Creative Commons Attribution (CC BY) license (https:// creativecommons.org/licenses/by/ 4.0/). 1 Korea Institute of Civil Engineering and Building Technology, Goyang 10223, Korea; [email protected] 2 School of Civil and Environmental Engineering, Georgia Institute of Technology, Atlanta, GA 30332, USA; [email protected] * Correspondence: [email protected]; Tel.: +82-31-910-0753 Abstract: Since the Fourth Industrial Revolution, existing manpower-centric manufacture has been shifting towards technology and data-centric production in all areas of society. The construction sector is also facing a new paradigm called smart construction with a clear purpose of improving pro- ductivity and securing safety by applying site management using information and communications technology (ICT). This study aims to develop a framework for earthwork process digitalization based on images acquired by using the unmanned aerial system (UAS). The entire framework includes precise UAS data acquisition, cut-and-fill volume estimation, cross-section drawing, and geo-fencing generation. To this end, homogeneous time-series drone image data were obtained from active road construction sites under earthwork. The developed system was able to generate precise 3D topographical models and estimate cut-and-fill volume changes. In addition, the proposed frame- work generated cross-sectional views of each area of interest throughout the construction stages and finally created geo-fencing to assist the safe operation of heavy equipment. We expect that the proposed framework can contribute to smart construction areas by automating the process of digitizing earthwork progress. Keywords: UAS (Unmanned Aerial Systems); earthwork; volume estimation; point cloud; construc- tion management; drones 1. Introduction Many technologically advanced countries are attempting to expand and apply infor- mation and communications technology (ICT) to the construction sector. Most nations consider this objective as a national agenda. For example, the South Korean government has presented a vision of “Smart Construction 2025” for technological innovation in the construction sector and announced the “Roadmap for Smart Construction Technology”. The South Korean government is promoting various policies and projects based on cutting- edge technology to create opportunities for the construction industry to take a leap forward. Generally, smart construction is defined as a method that innovatively enhances construc- tion productivity and safety by combining smart construction technology with traditional construction methods [1]. The main technologies for smart construction include unmanned aerial systems (UAS), building information modeling (BIM), augmented/virtual reality (AR/VT), the internet of things (IoT), Big Data, etc. [2]. These are the critical technologies for each stage of the construction process, such as design, construction, and maintenance. The earthworks for road and building complex construction are the optimal construc- tion process to which these technologies supporting smart construction can be applied. Both the private and public sectors have shown great interest and demand in the develop- ment of a digital platform for comprehensive management of earthworks based on data (soil movement and loading) and monitoring technology that can automatically manage the quality of each construction process. Therefore, various methodologies have been proposed for the systematic management of earthworks in road construction. Studies such Drones 2021, 5, 147. https://doi.org/10.3390/drones5040147 https://www.mdpi.com/journal/drones
-
Upload
khangminh22 -
Category
Documents
-
view
1 -
download
0
Transcript of Large-Scale Earthwork Progress Digitalization Practices ...

drones
Article
Large-Scale Earthwork Progress Digitalization Practices UsingSeries of 3D Models Generated from UAS Images
Jin-Woo Cho 1, Jae-Kang Lee 1,* and Jisoo Park 2
�����������������
Citation: Cho, J.-W.; Lee, J.-K.; Park,
J. Large-Scale Earthwork Progress
Digitalization Practices Using Series
of 3D Models Generated from UAS
Images. Drones 2021, 5, 147. https://
doi.org/10.3390/drones5040147
Academic Editor: Sungjin Kim
Received: 11 November 2021
Accepted: 10 December 2021
Published: 12 December 2021
Publisher’s Note: MDPI stays neutral
with regard to jurisdictional claims in
published maps and institutional affil-
iations.
Copyright: © 2021 by the authors.
Licensee MDPI, Basel, Switzerland.
This article is an open access article
distributed under the terms and
conditions of the Creative Commons
Attribution (CC BY) license (https://
creativecommons.org/licenses/by/
4.0/).
1 Korea Institute of Civil Engineering and Building Technology, Goyang 10223, Korea; [email protected] School of Civil and Environmental Engineering, Georgia Institute of Technology, Atlanta, GA 30332, USA;
[email protected]* Correspondence: [email protected]; Tel.: +82-31-910-0753
Abstract: Since the Fourth Industrial Revolution, existing manpower-centric manufacture has beenshifting towards technology and data-centric production in all areas of society. The constructionsector is also facing a new paradigm called smart construction with a clear purpose of improving pro-ductivity and securing safety by applying site management using information and communicationstechnology (ICT). This study aims to develop a framework for earthwork process digitalization basedon images acquired by using the unmanned aerial system (UAS). The entire framework includesprecise UAS data acquisition, cut-and-fill volume estimation, cross-section drawing, and geo-fencinggeneration. To this end, homogeneous time-series drone image data were obtained from activeroad construction sites under earthwork. The developed system was able to generate precise 3Dtopographical models and estimate cut-and-fill volume changes. In addition, the proposed frame-work generated cross-sectional views of each area of interest throughout the construction stagesand finally created geo-fencing to assist the safe operation of heavy equipment. We expect thatthe proposed framework can contribute to smart construction areas by automating the process ofdigitizing earthwork progress.
Keywords: UAS (Unmanned Aerial Systems); earthwork; volume estimation; point cloud; construc-tion management; drones
1. Introduction
Many technologically advanced countries are attempting to expand and apply infor-mation and communications technology (ICT) to the construction sector. Most nationsconsider this objective as a national agenda. For example, the South Korean governmenthas presented a vision of “Smart Construction 2025” for technological innovation in theconstruction sector and announced the “Roadmap for Smart Construction Technology”.The South Korean government is promoting various policies and projects based on cutting-edge technology to create opportunities for the construction industry to take a leap forward.Generally, smart construction is defined as a method that innovatively enhances construc-tion productivity and safety by combining smart construction technology with traditionalconstruction methods [1]. The main technologies for smart construction include unmannedaerial systems (UAS), building information modeling (BIM), augmented/virtual reality(AR/VT), the internet of things (IoT), Big Data, etc. [2]. These are the critical technologiesfor each stage of the construction process, such as design, construction, and maintenance.
The earthworks for road and building complex construction are the optimal construc-tion process to which these technologies supporting smart construction can be applied.Both the private and public sectors have shown great interest and demand in the develop-ment of a digital platform for comprehensive management of earthworks based on data(soil movement and loading) and monitoring technology that can automatically managethe quality of each construction process. Therefore, various methodologies have beenproposed for the systematic management of earthworks in road construction. Studies such
Drones 2021, 5, 147. https://doi.org/10.3390/drones5040147 https://www.mdpi.com/journal/drones
Drones 2021, 5, 147 2 of 16
as automation of earthmoving equipment [3,4], the control system for optimal equipmentoperation [5–7], and digital platform for earthwork sites [8] are the representative fun-damental research studies. In order to automate and digitize such earthwork sites, it isnecessary to collect, monitor, analyze, predict, and share various data of the constructionsite. In addition, technology that can accurately and quickly monitor changed topogra-phy information and construction progress at the earthwork site is required. In the past,ground survey equipment such as the total station was primarily used to acquire thetopographic information at earthworks sites. However, the occurrence of shaded areasdue to obstacles, such as mountainous terrain and excessive workforce and time requiredto acquire field information, has been pointed out as a problem with the total station.Recently, UASs have received attention as a key method that can monitor site informationquickly and accurately.
Although drones are moving objects that are very sensitive to the weather environ-ment, they can easily observe a large area periodically [9]. In addition, UAS has theadvantage of quickly judging the standards of image quality set in advance and respond-ing at the site. UASs have higher efficiency than conventional surveying methods interms of convenient operation, promptness, and economics [10]. These image data can beused for construction change detection, progress monitoring, and digital documentation.Moreover, if an appropriate number of ground control points (GCPs) for georeferenc-ing are secured, generating highly accurate digital surface models (DSM) and 3D pointclouds is possible [11,12]. The DSMs and 3D point clouds can be applied to cut-and-fillvolume estimation [13]. It is deemed that these advantages are able to contribute signifi-cantly to periodic, systematic, and data-based construction process management proposedin this study.
Based on the advantages of UAS, this study aims to develop an all-in-one frameworkfor earthwork digitalization using UAS images. The proposed framework is divided intotwo main parts. First, standards for UAS operation, image production, and image qualityto construct a 3D construction topo-graphic map were proposed. In addition, the secondpart includes data analysis for construction progress monitoring and digitalization using3D models.
2. Related Studies2.1. 3D Construction Topographic Modeling
Conventional methods to create 3D topographic models of construction sites use tradi-tional field survey technologies such as total stations and global navigation satellite systems(GNSS). These surveying devices are still used in many construction fields or infrastruc-ture monitoring areas because they can output accurate global coordinates of measuredpoints [14–16]. However, since this type of surveying technology yields coordinates of aspecific point during single surveying, generating a high-density 3D model with them ischallenging. In order to address the problems, several researchers employed terrestriallaser scanning (TLS) to generate dense point clouds. Slattery et al. (2012) introduced amethod of using TLS for road construction earthwork volume calculation [17]. Williams(2012) compared the 3D positioning accuracy of TLS and mobile laser scanning (MLS) [18].Although TLS-based modeling technology can create high-density 3D point clouds ofearthwork fields, laser scanning of large-scale construction sites takes plenty of time andlabor, and the registration process for aligning multiple scans into a single model also re-quires numerous time and expertise. In particular, since laser scanning in road constructionfields where long-strip scanning is required does not allow making a closed-condition forregistration, the registration error can be accumulated in the longitudinal direction [19].
Compared to TLS, UAS is a more straightforward solution for generating 3D topo-graphic models of large-scale construction sites. For this reason, various studies on 3Dmapping for construction projects using UASs have been presented. Kim et al. (2020)demonstrated a method of construction management using UASs [20]. Park et al. (2018)and Kim et al. (2019) also proposed an automated framework using UAS and mobile
Drones 2021, 5, 147 3 of 16
laser scanning robots at the same time to generate 3D models of construction sites [21,22].They developed an approach to build occlusion-free 3D models by combining 3D modelscreated from UASs and mobile robots. As such, the photogrammetric method based onUAS images has become the most widely used for 3D topographic modeling of largeconstruction sites based on UAS’s high usability and efficiency. For this reason, this studyalso employed 3D topographic models built by sequential UAS images for earthworkprogress documentation and digitalization.
2.2. Earthwork Progress Digitalization Using UAS
With the advantages of UAS applications, several researchers have employed UASapplications for earthwork progress monitoring and documentation. Siebert and Teizer(2014) presented the UAS-based 3D topo model generation method. They built a digitalelevation model generation (DEM) from sequential UAS images with a photogrammetrictechnique and visualized cut-and-fill areas. Cho and Park (2019) compared the efficiency ofdifferent technologies, such as TLS, MMS, and UAS, in road earthwork construction surveyand volume estimation [19]. They identified that UAS is the most effective method for 3Dgrade control and volume estimation in roadway construction in terms of time and cost forcreating 3D dense point clouds. Wang et al. (2017) demonstrated a method for calculatingvolume from UAS-generated 3D topographic models [23], and Kavaliauskas et al. (2021)presented a BIM-based earthwork quantity estimation using UAS-generated 3D realitymesh models [24]. The aforementioned studies emphasized the efficiency and usabilityof UASs in large-scale earthwork progress monitoring and volume estimation. However,most studies have calculated the current amount of earthwork by comparing only onemodel with the design model. Few studies on calculating the amount of earthwork bysequentially comparing a number of models progressively generated over a long period ofearthwork progress have been presented. Moreover, although some studies demonstrateda method of creating slope maps with UAS images for the safe operation of ground vehiclesin construction sites [25,26], there is a lack of research on drawing geo-fencing generatedfrom UASs for the safe operation of heavy equipment. This study, therefore, introducesactual practices on UAS-based earthwork progress digitalization by using timely generatedsequential models of an active earthwork construction site. The practices include the entireprocess from UAS data acquisition to documentation.
3. Earthwork Progress Digitalization Practices Using UAS3.1. Overall Framework
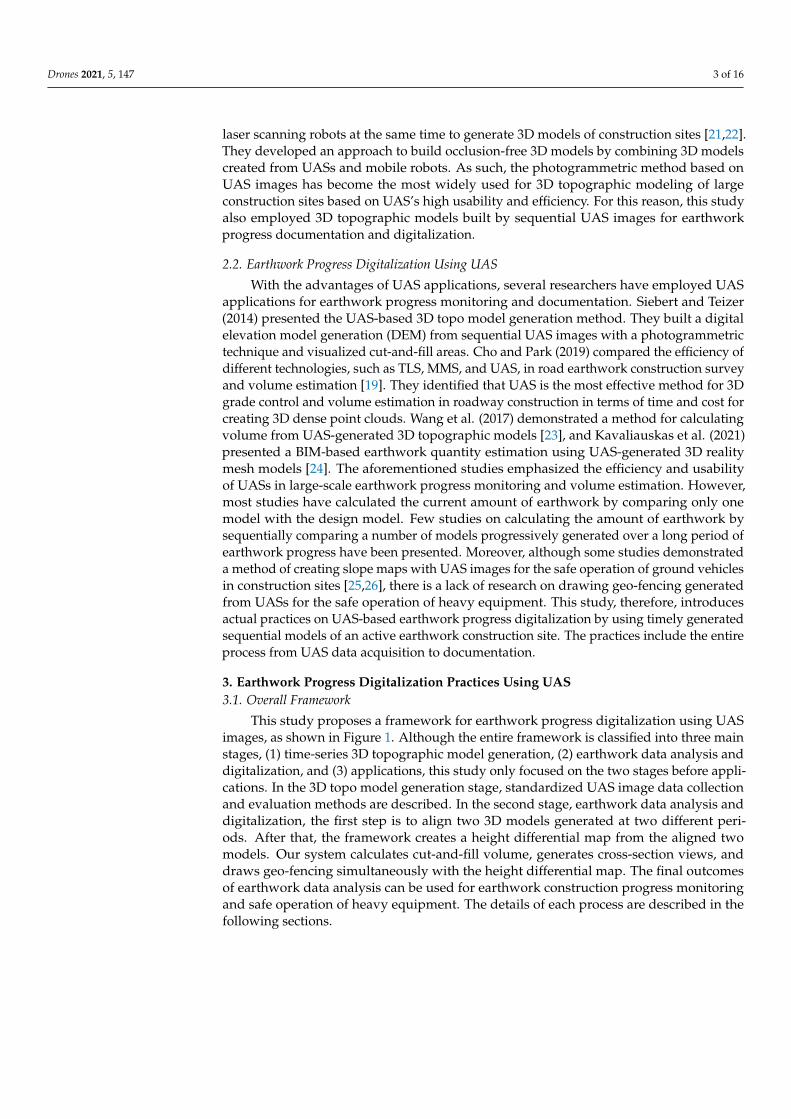
This study proposes a framework for earthwork progress digitalization using UASimages, as shown in Figure 1. Although the entire framework is classified into three mainstages, (1) time-series 3D topographic model generation, (2) earthwork data analysis anddigitalization, and (3) applications, this study only focused on the two stages before appli-cations. In the 3D topo model generation stage, standardized UAS image data collectionand evaluation methods are described. In the second stage, earthwork data analysis anddigitalization, the first step is to align two 3D models generated at two different peri-ods. After that, the framework creates a height differential map from the aligned twomodels. Our system calculates cut-and-fill volume, generates cross-section views, anddraws geo-fencing simultaneously with the height differential map. The final outcomesof earthwork data analysis can be used for earthwork construction progress monitoringand safe operation of heavy equipment. The details of each process are described in thefollowing sections.
Drones 2021, 5, 147 4 of 16Drones 2021, 5, x FOR PEER REVIEW 4 of 16
Figure 1. The overall framework for earthwork progress digitalization using UAS images.
3.2. Cartography Using UAS Images for 3D Earthwork Construction Topographic Map 3.2.1. Summary
The first step for earthwork construction process digitalization and documentation is constructing a digital topographic map of the construction site. The construction topo-graphic map built in this study was simultaneously utilized as a base map of the smart earthwork platform. The smart earthwork platform is a platform for digitizing overall earthwork, such as the analysis of compaction performance by compaction equipment. In order for the construction topographic map to be used as the base map of the entire sys-tem, high-quality image resolution, timed image production, and positioning accuracy must be satisfied. Furthermore, safety management of the construction site and the con-sistency of the time-series production drawing in the construction process were consid-ered when producing images. This section covers the standardized procedures for georef-erenced UAS image data acquisition, 3D construction topographic map generation, and quality control.
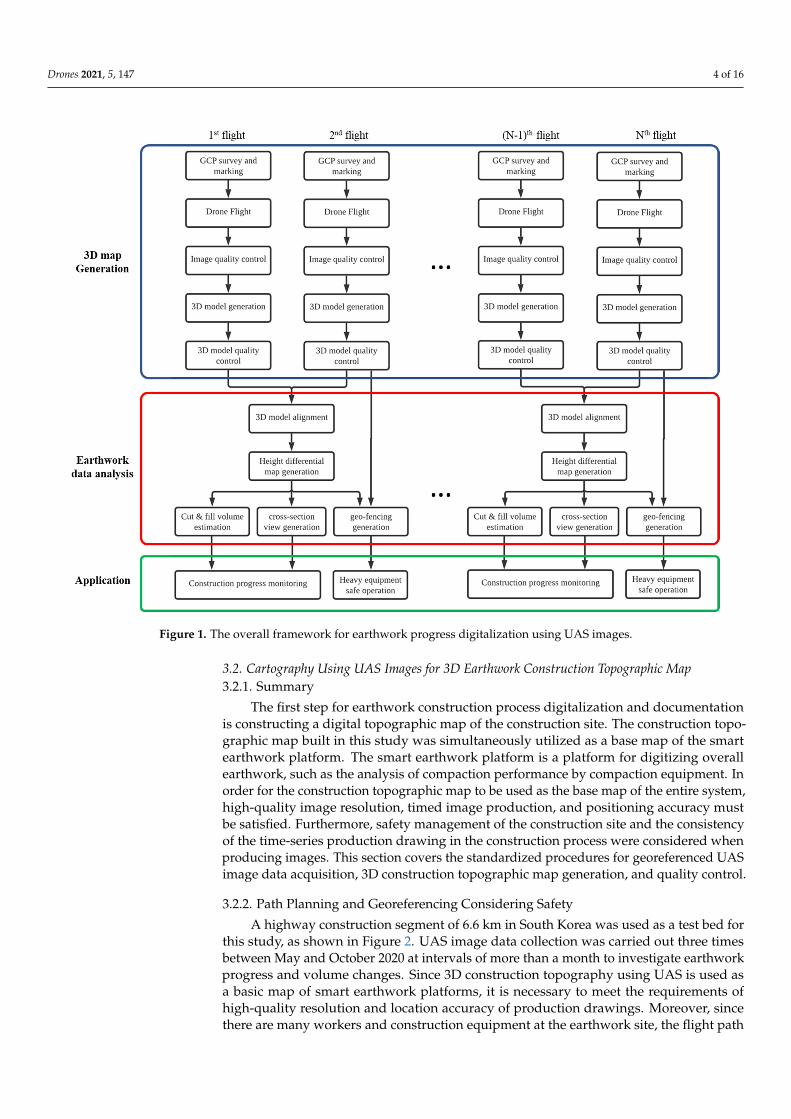
3.2.2. Path Planning and Georeferencing Considering Safety A highway construction segment of 6.6 km in South Korea was used as a test bed for
this study, as shown in Figure 2. UAS image data collection was carried out three times between May and October 2020 at intervals of more than a month to investigate earthwork progress and volume changes. Since 3D construction topography using UAS is used as a basic map of smart earthwork platforms, it is necessary to meet the requirements of high-quality resolution and location accuracy of production drawings. Moreover, since there
Figure 1. The overall framework for earthwork progress digitalization using UAS images.
3.2. Cartography Using UAS Images for 3D Earthwork Construction Topographic Map3.2.1. Summary
The first step for earthwork construction process digitalization and documentationis constructing a digital topographic map of the construction site. The construction topo-graphic map built in this study was simultaneously utilized as a base map of the smartearthwork platform. The smart earthwork platform is a platform for digitizing overallearthwork, such as the analysis of compaction performance by compaction equipment. Inorder for the construction topographic map to be used as the base map of the entire system,high-quality image resolution, timed image production, and positioning accuracy mustbe satisfied. Furthermore, safety management of the construction site and the consistencyof the time-series production drawing in the construction process were considered whenproducing images. This section covers the standardized procedures for georeferenced UASimage data acquisition, 3D construction topographic map generation, and quality control.
3.2.2. Path Planning and Georeferencing Considering Safety
A highway construction segment of 6.6 km in South Korea was used as a test bed forthis study, as shown in Figure 2. UAS image data collection was carried out three timesbetween May and October 2020 at intervals of more than a month to investigate earthworkprogress and volume changes. Since 3D construction topography using UAS is used asa basic map of smart earthwork platforms, it is necessary to meet the requirements ofhigh-quality resolution and location accuracy of production drawings. Moreover, sincethere are many workers and construction equipment at the earthwork site, the flight path

Drones 2021, 5, 147 5 of 16
and environmental factors should be reviewed in consideration of their safety. In orderto ensure the safety of field workers, a stable rotary-wing type drone capable of verticaltake-off and landing (VTOL) must be used, and a battery capacity capable of flying at least25 min must be ensured. In order to satisfy flight safety and output quality, we used acommercial quadrotor drone, which has a 24-megapixel camera and lithium-ion batteriesthat can fly for more than 35 min. In addition, the drone was flown only when the windspeed was less than six m/s to increase the safety of the flight. The weight and size of thedrone used are 1800 × 1230 × 250 mm and 5.0 kg, and its maximum speed is 50 km/h.We also used Pix4D v.4.5 for photogrammetry. The detailed flight parameters and dataprocessing are described in Table 1.
Drones 2021, 5, x FOR PEER REVIEW 5 of 16
are many workers and construction equipment at the earthwork site, the flight path and environmental factors should be reviewed in consideration of their safety. In order to en-sure the safety of field workers, a stable rotary-wing type drone capable of vertical take-off and landing (VTOL) must be used, and a battery capacity capable of flying at least 25 min must be ensured. In order to satisfy flight safety and output quality, we used a com-mercial quadrotor drone, which has a 24-megapixel camera and lithium-ion batteries that can fly for more than 35 min. In addition, the drone was flown only when the wind speed was less than six m/s to increase the safety of the flight. The weight and size of the drone used are 1800 × 1230 × 250 mm and 5.0 kg, and its maximum speed is 50 km/h. We also used Pix4D v.4.5 for photogrammetry. The detailed flight parameters and data processing are described in Table 1.
Figure 2. The test field for the UAS image data acquisition.
Table 1. Flight parameters and data processing details.
Categories Flight Parameter Categories Data Processing Flight height 100 m # of images 268–281
ISO 400 Image resolution 4000 × 6000 px Shutter speeds 1/1250 s CPU AMD 3.60 GHz
Flight time 25 min GPU NVDIA RTX 2060 Overlapping
(HTZL/VERT) 75%/80% Processing time 2.5 h
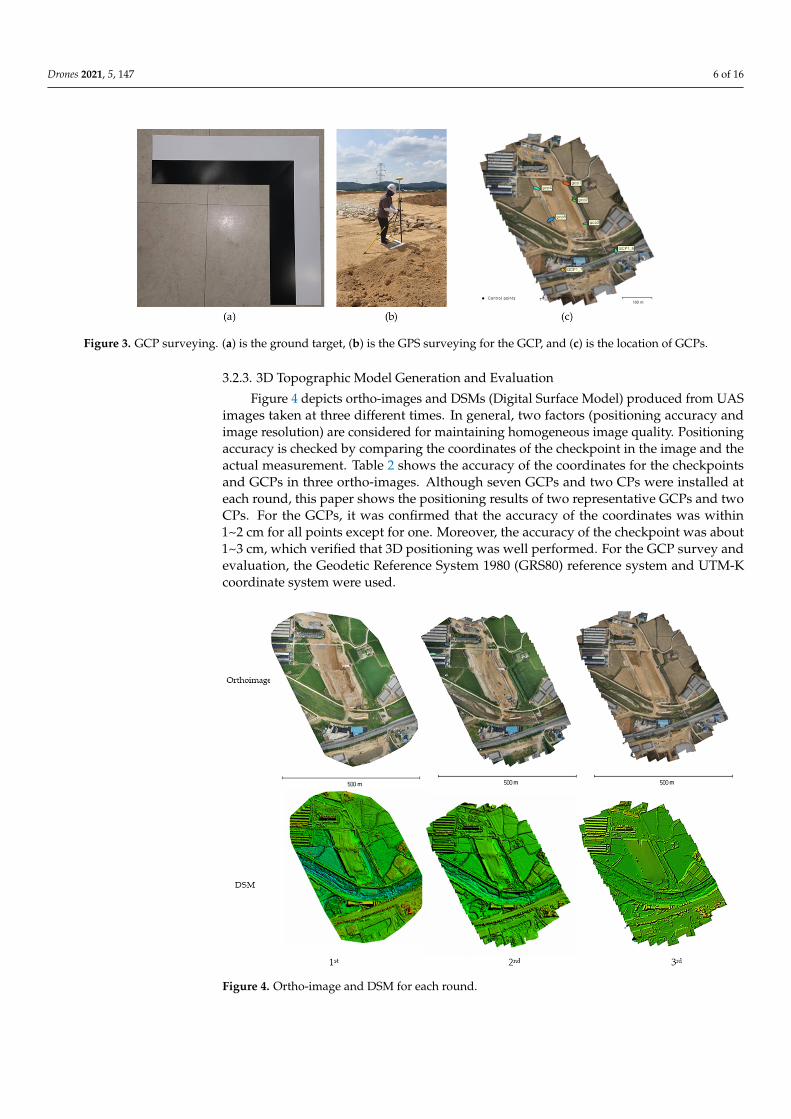
Before deploying UAS, several reference points called GCP and checkpoint (CP) were measured in advance. RTK-GPS was used to obtain GCP coordinates, and an average of ten observation values for each GCP was finally collected. In fact, there is no regulated tolerance for earthwork volume estimation. Nevertheless, the accuracy and precision of the model are critical in calculating the amount of earthwork, which is in contrast to meas-urement range and processing speed being more important than the accuracy of the model for change measurement of disaster areas [27–29]. For this reason, we internally set up a tolerable positioning error and image resolution requirement of 3 cm. Figure 3 shows an example of the target for photogrammetry and a scene of acquiring the coordinates at the site. Two of seven GCPs were installed outside the main road construction area so that they could be used continuously during the entire earthwork process.
Figure 2. The test field for the UAS image data acquisition.
Table 1. Flight parameters and data processing details.
Categories Flight Parameter Categories Data Processing
Flight height 100 m # of images 268–281ISO 400 Image resolution 4000 × 6000 px
Shutter speeds 1/1250 s CPU AMD 3.60 GHzFlight time 25 min GPU NVDIA RTX 2060
Overlapping (HTZL/VERT) 75%/80% Processing time 2.5 h
Before deploying UAS, several reference points called GCP and checkpoint (CP) weremeasured in advance. RTK-GPS was used to obtain GCP coordinates, and an average often observation values for each GCP was finally collected. In fact, there is no regulatedtolerance for earthwork volume estimation. Nevertheless, the accuracy and precisionof the model are critical in calculating the amount of earthwork, which is in contrast tomeasurement range and processing speed being more important than the accuracy of themodel for change measurement of disaster areas [27–29]. For this reason, we internally setup a tolerable positioning error and image resolution requirement of 3 cm. Figure 3 showsan example of the target for photogrammetry and a scene of acquiring the coordinates atthe site. Two of seven GCPs were installed outside the main road construction area so thatthey could be used continuously during the entire earthwork process.
Drones 2021, 5, 147 6 of 16Drones 2021, 5, x FOR PEER REVIEW 6 of 16
Figure 3. GCP surveying. (a) is the ground target, (b) is the GPS surveying for the GCP, and (c) is the location of GCPs.
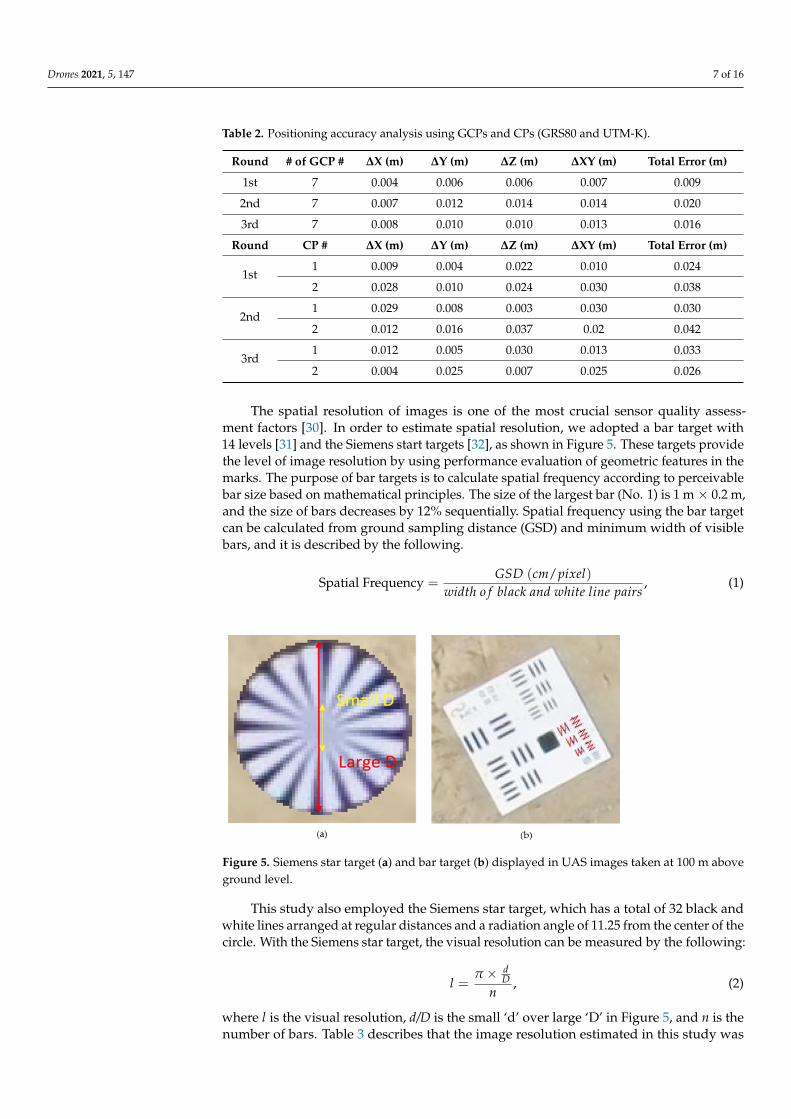
3.2.3. 3D Topographic Model Generation and Evaluation Figure 4 depicts ortho-images and DSMs (Digital Surface Model) produced from
UAS images taken at three different times. In general, two factors (positioning accuracy and image resolution) are considered for maintaining homogeneous image quality. Posi-tioning accuracy is checked by comparing the coordinates of the checkpoint in the image and the actual measurement. Table 2 shows the accuracy of the coordinates for the check-points and GCPs in three ortho-images. Although seven GCPs and two CPs were installed at each round, this paper shows the positioning results of two representative GCPs and two CPs. For the GCPs, it was confirmed that the accuracy of the coordinates was within 1~2 cm for all points except for one. Moreover, the accuracy of the checkpoint was about 1~3 cm, which verified that 3D positioning was well performed. For the GCP survey and evaluation, the Geodetic Reference System 1980 (GRS80) reference system and UTM-K coordinate system were used.
Figure 4. Ortho-image and DSM for each round.
Figure 3. GCP surveying. (a) is the ground target, (b) is the GPS surveying for the GCP, and (c) is the location of GCPs.
3.2.3. 3D Topographic Model Generation and Evaluation
Figure 4 depicts ortho-images and DSMs (Digital Surface Model) produced from UASimages taken at three different times. In general, two factors (positioning accuracy andimage resolution) are considered for maintaining homogeneous image quality. Positioningaccuracy is checked by comparing the coordinates of the checkpoint in the image and theactual measurement. Table 2 shows the accuracy of the coordinates for the checkpointsand GCPs in three ortho-images. Although seven GCPs and two CPs were installed ateach round, this paper shows the positioning results of two representative GCPs and twoCPs. For the GCPs, it was confirmed that the accuracy of the coordinates was within1~2 cm for all points except for one. Moreover, the accuracy of the checkpoint was about1~3 cm, which verified that 3D positioning was well performed. For the GCP survey andevaluation, the Geodetic Reference System 1980 (GRS80) reference system and UTM-Kcoordinate system were used.
Drones 2021, 5, x FOR PEER REVIEW 6 of 16
Figure 3. GCP surveying. (a) is the ground target, (b) is the GPS surveying for the GCP, and (c) is the location of GCPs.
3.2.3. 3D Topographic Model Generation and Evaluation Figure 4 depicts ortho-images and DSMs (Digital Surface Model) produced from
UAS images taken at three different times. In general, two factors (positioning accuracy and image resolution) are considered for maintaining homogeneous image quality. Posi-tioning accuracy is checked by comparing the coordinates of the checkpoint in the image and the actual measurement. Table 2 shows the accuracy of the coordinates for the check-points and GCPs in three ortho-images. Although seven GCPs and two CPs were installed at each round, this paper shows the positioning results of two representative GCPs and two CPs. For the GCPs, it was confirmed that the accuracy of the coordinates was within 1~2 cm for all points except for one. Moreover, the accuracy of the checkpoint was about 1~3 cm, which verified that 3D positioning was well performed. For the GCP survey and evaluation, the Geodetic Reference System 1980 (GRS80) reference system and UTM-K coordinate system were used.
Figure 4. Ortho-image and DSM for each round. Figure 4. Ortho-image and DSM for each round.
Drones 2021, 5, 147 7 of 16
Table 2. Positioning accuracy analysis using GCPs and CPs (GRS80 and UTM-K).
Round # of GCP # ∆X (m) ∆Y (m) ∆Z (m) ∆XY (m) Total Error (m)
1st 7 0.004 0.006 0.006 0.007 0.009
2nd 7 0.007 0.012 0.014 0.014 0.020
3rd 7 0.008 0.010 0.010 0.013 0.016
Round CP # ∆X (m) ∆Y (m) ∆Z (m) ∆XY (m) Total Error (m)
1st1 0.009 0.004 0.022 0.010 0.024
2 0.028 0.010 0.024 0.030 0.038
2nd1 0.029 0.008 0.003 0.030 0.030
2 0.012 0.016 0.037 0.02 0.042
3rd1 0.012 0.005 0.030 0.013 0.033
2 0.004 0.025 0.007 0.025 0.026
The spatial resolution of images is one of the most crucial sensor quality assess-ment factors [30]. In order to estimate spatial resolution, we adopted a bar target with14 levels [31] and the Siemens start targets [32], as shown in Figure 5. These targets providethe level of image resolution by using performance evaluation of geometric features in themarks. The purpose of bar targets is to calculate spatial frequency according to perceivablebar size based on mathematical principles. The size of the largest bar (No. 1) is 1 m × 0.2 m,and the size of bars decreases by 12% sequentially. Spatial frequency using the bar targetcan be calculated from ground sampling distance (GSD) and minimum width of visiblebars, and it is described by the following.
Spatial Frequency =GSD (cm/pixel)
width o f black and white line pairs, (1)
Drones 2021, 5, x FOR PEER REVIEW 7 of 16
Table 2. Positioning accuracy analysis using GCPs and CPs (GRS80 and UTM-K).
Round # of GCP # ∆X (m) ∆Y (m) ∆Z (m) ∆XY (m) Total Error (m) 1st 7 0.004 0.006 0.006 0.007 0.009 2nd 7 0.007 0.012 0.014 0.014 0.020 3rd 7 0.008 0.010 0.010 0.013 0.016
Round CP # ∆X (m) ∆Y (m) ∆Z (m) ∆XY (m) Total Error (m)
1st 1 0.009 0.004 0.022 0.010 0.024 2 0.028 0.010 0.024 0.030 0.038
2nd 1 0.029 0.008 0.003 0.030 0.030 2 0.012 0.016 0.037 0.02 0.042
3rd 1 0.012 0.005 0.030 0.013 0.033 2 0.004 0.025 0.007 0.025 0.026
The spatial resolution of images is one of the most crucial sensor quality assessment factors [30]. In order to estimate spatial resolution, we adopted a bar target with 14 levels [31] and the Siemens start targets [32], as shown in Figure 5. These targets provide the level of image resolution by using performance evaluation of geometric features in the marks. The purpose of bar targets is to calculate spatial frequency according to perceivable bar size based on mathematical principles. The size of the largest bar (No. 1) is 1 m × 0.2 m, and the size of bars decreases by 12% sequentially. Spatial frequency using the bar target can be calculated from ground sampling distance (GSD) and minimum width of visible bars, and it is described by the following. Spatial Frequency / , (1)
This study also employed the Siemens star target, which has a total of 32 black and white lines arranged at regular distances and a radiation angle of 11.25 from the center of the circle. With the Siemens star target, the visual resolution can be measured by the fol-lowing: 𝑙
, (2)
where 𝑙 is the visual resolution, d/D is the small ‘d’ over large ‘D’ in Figure 5, and n is the number of bars. Table 3 describes that the image resolution estimated in this study was about 2.9 cm, which satisfied the internally required image resolution of 3 cm. The finaly generated 3D models are displayed in Figure 6.
Figure 5. Siemens star target (a) and bar target (b) displayed in UAS images taken at 100 m aboveground level.
This study also employed the Siemens star target, which has a total of 32 black andwhite lines arranged at regular distances and a radiation angle of 11.25 from the center of thecircle. With the Siemens star target, the visual resolution can be measured by the following:
l =π × d
Dn
, (2)
where l is the visual resolution, d/D is the small ‘d’ over large ‘D’ in Figure 5, and n is thenumber of bars. Table 3 describes that the image resolution estimated in this study was

Drones 2021, 5, 147 8 of 16
about 2.9 cm, which satisfied the internally required image resolution of 3 cm. The finalygenerated 3D models are displayed in Figure 6.
Table 3. UAS image resolution verification and analysis.
Siemens Star Categories Large D Small d Diameter Ratio Result
Visual resolution at 100 m altitude 1.02 m 0.267 m 0.261 0.025 m
Bar Target Categories No. 7 No. 8 No. 9 No. 10 Average
Spatial resolution at 100 m altitude Recognized Recognized Recognized Not recognized 0.029 m
Drones 2021, 5, x FOR PEER REVIEW 8 of 16
Figure 5. Siemens star target (a) and bar target (b) displayed in UAS images taken at 100 m above ground level.
Table 3. UAS image resolution verification and analysis.
Siemens Star Categories Large D Small d Diameter Ratio Result
Visual resolution at 100 m altitude 1.02 m 0.267 m 0.261 0.025 m
Bar Target Categories No. 7 No. 8 No. 9 No. 10 Average
Spatial resolution at 100 m altitude Recognized Recognized Recognized Not recognized 0.029 m
Figure 6. 3D construction map for each round: (a) the 1st round, (b) the 2nd round, and (c) the 3rd round.
3.3. Development of Earthwork Progress Digitalization System This study developed UAS image-based earthwork progress management and digi-
talization system based on Python computer programming language. Open-source librar-ies, such as Matplotlib, Open3D [33], and point cloud library (PCL) [34], were actively utilized to implement functions for 3D point cloud data processing. These functions in-clude the following: 1. Importing UAS-generated point clouds; 2. Aligning point clouds; 3. Setting and extracting the area of interest; 4. Estimating cut and fill volume; 5. Generating cross-section views; 6. Drawing geo-fencing.
The detailed explanations and examples of each function are described in the follow-ing sections.
3.3.1. Model Alignment The first step to compute the cut-and-fill volume change in two different point clouds
is by finely aligning both point clouds into a single coordinate system. Since the point clouds used in this study are georeferenced by GCPs measured from RTK-GPS, all point clouds were initially aligned in the World Geodetic System (WGS-84), an Earth-centered one geodetic datum. However, the coordinates measured by using GNSS may be shifted as much as 20 cm or more depending on the weather conditions and satellite positional conditions of the measuring day. For this reason, the developed system employs an itera-tive closest point (ICP) algorithm for fine alignment of shifted models. ICP is an algorithm for finding a transformation matrix to make the difference between two point clouds min-imize [35]. Since the ICP algorithm calculates the distance of closest points, our system first extracts unchanged areas in both point clouds and then finds the transformation
Figure 6. 3D construction map for each round: (a) the 1st round, (b) the 2nd round, and (c) the 3rd round.
3.3. Development of Earthwork Progress Digitalization System
This study developed UAS image-based earthwork progress management and digital-ization system based on Python computer programming language. Open-source libraries,such as Matplotlib, Open3D [33], and point cloud library (PCL) [34], were actively uti-lized to implement functions for 3D point cloud data processing. These functions includethe following:
1. Importing UAS-generated point clouds;2. Aligning point clouds;3. Setting and extracting the area of interest;4. Estimating cut and fill volume;5. Generating cross-section views;6. Drawing geo-fencing.
The detailed explanations and examples of each function are described in thefollowing sections.
3.3.1. Model Alignment
The first step to compute the cut-and-fill volume change in two different point cloudsis by finely aligning both point clouds into a single coordinate system. Since the pointclouds used in this study are georeferenced by GCPs measured from RTK-GPS, all pointclouds were initially aligned in the World Geodetic System (WGS-84), an Earth-centeredone geodetic datum. However, the coordinates measured by using GNSS may be shiftedas much as 20 cm or more depending on the weather conditions and satellite positionalconditions of the measuring day. For this reason, the developed system employs an iterativeclosest point (ICP) algorithm for fine alignment of shifted models. ICP is an algorithmfor finding a transformation matrix to make the difference between two point cloudsminimize [35]. Since the ICP algorithm calculates the distance of closest points, our systemfirst extracts unchanged areas in both point clouds and then finds the transformation matrixfrom the selected areas with ICP. Then, the computed transformation matrix can be applied
Drones 2021, 5, 147 9 of 16
to entire point clouds for fine alignment. The rigid transformation for the fine alignment oftwo point clouds can be expressed by the following:
sj = T∗(mi) = R∗mi + t∗, (3)
where sj and mi are points in the reference point cloud and the merged point cloud,respectively, T∗ is the optimal transformation matrix computed from ICP, and R∗ and t∗
represent the optimal rotation and the optimal translation, respectively. With the finelyaligned point cloud, the proposed system generates a height differential map for estimatingcut-and-fill volume change.
3.3.2. Volume Estimation
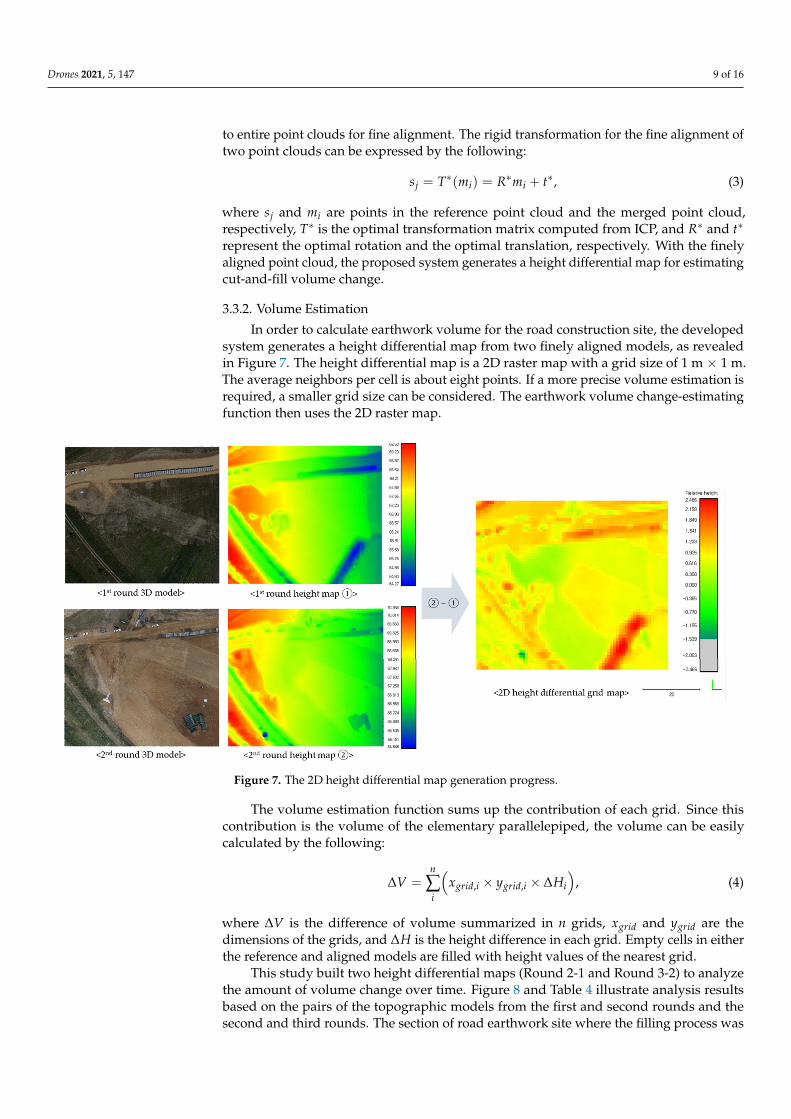
In order to calculate earthwork volume for the road construction site, the developedsystem generates a height differential map from two finely aligned models, as revealedin Figure 7. The height differential map is a 2D raster map with a grid size of 1 m × 1 m.The average neighbors per cell is about eight points. If a more precise volume estimation isrequired, a smaller grid size can be considered. The earthwork volume change-estimatingfunction then uses the 2D raster map.
Drones 2021, 5, x FOR PEER REVIEW 9 of 16
matrix from the selected areas with ICP. Then, the computed transformation matrix can be applied to entire point clouds for fine alignment. The rigid transformation for the fine alignment of two point clouds can be expressed by the following: 𝑠 𝑇∗ 𝑚 𝑅∗𝑚 𝑡∗, (3)
where 𝑠 and 𝑚 are points in the reference point cloud and the merged point cloud, re-spectively, 𝑇∗ is the optimal transformation matrix computed from ICP, and 𝑅∗ and 𝑡∗ represent the optimal rotation and the optimal translation, respectively. With the finely aligned point cloud, the proposed system generates a height differential map for estimat-ing cut-and-fill volume change.
3.3.2. Volume Estimation In order to calculate earthwork volume for the road construction site, the developed
system generates a height differential map from two finely aligned models, as revealed in Figure 7. The height differential map is a 2D raster map with a grid size of 1 m ×1 m. The average neighbors per cell is about eight points. If a more precise volume estimation is required, a smaller grid size can be considered. The earthwork volume change-estimating function then uses the 2D raster map.
Figure 7. The 2D height differential map generation progress.
The volume estimation function sums up the contribution of each grid. Since this contribution is the volume of the elementary parallelepiped, the volume can be easily cal-culated by the following: ∆𝑉 ∑ 𝑥 , 𝑦 , ∆𝐻 , (4)
Where ∆𝑉 is the difference of volume summarized in n grids, 𝑥 and 𝑦 are the di-mensions of the grids, and ∆𝐻 is the height difference in each grid. Empty cells in either the reference and aligned models are filled with height values of the nearest grid.
This study built two height differential maps (Round 2-1 and Round 3-2) to analyze the amount of volume change over time. Figure 8 and Table 4 illustrate analysis results based on the pairs of the topographic models from the first and second rounds and the second and third rounds. The section of road earthwork site where the filling process was
Figure 7. The 2D height differential map generation progress.
The volume estimation function sums up the contribution of each grid. Since thiscontribution is the volume of the elementary parallelepiped, the volume can be easilycalculated by the following:
∆V =n
∑i
(xgrid,i × ygrid,i × ∆Hi
), (4)
where ∆V is the difference of volume summarized in n grids, xgrid and ygrid are thedimensions of the grids, and ∆H is the height difference in each grid. Empty cells in eitherthe reference and aligned models are filled with height values of the nearest grid.
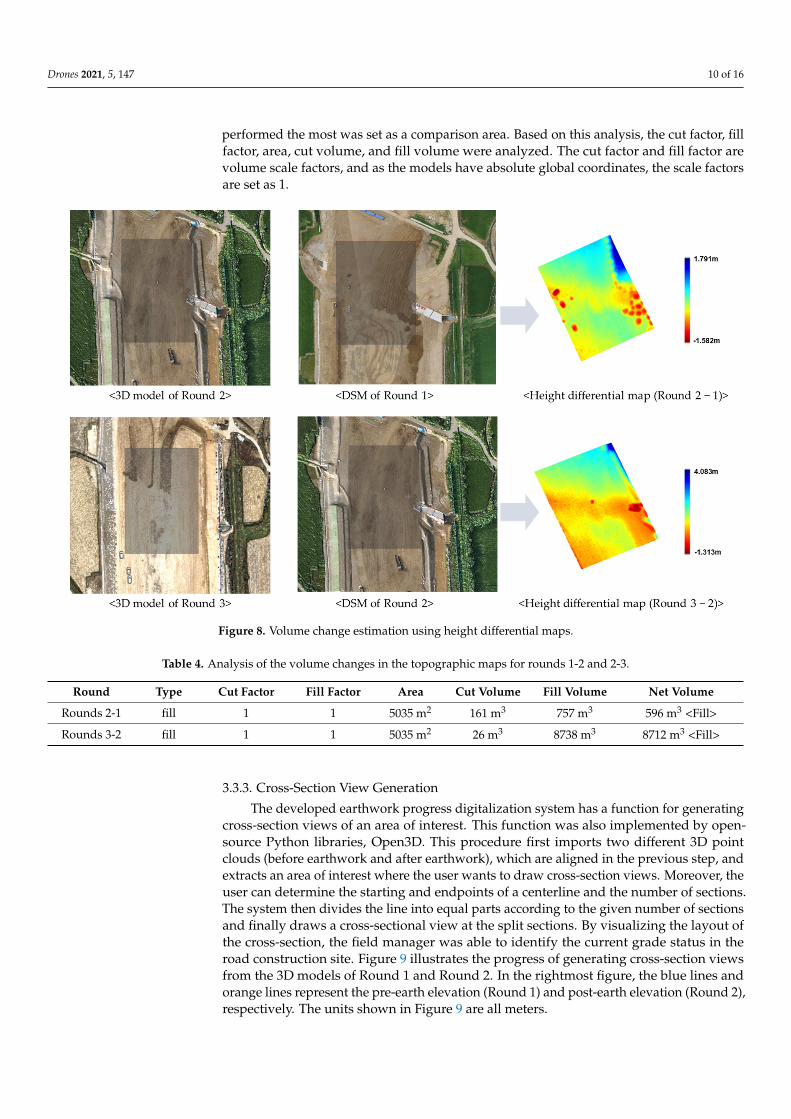
This study built two height differential maps (Round 2-1 and Round 3-2) to analyzethe amount of volume change over time. Figure 8 and Table 4 illustrate analysis resultsbased on the pairs of the topographic models from the first and second rounds and thesecond and third rounds. The section of road earthwork site where the filling process was
Drones 2021, 5, 147 10 of 16
performed the most was set as a comparison area. Based on this analysis, the cut factor, fillfactor, area, cut volume, and fill volume were analyzed. The cut factor and fill factor arevolume scale factors, and as the models have absolute global coordinates, the scale factorsare set as 1.
Drones 2021, 5, x FOR PEER REVIEW 10 of 16
performed the most was set as a comparison area. Based on this analysis, the cut factor, fill factor, area, cut volume, and fill volume were analyzed. The cut factor and fill factor are volume scale factors, and as the models have absolute global coordinates, the scale factors are set as 1.
Figure 8. Volume change estimation using height differential maps.
Table 4. Analysis of the volume changes in the topographic maps for rounds 1-2 and 2-3.
Round Type Cut Factor Fill Factor Area Cut Volume Fill Volume Net Volume
Rounds 2-1 fill 1 1 5035 m2 161 m3 757 m3 596 m3 <Fill>
Rounds 3-2 fill 1 1 5035 m2 26 m3 8738 m3 8712 m3
<Fill>
3.3.3. Cross-Section View Generation The developed earthwork progress digitalization system has a function for generat-
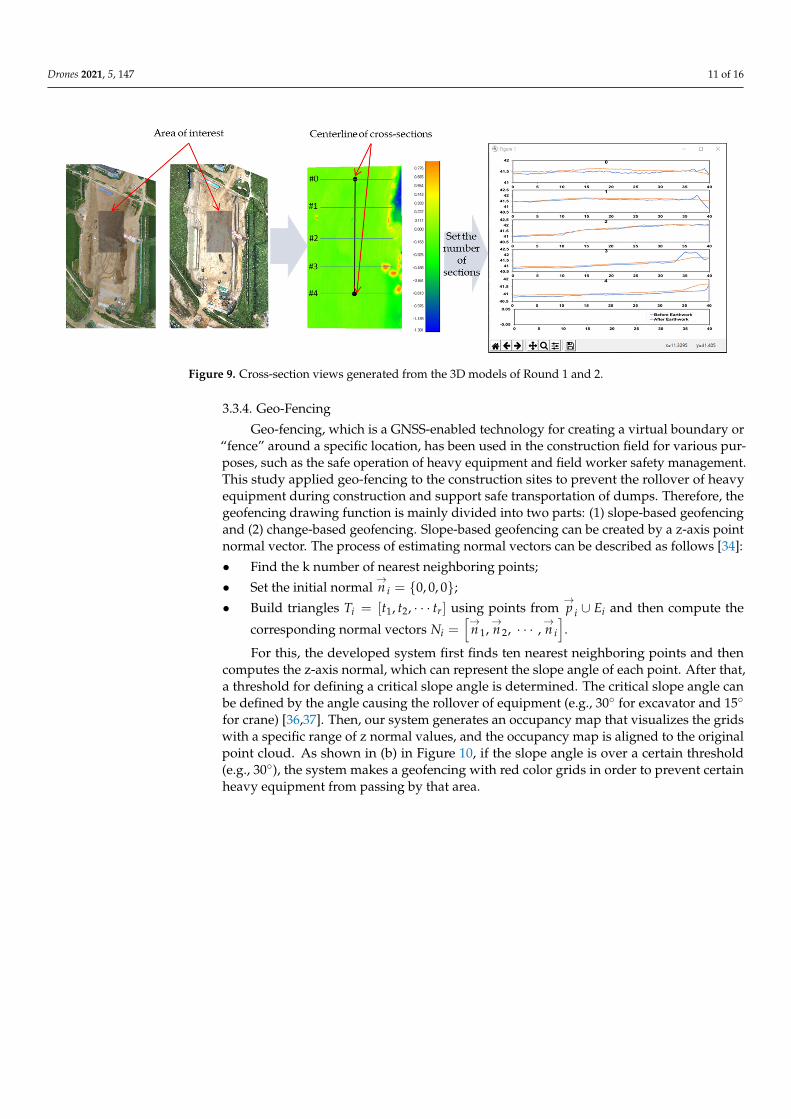
ing cross-section views of an area of interest. This function was also implemented by open-source Python libraries, Open3D. This procedure first imports two different 3D point clouds (before earthwork and after earthwork), which are aligned in the previous step, and extracts an area of interest where the user wants to draw cross-section views. Moreo-ver, the user can determine the starting and endpoints of a centerline and the number of sections. The system then divides the line into equal parts according to the given number of sections and finally draws a cross-sectional view at the split sections. By visualizing the layout of the cross-section, the field manager was able to identify the current grade status in the road construction site. Figure 9 illustrates the progress of generating cross-section views from the 3D models of Round 1 and Round 2. In the rightmost figure, the blue lines and orange lines represent the pre-earth elevation (Round 1) and post-earth elevation (Round 2), respectively. The units shown in Figure 9 are all meters.
Figure 8. Volume change estimation using height differential maps.
Table 4. Analysis of the volume changes in the topographic maps for rounds 1-2 and 2-3.
Round Type Cut Factor Fill Factor Area Cut Volume Fill Volume Net Volume
Rounds 2-1 fill 1 1 5035 m2 161 m3 757 m3 596 m3 <Fill>
Rounds 3-2 fill 1 1 5035 m2 26 m3 8738 m3 8712 m3 <Fill>
3.3.3. Cross-Section View Generation
The developed earthwork progress digitalization system has a function for generatingcross-section views of an area of interest. This function was also implemented by open-source Python libraries, Open3D. This procedure first imports two different 3D pointclouds (before earthwork and after earthwork), which are aligned in the previous step, andextracts an area of interest where the user wants to draw cross-section views. Moreover, theuser can determine the starting and endpoints of a centerline and the number of sections.The system then divides the line into equal parts according to the given number of sectionsand finally draws a cross-sectional view at the split sections. By visualizing the layout ofthe cross-section, the field manager was able to identify the current grade status in theroad construction site. Figure 9 illustrates the progress of generating cross-section viewsfrom the 3D models of Round 1 and Round 2. In the rightmost figure, the blue lines andorange lines represent the pre-earth elevation (Round 1) and post-earth elevation (Round 2),respectively. The units shown in Figure 9 are all meters.
Drones 2021, 5, 147 11 of 16Drones 2021, 5, x FOR PEER REVIEW 11 of 16
Figure 9. Cross-section views generated from the 3D models of Round 1 and 2.
3.3.4. Geo-Fencing Geo-fencing, which is a GNSS-enabled technology for creating a virtual boundary or
“fence” around a specific location, has been used in the construction field for various pur-poses, such as the safe operation of heavy equipment and field worker safety manage-ment. This study applied geo-fencing to the construction sites to prevent the rollover of heavy equipment during construction and support safe transportation of dumps. There-fore, the geofencing drawing function is mainly divided into two parts: (1) slope-based geofencing and (2) change-based geofencing. Slope-based geofencing can be created by a z-axis point normal vector. The process of estimating normal vectors can be described as follows [34]: • Find the k number of nearest neighboring points; • Set the initial normal 𝑛 0,0,0 ; • Build triangles 𝑇 𝑡 , 𝑡 , ⋯ 𝑡 using points from �� ∪ 𝐸 and then compute the
corresponding normal vectors 𝑁 𝑛 , 𝑛 , ⋯ , 𝑛 . For this, the developed system first finds ten nearest neighboring points and then
computes the z-axis normal, which can represent the slope angle of each point. After that, a threshold for defining a critical slope angle is determined. The critical slope angle can be defined by the angle causing the rollover of equipment (e.g., 30° for excavator and 15° for crane) [36,37]. Then, our system generates an occupancy map that visualizes the grids with a specific range of z normal values, and the occupancy map is aligned to the original point cloud. As shown in (b) in Figure 10, if the slope angle is over a certain threshold (e.g., 30°), the system makes a geofencing with red color grids in order to prevent certain heavy equipment from passing by that area.
Figure 9. Cross-section views generated from the 3D models of Round 1 and 2.
3.3.4. Geo-Fencing
Geo-fencing, which is a GNSS-enabled technology for creating a virtual boundary or“fence” around a specific location, has been used in the construction field for various pur-poses, such as the safe operation of heavy equipment and field worker safety management.This study applied geo-fencing to the construction sites to prevent the rollover of heavyequipment during construction and support safe transportation of dumps. Therefore, thegeofencing drawing function is mainly divided into two parts: (1) slope-based geofencingand (2) change-based geofencing. Slope-based geofencing can be created by a z-axis pointnormal vector. The process of estimating normal vectors can be described as follows [34]:
• Find the k number of nearest neighboring points;
• Set the initial normal→n i = {0, 0, 0};
• Build triangles Ti = [t1, t2, · · · tr] using points from→p i ∪ Ei and then compute the
corresponding normal vectors Ni =[→
n 1,→n 2, · · · ,
→n i
].
For this, the developed system first finds ten nearest neighboring points and thencomputes the z-axis normal, which can represent the slope angle of each point. After that,a threshold for defining a critical slope angle is determined. The critical slope angle canbe defined by the angle causing the rollover of equipment (e.g., 30◦ for excavator and 15◦
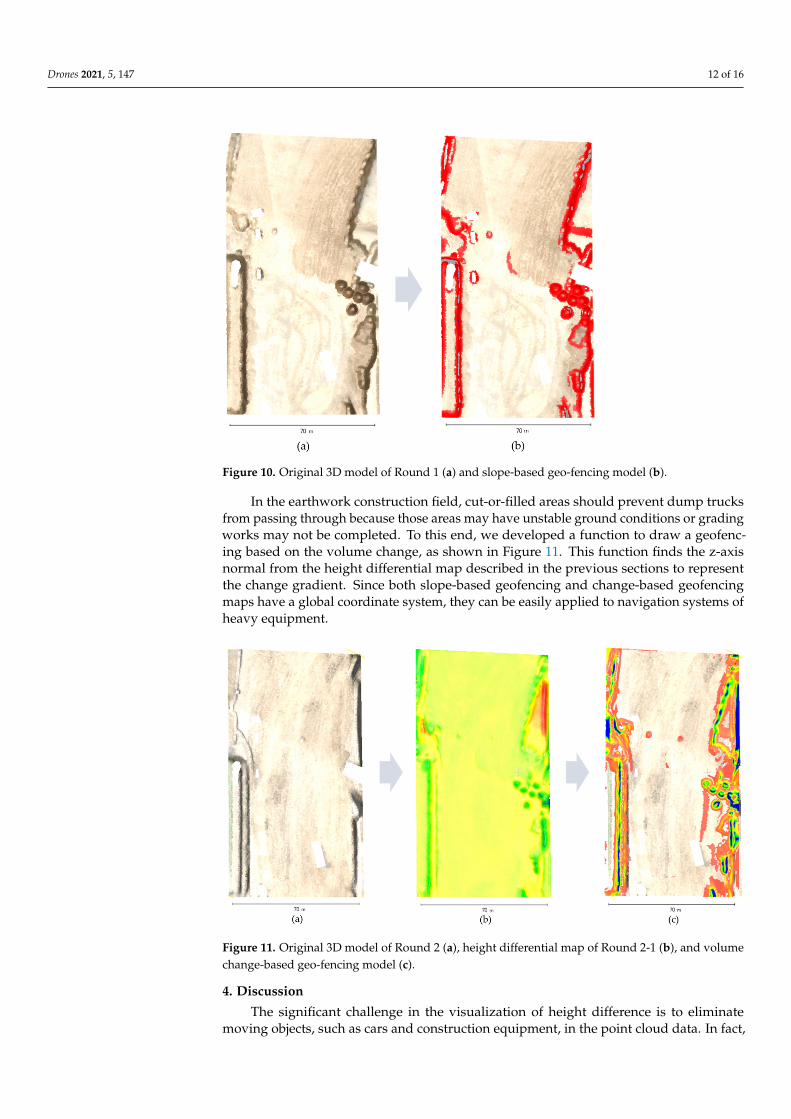
for crane) [36,37]. Then, our system generates an occupancy map that visualizes the gridswith a specific range of z normal values, and the occupancy map is aligned to the originalpoint cloud. As shown in (b) in Figure 10, if the slope angle is over a certain threshold(e.g., 30◦), the system makes a geofencing with red color grids in order to prevent certainheavy equipment from passing by that area.
Drones 2021, 5, 147 12 of 16Drones 2021, 5, x FOR PEER REVIEW 12 of 16
Figure 10. Original 3D model of Round 1 (a) and slope-based geo-fencing model (b).
In the earthwork construction field, cut-or-filled areas should prevent dump trucks from passing through because those areas may have unstable ground conditions or grad-ing works may not be completed. To this end, we developed a function to draw a geofenc-ing based on the volume change, as shown in Figure 11. This function finds the z-axis normal from the height differential map described in the previous sections to represent the change gradient. Since both slope-based geofencing and change-based geofencing maps have a global coordinate system, they can be easily applied to navigation systems of heavy equipment.
Figure 11. Original 3D model of Round 2 (a), height differential map of Round 2-1 (b), and volume change-based geo-fencing model (c).
4. Discussion The significant challenge in the visualization of height difference is to eliminate mov-
ing objects, such as cars and construction equipment, in the point cloud data. In fact, the
Figure 10. Original 3D model of Round 1 (a) and slope-based geo-fencing model (b).
In the earthwork construction field, cut-or-filled areas should prevent dump trucksfrom passing through because those areas may have unstable ground conditions or gradingworks may not be completed. To this end, we developed a function to draw a geofenc-ing based on the volume change, as shown in Figure 11. This function finds the z-axisnormal from the height differential map described in the previous sections to representthe change gradient. Since both slope-based geofencing and change-based geofencingmaps have a global coordinate system, they can be easily applied to navigation systems ofheavy equipment.
Drones 2021, 5, x FOR PEER REVIEW 12 of 16
Figure 10. Original 3D model of Round 1 (a) and slope-based geo-fencing model (b).
In the earthwork construction field, cut-or-filled areas should prevent dump trucks from passing through because those areas may have unstable ground conditions or grad-ing works may not be completed. To this end, we developed a function to draw a geofenc-ing based on the volume change, as shown in Figure 11. This function finds the z-axis normal from the height differential map described in the previous sections to represent the change gradient. Since both slope-based geofencing and change-based geofencing maps have a global coordinate system, they can be easily applied to navigation systems of heavy equipment.
Figure 11. Original 3D model of Round 2 (a), height differential map of Round 2-1 (b), and volume change-based geo-fencing model (c).
4. Discussion The significant challenge in the visualization of height difference is to eliminate mov-
ing objects, such as cars and construction equipment, in the point cloud data. In fact, the
Figure 11. Original 3D model of Round 2 (a), height differential map of Round 2-1 (b), and volumechange-based geo-fencing model (c).
4. Discussion
The significant challenge in the visualization of height difference is to eliminatemoving objects, such as cars and construction equipment, in the point cloud data. In fact,
Drones 2021, 5, 147 13 of 16
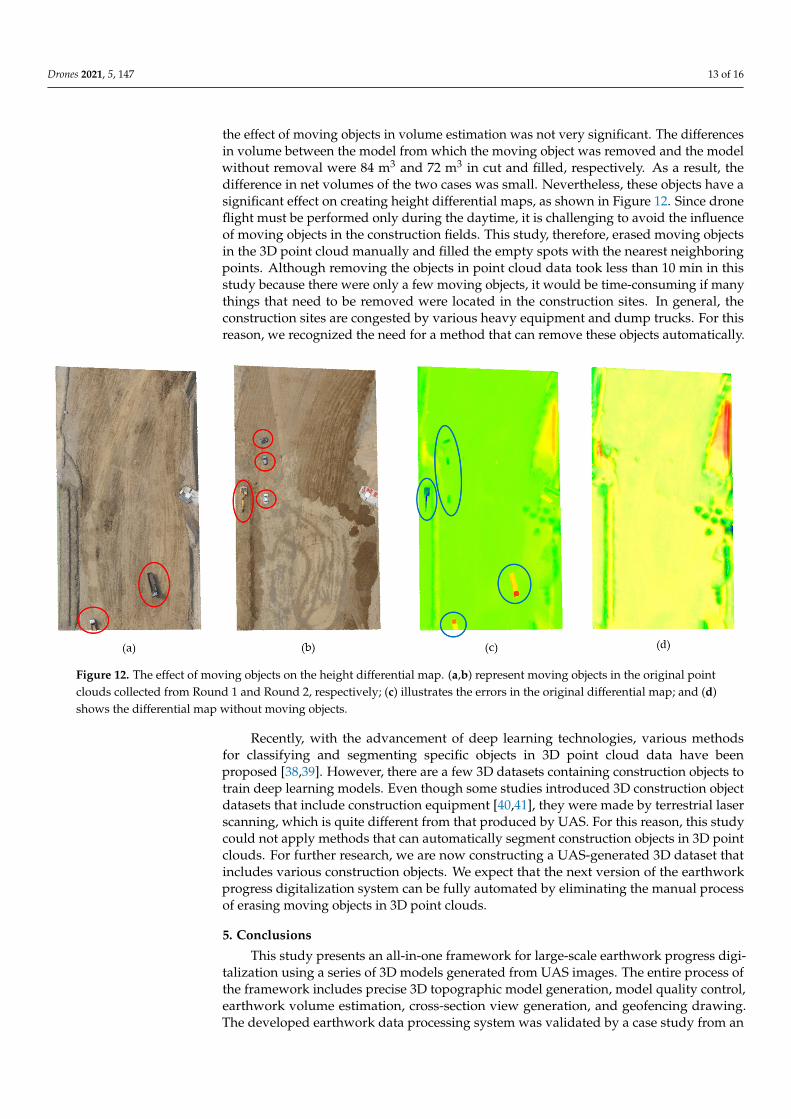
the effect of moving objects in volume estimation was not very significant. The differencesin volume between the model from which the moving object was removed and the modelwithout removal were 84 m3 and 72 m3 in cut and filled, respectively. As a result, thedifference in net volumes of the two cases was small. Nevertheless, these objects have asignificant effect on creating height differential maps, as shown in Figure 12. Since droneflight must be performed only during the daytime, it is challenging to avoid the influenceof moving objects in the construction fields. This study, therefore, erased moving objectsin the 3D point cloud manually and filled the empty spots with the nearest neighboringpoints. Although removing the objects in point cloud data took less than 10 min in thisstudy because there were only a few moving objects, it would be time-consuming if manythings that need to be removed were located in the construction sites. In general, theconstruction sites are congested by various heavy equipment and dump trucks. For thisreason, we recognized the need for a method that can remove these objects automatically.
Drones 2021, 5, x FOR PEER REVIEW 13 of 16
effect of moving objects in volume estimation was not very significant. The differences in volume between the model from which the moving object was removed and the model without removal were 84 m3 and 72 m3 in cut and filled, respectively. As a result, the dif-ference in net volumes of the two cases was small. Nevertheless, these objects have a sig-nificant effect on creating height differential maps, as shown in Figure 12. Since drone flight must be performed only during the daytime, it is challenging to avoid the influence of moving objects in the construction fields. This study, therefore, erased moving objects in the 3D point cloud manually and filled the empty spots with the nearest neighboring points. Although removing the objects in point cloud data took less than 10 min in this study because there were only a few moving objects, it would be time-consuming if many things that need to be removed were located in the construction sites. In general, the con-struction sites are congested by various heavy equipment and dump trucks. For this rea-son, we recognized the need for a method that can remove these objects automatically.
Figure 12. The effect of moving objects on the height differential map. (a,b) represent moving objects in the original point clouds collected from Round 1 and Round 2, respectively; (c) illustrates the errors in the original differential map; and (d) shows the differential map without moving objects.
Recently, with the advancement of deep learning technologies, various methods for classifying and segmenting specific objects in 3D point cloud data have been proposed [38,39]. However, there are a few 3D datasets containing construction objects to train deep learning models. Even though some studies introduced 3D construction object datasets that include construction equipment [40,41], they were made by terrestrial laser scanning, which is quite different from that produced by UAS. For this reason, this study could not apply methods that can automatically segment construction objects in 3D point clouds. For further research, we are now constructing a UAS-generated 3D dataset that includes various construction objects. We expect that the next version of the earthwork progress digitalization system can be fully automated by eliminating the manual process of erasing moving objects in 3D point clouds.
5. Conclusions This study presents an all-in-one framework for large-scale earthwork progress dig-
italization using a series of 3D models generated from UAS images. The entire process of the framework includes precise 3D topographic model generation, model quality control, earthwork volume estimation, cross-section view generation, and geofencing drawing. The developed earthwork data processing system was validated by a case study from an
Figure 12. The effect of moving objects on the height differential map. (a,b) represent moving objects in the original pointclouds collected from Round 1 and Round 2, respectively; (c) illustrates the errors in the original differential map; and (d)shows the differential map without moving objects.
Recently, with the advancement of deep learning technologies, various methodsfor classifying and segmenting specific objects in 3D point cloud data have beenproposed [38,39]. However, there are a few 3D datasets containing construction objects totrain deep learning models. Even though some studies introduced 3D construction objectdatasets that include construction equipment [40,41], they were made by terrestrial laserscanning, which is quite different from that produced by UAS. For this reason, this studycould not apply methods that can automatically segment construction objects in 3D pointclouds. For further research, we are now constructing a UAS-generated 3D dataset thatincludes various construction objects. We expect that the next version of the earthworkprogress digitalization system can be fully automated by eliminating the manual processof erasing moving objects in 3D point clouds.
5. Conclusions
This study presents an all-in-one framework for large-scale earthwork progress digi-talization using a series of 3D models generated from UAS images. The entire process ofthe framework includes precise 3D topographic model generation, model quality control,earthwork volume estimation, cross-section view generation, and geofencing drawing.The developed earthwork data processing system was validated by a case study from an
Drones 2021, 5, 147 14 of 16
active highway construction site. By examining the case study, we identified that highlyprecise 3D topographical maps can be created by UAS images, and the 3D maps canbe actively used for volume change estimation and earthwork progress documentation.Moreover, the developed system was able to draw geofencing onto 3D models, which canbe used for safe operation and transportation of heavy equipment. We expect that theproposed framework can contribute to smart construction areas by automating the processof digitizing earthwork.
As discussed, a major limitation of the proposed practices is that this system needsmanual preprocessing to remove outliers in 3D point clouds caused by moving objects,such as construction equipment, cars, or workers. These objects can cause significant errorswhen estimating volume changes or creating geofencing. In future studies, therefore, wewill investigate a method of automatically removing non-construction objects to buildprecise 3D topo models. Another drawback of this study is that a rather small numberof GCPs were used for georeferencing because the site where we acquired the data wasan active construction site. Although the positioning errors of 3D point clouds measuredin this study were less than 3 cm in the horizontal direction and 4 cm in the verticaldirection, these errors could be further reduced if more GCPs were used. Thus, in futurestudies, a larger number of GCPs can be installed by conducting prior consultation withthe construction field managers.
Author Contributions: Conceptualization, J.-K.L. and J.-W.C.; methodology, J.-K.L.; software, J.P.;validation, J.-K.L. and J.-W.C.; formal analysis, J.P.; investigation, J.-W.C.; resources, J.-W.C.; datacuration, J.-K.L.; writing—original draft preparation, J.-W.C.; writing—review and editing, J.-K.L.and J.P.; visualization, J.P.; supervision, J.-K.L.; project administration, J.-W.C.; funding acquisition,J.-K.L. All authors have read and agreed to the published version of the manuscript.
Funding: This research was funded by the Korea Agency for Infrastructure Technology Advancementunder the Ministry of Land, Infrastructure and Transport, grant number (No.2 1SMIP-A158708-02).
Institutional Review Board Statement: Not applicable.
Informed Consent Statement: Not applicable.
Data Availability Statement: Not applicable.
Acknowledgments: This research was conducted with the support of the “National R&D Projectfor Smart Construction Technology (No.2 1SMIP-A158708-02)” funded by the Korea Agency forInfrastructure Technology Advancement under the Ministry of Land, Infrastructure and Transport,and managed by the Korea Expressway Corporation.
Conflicts of Interest: The authors declare no conflict of interest.
References1. Štefanic, M.; Stankovski, V. A review of technologies and applications for smart construction. In Proceedings of the Institution of
Civil Engineers-Civil Engineering; Thomas Telford Ltd.: London, UK, 2018; pp. 83–87.2. Liu, D.; Lu, W.; Niu, Y. Extended technology-acceptance model to make smart construction systems successful. J. Constr. Eng.
Manag. 2018, 144, 4018035. [CrossRef]3. Azar, E.R.; Kamat, V.R. Earthmoving equipment automation: A review of technical advances and future outlook. J. Inf. Technol.
Constr. 2017, 22, 247–265.4. Han, S.-W.; Lee, S.-Y.; Halpin, D.W. Productivity evaluation of the conventional and GPS-based earthmoving systems using
construction simulation. In Proceedings of the Construction Research Congress 2005: Broadening Perspectives, San Diego, CA,USA, 5–7 April 2005; pp. 1–9.
5. Kim, S.-K.; Min, S.-G. Development of a work information model and a work path simulator for an intelligent excavation. J.Korean Soc. Civ. Eng. 2012, 32, 259–267.
6. Park, J.S.; Seo, J.W. Application of Construction Equipment Fleet Management System through the Case Study of Air and VesselTraffic Control Technology. J. Korean Soc. Civ. Eng. 2015, 35, 493–500. [CrossRef]
7. Gwak, H.-S.; Seo, J.-W.; Lee, D.-E. Earthmoving haul-route searching method for energy saving based on evolutionary algorithm.J. Archit. Inst. Korea Struct. Constr. 2015, 31, 81–88. [CrossRef]
8. Park, J.; Kim, S. Productivity analysis for the 3D digitization of earthwork sites based on scanning conditions. Int. J. Railw. 2018,11, 1–9.
Drones 2021, 5, 147 15 of 16
9. Kim, S.; Irizarry, J.; Costa, D.B. Potential factors influencing the performance of unmanned aerial system (UAS) integrated safetycontrol for construction worksites. In Proceedings of the Construction Research Congress 2016, San Juan, PR, USA, 31 May–2June 2016; pp. 2614–2623.
10. Gupta, L.; Jain, R.; Vaszkun, G. Survey of important issues in UAV communication networks. IEEE Commun. Surv. Tutor. 2015, 18,1123–1152. [CrossRef]
11. Rangel, J.M.G.; Gonçalves, G.R.; Pérez, J.A. The impact of number and spatial distribution of GCPs on the positional accuracy ofgeospatial products derived from low-cost UASs. Int. J. Remote Sens. 2018, 39, 7154–7171. [CrossRef]
12. Oniga, V.-E.; Breaban, A.-I.; Pfeifer, N.; Chirila, C. Determining the Suitable Number of Ground Control Points for UAS ImagesGeoreferencing by Varying Number and Spatial Distribution. Remote Sens. 2020, 12, 876. [CrossRef]
13. Ronchi, D.; Limongiello, M.; Barba, S. Correlation among Earthwork and Cropmark Anomalies within Archaeological LandscapeInvestigation by Using LiDAR and Multispectral Technologies from UAV. Drones 2020, 4, 72. [CrossRef]
14. Hanna, A.; Hintz, C.; Vonderohe, A. 3D Design Terrain Models for Construction Plans and GPS Control of Highway ConstructionEquipment; CFIRE: Madison, WI, USA, 2010.
15. Lee, J.K.; Park, J.S.; Roberts, G.W.; Oluropo, O.; Moon, D.J. Study on Issues of Tilt-meters and Utilization of GPS in BridgeMonitoring System (BMS). In Proceedings of the Joint International Symposium on Deformation Monitoring, Hong Kong, China,2–4 November 2011; pp. 2–4.
16. Dampegama, K.P.; Abesinghe, A.; Dinusha, K.A.; Vandebona, R. Comparative Study on Methods For 3D Modelling withTraditional Surveying Technique and Total Station Technique. In Proceedings of the 11th International Research Conference,Rathmalana, Sri Lanka, 13–14 September 2018.
17. Slattery, K.T.; Slattery, D.K.; Peterson, J.P. Road construction earthwork volume calculation using three-dimensional laser scanning.J. Surv. Eng. 2012, 138, 96–99. [CrossRef]
18. Williams, K.E. Accuracy Assessment of LiDAR Point Cloud Geo-Referencing. Master’s Thesis, Oregon State University, Corvallis,OR, USA, June 2012.
19. Cho, Y.K.; Park, J. Assessment of Construction Points for Grade Control and Reference in 3D; Georgia Dept. of Transportation:Atlanta, GA, USA, 2018. Available online: http://g92018.eos-intl.net/eLibSQL14_G92018_Documents/16-18.pdf (accessed on 10November 2021).
20. Kim, S.; Irizarry, J.; Costa, D.B. Field Test-Based UAS Operational Procedures and Considerations for Construction SafetyManagement: A Qualitative Exploratory Study. Int. J. Civ. Eng. 2020, 18, 919–933. [CrossRef]
21. Park, J.; Kim, P.; Cho, Y.K. Automated collaboration framework of UAV and UGV for 3D visualization of construction sites. InProceedings of the 18th International Conference on Construction Applications of Virtual Reality, Auckland, New Zealand, 22–23November 2018.
22. Kim, P.; Price, L.C.; Park, J.; Cho, Y.K. UAV-UGV Cooperative 3D Environmental Mapping. In Proceedings of the ASCEInternational Conference on Computing in Civil Engineering 2019: Data, Sensing, and Analytics, Atlanta, GA, USA, 17–19 June2019; pp. 384–392. [CrossRef]
23. Wang, X.; Al-Shabbani, Z.; Sturgill, R.; Kirk, A.; Dadi, G.B. Estimating earthwork volumes through use of unmanned aerialsystems. Transp. Res. Rec. 2017, 2630, 1–8. [CrossRef]
24. Kavaliauskas, P.; Židanavicius, D.; Jurelionis, A. Geometric Accuracy of 3D Reality Mesh Utilization for BIM-Based EarthworkQuantity Estimation Workflows. ISPRS Int. J. Geo-Inf. 2021, 10, 399. [CrossRef]
25. Jeong, I.; Jang, Y.; Park, J.; Cho, Y.K. Motion Planning of Mobile Robots for Autonomous Navigation on Uneven Ground Surfaces.J. Comput. Civ. Eng. 2021, 35, 4021001. [CrossRef]
26. Kim, P.; Park, J.; Cho, Y.K. As-is geometric data collection and 3D visualization through the collaboration between UAV and UGV.In Proceedings of the International Symposium on Automation and Robotics in Construction (ISARC 2019), Banff, AB, Canada,21–24 May 2019. [CrossRef]
27. Mandirola, M.; Casarotti, C.; Peloso, S.; Lanese, I.; Brunesi, E.; Senaldi, I.; Risi, F.; Monti, A.; Facchetti, C. Guidelines for the use ofUnmanned Aerial Systems for fast photogrammetry-oriented mapping in emergency response scenarios. Int. J. Disaster RiskReduct. 2021, 58, 102207. [CrossRef]
28. Calantropio, A.; Chiabrando, F.; Sammartano, G.; Spanò, A.; Losè, L.T. UAV Strategies Validation and Remote Sensing Data forDamage Assessment in Post-Disaster Scenarios. In Proceedings of the International Archives of the Photogrammetry, RemoteSensing and Spatial Information Sciences, Istanbul, Turkey, 18–21 March 2018; pp. 121–128.
29. Chiabrando, F.; Giulio Tonolo, F.; Lingua, A. UAV Direct Georeferencing Approach in an Emergency Mapping Context. The 2016 CentralItaly Earthquake Case Study; International Society for Photogrammetry and Remote Sensing: Enschede, The Netherlands, 2019.
30. Orych, A. Review of methods for determining the spatial resolution of UAV sensors. Int. Arch. Photogramm. Remote Sens. Spat. Inf.Sci. 2015, 40, 391–395. [CrossRef]
31. Lee, T.Y. Spatial Resolution Analysis of Aerial Digital Camera. Ph.D. Thesis, Dong-A University, Busan, Korea, 2012.32. Lee, J.; Sung, S. Evaluating spatial resolution for quality assurance of UAV images. Spat. Inf. Res. 2016, 24, 141–154. [CrossRef]33. Zhou, Q.-Y.; Park, J.; Koltun, V. Open3D: A modern library for 3D data processing. arXiv 2018, arXiv:1801.09847. Available online:
https://arxiv.org/abs/1801.09847v1 (accessed on 10 November 2021).34. Rusu, R.B.; Cousins, S. 3D is here: Point Cloud Library (PCL). In Proceedings of the 2011 IEEE International Conference on
Robotics and Automation, Shanghai, China, 9–13 May 2011.

Drones 2021, 5, 147 16 of 16
35. Zhang, Z. Iterative point matching for registration of free-form curves and surfaces. Int. J. Comput. Vis. 1994, 13, 119–152.[CrossRef]
36. Gonzalez, M.; Luaces, A.; Dopico, D.; Cuadrado, J. A 3d physics-based hydraulic excavator simulator. In Proceedings of theASME World Conference on Innovative Virtual Reality, Chalon-sur-Saône, France, 25–26 February 2009; pp. 75–80.
37. Ni, T.; Zhang, H.; Yu, C.; Zhao, D.; Liu, S. Design of highly realistic virtual environment for excavator simulator. Comput. Electr.Eng. 2013, 39, 2112–2123. [CrossRef]
38. Qi, C.R.; Su, H.; Mo, K.; Guibas, L.J. PointNet: Deep learning on point sets for 3D classification and segmentation. In Proceedingsof the IEEE Conference on Computer Vision and Pattern Recognition, Honolulu, HI, USA, 21–27 July 2017; pp. 77–85. [CrossRef]
39. Qi, C.R.; Yi, L.; Su, H.; Guibas, L.J. PointNet++: Deep hierarchical feature learning on point sets in a metric space. arXiv 2017,arXiv:1706.02413. Available online: https://arxiv.org/abs/1706.02413 (accessed on 10 November 2021).
40. Park, J.; Cho, Y.K. Point Cloud Information Modeling: Deep Learning–Based Automated Information Modeling Framework forPoint Cloud Data. J. Constr. Eng. Manag. 2022, 148, 4021191. [CrossRef]
41. Park, J.; Chen, J.; Cho, Y.K. Point Cloud Information Modeling (PCIM): An Innovative Framework for as-is Information Modelingof Construction Sites. In Proceedings of the Construction Research Congress 2020: Computer Applications, Tempe, AZ, USA,8–10 March 2020; pp. 1319–1326. [CrossRef]