Landscape of fear influences the relative importance of consumptive and nonconsumptive predator...
9
Ecology, 92(12), 2011, pp. 2258–2266 Ó 2011 by the Ecological Society of America Landscape of fear influences the relative importance of consumptive and nonconsumptive predator effects CATHERINE M. MATASSA 1 AND GEOFFREY C. TRUSSELL Marine Science Center, Northeastern University, East Point, Nahant, Massachusetts 01908 USA Abstract. Predators can initiate trophic cascades by consuming and/or scaring their prey. Although both forms of predator effect can increase the overall abundance of prey’s resources, nonconsumptive effects may be more important to the spatial and temporal distribution of resources because predation risk often determines where and when prey choose to forage. Our experiment characterized temporal and spatial variation in the strength of consumptive and nonconsumptive predator effects in a rocky intertidal food chain consisting of the predatory green crab (Carcinus maenas), an intermediate consumer (the dogwhelk, Nucella lapillus), and barnacles (Semibalanus balanoides) as a resource. We tracked the survival of individual barnacles through time to map the strength of predator effects in experimental communities. These maps revealed striking spatiotemporal patterns in Nucella foraging behavior in response to each predator effect. However, only the nonconsumptive effect of green crabs produced strong spatial patterns in barnacle survivorship. Predation risk may play a pivotal role in determining the small-scale distribution patterns of this important rocky intertidal foundation species. We suggest that the effects of predation risk on individual foraging behavior may scale up to shape community structure and dynamics at a landscape level. Key words: Carcinus maenas; consumptive effect; nonconsumptive effect; Nucella lapillus; predation risk; Semibalanus balanoides; trait-mediated indirect interaction; trophic cascade. INTRODUCTION Predators can strongly influence ecological communi- ties through trophic cascades. Trophic cascades, in the classical sense, occur when predators eat prey (a consumptive effect or CE), thereby reducing prey density and relaxing consumer pressure on basal resources (Hairston et al. 1960, Paine 1980). Predators can also initiate trophic cascades by scaring prey (a nonconsumptive effect or NCE), because prey often reduce foraging rates in response to predation risk (Sih 1980, Lima and Dill 1990, Abrams et al. 1996, Peacor and Werner 1997, Werner and Peacor 2003). Although both forms of predator effect can enhance the abun- dance of basal resources, the effects of predation risk may more strongly dictate when, where, and what prey eat (for review, see Schmitz et al. [2004]). For example, many prey shift their foraging activities from risky to refuge habitats when they detect predation risk (Werner et al. 1983, Turner and Mittelbach 1990, Trussell et al. 2006). Hence, nonconsumptive effects may play a primary role in determining the distribution and abundance of resources over space and time. The consumptive and nonconsumptive effects of predators are important features of rocky intertidal systems (Trussell et al. 2002, 2004). Carnivorous whelks are common and effective consumers of mussels and barnacles and their impact on the abundance of these resources can strongly influence the structure and dynamics of rocky intertidal communities (Connell 1961, Menge 1976, 1978a, b, Lubchenco and Menge 1978, Hughes and Burrows 1993). The impact of whelk foraging in these systems is determined by a suite of abiotic (e.g., refuge availability, wave exposure, thermal stress; Menge 1978a, b, Fairweather 1988b, Burrows and Hughes 1989, 1990) and biotic factors (e.g., whelk density, age, size, energetic state, and diet history, the availability of mussel or barnacle resources, presence/ absence of predators [Dunkin and Hughes 1984, Hughes and Drewett 1985, Fairweather 1988a, b, Burrows and Hughes 1990, 1991, Palmer 1990, Hughes et al. 1992, Vadas et al. 1994, Trussell et al. 2006, 2008]) that can influence whelk population sizes and shape their foraging decisions. On the rocky shores of New England, risk cues from the predatory green crab (Carcinus maenas) strongly suppress the foraging rates of the Atlantic dogwhelk (Nucella lapillus), driving trait- mediated trophic cascades that rival or exceed the strength of density-mediated cascades driven by reduc- tions in whelk density (Trussell et al. 2006, 2008). Moreover, the absolute and relative strength of non- consumptive effects in this system strongly depends upon habitat type (risky vs. refuge) and resource identity (barnacles [Semibalanus balanoides] vs. mussels [Mytilus edulis]). In risky habitats, green crab predation risk reduces Nucella foraging rates by over 50%, with strong, positive indirect effects on resources, but has little to no Manuscript received 3 March 2011; revised 8 June 2011; accepted 13 June 2011. Corresponding Editor: S. G. Morgan. 1 E-mail: [email protected] 2258
-
Upload
averypoint-uconn -
Category
Documents
-
view
2 -
download
0
Transcript of Landscape of fear influences the relative importance of consumptive and nonconsumptive predator...

Ecology, 92(12), 2011, pp. 2258–2266� 2011 by the Ecological Society of America
Landscape of fear influences the relative importance of consumptiveand nonconsumptive predator effects
CATHERINE M. MATASSA1
AND GEOFFREY C. TRUSSELL
Marine Science Center, Northeastern University, East Point, Nahant, Massachusetts 01908 USA
Abstract. Predators can initiate trophic cascades by consuming and/or scaring their prey.Although both forms of predator effect can increase the overall abundance of prey’s resources,nonconsumptive effects may be more important to the spatial and temporal distribution ofresources because predation risk often determines where and when prey choose to forage. Ourexperiment characterized temporal and spatial variation in the strength of consumptive andnonconsumptive predator effects in a rocky intertidal food chain consisting of the predatorygreen crab (Carcinus maenas), an intermediate consumer (the dogwhelk, Nucella lapillus), andbarnacles (Semibalanus balanoides) as a resource. We tracked the survival of individualbarnacles through time to map the strength of predator effects in experimental communities.These maps revealed striking spatiotemporal patterns in Nucella foraging behavior in responseto each predator effect. However, only the nonconsumptive effect of green crabs producedstrong spatial patterns in barnacle survivorship. Predation risk may play a pivotal role indetermining the small-scale distribution patterns of this important rocky intertidal foundationspecies. We suggest that the effects of predation risk on individual foraging behavior may scaleup to shape community structure and dynamics at a landscape level.
Key words: Carcinus maenas; consumptive effect; nonconsumptive effect; Nucella lapillus; predationrisk; Semibalanus balanoides; trait-mediated indirect interaction; trophic cascade.
INTRODUCTION
Predators can strongly influence ecological communi-
ties through trophic cascades. Trophic cascades, in the
classical sense, occur when predators eat prey (a
consumptive effect or CE), thereby reducing prey
density and relaxing consumer pressure on basal
resources (Hairston et al. 1960, Paine 1980). Predators
can also initiate trophic cascades by scaring prey (a
nonconsumptive effect or NCE), because prey often
reduce foraging rates in response to predation risk (Sih
1980, Lima and Dill 1990, Abrams et al. 1996, Peacor
and Werner 1997, Werner and Peacor 2003). Although
both forms of predator effect can enhance the abun-
dance of basal resources, the effects of predation risk
may more strongly dictate when, where, and what prey
eat (for review, see Schmitz et al. [2004]). For example,
many prey shift their foraging activities from risky to
refuge habitats when they detect predation risk (Werner
et al. 1983, Turner and Mittelbach 1990, Trussell et al.
2006). Hence, nonconsumptive effects may play a
primary role in determining the distribution and
abundance of resources over space and time.
The consumptive and nonconsumptive effects of
predators are important features of rocky intertidal
systems (Trussell et al. 2002, 2004). Carnivorous whelks
are common and effective consumers of mussels and
barnacles and their impact on the abundance of these
resources can strongly influence the structure and
dynamics of rocky intertidal communities (Connell
1961, Menge 1976, 1978a, b, Lubchenco and Menge
1978, Hughes and Burrows 1993). The impact of whelk
foraging in these systems is determined by a suite of
abiotic (e.g., refuge availability, wave exposure, thermal
stress; Menge 1978a, b, Fairweather 1988b, Burrows and
Hughes 1989, 1990) and biotic factors (e.g., whelk
density, age, size, energetic state, and diet history, the
availability of mussel or barnacle resources, presence/
absence of predators [Dunkin and Hughes 1984, Hughes
and Drewett 1985, Fairweather 1988a, b, Burrows and
Hughes 1990, 1991, Palmer 1990, Hughes et al. 1992,
Vadas et al. 1994, Trussell et al. 2006, 2008]) that can
influence whelk population sizes and shape their
foraging decisions. On the rocky shores of New
England, risk cues from the predatory green crab
(Carcinus maenas) strongly suppress the foraging rates
of the Atlantic dogwhelk (Nucella lapillus), driving trait-
mediated trophic cascades that rival or exceed the
strength of density-mediated cascades driven by reduc-
tions in whelk density (Trussell et al. 2006, 2008).
Moreover, the absolute and relative strength of non-
consumptive effects in this system strongly depends
upon habitat type (risky vs. refuge) and resource identity
(barnacles [Semibalanus balanoides] vs. mussels [Mytilus
edulis]). In risky habitats, green crab predation risk
reduces Nucella foraging rates by over 50%, with strong,
positive indirect effects on resources, but has little to no
Manuscript received 3 March 2011; revised 8 June 2011;accepted 13 June 2011. Corresponding Editor: S. G. Morgan.
1 E-mail: [email protected]
2258

effect on consumers or resources in refuge habitats
(Trussell et al. 2006). In contrast, consumptive effects
(reductions in Nucella density) enhance resource abun-
dance in both risky and refuge habitats. Hence,
predation risk may more strongly dictate the spatial
distribution of resources according to the location of
risky vs. refuge habitats within a consumer’s environ-
ment, i.e., the ‘‘landscape of fear’’ (Laundre et al. 2001).
It is becoming increasingly clear that ecological
context can shape the interactions between predators,
consumers, and resources. Studies that have mapped
landscapes of fear for ecologically important consumers
found spatiotemporal correlations among habitat types,
resources, consumers, and predators in the field (Van
der Merwe and Brown 2008, Valeix et al. 2009).
However, to determine the relative importance of
predation risk (NCE) vs. consumer removal (CE) across
a landscape of fear, it is necessary to manipulate each
predator effect independently. In this study, we exam-
ined how the NCEs and CEs of the green crab influenced
spatiotemporal patterns of barnacle survival by altering
Nucella foraging behavior within experimental meso-
cosm communities. Although we recognize the limita-
tions of mesocosm experiments, an advantage of our
experimental system is that we are able to independently
apply both forms of predator effect across an entire
landscape of fear, thereby allowing us to directly map
the strength of each predator effect in isolation and
together (the total predator effect) through time. We
predicted that the strength and relative importance of
NCEs on whelk foraging would increase with distance
from whelk refuges and lead to pronounced spatial
gradients in barnacle survival. Our maps revealed
spatiotemporal patterns in consumer foraging behavior
in response to both NCEs and CEs, but only NCEs
produced strong spatial patterns in resource survival.
MATERIALS AND METHODS
We explored how the predatory green crab (Carcinus
maenas) influenced spatial variation in the foraging
behavior of the whelk Nucella lapillus feeding on
barnacles (Semibalanus balanoides). We fully crossed
two levels of predation risk (crab cues, no crab cues)
with two levels of Nucella removal (removal, no
removal) and randomly applied each treatment combi-
nation to 20 independent flow-through mesocosms (n ¼5) for 36 days. The four treatment combinations of this
design allowed us to obtain independent estimates of
nonconsumptive (NCEs), consumptive (CEs), and total
predator effects (TEs) relative to predator-free controls.
Mesocosms were modified plastic utility boxes (27 3 15
3 5 cm) divided into two chambers with a perforated
barrier. Seawater was delivered to the upstream crab
chamber, which was stocked weekly with 10 Nucella (as
crab food) plus a single green crab (crab cues) or no crab
(no crab cues) to manipulate predation risk. An
experimental barnacle community (15 3 15 cm granite
tile; mean 6 SE, 3150 6 90 barnacles/tile, approximate-
ly 14 barnacles/cm2) and 20 experimental Nucella
( juveniles, shell length 8–10 mm) were placed in the
downstream chamber. Nucella were collected from the
mid- to upper-intertidal near Chamberlain, Maine,
USA. Field estimates of Nucella density at this site
range from 36–152 adults/m2, but reach densities of 436
whelk/m2 when juveniles are included in these estimates
(Menge 1976, 1978b). During our spring–summer
sampling (using 0.263 0.26 m quadrats, n¼ 10), Nucella
densities ranged from 192 to 828 snails/m2 (mean 6 95%CI; 402 6 152 snails/m2) in and around favorable
habitats such as crevices or shaded rock overhangs, and
we observed feeding/breeding aggregations having even
higher densities (Feare 1971).
To simulate green crab consumptive effects, we
manually removed either 0% (no removal) or 16%(removal) of the experimental Nucella present in
appropriate mesocosms every three days (see Peacor
and Werner 2001 and Trussell et al. 2006 for similar
approaches). This simulated ‘‘predation rate’’ (;0.5
snails�crab�1�d�1) exceeds field estimates of green crab
predation on Nucella by more than an order of
magnitude (see Trussell et al. 2006). In addition, we
have also found that the effects of green crab predation
risk on Nucella foraging rates are surprisingly similar for
a broad range of risk cue exposures (Trussell et al. 2011).
For example, exposure to risk cues 25% vs. 100% of the
time (as in this experiment) suppressed Nucella foraging
to the same degree. Hence, we think that our estimates
of the relative strength of NCEs compared to CEs are
likely conservative.
We examined how predator effects on Nucella foraging
behavior and resulting indirect effects on barnacles varied
over space and time by mapping and tracking the survival
of individual barnacles within experimental communities.
We digitally photographed barnacle communities in the
same orientation every 12 d (see Appendix for details).
We divided each community into a 103 10 grid (1.531.5
cm squares; see Appendix: Fig. A1) and determined the
number of live barnacles (B) within each grid square, s, at
time x as Bsx. We calculated the number of barnacles
consumed in each square as Bs0 � Bsx, where Bs0 is the
number of barnacles initially alive in square s at time 0.
To evaluate how predators influenced Nucella–barnacle
interactions, we first calculated the per capita consump-
tion (C ) of barnacles by Nucella (N ) in each square using
the formula Csx¼ (Bs0 – Bsx)/Nx, where Nx is the average
number of Nucella present in the mesocosm through time
x. We then estimated the size of nonconsumptive
(NCEsx), consumptive (CEsx), and total (TEsx) predator
effects on Nucella–barnacle interactions using the follow-
ing equations:
NCEsx ¼ 1� ðCsx Crab;NoRemoval=Csx NoCrab;NoRemovalÞ ð1Þ
CEsx ¼ 1� ðCsx NoCrab;Removal=Csx NoCrab;NoRemovalÞ ð2Þ
TEsx ¼ 1� ðCsx Crab;Removal=Csx NoCrab;NoRemovalÞ: ð3Þ
December 2011 2259LANDSCAPE OF FEAR
The denominator was the mean Csx for square s at time x,
averaged across all five no-predator control replicates.
This technique yielded five replicate estimates of NCEsx,
CEsx, and TEsx for each square, s, at each time period.
For example, an effect size of 0.65 means that Nucella
reduced per capita foraging rates by 65% relative to no-
predator controls. A negative effect size indicates an
increase in foraging rates, while zero indicates no effect
(see Peacor and Werner 2004 and Trussell et al. 2008 for
similar approaches).We could not calculate the strength of indirect effects
on barnacle abundance using similar equations (e.g.,
TMII or DMII; Okuyama and Bolker 2007, Trussell et
al. 2008) because of the high frequency of zero-value
denominators (BsxNoCrab,No removal¼ 0) by day 24 of the
experiment. Instead, we calculated barnacle survival rate
as the proportion of barnacles in each square that
survived as Psx¼Bsx/Bs0. Comparing Psx in the predator
treatments to the no-predator controls allowed us to
evaluate the indirect effects of predation risk and snail
removal on barnacles.
We constructed contour maps of predator effect size
and barnacle survival at days 12, 24, and 36 across our
experimental communities using values from our 10310
grid. We mapped NCEs, CEs, and TEs on Nucella
foraging behavior by averaging our five replicate
estimates of NCEsx, CEsx, and TEsx, to obtain a single
value per square per time period. We similarly averaged
our five replicate estimates of Psx to map barnacle
survival rates in the no-predator controls (no crab, no
removal) and in each of the three predator treatments
(NCE, CE, and TE) at each time period. From these
contour maps, as well as in our previous work (e.g.,
Trussell et al. 2006, 2008) using the same mesocosm
design, we found that snails under predation risk
retreated to the edges of the tiles for refuge. Presumably
these areas, where the tile contacts the walls of the
mesocosm, simulate the cracks and crevices that snails
utilize in the field. To quantitatively analyze these
patterns, we binned squares from the 10 3 10 grid into
‘‘risk zones’’ that ran parallel to the tile edge (0.0–1.5
cm, 1.5–3.0 cm, 3.0–4.5 cm and 4.5–6.0 cm from the tile
edge; see Appendix: Fig. A1). At each time period, we
randomly selected 10 squares from each risk zone and
calculated the mean effect size and mean proportion of
barnacles that survived for each zone within each
replicate.
We analyzed predator effect sizes using a split-plot
ANOVA that fully crossed effect type (NCE, CE, and
TE), zone (1–4), and day (12, 24, and 36), and
considered these factors as fixed effects. Replicate tiles
were nested within effect type, crossed with zone and
day, and considered random effects (REML methods
used with the ANOVA). To correct for correlated errors
over space (i.e., zone) and time (i.e., day), we used
Greenhouse-Geisser estimates of Box’s epsilon to correct
the degrees of freedom for tests involving zone and day
(PG-G). Because NCE, CE, and TE are ratios, we also
analyzed the data using permutation tests (N¼ 5000) for
comparison (Pperm). We report the most conservative P
values in our results, but provide full details of statistical
tests in the Appendix (Tables A1 and A2).
We analyzed barnacle survival (Psx) in a similar
fashion, with predation risk, removal, zone, and day as
fully crossed, fixed effects. Replicate tiles were nested
within predation risk and removal, crossed with zone
and day, and considered random effects. Assumptions
of normality and equal variances were satisfied for
analyses of both predator effect size and barnacle
survival rates. Analyses were performed using R (R
Development Core Team 2010) with package ‘‘ez’’
(available online).2 We used JMP software (SAS
Institute, Cary, North Carolina, USA) to conduct post
hoc comparisons and to construct contour maps.
RESULTS
Predator effects on the per capita foraging rates
of Nucella
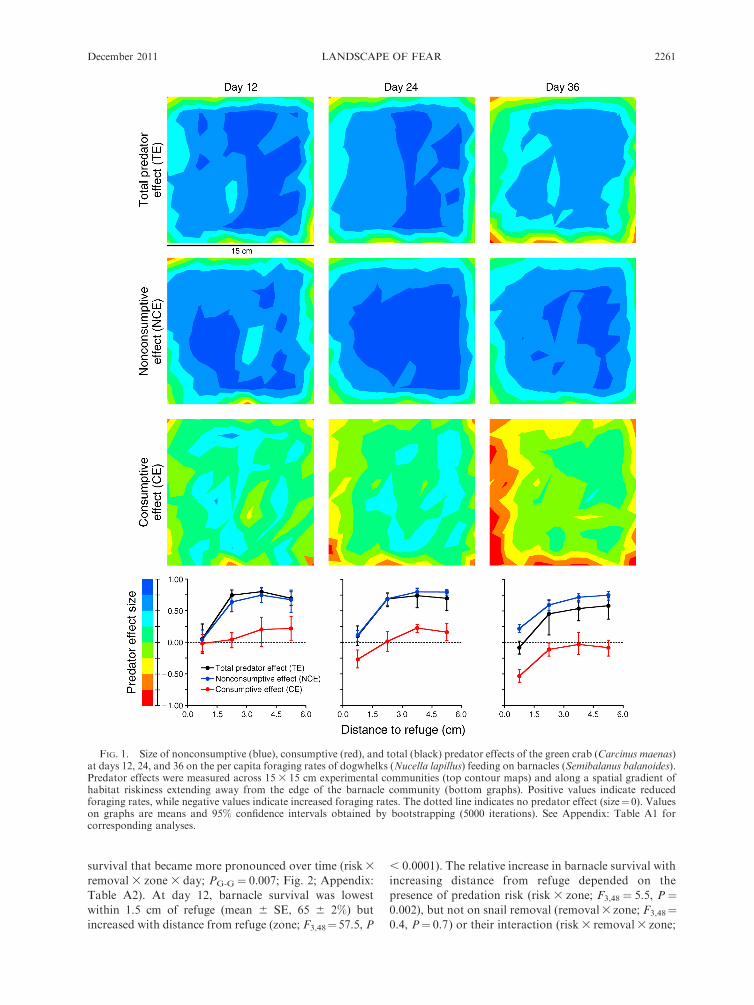
Differences in the size of each predator effect emerged
quickly, but these differences depended on distance from
refuge and varied over time (effect type 3 zone 3 day;
PG-G ¼ 0.035; Fig. 1; Appendix: Table A1). During the
first 12 days, predators had no effect on Nucella foraging
rates in areas closest (0–1.5 cm) to refuge habitat (Fig. 1,
Day 12). However, the size of NCEs and TEs increased
with distance from refuge (zone, F3,16 ¼ 13.5 and 17.6,
respectively, both P , 0.0001), while zone had no effect
on the size of CEs (F3,16¼ 1.3, P¼ 0.3). In habitats more
than 1.5 cm from Nucella refuges, NCEs reduced
Nucella foraging rates by (mean 6 SE) 68 6 8%. NCEs
were 4.4 times stronger than CEs (effect type, F1,8¼20.2,
P ¼ 0.002), and drove the total predator effect through
day 12 in these habitats (Fig. 1, day 12).
NCEs remained stronger than CEs throughout the
experiment in risky habitats (areas . 1.5 cm from
refuge; F1,8 ¼ 95.0, P , 0.0001; Fig. 1, day 36). As a
result, the strong foraging reductions caused by TEs (53
6 12%) were more strongly driven by NCEs (69 6 5%)
than by CEs (�7 6 8%) in risky habitats. In habitats
near refuge, however, NCEs reduced foraging (22 6
4%), but CEs enhanced Nucella per capita foraging rates
(�53 6 5%), perhaps by reducing intraspecific compe-
tition for resources in this preferred habitat. Based on
the absolute value of each effect size, CEs were 2.4 times
stronger than NCEs near refuge (F1,8¼ 21.0, P¼ 0.002),
but TEs remained weak (�8 6 6%) near refuges because
of the opposing contributions of CEs (foraging en-
hancement) and NCEs (foraging reduction) in this
habitat.
Indirect effects of predators on barnacle survival
Changes in Nucella foraging in response to predation
risk quickly produced spatial patterns in barnacle
2 hhttp://CRAN.R-project.org/package¼ezi
CATHERINE M. MATASSA AND GEOFFREY C. TRUSSELL2260 Ecology, Vol. 92, No. 12
survival that became more pronounced over time (risk3
removal 3 zone 3 day; PG-G¼ 0.007; Fig. 2; Appendix:
Table A2). At day 12, barnacle survival was lowest
within 1.5 cm of refuge (mean 6 SE, 65 6 2%) but
increased with distance from refuge (zone; F3,48¼57.5, P
, 0.0001). The relative increase in barnacle survival with
increasing distance from refuge depended on the
presence of predation risk (risk 3 zone; F3,48 ¼ 5.5, P ¼0.002), but not on snail removal (removal3 zone; F3,48¼0.4, P¼ 0.7) or their interaction (risk3 removal3 zone;
FIG. 1. Size of nonconsumptive (blue), consumptive (red), and total (black) predator effects of the green crab (Carcinus maenas)at days 12, 24, and 36 on the per capita foraging rates of dogwhelks (Nucella lapillus) feeding on barnacles (Semibalanus balanoides).Predator effects were measured across 15 3 15 cm experimental communities (top contour maps) and along a spatial gradient ofhabitat riskiness extending away from the edge of the barnacle community (bottom graphs). Positive values indicate reducedforaging rates, while negative values indicate increased foraging rates. The dotted line indicates no predator effect (size¼ 0). Valueson graphs are means and 95% confidence intervals obtained by bootstrapping (5000 iterations). See Appendix: Table A1 forcorresponding analyses.
December 2011 2261LANDSCAPE OF FEAR
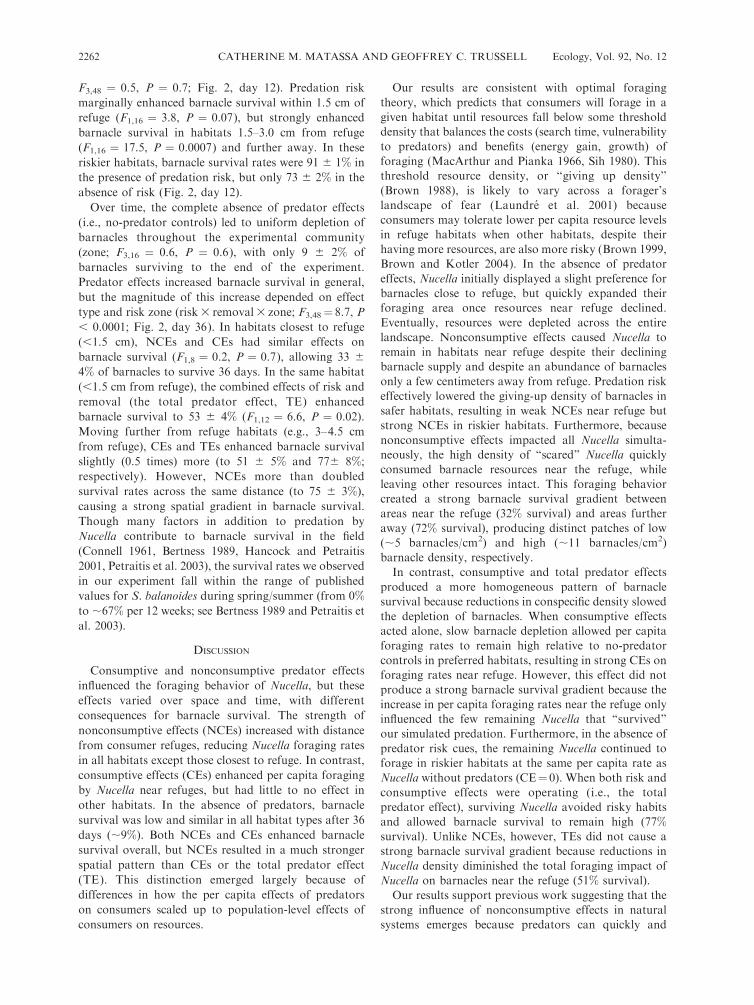
F3,48 ¼ 0.5, P ¼ 0.7; Fig. 2, day 12). Predation risk
marginally enhanced barnacle survival within 1.5 cm of
refuge (F1,16 ¼ 3.8, P ¼ 0.07), but strongly enhanced
barnacle survival in habitats 1.5–3.0 cm from refuge
(F1,16 ¼ 17.5, P ¼ 0.0007) and further away. In these
riskier habitats, barnacle survival rates were 91 6 1% in
the presence of predation risk, but only 73 6 2% in the
absence of risk (Fig. 2, day 12).
Over time, the complete absence of predator effects
(i.e., no-predator controls) led to uniform depletion of
barnacles throughout the experimental community
(zone; F3,16 ¼ 0.6, P ¼ 0.6), with only 9 6 2% of
barnacles surviving to the end of the experiment.
Predator effects increased barnacle survival in general,
but the magnitude of this increase depended on effect
type and risk zone (risk3 removal3 zone; F3,48¼ 8.7, P
, 0.0001; Fig. 2, day 36). In habitats closest to refuge
(,1.5 cm), NCEs and CEs had similar effects on
barnacle survival (F1,8 ¼ 0.2, P ¼ 0.7), allowing 33 6
4% of barnacles to survive 36 days. In the same habitat
(,1.5 cm from refuge), the combined effects of risk and
removal (the total predator effect, TE) enhanced
barnacle survival to 53 6 4% (F1,12 ¼ 6.6, P ¼ 0.02).
Moving further from refuge habitats (e.g., 3–4.5 cm
from refuge), CEs and TEs enhanced barnacle survival
slightly (0.5 times) more (to 51 6 5% and 776 8%;
respectively). However, NCEs more than doubled
survival rates across the same distance (to 75 6 3%),
causing a strong spatial gradient in barnacle survival.
Though many factors in addition to predation by
Nucella contribute to barnacle survival in the field
(Connell 1961, Bertness 1989, Hancock and Petraitis
2001, Petraitis et al. 2003), the survival rates we observed
in our experiment fall within the range of published
values for S. balanoides during spring/summer (from 0%
to ;67% per 12 weeks; see Bertness 1989 and Petraitis et
al. 2003).
DISCUSSION
Consumptive and nonconsumptive predator effects
influenced the foraging behavior of Nucella, but these
effects varied over space and time, with different
consequences for barnacle survival. The strength of
nonconsumptive effects (NCEs) increased with distance
from consumer refuges, reducing Nucella foraging rates
in all habitats except those closest to refuge. In contrast,
consumptive effects (CEs) enhanced per capita foraging
by Nucella near refuges, but had little to no effect in
other habitats. In the absence of predators, barnacle
survival was low and similar in all habitat types after 36
days (;9%). Both NCEs and CEs enhanced barnacle
survival overall, but NCEs resulted in a much stronger
spatial pattern than CEs or the total predator effect
(TE). This distinction emerged largely because of
differences in how the per capita effects of predators
on consumers scaled up to population-level effects of
consumers on resources.
Our results are consistent with optimal foraging
theory, which predicts that consumers will forage in a
given habitat until resources fall below some threshold
density that balances the costs (search time, vulnerability
to predators) and benefits (energy gain, growth) of
foraging (MacArthur and Pianka 1966, Sih 1980). This
threshold resource density, or ‘‘giving up density’’
(Brown 1988), is likely to vary across a forager’s
landscape of fear (Laundre et al. 2001) because
consumers may tolerate lower per capita resource levels
in refuge habitats when other habitats, despite their
having more resources, are also more risky (Brown 1999,
Brown and Kotler 2004). In the absence of predator
effects, Nucella initially displayed a slight preference for
barnacles close to refuge, but quickly expanded their
foraging area once resources near refuge declined.
Eventually, resources were depleted across the entire
landscape. Nonconsumptive effects caused Nucella to
remain in habitats near refuge despite their declining
barnacle supply and despite an abundance of barnacles
only a few centimeters away from refuge. Predation risk
effectively lowered the giving-up density of barnacles in
safer habitats, resulting in weak NCEs near refuge but
strong NCEs in riskier habitats. Furthermore, because
nonconsumptive effects impacted all Nucella simulta-
neously, the high density of ‘‘scared’’ Nucella quickly
consumed barnacle resources near the refuge, while
leaving other resources intact. This foraging behavior
created a strong barnacle survival gradient between
areas near the refuge (32% survival) and areas further
away (72% survival), producing distinct patches of low
(;5 barnacles/cm2) and high (;11 barnacles/cm2)
barnacle density, respectively.
In contrast, consumptive and total predator effects
produced a more homogeneous pattern of barnacle
survival because reductions in conspecific density slowed
the depletion of barnacles. When consumptive effects
acted alone, slow barnacle depletion allowed per capita
foraging rates to remain high relative to no-predator
controls in preferred habitats, resulting in strong CEs on
foraging rates near refuge. However, this effect did not
produce a strong barnacle survival gradient because the
increase in per capita foraging rates near the refuge only
influenced the few remaining Nucella that ‘‘survived’’
our simulated predation. Furthermore, in the absence of
predator risk cues, the remaining Nucella continued to
forage in riskier habitats at the same per capita rate as
Nucella without predators (CE¼ 0). When both risk and
consumptive effects were operating (i.e., the total
predator effect), surviving Nucella avoided risky habits
and allowed barnacle survival to remain high (77%survival). Unlike NCEs, however, TEs did not cause a
strong barnacle survival gradient because reductions in
Nucella density diminished the total foraging impact of
Nucella on barnacles near the refuge (51% survival).
Our results support previous work suggesting that the
strong influence of nonconsumptive effects in natural
systems emerges because predators can quickly and
CATHERINE M. MATASSA AND GEOFFREY C. TRUSSELL2262 Ecology, Vol. 92, No. 12
FIG. 2. Contour maps (top) of the proportion of barnacles (Semibalanus balanoides) surviving (Psx) to days 12, 24, and 36within 15315 cm experimental communities. Graphs (bottom) indicate the proportion barnacles surviving (mean 6 SE) at varyingdistances from refuge habitats in no-predator controls (open symbols) or in treatments testing for nonconsumptive (blue),consumptive (red), and total (black) predator effects of the green crab (Carcinus maenas) on dogwhelks (Nucella lapillus). At right,we present photographs of representative barnacle communities at days 12, 24, and 36; the bottom photograph is a samplecommunity at the beginning of the experiment (0 d). See Appendix: Table A2 for corresponding analyses.
December 2011 2263LANDSCAPE OF FEAR
simultaneously scare many prey, with strong and rapid
effects on resources (Peacor and Werner 2001, Werner
and Peacor 2003). Increased attention to the effects of
predation risk is changing views of how communities are
structured and ecosystems function over space and time
(e.g., Schmitz et al. 2008). For example, the reintroduc-
tion of wolves in Yellowstone National Park has had
significant impacts on this ecosystem that appear to be
strongly driven by elk responses to wolf predation risk
(Creel et al. 2005). When wolves are present, elk retreat
from open grasslands and riverbeds to the protective
cover of forest edges (Creel et al. 2005, Fortin et al.
2005). This behavior has fostered the recovery of woody
vegetation along riverbeds and helped to restore beaver
populations, riparian ecosystem functions, and hydro-
logical processes (Ripple and Beschta 2004). In addition,
changes in elk habitat use alter spatial patterns of energy
and nutrient dynamics across the Yellowstone landscape
(Frank 2008). However, determining the relative impor-
tance of NCEs and CEs to the dynamics of this system
has been difficult (Creel and Christianson 2009) because
the experiments necessary to do so are particularly
challenging at this scale.
Although our experiment involved considerably
smaller spatial scales, we suggest that the observed
effects of predation risk on the spatial distribution of
barnacles may scale up to influence rocky intertidal
community dynamics on a landscape level. Indeed,
community structure can be driven by interactions
operating on an even smaller spatial scale. Raimondi
et al. (2000) found that the greater structural complexity
afforded by conic vs. predator-induced bent morphs of
barnacles (Chthamalus anisopoma) dictated whether a
patch became mussel or algae dominated. The small-
scale patterns of barnacle survival caused by predation
risk in our experiment are similar to the gradients in
barnacle population structure and ‘‘predation haloes’’
around cracks and crevices often noted by others
working in the field (Fairweather 1988d, Johnson et al.
1998). For example, the risk of dislodgement due to high
wave energy restricts the foraging range of whelks on
exposed headlands, resulting in areas of bare space or
reduced prey density near crevices used by whelks for
refuge (Menge 1978b). The risk of desiccation or thermal
stress may cause similar patterns on more protected
shores, where crevices, the undersides of boulders, tide
pools, or algal patches provide cool, moist refuges
(Fairweather 1988d, Johnson et al. 1998). By altering the
spatial foraging patterns of consumers, predation risk
may have a broad influence on the structure and
dynamics of rocky shore communities by creating the
striking spatial patterning in barnacle distributions that
are often observed in the field (Fairweather 1988c, d,
1990).
On the rocky shores of New England, barnacles
strongly influence community succession (Menge 1976,
1978a, b, 1995, Bertness et al. 2002, 2004, Kordas and
Dudgeon 2010) because they buffer thermal stress,
provide physical structure for settlement of other
species, and interfere with herbivore grazing on algal
recruits (Lubchenco 1983, Bertness 1989, Navarrete and
Castilla 1990). The prominent role of barnacles is
partially due to their ability to preempt space because
they are one of first organisms to recruit in early spring
after winter storm disturbances, and their density
influences the subsequent recruitment of other species,
such as canopy-forming seaweeds (e.g., Ascophyllum
nodosum, Fucus spp.) and mussels (Mytilus edulis)
(Lubchenco 1983, Bertness et al. 2002). For example,
depending on their development stage (e.g., Kordas and
Dudgeon 2010), barnacle density can facilitate seaweed
recruitment by creating spatial refuges that limit the
effectiveness of herbivore grazing (Lubchenco 1983).
We suggest that the strength of positive interactions
between barnacles and other species may be determined
by how the effects of risk on Nucella foraging behavior
shape the abundance and distribution of barnacles.
Predation risk should allow positive interactions be-
tween barnacles and other species to be strong in areas
away from Nucella refuges (high barnacle survival), but
weak in areas close to refuges (low barnacle survival).
Spatial patterns in barnacle survival could also shape
density-dependent intraspecific interactions, growth
rates, morphology (e.g., hummock formation), and
fitness of individual barnacles (Bertness 1989, Bertness
et al. 1998). Furthermore, by increasing heterogeneity or
patchiness of the barnacle community (i.e., causing
adjacent patches of high and low barnacle survival or
density), nonconsumptive effects may influence diversi-
ty, productivity, and dynamics at the community and
landscape level (Duggins 1983, Sousa 1984, Fairweather
1988c, Dunstan and Johnson 2006). Indeed, predation
risk and the landscape of fear (i.e., the distribution of
consumer refuges) may provide an explanation for why
consumer pressure and community structure is often
patchy on rocky shores (Lubchenco and Menge 1978,
Fairweather 1988c, d, 1990).
The scale of our experiment allowed us to indepen-
dently estimate the influence of nonconsumptive, con-
sumptive, and total predator effects on individual prey
foraging decisions that, in turn, determined the survival
and distribution of resources. Our study highlights that
the effects of predators on Nucella–barnacle interactions
are ultimately context dependent: they rely upon the
location of barnacles within Nucella’s landscape of fear.
Nonconsumptive effects on foraging behavior are much
stronger than consumptive effects in habitats where
Nucella are more vulnerable to predators. Noncon-
sumptive effects drive the total predator effect in these
habitats and strongly influence the distribution of
resources. In contrast, consumptive effects on foraging
behavior develop slowly and only in refuge habitats,
with much weaker effects on resource distribution. We
suggest that mapping the strength of predator effects
across landscapes of fear at larger spatial scales may
allow more robust assessment of where, when and how
CATHERINE M. MATASSA AND GEOFFREY C. TRUSSELL2264 Ecology, Vol. 92, No. 12

predators influence community structure and ecosystem
function. Such maps may reveal the contexts in whichpredator introduction or removal can be an effective
management strategy.
ACKNOWLEDGMENTS
We thank the Marine Science Center for providing anexcellent work environment, our families for their support, andP. Ewanchuk, G. Bernatchez, E. Bryson, and J. Page forenduring winters on the river. We thank an anonymousreviewer and P. Petraitis for especially helpful comments thatimproved this manuscript. This study is part of the Ph.D.dissertation of C. M. Matassa and was generously supported byNSF grants OCE-0648525 and OCE-0727628 to G. C. Trussell.This is contribution #274 from Northeastern University’sMarine Science Center.
LITERATURE CITED
Abrams, P. A., B. A. Menge, G. G. Mittelbach, D. Spiller, andP. Yodzis. 1996. The role of indirect effects in food webs.Pages 371–395 in G. Polis and K. Winemiller, editors. Foodwebs: dynamics and structure. Chapman and Hall, NewYork, New York, USA.
Bertness, M. D. 1989. Intraspecific competition and facilitationin a northern acorn barnacle population. Ecology 70:257–268.
Bertness, M. D., S. D. Gaines, and S. M. Yeh. 1998. Makingmountains out of barnacles: the dynamics of acorn barnaclehummocking. Ecology 79:1382–1394.
Bertness, M. D., G. C. Trussell, P. J. Ewanchuk, and B. R.Silliman. 2002. Do alternate stable community states exist inthe Gulf of Maine rocky intertidal zone? Ecology 83:3434–3448.
Bertness, M. D., G. C. Trussell, P. J. Ewanchuk, B. R. Silliman,and C. M. Crain. 2004. Consumer-controlled communitystates on Gulf of Maine rocky shores. Ecology 85:1321–1331.
Brown, J. S. 1988. Patch use as an indicator of habitatpreference, predation risk, and competition. BehavioralEcology and Sociobiology 22:37–47.
Brown, J. S. 1999. Vigilance, patch use and habitat selection:foraging under predation risk. Evolutionary Ecology Re-search 1:49–71.
Brown, J. S., and B. P. Kotler. 2004. Hazardous duty pay andthe foraging cost of predation. Ecology Letters 7:999–1014.
Burrows, M. T., and R. N. Hughes. 1989. Natural foraging ofthe dogwhelk, Nucella lapillus (Linnaeus); the weather andwhether to feed. Journal of Molluscan Studies 55:285–295.
Burrows, M. T., and R. N. Hughes. 1990. Variation in growthand consumption among individuals and populations ofdogwhelks, Nucella lapillus: a link between foraging behav-iour and fitness. Journal of Animal Ecology 59:723–742.
Burrows, M. T., and R. N. Hughes. 1991. Variation in foragingbehaviour among individuals and populations of dogwhelks,Nucella lapillus: natural constraints on energy intake. Journalof Animal Ecology 60:497–514.
Connell, J. H. 1961. Effects of competition, predation by Thaislapillus, and other factors on natural populations of thebarnacle Balanus balanoides. Ecological Monographs 31:61–104.
Creel, S., and D. Christianson. 2009. Wolf presence andincreased willow consumption by Yellowstone elk: implica-tions for trophic cascades. Ecology 90:2454–2466.
Creel, S., J. John Winnie, B. Maxwell, K. Hamlin, and M.Creel. 2005. Elk alter habitat selection as an antipredatorresponse to wolves. Ecology 86:3387–3397.
Duggins, D. O. 1983. Starfish predation and the creation ofmosaic patterns in a kelp-dominated community. Ecology64:1610–1619.
Dunkin, S., and R. N. Hughes. 1984. Behavioural componentsof prey-selection by dogwhelks, Nucella lapillus (L.), feeding
on barnacles, Semibalanus balanoides (L.), in the laboratory.Journal of Experimental Marine Biology and Ecology 79:91–103.
Dunstan, P. K., and C. R. Johnson. 2006. Linking richness,community variability, and invasion resistance with patchsize. Ecology 87:2842–2850.
Fairweather, P. G. 1988a. Correlations of predatory whelkswith intertidal prey at several scales of space and time.Marine Ecology Progress Series 45:237–243.
Fairweather, P. G. 1988b. Movements of intertidal whelks(Morula marginalba and Thais orbita) in relation toavailability of prey and shelter. Marine Biology 100:63–68.
Fairweather, P. G. 1988c. Predation can increase variability inthe abundance of prey on seashores. Oikos 53:87–92.
Fairweather, P. G. 1988d. Predation creates haloes of barespace among prey on rocky seashores in New South Wales.Australian Journal of Ecology 13:401–409.
Fairweather, P. G. 1990. Is predation capable of interactingwith other community processes on rocky reefs? AustralianJournal of Ecology 15:453–464.
Feare, C. J. 1971. The adaptive significance of aggregationbehaviour in the dogwhelk Nucella lapillus (L.). Oecologia7:117–126.
Fortin, D., H. L. Beyer, M. S. Boyce, D. W. Smith, T.Duchesne, and J. S. Mao. 2005. Wolves influence elkmovements: behavior shapes a trophic cascade in Yellow-stone National Park. Ecology 86:1320–1330.
Frank, D. A. 2008. Evidence for top predator control of agrazing ecosystem. Oikos 117:1718–1724.
Hairston, N. G., F. E. Smith, and L. B. Slobodkin. 1960.Community structure, population control, and competition.American Naturalist 94:421.
Hancock, K. M., and P. S. Petraitis. 2001. Effects ofherbivorous snails and macroalgal canopy on recruitmentand early survivorship of the barnacle Semibalanus bala-noides (L.). Journal of Experimental Marine Biology andEcology 257:205–218.
Hughes, R. N., and M. T. Burrows. 1993. Predatory behaviourof the intertidal snail, Nucella lapillus, and its effect oncommunity structure. Pages 63–83 in H. Kawanabe, J. E.Cohen, and K. Iwasaki, editors. Mutualism and communityorganisation: behavioral, theoretical and food-web ap-proaches. Oxford University Press, Oxford, UK.
Hughes, R., M. Burrows, and S. Rogers. 1992. Ontogeneticchanges in foraging behaviour of the dogwhelk Nucellalapillus (L.). Journal of Experimental Marine Biology andEcology 155:199–212.
Hughes, R., and D. Drewett. 1985. A comparison of theforaging behaviour of dogwhelks, Nucella lapillus (L.),feeding on barnacles or mussels on the shore. Journal ofMolluscan Studies 51:73–77.
Johnson, M. P., R. N. Hughes, M. T. Burrows, and S. J.Hawkins. 1998. Beyond the predation halo: small scalegradients in barnacle populations affected by the relativerefuge value of crevices. Journal of Experimental MarineBiology and Ecology 231:163–170.
Kordas, R. L., and S. Dudgeon. 2010. Dynamics of speciesinteraction strength in space, time and with developmentalstage. Proceedings of the Royal Society B. [doi: 10.1098/rspb.2010.2246]
Laundre, J. W., L. Hernandez, and K. B. Altendorf. 2001.Wolves, elk, and bison: reestablishing the ‘‘landscape of fear’’in Yellowstone National Park, USA. Canadian Journal ofZoology 79:1401–1409.
Lima, S. L., and L. M. Dill. 1990. Behavioural decisions madeunder the risk of predation: a review and prospectus.Canadian Journal of Zoology 68:619–640.
Lubchenco, J. 1983. Littorina and Fucus: effects of herbivores,substratum heterogeneity, and plant escapes during succes-sion. Ecology 64:1116–1123.
December 2011 2265LANDSCAPE OF FEAR
Lubchenco, J., and B. A. Menge. 1978. Community develop-ment and persistence in a low rocky intertidal zone.Ecological Monographs 48:67–94.
MacArthur, R. H., and E. R. Pianka. 1966. On optimal use of apatchy environment. American Naturalist 100:603.
Menge, B. A. 1976. Organization of the New England rockyintertidal community: role of predation, competition, andenvironmental heterogeneity. Ecological Monographs46:355–393.
Menge, B. A. 1978a. Predation intensity in a rocky intertidalcommunity. Effect of an algal canopy, wave action anddesiccation on predator feeding rates. Oecologia 34:17–35.
Menge, B. A. 1978b. Predation intensity in a rocky intertidalcommunity. Relation between predator foraging activity andenvironmental harshness. Oecologia 34:1–16.
Menge, B. A. 1995. Indirect effects in marine rocky intertidalinteraction webs: patterns and importance. EcologicalMonographs 65:21–74.
Navarrete, S. A., and J. C. Castilla. 1990. Barnacle walls asmediators of intertidal mussel recruitment: effects of patchsize on the utilization of space. Marine Ecology ProgressSeries 68:113–119.
Okuyama, T., and B. M. Bolker. 2007. On quantitativemeasures of indirect interactions. Ecology Letters 10:264–271.
Paine, R. T. 1980. Food webs: linkage, interaction strength andcommunity infrastructure. Journal of Animal Ecology49:667–685.
Palmer, A. R. 1990. Effect of crab effluent and scent ofdamaged conspecifics on feeding, growth, and shell mor-phology of the Atlantic dogwhelk Nucella lapillus (L.).Hydrobiologia 193:155–182.
Peacor, S. D., and E. E. Werner. 1997. Trait-mediated indirectinteractions in a simple aquatic food web. Ecology 78:1146–1156.
Peacor, S. D., and E. E. Werner. 2001. The contribution oftrait-mediated indirect effects to the net effects of a predator.Proceedings of the National Academy of Sciences USA98:3904–3908.
Peacor, S. D., and E. E. Werner. 2004. How dependent arespecies-pair interaction strengths on other species in the foodweb? Ecology 85:2754–2763.
Petraitis, P. S., E. C. Rhile, and S. Dudgeon. 2003. Survivorshipof juvenile barnacles and mussels: spatial dependence and theorigin of alternative communities. Journal of ExperimentalMarine Biology and Ecology 293:217–236.
R Development Core Team. 2010. R: a language andenvironment for statistical computing. R Foundation forStatistical Computing, Vienna, Austria. hhttp://www.R-project.org/i
Raimondi, P. T., S. E. Forde, L. F. Delph, and C. M. Lively.2000. Processes structuring communities: evidence for trait-mediated indirect effects through induced polymorphisms.Oikos 91:353–361.
Ripple, W. J., and R. L. Beschta. 2004. Wolves and the ecologyof fear: can predation risk structure ecosystems? BioScience54:755–766.
Schmitz, O. J., J. H. Grabowski, B. L. Peckarsky, E. L. Preisser,G. C. Trussell, and J. R. Vonesh. 2008. From individuals toecosystem function: toward an integration of evolutionaryand ecosystem ecology. Ecology 89:2436–2445.
Schmitz, O. J., V. Krivan, and O. Ovadia. 2004. Trophiccascades: the primacy of trait-mediated indirect interactions.Ecology Letters 7:153–163.
Sih, A. 1980. Optimal behavior: can foragers balance twoconflicting demands? Science 210:1041.
Sousa, W. P. 1984. Intertidal mosaics: patch size, propaguleavailability, and spatially variable patterns of succession.Ecology 65:1918–1935.
Trussell, G. C., P. J. Ewanchuk, and M. D. Bertness. 2002.Field evidence of trait-mediated indirect interactions in arocky intertidal food web. Ecology Letters 5:241–245.
Trussell, G. C., P. J. Ewanchuk, M. D. Bertness, and B. R.Silliman. 2004. Trophic cascades in rocky shore tide pools:distinguishing lethal and nonlethal effects. Oecologia139:427–432.
Trussell, G. C., P. J. Ewanchuk, and C. M. Matassa. 2006.Habitat effects on the relative importance of trait- anddensity-mediated indirect interactions. Ecology Letters9:1245–1252.
Trussell, G. C., P. J. Ewanchuk, and C. M. Matassa. 2008.Resource identity modifies the influence of predation risk onecosystem function. Ecology 89:2798–2807.
Trussell, G. C., C. M. Matassa, and B. Luttbeg. 2011. Theeffects of variable predation risk on foraging and growth: lessrisk is not necessarily better. Ecology 92:1799–1806.
Turner, A., and G. Mittelbach. 1990. Predator avoidance andcommunity structure: interactions among piscivores, plank-tivores, and plankton. Ecology 71:2241–2254.
Vadas, R., M. Burrows, and R. Hughes. 1994. Foragingstrategies of dogwhelks, Nucella lapillus (L.): interactingeffects of age, diet and chemical cues to the threat ofpredation. Oecologia 100:439–450.
Valeix, M., A. Loveridge, S. Chamaille-Jammes, Z. Davidson,F. Murindagomo, H. Fritz, and D. MacDonald. 2009.Behavioral adjustments of African herbivores to predationrisk by lions: spatiotemporal variations influence habitat use.Ecology 90:23–30.
Van der Merwe, M., and J. S. Brown. 2008. Mapping thelandscape of fear of the cape ground squirrel (Xerus inauris).Journal of Mammalogy 89:1162–1169.
Werner, E. E., J. F. Gilliam, D. J. Hall, and G. G. Mittelbach.1983. An experimental test of the effects of predation risk onhabitat use in fish. Ecology 64:1540–1548.
Werner, E. E., and S. D. Peacor. 2003. A review of trait-mediated indirect interactions in ecological communities.Ecology 84:1083–1100.
APPENDIX
Description of techniques used to map and monitor barnacles and tables of statistical results (Ecological Archives E092-196-A1).
CATHERINE M. MATASSA AND GEOFFREY C. TRUSSELL2266 Ecology, Vol. 92, No. 12