Combined Micro-Channel Heat Sink Optimization for Cooled Electronics

Land Use Change and Forest Carbon SinkAssessment in an Alpine Mountain Area of theVeneto Region (Northeast Italy)Elena Dalla Valle1*, Silvia Lamedica1, Roberto Pilli 2, and Tommaso Anfodillo1
* Corresponding author: [email protected] University of Padova, Department of Land and Agroforest Environment, viale dell’Universita 23, 35020 Legnaro (PD), Italy2 European Commission, Joint Research Centre, Institute for Environment and Sustainability Climate Change Unit, TP 050 Via Fermi, 21027 Ispra(VA), Italy
Open access article: please credit the authors and the full source.
In this study, we analyzed
the variation of forest land
cover in a mountain area
of Veneto Region in
northeast Italy. The
analysis was done by
comparing orthorectified
aerial photographs taken
in 1991 with orthophotos
dated 2003, using photo
interpretation of points with casual distribution on sample
areas, according to a stratified sampling. The study yielded a
statistically relevant increment of about 0.095% (ie about
42 ha) of forestland only up to 1500 m above sea level
compared with the estimated forest cover for 1990,
highlighting that this low increase was mainly due to
abandoned grazing; the forest surface area estimate in 1990
was affected by a standard error of approximately 2.8%. We
then estimated the carbon sink in the areas where forests had
expanded. This was achieved by collecting biometric data in
the field, and then using allometric functions. The annual
carbon sink was estimated as 0.69 Mg ha21 year21.
Keywords: Kyoto Protocol; land use change; photo
interpretation; carbon sink; Italy.
Peer-reviewed: February 2009 Accepted: March 2009
Introduction
In many European countries, landscape dynamics arecharacterized by forest expansion, a phenomenon that ismainly due to forest recolonization following theabandonment of traditional agricultural practices. Theeffects of these land use changes can be considered fromthe point of view of biodiversity, landscape conservation,and existing biotopes. Perhaps more importantly, forestexpansion implies an increased potential for atmosphericcarbon sequestration. An inventory of the areasrecolonized by forest and an assessment of their carbonsink capacity thus also constitute focal issues in relation tothe carbon cycle and the Kyoto Protocol (KP).
The KP obligates countries that have committed toreducing their greenhouse gas emissions to report on thebalance between carbon sinks and sources derived fromland use change activities (UN 1998, Article 3.3). Theseinclude all human-induced forest conversion activitiessince 1990 on land that was without forest for less than 50years (reforestation) or for more than 50 years(afforestation) through forest plantation, sowing, and/orhuman actions to support natural propagation. Italy,taking the so-called broad approach in defining forestmanagement (IPCC 2003), considers all afforestation andreforestation (AR) activities as human induced (Lumicisiet al 2007).
To assess afforestation, reforestation, anddeforestation (ARD) activities it is necessary to (1) select aclear forest definition, (2) assess forest surface variations,(3) obtain information on the origins of the changeprocesses, and (4) assess the sink capacity of new forestformations. The present study applied the forestdefinition used in the Italian National Forest Inventory.According to this definition, a forest is an area of at least5000 m2 covered by trees, with a crown cover of over 10%and a canopy width of over 20 m (ISAFA 1998).
The objectives of the present study were to assess theforest surface changes since 1990 in one representativearea of the mountainous part of Veneto Region (Agordinamountain community), and to assess the carbon sinkcapacity of this area.
Material and methods
Study area
Considering the available information and in agreementwith previous studies (Salvadori et al 2006), we adoptedone mountain community (MC) as a reference unit. Amountain community is a local body that unites Alpineand pre-Alpine municipalities with a view to developingmarginalized mountainous areas. Area detectioncomplied with Intergovernmental Panel on ClimateChange (IPCC) reporting methods (IPCC 2003).
MountainResearchSystems knowledge
Mountain Research and Development (MRD)An international, peer-reviewed open access journalpublished by the International Mountain Society (IMS)www.mrd-journal.org
Mountain Research and Development Vol 29 No 2 May 2009: 161–168 http://dx.doi.org/doi:10.1659/mrd.1071 � 2009 by the authors161

The study area was thus defined as the Agordina MC,which is representative of the alpine part of VenetoRegion in terms of location and morphology (Figure 1).The Agordina MC consists of 16 municipalities and issituated in the northwest of Belluno Province. It covers anarea of 65,916.29 ha at elevations between 300 and 3000meters above sea level (masl). From south to north, forestsin the study area range from pure or mixed formations ofEuropean hop-hornbeam (Ostrya carpinifolia) in thesouthern part to mountain beech forest (Fagus sylvatica),mixed formations of spruce and fir (Picea abies and Abiesalba), mixed forests of spruce and beech, and spruceforests in the mesalpic area (the southern Alpine areawith an average annual precipitation of 1400 mm and anaverage annual temperature of 7uC), the latter extendinginto the endalpic area (the northern and inner Alpine
area with an average annual precipitation of 1000 mmand an average annual temperature of 5uC), where stonepine (Pinus cembra) and larch (Larix decidua) prevail above1600 m asl (Del Favero and Lasen 1993).
Research methodology
The analysis of land use change in the Agordina MC wasbased on a multitemporal approach (Corona et al 2007;De Natale et al 2007). Aerial photographs were used for1991, taken by the ‘‘Montagna Veneta’’ flight and thenorthorectified; these photos were chosen because theydated the nearest to the KP baseline year (1990). The datafor 2003 came from digital, color, orthorectified aerialphotographs (orthophotos). Orthorectification was donebased on technical regional numeric maps (Carta TecnicaRegionale Numerica, CTRN); these are digital maps
FIGURE 1 Geographical location of Veneto Region, with the Agordina mountain community shownin light gray, and forest cover in the Agordina mountain community (orthophotos from 2003).(Map and orthophotos by Veneto Region)
MountainResearch
Mountain Research and Development http://dx.doi.org/doi:10.1659/mrd.1071162

produced by Veneto Region at a scale of 1:5000 and withall artificial and natural details reported; each CTRNcovers a surface of about 900 ha.
The methodology proceeded with the steps describedbelow.
Sampling frame: A multi-stage sampling was done usingthe following procedure (Philip 1994):
N Division of the sample (the MC) into subsamples calledprimary units (M), in this case represented by the CTRN;
N Extraction of a random sample (m) from the total set ofprimary units (M);
N Division of the sample primary unit (m) into smallersubsets called secondary units, which are randomsample points at a density of 1/12 ha (optimum densityaccording to Salvadori et al [2006]);
N Extraction of a random sample of secondary unitsfrom each primary unit;
N Survey of the attribute of interest, ie the sample pointson the aerial photographs on which the interpretationis done, in every selected unit.
The sampling method was applied wherever both theCTRN and aerial photographs were available. Afterextracting the primary sample, random sample pointswere picked for photographic interpretation.
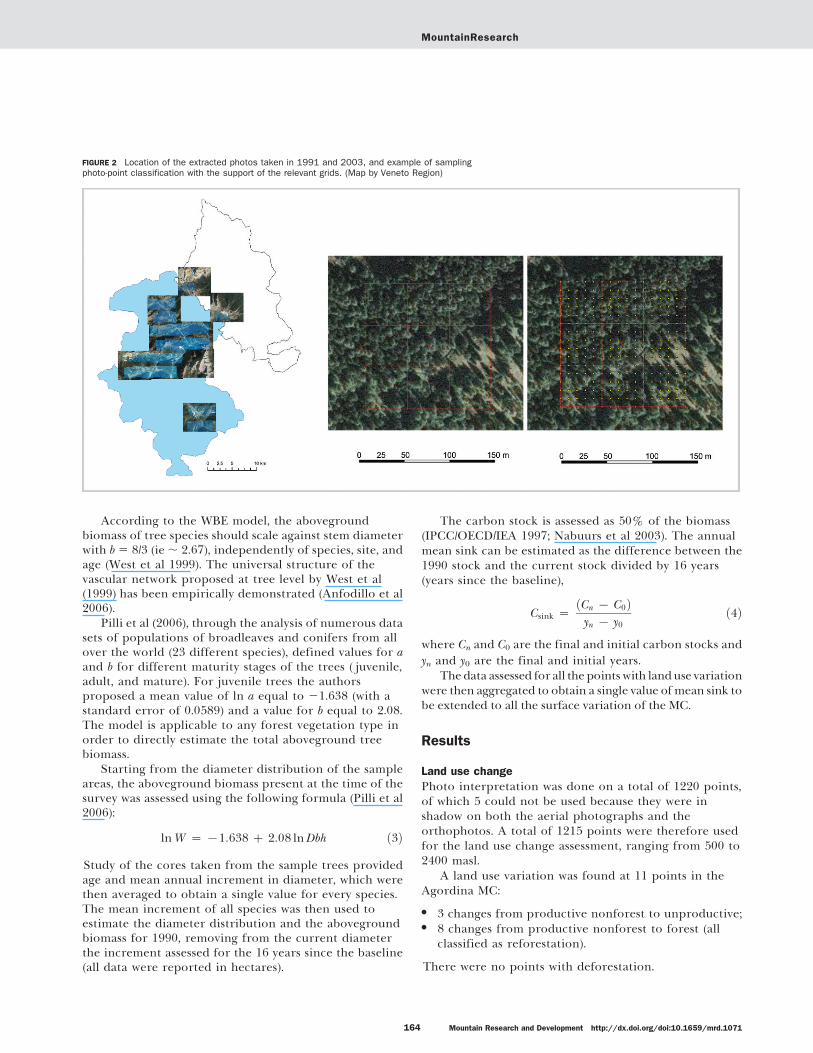
Photo interpretation by sample points: The sample pointswere classified into 3 land use categories: forest, productivenonforest (eg agricultural land), and unproductive (eg scree).The forest surface was assessed using the point-countmethod according to the Italian National Inventory(Tabacchi 2001). Each point was assigned to 1 of the 3different land use categories according to the procedureproposed by De Natale et al (2003) and used in other studies(Corona et al 2007, De Natale et al 2007) (Figure 2). Groundsurveys were used to classify points where classification byphoto interpretation was uncertain.
Field measurements: All points classified as afforestationand reforestation were measured. For each point, 2concentric circular sample areas were identified in whichto obtain different attributes (De Natale et al 2004). Thecenter of the sample area was the point at which the landuse change had been detected, identified through a globalpositioning system. For the outer area, with a radius of18 m and a surface of about 1000 m2, the followingattributes were surveyed:
N Previous land use;N Forest origin (natural, artificial, mixed);N Presence of regeneration (assessment of trees less than
2 m tall);N Presence of shrub species.
The inner area, with a radius of 8 m and a surfaceof about 200 m2, was investigated with regard to thefollowing attributes:
N Tree species;N Diameter of all trees with a diameter at breast height
(Dbh) . 3 cm;N Tree height of some sample trees identified as
representative of the forest (1–2 sample trees for eachdiameter class with a minimum of 4 sample trees intotal);
N The height sample trees were core-sampled (taken atthe base for trees with Dbh , 15 cm and at 1.30 m fortrees with Dbh . 15 cm).
Data analysis: The tree rings were counted for all sampletrees and all cores were analyzed with a computer-controlled tree ring measuring device. The statisticalrelevance of the land use variation detected between 1991and 2003 was evaluated with the McNemar test for paireddata that involves calculation of the statistics (Zar 1998):
X2c ~
f12 { f21j j{ 1ð Þ2
f12 z f21ð1Þ
where f12 and f21 are the frequencies obtained from a 2 3
2 contingency table. The assessment of the proportion ineach class and the relative rates of variance and standarddeviation are described in previous studies (Corona et al2007). In order to report all land use change values to1990—the baseline year for the KP—the total forestsurface variation was extrapolated between 1990 and2006, the year of the field surveys.
Carbon sink assessment: The proposed methodology toassess carbon sink capacity is based on the application ofallometric equations to the diameter distribution of thetrees in the sample areas located at all points with landuse variation. It is commonly believed that a species-specific equation should be used because tree species maydiffer in architecture as well as wood density (Ketteringset al 2001). However, a different approach was proposedby West et al (1999), who presented a general model,known as the WBE model, to estimate values of scalingexponents using a functional relationship (Enquist et al1999; Enquist 2002). The model proposes that evolutionby natural selection has resulted in an optimal fractal-likevascular network. As a result of this general principle,organisms should exhibit a common set of quarter-powerscaling relationships with body mass. Allometricequations are generally based on empirical relationshipsin the form of a power function:
W ~ aDbhb ð2Þ
whereW is the total aboveground biomass; a and b are thescaling coefficient and scaling exponent, respectively; andDbh is the tree breast-height diameter (Niklas 1994). Both aandbaregenerallyreportedtovarywithspecies, site, andage.
MountainResearch
Mountain Research and Development http://dx.doi.org/doi:10.1659/mrd.1071163
According to the WBE model, the abovegroundbiomass of tree species should scale against stem diameterwith b 5 8/3 (ie , 2.67), independently of species, site, andage (West et al 1999). The universal structure of thevascular network proposed at tree level by West et al(1999) has been empirically demonstrated (Anfodillo et al2006).
Pilli et al (2006), through the analysis of numerous datasets of populations of broadleaves and conifers from allover the world (23 different species), defined values for aand b for different maturity stages of the trees ( juvenile,adult, and mature). For juvenile trees the authorsproposed a mean value of ln a equal to 21.638 (with astandard error of 0.0589) and a value for b equal to 2.08.The model is applicable to any forest vegetation type inorder to directly estimate the total aboveground treebiomass.
Starting from the diameter distribution of the sampleareas, the aboveground biomass present at the time of thesurvey was assessed using the following formula (Pilli et al2006):
lnW ~ {1:638 z 2:08 lnDbh ð3Þ
Study of the cores taken from the sample trees providedage and mean annual increment in diameter, which werethen averaged to obtain a single value for every species.The mean increment of all species was then used toestimate the diameter distribution and the abovegroundbiomass for 1990, removing from the current diameterthe increment assessed for the 16 years since the baseline(all data were reported in hectares).
The carbon stock is assessed as 50% of the biomass(IPCC/OECD/IEA 1997; Nabuurs et al 2003). The annualmean sink can be estimated as the difference between the1990 stock and the current stock divided by 16 years(years since the baseline),
Csink ~Cn { C0ð Þyn { y0
ð4Þ
where Cn and C0 are the final and initial carbon stocks andyn and y0 are the final and initial years.
Thedata assessed for all thepointswith landuse variationwere then aggregated to obtain a single value ofmean sink tobe extended to all the surface variation of the MC.
Results
Land use change
Photo interpretation was done on a total of 1220 points,of which 5 could not be used because they were inshadow on both the aerial photographs and theorthophotos. A total of 1215 points were therefore usedfor the land use change assessment, ranging from 500 to2400 masl.
A land use variation was found at 11 points in theAgordina MC:
N 3 changes from productive nonforest to unproductive;N 8 changes from productive nonforest to forest (all
classified as reforestation).
There were no points with deforestation.
FIGURE 2 Location of the extracted photos taken in 1991 and 2003, and example of samplingphoto-point classification with the support of the relevant grids. (Map by Veneto Region)
MountainResearch
Mountain Research and Development http://dx.doi.org/doi:10.1659/mrd.1071164

The mean annual forest surface increase was 0.089%compared with the 1991 surface and equal to about 42 ha.This variation was statistically significant: the McNemartest yielded a value of P , 0.025.
The land use change data were then evaluated in termsof significance by subdividing the sample points with landuse variation into altitudinal bands: the McNemar testreported a statistically relevant value for heights below1500 masl, whereas the variation was not significant forthe highest points.
In the 1991–2003 period, considering only the landbelow 1500 masl (36,500.42 ha; see Table 1), the annualpercentage rate of forest surface change (error 2.81%)amounted to 0.074% of the total forest surface of theAgordina MC assessed for 1991, and 0.095% of the forestsurface below 1500 masl assessed for 1991.
Subsequently the total forest surface variation in 2006was estimated (confidence interval at 0.05 probabilitylevel):
N 26.87 6 0.75 ha yr21 of forest surface variation;N 429.92 6 12.08 ha of total variation between 1990 and
2006;N Equal to 1.18% of the total surface of the Agordina MC;N Equal to 1.53% of the forest surface assessed for 1991.
Field measurements
Biometric measurements were taken only in 6 of the8 points showing reforestation because the other 2 wereinaccessible. These 6 points showed different types ofreforestation, all verified on the ground: 2 plantations (1of larch and 1 of spruce), 1 example of ex-pasture naturalforest regrowth (at about 1950 masl), and 3 examples ofreforestation of meadow areas (2 of these points wereclose to villages and 1 was near an abandoned sawmill).
Spruce is the main species at all altitudes within theAgordina MC; other species are the sycamore maple (Acerpseudoplatanus), larch (Larix decidua), and mountain ash(Sorbus aucuparia).
Carbon sink assessment
Analysis of the cores of the sample trees was used toderive the age (Table 2) and mean increment of the
different species (0.50 cm yr21 for spruce, 0.67 cm yr21
for larch, 0.56 cm yr21 for maple; an average of0.54 cm yr21 for conifers and 0.44 cm yr21 forbroadleaves), as well as both the current and the 1990diameter distribution (Figure 3).
The mean carbon sink for the period was assessedusing equations 3 and 4. The single values obtained foreach point were then averaged to acquire an average sinkof 0.69 Mg C ha21 yr21 (standard deviation 5 0.38)(Table 3). Multiplying this last value for the mean annualforest surface variation we obtained the mean annual sink(aboveground biomass) of the areas with afforestation/reforestation activities in the Agordina MC: 18.54 Mg Cyr21.
Discussion and conclusion
Forest surface variation
Subdivision of the points into altitudinal bands was usefulto better understand the dynamics in this area, which hasa complex geomorphology. Comparing the annual forestgrowth rate obtained in this study with that obtained inanalogous studies we can see that:
N For the Agordina MC the annual forest expansion rateis 0.095% of the forest surface below 1500 maslassessed for 1991 (equal to 26.87 6 0.75 ha yr21);
N For the Grappa MC (pre-Alpine area of VenetoRegion) the annual forest expansion rate is 0.54% oftheforest surface assessed for 1991 (equal to 28.08 6
0.55 ha yr21) (Salvadori et al 2006);N For Abruzzo Region in central Italy, Corona et al
(2007) estimated an annual forest expansion of 0.60%of the forest surface assessed for 1990;
N For Trento Province in the Alpine region De Nataleet al (2007) estimated an annual forest expansion of0.10% of the total surface.
The different annual rates are due to regionalsocioeconomic reasons, geomorphology, and prevalentland uses in the different territories. Comparing theAgordina MC with the Grappa MC shows that the formerhas about 70% of the land covered by forest, with most of
TABLE 1 Land use change in the period 1991–2003 and mean annual value for all land use categories (500–1500 masl). The changes detected are from productivenon-forest to forest and unproductive.
Land use type
Land use
change (ha)
Standard
deviation
Standard
error (ha)
Annual
variation (ha)
Standard
error (ha)
Error
(%)
Forest area 322.43 0.00025 8.99 26.87 0.749 2.79
Productive
nonforest
2516.70 0.01746 11.31 243.06 0.942 2.19
Unproductive 194.28 0.00016 5.79 16.19 0.483 6.14
MountainResearch
Mountain Research and Development http://dx.doi.org/doi:10.1659/mrd.1071165

TABLE 2 Diameter (Dbh), height (H), and age of the sample trees in 2006.
Sample point Species Dbh (cm) H (m) Age (yr) Increment (cm yr21)
2005 pa 8 6.5 22 0.36
pa 5 18 0.28
pa 13 10.0 17 0.76
pa 3 2.5 17 0.18
747 pa 8 7.5 20 0.40
pa 25 13.5 17 1.47
pa 5 4.5 20 0.25
pa 10 8.5 15 0.67
3660 pa 7 3.8 16 0.44
pa 7 3.0 12 0.58
pa 12 4.8 18 0.67
pa 5 3.0 16 0.31
3991 ld 7 7.5 17 0.41
ld 6 7.0 11 0.55
ld 7 7.0 13 0.54
ld 16 9.5 12 1.33
ld 5 8.0 10 0.50
7416 pa 13 9.5 24 0.54
pa 5 4.5 13 0.38
pa 5 3.8 11 0.45
pa 4 3.5 13 0.31
sa 7 6.0 17 0.41
sa 6 6.5 13 0.46
sa 4 5.5 16 0.25
sa 6 6.0 12 0.50
sa 5 6.0 17 0.29
sa 4 5.5 17 0.24
5831 ap 10 12.0 17 0.59
ap 10 13.0 16 0.63
ap 6 9.5 12 0.50
ap 7 9.0 13 0.54
pa, Picea abies; ld, Larix decidua; sa, Sorbus aucuparia; ap, Acer pseudoplatanus.
MountainResearch
Mountain Research and Development http://dx.doi.org/doi:10.1659/mrd.1071166

the rest of the territory situated above the timber line,while the latter is situated at lower elevations and only29% of the land is covered by forest; therefore, thepotential for forest expansion in the former is lower, withslower expansion (Korner 1998). These observations arealso valid for Abruzzo Region, whereas Trento Provincehas features similar to Agordina MC.
Carbon sink assessment
The methodology used for the sink assessment of theafforested/reforested areas gives an initial idea of thepotential of this territory as a carbon sink.
The assessment was done only for the treeaboveground biomass, without any reference to thebelowground and organic soil biomass; nevertheless thisestimate is indicative of the general trend, because thetree aboveground biomass increment is the highestcontributor to the general increment of a forestecosystem as carbon sink, especially in stands withoutlogging (Nabuurs et al 2003). There are no studiesavailable to compare the reforestation sink capacity inItaly. Data for the forest surface variation and carbon sink
in Europe between 1950 and 1999 reported by Nabuurs etal (2003) shows an average sink of 0.32 Mg C ha21 yr21, ieless than half of the amount obtained in this study for theAgordina MC (0.69 Mg C ha21 yr21). Another study donefor the whole of Europe shows an average net annualincrement for Italy of 0.9 Mg C ha21 yr21 and a Europeanaverage of 1.8 Mg C ha21 yr21, considering carbon inwoody biomass (Liski et al 2000). For the early 21stcentury, Eggers et al (2008) report a carbon stock changefor tree biomass in Europe of 0.7 Mg C ha21 yr21, mainlydue to forest management, while AR activities have asmaller-scale effect.
First Commitment Period projection
Knowing the annual rate of surface variation it is possibleto propose a forecast of the 2008 forest surface,hypothesizing that the annual rate will be constant in thefuture (a conjecture acceptable only for the short term)(Zanchi et al 2005). Regarding the First CommitmentPeriod (2008–2012) projection, the forecasted 2008surface with afforestation/reforestation amounts to 483.66 13.50 ha; the forecasted forest surface variationbetween 1990 and 2012 is 618.03 6 17.25 ha for the entireAgordina MC. If the carbon sink remains stable duringthe FCP, the carbon uptake in the formations with ARDactivities will be 3.43 Mg ha21. Multiplying this value forthe total ARD surface we obtain a sink of 461.11 Mg C.
Forest expansion is an important issue in the ItalianAlpine area. The methodology used in this study to assessland use change is consistent with the Good PracticeGuidance rules established by the International Panel onClimate Change, and it meets the Reporting Method 1criteria by providing the associated error for the land usechange assessment (IPCC 2003). Concerning the carbonsink estimation, further studies are needed to betterinvestigate the potential of the new forest formations andthe levels of uncertainty.
TABLE 3 Aboveground biomass (Mg ha21) and carbon sink of the sample points for trees with Dbh . 3 cm.
Sample point
1990 Biomass 2006 Biomass C sink Annual C sink
Mg ha21 Mg ha21 Mg C ha21 Mg C ha21 yr21
5831 4.53 41.17 18.32 1.15
7416 0.69 18.90 9.10 0.57
2005 0.27 3.31 1.52 0.10
747 17.51 51.56 17.03 1.06
3991 1.03 18.63 8.80 0.55
3660 1.17 23.42 11.13 0.70
Average 4.20 26.17 10.98 0.69
FIGURE 3 Sample point 7461: 2006 and 1990 diameter distributions(coordinates 12u12919.9930 longitude, 46u27936.6570 latitude).
MountainResearch
Mountain Research and Development http://dx.doi.org/doi:10.1659/mrd.1071167

ACKNOWLEDGMENTS
This study is part of a wider research project funded by the Forestry andMountain Economy Department of Veneto Region to assess the regional forestcarbon stock using inventory data available at the regional level.
REFERENCES
Anfodillo T, Carraro V, Carrer M, Fior C, Rossi S. 2006. Convergent tapering ofxylem conduits in different woody species. New Phytologist 169:279–290.http://dx.doi:10.1111/j.1469-8137.2005.01587.x.Corona P, Pompei E, Scarascia Mugnozza G. 2007. Forest land changeassessment by continuous inventory. In: Reynolds KM, Thomson AJ, ShannonMA, Kohl M, Ray D, Rennolls K, editors. Sustainable Forestry: From Monitoringand Modelling to Knowledge Management and Policy Science. New York, NY:CAB International, pp 257–268.De Natale F, Gasparini P, Carriero A. 2007. A study on tree colonization ofabandoned land in the Italian Alps: Extent and some characteristics of newforest stands in Trentino. In: Reynolds KM, Thomson AJ, Shannon MA, Kohl M,Ray D, Rennolls K, editors. Sustainable Forestry: From Monitoring and Modellingto Knowledge Management and Policy Science. New York, NY: CABInternational, pp 269–284.De Natale F, Gasparini P, Puzzolo V, Tosi V. 2003. Stima del grado di coperturaforestale da ortofoto e applicazione della definizione di bosco negli inventariforestali. L’Italia Forestale e Montana 4:289–300.De Natale F, Gasparini P, Sitzia T, Anderle A. 2004. Istruzioni per l’esecuzionedei rilievi al suolo nei boschi di neoformazione. Provincia Autonoma di Trento,Servizio Foreste. http://paduaresearch.cab.unipd.it/1037/1/rilev_boschi_neofor.pdf; accessed on 5 March 2009.Del Favero R, Lasen C. 1993. La Vegetazione Forestale del Veneto. Mestre,Italy: Regione Veneto, Dipartimento Foreste.Eggers J, Lindner M, Zudin S, Zaehle S, Liski J. 2008. Impact of changingwood demand, climate and land use on European forest resources and carbonstocks during the 21st century. Global Change Biology 14:2288–2303.http://dx.doi:10.1111/j.1365-2486.2008.01653.x.Enquist BJ. 2002. Universal scaling in tree and vascular plant allometry: Towarda general quantitative theory linking plant form and function from cells toecosystems. Tree Physiology 22:1045–1064.Enquist BJ, West GB, Charnov EL, Brown JH. 1999. Allometric scaling ofproduction and life-history variation in vascular plants. Nature 401:907–911.http://dx.doi:10.1038/44819, Letter.IPCC [Intergovernmental Panel on Climate Change]. 2003. Good PracticeGuidance for Land Use, Land-Use Change and Forestry, Prepared by theNational Greenhouse Gas Inventories Programme. Hayama, Japan: IGES[Institute for Global Environmental Strategies]. http://www.ipcc-nggip.iges.or.jp/public/gpglulucf/gpglulucf.html; accessed on 2 February 2008.IPCC [Intergovernmental Panel on Climate Change]/OECD [Organisation forEconomic Co-operation and Development]/IEA [International EnergyAgency]. 1997. Revised 1996 IPCC Guidelines for National Greenhouse GasInventories. Bracknell, United Kingdom: IPCC. http://www.ipcc-nggip.iges.or.jp/public/gl/invs1.html; accessed on 2 February 2008.ISAFA [Istituto Sperimentale per l’Assestamento Forestale e perl’Apicoltura]. 1998. 2u Inventario Forestale Nazionale. Studio di fattibilita.Istituto Sperimentale per l’Assestamento Forestale e per l’ Alpicoltura. www.
isafa.it/scientifica/pubblicazioni/pu_infc/Pubblic.html; accessed on 5 March2009.Ketterings QA, Coe R, Van Noordwijk M, Ambagau Y, Palm CA. 2001.Reducing uncertainty in the use of allometric biomass equations for predictingabove-ground tree biomass in mixed secondary forests. Forest Ecology andManagement 146:199–209.Korner C. 1998. A re-assessment of high elevation treeline positions and theirexplanation. Oecologia 115:445–459.Liski J, Karjalainen T, Pussinen A, Nabuurs GJ, Kauppi P. 2000. Trees ascarbon sinks and sources in the European Union. Environment Science andPolicy 3:91–97.Lumicisi A, Tedeschi V, Vitullo M, Federici S, Pompei E. 2007. Il ruolo delloStato e delle amministrazioni regionali e locali nell’applicazione del Protocollo diKyoto nel settore forestale. Forest@ 4:246–249.Nabuurs G, Schelhaas M, Mohren G, Field C. 2003. Temporal evolution of theEuropean Forest sector carbon sink from 1950 to 1999. Global Change Biology9:152–160.Niklas KJ. 1994. Plant Allometry. The Scaling of Form and Process. Chicago, IL:University of Chicago Press.Philip MS. 1994. Measuring Trees and Forests. New York, NY: CABInternational.Pilli R, Anfodillo T, Carrer M. 2006. Towards a functional allometry forestimating forest biomass. Forest Ecology and Management 237:583–593.http://dx.doi:10.1016/j.foreco.2006.10.004.Salvadori I, Pilli R, Anfodillo T. 2006. Proposta di una metodologia di analisidella variazione di superficie boscata tramite foto aeree per l’applicazione delprotocollo di Kyoto: il caso della Comunita Montana del Grappa (TV). Forest@ 3:339–350.Tabacchi G. 2001. Note su alcuni schemi di campionamento impiegabilinell’inventariazione delle risorse forestali di ampi territori. Comunicazioni diRicerca dell’Istituto Sperimentale per l’Assestamento Forestale e perl’Alpicoltura 2001(2):25–38. http://www.isafa.it/scientifica/pubblicazioni/pubblicazioni.htm; accessed on 24 April 2009.UN [United Nations]. 1998. Kyoto Protocol to the United Nations FrameworkConvention on Climate Change. http://unfccc.int/resource/docs/convkp/kpeng.pdf; accessed on 24 April 2009.West GB, Brown JH, Enquist BJ. 1999. A general model for the structure andallometry of plant vascular systems. Nature 400:664–667. http://dx.doi:10.1038/23251.Zanchi G, Pettenella D, Ciccarese L. 2005. Revegetation activities in theMediterranean areas as influenced by the definition of forest. Proceedings ofWorkshop ‘‘Land-Use Choices Under The Kyoto Protocol. Obligations, Optionsand Methodologies for Defining ‘Forest’ and Selecting Activities Under KyotoProtocol Article 3.4’’ held at Joanneum Research, Graz, Austria, 2 to 4 May2005. http://www.joanneum.at/CarboInvent/Workshop/presentation.html;accessed on 10 May 2008.Zar HD. 1998. Biostatistical Analysis. 4th edition. Upper Saddle River, NJ:Prentice Hall.
MountainResearch
Mountain Research and Development http://dx.doi.org/doi:10.1659/mrd.1071168
Copyright © 2022 FDOKUMEN