Labour market transitions of young women and men in the ...
79
Labour market transitions of young women and men in the United Republic of Tanzania Publication Series Leyla Shamchiyeva, Takaaki Kizu and Godius Kahyarara Youth Employment Programme Employment Policy Department December 2014 No. 26 LABOUR MARKET TRANSITIONS OF YOUNG WOMEN AND MEN IN THE UNITED REPUBLIC OF TANZANIA ILO
-
Upload
khangminh22 -
Category
Documents
-
view
3 -
download
0
Transcript of Labour market transitions of young women and men in the ...
Labour market transitions of young women and men in the United Republic of Tanzania
Publication Series
Leyla Shamchiyeva, Takaaki Kizu and Godius Kahyarara
Youth Employment ProgrammeEmployment Policy Department
December 2014
No. 26
Lab
ou
r ma
rket tra
nsitio
ns o
f you
ng w
om
en a
nd m
en in
the u
nited repu
bLic o
f tan
zan
iaiLo
Work4Youth Publication Series No. 26
Labour market transitions of young women and men in the United Republic of Tanzania
Leyla Shamchiyeva, Takaaki Kizu and Godius Kahyarara
International Labour Office ● Geneva
December 2014
Copyright © International Labour Organization 2014 First published 2014
Publications of the International Labour Office enjoy copyright under Protocol 2 of the Universal Copyright Convention. Nevertheless, short
excerpts from them may be reproduced without authorization, on condition that the source is indicated. For rights of reproduction or
translation, application should be made to the Publications Bureau (Rights and Permissions), International Labour Office, CH–1211 Geneva
22, Switzerland, or by email: [email protected]. The International Labour Office welcomes such applications.
Libraries, institutions and other users registered with reproduction rights organizations may make copies in accordance with the licences
issued to them for this purpose. Visit www.ifrro.org to find the reproduction rights organization in your country.
ILO Cataloguing in Publication Data
Shamchiyeva, Leyla; Kizu, Takaaki; Kahyarara, Godius
Labour market transitions of young women and men in the United Republic of Tanzania / Leyla Shamchiyeva, Takaaki Kizu and Godius
Kahyarara ; International Labour Office, Youth Employment Programme, Employment Policy Department. - Geneva: ILO, 2014
(Work4Youth publication series ; No. 26, ISSN: 2309-6780 ; 2309-6799 (web pdf))
International Labour Office Employment Policy Dept.
youth employment / youth unemployment / transition from school to work / data collecting / methodology / Tanzania
13.01.3
Cover design by: Creative Cow
The designations employed in ILO publications, which are in conformity with United Nations practice, and the presentation of material therein do not imply the expression of any opinion whatsoever on the part of the International Labour Office concerning the legal status of
any country, area or territory or of its authorities, or concerning the delimitation of its frontiers.
The responsibility for opinions expressed in signed articles, studies and other contributions rests solely with their authors, and publication
does not constitute an endorsement by the International Labour Office of the opinions expressed in them.
Reference to names of firms and commercial products and processes does not imply their endorsement by the International Labour Office,
and any failure to mention a particular firm, commercial product or process is not a sign of disapproval.
ILO publications can be obtained through major booksellers or ILO local offices in many countries, or direct from ILO Publications,
International Labour Office, CH–1211 Geneva 22, Switzerland. Catalogues or lists of new publications are available free of charge from the
above address, or by email: [email protected] Visit our website: www.ilo.org/publns
Printed by the International Labour Office, Geneva, Switzerland
iii
Preface
Youth is a crucial time of life when young people start realizing their aspirations,
assuming their economic independence and finding their place in society. The global jobs
crisis has exacerbated the vulnerability of young people in terms of: (i) higher
unemployment, (ii) lower quality of jobs for those who find work, (iii) greater labour
market inequalities among different groups of young people, (iv) longer and more insecure
school-to-work transitions, and (v) increased detachment from the labour market.
In June 2012, the International Labour Conference of the ILO resolved to take urgent
action to tackle the unprecedented youth employment crisis through a multi-pronged
approach geared towards pro-employment growth and decent job creation. The resolution
“The youth employment crisis: A call for action” contains a set of conclusions that
constitute a blueprint for shaping national strategies for youth employment.1 It calls for
increased coherence of policies and action on youth employment across the multilateral
system. In parallel, the UN Secretary-General highlighted youth as one of the five
generational imperatives to be addressed through the mobilization of all the human,
financial and political resources available to the United Nations. As part of this agenda, the
United Nations has developed a System-wide Action Plan on Youth, with youth
employment as one of the main priorities, to strengthen youth programmes across the UN
system.
The ILO supports Governments and social partners in designing and implementing
integrated employment policy responses. As part of this work, the ILO seeks to enhance
the capacity of national and local level institutions to undertake evidence-based analysis
that feeds social dialogue and the policy-making process. To assist member States in
building a knowledge base on youth employment, the ILO has designed the “school-to-
work transition survey” (SWTS) and the “labour demand enterprise survey” (LDES). The
current report, which presents the results of the surveys in Tanzania, is a product of a
partnership between the ILO and The MasterCard Foundation. The Work4Youth project
entails collaboration with statistical partners and policy-makers of 28 low- and middle-
income countries to undertake the SWTS and assist governments and the social partners in
the use of the data for effective policy design and implementation.
It is not an easy time to be a young person in the labour market today. The hope is
that the international community, with leadership from the UN system, with the
commitment of Governments, trade unions and employers’ organization and through the
active participation of donors such as The MasterCard Foundation, can provide the
effective assistance needed to help young women and men make a good start in the world
of work. If we can get this right, it will positively affect young people’s professional and
personal success in all future stages of life.
Azita Berar Awad
Director
Employment Policy Department
Alexio Musindo
Director
ILO Country Office for Kenya, Tanzania
and Uganda
1 The full text of the 2012 resolution “The youth employment crisis: A call for action” can be found
on the ILO website at: http://www.ilo.org/ilc/ILCSessions/101stSession/texts-
adopted/WCMS_185950/lang--en/index.htm.
iv
Contents
Page
Preface ............................................................................................................................................... iii
Contents ............................................................................................................................ iv
Acknowledgements ........................................................................................................................... ix
1. Introduction and main findings ............................................................................................... 1
1.1 Overview ....................................................................................................................... 1
1.2 Main findings ................................................................................................................ 2
1.3 Structure of the report ................................................................................................... 4
2. Overview of the labour market and survey methodology ....................................................... 5
2.1 The socio-economic context ......................................................................................... 5
2.2 The labour market in Tanzania ..................................................................................... 6
2.3 School-to-work transition survey and labour demand enterprise surveys: Objectives
and methodology ..................................................................................................................... 7
2.3.1 Questionnaire development ................................................................................ 8
2.3.2 Sample design ..................................................................................................... 8
3. Characteristics of youth in the sample .................................................................................... 9
3.1 Individual characteristics of youth ................................................................................ 9
3.1.1 Household financial status .................................................................................. 10
3.1.2 Financial inclusion .............................................................................................. 11
3.2 Educational attainment ................................................................................................. 11
3.2.1 Educational status ............................................................................................... 11
3.2.2 Parents’ educational attainment ......................................................................... 14
3.3.3 Current students .................................................................................................. 14
3.3 Aspirations and life goals ............................................................................................. 18
3.4 Current activity status of youth ..................................................................................... 19
3.5 Characteristics of employed youth ............................................................................... 21
3.5.1 Status in employment ......................................................................................... 22
3.5.2 Sector and occupation of working youth ............................................................ 23
3.5.3 Wage and salaried workers (employees) ............................................................ 25
3.5.4 Self-employed youth .......................................................................................... 27
3.5.5 Hours of work ..................................................................................................... 28
3.5.6 Wages ................................................................................................................. 29
3.5.7 Informal employment ......................................................................................... 30
3.5.8 Qualifications mismatch ..................................................................................... 31
3.5.9 Security and job satisfaction ............................................................................... 32
3.6 Characteristics of unemployed youth............................................................................ 33
3.7 Characteristics of youth outside the labour market (inactive youth) ............................ 37
4. Stages of transition .................................................................................................................. 38
v
4.1 Concepts and definitions ............................................................................................... 38
4.2 Stages of transition by sex, education level, age group and area of residence ............. 39
4.2.1 Youth who have not started transition ................................................................ 40
4.2.2 Youth in transition .............................................................................................. 40
4.2.3 Characteristics of a completed transition ............................................................ 41
4.3 Transition paths and lengths of transition ..................................................................... 43
5. Creating jobs for young people: The employers’ perspective ................................................. 46
5.1 Characteristics of enterprises ........................................................................................ 46
5.2 Recruitment of workers ................................................................................................ 48
5.3 Hiring preferences of enterprises .................................................................................. 49
5.4 Skills assessment of young workers ............................................................................. 51
5.5 Education and training .................................................................................................. 52
5.6 Labour demand ............................................................................................................. 52
5.6.1 Hard-to-fill vacancies ......................................................................................... 53
6. Relevant policy framework and policy implications ............................................................... 55
6.1 Policy framework .......................................................................................................... 55
6.2 Policy implications ....................................................................................................... 57
References ......................................................................................................................................... 61
Annex I. Definitions of labour market statistics ............................................................................... 63
Annex II. SWTS-Tanzania, 2013 sampling design ........................................................................... 65
Tables
2.1 Sectoral distribution of GDP in Tanzania Mainland ............................................................... 5
2.2 Key labour market indicators, 2000/01 and 2006 (%) ............................................................ 6
3.1 Youth population by selected characteristics and sex ............................................................. 9
3.2 Migration status of youth by sex (%) ...................................................................................... 10
3.3 Household financial situation of youth by area of residence (%) ........................................... 10
3.4 Youth’s access to financial services ........................................................................................ 11
3.5 Reasons for leaving school early by area of residence and sex (%) ........................................ 13
3.6 Level of completed education of youth by area of residence and sex (%) .............................. 13
3.7 Education level of youth and their parents (%) ....................................................................... 14
3.8 Current students by level of enrolment by sex (%) ................................................................. 15
3.9 Current students by fields of study by sex (%) ....................................................................... 15
3.10 Current students by future plans (%) ...................................................................................... 16
3.11 Current students by desired future occupation and place of work and sex (%) ...................... 17
3.12 Sectoral distribution of formal employment in Tanzania (mainland), 2013 ........................... 18
3.13 Youth aspirations in life (%) ................................................................................................... 18
vi
3.14 Youth population by main economic activity, according to area of residence and sex (%) ... 20
3.15 Youth population by educational attainment and current activity status (%) ......................... 21
3.16 Young workers by status in employment, according to area of residence and sex (%) .......... 23
3.17 Employed youth by occupation, according to area of residence and sex (%) ......................... 24
3.18 Young wage and salaried workers by contract situation, according to area of residence and
sex (%) .................................................................................................................................... 25
3.19 Employed youth by contract situation in major sectors (%) ................................................... 26
3.20 Young wage and salaried workers by access to entitlements, according to area of residence
and sex (%).............................................................................................................................. 26
3.21 Self-employed youth by sources of start-up financing, according to area of residence and
sex (%) .................................................................................................................................... 28
3.22 Average monthly wages of young workers (wage and salaried workers and self-employed
workers) by sex, area of residence and level of completed education (in Tanzanian
shillings) .................................................................................................................................. 30
3.23 ISCO major groups and education levels ................................................................................ 31
3.24 Shares of overeducated and undereducated young workers by major occupational category
(ISCO-08, %) .......................................................................................................................... 32
3.25 Main reason for wanting to change current employment by sex (%) ..................................... 33
3.26 Youth unemployment rate and share of unemployed youth by unemployment duration,
according to area of residence and sex (%) ............................................................................. 34
3.27 Unemployed and employed youth (strict definition) by job search method (%) .................... 35
3.28 Unemployed youth by occupation sought, according to area of residence and sex (%) ......... 36
3.29 Unemployed youth by opinion of main obstacle to finding work, according to area of
residence and sex (%) ............................................................................................................. 37
3.30 Inactive youth by reason for inactivity, according to area of residence and sex (%) .............. 37
4.1 Stage of transition by sex, age group, area of residence and level of completed education
(%) ........................................................................................................................................... 40
4.2 Youth “in transition” by sub-category, according to area of residence and sex (%)............... 41
4.3 Indicators on the path of transition for youth who completed their labour market transition . 44
5.1 Type of enterprise by number of employees (%) .................................................................... 46
5.2 Main obstacles faced by the enterprise (%) ............................................................................ 47
5.3 Enterprises by size and main recruitment method (%) ........................................................... 49
5.4 Preferred hiring criteria of enterprises (%) ............................................................................. 50
5.5 Most important characteristic that employers consider in recruiting workers (%) ................. 51
5.6 Enterprises by number of workers trained, type and place of training and training provider
(%) ........................................................................................................................................... 52
5.7 Forecasted vacancies by occupation in the next 2−3 years (%) .............................................. 53
5.8 Hard-to-fill vacancies identified by enterprises ...................................................................... 54
5.9 The most common consequences of hard-to-fill vacancies .................................................... 54
A.1 List of zones and their regions ................................................................................................ 65
A.2 List of selected regions and districts per zone......................................................................... 65
vii
A.3 Number of villages/EAs and households selected per region and district .............................. 66
Figures
3.1 Youth population by status in education, according to area of residence and sex ................. 12
3.2 Distribution of youth population according to the SWTS framework 20
3.3 Youth employment-to-population ratio by area of residence, sex and age group .................. 22
3.4 Youth employment by sector and sex .................................................................................... 23
3.5 Self-employed youth by reason and sex ................................................................................. 27
3.6 Employed youth by actual hours worked per week ............................................................... 29
3.7 Youth informal employment rate and sub-categories of informal employment by area of
residence and sex ................................................................................................................... 31
3.8 Youth unemployment rate by level of educational attainment and sex ................................. 34
4.1 Youth in transition by sub-categories and level of education ................................................ 41
4.2 Distribution of transition groups (transited and in-transition youth) by sex, area of
residence and educational attainment level ............................................................................ 42
4.3 Transited youth by sub-category and sex, area of residence and educational attainment
level ......................................................................................................................................... 43
4.4 Flow to stable and/or satisfactory employment (transited category) by sex .......................... 44
4.5 Classification of length of transition of youth who have completed the transition, by sex ... 45
4.6 Share of direct transition to stable employment and satisfactory self- or temporary
employment (%) ..................................................................................................................... 45
5.1 Employers’ perception of the growth of business in the next 12 months .............................. 47
5.2 Recruitment methods of enterprises by type of employees .................................................... 48
5.3 Employers’ assessment of young job applicants’ skills (aged 15−29) ................................... 51
Boxes
1. Definition of youth .................................................................................................................. 7
2. Work4Youth: An ILO project in partnership with The MasterCard Foundation .................... 8
3. Approaches to boost aggregate demand and promote youth employment .............................. 58

ix
Acknowledgements
The 2013 school-to-work transition survey in the United Republic of Tanzania was
implemented by the Department of Statistics of the University of Dar es Salaam with
funding from the ILO Work4Youth partnership with The MasterCard Foundation. The ILO
is extremely grateful to the implementation team under the capable leadership of Professor
Maurice Mbago.
Numerous people were involved in the report-writing process: Dr Godius Kahyarara
of the Department of Economics of the University of Dar es Salaam took charge of the first
version of the report; Takaaki Kizu, ILO Research Assistant, contributed Chapter 5; and
Leyla Shamchiyeva, ILO consultant, undertook the final rewrite with guidance and input
from Sara Elder, Coordinator of the ILO Work4Youth team. Sukanya Garg, an ILO intern,
also contributed with research assistance. Yves Perardel, of the Work4Youth team, offered
significant technical support during all stages of the survey.
The preliminary results of the survey were presented at a national workshop in Dar es
Salaam on 27 November 2014. The authors wish to thank the participants of the workshop
for their validation of the results and feedback on the relevance of the survey to the
national policy framework for youth employment. Alexio Musindo, Director of the ILO
Country Office for Kenya, Tanzania and Uganda, and Nancy Lazaro, Programme
Assistant, offered invaluable assistance in supporting the activities in the country and were
indispensable to the organization of the workshop.
Finally, the ILO would like to acknowledge the support given by The MasterCard
Foundation in allowing the research to move forward, under the scope of the Work4Youth
partnership.

1
1. Introduction and main findings
1.1 Overview
Youth is the time when most people formulate their aspirations and life goals, seek
and find their own roles and responsibilities in society and move towards economic
independence. The transition from youth to adulthood is transformational. In social,
psychological and economic terms, young people are called on to make important
decisions and choices that fundamentally affect the course of their lives.
The quality of life for youth is largely determined, primarily, by their ability to attain
an education and, second, by how successfully they make the transition from school to
work (Sparreboom and Staneva, 2014). Failure to obtain a decent job after completing
education can have a serious and lasting impact on a young graduate’s professional
capacities and skills, as well as on his or her income. Any time spent in unemployment,
underemployment and inactivity can have a “scarring” effect on the young individual
(ILO, 2012). By contrast, a positive start in the labour market can have a beneficial impact
on professional and personal success in the subsequent stages of life.
Despite recognition of the importance of improving the school-to-work transition,
reflected in the various employment-related policies already initiated, the United Republic
of Tanzania needs to address the question of how to facilitate this transition for youth and
reduce the high youth unemployment rate and the even higher shares of youth in poor
quality employment. The available labour market data cannot adequately inform efforts to
improve this sort of transition. Recognizing this information gap, the ILO undertook two
complementary surveys in the United Republic of Tanzania; namely, the school-to-work
transition survey (SWTS) and the labour demand enterprise survey (LDES). The SWTS
covers young people aged 15 to 29 years and aims to generate information on the current
labour market situation, the history of economic activities and the perceptions and
aspirations of youth. The LDES then complements the supply side picture provided by the
SWTS by analysing the current and expected workforce needs of enterprises and the
perspectives of managers regarding the pool of available young jobseekers and workers.
This report presents findings from these two surveys, and is intended for the policy-makers
and social partners in the United Republic of Tanzania who are involved in the
implementation of youth-related policies and programmes.
The indicators generated from the survey and analysed in this report aim to present a
much more detailed picture of the youth labour market than is usually available from
standard surveys, including the labour force survey. Unemployment among youth is a
major national concern, but it is also important to consider the quality of work made
available to the youth population. Does this work provide the wages and security necessary
to empower young Tanzanians to move towards self-sufficiency in their pending
adulthood? The emphasis on quality of employment in this report should help to answer
this question. The report also draws attention to the path, duration and characteristics of
young people’s transition from school to work, drawing conclusions on these experiences
to allow the development of policies to promote a smoother transition.
2
1.2 Main findings
Many young women and men, especially in rural areas, are not fully benefiting
from the educational system.
Most of the surveyed youth had attended school or a training programme at some
point in their lives and only 2.5 per cent of youth had never been to school. Over one-half
of youth had already completed their schooling (54.8 per cent) and over one-quarter (29.0
per cent) were still studying at the time of the survey. Nonetheless, 13.7 per cent had left
school before graduating. Higher drop-out rates were observed among rural youth (16.1
per cent, compared to 7.3 per cent of urban youth). Financial reasons, such as the inability
to afford school fees or the need to earn an income, were given as the main reason for
school drop-outs (42.9 per cent). Almost one-third of urban youth left school because they
were not interested in education or training (31.2 per cent, compared to 8.4 per cent in rural
areas).
Among those youth who did complete their education, levels of attainment remain
low. The majority of Tanzanian youth – nearly one-half (44.8 per cent) – finished their
schooling at the secondary level, while 38.2 per cent acquired only primary-level
education. There were also 7.1 per cent of youth who did not have any education. A small
share of young people completed secondary vocational school (5.1 per cent) and post-
secondary vocational school (3.6 per cent). Only 1.1 per cent of youth graduated from a
university: 2.9 per cent of urban youth have a university degree, compared to only 0.6 per
cent of rural youth.
As a direct result of low education levels, the majority of young workers are
undereducated for the jobs they hold.
More than one-half (58.5 per cent) of employed youth in Tanzania were
undereducated for the job they do and 8.6 per cent were overqualified for their post.
Sometimes, even those who were working as low-skilled manual workers or in elementary
occupations were undereducated because even persons in the lesser skilled occupations
should have benefited from the basics of primary education (which unfortunately too many
young Tanzanians still lack). Undereducation has an impact on workers’ productivity, as
well as on their levels of confidence and well-being.
There are signs of an imminent mismatch between supply and demand in the
labour market.
Current students in Tanzania express strong preferences for working in “modern
sector” jobs, such as professionals (54.8 per cent) and technicians and associate
professionals (20.8 per cent). However, the current shares of professional occupations in
total employment are very low (5.5 per cent). Consequently, if those who aspire to become
professionals do attain the necessary education, they will be competing for a very small
pool of vacancies. Already, the unemployment rate of young tertiary graduates is nearly
three times greater than that of youth with only primary-level education.
Two-thirds of youth indicate that they would like to work for the government. The
strong appeal of public sector work is due to its stability and benefits. It is therefore
understandable that many young people aspire to enter the government sector, especially
those who have invested time and resources in their education. However, it is not realistic
to assume that the public sector will have the capacity to absorb a significant number of the
emerging graduates.
3
More than one-fifth (21.1 per cent) of youth in the labour force were unemployed
in Tanzania (according to the strict unemployment rate). Rates increase with the level of
education as a result of bottlenecks in hiring of well-educated but inexperienced youth.
Whether applying the strict or relaxed definition, youth unemployment rates are high
in Tanzania, and higher than in most other sub-Saharan African countries.2 The
unemployment rate, according to the strict definition, was 21.1 per cent and the rate
according to the relaxed definition was as high as 38.3 per cent. The female unemployment
rate (strict definition) was nearly double the male rate at 27.6 per cent and 15.9 per cent,
respectively. The unemployment rate was lowest among youth with lower levels of
education, while it climbed as high as 30.8 per cent among university graduates. Such high
levels of unemployment among the well-educated youth are explained both by an
insufficient demand in higher skilled occupations, at least among candidates with little
work experience, and by the fact that more highly educated youth are more likely to hold
out for a suitable job than to take any available work.
Still, there are good returns to staying in school. Youth with higher education can
earn at least twice the level of wages of youth with less than primary education and have
the best chance of attaining a stable job.
The wage level of young workers increased incrementally with the level of
educational attainment. Young workers with a university education earned more than twice
the wage of a young worker with less than primary education. Youth with tertiary
education also managed to complete the transition to a stable job (compared to satisfactory
self-employment or temporary jobs) in two out of three cases (66.0 per cent). Completion
of education at the secondary level, in contrast, was not enough to substantially increase
the chances of obtaining stable work. The results imply that investment in education does
pay off in Tanzania and that youth should be encouraged to persevere at least until
completion of secondary education if they hope to attain a better quality job.
Despite high unemployment rates among tertiary graduates, employers still cite a
lack of qualified, well-educated youth to fill professional posts.
The “hard-to-fill” vacancies identified by employers in Tanzania were mainly in the
area of skilled and higher-skilled professionals, including plant and machine operators,
handicraft and printing workers, science and engineering professionals and production
managers. For professional occupations, education and training is valued by employers as
highly as work experience (40.7 per cent). Young jobseekers are unlikely to have
significant work experience and must rely on their academic credentials. Yet a very small
proportion of youth have completed tertiary education (1.1 per cent) and the share of
unemployed among that cohort remains high.
Employment services in Tanzania are unpopular and ineffective.
In Tanzania, as elsewhere in the region, most youth rely on informal networks when
searching for jobs. The most popular method of job search among the youth who were
actively looking for work was inquiring with friends, relatives and acquaintances (32.9 per
cent). One-quarter of youth (25.1 per cent) placed or answered job advertisements and one-
fifth (19.3 per cent) inquired about vacancies directly at workplaces. Only 11.0 per cent of
unemployed youth registered at employment centres, and a mere 0.5 per cent of currently
employed youth found their present job through employment services. This suggests the
absence of a robust system of public or private employment services in Tanzania.
2 The average youth unemployment rate (strict definition) of eight sub-Saharan African countries
was 12.0 per cent (22.8 per cent by the relaxed definition) (Elder and Koné, 2014).
4
Informal employment is the prevalent mode of work among youth in Tanzania.
The youth informal employment rate in Tanzania based on the SWTS was 78.2 per
cent. It comprises two categories; namely, workers in the informal (unregistered) sector
and paid employees holding informal jobs in the formal sector (lacking core benefits, such
as social security coverage, paid sick leave or annual leave). The majority of young
Tanzanians who work informally were employed in the informal sector (72.8 per cent),
while the remaining 27.2 per cent held informal jobs in the formal sector. The informal
employment rate was much higher among young women than among men (89.1 and 70.5
per cent, respectively).
Own-account workers and contributing family workers together make up a category
of “vulnerable employment”. These are the workers who face high levels of job insecurity
and who do not have access to safety nets to cover them during periods when they are
unable to work due to sickness or disability. More than one-half of young workers in
Tanzania were classified as “vulnerable” (54.0 per cent) based on the SWTS results, with
young women in rural areas being most likely to engage in vulnerable employment (71.4
per cent). Worse, job security is also not guaranteed even for the young wage and salaried
workers (35.9 per cent of total young workers) as only 17.7 per cent of young employees
were protected by a written contract.
The majority of Tanzanian youth had begun their transition from studying to the
labour market.
Overall, the survey results show that young Tanzanians were either in a period of
labour market transition (47.3 per cent) or had completed their transition to a job
designated as either stable and/or satisfactory (31.9 per cent). While nearly one-third of
Tanzanian youth had completed their transition, most transitions were made into either
low-skill or unskilled manual jobs that the respondent deemed satisfactory, perhaps in
recognition of the limited options available. Young people were rarely found in
professional jobs as managers, professionals or technicians. Despite the general degree of
job satisfaction reported by young workers, 72.2 per cent of young workers expressed a
desire to change their current job. In the meantime, most highly educated youth with
university degrees (62.7 per cent) remained in transition, having not yet attained a stable
and/or satisfactory job.
It took, on average, over 1.5 years (19.4 months) for a young person to complete the
transition if they did not move directly to the stable and/or satisfactory post. The average
length of an unemployment spell within the period of transition was 21 months, while the
average length of self-employment spells was 37.7 months.
1.3 Structure of the report
Section 2 of present report sets out the socio-economic and labour market conditions
for Tanzania and introduces the objectives and methodology of the survey process. Section
3 presents the results of the SWTS with details on the characteristics of youth and their
labour market outcomes. Section 4 analyses the classification of stages of labour market
transition and investigates the characteristics that lead to more advantageous labour market
outcomes, specifically in the attainment of stable employment. Section 5 presents the
results of the LDES with particular focus on what enterprises look for in prospective
employees and whether or not the supply of labour as defined by the SWTS is likely to
satisfy the labour demand. Finally, Chapter 6 outlines the national framework guiding
youth employment in the United Republic of Tanzania and presents the policy implications
that have been drawn from the analysis of the two surveys.
5
2. Overview of the labour market and survey methodology
2.1 The socio-economic context
The United Republic of Tanzania (hereafter Tanzania) was formed in 1964 when two
republics, Tanganyika and Zanzibar, united to form a sovereign state, having attained
independence from British colonial rule. Tanzania is administered by the Union
Government, while the island of Zanzibar enjoys a high degree of autonomy and is ruled
by the Zanzibar Revolutionary Government.
In terms of land area, Tanzania is the largest East African country (Mpangile, 2008).
The population is estimated at around 49.3 million people, having expanded from 33.5
million in 2002 at an annual rate of 2.7 per cent (Agwanda and Amani, 2014). In 2014,
Tanzania was ranked 159 out of the 187 countries on the human development index. The
headcount poverty ratio at the national poverty line was 28.2 per cent of the population in
2012. According to 2012 census results from the National Bureau of Statistics, the youth
population aged 15–29 numbered nearly 12 million people, making up around one-quarter,
or 24.3 per cent, of the total population (estimated at 44.9 million).
Tanzania has experienced strong economic growth over the past decade. The gross
domestic product (GDP) growth rate stood at an average of 7.0 per cent in the 2004–2013
period, driven largely by growth in capital-intensive sectors, such as communications,
financial services and construction. The country has also benefited from increasing
investments in the recently discovered natural gas reserves and expansion in public
investments (ILO, 2013a). The scale of the impact that these developments will have on
Tanzania’s economy is uncertain; however, the natural resource revenues will have to be
managed carefully to ensure that the associated economic growth is inclusive.
The country’s Decent Work Country Programme (DWCP) 2013–2016 (ILO, 2013a)
concludes that, despite the strong economic growth in the first decade of the twenty-first
century, poverty reduction has failed to keep pace, declining only slightly from 35.7 per
cent in 2001 to 33.6 per cent in 2007, and more significantly to 28.2 per cent in 2012. The
DWCP attributes the high poverty rate to underemployment and low productivity,
especially in rural areas and among women and youth. This lag in translation of economic
growth into poverty reduction is due to the fact that growth is being driven by capital-
intensive sectors, such as financial services. At the same time, the labour-intensive sectors,
such as agriculture, which still employs 80 per cent of the working population, have been
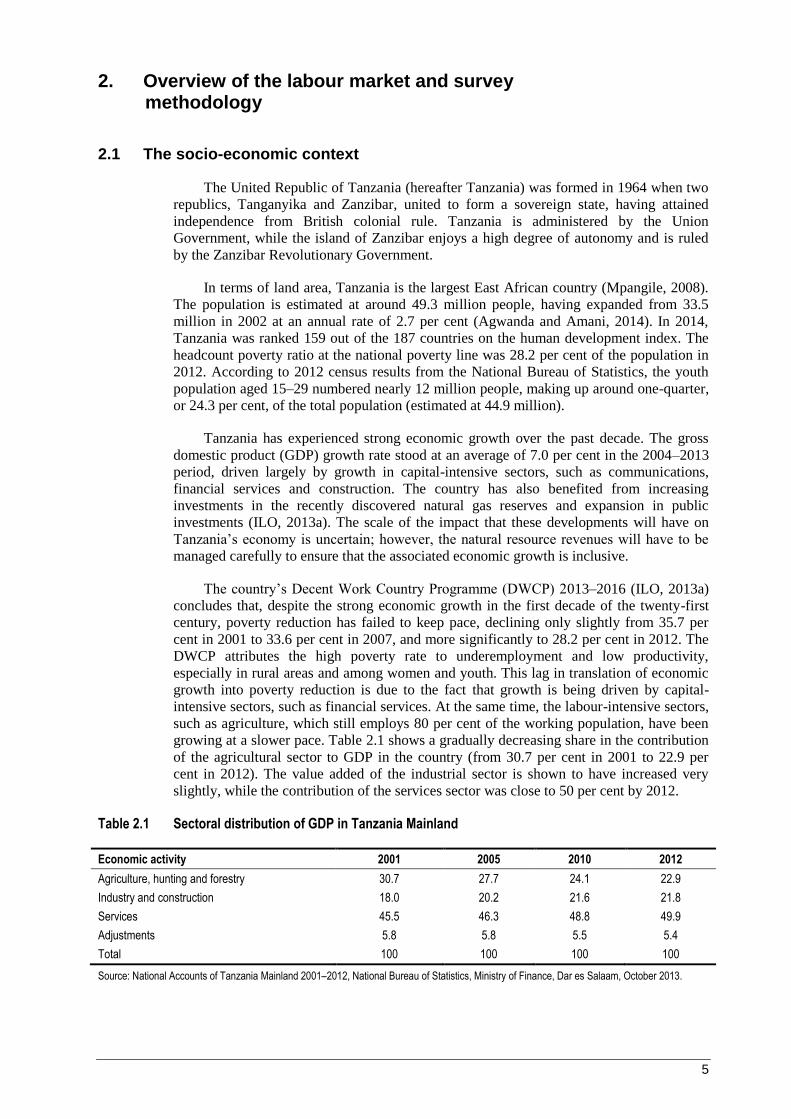
growing at a slower pace. Table 2.1 shows a gradually decreasing share in the contribution
of the agricultural sector to GDP in the country (from 30.7 per cent in 2001 to 22.9 per
cent in 2012). The value added of the industrial sector is shown to have increased very
slightly, while the contribution of the services sector was close to 50 per cent by 2012.
Table 2.1 Sectoral distribution of GDP in Tanzania Mainland
Economic activity 2001 2005 2010 2012
Agriculture, hunting and forestry 30.7 27.7 24.1 22.9
Industry and construction 18.0 20.2 21.6 21.8
Services 45.5 46.3 48.8 49.9
Adjustments 5.8 5.8 5.5 5.4
Total 100 100 100 100
Source: National Accounts of Tanzania Mainland 2001–2012, National Bureau of Statistics, Ministry of Finance, Dar es Salaam, October 2013.

6
2.2 The labour market in Tanzania
Table 2.2 compares the findings of the 2000/01 and the most recently available 2006
Integrated Labour Force Surveys presented in the Decent Work Country Profile for
Tanzania (mainland) (ILO, 2010a). While these surveys predate the global economic crisis
of 2008 and exclude Zanzibar, the figures help to portray the general context and trends of
the country’s labour market. The first set of figures refers to the national definition of
employment and unemployment used by the National Bureau of Statistics, while the
second set refers to the international definition of employment and relaxed unemployment
(see Annex I for the standard and national definitions of labour market statistics).
The employment-to-population ratio (EPR) in Tanzania (standard definition) was
high, at 87.1 per cent, in 2006, with only minor gender differences (89.1 per cent among
men and 85.3 per cent among women). There was, however, a large disparity in EPR
between urban and rural areas: 91.3 per cent of the rural population was engaged in work,
compared to only 76.9 per cent of the urban population. The employment-to-population
ratio increased by 1.8 percentage points between 2000/01 and 2006, mainly driven by the
3.0 percentage point increase in the ratio among men, and the 8.2 percentage point increase
in the ratio among the urban population.
Table 2.2 Key labour market indicators, 2000/01 and 2006 (%)
2000/01 2006
Total Male Female Urban Rural Total Male Female Urban Rural
Nat
iona
l
defin
ition
Employment-to-population ratio (age 15–64)
78.0 80.0 76.1 54.6 85.1 80.7 82.0 79.5 68.2 85.9
Unemployment rate 13.0 11.6 14.4 32.6 7.9 11.7 10.7 12.6 22.6 7.5
Vulnerable employment 90.4 86.3 94.5 62.8 95.7 87.7 82.1 92.9 65.3 94.7
Sta
ndar
d de
finiti
on Employment-to-population
ratio (age 15–64) 85.3 86.1 84.0 68.7 90.4 87.1 89.1 85.3 76.9 91.3
Unemployment rate (relaxed definition)
5.0 4.2 5.8 15.2 2.4 4.7 3.0 6.2 12.4 1.7
Informal employment (proxy)
95.0 92.5 97.3 82.5 97.8 93.3 90.2 96.3 82.1 97.0
Vulnerable employment 91.2 87.3 95.0 70.4 96.0 88.6 83.5 93.4 69.3 95.0
Notes: Unless otherwise indicated, the indicators cover persons aged 15 years and older. See Annex I for national and standard definitions. The proxy for informal employment includes contributing family workers, own-account workers on own farm or shamba (vegetable garden), paid employees and self-employed workers in informal enterprises or household units. Source: ILO, 2010a, table 1.
Looking at the standard definition, the unemployment rate (relaxed definition)
declined by 0.3 percentage points during the period in question. The male rate decreased
from 4.2 to 3.0 per cent, while the female rate increased from 5.8 to 6.2 per cent. The
urban unemployment rate remained high at 12.4 per cent in 2006, even though it recorded
a significant drop from 15.2 per cent in 2000/01. The unemployment rate of the rural
population was much lower at 1.7 per cent in 2006. The low unemployment rate in rural
areas is explained by the assumption that a majority of persons in rural areas are engaged
in agricultural activities, and are therefore considered employed.
A high employment-to-population ratio does not always indicate productive
utilization of labour. The informal and precarious nature of the work undertaken by most
of the population is a cause of great concern in Tanzania. According to the National
Bureau of Statistics (2014), 93.3 per cent of employed persons in 2006 were working
informally. More women than men were engaged in informal employment (96.3 and 90.2
per cent, respectively). The informal employment rate in rural areas was 97.0 per cent,
compared to 82.1 per cent in urban areas. Vulnerable employment rates were also high;

7
88.6 per cent of Tanzania’s working population was engaged in the more precarious
statuses of own-account workers or contributing family workers in 2006. The share was as
high as 93.4 per cent for women (compared to 83.5 per cent for men) and 95.0 per cent for
workers in rural areas (compared to 69.3 per cent in urban areas).
The key labour market indicators presented in table 2.2 show a degree of
improvement over the years. However, what is apparent is that employment continues to
bring little return to the majority of workers in terms of quality and security, and that
women are particularly disadvantaged. The high shares of informal and vulnerable
employment, especially in rural areas, are of great concern. In combination with a high
employment-to-population ratio, this implies that an increasing number of people have to
work in low-quality and/or insecure jobs in order to make a living.
2.3 School-to-work transition survey and labour demand enterprise surveys: Objectives and methodology
The limited labour market information currently available has made it challenging to
analyse why school-to-work transitions are such long and difficult processes for young
people today. At the same time, the goal of improving the transitions of youth is among the
top policy priorities of most countries in the world. In response to this obvious information
gap, the ILO has developed two surveys. A detailed household SWTS covering young
people aged 15 to 29 years (see box 1) is applied at the national level to generate
information on the current labour market situation, the history of economic activities and
the perceptions and aspirations of youth. This supply-side picture is then balanced by a
second questionnaire that aims to measure labour demand, particularly for young workers.
The labour demand enterprise survey (LDES) investigates the current and expected
workforce needs of enterprises, and elicits the opinions of managers on the pool of
available young jobseekers and workers.
Box 1. Definition of youth
While, in other contexts, a youth is defined as a person aged between 15 and 24 (United Nations) or between 15 and 35 (African Union and the United Republic of Tanzania), for the purposes of the SWTS and related reports, the upper age limit is 29. This recognizes the fact that some young people remain in education beyond the age of 24, and allows the opportunity to capture more information on the post-graduation employment experiences of young people.
The SWTS and LDES were introduced in Tanzania to collect and analyse information
on the various challenges that young men and women face while making the transition into
working life. The survey fieldwork was completed in February–March 2013 by the
Department of Statistics, University of Dar es Salaam.3 The data were received and
checked by the ILO and are made available on the Work4Youth website.4 Funding for the
surveys came from the Work4Youth partnership between the ILO Youth Employment
Programme and The MasterCard Foundation (see box 2). The partnership supports the
SWTS in 28 target countries and data from the first round were made available throughout
3 The Department of Statistics, University of Dar es Salaam was selected as implementation partner
following a formal bidding process. The National Bureau of Statistics was unavailable to implement
the SWTS due to its workload pertaining to the 2012 population census.
4 The raw dataset is available on the ILO website:
http://www.ilo.org/employment/areas/WCMS_234860/lang--en/index.htm. Tabulated data are
available on the youthSTATS page of the ILOSTAT database at www.ilo.org/ilostat.
8
2013. A second round of the SWTS will take place in 2014–15 in most of the previously
surveyed countries.
2.3.1 Questionnaire development
The standard ILO SWTS questionnaire for youth and the LDES were adapted to the
national context based on a consultative process between the Department of Statistics,
University of Dar es Salaam and the ILO. The questionnaires were drafted and
administered in both English and Kiswahili.
2.3.2 Sample design
The SWTS followed the sample design used by the 2012 national census. A
multistage cluster sampling technique was used. First stage units were clusters
(enumeration areas), while second stage units were households. The sampling frame for
the selection of clusters was the 2012 population and housing census, which contains an
exhaustive list of all the enumeration areas with their respective population sizes. The
sample design used stratification (districts) in order to improve survey estimates. The
number of primary sampling units (PSU) was determined for each district based on the
number of households, as reported in the 2012 census. The survey used probability
proportional to size (PPS) to select enumeration areas. The final sample size totalled 1,988
youth aged 15–29.
For the LDES, the sample was based on a list of registered enterprises. From an
original sample size of 400 enterprises, fieldworkers managed to complete the
questionnaire for only 197 enterprises. See Annex II for more information on the sampling
methodology.
Box 2. Work4Youth: An ILO project in partnership with The MasterCard Foundation
The Work4Youth (W4Y) Project is a partnership between the ILO Youth Employment Programme and The MasterCard Foundation. The project has a budget of US$14.6 million and will run for five years to mid-2016. Its aim is to “promot[e] decent work opportunities for young men and women through knowledge and action”. The immediate objective of the partnership is to produce more and better labour market information specific to youth in developing countries, focusing in particular on transition paths to the labour market. The assumption is that governments and social partners in the project’s 28 target countries will be better prepared to design effective policy and programme initiatives once armed with detailed information on:
what young people expect in terms of transition paths and quality of work;
what employers expect in terms of young applicants;
what issues prevent the two sides – supply and demand – from matching; and
what policies and programmes can have a real impact.
Work4Youth target areas and countries:
Asia and the Pacific: Bangladesh, Cambodia, Nepal, Samoa, Viet Nam Eastern Europe and Central Asia: Armenia, the former Yugoslav Republic of Macedonia, Kyrgyzstan, Republic of Moldova, Russian Federation, Ukraine Latin America and the Caribbean: Brazil, Colombia, El Salvador, Jamaica, Peru Middle East and North Africa: Egypt, Jordan, Occupied Palestinian Territory, Tunisia Sub-Saharan Africa: Benin, Liberia, Madagascar, Malawi, the United Republic of Tanzania, Togo, Uganda, Zambia
9
3. Characteristics of youth in the sample
3.1 Individual characteristics of youth
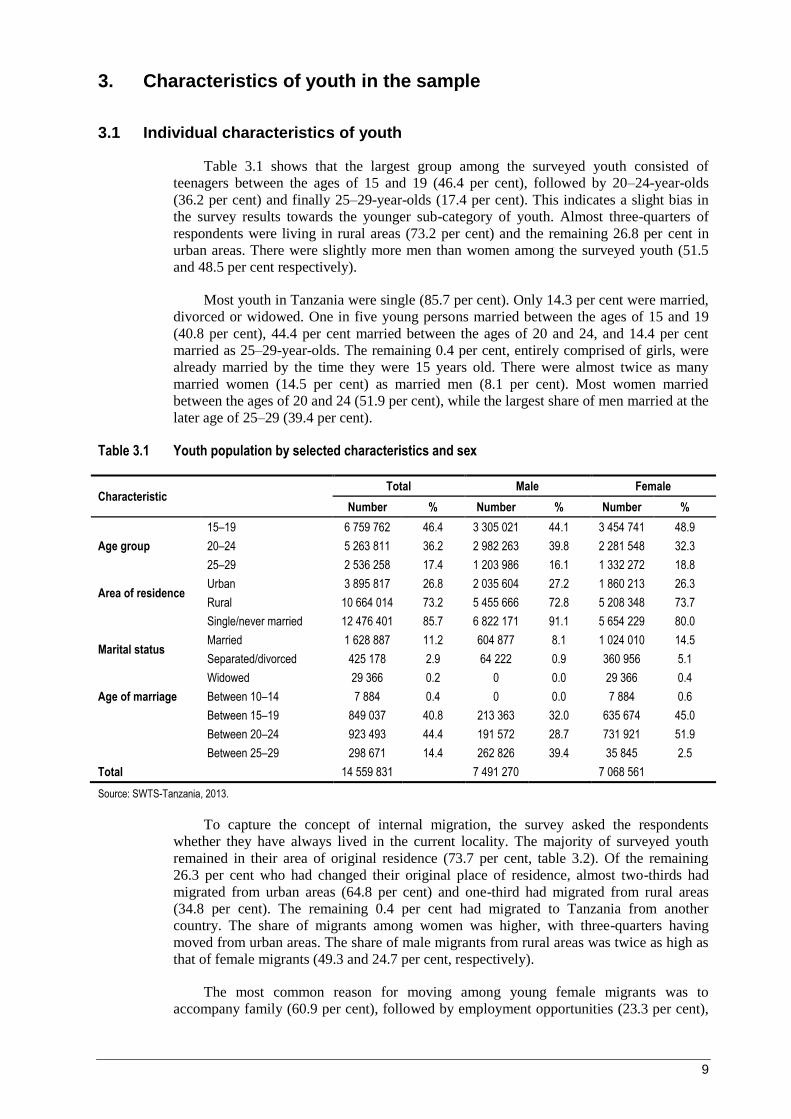
Table 3.1 shows that the largest group among the surveyed youth consisted of
teenagers between the ages of 15 and 19 (46.4 per cent), followed by 20–24-year-olds
(36.2 per cent) and finally 25–29-year-olds (17.4 per cent). This indicates a slight bias in
the survey results towards the younger sub-category of youth. Almost three-quarters of
respondents were living in rural areas (73.2 per cent) and the remaining 26.8 per cent in
urban areas. There were slightly more men than women among the surveyed youth (51.5
and 48.5 per cent respectively).
Most youth in Tanzania were single (85.7 per cent). Only 14.3 per cent were married,
divorced or widowed. One in five young persons married between the ages of 15 and 19
(40.8 per cent), 44.4 per cent married between the ages of 20 and 24, and 14.4 per cent
married as 25–29-year-olds. The remaining 0.4 per cent, entirely comprised of girls, were
already married by the time they were 15 years old. There were almost twice as many
married women (14.5 per cent) as married men (8.1 per cent). Most women married
between the ages of 20 and 24 (51.9 per cent), while the largest share of men married at the
later age of 25–29 (39.4 per cent).
Table 3.1 Youth population by selected characteristics and sex
Characteristic Total Male Female
Number % Number % Number %
Age group
15–19 6 759 762 46.4 3 305 021 44.1 3 454 741 48.9
20–24 5 263 811 36.2 2 982 263 39.8 2 281 548 32.3
25–29 2 536 258 17.4 1 203 986 16.1 1 332 272 18.8
Area of residence Urban 3 895 817 26.8 2 035 604 27.2 1 860 213 26.3
Rural 10 664 014 73.2 5 455 666 72.8 5 208 348 73.7
Marital status
Single/never married 12 476 401 85.7 6 822 171 91.1 5 654 229 80.0
Married 1 628 887 11.2 604 877 8.1 1 024 010 14.5
Separated/divorced 425 178 2.9 64 222 0.9 360 956 5.1
Widowed 29 366 0.2 0 0.0 29 366 0.4
Age of marriage Between 10–14 7 884 0.4 0 0.0 7 884 0.6
Between 15–19 849 037 40.8 213 363 32.0 635 674 45.0
Between 20–24 923 493 44.4 191 572 28.7 731 921 51.9
Between 25–29 298 671 14.4 262 826 39.4 35 845 2.5
Total 14 559 831
7 491 270
7 068 561
Source: SWTS-Tanzania, 2013.
To capture the concept of internal migration, the survey asked the respondents
whether they have always lived in the current locality. The majority of surveyed youth
remained in their area of original residence (73.7 per cent, table 3.2). Of the remaining
26.3 per cent who had changed their original place of residence, almost two-thirds had
migrated from urban areas (64.8 per cent) and one-third had migrated from rural areas
(34.8 per cent). The remaining 0.4 per cent had migrated to Tanzania from another
country. The share of migrants among women was higher, with three-quarters having
moved from urban areas. The share of male migrants from rural areas was twice as high as
that of female migrants (49.3 and 24.7 per cent, respectively).
The most common reason for moving among young female migrants was to
accompany family (60.9 per cent), followed by employment opportunities (23.3 per cent),
10
and acquiring education or training (13.7 per cent). For most male migrants, on the other
hand, the main drivers were work (44.3 per cent) and family (40.1 per cent), while 14.3 per
cent had moved to take advantage of education or training opportunities.
Table 3.2 Migration status of youth by sex (%)
Migration status and reason Total Male Female
Migration status to the current residence
Did not migrate 73.7 79.0 68.0
Migrated 26.3 21.0 32.0
Total (absolute numbers) 14 559 831 7 491 270 7 068 561
Migrated from
Rural areas 34.8 49.3 24.7
Urban areas 64.8 50.1 75.0
Another country 0.4 0.6 0.3
Total (absolute numbers) 3 842 327 1 579 027 2 263 301
Main reason for migration
To accompany family 52.5 40.1 60.9
Education/training 13.9 14.3 13.7
To take up work / employment purposes 31.8 44.3 23.3
Other reasons 1.8 1.3 2.1
Total (absolute numbers) 3 788 519 1 530 354 2 258 165
Source: SWTS-Tanzania, 2013.
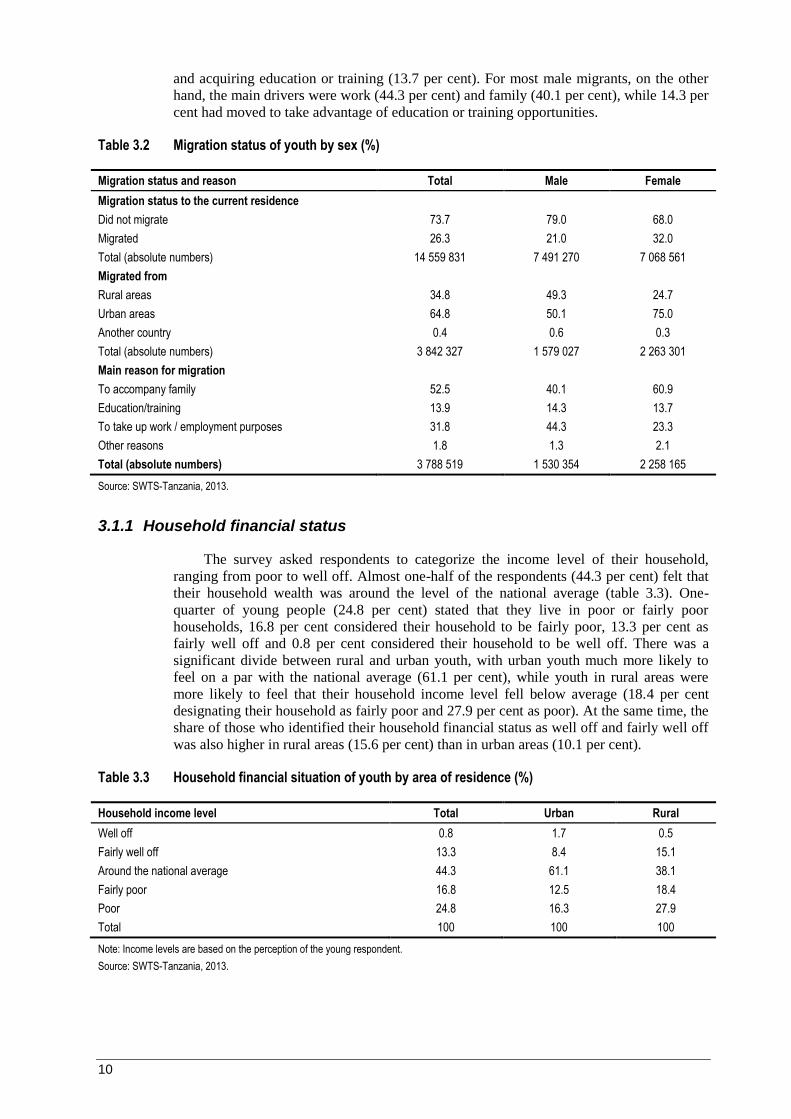
3.1.1 Household financial status
The survey asked respondents to categorize the income level of their household,
ranging from poor to well off. Almost one-half of the respondents (44.3 per cent) felt that
their household wealth was around the level of the national average (table 3.3). One-
quarter of young people (24.8 per cent) stated that they live in poor or fairly poor
households, 16.8 per cent considered their household to be fairly poor, 13.3 per cent as
fairly well off and 0.8 per cent considered their household to be well off. There was a
significant divide between rural and urban youth, with urban youth much more likely to
feel on a par with the national average (61.1 per cent), while youth in rural areas were
more likely to feel that their household income level fell below average (18.4 per cent
designating their household as fairly poor and 27.9 per cent as poor). At the same time, the
share of those who identified their household financial status as well off and fairly well off
was also higher in rural areas (15.6 per cent) than in urban areas (10.1 per cent).
Table 3.3 Household financial situation of youth by area of residence (%)
Household income level Total Urban Rural
Well off 0.8 1.7 0.5
Fairly well off 13.3 8.4 15.1
Around the national average 44.3 61.1 38.1
Fairly poor 16.8 12.5 18.4
Poor 24.8 16.3 27.9
Total 100 100 100
Note: Income levels are based on the perception of the young respondent.
Source: SWTS-Tanzania, 2013.

11
3.1.2 Financial inclusion
Very few young people in Tanzania make use of formal financial services. Only 2.1
per cent of the surveyed youth had acquired a business loan, 1.4 per cent had taken out a
consumption loan and 0.2 per cent an emergency loan (table 3.4). More common was the
use of financial services for own savings (11.3 per cent). Over two-fifths (42.9 per cent) of
Tanzanian youth reported that their family and friends provided their main source of
financial support. For one-fifth of respondents (22.5 per cent) banks were the main source
of financial services, 6.5 per cent used microfinance institutions and 0.9 per cent resorted
to using the financial services provided by informal operators. Over one-third of surveyed
youth (37.0 per cent) stated that they had no means of covering unforeseen expenses.
Others rely on their own savings (21.9 per cent), take out a loan (5.5 per cent), make
sacrifices on other expenditure (2.4 per cent) or intend to sell assets (2.0 per cent) in case
of unexpected expenses.
Table 3.4 Youth’s access to financial services
Personal use of financial services %
None 80.2
Business loan 2.1
Emergency loan 0.2
Consumption loan 1.4
Savings 11.3
Remittance 2.9
Other service 1.9
Main source of financial services
Banks 22.5
Insurance 0.9
Microfinance institution 6.5
Money transfer operators (money gram, Western Union, etc.) 0.4
Informal financial operators, money lenders, pawn shops 0.9
Friends and relatives 42.9
None 26.0
Means of covering unforeseen expenses
No means to cover them 37.0
Saving 21.9
Loan 5.5
(Micro)insurance 0.6
Sacrifice other expenditure (food, house, health, education, etc.) 2.4
Work extra hours to earn more income 8.8
Sell assets 2.0
Other services 21.9
Source: SWTS-Tanzania, 2013.
3.2 Educational attainment
3.2.1 Educational status
Education and training potentially increase the productivity and employability of
young people, opening up new opportunities in different sectors and occupations.
Educational enrolment and attainment also have a positive impact on the health of young
persons, decisions regarding marriage and reproduction, social capital and quality of life.
12
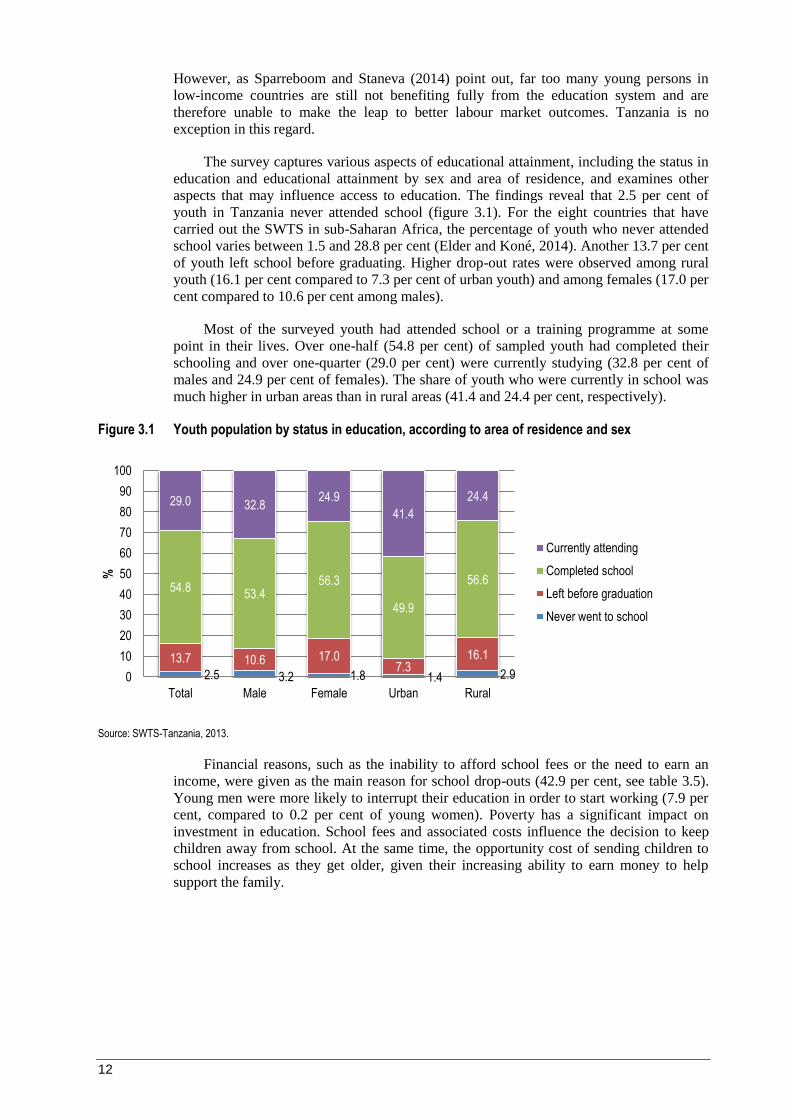
However, as Sparreboom and Staneva (2014) point out, far too many young persons in
low-income countries are still not benefiting fully from the education system and are
therefore unable to make the leap to better labour market outcomes. Tanzania is no
exception in this regard.
The survey captures various aspects of educational attainment, including the status in
education and educational attainment by sex and area of residence, and examines other
aspects that may influence access to education. The findings reveal that 2.5 per cent of
youth in Tanzania never attended school (figure 3.1). For the eight countries that have
carried out the SWTS in sub-Saharan Africa, the percentage of youth who never attended
school varies between 1.5 and 28.8 per cent (Elder and Koné, 2014). Another 13.7 per cent
of youth left school before graduating. Higher drop-out rates were observed among rural
youth (16.1 per cent compared to 7.3 per cent of urban youth) and among females (17.0 per
cent compared to 10.6 per cent among males).
Most of the surveyed youth had attended school or a training programme at some
point in their lives. Over one-half (54.8 per cent) of sampled youth had completed their
schooling and over one-quarter (29.0 per cent) were currently studying (32.8 per cent of
males and 24.9 per cent of females). The share of youth who were currently in school was
much higher in urban areas than in rural areas (41.4 and 24.4 per cent, respectively).
Figure 3.1 Youth population by status in education, according to area of residence and sex
Source: SWTS-Tanzania, 2013.
Financial reasons, such as the inability to afford school fees or the need to earn an
income, were given as the main reason for school drop-outs (42.9 per cent, see table 3.5).
Young men were more likely to interrupt their education in order to start working (7.9 per
cent, compared to 0.2 per cent of young women). Poverty has a significant impact on
investment in education. School fees and associated costs influence the decision to keep
children away from school. At the same time, the opportunity cost of sending children to
school increases as they get older, given their increasing ability to earn money to help
support the family.
2.5 3.2 1.8 1.4 2.9
13.7 10.6 17.0 7.3
16.1
54.8 53.4
56.3
49.9
56.6
29.0 32.8 24.9
41.4
24.4
0
10
20
30
40
50
60
70
80
90
100
Total Male Female Urban Rural
%
Currently attending
Completed school
Left before graduation
Never went to school
13
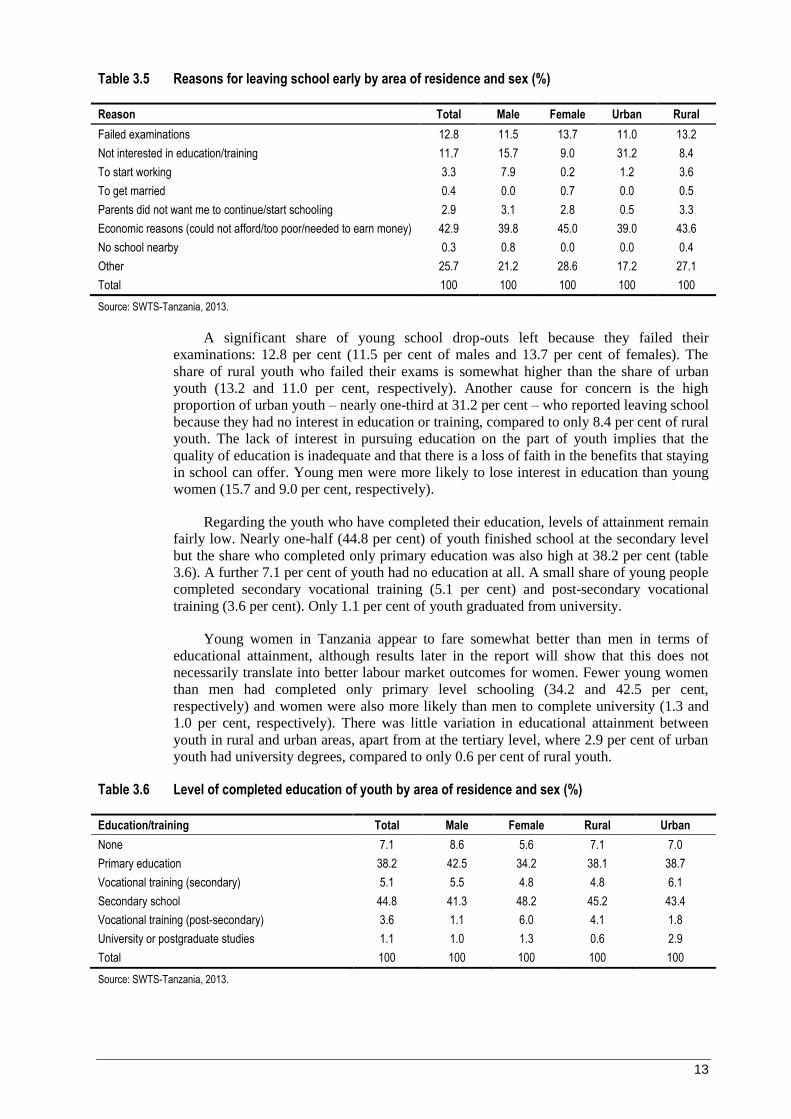
Table 3.5 Reasons for leaving school early by area of residence and sex (%)
Reason Total Male Female Urban Rural
Failed examinations 12.8 11.5 13.7 11.0 13.2
Not interested in education/training 11.7 15.7 9.0 31.2 8.4
To start working 3.3 7.9 0.2 1.2 3.6
To get married 0.4 0.0 0.7 0.0 0.5
Parents did not want me to continue/start schooling 2.9 3.1 2.8 0.5 3.3
Economic reasons (could not afford/too poor/needed to earn money) 42.9 39.8 45.0 39.0 43.6
No school nearby 0.3 0.8 0.0 0.0 0.4
Other 25.7 21.2 28.6 17.2 27.1
Total 100 100 100 100 100
Source: SWTS-Tanzania, 2013.
A significant share of young school drop-outs left because they failed their
examinations: 12.8 per cent (11.5 per cent of males and 13.7 per cent of females). The
share of rural youth who failed their exams is somewhat higher than the share of urban
youth (13.2 and 11.0 per cent, respectively). Another cause for concern is the high
proportion of urban youth – nearly one-third at 31.2 per cent – who reported leaving school
because they had no interest in education or training, compared to only 8.4 per cent of rural
youth. The lack of interest in pursuing education on the part of youth implies that the
quality of education is inadequate and that there is a loss of faith in the benefits that staying
in school can offer. Young men were more likely to lose interest in education than young
women (15.7 and 9.0 per cent, respectively).
Regarding the youth who have completed their education, levels of attainment remain
fairly low. Nearly one-half (44.8 per cent) of youth finished school at the secondary level
but the share who completed only primary education was also high at 38.2 per cent (table
3.6). A further 7.1 per cent of youth had no education at all. A small share of young people
completed secondary vocational training (5.1 per cent) and post-secondary vocational
training (3.6 per cent). Only 1.1 per cent of youth graduated from university.
Young women in Tanzania appear to fare somewhat better than men in terms of
educational attainment, although results later in the report will show that this does not
necessarily translate into better labour market outcomes for women. Fewer young women
than men had completed only primary level schooling (34.2 and 42.5 per cent,
respectively) and women were also more likely than men to complete university (1.3 and
1.0 per cent, respectively). There was little variation in educational attainment between
youth in rural and urban areas, apart from at the tertiary level, where 2.9 per cent of urban
youth had university degrees, compared to only 0.6 per cent of rural youth.
Table 3.6 Level of completed education of youth by area of residence and sex (%)
Education/training Total Male Female Rural Urban
None 7.1 8.6 5.6 7.1 7.0
Primary education 38.2 42.5 34.2 38.1 38.7
Vocational training (secondary) 5.1 5.5 4.8 4.8 6.1
Secondary school 44.8 41.3 48.2 45.2 43.4
Vocational training (post-secondary) 3.6 1.1 6.0 4.1 1.8
University or postgraduate studies 1.1 1.0 1.3 0.6 2.9
Total 100 100 100 100 100
Source: SWTS-Tanzania, 2013.
14
3.2.2 Parents’ educational attainment
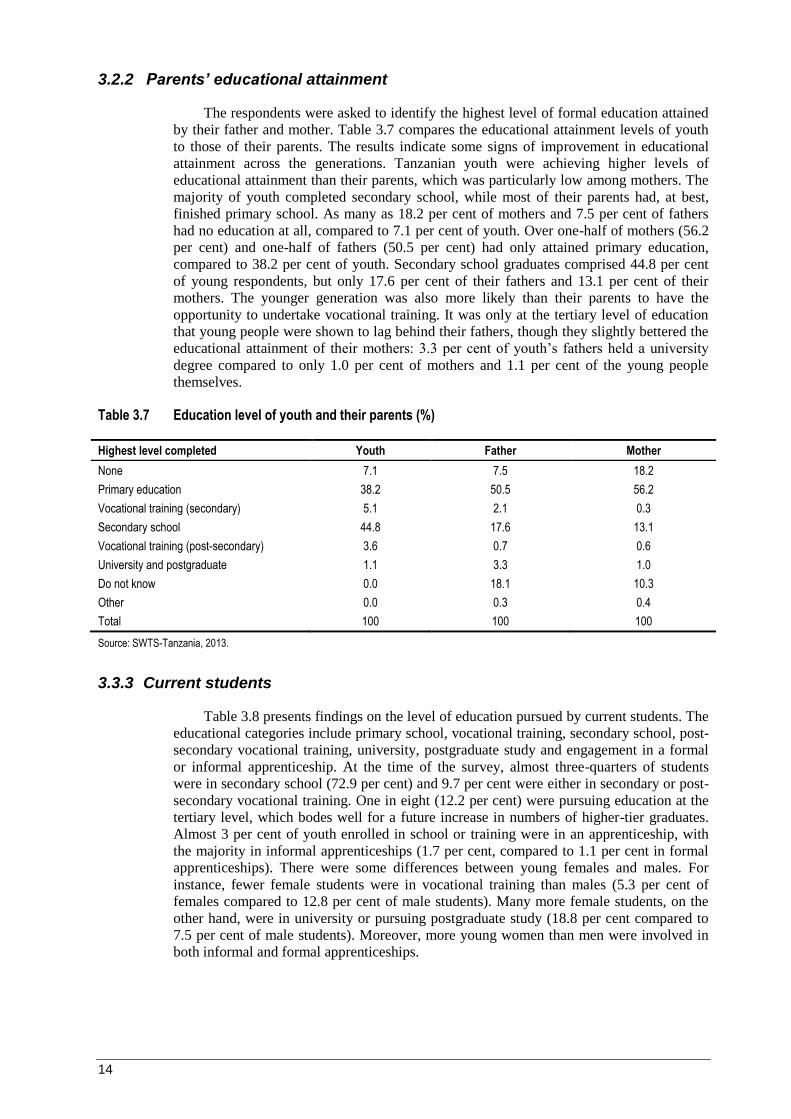
The respondents were asked to identify the highest level of formal education attained
by their father and mother. Table 3.7 compares the educational attainment levels of youth
to those of their parents. The results indicate some signs of improvement in educational
attainment across the generations. Tanzanian youth were achieving higher levels of
educational attainment than their parents, which was particularly low among mothers. The
majority of youth completed secondary school, while most of their parents had, at best,
finished primary school. As many as 18.2 per cent of mothers and 7.5 per cent of fathers
had no education at all, compared to 7.1 per cent of youth. Over one-half of mothers (56.2
per cent) and one-half of fathers (50.5 per cent) had only attained primary education,
compared to 38.2 per cent of youth. Secondary school graduates comprised 44.8 per cent
of young respondents, but only 17.6 per cent of their fathers and 13.1 per cent of their
mothers. The younger generation was also more likely than their parents to have the
opportunity to undertake vocational training. It was only at the tertiary level of education
that young people were shown to lag behind their fathers, though they slightly bettered the
educational attainment of their mothers: 3.3 per cent of youth’s fathers held a university
degree compared to only 1.0 per cent of mothers and 1.1 per cent of the young people
themselves.
Table 3.7 Education level of youth and their parents (%)
Highest level completed Youth Father Mother
None 7.1 7.5 18.2
Primary education 38.2 50.5 56.2
Vocational training (secondary) 5.1 2.1 0.3
Secondary school 44.8 17.6 13.1
Vocational training (post-secondary) 3.6 0.7 0.6
University and postgraduate 1.1 3.3 1.0
Do not know 0.0 18.1 10.3
Other 0.0 0.3 0.4
Total 100 100 100
Source: SWTS-Tanzania, 2013.
3.3.3 Current students
Table 3.8 presents findings on the level of education pursued by current students. The
educational categories include primary school, vocational training, secondary school, post-
secondary vocational training, university, postgraduate study and engagement in a formal
or informal apprenticeship. At the time of the survey, almost three-quarters of students
were in secondary school (72.9 per cent) and 9.7 per cent were either in secondary or post-
secondary vocational training. One in eight (12.2 per cent) were pursuing education at the
tertiary level, which bodes well for a future increase in numbers of higher-tier graduates.
Almost 3 per cent of youth enrolled in school or training were in an apprenticeship, with
the majority in informal apprenticeships (1.7 per cent, compared to 1.1 per cent in formal
apprenticeships). There were some differences between young females and males. For
instance, fewer female students were in vocational training than males (5.3 per cent of
females compared to 12.8 per cent of male students). Many more female students, on the
other hand, were in university or pursuing postgraduate study (18.8 per cent compared to
7.5 per cent of male students). Moreover, more young women than men were involved in
both informal and formal apprenticeships.
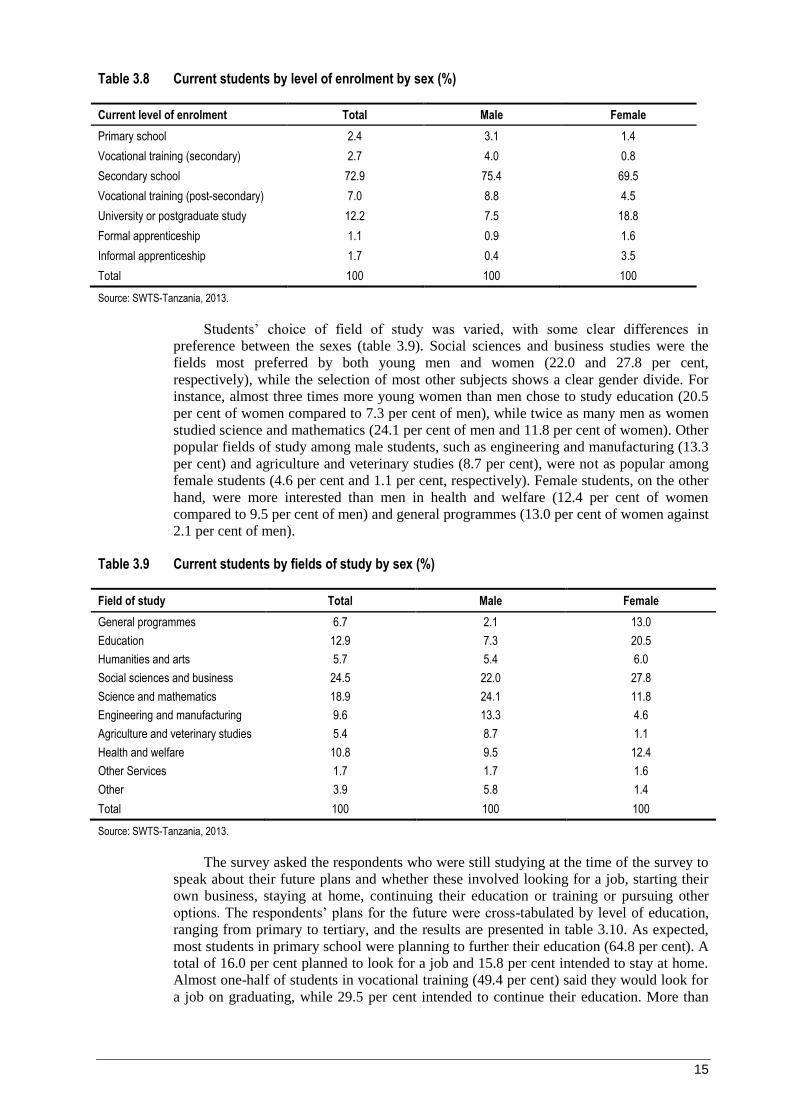
15
Table 3.8 Current students by level of enrolment by sex (%)
Current level of enrolment Total Male Female
Primary school 2.4 3.1 1.4
Vocational training (secondary) 2.7 4.0 0.8
Secondary school 72.9 75.4 69.5
Vocational training (post-secondary) 7.0 8.8 4.5
University or postgraduate study 12.2 7.5 18.8
Formal apprenticeship 1.1 0.9 1.6
Informal apprenticeship 1.7 0.4 3.5
Total 100 100 100
Source: SWTS-Tanzania, 2013.
Students’ choice of field of study was varied, with some clear differences in
preference between the sexes (table 3.9). Social sciences and business studies were the
fields most preferred by both young men and women (22.0 and 27.8 per cent,
respectively), while the selection of most other subjects shows a clear gender divide. For
instance, almost three times more young women than men chose to study education (20.5
per cent of women compared to 7.3 per cent of men), while twice as many men as women
studied science and mathematics (24.1 per cent of men and 11.8 per cent of women). Other
popular fields of study among male students, such as engineering and manufacturing (13.3
per cent) and agriculture and veterinary studies (8.7 per cent), were not as popular among
female students (4.6 per cent and 1.1 per cent, respectively). Female students, on the other
hand, were more interested than men in health and welfare (12.4 per cent of women
compared to 9.5 per cent of men) and general programmes (13.0 per cent of women against
2.1 per cent of men).
Table 3.9 Current students by fields of study by sex (%)
Field of study Total Male Female
General programmes 6.7 2.1 13.0
Education 12.9 7.3 20.5
Humanities and arts 5.7 5.4 6.0
Social sciences and business 24.5 22.0 27.8
Science and mathematics 18.9 24.1 11.8
Engineering and manufacturing 9.6 13.3 4.6
Agriculture and veterinary studies 5.4 8.7 1.1
Health and welfare 10.8 9.5 12.4
Other Services 1.7 1.7 1.6
Other 3.9 5.8 1.4
Total 100 100 100
Source: SWTS-Tanzania, 2013.
The survey asked the respondents who were still studying at the time of the survey to
speak about their future plans and whether these involved looking for a job, starting their
own business, staying at home, continuing their education or training or pursuing other
options. The respondents’ plans for the future were cross-tabulated by level of education,
ranging from primary to tertiary, and the results are presented in table 3.10. As expected,
most students in primary school were planning to further their education (64.8 per cent). A
total of 16.0 per cent planned to look for a job and 15.8 per cent intended to stay at home.
Almost one-half of students in vocational training (49.4 per cent) said they would look for
a job on graduating, while 29.5 per cent intended to continue their education. More than
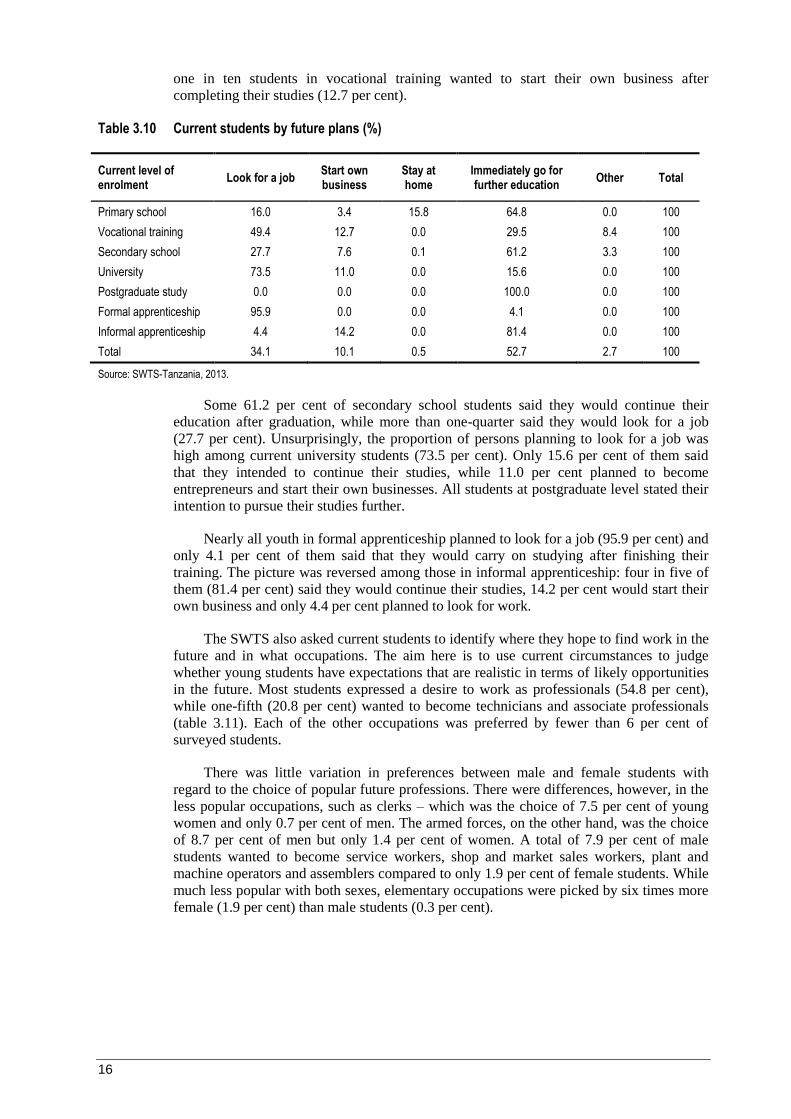
16
one in ten students in vocational training wanted to start their own business after
completing their studies (12.7 per cent).
Table 3.10 Current students by future plans (%)
Current level of enrolment
Look for a job Start own business
Stay at home
Immediately go for further education
Other Total
Primary school 16.0 3.4 15.8 64.8 0.0 100
Vocational training 49.4 12.7 0.0 29.5 8.4 100
Secondary school 27.7 7.6 0.1 61.2 3.3 100
University 73.5 11.0 0.0 15.6 0.0 100
Postgraduate study 0.0 0.0 0.0 100.0 0.0 100
Formal apprenticeship 95.9 0.0 0.0 4.1 0.0 100
Informal apprenticeship 4.4 14.2 0.0 81.4 0.0 100
Total 34.1 10.1 0.5 52.7 2.7 100
Source: SWTS-Tanzania, 2013.
Some 61.2 per cent of secondary school students said they would continue their
education after graduation, while more than one-quarter said they would look for a job
(27.7 per cent). Unsurprisingly, the proportion of persons planning to look for a job was
high among current university students (73.5 per cent). Only 15.6 per cent of them said
that they intended to continue their studies, while 11.0 per cent planned to become
entrepreneurs and start their own businesses. All students at postgraduate level stated their
intention to pursue their studies further.
Nearly all youth in formal apprenticeship planned to look for a job (95.9 per cent) and
only 4.1 per cent of them said that they would carry on studying after finishing their
training. The picture was reversed among those in informal apprenticeship: four in five of
them (81.4 per cent) said they would continue their studies, 14.2 per cent would start their
own business and only 4.4 per cent planned to look for work.
The SWTS also asked current students to identify where they hope to find work in the
future and in what occupations. The aim here is to use current circumstances to judge
whether young students have expectations that are realistic in terms of likely opportunities
in the future. Most students expressed a desire to work as professionals (54.8 per cent),
while one-fifth (20.8 per cent) wanted to become technicians and associate professionals
(table 3.11). Each of the other occupations was preferred by fewer than 6 per cent of
surveyed students.
There was little variation in preferences between male and female students with
regard to the choice of popular future professions. There were differences, however, in the
less popular occupations, such as clerks – which was the choice of 7.5 per cent of young
women and only 0.7 per cent of men. The armed forces, on the other hand, was the choice
of 8.7 per cent of men but only 1.4 per cent of women. A total of 7.9 per cent of male
students wanted to become service workers, shop and market sales workers, plant and
machine operators and assemblers compared to only 1.9 per cent of female students. While
much less popular with both sexes, elementary occupations were picked by six times more
female (1.9 per cent) than male students (0.3 per cent).
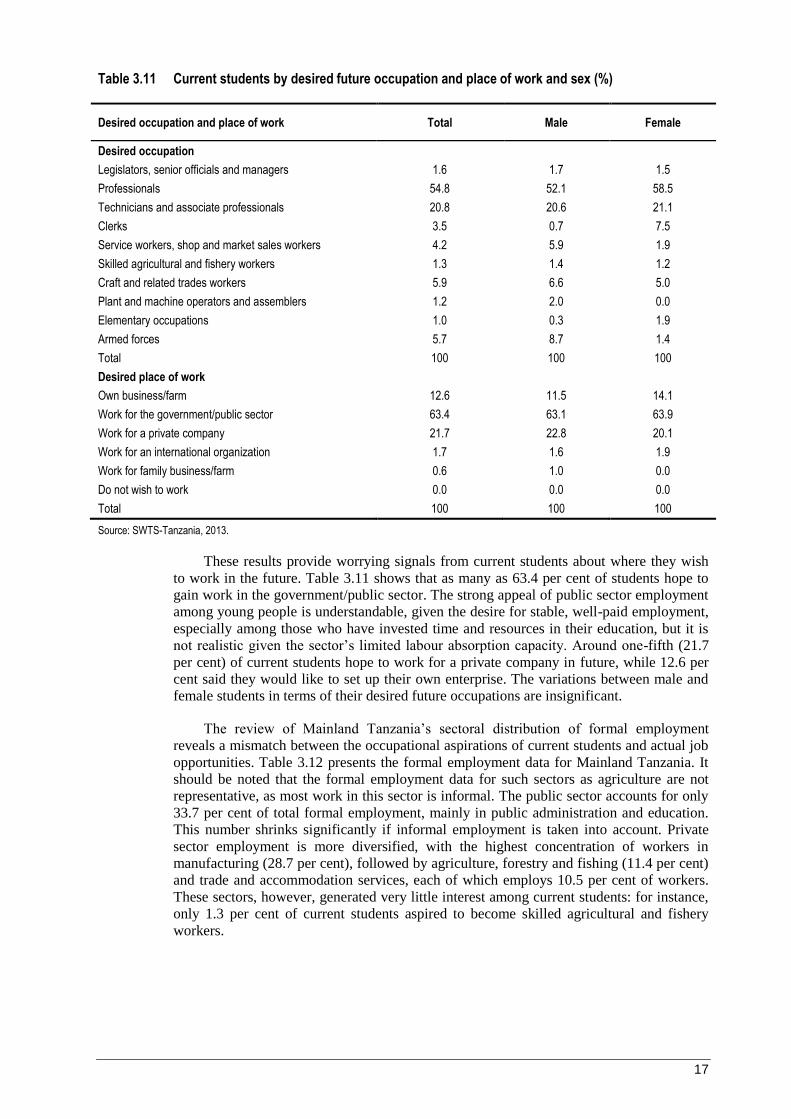
17
Table 3.11 Current students by desired future occupation and place of work and sex (%)
Desired occupation and place of work Total Male Female
Desired occupation
Legislators, senior officials and managers 1.6 1.7 1.5
Professionals 54.8 52.1 58.5
Technicians and associate professionals 20.8 20.6 21.1
Clerks 3.5 0.7 7.5
Service workers, shop and market sales workers 4.2 5.9 1.9
Skilled agricultural and fishery workers 1.3 1.4 1.2
Craft and related trades workers 5.9 6.6 5.0
Plant and machine operators and assemblers 1.2 2.0 0.0
Elementary occupations 1.0 0.3 1.9
Armed forces 5.7 8.7 1.4
Total 100 100 100
Desired place of work
Own business/farm 12.6 11.5 14.1
Work for the government/public sector 63.4 63.1 63.9
Work for a private company 21.7 22.8 20.1
Work for an international organization 1.7 1.6 1.9
Work for family business/farm 0.6 1.0 0.0
Do not wish to work 0.0 0.0 0.0
Total 100 100 100
Source: SWTS-Tanzania, 2013.
These results provide worrying signals from current students about where they wish
to work in the future. Table 3.11 shows that as many as 63.4 per cent of students hope to
gain work in the government/public sector. The strong appeal of public sector employment
among young people is understandable, given the desire for stable, well-paid employment,
especially among those who have invested time and resources in their education, but it is
not realistic given the sector’s limited labour absorption capacity. Around one-fifth (21.7
per cent) of current students hope to work for a private company in future, while 12.6 per
cent said they would like to set up their own enterprise. The variations between male and
female students in terms of their desired future occupations are insignificant.
The review of Mainland Tanzania’s sectoral distribution of formal employment
reveals a mismatch between the occupational aspirations of current students and actual job
opportunities. Table 3.12 presents the formal employment data for Mainland Tanzania. It
should be noted that the formal employment data for such sectors as agriculture are not
representative, as most work in this sector is informal. The public sector accounts for only
33.7 per cent of total formal employment, mainly in public administration and education.
This number shrinks significantly if informal employment is taken into account. Private
sector employment is more diversified, with the highest concentration of workers in
manufacturing (28.7 per cent), followed by agriculture, forestry and fishing (11.4 per cent)
and trade and accommodation services, each of which employs 10.5 per cent of workers.
These sectors, however, generated very little interest among current students: for instance,
only 1.3 per cent of current students aspired to become skilled agricultural and fishery
workers.
18
Table 3.12 Sectoral distribution of formal employment in Tanzania (mainland), 2013
Industry Private Public Total
Agriculture, forestry, fishing 11.4 0.5 7.7
Mining and quarrying 1.4 0.0 0.9
Manufacturing 28.7 0.1 19.1
Electricity, gas, etc. 0.2 1.9 0.8
Water supply and waste management 0.1 0.8 0.3
Construction 3.7 0.1 2.5
Wholesale and retail trade, repair services 10.5 0.1 7.0
Transportation and storage 4.4 2.1 3.6
Accommodation and food service activities 10.5 0.0 6.9
Information and communication 1.6 0.5 1.3
Financial and insurance activities 1.9 1.0 1.6
Real estate activities 0.1 0.1 0.1
Professional, scientific and technical activities 1.2 2.2 1.6
Administrative and support service activities 4.0 0.1 2.7
Public administration, defence, compulsory social security 0.7 44.4 15.3
Education 7.5 36.8 17.3
Human health and social work activities 5.4 8.9 6.6
Arts, entertainment and recreation 0.3 0.1 0.3
Other services 6.4 0.3 4.4
Total (%) 100 100 100
Total employees 1 233 068 625 901 1 858 969
Source: National Bureau of Statistics of Tanzania, 2014, p. 19.
3.3 Aspirations and life goals
The SWTS asked young respondents to identify their primary life goal. The results
summarized in table 3.13 provide an interesting insight into the priorities and ambitions of
current cohort of youth. One-half of all respondents (50.1 per cent) aspired to have a good
family life, with only minor differences in shares between young men and women (52.2
and 47.9 per cent, respectively). The second most common answer among surveyed youth
was to be successful in work, with more women than men indicating a successful career as
their primary aspiration in life (34.2 per cent of women compared to 26.3 per cent of men).
Making a positive contribution to society was the objective of 11.8 per cent of respondents
with no major gender discrepancy. Only 9.2 per cent of young men and 6.6 per cent of
young women stated that their main goal in life was to have a lot of money.
Table 3.13 Youth aspirations in life (%)
Primary life goal Total Male Female
Being successful in work 30.1 26.3 34.2
Making a contribution to society 11.8 12.3 11.3
Having lots of money 8.0 9.2 6.6
Having a good family life 50.1 52.2 47.9
Total 100 100 100
Source: SWTS-Tanzania, 2013.
19
3.4 Current activity status of youth
The traditional classification of current economic activity status has three categories:
employed, unemployed or inactive. The employed and unemployed are added together to
form the total labour force (also known as the economically active population).
Unemployment, according to international standards, is defined as the situation of a person
who: (a) did not work in the reference period, (b) was available to take up a job had one
been offered in the week prior to the reference period, and (c) actively sought work within
the past 30 days (for example, by registering at an employment centre or answering a job
advertisement) (ILO, 2013b, p. 39; see also Annex I on definitions). In contrast, the
definition of “relaxed unemployment” (also known as “broad unemployment”), differs in
the relaxation of the “seeking work” criterion. According to the international standards, the
seeking work criterion may be relaxed “in situations where the conventional means of
seeking work are of limited relevance, where the labour market is largely unorganized or
of limited scope, where labour absorption is, at the time, inadequate or where the labour
force is largely self-employed” (ILO, 2013b, pp. 39−40). As this description largely fits the
situation in Tanzania, the relaxed definition is preferred in much of this report’s analysis.
In Tanzania, 43.6 per cent of youth were employed, which is below the average
working youth population in the eight sub-Saharan African countries that undertook the
SWTS in 2012/13 (53.2 per cent) (Elder and Koné, 2014). When applying the strict
definition of unemployment, the survey results show that 11.7 per cent were unemployed
and 44.7 per cent inactive (table 3.11). The share of unemployed women was higher at
13.3 per cent than that of men at 10.0 per cent. Even though the difference in labour force
participation patterns between rural and urban young women is minor, the area of
residence seems to be of greater significance in male youth labour force participation. The
share of working young men in rural areas was almost twice that of urban young men (57.0
and 30.6 per cent, respectively), while the proportion of unemployed (strict definition) was
nearly half the proportion of unemployed in urban areas (7.9 and 13.4 per cent,
respectively). The percentage of inactive young men was also much higher in urban areas
at 56.0 per cent, compared to 35.1 per cent in rural areas.
This picture changes when the relaxed definition of unemployment is applied (table
3.14). The relaxed inactivity rate was much lower at 29.4 per cent, although still higher
among urban youth (42.3 per cent, compared to 24.6 per cent in rural areas). The
unemployed share reached 27.1 per cent of Tanzania’s youth population, with the share of
unemployed women considerably higher at 33.4 per cent at the national level and 38.2 per
cent in rural areas (respective rates for men were 20.4 and 18.3 per cent). The leap in
unemployment shares when applying the relaxed definition confirms the weak labour
market institutions in the country, which mean that few young people bother to actively
seek work.
In the ILO report Global Employment Trends for Youth 2013, the argument is made
that comparing traditional labour market indicators with a more detailed disaggregation of
indicators made available through the SWTS gives a more accurate picture of the
challenges that youth face in developing economies (ILO, 2013b, Chapter 4). The SWTS
framework proposes the distribution of the youth population in the following five
categories: (a) regular employment, defined as wage and salaried workers holding a
contract of duration greater than 12 months plus self-employed youth with employees
(employers); (b) irregular employment, defined as wage and salaried workers holding a
contract of limited duration, i.e. set to terminate within 12 months, self-employed youth
with no employees (own-account workers) and contributing family workers; (c)
unemployed (relaxed definition), defined as persons currently without work and available
to take up work in the week prior to the reference period; (d) inactive non-students; and (e)
inactive students.

20
Table 3.14 Youth population by main economic activity, according to area of residence and sex (%)
Economic activity Total Urban Rural
Total Male Female Total Male Female Total Male Female
Strict definition
Employed 43.6 52.8 34.9 33.2 30.6 36.1 47.3 57.0 37.3
Unemployed 11.7 10.0 13.3 13.2 13.4 13.1 11.1 7.9 14.5
Inactive 44.7 37.3 51.8 53.5 56.0 50.8 41.5 35.1 48.3
Total youth population
100 100 100 100 100 100 100 100 100
Relaxed definition
Employed 43.6 52.8 34.9 33.2 30.6 36.1 47.3 57.0 37.3
Unemployed 27.1 20.4 33.4 24.4 21.8 27.3 28.0 18.3 38.2
Inactive 29.4 26.8 31.7 42.3 47.5 36.6 24.6 24.8 24.5
Total youth population
100 100 100 100 100 100 100 100 100
Source: SWTS-Tanzania, 2013.
Figure 3.2 shows the results for Tanzania. A mere 15.1 per cent of Tanzanian youth
were engaged in regular employment, while almost twice as many (28.4 per cent) were in
irregular employment. One-fifth (20.5 per cent) of Tanzanian youth were inactive students,
hopefully engaged in increasing their skills and knowledge to better their employment
prospects in the future. The 8.8 per cent of youth that were inactive non-students were
neither in the labour force, nor in education or training. The share of young men in regular
employment was 19.1 per cent while that figure was much lower among women, at 10.9
per cent. The male share in irregular employment was, however, also higher than the
female share, at 30.7 and 26.1 per cent, respectively. The share of young women in the
inactive non-student category was higher than that of young men (11.4 and 6.3 per cent,
respectively) but young women constituted a lower share of inactive students (with 16.2
per cent in contrast to 24.6 per cent of young men). More worrying is the difference in the
shares of unemployed (relaxed definition); the share of unemployed among young women
was nearly double that among young men (at 35.4 and 19.2 per cent, respectively).
Figure 3.2 Distribution of youth population according to the SWTS framework
Source: SWTS-Tanzania, 2013.
15.1 19.1 10.9 14.4 15.4
28.4 30.7
26.1 18.8
31.9
27.1 19.2 35.4
24.4
28.0
20.5 24.6 16.2
31.6
16.5
8.8 6.3 11.4 10.7 8.1
0
10
20
30
40
50
60
70
80
90
100
Total Male Female Urban Rural
%
Inactive non-students
Inactive students
Unemployed (relaxed)
In Irregular employment
In regular employment
21
The regional differences are evident when it comes to the share of young people in
irregular employment: in rural areas almost one-third of youth (31.9 per cent) were in
irregular employment, compared to 18.8 per cent of urban youth. There were also many
more inactive students in urban areas (31.6 per cent) than among rural youth (16.5 per
cent).
The labour underutilization rate is calculated as the sum of the shares of youth in
irregular employment, unemployed (relaxed definition) and the inactive non-students.
These results suggest that, instead of an unutilized labour potential of 11.7 per cent (the
share of unemployed based on the strict definition), policy-makers in Tanzania should be
concerned that as many as 64.3 per cent of youth can be considered to fall within the
category of underutilized labour. The rate of labour underutilization was higher among
female youth (72.9 per cent) than male youth (56.2 per cent). Two-thirds (68.0 per cent) of
rural youth and over one-half (53.9 per cent) of urban youth are not able to realize their full
economic potential.
The level of education is usually positively correlated with the activity status of youth.
In Tanzania, however, youth who have never attended school were most likely to be
employed (78.2 per cent were working) and least likely to be unemployed (only 5.7 per
cent, table 3.15). Less than one-half of secondary school graduates – recalling that
secondary school graduates constituted the largest share among youth – were in
employment (45.7 per cent) and almost as many were inactive (40.3 per cent); the share of
unemployed was significantly higher than among those with a lower level of education at
13.9 per cent. The largest jump between the shares in unemployment, however, was seen
in university graduates, where as many as 26.7 per cent were unemployed. Such high
levels of unemployment among well-educated youth are explained by the fact that, having
spent years studying, they are less likely to settle for the first available job but are prepared
to wait for a job that is better suited to their level of skills. Unfortunately, however, there
remains a scarcity of jobs for higher skilled youth in Tanzania, which means that job
queues can be long (see section 3.6 for more details on the characteristics of unemployed
youth).
Table 3.15 Youth population by educational attainment and current activity status (%)
Educational attainment Employed Unemployed Inactive Total
Never attended 78.2 5.7 16.1 100
Lower than primary 72.0 8.4 19.6 100
Primary 64.5 8.2 27.3 100
Vocational (secondary) 68.0 16.0 16.0 100
Secondary 45.7 13.9 40.3 100
Post-secondary vocational 19.2 76.5 4.2 100
University and postgraduate 60.0 26.7 13.3 100
Total 55.3 13.7 31.0 100
Source: SWTS-Tanzania, 2013.
3.5 Characteristics of employed youth
The “employed” comprise all persons surveyed who worked for pay, profit or family
gain for at least one hour in the reference week plus the number of persons who are
temporarily absent from their jobs (see Annex I for more detailed definitions). By current
activity status, 43.6 per cent of Tanzanian youth – 52.8 per cent of young men and only
one-third (34.9 per cent) of young women – were employed (figure 3.3). A variety of
factors can account for this gender gap, including access to education (young women were
less likely to be in school than young men and more likely to leave school early but,
22
among those who do manage to stay in school, they had a tendency to complete their
education at a higher level than their male counterparts) and socio-cultural barriers to
women’s employment.
Tanzanians aged 25–29 had the highest employment-to-population ratio at 62.9 per
cent. Persons in this age group were more likely to have completed school and acquired
some work experience, making them more employable. The employment-to-population
ratio of youth aged 20–24 was 55.3 per cent. However, SWTS results show that 27.2 per
cent of adolescents between the ages of 15 and 19 were also working. Having to leave their
education and start working at such an early age greatly reduces their chances of finding
stable well-paid jobs in the future.
Figure 3.3 Youth employment-to-population ratio by area of residence, sex and age group
Source: SWTS-Tanzania, 2013.
3.5.1 Status in employment
The categorization of status in employment is important because different groups of
workers face different economic risks. Wage and salaried workers, or employees, are
attached to an institution and generally receive a regular wage (although persons on daily
wages would also be included in this category). They face relatively low economic risks
compared to the self-employed and unpaid family workers. In general, a country with a
high proportion of wage and salaried workers is likely to have a strong formal economy
with effective labour market institutions (Elder and Koné, 2014). The self-employed,
whether own-account workers or employers, face relatively higher economic risks since
their remuneration is dependent on the number of units sold or services rendered. Their
incomes are subject to fluctuations and they do not have access to the entitlements made
available to some wage and salaried workers. In most developing economies, the majority
of self-employed workers operate in the informal sector.
Table 3.16 shows that almost equal proportions of young working Tanzanians were
wage and salaried workers (35.9 per cent) and own-account workers (35.8 per cent). A
sizable share (18.2 per cent) were contributing family workers and only 6.8 per cent were
employers. Own-account workers and contributing family workers together make up a
category of “vulnerable employment”. These are the workers who face high levels of job
insecurity and who do not have access to safety nets to cover them during periods when
they are unable to work due to sickness or disability. More than one-half of young workers
in Tanzania can be classified as “vulnerable” (54.0 per cent), based on the SWTS results,
with young women in rural areas being those most likely to engage in vulnerable
employment (71.4 per cent).
27.2
55.3
62.9
52.8
34.9
33.2
47.3
43.6
0 10 20 30 40 50 60 70
15-19
20-24
25-29
Male
Female
Urban
Rural
Total
%
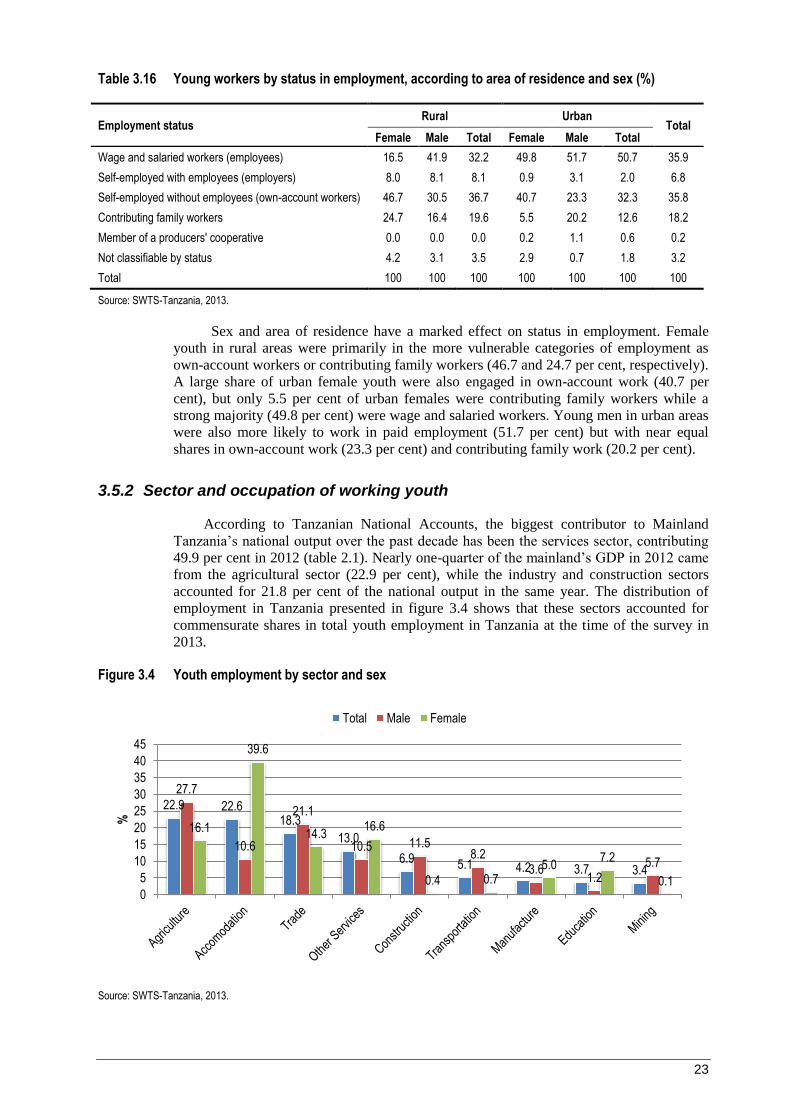
23
Table 3.16 Young workers by status in employment, according to area of residence and sex (%)
Employment status Rural Urban
Total Female Male Total Female Male Total
Wage and salaried workers (employees) 16.5 41.9 32.2 49.8 51.7 50.7 35.9
Self-employed with employees (employers) 8.0 8.1 8.1 0.9 3.1 2.0 6.8
Self-employed without employees (own-account workers) 46.7 30.5 36.7 40.7 23.3 32.3 35.8
Contributing family workers 24.7 16.4 19.6 5.5 20.2 12.6 18.2
Member of a producers' cooperative 0.0 0.0 0.0 0.2 1.1 0.6 0.2
Not classifiable by status 4.2 3.1 3.5 2.9 0.7 1.8 3.2
Total 100 100 100 100 100 100 100
Source: SWTS-Tanzania, 2013.
Sex and area of residence have a marked effect on status in employment. Female
youth in rural areas were primarily in the more vulnerable categories of employment as
own-account workers or contributing family workers (46.7 and 24.7 per cent, respectively).
A large share of urban female youth were also engaged in own-account work (40.7 per
cent), but only 5.5 per cent of urban females were contributing family workers while a
strong majority (49.8 per cent) were wage and salaried workers. Young men in urban areas
were also more likely to work in paid employment (51.7 per cent) but with near equal
shares in own-account work (23.3 per cent) and contributing family work (20.2 per cent).
3.5.2 Sector and occupation of working youth
According to Tanzanian National Accounts, the biggest contributor to Mainland
Tanzania’s national output over the past decade has been the services sector, contributing
49.9 per cent in 2012 (table 2.1). Nearly one-quarter of the mainland’s GDP in 2012 came
from the agricultural sector (22.9 per cent), while the industry and construction sectors
accounted for 21.8 per cent of the national output in the same year. The distribution of
employment in Tanzania presented in figure 3.4 shows that these sectors accounted for
commensurate shares in total youth employment in Tanzania at the time of the survey in
2013.
Figure 3.4 Youth employment by sector and sex
Source: SWTS-Tanzania, 2013.
22.9 22.6 18.3
13.0
6.9 5.1 4.2 3.7 3.4
27.7
10.6
21.1
10.5 11.5 8.2
3.6 1.2
5.7
16.1
39.6
14.3 16.6
0.4 0.7 5.0
7.2
0.1 0
5
10
15
20
25
30
35
40
45
%
Total Male Female
24
Similar to the sectoral contribution to the national output, the services sector
accounted for the largest share of youth employment in Tanzania (57.6 per cent). The
services sector includes accommodation, which employs as many as 39.6 per cent of young
women compared to only 10.6 per cent of men, trade (21.1 per cent of men and 14.3 per
cent of women), education (7.2 per cent of women and 1.2 per cent of men), and other
services (16.6 per cent of women and 10.5 per cent of men). The second largest share of
employment in Tanzania is in the agriculture sector, where 22.9 per cent of Tanzanian
working youth were engaged. The share of young male workers in this sector was much
higher than the share of young female workers (27.7 and 16.1 per cent, respectively).
Finally, the industry and construction sector employs 19.6 per cent of youth. This figure
also comprises the youth working in transportation, manufacturing and mining, each of
these sectors accounting for less than 7 per cent of total youth employment.
There is a significant disparity in the shares of male and female workers by sectors of
employment. Young female workers were primarily found in services, while male youth
are also involved in agriculture and industry. More than three-quarters of young female
workers were engaged in services (77.7 per cent) compared to 43.4 per cent of young male
workers. Industry, on the other hand, employed almost five times as many men as women
(29.0 per cent of men and 6.2 per cent of women). In agriculture, the share of male workers
was almost double that of female workers. Young women were virtually absent from the
labour-intensive sectors, such as construction, transportation and mining.
The distribution of young workers by occupations is presented in table 3.17. One-
third of employed youth were engaged in elementary occupations5 (35.8 per cent). A total
of 20 per cent (20.6) were service workers, shop and market sales workers, while 17.5 per
cent were craft and related trades workers. Some 14.7 per cent of employed youth were
skilled agricultural and fishery workers, 4.2 per cent worked as technicians and associate
professionals and 3.8 per cent as plant and machine operators or assemblers. Fewer than 4
per cent of young Tanzanians were working in occupations that require higher
qualifications, such as clerks (1.8 per cent), professionals (1.3 per cent) or legislators,
senior officials and managers (0.2 per cent).
Table 3.17 Employed youth by occupation, according to area of residence and sex (%)
Occupation (ISCO-08) Total Male Female Rural Urban
Elementary occupations 35.8 36.5 34.8 36.6 32.7
Service workers, shop and market sales workers 20.6 20.5 20.8 17.8 31.6
Craft and related trades workers 17.5 10.3 27.7 17.6 17.0
Skilled agricultural and fishery workers 14.7 17.6 10.6 17.9 2.5
Technicians and associate professionals 4.2 6.3 1.1 4.0 4.8
Plant and machine operators and assemblers 3.8 6.4 0.1 3.9 3.5
Clerks 1.8 0.9 3.1 0.9 5.5
Professionals 1.3 0.9 1.8 1.0 2.4
Legislators, senior officials and managers 0.2 0.3 0.0 0.2 0.0
Armed forces 0.1 0.1 0.0 0.1 0.0
Total 100 100 100 100 100
Source: SWTS-Tanzania, 2013.
5 The International Standard Classification of Occupations (ISCO-88) describes elementary
occupations as those “which require the knowledge and experience necessary to perform mostly
simple and routine tasks, involving the use of hand-held tools and in some cases considerable
physical effort, and, with few exceptions, only limited personal initiative or judgment. The main
tasks consist of selling goods in streets, door-keeping and property watching, as well as cleaning,
washing, pressing, and working as labourers in the fields of mining, agriculture and fishing,
construction and manufacturing”.
25
Gender segregation is evident in certain occupations but not in others. For instance,
elementary occupations employ a similar share of young men and women (36.5 and 34.8
per cent, respectively). The proportion of men and women was almost the same in service
and sales related occupations, at around 20.5 per cent. On the other hand, there were more
than twice as many female craft and related trades workers as male (27.7 and 10.3 per cent,
respectively). At the same time, the share of young males working as technicians and
associate professionals was six times that of women (6.3 per cent of men and 1.1 per cent
of women). Male youth were also more likely to be skilled agricultural and fishery workers
(17.6 per cent, compared to 10.6 per cent of female youth).
Unsurprisingly, rural youth were more likely to work as skilled agricultural and
fishery workers (17.9 per cent, compared to 2.5 per cent of urban young workers). Urban
youth on the other hand were more likely to be service workers, shop and market sales
workers (31.6 per cent, compared to 17.8 per cent of rural youth), and much more likely to
work in “office” jobs as clerks and professionals.
3.5.3 Wage and salaried workers (employees)
Young men comprised 71.3 per cent of wage and salaried workers and young women
just over one-quarter (28.7 per cent) (table 3.18). Almost three-quarters of wage workers
resided in rural areas (71.2 per cent). Only 17.7 per cent of young employees had a written
contract. The remaining 82.3 per cent were engaged in work based on oral contracts,
affecting four out of five workers in rural areas (87.1 per cent) and 70.6 per cent of
workers in urban areas. Most urban workers benefited from contracts of unlimited duration
(71.9 per cent), which is not surprising given the oral and non-binding nature of the
contracts of most young employees. Among those with limited-duration contracts, almost
two-thirds had contracts of less than 12 months’ duration (64.9 per cent). In rural areas,
over one-half of workers had unlimited contracts (57.5 per cent) and most contracts of
limited duration were shorter than one year (56.3 per cent), whereas one-third lasted
between one and three years (36.8 per cent). Few limited contracts were of more than three
years in duration (7.9 per cent).
Table 3.18 Young wage and salaried workers by contract situation, according to area of residence and sex (%)
Total Male Female Urban Rural
Employee 100 71.3 28.7 28.8 71.2
Type of contract
Written contract 17.7 17.9 17.0 29.4 12.9
Oral contract 82.3 82.1 83.0 70.6 87.1
Total 100 100 100 100 100
Nature of contract
Unlimited duration 61.7 54.5 79.4 71.9 57.5
Limited duration 38.3 45.5 20.6 28.1 42.5
Total 100 100 100 100 100
Duration of contract
Less than 12 months 58.1 62.6 33.8 64.9 56.3
12 months to less than 36 months 34.0 32.2 44.0 23.7 36.8
36 months or more 7.9 5.2 22.2 11.4 6.9
Total 100 100 100 100 100
Source: SWTS-Tanzania, 2013.
Written contracts are rarely offered to young employees, but youth working in the
services sector were most likely to benefit from a written agreement; 20.3 per cent of
26
young paid workers in services had a written contract compared to 12.2 per cent in
agriculture and 11.8 per cent in industry (table 3.19). In agriculture and services, most
contracts were unlimited in duration (90.6 and 65.0 per cent, respectively), while in the
industrial sector contracts of limited duration were more common (61.1 per cent). The
duration of such contracts varies depending on the sector: in industry, 92.2 per cent of
limited-duration contracts lasted less than a year, while in services more than one half of
contracts lasted between one and three years (53.2 per cent).
Table 3.19 Employed youth by contract situation in major sectors (%)
Agriculture Industry Services Total
Type of contract
Written contract 12.2 11.8 20.3 17.7
Oral agreement 87.8 88.2 79.7 82.3
Total 100 100 100 100
Nature of contract
Unlimited duration 90.6 38.9 65.0 61.7
Limited duration 9.4 61.1 35.0 38.3
Total 100 100 100 100
Duration of contract
Less than 12 months 81.3 92.2 38.4 58.1
12 months to less than 36 months 18.1 0.5 53.2 34.0
36 months or more 0.6 7.3 8.4 7.9
Total 100 100 100 100
Source: SWTS-Tanzania, 2013.
Young employees in Tanzania are rarely covered by entitlements. Table 3.20 presents
the survey results showing that only one-quarter of young employees enjoyed extra
benefits (25.6 per cent). There was also considerable disparity between young men and
women in terms of the extent and nature of benefits coverage. Fewer young female
employees were entitled to overtime payments than male employees (12.4 per cent against
33.7 per cent, respectively) and three times more men were covered by occupational health
and safety benefits (44.4 and 15.3 per cent, respectively); in part, this is a reflection of the
different sectors where the majority of young men and women are to be found.
Table 3.20 Young wage and salaried workers by access to entitlements, according to area of residence and sex (%)
Entitlement Total Male Female Rural Urban
Transport allowance 30.3 30.8 29.0 33.4 22.6
Meal allowance 65.4 62.4 72.9 65.5 65.1
Annual paid leave 28.3 27.7 29.6 31.3 21.6
Paid sick leave 29.9 29.6 30.6 29.2 31.5
Pension 7.6 7.6 7.6 5.4 12.5
Severance payment 12.5 10.5 17.2 11.1 15.6
Overtime payments 27.3 33.7 12.4 29.5 22.3
Medical insurance 18.4 17.7 19.9 20.6 13.5
Bonus 34.4 36.3 29.8 40.3 21.4
Social security 16.8 15.8 19.0 20.7 8.3
Educational and training courses 26.6 29.3 20.4 27.9 23.8
Occupation health and safety benefits 35.6 44.4 15.3 40.3 25.0
Childcare facilities 6.5 2.2 16.4 5.9 7.7
Maternity/paternity leave 19.1 21.4 13.8 19.5 18.1
Average 25.6 26.4 23.8 27.2 22.1
Source: SWTS-Tanzania, 2013.
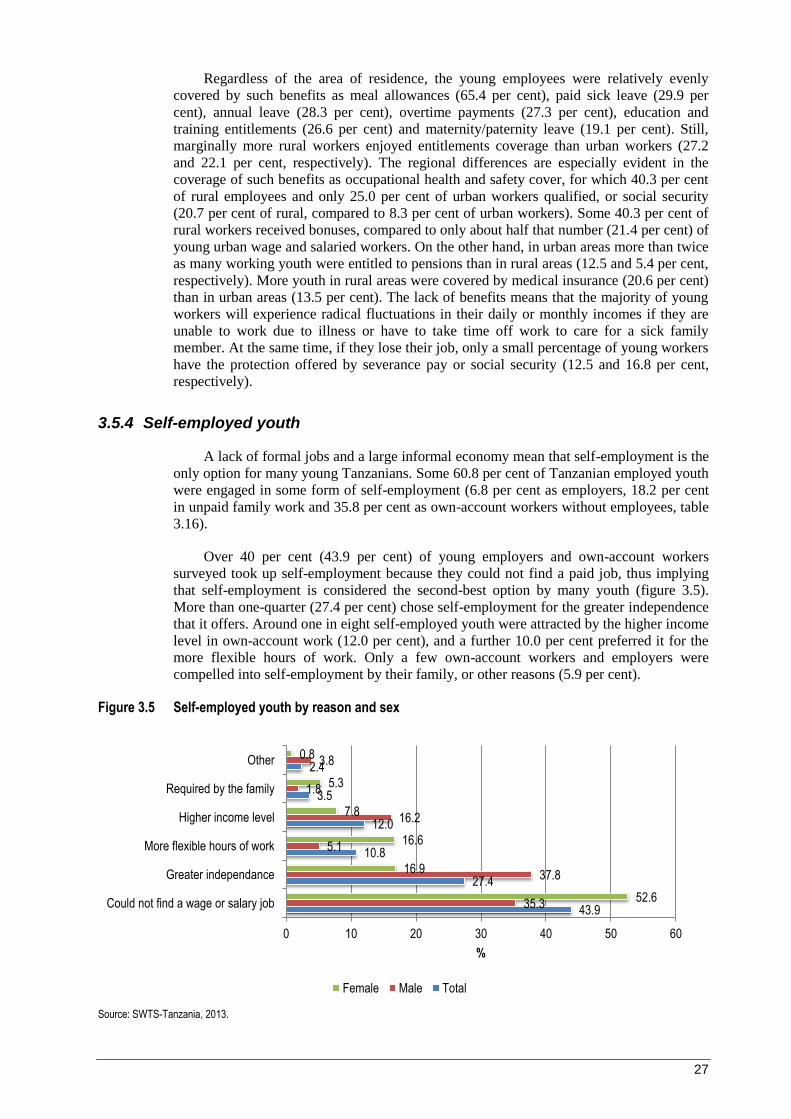
27
Regardless of the area of residence, the young employees were relatively evenly
covered by such benefits as meal allowances (65.4 per cent), paid sick leave (29.9 per
cent), annual leave (28.3 per cent), overtime payments (27.3 per cent), education and
training entitlements (26.6 per cent) and maternity/paternity leave (19.1 per cent). Still,
marginally more rural workers enjoyed entitlements coverage than urban workers (27.2
and 22.1 per cent, respectively). The regional differences are especially evident in the
coverage of such benefits as occupational health and safety cover, for which 40.3 per cent
of rural employees and only 25.0 per cent of urban workers qualified, or social security
(20.7 per cent of rural, compared to 8.3 per cent of urban workers). Some 40.3 per cent of
rural workers received bonuses, compared to only about half that number (21.4 per cent) of
young urban wage and salaried workers. On the other hand, in urban areas more than twice
as many working youth were entitled to pensions than in rural areas (12.5 and 5.4 per cent,
respectively). More youth in rural areas were covered by medical insurance (20.6 per cent)
than in urban areas (13.5 per cent). The lack of benefits means that the majority of young
workers will experience radical fluctuations in their daily or monthly incomes if they are
unable to work due to illness or have to take time off work to care for a sick family
member. At the same time, if they lose their job, only a small percentage of young workers
have the protection offered by severance pay or social security (12.5 and 16.8 per cent,
respectively).
3.5.4 Self-employed youth
A lack of formal jobs and a large informal economy mean that self-employment is the
only option for many young Tanzanians. Some 60.8 per cent of Tanzanian employed youth
were engaged in some form of self-employment (6.8 per cent as employers, 18.2 per cent
in unpaid family work and 35.8 per cent as own-account workers without employees, table
3.16).
Over 40 per cent (43.9 per cent) of young employers and own-account workers
surveyed took up self-employment because they could not find a paid job, thus implying
that self-employment is considered the second-best option by many youth (figure 3.5).
More than one-quarter (27.4 per cent) chose self-employment for the greater independence
that it offers. Around one in eight self-employed youth were attracted by the higher income
level in own-account work (12.0 per cent), and a further 10.0 per cent preferred it for the
more flexible hours of work. Only a few own-account workers and employers were
compelled into self-employment by their family, or other reasons (5.9 per cent).
Figure 3.5 Self-employed youth by reason and sex
Source: SWTS-Tanzania, 2013.
43.9
27.4
10.8
12.0
3.5
2.4
35.3
37.8
5.1
16.2
1.8
3.8
52.6
16.9
16.6
7.8
5.3
0.8
0 10 20 30 40 50 60
Could not find a wage or salary job
Greater independance
More flexible hours of work
Higher income level
Required by the family
Other
%
Female Male Total

28
A higher share of young women opted for self-employment because they could not
find another job (52.6 per cent, compared to 35.3 per cent of men). More men than women,
on the other hand, became self-employed because of the greater independence (37.8 and
16.9 per cent, respectively). Young self-employed female workers were three times more
likely to have chosen this status to have more flexible hours of work (16.6 per cent,
compared to 5.1 per cent of men). Furthermore, more women ended up in self-employment
at the request of their family (5.3 per cent, compared to only 1.8 per cent of men). All in
all, young men were more likely to have chosen self-employment for positive reasons,
such as higher income levels and greater independence. Young women, on the other hand,
were more likely to end up in self-employment due to less favourable reasons, such as
following a family requirement, inability to find a paid job and for the more flexible
working hours, presumably to have more time to take care of family.
Around one-fifth (19.8 per cent) of young employers and own-account workers
claimed that no financing was needed to start their own business, an indication of the low
level of production of the enterprises (table 3.21). An example is a young person selling
fruits on the street picked from their own back garden. One-third (32.1 per cent) relied on
their own savings, while another third (34.2 per cent) borrowed money from family and
friends. Self-employed youth hardly used any financial services from formal institutions,
such as microfinance institutions, banks, informal financial operators or non-governmental
organizations (NGOs). This suggests either a lack of awareness of the availability of
financial services among youth in Tanzania or restrictive policies that make financial
instruments unavailable to youth. Measures aimed at improving financial services to young
people are likely to stimulate labour demand and generate new employment opportunities
for them.
Table 3.21 Self-employed youth by sources of start-up financing, according to area of residence and sex (%)
Source of funding Total Male Female Urban Rural
No money needed 19.8 27.4 12.0 16.1 20.5
Own savings 32.1 33.3 31.0 36.5 31.3
Money from family or friends 34.2 20.8 47.8 31.9 34.6
Loan from microfinance institution (including cooperatives) 2.1 0.8 3.5 10.3 0.5
Loan from bank 0.0 0.0 0.1 0.2 0.0
Loan from an informal financial operator (money lender) 1.5 1.8 0.0 0.0 1.5
Remittances from abroad 1.1 2.2 1.1 1.6 1.3
Other 9.2 13.7 4.5 3.5 10.3
Total 100 100 100 100 100
Source: SWTS-Tanzania, 2013.
3.5.5 Hours of work
Short working time among youth in Tanzania is another area of concern. Many young
people work short hours despite their desire to work more. Around one-third (31.8 per
cent) of employed youth worked less than 20 hours during the reference week, and almost
one-half (46.4 per cent) worked part time, or less than 30 hours per week (figure 3.6). The
short working hours reflect the lack of regular jobs and the precariousness of the
occasional young worker in the country. Short working hours can be beneficial when they
offer young students the opportunity to earn while still in school, or give young parents the
opportunity to combine work with family care. The latter is likely to be the main reason
why 39.0 per cent of young women work less than 20 hours a week (compared to 26.8 per
cent of men). However, it may also be the case in Tanzania that the short working time is
all that is available to many young workers.
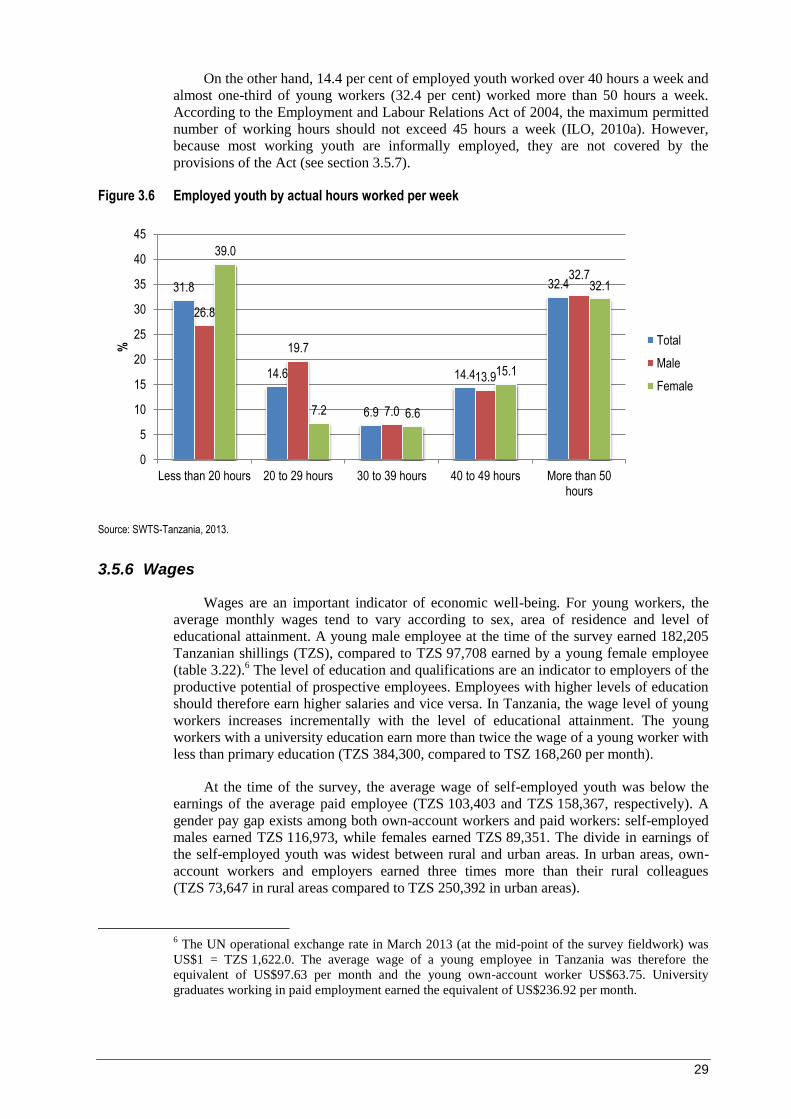
29
On the other hand, 14.4 per cent of employed youth worked over 40 hours a week and
almost one-third of young workers (32.4 per cent) worked more than 50 hours a week.
According to the Employment and Labour Relations Act of 2004, the maximum permitted
number of working hours should not exceed 45 hours a week (ILO, 2010a). However,
because most working youth are informally employed, they are not covered by the
provisions of the Act (see section 3.5.7).
Figure 3.6 Employed youth by actual hours worked per week
Source: SWTS-Tanzania, 2013.
3.5.6 Wages
Wages are an important indicator of economic well-being. For young workers, the
average monthly wages tend to vary according to sex, area of residence and level of
educational attainment. A young male employee at the time of the survey earned 182,205
Tanzanian shillings (TZS), compared to TZS 97,708 earned by a young female employee
(table 3.22).6 The level of education and qualifications are an indicator to employers of the
productive potential of prospective employees. Employees with higher levels of education
should therefore earn higher salaries and vice versa. In Tanzania, the wage level of young
workers increases incrementally with the level of educational attainment. The young
workers with a university education earn more than twice the wage of a young worker with
less than primary education (TZS 384,300, compared to TSZ 168,260 per month).
At the time of the survey, the average wage of self-employed youth was below the
earnings of the average paid employee (TZS 103,403 and TZS 158,367, respectively). A
gender pay gap exists among both own-account workers and paid workers: self-employed
males earned TZS 116,973, while females earned TZS 89,351. The divide in earnings of
the self-employed youth was widest between rural and urban areas. In urban areas, own-
account workers and employers earned three times more than their rural colleagues
(TZS 73,647 in rural areas compared to TZS 250,392 in urban areas).
6 The UN operational exchange rate in March 2013 (at the mid-point of the survey fieldwork) was
US$1 = TZS 1,622.0. The average wage of a young employee in Tanzania was therefore the
equivalent of US$97.63 per month and the young own-account worker US$63.75. University
graduates working in paid employment earned the equivalent of US$236.92 per month.
31.8
14.6
6.9
14.4
32.4
26.8
19.7
7.0
13.9
32.7
39.0
7.2 6.6
15.1
32.1
0
5
10
15
20
25
30
35
40
45
Less than 20 hours 20 to 29 hours 30 to 39 hours 40 to 49 hours More than 50hours
% Total
Male
Female

30
Table 3.22 Average monthly wages of young workers (wage and salaried workers and self-employed workers) by sex, area of residence and level of completed education (in Tanzanian shillings)
Wage and salaried workers
Own-account workers and employers
All
Mean monthly
wage SD
Mean monthly income
SD Mean
monthly earnings
SD
Total
158 367 148 103 403 251 125 870 161
Sex Female 97 708 394 89 351 221 91 726 194
Male 182 205 131 116 973 444 149 186 235
Area of residence
Rural 169 077 190 73 647 165 108 686 128
Urban 133 622 215 250 392 1 219 185 742 560
Level of education
Less than primary
168 260 1 697 35 553 106 72 956 494
Primary 66 311 79 65 005 160 65 530 101
Secondary 217 847 162 165 723 635 188 709 363
Tertiary 384 300 1 340 767 519 5 075 556 585 2 567
Note: SD = standard deviation. Source: SWTS-Tanzania, 2013.
3.5.7 Informal employment
Informal employment7 is a common condition among young workers in Tanzania.
The informal employment rate among youth in Tanzania was 78.2 per cent at the national
level, 75.3 per cent in rural areas and as high as 89.1 per cent in urban areas (figure 3.7).
Informal employment is made up of two sub-categories: workers in the informal
(unregistered) sector and paid employees holding informal jobs in the formal sector.
Workers in the latter category do earn a salary but do not receive the other benefits, such as
social security contributions or paid annual or sick leave, that would normally be
associated with a formal job. As seen in figure 3.7, most informal employment in Tanzania
is found in the informal sector (72.8 per cent), with the remaining category of informal
jobs in the formal sector being much smaller, at 27.2 per cent. The informal employment
rate was significantly higher among young women than men (89.1 and 70.5 per cent,
respectively) and in urban than in rural areas (89.1 and 75.3 per cent, respectively).8 Young
men in informal employment were twice as likely as females to hold informal jobs in the
formal sector (37.9 per cent of men in contrast to only 15.2 per cent of women). In urban
areas, one-third of informal employment occurred in the formal sector (35.1 per cent),
compared to one-quarter (24.8 per cent) in rural areas.
7 Informal employment is measured according to the guidelines recommended by the 17th
International Conference of Labour Statisticians (2003). The calculation applied here includes the
following sub-categories of workers: (a) paid employees in “informal jobs”, i.e. jobs without a
social security entitlement, paid annual leave or paid sick leave; (b) paid employees in an
unregistered enterprise with size classification below five employees; (c) own-account workers in
an unregistered enterprise with size classification below five employees; (d) employers in an
unregistered enterprise with size classification below five employees; and (e) contributing family
workers. Sub-categories (b) to (d) are used in the calculation of “employment in the informal
sector”, sub-category (a) applies to “informal job in the formal sector” and sub-category (e) can fall
within either grouping depending on the registration status of the enterprise that engages the
contributing family worker.
8 This trend goes contrary to the usual results, in which informal employment shares are higher in
rural than urban areas. For an in-depth investigation of youth informal employment, see Shehu and
Nilsson, 2014.
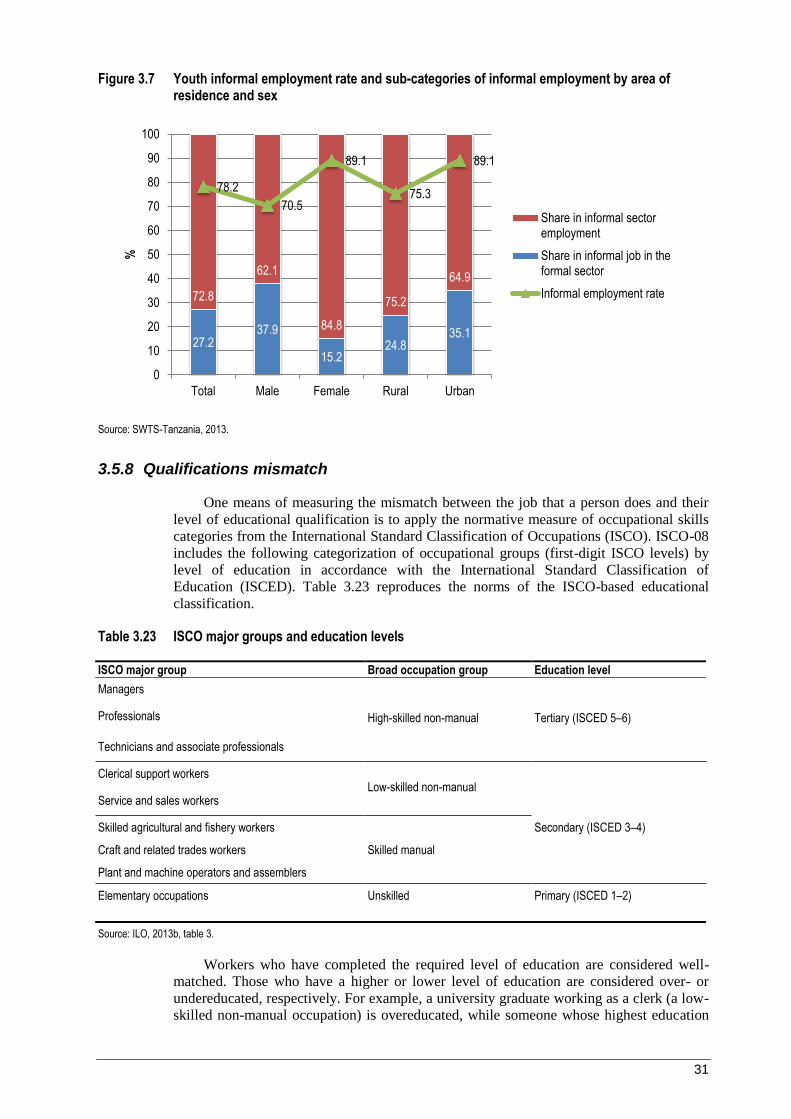
31
Figure 3.7 Youth informal employment rate and sub-categories of informal employment by area of residence and sex
Source: SWTS-Tanzania, 2013.
3.5.8 Qualifications mismatch
One means of measuring the mismatch between the job that a person does and their
level of educational qualification is to apply the normative measure of occupational skills
categories from the International Standard Classification of Occupations (ISCO). ISCO-08
includes the following categorization of occupational groups (first-digit ISCO levels) by
level of education in accordance with the International Standard Classification of
Education (ISCED). Table 3.23 reproduces the norms of the ISCO-based educational
classification.
Table 3.23 ISCO major groups and education levels
ISCO major group Broad occupation group Education level
Managers
High-skilled non-manual Tertiary (ISCED 5–6) Professionals
Technicians and associate professionals
Clerical support workers Low-skilled non-manual
Service and sales workers
Skilled agricultural and fishery workers Secondary (ISCED 3–4)
Craft and related trades workers Skilled manual
Plant and machine operators and assemblers
Elementary occupations Unskilled Primary (ISCED 1–2)
Source: ILO, 2013b, table 3.
Workers who have completed the required level of education are considered well-
matched. Those who have a higher or lower level of education are considered over- or
undereducated, respectively. For example, a university graduate working as a clerk (a low-
skilled non-manual occupation) is overeducated, while someone whose highest education
27.2 37.9
15.2 24.8
35.1
72.8
62.1
84.8
75.2
64.9
78.2
70.5
89.1
75.3
89.1
0
10
20
30
40
50
60
70
80
90
100
Total Male Female Rural Urban
%
Share in informal sectoremployment
Share in informal job in theformal sector
Informal employment rate
32
level is at the secondary level who is working as an engineer (a high-skilled non-manual
occupation) is undereducated.
The SWTS results for Tanzanian youth show that undereducation of young workers
poses the greater challenge: 58.5 per cent of young workers were undereducated, while
only 8.6 per cent were overeducated (table 3.24). Less than one-half of working youth
were well-matched in their jobs, i.e. possessing the necessary level of education for the
position they hold (46.5 per cent). With a substantial share of youth completing their
education at primary (38.2 per cent) or secondary level (44.8 per cent; see table 3.7), it is
not surprising to find more Tanzanian youth classified as undereducated than
overeducated.
Table 3.24 also shows the degree of education mismatch by specific occupation.
Since every worker is expected to have at least a primary education, according to the
classification, even young workers in low-skilled non-manual jobs or skilled manual jobs
are undereducated when they did not complete primary level education. Two-thirds of
young persons working as skilled agricultural and fishery workers were undereducated in
terms of the jobs they held (66.0 per cent). In a country where 7.1 per cent of total youth
have no education at all (see table 3.7), even working in elementary occupations, 11.1 per
cent of youth were classified as undereducated.
Undereducation has an impact on the productivity of the worker, as well as on their
levels of confidence and well-being. One way of addressing the qualifications mismatch to
ensure that young workers have the necessary skills to perform available jobs most
effectively is to offer on-the-job training. A trained worker has the possibility of being
more efficient, effective and better motivated at work than an untrained (and hence
insecure) worker.
Table 3.24 Shares of overeducated and undereducated young workers by major occupational category (ISCO-08, %)
Major occupational category (ISCO-08) Overeducated Undereducated Matching
qualifications
1: Legislators, senior officials and managers – 100 –
2: Professionals – 69.9 30.1
3: Technicians and associate professionals – 90.7 9.3
4: Clerks – 14.6 85.4
5: Service workers, shop and market sales workers 2.0 39.5 58.5
6: Skilled agricultural and fishery workers 0.3 66.0 33.7
7: Craft and related trades workers 0.0 48.5 51.5
8: Plant and machine operators and assemblers 3.7 44.9 51.4
9: Elementary occupations 36.8 11.1 52.1
10: Armed forces – 100 –
Total 8.6 58.5 46.5
Note: – = Insignificant response rate. Total employed excludes those whose education levels are unknown.
Source: SWTS-Tanzania, 2013.
3.5.9 Security and job satisfaction
The survey examined the degree of job satisfaction of the surveyed youth by asking
them whether or not they would like to change jobs. The findings reveal that as many as
72.2 per cent of respondents reported that they would like to change their present job. The
reasons for wanting to change job are presented in table 3.25. The most common reasons
were low pay (37.3 per cent), temporary nature of the current job (19.8 per cent), desire to
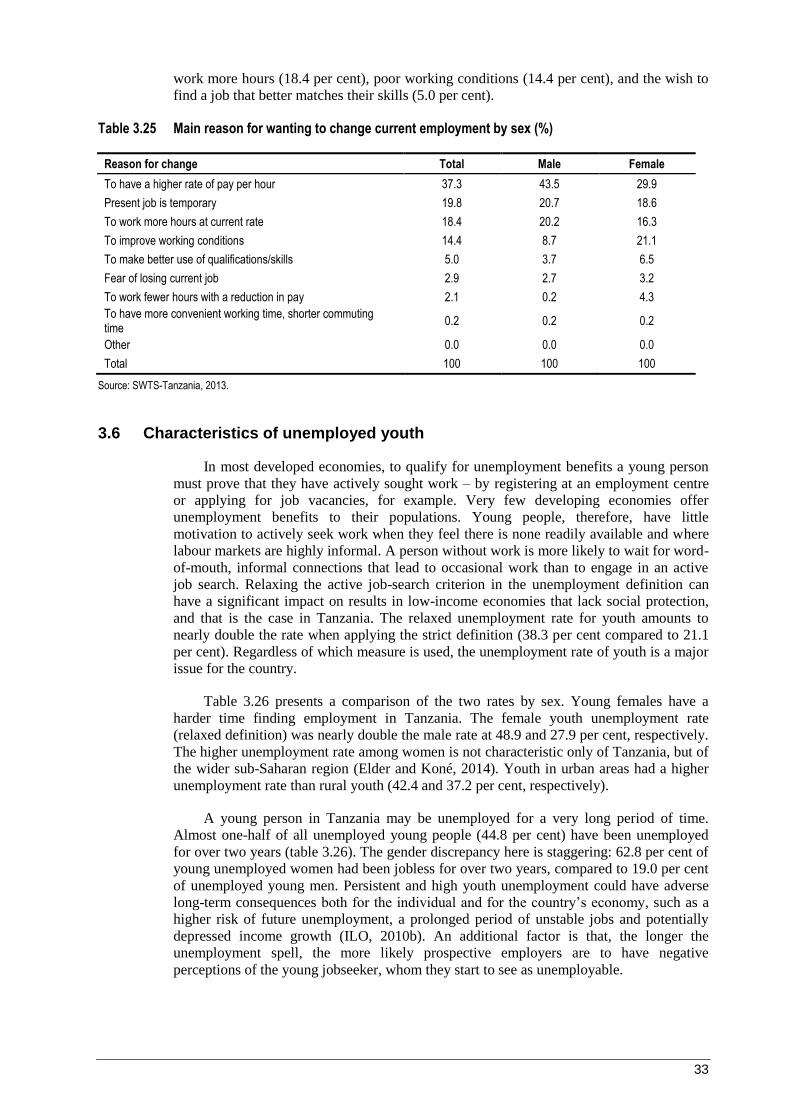
33
work more hours (18.4 per cent), poor working conditions (14.4 per cent), and the wish to
find a job that better matches their skills (5.0 per cent).
Table 3.25 Main reason for wanting to change current employment by sex (%)
Reason for change Total Male Female
To have a higher rate of pay per hour 37.3 43.5 29.9
Present job is temporary 19.8 20.7 18.6
To work more hours at current rate 18.4 20.2 16.3
To improve working conditions 14.4 8.7 21.1
To make better use of qualifications/skills 5.0 3.7 6.5
Fear of losing current job 2.9 2.7 3.2
To work fewer hours with a reduction in pay 2.1 0.2 4.3
To have more convenient working time, shorter commuting time
0.2 0.2 0.2
Other 0.0 0.0 0.0
Total 100 100 100
Source: SWTS-Tanzania, 2013.
3.6 Characteristics of unemployed youth
In most developed economies, to qualify for unemployment benefits a young person
must prove that they have actively sought work – by registering at an employment centre
or applying for job vacancies, for example. Very few developing economies offer
unemployment benefits to their populations. Young people, therefore, have little
motivation to actively seek work when they feel there is none readily available and where
labour markets are highly informal. A person without work is more likely to wait for word-
of-mouth, informal connections that lead to occasional work than to engage in an active
job search. Relaxing the active job-search criterion in the unemployment definition can
have a significant impact on results in low-income economies that lack social protection,
and that is the case in Tanzania. The relaxed unemployment rate for youth amounts to
nearly double the rate when applying the strict definition (38.3 per cent compared to 21.1
per cent). Regardless of which measure is used, the unemployment rate of youth is a major
issue for the country.
Table 3.26 presents a comparison of the two rates by sex. Young females have a
harder time finding employment in Tanzania. The female youth unemployment rate
(relaxed definition) was nearly double the male rate at 48.9 and 27.9 per cent, respectively.
The higher unemployment rate among women is not characteristic only of Tanzania, but of
the wider sub-Saharan region (Elder and Koné, 2014). Youth in urban areas had a higher
unemployment rate than rural youth (42.4 and 37.2 per cent, respectively).
A young person in Tanzania may be unemployed for a very long period of time.
Almost one-half of all unemployed young people (44.8 per cent) have been unemployed
for over two years (table 3.26). The gender discrepancy here is staggering: 62.8 per cent of
young unemployed women had been jobless for over two years, compared to 19.0 per cent
of unemployed young men. Persistent and high youth unemployment could have adverse
long-term consequences both for the individual and for the country’s economy, such as a
higher risk of future unemployment, a prolonged period of unstable jobs and potentially
depressed income growth (ILO, 2010b). An additional factor is that, the longer the
unemployment spell, the more likely prospective employers are to have negative
perceptions of the young jobseeker, whom they start to see as unemployable.
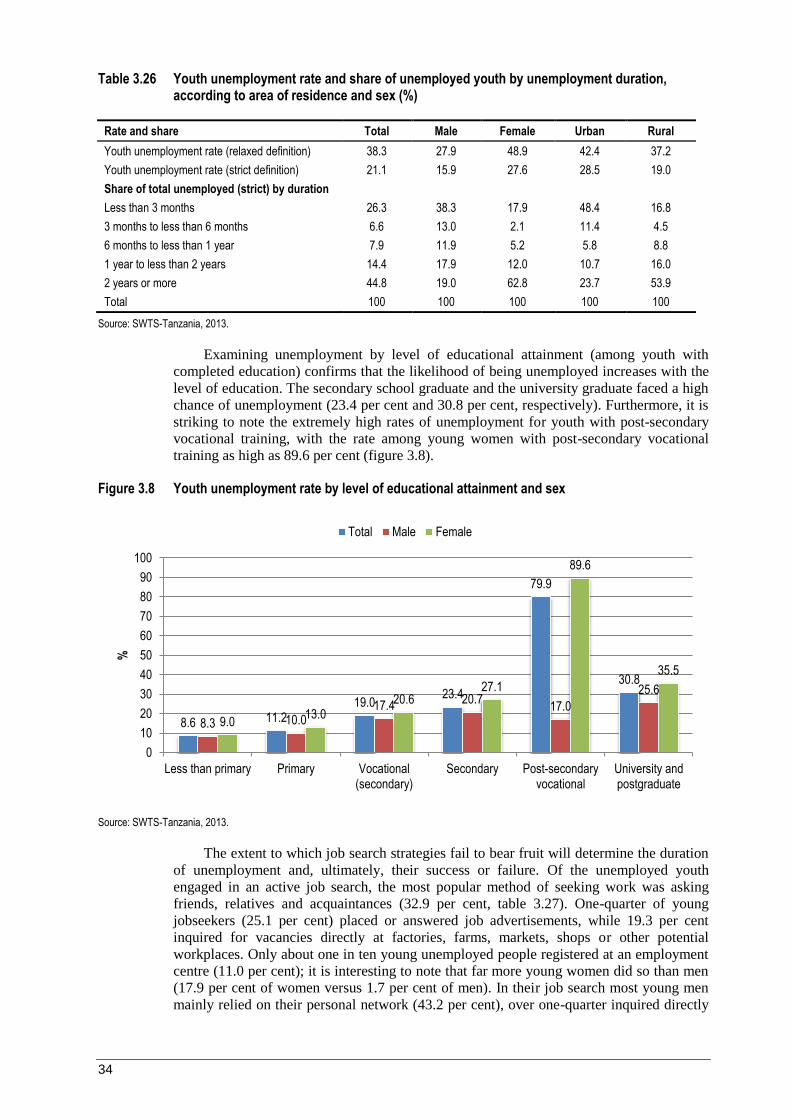
34
Table 3.26 Youth unemployment rate and share of unemployed youth by unemployment duration, according to area of residence and sex (%)
Rate and share Total Male Female Urban Rural
Youth unemployment rate (relaxed definition) 38.3 27.9 48.9 42.4 37.2
Youth unemployment rate (strict definition) 21.1 15.9 27.6 28.5 19.0
Share of total unemployed (strict) by duration
Less than 3 months 26.3 38.3 17.9 48.4 16.8
3 months to less than 6 months 6.6 13.0 2.1 11.4 4.5
6 months to less than 1 year 7.9 11.9 5.2 5.8 8.8
1 year to less than 2 years 14.4 17.9 12.0 10.7 16.0
2 years or more 44.8 19.0 62.8 23.7 53.9
Total 100 100 100 100 100
Source: SWTS-Tanzania, 2013.
Examining unemployment by level of educational attainment (among youth with
completed education) confirms that the likelihood of being unemployed increases with the
level of education. The secondary school graduate and the university graduate faced a high
chance of unemployment (23.4 per cent and 30.8 per cent, respectively). Furthermore, it is
striking to note the extremely high rates of unemployment for youth with post-secondary
vocational training, with the rate among young women with post-secondary vocational
training as high as 89.6 per cent (figure 3.8).
Figure 3.8 Youth unemployment rate by level of educational attainment and sex
Source: SWTS-Tanzania, 2013.
The extent to which job search strategies fail to bear fruit will determine the duration
of unemployment and, ultimately, their success or failure. Of the unemployed youth
engaged in an active job search, the most popular method of seeking work was asking
friends, relatives and acquaintances (32.9 per cent, table 3.27). One-quarter of young
jobseekers (25.1 per cent) placed or answered job advertisements, while 19.3 per cent
inquired for vacancies directly at factories, farms, markets, shops or other potential
workplaces. Only about one in ten young unemployed people registered at an employment
centre (11.0 per cent); it is interesting to note that far more young women did so than men
(17.9 per cent of women versus 1.7 per cent of men). In their job search most young men
mainly relied on their personal network (43.2 per cent), over one-quarter inquired directly
8.6 11.2 19.0
23.4
79.9
30.8
8.3 10.0 17.4
20.7 17.0
25.6
9.0 13.0
20.6 27.1
89.6
35.5
0
10
20
30
40
50
60
70
80
90
100
Less than primary Primary Vocational(secondary)
Secondary Post-secondaryvocational
University andpostgraduate
%
Total Male Female
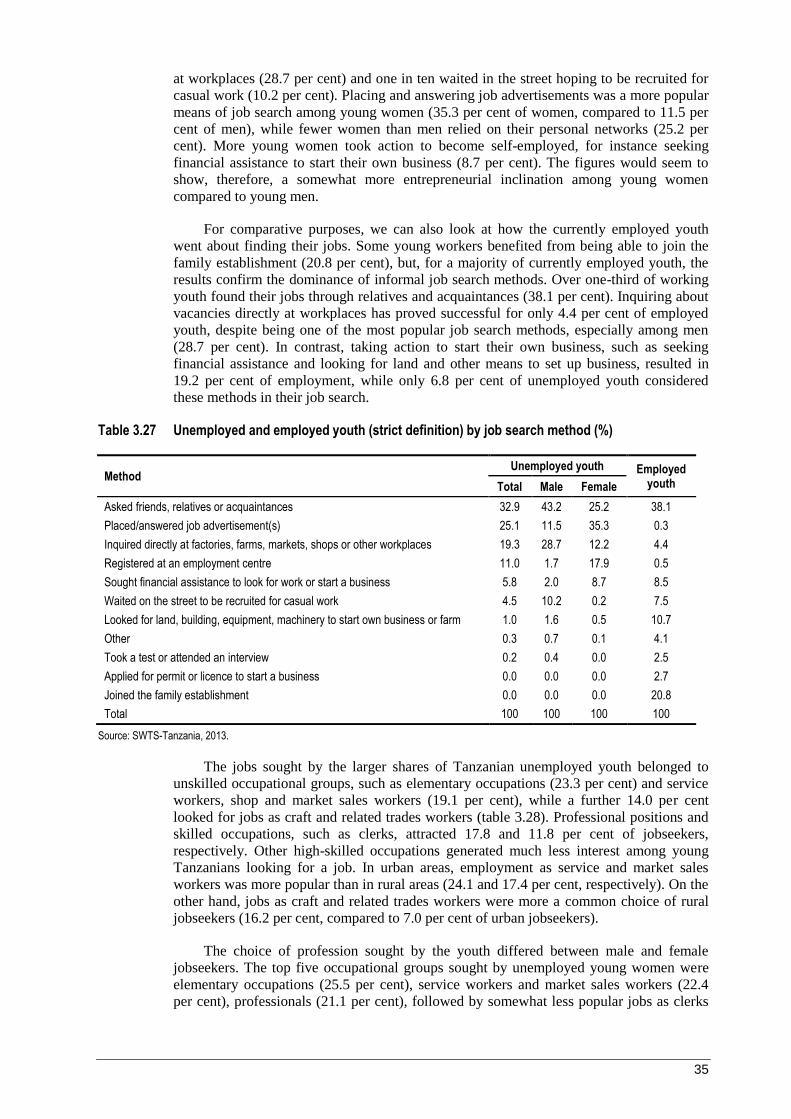
35
at workplaces (28.7 per cent) and one in ten waited in the street hoping to be recruited for
casual work (10.2 per cent). Placing and answering job advertisements was a more popular
means of job search among young women (35.3 per cent of women, compared to 11.5 per
cent of men), while fewer women than men relied on their personal networks (25.2 per
cent). More young women took action to become self-employed, for instance seeking
financial assistance to start their own business (8.7 per cent). The figures would seem to
show, therefore, a somewhat more entrepreneurial inclination among young women
compared to young men.
For comparative purposes, we can also look at how the currently employed youth
went about finding their jobs. Some young workers benefited from being able to join the
family establishment (20.8 per cent), but, for a majority of currently employed youth, the
results confirm the dominance of informal job search methods. Over one-third of working
youth found their jobs through relatives and acquaintances (38.1 per cent). Inquiring about
vacancies directly at workplaces has proved successful for only 4.4 per cent of employed
youth, despite being one of the most popular job search methods, especially among men
(28.7 per cent). In contrast, taking action to start their own business, such as seeking
financial assistance and looking for land and other means to set up business, resulted in
19.2 per cent of employment, while only 6.8 per cent of unemployed youth considered
these methods in their job search.
Table 3.27 Unemployed and employed youth (strict definition) by job search method (%)
Method Unemployed youth Employed
youth Total Male Female
Asked friends, relatives or acquaintances 32.9 43.2 25.2 38.1
Placed/answered job advertisement(s) 25.1 11.5 35.3 0.3
Inquired directly at factories, farms, markets, shops or other workplaces 19.3 28.7 12.2 4.4
Registered at an employment centre 11.0 1.7 17.9 0.5
Sought financial assistance to look for work or start a business 5.8 2.0 8.7 8.5
Waited on the street to be recruited for casual work 4.5 10.2 0.2 7.5
Looked for land, building, equipment, machinery to start own business or farm 1.0 1.6 0.5 10.7
Other 0.3 0.7 0.1 4.1
Took a test or attended an interview 0.2 0.4 0.0 2.5
Applied for permit or licence to start a business 0.0 0.0 0.0 2.7
Joined the family establishment 0.0 0.0 0.0 20.8
Total 100 100 100 100
Source: SWTS-Tanzania, 2013.
The jobs sought by the larger shares of Tanzanian unemployed youth belonged to
unskilled occupational groups, such as elementary occupations (23.3 per cent) and service
workers, shop and market sales workers (19.1 per cent), while a further 14.0 per cent
looked for jobs as craft and related trades workers (table 3.28). Professional positions and
skilled occupations, such as clerks, attracted 17.8 and 11.8 per cent of jobseekers,
respectively. Other high-skilled occupations generated much less interest among young
Tanzanians looking for a job. In urban areas, employment as service and market sales
workers was more popular than in rural areas (24.1 and 17.4 per cent, respectively). On the
other hand, jobs as craft and related trades workers were more a common choice of rural
jobseekers (16.2 per cent, compared to 7.0 per cent of urban jobseekers).
The choice of profession sought by the youth differed between male and female
jobseekers. The top five occupational groups sought by unemployed young women were
elementary occupations (25.5 per cent), service workers and market sales workers (22.4
per cent), professionals (21.1 per cent), followed by somewhat less popular jobs as clerks
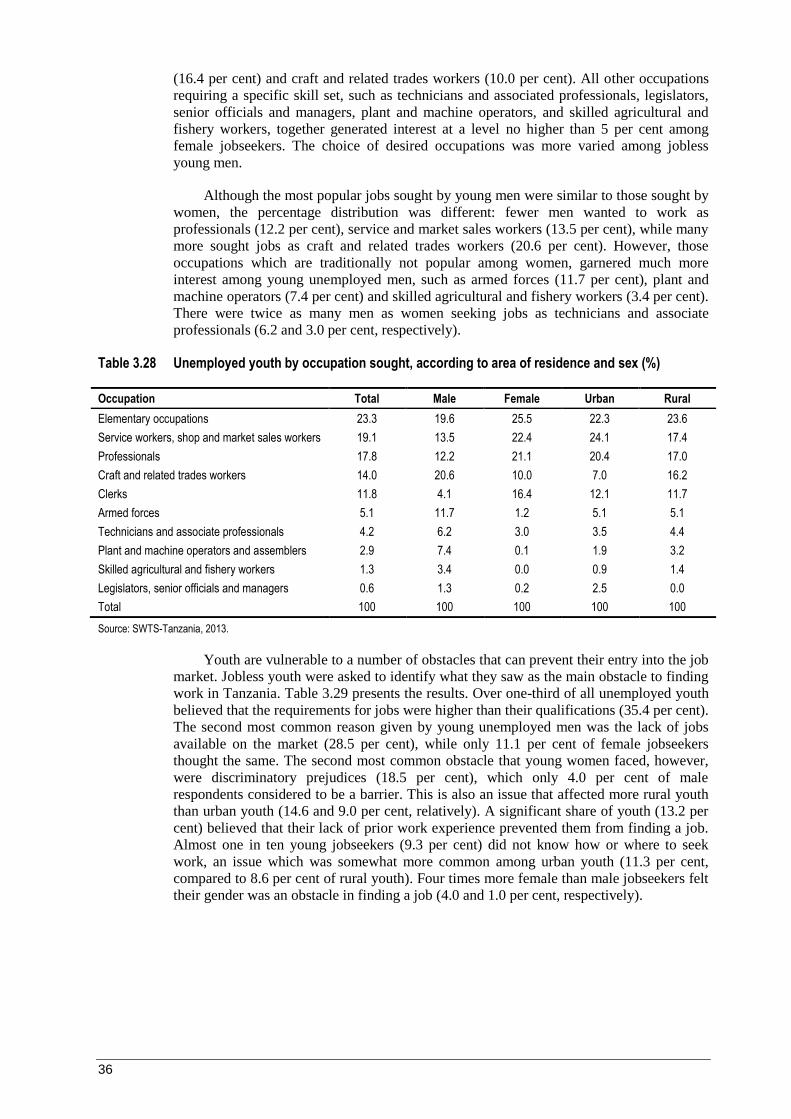
36
(16.4 per cent) and craft and related trades workers (10.0 per cent). All other occupations
requiring a specific skill set, such as technicians and associated professionals, legislators,
senior officials and managers, plant and machine operators, and skilled agricultural and
fishery workers, together generated interest at a level no higher than 5 per cent among
female jobseekers. The choice of desired occupations was more varied among jobless
young men.
Although the most popular jobs sought by young men were similar to those sought by
women, the percentage distribution was different: fewer men wanted to work as
professionals (12.2 per cent), service and market sales workers (13.5 per cent), while many
more sought jobs as craft and related trades workers (20.6 per cent). However, those
occupations which are traditionally not popular among women, garnered much more
interest among young unemployed men, such as armed forces (11.7 per cent), plant and
machine operators (7.4 per cent) and skilled agricultural and fishery workers (3.4 per cent).
There were twice as many men as women seeking jobs as technicians and associate
professionals (6.2 and 3.0 per cent, respectively).
Table 3.28 Unemployed youth by occupation sought, according to area of residence and sex (%)
Occupation Total Male Female Urban Rural
Elementary occupations 23.3 19.6 25.5 22.3 23.6
Service workers, shop and market sales workers 19.1 13.5 22.4 24.1 17.4
Professionals 17.8 12.2 21.1 20.4 17.0
Craft and related trades workers 14.0 20.6 10.0 7.0 16.2
Clerks 11.8 4.1 16.4 12.1 11.7
Armed forces 5.1 11.7 1.2 5.1 5.1
Technicians and associate professionals 4.2 6.2 3.0 3.5 4.4
Plant and machine operators and assemblers 2.9 7.4 0.1 1.9 3.2
Skilled agricultural and fishery workers 1.3 3.4 0.0 0.9 1.4
Legislators, senior officials and managers 0.6 1.3 0.2 2.5 0.0
Total 100 100 100 100 100
Source: SWTS-Tanzania, 2013.
Youth are vulnerable to a number of obstacles that can prevent their entry into the job
market. Jobless youth were asked to identify what they saw as the main obstacle to finding
work in Tanzania. Table 3.29 presents the results. Over one-third of all unemployed youth
believed that the requirements for jobs were higher than their qualifications (35.4 per cent).
The second most common reason given by young unemployed men was the lack of jobs
available on the market (28.5 per cent), while only 11.1 per cent of female jobseekers
thought the same. The second most common obstacle that young women faced, however,
were discriminatory prejudices (18.5 per cent), which only 4.0 per cent of male
respondents considered to be a barrier. This is also an issue that affected more rural youth
than urban youth (14.6 and 9.0 per cent, relatively). A significant share of youth (13.2 per
cent) believed that their lack of prior work experience prevented them from finding a job.
Almost one in ten young jobseekers (9.3 per cent) did not know how or where to seek
work, an issue which was somewhat more common among urban youth (11.3 per cent,
compared to 8.6 per cent of rural youth). Four times more female than male jobseekers felt
their gender was an obstacle in finding a job (4.0 and 1.0 per cent, respectively).
37
Table 3.29 Unemployed youth by opinion of main obstacle to finding work, according to area of residence and sex (%)
Obstacle to finding work Total Male Female Urban Rural
Requirements for job were higher than education/training received 35.4 32.7 36.9 36.7 35.0
Not enough jobs available 17.4 28.5 11.1 16.6 17.6
Discriminatory prejudices (for example, disability or religion) 13.2 4.0 18.5 9.0 14.6
Not enough work experience 13.2 10.7 14.6 11.8 13.7
Did not know how or where to seek work 9.3 9.8 9.0 11.3 8.6
Other 3.6 4.2 3.2 8.4 2.1
Being male/female 2.9 1.0 4.0 0.2 3.8
Low wages in available jobs 2.0 3.5 1.2 1.1 2.3
Considered too young 2.0 3.6 1.1 3.4 1.6
Poor working conditions in available jobs 0.9 2.0 0.3 1.5 0.7
Total 100 100 100 100 100
Source: SWTS-Tanzania, 2013.
3.7 Characteristics of youth outside the labour market (inactive youth)
In Tanzania, over one-quarter (29.4 per cent) of young people were economically
inactive, i.e. did not participate in the labour force (26.8 per cent of male and 31.7 per cent
of female youth; see table 3.14). The reasons for inactivity vary between young men and
women and between urban and rural youth. The most common reason for inactivity – cited
by 74.2 per cent of inactive youth – was attending education or training (table 3.30). Fewer
women than men do not participate in the labour force because they are engaged in
education (64.5 per cent of women compared to 82.9 per cent of men). The most common
reason for inactivity among women not in education was unwillingness to work (12.8 per
cent of all inactive young women, in contrast to only 1.5 per cent of inactive young men).
The absence of desire to work was more commonplace among rural youth (10.1 per cent)
than urban youth (1.5 per cent). Family responsibilities prevented 6.9 per cent of inactive
young women and 4.3 per cent of inactive young men from joining the labour force; this
was twice as likely to be the reason for inactivity given by rural youth compared to urban
youth (6.9 and 3.2 per cent, respectively).
Table 3.30 Inactive youth by reason for inactivity, according to area of residence and sex (%)
Reason Total Male Female Urban Rural
Attending education/training 74.2 82.9 64.5 79.8 70.9
Family responsibilities 5.5 4.3 6.9 3.2 6.9
Pregnancy 1.8 0.0 2.7 0.1 2.9
Illness, injury or disability 2.9 2.3 4.7 0.7 4.2
Too young to work 1.2 0.3 2.3 1.3 1.2
No desire to work 6.9 1.5 12.8 1.5 10.1
Off-season 1.2 2.2 0.0 2.5 0.4
Other reason 6.2 6.5 5.9 10.8 3.5
Total 100 100 100 100 100
Source: SWTS-Tanzania, 2013.
38
4. Stages of transition
4.1 Concepts and definitions9
In the preceding sections, the situation of young Tanzanians with respect to their
current activity was analysed. This section looks at another means of classifying youth,
based on where they stand in terms of their transition into the labour market. The labour
market transition of young people concerns not only the length of time between their exit
from education (either upon graduation or early exit without completion) to their first entry
into any job, but also qualitative elements, such as whether the job is stable (measured by
contract type).
The SWTS applies a stricter definition of “stable employment” than is typically used.
By starting from the premise that a person has not “transited” until settled in a job that
meets very basic criteria of stability, as defined by the duration of the employment
contract, the SWTS analytical framework introduces a new quality element to the standard
definition of labour market transitions. However, as seen in previous sections, only a very
small share of youth in Tanzania attains stable employment; if the “end goal” does not fit
reality, then it is likely that the statistics are not framed widely enough. For this reason, the
ILO’s model also takes job satisfaction into consideration and builds it into the concept of
labour market transition.
More specifically, labour market transition is defined as the passage of a young
person from the end of schooling (or entry to first economic activity) to the first stable or
satisfactory job. Stable employment is defined in terms of the contract of employment
(written or oral) and the duration of the contract (greater than 12 months). Introducing the
issue of a contract automatically excludes the employment status of self-employed, where
the employment relationship is not defined by a contract. The opposite of stable
employment is temporary employment, or wage and salaried employment of limited
duration. Satisfactory employment is a subjective concept, based on the self-assessment of
the jobholder. It implies that the respondent considers the job to be a good “fit” with their
desired employment path at that moment in time. The contrary is termed non-satisfactory
employment, implying a sense of dissatisfaction with the job. Based on this definition of
labour market transition, the stages of transition are classified as follows:
Transited – A young person who has “transited” is one who is currently employed
in:
- a stable job, whether satisfactory or non-satisfactory; or
- a satisfactory but temporary job; or
- satisfactory self-employment.
In transition – A young person still “in transition” is one who is currently:
- unemployed (relaxed definition); or
- employed in a temporary and non-satisfactory job; or
- in non-satisfactory self-employment; or
- inactive and not in school, with the aim of looking for work later.
Transition not yet started – A young person whose “transition has not yet started” is
one who is currently:
9 This section is adapted from ILO, 2013b, Chapter 5.
39
- still in school and inactive (inactive student); or
- inactive and not in school (inactive non-student), with no intention of looking
for work.
Two elements of this classification are noteworthy. First, the stages of transition span
the boundaries of economic activity as defined in the standard labour force framework.10
The “transited” category includes a subset of youth classified as employed; the remaining
employed fall within the category of “in transition”, which includes the strict definition of
unemployed and portions of the inactive (namely, those without work, available for work
but not actively seeking work11
and inactive non-students who have stated an intention to
join the labour force at a later stage). The “transition not yet started” category is the
residual of the inactive population.
Because of the inclusion of youth in satisfactory self-employment and satisfactory
temporary employment, one cannot say that all young people in the transited category have
transited to a “good” job. By definition, the self-employed make up the bulk of the
country’s share of irregularly employed and almost all of them will be in the informal
sector in Tanzania. Yet many have expressed a degree of satisfaction with their job, and
they are likely to have finished their transition in the sense that they will remain in the self-
employed classification for the remainder of their working lives.
4.2 Stages of transition by sex, education level, age group and area of residence
Overall, the survey results show that most young Tanzanians were either in transition
(47.3 per cent) or had completed their transition to stable and/or satisfactory self-
employment (31.9 per cent, table 4.1). However, a significant number of young Tanzanians
were yet to start their transition (20.8 per cent). In most developed economies, a larger
share of youth can be found among the transition-not-yet-started category as many are still
in school. The high number of youth who are in transition or transited is a reflection of low
levels of school attendance and early labour market entry in Tanzania.
Young Tanzanian men have a better chance of completing the transition to stable
and/or satisfactory employment than young women (37.8 and 25.6 per cent, respectively).
Young women, on the other hand, are far more likely than young men to remain in
transition (57.9 and 37.4 per cent, respectively). Transition has not yet started for one-
quarter of young males (24.8 per cent) and only 16.5 per cent of young females.
As one might expect, the age of the young person influences their current stage in
labour market transition. The tendency for the young person to move into the labour
market increases with age. The younger age cohorts make up a much larger share of the
transition-not-yet-started category because there is an overlap with the typical schooling
ages. Still, the fact that so many of the 15–19-year-olds (65.5 per cent) are firmly in the
labour market, either with a completed transition or still in transition, is worrying when
they should normally be in school.
10
The international guidelines for measuring statistics within the economically active population,
set out by the 13th International Conference of Labour Statisticians (ICLS) in 1982, provide the
framework for determining who is counted as employed and as unemployed, according to the
economic production boundaries set out by the System of National Accounts.
11 This is the portion added to the “strictly” unemployed category to make up the unemployed
(relaxed definition).
40
Table 4.1 Stage of transition by sex, age group, area of residence and level of completed education (%)
Characteristic Transited In transition Transition not yet
started Total
Total 31.9 47.3 20.8 100
Sex
Male 37.9 37.4 24.8 100
Female 25.6 57.9 16.5 100
Age group
15–19 22.6 42.9 34.5 100
20–24 38.3 50.1 11.5 100
25–29 43.2 53.3 3.5 100
Area of residence
Urban 23.0 44.9 32.1 100
Rural 35.1 48.2 16.7 100
Education (excluding current students)
None or less than primary 41.8 57.8 0.5 100
Primary 51.0 48.7 0.3 100
Secondary 33.5 66.5 0.0 100
University and above 37.3 62.7 0.0 100
Note: The stage of transition by level of completed education excludes current students whose final education level is still unknown. Source: SWTS-Tanzania, 2013.
There are some differences between the shares of youth by transition stages across
geographic areas: rural youth were more likely to have completed their transition (35.1 per
cent, compared to 23.0 per cent of urban youth) and less likely to not have started their
transition (16.7 per cent against 32.1 per cent of urban youth). The level of educational
attainment is a less reliable predictor of a young person’s place within the stages of
transition. Here, those with only primary level education were most likely to have
completed their labour market transition into stable or satisfactory employment (51.0 per
cent). Secondary school graduates and university degree holders were more likely to
remain in transition (66.5 and 62.7 per cent, respectively). Only around one-third of youth
with secondary and tertiary education had completed their transition. The young people
who have spent more years in school, have spent less time working than those who joined
the labour force at an earlier age, and therefore lack both work experience and experience
in searching for work. In addition, the better educated tend to aim for better-paid, higher
quality employment rather than settling for the sub-par jobs more readily available in the
market. The calculations here exclude current students, which is the reason why the share
of those who have not yet started their transition is insignificant.
4.2.1 Youth who have not started transition
The results of the SWTS show that almost all the youth who had not started their
transition were in school (99.5 per cent), and only 0.5 per cent were inactive and not in
school with no intention of looking for work. There were only slight differences between
men and women among the inactive students (99.8 and 98.9 per cent, respectively). Only
1.1 per cent of young women were inactive non-students with no intention of joining the
labour market in the future, compared to 0.2 per cent of young men.
4.2.2 Youth in transition
A young person is classified as “in transition” if they are either unemployed (relaxed
definition), engaged in self-employment or in a paid temporary job with which they have
expressed dissatisfaction, or if they are an inactive non-student with an attachment to the
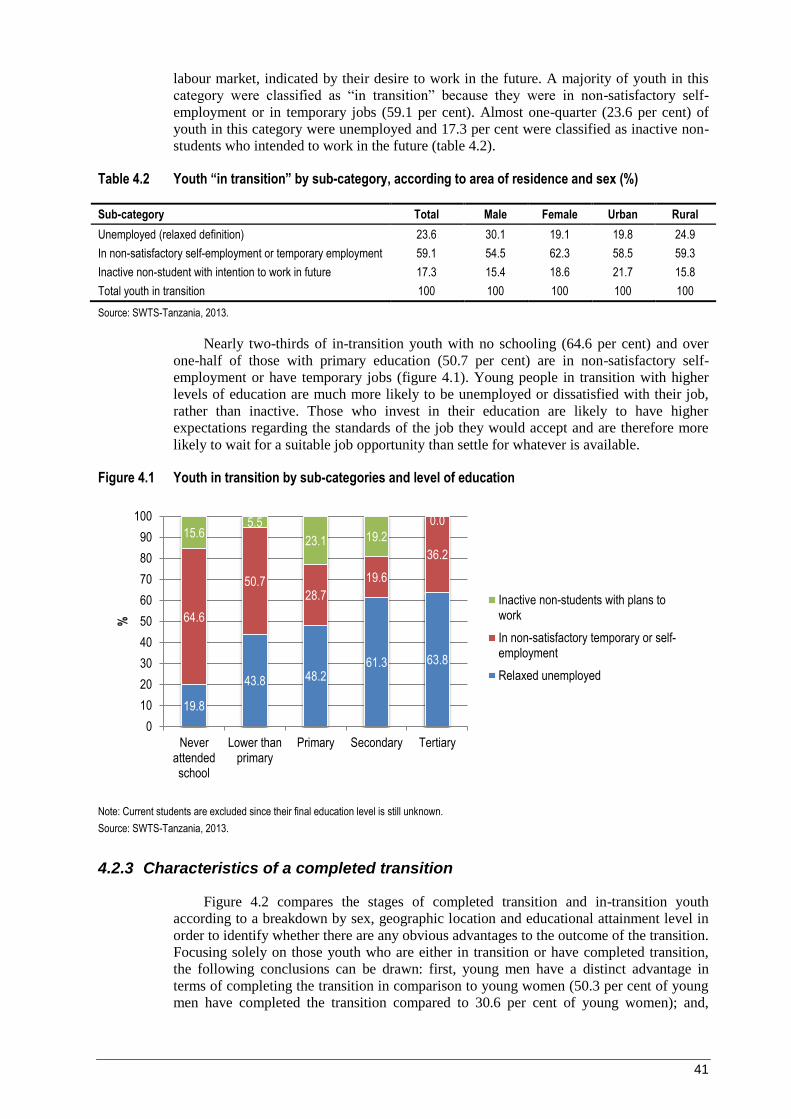
41
labour market, indicated by their desire to work in the future. A majority of youth in this
category were classified as “in transition” because they were in non-satisfactory self-
employment or in temporary jobs (59.1 per cent). Almost one-quarter (23.6 per cent) of
youth in this category were unemployed and 17.3 per cent were classified as inactive non-
students who intended to work in the future (table 4.2).
Table 4.2 Youth “in transition” by sub-category, according to area of residence and sex (%)
Sub-category Total Male Female Urban Rural
Unemployed (relaxed definition) 23.6 30.1 19.1 19.8 24.9
In non-satisfactory self-employment or temporary employment 59.1 54.5 62.3 58.5 59.3
Inactive non-student with intention to work in future 17.3 15.4 18.6 21.7 15.8
Total youth in transition 100 100 100 100 100
Source: SWTS-Tanzania, 2013.
Nearly two-thirds of in-transition youth with no schooling (64.6 per cent) and over
one-half of those with primary education (50.7 per cent) are in non-satisfactory self-
employment or have temporary jobs (figure 4.1). Young people in transition with higher
levels of education are much more likely to be unemployed or dissatisfied with their job,
rather than inactive. Those who invest in their education are likely to have higher
expectations regarding the standards of the job they would accept and are therefore more
likely to wait for a suitable job opportunity than settle for whatever is available.
Figure 4.1 Youth in transition by sub-categories and level of education
Note: Current students are excluded since their final education level is still unknown.
Source: SWTS-Tanzania, 2013.
4.2.3 Characteristics of a completed transition
Figure 4.2 compares the stages of completed transition and in-transition youth
according to a breakdown by sex, geographic location and educational attainment level in
order to identify whether there are any obvious advantages to the outcome of the transition.
Focusing solely on those youth who are either in transition or have completed transition,
the following conclusions can be drawn: first, young men have a distinct advantage in
terms of completing the transition in comparison to young women (50.3 per cent of young
men have completed the transition compared to 30.6 per cent of young women); and,
19.8
43.8 48.2 61.3 63.8
64.6
50.7 28.7
19.6
36.2
15.6 5.5
23.1 19.2
0.0
0
10
20
30
40
50
60
70
80
90
100
Neverattendedschool
Lower thanprimary
Primary Secondary Tertiary
%
Inactive non-students with plans towork
In non-satisfactory temporary or self-employment
Relaxed unemployed
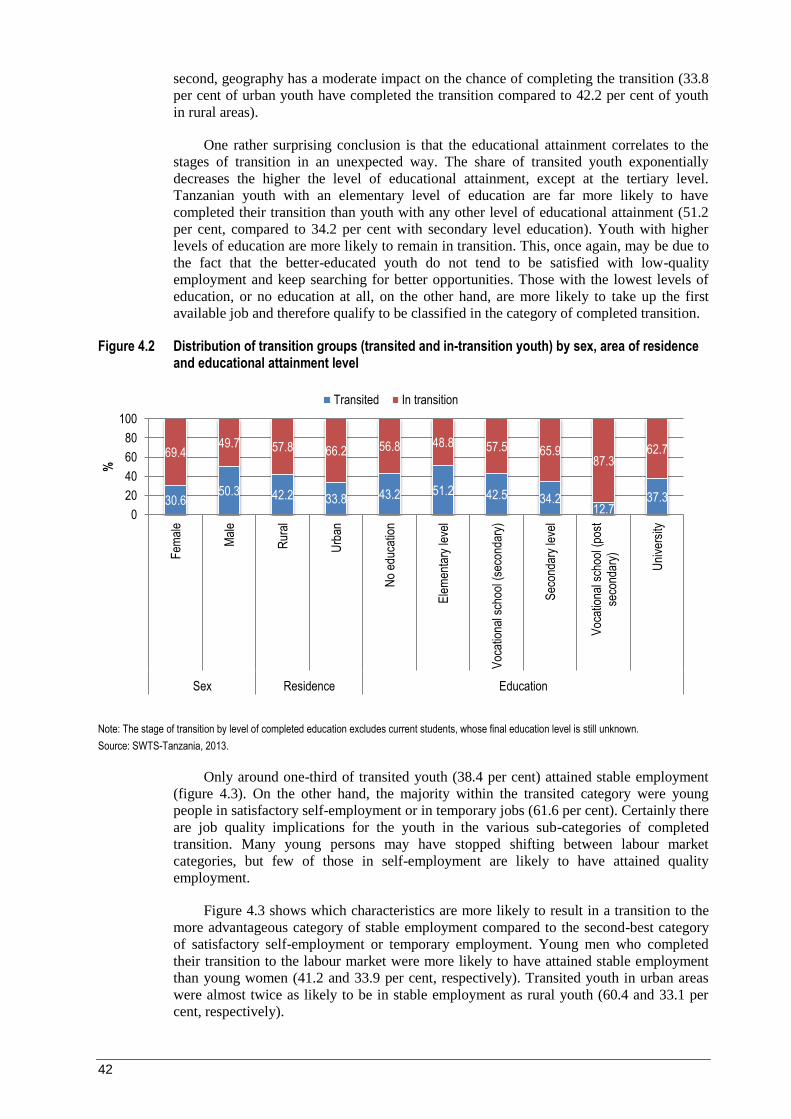
42
second, geography has a moderate impact on the chance of completing the transition (33.8
per cent of urban youth have completed the transition compared to 42.2 per cent of youth
in rural areas).
One rather surprising conclusion is that the educational attainment correlates to the
stages of transition in an unexpected way. The share of transited youth exponentially
decreases the higher the level of educational attainment, except at the tertiary level.
Tanzanian youth with an elementary level of education are far more likely to have
completed their transition than youth with any other level of educational attainment (51.2
per cent, compared to 34.2 per cent with secondary level education). Youth with higher
levels of education are more likely to remain in transition. This, once again, may be due to
the fact that the better-educated youth do not tend to be satisfied with low-quality
employment and keep searching for better opportunities. Those with the lowest levels of
education, or no education at all, on the other hand, are more likely to take up the first
available job and therefore qualify to be classified in the category of completed transition.
Figure 4.2 Distribution of transition groups (transited and in-transition youth) by sex, area of residence and educational attainment level
Note: The stage of transition by level of completed education excludes current students, whose final education level is still unknown.
Source: SWTS-Tanzania, 2013.
Only around one-third of transited youth (38.4 per cent) attained stable employment
(figure 4.3). On the other hand, the majority within the transited category were young
people in satisfactory self-employment or in temporary jobs (61.6 per cent). Certainly there
are job quality implications for the youth in the various sub-categories of completed
transition. Many young persons may have stopped shifting between labour market
categories, but few of those in self-employment are likely to have attained quality
employment.
Figure 4.3 shows which characteristics are more likely to result in a transition to the
more advantageous category of stable employment compared to the second-best category
of satisfactory self-employment or temporary employment. Young men who completed
their transition to the labour market were more likely to have attained stable employment
than young women (41.2 and 33.9 per cent, respectively). Transited youth in urban areas
were almost twice as likely to be in stable employment as rural youth (60.4 and 33.1 per
cent, respectively).
30.6 50.3 42.2 33.8 43.2 51.2 42.5 34.2
12.7 37.3
69.4 49.7 57.8 66.2 56.8 48.8 57.5 65.9
87.3 62.7
0
20
40
60
80
100
Fem
ale
Mal
e
Rur
al
Urb
an
No
educ
atio
n
Ele
men
tary
leve
l
Voc
atio
nal s
choo
l (se
cond
ary)
Sec
onda
ry le
vel
Voc
atio
nal s
choo
l (po
stse
cond
ary)
Uni
vers
ity
Sex Residence Education
%
Transited In transition
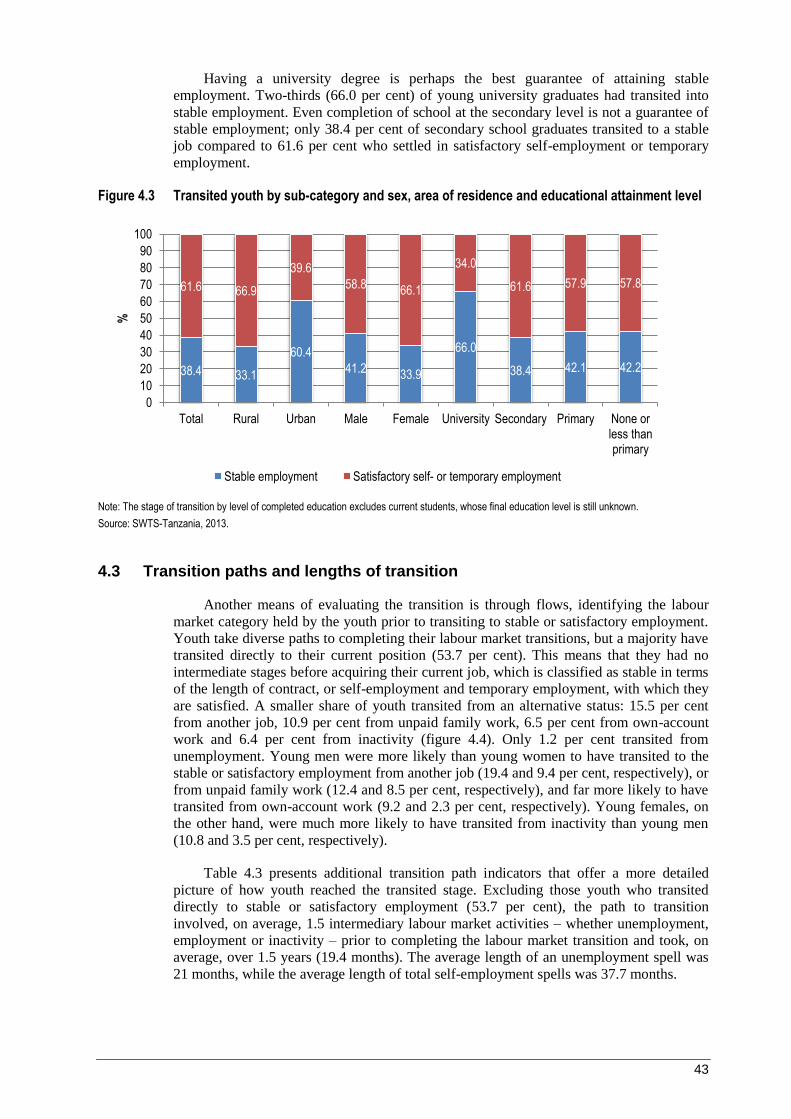
43
Having a university degree is perhaps the best guarantee of attaining stable
employment. Two-thirds (66.0 per cent) of young university graduates had transited into
stable employment. Even completion of school at the secondary level is not a guarantee of
stable employment; only 38.4 per cent of secondary school graduates transited to a stable
job compared to 61.6 per cent who settled in satisfactory self-employment or temporary
employment.
Figure 4.3 Transited youth by sub-category and sex, area of residence and educational attainment level
Note: The stage of transition by level of completed education excludes current students, whose final education level is still unknown.
Source: SWTS-Tanzania, 2013.
4.3 Transition paths and lengths of transition
Another means of evaluating the transition is through flows, identifying the labour
market category held by the youth prior to transiting to stable or satisfactory employment.
Youth take diverse paths to completing their labour market transitions, but a majority have
transited directly to their current position (53.7 per cent). This means that they had no
intermediate stages before acquiring their current job, which is classified as stable in terms
of the length of contract, or self-employment and temporary employment, with which they
are satisfied. A smaller share of youth transited from an alternative status: 15.5 per cent
from another job, 10.9 per cent from unpaid family work, 6.5 per cent from own-account
work and 6.4 per cent from inactivity (figure 4.4). Only 1.2 per cent transited from
unemployment. Young men were more likely than young women to have transited to the
stable or satisfactory employment from another job (19.4 and 9.4 per cent, respectively), or
from unpaid family work (12.4 and 8.5 per cent, respectively), and far more likely to have
transited from own-account work (9.2 and 2.3 per cent, respectively). Young females, on
the other hand, were much more likely to have transited from inactivity than young men
(10.8 and 3.5 per cent, respectively).
Table 4.3 presents additional transition path indicators that offer a more detailed
picture of how youth reached the transited stage. Excluding those youth who transited
directly to stable or satisfactory employment (53.7 per cent), the path to transition
involved, on average, 1.5 intermediary labour market activities – whether unemployment,
employment or inactivity – prior to completing the labour market transition and took, on
average, over 1.5 years (19.4 months). The average length of an unemployment spell was
21 months, while the average length of total self-employment spells was 37.7 months.
42.2 42.1 38.4
66.0
33.9 41.2
60.4
33.1 38.4
57.8 57.9 61.6
34.0
66.1 58.8
39.6
66.9 61.6
0
10
20
30
40
50
60
70
80
90
100
None orless thanprimary
PrimarySecondaryUniversityFemaleMaleUrbanRuralTotal
%
Stable employment Satisfactory self- or temporary employment
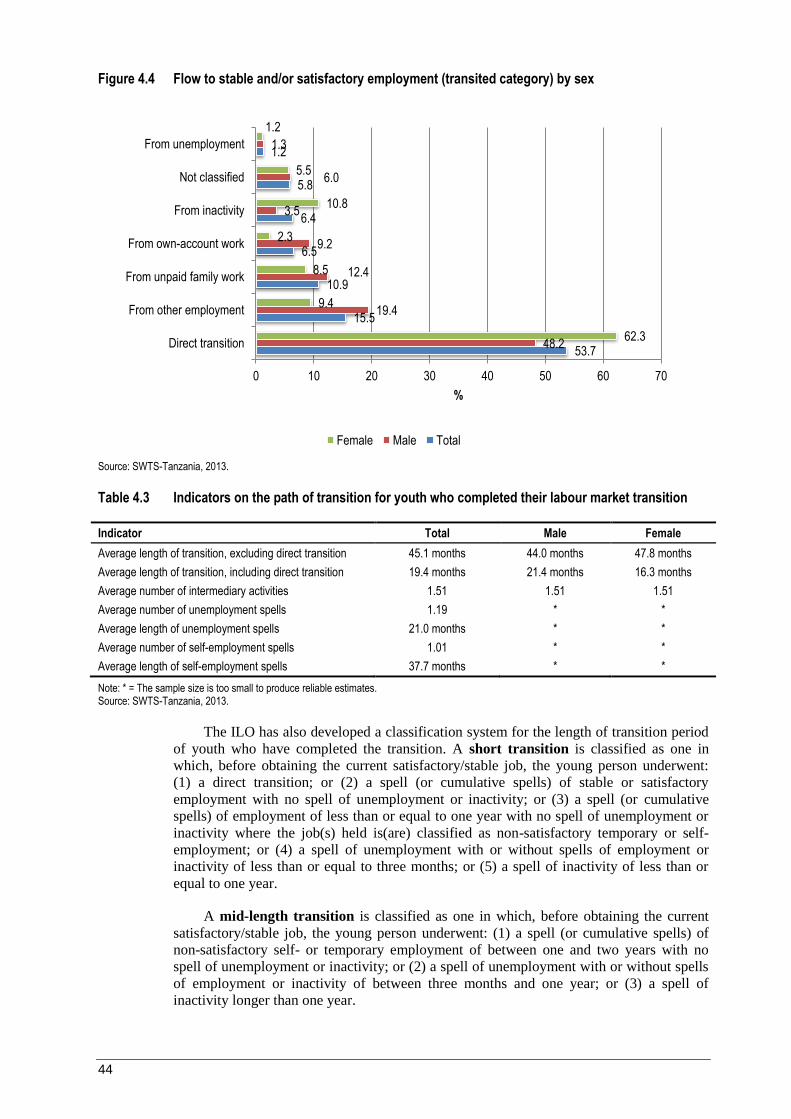
44
Figure 4.4 Flow to stable and/or satisfactory employment (transited category) by sex
Source: SWTS-Tanzania, 2013.
Table 4.3 Indicators on the path of transition for youth who completed their labour market transition
Indicator Total Male Female
Average length of transition, excluding direct transition 45.1 months 44.0 months 47.8 months
Average length of transition, including direct transition 19.4 months 21.4 months 16.3 months
Average number of intermediary activities 1.51 1.51 1.51
Average number of unemployment spells 1.19 * *
Average length of unemployment spells 21.0 months * *
Average number of self-employment spells 1.01 * *
Average length of self-employment spells 37.7 months * *
Note: * = The sample size is too small to produce reliable estimates. Source: SWTS-Tanzania, 2013.
The ILO has also developed a classification system for the length of transition period
of youth who have completed the transition. A short transition is classified as one in
which, before obtaining the current satisfactory/stable job, the young person underwent:
(1) a direct transition; or (2) a spell (or cumulative spells) of stable or satisfactory
employment with no spell of unemployment or inactivity; or (3) a spell (or cumulative
spells) of employment of less than or equal to one year with no spell of unemployment or
inactivity where the job(s) held is(are) classified as non-satisfactory temporary or self-
employment; or (4) a spell of unemployment with or without spells of employment or
inactivity of less than or equal to three months; or (5) a spell of inactivity of less than or
equal to one year.
A mid-length transition is classified as one in which, before obtaining the current
satisfactory/stable job, the young person underwent: (1) a spell (or cumulative spells) of
non-satisfactory self- or temporary employment of between one and two years with no
spell of unemployment or inactivity; or (2) a spell of unemployment with or without spells
of employment or inactivity of between three months and one year; or (3) a spell of
inactivity longer than one year.
53.7
15.5
10.9
6.5
6.4
5.8
1.2
48.2
19.4
12.4
9.2
3.5
6.0
1.3
62.3
9.4
8.5
2.3
10.8
5.5
1.2
0 10 20 30 40 50 60 70
Direct transition
From other employment
From unpaid family work
From own-account work
From inactivity
Not classified
From unemployment
%
Female Male Total

45
A lengthy transition is classified as one in which, before obtaining the current
satisfactory/stable job, the young person underwent: (1) a spell (or cumulative spells) of
non-satisfactory self- or temporary employment of two years or more with no spell of
unemployment or inactivity; or (2) a spell of unemployment with or without spells of
employment or inactivity of one year or more.
In Tanzania, when including the direct transits, the majority of youth experienced a
short transition (76.3 per cent, figure 4.5) with only minor gender differences. More young
men experienced a lengthy transition than women (16.3 and 11.4 per cent, respectively),
while more young women underwent a mid-length transition (11.6 per cent, compared to
7.9 per cent of men).
Figure 4.5 Classification of length of transition of youth who have completed the transition, by sex
Source: SWTS-Tanzania, 2013.
As shown earlier in figure 4.4, more than one-half of transited youth in Tanzania
(53.7 per cent) transited directly to stable or satisfactory self- or temporary employment
without experiencing any spells of unemployment or inactivity. What are the
characteristics of the young people who transited directly to stable and/or satisfactory
employment and, perhaps more importantly, in which of the sub-categories did they end
up? More than two-thirds (69.0 per cent) of youth who transited directly went into
satisfactory self- or temporary employment (figure 4.6). Only the remaining 31.0 per cent
landed in stable satisfactory jobs.
Figure 4.6 Share of direct transition to stable employment and satisfactory self- or temporary employment (%)
Source: SWTS-Tanzania, 2013.
76.3 75.8 77.0
9.3 7.9 11.6
14.4 16.3 11.4
0
10
20
30
40
50
60
70
80
90
100
Total Male Female
%
Lengthy transition
Mid-length transition
Short transition
Stable satisfactory employment
31%
Satisfactory self- or
temporary employment
69%
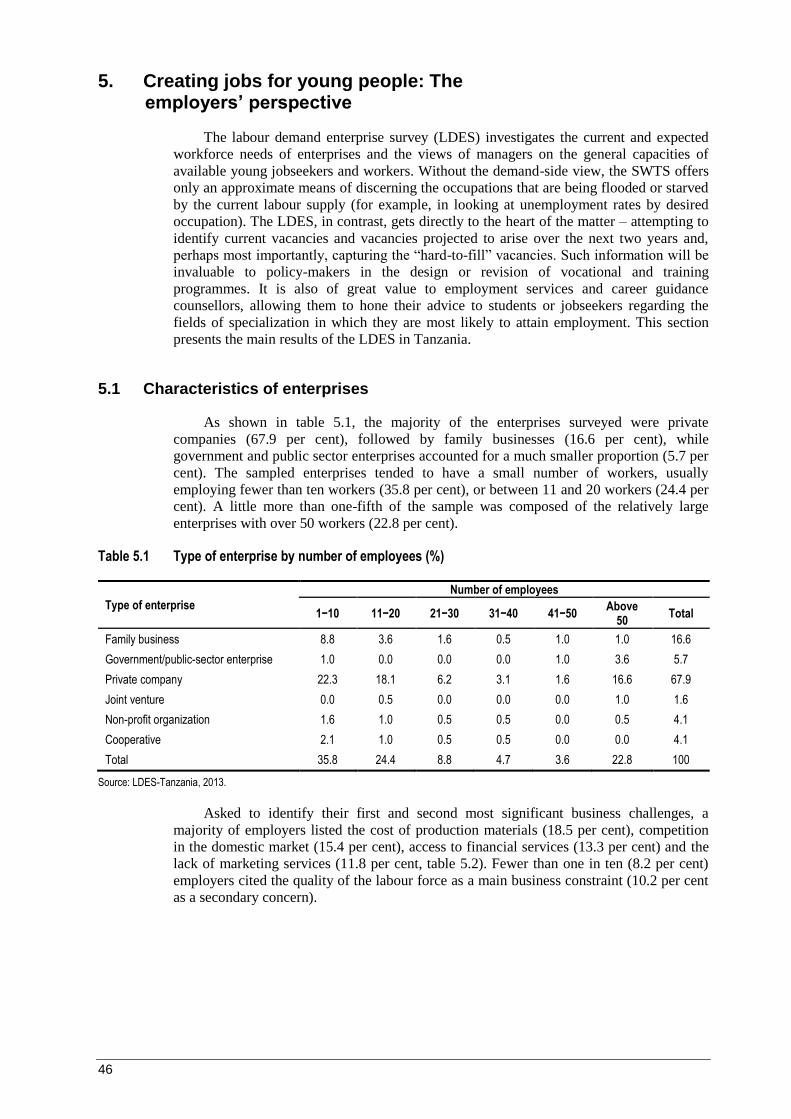
46
5. Creating jobs for young people: The employers’ perspective
The labour demand enterprise survey (LDES) investigates the current and expected
workforce needs of enterprises and the views of managers on the general capacities of
available young jobseekers and workers. Without the demand-side view, the SWTS offers
only an approximate means of discerning the occupations that are being flooded or starved
by the current labour supply (for example, in looking at unemployment rates by desired
occupation). The LDES, in contrast, gets directly to the heart of the matter – attempting to
identify current vacancies and vacancies projected to arise over the next two years and,
perhaps most importantly, capturing the “hard-to-fill” vacancies. Such information will be
invaluable to policy-makers in the design or revision of vocational and training
programmes. It is also of great value to employment services and career guidance
counsellors, allowing them to hone their advice to students or jobseekers regarding the
fields of specialization in which they are most likely to attain employment. This section
presents the main results of the LDES in Tanzania.
5.1 Characteristics of enterprises
As shown in table 5.1, the majority of the enterprises surveyed were private
companies (67.9 per cent), followed by family businesses (16.6 per cent), while
government and public sector enterprises accounted for a much smaller proportion (5.7 per
cent). The sampled enterprises tended to have a small number of workers, usually
employing fewer than ten workers (35.8 per cent), or between 11 and 20 workers (24.4 per
cent). A little more than one-fifth of the sample was composed of the relatively large
enterprises with over 50 workers (22.8 per cent).
Table 5.1 Type of enterprise by number of employees (%)
Type of enterprise
Number of employees
1−10 11−20 21−30 31−40 41−50 Above
50 Total
Family business 8.8 3.6 1.6 0.5 1.0 1.0 16.6
Government/public-sector enterprise 1.0 0.0 0.0 0.0 1.0 3.6 5.7
Private company 22.3 18.1 6.2 3.1 1.6 16.6 67.9
Joint venture 0.0 0.5 0.0 0.0 0.0 1.0 1.6
Non-profit organization 1.6 1.0 0.5 0.5 0.0 0.5 4.1
Cooperative 2.1 1.0 0.5 0.5 0.0 0.0 4.1
Total 35.8 24.4 8.8 4.7 3.6 22.8 100
Source: LDES-Tanzania, 2013.
Asked to identify their first and second most significant business challenges, a
majority of employers listed the cost of production materials (18.5 per cent), competition
in the domestic market (15.4 per cent), access to financial services (13.3 per cent) and the
lack of marketing services (11.8 per cent, table 5.2). Fewer than one in ten (8.2 per cent)
employers cited the quality of the labour force as a main business constraint (10.2 per cent
as a secondary concern).
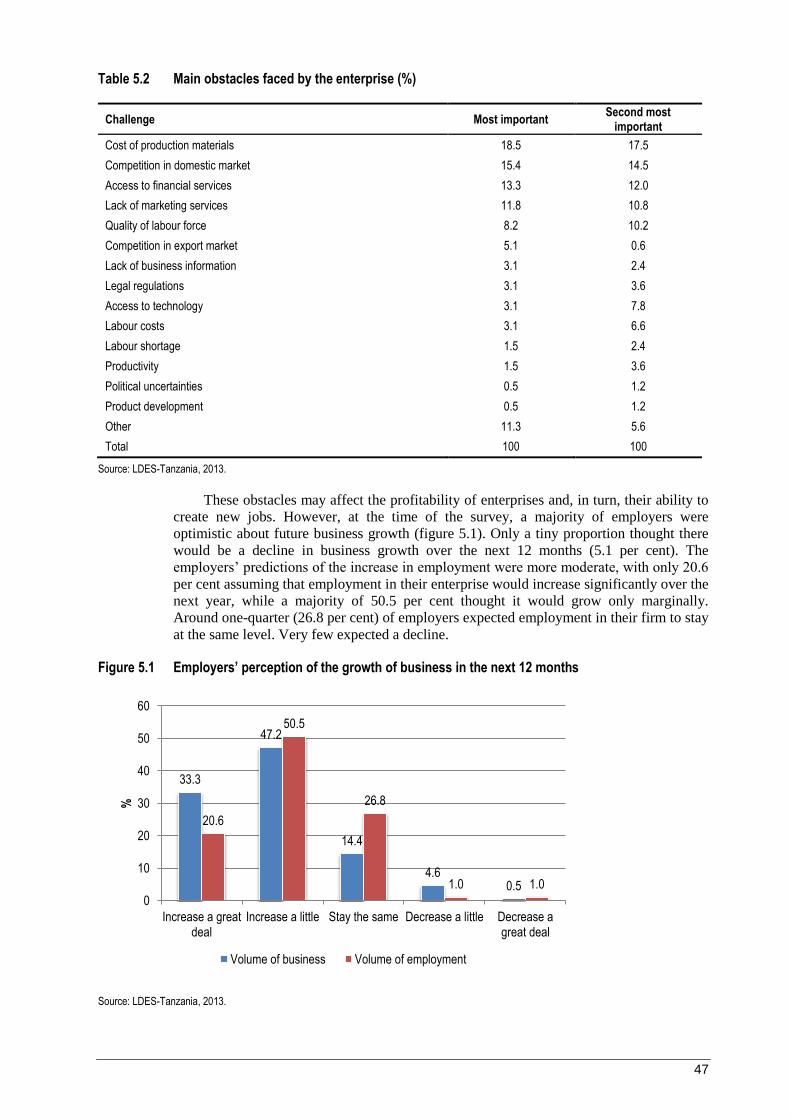
47
Table 5.2 Main obstacles faced by the enterprise (%)
Challenge Most important Second most
important
Cost of production materials 18.5 17.5
Competition in domestic market 15.4 14.5
Access to financial services 13.3 12.0
Lack of marketing services 11.8 10.8
Quality of labour force 8.2 10.2
Competition in export market 5.1 0.6
Lack of business information 3.1 2.4
Legal regulations 3.1 3.6
Access to technology 3.1 7.8
Labour costs 3.1 6.6
Labour shortage 1.5 2.4
Productivity 1.5 3.6
Political uncertainties 0.5 1.2
Product development 0.5 1.2
Other 11.3 5.6
Total 100 100
Source: LDES-Tanzania, 2013.
These obstacles may affect the profitability of enterprises and, in turn, their ability to
create new jobs. However, at the time of the survey, a majority of employers were
optimistic about future business growth (figure 5.1). Only a tiny proportion thought there
would be a decline in business growth over the next 12 months (5.1 per cent). The
employers’ predictions of the increase in employment were more moderate, with only 20.6
per cent assuming that employment in their enterprise would increase significantly over the
next year, while a majority of 50.5 per cent thought it would grow only marginally.
Around one-quarter (26.8 per cent) of employers expected employment in their firm to stay
at the same level. Very few expected a decline.
Figure 5.1 Employers’ perception of the growth of business in the next 12 months
Source: LDES-Tanzania, 2013.
33.3
47.2
14.4
4.6 0.5
20.6
50.5
26.8
1.0 1.0
0
10
20
30
40
50
60
Increase a greatdeal
Increase a little Stay the same Decrease a little Decrease agreat deal
%
Volume of business Volume of employment

48
5.2 Recruitment of workers
Enterprises were asked to identify their most frequently used method for hiring
workers for managerial or professional jobs and production or elementary jobs. Enterprises
indicated that when they need to hire professional workers they mainly use advertisements
(34.6 per cent), personal networks, such as friends and relatives (17.3 per cent), and
internal staff resources (15.1 per cent, figure 5.2). When looking for production staff,
however, enterprises mainly rely on their personal networks (37.8 per cent) and, to a lesser
extent, on advertisements (21.4 per cent) and promoting internal staff (13.3 per cent).
Public and private employment services were among the least popular recruitment methods
(only around 6.0 per cent of recruitment was done through these specialized agencies).
There is an obvious mismatch between the recruitment methods primarily used by
enterprises and the job search methods of the employed youth, given that only 0.3 per cent
of employed youth found their jobs through advertisements (table 3.27). Alternatively, the
informal channels, i.e. inquiring within the personal network of friends, relatives and
acquaintances, are a means routinely used by both employers and the employed youth.
Figure 5.2 Recruitment methods of enterprises by type of employees
Source: LDES-Tanzania, 2013.
The preferred recruitment methods vary depending on the size of the enterprise. The
larger firms with over 50 employees do most of their recruitment through advertisements
(51.0 per cent), while smaller firms with fewer than 50 employees mainly use informal
channels. Around 15.0 per cent of smaller firms report never having vacancies at all. The
larger the firm, the more likely it is to use advertisements to recruit employees and the less
likely to rely on informal channels. Using the services of employment agencies appears to
be relatively unpopular among firms of all sizes, especially the small ones, among which
only 2.4 per cent used a specialized agency in their recruitment. Companies with over ten
employees also considered internal staff for vacant positions (15.3 per cent, slightly more
than smaller firms of under ten employees – 9.5 per cent).
34.6
17.3
15.1
10.6
10.1
6.7
5.6
21.4
37.8
13.3
11.7
1.5
5.6
8.7
0 5 10 15 20 25 30 35 40
Advertisements
Through relatives or friends
Within the enterprise
Other
Never have vacancies
Employment services
Education/training institutions
%
Production workers / Elementary Occupations Managers / Professionals
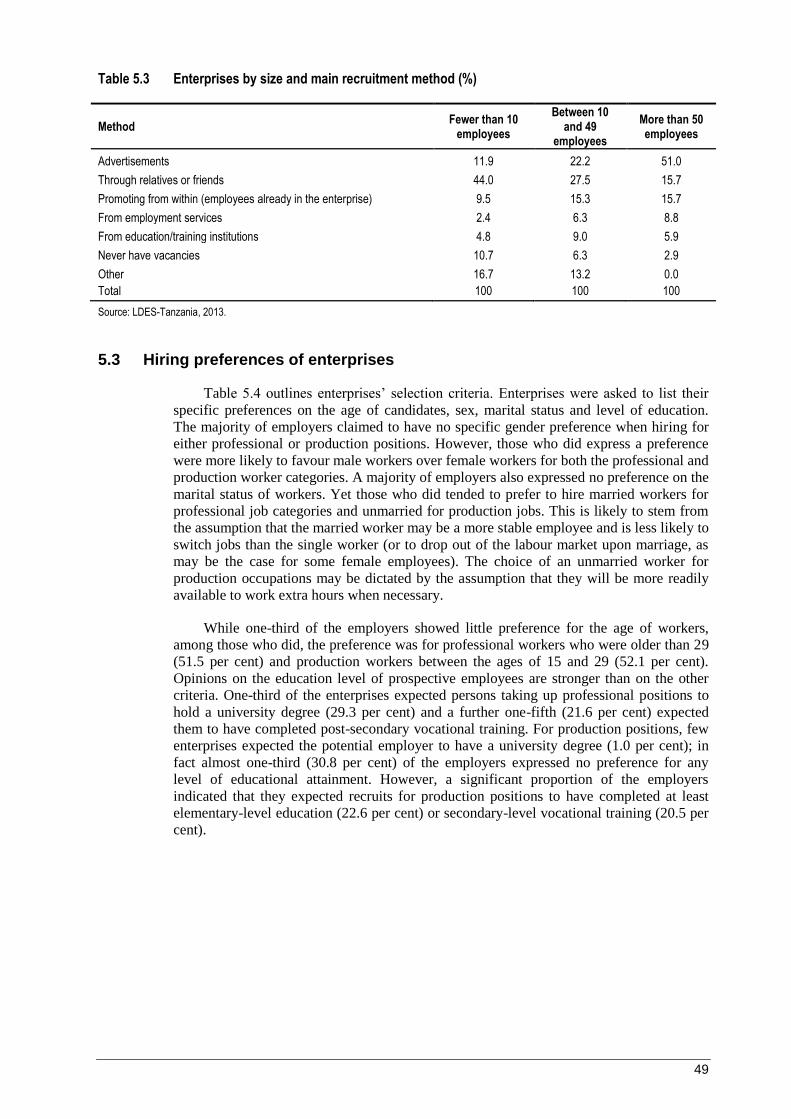
49
Table 5.3 Enterprises by size and main recruitment method (%)
Method Fewer than 10
employees
Between 10 and 49
employees
More than 50 employees
Advertisements 11.9 22.2 51.0
Through relatives or friends 44.0 27.5 15.7
Promoting from within (employees already in the enterprise) 9.5 15.3 15.7
From employment services 2.4 6.3 8.8
From education/training institutions 4.8 9.0 5.9
Never have vacancies 10.7 6.3 2.9
Other 16.7 13.2 0.0
Total 100 100 100
Source: LDES-Tanzania, 2013.
5.3 Hiring preferences of enterprises
Table 5.4 outlines enterprises’ selection criteria. Enterprises were asked to list their
specific preferences on the age of candidates, sex, marital status and level of education.
The majority of employers claimed to have no specific gender preference when hiring for
either professional or production positions. However, those who did express a preference
were more likely to favour male workers over female workers for both the professional and
production worker categories. A majority of employers also expressed no preference on the
marital status of workers. Yet those who did tended to prefer to hire married workers for
professional job categories and unmarried for production jobs. This is likely to stem from
the assumption that the married worker may be a more stable employee and is less likely to
switch jobs than the single worker (or to drop out of the labour market upon marriage, as
may be the case for some female employees). The choice of an unmarried worker for
production occupations may be dictated by the assumption that they will be more readily
available to work extra hours when necessary.
While one-third of the employers showed little preference for the age of workers,
among those who did, the preference was for professional workers who were older than 29
(51.5 per cent) and production workers between the ages of 15 and 29 (52.1 per cent).
Opinions on the education level of prospective employees are stronger than on the other
criteria. One-third of the enterprises expected persons taking up professional positions to
hold a university degree (29.3 per cent) and a further one-fifth (21.6 per cent) expected
them to have completed post-secondary vocational training. For production positions, few
enterprises expected the potential employer to have a university degree (1.0 per cent); in
fact almost one-third (30.8 per cent) of the employers expressed no preference for any
level of educational attainment. However, a significant proportion of the employers
indicated that they expected recruits for production positions to have completed at least
elementary-level education (22.6 per cent) or secondary-level vocational training (20.5 per
cent).
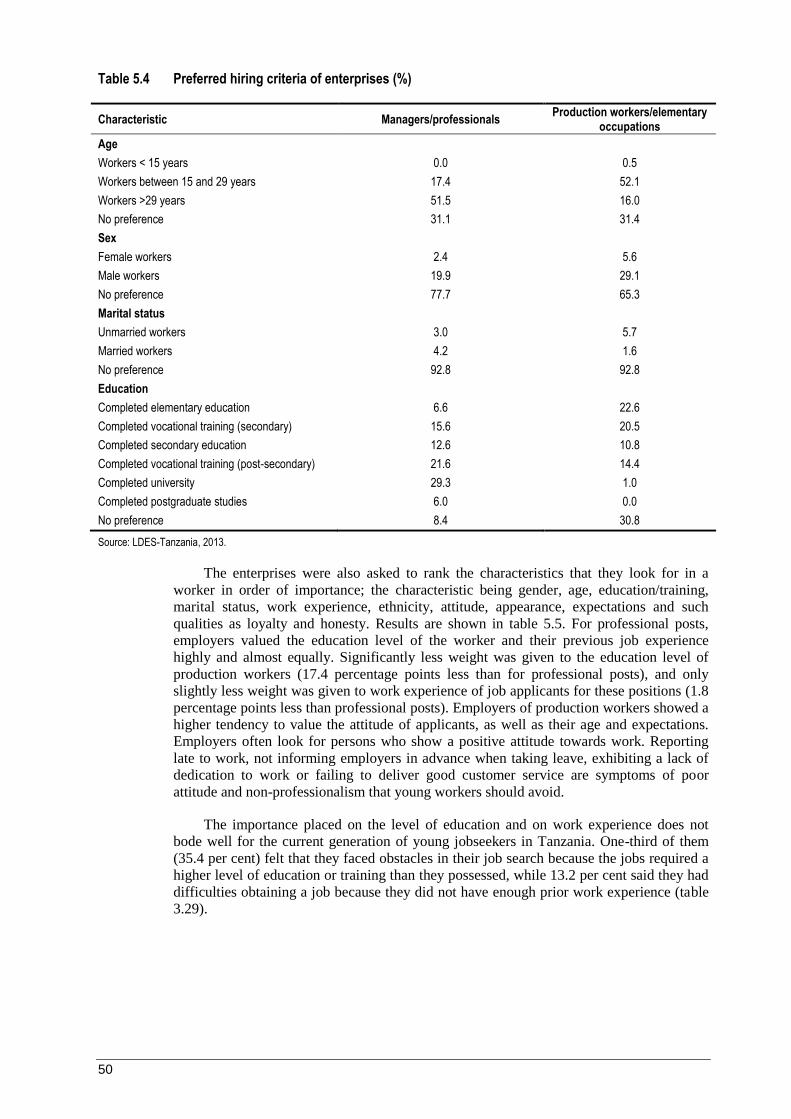
50
Table 5.4 Preferred hiring criteria of enterprises (%)
Characteristic Managers/professionals Production workers/elementary
occupations
Age
Workers < 15 years 0.0 0.5
Workers between 15 and 29 years 17.4 52.1
Workers >29 years 51.5 16.0
No preference 31.1 31.4
Sex
Female workers 2.4 5.6
Male workers 19.9 29.1
No preference 77.7 65.3
Marital status
Unmarried workers 3.0 5.7
Married workers 4.2 1.6
No preference 92.8 92.8
Education
Completed elementary education 6.6 22.6
Completed vocational training (secondary) 15.6 20.5
Completed secondary education 12.6 10.8
Completed vocational training (post-secondary) 21.6 14.4
Completed university 29.3 1.0
Completed postgraduate studies 6.0 0.0
No preference 8.4 30.8
Source: LDES-Tanzania, 2013.
The enterprises were also asked to rank the characteristics that they look for in a
worker in order of importance; the characteristic being gender, age, education/training,
marital status, work experience, ethnicity, attitude, appearance, expectations and such
qualities as loyalty and honesty. Results are shown in table 5.5. For professional posts,
employers valued the education level of the worker and their previous job experience
highly and almost equally. Significantly less weight was given to the education level of
production workers (17.4 percentage points less than for professional posts), and only
slightly less weight was given to work experience of job applicants for these positions (1.8
percentage points less than professional posts). Employers of production workers showed a
higher tendency to value the attitude of applicants, as well as their age and expectations.
Employers often look for persons who show a positive attitude towards work. Reporting
late to work, not informing employers in advance when taking leave, exhibiting a lack of
dedication to work or failing to deliver good customer service are symptoms of poor
attitude and non-professionalism that young workers should avoid.
The importance placed on the level of education and on work experience does not
bode well for the current generation of young jobseekers in Tanzania. One-third of them
(35.4 per cent) felt that they faced obstacles in their job search because the jobs required a
higher level of education or training than they possessed, while 13.2 per cent said they had
difficulties obtaining a job because they did not have enough prior work experience (table
3.29).
51
Table 5.5 Most important characteristic that employers consider in recruiting workers (%)
Sub-category Managers/professionals Production
workers/elementary occupations
Education/training 40.7 23.3
Job experience 40.1 38.3
Age 5.1 9.3
Other 5.1 2.1
Marital status 2.8 3.6
Attitude 2.8 7.8
Sex 2.3 5.7
Ethnic background 0.6 1.6
Expectations 0.6 6.7
Appearance 0.0 1.6
Total 100 100
Source: LDES-Tanzania, 2013.
5.4 Skills assessment of young workers
Employers were asked to rate the aptitude of young applicants (aged 15−29) in the
following skills: writing, technical, communication, breadth of education or training,
application of knowledge to work, commitment and discipline, and whether or not the
young people had realistic expectations about the labour market. Figure 5.3 shows that, for
the most part, enterprises were content with the skills of young job applicants but not
particularly impressed. More than one-half of the employers gave an overall “adequate”
rating of the skills of young job applicants (53.2 per cent), while around one in four, or
28.5 per cent, assessed applicants’ skills as “good”. However, the highest mark of
“excellent” was given by only 4.3 per cent of the employers. The favourable marks went to
skills such as writing, oral communication and commitment to work (more than 30.0 per
cent of employers rated young applicants as good or excellent for these skills). The areas
that received the lowest assessments – with about 30 per cent ranking as “poor” or “very
poor” – were technical and computer skills, breadth of educational or training and having
realistic expectations about the world of work. Thus, in the employers’ eyes, young job
applicants are equipped with traditional school-based skills, but lack practical work-related
skills.
Figure 5.3 Employers’ assessment of young job applicants’ skills (aged 15−29)
Source: LDES-Tanzania, 2013.
10.8
10.0
7.5
6.0
10.4
16.0
6.3
4.3
25.8
22.0
29.3
21.1
19.8
19.6
23.4
28.5
43.8
34.5
43.5
41.6
43.8
43.8
41.1
53.2
15.0
25.1
16.0
25.4
20.3
16.0
22.9
11.3
4.6
8.4
3.7
5.9
5.7
4.6
6.3
2.7
0 10 20 30 40 50 60 70 80 90 100
Writing
Technical
Communication
Education/Training
Application of knowledge
Commitment
Expectations
Overall
%
Excellent
Good
Adequate
Poor
Very poor

52
5.5 Education and training
Section 3.5.8 investigated the issue of overeducation and undereducation among
young workers. The conclusion was that both phenomena are of concern, though to a
different extent. Over one-half or 58.5 per cent of young workers were undereducated and
8.6 per cent were overeducated (table 3.24). A research study reports that education
mismatch and skills mismatch in Tanzania show a weak positive correlation and therefore
those two types of mismatch are not perfect substitutes (Ame et al., 2013). However, it is
worth noting that the sample enterprises in LDES expressed the strongest dissatisfaction
regarding job applicants’ technical and computer skills, which coincides with a very high
undereducation rate among technicians and associate professional occupations (90.7 per
cent) (table 3.24).
One means of addressing the qualifications mismatch and making sure that young
workers have the necessary skills to undertake available jobs most effectively is to offer
on-the-job training. A trained worker has the potential to be more efficient, effective and
better motivated at work than an untrained (and hence insecure) worker.
The LDES reveals that employers seem reluctant to invest in training, perhaps due to
the cost constraints. Less than half (43.9 per cent) of the surveyed employers had offered
some level of training to their employees over the previous 12 months. Of the employers
who did invest in training, the majority had trained fewer than five employees (75.0 per
cent), 17.9 per cent had trained between five and 25 employees, and 7.1 per cent had
trained more than 25 employees (table 5.6). Most training was job-related (94.2 per cent),
half of which was on-the-job training (50.0 per cent) and training held at the enterprises
(51.2 per cent). Greater investment in training could significantly improve the productivity
and profitability of enterprises, while raising both the confidence and earning power of
workers.
Table 5.6 Enterprises by number of workers trained, type and place of training and training provider (%)
Number trained and place % Type of training and institution %
Number of workers trained
Type of training
Fewer than 5 75.0 Job-related education/training 94.2
Between 5 and 25 17.9 Non-job-related education/training 5.8
More than 25 7.1 Training institution
Place of training
Enterprise 51.2
On the job, informal 50.0 Private-sector training institution 30.2
Classroom, on premises 18.6 Government training institution 15.1
Classroom, off premises 23.3 Other 3.5
Other 8.1
Source: LDES-Tanzania, 2013.
5.6 Labour demand
Employers were asked to identify the possible vacancies that would open up in the
next two to three years. Bearing in mind that responses are perceptions only, the overall
growth prospects are skewed towards high-skilled non-manual jobs, a projection which
provides some hope for the youth emerging from higher education. Within the high-skilled
non-manual category, the demand for science and engineering associate professionals is
strongest (16.7 per cent, table 5.7). Furthermore, the demand for skilled manual
occupations is also evident – within the skilled manual category of occupations, drivers

53
and mobile plant operators were most in demand (14.4 per cent), as were stationary plant
and machine operators (13.3 per cent). Ten per cent of the projected labour demand is for
business and administration professional positions.
Table 5.7 Forecasted vacancies by occupation in the next 2−3 years (%)
ISCO-08 category (2-digit) %
Science and engineering associate professionals 16.7
Drivers and mobile plant operators 14.4
Stationary plant and machine operators 13.3
Business and administration professionals 10.0
Science and engineering professionals 8.9
Sales workers 8.9
Cleaners and helpers 7.8
Customer services clerks 6.7
Metal, machinery and related trades workers 6.7
Food processing, wood working, garment and other craft and related trades workers 6.7
Total 100
Source: LDES-Tanzania, 2013.
5.6.1 Hard-to-fill vacancies
Hard-to-fill vacancies are openings where employers find themselves unable to find
persons to hire. The reason could be insufficient quality among the candidates who apply
for these posts in terms of inadequate skills, experience, qualifications or poor attitude.
Alternatively, hard-to-fill vacancies can exist as a result of an insufficient number of
applicants targeting the vacancy, perhaps due to the wages or terms offered for the job.
Almost half of the hard-to-fill vacancies identified by employers fell within the
skilled manual occupations category (45.3 per cent), one-third within the high-skilled non-
manual category (30.2 per cent) and a little less than one-fifth within the low-skilled non-
manual category (17.0 per cent) (table 5.8). Unskilled occupations were considered hard to
fill by the smallest proportion of employers (7.5 per cent). By specific occupational titles,
the five most hard-to-fill occupations were handicraft and printing workers, science and
engineering associates, production and specialized services managers, customer services
clerks and garment and other craft and related trades workers.
The consequences of hard-to-fill vacancies as identified by enterprises in table 5.9
included the potential increase in operating costs (19.4 per cent), loss of business (15.1 per
cent), difficulties in meeting quality standards (12.9 per cent), delay in development of
new products and services (9.7 per cent), difficulty in meeting customer service objectives
(9.7 per cent) and even the withdrawal of products (2.2 per cent). However, it is also worth
noting that one-third of the enterprises stated that hard-to-fill vacancies would have no
impact at all on their business (29.0 per cent).
54
Table 5.8 Hard-to-fill vacancies identified by enterprises
Broad categories of occupations
Occupational titles (ISCO 2-digit) %
High-skilled non-manual
Production and specialised services managers 7.5
30.2
Science and engineering professionals 5.7
Teaching professionals 3.8
Science and engineering associate professionals 9.4
Health associate professionals 1.9
Business and administration associate professionals 1.9
Low-skilled non-manual
Customer services clerks 7.5
17.0 Numerical and material recording clerks 1.9
Other clerical support workers 3.8
Personal service workers 3.8
Skilled manual
Sales workers 1.9
45.3
Subsistence farmers, fishers, hunters and gatherers 1.9
Building and related trades workers, excluding electricians 1.9
Metal, machinery and related trades workers 3.8
Handicraft and printing workers 11.3
Electrical and electronic trades workers 3.8
Food processing, wood working, garment and other craft and related trades workers 7.5
Stationary plant and machine operators 5.7
Assemblers 1.9
Drivers and mobile plant operators 5.7
Unskilled
Cleaners and helpers 1.9
7.5 Food preparation assistants 3.8
Refuse workers and other elementary workers 1.9
Total 100 100
Source: LDES-Tanzania, 2013.
Table 5.9 The most common consequences of hard-to-fill vacancies
Consequences of hard-to-fill vacancies %
No impact at all 29.0
Increase in operating costs 19.4
Loss of business 15.1
Difficulties in meeting quality standards 12.9
Delay in development of new products/services 9.7
Difficulty in meeting customer service objectives 9.7
Withdrawal of products 2.2
Other 2.2
Total 100
Source: LDES-Tanzania, 2013.
55
6. Relevant policy framework and policy implications
This section provides an overview of the relevant policy frameworks affecting the
youth employment issue in Tanzania, including the long-term development vision, national
poverty reduction strategies and national employment policies. The second part of this
section discusses the policy implications for youth employment promotion.
6.1 Policy framework
Youth employment is currently a major concern in Tanzania. The National
Employment Policy, its derivative the National Employment Creation Strategy and, above
all, the overarching national development plan – the National Strategy for Growth and
Reduction of Poverty – clearly demonstrate this commitment. The goal of the National
Employment Creation Programme (NECP) (2007) is to generate greater employment
opportunities and incomes a a crucial element of development policies and strategies. The
objective is to adopt development strategies whereby employment creation is promoted
with the outcome of an improved quality of life that is characterized by decent incomes
and consumption. The objectives of the programme are:
to increase public investment in construction and other potential employment-
creating sectors, namely agriculture, tourism, mining and manufacturing;
to improve the institutional and regulatory framework and capacity building for
coordination and management of the NECP;
to implement policies and strategies to stimulate private sector growth and
therefore increase employment and self-employment;
to undertake demand-driven skills development programmes for promoting self-
employment and enhanced labour productivity.
Tanzania’s Decent Work Country Programme, 2013–16 presents a detailed review of
the country’s relevant policy framework. This review is cited here to provide the context in
the country (ILO, 2013a, pp. 10–11):
Tanzania’s long-term vision is to become a middle-income country by 2025 and 2020 for
Mainland and Zanzibar respectively. The Long-Term Development Vision 2025 for
Mainland and Vision 2020 for Zanzibar [emphasis added] have been translated into
National Poverty Reduction Strategies (MKUKUTA for Mainland and MKUZA for
Zanzibar). The first generation MKUKUTA and MKUZA (2006–2010) strategies
assumed that high growth rate with adequate increases in the social sector will reduce
rural poverty from 38.6 per cent to 27 per cent and unemployment from 13 per cent to 6.9
per cent by 2010. The poverty reduction target has clearly not been achieved.
In 2010, the second generation of the MKUKUTA and MKUZA II (2011–2015) were
launched. Moreover, a Five-Year Development Plan (2011–2015) was prepared to
accelerate economic growth and put the country on track to realize the Vision 2025.
These policy documents represent a shift towards a more employment-centric approach in
which the Decent Work Agenda – underpinned by four pillars of labour standards,
employment promotion, social protection and social dialogue – is embedded. The
underpinning rationale being that without productive employment, significant progress in
poverty reduction, even amidst high growth rates, will remain elusive. In addition, there is
acknowledgment that there is need to develop policy coherence across all these initiatives
to support structural transformation and productive employment creation in both the
agriculture and industrial sectors.

56
The employment content of these strategies is also articulated in the National
Employment Policy and the National Employment Creation Programme (2007) and the
National Youth Employment Action Plan (NYEAP), 2007/08 – 2009/10 for Mainland and
the National Employment Policy (2008) in Zanzibar. Using the UN Chief Executive
Board (CEB) Toolkit on Mainstreaming Employment Creation and Decent Work goals in
policies and plans as a reference-guiding document, the capacity of Planning Officials in
MDAs and LGA has been strengthened.
Addressing employment is a national priority and given the limitations of the formal
sector to absorb the increasing number of labour market entrants, great emphasis is placed
on enterprise development, including cooperatives. The Government has launched two
funds, the Youth Development Fund (YDF) and the Economic Empowerment Fund
(EEF) that were launched in 2000 and 2007 respectively to promote employment creation
for Tanzanian youths and adults for self-employment to enable them to generate incomes
to fight poverty and meet their needs. The implementation of both funds has been done
using the Savings and Credit Cooperatives (SACCOS) as the credit channel to reach the
target group. Given the wide reach of cooperatives, they have the potential to be an
effective channel in reaching out to women and youth and contributing to their self-
empowerment.
An employment creation strategy, which aims to promote decent work under the
conditions of equity, security and dignity, is a component of the National Strategy for
Growth and Reduction of Poverty. The strategy also incorporates specific areas, such as
the informal sector, establishment of incentive structures that promote employment
creation through direct investments in sectors that are productive and labour intensive with
a view to supporting small and medium-sized enterprises. It has been noted that youth are
marginalized by formal labour market processes. There is a need, therefore, to facilitate
their entry into the labour market in order to enhance their absorption into productive
activities and prevent them from becoming unemployed and underemployed. Early
interventions and assistance will provide the target group with invaluable training and
exposure to work culture to make them more attractive to employers. Apart from the
activities and programmes that have been undertaken to date, there is a need to revisit the
following policy measures to see how effective they have been and determine the best way
forward. These measures include:
pre-labour market interventions;
appropriate reforms in primary, secondary and tertiary education to complement
employment needs;
programmes to encourage enterprise training for youth;
training for self-employment tied to promotional measures for micro-enterprise
development in rural and urban settings;
direct employment creation initiatives to absorb the unemployed.
One of the measures to directly increase employment opportunities is to undertake
active labour market policies. This can be done by implementing special employment and
public works programmes for those who cannot be immediately absorbed into productive
employment.
The Ministry of Labour, Employment and Youth Development formulated the Youth
Employment Action Plan in 2007 with support from the Youth Employment Network, a
collaboration between the ILO, the World Bank and the United Nations. Areas covered in
the action plan include:
employment infrastructure programme;
57
community-based training skills for employment;
resettlement of landless youth in new settlement areas;
job creation and poverty alleviation through cooperatives;
integrated urban employment promotion;
enhancing women’s employment opportunities through horticulture and related
activities; and
providing support for small-scale miners.
6.2 Policy implications
Identifying the nature and extent of the youth employment challenge at the country
level is a prerequisite to formulating evidence-based and integrated policies and
programmatic interventions. With detailed information on the obstacles that are preventing
sufficient job creation from absorbing the cohorts of young labour market entrants,
governments will be better prepared to design effective policy responses. Facilitating an
improved school-to-work transition is a precondition to helping young people overcome
the difficulties in finding and maintaining decent jobs.
Transition from school to work has dimensions that, in many respects, require
strategic intervention. Given the existing problems of employment creation and youth
unemployment, a number of issues emerge that call for policy attention to facilitate young
people’s successful integration into the labour force.
Most enterprises in the modern sectors (manufacturing, telecommunication, trade,
tourism, banking and mining) prefer skilled and experienced human resources over
unskilled and inexperienced newcomers (confirmed by the LDES results). Tanzania suffers
from an acute problem of skills mismatch (undereducated or overeducated labour force),
informal employment and general low quality of jobs. This is despite the continuous
improvement in the educational level of the labour force, as measured by the highest level
of educational attainment declared in successive censuses. While the gradually improving
macroeconomic performance of the country creates a conducive environment for job
creation, the structural reforms of both the general and vocational educational systems and
the strengthening of employment services for improved professional guidance are needed
in order to address issues of mismatch in both the demand and supply of labour. Offering
career and education guidance within education and training institutions could help to
guide young people towards existing hard-to-fill occupations.
The analysis of the SWTS in Tanzania highlights major challenges for the Tanzanian
labour market generally, and the youth labour market specifically. The evidence from the
survey clearly demonstrates that Tanzania needs a vision for the future of its labour market
and a strategy to improve its labour market outcomes, particularly for youth. The present
SWTS dataset can make a significant contribution to providing policy-makers with
information to initiate, monitor and evaluate the numerous policies and programmes
outlined in the current policy documents. General areas to be addressed include:
1. Design macroeconomic policy to promote job growth. The results have shown that a
large number of current students (54.8 per cent) are hoping to gain work as “professionals”,
while the occupation group currently ranks low among the employed youth. There is a clear
gap in the supply and demand of young “professionals” and an absence of a thriving
modern sector to absorb them. The young person seeking a job in elementary occupations,
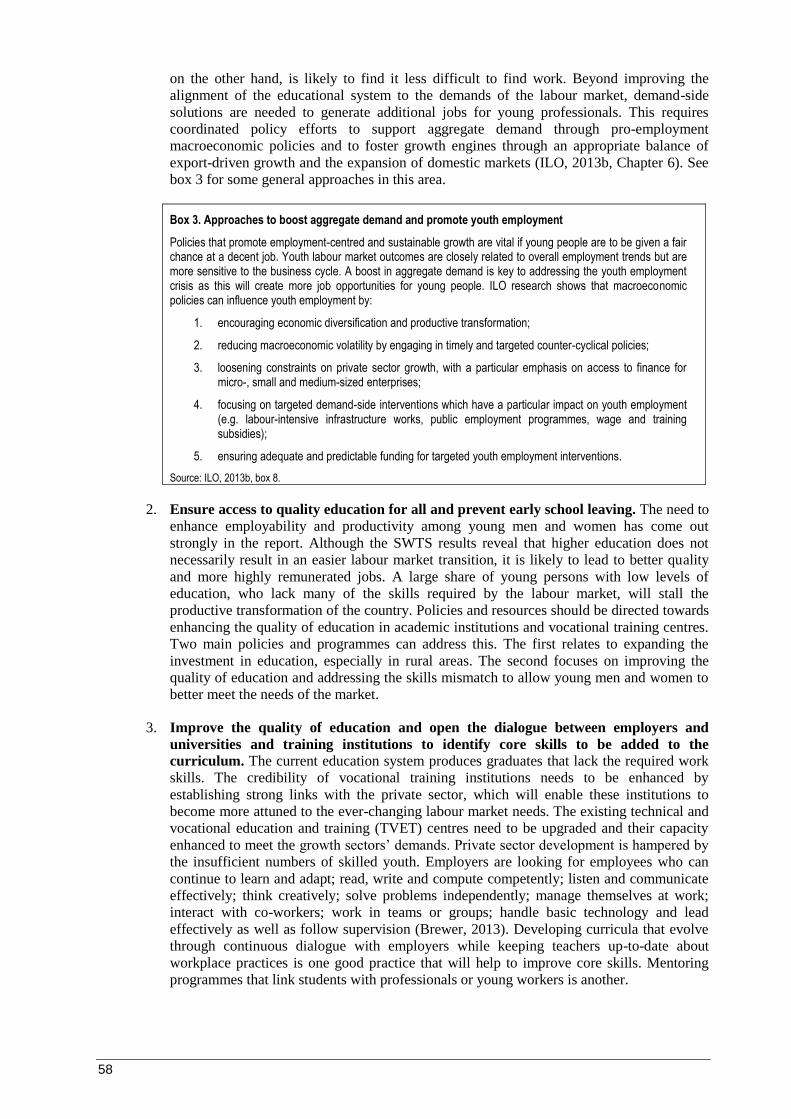
58
on the other hand, is likely to find it less difficult to find work. Beyond improving the
alignment of the educational system to the demands of the labour market, demand-side
solutions are needed to generate additional jobs for young professionals. This requires
coordinated policy efforts to support aggregate demand through pro-employment
macroeconomic policies and to foster growth engines through an appropriate balance of
export-driven growth and the expansion of domestic markets (ILO, 2013b, Chapter 6). See
box 3 for some general approaches in this area.
Box 3. Approaches to boost aggregate demand and promote youth employment
Policies that promote employment-centred and sustainable growth are vital if young people are to be given a fair chance at a decent job. Youth labour market outcomes are closely related to overall employment trends but are more sensitive to the business cycle. A boost in aggregate demand is key to addressing the youth employment crisis as this will create more job opportunities for young people. ILO research shows that macroeconomic policies can influence youth employment by:
1. encouraging economic diversification and productive transformation;
2. reducing macroeconomic volatility by engaging in timely and targeted counter-cyclical policies;
3. loosening constraints on private sector growth, with a particular emphasis on access to finance for micro-, small and medium-sized enterprises;
4. focusing on targeted demand-side interventions which have a particular impact on youth employment (e.g. labour-intensive infrastructure works, public employment programmes, wage and training subsidies);
5. ensuring adequate and predictable funding for targeted youth employment interventions.
Source: ILO, 2013b, box 8.
2. Ensure access to quality education for all and prevent early school leaving. The need to
enhance employability and productivity among young men and women has come out
strongly in the report. Although the SWTS results reveal that higher education does not
necessarily result in an easier labour market transition, it is likely to lead to better quality
and more highly remunerated jobs. A large share of young persons with low levels of
education, who lack many of the skills required by the labour market, will stall the
productive transformation of the country. Policies and resources should be directed towards
enhancing the quality of education in academic institutions and vocational training centres.
Two main policies and programmes can address this. The first relates to expanding the
investment in education, especially in rural areas. The second focuses on improving the
quality of education and addressing the skills mismatch to allow young men and women to
better meet the needs of the market.
3. Improve the quality of education and open the dialogue between employers and
universities and training institutions to identify core skills to be added to the
curriculum. The current education system produces graduates that lack the required work
skills. The credibility of vocational training institutions needs to be enhanced by
establishing strong links with the private sector, which will enable these institutions to
become more attuned to the ever-changing labour market needs. The existing technical and
vocational education and training (TVET) centres need to be upgraded and their capacity
enhanced to meet the growth sectors’ demands. Private sector development is hampered by
the insufficient numbers of skilled youth. Employers are looking for employees who can
continue to learn and adapt; read, write and compute competently; listen and communicate
effectively; think creatively; solve problems independently; manage themselves at work;
interact with co-workers; work in teams or groups; handle basic technology and lead
effectively as well as follow supervision (Brewer, 2013). Developing curricula that evolve
through continuous dialogue with employers while keeping teachers up-to-date about
workplace practices is one good practice that will help to improve core skills. Mentoring
programmes that link students with professionals or young workers is another.
59
4. Improve conditions of work by ensuring equal treatment for and rights of young
workers. The survey results show that young people continue to suffer from decent work
deficits and low-quality jobs. Most working youth are in irregular employment in the
informal economy with the informal employment rate as high as 78.2 per cent. Labour laws
and collective agreements, including the implementation of sanctioning mechanisms, can
protect youth workers and facilitate their transitions into stable and decent employment. In
parallel, a system of incentives to encourage the registration of enterprises is to be initiated,
which would simultaneously provide incentives for employers to invest in the improvement
of young people’s working conditions. Given the large share of youth in elementary
occupations, including in domestic work, it will also be important to strengthen the
capacities and institutions in Tanzania that facilitate policy and legislative reforms and to
promote the eventual ratification and implementation of the Domestic Workers Convention,
2011 (No. 189) and Recommendation (No. 201).
5. Support employers in taking an active part in the creation of decent jobs for young
people. Employers may take on young people when subsidies are offered in the way of tax
breaks or other financial incentives, although the very high levels of informality among
enterprises in the country could hamper the effectiveness of such a strategy. Perhaps more
can be done to make the business case for employing young people by highlighting how
this impacts on organizations’ competitiveness. Helping employers to link investment in
young people and training of their young staff to their business strategy is an area that
should be explored.
6. As very few young people use formal means of finding work, enhancing the role of
institutions that deal with employment/unemployment issues and improving the
collection and dissemination of labour market information may result in better matched
and more efficient recruitment. Young people mainly use informal methods to search for
jobs. Given the situation, increasing labour demand without improving information and
access to the labour market will do little to help integrate disadvantaged youth who lack
personal connections into the labour market.
7. Labour market information, job search assistance, vocational counselling and career
guidance should be promoted in Tanzania to assist and orient young people. Greater
investment in employment offices and agencies can help to improve the connection
between young people and enterprises. Specific recommendations for policy-makers and
programme formulation are: (i) build a knowledge base about youth employment in
Tanzania; (ii) continue to conduct school-to-work transition surveys; (iii) prepare a “pocket
guide” to youth employment with information about job search, résumé writing, interview
techniques, training institutions, required licences, workers’ rights, useful websites and
other information; and (iv) introduce job fairs for young people.
8. Facilitate the financial inclusion of youth and access to credit and business support
services to young entrepreneurs. Access to finance is consistently listed as a major
constraint for enterprises wishing to expand their capacity via investments that lead to the
creation of new jobs (Matsumoto et al., 2012). This is particularly important in countries
where a majority of establishments are micro- and small enterprises. Financial education of
entrepreneurial youth and their access to capital needs to be improved. Measures aiming to
improve financial inclusion are likely to stimulate labour demand and thereby generate new
employment opportunities for young people. At the same time, young entrepreneurs will
need more than financial support to stay in business. Policies and programmes to strengthen
business development services for young people and provide mentoring programmes in
which an established company provides support to a youth business are also necessary.
9. Promote bipartite and tripartite cooperation on youth employment to yield better
employment outcomes. Establishing an enabling environment for the successful
implementation of employment and labour market interventions for young people requires

60
bipartite and tripartite cooperation. This is confirmed by the results of evaluations of youth
employment programmes. The Government, employers’ organizations and trade unions of
Tanzania have a role to play by fulfilling their own specific mandates and through
concerted and joint efforts for the promotion of decent work for youth in the country.
61
References
Agwanda, A.; Amani, H. 2014. Population growth, structure and momentum in Tanzania,
THDR 2014: Background Paper No. 7, ESRF Discussion Paper 61 (Dar es Salaam, The
Economic and Social Research Foundation).
Ame, A.; Chaya, P.; Mashindano, O. 2013. “Covariance and correlation between education
mismatch and skills mismatch in Tanzanian formal sector”, in Global Journal of Human
Social Science Economics, Vol. 13, Issue 2, Version 1.0.
Brewer, L. 2013. Enhancing youth employability: What? Why? and How? Guide to core
work skills, Skills and Employability Department (Geneva, ILO).
Elder, S.; Koné, K.S. 2014. Labour market transitions of young women and men in sub-
Saharan Africa, Work4Youth Publication series No. 9 (Geneva, ILO).
International Labour Organization (ILO). 2010a. Decent Work Country Profile: Tanzania
(mainland) (Dar es Salaam and Geneva).
—. 2010b. Global Employment Trends for Youth 2010: Special issue on the impact of the
global economic crisis on youth (Geneva).
—. 2012. Key Indicators of the Labour Market (KILM), seventh edition (Geneva).
—. 2013a. Tanzania Decent Work Country Programme 2013–2016 (Dar es Salaam and
Geneva).
—. 2013b. Global Employment Trends for Youth 2013: A generation at risk (Geneva).
Matsumoto, M.; Hengge, M.; Islam, I. 2012. Tackling the youth employment crisis: A
macroeconomic perspective, Employment Working Paper No. 124 (Geneva, ILO).
Mpangile, H.M. 2008. “Tanzania”, in International comparisons of taxation in developing
countries 2008 (Tokyo, Keio University), Chapter 4.
National Bureau of Statistics of Tanzania (NBS). 2014. Mainland Tanzania: Formal
Sector Employment and Earnings Survey – Analytical Report 2013 (Dar es Salaam,
Ministry of Finance).
Shehu, E.; Nilsson, B. 2014. Informal employment among youth: Evidence from 20 school-
to-work transition surveys, Work4Youth Publication Series No. 8 (Geneva, ILO).
Sparreboom, T.; Staneva, A. 2014. Is education the solution to decent work for youth in
developing economies? Identifying qualification mismatch from 28 school-to-work
transition surveys, Work4Youth Publication Series No. 23 (Geneva, ILO).

63
Annex I. Definitions of labour market statistics
1. The following units are defined according to the standards of the International Conference
of Labour Statisticians:
a. The employed include all persons of 15 years of age or more who, during a week of
reference:
- worked for wage or profit (in cash or in kind) for at least one hour;
- were temporarily absent from work (because of illness, leave, studies, a break
in the activity of the firm, for example), but had a formal attachment to their
job;
- performed some work without pay for family gain.
b. The unemployed (strictly defined) include all persons of 15 years of age or more who
met the following three conditions during the week of reference:
- they did not work (according to the abovementioned definition);
- they were actively searching for a job or took concrete action to start their own
business;
- they were available to start work within the two weeks following the reference
week.
c. Persons neither included in the employed nor in the unemployed category are
classified as not in the labour force (also known as inactive).
2. The International Classification of Status in Employment (ICSE) categorizes the employed
population on the basis of their explicit or implicit contract of employment, as follows:
a. Employees (also wage and salaried workers) are all those workers who hold the type
of jobs defined as “paid employment jobs”, where the incumbents hold explicit
(written or oral) or implicit employment contracts that give them a basic remuneration
which is not directly dependent upon the revenue of the unit for which they work.
b. Employers are those workers who, working on their own account or with one or a few
partners, hold the type of jobs defined as “self-employment jobs” (i.e. jobs where the
remuneration is directly dependent upon the profits derived from the goods and
services produced) and, in this capacity, have engaged, on a continuous basis, one or
more persons to work for them as employee(s).
c. Own-account workers are those who, working on their own account or with one or
more partners, hold the type of jobs defined as “self-employment jobs” and have not
engaged, on a continuous basis, any employees to work for them.
d. Contributing (unpaid) family workers are those workers who hold “self-
employment jobs” as own-account workers in a market-oriented establishment
operated by a related person living in the same household.
e. Vulnerable employment (defined outside the scope of ICSE) is the sum of own-
account workers and contributing family workers.
3. A household is a family or other community of persons living together and jointly
spending their income to satisfy the basic necessities of life. The concept of household
includes members present in the place where the household resides, as well as individuals
who are temporarily absent and living elsewhere, including abroad, for business, education
64
or other purposes, as long as their residence in the foreign country does not exceed one
year. A person living alone can also qualify as a household (“single household”) if she or
he does not already belong to another unit. The single household can reside in a separate or
shared dwelling, and will be considered as an independent unit as long as the household’s
income is not shared with other residents. Collective households, such as prisons and
institutions, and their members are not observed in the Labour Force Survey.
4. The reporting period, to which the questions for the economic activity are related, is the
week before the week of interview (52 reporting weeks throughout the year).
5. The following units are also defined within the SWTS analysis but are outside the scope of
those defined within the international framework of labour market statistics mentioned in
item 1 above:
a. Relaxed unemployment – a person without work and available to work (relaxing the
jobseeking criterion of item 1b above).
b. Labour underutilization rate – the sum of shares of youth in irregular employment,
unemployed (relaxed definition) and youth neither in the labour force nor in
education/training (inactive non-students) as a percentage of the youth population.
c. Regular employment – the sum of employees with a contract (oral or written) of 12
months or more in duration and employers; the indicators are therefore a mix of
information on status in employment and contract situations.
d. Satisfactory employment – based on self-assessment of the jobholder; implies a job
that respondents consider to “fit” their desired employment path at that moment in
time.
e. Stable employment – employees with a contract (oral or written) of 12 months or
more in duration.
f. Temporary employment – employees with a contract (oral or written) of less than 12
months in duration.
6. The National Bureau of Statistics of Tanzania has developed national definitions of
unemployment and employment. Unemployment is defined as encompassing persons
without work and available to work (see “relaxed unemployment” above) plus those who
state that their work, during the reference period, was not reliable and adequate in terms of
availability and hours of work. In addition, it refers to persons who, during the reference
period, were absent from their work for the reason of their job or due to land for cultivation
being unsuitable or because the reference period is part of the off-season or because of lack
of raw materials, equipment and finance. The national definition of employment includes
persons with work where the work is adequate in terms of availability and number of hours
worked.

65
Annex II. SWTS-Tanzania, 2013 sampling design
The sampling plan used was multistage stratified sampling. The stratification was by
zone and urban/rural areas; this implies that the required sampling weights are for each
zone by location (rural/urban). In rural areas, villages were selected, while in urban areas
enumeration areas were selected. The list of zones with their regions is shown in table A.1.
Table A.1 List of zones and their regions
No. Zones Regions
1 Dar es Salaam Kinondoni, Ilala, Temeke
2 Zanzibar Unguja, Pemba
3 East Pwani, Tanga, Lindi, Mtwara
4 Central Singida, Dodoma, Morogoro
5 Lake Mwanza, Kagera, Mara
6 Western Tabora, Kigoma, Shinyanga
7 Southern Highland Iringa, Mbeya, Rukwa, Ruvuma
8 North Arusha, Kilimanjaro, Manyara
Selection of regions and districts per zone
In each zone, two regions were randomly selected, except in Dar es Salaam, where all
the regions were covered. Again, in each selected region one district was randomly
selected. The selected regions and districts are shown in table A.2.
Table A.2 List of selected regions and districts per zone
Zone Region District
Dar es Salaam Dar es Salaam
Kinondoni
Ilala
Temeke
Zanzibar Unguja – Mjini Magharibi Magharibi
Pemba – Kusini Chake
East Tanga Tanga
Mtwara Mtwara Urban
Central Singida Singida Urban
Morogoro Morogoro Urban
Lake Kagera Bukoba Urban
Mara Musoma Urban
Western Kigoma Kigoma Urban
Shinyanga Shinyanga Urban
Southern Highlands Iringa Iringa Urban
Mbeya Mbeya Urban
North Kilimanjaro Moshi Urban
Moshi Rural
Arusha Arusha
Selection of villages and enumeration areas
The villages and enumeration areas (EA) were selected randomly using probability
proportional to the number of households per village/enumeration area. The list of all
villages/enumeration areas in the selected region/district was used for the selection of the
villages/enumeration areas. For each village/enumeration area, the number of private
households was obtained. These numbers of households were used as the size measure of
the village/enumeration area. A total of four villages and four enumeration areas were
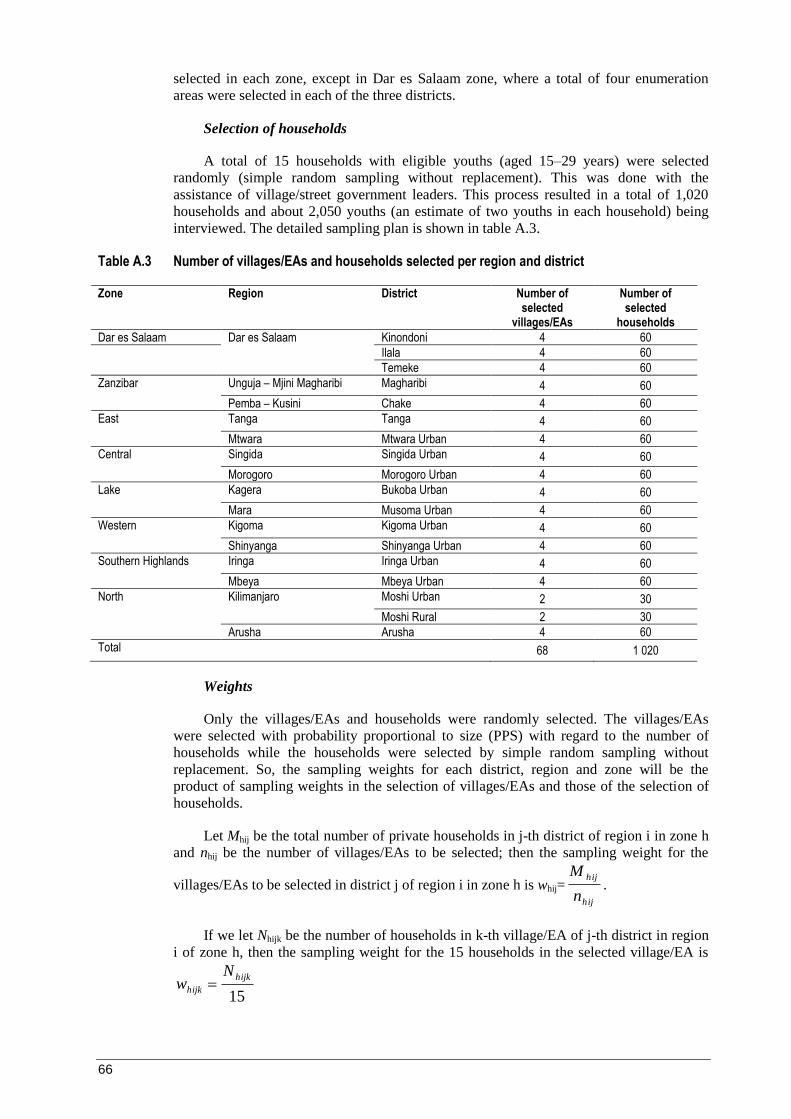
66
selected in each zone, except in Dar es Salaam zone, where a total of four enumeration
areas were selected in each of the three districts.
Selection of households
A total of 15 households with eligible youths (aged 15–29 years) were selected
randomly (simple random sampling without replacement). This was done with the
assistance of village/street government leaders. This process resulted in a total of 1,020
households and about 2,050 youths (an estimate of two youths in each household) being
interviewed. The detailed sampling plan is shown in table A.3.
Table A.3 Number of villages/EAs and households selected per region and district
Zone Region District Number of selected
villages/EAs
Number of selected
households
Dar es Salaam Dar es Salaam
Kinondoni 4 60
Ilala 4 60
Temeke 4 60
Zanzibar Unguja – Mjini Magharibi Magharibi 4 60
Pemba – Kusini Chake 4 60
East Tanga Tanga 4 60
Mtwara Mtwara Urban 4 60
Central Singida Singida Urban 4 60
Morogoro Morogoro Urban 4 60
Lake Kagera Bukoba Urban 4 60
Mara Musoma Urban 4 60
Western Kigoma Kigoma Urban 4 60
Shinyanga Shinyanga Urban 4 60
Southern Highlands Iringa Iringa Urban 4 60
Mbeya Mbeya Urban 4 60
North Kilimanjaro Moshi Urban 2 30
Moshi Rural 2 30
Arusha Arusha 4 60
Total 68 1 020
Weights
Only the villages/EAs and households were randomly selected. The villages/EAs
were selected with probability proportional to size (PPS) with regard to the number of
households while the households were selected by simple random sampling without
replacement. So, the sampling weights for each district, region and zone will be the
product of sampling weights in the selection of villages/EAs and those of the selection of
households.
Let Mhij be the total number of private households in j-th district of region i in zone h
and nhij be the number of villages/EAs to be selected; then the sampling weight for the
villages/EAs to be selected in district j of region i in zone h is whij= .
If we let Nhijk be the number of households in k-th village/EA of j-th district in region
i of zone h, then the sampling weight for the 15 households in the selected village/EA is
hij
hij
n
M
15
hijk
hijk
Nw

67
The overall sampling weight for district j in region i of zone h will be
In order to obtain values for these weights we need to have the total number of private
households in each of the selected districts per village/EA.
hijkhijhi xwwW

This report presents the highlights of the 2013 School-to-work Transition Survey (SWTS) and the Labour Demand Enterprise Survey (LDES) run together with the Department of Statistics, University of Dar es Salaam within the framework of the ILO Work4Youth Project. This Project is a five-year partnership between the ILO and The MasterCard Foundation that aims to promote decent work opportunities for young men and women through knowledge and action. The W4Y Publication Series is designed to disseminate data and analyses from the SWTS administered by the ILO in 28 countries covering five regions of the world. The SWTS is a unique survey instrument that generates relevant labour market information on young people aged 15 to 29 years. The survey captures longitudinal information on transitions within the labour market, thus providing evidence of the increasingly tentative and indirect paths to decent and productive employment that today’s young men and women face.
The W4Y Publications Series covers national reports, with main survey findings and details on current national policy interventions in the area of youth employment, and regional synthesis reports that highlight regional patterns in youth labour market transitions and distinctions in national policy frameworks.
For more information, visit our website: www.ilo.org/w4yYouth Employment Programme4 route des MorillonsCH-1211 Genève 22Switzerland [email protected] ISSN 2309-6780
Lab
ou
r ma
rket tra
nsitio
ns o
f you
ng w
om
en a
nd m
en in
the u
nited repu
bLic o
f tan
zan
iaiLo