
Labour Market Effects of Immigration: an Empirical Analysis Based on Italian Data
35
Working Papers Labour Market Effects of Immigration: an Empirical Analysis Based on Italian Data A. Venturini and C. Villosio ChilD n. 17/2004 e-mail: [email protected] Web site: http://www.child-centre.it
-
Upload
laboratoriorevelli -
Category
Documents
-
view
0 -
download
0
Transcript of Labour Market Effects of Immigration: an Empirical Analysis Based on Italian Data

Working Papers
Labour Market Effects of Immigration:
an Empirical Analysis Based on Italian Data
A. Venturini and C. Villosio
ChilD n. 17/2004
e-mail: [email protected] Web site: http://www.child-centre.it

1
Labour Market Effects of Immigration: an Empirical Analysis Based on Italian Data
Alessandra Venturini *, University of Turin, CHILD, IZA, Bonn.
Claudia Villosio °, R&P Ricerche e Progetti, Torino
Preliminary version, not to be quoted July 2004 ABSTRACT Gavosto, Venturini, Villosio (1999) found that the impact of immigrants on the wage rates of natives was positive. This result has led to the present paper which analyses the effect of immigrants on native employment. Two aspects of being unemployed are considered: i) displacement risk, the probability of moving from employment into unemployment; and ii) job-search effectiveness, the probability of moving from unemployment into employment within one year. The quarterly Labour Force Survey data (ISTAT) from 1993 to 1997 are used. The transition probabilities depend on two sets of independent variables at time t: the individual’s characteristics and the external conditions of the market. A probit model is applied for repeated-cross-sections on “specific” local areas in order to check for possible autocorrelation and endogeneity. The results show that in the North of Italy, where most immigrants are located, the share of immigrants has either no effect or has a complementary effect on the probability of finding a job in the case of workers looking for a new job; while in the case of people looking for a first job (young people) the effect was negative in 1993; while it was positive in the last years. A complementary effect prevails in the case of native transition from employment to unemployment. There is a negative effect only in the manufacturing sector in Northern Italy for 1996, and this is probably due to other factors, such as the increased use of temporary contracts in that area during that year. Theme: Migration Keywords: Migration, Competition, Employment, Unemployment JEL-Code:J61, F22.
* Correspondence: Università di Torino, Dipartimento di Economia, Via Po 53, 10124 Torino, Italy e-mail: [email protected] , tel.+39 011-6702742
This research has received financial support from the "Commissione per le Politiche di Integrazione degli Immigrati - Presidenza del Consiglio dei Ministri" and from the University of Padua. We would like to thank Vittorio Valli for his suggestion to combine ISTAT and INPS data, Chiara Monfardini for her valuable discussion, Giorgio Brunello, Stefano Fachin, Enrico Rettore, Ugo Colombino, Rolf Aaberge, Steiner Strom, Paul O’Brian, the participants at the XV AIEL Conference, at the CIDE seminars and at the ESPE annual conference for their useful comments on a previous version of this paper. The usual disclaimers apply.

2
The aim of the paper is to investigate whether natives and immigrants compete for jobs. The paper is organised as follows: in section 1 there is an overview of the phenomenon of immigration in Italy, and of the main empirical findings; section 2 presents some special aspects of Italian domestic labour mobility and how it affects foreign immigration together with the dataset used in the analysis; section 3 describes the approach adopted in this research. Section 4 reports the results and section 5 offers some conclusions.
1 Immigration in Italy: what we know During the 80s, the South European countries, including Italy, stopped being exporters of labour and became importers. Since then, the stock of foreign residents in Italy has increased from 300,000 in 1980 to one million and a half in 2000, when it reached 2.5% of the total population, (see Figure 1). Still a small number when compared to the North European countries, but the change was very rapid and it was made up, almost exclusively of, immigrants from non-European Union countries. In 2000 85% of the foreign residents in Italy came from non-European Union countries. In the ‘80s the most important flows were from Africa and Asia, mainly Morocco, Tunisia, and the Philippines, while in the 90’s, the initial waves of immigrants were joined by large flows from the East European countries, specifically, from the former Yugoslavia, Romania and Albania. The early inflows of foreigners into Italy were unexpected and spontaneous, and the pressure of the immigration phenomenon forced the Government to pass the first amnesty law in 1987. It was designed to legalise the presence of a large number of unexpected immigrants. The law was followed by a number of amendments and so far, 5 additional laws have been passed1. These legal measures help to explain the heapings in figure 1 which occur when the legalisations have been worked through 2. And this also implies that about 75% of today’s legal immigrants were for some time illegal immigrants and their transition into legality took place through one of the legalization measures, which required “in general” an explicit job offer3. Thus 65% of the total residency permits were granted for work.
1 For more detail regarding the institutional aspects, see for instance the Caritas reports for the various years, Zincone 2001, Strozza 2002, Strozza Venturini 2002. 2 The expiry date of the amnesties had to be extended many times and in general the final effect expired 2 years later. 3 The first law in 1987-88 was limited to non-Europeans in employment and foreigners looking for a job, while the second one in 1990 covered all categories of foreigners. The third one was again limited to foreigners in employment (83% of the total) and their family

3
Information regarding legal immigrants is available, even though it is limited, while information on illegal immigrants has been derived from surveys. Given the rapid changes of the phenomenon it rapidly becomes out-of-date. Even estimates regarding the number of illegal immigrants present in the country at any one time vary widely4, they range from 200.000 to 500.000 with the figure changing in relation to the new amnesties being granted. This analysis, therefore, is limited to the legal foreign immigrants (foreigners who hold a residence permit). Figure 1 Residence permits (thousands)
0
200000
400000
600000
800000
1000000
1200000
1400000
1600000
1978 1979 1980 1981 1982 1983 1984 1985 1986 1987 1988 1989 1990 1991 1992 1993 1994 1995 1996 1997 1998 1999 2000
years
Abs
olut
e va
lue
Res
iden
ce p
erm
its
Residence permitsRevised Residence Permits
Source: Residence Permits issued by the Ministry of the Interior, revised by ISTAT after the 1990 Census by eliminating the number of expired permits. Table 1 summarises the foreigners’ characteristics and they can be classified as mainly young, mainly unskilled or better they are hired to do unskilled jobs and they are employed mainly in the North. Foreigners are mainly employed either in the industrial sector or in the services. A small number of foreigners
members, as were the subsequent amnesties in 1998-99 (77.8% of the total), and in 2002. The last revision of the Law(2003) was even more restrictive limiting the granting of a residency permit to a job offer. 4 For a survey of the different estimates of the illegal population see Strozza 2000.

4
also work in the agricultural sector and another small but larger group are employed as domestic workers. The debate about what effect immigrants have on the labour market has been very heated. On the one hand, natives fear the competition of immigrants in the labour markets, while, on the other hand, there is a strong demand for labour, which is not matched by a supply of native workers. The issue regarding competition, however, has been raised only recently, not only because the dynamics of the phenomenon has centred attention on access into the country, and on the presence of illegal immigrants, but also because no dataset is available to study this issue. Only recently have Venturini, Villosio (1999) extrapolated an individual dataset on foreign employment from the social security archive and so made it possible to analyse the effect of immigration on the Italian labour market. Gavosto, Venturini, Villosio (1999) tested how the share of foreign workers affects native wages. Their results show that the inflow of immigrants raises the wages of native manual workers (i.e. it has a complementary effect), and this effect is larger in small firms and in the North of the country. Such a result was to be expected for two main reasons: first, immigrants are employed in booming areas, where there is an excess demand for labour5 and competition is unlikely and second, Italy has strong trade unions and centralised bargaining, subsequently wages are not very sensitive to supply or demand changes with adjustments probably taking place on the quantity side. These results are supported by evidence from the USA, Canada and Europe (for a survey see for instance Bauer, Zimmermann (1999) and Venturini (2001)). A similar complementary effect has been revealed using a similar approach by Haisken-De New and Zimmermann (1999) in Germany, by Dolado, Jimeno and Duce (1996) in Spain, by Winter-Ebner and Zweimuller (1996) in Austria, and by Carrigton and De Lima (1996) in Portugal6. However, immigration seems to affect native employment or unemployment in a less homogeneous way, for instance Pischke and Velling (1997) found no evidence of the displacement effect on unemployed natives in Germany, Winter-Ebner and Zimmermann (1999) showed that immigration in Austria reduced the employment of natives in high immigration industries. In Germany, immigrants seem to have a complementary effect, and in Spain, Dolado, Jimeno and Duce (1996) obtained a negative but not significant coefficient for the foreign share variable in the native employment growth equation.
5 Immigrants find jobs in areas with excess demand for labour, namely firms would like to expand production but they lack manual workers, thus immigrants allow both an increase in native employment and an increase in natives’ wages, as they can now shift to better paid and more skilled tasks. 6 This analysis is methodologically different because the authors do not have individual data. Jennifer Hunt (1992) analysed the repatriation of immigrants from Algeria to France, but given the very different characteristics of the flow it has to be considered as a special case.

5
The effect of immigration on Italian unemployment has not yet been analysed and the aim of this paper is to investigate whether there is competition between natives and immigrants at an occupational level. Table 1 Foreigner’s Characteristics Residence permits by country of origin (a) Main areas thousands % First nationalities thousands %
Total 1.392 100 Total 1.392 100
MDCs(b) 231 16,6 1.Morocco 162 11,7 LDCs (c) 1.161 83,4 2.Albania 147 10,6 European Union 149 10,7 3. Romania 70 5 Eastern Europe 397 28,5 4. Philippines 65 4,7 Other European countries 20 1,5 5. China 60 4,3 Northern Africa 255 18,3 6. Tunisia 46 3,3 Rest of Africa 134 9,6 7.Former Jugoslavia 40 2,9 Asia 268 19,2 8. Senegal 39 2,8 North America 49 3,5 9. Sri Lanka 34 2,4 Latin America 116 8,3 10. Egypt 32 2,3 Oceania 2 0,2 11. Polond 31 2,2 Residency permits by 12. Perù 30 2,2 Age(a) % Residency permits by 0-17 4,6 Territorial location(a) % 18-25 12,3 Noth-West 32,5 26-34 42,3 North-East 23,9 35-44 27,6 Center 29 45-59 10,6 South and Islands 14 60- 2,8
Employees by sector and skill Sector (d) % Skill (e) % Agriculture 15 Blue collar 83,9 Building 6,6 White collar 13,0 Industry 27,6 Apprehenders 1,3 Service 19,7 Managers 0,8 House keeping 30 Note: (a) year of reference 2000 our elaboration of Interior Ministry data revised by the National Institute of Statistics [Istat, 2001] (b) MDC more development countries (c) LDC Less developed countries include countries in Africa, Asia (excluding Japan), Latin America and Central and Eastern Europe (including Albania and former Yugoslavia), (d) year of references 1998 derived from INPS data, Caritas 2000, (e) year of references 1998, INPS data from Villosio, Venturini ,1999.

6
2 Theory, regional fixed effects and the data available There is a standard method to analyse the role of immigrants in the destination country’s labour market. The effect of immigrants is measured by comparing wage changes in different labour markets by area, by sector or by area and sector in which there have been different supply shocks (new immigrants) while at the same time controlling for different demand shocks and fixed effects. Such a cross-sectional approach has been vigorously criticised, even by one of the first researchers to use it, Borjas (1999). It is questioned whether the limited effect of immigration on natives’ wage found by all the econometric research in the USA is due to the large internal mobility in the USA which spreads the effect of an increase of foreign immigrants in one area to other areas; an example being internal flows of natives from California to New England. This is not the case in Italy because internal mobility both for work and for other reasons is unexpectedly low. Research carried out by Fazio (1999) using ISTAT Census data from 1986 to 1991 revealed that only 6,7% of the population changed urban district areas (comuni), 5,9% went to another urban district in Italy while 0,8% went abroad. These figures are very small and raises many questions, given the high unemployment differential between Northern (5%) and Southern regions (19%) and an income per capita differential between the richest and the poorest regions of 2.24 times (EUROSTAT). Many different explanations have been put forward, two of them being the difference in house prices and widespread extended-family support in the South. Both factors increase the cost of migration. What is more puzzling is that the high income per capita differential is matched by a low consumption per capita differential which can explain the low migration propensity and the strong attachment to the area of origin7. Whichever explanation is preferred the result is a strong fixed territorial effect that produces the low internal mobility decisions of natives. The data presented however also include people who are not of working age and people who move for reasons other than work and the urban districts (comuni) are very small areas with the result that overall internal mobility is, if anything, being overstated. If the analysis is limited to the people who left the South for other areas, a special ISTAT survey analysed by Fazio (1999) reveals that of those who moved only 5.9% were unemployed people looking for a new job and 6,7% were looking for their first job. Another dataset (INPS) which monitored employees in private firms from 1985 to 1996 reveals that only 1% of the workers left their area of
7 For a more detailed discussion of this issue see for instance Faini, Galli, Rossi 1997.

7
employment for another region of employment8. During the same period (11 years) only 6% of the male and 3% of the female workers who changed job also moved to another region with a surprisingly uniform distribution among regions (Leombruni R., Quaranta R., 2002)9. As already stated, this low or nil internal mobility is surprising considering the high unemployment rate differential between the South and the North of Italy. Immigrants do not have this territorial attachment so they are mainly located where the demand for labour is high and the unemployment rate is low. A simple correlation between unemployment rates and foreign workers in jobs in each region gives -0.7. Moreover over time, this polarisation becomes even stronger. There are two different reasons for this result: one is that the unemployment rate which remained unchanged in the northern and central region increased in the south; the other is that the increase in foreign employment has been particularly strong in the northern regions. These findings suggest that immigrants do not displace native workers, in fact they are concentrated in areas where there is excess demand for labour and where the unemployment rate is low. Fig.2 , which, up to now, was the only evidence available on the subject indicates these two different phenomena clearly. This evidence, however, is based on aggregates which can hide differences of gender, age and education; factors which are highly relevant when the implications for the immigration policy are being analysed. Separate data on how many natives are unemployed and how long they have been unemployed are necessary if this question is to be studied in detail. Unfortunately such data are not available. Another aspect of the same issue, namely, what effect immigrants have on the native workers probability of transition from employment to unemployment or from unemployment to employment was therefore considered. In fact, the only available data which can be used to analyse the effect of immigration on native employment, are the micro data of the Italian Labour Force Survey. This survey however is of limited value because it collects, quarterly, information regarding the main characteristics of the labour supply from a sample of about 76.000 households, and only a small section of the sample has the characteristics of a panel. Further, it is difficult to extrapolate
8 We thank Roberta Quaranta for providing us with this information. 9 If we consider the workers who changed job during the 1985-1996 period, the share was 6.5% in the Northwest and Northeast, 9% in the Centre and 8.5% in the South with very limited territorial variation.

8
details about the length of unemployment because there are so few observations10.
Fig. 2. Unemployment rates and share of foreign workers by region - 1996
Thus, it is necessary to use a cross-section version of this survey which contains, in the second quarter, a retrospective question on the individuals’ professional status in the previous year. The answers to this question are used to determine whether a native has moved from unemployment into employment and vice versa in a year. It is impossible to study what effect immigrants have on long term unemployment11. However it is possible to get an idea of what effect immigrants have on short and medium term unemployment. Two aspects of unemployment are examined: displacement risk and job-search effectiveness. Both are aspects which can be affected by the presence of immigrants in the labour market.
10 A panel is necessary in order to have information on the completed spells of unemployment because a cross-section has only information on the current spell. However, due to the way the survey is conducted there are problems regarding length bias and heaping which cannot be solved with the panel section of the survey. These two problems may introduce bias in the estimation of the length of unemployment (see Trivellato U., Torelli N. 1989). 11 There are, however, structural causes for long term unemployment in Italy.
SardegnaSiciliaCalabria
BasilicataPuglia Campania
Molise
Abruzzo
LazioMarche
Umbria
Toscana
Emilia-Romagna
Liguria
Friuli VG
Veneto
Trentino-A.A
Lombardia
Piemonte
0.0
1.0
2.0
3.0
4.0
5.0
6.0
7.0
0.0 5.0 10.0 15.0 20.0 25.0 30.0
Unemployment rate
Sha
re o
f for
eign
wor
kers

9
Displacement risk occurs to employed workers who can be displaced by foreign workers. Neo-classical theory assumes that competition can be stronger for specific categories of workers either because they do work which is similar to immigrants or because they are weak categories i.e. young people and workers with a low level of education. Job search can also be affected by the presence of immigrants because they may reduce the probability of natives finding a job. The effect of immigrants on job search for natives can be different for first job seekers who are young or for workers looking for a new job, namely older workers with job experience. Even if another aspect of the native unemployment issue is considered and it is possible to catch only the short and medium unemployment search, the transitions strictly follow the regional distribution of the unemployment rate shown above. The share of foreign workers is higher in the regions where the probability of becoming unemployed is low, (Fig.3.1) and where the probability of moving from unemployment to a first or new job is high (Fig.3.2-3.3). At first glance the Figures below suggest territorial polarization, namely that Italy can be divided into two areas with different economic trends which determine different transition probabilities and different immigrant employment share. Fig.3.1 Transition rates from employment into unemployment and share of foreign workers by region,1996
SardegnaSiciliaCalabria
BasilicataPuglia Campania
Molise
Abruzzo
LazioMarche
Umbria
Toscana
Emilia-Romagna
Liguria
Friuli VG
Veneto
Trentino-A.A
Lombardia
Piemonte
0,00
1,00
2,00
3,00
4,00
5,00
6,00
7,00
0 2 4 6 8 10 12
transition rate (employm-->unemploym)
Shar
e of
fore
ign
wor
kers

10
Fig.3.2 Transition rates from unemployment to new employment and the share of foreign workers by region 1996
SardegnaSiciliaCalabria
Basilicata
Puglia Campania
Molise
Abruzzo
Lazio Marche
Umbria
Toscana
Emilia-Romagna
Liguria
Friuli VG
Veneto
Trentino-A.A
Lombardia
Piemonte
0,00
1,00
2,00
3,00
4,00
5,00
6,00
7,00
10,0 15,0 20,0 25,0 30,0 35,0 40,0 45,0 50,0 55,0 60,0
Transition rate(unemploym-->new job)
Sha
re o
f for
eign
wor
kers
The analysis has been carried out for the years 1993-199712 in order to see whether subsequent immigration flows modified the employment opportunities for natives over time. Data on individuals are merged with some aggregate data drawn from different statistical sources in order to check for the local condition of the market in which individuals make their choice. One of these variables is the foreign share derived from administrative data (as explained in Venturini, Villosio 1999, Gavosto, Venturini, Villosio 1999)13. The analysis for the E-U transition has been carried out only for those workers employed in the manufacturing, commerce, and transport sectors.
12 The analysis is made on repeated cross-sections; due to a problem of data availability, the transition of the following years has been analysed: -U-E transitions: 1992-93, 1993-94, 1994-95, 1995-96, 1996-97. - E-U transitions: 1992-93, 1993-94, 1994-95, 1995-96. 13 The information on foreign workers that is used in this paper has been extrapolated from the Social Security Archives (INPS) on private employment. This archive represents about 70% of the relevant total employment for foreigners because domestic workers and employees in the agricultural sector are registered in two other archives. For a more detailed description of how these data were constructed see Venturini, Villosio 1999, Gavosto, Venturini, Villosio 1999.
11
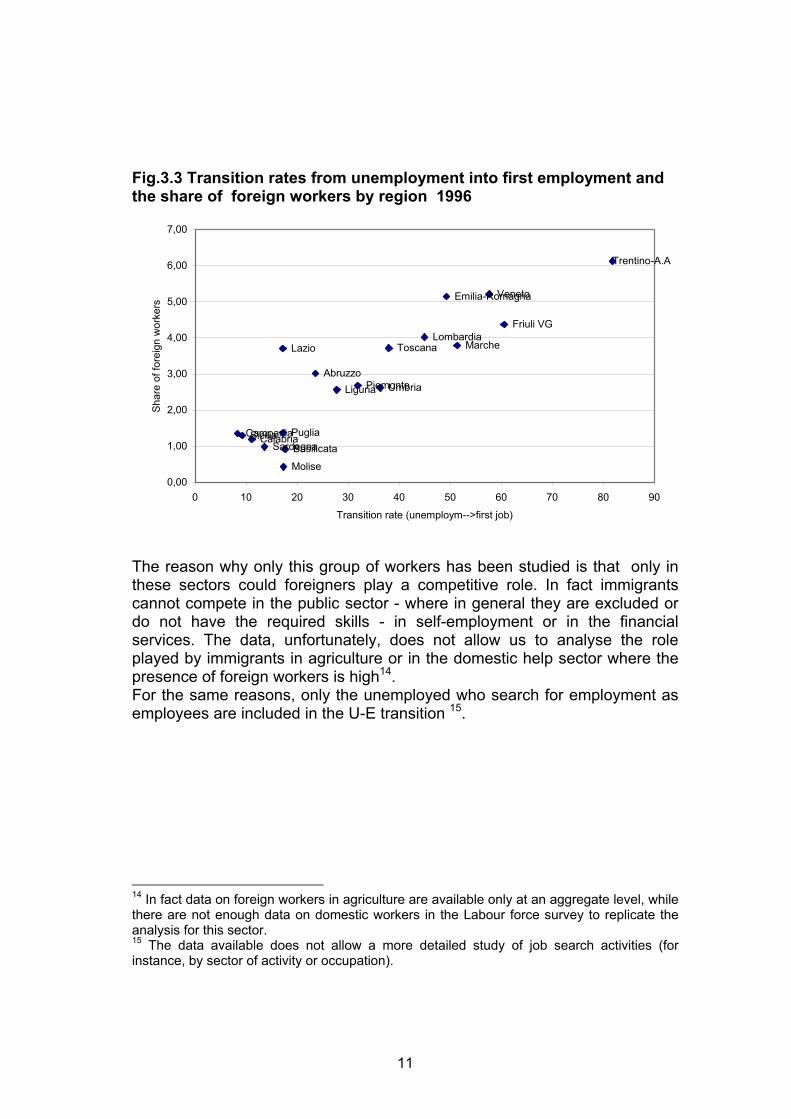
Fig.3.3 Transition rates from unemployment into first employment and the share of foreign workers by region 1996
SardegnaSiciliaCalabria
BasilicataPugliaCampania
Molise
Abruzzo
Lazio Marche
Umbria
Toscana
Emilia-Romagna
Liguria
Friuli VG
Veneto
Trentino-A.A
Lombardia
Piemonte
0,00
1,00
2,00
3,00
4,00
5,00
6,00
7,00
0 10 20 30 40 50 60 70 80 90
Transition rate (unemploym-->first job)
Sha
re o
f for
eign
wor
kers
The reason why only this group of workers has been studied is that only in these sectors could foreigners play a competitive role. In fact immigrants cannot compete in the public sector - where in general they are excluded or do not have the required skills - in self-employment or in the financial services. The data, unfortunately, does not allow us to analyse the role played by immigrants in agriculture or in the domestic help sector where the presence of foreign workers is high14. For the same reasons, only the unemployed who search for employment as employees are included in the U-E transition 15.
14 In fact data on foreign workers in agriculture are available only at an aggregate level, while there are not enough data on domestic workers in the Labour force survey to replicate the analysis for this sector. 15 The data available does not allow a more detailed study of job search activities (for instance, by sector of activity or occupation).

12
3 The model and the empirical strategy
3.1 The model In this analysis displacement risk and job search effectiveness are considered separately. Let us define a latent (unobserved) variable EU
iry as the propensity of the employed individual i in area r at time t-1 to enter unemployment status at time t (displacement risk). Analogously, let UE
iry represent the propensity of the unemployed individual i in area r at time t-1 to enter employment status at time t (job search effectiveness). Without loss of generality we can set
0 the transition from E to U take place
0 the transition from E to U do not take place
EUirEUir
yy
> ↔
≤ ↔
and analogously
0 the transition from U to E take place
0 the transition from U to E do not take place
UEirUEir
yy
> ↔
≤ ↔
What we observe however is
1 if 00 otherwise
ff ir
iry
Y >
=
for transition of type f, with f = UE or EU. We choose the following empirical specification for the latent variables:
irrrif
ir uWWXy +++= 2211 δδβ i=individuals r=areas (1) )1,0( IID ~ Nuir
where the propensity of the individual i in area16 r at time t-1 to change employment status yf depends on two sets of independent variables, Xi related to the individual’s characteristics at time t and Wr related to the external conditions of the labour market of area r at time t, which can be split into two parts W1r which represents the foreign employment share in area r, and W2r which represents other variables which affect the transition in that area. 16 Area is defined by region (20) in the U-E transition, and by region (20) and branch (5) in the E-U transition

13
Therefore the probability of transition of type f can be written as:
{ },2,1,|1Pr)0Pr( rrif
irf
ir WWXYy ==> When equation (1) is estimated, using a probit model, two problems arise. First, in this model, the individual’s characteristics and aggregate information are considered jointly. This raises the well known problem posed first by Moulton (1990) when he showed that in models where aggregate information is considered jointly with an individual’s characteristics the disturbance terms might be correlated within the aggregation groups. In such a case the estimated coefficients are consistent but not efficient, specifically the estimated standard errors are biased downwards. Unfortunately the standard procedure proposed by Moulton for a linear model to solve the correlation problem cannot be applied to a binomial case such as ours in a straightforward way. The problem is how standard errors can be estimated given that there are no proper residuals in a probit model. Now equation (1) can be rewritten taking into account the above mentioned Moulton problem, as (2)
irrrif
ir aWWXy εδδβ ++++= 2211 (2)
where irir ua =+ ε ε i~ IID N(0,1) : E(ar)=0 Var (ar)= σ2
a E(ar εi) =0 ar are other variables related to the relevant labour market that affect the transition but are not included in W2r . Thus ar are omitted variables in model (1) which implies that even if Euir=0, the errors of two different individuals i and j are correlated: E(uir ujr) = σ2
a The solution to the problem proposed here is to condition the analysis to homogeneous areas so as to be able to check for possible correlation within the aggregation groups. If the local dimension is correctly described by variables W2r, then ar is equal to zero (ar =0, σ2
a =0), with absence of correlation in the error terms (E(uir ujr) =0). The second problem lies in the possible endogenous nature of the immigrant share. It is known that the supply of foreign labour is itself driven by the labour market conditions of an area, factors such as the structure of employment or the wage paid to immigrants in that area. And the problem of

14
the endogeneity of the foreign share is usually solved by instrumental variables17. Assuming that the share of immigrants W1r is a function of a vector Sr of instruments Sr=(W2r, W3r)18
rrr vSW += γ1 vr~ IID N(0,σ2v) (3) However, if in addition to the above mentioned observable factors, there are also some unobservable local factors that attract immigrants to a specific area, then IV do not solve the problem. As we have seen above, immigrants in Italy are not spread uniformly across regions and sectors, but are concentrated in specific areas. These factors of attraction affect only immigrants because the natives show very little mobility across regions, as was stated in section 2. Thus, in this case, it is more appropriate to assume that the equation for the immigrants share is given by 4:
rrrr *aSW ηγ ++=1 where vr =a*r + ηr ηr ~ IID N(0,σ2η) (4) a*r are omitted variables related to the local labour market relevant to the migrant’s choice of location if a*r ≠ 0 then E(uir vr)) ≠ 0 ; E(W1r uir ) ≠ 0 the error terms in eq. (3) and eq (1) are correlated and so are the variables W1 and the errors ui in eq. (1) giving endogeneity. Thus, if the model is estimated at a national level, even if IV is used for the immigrant share, the endogeneity problem is not solved. As for the "Moulton problem" again the proposed solution is to estimate the model in areas where ar* is constant and the same across immigrants. The variables ar and a*r can be different local variables, the former are relevant for the native’s transition from employment to unemployment and vice versa, the latter are relevant for the migrant’s choice of location. However, when estimating conditioning on r , if the local area is correctly characterized, both ar and a*r can be eliminated from the model, so the
17 See for instance Winter-Ebmer et al. (1999) 18 The variables W3r chosen to instrument the foreign share were the lagged foreign share, the share of woman and blue collars in certain regions or industries (as measures of the structure of employment) and the average wage among immigrants as a measure of the attractiveness for a foreign worker to enter that sector of the market.

15
errors in eq. (1) are not correlated and W1r, the foreign employment share, is not endogenous. Thus, the model is applied separately to local homogeneous areas given by a regional or a region by branch dimension, and two tests were carried out in order to verify the absence of omitted variables and endogeneity in each area.
3.2 Definition of a local area As explained in the above section, the solution of the econometric problems that arise in the model lies in the estimations made within homogeneous local areas. An indication of the type of appropriate homogenious local areas can be seen in figures 3.1,3.2 and 3.3. Territorial dispersion seems to be very important and this was confirmed by previous estimates which checked only for the endogeneity of the immigration share using a probit IV. These checks showed that at a national level, there was evidence of endogeneity of the immigrants share variable (the coefficient of the immigrants share variable in the probit and in the probit IV were very different), while at the level of North and Centre sub areas, the evidence disappeared (the two coefficients were the same). Empirical analysis also shows that immigrants are in low wage sectors but they are in high wage regions, thus cross regional analyses could be biased in favour of complementarity, while cross sector analysis could be biased in favour of competition19. In order to avoid this possible bias, when possible, the branch-region dimension was chosen. A sort of compromise has to be accepted between a more specific definition of the area and the amount of data available. In the estimation of job search effectiveness only the geographical area differences were considered because the sector in which the individual is searching for a job is unknown. Given the polarisation between northern and southern regions as shown in Fig.3, the most obvious way to define a local market is to discriminate between northern and central regions, on one hand, and southern regions, on the other. In the estimation of displacement risk (transition from employment to unemployment), more observations are available and more importantly the branch in which the individual is employed is known, so it is also possible to define smaller geographical areas, as well as the sector. Thus, the local areas are defined as follows:
19 See for instance Winter-Ebner and Zweimuller (1999).

16
Job search effectiveness (U-E transition) Unemployed looking for a first job (1) North and Centre20
Unemployed looking for a new job (1) North and Centre
(2) South Displacement risk (E-U transition) (1) North manufacturing (excluding Construction) (2) North construction (3) North services (4) Centre Italy manufacturing (5) Centre Italy services (6) South
In order to check correctly for all the factors that can affect the transition within each area, special attention was paid to the choice and the definition of the variables W2r in eq. (1). Variables whose aim is to represent the external conditions of the market in which individuals make their choice. Effects on the demand side are measured by the growth in added value between time t-1 and t, and the unemployment rate. Labour demand for employees is measured by the net creation rate of all firms at time t-1. The effect of immigration -variable W1r in eq. (1)- on the employment prospects of natives is measured by the foreign employment share (foreign employment over native employment)21. The level of aggregation in the variables W1r and W2r is region (20) for job search effectiveness (U-E transitions); while it is branch (5) by region (20) for displacement risk (E-U transitions)22. The individual variables Xi included in the model are: age (a linear and squared term), gender, marital status, number of individuals in the household separately for married23 and unmarried individuals, and education. Industry and area dummies have also been included to check for fixed effects depending on area or industry.
20 For the analysis of the U-E transition for individuals looking for a first job insufficient information is available for the southern regions to perform the probit estimation. Thus in this case the analysis is restricted to individuals in the northern and central regions. 21 Similar studies for other countries use either the foreign share (Winter-Ebmer and Zweimuller 1999) or the changes in the share of foreign employment in a given region or industry (Card 1990; DeNew e Zimmermann 1994) as a measure of immigration. 22 The unemployment variables are only at regional level. 23 This variable (the number of components linked to the marital status) is used as a proxy for the number of children, information which is not available in the survey.

17
3.3 Testing the definition of the local area As explained in 3.1, if the local dimension of the labour market has been characterised correctly, then ar in eq. (2) is equal to zero and errors are not correlated. For this reason, in order to test whether our specification characterises the local dimension of the labour market correctly, it is necessary to carry out a simple test of omitted variables to see whether other variables which can contribute to the characterisation of the labour market can be included in the specification. The supplementary variables tested are job creation, job destruction, activity rate, share of imports and exports. These variables were never significant and, furthermore, contributed very little to the overall significance of the model. A test was carried out on the joint significance of these supplementary variables and the null hypothesis that the supplementary variables are jointly zero was never rejected (See the appendix for more details regarding this test Table 6.3). Blundell and Smith’s (1986) exogeneity test was used to check for the endogeneity of the immigrant share. The test has two stages; at the first stage, a linear equation was used to estimate the immigrant share as a function of the appropriate instruments; while at the second stage, the probit equation was estimated using the error term estimated at the first stage as one of the independent variables. If the error term turns out to be significantly different from zero, then the exogeneity of the variable is rejected and instrumentation has to be done. The variables W3r, chosen to instrument the foreign share were the lagged foreign share, the share of women and blue collars in a certain region or industry (measures of the structure of employment) and the average wage among immigrants (a measure of how attractive it is for a foreign worker to enter in that sector of the market) and the sum of imports and exports over the value added. For any chosen local area there is no evidence of endogeneity of the foreign share variable for the unemployed (looking for a new job or a first job) or for the employed. (See the appendix for more details Table 6.4). Instead, when the same test is applied to the model estimated at a national level there is evidence of endogeneity which confirms the validity of our approach24. These are standard instrument variables commonly used in the literature25; however one could object that if the instruments chosen are not good, then the endogeneity test will give incorrect results. Unfortunately a simple test for the validity of the 24 In about one case out of three the test showed evidence of endogeneity. 25 see for instance Winter-Ebmer et al. (1999)

18
instruments in a non-linear case cannot be applied. Bound et al (1995) suggest that, for the linear case, the partial R2 and the F statistic should be used on the excluded instruments in the first-stage regression as a rough guide to the quality of IV estimates. The results of this test show that if the instruments are excluded in the first stage of the regression, its performance is very bad26.
4 Results
4.1 Job search effectiveness A) Search for a first job
In this section the analysis concentrates on those who are looking for their first job; that is to say, generally, people who, like immigrants, are young. So as to concentrate attention only on the young unemployed, they being very similar to immigrants and therefore most at risk, 27 the sample was restricted to individuals under the age of 30, a group, which includes most of those looking for a first job. The full set of results is reported in the appendix. Before discussing the effect of immigration on native employment, it is interesting first to consider the results for the other variables in the specification. The probability of finding a job is lower for women, it falls with age at a declining rate. The likelihood of finding a job has no significant correlation with education or with marital status and the number of individuals in the household does not appear to have any significant effect. Considering the variables at the macroeconomic level, the unemployment rate has the (expected) negative sign, namely when unemployment is falling, the probability of finding a job increases. Upward changes in added values increase the probability of finding a job, while when the net creation rate of all firms is significant, it has the expected positive sign. Finally, the effect of immigration can be seen in table 4.1sectionA. Results from the probit equation for North and Central Italy suggest that the presence of immigrants reduced the probability of finding a job only in 1993, while no significant effect emerges in the subsequent years and in 1997 a complementary effect seems to prevail, a 1% increase in the share of foreign labour favour the transition to employment by 8.6% (see marginal value in the Table 6.5 in the appendix). The competitive effect in 1993 can be imputed
26 Running the first stage regression with instruments we have F-value= 61.01 and R2= 0.94, without instrument we have F-value =1.82 and R2=0.15 27 We also wonted to exclude those who have had some previous unrecorded working experience, as would be the case of someone who had worked in the black economy.

19
to the end of the 1991 amnesty which introduced about 200.000 foreigners into the labour market in just one year. It is impossible to replicate the analyses for the South because the number of observation is too small. In order to get a better understanding of the degree of possible competition between the target group and immigrants, natives were subdivided by level of education. The aggregate effect as is well known hides different group effects. Immigrants do not reduce the probability of finding a job for the highly educated and also for the low educated. The group which is most at risk is the medium educated, but this was found only in 1993. The shortage of intermediate skilled workers is typical of the Italian labour market and the presence of immigrants probably favours the continuation of low skill production methods and discourages skill upgrading. When immigrants are complementary (in 1997), thus favour the native employment, they complement the low educated. Tab. 4.1 The effect of foreign workers on the probability of the unemployed natives of finding a job.
1993 1994 1995 1996 1997 Section A
Unemployed looking for their first job North and Central Italy
All -0.35 (-2.5) -0.03 (-0.3) 0.01 (0.1) 0.20 (1.3) 0.27 (1.9) High education -0.37 -(1.3) -0.44 -(1.6) 0.06 (0.2) 0.22 (0.8) 0.19 (0.8)
Medium education -0.48 -(2.9) 0.13 (1.0) 0.10 (0.6) 0.18 (1.1) 0.19 (1.2) Low education -0.25 -(1.6) -0.14 -(1.1) -0.11 -(0.6) 0.21 (1.2) 0.36 (2.3)
Section B
Unemployed looking for a new job North and Central Italy
All 0.25 (2.1) 0.07 (0.9) -0.07 (-0.7) -0.04 (-0.3) 0.31 (3.0) High education -0.02 -(0.1) 0.19 (0.8) 0.30 (1.2) -0.09 -(0.4) 0.43 (2.1)
Medium education 0.19 (1.3) 0.06 (0.5) 0.02 (0.2) -0.06 -(0.5) 0.35 (3.1) Low education 0.28 (2.2) 0.07 (0.8) -0.13 -(1.2) -0.03 -(0.2) 0.28 (2.6)
South All 0.10 (0.7) 0.05 (0.4) -0.08 (-0.6) -0.07 (-0.4) 0.30 (2.6)
High education 0.23 (0.3) -1.13 -(1.5) -0.35 -(0.7) -0.29 -(0.4) 0.16 (0.5) Medium education -0.32 -(1.2) 0.03 (0.1) -0.51 -(2.3) -0.09 -(0.3) 0.26 (1.7)
Low education 0.25 (1.5) 0.10 (0.7) 0.04 (0.3) -0.06 -(0.3) 0.34 (2.6) Probit stage regression. t-statistics in parenthesis High education: University degree, Medium education: secondary level of education, Low education: first or lower level of education

20
B) Search for a new job Similarly the probit analysis was replicated for those searching for a new job and, as above, the full set of results is reported in the appendix. The results are in line with expectations: the probability of finding a new job is lower for women, it falls with age, and is not affected by marital status or by the number of cohabitants and, finally, it is higher for those with a higher education (see Table 6.6 in the appendix). Considering the macroeconomic variables, the unemployment rate negatively affects the probability of finding a new job, while there are almost no significant effects due to the value added and the net creation rate of all firms. What is more important in this analysis, however, is the effect that immigrants have on the native transition probability (Tab.4.1section B). In this case, the results are different from those obtained in other studies, the impact of foreign workers in Northern and Central Italy and in the South is either not significant or positive. Especially during 1996, immigrants in the North-Center of Italy seem to complement all skill groups, (the aggregate marginal value implies that an increase of 1% in the foreign share increases native employment by 13%, see appendix), while in the South they complement only the less skilled. This result was partly to be expected because unemployed workers looking for a new job are generally older than the immigrants and have previous job experience. Thus they are very different to newly arrived immigrants. Competition is present only in one case in the South for medium educated in 1995 the group expected to be most at risk.
4.2 Displacement risk In the test of transition from employment into unemployment it is necessary to include the share of foreign workers at time t (see Tab. 4.2) and as no data is available after 1996, transition can be analysed only up to 1995-96. Again, most of the findings for this transition are in line with the earlier results (see Table7.7 in the appendix). The probability of losing one’s job is higher for women, it falls with age, and is higher for the unmarried or divorced. It is lower for better educated individuals, especially if they have a secondary school qualification. The likelihood of becoming unemployed is higher in

21
those regions where unemployment is higher, while it is lower when the net number of new firms increases and, when value added is increasing28. Tab. 4.2 The effect of foreign workers on the probability of losing a job for native workers.
1993 1994 1995 1996 (1) North Manufact. (Excl. Constr.) -0.20 (-1.5) -0.06 (-1.1) 0.06 (0.7) 0.15 (4.2) (2) North construction 0.06 (2.1) -0.05 (-0.8) 0.08 (1.2) 0.11 (1.4) (3) North services 0.02 (0.7) -0.10 (-3.5) 0.05 (1.6) 0.02 (1.1) (4) Centre Italy manufacturing 0.19 (1.7) -0.12 (-0.7) -0.00 (-0.01) -0.14 (-2.0) (5) Centre Italy services -0.01 (-0.2) -0.01 (-0.1) -0.02 (-0.3) -0.12 (-3.2) (6) South -0.02 (-0.7) -0.03 (-0.9) -0.11 (-2.3) 0.01 (0.4)
The share of immigrants employed (Tab.4.2) generally seems to have either no effect or a complementary effect on native workers, with the exception of the building industry in the North in 1993 and manufacturing in the North in 1996 where competitive effects were identified. If the 1993 results confirm the reasoning of the legalisation which ended during 1993, a year when a large number of foreigners was introduced onto the labour market, it is more difficult to explain what happened in 1996. Unfortunately, data on the share of migrants in the years after 1996 are not available, so it is not possible to see whether the competition effect that emerges for 1996, continues in the subsequent years. However if the variable for the immigrants’ share is reported at year t-1 instead of year t, so as to see whether, immigrants affect not only how long the search will be but also the probability of leaving employment, the effect registered for 1996 is the same and continues into the following year, 1997. One possible explanation could be the large increase in temporary contracts in recent years. Unfortunately no information is available regarding the nature of the job contracts and it is impossible to run a separate test for workers with temporary or open-end contracts. However, the inclusion of the changes in the number of temporary contracts among the macroeconomic variables does not change the coefficient of the foreign share variable. And furthermore a separate analysis of layoffs does not cause any change to the relevant coefficients. As different sub-groups may react in different ways to the presence of immigrants, Table 4.3 presents a more detailed analysis of the foreign share effect by education and age.
28 In the appendix only the regression for manufacturing in the North is reported. The other complete sets of results are available from the authors upon request.

22
The overall effect of foreign workers on natives of whatever level of education appears to be nil until 1995. The effect continues to be nil for the highly educated natives; while competition is detected for the medium and low educated natives of whatever age group. If the results are examined closely, competition is stronger with the medium educated natives, therefore, as was mentioned earlier, they are the group most at risk in the Italian labour market. These results are however surprising because the total number of transitions from employment to unemployment is decreasing. The total number of workers fired falls as well as the number of workers leaving employment because their temporary contract has ended. Even in this changed situation the natives seem to be affected by the share of immigrants. Looking at the marginal value however the negative effect is very small, for a 1% increase in the share of immigrants there is a 0.4% increase in the probability of transition from employment to unemployment. If this result is not incidental to the 1996 legalisation it indicates a small change in the hiring policy of firms affected by the new foreign labour force. Tab 4.3 The effect of foreign workers on the probability of native workers losing their job in the North Manufacturing Sector by level of education
1993 1994 1995 1996 All
High education 0.13 (0.5) -0.14 -(1.0) 0.02 (0.2) 0.10 (0.0) Medium education -0.23 -(1.6) -0.07 -(1.1) 0.04 (0.5) 0.24 (5.6) Low education -0.21 -(1.5) -0.04 -(0.8) 0.07 (0.9) 0.12 (3.3)
Young
high education 0.13 (0.5) -0.15 -(1.1) 0.02 (0.2) 0.08 (0.0) medium education -0.23 -(1.6) -0.07 -(1.2) 0.05 (0.6) 0.24 (5.6) low education -0.21 -(1.5) -0.03 -(0.6) 0.09 (1.2) 0.12 (3.4)
Old high education -2.07 (0.0) -0.03 -(0.2) 0.03 (0.2) 0.11 (0.0) medium education -0.09 -(0.6) -0.01 -(0.2) 0.07 (0.8) 0.23 (4.6) low education -0.20 -(1.5) -0.06 -(1.1) 0.04 (0.6) 0.11 (3.0) Probit regression. T-statistics in parenthesis. High education: University degree, Medium education: secondary level of education, Low education: first or lower level of education. Young: less than 41 years old; Old: more than 40 years old

23
5 Conclusion
Immigration in Italy is no longer a new phenomenon, however empirical evidence regarding the effect of immigration on the labour market is still scarce. Only Gavosto, Venturini, Villosio (1999) have tested the effect of immigrants on native wages. Their results suggest immigrants have a complementary effect, namely immigrants favour wage increases for unskilled natives. This result was to some extent expected mainly for two reasons: the strong Italian trade unions which impose bargaining at a national level and the concentration of immigrants in the Northern regions where there is an excess demand for labour and unemployment is low. There has not been any analysis of what effect immigrants have on the native employment levels which could be the other aspect of the immigration effect. In this paper cross-sectional analyses of the displacement risk (transition from employment to unemployment) and job search effectiveness (transition from unemployment to employment) are carried out using a probit model on transition probabilities. Such a cross-sectional approach has one important weakness; in that, the widespread internal mobility of natives spreads the effect of an increase of foreign immigrants in one area to other areas. However, this is not the case in Italy where the internal mobility of natives, as the reported by the indicators, is nil. Data from the Italian Labour Force Survey merged with information about the employment of foreigners and indicators regarding the local labour market have been used. The period analysed was from 1993-1997 and during this time the second important legalisation procedure of 1991 was completed, and a later one was passed in 1996. This analysis is restricted to foreign workers legally employed in the private sector, more specifically, employees in some selected sectors (manufacturing, building, commerce and transport). Our model jointly considers an individual’s characteristics and aggregate information. Thus, the first problem that had to be faced was the presence of correlation in the error terms. As the standard approach to the problem proposed by Moulton cannot be applied in this non-linear case, a solution was found by estimating the model separately by subareas. A test on the presence of omitted variables shows that the local labour market was characterised correctly, thus confirming the validity of our approach. The second problem which had to be solved was to allow for the endogeneity of the variable for immigrants caused by the presence of unobservable factors that attract immigrants to a specific area. Similarly this problem was solved by separate estimates for homogeneous local areas where it is

24
possible to assume that the unobservable factors are constant for all immigrants. Blundell and Smith test confirmed the absence of endogeneity in each of the subareas chosen. Regarding job search effectiveness in the northern and central regions of Italy, small differences emerge in the reactions to the presence of foreign workers between the unemployed looking for their first job and the unemployed looking for a new job. In the former case of young unemployed people with no job experience, the presence of foreign workers could have had a negative effect, which was limited in size and restricted to the first year of the period analyzed (1993). The effect is positive but not always significant in the later years. When the specific effect for the natives’ educational level is considered, the only group negatively affected was the one whose level of education was classified as medium and only in 1993. For the unemployed looking for a new job there was either no effect, or a complementary effect, between immigrants and natives in the Northern and in the Central regions, while complementarity always prevailed in the South. The displacement risk for the employed, seems to indicate a complementary or nil effect. There was an exception in 1996 when the analysis reveals competition between foreign and native workers in manufacturing in the North of Italy. This effect can be traced to the 1996 legalisation but there are other important reasons, such as, the spread of temporary jobs in that area in that year and the increase in the number of (in)voluntary quits. After checking for the increase in temporary contracts and after running a separate regression for quits and layoffs, the competitive effects remain. The analyses by educational levels and age groups show that initially the groups most at risk are the medium educated workers, while later it is the lower educated group irrespective of age which is affected. The unemployment rate, which in the North is 6.6% for the medium educated and 6.2% for the low educated, confirms these findings29. Thus, taking into account all the differences highlighted above, the role played by foreigners in the Italian labour market is predominantly a complementary effect, thus while foreigners seem to have a positive effect on wages (prices) (Gavosto, Venturini, Villosio 1999), the probability of transition from unemployment and into unemployment (quantities) does not seem to become worse because of immigration.
29 For the other group, the unemployment rate of the highly educated in the North is 5%, source Labour Force Survey.

25
References Amemiya, T. (1979), The estimation of a simultaneous equation Tobit model,
International Economic Review vol. 20 pp. 169-181 Bauer T., 1997, Do Immigrants Reduce Natives’ Wages? Evidence from
Germany, Munchener Wirtschaftswissenschaftliche Discussion Papers n. 97-5.
Bauer T., Zimmermann K., 1997, Integrating the East: The Labour Market Effects of Immigration, in Black S.W. (ed), Europe’s Economy Looks East: Implications for Germany and the EU, Cambridge University Press, Cambridge, pp.269-306.
Bauer T., Zimmermann K., 1999, Assessment of Possible Migration Pressure and its Labour Market Impact Following EU Enlargement to Central and Eastern Europe, IZA, Research report n.3.
Blundell R.W., Smith R.J. (1986), An exogeneity test for a simultaneous equation Tobit model with an application to labour supply, Econometrica, 54, 679-685.
Bonifazi C. (ed), 1999, Mezzogiorno e migrazioni interne, IRP, Monografie n.10. Borjas G., 1999, The Heaven Door, Princeton University Press, Pricenton. Bound J., Jaeger D. A. and Baker R. M., 1995, On Potential Problems with
Instrumental Variables Estimation When the Correlation Between the Instruments and the Endogenous Explanatory Variable is Weak, Journal of the American Statistical Association 90, June, 443-450.
Card D., (1990) The Impact of the Mariel Boatlift on the Miami Labor Market, Industrial and Labor Relations Review 43, n.2: 245-257.
De Lima P., Carrington W., 1996, The impact of 1970’s Repatriates from Africa on the Portuguise Labour Market, Industrial and Labour Relations Review, vol.49, n.2, pp.330-347.
Commissione per le politiche di integrazione degli immigrati (2000) "Primo rapporto sull'integrazione degli immigrati in Italia", Il Mulino, Bologna
DeNew J.P., Zimmermann K.F., (1994) Native Wage Impacts of Foreign Labor: A Random Effects Panel Analysis, Journal of Population Economics, 7: 177-192.
Dolado J., Jimeno J.F., Duce R., 1996, The Effects of Migration on the Relative Demand of Skilled versus Unskilled Labour: Evidence from Spain, CEPR Discussion Paper n.1476
Faini R., Galli G., Rossi F., 1996, Mobilita’ e disoccupazione in Italia:Un’analisi dell’offerta di lavoro in G.Galli (ed.) La mobilita’ della sociata’ italiana, SIPI, Roma.

26
Faini R., Galli G., Gennari P., Rossi F., 1997, An empirical puzzle:Falling migration and growing unemployment differentials among Italian regions, European Economic Review , n.41, pp.571-579.
Fazio G., 1999, Le migrazioni interne del Mezzogiorno attraverso I dati del Censimento della popolazione del 1991, in Bonifazi C. (ed).
Galli G.P, (a cura di) La mobilita’ della societa’ Italiana: le persone, le imprese, le istituzioni, SIPI Editore, Roma.
Gavosto, A. Venturini, A., Villosio, C. (1999) Do immigrants compete with natives? Labour no. 3:13.
Gross D.M., 1999, Three million Foreigners, Three Million Unemployed? Immigration and the French Labour Market, IMF Working Paper, n.124.
Haisken-De New J.P., Zimmermann K., 1999, Wage and Mobility Effects of Trade and Migration Dewatripont M., Sapir A., Sekkat K., (eds) , Trade and Jobs in Europe, Much Ado about Nothing?, Oxford University Press, pp.139-160.
Hunt J., 1992, The Impact of the 1962 Repatriates from Algeria on the French Labor Market, Industrial and Labour Relations Review, 45(3), pp.556-572.
ISTAT (1999) Forze di lavoro: media 1988, Annuario, n. 4. ISTAT, (2000) La presenza straniera in Italia caratteristiche demografiche,
Collana Informazione, n.7. Leombruni R., Quaranta R. 2002, La mobilita’ dei lavoratori 1985-1996:
cambiamenti strutturali e comportamenti ciclici, in LABORatoro R.Revelli, Osservatorio sulla mobilita’ in Italia, Il Mulino, Bologna.
Maddala G.S (1983), "Limited dependent and qualitative variables in econometrics", Cambridge University Press
Moulton B.R., (1990) An Illustration of a Pitfall in Estimating the Effects of Aggregate Variables on Micro Units, The Review of Economics and Statistics, 32: 334-338.
Natale, Casacchia, Strozza (1999) "Migrazioni interne, migrazioni internazionali: il nuovo ruolo del Mezzogiorno" in Bonifazi C. (eds.) "Mezzogiorno e migrazioni interne", IRP, monografie IO/1999.
Nelson F., Olsen L. (1978), Specification and estimation of a simultaneous-equation model with limited dependent variables International Economic Review vol. 19 pp. 695-709
Pischke, J. S., Velling, J. (1997) Employment effects of immigration to Germany: an analysis based on local labor markets. Review of Economics and Statistics, Vol. 79, No. 4, pp. 594-604
SOPEMI (1997) Trends in International Migrations, OCDE, Paris. Strozza S. (2002), “Gli immigrati stranieri in Italia: caratteristiche e
inserimento lavorativo”, in Natale M. (a cura di), Economia e Popolazione, Franco Angeli, Milano, pp. 435-474.
Strozza S., Venturini A., (2002), Italy is no longer a country of Emigration: Foreigners in Italy, How Many, Where They Come From and What They

27
Do, R.Rotte, P Stein (eds) Migration Policy and the Economy: International Experiences, Studies and Comments 1 series, Hanns Seidel Stiftung, Munich.
Trivellato U., Torelli N. (1989) Analysis of labour force dynamics from rotating panel suvey data "Bullettin of the International Statistical Institute", vol. LIII, book 2, pp. 425-444
Venturini A., (1999) Do Immigrants working illegally reduce the natives’ legal employment? Evidence from Italy, Journal of Population Economics 12, n.1: 135-154
Venturini, A. e Villosio C. (1999) Foreign workers in Italy: are they assimilating to natives? Are they competing against natives? An analysis by the SSA dataset 33. Arbaitstagung der Deutschen Gesellschaft fur Bevolkerungswissenschaft in Zusammenarbeit mit dem Istitut fur Migrationsforschung und Interkulturelle Studien der Universitat Osnabruck.
Winter-Ebmer R., Zimmermann K, (1999) East-West Trade and Migration: The Austro-German case in Faini R., De Melo J., Zimmermann K., 1999, Migration. The controversies and the evidence, Cambridge University Press, 296-327.
Winter-Ebmer R., Zweimuller J., 1996, Immigration and the Earnings of Young Native Workers, Oxford Economic Papers, vol..48, pp.473-491.
Winter-Ebner R., Zweimuller J., (1999), Do immigrants displace young native workers: the Austrian Experience, Journal Of Population Economics, vol. 12 N.2 pp. 327-340
Zincone G. 2000 (ed.) Primo rapporto sull’integrazione degli immigrati in Italia, Il Mulino, Bologna. Zincone G. 2001 (ed.) Secondo rapporto sull’integrazione degli immigrati in Italia, Il Mulino, Bologna.

28
6 Appendix
6.1 Transition matrices The second quarter of the LFS survey contains a question on the individual’s professional status in the previous year. This question makes it possible to build transition matrices at one year intervals. Tab. 6.1 Transitions between t and t-1 for years 1992-1996 a. Unemployed looking for a first job (aged less than 31) Status in year t Unemployed looking for the first job in t-1
Unemployed Employed % employed on unemployed in t-1
1992 4789 3849 940 19.6 1993 4912 4055 857 17.4 1994 5268 4264 1004 19.1 1995 5478 4422 1056 19.3 1996 5615 4570 1045 18.6 b. Unemployed looking for a new job Status in year t Unemployed looking for a new job in year t-1
Unemployed Employed % employed on unemployed in t-1
1992 3630 2506 1124 31.0 1993 4581 3221 1360 29.7 1994 5268 3649 1619 30.7 1995 5452 3646 1806 33.1 1996 5478 3673 1805 32.9 c. Employed° Status in year t Employed at year t-1 Employed Unemployed % unemployed on
employed in t-1 1992 26776 25690 1086 4.1 1993 25692 24600 1092 4.3 1994 25078 24178 900 3.6 1995 24843 23994 849 3.4 °Due to a problem of data availability we have analysed the transition of the following years: -U-E transitions: 1992-93, 1993-94, 1994-95, 1995-96, 1996-97 and - E-U transitions: 1992-93, 1993-94, 1994-95, 1995-96.
29
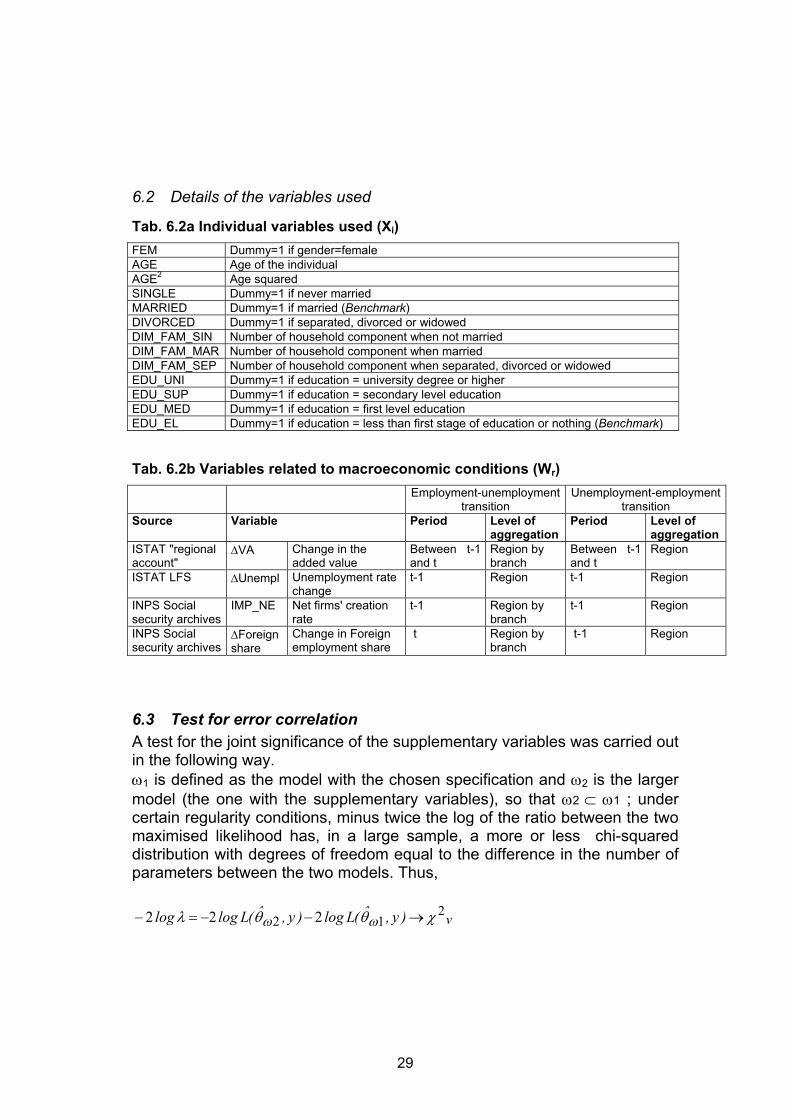
6.2 Details of the variables used
Tab. 6.2a Individual variables used (Xi) FEM Dummy=1 if gender=female AGE Age of the individual AGE2 Age squared SINGLE Dummy=1 if never married MARRIED Dummy=1 if married (Benchmark) DIVORCED Dummy=1 if separated, divorced or widowed DIM_FAM_SIN Number of household component when not married DIM_FAM_MAR Number of household component when married DIM_FAM_SEP Number of household component when separated, divorced or widowed EDU_UNI Dummy=1 if education = university degree or higher EDU_SUP Dummy=1 if education = secondary level education EDU_MED Dummy=1 if education = first level education EDU_EL Dummy=1 if education = less than first stage of education or nothing (Benchmark)
Tab. 6.2b Variables related to macroeconomic conditions (Wr) Employment-unemployment
transition Unemployment-employment
transition Source Variable Period Level of
aggregation Period Level of
aggregation ISTAT "regional account"
∆VA Change in the added value
Between t-1 and t
Region by branch
Between t-1 and t
Region
ISTAT LFS ∆Unempl Unemployment rate change
t-1 Region t-1 Region
INPS Social security archives
IMP_NE Net firms' creation rate
t-1 Region by branch
t-1 Region
INPS Social security archives
∆Foreign share
Change in Foreign employment share
t Region by branch
t-1 Region
6.3 Test for error correlation A test for the joint significance of the supplementary variables was carried out in the following way. ω1 is defined as the model with the chosen specification and ω2 is the larger model (the one with the supplementary variables), so that ω2 ⊂ ω1 ; under certain regularity conditions, minus twice the log of the ratio between the two maximised likelihood has, in a large sample, a more or less chi-squared distribution with degrees of freedom equal to the difference in the number of parameters between the two models. Thus,
v)y,ˆ(Llog)y,ˆ(Lloglog 212 222 χθθλ ωω →−−=−

30
where the degrees of freedom are v=dim(ω2) - dim (ω1), the number of parameters in the larger model ω2 minus the number of parameters in the smaller model ω1. The table shows that in every subarea analysed, the null hypothesis that the supplementary variables are jointly zero is never rejected. Tab. 6.3 Results from the test on omitted variables (p>Chi squared in parenthesis)
1993 1994 1995 1996 1997 Transition unemployment-employment for people looking for the first job
North and Centre Italy -2logλ -3.769 (0.44) -4.664 (0.32) -1.556 (0.82) -3.829 (0.43) -4.304 (0.37)
Transition unemployment-employment for people looking for a new job North and Centre Italy
-2logλ -4.285 (0.37) -4.452 (0.35) -4.178 (0.38) -3.590 (0.46) -3.891 (0.42)South
-2logλ 2.075 (0.72) 0.779 (0.94) 3.735 (0.44) 1.922 (0.75) 0.093 (1.00)Transition employment-unemployment
North in manufacturing (excl. Construction) -2logλ 4.455 (0.35) 3.310 (0.51) 2.268 (0.69) 2.066 (0.72)
North in construction -2logλ 1.072 (0.90) 1.132 (0.89) 1.732 (0.78) 0.519 (0.97)
North in services -2logλ 3.651 (0.46) 3.775 (0.44) 0.038 (1.00) 3.554 (0.47)
Centre Italy in manufacturing -2logλ 4.804 (0.31) 2.337 (0.67) 0.301 (0.99) 3.508 (0.48)
Centre Italy in services -2logλ 2.227 (0.69) 1.580 (0.81) 0.911 (0.92) 1.979 (0.74)
South Italy -2logλ 0.430 (0.98) 1.098 (0.89) 0.392 (0.98) 2.302 (0.68)
Likelihood ratio test. λ is the ratio between the maximised likelihood in the smaller model and the larger model. The supplementary variables included in the larger model are: net job creation, activity rate, share of imports and exports.
6.4 Test for endogeneity Following Blundell and Smith (1986) at the first stage, a regression of the foreign employment share function of appropriate instruments (eq. 5) was performed, then the error terms from this estimation were included in the probit equation (eq. 6)
rrir vˆSw += γ Sr=(W2r, W3r) (5)

31
irrrriir evWWX*Y +Φ+++= 2211 δδβ (6)
where Φvr are the estimated error terms from (5). ΦMV=0 is tested under the null hypothesis H0 : E(uirvr)=0 Table 6.4 reports the results of the endogeneity test for the definition of the chosen local market. As can be seen from the table, when the chosen dimension is considered there is no evidence of endogeneity either for the unemployed looking for a job or a first job or for the employed, the null hypothesis is never rejected. Tab. 6.4 Results from the endogeneity test (t statistics in parenthesis)
1993 1994 1995 1996 1997 Transition unemployment-employment for people looking for the first job
North and Central Italy ΦMV 0.92 (0.64) 0.26 (0.73) 0.24 (0.65) -0.056 (-0.13) -0.14 (-0.27)
Transition unemployment-employment for people looking for a new job North and Central Italy
ΦMV 1.87 (1.04) 0.11 (0.42) 0.35 (0.70) -0.59 (-0.85) -0.15 (-0.43)South
ΦMV -0.26 (0.70) 1.25 (1.05) -0.29 (-0.40) 1.28 (1.18) 0.56 (1.04)Transition employment-unemployment
North in manufacturing (excl. Construction) ΦMV -7.65 (-0.02) -6.70 (-0.06) -0.20 (-0.01) -8.85 (-0.01)
North in construction ΦMV -1.83 (-0.01) -1.18 (-0.01) -3.62 (-0.01) -3.23 (-0.02)
North in services ΦMV 0.24 (1.48) -0.04 (-0.38) 0.18 (1.33) 0.16 (0.62)
Central Italy in manufacturing ΦMV 0.44 (0.01) -9.55 (-0.71) -1.50 (-0.41) -0.095 (-0.48)
Central Italy in services ΦMV -0.16 (-0.35) -0.05 (-0.14) 2.76 (0.06) 9.46 (0.01)
South Italy ΦMV 0.09 (0.86) 0.02 (0.83) -0.14 (-1.17) -0.002 (-0.03)
Two-stage procedure. ΦMV is the estimated coefficient in the probit equation of the error terms from the first stage. At the first stage, the dependent variable is the foreign share, right hand side variables are: lagged foreign share, share of women and blue collars, the average wage among immigrants, and the sum of imports plus exports over the value added.

32
6.5 Results from the probit regression on the probability of the transition from unemployment into employment for people looking for a first job (t-statistics in parenthesis) - North and Central Italy
Variable 1993 1994 1995 1996 1997 Marginal
effect (*)Intercep 5.97 (3.6) 1.81 (1.2) 3.37 (1.9) 4.02 (2.0) 5.10 (3.1)∆fem -0.28 -(3.2) -0.20 -(2.3) -0.23 -(2.9) -0.29 -(3.7) -0.28 -(3.4) -10.5%Age -0.30 -(2.4) -0.19 -(1.4) -0.17 -(1.3) -0.30 -(2.4) -0.31 -(2.4)Age2 0.01 (2.0) 0.00 (1.3) 0.00 (1.3) 0.01 (2.2) 0.01 (2.2) -0.5%
Single -0.15 -(0.3) 0.91 (1.5) -0.52 -(1.0) -0.80 -(1.4) -1.20 -(2.3) -45.0%Divorced 5.03 (0.0) 1.36 (1.2) -25.16 (0.0) -2.77 -(0.6) -23.70 (0.0) -70.2%Dim-fam_sin -0.13 -(2.6) -0.02 -(0.5) 0.04 (0.8) -0.04 -(1.0) -0.03 -(0.7) -1.2%Dim-fam_mar -0.13 -(1.1) 0.23 (1.3) -0.07 -(0.4) -0.34 -(2.0) -0.34 -(2.2) -12.7%Dim-fam_sep -1.93 (0.0) 0.09 (0.3) 5.22 (0.0) 0.22 (0.2) 5.50 (0.0) 29.8%edu_uni 0.03 (0.1) 0.08 (0.3) -0.25 -(0.9) 0.47 (1.6) 0.35 (1.2) 11.0%edu_sup -0.08 -(0.3) 0.37 (1.4) 0.05 (0.2) 0.24 (0.9) 0.40 (1.6) 12.2%edu_med -0.40 -(1.8) 0.04 (0.2) -0.22 -(0.9) 0.03 (0.1) 0.09 (0.3) 2.9%∆va 0.00 (0.0) 0.17 (2.3) 0.03 (0.4) 0.03 (0.3) -0.24 -(2.0) -8.9%∆Unempl -0.12 -(3.0) 0.00 (0.0) -0.18 -(3.2) -0.07 -(1.3) 0.00 -(0.1) -0.1%imp_ne 0.22 (0.6) 0.35 (2.1) -0.05 -(0.3) 0.32 (2.3) 0.47 (2.1) 13.9%Foreign sharet -0.35 -(2.5) -0.04 -(0.3) 0.01 (0.1) 0.20 (1.2) 0.27 (1.9) 8.6%d_NorthEast 0.37 (1.4) -0.29 -(1.2) 0.16 (0.8) -0.07 -(0.3) 0.43 (2.3) 12.9%d_Center 0.14 (0.6) -0.25 -(1.4) 0.12 (0.5) 0.18 (1.4) 0.17 (1.2) 5.6% -2 Log L. 1209.96 1250.99 1401.23 1428.59 1284.90 Wald Chi-sq 68.28 (17 DF) 83.36 (17 DF) 105.05 (17 DF) 139.58 (17 DF) 128.35 (17 DF)N. obs. 1330 1369 1513 1484 1426 Y=1 417 433 517 534 503
(*) Marginal effect is the increase in the probability of the effect of that characteristic with respect to the benchmark (male, average age, married, low education, average value added, average unemployment rate, average net firm creation, and average foreign share, North-West). For continuous variables the marginal effect is computed for 1 percentage increase in the variable with respect to their sample mean.
33
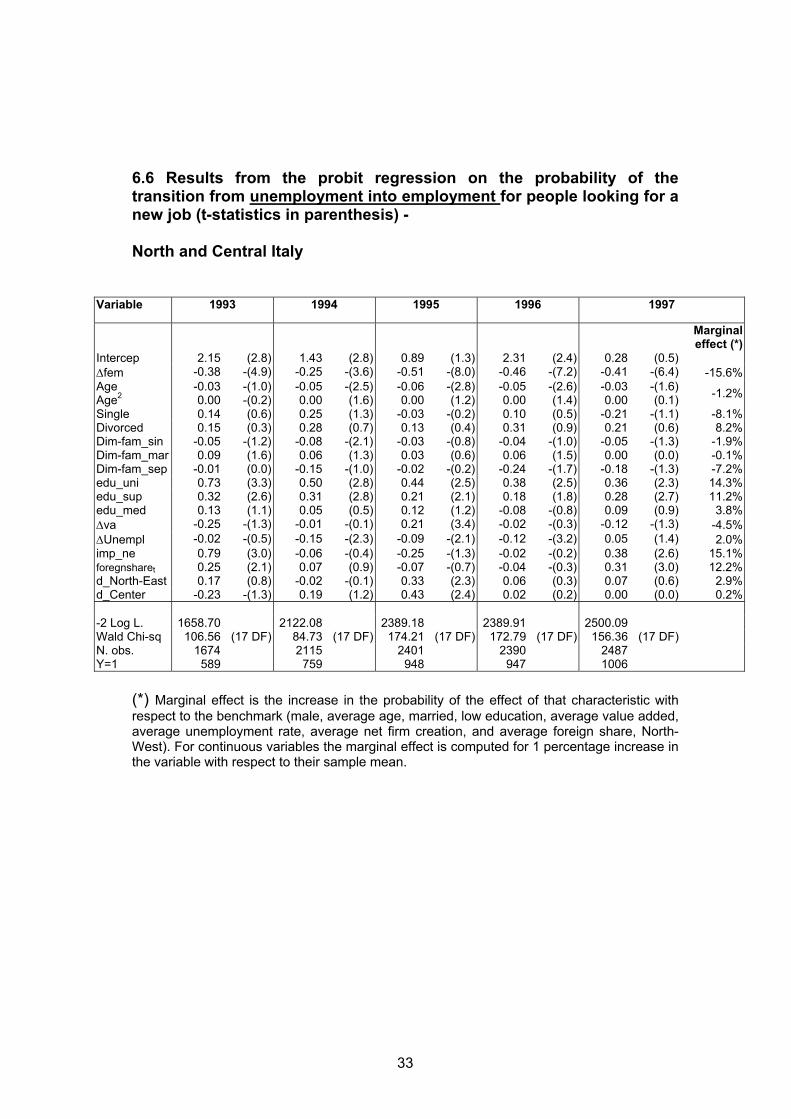
6.6 Results from the probit regression on the probability of the transition from unemployment into employment for people looking for a new job (t-statistics in parenthesis) - North and Central Italy
Variable 1993 1994 1995 1996 1997
Marginal effect (*)
Intercep 2.15 (2.8) 1.43 (2.8) 0.89 (1.3) 2.31 (2.4) 0.28 (0.5)∆fem -0.38 -(4.9) -0.25 -(3.6) -0.51 -(8.0) -0.46 -(7.2) -0.41 -(6.4) -15.6%Age -0.03 -(1.0) -0.05 -(2.5) -0.06 -(2.8) -0.05 -(2.6) -0.03 -(1.6)Age2 0.00 -(0.2) 0.00 (1.6) 0.00 (1.2) 0.00 (1.4) 0.00 (0.1) -1.2%
Single 0.14 (0.6) 0.25 (1.3) -0.03 -(0.2) 0.10 (0.5) -0.21 -(1.1) -8.1%Divorced 0.15 (0.3) 0.28 (0.7) 0.13 (0.4) 0.31 (0.9) 0.21 (0.6) 8.2%Dim-fam_sin -0.05 -(1.2) -0.08 -(2.1) -0.03 -(0.8) -0.04 -(1.0) -0.05 -(1.3) -1.9%Dim-fam_mar 0.09 (1.6) 0.06 (1.3) 0.03 (0.6) 0.06 (1.5) 0.00 (0.0) -0.1%Dim-fam_sep -0.01 (0.0) -0.15 -(1.0) -0.02 -(0.2) -0.24 -(1.7) -0.18 -(1.3) -7.2%edu_uni 0.73 (3.3) 0.50 (2.8) 0.44 (2.5) 0.38 (2.5) 0.36 (2.3) 14.3%edu_sup 0.32 (2.6) 0.31 (2.8) 0.21 (2.1) 0.18 (1.8) 0.28 (2.7) 11.2%edu_med 0.13 (1.1) 0.05 (0.5) 0.12 (1.2) -0.08 -(0.8) 0.09 (0.9) 3.8%∆va -0.25 -(1.3) -0.01 -(0.1) 0.21 (3.4) -0.02 -(0.3) -0.12 -(1.3) -4.5%∆Unempl -0.02 -(0.5) -0.15 -(2.3) -0.09 -(2.1) -0.12 -(3.2) 0.05 (1.4) 2.0%imp_ne 0.79 (3.0) -0.06 -(0.4) -0.25 -(1.3) -0.02 -(0.2) 0.38 (2.6) 15.1%foregnsharet 0.25 (2.1) 0.07 (0.9) -0.07 -(0.7) -0.04 -(0.3) 0.31 (3.0) 12.2%d_North-East 0.17 (0.8) -0.02 -(0.1) 0.33 (2.3) 0.06 (0.3) 0.07 (0.6) 2.9%d_Center -0.23 -(1.3) 0.19 (1.2) 0.43 (2.4) 0.02 (0.2) 0.00 (0.0) 0.2% -2 Log L. 1658.70 2122.08 2389.18 2389.91 2500.09 Wald Chi-sq 106.56 (17 DF) 84.73 (17 DF) 174.21 (17 DF) 172.79 (17 DF) 156.36 (17 DF)N. obs. 1674 2115 2401 2390 2487 Y=1 589 759 948 947 1006
(*) Marginal effect is the increase in the probability of the effect of that characteristic with respect to the benchmark (male, average age, married, low education, average value added, average unemployment rate, average net firm creation, and average foreign share, North-West). For continuous variables the marginal effect is computed for 1 percentage increase in the variable with respect to their sample mean.

34
Tab. 6.7 Results from the probit regression on the probability of the transition from employment into unemployment (t-statistics in parenthesis) - North Manufacturing (excluding construction) Variable 1993 1994 1995 1996
Marginal effect (*)
intercep -0.64 -(1.0) -1.48 -(4.0) -2.74 -(3.8) -2.31 -(5.9) ∆fem 0.32 (9.5) 0.22 (6.6) 0.29 (8.3) 0.27 (8.2) 0.82%age -0.04 -(4.0) -0.03 -(2.4) -0.01 -(0.5) -0.06 -(5.3) age2 0.00 (3.1) 0.00 (1.6) 0.00 (0.1) 0.00 (4.8) -0.01%
single 0.30 (2.6) -0.18 -(1.7) 0.49 (4.4) 0.63 (5.7) 2.89%divorced 0.78 (4.0) 0.91 (3.2) -0.03 -(0.1) -0.52 -(1.8) -0.61%dim.fam_sin 0.03 (1.5) 0.05 (2.1) -0.07 -(3.1) -0.04 -(1.7) -0.07%dim.fam_mar 0.03 (1.0) -0.04 -(1.9) 0.03 (1.3) 0.10 (3.8) 0.23%dim.fam_sep -0.12 -(1.6) -0.57 -(3.5) 0.08 (0.9) 0.32 (3.9) 1.03%edu_uni -0.21 -(1.8) -0.28 -(2.3) 0.05 (0.5) -3.50 -(0.1) -0.78%edu_sup -0.28 -(4.9) -0.29 -(5.3) -0.33 -(5.7) -0.28 -(5.0) -0.43%edu_med -0.13 -(2.6) -0.13 -(2.6) -0.12 -(2.4) -0.07 -(1.3) -0.13%∆va -0.02 -(2.0) 0.01 (1.1) 0.00 (0.1) -0.03 -(2.3) -0.07%unemp -0.04 -(0.8) 0.05 (1.5) 0.06 (1.5) 0.08 (3.2) 0.18%firm_ne -0.08 -(2.3) -0.02 -(0.6) -0.02 -(1.0) 0.01 (0.2) 0.00%foregnsharet -0.20 -(1.5) -0.06 -(1.1) 0.06 (0.7) 0.15 (4.2) 0.38%D_nothwest -0.27 -(2.0) 0.04 (0.5) 0.03 (0.4) 0.07 (1.1) 0.59% -2 Log L. 6434.78 6473.64 5743.25 6302.13 Wald Chi-sq 379.44 (16 DF) 190.99 (16 DF) 149.47 (16 DF) 284.3 (16 DF) N. obs. 8655 8459 8404 8396 Y=1 208 175 137 117 (*) Marginal effect is the increase in the probability of the effect of that characteristic withrespect to the benchmark (male, average age, married, low education, average value added, average unemployment rate, average net firm creation, and average foreign share, North-East). For continuous variables the marginal effect is computed for 1 percentage increase in the variable with respect to their sample mean.