Laboratory evaluation of two LISST-25X using river sediments
9
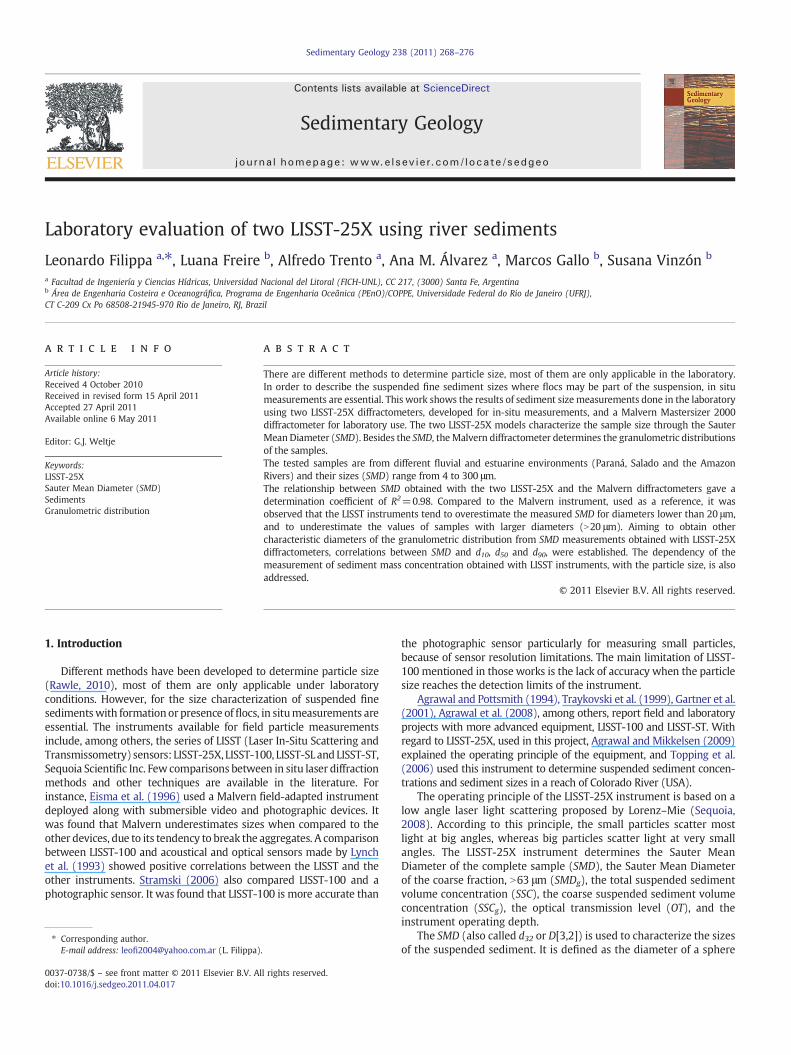
Laboratory evaluation of two LISST-25X using river sediments Leonardo Filippa a, ⁎, Luana Freire b , Alfredo Trento a , Ana M. Álvarez a , Marcos Gallo b , Susana Vinzón b a Facultad de Ingeniería y Ciencias Hídricas, Universidad Nacional del Litoral (FICH-UNL), CC 217, (3000) Santa Fe, Argentina b Área de Engenharia Costeira e Oceanográfica, Programa de Engenharia Oceânica (PEnO)/COPPE, Universidade Federal do Rio de Janeiro (UFRJ), CT C-209 Cx Po 68508-21945-970 Rio de Janeiro, RJ, Brazil abstract article info Article history: Received 4 October 2010 Received in revised form 15 April 2011 Accepted 27 April 2011 Available online 6 May 2011 Editor: G.J. Weltje Keywords: LISST-25X Sauter Mean Diameter (SMD) Sediments Granulometric distribution There are different methods to determine particle size, most of them are only applicable in the laboratory. In order to describe the suspended fine sediment sizes where flocs may be part of the suspension, in situ measurements are essential. This work shows the results of sediment size measurements done in the laboratory using two LISST-25X diffractometers, developed for in-situ measurements, and a Malvern Mastersizer 2000 diffractometer for laboratory use. The two LISST-25X models characterize the sample size through the Sauter Mean Diameter (SMD). Besides the SMD, the Malvern diffractometer determines the granulometric distributions of the samples. The tested samples are from different fluvial and estuarine environments (Paraná, Salado and the Amazon Rivers) and their sizes (SMD) range from 4 to 300 μm. The relationship between SMD obtained with the two LISST-25X and the Malvern diffractometers gave a determination coefficient of R 2 =0.98. Compared to the Malvern instrument, used as a reference, it was observed that the LISST instruments tend to overestimate the measured SMD for diameters lower than 20 μm, and to underestimate the values of samples with larger diameters (N 20 μm). Aiming to obtain other characteristic diameters of the granulometric distribution from SMD measurements obtained with LISST-25X diffractometers, correlations between SMD and d 10 , d 50 and d 90 , were established. The dependency of the measurement of sediment mass concentration obtained with LISST instruments, with the particle size, is also addressed. © 2011 Elsevier B.V. All rights reserved. 1. Introduction Different methods have been developed to determine particle size (Rawle, 2010), most of them are only applicable under laboratory conditions. However, for the size characterization of suspended fine sediments with formation or presence of flocs, in situ measurements are essential. The instruments available for field particle measurements include, among others, the series of LISST (Laser In-Situ Scattering and Transmissometry) sensors: LISST-25X, LISST-100, LISST-SL and LISST-ST, Sequoia Scientific Inc. Few comparisons between in situ laser diffraction methods and other techniques are available in the literature. For instance, Eisma et al. (1996) used a Malvern field-adapted instrument deployed along with submersible video and photographic devices. It was found that Malvern underestimates sizes when compared to the other devices, due to its tendency to break the aggregates. A comparison between LISST-100 and acoustical and optical sensors made by Lynch et al. (1993) showed positive correlations between the LISST and the other instruments. Stramski (2006) also compared LISST-100 and a photographic sensor. It was found that LISST-100 is more accurate than the photographic sensor particularly for measuring small particles, because of sensor resolution limitations. The main limitation of LISST- 100 mentioned in those works is the lack of accuracy when the particle size reaches the detection limits of the instrument. Agrawal and Pottsmith (1994), Traykovski et al. (1999), Gartner et al. (2001), Agrawal et al. (2008), among others, report field and laboratory projects with more advanced equipment, LISST-100 and LISST-ST. With regard to LISST-25X, used in this project, Agrawal and Mikkelsen (2009) explained the operating principle of the equipment, and Topping et al. (2006) used this instrument to determine suspended sediment concen- trations and sediment sizes in a reach of Colorado River (USA). The operating principle of the LISST-25X instrument is based on a low angle laser light scattering proposed by Lorenz–Mie (Sequoia, 2008). According to this principle, the small particles scatter most light at big angles, whereas big particles scatter light at very small angles. The LISST-25X instrument determines the Sauter Mean Diameter of the complete sample (SMD), the Sauter Mean Diameter of the coarse fraction, N 63 μm(SMD g ), the total suspended sediment volume concentration (SSC), the coarse suspended sediment volume concentration (SSC g ), the optical transmission level (OT), and the instrument operating depth. The SMD (also called d 32 or D[3,2]) is used to characterize the sizes of the suspended sediment. It is defined as the diameter of a sphere Sedimentary Geology 238 (2011) 268–276 ⁎ Corresponding author. E-mail address: leofi[email protected] (L. Filippa). 0037-0738/$ – see front matter © 2011 Elsevier B.V. All rights reserved. doi:10.1016/j.sedgeo.2011.04.017 Contents lists available at ScienceDirect Sedimentary Geology journal homepage: www.elsevier.com/locate/sedgeo
Transcript of Laboratory evaluation of two LISST-25X using river sediments
Sedimentary Geology 238 (2011) 268–276
Contents lists available at ScienceDirect
Sedimentary Geology
j ourna l homepage: www.e lsev ie r.com/ locate /sedgeo
Laboratory evaluation of two LISST-25X using river sediments
Leonardo Filippa a,⁎, Luana Freire b, Alfredo Trento a, Ana M. Álvarez a, Marcos Gallo b, Susana Vinzón b
a Facultad de Ingeniería y Ciencias Hídricas, Universidad Nacional del Litoral (FICH-UNL), CC 217, (3000) Santa Fe, Argentinab Área de Engenharia Costeira e Oceanográfica, Programa de Engenharia Oceânica (PEnO)/COPPE, Universidade Federal do Rio de Janeiro (UFRJ),CT C-209 Cx Po 68508-21945-970 Rio de Janeiro, RJ, Brazil
⁎ Corresponding author.E-mail address: [email protected] (L. Filippa)
0037-0738/$ – see front matter © 2011 Elsevier B.V. Adoi:10.1016/j.sedgeo.2011.04.017
a b s t r a c t
a r t i c l e i n f oArticle history:Received 4 October 2010Received in revised form 15 April 2011Accepted 27 April 2011Available online 6 May 2011
Editor: G.J. Weltje
Keywords:LISST-25XSauter Mean Diameter (SMD)SedimentsGranulometric distribution
There are different methods to determine particle size, most of them are only applicable in the laboratory.In order to describe the suspended fine sediment sizes where flocs may be part of the suspension, in situmeasurements are essential. This work shows the results of sediment sizemeasurements done in the laboratoryusing two LISST-25X diffractometers, developed for in-situ measurements, and a Malvern Mastersizer 2000diffractometer for laboratory use. The two LISST-25X models characterize the sample size through the SauterMean Diameter (SMD). Besides the SMD, theMalvern diffractometer determines the granulometric distributionsof the samples.The tested samples are from different fluvial and estuarine environments (Paraná, Salado and the AmazonRivers) and their sizes (SMD) range from 4 to 300 μm.The relationship between SMD obtained with the two LISST-25X and the Malvern diffractometers gave adetermination coefficient of R2=0.98. Compared to the Malvern instrument, used as a reference, it wasobserved that the LISST instruments tend to overestimate the measured SMD for diameters lower than 20 μm,and to underestimate the values of samples with larger diameters (N20 μm). Aiming to obtain othercharacteristic diameters of the granulometric distribution from SMD measurements obtained with LISST-25Xdiffractometers, correlations between SMD and d10, d50 and d90, were established. The dependency of themeasurement of sediment mass concentration obtained with LISST instruments, with the particle size, is alsoaddressed.
.
ll rights reserved.
© 2011 Elsevier B.V. All rights reserved.
1. Introduction
Different methods have been developed to determine particle size(Rawle, 2010), most of them are only applicable under laboratoryconditions. However, for the size characterization of suspended finesedimentswith formationor presence offlocs, in situmeasurements areessential. The instruments available for field particle measurementsinclude, among others, the series of LISST (Laser In-Situ Scattering andTransmissometry) sensors: LISST-25X, LISST-100, LISST-SL and LISST-ST,Sequoia Scientific Inc. Few comparisons between in situ laser diffractionmethods and other techniques are available in the literature. Forinstance, Eisma et al. (1996) used a Malvern field-adapted instrumentdeployed along with submersible video and photographic devices. Itwas found that Malvern underestimates sizes when compared to theother devices, due to its tendency to break the aggregates. A comparisonbetween LISST-100 and acoustical and optical sensors made by Lynchet al. (1993) showed positive correlations between the LISST and theother instruments. Stramski (2006) also compared LISST-100 and aphotographic sensor. It was found that LISST-100 is more accurate than
the photographic sensor particularly for measuring small particles,because of sensor resolution limitations. The main limitation of LISST-100 mentioned in those works is the lack of accuracy when the particlesize reaches the detection limits of the instrument.
Agrawal and Pottsmith (1994), Traykovski et al. (1999), Gartner et al.(2001), Agrawal et al. (2008), among others, report field and laboratoryprojects with more advanced equipment, LISST-100 and LISST-ST. Withregard to LISST-25X, used in this project, Agrawal and Mikkelsen (2009)explained the operating principle of the equipment, and Topping et al.(2006) used this instrument to determine suspended sediment concen-trations and sediment sizes in a reach of Colorado River (USA).
The operating principle of the LISST-25X instrument is based on alow angle laser light scattering proposed by Lorenz–Mie (Sequoia,2008). According to this principle, the small particles scatter mostlight at big angles, whereas big particles scatter light at very smallangles. The LISST-25X instrument determines the Sauter MeanDiameter of the complete sample (SMD), the Sauter Mean Diameterof the coarse fraction, N63 μm (SMDg), the total suspended sedimentvolume concentration (SSC), the coarse suspended sediment volumeconcentration (SSCg), the optical transmission level (OT), and theinstrument operating depth.
The SMD (also called d32 or D[3,2]) is used to characterize the sizesof the suspended sediment. It is defined as the diameter of a sphere
269L. Filippa et al. / Sedimentary Geology 238 (2011) 268–276
that has the same volume/surface area ratio as the particle of interest.Mathematically, it is defined according to the following equation(Pacek et al., 1998):
SMD = d32 =
∫dmin
dmax
d3p dð Þdd
∫dmin
dmax
d2p dð Þddð1Þ
where d indicates the particle diameter, dmax and dmin indicate themaximum and minimum diameters of particle distribution, respec-tively, and p(d) indicates the probability density function of d. TheLISST-25X instrument mathematically transforms the scatteringintensity into the following two variables: particle volume concen-tration, SSCvol, and particle area concentration, SSCsup. It thendetermines the sample SMD based on the following relationshipbetween the concentrations (Agrawal and Mikkelsen, 2009):
SMD = 1:5SSCvol
SSC sup : ð2Þ
Thecoefficient 1.5 results fromconsidering the surfaceareaprojected.Moredetailed informationabout theoperatingprinciple of the LISST-25Xsensors aswell as an introduction to theequations to calculate the outputvariables can be found in Agrawal and Mikkelsen (2009).
According to Sequoia Scientific Inc. (Sequoia, 2009), LISST-25X canmeasure: SMD between 2.50 μmand 500 μm; SMDg between 63 μmand500 μm; SSC and SSCg from 0.10 to 1000 mg/L, approximately, for anoptical path length of 2.50 cm; OT varies at the 0–100%, with anoptimum interval of 30–98%. The optical path length is the product ofthe geometric length of the path that the light follows through thesystem, and the index of refraction of the medium through which itpropagates. The SMD and SSC vary linearly according to the optical pathlength of the instrument. The SMD variation is directly proportional tothe path length, whereas for SSC the relation is inverted. The instrumentresolution is 0.025% for SSC and SSCg, 1.0 μm for SMD and SMDg and0.10% for OT.
Malvern Mastersizer 2000 is broadly used in laboratory work.There are a variety of applications within Malvern to measure particle
Magnetic stirrer
Testing chamber
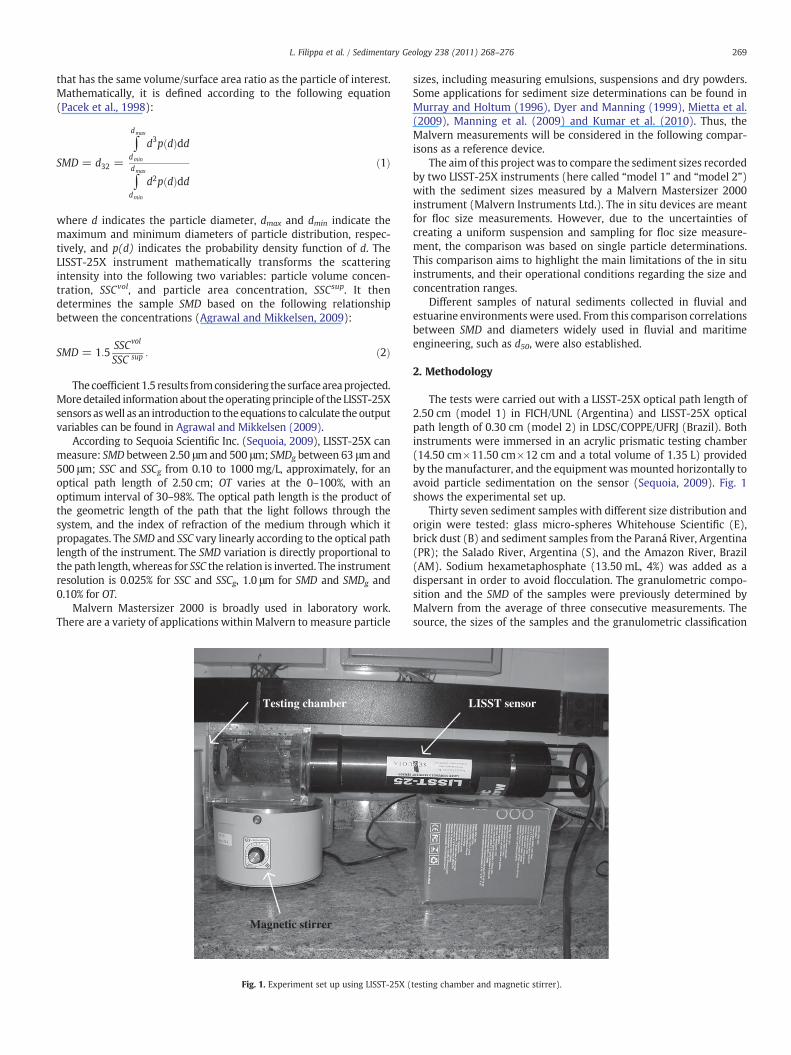
Fig. 1. Experiment set up using LISST-25X (
sizes, including measuring emulsions, suspensions and dry powders.Some applications for sediment size determinations can be found inMurray and Holtum (1996), Dyer and Manning (1999), Mietta et al.(2009), Manning et al. (2009) and Kumar et al. (2010). Thus, theMalvern measurements will be considered in the following compar-isons as a reference device.
The aim of this project was to compare the sediment sizes recordedby two LISST-25X instruments (here called “model 1” and “model 2”)with the sediment sizes measured by a Malvern Mastersizer 2000instrument (Malvern Instruments Ltd.). The in situ devices are meantfor floc size measurements. However, due to the uncertainties ofcreating a uniform suspension and sampling for floc size measure-ment, the comparison was based on single particle determinations.This comparison aims to highlight the main limitations of the in situinstruments, and their operational conditions regarding the size andconcentration ranges.
Different samples of natural sediments collected in fluvial andestuarine environments were used. From this comparison correlationsbetween SMD and diameters widely used in fluvial and maritimeengineering, such as d50, were also established.
2. Methodology
The tests were carried out with a LISST-25X optical path length of2.50 cm (model 1) in FICH/UNL (Argentina) and LISST-25X opticalpath length of 0.30 cm (model 2) in LDSC/COPPE/UFRJ (Brazil). Bothinstruments were immersed in an acrylic prismatic testing chamber(14.50 cm×11.50 cm×12 cm and a total volume of 1.35 L) providedby themanufacturer, and the equipment wasmounted horizontally toavoid particle sedimentation on the sensor (Sequoia, 2009). Fig. 1shows the experimental set up.
Thirty seven sediment samples with different size distribution andorigin were tested: glass micro-spheres Whitehouse Scientific (E),brick dust (B) and sediment samples from the Paraná River, Argentina(PR); the Salado River, Argentina (S), and the Amazon River, Brazil(AM). Sodium hexametaphosphate (13.50 mL, 4%) was added as adispersant in order to avoid flocculation. The granulometric compo-sition and the SMD of the samples were previously determined byMalvern from the average of three consecutive measurements. Thesource, the sizes of the samples and the granulometric classification
LISST sensor
testing chamber and magnetic stirrer).
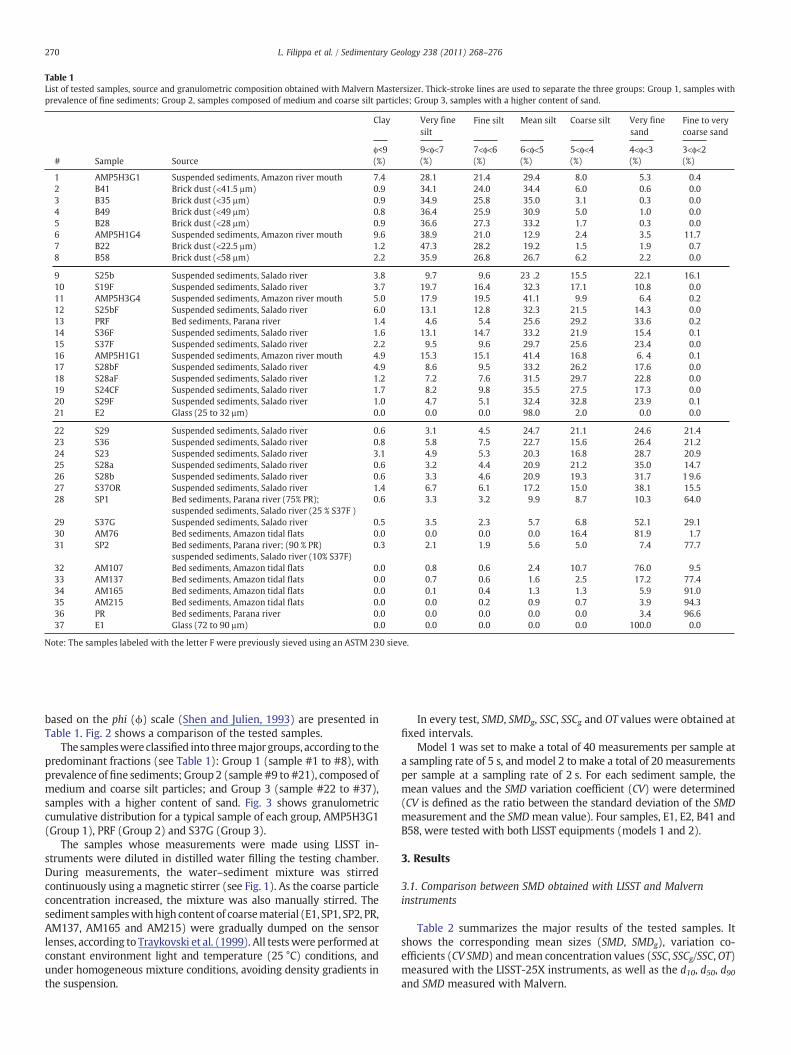
Table 1List of tested samples, source and granulometric composition obtained with Malvern Mastersizer. Thick-stroke lines are used to separate the three groups: Group 1, samples withprevalence of fine sediments; Group 2, samples composed of medium and coarse silt particles; Group 3, samples with a higher content of sand.
# Sample Source
Clay Very fine
silt
Fine silt Mean silt Coarse silt Very fine
sand
Fine to very
coarse sand
φ<9 9<φ<7 7<φ<6 6<φ<5 5<φ<4 4<φ<3 3<φ<2
(%) (%) (%) (%) (%) (%) (%)
1 AMP5H3G1 Suspended sediments, Amazon river mouth 7.4 28.1 21.4 29.4 8.0 5.3 0.4
2 B41 Brick dust (<41.5 μm) 0.9 34.1 24.0 34.4 6.0 0.6 0.0
3 B35 Brick dust (<35 μm) 0.9 34.9 25.8 35.0 3.1 0.3 0.0
4 B49 Brick dust (<49 μm) 0.8 36.4 25.9 30.9 5.0 1.0 0.0
5 B28 Brick dust (<28 μm) 0.9 36.6 27.3 33.2 1.7 0.3 0.0
6 AMP5H1G4 Suspended sediments, Amazon river mouth 9.6 38.9 21.0 12.9 2.4 3.5 11.7
7 B22 Brick dust (<22.5 μm) 1.2 47.3 28.2 19.2 1.5 1.9 0.7
8 B58 Brick dust (<58 μm) 2.2 35.9 26.8 26.7 6.2 2.2 0.0
9 S25b Suspended sediments, Salado river 3.8 9.7 9.6 23 .2 15.5 22.1 16.1
10 S19F Suspended sediments, Salado river 3.7 19.7 16.4 32.3 17.1 10.8 0.0
11 AMP5H3G4 Suspended sediments, Amazon river mouth 5.0 17.9 19.5 41.1 9.9 6.4 0.2
12 S25bF Suspended sediments, Salado river 6.0 13.1 12.8 32.3 21.5 14.3 0.0
13 PRF Bed sediments, Parana river 1.4 4.6 5.4 25.6 29.2 33.6 0.2
14 S36F Suspended sediments, Salado river 1.6 13.1 14.7 33.2 21.9 15.4 0.1
15 S37F Suspended sediments, Salado river 2.2 9.5 9.6 29.7 25.6 23.4 0.0
16 AMP5H1G1 Suspended sediments, Amazon river mouth 4.9 15.3 15.1 41.4 16.8 6. 4 0.1
17 S28bF Suspended sediments, Salado river 4.9 8.6 9.5 33.2 26.2 17.6 0.0
18 S28aF Suspended sediments, Salado river 1.2 7.2 7.6 31.5 29.7 22.8 0.0
19 S24CF Suspended sediments, Salado river 1.7 8.2 9.8 35.5 27.5 17.3 0.0
20 S29F Suspended sediments, Salado river 1.0 4.7 5.1 32.4 32.8 23.9 0.1
21 E2 Glass (25 to 32 μm) 0.0 0.0 0.0 98.0 2.0 0.0 0.0
22 S29 Suspended sediments, Salado river 0.6 3.1 4.5 24.7 21.1 24.6 21.4
23 S36 Suspended sediments, Salado river 0.8 5.8 7.5 22.7 15.6 26.4 21.2
24 S23 Suspended sediments, Salado river 3.1 4.9 5.3 20.3 16.8 28.7 20.9
25 S28a Suspended sediments, Salado river 0.6 3.2 4.4 20.9 21.2 35.0 14.7
26 S28b Suspended sediments, Salado river 0.6 3.3 4.6 20.9 19.3 31.7 1 9.6
27 S37OR Suspended sediments, Salado river 1.4 6.7 6.1 17.2 15.0 38.1 15.5
28 SP1 Bed sediments, Parana river (75% PR);
suspended sediments, Salado river (25 % S37F )
0.6 3.3 3.2 9.9 8.7 10.3 64.0
29 S37G Suspended sediments, Salado river 0.5 3.5 2.3 5.7 6.8 52.1 29.1
30 AM76 Bed sediments, Amazon tidal flats 0.0 0.0 0.0 0.0 16.4 81.9 1.7
31 SP2 Bed sediments, Parana river; (90 % PR)
suspended sediments, Salado river (10% S37F)
0.3 2.1 1.9 5.6 5.0 7.4 77.7
32 AM107 Bed sediments, Amazon tidal flats 0.0 0.8 0.6 2.4 10.7 76.0 9.5
33 AM137 Bed sediments, Amazon tidal flats 0.0 0.7 0.6 1.6 2.5 17.2 77.4
34 AM165 Bed sediments, Amazon tidal flats 0.0 0.1 0.4 1.3 1.3 5.9 91.0
35 AM215 Bed sediments, Amazon tidal flats 0.0 0.0 0.2 0.9 0.7 3.9 94.3
36 PR Bed sediments, Parana river 0.0 0.0 0.0 0.0 0.0 3.4 96.6
37 E1 Glass (72 to 90 μm) 0.0 0.0 0.0 0.0 0.0 100.0 0.0
Note: The samples labeled with the letter F were previously sieved using an ASTM 230 sieve.
270 L. Filippa et al. / Sedimentary Geology 238 (2011) 268–276
based on the phi (ϕ) scale (Shen and Julien, 1993) are presented inTable 1. Fig. 2 shows a comparison of the tested samples.
The sampleswere classified into threemajor groups, according to thepredominant fractions (see Table 1): Group 1 (sample #1 to #8), withprevalence of fine sediments; Group 2 (sample #9 to #21), composed ofmedium and coarse silt particles; and Group 3 (sample #22 to #37),samples with a higher content of sand. Fig. 3 shows granulometriccumulative distribution for a typical sample of each group, AMP5H3G1(Group 1), PRF (Group 2) and S37G (Group 3).
The samples whose measurements were made using LISST in-struments were diluted in distilled water filling the testing chamber.During measurements, the water–sediment mixture was stirredcontinuously using a magnetic stirrer (see Fig. 1). As the coarse particleconcentration increased, the mixture was also manually stirred. Thesediment sampleswithhigh content of coarsematerial (E1, SP1, SP2, PR,AM137, AM165 and AM215) were gradually dumped on the sensorlenses, according to Traykovski et al. (1999). All testswere performed atconstant environment light and temperature (25 °C) conditions, andunder homogeneous mixture conditions, avoiding density gradients inthe suspension.
In every test, SMD, SMDg, SSC, SSCg and OT values were obtained atfixed intervals.
Model 1 was set to make a total of 40 measurements per sample ata sampling rate of 5 s, andmodel 2 to make a total of 20 measurementsper sample at a sampling rate of 2 s. For each sediment sample, themean values and the SMD variation coefficient (CV) were determined(CV is defined as the ratio between the standard deviation of the SMDmeasurement and the SMD mean value). Four samples, E1, E2, B41 andB58, were tested with both LISST equipments (models 1 and 2).
3. Results
3.1. Comparison between SMD obtained with LISST and Malverninstruments
Table 2 summarizes the major results of the tested samples. Itshows the corresponding mean sizes (SMD, SMDg), variation co-efficients (CV SMD) andmean concentration values (SSC, SSCg/SSC, OT)measured with the LISST-25X instruments, as well as the d10, d50, d90and SMD measured with Malvern.

0%
20%
40%
60%
80%
100%
AM
P5H
3G1
B41
B35
B49
B28
AM
P5H
1G4
B22
B58
S25b
S19F
AM
P5H
3G4
S25b
FP
RF
S36F
S37F
AM
P5H
1G1
S28b
FS2
8aF
S24C
FS2
9F E2
S29
S36
S23
S28a
S28b
S37O
RS
P1
S37G
AM
76S
P2
AM
107
AM
137
AM
165
AM
215
PR E1
9<Ø (clay) 7< Ø< 9 (very fine silt) 6< Ø< 7 (fine silt)5< Ø< 6 (mean silt) 4< Ø< 5 (coarse silt) 3< Ø< 4 (very fine sand)1< Ø< 3 (fine to very coarse sand)
Group 1 Group 2 Group 3
Fig. 2. Granulometric composition of samples obtained withMalvernMastersizer. Percentages of clay, very fine silt, fine silt, mean silt, coarse silt, very fine sand, fine and coarse sand.
271L. Filippa et al. / Sedimentary Geology 238 (2011) 268–276
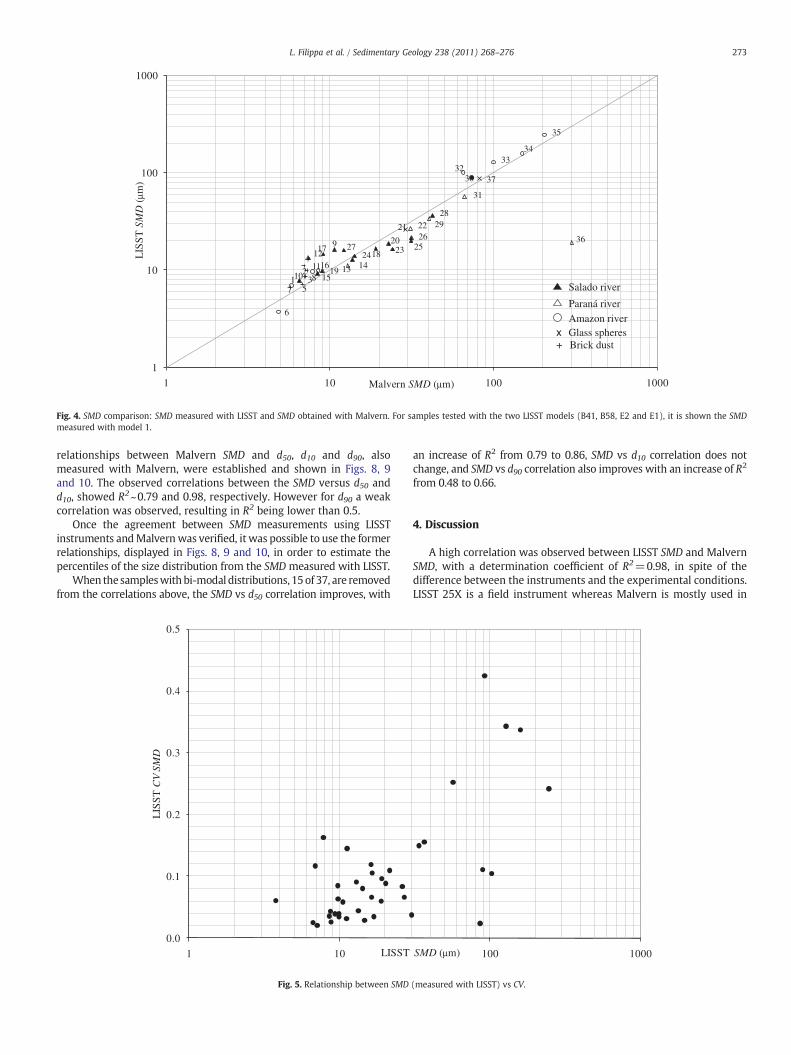
Fig. 4 compares the SMDmeasured using the two LISST-25X sensorsto the SMDmeasuredwith theMalvern diffractometer. The SMD rangedfrom 4 to 300 μm, approximately. The correlation coefficient wasR2=0.98. The PR sample was excluded from this correlation due to itshigh sand content (Fig. 2).
From the comparison shown in Fig. 4, it is possible to note that forsmaller sizes (SMDb20 μm) the diameters measured with LISST tend
0
10
20
30
40
50
60
70
80
90
100
0.01 0.1 1 1
% V
olum
e
Particle
Amazon (AMP5H3G1)
Parana (PRF)
Salado (S37G)
Fig. 3. Granulometric curves corresponding to indicative samples of each s
to be larger than those measured with Malvern. For instance, this wasthe case with B49, B41, S25bF and S28bF samples (Groups 1 and 2)because they had a high percentage of fine material, 99, 99, 85 and82%, respectively. The maximum relative difference observed be-tween the measured SMDwas 80% (5.9 μm, for the S25bF sample). Forlarger sizes, the SMD measured with LISST showed lower results thanthose measured with Malvern. Belonging to this group (Group 3) are
0 100 1000 10000
Size (µm)
ubgroup: AMP5H3G1 (Group 1), PRF (Group 2) and S37G (Group 3).
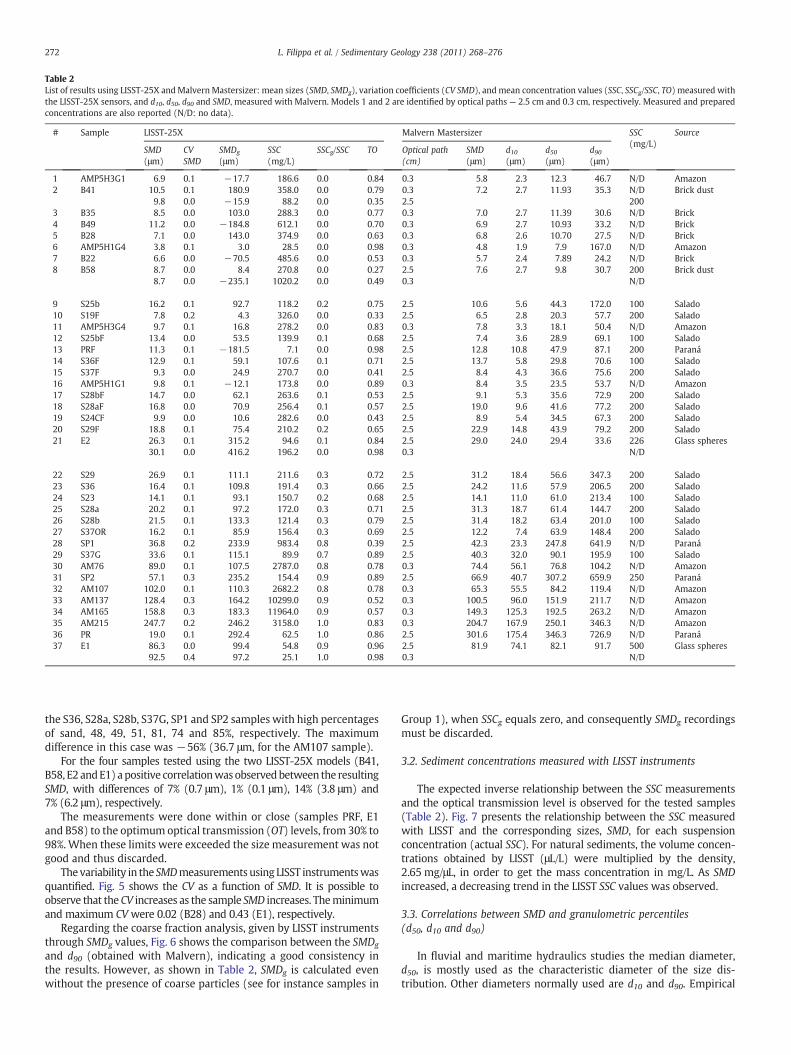
Table 2List of results using LISST-25X andMalvernMastersizer: mean sizes (SMD, SMDg), variation coefficients (CV SMD), and mean concentration values (SSC, SSCg/SSC, TO) measured withthe LISST-25X sensors, and d10, d50, d90 and SMD, measured with Malvern. Models 1 and 2 are identified by optical paths — 2.5 cm and 0.3 cm, respectively. Measured and preparedconcentrations are also reported (N/D: no data).
# Sample LISST-25X Malvern Mastersizer SSC(mg/L)
Source
SMD(μm)
CVSMD
SMDg
(μm)SSC(mg/L)
SSCg/SSC TO Optical path(cm)
SMD(μm)
d10(μm)
d50(μm)
d90(μm)
1 AMP5H3G1 6.9 0.1 −17.7 186.6 0.0 0.84 0.3 5.8 2.3 12.3 46.7 N/D Amazon2 B41 10.5 0.1 180.9 358.0 0.0 0.79 0.3 7.2 2.7 11.93 35.3 N/D Brick dust
9.8 0.0 −15.9 88.2 0.0 0.35 2.5 2003 B35 8.5 0.0 103.0 288.3 0.0 0.77 0.3 7.0 2.7 11.39 30.6 N/D Brick4 B49 11.2 0.0 −184.8 612.1 0.0 0.70 0.3 6.9 2.7 10.93 33.2 N/D Brick5 B28 7.1 0.0 143.0 374.9 0.0 0.63 0.3 6.8 2.6 10.70 27.5 N/D Brick6 AMP5H1G4 3.8 0.1 3.0 28.5 0.0 0.98 0.3 4.8 1.9 7.9 167.0 N/D Amazon7 B22 6.6 0.0 −70.5 485.6 0.0 0.53 0.3 5.7 2.4 7.89 24.2 N/D Brick8 B58 8.7 0.0 8.4 270.8 0.0 0.27 2.5 7.6 2.7 9.8 30.7 200 Brick dust
8.7 0.0 −235.1 1020.2 0.0 0.49 0.3 N/D
9 S25b 16.2 0.1 92.7 118.2 0.2 0.75 2.5 10.6 5.6 44.3 172.0 100 Salado10 S19F 7.8 0.2 4.3 326.0 0.0 0.33 2.5 6.5 2.8 20.3 57.7 200 Salado11 AMP5H3G4 9.7 0.1 16.8 278.2 0.0 0.83 0.3 7.8 3.3 18.1 50.4 N/D Amazon12 S25bF 13.4 0.0 53.5 139.9 0.1 0.68 2.5 7.4 3.6 28.9 69.1 100 Salado13 PRF 11.3 0.1 −181.5 7.1 0.0 0.98 2.5 12.8 10.8 47.9 87.1 200 Paraná14 S36F 12.9 0.1 59.1 107.6 0.1 0.71 2.5 13.7 5.8 29.8 70.6 100 Salado15 S37F 9.3 0.0 24.9 270.7 0.0 0.41 2.5 8.4 4.3 36.6 75.6 200 Salado16 AMP5H1G1 9.8 0.1 −12.1 173.8 0.0 0.89 0.3 8.4 3.5 23.5 53.7 N/D Amazon17 S28bF 14.7 0.0 62.1 263.6 0.1 0.53 2.5 9.1 5.3 35.6 72.9 200 Salado18 S28aF 16.8 0.0 70.9 256.4 0.1 0.57 2.5 19.0 9.6 41.6 77.2 200 Salado19 S24CF 9.9 0.0 10.6 282.6 0.0 0.43 2.5 8.9 5.4 34.5 67.3 200 Salado20 S29F 18.8 0.1 75.4 210.2 0.2 0.65 2.5 22.9 14.8 43.9 79.2 200 Salado21 E2 26.3 0.1 315.2 94.6 0.1 0.84 2.5 29.0 24.0 29.4 33.6 226 Glass spheres
30.1 0.0 416.2 196.2 0.0 0.98 0.3 N/D
22 S29 26.9 0.1 111.1 211.6 0.3 0.72 2.5 31.2 18.4 56.6 347.3 200 Salado23 S36 16.4 0.1 109.8 191.4 0.3 0.66 2.5 24.2 11.6 57.9 206.5 200 Salado24 S23 14.1 0.1 93.1 150.7 0.2 0.68 2.5 14.1 11.0 61.0 213.4 100 Salado25 S28a 20.2 0.1 97.2 172.0 0.3 0.71 2.5 31.3 18.7 61.4 144.7 200 Salado26 S28b 21.5 0.1 133.3 121.4 0.3 0.79 2.5 31.4 18.2 63.4 201.0 100 Salado27 S37OR 16.2 0.1 85.9 156.4 0.3 0.69 2.5 12.2 7.4 63.9 148.4 200 Salado28 SP1 36.8 0.2 233.9 983.4 0.8 0.39 2.5 42.3 23.3 247.8 641.9 N/D Paraná29 S37G 33.6 0.1 115.1 89.9 0.7 0.89 2.5 40.3 32.0 90.1 195.9 100 Salado30 AM76 89.0 0.1 107.5 2787.0 0.8 0.78 0.3 74.4 56.1 76.8 104.2 N/D Amazon31 SP2 57.1 0.3 235.2 154.4 0.9 0.89 2.5 66.9 40.7 307.2 659.9 250 Paraná32 AM107 102.0 0.1 110.3 2682.2 0.8 0.78 0.3 65.3 55.5 84.2 119.4 N/D Amazon33 AM137 128.4 0.3 164.2 10299.0 0.9 0.52 0.3 100.5 96.0 151.9 211.7 N/D Amazon34 AM165 158.8 0.3 183.3 11964.0 0.9 0.57 0.3 149.3 125.3 192.5 263.2 N/D Amazon35 AM215 247.7 0.2 246.2 3158.0 1.0 0.83 0.3 204.7 167.9 250.1 346.3 N/D Amazon36 PR 19.0 0.1 292.4 62.5 1.0 0.86 2.5 301.6 175.4 346.3 726.9 N/D Paraná37 E1 86.3 0.0 99.4 54.8 0.9 0.96 2.5 81.9 74.1 82.1 91.7 500 Glass spheres
92.5 0.4 97.2 25.1 1.0 0.98 0.3 N/D
272 L. Filippa et al. / Sedimentary Geology 238 (2011) 268–276
the S36, S28a, S28b, S37G, SP1 and SP2 samples with high percentagesof sand, 48, 49, 51, 81, 74 and 85%, respectively. The maximumdifference in this case was −56% (36.7 μm, for the AM107 sample).
For the four samples tested using the two LISST-25X models (B41,B58, E2 andE1) apositive correlationwasobservedbetween the resultingSMD, with differences of 7% (0.7 μm), 1% (0.1 μm), 14% (3.8 μm) and7% (6.2 μm), respectively.
The measurements were done within or close (samples PRF, E1and B58) to the optimum optical transmission (OT) levels, from 30% to98%. When these limits were exceeded the size measurement was notgood and thus discarded.
The variability in the SMDmeasurements using LISST instrumentswasquantified. Fig. 5 shows the CV as a function of SMD. It is possible toobserve that the CV increases as the sample SMD increases. Theminimumand maximum CVwere 0.02 (B28) and 0.43 (E1), respectively.
Regarding the coarse fraction analysis, given by LISST instrumentsthrough SMDg values, Fig. 6 shows the comparison between the SMDg
and d90 (obtained with Malvern), indicating a good consistency inthe results. However, as shown in Table 2, SMDg is calculated evenwithout the presence of coarse particles (see for instance samples in
Group 1), when SSCg equals zero, and consequently SMDg recordingsmust be discarded.
3.2. Sediment concentrations measured with LISST instruments
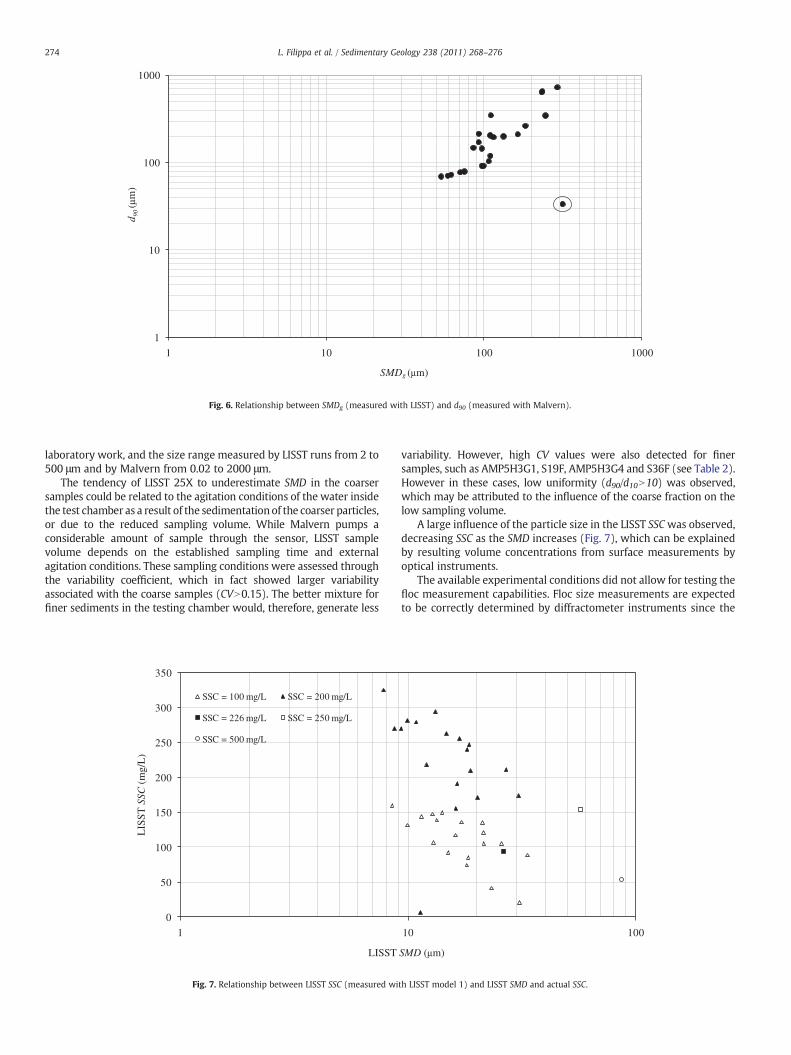
The expected inverse relationship between the SSC measurementsand the optical transmission level is observed for the tested samples(Table 2). Fig. 7 presents the relationship between the SSC measuredwith LISST and the corresponding sizes, SMD, for each suspensionconcentration (actual SSC). For natural sediments, the volume concen-trations obtained by LISST (μL/L) were multiplied by the density,2.65 mg/μL, in order to get the mass concentration in mg/L. As SMDincreased, a decreasing trend in the LISST SSC values was observed.
3.3. Correlations between SMD and granulometric percentiles(d50, d10 and d90)
In fluvial and maritime hydraulics studies the median diameter,d50, is mostly used as the characteristic diameter of the size dis-tribution. Other diameters normally used are d10 and d90. Empirical
12
3
4
5
6
78
9
1011
12
13 141516
1718
19
20
21 22
2324
2526
27
2829
30
31
3233
34
35
36
37
1
10
100
1000
1 10 100 1000
LIS
ST
SM
D (
µm)
Malvern SMD (µm)
Salado river
Paraná riverAmazon river
x Glass spheres+ Brick dust
Fig. 4. SMD comparison: SMD measured with LISST and SMD obtained with Malvern. For samples tested with the two LISST models (B41, B58, E2 and E1), it is shown the SMDmeasured with model 1.
273L. Filippa et al. / Sedimentary Geology 238 (2011) 268–276
relationships between Malvern SMD and d50, d10 and d90, alsomeasured with Malvern, were established and shown in Figs. 8, 9and 10. The observed correlations between the SMD versus d50 andd10, showed R2~0.79 and 0.98, respectively. However for d90 a weakcorrelation was observed, resulting in R2 being lower than 0.5.
Once the agreement between SMD measurements using LISSTinstruments andMalvernwas verified, it was possible to use the formerrelationships, displayed in Figs. 8, 9 and 10, in order to estimate thepercentiles of the size distribution from the SMD measured with LISST.
When thesampleswith bi-modal distributions, 15of 37, are removedfrom the correlations above, the SMD vs d50 correlation improves, with
0.0
0.1
0.2
0.3
0.4
0.5
1 10
LIS
ST
CV
SM
D
LISST
Fig. 5. Relationship between SMD
an increase of R2 from 0.79 to 0.86, SMD vs d10 correlation does notchange, and SMD vs d90 correlation also improves with an increase of R2
from 0.48 to 0.66.
4. Discussion
A high correlation was observed between LISST SMD and MalvernSMD, with a determination coefficient of R2=0.98, in spite of thedifference between the instruments and the experimental conditions.LISST 25X is a field instrument whereas Malvern is mostly used in
100 1000 SMD (µm)
(measured with LISST) vs CV.
1
10
100
1000
1 10 100 1000
d 90 (µ
m)
SMDg (µm)
Fig. 6. Relationship between SMDg (measured with LISST) and d90 (measured with Malvern).
274 L. Filippa et al. / Sedimentary Geology 238 (2011) 268–276
laboratory work, and the size range measured by LISST runs from 2 to500 μm and by Malvern from 0.02 to 2000 μm.
The tendency of LISST 25X to underestimate SMD in the coarsersamples could be related to the agitation conditions of the water insidethe test chamber as a result of the sedimentationof the coarser particles,or due to the reduced sampling volume. While Malvern pumps aconsiderable amount of sample through the sensor, LISST samplevolume depends on the established sampling time and externalagitation conditions. These sampling conditions were assessed throughthe variability coefficient, which in fact showed larger variabilityassociated with the coarse samples (CVN0.15). The better mixture forfiner sediments in the testing chamber would, therefore, generate less
0
50
100
150
200
250
300
350
1
LIS
ST S
SC (
mg/
L)
LISST
SSC = 100 mg/L SSC = 200 mg/L
SSC = 226 mg/L SSC = 250 mg/L
SSC = 500 mg/L
Fig. 7. Relationship between LISST SSC (measured wi
variability. However, high CV values were also detected for finersamples, such as AMP5H3G1, S19F, AMP5H3G4 and S36F (see Table 2).However in these cases, low uniformity (d90/d10N10) was observed,which may be attributed to the influence of the coarse fraction on thelow sampling volume.
A large influence of the particle size in the LISST SSCwas observed,decreasing SSC as the SMD increases (Fig. 7), which can be explainedby resulting volume concentrations from surface measurements byoptical instruments.
The available experimental conditions did not allow for testing thefloc measurement capabilities. Floc size measurements are expectedto be correctly determined by diffractometer instruments since the
10 100
SMD (µm)
th LISST model 1) and LISST SMD and actual SSC.

d50 = 3.4 SMD0.83
R2 = 0.79
1
10
100
1000
1 10 100 1000
d 50 (µ
m)
Malvern SMD (µm)
Fig. 8. Relationship between SMD and d50, both measured with Malvern.
275L. Filippa et al. / Sedimentary Geology 238 (2011) 268–276
density of the particles will not interfere with the measurements.However, for suspended sediment concentration measurements,flocculation can be an extra factor limiting their usage.
5. Conclusions
The comparison between the SMD obtained with the LISST-25X(models 1 and 2) and the Malvern diffractometers showed that insamples bigger than 20 μm, the LISST instrument underestimated thevalues measured with the Malvern instrument; whereas, in samples
1
10
100
1000
1 10
d 10 (µ
m)
Malvern S
Fig. 9. Relationship between SMD and
smaller than 20 μm, the LISST instrument overestimated the valuesmeasured with the Malvern instrument. However, the relationshipbetween the diffractometers was highly satisfactory, with a determi-nation coefficient of R2=0.98.
The observed results may indicate that where the mentionedsampling constraints do not appear, LISST-25X particle size measure-ments in natural water bodies improve. It is important to emphasizethe need for following the recommended optical transmission, withinthe optimum levels: 30% to 98%, which can be restrictive for manynatural environments.
d10 = 0.31 SMD1.2
R2 = 0.98
100 1000MD (µm)
d10, both measured with Malvern.

d90 = 17.5 SMD0.57
R2 = 0.48
1
10
100
1000
1 10 100 1000
d 90 (µ
m)
Malvern SMD (µm)
Fig. 10. Relationship between SMD and d90, both measured with Malvern.
276 L. Filippa et al. / Sedimentary Geology 238 (2011) 268–276
Satisfactory correlations were established between SMD and othercharacteristic diameters of the granulometric distribution, such as withd10, d50 and d90, all measured with Malvern. Therefore, it is possible toextend these correlations to the SMD obtained with LISST-25X and touse them to calculate the granulometric parameters of samples.
Acknowledgments
This work was supported by the Universidad Nacional del Litoral(UNL) and the Agencia Nacional de Promoción Científica y Tecnológica(ANPyCT) grant PICT 35885 to Dr. Alfredo Trento. Leonardo Filippa andLuana Freire receive PhD scholarships from ANPCyT, Agencia Nacionalde Promoción Científica y Tecnológica, Argentina, and FAPERJ, Fundaçãode Amparo à Pesquisa do Estado do Rio de Janeiro, Brazil, respectively.Marcos Gallo is supported through the Pos-doc program PNPD/CAPES,Coordenação de Aperfeiçoamento de Pessoal de Nível Superior, Brazil.The authors are also grateful to the Laboratório de Geofísica Marinha(UERJ, Universidade Estadual do Rio de Janeiro, Brazil) for the use of theMalvern instrument.
References
Agrawal, Y.C., Mikkelsen, O.A., 2009. Shaped focal plane detectors for particleconcentration and mean size observations. Optics Express, Optical Society of America17, 23066–23077.
Agrawal, Y.C., Pottsmith, H.C., 1994. Laser diffraction particle sizing in STRESS.Continental Shelf Research 14, 1101–1112.
Agrawal, Y.C., Whitmire, A., Mikkelsen, O.A., Pottsmith, H.C., 2008. Light scattering byrandom shaped particles and consequences on measuring suspended sediments bylaser diffraction. Journal of Geophysical Research 113, 1–11.
Dyer, K.R., Manning, A.J., 1999. Observation of the size, settling velocity and effectivedensity of flocs, and their fractal dimensions. Journal of Sea Research 41, 87–95.
Eisma, D., Bale, A.J., Dearnaley, M.P., Fennessy, M.J. Van, Leussen, W., Maldiney, M.A.,Pfeiffer, A., Wells, J.T., 1996. Intercomparison of in situ suspended matter (floc) sizemeasurements. Journal of Sea Research 36 (1/2), 3–14.
Gartner, J., Cheng, R., Wang, P., Richter, K., 2001. Laboratory and field evaluations of theLISST-100 instrument for suspended particles size determinations. InternationalJournal of Marine Geology, Geochemistry and Geophysics 175, 199–219.
Kumar, R.G., Strom, K.B., Keyvani, A., 2010. Floc properties and settling velocity of SanJacinto estuary mud under variable shear and salinity conditions. Continental ShelfResearch 30, 2067–2081.
Lynch, J.F., Irish, J.D., Sherwood, C.R., Agrawal, Y.C., 1993. Determining suspendedsediment particle size information from acoustical and optical backscattermeasurements. Continental Shelf Research 14 (10/11), 1139–1165.
Manning, A. J., Mietta, F., & Winterwerp, J.C., 2009. An examination of the flocculationproperties of natural cohesive sediment from the Scheldt estuary. In Proc. of 10thInternational Conference on Cohesive Sediment Transport Processes (INTERCOH 09).Río de Janeiro, Brasil.
Mietta, F., Chassagne, C., Winterwerp, J.C., 2009. Shear-induced flocculation of asuspension of kaolinite as function of pH and salt concentration. Journal of Colloidand Interface Science 336, 134–141.
Murray, D.M., Holtum, D.A., 1996. Inter-conversion of Malvern and sieve sizedistributions. Minerals Engineering 9 (12), 1263–1268.
Pacek, A.W., Man, C.C., Nienow, A.W., 1998. On the Sauter mean diameter and sizedistribution in turbulent liquid/liquid dispersions in a stirred vessel. ChemicalEngineering Science 53, 2005–2011.
Rawle, A., 2010. Basic principles of particle size analysis. Technical report, bhttp://www.malvern.com/malvern/kbase.nsf/allbyno/KB000021/$file/Basic_principles_of_particle_size_analysis_MRK034-low_res.pdfN.
Sequoia, 2008. Operating principle of the LISST-25 constant calibration sedimentsensor, bhttp://sequoiasci.com/ArticlesN.
Sequoia, 2009. LISST – 25 User's Guide, bhttp://sequoiasci.comN.Shen, H.W., Julien, P.Y., 1993. Erosion and sediment transport. In: Maidment, D. (Ed.),
Handbook of Hydrology. McGraw-Hill Inc.Stramski, D., 2006. Parallel Measurements of Light Scattering and Characterization of
Marine Particles in Water: An Evaluation of Methodology, http://www.mpl.ucsd.edu/people/stramski.
Topping, D., Wright, S. A., Melis, T. S., & Rubin, D. M., 2006. High resolution monitoringof suspended sediment concentration and grain size in the Colorado river usinglaser diffraction instruments and a three-frequency acoustic system. Final Proc. of5th Symposium, Federal Interagency Sedimentation Comm., Reno, NV.
Traykovski, P., Latter, R., Irish, J., 1999. A laboratory evaluation of the laser in situ scatteringand transmissometery instrument using natural sediments. International Journal ofMarine Geology, Geochemistry and Geophysic 159, 355–367.