La nature et l'évolution du contact entre le Domaine de Kovik ...
79
© Thierry Karl Gélinas, 2022 La nature et l’évolution du contact entre le Domaine de Kovik et le Domaine Nord, Orogène de l’Ungava, Nord du Québec Mémoire Thierry Karl Gélinas Maîtrise interuniversitaire en sciences de la Terre - avec mémoire Maître ès sciences (M. Sc.) Québec, Canada
-
Upload
khangminh22 -
Category
Documents
-
view
0 -
download
0
Transcript of La nature et l'évolution du contact entre le Domaine de Kovik ...
© Thierry Karl Gélinas, 2022
La nature et l’évolution du contact entre le Domaine de Kovik et le Domaine Nord, Orogène de l’Ungava, Nord
du Québec
Mémoire
Thierry Karl Gélinas
Maîtrise interuniversitaire en sciences de la Terre - avec mémoire
Maître ès sciences (M. Sc.)
Québec, Canada
La nature et l’évolution du contact entre le Domaine de
Kovik et le Domaine Nord, Orogène de l’Ungava, Nord du
Québec
Mémoire par insertion d’article
Thierry Karl Gélinas
Sous la direction de :
Carl Guilmette, directeur de recherche
Kyle Larson, codirecteur de recherche
ii
Résumé
L’Orogène de l’Ungava correspond à la branche nord-est de l’Orogène Trans-Hudsonien et
est situé sur la péninsule de l’Ungava dans le nord du Québec. La présence d’une éclogite de
1,8 Ga au sein du Domaine de Kovik dans l’Orogène de l’Ungava a été utilisée pour proposer
une tectonique des plaques moderne active au Paléoprotérozoïque. Cette étude vise à
contraindre la cinématique, la température et la chronologie de la déformation associée à une
structure interprétée comme ayant permis l’exhumation de cette éclogite, la zone de
cisaillement séparant le Domaine de Kovik du Domaine Nord. Nous avons combiné les
observations de terrain le long de transects à travers le contact entre le Domaine de Kovik et
le Domaine Nord, l’analyse microstructurale du quartz et de la titanite et des datations U-Pb
sur titanite. Deux zones de cisaillement, localisées dans les orthogneiss du domaine de Kovik,
ont été identifiées. La zone de cisaillement principale, distale au contact, est caractérisée par
une cinématique de sommet-vers-le-sud et des fabriques d’axes-c du quartz associées à une
déformation en aplatissement. La zone de cisaillement secondaire, proximale au contact, est
caractérisée par une cinématique de sommet-vers-le-nord et des fabriques d’axes-c du quartz
associées à une déformation plane. La température de déformation est contrainte à 627 et 580
± 50°C pour les zones de cisaillement principale et secondaire, respectivement. La
géochronologie U-Pb sur titanite a permis de définir deux populations de titanite. La vielle
population, contrainte à 1890 Ma, est contemporaine de la mise en place de la grande
province ignée du Circum-Supérieur. La jeune population, contrainte à 1740 Ma, est
interprétée comme représentant la réinitialisation de la vieille population pendant un épisode
de déformation tardive possiblement relié à l’effondrement de l’orogène. Nous interprétons
que le contact entre le Domaine de Kovik et le Domaine Nord représente un détachement.
iii
Table des matières
Résumé ................................................................................................................................... ii
Table des matières ................................................................................................................. iii
Liste des figures ...................................................................................................................... v
Liste des tableaux .................................................................................................................. vi
Remerciements .................................................................................................................... viii
Avant-propos ......................................................................................................................... ix
Introduction ............................................................................................................................ 1
Contexte géologique ............................................................................................................ 2
Chapitre 1: Constraining the nature and timing of the contact between the Kovik Domain
and Northern Domain, Ungava Orogen, Northern Québec .................................................... 5
1.1 Résumé .......................................................................................................................... 5
1.2 Abstract ......................................................................................................................... 6
1.3 Introduction ................................................................................................................... 7
1.4 Geological setting ......................................................................................................... 8
1.4.1 The Ungava Orogen ............................................................................................... 8
1.4.2 Tectonic and metamorphic history of the Kovik Domain .................................... 12
1.5 Field observations and sampling ................................................................................. 15
1.6 Methodology ............................................................................................................... 18
1.6.1 Petrography .......................................................................................................... 18
1.6.2 Quartz c-axis analysis........................................................................................... 19
1.6.3 Opening angle and deformation temperature ....................................................... 19
1.6.4 μ-XRF Maps and titanite grains imaging (EPMA/EBSD) ................................... 20
1.6.5 U-Pb geochronology and geochemistry by Laser Ablation Inductively Coupled
Plasma Mass Spectrometry (LA-ICPMS) ..................................................................... 21
1.6.6 Zr-in-titanite thermometry.................................................................................... 22
1.7 Results ......................................................................................................................... 22
1.7.1 Petrography and microstructures .......................................................................... 22
1.7.2 Quartz c-axis analysis........................................................................................... 26
1.7.3 Opening angles and deformation temperature ..................................................... 29
1.7.4 Microstructural features and trace element zoning of titanite .............................. 30
iv
1.7.5 Titanite U-Pb geochronology ............................................................................... 31
1.7.6 Zr-in-titanite thermometer .................................................................................... 33
1.8 Discussion ................................................................................................................... 34
1.8.1 Microstructures and temperature of deformation ................................................. 34
1.8.2 Structural interpretations ...................................................................................... 35
1.8.3 Interpretation of titanite geochronology ............................................................... 37
1.8.4 Evolution of the contact between the Kovik Domain and the Northern Domain 40
1.8.5 Comparison between the Kovik Domain and the Tso Morari Nappe .................. 40
1.9 Conclusion .................................................................................................................. 42
1.10 Acknowledgements ................................................................................................... 44
1.11 References ................................................................................................................. 45
1.12 Supplementary data: BSE, EPMA, EBSD and tables ............................................... 45
Conclusion ............................................................................................................................ 61
Bibliographie ........................................................................................................................ 63

v
Liste des figures
Figure 1: Simplified geological map of the Ungava Orogen in northern Québec, Canada
…………………………………………………………...…………………………………11
Figure 2: Comparison between the regional antiform model of the Kovik Domain and the
upper crustal features of many ultra-high-pressure rocks complex.
…………………………………………………………...…………………………………14
Figure 3: Field observation photos…………………………………………………………17
Figure 4: Schematic cross section across the Kovik Domain and Northern Domain Contact
……….…………………………………………………………………………...………...18
Figure 5: Microstructural and textural observations in thin section………………………24
Figure 6: Kinematic indicators from the lower shear zone and the upper shear zone…….25
Figure 7: Lower hemispherical, equal area projections of quartz c-axis fabrics from the USZ
and LSZ…………………………………………………………………………………….28
Figure 8: Temperatures of deformation of each fabric along the transects projected with
respect to their horizontal distance from the Kovik Domain and Northern Domain
contact……………………………………………………………………………………...29
Figure 9: BSE, EPMA, misorientation and kernel average misorientation maps of titanite in
the LSZ……………………………………………………………………………………..31
Figure 10: Tera-Waserburg diagrams of specimens TG-4015, TG-4022 and TG-4023…..33
Figure 11: Calculated temperature of crystallization of titanite from Zr-in-titanite
thermometry.…………………………………………..………………………...…………34
Figure A1: Y distribution, BSE, misorientation and KAM maps from titanite TG-4015-4 and
TG-4015-1 with the 238U/206Pb corrected for the 207Pb age plotted…………………….50
Figure A2: Y distribution, BSE, misorientation and KAM maps from titanite TG-4015-2
with the 238U/206Pb corrected for the 207Pb age plotted………………………………… 51
Figure A3: Y distribution, BSE, misorientation and KAM maps from titanite TG-4022-1
with the 238U/206Pb corrected for the 207Pb age plotted…………………………………52
Figure A4: Y distribution, BSE, misorientation and KAM maps from titanite TG-4023-6 and
TG-4023-7 with the 238U/206Pb corrected for the 207Pb age plotted…………………….53
Figure A5: Y distribution, BSE, misorientation and KAM maps from titanite TG-4023-4 and
TG-4023-2 with the 238U/206Pb corrected for the 207Pb age plotted……………………54
vi
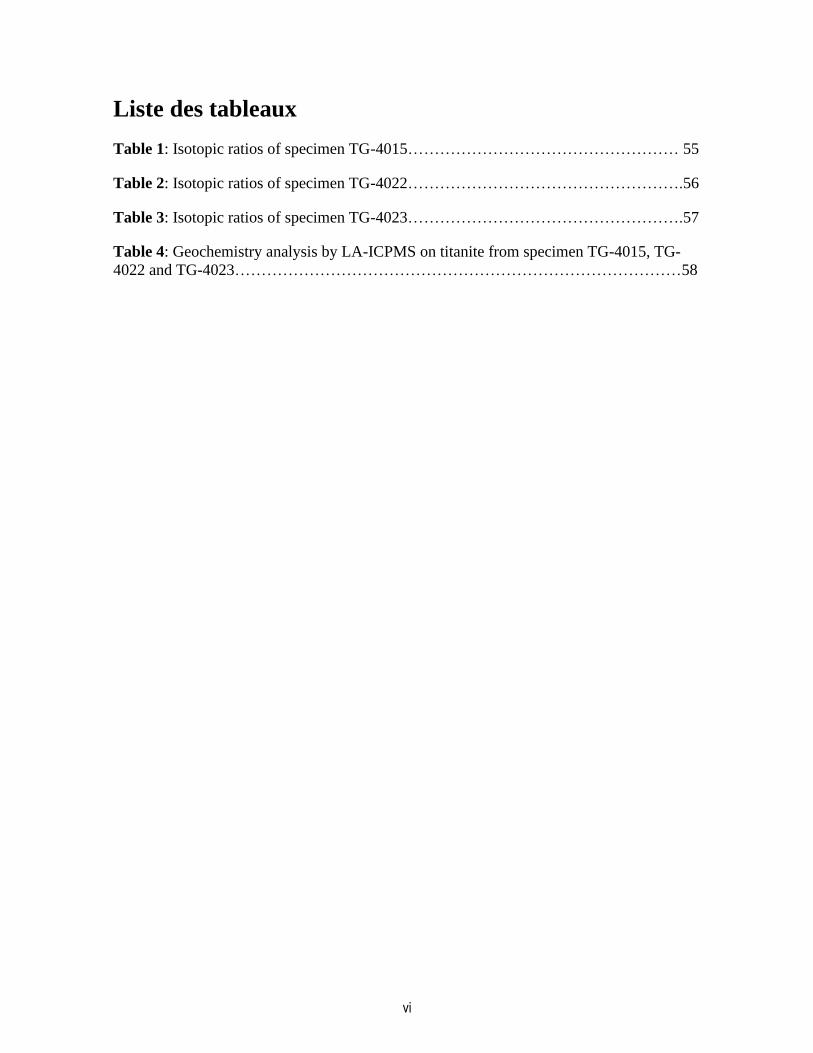
Liste des tableaux
Table 1: Isotopic ratios of specimen TG-4015…………………………………………… 55
Table 2: Isotopic ratios of specimen TG-4022…………………………………………….56
Table 3: Isotopic ratios of specimen TG-4023…………………………………………….57
Table 4: Geochemistry analysis by LA-ICPMS on titanite from specimen TG-4015, TG-
4022 and TG-4023…………………………………………………………………………58
vii
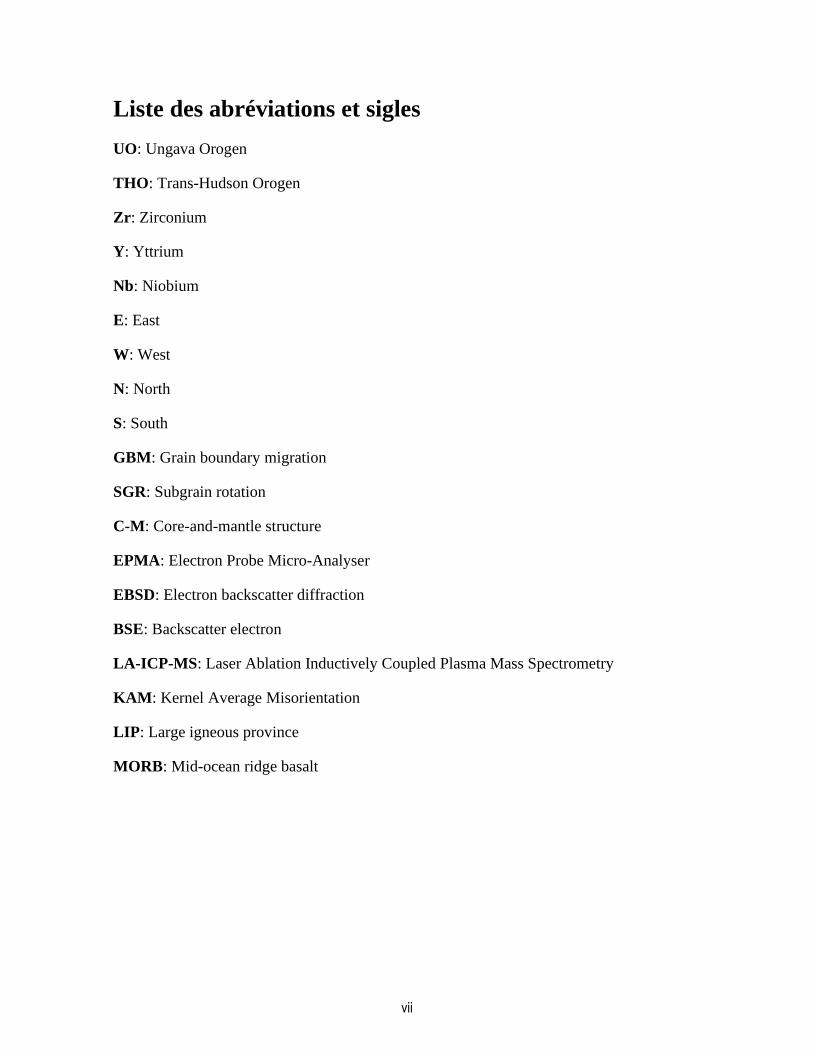
Liste des abréviations et sigles
UO: Ungava Orogen
THO: Trans-Hudson Orogen
Zr: Zirconium
Y: Yttrium
Nb: Niobium
E: East
W: West
N: North
S: South
GBM: Grain boundary migration
SGR: Subgrain rotation
C-M: Core-and-mantle structure
EPMA: Electron Probe Micro-Analyser
EBSD: Electron backscatter diffraction
BSE: Backscatter electron
LA-ICP-MS: Laser Ablation Inductively Coupled Plasma Mass Spectrometry
KAM: Kernel Average Misorientation
LIP: Large igneous province
MORB: Mid-ocean ridge basalt

viii
Remerciements
Un petit merci à François pour ses conseils sur la pêche à la mouche et à Sacha pour son
amour des grands discours sur l’amour. Un grand merci à Alexandra pour son support et ses
beaux yeux et une mention honorable à la pandémie de Covid 19 sans qui, ce mémoire aurait
déjà été terminé.
ix
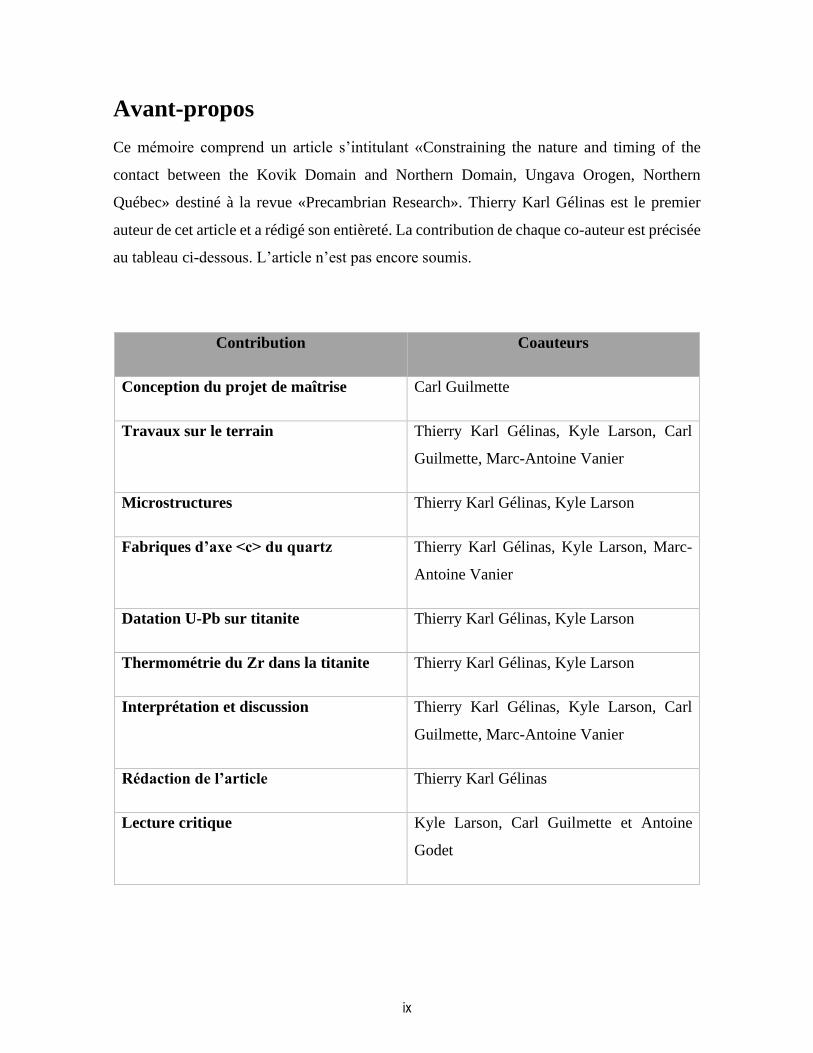
Avant-propos
Ce mémoire comprend un article s’intitulant «Constraining the nature and timing of the
contact between the Kovik Domain and Northern Domain, Ungava Orogen, Northern
Québec» destiné à la revue «Precambrian Research». Thierry Karl Gélinas est le premier
auteur de cet article et a rédigé son entièreté. La contribution de chaque co-auteur est précisée
au tableau ci-dessous. L’article n’est pas encore soumis.
Contribution Coauteurs
Conception du projet de maîtrise Carl Guilmette
Travaux sur le terrain Thierry Karl Gélinas, Kyle Larson, Carl
Guilmette, Marc-Antoine Vanier
Microstructures Thierry Karl Gélinas, Kyle Larson
Fabriques d’axe <c> du quartz Thierry Karl Gélinas, Kyle Larson, Marc-
Antoine Vanier
Datation U-Pb sur titanite Thierry Karl Gélinas, Kyle Larson
Thermométrie du Zr dans la titanite Thierry Karl Gélinas, Kyle Larson
Interprétation et discussion Thierry Karl Gélinas, Kyle Larson, Carl
Guilmette, Marc-Antoine Vanier
Rédaction de l’article Thierry Karl Gélinas
Lecture critique Kyle Larson, Carl Guilmette et Antoine
Godet

1
Introduction
Les processus associés aux mouvements des plaques tectoniques sont relativement bien
compris. Toutefois, le moment de l’initiation de la tectonique des plaques est l’un des sujets
les plus controversés en géosciences. La récente découverte d’un fragment éclogitique dans
l’Orogène de l’Ungava (OU) au Canada et plus précisément dans le Domaine de Kovik est
interprétée comme le signe qu’une tectonique des plaques modernes était déjà établie au
Paléoprotérozoïque (Weller and St-Onge, 2017). L’OU est la branche nord-est de l’Orogène
Trans-Hudsonien (OTH). L’OTH est considéré comme étant l’un des Cycles de Wilson le
mieux préservé sur Terre (Corrigan et al., 2009) et résulte de la collision entre la plaque
inférieure du Supérieur et de l’amalgamation de micro-continents et de croûte juvénile
formant la plaque supérieure du Churchill (Corrigan et al, 2009; St‐Onge et al., 2006).
Plusieurs auteurs considèrent l’OTH comme un analogue ancien à l’Orogène de l’Himalaya-
Tibet (OHT) sur la base de leurs géométries et de leurs évolutions temporelle, structurale,
magmatique et thermale (Corrigan et al., 2009; Corrigan et al., 2021; St‐Onge et al., 2006;
Weller et St-Onge, 2017). Notamment, l’association spatiale du Domaine de Kovik et du
Domaine de Nord, hôte d’un fragment éclogitique et d’une ophiolite, respectivement, a été
utilisée comme analogue au complexe de roche d’ultra-haute pression (UHP) du Tso Morari
dans l’OTH (Weller and St-Onge, 2017).
L’histoire tectono-métamorphique de la Nappe du Tso Morari est bien caractérisée et sa
configuration actuelle a été atteinte rapidement après la collision initiale entre l’Inde et l’Asie
(Leech et al., 2005; Epard et Steck, 2008). À l’inverse, l’exhumation du Domaine de Kovik
est moins bien contrainte avec quelques âges Ar40/Ar39 sur micas et hornblende indiquant un
refroidissement de plusieurs dizaines de millions d’années après la collision (Kellett et al.
2020; Skipton et al., 2020). La nature et la chronologie de l’activité de la zone de cisaillement
séparant le Domaine de Kovik et le Domaine Nord sont inconnues et pourraient s’avérer
importantes quant à la compréhension des processus tectoniques actifs au
Paléoprotérozoïque.
Ce mémoire de maîtrise se concentre sur la zone de cisaillement séparant le Domaine de
Kovik et le Domaine Nord dans l’Orogène de l’Ungava. Les objectifs sont de préciser la

2
cinématique, la température et la chronologie de la déformation de la zone de cisaillement
entre le Domaine de Kovik et le Domaine Nord. Ce mémoire de maîtrise documente les
observations de terrains le long de de trois transects recoupant le contact entre le Domaine
de Kovik et le Domaine Nord, ainsi que les résultats d’une étude pétrologique et structurale
détaillée incluant une analyse des indicateurs cinématiques, des pétrofabriques du quartz, de
la thermométrie et des dates U-Pb sur titanite. Une discussion sur les similarités entre la
Nappe du Tso Morari et le Domaine de Kovik sera également présentée.
Contexte géologique
L’Orogène de l’Ungava (OU) correspond à la branche Nord-Est de l’Orogène Trans-
Hudsonien et est situé sur la péninsule de l’Ungava au Nunavik où il s’étend d’est en ouest
sur ~300 kilomètres (Figure 1). Le Ministère de l’Énergie et des Ressources naturelles
(MERN) divises l’OU en cinq domaines lithotectoniques, qui sont du Sud vers le Nord, la
Province du Supérieur, le Domaine Sud, le Domaine Nord, le Domaine de Kovik et le
Domaine de Narsajuaq (Lucas et St-Onge, 1992; St-Onge et Lucas, 1992; St-Onge et al.,
1999; Lamothe, 2007; Charette et Beaudette, 2018; Vanier et Lafrance, 2019).
Le Domaine Sud est composé du Groupe de Povungnituk et du Groupe de Chukotat. Le
Groupe de Povungnituk consiste en un assemblage de roches volcanosédimentaires de ~2.04-
1.96 Ga (Machado et al., 1993), en contact stratigraphique sous-jacent au Groupe de Chukotat
(Bleeker and Kamo, 2017). Le Groupe de Chukotat est composé principalement de roche
volcanique mafique de composition MORB et d’une quantité mineure de roche sédimentaire
(Hynes et Francis, 1982; Picard, 1989; Beaudette et al., 2020). Le Groupe de Povungnituk
est interprété comme s’étant déposé sur la marge du Supérieur lors d’un épisode de rift
continental (e.g. Machado et al., 1993). Alternativement, les basaltes tholéitiques de la
Formation de Beauparlant du Groupe de Povungnituk pourraient être reliés à la grande
province ignée de Minto-Povungnituk (Kastek et al., 2018). Le Groupe de Chukotat est
interprété comme faisant partie de la grande province ignée du Circum-Supérieur (e.g.
Bleeker and Kamo, 2017).
3
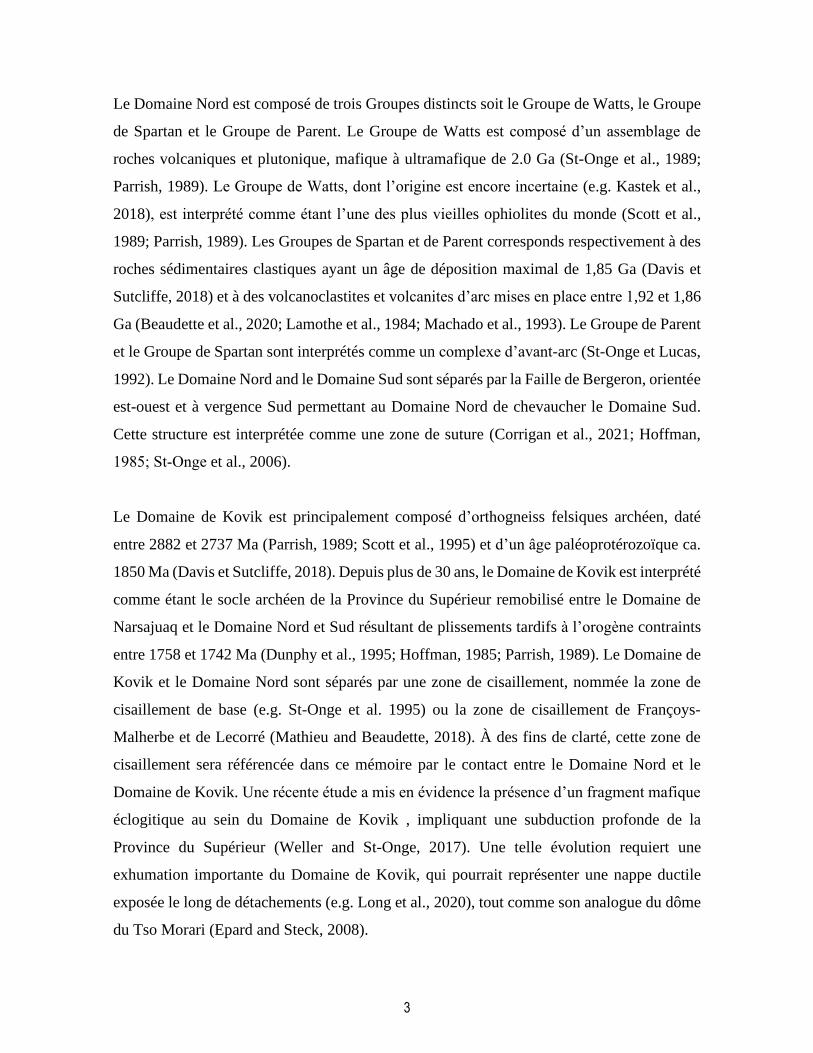
Le Domaine Nord est composé de trois Groupes distincts soit le Groupe de Watts, le Groupe
de Spartan et le Groupe de Parent. Le Groupe de Watts est composé d’un assemblage de
roches volcaniques et plutonique, mafique à ultramafique de 2.0 Ga (St-Onge et al., 1989;
Parrish, 1989). Le Groupe de Watts, dont l’origine est encore incertaine (e.g. Kastek et al.,
2018), est interprété comme étant l’une des plus vieilles ophiolites du monde (Scott et al.,
1989; Parrish, 1989). Les Groupes de Spartan et de Parent corresponds respectivement à des
roches sédimentaires clastiques ayant un âge de déposition maximal de 1,85 Ga (Davis et
Sutcliffe, 2018) et à des volcanoclastites et volcanites d’arc mises en place entre 1,92 et 1,86
Ga (Beaudette et al., 2020; Lamothe et al., 1984; Machado et al., 1993). Le Groupe de Parent
et le Groupe de Spartan sont interprétés comme un complexe d’avant-arc (St-Onge et Lucas,
1992). Le Domaine Nord and le Domaine Sud sont séparés par la Faille de Bergeron, orientée
est-ouest et à vergence Sud permettant au Domaine Nord de chevaucher le Domaine Sud.
Cette structure est interprétée comme une zone de suture (Corrigan et al., 2021; Hoffman,
1985; St‐Onge et al., 2006).
Le Domaine de Kovik est principalement composé d’orthogneiss felsiques archéen, daté
entre 2882 et 2737 Ma (Parrish, 1989; Scott et al., 1995) et d’un âge paléoprotérozoïque ca.
1850 Ma (Davis et Sutcliffe, 2018). Depuis plus de 30 ans, le Domaine de Kovik est interprété
comme étant le socle archéen de la Province du Supérieur remobilisé entre le Domaine de
Narsajuaq et le Domaine Nord et Sud résultant de plissements tardifs à l’orogène contraints
entre 1758 et 1742 Ma (Dunphy et al., 1995; Hoffman, 1985; Parrish, 1989). Le Domaine de
Kovik et le Domaine Nord sont séparés par une zone de cisaillement, nommée la zone de
cisaillement de base (e.g. St-Onge et al. 1995) ou la zone de cisaillement de Françoys-
Malherbe et de Lecorré (Mathieu and Beaudette, 2018). À des fins de clarté, cette zone de
cisaillement sera référencée dans ce mémoire par le contact entre le Domaine Nord et le
Domaine de Kovik. Une récente étude a mis en évidence la présence d’un fragment mafique
éclogitique au sein du Domaine de Kovik , impliquant une subduction profonde de la
Province du Supérieur (Weller and St-Onge, 2017). Une telle évolution requiert une
exhumation importante du Domaine de Kovik, qui pourrait représenter une nappe ductile
exposée le long de détachements (e.g. Long et al., 2020), tout comme son analogue du dôme
du Tso Morari (Epard and Steck, 2008).
4
Le Domaine de Narsajuaq correspond quant à lui à la partie continentale du Block de Sugluk
(Corrigan et al.,2009; 2021). Ce dernier est interprété comme un microcontinent archéen
s’étant formé entre 2794 et 2560 Ma (Davis et Sutcliffe, 2018) et est l’hôte d’intrusions
paléoprotérozoïques (Corrigan et al., 2021; Dunphy et Ludden, 1998). Le secteur ouest du
Domaine de Narsajuaq a fait l’objet de levé géologique récents (Charrette and Beaudette,
2018; Vanier and Lafrance, 2020). Ces travaux révèlent une prédominance d’orthogneiss
intermédiaires à felsiques au sein desquels sont intercalées des unités méta-sédimentaires et
mafiques. Le Domaine de Narsajuaq et le Domaine de Kovik sont séparés par la zone de
cisaillement de Sugluk, interprétée comme un chevauchement vers le sud avec une
composante dextre s’étendant sur environ 150 km dans l’axe OSO-ENE (Charette and
Beaudette, 2018; Vanier and Lafrance, 2020;).
5
Chapitre 1: Constraining the nature and timing of the
contact between the Kovik Domain and Northern Domain,
Ungava Orogen, Northern Québec
GÉLINAS, Thierry Karl1 GUILMETTE, Carl1, LARSON, Kyle P2, VANIER, Marc-
Antoine3, GODET, Antoine1.
Département de Géologie et de Génie Géologique, Université Laval, Québec, QC G1V 0A6,
Canada, (2) Earth, Environmental and Geographic Sciences, University of British Columbia
Okanagan, Kelowna, BC V1V 1V7, Canada, (3) Ministère de l’Énergie et des Ressources
naturelle, 5700 4e Av O, Québec, QC G1H 6R1
1.1 Résumé
Le Domaine de Kovik et le Domaine Nord contiennent respectivement des unités
ophiolitiques et éclogitiques de l’Orogène Paléoprotérozoique de l’Ungava, et sont clés quant
à la compréhension de son évolution tectonique. Cette étude vise à contraindre la
cinématique, la température et la chronologie de la déformation du contact séparant ces deux
domaines. Les observations de terrains, l’analyse des microstructures et des datations U-Pb
sur titanites ont été combinées. Deux zones de cisaillement ont été identifiées, les zones de
cisaillement inférieure (LSZ) et supérieure (USZ). La LSZ est caractérisée par une
cinématique de sommet-vers-le-sud et une température de déformation de 627± 50°C. La
USZ est caractérisée par une cinématique de sommet-vers-le-nord et une température de
déformation de 580 ± 50°C. Les datations sur titanite ont permis de contraindre la
déformation entre 1737 et 1752 Ma. Nous interprétons que le contact entre le Domaine de
Kovik et le Domaine Nord représente un détachement.
6
1.2 Abstract
The Ungava Orogen is located on the Ungava Peninsula, northern Québec and corresponds
to the northeastern branch of the Trans-Hudson Orogen. The discovery of eclogite in the
Kovik Domain in the UO has been used to propose it as an analog to modern tectonic
archetypes of ultra-high pressure complex such as the Tso Morari Nappe (TMN) of the
Himalaya-Tibet Orogen. Ultra-high-pressure complexes are typically associated with
extensional structures that have helped to exhume the deeply buried rocks. The aim of this
study is to investigate the kinematics, timing, and temperature of deformation at the contact
between the Kovik Domain and adjacent Northern Domain to determine if it could have acted
as such an extensional structure. To do so, we have combined field mapping, microstructural
analysis of quartz, and titanite and U-Pb in situ geochronology on titanite. Analysis of the
multi-variate dataset has revealed two shear zones. The structurally lower shear zone (LSZ),
distal to the contact, is characterized by a top-to-the-south sense of shear and quartz c-axis
fabrics that indicate overall flattening strain. The upper shear zone (USZ), proximal to the
contact, is defined by a top-to-the-north sense of shear and is associated with quartz c-axis
fabrics that approximate plane strain. The temperatures of deformation in the LSZ and USZ,
as informed by the quartz c-axis fabric opening angle thermometer, are 627 and 580°C ±
50°C, respectively. U-Pb geochronology on titanite from orthogneiss from the LSZ yielded
two distinct populations: an old population of 1894 ± 31 Ma and a young population with
ages between 1752 ± 40 Ma and 1737 ± 7 Ma. The ca. 1740 Ma population is interpreted to
reflect the time of movement along the LSZ. Although we interpret the LSZ as a detachment,
the results of this study are hard to reconcile with the Kovik Domain as an analog to the
TMN.
7
1.3 Introduction
The onset of modern plate tectonics is one of the most heated debates in geosciences (Brown
and Johnson, 2018; Palin et al., 2020; Shirey et al., 2008). Geological records are ambiguous,
but combinations of geological elements, especially those found in the Ungava Orogen (UO)
of Canada, have been interpreted as a sign that modern tectonics was already ongoing by 1.8-
2.0 Ga (Weller and St-Onge, 2017; Scott et al., 1989). The UO corresponds to the
northeastern branch of the larger Trans-Hudson Orogen (THO). The THO is a
Paleoproterozoic orogen located within the North American continent and is thought to have
remarkably preserved geological archives of one the oldest Wilson-Cycles on Earth
(Corrigan et al., 2009; Hoffman, 1988). The THO resulted from the collision between the
Superior lower plate and amalgamated microcontinents and juvenile crusts, forming the
Churchill upper plate ca. 1830 Ma (Corrigan et al., 2009; St‐Onge et al., 2006). Many authors
consider the THO and the Himalaya-Tibet Orogen as analogous based on their geometry,
duration, and structural, magmatic and thermal evolutions (Corrigan et al., 2021; Corrigan et
al, 2009; St‐Onge et al., 2006; Weller and St-Onge, 2017). Recently, the ophiolite-eclogite
association of the Northern and Kovik Domains, respectively, in the UO have been proposed
as analogs to modern tectonics archetypes like Tso Morari Nappe and Indus ophiolites of the
Himalaya-Tibet Orogen (Weller and St-Onge, 2017). Although the Northern Domain and
Kovik Domain show the appropriate spatial and structural relationships, the timing of their
assembly remains unconstrained. The tectono-metamorphic history of the Tso Morari Nappe
and the overlying ophiolite in the Himalaya-Tibet Orogen is well characterized and they
reached their current configuration in the earliest stages of collision between India and Asia
(Leech et al., 2005; Epard and Steck, 2008). The exhumation of the Kovik Domain, in
contrast, is only loosely constrained, with a few Ar40/Ar39 ages in the Kovik Domain and
overlying rocks clustered around 1700-1750 Ma that seem to indicate very late cooling,
several Ma after the initial collision (Kellett et al., 2020; Skipton et al., 2020).
In this contribution, we focus on an exceptionally well-exposed shear zone in the eastern
segment of the orogen. It separates the Northern Domain from the underlying Kovik Domain,
and was initially interpreted as a folded thrust (e.g. St-Onge and Lucas, 1995). The
occurrence of eclogite in the Kovik Domain (Weller and St-Onge, 2017), however, indicates

8
a significant metamorphic gap between the Kovik and Northern Domains and the shear zone
between them may have acted as a detachment fault. Here we report field observations,
kinematic indicators, quartz c-axis fabrics, thermometry and U-Pb geochronology on titanite
for this shear zone. We interpret shear sense, conditions and timing of the deformation and
discuss similarities with the Tso-Morari Nappe modern analog.
1.4 Geological setting
1.4.1 The Ungava Orogen
The UO is composed of five principal lithotectonic domains. From South to North, these are
the Superior Province, the Southern Domain, the Northern Domain, the Kovik Domain and
the Narsajuaq Domain (Figure 1). The Superior Province is the largest Archean craton of the
Canadian Shield and in the study area, is mainly composed of ca. 2.7 to 3.0 Ga felsic plutonic
rocks (Percival and Skulski, 2000; Percival et al., 1994). The Southern Domain is composed
of the Povungnituk and the Chukotat Groups. The Povungnituk Group consists of ca. 2.04-
1.96 Ga volcanosedimentary rock assemblage (Machado et al., 1993; Parrish, 1989) in
stratigraphic contact with the overlying Chukotat Group (Bleeker and Kamo, 2017). The
Povungnituk Group is interpreted to have been deposited on the Superior Province margin
during a continental rift (e.g. Machado et al., 1993) and is mainly allochthonous within the
Southern Domain, with locally autochthonous clastic sedimentary rocks capped by the basal
décollement of the orogen (St-Onge and Lucas, 1992). It is also possible that the tholeiitic
basalt of the Beauparlant Formation in the Povungnituk Group may be part of a large igneous
province (LIP), the Minto-Povungnituk LIP (Kastek et al., 2018). The Chukotat Group is
mainly composed of a ca. 1.88-1.87 Ga mafic volcanic rocks with MORB-like (Mid-ocean
ridge basalt) composition and sedimentary rocks (Hynes and Francis, 1982; Picard, 1989, St-
Onge et al., 1992; Parrish, 1989; Bleeker and Kamo, 2018). The Chukotat Group is
interpreted to be part of the Circum-Superior LIP (e.g. Bleeker and Kamo, 2017).
The Northern Domain consists of the Watts Group, composed of ca. 2.0 Ga mafic to
ultramafic plutonic and volcanic rocks (Parrish, 1989; St-Onge et al., 1992), the Spartan
Group, corresponding to clastic sedimentary rocks with a maximal deposition age of 1852
9
Ma (Davis and Sutcliffe, 2018) and the Parent Group, composed of volcanosedimentary
rocks constrained between 1917-1860 Ma (Machado et al., 1993; Lamothe et al., 1984;
Beaudette et al., 2020). The Watts Group, whose origin remains unclear (e.g. Kastek et al.,
2018), has been interpreted as one of the oldest ophiolites on Earth (Scott et al., 1989), while
the Parent and Spartan Group are interpreted as a forearc complex (St-Onge et al., 1992).
The Southern and Northern Domains are separated by the Bergeron Fault, a major structure
that extends across Ungava from Hudson Bay to Wakeham Bay (Figure 1). It is interpreted
as having accommodated thrust-sense displacement verging towards the South (Bergeron,
1957; St-Onge et al., 1999). Additionally, the Southern and Northern Domains are dissected
by a series of east-west trending faults with southerly displacement that are locally crosscut
by out-of-sequence structures (Lucas, 1989).
The Kovik Domain (Vanier and Lafrance, 2020), is mainly composed of tonalite and
granodiorite of Archean age, between 2882-2737 Ma (Parrish, 1989; Scott and St-Onge,
1995) and one Paleoproterozoic age, ca. 1850 Ma (Davis and Sutcliffe, 2018), with minor
ultramafic to mafic and sedimentary enclaves (St-Onge et al., 1992). Sedimentary bands
dominated by pelite and semipelite are also present (Charette and Beaudette, 2018; St-Onge
et al., 1992). The Kovik Domain rocks are locally migmatized and crosscut by granitic
injections (Vanier and Lafrance, 2020). This domain is interpreted as reworked Archean
basement of the Superior Province (Hoffman, 1985; St-Onge et al., 1999). The structural and
metamorphic history of the Kovik Domain will be discussed in further details in the following
section. The Kovik Domain and the Northern Domain are separated by a wide shear zone
(Figure 1), which has been referred to as the ‘basal shear zone’ (e.g. St-Onge and Lucas.
1995) or the Françoys-Malherbe and the Lecorré shear zones (Mathieu and Beaudette, 2018).
For clarity, this deformation zone will be referred to here as the contact between the Kovik
Domain and the Northern Domain.
The Narsajuaq Domain (Vanier and Lafrance, 2020), is composed of intermediate to felsic
orthogneiss with minor metasedimentary and mafic units bracketed between 2794 and 2560
Ma (Davis and Sutcliffe, 2018) with intrusions of Paleoproterozoic felsic rocks (Dunphy et

10
al., 1998). The Narsajuaq Domain is interpreted as the penetratively deformed continental
part of the Sugluk block (Corrigan et al., 2009, 2021), an Archean micro-continent. The
Narsajuaq Domain is separated from the Northern and Kovik domains by the Sugluk shear
zone, a ~150 km long WSW-ENE thrust toward the SSE with a dextral component (Figure
1; Vanier and Lafrance, 2020; Charette and Beaudette, 2018).
The timing of deformation along the main structures mentioned above in the UO is currently
poorly constrained and are loosely bracketed either by intrusions crosscutting the structures
(e.g. Dunphy et al., 1995), the presence of the youngest unit in a given area (e.g. Lucas and
St-Onge, 1992; St-Onge et al., 1992), or by its inferred correlation with the growth of
metamorphic minerals dated outside of the structure (e.g. Scott and St-Onge, 1995). Direct
assessment of the timing of deformation through in situ geochronology is, therefore, essential
to understand the relationships between each domain. This is especially true for the contact
between the Kovik Domain and the Northern Domain, whose nature and timing of activity
remain unclear (see following section).

11
Figure 1: Simplified geological map of the Ungava Orogen in northern Québec, Canada
(modified from SIGÉOM, 2021 and St-Onge et al., 2006). The transects B-B’, C-C’, D-D’
12
and E-E’ crosscutting the Kovik Domain and Northern Domain contact are shown in Figure
4.
1.4.2 Tectonic and metamorphic history of the Kovik Domain
In the eastern segment of the UO, Kovik Domain rocks are characterized by metamorphic
conditions range from amphibolite to granulite facies assemblage (St-Onge and Lucas, 1995;
St-Onge and Ijewliw, 1996). Although all units contain local granulite facies assemblages,
such assemblages dominantly occur between 5 km and 20 km north of the contact between
the Kovik Domain and the Northern and Southern Domain (Figure 1; St-Onge et al., 1995).
South of this limit, the granulite facies assemblage is overprinted by an amphibolite facies
assemblage. The transition between the amphibolite-granulite facies is marked by the
absence or presence of clinopyroxene-orthopyroxene (St-Onge and Lucas, 1995). Granulite
facies metamorphism is associated with temperatures and pressures of ~860-920°C and 3.5
kbar (St‐Onge and Lucas., 1995; St-Onge and Ijewliw, 1996). U-Pb geochronology on a
metamorphic zircon overgrowth yielded an age of 2.73 Ga and is interpreted to represent the
timing of the granulite metamorphism (Scott and St-Onge, 1995). Amphibolite facies
metamorphism, in contrast, records temperatures and pressures of ~640-715°C and 7.7-9.8
kbar (St-Onge and Ijewliw, 1996) and has been associated with titanite growth between 1814
+19/-8 Ma and 1789 Ma (Scott and St-Onge, 1995). Titanite is interpreted as a marker of the
amphibolite overprint as it occurs as coronitic overgrowth around ilmenite, as inclusions in
hornblende and garnet, but is never associated with pyroxene and is absent from granulite
facies domain (Scott et St-Onge, 1995; St-Onge and Ijewliw, 1996; St‐Onge and Lucas,
1995). Multiequilibrium thermobarometry on titanite-bearing assemblage in the Kovik
Domain yielded temperatures of crystallization of 660-700°C (Scott and St-Onge, 1995).
Granulite facies metamorphism is interpreted to be coeval with the development of the
foliation affecting the plutonic rocks of the Kovik Domain (Lucas and St-Onge, 1995). The
Archean foliation appears to be reworked by two Paleoproterozoic deformation events. The
first is mainly concentrated between the Southern-Northern Domain and the Kovik Domain
forming a 0.5 to 400 m thick shear zone interpreted as the result of south-directed thrusting
the Southern Domain and Northern Domain over the Kovik Domain (St‐Onge and Lucas,
1995; Lucas et St-Onge, 1992). This deformation was accompanied by the imbrication of

13
several map-scale basement slices (Figure 1; Lucas, 1990). The significant extent of this
shear zone at the contact between the Kovik Domain and Northern Domain (Figure 1) can be
attributed to the presence of folds and by the possible internal imbrication of the Kovik
Domain (St-Onge and Lucas, 1995). Compilations of structural data from the Geological
Survey of Canada and the MERN at the contact between the Kovik Domain and Northern
Domain in the investigated area indicate a strong E-W foliation, locally mylonitic, a North-
plunging mineral and stretching lineation and a South-directed shear sense (St-Onge and
Lucas., 1997; St-Onge et al., 1990; Mathieu and Beaudette, 2018). The second
Paleoproterozoic deformation event is expressed by two folding episodes (Figure 1), which
also affect all tectonic domains of the UO (Lucas and Byrnes, 1992; St-Onge et al., 1990).
The first episode of folding is recorded as east-trending folds, ranging from meter to map
scale with a south to southwest-verging asymmetry (Lucas and Byrnes, 1992; Lucas, 1990).
The east-trending folds are refolded by north to northeast-trending folds (St-Onge et al.,
1990; Lucas and Byrnes, 1992). U-Pb geochronology on zircon from crosscutting intrusions
constrained the east-trending and north to northeast-trending folding event between 1758+/-
1 Ma and 1742 +/-1 Ma, respectively (Parrish, 1989; Dunphy and Ludden, 1995).
For the past ~30 years, the Kovik Domain has been interpreted as reworked Archean
crystalline basement of the Superior Craton (Hoffman, 1985; St-Onge et al., 1999) exposed
in a tectonic window following post-orogenic folding. As a corollary of that interpretation,
the basal shear zone located between the Superior Province and the Povungnituk group
should be exposed (Figure 2) between the Kovik Domain and Northern Domain (Hoffman,
1985; St-Onge et al., 1995). This interpretation is mainly supported by the continuity between
the Kovik Domain and the Superior Province in the east without a structure separating them
(Figure 1; Taylor, 1982), the inferred structural architecture (Figure 2) (Hoffman, 1985), and
the Archean age of the Kovik Domain (Parrish, 1989; Scott and St-Onge, 1995). However,
Weller and St-Onge (2017) described a mafic eclogite in the Kovik Domain which they
interpreted to be the result of a deep subduction of the Superior Province and compared it to
the Tso Morari Nappe in the Himalaya-Tibet Orogen. Although the presence of an eclogite
is not necessarily diagnostic of a subduction (Palin et al., 2020), the similarities between the
UO and the Tso Morari eclogite in terms of their field relationships, such as boudins of mafic
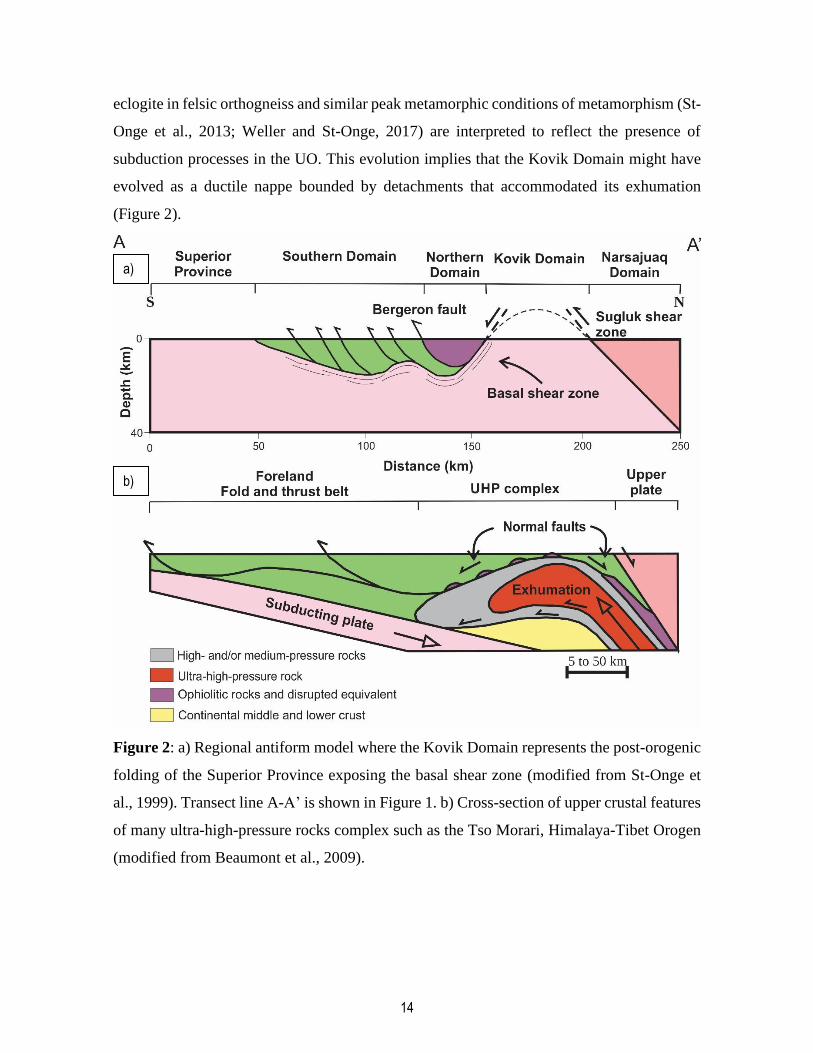
14
eclogite in felsic orthogneiss and similar peak metamorphic conditions of metamorphism (St‐
Onge et al., 2013; Weller and St-Onge, 2017) are interpreted to reflect the presence of
subduction processes in the UO. This evolution implies that the Kovik Domain might have
evolved as a ductile nappe bounded by detachments that accommodated its exhumation
(Figure 2).
Figure 2: a) Regional antiform model where the Kovik Domain represents the post-orogenic
folding of the Superior Province exposing the basal shear zone (modified from St-Onge et
al., 1999). Transect line A-A’ is shown in Figure 1. b) Cross-section of upper crustal features
of many ultra-high-pressure rocks complex such as the Tso Morari, Himalaya-Tibet Orogen
(modified from Beaumont et al., 2009).
a)
b)
15
1.5 Field observations and sampling
Three transects crosscutting the Kovik Domain and the Northern Domain contact have been
investigated. Two North-South (transect B-B’ and D-D’, Figures 1 and 3) and one East-West
(transect C-C’, Figure 1 and 3) traverses were carried out across a Northern Domain klippe
affected by North and East-axis folds inside the Kovik Domain. An additional composite
North-South transect (E-E’) across the main contact was interpreted from structural and field
observation data (Figure 1). Together the transects comprise over 5000 meters of horizontal
distance of almost continuous outcrop, accounting for a 600m structural thickness (Figure 3).
As the fabrics are very gently dipping, our lowest structural sample was collected in the
deepest valley nearby and was still within the shear zone. Accordingly, we have no clear
control on the true structural thickness of the shear zone. The main lithologies encountered
in the Kovik Domain include biotite-muscovite orthogneiss (Figure 3b) with locally
decametric to plurimetric horizons of metagabbro and metasediments. Garnet-rich
metagabbro and metapyroxenite are observed in the Northern Domain, where the garnet
content locally exceeded 40% of the mafic and ultramafic rocks. Between the Kovik Domain
and the Northern Domain, a thin layer of metasedimentary rocks and amphibolite are
observed and are correlated with the Nituk Formation (Figures 3c-d), belonging to the
Southern Domain. The orthogneiss, metasediment and amphibolite-gabbro and pyroxenite
sequence occurs at the Northern Domain klippe and at the main contact (Figure 3e-f and 4).
The foliation is defined by aligned biotite and muscovite in the orthogneiss from the Kovik
Domain, by chlorite, hornblende and biotite in the metasedimentary rocks and amphibolite
of the Nituk Formation, and by the preferred orientation of layer-rich garnet and by
hornblende in the Northern Domain metagabbro and metapyroxenite. The average foliation
plane from the two North-South transects strikes SE-NW and dips gently toward the SW
(Figure 4). For the East-West D-D’ transect, the average mineral foliation plane strikes N-S
and dips gently toward the W (Stereonet, Figure 4). The stretching and mineral lineations are
defined by quartz and biotite, respectively, in the orthogneiss from the Kovik Domain. In the
metasediment and amphibolite of the Nituk Formation and the metagabbro and
metapyroxenite from the Northern Domain, the mineral lineations are marked by aligned
16
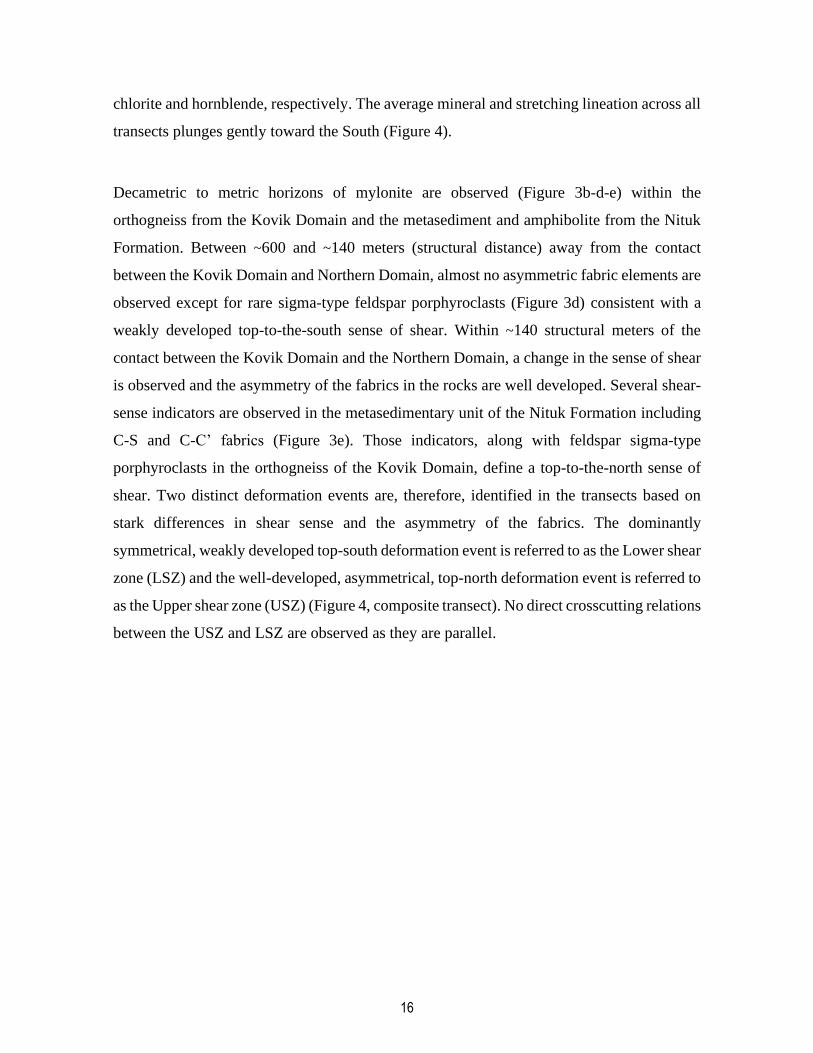
chlorite and hornblende, respectively. The average mineral and stretching lineation across all
transects plunges gently toward the South (Figure 4).
Decametric to metric horizons of mylonite are observed (Figure 3b-d-e) within the
orthogneiss from the Kovik Domain and the metasediment and amphibolite from the Nituk
Formation. Between ~600 and ~140 meters (structural distance) away from the contact
between the Kovik Domain and Northern Domain, almost no asymmetric fabric elements are
observed except for rare sigma-type feldspar porphyroclasts (Figure 3d) consistent with a
weakly developed top-to-the-south sense of shear. Within ~140 structural meters of the
contact between the Kovik Domain and the Northern Domain, a change in the sense of shear
is observed and the asymmetry of the fabrics in the rocks are well developed. Several shear-
sense indicators are observed in the metasedimentary unit of the Nituk Formation including
C-S and C-C’ fabrics (Figure 3e). Those indicators, along with feldspar sigma-type
porphyroclasts in the orthogneiss of the Kovik Domain, define a top-to-the-north sense of
shear. Two distinct deformation events are, therefore, identified in the transects based on
stark differences in shear sense and the asymmetry of the fabrics. The dominantly
symmetrical, weakly developed top-south deformation event is referred to as the Lower shear
zone (LSZ) and the well-developed, asymmetrical, top-north deformation event is referred to
as the Upper shear zone (USZ) (Figure 4, composite transect). No direct crosscutting relations
between the USZ and LSZ are observed as they are parallel.
17
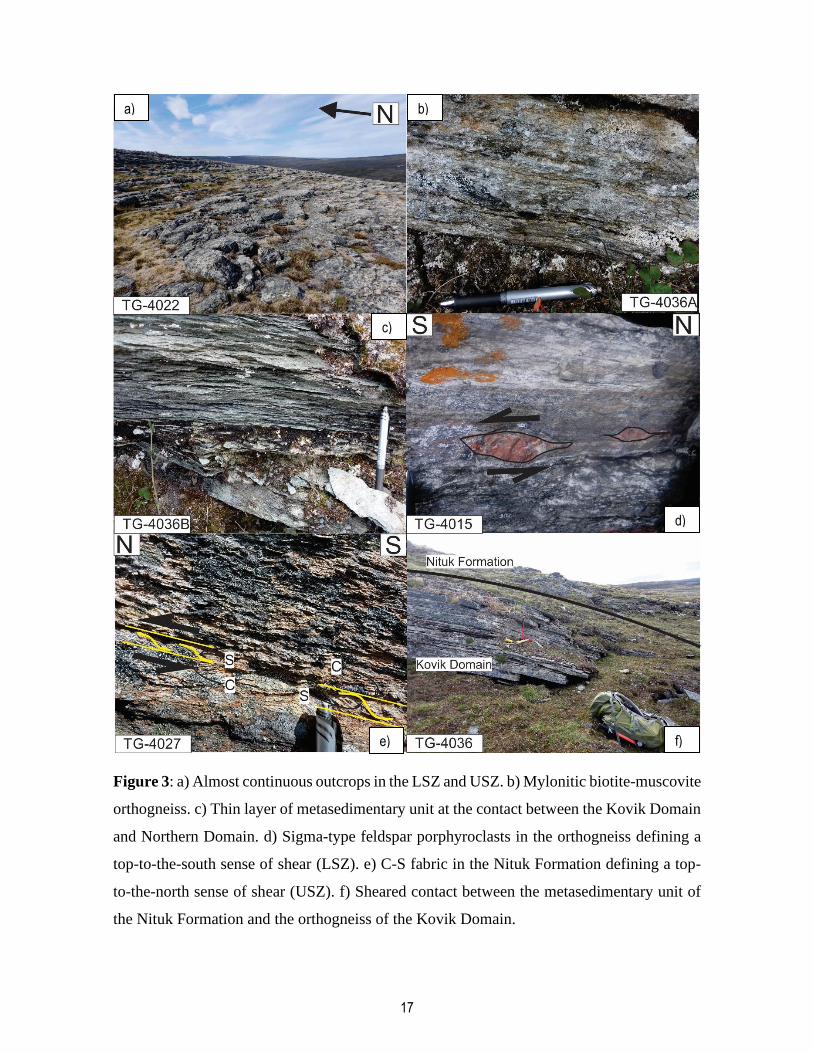
Figure 3: a) Almost continuous outcrops in the LSZ and USZ. b) Mylonitic biotite-muscovite
orthogneiss. c) Thin layer of metasedimentary unit at the contact between the Kovik Domain
and Northern Domain. d) Sigma-type feldspar porphyroclasts in the orthogneiss defining a
top-to-the-south sense of shear (LSZ). e) C-S fabric in the Nituk Formation defining a top-
to-the-north sense of shear (USZ). f) Sheared contact between the metasedimentary unit of
the Nituk Formation and the orthogneiss of the Kovik Domain.
a) b)
d)
e) f)
c)

18
Figure 4: Schematic cross section across the Kovik Domain and Northern Domain Contact.
The E-E’ transect represents a composite of the structural data from transect B-B’, C-C’ and
D-D’ where the two shear zones identify are color coded.
1.6 Methodology
1.6.1 Petrography
Over 50 oriented specimens were sampled along the transects. These oriented specimens,
including all observed lithologies and transposed quartz veins, were cut perpendicular to the
foliation and parallel to the lineation (representative of the XZ plan) to produce oriented thin
sections used to investigate the sense of shear, quartz and titanite microstructures and
microtextural relations between phases.
19
1.6.2 Quartz c-axis analysis
Quartz c-axis analysis was used to assess the kinematic and the 3D strain history (Lister and
Hobbs, 1980; Passchier and Trouw, 2005). Quartz c-axis orientations were obtained from 13
oriented thin sections with a Russell-Head Instruments G60+ Automated Fabric Analyser at
the University of British Columbia, Okanagan. Quartz c-axis fabrics were generated based
on one representative point per grain using the instrument’s software package. Quartz c-axis
were plotted in lower hemisphere, equal area projections such that the lineation plots as an
E-W horizontal line and the foliation plots as a vertical, E-W striking plane. The plots were
constructed using the FabricPlotR scripts from Larson (2021) for the open and free R
software environment.
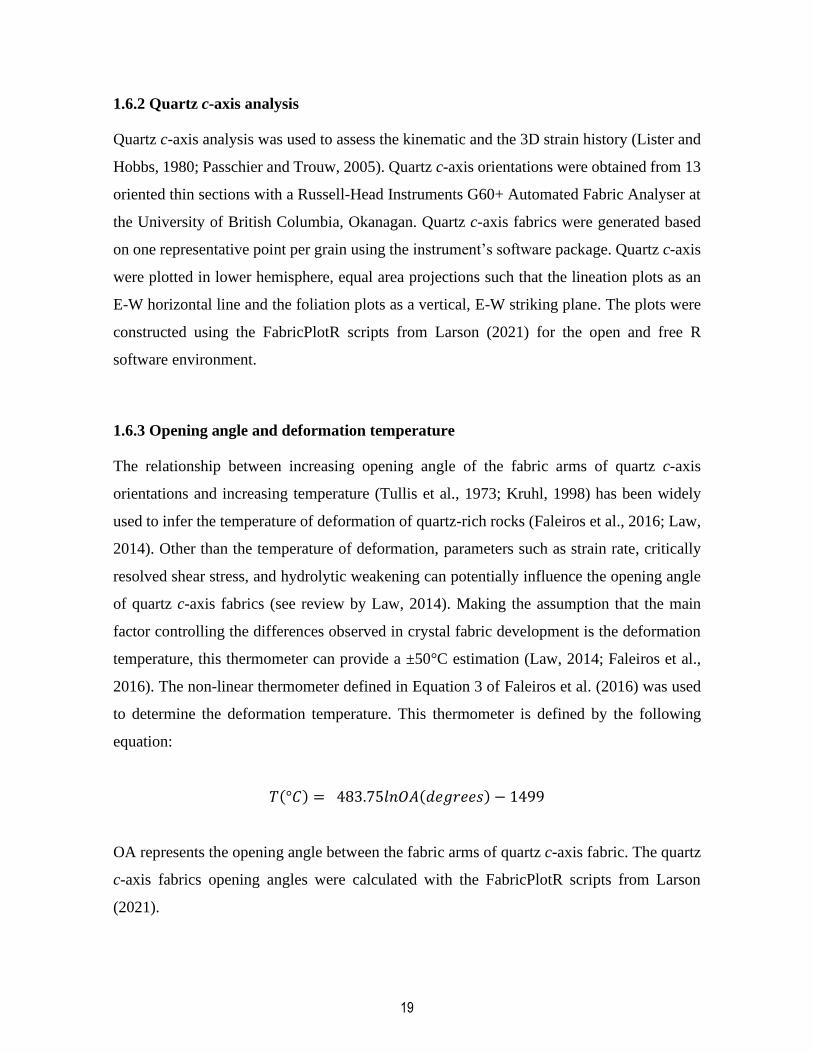
1.6.3 Opening angle and deformation temperature
The relationship between increasing opening angle of the fabric arms of quartz c-axis
orientations and increasing temperature (Tullis et al., 1973; Kruhl, 1998) has been widely
used to infer the temperature of deformation of quartz-rich rocks (Faleiros et al., 2016; Law,
2014). Other than the temperature of deformation, parameters such as strain rate, critically
resolved shear stress, and hydrolytic weakening can potentially influence the opening angle
of quartz c-axis fabrics (see review by Law, 2014). Making the assumption that the main
factor controlling the differences observed in crystal fabric development is the deformation
temperature, this thermometer can provide a ±50°C estimation (Law, 2014; Faleiros et al.,
2016). The non-linear thermometer defined in Equation 3 of Faleiros et al. (2016) was used
to determine the deformation temperature. This thermometer is defined by the following
equation:
𝑇(°𝐶) = 483.75𝑙𝑛𝑂𝐴(𝑑𝑒𝑔𝑟𝑒𝑒𝑠) − 1499
OA represents the opening angle between the fabric arms of quartz c-axis fabric. The quartz
c-axis fabrics opening angles were calculated with the FabricPlotR scripts from Larson
(2021).
20
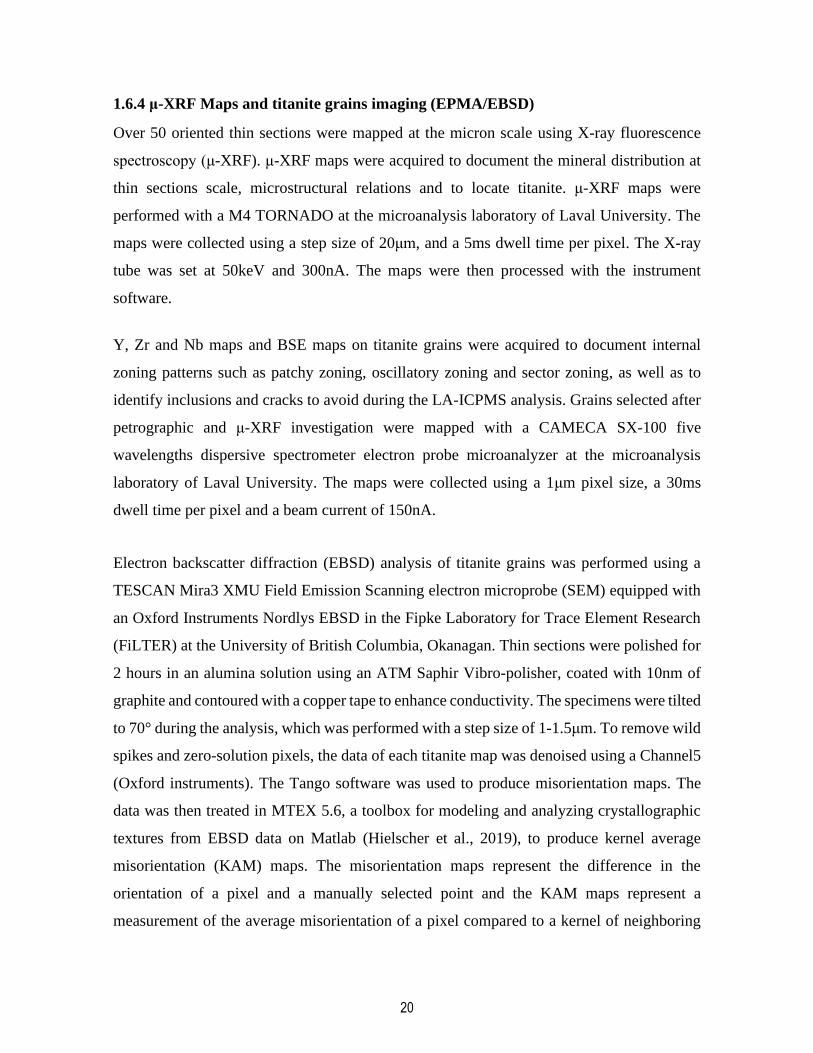
1.6.4 μ-XRF Maps and titanite grains imaging (EPMA/EBSD)
Over 50 oriented thin sections were mapped at the micron scale using X-ray fluorescence
spectroscopy (μ-XRF). μ-XRF maps were acquired to document the mineral distribution at
thin sections scale, microstructural relations and to locate titanite. μ-XRF maps were
performed with a M4 TORNADO at the microanalysis laboratory of Laval University. The
maps were collected using a step size of 20μm, and a 5ms dwell time per pixel. The X-ray
tube was set at 50keV and 300nA. The maps were then processed with the instrument
software.
Y, Zr and Nb maps and BSE maps on titanite grains were acquired to document internal
zoning patterns such as patchy zoning, oscillatory zoning and sector zoning, as well as to
identify inclusions and cracks to avoid during the LA-ICPMS analysis. Grains selected after
petrographic and μ-XRF investigation were mapped with a CAMECA SX-100 five
wavelengths dispersive spectrometer electron probe microanalyzer at the microanalysis
laboratory of Laval University. The maps were collected using a 1μm pixel size, a 30ms
dwell time per pixel and a beam current of 150nA.
Electron backscatter diffraction (EBSD) analysis of titanite grains was performed using a
TESCAN Mira3 XMU Field Emission Scanning electron microprobe (SEM) equipped with
an Oxford Instruments Nordlys EBSD in the Fipke Laboratory for Trace Element Research
(FiLTER) at the University of British Columbia, Okanagan. Thin sections were polished for
2 hours in an alumina solution using an ATM Saphir Vibro-polisher, coated with 10nm of
graphite and contoured with a copper tape to enhance conductivity. The specimens were tilted
to 70° during the analysis, which was performed with a step size of 1-1.5μm. To remove wild
spikes and zero-solution pixels, the data of each titanite map was denoised using a Channel5
(Oxford instruments). The Tango software was used to produce misorientation maps. The
data was then treated in MTEX 5.6, a toolbox for modeling and analyzing crystallographic
textures from EBSD data on Matlab (Hielscher et al., 2019), to produce kernel average
misorientation (KAM) maps. The misorientation maps represent the difference in the
orientation of a pixel and a manually selected point and the KAM maps represent a
measurement of the average misorientation of a pixel compared to a kernel of neighboring
21
pixels. Both maps were used to target grains, subgrains and local dislocations during the LA-
ICPMS analysis.
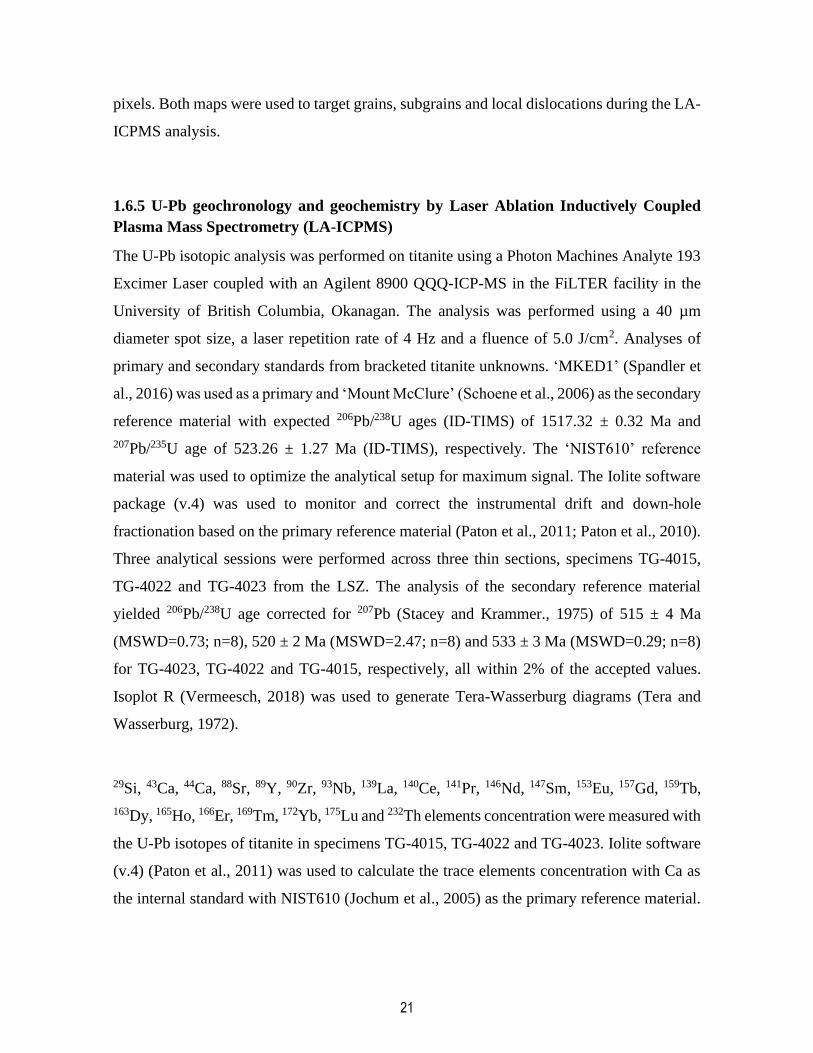
1.6.5 U-Pb geochronology and geochemistry by Laser Ablation Inductively Coupled
Plasma Mass Spectrometry (LA-ICPMS)
The U-Pb isotopic analysis was performed on titanite using a Photon Machines Analyte 193
Excimer Laser coupled with an Agilent 8900 QQQ-ICP-MS in the FiLTER facility in the
University of British Columbia, Okanagan. The analysis was performed using a 40 µm
diameter spot size, a laser repetition rate of 4 Hz and a fluence of 5.0 J/cm2. Analyses of
primary and secondary standards from bracketed titanite unknowns. ‘MKED1’ (Spandler et
al., 2016) was used as a primary and ‘Mount McClure’ (Schoene et al., 2006) as the secondary
reference material with expected 206Pb/238U ages (ID-TIMS) of 1517.32 ± 0.32 Ma and
207Pb/235U age of 523.26 ± 1.27 Ma (ID-TIMS), respectively. The ‘NIST610’ reference
material was used to optimize the analytical setup for maximum signal. The Iolite software
package (v.4) was used to monitor and correct the instrumental drift and down-hole
fractionation based on the primary reference material (Paton et al., 2011; Paton et al., 2010).
Three analytical sessions were performed across three thin sections, specimens TG-4015,
TG-4022 and TG-4023 from the LSZ. The analysis of the secondary reference material
yielded 206Pb/238U age corrected for 207Pb (Stacey and Krammer., 1975) of 515 ± 4 Ma
(MSWD=0.73; n=8), 520 ± 2 Ma (MSWD=2.47; n=8) and 533 ± 3 Ma (MSWD=0.29; n=8)
for TG-4023, TG-4022 and TG-4015, respectively, all within 2% of the accepted values.
Isoplot R (Vermeesch, 2018) was used to generate Tera-Wasserburg diagrams (Tera and
Wasserburg, 1972).
29Si, 43Ca, 44Ca, 88Sr, 89Y, 90Zr, 93Nb, 139La, 140Ce, 141Pr, 146Nd, 147Sm, 153Eu, 157Gd, 159Tb,
163Dy, 165Ho, 166Er, 169Tm, 172Yb, 175Lu and 232Th elements concentration were measured with
the U-Pb isotopes of titanite in specimens TG-4015, TG-4022 and TG-4023. Iolite software
(v.4) (Paton et al., 2011) was used to calculate the trace elements concentration with Ca as
the internal standard with NIST610 (Jochum et al., 2005) as the primary reference material.

22
The expected values of trace elements concentration for the NIST610 are generally matched
within 5% (GeoReM database, Jochum et al., 2005).
1.6.6 Zr-in-titanite thermometry
The Zr-in-titanite thermometer (Hayden et al., 2008) relies on the substitution of Ti4+ for Zr4+
in titanite with varying temperatures and pressures and has been widely used across orogens
to estimate the temperature of crystallization of titanite (Garber et al., 2017; Kohn, 2017;
Kohn et al., 2011; Spencer et al., 2013). The calibration of Hayden et al. (2008) is defined by
the following equation:
(𝑍𝑟𝑡𝑖𝑡𝑎𝑛𝑖𝑡𝑒 , 𝑝𝑝𝑚) = 10.52(±0.10) −7708(±101)
𝑇(𝐾)− 960(±10)
𝑃(𝐺𝑃𝐴)
𝑇(𝐾)− 𝑙𝑜𝑔(𝛼𝑇𝑖𝑂2) − 𝑙𝑜𝑔 (𝛼𝑆𝑖𝑂2)
The Zr-in-titanite temperature was calculated for rutile absent, quartz and titanite bearing
assemblages assuming a αSiO2 =1.00 and αTiO2 = 0.75 ± 0.25 (Kapp et al., 2009), where 𝛼
stands for activity. Zircon and quartz are commonly observed to coexist with titanite grains.
Pressures in the shear zone between the Kovik Domain and the Northern domain have not
been formally calculated, so a ‘representative’ pressure of 0.9 ± 0.1 GPa was assumed from
previous thermobarometric works in the Kovik Domain in the study area, that range from
0.77 to 0.98 GPa (St-Onge and Ijewliw, 1996). Uncertainties of each parameter were
propagated.
1.7 Results
1.7.1 Petrography and microstructures
All specimens of orthogneiss from the Kovik Domain present a similar mineral assemblage
composed of quartz-feldspar-biotite-muscovite-epidote-zoisite-titanite ± hornblende ±
allanite. The specimens contain a strongly developed foliation mainly defined by muscovite
and biotite. Titanite, hornblende, epidote and zoisite are also deformed and aligned along the
foliation, locally forming porphyroclasts (Figure 6a-b,f). The titanite grains are euhedral to
23
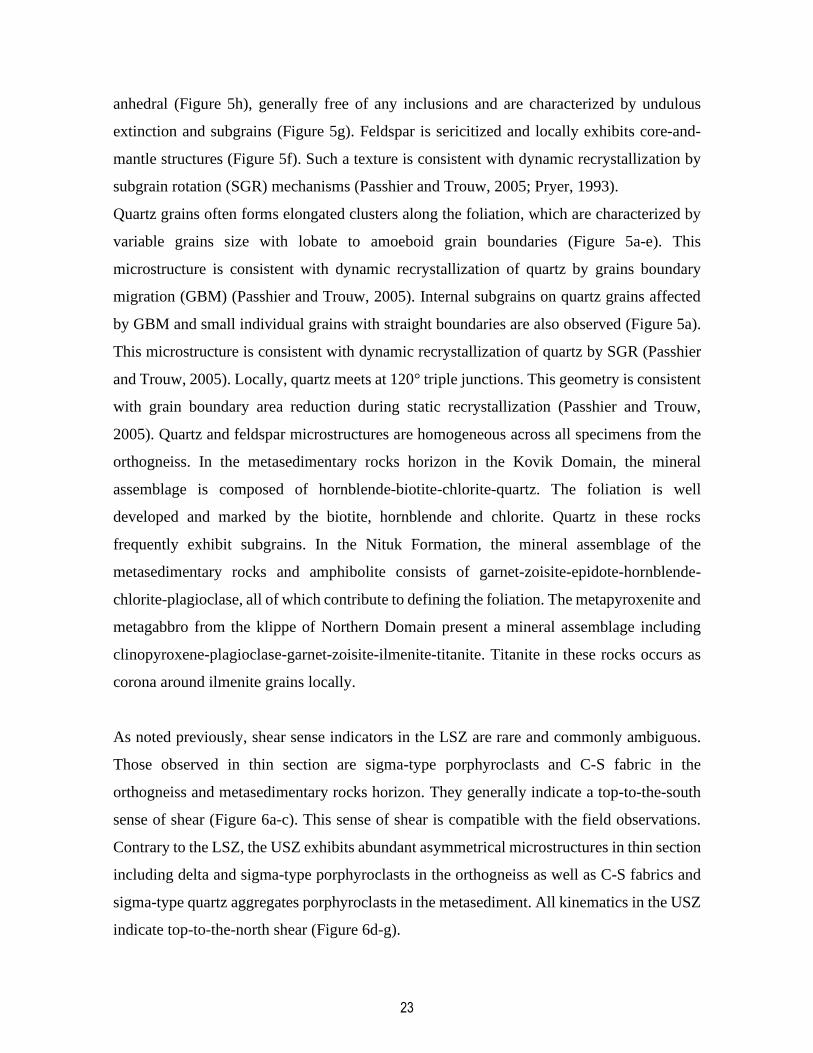
anhedral (Figure 5h), generally free of any inclusions and are characterized by undulous
extinction and subgrains (Figure 5g). Feldspar is sericitized and locally exhibits core-and-
mantle structures (Figure 5f). Such a texture is consistent with dynamic recrystallization by
subgrain rotation (SGR) mechanisms (Passhier and Trouw, 2005; Pryer, 1993).
Quartz grains often forms elongated clusters along the foliation, which are characterized by
variable grains size with lobate to amoeboid grain boundaries (Figure 5a-e). This
microstructure is consistent with dynamic recrystallization of quartz by grains boundary
migration (GBM) (Passhier and Trouw, 2005). Internal subgrains on quartz grains affected
by GBM and small individual grains with straight boundaries are also observed (Figure 5a).
This microstructure is consistent with dynamic recrystallization of quartz by SGR (Passhier
and Trouw, 2005). Locally, quartz meets at 120° triple junctions. This geometry is consistent
with grain boundary area reduction during static recrystallization (Passhier and Trouw,
2005). Quartz and feldspar microstructures are homogeneous across all specimens from the
orthogneiss. In the metasedimentary rocks horizon in the Kovik Domain, the mineral
assemblage is composed of hornblende-biotite-chlorite-quartz. The foliation is well
developed and marked by the biotite, hornblende and chlorite. Quartz in these rocks
frequently exhibit subgrains. In the Nituk Formation, the mineral assemblage of the
metasedimentary rocks and amphibolite consists of garnet-zoisite-epidote-hornblende-
chlorite-plagioclase, all of which contribute to defining the foliation. The metapyroxenite and
metagabbro from the klippe of Northern Domain present a mineral assemblage including
clinopyroxene-plagioclase-garnet-zoisite-ilmenite-titanite. Titanite in these rocks occurs as
corona around ilmenite grains locally.
As noted previously, shear sense indicators in the LSZ are rare and commonly ambiguous.
Those observed in thin section are sigma-type porphyroclasts and C-S fabric in the
orthogneiss and metasedimentary rocks horizon. They generally indicate a top-to-the-south
sense of shear (Figure 6a-c). This sense of shear is compatible with the field observations.
Contrary to the LSZ, the USZ exhibits abundant asymmetrical microstructures in thin section
including delta and sigma-type porphyroclasts in the orthogneiss as well as C-S fabrics and
sigma-type quartz aggregates porphyroclasts in the metasediment. All kinematics in the USZ
indicate top-to-the-north shear (Figure 6d-g).
24
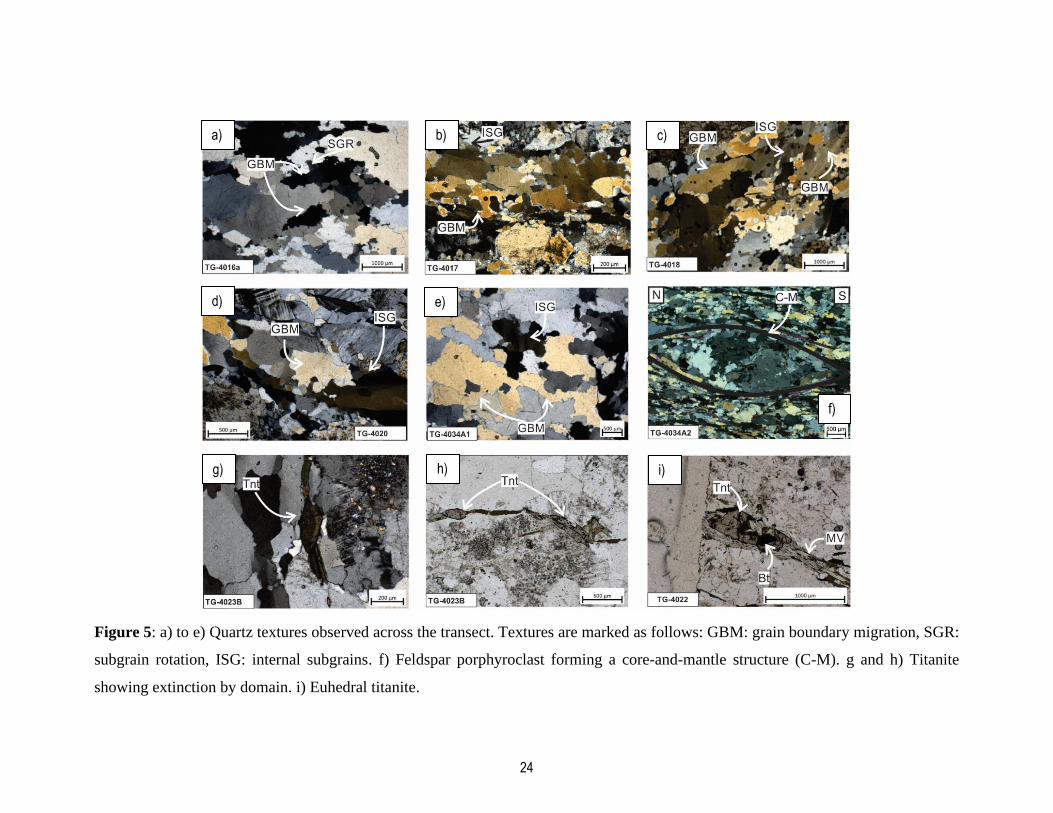
Figure 5: a) to e) Quartz textures observed across the transect. Textures are marked as follows: GBM: grain boundary migration, SGR:
subgrain rotation, ISG: internal subgrains. f) Feldspar porphyroclast forming a core-and-mantle structure (C-M). g and h) Titanite
showing extinction by domain. i) Euhedral titanite.
a) b) c)
d) e)
f)
g) h) i)
25
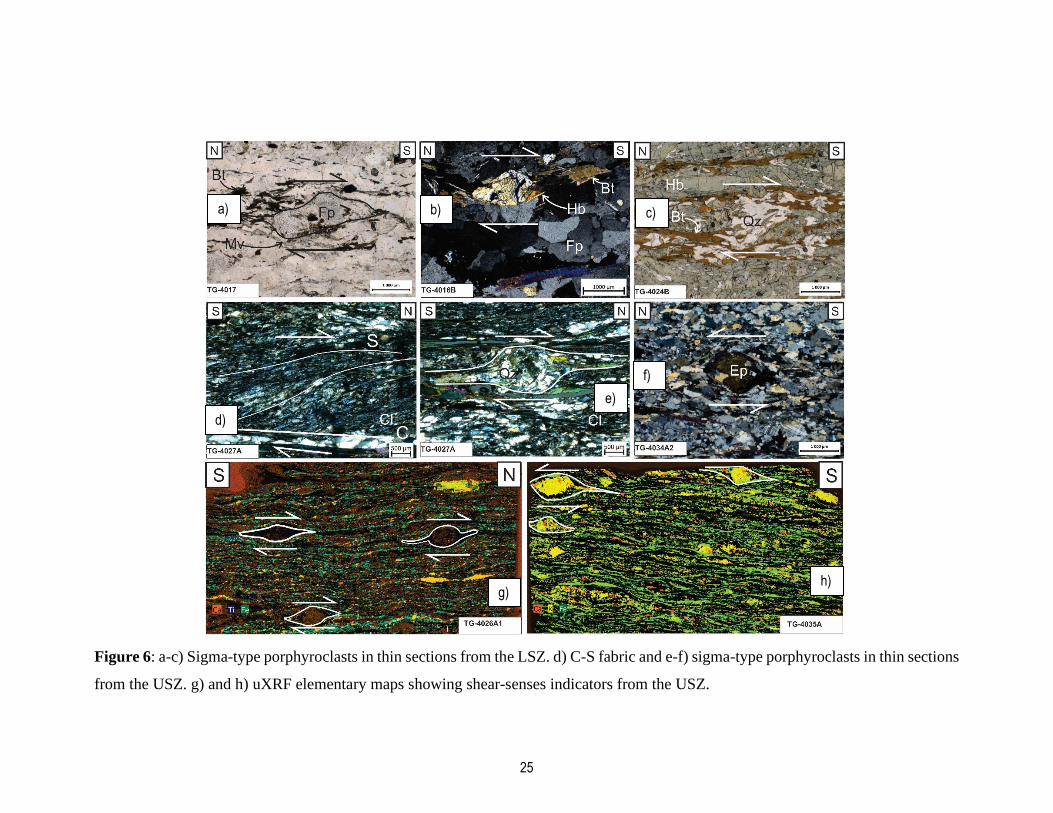
Figure 6: a-c) Sigma-type porphyroclasts in thin sections from the LSZ. d) C-S fabric and e-f) sigma-type porphyroclasts in thin sections
from the USZ. g) and h) uXRF elementary maps showing shear-senses indicators from the USZ.
a) b) c)
d)
e)
f)
g) h)
26
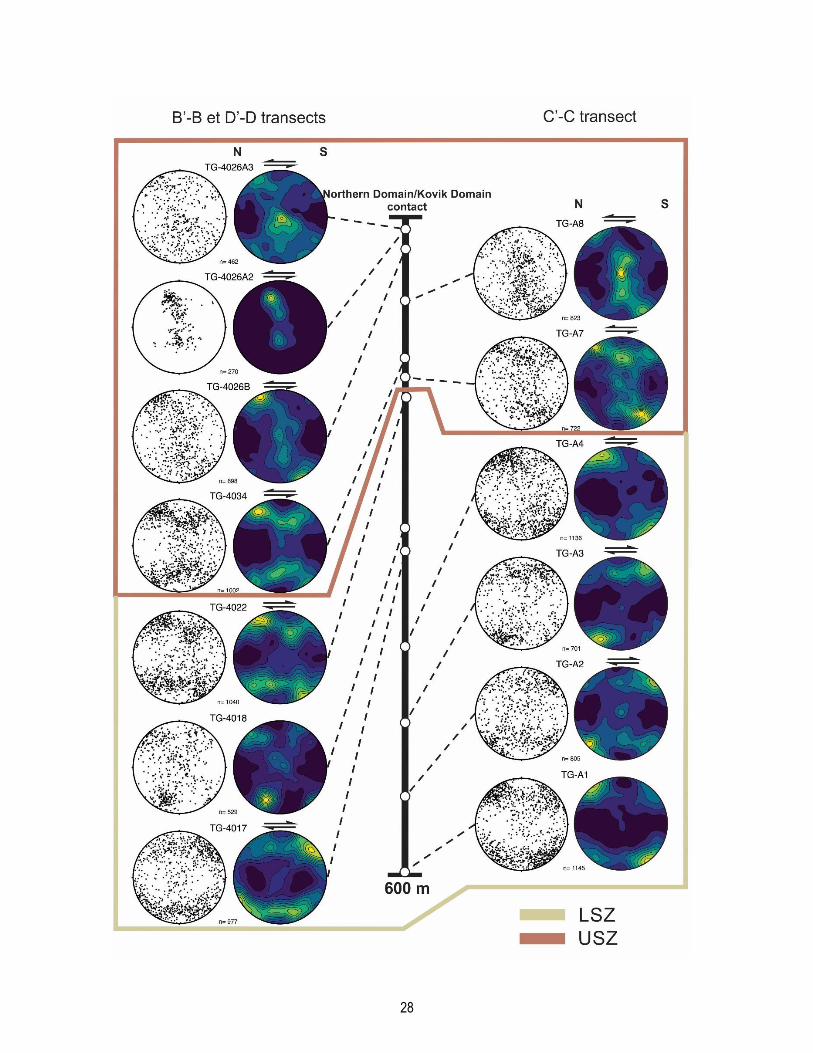
1.7.2 Quartz c-axis analysis
Si, Na, Ca, K μ-XRF maps were superposed and used to ensure that only quartz grains and
subgrains were selected and feldspars excluded. Between 270 and 1136 individual quartz c-
axes were obtained from each of the thirteen specimens investigated from the Kovik Domain.
Approximately 600 m structural distance separates the structurally lower specimens from the
structurally higher specimens and include both shear zones. The structurally lowest sample
is still within the LSZ, for which as mentioned before we could not assess the true thickness.
The quartz c-axis fabrics of each specimen are depicted with respect to their structural
distance between the Kovik Domain and Northern Domain contact (Figure 7). The quartz c-
axis fabrics from the two shear zones will be discussed separately.
Quartz c-axis fabrics from the LSZ were measured to specimens TG-4017, TG-4018, TG-
4022, TG-A1, TG-A2, TG-A3 and TG-A4. Excluding TG-4018, this group is characterized
by strongly developed fabrics with a combination of rhomb<a> and basal<a> slips defining
small circles normal to the flow planes, which are linked with a weak central girdle consistent
with some measure of prism <a> slip. Fabrics with similar patterns are generally associated
with flattening strain (Lister and Hobbs, 1980). TG-4018 differs from the other quartz c-axis
fabrics of the LSZ and presents a combination of basal <a>, prism<a> and rhomb<a> slip
forming a weakly developed type II cross girdle (Lister, 1977). Type II cross girdles are
associated with constrictional strain (Lister and Hobbs, 1980). TG-4017, TG-4022, TG-A2
and TG-A3 quartz c-axis fabrics are characterized by a weak asymmetry toward the south,
defining a top-to-the-south sense of shear. This sense of shear is compatible with the field
and oriented thin section observations. TG-A4 quartz c-axis fabric is characterized by a very
weak asymmetry toward the South. TG-4018 did not yield an interpretable sense of shear.
The quartz c-axis fabrics from the USZ correspond to the specimens TG-4026A2, TG-
4026A3, TG-4026B, TG-4034, TG-A7 and TG-A8. Specimens TG-4026A3, TG-4026B,
TG-A7 and TG-A8 are characterized by rhomb <a>, basal <a> and prism<a> slips generally
forming type I cross girdles (Lister, 1977) indicative of plane strain deformation (Lister &
Hobbs, 1980). The specimen TG-4026A3 yielded a fabric defined by a combination of
27
rhomb<a>, prism<a> and basal<a> and forms a single girdle, which is also compatible with
plane strain deformation. Specimen TG-4034 yielded more complex fabrics characterized by
a combination of rhomb<a> and basal<a> slips that form small circles normal to the flow
plane linked by a weak central girdle formed by prism <a> slips. This pattern is similar to
that observed in the LSZ, implying a component of flattening strain (Lister and Hobbs, 1980).
All quartz c-axis fabrics, however, including TG-4034, yielded a strong asymmetry towards
the north, defining a top-to-the-north sense of shear. This sense of shear is compatible with
the field and oriented thin sections observations.
28
29
Figure 7: Lower hemispherical, equal area projections of quartz c-axis fabrics. Left are
scatterplots and right are the density contour plots. All specimens are oriented with the North
to the left and South to the right. Specimens are plotted according to their horizontal distance
with the contact between the Kovik Domain and Northern Domain.
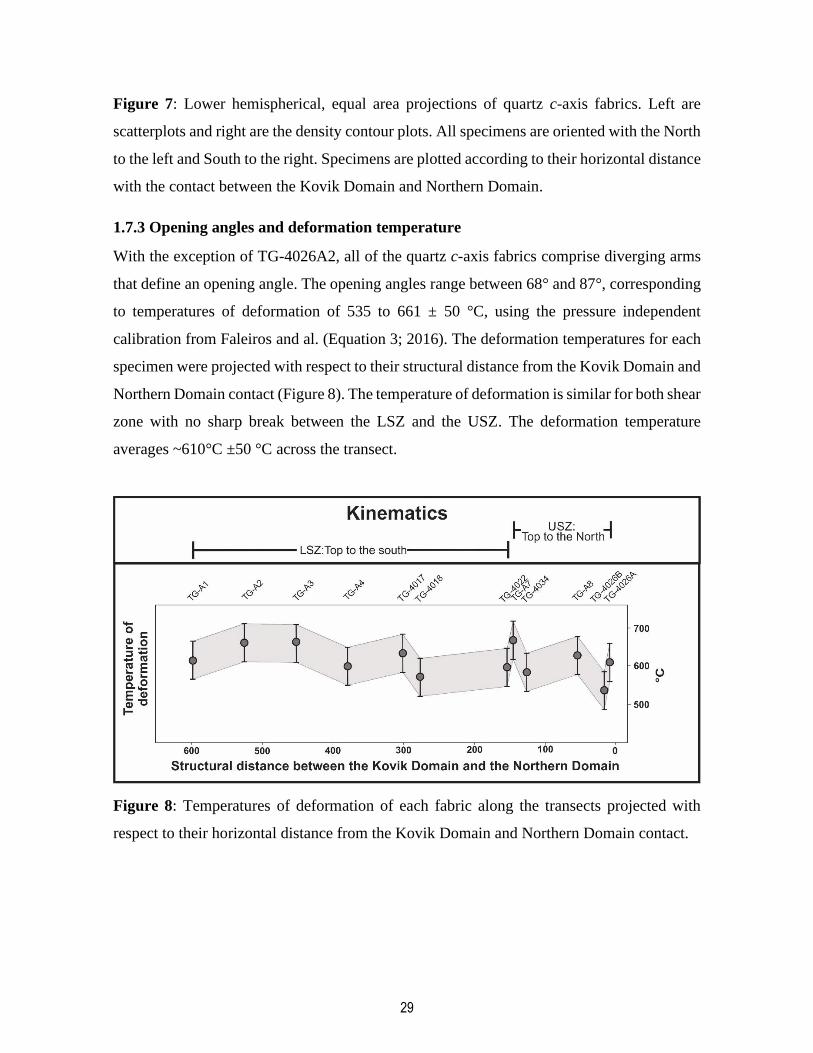
1.7.3 Opening angles and deformation temperature
With the exception of TG-4026A2, all of the quartz c-axis fabrics comprise diverging arms
that define an opening angle. The opening angles range between 68° and 87°, corresponding
to temperatures of deformation of 535 to 661 ± 50 °C, using the pressure independent
calibration from Faleiros and al. (Equation 3; 2016). The deformation temperatures for each
specimen were projected with respect to their structural distance from the Kovik Domain and
Northern Domain contact (Figure 8). The temperature of deformation is similar for both shear
zone with no sharp break between the LSZ and the USZ. The deformation temperature
averages ~610°C ±50 °C across the transect.
Figure 8: Temperatures of deformation of each fabric along the transects projected with
respect to their horizontal distance from the Kovik Domain and Northern Domain contact.
30
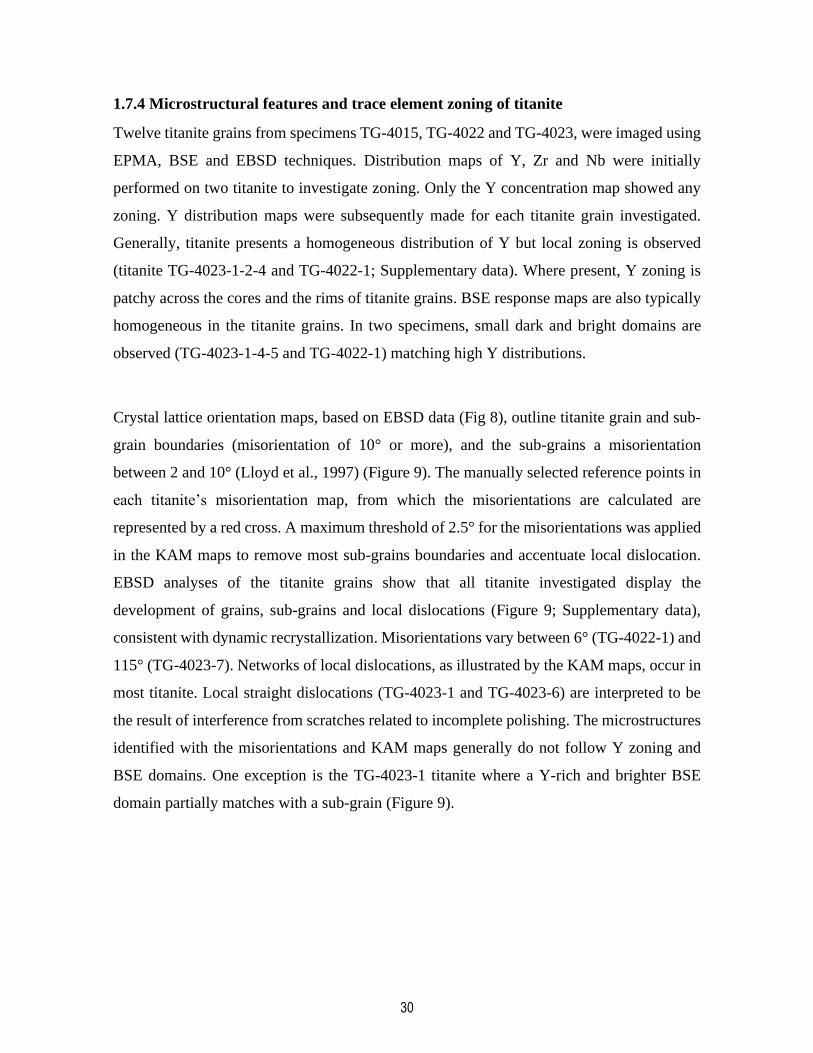
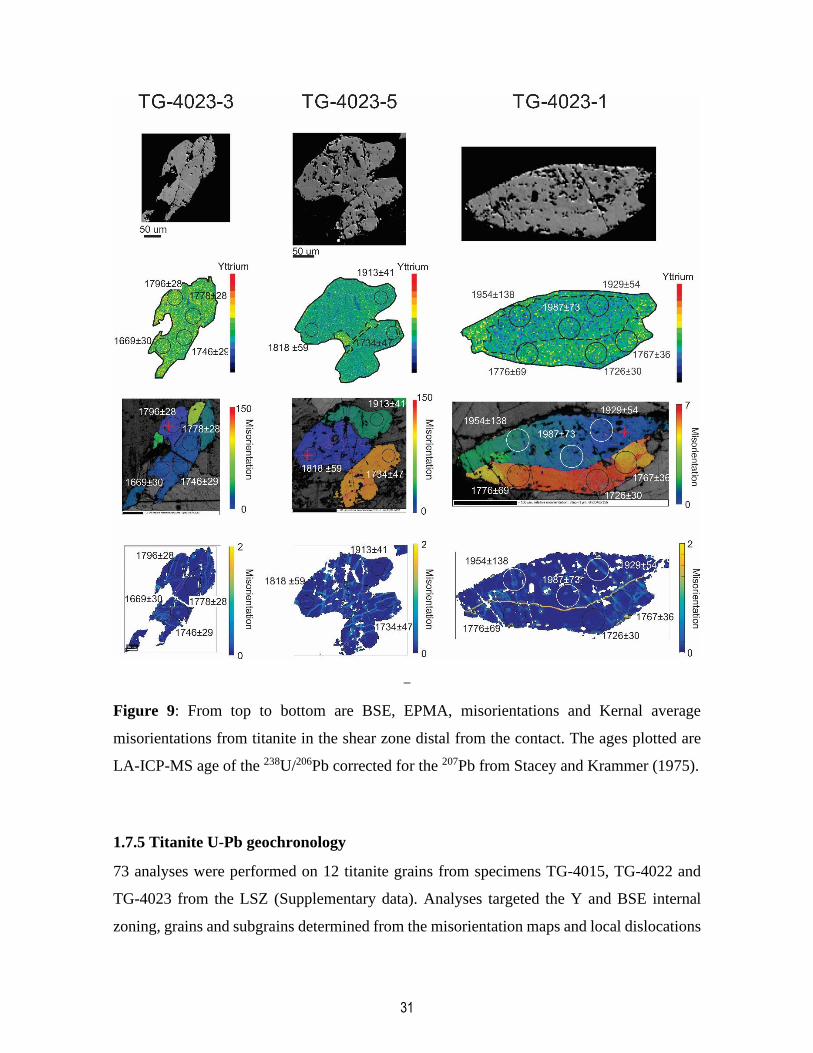
1.7.4 Microstructural features and trace element zoning of titanite
Twelve titanite grains from specimens TG-4015, TG-4022 and TG-4023, were imaged using
EPMA, BSE and EBSD techniques. Distribution maps of Y, Zr and Nb were initially
performed on two titanite to investigate zoning. Only the Y concentration map showed any
zoning. Y distribution maps were subsequently made for each titanite grain investigated.
Generally, titanite presents a homogeneous distribution of Y but local zoning is observed
(titanite TG-4023-1-2-4 and TG-4022-1; Supplementary data). Where present, Y zoning is
patchy across the cores and the rims of titanite grains. BSE response maps are also typically
homogeneous in the titanite grains. In two specimens, small dark and bright domains are
observed (TG-4023-1-4-5 and TG-4022-1) matching high Y distributions.
Crystal lattice orientation maps, based on EBSD data (Fig 8), outline titanite grain and sub-
grain boundaries (misorientation of 10° or more), and the sub-grains a misorientation
between 2 and 10° (Lloyd et al., 1997) (Figure 9). The manually selected reference points in
each titanite’s misorientation map, from which the misorientations are calculated are
represented by a red cross. A maximum threshold of 2.5° for the misorientations was applied
in the KAM maps to remove most sub-grains boundaries and accentuate local dislocation.
EBSD analyses of the titanite grains show that all titanite investigated display the
development of grains, sub-grains and local dislocations (Figure 9; Supplementary data),
consistent with dynamic recrystallization. Misorientations vary between 6° (TG-4022-1) and
115° (TG-4023-7). Networks of local dislocations, as illustrated by the KAM maps, occur in
most titanite. Local straight dislocations (TG-4023-1 and TG-4023-6) are interpreted to be
the result of interference from scratches related to incomplete polishing. The microstructures
identified with the misorientations and KAM maps generally do not follow Y zoning and
BSE domains. One exception is the TG-4023-1 titanite where a Y-rich and brighter BSE
domain partially matches with a sub-grain (Figure 9).
31
_
Figure 9: From top to bottom are BSE, EPMA, misorientations and Kernal average
misorientations from titanite in the shear zone distal from the contact. The ages plotted are
LA-ICP-MS age of the 238U/206Pb corrected for the 207Pb from Stacey and Krammer (1975).
1.7.5 Titanite U-Pb geochronology
73 analyses were performed on 12 titanite grains from specimens TG-4015, TG-4022 and
TG-4023 from the LSZ (Supplementary data). Analyses targeted the Y and BSE internal
zoning, grains and subgrains determined from the misorientation maps and local dislocations
32
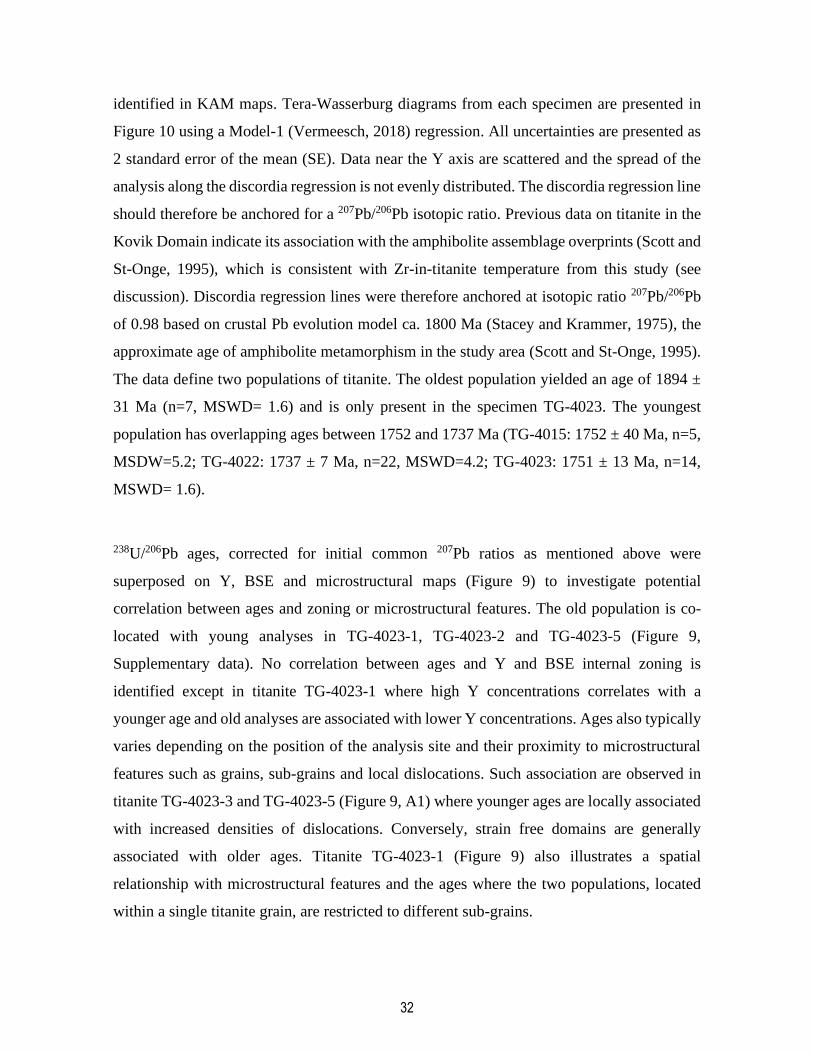
identified in KAM maps. Tera-Wasserburg diagrams from each specimen are presented in
Figure 10 using a Model-1 (Vermeesch, 2018) regression. All uncertainties are presented as
2 standard error of the mean (SE). Data near the Y axis are scattered and the spread of the
analysis along the discordia regression is not evenly distributed. The discordia regression line
should therefore be anchored for a 207Pb/206Pb isotopic ratio. Previous data on titanite in the
Kovik Domain indicate its association with the amphibolite assemblage overprints (Scott and
St-Onge, 1995), which is consistent with Zr-in-titanite temperature from this study (see
discussion). Discordia regression lines were therefore anchored at isotopic ratio 207Pb/206Pb
of 0.98 based on crustal Pb evolution model ca. 1800 Ma (Stacey and Krammer, 1975), the
approximate age of amphibolite metamorphism in the study area (Scott and St-Onge, 1995).
The data define two populations of titanite. The oldest population yielded an age of 1894 ±
31 Ma (n=7, MSWD= 1.6) and is only present in the specimen TG-4023. The youngest
population has overlapping ages between 1752 and 1737 Ma (TG-4015: 1752 ± 40 Ma, n=5,
MSDW=5.2; TG-4022: 1737 ± 7 Ma, n=22, MSWD=4.2; TG-4023: 1751 ± 13 Ma, n=14,
MSWD= 1.6).
238U/206Pb ages, corrected for initial common 207Pb ratios as mentioned above were
superposed on Y, BSE and microstructural maps (Figure 9) to investigate potential
correlation between ages and zoning or microstructural features. The old population is co-
located with young analyses in TG-4023-1, TG-4023-2 and TG-4023-5 (Figure 9,
Supplementary data). No correlation between ages and Y and BSE internal zoning is
identified except in titanite TG-4023-1 where high Y concentrations correlates with a
younger age and old analyses are associated with lower Y concentrations. Ages also typically
varies depending on the position of the analysis site and their proximity to microstructural
features such as grains, sub-grains and local dislocations. Such association are observed in
titanite TG-4023-3 and TG-4023-5 (Figure 9, A1) where younger ages are locally associated
with increased densities of dislocations. Conversely, strain free domains are generally
associated with older ages. Titanite TG-4023-1 (Figure 9) also illustrates a spatial
relationship with microstructural features and the ages where the two populations, located
within a single titanite grain, are restricted to different sub-grains.
33
Figure 10: Tera-Waserburg diagrams of TG-4023, TG-4022 and TG-4015. TG-4023-a and
TG-4023-b representing the old and young populations, respectively, present in TG-4023.
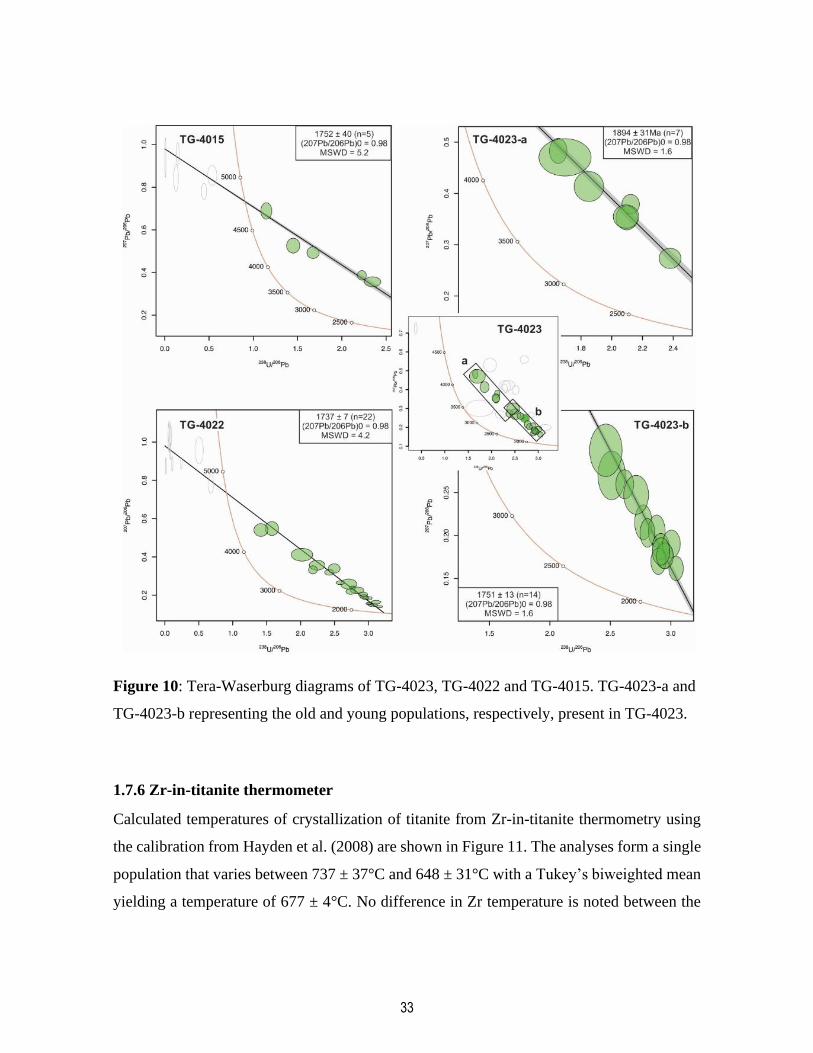
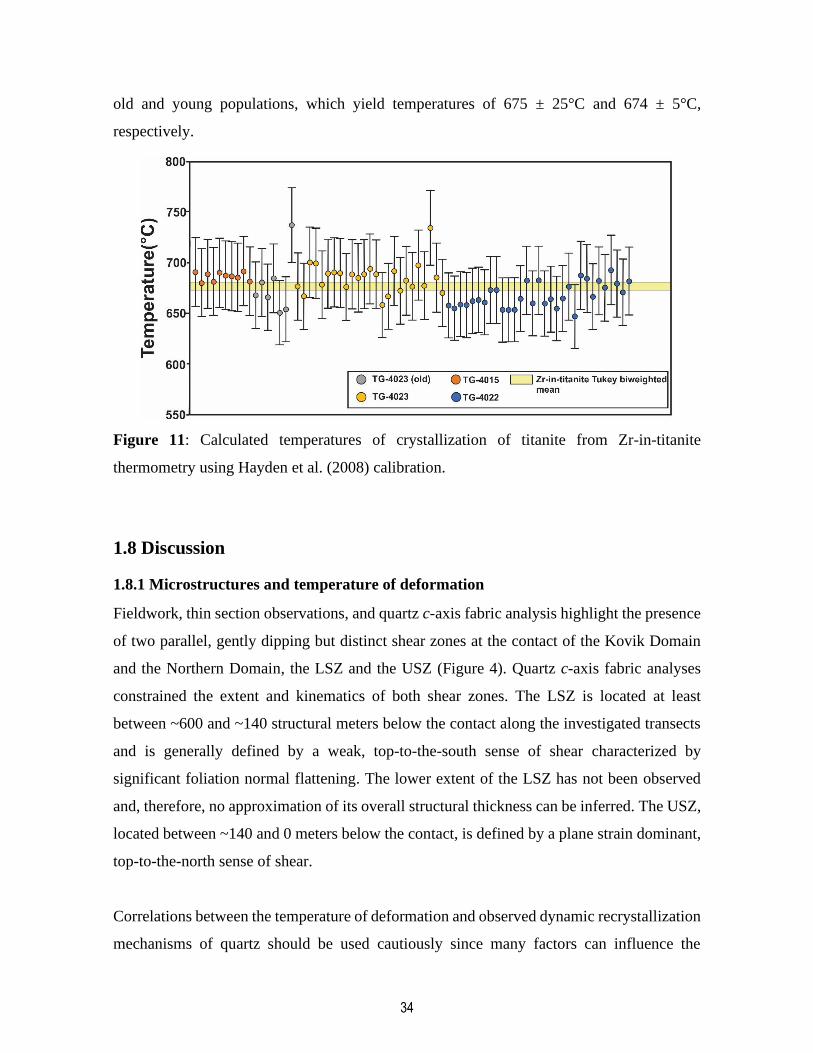
1.7.6 Zr-in-titanite thermometer
Calculated temperatures of crystallization of titanite from Zr-in-titanite thermometry using
the calibration from Hayden et al. (2008) are shown in Figure 11. The analyses form a single
population that varies between 737 ± 37°C and 648 ± 31°C with a Tukey’s biweighted mean
yielding a temperature of 677 ± 4°C. No difference in Zr temperature is noted between the
34
old and young populations, which yield temperatures of 675 ± 25°C and 674 ± 5°C,
respectively.
Figure 11: Calculated temperatures of crystallization of titanite from Zr-in-titanite
thermometry using Hayden et al. (2008) calibration.
1.8 Discussion
1.8.1 Microstructures and temperature of deformation
Fieldwork, thin section observations, and quartz c-axis fabric analysis highlight the presence
of two parallel, gently dipping but distinct shear zones at the contact of the Kovik Domain
and the Northern Domain, the LSZ and the USZ (Figure 4). Quartz c-axis fabric analyses
constrained the extent and kinematics of both shear zones. The LSZ is located at least
between ~600 and ~140 structural meters below the contact along the investigated transects
and is generally defined by a weak, top-to-the-south sense of shear characterized by
significant foliation normal flattening. The lower extent of the LSZ has not been observed
and, therefore, no approximation of its overall structural thickness can be inferred. The USZ,
located between ~140 and 0 meters below the contact, is defined by a plane strain dominant,
top-to-the-north sense of shear.
Correlations between the temperature of deformation and observed dynamic recrystallization
mechanisms of quartz should be used cautiously since many factors can influence the

35
dominant mechanisms (Law, 2014; Passchier and Trouw, 2005). The original calibration of
microstructures against the estimation of deformation temperature reported by Stippet al.
(2002a,b) is valid only for the water content and strain rates of the mylonites sampled in their
studies. Nonetheless, this microstructural thermometer was used to qualitatively assess the
relative temperatures of deformation of the LSZ and USZ for comparison with the quartz c-
axis opening angle thermometer. The main recrystallization mechanism of quartz observed
in the LSZ and USZ is GBM and to a lesser extent, SGR (Figure 5) indicating deformation
at moderate temperatures (between 500 and 700°C in Stipp et al., 2002a,b). The core-and-
mantle texture of the feldspar porphyroclasts (Figure5f) observed has been described to be
an efficient recrystallization mechanism at temperatures in excess of 450°C (Passchier and
Trouw, 2005), which is consistent with the temperature indicated based on the Stipp et al.
(2002a,b) quartz textural calibration.
The quartz c-axis opening angle thermometer provides further information about deformation
temperatures. This thermometer was calibrated with LS tectonites and its application with
S>L or L>S tectonites may have an effect of over- and underestimating the temperature of
deformation, respectively (Faleiros et al., 2016; Law, 2014). Except for TG-4018, quartz c-
axis fabrics from the LSZ are associated with flattening strain (S>L tectonites), which could
overestimate the temperature of deformation. The average temperature of deformation from
these fabrics (removing temperature of deformation of TG-4018) is 627 ± 50°C and is
therefore considered as a maximum temperature for the LSZ. Fabrics with deformation that
approximate plane strain (LS tectonites) from the USZ (fabrics TG-4026A3, TG-4026B, TG-
A7, TG-A8), which do not suffer the same potential problems, yielded an average
temperature of 580 ± 50°C. No sharp break in temperature of deformation can be resolved
between the USZ and LSZ, which is compatible with the similar quartz and feldspar textures
along all transects.
1.8.2 Structural interpretations
The LSZ is generally defined by a top-to-the-south sense of shear associated with quartz c-
axis fabric with a weak to absent asymmetry and patterns characteristic of flattening strain.
The flattening pattern combined with the weak to absent asymmetry of the quartz c-axis

36
fabrics and the general absence of shear-senses indicators in the field and oriented thin
sections are consistent with an important component of pure shear deformation since coaxial
deformation tends to form symmetrical structures (Fossen, 2016). The top-to-the-south shear-
senses are compatible with the sense of shear documented in earlier works (e.g. Lamothe et
al., 1984; Lucas and St-Onge, 1991) and are consistent with the interpretation that this
structure represents the exposed basal shear zone of the orogen since a folded thrust, as
proposed by previous workers (e.g. Hoffman, 1985), would yield a top-to-the-south sense of
shear (see Figure 2). Top-south kinematics are also compatible with a model in which this
shear zone represents a detachment (inferred from Weller and St-Onge, 2017), since a
detachment between the foreland and the UHP complex would also yield top-to-the-south
shear sense along a south dipping SZ (see Figure 2).
In contrast to the LSZ, the USZ is defined by a top-to-the-north sense of shear and strongly
asymmetric quartz c-axis fabrics that approximate plane strain (Figure 7). These observations
are consistent with a significant component of simple shear strain in the USZ (Passchier and
Trouw, 2005). Critically, the top-to-the-north kinematics within the USZ has not been
reported by previous workers.
The quartz c-axis fabric extracted from TG-4034, within the USZ, helps mark the switch
between the top-to-the-south sense of shear LSZ and the top-to-the-north sense of shear of
the USZ (Figure 7). This fabric contains a c-axis orientation pattern characteristic of a
component of flattening strain, similar to the fabrics from the LSZ. It also, however, records
top-to-the-north sense of shear, characteristic of the USZ. Quartz c-axis fabrics have been
documented to record multiple strain histories within single specimen (e.g. Kirschner and
Teyssier, 1991; Larson and Cottle, 2014). The presence of a hybrid fabric may indicate the
overprinting of the LSZ by the USZ or the opposite. Alternatively, the absence of crosscutting
relationships in the field, similar quartz and feldspar microstructures and temperatures of
deformation, constrained between 627 and 580°C ± 50°C for the LSZ and USZ respectively,
might indicate coeval activities (e.g. Dutta et Mukherjee, 2021). Future work on the timing
of deformation of the USZ should be assessed to better understand the overall interaction
between the USZ and LSZ.
37
1.8.3 Interpretation of titanite geochronology
Titanite can occur as a primary igneous and/or secondary metamorphic mineral (Frost et al.
2001; Kohn, 2017). The U-Pb system in titanite can record multiple crystallization events
and can be reset by thermally mediated volume diffusion, interaction with fluids, or by plastic
deformation (Garber et al., 2017; Holder and Hacker, 2019; Spencer et al., 2013; Stearns et
al., 2015). Our titanite dates could represent protolith ages (for igneous titanite), cooling (for
thermally diffused titanite), metamorphic ages (for metamorphic titanite) or reset ages
reflecting recrystallization during deformation. Assessing potential Pb diffusion mechanisms
in the titanite grains is thus critical to our geological interpretation of ca. 1740 Ma and 1894
Ma populations obtained in this study.
Titanite dates have been interpreted as cooling ages because of their historically low closure
temperature estimations, initially thought to be between 450 and 600°C (Cherniak, 1993;
Mattinson, 1978). However, recent studies have demonstrated the robustness of titanite to
thermally mediated volume diffusion of Pb and calculated relatively high closure
temperatures, bracketed between 700 and 850°C (Gao et al., 2012; Garber et al., 2017; Kohn,
2017; Kohn and Corrie, 2011; Spencer et al., 2013, Holder et al., 2019). Kirkland et al. (2016)
demonstrated that titanite grains with a diameter of ≥ 210 µm were only partially reset under
temperatures of 695-725°C. Similarly, Spencer et al. (2013) concluded that titanite grains as
small as 200 µm can preserve their crystallization age even after reaching temperatures over
750°C for 40 Myr. Titanite grains from this study are 260 µm in size on average (ranging
from ̴150 to ̴1000 µm) and the amphibolite-grade metamorphic event they are associated
with in the Kovik Domain reached temperatures of 640-715°C (St-Onge and Ijewliw, 1996).
The large size of our titanite grains and the limited peak metamorphic temperatures likely
limited the effectiveness of thermally mediated Pb diffusion. Accordingly, the ages
determined are not considered to be cooling ages.
Zr-in-titanite is a thermometer that could help differentiate between igneous and
metamorphic titanite ages (e.g. Olierook et al., 2019). Temperatures obtained with the Zr-in-
titanite thermometer from this study are of the same order are similar (Tukey weighted mean

38
of 677 ± 4°C) to those reported for the amphibolite facies metamorphism associated with
titanite growth (~640-715°C; Scott et St-Onge, 1995, St-Onge et Ijewliw, 1996) We interpret
that the ca. 1890 Ma population of titanite outlined in this study, therefore, do not represent
a protolith age, but a metamorphic age. This metamorphic age is ~80 Ma older than
previously reported metamorphic titanite ages (Scott and St-Onge, 1995). The titanite
geochronology presented in Scott et St-Onge (1995) is based on an anion-exchange
chromatographic technic and, therefore, may represent mixing between different titanite
domains, highlighting the potential importance of in situ dating. A ca. 1890 Ma metamorphic
age could be related to the ca. 1880 Ma Circum-Superior LIP emplaced around the Superior
Province (Bleeker and Kamo, 2017) leading to the initial hydration of the Archean basement.
As for the younger ca. 1740 Ma population, the spot analyses that define it have an
indistinguishable Zr temperature from the older population: 675 ± 25°C and 674 ± 5°C for
the 1894 Ma and ca. 1740 Ma populations, respectively. The younger age could be explained
through plastic deformation and/or fluid-mediated resetting or a young crystallization event
(Garber et al., 2017; Holder and Hacker, 2019; Spencer et al., 2013; Stearns et al., 2015).
Plastic deformation is an important mechanism of Pb diffusion in titanite (Spencer et al.,
2013; Stearns et al., 2015; Gordon et al., 2021) where it can create pathways for fast diffusion
of Pb. The apparent control of the age by grains, sub-grains and the correlation between high
strain domains and young ages and low strain domains and old ages illustrated in KAM maps
(Figure 9) are consistent with partial resetting of Pb in titanite grains through dynamic
recrystallization.
Multiple crystallization events are unlikely, given the general lack of spatial association of
young ages with only the outside portions of grains. Moreover, the absence of correlation
between the 238U/206Pb ages, corrected for common 207Pb contamination (Stacey and
Kramers, 1975) and differences in BSE response maps (Figure 9, supplementary data)
supports a single crystallization event (e.g. Gao et al., 2012, Papapavlou et al., 2017). Titanite
is prone to developing sector zoning, which presents as the difference in composition
controlled by the crystallography (Kohn, 2017). The differences in Y distribution and BSE
response maps observed in titanite from this study may be ascribed to such zoning.
39
Although plastic deformation is interpreted as the main mechanism responsible for Pb
diffusion, fluid-titanite interaction could also have contributed. Fluid-mediated resetting of
titanite is envisioned to take place by interface-couped dissolution-precipitation reactions
(ICDR) and is hypothesized to be the primary mechanism by which titanite dates are reset
below the temperature of closure (Holder and Hacker, 2019). ICDR, where an older titanite
is partially replaced by a younger titanite with different compositions as a result of the
interaction with a fluid, will lead to patchy, lobate and oscillatory zoning and the presence of
inclusions and porosity in titanite grains (Holder and Hacker, 2019; Putnis, 2009). Some of
these features are present in titanite grains in this study, such as local patchy zoning, which
might indicate that fluid-mediated resetting could have been involved perhaps in conjunction
with plastic deformation.
Because plastic deformation and fluid-titanite interaction can lead to Zr diffusion (e.g. Stearn
et al. 2015), we must assess the robustness of the crystallization temperature from the Zr-in-
titanite thermometry. The lower temperature of crystallization of TG-4022 (Figure 11) could
indicate that the Zr might have slightly diffused out of the titanite from specimen TG-4022
during the deformation. However, Pb has been observed to be more mobile than Zr in titanite
grains following plastic deformation and fluid-titanite interaction (Gordon et al., 2021;
Holder and Hacker, 2019). Because the Zr-in-titanite temperatures between the old and
young populations from this study are nearly identical (675 ± 25°C and 674 ± 5°C,
respectively, Figure 11) it would be unlikely that the old population preserved its
crystallization age but not its temperature. This indicates that the temperatures of
crystallization of the titanite calculated from Zr-in-titanite thermometry are robust and likely
represent the temperature of crystallization of titanite at ca. 1894 Ma and therefore, the
estimation of temperature for the amphibolite facies. Moreover, the temperatures of
crystallization of titanite in this study overlap with the previous estimate of 660-700°C on
titanite grains located outside of the contact between the Kovik Domain and the Northern
Domain (Scott and St-Onge, 1995).

40
1.8.4 Evolution of the contact between the Kovik Domain and the Northern Domain
Our ca. 1740 Ma shearing ages predates or overlap with most biotite, muscovite, and
hornblende 40Ar/39Ar dates reported from the Southern Domain, Northern Domain and Kovik
Domain (Kellett et al., 2020; Skipton et al., 2020), which range between 1750 and 1700 Ma.
This indicates that the late amphibolite-grade top-to-the-south shearing event recorded in the
LSZ was contemporaneous with the onset of regional cooling. Kellett et al. (2020) identify
significant and widespread exhumation following lithospheric delamination as a likely
process to explain relatively high post-terminal THO cooling rates. We suggest that the
contact between the Kovik Domain and the Northern Domain may be one of the structures
that accommodated the exhumation of rocks in the UO. The ca. 1740 Ma timing of shearing
at the contact between the Kovik Domain and the Northern Domain also indicates that it was
coeval with the formation of the dome structure of the Kovik Domain, previously suggested
to have occurred between 1758+/-1 Ma and 1742 +/-1 (Parrish, 1989; Dunphy et al., 1995).
The kinematics and timing of the LSZ and the structural architecture of the Kovik Domain
are, therefore, consistent with a model in which the latter is a post-orogenic metamorphic
dome. In such a model, the LSZ, south dipping, would have acted as a detachment at the
southern margin of this dome, providing a potential explanation for the pressure gap inferred
from the presence of an eclogite in the western Kovik Domain and the amphibolite
metamorphic condition of the Northern Domain. Such model would be compatible with the
overall upper structural features of many UHP complex (Figure 2b). As for the USZ, its
interpretation remains ambiguous as no data were collected that can inform its movement
timing relative to that along the LSZ.
1.8.5 Comparison between the Kovik Domain and the Tso Morari Nappe
Weller and St-Onge (2017) suggested that the Kovik Domain represents a Paleoproterozoic
analog to the Tso Morari Nappe in the Himalaya-Tibet Orogen. Although the Tso Morari
Nappe and the Kovik Domain share apparent similarities such as comparable timing-lag of
eclogite metamorphism (Weller and St-Onge, 2017; St‐Onge et al., 2013; Leech et al., 2005),
and similar structural characteristics such as size, ophiolite association and the dome structure
(Epard and Steck, 2008; St-Onge et al., 1999), the overall tectono-metamorphic histories
diverge significantly.

41
Collision ages of ca. 55 Ma for India-Asia (Najman et al., 2017; Zhu et al., 2015) and ca.1830
Ma for Churchill-Superior (St-Onge et al., 2006; Corrigan et al., 2009) are used for the
following explanation. After reaching peak UHP conditions within ~10 Myrs after the
collision (pc) between India and Asia (Leech et al., 2005; St‐Onge et al., 2013; Donaldson et
al., 2013), the Tso Morari Nappe detached from the Indian subducting crust and exhumed
via extensional shearing that may have been active until 25 Myrs post-collision (Long et al.,
2020). The exhumation of the Tso Morari Nappe to mid-crustal levels was accompanied by
amphibolite facies metamorphism within ~7-10 Myrs post-collision (Epard and Steck, 2008;
St‐Onge, 2013; Wilke, 2015). The structural doming of the Tso Morari Complex formed by
~8-25 Myrs post-collision and was driven by the emplacement and the exhumation of the Tso
Morari Nappe to structurally higher rocks of the subducting Indian margin (Epard and Steck,
2008).
In the Kovik Domain, eclogite metamorphism was also reached within ~10 Myrs post-
collision (Weller and St-Onge, 2017). However, the shearing between the Kovik Domain and
the Northern Domain and the formation of the structural dome happened later than in the Tso
Morari Nappe and are constrained between ~78-93 Myrs post-collision (this study) and ~72-
88 Myrs post-collision (Parrish, 1989; Dunphy, 1995). The granulite facies assemblage is
overprinted by an amphibolite facies assemblage, as marked by the growth of titanite ca. 64
Myrs post-collision (this study). The emplacement of the Tso Morari Nappe to its current
location was a rapid process achieved at least within 25 Myrs following the collision. In stark
contrast, the final configuration of the Kovik Domain was achieved ~90 Myrs after initial
collision. The dissonance between the rapid exhumation of the Tso Morari Nappes and the
slow evolution of the Kovik Domain following the collision imply that the latter did not
evolve similarly as the Tso Morari or, at least, on a significantly different timescale.
42
1.9 Conclusion
Investigation of the contact between the Kovik Domain and the Northern Domain
highlighted the following:
• Based on fieldwork and thin section observations, and quartz c-axis fabric analysis,
two distinct shear zones were identified at the contact of the Kovik Domain and the
Northern Domain
• The LSZ is located at least ~within 600 and ~140 structural meters of the contact, as
the northern extent of this shear zone has not been investigated and is defined by a
top-to-the-south sense of shear associated with quartz c-axis patterns characteristic of
flattening strain.
• The USZ is located within ~140 structural meters of the contact and is defined by a
top-to-the-north sense of shear and quartz c-axis fabric characteristic of deformation
that approximates plane strain.
• The temperatures of deformation of the LSZ and USZ are constrained at 627 ± 50°C
and 580°C ± 50°C, respectively.
• Two populations of titanite are identified. The old population yielded an age of 1894
± 31 Ma and the young population yielded an age at ca. 1740 Ma.
• The old population is interpreted as metamorphic titanite related to the ca. 1880 Ma
Circum-Superior LIP emplaced around the Superior Province (Bleeker and Kamo,
2018) leading to the initial hydration of the Archean basement causing the
amphibolite facies overprint. The young population is interpreted to represent
resetting of the titanite via dynamic recrystallization during deformation within the
LSZ.
Although we interpret LSZ as a detachment, the results of this study are hard to reconcile
with the modern plate tectonic model exhuming UHP complex as seen in the Tso Morari in
43
the Himalaya-Tibet Orogen and imply that the Kovik Domain evolved differently, or at least
on different timescales.
44
1.10 Acknowledgements
This project was funded by the Ministère de l’Énergie and des Ressource Naturelle du
Québec (MERN) and by a NSERC grant RGPIN-2020-06400 to CG. The authors would like
to thank Edmond Rousseau, Suzie Côté, Riccardo Graziani and Mark Button for the sample
preparation, X-ray fluorescence analyses, EBSD analyses and LA-ICPMS analyses,
respectively.
45
1.11 References
Beaudette, M., Bilodeau, C., Mathieu, G. 2020. Géologie de la région du lac Parent, Fosse
de l’Ungava, Nunavik, Québec, Canada. MERN. BG 2020-04, 1 plan.
Beaumont, C., Jamieson, R. A., Butler, J., Warren, C. J. E., & Letters, P. S. (2009). Crustal
structure: A key constraint on the mechanism of ultra-high-pressure rock exhumation.
287(1-2), 116-129.
Bergeron, R., & Quebec (Province). Dept. of Mines. (1957). Preliminary report on Cape
Smith-Wakeham Bay belt, New Quebec. Department of Mines.
Bleeker, W., & Kamo, S. L. (2017). Extent, origin, and deposit-scale controls of the 1883
Ma Circum-Superior large igneous province, northern Manitoba, Ontario, Quebec,
Nunavut and Labrador. Targeted Geoscience Initiative, 5-14.
Brown, M. and T. Johnson (2018). "Secular change in metamorphism and the onset of
global plate tectonics." American Mineralogist 103(2): 181-196.
Charette, & Beaudette. (2018). Géologie de la région du Cap Wolstenholme, Orogène de
l’Ungava, Province de Churchill, sud-est d’Ivujivik, Québec, Canada. Ministère de
l’Énergie et des Ressources naturelles, Québec. Retrieved 2018
Cherniak, D. (1993). Lead diffusion in titanite and preliminary results on the effects of
radiation damage on Pb transport. Chemical Geology, 110(1-3), 177-194.
Corrigan, D. van Rooyen, D., & Wodicka, N. (2021). Indenter tectonics in the Canadian
Shield: A case study for Paleoproterozoic lower crust exhumation, orocline
development, and lateral extrusion. Precambrian Research, 355, 106083.
Corrigan, D., Pehrsson, S., Wodicka, N., & De Kemp, E. London, Special Publications.
(2009). The Palaeoproterozoic Trans-Hudson Orogen: a prototype of modern
accretionary processes. 327(1), 457-479.
Davis, D. W., & Sutcliff, C. N. (2018). U-Pb Geochronology of Zircon and Monazite by LA-
ICPMS in Samples from Northern Quebec.
De Sigoyer, J., Guillot, S., & Dick, P. J. T. (2004). Exhumation of the ultrahigh‐pressure Tso
Morari unit in eastern Ladakh (NW Himalaya): A case study. 23(3).
Donaldson, D. G., Webb, A. A. G., Menold, C. A., Kylander-Clark, A. R., & Hacker, B. R.
(2013). Petrochronology of Himalayan ultrahigh-pressure eclogite. Geology, 41(8),
835-838.
Dunphy, J., Ludden, J., & Parrish, R. (1995). Stitching together the Ungava Orogen, northern
Quebec: geochronological (TIMS and ICP–MS) and geochemical constraints on late
magmatic events. Canadian Journal of Earth Sciences, 32(12), 2115-2127.
Dunphy, J., & Ludden, J. (1998). Petrological and geochemical characteristics of a
Paleoproterozoic magmatic arc (Narsajuaq terrane, Ungava Orogen, Canada) and
comparisons to Superior Province granitoids. Precambrian Research, 91(1-2), 109-
142.
Dutta, D., & Mukherjee, S. (2021). Extrusion kinematics of UHP terrane in a collisional
orogen: EBSD and microstructure-based approach from the Tso Morari Crystallines
(Ladakh Himalaya). Tectonophysics, 800, 228641.
Epard, J. L., & Steck, A. (2008). Structural development of the Tso Morari ultra-high
pressure nappe of the Ladakh Himalaya. Tectonophysics, 451(1-4), 242-264.
Erickson, T., Pearce, M., Taylor, R., Timms, N. E., Clark, C., Reddy, S., & Buick, I. (2015).
Deformed monazite yields high-temperature tectonic ages. Geology, 43(5), 383-386.
46
Faleiros, F., Moraes, R. d., Pavan, M., & Campanha, G. d. C. (2016). A new empirical
calibration of the quartz c-axis fabric opening-angle deformation thermometer.
Tectonophysics, 671, 173-182.
Fossen, H. (2016). Structural geology: Cambridge University Press.
Frost, B. R., Chamberlain, K. R., & Schumacher, J. C. (2001). Sphene (titanite): phase
relations and role as a geochronometer. Chemical geology, 172(1-2), 131-148.
Furnes, H., de Wit, M., Staudigel, H., Rosing, M., & Muehlenbachs, K. (2007). A vestige of
Earth's oldest ophiolite. Science, 315(5819), 1704-1707.
Gao, X. Y., Zheng, Y. F., Chen, Y. X., & Guo, J. (2012). Geochemical and U–Pb age
constraints on the occurrence of polygenetic titanites in UHP metagranite in the
Dabie orogen. Lithos, 136, 93-108.
Garber, J., Hacker, B., Kylander-Clark, A., Stearns, M., & Seward, G. (2017). Controls on
trace element uptake in metamorphic titanite: Implications for petrochronology.
Journal of Petrology, 58(6), 1031-1057.
Gerya, T. (2015). Tectonic overpressure and underpressure in lithospheric tectonics and
metamorphism. Journal of Metamorphic Geology, 33(8), 785-800.
Gordon, S. M., Kirkland, C. L., Reddy, S. M., Blatchford, H. J., Whitney, D. L., Teyssier,
C., ... & McDonald, B. J. (2021). Deformation-enhanced recrystallization of titanite
drives decoupling between U-Pb and trace elements. Earth and Planetary Science
Letters, 560, 116810.
Hamilton, W. B. (2011). Plate tectonics began in Neoproterozoic time, and plumes from deep
mantle have never operated. Lithos, 123(1-4), 1-20.
Hayden, L. A., Watson, E. B., & Wark, D. A. (2008). A thermobarometer for sphene
(titanite). Contributions to Mineralogy and Petrology, 155(4), 529-540.
Hielscher, R., Silbermann, C. B., Schmidl, E., & Ihlemann, J. (2019). Denoising of crystal
orientation maps. Journal of Applied Crystallography, 52(5), 984-996.
Hobbs, B. (1985). The hydrolytic weakening effect in quartz. Point defects in minerals, 31,
151-170.
Hoffman, P. F. J. (1985). Is the Cape Smith belt (northern Quebec) a klippe? Canadian
Journal of Earth Sciences, 22(9), 1361-1369.
Hoffman, P. F. (1988). United plates of America, the birth of a craton: Early Proterozoic
assembly and growth of Laurentia. Annual Review of Earth and Planetary Sciences,
16(1), 543-603.
Holder, R. M., & Hacker, B. R. (2019). Fluid-driven resetting of titanite following ultrahigh-
temperature metamorphism in southern Madagascar. Chemical Geology, 504, 38-52.
Holder, R. M., Hacker, B. R., Seward, G. G., & Kylander-Clark, A. R. (2019). Interpreting
titanite U–Pb dates and Zr thermobarometry in high-grade rocks: empirical
constraints on elemental diffusivities of Pb, Al, Fe, Zr, Nb, and Ce. Contributions to
Mineralogy and Petrology, 174(5), 1-19.
Hopkins, M., Harrison, T. M., & Manning, C. E. (2008). Low heat flow inferred from> 4 Gyr
zircons suggests Hadean plate boundary interactions. Nature, 456(7221), 493-496.
Hynes, A., Francis, D.M., 1982. A transect of the early Proterozoic Cape Smith foldbelt, New
Quebec. Tectonophysics; volume 88, pages 23-59.
Jochum, K. P., Nohl, U., Herwig, K., Lammel, E., Stoll, B., & Hofmann, A. W. (2005).
GeoReM: a new geochemical database for reference materials and isotopic standards.
Geostandards and Geoanalytical Research, 29(3), 333-338.
47
Kapp, P., Manning, C., & Tropper, P. (2009). Phase‐equilibrium constraints on titanite and
rutile activities in mafic epidote amphibolites and geobarometry using titanite–rutile
equilibria. Journal of Metamorphic Geology, 27(7), 509-521.
Kastek, N., Ernst, R. E., Cousens, B. L., Kamo, S. L., Bleeker, W., Söderlund, U., &
Sylvester, P. (2018). U-Pb Geochronology and geochemistry of the Povungnituk
Group of the Cape Smith Belt: part of a craton-scale circa 2.0 Ga Minto-
Povungnituk large igneous province, northern Superior craton. Lithos, 320, 315-
331.
Kellett, D. A., Pehrsson, S., Skipton, D. R., Regis, D., Camacho, A., Schneider, D. A., &
Berman, R. (2020). Thermochronological history of the Northern Canadian Shield.
Precambrian Research, 342, 105703.
Kirkland, C. L., Spaggiari, C., Johnson, T., Smithies, R. H., Danišík, M., Evans, N., . . .
Mikucki, E. (2016). Grain size matters: Implications for element and isotopic
mobility in titanite. Precambrian Research, 278, 283-302.
Kirschner, D., & Teyssier, C. (1991). Quartz c-axis fabric differences between
porphyroclasts and recrystallized grains. Journal of Structural Geology, 13(1), 105-
109.
Kohn, M. J. (2017). Titanite petrochronology. Reviews in Mineralogy and Geochemistry,
83(1), 419-441.
Kohn, M. J., & Corrie, S. L. (2011). Preserved Zr-temperatures and U–Pb ages in high-grade
metamorphic titanite: evidence for a static hot channel in the Himalayan orogen.
Earth and Planetary Science Letters, 311(1-2), 136-143.
Kruhl, J.H., 1998. Prism- and basal-plane parallel subgrain boundaries in quartz: a
microstructural geothermobarometer: Reply. J. Metamorph. Geol. 16, 142–146
Lamothe, D., Picard, C., & Moorhead, J. (1984). Bande de Cap Smith-Maricourt, région du
lac Beauparlant: Ministère des Ressources naturelles. Québec, DP, 84-39.
Lamothe, D. (2007). Lexique stratigraphique de l'Orogène de l'Ungava. Géologie Québec.
Larson, K. P. (2018). Refining the structural framework of the Khimti Khola region, east-
central Nepal Himalaya, using quartz textures and c-axis fabrics. Journal of
Structural Geology, 107, 142-152.
Larson , K. P. (2021). FabricPlotR.
Larson, K. P., & Cottle, J. M. (2014). Midcrustal discontinuities and the assembly of the
Himalayan midcrust. Tectonics, 33(5), 718-740.
Law, R. D. J. J. o. s. G. (2014). Deformation thermometry based on quartz c-axis fabrics and
recrystallization microstructures: A review. 66, 129-161.
Leech, M. L., Singh, S., Jain, A., Klemperer, S. L., & Manickavasagam, R. (2005). The onset
of India–Asia continental collision: early, steep subduction required by the timing of
UHP metamorphism in the western Himalaya. Earth and Planetary Science Letters,
234(1-2), 83-97.
Lister, G. (1977). Discussion: crossed-girdle c-axis fabrics in quartzites plastically deformed
by plane strain and progressive simple shear. Tectonophysics, 39(1-3), 51-54.
Lister, G., & Hobbs, B. (1980). The simulation of fabric development during plastic
deformation and its application to quartzite: the influence of deformation history.
Journal of Structural Geology, 2(3), 355-370.
48
Lloyd, G. E., Farmer, A. B., & Mainprice, D. (1997). Misorientation analysis and the
formation and orientation of subgrain and grain boundaries. Tectonophysics, 279(1-
4), 55-78.
Long, S. P., Kohn, M. J., Kerswell, B. C., Starnes, J. K., Larson, K. P., Blackford, N. R., &
Soignard, E. (2020). Thermometry and microstructural analysis imply protracted
extensional exhumation of the Tso Morari UHP nappe, northwestern Himalaya:
Implications for models of UHP exhumation. Tectonics, 39(12), e2020TC006482.
Lucas. (1989). Structural evolution of the Cape Smith Thrust Belt and the role of out‐of‐
sequence faulting in the thickening of mountain belts. 8(4), 655-676.
Lucas, S. B. (1990). Relations between thrust belt evolution, grain-scale deformation, and
metamorphic processes: Cape Smith Belt, northern Canada. Tectonophysics, 178(2-
4), 151-182.
Lucas, S. & St-Onge. (1992). Terrane accretion in the internal zone of the Ungava orogen,
northern Quebec. Part 2: Structural and metamorphic history. Canadian Journal of
Earth Sciences - CAN J EARTH SCI, 29, 765-782. doi:10.1139/e92-065
Lucas, S. & St-Onge, J. G. S. o. C. P. (1991). Evolution of Archaean and early Proterozoic
magmatic arcs in the northeastern Ungava Peninsula, Québec. 91, 109-119.
Lucas, S., & Byrne, T. J. J. o. t. G. S. (1992). Footwall involvement during arc-continent
collision, Ungava orogen, northern Canada. 149(2), 237-248.
Lucas, S. B., & St-Onge, M. R. (1995). Syn-tectonic magmatism and the development of
compositional layering, Ungava Orogen
Machado, N., David, J., Scott, D. J., Lamothe, D., Philippe, S., & Gariépy, C. (1993). U
Pb geochronology of the western Cape Smith Belt, Canada: new insights on the age
of initial rifting and arc magmatism. Precambrian Research, 63(3-4), 211-223.
Mathieu, G., & Beaudette, M. (2018). Géologie de la région du lac Watts, Domaine Nord,
Fosse de l’Ungava, Nunavik, Québec, Canada. Bulletin géologiQUE.
Mattinson, J. M. (1978). Age, origin, and thermal histories of some plutonic rocks from the
Salinian block of California. Contributions to Mineralogy and Petrology, 67(3), 233-
245.
Müller, S., Dziggel, A., Kolb, J., & Sindern, S. (2018). Mineral textural evolution and PT-
path of relict eclogite-facies rocks in the Paleoproterozoic Nagssugtoqidian Orogen,
South-East Greenland. Lithos, 296, 212-232.
Najman, Y., Jenks, D., Godin, L., Boudagher-Fadel, M., Millar, I., Garzanti, E., ... &
Bracciali, L. (2017). The Tethyan Himalayan detrital record shows that India–Asia
terminal collision occurred by 54 Ma in the Western Himalaya. Earth and Planetary
Science Letters, 459, 301-310.
Olierook, H. K., Taylor, R. J., Erickson, T. M., Clark, C., Reddy, S. M., Kirkland, C. L., ...
& Barham, M. (2019). Unravelling complex geologic histories using U–Pb and
trace element systematics of titanite. Chemical Geology, 504, 105-122.
Palin, R. M., Santosh, M., Cao, W., Li, S.-S., Hernández-Uribe, D., & Parsons, A. (2020).
Secular change and the onset of plate tectonics on Earth. Earth-Science Reviews, 207.
Papapavlou, K., Darling, J. R., Storey, C. D., Lightfoot, P. C., Moser, D. E., & Lasalle, S.
(2017). Dating shear zones with plastically deformed titanite: New insights into the
orogenic evolution of the Sudbury impact structure (Ontario, Canada). Precambrian
Research, 291, 220-235.
Parrish, R. R. J. G. C. (1989). U-Pb geochronology of the Cape Smith Belt and Sugluk block,
northern Quebec. 16(3).
49
Passchier, C. W., & Trouw, R. A. (2005). Microtectonics: Springer Science & Business
Media.
Paton, C., Hellstrom, J., Paul, B., Woodhead, J., & Hergt, J. (2011). Iolite: Freeware for the
visualisation and processing of mass spectrometric data. Journal of Analytical Atomic
Spectrometry, 26(12), 2508-2518.
Paton, C., Woodhead, J. D., Hellstrom, J. C., Hergt, J. M., Greig, A., & Maas, R. (2010).
Improved laser ablation U‐Pb zircon geochronology through robust downhole
fractionation correction. Geochemistry, Geophysics, Geosystems, 11(3).
Percival, J. A., Stern, R. A., Skulski, T., Card, K. D., Mortensen, J. K., & Begin, N. J.
(1994). Minto block, Superior province: Missing link in deciphering assembly of
the craton at 2.7 Ga. Geology, 22(9), 839-842.
Percival, J. A., & Skulski, T. (2000). Tectonothermal evolution of the northern Minto
block, Superior Province, Quebec, Canada. The Canadian Mineralogist, 38(2), 345-
378.
Picard, C. (1989). Lithochimie des roches volcaniques protérozoïques de la partie
occidentale de la Fosse de l'Ungava (région au sud du lac Lanyan). [Ministère de
l'énergie et des ressources (Mines)], Direction générale de l'exploration géologique
et minérale, Direction de la recherche géologique, Service de la géologie.
Putnis, A. (2009). Mineral replacement reactions. Reviews in Mineralogy and Geochemistry,
70(1), 87-124.
Pryer, L. L. (1993). Microstructures in feldspars from a major crustal thrust zone: the
Grenville Front, Ontario, Canada. Journal of structural Geology, 15(1), 21-36.
Reuber, G., Kaus, B. J., Schmalholz, S. M., & White, R. W. (2016). Nonlithostatic pressure
during subduction and collision and the formation of (ultra) high-pressure rocks.
Geology, 44(5), 343-346.
Schmalholz, S. M., & Podladchikov, Y. Y. (2013). Tectonic overpressure in weak crustal‐
scale shear zones and implications for the exhumation of high‐pressure rocks.
Geophysical Research Letters, 40(10), 1984-1988.
Schmid, S., & Casey, M. (1986). Complete fabric analysis of some commonly observed
quartz c-axis patterns. Geophysical Monograph, 36(6), 263-286.
Schoene, B., & Bowring, S. A. (2006). U–Pb systematics of the McClure Mountain syenite:
thermochronological constraints on the age of the 40 Ar/39 Ar standard MMhb.
Contributions to Mineralogy and Petrology, 151(5), 615.
Scott, D. J., St-Onge, M. R., Lucas, S. B., & Helmstaedt, H. (1989). The 1998 Ma Purtuniq
ophiolite: imbricated and metamorphosed oceanic crust in the Cape Smith Thrust
Belt, northern Quebec. Geoscience Canada.
Scott, D. J., & St-Onge, M. R. J. G. (1995). Constraints on Pb closure temperature in titanite
based on rocks from the Ungava orogen, Canada: Implications for U-Pb
geochronology and PTt path determinations. 23(12), 1123-1126.
Scott, D. J. (1997). Geology, U–Pb, and Pb–Pb geochronology of the Lake Harbour area,
southern Baffin Island: implications for the Paleoproterozoic tectonic evolution of
northeastern Laurentia. Canadian Journal of Earth Sciences, 34(2), 140-155.
Shirey, S. B., Kamber, B. S., Whitehouse, M. J., Mueller, P. A., & Basu, A. R. (2008). A
review of the isotopic and trace element evidence for mantle and crustal processes
in the Hadean and Archean: Implications for the onset of plate tectonic subduction.
When did plate tectonics begin on planet Earth?, 440, 1.
Skipton, D. R., St-Onge, M. R., & Joyce, N. L. 40Ar/39Ar biotite, muscovite, and
50
hornblende ages from the Cape Smith belt and Superior Craton, northern Quebec.
Spandler, C., Hammerli, J., Sha, P., Hilbert-Wolf, H., Hu, Y., Roberts, E., & Schmitz, M.
(2016). MKED1: a new titanite standard for in situ analysis of Sm–Nd isotopes and
U–Pb geochronology. Chemical Geology, 425, 110-126.
Spencer, K., Hacker, B., Kylander-Clark, A., Andersen, T., Cottle, J., Stearns, M., . . .
Seward, G. (2013). Campaign-style titanite U–Pb dating by laser-ablation ICP:
Implications for crustal flow, phase transformations and titanite closure. Chemical
Geology, 341, 84-101.
St-Onge, M. R., Lucas, S. B., Scott, D. J., & Bégin, N. J. (1989). Evidence for the
development of oceanic crust and for continental rifting in the tectonostratigraphy
of the early Proterozoic Cape Smith Belt. Geoscience Canada.
St-Onge, M. R., Lucas, S. B., Scott, D. J., & Wodicka, N. (1999). Upper and lower plate
juxtaposition, deformation and metamorphism during crustal convergence, Trans-
Hudson Orogen (Quebec–Baffin segment), Canada. Precambrian Research, 93, 27-
49. doi:10.1016/S0301-9268(98)00096-5
St-Onge, M. & Lucas, S. (1990). Evolution of the Cape Smith Belt: early Proterozoic
continental underthrusting, ophiolite obduction, and thick-skinned folding.
Geological Association of Canada Special Paper, 37, 313-351.
St-Onge, M. & Lucas, S. (1992). New insight on the crustal structure and tectonic history of
the Ungava orogen, Kovik Bay and Cap Wolstenholme, Quebec. 31-41.
St-Onge, M., & Ijewliw, O. J. J. o. P. (1996). Mineral corona formation during high-P
retrogression of granulitic rocks, Ungava Orogen, Canada. 37(3), 553-582.
St-Onge, M., & Lucas, S. (1997). Geological Maps and Descriptive Notes and Legend, Parts
of Northern Quebec and Northwest Territories: Cartes Géologiques Notes
Descriptives et Légende, Parties Du Nord Du Québec et Des Territoires Du Nord-
Ouest: Geological Survey of Canada.
St-Onge, M., Lucas, S., Scott, D., & Bégin, N. (1990). Geology, Eastern Portion of the Cape
Smith Thrust-Fold Belt, Parts of the Wakeham Bay, Cratere du Nouveau-Québec and
Nuvilik Lakes Map Areas, Northern Québec. Geological Survey of Canada Maps,
1721A–1735A, 1(50,000).
St‐Onge, M. Searle, M. P., & Wodicka, N. J. T. (2006). Trans‐Hudson Orogen of North
America and Himalaya‐Karakoram‐Tibetan Orogen of Asia: Structural and thermal
characteristics of the lower and upper plates. 25(4).
St‐Onge, M., & Lucas, S. (1995). Large‐scale fluid infiltration, metasomatism and re‐
equilibration of Archaean basement granulites during Palaeoproterozoic thrust belt
construction, Ungava Orogen, Canada. Journal of Metamorphic Geology, 13(4), 509-
535.
St‐Onge, M., Rayner, N., Palin, R., Searle, M., & Waters, D. (2013). Integrated pressure–
temperature–time constraints for the T so M orari dome (N orthwest I ndia):
implications for the burial and exhumation path of UHP units in the western H
imalaya. Journal of Metamorphic Geology, 31(5), 469-504.
Stacey, J. t., & Kramers, J. (1975). Approximation of terrestrial lead isotope evolution by a
two-stage model. Earth and Planetary Science Letters, 26(2), 207-221.
Stearns, M., Hacker, B., Ratschbacher, L., Rutte, D., & Kylander‐Clark, A. (2015). Titanite
petrochronology of the Pamir gneiss domes: Implications for middle to deep crust
exhumation and titanite closure to Pb and Zr diffusion. Tectonics, 34(4), 784-802.
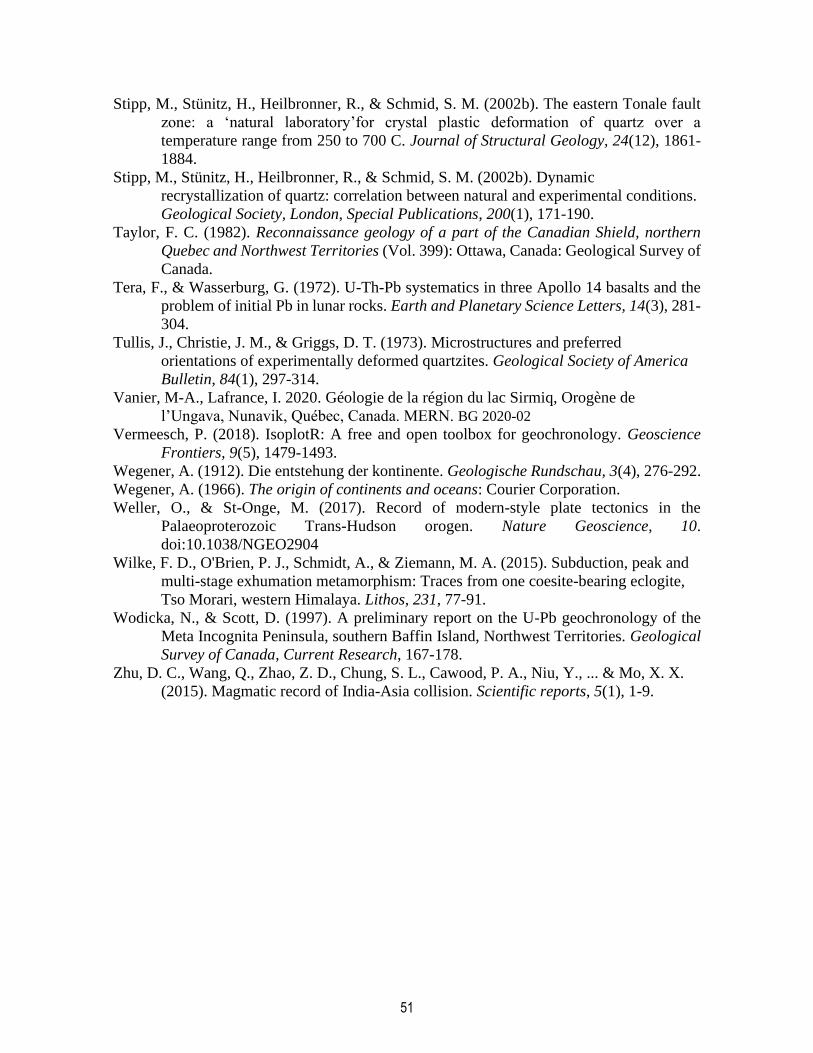
51
Stipp, M., Stünitz, H., Heilbronner, R., & Schmid, S. M. (2002b). The eastern Tonale fault
zone: a ‘natural laboratory’for crystal plastic deformation of quartz over a
temperature range from 250 to 700 C. Journal of Structural Geology, 24(12), 1861-
1884.
Stipp, M., Stünitz, H., Heilbronner, R., & Schmid, S. M. (2002b). Dynamic
recrystallization of quartz: correlation between natural and experimental conditions.
Geological Society, London, Special Publications, 200(1), 171-190.
Taylor, F. C. (1982). Reconnaissance geology of a part of the Canadian Shield, northern
Quebec and Northwest Territories (Vol. 399): Ottawa, Canada: Geological Survey of
Canada.
Tera, F., & Wasserburg, G. (1972). U-Th-Pb systematics in three Apollo 14 basalts and the
problem of initial Pb in lunar rocks. Earth and Planetary Science Letters, 14(3), 281-
304.
Tullis, J., Christie, J. M., & Griggs, D. T. (1973). Microstructures and preferred
orientations of experimentally deformed quartzites. Geological Society of America
Bulletin, 84(1), 297-314.
Vanier, M-A., Lafrance, I. 2020. Géologie de la région du lac Sirmiq, Orogène de
l’Ungava, Nunavik, Québec, Canada. MERN. BG 2020-02
Vermeesch, P. (2018). IsoplotR: A free and open toolbox for geochronology. Geoscience
Frontiers, 9(5), 1479-1493.
Wegener, A. (1912). Die entstehung der kontinente. Geologische Rundschau, 3(4), 276-292.
Wegener, A. (1966). The origin of continents and oceans: Courier Corporation.
Weller, O., & St-Onge, M. (2017). Record of modern-style plate tectonics in the
Palaeoproterozoic Trans-Hudson orogen. Nature Geoscience, 10.
doi:10.1038/NGEO2904
Wilke, F. D., O'Brien, P. J., Schmidt, A., & Ziemann, M. A. (2015). Subduction, peak and
multi-stage exhumation metamorphism: Traces from one coesite-bearing eclogite,
Tso Morari, western Himalaya. Lithos, 231, 77-91.
Wodicka, N., & Scott, D. (1997). A preliminary report on the U-Pb geochronology of the
Meta Incognita Peninsula, southern Baffin Island, Northwest Territories. Geological
Survey of Canada, Current Research, 167-178.
Zhu, D. C., Wang, Q., Zhao, Z. D., Chung, S. L., Cawood, P. A., Niu, Y., ... & Mo, X. X.
(2015). Magmatic record of India-Asia collision. Scientific reports, 5(1), 1-9.

52
1.12 Supplementary data: BSE, EPMA, EBSD and tables
Figure A1: From top to bottom are BSE, EPMA, misorientation and Kernal average
misorientation from titanite in the shear zone distal from the contact. The age plot are LA-
ICP-MS age of the 238U/206Pb corrected for the 207Pb.
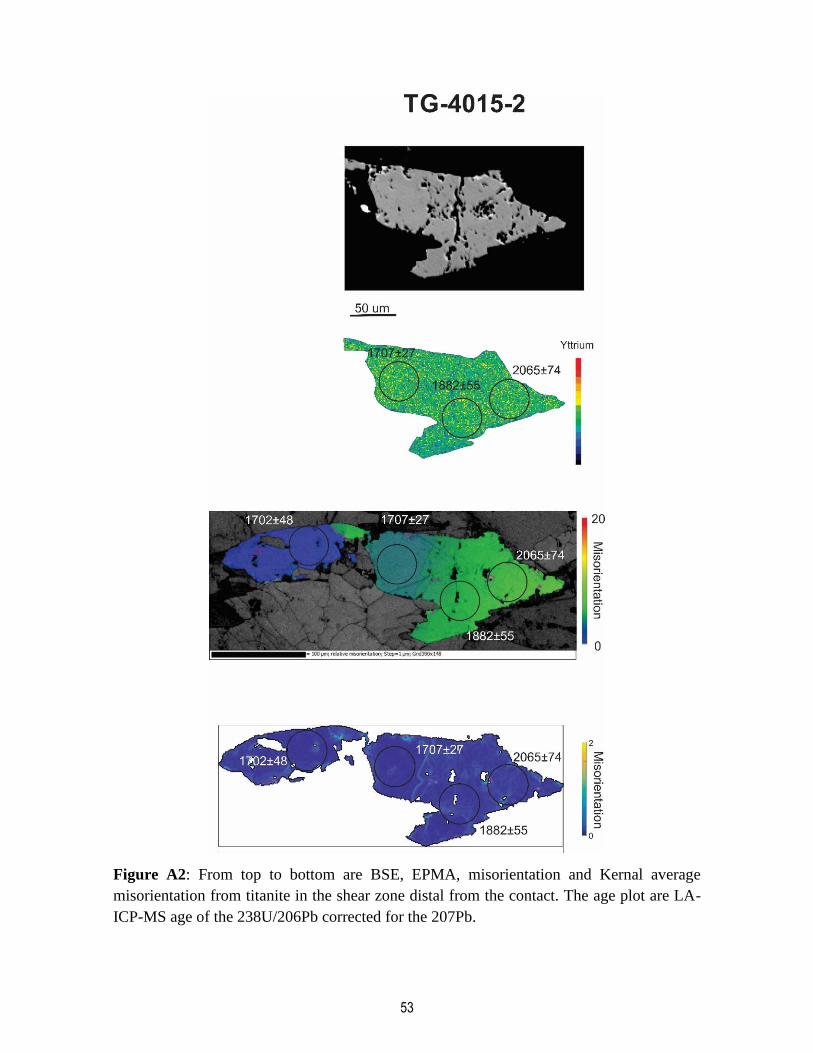
53
Figure A2: From top to bottom are BSE, EPMA, misorientation and Kernal average
misorientation from titanite in the shear zone distal from the contact. The age plot are LA-
ICP-MS age of the 238U/206Pb corrected for the 207Pb.

54
Figure A3: From top to bottom are BSE, EPMA, misorientation and Kernal average
misorientation from titanite in the shear zone distal from the contact. The age plot are LA-
ICP-MS age of the 238U/206Pb corrected for the 207Pb.
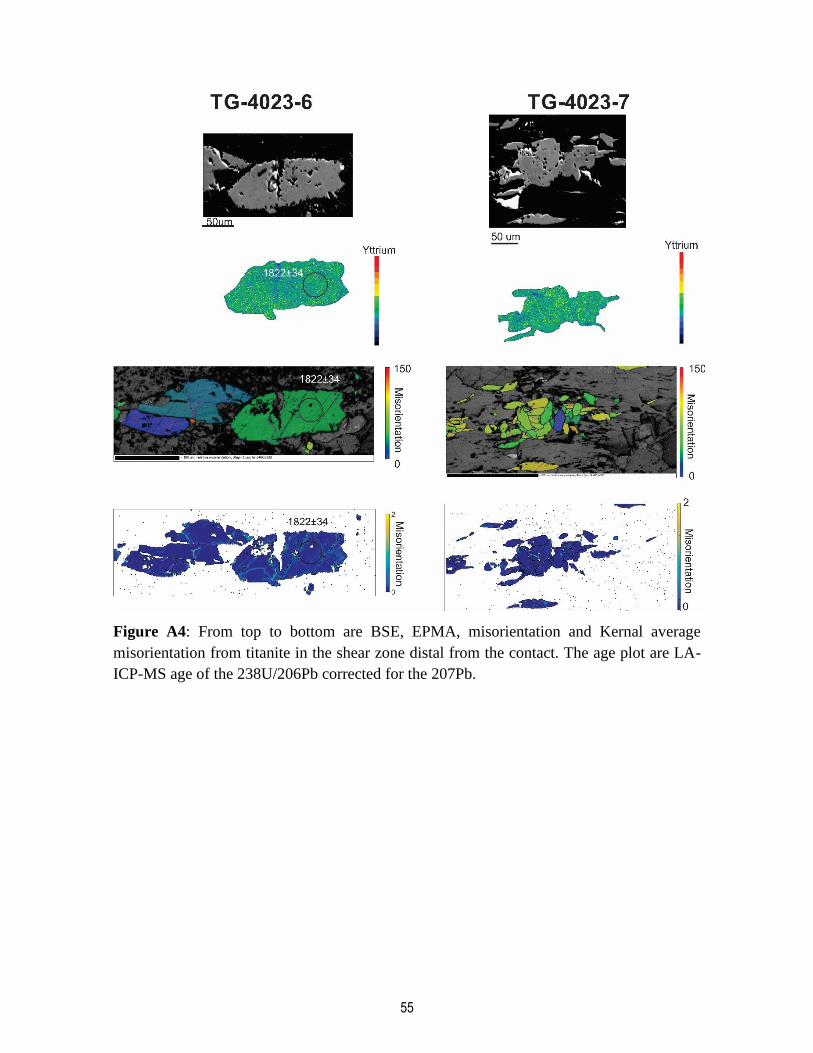
55
Figure A4: From top to bottom are BSE, EPMA, misorientation and Kernal average
misorientation from titanite in the shear zone distal from the contact. The age plot are LA-
ICP-MS age of the 238U/206Pb corrected for the 207Pb.
56
Figure A5: From top to bottom are BSE, EPMA, misorientation and Kernal average
misorientation from titanite in the shear zone distal from the contact. The age plot are LA-
ICP-MS age of the 238U/206Pb corrected for the 207Pb.

57
Table 1: Isotopic ratios of specimen TG-4015
* Analysis not used in the age calculation.
Specimen-grains-spot U Th Pb U/Th 238U/206Pb 2σ (%) 207Pb/206Pb 2σ (%) 207Pb/235U 2σ (%) 206Pb/238U 2σ (%) rho206Pb/238U Age(Ma)
207 Corr2σ (abs) 2σ (abs)
TG-4015-1-1* 0.84 0.10 6.5 8.80 0.4431 5.51 0.7804 4.01 252.8323 6.72 2.3507 5.39 0.80 4775 183 688 34
TG-4015-1-2* 0.66 0.04 1634 18.83 0.0074 70.48 0.9387 8.13 63423.8749 46.43 490.2346 45.72 0.98 4850 1418 687 34
TG-4015-1-3* 0.71 0.03 46.6 25.15 0.1272 16.94 0.8432 6.23 1083.7326 18.54 9.3261 17.46 0.94 4972 576 686 34
TG-4015-2-1 6.62 0.29 5.5 23.20 2.2260 1.83 0.3867 4.70 24.0583 5.15 0.4514 2.12 0.41 1707.5 27.4 691 34
TG-4015-2-2 5.63 0.42 16.8 13.48 1.4508 4.21 0.5261 5.43 50.9012 7.03 0.7021 4.47 0.64 2065.7 74.2 681 33
TG-4015-2-3 6.29 0.50 13.7 12.53 1.6748 3.37 0.4933 4.57 41.1107 5.87 0.6046 3.68 0.63 1882 55 690 34
TG-4015-2-4 9.97 0.33 9.1 30.11 2.3472 3.23 0.3566 5.36 21.2068 6.35 0.4316 3.40 0.54 1702.4 48.2 682 34
TG-4015-3-1* 0.17 - 4.4 - 0.1461 9.81 0.9553 4.60 1012.7275 10.48 7.6921 9.42 0.90 4748 314 692 34
TG-4015-4-1 1.67 - 4.5 - 1.1470 4.44 0.6889 4.55 83.7547 6.27 0.8821 4.31 0.69 1551 61 691 34
TG-4015-4-2* 0.55 - 3.5 - 0.5359 7.89 0.8554 4.52 236.2158 9.01 2.0036 7.79 0.87 5035 274 682 34
Concentrations (ppm) Mesured isotopic ratios Isotopic ages Zr-in-titanite temperature
Temperature (°C)
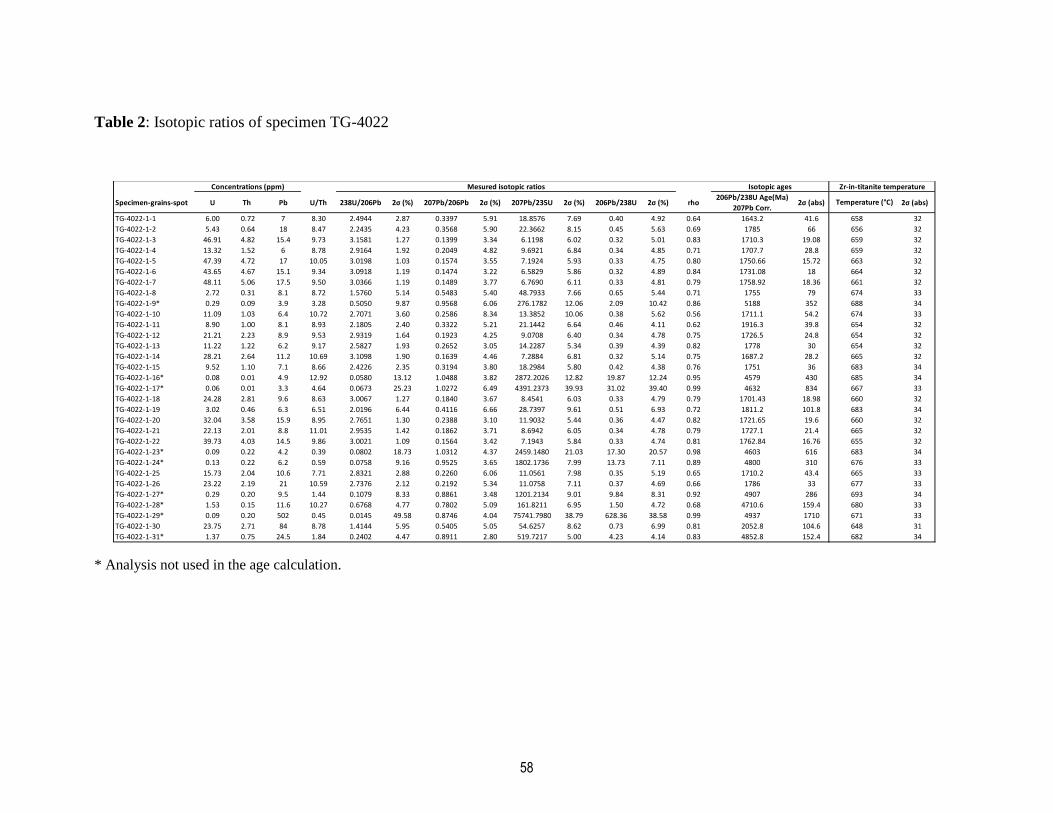
58
Table 2: Isotopic ratios of specimen TG-4022
* Analysis not used in the age calculation.
Specimen-grains-spot U Th Pb U/Th 238U/206Pb 2σ (%) 207Pb/206Pb 2σ (%) 207Pb/235U 2σ (%) 206Pb/238U 2σ (%) rho206Pb/238U Age(Ma)
207Pb Corr.2σ (abs) 2σ (abs)
TG-4022-1-1 6.00 0.72 7 8.30 2.4944 2.87 0.3397 5.91 18.8576 7.69 0.40 4.92 0.64 1643.2 41.6 658 32
TG-4022-1-2 5.43 0.64 18 8.47 2.2435 4.23 0.3568 5.90 22.3662 8.15 0.45 5.63 0.69 1785 66 656 32
TG-4022-1-3 46.91 4.82 15.4 9.73 3.1581 1.27 0.1399 3.34 6.1198 6.02 0.32 5.01 0.83 1710.3 19.08 659 32
TG-4022-1-4 13.32 1.52 6 8.78 2.9164 1.92 0.2049 4.82 9.6921 6.84 0.34 4.85 0.71 1707.7 28.8 659 32
TG-4022-1-5 47.39 4.72 17 10.05 3.0198 1.03 0.1574 3.55 7.1924 5.93 0.33 4.75 0.80 1750.66 15.72 663 32
TG-4022-1-6 43.65 4.67 15.1 9.34 3.0918 1.19 0.1474 3.22 6.5829 5.86 0.32 4.89 0.84 1731.08 18 664 32
TG-4022-1-7 48.11 5.06 17.5 9.50 3.0366 1.19 0.1489 3.77 6.7690 6.11 0.33 4.81 0.79 1758.92 18.36 661 32
TG-4022-1-8 2.72 0.31 8.1 8.72 1.5760 5.14 0.5483 5.40 48.7933 7.66 0.65 5.44 0.71 1755 79 674 33
TG-4022-1-9* 0.29 0.09 3.9 3.28 0.5050 9.87 0.9568 6.06 276.1782 12.06 2.09 10.42 0.86 5188 352 688 34
TG-4022-1-10 11.09 1.03 6.4 10.72 2.7071 3.60 0.2586 8.34 13.3852 10.06 0.38 5.62 0.56 1711.1 54.2 674 33
TG-4022-1-11 8.90 1.00 8.1 8.93 2.1805 2.40 0.3322 5.21 21.1442 6.64 0.46 4.11 0.62 1916.3 39.8 654 32
TG-4022-1-12 21.21 2.23 8.9 9.53 2.9319 1.64 0.1923 4.25 9.0708 6.40 0.34 4.78 0.75 1726.5 24.8 654 32
TG-4022-1-13 11.22 1.22 6.2 9.17 2.5827 1.93 0.2652 3.05 14.2287 5.34 0.39 4.39 0.82 1778 30 654 32
TG-4022-1-14 28.21 2.64 11.2 10.69 3.1098 1.90 0.1639 4.46 7.2884 6.81 0.32 5.14 0.75 1687.2 28.2 665 32
TG-4022-1-15 9.52 1.10 7.1 8.66 2.4226 2.35 0.3194 3.80 18.2984 5.80 0.42 4.38 0.76 1751 36 683 34
TG-4022-1-16* 0.08 0.01 4.9 12.92 0.0580 13.12 1.0488 3.82 2872.2026 12.82 19.87 12.24 0.95 4579 430 685 34
TG-4022-1-17* 0.06 0.01 3.3 4.64 0.0673 25.23 1.0272 6.49 4391.2373 39.93 31.02 39.40 0.99 4632 834 667 33
TG-4022-1-18 24.28 2.81 9.6 8.63 3.0067 1.27 0.1840 3.67 8.4541 6.03 0.33 4.79 0.79 1701.43 18.98 660 32
TG-4022-1-19 3.02 0.46 6.3 6.51 2.0196 6.44 0.4116 6.66 28.7397 9.61 0.51 6.93 0.72 1811.2 101.8 683 34
TG-4022-1-20 32.04 3.58 15.9 8.95 2.7651 1.30 0.2388 3.10 11.9032 5.44 0.36 4.47 0.82 1721.65 19.6 660 32
TG-4022-1-21 22.13 2.01 8.8 11.01 2.9535 1.42 0.1862 3.71 8.6942 6.05 0.34 4.78 0.79 1727.1 21.4 665 32
TG-4022-1-22 39.73 4.03 14.5 9.86 3.0021 1.09 0.1564 3.42 7.1943 5.84 0.33 4.74 0.81 1762.84 16.76 655 32
TG-4022-1-23* 0.09 0.22 4.2 0.39 0.0802 18.73 1.0312 4.37 2459.1480 21.03 17.30 20.57 0.98 4603 616 683 34
TG-4022-1-24* 0.13 0.22 6.2 0.59 0.0758 9.16 0.9525 3.65 1802.1736 7.99 13.73 7.11 0.89 4800 310 676 33
TG-4022-1-25 15.73 2.04 10.6 7.71 2.8321 2.88 0.2260 6.06 11.0561 7.98 0.35 5.19 0.65 1710.2 43.4 665 33
TG-4022-1-26 23.22 2.19 21 10.59 2.7376 2.12 0.2192 5.34 11.0758 7.11 0.37 4.69 0.66 1786 33 677 33
TG-4022-1-27* 0.29 0.20 9.5 1.44 0.1079 8.33 0.8861 3.48 1201.2134 9.01 9.84 8.31 0.92 4907 286 693 34
TG-4022-1-28* 1.53 0.15 11.6 10.27 0.6768 4.77 0.7802 5.09 161.8211 6.95 1.50 4.72 0.68 4710.6 159.4 680 33
TG-4022-1-29* 0.09 0.20 502 0.45 0.0145 49.58 0.8746 4.04 75741.7980 38.79 628.36 38.58 0.99 4937 1710 671 33
TG-4022-1-30 23.75 2.71 84 8.78 1.4144 5.95 0.5405 5.05 54.6257 8.62 0.73 6.99 0.81 2052.8 104.6 648 31
TG-4022-1-31* 1.37 0.75 24.5 1.84 0.2402 4.47 0.8911 2.80 519.7217 5.00 4.23 4.14 0.83 4852.8 152.4 682 34
Concentrations (ppm) Mesured isotopic ratios Isotopic ages Zr-in-titanite temperature
Temperature (°C)
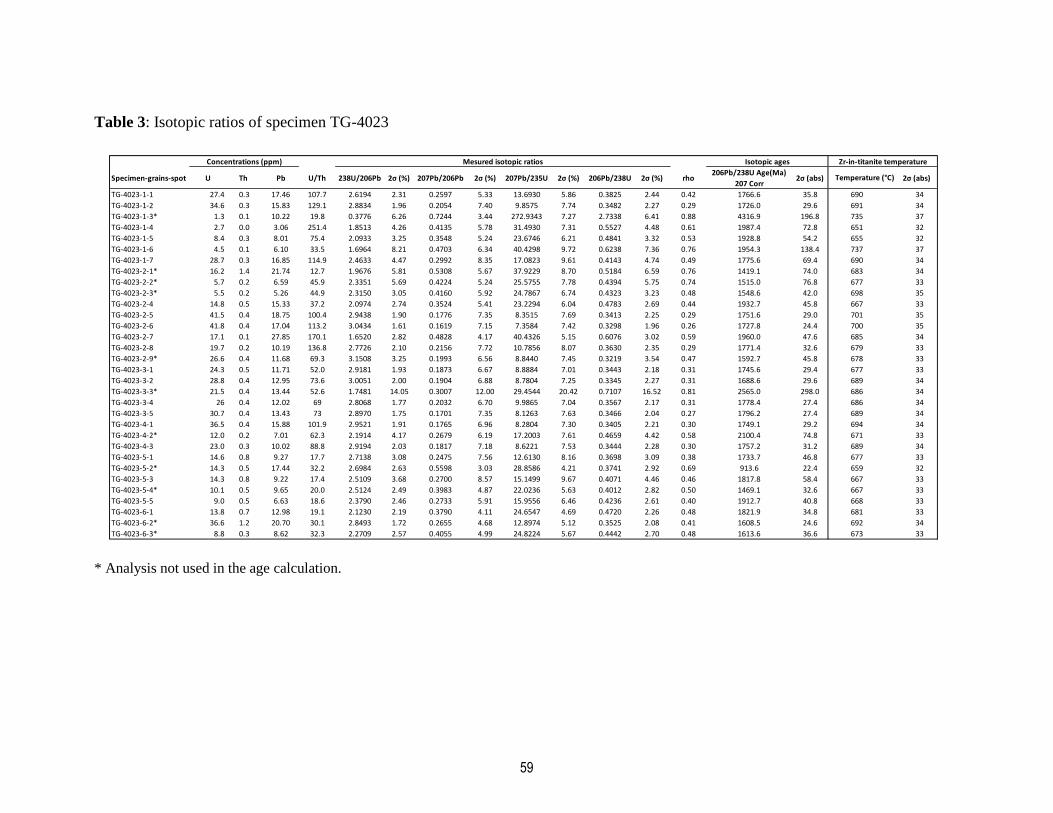
59
Table 3: Isotopic ratios of specimen TG-4023
* Analysis not used in the age calculation.
Specimen-grains-spot U Th Pb U/Th 238U/206Pb 2σ (%) 207Pb/206Pb 2σ (%) 207Pb/235U 2σ (%) 206Pb/238U 2σ (%) rho206Pb/238U Age(Ma)
207 Corr2σ (abs) 2σ (abs)
TG-4023-1-1 27.4 0.3 17.46 107.7 2.6194 2.31 0.2597 5.33 13.6930 5.86 0.3825 2.44 0.42 1766.6 35.8 690 34
TG-4023-1-2 34.6 0.3 15.83 129.1 2.8834 1.96 0.2054 7.40 9.8575 7.74 0.3482 2.27 0.29 1726.0 29.6 691 34
TG-4023-1-3* 1.3 0.1 10.22 19.8 0.3776 6.26 0.7244 3.44 272.9343 7.27 2.7338 6.41 0.88 4316.9 196.8 735 37
TG-4023-1-4 2.7 0.0 3.06 251.4 1.8513 4.26 0.4135 5.78 31.4930 7.31 0.5527 4.48 0.61 1987.4 72.8 651 32
TG-4023-1-5 8.4 0.3 8.01 75.4 2.0933 3.25 0.3548 5.24 23.6746 6.21 0.4841 3.32 0.53 1928.8 54.2 655 32
TG-4023-1-6 4.5 0.1 6.10 33.5 1.6964 8.21 0.4703 6.34 40.4298 9.72 0.6238 7.36 0.76 1954.3 138.4 737 37
TG-4023-1-7 28.7 0.3 16.85 114.9 2.4633 4.47 0.2992 8.35 17.0823 9.61 0.4143 4.74 0.49 1775.6 69.4 690 34
TG-4023-2-1* 16.2 1.4 21.74 12.7 1.9676 5.81 0.5308 5.67 37.9229 8.70 0.5184 6.59 0.76 1419.1 74.0 683 34
TG-4023-2-2* 5.7 0.2 6.59 45.9 2.3351 5.69 0.4224 5.24 25.5755 7.78 0.4394 5.75 0.74 1515.0 76.8 677 33
TG-4023-2-3* 5.5 0.2 5.26 44.9 2.3150 3.05 0.4160 5.92 24.7867 6.74 0.4323 3.23 0.48 1548.6 42.0 698 35
TG-4023-2-4 14.8 0.5 15.33 37.2 2.0974 2.74 0.3524 5.41 23.2294 6.04 0.4783 2.69 0.44 1932.7 45.8 667 33
TG-4023-2-5 41.5 0.4 18.75 100.4 2.9438 1.90 0.1776 7.35 8.3515 7.69 0.3413 2.25 0.29 1751.6 29.0 701 35
TG-4023-2-6 41.8 0.4 17.04 113.2 3.0434 1.61 0.1619 7.15 7.3584 7.42 0.3298 1.96 0.26 1727.8 24.4 700 35
TG-4023-2-7 17.1 0.1 27.85 170.1 1.6520 2.82 0.4828 4.17 40.4326 5.15 0.6076 3.02 0.59 1960.0 47.6 685 34
TG-4023-2-8 19.7 0.2 10.19 136.8 2.7726 2.10 0.2156 7.72 10.7856 8.07 0.3630 2.35 0.29 1771.4 32.6 679 33
TG-4023-2-9* 26.6 0.4 11.68 69.3 3.1508 3.25 0.1993 6.56 8.8440 7.45 0.3219 3.54 0.47 1592.7 45.8 678 33
TG-4023-3-1 24.3 0.5 11.71 52.0 2.9181 1.93 0.1873 6.67 8.8884 7.01 0.3443 2.18 0.31 1745.6 29.4 677 33
TG-4023-3-2 28.8 0.4 12.95 73.6 3.0051 2.00 0.1904 6.88 8.7804 7.25 0.3345 2.27 0.31 1688.6 29.6 689 34
TG-4023-3-3* 21.5 0.4 13.44 52.6 1.7481 14.05 0.3007 12.00 29.4544 20.42 0.7107 16.52 0.81 2565.0 298.0 686 34
TG-4023-3-4 26 0.4 12.02 69 2.8068 1.77 0.2032 6.70 9.9865 7.04 0.3567 2.17 0.31 1778.4 27.4 686 34
TG-4023-3-5 30.7 0.4 13.43 73 2.8970 1.75 0.1701 7.35 8.1263 7.63 0.3466 2.04 0.27 1796.2 27.4 689 34
TG-4023-4-1 36.5 0.4 15.88 101.9 2.9521 1.91 0.1765 6.96 8.2804 7.30 0.3405 2.21 0.30 1749.1 29.2 694 34
TG-4023-4-2* 12.0 0.2 7.01 62.3 2.1914 4.17 0.2679 6.19 17.2003 7.61 0.4659 4.42 0.58 2100.4 74.8 671 33
TG-4023-4-3 23.0 0.3 10.02 88.8 2.9194 2.03 0.1817 7.18 8.6221 7.53 0.3444 2.28 0.30 1757.2 31.2 689 34
TG-4023-5-1 14.6 0.8 9.27 17.7 2.7138 3.08 0.2475 7.56 12.6130 8.16 0.3698 3.09 0.38 1733.7 46.8 677 33
TG-4023-5-2* 14.3 0.5 17.44 32.2 2.6984 2.63 0.5598 3.03 28.8586 4.21 0.3741 2.92 0.69 913.6 22.4 659 32
TG-4023-5-3 14.3 0.8 9.22 17.4 2.5109 3.68 0.2700 8.57 15.1499 9.67 0.4071 4.46 0.46 1817.8 58.4 667 33
TG-4023-5-4* 10.1 0.5 9.65 20.0 2.5124 2.49 0.3983 4.87 22.0236 5.63 0.4012 2.82 0.50 1469.1 32.6 667 33
TG-4023-5-5 9.0 0.5 6.63 18.6 2.3790 2.46 0.2733 5.91 15.9556 6.46 0.4236 2.61 0.40 1912.7 40.8 668 33
TG-4023-6-1 13.8 0.7 12.98 19.1 2.1230 2.19 0.3790 4.11 24.6547 4.69 0.4720 2.26 0.48 1821.9 34.8 681 33
TG-4023-6-2* 36.6 1.2 20.70 30.1 2.8493 1.72 0.2655 4.68 12.8974 5.12 0.3525 2.08 0.41 1608.5 24.6 692 34
TG-4023-6-3* 8.8 0.3 8.62 32.3 2.2709 2.57 0.4055 4.99 24.8224 5.67 0.4442 2.70 0.48 1613.6 36.6 673 33
Concentrations (ppm) Mesured isotopic ratios Isotopic ages Zr-in-titanite temperature
Temperature (°C)

60
Table 4: Geochemistry analysis by LA-ICPMS on titanite from specimen TG-4015, TG-4022 and TG-4023
Specimen-grains-spot Sr Y Zr La Ce Pr Nd Sm Eu Gd Tb Dy Ho Er Tm Yb Lu
TG-4015-1 57 73 53 1.2 BelowLOD 1.4 7.9 4.8 2.6 6.4 1.3 10.4 2.6 8.4 1.3 9.4 1.3
TG-4015-2 32 70 52 0.63 3.8 0.8 5.5 3.9 2.4 5.8 1.3 10.7 2.6 8.4 1.2 8.8 1.3
TG-4015-3 32 66 51 0.7 4.2 0.9 5.7 4.2 2.4 6.1 1.3 9.6 2.3 8.1 1.2 9.3 1.3
TG-4015-4 36 338 57 5.5 37.6 9.5 66 38 21.7 54 9.6 63 12.5 37 5.0 35 4.9
TG-4015-5 31.7 308 45 4.8 30.6 8.4 59 36 21.7 52 9.0 58 11.4 32.7 4.5 29.8 4.2
TG-4015-6 33.7 317 55 5.3 34.0 8.9 62 37 22.6 53 9.1 59 11.9 34 4.8 32 4.6
TG-4015-7 47 437 47 7.72 54 14.6 105 62 36.3 85 14.1 87 16.6 45 6.0 39 5.3
TG-4015-8 41 3.9 58 0.32 2.0 0.37 1.7 0.7 1.6 0.6 0.06 0.4 0.10 0.6 0.20 2.4 0.45
TG-4015-9 38 152 56 1.64 10.9 2.4 14.9 10.2 11.6 15.6 3.3 24 5.5 17.8 2.5 19 2.5
TG-4015-10 39 68 47 0.58 3.5 0.8 4.7 3.6 3.9 5.5 1.3 10 2.3 7.6 1.2 9.1 1.2
TG-4022-1 27.2 345 27.7 1.8 10.3 2.4 16.0 11 38 20 4.4 37.6 9.4 35 5.7 40 5.7
TG-4022-2 27.1 335 25.9 1.6 9.5 2.3 15.2 10.0 36.7 17.5 4.3 35 9.1 34 5.4 38 5.1
TG-4022-3 27.6 2003 28.3 13.5 76 19.3 137 107 198 191 42.9 321 68 199 25.1 148 17.2
TG-4022-4 26.8 906 27.8 4.4 25 6.6 49 39 69 72 17 131 30 95 13.9 85 10.8
TG-4022-5 28.3 2236 30.5 15.0 79 20.0 143 109 209 206 47 356 77 222 28.4 163 18.7
TG-4022-6 29.8 2078 31.2 13.6 76 18.7 134 105 188 195 42.7 335 71 206 27.0 153 17.3
TG-4022-7 27.9 2297 29.6 14.6 79 19.8 142 112 205 211 46.9 366 78 229 29.6 167 18.9
TG-4022-8 42 98 38.8 1.9 5.3 1.5 9 5.5 11 10 2.1 15 3.4 10.0 1.4 9.0 1.2
TG-4022-9 44 40 53 2.1 2.0 0.7 2.1 1.0 2.0 1.5 0.4 4.1 1.2 5.1 0.9 6.0 0.7
TG-4022-10 39 605 39 3.4 18 4.6 31 27 49 51 12 97 22 63 8 46 5.1
TG-4022-11 27.4 458 25.0 2.8 15.8 3.8 28 18.9 52 32 7.2 58 13.6 45 6.9 45 5.9
TG-4022-12 28.0 827 25.0 6.6 36 9.0 64 44 103 78 16.6 124 27.0 80 11.1 67 8.2
TG-4022-13 28.0 443 25.1 3.9 20.0 5.0 34 21.7 64 35 7.3 57 12.8 42 6.4 42 5.6
TG-4022-14 34 1427 32.0 9 46 12 84 68 124 130 30 232 49 143 19 107 12
TG-4022-15 40 349 48 5.3 18.5 4.8 30 19 42 33 7.2 54 11.4 34 4.5 27 3.0
TG-4022-16 45 7.5 50 0.02 0.09 Below LOD Below LOD 0.2 0.3 0.3 0.06 0.8 0.21 0.7 0.15 1.5 0.24
TG-4022-17 42 2.9 33.6 0.3 0.3 0.08 Below LOD 0.2 0.2 0.3 0.05 0.4 0.11 0.3 0.05 0.3 0.03
TG-4022-18 30.9 781 29.0 9.2 44 10.8 73 49 112 79 16.3 119 24.7 73 9.9 60 7.6
TG-4022-19 40 284 48 4.1 7.2 2.0 11 7 17 14 3.7 34 9 35 6 41 4.9
TG-4022-20 29.2 1094 28.9 14.2 62 15.2 98 66 148 107 23.1 171 36 104 13.7 82 9.9
TG-4022-21 34.9 1032 31.8 6.4 36 9.3 65 52 95 92 21.0 163 34 101 13.6 78 8.6
TG-4022-22 27.5 1368 25.8 12.6 68 17.2 115 82 167 135 28.1 215 44 129 16.8 103 12.2
TG-4022-23 45 2.3 47 1.8 1.8 0.6 2.0 0.5 0.3 0.2 0.06 0.4 0.06 0.21 0.04 0.2 0.03
TG-4022-24 44 5.1 41 4.1 3.2 1.2 4.2 0.7 0.3 0.5 0.09 0.5 0.13 0.5 0.12 1.0 0.15
TG-4022-25 28.8 716 32 15 39 10.5 58 36 81 59 12.9 102 22.4 70 10.2 66 8.2
TG-4022-26 35.4 1139 42 8.0 40 10.0 69 52 101 98 23.3 182 40 119 15.8 90 10.1
TG-4022-27 45 12 59 5.0 3.8 1.6 4.9 1.2 0.9 1.0 0.21 1.6 0.4 1.3 0.21 1.4 0.17
TG-4022-28 41 179 45 0.6 2.7 0.6 4.5 3.6 10 7.5 2.0 20 5.6 22 3.8 27 3.4
TG-4022-29 41 4.9 36.9 3.4 2.7 1.0 3.3 0.7 0.2 0.6 0.08 0.6 0.1 0.6 0.15 1.4 0.2
TG-4022-30 26.7 785 21.6 14.5 56 14.9 93 56 111 87 17.6 129 28 79 10.7 63 7.0
TG-4022-31 45 49 47 17 25 6.1 20 5.2 3.1 4.4 1.0 7.0 1.6 5.3 0.9 6.6 0.9
TG-4023-1-1 22 316 55 7.5 41 8.7 47 22 22 34 6.3 47 10.9 34 5.2 36 5.6
TG-4023-1-2 23 261 57 9 48 9 50 22 29 29 5.7 37 9 27 4.2 32 4.8
TG-4023-1-3 12 5.3 138 47 64 5.1 14 1.5 9.6 1.1 0.1 0.9 0.2 0.5 0.1 0.7 0.1
TG-4023-1-4 12.1 26 23 18 20 1.8 6 2.2 5.1 2.6 0.5 3.8 0.9 2.8 0.5 3.5 0.5
TG-4023-1-5 47 79 25 21 43 6 23 7 7.7 9 1.7 12 2.8 8.6 1.4 10 1.2
TG-4023-1-6 14 20 145 89 138 12 32 5 18 3.2 0.5 3.1 0.6 2.1 0.4 3.4 0.6
TG-4023-1-7 38 383 56 7.5 37 8.1 46 24 28 38 7.5 58 13 41 6.5 45 6.5
TG-4023-2-1 60 81 47 59 135 17 58 13 11 12 2.0 13 2.8 9 1.5 12 1.8
TG-4023-2-2 23 45 42 43 75 8 29 6 6.4 4.7 0.8 6.0 1.4 5.0 0.9 8 1.3
TG-4023-2-3 18 37 66 24 39 4.4 17 4.3 6.5 3.6 0.8 5.2 1.4 4.2 0.8 7 1.1
TG-4023-2-4 25 133 33 22 61 9.9 47 19 12 21 3.4 22 4.7 14 2.0 14 1.9
TG-4023-2-5 24 342 70 11.4 59 12.0 66 29 37 40 6.9 51 11 36 5.4 41 6.1
TG-4023-2-6 23 305 68 10.2 53 11 61 27 34 37 6.7 47 10.2 33 5.0 36 5.4
TG-4023-2-7 21 203 50 12 32 4.8 23 10 13 15 3.7 28 7 22 3.8 30 4.9
TG-4023-2-8 20 194 43 4.3 22 4.7 26 12 18 18 3.6 27 6.3 22 3.4 25 3.7
TG-4023-2-9 17 593 43 5.7 29 6.3 37 23 30 47 11 90 21 67 10 68 10
TG-4023-3-1 26 246 42 10.6 56 11.9 66 29 17 37 6.5 42 9.0 26 3.6 25 3.2
TG-4023-3-2 24 339 54 10 52 11 63 29 19 39 7.2 51 11.5 36 5.5 39 5.4
TG-4023-3-3 22 273 51 13 67 14 77 31 18 39 6.9 44 9.2 28 4.0 27 3.9
TG-4023-3-4 21 323 51 8.6 47 9.6 55 26 19 37 7.0 49 11.3 35 5.3 38 5.1
TG-4023-3-5 22 358 55 9.8 57 11.1 63 29 20 42 8.0 56 12 39 5.8 40 6
TG-4023-4-1 23 311 61 10.9 58 11.9 65 28 27 38 6.9 48 10.4 33 4.8 34 4.8
TG-4023-4-2 18 91 37 57 129 14 53 13 20 14 2.1 15 3.0 10 1.5 10 1.6
TG-4023-4-3 19 177 54 37 93 13 54 18 25 22 3.9 28 5.9 18 3.0 20 2.9
TG-4023-5-2 16.0 61 28 21 51 10.9 46 13 7.5 11 1.7 10 2.1 6.4 1.1 8 1.5
TG-4023-5-3 21 100 34 11.1 51 10.3 54 18 13 18 3.0 18 3.5 11 1.5 11 1.8
TG-4023-5-4 19 64 34 16 50 8.8 41 11 8.1 11 1.8 10.4 2.1 6.6 1.1 8.7 1.5
TG-4023-5-5 16.6 79 35 26 100 18.1 85 22 10.8 17 2.6 15 2.7 7.8 1.2 8.9 1.4
TG-4023-5-6 21 123 42 8.5 42 8.7 46 17 14 18 2.9 20 4.0 13 2.0 14 2.2
TG-4023-6-1 50 113 46 32 67 9.9 44 16 12.1 18 2.9 19 4.1 12 1.8 14 2.1
TG-4023-6-2 24 194 58 18 66 13.9 68 24 27 26 4.4 29 6.3 20 3.1 22 3.7
TG-4023-6-3 18 110 38 13.1 34 5.9 31 14 9.3 16 3.0 19 4.2 12 1.8 12 1.7
Concentration (ppm)

61
Conclusion
La présente étude du contact entre le Domaine de Kovik et le Domaine Nord a permis de
souligner les informations suivantes :
• Deux zones de cisaillements entre le Domaine de Kovik et le Domaine Nord ont été
identifiées sur la base d’observations de terrains, de lames minces orientées de
d’analyse des axes-c du quartz.
• La LSZ est située à au moins entre ~600 et ~140 mètres structurellement du contact,
puisque son étendue Nord n’a pas été investiguée. Elle montre une cinématique de
sommet-vers-le-sud et des fabriques d’axes-c du quartz caractéristiques d’une
déformation en aplatissement.
• La USZ est située entre ~140 et 0 mètre structurellement du contact et montre une
cinématique de sommet-vers-le-nord et des fabriques d’axe <c> du quartz
caractéristiques d’une déformation plane.
• Les températures de déformation de la LSZ et de la USZ de cisaillement sont
contraintes à 627 ± 50°C et 580 ± 50°C, respectivement.
• Deux populations de titanite ont été identifiées. La population la plus vieille est datée
à 1894 ± 31 Ma alors que la population la plus jeune est datée à 1737-1752 Ma.
• La population la plus jeune représente la réinitialisation de la population la plus vieille
lors de l’activité de la LSZ. La population la plus vieille est interprétée comme étant
reliée à l’emplacement de la grande province ignée Circum Supérieur.
Bien que nos résultats supportent que le contact entre le Domaine de Kovik et le Domaine
Nord correspond à un détachement, la chronologie des événements tectono-métamorphiques
du Domaine de Kovik est difficilement corrélable avec celle observée dans la nappe du Tso
Morari dans l'Orogène Himalaya-Tibet.
62
Pour de travaux futurs, la USZ observée au contact Domaine de Kovik et Domaine Nord
devrait être datée en combinant les données du EBSD et de datation U-Pb in situ sur titanite
afin de comparer la chronologie de son activité avec celle de la LSZ. D’autres transects à
travers le Domaine de Kovik et le Domaine Nord pourraient être effectués dans la partie
occidentale du Domaine de Kovik afin de pouvoir mieux définir l’étendue et la cinématique
des zones de cisaillement identifiées dans ce mémoire.

63
Bibliographie
Beaudette, M., Bilodeau, C., Mathieu, G. 2020. Géologie de la région du lac Parent, Fosse
de l’Ungava, Nunavik, Québec, Canada. MERN. BG 2020-04, 1 plan.
Beaumont, C., Jamieson, R. A., Butler, J., Warren, C. J. E., & Letters, P. S. (2009). Crustal
structure: A key constraint on the mechanism of ultra-high-pressure rock exhumation.
287(1-2), 116-129.
Bergeron, R., & Quebec (Province). Dept. of Mines. (1957). Preliminary report on Cape
Smith-Wakeham Bay belt, New Quebec. Department of Mines.
Bleeker, W., & Kamo, S. L. (2017). Extent, origin, and deposit-scale controls of the 1883
Ma Circum-Superior large igneous province, northern Manitoba, Ontario, Quebec,
Nunavut and Labrador. Targeted Geoscience Initiative, 5-14.
Brown, M. and T. Johnson (2018). "Secular change in metamorphism and the onset of
global plate tectonics." American Mineralogist 103(2): 181-196.
Charette, & Beaudette. (2018). Géologie de la région du Cap Wolstenholme, Orogène de
l’Ungava, Province de Churchill, sud-est d’Ivujivik, Québec, Canada. Ministère de
l’Énergie et des Ressources naturelles, Québec. Retrieved 2018
Cherniak, D. (1993). Lead diffusion in titanite and preliminary results on the effects of
radiation damage on Pb transport. Chemical Geology, 110(1-3), 177-194.
Corrigan, D. van Rooyen, D., & Wodicka, N. (2021). Indenter tectonics in the Canadian
Shield: A case study for Paleoproterozoic lower crust exhumation, orocline
development, and lateral extrusion. Precambrian Research, 355, 106083.
Corrigan, D., Pehrsson, S., Wodicka, N., & De Kemp, E. London, Special Publications.
(2009). The Palaeoproterozoic Trans-Hudson Orogen: a prototype of modern
accretionary processes. 327(1), 457-479.
Davis, D. W., & Sutcliff, C. N. (2018). U-Pb Geochronology of Zircon and Monazite by LA-
ICPMS in Samples from Northern Quebec.
De Sigoyer, J., Guillot, S., & Dick, P. J. T. (2004). Exhumation of the ultrahigh‐pressure Tso
Morari unit in eastern Ladakh (NW Himalaya): A case study. 23(3).
Donaldson, D. G., Webb, A. A. G., Menold, C. A., Kylander-Clark, A. R., & Hacker, B. R.
(2013). Petrochronology of Himalayan ultrahigh-pressure eclogite. Geology, 41(8),
835-838.
Dunphy, J., Ludden, J., & Parrish, R. (1995). Stitching together the Ungava Orogen, northern
Quebec: geochronological (TIMS and ICP–MS) and geochemical constraints on late
magmatic events. Canadian Journal of Earth Sciences, 32(12), 2115-2127.
Dunphy, J., & Ludden, J. (1998). Petrological and geochemical characteristics of a
Paleoproterozoic magmatic arc (Narsajuaq terrane, Ungava Orogen, Canada) and
comparisons to Superior Province granitoids. Precambrian Research, 91(1-2), 109-
142.
Dutta, D., & Mukherjee, S. (2021). Extrusion kinematics of UHP terrane in a collisional
orogen: EBSD and microstructure-based approach from the Tso Morari Crystallines
(Ladakh Himalaya). Tectonophysics, 800, 228641.
Epard, J. L., & Steck, A. (2008). Structural development of the Tso Morari ultra-high
pressure nappe of the Ladakh Himalaya. Tectonophysics, 451(1-4), 242-264.

64
Erickson, T., Pearce, M., Taylor, R., Timms, N. E., Clark, C., Reddy, S., & Buick, I. (2015).
Deformed monazite yields high-temperature tectonic ages. Geology, 43(5), 383-386.
Faleiros, F., Moraes, R. d., Pavan, M., & Campanha, G. d. C. (2016). A new empirical
calibration of the quartz c-axis fabric opening-angle deformation thermometer.
Tectonophysics, 671, 173-182.
Fossen, H. (2016). Structural geology: Cambridge University Press.
Frost, B. R., Chamberlain, K. R., & Schumacher, J. C. (2001). Sphene (titanite): phase
relations and role as a geochronometer. Chemical geology, 172(1-2), 131-148.
Furnes, H., de Wit, M., Staudigel, H., Rosing, M., & Muehlenbachs, K. (2007). A vestige of
Earth's oldest ophiolite. Science, 315(5819), 1704-1707.
Gao, X. Y., Zheng, Y. F., Chen, Y. X., & Guo, J. (2012). Geochemical and U–Pb age
constraints on the occurrence of polygenetic titanites in UHP metagranite in the
Dabie orogen. Lithos, 136, 93-108.
Garber, J., Hacker, B., Kylander-Clark, A., Stearns, M., & Seward, G. (2017). Controls on
trace element uptake in metamorphic titanite: Implications for petrochronology.
Journal of Petrology, 58(6), 1031-1057.
Gerya, T. (2015). Tectonic overpressure and underpressure in lithospheric tectonics and
metamorphism. Journal of Metamorphic Geology, 33(8), 785-800.
Gordon, S. M., Kirkland, C. L., Reddy, S. M., Blatchford, H. J., Whitney, D. L., Teyssier,
C., ... & McDonald, B. J. (2021). Deformation-enhanced recrystallization of titanite
drives decoupling between U-Pb and trace elements. Earth and Planetary Science
Letters, 560, 116810.
Hamilton, W. B. (2011). Plate tectonics began in Neoproterozoic time, and plumes from deep
mantle have never operated. Lithos, 123(1-4), 1-20.
Hayden, L. A., Watson, E. B., & Wark, D. A. (2008). A thermobarometer for sphene
(titanite). Contributions to Mineralogy and Petrology, 155(4), 529-540.
Hielscher, R., Silbermann, C. B., Schmidl, E., & Ihlemann, J. (2019). Denoising of crystal
orientation maps. Journal of Applied Crystallography, 52(5), 984-996.
Hobbs, B. (1985). The hydrolytic weakening effect in quartz. Point defects in minerals, 31,
151-170.
Hoffman, P. F. J. (1985). Is the Cape Smith belt (northern Quebec) a klippe? Canadian
Journal of Earth Sciences, 22(9), 1361-1369.
Hoffman, P. F. (1988). United plates of America, the birth of a craton: Early Proterozoic
assembly and growth of Laurentia. Annual Review of Earth and Planetary Sciences,
16(1), 543-603.
Holder, R. M., & Hacker, B. R. (2019). Fluid-driven resetting of titanite following ultrahigh-
temperature metamorphism in southern Madagascar. Chemical Geology, 504, 38-52.
Holder, R. M., Hacker, B. R., Seward, G. G., & Kylander-Clark, A. R. (2019). Interpreting
titanite U–Pb dates and Zr thermobarometry in high-grade rocks: empirical
constraints on elemental diffusivities of Pb, Al, Fe, Zr, Nb, and Ce. Contributions to
Mineralogy and Petrology, 174(5), 1-19.
Hopkins, M., Harrison, T. M., & Manning, C. E. (2008). Low heat flow inferred from> 4 Gyr
zircons suggests Hadean plate boundary interactions. Nature, 456(7221), 493-496.
Hynes, A., Francis, D.M., 1982. A transect of the early Proterozoic Cape Smith foldbelt, New
Quebec. Tectonophysics; volume 88, pages 23-59.
65
Jochum, K. P., Nohl, U., Herwig, K., Lammel, E., Stoll, B., & Hofmann, A. W. (2005).
GeoReM: a new geochemical database for reference materials and isotopic standards.
Geostandards and Geoanalytical Research, 29(3), 333-338.
Kapp, P., Manning, C., & Tropper, P. (2009). Phase‐equilibrium constraints on titanite and
rutile activities in mafic epidote amphibolites and geobarometry using titanite–rutile
equilibria. Journal of Metamorphic Geology, 27(7), 509-521.
Kastek, N., Ernst, R. E., Cousens, B. L., Kamo, S. L., Bleeker, W., Söderlund, U., &
Sylvester, P. (2018). U-Pb Geochronology and geochemistry of the Povungnituk
Group of the Cape Smith Belt: part of a craton-scale circa 2.0 Ga Minto-
Povungnituk large igneous province, northern Superior craton. Lithos, 320, 315-
331.
Kellett, D. A., Pehrsson, S., Skipton, D. R., Regis, D., Camacho, A., Schneider, D. A., &
Berman, R. (2020). Thermochronological history of the Northern Canadian Shield.
Precambrian Research, 342, 105703.
Kirkland, C. L., Spaggiari, C., Johnson, T., Smithies, R. H., Danišík, M., Evans, N., . . .
Mikucki, E. (2016). Grain size matters: Implications for element and isotopic
mobility in titanite. Precambrian Research, 278, 283-302.
Kirschner, D., & Teyssier, C. (1991). Quartz c-axis fabric differences between
porphyroclasts and recrystallized grains. Journal of Structural Geology, 13(1), 105-
109.
Kohn, M. J. (2017). Titanite petrochronology. Reviews in Mineralogy and Geochemistry,
83(1), 419-441.
Kohn, M. J., & Corrie, S. L. (2011). Preserved Zr-temperatures and U–Pb ages in high-grade
metamorphic titanite: evidence for a static hot channel in the Himalayan orogen.
Earth and Planetary Science Letters, 311(1-2), 136-143.
Kruhl, J.H., 1998. Prism- and basal-plane parallel subgrain boundaries in quartz: a
microstructural geothermobarometer: Reply. J. Metamorph. Geol. 16, 142–146
Lamothe, D., Picard, C., & Moorhead, J. (1984). Bande de Cap Smith-Maricourt, région du
lac Beauparlant: Ministère des Ressources naturelles. Québec, DP, 84-39.
Lamothe, D. (2007). Lexique stratigraphique de l'Orogène de l'Ungava. Géologie Québec.
Larson, K. P. (2018). Refining the structural framework of the Khimti Khola region, east-
central Nepal Himalaya, using quartz textures and c-axis fabrics. Journal of
Structural Geology, 107, 142-152.
Larson , K. P. (2021). FabricPlotR.
Larson, K. P., & Cottle, J. M. (2014). Midcrustal discontinuities and the assembly of the
Himalayan midcrust. Tectonics, 33(5), 718-740.
Law, R. D. J. J. o. s. G. (2014). Deformation thermometry based on quartz c-axis fabrics and
recrystallization microstructures: A review. 66, 129-161.
Leech, M. L., Singh, S., Jain, A., Klemperer, S. L., & Manickavasagam, R. (2005). The onset
of India–Asia continental collision: early, steep subduction required by the timing of
UHP metamorphism in the western Himalaya. Earth and Planetary Science Letters,
234(1-2), 83-97.
Lister, G. (1977). Discussion: crossed-girdle c-axis fabrics in quartzites plastically deformed
by plane strain and progressive simple shear. Tectonophysics, 39(1-3), 51-54.
66
Lister, G., & Hobbs, B. (1980). The simulation of fabric development during plastic
deformation and its application to quartzite: the influence of deformation history.
Journal of Structural Geology, 2(3), 355-370.
Lloyd, G. E., Farmer, A. B., & Mainprice, D. (1997). Misorientation analysis and the
formation and orientation of subgrain and grain boundaries. Tectonophysics, 279(1-
4), 55-78.
Long, S. P., Kohn, M. J., Kerswell, B. C., Starnes, J. K., Larson, K. P., Blackford, N. R., &
Soignard, E. (2020). Thermometry and microstructural analysis imply protracted
extensional exhumation of the Tso Morari UHP nappe, northwestern Himalaya:
Implications for models of UHP exhumation. Tectonics, 39(12), e2020TC006482.
Lucas, S. (1989). Structural evolution of the Cape Smith Thrust Belt and the role of out‐of‐
sequence faulting in the thickening of mountain belts. 8(4), 655-676.
Lucas, S. B. (1990). Relations between thrust belt evolution, grain-scale deformation, and
metamorphic processes: Cape Smith Belt, northern Canada. Tectonophysics, 178(2-
4), 151-182.
Lucas, S.& St-Onge. (1992). Terrane accretion in the internal zone of the Ungava orogen,
northern Quebec. Part 2: Structural and metamorphic history. Canadian Journal of
Earth Sciences - CAN J EARTH SCI, 29, 765-782. doi:10.1139/e92-065
Lucas, S. & St-Onge, J. G. S. o. C. P. (1991). Evolution of Archaean and early Proterozoic
magmatic arcs in the northeastern Ungava Peninsula, Québec. 91, 109-119.
Lucas, S., & Byrne, T. J. J. o. t. G. S. (1992). Footwall involvement during arc-continent
collision, Ungava orogen, northern Canada. 149(2), 237-248.
Lucas, S. B., & St-Onge, M. R. (1995). Syn-tectonic magmatism and the development of
compositional layering, Ungava Orogen
Machado, N., David, J., Scott, D. J., Lamothe, D., Philippe, S., & Gariépy, C. (1993). U
Pb geochronology of the western Cape Smith Belt, Canada: new insights on the age
of initial rifting and arc magmatism. Precambrian Research, 63(3-4), 211-223.
Mathieu, G., & Beaudette, M. (2018). Géologie de la région du lac Watts, Domaine Nord,
Fosse de l’Ungava, Nunavik, Québec, Canada. Bulletin géologiQUE.
Mattinson, J. M. (1978). Age, origin, and thermal histories of some plutonic rocks from the
Salinian block of California. Contributions to Mineralogy and Petrology, 67(3), 233-
245.
Müller, S., Dziggel, A., Kolb, J., & Sindern, S. (2018). Mineral textural evolution and PT-
path of relict eclogite-facies rocks in the Paleoproterozoic Nagssugtoqidian Orogen,
South-East Greenland. Lithos, 296, 212-232.
Najman, Y., Jenks, D., Godin, L., Boudagher-Fadel, M., Millar, I., Garzanti, E., ... &
Bracciali, L. (2017). The Tethyan Himalayan detrital record shows that India–Asia
terminal collision occurred by 54 Ma in the Western Himalaya. Earth and Planetary
Science Letters, 459, 301-310.
Olierook, H. K., Taylor, R. J., Erickson, T. M., Clark, C., Reddy, S. M., Kirkland, C. L., ...
& Barham, M. (2019). Unravelling complex geologic histories using U–Pb and
trace element systematics of titanite. Chemical Geology, 504, 105-122.
Palin, R. M., Santosh, M., Cao, W., Li, S.-S., Hernández-Uribe, D., & Parsons, A. (2020).
Secular change and the onset of plate tectonics on Earth. Earth-Science Reviews, 207.
Papapavlou, K., Darling, J. R., Storey, C. D., Lightfoot, P. C., Moser, D. E., & Lasalle, S.
(2017). Dating shear zones with plastically deformed titanite: New insights into the
67
orogenic evolution of the Sudbury impact structure (Ontario, Canada). Precambrian
Research, 291, 220-235.
Parrish, R. R. J. G. C. (1989). U-Pb geochronology of the Cape Smith Belt and Sugluk block,
northern Quebec. 16(3).
Passchier, C. W., & Trouw, R. A. (2005). Microtectonics: Springer Science & Business
Media.
Paton, C., Hellstrom, J., Paul, B., Woodhead, J., & Hergt, J. (2011). Iolite: Freeware for the
visualisation and processing of mass spectrometric data. Journal of Analytical Atomic
Spectrometry, 26(12), 2508-2518.
Paton, C., Woodhead, J. D., Hellstrom, J. C., Hergt, J. M., Greig, A., & Maas, R. (2010).
Improved laser ablation U‐Pb zircon geochronology through robust downhole
fractionation correction. Geochemistry, Geophysics, Geosystems, 11(3).
Percival, J. A., Stern, R. A., Skulski, T., Card, K. D., Mortensen, J. K., & Begin, N. J.
(1994). Minto block, Superior province: Missing link in deciphering assembly of
the craton at 2.7 Ga. Geology, 22(9), 839-842.
Percival, J. A., & Skulski, T. (2000). Tectonothermal evolution of the northern Minto
block, Superior Province, Quebec, Canada. The Canadian Mineralogist, 38(2), 345-
378.
Picard, C. (1989). Lithochimie des roches volcaniques protérozoïques de la partie
occidentale de la Fosse de l'Ungava (région au sud du lac Lanyan). [Ministère de
l'énergie et des ressources (Mines)], Direction générale de l'exploration géologique
et minérale, Direction de la recherche géologique, Service de la géologie.
Putnis, A. (2009). Mineral replacement reactions. Reviews in Mineralogy and Geochemistry,
70(1), 87-124.
Pryer, L. L. (1993). Microstructures in feldspars from a major crustal thrust zone: the
Grenville Front, Ontario, Canada. Journal of structural Geology, 15(1), 21-36.
Reuber, G., Kaus, B. J., Schmalholz, S. M., & White, R. W. (2016). Nonlithostatic pressure
during subduction and collision and the formation of (ultra) high-pressure rocks.
Geology, 44(5), 343-346.
Schmalholz, S. M., & Podladchikov, Y. Y. (2013). Tectonic overpressure in weak crustal‐
scale shear zones and implications for the exhumation of high‐pressure rocks.
Geophysical Research Letters, 40(10), 1984-1988.
Schmid, S., & Casey, M. (1986). Complete fabric analysis of some commonly observed
quartz c-axis patterns. Geophysical Monograph, 36(6), 263-286.
Schoene, B., & Bowring, S. A. (2006). U–Pb systematics of the McClure Mountain syenite:
thermochronological constraints on the age of the 40 Ar/39 Ar standard MMhb.
Contributions to Mineralogy and Petrology, 151(5), 615.
Scott, D. J., St-Onge, M. R., Lucas, S. B., & Helmstaedt, H. (1989). The 1998 Ma Purtuniq
ophiolite: imbricated and metamorphosed oceanic crust in the Cape Smith Thrust
Belt, northern Quebec. Geoscience Canada.
Scott, D. J., & St-Onge, M. R. J. G. (1995). Constraints on Pb closure temperature in titanite
based on rocks from the Ungava orogen, Canada: Implications for U-Pb
geochronology and PTt path determinations. 23(12), 1123-1126.
Scott, D. J. (1997). Geology, U–Pb, and Pb–Pb geochronology of the Lake Harbour area,
southern Baffin Island: implications for the Paleoproterozoic tectonic evolution of
northeastern Laurentia. Canadian Journal of Earth Sciences, 34(2), 140-155.
Shirey, S. B., Kamber, B. S., Whitehouse, M. J., Mueller, P. A., & Basu, A. R. (2008). A
68
review of the isotopic and trace element evidence for mantle and crustal processes
in the Hadean and Archean: Implications for the onset of plate tectonic subduction.
When did plate tectonics begin on planet Earth?, 440, 1.
Skipton, D. R., St-Onge, M. R., & Joyce, N. L. 40Ar/39Ar biotite, muscovite, and
hornblende ages from the Cape Smith belt and Superior Craton, northern Quebec.
Spandler, C., Hammerli, J., Sha, P., Hilbert-Wolf, H., Hu, Y., Roberts, E., & Schmitz, M.
(2016). MKED1: a new titanite standard for in situ analysis of Sm–Nd isotopes and
U–Pb geochronology. Chemical Geology, 425, 110-126.
Spencer, K., Hacker, B., Kylander-Clark, A., Andersen, T., Cottle, J., Stearns, M., . . .
Seward, G. (2013). Campaign-style titanite U–Pb dating by laser-ablation ICP:
Implications for crustal flow, phase transformations and titanite closure. Chemical
Geology, 341, 84-101.
St-Onge, M. R., Lucas, S. B., Scott, D. J., & Bégin, N. J. (1989). Evidence for the
development of oceanic crust and for continental rifting in the tectonostratigraphy
of the early Proterozoic Cape Smith Belt. Geoscience Canada.
St-Onge, M. R., Lucas, S. B., Scott, D. J., & Wodicka, N. (1999). Upper and lower plate
juxtaposition, deformation and metamorphism during crustal convergence, Trans-
Hudson Orogen (Quebec–Baffin segment), Canada. Precambrian Research, 93, 27-
49. doi:10.1016/S0301-9268(98)00096-5
St-Onge, M. & Lucas, S. (1990). Evolution of the Cape Smith Belt: early Proterozoic
continental underthrusting, ophiolite obduction, and thick-skinned folding.
Geological Association of Canada Special Paper, 37, 313-351.
St-Onge, M. & Lucas, S. (1992). New insight on the crustal structure and tectonic history of
the Ungava orogen, Kovik Bay and Cap Wolstenholme, Quebec. 31-41.
St-Onge, M., & Ijewliw, O. J. J. o. P. (1996). Mineral corona formation during high-P
retrogression of granulitic rocks, Ungava Orogen, Canada. 37(3), 553-582.
St-Onge, M., & Lucas, S. (1997). Geological Maps and Descriptive Notes and Legend, Parts
of Northern Quebec and Northwest Territories: Cartes Géologiques Notes
Descriptives et Légende, Parties Du Nord Du Québec et Des Territoires Du Nord-
Ouest: Geological Survey of Canada.
St-Onge, M., Lucas, S., Scott, D., & Bégin, N. (1990). Geology, Eastern Portion of the Cape
Smith Thrust-Fold Belt, Parts of the Wakeham Bay, Cratere du Nouveau-Québec and
Nuvilik Lakes Map Areas, Northern Québec. Geological Survey of Canada Maps,
1721A–1735A, 1(50,000).
St‐Onge, M. Searle, M. P., & Wodicka, N. J. T. (2006). Trans‐Hudson Orogen of North
America and Himalaya‐Karakoram‐Tibetan Orogen of Asia: Structural and thermal
characteristics of the lower and upper plates. 25(4).
St‐Onge, M., & Lucas, S. (1995). Large‐scale fluid infiltration, metasomatism and re‐
equilibration of Archaean basement granulites during Palaeoproterozoic thrust belt
construction, Ungava Orogen, Canada. Journal of Metamorphic Geology, 13(4), 509-
535.
St‐Onge, M., Rayner, N., Palin, R., Searle, M., & Waters, D. (2013). Integrated pressure–
temperature–time constraints for the T so M orari dome (N orthwest I ndia):
implications for the burial and exhumation path of UHP units in the western H
imalaya. Journal of Metamorphic Geology, 31(5), 469-504.
Stacey, J. t., & Kramers, J. (1975). Approximation of terrestrial lead isotope evolution by a
two-stage model. Earth and Planetary Science Letters, 26(2), 207-221.

69
Stearns, M., Hacker, B., Ratschbacher, L., Rutte, D., & Kylander‐Clark, A. (2015). Titanite
petrochronology of the Pamir gneiss domes: Implications for middle to deep crust
exhumation and titanite closure to Pb and Zr diffusion. Tectonics, 34(4), 784-802.
Stipp, M., Stünitz, H., Heilbronner, R., & Schmid, S. M. (2002b). The eastern Tonale fault
zone: a ‘natural laboratory’for crystal plastic deformation of quartz over a
temperature range from 250 to 700 C. Journal of Structural Geology, 24(12), 1861-
1884.
Stipp, M., Stünitz, H., Heilbronner, R., & Schmid, S. M. (2002b). Dynamic
recrystallization of quartz: correlation between natural and experimental conditions.
Geological Society, London, Special Publications, 200(1), 171-190.
Taylor, F. C. (1982). Reconnaissance geology of a part of the Canadian Shield, northern
Quebec and Northwest Territories (Vol. 399): Ottawa, Canada: Geological Survey of
Canada.
Tera, F., & Wasserburg, G. (1972). U-Th-Pb systematics in three Apollo 14 basalts and the
problem of initial Pb in lunar rocks. Earth and Planetary Science Letters, 14(3), 281-
304.
Tullis, J., Christie, J. M., & Griggs, D. T. (1973). Microstructures and preferred
orientations of experimentally deformed quartzites. Geological Society of America
Bulletin, 84(1), 297-314.
Vanier, M-A., Lafrance, I. 2020. Géologie de la région du lac Sirmiq, Orogène de
l’Ungava, Nunavik, Québec, Canada. MERN. BG 2020-02
Vermeesch, P. (2018). IsoplotR: A free and open toolbox for geochronology. Geoscience
Frontiers, 9(5), 1479-1493.
Wegener, A. (1912). Die entstehung der kontinente. Geologische Rundschau, 3(4), 276-292.
Wegener, A. (1966). The origin of continents and oceans: Courier Corporation.
Weller, O., & St-Onge, M. (2017). Record of modern-style plate tectonics in the
Palaeoproterozoic Trans-Hudson orogen. Nature Geoscience, 10.
doi:10.1038/NGEO2904
Wilke, F. D., O'Brien, P. J., Schmidt, A., & Ziemann, M. A. (2015). Subduction, peak and
multi-stage exhumation metamorphism: Traces from one coesite-bearing eclogite,
Tso Morari, western Himalaya. Lithos, 231, 77-91.
Wodicka, N., & Scott, D. (1997). A preliminary report on the U-Pb geochronology of the
Meta Incognita Peninsula, southern Baffin Island, Northwest Territories. Geological
Survey of Canada, Current Research, 167-178.
Zhu, D. C., Wang, Q., Zhao, Z. D., Chung, S. L., Cawood, P. A., Niu, Y., ... & Mo, X. X.
(2015). Magmatic record of India-Asia collision. Scientific reports, 5(1), 1-9.