Anthropologie et linguistique: influences, séparations et dialogues
Upload
independentCategory
view
0download
0
Mortality in Belarus, Lithuania, and Russia:Divergence in Recent Trends and Possible Explanations
La mortalite en Bielorussie, Lituanie et Russie: Divergence dansles Tendances Recentes et Explications Possibles
Pavel Grigoriev • Vladimir Shkolnikov •
Evgueni Andreev • Domantas Jasilionis •
Dmitri Jdanov • France Mesle • Jacques Vallin
Received: 23 April 2009 / Accepted: 11 December 2009 / Published online: 19 March 2010
� Springer Science+Business Media B.V. 2010
Abstract Before the collapse of the Soviet Union, Belarus, Lithuania, and Russia
were quite comparable in terms of their socioeconomic development. Despite some
differences in overall mortality levels, the three former Soviet republics were also
very close to each other in terms of directions of mortality trends and age- and
cause-specific mortality patterns. After 1991, all the three countries experienced
substantial political and social transformations, and the challenges associated with
the transition from a socialist to a market economy system. The sudden changes
brought numerous problems, such as rapid growth in unemployment, falling stan-
dards of living, and growing social and income inequalities. These factors con-
tributed to the significant deterioration of the health situation in all the countries, but
the size and the nature of the mortality crisis was different in Belarus than it was in
Lithuania and Russia. The marked similarities in socioeconomic and mortality
trends in the countries up to 1991 contrast with their notable divergence during the
subsequent years. The nature and success of market reforms seems to be the most
plausible explanation for these differences. Russia and Lithuania have chosen more
radical forms of economic and political transformations, which have led to massive
privatization campaigns. The reforms were more sustainable and systematic in
P. Grigoriev (&)
Rostock Center for the Study of Demographic Change/Max Planck Institute for Demographic
Research, Konrad Zuse Str. 1, 18057 Rostock, Germany
e-mail: [email protected]
V. Shkolnikov � E. Andreev � D. Jasilionis � D. Jdanov
Max Planck Institute for Demographic Research, Konrad Zuse Str. 1, 18057 Rostock, Germany
F. Mesle � J. Vallin
Institut National d’etudes Demographiques (INED), 133 Boulevard Davout, 75980 Paris Cedex 20,
France
123
Eur J Population (2010) 26:245–274
DOI 10.1007/s10680-010-9210-1
peer
-005
3548
4, v
ersi
on 1
- 11
Nov
201
0Author manuscript, published in "European Journal of Population / Revue européenne de
Démographie 26, 3 (2010) 245-274" DOI : 10.1007/s10680-010-9210-1

Lithuania than in Russia. By contrast, Belarus has chosen a gradual and slow
transition path. Recent mortality trends in Belarus are explored in detail here, and
are contrasted with those observed in Lithuania and Russia. Including a cause-of-
death analysis sheds more light on the plausible determinants of the variations in
mortality levels between the countries.
Keywords Belarus � Lithuania � Russia � Mortality trends � Causes of death �Market reforms � Socioeconomic changes
Resume Avant la chute de l’Union Sovietique, la Bielorussie, la Lituanie et la
Russie etaient tout a fait comparables en termes de developpement socio-econo-
mique. En depit de quelques differences de taux de mortalite generale, les ex-
Republiques Sovietiques etaient egalement tres proches en termes de tendances et
de variations de la mortalite par cause et par age. Apres 1991, les 3 pays ont connu
des bouleversements politiques et sociaux, et ont du faire face aux defis associes au
passage d’une economie socialiste a l’economie de marche. Ces changements
soudains ont provoque de nombreux problemes, tels qu’une montee rapide du
chomage, la baisse du niveau de vie et le developpement d’inegalites sociales et de
revenu. L’ensemble de ces facteurs a contribue a une deterioration significative de la
situation sanitaire dans tous les pays, mais la crise de mortalite en Bielorussie etait
differente de celles de la Lituanie et de la Russie, a la fois en termes d’etendue et de
nature. Les grandes similitudes des tendances socio-economiques et de mortalite
dans ces pays jusqu’en 1991 contrastent avec leur divergence notable au cours des
annees qui ont suivi. La nature et le succes des reformes liees au passage a
l’economie de marche est l’explication la plus plausible de ces differences. La
Russie et la Lituanie ont choisi des formes plus radicales de transformation econ-
omique et politique, qui ont mene a des campagnes de privatisation massives. Les
reformes etaient plus durables et systematiques en Lituanie qu’en Russie. La Bie-
lorussie, en revanche, a choisi la voie d’une transformation graduelle et lente. Les
tendances recentes de la mortalite en Bielorussie sont examinees en detail dans cette
etude, et comparees a celles observees en Lituanie et en Russie. Une analyse des
causes de deces eclaire sur les determinants plausibles des variations de niveau de
mortalite entre ces pays.
Mots-cles Bielarussie � Lituanie � Russie � Tendances de la mortalite �Causes de deces � Reformes du marche � Changements socio-economiques
1 Introduction
Unfavorable mortality trends in the former Soviet republics have attracted the
attention of many researchers. The increase in mortality observed in the former
USSR, and, after its collapse, in the New Independent States (NIS), represents a
trend that is unprecedented in peacetime, and has thus stimulated extensive research.
As a result, several kinds of explanations for the recent mortality crisis have been
246 P. Grigoriev et al.
123
peer
-005
3548
4, v
ersi
on 1
- 11
Nov
201
0

proposed, each tending to complement rather than contradict the others. The most
straightforward, widespread, and well documented of them is that excessive alcohol
consumption has had a strong influence on life expectancy at birth (Anderson and
Silver 1990; Mesle et al. 1992; Shkolnikov and Nemtsov 1997; Shkolnikov et al.
1998). Alcohol is known to be directly associated not only with violent mortality,
but also with other causes of death. Research has demonstrated that heavy alcohol
consumption has been an important determinant of cardiovascular mortality in the
region (McKee and Britton 1998; Malyutina et al. 2002). A number of very recent
epidemiological case–control studies conducted in some cities of Russia have
shown that mortality among the working-age population is strongly associated with
high-risk patterns of alcohol consumption (Leon et al. 2007; Zaridze et al. 2009).
However, while alcohol plays an important role as both an immediate and an
intermediate mortality determinant, it is far from being the only driver of the recent
health crisis. There are additional explanations linked to the abrupt political changes
that triggered a very severe socioeconomic crisis, particularly in Russia (Mesle et al.
2000, 2003). Unemployment growth, the erosion of the social security system and of
the health sector, falling living standards, and growing income inequality are viewed
as determinants of psychological stress and unhealthy behavioral patterns, which in
turn have a negative impact on the health status of the population (Bobak et al.
1998, 2000; Cockerham et al. 2006; Cornia and Paniccia 2000). Other theories
regarding the mortality crisis, such as declining standards of medical care and
changes in dietary habits, have not received substantial support (Brainerd and Cutler
2005). Furthermore, the recent negative mortality dynamics cannot be fully
attributed to the above-mentioned factors only. First, the health crisis in the former
Soviet republics is known to be the long-standing; it emerged well before the
collapse of the USSR (Eberstadt 1981; Feshbach 1984; McKee 2006). Until the
early 1960s, life expectancy at birth in the USSR was growing and catching up with
that of the Western world. The Soviet health care system was very successful in
combating infectious diseases, but less effective against non-communicable
diseases. In particular, unlike Western countries, the Soviet Union failed to benefit
from the ‘‘cardiovascular revolution’’ (i.e., the steady reduction in cardiovascular
mortality, which was unanticipated and revolutionary from the viewpoint of the
classical theory of epidemiologic transition; Omran 1972). In the mid-1960s,
cardiovascular diseases became the major cause of death, and mortality from
accidents and other external causes was unusually high. From that time onwards, the
USSR experienced a dramatic reversal on the path toward declining mortality, a
trend which was especially pronounced in working-age men. Second, mortality
trends in the early 1990s might have still been affected by the inverse effect of the
anti-alcohol campaign launched by the Soviet government in 1985. To sum up, the
literature suggests that the mortality trends in the region seem to be influenced by
the interplay of three major factors: the long-standing health crisis that began in the
USSR several decades ago, the effects of the anti-alcohol campaign, and the
socioeconomic and political changes that emerged with the dissolution of the USSR.
Our study focuses on the divergence in the recent mortality trends in the
countries of the former USSR. To explore the potential mechanisms of such a
divergence, we purposely selected three very contrasting cases in terms of the recent
Mortality in Belarus, Lithuania, and Russia 247
123
peer
-005
3548
4, v
ersi
on 1
- 11
Nov
201
0

socioeconomic and demographic developments: Belarus, Lithuania, and Russia.
Before the dissolution of the Soviet Union, these countries were quite comparable in
terms of economic performance and living standards. Despite some differences in
overall mortality levels, they were also very close to each other in terms of
directions of mortality trends and age- and cause-specific mortality patterns. After
1991, Belarus, Lithuania, and Russia experienced substantial political and social
transformations, and faced multiple challenges associated with the transition from a
socialist to a market economy system. The sudden changes brought numerous
problems, such as unemployment, falling living standards, a rise in poverty, and
socioeconomic differentiation. These factors contributed to the significant deteri-
oration in the already poor health situation (Cockerham 1997), but their magnitude
and impact on the mortality crisis differed from country to country. It is interesting
that marked similarities in socioeconomic and mortality trends among countries up
to 1991 contrast with notable divergence over the subsequent years. In the early
1990s, Russia and Lithuania chose more radical forms of economic and political
transformations, which led to massive privatization campaigns and to the
establishment of fully functioning market economies. The reforms were more
sustainable and systematic in Lithuania than in Russia, where rapid liberalization
was implemented without creating strong market institutions (Popov 2007). In 2004,
Lithuania entered the European Union after making the changes necessary for entry.
By contrast, Belarus has chosen a gradual and slow transition path, maintaining
many of the key features of the old-fashioned planned economy established during
the Soviet era. Under such circumstances, the most plausible explanation for the
diverging mortality trends seen in Belarus, Lithuania, and Russia is provided by the
different modalities and unequal success of the market reforms, which are known to
have influenced mortality trends in transition countries (Brainerd 1998; Sachs 1996;
Shapiro 1995; Stuckler et al. 2009).
Our study aims to explore and understand the potential causes of the variations in
mortality levels between the selected countries. It is organized as follows. First, we
analyze general mortality trends in the countries so that major phases of the
divergence process can be determined. Next, we perform a demographic analysis to
explore the changes that have occurred in cause-specific mortality patterns within
and between the three countries. Finally, the analysis of available socioeconomic
indicators provides us with an opportunity to suggest possible explanations for the
divergence in recent mortality trends in Belarus, Lithuania, and Russia.
2 Data and Methods
The analysis focuses on males because they have been much more severely hit by
Soviet and post-Soviet health crises than females. It covers the period 1990–2005
for three former Soviet republics: Russia, Belarus, and Lithuania. The study is based
on mortality data obtained from the Human Mortality Database (HMD),1 the
1 http://www.mortality.org/.
248 P. Grigoriev et al.
123
peer
-005
3548
4, v
ersi
on 1
- 11
Nov
201
0

European Health for All Database (HFA-DB),2 original statistical data on causes of
death, and available aggregated data on economic indicators obtained from
TransMonee Database,3 and World Income Inequality Database (WIID2).4 The data
on the economic indicators include such indicators as Gross Domestic Product at
purchasing power parity per capita (GDP per capita $PPP), and the Gini coefficient.
Unlike mortality data, the reliability, consistency, and comparability of data on
socioeconomic development are very questionable. They are collected from
different sources, and do not always follow the same methodology. This is
especially the case for the early 1990s, or the first transitional years, which were also
very challenging for statistical systems. The new reality called for a reconsideration
of methodological approaches to data collection. The problem of coverage and
completeness of registration (emerging private enterprises, ‘‘hidden economy,’’ etc.)
was complicated by a number of other challenges, such as hyperinflation. All these
eventually affected the quality of estimates of real GDP and other important
macroeconomic indicators. For the above-mentioned reasons, the socioeconomic
data seem to be rather insufficient for building sophisticated statistical models.
Nonetheless, if used with caution, they can still complement the demographic
analysis, and may shed more light on the complex relationship between
socioeconomic changes and mortality.
A few remarks regarding the quality of mortality data are also worth making
here. There are reasonable concerns that the two Chechen wars as well as return and
labor migration might have a significant impact on the level of male life expectancy
in Russia. Nevertheless, we have reasons to assume that these possible distortions
do not have a notable impact on mortality dynamics. First of all, over the period
1993–2002, the territory of the Chechen Republic was excluded from Russian vital
statistics (Shkolnikov and Jdanov 2006). Life expectancy estimates for this period
do not account for the war losses among the Chechen population. Secondly, it can
be also assumed that return migration was adequately covered by the system of vital
statistics. Russian repatriates determined immigration flows in Russia in the 1990s.
According to official statistics, during 1989–2004, more than 3 million ethnic
Russians migrated from other former Soviet republics to Russia. More than half of
them (1.8 million) emigrated during 1992–1995 (Annual Demographic Report
2006). Presumably, since repatriates moved for permanent residence, they were
registered by local authorities. Finally, although the registration of vital events
concerning temporary labor migrants is biased (while not included in the population
at risk (exposure) a migrant whose death occurred in Russia is registered by Russian
authorities), it should not lead to a significant overestimation of the mortality level.
To make such a conclusion, we analyzed the unpublished data of the Central
Statistical Office of Russia on the number of deceased by country of permanent
residence. For example, in 2005, the number of deceased having foreign (non-
Russian) origin constituted approximately 0.5% of the total number of deaths that
2 http://www.euro.who.int.3 http://www.unicef-irc.org.4 http://www.wider.unu.edu.
Mortality in Belarus, Lithuania, and Russia 249
123
peer
-005
3548
4, v
ersi
on 1
- 11
Nov
201
0

occurred in Russia. This share varied slightly by sex and age within the range of
0.4–0.7%.
Overall, most experts who deal with mortality data for Russia, the Baltic States,
and Belarus agree that the registration of deaths in these countries is complete
(Murray and Bobadilla 1997). Anderson and Silver (1997) note that recent mortality
data for these countries ‘‘are generally trustworthy, especially at the working ages.’’
On the basis of death registration data (1981–2001), the World Health Organization
(WHO) ranks Belarus and Russia as countries with mortality data of medium
quality, and Lithuania as a country with high-quality mortality data. The WHO
assessed the completeness of the death registration (i.e., the proportion of all deaths
that are registered among the population covered by the vital registration system of
the country) to be 100% in each country. The coverage of death registration (i.e., the
total number of deaths recorded by the vital registration system for a given year,
divided by the total number of deaths estimated by the WHO for that year) has been
estimated to be 98% in Belarus, 97% in Lithuania, and 100% in Russia (Mathers
et al. 2005). For more details regarding the data-quality issues in the three countries,
such as territorial coverage, the implementation of the WHO definition of live birth,
etc., see Grigoriev (2008), Jasilionis and Stankuniene (2008), and Shkolnikov and
Jdanov (2006).
Given the objective of our study and data-quality considerations, we decided to
adopt the descriptive approach. Conventional demographic methods, such as the life
table decomposition technique (Andreev 1982), are widely employed in analyzing
mortality trends. This method enables us to determine precisely the ages and causes
of death responsible for changes in life expectancy at birth over time, and between
countries.
3 General Mortality Trends
Prior the collapse of the USSR, the directions of the mortality trends in Belarus,
Lithuania, and Russia were very similar (Fig. 1). Over the entire period of 1965–
1990, levels of life expectancy at birth5 in Belarus and Lithuania were almost the
same, and exceeded that of Russia.
In the mid-1980s, all countries experienced significant improvements, which are
attributable to the effect of the anti-alcohol campaign (Shkolnikov and Nemtsov
1997). The anti-alcohol campaign seemed to be slightly more beneficial for Russia:
between 1984 and 1986, male life expectancy in this country increased by 3.1 years,
compared with 2.3 years in Lithuania and 2.6 years in Belarus. Subsequently, life
expectancy trends again started to deteriorate. Seemingly, the life expectancy trends
in the late 1980s were driven by the inverse effect of the campaign, which ended in
1987. The Chernobyl disaster, which occurred in 1986, may also have had an impact
5 HMD estimates of life expectancy are not adjusted to the change in the registration of infant mortality
that occurred in the USSR in the middle of 1970s (see Anderson and Silver 1986). The registration of
infant mortality prior to this time was incomplete, which resulted in a moderate overestimation of life
expectancy (Mesle et al. 2003). We assumed that the magnitude of such an overestimation was about
equal in each of the three countries, and we therefore did not make any adjustments to life expectancy.
250 P. Grigoriev et al.
123
peer
-005
3548
4, v
ersi
on 1
- 11
Nov
201
0

on mortality trends. This impact would be especially noticeable for Belarus, which
was among the countries most affected by the aftermath of the Chernobyl accident.
However, according to the comprehensive report of the Chernobyl Forum6 ‘‘…there is no clearly demonstrated increase in the incidence of solid cancers or
leukemia due to radiation in the most affected populations. …It is impossible to
assess reliably, with any precision, numbers of fatal cancers caused by radiation
exposure due to the Chernobyl accident… The projections indicate that, among the
most exposed populations (liquidators, evacuees and residents of the so-called ‘strict
control zones’), total cancer mortality might increase by up to a few per cent owing
to Chernobyl related radiation exposure. Such an increase could mean eventually up
to several thousand fatal cancers in addition to perhaps one hundred thousand cancer
deaths expected in these populations from all other causes. An increase of this
magnitude would be very difficult to detect, even with very careful long term
epidemiological studies’’ (Chernobyl Forum 2006). Thus, even the dramatic
environmental and health consequences of the Chernobyl accident did not seem to
influence life expectancy trends in the three countries. In general, the period
between 1980 and 1990 can be characterized as a period of gradual convergence of
mortality trends between Russia on one hand, and Belarus and Lithuania on the
other, with Russia slowly catching up the other two countries. While in 1980, the
difference in male life expectancy between them was more than 4 years, by 1990
this gap was reduced to about 2 years.
The divergent mortality trends observed since 1990 deserve particular attention.
They can be divided into three main stages. The first, from 1990 to 1994, was
characterized by a rapid mortality increase, but the magnitude of the negative
6 The Chernobyl Forum is the name of a group of UN agencies, founded on 3–5 February 2003 at the
International Atomic Energy Agency (IAEA) Headquarters in Vienna, to scientifically assess the health
effects and environmental consequences of the Chernobyl accident and to issue factual, authoritative
reports on its environmental and health effects (source: http://en.wikipedia.org/wiki/Chernobyl_Forum).
Fig. 1 Male life expectancy at birth in Russia, Belarus, and Lithuania; 1965–2005. Source: HumanMortality Database (HMD). Note: during 1993–2002 the territory of the Chechen Republic was notcovered by vital statistics of Russia (Shkolnikov and Jdanov 2006)
Mortality in Belarus, Lithuania, and Russia 251
123
peer
-005
3548
4, v
ersi
on 1
- 11
Nov
201
0

changes differed from country to country. For example, between 1990 and 1994,
male life expectancy in Belarus and Lithuania decreased by 2.8 and 3.9 years,
respectively, while in Russia it decreased by 6.4 years (Table 1). Clearly, the
mortality increase in all countries varied greatly with age. Whatever the causes of
the mortality increase, the middle age groups were the most affected. Even though
mortality among children and the elderly also rose between 1990 and 1994, the
negative contributions of these groups to the life expectancy losses were much
smaller. The relatively modest mortality increase among children and the elderly on
one hand, and the sharp increase in working-age mortality on the other, suggest
social causes played a more prominent role than biomedical ones (Cockerham
1997). Working-age males appeared to be more exposed not only to risky behavior
patterns, but also to the negative consequences of the economic crisis in the
beginning of the 1990s.
During the second stage (1994–1998), life expectancy at birth rose in all
countries except Belarus, where it decreased steadily. Symmetrically to the previous
period, the working-age population benefited the most from the life expectancy
increase in Russia and Lithuania.
During the third stage (1998–2005), the trends in life expectancy in the three
countries did not reveal such drastic fluctuations as in the previous years.
In Russia, mortality again increased rapidly until 2000—which might be
explained by the consequences of the Russian financial crisis in 1998 (Gavrilova
et al. 2000)—and then stabilized. In Lithuania, the decrease in mortality slowed
around 2000, and life expectancy stagnated and even declined in 2005, raising some
doubts about the sustainability of the improvement in health. Finally, in Belarus,
Table 1 Age contributions to the change in male life expectancy at birth in Belarus, Lithuania, and
Russia, by periods (years)
Age Belarus Lithuania Russia
1990–
1994
1994–
1998
1998–
2005
1990–
1994
1994–
1998
1998–
2005
1990–
1994
1994–
1998
1998–
2005
0 -0.05 0.04 0.39 -0.25 0.28 0.17 -0.13 0.17 0.38
1–4 0.02 0.00 0.06 0.00 0.08 0.04 -0.02 0.02 0.06
5–14 -0.05 0.05 0.05 -0.01 0.09 -0.02 -0.01 0.05 0.03
15–24 -0.10 0.01 0.16 -0.26 0.19 0.05 -0.41 0.06 0.11
25–34 -0.36 -0.10 -0.03 -0.54 0.39 -0.08 -0.89 0.42 -0.63
35–44 -0.51 -0.08 -0.14 -0.79 0.75 -0.11 -1.44 0.89 -0.75
45–54 -0.64 -0.18 0.04 -0.95 0.64 -0.11 -1.60 1.07 -0.84
55–64 -0.60 -0.29 -0.16 -0.70 0.65 -0.45 -1.13 0.73 -0.56
65–74 -0.35 -0.24 -0.09 -0.22 0.21 -0.10 -0.52 0.25 -0.16
75–84 -0.16 -0.02 0.00 -0.11 0.14 -0.01 -0.16 0.12 -0.01
85? -0.04 0.00 -0.01 -0.02 0.02 -0.06 -0.04 0.03 0.01
Total -2.84 -0.81 0.27 -3.85 3.44 -0.68 -6.35 3.81 -2.38
Source: own calculations based on the HMD data
252 P. Grigoriev et al.
123
peer
-005
3548
4, v
ersi
on 1
- 11
Nov
201
0

mortality trends contrasted with those seen in the other two countries by avoiding
acute fluctuations, but persisting in a more regular deterioration without any
significant improvement since 1998. Trends in Belarus appear to still be driven by
long-standing negative factors, and not by specific consequences of the transition
period.
4 Changes in Cause-Specific Patterns of Mortality
4.1 Data on Causes of Death
Studying cause-specific patterns of mortality can provide us with a better
understanding of overall mortality dynamics. Mortality from certain causes of
death is correlated with specific risk factors and behavioral patterns. Thus, the
analysis of causes of death plays a vital role in establishing causal links between
mortality and its determinants.
Unfortunately, such an analysis is complicated by the changes made in the
revisions of the International Classifications of Diseases (ICD). Since 1990, several
different classifications of causes of death introduced in different years have been
used in Belarus, Lithuania, and Russia. Specifically, in 2002, Belarus shifted from
the 1981/1988 Soviet classification of causes of death7 to ICD-10 (a specific
abridged version). While Lithuania adopted the ICD-10 much earlier, in 1998, the
Soviet classification of 1981/1988 was in use until 1992, and was then replaced by
ICD-9 (1993–1997). Finally, in 1999, the last Soviet classification was replaced in
Russia by a specific abridged version of the ICD-10.
Ideally, to fill in the breaks in the statistical series due to changes in the cause-of-
death classification, a precise reconstruction method should be applied (Mesle et al.
1992; Mesle and Vallin 1996). However, such a time-consuming method can be
replaced by a rough grouping of classification items that make it possible to capture
major changes in cause-specific mortality by dealing with very broad groups of
causes. The seven selected groups of causes and their correspondence to the
different classifications are presented in Table 2.
4.2 Life Expectancy Changes by Periods
Age and cause components of observed changes in male life expectancy at birth
during three periods in Belarus, Lithuania, and Russia are presented in Table 3.
They underline the key role of circulatory diseases and external causes in changing
mortality levels over the selected periods. Indeed, the highest contributions to the
decrease in life expectancy in Belarus and Russia over the whole period 1990–2005
were from diseases of the circulatory system (-2 years in Belarus, -2.4 in Russia),
followed by external causes in second position (-1.4 and -1.9). However, different
patterns emerge for the three sub-periods studied here. In particular, external causes
were the most important factor in the deterioration between 1990 and 1994: 53% of
7 Soviet classification of 1981 modified in 1988.
Mortality in Belarus, Lithuania, and Russia 253
123
peer
-005
3548
4, v
ersi
on 1
- 11
Nov
201
0
the overall decrease in male life expectancy was due to external causes of death in
Lithuania, compared to 41% in Belarus and 45% in Russia. The impact of
cardiovascular mortality was most pronounced in Belarus (43% of the overall
decrease), followed by Russia (35%), but accounted for only 18% in Lithuania.
During the intermediate period, when life expectancy in Russia and Lithuania made
significant progress (and deteriorated slightly in Belarus), the effects of circulatory
diseases and external causes were almost the same. However, from 1998 to 2005,
external causes had much less impact than cardiovascular diseases in the three
countries.
Figure 2 illustrates the age-cause specific contributions to the change in male life
expectancy in Belarus, Lithuania, and Russia over the three periods. From 1990 to
1994, even if the magnitude of the deterioration is much larger in Russia than in
Belarus, the two age- and cause-specific patterns look very similar. Both external
causes and cardiovascular diseases play major roles. While external causes mainly
affect younger adult ages, cardiovascular diseases are more prevalent at older adult
ages. The case of Lithuania is quite different. External causes of death not only have
much more significant effects on the life expectancy decrease in Lithuania than in
Belarus and Russia, but external causes are much more important at the youngest
adult ages (20–34). Under age 45, the impact of cardiovascular mortality is
relatively small. Also, unlike in Russia and Belarus, other causes of death
Table 2 Causes of deaths according to different classifications and their correspondence to items of the
Soviet classification (1988), ICD-9 and ICD-10
Group of causes
of death
Classification
Soviet classification
(1988 revision)
ICD 10 (abridged list)
used in
ICD9
(list B)
ICD10
(detailed list)
Russia Belarus
Infectious diseases 1–44 1–55 1–58 B01–B07 A00–A99,
B00–B99
Neoplasms 45–67 56–89 59–94 B08–B17 C00–C97,
D00–D48
Diseases of the
circulatory system
84–102 115–147 124–159 B25–B30 I00–I99
Diseases of the
respiratory system
103–114 148–164 160–177 B31–B32 J00–J99
Diseases of the digestive
system
115–127 165–179 178–193 B33–B34 K00–K93
External causes of death 160–175 239–255 256–277 B47–B56 V01–Y98
Other causes of death 68–83, 90–114, 95–123, B18–B24, D50–H95,
128–159 180–227 194–255 B35–B46 L00–R99
All causes 1–175 1–228, 1–277 B01–B56 A00–R99,
239–255 V01–Y98
254 P. Grigoriev et al.
123
peer
-005
3548
4, v
ersi
on 1
- 11
Nov
201
0

Ta
ble
3C
on
trib
uti
on
so
fth
ese
lect
edca
use
so
fd
eath
toch
ang
esin
mal
eli
feex
pec
tan
cyat
bir
thin
Bel
aru
s(B
LR
),L
ith
uan
ia(L
TU
),an
dR
uss
ia(R
US
),b
yp
erio
ds
(yea
rs)
19
90
–1
99
41
99
4–
199
81
99
8–
20
05
19
90–
20
05
BL
RL
TU
RU
SB
LR
LT
UR
US
BL
RL
TU
RU
SB
LR
LT
UR
US
Infe
ctio
us
dis
ease
s-
0.0
6-
0.1
5-
0.2
0-
0.0
30
.05
0.0
1-
0.1
30
.00
-0
.15
-0
.22
-0
.09
-0
.33
Neo
pla
sms
-0
.15
-0
.12
-0
.04
0.0
90
.15
0.2
10
.24
0.1
00
.17
0.1
80
.13
0.3
4
Dis
ease
so
fth
eci
rcu
lato
rysy
stem
-1
.21
-0
.69
-2
.23
-0
.36
1.1
21
.29
-0
.38
-0
.63
-1
.50
-1
.95
-0
.21
-2
.44
Dis
ease
so
fth
ere
spir
ato
rysy
stem
-0
.06
-0
.11
-0
.42
0.0
00
.15
0.3
70
.17
-0
.07
-0
.16
0.1
1-
0.0
3-
0.2
2
Dis
ease
so
fth
ed
iges
tiv
esy
stem
-0
.05
-0
.18
-0
.27
-0
.06
-0
.06
0.1
2-
0.1
8-
0.2
5-
0.4
0-
0.3
0-
0.4
8-
0.5
4
Ex
tern
alca
use
s-
1.1
7-
2.0
3-
2.8
4-
0.4
61
.23
1.5
00
.22
-0
.02
-0
.57
-1
.40
-0
.82
-1
.91
Oth
erca
use
s-
0.1
4-
0.5
7-
0.3
50
.01
0.8
00
.31
0.3
30
.19
0.2
30
.20
0.4
10
.18
To
tal
-2
.84
-3
.85
-6
.35
-0
.81
3.4
43
.81
0.2
7-
0.6
8-
2.3
8-
3.3
8-
1.0
9-
4.9
2
So
urc
e:o
wn
calc
ula
tio
ns
bas
edo
no
rig
inal
tab
les
on
cau
ses
of
dea
than
dd
ata
from
HM
D
Fo
rL
ith
uan
iaw
eu
sed
reco
nst
ruct
edti
me
seri
esb
yca
use
so
fd
eath
inac
cord
ance
wit
hIC
D1
0;
ill-
defi
ned
cau
ses
of
dea
thw
ere
pro
port
ion
ally
red
istr
ibu
ted
amo
ng
oth
er
cau
ses
Mortality in Belarus, Lithuania, and Russia 255
123
peer
-005
3548
4, v
ersi
on 1
- 11
Nov
201
0

(particularly at age 0) have played an important role in the deterioration of life
expectancy in Lithuania.8
During 1994–1998, life expectancy in Belarus continued to deteriorate slightly,
while Lithuania and Russia experienced considerable improvement. In the latter two
countries, age- and cause-specific impacts are almost symmetrical when compared
to the deterioration of the previous period. However, there is an important
difference: in Lithuania, the positive role of cardiovascular diseases is more
Age groups
Co
ntr
ibu
tio
ns
, y
ea
rs
-0.8
-0.6
-0.4
-0.2
0
0.2
0.4
0.6
0.8
0 1 5
10
15
20
25
30
35
40
45
50
55
60
65
70
75
80
85
+
Belarus, 1990-1994
Difference= -2.84
-0.8
-0.6
-0.4
-0.2
0
0.2
0.4
0.6
0.8
0 1 5
10
15
20
25
30
35
40
45
50
55
60
65
70
75
80
85
+
Lithuania, 1990-1994
Difference= -3.85-0.8
-0.6
-0.4
-0.2
0
0.2
0.4
0.6
0.8
0 1 5
10
15
20
25
30
35
40
45
50
55
60
65
70
75
80
85
+
Russia, 1990-1994
Difference= -6.35
-0.8
-0.6
-0.4
-0.2
0
0.2
0.4
0.6
0.8
0 1 5
10
15
20
25
30
35
40
45
50
55
60
65
70
75
80
85
+
Belarus, 1994-1998
Difference= -0.81-0.8
-0.6
-0.4
-0.2
0
0.2
0.4
0.6
0.8
0 1 5
10
15
20
25
30
35
40
45
50
55
60
65
70
75
80
85
+
Lithuania, 1994-1998
Difference= 3.44
-0.8
-0.6
-0.4
-0.2
0
0.2
0.4
0.6
0.8
0 1 5
10
15
20
25
30
35
40
45
50
55
60
65
70
75
80
85
+
Russia, 1994-1998
Difference= 3.81
Infectious diseases Neoplasms Diseases of circulatory system
Diseases of respiratory system Diseases of digestive system External causes
Other causes
-0.8
-0.6
-0.4
-0.2
0
0.2
0.4
0.6
0.8
0 1 5
10
15
20
25
30
35
40
45
50
55
60
65
70
75
80
85
+
Belarus, 1998-2005
Difference= 0.27
-0.8
-0.6
-0.4
-0.2
0
0.2
0.4
0.6
0.8
0 1 5
10
15
20
25
30
35
40
45
50
55
60
65
70
75
80
85
+
Russia, 1998-2005
Difference= -2.38
-0.8
-0.6
-0.4
-0.2
0
0.2
0.4
0.6
0.8
0 1 5
10
15
20
25
30
35
40
45
50
55
60
65
70
75
80
85
+
Difference= -0.68
Lithuania, 1998-2005
Fig. 2 Age-cause contributions to the change in male life expectancy at birth in Belarus, Lithuania, andRussia, by periods (years) Source: as in Table 3
8 Levels of infant mortality increased substantially in Lithuania between 1990 and 1994, due mainly to
the adoption of the WHO definition of live birth in 1991. Russia and Belarus adopted the WHO definition
in 1993 and 1994, respectively. However, unlike in Lithuania, the WHO definition of live birth was not
fully implemented in these counties. For more details, see Grigoriev (2008) and Shkolnikov and Jdanov
(2006).
256 P. Grigoriev et al.
123
peer
-005
3548
4, v
ersi
on 1
- 11
Nov
201
0

important than the negative role seen in the previous period (33% of the increase
versus of 18% of the decrease); while in Russia, it is the reverse. Over the same
period, the relative importance of younger adult ages in the positive role of external
causes in Lithuania is more pronounced. In Belarus, as in the previous period,
diseases of the circulatory system and external causes of death were mostly
responsible for the continuing deterioration, but, compared to the 1990–1994 period,
negative contributions shifted to older ages.
Between 1998 and 2005, more similarities are observed between Belarus and
Lithuania, while Russia experienced much greater losses in life expectancy.
Everywhere, the increase in cardiovascular mortality is the most important negative
factor. While external causes still play an important role, they are no longer
prominent, and all other causes are quite negligible in Belarus and Lithuania. In the
three countries, the contrast between young people (under age 25) and older adults
is more pronounced than ever. Belarus and Russia benefit from quite substantial
gains due to the decrease in infant mortality. In addition, the reduction in external
causes around age 20 brings some gains, especially in Belarus and Lithuania. As
negative contributions at adult ages are still very large, a clear dividing line appears
in Russia at age 25, with small gains but almost no losses at all ages below 25, and
dramatic losses and almost no gains above that age.
4.3 Changes in Life Expectancy Differences Between Countries
Another way to capture the comparative effects of age- and cause-specific mortality
changes is to compare life expectancy levels between countries at given points in
time. Figure 3 depicts the comparison between Belarus and Russia, and Belarus and
Lithuania, in 1990, 1994, 1998, and 2005. At the beginning of the study period, in
1990, the gap in male life expectancy between Belarus and Russia was mostly
determined by three factors: infant mortality, much lower in Belarus than in Russia;
external causes among youth and young adults (from ages 5 to 55); and, finally,
diseases of the circulatory system at older ages.
The situation was quite different in 1994. Russia was severely hit by the dramatic
socioeconomic crisis of 1992–1993, while Belarus managed to minimize its
consequences. Infant mortality aside (for which Belarus maintains more or less the
same advantage), the Belarus advantage was far bigger than in 1990, and the effects
of external causes and cardiovascular diseases, while still dominant, are spread
much more widely over the age groups. The impact of external causes is very strong
from ages 15 to 55, while that of cardiovascular diseases is massive from ages 35 to
70, with a large overlap between these two groups of causes. The impact of other
causes is quite negligible. After the Russian post-crisis recovery, in 1998, the gap in
male life expectancy between Belarus and Russia almost vanished, becoming even
smaller than it was in 1990. However, apart from infant mortality, the gap was
exclusively due to external causes. The small impact of the difference in
cardiovascular diseases is even to the advantage of Russia.
Russia then resumed its unfavorable long-term trends, and by 2005 the
difference favored Belarus much more than at the beginning of the study (1990).
All the complex changes seen over this often chaotic 15-year period resulted in an
Mortality in Belarus, Lithuania, and Russia 257
123
peer
-005
3548
4, v
ersi
on 1
- 11
Nov
201
0

increased advantage for Belarus, which escaped the major fluctuations observed in
Russia after the move to a market economy. But they also resulted in a quite
different pattern of ages and causes. Apart from infant mortality, in which Belarus
-0.8
-0.6
-0.4
-0.2
0
0.2
0.4
0.6
0.8
0 1 5 10 15 20 25 30 35 40 45 50 55 60 65 70 75 80 85+
Difference= -2.44
Belarus-Lithuania, 2005
Con
trib
utio
ns, y
ears
-0.8
-0.6
-0.4
-0.2
0
0.2
0.4
0.6
0.8
0 1 5 10 15 20 25 30 35 40 45 50 55 60 65 70 75 80
85+
Difference= 2.45
Belarus-Russia, 1990
-0.8
-0.6
-0.4
-0.2
0
0.2
0.4
0.6
0.8
0 1 5 10 15 20 25 30 35 40 45 50 55 60 65 70 75 80
85+
Difference= -0.15
Belarus-Lithuania, 1990
-0.8
-0.6
-0.4
-0.2
0
0.2
0.4
0.6
0.8
0 1 5 10 15 20 25 30 35 40 45 50 55 60 65 70 75 80
85+
Difference= 6.01
Belarus-Russia, 1994
-0.8
-0.6
-0.4
-0.2
0
0.2
0.4
0.6
0.8
0 1 5 10 15 20 25 30 35 40 45 50 55 60 65 70 75 80
85+
Difference= 0.86
Belarus-Lithuania, 1994
-0.8
-0.6
-0.4
-0.2
0
0.2
0.4
0.6
0.8
0 1 5 10 15 20 25 30 35 40 45 50 55 60 65 70 75 80
85+
Difference= 1.39
Belarus-Russia, 1998
-0.8
-0.6
-0.4
-0.2
0
0.2
0.4
0.6
0.8
0 1 5 10 15 20 25 30 35 40 45 50 55 60 65 70 75 80
85+
Difference= -3.39
Belarus-Lithuania, 1998
Infectious diseases Neoplasms Diseases of circulatory system
Diseases of respiratory system Diseases of digestive system External causes
Other causes
-0.8
-0.6
-0.4
-0.2
0
0.2
0.4
0.6
0.8
0 1 5 10 15 20 25 30 35 40 45 50 55 60 65 70 75 80
85+
Difference= 4.04
Belarus-Russia, 2005
Age groups
Fig. 3 Age-cause contributions to the difference in male life expectancy at birth between Belarus andRussia, and Belarus and Lithuania; 1990, 1994, 1998, and 2005. (years). Source: as in Fig. 2
258 P. Grigoriev et al.
123
peer
-005
3548
4, v
ersi
on 1
- 11
Nov
201
0

maintained the same advantage throughout the whole period, the gap between
Belarus and Russia was now almost exclusively attributable to younger adult ages
(from 20 to 55), even though the impact of external causes was still more
prominent at younger ages than that of cardiovascular diseases. Whereas in 1990,
cardiovascular diseases contributed to the gap only after age 55, by 2005, they also
contributed at ages 40–55. Conversely, while external causes were more important
before age 40 in 1990, they had, by 2005, become important up to age 50, and also
more concentrated around ages 25–34. Very little difference was observed at ages
1–15, or at ages 60 and above. In 2005, the difference was largely attributable to
working ages.
Comparing Belarus to Lithuania, we see that the changes between 1990 and 2005
were even greater. Indeed, in 1990, there was neither a difference in life expectancy
levels, nor a large contrast between the two countries in terms of age- and cause-
specific patterns. Except for a non-negligible Lithuanian advantage in terms of
infant mortality, many small cause-specific differences resulted in either Belarus or
Lithuania having minor advantages based on age. However, the considerable
advantage enjoyed by Lithuania in 2005 could be primarily explained by a huge
cardiovascular gap at the oldest ages (especially at ages 50–80). The differences at
ages below 30 were very tiny, and the not insignificant role of external causes,
concentrated at ages 30–45, appeared to be secondary when compared to the effect
of the difference in cardiovascular diseases.
Naturally, as was the case in the comparison between Belarus and Russia, the
final differences that emerged between Belarus and Lithuania also came about
through chaotic intermediate changes. In 1994, a huge contrast was observed at
adult ages between a large Belarusian advantage in terms of external causes, and a
moderate disadvantage in terms of cardiovascular diseases. This situation differed
greatly from the Belarus/Russia comparison. The contrast between the two
comparisons was even greater in 1998. At that time, Belarus was the winner
against Russia, and was the loser against Lithuania in all areas, such as infant
mortality, external causes at adult ages, and especially cardiovascular diseases at all
ages above age 30, including the very old ages, up to 85 and above. The situation
observed in 1998 may be attributed to the fact that Lithuania had finally started to
take part in the cardiovascular revolution, while Belarus had not yet done so.
Indeed, the situation observed in 2005 is an indication that the spectacular success
achieved by Lithuania in the late 1990s was still fragile, since the 2005 comparison
is a bit less favorable to that country, but the age and cause pattern of the difference
is very similar, and confirms that Belarus did not succeed in reducing cardiovascular
mortality.
Finally, while the life expectancy level of Belarus is currently roughly half-way
between the levels of Russia and Lithuania, the respective distances are not related
to the same age- and cause-specific differences. Three specific differences (infant
mortality, external causes at young adult ages, and cardiovascular diseases at middle
adult ages) place Belarus at an advantage compared with Russia; while cardiovas-
cular mortality alone, but at much older ages, places Belarus at a disadvantage
compared with Lithuania.
Mortality in Belarus, Lithuania, and Russia 259
123
peer
-005
3548
4, v
ersi
on 1
- 11
Nov
201
0

External causes and, in part, cardiovascular mortality (at least at young adult
ages) are also known to be closely associated with risky behavioral patterns, such as
the excessive alcohol consumption (McKee and Britton 1998). Mortality from
accidental alcohol poisoning (obviously correlated with alcohol consumption) was
found to be a good predictor of overall mortality in Russia (Shkolnikov and
Nemtsov 1997). The same relationship holds for both Belarus and Lithuania, as
shown in Fig. 4.
In 1990, the male standardized death rate (SDR) from accidental alcohol
poisoning in Belarus and Russia was twice as high as in Lithuania. By 1994, the rate
had increased about 4-fold in Lithuania, more than 3-fold in Russia, and around 2-
fold in Belarus. During 1994–1998, mortality from this cause of death declined
steadily in Lithuania and Russia, so that by 1998 it had almost returned to the level
of 1990. By contrast, mortality from accidental alcohol poisoning in Belarus rose
sharply in 1994, and remained at approximately the same level until 2000.
Thereafter, it started increasing rapidly to the extent that in 2005 the SDR from
accidental alcohol poisoning exceeded that of Russia. Given the historical
importance of alcohol in influencing overall mortality, this tendency severely
compromises the prospects for future demographic growth in Belarus.
Nevertheless, alcohol consumption is not the only reason why Belarusian life
expectancy is between that of Russia and Lithuania, and it is not even the most
Fig. 4 Association between male life expectancy at birth and the SDR from accidental alcohol poisoningin Belarus, Lithuania, and Russia; 1990–2005. Source: As in Fig. 2. Note: SDR standardized death ratefrom accidental alcohol poisoning, LE male life expectancy at birth. *** Pearson correlation at 0.01 levelof significance
260 P. Grigoriev et al.
123
peer
-005
3548
4, v
ersi
on 1
- 11
Nov
201
0

important one. It is very likely that the socioeconomic transformations initiated in
the early 1990s have much more fundamental and complex links with mortality
trends. Is it possible to identify these links using some socioeconomic indicators?
5 Impact of Socioeconomic Changes
Prior to the dissolution of the Soviet Union, Belarus, Lithuania, and Russia shared
many similarities in terms of economic performance and living standards. They
were considered to be among the most developed and prosperous regions relative to
other republics of the USSR. In 1990, Lithuania and Russia enjoyed the highest
Human Development Index (HDI) in the USSR. Their values exceeded 0.8,
meaning that living standards in these republics were not far from those of Western
countries. Belarus was slightly behind, with an HDI of 0.793 (UNDP 2009).
The collapse of the USSR in 1991 had dramatic socioeconomic consequences for
all the former Soviet republics. While they differed in magnitude and were specific
to each newly independent state, all the former republics faced a similar set of
challenges in the early years of the transition period, including a deep economic
crisis accompanied by macroeconomic instability, inefficiencies of the state-owned
enterprises, hyperinflation, unemployment growth, and a drastic decline in the well
being of the population. At this critical point, Russia and Lithuania chose more
radical forms of economic and political transformations, which led to massive
privatization campaigns and the establishment of fully functioning market
economies. As noted by experts at the European Bank for Reconstruction and
Development (EBRD), the reforms were more sustainable and systematic in
Lithuania than in Russia (EBRD 1999). Meanwhile, in an attempt to insulate its
population from the pain of reforms, Belarus chose the policy of gradualism. This
involved preserving the main features of the old-fashioned planned economy and
methods of the administrative regulations established under the Soviet rule, such as
protecting jobs and wages, maintaining state control over most production
resources, and large social expenditures and subsidies (World Bank 2008). Today,
the economic system of Belarus has a number of features which make it very
different from most transition economies. Among them are: (i) the dominance of the
state-owned enterprises; (ii) the high degree of government intervention in
enterprise operations, including the preservation of some elements of central
government planning of output, wages, and employment; (iii) the high level of
taxation; and the major budget redistribution of funds aimed at supporting
traditional firms and employment (World Bank 2005)
The process of transition to a market economy is obviously far from complete in
Belarus. According to the European Bank of Reconstruction and Development
(EBRD), Belarus remains one of the slowest-reforming countries among all the
transition economies. The EBRD developed a methodology for ranking countries by
the progress made in market reforms (see EBRD transition reports for more details).
The following figure depicts the position of Belarus relative to Russia and
Lithuania, and to other republics of the former USSR on the path to becoming
market economies (Fig. 5).
Mortality in Belarus, Lithuania, and Russia 261
123
peer
-005
3548
4, v
ersi
on 1
- 11
Nov
201
0

In 1994, Belarus had one of the lowest average country scores among the former
Soviet republics. By 1998, it occupied the place next to Turkmenistan, which had
the last position not only in the former USSR, but also among all the transition
countries in Central and Eastern Europe.
The higher the speed and the less systematic the reforms, the more painful they
may be for people, especially during the initial stage. Economic reforms may
influence health through the following: (i) macroeconomic instability, which in turn
may cause stress and anxiety; (ii) changes in prices, which may put constraints on
consumption behavior; and (iii) poverty, erosion of the social security system, and
deterioration of the public health infrastructure (Brainerd 1998). These findings may
appear to suggest that the slower (compared to Russia and Lithuania) mortality
increase seen in Belarus during 1990–1994 was associated with the less radical and
slower market reforms implemented in that country. However, this does not
necessarily imply that there is a clear association between socioeconomic changes
and mortality. The mortality response may be different from one population to
another, as it depends heavily on initial conditions. The case of the Czech Republic
is very illustrative: during the period of economic transformation, life expectancy in
1994
Estonia
BelarusArmenia
KyrgystanLatviaLithuania
Russia
Ukraine
Moldova
AzerbaijanGeorgia
Kazakhstan
Uzbekistan
Tajikistan
Turkmenistan1
1.5
2
2.5
3
3.5
Ave
rage
cou
ntry
sco
re
1998
Estonia
Belarus
Azerbaijan
LatviaLithuania
RussiaUkraine
MoldovaArmeniaGeorgia
KyrgystanKazakhstan
Uzbekistan
Tajikistan
Turkmenistan
1
1.5
2
2.5
3
3.5
4
CIS
Baltics South-eastern and Central CIS Caucasus Central Asia
Baltics South-eastern and Central Caucasus Central Asia
Ave
rage
cou
ntry
sco
re
Fig. 5 Regional patterns of reforms by countries of the former USSR in 1994 and 1998. Source: EBRD1994 and 1998. Notes: CIS commonwealth of Independent States, the calculation method for the averagecountry score is provided in the appendix
262 P. Grigoriev et al.
123
peer
-005
3548
4, v
ersi
on 1
- 11
Nov
201
0
this country actually increased (Brainerd 1998). The same could be said of Poland.
But past conditions in communist Central European countries were not identical to
those of the former Soviet Union republics. And, while the very different paths
chosen by Belarus, Russia, and Lithuania could explain the differences between the
mortality trends of Belarus and those of Russia and Lithuania in the early 1990s,
they do not explain the more recent diverging trends.
Even if available socioeconomic indicators are not sufficient to draw firm
conclusions, they do capture the major changes occurring in the former Soviet
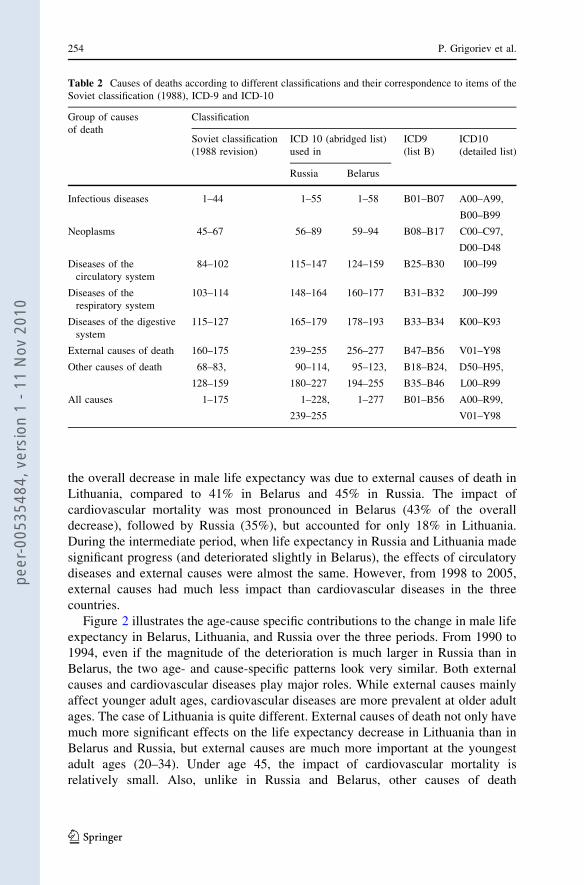
republics. For example, the huge fall in the gross domestic product (GDP) per capita
(PPP US$)9 at the beginning of 1990 indicates the depth and severity of the
economic recession (Fig. 6). The magnitude and duration of the crisis differed from
country to country. Lithuania experienced the sharpest drop in per capita income,
but managed to recover earlier. By contrast, Belarus had the slowest decrease in
annual per capita income, which may explain why the mortality increase in this
country was less dramatic than in Russia and Lithuania. Yet despite an increase in
GDP, the health situation in Belarus deteriorated steadily. Meanwhile, by 1998, life
expectancy in Russia had almost caught up to that of Belarus, even though Russia
had not made any progress on its GDP per capita. Furthermore, from 1998 to 2000,
while GDP per capita was going up in the three countries, life expectancy declined
in Russia, stagnated in Belarus, and increased in Lithuania. Finally, from 2002,
while GDP was rising even more steadily in the three countries, life expectancy
stagnated in all of them. Thus, there is no direct relationship at all between GDP per
capita (PPP US$) and life expectancy changes.
GDP (PPP, current international $)
Belarus
Russia
Lithuania
2000
3500
5000
6500
8000
9500
11000
12500
14000
15500
1990 1991 1992 1993 1994 1995 1996 1997 1998 1999 2000 2001 2002 2003 2004 2005
US
Do
llars
Male life expectancy, years
Russia
Belarus
Lithuania
56
58
60
62
64
66
68
70
1990 1991 1992 1993 1994 1995 1996 1997 1998 1999 2000 2001 2002 2003 2004 2005
LE
, yea
rs
Fig. 6 GDP per capita (PPP US$) and male life expectancy at birth in Belarus, Lithuania, and Russiaduring 1990–2005. Sources: TransMonee Database, Human Mortality Database. Note: the correlationbetween GDP per capita and male life expectancy is not statistically significant (r = 0.195, sig (2-tailed) = 0.184, N = 48)
9 Purchasing Power Parity. A rate of exchange that accounts for price differences across countries,
allowing international comparisons of real output and incomes. PPP US$1 has the same purchasing power
in the domestic economy as US$1 has in the United States (source: United Nation Development
Programme (UNDP) 2009).
Mortality in Belarus, Lithuania, and Russia 263
123
peer
-005
3548
4, v
ersi
on 1
- 11
Nov
201
0

Indeed, the same level of GDP per capita can result from many different
situations in terms of individual wealth and living standards. Individual health is
not linked to GDP directly, but to its distribution among individuals. Even in the
richest countries, some portion of the population is subject to relative deprivation
because of their low incomes and low social status. Income inequality measured
by the Gini coefficient10 at the population level may be an important indicator
for explaining health differentials between countries of similar GDP per capita
(Wagstaff and Van Doorslaer 2000). The changes which occurred in distribu-
tional patterns of income in Belarus, Lithuania, and Russia in recent decades are
shown in Fig. 7.
With the collapse of the USSR, disparities in income distribution increased
tremendously in all countries except Belarus, a country where market-oriented
reforms were very limited, and where one might expect income distribution to have
remained more equal. By contrast, the growth in income inequality in Russia during
1990–1995 was unprecedented. It indicates the extent of the socioeconomic
disparities experienced by the Russian population during the initial years after the
dissolution of the USSR, and mortality dynamics during this time seem to respond to
the abrupt social and economic differentiations. The degree of inequality in Russia
compared to other countries is remarkable. In 1995, the income of the richest 10% of
the population was more than 30 times higher than that of the poorest 10%! The
corresponding ratio was 10 in Lithuania and 5 in Belarus (WIID2 2009). Clearly, the
stable level of income inequality in Belarus may explain the specifics of mortality
dynamics in this country. However, it is equally clear that inequality in income
distribution alone does not provide the whole explanation, since Lithuania, the only
country of the three in which life expectancy is almost as high today as it was
15 years ago, is also a country in which the Gini coefficient has increased
Belarus
Lithuania Lithuania
BelarusBelarus
BelarusLithuania
Lithuania
Russia RussiaRussia
Russia
0.2
0.3
0.4
0.5
0.6
1990 1995 2000 2005
Fig. 7 Gini coefficient in Belarus, Lithuania, and Russia, 1990–2005 Source: WIID2 (2009)
10 Standard economic measure of income inequality, based on Lorenz Curve. A society that scores 0.0 on
the Gini scale has perfect equality in income distribution. The higher the number over 0, the higher the
inequality, and the score of 1.0 (or 100) indicates total inequality, in which only one person corners all the
income. Named after its inventor, the Italian statistician Corrado Gini (1884–1965). Also called Gini
coefficient or index of concentration (source: http://www.businessdictionary.com/definition/gini-index.
htm).
264 P. Grigoriev et al.
123
peer
-005
3548
4, v
ersi
on 1
- 11
Nov
201
0

considerably. In Fig. 7, Lithuania is midway between Belarus and Russia, so why is
life expectancy in Belarus between the levels of Russia and Lithuania?
Another aspect of national income distribution could be of interest here. Even if
it is not a guarantee of good health care performance, the proportion of GDP
devoted to the health care system can be an indicator more directly related to life
expectancy than GDP per capita, or even the Gini coefficient. In 1990, total health
expenditures in the three countries were at about the same level, and varied between
160 and 180 PPP US$ per capita. By 1995, per capita health expenditures had been
almost halved in Russia, while Belarus and Lithuania increased health spending
slightly. In 2000, the per capita health expenditures of Belarus and Lithuania were
again at about the same level, or 445 and 426 US$, respectively. Russia was far
behind, with 243 US$ per head (HFA-DB). Unlike Russia, both the authoritarian
regime in Belarus and the democratic one in Lithuania managed to avert
institutional collapse. Health expenditures may indicate the commitment of the
state to fulfilling its social obligations. In this respect, there is a huge difference
between Russia on one hand, and Belarus and Lithuania on the other. The difference
in the amount of investment in health care between Belarus and Russia might at
least partially explain the gap in life expectancy levels between these two countries.
However, once again, how can we explain the fact that Lithuania, but not Belarus,
achieved success in combating cardiovascular mortality, given basically the same
level of health expenditures in both the countries? It appears that it is not just the
amount of money that is invested in health that matters, but also other aspects, such
as the efficient use of resources, equity, accessibility, affordability, and quality of
care.
On these aspects, there is also considerable diversity between the countries.
Belarus has maintained the system of providing free basic care to the entire
population. This was achieved by introducing incremental reforms to the inherited
Semashko health care system. Despite some achievements (e.g., reduction of infant
and maternal mortality), the reforms have not been very successful in tackling non-
communicable diseases. More fundamental changes are required to improve the
quality and efficiency of services (Richardson et al. 2008).
Like in Belarus, the health care system of Lithuania remained relatively stable at
the time of severe economic crisis. In the initial stages, health care reforms were
implemented gradually, with the awareness that they should follow the structural
changes of the economic sector. Since 1997, the financing of health care in
Lithuania has progressively moved toward a stationary health insurance system
based on a combination of insurance contributions and tax revenues. The steady
economic growth accompanying Lithuanian socioeconomic development since
1995 created the conditions necessary for the implementation of this new system.
The health status of the population improved, as indicated by life expectancy at
birth, which, in 1998, exceeded its pre-reform level. However, for Lithuania to
develop a fully functional and efficient health care system, a number of issues
should be addressed. Among them are inequalities in regional allocations of
resources, growing private health care expenditures, and high fixed costs due to
large numbers of physicians and hospital beds (Health Care Systems in Transition:
Lithuania 2000).
Mortality in Belarus, Lithuania, and Russia 265
123
peer
-005
3548
4, v
ersi
on 1
- 11
Nov
201
0

The health care reforms in Russia were intended to preserve access to a basic
package of care for the whole population, but they failed to meet this goal. The
Russian health care system has been increasingly financed ‘‘out-of-pocket’’ and
‘‘under-the-table.’’ There are also growing disparities in economic developments
across regions of Russia, which further contribute to the inequity in service
provision. Russia experienced a dramatic downturn in health indicators associated
with the economic chaos of the early 1990s. Effective health care delivery was
interrupted. Today, the Russian health care system is still very much in transition.
Due to the incomplete implementation of health insurance legislation and the only
partial functioning of insurance companies, the health care system has not made the
anticipated efficiency gains (Tragakes and Lessof 2003).
Traditionally, some causes of death are more sensitive than others to the
efficiency of health policies. For example, during the final stage of the long fight
against infectious diseases, mortality by tuberculosis was quite a good indicator of
the performance of health care systems. The former USSR demonstrated great
efficiency in reducing the number of deaths from tuberculosis, and from many other
infectious diseases as well, until the mid-1960s. Thanks to this success, life
expectancy levels in all the European republics of the USSR had, at that time,
almost caught up with those of the Western world. By contrast, the severe social and
economic crisis of 1992–1993 resulted in a dramatic increase in tuberculosis
mortality in Russia and Lithuania (Fig. 8), reflecting the crisis in the former health
system.
Meanwhile, Belarus kept its tuberculosis mortality rate stable. However, over the
last 10 years, trends in tuberculosis mortality have been going up, not only in Russia
(after a short period of post-crisis recovery), but also in Belarus, while declining in
Lithuania. Belarus was unsuccessful in maintaining the performance of the health
care system inherited from the USSR, and began to experience the long-term
deterioration observed in countries like Russia (Mesle et al. 2000) or Ukraine
0
5
10
15
20
25
30
35
40
45
1990 1991 1992 1993 1994 1995 1996 1997 1998 1999 2000 2001 2002 2003 2004 2005
SD
R, p
er 1
00 0
00
Belarus Lithuania Russia
Fig. 8 Standardized male death rate from tuberculosis in Belarus, Lithuania, and Russia, 1990–2005 (per100 000). Source: HFA-DB (2009)
266 P. Grigoriev et al.
123
peer
-005
3548
4, v
ersi
on 1
- 11
Nov
201
0

(Mesle and Vallin 2003) since the mid-1960s. By contrast, once the shock of the
move to a market economy had passed, the new Lithuanian health system was
successful in further reducing tuberculosis mortality.
Considering the difficulties faced by countries like Russia and Belarus in simply
preserving the benefits inherited from the Soviet time in the area of infectious
disease control, it is not surprising to observe that their health care systems are
unable to tackle efficiently the much more difficult problem of cardiovascular
disease. To succeed in that field, it is not only necessary to invest more money in the
health care system but also to adopt new strategies, at both the collective and the
individual levels, which were not familiar to the old Soviet system partially
preserved in Belarus, and are not at all on the agenda of post-Soviet Russia. By
contrast, it seems that Lithuania was on the way to adopting these strategies in the
late 1990s, even if the 5 years that followed show that its success remains quite
fragile.
Linking mortality trends with ongoing socioeconomic changes is not a simple
task, and does not only depend on the availability of reliable data. The main
features of the Belarusian economic system have little in common with those
found in the neighboring countries. Clearly, in countries with a market economy,
the mechanisms whereby national income influences life expectancy via the
income of the poor and via public health expenditures differ from those in
countries with regulated economies. All these factors should be taken into
account when comparing countries and analyzing the relationship between
socioeconomic development and mortality. Furthermore, income, income inequal-
ity, and health expenditures are important mortality determinants, but they are
just a few variables among many others. While admitting the relevance of
economic variables, Sen (1998) emphasizes ‘‘their severe inadequacy in capturing
many of the causal influences on the quality of life and the survival chances of
people.’’
6 Conclusions and Discussion
Three main conclusions can be drawn from the divergence of mortality trends
among the countries, based on a comparison of age- and cause-specific mortality
and of some available socioeconomic indicators. The first conclusion is quite
clear: differences in the speed and the extent of the move to a market economy
resulted in quite different effects on mortality trends. Market reforms influence the
health and mortality of individuals through the unstable socioeconomic situation,
which produces stress and anxiety, and modifies people’s lifestyles. The
magnitude of negative changes differed greatly between the three countries here
studied. Russia experienced the sharpest mortality growth in the beginning of the
1990s, caused by painful market reforms that were not accompanied by the
creation of strong market institutions or by a commitment of the state to fulfill its
social obligations. Lithuania also experienced radical market reforms, but, unlike
Russia, avoided institutional collapse, and managed to maintain a relatively stable
Mortality in Belarus, Lithuania, and Russia 267
123
peer
-005
3548
4, v
ersi
on 1
- 11
Nov
201
0

health care system at a time of severe economic recession. As a result, mortality
growth in Lithuania in the early 1990s was less dramatic. By contrast, Belarus,
which followed the slowest transition path, suffered the lowest increase in
mortality. Nevertheless, the experience of the three former Soviet republics does
not necessarily imply that more radical liberalization is correlated with higher
mortality. The association between economic policy and health in the transition
countries is complex and rather country-specific. In some transition countries,
such as Poland and the Czech Republic, the implementation of rapid reforms was
not accompanied by growing mortality (Brainerd 1998). Stuckler et al. (2009)
attribute this fact to the impact of social capital, a mediating variable between
economic change and mortality. They argue that, with increasing social capital,
the effect of rapid privatization on adult male mortality decreases linearly.
Differences in initial economic conditions between countries can also predeter-
mine the success of market reforms, and, consequently, affect health. Popov
(2007) demonstrated that more than half of the differences in the economic
performance of transition countries can be explained by ‘‘uneven initial conditions
such as the level of development and pre-transition disproportions in industrial
structure and trade patterns.’’ In some cases, drastic economic measures can be
considered successful, even though at the initial stages they had a negative impact
on health. The case of Estonia shows that painful reforms can prove to be
justifiable in the long run. Like Russia and Lithuania, Estonia underwent quite
radical privatization, and experienced very sharp mortality growth during 1990–
1994. However, unlike other former Soviet republics, Estonia managed to recover
quickly, and achieved very impressive progress in life expectancy. In 2005, male
life expectancy in Estonia was 67.3 years, compared with 58.9 years in Russia,
62.8 years in Belarus, and 65.4 years in Lithuania. By contrast, in 1990, male life
expectancy in Estonia (64.7) was 1.6–1.7 years lower than in Lithuania and
Belarus, and just about 1 year higher than in Russia (Human Mortality Database).
Successful reforms of the health system implemented in the early 1990s are
viewed as the key factor in the recent steady increase in life expectancy in Estonia
(Koppel et al. 2008).
The second conclusion is that no socioeconomic determinant can fully explain
the divergence observed between the three countries after the immediate effects of
the 1992–1993 crisis. Apart from the period 1990–1994, the correlation between
GDP per capita and mortality is very weak. The degree of income inequality
measured by the Gini coefficient and the dynamics of total health expenditures
could partly explain the difference between Belarus and Russia, but they do not
explain the difference between Belarus and Lithuania. It seems that recent
diverging trends are more closely linked to the efficiency of health systems and
policies than to the amount of money invested in health. A careful examination of
mortality trends by particular causes of deaths, such as tuberculosis, can be very
useful in investigating the matter. Clearly, even though it is among the main
causes of death amenable to medical care (Nolte and McKee 2003), tuberculosis
alone cannot fully characterize the performance of the health care system. Other
causes of death known to be amenable to health care (e.g., diabetes mellitus,
intestinal infections, and epilepsy) should be taken into account. Estimating
268 P. Grigoriev et al.
123
peer
-005
3548
4, v
ersi
on 1
- 11
Nov
201
0

mortality attributable to the performance of health care for each country, and then
comparing the results, seems to constitute an appropriate approach for further
research in this direction. Furthermore, the differences in the performance of
health care systems alone may not fully explain the diverging mortality trends
between the three countries; other factors, such as different attitudes toward health
seeking, may also play a role (Balabanova et al. 2004).
Finally, the initial advantage enjoyed by Belarus thanks to its choice of a slow
and an incomplete transition to a market economy now appears to have turned
into a prolongation of the unfavorable long-term trends that began in the USSR in
the mid-1960s. Belarus does not seem to have overcome the health crisis which
began several decades ago, and which accelerated in the early 1990s. One of the
typical symptoms of the mortality crisis is the high proportion of violent causes of
death among males at working ages, and high cardiovascular mortality. Rapidly
rising mortality from accidental poisoning by alcohol is a particularly alarming
tendency, given the historical role of alcohol in influencing overall mortality.
Even though the policy of gradualism chosen by Belarusian authorities reduced
social pressure and slowed mortality growth in the early 1990s, it did not resolve
the root problem. Mortality grew more substantially and for longer periods than in
Russia and Lithuania. The recent mortality dynamics raise doubts about the future
sustainability of demographic development in Belarus. The situation may even
deteriorate; sooner or later, Belarus will have to undergo radical economic
reforms, which may bring negative demographic consequences. Unlike in Belarus
and Russia, the situation in Lithuania shows signs of recovery, particularly in the
dynamics of cardiovascular mortality. It was cardiovascular mortality which
differentiated the USSR from Western Europe starting in the mid-1960s. Even
though life expectancy in Lithuania has not increased in recent years, it is obvious
that this country is doing better than neighboring Belarus and Russia. Both these
countries, which had very different levels of excess mortality during the transition
period, currently appear to be following the unfavorable mortality trends observed
in the USSR since the 1960s.
Acknowledgments Research was conducted within the framework of the joint ANR-DFG project
‘‘European Divergence and Convergence in Causes of Death’’. The authors are very grateful to the editors
and two anonymous reviewers for their constructive comments and suggestions.
Appendix
Mortality in Belarus, Lithuania, and Russia 269
123
peer
-005
3548
4, v
ersi
on 1
- 11
Nov
201
0

Tab
le4
Pro
gre
ssin
tran
siti
on
inB
elar
us,
Lit
huan
ia,
and
Russ
ia,
1994–2005
Pri
vat
ese
cto
rsh
are
of
GD
Pin
%(r
ou
gh
EB
RD
esti
mat
e)
Ente
rpri
ses
Mar
ket
san
dtr
ade
Fin
anci
alin
stit
uti
ons
Aver
age
sco
reL
arg
e-sc
ale
pri
vat
izat
ion
Sm
all-
scal
e
pri
vat
izat
ion
Go
ver
nan
ce
and
rest
ruct
uri
ng
Pri
ce
liber
aliz
atio
n
Tra
de
and
fore
ign
exch
ange
syst
em
Com
pet
itio
n
po
licy
Ban
kin
gre
form
and
inte
rest
rate
liber
aliz
atio
n
Sec
uri
ties
mar
ket
s
and
no
n-b
ank
fin
anci
al
inst
itu
tio
ns
12
34
56
78
91
0a
19
94
BL
R1
52
22
21
…1
…1
.66
7
LT
U5
03
42
34
…2
…3
.00
0
RU
S5
03
32
33
…2
…2
.66
6
19
98
BL
R2
01
21
21
21
21
.50
0
LT
U7
03
43-
34
2?
32?
3.0
41
RU
S7
03?
42
3-
2?
2?
22-
2.5
41
20
01
BL
R2
01
21
22
21
21
.62
5
LT
U7
03?
4?
3-
34?
33
33
.33
3
RU
S7
03?
42?
33-
2?
2-
2-
2.6
25
20
03
BL
R2
51
2?
13-
2?
22-
21
.87
5
LT
U7
54-
4?
34?
4?
33
33
.58
3
RU
S7
03?
42?
43?
2?
23-
2.9
99
20
05
BL
R2
51
2?
13-
2?
22-
21
.87
5
LT
U7
54
4?
34?
4?
34-
33
.70
8
270 P. Grigoriev et al.
123
peer
-005
3548
4, v
ersi
on 1
- 11
Nov
201
0

Tab
le4
con
tin
ued
Pri
vat
ese
cto
rsh
are
of
GD
Pin
%(r
ou
gh
EB
RD
esti
mat
e)
Ente
rpri
ses
Mar
ket
san
dtr
ade
Fin
anci
alin
stit
uti
ons
Aver
age
sco
reL
arg
e-sc
ale
pri
vat
izat
ion
Sm
all-
scal
e
pri
vat
izat
ion
Go
ver
nan
ce
and
rest
ruct
uri
ng
Pri
ce
liber
aliz
atio
n
Tra
de
and
fore
ign
exch
ange
syst
em
Com
pet
itio
n
po
licy
Ban
kin
gre
form
and
inte
rest
rate
liber
aliz
atio
n
Sec
uri
ties
mar
ket
s
and
no
n-b
ank
fin
anci
al
inst
itu
tio
ns
RU
S6
53
42?
43?
2?
2?
3-
2.9
99
So
urc
es:
EB
RD
tran
siti
on
rep
ort
s(1
99
4,
19
98,
20
01,
20
03,
20
05)
EB
RD
use
sei
ght
indic
ato
rs(c
olu
mns
2–
9in
the
tab
le)
toas
sess
the
pro
gre
ssin
tran
siti
on
.P
rog
ress
ism
easu
red
agai
nst
the
stan
dar
ds
of
ind
ust
rial
ized
mar
ket
eco
no
mie
s,
reco
gn
izin
gth
atth
ere
isn
eith
era
per
fect
lyfu
nct
ion
ing
mar
ket
econ
om
yn
or
au
niq
ue
end
-poin
tin
tran
siti
on
.T
he
mea
sure
men
tsc
ale
ran
ges
from
1to
4?
,w
her
e1
repre
sen
tsli
ttle
or
no
chan
ge
from
rig
idly
pla
nn
edec
on
om
y,
and
4?
repre
sents
the
stan
dar
dof
anin
dust
rial
ized
mar
ket
econom
y.
To
furt
her
refi
ne
the
clas
sifi
cati
on
syst
em,
plu
ses
and
min
use
sar
ead
ded
toin
dic
ate
cou
ntr
ies
on
the
bo
rder
lin
eb
etw
een
two
cate
go
ries
.T
he
tran
siti
on
ind
exes
sho
uld
be
use
dw
ith
cau
tio
n.
Th
eyre
pre
sen
t
sub
ject
ive
rati
ng
sre
flec
tin
gth
eE
BR
D’s
asse
ssm
ent
of
bo
thth
eef
fect
iven
ess
and
exte
nsi
ven
ess
of
po
licy
mea
sure
s,w
hic
his
som
etim
esb
ased
on
inco
mple
teo
rim
per
fect
info
rmat
ion
(Mer
lev
ede
and
Sch
oo
rs2
00
4)
aO
wn
calc
ula
tio
ns
bas
edo
nth
eE
BR
Dm
eth
odo
log
y.T
he
aver
age
sco
rere
pre
sen
tsan
un
wei
gh
ted
aver
age
of
eig
ht
ind
icat
ors
;0
.33
po
ints
are
add
edo
rsu
btr
acte
dfo
r‘‘
?’’
and
‘‘-
’’ra
tin
gs
Mortality in Belarus, Lithuania, and Russia 271
123
peer
-005
3548
4, v
ersi
on 1
- 11
Nov
201
0

References
Anderson, B. A., & Silver, B. (1986). Infant mortality in the Soviet Union: Regional differences and
measurement issues. Population and Development Review, 12(4), 705–738.
Anderson, B. A., & Silver, B. (1990). Trends in mortality of the Soviet population. Soviet Economy, 3,
191–251.
Anderson, B. A., & Silver, B. (1997). Issues of data quality in assessing mortality trends and levels in the
New Independent States. In J. L. Bobadilla, C. Costello, & F. Mitchell (Eds.), Premature death inthe New Independent States (pp. 120–155). Washington, DC: National Academy Press.
Andreev, E. M. (1982). Method komponent v analize prodoljitelnosty zjizni [The method of components
in the analysis of length of life]. Vestnik Statistiki, 9, 42–47.
Balabanova, D., McKee, M., Pomerleau, J., Rose, R., & Haerpfer, C. (2004). Health service utilization in
the former Soviet Union: Evidence from eight countries. Health Services Research, 39, 1927–1949.
Bobak, M., Pikhart, H., Herzman, C., Rose, R., & Marmot, M. (1998). Socioeconomic factors, perceived
control and self-reported health in Russia: A cross-sectional survey. Social Science and Medicine,47, 269–279.
Bobak, M., Pikhart, H., Herzman, C., Rose, R., & Marmot, M. (2000). Socioeconomic factors, material
inequalities, and perceived control in self-rated health: Cross-sectional data from seven post-
communist countries. Social Science and Medicine, 51, 1343–1350.
Brainerd, E. (1998). Market reform and mortality in transition economies. World Development, 26, 2013–
2027.
Brainerd, E., & Cutler, D. M. (2005). Autopsy on an empire: Understanding mortality in Russia and the
Former Soviet Union. Journal of Economic Perspectives, 19, 107–130.
Chernobyl Forum. (2006). Chernobyl’s legacy: Health, environmental and socio-economic impacts and
recommendations to the governments of Belarus, the Russian Federation and Ukraine, Chernobyl
Forum, 2003–2005. Second revised version, IAEA, Vienna. http://www.iaea.org. Accessed on 26
October 2009.
Cockerham, W. C. (1997). The social determinants of the decline of life expectancy in Russia and Eastern
Europe: A lifestyle explanation. Journal of Health and Social Behavior, 38(2), 117–130.
Cockerham, W. C., Hinotea, B. P., & Abbott, P. (2006). Psychological distress, gender, and health
lifestyles in Belarus, Kazakhstan, Russia, and Ukraine. Social Science and Medicine, 63, 2381–
2394.
Cornia, G. A., & Paniccia, R. (2000). The transition mortality crisis: Evidence, interpretation, and policy
responses. In G. A. Cornia & R. Paniccia (Eds.), The mortality crisis in transitional economies (pp.
3–37). Oxford: Oxford University Press.
Eberstadt, N. (1981). The health crisis in the USSR. The New York Review of Book, 28(2).
EBRD. (1998). Transition report 1998: Financial sector in transition; economic transition in central andeastern Europe, the Baltic states and the CIS, VIII. London: European Bank for Reconstruction and
Development.
EBRD. (1999). Transition report 1999: Ten years of transition; economic transition in central andEastern Europe, the Baltic States and the CIS, VIII. London: European Bank for Reconstruction and
Development.
EBRD. (2001). Transition report: Energy in transition; economic transition in central and easternEurope, the Baltic States and the CIS, VIII. London: European Bank for Reconstruction and
Development.
EBRD. (2003). Transition report: Integration and regional cooperation, VIII. London: European Bank
for Reconstruction and Development.
EBRD. (2005). Transition report 2005: Business in transition, VIII. London: European Bank for
Reconstruction and Development.
European Bank for Reconstruction, Development (EBRD). (1994). Transition report 1994: Economictransition in Eastern Europe and the former Soviet Union, V. London: European Bank for
Reconstruction and Development.
Feshbach, M. (1984). Soviet health problems. Proceedings of the Academy of Political Science, 35(3),
81–97.
Gavrilova, N. S., Semyonova, V. G., Evdokushkina, G. N., & Gavrilov, L. A. (2000). The response of
violent mortality to economic crisis in Russia. Population Research and Policy Review, 19, 397–
419.
272 P. Grigoriev et al.
123
peer
-005
3548
4, v
ersi
on 1
- 11
Nov
201
0

Grigoriev, P. (2008). About mortality data for Belarus. Human Mortality Database: Background and
Documentation. University of California, Berkeley and Max Planck Institute for Demographic
Research. http://www.mortality.org. Accessed 30 September 2009.
Health Care Systems in Transition: Lithuania. (2000). The European observatory on health care systems.
Copenhagen: WHO Regional Office for Europe.
Human Mortality Database (HMD). www.mortality.org. Accessed April 2008.
Jasilionis, D., & Stankuniene, V. (2008). About mortality data for Lithuania. Human Mortality Database:
Background and Documentation. University of California, Berkeley and Max Planck Institute for
Demographic Research. http://www.mortality.org. Accessed 30 September 2009.
Koppel, A., Kahur, K., Habicht, T., Saar, P., Habicht, J., & van Ginneken, E. (2008). Estonia: Health
system review. Health Systems in Transition, 10(1), 1–230.
Leon, D. A., Saburova, L., Tomkins, S., Andreev, E., Kiryanov, N., McKee, M., et al. (2007). Hazardous
alcohol drinking and premature mortality in Russia: A population based case-control study. Lancet,369, 2001–2009.
Malyutina, S., Bobak, M., Kurilovitch, S., et al. (2002). Relation between heavy and binge drinking and
all-cause and cardiovascular mortality in Novosibirsk, Russia: A prospective cohort study. Lancet,360, 1448–1454.
Mathers, C. D., Ma Fat, D., Inoue, M., Rao, C., & Lopez, A. D. (2005). Counting the dead and what they
died from: An assessment of the global status of cause of death data. Bulletin of the World HealthOrganization, 83(3), 161–240.
McKee, M. (2006). Commentary: The health crisis in the USSR: Looking behind the facade.
International Journal of Epidemiology, 35, 1398–1399.
McKee, M., & Britton, A. (1998). The positive relationship between alcohol and heart disease in Eastern
Europe: Potential physiological mechanisms. Journal of the Royal Society of Medicine, 91, 402–
407.
Merlevede, B., & Schoors, K. (2004). Reform, FDI and economic growth: Tale of the tortoise and the
hare. William Davidson Institut, working paper, 730.
Mesle, F., Shkolnikov, V., & Vallin, J. (1992). Mortality by cause in the USSR population in the 1970–
1987: The reconstruction of time series. European Journal of Population, 8, 281–308.
Mesle, F., & Vallin, J. (1996). Reconstructing long term series of causes of death: The case of France.
Historical Methods, 29(2), 72–87.
Mesle, F., & Vallin, J. (2003). Mortalite et causes de deces en Ukraine au XXe siecle. Paris: INED (Les
Cahiers de l’INED).
Mesle, F., Vallin, J., Hertrich, V., Andreev, E. M., & Shkolnikov, V. M. (2003). Causes of death in
Russia: Assessing trends since the 1950s. In I. Kotowska & J. Jozwiak (Eds.), Population of Centraland Eastern Europe. Challenges and opportunities (pp. 389–414). Warsaw: Statistical Publishing
Establishment.
Mesle, F., Vallin, J., & Shkolnikov, V. (2000). Reversal of mortality decline: The case of contemporary
Russia. World Health Statistics Quarterly, 51, 191–206.
Murray, C. J., & Bobadilla, J. L. (1997). Epidemiological transitions in the formerly socialist economies:
Divergent patterns of mortality and 11 causes of death. In J. L. Bobadilla, C. Costello, & F. Mitchell
(Eds.), Premature death in the New Independent States (pp. 184–219). Washington, DC: National
Academy Press.
Nolte, E., & McKee, M. (2003). Measuring the health of nations: Analysis of mortality amenable to
health care. British Medical Journal, 327, 1129.
Omran, A. (1972). The epidemiologic transition: A theory of the epidemiology of population change.
Milbank Memorial Fund Quarterly, 49, 509–538.
Popov, V. (2007). Shock therapy versus gradualism reconsidered: Lessons from transition economies
after 15 years of reforms. Comparative Economic Studies, 49, 1–31.
Richardson, E., et al. (2008). Belarus: Health system review. Health Systems in Transition, 10(6), 1–118.
Sachs, J. (1996). The transition at mid decade. American Economic Review (AEA Papers andProceedings), 86(2), 128–133.
Sen, A. (1998). Mortality as an indicator of economic success or failure. The Economic Journal,108(446), 1–25.
Shapiro, J. (1995). The Russian mortality crisis and its causes. In A. Aslund (Ed.), Russian economicreform at risk (pp. 149–178). London: Pinter Publishers.
Shkolnikov, V. M., Cornia, G. A., Leon, D. A., & Mesle, F. (1998). Causes of the Russian mortality crisis:
Evidence and interpretations. World Development, 26(11), 1995–2011.
Mortality in Belarus, Lithuania, and Russia 273
123
peer
-005
3548
4, v
ersi
on 1
- 11
Nov
201
0

Shkolnikov, V., & Jdanov, D. (2006). About mortality data for Russia. Human Mortality Database:
Background and Documentation. University of California, Berkeley and Max Planck Institute for
Demographic Research. http://www.mortality.org. Accessed 30 September 2009.
Shkolnikov, V. M., & Nemtsov, A. V. (1997). The anti-alcohol campaign and variations in Russianmortality. In J. L. Bobadilla, C. Costello, & F. Mitchell (Eds.), Premature death in the NewIndependent States (pp. 239–261). Washington, DC: National Academy Press.
Stuckler, D., King, L., & McKee, M. (2009). Mass privatisation and the post-communist mortality crisis:
A cross-national analysis. Lancet, 373(9661), 399–407.
Tragakes, E., & Lessof, S. (2003). Health care systems in transition: Russian Federation. European
Observatory on Health Systems and Policies: Copenhagen.
TransMonee Database. Data on children in Central and Eastern Europe and the Commonwealth of
Independent States. http://www.unicef-irc.org/databases/transmonee. Accessed December 2007.
United Nation Development Programme (UNDP) (2009). Human Development Reports. http://www.
undp.org. Accessed March 2009.
Vischnevski, A. G. (2006). Population of Russia in 2003–2004. 11th and 12th annual demographic report(2006). Moscow: Nauka. (in Russian).
Wagstaff, A., & Van Doorslaer, E. (2000). Income inequality and health: What does the literature tell us?
Annual Review of Public Health, 21, 543–567.
World Bank. (2005). Belarus: Window of Opportunity to Enhance Competitiveness and Sustain
Economic Growth. Country Economic Memorandum for the Republic of Belarus. November 8,
2005. World Bank Report #32346-BY.
World Bank. (2008). Belarus Country Brief 2003. Retrieved April 2008, from http://www.worldbank.org/.
World Health Organization Regional Office for Europe. (2009). European Health for All Database (HFA-
DB). www.euro.who.int. Accessed March 2009.
World Income Inequality Database V 2c May 2008 (WIID2). http://www.wider.unu.edu. Accessed March
2009.
Zaridze, D., Brennan, P., Boreham, J., et al. (2009). Alcohol and cause-specific mortality in Russia: A
retrospective case–control study of 48 557 adult deaths. Lancet, 373, 2201–2214.
274 P. Grigoriev et al.
123
peer
-005
3548
4, v
ersi
on 1
- 11
Nov
201
0
Copyright © 2022 FDOKUMEN


![[tapuscrit original] Femme et langue. Sexe et langage (1982)](https://static.fdokumen.com/doc/165x107/6336af56e8daaa60da100428/tapuscrit-original-femme-et-langue-sexe-et-langage-1982.jpg)