KONA Powder and Particle Journal No. 37 (2020)
282
CODEN: KPPJAD ISSN 0288-4534 available online-www.kona.or.jp Powder and Particle Journal Powder and Particle Journal KONA Hosokawa Powder Technology Foundation No.37 (2020)
-
Upload
khangminh22 -
Category
Documents
-
view
1 -
download
0
Transcript of KONA Powder and Particle Journal No. 37 (2020)
Process Technologies for Tomorrow
CODEN: KPPJADISSN 0288-4534
available online-www.kona.or.jp
Powder and
Particle Journal
Powder and
Particle JournalKONA
Hosokawa Powder Technology Foundation
No.37 (2020)
No.37 (2020)
KO
NA
Po
wd
er and
Particle Jo
urn
al
A smarter way to optimise
your processplant’s capability
With Hosokawa GEN4’s flexible digital toolkit we convert live data from sensorsand controls to achieve measurable manufacturing improvements.
Hosokawa Micron Ltd - at the forefront of powder processing, containment anddigital technologies.
UNDERSTAND MONITOR CONTROLE. [email protected] www.hosokawa.co.uk
About this Journal
KONA Powder and Particle Journal is a refereed scientific journal that publishes articles in the field of powder and particle science and technology annually since 1983. This journal is distributed free of charge to the members of scien-tific communities and universities and research libraries throughout the world, by the Hosokawa Powder Technology Foundation (www.kona.or.jp/) established by Mr. Masuo Hosokawa in 1991.
The Chinese character “粉 ” in the cover is pronounced as “KONA” in Japanese, and means "Powder", which was hand-written by Mr. Eiichi Hosokawa, the founder of the Hosokawa Micron Corporation (www.hosokawamicron.co.jp/en/global.html).
Headquarters of Hosokawa Micron Corporation
Publication OfficeHosokawa Powder Technology Foundation (www.kona.or.jp)(in the headquarters building of Hosokawa Micron Corporation)1-9, Shodaitajika, Hirakata-shi, Osaka 573-1132, JapanE-mail: [email protected]
Printing Office: Nakanishi Printing Co., Ltd., Japan
Publication Date: 10 January 2020
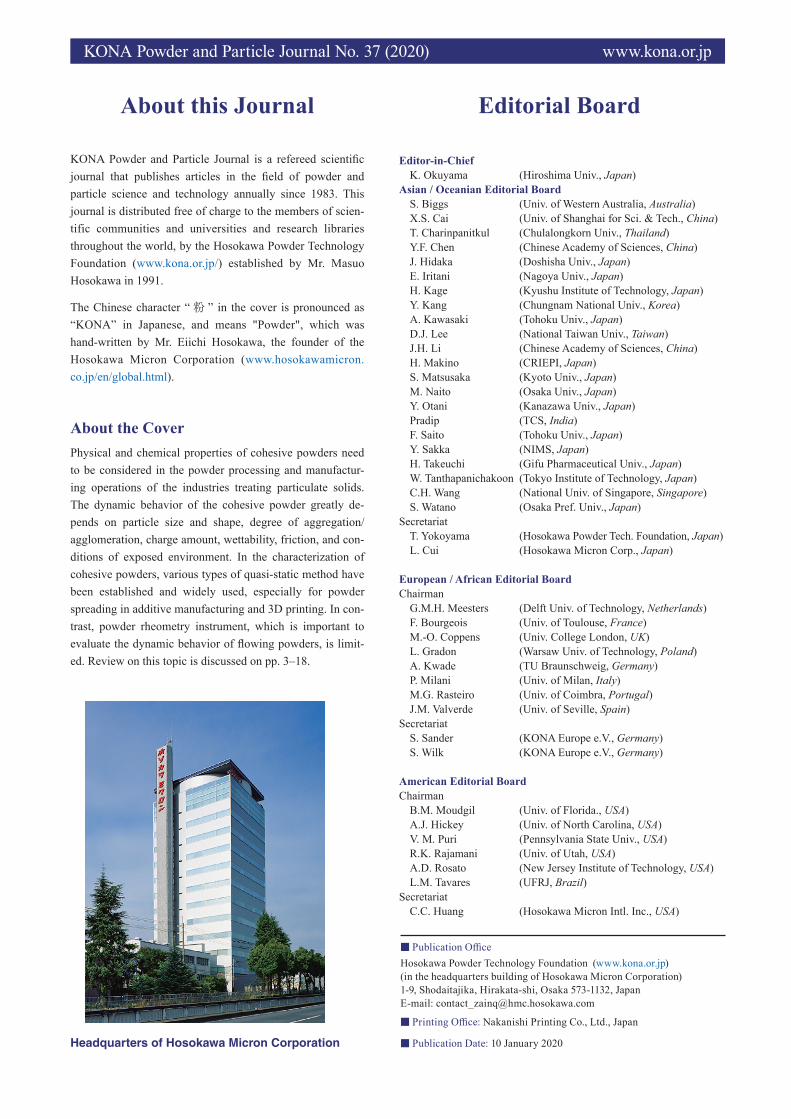
About the CoverPhysical and chemical properties of cohesive powders need to be considered in the powder processing and manufactur-ing operations of the industries treating particulate solids. The dynamic behavior of the cohesive powder greatly de-pends on particle size and shape, degree of aggregation/ agglomeration, charge amount, wettability, friction, and con-ditions of exposed environment. In the characterization of cohesive powders, various types of quasi-static method have been established and widely used, especially for powder spreading in additive manufacturing and 3D printing. In con-trast, powder rheometry instrument, which is important to evaluate the dynamic behavior of flowing powders, is limit-ed. Review on this topic is discussed on pp. 3–18.
Editorial Board
Editor-in-Chief K. Okuyama (Hiroshima Univ., Japan)
Asian / Oceanian Editorial BoardS. Biggs (Univ. of Western Australia, Australia)X.S. Cai (Univ. of Shanghai for Sci. & Tech., China)T. Charinpanitkul (Chulalongkorn Univ., Thailand)Y.F. Chen (Chinese Academy of Sciences, China)J. Hidaka (Doshisha Univ., Japan)E. Iritani (Nagoya Univ., Japan)H. Kage (Kyushu Institute of Technology, Japan)Y. Kang (Chungnam National Univ., Korea)A. Kawasaki (Tohoku Univ., Japan)D.J. Lee (National Taiwan Univ., Taiwan)J.H. Li (Chinese Academy of Sciences, China)H. Makino (CRIEPI, Japan)S. Matsusaka (Kyoto Univ., Japan)M. Naito (Osaka Univ., Japan)Y. Otani (Kanazawa Univ., Japan)Pradip (TCS, India)F. Saito (Tohoku Univ., Japan)Y. Sakka (NIMS, Japan)H. Takeuchi (Gifu Pharmaceutical Univ., Japan)W. Tanthapanichakoon (Tokyo Institute of Technology, Japan)C.H. Wang (National Univ. of Singapore, Singapore)S. Watano (Osaka Pref. Univ., Japan)
Secretariat T. Yokoyama (Hosokawa Powder Tech. Foundation, Japan)L. Cui (Hosokawa Micron Corp., Japan)
European / African Editorial BoardChairman
G.M.H. Meesters (Delft Univ. of Technology, Netherlands) F. Bourgeois (Univ. of Toulouse, France)M.-O. Coppens (Univ. College London, UK)L. Gradon (Warsaw Univ. of Technology, Poland)A. Kwade (TU Braunschweig, Germany)P. Milani (Univ. of Milan, Italy)M.G. Rasteiro (Univ. of Coimbra, Portugal)J.M. Valverde (Univ. of Seville, Spain)
SecretariatS. Sander (KONA Europe e.V., Germany)S. Wilk (KONA Europe e.V., Germany)
American Editorial BoardChairman
B.M. Moudgil (Univ. of Florida., USA)A.J. Hickey (Univ. of North Carolina, USA)V. M. Puri (Pennsylvania State Univ., USA)R.K. Rajamani (Univ. of Utah, USA)A.D. Rosato (New Jersey Institute of Technology, USA)L.M. Tavares (UFRJ, Brazil)
SecretariatC.C. Huang (Hosokawa Micron Intl. Inc., USA)
KONA Powder and Particle Journal No. 37 (2020) www.kona.or.jp
KONA Powder and Particle Journal No. 37 (2020) Contents
i
1 Editor's Preface
<Review Papers>
<Editorial>
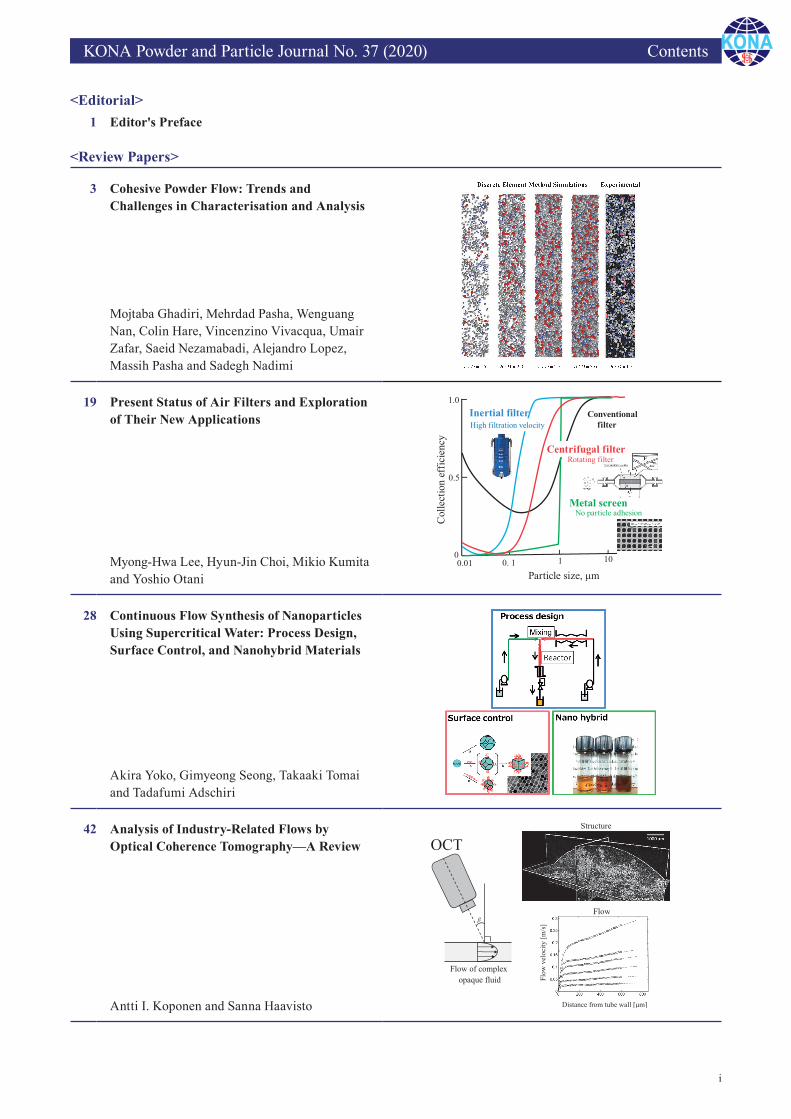
3 Cohesive Powder Flow: Trends and Challenges in Characterisation and Analysis
Mojtaba Ghadiri, Mehrdad Pasha, Wenguang Nan, Colin Hare, Vincenzino Vivacqua, Umair Zafar, Saeid Nezamabadi, Alejandro Lopez, Massih Pasha and Sadegh Nadimi
19 Present Status of Air Filters and Exploration of Their New Applications
Myong-Hwa Lee, Hyun-Jin Choi, Mikio Kumita and Yoshio Otani
28 Continuous Flow Synthesis of Nanoparticles Using Supercritical Water: Process Design, Surface Control, and Nanohybrid Materials
Akira Yoko, Gimyeong Seong, Takaaki Tomai and Tadafumi Adschiri
42 Analysis of Industry-Related Flows by Optical Coherence Tomography—A Review
Antti I. Koponen and Sanna Haavisto

KONA Powder and Particle Journal No. 37 (2020) Contents
ii
64 Microbial Aerosols: Sources, Properties, Health Effects, Exposure Assessment—A Review
Rafał L. Górny
85 Review of Encapsulated Salt Hydrate Core-Shell Phase Change Materials
Hui Wang, Yunfa Chen, Jianqiang Li, Lijiang Guo and Minghao Fang
97 Nanoparticle Technology for Respiratory Tract Mucosal Vaccine Delivery
Leah M. Johnson, Jeffrey B. Mecham, Frederick Quinn and Anthony J. Hickey
114 Fluidised Bed Reactors for the Thermochemical Conversion of Biomass and Waste
Stefano Iannello, Shane Morrin and Massimiliano Materazzi
KONA Powder and Particle Journal No. 37 (2020) Contents
iii
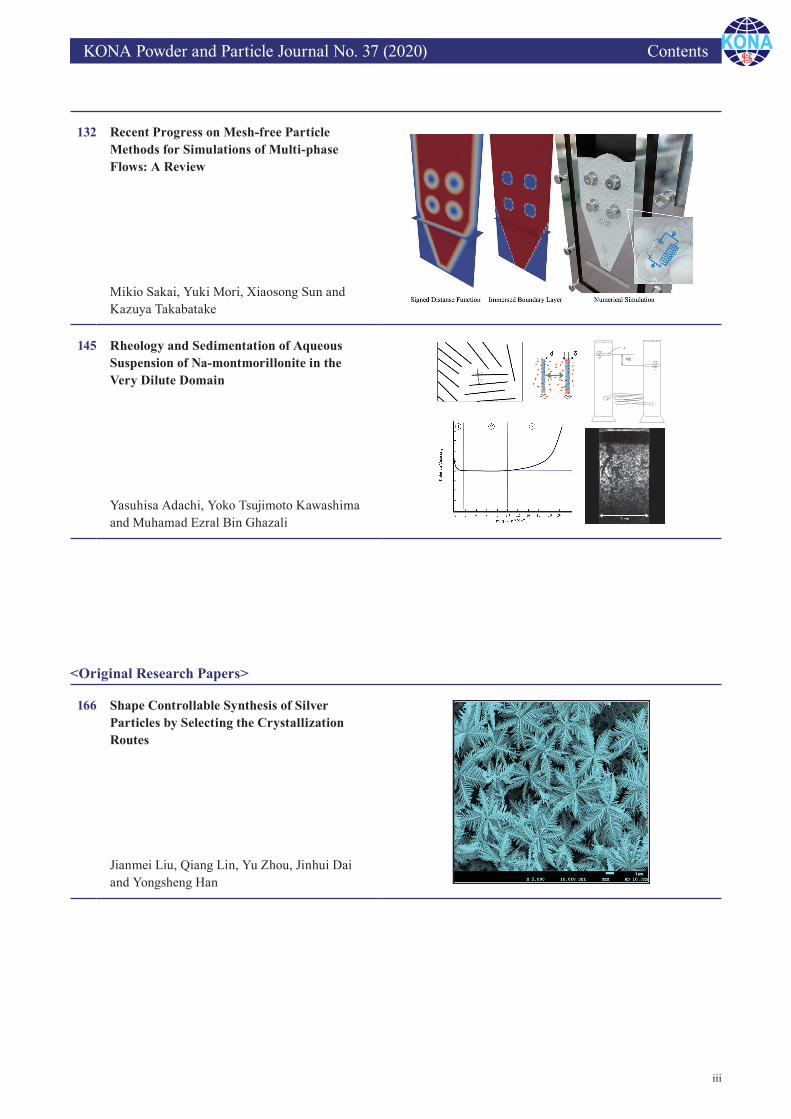
132 Recent Progress on Mesh-free Particle Methods for Simulations of Multi-phase Flows: A Review
Mikio Sakai, Yuki Mori, Xiaosong Sun and Kazuya Takabatake
166 Shape Controllable Synthesis of Silver Particles by Selecting the Crystallization Routes
Jianmei Liu, Qiang Lin, Yu Zhou, Jinhui Dai and Yongsheng Han
<Original Research Papers>
145 Rheology and Sedimentation of Aqueous Suspension of Na-montmorillonite in the Very Dilute Domain
Yasuhisa Adachi, Yoko Tsujimoto Kawashima and Muhamad Ezral Bin Ghazali
KONA Powder and Particle Journal No. 37 (2020) Contents
iv
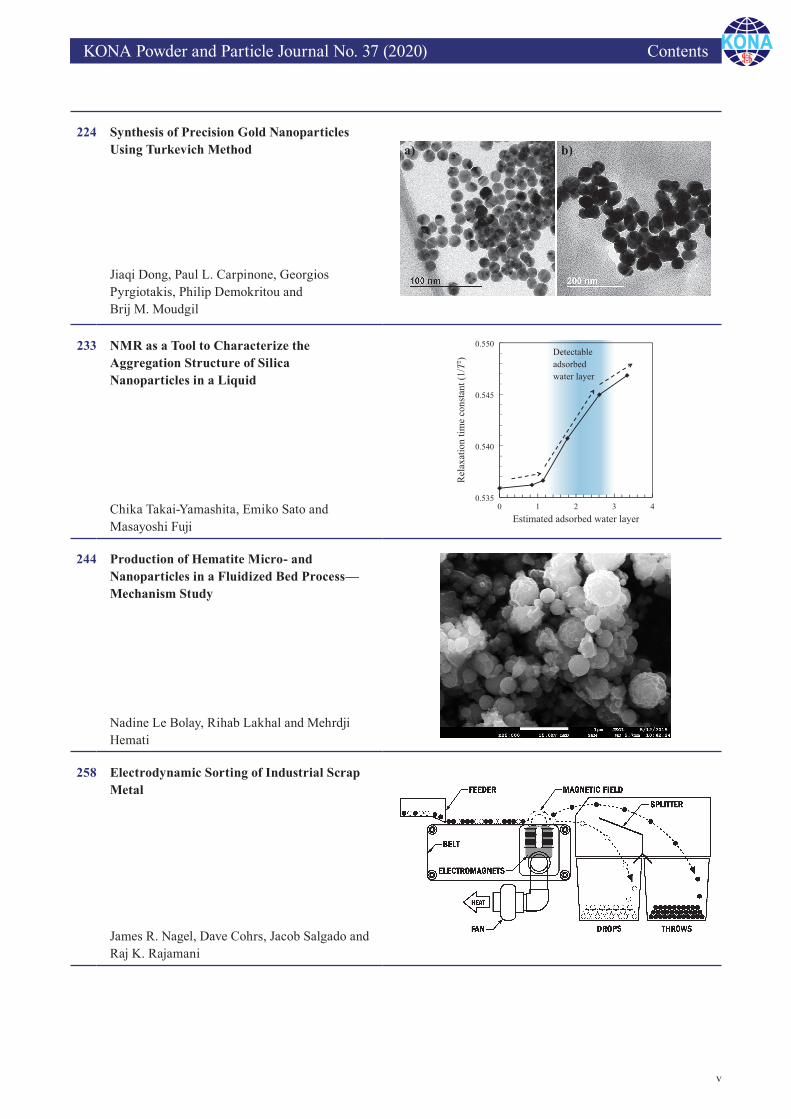
187 Development and Validation of a Simplified Laboratory Test to Design Vertical Stirred Mills
Maurício G. Bergerman and Homero Delboni Junior
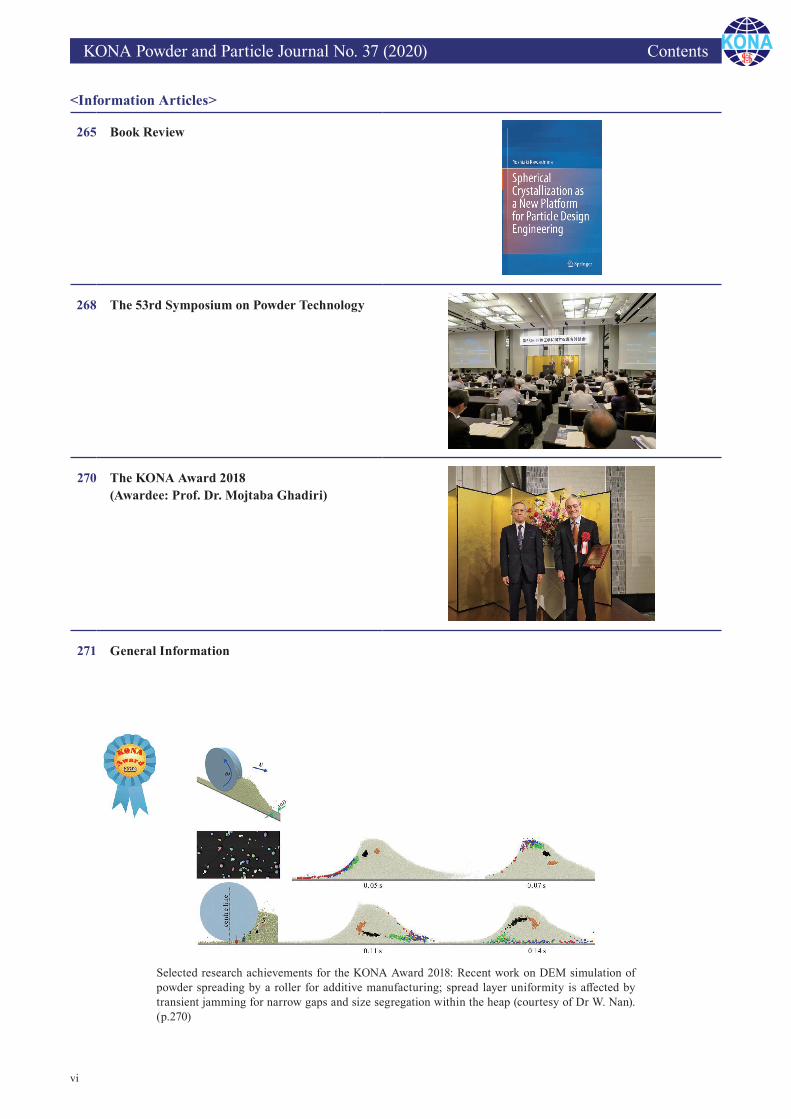
195 Integrating Particle Microstructure, Surface and Mechanical Characterization with Bulk Powder Processing
Rodolfo Pinal and M. Teresa Carvajal
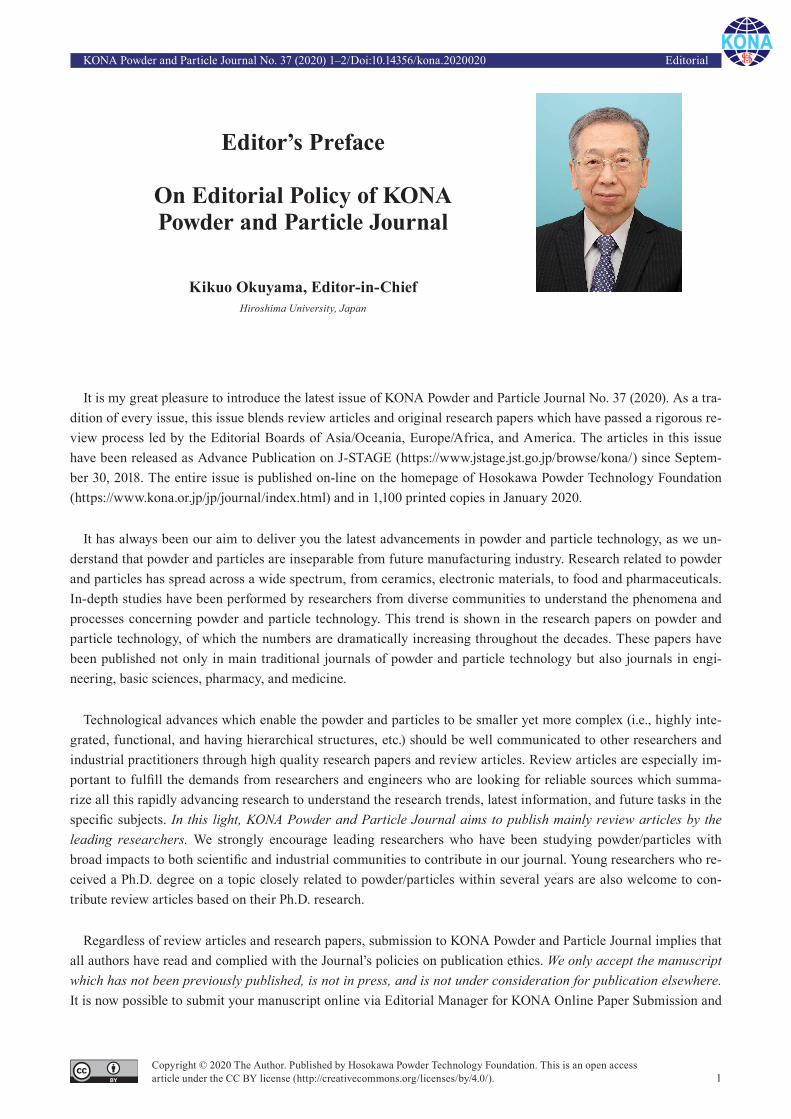
214 Preparation and Properties of Spherical Natural Rubber/Silica Composite Powders via Spray Drying
Siah Ying Tang, Prachaya Sopanon, Wiwut Tanthapanichakoon and Apinan Soottitantawat
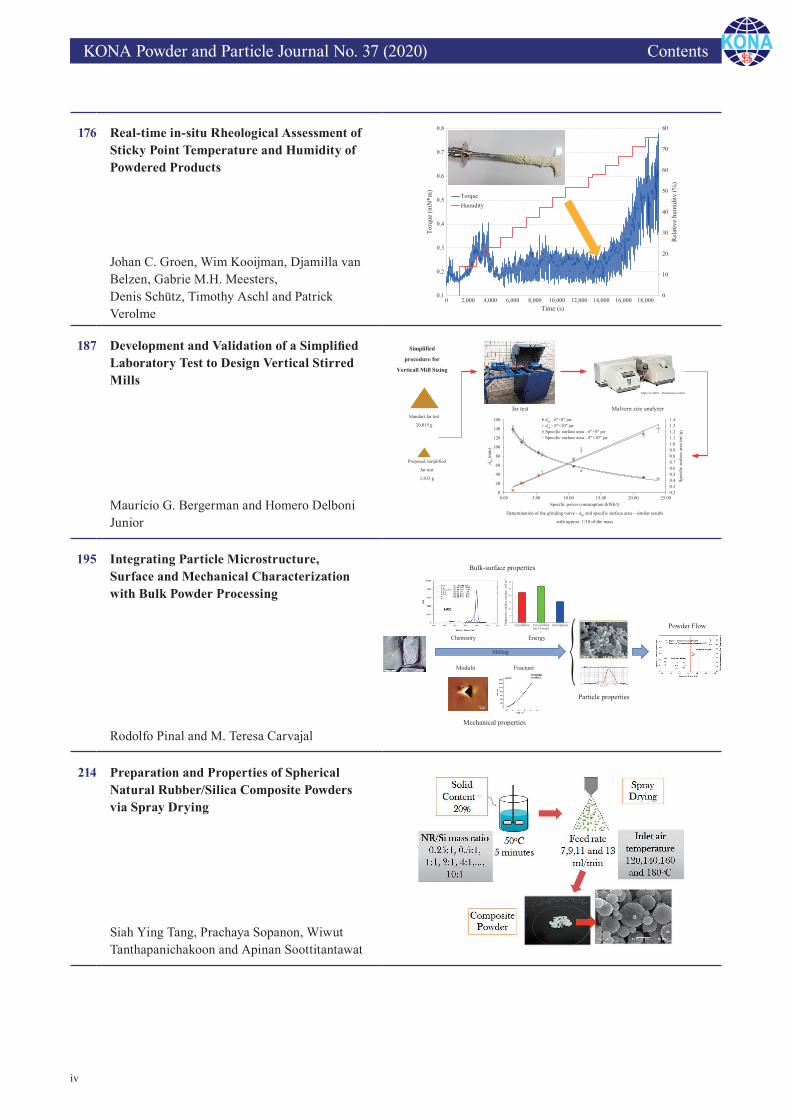
176 Real-time in-situ Rheological Assessment of Sticky Point Temperature and Humidity of Powdered Products
Johan C. Groen, Wim Kooijman, Djamilla van Belzen, Gabrie M.H. Meesters, Denis Schütz, Timothy Aschl and Patrick Verolme
KONA Powder and Particle Journal No. 37 (2020) Contents
v
224 Synthesis of Precision Gold Nanoparticles Using Turkevich Method
Jiaqi Dong, Paul L. Carpinone, Georgios Pyrgiotakis, Philip Demokritou and Brij M. Moudgil
233 NMR as a Tool to Characterize the Aggregation Structure of Silica Nanoparticles in a Liquid
Chika Takai-Yamashita, Emiko Sato and Masayoshi Fuji
244 Production of Hematite Micro- and Nanoparticles in a Fluidized Bed Process—Mechanism Study
Nadine Le Bolay, Rihab Lakhal and Mehrdji Hemati
258 Electrodynamic Sorting of Industrial Scrap Metal
James R. Nagel, Dave Cohrs, Jacob Salgado and Raj K. Rajamani
KONA Powder and Particle Journal No. 37 (2020) Contents
vi
<Information Articles>
265 Book Review
268 The 53rd Symposium on Powder Technology
270 The KONA Award 2018 (Awardee: Prof. Dr. Mojtaba Ghadiri)
271 General Information
Selected research achievements for the KONA Award 2018: Recent work on DEM simulation of powder spreading by a roller for additive manufacturing; spread layer uniformity is affected by transient jamming for narrow gaps and size segregation within the heap (courtesy of Dr W. Nan).(p.270)
KONA Powder and Particle Journal No. 37 (2020) 1–2/Doi:10.14356/kona.2020020 Editorial
Copyright © 2020 The Author. Published by Hosokawa Powder Technology Foundation. This is an open access article under the CC BY license (http://creativecommons.org/licenses/by/4.0/). 1
Editor’s Preface
On Editorial Policy of KONA Powder and Particle Journal
Kikuo Okuyama, Editor-in-ChiefHiroshima University, Japan
It is my great pleasure to introduce the latest issue of KONA Powder and Particle Journal No. 37 (2020). As a tra-dition of every issue, this issue blends review articles and original research papers which have passed a rigorous re-view process led by the Editorial Boards of Asia/Oceania, Europe/Africa, and America. The articles in this issue have been released as Advance Publication on J-STAGE (https://www.jstage.jst.go.jp/browse/kona/) since Septem-ber 30, 2018. The entire issue is published on-line on the homepage of Hosokawa Powder Technology Foundation (https://www.kona.or.jp/jp/journal/index.html) and in 1,100 printed copies in January 2020.
It has always been our aim to deliver you the latest advancements in powder and particle technology, as we un-derstand that powder and particles are inseparable from future manufacturing industry. Research related to powder and particles has spread across a wide spectrum, from ceramics, electronic materials, to food and pharmaceuticals. In-depth studies have been performed by researchers from diverse communities to understand the phenomena and processes concerning powder and particle technology. This trend is shown in the research papers on powder and particle technology, of which the numbers are dramatically increasing throughout the decades. These papers have been published not only in main traditional journals of powder and particle technology but also journals in engi-neering, basic sciences, pharmacy, and medicine.
Technological advances which enable the powder and particles to be smaller yet more complex (i.e., highly inte-grated, functional, and having hierarchical structures, etc.) should be well communicated to other researchers and industrial practitioners through high quality research papers and review articles. Review articles are especially im-portant to fulfill the demands from researchers and engineers who are looking for reliable sources which summa-rize all this rapidly advancing research to understand the research trends, latest information, and future tasks in the specific subjects. In this light, KONA Powder and Particle Journal aims to publish mainly review articles by the leading researchers. We strongly encourage leading researchers who have been studying powder/particles with broad impacts to both scientific and industrial communities to contribute in our journal. Young researchers who re-ceived a Ph.D. degree on a topic closely related to powder/particles within several years are also welcome to con-tribute review articles based on their Ph.D. research.
Regardless of review articles and research papers, submission to KONA Powder and Particle Journal implies that all authors have read and complied with the Journal’s policies on publication ethics. We only accept the manuscript which has not been previously published, is not in press, and is not under consideration for publication elsewhere. It is now possible to submit your manuscript online via Editorial Manager for KONA Online Paper Submission and
2
Paper Review System. For all further information, please go to the Journal’s homepage on http://www.kona.or.jp/journal/info.html. Publication in KONA Powder and Particle Journal is free of charge for the authors.
On May 1st 2019, the Japan’s Era name changed from Heisei to Reiwa, which means “beautiful harmony”. I hope the change of era inspires us, as researchers, industrial practitioners, and editorial board of KONA Powder and Par-ticle Journal, to strongly cooperate for the better advancements of powder and particle technology in a beautiful harmony.
Reviewer Appreciation
I express our gratitude to the reviewers for the publication of this KONA Powder and Particle Journal. Thanks to the generous contributions of the volunteer reviewers as well as the interest of researchers in our journal, the num-ber of submission to this journal is increasing after the registration on the major international journal platforms and its level is further improving. Because of the limited space of this annual journal, the number of papers published there is regrettably rather restricted. Therefore the papers of good quality need to be selected for the journal and further improved and refined by the reviewing.
The editorial team of KONA Journal would like to take this opportunity to gratefully acknowledge the reviewers here and deeply appreciate their valuable time and professional contributions to the KONA Journal. We apologize to any reviewer who may have inadvertently been omitted from this list. We are sincerely grateful to all who have been of any assistance to the publication of this journal.
FUJI, Masayoshi MEESTERS, Gabrie M.H. SAITO, Fumio GRADOŃ, Leon MUTTIL, Pavan SAKAI, Mikio HICKEY, Anthony MYOJO, Toshihiko TANAKA, Toshitsugu IIJIMA, Motoyuki NOMURA, Toshiyuki TAVARES, Luís Marcelo Marques IRITANI, Eiji OGATA, Koichiro TOKORO, Chiharu ISHIGAMI, Toru OGI, Takashi VALVERDE, José Manuel KANO, Junya PURI, Virendra YAMAMOTO, Tetsuya KUROSE, Ryoichi RAJAMANI, Raj YOKOYAMA, Toyokazu MATSUSAKA, Shuji RASTEIRO, Maria da Graça MATSUYAMA, Tatsushi REN, Jie
Kikuo OkuyamaEditor-in-ChiefProf. Emeritus, Hiroshima UniversityOctober, 2019
KONA Powder and Particle Journal No. 37 (2020) 3–18/Doi:10.14356/kona.2020018 Review Paper
3Copyright © 2020 The Authors. Published by Hosokawa Powder Technology Foundation. This is an open ac-cess article under the CC BY license (http://creativecommons.org/licenses/by/4.0/).
Cohesive Powder Flow: Trends and Challenges in Characterisation and Analysis †
Mojtaba Ghadiri 1*, Mehrdad Pasha 1, Wenguang Nan 2, Colin Hare 3, Vincenzino Vivacqua 1, Umair Zafar 1, Saeid Nezamabadi 4,5, Alejandro Lopez 6, Massih Pasha 1,7 and Sadegh Nadimi 8
1 School of Chemical and Process Engineering, University of Leeds, UK2 School of Mechanical and Power Engineering, Nanjing Tech University, China3 Department of Chemical and Process Engineering, University of Surrey, UK4 LMGC, Université de Montpellier, CNRS, France5 IATE, CIRAD, INRA, Montpellier SupAgro, Université de Montpellier, France6 University of Deusto, Spain7 The Chemours Company, Wilmington, Delaware, USA8 School of Engineering, Newcastle University, UK
AbstractPowder processing and manufacturing operations are rate processes for which the bottleneck is cohesive powder flow. Diversity of material properties, particulate form, and sensitivity to environmental conditions, such as humidity and tribo-electric charging, make its prediction very challenging. However, this is highly desirable particularly when addressing a powder material for which only a small quantity is available. Furthermore, in a number of applications powder flow testing at low stress levels is highly desirable.Characterisation of bulk powder failure for flow initiation (quasi-static) is well established. However, bulk flow parameters are all sensitive to strain rate with which the powder is sheared, but in contrast to quasi-static test methods, there is no shear cell for characterisation of the bulk parameters in the dynamic regime. There are only a handful of instruments available for powder rheometry, in which the bulk resistance to motion can be quantified as a function of the shear strain rate, but the challenge is relating the bulk behaviour to the physical and mechanical properties of constituting particles. A critique of the current state of the art in characterisation and analysis of cohesive powder flow is presented, addressing the effects of cohesion, strain rate, fluid medium drag and particle shape.
Keywords: cohesive powder, bulk flow, characterisation, flowability, spreadability, additive manufacturing
1. Introduction
Particulate solids are ubiquitous in many manufactur-ing industries, ranging from pharmaceuticals, foods, chemicals and minerals to additive manufacturing, which is the fastest growing sector in high value manufacturing and depends critically on powder spreading. Powder pro-
cessing and manufacturing operations are rate processes for which the bottleneck is cohesive powder flow. Diver-sity of material properties and sensitivity to environmen-tal conditions, such as humidity and tribo-electric charging, make the prediction of powder flow very chal-lenging. However, such prediction is highly desirable par-ticularly when addressing a powder material for which only a small quantity is available or when flow testing at low stress levels is required.
Characterisation of bulk powder failure for flow initia-tion (quasi-static) is well established, although empiricism is still the order of the day. There are in fact a large num-ber of commercial devices as well as some developed in-house, which can apply a compressive and shearing or a tensile load to a powder bed and provide information on bulk density, bulk cohesion, internal and wall angles of friction, unconfined yield stress and tensile failure stress, all of which can be obtained as functions of applied load and consolidation time. Examples of such instruments
† Received 28 August 2019; Accepted 24 September 2019 J-STAGE Advance published online 19 October 20191 Leeds LS2 9JT, United Kingdom2 Nanjing 211816, China3 Guildford, Surrey GU2 7XH, United Kingdom4 860 Rue de St - Priest, 34090 Montpellier, France5 2 place Pierre Viala, 34060 Montpellier, France6 Avenida de las Universidades 24, Bilbao, 48007, Spain7 1007 Market Street, Wilmington, Delaware, United States8 Merz Court, Newcastle upon Tyne NE1 7RU, United Kingdom* Corresponding author: Mojtaba Ghadiri; E-mail: [email protected] TEL: +44(0)113-343-2406 FAX: +44(0)113-343-2384
Mojtaba Ghadiri et al. / KONA Powder and Particle Journal No. 37 (2020) 3–18
4
include: Schulze Ring Shear Tester (Schulze, 1994), Brookfield Powder Flow Tester (Berry et al., 2014), Jenike and Peschel Powder Testers, as reviewed by Schwedes and Schulze (1990), Salerno Unconfined Compression Tester (Parrella et al., 2008), Edinburgh Powder Tester (Bell, 2007), Environmental Caking Tester (Calvert et al., 2013), Ball Indentation Method (Hassanpour and Ghadiri, 2007), SSSpin Tester of Material Flow Solutions Inc. (Johanson, 2019), the shear cell of FT4 Powder Rheometer (Freeman Technology), Sevilla Powder Tester (Castellanos et al., 2004), and the Calabria Raining Bed method (Girimonte et al., 2018). These testers all produce different quantitative values of the bulk parameters, as the powder response depends on the residual stress history and bulk structure. Cohesive powders readily form clusters, the size and packing density of which depend on the stress history (Li et al., 2018; Ku et al., 2015). Moreover, beyond the quasi- static regime the bulk flow parameters are all sensitive to shear strain rate (Tardos et al., 2003), but in contrast to quasi-static test methods, there is no shear cell that can characterise the bulk parameters at high strain rates, i.e. in the dynamic regime. There are only a handful of instruments available for powder rheometry, the most prominent ones being the FT4 Rheometer of Freeman Technology, the powder cell of Anton Paar Modular Com-pact Rheometer and a Couette device, as described later below. In these devices the bulk resistance to motion can be quantified as a function of speed of shearing (strain rate) and is reviewed here. However, a challenge remains to relate the bulk rheological characteristics, i.e. bulk fric-tion and viscosity, to the physical and mechanical proper-ties of constituting particles in order to predict the bulk flow behaviour.
For free flowing (cohesionless) granular materials, the dimensionless group inertial number, I, has been pro-posed to account for the dependence of bulk internal fric-tion coefficient, μb, and apparent shear viscosity of flowing powder, η, on the shear strain rate:
ppI d
P
(1)
where γ is shear strain rate (1/s), dp is particle size (m), ρp is particle density (kg/m3), and P is hydrostatic pressure (N/m2). It is noteworthy that the dimensionless shear strain rate, γ0, proposed by Tardos et al. (2003), is a spe-cial case of inertial number, where the pressure is approx-imated by the stress exerted by the weight of a single particle distributed over its projected area:
p0 dg
(2)
where g is gravitational acceleration (m/s2). For cohesion-less particles, Jop et al. (2006) propose the following form for the bulk internal friction coefficient:
2 1b 1
0 1P I / I
(3)
where τ is the shear stress, μ1 is the bulk friction coeffi-cient in the quasi-static regime, μ2 is the asymptotic value corresponding to large inertial numbers and I0 is a fitting constant. Chialvo et al. (2012) propose a similar func-tional form with slightly different constants in the above equation.
The apparent shear viscosity, η = τ/γ, generally follows a typical shear-thinning Non-Newtonian trend, but the in-fluence of particle shape, adhesive interactions and me-dium fluid drag has not yet been extensively analysed.
Rognon et al. (2008) modelled shear deformation of dense cohesive granular material by Discrete Element Method (DEM) using a simple cohesive force, which ap-proximates the DMT theory (Derjaguin et al., 1975), to-gether with a linear spring model for the normal force and Coulombic friction condition for the tangential direction. Various features of the macroscopic bulk behaviour such as bulk friction, microstructure, anisotropy and void frac-tion were analysed. More recently, Berger et al. (2015) propose an extension for cohesive powders by defining a cohesive inertial number:
c 1II
(4)
where β is the ratio of cohesive contact force over the normal stress and particle size, i.e. fc/(σndp) for a two- dimensional geometry, α is a coefficient accounting for the structure of the packing or the details of dissipation mechanisms during flow. Its equivalence for bulk powder materials is the modified Bond number, describing the ra-tio of the adhesive force over the particle weight, i.e. fc/mg. For a wide range of conditions, their simulation predic-tions for the dependence of bulk cohesion, following Cou-lomb’s law, are unified against the cohesive inertial number. Their analysis prescribes the dependence of bulk cohesion as well as bulk friction coefficient on the shear strain rate. A method and device are therefore required for validation of such simulation trends. As mentioned above, there is no shear cell which can characterise the bulk parameters in the dynamic regime. There are only three instruments available for powder rheometry: the Couette device (Tardos et al., 2003), the FT4 Powder Rhe-ometer of Freeman Technology (Freeman, 2007), as anal-ysed recently by a large number of workers, see e.g. Bharadwaj et al. (2010), Hare et al. (2015), Nan et al. (2017a-c), Wilkinson et al. (2017) and Vivacqua et al. (2019) and the powder cell of Anton Paar Modular Com-pact Rheometer, as recently analysed by Salehi et al. (2018). There are of course other instruments, such as GranuDrum of GranuTools (Lumay et al., 2012), Hall Flow Tester (ASTM B213-17) and Hosokawa Micron Powder Tester (ASTM D6393-08), with the latter integrating
Mojtaba Ghadiri et al. / KONA Powder and Particle Journal No. 37 (2020) 3–18
5
several test methods into one instrument, giving indirect measures of bulk behaviour under flowing conditions. Recently, Ogata (2019) has reviewed the latest works on the evaluation of flowability and floodability of powders with a focus on the experimental methods. In the work re-viewed here, we provide a complementary critique of cur-rent trends and challenges in the characterisation methods and instruments, and analysis of dynamics of cohesive powder flow with a focus on the rheological properties and methods for their characterisation. The effects of par-ticle size and shape, fluid drag, cohesion and strain rate are covered.
2. Instruments for powder rheometry
Powders exhibit extreme dynamic flow behaviour from highly frictional to almost inviscid, as influenced by par-ticle properties, the drag of the fluid medium and the strain rate. We first review the state of the art in measure-ment of the bulk rheological response of cohesive pow-ders, subjected to shear straining, followed by a critique of current understanding of the effects of particle proper-ties and process conditions. The dynamic flow testers may conveniently be classified into two categories: (i) those which address powder rheometry by measuring the pow-der resistance to shearing as a function of shearing speed by a rotating impeller or surface, and (ii) other dynamic flow testers in which the flow behaviour and characteris-tics are indirectly inferred. In the first category the Cou-ette device, powder cell of the Anton Paar Modular Compact Rheometer and FT4 Powder Rheometer of Free-man Technology are placed. The rotating drum and Ball Indentation Method (BIM) at high strain rates, are placed in the second category. We also include here a review of powder spreadability testing by a blade in view of its in-creasing importance in additive manufacturing and its re-lation with powder flowability.
2.1 Powder rheometers
2.1.1 Couette deviceThis is a simple device based on the design of a classic
liquid rheometer, consisting of two co-axial vertical cyl-inders in which powder is sheared in the annular gap be-tween the two cylinders by rotating the inner cylinder whilst keeping the outer cylinder stationary (Lun et al., 1984; Tardos et al., 1998). Such a device is common for rheological measurements of liquids, though was first re-ported for powders by Savage and Sayed (1984). It is nec-essary to ensure the powder is gripped at the wall to provide a no-slip boundary condition and therefore ensure that the entire bed is sheared, as such sandpaper is typi-cally glued to the cylinder walls (Tardos et al., 2003). The
normal stress is adjusted simply by varying the mass of powder above the sheared bed, referred to as the ‘overbur-den’. Sensors are placed at the outer wall that enable mea-surement of normal and shear stresses across the height of the sheared region.
A Couette device can be operated in ‘batch’ or ‘contin-uous’ mode; with a slow, downward axial flow of powder being introduced in the latter, with the removed powder being recirculated to the top, whilst no such axial flow is induced in the former. Batch mode (no axial flow) results in a near constant packing fraction regardless of the shear rate induced by the Couette (Vidyapati, 2012), and conse-quently leads to shear stress remaining constant across the range of shear rates (Langroudi et al., 2010). It should be noted that the reported work is for large, granular me-dia, and for fine, cohesive powder it could be expected that packing fraction would still vary with strain rate in batch mode. In continuous mode, at low shear rates the packing fraction is lower than that in the batch mode op-eration, and consequently so is the shear stress, however an increase in shear rate results in dilation and a subse-quent increase in shear stress as the flow approaches the collisional regime. Experimental work reported by Savage and Sayed (1984), Qin (2000), Klausner et al. (2000) and Tardos et al. (2003) show the dependency of the shear stress on the strain rate for a number of materials in the quasi-static, intermediate and dynamic regimes, where there is a general agreement that the shear stress increases with strain rate in the intermediate and dynamic regimes. Tardos et al. (2003) defined approximate boundaries of the dimensionless shear strain rate for the quasi-static to intermediate (γ0 = 0.15 to 0.25) and intermediate to rapid (γ0 = 3) granular flow regimes, based on the dimension-less strain rate given by Eq. (2). Vidyapati et al. (2012) carried out DEM simulations of this device and showed agreement with these boundaries, and indicated that the number of enduring contacts reduces with increasing strain rate, and increases with solid fraction and particle friction.
Langroudi et al. (2010) expressed the bed stress ratio using Eq. (5).
na b
(5)
where τ and σ are shear and normal stresses, respectively, and a, b and n are constants. This can be further gener-alised by substituting a = tan(ϕ), where ϕ is the internal angle of friction, thus at zero shear rate Eq. (5) reduces to the Coulomb yield condition with no cohesion.
The vertical force due to gravity compressing the pow-der is not constant throughout the bed; varying signifi-cantly with depth since the cylinders are tall (Tardos et al., 1998). Contradictory trends of vertical and radial stress variations throughout the bed height have been
Mojtaba Ghadiri et al. / KONA Powder and Particle Journal No. 37 (2020) 3–18
6
shown, with Tardos et al. (1998) finding the stress varied with ρgz, Tardos et al. (2003) finding stress scaling with 3tan(ϕ)ρgz, and Gutam et al. (2013) showing an exponen-tial growth of stress with z. Furthermore, Gutam et al. (2013) show that the direction of σrz switches at the onset of shearing, and that the stress variation across the pow-der bed is dependent on the gap width. It is suggested that this could be driven by a downward flow of particles near the outer wall, due to the anisotropic bed fabric; an obser-vation that shows that the strain field is not as simple as that intended by the Couette design. Anisotropy of the bed fabric has been shown for much simpler systems of static sand piles (Vanel et al., 1999) and during shear (Howell et al., 1999), and hence it is expected that this would indeed also be the case in the more complex Couette flow. Furthermore, Gutam et al. (2013) state that Couette is one of the few devices where gravity is perpen-dicular to the shear direction, which may have significant effects on the rheology, however this is also true of blade-driven powder rheometers that are discussed further be-low. Another drawback of the Couette device is the potential for wall slip at the rotating inner cylinder, and steps should be taken to mitigate it. This device also re-quires a large quantity of powder, so it is not suitable for instances where the powder quantity is scarce.
2.1.2 Powder cell of the Anton Paar modular compact rheometer
The Anton Paar powder rheometer measures the torque required by an impeller blade to rotate at a fixed height inside a powder bed. Different impeller shapes are avail-able (cylindrical, including one having grooved surfaces, blade, and a ring with radial fins) to investigate the resis-tance to shearing and influence of wall friction. The pow-der cell is a 50 mm diameter glass cylinder, having a porous base plate for aeration. The torque sensor can measure a wide range (10–8 to 0.3 Nm), making it possible to accurately measure the torque whilst the powder is flui-dised and sheared. In a standard test procedure the blade is placed at 10 mm above the bottom of the cell and can be rotated from a very slow speed of 0.001 to 500 rpm. The powder bed can also be conditioned prior to torque measurement to remove any residual vertical friction due to insertion of the impeller in the bed. Recently, Salehi et al. (2017), evaluated the Anton Paar powder cell for char-acterising flowability at low stresses using glass beads, sand and alumina powder. They reported that the mini-mum torque necessary to rotate an impeller in a powder bed depends on material properties, air flow rate, impeller depth and shape of the impeller. Furthermore, Salehi et al. (2018) compared torque measurements between different sizes of glass beads and different impeller geometries and used DEM to analyse the dynamic behaviour of the pow-der. Differences between the temporal profiles of torque
of different impeller shapes are reported which might be attributed to the differences in shearing surfaces and the formation of instantaneous high magnitude force chains. Moreover, as the flow response is measured at a fixed po-sition of the rotating component in the powder bed, the results may not be representative for the whole powder bed (e.g. due to a number of factors such as segregation, local aeration, slipping, etc.). On the other hand, the verti-cal stress is constant throughout the measurement, which is advantageous for analysis.
2.1.3 FT4 powder rheometer of Freeman TechnologyThis instrument (referred to as FT4 herein) measures
the mechanical work done by a twisted-shape impeller while penetrating into a powder bed at given rotational and downward translational speeds (Freeman, 2007). The expended work is taken as a measure of flowability under dynamic condition. Two types of test can be carried out: a downward test and an upward test. In the downward test the impeller rotates anticlockwise with its blade surface facing downward, thus compressing and shearing the powder bed. The work expended in this test has been termed ‘Basic Flow Energy (BFE)’. In the upward test, once the downward traverse is complete and the impeller is close to the bottom of the bed, the rotation direction is reversed (clockwise) and the impeller cuts and lifts the powder bed i.e. a dominant tensile and shearing action. The work associated with this action per unit mass of the material is known as ‘Specific Energy (SE)’.
Nowadays, FT4 is used extensively in industry to pro-vide a relative measure of the ease with which powder flows. For example, Fu et al. (2012) reported that FT4 could be used to identify the importance of the effect of particle size and shape of three grades of lactose particles. Li et al. (2018) attributed the torque fluctuation of highly cohesive powders to breakage of cohesive clusters. Wilkinson et al. (2017) carried out a parametric evalua-tion of flowability as indicated by FT4 through statistical and sensitivity analyses using DEM. A question which naturally emerges is how the work expended on both pen-etrating and withdrawing the impeller is influenced by particle properties, and whether it can actually reflect bulk rheological properties, such as bulk friction and shear viscosity. In recent years, a good number of at-tempts have been made to elucidate the correlation be-tween the expended work and the bulk mechanical and rheological features of cohesive powders. Using silanisa-tion to provide controlled bulk cohesion for otherwise free flowing glass ballotini, Hare et al. (2015) showed that the expended work can be simulated by Discrete Element Method (DEM). Several attempts have been made to link the measured flow energy from FT4 to processes that the powder experiences at high strain rates (Goh et al., 2018; Mellin et al., 2017). However, no direct correlation has
Mojtaba Ghadiri et al. / KONA Powder and Particle Journal No. 37 (2020) 3–18
7
been consistently found. In another study, Li et al. (2018) showed that cohesive powders exhibit cyclic torque in FT4, and as cohesion increases, the cycle time increases, whilst free-flowing powders act like liquids with no peri-odic response. It is noteworthy that powder flow in indus-trial operations is not necessarily actuated by a moving impeller, and therefore the influence of the presence of the impeller on the powder rheology cannot be ignored, due to the potential of slip on the impeller tip and containing walls, and the local aeration or jamming of particles in the impeller-wall clearance. Nevertheless, to use FT4 and Anton Paar instruments as powder rheometers, it is clearly necessary to analyse the mechanics of powder flow induced by the impeller and relate the expended work to the bulk powder rheological characteristics. For this pur-pose, Ghadiri and co-workers have carried out a system-atic study of the effects of cohesion, air drag and strain rate, and particle shape on bulk powder rheology by ana-lysing the stress and strain fields within FT4 using numer-ical simulations by a combined DEM-CFD approach (Nan et al., 2017a, b, c; Vivacqua et al., 2019). With current computer power and memory, it is too challenging to use fine cohesive powders with a complex shape in such sim-ulations. For this reason, each effect of cohesion, air drag, and particle shape has been analysed separately as a func-tion of strain rate using large particles for which experi-mental validation can be made. Salient features of the outcomes of their analysis are summarised in section 3 on the analysis of cohesive powder flow.
2.2 Other dynamic flow testers
2.2.1 Rotating drumOne of the most practical geometries used to study the
flow properties of powders, or more generally granular materials, is the rotating drum (e.g. GranuDrum of GranuTools and Revolution Powder Analyzer of Process-technik). It is a free surface flow test under dynamic ava-lanching condition, contrary to shear testers, where a powder bed is subjected to a compressive load and the re-sistance to shearing is measured (Nalluri and Kuentz, 2010; Lumay et al., 2012; Yang et al., 2016). The free dy-namic flow inside the rotating drum is similar to many in-dustrial processes such as mixers, granulators, and heap formation. The non-cohesive (or mildly cohesive) powder flow inside the rotating drum is commonly defined as a function of the Froude number Fr = RΩ2/g (where Ω is the rotational speed and R is the drum radius). It can take on one of a number of regimes such as slumping, rolling, cascading, cataracting and centrifuging. By measuring the flowing angle or speed, all of these regimes can be characterised (MiDi, 2004; Fischer et al., 2008; Morrison et al., 2016). For cohesive powders, determining these pa-rameters is difficult due to the irregular surface of the
flow and the lack of a continuous regime. In this context, some authors propose to measure the standard deviation of the fluctuations of the flow interface in order to charac-terise the cohesive powders (e.g. Alexander et al., 2006; Lumay et al., 2012, 2016). However, such dynamic tests are generally very challenging to interpret, as adhesive contacts cause clump formation, and adhesion and parti-cle friction have a coupled effect on flow. Although more relevant to free-flowing powders, rotating drums are very effective in causing segregation, adversely affecting the homogeneity of the powder and hence rheological re-sponse.
2.2.2 Ball indentation method (BIM) at high strain rates
This test method was initially developed for quasi-static testing of the flow resistance of a powder bed against the penetration of a spherical indenter, which promotes shear-ing of the bed without further compression (Hassanpour and Ghadiri, 2007). The flow resistance, expressed as hardness, can be related to unconfined yield strength by the constraint factor—a material dependent property—which can be established by carrying out measurements of hardness and unconfined yield strength under identical consolidation conditions. Zafar et al. (2017) have shown the constraint factor to be independent of consolidation stress for a given material. This technique has the advan-tages of being applicable at low consolidation stresses and requiring only a very small quantity of powder, whilst the disadvantage is measuring hardness rather than uncon-fined yield strength directly.
The BIM has recently been extended to the dynamic range by dropping a ball onto a powder bed and measur-ing its penetration depth (Zafar et al., 2019). The dynamic flow resistance expressed by the dynamic hardness of the powder bed surface, H, is determined by
212MVHU
(6)
where M is the mass of the indenter, V is the indenter ve-locity at impact and U is the volume of the crater formed by the indentation (Tirupataiah and Sundararajan, 1990). On the face of it, dynamic indentation appears to be a rel-atively quick and simple approach for assessing powder flowability under a wide range of strain rates. However, as well as the disadvantages listed above, this technique is also challenging to apply in practice and requires further development. Moreover, dependence of the constraint fac-tor on strain rate needs to be established if the powder yield stress, rather than the flow resistance, is desired.
Since the indenter is fired at the sample at a given ve-locity (or released from a given height), the depth to which it penetrates the powder bed is not directly controlled. It has been shown for quasi-static indentation that the
Mojtaba Ghadiri et al. / KONA Powder and Particle Journal No. 37 (2020) 3–18
8
hardness should be measured in a given acceptable range of the penetration depths (Pasha et al., 2013; Zafar et al., 2017). So iterative refinement of test conditions may be required in order to generate reliable flow measurement results at higher strain rates. If the quasi-static hardness is known a priori, then the penetration depth can be esti-mated for an indenter of given size, density and velocity, and hence a maximum velocity which enables reliable measurement can be determined. However, since the ex-pectation is that flow resistance will vary with strain rate, this approach can only provide an estimate of the upper operational range. Other practical considerations of the dynamic indentation test are the requirement to measure penetration depth (to determine the crater volume) and the indenter velocity. A high-speed camera can serve both functions. In order to explore a wider range of strain rates, a variety of indenters of differing material and size can be applied from a range of drop heights, as shown by Tirapelle et al. (2019)
2.2.3 Powder spreadability testers for additive manufacturing
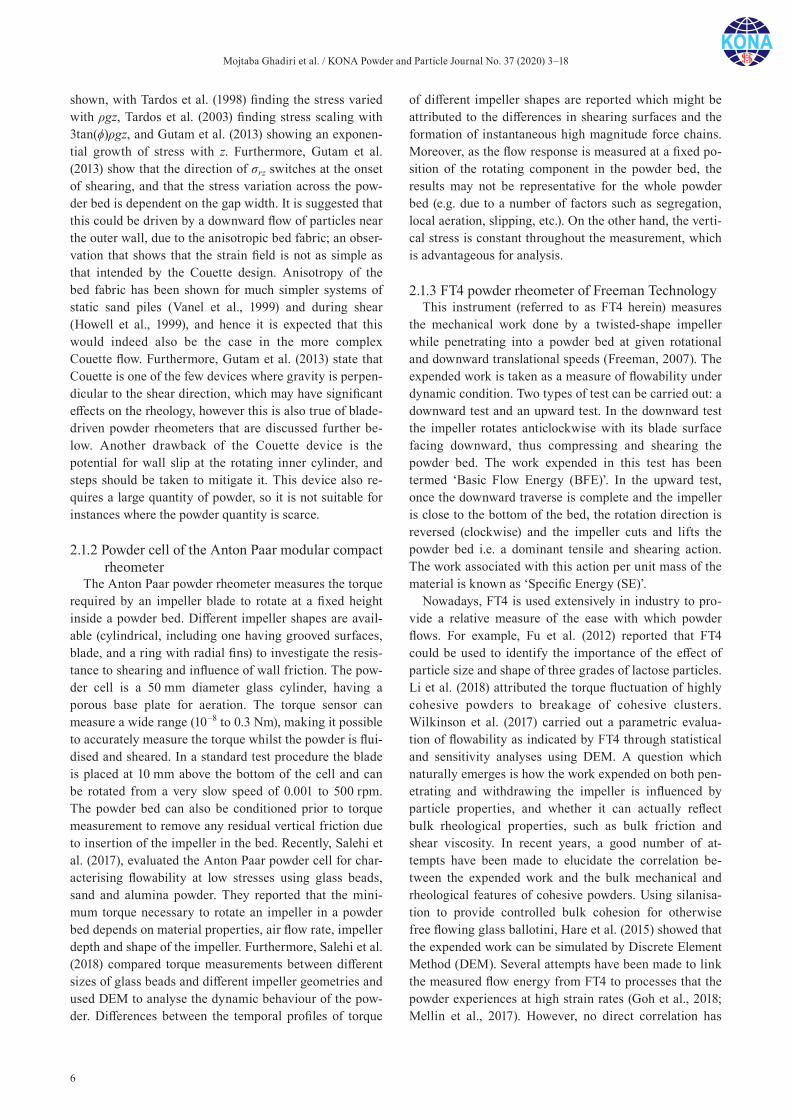
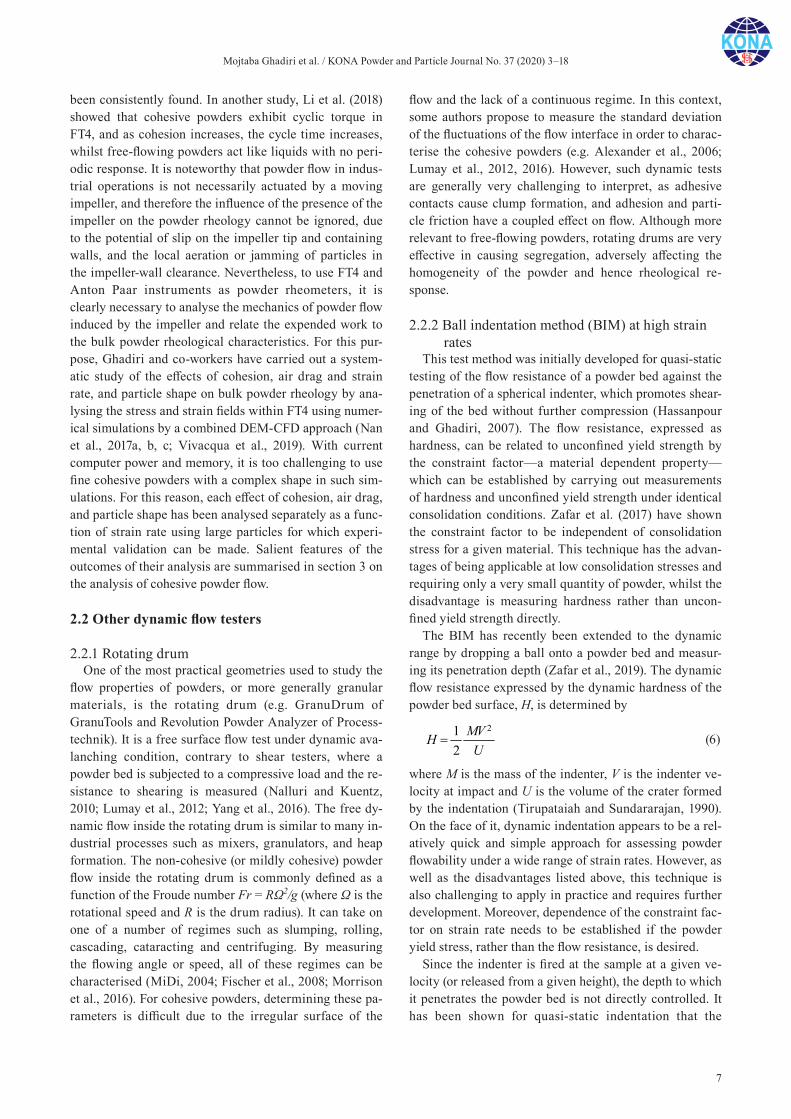
Characterisation of bulk cohesive powder flow has re-cently attracted increased attention for powder spreading in additive manufacturing (AM). However, there is no standard method for testing whether a given powder can produce the required spread uniformity for further pro-cessing. Across the community, every possible character-istic of bulk mechanical properties is being analysed in an attempt to characterise features of powder properties which give uniform spreading (e.g. Nguyen et al., 2017; Carrozza, 2017; Han et al., 2019). However, the recent work of Nan et al. (2018) shows that uniform spreading is affected by transient jamming and arching. Therefore, spreadability and flowability are two different measures of powder bulk flow characteristics, albeit inter-related. The former refers to flow of powders in narrow gaps, whilst flowability is more a measure of bulk behaviour, i.e. not having boundary constraint. Nan et al. (2018) characterised the physical and mechanical properties of gas-atomised stainless steel powders for DEM simulation of powder spreading. They show that for spreading gaps typically used in metal AM applications, empty patches/spaces could be found within the spread particle layer, as shown in Fig. 1, which adversely affects the uniformity of the spread powder layer. They find that the characteristic particle size, D, for which 90 % particles by number have a diameter less than D, best describes the transient jam-ming condition. By using Eq. (7) for diagnosing the empty patches, the transient jamming is found to have a frequency in the range 10–100 Hz, as shown in Fig. 2. In Eq. (7), ΣVp is the total volume of spread particles and the denominator is the volume swept by the spreader blade. A gap size, δ, that is less than about 3D causes transient
Fig. 1 Discrete Element Method simulation and experimental validation of spreading of gas-atomised metal powders by a blade, showing empty patches and size segrega-tion in the spread layer as a function of spreader gap height. Narrow gaps cause transient jamming, as evi-dent by empty patches. The frequency of formation and size of empty patches can also be inferred, as shown in Fig. 2. The particles are coloured based on their pro-jected area equivalent circle diameter, blue (15–25 μm), dark grey (25–35 μm), light grey (35–45 μm), and red (45–55 μm). The number density of the largest particles (shown in red) is the lowest for the smallest gap, as predicted by Nan et al. (2018). The simulation results are for four gap heights and the experimental one is a scanning electron micrograph for the smallest gap, courtesy of Mr M.T. Hussein. Gap heights are nor-malised with respect to the characteristic particle size below which 90 % of particles by number lie (D90).
Fig. 2 Frequency of empty patches for each patch length as a function of gap height (Nan et al. (2018), https://doi.org/10.1016/j.powtec.2018.07.030. Copyright: (2018) Elsevier B.V. under https://creativecommons.org/ licenses/by/4.0/.
Mojtaba Ghadiri et al. / KONA Powder and Particle Journal No. 37 (2020) 3–18
9
jamming, leading to empty patches.
p
c0.1
( )V
x y
(7)
Nan and Ghadiri (2019) identify a critical spreading speed above which the mass flow rate of powder through the gap is independent on the blade spreading speed. Haeri (2017) identified the optimum blade tip shape to produce a spread particle layer with volume fraction and surface roughness comparable to a roller at the actual op-eration conditions. Geer et al. (2018) and Han et al. (2019) measured the repose angle and pile bulk density of metal powders, and then used DEM simulations to calibrate and characterise the sliding and rolling friction coefficient and surface energy of the powder to be used in their simula-tions of the spreading process. Desai et al. (2019) also de-veloped a DEM calibration method based on angle of repose testing and powder rheometry for AM, which was designed around multiple characterization experiments applicable to the spreading step. However, particle adhe-sion and sliding friction influence the repose angle in a complex way, which is not yet fully understood and hence calibration methods should be treated with caution. More work is needed to identify and characterise factors which influence spreadability of powders in AM and develop appropriate instrument for its characterisation.
3. Analysis of cohesive powder flow
3.1 Effect of cohesion
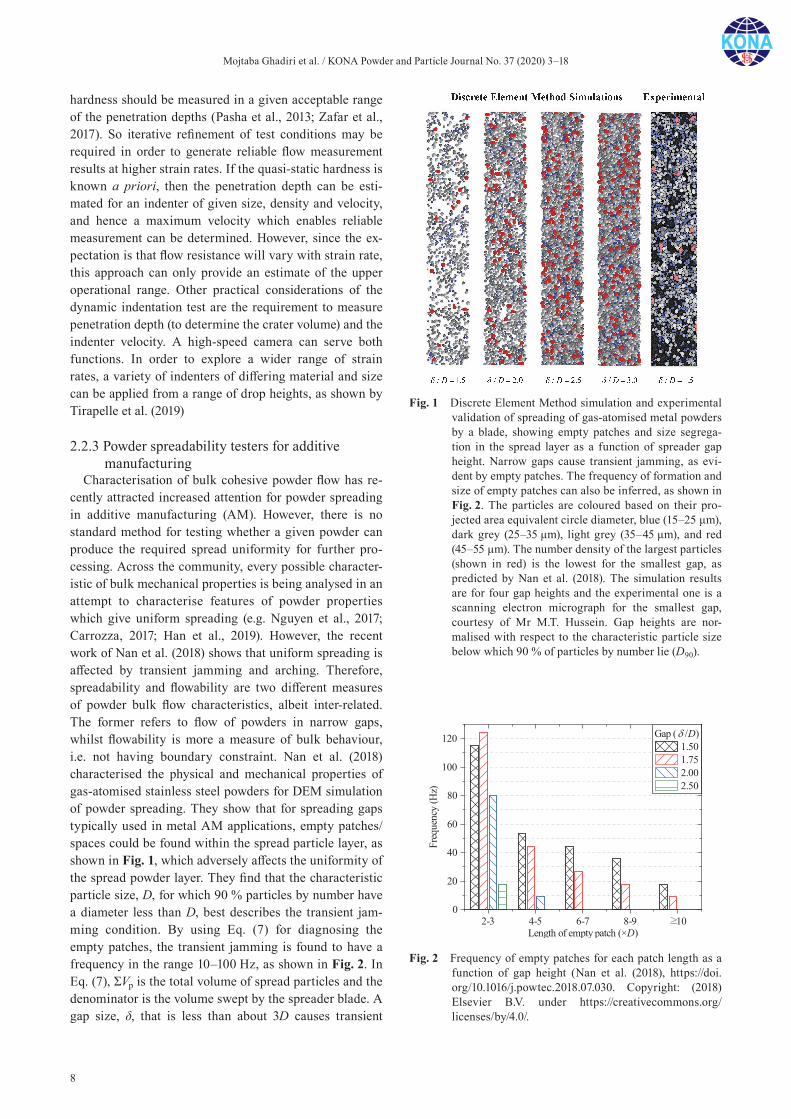
The relative cohesivity of a powder is most commonly described by the granular bond number, Bo, the ratio of the attractive force (adhesive or cohesive) over particle weight (Castellanos, 2005). Cohesion is commonly due to van der Waals, liquid bridge and/or electrostatic forces. There are extensive analyses of bulk cohesion reported in the literature, but its influence on the dynamic flow be-haviour has not been as widely investigated. Recently, Hare et al. (2015) made large spherical glass beads (1.7–2.1 mm) cohesive by silanising their surfaces and mea-sured their surface energy by the Drop Test Method (Zafar et al., 2014). They measured the work (basic flow energy) required to penetrate the rotating impeller into the cohe-sive powder bed, and showed that this could also be quan-titatively predicted by DEM using the elasto-plastic adhesive model of Pasha et al. (2014). Bulk cohesion sim-ply lifts up the baseline of powder resistance to bulk mo-tion and the functional dependence on the shear strain rate has the same trend, as recently analysed by Vivacqua et al. (2019). They simulated the FT4 test using DEM for both cohesive (two levels) and cohesionless contacts, us-ing Luding’s contact model (Luding, 2008) and calculated
the shear stress on the impeller blade as a function of the impeller tip speed, as shown in Fig. 3. Clearly, at low speeds the lines are parallel with the intercept with ordi-nate being a function of cohesion, and interestingly at high speeds interparticle cohesion has little influence on the shear stress acting on the impeller blades.
The above experimental observations are consistent with the recent numerical analysis of Berger et al. (2015), who used contact dynamics simulations to investigate co-hesive shear flows at a wide range of strain rates. Their simulation predictions for the dependence of bulk cohe-sion, following Coulomb’s law, on the shear strain rate shows a logarithmic decrease for a wide range of condi-tions. This effect was attributed to the reduction in the co-ordination number with increasing shear strain rate, expressed in terms of inertial number.
3.2 Effect of shear strain rate and medium fluid drag
As the particles become finer, the effect of air drag be-comes more pronounced at large shear strain rates. So, this has to be taken into account in the analysis of fine co-hesive powder dynamics. Guo et al. (2011a, 2011b) pro-pose a dimensionless number made of the product of the Archimedes number and the ratio of particle envelop den-sity over the fluid density (i.e. an air sensitivity index) to account for the influence of air drag in die filling. They define a critical value of this group below which the fluid drag effect is notable. However, this approach is more rel-evant to lean particle-fluid systems. Nan et al. (2017a, 2017b) used large particles (for faster simulation) with air
Fig. 3 DEM prediction of shear stress on the impeller blade of the FT4 rheometer as a function of impeller blade tip speed for glass beads for three adhesive indices accord-ing to the contact model of Luding (2008). Simulation data are from Vivacqua et al. (2019): https://doi.org/10.1016/j.powtec.2018.10.034. Copyright: (2019) Elsevier B.V. under https://creativecommons.org/licenses/by/4.0/.
Mojtaba Ghadiri et al. / KONA Powder and Particle Journal No. 37 (2020) 3–18
10
permeation from the base of the FT4 rheometer to provide notable drag. In this way the effect of air drag and strain rate could be analysed in reasonable time for glass beads of 0.3–0.35 mm and polyethylene spheres of 0.5–0.6 mm for permeating gas velocities ranging from no gas flow to near fluidisation. The expended work for penetrating the rotating impeller into the bed and gas pressure drop could be both measured and predicted, thus providing further validation of the simulations. In the absence of air, the ex-pended work increases with the speed of the impeller, as intuitively expected. An interesting outcome of their anal-ysis is that the expended work scales with the potential energy of the bed above the impeller height, except for the top 10 mm, where the entrance effect of the blade is very strong.
Nan et al. (2017a, 2017b) also analysed the stress and strain fields in cells in front of the blade of FT4 rheometer. Their work reveals the sensitivity of powder rheology to both the strain rate and gas velocity. Their simulation re-sults show that the normalised expended work (with re-spect to the potential energy of the bed mass above the mid-position of the impeller blade) for all conditions in-cluding permeating air is actually a linear function of the prevailing normalised shear stress, with the latter in turn being a function of the strain rate and the prevailing pres-sure, as the latter changes with height. The most notable outcome of their analysis is the prediction of the bulk friction coefficient as a function of the inertial Number. The effect of permeating air simply modifies the prevail-ing pressure on the particles, whereby increasing the per-meating air speed reduces the pressure and therefore increases the inertial number. By introducing the perme-ating air, the powder flow, which is initially in the quasi- static state, could transform into the intermediate or even dynamic state, where the bulk friction coefficient is shown to increase almost linearly with the inertial num-ber.
Bruni et al. (2007, 2005) and Tomasetta et al. (2012) used a mechanically stirred fluid-bed rheometer to study the rheology of aerated and fluidised powders, which was followed by Salehi et al. (2017, 2018). To keep the bed in quasi-static state, the rotational speed of the impeller and gas superficial velocity were chosen to have low values. Based on the method of differential slices (Janssen’s ap-proach) and the Mohr-Coulomb description of the powder failure, they developed a model to describe the applied torque. In their model, the effect of air drag on the powder stress was considered by subtracting the pressure gradient force from the gravity force. The most interesting out-come of their work is that the applied torque of the impel-ler could be linked to the stress state of the powder. However, as the powder bed was in quasi-static state, their analyses did not reveal the response of powder rhe-ology to the variation of the strain rate or flow regimes. In
conclusion, the dynamic behaviour of fine cohesive pow-der affected by the fluid medium drag is still a very chal-lenging task to analyse, but based on the above observations, the trend shown in Fig. 3 for large cohesive particle should also prevail for fine powders, subject to taking account of fluid drag effects.
3.3 Effect of particle shape
Granular flow is highly affected by particle shape due to interlocking of the particles. High fidelity simulation of particle shape provides a complexity which is ill-afforded by the DEM approach, from the viewpoint of contact me-chanics. Therefore, approximating to simple shapes is the order of the day. There are a good number of approaches for consideration of shape of particles in DEM simula-tions: clumped spheres, (Favier et al., 1999), elliptical (Rothenburg and Bathurst, 1991), polygonal (Cundall, 1988), bonded assemblies of polygons (Potapov and Campbell, 1996), spherosimplices (Pournin et al., 2005), super-quadrics (Williams and Pentland, 1992), and digi-talisation of particles of arbitrary shapes by voxel packing (Jia and Williams, 2001). For particles with a rounded shape, the clumped sphere approach of Favier et al. (1999) is commonly used. For example, Hare et al. (2013) used this approach to show that the stress ratio in a shear box is greater for rods than for spheres, though decreases as as-pect ratio is increased from 1.25–2, remaining constant beyond this due to alignment of the particles. Pasha et al. (2016) simulated mixing of corn kernels by this method, showing that an adequate description of the effect of par-ticle shape on particle velocity profile in a mixer could be achieved. Alizadeh et al. (2017) used X-Ray tomograms of spray dried particles to construct clumped spheres and obtained reliable prediction of the repose angle and segre-gation of binary mixtures. Nan et al. (2017c) simulated the rheological behaviour of rod-like particles in the FT4 rhe-ometer, using the clumped-sphere approach. They re-ported the flow energy required for the FT4 impeller penetrating the powder bed is much larger for rod-like particles than for spheres. This was attributed to the com-bined effect of the coordination number and excluded vol-ume. They also proposed an empirical correlation for the binary mixture of rodlike particles with aspect ratio AR = lmax/lmin – 1 (i.e. AR = 1.5 and 3.0) and spherical par-ticles (i.e. AR = 0.0). The flow energy was larger for non-spherical particles than that of spherical particles, due to interlocking between particles.
For crystalline solid structures with faceted shapes, sharp edges and corners, it is inappropriate to use clumped spheres. Recently, Vivacqua et al. (2019) used bonded Polyhedra to construct faceted shapes in the DEM simulation software package ROCKY-DEM, ESSS, Brazil, and followed the same approach as Hare et al.
Mojtaba Ghadiri et al. / KONA Powder and Particle Journal No. 37 (2020) 3–18
11
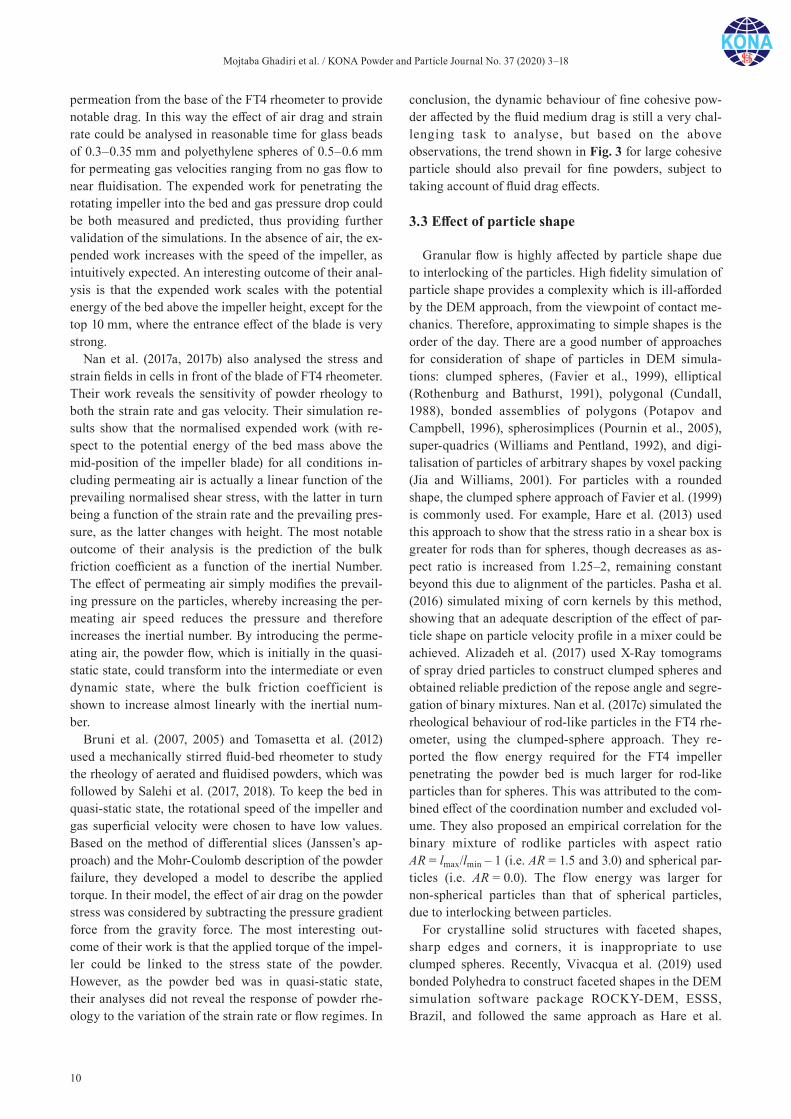
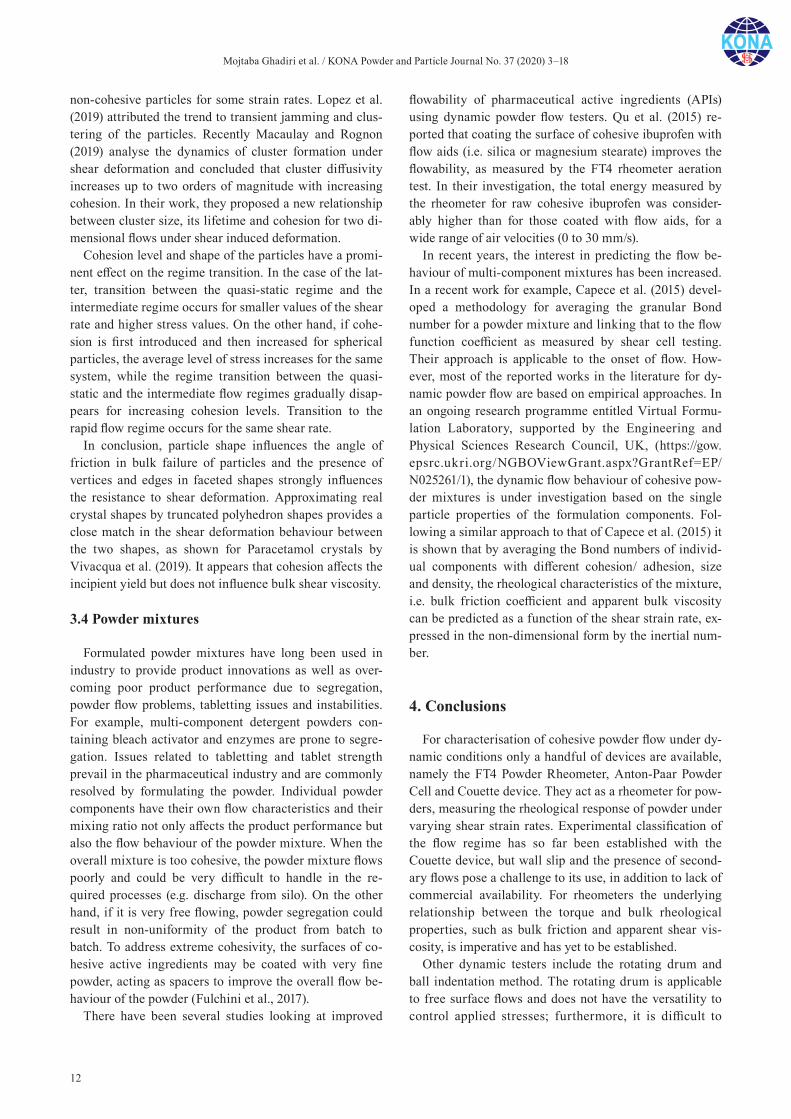
(2015) and Nan et al. (2017c) to analyse the effect of fac-eted particle shape on the powder flow rheology for both adhesive and non-adhesive particles using the FT4 rheom-eter. They investigated the effect of the shapes as illus-trated in Table 1. The results obtained by Vivacqua et al. (2019) are shown in Figs. 4 and 5. They agree qualita-tively with the trend shown previously by Nan et al. (2017a); the average shear stress is initially independent of the strain rate, corresponding to the quasi-static value, but starts increasing at large strain rates. The notable point is that faceted shapes present much larger shear stresses, with vertices and edges influencing the resistance, but follow the same trend as that of the spheres, with the base line shifted to larger values of shear stress (as with the ef-fect of cohesion discussed above). A similar trend also prevails when the interparticle adhesion is increased for these faceted shapes. In both cases the normalised shear stress (τ/ρpdp
2γ2) obeys the following relationship with the inertial number for spheres (Eq. 8) and all faceted shapes, shown in Table 1, unified and given by Eq. (9):
1.7432 2
p p0.481I
d
(8)
1.7542 2
p p0.918I
d
(9)
Thus, two rheological models with roughly the same power index, but with different pre-exponential constants, are obtained for cohesive spheres (Eq. 8) and faceted par-ticles (Eq. 9). These equations point toward the possibility of obtaining a unified rheological model incorporating the effect of cohesion, strain rate and shape.
In a subsequent study by Lopez et al. (2019), powder flow of faceted particles in screw feeders was analysed. Analysis of the stresses in the screw based on the same
approach as Vivacqua et al (2019) showed a linear rela-tionship in a logarithmic plot between the non-dimensional shear stress and the inertial number for different cohesion and strain rate levels. When both analyses are plotted in the same graph, an overlap between the lowest shear rates of the FT4 and the highest shear rates of the screw feeder exists. This shows the close relationship between the flow regimes in both devices for the same shear rates.
The apparent viscosity (η = τ/γ) follows a linear trend with the inertial number on a log-log plot, with a negative slope for both spheres and faceted particles indicating a shear thinning behaviour. The slope obtained for cohesive particles, however, deviates from the behaviour of
Table 1 Polyhedra used by Vivacqua et al. (2019) for simulat-ing faceted shapes. https://doi.org/10.1016/j.powtec. 2018.10.034. Copyright: (2019) Elsevier B.V. under https://creativecommons.org/licenses/by/4.0/.
Name Number of faces
Number of corners
3D shape
Deltahedron 16 10
Faced cylinder 12 20
Actual paracetamol shape 25 44
Dodecahedron 12 20
Truncated polyhedron 14 16
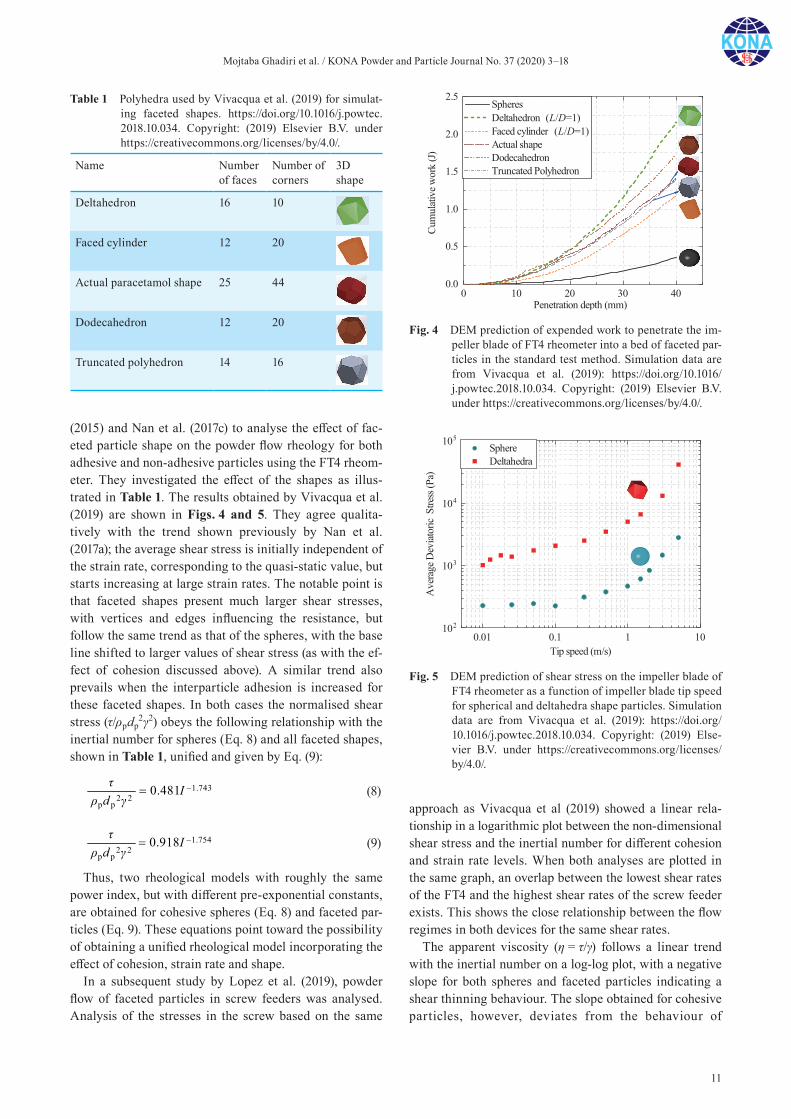
Fig. 4 DEM prediction of expended work to penetrate the im-peller blade of FT4 rheometer into a bed of faceted par-ticles in the standard test method. Simulation data are from Vivacqua et al. (2019): https://doi.org/10.1016/j.powtec.2018.10.034. Copyright: (2019) Elsevier B.V. under https://creativecommons.org/licenses/by/4.0/.
Fig. 5 DEM prediction of shear stress on the impeller blade of FT4 rheometer as a function of impeller blade tip speed for spherical and deltahedra shape particles. Simulation data are from Vivacqua et al. (2019): https://doi.org/ 10.1016/j.powtec.2018.10.034. Copyright: (2019) Else-vier B.V. under https://creativecommons.org/licenses/by/4.0/.
Mojtaba Ghadiri et al. / KONA Powder and Particle Journal No. 37 (2020) 3–18
12
non- cohesive particles for some strain rates. Lopez et al. (2019) attributed the trend to transient jamming and clus-tering of the particles. Recently Macaulay and Rognon (2019) analyse the dynamics of cluster formation under shear deformation and concluded that cluster diffusivity increases up to two orders of magnitude with increasing cohesion. In their work, they proposed a new relationship between cluster size, its lifetime and cohesion for two di-mensional flows under shear induced deformation.
Cohesion level and shape of the particles have a promi-nent effect on the regime transition. In the case of the lat-ter, transition between the quasi-static regime and the intermediate regime occurs for smaller values of the shear rate and higher stress values. On the other hand, if cohe-sion is first introduced and then increased for spherical particles, the average level of stress increases for the same system, while the regime transition between the quasi- static and the intermediate flow regimes gradually disap-pears for increasing cohesion levels. Transition to the rapid flow regime occurs for the same shear rate.
In conclusion, particle shape influences the angle of friction in bulk failure of particles and the presence of vertices and edges in faceted shapes strongly influences the resistance to shear deformation. Approximating real crystal shapes by truncated polyhedron shapes provides a close match in the shear deformation behaviour between the two shapes, as shown for Paracetamol crystals by Vivacqua et al. (2019). It appears that cohesion affects the incipient yield but does not influence bulk shear viscosity.
3.4 Powder mixtures
Formulated powder mixtures have long been used in industry to provide product innovations as well as over-coming poor product performance due to segregation, powder flow problems, tabletting issues and instabilities. For example, multi-component detergent powders con-taining bleach activator and enzymes are prone to segre-gation. Issues related to tabletting and tablet strength prevail in the pharmaceutical industry and are commonly resolved by formulating the powder. Individual powder components have their own flow characteristics and their mixing ratio not only affects the product performance but also the flow behaviour of the powder mixture. When the overall mixture is too cohesive, the powder mixture flows poorly and could be very difficult to handle in the re-quired processes (e.g. discharge from silo). On the other hand, if it is very free flowing, powder segregation could result in non-uniformity of the product from batch to batch. To address extreme cohesivity, the surfaces of co-hesive active ingredients may be coated with very fine powder, acting as spacers to improve the overall flow be-haviour of the powder (Fulchini et al., 2017).
There have been several studies looking at improved
flowability of pharmaceutical active ingredients (APIs) using dynamic powder flow testers. Qu et al. (2015) re-ported that coating the surface of cohesive ibuprofen with flow aids (i.e. silica or magnesium stearate) improves the flowability, as measured by the FT4 rheometer aeration test. In their investigation, the total energy measured by the rheometer for raw cohesive ibuprofen was consider-ably higher than for those coated with flow aids, for a wide range of air velocities (0 to 30 mm/s).
In recent years, the interest in predicting the flow be-haviour of multi-component mixtures has been increased. In a recent work for example, Capece et al. (2015) devel-oped a methodology for averaging the granular Bond number for a powder mixture and linking that to the flow function coefficient as measured by shear cell testing. Their approach is applicable to the onset of flow. How-ever, most of the reported works in the literature for dy-namic powder flow are based on empirical approaches. In an ongoing research programme entitled Virtual Formu-lation Laboratory, supported by the Engineering and Physical Sciences Research Council, UK, (https://gow.epsrc.ukri.org/NGBOViewGrant.aspx?GrantRef=EP/N025261/1), the dynamic flow behaviour of cohesive pow-der mixtures is under investigation based on the single particle properties of the formulation components. Fol-lowing a similar approach to that of Capece et al. (2015) it is shown that by averaging the Bond numbers of individ-ual components with different cohesion/ adhesion, size and density, the rheological characteristics of the mixture, i.e. bulk friction coefficient and apparent bulk viscosity can be predicted as a function of the shear strain rate, ex-pressed in the non-dimensional form by the inertial num-ber.
4. Conclusions
For characterisation of cohesive powder flow under dy-namic conditions only a handful of devices are available, namely the FT4 Powder Rheometer, Anton-Paar Powder Cell and Couette device. They act as a rheometer for pow-ders, measuring the rheological response of powder under varying shear strain rates. Experimental classification of the flow regime has so far been established with the Couette device, but wall slip and the presence of second-ary flows pose a challenge to its use, in addition to lack of commercial availability. For rheometers the underlying relationship between the torque and bulk rheological properties, such as bulk friction and apparent shear vis-cosity, is imperative and has yet to be established.
Other dynamic testers include the rotating drum and ball indentation method. The rotating drum is applicable to free surface flows and does not have the versatility to control applied stresses; furthermore, it is difficult to
Mojtaba Ghadiri et al. / KONA Powder and Particle Journal No. 37 (2020) 3–18
13
interpret a relevant cohesion parameter from such tests. Ball indentation is a relatively new test method which al-lows stress to be controlled and a range of strain rates to be applied by manipulating indenter properties. However, its operating range is narrow, due to the limited accept-able indentation depth.
An increasingly important sector dealing with powders operated at high strain rates is additive manufacturing (3D printing). There is currently great effort being put into re-lating the spreading performance in additive manufactur-ing to various flow testers. However, in contrast to flow resistance in shear flows, additive manufacturing pro-cesses utilise a very thin powder layer in close proximity to wall boundaries. As such the flow behaviour is strongly influenced by transient jamming/arching. A different ap-proach is needed to describe the rheology of spreading of thin powder layers for the increased demand of powder spreading in additive manufacturing.
The prediction of bulk rheological characteristics of fine cohesive powders is still a grand challenge. Such powders are in dynamic cluster forms, the size and pack-ing density of which depends on the stress history that the powder has experienced. The current research effort is aimed at addressing the influence of particle properties on bulk rheological behaviour in a systematic way, but there is still a long way to go to develop fully predictive tools.
Acknowledgments
The support of the following research programmes is gratefully acknowledged: (i) Virtual Formulation Labora-tory Grant of the EPSRC Future Formulation Programme (EP/N025261/1); (ii) Advanced Manufacturing Supply Chains Initiative (AMSCI) and the Medicines Manufac-turing Industry Partnership (MMIP), UK, through the funding of the ‘Advanced Digital Design of Pharmaceuti-cal Therapeutics’ (Grant No. 14060); (iii) the EPSRC Pro-gramme Grant: Friction: The Tribology Enigma (EP/R001766/1) ; (iv) Project ID 1502-607 funded through ANR (the French National Research Agency) under the “Investissements d’avenir” programme with the reference ANR-10-LABX- 001-01 Labex Agro and coordinated by Agropolis Fondation, France, under the frame of I-SITE MUSE (ANR-16-IDEX-0006).
References
Alexander A.W., Chaudhuri B., Faqih A., Muzzio F.J., Davies C., Tomassone M.S., Avalanching flow of cohesive pow-ders, Powder Technology, 164 (2006) 13–21. DOI: 10.1016/j.powtec.2006.01.017
Alizadeh M., Hassanpour A., Pasha M., Ghadiri M., Bayly A., The effect of particle shape on predicted segregation in binary powder mixtures, Powder Technology, 319 (2017) 313–322. DOI: 10.1016/j.powtec.2017.06.059
ASTM B213-17, Standard Test Methods for Flow Rate of Metal Powders Using the Hall Flowmeter Funnel.
Bell A.T., Evaluation of Edinburgh Powder Tester, Proceedings of PARTEC, Nuremburg, Germany, 2007.
Berger N., Azéma E., Douce J. F., Radjai F., Scaling behaviour of cohesive granular flows, EPL (Europhysics Letters), 112 (2015) 64004. DOI: 10.1209/0295-5075/112/64004
Berry R.J., Bradley M.S.A., McGregor R.G., Brookfield powder flow tester – Results of round robin tests with CRM-116 limestone powder, Proceedings of the Institution of Mechanical Engineers, Part E: Journal of Process Mechani-cal Engineering, 229 (2014) 215–230. DOI: 10.1177/ 0954408914525387
Bharadwaj R., Ketterhagen W.R., Hancock B.C., Discrete ele-ment simulation study of a Freeman powder rheometer, Chemical Engineering Science, 65 (2010) 5747–5765. DOI: 10.1016/j.ces.2010.04.002
Bruni G., Barletta D., Poletto M., Lettieri P., A rheological model for the flowability of aerated fine powders, Chemical Engineering Science, 62 (2007) 397–407. DOI: 10.1016/j.ces.2006.08.060
Bruni G., Colafigli A., Lettieri P., Elson T., Torque measure-ments in aerated powders using a mechanically stirred flu-idized bed rheometer (msFBR), Chemical Engineering Research and Design, 83 (2005) 1311–1318. DOI: 10.1205/cherd.05092
Calvert G., Curcic N., Redhead C., Ahmadian H., Owen C., Beckett D., Ghadiri M., A new environmental bulk powder caking tester, Powder Technology, 249 (2013) 323–329. DOI: 10.1016/j.powtec.2013.08.037
Capece M., Ho R., Strong J., Gao P., Prediction of powder flow performance using a multi-component granular bond num-ber, Powder Technology, 286 (2015) 561–571. DOI: 10.1016/j.powtec.2015.08.031
Carrozza A., Characterization of powders to be used in a laser powder bed machine: Analysis of the critical parameters and relationship with powder flowability, MSc Thesis, Politecnico di Torino (2017).
Castellanos A., Valverde J.M., Quintanilla M.A.S., The Sevilla Powder Tester: A tool for characterizing the physical prop-erties of fine cohesive powders at very small consolidations, KONA Powder and Particle Journal, 22 (2004) 66–81. DOI: 10.14356/kona.2004011
Castellanos A., The relationship between attractive interparticle forces and bulk behaviour in dry and uncharged fine pow-ders, Advances in physics, 54 (2005) 263–376. DOI: 10.1080/17461390500402657
Chialvo S., Sun J., Sundaresan S., Bridging the rheology of granular flows in three regimes, Physical Review E, 85 (2012) 021305. DOI: 10.1103/PhysRevE.85.021305
Cundall P.A., Formulation of a three-dimensional distinct ele-ment model—Part I. A scheme to detect and represent con-tacts in a system composed of many polyhedral blocks, International Journal of Rock Mechanics and Mining Sci-
Mojtaba Ghadiri et al. / KONA Powder and Particle Journal No. 37 (2020) 3–18
14
ences & Geomechanics Abstracts, 25 (1988) 107–116. DOI: 10.1016/0148-9062(88)92293-0
Derjaguin, B.V., Muller, V.M., Toporov, Y.P., Effect of contact deformations on the adhesion of particles, Journal of Col-loid and Interface Science, 53 (1975) 314–326. DOI: 10.1016/0021-9797(75)90018-1
Desai P.S., Mehta A., Dougherty P.S.M., Higgs C.F., A rheome-try based calibration of a first-order DEM model to gener-ate virtual avatars of metal Additive Manufacturing (AM) powders, Powder Technology, 342 (2019) 441–456. DOI: 10.1016/j.powtec.2018.09.047
Favier J.F., Abbaspour-Fard M.H., Kremmer M., Raji A.O., Shape representation of axi-symmetrical, non-spherical particles in discrete element simulation using multi-element model particles, Engineering Computations, 16 (1999) 467–480. DOI: 10.1108/02644409910271894
Fischer R., Gondret P., Perrin B., Rabaud M., Dynamics of dry granular avalanches, Physical Review E, 78 (2008) 021302. DOI: 10.1103/PhysRevE.78.021302
Freeman R., Measuring the flow properties of consolidated, conditioned and aerated powders – a comparative study using a powder rheometer and a rotational shear cell, Pow-der Technology, 174 (2007) 25–33. DOI: 10.1016/j.powtec. 2006.10.016
Fu X., Huck D., Makein L., Armstrong B., Willen U., Freeman T., Effect of particle shape and size on flow properties of lactose powders, Particuology, 10 (2012) 203–208. DOI: 10.1016/j.partic.2011.11.003
Fulchini F., Zafar U., Hare C., Ghadiri M., Tantawy H., Ahmadian H., Poletto M., Relationship between surface area coverage of flow-aids and flowability of cohesive parti-cles, Powder Technology, 322 (2017) 417–427. DOI: 10.1016/j.powtec.2017.09.013
Geer S., Bernhardt-Barry M.L., Garboczi E.J., Whiting J., Donmez A., A more efficient method for calibrating dis-crete element method parameters for simulations of metal-lic powder used in additive manufacturing, Granular Mat-ter, 20 (2018) 1–17. DOI: 10.1007/s10035-018-0848-4
Girimonte R., Bernardo P., Minnicelli A., Formisani B., Experi-mental characterization of the cohesive behaviour of fine powders by the raining bed test, Powder Technology, 325 (2018) 373–380. DOI: 10.1016/j.powtec.2017.11.038
Goh H.P., Heng P.W.S., Liew C.V., Investigation on the impact of powder arching in small die filling, International Journal of Pharmaceutics, 551 (2018) 42–51. DOI: 10.1016/j.ijpharm.2018.09.005
Guo Y., Wu C.Y., Kafui K.D., Thornton C., 3D DEM/CFD anal-ysis of size-induced segregation during die filling, Powder Technology, 206 (2011a) 177–188. DOI: 10.1016/j.powtec. 2010.05.029
Guo Y., Wu C.Y., Thornton C., The effects of air and particle density difference on segregation of powder mixtures during die filling, Chemical Engineering Science, 66 (2011b) 661–673. DOI: 10.1016/j.ces.2010.11.017
Gutam K.J., Mehandia V., Nott P.R., Rheometry of granular materials in cylindrical Couette cells: Anomalous stress caused by gravity and shear, Physics of Fluids, 25 (2013) 070602. DOI: 10.1063/1.4812800
Haeri S., Optimisation of blade type spreaders for powder bed preparation in Additive Manufacturing using DEM simula-tions, Powder Technology, 321 (2017) 94–104. DOI: 10.1016/j.powtec.2017.08.011
Han Q., Gu H., Setchi R., Discrete element simulation of pow-der layer thickness in laser additive manufacturing, Powder Technology, 352 (2019) 91–102. DOI: 10.1016/j.powtec. 2019.04.057
Hare C., Ghadiri M., The influence of aspect ratio and rough-ness on flowability, API Conference Proceedings, 1542 (2013) 887–890. DOI: 10.1063/1.4812074
Hare C., Zafar U., Ghadiri M., Freeman T., Clayton J., Murtagh M.J., Analysis of the dynamics of the FT4 powder rheome-ter, Powder Technology, 285 (2015) 123–127. DOI: 10.1016/j.powtec.2015.04.039
Hassanpour A., Ghadiri M., Characterisation of flowability of loosely compacted cohesive powders by indentation, Parti-cle & Particle Systems Characterization, 24 (2007) 117–123. DOI: 10.1002/ppsc.200601111
Howell, D., Behringer, R.P., Veje, C., Stress fluctuations in a 2D granular Couette experiment: A continuous transition, Physical Review Letters, 82 (1999) 5241–5244. DOI: 10.1103/PhysRevLett.82.5241
Hosokawa Micron Powder Tester PT-X, Standard Test Method for Bulk Solids Characterization by Carr Indices, ASTM International Designation: D 6393-08.
Jia X., Williams R.A., A packing algorithm for particles of arbi-trary shapes. Powder Technology, 120 (2001) 175–186. DOI: 10.1016/S0032-5910(01)00268-6
Johanson K., SSSpinTester-X Powder Strength Tester, Material Flow Solutions, Inc., https://www.matflowsol.com/images/PDF/products/SSSpinTester/Full%20Brochure.pdf, (2019).
Jop P., Forterre Y, Pouliquen O., A constitutive law for dense granular flows, Nature, 441 (2006) 727–730. DOI: 10.1038/nature04801
Klausner J.F., Chen D., Mei R., Experimental investigation of cohesive powder rheology, Powder Technology, 112 (2000) 94–101. DOI: 10.1016/S0032-5910(99)00310-1
Ku N., Hare C.L., Ghadiri M., Murtagh M.J., Oram P., Haber R.A., Auto-granulation of fine cohesive powder by mechan-ical vibration, Procedia Engineering, 102 (2015) 72–80. DOI: 10.1016/j.proeng.2015.01.108
Langroudi M.K., Turek S., Ouazzi A., Tardos G.I., An investi-gation of frictional and collisional powder flows using a unified constitutive equation, Powder Technology, 197 (2010) 91–101. DOI: 10.1016/j.powtec.2009.09.001
Li M., Leturia M., Saleh K., Analysis of the periodic motion in a powder rheometer and development of a new Flowability testing method, KONA Powder and Particle Journal, 35 (2018) 160–171. DOI: 10.14356/kona.2018002
López A., Vivacqua V., Hammond R., Ghadiri M., Analysis of screw feeding of faceted particles by discrete element method, Personal Communication (2019).
Luding S., Cohesive frictional powders: contact models for ten-sion, Granular Matter, 10 (2008) 235–246. DOI: 10.1007/s10035-008-0099-x
Lumay G., Boschini F., Traina K., Bontempi S., Remy J.-C., Cloots R., Vandewalle N., Measuring the flowing properties
Mojtaba Ghadiri et al. / KONA Powder and Particle Journal No. 37 (2020) 3–18
15
of powders and grains, Powder Technology, 224 (2012) 19–27. DOI: 10.1016/j.powtec.2012.02.015
Lumay G., Traina K., Boschini F., Delaval V., Rescaglio A., Cloots R., Vandewalle N., Effect of relative air humidity on the flowability of lactose powders, Journal of Drug Deliv-ery Science and Technology, 35 (2016) 207–212. DOI: 10.1016/j.jddst.2016.04.007
Lun C.K.K., Savage S.B., Jeffrey D.J., Chepurniy N., Kinetic theories for granular flow: inelastic particles in Couette flow and slightly inelastic particles in a general flow field, Journal of Fluid Mechanics, 140 (1984) 223–256. DOI: 10.1017/S0022112084000586
Macaulay M., Rognon P., Shear-induced diffusion in cohesive granular flows: Effect of enduring clusters, Journal of Fluid Mechanics, 858 (2019) R2. DOI: 10.1017/jfm.2018.861
Mellin P., Lyckfeldt O., Harlin P., Brodin H., Blom H., Strondl A., Evaluating flowability of additive manufacturing pow-ders, using the Gustavsson flow meter, Metal Powder Report, 72 (2017) 322–326. DOI: 10.1016/j.mprp.2017.06.003
MiDi G.D.R., On dense granular flows, The European Physical Journal E, 14 (2004) 341–365. DOI: 10.1140/epje/i2003-10153-0
Morrison A.J., Govender I., Mainza A.N., Parker D.J., The shape and behaviour of a granular bed in a rotating drum using Eulerian flow fields obtained from PEPT, Chemical Engineering Science, 152 (2016) 186–198. DOI: 10.1016/j.ces.2016.06.022
Nalluri V.R., Kuentz M., Flowability characterisation of drug-excipient blends using a novel powder avalanching method, European Journal of Pharmaceutics and Biophar-maceutics, 74 (2010) 388. DOI: 10.1016/j.ejpb.2009.09.010
Nan W., Ghadiri M., Numerical simulation of powder flow during spreading in additive manufacturing, Powder Tech-nology, 342 (2019) 801–807. DOI: 10.1016/j.powtec.2018. 10.056
Nan W., Pasha M., Bonakdar T., Lopez A., Zafar U., Nadimi S., Ghadiri M., Jamming during particle spreading in additive manufacturing, Powder Technology, 338 (2018) 253–262. DOI: 10.1016/j.powtec.2018.07.030
Nan W., Ghadiri M., Wang Y., Analysis of powder rheometry of FT4: Effect of air flow, Chemical Engineering Science, 162 (2017a) 141–151. DOI: 10.1016/j.ces.2017.01.002
Nan W., Vivacqua V., Ghadiri M., Wang Y., Numerical analysis of air effect on the powder flow dynamics in the FT4 Pow-der Rheometer, EPJ Web of Conferences, 140 (2017b) 03036. DOI: 10.1051/epjconf/201714003036
Nan W, Ghadiri M, Wang Y, Analysis of powder rheometry of FT4: Effect of particle shape, Chemical Engineering Sci-ence, 173 (2017c) 374–383. DOI: 10.1016/j.ces.2017.08.004
Nguyen Q.B., Nai M.L.S., Zhu Z., Sun C.N., Wei J., Zhou W., Characteristics of Inconel powders for powder-bed additive manufacturing, Engineering, 3 (2017) 695–700. DOI: 10. 1016/J.ENG.2017.05.012
Ogata K., A review: Recent progress on evaluation of flowabil-ity and floodability of powder, KONA Powder and Particle Journal, 36 (2019) 33–49. DOI: 10.14356/kona.2019002
Parrella L., Barletta D., Boerefijin R., Poletto M., Comparison between a uniaxial compaction tester and a shear tester for
the characterization of powder flowability, KONA Powder and Particle Journal, 26 (2008) 178–189. DOI: 10.14356/kona.2008016
Pasha M., Hare C., Hassanpour A., Ghadiri M., Analysis of ball indentation on cohesive powder beds using distinct element modelling, Powder Technology, 233 (2013) 80–90. DOI: 10.1016/j.powtec.2012.08.017
Pasha M., Dogbe S., Hare C., Hassanpour A., Ghadiri M., A linear model of elasto-plastic and adhesive contact defor-mation, Granular Matter, 16 (2014) 151–162. DOI: 10.1007/s10035-013-0476-y
Pasha M., Hare C., Ghadiri M., Gunadi A., Piccione P.M., Effect of particle shape on flow in discrete element method simu-lation of a rotary batch seed coater, Powder Technology, 296 (2016) 29–36. DOI: 10.1016/j.powtec.2015.10.055
Potapov A.V., Campbell C.S., A three-dimensional simulation of brittle solid fracture, International Journal of Modern Physics C, 7 (1996) 717–729. DOI: 10.1142/S0129183196000594
Pournin L., Weber M., Tsukahara M., Ferrez J.A., Ramaioli M., Liebling T.M., Three-dimensional distinct element simula-tion of spherocylinder crystallization, Granular Matter, 7 (2005) 119–126. DOI: 10.1007/s10035-004-0188-4
Qin H., Flow behavior of granular materials: quasi-static to inertial transition, Doctoral dissertation, University of Florida, (2000).
Qu L., Zhou Q.T., Denman J.A., Stewart P.J., Hapgood K.P., Morton D.A., Influence of coating material on the flowabil-ity and dissolution of dry-coated fine ibuprofen powders, European Journal of Pharmaceutical Sciences, 78 (2015) 264–272. DOI: 10.1016/j.ejps.2015.07.016
Rognon P.G., Roux J.-N., Naaïm M, Chevoir F., Dense flow of cohesive granular materials, Journal of Fluid Mechanics, 596 (2008) 21–47. DOI: 10.1017/S0022112007009329
Rothenburg L., Bathurst R.J., Numerical simulation of idealized granular assemblies with plane elliptical particles, Comput-ers and Geotechnics, 11 (1991) 315–329. DOI: 10.1016/0266-352X(91)90015-8
Savage S.B., Sayed M., Stresses developed by dry cohesionless granular materials sheared in an annular shear cell, Journal of Fluid Mechanics, 142 (1984) 391–430. DOI: 10.1017/S0022112084001166
Salehi H., Barletta D., Poletto M., Schütz D., Romirer R., On the use of a powder rheometer to characterize the powder flow-ability at low consolidation with torque resistances, AIChE Journal, 63 (2017) 4788–4798. DOI: 10.1002/aic.15934
Salehi H., Sofia D., Schütz D., Barletta D., Poletto M., Experi-ments and simulation of torque in Anton Paar powder cell, Particulate Science and Technology, 36 (2018) 501–512. DOI: 10.1080/02726351.2017.1409850
Schulze D., A new ring shear tester for flowability and time consolidation measurements, in: 1st International Particle Technology Forum, USA, (1994) 11–16.
Schwedes J., Schulze D., Measurement of flow properties of bulk solids, Powder Technology, 61 (1990) 59–68. DOI: 10.1016/0032-5910(90)80066-8
Tardos G.I., Khan M.I., Schaeffer D.G., Forces on a slowly rotating, rough cylinder in a Couette device containing a
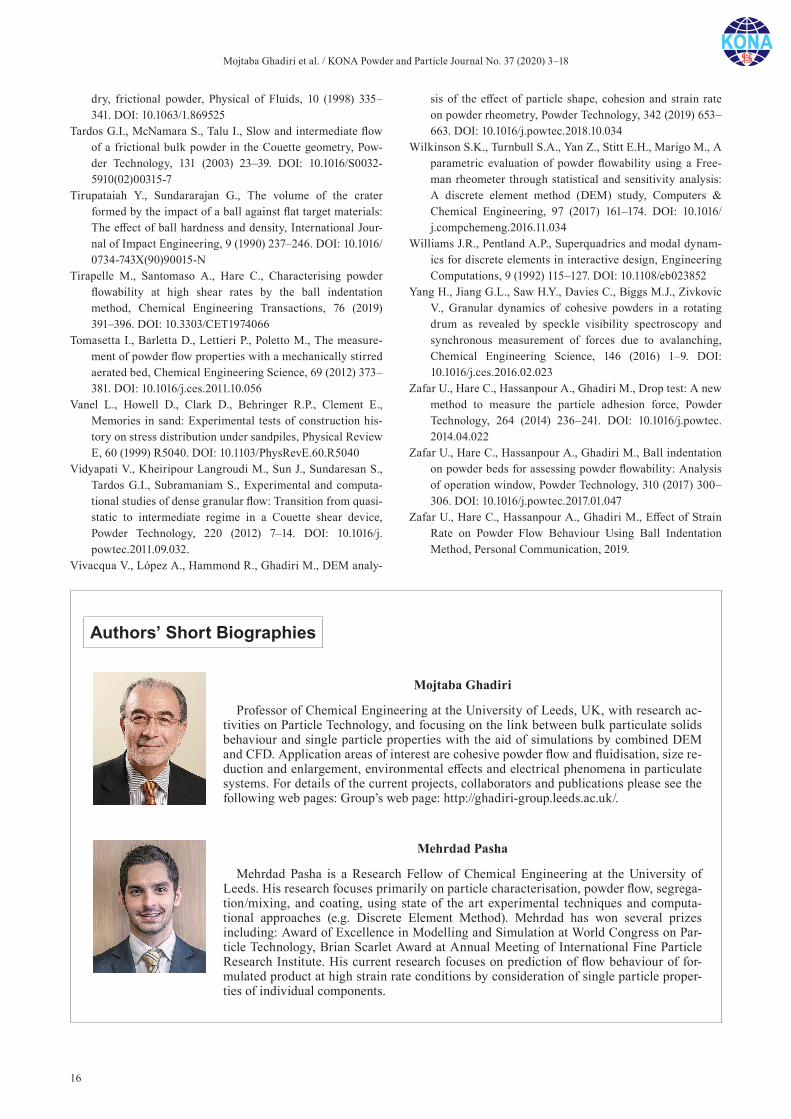
Mojtaba Ghadiri et al. / KONA Powder and Particle Journal No. 37 (2020) 3–18
16
dry, frictional powder, Physical of Fluids, 10 (1998) 335–341. DOI: 10.1063/1.869525
Tardos G.I., McNamara S., Talu I., Slow and intermediate flow of a frictional bulk powder in the Couette geometry, Pow-der Technology, 131 (2003) 23–39. DOI: 10.1016/S0032-5910(02)00315-7
Tirupataiah Y., Sundararajan G., The volume of the crater formed by the impact of a ball against flat target materials: The effect of ball hardness and density, International Jour-nal of Impact Engineering, 9 (1990) 237–246. DOI: 10.1016/ 0734-743X(90)90015-N
Tirapelle M., Santomaso A., Hare C., Characterising powder flowability at high shear rates by the ball indentation method, Chemical Engineering Transactions, 76 (2019) 391–396. DOI: 10.3303/CET1974066
Tomasetta I., Barletta D., Lettieri P., Poletto M., The measure-ment of powder flow properties with a mechanically stirred aerated bed, Chemical Engineering Science, 69 (2012) 373–381. DOI: 10.1016/j.ces.2011.10.056
Vanel L., Howell D., Clark D., Behringer R.P., Clement E., Memories in sand: Experimental tests of construction his-tory on stress distribution under sandpiles, Physical Review E, 60 (1999) R5040. DOI: 10.1103/PhysRevE.60.R5040
Vidyapati V., Kheiripour Langroudi M., Sun J., Sundaresan S., Tardos G.I., Subramaniam S., Experimental and computa-tional studies of dense granular flow: Transition from quasi- static to intermediate regime in a Couette shear device, Powder Technology, 220 (2012) 7–14. DOI: 10.1016/j. powtec.2011.09.032.
Vivacqua V., López A., Hammond R., Ghadiri M., DEM analy-
sis of the effect of particle shape, cohesion and strain rate on powder rheometry, Powder Technology, 342 (2019) 653–663. DOI: 10.1016/j.powtec.2018.10.034
Wilkinson S.K., Turnbull S.A., Yan Z., Stitt E.H., Marigo M., A parametric evaluation of powder flowability using a Free-man rheometer through statistical and sensitivity analysis: A discrete element method (DEM) study, Computers & Chemical Engineering, 97 (2017) 161–174. DOI: 10.1016/j.compchemeng.2016.11.034
Williams J.R., Pentland A.P., Superquadrics and modal dynam-ics for discrete elements in interactive design, Engineering Computations, 9 (1992) 115–127. DOI: 10.1108/eb023852
Yang H., Jiang G.L., Saw H.Y., Davies C., Biggs M.J., Zivkovic V., Granular dynamics of cohesive powders in a rotating drum as revealed by speckle visibility spectroscopy and synchronous measurement of forces due to avalanching, Chemical Engineering Science, 146 (2016) 1–9. DOI: 10.1016/j.ces.2016.02.023
Zafar U., Hare C., Hassanpour A., Ghadiri M., Drop test: A new method to measure the particle adhesion force, Powder Technology, 264 (2014) 236–241. DOI: 10.1016/j.powtec. 2014.04.022
Zafar U., Hare C., Hassanpour A., Ghadiri M., Ball indentation on powder beds for assessing powder flowability: Analysis of operation window, Powder Technology, 310 (2017) 300–306. DOI: 10.1016/j.powtec.2017.01.047
Zafar U., Hare C., Hassanpour A., Ghadiri M., Effect of Strain Rate on Powder Flow Behaviour Using Ball Indentation Method, Personal Communication, 2019.
Authors’ Short Biographies
Mojtaba Ghadiri
Professor of Chemical Engineering at the University of Leeds, UK, with research ac-tivities on Particle Technology, and focusing on the link between bulk particulate solids behaviour and single particle properties with the aid of simulations by combined DEM and CFD. Application areas of interest are cohesive powder flow and fluidisation, size re-duction and enlargement, environmental effects and electrical phenomena in particulate systems. For details of the current projects, collaborators and publications please see the following web pages: Group’s web page: http://ghadiri-group.leeds.ac.uk/.
Mehrdad Pasha
Mehrdad Pasha is a Research Fellow of Chemical Engineering at the University of Leeds. His research focuses primarily on particle characterisation, powder flow, segrega-tion/mixing, and coating, using state of the art experimental techniques and computa-tional approaches (e.g. Discrete Element Method). Mehrdad has won several prizes including: Award of Excellence in Modelling and Simulation at World Congress on Par-ticle Technology, Brian Scarlet Award at Annual Meeting of International Fine Particle Research Institute. His current research focuses on prediction of flow behaviour of for-mulated product at high strain rate conditions by consideration of single particle proper-ties of individual components.
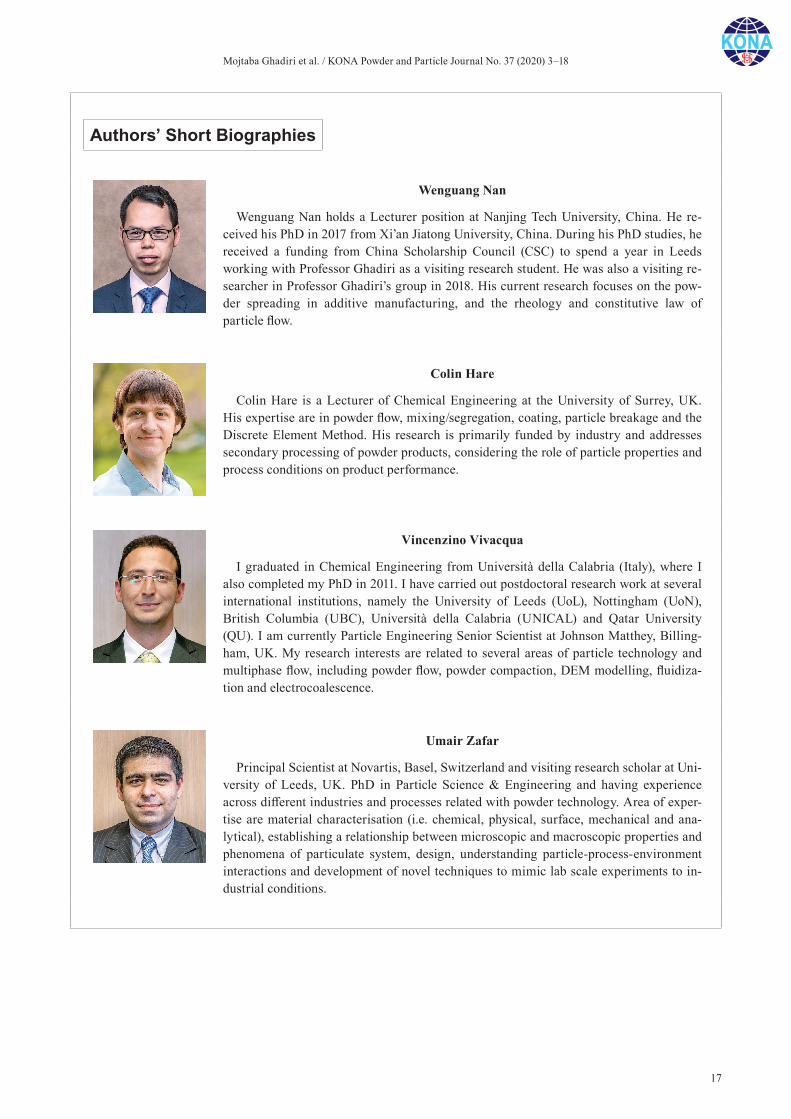
Mojtaba Ghadiri et al. / KONA Powder and Particle Journal No. 37 (2020) 3–18
17
Authors’ Short Biographies
Wenguang Nan
Wenguang Nan holds a Lecturer position at Nanjing Tech University, China. He re-ceived his PhD in 2017 from Xi’an Jiatong University, China. During his PhD studies, he received a funding from China Scholarship Council (CSC) to spend a year in Leeds working with Professor Ghadiri as a visiting research student. He was also a visiting re-searcher in Professor Ghadiri’s group in 2018. His current research focuses on the pow-der spreading in additive manufacturing, and the rheology and constitutive law of particle flow.
Colin Hare
Colin Hare is a Lecturer of Chemical Engineering at the University of Surrey, UK. His expertise are in powder flow, mixing/segregation, coating, particle breakage and the Discrete Element Method. His research is primarily funded by industry and addresses secondary processing of powder products, considering the role of particle properties and process conditions on product performance.
Vincenzino Vivacqua
I graduated in Chemical Engineering from Università della Calabria (Italy), where I also completed my PhD in 2011. I have carried out postdoctoral research work at several international institutions, namely the University of Leeds (UoL), Nottingham (UoN), British Columbia (UBC), Università della Calabria (UNICAL) and Qatar University (QU). I am currently Particle Engineering Senior Scientist at Johnson Matthey, Billing-ham, UK. My research interests are related to several areas of particle technology and multiphase flow, including powder flow, powder compaction, DEM modelling, fluidiza-tion and electrocoalescence.
Umair Zafar
Principal Scientist at Novartis, Basel, Switzerland and visiting research scholar at Uni-versity of Leeds, UK. PhD in Particle Science & Engineering and having experience across different industries and processes related with powder technology. Area of exper-tise are material characterisation (i.e. chemical, physical, surface, mechanical and ana-lytical), establishing a relationship between microscopic and macroscopic properties and phenomena of particulate system, design, understanding particle-process-environment interactions and development of novel techniques to mimic lab scale experiments to in-dustrial conditions.
Mojtaba Ghadiri et al. / KONA Powder and Particle Journal No. 37 (2020) 3–18
18
Authors’ Short Biographies
Saeid Nezamabadi
Associate Professor in the Laboratory of Mechanic and Civil Engineering (LMGC) at the University of Montpellier, France, with research activities on powders and granular materials, and focusing on the link between the rheology of granular media and single particle properties with the aid of numerical simulations by combined continuum and discrete approaches. Application areas of interest are specially compressive and shear behaviours of soft particle materials. For details of research works, please see my per-sonal page (http://www.lmgc.univ-montp2.fr/perso/saeid-nezamabadi/) and our research team in LMGC (http://www.lmgc.univ-montp2.fr/perso/pmmd/).
Alejandro Lopez
Alejandro Lopez is a Lecturer in Applied Mechanics at the University of Deusto (Bil-bao, Spain). His research focuses on CFD and DEM modelling of multiphase flows, ero-sion processes, cohesive powder flow and manufacturing processes, He worked as a Manager in the service industry in Spain before deciding to pursue an academic career. He received his PhD in Mechanical and Aerospace Engineering from the University of Strathclyde (Glasgow, UK), specifically studying erosion processes with CFD. After his PhD he joined Ghadiri Research Group (http://ghadiri-group.leeds.ac.uk/) before being recruited for his current position.
Massih Pasha
Massih Pasha is a Particle Technology Consultant at The Chemours Company, provid-ing technical consultation to the industrial and research facilities of Chemours and its key customers in the area of particle science and technology. He received a PhD degree from the University of Leeds working on ‘Numerical Modeling of Cohesive Powder Flow’. Massih is a Visiting Research Fellow at the University of Leeds and currently acts as Vice Chairman of the Board of International Fine Particle Research Institute (IFPRI). His area of expertise includes dry solids handling and processes such as powder flow, mixing, size reduction, and agglomeration.
Sadegh Nadimi
Dr Sadegh Nadimi is a Lecturer (Assist. Prof) in the School of Engineering at New-castle University and a Visiting Researcher at the University of Leeds. He holds a PhD in Geotechnical Engineering from City, University of London and an MSc in Geotechnical Engineering from Newcastle University. Following the award of his doctorate, Sadegh moved to the University of Leeds as Post-doctoral Research Fellow to focus on tribology of particulate solids, working with Prof Mojtaba Ghadiri and Prof Anne Neville. Sadegh is committed to advancing fundamental engineering research and teaching.
KONA Powder and Particle Journal No. 37 (2020) 19–27/Doi:10.14356/kona.2020001 Review Paper
19Copyright © 2020 The Authors. Published by Hosokawa Powder Technology Foundation. This is an open ac-cess article under the CC BY license (http://creativecommons.org/licenses/by/4.0/).
Present Status of Air Filters and Exploration of Their New Applications †
Myong-Hwa Lee 1, Hyun-Jin Choi 2, Mikio Kumita 3 and Yoshio Otani 3*1 Kangwon National University, Korea2 Korea Environment Institute, Korea3 College of Science and Engineering, Kanazawa University, Japan
AbstractThere is an increasing demand of air filters with a high collection performance, i.e., high collection efficiency and low pressure drop, for the application to indoor air cleaning. Air filters consisting of nanofibers have attracted great interests since they may have a low pressure drop because of slip flow effect and high collection efficiency due to enhanced interception effect. Although various nanofiber filters are available on the market, their collection performance is not as high as expected by the conventional filtration theory because non-uniform packing of fibers plays a significant role in the nanofiber filtration. In the present review, the present status of development of high performance air filters are reviewed. We may use air filters not only for the removal of particles but also for the classification of particles by selecting an appropriate filter by operating it under an optimized filtration condition for classification. Other topics introduced in the present review are the applications of filters and metal screen for aerosol classification and the use of centrifugal force for enhancing collection efficiency without increasing the pressure drop.
Keywords: air filtration, quality factor, nanofiber filter, aerosol classification, measurement
1. Introduction
Air filtration is the simplest and the most economical way of obtaining clean air. The first industrial application of air filter is dated back to AD 50 when woven cloths were used to filter breathing air in a mine. Air filtration theory for initial performance was established by Fuchs et al. and introduced in the treatise Fundamentals of Aerosol Science (Kirsch and Stechkina, 1978). Many problems were posed in this book but most of them still remain un-resolved. Current research topics on air filtration may be summarized into the following three subjects:(1) Development of high performance air filters—high
collection efficiency and low pressure drop(2) Change in collection performance with dust load—
prediction of filter life(3) Collection of nanoparticles—thermal rebound of
sub-10 nm particles
As for the first topic, nanofiber filters have attracted great attention because of the development of various manufacturing techniques of nanofibers (Choi et al., 2014; Choi et al., 2017; Xia et al., 2018). First part of this review will focus on the first topic. The second topic was recently reviewed by Kanaoka (2018), to which the readers of this review may refer. The third topic was first introduced by Wang and Kasper (1991) but the experimental verification and the quantification of thermal rebound effect on the filtration efficiency strongly rely on the development of a generation method of well-defined nanoparticles and a measuring method of sub-10 nm particles. The review on the third topic has to be done after the development of these techniques.
We may use air filters not only for the removal of parti-cles but also for classification of particles by selecting an appropriate filter media by operating it under an opti-mized filtration condition for classification. Other topics introduced in the present review are the applications of filters and metal screen for aerosol classification and the use of centrifugal force for enhancing collection effi-ciency without increasing the pressure drop.
† Received 29 May 2018; Accepted 23 July 2018 J-STAGE Advance published online 30 September 2018
1 1 Kangwondaehak-gil, Chuncheon-si, Gangwon-do 24341, Korea2 9F, Bldg. B, 370 Sicheong-daero, Sejong, 30147, Korea3 Kakuma-machi, Kanazawa, Ishikawa 920-1192, Japan* Corresponding author: Yoshio Otani; E-mail: [email protected] TEL: +81-76-234-4813 FAX: +81-76-264-6239
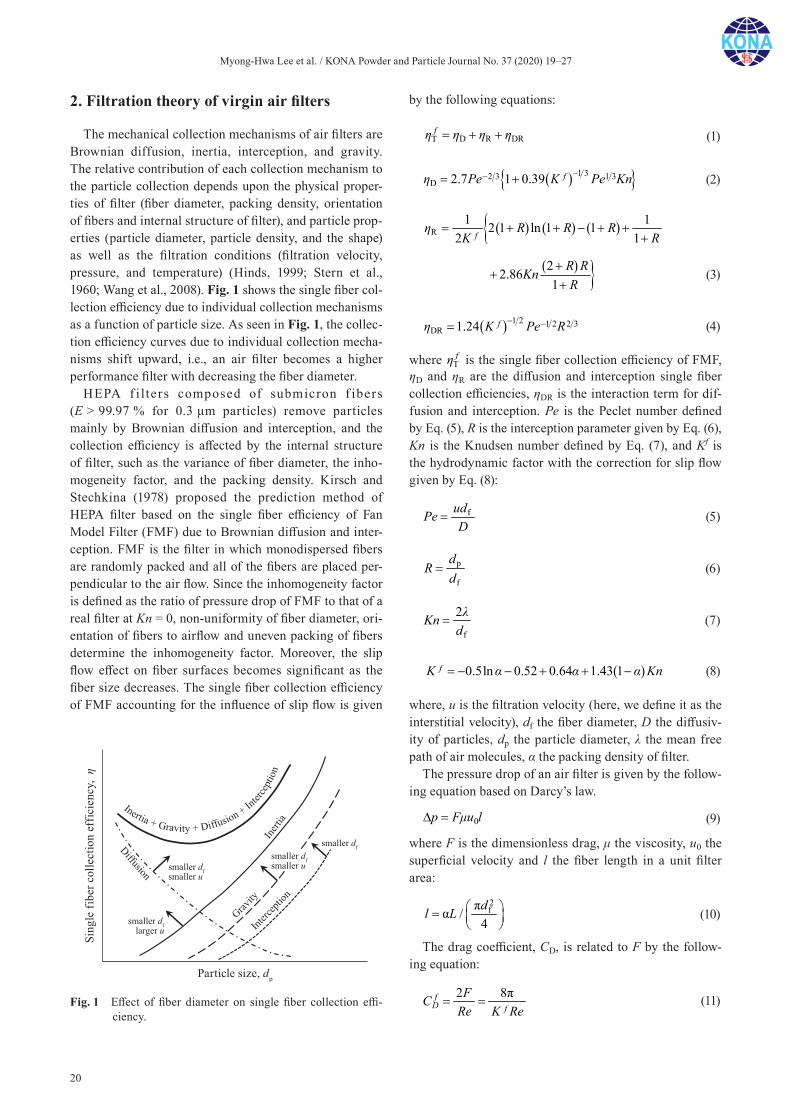
Myong-Hwa Lee et al. / KONA Powder and Particle Journal No. 37 (2020) 19–27
20
2. Filtration theory of virgin air filters
The mechanical collection mechanisms of air filters are Brownian diffusion, inertia, interception, and gravity. The relative contribution of each collection mechanism to the particle collection depends upon the physical proper-ties of filter (fiber diameter, packing density, orientation of fibers and internal structure of filter), and particle prop-erties (particle diameter, particle density, and the shape) as well as the filtration conditions (filtration velocity, pressure, and temperature) (Hinds, 1999; Stern et al., 1960; Wang et al., 2008). Fig. 1 shows the single fiber col-lection efficiency due to individual collection mechanisms as a function of particle size. As seen in Fig. 1, the collec-tion efficiency curves due to individual collection mecha-nisms shift upward, i.e., an air filter becomes a higher performance filter with decreasing the fiber diameter.
HEPA f i lters composed of submicron f ibers (E > 99.97 % for 0.3 μm particles) remove particles mainly by Brownian diffusion and interception, and the collection efficiency is affected by the internal structure of filter, such as the variance of fiber diameter, the inho-mogeneity factor, and the packing density. Kirsch and Stechkina (1978) proposed the prediction method of HEPA filter based on the single fiber efficiency of Fan Model Filter (FMF) due to Brownian diffusion and inter-ception. FMF is the filter in which monodispersed fibers are randomly packed and all of the fibers are placed per-pendicular to the air flow. Since the inhomogeneity factor is defined as the ratio of pressure drop of FMF to that of a real filter at Kn = 0, non-uniformity of fiber diameter, ori-entation of fibers to airflow and uneven packing of fibers determine the inhomogeneity factor. Moreover, the slip flow effect on fiber surfaces becomes significant as the fiber size decreases. The single fiber collection efficiency of FMF accounting for the influence of slip flow is given
by the following equations:
D R DRTfη η η η (1)
1 32 3 1 3D 2.7 1 0.39 fη Pe K Pe Kn (2)
R1 12 1 ln 1 1
2 1fη R R R
K R
22.861R RKnR
(3)
1 2 1 2 2 3DR 1.24 fη K Pe R (4)
where Tfη is the single fiber collection efficiency of FMF,
ηD and ηR are the diffusion and interception single fiber collection efficiencies, ηDR is the interaction term for dif-fusion and interception. Pe is the Peclet number defined by Eq. (5), R is the interception parameter given by Eq. (6), Kn is the Knudsen number defined by Eq. (7), and Kf is the hydrodynamic factor with the correction for slip flow given by Eq. (8):
fudPeD
(5)
p
f
dR
d (6)
f
2λKnd
(7)
0.5ln 0.52 0.64 1.43 1fK α α α Kn (8)
where, u is the filtration velocity (here, we define it as the interstitial velocity), df the fiber diameter, D the diffusiv-ity of particles, dp the particle diameter, λ the mean free path of air molecules, α the packing density of filter.
The pressure drop of an air filter is given by the follow-ing equation based on Darcy’s law.
0p Fμu l (9)
where F is the dimensionless drag, μ the viscosity, u0 the superficial velocity and l the fiber length in a unit filter area:
2fπα /4dl L
(10)
The drag coefficient, CD, is related to F by the follow-ing equation:
2 8πfD f
FCRe K Re
(11)Fig. 1 Effect of fiber diameter on single fiber collection effi-ciency.
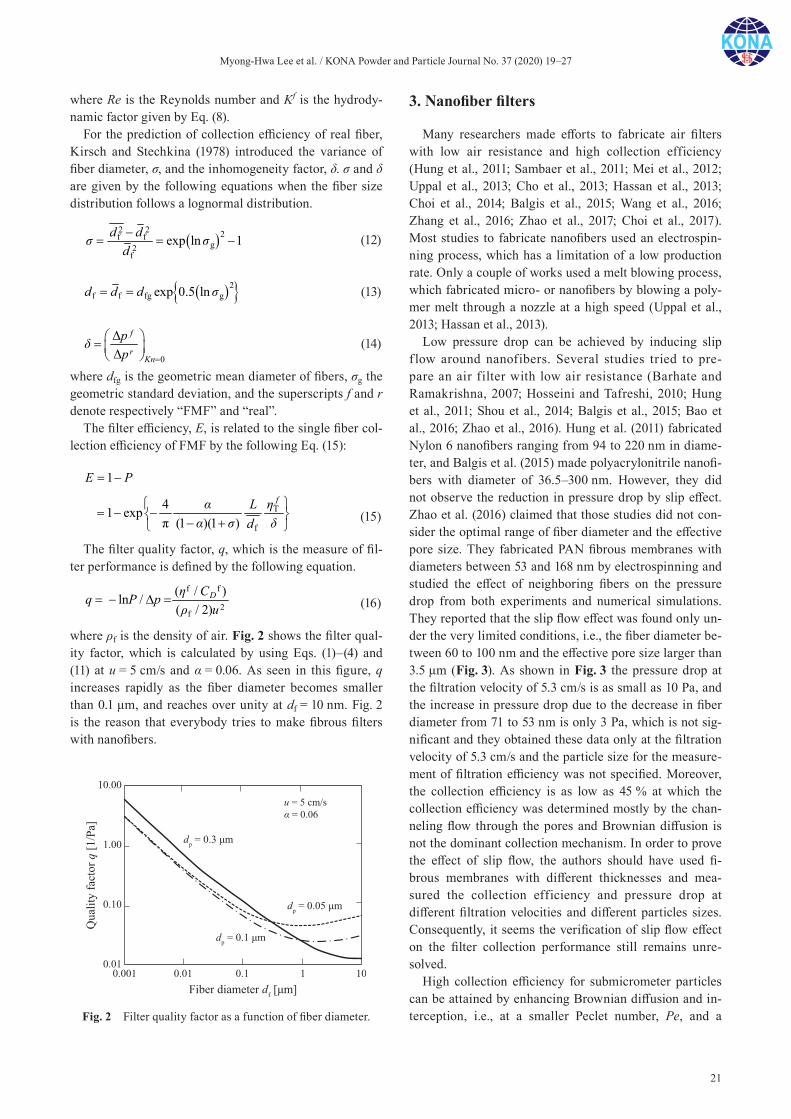
Myong-Hwa Lee et al. / KONA Powder and Particle Journal No. 37 (2020) 19–27
21
where Re is the Reynolds number and Kf is the hydrody-namic factor given by Eq. (8).
For the prediction of collection efficiency of real fiber, Kirsch and Stechkina (1978) introduced the variance of fiber diameter, σ, and the inhomogeneity factor, δ. σ and δ are given by the following equations when the fiber size distribution follows a lognormal distribution.
2 2 2f f
g2f
exp ln 1d dσ σd
(12)
2f f fg gexp 0.5 lnd d d σ (13)
0
ΔΔ
f
rKn
pδp
(14)
where dfg is the geometric mean diameter of fibers, σg the geometric standard deviation, and the superscripts f and r denote respectively “FMF” and “real”.
The filter efficiency, E, is related to the single fiber col-lection efficiency of FMF by the following Eq. (15):
1E P
Tf
41 expπ (1 )(1 )
fα L ηα σ δd
(15)
The filter quality factor, q, which is the measure of fil-ter performance is defined by the following equation.
f f
2f
( / ) ln / ( / 2)
Dη Cq P pρ u
(16)
where ρf is the density of air. Fig. 2 shows the filter qual-ity factor, which is calculated by using Eqs. (1)–(4) and (11) at u = 5 cm/s and α = 0.06. As seen in this figure, q increases rapidly as the fiber diameter becomes smaller than 0.1 μm, and reaches over unity at df = 10 nm. Fig. 2 is the reason that everybody tries to make fibrous filters with nanofibers.
3. Nanofiber filters
Many researchers made efforts to fabricate air filters with low air resistance and high collection efficiency (Hung et al., 2011; Sambaer et al., 2011; Mei et al., 2012; Uppal et al., 2013; Cho et al., 2013; Hassan et al., 2013; Choi et al., 2014; Balgis et al., 2015; Wang et al., 2016; Zhang et al., 2016; Zhao et al., 2017; Choi et al., 2017). Most studies to fabricate nanofibers used an electrospin-ning process, which has a limitation of a low production rate. Only a couple of works used a melt blowing process, which fabricated micro- or nanofibers by blowing a poly-mer melt through a nozzle at a high speed (Uppal et al., 2013; Hassan et al., 2013).
Low pressure drop can be achieved by inducing slip f low around nanofibers. Several studies tried to pre-pare an air filter with low air resistance (Barhate and Ramakrishna, 2007; Hosseini and Tafreshi, 2010; Hung et al., 2011; Shou et al., 2014; Balgis et al., 2015; Bao et al., 2016; Zhao et al., 2016). Hung et al. (2011) fabricated Nylon 6 nanofibers ranging from 94 to 220 nm in diame-ter, and Balgis et al. (2015) made polyacrylonitrile nanofi-bers with diameter of 36.5–300 nm. However, they did not observe the reduction in pressure drop by slip effect. Zhao et al. (2016) claimed that those studies did not con-sider the optimal range of fiber diameter and the effective pore size. They fabricated PAN fibrous membranes with diameters between 53 and 168 nm by electrospinning and studied the effect of neighboring fibers on the pressure drop from both experiments and numerical simulations. They reported that the slip flow effect was found only un-der the very limited conditions, i.e., the fiber diameter be-tween 60 to 100 nm and the effective pore size larger than 3.5 μm (Fig. 3). As shown in Fig. 3 the pressure drop at the filtration velocity of 5.3 cm/s is as small as 10 Pa, and the increase in pressure drop due to the decrease in fiber diameter from 71 to 53 nm is only 3 Pa, which is not sig-nificant and they obtained these data only at the filtration velocity of 5.3 cm/s and the particle size for the measure-ment of filtration efficiency was not specified. Moreover, the collection efficiency is as low as 45 % at which the collection efficiency was determined mostly by the chan-neling flow through the pores and Brownian diffusion is not the dominant collection mechanism. In order to prove the effect of slip flow, the authors should have used fi-brous membranes with different thicknesses and mea-sured the collection efficiency and pressure drop at different filtration velocities and different particles sizes. Consequently, it seems the verification of slip flow effect on the filter collection performance still remains unre-solved.
High collection efficiency for submicrometer particles can be attained by enhancing Brownian diffusion and in-terception, i.e., at a smaller Peclet number, Pe, and a Fig. 2 Filter quality factor as a function of fiber diameter.

Myong-Hwa Lee et al. / KONA Powder and Particle Journal No. 37 (2020) 19–27
22
larger interception parameter, R, both of which results from a finer fiber (Podgorski et al., 2006; Wang et al., 2007; Yun et al., 2010; Wang et al., 2013; Choi et al., 2014; Bao et al., 2016). Choi et al. (2014) showed that submi-crometer particles were effectively collected in a poly-urethane nanofiber filter due to increased interception (in Fig. 4, particles ranging from 20 to 300 nm were evenly captured in a filter with the diameter of around 180 nm).
4. Application of air filters to aerosol classification
4.1 Inertial filter
The collection efficiency curve of an air filter is always concave against the axis of particle size as shown in Fig. 1, and the curves shift by changing the filter proper-ties (fiber size, packing density, etc.) and the filtration conditions (filtration velocity, pressure, temperature, etc.). One extreme case is to use very high filtration velocity at
which only inertia is the dominant collection mechanism and the collection of particles by diffusion is minimized. This is the case of inertial filter (Otani, et al., 2007). The measure of inertia is the Stokes number defined by:
2c p p
f
9C ρ d u
Stkμd
(17)
The representative length of a solid plate impactor is the diameter of the nozzle in the order of tens of microm-eters, but for the inertial filter, it is the fiber diameter so that we can make Stk large enough to capture small parti-cles at a relatively low air velocity through a nozzle. Fig. 5 shows the separation curves of a cascade impactor (Nanosampler, Kanomax, Model 3182) in which an iner-tial impactor stage was added downstream of the solid plate impactors. Since the inertial filter stage can separate submicron particles at the ambient pressure, we may have an additional fraction of particles in submicron size.
Fig. 3 Changes in pressure drop by fiber diameter, cited from Ref. (Zhao et al., 2016). Copyright: (2016) The Author(s).
(a) Fiber diameter, (b) Pore size.
Fig. 4 Image of sub-micrometer particles captured on nanofi-bers. Fig. 5 Separation curves of Nanosampler with inertial filter
stage for separating 0.1 μm (Kanomax, Model 3182).
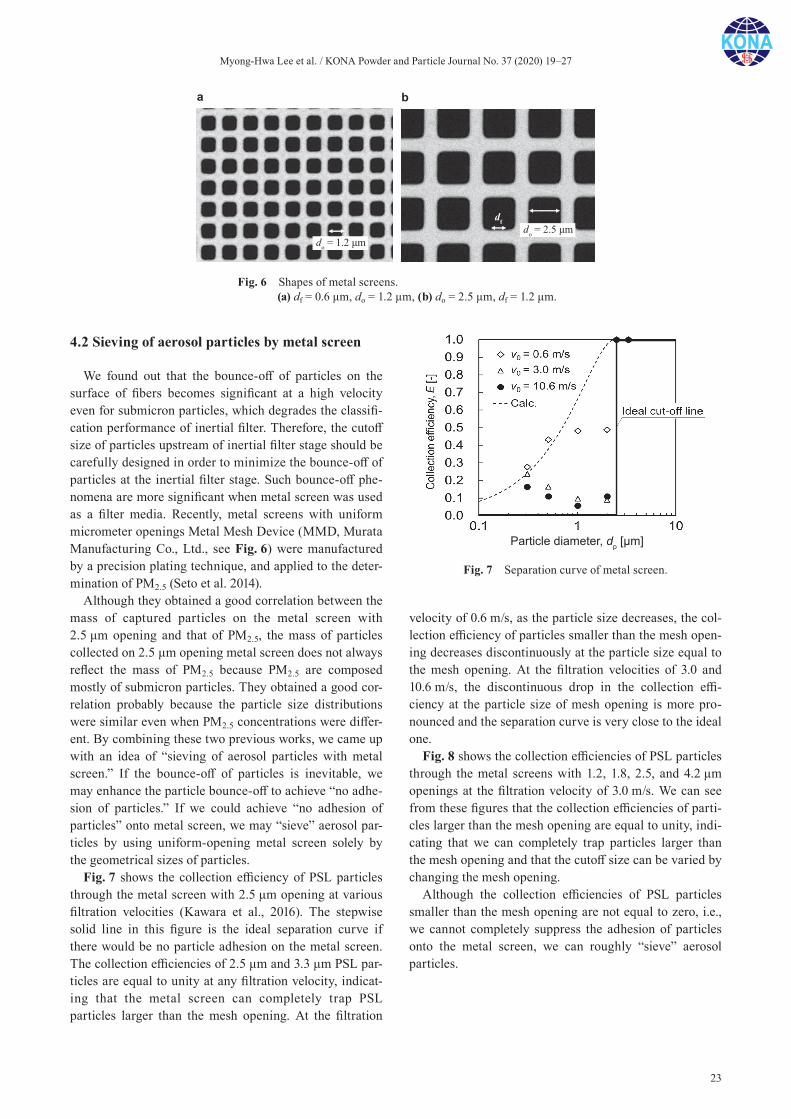
Myong-Hwa Lee et al. / KONA Powder and Particle Journal No. 37 (2020) 19–27
23
4.2 Sieving of aerosol particles by metal screen
We found out that the bounce-off of particles on the surface of fibers becomes significant at a high velocity even for submicron particles, which degrades the classifi-cation performance of inertial filter. Therefore, the cutoff size of particles upstream of inertial filter stage should be carefully designed in order to minimize the bounce-off of particles at the inertial filter stage. Such bounce-off phe-nomena are more significant when metal screen was used as a filter media. Recently, metal screens with uniform micrometer openings Metal Mesh Device (MMD, Murata Manufacturing Co., Ltd., see Fig. 6) were manufactured by a precision plating technique, and applied to the deter-mination of PM2.5 (Seto et al. 2014).
Although they obtained a good correlation between the mass of captured particles on the metal screen with 2.5 μm opening and that of PM2.5, the mass of particles collected on 2.5 μm opening metal screen does not always reflect the mass of PM2.5 because PM2.5 are composed mostly of submicron particles. They obtained a good cor-relation probably because the particle size distributions were similar even when PM2.5 concentrations were differ-ent. By combining these two previous works, we came up with an idea of “sieving of aerosol particles with metal screen.” If the bounce-off of particles is inevitable, we may enhance the particle bounce-off to achieve “no adhe-sion of particles.” If we could achieve “no adhesion of particles” onto metal screen, we may “sieve” aerosol par-ticles by using uniform-opening metal screen solely by the geometrical sizes of particles.
Fig. 7 shows the collection efficiency of PSL particles through the metal screen with 2.5 μm opening at various filtration velocities (Kawara et al., 2016). The stepwise solid line in this figure is the ideal separation curve if there would be no particle adhesion on the metal screen. The collection efficiencies of 2.5 μm and 3.3 μm PSL par-ticles are equal to unity at any filtration velocity, indicat-ing that the metal screen can completely trap PSL particles larger than the mesh opening. At the filtration
velocity of 0.6 m/s, as the particle size decreases, the col-lection efficiency of particles smaller than the mesh open-ing decreases discontinuously at the particle size equal to the mesh opening. At the filtration velocities of 3.0 and 10.6 m/s, the discontinuous drop in the collection effi-ciency at the particle size of mesh opening is more pro-nounced and the separation curve is very close to the ideal one.
Fig. 8 shows the collection efficiencies of PSL particles through the metal screens with 1.2, 1.8, 2.5, and 4.2 μm openings at the filtration velocity of 3.0 m/s. We can see from these figures that the collection efficiencies of parti-cles larger than the mesh opening are equal to unity, indi-cating that we can completely trap particles larger than the mesh opening and that the cutoff size can be varied by changing the mesh opening.
Although the collection efficiencies of PSL particles smaller than the mesh opening are not equal to zero, i.e., we cannot completely suppress the adhesion of particles onto the metal screen, we can roughly “sieve” aerosol particles.
Fig. 6 Shapes of metal screens.(a) df = 0.6 μm, do = 1.2 μm, (b) do = 2.5 μm, df = 1.2 μm.
Fig. 7 Separation curve of metal screen.

Myong-Hwa Lee et al. / KONA Powder and Particle Journal No. 37 (2020) 19–27
24
4.3 Centrifugal filter
One of the big drawbacks of air filter is such that we cannot change the collection efficiency once an air filter is installed when the filtration velocity is constant. Can we make the collection efficiency adjustable depending on the air quality, i.e., particle size distribution and concen-tration?
Nakajima et al. (2015) proposed a new type of filter named as “centrifugal filter” which collects aerosol parti-cles by centrifugal force together with the conventional mechanical collection mechanisms so that the centrifugal filter can adjust the collection efficiency by changing the rotation speed (Fig. 9).
The attempts to combine centrifugal force and mechan-ical collection mechanisms were made previously and there are commercially available rotary filters (Sinto-kogio, Ltd. 2015). The biggest difference between the centrifugal filter proposed by the authors and the conven-tional rotary filters is such that in the centrifugal filter the centrifugal force exerts particles in the direction perpen-dicular to the airflow. In the conventional rotary filters, the centrifugal force exerts parallel to the airflow and the targeted particle size of collection is mostly several tens of micrometers. By letting the centrifugal force act per-pendicular to the airflow, the centrifugal filter possesses many advantages over the conventional ones, i.e., depth
filtration with a long residence time of particles in the fil-ter, and no shedding of particles into the filtered air.
Fig. 10 shows the collection efficiencies of centrifugal filter against the particle diameter at the fixed filtration velocity, u = 2.5 cm/s. SUS fiber filter with diameter, df = 50 μm, was used as a filter media. As shown in the
Fig. 8 Separation curve of metal screens with various openings at filtration velocity of 3 m/s.
Fig. 9 Two types of realizing centrifugal filter.
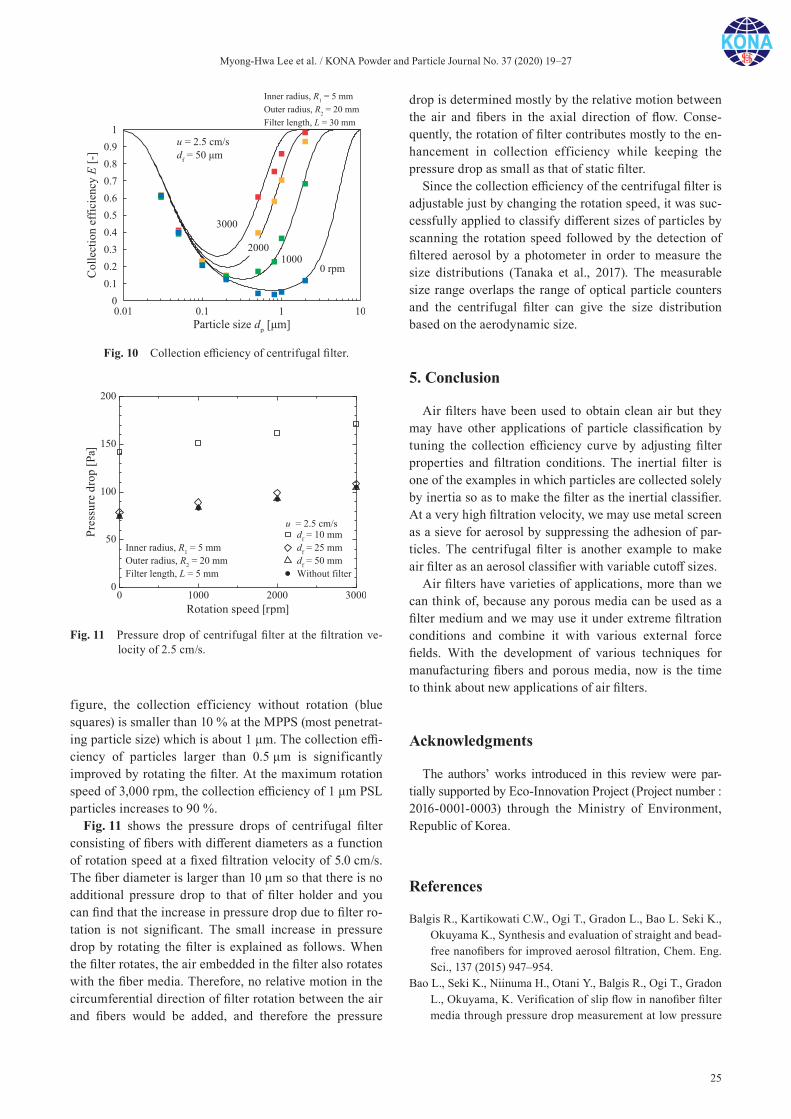
Myong-Hwa Lee et al. / KONA Powder and Particle Journal No. 37 (2020) 19–27
25
figure, the collection efficiency without rotation (blue squares) is smaller than 10 % at the MPPS (most penetrat-ing particle size) which is about 1 μm. The collection effi-ciency of particles larger than 0.5 μm is significantly improved by rotating the filter. At the maximum rotation speed of 3,000 rpm, the collection efficiency of 1 μm PSL particles increases to 90 %.
Fig. 11 shows the pressure drops of centrifugal filter consisting of fibers with different diameters as a function of rotation speed at a fixed filtration velocity of 5.0 cm/s. The fiber diameter is larger than 10 μm so that there is no additional pressure drop to that of filter holder and you can find that the increase in pressure drop due to filter ro-tation is not significant. The small increase in pressure drop by rotating the filter is explained as follows. When the filter rotates, the air embedded in the filter also rotates with the fiber media. Therefore, no relative motion in the circumferential direction of filter rotation between the air and fibers would be added, and therefore the pressure
drop is determined mostly by the relative motion between the air and fibers in the axial direction of flow. Conse-quently, the rotation of filter contributes mostly to the en-hancement in collection efficiency while keeping the pressure drop as small as that of static filter.
Since the collection efficiency of the centrifugal filter is adjustable just by changing the rotation speed, it was suc-cessfully applied to classify different sizes of particles by scanning the rotation speed followed by the detection of filtered aerosol by a photometer in order to measure the size distributions (Tanaka et al., 2017). The measurable size range overlaps the range of optical particle counters and the centrifugal filter can give the size distribution based on the aerodynamic size.
5. Conclusion
Air filters have been used to obtain clean air but they may have other applications of particle classification by tuning the collection efficiency curve by adjusting filter properties and filtration conditions. The inertial filter is one of the examples in which particles are collected solely by inertia so as to make the filter as the inertial classifier. At a very high filtration velocity, we may use metal screen as a sieve for aerosol by suppressing the adhesion of par-ticles. The centrifugal filter is another example to make air filter as an aerosol classifier with variable cutoff sizes.
Air filters have varieties of applications, more than we can think of, because any porous media can be used as a filter medium and we may use it under extreme filtration conditions and combine it with various external force fields. With the development of various techniques for manufacturing fibers and porous media, now is the time to think about new applications of air filters.
Acknowledgments
The authors’ works introduced in this review were par-tially supported by Eco-Innovation Project (Project number : 2016-0001-0003) through the Ministry of Environment, Republic of Korea.
References
Balgis R., Kartikowati C.W., Ogi T., Gradon L., Bao L. Seki K., Okuyama K., Synthesis and evaluation of straight and bead-free nanofibers for improved aerosol filtration, Chem. Eng. Sci., 137 (2015) 947–954.
Bao L., Seki K., Niinuma H., Otani Y., Balgis R., Ogi T., Gradon L., Okuyama, K. Verification of slip flow in nanofiber filter media through pressure drop measurement at low pressure
Fig. 11 Pressure drop of centrifugal filter at the filtration ve-locity of 2.5 cm/s.
Fig. 10 Collection efficiency of centrifugal filter.
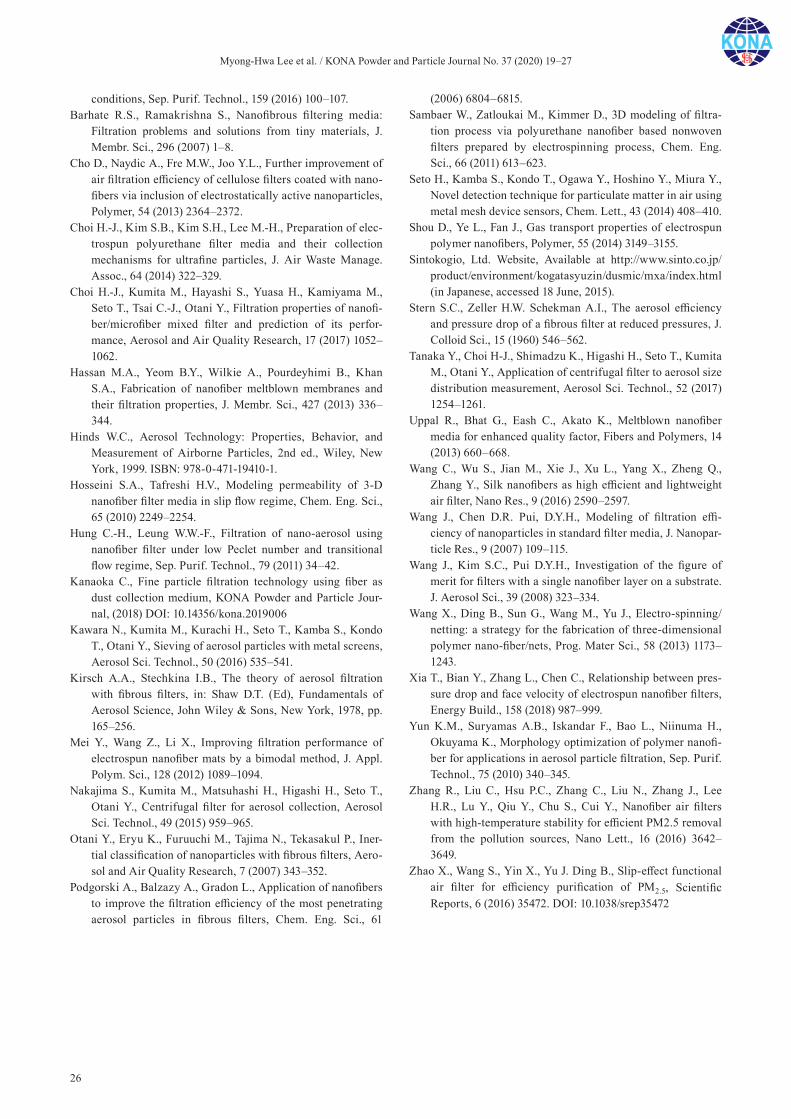
Myong-Hwa Lee et al. / KONA Powder and Particle Journal No. 37 (2020) 19–27
26
conditions, Sep. Purif. Technol., 159 (2016) 100–107.Barhate R.S., Ramakrishna S., Nanofibrous filtering media:
Filtration problems and solutions from tiny materials, J. Membr. Sci., 296 (2007) 1–8.
Cho D., Naydic A., Fre M.W., Joo Y.L., Further improvement of air filtration efficiency of cellulose filters coated with nano-fibers via inclusion of electrostatically active nanoparticles, Polymer, 54 (2013) 2364–2372.
Choi H.-J., Kim S.B., Kim S.H., Lee M.-H., Preparation of elec-trospun polyurethane filter media and their collection mechanisms for ultrafine particles, J. Air Waste Manage. Assoc., 64 (2014) 322–329.
Choi H.-J., Kumita M., Hayashi S., Yuasa H., Kamiyama M., Seto T., Tsai C.-J., Otani Y., Filtration properties of nanofi-ber/microfiber mixed filter and prediction of its perfor-mance, Aerosol and Air Quality Research, 17 (2017) 1052–1062.
Hassan M.A., Yeom B.Y., Wilkie A., Pourdeyhimi B., Khan S.A., Fabrication of nanofiber meltblown membranes and their filtration properties, J. Membr. Sci., 427 (2013) 336–344.
Hinds W.C., Aerosol Technology: Properties, Behavior, and Measurement of Airborne Particles, 2nd ed., Wiley, New York, 1999. ISBN: 978-0-471-19410-1.
Hosseini S.A., Tafreshi H.V., Modeling permeability of 3-D nanofiber filter media in slip flow regime, Chem. Eng. Sci., 65 (2010) 2249–2254.
Hung C.-H., Leung W.W.-F., Filtration of nano-aerosol using nanofiber filter under low Peclet number and transitional flow regime, Sep. Purif. Technol., 79 (2011) 34–42.
Kanaoka C., Fine particle filtration technology using fiber as dust collection medium, KONA Powder and Particle Jour-nal, (2018) DOI: 10.14356/kona.2019006
Kawara N., Kumita M., Kurachi H., Seto T., Kamba S., Kondo T., Otani Y., Sieving of aerosol particles with metal screens, Aerosol Sci. Technol., 50 (2016) 535–541.
Kirsch A.A., Stechkina I.B., The theory of aerosol filtration with fibrous filters, in: Shaw D.T. (Ed), Fundamentals of Aerosol Science, John Wiley & Sons, New York, 1978, pp. 165–256.
Mei Y., Wang Z., Li X., Improving filtration performance of electrospun nanofiber mats by a bimodal method, J. Appl. Polym. Sci., 128 (2012) 1089–1094.
Nakajima S., Kumita M., Matsuhashi H., Higashi H., Seto T., Otani Y., Centrifugal filter for aerosol collection, Aerosol Sci. Technol., 49 (2015) 959–965.
Otani Y., Eryu K., Furuuchi M., Tajima N., Tekasakul P., Iner-tial classification of nanoparticles with fibrous filters, Aero-sol and Air Quality Research, 7 (2007) 343–352.
Podgorski A., Balzazy A., Gradon L., Application of nanofibers to improve the filtration efficiency of the most penetrating aerosol particles in fibrous filters, Chem. Eng. Sci., 61
(2006) 6804–6815.Sambaer W., Zatloukai M., Kimmer D., 3D modeling of filtra-
tion process via polyurethane nanofiber based nonwoven filters prepared by electrospinning process, Chem. Eng. Sci., 66 (2011) 613–623.
Seto H., Kamba S., Kondo T., Ogawa Y., Hoshino Y., Miura Y., Novel detection technique for particulate matter in air using metal mesh device sensors, Chem. Lett., 43 (2014) 408–410.
Shou D., Ye L., Fan J., Gas transport properties of electrospun polymer nanofibers, Polymer, 55 (2014) 3149–3155.
Sintokogio, Ltd. Website, Available at http://www.sinto.co.jp/product/environment/kogatasyuzin/dusmic/mxa/index.html (in Japanese, accessed 18 June, 2015).
Stern S.C., Zeller H.W. Schekman A.I., The aerosol efficiency and pressure drop of a fibrous filter at reduced pressures, J. Colloid Sci., 15 (1960) 546–562.
Tanaka Y., Choi H-J., Shimadzu K., Higashi H., Seto T., Kumita M., Otani Y., Application of centrifugal filter to aerosol size distribution measurement, Aerosol Sci. Technol., 52 (2017) 1254–1261.
Uppal R., Bhat G., Eash C., Akato K., Meltblown nanofiber media for enhanced quality factor, Fibers and Polymers, 14 (2013) 660–668.
Wang C., Wu S., Jian M., Xie J., Xu L., Yang X., Zheng Q., Zhang Y., Silk nanofibers as high efficient and lightweight air filter, Nano Res., 9 (2016) 2590–2597.
Wang J., Chen D.R. Pui, D.Y.H., Modeling of filtration effi-ciency of nanoparticles in standard filter media, J. Nanopar-ticle Res., 9 (2007) 109–115.
Wang J., Kim S.C., Pui D.Y.H., Investigation of the figure of merit for filters with a single nanofiber layer on a substrate. J. Aerosol Sci., 39 (2008) 323–334.
Wang X., Ding B., Sun G., Wang M., Yu J., Electro-spinning/netting: a strategy for the fabrication of three-dimensional polymer nano-fiber/nets, Prog. Mater Sci., 58 (2013) 1173–1243.
Xia T., Bian Y., Zhang L., Chen C., Relationship between pres-sure drop and face velocity of electrospun nanofiber filters, Energy Build., 158 (2018) 987–999.
Yun K.M., Suryamas A.B., Iskandar F., Bao L., Niinuma H., Okuyama K., Morphology optimization of polymer nanofi-ber for applications in aerosol particle filtration, Sep. Purif. Technol., 75 (2010) 340–345.
Zhang R., Liu C., Hsu P.C., Zhang C., Liu N., Zhang J., Lee H.R., Lu Y., Qiu Y., Chu S., Cui Y., Nanofiber air filters with high-temperature stability for efficient PM2.5 removal from the pollution sources, Nano Lett., 16 (2016) 3642–3649.
Zhao X., Wang S., Yin X., Yu J. Ding B., Slip-effect functional air filter for efficiency purification of PM2.5, Scientific Reports, 6 (2016) 35472. DOI: 10.1038/srep35472
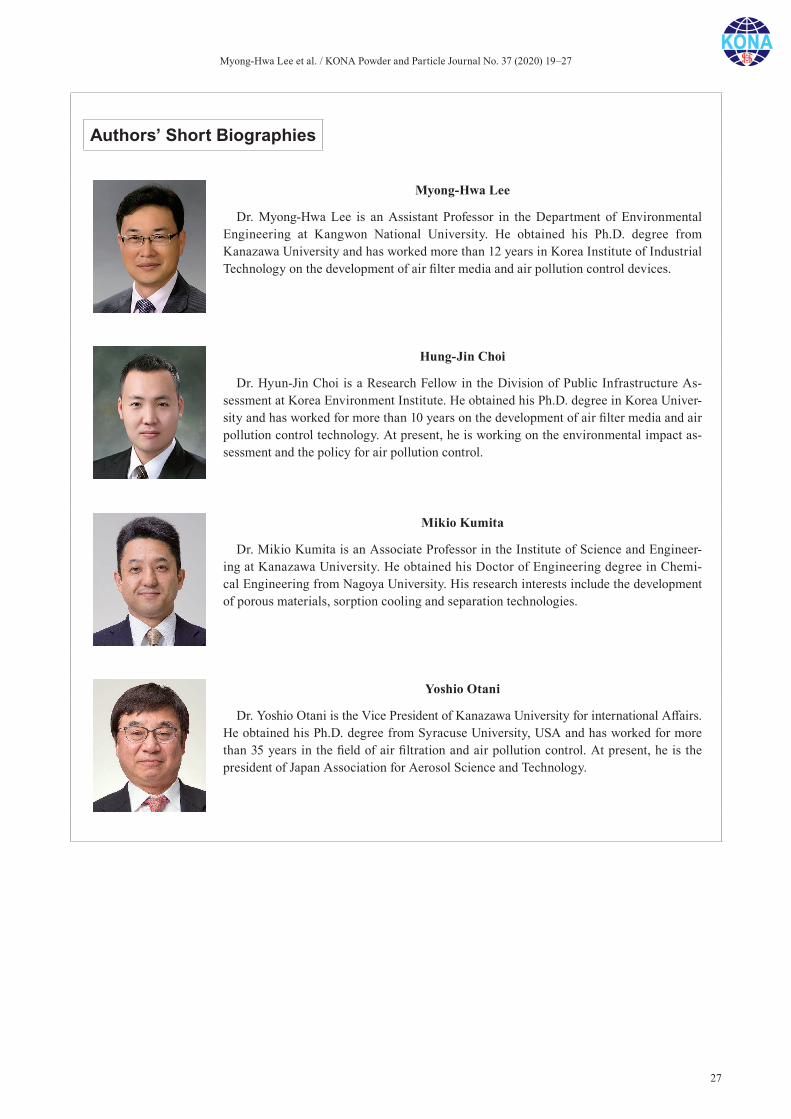
Myong-Hwa Lee et al. / KONA Powder and Particle Journal No. 37 (2020) 19–27
27
Authors’ Short Biographies
Myong-Hwa Lee
Dr. Myong-Hwa Lee is an Assistant Professor in the Department of Environmental Engineering at Kangwon National University. He obtained his Ph.D. degree from Kanazawa University and has worked more than 12 years in Korea Institute of Industrial Technology on the development of air filter media and air pollution control devices.
Hung-Jin Choi
Dr. Hyun-Jin Choi is a Research Fellow in the Division of Public Infrastructure As-sessment at Korea Environment Institute. He obtained his Ph.D. degree in Korea Univer-sity and has worked for more than 10 years on the development of air filter media and air pollution control technology. At present, he is working on the environmental impact as-sessment and the policy for air pollution control.
Mikio Kumita
Dr. Mikio Kumita is an Associate Professor in the Institute of Science and Engineer-ing at Kanazawa University. He obtained his Doctor of Engineering degree in Chemi-cal Engineering from Nagoya University. His research interests include the development of porous materials, sorption cooling and separation technologies.
Yoshio Otani
Dr. Yoshio Otani is the Vice President of Kanazawa University for international Affairs. He obtained his Ph.D. degree from Syracuse University, USA and has worked for more than 35 years in the field of air filtration and air pollution control. At present, he is the president of Japan Association for Aerosol Science and Technology.
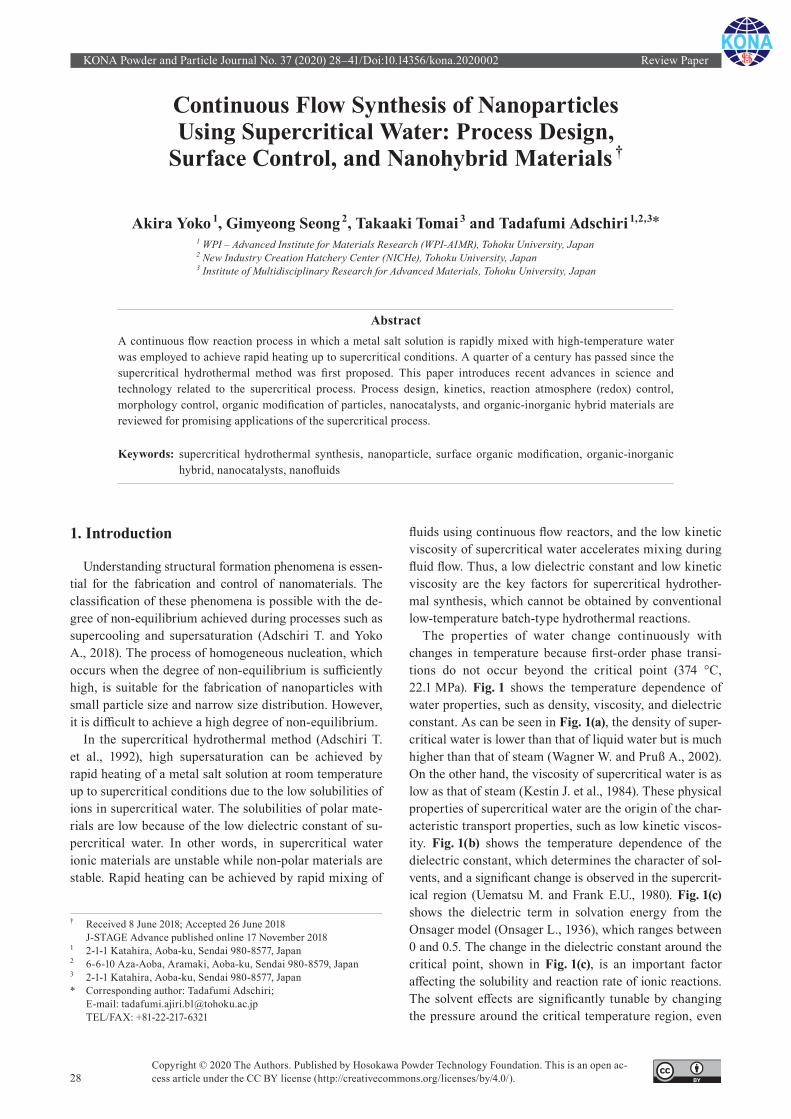
KONA Powder and Particle Journal No. 37 (2020) 28–41/Doi:10.14356/kona.2020002 Review Paper
28Copyright © 2020 The Authors. Published by Hosokawa Powder Technology Foundation. This is an open ac-cess article under the CC BY license (http://creativecommons.org/licenses/by/4.0/).
Continuous Flow Synthesis of Nanoparticles Using Supercritical Water: Process Design,
Surface Control, and Nanohybrid Materials †
Akira Yoko 1, Gimyeong Seong 2, Takaaki Tomai 3 and Tadafumi Adschiri 1,2,3*1 WPI – Advanced Institute for Materials Research (WPI-AIMR), Tohoku University, Japan2 New Industry Creation Hatchery Center (NICHe), Tohoku University, Japan3 Institute of Multidisciplinary Research for Advanced Materials, Tohoku University, Japan
AbstractA continuous flow reaction process in which a metal salt solution is rapidly mixed with high-temperature water was employed to achieve rapid heating up to supercritical conditions. A quarter of a century has passed since the supercritical hydrothermal method was first proposed. This paper introduces recent advances in science and technology related to the supercritical process. Process design, kinetics, reaction atmosphere (redox) control, morphology control, organic modification of particles, nanocatalysts, and organic-inorganic hybrid materials are reviewed for promising applications of the supercritical process.
Keywords: supercritical hydrothermal synthesis, nanoparticle, surface organic modification, organic-inorganic hybrid, nanocatalysts, nanofluids
1. Introduction
Understanding structural formation phenomena is essen-tial for the fabrication and control of nanomaterials. The classification of these phenomena is possible with the de-gree of non-equilibrium achieved during processes such as supercooling and supersaturation (Adschiri T. and Yoko A., 2018). The process of homogeneous nucleation, which occurs when the degree of non-equilibrium is sufficiently high, is suitable for the fabrication of nanoparticles with small particle size and narrow size distribution. However, it is difficult to achieve a high degree of non-equilibrium.
In the supercritical hydrothermal method (Adschiri T. et al., 1992), high supersaturation can be achieved by rapid heating of a metal salt solution at room temperature up to supercritical conditions due to the low solubilities of ions in supercritical water. The solubilities of polar mate-rials are low because of the low dielectric constant of su-percritical water. In other words, in supercritical water ionic materials are unstable while non-polar materials are stable. Rapid heating can be achieved by rapid mixing of
fluids using continuous flow reactors, and the low kinetic viscosity of supercritical water accelerates mixing during fluid flow. Thus, a low dielectric constant and low kinetic viscosity are the key factors for supercritical hydrother-mal synthesis, which cannot be obtained by conventional low-temperature batch-type hydrothermal reactions.
The properties of water change continuously with changes in temperature because first-order phase transi-tions do not occur beyond the critical point (374 °C, 22.1 MPa). Fig. 1 shows the temperature dependence of water properties, such as density, viscosity, and dielectric constant. As can be seen in Fig. 1(a), the density of super-critical water is lower than that of liquid water but is much higher than that of steam (Wagner W. and Pruß A., 2002). On the other hand, the viscosity of supercritical water is as low as that of steam (Kestin J. et al., 1984). These physical properties of supercritical water are the origin of the char-acteristic transport properties, such as low kinetic viscos-ity. Fig. 1(b) shows the temperature dependence of the dielectric constant, which determines the character of sol-vents, and a significant change is observed in the supercrit-ical region (Uematsu M. and Frank E.U., 1980). Fig. 1(c) shows the dielectric term in solvation energy from the Onsager model (Onsager L., 1936), which ranges between 0 and 0.5. The change in the dielectric constant around the critical point, shown in Fig. 1(c), is an important factor affecting the solubility and reaction rate of ionic reactions. The solvent effects are significantly tunable by changing the pressure around the critical temperature region, even
† Received 8 June 2018; Accepted 26 June 2018 J-STAGE Advance published online 17 November 2018
1 2-1-1 Katahira, Aoba-ku, Sendai 980-8577, Japan2 6-6-10 Aza-Aoba, Aramaki, Aoba-ku, Sendai 980-8579, Japan3 2-1-1 Katahira, Aoba-ku, Sendai 980-8577, Japan* Corresponding author: Tadafumi Adschiri; E-mail: [email protected] TEL/FAX: +81-22-217-6321
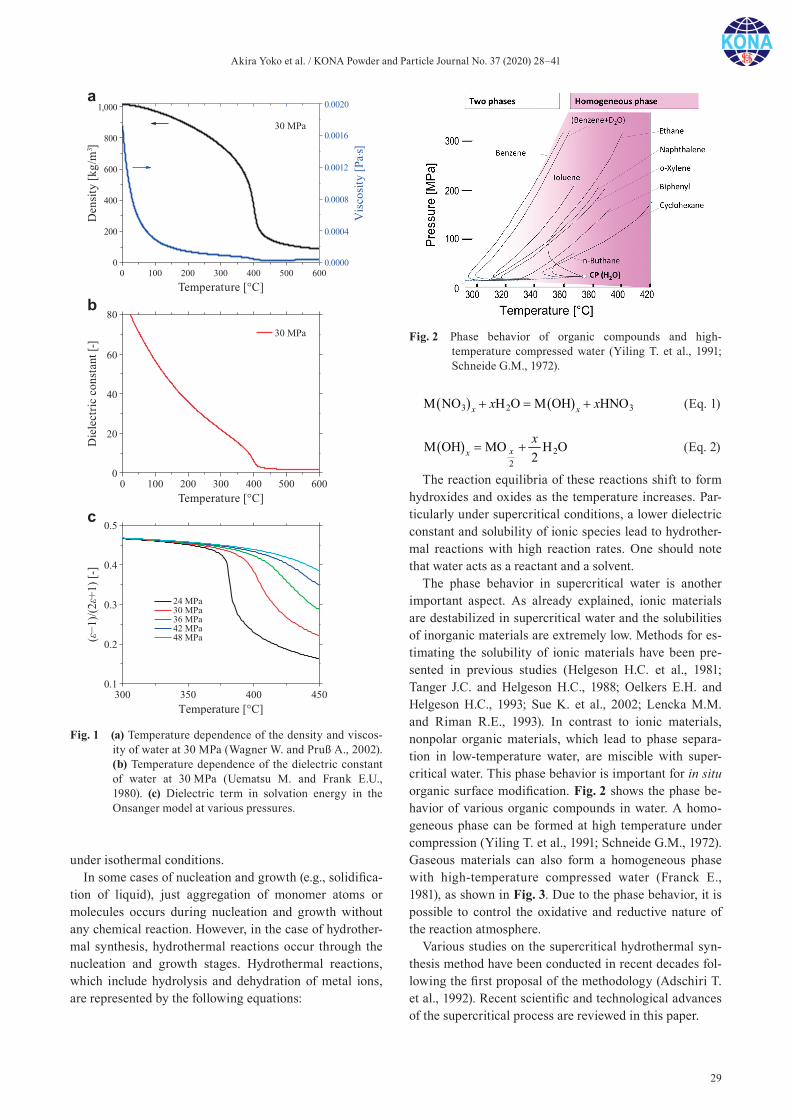
Akira Yoko et al. / KONA Powder and Particle Journal No. 37 (2020) 28–41
29
under isothermal conditions.In some cases of nucleation and growth (e.g., solidifica-
tion of liquid), just aggregation of monomer atoms or molecules occurs during nucleation and growth without any chemical reaction. However, in the case of hydrother-mal synthesis, hydrothermal reactions occur through the nucleation and growth stages. Hydrothermal reactions, which include hydrolysis and dehydration of metal ions, are represented by the following equations:
3 2 3M NO H O M OH HNOx xx x (Eq. 1)
22
M OH MO H O2xxx
(Eq. 2)
The reaction equilibria of these reactions shift to form hydroxides and oxides as the temperature increases. Par-ticularly under supercritical conditions, a lower dielectric constant and solubility of ionic species lead to hydrother-mal reactions with high reaction rates. One should note that water acts as a reactant and a solvent.
The phase behavior in supercritical water is another important aspect. As already explained, ionic materials are destabilized in supercritical water and the solubilities of inorganic materials are extremely low. Methods for es-timating the solubility of ionic materials have been pre-sented in previous studies (Helgeson H.C. et al., 1981; Tanger J.C. and Helgeson H.C., 1988; Oelkers E.H. and Helgeson H.C., 1993; Sue K. et al., 2002; Lencka M.M. and Riman R.E., 1993). In contrast to ionic materials, nonpolar organic materials, which lead to phase separa-tion in low-temperature water, are miscible with super-critical water. This phase behavior is important for in situ organic surface modification. Fig. 2 shows the phase be-havior of various organic compounds in water. A homo-geneous phase can be formed at high temperature under compression (Yiling T. et al., 1991; Schneide G.M., 1972). Gaseous materials can also form a homogeneous phase with high-temperature compressed water (Franck E., 1981), as shown in Fig. 3. Due to the phase behavior, it is possible to control the oxidative and reductive nature of the reaction atmosphere.
Various studies on the supercritical hydrothermal syn-thesis method have been conducted in recent decades fol-lowing the first proposal of the methodology (Adschiri T. et al., 1992). Recent scientific and technological advances of the supercritical process are reviewed in this paper.
Fig. 1 (a) Temperature dependence of the density and viscos-ity of water at 30 MPa (Wagner W. and Pruß A., 2002). (b) Temperature dependence of the dielectric constant of water at 30 MPa (Uematsu M. and Frank E.U., 1980). (c) Dielectric term in solvation energy in the Onsanger model at various pressures.
Fig. 2 Phase behavior of organic compounds and high- temperature compressed water (Yiling T. et al., 1991; Schneide G.M., 1972).
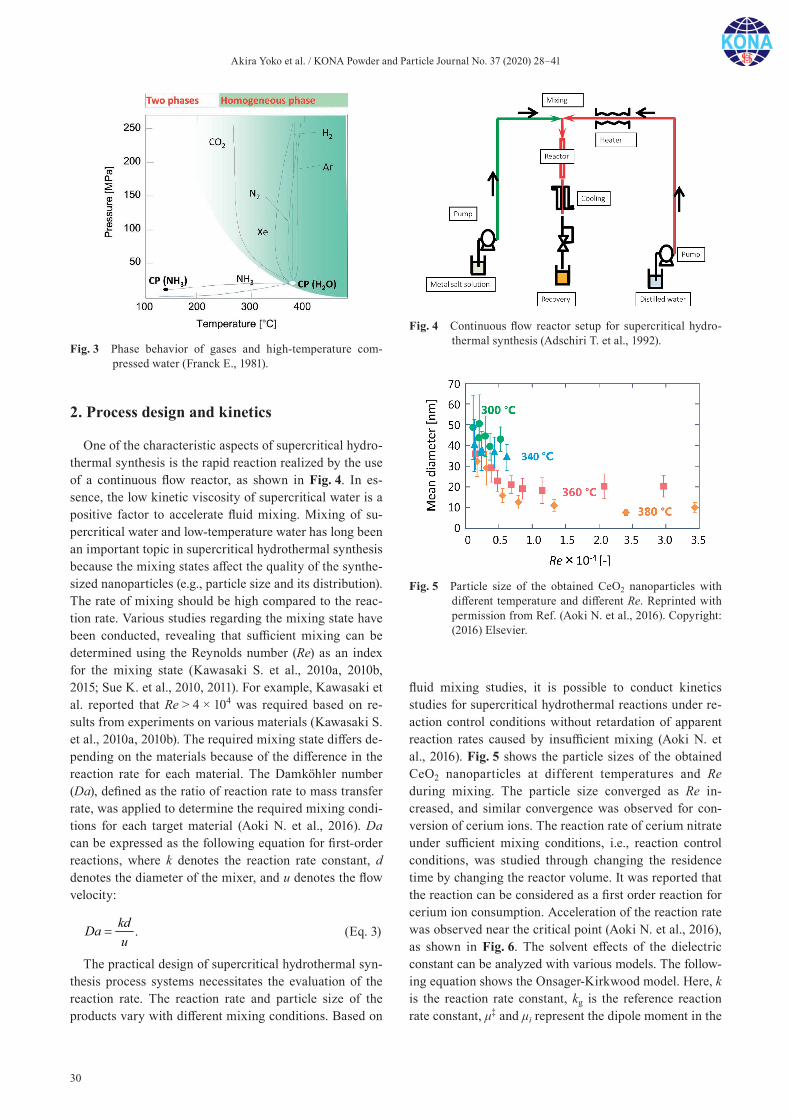
Akira Yoko et al. / KONA Powder and Particle Journal No. 37 (2020) 28–41
30
2. Process design and kinetics
One of the characteristic aspects of supercritical hydro-thermal synthesis is the rapid reaction realized by the use of a continuous flow reactor, as shown in Fig. 4. In es-sence, the low kinetic viscosity of supercritical water is a positive factor to accelerate fluid mixing. Mixing of su-percritical water and low-temperature water has long been an important topic in supercritical hydrothermal synthesis because the mixing states affect the quality of the synthe-sized nanoparticles (e.g., particle size and its distribution). The rate of mixing should be high compared to the reac-tion rate. Various studies regarding the mixing state have been conducted, revealing that sufficient mixing can be determined using the Reynolds number (Re) as an index for the mixing state (Kawasaki S. et al., 2010a, 2010b, 2015; Sue K. et al., 2010, 2011). For example, Kawasaki et al. reported that Re > 4 × 10⁴ was required based on re-sults from experiments on various materials (Kawasaki S. et al., 2010a, 2010b). The required mixing state differs de-pending on the materials because of the difference in the reaction rate for each material. The Damkӧhler number (Da), defined as the ratio of reaction rate to mass transfer rate, was applied to determine the required mixing condi-tions for each target material (Aoki N. et al., 2016). Da can be expressed as the following equation for first-order reactions, where k denotes the reaction rate constant, d denotes the diameter of the mixer, and u denotes the flow velocity:
kdDau
. (Eq. 3)
The practical design of supercritical hydrothermal syn-thesis process systems necessitates the evaluation of the reaction rate. The reaction rate and particle size of the products vary with different mixing conditions. Based on
fluid mixing studies, it is possible to conduct kinetics studies for supercritical hydrothermal reactions under re-action control conditions without retardation of apparent reaction rates caused by insufficient mixing (Aoki N. et al., 2016). Fig. 5 shows the particle sizes of the obtained CeO2 nanoparticles at different temperatures and Re during mixing. The particle size converged as Re in-creased, and similar convergence was observed for con-version of cerium ions. The reaction rate of cerium nitrate under sufficient mixing conditions, i.e., reaction control conditions, was studied through changing the residence time by changing the reactor volume. It was reported that the reaction can be considered as a first order reaction for cerium ion consumption. Acceleration of the reaction rate was observed near the critical point (Aoki N. et al., 2016), as shown in Fig. 6. The solvent effects of the dielectric constant can be analyzed with various models. The follow-ing equation shows the Onsager-Kirkwood model. Here, k is the reaction rate constant, kg is the reference reaction rate constant, μ‡ and μi represent the dipole moment in the
Fig. 3 Phase behavior of gases and high-temperature com-pressed water (Franck E., 1981).
Fig. 5 Particle size of the obtained CeO2 nanoparticles with different temperature and different Re. Reprinted with permission from Ref. (Aoki N. et al., 2016). Copyright: (2016) Elsevier.
Fig. 4 Continuous flow reactor setup for supercritical hydro-thermal synthesis (Adschiri T. et al., 1992).
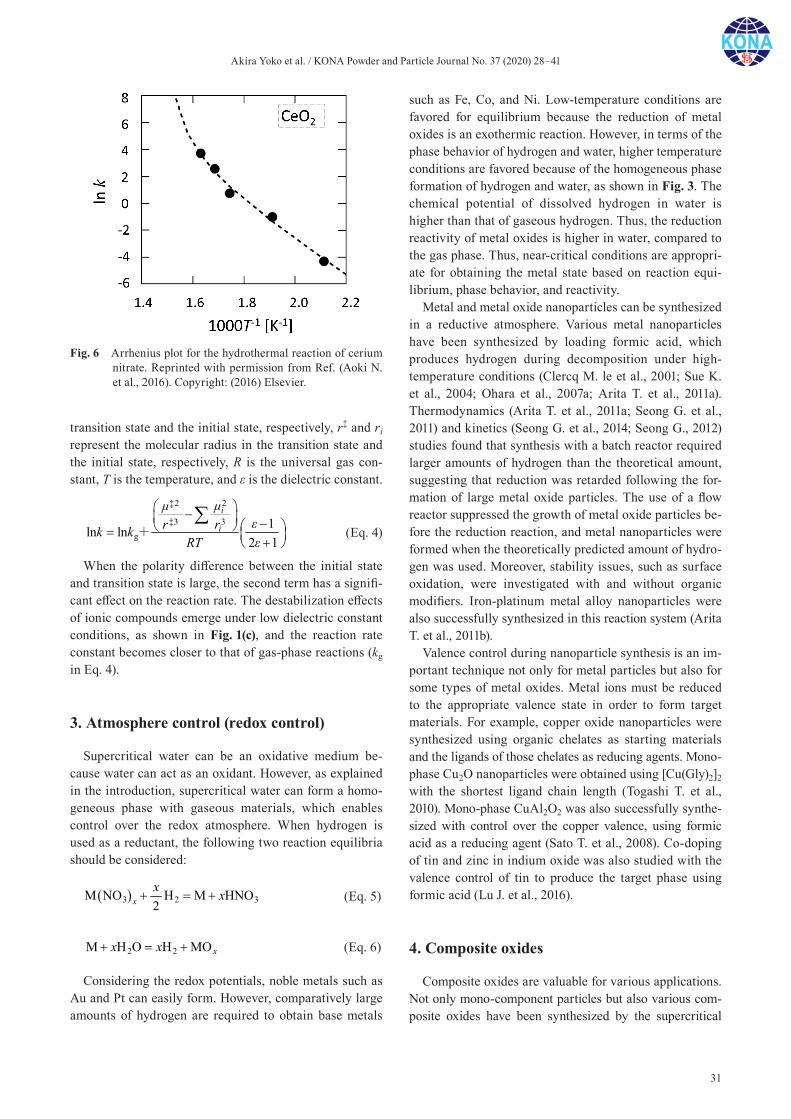
Akira Yoko et al. / KONA Powder and Particle Journal No. 37 (2020) 28–41
31
transition state and the initial state, respectively, r‡ and ri represent the molecular radius in the transition state and the initial state, respectively, R is the universal gas con-stant, T is the temperature, and ε is the dielectric constant.
‡2 2
‡3 3 g
1ln ln2 1
i
i
μ μεr rk k
RT ε
+
(Eq. 4)
When the polarity difference between the initial state and transition state is large, the second term has a signifi-cant effect on the reaction rate. The destabilization effects of ionic compounds emerge under low dielectric constant conditions, as shown in Fig. 1(c), and the reaction rate constant becomes closer to that of gas-phase reactions (kg in Eq. 4).
3. Atmosphere control (redox control)
Supercritical water can be an oxidative medium be-cause water can act as an oxidant. However, as explained in the introduction, supercritical water can form a homo-geneous phase with gaseous materials, which enables control over the redox atmosphere. When hydrogen is used as a reductant, the following two reaction equilibria should be considered:
3 2 3M NO H M HNO2xx x (Eq. 5)
2 2M H O H MO xx x (Eq. 6)
Considering the redox potentials, noble metals such as Au and Pt can easily form. However, comparatively large amounts of hydrogen are required to obtain base metals
such as Fe, Co, and Ni. Low-temperature conditions are favored for equilibrium because the reduction of metal oxides is an exothermic reaction. However, in terms of the phase behavior of hydrogen and water, higher temperature conditions are favored because of the homogeneous phase formation of hydrogen and water, as shown in Fig. 3. The chemical potential of dissolved hydrogen in water is higher than that of gaseous hydrogen. Thus, the reduction reactivity of metal oxides is higher in water, compared to the gas phase. Thus, near-critical conditions are appropri-ate for obtaining the metal state based on reaction equi-librium, phase behavior, and reactivity.
Metal and metal oxide nanoparticles can be synthesized in a reductive atmosphere. Various metal nanoparticles have been synthesized by loading formic acid, which produces hydrogen during decomposition under high- temperature conditions (Clercq M. le et al., 2001; Sue K. et al., 2004; Ohara et al., 2007a; Arita T. et al., 2011a). Thermodynamics (Arita T. et al., 2011a; Seong G. et al., 2011) and kinetics (Seong G. et al., 2014; Seong G., 2012) studies found that synthesis with a batch reactor required larger amounts of hydrogen than the theoretical amount, suggesting that reduction was retarded following the for-mation of large metal oxide particles. The use of a flow reactor suppressed the growth of metal oxide particles be-fore the reduction reaction, and metal nanoparticles were formed when the theoretically predicted amount of hydro-gen was used. Moreover, stability issues, such as surface oxidation, were investigated with and without organic modifiers. Iron-platinum metal alloy nanoparticles were also successfully synthesized in this reaction system (Arita T. et al., 2011b).
Valence control during nanoparticle synthesis is an im-portant technique not only for metal particles but also for some types of metal oxides. Metal ions must be reduced to the appropriate valence state in order to form target materials. For example, copper oxide nanoparticles were synthesized using organic chelates as starting materials and the ligands of those chelates as reducing agents. Mono- phase Cu2O nanoparticles were obtained using [Cu(Gly)2]2 with the shortest ligand chain length (Togashi T. et al., 2010). Mono-phase CuAl2O2 was also successfully synthe-sized with control over the copper valence, using formic acid as a reducing agent (Sato T. et al., 2008). Co-doping of tin and zinc in indium oxide was also studied with the valence control of tin to produce the target phase using formic acid (Lu J. et al., 2016).
4. Composite oxides
Composite oxides are valuable for various applications. Not only mono-component particles but also various com-posite oxides have been synthesized by the supercritical
Fig. 6 Arrhenius plot for the hydrothermal reaction of cerium nitrate. Reprinted with permission from Ref. (Aoki N. et al., 2016). Copyright: (2016) Elsevier.
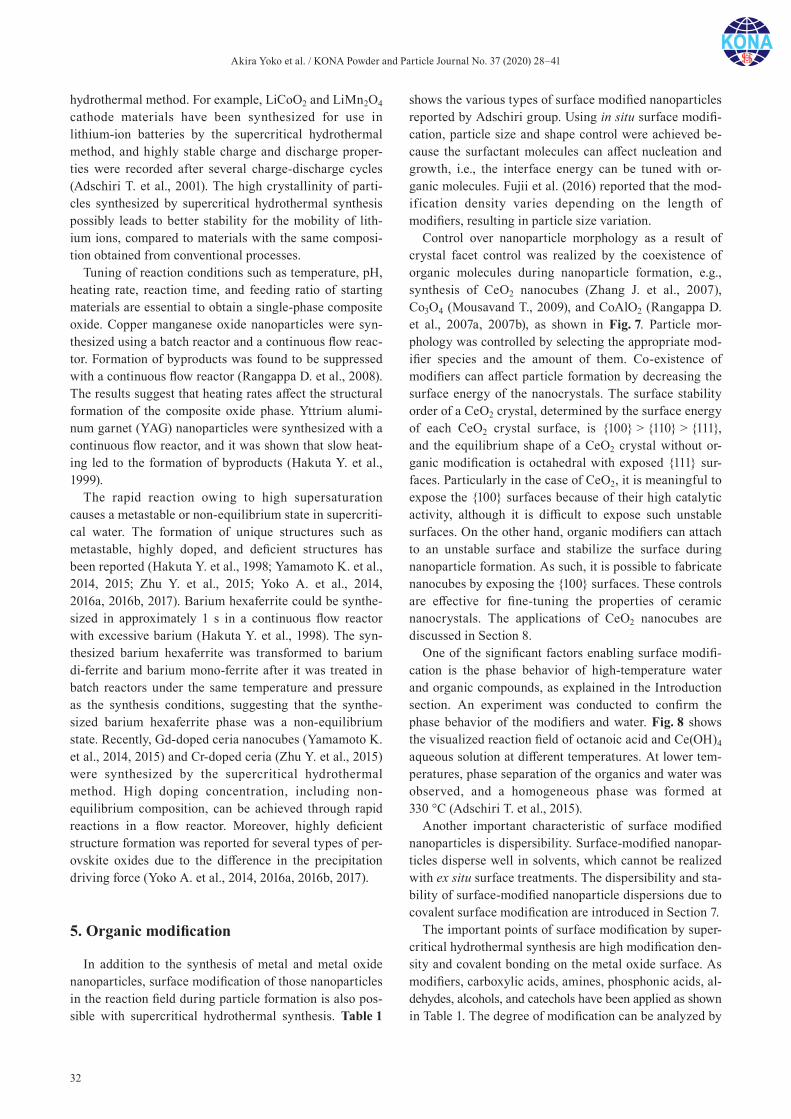
Akira Yoko et al. / KONA Powder and Particle Journal No. 37 (2020) 28–41
32
hydrothermal method. For example, LiCoO2 and LiMn2O4 cathode materials have been synthesized for use in lithium- ion batteries by the supercritical hydrothermal method, and highly stable charge and discharge proper-ties were recorded after several charge-discharge cycles (Adschiri T. et al., 2001). The high crystallinity of parti-cles synthesized by supercritical hydrothermal synthesis possibly leads to better stability for the mobility of lith-ium ions, compared to materials with the same composi-tion obtained from conventional processes.
Tuning of reaction conditions such as temperature, pH, heating rate, reaction time, and feeding ratio of starting materials are essential to obtain a single-phase composite oxide. Copper manganese oxide nanoparticles were syn-thesized using a batch reactor and a continuous flow reac-tor. Formation of byproducts was found to be suppressed with a continuous flow reactor (Rangappa D. et al., 2008). The results suggest that heating rates affect the structural formation of the composite oxide phase. Yttrium alumi-num garnet (YAG) nanoparticles were synthesized with a continuous flow reactor, and it was shown that slow heat-ing led to the formation of byproducts (Hakuta Y. et al., 1999).
The rapid reaction owing to high supersaturation causes a metastable or non-equilibrium state in supercriti-cal water. The formation of unique structures such as metastable, highly doped, and deficient structures has been reported (Hakuta Y. et al., 1998; Yamamoto K. et al., 2014, 2015; Zhu Y. et al., 2015; Yoko A. et al., 2014, 2016a, 2016b, 2017). Barium hexaferrite could be synthe-sized in approximately 1 s in a continuous flow reactor with excessive barium (Hakuta Y. et al., 1998). The syn-thesized barium hexaferrite was transformed to barium di-ferrite and barium mono-ferrite after it was treated in batch reactors under the same temperature and pressure as the synthesis conditions, suggesting that the synthe-sized barium hexaferrite phase was a non-equilibrium state. Recently, Gd-doped ceria nanocubes (Yamamoto K. et al., 2014, 2015) and Cr-doped ceria (Zhu Y. et al., 2015) were synthesized by the supercritical hydrothermal method. High doping concentration, including non- equilibrium composition, can be achieved through rapid reactions in a flow reactor. Moreover, highly deficient structure formation was reported for several types of per-ovskite oxides due to the difference in the precipitation driving force (Yoko A. et al., 2014, 2016a, 2016b, 2017).
5. Organic modification
In addition to the synthesis of metal and metal oxide nanoparticles, surface modification of those nanoparticles in the reaction field during particle formation is also pos-sible with supercritical hydrothermal synthesis. Table 1
shows the various types of surface modified nanoparticles reported by Adschiri group. Using in situ surface modifi-cation, particle size and shape control were achieved be-cause the surfactant molecules can affect nucleation and growth, i.e., the interface energy can be tuned with or-ganic molecules. Fujii et al. (2016) reported that the mod-ification density varies depending on the length of modifiers, resulting in particle size variation.
Control over nanoparticle morphology as a result of crystal facet control was realized by the coexistence of organic molecules during nanoparticle formation, e.g., synthesis of CeO2 nanocubes (Zhang J. et al., 2007), Co3O4 (Mousavand T., 2009), and CoAlO2 (Rangappa D. et al., 2007a, 2007b), as shown in Fig. 7. Particle mor-phology was controlled by selecting the appropriate mod-ifier species and the amount of them. Co-existence of modifiers can affect particle formation by decreasing the surface energy of the nanocrystals. The surface stability order of a CeO2 crystal, determined by the surface energy of each CeO2 crystal surface, is 100 > 110 > 111, and the equilibrium shape of a CeO2 crystal without or-ganic modification is octahedral with exposed 111 sur-faces. Particularly in the case of CeO2, it is meaningful to expose the 100 surfaces because of their high catalytic activity, although it is difficult to expose such unstable surfaces. On the other hand, organic modifiers can attach to an unstable surface and stabilize the surface during nanoparticle formation. As such, it is possible to fabricate nanocubes by exposing the 100 surfaces. These controls are effective for fine-tuning the properties of ceramic nanocrystals. The applications of CeO2 nanocubes are discussed in Section 8.
One of the significant factors enabling surface modifi-cation is the phase behavior of high-temperature water and organic compounds, as explained in the Introduction section. An experiment was conducted to confirm the phase behavior of the modifiers and water. Fig. 8 shows the visualized reaction field of octanoic acid and Ce(OH)4 aqueous solution at different temperatures. At lower tem-peratures, phase separation of the organics and water was observed, and a homogeneous phase was formed at 330 °C (Adschiri T. et al., 2015).
Another important characteristic of surface modified nanoparticles is dispersibility. Surface-modified nanopar-ticles disperse well in solvents, which cannot be realized with ex situ surface treatments. The dispersibility and sta-bility of surface-modified nanoparticle dispersions due to covalent surface modification are introduced in Section 7.
The important points of surface modification by super-critical hydrothermal synthesis are high modification den-sity and covalent bonding on the metal oxide surface. As modifiers, carboxylic acids, amines, phosphonic acids, al-dehydes, alcohols, and catechols have been applied as shown in Table 1. The degree of modification can be analyzed by
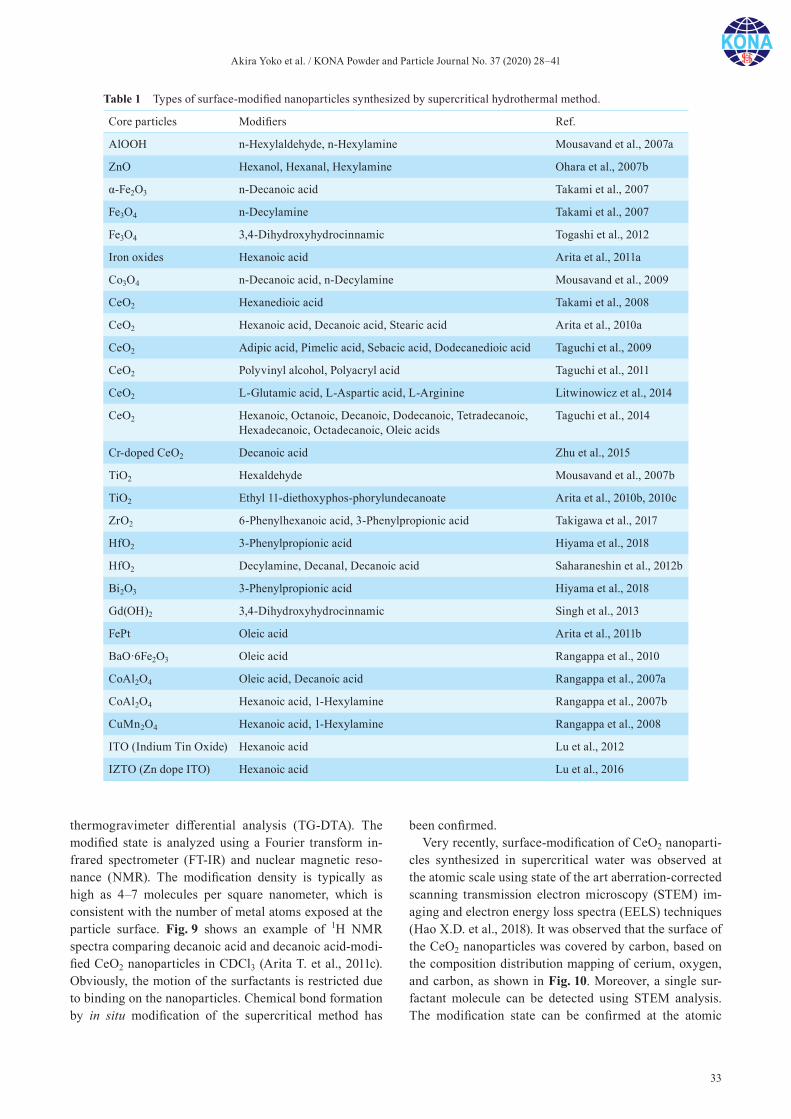
Akira Yoko et al. / KONA Powder and Particle Journal No. 37 (2020) 28–41
33
thermogravimeter differential analysis (TG-DTA). The modified state is analyzed using a Fourier transform in-frared spectrometer (FT-IR) and nuclear magnetic reso-nance (NMR). The modification density is typically as high as 4–7 molecules per square nanometer, which is consistent with the number of metal atoms exposed at the particle surface. Fig. 9 shows an example of 1H NMR spectra comparing decanoic acid and decanoic acid-modi-fied CeO2 nanoparticles in CDCl3 (Arita T. et al., 2011c). Obviously, the motion of the surfactants is restricted due to binding on the nanoparticles. Chemical bond formation by in situ modification of the supercritical method has
been confirmed.Very recently, surface-modification of CeO2 nanoparti-
cles synthesized in supercritical water was observed at the atomic scale using state of the art aberration-corrected scanning transmission electron microscopy (STEM) im-aging and electron energy loss spectra (EELS) techniques (Hao X.D. et al., 2018). It was observed that the surface of the CeO2 nanoparticles was covered by carbon, based on the composition distribution mapping of cerium, oxygen, and carbon, as shown in Fig. 10. Moreover, a single sur-factant molecule can be detected using STEM analysis. The modification state can be confirmed at the atomic
Table 1 Types of surface-modified nanoparticles synthesized by supercritical hydrothermal method.
Core particles Modifiers Ref.
AlOOH n-Hexylaldehyde, n-Hexylamine Mousavand et al., 2007a
ZnO Hexanol, Hexanal, Hexylamine Ohara et al., 2007b
α-Fe2O3 n-Decanoic acid Takami et al., 2007
Fe3O4 n-Decylamine Takami et al., 2007
Fe3O4 3,4-Dihydroxyhydrocinnamic Togashi et al., 2012
Iron oxides Hexanoic acid Arita et al., 2011a
Co3O4 n-Decanoic acid, n-Decylamine Mousavand et al., 2009
CeO2 Hexanedioic acid Takami et al., 2008
CeO2 Hexanoic acid, Decanoic acid, Stearic acid Arita et al., 2010a
CeO2 Adipic acid, Pimelic acid, Sebacic acid, Dodecanedioic acid Taguchi et al., 2009
CeO2 Polyvinyl alcohol, Polyacryl acid Taguchi et al., 2011
CeO2 L-Glutamic acid, L-Aspartic acid, L-Arginine Litwinowicz et al., 2014
CeO2 Hexanoic, Octanoic, Decanoic, Dodecanoic, Tetradecanoic, Hexadecanoic, Octadecanoic, Oleic acids
Taguchi et al., 2014
Cr-doped CeO2 Decanoic acid Zhu et al., 2015
TiO2 Hexaldehyde Mousavand et al., 2007b
TiO2 Ethyl 11-diethoxyphos-phorylundecanoate Arita et al., 2010b, 2010c
ZrO2 6-Phenylhexanoic acid, 3-Phenylpropionic acid Takigawa et al., 2017
HfO2 3-Phenylpropionic acid Hiyama et al., 2018
HfO2 Decylamine, Decanal, Decanoic acid Saharaneshin et al., 2012b
Bi2O3 3-Phenylpropionic acid Hiyama et al., 2018
Gd(OH)2 3,4-Dihydroxyhydrocinnamic Singh et al., 2013
FePt Oleic acid Arita et al., 2011b
BaO·6Fe2O3 Oleic acid Rangappa et al., 2010
CoAl2O4 Oleic acid, Decanoic acid Rangappa et al., 2007a
CoAl2O4 Hexanoic acid, 1-Hexylamine Rangappa et al., 2007b
CuMn2O4 Hexanoic acid, 1-Hexylamine Rangappa et al., 2008
ITO (Indium Tin Oxide) Hexanoic acid Lu et al., 2012
IZTO (Zn dope ITO) Hexanoic acid Lu et al., 2016

Akira Yoko et al. / KONA Powder and Particle Journal No. 37 (2020) 28–41
34
level by direct observation.The effects of modifiers on nanoparticle structure are
also an interesting and significant topic. Stabilization of oxygen vacancies due to the existence of organic modifi-ers was reported for CeO2 (Zhang J. et al, 2011a). The va-lence state of cations can also be affected by surface modifiers. This result suggests that the effects of modifi-ers on nanoparticle structure cannot be neglected in some cases.
6. Cluster formation
Arranging individual nanocrystals into superlattices is a challenging topic for applications of nanoparticles. Cluster synthesis has been achieved using the supercriti-cal method. Modifiers with functional groups on both ends of a molecular chain, i.e., bifunctional compounds
Fig. 7 TEM images of CeO2 nanocubes with and without modifiers (Zhang J. et al., 2007), Co3O4 nanocubes (Mousavand T. et al., 2009), BaFe12O19 nanocubes (Rangappa D. et al., 2010), and CuAlO2 nanocubes (Rangappa D. et al., 2007a, 2007b).
Fig. 8 Visualized phase behavior of modifiers and aqueous Ce(OH)4 with increasing temperature (Adschiri T. et al., 2015).
Fig. 9 1H NMR (400 MHz) spectra of decanoic acid-modified CeO2 nanoparticles (5 mg) and free decanoic acid (1 mg) in 500 μL of CDCl3. The numbering of carbon is indicated in the upper left corner. Reprinted with permission from Ref. (Arita T. et al., 2011c). Copyright: (2011) American Chemical Society.
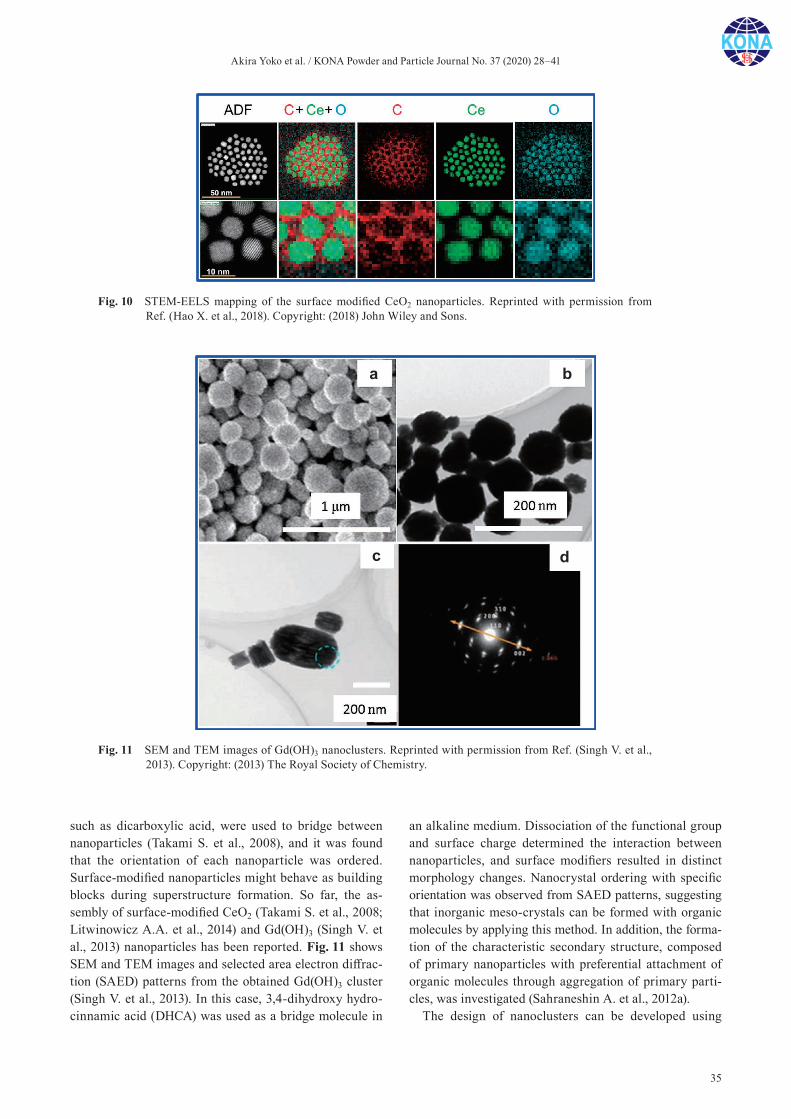
Akira Yoko et al. / KONA Powder and Particle Journal No. 37 (2020) 28–41
35
such as dicarboxylic acid, were used to bridge between nanoparticles (Takami S. et al., 2008), and it was found that the orientation of each nanoparticle was ordered. Surface-modified nanoparticles might behave as building blocks during superstructure formation. So far, the as-sembly of surface-modified CeO2 (Takami S. et al., 2008; Litwinowicz A.A. et al., 2014) and Gd(OH)3 (Singh V. et al., 2013) nanoparticles has been reported. Fig. 11 shows SEM and TEM images and selected area electron diffrac-tion (SAED) patterns from the obtained Gd(OH)3 cluster (Singh V. et al., 2013). In this case, 3,4-dihydroxy hydro-cinnamic acid (DHCA) was used as a bridge molecule in
an alkaline medium. Dissociation of the functional group and surface charge determined the interaction between nanoparticles, and surface modifiers resulted in distinct morphology changes. Nanocrystal ordering with specific orientation was observed from SAED patterns, suggesting that inorganic meso-crystals can be formed with organic molecules by applying this method. In addition, the forma-tion of the characteristic secondary structure, composed of primary nanoparticles with preferential attachment of organic molecules through aggregation of primary parti-cles, was investigated (Sahraneshin A. et al., 2012a).
The design of nanoclusters can be developed using
Fig. 10 STEM-EELS mapping of the surface modified CeO2 nanoparticles. Reprinted with permission from Ref. (Hao X. et al., 2018). Copyright: (2018) John Wiley and Sons.
Fig. 11 SEM and TEM images of Gd(OH)3 nanoclusters. Reprinted with permission from Ref. (Singh V. et al., 2013). Copyright: (2013) The Royal Society of Chemistry.
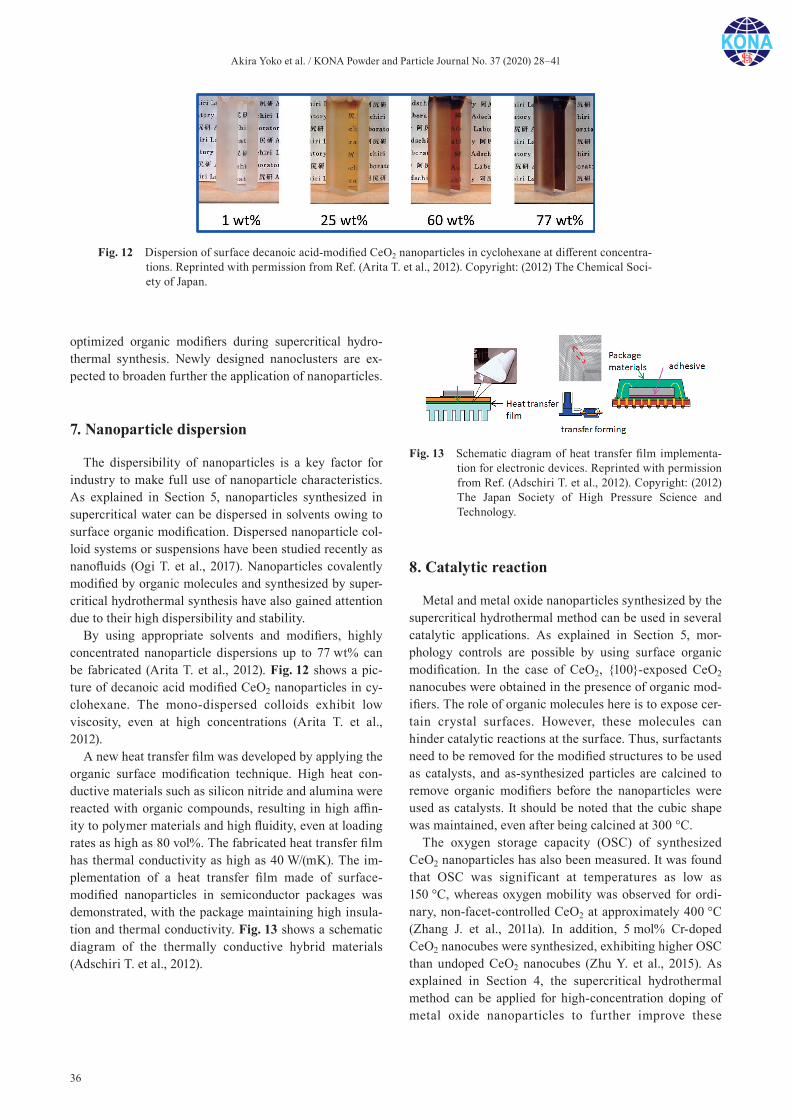
Akira Yoko et al. / KONA Powder and Particle Journal No. 37 (2020) 28–41
36
optimized organic modifiers during supercritical hydro-thermal synthesis. Newly designed nanoclusters are ex-pected to broaden further the application of nanoparticles.
7. Nanoparticle dispersion
The dispersibility of nanoparticles is a key factor for industry to make full use of nanoparticle characteristics. As explained in Section 5, nanoparticles synthesized in supercritical water can be dispersed in solvents owing to surface organic modification. Dispersed nanoparticle col-loid systems or suspensions have been studied recently as nanofluids (Ogi T. et al., 2017). Nanoparticles covalently modified by organic molecules and synthesized by super-critical hydrothermal synthesis have also gained attention due to their high dispersibility and stability.
By using appropriate solvents and modifiers, highly concentrated nanoparticle dispersions up to 77 wt% can be fabricated (Arita T. et al., 2012). Fig. 12 shows a pic-ture of decanoic acid modified CeO2 nanoparticles in cy-clohexane. The mono-dispersed colloids exhibit low viscosity, even at high concentrations (Arita T. et al., 2012).
A new heat transfer film was developed by applying the organic surface modification technique. High heat con-ductive materials such as silicon nitride and alumina were reacted with organic compounds, resulting in high affin-ity to polymer materials and high fluidity, even at loading rates as high as 80 vol%. The fabricated heat transfer film has thermal conductivity as high as 40 W/(mK). The im-plementation of a heat transfer film made of surface- modified nanoparticles in semiconductor packages was demonstrated, with the package maintaining high insula-tion and thermal conductivity. Fig. 13 shows a schematic diagram of the thermally conductive hybrid materials (Adschiri T. et al., 2012).
8. Catalytic reaction
Metal and metal oxide nanoparticles synthesized by the supercritical hydrothermal method can be used in several catalytic applications. As explained in Section 5, mor-phology controls are possible by using surface organic modification. In the case of CeO2, 100-exposed CeO2 nanocubes were obtained in the presence of organic mod-ifiers. The role of organic molecules here is to expose cer-tain crystal surfaces. However, these molecules can hinder catalytic reactions at the surface. Thus, surfactants need to be removed for the modified structures to be used as catalysts, and as-synthesized particles are calcined to remove organic modifiers before the nanoparticles were used as catalysts. It should be noted that the cubic shape was maintained, even after being calcined at 300 °C.
The oxygen storage capacity (OSC) of synthesized CeO2 nanoparticles has also been measured. It was found that OSC was significant at temperatures as low as 150 °C, whereas oxygen mobility was observed for ordi-nary, non-facet-controlled CeO2 at approximately 400 °C (Zhang J. et al., 2011a). In addition, 5 mol% Cr-doped CeO2 nanocubes were synthesized, exhibiting higher OSC than undoped CeO2 nanocubes (Zhu Y. et al., 2015). As explained in Section 4, the supercritical hydrothermal method can be applied for high-concentration doping of metal oxide nanoparticles to further improve these
Fig. 12 Dispersion of surface decanoic acid-modified CeO2 nanoparticles in cyclohexane at different concentra-tions. Reprinted with permission from Ref. (Arita T. et al., 2012). Copyright: (2012) The Chemical Soci-ety of Japan.
Fig. 13 Schematic diagram of heat transfer film implementa-tion for electronic devices. Reprinted with permission from Ref. (Adschiri T. et al., 2012). Copyright: (2012) The Japan Society of High Pressure Science and Technology.
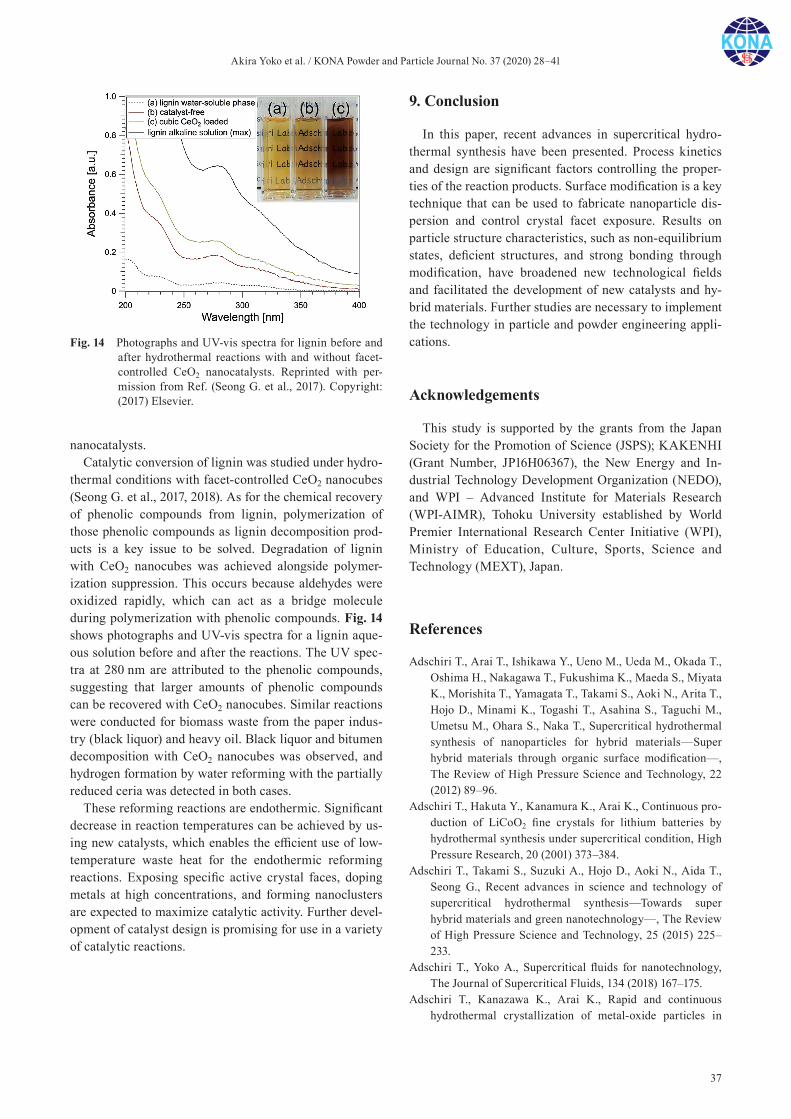
Akira Yoko et al. / KONA Powder and Particle Journal No. 37 (2020) 28–41
37
nanocatalysts.Catalytic conversion of lignin was studied under hydro-
thermal conditions with facet-controlled CeO2 nanocubes (Seong G. et al., 2017, 2018). As for the chemical recovery of phenolic compounds from lignin, polymerization of those phenolic compounds as lignin decomposition prod-ucts is a key issue to be solved. Degradation of lignin with CeO2 nanocubes was achieved alongside polymer-ization suppression. This occurs because aldehydes were oxidized rapidly, which can act as a bridge molecule during polymerization with phenolic compounds. Fig. 14 shows photographs and UV-vis spectra for a lignin aque-ous solution before and after the reactions. The UV spec-tra at 280 nm are attributed to the phenolic compounds, suggesting that larger amounts of phenolic compounds can be recovered with CeO2 nanocubes. Similar reactions were conducted for biomass waste from the paper indus-try (black liquor) and heavy oil. Black liquor and bitumen decomposition with CeO2 nanocubes was observed, and hydrogen formation by water reforming with the partially reduced ceria was detected in both cases.
These reforming reactions are endothermic. Significant decrease in reaction temperatures can be achieved by us-ing new catalysts, which enables the efficient use of low- temperature waste heat for the endothermic reforming reactions. Exposing specific active crystal faces, doping metals at high concentrations, and forming nanoclusters are expected to maximize catalytic activity. Further devel-opment of catalyst design is promising for use in a variety of catalytic reactions.
9. Conclusion
In this paper, recent advances in supercritical hydro-thermal synthesis have been presented. Process kinetics and design are significant factors controlling the proper-ties of the reaction products. Surface modification is a key technique that can be used to fabricate nanoparticle dis-persion and control crystal facet exposure. Results on particle structure characteristics, such as non-equilibrium states, deficient structures, and strong bonding through modification, have broadened new technological fields and facilitated the development of new catalysts and hy-brid materials. Further studies are necessary to implement the technology in particle and powder engineering appli-cations.
Acknowledgements
This study is supported by the grants from the Japan Society for the Promotion of Science (JSPS); KAKENHI (Grant Number, JP16H06367), the New Energy and In-dustrial Technology Development Organization (NEDO), and WPI – Advanced Institute for Materials Research (WPI-AIMR), Tohoku University established by World Premier International Research Center Initiative (WPI), Ministry of Education, Culture, Sports, Science and Technology (MEXT), Japan.
References
Adschiri T., Arai T., Ishikawa Y., Ueno M., Ueda M., Okada T., Oshima H., Nakagawa T., Fukushima K., Maeda S., Miyata K., Morishita T., Yamagata T., Takami S., Aoki N., Arita T., Hojo D., Minami K., Togashi T., Asahina S., Taguchi M., Umetsu M., Ohara S., Naka T., Supercritical hydrothermal synthesis of nanoparticles for hybrid materials—Super hybrid materials through organic surface modification—, The Review of High Pressure Science and Technology, 22 (2012) 89–96.
Adschiri T., Hakuta Y., Kanamura K., Arai K., Continuous pro-duction of LiCoO2 fine crystals for lithium batteries by hydrothermal synthesis under supercritical condition, High Pressure Research, 20 (2001) 373–384.
Adschiri T., Takami S., Suzuki A., Hojo D., Aoki N., Aida T., Seong G., Recent advances in science and technology of supercritical hydrothermal synthesis—Towards super hybrid materials and green nanotechnology—, The Review of High Pressure Science and Technology, 25 (2015) 225–233.
Adschiri T., Yoko A., Supercritical fluids for nanotechnology, The Journal of Supercritical Fluids, 134 (2018) 167–175.
Adschiri T., Kanazawa K., Arai K., Rapid and continuous hydrothermal crystallization of metal-oxide particles in
Fig. 14 Photographs and UV-vis spectra for lignin before and after hydrothermal reactions with and without facet- controlled CeO2 nanocatalysts. Reprinted with per-mission from Ref. (Seong G. et al., 2017). Copyright: (2017) Elsevier.
Akira Yoko et al. / KONA Powder and Particle Journal No. 37 (2020) 28–41
38
supercritical water, Journal of the American Ceramic Soci-ety, 75 (1992) 1019–1022.
Aoki N., Sato A., Sasaki H., Litwinowicz A.A., Seong G., Aida T., Hojo D., Takami S., Adschiri T., Kinetics study to iden-tify reaction-controlled conditions for supercritical hydro-thermal nanoparticle synthesis with flow-type reactors, The Journal of Supercritical Fluids, 110 (2016) 161–166.
Arita T., Hitaka H., Minami K., Naka T., Adschiri T., Synthesis of iron nanoparticle: Challenge to determine the limit of hydrogen reduction in supercritical water, The Journal of Supercritical Fluids, 57 (2011a) 183–189.
Arita T., Hitaka H., Minami K., Naka T., Adschiri T., Synthesis and characterization of surface-modified FePt nanocrystals by supercritical hydrothermal method, Chemistry Letters, 40 (2011b) 588–590.
Arita T., Yoo J., Adschiri T., Relation between the solution-state behavior of self-assembled monolayers on nanoparticles and dispersion of nanoparticles in organic solvents, Journal of Physical Chemistry C, 115 (2011c) 3899–3909.
Arita T., Yoo J., Adschiri T., Synthesis and characterization of a fatty acid self-assembled monolayer on CeO2 nanoparticles: to explore solution-state property of a SAM, Journal of Nanoparticle Research, 12 (2010a) 2567–2578.
Arita T., Moriya K.I., Minami K., Naka T., Adschiri T., Super-critical hydrothermal synthesis of carboxylic acid- surface-functionalized TiO2 nanocrystals: pH sensitive dispersion and hybridization with organic compounds, Chemistry Let-ters, 39 (2010b) 961–963.
Arita T., Moriya K., Yoshimura T., Minami K., Naka T., Adschiri T., Dispersion of phosphonic acids surface- modified titania nanocrystals in various organic solvents, Industrial & Engineering Chemistry Research, 49 (2010c) 9815–9821.
Arita T., Yoo J., Ueda Y., Adschiri T., Highly concentrated colloi-dal dispersion of decanoic acid self-assembled monolayer- protected CeO2 nanoparticles dispersed to a concentration of up to 77 wt% in an organic solvent, Chemistry Letters, 41 (2012) 1235–1237.
Clercq M. le, Adschiri T., Arai K., Hydrothermal processing of nickel containing biomining or bioremediation biomass, Biomass Bioenergy, 21 (2001) 73–80.
Franck E., Special aspects of fluid solutions at high pressures and sub-and supercritical temperatures, Pure and Applied Chemistry, 53 (1981) 1401–1416.
Fujii T., Kawasaki S.-I., Suzuki A., Adschiri T., High-speed morphology control of boehmite nanoparticles by supercrit-ical hydrothermal treatment with carboxylic acids, Crystal Growth and Design, 16 (2016) 1996–2001.
Hakuta Y., Adschiri T., Suzuki T., Chida T., Seino K., Arai K., Flow method for rapidly producing barium hexaferrite par-ticles in supercritical water, Journal of the American Ceramic Society, 81 (1998) 2461–2464.
Hakuta Y., Seino K., Ura H., Adschiri T., Takizawa H., Arai K., Production of phosphor (YAG: Tb) fine particles by hydro-thermal synthesis in supercritical water, Journal of Materi-als Chemistry, 9 (1999) 2671–2674.
Hao X., Chen C., Saito M., Yin D., Inoue K., Takami S., Adschiri T., Ikuhara Y., Direct imaging for single molecu-
lar chain of surfactant on CeO2 nanocrystals, Small, 14 (2018) 1801093 (7pp).
Helgeson H.C., Kirkham D.H., Flowers G.C., Theoretical pre-diction of the thermodynamic behavior of aqueous electro-lytes by high pressures and temperatures, IV, Calculation of activity coefficients, osmotic coefficients, and apparent molal and standard and relative partial molal properties to 600 degrees C and 5 kb, American Journal of Science, 281 (1981) 1249–1516.
Hiyama F., Noguchi T., Koshimizu M., Kishimoto S., Haruki R., Nishikido F., Yanagida T., Fujimoto Y., Aida T., Takami S., Adschiri T., Asai K., X-ray detection capabilities of plastic scintillators incorporated with hafnium oxide nanoparticles surface-modified with phenyl propionic acid, Japanese Journal of Applied Physics, 57 (2018) 012601 (6pp).
Kawasaki S.I., Sue K., Ookawara R., Wakashima Y., Suzuki A., Hakuta Y., Arai K., Engineering study of continuous super-critical hydrothermal method using a T-shaped mixer: Experimental synthesis of NiO nanoparticles and CFD sim-ulation, The Journal of Supercrit Fluids, 54 (2010a) 96–102.
Kawasaki S., Sue K., Ookawara R., Wakashima Y., Suzuki A., Development of novel micro swirl mixer for producing fine metal oxide nanoparticles by continuous supercritical hydrothermal method, Journal of Oleo Science, 59 (2010b) 557–562.
Kawasaki S., Sue K., Ookawara R., Wakashima Y., Suzuki A., Practical development of continuous supercritical fluid pro-cess using high pressure and high temperature micromixer, AIP Conference Proceedings, 1699 (2015) 020001 (8pp).
Kestin J., Sengers J., Kamgar-Parsi B., Sengers J.L., Thermo-physical properties of fluid H2O, Journal of Physical and Chemical Reference Data, 13 (1984) 175–183.
Lencka M.M., Riman R.E., Thermodynamic modeling of hydrothermal synthesis of ceramic powders, Chemistry of Materials, 5 (1993) 61–70.
Litwinowicz A.A., Takami S., Hojo D., Aoki N., Adschiri T., Hydrothermal synthesis of cerium oxide nanoassemblies through coordination programming with amino acids, Chemistry Letters, 43 (2014) 1343–1345.
Lu J., Minami K., Takami S., Shibata M., Kaneko Y., Adschiri T., Supercritical hydrothermal synthesis and in situ organ-ic modification of indium tin oxide nanoparticles using continuous-flow reaction system, ACS Applied Materials & Interfaces, 4 (2012) 351–354.
Lu J., Minami K., Takami S., Shibata M., Kaneko Y., Adschiri T., Co–doping of tin and zinc into indium oxide nanocrys-tals using a facile hydrothermal method, ChemistrySelect, 1 (2016) 518–523.
Mousavand T., Ohara S., Umetsu M., Zhang J., Takami S., Naka T., Adschiri T., Hydrothermal synthesis and in situ surface modification of boehmite nanoparticles in supercritical water, The Journal Supercrit Fluids, 40 (2007a) 397–401.
Mousavand T., Zhang J., Ohara S., Umetsu M., Naka T., Adschiri T., Organic-ligand-assisted supercritical hydro-thermal synthesis of titanium oxide nanocrystals leading to perfectly dispersed titanium oxide nanoparticle in organic phase, Journal of Nanoparticle Research, 9 (2007b) 1067–1071.
Akira Yoko et al. / KONA Powder and Particle Journal No. 37 (2020) 28–41
39
Mousavand T., Naka T., Sato K., Ohara S., Umetsu M., Takami S., Nakane T., Matsushita A., Adschiri T., Crystal size and magnetic field effects in Co3O4 antiferromagnetic nano-crystals, Physical Review B, 79 (2009) 144411 (5pp).
Oelkers E.H., Helgeson H.C., Multiple ion association in supercritical aqueous solutions of single electrolytes, Sci-ence, 261 (1993) 888–891.
Ogi T., Zulhijah R., Iwaki T., Okuyama K., Recent progress in nanoparticle dispersion using bead mill, KONA Powder and Particle Journal, 34 (2017) 3–23.
Ohara S., Hitaka H., Zhang J., Umetsu M., Naka T., Adschiri T., Hydrothermal synthesis of cobalt nanoparticles in super-critical water, Journal of the Japanese Society of Powder and Powder Metallurgy, 54 (2007a) 635–638.
Ohara S., Tahereh M., Sasaki T., Umetsu M., Naka T., Adschiri T., Continuous production of fine zinc oxide nanorods by hydrothermal synthesis in supercritical water, Journal of Materials Science, 43 (2007b) 2393–2396.
Onsager L., Electric moments of molecules in liquids, Journal of American Chemical Society, 58 (1936) 1486–1493.
Rangappa D., Naka T., Kondo A., Ishii M., Kobayashi T., Adschiri T., Transparent CoAl2O4 hybrid nano pigment by organic ligand-assisted supercritical water, Journal of the American Chemical Society, 129 (2007a) 11061–11066.
Rangappa D., Ohara S., Naka T., Kondo A., Ishii M., Adschiri T., Synthesis and organic modification of CoAl2O4 nano-crystals under supercritical water conditions, Journal of Materials Chemistry, 17 (2007b) 4426–4429.
Rangappa D., Ohara S., Umetsu M., Naka T., Adschiri T., Syn-thesis, characterization and organic modification of copper manganese oxide nanocrystals under supercritical water, The Journal of Supercritical Fluids, 44 (2008) 441–445.
Rangappa D., Naka T., Ohara S., Adschiri T., Preparation of Ba-hexaferrite nanocrystals by an organic ligand-assisted supercritical water process, Crystal Growth & Design, 10 (2010) 11–15.
Sahraneshin A., Takami S., Hojo D., Arita T., Minami K., Adschiri T., Mechanistic study on the synthesis of one- dimensional yttrium aluminum garnet nanostructures under supercritical hydrothermal conditions in the presence of organic amines, CrystEngComm, 14 (2012a) 6085–6092.
Sahraneshin A., Takami S., Hojo D., Minami K., Arita T., Adschiri T., Synthesis of shape-controlled and organic- hybridized hafnium oxide nanoparticles under sub- and supercritical hydrothermal conditions, The Journal of Supercrit Fluids, 62 (2012b) 190–196.
Sato T., Sue K., Tsumatori H., Suzuki M., Tanaka S., Kawai- Nakamura A., Saitoh K., Aida K., Hiaki T., Hydrothermal synthesis of CuAlO2 with the delafossite structure in super-critical water, The Journal of Supercrit Fluids, 46 (2008) 173–177.
Schneide G.M., Phase behavior and critical phenomena in fluid mixtures under pressure, Fluide Systeme, 76 (1972) 325–331.
Seong G., Adschiri T., The reductive supercritical hydrothermal process, a novel synthesis method for cobalt nanoparticles: Synthesis and investigation on the reaction mechanism, Dalton Transactions, 43 (2014) 10778–10786.
Seong G., Dejhosseini M., Adschiri T., A kinetic study of cata-lytic hydrothermal reactions of acetaldehyde with cubic CeO2 nanoparticles, Applied Catalysis A: General, 550 (2018) 284–294.
Seong G., Reductive supercritical hydrothermal synthesis of metal nanoparticles, Doctor thesis, Tohoku University (2012).
Seong G., Takami S., Arita T., Minami K., Hojo D., Yavari A.R., Adschiri T., Supercritical hydrothermal synthesis of metal-lic cobalt nanoparticles and its thermodynamic analysis, The Journal of Supercritical Fluids, 60 (2011) 113–120.
Seong G., Yoko A., Inoue R., Takami S., Adschiri T., Selective chemical recovery from biomass under hydrothermal conditions using metal oxide nanocatalyst, The Journal of Supercritical Fluids, 133 (2017) 726–737
Singh V., Naka T., Takami S., Sahraneshin A., Togashi T., Aoki N., Hojo D., Arita T., Adschiri T., Hydrothermal synthesis of inorganic-organic hybrid gadolinium hydroxide nano-clusters with controlled size and morphology, Dalton trans-actions, 42 (2013) 16176–16184.
Sue K., Adschiri T., Arai K., Predictive model for equilibrium constants of aqueous inorganic species at subcritical and supercritical conditions, Industrial & Engineering Chemis-try Research, 41 (2002) 3298–3306.
Sue K., Kakinuma N., Adschiri T., Arai K., Continuous produc-tion of nickel fine particles by hydrogen reduction in near-critical water, Industrial & Engineering Chemistry Research, 43 (2004) 2073–2078.
Sue K., Kawasaki S.I., Suzuki M., Hakuta Y., Hayashi H., Arai K., Takebayashi Y., Yoda S., Furuya T., Continuous hydro-thermal synthesis of Fe2O3, NiO, and CuO nanoparticles by superrapid heating using a T-type micro mixer at 673 K and 30 MPa, Chemical Engineering Journal, 166 (2011) 947–953.
Sue K., Sato T., Kawasaki S.I., Takebayashi Y., Yoda S., Furuya T., Hiaki T., Continuous hydrothermal synthesis of Fe2O3 nanoparticles using a central collision-type micromixer for rapid and homogeneous nucleation at 673 K and 30 MPa, Industrial & Engineering Chemistry Research, 49 (2010) 8841–8846.
Taguchi M., Takami S., Adschiri T., Nakane T., Sato K., Naka T., Supercritical hydrothermal synthesis of hydrophilic polymer-modified water-dispersible CeO2 nanoparticles, CrystEngComm, 13 (2011) 2841–2848.
Taguchi M., Takami S., Naka T., Adschiri T., Growth mecha-nism and surface chemical characteristics of dicarboxylic acid-modified CeO2 Nanocrystals produced in supercritical water: Tailor-made water-soluble CeO2 nanocrystals, Crys-tal Growth & Design, 9 (2009) 5297–5303.
Taguchi M., Yamamoto N., Hojo D., Takami S., Adschiri T., Funazukuri T., Naka T., Synthesis of monocarboxylic acid-modified CeO2 nanoparticles using supercritical water, RSC Advances, 4 (2014) 49605–49613.
Takami S., Ohara S., Adschiri T., Wakayama Y., Chikyow T., Continuous synthesis of organic-inorganic hybridized cubic nanoassemblies of octahedral cerium oxide nanocrystals and hexanedioic acid, Dalton Transactions, 40 (2008) 5442–5446.

Akira Yoko et al. / KONA Powder and Particle Journal No. 37 (2020) 28–41
40
Takami S., Sato T., Mousavand T., Ohara S., Umetsu M., Adschiri T., Hydrothermal synthesis of surface-modified iron oxide nanoparticles, Materials Letters, 61 (2007) 4769–4772.
Takigawa S., Koshimizu M., Noguchi T., Aida T., Takami S., Adschiri T., Fujimoto Y., Yoko A., Seong G., Tomai T., Asai K., Synthesis of ZrO2 nanoparticles for liquid scintillators used in the detection of neutrinoless double beta decay, Journal of Radioanalytical Nuclear Chemistry, 314 (2017) 611–615.
Tanger J.C., Helgeson H.C., Calculation of the thermodynamic and transport properties of aqueous species at high pres-sures and temperatures, revised equations of state for the standard partial molal properties of ions and electrolytes, American Journal of Science, 288 (1988) 19–98.
Togashi T., Hitaka H., Ohara S., Naka T., Takami S., Adschiri T., Controlled reduction of Cu2+ to Cu+ with an N,O-type chelate under hydrothermal conditions to produce Cu2O nanoparticles, Materials Letters, 64 (2010) 1049–1051.
Togashi T., Takami S., Kawakami K., Yamamoto H., Naka T., Sato K., Abe K., Adschiri T., Continuous hydrothermal synthesis of 3,4-dihydroxyhydrocinnamic acid-modified magnetite nanoparticles with stealth-functionality against immunological response, Journal of Materials Chemistry, 22 (2012) 9041–9045.
Uematsu M., Frank E.U., Static dielectric constant of water and steam, Journal of Physical and Chemical Reference Data, 9 (1980) 1291–1306.
Wagner W., Pruß A., The IAPWS formulation 1995 for the ther-modynamic properties of ordinary water substance for gen-eral and scientific use, Journal of Physical and Chemical Reference Data, 31 (2002) 387–535.
Yamamoto K., Hashishin T., Matsuda M., Qiu N., Tan Z., Ohara S., High-performance Ni nanocomposite anode fabricated from Gd-doped ceria nanocubes for low-temperature solid- oxide fuel cells, Nano Energy, 6 (2014) 103–108.
Yamamoto K., Qiu N., Ohara S., In situ fabrication of high- performance Ni-GDC-nanocube core-shell anode for low- temperature solid-oxide fuel cells, Scientific Reports, 5 (2015) 17433 (6pp).
Yiling T., Michelberger T., Franck E.U., High-pressure phase
equilibria and critical curves of (water + n-butane) and (water + n-hexane) at temperatures to 700 K and pressures to 300 MPa, The Journal of Chemical Thermodynamics, 23 (1991) 105–112.
Yoko A., Akizuki M., Oshima Y., Formation mechanism of bar-ium zirconate nanoparticles under supercritical hydrother-mal synthesis, Journal of Nanoparticle Research, 16 (2014) 2330 (9pp).
Yoko A., Akizuki M., Hirao N., Kohara S., Kumar M., Umezawa N., Ohno T., Oshima Y., In situ X-ray diffraction for millisecond-order dynamics of BaZrO3 nanoparticle formation in supercritical water, The Journal of Supercriti-cal Fluids, 107 (2016a) 746–752.
Yoko A., Akizuki M., Umezawa N., Ohno T., Oshima Y., Growth of Ba1−xSrxZrO3 (0 ≤ x ≤ 1) nanoparticles in super-critical water, RSC Advances, 6 (2016b) 67525–67533.
Yoko A., Wang J.J., Umezawa N., Ohno T., Oshima Y., A-Site cation bulk and surface diffusion in A-site-deficient BaZrO3 and SrZrO3 perovskites, Journal of Physical Chem-istry C, 121 (2017) 12220–12229.
Zhang J., Ohara S., Umetsu M., Naka T., Hatakeyama Y., Adschiri T., Colloidal ceria nanocrystals: A tailor-made crystal morphology in supercritical water, Advanced Mate-rials, 19 (2007) 203–206.
Zhang J., Naka T., Ohara S., Kaneko K., Trevethan T., Shluger A., Adschiri T., Surface ligand assisted valence change in ceria nanocrystals, Physical Review B, 84 (2011a) 045411 (9pp).
Zhang J., Kumagai H., Yamamura K., Ohara S., Takami S., Morikawa A., Shinjoh H., Kaneko K., Adschiri T., Suda A., Extra-low-temperature oxygen storage capacity of CeO2 nanocrystals with cubic facets, Nano Letters, 11 (2011b) 361–364.
Zhu Y., Takami S., Seong G., Dejhosseini M., Hossain M.Z., Noguchi T., Hojo D., Aoki N., Aida T., Adschiri T., Green solvent for green materials: a supercritical hydrothermal method and shape-controlled synthesis of Cr-doped CeO2 nanoparticles, Philosophical transactions. Series A, Mathe-matical, physical, and engineering sciences, 373 (2015) 20150012 (14pp).
Akira Yoko et al. / KONA Powder and Particle Journal No. 37 (2020) 28–41
41
Authors’ Short Biographies
Akira Yoko
Dr. A. Yoko received his Ph.D. from The University of Tokyo in 2017. Regarding his thesis, he won the Dean’s Award for Outstanding Achievement, Graduate School of Frontier Sciences, The University of Tokyo in 2017. In 2017, he moved to Tohoku Univer-sity and he is Assistant Professor of WPI – AIMR from 2018. He has been studying nanoparticle formation in supercritical water. Recently, he also works on theoretical re-searches of nanoparticle structure and property.
Gimyeong Seong
Assistant Prof. G. Seong received his Bachelor’s and Master’s degrees in Engineering from Sogang University, Seoul, Republic of Korea in 2006 and 2008, respectively. In Oct. 2008, he moved to Japan and transferred to Tohoku University, where he began to study on the synthesis of metal nanoparticles using supercritical fluid, and he received his Doctorate in Engineering in 2012. After two years of postdoctoral research, he be-came an Assistant Professor of NICHe, Tohoku Univ. in 2014. Currently, he focuses his research on various nanomaterials including metal oxides as well as metal nanoparticle synthesis using supercritical fluid technology.
Takaaki Tomai
Prof. T. Tomai received his Ph.D from The University of Tokyo in 2008.In 2010, he moved to Tohoku University as Assistant Professor of IMRAM, and be-
came Associate Professor of IMRAM in 2017. He has been studying on the materials science and engineering using supercritical fluids.
Tadafumi Adschiri
Prof. T. Adschiri received his Doctorate in Engineering from The University of Tokyo in 1986. In 1989, he moved to Tohoku University and began studying reactions in super-critical fluids for biomass conversion, chemical recycling of wastes, organic reactions, and materials synthesis. He became Professor of IMRAM in 2002, and since 2007, he is Professor of WPI – AIMR, Tohoku University. He has been awarded many prizes, in-cluding the Minister’s awards of MEXT, Japan. Currently, he is a member of the Science Council of Japan (23rd and 24th terms) and the President of the Society of Chemical Engi-neers, Japan.
KONA Powder and Particle Journal No. 37 (2020) 42–63/Doi:10.14356/kona.2020003 Review Paper
42Copyright © 2020 The Authors. Published by Hosokawa Powder Technology Foundation. This is an open ac-cess article under the CC BY license (http://creativecommons.org/licenses/by/4.0/).
Analysis of Industry-Related Flows by Optical Coherence Tomography—A Review †
Antti I. Koponen 1* and Sanna Haavisto 2
1 VTT Technical Research Centre of Finland Ltd., Finland2 Spinnova Ltd., Finland
AbstractOptical Coherence Tomography (OCT) is a light-based imaging method capable of simultaneously capturing the internal structure and motion (1D, 2D or 3D) of various opaque and turbid materials with a micron-level spatial resolution. Depending on the OCT technology, axial scanning rates can vary in a range of tens to hundreds of kHz. The actual imaging depth significantly depends on the optical properties of the material and can vary from micrometers to a few millimeters. From the viewpoint of industrial applications, OCT technology is very appealing. Due to its resolution, speed, and ability to deal with opaque materials, it fills an apparent gap in available measurement methods. Nonetheless, OCT has not to date seen widespread growth in the industrial field. This has been at least partly due to a lack of commercial devices compact and flexible enough to adapt to industrial needs. The recent emergence of more generic commercial OCT devices has considerably lowered the threshold for adapting the technique. The utilization of OCT for structural analysis, also outside the medical field, has been thoroughly discussed in scientific literature. Therefore, in this paper, we will mainly concentrate on applications of OCT that also utilize its capability of performing velocity measurements. The emphasis will be on industrially motivated problems such as rheology, microfluidics, fouling and turbulence.
Keywords: optical coherence tomography, OCT, industrial applications, microfluidics, rheology, fouling
1. Introduction
Research, process development and operation as well as process quality control depend greatly upon our ability to collect information with measurements, through which engineers hope to get answers to the questions “what and why?”. The enormous developments that have taken place in the process industry during the last twenty years have been mainly related to improvements in accuracy, reli-ability, and speed of measurement techniques. The ulti-mate goal of process engineers is the ability to perform the measurements in situ, online and in real time. How-ever, due to a lack of existing online techniques, one often has to settle for offline measurements.
There are a number of measurement technologies and approaches available today, each one with their respective advantages. Optical measurement systems, such as an in-terferometer, optical displacement meter, moiré inspection,
stereoscopy, and holography, are some of them with sev-eral advantages. Firstly, they are noninvasive and nonde-structive methods which afford flexibility in setting up measuring systems. Secondly, one is not limited to pointwise measurements, as full-field measurements are possible. This feature is essentially inherent, e.g. in CCD imaging. For many applications, the number one benefit of optical measurement methods is their capability for high-speed sampling. Optical sensors also have the ad-vantage of high precision in comparison, e.g. with ultra-sonic, electromagnetic, and electrostatic sensors. They are widely used in industry, e.g. for end-product quality, material surface, topography, defect detection, 3D dimen-sion measurement, and color inspection.
Optical Coherence Tomography (OCT) is a rather new member of the family of optical sensors (Drexler and Fujimoto, 2008; Popescu et al., 2011). OCT is capable of measuring the internal structure of various semi- transparent materials with a micron-level spatial resolu-tion, as illustrated in Fig. 1a. Depending on the OCT technology, axial scanning rates can vary in a range of tens to hundreds of kHz. The actual imaging depth signifi-cantly depends on the optical properties of the material and can vary from micrometers to a few millimeters. The OCT technique was invented in the late 1980s. It mainly
† Received 14 May 2018; Accepted 5 July 2018 J-STAGE Advance published online 17 November 2018
1 P.O. Box 1603, FIN-40401 Jyväskylä, Finland2 Palokärjentie 2-4, FIN-40320 Jyväskylä, Finland* Corresponding author: Antti I. Koponen; E-mail: [email protected] TEL: +358-20-722-2717 FAX: +358-20-722-2596

Antti I. Koponen et al. / KONA Powder and Particle Journal No. 37 (2020) 42–63
43
evolved in the medical field, especially in ophthalmology in the 1990s. Later, it attracted attention for application in other fields as well. Applications of OCT—also outside of the biomedical field—have been reviewed in (Wiesauer et al., 2005a; Stifter, 2007; Song and Harding, 2012; Kawasaki, 2013; Yoshizawa, 2015).
While online sensors are still scarce, the applicability of OCT for structural analysis for industrial purposes has been demonstrated in numerous cases. These include crystallization processes in polymers (Hierzenberger, 2014), liquid sorption in paper (Fabritius, 2007), thermal degradation of epoxy resin composites (Awaja et al., 2009), automotive coatings (Lawman et al., 2017a), nano-composites (Schneider et al., 2016), polymer-fiber com-posites (Stifter et al., 2008), quality control of film coating (Koller et al., 2011; Nemeth et al., 2012; Markl et al., 2014a; Markl et al., 2015a; Markl et al., 2015b), and LCD-display production (Shirazi et al., 2016; Wijesinghe et al., 2017). An important functional extension of OCT, namely polarization-sensitive OCT (Boer et al., 2017), has been used, e.g. for the analysis of stress fields of various materials (Stifter et al., 2003; Wiesauer et al., 2005b; Wiesauer et al., 2007; Heise et al., 2010; Stifter et al., 2010). Markl et al., (2014b), discuss general aspects related to the inline quality control of moving objects with OCT.
In addition to structural analysis, the capability of mea-suring flow velocities is often vital for industrial purposes such as process development and process control. While there are robust indicators for measuring average volu-metric flows, e.g. in pipes, the availability of instruments for measuring local velocities is more limited. Various techniques that can provide information on velocity fields are presented, e.g. in Chaouki et al. (1997) and Powell (2008). If the medium is transparent and there is optical access, one can apply, e.g. PIV or LDA techniques. For turbid media, however, only Ultrasound Velocity Profiling (UVP), has gained broader use in industry (Takeda, 2012). Other methods, such as Nuclear Magnetic Reso-nance Imaging (MRI) and various tomographic methods are widely used on a lab scale, but their industrial use is still very limited. Another option for velocity field mea-surements is Doppler OCT (Drexler and Fujimoto, 2008). DOCT combines the Doppler principle with OCT to
obtain velocity information simultaneously with struc-tural imaging (see Fig. 1b). It was first used in ophthal-mology for the quantitative imaging of blood flow in vessels in vivo. Recently, the use of DOCT has finally spread outside of biomedicine, but it is still in its infancy for industrial applications.
In principle, from the viewpoint of industrial applica-tions, OCT technology should be very appealing. Due to its resolution, speed, and ability to deal with opaque ma-terials, it fills an apparent gap in the available measure-ment methods. Nonetheless, OCT has not to date seen large growth in the industrial field. This has been at least partly due to a lack of commercial devices compact and flexible enough to adapt to industrial needs. The recent emergence of more generic commercial OCT devices such as Telesto SD-OCT Systems by Thorlabs have some-what decreased this bottleneck. While they cannot beat the performance of state-of-the-art laboratory-built devices, the commercial OCT devices have lowered the threshold for adapting the technique considerably.
As discussed above, the utilization of OCT for struc-tural analysis, also outside the medical field, has been thoroughly reviewed in scientific literature. Therefore, in this paper, we will mainly concentrate on OCT applica-tions that utilize its capability of performing velocity measurements. The emphasis will be on industrially mo-tivated problems such as rheology, microfluidics, fouling, and turbulence. We hope this paper will encourage more people to adopt this emerging field of measurement tech-nology for solving additional R&D problems.
2. Optical coherence tomography
OCT employs low-coherence spectroscopy and inter-ferometry to determine the optical properties of the sam-ple as a depth-dependent reflectivity profile (Drexler and Fujimoto 2008; Popescu et al., 2011; Leitgeb et al., 2014; Hong, 2018). The short coherence length of the employed broad bandwidth light source is utilized for axial section-ing. 2D slice images (B scans) or 3D volumes can be con-structed by employing scanners to acquire a series of axial scans (A scans) at different lateral locations.
Fig. 1 a) 3D structural OCT image of microfibrillated cellulose (MFC) suspension in a pipe with a diameter of 8.6 mm. Image taken with permission from Haavisto et al. (2015a). b) Marangoni effect (spontaneous flow due to evaporation of alcohol) in a droplet of wine as imaged with Doppler OCT (unpublished).
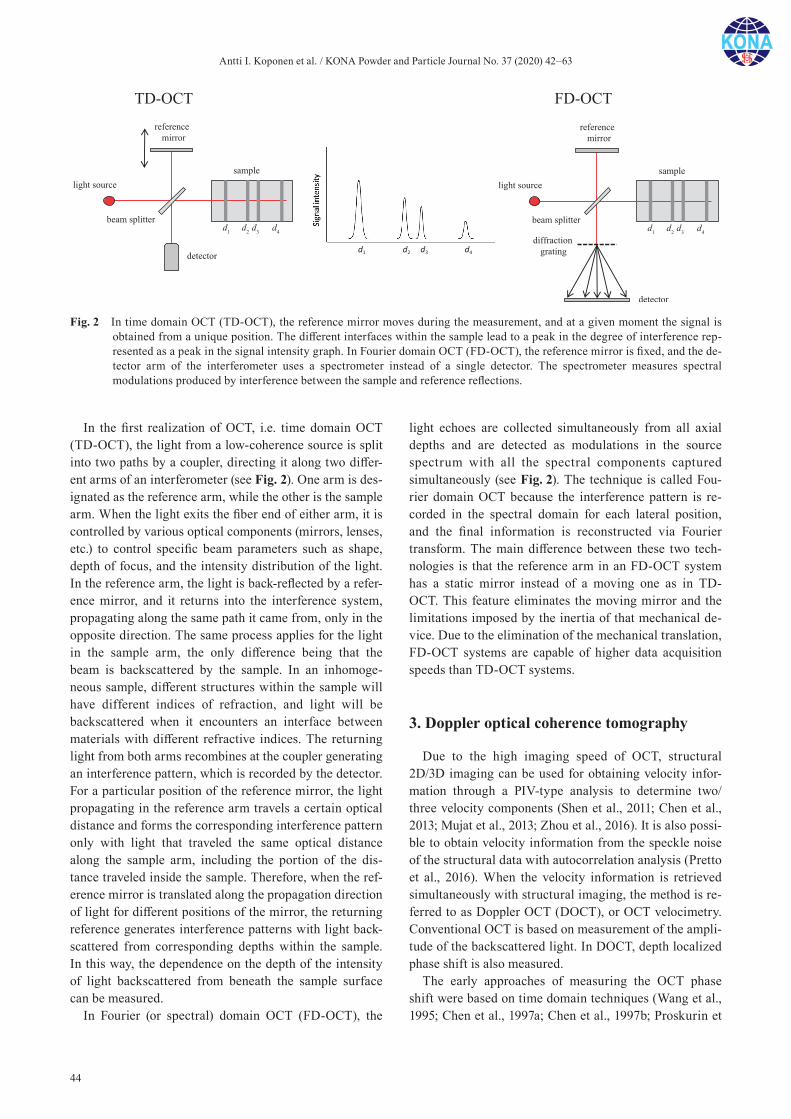
Antti I. Koponen et al. / KONA Powder and Particle Journal No. 37 (2020) 42–63
44
In the first realization of OCT, i.e. time domain OCT (TD-OCT), the light from a low-coherence source is split into two paths by a coupler, directing it along two differ-ent arms of an interferometer (see Fig. 2). One arm is des-ignated as the reference arm, while the other is the sample arm. When the light exits the fiber end of either arm, it is controlled by various optical components (mirrors, lenses, etc.) to control specific beam parameters such as shape, depth of focus, and the intensity distribution of the light. In the reference arm, the light is back-reflected by a refer-ence mirror, and it returns into the interference system, propagating along the same path it came from, only in the opposite direction. The same process applies for the light in the sample arm, the only difference being that the beam is backscattered by the sample. In an inhomoge-neous sample, different structures within the sample will have different indices of refraction, and light will be backscattered when it encounters an interface between materials with different refractive indices. The returning light from both arms recombines at the coupler generating an interference pattern, which is recorded by the detector. For a particular position of the reference mirror, the light propagating in the reference arm travels a certain optical distance and forms the corresponding interference pattern only with light that traveled the same optical distance along the sample arm, including the portion of the dis-tance traveled inside the sample. Therefore, when the ref-erence mirror is translated along the propagation direction of light for different positions of the mirror, the returning reference generates interference patterns with light back-scattered from corresponding depths within the sample. In this way, the dependence on the depth of the intensity of light backscattered from beneath the sample surface can be measured.
In Fourier (or spectral) domain OCT (FD-OCT), the
light echoes are collected simultaneously from all axial depths and are detected as modulations in the source spectrum with all the spectral components captured simultaneously (see Fig. 2). The technique is called Fou-rier domain OCT because the interference pattern is re-corded in the spectral domain for each lateral position, and the final information is reconstructed via Fourier transform. The main difference between these two tech-nologies is that the reference arm in an FD-OCT system has a static mirror instead of a moving one as in TD-OCT. This feature eliminates the moving mirror and the limitations imposed by the inertia of that mechanical de-vice. Due to the elimination of the mechanical translation, FD-OCT systems are capable of higher data acquisition speeds than TD-OCT systems.
3. Doppler optical coherence tomography
Due to the high imaging speed of OCT, structural 2D/3D imaging can be used for obtaining velocity infor-mation through a PIV-type analysis to determine two/three velocity components (Shen et al., 2011; Chen et al., 2013; Mujat et al., 2013; Zhou et al., 2016). It is also possi-ble to obtain velocity information from the speckle noise of the structural data with autocorrelation analysis (Pretto et al., 2016). When the velocity information is retrieved simultaneously with structural imaging, the method is re-ferred to as Doppler OCT (DOCT), or OCT velocimetry. Conventional OCT is based on measurement of the ampli-tude of the backscattered light. In DOCT, depth localized phase shift is also measured.
The early approaches of measuring the OCT phase shift were based on time domain techniques (Wang et al., 1995; Chen et al., 1997a; Chen et al., 1997b; Proskurin et
Fig. 2 In time domain OCT (TD-OCT), the reference mirror moves during the measurement, and at a given moment the signal is obtained from a unique position. The different interfaces within the sample lead to a peak in the degree of interference rep-resented as a peak in the signal intensity graph. In Fourier domain OCT (FD-OCT), the reference mirror is fixed, and the de-tector arm of the interferometer uses a spectrometer instead of a single detector. The spectrometer measures spectral modulations produced by interference between the sample and reference reflections.
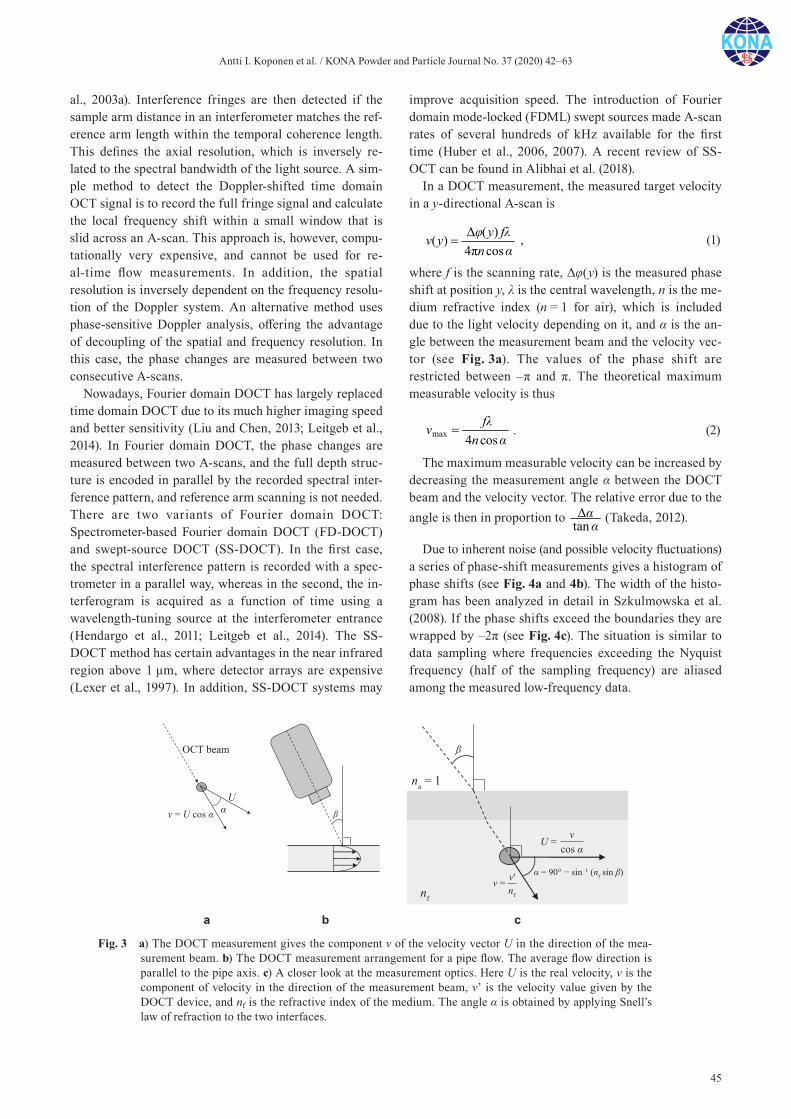
Antti I. Koponen et al. / KONA Powder and Particle Journal No. 37 (2020) 42–63
45
al., 2003a). Interference fringes are then detected if the sample arm distance in an interferometer matches the ref-erence arm length within the temporal coherence length. This defines the axial resolution, which is inversely re-lated to the spectral bandwidth of the light source. A sim-ple method to detect the Doppler-shifted time domain OCT signal is to record the full fringe signal and calculate the local frequency shift within a small window that is slid across an A-scan. This approach is, however, compu-tationally very expensive, and cannot be used for re-al-time flow measurements. In addition, the spatial resolution is inversely dependent on the frequency resolu-tion of the Doppler system. An alternative method uses phase-sensitive Doppler analysis, offering the advantage of decoupling of the spatial and frequency resolution. In this case, the phase changes are measured between two consecutive A-scans.
Nowadays, Fourier domain DOCT has largely replaced time domain DOCT due to its much higher imaging speed and better sensitivity (Liu and Chen, 2013; Leitgeb et al., 2014). In Fourier domain DOCT, the phase changes are measured between two A-scans, and the full depth struc-ture is encoded in parallel by the recorded spectral inter-ference pattern, and reference arm scanning is not needed. There are two variants of Fourier domain DOCT: Spectrometer- based Fourier domain DOCT (FD-DOCT) and swept-source DOCT (SS-DOCT). In the first case, the spectral interference pattern is recorded with a spec-trometer in a parallel way, whereas in the second, the in-terferogram is acquired as a function of time using a wavelength-tuning source at the interferometer entrance (Hendargo et al., 2011; Leitgeb et al., 2014). The SS-DOCT method has certain advantages in the near infrared region above 1 μm, where detector arrays are expensive (Lexer et al., 1997). In addition, SS-DOCT systems may
improve acquisition speed. The introduction of Fourier domain mode-locked (FDML) swept sources made A-scan rates of several hundreds of kHz available for the first time (Huber et al., 2006, 2007). A recent review of SS-OCT can be found in Alibhai et al. (2018).
In a DOCT measurement, the measured target velocity in a y-directional A-scan is
Δ ( )( )4π cosφ y fλv yn α
, (1)
where f is the scanning rate, Δφ(y) is the measured phase shift at position y, λ is the central wavelength, n is the me-dium refractive index (n = 1 for air), which is included due to the light velocity depending on it, and α is the an-gle between the measurement beam and the velocity vec-tor (see Fig. 3a). The values of the phase shift are restricted between –π and π. The theoretical maximum measurable velocity is thus
max 4 cosfλv
n α . (2)
The maximum measurable velocity can be increased by decreasing the measurement angle α between the DOCT beam and the velocity vector. The relative error due to the angle is then in proportion to Δ
tanαα (Takeda, 2012).
Due to inherent noise (and possible velocity fluctuations) a series of phase-shift measurements gives a histogram of phase shifts (see Fig. 4a and 4b). The width of the histo-gram has been analyzed in detail in Szkulmowska et al. (2008). If the phase shifts exceed the boundaries they are wrapped by –2π (see Fig. 4c). The situation is similar to data sampling where frequencies exceeding the Nyquist frequency (half of the sampling frequency) are aliased among the measured low- frequency data.
Fig. 3 a) The DOCT measurement gives the component v of the velocity vector U in the direction of the mea-surement beam. b) The DOCT measurement arrangement for a pipe flow. The average flow direction is parallel to the pipe axis. c) A closer look at the measurement optics. Here U is the real velocity, v is the component of velocity in the direction of the measurement beam, v’ is the velocity value given by the DOCT device, and nf is the refractive index of the medium. The angle α is obtained by applying Snell’s law of refraction to the two interfaces.
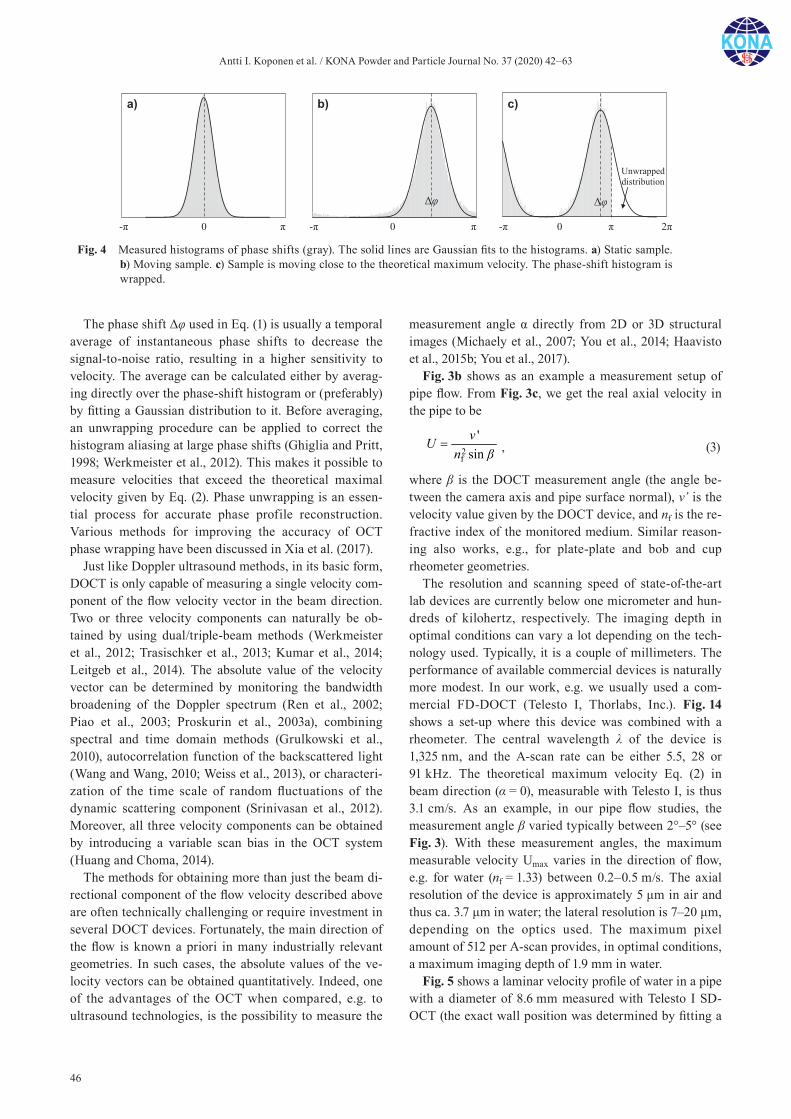
Antti I. Koponen et al. / KONA Powder and Particle Journal No. 37 (2020) 42–63
46
The phase shift Δφ used in Eq. (1) is usually a temporal average of instantaneous phase shifts to decrease the signal- to-noise ratio, resulting in a higher sensitivity to velocity. The average can be calculated either by averag-ing directly over the phase-shift histogram or (preferably) by fitting a Gaussian distribution to it. Before averaging, an unwrapping procedure can be applied to correct the histogram aliasing at large phase shifts (Ghiglia and Pritt, 1998; Werkmeister et al., 2012). This makes it possible to measure velocities that exceed the theoretical maximal velocity given by Eq. (2). Phase unwrapping is an essen-tial process for accurate phase profile reconstruction. Various methods for improving the accuracy of OCT phase wrapping have been discussed in Xia et al. (2017).
Just like Doppler ultrasound methods, in its basic form, DOCT is only capable of measuring a single velocity com-ponent of the flow velocity vector in the beam direction. Two or three velocity components can naturally be ob-tained by using dual/triple-beam methods (Werkmeister et al., 2012; Trasischker et al., 2013; Kumar et al., 2014; Leitgeb et al., 2014). The absolute value of the velocity vector can be determined by monitoring the bandwidth broadening of the Doppler spectrum (Ren et al., 2002; Piao et al., 2003; Proskurin et al., 2003a), combining spectral and time domain methods (Grulkowski et al., 2010), autocorrelation function of the backscattered light (Wang and Wang, 2010; Weiss et al., 2013), or characteri-zation of the time scale of random fluctuations of the dynamic scattering component (Srinivasan et al., 2012). Moreover, all three velocity components can be obtained by introducing a variable scan bias in the OCT system (Huang and Choma, 2014).
The methods for obtaining more than just the beam di-rectional component of the flow velocity described above are often technically challenging or require investment in several DOCT devices. Fortunately, the main direction of the flow is known a priori in many industrially relevant geometries. In such cases, the absolute values of the ve-locity vectors can be obtained quantitatively. Indeed, one of the advantages of the OCT when compared, e.g. to ultrasound technologies, is the possibility to measure the
measurement angle α directly from 2D or 3D structural images (Michaely et al., 2007; You et al., 2014; Haavisto et al., 2015b; You et al., 2017).
Fig. 3b shows as an example a measurement setup of pipe flow. From Fig. 3c, we get the real axial velocity in the pipe to be
2f
'sinvU
n β , (3)
where β is the DOCT measurement angle (the angle be-tween the camera axis and pipe surface normal), v’ is the velocity value given by the DOCT device, and nf is the re-fractive index of the monitored medium. Similar reason-ing also works, e.g., for plate-plate and bob and cup rheometer geometries.
The resolution and scanning speed of state-of-the-art lab devices are currently below one micrometer and hun-dreds of kilohertz, respectively. The imaging depth in optimal conditions can vary a lot depending on the tech-nology used. Typically, it is a couple of millimeters. The performance of available commercial devices is naturally more modest. In our work, e.g. we usually used a com-mercial FD-DOCT (Telesto I, Thorlabs, Inc.). Fig. 14 shows a set-up where this device was combined with a rheometer. The central wavelength λ of the device is 1,325 nm, and the A-scan rate can be either 5.5, 28 or 91 kHz. The theoretical maximum velocity Eq. (2) in beam direction (α = 0), measurable with Telesto I, is thus 3.1 cm/s. As an example, in our pipe flow studies, the measurement angle β varied typically between 2°–5° (see Fig. 3). With these measurement angles, the maximum measurable velocity Umax varies in the direction of flow, e.g. for water (nf = 1.33) between 0.2–0.5 m/s. The axial resolution of the device is approximately 5 μm in air and thus ca. 3.7 μm in water; the lateral resolution is 7–20 μm, depending on the optics used. The maximum pixel amount of 512 per A-scan provides, in optimal conditions, a maximum imaging depth of 1.9 mm in water.
Fig. 5 shows a laminar velocity profile of water in a pipe with a diameter of 8.6 mm measured with Telesto I SD-OCT (the exact wall position was determined by fitting a
Fig. 4 Measured histograms of phase shifts (gray). The solid lines are Gaussian fits to the histograms. a) Static sample. b) Moving sample. c) Sample is moving close to the theoretical maximum velocity. The phase-shift histogram is wrapped.
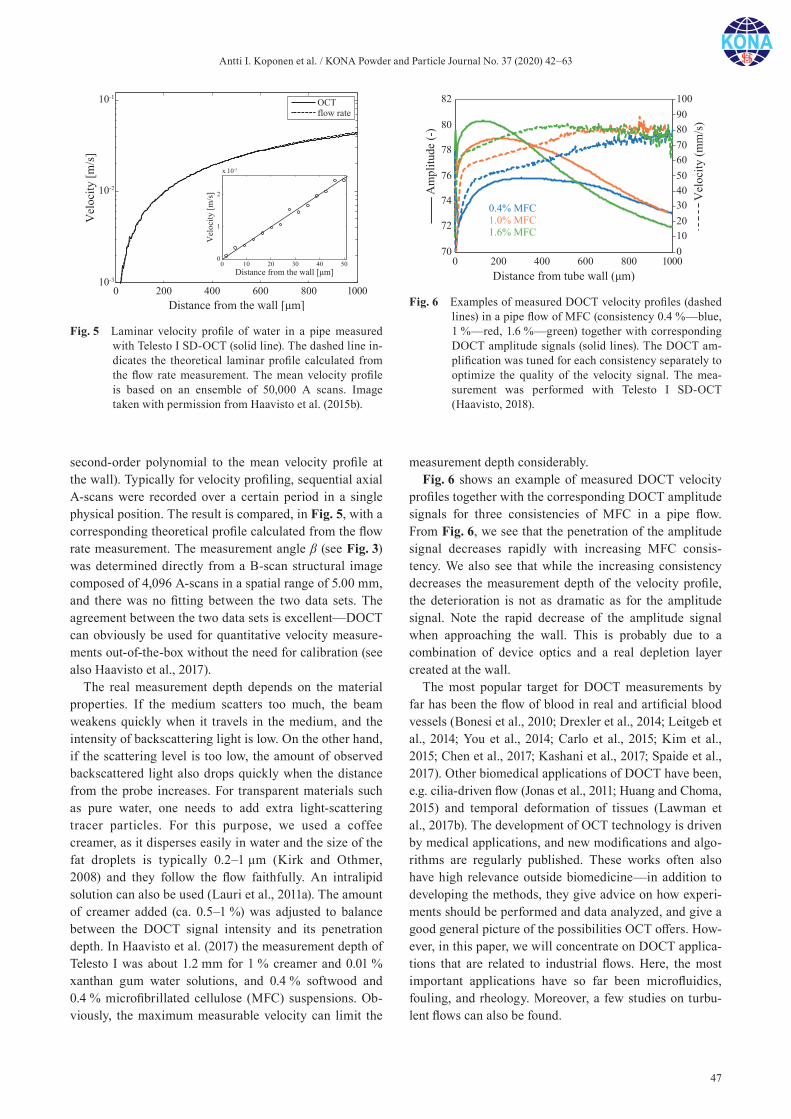
Antti I. Koponen et al. / KONA Powder and Particle Journal No. 37 (2020) 42–63
47
second-order polynomial to the mean velocity profile at the wall). Typically for velocity profiling, sequential axial A-scans were recorded over a certain period in a single physical position. The result is compared, in Fig. 5, with a corresponding theoretical profile calculated from the flow rate measurement. The measurement angle β (see Fig. 3) was determined directly from a B-scan structural image composed of 4,096 A-scans in a spatial range of 5.00 mm, and there was no fitting between the two data sets. The agreement between the two data sets is excellent—DOCT can obviously be used for quantitative velocity measure-ments out-of-the-box without the need for calibration (see also Haavisto et al., 2017).
The real measurement depth depends on the material properties. If the medium scatters too much, the beam weakens quickly when it travels in the medium, and the intensity of backscattering light is low. On the other hand, if the scattering level is too low, the amount of observed backscattered light also drops quickly when the distance from the probe increases. For transparent materials such as pure water, one needs to add extra light-scattering tracer particles. For this purpose, we used a coffee creamer, as it disperses easily in water and the size of the fat droplets is typically 0.2–1 μm (Kirk and Othmer, 2008) and they follow the flow faithfully. An intralipid solution can also be used (Lauri et al., 2011a). The amount of creamer added (ca. 0.5–1 %) was adjusted to balance between the DOCT signal intensity and its penetration depth. In Haavisto et al. (2017) the measurement depth of Telesto I was about 1.2 mm for 1 % creamer and 0.01 % xanthan gum water solutions, and 0.4 % softwood and 0.4 % microfibrillated cellulose (MFC) suspensions. Ob-viously, the maximum measurable velocity can limit the
measurement depth considerably.Fig. 6 shows an example of measured DOCT velocity
profiles together with the corresponding DOCT amplitude signals for three consistencies of MFC in a pipe flow. From Fig. 6, we see that the penetration of the amplitude signal decreases rapidly with increasing MFC consis-tency. We also see that while the increasing consistency decreases the measurement depth of the velocity profile, the deterioration is not as dramatic as for the amplitude signal. Note the rapid decrease of the amplitude signal when approaching the wall. This is probably due to a combination of device optics and a real depletion layer created at the wall.
The most popular target for DOCT measurements by far has been the flow of blood in real and artificial blood vessels (Bonesi et al., 2010; Drexler et al., 2014; Leitgeb et al., 2014; You et al., 2014; Carlo et al., 2015; Kim et al., 2015; Chen et al., 2017; Kashani et al., 2017; Spaide et al., 2017). Other biomedical applications of DOCT have been, e.g. cilia-driven flow (Jonas et al., 2011; Huang and Choma, 2015) and temporal deformation of tissues (Lawman et al., 2017b). The development of OCT technology is driven by medical applications, and new modifications and algo-rithms are regularly published. These works often also have high relevance outside biomedicine—in addition to developing the methods, they give advice on how experi-ments should be performed and data analyzed, and give a good general picture of the possibilities OCT offers. How-ever, in this paper, we will concentrate on DOCT applica-tions that are related to industrial flows. Here, the most important applications have so far been microfluidics, fouling, and rheology. Moreover, a few studies on turbu-lent flows can also be found.
Fig. 5 Laminar velocity profile of water in a pipe measured with Telesto I SD-OCT (solid line). The dashed line in-dicates the theoretical laminar profile calculated from the flow rate measurement. The mean velocity profile is based on an ensemble of 50,000 A scans. Image taken with permission from Haavisto et al. (2015b).
Fig. 6 Examples of measured DOCT velocity profiles (dashed lines) in a pipe flow of MFC (consistency 0.4 %—blue, 1 %—red, 1.6 %—green) together with corresponding DOCT amplitude signals (solid lines). The DOCT am-plification was tuned for each consistency separately to optimize the quality of the velocity signal. The mea-surement was performed with Telesto I SD-OCT (Haavisto, 2018).
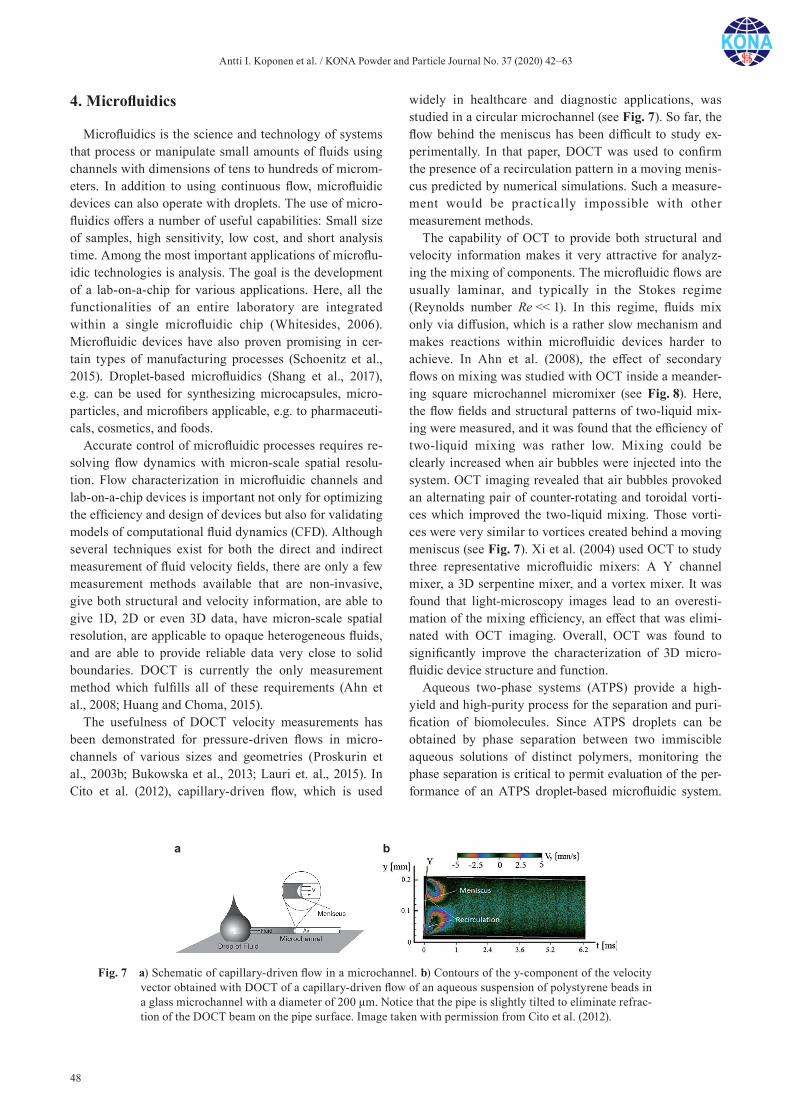
Antti I. Koponen et al. / KONA Powder and Particle Journal No. 37 (2020) 42–63
48
4. Microfluidics
Microfluidics is the science and technology of systems that process or manipulate small amounts of fluids using channels with dimensions of tens to hundreds of microm-eters. In addition to using continuous flow, microfluidic devices can also operate with droplets. The use of micro-fluidics offers a number of useful capabilities: Small size of samples, high sensitivity, low cost, and short analysis time. Among the most important applications of microflu-idic technologies is analysis. The goal is the development of a lab-on-a-chip for various applications. Here, all the functionalities of an entire laboratory are integrated within a single microfluidic chip (Whitesides, 2006). Microfluidic devices have also proven promising in cer-tain types of manufacturing processes (Schoenitz et al., 2015). Droplet-based microfluidics (Shang et al., 2017), e.g. can be used for synthesizing microcapsules, micro-particles, and microfibers applicable, e.g. to pharmaceuti-cals, cosmetics, and foods.
Accurate control of microfluidic processes requires re-solving flow dynamics with micron-scale spatial resolu-tion. Flow characterization in microfluidic channels and lab-on-a-chip devices is important not only for optimizing the efficiency and design of devices but also for validating models of computational fluid dynamics (CFD). Although several techniques exist for both the direct and indirect measurement of fluid velocity fields, there are only a few measurement methods available that are non-invasive, give both structural and velocity information, are able to give 1D, 2D or even 3D data, have micron-scale spatial resolution, are applicable to opaque heterogeneous fluids, and are able to provide reliable data very close to solid boundaries. DOCT is currently the only measurement method which fulfills all of these requirements (Ahn et al., 2008; Huang and Choma, 2015).
The usefulness of DOCT velocity measurements has been demonstrated for pressure-driven flows in micro-channels of various sizes and geometries (Proskurin et al., 2003b; Bukowska et al., 2013; Lauri et. al., 2015). In Cito et al. (2012), capillary-driven flow, which is used
widely in healthcare and diagnostic applications, was studied in a circular microchannel (see Fig. 7). So far, the flow behind the meniscus has been difficult to study ex-perimentally. In that paper, DOCT was used to confirm the presence of a recirculation pattern in a moving menis-cus predicted by numerical simulations. Such a measure-ment would be practically impossible with other measurement methods.
The capability of OCT to provide both structural and velocity information makes it very attractive for analyz-ing the mixing of components. The microfluidic flows are usually laminar, and typically in the Stokes regime (Reynolds number Re << 1). In this regime, fluids mix only via diffusion, which is a rather slow mechanism and makes reactions within microfluidic devices harder to achieve. In Ahn et al. (2008), the effect of secondary flows on mixing was studied with OCT inside a meander-ing square microchannel micromixer (see Fig. 8). Here, the flow fields and structural patterns of two-liquid mix-ing were measured, and it was found that the efficiency of two-liquid mixing was rather low. Mixing could be clearly increased when air bubbles were injected into the system. OCT imaging revealed that air bubbles provoked an alternating pair of counter-rotating and toroidal vorti-ces which improved the two-liquid mixing. Those vorti-ces were very similar to vortices created behind a moving meniscus (see Fig. 7). Xi et al. (2004) used OCT to study three representative microfluidic mixers: A Y channel mixer, a 3D serpentine mixer, and a vortex mixer. It was found that light-microscopy images lead to an overesti-mation of the mixing efficiency, an effect that was elimi-nated with OCT imaging. Overall, OCT was found to significantly improve the characterization of 3D micro-fluidic device structure and function.
Aqueous two-phase systems (ATPS) provide a high-yield and high-purity process for the separation and puri-fication of biomolecules. Since ATPS droplets can be obtained by phase separation between two immiscible aqueous solutions of distinct polymers, monitoring the phase separation is critical to permit evaluation of the per-formance of an ATPS droplet-based microfluidic system.
Fig. 7 a) Schematic of capillary-driven flow in a microchannel. b) Contours of the y-component of the velocity vector obtained with DOCT of a capillary-driven flow of an aqueous suspension of polystyrene beads in a glass microchannel with a diameter of 200 μm. Notice that the pipe is slightly tilted to eliminate refrac-tion of the DOCT beam on the pipe surface. Image taken with permission from Cito et al. (2012).
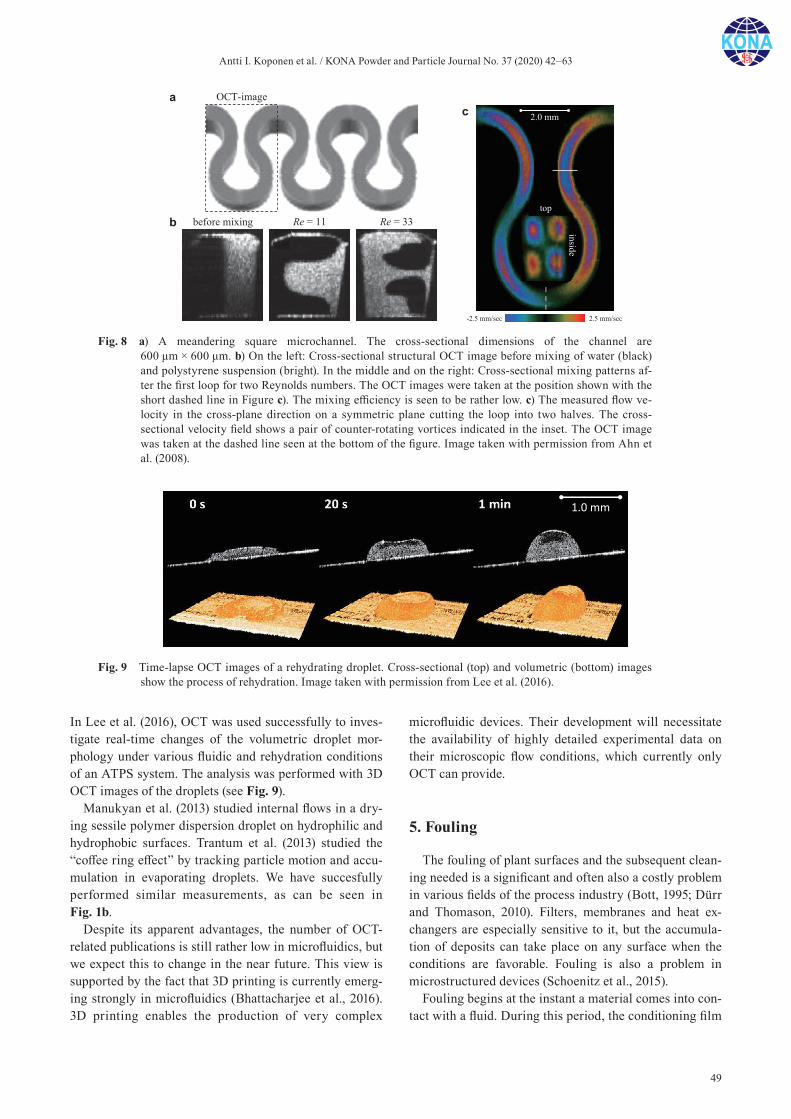
Antti I. Koponen et al. / KONA Powder and Particle Journal No. 37 (2020) 42–63
49
In Lee et al. (2016), OCT was used successfully to inves-tigate real-time changes of the volumetric droplet mor-phology under various fluidic and rehydration conditions of an ATPS system. The analysis was performed with 3D OCT images of the droplets (see Fig. 9).
Manukyan et al. (2013) studied internal flows in a dry-ing sessile polymer dispersion droplet on hydrophilic and hydrophobic surfaces. Trantum et al. (2013) studied the “coffee ring effect” by tracking particle motion and accu-mulation in evaporating droplets. We have succesfully performed similar measurements, as can be seen in Fig. 1b.
Despite its apparent advantages, the number of OCT- related publications is still rather low in microfluidics, but we expect this to change in the near future. This view is supported by the fact that 3D printing is currently emerg-ing strongly in microfluidics (Bhattacharjee et al., 2016). 3D printing enables the production of very complex
microfluidic devices. Their development will necessitate the availability of highly detailed experimental data on their microscopic flow conditions, which currently only OCT can provide.
5. Fouling
The fouling of plant surfaces and the subsequent clean-ing needed is a significant and often also a costly problem in various fields of the process industry (Bott, 1995; Dürr and Thomason, 2010). Filters, membranes and heat ex-changers are especially sensitive to it, but the accumula-tion of deposits can take place on any surface when the conditions are favorable. Fouling is also a problem in micro structured devices (Schoenitz et al., 2015).
Fouling begins at the instant a material comes into con-tact with a fluid. During this period, the conditioning film
Fig. 8 a) A meandering square microchannel. The cross-sectional dimensions of the channel are 600 μm × 600 μm. b) On the left: Cross-sectional structural OCT image before mixing of water (black) and polystyrene suspension (bright). In the middle and on the right: Cross-sectional mixing patterns af-ter the first loop for two Reynolds numbers. The OCT images were taken at the position shown with the short dashed line in Figure c). The mixing efficiency is seen to be rather low. c) The measured flow ve-locity in the cross-plane direction on a symmetric plane cutting the loop into two halves. The cross- sectional velocity field shows a pair of counter-rotating vortices indicated in the inset. The OCT image was taken at the dashed line seen at the bottom of the figure. Image taken with permission from Ahn et al. (2008).
Fig. 9 Time-lapse OCT images of a rehydrating droplet. Cross-sectional (top) and volumetric (bottom) images show the process of rehydration. Image taken with permission from Lee et al. (2016).
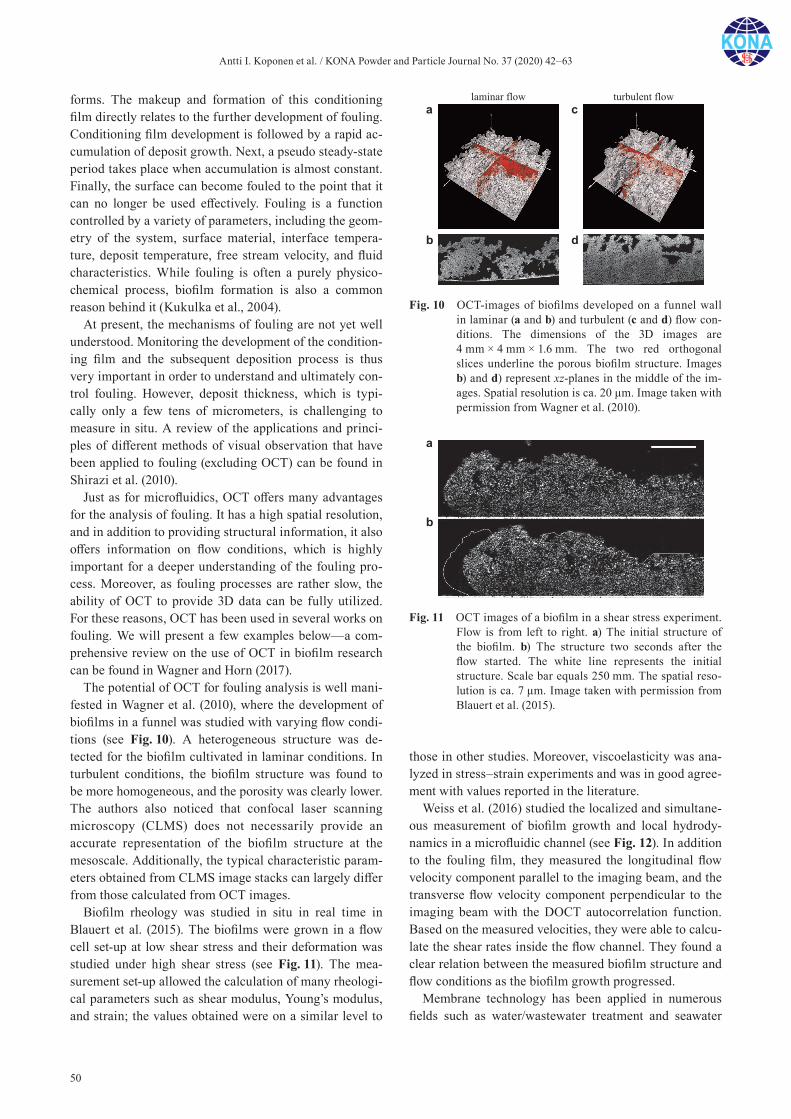
Antti I. Koponen et al. / KONA Powder and Particle Journal No. 37 (2020) 42–63
50
forms. The makeup and formation of this conditioning film directly relates to the further development of fouling. Conditioning film development is followed by a rapid ac-cumulation of deposit growth. Next, a pseudo steady-state period takes place when accumulation is almost constant. Finally, the surface can become fouled to the point that it can no longer be used effectively. Fouling is a function controlled by a variety of parameters, including the geom-etry of the system, surface material, interface tempera-ture, deposit temperature, free stream velocity, and fluid characteristics. While fouling is often a purely physico-chemical process, biofilm formation is also a common reason behind it (Kukulka et al., 2004).
At present, the mechanisms of fouling are not yet well understood. Monitoring the development of the condition-ing film and the subsequent deposition process is thus very important in order to understand and ultimately con-trol fouling. However, deposit thickness, which is typi-cally only a few tens of micrometers, is challenging to measure in situ. A review of the applications and princi-ples of different methods of visual observation that have been applied to fouling (excluding OCT) can be found in Shirazi et al. (2010).
Just as for microfluidics, OCT offers many advantages for the analysis of fouling. It has a high spatial resolution, and in addition to providing structural information, it also offers information on flow conditions, which is highly important for a deeper understanding of the fouling pro-cess. Moreover, as fouling processes are rather slow, the ability of OCT to provide 3D data can be fully utilized. For these reasons, OCT has been used in several works on fouling. We will present a few examples below—a com-prehensive review on the use of OCT in biofilm research can be found in Wagner and Horn (2017).
The potential of OCT for fouling analysis is well mani-fested in Wagner et al. (2010), where the development of biofilms in a funnel was studied with varying flow condi-tions (see Fig. 10). A heterogeneous structure was de-tected for the biofilm cultivated in laminar conditions. In turbulent conditions, the biofilm structure was found to be more homogeneous, and the porosity was clearly lower. The authors also noticed that confocal laser scanning micro scopy (CLMS) does not necessarily provide an accurate representation of the biofilm structure at the mesoscale. Additionally, the typical characteristic param-eters obtained from CLMS image stacks can largely differ from those calculated from OCT images.
Biofilm rheology was studied in situ in real time in Blauert et al. (2015). The biofilms were grown in a flow cell set-up at low shear stress and their deformation was studied under high shear stress (see Fig. 11). The mea-surement set-up allowed the calculation of many rheologi-cal parameters such as shear modulus, Young’s modulus, and strain; the values obtained were on a similar level to
those in other studies. Moreover, viscoelasticity was ana-lyzed in stress–strain experiments and was in good agree-ment with values reported in the literature.
Weiss et al. (2016) studied the localized and simultane-ous measurement of biofilm growth and local hydrody-namics in a microfluidic channel (see Fig. 12). In addition to the fouling film, they measured the longitudinal flow velocity component parallel to the imaging beam, and the transverse flow velocity component perpendicular to the imaging beam with the DOCT autocorrelation function. Based on the measured velocities, they were able to calcu-late the shear rates inside the flow channel. They found a clear relation between the measured biofilm structure and flow conditions as the biofilm growth progressed.
Membrane technology has been applied in numerous fields such as water/wastewater treatment and seawater
Fig. 10 OCT-images of biofilms developed on a funnel wall in laminar (a and b) and turbulent (c and d) flow con-ditions. The dimensions of the 3D images are 4 mm × 4 mm × 1.6 mm. The two red orthogonal slices underline the porous biofilm structure. Images b) and d) represent xz-planes in the middle of the im-ages. Spatial resolution is ca. 20 μm. Image taken with permission from Wagner et al. (2010).
Fig. 11 OCT images of a biofilm in a shear stress experiment. Flow is from left to right. a) The initial structure of the biofilm. b) The structure two seconds after the flow started. The white line represents the initial structure. Scale bar equals 250 mm. The spatial reso-lution is ca. 7 μm. Image taken with permission from Blauert et al. (2015).
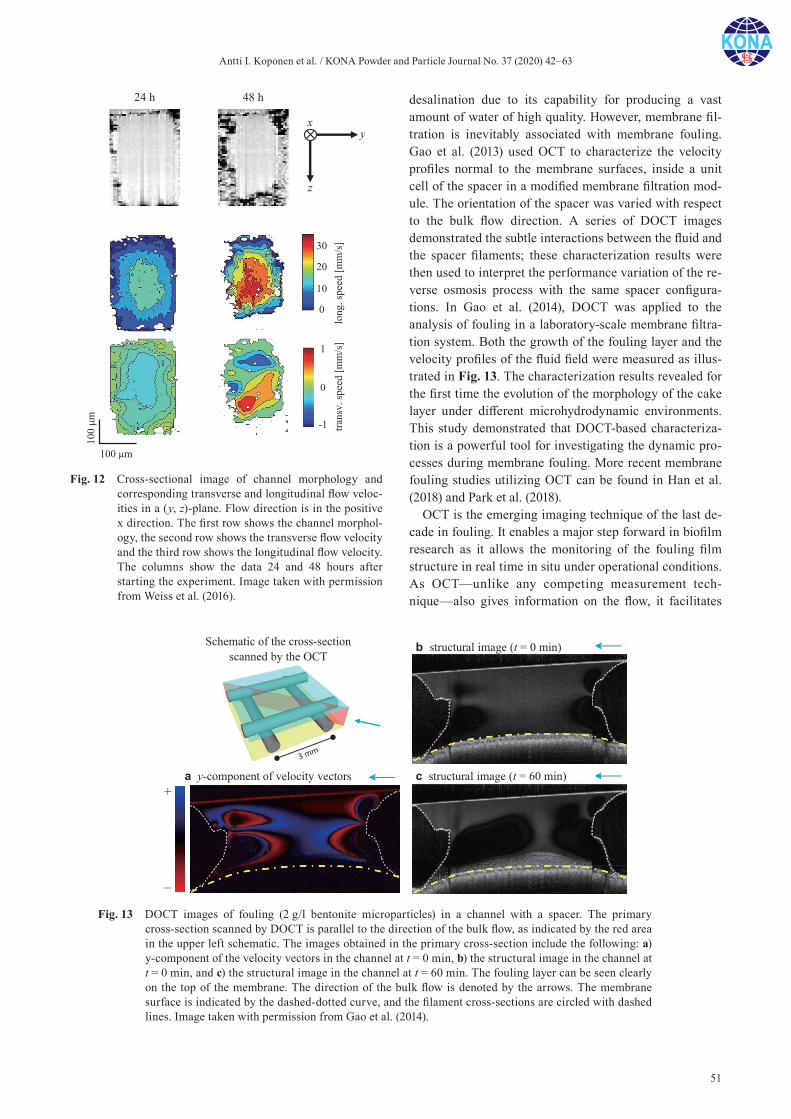
Antti I. Koponen et al. / KONA Powder and Particle Journal No. 37 (2020) 42–63
51
desalination due to its capability for producing a vast amount of water of high quality. However, membrane fil-tration is inevitably associated with membrane fouling. Gao et al. (2013) used OCT to characterize the velocity profiles normal to the membrane surfaces, inside a unit cell of the spacer in a modified membrane filtration mod-ule. The orientation of the spacer was varied with respect to the bulk flow direction. A series of DOCT images demonstrated the subtle interactions between the fluid and the spacer filaments; these characterization results were then used to interpret the performance variation of the re-verse osmosis process with the same spacer configura-tions. In Gao et al. (2014), DOCT was applied to the analysis of fouling in a laboratory-scale membrane filtra-tion system. Both the growth of the fouling layer and the velocity profiles of the fluid field were measured as illus-trated in Fig. 13. The characterization results revealed for the first time the evolution of the morphology of the cake layer under different microhydrodynamic environments. This study demonstrated that DOCT-based characteriza-tion is a powerful tool for investigating the dynamic pro-cesses during membrane fouling. More recent membrane fouling studies utilizing OCT can be found in Han et al. (2018) and Park et al. (2018).
OCT is the emerging imaging technique of the last de-cade in fouling. It enables a major step forward in biofilm research as it allows the monitoring of the fouling film structure in real time in situ under operational conditions. As OCT—unlike any competing measurement tech-nique—also gives information on the flow, it facilitates
Fig. 12 Cross-sectional image of channel morphology and corresponding transverse and longitudinal flow veloc-ities in a (y, z)-plane. Flow direction is in the positive x direction. The first row shows the channel morphol-ogy, the second row shows the transverse flow velocity and the third row shows the longitudinal flow velocity. The columns show the data 24 and 48 hours after starting the experiment. Image taken with permission from Weiss et al. (2016).
Fig. 13 DOCT images of fouling (2 g/l bentonite microparticles) in a channel with a spacer. The primary cross-section scanned by DOCT is parallel to the direction of the bulk flow, as indicated by the red area in the upper left schematic. The images obtained in the primary cross-section include the following: a) y-component of the velocity vectors in the channel at t = 0 min, b) the structural image in the channel at t = 0 min, and c) the structural image in the channel at t = 60 min. The fouling layer can be seen clearly on the top of the membrane. The direction of the bulk flow is denoted by the arrows. The membrane surface is indicated by the dashed-dotted curve, and the filament cross-sections are circled with dashed lines. Image taken with permission from Gao et al. (2014).
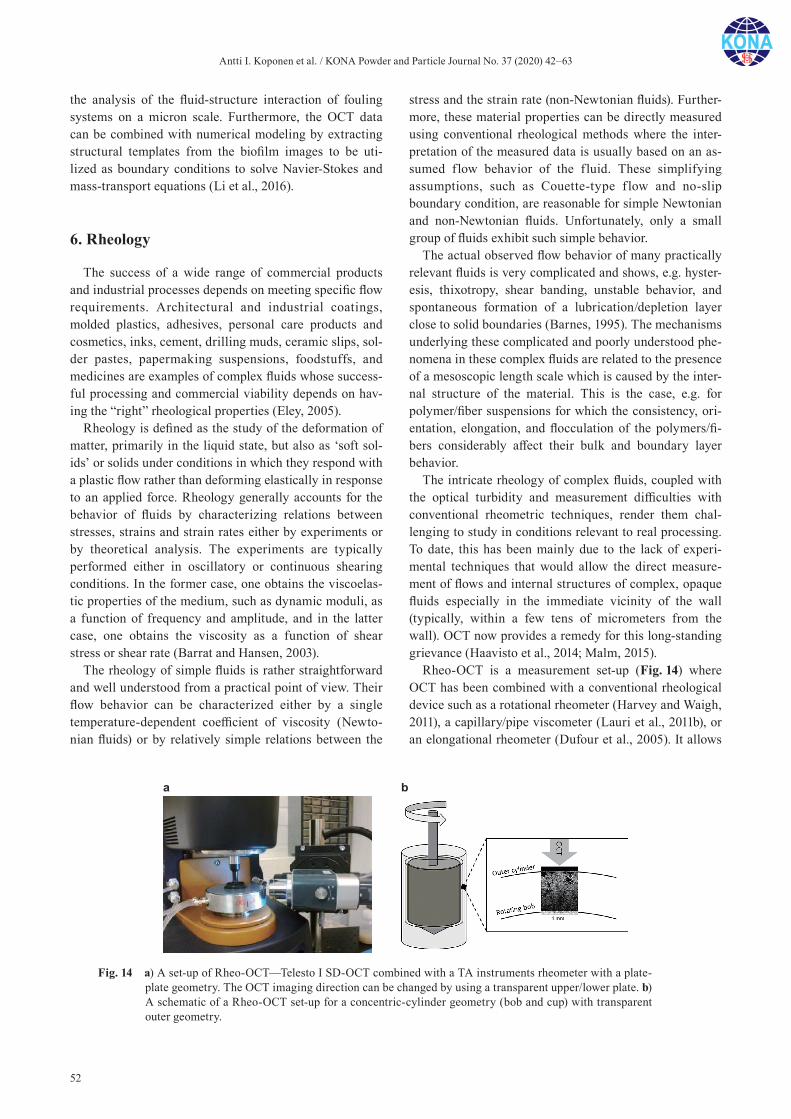
Antti I. Koponen et al. / KONA Powder and Particle Journal No. 37 (2020) 42–63
52
the analysis of the fluid-structure interaction of fouling systems on a micron scale. Furthermore, the OCT data can be combined with numerical modeling by extracting structural templates from the biofilm images to be uti-lized as boundary conditions to solve Navier-Stokes and mass-transport equations (Li et al., 2016).
6. Rheology
The success of a wide range of commercial products and industrial processes depends on meeting specific flow requirements. Architectural and industrial coatings, molded plastics, adhesives, personal care products and cosmetics, inks, cement, drilling muds, ceramic slips, sol-der pastes, papermaking suspensions, foodstuffs, and medicines are examples of complex fluids whose success-ful processing and commercial viability depends on hav-ing the “right” rheological properties (Eley, 2005).
Rheology is defined as the study of the deformation of matter, primarily in the liquid state, but also as ‘soft sol-ids’ or solids under conditions in which they respond with a plastic flow rather than deforming elastically in response to an applied force. Rheology generally accounts for the behavior of fluids by characterizing relations between stresses, strains and strain rates either by experiments or by theoretical analysis. The experiments are typically performed either in oscillatory or continuous shearing conditions. In the former case, one obtains the viscoelas-tic properties of the medium, such as dynamic moduli, as a function of frequency and amplitude, and in the latter case, one obtains the viscosity as a function of shear stress or shear rate (Barrat and Hansen, 2003).
The rheology of simple fluids is rather straightforward and well understood from a practical point of view. Their flow behavior can be characterized either by a single temperature-dependent coefficient of viscosity (Newto-nian fluids) or by relatively simple relations between the
stress and the strain rate (non-Newtonian fluids). Further-more, these material properties can be directly measured using conventional rheological methods where the inter-pretation of the measured data is usually based on an as-sumed flow behavior of the fluid. These simplifying assumptions, such as Couette-type f low and no-slip boundary condition, are reasonable for simple Newtonian and non-Newtonian fluids. Unfortunately, only a small group of fluids exhibit such simple behavior.
The actual observed flow behavior of many practically relevant fluids is very complicated and shows, e.g. hyster-esis, thixotropy, shear banding, unstable behavior, and spontaneous formation of a lubrication/depletion layer close to solid boundaries (Barnes, 1995). The mechanisms underlying these complicated and poorly understood phe-nomena in these complex fluids are related to the presence of a mesoscopic length scale which is caused by the inter-nal structure of the material. This is the case, e.g. for polymer/fiber suspensions for which the consistency, ori-entation, elongation, and flocculation of the polymers/fi-bers considerably affect their bulk and boundary layer behavior.
The intricate rheology of complex fluids, coupled with the optical turbidity and measurement difficulties with conventional rheometric techniques, render them chal-lenging to study in conditions relevant to real processing. To date, this has been mainly due to the lack of experi-mental techniques that would allow the direct measure-ment of flows and internal structures of complex, opaque fluids especially in the immediate vicinity of the wall (typically, within a few tens of micrometers from the wall). OCT now provides a remedy for this long-standing grievance (Haavisto et al., 2014; Malm, 2015).
Rheo-OCT is a measurement set-up (Fig. 14) where OCT has been combined with a conventional rheological device such as a rotational rheometer (Harvey and Waigh, 2011), a capillary/pipe viscometer (Lauri et al., 2011b), or an elongational rheometer (Dufour et al., 2005). It allows
Fig. 14 a) A set-up of Rheo-OCT—Telesto I SD-OCT combined with a TA instruments rheometer with a plate-plate geometry. The OCT imaging direction can be changed by using a transparent upper/lower plate. b) A schematic of a Rheo-OCT set-up for a concentric-cylinder geometry (bob and cup) with transparent outer geometry.
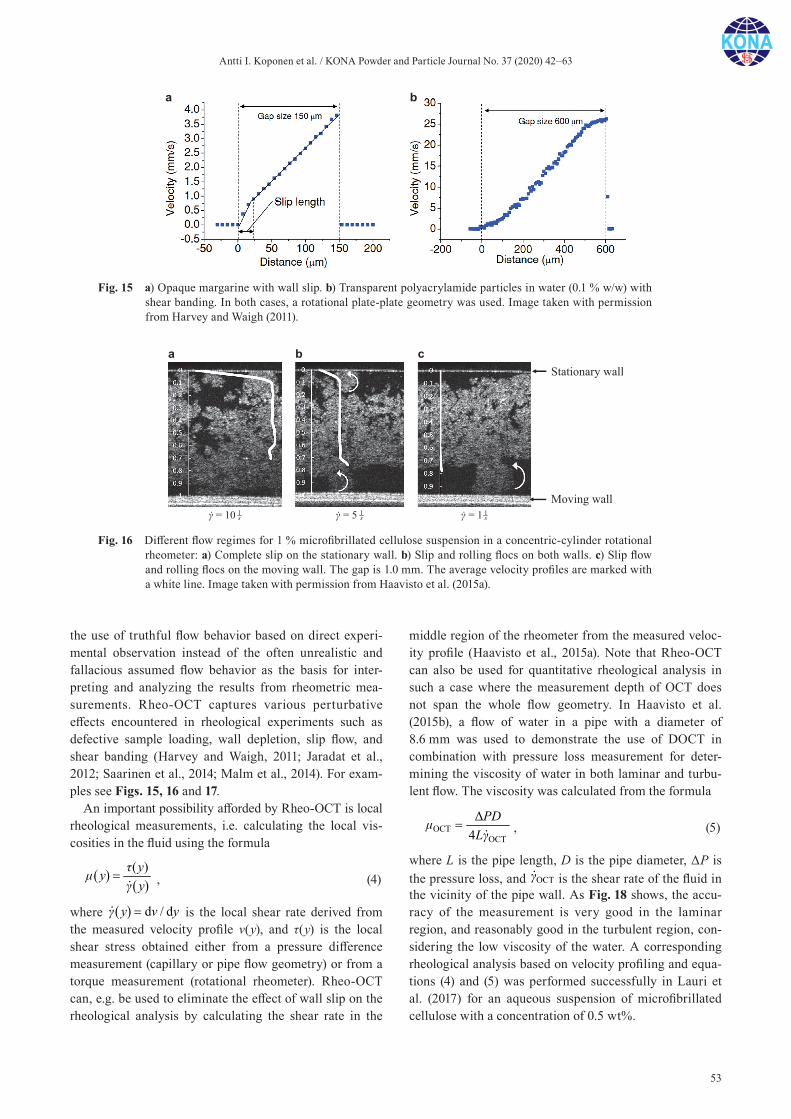
Antti I. Koponen et al. / KONA Powder and Particle Journal No. 37 (2020) 42–63
53
the use of truthful flow behavior based on direct experi-mental observation instead of the often unrealistic and fallacious assumed flow behavior as the basis for inter-preting and analyzing the results from rheometric mea-surements. Rheo-OCT captures various perturbative effects encountered in rheological experiments such as defective sample loading, wall depletion, slip flow, and shear banding (Harvey and Waigh, 2011; Jaradat et al., 2012; Saarinen et al., 2014; Malm et al., 2014). For exam-ples see Figs. 15, 16 and 17.
An important possibility afforded by Rheo-OCT is local rheological measurements, i.e. calculating the local vis-cosities in the fluid using the formula
( )τ yμ yγ y
, (4)
where d / dγ y v y is the local shear rate derived from the measured velocity profile v(y), and τ(y) is the local shear stress obtained either from a pressure difference measurement (capillary or pipe flow geometry) or from a torque measurement (rotational rheometer). Rheo-OCT can, e.g. be used to eliminate the effect of wall slip on the rheological analysis by calculating the shear rate in the
middle region of the rheometer from the measured veloc-ity profile (Haavisto et al., 2015a). Note that Rheo-OCT can also be used for quantitative rheological analysis in such a case where the measurement depth of OCT does not span the whole flow geometry. In Haavisto et al. (2015b), a flow of water in a pipe with a diameter of 8.6 mm was used to demonstrate the use of DOCT in combination with pressure loss measurement for deter-mining the viscosity of water in both laminar and turbu-lent flow. The viscosity was calculated from the formula
OCTOCT
Δ4PDμLγ
, (5)
where L is the pipe length, D is the pipe diameter, ΔP is the pressure loss, and OCTγ is the shear rate of the fluid in the vicinity of the pipe wall. As Fig. 18 shows, the accu-racy of the measurement is very good in the laminar region, and reasonably good in the turbulent region, con-sidering the low viscosity of the water. A corresponding rheological analysis based on velocity profiling and equa-tions (4) and (5) was performed successfully in Lauri et al. (2017) for an aqueous suspension of microfibrillated cellulose with a concentration of 0.5 wt%.
Fig. 15 a) Opaque margarine with wall slip. b) Transparent polyacrylamide particles in water (0.1 % w/w) with shear banding. In both cases, a rotational plate-plate geometry was used. Image taken with permission from Harvey and Waigh (2011).
Fig. 16 Different flow regimes for 1 % microfibrillated cellulose suspension in a concentric-cylinder rotational rheometer: a) Complete slip on the stationary wall. b) Slip and rolling flocs on both walls. c) Slip flow and rolling flocs on the moving wall. The gap is 1.0 mm. The average velocity profiles are marked with a white line. Image taken with permission from Haavisto et al. (2015a).
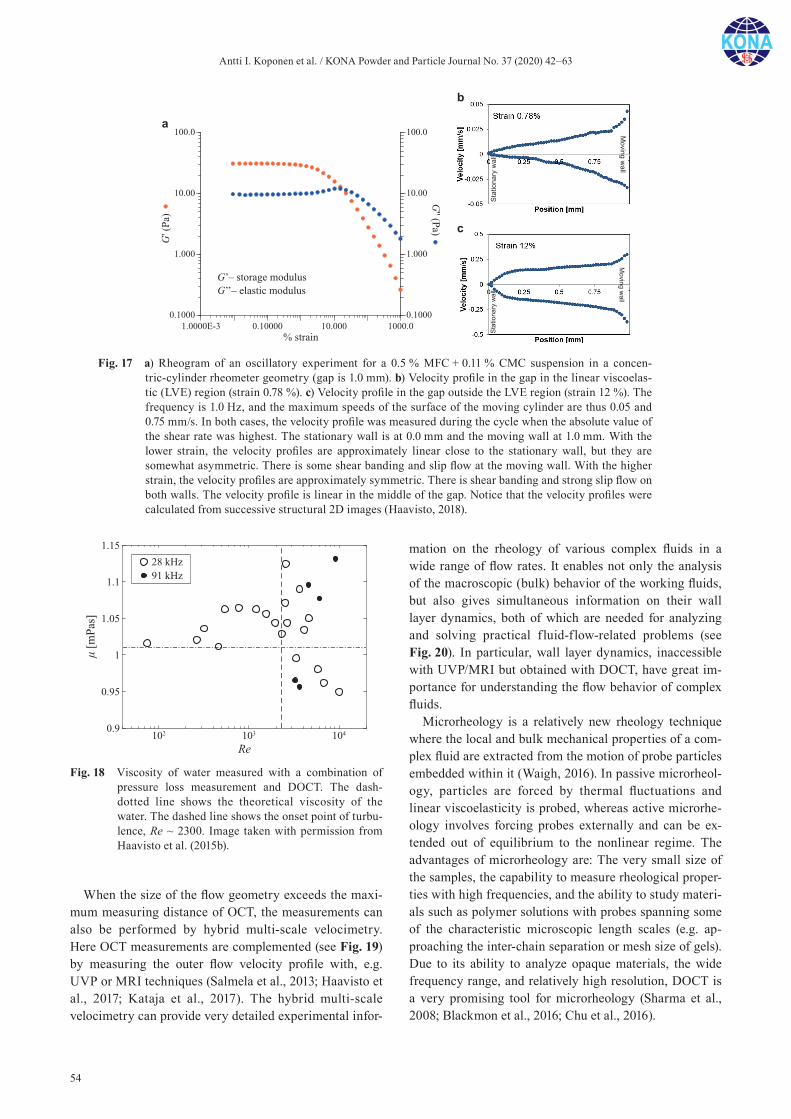
Antti I. Koponen et al. / KONA Powder and Particle Journal No. 37 (2020) 42–63
54
When the size of the flow geometry exceeds the maxi-mum measuring distance of OCT, the measurements can also be performed by hybrid multi-scale velocimetry. Here OCT measurements are complemented (see Fig. 19) by measuring the outer flow velocity profile with, e.g. UVP or MRI techniques (Salmela et al., 2013; Haavisto et al., 2017; Kataja et al., 2017). The hybrid multi-scale velocimetry can provide very detailed experimental infor-
mation on the rheology of various complex fluids in a wide range of flow rates. It enables not only the analysis of the macroscopic (bulk) behavior of the working fluids, but also gives simultaneous information on their wall layer dynamics, both of which are needed for analyzing and solving practical fluid-flow-related problems (see Fig. 20). In particular, wall layer dynamics, inaccessible with UVP/MRI but obtained with DOCT, have great im-portance for understanding the flow behavior of complex fluids.
Microrheology is a relatively new rheology technique where the local and bulk mechanical properties of a com-plex fluid are extracted from the motion of probe particles embedded within it (Waigh, 2016). In passive microrheol-ogy, particles are forced by thermal fluctuations and linear viscoelasticity is probed, whereas active microrhe-ology involves forcing probes externally and can be ex-tended out of equilibrium to the nonlinear regime. The advantages of microrheology are: The very small size of the samples, the capability to measure rheological proper-ties with high frequencies, and the ability to study materi-als such as polymer solutions with probes spanning some of the characteristic microscopic length scales (e.g. ap-proaching the inter-chain separation or mesh size of gels). Due to its ability to analyze opaque materials, the wide frequency range, and relatively high resolution, DOCT is a very promising tool for microrheology (Sharma et al., 2008; Blackmon et al., 2016; Chu et al., 2016).
Fig. 18 Viscosity of water measured with a combination of pressure loss measurement and DOCT. The dash- dotted line shows the theoretical viscosity of the water. The dashed line shows the onset point of turbu-lence, Re ~ 2300. Image taken with permission from Haavisto et al. (2015b).
Fig. 17 a) Rheogram of an oscillatory experiment for a 0.5 % MFC + 0.11 % CMC suspension in a concen-tric-cylinder rheometer geometry (gap is 1.0 mm). b) Velocity profile in the gap in the linear viscoelas-tic (LVE) region (strain 0.78 %). c) Velocity profile in the gap outside the LVE region (strain 12 %). The frequency is 1.0 Hz, and the maximum speeds of the surface of the moving cylinder are thus 0.05 and 0.75 mm/s. In both cases, the velocity profile was measured during the cycle when the absolute value of the shear rate was highest. The stationary wall is at 0.0 mm and the moving wall at 1.0 mm. With the lower strain, the velocity profiles are approximately linear close to the stationary wall, but they are somewhat asymmetric. There is some shear banding and slip flow at the moving wall. With the higher strain, the velocity profiles are approximately symmetric. There is shear banding and strong slip flow on both walls. The velocity profile is linear in the middle of the gap. Notice that the velocity profiles were calculated from successive structural 2D images (Haavisto, 2018).
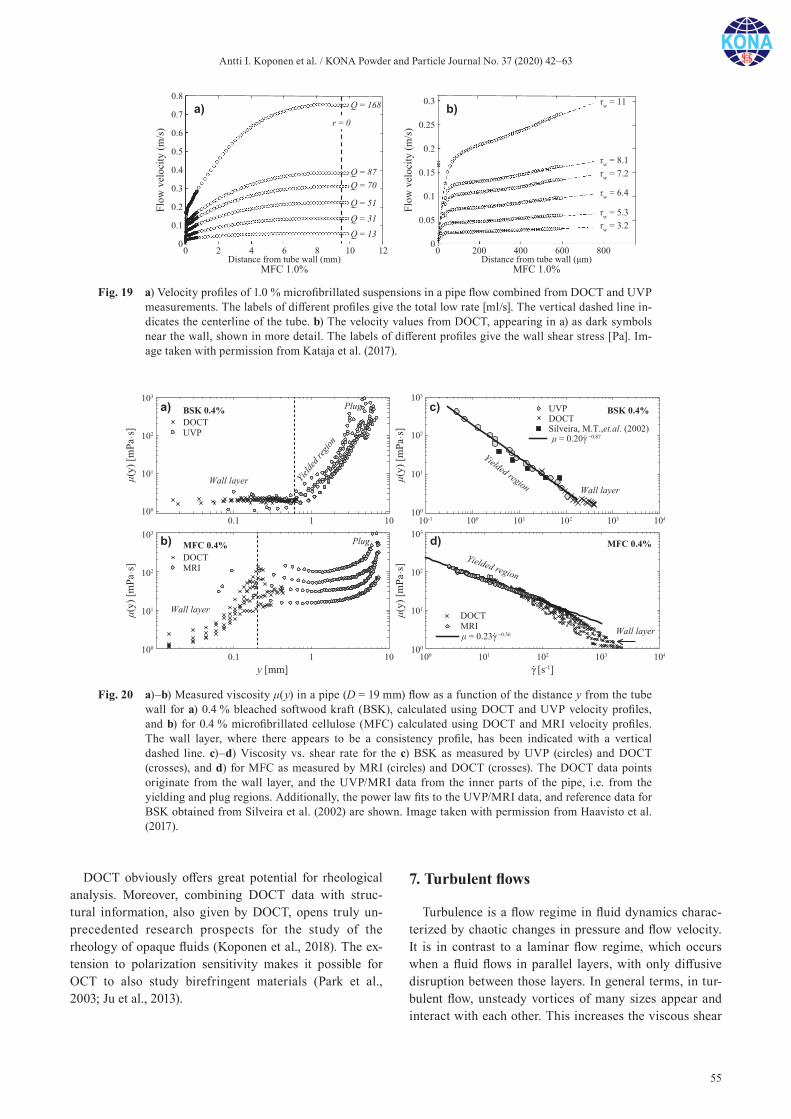
Antti I. Koponen et al. / KONA Powder and Particle Journal No. 37 (2020) 42–63
55
DOCT obviously offers great potential for rheological analysis. Moreover, combining DOCT data with struc-tural information, also given by DOCT, opens truly un-precedented research prospects for the study of the rheology of opaque fluids (Koponen et al., 2018). The ex-tension to polarization sensitivity makes it possible for OCT to also study birefringent materials (Park et al., 2003; Ju et al., 2013).
7. Turbulent flows
Turbulence is a flow regime in fluid dynamics charac-terized by chaotic changes in pressure and flow velocity. It is in contrast to a laminar flow regime, which occurs when a fluid flows in parallel layers, with only diffusive disruption between those layers. In general terms, in tur-bulent flow, unsteady vortices of many sizes appear and interact with each other. This increases the viscous shear
Fig. 19 a) Velocity profiles of 1.0 % microfibrillated suspensions in a pipe flow combined from DOCT and UVP measurements. The labels of different profiles give the total low rate [ml/s]. The vertical dashed line in-dicates the centerline of the tube. b) The velocity values from DOCT, appearing in a) as dark symbols near the wall, shown in more detail. The labels of different profiles give the wall shear stress [Pa]. Im-age taken with permission from Kataja et al. (2017).
Fig. 20 a)–b) Measured viscosity μ(y) in a pipe (D = 19 mm) flow as a function of the distance y from the tube wall for a) 0.4 % bleached softwood kraft (BSK), calculated using DOCT and UVP velocity profiles, and b) for 0.4 % microfibrillated cellulose (MFC) calculated using DOCT and MRI velocity profiles. The wall layer, where there appears to be a consistency profile, has been indicated with a vertical dashed line. c)–d) Viscosity vs. shear rate for the c) BSK as measured by UVP (circles) and DOCT (crosses), and d) for MFC as measured by MRI (circles) and DOCT (crosses). The DOCT data points originate from the wall layer, and the UVP/MRI data from the inner parts of the pipe, i.e. from the yielding and plug regions. Additionally, the power law fits to the UVP/MRI data, and reference data for BSK obtained from Silveira et al. (2002) are shown. Image taken with permission from Haavisto et al. (2017).

Antti I. Koponen et al. / KONA Powder and Particle Journal No. 37 (2020) 42–63
56
stresses and the energy consumption, e.g. in pipe flow. Turbulence is involved in many processes in the process industry. It is not only a nuisance, but turbulence also has the ability to mix and transport species, momentum, and energy much faster than is done by molecular diffusion and is therefore employed in, for example, chemical reac-tors to make them perform better. It is of great importance to have a detailed understanding of the turbulence when industrial processes and devices are developed. Typically, this work is done with a combination of computational f luid dynamics and experiments (Batchelor, 2000; Hjertager et al., 2003).
DOCT is in principle capable of performing measure-ments with a high enough temporal and spatial resolution to visualize the turbulent eddies. However, the measur-able velocity region is rather limited for the most popular realization of DOCT, the FD-OCT, and phase wrapping is often a problem. As discussed above, in laminar flows, even then it is possible to retrieve the actual velocity value by phase-unwrapping methods, if the phase wrapping is not too big. This is, however, problematic in turbulent flows, as the velocity fluctuations can exceed the measur-able velocity region considerably. Moreover, the basic measurement set-ups of DOCT see only one velocity component, whereas turbulence is always a 3D phenome-non. While there are various ways to improve the method to measure two or even three velocity components simul-taneously (as discussed above), to this day they appear not to have been applied for the quantitative analysis of tur-bulence.
Despite its current limitations, a few studies can be found where DOCT has been applied for turbulent flow analysis—mainly for obtaining temporally averaged pro-files. Bonesi et al. (2007) used DOCT for monitoring
turbulent velocity profiles in micro-channels. They ob-served, e.g. the transition from laminar to turbulent flow velocity profiles in a T-shaped micro-vessel junction (see Fig. 21). Villey et al. (2010) used TD-OCT and a zero crossing algorithm to obtain velocity maps in a 1.0-mm capillary free from phase aliasing or other common OCT artifacts. In Haavisto et al. (2017), DOCT was combined with MRI to measure the mean velocity profiles of turbu-lent flow of pure water and a xanthan gum solution in a 19-mm pipe. The combined velocity profiles obtained were in excellent agreement with their theoretical coun-terparts (see Fig. 22).
The flow instabilities of solutions of high molecular weight DNA were investigated with DOCT in a parallel plate rheometer in Malm and Waigh (2017). At lower DNA concentrations and low shear rates, the velocity fluctuations were well described by Gaussian functions, and the velocity gradient was uniform across the rheome-ter gap, which is expected for Newtonian flows. As the DNA concentration and shear rate were increased, there was a stable wall slip regime followed by an evolving wall slip regime which was finally followed by the onset of elastic turbulence (see Fig. 23).
8. Some limitations of OCT
Just like all measurement methods, OCT also has its limitations. The penetration depth, even in optimal condi-tions, may be too low for some applications and especially in highly scattering materials, it can be very limited. In Aigner et al. (2014), e.g. the f low characteristics of glass-fiber-reinforced polymers were directly analyzed in a real production process for an elongational rheometry.
Fig. 21 Stationary velocity profiles taken across a T-shaped junction. a) Initial flow distribution at the end of the inlet arm. b) Velocity flow distribution across the T junction. c), d) Turbulent flow profiles in the left and right outlet arms, respectively. The red and blue colors introduce minimum and maximum rates of the velocity of flow, respectively. e) The T-shaped micro vessel is 1.8 mm in diameter. Image taken with permission from Bonesi et al. (2007).
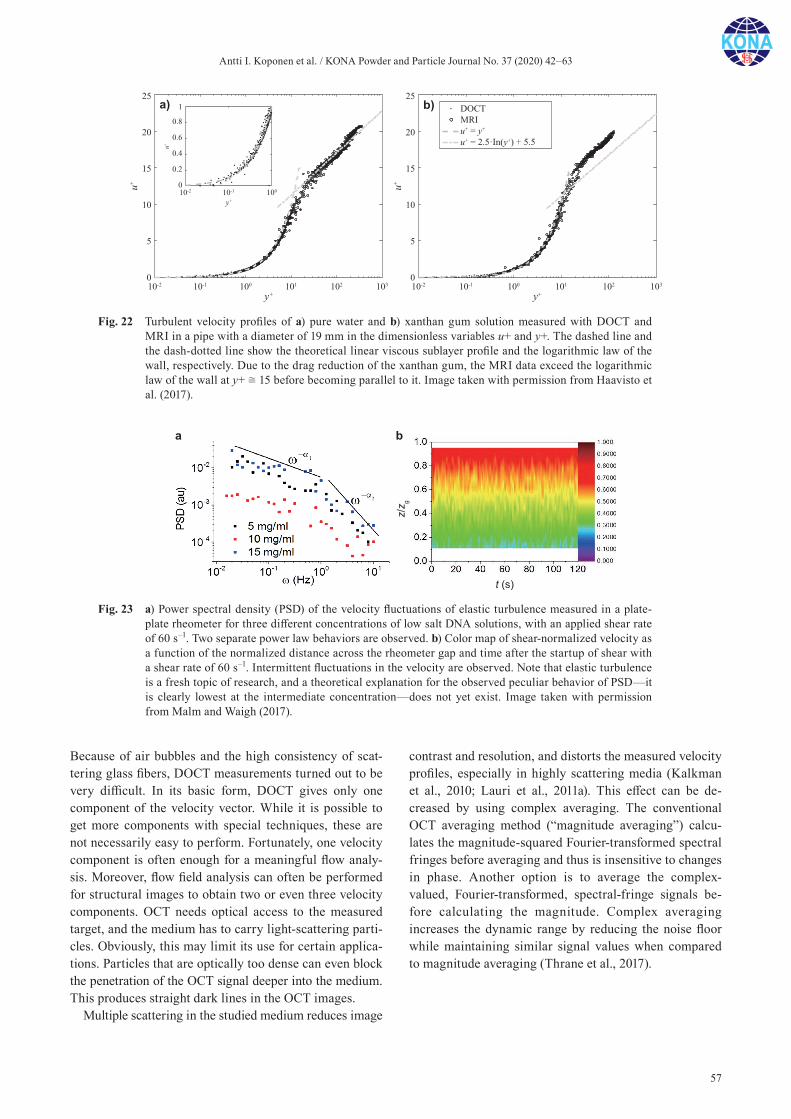
Antti I. Koponen et al. / KONA Powder and Particle Journal No. 37 (2020) 42–63
57
Because of air bubbles and the high consistency of scat-tering glass fibers, DOCT measurements turned out to be very difficult. In its basic form, DOCT gives only one component of the velocity vector. While it is possible to get more components with special techniques, these are not necessarily easy to perform. Fortunately, one velocity component is often enough for a meaningful flow analy-sis. Moreover, flow field analysis can often be performed for structural images to obtain two or even three velocity components. OCT needs optical access to the measured target, and the medium has to carry light-scattering parti-cles. Obviously, this may limit its use for certain applica-tions. Particles that are optically too dense can even block the penetration of the OCT signal deeper into the medium. This produces straight dark lines in the OCT images.
Multiple scattering in the studied medium reduces image
contrast and resolution, and distorts the measured velocity profiles, especially in highly scattering media (Kalkman et al., 2010; Lauri et al., 2011a). This effect can be de-creased by using complex averaging. The conventional OCT averaging method (“magnitude averaging”) calcu-lates the magnitude-squared Fourier-transformed spectral fringes before averaging and thus is insensitive to changes in phase. Another option is to average the complex- valued, Fourier-transformed, spectral-fringe signals be-fore calculating the magnitude. Complex averaging increases the dynamic range by reducing the noise floor while maintaining similar signal values when compared to magnitude averaging (Thrane et al., 2017).
Fig. 23 a) Power spectral density (PSD) of the velocity fluctuations of elastic turbulence measured in a plate-plate rheometer for three different concentrations of low salt DNA solutions, with an applied shear rate of 60 s–1. Two separate power law behaviors are observed. b) Color map of shear-normalized velocity as a function of the normalized distance across the rheometer gap and time after the startup of shear with a shear rate of 60 s–1. Intermittent fluctuations in the velocity are observed. Note that elastic turbulence is a fresh topic of research, and a theoretical explanation for the observed peculiar behavior of PSD—it is clearly lowest at the intermediate concentration—does not yet exist. Image taken with permission from Malm and Waigh (2017).
Fig. 22 Turbulent velocity profiles of a) pure water and b) xanthan gum solution measured with DOCT and MRI in a pipe with a diameter of 19 mm in the dimensionless variables u+ and y+. The dashed line and the dash-dotted line show the theoretical linear viscous sublayer profile and the logarithmic law of the wall, respectively. Due to the drag reduction of the xanthan gum, the MRI data exceed the logarithmic law of the wall at y+ ≅ 15 before becoming parallel to it. Image taken with permission from Haavisto et al. (2017).
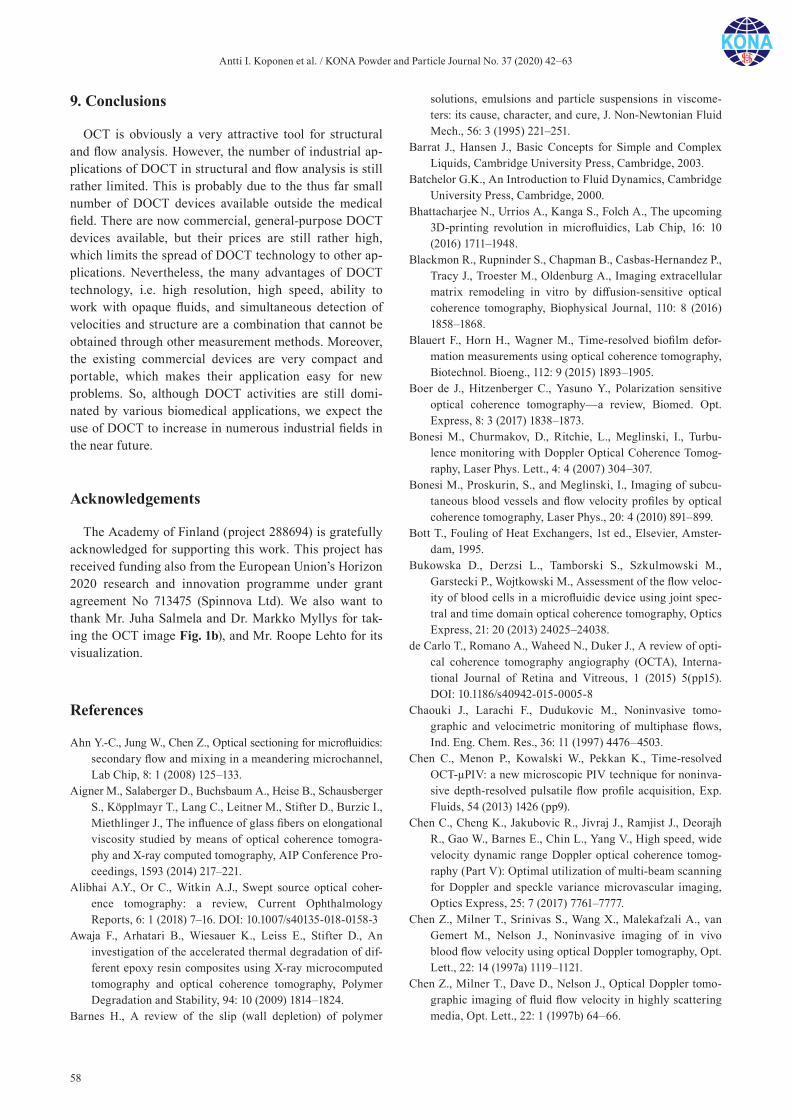
Antti I. Koponen et al. / KONA Powder and Particle Journal No. 37 (2020) 42–63
58
9. Conclusions
OCT is obviously a very attractive tool for structural and flow analysis. However, the number of industrial ap-plications of DOCT in structural and flow analysis is still rather limited. This is probably due to the thus far small number of DOCT devices available outside the medical field. There are now commercial, general-purpose DOCT devices available, but their prices are still rather high, which limits the spread of DOCT technology to other ap-plications. Nevertheless, the many advantages of DOCT technology, i.e. high resolution, high speed, ability to work with opaque fluids, and simultaneous detection of velocities and structure are a combination that cannot be obtained through other measurement methods. Moreover, the existing commercial devices are very compact and portable, which makes their application easy for new problems. So, although DOCT activities are still domi-nated by various biomedical applications, we expect the use of DOCT to increase in numerous industrial fields in the near future.
Acknowledgements
The Academy of Finland (project 288694) is gratefully acknowledged for supporting this work. This project has received funding also from the European Union’s Horizon 2020 research and innovation programme under grant agreement No 713475 (Spinnova Ltd). We also want to thank Mr. Juha Salmela and Dr. Markko Myllys for tak-ing the OCT image Fig. 1b), and Mr. Roope Lehto for its visualization.
References
Ahn Y.-C., Jung W., Chen Z., Optical sectioning for microfluidics: secondary flow and mixing in a meandering microchannel, Lab Chip, 8: 1 (2008) 125–133.
Aigner M., Salaberger D., Buchsbaum A., Heise B., Schausberger S., Köpplmayr T., Lang C., Leitner M., Stifter D., Burzic I., Miethlinger J., The influence of glass fibers on elongational viscosity studied by means of optical coherence tomogra-phy and X-ray computed tomography, AIP Conference Pro-ceedings, 1593 (2014) 217–221.
Alibhai A.Y., Or C., Witkin A.J., Swept source optical coher-ence tomography: a review, Current Ophthalmology Reports, 6: 1 (2018) 7–16. DOI: 10.1007/s40135-018-0158-3
Awaja F., Arhatari B., Wiesauer K., Leiss E., Stifter D., An investigation of the accelerated thermal degradation of dif-ferent epoxy resin composites using X-ray microcomputed tomography and optical coherence tomography, Polymer Degradation and Stability, 94: 10 (2009) 1814–1824.
Barnes H., A review of the slip (wall depletion) of polymer
solutions, emulsions and particle suspensions in viscome-ters: its cause, character, and cure, J. Non-Newtonian Fluid Mech., 56: 3 (1995) 221–251.
Barrat J., Hansen J., Basic Concepts for Simple and Complex Liquids, Cambridge University Press, Cambridge, 2003.
Batchelor G.K., An Introduction to Fluid Dynamics, Cambridge University Press, Cambridge, 2000.
Bhattacharjee N., Urrios A., Kanga S., Folch A., The upcoming 3D-printing revolution in microfluidics, Lab Chip, 16: 10 (2016) 1711–1948.
Blackmon R., Rupninder S., Chapman B., Casbas-Hernandez P., Tracy J., Troester M., Oldenburg A., Imaging extracellular matrix remodeling in vitro by diffusion-sensitive optical coherence tomography, Biophysical Journal, 110: 8 (2016) 1858–1868.
Blauert F., Horn H., Wagner M., Time-resolved biofilm defor-mation measurements using optical coherence tomography, Biotechnol. Bioeng., 112: 9 (2015) 1893–1905.
Boer de J., Hitzenberger C., Yasuno Y., Polarization sensitive optical coherence tomography—a review, Biomed. Opt. Express, 8: 3 (2017) 1838–1873.
Bonesi M., Churmakov, D., Ritchie, L., Meglinski, I., Turbu-lence monitoring with Doppler Optical Coherence Tomog-raphy, Laser Phys. Lett., 4: 4 (2007) 304–307.
Bonesi M., Proskurin, S., and Meglinski, I., Imaging of subcu-taneous blood vessels and flow velocity profiles by optical coherence tomography, Laser Phys., 20: 4 (2010) 891–899.
Bott T., Fouling of Heat Exchangers, 1st ed., Elsevier, Amster-dam, 1995.
Bukowska D., Derzsi L., Tamborski S., Szkulmowski M., Garstecki P., Wojtkowski M., Assessment of the flow veloc-ity of blood cells in a microfluidic device using joint spec-tral and time domain optical coherence tomography, Optics Express, 21: 20 (2013) 24025–24038.
de Carlo T., Romano A., Waheed N., Duker J., A review of opti-cal coherence tomography angiography (OCTA), Interna-tional Journal of Retina and Vitreous, 1 (2015) 5(pp15). DOI: 10.1186/s40942-015-0005-8
Chaouki J., Larachi F., Dudukovic M., Noninvasive tomo-graphic and velocimetric monitoring of multiphase flows, Ind. Eng. Chem. Res., 36: 11 (1997) 4476–4503.
Chen C., Menon P., Kowalski W., Pekkan K., Time-resolved OCT-μPIV: a new microscopic PIV technique for noninva-sive depth-resolved pulsatile flow profile acquisition, Exp. Fluids, 54 (2013) 1426 (pp9).
Chen C., Cheng K., Jakubovic R., Jivraj J., Ramjist J., Deorajh R., Gao W., Barnes E., Chin L., Yang V., High speed, wide velocity dynamic range Doppler optical coherence tomog-raphy (Part V): Optimal utilization of multi-beam scanning for Doppler and speckle variance microvascular imaging, Optics Express, 25: 7 (2017) 7761–7777.
Chen Z., Milner T., Srinivas S., Wang X., Malekafzali A., van Gemert M., Nelson J., Noninvasive imaging of in vivo blood flow velocity using optical Doppler tomography, Opt. Lett., 22: 14 (1997a) 1119–1121.
Chen Z., Milner T., Dave D., Nelson J., Optical Doppler tomo-graphic imaging of fluid flow velocity in highly scattering media, Opt. Lett., 22: 1 (1997b) 64–66.
Antti I. Koponen et al. / KONA Powder and Particle Journal No. 37 (2020) 42–63
59
Chu K., Mojahed D., Fernandez C., Li Y., Liu L., Wilsterman E., Diephuis B., Birket S., Bowers H., Martin Solomon G., Schuster B., Hanes J., Rowe S., Tearney G., Particle-tracking microrheology using micro-optical coherence tomography, Biophys J., 111: 5 (2016) 1053–1063.
Cito S., Ahn Y., Pallares J., Duarte R., Chen Z., Madou M., Katakis I., Visualization and measurement of capillary- driven blood flow using spectral domain optical coherence tomography, Microfluid Nanofluid, 13: 2 (2012) 227–237.
Drexler W., Fujimoto J. (Eds.), Optical Coherence Tomogra-phy—Technology and Applications, Springer-Verlag Berlin Heidelberg, Springer Science and Business Media, 2008.
Drexler W., Liu M., Kumar A., Kamali T., Unterhuber A., Leitgeb R.A., Optical coherence tomography today: speed, contrast, and multimodality, J. of Biomedical Optics, 19: 7 (2014) 071412 (pp34).
Dufour M., Lamouche G., Detalle V., Gauthier B., Sammut P., Low-coherence interferometry—an advanced technique for optical metrology in industry, Insight-Non-Destructive Testing and Condition Monitoring, 47: 4 (2005) 216–219.
Dürr S., Thomason J.C. (Eds.), Biofouling, Blackwell Publish-ing, Oxford, 2010.
Eley R., Applied rheology in the protective and decorative coat-ings industry, Rheology Reviews, 5 (2005) 173–240.
Fabritius T., Optical method for liquid sorption measurements in paper, doctoral thesis, University of Oulu, 2007.
Gao Y., Haavisto S., Tang C., Salmela J., Li W., Characterization of fluid dynamics in spacer-filled channels for membrane filtration using Doppler optical coherence tomography, Journal of Membrane Science, 448 (2013) 198–208.
Gao Y., Haavisto S., Tang C., Salmela J., Li W., Novel approach to characterizing thegGrowth of a fouling layer during membrane filtration via optical coherence tomography, Environ. Sci. Technol., 48: 24 (2014) 14273−14281.
Ghiglia D., Pritt M., Two-Dimensional Phase-Unwrapping: Theory, Algorithm, and Software, Wiley, New York, 1998.
Grulkowski I., Szkulmowski M., Bukowska D., Tamborski S., Gorczynska I., Kowalczyk A., Wojtkowski M., True veloc-ity mapping using joint spectral and time domain optical coherence tomography, Ophthalmic Technologies XX, International Society for Optics and Photonics, 7550 (2010) 75500G (pp7).
Haavisto S., Koponen A., Salmela J., New insight into rheology and flow properties of complex fluids with Doppler optical coherence tomography, Front. Chem., 2 (2014) 27(pp6).
Haavisto S., Salmela S., Jäsberg A., Saarinen T., Sorvari A., Koponen A., Rheological characterization of MFC using optical coherence tomography, TAPPI Journal, 14: 5 (2015a) 291–302.
Haavisto S., Salmela J., Koponen A., Accurate velocity mea-surements of boundary-layer flows using Doppler optical coherence tomography, Exp. Fluids, 56: 5 (2015b) 96 (pp6). DOI: 10.1007/s00348-015-1962-2
Haavisto S., Cardona M., Salmela J., Powell R., McCarthy M., Kataja M., Koponen A., Experimental investigation of the flow dynamics and rheology of complex fluids in pipe flow by hybrid multi-scale velocimetry, Exp. Fluids, 58: 11 (2017) 158(pp13). DOI: 10.1007/s00348-017-2440-9
Haavisto S., Application of Doppler optical coherence tomogra-phy in velocity profiling rheometry of complex fluids, Ph’D thesis, University of Jyväskylä, 2018.
Han Q., Li W.,Trinh T., Fane A., Chew J., Effect of the surface charge of monodisperse particulate foulants on cake forma-tion, Journal of Membrane Science, 548 (2018) 108–116.
Harvey M., Waigh T.A., Optical coherence tomography veloci-metry in controlled shear flow, Phys. Rev. E, 83:3 (2011) 031502(pp5).
Heise B., Wiesauer K., Götzinger E., Pircher M., Hitzenberger C., Engelke R., Ahrens G., Grützner G., Stifter D, Spatially resolved stress measurements in materials with polarization- sensitive optical coherence tomography: image acquisition and processing aspects, Strain, 46 (2010) 61–68.
Hendargo H., McNabb R., Dhalla A., Shepherd N., Izatt J., Dop-pler velocity detection limitations in spectrometer-based versus swept-source optical coherence tomography, Biomed. Opt. Express, 2: 8 (2011) 2175–2188.
Hierzenberger P., Leiss-Holzinger E., Heise B., Stifter D., Eder G., In-situ optical coherence tomography (OCT) for the time-resolved investigation of crystallization processes in polymers, Macromolecules, 47: 6 (2014) 2072–2079.
Hjertager L., Hjertager B., Deen N., Solberg T., Measurement of turbulent mixing in a confined wake flow using combined PIV and PLIF, The Canadian Journal of Chemical Engi-neering, 81: 6 (2003) 1149–1158.
Hong M. (Ed.), Coronary Imaging and Physiology, Springer, Singapore, 2018.
Huang B., Choma M., Resolving directional ambiguity in dynamic light scattering-based transverse motion velocim-etry in optical coherence tomography, Opt Lett., 39: 3 (2014) 521–524.
Huang B., Choma M., Microscale imaging of cilia-driven fluid flow, Cell. Mol. Life Sci. 72: 6 (2015) 1095–1113.
Huber R., Wojtkowski M., Fujimoto J., Fourier Domain Mode Locking (FDML): A new laser operating regime and appli-cations for optical coherence tomography, Optics Express, 14: 8 (2006) 3225–3237.
Huber R., Adler D., Srinivasan V., Fujimoto J., Fourier domain mode locking at 1050 nm for ultra-high-speed optical coherence tomography of the human retina at 236,000 axial scans per second, Opt. Lett., 32: 14 (2007) 2049–2051.
Jaradat S., Harvey M.,Waigh T., Shear-banding in polyacryl-amide solutions revealed via optical coherence tomography velocimetry, Soft Matt, 8 (2012) 11677–11686.
Jonas S., Bhattacharya D., Khokha M., Choma M., Microfluidic characterization of cilia-driven fluid flow using optical coherence tomography-based particle tracking velocimetry, Biomed. Opt. Express, 2: 7 (2011) 2022–2034.
Ju M., Hong Y.-J., Makita S., Lim Y., Kurokawa K., Duan L., Miura M., Tang S., Yasuno Y., Advanced multi-contrast Jones matrix optical coherence tomography for Doppler and polarization sensitive imaging, Optics Express, 21: 16 (2013) 19412–19436.
Kalkman J., Bykov A., Faber D., van Leeuwen T., Multiple and dependent scattering effects in Doppler optical coherence tomography, Optics Express, 18: 4 (2010) 3883–3892.
Kashani A., Chen C.-L., Gahm J., Zheng F., Richter G., Rosenfeld
Antti I. Koponen et al. / KONA Powder and Particle Journal No. 37 (2020) 42–63
60
P., Shi Y., Wang R., Optical coherence tomography angiog-raphy: A comprehensive review of current methods and clinical applications, Progress in Retinal and Eye Research, 60 (2017) 66–100.
Kataja M., Haavisto S., Lehto R., Salmela J., Koponen A., Char-acterization of microfibrillated cellulose fibre suspension flow using multi scale velocity profile measurements, Nor-dic Pulp and Paper Research Journal, 32: 3 (2017) 473–482.
Kawasaki M. (Ed.), Optical Coherence Tomography, InTe-chOpen, 2013.
Kim J., Brown W., Maher J., Levinson H., Wax A., Functional optical coherence tomography: principles and progress, Phys. Med. Biol., 60: 10 (2015) R211–R237.
Kirk R., Othmer D., Kirk-Othmer Food and Feed Technology, Wiley Interscience, 2008.
Koller D., Hannesschläger G., Leitner M., Khinast J., Non- destructive analysis of tablet coatings with optical coherence tomography, European Journal of Pharmaceutical Sciences, 44: 1–2 (2011) 142–148.
Koponen A., Lauri J., Haavisto S., Fabritius T., Rheological and flocculation analysis of microfibrillated cellulose suspen-sion using optical coherence tomography, Applied Sciences, 8 (2018) 775(pp10).
Kukulka D., Baier R., Mollendorf J., Factors associated with fouling in the process industry, Heat Transfer Engineering, 25: 5 (2004) 23–29.
Kumar S., Verma Y., Sharma P., Shrimali R., Gupta P., Single detector-based absolute velocity measurement using spec-tral domain Doppler optical coherence tomography, Appl. Phys. B, 117: 1 (2014) 395–399.
Lauri J., Bykov A., Priezzhev V., Myllylä R., Experimental study of the multiple scattering effect on the flow velocity profiles measured in intralipid phantoms by DOCT, Laser Physics, 21: 4 (2011a) 813–817.
Lauri J., Bykov A., Myllylä R., Determination of suspension viscosity from the flow velocity profile measured by Dop-pler optical coherence tomography, Photonics Letters of Poland, 3: 2 (2011b) 82–84.
Lauri J., Czajkowski J., Myllylä R., Fabritius T., Measuring flow dynamics in a microfluidic chip using optical coherence tomography with 1 µm axial resolution, Flow Meas. Instrum., 43 (2015) 1–5.
Lauri J., Koponen A., Czajkowski J., Haavisto S., Fabritius T., Analysis of rheology and wall depletion of microfibrillated cellulose using optical coherence tomography, Cellulose, 24: 11 (2017) 4715–4728.
Lawman S., Williams B., Zhang, J., Shen Y.-C., Zheng, Y., Scan-less line field optical coherence tomography, with automatic image segmentation, as a measurement tool for automotive coatings, Applied Sciences, 7: 4 (2017a) 351 (pp13).
Lawman S., Madden P., Romano V., Dong Y., Mason S., Williams B., Kaye S., Willoughby C., Harding S., Shen Y.-C., Zheng Y., Deformation velocity imaging using optical coherence tomography and its applications to the cornea, Biomed. Opt. Express, 8: 12 (2017b) 5579–5593.
Lexer F., Hitzenberger C., Fercher A., Kulhavy M., Wavelength- tuning interferometry of intraocular distances, Appl. Opt.,
36: 25 (1997) 6548–6553.Lee J., Bathany C., Ahn Y., Takayama S., Jung W, Volumetric
monitoring of aqueous two phase system droplets using time-lapse optical coherence tomography, Laser Phys. Lett., 13 (2016) 025606(pp5).
Leitgeb R., Werkmeister R., Blatter C., Schmetterer L., Doppler optical coherence tomography, Prog. Retinal Eye Res., 41 (2014) 26–43.
Li C., Wagner M., Lackner S., Horn H., Assessing the influence of biofilm surface roughness on mass transfer by combining optical coherence tomography and two-dimensional model-ing, Biotechnol. Bioeng., 1135 (2016) 989–1000.
Liu G., Chen Z., Advances in Doppler OCT, Chin. Opt. Lett., 11: 1 (2013) 011702(pp27).
Malm A., Harrison A., Waigh T., Optical coherence tomography velocimetry of colloidal suspensions, Soft Matter, 10: 41 (2014) 8210–8215.
Malm A., OCT velocimetry and X-ray scattering rheology of complex fluids, doctoral thesis, University of Manchester, 2015.
Malm A., Waigh T., Elastic turbulence in entangled semi-dilute DNA solutions measured with optical coherence tomogra-phy velocimetry, Sci. Rep., 7 (2017) 1186(pp13).
Manukyan S., Sauer H., Roisman I., Baldwin K., Fairhurst D., Liang H., Venzmer J., Tropea C., Imaging internal flows in a drying sessile polymer dispersion drop using Spectral Radar Optical Coherence Tomography (SR-OCT), J. Colloid Interface Sci., 395 (2013) 287–293.
Markl D., Hannesschläger G., Sacher S., Leitner M., Khinast J., Optical coherence tomography as a novel tool for in-line monitoring of a pharmaceutical film-coating process, Eur. J. Pharm. Sci., 55 (2014a) 58–67.
Markl D., Hannesschläger G., Buchsbaum A., Sacher S., Khinast J., Leitner M., In-line quality control of moving objects by means of spectral-domain OCT, Optics and Lasers in Engi-neering, 59 (2014b) 1–10.
Markl D., Hannesschläger G., Sacher S., Leitner M., Khinast J., Buchsbaum A., Automated pharmaceutical tablet coating layer evaluation of optical coherence tomography images, Meas. Sci. Technol., 26 (2015a) 035701(pp12).
Markl D., Zettl M., Hannesschläger G., Sacher S., Leitner M., Buchsbaum A., Khinast J., Calibration-free in-line moni-toring of pellet coating processes via optical coherence tomography, Chemical Engineering Science, 125 (2015b) 200–208.
Michaely R., Bachmann A., Villiger M., Blatter C., Lasser T., Leitgeb R., Vectorial reconstruction of retinal blood flow in three dimensions measured with high resolution resonant Doppler Fourier domain optical coherence tomography, J. Biomed. Opt., 12(4) (2007) 041213(pp7).
Mujat M., Ferguson R., Iftimia N., Hammer D., Nedyalkov I., Wosnik M., Legner H., Optical coherence tomography- based micro-particle image velocimetry, Opt. Lett., 38: 22 (2013) 4558–4561.
Nemeth A., Gahleitner R., Hannesschläger G., Pfandler G., Leitner M., Ambiguity-free spectral-domain optical coher-ence tomography for determining the layer thicknesses in fluttering foils in real time, Optics and Lasers in Engineer-
Antti I. Koponen et al. / KONA Powder and Particle Journal No. 37 (2020) 42–63
61
ing, 50: 10 (2012) 1372–1376.Park B., Pierce M., Cense B., de Boer J., Real-time multi-
functional optical coherence tomography, Optics Express, 11: 7 (2003) 782–793.
Park S., You J., Ahn Y., Jung W., Kim J., Lee S., Park J., Cho K., Evaluating the effects of organic matter bioavailability on nanofiltration membrane using real-time monitoring, J. Membr. Sci., 548 (2018) 519–525.
Piao D., Otis L., Zhu Q., Doppler angle and flow velocity map-ping by combined Doppler shift and Doppler bandwidth measurements in optical Doppler tomography, Opt. Lett., 28: 13 (2003) 1120–1122.
Popescu D., Choo-Smith L.-P., Flueraru C., Mao Y., Chang S., Disano J., Sherif S., Sowa M., Optical coherence tomogra-phy: fundamental principles, instrumental designs and bio-medical applications, Biophysical Reviews, 3: 155 (2011) 155–169.
Powell R., Experimental techniques for multiphase flows, Phys. Fluids, 20: 4 (2008) 040605(pp12).
de Pretto L., Nogueira G., Freitas A., Microfluidic volumetric flow determination using optical coherence tomography speckle: An autocorrelation approach, Journal of Applied Physics, 119 (2016) 163105(pp5).
Proskurin S., He Y., Wang R., Determination of flow velocity vector based on Doppler shift and spectrum broadening with optical coherence tomography, Opt. Lett., 28: 14 (2003a) 1227–1229.
Proskurin S., Sokolova I., Wang R., Imaging of non-parabolic velocity profiles in converging flow with optical coherence tomography, Phys. Med. Biol., 48 (2003b) 2907–2918.
Ren H., Brecke K., Ding Z., Zhao Y., Nelson J., Chen Z., Imag-ing and quantifying transverse flow velocity with the Dop-pler bandwidth in a phase-resolved functional optical coherence tomography, Opt. Lett., 27: 6 (2002) 409–411.
Saarinen T., Haavisto S., Sorvari A., Salmela J., Seppälä J., The effect of wall depletion on the rheology of microfibrillated cellulose water suspensions by Optical Coherence Tomog-raphy, Cellulose, 21: 3 (2014) 1261–1275.
Salmela J., Haavisto S., Koponen A., Jäsberg A., Kataja M., Rheological characterization of micro-fibrillated cellulose fibre suspension using multi scale velocity profile mea-surements, proceedings of 15th Fundamental Research Symposium, Robinson College, Cambridge, UK. 8th–13th September 2013, 495–509.
Schneider S., Eppler F., Weber M., Olowojoba G., Weiss P., Hübner C., Mikonsaari I., Freude W., Koos C., Multiscale dispersion-state characterization of nanocomposites using optical coherence tomography, Sci. Rep., 6 (2016) 31733 (pp12).
Schoenitz M., Grundemann L., Augustin W., Scholla S., Foul-ing in microstructured devices: a review, Chem. Commun., 51: 39 (2015) 8213–8228.
Shang L., Cheng Y., Zhao Y., Emerging droplet microfluidics, Chem. Rev., 117: 12 (2017) 7964−8040.
Sharma R., Papagiannopoulos A., Waigh T., Optical coherence tomography picorheology of biopolymer solutions, Appl. Phys. Lett., 92: 17 (2008) 173903(pp3).
Shen Z., Zeng N., He Y., Transverse flow-velocity quantification
using optical coherence tomography with correlation, J. Phys.: Conf. Ser., 277 (2011) 012033(pp6).
Shirazi M., Park K., Wijesinghe R., Jeong H., Han S., Kim P., Jeon M., Kim J., Fast industrial inspection of optical thin film using optical coherence tomography, Sensors, 16: 10 (2016) E1598(pp13).
Shirazi S., Lin C.-J., Chen D., Inorganic fouling of pressure- driven membrane processes—A critical review, Desalina-tion, 250: 1 (2010) 236–248.
Silveira M., Ferreire A., Lobo L., The viscosity of aqueous sus-pensions of cellulose fibers: Part 1. influence of consistency and fiber length, Silva Lusitana, 10: 2 (2002) 171–178.
Song G., Harding K., OCT for industrial applications, Optical metrology and inspection for industrial applications II, 8563 (2012) 85630N(pp10).
Spaide R.F., Fujimoto J.G., Waheed N.K., Sadda S.R., Staurenghi G., Optical coherence tomography angiography, Progress in Retinal and Eye Research, 64 (2018) 1–55.
Srinivasan V., Radhakrishnan H., Lo E., Mandeville E., Jiang J., Barry S., Cable A., OCT methods for capillary velocimetry, Biomed. Opt. Express, 3: 3 (2012) 612–629.
Stifter D., Burgholzer P., Höglinger O., Götzinger E., Hitzenberger C., Polarisation-sensitive optical coherence tomography for material characterisation and strain-field mapping, Applied Physics A, 76: 6 (2003) 947–951.
Stifter D., Beyond biomedicine: A review of alternative applica-tions and developments for optical coherence tomography, Applied Physics B, 88: 3 (2007) 337–357.
Stifter D., Wiesauer K., Wurm M., Schlotthauer E., Kastner J., Pircher M., Götzinger E., Hitzenberger C., Investigation of polymer and polymer/fibre composite materials with optical coherence tomography, Meas. Sci. Technol., 19: 7 (2008) 074011(pp8).
Stifter D., Leiss-Holzinger E., Major Z., Baumann B., Pircher M., Götzinger E., Hitzenberger C., Heise B., Dynamic optical studies in materials testing with spectral-domain polarization-sensitive optical coherence tomography, Optics Express, 18: 25 (2010) 25712–25725.
Szkulmowska A., Szkulmowski M., Kowalczyk A., Wojtkowski M., Phase-resolved Doppler optical coherence tomogra-phy—limitations and improvements, Opt. Lett., 33: 13 (2008) 1425–1427.
Takeda Y. (Ed.), Ultrasonic Doppler Velocity Profiler for Fluid Flow, Springer Science and Business Media, Springer Japan, 2012.
Thrane L., Brecken S., Blackburn J., Damodaran K., Rollins A., Jenkins M., Complex decorrelation averaging in optical coherence tomography: A way to reduce the effect of multi-ple scattering and improve image contrast in a dynamic scattering medium, Opt. Lett., 42: 14 (2017) 2738–2741.
Trantum J., Eagleton Z., Patil C., Tucker-Schwartz J., Baglia M., Skala M., Haselton F., Cross-sectional tracking of particle motion in evaporating drops: Flow fields and interfacial accumulation, Langmuir, 29: 21 (2013) 6221−6231.
Trasischker W., Werkmeister R., Zotter S., Baumann B., Torzicky T., Pircher M., Hitzenberger C., In vitro and in vivo three-dimensional velocity vector measurement by three-beam spectral-domain Doppler optical coherence tomogra-
Antti I. Koponen et al. / KONA Powder and Particle Journal No. 37 (2020) 42–63
62
phy, J. Biomed. Opt., 18: 11 (2013) 116010(pp11).Villey R., Carrion L., Morneau D., Boudoux C., Maciejko R.,
High-velocity-flow imaging with real-time Doppler optical coherence tomography, Applied Optics, 49: 16 (2010) 3140–3149.
Wagner M., Taherzadeh D., Haisch C., Horn H., Investigation of the mesoscale structure and volumetric features of biofilms using optical coherence tomography, Biotechnol. Bioeng., 107: 5 (2010) 844–853.
Wagner M., Horn H., Optical coherence tomography in biofilm research: A comprehensive review, Biotechnol. Bioeng., 114: 7 (2017) 1386–1402.
Waigh T., Advances in the microrheology of complex fluids, Rep. Prog. Phys., 79 (2016) 074601(pp62).
Wang X., Milner T., Nelson J., Characterization of fluid flow velocity by optical Doppler tomography, Opt. Lett., 20: 11 (1995) 1337–1339.
Wang Y., Wang R., Autocorrelation optical coherence tomogra-phy for mapping transverse particle-flow velocity, Opt. Lett., 35: 21 (2010) 3538–3540.
Weiss N., van Leeuwen T., Kalkman J., Localized measurement of longitudinal and transverse flow velocities in colloidal suspensions using optical coherence tomography, Physical Review E, 88: 4 (2013) 042312(pp7).
Weiss N., El Obied K., Kalkman J., Lammertink R., van Leeuwen T., Measurement of biofilm growth and local hydrodynamics using optical coherence tomography, Bio-med. Opt. Express, 7: 9 (2016) 3508–3518.
Werkmeister R., Dragostinoff N., Palkovits S., Told R., Boltz A., Leitgeb R., Groschl M., Garhofer G., Schmetterer L., Measurement of absolute blood flow velocity and blood flow in the human retina by dual-beam bidirectional Doppler Fourier-domain optical coherence tomography, Invest. Ophthalmol. Visual Sci., 53: 10 (2012) 6062–6071.
Whitesides G., The origins and the future of microfluidics, Nature, 442 (2006) 368–373.
Wiesauer K., Pircher M., Götzinger E., Bauer S., Engelke R., Ahrens G., Grützner G., Hitzenberger C., Stifter D., En-face scanning optical coherence tomography with ultra-
high resolution for material investigation, Optical Express, 13: 3 (2005a) 1015–1024.
Wiesauer K., Dufau A., Götzinger E., Pircher M., Hitzenberger C., Stifter D., Non-destructive quantification of internal stress in polymer materials by polarisation sensitive optical coherence tomography, Acta Materialia, 53: 9 (2005b) 2785–2791.
Wiesauer K., Pircher M., Götzinger E., Hitzenberger C., Oster R., Stifter D., Investigation of glass–fibre reinforced poly-mers by polarisation-sensitive, ultra-high resolution optical coherence tomography: Internal structures, defects and stress, Compos. Sci. Technol., 67: 15–16 (2007) 3051–3058.
Wijesinghe R., Parka K., Jung Y., Kimc P., Jeona M., Kima J., Industrial resin inspection for display production using automated fluid-inspection based on multimodal optical detection techniques, Optics and Lasers in Engineering, 96 (2017) 75–82.
Xia S., Huang Y., Peng S., Wu Y., Tan X., Robust phase unwrapping for phase images in Fourier domain Doppler optical coherence tomography, J. Biomed. Opt., 22: 3 (2017) 036014(pp8).
Xi C., Marks D., Parikh D., Raskin L., Boppart S., Structural and functional imaging of 3D microfluidic mixers using optical coherence tomography, PNAS, 101: 20 (2004) 7516 –7521.
Yoshizawa T. (Ed.), Handbook of Optical Metrology, Principles and Applications, second edition, CRC Press, 2015.
You J., Du C., Volkow N., Pan Y., Optical coherence Doppler tomography for quantitative cerebral blood flow imaging, Biomed. Opt. Express, 5: 9 (2014) 3217–3230.
You J., Li A., Du C., Pana Y., Volumetric Doppler angle correc-tion for ultrahigh-resolution optical coherence Doppler tomography, Appl. Phys. Lett., 110: 1 (2017) 011102(pp4).
Zhou K., Huang B., Gamm U., Bhandari V., Khokha M., Choma M., Particle streak velocimetry-optical coherence tomogra-phy: a novel method for multidimensional imaging of microscale fluid flows, Biomed. Opt. Express, 7: 4 (2016) 1590–1603.

Antti I. Koponen et al. / KONA Powder and Particle Journal No. 37 (2020) 42–63
63
Authors’ Short Biographies
Antti Koponen
Antti Koponen prepared a Ph.D. thesis on simulations of fluid flow in porous media and obtained his Ph.D. degree in 1998 from the University of Jyväskylä (Finland). In 2003, Koponen obtained a docentship in applied physics at the University of Jyväskylä. Principal scientist Antti Koponen has worked at VTT Technical Research Centre of Fin-land Ltd. since 2001. His work focuses on the rheology of complex fluids and flows in complex geometries. Recently, Koponen has worked extensively with the novel OCT-based rheological analysis of complex fluids (Rheo-OCT).
Sanna Haavisto
Sanna Haavisto is currently a Product Development Specialist at Spinnova Ltd., devel-oping environmentally friendly fibre technology. She is also finalizing her PhD at the University of Jyväskylä where she obtained her master’s degree (industrial physics) in 2004. Until 2014, Sanna Haavisto was employed at VTT Technical Research Centre of Finland as a senior scientist. Her work was mainly focused on experimental research of the flow properties and rheology of complex fluids, including novel OCT-based rheologi-cal measurements (Rheo-OCT).
KONA Powder and Particle Journal No. 37 (2020) 64–84/Doi:10.14356/kona.2020005 Review Paper
64Copyright © 2020 The Author. Published by Hosokawa Powder Technology Foundation. This is an open access article under the CC BY license (http://creativecommons.org/licenses/by/4.0/).
Microbial Aerosols: Sources, Properties, Health Effects, Exposure Assessment—A Review †
Rafał L. Górny1 Laboratory of Biohazards, Department of Chemical, Aerosol and Biological Hazards,
Central Institute for Labour Protection – National Research Institute, Poland
AbstractMicroorganisms are ubiquitous in the environment. Wherever their sources are present, the particles can be released into the air forming microbiological aerosols. Although most of their particles cause no harm to the exposed individuals, some of their propagules may have infectious or allergenic potential and may carry toxic or irritant substances and components. Their inhalation usually poses a significant health risk and is responsible for numerous adverse outcomes, from allergic reactions, infections and toxic responses to various nonspecific symptoms. This review article provides fundamental background information on the role of microorganisms in the environment, defines and characterizes environmental sources of microbial aerosols, describes microbial abilities for airborne transport and comments on their role in atmospheric processes, discusses their physical and biological characteristics which result in adverse health outcomes observed in exposed individuals. The paper characterizes comprehensively numerous sampling and analysis techniques involved in the quantitative and qualitative evaluation of microbial aerosols together with their practical applications, presents strategies applied in the assessment of harmful microbial agents formed by bioaerosols, explains the ways of creating hygienic standards (understood here as reference/threshold limits) for microbiological aerosols conditioned by both medical and environmental determinants, and comments on their usefulness in the control and protection of environment and health.
Keywords: microbial aerosols, sources, properties, health effects, analysis, exposure assessment
1. Microorganisms in the environment
From among different organisms, microbes are those that dominate earth habitats. Microorganisms are not only omnipresent but they are essential to all other life forms. They are a primary source for nutrients and the major re-cyclers of dead matter back to available organic form. Along with all other animals and plants, the human con-dition is deeply affected by microbes. Compared to the human population (~6 × 10⁹), the population of, e.g. ter-restrial ecosystem bacteria is significantly higher (> 1030). The human body is inhabited by more bacterial cells (1014) than its own cells (1013). Being aware of these population differences and using the most advanced analytical tech-niques, it is possible to recognize and characterize not more than 9 % of the total microbial species only (i.e. ~158,760 out of ~1,830,000 including viruses, bacteria,
algae, fungi, lichen, and protozoa). Microorganisms are essential to human survival, health and disease, and hence their environmental abundance and diversity are of great practical importance (Bisen et al., 2012). Since the 1970s, enormous analytical progress has moved us from the age of phylogenetic analyses (that take into account physical and metabolic characteristics of organisms) to the molec-ular future, which also determines evolutionary relation-ships. A look at the world of organisms through their genomes has reformulated our perception of the natural system. Life’s diversity seen as comprising 3 domains, i.e. bacteria, archaea and eucarya, has been dramatically broadened taking into account both community and eco-system interrelations (Hug et al., 2016; Whose and Fox, 1977; Woese et al., 1990). The genome-based approach al-lowed building the tree of life that today includes 92 named bacterial and 26 archaeal phyla as well as 5 eukary-otic supergroups. Despite these impressive numbers, how-ever, the functional diversities of classified organisms and, what is even more important, their influence on the im-munological system of exposed individuals in the form of an ‘airborne cocktail of particles’ remain so far unknown.
† Received 15 May 2018; Accepted 16 January 2019 J-STAGE Advance published online 21 March 2019
1 Czerniakowska 16 Street, 00-701 Warsaw, Poland E-mail: [email protected] TEL: +48-22-623-4677 FAX: +48-22-623-3693
Rafał L. Górny / KONA Powder and Particle Journal No. 37 (2020) 64–84
65
2. Sources of microbial aerosols and factors influencing their environmental spread
Microbial aerosols (i.e. airborne particles of microbio-logical origin) are usually naturally present in the envi-ronment. They are ubiquitous both indoors and outdoors. Their environmental presence is associated with different geographic regions, climate zones, continents or popula-tions of plants and animals. Their major outdoor sources are located on the earth surfaces and are formed by conti-nental (soils, plants including crops and forests, wetlands, deserts, land ice, urban, etc.) as well as natural and an-thropogenic water reservoirs. As an example, Table 1 re-veals approximate bacterial concentrations in near-surface air of various ecosystems (Burrows et al., 2009). Terrestrial ecosystems (e.g. cultivated soils, plant surfaces, mineral including desert dusts) are usually the most productive in this context.
The comparison of the global bioaerosol emission be-tween terrestrial and water ecosystems is difficult due to limited knowledge of the latter. There are several pro-cesses that favor microbial particle release from the water including eruption of rising bubbles through the sea- surface microlayer or wind ejection of spume drops from the breaking wave crest. Nevertheless, terrestrial emission processes are usually much more productive than those of aquatic sources (Aller et al., 2005; Blanchard et al., 1981; Elbert et al., 2007; Hultin et al., 2011; Veron, 2015).
Microbial aerosol sources are also widespread in indoor environments. They can derive from industrial and non- industrial settings and differ significantly in terms of their emission efficiency. In the first case, the most effective occupational aerosolization processes (being responsible for microbial aerosol concentrations up to 1012 cfu m–3)
are: silo loading/unloading, animal feeding in broiler houses, piggeries as well as different dust-releasing tasks in composting plants, granaries, animal food stores, malt-houses, and reloading of stored moldy raw materials (Dutkiewicz and Jabłoński, 1989). Against this back-ground, non-industrial indoor sources are less productive and usually closely connected with the presence and physical activity of humans (including numerous physio-logical processes such as breathing, talking, sneezing, coughing or scratching as well as movement and dust, in-cluding microbial dust residues, resuspension). Such types of emissions are usually able to create microbial concen-trations of about 103 cfu m–3; however, some chamber bio-aerosol studies revealed that even one person under seated conditions is able to release up to 106 biological aerosol particulates per hour into the air and the origin of such a microbial cloud can be assigned to the individual that emits it (Bhangar et al., 2016; Meadow et al., 2015). Also, indoor water reservoirs such as aquariums, toilets, sinks or even washing machines may load the air with high numbers of both saprophytic and pathogenic microorgan-isms. Such emissions (reaching usually 103–104 cfu m–3) may result not only in contamination of surrounding sur-faces but pose a real threat to exposed individuals through inhalation of different pathogens (including Bacillus, Aero-monas, Campylobacter, Clostridium, Escherichia, Klebsi-ella, Staphylococcus, Salmonella, Pseudomonas, Serratia, Shigella bacterial genera and molds) (Barker and Jones, 2005; Best et al., 2012; Getto et al., 2011; Lai et al., 2018; O’Toole et al., 2009; Pastuszka et al., 1996; Stapleton et al., 2013).
As the locations of microbial aerosol sources are (in an obvious way) not spatially uniformly distributed and their productivity differs, both temporal (including diurnal, seasonal, and annual) and environmental changes in bio-aerosol structure are observed. Moreover, microbial sources do not release bioaerosol particles continuously as numerous physical (temperature, relative humidity, avail-ability of water and nutrients, radiation, environmental oxygen presence, etc.) and biological (individual species properties, growth in microbial consortium) factors influ-ence such a process. Hence, all of the above results in fluctuations of quantitative and qualitative composition of airborne microorganisms (Burge, 1995; Lighthart and Stetzenbach, 1994; Macher, 1999).
From the above-listed physical factors, one of the major factors is temperature. It directly affects the rate of micro-bial metabolism, reproduction, and culturability. It also correlates with a number of important meteorological and climatic variables (e.g. air turbulence, time of day and season) that may affect concentrations of microorganisms in the air. In turn, the role of relative humidity as a factor influencing microbial aerosol is often emphasized in the literature; however, the empirical data do not adequately
Table 1 Total bacterial concentrations in near-surface air of various ecosystems.
Ecosystem The highest estimate [# m–3]
Coastal 1.3 × 10⁵
Crops 1.7 × 10⁵
Deserts 3.8 × 10⁴
Forests 8.8 × 10⁴
Grasslands 8.4 × 10⁵
Land ice 1 × 10⁴
Seas 8 × 10⁴
Shrubs 8.4 × 10⁵
Tundra 5.6 × 10⁴
Wetlands 8 × 10⁵
Urban 9.2 × 10⁵
Rafał L. Górny / KONA Powder and Particle Journal No. 37 (2020) 64–84
66
define the range of environmental conditions that are fa-vorable for this parameter. The environmental results of the bacterial aerosol test are ambiguous and the relative humidity is assessed as marginal and once significant (Krzysztofik et al., 1994; Nevalainen, 1989; Pasanen et al., 2000). For both of these parameters, however, their proper environmental levels are strictly connected with specific microbial strains determining the issues of survival in the air, (if deposited) conditioning the possibilities to colonize the surfaces and as such should be individually consid-ered (Burrows et al., 2009; Stetzenbach, 1997).
Regarding radiation, each type acts destructively on microbial particles. Sunlight has a known bactericidal ef-fect due to the part of the spectrum that includes short, violet and ultraviolet waves. For example, the vegetative bacterial forms (including Mycobacterium tuberculosis) die after several hours of irradiation, especially in the summer. Also, artificial (xenon) radiation with the same wavelength spectrum as solar light reduces the quantity of viable microorganisms (which was shown in laboratory experiments with Escherichia coli or Serratia marcescens aerosols) (Carroll et al., 2016; Hurst, 1997). Ultraviolet rays (with wavelengths from 250 nm to 280 nm), just as other high-energy radiation types (such as gamma and X rays), penetrate into microbial cells and induce a number of reactions, including those with free radicals. Such pro-cesses damage the structure of nucleic acids, proteins, carbohydrates, lipids, and cell membranes, leading to changes in cell functioning and/or death. The influence of long-wave radiation (infrared, microwaves) carrying a lower energy potential is usually reduced to its impact on temperature and by that on water relations in the cell; however, the direct (‘microwave’) effect on nucleic acids was also observed (Cox and Wathes, 1995; Górny et al., 2007).
Microorganisms have different requirements for the at-mospheric presence (or absence) of oxygen. Depending on the degree of oxygen tolerance, they are divided into four groups: absolute or relative anaerobes, microaerophiles (tolerant anaerobes), and absolute aerobes. The influence of oxygen on microbial aerosols may reveal both toxic and protective effects. The positive effect of oxygen is hy-pothesized based on laboratory experiments with the sup-pression of activity of toxic substances, whereas the toxicity is due to its enzymatic reduction inside the cell to hydrogen peroxide and toxic free radicals (O2
–). Aerobes and relative anaerobes are protected against these prod-ucts by the presence of superoxide dismutase or catalase enzymes. The oxygen toxicity to the microbial cell de-pends on the degree of cell hydration and is observed at a relative humidity below 65–70 % when the oxygen con-tent is about 30 % (further increase in oxygen content no longer produces an additional toxic effect) (Cox and Wathes, 1995; Carroll et al., 2016).
3. Presence and transport of microbial particles in the atmosphere
Wherever microbial sources are present, these particles can be released into the air forming biological aerosols. They can be both actively (e.g. by breathing, coughing) and passively (through meteorological processes) emitted to the atmosphere from almost all surfaces (Jones and Harrison, 2004). When airborne, microbial particles (as their non- biological counterparts) are primarily carried by air streams. In such a state, they may be present solely as mi-crobial particles, may form aggregates with both biological and non-biological particles or simply be attached to (usu-ally bigger) dust particles or fibers. The sizes of the formed structures condition the aerodynamic behavior influencing their half-life times (see below). Microbial particles are not ‘ideal’ spherical and smooth structures, and in the over-whelming majority of cases are asymmetric with rough or porous surfaces. All this makes the physical dimensions of microbial particles different from their aerodynamic di-ameters influencing their stability in the air. Independent of the air turbulence (that are almost always present in the environment), microbial particles are constantly removed from the air due to gravitational sedimentation, intercep-tion, impaction or precipitation processes, ending in both cases in deposition on surfaces as ‘free’ microbial particles or inside water droplets or ice crystals (Górny et al., 2017; Gregory, 1973; Lacey, 1991; Madelin and Johnson, 1992; Reponen et al., 1998, 2001; Tong and Lighthart, 2000).
Dry deposition plays the major role in the removal of airborne microbial particles with diameters bigger than 10 μm; however, they rarely penetrate deeper into the re-spiratory tract. For microbial particles, important from the human health perspective (i.e. inhalable particulates below 10 μm in diameter), ‘wet’ processes of bioaerosol sweeping from the atmosphere are of a fundamental im-portance (Després et al., 2012). Due to them, such micro-bial particles are usually present in large numbers in the troposphere (especially in the planetary boundary layer); however, both their vertical (beyond the troposphere) and horizontal (between environments, e.g. land and water, continents or climate zones) long-range transport is possi-ble and observed. Such transport over geographic barriers supports dissemination of reproductive structures and by that allows also the transfer of genetic material within micro biocenosis and between the microbiocenoses of dif-ferent ecosystems. In many aspects, the environmental transport of microbial propagules resembles those of dust particles (e.g. Bovallius et al., 1978; Jeon et al., 2011; Prospero et al., 2005), and over the last two decades, many models have been created to precisely describe the complexity of this phenomenon (e.g. Ganio et al., 1995; Helbig et al., 2004; Jarosz et al., 2004; Skelsey et al., 2008; Sofiev et al., 2006; Wilkinson et al., 2012).
Rafał L. Górny / KONA Powder and Particle Journal No. 37 (2020) 64–84
67
4. Microbial contribution to the atmospheric processes
When microbial aerosols are released into the air, they can be transported between different ecosystems and are influenced during this process by climate and seasonal changes, life cycles, aging, chemical and physical interac-tions, and variations in microbial populations (Fröhlich- Nowoisky et al., 2016; Huffman et al., 2013; Sesartic et al., 2012). Microbial particles already in the airborne state above ground may undergo frontal uplift, convection or further turbulence, driving them even above the tropo-sphere (Lindemann et al., 1982). The presence of micro-bial particles has already been confirmed at very high altitudes reaching into the stratosphere (Rogers and Meier, 1936; Shivaji et al., 2006; Wainwright et al., 2003) and mesosphere (Imshenetsky et al., 1978), and by that microbial particulates may affect numerous atmospheric processes. They may act as cloud condensation nuclei (CCN) or ice nuclei (IN) responsible for the formation of cloud droplets, ice crystals and precipitation, and thus in-fluence the hydrological cycle and climate. Biological CCN or IN may be present as both viable and non-viable microbial cells and conidia, their structural fragments and detached macromolecules. For example, many gram- negative bacterial species from Pseudomonas, Pantoea, and Xanthomonas genera act as IN through both their cells and outer membrane proteins. The bacterium Pseu-domonas syringae is now available as the commercial product for use in cloud seeding (e.g. Franc and Demott, 1998; Fröhlich-Nowoisky et al., 2016; Hill et al., 2014; Huffman et al., 2013; Kozloff et al., 1991; Lundheim and Zachariassen, 1999; Möhler et al., 2007; O’Sullivan et al., 2016; Pouleur et al., 1992; Šantl-Temkiv et al., 2015; Sattler et al., 2001).
For both viable and non-viable microbial particles, the atmosphere in not only the environment allows their transport but influences and modifies their basic physical, chemical, and biological features as well. For example, the atmospheric fragmentation of microbial particles may affect their transport and abilities to serve as CCN or IN (Diehl et al., 2001; Morris et al., 2004). Also, coating for-mation on microbial particles by organic and inorganic materials may influence their basic biological features and reactivity. Certain chemical reactions that influence pri-mary structural and functional cell compounds may reor-ganize both the molecular arrangement and immunological reactivity of microbial aerosol particles (e.g. ozone and nitric oxide reveal the ability to increase the allergenicity of airborne mold conidia proteins) (Gruijthuijsen et al., 2006; Lang-Yona et al., 2016). Although the air is the main environment for the spread of microorganisms, it is a biotope unfavorable to their survival. A lack of suffi-cient nutrients, numerous physical and chemical stressors
often result in sudden changes in microclimate, radiation, and osmotic parameters. Together with the imbalance be-tween oxidants and antioxidants in the surroundings, they may influence the metabolic activity and even viability of microbial cells. Atmospheric conditions are not conducive to maintain the metabolic activity of microbial particles (except for a few experiments with cloud water droplets and microorganisms being airborne for an extended pe-riod of time) (Amato et al., 2005, 2007; Dimmick et al., 1975; Vaïtilingom et al., 2013). On the other hand, these unfavorable atmospheric conditions may (to some extent) provoke a substantial shift among microbial particles leading to microbiome reformulation through relative se-lection and/or evolutionary changes. However, it should be clearly stated that the influence of the airborne state on microorganism behavior is so far not well understood and still requires more studies.
5. Behavior and dynamics in the air
In the physical sense, microbiological agents can be treated as solid particles. Several physical (size, shape, density, electrical charge), chemical (composition, hygro-scopicity), and biological (breathing pattern, route of breathing, anatomy of the airways) factors condition their behavior both in the air and, if inhaled, in the lungs (WHO, 2002). The basic and one of the most important characteristics of microbial particles is their diameter. The sizes of microbial aerosol particles range from ~0.02 μm up to tens of micrometers. Bioaerosol particles are rarely spherical and, when studied, their usually irregular shapes are characterized using certain equivalents of particle di-ameter (in aerobiology, the most frequently used are aero-dynamic and optical approximations). It is worth mentioning here that data from remote measurements (see below) suggest that microbial particles usually tend to form aggregates larger than 2.5 μm in diameter (Ho J., 2014). Both equivalent diameters may be significantly dis-tinct from their physical dimensions. As examples, one can mention here the dimensions of Bacillus subtilis en-dospore-forming gram-positive rods and Cladosporium cladosporioides fungal conidia, whose physical sizes of 0.7–0.8 × 1.5–1.8 μm and 3–7 × 2–4 μm correspond with aerodynamic diameters of 0.9 μm and 1.8 μm, respectively (Kulkarni et al., 2011; Macher, 1999; Reponen 1994).
To be inhaled, microbial particles must be airborne for a sufficient period of time. In the vast majority of envi-ronmental situations, when the air is almost permanently turbulent, such a time frame is characterized by the ‘half-life’ term. In brief: as rarely spherical, the sedimentation velocity of airborne microbial particles depends inter alia on the square of the particle diameter. Hence, according to Stokes’ law, for microbial particles of 100, 10, 3, 1, and
Rafał L. Górny / KONA Powder and Particle Journal No. 37 (2020) 64–84
68
0.5 μm, the expected half-life times are 5.8 sec, 8.2 min, 1.5 h, 12 h, and 41 h, respectively (Kulkarni et al., 2011; Martinez, 2002).
6. Stability in the air and on surfaces
As already mentioned, the air – being deprived of nu-trient sources, with constantly changing moisture content, and a wide range of different stress factors—on the whole disfavors microbial survival. Despite these disadvantages, microbial particles are capable of preserving their viability and, with it, also all related biological properties (includ-ing infectivity, toxicity, allergenicity, etc.) much longer than bigger organisms. Table 2 presents a few examples of survival times for microorganisms representing differ-ent groups of biological agents that are important from the human health perspective (Burge, 1995; Flannigan, 1994; Kramer et al., 2006; Mandrioli et al., 2003; Neira et al., 2016; Yang, 1994). If deposited on surfaces, the micro-bial particles may also maintain their viability for a long period of time and, when resuspended in the air, may still pose a serious threat to the exposed individuals. As the inhalation of immunologically active particles can be re-sponsible for numerous adverse health conditions, the re-lationship between their stability on surfaces and viability in the air is of great importance from the exposure assess-ment point of view.
7. Biological properties
A microbial aerosol has a dual nature, i.e. physical like other particulates or fibrous aerosols, and biological, i.e. it possesses specific features characteristic for these types of airborne particulates only. As mentioned earlier, micro-organisms may be present in the air as viable (i.e. having the ability to reproduce/replicate or possessing metabolic activity under given conditions) or non-viable particles (deprived of the capacity to form progenies, being, e.g. dead or unable to reproduce neither from whole cells nor from their fragments). Conditio sine qua non for micro-organisms to be infectious is their viability (which in con-trast to allergenicity and toxicity can also be maintained by both non-viable cells and their fragments). Moreover, in the environment, viable microorganisms are under the constant influence of numerous disruptive and/or stress factors. Their interference may end in genotype (muta-tions) and phenotype changes, evolution and relative se-lection, which can equip microbes with features and properties (e.g. bacterial mutants resistant to antibiotics or disinfectants, fungi resistant to fungicides, etc.) hitherto not possessed (Després et al., 2012; Dutkiewicz and Jabłoński, 1989).
8. Causative role in adverse health effects
Microbiological aerosols are of the greatest epidemio-logical importance. Although most of the bioaerosols are harmless constituents of normal environments, some of their particles may be infectious agents or allergens, may carry or produce toxic and/or irritant substances or me-tabolites. Taking into account the health effects provoked by airborne microbial particulates, the difference between outdoor and indoor environments seems to play a signifi-cant role. In an outdoor environment, except in periods of snow cover, microorganisms are always present. Except for intensively emitting sources, their concentrations are not usually high, as spatial effect result in their more or less uniform dispersion. Once disseminated in the ambi-ent air, microbial aerosols may find their way into the in-door environment. Here, a lack of ventilation and other dispersal or elimination mechanisms, together with the substantial amount of time people spend indoors, create harmful conditions from the health perspective. Global estimates reveal that in an occupational environment only, each year several hundred million workers have been ex-posed to microbial agents in concentrations harmful to their health. The social costs of such exposure are signifi-cant, reaching billions of dollars (Cox and Wathes, 1995; Crook, 2007).
Among microbial aerosol particles, one can find: infec-tious agents, allergens, toxins and other biological com-pounds that are able to provoke similar toxic effects (e.g. endotoxins, β-glucans), carcinogens (e.g. mycotoxins), and biologically active (submicrometric and nanometric) frag-ments of microorganisms. All these particles may per-form a causative role of many adverse health conditions
Table 2 Viability of microbial particles in the air and on sur-faces.
Biological agentViability/persistence
In the air On inanimate surfaces
Influenza virus Up to 21 days Up to 11 days
Staphylococci About 3 days From 7 days to 7 months
Streptococci Up to 48 hours From 1 day to 6.5 months
Escherichia coli Up to 60 minutes From 90 minutes to 16 months
Legionella pneumophila Up to 15 minutes Not detected
Aspergillus and Penicillium conidia Up to 22 years Up to 22 years
Dust mite allergens Up to few months Up to few months

Rafał L. Górny / KONA Powder and Particle Journal No. 37 (2020) 64–84
69
from allergic reactions, infections and toxic reactions to other non-specific symptoms known in scientific litera-ture as ‘sick or tight building syndrome’ (SBS or TBS), ‘building-related illnesses’ (BRIs) or ‘mucous membrane syndrome’ (MMS). Regarding those non-specific reac-tions, accompanied usually by a dry cough, eye, nose and throat irritations, they may not necessarily involve im-mune responses or inflammatory mediators because in most cases, the observed adverse effects are a result of mixed exposure to both toxins and allergens. Aerosols composed of infectious microorganisms may attack the respiratory tract and, in more generalized cases, other body organs as well. When among airborne microbial contaminants, non-viable ones—usually together with their fragments—are present, such exposure may lead to chronic or acute illnesses. Such non-infectious microbial particulates, if abundantly present in the environment, may also sensitize exposed individuals (Bunger et al., 2004; Douwes et al., 2003; Falkinham, 2003; Fogelmark et al., 1991; Roy and Milton, 2004; Roy and Reed, 2012; Shahan et al., 1994).
During the inhalation of microbial aerosols, both the upper and lower airways are exposed. The diseases (if they occur) most often appear within the part of respiratory tract into which the particular microbial agent penetrates and deposits. For example, the influenza virus (represent-ing the Orthomyxoviridae family) together with other rhino-, adeno-, and coronaviruses that are responsible for the common cold usually infect the upper respiratory tract. Also, sensitization diseases (such as allergic rhinitis or sinusitis) are located in the upper airways (Lopardo et al., 2012; Louie et al., 2005; May S. et al., 2012). In turn, lower respiratory tract diseases (such as bronchitis or pneumonia) are mainly provoked by aerodynamically big-ger structures such as bacteria (e.g. Legionella spp., Streptococcus spp., Haemophilus influenzae); however, nanometric particles such as avian influenza (H5N1; virion of 80–120 nm in diameter) or parainfluenza viruses can also infect the lower respiratory tract (Dasaraju and Liu, 1996; Hall, 2001). The lower airways (especially the bron-chi and alveoli) are also a target for numerous viable bac-terial cells and spores, fungal conidia, and non-viable microbial allergenic and toxic particulates responsible for chronic diseases such as asthma, chronic obstructive pulmonary diseases, and hypersensitivity pneumonitis (Bettoncelli et al., 2014; O’Connor et al., 2013; Reynolds et al., 2013; Sferrazza Papa et al., 2014; Takemura et al., 2008).
Microbial aerosols are ubiquitous and, as such, should also gain special attention indoors. Such closed spaces, quite often harboring a wide spectrum of microbiota, characterize high concentrations of bioaerosols and as such pose a real risk to human health. The observed dis-eases, however, are often hard to attribute to specific
micro bial agents as they usually constitute only a part of a particulate cocktail together with other allergens de-rived from organic chemistry products (Blais-Lecours et al., 2015; May S. et al., 2012).
9. Inhalation and deposition mechanisms
Microbial aerosols may affect human health in several ways, i.e. due to their inhalation or direct contact with the skin and mucous membrane of the eye. Inhalation is a major route of entry for microbial pathogens and the pos-sible adverse reactions can affect both upper and lower respiratory tracts. The type of interactions between micro bial aerosol particles and human cells depends on their place of deposition and is conditioned by their reten-tion time in the airways.
Microbial aerosol particles can be deposited due to sev-eral mechanisms (Fig. 1): larger particles—by inertial impaction, sedimentation, and if resembling fibers (like chains of fungal conidia)—by interception; smaller parti-cles—by diffusion. Electrostatic effects may enhance or modify the deposition of charged particles of any size.
As already mentioned, the settling velocity of particles with diameters above 10 μm is big enough to prevent their inhalation (except the cases when exposed individuals are in the immediate vicinity of the active emission source). Microbial particles with smaller diameters (represented usually by vegetative cells, spores, conidia, their frag-ments, aggregates entirely formed by microbial particles
Fig. 1 Schematic view of major mechanisms of particle depo-sition in the respiratory tract.
Rafał L. Górny / KONA Powder and Particle Journal No. 37 (2020) 64–84
70
or consisting of microbial and other non-biological aero-sols) may penetrate into the respiratory tract. From them, about 80 % of particles between 5–10 μm in diameter are stopped by the nasopharynx. Here, the air entering the airways has the highest velocity and their anatomic for-mation supports and facilitates both the inertial impaction and centrifugal condensation processes. For particles re-sembling fibers (such as chains of fungal conidia), their capture is realized due to interception. When inspired air leaves the nasopharynx and then turns downward into the lower stages of the respiratory tract, its velocity decreases and directional changes are less abrupt, allowing the sep-aration of smaller particles between 0.5–5 μm in diame-ter. Particles within that size range are separated from the air stream by impaction and sedimentation, and their deposition probability is directly proportional to the res-idence time. Finally, the finest particles with diameters below 0.1–0.5 μm are removed from the air and subse-quently deposited almost entirely by Brownian motion and diffusion. This process is inversely proportional to the diameters of driven particles and is usually bolstered by electrostatic forces. Very small aerosol particles with diameters of about 0.01 μm have negligible inertia and they may start to behave as highly reactive gases, diffus-ing dynamically through the walls of the respiratory tracts. It is worth mentioning here that some of the micro-bial aerosol particles are highly hygroscopic. During their passage through the airways, they face significant changes of both the air stream temperature and humidity (the lat-ter parameter may reach almost 100 %). In such circum-stances, the aerodynamic diameters of microbial particles may expand, resulting in their deposition. These hygro-scopic changes are most pronounced for particles between 0.5–2 μm in diameter and its increase may reach 20 %. This fact can have a significant impact on both the magni-tude of the actual exposure and on the dose of inhaled particles and should always be considered when microbial exposure assessment is to be performed (Clarke, 1990; Cohen et al. 1998, 2000; Lippmann, 1986; Reponen et al., 2001; Spengler and Wilson, 1996; Utell and Samet, 1996; Walton, 1977; Wang, 2005).
In contrast to the deposition of particles, which is a purely physical phenomenon, lung clearance is a biologi-cal process. There are four major mechanisms by which deposited particles are removed from the airways: trans-port by mucociliary escalators to the pharynx followed by entry into the gastrointestinal tract, incorporation by al-veolar macrophages followed by mucociliary escalator transport or lymph nodes, entry into lymph nodes via lymphatic vessels, and dissolution followed by absorption into the blood circulation. The particle clearance effi-ciency is different in specific airway regions. Particles stopped in extrathoracic regions are removed by wiping, sneezing or blowing, and these processes usually take
minutes; those trapped in tracheobronchial parts are re-moved with the mucus flow and the average time neces-sary for that ranges from less than an hour to two days; finally, removal of insoluble particles caught in the lower respiratory tract (alveolar region) is much slower taking hundreds of days; highly soluble particles may dissolve almost immediately after their deposition (Foster and Costa, 2011; Gehr and Heyder, 2000; Spengler and Wilson, 1996; Utell and Samet, 1996; Wang, 2005).
The place of particle deposition and their retention in the respiratory tract determine the type and severity of interactions between the inhaled microorganisms and ex-posed tissues. Particles of: 10 μm in diameter or bigger (usually microbial aggregates with other non-biological particulates) may be responsible for eye and/or nose irri-tations; 5–10 μm in diameter (e.g. bigger fungal conidia or multiparticle microbial aggregates) may elicit asthmatic reactions; 5 μm or smaller (e.g. individual fungal conidia, bacterial cells or spores, their fragments as well as small aggregates of microbial and dust particles) may induce allergic alveolitis-type reactions (Horner et al., 1995; Owen et al., 1992). Lessons learned from both experimen-tal and field studies revealed that the physiologic impact of ‘fine’ (including microbial) particles of 2.5 μm in di-ameter or smaller (e.g. actinomycetal spores, majority of indoor mold conidia) has been associated with negative health results. Adverse respiratory effects in exposed hu-man populations include an increase in asthmatic epi-sodes, a rise in the prevalence of chronic bronchitis and chronic obstructive pulmonary disease. These particles may also negatively impact the cardiovascular system; however, their deleterious role here is still poorly under-stood (Cohen et al. 1998, 2000; Foster and Costa, 2011; Gehr and Heyder, 2000; Spengler and Wilson, 1996; Walton, 1977; Wang, 2005).
10. Exposure assessment measures
To properly evaluate the health hazards, an appropriate conceptual framework must be built and applied covering both the physical (how many microbial particles are in a particular volume of the air; how many microbial agents are in or on other non-biological, i.e. particulate and/or fi-brous aerosol, particles; what is the particle size distribu-tion) and biological characteristics (which microbial agent is present, how many agents are viable and non-viable, how many agents are immunologically reactive, how many of them are necessary to cause adverse reactions) of aerosolized microbial agents. To reach that goal, both the identification and characterization of microbial aerosol particles should be performed precisely and accurately. Despite the constantly expanding knowledge within this field, a clear link between the dose of microbial pollutants
Rafał L. Górny / KONA Powder and Particle Journal No. 37 (2020) 64–84
71
and the subsequently provoked response for the majority of these agents cannot be conclusively confirmed. Among the rationales behind this is the inappropriateness of ana-lytical methods related to and used in assessment of the exposure to microbial aerosols.
11. Microbial aerosol sampling and analysis
Compared to other aerosols, microbial aerosol sam-pling requires special handling procedures. Traditional sampling methods (i.e. filtration and impaction, including impingement) and analysis (cultivation) focus on the eval-uation of viable microbial propagules including conidia, spores and vegetative cells. Such an approach excludes the meaning of both non-viable particles and/or their frag-ments and consequently underestimates the real exposure, measuring only a small part of available particles. The quantitative and qualitative results of these methods (re-gardless of whether they are carried out as stationary or personal measurements) are additionally biased by the sampling time (relatively short in the majority of cases) and numerous environmental, spatial or temporal alter-ations. Even characterization of the microbial source, per-formed usually by surface sampling (using transparent sticky tape, swabs or contact plates) or, much less often, by source strength evaluation (based on aerosolization techniques that use a perpendicular or swirling air stream for the release of microbial propagules) cannot precisely estimate the magnitude of microbial particle emission into the air (Després et al., 2012; Górny and Ławniczek-Wałczyk, 2012; Hung et al., 2005; Kulkarni et al., 2011; Macher, 1999; Yang and Heinsohn, 2007).
Samplers utilizing inertial forces have been broadly ap-plied for microbial aerosol measurements. Among them, the most common are: single-stage and cascade impactors as well as slit samplers (if the impaction stage consists of slits instead of circular holes). Especially cascade impac-tors in their six-, seven-, eight- or ten-stage forms have often been utilized as a reference device for the collection of culturable microorganisms, providing a precise separa-tion of sampled particles due to the well-established cut-off sizes of particular impactor stages. These impactors are available in both stationery (e.g. Andersen type) and personal (e.g. Marple type) models. Particle separation from the air by centrifugal force as a special case of iner-tia but with a radial geometry has also been successfully applied for microbial aerosol particle collection. On the other hand, impingers (such as AGI-30 or BioSampler) combine the collection of airborne particles by impaction into a liquid with particle diffusion within the liquid bub-bles. Compared to impactors, impingers offer a significant extension of sampling times and increase of collection efficiency, preserving at the same time a vast majority of
biological properties of the microbial aerosol particles (Crook, 1995a, b; Kulkarni et al., 2011). Non-inertial col-lection techniques represented by sedimentation or filtra-tion have also been frequently applied for microbial aerosol sampling. More sophisticated devices such as electrostatic samplers and thermal precipitators have been developed which enable the ‘gentle’ collection of micro-bial aerosol particles while preserving their viability during the sampling process and at the same time enhanc-ing their collection efficiency (Kethley et al., 1952; Mainelis et al., 1999, 2001, 2002; Orr C. et al., 1956; Tan M. et al., 2011).
Traditional microbiological methodology utilizes culti-vation methods and microscopic analysis to describe both the diversity and concentration of microorganisms in col-lected airborne samples. Although these are already ‘older’ methods, they are still to this day successfully used in aerobiological studies. On the other hand, how-ever, cultivation methods have serious limitations as they are dedicated to the detection of viable (understood usu-ally as culturable) microbial agents, neglecting the re-maining load of particulates of microbial origin including viable but non-culturable and dead microbes as well as their fragments. It should be clearly stated here that the majority of airborne particles of microbial origin, even when viable, is non-culturable and unable to form new colonies on an appropriate medium (Amann et al., 1995; Colwell, 2000; Cox and Wathes, 1995; Hung et al., 2005; Rappé and Giovannoni, 2003; Roszak and Colwell, 1987; Staley and Konopka, 1985; Wainwright et al., 2004; Yang and Heinsohn, 2007). Hence, by definition, the inference about air pollution based on cultivation methods signifi-cantly reduces the value of real exposure. The hitherto obtained results show that the percentage of culturable microbial particulates in the total microbiota did not ex-ceed ~25 % for bacteria and ~17 % for fungi, being usu-ally between 0.03 % and 1 % (Bridge and Spooner, 2001; Chi and Li, 2007; Gołofit-Szymczak and Górny, 2010; Heidelberg et al., 1997; Lighthart, 2000). Among the factors influencing these numbers are those of technical (collection method, sampling time, collection/growth medium, incubation conditions), biological (microbial strain; type of sampled propagules, i.e. vegetative cells, spores, conidia), and environmental origin (e.g. tempera-ture; relative humidity; time of day; season; climate zone; geographic region; type of natural reservoirs such as water, soil, forest, desert, etc.; presence of plant and ani-mal populations, etc.) (Amato et al., 2007; Dutkiewicz and Jabłoński, 1989; Griffin et al., 2006; Shahamat et al., 1997; Stewart et al., 1995; Tong and Lighthart, 1999; Wang Z. et al., 2001; Wang C.-C. et al., 2007, 2008).
Since construction of the first optical microscope at the end of the 16th century, microscopic techniques still to this day play an important role in microbiological studies,
Rafał L. Górny / KONA Powder and Particle Journal No. 37 (2020) 64–84
72
including those related to biological aerosols. They allow the observation and assessment of the size of both large micrometric and smaller objects with submicro- and nanometric dimensions. They also enable observation of their internal structure. At the same time, they provide the opportunity not only to qualitatively identify the via-ble and non-viable microorganisms, but also to assess the number of such agents from vegetative cells, spores or co-nidia through the particles that are their structural ele-ments, to small infectious agents such as viruses. Bright field or light microscopes are usually used for simple ob-servations of particulate shapes and sizes as well as to count microorganisms. The particles in the samples can be observed in the transmitted light (for transparent spec-imens) or in the reflected light (for opaque ones), in a light or dark field or in polarized light to increase their contrast and make their details visible in more precise way. They can be also stained using, e.g. methylene blue, crystal vio-let, safranin, fuchsine or other differential stains to allow classification of microbial particles into groups of species. On the other hand, a phase-contrast microscope is used when the microbial particulates are nearly invisible and an alternative mounting medium is not possible or per-missible. Such microscopes do not require sample stain-ing but offer detailed examination of the internal structure of observed particulates. A variety of light microscopy is fluorescence microscopy which uses an ultraviolet or near-ultraviolet source of illumination that causes fluores-cent particle compounds to emit light. Direct count meth-ods, applied also to aerobiological studies to, e.g. count the number of ‘total’ microbial particles (i.e. viable and non-viable together), today constitute one of the most wide-spread analytical techniques. The application of a wide range of f luorochromes (e.g. acridine orange, 4’,6- diamidino-2-phenylindole, 5-cyano-2,3-ditolyl tetra-zolium chloride or fluorescein isothiocyanate), selectively bounded to the studied cell structure or coupled with spe-cific antibodies or molecular probes, allows the location of individual structures in a cell and observation of se-lected physiological processes. Currently, the majority of the fluorescent microscopes are the ‘epi’ ones (i.e. where the light source is mounted above the specimen) equipped with digital cameras which allow recording the image di-rectly in a digital form. The automatic acquisition of im-ages together with their analysis makes the examination time shorter and the use of several fluorochromes enables the simultaneous measurement of multiple parameters (Bartoszek and Rosowski, 2017; Després et al., 2012; Francisco et al., 1973; Harrison et al., 2005; Hernandez et al., 1999; Hobbie et al., 1977; Jensen et al., 1994; Karlsson and Malmberg, 1989; Kepner and Pratt, 1994; Macher, 1999; Pöhlker et al., 2011). Electron microscopy uses a beam of electrons instead of light. In a scanning electron microscope (SEM), the sample surface is scanned with a
collimated electron beam. Electron signals, obtained as a result of the electron stream interaction with the surface of the examined object, are collected by appropriate de-tectors and transformed into images. The high-vacuum mode is fundamental for each SEM mode of work. It al-lows obtaining the magnification of sample images up to 10,000,000 × . On the other hand, use of the low-vacuum mode prevents the accumulation of a charge on the sur-face of the examined sample, which allows good quality images for non-conductive samples to be obtained. In turn, the environmental mode enables the imaging of samples of solids, suspensions and non-dehydrated bio-logical preparations and carrying out experiments under dynamic change conditions. SEM in aerobiological stud-ies is usually used to characterize the size and shapes of individual microbial particulates, describe their ability to form aggregates, and bind to other aerosol particles or fibers. Also, taxonomical characterization of microbial aerosols is possible to a certain degree based on morpho-logical criteria. On the other hand, in transmission electron microscope (TEM), the stream of high-energy electrons produced by the electron gun is directed to the thin (i.e. several dozen to several hundred nanometers) sample where it may be reflected, absorbed or penetrate through. In the transmission mode, electrons are used to create the image of the sample structure. Reflected electrons in scanning mode are utilized to characterize the object sur-face. TEM allows high-resolution images to be obtained. With the limit of about 0.1 nm, TEM enables observation of the arrangement of atoms in the examined sample. Finally, atomic force microscopes (AFM) use a scanning probe (cantilever) to examine surfaces, registering the force affecting it in the function of its position. The forces (mainly van der Waals ones) between the cantilever tip and the sample cause deflection of the measuring lever, which leads to imaging of the topography of the examined material. In the tapping mode, the cantilever tip is in con-tact with the sample surface for a short time and, in this way, is able to visually reproduce the image of soft and delicate samples like microbial ones (Bartoszek and Rosowski, 2017; Jensen et al., 1994; Jonson et al., 2014; Karlsson and Malmberg, 1989; Macher, 1999).
In many cases, the above-mentioned laborious and time-consuming analyses, often requiring the involve-ment of highly qualified analysts and expensive research instruments, are simply not possible. In such cases, nu-merous constituents or metabolites of microorganisms can be measured as a surrogate of environmental micro-bial exposure. So far, several chemical tracers have been introduced as surrogates of different microbial contami-nants (e.g. endotoxins for gram-negative bacteria; muramic acid from peptidoglycans for gram-positive bacteria; er-gosterol, N-acetylhexosaminidase, and (1→3)-β-D-glucan for fungal biomass). Also, numerous instrumental and
Rafał L. Górny / KONA Powder and Particle Journal No. 37 (2020) 64–84
73
bioanalytical techniques corresponding to the selected microbial constituents have been practically tested. For example: for the qualitative and quantitative assessment of endotoxins in environmental samples, a wide palette of in vitro analyses are proposed including a few modifica-tions of the Limulus test, recombinant Factor C assay as well as liquid or gas chromatography (used alone or cou-pled with mass spectrometry, GCMS). In turn, the mea-surements of muramic or diaminopimelic acids as markers of peptidoglycans that are structural components of bacterial cell wall can be done using GCMS. Also, de-tection of β-glucans can be realized by applying four dif-ferent assays: modified Limulus test, inhibition enzyme immunoassay, enzyme-linked immunosorbent assay, and monoclonal antibody-based two-site enzyme immunoas-say. Markers for the assessment of fungal biomass include also ergosterol analysis by GCMS, extracellular polysac-charides measured with specific enzyme immunoassays, and N-acetylhexosaminidase activity assessment (method based on a fluorescence labeled substrate which can be cleaved by the enzyme found in fungi). Moreover, sec-ondary products of fungal metabolism, i.e. mycotoxins, can be measured using different variants of thin-layer chromatography, gas chromatography with or without mass spectrometry or high-pressure liquid chromatogra-phy. These two latest techniques can be also successfully applied in quantitative analyses of volatile organic com-pounds (VOCs), which can be suitable markers of fungal growth (Demirev and Fenselau, 2008; Després et al., 2012; Douwes et al., 1999; Griffith and DeCosemo, 1994; Hung et al., 2005; IOM, 2004; Macher, 1999; Miller and Young, 1997; Pöschl, 2005; Reeslev et al., 2003; Reponen et al., 1995; Rylander et al., 2010; WHO, 2009). Evalua-tion of the pros and cons of the above-listed methods clearly shows that although the analysis of chemical markers provides quite precise quantitative information, it does not supply us with data regarding the biodiversity of microbial particles. Nowadays, such a gap in knowledge can be fortunately fulfilled by a spectrum of different mo-lecular techniques enabling precise identification of micro-bial strains that form bioaerosols (see below).
As none of the above-described methods offers real- time detection of microbial aerosols, numerous optical techniques were introduced to overcome this limitation. Among them are those utilizing light scattering, conden-sation, and fluorescence of microbial particles. Some of these methods offer both the measurement and separation of microbial particulates beginning from nanometer sizes. Amid the instruments operating on the above-described principles are optical (utilizing light scattering) particle counters (e.g. Grimm 11A; allowing the measurements of particle sizes, mops, within the range of 0.25–32 μm) and condensation (alcohol vapor) nuclei counters (e.g. P-TRAK; mops of 0.01–2 μm) as well as aerodynamic (combining
analyses of the particle aerodynamic diameters and their light-scattering intensities; e.g. DSP Aerosizer; mops of 0.2–200 μm) and scanning mobility particle sizer spectrome-ters (e.g. SMPS; mops of 1–1000 nm based on differential mobility analysis). In turn, the electrical low-pressure im-pactor (ELPI) allows combining the quantitative control of microbial propagules with rapid real-time description of their size distribution (mops of 0.006–10 μm). In ELPI, like in many other volumetric devices, the sampling pro-cess is inseparably connected with certain measurement limitations. The impaction of particles onto hard surfaces, their bounce and subsequent reaerosolization, friction during passage through the instrument, desiccation can significantly affect the precision of the assessment and control of microbial aerosols. These facts should always be kept in mind when sampling biological particles (Hung et al., 2005; Jonsson et al., 2014; Kulkarni et al., 2011; Macher, 1999).
The instruments utilizing fluorescence as a method of detection are based on the phenomenon that all biological particles containing fluorophores originate from aromatic amino acid residues (intrinsic constituents of almost all proteins). Tryptophan, tyrosine, and phenylalanine are the amino acids capable of emitting fluorescence induced by UV light, and this phenomenon can be utilized for the de-tection of microbial aerosols. Techniques based on the fluorescence phenomenon enable recognition of microbial particles both on a laboratory scale and over areas of tens of square kilometers. Such devices can successfully form the core of monitoring systems to be used over, e.g. crowded spaces (Eng J. et al., 1989; Harrison and Chance, 1970; Iwami et al., 2001; Jonsson et al., 2014; Kell et al., 1991; Li J.K. et al., 1991).
Among the first commercial applications utilizing in-duced fluorescence were the fluorescence aerosol particle sensor (FLAPS) and the ultraviolet aerodynamic particle sizer, UV-APS, the instruments dedicated to real-time analysis of biological aerosols. FLAPS technology was developed in the early 1990s and was based on an aerody-namic particle sizer with laser added to excite fluores-cence of the sized particles. In its latest version, it uses a CW laser diode for both excitation and optical sizing. The system analyses individual particles in the size range of 0.8–10 μm, offering exceptional discrimination of micro-bial aerosol particulates including bacteria, fungi, viruses, and toxins. Its performance was broadly confirmed in laboratory, military, working and non-occupational appli-cations. On the other hand, the UV-APS (that is techni-cally a newer version of FLAPS II) measures the real-time fluorescence of airborne particles (after excitation by a pulsed UV laser) and simultaneously provides a number size distribution and scatter light intensities for them. The instrument is able to discriminate particles within 0.8–15 μm aerodynamic size range and has so far been applied
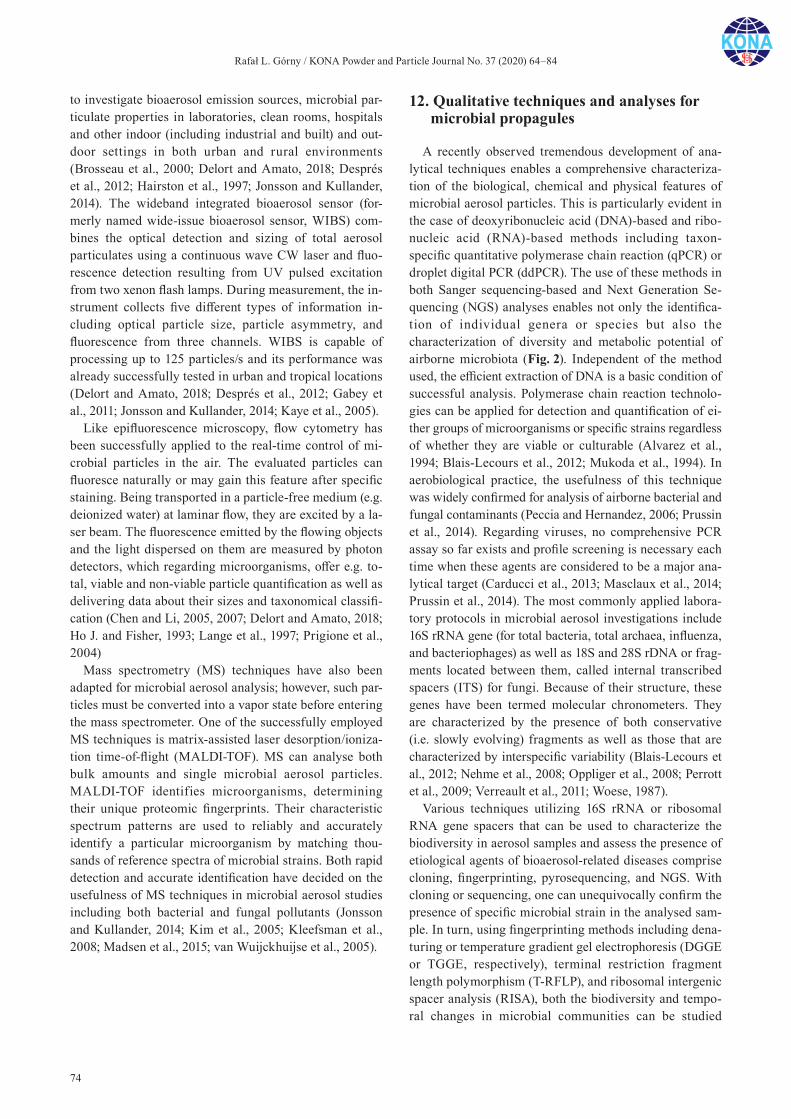
Rafał L. Górny / KONA Powder and Particle Journal No. 37 (2020) 64–84
74
to investigate bioaerosol emission sources, microbial par-ticulate properties in laboratories, clean rooms, hospitals and other indoor (including industrial and built) and out-door settings in both urban and rural environments (Brosseau et al., 2000; Delort and Amato, 2018; Després et al., 2012; Hairston et al., 1997; Jonsson and Kullander, 2014). The wideband integrated bioaerosol sensor (for-merly named wide-issue bioaerosol sensor, WIBS) com-bines the optical detection and sizing of total aerosol particulates using a continuous wave CW laser and fluo-rescence detection resulting from UV pulsed excitation from two xenon flash lamps. During measurement, the in-strument collects five different types of information in-cluding optical particle size, particle asymmetry, and fluorescence from three channels. WIBS is capable of processing up to 125 particles/s and its performance was already successfully tested in urban and tropical locations (Delort and Amato, 2018; Després et al., 2012; Gabey et al., 2011; Jonsson and Kullander, 2014; Kaye et al., 2005).
Like epifluorescence microscopy, flow cytometry has been successfully applied to the real-time control of mi-crobial particles in the air. The evaluated particles can fluoresce naturally or may gain this feature after specific staining. Being transported in a particle-free medium (e.g. deionized water) at laminar flow, they are excited by a la-ser beam. The fluorescence emitted by the flowing objects and the light dispersed on them are measured by photon detectors, which regarding microorganisms, offer e.g. to-tal, viable and non-viable particle quantification as well as delivering data about their sizes and taxonomical classifi-cation (Chen and Li, 2005, 2007; Delort and Amato, 2018; Ho J. and Fisher, 1993; Lange et al., 1997; Prigione et al., 2004)
Mass spectrometry (MS) techniques have also been adapted for microbial aerosol analysis; however, such par-ticles must be converted into a vapor state before entering the mass spectrometer. One of the successfully employed MS techniques is matrix-assisted laser desorption/ioniza-tion time-of-flight (MALDI-TOF). MS can analyse both bulk amounts and single microbial aerosol particles. MALDI-TOF identifies microorganisms, determining their unique proteomic fingerprints. Their characteristic spectrum patterns are used to reliably and accurately identify a particular microorganism by matching thou-sands of reference spectra of microbial strains. Both rapid detection and accurate identification have decided on the usefulness of MS techniques in microbial aerosol studies including both bacterial and fungal pollutants (Jonsson and Kullander, 2014; Kim et al., 2005; Kleefsman et al., 2008; Madsen et al., 2015; van Wuijckhuijse et al., 2005).
12. Qualitative techniques and analyses for microbial propagules
A recently observed tremendous development of ana-lytical techniques enables a comprehensive characteriza-tion of the biological, chemical and physical features of microbial aerosol particles. This is particularly evident in the case of deoxyribonucleic acid (DNA)-based and ribo-nucleic acid (RNA)-based methods including taxon- specific quantitative polymerase chain reaction (qPCR) or droplet digital PCR (ddPCR). The use of these methods in both Sanger sequencing-based and Next Generation Se-quencing (NGS) analyses enables not only the identifica-tion of individual genera or species but also the characterization of diversity and metabolic potential of airborne microbiota (Fig. 2). Independent of the method used, the efficient extraction of DNA is a basic condition of successful analysis. Polymerase chain reaction technolo-gies can be applied for detection and quantification of ei-ther groups of microorganisms or specific strains regardless of whether they are viable or culturable (Alvarez et al., 1994; Blais-Lecours et al., 2012; Mukoda et al., 1994). In aerobiological practice, the usefulness of this technique was widely confirmed for analysis of airborne bacterial and fungal contaminants (Peccia and Hernandez, 2006; Prussin et al., 2014). Regarding viruses, no comprehensive PCR assay so far exists and profile screening is necessary each time when these agents are considered to be a major ana-lytical target (Carducci et al., 2013; Masclaux et al., 2014; Prussin et al., 2014). The most commonly applied labora-tory protocols in microbial aerosol investigations include 16S rRNA gene (for total bacteria, total archaea, influenza, and bacteriophages) as well as 18S and 28S rDNA or frag-ments located between them, called internal transcribed spacers (ITS) for fungi. Because of their structure, these genes have been termed molecular chronometers. They are characterized by the presence of both conservative (i.e. slowly evolving) fragments as well as those that are characterized by interspecific variability (Blais-Lecours et al., 2012; Nehme et al., 2008; Oppliger et al., 2008; Perrott et al., 2009; Verreault et al., 2011; Woese, 1987).
Various techniques utilizing 16S rRNA or ribosomal RNA gene spacers that can be used to characterize the biodiversity in aerosol samples and assess the presence of etiological agents of bioaerosol-related diseases comprise cloning, fingerprinting, pyrosequencing, and NGS. With cloning or sequencing, one can unequivocally confirm the presence of specific microbial strain in the analysed sam-ple. In turn, using fingerprinting methods including dena-turing or temperature gradient gel electrophoresis (DGGE or TGGE, respectively), terminal restriction fragment length polymorphism (T-RFLP), and ribosomal intergenic spacer analysis (RISA), both the biodiversity and tempo-ral changes in microbial communities can be studied
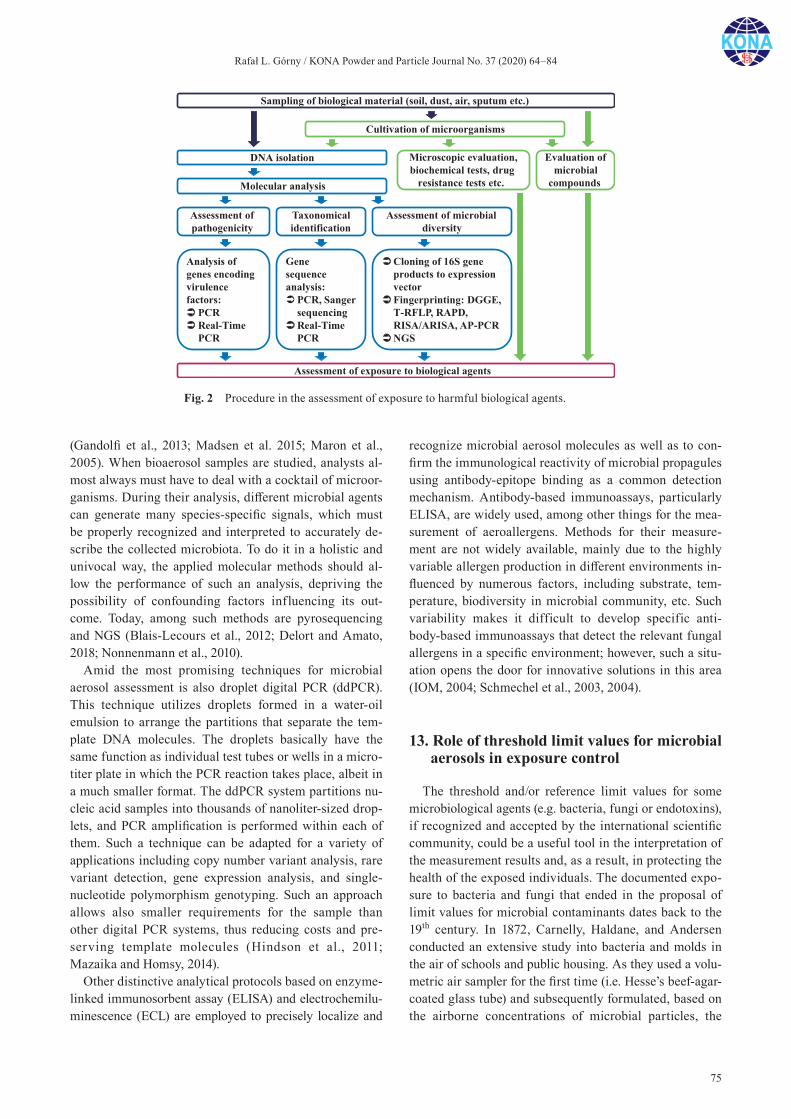
Rafał L. Górny / KONA Powder and Particle Journal No. 37 (2020) 64–84
75
(Gandolfi et al., 2013; Madsen et al. 2015; Maron et al., 2005). When bioaerosol samples are studied, analysts al-most always must have to deal with a cocktail of microor-ganisms. During their analysis, different microbial agents can generate many species-specific signals, which must be properly recognized and interpreted to accurately de-scribe the collected microbiota. To do it in a holistic and univocal way, the applied molecular methods should al-low the performance of such an analysis, depriving the possibility of confounding factors influencing its out-come. Today, among such methods are pyrosequencing and NGS (Blais-Lecours et al., 2012; Delort and Amato, 2018; Nonnenmann et al., 2010).
Amid the most promising techniques for microbial aerosol assessment is also droplet digital PCR (ddPCR). This technique utilizes droplets formed in a water-oil emulsion to arrange the partitions that separate the tem-plate DNA molecules. The droplets basically have the same function as individual test tubes or wells in a micro-titer plate in which the PCR reaction takes place, albeit in a much smaller format. The ddPCR system partitions nu-cleic acid samples into thousands of nanoliter-sized drop-lets, and PCR amplification is performed within each of them. Such a technique can be adapted for a variety of applications including copy number variant analysis, rare variant detection, gene expression analysis, and single- nucleotide polymorphism genotyping. Such an approach allows also smaller requirements for the sample than other digital PCR systems, thus reducing costs and pre-serving template molecules (Hindson et al., 2011; Mazaika and Homsy, 2014).
Other distinctive analytical protocols based on enzyme- linked immunosorbent assay (ELISA) and electrochemilu-minescence (ECL) are employed to precisely localize and
recognize microbial aerosol molecules as well as to con-firm the immunological reactivity of microbial propagules using antibody-epitope binding as a common detection mechanism. Antibody-based immunoassays, particularly ELISA, are widely used, among other things for the mea-surement of aeroallergens. Methods for their measure-ment are not widely available, mainly due to the highly variable allergen production in different environments in-fluenced by numerous factors, including substrate, tem-perature, biodiversity in microbial community, etc. Such variability makes it difficult to develop specific anti-body-based immunoassays that detect the relevant fungal allergens in a specific environment; however, such a situ-ation opens the door for innovative solutions in this area (IOM, 2004; Schmechel et al., 2003, 2004).
13. Role of threshold limit values for microbial aerosols in exposure control
The threshold and/or reference limit values for some microbiological agents (e.g. bacteria, fungi or endotoxins), if recognized and accepted by the international scientific community, could be a useful tool in the interpretation of the measurement results and, as a result, in protecting the health of the exposed individuals. The documented expo-sure to bacteria and fungi that ended in the proposal of limit values for microbial contaminants dates back to the 19th century. In 1872, Carnelly, Haldane, and Andersen conducted an extensive study into bacteria and molds in the air of schools and public housing. As they used a volu-metric air sampler for the first time (i.e. Hesse’s beef-agar-coated glass tube) and subsequently formulated, based on the airborne concentrations of microbial particles, the
Fig. 2 Procedure in the assessment of exposure to harmful biological agents.
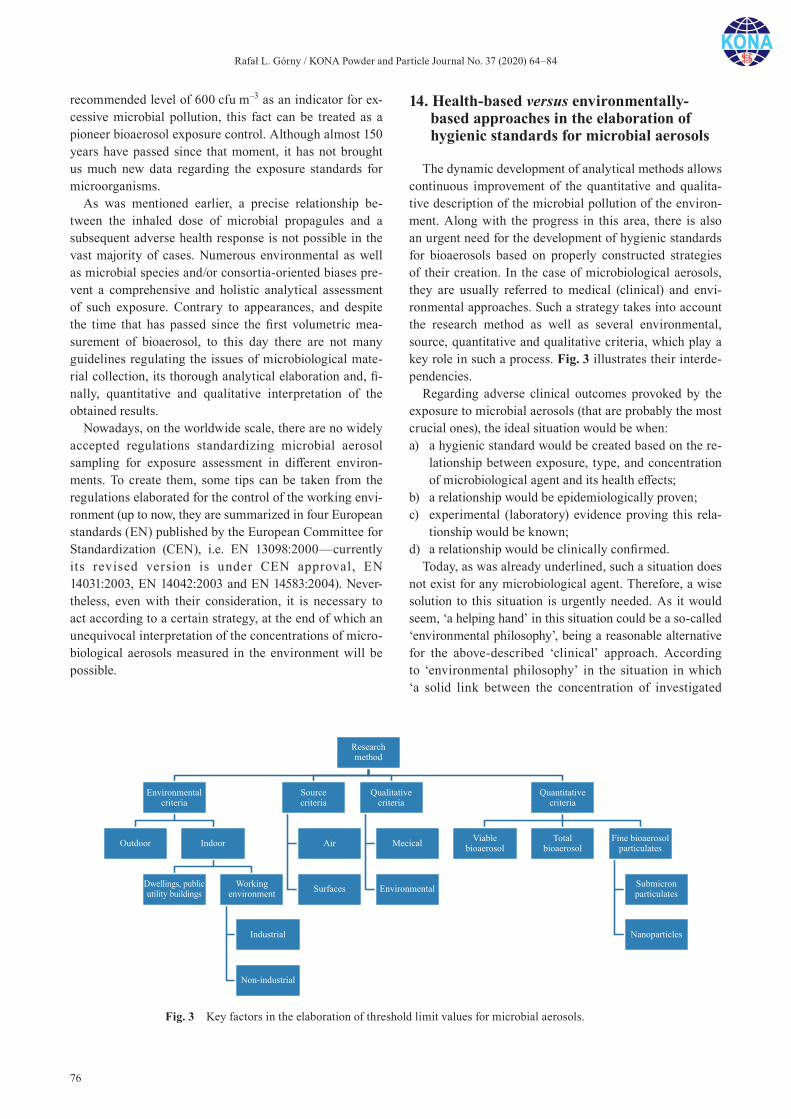
Rafał L. Górny / KONA Powder and Particle Journal No. 37 (2020) 64–84
76
recommended level of 600 cfu m–3 as an indicator for ex-cessive microbial pollution, this fact can be treated as a pioneer bioaerosol exposure control. Although almost 150 years have passed since that moment, it has not brought us much new data regarding the exposure standards for microorganisms.
As was mentioned earlier, a precise relationship be-tween the inhaled dose of microbial propagules and a subsequent adverse health response is not possible in the vast majority of cases. Numerous environmental as well as microbial species and/or consortia-oriented biases pre-vent a comprehensive and holistic analytical assessment of such exposure. Contrary to appearances, and despite the time that has passed since the first volumetric mea-surement of bioaerosol, to this day there are not many guidelines regulating the issues of microbiological mate-rial collection, its thorough analytical elaboration and, fi-nally, quantitative and qualitative interpretation of the obtained results.
Nowadays, on the worldwide scale, there are no widely accepted regulations standardizing microbial aerosol sampling for exposure assessment in different environ-ments. To create them, some tips can be taken from the regulations elaborated for the control of the working envi-ronment (up to now, they are summarized in four European standards (EN) published by the European Committee for Standardization (CEN), i.e. EN 13098:2000—currently its revised version is under CEN approval, EN 14031:2003, EN 14042:2003 and EN 14583:2004). Never-theless, even with their consideration, it is necessary to act according to a certain strategy, at the end of which an unequivocal interpretation of the concentrations of micro-biological aerosols measured in the environment will be possible.
14. Health-based versus environmentally-based approaches in the elaboration of hygienic standards for microbial aerosols
The dynamic development of analytical methods allows continuous improvement of the quantitative and qualita-tive description of the microbial pollution of the environ-ment. Along with the progress in this area, there is also an urgent need for the development of hygienic standards for bioaerosols based on properly constructed strategies of their creation. In the case of microbiological aerosols, they are usually referred to medical (clinical) and envi-ronmental approaches. Such a strategy takes into account the research method as well as several environmental, source, quantitative and qualitative criteria, which play a key role in such a process. Fig. 3 illustrates their interde-pendencies.
Regarding adverse clinical outcomes provoked by the exposure to microbial aerosols (that are probably the most crucial ones), the ideal situation would be when:a) a hygienic standard would be created based on the re-
lationship between exposure, type, and concentration of microbiological agent and its health effects;
b) a relationship would be epidemiologically proven;c) experimental (laboratory) evidence proving this rela-
tionship would be known;d) a relationship would be clinically confirmed.
Today, as was already underlined, such a situation does not exist for any microbiological agent. Therefore, a wise solution to this situation is urgently needed. As it would seem, ‘a helping hand’ in this situation could be a so-called ‘environmental philosophy’, being a reasonable alternative for the above-described ‘clinical’ approach. According to ‘environmental philosophy’ in the situation in which ‘a solid link between the concentration of investigated
Fig. 3 Key factors in the elaboration of threshold limit values for microbial aerosols.
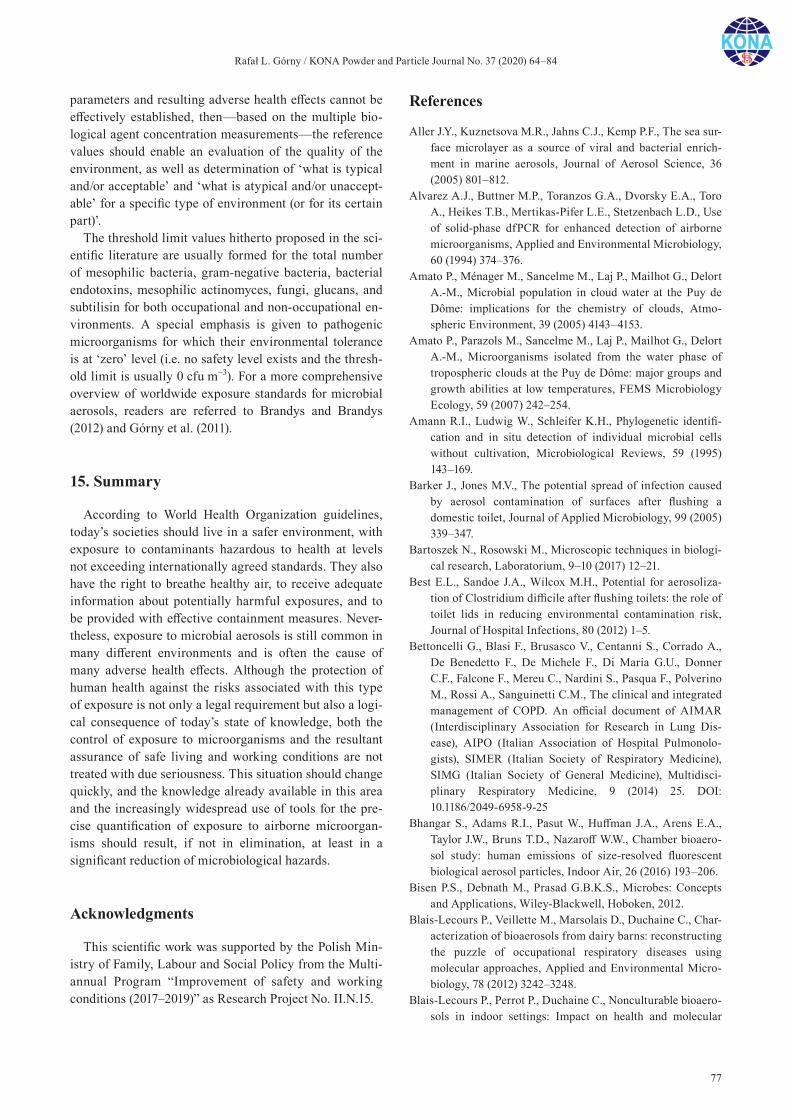
Rafał L. Górny / KONA Powder and Particle Journal No. 37 (2020) 64–84
77
parameters and resulting adverse health effects cannot be effectively established, then—based on the multiple bio-logical agent concentration measurements—the reference values should enable an evaluation of the quality of the environment, as well as determination of ‘what is typical and/or acceptable’ and ‘what is atypical and/or unaccept-able’ for a specific type of environment (or for its certain part)’.
The threshold limit values hitherto proposed in the sci-entific literature are usually formed for the total number of mesophilic bacteria, gram-negative bacteria, bacterial endotoxins, mesophilic actinomyces, fungi, glucans, and subtilisin for both occupational and non-occupational en-vironments. A special emphasis is given to pathogenic microorganisms for which their environmental tolerance is at ‘zero’ level (i.e. no safety level exists and the thresh-old limit is usually 0 cfu m–3). For a more comprehensive overview of worldwide exposure standards for microbial aerosols, readers are referred to Brandys and Brandys (2012) and Górny et al. (2011).
15. Summary
According to World Health Organization guidelines, today’s societies should live in a safer environment, with exposure to contaminants hazardous to health at levels not exceeding internationally agreed standards. They also have the right to breathe healthy air, to receive adequate information about potentially harmful exposures, and to be provided with effective containment measures. Never-theless, exposure to microbial aerosols is still common in many different environments and is often the cause of many adverse health effects. Although the protection of human health against the risks associated with this type of exposure is not only a legal requirement but also a logi-cal consequence of today’s state of knowledge, both the control of exposure to microorganisms and the resultant assurance of safe living and working conditions are not treated with due seriousness. This situation should change quickly, and the knowledge already available in this area and the increasingly widespread use of tools for the pre-cise quantification of exposure to airborne microorgan-isms should result, if not in elimination, at least in a significant reduction of microbiological hazards.
Acknowledgments
This scientific work was supported by the Polish Min-istry of Family, Labour and Social Policy from the Multi-annual Program “Improvement of safety and working conditions (2017–2019)” as Research Project No. II.N.15.
References
Aller J.Y., Kuznetsova M.R., Jahns C.J., Kemp P.F., The sea sur-face microlayer as a source of viral and bacterial enrich-ment in marine aerosols, Journal of Aerosol Science, 36 (2005) 801–812.
Alvarez A.J., Buttner M.P., Toranzos G.A., Dvorsky E.A., Toro A., Heikes T.B., Mertikas-Pifer L.E., Stetzenbach L.D., Use of solid-phase dfPCR for enhanced detection of airborne microorganisms, Applied and Environmental Microbiology, 60 (1994) 374–376.
Amato P., Ménager M., Sancelme M., Laj P., Mailhot G., Delort A.-M., Microbial population in cloud water at the Puy de Dôme: implications for the chemistry of clouds, Atmo-spheric Environment, 39 (2005) 4143–4153.
Amato P., Parazols M., Sancelme M., Laj P., Mailhot G., Delort A.-M., Microorganisms isolated from the water phase of tropospheric clouds at the Puy de Dôme: major groups and growth abilities at low temperatures, FEMS Microbiology Ecology, 59 (2007) 242–254.
Amann R.I., Ludwig W., Schleifer K.H., Phylogenetic identifi-cation and in situ detection of individual microbial cells without cultivation, Microbiological Reviews, 59 (1995) 143–169.
Barker J., Jones M.V., The potential spread of infection caused by aerosol contamination of surfaces after flushing a domestic toilet, Journal of Applied Microbiology, 99 (2005) 339–347.
Bartoszek N., Rosowski M., Microscopic techniques in biologi-cal research, Laboratorium, 9–10 (2017) 12–21.
Best E.L., Sandoe J.A., Wilcox M.H., Potential for aerosoliza-tion of Clostridium difficile after flushing toilets: the role of toilet lids in reducing environmental contamination risk, Journal of Hospital Infections, 80 (2012) 1–5.
Bettoncelli G., Blasi F., Brusasco V., Centanni S., Corrado A., De Benedetto F., De Michele F., Di Maria G.U., Donner C.F., Falcone F., Mereu C., Nardini S., Pasqua F., Polverino M., Rossi A., Sanguinetti C.M., The clinical and integrated management of COPD. An official document of AIMAR (Interdisciplinary Association for Research in Lung Dis-ease), AIPO (Italian Association of Hospital Pulmonolo-gists), SIMER (Italian Society of Respiratory Medicine), SIMG (Italian Society of General Medicine), Multidisci-plinary Respiratory Medicine, 9 (2014) 25. DOI: 10.1186/2049-6958-9-25
Bhangar S., Adams R.I., Pasut W., Huffman J.A., Arens E.A., Taylor J.W., Bruns T.D., Nazaroff W.W., Chamber bioaero-sol study: human emissions of size-resolved fluorescent biological aerosol particles, Indoor Air, 26 (2016) 193–206.
Bisen P.S., Debnath M., Prasad G.B.K.S., Microbes: Concepts and Applications, Wiley-Blackwell, Hoboken, 2012.
Blais-Lecours P., Veillette M., Marsolais D., Duchaine C., Char-acterization of bioaerosols from dairy barns: reconstructing the puzzle of occupational respiratory diseases using molecular approaches, Applied and Environmental Micro-biology, 78 (2012) 3242–3248.
Blais-Lecours P., Perrot P., Duchaine C., Nonculturable bioaero-sols in indoor settings: Impact on health and molecular
Rafał L. Górny / KONA Powder and Particle Journal No. 37 (2020) 64–84
78
approaches for detection, Atmospheric Environment, 110 (2015) 45–53.
Blanchard D.C., Syzdek L.D., Weber M.E., Bubble scavenging of bacteria in freshwater quickly produces bacterial enrich-ment in air-borne jet drops, Limnology and Oceanography, 26 (1981) 961–964.
Bovallius A., Bucht B., Roffey R., Anas P., Long-range air transmission of bacteria, Applied and Environmental Microbiology, 35 (1978) 1231–1232.
Boyle T., Health and Safety: Risk Management, IOSH Services Ltd; Leicester, 2008.
Brandys R.C., Brandys G.M., Worldwide Exposure Standards for Mold and Bacteria. 10th ed., OEHCS, Inc., Hinsdale, 2012.
Bridge P., Spooner B., Soil fungi: diversity and detection, Plant Soil, 232 (2001) 147–154.
Brosseau L.M., Vesley D., Rice N., Goodell M.N., Hairston P. Differences in detected fluorescence among several bacte-rial species measured with a direct-reading particle sizer and fluorescence detector, Aerosol Science and Technology, 32 (2000) 545–558.
Bunger J., Westphal G., Monnich A., Hinnendahl B., Hallier E., Muller M., Cytotoxicity of occupationally and environmen-tally relevant mycotoxins, Toxicology, 202 (2004) 199–211.
Burge H.A., Ed., Bioaerosols, Lewis Publishers/CRC Press, Inc., Boca Raton, 1995.
Burrows S.M., Elbert W., Lawrence M.G., Pöschl U., Bacteria in the global atmosphere—Part 1: Review and synthesis of literature data for different ecosystems, Atmospheric Chemistry and Physics, 9 (2009) 9263–9280.
Carducci A., Federigi I., Verani M., Virus occupational expo-sure in solid waste processing facilities, Annals of Occupa-tional Hygiene, 57 (2013) 1115–1127.
Carroll K.C., Hobden J.A., Miller S., Morse S.A., Mietzner T.A., Detrick B., Mitchell T.G., McKerrow J.H., Sakanari J.A., Eds., Jawetz, Melnick, & Adelberg’s Medical Microbi-ology, 27th Edition, McGraw-Hill Education, Columbus, 2016.
Clarke S., Physical defenses, in: Brewis R.A.L., Gibson G.J., Geddes D.M. (Eds.), Respiratory Medicine, Bailliere Tin-dall, London, 1990, pp. 176–189.
Chen P.S., Li C.S., Sampling performance for bioaerosols by flow cytometry with fluorochrome, Aerosol Science and Technology, 39 (2005) 231–237.
Chen P.S., Li C.S., Real-time monitoring for bioaerosols—flow cytometry, Analyst, 132 (2007) 14–16.
Chi M.C., Li C.S. Fluorochrome in monitoring atmospheric bio-aerosols and correlations with meteorological factors and air pollutants, Aerosol Science and Technology, 41 (2007) 672–678.
Cohen B.S., Xiong J.Q., Fang C., Li W., Deposition of charged particles in lung airways, Health Physics, 74 (1998) 554–560.
Cohen M.D., Zelikoff J.T., Schlesinger R.B., Eds., Pulmonary Immunotoxicology, Kluwer Academic Publications, Dor-drecht, 2000.
Colwell R., Viable but nonculturable bacteria: a survival strat-egy, Journal of Infection and Chemotherapy, 6 (2000) 121–
125.Cox C.S., Wathes C.M., Eds., Bioaerosols Handbook, Lewis
Publishers/CRC Press, Inc., Boca Raton, 1995.Crook B., Difficulty of assessing biological risks in the work-
place. Seminar Occupational biological risks: Facing up to the challenges organized by EU-OSHA, Brussels, 5-6.06. 2007, <http://extranet.osha.europa.eu/12103/504488/765530/ 765646/view?searchterm=Crook> accessed 26.04.2018.
Crook B., Inertial samplers: biological perspectives, in: Cox C.S., Wathes C.M. (Eds.), Bioaerosols Handbook, CRC Press, Boca Raton, 1995a, pp. 247–268.
Crook, B., Non-inertial Samplers, in: Cox C.S., Wathes C.M. (Eds.), Bioaerosols Handbook, CRC Press, Boca Raton, 1995b, pp. 269–284.
Dasaraju P.V., Liu C., Medical Microbiology, University of Texas Medical Branch at Galveston, Galveston, 1996.
Delort A.-M., Amato P., Eds., Microbiology of Aerosols, Wiley Blackwell, Hoboken, 2018.
Demirev P.A., Fenselau C., Mass spectrometry for rapid charac-terization of microorganisms, Annual Review of Analytical Chemistry, 1 (2008) 71–93.
Després V.R., Huffman J.A., Burrows S.M., Hoose C., Safatov A., Buryak G., Fröhlich-Nowoisky J., Elbert W., Andreae M., Pöschl U., Jaenicke R., Primary biological aerosol par-ticles in the atmosphere: a review AU - Després, VivianeR, Tellus B: Chemical and Physical Meteorology, 64 (2012) 15598. DOI: 10.3402/tellusb.v64i0.15598
Diehl K., Quick C., Matthias-Maser S., Mitra S.K., Jaenicke R., The ice nucleating ability of pollen: part I: laboratory stud-ies in deposition and condensation freezing modes, Atmo-spheric Research, 58 (2001) 75–87.
Dimmick R.L., Straat P.A., Wolochow H., Levin G.V., Chatigny M.A., Schrot J.R., Evidence for metabolic activity of air-borne bacteria, Journal of Aerosol Science, 6 (1975) 387–393.
Douwes J., Thorne P., Pearce N., Heederik D., Bioaerosol health effects and exposure assessment: progress and prospects, Annals of Occupational Hygiene, 47 (2003) 187–200.
Douwes J., van der Sluis B., Doekes G., van Leusden F., Wijnands L., van Strien R., Verhoeff A., Brunekreef B., Fungal extracellular polysaccharides in house dust as a marker for exposure to fungi: relations with culturable fungi, reported home dampness and respiratory symptoms, Journal of Allergy and Clinical Immunology, 103 (1999) 494–500.
Dutkiewicz J., Jabłoński L., Biologiczne Szkodliwości Zawodowe, Państwowy Zakład Wydawnictw Lekarskich, Warszawa, 1989.
Elbert W., Taylor P.E., Andreae M.O., Pöschl U., Contribution of fungi to primary biogenic aerosols in the atmosphere: wet and dry discharged spores, carbohydrates, and inor-ganic ions, Atmospheric Chemistry and Physics, 7 (2007) 4569–4588.
Eng J., Lynch R.M., Balaban R.S., Nicotinamide adenine dinu-cleotide fluorescence spectroscopy and imaging of isolated cardiac myocytes, Biophysical Journal, 55 (1989) 621–630.
Falkinham 3rd J.O., Mycobacterial aerosols and respiratory dis-ease, Emerging Infectious Diseases, 9 (2003) 763–767.
Rafał L. Górny / KONA Powder and Particle Journal No. 37 (2020) 64–84
79
Flannigan B., Biological particles in the air of indoor environ-ments, in: Johanning E., Yang, C.S. (Eds.), Fungi and Bac-teria in Indoor Air Environment, Proceedings of the Inter-national Conference at Saratoga Springs, New York, 1994, pp. 21–29.
Fogelmark B., Lacey J., Rylander R., Experimental allergic alveolitis after exposure to different microorganisms, Inter-national Journal of Experimental Pathology, 72 (1991) 387–395.
Foster W.M., Costa D.L., Eds., Air Pollutants and the Respira-tory Tract, Informa Healthcare, New York, 2011.
Franc G.D., Demott P.J., Cloud activation characteristics of air-borne Erwinia carotovora cells, Journal of Applied Meteo-rology, 37 (1998) 1293–1300.
Francisco D.E., Mah R.A., Rabin A.C., Acridine orange- epifluorescence technique for counting bacteria in natural waters, Transactions of the American Microscopical Soci-ety, 92 (1973) 416–421.
Fröhlich-Nowoisky J., Kampf C.J., Weber B., Huffman J.A., Pöhlker C., Andreae M.O., Lang-Yona N., Burrows S.M., Gunthe S.S., Elbert W., Su H., Hoor P., Thines E., Hoffmann T., Després V.R., Pöschl U., Bioaerosols in the Earth sys-tem: Climate, health, and ecosystem interactions, Atmo-spheric Research, 182 (2016) 346–376.
Gabey A.M., Stanley W.R., Gallagher M.W., Kaye P.H., The flu-orescence properties of aerosol larger than 0.8 μm in urban and tropical rainforest locations, Atmospheric Chemistry and Physics, 11 (2011) 5491–5504.
Gandolfi I., Bertolini V., Ambrosini R., Bestetti G., Franzetti A., Unravelling the bacterial diversity in the atmosphere, Applied Microbiology and Biotechnology, 97 (2013) 4727–4736.
Ganio L.M., Mohr A.J., Lighthart B., A comparison between computer modeled bioaerosol dispersion and a bioaerosol field spray event, Aerobiologia, 11 (1995) 183–188.
Gehr P., Heyder J., Eds., Particle-Lung Interactions, Marcel Dekker, Inc., New York, 2000.
Getto L., Zeserson E., Breyer M., Vomiting, diarrhea, constipa-tion, and gastroenteritis, Emergency Medicine Clinics of North America, 29 (2011) 211–237.
Gołofit-Szymczak M., Górny R.L., Bacterial and fungal aero-sols in air-conditioned office buildings in Warsaw, Poland—preliminary results (winter season), International Journal of Occupational Safety and Ergonomics, 16 (2010) 407–418.
Górny R.L., Cyprowski M., Ławniczek-Wałczyk A., Gołofit-Szymczak M., Zapór L., Biohazards in the indoor envi-ronment—a role for threshold limit values in exposure assessment, in: Dudzińska M.R. (Ed.), Management of Indoor Air Quality, CRC Press/Balkema, Leiden, 2011, pp. 1–20.
Górny R.L., Gołofit-Szymczak M., Cyprowski M., Stobnicka A., Ławniczek-Wałczyk A., Effect of electrical charges on potential of fibers for transport of microbial particles in dry and humid air, Journal of Aerosol Science, 116 (2017) 66–82.
Górny R.L., Ławniczek-Wałczyk A., Effect of two aerosoliza-tion methods on the release of fungal propagules from
contaminated agar surface, Annals of Agricultural and Environmental Medicine, 19 (2012) 279–284.
Górny R.L., Mainelis G., Wlazło A., Niesler A., Lis D.O., Marzec S., Siwińska E., Łudzeń-Izbińska B., Harkawy A., Kasznia-Kocot J., Viability of fungal and actinomycetal spores after microwave radiation of building materials, Annals of Agricultural and Environmental Medicine, 14 (2007) 313–324.
Gregory P.H., The Microbiology of the Atmosphere. 2nd ed., Leonard Hill Books, Plymouth, 1973.
Griffin D.W., Westphal D.L., Gray M.A., Airborne microorgan-isms in the African desert dust corridor over the mid- Atlantic ridge, Ocean Drilling Program, Leg 209, Aerobiologia, 22 (2006) 211–226.
Griffith W.D., DeCosemo G.A.L., The assessment of bioaero-sols: a critical review, Journal of Aerosol Science, 25 (1994) 1425–1458.
Gruijthuijsen Y.K., Grieshuber I., Stöcklinger A., Tischler U., Fehrenbach T., Weller M.G., Vogel L., Vieths S., Pöschl U., Duschl A., Nitration enhances the allergenic potential of proteins, International Archives of Allergy and Immunol-ogy, 141 (2006) 265–275.
Hairston P.P., Ho J., Quant F.R., Design of an instrument for real-time detection of bioaerosols using simultaneous mea-surement of particle aerodynamic size and intrinsic fluores-cence, Journal of Aerosol Science, 28 (1997) 471–482.
Hall C.B., Respiratory syncytial virus and parainfluenza virus, New England Journal of Medicine, 344 (2001) 1917–1928.
Harrison D.E., Chance B., Fluorimetric technique for monitor-ing changes in level of reduced nicotinamide nucleotides in continuous cultures of microorganisms, Applied Microbiol-ogy, 19 (1970) 446–450.
Harrison R.M., Jones A.M., Biggins P.D.E., Pomeroy N., Cox C.S., Kidd S.P., Hobman J.L., Brown N.L., Beswick A., Climate factors influencing bacterial count in background air samples, International Journal of Biometeorology, 49 (2005) 167–178.
Heidelberg J.F., Shahamat M., Levin M., Rahman I., Stelma G., Grim C., Colwell R.R., Effect of aerosolization on cultur-ability and viability of gram-negative bacteria, Applied and Environmental Microbiology, 63 (1997) 3585–3588.
Helbig N., Vogel B., Vogel H., Fiedler F., Numerical modelling of pollen dispersion on the regional scale, Aerobiologia, 20 (2004) 3–19.
Hernandez M., Miller S.L., Landfear D.W., Macher J.M., A combined fluorochrome method for quantitation of meta-bolically active and inactive airborne bacteria, Aerosol Sci-ence and Technology, 30 (1999) 145–160.
Hill T.C.J., Moffett B.F., DeMott P.J., Georgakopoulos D.G., Stump W.L., Franc G.D., Measurement of ice nucleation- active bacteria on plants and in precipitation by quantitative PCR, Applied and Environmental Microbiology, 80 (2014) 1256–1267.
Hindson B.J., Ness K.D., Masquelier D.A., Belgrader P., Heredia N.J., Makarewicz A.J., Bright I.J., Lucero M.Y., Hiddessen A.L., Legler T.C., High-throughput droplet digital PCR system for absolute quantitation of DNA copy number, Analytical Chemistry, 83 (2011) 8604–8610.
Rafał L. Górny / KONA Powder and Particle Journal No. 37 (2020) 64–84
80
Ho J., History of the early biodetection development, in: Jons-son P., Olofsson G., Tjarnhage T. (Eds.), Bioaerosol Detec-tion Technologies, Springer-Verlag, New York, 2014, pp. 9–32.
Ho J., Fisher G., Detection of BW Agents: Flow Cytometry Measurement of Bacillus subtilis (BS) Spore Fluorescence, Defense Research Establishment Suffield, Medicine Hat, Alberta, Canada, 1993, pp. 1–34.
Hobbie J.E., Daley R.J., Jasper S., Use of nuclepore filters for counting bacteria by fluorescence microscopy, Applied and Environmental Microbiology, 33 (1977) 1225–1228.
Horner W.E., Helbling A., Salvaggio J.E., Lehrer S.B., Fungal allergens, Clinical Microbiology Reviews, 8 (1995) 161–179.
Huffman J.A., Prenni A.J., DeMott P.J., Pöhlker C., Mason R.H., Robinson N.H., Fröhlich-Nowoisky J., Tobo Y., Després V.R., Garcia E., Gochis D.J., Harris E., Müller-Germann I., Ruzene C., Schmer B., et al., High con-centrations of biological aerosol particles and ice nuclei during and after rain, Atmospheric Chemistry and Physics (Print), 13 (2013) 6151–6164. DOI: 10.5194/acp-13-6151-2013
Hug L.A., Baker B.J., Anantharaman K., Brown C.T., Probst A.J., Castelle C.J., Butterfield C.N., Hernsdorf A.W., Amano Y., Ise K., Suzuki Y., Dudek N., Relman D.A., Finstad K.M., Amundson R., Thomas B.C., Banfield J.F., A new view of the tree of life, Nature Microbiology, 1 (2016) 1–6 (16048).
Hultin K.A.H., Krejci R., Pinhassi J., Gomez-Consarnau L., Mårtensson E.M., Hagström Å., Nilsson E.D., Aerosol and bacterial emissions from Baltic seawater, Atmospheric Research, 99 (2011) 1–14.
Hung L.-L., Miller J.D., Dillon K., Eds., Field Guide for the Determination of Biological Contaminants in Environmen-tal Samples, AIHA, Fairfax, 2005.
Hurst C.J., Ed., Manual of Environmental Microbiology. ASM Press, Washington, D.C., 1997.
Imshenetsky A., Lysenko S., Kazakov G., Upper boundary of the biosphere, Applied and Environmental Microbiology, 35 (1978) 1–5.
IOM—Institute of Medicine, Damp Indoor Spaces and Health, National Academies Press, Washington, 2004.
Iwami Y., Takahashi-Abbe S., Takahashi N., Yamada T., Kano N., Mayanagi H., The time-course of acid excretion, levels of fluorescence dependent on cellular nicotinamide adenine nucleotide and glycolytic intermediates of Streptococcus mutans cells exposed and not exposed to air in the presence of glucose and sorbitol, Oral Microbiology and Immunol-ogy, 16 (2001) 34–39.
Jarosz N., Loubet B., Huber L., Modelling airborne concentra-tion and deposition rate of maize pollen, Atmospheric Environment, 38 (2004) 5555–5566.
Jensen P.A., Lighthart B., Moohr A.J., Shaffer B.T., Instrumen-tation used with microbial bioaerosols, in: Lighthart B., Mohr A.J. (Eds.), Atmospheric Microbial Aerosols: Theory and Applications, Chapman and Hall, Inc., New York, 1994, pp. 226–284.
Jeon E.M., Kim H.J., Jung K., Kim J.H., Kim M.Y., Kim Y.P.,
Ka J.-O., Impact of Asian dust events on airborne bacterial community assessed by molecular analyses, Atmospheric Environment, 45 (2011) 4313–4321.
Jones A.M., Harrison R.M., The effects of meteorological fac-tors on atmospheric bioaerosol concentrations—a review, Science of the Total Environment, 326 (2004) 151–180.
Jonsson P., Kullander F., Bioaerosol detection with fluorescence spectrometry, in: Jonsson P., Olofsson G., Tjarnhage T. (Eds.), Bioaerosol Detection Technologies, Springer-Verlag, New York, 2014, pp. 111–141.
Jonsson P., Olofsson G., Tjarnhage T., Eds., Bioaerosol Detec-tion Technologies. Springer-Verlag, New York, 2014.
Karlsson K., Malmberg P., Characterization of exposure to molds and actinomycetes in agricultural dusts by scanning electron microscopy, fluorescence microscopy and the cul-ture methods, Scandinavian Journal of Work Environment and Health, 15 (1989) 353–359.
Kaye P.H., Stanley W.R., Hirst E., Foot E.V., Baxter K.L., Barrington S.J., Single particle multichannel bio-aerosol fluorescence sensor, Optics Express, 13 (2005) 3583–3593.
Kell D.B., Ryder H.M., Kaprelyants A.S., Westerhoff H.V., Quantifying heterogeneity—flow cytometry of bacterial cultures, Antonie Van Leeuwenhoek International Journal of General and Molecular Microbiology, 60 (1991) 145–158.
Kepner R.L., Pratt J.R., Use of fluorochromes for direct enu-meration of total bacteria in environmental samples—past and present, Microbiological Reviews, 58 (1994) 603–615.
Kethley T.W., Gordon M.T., Orr C., A thermal precipitator for aerobacteriology, Science, 116 (1952) 368–369.
Kim J.K., Jackson S.N., Murray K.K., Matrix assisted laser desorption/ionization mass spectrometry of collected bio-aerosol particles, Rapid Communications in Mass Spec-trometry, 19 (2005) 1725–1729.
Kleefsman W.A., Stowers M.A., Verheijen P.J.T., Marijnissen J.C.M., Single particle mass spectrometry—bioaerosol analysis by MALDI MS, KONA Powder and Particle Jour-nal, 26 (2008) 205–214.
Kozloff L.M., Turner M.A., Arellano F., Formation of bacterial membrane icenucleating lipoglycoprotein complexes, Jour-nal of Bacteriology, 173 (1991) 6528–6536.
Kramer A., Schwebke I., Kampf G., How long nosocomial pathogens persist on inanimate surfaces? A systematic review, BMC Infectious Diseases, 6 (2006) 1–8.
Krzysztofik B., Kosińska I., Ossowska-Cypryk K., Rubiec A., Rogowska A., Badania wpływu warunków mikroklimatyc-znych oraz mikroflory powietrza pomieszczeń miesz-kalnych na zdrowie człowieka, Problemy Higieny, 46 (1994) 77–83.
Kulkarni P., Baron P.A., Willeke K., Eds., Aerosol Measure-ment: Principles, Techniques, and Applications, John Wiley & Sons, Inc., Hoboken, 2011.
Lacey J., Aggregation of spores and its effect on aerodynamic behavior, Grana, 30 (1991) 437–445.
Lai A.C.K., Tan T.F., Li W.S., Ip D.K.M., Emission strength of airborne pathogens during toilet flushing, Indoor Air, 28 (2018) 73–79.
Lange J.L., Thorne P.S., Lynch N., Application of flow cytome-try and fluorescent in situ hybridization for assessment of
Rafał L. Górny / KONA Powder and Particle Journal No. 37 (2020) 64–84
81
exposures to airborne bacteria, Applied and Environmental Microbiology, 63 (1997) 1557–1563.
Lang-Yona N., Shuster-Meiseles T., Mazar Y., Yarden O., Rudich Y., Impact of urban air pollution on the allergenicity of Aspergillus fumigatus conidia: outdoor exposure study supported by laboratory experiments, Science of the Total Environment, 541 (2016) 365–371.
Lee B.U., Yermakov M., Grinshpun, S.A., Filtering efficiency of N95- and R95-type facepiece respirators, dust-mist facepiece respirators, and surgical masks operating in uni-polarly ionized indoor air environments, Aerosol and Air Quality, 5 (2005) 25–38.
Li J.K., Asali E.C., Humphrey A.E., Monitoring cell concentra-tion and activity by multiple excitation flourometry, Bio-technology Progress, 7 (1991) 21–27.
Lighthart B., Stetzenbach L.D.‚ Distribution of microbial bio-aerosol, in: Lighthart B., Mohr A.J. (Eds.), Atmospheric Microbial Aerosols: Theory and Applications, Chapman and Hall, Inc., New York, 1994, pp. 68–98.
Lighthart B., Mini-review of the concentration variations found in the alfresco atmospheric bacterial populations, Aerobio-logia, 16 (2000) 7–16.
Lindemann J., Constantinidou H.A., Barchet W.R., Upper C.D., Plants as sources of airborne bacteria, including ice nucle-ation-active bacteria, Applied and Environmental Microbi-ology, 44 (1982) 1059–1063.
Lippmann M., Respiratory tract deposition and clearance of aerosols, in: Lee S.D., Schneider T., Grant L.D., Verkerk P.J. (Eds.), Risk Assessment and Control Strategies, Lewis Publishers, Chelsea, 1986, pp. 43–57.
Lopardo G., Calmaggi A., Clara L., Levy Hara G., Mykietiuk A., Pryluka D., Ruvinsky S., Vujacich C., Yahni D., Bogdanowicz E., Klein M., Lopez Furst M.J., Pensotti C., Rial M.J., Scapellato P., et al., Consensus guidelines for the management of upper respiratory tract infections, Medicina (B Aires), 72 (2012) 484–494.
Louie J.K., Hacker J.K., Gonzales R., Mark J., Maselli J.H., Yagi S., Drew W.L., Characterization of viral agents caus-ing acute respiratory infection in a San Francisco Univer-sity Medical Center Clinic during the influenza season, Clinical Infectious Diseases, 41 (2005) 822–828.
Lundheim R., Zachariassen K.E., Applications of biological ice nucleators. in: Margesin R., Schinner F. (Eds.), Biotechno-logical Applications of Cold-Adapted Organisms, Spring-er-Verlag, Berlin, 1999, pp. 309–318.
Macher J., Ed., Bioaerosols: Assessment and Control, American Conference of Governmental Industrial Hygienists, Cincin-nati, 1999.
Madelin T.M., Johnson H.E., Fungal and actinomycete spore aerosols measured at different humidities with an aerody-namic particle sizer, Journal of Applied Bacteriology, 72 (1992) 400–409.
Madsen A.M., Zervas A., Tendal K., Lund Nielsen J., Microbial diversity in bioaerosol samples causing ODTS compared to reference bioaerosol samples as measured using Illumina sequencing and MALDI-TOF, Environmental Research, 140 (2015) 255–267.
Mainelis G., Adhikari A., Willeke K., Lee S.A., Reponen T.,
Grinshpun S.A., Collection of airborne microorganisms by a new electrostatic precipitator, Journal of Aerosol Science, 33 (2002) 1417–1432.
Mainelis G., Grinshpun S.A., Willeke K., Reponen T., Ulevicius V., Hintz P.J., Collection of airborne microorganisms by electrostatic precipitation, Aerosol Science and Technology, 30 (1999) 127–144.
Mainelis G., Willeke K., Baron P., Grinshpun S.A., Reponen T., Górny R.L., Trakumas S., Electrical charges on airborne microorganisms, Journal of Aerosol Science, 32 (2001) 1087–1110.
Mandrioli P., Caneva G., Sabbioni C., Eds., Cultural Heritage and Aerobiology, Kluver Academic Publishers, Dordrecht, 2003.
Maron P.-A., Lejon D.P.H., Carvalho E., Bizet K., Lemanceau P., Ranjard L., Mougel C., Assessing genetic structure and diversity of airborne bacterial communities by DNA finger-printing and 16S rDNA clone library, Atmospheric Envi-ronment, 39 (2005) 3687–3695.
Martinez K.F., Anthrax: environmental sampling, in: Mold, Spores, and Remediation Workshop, ACGIH Worldwide, Cincinnati, 2002.
Masclaux F.G., Hotz P., Gashi D., Savova-Bianchi D., Oppliger A., Assessment of airborne virus contamination in waste-water treatment plants, Environmental Research, 133 (2014) 260–265.
Matthias-Maser S., Brinkmann J., Schneider W., The size dis-tribution of marine atmospheric aerosol with regard to pri-mary biological aerosol particles over the South Atlantic Ocean, Atmospheric Environment, 33 (1999) 3569–3575.
May S., Romberger D.J., Poole J.A., Respiratory health effects of large animal farming environments, Journal of Toxicol-ogy and Environmental Health Part B Critical Reviews, 15 (2012) 524–541.
Mazaika E., Homsy J., Digital droplet PCR: CNV analysis and other applications, Current Protocols in Human Genetics, 82 (2014) 7.24.1–7.24.13.
Meadow J.F., Altrichter A.E., Bateman A.C., Stenson J., Brown G., Green J.L., Bohannan B.J.M., Humans differ in their personal microbial cloud, PeerJ 3 (2015) e1258. DOI: 10.7717/peerj.1258
Miller J.D., Young J.C., The use of ergosterol to measure expo-sure to fungal propagules in indoor air, American Industrial Hygiene Association Journal, 58 (1997) 39–43.
Möhler O., DeMott P.J., Vali G., Levin Z., Microbiology and atmospheric processes: the role of biological particles in cloud physics, Biogeosciences, 4 (2007) 1059–1071.
Morris C.E., Georgakopoulos D.G., Sands D.C., Ice nucleation active bacteria and their potential role in precipitation, Journal of Physics, 121 (2004) 87–103.
Mukoda T., Todd L.A., Sobsey M.D., PCR and gene probes for detecting bioaerosols, Journal of Aerosol Science, 25 (1994) 1523–1532.
Nehme B., Letourneau V., Forster R.J., Veillette M., Duchaine C., Culture independent approach of the bacterial bioaero-sol diversity in the standard swine confinement buildings, and assessment of the seasonal effect, Environmental Microbiology, 10 (2008) 665–675.
Rafał L. Górny / KONA Powder and Particle Journal No. 37 (2020) 64–84
82
Neira V., Rabinowitz P., Rendahl A., Paccha B., Gobbs S.G., Terremorell M., Characterization of viral load, viability and persistence of influenza A virus in air and on surfaces of swine production facilities, PLoS ONE, 11 (2016) e0146616. DOI: 10.1371/journal.pone.0146616
Nevalainen A., Bacterial Aerosols in Indoor Air, National Pub-lic Health Institute, Helsinki, 1989.
Nonnenmann M.W., Bextine B., Dowd S.E., Gilmore K., Levin J.L., Culture independent characterization of bacteria and fungi in a poultry bioaerosol using pyrosequencing: a new approach, Journal of Occupational and Environmental Hygiene, 7 (2010) 693–699.
O’Connor D.J., Healy D.A., Sodeau J.R., The on-line detection of biological particle emissions from selected agricultural using the WISB-4 (Waveband integrated Bioaerosol Sen-sor) technique, Atmospheric Environment, 80 (2013) 415–425.
Oppliger A., Charriere N., Droz P.O., Rinsoz T., Exposure to bioaerosols in poultry houses at different stages of fatten-ing; use of real-time PCR for airborne bacterial quantifica-tion, Annals of Occupational Hygiene, 52 (2008) 405–412.
Orr C., Gordon M.T., Kordecki M.C., Thermal precipitation for sampling air-borne microorganisms, Applied Microbiology, 4 (1956) 116–118.
O’Sullivan D., Murray B.J., Ross J.F., Webb M.E., The adsorp-tion of fungal ice nucleating proteins on mineral dusts: a terrestrial reservoir of atmospheric ice nucleating particles, Atmospheric Chemistry and Physics, 16 (2016) 7879–7887.
O’Toole J., Keywood M., Sinclair M., Leder K., Risk in the mist? Deriving data to quantify microbial health risks asso-ciated with aerosol generation by water-efficient devices during typical domestic water-using activities, Water Sci-ence and Technology, 60 (2009) 2913–2920.
Owen M.K., Ensor D.S., Sparks L.E., Airborne particle sizes and sources found in indoor air, Atmospheric Environment, 26 (1992) 2149–2162.
Pasanen A.L., Rautiala S., Kasanen J.P., Raunio P., Rantamäki J., Kalliokoski P., The relationship between measured mois-ture conditions and fungal concentrations in water- damaged building materials, Indoor Air, 10 (2000) 111–120.
Pastuszka J.S., Górny R.L., Lis D.O., Emission of bacterial aerosol from the fish aquarium, Journal of Aerosol Sience, 27 (1996) S253–S254.
Peccia J., Hernandez M., Incorporating polymerase chain reaction- based identification, population characterization, and quantification of microorganisms into aerosol science: a review, Atmospheric Environment, 40 (2006) 3941–3961.
Perrott P., Smith G., Ristovski Z., Harding R., Hargreaves M., A nested real-time PCR assay has an increased sensitivity suitable for detection of viruses in aerosol studies, Journal of Applied Microbiology, 106 (2009) 1438–1447.
Pöhlker C., Huffman J.A., Pöschl U., Autofluorescence of atmo-spheric bioaerosols–fluorescent biomolecules and potential interferences, Atmospheric Measurement Techniques Dis-cussions, 4 (2011) 5857–5933.
Pöschl U., Atmospheric aerosols: composition, transformation, climate and health effects, Angewandte Chemie- International Edition, 44 (2005) 7520–7540.
Pouleur S., Richard C., Martin J.G., Antoun H., Ice nucleation activity in Fusarium acuminatum and Fusarium avena-ceum, Applied and Environmental Microbiology, 58 (1992) 2960–2964.
Prigione V., Lingua G., Marchisio V.F., Development and use of flow cytometry for detection of airborne fungi, Applied and Environmental Microbiology, 70 (2004) 1360–1365.
Prospero J.M., Blades E., Mathison G., Naidu R., Interhemi-spheric transport of viable fungi and bacteria from Africa to the Caribbean with soil dust, Aerobiologia, 21 (2005) 1–19.
Prussin 2nd A.J., Marr L.C., Bibby K.J., Challenges of studying viral aerosol metagenomics and communities in compari-son with bacterial and fungal aerosols, FEMS Microbiology Letters, 357 (2014) 1–9.
Rappé M.S., Giovannoni S.J., The uncultured microbial major-ity, Annual Review of Microbiology, 57 (2003) 369–394.
Reponen T., Viable Fungal Spores as Indoor Aerosols, Univer-sity of Kuopio, Kuopio, 1994.
Reponen T.A., Gazenko S.V., Grinshpun S.A., Willeke K., Cole E.C., Characteristics of airborne actinomycete spores, Applied and Environmental Microbiology, 64 (1998) 3807–3812.
Reponen T., Grinshpun S.A., Conwell K.L., Wiest J., Anderson M., Aerodynamic versus physical size of spores: measure-ment and implication on respiratory deposition, Grana, 40 (2001) 119–125.
Reponen T., Willeke K., Grinshpun S., Nevalainen A., Biologi-cal particle sampling, in: Bioaerosol Handbook, Cox C.S., Wathes C.M. (Eds.), CRC-Press, Boca Raton, 1995, pp. 751–778.
Reeslev M., Miller M., Nielsen K.F., Quantifying mold biomass on gypsum board: Comparison of ergosterol and beta- N-acetylhexosaminidase as mold biomass parameters, Applied and Environmental Microbiology, 69 (2003) 3996–3998.
Reynolds S.J., Nonnenmann M.W., Basinas I., Davidson M., Elfman L., Gordon J., Kirychuck S., Reed S., Schaeffer J.W., Schenker M.B., Schlunssen V., Sigsgaard T., System-atic review of respiratory health among dairy workers, Journal of Agromedicine, 18 (2013) 219–243.
Rogers L.A., Meier F.C., The collection of micro-organisms above 36,000 feet, National Geographic Society, Technical Papers, (1936) 146–151.
Roszak D.B., Colwell R.R., Survival strategies of bacteria in the natural-environment, Microbiological Reviews, 51 (1987) 365–379.
Roy C.J., Milton D.K., Airborne transmission of communicable infectionethe elusive pathway, New England Journal of Medicine, 350 (2004) 1710–1712.
Roy C.J., Reed D.S., Infectious disease aerobiology: miasma incarnate, Frontiers in Cellular and Infection Microbiology, 2 (2012) 1–2.
Rylander R., Reeslev M., Hulander T., Airborne enzyme mea-surements to detect indoor mould exposure, Journal of Environmental Monitoring, 12 (2010) 2161–2164.
Šantl-Temkiv T., Sahyoun M., Finster K., Hartmann S., Augustin S., Stratmann F., Wex H., Clauss T., Nielsen N.W., Sørensen
Rafał L. Górny / KONA Powder and Particle Journal No. 37 (2020) 64–84
83
J.H., Korsholm U.S., Wick L.Y., Karlson U.G., Characteri-zation of airborne ice-nucleation-active bacteria and bacte-rial fragments, Atmospheric Environment, 109 (2015) 105–117.
Sattler B., Puxbaum H., Psenner R., Bacterial growth in super-cooled cloud droplets, Geophysical Research Letters, 28 (2001) 239–242.
Schmechel D., Górny R.L., Simpson J.P., Reponen T., Grinshpun S.A., Beezhold D., Lewis D.M., The potentials and limita-tions of monoclonal antibody-based monitoring techniques for fungal bioaerosols, Workshop on Methods of bioaerosol detection, Karlsruhe, Germany, 8–9 July, 2004.
Schmechel D., Górny R.L., Simpson J.P., Reponen T., Grinshpun S.A., Lewis D.M., Limitations of monoclonal antibodies for monitoring of fungal aerosols using Penicillium brevicom-pactum as a model fungus, Journal of Immunological Methods, 283 (2003) 235–245.
Sesartic A., Lohmann U., Storelvmo T., Bacteria in the ECHAM5-HAM global climate model, Atmospheric Chemistry and Physics, 12 (2012) 8645–8661.
Sferrazza Papa G.F., Pellegrino G.M., Pellegrino R., Asthma and respiratory physiology: putting lung function into per-spective, Respirology, 19 (2014) 960–969.
Shahamat M., Levin M., Rahman I., Grim C., Heidelberg J., Stelma G., Colwell R., Evaluation of media for recovery of aerosolized bacteria, Aerobiologia, 13 (1997) 219–226.
Shahan T.A., Sorenson W.G., Lewis D.M., Superoxide anion production in response to bacterial lipopolysaccharide and fungal spores implicated in organic dust toxic syndrome, Environmental Research, 67 (1994) 98–107.
Shivaji S., Chaturvedi P., Suresh K., Reddy G., Dutt C., Wainwright M., Narlikar J., Bhargava P., Bacillus aerius sp. nov., Bacillus aerophilus sp. nov., Bacillus stratosphericus sp. nov. and Bacillus altitudinis sp. nov., isolated from cryogenic tubes used for collecting air samples from high altitudes, International Journal of Systematic and Evolu-tionary Microbiology, 56 (2006) 1465–1473.
Skelsey P., Holtslag A., Vanderwerf W. Development and vali-dation of a quasi-Gaussian plume model for the transport of botanical spores, Agricultural and Forest Meteorology, 148 (2008) 1383–1394.
Sofiev M., Silijamo P., Ranta H., Rantio-Lehtimäki A., Towards numerical forecasting of long-range air transport of birch pollen: theoretical considerations and a feasibility study, International Journal of Biometeorology, 50 (2006) 392–402.
Spengler J., Wilson R., Emission, dispersion, and concentration of particles, in: Wilson, R., Spengler, J.D. (Eds.), Particles in Our Air: Concentrations and Health Effects, Harvard University Press, Cambridge, 1996, pp. 41–62.
Staley J., Konopka A., Measurement of in situ activities of non-photosynthetic microorganisms in aquatic and terrestrial habitats, Annual Review of Microbiology, 39 (1985) 321–346.
Stapleton K., Hill K., Day K., Perry J.D., Dean J.R., The poten-tial impact of washing machines on laundry malodour gen-eration, Letters in Applied Microbiology, 56 (2013) 299–306.
Stetzenbach L., Introduction to aerobiology, in: Hurst C.J. (Ed.), Manual of Environmental Microbiology, ASM Press, Washington, 1997, pp. 619–628.
Stewart S., Grinshpun S., Willeke K., Terzieva S., Ulevicius V., Donnelly, J., Effect of impact stress on microbial recovery on an agar surface, Applied and Environmental Microbiol-ogy, 61 (1995) 1232–1239.
Takemura T., Akashi T., Ohtani Y., Inase N., Yoshizawa Y., Pathology of hypersensitivity pneumonitis, Current Opin-ions in Pulmonary Medicine, 14 (2008) 440–454.
Tan M., Shen F., Yao M., Zhu T., Development of automated electrostatic sampler (AES) for bioaerosol detection, Aero-sol Science and Technology, 45 (2011) 1154–1160.
Tong Y., Lighthart B., Diurnal distribution of total and cultur-able atmospheric bacteria at a rural site, Aerosol Science and Technology, 30 (1999) 246–254.
Tong Y., Lighthart B., The annual bacterial particle concentra-tion and size distribution in the ambient atmosphere in a rural area of the Willamette Valley, Oregon, Aerosol Sci-ence and Technology, 32 (2000) 393–493.
Utell M., Samet J., Airborne particles and respiratory disease: clinical and pathogenetic considerations, in: Wilson R., Spengler J.D. (Eds.), Particles in Our Air: Concentrations and Health Effects, Harvard University Press, Cambridge, 1996, pp. 169–188.
van Wuijckhuijse A.L., Stowers M.A., Kleefsman W.A., van Baar B.L.M., Kientz C.E., Marijnissen J.C.M., Matrix- assisted laser desorption/ionisation aerosol time-of-flight mass spectrometry for the analysis of bioaerosols: develop-ment of a fast detector for airborne biological pathogens, Journal of Aerosol Science, 36 (2005) 677–687.
Vaïtilingom M., Deguillaume L., Vinatier V., Sancelme M., Amato P., Chaumerliac N., Delort A.-M., Potential impact of microbial activity on the oxidant capacity and organic carbon budget in clouds, Proceedings of the National Acad-emy of Sciences USA, 110 (2013) 559–564.
Veron F., Ocean spray, Annual Review of Fluid Mechanics, 47 (2015) 507–538. DOI: 10.1146/annurev-fluid-010814-014651
Verreault D., Gendron L., Rousseau G.M., Veillette M., Masse D., Lindsley W.G., Moineau S., Duchaine C., Detection of airborne lactococcal bacteriophages in cheese manufactur-ing plants, Applied and Environmental Microbiology, 77 (2011) 491–497.
Wainwright M., Wickramasinghe N., Narlikar J., Rajaratnam P., Microorganisms cultured from stratospheric air samples obtained at 41 km, FEMS Microbiology Letters, 218 (2003) 161–165.
Wainwright M., Wickramasinghe N.C., Narlikar J.V., Rajaratnam P., Perkins J., Confirmation of the presence of viable but non-cultureable bacteria in the stratosphere, International Journal of Astrobiology, 3 (2004) 13–15.
Walton W.H, Ed., Inhaled Particles, Pergamon Press, Oxford, 1977.
Wang C.-C., Fang G.-C., Lee L.-Y., Bioaerosols study in central Taiwan during summer season, Toxicology and Industrial Health, 23 (2007) 133–139.
Wang C.-C., Fang G.-C., Lee L.-Y., The study of ambient air bioaerosols during summer daytime and nighttime periods

Rafał L. Górny / KONA Powder and Particle Journal No. 37 (2020) 64–84
84
in Taichung, Central Taiwan, Environmental Forensics, 9 (2008) 6–14.
Wang C.-S., Inhaled Particles, Elsevier Academic Press, Amsterdam, 2005.
Wang Z., Reponen T., Grinshpun S.A., Górny R.L., Willeke K., Effect of sampling time and air humidity on the bioeffi-ciency of filter samplers for bioaerosol collection, Journal of Aerosol Science, 32 (2001) 661–674.
Wilkinson D.M., Koumoutsaris S., Mitchell E.A.D., Bey I., Modelling the effect of size on the aerial dispersal of microorganisms, Journal of Biogeography, 39 (2012) 89–97.
WHO—World Health Organization, European Centre for Envi-ronment and Health—Air Quality and Health, Guidelines for indoor air quality: dampness and mould, WHO Regional Office for Europe, Copenhagen, 2009.
WHO—World Health Organization, Guidelines for Concentra-tion and Exposure-Response Measurement of Fine and Ultra-fine Particulate Matter for Use in Epidemiological
Studies, 2002, pp. 39–65. <http://whqlibdoc.who.int/hq/ 2002/a76621.pdf> accessed 26.04.2018
Woese C.R., Bacterial evolution, Microbiological Reviews, 51 (1987) 221–271.
Woese C.R., Fox G.E., Phylogenetic structure of the prokaryotic domain: The primary kingdoms, Proceedings of the National Academy of Sciences USA, 74 (1977) 4576–4579.
Woese C.R., Kandler O., Wheelis M.L., Towards a natural sys-tem of organisms: proposal for the domains Archaea, Bac-teria, and Eucarya, Proceedings of the National Academy of Sciences USA, 87 (1990) 4576–4579.
Yang C.S., Understanding the biology of fungi found indoors, in: Johanning E., Yang, C.S. (Eds.), Fungi and Bacteria in Indoor Air Environment, Proceedings of the International Conference at Saratoga Springs, New York, 1994, pp. 131–137.
Yang C.S., Heinsohn P., Sampling and Analysis of Indoor Microorganisms, John Wiley and Sons, Hoboken, 2007.
Author’s Short Biography
Rafał L. Górny
Rafał L. Górny is a Full Professor of medical sciences, is currently Head of the Labo-ratory of Biohazards at the Central Institute for Labour Protection—National Research Institute, Warsaw, Poland. In the last 25 years of professional work, he has been engaged in numerous studies on the health-related aspects of exposure to particulate, biological, and fibrous aerosols in occupational and non-occupational environments. His research efforts have been presented in more than 70 peer-reviewed publications, more than 100 conference presentations, several monographs and book chapters. Since 2002, he has been working as a World Health Organization and European Commission adviser within the field of biological agents.

KONA Powder and Particle Journal No. 37 (2020) 85–96/Doi:10.14356/kona.2020010 Review Paper
85Copyright © 2020 The Authors. Published by Hosokawa Powder Technology Foundation. This is an open ac-cess article under the CC BY license (http://creativecommons.org/licenses/by/4.0/).
Review of Encapsulated Salt Hydrate Core-Shell Phase Change Materials †
Hui Wang 1,2, Yunfa Chen 2, Jianqiang Li 2*, Lijiang Guo 2 and Minghao Fang 1
1 Beijing Key Laboratory of Materials Utilization of Nonmetallic Minerals and Solid Wastes, National Laboratory of Mineral Materials, School of Materials Science and Technology, China University of Geosciences (Beijing), China
2 National Engineering Laboratory for Hydrometallurgical Cleaner Production Technology, Key Laboratory of Green Process and Engineering, Institute of Process Engineering, Chinese Academy of Sciences, China
AbstractThe salt hydrate heat storage phase change material (PCM) has a promising prospect of application and has become a research hotspot because of the advantages of high thermal storage density, high thermal conductivity, moderate phase change temperature, and low price. However, some problems have restricted the application of salt hydrate heat storage materials, such as phase separation, supercooling, and corrosion of the metal container. A microencapsulated PCM using the microencapsulated technology of solid PCM coated packaging with core-shell structure composite material is an effective method to solve the above problems. In this paper, the research situations involving microencapsulated salt hydrate are analysed. This review introduces the selection of core and shell materials, compares the different preparation methods of encapsulated salt hydrate PCMs and summarizes the application fields.
Keywords: salt hydrate, core-shell microcapsules, phase change materials, encapsulating methods, application
1. Introduction
With the rapid development of global industry, a great deal of energy is consumed. At the same time, the in-crease in energy demand has spurred people to find more effective energy technologies to achieve rational utiliza-tion of energy structures in the global economy (Waqas A. and Ud Din Z., 2013). The development of renewable en-ergy must be accelerated, such as solar energy, wind en-ergy, water energy, and so on (Milian Y.E. et al., 2017; Xu B. et al., 2015; Mellouli S. et al., 2015). However, these energy sources are constrained by their own characteris-tics for large-scale development. For example, because of changes in time and season, solar energy and wind energy are discontinuous and unstable (Tyagi V.V. et al., 2016). Affected by environmental, ecological, and safety issues, the development of hydropower and nuclear energy has also been limited. Thermal energy storage has been de-veloped in the past decades, as it can transfer heat to stor-
age during the charging, and release it during the discharging. Thermal energy storage has two methods usually, including sensible heat or latent heat. However sensible heat storage material has the lower storage capac-ity compared to the latent heat storage materials, which lead to the sensible heat storage systems need to occupy a huge volume and large space. Therefore, latent heat stor-age called phase change materials has a high storage den-sity with a small temperature during storing and releasing heat (Zhang H.L. et al., 2016). Phase-change energy stor-age technology can realize multi-energy comprehensive application and allow safe, continuous, and stable output through the application of large-scale energy storage technology (Tyagi V.V. et al., 2012).
Phase change energy storage technology involves the energy storage and release of latent heat generated by phase change materials (PCMs) during the process of phase change, thereby alleviating the contradiction of the mismatch between the supply of heat energy and the de-mand in time and space (Farid M.M. et al., 2004; Pasupathy A. et al., 2008), which is the key technology to achieve energy conservation and comprehensive gradient utiliza-tion. Energy storage is directly affected by the perfor-mance of PCMs. The primary selection criterias of PCMs include high thermal storage capacity, high thermal con-ductivity, safety and low price. The PCMs are mainly classified by chemical composition, including organic
† Received 10 March 2019; Accepted 20 May 2019 J-STAGE Advance published online 13 July 20191 No. 29 Xueyuan Road, Haidian District, Beijing 100083, China2 1 North 2nd Street, Zhongguancun, Haidian District, Beijing
100190, China* Corresponding author: Jianqiang LI; E-mail: [email protected] TEL: +1-352-071-7191
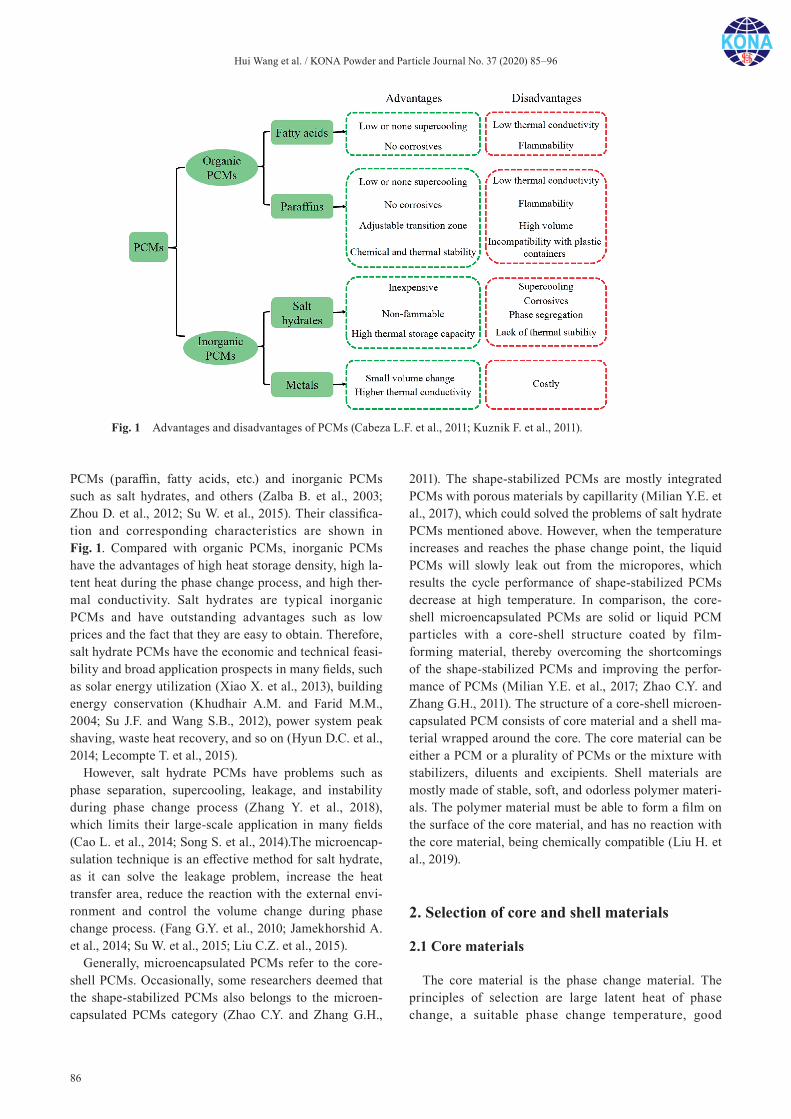
Hui Wang et al. / KONA Powder and Particle Journal No. 37 (2020) 85–96
86
PCMs (paraffin, fatty acids, etc.) and inorganic PCMs such as salt hydrates, and others (Zalba B. et al., 2003; Zhou D. et al., 2012; Su W. et al., 2015). Their classifica-tion and corresponding characteristics are shown in Fig. 1. Compared with organic PCMs, inorganic PCMs have the advantages of high heat storage density, high la-tent heat during the phase change process, and high ther-mal conductivity. Salt hydrates are typical inorganic PCMs and have outstanding advantages such as low prices and the fact that they are easy to obtain. Therefore, salt hydrate PCMs have the economic and technical feasi-bility and broad application prospects in many fields, such as solar energy utilization (Xiao X. et al., 2013), building energy conservation (Khudhair A.M. and Farid M.M., 2004; Su J.F. and Wang S.B., 2012), power system peak shaving, waste heat recovery, and so on (Hyun D.C. et al., 2014; Lecompte T. et al., 2015).
However, salt hydrate PCMs have problems such as phase separation, supercooling, leakage, and instability during phase change process (Zhang Y. et al., 2018), which limits their large-scale application in many fields (Cao L. et al., 2014; Song S. et al., 2014).The microencap-sulation technique is an effective method for salt hydrate, as it can solve the leakage problem, increase the heat transfer area, reduce the reaction with the external envi-ronment and control the volume change during phase change process. (Fang G.Y. et al., 2010; Jamekhorshid A. et al., 2014; Su W. et al., 2015; Liu C.Z. et al., 2015).
Generally, microencapsulated PCMs refer to the core-shell PCMs. Occasionally, some researchers deemed that the shape-stabilized PCMs also belongs to the microen-capsulated PCMs category (Zhao C.Y. and Zhang G.H.,
2011). The shape-stabilized PCMs are mostly integrated PCMs with porous materials by capillarity (Milian Y.E. et al., 2017), which could solved the problems of salt hydrate PCMs mentioned above. However, when the temperature increases and reaches the phase change point, the liquid PCMs will slowly leak out from the micropores, which results the cycle performance of shape-stabilized PCMs decrease at high temperature. In comparison, the core-shell microencapsulated PCMs are solid or liquid PCM particles with a core-shell structure coated by film- forming material, thereby overcoming the shortcomings of the shape-stabilized PCMs and improving the perfor-mance of PCMs (Milian Y.E. et al., 2017; Zhao C.Y. and Zhang G.H., 2011). The structure of a core-shell microen-capsulated PCM consists of core material and a shell ma-terial wrapped around the core. The core material can be either a PCM or a plurality of PCMs or the mixture with stabilizers, diluents and excipients. Shell materials are mostly made of stable, soft, and odorless polymer materi-als. The polymer material must be able to form a film on the surface of the core material, and has no reaction with the core material, being chemically compatible (Liu H. et al., 2019).
2. Selection of core and shell materials
2.1 Core materials
The core material is the phase change material. The principles of selection are large latent heat of phase change, a suitable phase change temperature, good
Fig. 1 Advantages and disadvantages of PCMs (Cabeza L.F. et al., 2011; Kuznik F. et al., 2011).

Hui Wang et al. / KONA Powder and Particle Journal No. 37 (2020) 85–96
87
stability and durability, low likelihood of leaking, large thermal conductivity, reversibility in a phase transition, and good chemical compatibility (Milian Y.E. et al., 2017). The phase change is reversible, and the chemical compatibility is good (Zhang J. et al., 2011). Salt hydrate PCMs are increasingly favoured for their outstanding ad-vantages such as high latent heat and low cost. Salt hy-drates, as shown in Table 1, are typical of the most studied PCMs. Although there are many salt hydrates, at present, the successfully coated salt hydrates as the core materials are Na2SO4·10H2O, CaCl2·6H2O, Na2HPO4· 12H2O, Mg(NO3)2·6H2O, Na2CO3·10H2O, and so on (Sharma S.D. et al., 2004; Sharma A. et al., 2009; Cabeza L.F. et al., 2011; Su W. et al., 2015; Yang J.M. and Kim J.S., 2017). The thermal properties of the microencapsu-lated PCMs are shown in Table 2.
2.2 Shell materials
From the viewpoint of structure stability, the shell ma-terial should meet the characteristics of high strength, high toughness, good compactness and good chemical stability to maintain its integrity and avoid leakage of core material under the action of external force. Consider-ing the preparation and use of the material, the shell ma-terial should have good chemical compatibility with the core material, no corrosion, no penetration, and it should be cheap and easy to obtain. In addition, to maintain the structure stability of core-shell microencapsulated PCMs, the melting point of the shell material should be higher than both the phase transition temperature of the core ma-
terial and the highest temperature to be used.Commonly shell materials are divided into organic and
inorganic materials. From the literatures, most of the pub-lished papers are reported on the preparation of core-shell microencapsulated PCMs with organic shell materials, which means organic materials are easier to form core-shell microencapsulated PCMs (Liu H. et al., 2019). Gen-erally used organic shell materials for coating salt hydrates are urea-formaldehyde resin, polymethyl methacrylate, sty-rene, polyurethane, and ethyl 2-cyanoacrylate, as shown in Table 2. Organic shell materials are costly and contain many harmful substances, such as benzene and aldehyde. Therefore, inorganic shell materials are more preferable due to the high thermal conductivity, safety and low prices. Although most of the inorganic shell materials have poor structure stability, considering the advantages of the inorganic shell materials, the development of new inorganic shell materials is important for improving the performance of shell materials and promoting the applica-tion and development of salt hydrate encapsulated PCMs.
3. Methods for preparation of salt hydrate core-shell phase change materials
The encapsulation methods of phase change core-shell PCMs are divided into chemical method and physical method (Su W. et al., 2015; Kośny J., 2015; Liu H. et al., 2019), and their classification characteristics are shown in Table 3. Among them, the suspension polymerization method, the complex coacervation method and the spray
Table 1 Thermal physical properties of typical salt hydrates.
PCMs Tm/°C ΔHm/J·g–1 k/W·m–1·k–1 ρ/kg·m–3 Cp/J·kg–1·°C–1
LiClO3·3H2O 8 253 n.a. 1720 (s), 1530 (l) n.a.
ZnCl2·3H2O 10 n.a. n.a. n.a. n.a.
CaCl2·6H20 29–30 170–192 1.008 (s), 0.561 (l) 1802 (s), 1562 (l) n.a.
Na2SO4·10H2O 32 251–254.0 0.544 1485 (s) 2
Na2CO3·10H2O 32 267 0.514 (s), 0.224 (l) 830 1.92 (s), 3.26 (l)
Na2HPO4·12H2O 35–40 256–281 n.a. 1522 n.a.
MgSO4·7H2O 48.5 202 n.a. n.a. n.a.
Na2S2O3·5H2O 48 209 n.a. 1600 n.a.
CH3COONa·3H2O 58 270–290 n.a. 1450 n.a.
FeSO4·7H2O 64 200 n.a. n.a. n.a.
Ba(OH)2·8H20 78 265–280 1.255 (s), 0.653 (l) 2070 (s), 1937 (l) n.a.
Mg(NO3)2·6H2O 89.9 167 0.0611 (s), 0.490 (l) 1550 (l), 1636 (s) n.a.
MgCl2·6H2O 117 167 0.704 (s), 0.570 (l) 1450 (l), 1570 (s) 2.25 (s), 2.61 (l)
Annotation: Tm: Phase change temperature (°C). ΔHm: Latent heat (J·g–1). k: Thermal conductivity (W·m–1·k–1). ρ: Density (kg·m–3). Cp: Specific heat capacity (J·kg–1·°C–1).
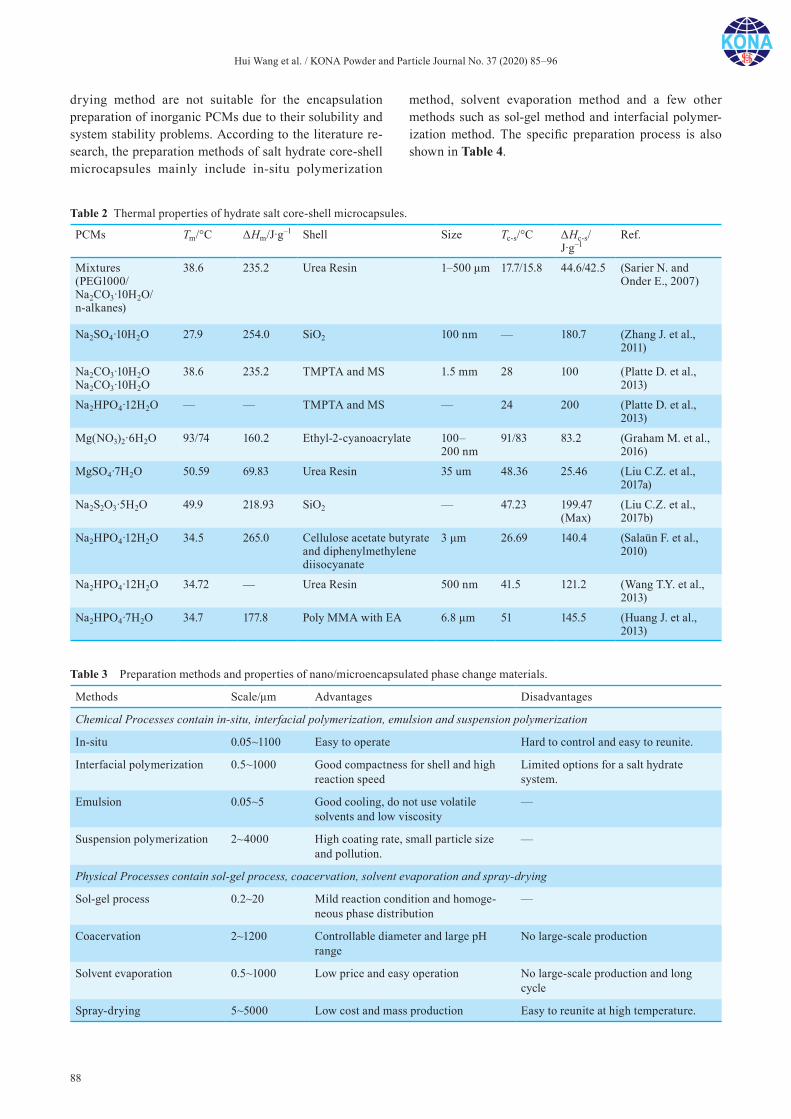
Hui Wang et al. / KONA Powder and Particle Journal No. 37 (2020) 85–96
88
drying method are not suitable for the encapsulation preparation of inorganic PCMs due to their solubility and system stability problems. According to the literature re-search, the preparation methods of salt hydrate core-shell microcapsules mainly include in-situ polymerization
method, solvent evaporation method and a few other methods such as sol-gel method and interfacial polymer-ization method. The specific preparation process is also shown in Table 4.
Table 2 Thermal properties of hydrate salt core-shell microcapsules.
PCMs Tm/°C ΔHm/J·g–1 Shell Size Tc-s/°C ΔHc-s/J·g–1
Ref.
Mixtures(PEG1000/Na2CO3·10H2O/ n-alkanes)
38.6 235.2 Urea Resin 1–500 μm 17.7/15.8 44.6/42.5 (Sarier N. and Onder E., 2007)
Na2SO4·10H2O 27.9 254.0 SiO2 100 nm — 180.7 (Zhang J. et al., 2011)
Na2CO3·10H2ONa2CO3·10H2O
38.6 235.2 TMPTA and MS 1.5 mm 28 100 (Platte D. et al., 2013)
Na2HPO4·12H2O — — TMPTA and MS — 24 200 (Platte D. et al., 2013)
Mg(NO3)2·6H2O 93/74 160.2 Ethyl-2-cyanoacrylate 100–200 nm
91/83 83.2 (Graham M. et al., 2016)
MgSO4·7H2O 50.59 69.83 Urea Resin 35 um 48.36 25.46 (Liu C.Z. et al., 2017a)
Na2S2O3·5H2O 49.9 218.93 SiO2 — 47.23 199.47 (Max)
(Liu C.Z. et al., 2017b)
Na2HPO4·12H2O 34.5 265.0 Cellulose acetate butyrate and diphenylmethylene diisocyanate
3 μm 26.69 140.4 (Salaün F. et al., 2010)
Na2HPO4·12H2O 34.72 — Urea Resin 500 nm 41.5 121.2 (Wang T.Y. et al., 2013)
Na2HPO4·7H2O 34.7 177.8 Poly MMA with EA 6.8 μm 51 145.5 (Huang J. et al., 2013)
Table 3 Preparation methods and properties of nano/microencapsulated phase change materials.
Methods Scale/μm Advantages Disadvantages
Chemical Processes contain in-situ, interfacial polymerization, emulsion and suspension polymerization
In-situ 0.05~1100 Easy to operate Hard to control and easy to reunite.
Interfacial polymerization 0.5~1000 Good compactness for shell and high reaction speed
Limited options for a salt hydrate system.
Emulsion 0.05~5 Good cooling, do not use volatile solvents and low viscosity
—
Suspension polymerization 2~4000 High coating rate, small particle size and pollution.
—
Physical Processes contain sol-gel process, coacervation, solvent evaporation and spray-drying
Sol-gel process 0.2~20 Mild reaction condition and homoge-neous phase distribution
—
Coacervation 2~1200 Controllable diameter and large pH range
No large-scale production
Solvent evaporation 0.5~1000 Low price and easy operation No large-scale production and long cycle
Spray-drying 5~5000 Low cost and mass production Easy to reunite at high temperature.
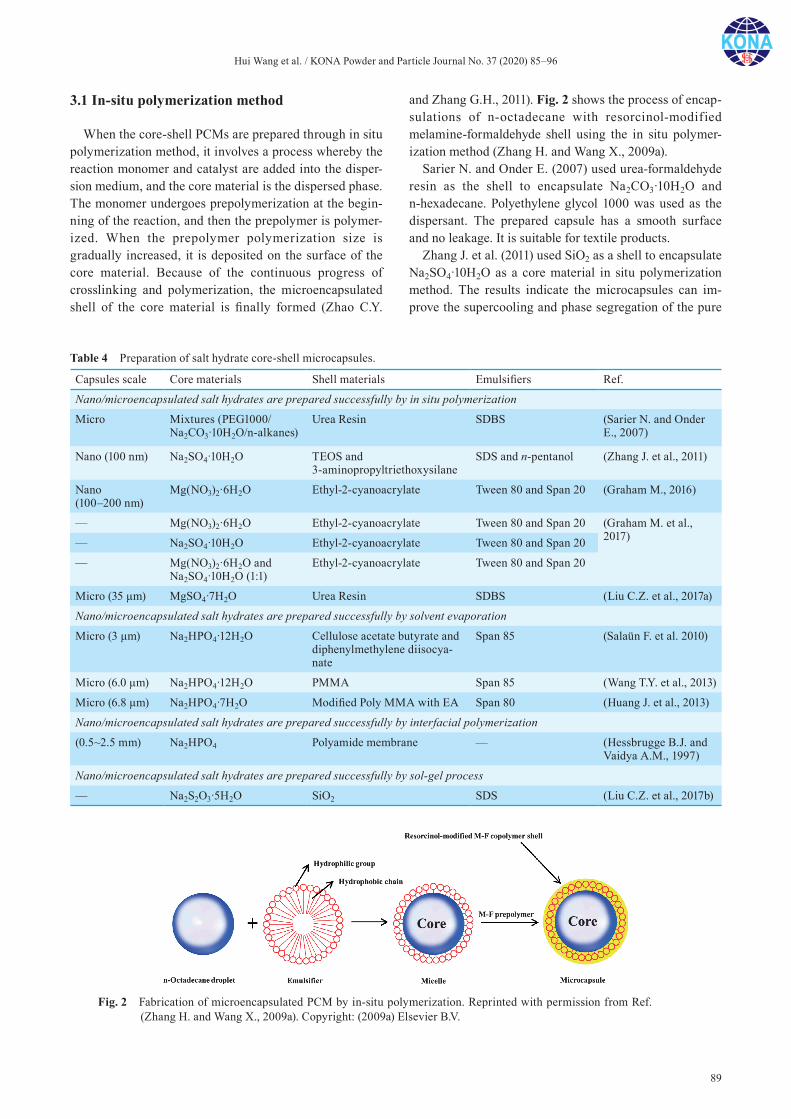
Hui Wang et al. / KONA Powder and Particle Journal No. 37 (2020) 85–96
89
3.1 In-situ polymerization method
When the core-shell PCMs are prepared through in situ polymerization method, it involves a process whereby the reaction monomer and catalyst are added into the disper-sion medium, and the core material is the dispersed phase. The monomer undergoes prepolymerization at the begin-ning of the reaction, and then the prepolymer is polymer-ized. When the prepolymer polymerization size is gradually increased, it is deposited on the surface of the core material. Because of the continuous progress of crosslinking and polymerization, the microencapsulated shell of the core material is finally formed (Zhao C.Y.
and Zhang G.H., 2011). Fig. 2 shows the process of encap-sulations of n-octadecane with resorcinol-modified melamine-formaldehyde shell using the in situ polymer-ization method (Zhang H. and Wang X., 2009a).
Sarier N. and Onder E. (2007) used urea-formaldehyde resin as the shell to encapsulate Na2CO3·10H2O and n-hexadecane. Polyethylene glycol 1000 was used as the dispersant. The prepared capsule has a smooth surface and no leakage. It is suitable for textile products.
Zhang J. et al. (2011) used SiO2 as a shell to encapsulate Na2SO4·10H2O as a core material in situ polymerization method. The results indicate the microcapsules can im-prove the supercooling and phase segregation of the pure
Table 4 Preparation of salt hydrate core-shell microcapsules.
Capsules scale Core materials Shell materials Emulsifiers Ref.
Nano/microencapsulated salt hydrates are prepared successfully by in situ polymerization
Micro Mixtures (PEG1000/Na2CO3·10H2O/n-alkanes)
Urea Resin SDBS (Sarier N. and Onder E., 2007)
Nano (100 nm) Na2SO4·10H2O TEOS and 3-aminopropyltriethoxysilane
SDS and n-pentanol (Zhang J. et al., 2011)
Nano (100–200 nm)
Mg(NO3)2·6H2O Ethyl-2-cyanoacrylate Tween 80 and Span 20 (Graham M., 2016)
— Mg(NO3)2·6H2O Ethyl-2-cyanoacrylate Tween 80 and Span 20 (Graham M. et al., 2017)— Na2SO4·10H2O Ethyl-2-cyanoacrylate Tween 80 and Span 20
— Mg(NO3)2·6H2O and Na2SO4·10H2O (1:1)
Ethyl-2-cyanoacrylate Tween 80 and Span 20
Micro (35 μm) MgSO4·7H2O Urea Resin SDBS (Liu C.Z. et al., 2017a)
Nano/microencapsulated salt hydrates are prepared successfully by solvent evaporation
Micro (3 μm) Na2HPO4·12H2O Cellulose acetate butyrate and diphenylmethylene diisocya-nate
Span 85 (Salaün F. et al. 2010)
Micro (6.0 μm) Na2HPO4·12H2O PMMA Span 85 (Wang T.Y. et al., 2013)
Micro (6.8 μm) Na2HPO4·7H2O Modified Poly MMA with EA Span 80 (Huang J. et al., 2013)
Nano/microencapsulated salt hydrates are prepared successfully by interfacial polymerization
(0.5~2.5 mm) Na2HPO4 Polyamide membrane — (Hessbrugge B.J. and Vaidya A.M., 1997)
Nano/microencapsulated salt hydrates are prepared successfully by sol-gel process
— Na2S2O3·5H2O SiO2 SDS (Liu C.Z. et al., 2017b)
Fig. 2 Fabrication of microencapsulated PCM by in-situ polymerization. Reprinted with permission from Ref. (Zhang H. and Wang X., 2009a). Copyright: (2009a) Elsevier B.V.

Hui Wang et al. / KONA Powder and Particle Journal No. 37 (2020) 85–96
90
Na2SO4·10H2O and have good cycling performance after 60 times, and good performance.
Platte D. et al. (2013) prepared salt hydrate microcap-sules by in-situ polymerization of mercaptan michael ad-dition using TMPTA and polyether as shells and Na2CO3·10H2O, Na2CO3·10H2O and Na2HPO4·12H2O as core materials.
Wang T. et al. (2013) selected Na2HPO4·12H2O as the core material and urea-formaldehyde resin as the shell material. The microcapsules were successfully prepared by in-situ polymerization. The effects of the molar ratio of urea and formaldehyde on the structure and morphology of the obtained microcapsules were studied. The results show that the prepared microcapsules have a core-shell structure with a well-proportioned coating. Its average particle size was about 500 nm, the latent heat of phase change was 121.2 J·g–1, and the weight loss was less than 10 % in the temperature range of 30–84 °C.
Graham M. et al. (2016) used in-situ microemulsion polymerization method to prepare microcapsules with 2-ethyl cyanoacrylate polymer as shell material and Mg(NO3)2·6H2O as core material. The capsule size was 100–200 nm. The latent heat of the PCM was reduced by 3 % after 100 times of phase thermal cycles, and the de-gree of supercooling was greatly reduced. This was the first time to produce a longer life (100 times) for salt hy-drate microcapsules. The latent heat of the microcapsule was 83.2 J·g–1. After hundreds of thermal cycles, the la-tent heat value did not change much. The researchers also confirmed by Fourier transform infrared spectroscopy and observation that the chemical properties of the micro-capsules were very stable after hundreds of thermal cy-cles. Graham M. et al. (2017) successfully prepared microcapsules containing Mg(NO3)2·6H2O, Na2H-PO4·12H2O and their mixture as core materials by the above methods.
Liu C.Z. et al. (2017a) successfully prepared microcap-sule by in-situ emulsion polymerization with urea formal-dehyde resin (UR) as the shell material and MgSO4·7H2O as the core material. They analysed the microscopic mor-
phology, particle size distribution, phase change tempera-ture, phase change latent heat of microcapsules. The results reveal that when using sodium dodecyl benzene sulfonate as the emulsifier, and emulsifier content was 0.5 g, the microcapsules had a smooth, uniform particle size; the average diameter was 34.99 microns, the phase change temperature of microcapsule was 48.36 °C and the phase change latent heat was 25.46 kJ·kg–1.
3.2 Solvent evaporation method
The solvent evaporation method means that the shell material or the shell material formed by the reaction is dissolved in the continuous phase first, and after the dis-persion medium is volatilized, a shell is formed on the surface of the droplet to obtain a microcapsule structure (Salaün F. et al., 2010). Fig. 3 shows a process by an inter-facial polymerization.
Salaün F. et al. (2010) used a solvent evaporation method, cellulose acetate butyrate and diphenylmethylene diisocyanate as shell materials, and Na2HPO4·12H2O as core material to prepare phase change microcapsules. The author discussed the effects of different solvents such as acetone, toluene, carbon tetrachloride, and chloroform on the morphology and coating rate of microcapsules, using toluene and chloroform as organic solvents to generate Na2HPO4·12H2O@polyurethane microcapsules with a coating rate of 68.4 % and a uniform particle size distri-bution. Through SEM observation, the morphology of the microcapsules was strongly influenced by the solvent. The thermal properties of the microcapsules were studied by TGA and DSC analysis, and the results show that the thermal properties of the microcapsule depended on the content of the core material and the synthesis conditions.
Wang T.Y. and Huang J. (2013) used polymethyl meth-acrylate (PMMA) as a shell material to encapsulate Na2HPO4·12H2O using the same method. The polymer-ization was sufficiently carried out at a reaction tempera-ture of 80 to 90 °C for 4 hours to form a composite phase change microcapsule with a radius of 1–10 μm. The
Fig. 3 Steps of microencapsulation by solvent evaporation. Reprinted with permission from Ref. (Li M. et al., 2008). Copyright: (2008) Elsevier B.V.
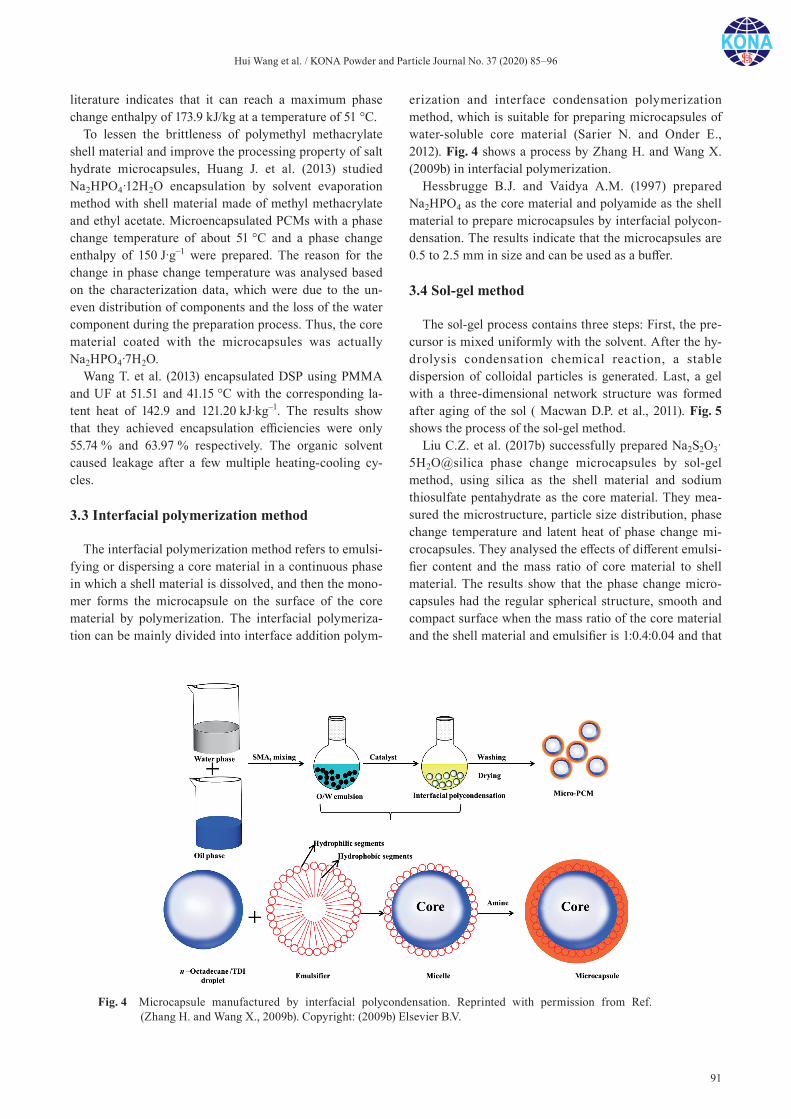
Hui Wang et al. / KONA Powder and Particle Journal No. 37 (2020) 85–96
91
literature indicates that it can reach a maximum phase change enthalpy of 173.9 kJ/kg at a temperature of 51 °C.
To lessen the brittleness of polymethyl methacrylate shell material and improve the processing property of salt hydrate microcapsules, Huang J. et al. (2013) studied Na2HPO4·12H2O encapsulation by solvent evaporation method with shell material made of methyl methacrylate and ethyl acetate. Microencapsulated PCMs with a phase change temperature of about 51 °C and a phase change enthalpy of 150 J·g–1 were prepared. The reason for the change in phase change temperature was analysed based on the characterization data, which were due to the un-even distribution of components and the loss of the water component during the preparation process. Thus, the core material coated with the microcapsules was actually Na2HPO4·7H2O.
Wang T. et al. (2013) encapsulated DSP using PMMA and UF at 51.51 and 41.15 °C with the corresponding la-tent heat of 142.9 and 121.20 kJ·kg–1. The results show that they achieved encapsulation efficiencies were only 55.74 % and 63.97 % respectively. The organic solvent caused leakage after a few multiple heating-cooling cy-cles.
3.3 Interfacial polymerization method
The interfacial polymerization method refers to emulsi-fying or dispersing a core material in a continuous phase in which a shell material is dissolved, and then the mono-mer forms the microcapsule on the surface of the core material by polymerization. The interfacial polymeriza-tion can be mainly divided into interface addition polym-
erization and interface condensation polymerization method, which is suitable for preparing microcapsules of water-soluble core material (Sarier N. and Onder E., 2012). Fig. 4 shows a process by Zhang H. and Wang X. (2009b) in interfacial polymerization.
Hessbrugge B.J. and Vaidya A.M. (1997) prepared Na2HPO4 as the core material and polyamide as the shell material to prepare microcapsules by interfacial polycon-densation. The results indicate that the microcapsules are 0.5 to 2.5 mm in size and can be used as a buffer.
3.4 Sol-gel method
The sol-gel process contains three steps: First, the pre-cursor is mixed uniformly with the solvent. After the hy-drolysis condensation chemical reaction, a stable dispersion of colloidal particles is generated. Last, a gel with a three-dimensional network structure was formed after aging of the sol ( Macwan D.P. et al., 2011). Fig. 5 shows the process of the sol-gel method.
Liu C.Z. et al. (2017b) successfully prepared Na2S2O3· 5H2O@silica phase change microcapsules by sol-gel method, using silica as the shell material and sodium thiosulfate pentahydrate as the core material. They mea-sured the microstructure, particle size distribution, phase change temperature and latent heat of phase change mi-crocapsules. They analysed the effects of different emulsi-fier content and the mass ratio of core material to shell material. The results show that the phase change micro-capsules had the regular spherical structure, smooth and compact surface when the mass ratio of the core material and the shell material and emulsifier is 1:0.4:0.04 and that
Fig. 4 Microcapsule manufactured by interfacial polycondensation. Reprinted with permission from Ref. (Zhang H. and Wang X., 2009b). Copyright: (2009b) Elsevier B.V.

Hui Wang et al. / KONA Powder and Particle Journal No. 37 (2020) 85–96
92
the particle size distribution was uniform. The latent heat of the prepared phase change microcapsules was 199.47 kJ·kg–1, and the coating rate was 94.65 %. After the silica coating, the supercooling degree and thermal conductivity were improved, and the thermal stability was obviously improved. At the same time, the leakage caused by the flow of the core material after melting was solved, thus extending the cycle life of the inorganic salt hydrates in practical application.
Yang J.M. and Kim J.S. (2018) successfully prepared microcapsules by using a combination of sol-gel and in-terfacial polymerization with siloxane and polyurea as shell materials and CaCl2·6H2O as core material. They studied the characteristics of microcapsules with different core-shell ratios and different pH values. The results indi-cate that the microcapsules can be prepared when the core-shell mass ratio was 3.0, and when the pH was be-tween 1.5 and 2.8. Especially when the pH was 2.35 and 2.55, the surface of the microcapsule was smooth with ex-cellent thermal properties and a high coverage ratio.
3.5 Comparison of different microencapsulation methods
The review has shown that salt hydrate PCMs can be encapsulated by different methods such as in-situ polym-erization, interfacial polymerization, solvent evaporation, sol-gel methods, and so on. In brief, in-situ polymeriza-tion can be suitable for producing nanocapsules, but it is difficult to achieve large-scale production because a high stirring rate is needed to generate droplets during the en-capsulation process, which will consume a great deal of energy and produce high costs. Solvent evaporation can be encapsulated using organic shells successfully. How-
ever, the organic shells have poor thermal conductivity and the preparation process is not controllable. Few stud-ies have been conducted on interfacial polymerization and sol-gel methods for salt hydrate core-shell microencapsu-lation.
4. Application
4.1 Temperature-regulating fabric
As early as the 1980s, NASA carried out research on the application of microencapsulated PCMs in thermal- regulation protective clothing. Since then, much- applied research has been carried out in the field of clothing (Giraud S. et al., 2005; Giraud S. et al., 2002). This type of functional clothing can adjust the temperature of the clothing and its surroundings, reduce the difference in skin temperature, and make the clothing more comfort-able. In the main process, microcapsules are added to the fibre or coated on the surface of cotton cloth to develop fi-bre and cloth with self-regulating temperature perfor-mance. Sarier N. and Onder E. (2007) accomplished the microencapsulation of PCMs by a manufacturing tech-nique that can ultimately be used in different textile appli-cations.
4.2 Buildings
PCMs have been used in buildings to meet comfort thermal requirements for peoples (Hawes D.W. et al., 1993; Neeper D.A., 2000; Kumirai T. et al., 2019). But, there are some problems for PCMs in building applica-tions, such as interaction between building structure and
Fig. 5 Schematic formation of a sol-gel process. Reprinted with permission from Ref. (Zhang H. et al., 2010). Copyright: (2010) Elsevier B.V.

Hui Wang et al. / KONA Powder and Particle Journal No. 37 (2020) 85–96
93
PCMs; leakage of PCMs to decrease the lifetime of the structure and poor heat transfer for PCMs in the solid state. To overcome the above problems, salt hydrate core-shell PCMs are applied in the field of energy-saving building materials. Physical methods such as miscibility and filling can be combined with traditional building ma-terials to prepare energy-saving building materials such as plates, coatings, and bricks with the function of phase change energy storage. A comprehensive review of encap-sulation techniques for inorganic phase change materials and the influence on their thermophysical properties had been carried out by Milian Y.E. et al. (2017). In this re-view, the researcher made a detailed summary of the ap-plication trend of microcapsules in the field of buildings. The application of microcapsule phase change energy storage materials in the buildings can reduce the fluctua-tion of indoor temperature and the power consumption of refrigeration or heating equipment to achieve the purpose of energy savings. But the researchers still admit great challenges to enlarge thermal and cycling stability and re-duce corrosion with building materials (Ma Z. et al., 2016).
Farid M.M. et al. (2004) mixed calcium chloride micro-capsules in hexahydrate into building cement and ob-tained a good temperature control effect.
In addition, salt hydrate microcapsule PCMs can also be used for cooling electronic components (Wirtz R.A. et al., 2012; Kandasamy R. et al., 2008), waste heat recovery, aerospace applications and so on.
5. Conclusions
This review introduced the selection of core and shell materials, compared the different preparation methods of encapsulated salt hydrate PCMs and summarized the ap-plication fields. Four types of preparation to successfully prepare salt hydrate core-shell microencapsulation were introduced: the in-situ polymerization method, solvent evaporation method, interfacial polymerization method and sol-gel method. The research works on encapsulated salt hydrate core-shell PCMs are relatively few compared to those on organic core-shell microencapsulation. The research has mainly focused on the study of the prepara-tion methods, mostly using polymers as shell materials because a polymer with a low coefficient of thermal con-ductivity will affect the heat transfer performance of mi-crocapsule PCMs, a new type of inorganic shell materials must be developed. Encapsulated salt hydrate core-shell PCMs have not been applied at large scales yet, but these PCMs have great potential application value. Therefore, it is necessary to strengthen the research on preparation technology and actively expand its application fields.
Acknowledgements
This work was supported by the National Key Research and Development Program of China (2016YFC0700905 and 2017YFC0703200) and Transformational Technolo-gies for Clean Energy and Demonstration Strategic Prior-ity Research Program of the Chinese Academy of Sciences (Grant No. XDA21070302).
Nomenclature
DSP Disodium hydrogen phosphate dodecahydrate
EA Ethyl acrylate
MMA Methylmethacrylate
PCMs Phase change materials
PMMA Polymethyl methacrylate
SDBS Sodium dodecyl benzene sulfonate
SDS Sodium dodecyl sulfonate
TEOS Tetraethyl orthosilicate
TMPTA Trimethylol propane triacrylate
UF Urea-formaldehyde resin
References
Cabeza L.F., Castell A., Barreneche C., de Gracia A., Fernández A.I., Materials used as PCM in thermal energy storage in buildings: A review, Renewable and Sustainable Energy Reviews, 15 (2011) 1675–1695. DOI: 10.1016/j.rser. 2010.11.018
Cao L., Tang F., Fang G., Preparation and characteristics of microencapsulated palmitic acid with TiO2 shell as shape-stabilized thermal energy storage materials, Solar Energy Materials and Solar Cells, 123 (2014) 183–188. DOI: 10.1016/j.solmat.2014.01.023
Fang G.Y., Chen Z., Li H., Synthesis and properties of microen-capsulated paraffin composites with SiO2 shell as thermal energy storage materials, Chemical Engineering Journal, 163 (2010) 154–159. DOI: 10.1016/j.cej.2010.07.054
Farid M.M., Khudhair A.M., Razack S.A.K., Al-Hallaj S., A review on phase change energy storage: Materials and applications, Energy Conversion and Management, 45 (2004) 1597–1615. DOI: 10.1016/j.enconman.2003.09.015
Giraud S., Bourbigot S., Rochery M., Vroman I., Tighzert L., Delobel R., Poutch F., Flame retarded polyurea with micro-encapsulated ammonium phosphate for textile coating, Polymer Degradation and Stability, 88 (2005) 106–113. DOI: 10.1016/j.polymdegradstab.2004.01.028
Giraud S., Bourbigota S., Rocherya M., Vromana I., Tighzertb L., Delobelc R., Microencapsulation of phosphate: Applica-
Hui Wang et al. / KONA Powder and Particle Journal No. 37 (2020) 85–96
94
tion to flame retarded coated cotton, Polymer Degradation and Stability, 77 (2002) 285–297. DOI: 10.1016/S0141-3910(02)00063-0
Graham M., Coca-Clemente J.A., Shchukina E., Shchukin D., Nanoencapsulated crystallohydrate mixtures for advanced thermal energy storage, Journal of Materials Chemistry A, 5 (2017) 13683–13691. DOI: 10.1039/c7ta02494k
Graham M., Shchukina E., De Castro P.F., Shchukin D., Nano-capsules containing salt hydrate phase change materials for thermal energy storage, Journal of Materials Chemistry A, 4 (2016) 16906–16912. DOI: 10.1039/c6ta06189c
Hawes D.W., Feldman D., Banu D., Latent heat storage in build-ing materials, Energy and Buildings, 20 (1993) 77–86. DOI: 10.1016/0378-7788(93)90040-2
Hessbrugge B.J., Vaidya A.M., Preparation and characterization of salt hydrates encapsulated in polyamide membranes, Journal of Membrane Science, 128 (1997) 175–182. DOI: 10.1013/s03767388(96)00307-9
Huang J., Wang T., Zhu P., Xiao J., Preparation, characteriza-tion, and thermal properties of the microencapsulation of a hydrated salt as phase change energy storage materials, Thermochimica Acta, 557 (2013) 1–6. DOI: 10.1016/j.tca.2013.01.019
Hyun D.C., Levinson N.S., Jeong U., Xia Y., Emerging applica-tions of phase-change materials (PCMs): Teaching an old dog new tricks, Angew Chem Int Ed Engl, 53 (2014) 3780–3795. DOI: 10.1002/anie.201305201
Jamekhorshid A., Sadrameli S.M., Farid M., A review of micro-encapsulation methods of phase change materials (PCMs) as a thermal energy storage (TES) medium, Renewable and Sustainable Energy Reviews, 31 (2014) 531–542. DOI: 10.1016/j.rser.2013.12.033
Kandasamy R., Wang X.-Q., Mujumdar A.S., Transient cooling of electronics using phase change material (PCM)-based heat sinks, Applied Thermal Engineering, 28 (2008) 1047–1057. DOI: 10.1016/j.applthermaleng.2007.06.010
Khudhair A.M., Farid M.M., A review on energy conservation in building applications with thermal storage by latent heat using phase change materials, Fuel and Energy Abstracts, 45 (2004) 04/01517. DOI: doi:10.1016/s01406701(04)90343
Kośny J., Overview of basic solid–liquid PCMs used in building envelopes—packaging methods, Encapsulation, and Ther-mal Enhancement, (2015) 61–105. DOI: 10.1007/978-3-319-14286-9_3
Kumirai T., Dirker J., Meyer J., Experimental analysis for ther-mal storage performance of three types of plate encapsu-lated phase change materials in air heat exchangers for ventilation applications, Journal of Building Engineering, 22 (2019) 75–89. DOI: 10.1016/j.jobe.2018.11.016
Kuznik F., David D., Johannes K., Roux J.-J., A review on phase change materials integrated in building walls, Renewable and Sustainable Energy Reviews, 15 (2011) 379–391. DOI: 10.1016/j.rser.2010.08.019
Lecompte T., Le Bideau P., Glouannec P., Nortershauser D., Le Masson S., Mechanical and thermo-physical behaviour of concretes and mortars containing phase change material, Energy and Buildings, 94 (2015) 52–60. DOI: 10.1016/j. enbuild.2015.02.044
Li M., Rouaud O., Poncelet D., Microencapsulation by solvent evaporation: State of the art for process engineering approaches, Int J Pharm, 363 (2008) 26–39. DOI: 10.1016/j.ijpharm.2008.07.018
Liu C.Z., Ma L., Rao Z.H., Li Y.M., Synthesis and thermal properties of magnesium sulfate heptahydrate/urea resin as thermal energy storage micro-encapsulated phase change material, Journal of Heat Transfer, 140 (2017a) 014501. DOI: 10.1115/1.4037340
Liu C.Z., Rao Z.H., Zhao J.T., Huo Y.T., Li Y.M., Review on nanoencapsulated phase change materials: Preparation, characterization and heat transfer enhancement, Nano Energy, 13 (2015) 814–826. DOI: 10.1016/j.nanoen. 2015.02.016
Liu C.Z., Wang C., Li Y., Rao Z.H., Preparation and characteri-zation of sodium thiosulfate pentahydrate/silica microen-capsulated phase change material for thermal energy storage, Rsc Advances, 7 (2017b) 7238–7249. DOI: 10.1039/c6ra28056k
Liu H., Wang X.D., Wu D.Z., Innovative design of microencap-sulated phase change materials for thermal energy storage and versatile applications: A review, Sustain. Energ. Fuels, (2019). DOI: 10.1039/c9se00019d
Ma Z., Lin W., Sohel M.I., Nano-enhanced phase change mate-rials for improved building performance, Renewable and Sustainable Energy Reviews, 58 (2016) 1256–1268. DOI: 10.1016/j.rser.2015.12.234
Macwan D.P., Dave P.N., Chaturvedi S., A review on nano-TiO2 sol–gel type syntheses and its applications, Journal of Materials Science, 46 (2011) 3669–3686. DOI: 10.1007/s10853-011-5378-y
Mellouli S., Ben Khedher N., Askri F., Jemni A., Ben Nasrallah S., Numerical analysis of metal hydride tank with phase change material, Applied Thermal Engineering, 90 (2015) 674–682. DOI: 10.1016/j.applthermaleng.2015.07.022
Milian Y.E., Gutierrez A., Grageda M., Ushak S., A review on encapsulation techniques for inorganic phase change mate-rials and the influence on their thermophysical properties, Renewable & Sustainable Energy Reviews, 73 (2017) 983–999
Neeper D.A., Thermal dynamics of wallboard with latent heat storage, Solar Energy, 68 (2000) 339–403. DOI: 10.1016/S0038-092X(00)00012-8
Pasupathy A., Velraj R., Seeniraj R.V., Phase change material- based building architecture for thermal management in res-idential and commercial establishments, Renewable and Sustainable Energy Reviews, 12 (2008) 39–64. DOI: 10.1016/j.rser.2006.05.010
Platte D., Helbig U., Houbertz R., Sextl G., Microencapsulation of Alkaline Salt Hydrate Melts for Phase Change Applica-tions by Surface Thiol-Michael Addition Polymerization, Macromolecular Materials and Engineering, 298 (2013) 67–77. DOI: 10.1002/mame.201100338
Salaün F., Devaux E., Bourbigot S., Rumeau P., Influence of the solvent on the microencapsulation of an hydrated salt, Car-bohydrate Polymers, 79 (2010) 964–974. DOI: 10.1016/j.carbpol.2009.10.027
Sarier N., Onder E., The manufacture of microencapsulated

Hui Wang et al. / KONA Powder and Particle Journal No. 37 (2020) 85–96
95
phase change materials suitable for the design of thermally enhanced fabrics, Thermochimica Acta, 452 (2007) 149–160. DOI: 10.1016/j.tca.2006.08.002
Sarier N., Onder E., Organic phase change materials and their textile applications: An overview, Thermochimica Acta, 540 (2012) 7–60. DOI: 10.1016/j.tca.2012.04.013
Sharma A., Tyagi V.V., Chen C.R., Buddhi D., Review on ther-mal energy storage with phase change materials and appli-cations, Renewable and Sustainable Energy Reviews, 13 (2009) 318–345. DOI: 10.1016/j.rser.2007.10.005
Sharma S.D., Kitano H., Sagara K., Phase change materials for low temperature solar thermal applications, Research Reports of the Faculty of Engineering, Mie University, 29 (2004) 31–64.
Song S., Dong L., Qu Z., Ren J., Xiong C., Microencapsulated capric–stearic acid with silica shell as a novel phase change material for thermal energy storage, Applied Thermal Engi-neering, 70 (2014) 546–551. DOI: 10.1016/j.applthermaleng. 2014.05.067
Su J.F., Wang S.B., Fabrication and properties of microencapsu-lated-paraffin/gypsum-matrix building materials for ther-mal energy storage, Advanced Materials Research, 427 (2012) 45–50. DOI: 10.4028/www.scientific.net/AMR. 427.45
Su W., Darkwa J., Kokogiannakis G., Review of solid–liquid phase change materials and their encapsulation technolo-gies, Renewable and Sustainable Energy Reviews, 48 (2015) 373–391. DOI: 10.1016/j.rser.2015.04.044
Tyagi V.V., Buddhi D., Kothari R., Tyagi S.K., Phase change material (PCM) based thermal management system for cool energy storage application in building: An experimental study, Energy and Buildings, 51 (2012) 248–254. DOI: 10.1016/j.enbuild.2012.05.023
Tyagi V.V., Pandey A.K., Buddhi D., Kothari R., Thermal per-formance assessment of encapsulated PCM based thermal management system to reduce peak energy demand in buildings, Energy and Buildings, 117 (2016) 44–52. DOI: 10.1016/j.enbuild.2016.01.042
Wang T., Huang J., Zhu P., Xiao J., Fabrication and characteri-zation of micro-encapsulated sodium phosphate dodecahy-drate with different crosslinked polymer shells, Colloid and Polymer Science, 291 (2013) 2463–2468. DOI: 10.1007/s00396-013-2973-2
Wang T.Y., Huang J., Synthesis and characterization of micro-encapsulated sodium phosphate dodecahydrate, Journal of Applied Polymer Science, 130 (2013) 1516–1523. DOI: 10.1002/app.39249
Waqas A., Ud Din Z., Phase change material (PCM) storage for free cooling of buildings—A review, Renewable and Sus-tainable Energy Reviews, 18 (2013) 607–625. DOI: 10.1016/j.rser.2012.10.034
Wirtz R.A., Swanson K., Yaquinto M., Thermal energy storage response model with application to thermal management of high power-density hand-held electronics, Journal of elec-tric packaging, 134 (2012) 011222. DOI: 10.1115/1.4005915
Xiao X., Zhang P., Li M., Preparation and thermal characteriza-
tion of paraffin/metal foam composite phase change mate-rial, Applied Energy, 112 (2013) 1357–1366. DOI: 10.1016/j.apenergy.2013.04.050
Xu B., Li P., Chan C., Application of phase change materials for thermal energy storage in concentrated solar thermal power plants: A review to recent developments, Applied Energy, 160 (2015) 286–307. DOI: 10.1016/j.apenergy.2015.09.016
Yang J.M., Kim J.S., The microencapsulation of calcium chlo-ride hexahydrate as a phase-change material by using the hybrid coupler of organoalkoxysilanes, Journal of Applied Polymer Science, 135 (2017) 45821. DOI: 10.1002/app. 45821
Zalba B., M. M.n.J., F. C.L., H. M., Review on thermal energy storage with phase change: Materials, heat transfer analysis and applications, Applied Thermal Engineering, 23 (2003) 251–283. DOI: 10.1016/s1359-4311(02)00192-8
Zhang H., Wang X., Fabrication and performances of microen-capsulated phase change materials based on n-octadecane core and resorcinol-modified melamine-formaldehyde shell, Colloids and Surfaces A: Physicochemical and Engineering Aspects, 332 (2009a) 129–138. DOI: 10.1016/j.colsurfa. 2008.09.013
Zhang H., Wang X., Synthesis and properties of microencapsu-lated n-octadecane with polyurea shells containing different soft segments for heat energy storage and thermal regula-tion, Solar Energy Materials and Solar Cells, 93 (2009b) 1366–1376. DOI: 10.1016/j.solmat.2009.02.021
Zhang H., Wang X., Wu D., Silica encapsulation of n-octadecane via sol-gel process: A novel microencapsulated phase-change material with enhanced thermal conductivity and performance, J Colloid Interface Sci, 343 (2010) 246–255. DOI: 10.1016/j.jcis.2009.11.036
Zhang H.L., Baeyens J., Cáceres G., Degrève J., Lv Y.Q., Ther-mal energy storage: Recent developments and practical aspects, Progress in Energy and Combustion Science, 53 (2016) 1–40. DOI: 10.1016/j.pecs.2015.10.003
Zhang J., Wang S.S., Zhang S.D., Tao Q.H., Pan L., Wang Z.Y., Zhang Z.P., Lei Y., Yang S.K., Zhao H.P., In situ synthesis and phase change properties of Na2SO4·10H2O@SiO2 solid nanobowls toward smart heat storage, The Journal of Phys-ical Chemistry C, 115 (2011) 20061–20066. DOI: 10.1021/jp202373b
Zhang Y., Li X., Li J., Ma C., Guo L., Meng X., Solar-driven phase change microencapsulation with efficient Ti4O7 nano-converter for latent heat storage, Nano Energy, 53 (2018) 579–586. DOI: 10.1016/j.nanoen.2018.09.018
Zhao C.Y., Zhang G.H., Review on microencapsulated phase change materials (MEPCMs): Fabrication, characterization and applications, Renewable and Sustainable Energy Reviews, 15 (2011) 3813–3832. DOI: 10.1016/j.rser. 2011.07.019
Zhou D., Zhao C.Y., Tian Y., Review on thermal energy storage with phase change materials (PCMs) in building applica-tions, Applied Energy, 92 (2012) 593–605. DOI: 10.1016/j.apenergy.2011.08.025

Hui Wang et al. / KONA Powder and Particle Journal No. 37 (2020) 85–96
96
Authors’ Short Biographies
Hui Wang
Hui Wang received her M.S. degree at Beijing University of Technology in 2012, and she is currently a graduate student under the supervision of Prof. Minghao Fang in China University of Geosciences (Beijing). Her research interests include inorganic phase change materials.
Yunfa Chen
Yunfa Chen is Professor at the Institute of Process Engineering, Chinese Academy of Sciences. He is President of the Chinese Society of Particuology, Vice-chairman of the air pollution control industry technology innovation strategic alliance and Editorial board member of the Particuology, Green Energy & Environment, etc. His research fo-cuses on the preparation of nanostructured materials, porous functional materials, envi-ronmental purification materials, nanocomposites and their engineering applications.
Jianqiang Li
Jianqiang Li is Professor at the Institute of Process Engineering, Chinese Academy of Sciences. He received his PhD from Tsinghua University in 2004. He worked as a JSPS fellow at the Department of Materials, the University of Tokyo, from 2004 to 2006. His re-search mainly focuses on phase change materials, metastable inorganic functional materi-als, etc.
Lijiang Guo
Lijiang Guo is currently a Research Fellow at the Institute of Process Engineering, Chinese Academy of Sciences. He received his PhD from Graduate University of Chinese Academy of Sciences in 2012. Then, he worked at Qinghai Institute of Salt Lakes, Chinese Academy of Sciences, until 2016. After that, he became a postdoctoral in Institute of Pro-cess Engineering, Chinese Academy of Sciences for two years. His research mainly fo-cuses on phase change materials, solution chemistry, including phase diagram and thermodynamic model of aqueous solution.
Minghao Fang
Minghao Fang is Professor at School of Materials Science and Technology, China Uni-versity of Geosciences (Beijing). He got his PhD from Tsinghua University in 2005. He was a visiting scholar at college of engineering, University of Michigan, from 2011 to 2012. His research mainly focuses on high-temperature protective materials, high-temperature energy-saving materials, advanced inorganic functional nano-material, etc.
KONA Powder and Particle Journal No. 37 (2020) 97–113/Doi:10.14356/kona.2020013 Review Paper
97Copyright © 2020 The Authors. Published by Hosokawa Powder Technology Foundation. This is an open ac-cess article under the CC BY license (http://creativecommons.org/licenses/by/4.0/).
Nanoparticle Technology for Respiratory Tract Mucosal Vaccine Delivery †
Leah M. Johnson 1, Jeffrey B. Mecham 1, Frederick Quinn 2 and Anthony J. Hickey 1,3*1 Center for Engineered Systems, RTI International, USA2 Department of Infectious Diseases, College of Veterinary Medicine, University of Georgia, USA3 Eshelman School of Pharmacy, University of North Carolina at Chapel Hill, USA
AbstractImmunization can be traced back to classical China. Modern immunization reduces the risk of infection by attenuating or killing the pathogen or using non-infectious antigens to elicit the immune response. The challenge of immunization is to raise a robust protective response without infecting the individual or overstimulating the immune response, and this can be achieved by using nanoparticle delivery systems to specifically target the innate immune system with known antigens and where necessary include an adjuvant to enhance the efficacy. These systems can be targeted to mucosal sites that are located throughout the body with the nasal and pulmonary routes of administration allowing ease of access. Macrophages are the first line of defense of the innate immune system and are the host cell for primary intracellular infection by several respiratory pathogens notably mycobacteria and streptococci. The breadth of nanoparticle technology available to deliver vaccines has been explored and consideration of its value in nasal and pulmonary delivery is addressed specifically.
Keywords: immunization, vaccine, nanoparticle, nasal, pulmonary, antigen
1. Introduction
Protection from disease by immunization was docu-mented in classical China (Arouet F.M., (Voltaire), 1733). Reports of the use of live organisms appeared in the eigh-teenth century most prominently by Jenner in preventing smallpox using a cowpox-based vaccine from which the term “vaccination” is derived (Smith K.A., 2011). Since the discoveries of Koch in the late nineteenth century vaccines have revolutionized disease prevention and have significantly decreased infant and child mortality (Gradmann C., 2006). The observation that individuals exposed to disease might develop immunity to future in-fection, and the initial steps at immunization were the foundation for the field of immunology and the desire to develop vaccines in the late nineteenth and early twenti-eth century. Advances in biotechnology combined with greater understanding of infectious disease and host im-munity have resulted in sophisticated approaches to vac-
cine delivery and adjuvancy (Hoft D.F., 2008; Kaufmann S.H.E., 2000).
The most prominent route of administration of vaccines has been subcutaneous or intra-dermal injection. Vac-cines also have been administered with adjuvant compo-nents intended to promote immunogenicity and elicit a protective immune response. The most common adjuvants were components of bacterial cell walls, such as Freund’s adjuvant that contains materials originating from myco-bacteria, or particulates such as alum (aluminum salts) (Dvorak A.M. and Dvorak H.F., 1974; Shah R.R. et al., 2017; Stils H.F., Jr., 2005).
As drug and vaccine delivery systems and knowledge of immunity have improved new administration methods and routes have been considered (Saallah S. et al, 2018). Nanoparticle systems are known to offer unique biophysi-cal opportunities to effectively deliver to antigen present-ing cells at the site of administration. These particles may be composed of a core inert non-degrading (waxes and plastics) substance to which antigen is adsorbed, or ma-trix degrading (natural and synthetic polymers) material into which antigen is incorporated. It is now understood that there is a unique component of the immune system that is associated with mucosal sites (respiratory, gastro- intestinal and urogenital tracts). Consequently, as new nanoparticulate vaccine delivery systems have been de-veloped new routes of administration also have been
† Received 5 June 2019; Accepted 12 July 2019 J-STAGE Advance published online 24 August 2019
1 3040 Cornwallis Road, Research Triangle Park, NC 27709, USA2 358 Vet Med, Biosciences Building, Athens, GA 30602, USA3 Room1079, Genetic Medicine Building, Mason Farm Road, Chapel
Hill, NC 27599, USA* Corresponding author: Anthony J. Hickey; E-mail: [email protected] TEL: +1-919-541-6771

Leah M. Johnson et al. / KONA Powder and Particle Journal No. 37 (2020) 97–113
98
considered including the respiratory (nasal and pulmo-nary) and gastro-intestinal epithelia, sites of mucosal- associated lymphoid tissue. These alternative routes of administration offer the advantage of non-invasive ease of administration.
The history of nanoparticle manufacture overlaps with microsphere technology (Burgess D.J. and Hickey A.J., 2007). The key components of natural and synthetic poly-mers had been clearly identified and all that was required were processes to allow the manufacture of nanoparticles. Since functionality of nanoparticles is often associated with smaller sizes a practical definition of 1–100 nm has been adopted widely but clearly the scientific definition is derived from fundamental length dimension of particles in sizes smaller than 1,000 nm (Commissioner O.o.t., 2014; Nishijima N. et al., 2017).
Vaccines have been developed primarily to viral and bacterial pathogens. Natural immunity proceeds though the innate and adaptive/acquired immune systems. Pro-cessing of the whole vector or organism allows specific components to be isolated as identifying antigens that the immune system employs as recognition factors to drive clearance of infection and long-term immunity.
As the first line of defense the innate immune system of phagocytic cells have been the target for engineered solutions to vaccine delivery. Monocytes and macro-phages are known to take up particles. From the later 1980s studies began to explore the interaction between particles and phagocytic cells to evaluate the ability to target these cells either through particle size alone or a combination of size and targeting moieties.
This review will consider manufacture and characteri-zation of nanoparticle-based vaccine delivery systems, and the immunological consequences leading to protec-tive immunity when delivered by different routes of ad-ministration.
2. Design and manufacturing of nanoparticle-based vaccines
The development of nanoparticle-based vaccine (nano-vaccine) delivery systems requires consideration of several factors: route of administration, formulations, passive or active targeted delivery, efficacious dosing, and required frequency of vaccine exposure. The material composition, the method of manufacture and processing parameters all contribute to key physicochemical proper-ties including the architecture with respect to antigen pre-sentation for nanoparticle-based vaccines. This section will briefly review the structures of nanoparticles and provide a concise overview of the design and composition of nanocarriers for delivery of vaccines, with an emphasis on those delivered through the mucosal route of adminis-
tration. A description of the manufacturing and character-ization of nanoparticle-based delivery systems will follow.
2.1 Mechanisms of controlled presentation from a carrier
The mechanism for controlled presentation from a car-rier vehicle is intimately linked to various parameters of the system. Requirements for temporal and spatial control of the biologically active ingredient (BAI) in vivo ulti-mately dictate design features, including formulations (e.g., drug, antigen, excipient, adjuvant), carrier material (e.g., polymer), and the architectural arrangements of in-dividual constituents. As reviewed elsewhere (Uhrich K.E. et al., 1999), temporally-regulated presentation of BAI is achieved by prolonging exposure of BAI to the surrounding environment. Two exemplary mechanisms can delay BAI presentation from a carrier: using the poly-mer vehicle to control diffusion of the BAI into the sur-rounding environment or by via slow erosion of the vehicle itself to delay delivery of BAI. For the diffusion- controlled mechanism, the release rates of BAI from a carrier vehicle is controlled by imposing physical barriers to transport (e.g., polymeric materials). In one example, reservoir-style vehicles have designated com-partments for the BAI and carrier material and use a per-meable polymer membrane to control BAI release. A wealth of examples exist for diffusion-controlled arrange-ments, including particle-based systems (Kamaly N. et al., 2016) and implantable systems (Bourges J.L. et al., 2006; Croxatto H.B., 2002; Htay T. and Liu M.W., 2005; Malcolm R.K. et al., 2012). The second temporally- regulated mechanism involves delaying the exposure of BAI into the environment through controlled erosion of the carrier polymer (e.g., polyester, polyanhydride). Deg-radation mechanisms typically involve hydrolysis to re-duce the polymeric molecular weight and facilitate release of the BAI (Kamaly N. et al., 2016).
2.2 Design and composition of nanoparticles for vaccine delivery
Given the breadth of nanoparticle-based delivery of vaccines (Zhao L. et al., 2014), a comprehensive review of each system is outside the aim of this review. This section will instead highlight nanoparticle vehicles for delivery of vaccines via the mucosal route of administration. We will review two broad categories of nanocarriers: polymeric nanoparticles and lipid-based nanoparticles.
Polymer Nanoparticles. Nanoparticles comprising polymers are broadly categorized based on the source material: natural or synthetic. Naturally sourced polymers commonly include polysaccharides sourced from animals,
Leah M. Johnson et al. / KONA Powder and Particle Journal No. 37 (2020) 97–113
99
plants, or microorganisms that are biocompatible and bio-degradable (Tiwari P. et al., 2014). Natural polymers, however, can carry disadvantages including possibility for unpredictable rates of degradation, unintended immu-nogenicity, microbial contamination, differences between batches, and poor mechanical strength (Bhatia S., 2016). Despite the potential for undesirable attributes, naturally- sourced polymers are successfully employed in various applications for drug delivery, tissue engineering, and wound dressings.
Chitosan, which is sourced from crustaceans, exists as a cationic polysaccharide at low pH and can complex with negative polyions to produce polyelectrolytes useful as carriers for drug delivery (Hamman J.H., 2010; Nagpal K. et al., 2010; Pandey R. and Khuller G.K., 2004). Chitosan nanoparticles have been explored for various vaccines (Illum L. et al., 2001), including Mycobacterium tubercu-losis (MTB) (Feng G. et al., 2013), diphtheria (van der Lubben I.M. et al., 2003), pertussis (Jabbal-Gill I. et al., 1998) influenza (Amidi M. et al., 2007; Sawaengsak C. et al., 2014), and pneumococcal diseases (Xu J. et al., 2011). Chitosan contains chemical groups, such as primary amines, which permit conjugation of different moieties onto the nanomaterial carrier for targeted applications (Chua B.Y. et al., 2012; Mohammed M.A. et al., 2017; Zhang X. et al., 2008). Another polysaccharide, the seaweed-derived alginate, comprises repeating units of α-L-guluronic acid and β-D-mannuronic acid and shows widespread utility as commercial wound dressings and drug delivery vehicles (Thomas S., 2000; Tønnesen H.H. and Karlsen J., 2002). Nanoparticles comprising alginate have been explored for vaccine delivery (Sarei F. et al., 2013), and also show utility as a coating for chitosan nanoparticles to improve stability of oral mucosally deliv-ered vaccines (Borges O. et al., 2005; Liu Z. et al., 2013). Guar gum, a polysaccharide comprising segments of mannose and galactose, is resilient to human gut enzymes while remaining susceptible to degradation by microflora in the human intestine, which makes this polymer benefi-cial for targeted delivery to the colon (Prasad Y.V. et al., 1998). Formulations of guar gum have been used to de-liver active pharmaceutical ingredients (APIs) to the co-lon, such as flurbiprofen to treat inflammation (Vemula S.K. and Bontha V.K., 2013) and methotrexate for colon cancer (Chaurasia M. et al., 2017) and for oral delivery of Ag85A antigen for tuberculosis vaccination (Kaur M. et al., 2015). A plant-based polysaccharide, pectin, is com-posed of a linear backbone of α-1,4-linked D-galacturonic acid (GalpA), in combination with diverse structural ar-rangements of branched regions (Liu L. et al., 2007). Pec-tin formulations can readily gel with mucin present within the nasal cavity, making this polymer useful for nasal drug administration (Morris G. et al., 2010; Watts P. and Smith A., 2009). Another natural polymer, gelatin, is pro-
duced through partial hydrolysis of collagen acquired from animal sources (Tiwari P. et al., 2014). Gelatin nanoparticles modified with polyethyleneimine (PEI), ov-albumin, and an immunostimulant were examined for a nasal administered vaccine (Lin S.F. et al., 2018).
Synthetic polymers represent the second source of ma-terials used to fabricate polymeric nanoparticles. Con-trary to natural polymers, synthetic polymers benefit from the ability to strictly tailor design parameters and syn-thetic steps to ultimately meet targeted product profiles in terms of mechanical properties, biodegradation time-frames, and purity. Synthetic polymers are either biode-gradable or non-biodegradable with each category holding unique advantages for the intended drug delivery system. Biodegradable synthetic materials are briefly reviewed here in the context of mucosal vaccine delivery.
The well-known family of biodegradable polyesters that include poly (lactic acid) (PLA), poly (glycolic acid) (PGA), and the accompanying copolymer (DL-lactide-co-glycolide) (PLGA) have been extensively studied and used in various biomedical applications and FDA-approved products, as reviewed elsewhere (Kapoor D.N. et al., 2015; Makadia H.K. and Siegel S.J., 2011). Delivery of BAIs from a PLGA copolymer involves bulk erosion via hydrolysis, which releases entrapped BAI. The hydrolytic erosion and the ensuing release rates of BAIs are tuned via polymer molecular weight, quantity of lactide and glycolide groups, crystallinity, and composition of end-groups. PLGA nanoparticles have been explored as carri-ers in a multitude of examples, including for oral and pulmonary vaccination against hepatitis B (Gupta P.N. et al., 2007; Mishra N. et al., 2011; Thomas C. et al., 2011), ocular and nasal delivery of influenza antigens (Alkie T.N. et al., 2018), and microparticles for pulmonary vaccina-tion against tuberculosis (Shi S. and Hickey A.J., 2010). Another biodegradable polyester, Poly-(ε-caprolactone) (PCL), is a hydrophobic semicrystalline polymer that un-dergoes bulk degradation in aqueous environments. As compared to PLGA, the homopolymer of PCL typically exhibits longer timeframes for degradation and bioresorp-tion (e.g., 2–4 years dependent on the molecular weight) (Woodruff M.A. and Hutmacher D.W., 2010). Nanoparti-cles comprising PCL have been explored for intranasal and intramuscular delivery of diptheria toxoid (Singh J. et al., 2006) and nasal administration of the influenza A H1N1 hemagglutinin protein (Gupta N.K. et al., 2011).
Polyanhydrides (PAs) are another class of synthetic polymers used in delivery systems (Tamada J. and Langer R., 1992). Since anhydride groups are highly susceptible to hydrolytic cleavage, polymer degradation occurs faster at surfaces exposed to aqueous environments resulting in BAI release from PA vehicles via surface erosion (Jain J.P. et al., 2008). Degradation rates of PAs vary based on the composition of the polymer, which is readily tailored by

Leah M. Johnson et al. / KONA Powder and Particle Journal No. 37 (2020) 97–113
100
selection of monomers (e.g., aliphatic, aromatic) and use of copolymers (Jain J.P. et al., 2008). Numerous studies have used PA nanoparticles for intranasal delivery of vac-cines (Irache J.M. et al., 2010; McGill J.L. et al., 2018; Zacharias Z.R. et al., 2018).
Lipid-Based Nanoparticles. In addition to polymeric nanoparticles, lipid-based nanoparticles are widely used for delivery of drugs and vaccines (Bulbake U. et al., 2017; Puri A. et al., 2009; Romero E.L. and Morilla M.J., 2011). Liposomes are one type of lipid-based nanoparticle, comprising spherical vesicles that self-assemble into a lipid bilayer around a core of BAI. The physicochemical properties of liposomes are readily customized though choice of amphipathic lipids, which typically comprise phospholipids (e.g., phosphatidylcholine) or cholesterol. Although intramuscular injection is the common route of administration for liposomal vaccines, intranasal delivery has also been explored (Bernasconi V. et al., 2016).
Solid lipid nanoparticles (SLNs) are another category of lipid-based carriers useful for delivery of BAIs. The com-position of SLNs include biocompatible materials (e.g., triglycerides, waxes), which are assembled into nanopar-ticles using scalable manufacturing processes, such as high-pressure homogenization (see below). SLNs show utility as mucosally-administered delivery systems, as demonstrated with SLNs comprising carnauba wax for intranasal vaccines against tuberculosis (Stylianou E. et al., 2014) and as intranasal carriers of the HIV-gp140 anti-gen (Arias M.A. et al., 2011).
The association of BAIs within these nanoparticle sys-tems is schematically shown in Fig. 1. The hypothetical location of the antigen and any molecular adjuvant within a nanoparticle system can vary, depending on the material composition and method of manufacture. Fig. 1(a) shows the embedding of the antigen in a polymer matrix resul-tant of a solvent evaporation technique of the in situ po-lymerization approach. Fig. 1(b) illustrates surface associated antigen that would occur as a result of passive physical adsorption or using covalent binding at the sur-
face. Fig. 1(c–d) show the potential combinations of anti-gen and molecular adjuvant (often bacterial protein or cell wall component). Fig. 1(c) and (d) require consideration of the release rate of both antigen and adjuvant to ensure that the kinetics of presentation to the immune system as-sure the required synergy. Fig. 1(e) is unlikely to offer the full benefit of the presence of the antigen since it would likely clear from the surface before significant antigen presentation occurred. Fig. 1(f) would require mecha-nisms of long-term attachment to the particle surface that would allow time for antigen and adjuvant presentation. The kinetics of desorption or erosion, for covalently linked molecules should not be instantaneous for this structure to be useful. In general, the examples shown in Fig. 1(a) to 1(d) are more practical than 1(e) and 1(f).
2.3 Methods of nanoparticle manufacture
Development of nanoscale materials is considered a modern technology, but their first uses can be traced back to the 4th century (NNI, 2019). In more recent history, Michael Faraday described the optical properties of nanometer-scale metals in 1857 (Faraday M., 1857), and over fifty years later, in the first years of the 20th century, Beilby (Beilby G.T. and Neville F.H., 1904) and Turner (Turner T. and Poynting John H., 1908) separately demon-strated that visibly transparent highly conductive metallic films could be fabricated using Faraday’s methods. Nanoscale materials development gained momentum 42 years later, when La Mer and Dinegar published a process to grow monodisperse colloids, in 1950 (Lamer V.K. and Dinegar R.H., 1950), with nanoscience finally being inter-nationally recognized later in the 20th century with the 1985 Nobel Prize for the development of the “buckyball” by Richard Smalley and his team at Rice University (Heath J.R. et al., 1985; Kroto H.W. et al., 1985; Zhang Q.L. et al., 1986). One year earlier, Bell Labs’ Louis Brus developed semiconductor nanocrystals (Brus L.E., 1984), known as “quantum dots”, which was later awarded the 2008 Kavli Prize in Nanotechnology. Completing the ma-jor developments in nanoscale materials in the 20th cen-tury, NEC’s Sumio Iijima developed the carbon nanotube in 1991 and shared the 2008 Kavli Prize with Brus.
Since that time, synthetic nanoscale materials have seen continuous development using two major strategies: top-down/mechano-physical or bottom-up/chemo- physical methods. Top-down methods are generally subtractive techniques, where larger materials are ground down to smaller materials through milling or grinding. Con-versely, bottom-up techniques arrange smaller constitu-ents into larger and more complex assemblies. This latter approach enables the use of building blocks such as indi-vidual molecules that can self-assemble into larger orga-nized arrays or monomers that can be polymerized into
Fig. 1 Schematic of general structure of nanoparticles with (a) matrix embedded antigen; (b) surface antigen; (c) ma-trix embedded adjuvant and antigen; (d) matrix adju-vant surface antigen; (e) matrix antigen surface adjuvant; and (f) surface antigen and adjuvant.
Leah M. Johnson et al. / KONA Powder and Particle Journal No. 37 (2020) 97–113
101
more targeted conformations and architectures such as nanoparticles for drug delivery (Antonietti M. and Landfester K., 2002; Kumari A. et al., 2010; Limayem I. et al., 2004; Reis C.P. et al., 2006). The nanoparticle for-mation process can be achieved through numerous tech-niques and processes that often include self-assembly and/or molecular-assembly polymerization techniques. Some of the more widely used methods involve microfluidics, dispersion of pre-formed polymers and polymerization of monomeric polymer pre-cursors.
Microfluidics is a technique that utilizes miniaturized systems to process extremely small volumes of fluids (as little as 10–14 ml), by means of flow channels with dimen-sions from ten to several hundred microns. A paper pub-lished in Nature in 2006 discussed how this emerging technique could be leveraged in molecular biology, phar-maceutical manufacturing, molecular analysis, biode-fence, and microelectronics (Whitesides G.M., 2006). Over 12 years later, microfluidics has been utilized as a processing technique in many different areas, including the production of nanoparticles (Baroud C.N. et al., 2010; Beebe D.J. et al., 2002; Di Carlo D., 2009; Lee J.N. et al., 2003; Lin Y.W. et al., 2015; Stroock A.D. et al., 2002). The microfluidic technique enables the rapid mixing of re-agents and precise control of temperature and reagent dy-namics, resulting in the production of a much narrower size distribution than bulk synthesis methods (Lim J.M. et al., 2014). The fine control and high degree of homogene-ity provided by the microfluidic synthesis are responsible for the resulting smaller particle size and lower polydis-persity (Valencia P.M. et al., 2012). Typically, microfluidic synthesis is used to produce small volumes of nanoparti-cles, but some high throughput systems have been devel-oped that are capable of scale-up (Lim J.M. et al., 2014).
Several nanoparticle manufacturing methods have been developed that involve the controlled dispersion of pre-formed polymers. Solvent evaporation was one of the first methods developed to form nanoparticles from a pre-formed polymer (Vanderhoff J.W. et al., 1979). Further de-velopment has been fostered by pharmaceutical chemists in the production of drugs (Gurny R. et al., 1981). This method uses solutions of polymers in volatile organic sol-vents into which the drug is loaded and dispersed. To this organic phase, water and surfactant are added and the complex mixture is agitated to from an emulsion (Allemann E. et al., 1993; Anton N. et al., 2008; Beilby G.T. and Neville F.H., 1904). Upon evaporation of the or-ganic solvent from the emulsion, via agitation or reduced pressure, a nanoparticle suspension is formed. Emulsion methods can employ a typical single emulsion route in-volving an oil-in-water approach (o/w), as described above, or a double emulsion (water-in-oil) in-water (“W/O/W”) approach. In either case, the aqueous phase con-tains the stabilizer/surfactant and the organic solvent con-
tains the pre-formed polymer phase. Both methods require high shear agitation methods, such as ultrasonica-tion or homogenization, to ensure that the emulsified re-action contains dispersed domains on the nanoscale, as these become the nanoparticles upon removal of the or-ganic phase by evaporation under reduced pressure or via extended stirring. The resulting nanoparticles can then be removed and collected from the aqueous phase using ul-tracentrifugation or lyophilization. Scale-up of this ap-proach can be challenging due to the need for high shear agitation and the requirement that the drug be oil-soluble. A second method that utilizes pre-formed polymers has been termed the nanoprecipitation or the solvent displace-ment method (Fessi H. et al., 1989). This method involves the interfacial deposition of a polymer via the displace-ment of a semi-polar water-miscible solvent such as ethanol or acetone which can be easily removed by evaporation with continued stirring (Mishra B. et al., 2010; Reis C.P. et al., 2006). The surfactant again resides in the aqueous phase and a narrow size distribution can be achieved by slow addition of the organic phase to the surfactant-containing aqueous phase, or vice-versa, while the size of the nanoparticles is a function of the type of surfactant used (i.e., ionic, amphiphilic or non-ionic) (Fessi H. et al., 1989; Limayem I. et al., 2004). The natu-ral pre-formed polymers chitosan and alginate require a different synthesis method involving ionotropic gelation. To prepare chitosan nanoparticles, chitosan is acidified to a pH of 4–6 to render it water-soluble to which an alkaline solution of sodium triphosphate (pH 7–9) is added. To produce a high yield of stable solid nanometric structures, the chitosan to sodium triphosphate weight ratio should target a range of 3:1 to 6:1. The synthetic conditions re-quired to produce a high yield of nanoparticles with a tar-geted nanoscale size vary significantly as a function of the purity, acid-salt form and overall molecular weight of chitosan utilized, which requires that the formulation pa-rameters be optimized for each chosen chitosan type (Janes K.A. et al., 2001). Alginate particle formation is triggered by divalent metal containing salts, such as cal-cium chloride. Like chitosan, the reaction to form alginate nanoparticles of targeted size involves precisely con-trolling the concentration/viscosity of the alginate solu-tion, counter-ion concentration, and the speed of its addition to the alginate, making it difficult to replicate the resulting particles with the degree of precision that other techniques afford (Kaloti M. and Bohidar H.B., 2010). One way to mitigate the synthetic challenges that chitosan and alginate pose is to use them as surface modifiers in pre-formed nanoparticles made from a different polymer. Using this approach, researchers were able to decorate the surface of PLGA-based nanoparticles with cationic chitosan and anionic alginate to facilitate the controlled release of resveratrol (Sanna V. et al., 2012) using a

Leah M. Johnson et al. / KONA Powder and Particle Journal No. 37 (2020) 97–113
102
layer-by-layer nanoprecipitation method (Zhou J. et al., 2010). Images of particles produced via this approach are shown in Fig. 2. PLGA-based nanoparticles, like related PLA, Poly-L-Lactic Acid (PLLA), and PCL and polyan-hydride nanoparticles, release their cargo via a hydrolysis mechanism.
When exposed to water, the polymer chains are hydro-lyzed, or cut, at the ester-bond (Ikada Y. and Tsuji H., 2000) (PLGA, PLA PLLA, PCL), or anhydride-bond (Whitaker-Brothers K. and Uhrich K., 2006). This chain scission event results in degradation of the mechanical properties of the polymer, with continued hydrolysis events degrading molecular weight to the point that the products can be removed from the body and excreted (Uhrich K.E. et al., 1999).
Most of the methods used to prepare polymeric nanoparticles use organic solvents. In order to minimize risks associated with their use, supercritical fluids can be substituted (Aboubakar M. et al., 1999). Supercritical flu-ids possess a critical temperature, above which the fluid remains a fluid, regardless of pressure. Supercritical car-bon dioxide (SCO2) is used very frequently due to its rela-tively mild supercritical conditions of 31.1 °C and 72.9 bar (1057.3 psi). The low polarity of SCO2 facilitates high sol-ubility of hydrophobic drugs which can then be sprayed through a capillary in a method called the Rapid Expan-sion of Supercritical Solution (RESS) process (Larson K.A. and King M.L., 1986). The rapid expansion of the solution into an ambient environment results in the gener-ation of nanoparticles. This method was first developed for inorganic particles before being used with pre-formed polymeric materials (Al-Kassas R. et al., 2017; Anton N. et al., 2008; Padrela L. et al., 2018; Williams H.D. et al.,
2013). Conversely, SCO2 can also be used as an anti- solvent, or precipitant, during the nanoparticle fabrication process. This method is applicable to drugs that do not dissolve well in SCO2 in a method called the Supercritical Anti-Solvent Process (SAS), where the SCO2 is passed through the drug solution. Addition of SCO2 expands the organic drug solution, causing the drug to precipitate, thereby leaving the precipitated nanoparticles free from any residual solvent (Reverchon E. et al., 2007).
In contrast to the methods described above that utilize pre-formed polymers, polymerization of monomeric ma-terials provides a much greater degree of control over the final properties of the produced nanoparticle. Emulsion polymerization, a free-radical chain growth method, is the most common route used in global production of poly-mers and is also a widely used nanoparticle production route. In conventional emulsion polymerization, water is used as the dispersion medium, a surfactant is used to disperse the water-insoluble monomers in the water and a water-soluble free radical initiator is used to trigger the polymerization chain reaction (Thickett S.C. and Gilbert R.G., 2007). The conventional emulsion approach typi-cally results in particles that are in the range of 50–250 nm (Asua J.M., 2004; Garay-Jimenez J.C. et al., 2009; Reis C.P. et al., 2006). The use of surfactants with this ap-proach requires the removal of the surfactant materials from the final product that can be costly at scale. To ad-dress this, surfactant-free emulsion techniques have been developed where the initiator is water soluble and the monomers are typically vinylic or acrylic. While this ap-proach is attractive as a polymerization method, nanopar-ticle size and polydispersity are more difficult to control, due to the absence of surfactant (Zhang G.Z. et al., 2001). In contrast, the mini-emulsion polymerization technique also utilizes water as the dispersion medium, as well as water-soluble surfactants and water-insoluble monomers. This approach differs in its use of a high shear device, such as an ultra-sonicator, and low a molecular weight co-stabilizer, due to the high interfacial surface tension of the system. For the polymerization of methacrylate (Mouran D. et al., 1996) and n-butylacrylate (Leiza J.R. et al., 1997), sodium laurylsulfate/dodecylmercaptan and so-dium dodecylsulfate/hexadecane was used, respectively, as the surfactant/co-stabilizer systems. Micro-emulsion polymerization, while similar to the mini-emulsion ap-proach, produces particles of smaller size and with fewer polymer chains per particle. In some cases, particles as small as 5–50 nm can be produced using this technique (Antonietti M. and Landfester K., 2002). Despite the po-tential of this nanoparticle synthesis method, micro- emulsion has seen limited commercial use due to the dilute concentration of polymer and the use of surfactants that typically exceed the monomer concentration in this polymerization approach. Interfacial polymerization is a
Fig. 2 Scanning electron microscopy images of PLGA (poly(d,l-lactide-co-glycolide)) (A), PLGA-CS1 (chi-tosan) (B), PLGA-CS2 (C), PLGA-CS3 (D), PL-GA-Alg1 (alginate) (E), PLGA-Alg2 (F), and PLGA-Alg3 (G) Resveratrol-loaded nanoparticles. All scale bars represent 500 nm (Sanna V. et al., 2012). Re-printed with permission from the original publisher Dove Medical Press LTD.
Leah M. Johnson et al. / KONA Powder and Particle Journal No. 37 (2020) 97–113
103
step growth polymerization approach that can be used to generate nanoparticles (Aboubakar M. et al., 1999; Vauthier C. et al., 2003). Interfacial polymerization in-volves the step-growth polymerization of two monomers that are soluble in two phases, one dispersed and one con-tinuous, where the reaction occurs at the interface of the two liquid solvents (Karode S.K. et al., 1998). Nanocap-sules containing an oil-based core can be formed (Fallouh N.A. et al., 1986), as can nanocapsules with an aqueous core (Gasco M.R. and Trotta M., 1986; Watnasirichaikul S. et al., 2000). Though the production of polymer-based nanoparticles has been well demonstrated, precise control of nanoparticle size and polydispersity remain as chal-lenges with this polymerization technique.
From the brief review described above, it can be under-stood that neither the top-down nor the bottom-up synthetic approach is preferable when scale-up to manu-facturing volumes is considered. Rather, the applicable synthetic technique is driven by considering the solvation conditions required to properly drive the cargo into the encapsulation system. Therefore, solvent considerations, in tandem with nanoparticle dimensional requirements, ultimately drives the choice of the synthetic scale-up ap-proach.
2.4 Methods of nanoparticle characterization
The quality of the particulate system employed to de-liver antigen and elicit an immune response must be as-sured and depends upon the particle size distribution, the inoculum (dose), and morphology (shape and surface characteristics). Specialized techniques are required to assess each of these features. For nanoparticle systems the primary method of particle size determination is dynamic light scattering (DLS). This is typically the first technique used to characterize the nanoparticles and provides infor-mation about their size and size-distribution, with the lat-ter typically referred to as the particle polydispersity. Results from the DLS method can be qualitatively con-firmed by transmission (TEM) and scanning electron mi-croscopy (SEM), which also allows assessment of the morphology and shape of the nanoparticles. SEM gener-ates an image of the particles by scanning it with a fo-cused beam of electrons which, when scattered, gives information on surface morphology and surface composi-tion. TEM accelerates electrons to nearly the speed of light and transmits them through the sample in a fashion similar to an optical light microscope. This technique provides information about the morphology of the sample, as well as information about the internal composition of the particle to identify crystallinity and magnetic domains. Atomic force microscopy (AFM) provides information about the particle surface via the use of a sub-micron probe tip. Using the probe tip in contact mode, a topo-
graphical map of the particles can be generated. Using non-contact mode requires the tip to hover over the sam-ple area of interest and is very useful for analyzing fragile biological and polymeric nanostructures (Mu L. and Feng S.S., 2003).
A variety of surface analytical methods can be per-formed and the release of the antigen and adjuvant can be conducted in dissolution media under appropriate condi-tions (pH, simulated gastric or pulmonary fluid) for the route of administration with a relevant analytical method. Methods include mass spectroscopy and electropho-retic approaches, such as sodium dodecyl sulfate- polyacrylamide gel electrophoresis (SDS-PAGE).
3. Delivery/Target-respiratory/Phagocytic cell system
3.1 Routes of administration
In order to be capable of engaging the key elements of innate and adaptive immunity, antigens must be pro-cessed and presented to immune cells. Antigen presenta-tion is mediated by MHC class I molecules, and the class II molecules found on the surface of antigen-presenting cells and certain other cells. The Major Histocompatibil-ity Complex-Class I (MHC-I) processing pathway is largely geared toward presentation of endogenous anti-gens encountered in the cytoplasm of most cell types. Peptides derived by cytosolic proteolysis of such antigens are translocated into the endoplasmic reticulum where they encounter and may assemble with newly synthesized MHC-I molecules. MHC class II molecules are expressed by antigen presenting cells, such as dendritic cells and macrophages. MHC class II molecules bind to peptides that are derived from proteins degraded in the endocytic pathway (Mantegazza, A.R. et al., 2013).
The most common routes of administration for vac-cines are parenteral, notably intra-muscular, intra-dermal or sub-cutaneous. However, there is increasing interest in mucosal routes of administration (Youngren-Ortiz, S.R. et al., 2017). Targeting of M-cells in the nasal mucosa, macrophages and dendritic cells in the lungs, and Peyer’s patches in the gastro-intestinal tract have been studied extensively in the last 25 years (Calderon-Nieva D. et al., 2017; Jia Y. et al., 2015; Padilla-Carlin D.J. et al., 2008). It is generally believed that nanoparticles are the most effec-tive way to target the antigen presenting cells and the cells of the phagocytic mononuclear cell system (Fig. 3). There are safety considerations related to the use of nanoparticle therapeutics that are beyond the scope of the present review (Somasundaran P. et al., 2010; Sayes C.M., 2014).
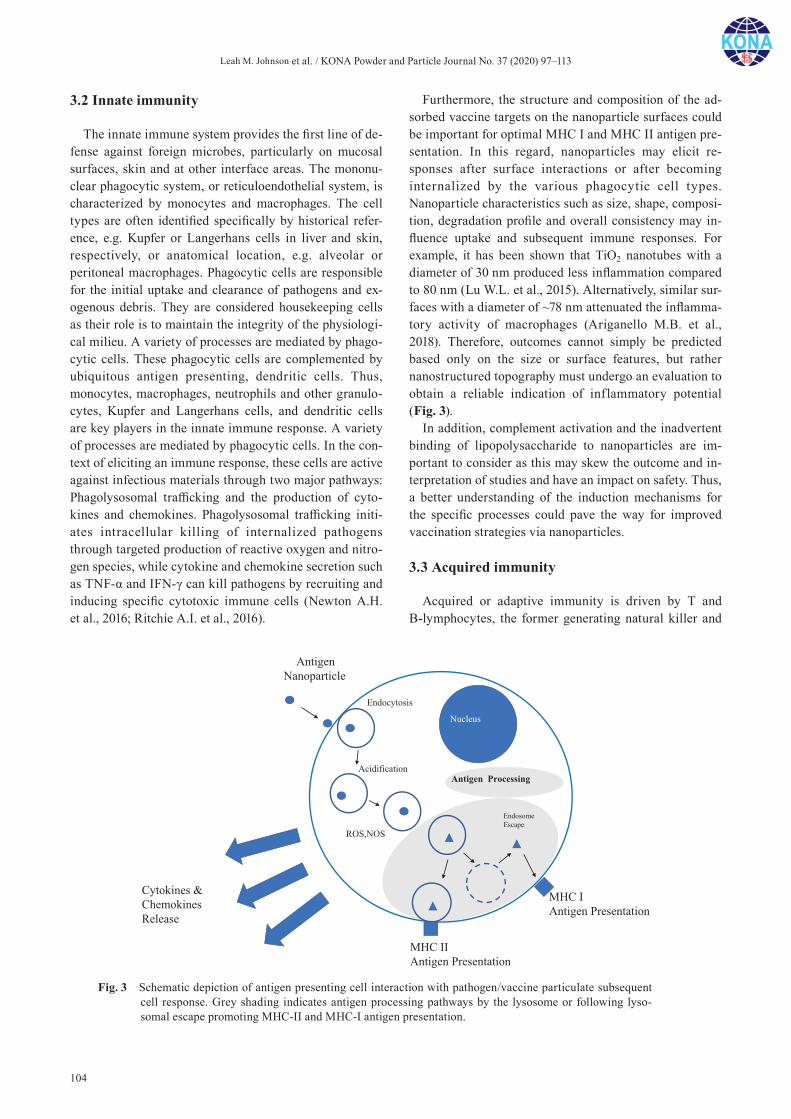
Leah M. Johnson et al. / KONA Powder and Particle Journal No. 37 (2020) 97–113
104
3.2 Innate immunity
The innate immune system provides the first line of de-fense against foreign microbes, particularly on mucosal surfaces, skin and at other interface areas. The mononu-clear phagocytic system, or reticuloendothelial system, is characterized by monocytes and macrophages. The cell types are often identified specifically by historical refer-ence, e.g. Kupfer or Langerhans cells in liver and skin, respectively, or anatomical location, e.g. alveolar or peritoneal macrophages. Phagocytic cells are responsible for the initial uptake and clearance of pathogens and ex-ogenous debris. They are considered housekeeping cells as their role is to maintain the integrity of the physiologi-cal milieu. A variety of processes are mediated by phago-cytic cells. These phagocytic cells are complemented by ubiquitous antigen presenting, dendritic cells. Thus, monocytes, macrophages, neutrophils and other granulo-cytes, Kupfer and Langerhans cells, and dendritic cells are key players in the innate immune response. A variety of processes are mediated by phagocytic cells. In the con-text of eliciting an immune response, these cells are active against infectious materials through two major pathways: Phagolysosomal trafficking and the production of cyto-kines and chemokines. Phagolysosomal trafficking initi-ates intracellular killing of internalized pathogens through targeted production of reactive oxygen and nitro-gen species, while cytokine and chemokine secretion such as TNF-α and IFN-γ can kill pathogens by recruiting and inducing specific cytotoxic immune cells (Newton A.H. et al., 2016; Ritchie A.I. et al., 2016).
Furthermore, the structure and composition of the ad-sorbed vaccine targets on the nanoparticle surfaces could be important for optimal MHC I and MHC II antigen pre-sentation. In this regard, nanoparticles may elicit re-sponses after surface interactions or after becoming internalized by the various phagocytic cell types. Nanoparticle characteristics such as size, shape, composi-tion, degradation profile and overall consistency may in-fluence uptake and subsequent immune responses. For example, it has been shown that TiO2 nanotubes with a diameter of 30 nm produced less inflammation compared to 80 nm (Lu W.L. et al., 2015). Alternatively, similar sur-faces with a diameter of ~78 nm attenuated the inflamma-tory activity of macrophages (Ariganello M.B. et al., 2018). Therefore, outcomes cannot simply be predicted based only on the size or surface features, but rather nanostructured topography must undergo an evaluation to obtain a reliable indication of inflammatory potential (Fig. 3).
In addition, complement activation and the inadvertent binding of lipopolysaccharide to nanoparticles are im-portant to consider as this may skew the outcome and in-terpretation of studies and have an impact on safety. Thus, a better understanding of the induction mechanisms for the specific processes could pave the way for improved vaccination strategies via nanoparticles.
3.3 Acquired immunity
Acquired or adaptive immunity is driven by T and B-lymphocytes, the former generating natural killer and
Fig. 3 Schematic depiction of antigen presenting cell interaction with pathogen/vaccine particulate subsequent cell response. Grey shading indicates antigen processing pathways by the lysosome or following lyso-somal escape promoting MHC-II and MHC-I antigen presentation.
Leah M. Johnson et al. / KONA Powder and Particle Journal No. 37 (2020) 97–113
105
other T-cells, and the latter producing antigen specific an-tibodies. This component of the immune system results in a memory of previous exposures that generates protective immunity to future infections. Additionally, citrate- buffered silver coated nanoparticles were shown to be phagocytosed by dendritic cells and macrophages, either derived from the peripheral lymph nodes or as cell lines (Njoroge J.M. et al., 2018). Work with the J774 mouse macrophage cell line demonstrated that the endocytosis of 57 nm PEG-treated silver-coated nanoparticles is depen-dent upon actin and clathrin-mediated endocytosis (Kuhn D.A. et al., 2014). Also, 24-hour exposure to these nanoparticles will induce elevated oxidative stress as demonstrated by ROS formation in Jurkat T cells (Manke A. et al., 2013). U937 human monocytic cells exposed to polyvinylpyrrolidone-treated silver nanoparticles demon-strated apoptotic cell death and ROS formation, however, the cellular effects were dependent upon the size of the particle (Abdal Dayem A. et al., 2017). Other studies us-ing primary human monocytes have similarly demon-strated a particle size-dependent effect. In these studies, the smaller coated nanoparticles induced greater levels of the pro-inflammatory cytokines (Elsabahy M. and Wooley K.L., 2013). Active uptake of nanoparticles by alveolar macrophages is enhanced by their presentation in micron- sized aggregates whereas nanoparticles are preferentially taken up by DCs in the respiratory tract.
As described earlier T cell activation by coated nanoparticles is impacted by the size, other physical as-pects, and the ability of the nanoparticles to stimulate in-nate immunity. However, many questions remain for therapeutic vaccine development requiring acquired im-munity. For example, it is critical to determine how to promote a T effector response, but not a T regulatory re-sponse, in an immunosuppressive microenvironment. Fine-tuning the balance between the strong T cell re-sponses and auto-immune side effects will also be a key challenge.
3.4 Vaccines
The strongest immune response will be raised to whole organisms that present all antigens such that a robust heterogeneous immunity can be achieved. Live virulent organisms typically generate natural immunity in immunocompetent individuals. The risk of infection is such that living organisms are usually attenuated in terms of virulence to give the host immune system an advan-tage. An alternative that preserves the entire antigen li-brary but mitigates risk entirely is the use of whole inactivated organisms.
The use of nanotechnology in vaccinology has been leading to the birth of “nanovaccinology” (Zhao L. et al., 2014). In both prophylactic and therapeutic approaches,
nanoparticles are used as either a delivery system to en-hance antigen processing and/or as an immunostimulant adjuvant to activate or enhance immunity. Therapeutic nanoparticle vaccines currently are mostly being applied to cancer treatment (Krishnamachari Y. et al., 2011), and less for treating infections. Alternatively, prophylactic nanoparticle vaccines have been applied for the preven-tion of different diseases, particularly infectious diseases.
3.5 Nasal and pulmonary vaccine delivery
Nanovaccines can be delivered to the mucosal surfaces in the respiratory tract as liquid suspension or micro- aggregated particles (Irvine D.J. et al., 2015). There is a long history of nasal delivery of vaccines (Arouet F.M., (Voltaire), 1733). Deposition in the nose is efficient with particles greater than 5µm being easily collected. A sus-pension of nanoparticles might be delivered from a nasal spray with a droplet median diameter of approximately 20µm, FlumistTM (Medimmune) is an example of this strategy (Yusuf H. and Kett V., 2017). The concentration and stability of the nanoparticle suspension will dictate the nature of presentation to local immune cells (as nanoparticles or nanoparticle aggregates). However, an ideal suspension product would be formulated to allow a stable homogeneous dispersion of nanoparticles. Pulmo-nary vaccine delivery required particle and droplet sizes below 5µm (Hickey A.J., 2004). Nebulized droplets con-taining nanoparticles or dry micro-aggregated particles can be used to deliver vaccines to the pulmonary mucosa (Osman N. et al., 2018).
One area of current interest is the use of the lungs as a route of administration for vaccines to prevent tuberculo-sis. MTB is the primary causative organism of this dis-ease. The mycobacteria present antigens that elicit natural immunity and can therefore be used for immunization. A variety of approaches have been attempted including at-tenuated whole organism (attenuated Mycobacterium bovis, Bacille Calmette Guerin) (Garcia-Contreras L. et al., 2008), sub-unit proteins (Lu D. et al., 2007), fusion proteins (Shi S. et al., 2010,) and viral vectored genes (Tameris M.D. et al., 2013). The whole organism has one dimension in the nanoscale and viral vectors are nano-sized. It may be possible to adopt a nanoparticle strategy to deliver mycobacterial antigens to the lung mucosa and protect against disease. In this context the M. tuberculosis heparin-binding haemagglutinin antigen has been ad-sorbed to wax particles and shown to successfully immu-nize mice (Stylianou E. et al., 2014). Delivery of particles of this nature to the lungs may be a means of inducing an enhanced innate immune response.

Leah M. Johnson et al. / KONA Powder and Particle Journal No. 37 (2020) 97–113
106
4. Conclusions and future perspectives
Vaccines for preventing or treating serious infectious diseases have been employed for millennia. The emer-gence of knowledge in microbiology and immunology at the end of the nineteenth century drove eradication of several otherwise deadly diseases. Research in the twenti-eth century improved vaccines and expanded their appli-cation to many otherwise untreatable viral diseases. However, some diseases have resisted significant vaccine development:—Prominent among these are mycobacterial diseases, such as tuberculosis and viral diseases such as influenza. The advent of nanoparticle technology and ex-perience with the delivery of antigen and adjuvant in or attached to an organic matrix material potentially ad-vances vaccine development. Moreover, interest in target-ing the cell mediated immune system located at accessible nasal and bronchial mucosal sites of the respiratory tract offers a strategy for disease prevention that has rarely been considered and might be advanced using nanotech-nology.
References
Abdal Dayem A., Hossain M.K., Lee S.B., Kim K., Saha S.K., Yang G.-M., Choi H.Y., Cho S.-G., The role of reactive oxy-gen species (ROS) in the biological activities of metallic nanoparticles, International Journal of Molecular Sciences, 18 (2017) 120(21pp). DOI: 10.3390/ijms18010120
Aboubakar M., Puisieux F., Couvreur P., Deyme M., Vauthier C., Study of the mechanism of insulin encapsulation in poly (isobutylcyanoacrylate) nanocapsules obtained by interfa-cial polymerization, Journal of Biomedical Materials Research, 47 (1999) 568–576. DOI: 10.1002/(sici)1097-4636(19991215)47:4<568::Aid-jbm14>3.3.Co;2-o
Al-Kassas R., Bansal M., Shaw J., Nanosizing techniques for improving bioavailability of drugs, Journal of Controlled Release, 260 (2017) 202–212. DOI: 10.1016/j.jconrel. 2017.06.003
Alkie T.N., Yitbarek A., Taha-Abdelaziz K., Astill J., Sharif S., Characterization of immunogenicity of avian influenza antigens encapsulated in PLGA nanoparticles following mucosal and subcutaneous delivery in chickens, PLOS ONE, 13 (2018) e0206324. DOI: 10.1371/journal.pone. 0206324
Allemann E., Gurny R., Doelker E., Drug-loaded nanoparti-cles—preparation methods and drug targeting issues, Euro-pean Journal of Pharmaceutics and Biopharmaceutics, 39 (1993) 173–191.
Amidi M., Romeijn S.G., Verhoef J.C., Junginger H.E., Bungener L., Huckriede A., Crommelin D.J.A., Jiskoot W., N-Trimethyl chitosan (TMC) nanoparticles loaded with influenza subunit antigen for intranasal vaccination: Bio-logical properties and immunogenicity in a mouse model, Vaccine, 25 (2007) 144–153. DOI: 10.1016/j.vaccine.2006.
06.086Anton N., Benoit J.P., Saulnier P., Design and production of
nanoparticles formulated from nano-emulsion templates—A review, Journal of Controlled Release, 128 (2008) 185–199. DOI: 10.1016/j.jconrel.2008.02.007
Antonietti M., Landfester K., Polyreactions in miniemulsions, Progress in Polymer Science, 27 (2002) 689–757. DOI: 10.1016/s0079-6700(01)00051-x
Arias M.A., Loxley A., Eatmon C., Van Roey G., Fairhurst D., Mitchnick M., Dash P., Cole T., Wegmann F., Sattentau Q., Shattock R., Carnauba wax nanoparticles enhance strong systemic and mucosal cellular and humoral immune responses to HIV-gp140 antigen, Vaccine, 29 (2011) 1258–1269. DOI: 10.1016/j.vaccine.2010.11.084
Ariganello M.B., Guadarrama Bello D., Rodriguez-Contreras A., Sadeghi S., Isola G., Variola F., Nanci A., Surface nano-cavitation of titanium modulates macrophage activity, International Journal of Nanomedicine, 13 (2018) 8297–8308. DOI: 10.2147/IJN.S185436
Arouet F.M., (Voltaire) Philosophical Letters, Letters Concern-ing the English Nation, 1733, pp. 41–45.
Asua J.M., Emulsion polymerization: From fundamental mech-anisms to process developments, Journal of Polymer Sci-ence Part a-Polymer Chemistry, 42 (2004) 1025–1041. DOI: 10.1002/pola.11096
Baroud C.N., Gallaire F., Dangla R., Dynamics of microfluidic droplets, Lab Chip, 10 (2010) 2032–2045. DOI: 10.1039/c001191f
Beebe D.J., Mensing G.A., Walker G.M., Physics and applica-tions of microfluidics in biology, Annual Review of Bio-medical Engineering, 4 (2002) 261–286. DOI: 10.1146/annurev.bioeng.4.112601.125916
Beilby G.T., Neville F.H., The effect of heat and of solvents on thin films of metal, Proceedings of the Royal Society of London, 72 (1904) 226–235. DOI: 10.1098/rspl.1903.0046
Bernasconi V., Norling K., Bally M., Höök F., Lycke N.Y., Mucosal vaccine development based on liposome technol-ogy, Journal of Immunology Research, 2016 (2016) 5482087–5482087. DOI: 10.1155/2016/5482087
Bhatia S., Natural Polymers vs Synthetic Polymer, in: Bhatia S. (Ed.) Natural Polymer Drug Delivery Systems: Nanoparti-cles, Plants, and Algae, Springer International Publishing, Cham, 2016, pp. 95–118, ISBN: 978-3-319-41129-3.
Borges O., Borchard G., Verhoef J.C., de Sousa A., Junginger H.E., Preparation of coated nanoparticles for a new mucosal vaccine delivery system, International Journal of Pharma-ceutics, 299 (2005) 155–166. DOI: 10.1016/j.ijpharm.2005. 04.037
Bourges J.L., Bloquel C., Thomas A., Froussart F., Bochot A., Azan F., Gurny R., BenEzra D., Behar-Cohen F., Intraocu-lar implants for extended drug delivery: Therapeutic appli-cations, Advanced Drug Delivery Reviews, 58 (2006) 1182–1202. DOI: 10.1016/j.addr.2006.07.026
Brus L.E., Electron Electron and Electron-hole interaaction in samll semiconductor crystallites—The size dependence of the lowest excited electronic state, Journal of Chemical Physics, 80 (1984) 4403–4409. DOI: 10.1063/1.447218
Bulbake U., Doppalapudi S., Kommineni N., Khan W., Liposomal
Leah M. Johnson et al. / KONA Powder and Particle Journal No. 37 (2020) 97–113
107
formulations in clinical use: An updated review, Pharma-ceutics, 9 (2017) 12. DOI: 10.3390/pharmaceutics9020012
Burgess D.J., Hickey, A.J., Microsphere technology and appli-cations, in: James Swarbrick (Ed.), Encyclopedia of Phar-maceutical Technology (Third Edition), Informa Healthcare USA, Inc., New York, 2007, pp. 2328–2338.
Calderon-Nieva D., Goonewardene K.B., Gomis S., Foldvari M., Veterinary vaccine nanotechnology: pulmonary and nasal delivery in livestock animals, Drug Delivery and Transla-tional Research, 7 (2017) 558–570. DOI: 10.1007/s13346-017-0400-9
Chaurasia M., Chourasia M.K., Jain N.K., Jain A., Soni V., Gupta Y., Jain S.K., Cross-linked guar gum microspheres: A viable approach for improved delivery of anticancer drugs for the treatment of colorectal cancer, AAPS Pharm-SciTech, 7 (2017) E143. DOI: 10.1208/pt070374
Chua B.Y., Al Kobaisi M., Zeng W., Mainwaring D., Jackson D.C., Chitosan microparticles and nanoparticles as biocom-patible delivery vehicles for peptide and protein-based immunocontraceptive vaccines, Molecular Pharmaceutics, 9 (2012) 81–90. DOI: 10.1021/mp200264m
Commissioner O.o.t., Guidance for Industry Considering Whether an FDA-Regulated Product Involves the Applica-tion of Nanotechnology, U.S. Department of Health and Human Services Food and Drug Administration, 2014. <https://www.fda.gov/media/88423/download>accessed 25.07.2019.
Croxatto H.B., Mechanisms that explain the contraceptive action of progestin implants for women, Contraception, 65 (2002) 21–27. DOI: 10.1016/s0010-7824(01)00294-3
Di Carlo D., Inertial microfluidics, Lab Chip, 9 (2009) 3038–3046. DOI: 10.1039/b912547g
Dunber C.A., Hickey A.J., Holzner P., Dispersion and charac-terization of pharmaceutical dry powder aerosols, KONA Powder and Particle Journal, 16 (1998) 7–45. DOI: 10.14356/kona.1998007
Dvorak A.M., Dvorak H., Structure of Freund’s complete and incomplete adjuvants: Relation of adjuvanticity to structure, Immunology, 27 (1974) 99–114.
Elsabahy M., Wooley K.L., Cytokines as biomarkers of nanoparticle immunotoxicity, Chemical Society Reviews, 42 (2013) 5552–5576. DOI: 10.1039/c3cs60064e
Fallouh N.A., Roblottreupel L., Fessi H., Devissaguet J.P., Puisieux F., Development of a new process for the manu-facture of polyisobutylcyanotacrylate nanocapsules, Inter-national Journal of Pharmaceutics, 28 (1986) 125–132.
Faraday M., X. The Bakerian Lecture.—Experimental relations of gold (and other metals) to light, Philosophical Transac-tions of the Royal Society of London, 147 (1857) 145–181. DOI: 10.1098/rstl.1857.0011
Feng G., Jiang Q., Xia M., Lu Y., Qiu W., Zhao D., Lu L., Peng G., Wang Y., Enhanced immune response and protective effects of nano-chitosan-based DNA vaccine encoding T cell epitopes of Esat-6 and FL against mycobacterium tuberculosis infection, PLOS ONE, 8 (2013) e61135. DOI: 10.1371/journal.pone.0061135
Fessi H., Puisieux F., Devissaguet J.P., Ammoury N., Benita S., Nanocapsule formation by interfacial polymer deposition
following solvent displacement, International Journal of Pharmaceutics, 55 (1989) R1–R4. DOI: 10.1016/0378-5173(89)90281-0
Garay-Jimenez J.C., Gergeres D., Young A., Lim D.V., Turos E., Physical properties and biological activity of poly (butyl acrylate-styrene) nanoparticle emulsions prepared with con-ventional and polymerizable surfactants, Nanomedicine- Nanotechnology Biology and Medicine, 5 (2009) 443–451. DOI: 10.1016/j.nano.2009.01.015
Garcia-Contreras L., Wong Y.-L., Muttil P., Padilla D., Sadoff J., DeRousse J., Germishuizen W.A., Goonesekera S., Elbert K., Bloom B.R., Miller R., Fourie P.B., Hickey A., Edwards D., Immunization by a bacterial aerosol, Proceedings of the National Academy of Sciences, 105 (2008) 4656–4660. DOI: 10.1073/pnas.0800043105
Gasco M.R., Trotta M., Nanoparticles from microemulsions, International Journal of Pharmaceutics, 29 (1986) 267–268. DOI: 10.1016/0378-5173(86)90125-0
Gradmann C., Robert Koch and the white death: from tubercu-losis to tuberculin, Microbes Infect, 8 (2006) 294–301. DOI: 10.1016/j.micinf.2005.06.004
Gupta N.K., Tomar P., Sharma V., Dixit V.K., Development and characterization of chitosan coated poly-(ɛ-caprolactone) nanoparticulate system for effective immunization against influenza, Vaccine, 29 (2011) 9026–9037. DOI: 10.1016/j.vaccine.2011.09.033
Gupta P.N., Khatri K., Goyal A.K., Mishra N., Vyas S.P., M-cell targeted biodegradable PLGA nanoparticles for oral immu-nization against hepatitis B, Journal of Drug Targeting, 15 (2007) 701–713. DOI: 10.1080/10611860701637982
Gurny R., Peppas N.A., Harrington D.D., Banker G.S., Devel-opment of biodegradable and injectable latices for con-trolled release of potent drugs, Drug Development and Industrial Pharmacy, 7 (1981) 1–25. DOI: 10.3109/ 03639048109055684
Hamman J.H., Chitosan based polyelectrolyte complexes as potential carrier materials in drug delivery systems, Marine Drugs, 8 (2010) 1305–1322. DOI: 10.3390/md8041305
Heath J.R., O’Brien S.C., Zhang Q., Liu Y., Curl R.F., Tittel F.K., Smalley R.E., Lanthanum complexes of spheroidal carbon shells, Journal of the American Chemical Society, 107 (1985) 7779–7780. DOI: 10.1021/ja00311a102
Hickey A.J., Summary of common approaches to pharmaceuti-cal aerosol administration in Pharmaceutical Inhalation Aerosol Technology, Marcel Dekker, New York, 2004, pp. 385–421.
Hickey A.J., Complexity in Pharmaceutical Powders for Inhala-tion: A perspective, KONA Powder and Particle Journal, 35 (2018) 3–13. DOI: 10.14356/kona.2018007
Hoft D.F., Tuberculosis vaccine development: Goals, immuno-logical design, and evaluation, The Lancet, 372 (2008) 164–175. DOI: 10.1016/S0140-6736(08)61036-3
Htay T., Liu M.W., Drug-eluting stent: A review and update, Vascular Health And Risk Management, 1 (2005) 263–276. DOI: 10.2147/vhrm.2005.1.4.263
Ikada Y., Tsuji H., Biodegradable polyesters for medical and ecological applications, Macromolecular Rapid Communi-cations, 21 (2000) 117–132. DOI: 10.1002/(sici)1521-

Leah M. Johnson et al. / KONA Powder and Particle Journal No. 37 (2020) 97–113
108
3927(20000201)21:3<117::aid-marc117>3.0.co;2-xIllum L., Jabbal-Gill I., Hinchcliffe M., Fisher A.N., Davis S.S.,
Chitosan as a novel nasal delivery system for vaccines, Advanced Drug Delivery Reviews, 51 (2001) 81–96. DOI: 10.1016/S0169-409X(01)00171-5
Irache J.M., Salman H.H., Gomez S., Espuelas S., Gamazo C., Poly (anhydride) nanoparticles as adjuvants for mucosal vaccination, Front Biosci (Schol Ed), 2 (2010) 876–890.
Irvine D.J., Hanson M.C., Rakhra K., Tokatlian T., Synthetic Nanoparticles for Vaccines and Immunotherapy, Chemical Reviews, 115 (2015) 11109–11146. DOI: 10.1021/acs. chemrev.5b00109
Jabbal-Gill I., Fisher A.N., Rappuoli R., Davis S.S., Illum L., Stimulation of mucosal and systemic antibody responses against Bordetella pertussis filamentous haemagglutinin and recombinant pertussis toxin after nasal administration with chitosan in mice, Vaccine, 16 (1998) 2039–2046. DOI: 10.1016/S0264-410X(98)00077-2
Jain J.P., Chitkara D., Kumar N., Polyanhydrides as localized drug delivery carrier: an update, Expert Opinion on Drug Delivery, 5 (2008) 889–907. DOI: 10.1517/17425247.5.8.889
Janes K.A., Calvo P., Alonso M.J., Polysaccharide colloidal par-ticles as delivery systems for macromolecules, Advanced Drug Delivery Reviews, 47 (2001) 83–97. DOI: 10.1016/s0169-409x(00)00123-x
Jia Y., Krishnan L., Omri A., Nasal and pulmonary vaccine delivery using particulate carriers, Expert Opinion on Drug Delivery, 12 (2015) 993–1008. DOI: 10.1517/17425247. 2015.1044435
Kaloti M., Bohidar H.B., Kinetics of coacervation transition versus nanoparticle formation in chitosan–sodium tripoly-phosphate solutions, Colloids and Surfaces B: Biointer-faces, 81 (2010) 165–173. DOI: 10.1016/j.colsurfb. 2010.07.006
Kamaly N., Yameen B., Wu J., Farokhzad O.C., Degradable controlled-release polymers and polymeric nanoparticles: Mechanisms of controlling drug release, Chemical Reviews, 116 (2016) 2602–2663. DOI: 10.1021/acs. chemrev.5b00346
Kapoor D.N., Bhatia A., Kaur R., Sharma R., Kaur G., Dhawan S., PLGA: A unique polymer for drug delivery, Therapeutic Delivery, 6 (2015) 41–58. DOI: 10.4155/tde.14.91
Karode S.K., Kulkarni S.S., Suresh A.K., Mashelkar R.A., New insights into kinetics and thermodynamics of interfacial polymerization, Chemical Engineering Science, 53 (1998) 2649–2663. DOI: 10.1016/s0009-2509(98)00083-9
Kaufmann S.H.E., Is the development of a new tuberculosis vaccine possible?, Nature Medicine, 6 (2000) 955–960. DOI: 10.1038/79631
Kaur M., Malik B., Garg T., Rath G., Goyal A.K., Development and characterization of guar gum nanoparticles for oral immunization against tuberculosis, Drug Delivery, 22 (2015) 328–334. DOI: 10.3109/10717544.2014.894594
Krishnamachari Y., Geary S.M., Lemke C.D., Salem A.K., Nanoparticle delivery systems in cancer vaccines, Pharma-ceutical Research, 28 (2011) 215–236. DOI: 10.1007/s11095-010-0241-4
Kroto H.W., Heath J.R., O’Brien S.C., Curl R.F., Smalley R.E.,
C60: Buckminsterfullerene, Nature, 318 (1985) 162–163. DOI: 10.1038/318162a0
Kuhn D.A., Vanhecke D., Michen B., Blank F., Gehr P., Petri-Fink A., Rothen-Rutishauser B., Different endocytotic uptake mechanisms for nanoparticles in epithelial cells and macrophages, Beilstein J Nanotechnol, 5 (2014) 1625–1636. DOI: 10.3762/bjnano.5.174
Kumari A., Yadav S.K., Yadav S.C., Biodegradable polymeric nanoparticles based drug delivery systems, Colloids and Surfaces B-Biointerfaces, 75 (2010) 1–18. DOI: 10.1016/j.colsurfb.2009.09.001
La Mer V.K., Dinegar R.H., Theory, production and mechanism of formation of monodispersed hydrosols, Journal of the American Chemical Society, 72 (1950) 4847–4854. DOI: 10.1021/ja01167a001
Larson K.A., King M.L., Evaluation of supercritical fluid extraction of supercritical fluid extraction in the pharma-ceutical industry. Biotechnology Progress, 2 (1986) 73–82. DOI: 10.1002/btpr.5420020206
Lee J.N., Park C., Whitesides G.M., Solvent compatibility of poly (dimethylsiloxane)-based microfluidic devices, Anal Chem, 75 (2003) 6544–6554. DOI: 10.1021/ac0346712
Leiza J.R., Sudoi E.D., ElAasser M.S., Preparation of high solids content poly (n-butyl acrylate) latexes through miniemulsion polymerization, Journal of Applied Polymer Science, 64 (1997) 1797–1809. DOI: 10.1002/(sici)1097-4628(19970531)64:9<1797::Aid-app16>3.0.Co;2-v
Lim J.M., Bertrand N., Valencia P.M., Rhee M., Langer R., Jon S., Farokhzad O.C., Karnik R., Parallel microfluidic synthe-sis of size-tunable polymeric nanoparticles using 3D flow focusing towards in vivo study, Nanomedicine, 10 (2014) 401–409. DOI: 10.1016/j.nano.2013.08.003
Limayem I., Charcosset C., Fessi H., Purification of nanoparti-cle suspensions by a concentration/diafiltration process, Separation and Purification Technology, 38 (2004) 1–9. DOI: 10.1016/j.seppur.2003.10.002
Lin S.F., Jiang P.L., Tsai J.S., Huang Y., Lin S.Y., Lin J.H., Liu D.-Z., Surface assembly of poly (I:C) on polyethylenei-mine-modified gelatin nanoparticles as immunostimulatory carriers for mucosal antigen delivery, 2018.
Lin Y.W., Wong J., Qu L., Chan H.K., Zhou Q., Powder produc-tion and particle engineering for dry powder inhaler formu-lations, Current Pharmaceutical Design, 21 (2015) 3902–3916. DOI: 10.2174/1381612821666150820111134
Liu L., Fishman M.L., Hicks K.B., Pectin in controlled drug delivery—A review, Cellulose, 14 (2007) 15–24. DOI: 10.1007/s10570-006-9095-7
Liu Z., Lv D., Liu S., Gong J., Wang D., Xiong M., Chen X., Xiang R., Tan X., Alginic acid-coated chitosan nanoparti-cles loaded with legumain DNA vaccine: Effect against breast cancer in mice, PLOS ONE, 8 (2013) e60190. DOI: 10.1371/journal.pone.0060190
Lu D., Garcia-Contreras L., Xu D., Kurtz S.L., Liu J., Braunstein M., McMurray D.N., Hickey A.J., Poly (lactide- co- glycolide) microspheres in respirable sizes enhance an in vitro T cell response to recombinant mycobacterium tuberculosis Anti-gen 85B, Pharmaceutical Research, 24 (2007) 1834–1843. DOI: 10.1007/s11095-007-9302-8
Leah M. Johnson et al. / KONA Powder and Particle Journal No. 37 (2020) 97–113
109
Lu W.L., Wang N., Gao P., Li C.Y., Zhao H.S., Zhang Z.T., Effects of anodic titanium dioxide nanotubes of different diameters on macrophage secretion and expression of cyto-kines and chemokines, Cell Prolif, 48 (2015) 95–104. DOI: 10.1111/cpr.12149
Makadia H.K., Siegel S.J., Poly lactic-co-glycolic acid (PLGA) as biodegradable controlled drug delivery carrier, Poly-mers, 3 (2011) 1377–1397. DOI: 10.3390/polym3031377
Malcolm R.K., Fetherston S.M., McCoy C.F., Boyd P., Major I., Vaginal rings for delivery of HIV microbicides, Interna-tional Journal of Women’s Health, 4 (2012) 595–605. DOI: 10.2147/ijwh.s36282
Manke A., Wang L., Rojanasakul Y., Mechanisms of Nanoparticle-Induced oxidative stress and toxicity, BioMed Research International, 2013 (2013) Article ID 942916, 15 pages. DOI: 10.1155/2013/942916
Mantegazza A.R., Magalhaes J.G., Amigorena S., Marks M.S., Presentation of phagocytosed antigens by MHC I and II, Traffic, 14 (2013) 135–152. DOI: 10.1111/tra.12026
McGill J.L., Kelly S.M., Kumar P., Speckhart S., Haughney S.L., Henningson J., Narasimhan B., Sacco R.E., Efficacy of mucosal polyanhydride nanovaccine against respiratory syncytial virus infection in the neonatal calf, Scientific Reports, 8 (2018) 3021. DOI: 10.1038/s41598-018-21292-2
Mishra B., Patel B.B., Tiwari S., Colloidal nanocarriers: A review on formulation technology, types and applica-tions toward targeted drug delivery, Nanomedicine- Nanotechnology Biology and Medicine, 6 (2010) 9–24. DOI: 10.1016/j.nano.2009.04.008
Mishra N., Tiwari S., Vaidya B., Agrawal G.P., Vyas S.P., Lec-tin anchored PLGA nanoparticles for oral mucosal immuni-zation against hepatitis B, Journal of Drug Targeting, 19 (2011) 67–78. DOI: 10.3109/10611861003733946
Mohammed M.A., Syeda J.T.M., Wasan K.M., Wasan E.K., An overview of chitosan nanoparticles and its application in non-parenteral drug delivery, Pharmaceutics, 9 (2017) 53. DOI: 10.3390/pharmaceutics9040053
Morris G., Kok S., Harding S., Adams G., Polysaccharide drug delivery systems based on pectin and chitosan, Biotechnol-ogy and Genetic Engineering Reviews, 27 (2010) 257–284. DOI: 10.1080/02648725.2010.10648153
Mouran D., Reimers J., Schork F.J., Miniemulsion polymeriza-tion of methyl methacrylate with dodecyl mercaptan as cos-urfactant, Journal of Polymer Science Part A-Polymer Chemistry, 34 (1996) 1073–1081. DOI: 10.1002/(sici)1099-0518(19960430)34:6<1073::Aid-pola16>3.0.Co;2-4
Mu L., Feng S.S., A novel controlled release formulation for the anticancer drug paclitaxel (Taxol®): PLGA nanoparticles containing vitamin E TPGS, Journal of Controlled Release, 86 (2003) 33–48. DOI: 10.1016/S0168-3659(02)00320-6
Nagpal K., Singh S.K., Mishra D.N., Chitosan nanoparticles: A promising system in novel drug delivery, Chemical and Pharmaceutical Bulletin, 58 (2010) 1423–1430. DOI: 10.1248/cpb.58.1423
Newton A.H., Cardani A., Braciale T.J., The host immune response in respiratory virus infection: balancing virus clearance and immunopathology, Semin Immunopathol, 38 (2016) 471–482. DOI: 10.1007/s00281-016-0558-0
Nishijima N., Hirai T., Misato K., Aoyama M., Kuroda E., Ishii K.J., Higashisaka K., Yoshioka Y., Tsutsumi Y., Human scavenger receptor A1-mediated inflammatory response to silica particle exposure is size specific, Frontiers in Immu-nology, 8 (2017) 379. DOI: 10.3389/fimmu.2017.00379
Njoroge J.M., Yourick J.J., Principato M.A., A flow cytometric analysis of macrophage-nanoparticle interactions in vitro: induction of altered Toll-like receptor expression, Interna-tional Journal of Nanomedicine, 13 (2018) 8365–8378. DOI: 10.2147/ijn.s174184
NNI (National Nanotechnology Initiative), 2019, Nanotechnol-ogy Timeline, <www.nano.gov/timeline> accessed 26.05. 2019.
Osman N., Kaneko K., Carini V., Saleem I., Carriers for the tar-geted delivery of aerosolized macromolecules for pulmo-nary pathologies, Expert Opinion on Drug Delivery, 15 (2018) 821–834. DOI: 10.1080/17425247.2018.1502267
Padilla-Carlin D.J., McMurray D.N., Hickey A.J., The guinea pig as a model of infectious diseases, Comparative Medi-cine, 58 (2008) 324–340.
Padrela L., Rodrigues M.A., Duarte A., Dias A.M.A., Braga M.E.M., de Sousa H.C., Supercritical carbon dioxide-based technologies for the production of drug nanoparticles/nano-crystals—A comprehensive review, Advanced Drug Deliv-ery Reviews, 131 (2018) 22–78. DOI: 10.1016/j.addr.2018. 07.010
Pandey R., Khuller G.K., Chemotherapeutic potential of alginate–chitosan microspheres as anti-tubercular drug carriers, Journal of Antimicrobial Chemotherapy, 53 (2004) 635–640. DOI: 10.1093/jac/dkh139
Prasad Y.V.R., Krishnaiah Y.S.R., Satyanarayana S., In vitro evaluation of guar gum as a carrier for colon-specific drug delivery, Journal of Controlled Release, 51 (1998) 281–287. DOI: 10.1016/S0168-3659(97)00181-8
Puri A., Loomis K., Smith B., Lee J.-H., Yavlovich A., Heldman E., Blumenthal R., Lipid-based nanoparticles as pharma-ceutical drug carriers: From concepts to clinic, Critical Reviews in Therapeutic Drug Carrier Systems, 26 (2009) 523–580.
Reis C.P., Neufeld R.J., Ribeiro A.J., Veiga F., Nanoencapsula-tion I. Methods for preparation of drug-loaded polymeric nanoparticles, Nanomedicine-Nanotechnology Biology and Medicine, 2 (2006) 8–21. DOI: 10.1016/j.nano.2005.12.003
Reverchon E., De Marco I., Torino E., Nanoparticles production by supercritical antisolvent precipitation: A general inter-pretation, Journal of Supercritical Fluids, 43 (2007) 126–138. DOI: 10.1016/j.supflu.2007.04.013
Ritchie A.I., Jackson D.J., Edwards M.R., Johnston S.L., Air-way epithelial orchestration of innate immune function in response to virus infection. A focus on asthma, Ann Am Thorac Soc, 13 Suppl 1 (2016) S55–63. DOI: 10.1513/AnnalsATS.201507-421MG
Romero E.L., Morilla M.J., Topical and mucosal liposomes for vaccine delivery, Wiley Interdiscip Rev Nanomed Nanobio-technol, 3 (2011) 356–375. DOI: 10.1002/wnan.131
Saallah S., Lenggoro I.W., Nanoparticles carrying biological molecules: Recent advances and applications, KONA Pow-der and Particle Journal, 35 (2018) 89–111. DOI: 10.14356/
Leah M. Johnson et al. / KONA Powder and Particle Journal No. 37 (2020) 97–113
110
kona.2018015Sanna V., Roggio A.M., Siliani S., Piccinini M., Marceddu S.,
Mariani A., Sechi M., Development of novel cationic chitosan-and anionic alginate-coated poly (D,L-lactide-co- glycolide) nanoparticles for controlled release and light protection of resveratrol, International Journal of Nano-medicine, 7 (2012) 5501–5516. DOI: 10.2147/ijn.s36684
Sarei F., Dounighi N.M., Zolfagharian H., Khaki P., Bidhendi S.M., Alginate nanoparticles as a promising adjuvant and vaccine delivery system, Indian Journal of Pharmaceutical Sciences, 75 (2013) 442–449. DOI: 10.4103/0250-474X. 119829
Sawaengsak C., Mori Y., Yamanishi K., Mitrevej A., Sinchaipanid N., Chitosan nanoparticle encapsulated hemagglutinin-split influenza virus mucosal vaccine, AAPS PharmSciTech, 15 (2014) 317–325. DOI: 10.1208/s12249-013-0058-7
Sayes C.M., The relationships among structure, activity and toxicity of engineered nanoparticles, KONA Powder and Particle Journal, 31 (2014) 10–21. DOI: 10.14356/kona. 2014002
Shah R.R., Hassett K.J., Brito L.A., Overview of vaccine adju-vants: Introduction, history, and current status, Methods in Molecular Biology, 1494 (2017) 1–13. DOI: 10.1007/978-1-4939-6445-1_1
Shi S., Hickey A.J., PLGA Microparticles in Respirable Sizes Enhance an in vitro T cell response to recombinant myco-bacterium tuberculosis antigen TB10.4-Ag85B, Pharma-ceutical Research, 27 (2010) 350–360. DOI: 10.1007/s11095-009-0028-7
Shi S., Yu L., Sun D., Liu J., Hickey A.J., Rational design of multiple TB antigens TB10.4 and TB10.4-Ag85B as subunit vaccine candidates against mycobacterium tuberculosis, Pharmaceutical Research, 27 (2010) 224–234. DOI: 10.1007/s11095-009-9995-y
Singh J., Pandit S., Bramwell V.W., Alpar H.O., Diphtheria tox-oid loaded poly-(ε-caprolactone) nanoparticles as mucosal vaccine delivery systems, Methods, 38 (2006) 96–105. DOI: 10.1016/j.ymeth.2005.11.003
Smith K.A., Edward Jenner and the small pox vaccine, Frontiers in Immunology, 2 (2011) 21(6pp). DOI: 10.3389/fimmu. 2011.00021
Smyth H.D.C., Martonen T.B., Isaacs K.K., Hickey A.J., Esti-mation of particle deposition in the airways from different inhaler formulations using an in silico model, KONA Pow-der and Particle Journal, 29 (2011) 107–117. DOI: 10.14356/kona.2011013
Somasundaran P., Fang X., Ponnurangam S., Li B., Nanoparti-cles: Characteristics, mechanisms and modulation of bio-toxicity, KONA Powder and Particle Journal, 28 (2010) 38–49. DOI: 10.14356/kona.2010007
Sosnowski T.R., Powder Particles and Technologies for Medi-cine Delivery to the Respiratory System: Challenges and Opportunities, KONA Powder and Particle Journal, 35 (2018) 122–138. DOI: 10.14356/kona.2018020
Stils H.F., Jr., Adjuvants and antibody production: Dispelling the myths associated with freund’s complete and other adjuvants, ILAR Journal, 46 (2005) 280–293. DOI:
10.1093/ilar.46.3.280Stroock A.D., Dertinger S.K., Ajdari A., Mezic I., Stone H.A.,
Whitesides G.M., Chaotic mixer for microchannels, Sci-ence, 295 (2002) 647–651. DOI: 10.1126/science.1066238
Stylianou E., Diogo G.R., Pepponi I., Dolleweerd C., Arias M.A., Locht C., Rider C.C., Sibley L., Cutting S.M., Loxley A., Ma J.K.C., Reljic R., Mucosal delivery of antigen—Coated nanoparticles to lungs confers protective immunity against tuberculosis infection in mice, European Journal of Immunology, 44 (2014) 440–449. DOI: 10.1002/eji. 201343887
Tamada J., Langer R., The development of polyanhydrides for drug delivery applications, Journal of Biomaterials Science, Polymer Edition, 3 (1992) 315–353. DOI: 10.1163/ 156856292X00402
Tameris M.D., Hatherill M., Landry B.S., Scriba T.J., Snowden M.A., Lockhart S., Shea J.E., McClain J.B., Hussey G.D., Hanekom W.A., Mahomed H., McShane H., Safety and effi-cacy of MVA85A, a new tuberculosis vaccine, in infants previously vaccinated with BCG: A randomised, place-bo-controlled phase 2b trial, Lancet, 381 (2013) 1021–1028. DOI: 10.1016/s0140-6736(13)60177-4
Thickett S.C., Gilbert R.G., Emulsion polymerization: State of the art in kinetics and mechanisms, Polymer, 48 (2007) 6965–6991. DOI: 10.1016/j.polymer.2007.09.031
Thomas C., Rawat A., Hope-Weeks L., Ahsan F., Aerosolized PLA and PLGA nanoparticles enhance humoral, mucosal and cytokine responses to hepatitis b vaccine, Molecular Pharmaceutics, 8 (2011) 405–415. DOI: 10.1021/mp100255c
Thomas S., Alginate dressings in surgery and wound manage-ment — part 1, Journal of Wound Care, 9 (2000) 56–60. DOI: 10.12968/jowc.2000.9.2.26338
Tiwari P., Bahuguna D.P., Pande Katare D., Kharkwal H., Natu-ral polymers in drug delivery, World Journal of Pharmacy and Pharmaceutical Sciences, 3 (2014) 1359–1905.
Tønnesen H.H., Karlsen J., Alginate in drug delivery systems, Drug Development and Industrial Pharmacy, 28 (2002) 621–630. DOI: 10.1081/DDC-120003853
Turner T., Poynting John H., Transparent silver and other metal-lic films, Proceedings of the Royal Society of London Series A, Containing Papers of a Mathematical and Physi-cal Character, 81 (1908) 301–310. DOI: 10.1098/rspa. 1908.0084
Uhrich K.E., Cannizzaro S.M., Langer R.S., Shakesheff K.M., Polymeric systems for controlled drug release, Chemical Reviews, 99 (1999) 3181–3198. DOI: 10.1021/cr940351u
Valencia P.M., Farokhzad O.C., Karnik R., Langer R., Microflu-idic technologies for accelerating the clinical translation of nanoparticles, Nature Nanotechnology, 7 (2012) 623–629. DOI: 10.1038/nnano.2012.168
van der Lubben I.M., Kersten G., Fretz M.M., Beuvery C., Coos Verhoef J., Junginger H.E., Chitosan microparticles for mucosal vaccination against diphtheria: oral and nasal effi-cacy studies in mice, Vaccine, 21 (2003) 1400–1408. DOI: 10.1016/S0264-410X(02)00686-2
Vanderhoff J.W., El-AasserJohn M.S., Ugelstad J., Polymer Emulsification Process, US Patent (1979) US4177177A.
Vauthier C., Dubernet C., Fattal E., Pinto-Alphandary H.,

Leah M. Johnson et al. / KONA Powder and Particle Journal No. 37 (2020) 97–113
111
Couvreur P., Poly (alkylcyanoacrylates) as biodegradable materials for biomedical applications, Advanced Drug Delivery Reviews, 55 (2003) 519–548. DOI: 10.1016/s0169-409x(03)00041-3
Vemula S.K., Bontha V.K., Colon targeted guar gum compres-sion coated tablets of flurbiprofen: Formulation, development, and pharmacokinetics, BioMed Research International, 2013 (2013) Article ID 287919, 8 pages. DOI: 10.1155/ 2013/287919
Watnasirichaikul S., Davies N.M., Rades T., Tucker I.G., Prepa-ration of biodegradable insulin nanocapsules from biocom-patible microemulsions, Pharmaceutical Research, 17 (2000) 684–689. DOI: 10.1023/a:1007574030674
Watts P., Smith A., PecSys: in situ gelling system for optimised nasal drug delivery, Expert Opinion on Drug Delivery, 6 (2009) 543–552. DOI: 10.1517/17425240902939135
Whitaker-Brothers K., Uhrich K., Investigation into the erosion mechanism of salicylate-based poly(anhydride-esters), Journal of Biomedical Materials Research Part A, 76 (2006) 470–479. DOI: 10.1002/jbm.a.30356
Whitesides G.M., The origins and the future of microfluidics, Nature, 442 (2006) 368–373. DOI: 10.1038/nature05058
Williams H.D., Trevaskis N.L., Charman S.A., Shanker R.M., Charman W.N., Pouton C.W., Porter C.J.H., Strategies to address low drug solubility in discovery and development, Pharmacological Reviews, 65 (2013) 315–499. DOI: 10.1124/pr.111.005660
Woodruff M.A., Hutmacher D.W., The return of a forgotten polymer—Polycaprolactone in the 21st century, Progress in Polymer Science, 35 (2010) 1217–1256. DOI: 10.1016/j.progpolymsci.2010.04.002
Xu J., Dai W., Wang Z., Chen B., Li Z., Fan X., Intranasal vac-cination with chitosan-DNA nanoparticles expressing pneumococcal surface antigen a protects mice against nasopharyngeal colonization by Streptococcus pneumo-niae, Clinical and Vaccine Immunology, 18 (2011) 75–81. DOI: 10.1128/cvi.00263-10
Xu Z., Hickey A.J., A comparison of aerosol performance using standardized entrainment tubes vs. dry powder inhaler devices, KONA Powder and Particle Journal, 30 (2013)
201–210. DOI: 10.14356/kona.2013019Youngren-Ortiz S.R., Gandhi N.S., España-Serrano L.,
Chougule M.B., Aerosol delivery of siRNA to the lungs. Part 2: Nanocarrier-based delivery systems, KONA Powder and Particle Journal, 34 (2017) 44–69. DOI: 10.14356/kona.2017005
Yusuf H., Kett V., Current prospects and future challenges for nasal vaccine delivery, Hum Vaccin Immunother, 13 (2017) 34–45. DOI: 10.1080/21645515.2016.1239668
Zacharias Z.R., Ross K.A., Hornick E.E., Goodman J.T., Narasimhan B., Waldschmidt T.J., Legge K.L., Polyanhy-dride nanovaccine induces robust pulmonary B and T cell immunity and confers protection against homologous and heterologous influenza a virus infections, Frontiers in Immunology, 9 (2018) 01953. DOI: 10.3389/fimmu. 2018.01953
Zhang G.Z., Niu A.Z., Peng S.F., Jiang M., Tu Y.F., Li M., Wu C., Formation of novel polymeric nanoparticles, Accounts of Chemical Research, 34 (2001) 249–256. DOI: 10.1021/ar000011x
Zhang Q.L., O’Brien S.C., Heath J.R., Liu Y., Curl R.F., Kroto H.W., Smalley R.E., Reactivity of large carbon clusters: Spheroidal carbon shells and their possible relevance to the formation and morphology of soot, The Journal of Physical Chemistry, 90 (1986) 525–528. DOI: 10.1021/j100276a001
Zhang X., Zhang H., Wu Z., Wang Z., Niu H., Li C., Nasal absorption enhancement of insulin using PEG-grafted chi-tosan nanoparticles, European Journal of Pharmaceutics and Biopharmaceutics, 68 (2008) 526–534. DOI: 10.1016/j.ejpb.2007.08.009
Zhao L., Seth A., Wibowo N., Zhao C.-X., Mitter N., Yu C., Middelberg A.P.J., Nanoparticle vaccines, Vaccine, 32 (2014) 327–337. DOI: 10.1016/j.vaccine.2013.11.069
Zhou J., Romero G., Rojas E., Ma L., Moya S., Gao C., Layer by layer chitosan/alginate coatings on poly (lactide-co- glycolide) nanoparticles for antifouling protection and Folic acid binding to achieve selective cell targeting, Journal of Colloid and Interface Science, 345 (2010) 241–247. DOI: 10.1016/j.jcis.2010.02.004
Leah M. Johnson et al. / KONA Powder and Particle Journal No. 37 (2020) 97–113
112
Authors’ Short Biographies
Leah M. Johnson
Dr. Leah Johnson is a Senior Research Chemist in the Engineered Systems (ES) Divi-sion at RTI International. Dr. Johnson leads a research team to develop advanced poly-meric materials for controlled delivery applications. She has experience with designing polymeric systems for applications in biosensing, tissue engineering, and drug delivery, with recent programs involving subcutaneous implants for prevention of infectious dis-eases, controlled-release dental materials, and polymeric implants for islet transplanta-tion. In her role at RTI, she collaborates with various groups from private industry, academic institutions, and government agencies to advance material systems to early stage technical products. Dr. Johnson received her B.S. (Biochemistry) from the Univer-sity of Michigan and her Ph.D. (Biochemistry) from the University of Colorado. She held a Postdoctoral Fellowship at Duke University (Biomedical Engineering), where she de-veloped a bio-separation processes for acoustic-mediated rare cell isolation and triggered-release systems for tissue engineering. She previously held positions at Pfizer working in the nuclear magnetic resonance (NMR) laboratories and at Gilead Sciences where she researched biological pathways of new pipeline antiretroviral (ARV) drugs and led small molecule screening campaigns for ARV discovery efforts.
Jeffrey B. Mecham
Dr. Mecham is a Research Chemist in RTI International’s Center for Engineered sys-tems, in the Technology Advancement and Commercialization Division. In this capacity, he is responsible for the design and synthesis of monomers, polymers and particles (at the micro- and nanoscale) with targeted performance capabilities for a wide array of applications. His team are contributors to the Center’s successful development of particle-based controlled release technologies for triggered release of therapeutics and chemistries for environmental remediation. The development of such materials over the last several years at RTI has resulted in IP that has been licensed by interested parties for further development and subsequent commercialization of particles with controlled re-lease properties.
Leah M. Johnson et al. / KONA Powder and Particle Journal No. 37 (2020) 97–113
113
Authors’ Short Biographies
Frederick Quinn
Dr. Quinn earned a BS from Marquette University, a MS and PhD in Microbiology and Biochemistry from Indiana University, Bloomington and completed a postdoctoral fellowship in Microbial Pathogenesis at Stanford University. He oversaw several labora-tory groups at the Centers for Disease Control and Prevention in Atlanta investigating bacterial disease outbreaks including Brazilian Purpuric Fever, Cat Scratch Disease, me-ningococcal meningitis, Buruli ulcer, and ultimately tuberculosis (TB). In 1999, Dr. Quinn completed a Fullbright Fellowship studying TB pathogenesis at the University of Bristol in Great Britain. In 2002, he became Professor and Head of the Department of Medical Microbiology and Parasitology (now Infectious Diseases) in the College of Vet-erinary Medicine at the University of Georgia. His research focuses on understanding the pathogenesis of Mycobacterium tuberculosis, with the ultimate goal of developing improved vaccines and diagnostic tests for TB. Current collaborative activities include novel TB vaccine development and animal efficacy testing, animal model development for disease transmission, and understanding TB social networking and zoonotic trans-mission patterns in TB endemic areas including Africa.
Anthony J. Hickey
Dr. Hickey is Distinguished RTI Fellow, at the Research Triangle Institute and Director of the UNC Catalyst for Rare Diseases of the Eshelman School of Pharmacy He obtained Ph.D. and D.Sc. degrees in pharmaceutical sciences from Aston University, Birmingham, UK. He is a Fellow of the Royal Society of Biology, the American Association of Pharma-ceutical Scientists, the American Association for the Advancement of Science and the Royal Society of Biology. He received the Research Achievement Award of the Particulate Presentations and Design Division of the Powder Technology Society of Japan, the Distin-guished Scientist Award of the American Association of Indian Pharmaceutical Scientists; the David W Grant Award in Physical Pharmacy of the American Association of Pharma-ceutical Scientists; Thomas T Mercer Joint Prize for Excellence in Inhaled Medicines and Pharmaceutical Aerosols of the American Association for Aerosol Research and the Inter-national Society for Aerosols in Medicine and the Ralph Shangraw Memorial Award for Excipient and Excipient Technology of the International Pharmaceutical Excipient Consor-tium Foundation. He is founder (and formerly President and CEO) of Cirrus Pharmaceuti-cals, Inc., acquired by Kemwell Pharma; founder (formerly CSO, 2002–2007) of Oriel Therapeutics, Inc, acquired by Sandoz and founder and CEO of Astartein, Inc.; member of the Pharmaceutical Dosage Forms Expert Committee of the United States Pharmacopeia and formerly Chair of the Aerosols Expert Committee of the USP. Dr. Hickey conducts a multidisciplinary research program in the field of pulmonary drug and vaccine delivery for treatment and prevention of a variety of diseases.
KONA Powder and Particle Journal No. 37 (2020) 114–131/Doi:10.14356/kona.2020016 Review Paper
114Copyright © 2020 The Authors. Published by Hosokawa Powder Technology Foundation. This is an open ac-cess article under the CC BY license (http://creativecommons.org/licenses/by/4.0/).
Fluidised Bed Reactors for the Thermochemical Conversion of Biomass and Waste †
Stefano Iannello, Shane Morrin and Massimiliano Materazzi *1 Department of Chemical Engineering, University College London, UK
AbstractThe growing population and economic development globally has led to increasing resource consumption and waste generation. This has generated concern at local, national and international levels on environmental issues including air quality, resource scarcity, waste management (including plastics) and global warming. The resulting antipathy towards fossil fuels and waste landfilling has spurred the demand for alternative bioenergy and biofuels production methods, making use of abundant biomass and waste feedstock. Although not new concepts, there has been renewed impetus recently to develop advanced thermochemical processes such as pyrolysis and gasification to treat biomass and municipal solid waste (including refuse-derived fuel therefrom). This is because these processes have the potential to add value to cheap and abundant materials by converting them into advanced biofuels and chemicals. The work presented in this paper is concerned principally with the technical analysis and review of new-generation, state-of-the-art systems based on fluidised bed reactors operated with biomass and solid waste. A comprehensive assessment of fluidised bed reactor types and operations is considered, with particular attention given to those processes aimed at the production of clean syngas for the subsequent synthesis of high-value products, including bio-hydrogen, synthetic natural gas (SNG), and liquid fuels.
Keywords: fluidised beds, waste, thermochemical processes, waste-to-fuels
1. Introduction
Biomass and municipal solid waste (MSW) feedstocks arise in vast quantities, presenting a largely untapped re-source. Harnessing the energy content of these feed-stocks—a significant portion of which will be renewable —offers significant environmental, economic and, indeed, societal benefits. While mass burning, for heat and/or power generation, has been the traditional route, thermo-chemical methods including gasification and pyrolysis open up a range of options from chemicals to synthetic natural gas and transport fuels (Barbuzza et al., 2019). This is becoming increasingly relevant given the drive to find alternatives to fossil fuels and reduce CO2 emissions (Masnadi et al., 2015).
Thermochemical processes have been known and used for centuries. Examples include the pyrolysis and gasifi-cation of coal as early as the 19th century (Kamble et al., 2019; Nie et al., 2017). The pyrolysis of coal produced coke and a coal gas, while the gasification of coal pro-
duced a combustible gas referred to as synthetic gas (syn-gas), or producer gas. In spite of this long history, the development of thermochemical technologies for process-ing biomass and waste materials has been relatively re-cent, driven by the demand for resource conservation and more efficient energy recovery. In terms of feedstock han-dled by gasification plants worldwide, for example, bio-mass and waste represent a very small portion, with most synthesis gas production derived from fossil sources. Notwithstanding this, the thermochemical treatment of residual biomass, including solid waste, has significant potential in its own right. In this respect, they add value to low- or negative-value feedstock by converting them to marketable fuels and products (Materazzi and Lettieri, 2017). Furthermore, while waste materials can present challenges, they have certain economic benefits over other biomass. For instance, most waste sources are subject to a gate fee for their disposal; collection systems tend to be established, the cost of which is normally incurred by the waste producer. Finally, unlike certain biomass materials, waste does not compete with the production of food (Matsakas et al., 2017).
Fluidised beds have historically been used in the thermal processing of solid fuels due to their flexibility and good conversion efficiency. Today, they still offer good prospects for a rapid deployment of new-generation
† Received 15 May 2019; Accepted 16 July 2019 J-STAGE Advance published online 1 October 2019
1 Torrington Place, London WC1E 7JE, United Kingdom.* Corresponding author: Massimiliano Materazzi; E-mail: [email protected] TEL: +44(0)2076797868
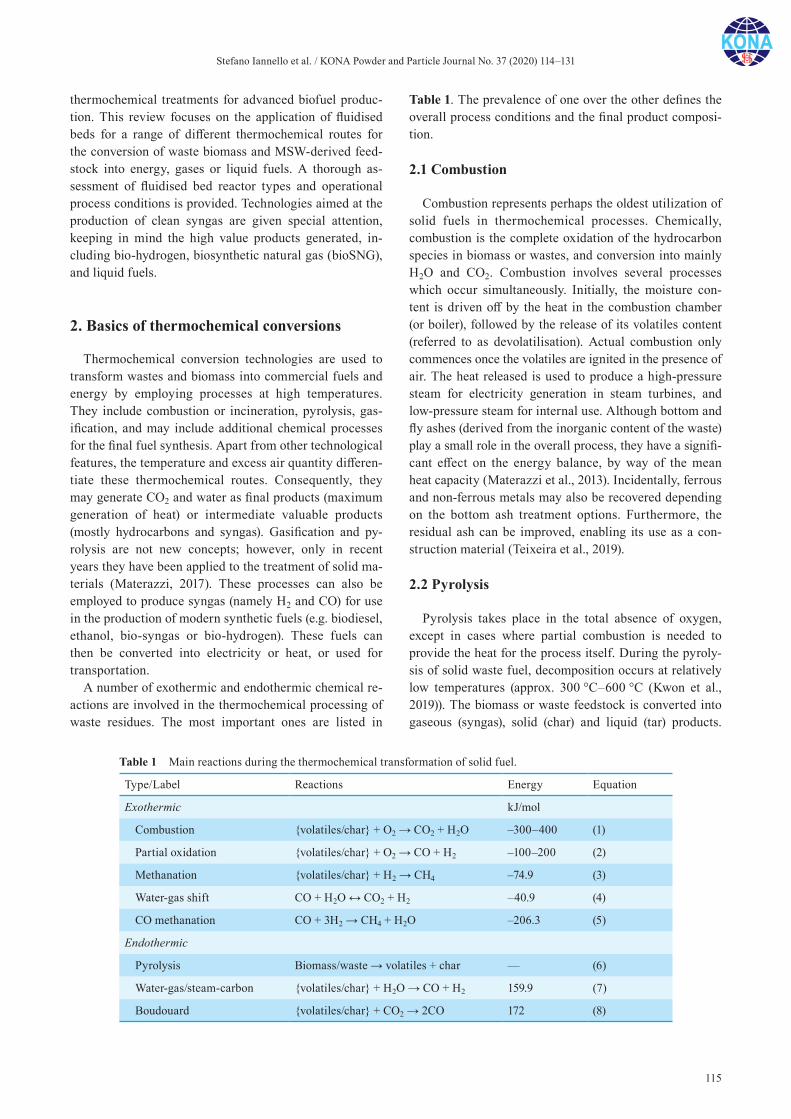
Stefano Iannello et al. / KONA Powder and Particle Journal No. 37 (2020) 114–131
115
thermochemical treatments for advanced biofuel produc-tion. This review focuses on the application of fluidised beds for a range of different thermochemical routes for the conversion of waste biomass and MSW-derived feed-stock into energy, gases or liquid fuels. A thorough as-sessment of fluidised bed reactor types and operational process conditions is provided. Technologies aimed at the production of clean syngas are given special attention, keeping in mind the high value products generated, in-cluding bio-hydrogen, biosynthetic natural gas (bioSNG), and liquid fuels.
2. Basics of thermochemical conversions
Thermochemical conversion technologies are used to transform wastes and biomass into commercial fuels and energy by employing processes at high temperatures. They include combustion or incineration, pyrolysis, gas-ification, and may include additional chemical processes for the final fuel synthesis. Apart from other technological features, the temperature and excess air quantity differen-tiate these thermochemical routes. Consequently, they may generate CO2 and water as final products (maximum generation of heat) or intermediate valuable products (mostly hydrocarbons and syngas). Gasification and py-rolysis are not new concepts; however, only in recent years they have been applied to the treatment of solid ma-terials (Materazzi, 2017). These processes can also be employed to produce syngas (namely H2 and CO) for use in the production of modern synthetic fuels (e.g. biodiesel, ethanol, bio-syngas or bio-hydrogen). These fuels can then be converted into electricity or heat, or used for transportation.
A number of exothermic and endothermic chemical re-actions are involved in the thermochemical processing of waste residues. The most important ones are listed in
Table 1. The prevalence of one over the other defines the overall process conditions and the final product composi-tion.
2.1 Combustion
Combustion represents perhaps the oldest utilization of solid fuels in thermochemical processes. Chemically, combustion is the complete oxidation of the hydrocarbon species in biomass or wastes, and conversion into mainly H2O and CO2. Combustion involves several processes which occur simultaneously. Initially, the moisture con-tent is driven off by the heat in the combustion chamber (or boiler), followed by the release of its volatiles content (referred to as devolatilisation). Actual combustion only commences once the volatiles are ignited in the presence of air. The heat released is used to produce a high-pressure steam for electricity generation in steam turbines, and low-pressure steam for internal use. Although bottom and fly ashes (derived from the inorganic content of the waste) play a small role in the overall process, they have a signifi-cant effect on the energy balance, by way of the mean heat capacity (Materazzi et al., 2013). Incidentally, ferrous and non-ferrous metals may also be recovered depending on the bottom ash treatment options. Furthermore, the residual ash can be improved, enabling its use as a con-struction material (Teixeira et al., 2019).
2.2 Pyrolysis
Pyrolysis takes place in the total absence of oxygen, except in cases where partial combustion is needed to provide the heat for the process itself. During the pyroly-sis of solid waste fuel, decomposition occurs at relatively low temperatures (approx. 300 °C–600 °C (Kwon et al., 2019)). The biomass or waste feedstock is converted into gaseous (syngas), solid (char) and liquid (tar) products.
Table 1 Main reactions during the thermochemical transformation of solid fuel.
Type/Label Reactions Energy Equation
Exothermic kJ/mol
Combustion volatiles/char + O2 → CO2 + H2O –300–400 (1)
Partial oxidation volatiles/char + O2 → CO + H2 –100–200 (2)
Methanation volatiles/char + H2 → CH4 –74.9 (3)
Water-gas shift CO + H2O ↔ CO2 + H2 –40.9 (4)
CO methanation CO + 3H2 → CH4 + H2O –206.3 (5)
Endothermic
Pyrolysis Biomass/waste → volatiles + char — (6)
Water-gas/steam-carbon volatiles/char + H2O → CO + H2 159.9 (7)
Boudouard volatiles/char + CO2 → 2CO 172 (8)

Stefano Iannello et al. / KONA Powder and Particle Journal No. 37 (2020) 114–131
116
The net calorific value of the syngas is typically in the range of 10–20 MJ/Nm3. The condensable fraction is re-covered by cooling the syngas for use as a liquid fuel. The rate of heating and the pyrolysis temperature affect the proportion of useful product generated from the process (namely H2, CO, CH4 and other hydrocarbons) (Safdari et al., 2019). The liquid product is referred to as bio-oil and can be used as an alternative fuel oil in power and heat applications or as feedstock in the production of various commodity chemicals. The major drawback concern ing bio-oil is its high oxygen content (35–60 wt%) (Uzoejinwa et al., 2018), which results in a low calorific value, insta-bility and corrosiveness of the fuel (Sharifzadeh et al., 2019). The lower heating value (LHV) is usually between 18 MJ/kg and 20 MJ/kg, which is lower than the LHV of conventional liquid fuels such as diesel (42 MJ/kg) and gasoline (44 MJ/kg) (Perkins et al., 2018). Recently, dif-ferent studies to solve this issue have been conducted on the co-pyrolysis of biomass and waste plastics. These substances are particularly attractive for their high hydro-gen contents of about 14 wt% (e.g. polyethylene, polypro-pylene, polystyrene), hence they could donate hydrogen during the process with biomass and improve the bio-oil quality (Zhou et al., 2006). According to Brebu et al. (2010), the calorific value of the fuel oil produced via the co-pyrolysis of wood chips with polypropylene (at 1:1 mixing ratio) is 45 MJ/kg. This value is much higher than that obtained from wood chips alone (at 19.9 MJ/kg).
2.3 Gasification
Gasification is an intermediate between combustion and pyrolysis, involving partial oxidation of the fuel. In particular, the oxygen is added but the amount is not suffi-cient to allow the fuel to be completely oxidised (i.e. sub-stoichiometric), at temperatures typically above 800 °C (Almeida et al., 2019). The products of gasification consist of partially oxidised compounds—mainly H2, CO and CO2. Partial combustion or an external heat supply are necessary to sustain the gasification process. The main product is a syngas which contains hydrogen, car-bon monoxide and methane with a net calorific value of 4–10 MJ/Nm3 (Materazzi et al. 2016). This high calorific value means that the gases from gasification can be used in gas turbines and/or internal combustion engines, or burned in conventional boilers connected to steam tur-bines. With regard to energy production, gasification has many advantages over combustion. For instance, the syn-gas product may be more valuable as it can be combusted at higher temperatures or used in fuel cells (Safarian et al., 2019; Whitty et al., 2008). It also produces a solid ash product, low in carbon (i.e. char) and other inorganic con-taminants (for example, chlorides, sulphides, heavy met-als, etc.). The biggest potential of waste and biomass
gasification, however, is still not fully realised. Once the syngas gas is cleaned and all impurities removed, it can be used to generate chemicals or high-quality fuels via catalytic stages (e.g. Fischer-Tropsch, methanation, etc.) (Karl and Pröll, 2018). This opens the door to a new and potentially outstanding biorefinery industry which sees gasification as one of the most promising thermochemical technologies in the future for the production of sustain-able fuels (Mazaheri et al., 2019).
3. Fluidised bed technologies applied to thermal treatments
Fluidised bed reactors (FBR) have a long record of suc-cess in the field of thermochemical conversion due to their favourable mixing features, near-constant temperatures and the good operating flexibility (Salatino and Solimene, 2017). These features make fluidised beds particularly suitable for the application with heterogeneous feedstock, including biomass and waste (Siedlecki et al., 2011).
In a fluidised bed, the fuel is suspended in a swirling mass of hot particles (such as sand), fluidised by an up-draft of hot gases. This system facilitates thorough mix-ing, and therefore good mass and heat transfer. These are the main reasons why fluidised beds are best suited to transform heterogeneous materials via thermochemical processes. The exit gases carry off some particulates of ash, fines and bed material. Heavier bed particles and ash are decanted from the base of the gasifier, and replaced with fresh bed material (normally inert sand) (Materazzi, 2017). This mechanism is fuel-dependent, as fuels with a higher ash content require more frequent extractions. In modern applications, fluidised bed plants are better suited to treating refuse-derived fuel (RDF) than raw MSW. This requires pretreatment of the waste feedstock to re-move recyclable materials, as well as dense, coarse ob-jects, and to reduce particle size. Fluidised beds offer flexibility in terms of feedstock calorific value, moisture, particle size and density and sulphur content. Nonethe-less, limitations may arise if the feed contains a signifi-cant portion of large, dense particles or low-melting-point ash. This flexibility centres on the ability to mix and hold the fuel within the fluid bed, providing a sufficient resi-dence time for reactions to reach completion. Alkaline materials (for example, limestone) can also be charged to the bed to help retain acidic impurities or to aid tar crack-ing and reforming reactions (Schmid et al., 2018). Worthy of note is that the heat input from the burning char (within the bed) and the devolatilised gases (above bed) balances the outgoing heat ‘consumed’ by endothermic reactions in the gas phase (e.g. water-gas/steam-carbon, steam reforming, etc.) (as illustrated in Fig. 1). This provides the basis for controlling the temperature of the bed during steady-state

Stefano Iannello et al. / KONA Powder and Particle Journal No. 37 (2020) 114–131
117
operation. In this respect, the equivalence ratio (ER) (namely the amount of air/oxygen inputted relative to that required for stoichiometric combustion) is the parameter that determines the difference between combustion, py-rolysis and gasification (Materazzi et al., 2013).
Fluidised bed technology is also well proven and ma-ture in other applications such as the combustion of pul-verised coal and biomass (Materazzi and Lettieri, 2017). Different technologies can be classified in accordance with their physical configuration and operating conditions (Fig. 2), as described in the following sections (Motta et al., 2018).
3.1 Bubbling fluidised bed reactor
Inside a bubbling fluidised bed reactor (BFB), the bed
media is fluidised from the bottom of the bed by way of a distribution plate or gas nozzles with a velocity varying in a range of 1 and 3 m/s (Molino et al., 2016). Under these conditions, the bed material (particle diameters ranging between 0.5 and 1.0 mm, Group B of Geldart classifica-tion) is fully fluidised and behaves like a boiling liquid (Kunii and Levenspiel, 1991). The fluidisation state is maintained by a gas-bubble emulsion which continuously agitates the solid phase, enabling good mass and heat transfer between the solid and gas phase. Within the up-per part of the reactor, namely the freeboard, only the gas phase is present, as the bed material does not normally get carried this high. Some of the gas-phase reactions take place here, even though the main stages of thermochemi-cal conversion occur within or just above the fluidised bed (Molino et al., 2016). The cross-sectional area of the
Fig. 1 Fuel transformation scheme and influence of temperature and oxidation stage in an FBR.
Fig. 2 Fluidised bed reactor configurations: (a) bubbling; (b) circulating; (c) dual. Source: Adapted from Motta et al. (2018).
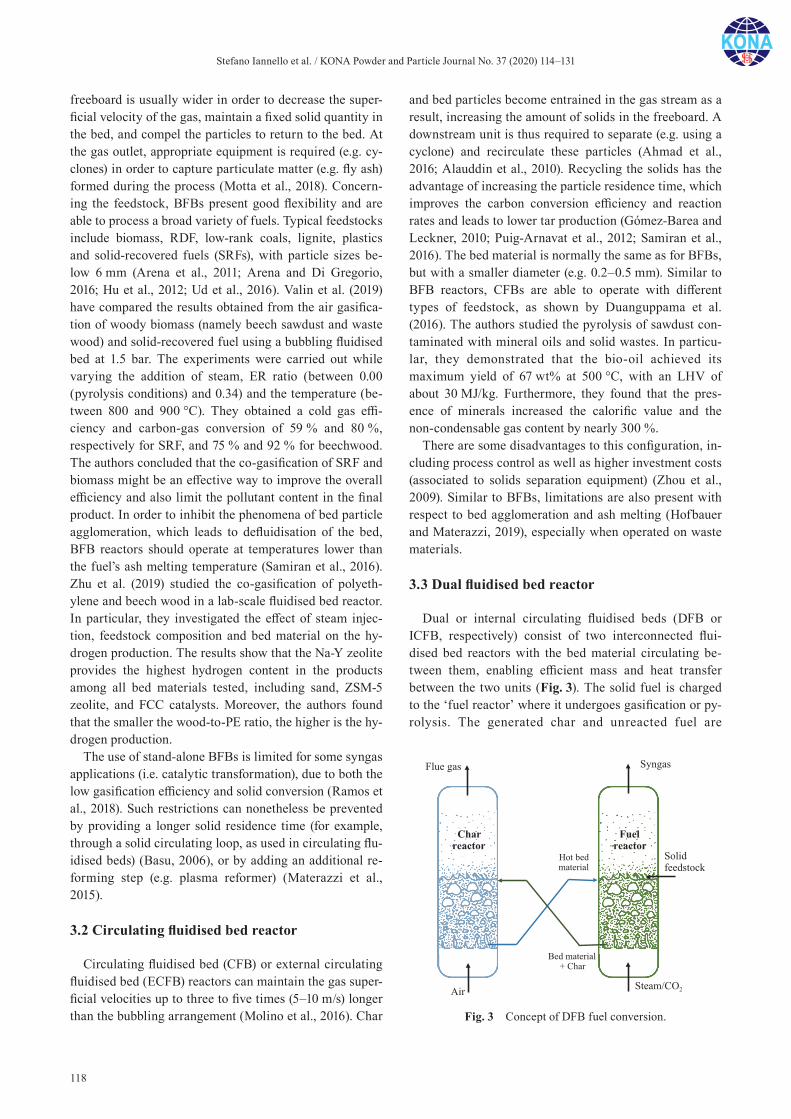
Stefano Iannello et al. / KONA Powder and Particle Journal No. 37 (2020) 114–131
118
freeboard is usually wider in order to decrease the super-ficial velocity of the gas, maintain a fixed solid quantity in the bed, and compel the particles to return to the bed. At the gas outlet, appropriate equipment is required (e.g. cy-clones) in order to capture particulate matter (e.g. fly ash) formed during the process (Motta et al., 2018). Concern-ing the feedstock, BFBs present good flexibility and are able to process a broad variety of fuels. Typical feedstocks include biomass, RDF, low-rank coals, lignite, plastics and solid-recovered fuels (SRFs), with particle sizes be-low 6 mm (Arena et al., 2011; Arena and Di Gregorio, 2016; Hu et al., 2012; Ud et al., 2016). Valin et al. (2019) have compared the results obtained from the air gasifica-tion of woody biomass (namely beech sawdust and waste wood) and solid-recovered fuel using a bubbling fluidised bed at 1.5 bar. The experiments were carried out while varying the addition of steam, ER ratio (between 0.00 (pyrolysis conditions) and 0.34) and the temperature (be-tween 800 and 900 °C). They obtained a cold gas effi-ciency and carbon-gas conversion of 59 % and 80 %, respectively for SRF, and 75 % and 92 % for beechwood. The authors concluded that the co-gasification of SRF and biomass might be an effective way to improve the overall efficiency and also limit the pollutant content in the final product. In order to inhibit the phenomena of bed particle agglomeration, which leads to defluidisation of the bed, BFB reactors should operate at temperatures lower than the fuel’s ash melting temperature (Samiran et al., 2016). Zhu et al. (2019) studied the co-gasification of polyeth-ylene and beech wood in a lab-scale fluidised bed reactor. In particular, they investigated the effect of steam injec-tion, feedstock composition and bed material on the hy-drogen production. The results show that the Na-Y zeolite provides the highest hydrogen content in the products among all bed materials tested, including sand, ZSM-5 zeolite, and FCC catalysts. Moreover, the authors found that the smaller the wood-to-PE ratio, the higher is the hy-drogen production.
The use of stand-alone BFBs is limited for some syngas applications (i.e. catalytic transformation), due to both the low gasification efficiency and solid conversion (Ramos et al., 2018). Such restrictions can nonetheless be prevented by providing a longer solid residence time (for example, through a solid circulating loop, as used in circulating flu-idised beds) (Basu, 2006), or by adding an additional re-forming step (e.g. plasma reformer) (Materazzi et al., 2015).
3.2 Circulating fluidised bed reactor
Circulating fluidised bed (CFB) or external circulating fluidised bed (ECFB) reactors can maintain the gas super-ficial velocities up to three to five times (5–10 m/s) longer than the bubbling arrangement (Molino et al., 2016). Char
and bed particles become entrained in the gas stream as a result, increasing the amount of solids in the freeboard. A downstream unit is thus required to separate (e.g. using a cyclone) and recirculate these particles (Ahmad et al., 2016; Alauddin et al., 2010). Recycling the solids has the advantage of increasing the particle residence time, which improves the carbon conversion efficiency and reaction rates and leads to lower tar production (Gómez-Barea and Leckner, 2010; Puig-Arnavat et al., 2012; Samiran et al., 2016). The bed material is normally the same as for BFBs, but with a smaller diameter (e.g. 0.2–0.5 mm). Similar to BFB reactors, CFBs are able to operate with different types of feedstock, as shown by Duanguppama et al. (2016). The authors studied the pyrolysis of sawdust con-taminated with mineral oils and solid wastes. In particu-lar, they demonstrated that the bio-oil achieved its maximum yield of 67 wt% at 500 °C, with an LHV of about 30 MJ/kg. Furthermore, they found that the pres-ence of minerals increased the calorific value and the non-condensable gas content by nearly 300 %.
There are some disadvantages to this configuration, in-cluding process control as well as higher investment costs (associated to solids separation equipment) (Zhou et al., 2009). Similar to BFBs, limitations are also present with respect to bed agglomeration and ash melting (Hofbauer and Materazzi, 2019), especially when operated on waste materials.
3.3 Dual fluidised bed reactor
Dual or internal circulating fluidised beds (DFB or ICFB, respectively) consist of two interconnected flui-dised bed reactors with the bed material circulating be-tween them, enabling efficient mass and heat transfer between the two units (Fig. 3). The solid fuel is charged to the ‘fuel reactor’ where it undergoes gasification or py-rolysis. The generated char and unreacted fuel are
Fig. 3 Concept of DFB fuel conversion.

Stefano Iannello et al. / KONA Powder and Particle Journal No. 37 (2020) 114–131
119
subsequently transported into the so-called ‘char reactor’ for full gasification or combustion. In this way, the con-version processes are decoupled, ensuring complete inde-pendence of the gas phase in the two vessels. This results in a purer and higher-quality gas product than that from single reactors (Fuchs et al., 2019).
In gasification systems, the fuel reactor is a bubbling fluidised bed gasifier operating between 800 °C and 850 °C with steam as the gasification medium (i.e. steam gasification). Since the reactions during the steam gasifi-cation are mostly endothermic (e.g. Eqn. (7), Table 1), heat must be generated and provided to this stage (Shen et al., 2008). The heat required is generated in the second reactor (fluidised with air), where combustion of the resid-ual char from the gasification section takes place at 900–950 °C (Fuchs et al., 2019). The flue gases generated exit the char combustion reactor separately from the produced syngas, which is therefore free of air/nitrogen. Concur-rently, the heated bed material is recirculated into the gas-ification reactor, acting as an external heat source (La Villetta et al., 2017).
DFBs present good scale-up potential and are suitable for high specific capacities, although their construction is rather complex (Puig-Arnavat et al., 2010). As for most fluidised bed systems, these reactors can process a broad variety of biomass including sewage sludge, grass (Van der Drift et al., 2005), wood chips and pellets (Hofbauer and Rauch, 2008), dried coffee grounds (Xu et al., 2006), cedar, oak sawdust (Suzuki and Namioka, 2005), almond shells and waste residues (RDF, SRF, mixed plastics, etc.) (Corella et al., 2007). Furthermore, dual fluidised bed sys-tems generate syngas with a reasonable calorific value, rich in hydrogen. In this respect, Benedikt et al. (2018) carried out a set of experiments using different types of biogenic fuels (i.e. sugar cane bagasse, softwood, olive pomace, bark and rice husk) and waste-derived fuels (i.e. MSW fraction, shredder light fraction and MSW fraction with 25 % blending of lignite) in a 100-kW pilot plant at TU Wien, Austria. The resulting product gas has a LHV of around 11–12.5 MJ/Nm3 for the gasification of biogenic feedstock, and 14–16 MJ/Nm3 for that of waste. More-over, the H2/CO ratio of the syngas reached a value up to 3.9 for the waste-derived fuels (Benedikt et al., 2018). A larger plant of 20 MWfuel based on the DFB concept is lo-cated in Göteborg, Sweden (Leckner, 2016) for the pro-duction of bioSNG from biomass.
A range of different design options can be considered for DFBs. This includes, for instance, two fast fluidised beds, a bubbling and a fast fluidised bed, or a combination of two bubbling fluidised beds (Fuchs et al., 2019; Kunii and Levenspiel, 1991; Paisley and Overend, 2002). An ex-ample of a design based on the ICFB principle is the MILENA gasification process (Fig. 4).
The gasification section includes a downcomer, riser
and settling chamber, whilst the combustion section en-closes a sand transport zone and the BFB. The biomass is fed into the riser where a small quantity of superheated steam is inputted from below (5 wt% of the biomass in-put) (Van der Meijden et al., 2010). In the riser, opposite and below the biomass feeding point, an orifice allows the entrance of the hot bed material (typically olivine or sand) from the combustor. The hot bed material serves as a heating source for the biomass, which reaches a tempera-ture of 850 °C. The heated fuel particles devolatilise and are converted into char, tar and gas, which rises through the reactor with a vertical velocity of nearly 6 m/s (Van der Meijden et al., 2010). This leads to a turbulent fluidi-sation regime within the riser as well as significant en-trainment of char and bed material. Since the vertical velocity decreases in the settling chamber, the gas sepa-rates from the solids, which fall down into the down-comer. The product gas exits from the top and is sent to the cooling and cleaning section. The char is oxidised with air in the bubbling fluidised combustor in order to heat the bed material up to 925 °C. Subsequently, it leaves the combustion section from the bottom and is sent to the riser again. The product syngas contains a certain number
Fig. 4 Lab-scale MILENA gasifier. Source: Adapted from Van der Meijden et al. (2010).
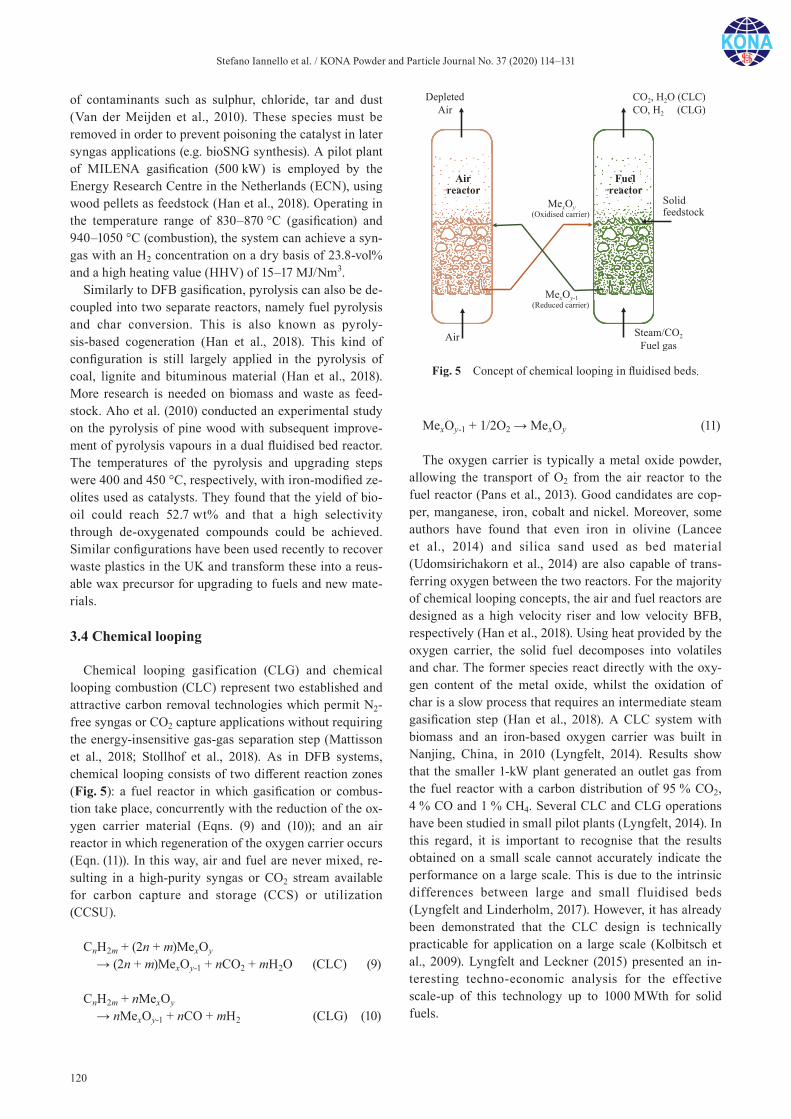
Stefano Iannello et al. / KONA Powder and Particle Journal No. 37 (2020) 114–131
120
of contaminants such as sulphur, chloride, tar and dust (Van der Meijden et al., 2010). These species must be removed in order to prevent poisoning the catalyst in later syngas applications (e.g. bioSNG synthesis). A pilot plant of MILENA gasification (500 kW) is employed by the Energy Research Centre in the Netherlands (ECN), using wood pellets as feedstock (Han et al., 2018). Operating in the temperature range of 830–870 °C (gasification) and 940–1050 °C (combustion), the system can achieve a syn-gas with an H2 concentration on a dry basis of 23.8-vol% and a high heating value (HHV) of 15–17 MJ/Nm3.
Similarly to DFB gasification, pyrolysis can also be de-coupled into two separate reactors, namely fuel pyrolysis and char conversion. This is also known as pyroly-sis-based cogeneration (Han et al., 2018). This kind of configuration is still largely applied in the pyrolysis of coal, lignite and bituminous material (Han et al., 2018). More research is needed on biomass and waste as feed-stock. Aho et al. (2010) conducted an experimental study on the pyrolysis of pine wood with subsequent improve-ment of pyrolysis vapours in a dual fluidised bed reactor. The temperatures of the pyrolysis and upgrading steps were 400 and 450 °C, respectively, with iron-modified ze-olites used as catalysts. They found that the yield of bio-oil could reach 52.7 wt% and that a high selectivity through de-oxygenated compounds could be achieved. Similar configurations have been used recently to recover waste plastics in the UK and transform these into a reus-able wax precursor for upgrading to fuels and new mate-rials.
3.4 Chemical looping
Chemical looping gasification (CLG) and chemical looping combustion (CLC) represent two established and attractive carbon removal technologies which permit N2-free syngas or CO2 capture applications without requiring the energy-insensitive gas-gas separation step (Mattisson et al., 2018; Stollhof et al., 2018). As in DFB systems, chemical looping consists of two different reaction zones (Fig. 5): a fuel reactor in which gasification or combus-tion take place, concurrently with the reduction of the ox-ygen carrier material (Eqns. (9) and (10)); and an air reactor in which regeneration of the oxygen carrier occurs (Eqn. (11)). In this way, air and fuel are never mixed, re-sulting in a high-purity syngas or CO2 stream available for carbon capture and storage (CCS) or utilization (CCSU).
CnH2m + (2n + m)MexOy → (2n + m)MexOy-1 + nCO2 + mH2O (CLC) (9)
CnH2m + nMexOy → nMexOy-1 + nCO + mH2 (CLG) (10)
MexOy-1 + 1/2O2 → MexOy (11)
The oxygen carrier is typically a metal oxide powder, allowing the transport of O2 from the air reactor to the fuel reactor (Pans et al., 2013). Good candidates are cop-per, manganese, iron, cobalt and nickel. Moreover, some authors have found that even iron in olivine (Lancee et al., 2014) and silica sand used as bed material (Udomsirichakorn et al., 2014) are also capable of trans-ferring oxygen between the two reactors. For the majority of chemical looping concepts, the air and fuel reactors are designed as a high velocity riser and low velocity BFB, respectively (Han et al., 2018). Using heat provided by the oxygen carrier, the solid fuel decomposes into volatiles and char. The former species react directly with the oxy-gen content of the metal oxide, whilst the oxidation of char is a slow process that requires an intermediate steam gasification step (Han et al., 2018). A CLC system with biomass and an iron-based oxygen carrier was built in Nanjing, China, in 2010 (Lyngfelt, 2014). Results show that the smaller 1-kW plant generated an outlet gas from the fuel reactor with a carbon distribution of 95 % CO2, 4 % CO and 1 % CH4. Several CLC and CLG operations have been studied in small pilot plants (Lyngfelt, 2014). In this regard, it is important to recognise that the results obtained on a small scale cannot accurately indicate the performance on a large scale. This is due to the intrinsic differences between large and small f luidised beds (Lyngfelt and Linderholm, 2017). However, it has already been demonstrated that the CLC design is technically practicable for application on a large scale (Kolbitsch et al., 2009). Lyngfelt and Leckner (2015) presented an in-teresting techno-economic analysis for the effective scale-up of this technology up to 1000 MWth for solid fuels.
Fig. 5 Concept of chemical looping in fluidised beds.

Stefano Iannello et al. / KONA Powder and Particle Journal No. 37 (2020) 114–131
121
4. Effect of operating conditions
The importance of operating conditions in thermo-chemical processes have been extensively studied, and many excellent reviews can be found in the literature (Heidenreich and Foscolo, 2015; Hofbauer and Materazzi, 2019; Yates and Lettieri, 2016). This section will only highlight some of the key aspects related to operation of FBRs on waste feedstock. Among all factors, temperature is perhaps the most important. As shown in Fig. 1, FBRs usually operate at atmospheric pressure and relatively low temperatures (< 900 °C) in order to avoid sintering of the ashes and subsequent melting and agglomeration issues. This is particularly relevant to operations with waste feedstock, due to the high presence of ashes and inorganic components in these fuels (Yates and Lettieri, 2016). On the other hand, the amount of tar produced is known to increase with decreasing temperature (Kinoshita et al., 1994). The typical approach to avoid this inconvenience is to stage the oxidation phase at multiple levels, achieving high temperatures only when needed, i.e. in those areas where bed material is not present. These can include, for example, the freeboard in fluidised beds, or the entire gas space in dedicated ‘thermal cracking’ units. However, controlling the agglomeration phenomenon is also possi-ble by means of frequent bed replacement and the addi-tion of other components to the bed inventory. Lu et al. (2015) conducted a study on catalytic coal gasification in a pressurised fluidised bed reactor. They demonstrated that the sintering temperature of the coal ash increased from 650 °C to 740 °C by adding a small amount (5 wt%) of water-washed ash. The ash content in the fuel also af-fects the conversion process more directly. For instance, ash can cause a reduction in the char activity by hindering the reaction between oxygen and carbon within the pores. Furthermore, solids discharge rates in FBRs have to be enhanced significantly in order to keep a constant bed depth, thus increasing the fraction of heat losses and fluc-tuations within the system (Yates and Lettieri, 2016). Bed depth and fluidising velocity, in turn, have an influence on the residence time of reacting gases and particles within the reactor, therefore affecting the thermal conversion ef-ficiency and gas composition. For example, an increase in bed height ensures a high residence time for the char par-ticles within the bed and more stable conditions. On the other hand, the fluidisation velocity controls the mixing and the expansion of the bed, as well as the gas residence time and elutriation rates. Plenty of work has been con-ducted on different bed materials to be used in thermo-chemical processes, either for their catalytic properties in tar reforming, or for different retention capacities of inor-ganic contaminants (Heidenreich and Foscolo, 2015; Thunman et al., 2018). Koppatz et al. (2011) compared sil-ica sand (as a reference inert material) and olivine in a
pilot-scale DFB system for wood pellet gasification. The authors tested olivine with a particle size range of 400–600 μm and particle density of 2850 kg/m3. The results show a reduction of GC (Gas Chromatograph) tar and gravimetric tar content (both related to the fuel input) by about 30 % and 57 %, respectively. Ly et al. (2018) inves-tigated dolomite with a particle size of 180–250 μm as a catalyst for bio-oil upgrading from tulip tree pyrolysis. They demonstrated that the HHV of the bio-oil reached a value between 23.09 and 28.1 MJ/kg, which was higher than that obtained from the pyrolysis with silica sand (i.e. 21.64–24.37 MJ/kg). In most cases, however, the extent to which solid particles affect the tar content and product composition is determined by a series of concurring ele-ments, including feedstock composition and atmosphere in the reactor, rather than bed material alone.
5. State of the art of FBRs for thermochemical conversion
5.1 Fluidised bed combustion
Combustion currently represents the most well- established thermochemical conversion of waste into en-ergy, with more than 1400 incineration plants in operation worldwide (Dong et al., 2018a,b; Leckner, 2015). There has been a progressive increase in the number of combus-tion plants in different parts of the world: in Europe 455 plants were in operation in 2012 (Lausselet et al., 2016), whereas the number in China has risen from 54 plants in 2004 to 188 in 2014 (Dong et al., 2018a). Even though the last generation of MSW combustors employs effective and advanced flue gas cleaning, ash recycling and the use of combined heat and power (CHP) cycle, there are still some limitations concerning electricity efficiency—which is low at about 22–25 % (Dong et al., 2018b; Panepinto et al. 2014). This is due to a restriction on the maximum steam temperature of the boiler, which is typically kept below 450 °C to avoid corrosion by HCl (Belgiorno et al., 2003). Although fluidised bed reactors are a promising technology, currently the main combustion technologies for MSW treatment remain moving-grate and rotary kiln combustors (Materazzi and Lettieri, 2017). Moving grates are employed in most of these applications and have been fully developed in order to meet the demands for large-scale performance. This is due to their ability to handle large volumes of waste, avoiding the need for prior re-moval of bulky material through shredding and sorting (Wissing et al., 2017). The percentage of MSW combus-tion plants utilising moving grates is 94 %, 88 %, 85 % and 76 % in Germany, EU, France and US, respectively, with the remaining plants being either rotary kiln or flui-dised bed combustors (Lu et al., 2017). However, the
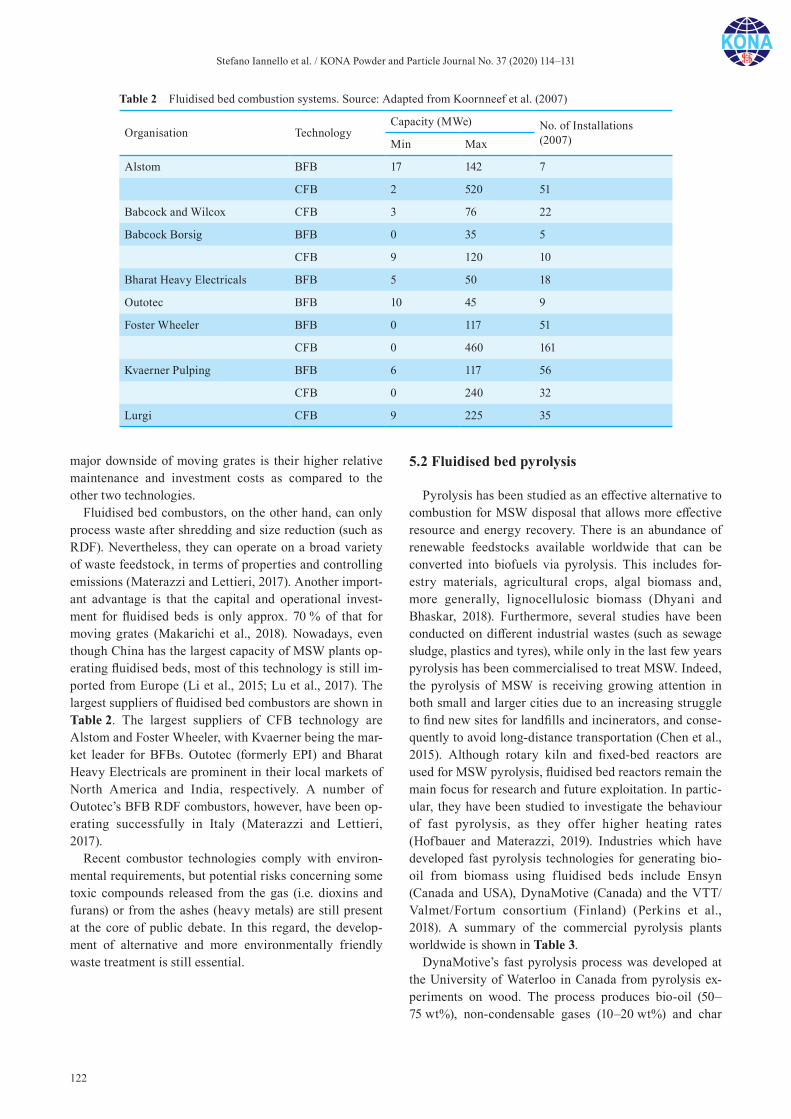
Stefano Iannello et al. / KONA Powder and Particle Journal No. 37 (2020) 114–131
122
major downside of moving grates is their higher relative maintenance and investment costs as compared to the other two technologies.
Fluidised bed combustors, on the other hand, can only process waste after shredding and size reduction (such as RDF). Nevertheless, they can operate on a broad variety of waste feedstock, in terms of properties and controlling emissions (Materazzi and Lettieri, 2017). Another import-ant advantage is that the capital and operational invest-ment for fluidised beds is only approx. 70 % of that for moving grates (Makarichi et al., 2018). Nowadays, even though China has the largest capacity of MSW plants op-erating fluidised beds, most of this technology is still im-ported from Europe (Li et al., 2015; Lu et al., 2017). The largest suppliers of fluidised bed combustors are shown in Table 2. The largest suppliers of CFB technology are Alstom and Foster Wheeler, with Kvaerner being the mar-ket leader for BFBs. Outotec (formerly EPI) and Bharat Heavy Electricals are prominent in their local markets of North America and India, respectively. A number of Outotec’s BFB RDF combustors, however, have been op-erating successfully in Italy (Materazzi and Lettieri, 2017).
Recent combustor technologies comply with environ-mental requirements, but potential risks concerning some toxic compounds released from the gas (i.e. dioxins and furans) or from the ashes (heavy metals) are still present at the core of public debate. In this regard, the develop-ment of alternative and more environmentally friendly waste treatment is still essential.
5.2 Fluidised bed pyrolysis
Pyrolysis has been studied as an effective alternative to combustion for MSW disposal that allows more effective resource and energy recovery. There is an abundance of renewable feedstocks available worldwide that can be converted into biofuels via pyrolysis. This includes for-estry materials, agricultural crops, algal biomass and, more generally, lignocellulosic biomass (Dhyani and Bhaskar, 2018). Furthermore, several studies have been conducted on different industrial wastes (such as sewage sludge, plastics and tyres), while only in the last few years pyrolysis has been commercialised to treat MSW. Indeed, the pyrolysis of MSW is receiving growing attention in both small and larger cities due to an increasing struggle to find new sites for landfills and incinerators, and conse-quently to avoid long-distance transportation (Chen et al., 2015). Although rotary kiln and fixed-bed reactors are used for MSW pyrolysis, fluidised bed reactors remain the main focus for research and future exploitation. In partic-ular, they have been studied to investigate the behaviour of fast pyrolysis, as they offer higher heating rates (Hofbauer and Materazzi, 2019). Industries which have developed fast pyrolysis technologies for generating bio-oil from biomass using fluidised beds include Ensyn (Canada and USA), DynaMotive (Canada) and the VTT/Valmet/Fortum consortium (Finland) (Perkins et al., 2018). A summary of the commercial pyrolysis plants worldwide is shown in Table 3.
DynaMotive’s fast pyrolysis process was developed at the University of Waterloo in Canada from pyrolysis ex-periments on wood. The process produces bio-oil (50–75 wt%), non-condensable gases (10–20 wt%) and char
Table 2 Fluidised bed combustion systems. Source: Adapted from Koornneef et al. (2007)
Organisation TechnologyCapacity (MWe) No. of Installations
(2007)Min Max
Alstom BFB 17 142 7
CFB 2 520 51
Babcock and Wilcox CFB 3 76 22
Babcock Borsig BFB 0 35 5
CFB 9 120 10
Bharat Heavy Electricals BFB 5 50 18
Outotec BFB 10 45 9
Foster Wheeler BFB 0 117 51
CFB 0 460 161
Kvaerner Pulping BFB 6 117 56
CFB 0 240 32
Lurgi CFB 9 225 35
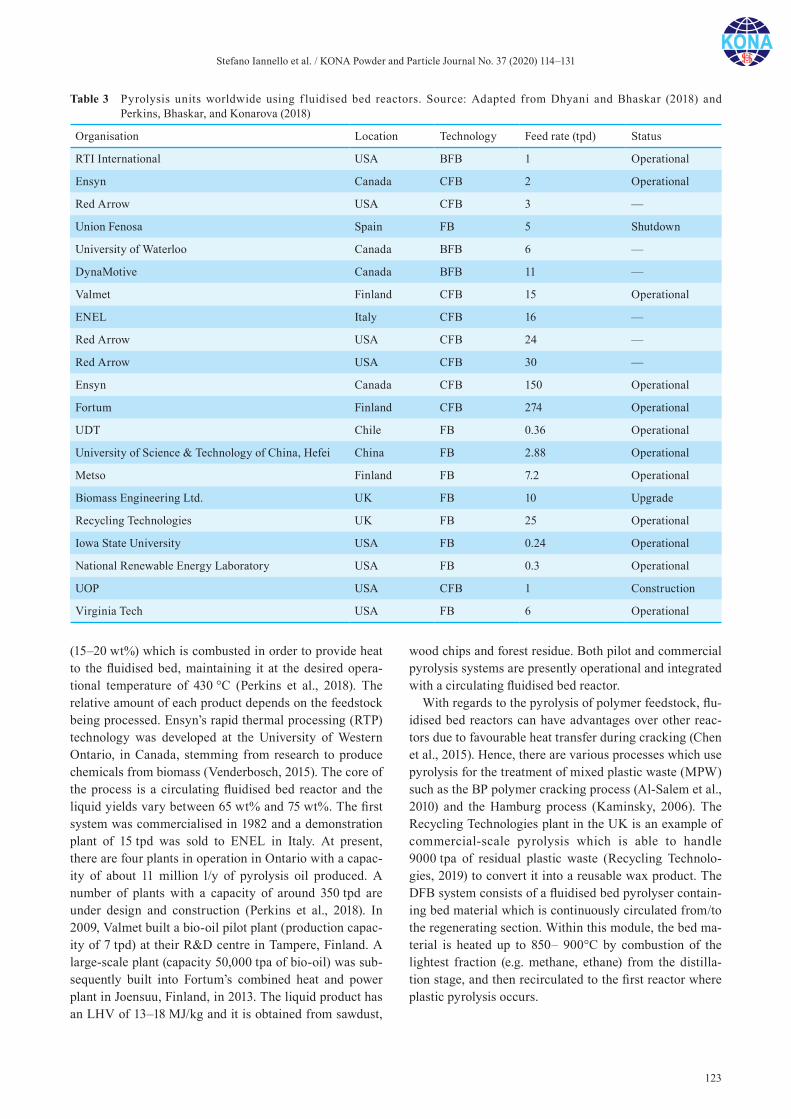
Stefano Iannello et al. / KONA Powder and Particle Journal No. 37 (2020) 114–131
123
(15–20 wt%) which is combusted in order to provide heat to the fluidised bed, maintaining it at the desired opera-tional temperature of 430 °C (Perkins et al., 2018). The relative amount of each product depends on the feedstock being processed. Ensyn’s rapid thermal processing (RTP) technology was developed at the University of Western Ontario, in Canada, stemming from research to produce chemicals from biomass (Venderbosch, 2015). The core of the process is a circulating fluidised bed reactor and the liquid yields vary between 65 wt% and 75 wt%. The first system was commercialised in 1982 and a demonstration plant of 15 tpd was sold to ENEL in Italy. At present, there are four plants in operation in Ontario with a capac-ity of about 11 million l/y of pyrolysis oil produced. A number of plants with a capacity of around 350 tpd are under design and construction (Perkins et al., 2018). In 2009, Valmet built a bio-oil pilot plant (production capac-ity of 7 tpd) at their R&D centre in Tampere, Finland. A large-scale plant (capacity 50,000 tpa of bio-oil) was sub-sequently built into Fortum’s combined heat and power plant in Joensuu, Finland, in 2013. The liquid product has an LHV of 13–18 MJ/kg and it is obtained from sawdust,
wood chips and forest residue. Both pilot and commercial pyrolysis systems are presently operational and integrated with a circulating fluidised bed reactor.
With regards to the pyrolysis of polymer feedstock, flu-idised bed reactors can have advantages over other reac-tors due to favourable heat transfer during cracking (Chen et al., 2015). Hence, there are various processes which use pyrolysis for the treatment of mixed plastic waste (MPW) such as the BP polymer cracking process (Al-Salem et al., 2010) and the Hamburg process (Kaminsky, 2006). The Recycling Technologies plant in the UK is an example of commercial-scale pyrolysis which is able to handle 9000 tpa of residual plastic waste (Recycling Technolo-gies, 2019) to convert it into a reusable wax product. The DFB system consists of a fluidised bed pyrolyser contain-ing bed material which is continuously circulated from/to the regenerating section. Within this module, the bed ma-terial is heated up to 850– 900°C by combustion of the lightest fraction (e.g. methane, ethane) from the distilla-tion stage, and then recirculated to the first reactor where plastic pyrolysis occurs.
Table 3 Pyrolysis units worldwide using f luidised bed reactors. Source: Adapted from Dhyani and Bhaskar (2018) and Perkins, Bhaskar, and Konarova (2018)
Organisation Location Technology Feed rate (tpd) Status
RTI International USA BFB 1 Operational
Ensyn Canada CFB 2 Operational
Red Arrow USA CFB 3 —
Union Fenosa Spain FB 5 Shutdown
University of Waterloo Canada BFB 6 —
DynaMotive Canada BFB 11 —
Valmet Finland CFB 15 Operational
ENEL Italy CFB 16 —
Red Arrow USA CFB 24 —
Red Arrow USA CFB 30 —
Ensyn Canada CFB 150 Operational
Fortum Finland CFB 274 Operational
UDT Chile FB 0.36 Operational
University of Science & Technology of China, Hefei China FB 2.88 Operational
Metso Finland FB 7.2 Operational
Biomass Engineering Ltd. UK FB 10 Upgrade
Recycling Technologies UK FB 25 Operational
Iowa State University USA FB 0.24 Operational
National Renewable Energy Laboratory USA FB 0.3 Operational
UOP USA CFB 1 Construction
Virginia Tech USA FB 6 Operational

Stefano Iannello et al. / KONA Powder and Particle Journal No. 37 (2020) 114–131
124
5.3 Fluidised bed gasification
Gasification is currently considered a more attractive process when compared to combustion and pyrolysis for both biomass and waste treatment, due to the wide choice of the various end products (Bhavanam and Sastry, 2011). Moreover, it represents a cleaner alternative solution with respect to increasing environmental restrictions (Arena, 2012). However, the gasification of problematic materials, such as waste, for biofuel production still needs to be proven on a large scale for commercial take-off. The de-sign of commercial gasifiers, currently used for combined heat and power (CHP) production only, depends on feed-stock availability, ranging from agricultural to industrial and municipal waste streams. As with pyrolysis, fluidised beds are the most employed for both waste and biomass treatment as they provide a robust and flexible technology, allowing a broad range of particle size feedstocks to be processed (Ramos et al., 2018).
A large-scale CHP gasification plant using a fluidised bed reactor is located at Lathi, Finland. It was developed by Foster Wheeler and has been operational since 2012 (Dong et al., 2018b). It has a capacity of 250,000 tpa of waste feedstock unsuitable for recycling, in the form of SRF. The plant achieves a CHP efficiency and a net elec-tricity efficiency of 61 % and 27 %, respectively. Waste gasification takes place in a circulating fluidised bed reac-tor operated at 850–900 °C. As mentioned in Section 3.3, DFB reactors are also being studied increasingly for gas-ification. This type of reactor has been operated success-fully since 2001 in Güssing, Austria; with wood chips as feedstock, olivine as bed material and operating at tem-peratures between 850 °C and 900 °C (Fuchs et al., 2019; Karl and Pröll, 2018). The thermal power input of the plant is 8 MW, employed in an electric gas engine of 2 MW. An important success was achieved in 2007 when an adsorption-enhanced reforming (AER) test was carried out on the Güssing system, demonstrating its feasibility even with a power plant engineered for conventional gas-ification (Fuchs et al., 2019). The effectiveness of an ad-vanced gasifier concept, namely UNIQUE, has also been proven with the same plant (Heidenreich et al., 2016). UNIQUE consists of a compact solution based on the in-tegration of fluidised bed gasification and gas cleaning and conditioning directly into one vessel reactor. This is achieved by adding sorbents to the bed, to promote pri-mary tar reforming and the removal of inorganic com-pounds, and by installing catalytic filters in the freeboard, for combined secondary tar reduction and particulate re-moval.
As of 2004, Ebara Corporation had 21 processes oper-ating commercially in Germany and Japan. The technol-ogy is based on twin internally circulating fluidised bed gasifiers. It was designed incorporating ash vitrification
technology for the detoxification of waste, energy recov-ery and material recycling within an integrated and eco-nomical process. A large-capacity plant located in Aomori, Japan, has been in operation since 2000, and is based on gasification and slagging combustion. The pro-cess is able to handle 450 tpd of automotive shredder resi-dues (ASR) and sewage sludge, with a power output of 17.8 MWe (TwE, 2013). More recent information on Ebara technology could not be found by the authors.
High-pressure operation in fluidised beds is also possi-ble to favour the direct production of light hydrocarbons, including methane, in the syngas. A well-proven example of this is the high-temperature Winkler process (also known as HTW). The process is an evolution of the early steam/oxygen coal gasifier patented by Winkler in 1922, further developed in 1997 for applications in power gen-eration and the production of methanol (Leckner, 2016). More recently (in 2011), Thyssen-Krupp-Uhde, Germany, commercialised the technology. One of their projects in-volves the production of methanol from syngas, after bio-mass gasification. The HTW gasifier employed, located in Sweden, has a capacity of 111 MW (Leckner, 2016). An-other proven process which employs the HTW technology co-fires pure biomass with waste-derived fuels under pressure (at 30 bar). This enables a methane-in-syngas level of 8 % (dry basis) to be achieved (Adlhoch et al., 2000). A summary of other available gasification systems across the world using fluidised bed technologies is pre-sented in Table 4.
6. Fluidised bed reactors for biofuel synthesis
The role of fluidised bed reactors as applied to the ther-mal treatment of solid feedstock has been described in the previous sections. However, these technologies also have significant potential with regard to other processes in the thermochemical industry. For instance, in recent years many authors have been studying a range of techniques for the production of biofuels using fluidised beds, includ-ing biosubstitute natural gas (bioSNG), biohydrogen and other chemicals.
6.1 Biohydrogen production
Producing hydrogen from biomass and waste can be an interesting and environmentally friendly solution for use in district heating and transport sectors (Heidenreich et al., 2016). Although there are many methods to produce hydrogen, those most commonly used are based on fossil fuel reforming. For instance, 95 % of H2 production in the US is by way of the steam reforming of methane (Muradov, 2017).
Obtaining a hydrogen-rich syngas from gasification is a
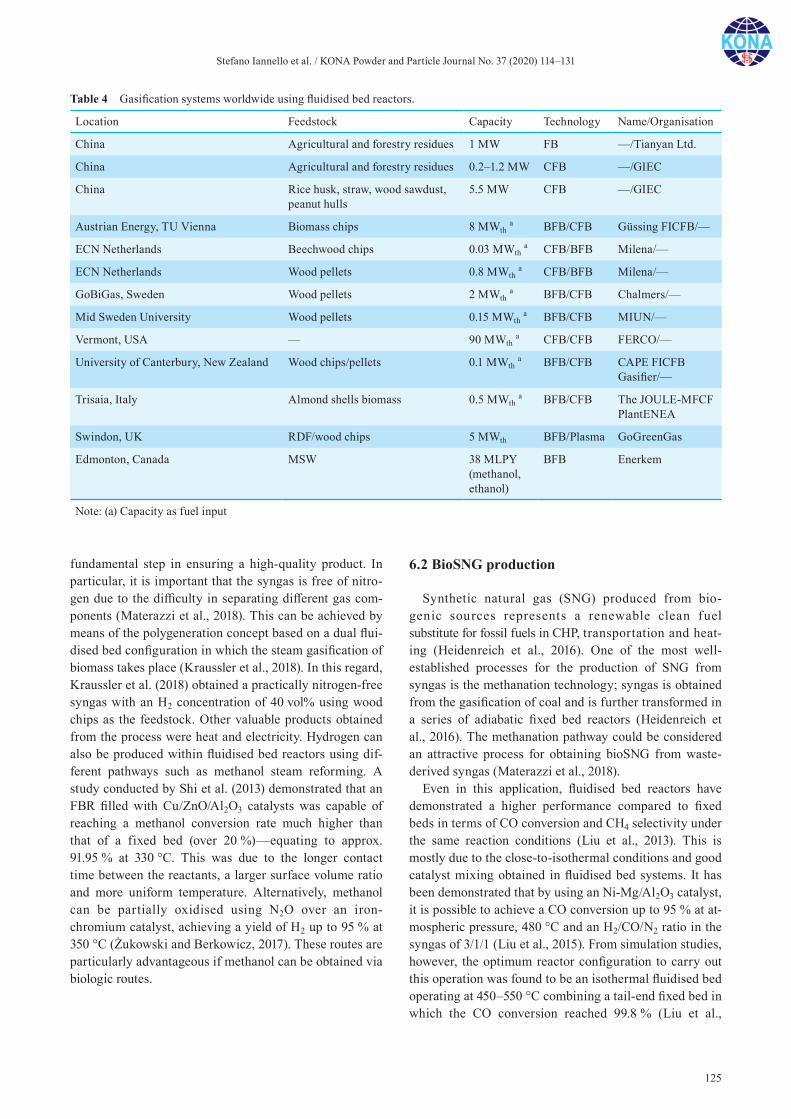
Stefano Iannello et al. / KONA Powder and Particle Journal No. 37 (2020) 114–131
125
fundamental step in ensuring a high-quality product. In particular, it is important that the syngas is free of nitro-gen due to the difficulty in separating different gas com-ponents (Materazzi et al., 2018). This can be achieved by means of the polygeneration concept based on a dual flui-dised bed configuration in which the steam gasification of biomass takes place (Kraussler et al., 2018). In this regard, Kraussler et al. (2018) obtained a practically nitrogen-free syngas with an H2 concentration of 40 vol% using wood chips as the feedstock. Other valuable products obtained from the process were heat and electricity. Hydrogen can also be produced within fluidised bed reactors using dif-ferent pathways such as methanol steam reforming. A study conducted by Shi et al. (2013) demonstrated that an FBR filled with Cu/ZnO/Al2O3 catalysts was capable of reaching a methanol conversion rate much higher than that of a fixed bed (over 20 %)—equating to approx. 91.95 % at 330 °C. This was due to the longer contact time between the reactants, a larger surface volume ratio and more uniform temperature. Alternatively, methanol can be partially oxidised using N2O over an iron- chromium catalyst, achieving a yield of H2 up to 95 % at 350 °C (Żukowski and Berkowicz, 2017). These routes are particularly advantageous if methanol can be obtained via biologic routes.
6.2 BioSNG production
Synthetic natural gas (SNG) produced from bio-genic sources represents a renewable clean fuel substitute for fossil fuels in CHP, transportation and heat-ing (Heidenreich et al., 2016). One of the most well- established processes for the production of SNG from syngas is the methanation technology; syngas is obtained from the gasification of coal and is further transformed in a series of adiabatic fixed bed reactors (Heidenreich et al., 2016). The methanation pathway could be considered an attractive process for obtaining bioSNG from waste- derived syngas (Materazzi et al., 2018).
Even in this application, fluidised bed reactors have demonstrated a higher performance compared to fixed beds in terms of CO conversion and CH4 selectivity under the same reaction conditions (Liu et al., 2013). This is mostly due to the close-to-isothermal conditions and good catalyst mixing obtained in fluidised bed systems. It has been demonstrated that by using an Ni-Mg/Al2O3 catalyst, it is possible to achieve a CO conversion up to 95 % at at-mospheric pressure, 480 °C and an H2/CO/N2 ratio in the syngas of 3/1/1 (Liu et al., 2015). From simulation studies, however, the optimum reactor configuration to carry out this operation was found to be an isothermal fluidised bed operating at 450–550 °C combining a tail-end fixed bed in which the CO conversion reached 99.8 % (Liu et al.,
Table 4 Gasification systems worldwide using fluidised bed reactors.
Location Feedstock Capacity Technology Name/Organisation
China Agricultural and forestry residues 1 MW FB —/Tianyan Ltd.
China Agricultural and forestry residues 0.2–1.2 MW CFB —/GIEC
China Rice husk, straw, wood sawdust, peanut hulls
5.5 MW CFB —/GIEC
Austrian Energy, TU Vienna Biomass chips 8 MWth a BFB/CFB Güssing FICFB/—
ECN Netherlands Beechwood chips 0.03 MWth a CFB/BFB Milena/—
ECN Netherlands Wood pellets 0.8 MWth a CFB/BFB Milena/—
GoBiGas, Sweden Wood pellets 2 MWth a BFB/CFB Chalmers/—
Mid Sweden University Wood pellets 0.15 MWth a BFB/CFB MIUN/—
Vermont, USA — 90 MWth a CFB/CFB FERCO/—
University of Canterbury, New Zealand Wood chips/pellets 0.1 MWth a BFB/CFB CAPE FICFB Gasifier/—
Trisaia, Italy Almond shells biomass 0.5 MWth a BFB/CFB The JOULE-MFCF PlantENEA
Swindon, UK RDF/wood chips 5 MWth BFB/Plasma GoGreenGas
Edmonton, Canada MSW 38 MLPY (methanol, ethanol)
BFB Enerkem
Note: (a) Capacity as fuel input
Stefano Iannello et al. / KONA Powder and Particle Journal No. 37 (2020) 114–131
126
2016). It also appears that the BFBs are more robust against C2–C3 contamination in the syngas, with a signifi-cantly lower carbon formation when compared to fixed beds (Kopyscinski et al., 2011).
The biological methanation of CO2 in fluidised beds is also being investigated for the production of bioSNG from multiple sources. For example, the catalytic direct meth-anation of carbon dioxide can be carried out in a BFB, reaching an average yield and concentration of CH4 equivalent to 96 % and 88 %, respectively. The results were obtained from experiments conducted in a biogas pilot plant in Zurich (Witte et al., 2019).
6.3 Liquid biofuels production
Similarly to bioSNG, liquid fuels such as Fischer- Tropsch diesel, biomethanol and bio-dimethyl ether (DME) are also gaining consideration as clean, drop-in replacements for fossil fuels.
Methanol can be obtained via the catalytic conversion of syngas from the fluidised bed gasification of both bio-mass (Liu et al., 2016) and waste (Iaquaniello et al., 2017). The plant in Edmonton run by Enerkem, Canada, is a commercially available example of methanol production from MSW (Arguin and Schubert, 2010). Methanol pro-duction is particularly relevant nowadays, not only be-cause the methanol market is rapidly expanding, but also because it represents an ideal chemical platform for the generation of other fuels including gasoline, olefins and kerosene (Ilias and Bhan, 2013). For example, fluidised beds are widely applied in methanol-to-gasoline (MTG) processes, operating by means of a ZSM-type zeolite cat-alyst, as demonstrated by Wang and Yuan (2014). They have shown that the temperature range of 410–430 °C en-sures a methanol conversion rate of 100 % and a gasoline yield up to 25 % at 410 °C (Wang and Yuan, 2014). Methanol-to-olefins (MTO) is another attractive process as these substances, mainly ethylene and propylene, are essential components in the chemical industry (Aghamohammadi and Haghighi, 2019). Producing light olefins (C2–C4) and clean fuels such as gasoline and mid-dle distillates from syngas is also possible via the Fischer-Tropsch synthesis (FTS). Kang et al. (2011) demonstrated that with iron-based catalysts in BFB reac-tors at 300 °C, it is possible to reach the highest product selectivity when compared to fixed bed reactors. The au-thors concluded that the best catalyst candidate was K/FeOx to obtain the highest yield of light olefins (i.e. up to 23 %) in the BFB reactor. In addition, recent studies demonstrate that by doping metal or metal oxides onto the ZSM-5 catalyst it is possible to produce aromatic species. This process is also known as methanol-to-aromatics (MTA). Laboratory trials have been carried out in a multi-stage fluidised bed system, allowing a stable yield of aro-
matics (at 62–66 %) to be reached (Chen et al., 2019).
7. Conclusions
In recent years, fluidised beds have been of special in-terest due to their potential as the central component in new thermochemical processes for utilising waste and biomass as sources of bioenergy and biorefinery products, notably in combustion, gasification and pyrolysis. This is because fluidised beds in all of their configurations offer a number of advantages over most other methods of hetero-geneous solid fuels processing. These include steady tem-peratures, high rates of heat transfer and good solids mobility. Disadvantages include the attrition of solids, particle losses by entrainment, limited reactor efficiency because of the gas bypassing, and several issues in scale-up and design due to the complexity of the involved processes. This is even more evident when problematic fuels like municipal solid waste or waste biomass have to be processed due to their heterogeneous nature and high ash and moisture content.
This review is representative of the activity worldwide in the field of thermochemical processes that see fluidised beds as the core technology for the effective transforma-tion of waste and biomass feedstocks. The application of fluidised beds for the catalytic synthesis of chemicals and biofuels is also briefly explored. Waste and biomass incin-eration is already widely applied commercially, while technologies for the conversion into biofuels or hydrogen are being gradually exploited, as shown in this paper. Al-though advanced technologies on lab and pilot scales have proven successful in many cases, they still struggle to be employed commercially due to competitive market factors that are beyond the scope of this review. It is expected that environmental policies and regulations will help the implementation of many sustainable technologies on a large scale in the coming years. Thus, the thermochemical processing of abundant and largely renewable sources like waste feedstock will play an essential role in shifting from fossil fuels to renewables quickly, economically and with low technological risk.
References
Adlhoch W., Sato H., Wolff J., Radtke K., High-temperature Winkler gasification of municipal solid waste, 2000 Gasification Technologies Conference, (2000) 15 pp. <globalsyngas.org/uploads/eventLibrary/Gtc00320.pdf> accessed 22082019.
Aghamohammadi S., Haghighi M., Spray-dried zeotype/clay nanocatalyst for methanol to light olefins in fluidized bed reactor: Comparison of active and non-active filler, Applied
Stefano Iannello et al. / KONA Powder and Particle Journal No. 37 (2020) 114–131
127
Clay Science, 170 (2019) 70–85. DOI: 10.1016/j.clay.2019. 01.006
Ahmad A.A., Zawawi N.A., Kasim F.H., Inayat A., Khasri A., Assessing the gasification performance of biomass: A review on biomass gasification process conditions, optimi-zation and economic evaluation, Renewable and Sustain-able Energy Reviews, 53 (2016) 1333–1347. DOI: 10.1016/j.rser.2015.09.030
Aho A., Kumar N., Lashkul A.V., Eränen K., Ziolek M., Decyk P., Salmi T., Holmbom B., Hupa M., Murzin D.Y., Catalytic upgrading of woody biomass derived pyrolysis vapours over iron modified zeolites in a dual-fluidized bed reactor, Fuel, 89 (2010) 1992–2000. DOI: 10.1016/j.fuel.2010.02.009
Al-Salem S.M., Lettieri P., Baeyens J., The valorization of plas-tic solid waste (PSW) by primary to quaternary routes: From re-use to energy and chemicals, Progress in Energy and Combustion Science, 36 (2010) 103–129. DOI: 10.1016/j.pecs.2009.09.001
Alauddin Z.A.B.Z., Lahijani P., Mohammadi M., Mohamed A.R., Gasification of lignocellulosic biomass in fluidized beds for renewable energy development: A review, Renew-able and Sustainable Energy Reviews, 14 (2010) 2852–2862. DOI: 10.1016/j.rser.2010.07.026
Almeida A., Neto P., Pereira I., Ribeiro A., Pilão R., Effect of temperature on the gasification of olive bagasse particles, Journal of the Energy Institute, 92 (2019) 153–160. DOI: 10.1016/j.joei.2017.10.012
Arena U., Process and technological aspects of municipal solid waste gasification. A review, Waste Management, 32 (2012) 625–639. DOI: 10.1016/j.wasman.2011.09.025
Arena U., Di Gregorio F., Amorese C., Mastellone M.L., A techno-economic comparison of fluidized bed gasification of two mixed plastic wastes, Waste Management, 31 (2011) 1494–1504. DOI: 10.1016/j.wasman.2011.02.004
Arena U., Di Gregorio F., Fluidized bed gasification of indus-trial solid recovered fuels, Waste Management, 50 (2016) 86–92. DOI: 10.1016/j.wasman.2016.02.011
Arguin D., Schubert J.W., Enerkem’s technology providing opportunities for cities: The Edmonton waste-to-biofuels project, in: 103rd Air and Waste Management Association Annual Conference and Exhibition 2010, (2010).
Barbuzza E., Buceti G., Pozio A., Santarelli M., Tosti S., Gasifi-cation of wood biomass with renewable hydrogen for the production of synthetic natural gas, Fuel, 242 (2019) 520–531. DOI: 10.1016/j.fuel.2019.01.079
Belgiorno V., De Feo G., Della Rocca C., Napoli R.M.A., Energy from gasification of solid wastes, Waste Manage-ment, 23 (2003) 1–15. DOI: 10.1016/S0956-053X(02) 00149-6
Benedikt F., Schmid J.C., Fuchs J., Mauerhofer A.M., Müller S., Hofbauer H., Fuel flexible gasification with an advanced 100 kW dual fluidized bed steam gasification pilot plant, Energy, 164 (2018) 329–343. DOI: 10.1016/j.energy. 2018.08.146
Bhavanam A., Sastry R., Biomass gasification processes in downd raft fixed bed reactors: A review, International Jour-nal of Chemical Engineering and Applications, 2 (2011) 425–433.
Brebu M., Ucar S., Vasile C., Yanik J., Co-pyrolysis of pine cone with synthetic polymers, Fuel, 89 (2010) 1911–1918. DOI: 10.1016/j.fuel.2010.01.029
Chen D., Yin L., Wang H., He P., Reprint of: Pyrolysis technol-ogies for municipal solid waste: A review, Waste Manage-ment, 37 (2015) 116–136. DOI: 10.1016/j.wasman.2015. 01.022
Chen Z., Hou Y., Yang Y., Cai D., Song W., Wang N., Qian W., A multi-stage fluidized bed strategy for the enhanced con-version of methanol into aromatics, Chemical Engineering Science, 204 (2019) 1–8. DOI: 10.1016/j.ces.2019.04.013
Corella J., Toledo J.M., Molina G., A review on dual fluid-ized-bed biomass gasifiers, Industrial and Engineering Chemistry Research, 46 (2007) 6831–6839. DOI: 10.1021/ie0705507
Dhyani V., Bhaskar T., A comprehensive review on the pyroly-sis of lignocellulosic biomass, Renewable Energy, 129 (2018) 695–716. DOI: 10.1016/j.renene.2017.04.035
Dong J., Tang Y., Nzihou A., Chi Y., Weiss-Hortala E., Ni M., Life cycle assessment of pyrolysis, gasification and inciner-ation waste-to-energy technologies: Theoretical analysis and case study of commercial plants, Science of the Total Environment, 626 (2018a) 744–753. DOI: 10.1016/j.scitotenv.2018.01.151
Dong J., Tang Y., Nzihou A., Chi Y., Weiss-Hortala E., Ni M., Zhou Z., Comparison of waste-to-energy technologies of gasification and incineration using life cycle assessment: Case studies in Finland, France and China, Journal of Cleaner Production, 203 (2018b) 287–300. DOI: 10.1016/j. jclepro.2018.08.139
Duanguppama K., Suwapaet N., Pattiya A., Fast pyrolysis of contaminated sawdust in a circulating fluidised bed reactor, Journal of Analytical and Applied Pyrolysis, 118 (2016) 63–74. DOI: 10.1016/j.jaap.2015.12.025
Fuchs J., Schmid J.C., Müller S., Hofbauer H., Dual fluidized bed gasification of biomass with selective carbon dioxide removal and limestone as bed material: A review, Renew-able and Sustainable Energy Reviews, 107 (2019) 212–231. DOI: 10.1016/j.rser.2019.03.013
Gómez-Barea A., Leckner B., Modeling of biomass gasification in fluidized bed, Progress in Energy and Combustion Sci-ence, 36 (2010) 444–509. DOI: 10.1016/j.pecs.2009.12.002
Han Z., Geng S., Zeng X., Xu S., An P., Cheng J., Yang J., Li F., Zhang S., Liu M., Guan G., Xu G., Reaction decoupling in thermochemical fuel conversion and technical progress based on decoupling using fluidized bed, Carbon Resources Conversion, 1 (2018) 109–125. DOI: 10.1016/j.crcon. 2018.06.003
Heidenreich S., Foscolo P.U., New concepts in biomass gasifica-tion, Progress in Energy and Combustion Science, 46 (2015) 72–95. DOI: 10.1016/j.pecs.2014.06.002
Heidenreich S., Müller M., Foscolo P.U., Advanced process integration, in: Advanced Biomass Gasification, Elsevier, 2016, pp. 18–54. DOI: 10.1016/B978-0-12-804296-0. 00004-X
Hofbauer H., Materazzi M., Waste gasification processes for SNG production, in: Substitute Natural Gas from Waste, Elsevier, 2019, pp. 105–160. DOI: 10.1016/B978-0-12-
Stefano Iannello et al. / KONA Powder and Particle Journal No. 37 (2020) 114–131
128
815554-7.00007-6Hofbauer H., Rauch R., Stoichiometric water consumption of
steam gasification by the ficfb-gasification process, Prog-ress in Thermochemical Biomass Conversion, (2008) 199–208. DOI: 10.1002/9780470694954.ch14
Hu J., Yu F., Lu Y., Application of Fischer–Tropsch synthesis in biomass to liquid conversion, Catalysts, 2 (2012) 303–326. DOI: 10.3390/catal2020303
Iaquaniello G., Centi G., Salladini A., Palo E., Perathoner S., Spadaccini L., Waste-to-methanol: Process and economics assessment, Bioresource Technology, 243 (2017) 611–619. DOI: 10.1016/j.biortech.2017.06.172
Ilias S., Bhan A., Mechanism of the catalytic conversion of methanol to hydrocarbons, ACS Catalysis, 3 (2013) 18–31. DOI: 10.1021/cs3006583
Kamble A.D., Saxena V.K., Chavan P.D., Mendhe V.A., Co- gasification of coal and biomass an emerging clean energy technology: Status and prospects of development in Indian context, International Journal of Mining Science and Tech-nology, 29 (2019) 171–186. DOI: 10.1016/j.ijmst.2018.03.011
Kaminsky W., The Hamburg fluidized-bed pyrolysis process to recycle polymer wastes and tires, in: Scheirs J., Scheirs J., Kaminsky W. (Eds.), Feedstock Recycling and Pyrolysis of Waste Plastics: Converting Waste Plastics into Diesel and Other Fuels, John Wiley & Sons, Ltd, 2006, pp. 475–491. DOI: 10.1002/0470021543.ch17
Kang S.H., Bae J.W., Cheon J.Y., Lee Y.J., Ha K.S., Jun K.W., Lee D.H., Kim B.W., Catalytic performance on iron-based Fischer-Tropsch catalyst in fixed-bed and bubbling fluidized -bed reactor, Applied Catalysis B: Environmental, 103 (2011) 169–180. DOI: 10.1016/j.apcatb.2011.01.024
Karl J., Pröll T., Steam gasification of biomass in dual fluidized bed gasifiers: A review, Renewable and Sustainable Energy Reviews, 98 (2018) 64–78. DOI: 10.1016/j.rser.2018.09.010
Kinoshita C.M., Wang Y., Zhou J., Tar formation under different biomass gasification conditions, Journal of Analytical and Applied Pyrolysis, 29 (1994) 169–181. DOI: 10.1016/0165-2370(94)00796-9
Kolbitsch P., Pröll T., Bolhar-Nordenkampf J., Hofbauer H., Design of a chemical looping combustor using a dual circu-lating fluidized bed reactor system, Chemical Engineering and Technology, 32 (2009) 398–403. DOI: 10.1002/ceat. 200800378
Koppatz S., Pfeifer C., Hofbauer H., Comparison of the perfor-mance behaviour of silica sand and olivine in a dual flui-dised bed reactor system for steam gasification of biomass at pilot plant scale, Chemical Engineering Journal, 175 (2011) 468–483. DOI: 10.1016/j.cej.2011.09.071
Kopyscinski J., Schildhauer T.J., Biollaz S.M.A., Methanation in a fluidized bed reactor with high initial CO partial pres-sure: Part II—Modeling and sensitivity study, Chemical Engineering Science, 66 (2011) 1612–1621. DOI: 10.1016/j.ces.2010.12.029
Kraussler M., Binder M., Schindler P., Hofbauer H., Hydrogen production within a polygeneration concept based on dual fluidized bed biomass steam gasification, Biomass and Bio-energy, 111 (2018) 320–329. DOI: 10.1016/j.biombioe. 2016.12.008
Kunii D., Levenspiel O., Fluidization Engineering (Second Edi-tion), Butterworth-Heinemann, 1991, ISBN: 9780080506647.
Kwon E.E., Kim S., Lee J., Pyrolysis of waste feedstocks in CO2 for effective energy recovery and waste treatment, Journal of CO2 Utilization, 31 (2019) 173–180. DOI: 10.1016/j.jcou.2019.03.015
La Villetta M., Costa M., Massarotti N., Modelling approaches to biomass gasification: A review with emphasis on the stoichiometric method, Renewable and Sustainable Energy Reviews, 74 (2017) 71–88. DOI: 10.1016/j.rser.2017.02.027
Lancee R.J., Dugulan A.I., Thüne P.C., Veringa H.J., Niemantsverdriet J.W., Fredriksson H.O.A., Chemical loop-ing capabilities of olivine, used as a catalyst in indirect bio-mass gasification, Applied Catalysis B: Environmental, 145 (2014) 216–222. DOI: 10.1016/j.apcatb.2013.01.041
Lausselet C., Cherubini F., del Alamo Serrano G., Becidan M., Strømman A.H., Life-cycle assessment of a Waste-to- Energy plant in central Norway: Current situation and effects of changes in waste fraction composition, Waste Management, 58 (2016) 191–201. DOI: 10.1016/j.wasman. 2016.09.014
Leckner B., Process aspects in combustion and gasification Waste-to-Energy (WtE) units, Waste Management, 37 (2015) 13–25. DOI: 10.1016/j.wasman.2014.04.019
Leckner B., Developments in fluidized bed conversion of solid fuels, Thermal Science, 20 (2016) S1–S18. DOI: 10.2298/TSCI150703135L
Li Y., Sheng K., Chen J., Wu Y., Zhang F., Chang Y., Wu H., Fu J., Zhang L., Wei W., Regulation of PGE2 signaling path-ways and TNF-alpha signaling pathways on the function of bone marrow-derived dendritic cells and the effects of CP-25, European Journal of Pharmacology, 769 (2015) 8–21. DOI: 10.1016/j.ejphar.2015.09.036
Liu J., Cui D., Yao C., Yu J., Su F., Xu G., Syngas methanation in fluidized bed for an advanced two-stage process of SNG production, Fuel Processing Technology, 141 (2016) 130–137. DOI: 10.1016/j.fuproc.2015.03.016
Liu J., Cui D., Yu J., Su F., Xu G., Performance characteristics of fluidized bed syngas methanation over Ni-Mg/Al2O3 cat-alyst, Chinese Journal of Chemical Engineering, 23 (2015) 86–92. DOI: 10.1016/j.cjche.2014.09.038
Liu J., Shen W., Cui D., Yu J., Su F., Xu G., Syngas methanation for substitute natural gas over Ni-Mg/Al2O3 catalyst in fixed and fluidized bed reactors, Catalysis Communica-tions, 38 (2013) 35–39. DOI: 10.1016/j.catcom.2013.04.014
Liu Z., Peng W., Motahari-Nezhad M., Shahraki S., Beheshti M., Circulating fluidized bed gasification of biomass for flexible end-use of syngas: A micro and nano scale study for production of bio-methanol, Journal of Cleaner Produc-tion, 129 (2016) 249–255. DOI: 10.1016/j.jclepro.2016. 04.076
Lu J.W., Zhang S., Hai J., Lei M., Status and perspectives of municipal solid waste incineration in China: A comparison with developed regions, Waste Management, 69 (2017) 170–186. DOI: 10.1016/j.wasman.2017.04.014
Lu T., Li K.-Z., Zhang R., Bi J.-C., Addition of ash to prevent agglomeration during catalytic coal gasification in a pres-surized fluidized bed, Fuel Processing Technology, 134
Stefano Iannello et al. / KONA Powder and Particle Journal No. 37 (2020) 114–131
129
(2015) 414–423. DOI: 10.1016/j.fuproc.2015.02.024Ly H.V., Lim D.-H., Sim J.W., Kim S.-S., Kim J., Catalytic
pyrolysis of tulip tree (Liriodendron) in bubbling fluid-ized-bed reactor for upgrading bio-oil using dolomite cata-lyst, Energy, 162 (2018) 564–575. DOI: 10.1016/j.energy.2018.08.001
Lyngfelt A., Chemical-looping combustion of solid fuels—Sta-tus of development, Applied Energy, 113 (2014) 1869–1873. DOI: 10.1016/j.apenergy.2013.05.043
Lyngfelt A., Leckner B., A 1000 MWth boiler for chemi-cal-looping combustion of solid fuels—Discussion of design and costs, Applied Energy, 157 (2015) 475–487. DOI: 10.1016/j.apenergy.2015.04.057
Lyngfelt A., Linderholm C., Chemical-Looping Combustion of Solid Fuels—Status and Recent Progress, Energy Procedia, 114 (2017) 371–386. DOI: 10.1016/j.egypro.2017.03.1179
Makarichi L., Jutidamrongphan W., Techato K. anan, The evo-lution of waste-to-energy incineration: A review, Renew-able and Sustainable Energy Reviews, 91 (2018) 812–821. DOI: 10.1016/j.rser.2018.04.088
Masnadi M.S., Grace J.R., Bi X.T., Lim C.J., Ellis N., From fos-sil fuels towards renewables: Inhibitory and catalytic effects on carbon thermochemical conversion during co- gasification of biomass with fossil fuels, Applied Energy, 140 (2015) 196–209. DOI: 10.1016/j.apenergy.2014.12.006
Materazzi M., Gasification of waste derived fuels in fluidized beds: Fundamental aspects and industrial challenges, in: Clean Energy from Waste, Springer Theses, 2017, pp. 19–63. DOI: 10.1007/978-3-319-46870-9_2
Materazzi M., Lettieri P., Fluidized Beds for the Thermochemi-cal Processing of Waste, in: Reference Module in Chemis-try, Molecular Sciences and Chemical Engineering, 2017. DOI: 10.1016/B978-0-12-409547-2.12180-8
Materazzi M., Lettieri P., Mazzei L., Taylor R., Chapman C., Thermodynamic modelling and evaluation of a two-stage thermal process for waste gasification, Fuel, 108 (2013) 356–369. DOI: 10.1016/j.fuel.2013.02.037
Materazzi M., Lettieri P., Mazzei L., Taylor R., Chapman C., Reforming of tars and organic sulphur compounds in a plasma-assisted process for waste gasification, Fuel Pro-cessing Technology, (2015). DOI: 10.1016/j.fuproc.2015. 03.007
Materazzi M., Lettieri P., Taylor R., Chapman C., Performance analysis of RDF gasification in a two stage fluidized bed-plasma process, Waste Management, 47 (2016) 256–266. DOI: 10.1016/j.wasman.2015.06.016
Materazzi M., Taylor R., Cozens P., Manson-Whitton C., Pro-duction of BioSNG from waste derived syngas: Pilot plant operation and preliminary assessment, Waste Management, 79 (2018) 752–762. DOI: 10.1016/j.wasman.2018.08.031
Matsakas L., Gao Q., Jansson S., Rova U., Christakopoulos P., Green conversion of municipal solid wastes into fuels and chemicals, Electronic Journal of Biotechnology, 26 (2017) 69–83. DOI: 10.1016/j.ejbt.2017.01.004
Mattisson T., Keller M., Linderholm C., Moldenhauer P., Rydén M., Leion H., Lyngfelt A., Chemical-looping technologies using circulating fluidized bed systems: Status of develop-ment, Fuel Processing Technology, 172 (2018) 1–12. DOI:
10.1016/j.fuproc.2017.11.016Mazaheri N., Akbarzadeh A.H., Madadian E., Lefsrud M., Sys-
tematic review of research guidelines for numerical simula-tion of biomass gasification for bioenergy production, Energy Conversion and Management, 183 (2019) 671–688. DOI: 10.1016/j.enconman.2018.12.097
Molino A., Chianese S., Musmarra D., Biomass gasification technology: The state of the art overview, Journal of Energy Chemistry, 25 (2016) 10–25. DOI: 10.1016/j.jechem. 2015.11.005
Motta I.L., Miranda N.T., Maciel Filho R., Wolf Maciel M.R., Biomass gasification in fluidized beds: A review of biomass moisture content and operating pressure effects, Renewable and Sustainable Energy Reviews, 94 (2018) 998–1023. DOI: 10.1016/j.rser.2018.06.042
Muradov N., Low to near-zero CO2 production of hydrogen from fossil fuels: Status and perspectives, International Journal of Hydrogen Energy, 42 (2017) 14058–14088. DOI: 10.1016/j.ijhydene.2017.04.101
Nie F., Meng T., Zhang Q., Pyrolysis of Low-Rank Coal: From Research to Practice, in: Pyrolysis, InTech, 2017. DOI: 10.5772/67498
Paisley M.A., Overend R.P., Verification of the performance of future energy resources’ silvagas® biomass gasifier—Oper-ating experience in the vermont gasifier, Pittsburgh Coal Conference, 3 (2002).
Panepinto D., Tedesco V., Brizio E., Genon G., Environmental performances and energy efficiency for MSW gasification treatment, Waste and Biomass Valorization, 6 (2014) 123–135. DOI: 10.1007/s12649-014-9322-7
Pans M.A., Abad A., De Diego L.F., García-Labiano F., Gayán P., Adánez J., Optimization of H2 production with CO2 cap-ture by steam reforming of methane integrated with a chemical-looping combustion system, International Journal of Hydrogen Energy, 38 (2013) 11878–11892. DOI: 10.1016/j.ijhydene.2013.06.114
Perkins G., Bhaskar T., Konarova M., Process development sta-tus of fast pyrolysis technologies for the manufacture of renewable transport fuels from biomass, Renewable and Sustainable Energy Reviews, 90 (2018) 292–315. DOI: 10.1016/j.rser.2018.03.048
Puig-Arnavat M., Bruno J.C., Coronas A., Review and analysis of biomass gasification models, Renewable and Sustainable Energy Reviews, 14 (2010) 2841–2851. DOI: 10.1016/j.rser.2010.07.030
Puig-Arnavat M., Bruno J.C., Coronas A., Modified thermody-namic equilibrium model for biomass gasification: A study of the influence of operating conditions, Energy and Fuels, 26 (2012) 1385–1394. DOI: 10.1021/ef2019462
Ramos A., Monteiro E., Silva V., Rouboa A., Co-gasification and recent developments on waste-to-energy conversion: A review, Renewable and Sustainable Energy Reviews, 81 (2018) 380–398. DOI: 10.1016/j.rser.2017.07.025
Recycling Technologies (web site), <recyclingtechnologies.co.uk/> accessed 02.08.2019.
Safarian S., Unnþórsson R., Richter C., A review of biomass gasification modelling, Renewable and Sustainable Energy Reviews, 110 (2019) 378–391. DOI: 10.1016/j.rser.2019.
Stefano Iannello et al. / KONA Powder and Particle Journal No. 37 (2020) 114–131
130
05.003Safdari M.-S., Amini E., Weise D.R., Fletcher T.H., Heating
rate and temperature effects on pyrolysis products from live wildland fuels, Fuel, 242 (2019) 295–304. DOI: 10.1016/j.fuel.2019.01.040
Salatino P., Solimene R., Mixing and segregation in fluidized bed thermochemical conversion of biomass, Powder Tech-nology, 316 (2017) 29–40. DOI: 10.1016/j.powtec.2016. 11.058
Samiran N.A., Jaafar M.N.M., Ng J.H., Lam S.S., Chong C.T., Progress in biomass gasification technique—With focus on Malaysian palm biomass for syngas production, Renewable and Sustainable Energy Reviews, 62 (2016) 1047–1062. DOI: 10.1016/j.rser.2016.04.049
Sharifzadeh M., Sadeqzadeh M., Guo M., Borhani T.N., Murthy Konda N.V.S.N., Garcia M.C., Wang L., Hallett J., Shah N., The multi-scale challenges of biomass fast pyrolysis and bio-oil upgrading: Review of the state of art and future research directions, Progress in Energy and Combustion Science, 71 (2019) 1–80. DOI: 10.1016/j.pecs.2018.10.006
Shen L., Gao Y., Xiao J., Simulation of hydrogen production from biomass gasification in interconnected fluidized beds, Biomass and Bioenergy, 32 (2008) 120–127. DOI: 10.1016/j.biombioe.2007.08.002
Shi Y., Du X., Yang L., Sun Y., Yang Y., Experiments on hydro-gen production from methanol steam reforming in fluidized bed reactor, International Journal of Hydrogen Energy, 38 (2013) 13974–13981. DOI: 10.1016/j.ijhydene.2013.08.073
Siedlecki M., de Jong W., Verkooijen A.H.M., Fluidized bed gasification as a mature and reliable technology for the pro-duction of bio-syngas and applied in the production of liq-uid transportation fuels-a review, Energies, 4 (2011) 389–434. DOI: 10.3390/en4030389
Stollhof M., Penthor S., Mayer K., Hofbauer H., Fluid dynamic evaluation of a 10 MW scale reactor design for chemical looping combustion of gaseous fuels, Chemical Engineer-ing Science, 178 (2018) 48–60. DOI: 10.1016/j.ces.2017. 12.015
Suzuki Y., Namioka T., Gasification of woody biomass by a cir-culating fluidized bed gasifier using porous particles, Boira Kenkyu, 332 (2005) 40–49.
TwE (Talent with Energy), Gasification Technologies Review, prepared by Talent with Energy Pty Ltd. for the City of Sydney’s Advanced Waste Treatment Master Plan, 2013. <vdocuments.site/review-gasification.html> accessed 22.08.2019
Teixeira E.R., Camões A., Branco F.G., Valorisation of wood fly ash on concrete, Resources, Conservation and Recycling, 145 (2019) 292–310. DOI: 10.1016/j.resconrec.2019.02.028
Thunman H., Seemann M., Berdugo Vilches T., Maric J., Pallares D., Ström H., Berndes G., Knutsson P., Larsson A., Breitholtz C., Santos O., Advanced biofuel production via gasification—lessons learned from 200 man-years of research activity with Chalmers’ research gasifier and the GoBiGas demonstration plant, Energy Science & Engineer-ing, 6 (2018) 6–34. DOI: 10.1002/ese3.188
Ud Din Z., Zainal Z.A., Biomass integrated gasification-SOFC systems: Technology overview, Renewable and Sustainable
Energy Reviews, 53 (2016) 1356–1376. DOI: 10.1016/j.rser.2015.09.013
Udomsirichakorn J., Basu P., Abdul Salam P., Acharya B., CaO-based chemical looping gasification of biomass for hydro-gen-enriched gas production with in situ CO2 capture and tar reduction, Fuel Processing Technology, 127 (2014) 7–12. DOI: 10.1016/j.fuproc.2014.06.007
Uzoejinwa B.B., He X., Wang S., El-Fatah Abomohra A., Hu Y., Wang Q., Co-pyrolysis of biomass and waste plastics as a thermochemical conversion technology for high-grade bio-fuel production: Recent progress and future directions else-where worldwide, Energy Conversion and Management, 163 (2018) 468–492. DOI: 10.1016/j.enconman.2018.02.004
Valin S., Ravel S., Pons de Vincent P., Thiery S., Miller H., Flu-idized bed air gasification of solid recovered fuel and woody biomass: Influence of experimental conditions on product gas and pollutant release, Fuel, 242 (2019) 664–672. DOI: 10.1016/j.fuel.2019.01.094
Van der Drift A., Van der Meijden C., Boerrigter H., MILENA gasification technology for high efficient SNG production from biomass, 14th European Biomass Conference & Exhi-bition, (2005) 17–21.
Van der Meijden C.M., Veringa H.J., Rabou L.P.L.M., The pro-duction of synthetic natural gas (SNG): A comparison of three wood gasification systems for energy balance and overall efficiency, Biomass and Bioenergy, 34 (2010) 302–311. DOI: 10.1016/j.biombioe.2009.11.001
Venderbosch R.H., A critical view on catalytic pyrolysis of bio-mass, ChemSusChem, 8 (2015) 1306–1316. DOI: 10.1002/cssc.201500115
Wang Y., Yuan F., The basic study of methanol to gasoline in a pilot-scale fluidized bed reactor, Journal of Industrial and Engineering Chemistry, 20 (2014) 1016–1021. DOI: 10.1016/j.jiec.2013.06.037
Whitty K.J., Zhang H.R., Eddings E.G., Emissions from Syngas Combustion, Combustion Science and Technology, 180 (2008) 1117–1136. DOI: 10.1080/00102200801963326
Wissing F., Wirtz S., Scherer V., Simulating municipal solid waste incineration with a DEM/CFD method—Influences of waste properties, grate and furnace design, Fuel, 206 (2017) 638–656. DOI: 10.1016/j.fuel.2017.06.037
Witte J., Calbry-Muzyka A., Wieseler T., Hottinger P., Biollaz S.M.A., Schildhauer T.J., Demonstrating direct methana-tion of real biogas in a fluidised bed reactor, Applied Energy, 240 (2019) 359–371. DOI: 10.1016/j.apenergy.2019. 01.230
Xu G., Murakami T., Suda T., Matsuzawa Y., Tani H., Gasifica-tion of coffee grounds in dual fluidized bed: Performance evaluation and parametric investigation, Energy and Fuels, 20 (2006) 2695–2704. DOI: 10.1021/ef060120d
Yates J.G., Lettieri P., Fluidized-Bed Reactors: Processes and Operating Conditions, Springer International Publishing, Cham, 2016. DOI: 10.1007/978-3-319-39593-7
Zhou L., Wang Y., Huang Q., Cai J., Thermogravimetric char-acteristics and kinetic of plastic and biomass blends co-py-rolysis, Fuel Processing Technology, 87 (2006) 963–969. DOI: 10.1016/j.fuproc.2006.07.002
Zhou Z.Q., Ma L.L., Yin X.L., Wu C.Z., Huang L.C., Wang C.,
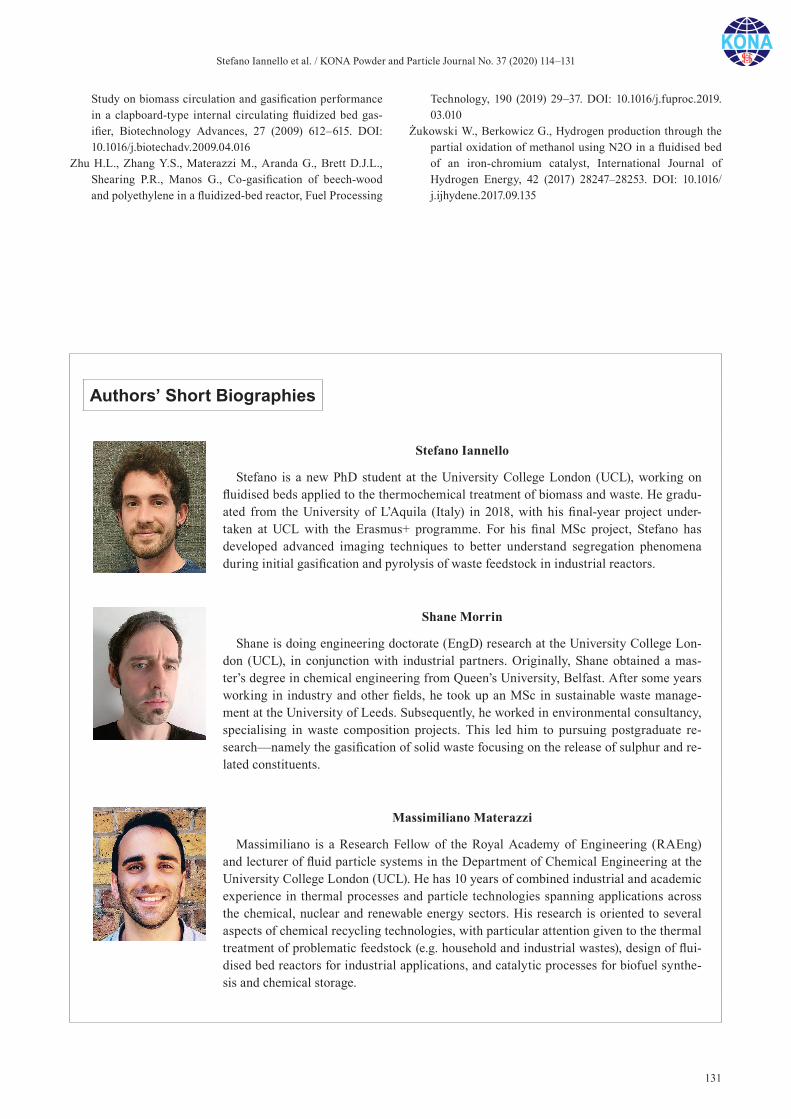
Stefano Iannello et al. / KONA Powder and Particle Journal No. 37 (2020) 114–131
131
Study on biomass circulation and gasification performance in a clapboard-type internal circulating fluidized bed gas-ifier, Biotechnology Advances, 27 (2009) 612–615. DOI: 10.1016/j.biotechadv.2009.04.016
Zhu H.L., Zhang Y.S., Materazzi M., Aranda G., Brett D.J.L., Shearing P.R., Manos G., Co-gasification of beech-wood and polyethylene in a fluidized-bed reactor, Fuel Processing
Technology, 190 (2019) 29–37. DOI: 10.1016/j.fuproc.2019. 03.010
Żukowski W., Berkowicz G., Hydrogen production through the partial oxidation of methanol using N2O in a fluidised bed of an iron-chromium catalyst, International Journal of Hydrogen Energy, 42 (2017) 28247–28253. DOI: 10.1016/j.ijhydene.2017.09.135
Authors’ Short Biographies
Stefano Iannello
Stefano is a new PhD student at the University College London (UCL), working on fluidised beds applied to the thermochemical treatment of biomass and waste. He gradu-ated from the University of L’Aquila (Italy) in 2018, with his final-year project under-taken at UCL with the Erasmus+ programme. For his final MSc project, Stefano has developed advanced imaging techniques to better understand segregation phenomena during initial gasification and pyrolysis of waste feedstock in industrial reactors.
Shane Morrin
Shane is doing engineering doctorate (EngD) research at the University College Lon-don (UCL), in conjunction with industrial partners. Originally, Shane obtained a mas-ter’s degree in chemical engineering from Queen’s University, Belfast. After some years working in industry and other fields, he took up an MSc in sustainable waste manage-ment at the University of Leeds. Subsequently, he worked in environmental consultancy, specialising in waste composition projects. This led him to pursuing postgraduate re-search—namely the gasification of solid waste focusing on the release of sulphur and re-lated constituents.
Massimiliano Materazzi
Massimiliano is a Research Fellow of the Royal Academy of Engineering (RAEng) and lecturer of fluid particle systems in the Department of Chemical Engineering at the University College London (UCL). He has 10 years of combined industrial and academic experience in thermal processes and particle technologies spanning applications across the chemical, nuclear and renewable energy sectors. His research is oriented to several aspects of chemical recycling technologies, with particular attention given to the thermal treatment of problematic feedstock (e.g. household and industrial wastes), design of flui-dised bed reactors for industrial applications, and catalytic processes for biofuel synthe-sis and chemical storage.
KONA Powder and Particle Journal No. 37 (2020) 132–144/Doi:10.14356/kona.2020017 Review Paper
132Copyright © 2020 The Authors. Published by Hosokawa Powder Technology Foundation. This is an open ac-cess article under the CC BY license (http://creativecommons.org/licenses/by/4.0/).
Recent Progress on Mesh-free Particle Methods for Simulations of Multi-phase Flows: A Review †
Mikio Sakai 1*, Yuki Mori 2, Xiaosong Sun 1 and Kazuya Takabatake 2
1 Resilience Engineering Research Center, School of Engineering, The University of Tokyo, Japan2 Department of Nuclear Engineering and Management, School of Engineering, The University of Tokyo, Japan
AbstractThe discrete element method (DEM) and the moving particle semi-implicit (MPS) method are the most popular mesh-free particle methods in the discontinuum and continuum. This paper describes a state-of-the-art modeling on multi-phase flows using these mesh-free particle methods. Herein, a combinational model of the signed distance function (SDF) and immersed boundary method (IBM) is introduced for an arbitrary-shaped wall boundary in the DEM simulation. Practically, this model uses a simple operation to create the wall boundary. Although the SDF is a scalar field for the wall boundary of the DEM, it is useful for the wall boundary of the CFD through combination with the IBM. Validation tests are carried out to demonstrate the adequacy of the SDF/IBM wall boundary model. Regarding the mesh-free particle method for continuum, the phase change problem is one of the challenging topics, as the solid state is usually modeled by extremely high viscous fluid in the phase change simulation. The phase change simulation is shown to be efficiently performed through an implicit algorithm and a heat flux model in the MPS method. The adequacy of these models is verified by the numerical examples.
Keywords: mesh-free particle method, discrete element method, DEM-CFD method, signed distance functions, immersed boundary method, moving particle semi-implicit method
1. Introduction
The discrete element method (DEM) (Cundall and Strack, 1979), the smoothed particle hydrodynamics (SPH) (Monaghan, 1994) and the moving particle semi-implicit (MPS) method (Koshizuka and Oka, 1996) are well known as a mesh-free particle methods for simu-lations of multi-phase flows. Although they require differ-ent targets, these methods are capable of easily simulating the violent motion of the media. The DEM, for instance, has been employed for simulating discontinuum as in the case of granular media and is known to inevitably and easily introduce inter-particle force. Consequently, the DEM can introduce cohesive forces, such as van der Waals force (Sakai et al., 2012) and liquid bridge force (Dhenge et al., 2013; Tsunazawa et al., 2016; Chan and Washino, 2018; Schmelzle and Nirschl, 2018; Sun and Sakai, 2018; Sakai et al., 2019). Very recently, modeling of the particle shape has been extensively studied in the
DEM (Zhou et al., 2011; Govender et al., 2019; Kafashan et al., 2019; Nie et al., 2019; Shrestha et al., 2019; Yang et al., 2019). In contrast, the continuum media have been simulated using the SPH and the MPS methods, which have been consistently employed in the computation of free surface fluid flows, such as droplet impingement (Xiong et al., 2010, 2011), free surface fluid flow through porous media (Sun et al., 2019), discharge of highly vis-cous fluid flow (Sun et al., 2012), and wave migration (Shibata et al., 2011). Hence, the mesh-free particle meth-ods make it possible to simulate complex multi-phase flow systems. From the background, this article highlights a discussion on the recent progress of these mesh-free par-ticle methods from the numerical simulation viewpoint of multi-phase flows.
Regarding the multi-phase flows involving solid parti-cles, the DEM–CFD method (Tsuji et al., 1993) has been widely employed, e.g., a fluidized bed (Sakai et al., 2010, 2014; Yue et al., 2019), a pneumatic conveyor (Klinzing, 2018), and a particle filtration technology (Kanaoka, 2019). With this method, the local volume average tech-nique (Anderson and Jackson, 1967) has been introduced into the governing equations for the fluid phase. More-over, staggered grids are usually employed in the fluid flow calculation, where the grid size is sufficiently larger
† Received 24 June 2019; Accepted 18 August 2019 J-STAGE Advance published online 12 October 20191,2 7-3-1 Hongo, Bunkyo-ku, Tokyo 113-8656, Japan* Corresponding author; Mikio Sakai; E-mail: [email protected] TEL: +81-3-5842-6977 FAX: +81-3-5842-6977
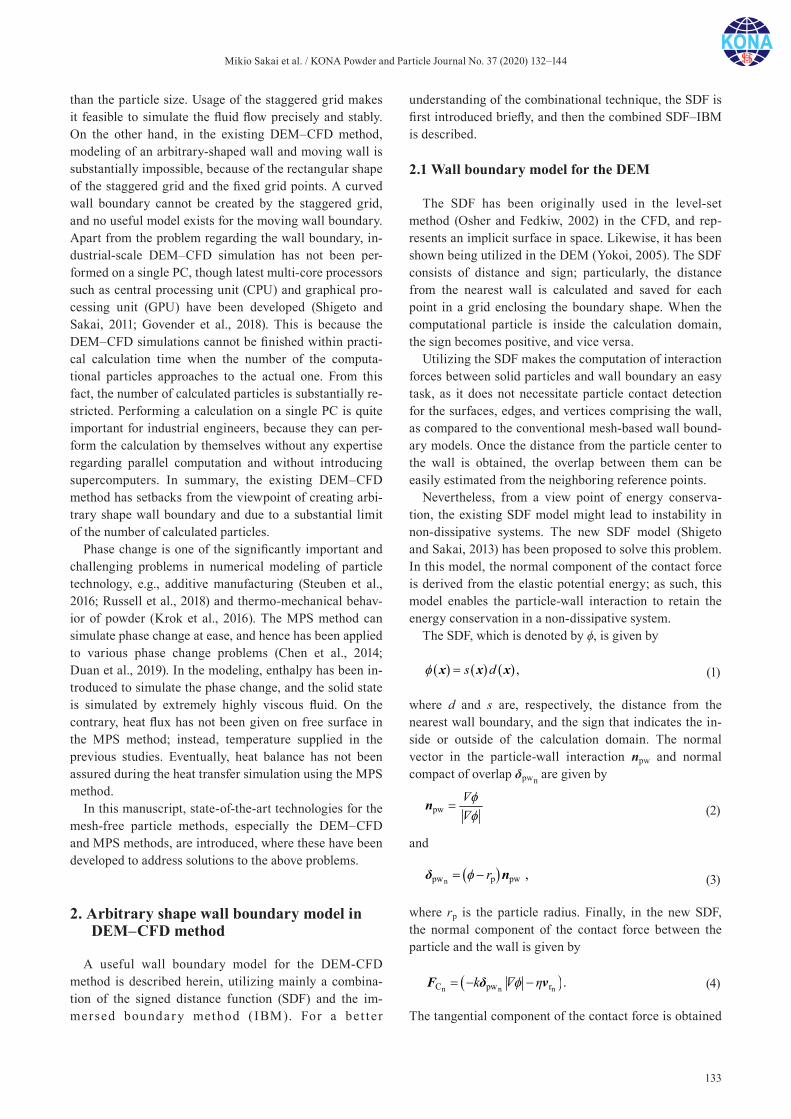
Mikio Sakai et al. / KONA Powder and Particle Journal No. 37 (2020) 132–144
133
than the particle size. Usage of the staggered grid makes it feasible to simulate the fluid flow precisely and stably. On the other hand, in the existing DEM–CFD method, modeling of an arbitrary-shaped wall and moving wall is substantially impossible, because of the rectangular shape of the staggered grid and the fixed grid points. A curved wall boundary cannot be created by the staggered grid, and no useful model exists for the moving wall boundary. Apart from the problem regarding the wall boundary, in-dustrial-scale DEM–CFD simulation has not been per-formed on a single PC, though latest multi-core processors such as central processing unit (CPU) and graphical pro-cessing unit (GPU) have been developed (Shigeto and Sakai, 2011; Govender et al., 2018). This is because the DEM–CFD simulations cannot be finished within practi-cal calculation time when the number of the computa-tional particles approaches to the actual one. From this fact, the number of calculated particles is substantially re-stricted. Performing a calculation on a single PC is quite important for industrial engineers, because they can per-form the calculation by themselves without any expertise regarding parallel computation and without introducing supercomputers. In summary, the existing DEM–CFD method has setbacks from the viewpoint of creating arbi-trary shape wall boundary and due to a substantial limit of the number of calculated particles.
Phase change is one of the significantly important and challenging problems in numerical modeling of particle technology, e.g., additive manufacturing (Steuben et al., 2016; Russell et al., 2018) and thermo-mechanical behav-ior of powder (Krok et al., 2016). The MPS method can simulate phase change at ease, and hence has been applied to various phase change problems (Chen et al., 2014; Duan et al., 2019). In the modeling, enthalpy has been in-troduced to simulate the phase change, and the solid state is simulated by extremely highly viscous fluid. On the contrary, heat flux has not been given on free surface in the MPS method; instead, temperature supplied in the previous studies. Eventually, heat balance has not been assured during the heat transfer simulation using the MPS method.
In this manuscript, state-of-the-art technologies for the mesh-free particle methods, especially the DEM–CFD and MPS methods, are introduced, where these have been developed to address solutions to the above problems.
2. Arbitrary shape wall boundary model in DEM–CFD method
A useful wall boundary model for the DEM-CFD method is described herein, utilizing mainly a combina-tion of the signed distance function (SDF) and the im-mersed boundar y method ( IBM). For a bet ter
understanding of the combinational technique, the SDF is first introduced briefly, and then the combined SDF–IBM is described.
2.1 Wall boundary model for the DEM
The SDF has been originally used in the level-set method (Osher and Fedkiw, 2002) in the CFD, and rep-resents an implicit surface in space. Likewise, it has been shown being utilized in the DEM (Yokoi, 2005). The SDF consists of distance and sign; particularly, the distance from the nearest wall is calculated and saved for each point in a grid enclosing the boundary shape. When the computational particle is inside the calculation domain, the sign becomes positive, and vice versa.
Utilizing the SDF makes the computation of interaction forces between solid particles and wall boundary an easy task, as it does not necessitate particle contact detection for the surfaces, edges, and vertices comprising the wall, as compared to the conventional mesh-based wall bound-ary models. Once the distance from the particle center to the wall is obtained, the overlap between them can be easily estimated from the neighboring reference points.
Nevertheless, from a view point of energy conserva-tion, the existing SDF model might lead to instability in non-dissipative systems. The new SDF model (Shigeto and Sakai, 2013) has been proposed to solve this problem. In this model, the normal component of the contact force is derived from the elastic potential energy; as such, this model enables the particle-wall interaction to retain the energy conservation in a non-dissipative system.
The SDF, which is denoted by ϕ, is given by
,s d x x x
(1)
where d and s are, respectively, the distance from the nearest wall boundary, and the sign that indicates the in-side or outside of the calculation domain. The normal vector in the particle-wall interaction npw and normal compact of overlap δpwn are given by
pw
n
(2)
and
npw p pw ,r δ n
(3)
where rp is the particle radius. Finally, in the new SDF, the normal component of the contact force between the particle and the wall is given by
n n nC pw r .k F δ v
(4)
The tangential component of the contact force is obtained
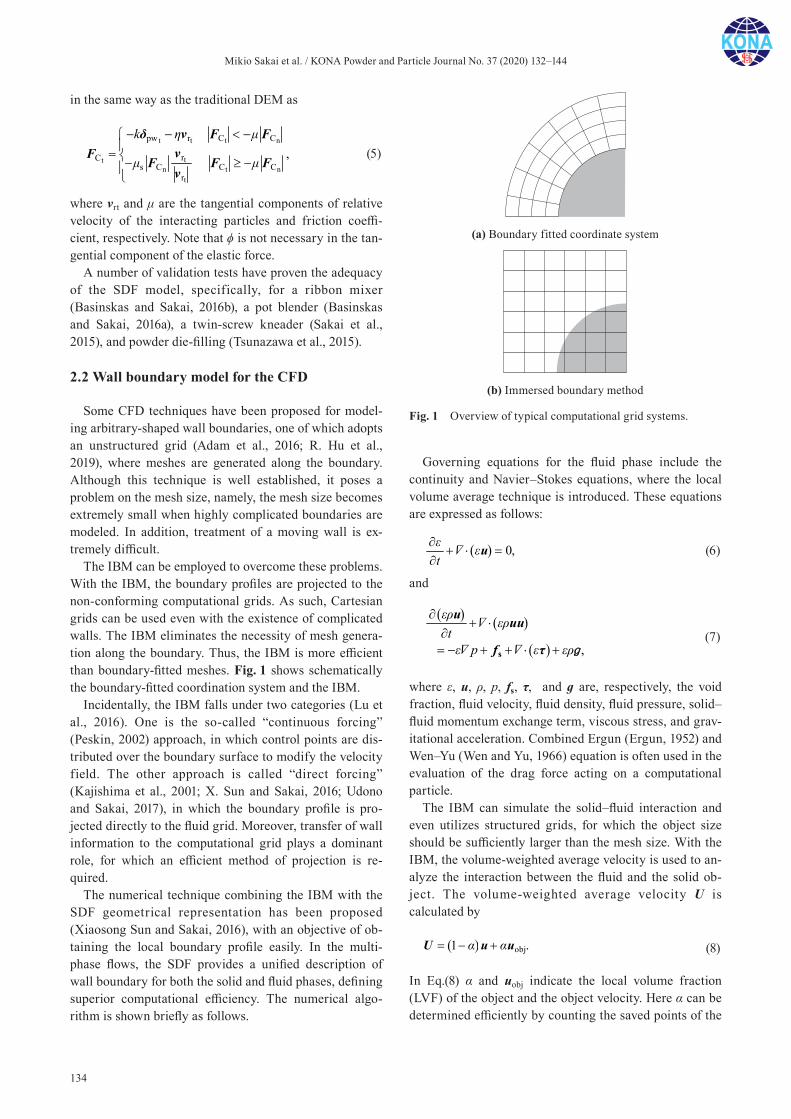
Mikio Sakai et al. / KONA Powder and Particle Journal No. 37 (2020) 132–144
134
in the same way as the traditional DEM as
t t t n
ttn t n
t
pw r C C
rCs C C C
r
,
k
δ v F FvF
F F Fv
(5)
where vrt and μ are the tangential components of relative velocity of the interacting particles and friction coeffi-cient, respectively. Note that ϕ is not necessary in the tan-gential component of the elastic force.
A number of validation tests have proven the adequacy of the SDF model, specifically, for a ribbon mixer (Basinskas and Sakai, 2016b), a pot blender (Basinskas and Sakai, 2016a), a twin-screw kneader (Sakai et al., 2015), and powder die-filling (Tsunazawa et al., 2015).
2.2 Wall boundary model for the CFD
Some CFD techniques have been proposed for model-ing arbitrary-shaped wall boundaries, one of which adopts an unstructured grid (Adam et al., 2016; R. Hu et al., 2019), where meshes are generated along the boundary. Although this technique is well established, it poses a problem on the mesh size, namely, the mesh size becomes extremely small when highly complicated boundaries are modeled. In addition, treatment of a moving wall is ex-tremely difficult.
The IBM can be employed to overcome these problems. With the IBM, the boundary profiles are projected to the non-conforming computational grids. As such, Cartesian grids can be used even with the existence of complicated walls. The IBM eliminates the necessity of mesh genera-tion along the boundary. Thus, the IBM is more efficient than boundary-fitted meshes. Fig. 1 shows schematically the boundary-fitted coordination system and the IBM.
Incidentally, the IBM falls under two categories (Lu et al., 2016). One is the so-called “continuous forcing” (Peskin, 2002) approach, in which control points are dis-tributed over the boundary surface to modify the velocity field. The other approach is called “direct forcing” (Kajishima et al., 2001; X. Sun and Sakai, 2016; Udono and Sakai, 2017), in which the boundary profile is pro-jected directly to the fluid grid. Moreover, transfer of wall information to the computational grid plays a dominant role, for which an efficient method of projection is re-quired.
The numerical technique combining the IBM with the SDF geometrical representation has been proposed (Xiaosong Sun and Sakai, 2016), with an objective of ob-taining the local boundary profile easily. In the multi-phase flows, the SDF provides a unified description of wall boundary for both the solid and fluid phases, defining superior computational efficiency. The numerical algo-rithm is shown briefly as follows.
Governing equations for the fluid phase include the continuity and Navier–Stokes equations, where the local volume average technique is introduced. These equations are expressed as follows:
0,t
u
(6)
and
, t
p
s
u uu
f τ ɡ
(7)
where ε, u, ρ, p, fs, τ, and ɡ are, respectively, the void fraction, fluid velocity, fluid density, fluid pressure, solid–fluid momentum exchange term, viscous stress, and grav-itational acceleration. Combined Ergun (Ergun, 1952) and Wen–Yu (Wen and Yu, 1966) equation is often used in the evaluation of the drag force acting on a computational particle.
The IBM can simulate the solid–fluid interaction and even utilizes structured grids, for which the object size should be sufficiently larger than the mesh size. With the IBM, the volume-weighted average velocity is used to an-alyze the interaction between the fluid and the solid ob-ject. The volume-weighted average velocity U is calculated by
obj1 . U u u
(8)
In Eq.(8) α and uobj indicate the local volume fraction (LVF) of the object and the object velocity. Here α can be determined efficiently by counting the saved points of the
Fig. 1 Overview of typical computational grid systems.
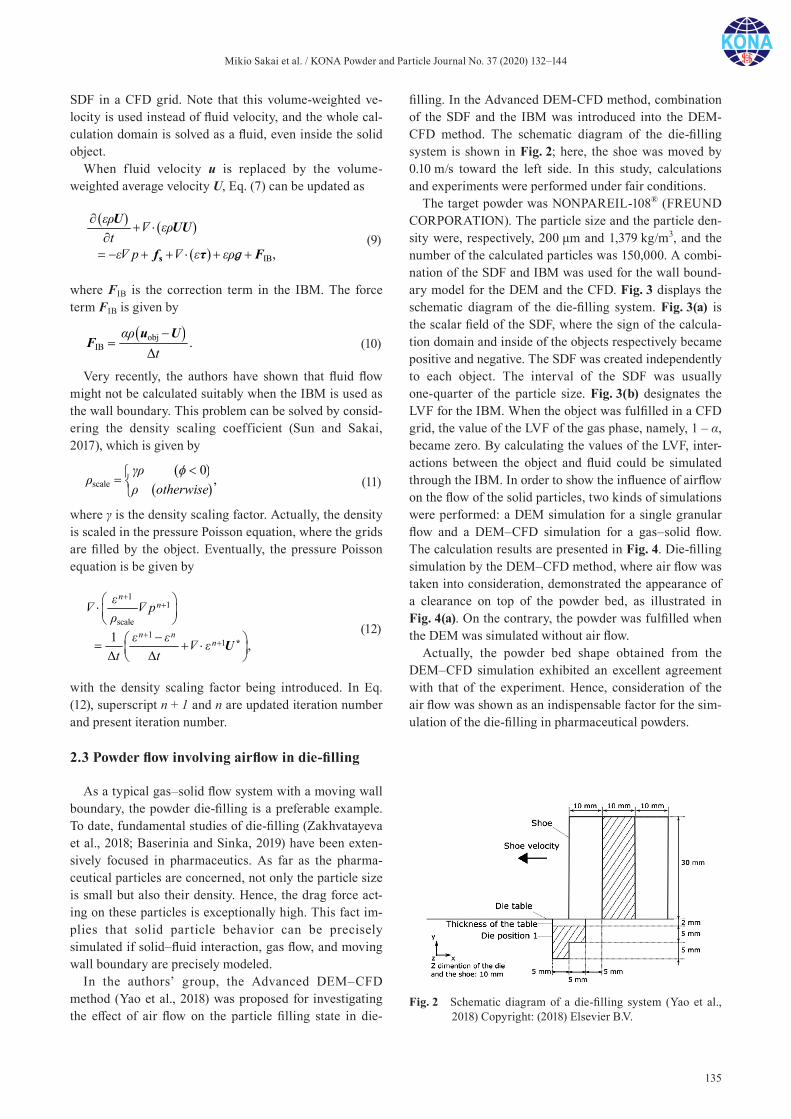
Mikio Sakai et al. / KONA Powder and Particle Journal No. 37 (2020) 132–144
135
SDF in a CFD grid. Note that this volume-weighted ve-locity is used instead of fluid velocity, and the whole cal-culation domain is solved as a fluid, even inside the solid object.
When fluid velocity u is replaced by the volume- weighted average velocity U, Eq. (7) can be updated as
IB , t
p
s
U UU
f τ Fɡ
(9)
where FIB is the correction term in the IBM. The force term FIB is given by
objIB .
Δt
u U
F
(10)
Very recently, the authors have shown that fluid flow might not be calculated suitably when the IBM is used as the wall boundary. This problem can be solved by consid-ering the density scaling coefficient (Sun and Sakai, 2017), which is given by
scale
0,
otherwise
(11)
where γ is the density scaling factor. Actually, the density is scaled in the pressure Poisson equation, where the grids are filled by the object. Eventually, the pressure Poisson equation is be given by
11
scale1
11 ,Δ Δ
nn
n nn
p
t t
*U
(12)
with the density scaling factor being introduced. In Eq. (12), superscript n + 1 and n are updated iteration number and present iteration number.
2.3 Powder flow involving airflow in die-filling
As a typical gas–solid flow system with a moving wall boundary, the powder die-filling is a preferable example. To date, fundamental studies of die-filling (Zakhvatayeva et al., 2018; Baserinia and Sinka, 2019) have been exten-sively focused in pharmaceutics. As far as the pharma-ceutical particles are concerned, not only the particle size is small but also their density. Hence, the drag force act-ing on these particles is exceptionally high. This fact im-plies that solid particle behavior can be precisely simulated if solid–fluid interaction, gas flow, and moving wall boundary are precisely modeled.
In the authors’ group, the Advanced DEM–CFD method (Yao et al., 2018) was proposed for investigating the effect of air flow on the particle filling state in die-
filling. In the Advanced DEM-CFD method, combination of the SDF and the IBM was introduced into the DEM-CFD method. The schematic diagram of the die-filling system is shown in Fig. 2; here, the shoe was moved by 0.10 m/s toward the left side. In this study, calculations and experiments were performed under fair conditions.
The target powder was NONPAREIL-108® (FREUND CORPORATION). The particle size and the particle den-sity were, respectively, 200 μm and 1,379 kg/m3, and the number of the calculated particles was 150,000. A combi-nation of the SDF and IBM was used for the wall bound-ary model for the DEM and the CFD. Fig. 3 displays the schematic diagram of the die-filling system. Fig. 3(a) is the scalar field of the SDF, where the sign of the calcula-tion domain and inside of the objects respectively became positive and negative. The SDF was created independently to each object. The interval of the SDF was usually one-quarter of the particle size. Fig. 3(b) designates the LVF for the IBM. When the object was fulfilled in a CFD grid, the value of the LVF of the gas phase, namely, 1 – α, became zero. By calculating the values of the LVF, inter-actions between the object and fluid could be simulated through the IBM. In order to show the influence of airflow on the flow of the solid particles, two kinds of simulations were performed: a DEM simulation for a single granular flow and a DEM–CFD simulation for a gas–solid flow. The calculation results are presented in Fig. 4. Die-filling simulation by the DEM–CFD method, where air flow was taken into consideration, demonstrated the appearance of a clearance on top of the powder bed, as illustrated in Fig. 4(a). On the contrary, the powder was fulfilled when the DEM was simulated without air flow.
Actually, the powder bed shape obtained from the DEM–CFD simulation exhibited an excellent agreement with that of the experiment. Hence, consideration of the air flow was shown as an indispensable factor for the sim-ulation of the die-filling in pharmaceutical powders.
Fig. 2 Schematic diagram of a die-filling system (Yao et al., 2018) Copyright: (2018) Elsevier B.V.
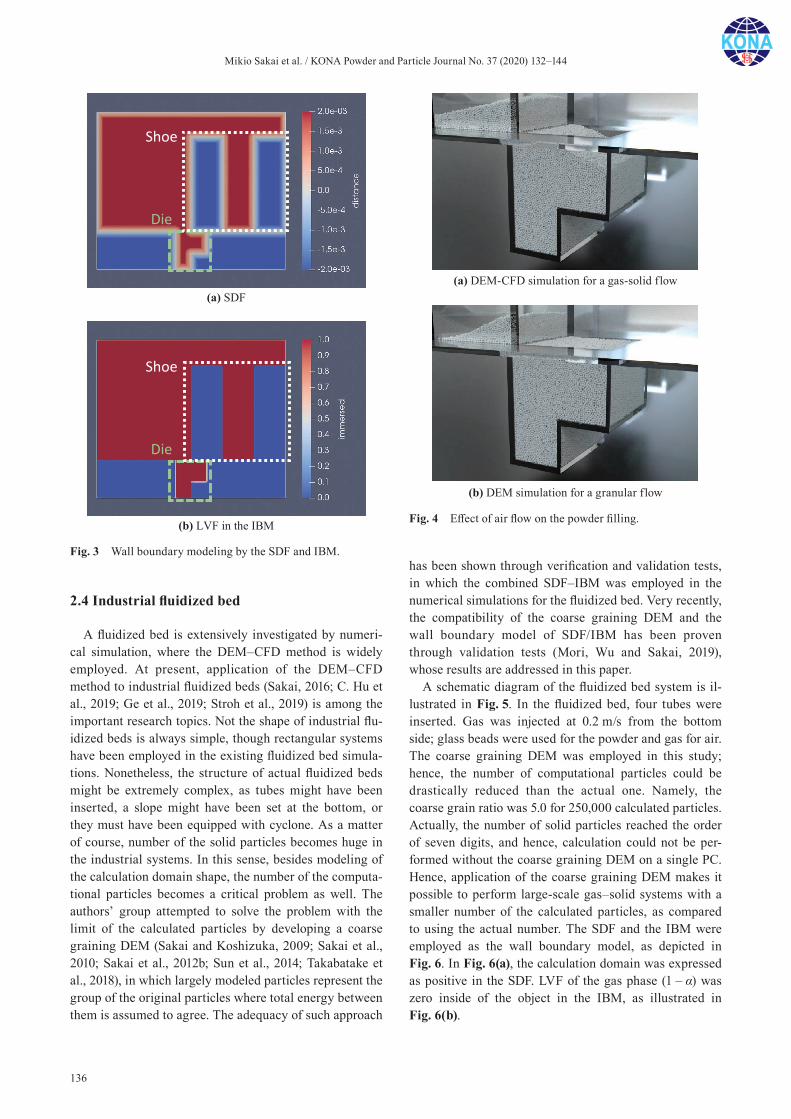
Mikio Sakai et al. / KONA Powder and Particle Journal No. 37 (2020) 132–144
136
2.4 Industrial fluidized bed
A fluidized bed is extensively investigated by numeri-cal simulation, where the DEM–CFD method is widely employed. At present, application of the DEM–CFD method to industrial fluidized beds (Sakai, 2016; C. Hu et al., 2019; Ge et al., 2019; Stroh et al., 2019) is among the important research topics. Not the shape of industrial flu-idized beds is always simple, though rectangular systems have been employed in the existing fluidized bed simula-tions. Nonetheless, the structure of actual fluidized beds might be extremely complex, as tubes might have been inserted, a slope might have been set at the bottom, or they must have been equipped with cyclone. As a matter of course, number of the solid particles becomes huge in the industrial systems. In this sense, besides modeling of the calculation domain shape, the number of the computa-tional particles becomes a critical problem as well. The authors’ group attempted to solve the problem with the limit of the calculated particles by developing a coarse graining DEM (Sakai and Koshizuka, 2009; Sakai et al., 2010; Sakai et al., 2012b; Sun et al., 2014; Takabatake et al., 2018), in which largely modeled particles represent the group of the original particles where total energy between them is assumed to agree. The adequacy of such approach
has been shown through verification and validation tests, in which the combined SDF–IBM was employed in the numerical simulations for the fluidized bed. Very recently, the compatibility of the coarse graining DEM and the wall boundary model of SDF/IBM has been proven through validation tests (Mori, Wu and Sakai, 2019), whose results are addressed in this paper.
A schematic diagram of the fluidized bed system is il-lustrated in Fig. 5. In the fluidized bed, four tubes were inserted. Gas was injected at 0.2 m/s from the bottom side; glass beads were used for the powder and gas for air. The coarse graining DEM was employed in this study; hence, the number of computational particles could be drastically reduced than the actual one. Namely, the coarse grain ratio was 5.0 for 250,000 calculated particles. Actually, the number of solid particles reached the order of seven digits, and hence, calculation could not be per-formed without the coarse graining DEM on a single PC. Hence, application of the coarse graining DEM makes it possible to perform large-scale gas–solid systems with a smaller number of the calculated particles, as compared to using the actual number. The SDF and the IBM were employed as the wall boundary model, as depicted in Fig. 6. In Fig. 6(a), the calculation domain was expressed as positive in the SDF. LVF of the gas phase (1 – α) was zero inside of the object in the IBM, as illustrated in Fig. 6(b).
Fig. 3 Wall boundary modeling by the SDF and IBM.
Fig. 4 Effect of air flow on the powder filling.
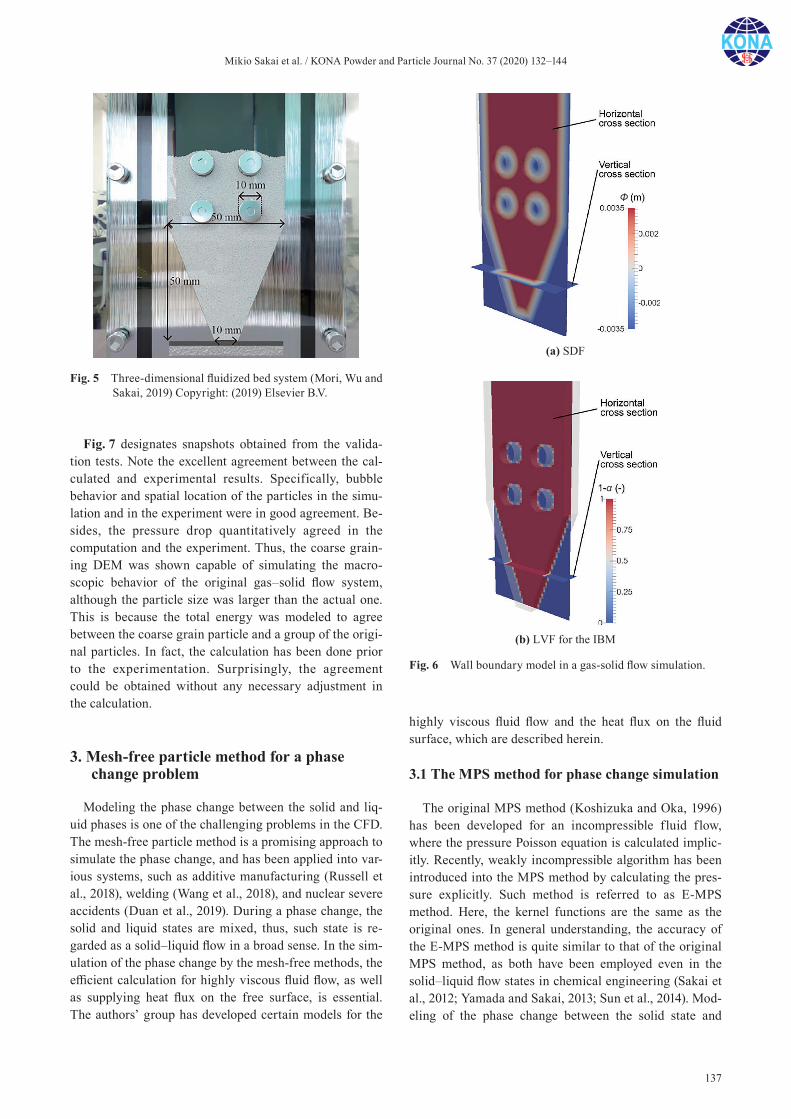
Mikio Sakai et al. / KONA Powder and Particle Journal No. 37 (2020) 132–144
137
Fig. 7 designates snapshots obtained from the valida-tion tests. Note the excellent agreement between the cal-culated and experimental results. Specifically, bubble behavior and spatial location of the particles in the simu-lation and in the experiment were in good agreement. Be-sides, the pressure drop quantitatively agreed in the computation and the experiment. Thus, the coarse grain-ing DEM was shown capable of simulating the macro-scopic behavior of the original gas–solid flow system, although the particle size was larger than the actual one. This is because the total energy was modeled to agree between the coarse grain particle and a group of the origi-nal particles. In fact, the calculation has been done prior to the experimentation. Surprisingly, the agreement could be obtained without any necessary adjustment in the calculation.
3. Mesh-free particle method for a phase change problem
Modeling the phase change between the solid and liq-uid phases is one of the challenging problems in the CFD. The mesh-free particle method is a promising approach to simulate the phase change, and has been applied into var-ious systems, such as additive manufacturing (Russell et al., 2018), welding (Wang et al., 2018), and nuclear severe accidents (Duan et al., 2019). During a phase change, the solid and liquid states are mixed, thus, such state is re-garded as a solid–liquid flow in a broad sense. In the sim-ulation of the phase change by the mesh-free methods, the efficient calculation for highly viscous fluid flow, as well as supplying heat flux on the free surface, is essential. The authors’ group has developed certain models for the
highly viscous fluid flow and the heat flux on the fluid surface, which are described herein.
3.1 The MPS method for phase change simulation
The original MPS method (Koshizuka and Oka, 1996) has been developed for an incompressible fluid flow, where the pressure Poisson equation is calculated implic-itly. Recently, weakly incompressible algorithm has been introduced into the MPS method by calculating the pres-sure explicitly. Such method is referred to as E-MPS method. Here, the kernel functions are the same as the original ones. In general understanding, the accuracy of the E-MPS method is quite similar to that of the original MPS method, as both have been employed even in the solid–liquid flow states in chemical engineering (Sakai et al., 2012; Yamada and Sakai, 2013; Sun et al., 2014). Mod-eling of the phase change between the solid state and
Fig. 5 Three-dimensional fluidized bed system (Mori, Wu and Sakai, 2019) Copyright: (2019) Elsevier B.V.
Fig. 6 Wall boundary model in a gas-solid flow simulation.
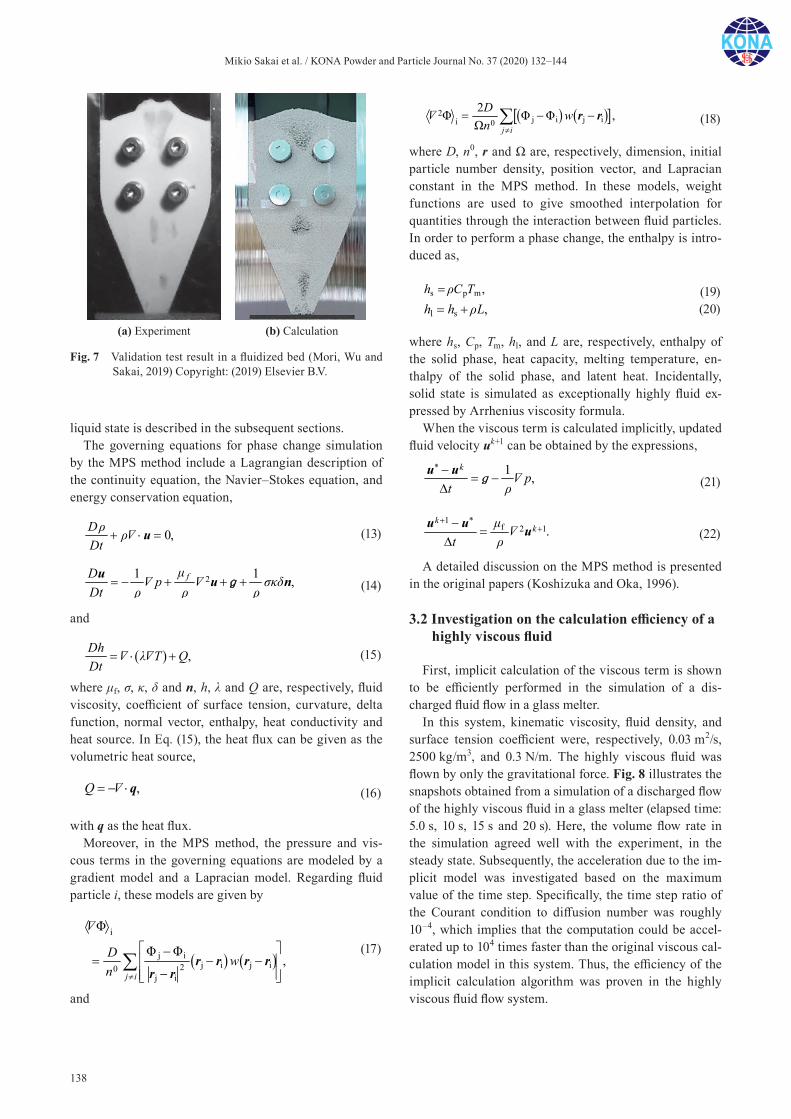
Mikio Sakai et al. / KONA Powder and Particle Journal No. 37 (2020) 132–144
138
liquid state is described in the subsequent sections.The governing equations for phase change simulation
by the MPS method include a Lagrangian description of the continuity equation, the Navier–Stokes equation, and energy conservation equation,
0,DDt
u
(13)
21 1 ,fD pDt
u u nɡ
(14)
and
,Dh T QDt
(15)
where μf, σ, κ, δ and n, h, λ and Q are, respectively, fluid viscosity, coefficient of surface tension, curvature, delta function, normal vector, enthalpy, heat conductivity and heat source. In Eq. (15), the heat flux can be given as the volumetric heat source,
,Q q
(16)
with q as the heat flux.Moreover, in the MPS method, the pressure and vis-
cous terms in the governing equations are modeled by a gradient model and a Lapracian model. Regarding fluid particle i, these models are given by
i
j ij i j i20
j i
Φ,
Φ
Φ
j i
D wn
r r r r
r r
(17)
and
2j i j ii 0
2Φ Φ Φ ,Ω j i
D wn
r r
(18)
where D, n0, r and Ω are, respectively, dimension, initial particle number density, position vector, and Lapracian constant in the MPS method. In these models, weight functions are used to give smoothed interpolation for quantities through the interaction between fluid particles. In order to perform a phase change, the enthalpy is intro-duced as,
s p m ,h C T
(19)l s ,h h L
(20)
where hs, Cp, Tm, hl, and L are, respectively, enthalpy of the solid phase, heat capacity, melting temperature, en-thalpy of the solid phase, and latent heat. Incidentally, solid state is simulated as exceptionally highly fluid ex-pressed by Arrhenius viscosity formula.
When the viscous term is calculated implicitly, updated fluid velocity uk+1 can be obtained by the expressions,
* 1 ,k
pt
u u
ɡ
(21)
1 *f 2 1.
kk
t
u u u (22)
A detailed discussion on the MPS method is presented in the original papers (Koshizuka and Oka, 1996).
3.2 Investigation on the calculation efficiency of a highly viscous fluid
First, implicit calculation of the viscous term is shown to be efficiently performed in the simulation of a dis-charged fluid flow in a glass melter.
In this system, kinematic viscosity, fluid density, and surface tension coefficient were, respectively, 0.03 m2/s, 2500 kg/m3, and 0.3 N/m. The highly viscous fluid was flown by only the gravitational force. Fig. 8 illustrates the snapshots obtained from a simulation of a discharged flow of the highly viscous fluid in a glass melter (elapsed time: 5.0 s, 10 s, 15 s and 20 s). Here, the volume flow rate in the simulation agreed well with the experiment, in the steady state. Subsequently, the acceleration due to the im-plicit model was investigated based on the maximum value of the time step. Specifically, the time step ratio of the Courant condition to diffusion number was roughly 10–4, which implies that the computation could be accel-erated up to 104 times faster than the original viscous cal-culation model in this system. Thus, the efficiency of the implicit calculation algorithm was proven in the highly viscous fluid flow system.
Fig. 7 Validation test result in a fluidized bed (Mori, Wu and Sakai, 2019) Copyright: (2019) Elsevier B.V.
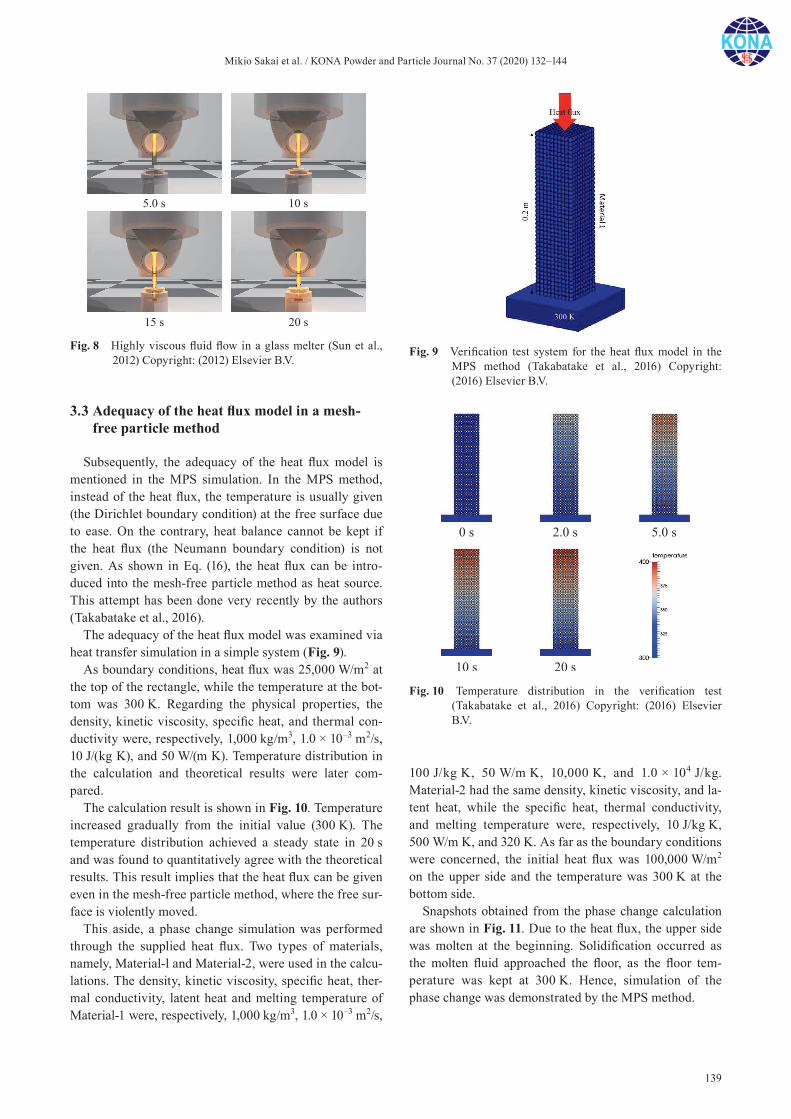
Mikio Sakai et al. / KONA Powder and Particle Journal No. 37 (2020) 132–144
139
3.3 Adequacy of the heat flux model in a mesh-free particle method
Subsequently, the adequacy of the heat flux model is mentioned in the MPS simulation. In the MPS method, instead of the heat flux, the temperature is usually given (the Dirichlet boundary condition) at the free surface due to ease. On the contrary, heat balance cannot be kept if the heat flux (the Neumann boundary condition) is not given. As shown in Eq. (16), the heat flux can be intro-duced into the mesh-free particle method as heat source. This attempt has been done very recently by the authors (Takabatake et al., 2016).
The adequacy of the heat flux model was examined via heat transfer simulation in a simple system (Fig. 9).
As boundary conditions, heat flux was 25,000 W/m2 at the top of the rectangle, while the temperature at the bot-tom was 300 K. Regarding the physical properties, the density, kinetic viscosity, specific heat, and thermal con-ductivity were, respectively, 1,000 kg/m3, 1.0 × 10⁻³ m2/s, 10 J/(kg K), and 50 W/(m K). Temperature distribution in the calculation and theoretical results were later com-pared.
The calculation result is shown in Fig. 10. Temperature increased gradually from the initial value (300 K). The temperature distribution achieved a steady state in 20 s and was found to quantitatively agree with the theoretical results. This result implies that the heat flux can be given even in the mesh-free particle method, where the free sur-face is violently moved.
This aside, a phase change simulation was performed through the supplied heat flux. Two types of materials, namely, Material-l and Material-2, were used in the calcu-lations. The density, kinetic viscosity, specific heat, ther-mal conductivity, latent heat and melting temperature of Material-1 were, respectively, 1,000 kg/m3, 1.0 × 10⁻³ m2/s,
100 J/kg K, 50 W/m K, 10,000 K, and 1.0 × 10⁴ J/kg. Material-2 had the same density, kinetic viscosity, and la-tent heat, while the specific heat, thermal conductivity, and melting temperature were, respectively, 10 J/kg K, 500 W/m K, and 320 K. As far as the boundary conditions were concerned, the initial heat flux was 100,000 W/m2 on the upper side and the temperature was 300 K at the bottom side.
Snapshots obtained from the phase change calculation are shown in Fig. 11. Due to the heat flux, the upper side was molten at the beginning. Solidification occurred as the molten fluid approached the floor, as the floor tem-perature was kept at 300 K. Hence, simulation of the phase change was demonstrated by the MPS method.
Fig. 8 Highly viscous fluid flow in a glass melter (Sun et al., 2012) Copyright: (2012) Elsevier B.V.
Fig. 9 Verification test system for the heat flux model in the MPS method (Takabatake et al., 2016) Copyright: (2016) Elsevier B.V.
Fig. 10 Temperature distribution in the verification test (Takabatake et al., 2016) Copyright: (2016) Elsevier B.V.
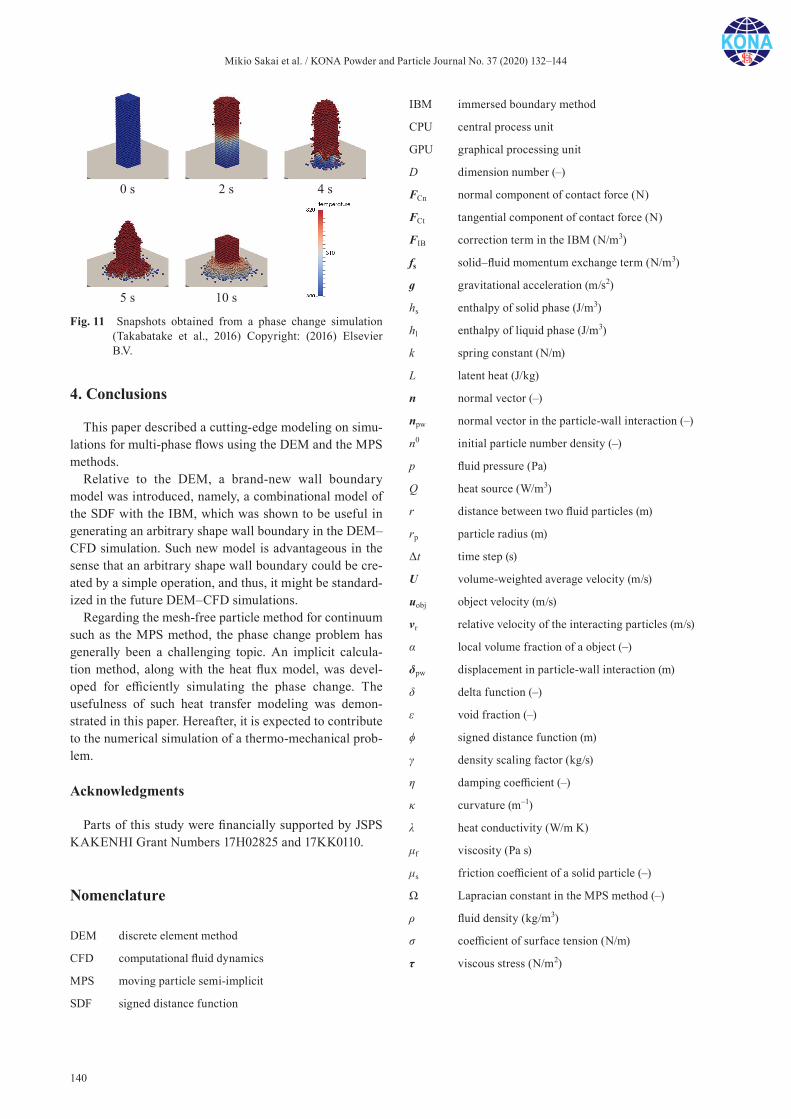
Mikio Sakai et al. / KONA Powder and Particle Journal No. 37 (2020) 132–144
140
4. Conclusions
This paper described a cutting-edge modeling on simu-lations for multi-phase flows using the DEM and the MPS methods.
Relative to the DEM, a brand-new wall boundary model was introduced, namely, a combinational model of the SDF with the IBM, which was shown to be useful in generating an arbitrary shape wall boundary in the DEM–CFD simulation. Such new model is advantageous in the sense that an arbitrary shape wall boundary could be cre-ated by a simple operation, and thus, it might be standard-ized in the future DEM–CFD simulations.
Regarding the mesh-free particle method for continuum such as the MPS method, the phase change problem has generally been a challenging topic. An implicit calcula-tion method, along with the heat flux model, was devel-oped for efficiently simulating the phase change. The usefulness of such heat transfer modeling was demon-strated in this paper. Hereafter, it is expected to contribute to the numerical simulation of a thermo-mechanical prob-lem.
Acknowledgments
Parts of this study were financially supported by JSPS KAKENHI Grant Numbers 17H02825 and 17KK0110.
Nomenclature
DEM discrete element method
CFD computational fluid dynamics
MPS moving particle semi-implicit
SDF signed distance function
IBM immersed boundary method
CPU central process unit
GPU graphical processing unit
D dimension number (–)
FCn normal component of contact force (N)
FCt tangential component of contact force (N)
FIB correction term in the IBM (N/m3)
fs solid–fluid momentum exchange term (N/m3)
ɡ gravitational acceleration (m/s2)
hs enthalpy of solid phase (J/m3)
hl enthalpy of liquid phase (J/m3)
k spring constant (N/m)
L latent heat (J/kg)
n normal vector (–)
npw normal vector in the particle-wall interaction (–)
n0 initial particle number density (–)
p fluid pressure (Pa)
Q heat source (W/m3)
r distance between two fluid particles (m)
rp particle radius (m)
Δt time step (s)
U volume-weighted average velocity (m/s)
uobj object velocity (m/s)
vr relative velocity of the interacting particles (m/s)
α local volume fraction of a object (–)
δpw displacement in particle-wall interaction (m)
δ delta function (–)
ε void fraction (–)
ϕ signed distance function (m)
γ density scaling factor (kg/s)
η damping coefficient (–)
κ curvature (m–1)
λ heat conductivity (W/m K)
μf viscosity (Pa s)
μs friction coefficient of a solid particle (–)
Ω Lapracian constant in the MPS method (–)
ρ fluid density (kg/m3)
σ coefficient of surface tension (N/m)
τ viscous stress (N/m2)
Fig. 11 Snapshots obtained from a phase change simulation (Takabatake et al., 2016) Copyright: (2016) Elsevier B.V.
Mikio Sakai et al. / KONA Powder and Particle Journal No. 37 (2020) 132–144
141
References
Adam A., Pavlidis D., Percival J.R., Salinas P., Xie Z., Fang F., Pain C.C., Muggeridge A.H., Jackson M.D., Higher-order conservative interpolation between control-volume meshes: Application to advection and multiphase flow problems with dynamic mesh adaptivity, Journal of Computational Physics., 321 (2016) 512–531. https://doi.org/10.1016/j.jcp. 2016.05.058
Anderson T.B., Jackson R., Fluid mechanical description of flu-idized beds. Equations of motion, Industrial and Engineer-ing Chemistry Research, 6 (1967) 527–539. https://doi.org/10.1021/i160024a007
Baserinia R., Sinka I.C., Powder die filling under gravity and suction fill mechanisms, International Journal of Pharma-ceutics, 563 (2019) 135–155. https://doi.org/10.1016/j.ijpharm.2019.01.068
Basinskas G., Sakai M., Numerical study of the mixing effi-ciency of a ribbon mixer using the discrete element method, Powder Technology, 287 (2016a) 380–394. https://doi.org/10.1016/j.powtec.2015.10.017
Basinskas G., Sakai M., Numerical study of the mixing effi-ciency of a batch mixer using the discrete element method, Powder Technology, 301 (2016b) 815–829. https://doi.org/10.1016/j.powtec.2016.07.017
Chan E.L., Washino K., Coarse grain model for DEM simula-tion of dense and dynamic particle flow with liquid bridge forces, Chemical Engineering Research and Design, 132 (2018) 1060–1069. https://doi.org/10.1016/j.cherd.2017. 12.033
Chen R., Oka Y., Li G., Matsuura T., Numerical investigation on melt freezing behavior in a tube by MPS method, Nuclear Engineering and Design, 273 (2014) 440–448. https://doi.org/10.1016/j.nucengdes.2014.03.049
Cundall P.A., Strack O.D.L., A discrete numerical model for granular assemblies, Geotechnique, 29 (1979) 47–65. https://doi.org/10.1680/geot.1979.29.1.47
Dhenge R.M., Washino K., Cartwright J.J., Hounslow M.J., Salman A.D., Twin screw granulation using conveying screws: Effects of viscosity of granulation liquids and flow of powders, Powder Technology, 238 (2013) 77–90. https://doi.org/10.1016/j.powtec.2012.05.045
Duan G., Yamaji A., Koshizuka S., A novel multiphase MPS algorithm for modeling crust formation by highly viscous fluid for simulating corium spreading, Nuclear Engineering and Design, 343 (2019) 218–231. https://doi.org/10.1016/j.nucengdes.2019.01.005
Ergun S., Fluid flow through packed columns. Chemical Engi-neering Progress Symposium Series, 48 (1952) 89–94.
Ge W., Chang Q., Li C., Wang J., Multiscale structures in parti-cle – fluid systems : Characterization, modeling, and simu-lation, Chemical Engineering Science, 198 (2019) 198–223. https://doi.org/10.1016/j.ces.2018.12.037
Govender N., Wilke D.N., Wu C., Tuzun U., Kureck H., A numerical investigation into the effect of angular particle shape on blast furnace burden topography and percolation using a GPU solved discrete element model, Chemical
Engineering Science, 204 (2019) 9–26. https://doi.org/ 10.1016/j.ces.2019.03.077
Govender N., Wilke D.N., Wu C.Y., Rajamani R., Khinast J., Glasser B.J., Large-scale GPU based DEM modeling of mixing using irregularly shaped particles, Advanced Pow-der Technology, 29 (2018) 2476–2490. https://doi.org/10. 1016/j.apt.2018.06.028
Hu C., Luo K., Wang S., Sun L., Fan J., Influences of operating parameters on the fluidized bed coal gasification process : A coarse-grained CFD-DEM study, Chemical Engineering Science, 195 (2019) 693–706. https://doi.org/10.1016/j.ces. 2018.10.015
Hu R., Fang F., Salinas P., Pain C.C., Domingo N.D.S., Mark O., Advances in water resources numerical simulation of floods from multiple sources using an adaptive anisotropic unstructured mesh method, Advances in Water Resources, 123 (2019) 173–188. https://doi.org/10.1016/j.advwatres. 2018.11.011
Kafashan J., Wiącek J., Abd N., Jieqing R., Two-dimensional particle shapes modelling for DEM simulations in engi-neering : A review, Granular Matter, (2019) 21:80. https://doi.org/10.1007/s10035-019-0935-1
Kajishima T., Takiguchi S., Hamasaki H., Miyake Y., Turbu-lence structure of particle-laden flow in a vertical plane channel due to vortex shedding, JSME International Journal Series B, 44 (2001) 526–535. https://doi.org/10.1299/jsmeb.44.526
Kanaoka C., Fine particle filtration technology using fiber as dust collection medium, KONA Powder and Particle Journal, 36 (2019) 88–113. https://doi.org/10.14356/kona. 2019006
Klinzing G.E., Historical review of pneumatic conveying, KONA Powder and Particle Journal, 35 (2018) 150–159. https://doi.org/10.14356/kona.2018010
Koshizuka S., Oka Y., Moving-particle semi-implicit method for fragmentation of incompressible fluid, Nuclear Science and Engineering, 123 (1996) 421–434. https://doi.org/ 10.13182/NSE96-A24205
Krok A., García-tri P., Peciar M., Wu C.-Y., Finite element anal-ysis of thermomechanical behaviour of powders during tableting, Chemical Engineering Research and Design, 110 (2016) 141–151. https://doi.org/10.1016/j.cherd.2016.03.019
Lu L., Xu J., Ge W., Gao G., Jiang Y., Zhao M., Liu X., Li J., Computer virtual experiment on fluidized beds using a coarse-grained discrete particle method—EMMS-DPM, Chemical Engineering Science, 155 (2016) 314–337. https://doi.org/10.1016/j.ces.2016.08.013
Monaghan J.J., Simulating free surface flows with SPH, Journal of Computational Physics, 110 (1994) 399–406. https://doi.org/10.1006/jcph.1994.1034
Mori Y., Wu C.-Y., Sakai M., Validation study on a scaling law model of the DEM in industrial gas-solid flows, Powder Technology, 343 (2019) 101–112. https://doi.org/10.1016/j.powtec.2018.11.015
Nie Z., Zhu Y., Wang X., Gong J., Investigating the effects of Fourier-based particle shape on the shear behaviors of rock-fill material via DEM, Granular Matter, 21 (2019) 22. https://doi.org/10.1007/s10035-019-0875-9
Mikio Sakai et al. / KONA Powder and Particle Journal No. 37 (2020) 132–144
142
Osher S., Fedkiw R., Level Set Methods and Dynamic Implicit Surfaces, Springer, 2002. ISBN 978-0-387-22746-7.
Peskin C.S., The immersed boundary method, Acta Numerica, 11 (2002) 479–517. https://doi.org/10.1017/S0962492902000077
Russell M.A., Souto-iglesias A., Zohdi T.I., Numerical simula-tion of Laser Fusion Additive Manufacturing processes using the SPH method, Computer Methods in Applied Mechanics and Engineering, 341 (2018) 163–187. https://doi.org/10.1016/j.cma.2018.06.033
Sakai M., How should the discrete element method be applied in industrial systems ?: A review, KONA Powder and Parti-cle Journal, 33 (2016) 169–178. https://doi.org/10.14356/kona.2016023
Sakai M., Abe M., Shigeto Y., Mizutani S., Takahashi H., Viré A., Percival J.R., Xiang J., Pain C.C., Verification and vali-dation of a coarse grain model of the DEM in a bubbling fluidized bed, Chemical Engineering Journal, 244 (2014) 33–43. https://doi.org/10.1016/j.cej.2014.01.029
Sakai M., Kazuya T., Kotaro T., Hatano K., Minakuchi A., Why do wet-particles adhere to a high-speed roll in a three-roll mill ? Physics of Fluids, 31 (2019) 033302. https://doi.org/ 10.1063/1.5085693
Sakai M., Koshizuka S., Large-scale discrete element modeling in pneumatic conveying, Chemical Engineering Science, 64 (2009) 533–539. https://doi.org/10.1016/j.ces.2008.10.003
Sakai M., Shigeto Y., Basinskas G., Hosokawa A., Fuji M., Dis-crete element simulation for the evaluation of solid mixing in an industrial blender, Chemical Engineering Journal, 279 (2015) 821–839. https://doi.org/10.1016/j.cej.2015.04.130
Sakai M., Shigeto Y., Sun X., Aoki T., Saito T., Xiong J., Koshizuka S., Lagrangian–Lagrangian modeling for a solid–liquid flow in a cylindrical tank. Chemical Engineer-ing Journal, 200–202 (2012a) 663–672. https://doi.org/ 10.1016/j.cej.2012.06.080
Sakai M., Takahashi H., Pain C.C., Latham J.-P., Xiang J., Study on a large-scale discrete element model for fine particles in a fluidized bed, Advanced Powder Technology, 23 (2012b) 673–681. https://doi.org/10.1016/j.apt.2011.08.006
Sakai M., Yamada Y., Shigeto Y., Shibata K., Kawasaki V.M., Koshizuka S., Large-scale discrete element modeling in a fluidized bed, International Journal for Numerical Methods in Fluids, 64 (2010) 1319–1335. https://doi.org/10.1016/j.ces.2008.10.003
Schmelzle S., Nirschl H., DEM simulations : Mixing of dry and wet granular material with different contact angles, Granu-lar Matter, 20 (2018) 19. https://doi.org/10.1007/s10035-018-0792-3
Shibata K., Koshizuka S., Sakai M., Tanizawa K., Transparent boundary condition for simulating nonlinear water waves by a particle method, Ocean Engineering, 38 (2011) 1839–1848. https://doi.org/10.1016/j.oceaneng.2011.09.012
Shigeto Y., Sakai M., Arbitrary-shaped wall boundary modeling based on signed distance functions for granular flow simu-lations, Chemical Engineering Journal, 231 (2013) 464–476. https://doi.org/10.1016/j.cej.2013.07.073
Shigeto Y., Sakai M., Parallel computing of discrete element method on multi-core processors, Particuology, 9 (2011) 398–405. https://doi.org/10.1016/j.partic.2011.04.002
Shrestha S., Kuang S., Yu A., Zhou Z., Particle shape effect on bubble dynamics in central air jet pseudo-2D fluidized beds : A CFD-DEM study, Chemical Engineering Science, 201 (2019) 448–466. https://doi.org/10.1016/j.ces.2019. 02.030
Steuben J.C., Iliopoulos A.P., Michopoulos J.G., Discrete ele-ment modeling of particle-based additive manufacturing processes, Computer Methods in Applied Mechanics and Engineering, 305 (2016) 537–561. https://doi.org/10.1016/j.cma.2016.02.023
Stroh A., Daikeler A., Nikku M., May J., Alobaid F., Bohnstein M. Von, Ströhle J., Epple B., Coarse grain 3D CFD-DEM simulation and validation with capacitance probe measure-ments in a circulating fluidized bed, Chemical Engineering Science, 196 (2019) 37–53. https://doi.org/10.1016/j.ces. 2018.11.052
Sun X., Sakai M., A liquid bridge model for spherical particles applicable to asymmetric configurations, Chemical Engi-neering Science, 182 (2018) 28–43. https://doi.org/10.1016/j.ces.2018.02.034
Sun X., Sakai M., Immersed boundary method with artificial density in pressure equation for modeling flows confined by wall boundaries, Journal of Chemical Engineering of Japan, 50 (2017) 161–169. https://doi.org/10.1252/jcej. 16we115
Sun X., Sakai M., Direct numerical simulation of gas-solid- liquid flows with capillary effects: An application to liquid bridge forces between spherical particles, Physical Review E, 94 (2016) 063301. https://doi.org/10.1103/PhysRevE.94. 063301
Sun Xiaosong, Sakai M., Numerical simulation of two-phase flows in complex geometries by using the volume-of-fluid /immersed-boundary method, Chemical Engineering Sci-ence, 139 (2016) 221–240. https://doi.org/10.1016/j.ces.2015. 09.031
Sun X., Sakai M., Sakai M.-T., Yamada Y., A Lagrangian–Lagrangian coupled method for three-dimensional solid–liquid flows involving free surfaces in a rotating cylindrical tank, Chemical Engineering Journal, 246 (2014) 122–141. https://doi.org/10.1016/j.cej.2014.02.049
Sun X., Sakai M., Shibata K., Tochigi Y., Fujiwara H., Numeri-cal modeling on the discharged fluid flow from a glass melter by a Lagrangian approach, Nuclear Engineering and Design, 248 (2012) 14–21. https://doi.org/10.1016/j. nucengdes.2012.04.004
Sun X., Sakai M., Sun M., Takabatake K., Pain C.C., Numerical simulation of free surface fluid flows through porous media by using the explicit MPS method, Transport in Porous Media, 127 (2019) 7–33. https://doi.org/10.1007/s11242-018-1178-z
Takabatake K., Mori Y., Khinast J.G., Sakai M., Numerical investigation of a coarse-grain discrete element method in solid mixing in a spouted bed, Chemical Engineering Jour-nal, 346 (2018) 416–426. https://doi.org/10.1016/j.cej. 2018.04.015
Takabatake K., Sun X., Sakai M., Pavlidis D., Xiang J., Pain C.C., Numerical study on a heat transfer model in a Lagrangian fluid dynamics simulation, International Jour-
Mikio Sakai et al. / KONA Powder and Particle Journal No. 37 (2020) 132–144
143
nal of Heat and Mass Transfer, 103 (2016) 635–645. https://doi.org/10.1016/j.ijheatmasstransfer.2016.07.073
Tsuji Y., Kawaguchi T., Tanaka T., Discrete particle simulation of two-dimensional fluidized bed, Powder Technology, 77 (1993) 79–87. https://doi.org/10.1016/0032-5910(93)85010-7
Tsunazawa Y., Fujihashi D., Fukui S., Sakai M., Tokoro C., Contact force model including the liquid-bridge force for wet-particle simulation using the discrete element method, Advanced Powder Technology, 27 (2016) 652–660. https://doi.org/10.1016/j.apt.2016.02.021
Tsunazawa Y., Shigeto Y., Tokoro C., Sakai M., Numerical sim-ulation of industrial die filling using the discrete element method, Chemical Engineering Science, 138 (2015) 791–809. https://doi.org/10.1016/j.ces.2015.09.014
Udono H., Sakai M., A numerical study on dynamic inertial focusing of microparticles in a confined flow, Granular Matter, 19 (2017) 79. https://doi.org/10.1007/s10035-017-0758-x
Wang X., Shao M., Gao S., Gau J., Tang H., Jin H., Liu H., Numerical simulation of laser impact spot welding, Journal of Manufacturing Processes, 35 (2018) 396–406. https://doi.org/10.1016/j.jmapro.2018.08.028
Wen C.Y., Yu Y.H., Mechanics of fluidization, Chem. Eng. Progr. Symposium Series, 62 (1966) 100–111.
Xiong J., Koshizuka S., Sakai M., Investigation of droplet impingement onto wet walls based on simulation using par-ticle method, Journal of Nuclear Science and Technology, 48 (2011) 145-153. https://doi.org/10.1080/18811248.2011. 9711689
Xiong J., Koshizuka S., Sakai M., Numerical analysis of droplet impingement using the moving particle semi-implicit
method, Journal of Nuclear Science and Technology, 47 (2010) 314–321. https://doi.org/10.3327/jnst.47.314
Yamada Y., Sakai M., Lagrangian–Lagrangian simulations of solid–liquid flows in a bead mill, Powder Technology, 239 (2013) 105–114. https://doi.org/10.1016/j.powtec.2013.01.030
Yang J., Guo Y., Buettner K.E., Curtis J.S., DEM investigation of shear flows of binary mixtures of non-spherical particles, Chemical Engineering Science, 202 (2019) 383–391. https://doi.org/10.1016/j.ces.2019.03.027
Yao H., Mori Y., Takabatake K., Sun X., Sakai M., Numerical investigation on the influence of air flow in a die filling pro-cess, Journal of the Taiwan Institute of Chemical Engi-neers, 90 (2018) 9–17. https://doi.org/10.1016/j.jtice.2017. 11.031
Yokoi K., Numerical method for interaction between multiparti-cle and complex structures, Physical Review E, 72 (2005) 046713. https://doi.org/10.1103/PhysRevE.72.046713
Yue Y., Wang T., Sakai M., Shen Y., Particle-scale study of spout deflection in a flat-bottomed spout fluidized bed, Chemical Engineering Science, 205 (2019) 121–133. https://doi.org/10.1016/j.ces.2019.04.031
Zakhvatayeva A., Zhong W., Makroo H.A., Hare C., Wu C.Y., An experimental study of die filling of pharmaceutical powders using a rotary die filling system, International Journal of Pharmaceutics, 553 (2018) 84–96. https://doi.org/10.1016/j.ijpharm.2018.09.067
Zhou Z.Y., Pinson D., Zou R.P., Yu A.B., Discrete particle sim-ulation of gas fluidization of ellipsoidal particles, Chemical Engineering Science, 66 (2011) 6128–6145. https://doi.org/10.1016/j.ces.2011.08.041

Mikio Sakai et al. / KONA Powder and Particle Journal No. 37 (2020) 132–144
144
Authors’ Short Biographies
Mikio Sakai
Dr. Mikio Sakai is currently Associate Professor in Resilience Engineering Research Center in The University of Tokyo. He earned his Ph.D. degree from The University of Tokyo in 2006. Then, he became Assistant Professor in 2007 and Associate Professor in 2008 in the same university. He has been Visiting Reader at Imperial College London since 2016. He extensively studies modeling of granular flows, multi-phase flows and the heat transfer, besides the parallel computation techniques. He is a world-leading profes-sor in computational granular dynamics, and hence, has delivered lots of invited lectures in conferences. He holds important posts in powder technology community, such as Di-rector of Society of Powder Technology of Japan and Head of Simulation & Modeling Division in Association of Powder Process Industry and Engineering, JAPAN. At pres-ent, he is also Associate Editor of Chemical Engineering Science and Editor of Granular Matter.
Yuki Mori
Mr. Yuki Mori is currently a freshman PhD student in Department of Nuclear Engi-neering and Management, School of Engineering, The University of Tokyo, and is JSPS Research Fellow (DC1). He joined Prof Sakai’s group since 2016 and won Dean’s Award (Annual Best Student Award) upon completion of his masteral course in The University of Tokyo.
Xiaosong Sun
Dr. Xiaosong Sun earned his Ph.D. degree from The University of Tokyo in 2016. Then, he became Project Researcher in Resilience Engineering Research Center, School of Engi-neering, The University of Tokyo. He joined Prof Sakai’s group since 2011 and won Dean’s Award (Annual Best Student Award) upon completion of his masteral and doctorate courses in The University of Tokyo.
Kazuya Takabatake
Mr. Kazuya Takabatake is currently a third-year PhD student in Department of Nu-clear Engineering and Management, School of Engineering, The University of Tokyo, and is JSPS Research Fellow (DC2) since 2018. He joined Prof Sakai’s group since 2015 and won Dean’s Award (Annual Best Student Award) upon completion of his masteral course in The University of Tokyo.
KONA Powder and Particle Journal No. 37 (2020) 145–165/Doi:10.14356/kona.2020019 Review Paper
145Copyright © 2020 The Authors. Published by Hosokawa Powder Technology Foundation. This is an open ac-cess article under the CC BY license (http://creativecommons.org/licenses/by/4.0/).
Rheology and Sedimentation of Aqueous Suspension of Na-montmorillonite in the Very Dilute Domain †
Yasuhisa Adachi 1*, Yoko Tsujimoto Kawashima 2 and Muhamad Ezral Bin Ghazali 3
1 Faculty of Life and Environmental Sciences, University of Tsukuba, Japan2 Innovative Materials and Resources Research Center, Public Works Researches Institute, Japan3 Graduate School of Life and Environmental Sciences, University of Tsukuba, Japan
AbstractThe scheme of DLVO theory and the concept of fractal structure of flocs applied to the suspension of montmorillonite have revealed out the unique nature of this clay dispersion. In this context, two major regimes are recognized. The first is the electrostatically dispersed regime. And the second is the coagulated regime. In the former, the formation of a diffusive electric double layer (EDL) characterized by reciprocal Debye length measured from the surface of the particle is distinctively important. Intrinsic viscosity with electroviscous effects and yield stress are interpreted by the steric presence of EDL. In the latter, the unit of transportation is a coagulated floc with finite cohesive strength. Sedimentation process reflecting these factors is carefully observed to recognize the turbulence generation by the formation of large flocs at the moment of gel collapse. Waiting time prior to gel collapse was found to be determined reflecting the pH-dependent charging behavior. By taking into account the effect pH-dependent charge, the DLVO based two regimes are further categorized into five. The developed tools can be extensively used for the system involved with different ionic species, pH, volume fraction and organic substances.
Keywords: Na-montmorillonite, Debye length, electroviscous effect, floc, cohesive strength, sedimentation turbulence
1. Introduction
In a natural environment, nutrients and chemical pol-lutant are apt to adsorb on the colloidal particles which are ubiquitously present in soil and water. Clays are major components of environmental colloid. Understanding the behavior of such colloid is critically important to predict the diffusion and fate of chemical substances. In addition to agricultural production, knowledge has been recog-nized very useful for the design and the development of the technology of environmental remediation. Macro-scopic transport properties in soils are determined reflect-ing microscopic interaction of colloidal phenomena in soils (Adachi Y. and Iwata S., 2003; Adachi Y., 2019). Rheological properties of an aqueous dispersion of clay have also received many attentions with respect to the transportation of cohesive sediment in river and estuary
(Winterwerp J.C and Kestern W.G.M.V., 2004), land con-solidation (Sudo S. and Yasutomi R., 1961), drilling mud for construction work and petroleum production (Van Olphen H., 1977) and usage in variety of application such as cosmetic, paint, agricultural chemical, cement, ceram-ics, and so on (Lagaly G. and Ziemer S., 2003).
One of the typical clays with outstanding surface prop-erties is the montmorillonite, which is a pure component of bentonite; a usually used clay industry. Interesting na-ture of the aquatic system of montmorillonite has classi-cally received scientific attention in the direction to swelling (Norrish K., 1954) and phase separation (Langmuir I., 1938; Michot L.J. et al., 2009). Another in-terest is also paid for the direct verification of DLVO the-ory (Callaghan I.C. and Ottewill R.H., 1974). In the present article, we limit our attention to the rheological properties of Na-montmorillonite suspension and sedi-mentation process of the same clay. Although the choice of Na-montmorillonite seems rather arbitral, this choice will be turned out to be appropriate to remind typical common features of soil colloid without losing their char-acteristic factors. The shape and distribution of electric charges in the unit of clay particles will realize the simplification of the complex nature of soil colloids in
† Received 31 July 2019; Accepted 16 September 2019 J-STAGE Advance published online 31 October 2019
1,3 1-1-1 Tennoudai, Tsukuba, Ibaraki 305-8572, Japan2 1-6 Minamihara, Tsukuba, Ibaraki 305-8516, Japan* Corresponding author: Yasuhisa Adachi; E-mail: [email protected] TEL: +81-298-534862
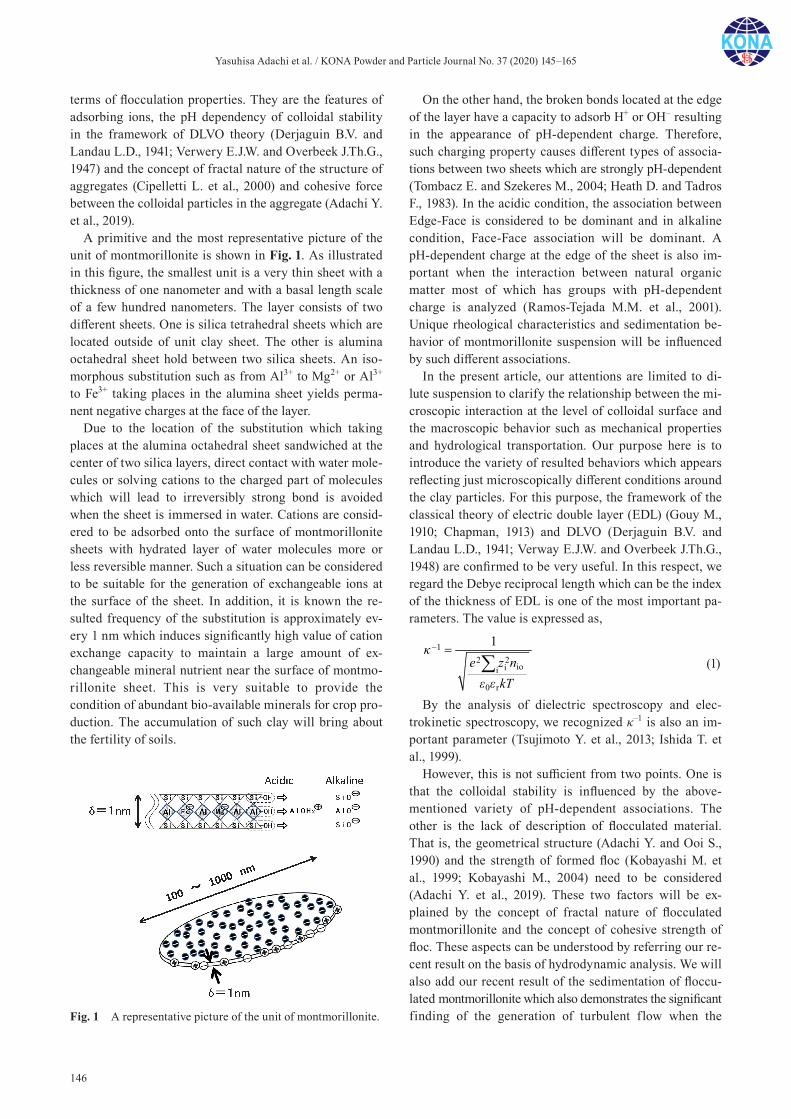
Yasuhisa Adachi et al. / KONA Powder and Particle Journal No. 37 (2020) 145–165
146
terms of flocculation properties. They are the features of adsorbing ions, the pH dependency of colloidal stability in the framework of DLVO theory (Derjaguin B.V. and Landau L.D., 1941; Verwery E.J.W. and Overbeek J.Th.G., 1947) and the concept of fractal nature of the structure of aggregates (Cipelletti L. et al., 2000) and cohesive force between the colloidal particles in the aggregate (Adachi Y. et al., 2019).
A primitive and the most representative picture of the unit of montmorillonite is shown in Fig. 1. As illustrated in this figure, the smallest unit is a very thin sheet with a thickness of one nanometer and with a basal length scale of a few hundred nanometers. The layer consists of two different sheets. One is silica tetrahedral sheets which are located outside of unit clay sheet. The other is alumina octahedral sheet hold between two silica sheets. An iso-morphous substitution such as from Al3+ to Mg2+ or Al3+ to Fe3+ taking places in the alumina sheet yields perma-nent negative charges at the face of the layer.
Due to the location of the substitution which taking places at the alumina octahedral sheet sandwiched at the center of two silica layers, direct contact with water mole-cules or solving cations to the charged part of molecules which will lead to irreversibly strong bond is avoided when the sheet is immersed in water. Cations are consid-ered to be adsorbed onto the surface of montmorillonite sheets with hydrated layer of water molecules more or less reversible manner. Such a situation can be considered to be suitable for the generation of exchangeable ions at the surface of the sheet. In addition, it is known the re-sulted frequency of the substitution is approximately ev-ery 1 nm which induces significantly high value of cation exchange capacity to maintain a large amount of ex-changeable mineral nutrient near the surface of montmo-rillonite sheet. This is very suitable to provide the condition of abundant bio-available minerals for crop pro-duction. The accumulation of such clay will bring about the fertility of soils.
On the other hand, the broken bonds located at the edge of the layer have a capacity to adsorb H+ or OH– resulting in the appearance of pH-dependent charge. Therefore, such charging property causes different types of associa-tions between two sheets which are strongly pH-dependent (Tombacz E. and Szekeres M., 2004; Heath D. and Tadros F., 1983). In the acidic condition, the association between Edge-Face is considered to be dominant and in alkaline condition, Face-Face association will be dominant. A pH-dependent charge at the edge of the sheet is also im-portant when the interaction between natural organic matter most of which has groups with pH-dependent charge is analyzed (Ramos-Tejada M.M. et al., 2001). Unique rheological characteristics and sedimentation be-havior of montmorillonite suspension will be influenced by such different associations.
In the present article, our attentions are limited to di-lute suspension to clarify the relationship between the mi-croscopic interaction at the level of colloidal surface and the macroscopic behavior such as mechanical properties and hydrological transportation. Our purpose here is to introduce the variety of resulted behaviors which appears reflecting just microscopically different conditions around the clay particles. For this purpose, the framework of the classical theory of electric double layer (EDL) (Gouy M., 1910; Chapman, 1913) and DLVO (Derjaguin B.V. and Landau L.D., 1941; Verway E.J.W. and Overbeek J.Th.G., 1948) are confirmed to be very useful. In this respect, we regard the Debye reciprocal length which can be the index of the thickness of EDL is one of the most important pa-rameters. The value is expressed as,
12 2
ioii
0 r
1e z n
kT
(1)
By the analysis of dielectric spectroscopy and elec-trokinetic spectroscopy, we recognized κ–1 is also an im-portant parameter (Tsujimoto Y. et al., 2013; Ishida T. et al., 1999).
However, this is not sufficient from two points. One is that the colloidal stability is influenced by the above- mentioned variety of pH-dependent associations. The other is the lack of description of flocculated material. That is, the geometrical structure (Adachi Y. and Ooi S., 1990) and the strength of formed floc (Kobayashi M. et al., 1999; Kobayashi M., 2004) need to be considered (Adachi Y. et al., 2019). These two factors will be ex-plained by the concept of fractal nature of flocculated montmorillonite and the concept of cohesive strength of floc. These aspects can be understood by referring our re-cent result on the basis of hydrodynamic analysis. We will also add our recent result of the sedimentation of floccu-lated montmorillonite which also demonstrates the significant finding of the generation of turbulent flow when the Fig. 1 A representative picture of the unit of montmorillonite.
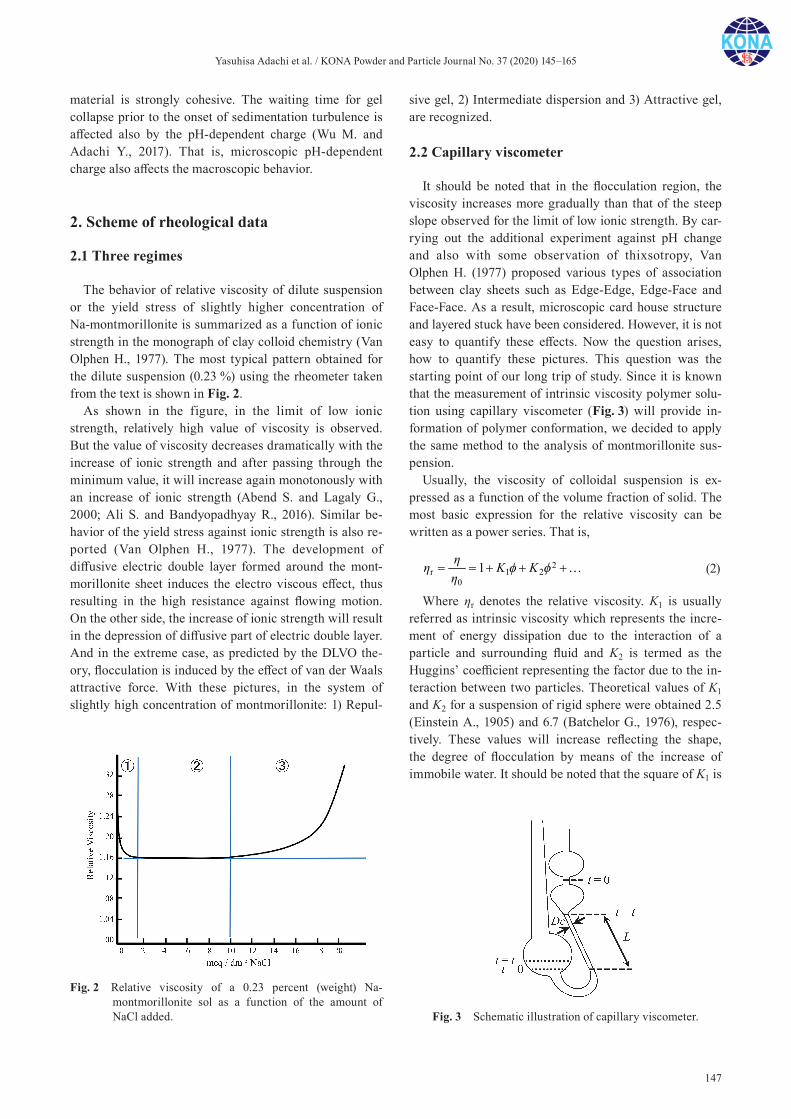
Yasuhisa Adachi et al. / KONA Powder and Particle Journal No. 37 (2020) 145–165
147
material is strongly cohesive. The waiting time for gel collapse prior to the onset of sedimentation turbulence is affected also by the pH-dependent charge (Wu M. and Adachi Y., 2017). That is, microscopic pH-dependent charge also affects the macroscopic behavior.
2. Scheme of rheological data
2.1 Three regimes
The behavior of relative viscosity of dilute suspension or the yield stress of slightly higher concentration of Na-montmorillonite is summarized as a function of ionic strength in the monograph of clay colloid chemistry (Van Olphen H., 1977). The most typical pattern obtained for the dilute suspension (0.23 %) using the rheometer taken from the text is shown in Fig. 2.
As shown in the figure, in the limit of low ionic strength, relatively high value of viscosity is observed. But the value of viscosity decreases dramatically with the increase of ionic strength and after passing through the minimum value, it will increase again monotonously with an increase of ionic strength (Abend S. and Lagaly G., 2000; Ali S. and Bandyopadhyay R., 2016). Similar be-havior of the yield stress against ionic strength is also re-ported (Van Olphen H., 1977). The development of diffusive electric double layer formed around the mont-morillonite sheet induces the electro viscous effect, thus resulting in the high resistance against flowing motion. On the other side, the increase of ionic strength will result in the depression of diffusive part of electric double layer. And in the extreme case, as predicted by the DLVO the-ory, flocculation is induced by the effect of van der Waals attractive force. With these pictures, in the system of slightly high concentration of montmorillonite: 1) Repul-
sive gel, 2) Intermediate dispersion and 3) Attractive gel, are recognized.
2.2 Capillary viscometer
It should be noted that in the flocculation region, the viscosity increases more gradually than that of the steep slope observed for the limit of low ionic strength. By car-rying out the additional experiment against pH change and also with some observation of thixsotropy, Van Olphen H. (1977) proposed various types of association between clay sheets such as Edge-Edge, Edge-Face and Face-Face. As a result, microscopic card house structure and layered stuck have been considered. However, it is not easy to quantify these effects. Now the question arises, how to quantify these pictures. This question was the starting point of our long trip of study. Since it is known that the measurement of intrinsic viscosity polymer solu-tion using capillary viscometer (Fig. 3) will provide in-formation of polymer conformation, we decided to apply the same method to the analysis of montmorillonite sus-pension.
Usually, the viscosity of colloidal suspension is ex-pressed as a function of the volume fraction of solid. The most basic expression for the relative viscosity can be written as a power series. That is,
2r 1 2
01 K K
(2)
Where ηr denotes the relative viscosity. K1 is usually referred as intrinsic viscosity which represents the incre-ment of energy dissipation due to the interaction of a particle and surrounding fluid and K2 is termed as the Huggins’ coefficient representing the factor due to the in-teraction between two particles. Theoretical values of K1 and K2 for a suspension of rigid sphere were obtained 2.5 (Einstein A., 1905) and 6.7 (Batchelor G., 1976), respec-tively. These values will increase reflecting the shape, the degree of flocculation by means of the increase of immobile water. It should be noted that the square of K1 is
Fig. 2 Relative viscosity of a 0.23 percent (weight) Na- montmorillonite sol as a function of the amount of NaCl added. Fig. 3 Schematic illustration of capillary viscometer.
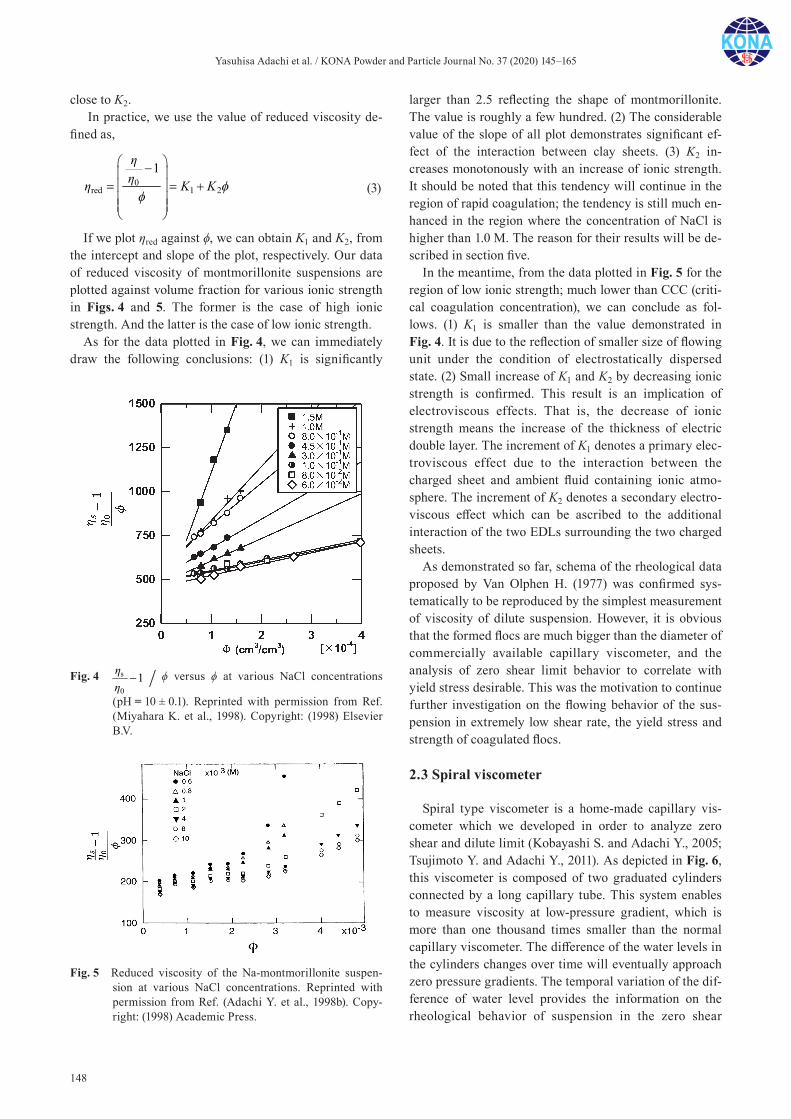
Yasuhisa Adachi et al. / KONA Powder and Particle Journal No. 37 (2020) 145–165
148
close to K2. In practice, we use the value of reduced viscosity de-
fined as,
0red 1 2
1K K
(3)
If we plot ηred against ϕ, we can obtain K1 and K2, from the intercept and slope of the plot, respectively. Our data of reduced viscosity of montmorillonite suspensions are plotted against volume fraction for various ionic strength in Figs. 4 and 5. The former is the case of high ionic strength. And the latter is the case of low ionic strength.
As for the data plotted in Fig. 4, we can immediately draw the following conclusions: (1) K1 is significantly
larger than 2.5 reflecting the shape of montmorillonite. The value is roughly a few hundred. (2) The considerable value of the slope of all plot demonstrates significant ef-fect of the interaction between clay sheets. (3) K2 in-creases monotonously with an increase of ionic strength. It should be noted that this tendency will continue in the region of rapid coagulation; the tendency is still much en-hanced in the region where the concentration of NaCl is higher than 1.0 M. The reason for their results will be de-scribed in section five.
In the meantime, from the data plotted in Fig. 5 for the region of low ionic strength; much lower than CCC (criti-cal coagulation concentration), we can conclude as fol-lows. (1) K1 is smaller than the value demonstrated in Fig. 4. It is due to the reflection of smaller size of flowing unit under the condition of electrostatically dispersed state. (2) Small increase of K1 and K2 by decreasing ionic strength is confirmed. This result is an implication of electroviscous effects. That is, the decrease of ionic strength means the increase of the thickness of electric double layer. The increment of K1 denotes a primary elec-troviscous effect due to the interaction between the charged sheet and ambient fluid containing ionic atmo-sphere. The increment of K2 denotes a secondary electro-viscous effect which can be ascribed to the additional interaction of the two EDLs surrounding the two charged sheets.
As demonstrated so far, schema of the rheological data proposed by Van Olphen H. (1977) was confirmed sys-tematically to be reproduced by the simplest measurement of viscosity of dilute suspension. However, it is obvious that the formed flocs are much bigger than the diameter of commercially available capillary viscometer, and the analysis of zero shear limit behavior to correlate with yield stress desirable. This was the motivation to continue further investigation on the flowing behavior of the sus-pension in extremely low shear rate, the yield stress and strength of coagulated flocs.
2.3 Spiral viscometer
Spiral type viscometer is a home-made capillary vis-cometer which we developed in order to analyze zero shear and dilute limit (Kobayashi S. and Adachi Y., 2005; Tsujimoto Y. and Adachi Y., 2011). As depicted in Fig. 6, this viscometer is composed of two graduated cylinders connected by a long capillary tube. This system enables to measure viscosity at low-pressure gradient, which is more than one thousand times smaller than the normal capillary viscometer. The difference of the water levels in the cylinders changes over time will eventually approach zero pressure gradients. The temporal variation of the dif-ference of water level provides the information on the rheological behavior of suspension in the zero shear
Fig. 4 s
01
/ ϕ versus ϕ at various NaCl concentrations
(pH = 10 ± 0.1). Reprinted with permission from Ref. (Miyahara K. et al., 1998). Copyright: (1998) Elsevier B.V.
Fig. 5 Reduced viscosity of the Na-montmorillonite suspen-sion at various NaCl concentrations. Reprinted with permission from Ref. (Adachi Y. et al., 1998b). Copy-right: (1998) Academic Press.
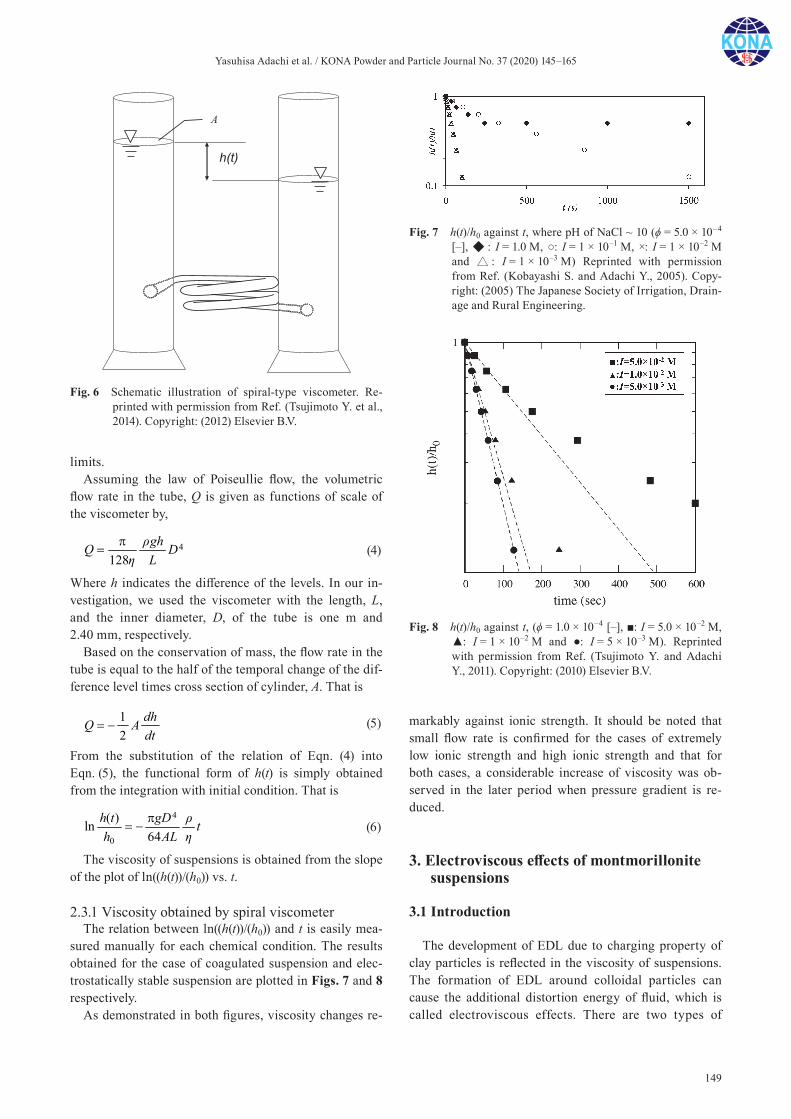
Yasuhisa Adachi et al. / KONA Powder and Particle Journal No. 37 (2020) 145–165
149
limits.Assuming the law of Poiseullie flow, the volumetric
flow rate in the tube, Q is given as functions of scale of the viscometer by,
4128
ghQ DL
(4)
Where h indicates the difference of the levels. In our in-vestigation, we used the viscometer with the length, L, and the inner diameter, D, of the tube is one m and 2.40 mm, respectively.
Based on the conservation of mass, the flow rate in the tube is equal to the half of the temporal change of the dif-ference level times cross section of cylinder, A. That is
12
dhQ Adt
(5)
From the substitution of the relation of Eqn. (4) into Eqn. (5), the functional form of h(t) is simply obtained from the integration with initial condition. That is
4
0
( )ln64
h t gD th AL
(6)
The viscosity of suspensions is obtained from the slope of the plot of ln((h(t))/(h0)) vs. t.
2.3.1 Viscosity obtained by spiral viscometerThe relation between ln((h(t))/(h0)) and t is easily mea-
sured manually for each chemical condition. The results obtained for the case of coagulated suspension and elec-trostatically stable suspension are plotted in Figs. 7 and 8 respectively.
As demonstrated in both figures, viscosity changes re-
markably against ionic strength. It should be noted that small flow rate is confirmed for the cases of extremely low ionic strength and high ionic strength and that for both cases, a considerable increase of viscosity was ob-served in the later period when pressure gradient is re-duced.
3. Electroviscous effects of montmorillonite suspensions
3.1 Introduction
The development of EDL due to charging property of clay particles is reflected in the viscosity of suspensions. The formation of EDL around colloidal particles can cause the additional distortion energy of fluid, which is called electroviscous effects. There are two types of
Fig. 6 Schematic illustration of spiral-type viscometer. Re-printed with permission from Ref. (Tsujimoto Y. et al., 2014). Copyright: (2012) Elsevier B.V.
Fig. 7 h(t)/h0 against t, where pH of NaCl ~ 10 (ϕ = 5.0 × 10⁻⁴ [–], : I = 1.0 M, : I = 1 × 10⁻¹ M, ×: I = 1 × 10⁻² M and : I = 1 × 10⁻³ M) Reprinted with permission from Ref. (Kobayashi S. and Adachi Y., 2005). Copy-right: (2005) The Japanese Society of Irrigation, Drain-age and Rural Engineering.
Fig. 8 h(t)/h0 against t, (ϕ = 1.0 × 10⁻⁴ [–], : I = 5.0 × 10⁻² M, : I = 1 × 10⁻² M and : I = 5 × 10⁻³ M). Reprinted with permission from Ref. (Tsujimoto Y. and Adachi Y., 2011). Copyright: (2010) Elsevier B.V.
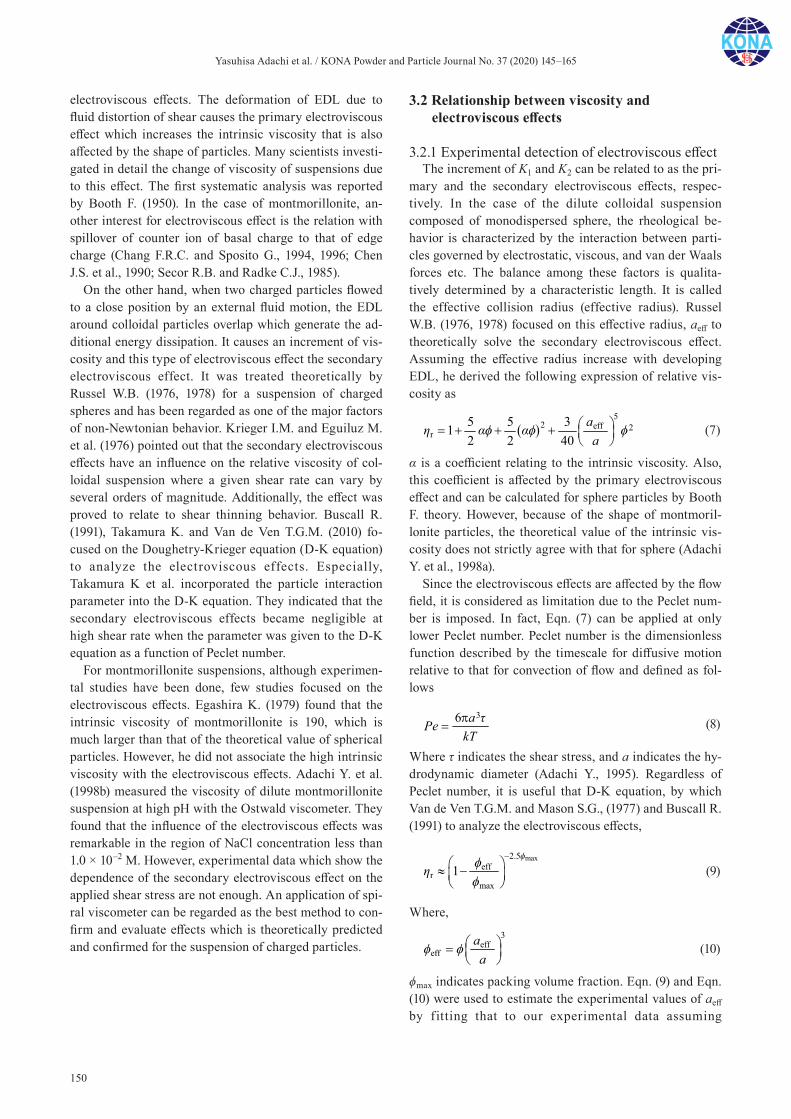
Yasuhisa Adachi et al. / KONA Powder and Particle Journal No. 37 (2020) 145–165
150
electroviscous effects. The deformation of EDL due to fluid distortion of shear causes the primary electroviscous effect which increases the intrinsic viscosity that is also affected by the shape of particles. Many scientists investi-gated in detail the change of viscosity of suspensions due to this effect. The first systematic analysis was reported by Booth F. (1950). In the case of montmorillonite, an-other interest for electroviscous effect is the relation with spillover of counter ion of basal charge to that of edge charge (Chang F.R.C. and Sposito G., 1994, 1996; Chen J.S. et al., 1990; Secor R.B. and Radke C.J., 1985).
On the other hand, when two charged particles flowed to a close position by an external fluid motion, the EDL around colloidal particles overlap which generate the ad-ditional energy dissipation. It causes an increment of vis-cosity and this type of electroviscous effect the secondary electroviscous effect. It was treated theoretically by Russel W.B. (1976, 1978) for a suspension of charged spheres and has been regarded as one of the major factors of non-Newtonian behavior. Krieger I.M. and Eguiluz M. et al. (1976) pointed out that the secondary electroviscous effects have an influence on the relative viscosity of col-loidal suspension where a given shear rate can vary by several orders of magnitude. Additionally, the effect was proved to relate to shear thinning behavior. Buscall R. (1991), Takamura K. and Van de Ven T.G.M. (2010) fo-cused on the Doughetry-Krieger equation (D-K equation) to analyze the electroviscous effects. Especially, Takamura K et al. incorporated the particle interaction parameter into the D-K equation. They indicated that the secondary electroviscous effects became negligible at high shear rate when the parameter was given to the D-K equation as a function of Peclet number.
For montmorillonite suspensions, although experimen-tal studies have been done, few studies focused on the electroviscous effects. Egashira K. (1979) found that the intrinsic viscosity of montmorillonite is 190, which is much larger than that of the theoretical value of spherical particles. However, he did not associate the high intrinsic viscosity with the electroviscous effects. Adachi Y. et al. (1998b) measured the viscosity of dilute montmorillonite suspension at high pH with the Ostwald viscometer. They found that the influence of the electroviscous effects was remarkable in the region of NaCl concentration less than 1.0 × 10⁻² M. However, experimental data which show the dependence of the secondary electroviscous effect on the applied shear stress are not enough. An application of spi-ral viscometer can be regarded as the best method to con-firm and evaluate effects which is theoretically predicted and confirmed for the suspension of charged particles.
3.2 Relationship between viscosity and electroviscous effects
3.2.1 Experimental detection of electroviscous effectThe increment of K1 and K2 can be related to as the pri-
mary and the secondary electroviscous effects, respec-tively. In the case of the dilute colloidal suspension composed of monodispersed sphere, the rheological be-havior is characterized by the interaction between parti-cles governed by electrostatic, viscous, and van der Waals forces etc. The balance among these factors is qualita-tively determined by a characteristic length. It is called the effective collision radius (effective radius). Russel W.B. (1976, 1978) focused on this effective radius, aeff to theoretically solve the secondary electroviscous effect. Assuming the effective radius increase with developing EDL, he derived the following expression of relative vis-cosity as
5
2 eff 2r
5 5 312 2 40
aa
(7)
α is a coefficient relating to the intrinsic viscosity. Also, this coefficient is affected by the primary electroviscous effect and can be calculated for sphere particles by Booth F. theory. However, because of the shape of montmoril-lonite particles, the theoretical value of the intrinsic vis-cosity does not strictly agree with that for sphere (Adachi Y. et al., 1998a).
Since the electroviscous effects are affected by the flow field, it is considered as limitation due to the Peclet num-ber is imposed. In fact, Eqn. (7) can be applied at only lower Peclet number. Peclet number is the dimensionless function described by the timescale for diffusive motion relative to that for convection of flow and defined as fol-lows
36 aPekT
(8)
Where τ indicates the shear stress, and a indicates the hy-drodynamic diameter (Adachi Y., 1995). Regardless of Peclet number, it is useful that D-K equation, by which Van de Ven T.G.M. and Mason S.G., (1977) and Buscall R. (1991) to analyze the electroviscous effects,
max2.5eff
rmax
1
(9)
Where,3
effeff
aa
(10)
ϕmax indicates packing volume fraction. Eqn. (9) and Eqn. (10) were used to estimate the experimental values of aeff by fitting that to our experimental data assuming
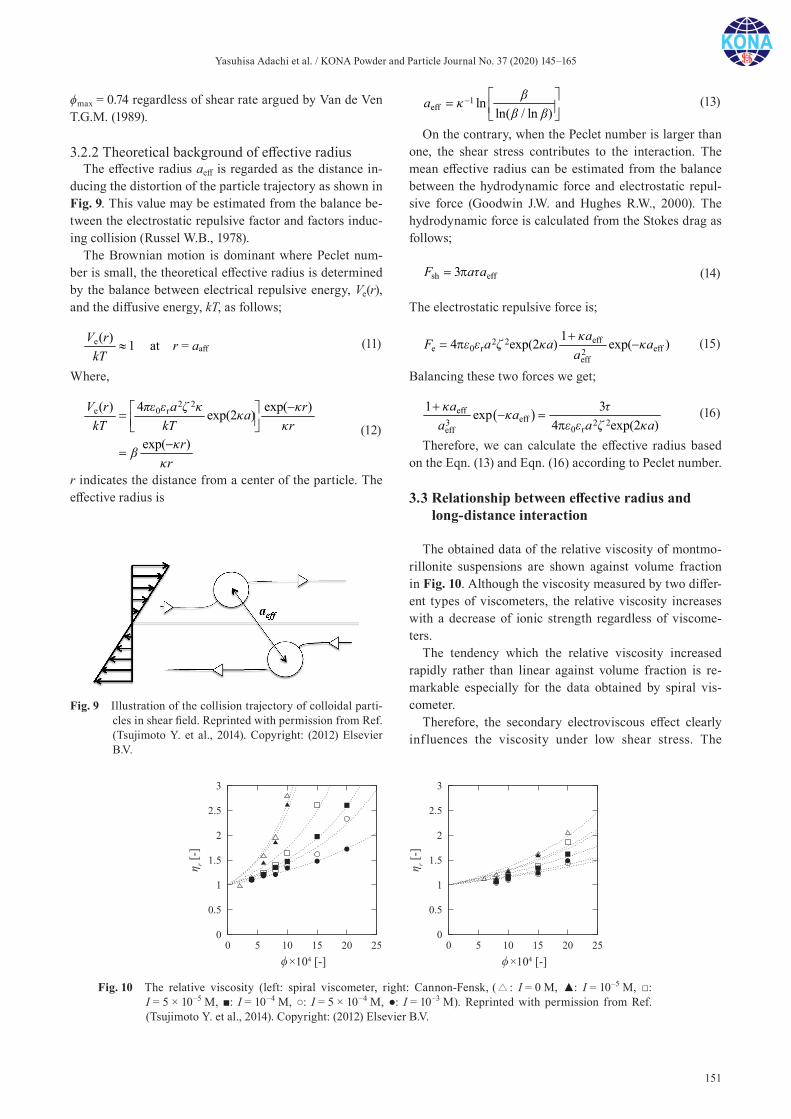
Yasuhisa Adachi et al. / KONA Powder and Particle Journal No. 37 (2020) 145–165
151
ϕmax = 0.74 regardless of shear rate argued by Van de Ven T.G.M. (1989).
3.2.2 Theoretical background of effective radiusThe effective radius aeff is regarded as the distance in-
ducing the distortion of the particle trajectory as shown in Fig. 9. This value may be estimated from the balance be-tween the electrostatic repulsive factor and factors induc-ing collision (Russel W.B., 1978).
The Brownian motion is dominant where Peclet num-ber is small, the theoretical effective radius is determined by the balance between electrical repulsive energy, Ve(r), and the diffusive energy, kT, as follows;
e( ) 1V rkT
at r = aaff
(11)
Where,
2 2e 0 r( ) 4 exp( )exp(2 )
exp( )
V r a rakT kT r
rr
(12)
r indicates the distance from a center of the particle. The effective radius is
1eff ln
ln( / ln )a
(13)
On the contrary, when the Peclet number is larger than one, the shear stress contributes to the interaction. The mean effective radius can be estimated from the balance between the hydrodynamic force and electrostatic repul-sive force (Goodwin J.W. and Hughes R.W., 2000). The hydrodynamic force is calculated from the Stokes drag as follows;
sh eff3F a a
(14)
The electrostatic repulsive force is;
eff2 2e 0 r eff2
eff
14 exp(2 ) exp( )aF a a aa
(15)
Balancing these two forces we get;
effeff3 2 2
0 reff
1 3exp4 exp(2 )
a aa a a
(16)
Therefore, we can calculate the effective radius based on the Eqn. (13) and Eqn. (16) according to Peclet number.
3.3 Relationship between effective radius and long-distance interaction
The obtained data of the relative viscosity of montmo-rillonite suspensions are shown against volume fraction in Fig. 10. Although the viscosity measured by two differ-ent types of viscometers, the relative viscosity increases with a decrease of ionic strength regardless of viscome-ters.
The tendency which the relative viscosity increased rapidly rather than linear against volume fraction is re-markable especially for the data obtained by spiral vis-cometer.
Therefore, the secondary electroviscous effect clearly influences the viscosity under low shear stress. The
Fig. 9 Illustration of the collision trajectory of colloidal parti-cles in shear field. Reprinted with permission from Ref. (Tsujimoto Y. et al., 2014). Copyright: (2012) Elsevier B.V.
Fig. 10 The relative viscosity (left: spiral viscometer, right: Cannon-Fensk, ( : I = 0 M, : I = 10–5 M, : I = 5 × 10⁻⁵ M, : I = 10–4 M, : I = 5 × 10⁻⁴ M, : I = 10–3 M). Reprinted with permission from Ref. (Tsujimoto Y. et al., 2014). Copyright: (2012) Elsevier B.V.
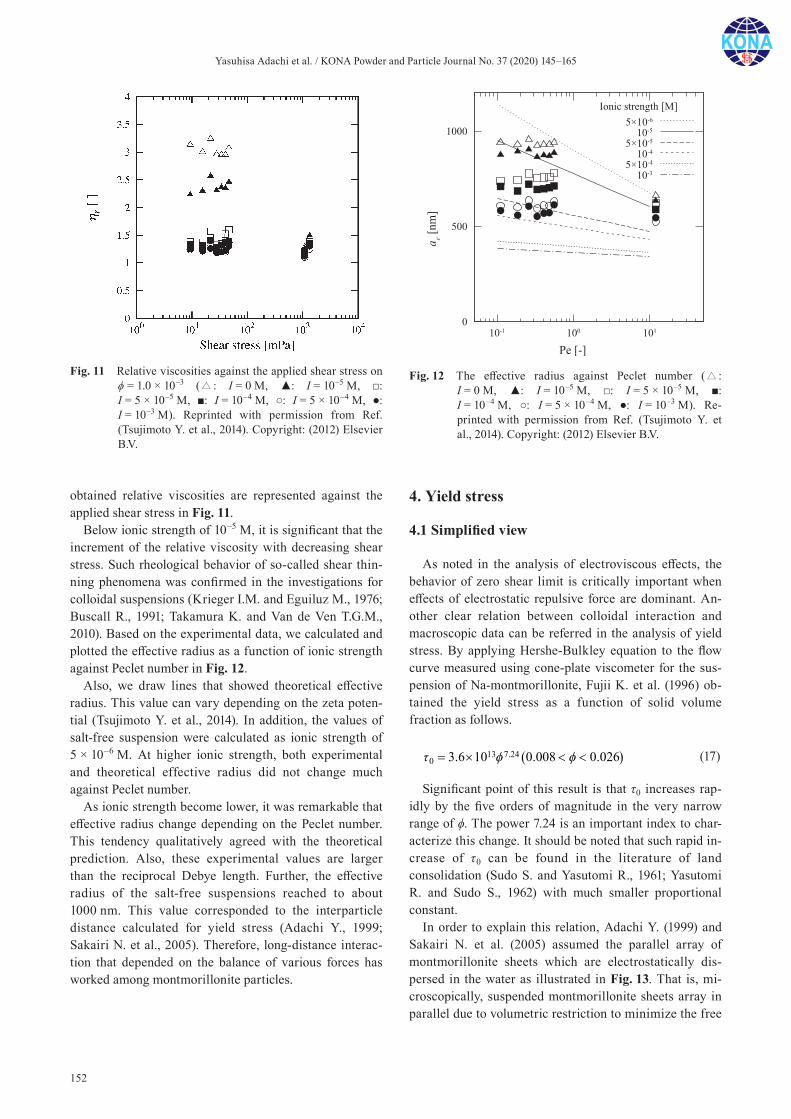
Yasuhisa Adachi et al. / KONA Powder and Particle Journal No. 37 (2020) 145–165
152
obtained relative viscosities are represented against the applied shear stress in Fig. 11.
Below ionic strength of 10–5 M, it is significant that the increment of the relative viscosity with decreasing shear stress. Such rheological behavior of so-called shear thin-ning phenomena was confirmed in the investigations for colloidal suspensions (Krieger I.M. and Eguiluz M., 1976; Buscall R., 1991; Takamura K. and Van de Ven T.G.M., 2010). Based on the experimental data, we calculated and plotted the effective radius as a function of ionic strength against Peclet number in Fig. 12.
Also, we draw lines that showed theoretical effective radius. This value can vary depending on the zeta poten-tial (Tsujimoto Y. et al., 2014). In addition, the values of salt-free suspension were calculated as ionic strength of 5 × 10⁻⁶ M. At higher ionic strength, both experimental and theoretical effective radius did not change much against Peclet number.
As ionic strength become lower, it was remarkable that effective radius change depending on the Peclet number. This tendency qualitatively agreed with the theoretical prediction. Also, these experimental values are larger than the reciprocal Debye length. Further, the effective radius of the salt-free suspensions reached to about 1000 nm. This value corresponded to the interparticle distance calculated for yield stress (Adachi Y., 1999; Sakairi N. et al., 2005). Therefore, long-distance interac-tion that depended on the balance of various forces has worked among montmorillonite particles.
4. Yield stress
4.1 Simplified view
As noted in the analysis of electroviscous effects, the behavior of zero shear limit is critically important when effects of electrostatic repulsive force are dominant. An-other clear relation between colloidal interaction and macroscopic data can be referred in the analysis of yield stress. By applying Hershe-Bulkley equation to the flow curve measured using cone-plate viscometer for the sus-pension of Na-montmorillonite, Fujii K. et al. (1996) ob-tained the yield stress as a function of solid volume fraction as follows.
13 7.240 3.6 10 0.008 0.026
(17)
Significant point of this result is that τ0 increases rap-idly by the five orders of magnitude in the very narrow range of ϕ. The power 7.24 is an important index to char-acterize this change. It should be noted that such rapid in-crease of τ0 can be found in the literature of land consolidation (Sudo S. and Yasutomi R., 1961; Yasutomi R. and Sudo S., 1962) with much smaller proportional constant.
In order to explain this relation, Adachi Y. (1999) and Sakairi N. et al. (2005) assumed the parallel array of montmorillonite sheets which are electrostatically dis-persed in the water as illustrated in Fig. 13. That is, mi-croscopically, suspended montmorillonite sheets array in parallel due to volumetric restriction to minimize the free
Fig. 11 Relative viscosities against the applied shear stress on ϕ = 1.0 × 10⁻³ ( : I = 0 M, : I = 10–5 M, : I = 5 × 10⁻⁵ M, : I = 10–4 M, : I = 5 × 10⁻⁴ M, : I = 10–3 M). Reprinted with permission from Ref. (Tsujimoto Y. et al., 2014). Copyright: (2012) Elsevier B.V.
Fig. 12 The effective radius against Peclet number ( : I = 0 M, : I = 10–5 M, : I = 5 × 10⁻⁵ M, : I = 10–4 M, : I = 5 × 10⁻⁴ M, : I = 10–3 M). Re-printed with permission from Ref. (Tsujimoto Y. et al., 2014). Copyright: (2012) Elsevier B.V.
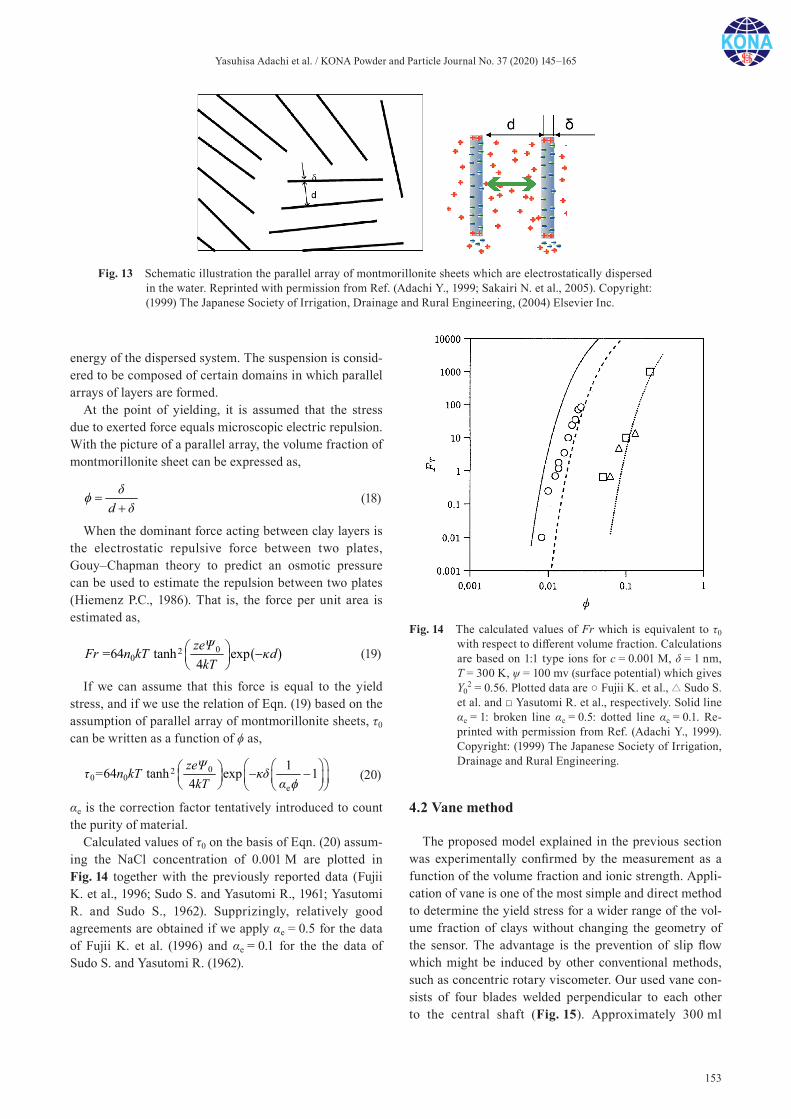
Yasuhisa Adachi et al. / KONA Powder and Particle Journal No. 37 (2020) 145–165
153
energy of the dispersed system. The suspension is consid-ered to be composed of certain domains in which parallel arrays of layers are formed.
At the point of yielding, it is assumed that the stress due to exerted force equals microscopic electric repulsion. With the picture of a parallel array, the volume fraction of montmorillonite sheet can be expressed as,
d
(18)
When the dominant force acting between clay layers is the electrostatic repulsive force between two plates, Gouy–Chapman theory to predict an osmotic pressure can be used to estimate the repulsion between two plates (Hiemenz P.C., 1986). That is, the force per unit area is estimated as,
020 = 64 tanh exp
4zeΨFr n kT dkT
(19)
If we can assume that this force is equal to the yield stress, and if we use the relation of Eqn. (19) based on the assumption of parallel array of montmorillonite sheets, τ0 can be written as a function of ϕ as,
020 0
e
1= 64 tanh exp 14zeΨn kTkT
(20)
αe is the correction factor tentatively introduced to count the purity of material.
Calculated values of τ0 on the basis of Eqn. (20) assum-ing the NaCl concentration of 0.001 M are plotted in Fig. 14 together with the previously reported data (Fujii K. et al., 1996; Sudo S. and Yasutomi R., 1961; Yasutomi R. and Sudo S., 1962). Supprizingly, relatively good agreements are obtained if we apply αe = 0.5 for the data of Fujii K. et al. (1996) and αe = 0.1 for the the data of Sudo S. and Yasutomi R. (1962).
4.2 Vane method
The proposed model explained in the previous section was experimentally confirmed by the measurement as a function of the volume fraction and ionic strength. Appli-cation of vane is one of the most simple and direct method to determine the yield stress for a wider range of the vol-ume fraction of clays without changing the geometry of the sensor. The advantage is the prevention of slip flow which might be induced by other conventional methods, such as concentric rotary viscometer. Our used vane con-sists of four blades welded perpendicular to each other to the central shaft (Fig. 15). Approximately 300 ml
Fig. 13 Schematic illustration the parallel array of montmorillonite sheets which are electrostatically dispersed in the water. Reprinted with permission from Ref. (Adachi Y., 1999; Sakairi N. et al., 2005). Copyright: (1999) The Japanese Society of Irrigation, Drainage and Rural Engineering, (2004) Elsevier Inc.
Fig. 14 The calculated values of Fr which is equivalent to τ0 with respect to different volume fraction. Calculations are based on 1:1 type ions for c = 0.001 M, δ = 1 nm, T = 300 K, ψ = 100 mv (surface potential) which gives Υ0
2 = 0.56. Plotted data are Fujii K. et al., Sudo S. et al. and Yasutomi R. et al., respectively. Solid line αe = 1: broken line αe = 0.5: dotted line αe = 0.1. Re-printed with permission from Ref. (Adachi Y., 1999). Copyright: (1999) The Japanese Society of Irrigation, Drainage and Rural Engineering.
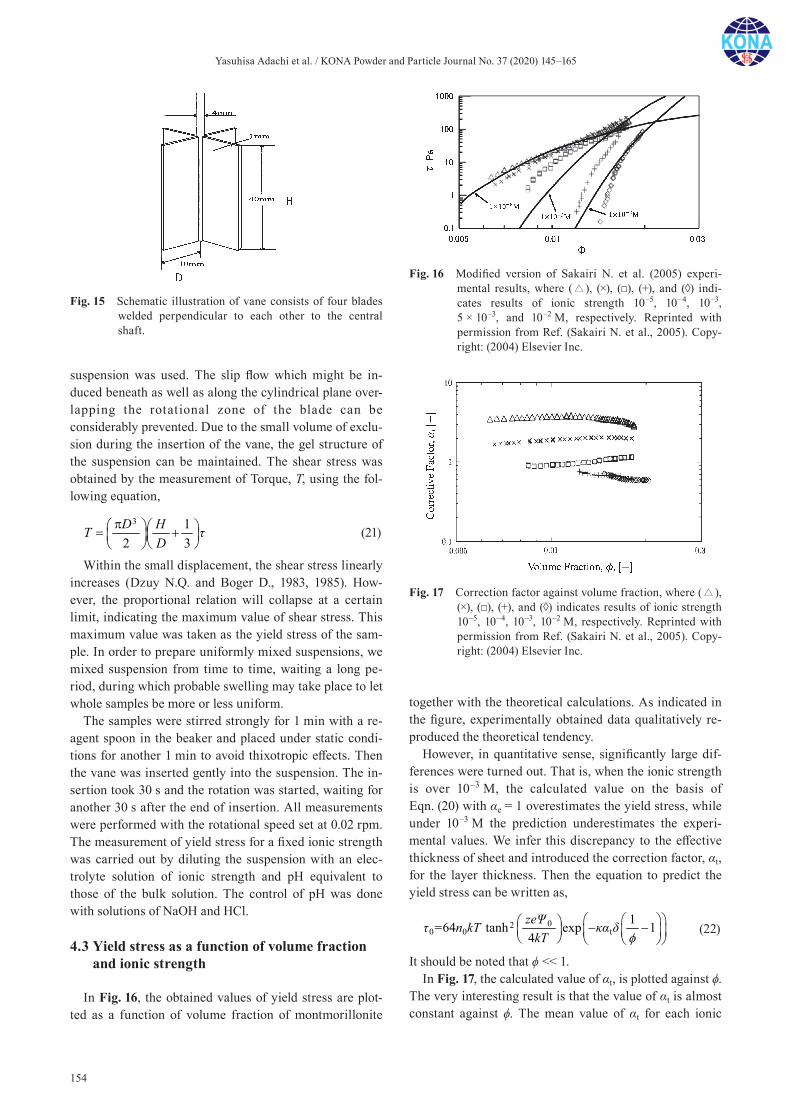
Yasuhisa Adachi et al. / KONA Powder and Particle Journal No. 37 (2020) 145–165
154
suspension was used. The slip flow which might be in-duced beneath as well as along the cylindrical plane over-lapping the rotational zone of the blade can be considerably prevented. Due to the small volume of exclu-sion during the insertion of the vane, the gel structure of the suspension can be maintained. The shear stress was obtained by the measurement of Torque, T, using the fol-lowing equation,
3 12 3D HT
D
(21)
Within the small displacement, the shear stress linearly increases (Dzuy N.Q. and Boger D., 1983, 1985). How-ever, the proportional relation will collapse at a certain limit, indicating the maximum value of shear stress. This maximum value was taken as the yield stress of the sam-ple. In order to prepare uniformly mixed suspensions, we mixed suspension from time to time, waiting a long pe-riod, during which probable swelling may take place to let whole samples be more or less uniform.
The samples were stirred strongly for 1 min with a re-agent spoon in the beaker and placed under static condi-tions for another 1 min to avoid thixotropic effects. Then the vane was inserted gently into the suspension. The in-sertion took 30 s and the rotation was started, waiting for another 30 s after the end of insertion. All measurements were performed with the rotational speed set at 0.02 rpm. The measurement of yield stress for a fixed ionic strength was carried out by diluting the suspension with an elec-trolyte solution of ionic strength and pH equivalent to those of the bulk solution. The control of pH was done with solutions of NaOH and HCl.
4.3 Yield stress as a function of volume fraction and ionic strength
In Fig. 16, the obtained values of yield stress are plot-ted as a function of volume fraction of montmorillonite
together with the theoretical calculations. As indicated in the figure, experimentally obtained data qualitatively re-produced the theoretical tendency.
However, in quantitative sense, significantly large dif-ferences were turned out. That is, when the ionic strength is over 10–3 M, the calculated value on the basis of Eqn. (20) with αe = 1 overestimates the yield stress, while under 10–3 M the prediction underestimates the experi-mental values. We infer this discrepancy to the effective thickness of sheet and introduced the correction factor, αt, for the layer thickness. Then the equation to predict the yield stress can be written as,
020 0 t
1= 64 tanh exp 14zeΨn kTkT
(22)
It should be noted that ϕ << 1.In Fig. 17, the calculated value of αt, is plotted against ϕ.
The very interesting result is that the value of αt is almost constant against ϕ. The mean value of αt for each ionic
Fig. 15 Schematic illustration of vane consists of four blades welded perpendicular to each other to the central shaft.
Fig. 16 Modified version of Sakairi N. et al. (2005) experi-mental results, where ( ), (×), (), (+), and (◊) indi-cates results of ionic strength 10–5, 10–4, 10–3, 5 × 10⁻³, and 10–2 M, respectively. Reprinted with permission from Ref. (Sakairi N. et al., 2005). Copy-right: (2004) Elsevier Inc.
Fig. 17 Correction factor against volume fraction, where ( ), (×), (), (+), and (◊) indicates results of ionic strength 10–5, 10–4, 10–3, 10–2 M, respectively. Reprinted with permission from Ref. (Sakairi N. et al., 2005). Copy-right: (2004) Elsevier Inc.
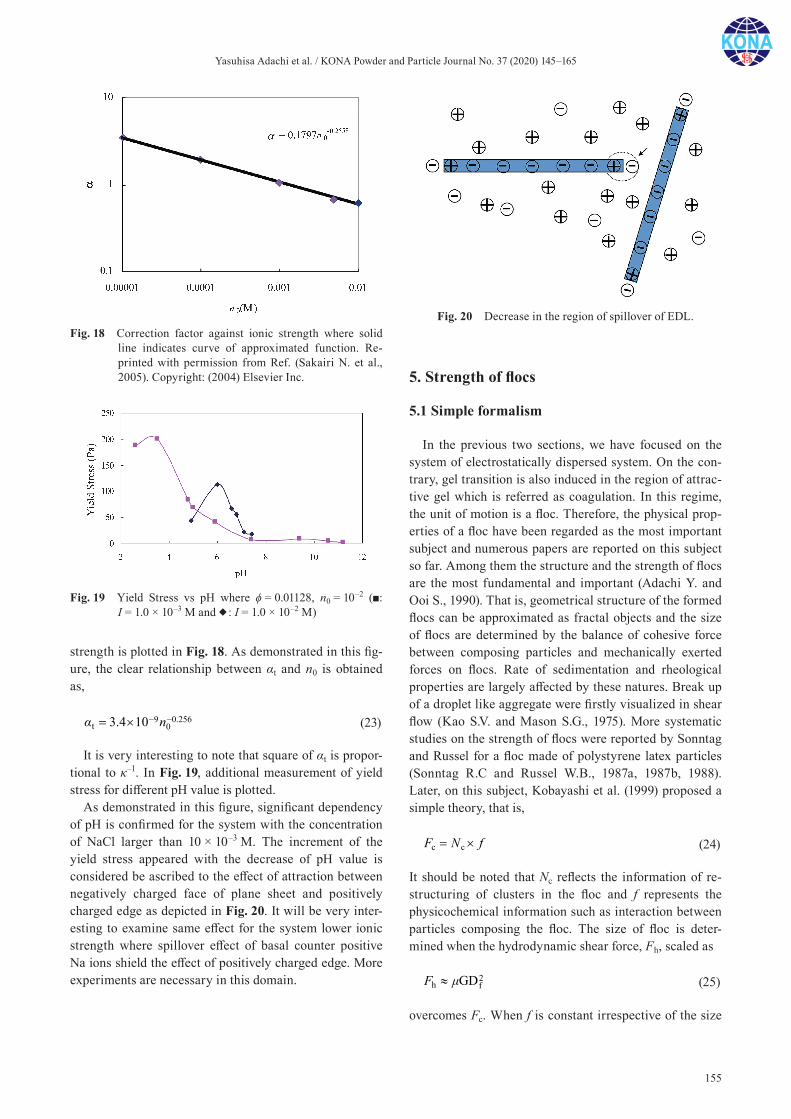
Yasuhisa Adachi et al. / KONA Powder and Particle Journal No. 37 (2020) 145–165
155
strength is plotted in Fig. 18. As demonstrated in this fig-ure, the clear relationship between αt and n0 is obtained as,
9 0.256t 03.4 10 n
(23)
It is very interesting to note that square of αt is propor-tional to κ–1. In Fig. 19, additional measurement of yield stress for different pH value is plotted.
As demonstrated in this figure, significant dependency of pH is confirmed for the system with the concentration of NaCl larger than 10 × 10–3 M. The increment of the yield stress appeared with the decrease of pH value is considered be ascribed to the effect of attraction between negatively charged face of plane sheet and positively charged edge as depicted in Fig. 20. It will be very inter-esting to examine same effect for the system lower ionic strength where spillover effect of basal counter positive Na ions shield the effect of positively charged edge. More experiments are necessary in this domain.
5. Strength of flocs
5.1 Simple formalism
In the previous two sections, we have focused on the system of electrostatically dispersed system. On the con-trary, gel transition is also induced in the region of attrac-tive gel which is referred as coagulation. In this regime, the unit of motion is a floc. Therefore, the physical prop-erties of a floc have been regarded as the most important subject and numerous papers are reported on this subject so far. Among them the structure and the strength of flocs are the most fundamental and important (Adachi Y. and Ooi S., 1990). That is, geometrical structure of the formed flocs can be approximated as fractal objects and the size of flocs are determined by the balance of cohesive force between composing particles and mechanically exerted forces on flocs. Rate of sedimentation and rheological properties are largely affected by these natures. Break up of a droplet like aggregate were firstly visualized in shear flow (Kao S.V. and Mason S.G., 1975). More systematic studies on the strength of flocs were reported by Sonntag and Russel for a floc made of polystyrene latex particles (Sonntag R.C and Russel W.B., 1987a, 1987b, 1988). Later, on this subject, Kobayashi et al. (1999) proposed a simple theory, that is,
c cF N f
(24)
It should be noted that Nc reflects the information of re-structuring of clusters in the floc and f represents the physicochemical information such as interaction between particles composing the floc. The size of floc is deter-mined when the hydrodynamic shear force, Fh, scaled as
2h fGDF
(25)
overcomes Fc. When f is constant irrespective of the size
Fig. 18 Correction factor against ionic strength where solid line indicates curve of approximated function. Re-printed with permission from Ref. (Sakairi N. et al., 2005). Copyright: (2004) Elsevier Inc.
Fig. 19 Yield Stress vs pH where ϕ = 0.01128, n0 = 10–2 (: I = 1.0 × 10⁻³ M and : I = 1.0 × 10⁻² M)
Fig. 20 Decrease in the region of spillover of EDL.
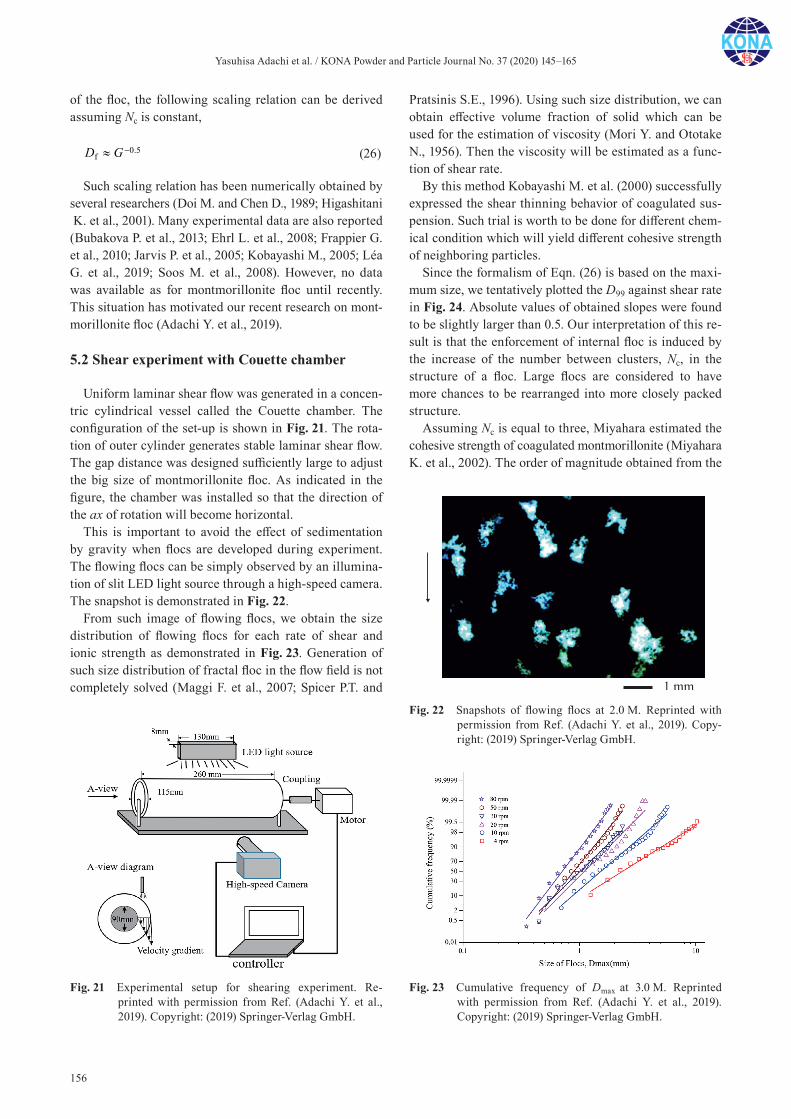
Yasuhisa Adachi et al. / KONA Powder and Particle Journal No. 37 (2020) 145–165
156
of the floc, the following scaling relation can be derived assuming Nc is constant,
0.5fD G
(26)
Such scaling relation has been numerically obtained by several researchers (Doi M. and Chen D., 1989; Higashitani K. et al., 2001). Many experimental data are also reported (Bubakova P. et al., 2013; Ehrl L. et al., 2008; Frappier G. et al., 2010; Jarvis P. et al., 2005; Kobayashi M., 2005; Léa G. et al., 2019; Soos M. et al., 2008). However, no data was available as for montmorillonite floc until recently. This situation has motivated our recent research on mont-morillonite floc (Adachi Y. et al., 2019).
5.2 Shear experiment with Couette chamber
Uniform laminar shear flow was generated in a concen-tric cylindrical vessel called the Couette chamber. The configuration of the set-up is shown in Fig. 21. The rota-tion of outer cylinder generates stable laminar shear flow. The gap distance was designed sufficiently large to adjust the big size of montmorillonite floc. As indicated in the figure, the chamber was installed so that the direction of the ax of rotation will become horizontal.
This is important to avoid the effect of sedimentation by gravity when flocs are developed during experiment. The flowing flocs can be simply observed by an illumina-tion of slit LED light source through a high-speed camera. The snapshot is demonstrated in Fig. 22.
From such image of flowing flocs, we obtain the size distribution of flowing flocs for each rate of shear and ionic strength as demonstrated in Fig. 23. Generation of such size distribution of fractal floc in the flow field is not completely solved (Maggi F. et al., 2007; Spicer P.T. and
Pratsinis S.E., 1996). Using such size distribution, we can obtain effective volume fraction of solid which can be used for the estimation of viscosity (Mori Y. and Ototake N., 1956). Then the viscosity will be estimated as a func-tion of shear rate.
By this method Kobayashi M. et al. (2000) successfully expressed the shear thinning behavior of coagulated sus-pension. Such trial is worth to be done for different chem-ical condition which will yield different cohesive strength of neighboring particles.
Since the formalism of Eqn. (26) is based on the maxi-mum size, we tentatively plotted the D99 against shear rate in Fig. 24. Absolute values of obtained slopes were found to be slightly larger than 0.5. Our interpretation of this re-sult is that the enforcement of internal floc is induced by the increase of the number between clusters, Nc, in the structure of a floc. Large flocs are considered to have more chances to be rearranged into more closely packed structure.
Assuming Nc is equal to three, Miyahara estimated the cohesive strength of coagulated montmorillonite (Miyahara K. et al., 2002). The order of magnitude obtained from the
Fig. 21 Experimental setup for shearing experiment. Re-printed with permission from Ref. (Adachi Y. et al., 2019). Copyright: (2019) Springer-Verlag GmbH.
Fig. 22 Snapshots of flowing flocs at 2.0 M. Reprinted with permission from Ref. (Adachi Y. et al., 2019). Copy-right: (2019) Springer-Verlag GmbH.
Fig. 23 Cumulative frequency of Dmax at 3.0 M. Reprinted with permission from Ref. (Adachi Y. et al., 2019). Copyright: (2019) Springer-Verlag GmbH.
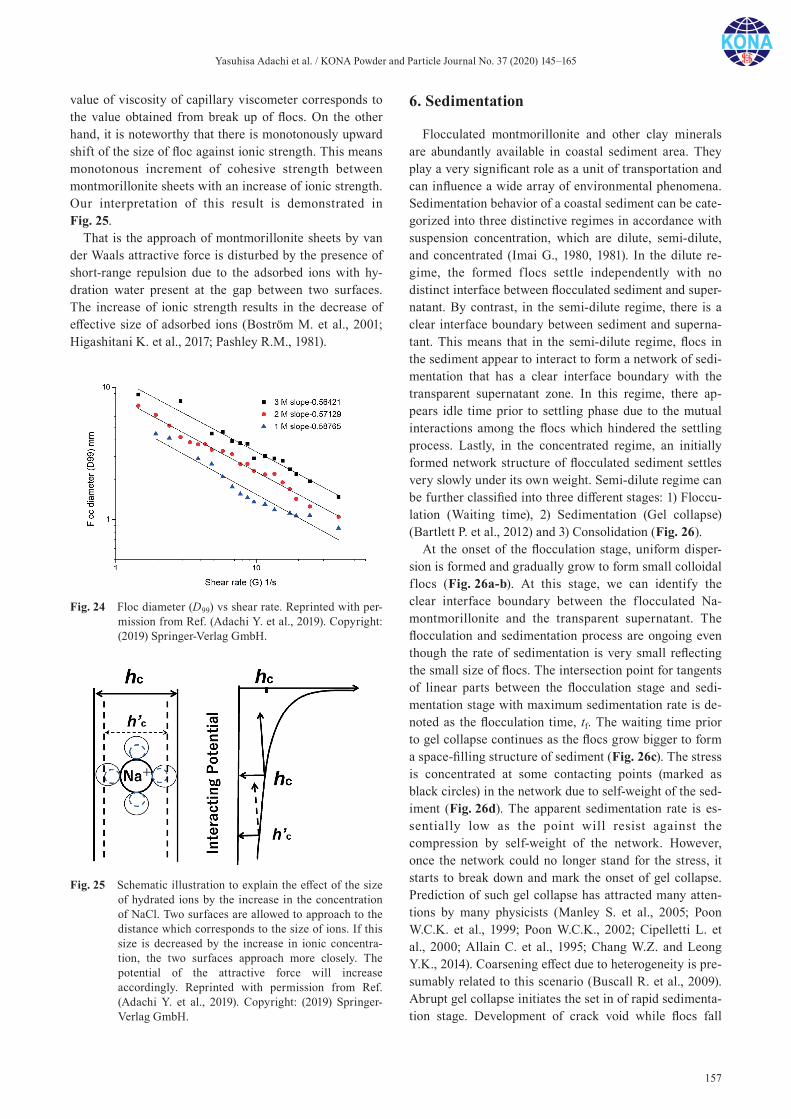
Yasuhisa Adachi et al. / KONA Powder and Particle Journal No. 37 (2020) 145–165
157
value of viscosity of capillary viscometer corresponds to the value obtained from break up of flocs. On the other hand, it is noteworthy that there is monotonously upward shift of the size of floc against ionic strength. This means monotonous increment of cohesive strength between montmorillonite sheets with an increase of ionic strength. Our interpretation of this result is demonstrated in Fig. 25.
That is the approach of montmorillonite sheets by van der Waals attractive force is disturbed by the presence of short-range repulsion due to the adsorbed ions with hy-dration water present at the gap between two surfaces. The increase of ionic strength results in the decrease of effective size of adsorbed ions (Boström M. et al., 2001; Higashi tani K. et al., 2017; Pashley R.M., 1981).
6. Sedimentation
Flocculated montmorillonite and other clay minerals are abundantly available in coastal sediment area. They play a very significant role as a unit of transportation and can influence a wide array of environmental phenomena. Sedimentation behavior of a coastal sediment can be cate-gorized into three distinctive regimes in accordance with suspension concentration, which are dilute, semi-dilute, and concentrated (Imai G., 1980, 1981). In the dilute re-gime, the formed flocs settle independently with no distinct interface between flocculated sediment and super-natant. By contrast, in the semi-dilute regime, there is a clear interface boundary between sediment and superna-tant. This means that in the semi-dilute regime, flocs in the sediment appear to interact to form a network of sedi-mentation that has a clear interface boundary with the transparent supernatant zone. In this regime, there ap-pears idle time prior to settling phase due to the mutual interactions among the flocs which hindered the settling process. Lastly, in the concentrated regime, an initially formed network structure of flocculated sediment settles very slowly under its own weight. Semi-dilute regime can be further classified into three different stages: 1) Floccu-lation (Waiting time), 2) Sedimentation (Gel collapse) (Bartlett P. et al., 2012) and 3) Consolidation (Fig. 26).
At the onset of the flocculation stage, uniform disper-sion is formed and gradually grow to form small colloidal flocs (Fig. 26a-b). At this stage, we can identify the clear interface boundary between the flocculated Na- montmorillonite and the transparent supernatant. The flocculation and sedimentation process are ongoing even though the rate of sedimentation is very small reflecting the small size of flocs. The intersection point for tangents of linear parts between the flocculation stage and sedi-mentation stage with maximum sedimentation rate is de-noted as the flocculation time, tf. The waiting time prior to gel collapse continues as the flocs grow bigger to form a space-filling structure of sediment (Fig. 26c). The stress is concentrated at some contacting points (marked as black circles) in the network due to self-weight of the sed-iment (Fig. 26d). The apparent sedimentation rate is es-sentially low as the point will resist against the compression by self-weight of the network. However, once the network could no longer stand for the stress, it starts to break down and mark the onset of gel collapse. Prediction of such gel collapse has attracted many atten-tions by many physicists (Manley S. et al., 2005; Poon W.C.K. et al., 1999; Poon W.C.K., 2002; Cipelletti L. et al., 2000; Allain C. et al., 1995; Chang W.Z. and Leong Y.K., 2014). Coarsening effect due to heterogeneity is pre-sumably related to this scenario (Buscall R. et al., 2009). Abrupt gel collapse initiates the set in of rapid sedimenta-tion stage. Development of crack void while flocs fall
Fig. 24 Floc diameter (D99) vs shear rate. Reprinted with per-mission from Ref. (Adachi Y. et al., 2019). Copyright: (2019) Springer-Verlag GmbH.
Fig. 25 Schematic illustration to explain the effect of the size of hydrated ions by the increase in the concentration of NaCl. Two surfaces are allowed to approach to the distance which corresponds to the size of ions. If this size is decreased by the increase in ionic concentra-tion, the two surfaces approach more closely. The potential of the attractive force will increase accordingly. Reprinted with permission from Ref. (Adachi Y. et al., 2019). Copyright: (2019) Springer- Verlag GmbH.
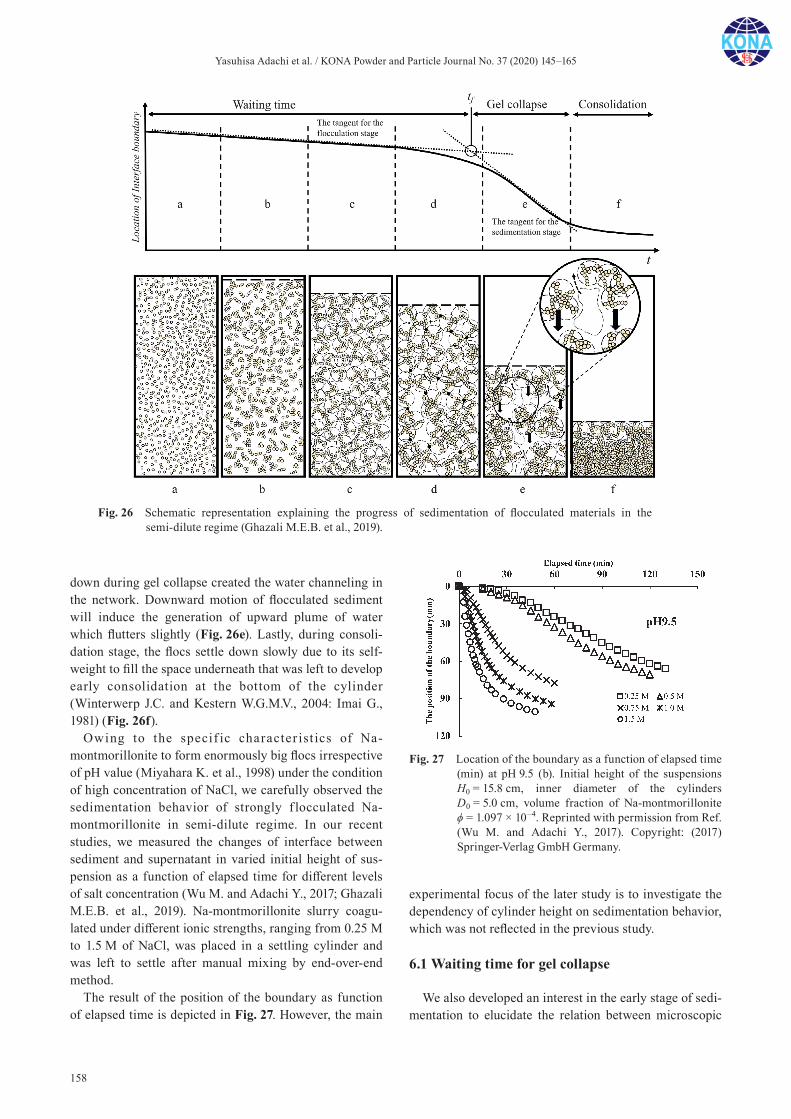
Yasuhisa Adachi et al. / KONA Powder and Particle Journal No. 37 (2020) 145–165
158
down during gel collapse created the water channeling in the network. Downward motion of flocculated sediment will induce the generation of upward plume of water which flutters slightly (Fig. 26e). Lastly, during consoli-dation stage, the flocs settle down slowly due to its self-weight to fill the space underneath that was left to develop early consolidation at the bottom of the cylinder (Winterwerp J.C. and Kestern W.G.M.V., 2004: Imai G., 1981) (Fig. 26f).
Owing to the specif ic character ist ics of Na- montmorillonite to form enormously big flocs irrespective of pH value (Miyahara K. et al., 1998) under the condition of high concentration of NaCl, we carefully observed the sedimentation behavior of strongly f locculated Na- montmorillonite in semi-dilute regime. In our recent studies, we measured the changes of interface between sediment and supernatant in varied initial height of sus-pension as a function of elapsed time for different levels of salt concentration (Wu M. and Adachi Y., 2017; Ghazali M.E.B. et al., 2019). Na-montmorillonite slurry coagu-lated under different ionic strengths, ranging from 0.25 M to 1.5 M of NaCl, was placed in a settling cylinder and was left to settle after manual mixing by end-over-end method.
The result of the position of the boundary as function of elapsed time is depicted in Fig. 27. However, the main
experimental focus of the later study is to investigate the dependency of cylinder height on sedimentation behavior, which was not reflected in the previous study.
6.1 Waiting time for gel collapse
We also developed an interest in the early stage of sedi-mentation to elucidate the relation between microscopic
Fig. 26 Schematic representation explaining the progress of sedimentation of flocculated materials in the semi-dilute regime (Ghazali M.E.B. et al., 2019).
Fig. 27 Location of the boundary as a function of elapsed time (min) at pH 9.5 (b). Initial height of the suspensions H0 = 15.8 cm, inner diameter of the cylinders D0 = 5.0 cm, volume fraction of Na-montmorillonite ϕ = 1.097 × 10⁻⁴. Reprinted with permission from Ref. (Wu M. and Adachi Y., 2017). Copyright: (2017) Springer-Verlag GmbH Germany.
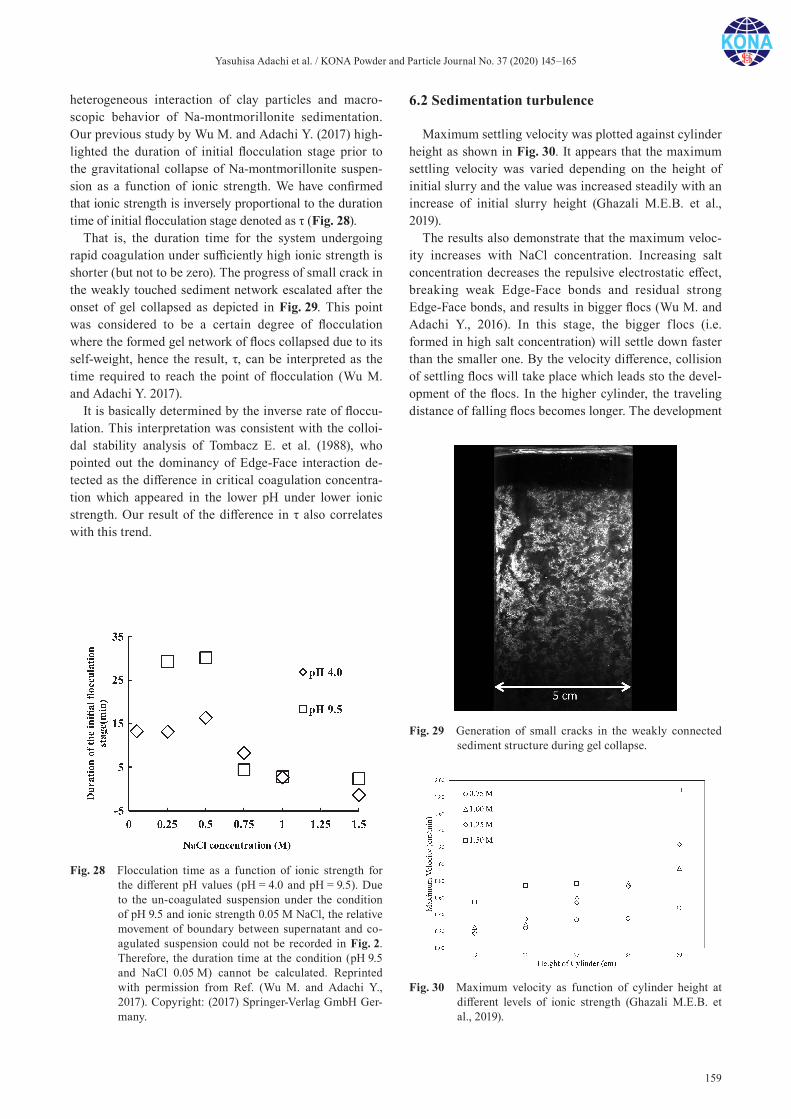
Yasuhisa Adachi et al. / KONA Powder and Particle Journal No. 37 (2020) 145–165
159
heterogeneous interaction of clay particles and macro-scopic behavior of Na-montmorillonite sedimentation. Our previous study by Wu M. and Adachi Y. (2017) high-lighted the duration of initial flocculation stage prior to the gravitational collapse of Na-montmorillonite suspen-sion as a function of ionic strength. We have confirmed that ionic strength is inversely proportional to the duration time of initial flocculation stage denoted as τ (Fig. 28).
That is, the duration time for the system undergoing rapid coagulation under sufficiently high ionic strength is shorter (but not to be zero). The progress of small crack in the weakly touched sediment network escalated after the onset of gel collapsed as depicted in Fig. 29. This point was considered to be a certain degree of flocculation where the formed gel network of flocs collapsed due to its self-weight, hence the result, τ, can be interpreted as the time required to reach the point of flocculation (Wu M. and Adachi Y. 2017).
It is basically determined by the inverse rate of floccu-lation. This interpretation was consistent with the colloi-dal stability analysis of Tombacz E. et al. (1988), who pointed out the dominancy of Edge-Face interaction de-tected as the difference in critical coagulation concentra-tion which appeared in the lower pH under lower ionic strength. Our result of the difference in τ also correlates with this trend.
6.2 Sedimentation turbulence
Maximum settling velocity was plotted against cylinder height as shown in Fig. 30. It appears that the maximum settling velocity was varied depending on the height of initial slurry and the value was increased steadily with an increase of initial slurry height (Ghazali M.E.B. et al., 2019).
The results also demonstrate that the maximum veloc-ity increases with NaCl concentration. Increasing salt concentration decreases the repulsive electrostatic effect, breaking weak Edge-Face bonds and residual strong Edge-Face bonds, and results in bigger flocs (Wu M. and Adachi Y., 2016). In this stage, the bigger flocs (i.e. formed in high salt concentration) will settle down faster than the smaller one. By the velocity difference, collision of settling flocs will take place which leads sto the devel-opment of the flocs. In the higher cylinder, the traveling distance of falling flocs becomes longer. The development
Fig. 28 Flocculation time as a function of ionic strength for the different pH values (pH = 4.0 and pH = 9.5). Due to the un-coagulated suspension under the condition of pH 9.5 and ionic strength 0.05 M NaCl, the relative movement of boundary between supernatant and co-agulated suspension could not be recorded in Fig. 2. Therefore, the duration time at the condition (pH 9.5 and NaCl 0.05 M) cannot be calculated. Reprinted with permission from Ref. (Wu M. and Adachi Y., 2017). Copyright: (2017) Springer-Verlag GmbH Ger-many.
Fig. 29 Generation of small cracks in the weakly connected sediment structure during gel collapse.
Fig. 30 Maximum velocity as function of cylinder height at different levels of ionic strength (Ghazali M.E.B. et al., 2019).

Yasuhisa Adachi et al. / KONA Powder and Particle Journal No. 37 (2020) 145–165
160
of flocs along the long traveling distance is coupled with the turbulence. This sequence creates a feed-forward mechanism which will further enhance the sedimentation process.
In the case of taller cylinder, the traveling distance of falling flocs becomes longer, the falling flocs will then have more chances to collide with the other small flocs and becomes still bigger in size and mass to accelerate the settling speed. As the result, the rapid sedimentation commenced at a different period of time (Imai G., 1981; Dobias B. et al., 1993). Each floc settled differently in term of velocity, due to different size and density. The void formed simultaneously is connected to create chan-neling of counter flow. The observed pattern of fluctuation was similar to a turbulent flow (Pope S.B, 2000). We term this phenomenon as the “sedimentation turbulence” (Ghazali M.E.B. et al., 2019). This phenomenon is not well described in the previous study (Michaels A.S. and Bolger J.C., 1962; Wu M. and Adachi Y., 2017; Miyahara K. et al., 2001, 2004) in which direct application of the re-sult of fluidized led for non-flocculated materials was done (Richardson J.F. and Zaki W.N., 1954).
The floc motion induces a turbulent flow, which will induce further development of flocs. That is, floc forma-tion is due to turbulent flow passing through, which in-creases the settling velocity. Consequently, the flocs will collide with the neighboring flocs to grow into bigger flocs.
7. Conclusion and remarks for the future
In the present article, we focus on the behavior of aque-ous dispersion of Na-montmorillonite in the dilute condi-tion to elucidate the relation between the level of colloidal and interface chemistry such as microscopic interaction of colloidal particles and the level of macroscopic proper-ties which will control the hydrological transport phe-nomena and the massive motion of the materials. The review was started to examine the simple viscosity as a function of ionic strength which is in accordance with the DLVO scheme.
In the limit of low ionic strength, viscosity increases dramatically demonstrating the electro-viscous effect es-pecially due to the interaction of EDLs formed around the suspended particles. The data obtained using our home-made spiral viscometer confirms the long-range interac-tion between the flowing montmorillonite sheets which will contribute to enhance the viscosity significantly in the limit of zero shear rate. The value of yield stress ob-tained by vane was found to be clearly reduced to that of electrostatic repulsion due to the interaction of EDLs. Un-fortunately, we are not able to convert the repulsion to at-traction which stands for the deformation. However, the
estimated distance obtained from the analysis of actual force between two sheets was estimated to be longer than the Debye reciprocal length implying the significance of long-range interaction. More systematic data against pH will elucidate the role of spillover effects of EDL of basal part and Edge-Face interaction.
On the contrary, the data obtained for the region of higher ionic strength, viscosity increases monotonously with an increase of ionic strength. This tendency was confirmed by the measurement on the size of flowing flocs. Our interpretation was the presence of additional repulsion due to the adsorption of hydrated sodium ions whose diameter decreases with an increase of ionic con-centration in the region of ionic concentration higher than CCC. The observation of sediment volume also confirms the tendency. One important finding for the sedimentation behavior is to find out the clear evidence for the feed- forward enhancement of the rate of sediment. That is, the sedimentation induces flocculation and flocculation will enhance the rate of sedimentation and so on. We term this behavior as sedimentation turbulence. Another important result was obtained for the difference of waiting prior to gel collapse against pH and ionic strength. That is, pH de-pendency exists for the concentration below 0.5 M but will disappear for the concentration higher than 1.0 M.
Although, our applied methods in the previous studies are done with very primitive instruments; viscosity mea-surement with Ostowald capillary viscometer, Spiral cap-illary viscometer, observation of floc in a simple shear flow, sedimentation behavior in the mess cylinder, we can conclude that there are five different regimes. They are, EDL dominative repulsive phase, pH-dependent repulsive phase, dispersed phase, pH-dependent attractive, pH- independent attractive phase. Continuous study for pre-cise pH dependency will clarify this picture. In addition, further investigation for different chemical conditions (Penner D. and Lagaly G., 2001; Montoro M.A. and Francisca F.M., 2019), such as effect of divalent ions (Kobayashi S. and Adachi Y., 2008) and effect of organic substances (Wilkinson N. et al., 2017; Tombacz E. et al., 1998) will provide us very useful result for the consider-ation of natural colloid.
Acknowledgements
This research was partly supported by JSPS Kakenhi 16H06382. Our former students, Dr. Katsumi Miyahara, Dr. Nobuyuki Sakairi, Mr. Maro Tamaki, Prof. Katsumi Fujii, Mr. Syunya Kobayashi, Mr. Di Chuan and Mr. Yanuar Argo are acknowledged for their experimen-tal support. Dr. Motoyoshi Kobayashi, Dr. Setsuo Ooi and Prof. Katsuya Nakaishi are thanked for their guidance throughout this study.
Yasuhisa Adachi et al. / KONA Powder and Particle Journal No. 37 (2020) 145–165
161
Nomenclature
α Corrective Factor
β Representative of long formulae
ε Dielectric constant (C2/J m)
ε0 Dielectric constant of vacuum (C2/J m)
εr Relative dielectric constant of water (C2/J m)
κ Debye reciprocal length
η Viscosity (mPa-s)
η0 Viscosity of solvent (mPa-s)
ηr Relative Viscosity (mPa-s)
ηs Viscosity of suspension (mPa-s)
δ Layer thickness (nm)
ρ Density of fluid (kg/m³)
τ Time of initial flocculation stage (min)
τ Shear stress (Pa)
τ0 Yield stress
τe Shear stress at end of torque (Pa)
τs Shear stress at side of torque (Pa)
τy Yield stress (Pa)
ϕ Volume fraction [-]
ϕmax Packing volume fraction [-]
ϕeff Effective volume fraction [-]
Ψ0 Surface potential (mV)
ξ Zeta potential (mV)
aeff Effective radius (nm)
CCC Critical Coagulation Concentration
D Diameter of the vane (mm), Inner diameter of capil-lary tube (mm)
D99 Floc diameter (mm)
Df Diameter of floc
Dmax Maximum floc size (mm)
d Mean distance of clay layers (nm)
EDL Electric Double Layer
e Elementary charge (C)
Fe Electrostatic repulsive force
Fr Force per unit area (Pa)
Fsh Hydrodynamic force
G Shear Rate (s–1)
g Gravitational acceleration (m/s2)
H Height of the blade (mm)
h Difference of the levels (mm)
h’c Distance (mm)
h0 Distance (mm)
hc Distance (mm)
K1 Intrinsic viscosity (ml/g)
K2 Huggins’ coeficiente [-]
k Boltzmann constant (J/K)
kT Diffusive energy (J)
L Length of capillary tube (m)
n0 Number concentration of the ions (M)
ni Ionic concentration (M)
Pe Peclet number [-]
Q Flow rate in the tube
r Distance from a center of the particle (nm)
rpm revolution per minute
T Absolute temperature (K)
T Torque (Nm)
Te End of torque (Nm)
Ts Side of torque (Nm)
t Time (sec, min)
Ve(r) Electrical repulsive energy (J)
z Valence of electrolyte solution [-]
References
Abend S., Lagaly G., Sol-gel transitions of sodium montmoril-lonite dispersions, Applied Clay Science, 16 (2000) 201–227. DOI: 10.1016/S0169-1317(99)00040-X
Adachi Y., Aspects of colloid and interface in the engineering science of soil and water with emphasis on the flocculation behavior of model particles, Paddy and Water Environment, 17 (2019) 203–210. DOI: 10.1007/s10333-019-00712-7
Adachi Y., Dynamic aspects of coagulation and flocculation, Advances in Colloid and Interface Science, 56 (1995) 1–31. DOI: 10.1016/0001-8686(94)00229-6
Adachi Y., Iwata S. (ed), Tsuchi no koroido genshou, Gakkai Shuppan Sentar (in Japanese) (2003)
Adachi Y., Kobayashi M., Ooi S., Applicability of fractals to the analysis of the projection of small flocs, Journal of Colloid and Interface Science, 208 (1998a) 353–355. DOI: 10.1006/jcis.1998.5839
Adachi Y., Nakaishi K., Tamaki M., Viscosity of a dilute sus-pension of sodium montmorillonite in a electrostatically stable condition, Journal of Colloid and Interface Science, 198 (1998b) 100–105. DOI: 10.1006/jcis.1997.5243
Adachi Y., Ooi S., Geometrical structure of a floc, Journal of Colloid and Interface Science, 135 (1990) 374–384. DOI: 10.1016/0021-9797(90)90007-B
Adachi Y., Di C., Xiao F., Kobayashi M., Size, orientation, and
Yasuhisa Adachi et al. / KONA Powder and Particle Journal No. 37 (2020) 145–165
162
strength of Na-montmorillonite flocs flowing in a laminar shear flow, Colloid and Polymer Science, 297 (2019) 979. DOI: 10.1007/s00396-019-04532-3
Adachi Y., Yield stress of Na-Montmorillonite suspension in an electrostatically dispersed state, Transactions of The Japa-nese Society of Irrigation, Drainage and Reclamation Engi-neering, 1999 (1999) 217–222, a2.
Ali S., Bandyopadhyay R., Aggregation and stability of aniso-tropic charged clay colloids in aqueous medium in the pres-ence of salt, Faraday Discuss., 186 (2016) 455–471. DOI: 10.1039/C5FD00124B
Allain C., Cloitre M., Wafra M., Aggregation and sedimentation in colloidal suspensions, Physical Review Letters, 74 (1995) 1478–1481. DOI: 10.1103/PhysRevLett.74.1478
Batchelor G.K., Brownian diffusion of particles with hydrody-namic interaction. Journal of Fluid Mechanics, 74 (1976) 1–29. DOI: 10.1017/S0022112076001663
Bartlett P., Teece L.J., Faers M.A., Sudden collapse of a colloi-dal gel, Physical Review E, 85 (2012) 021404-1- 021404-13. DOI: 10.1103/PhysRevE.85.021404
Booth F., The electroviscous effect for suspensions of solid spherical particles, Proceedings of the Royal Society A, 203 (1950) 533–551. DOI: 10.1098/rspa.1950.0155
Boström M., Williams D.R.M., Ninham B.W., Specific ion effects: why DLVO theory fails for biology and colloid sys-tems, Physical Review Letters, 87 (2001) 168103-1-168103-4. DOI: 10.1103/PhysRevLett.87.168103
Bubakova P., Pivokonsky M., Filip P., Effect of shear rate on aggregate size and structure in the process of aggregation and at steady state, Powder Technology, 235 (2013) 540–549. DOI: 10.1016/j.powtec.2012.11.014
Buscall R., Chounhury T.H., Faers M.A.J.W., Luckham P.A., Partridge S.J., Towards rationalizing collapse times for the delayed sedimentation, Soft Matter, 5 (2009) 1345–1349. DOI: 10.1039/B805807E
Buscall R., Effect of long-range repulsive forces on the viscosity of concentrated lattices: Comparison of experimental data with an effective hard sphere model, Journal of the Chemi-cal Society, Faraday Transactions, 87 (1991) 1365–1370. DOI: 10.1039/FT9918701365
Callaghan I.C., Ottewill R.H., Interparticle forces in montmo-rillonite gels, Faraday Discussions of the Chemical Society, 57 (1974) 110–118. DOI: 10.1039/DC9745700110
Chang F.R.C., Sposito G., The electrical double layer of a disk-shaped clay mineral particle: Effect of particle size, Journal of Colloid and Interface Science, 163 (1994) 19–27. DOI: 10.1006/jcis.1994.1076
Chang F.R.C., Sposito G., The electrical double layer of a disk-shaped clay mineral particle: effects of electrolyte proper-ties and surface charge density, Journal of Colloid and Interface Science, 178 (1996) 555–564. DOI: 10.1006/jcis.1996.0151
Chang W.Z., Leong Y.K., Ageing and collapse of bentonite gels-effects of Li, Na, K and Cs ions, Rheologica Acta, 53 (2014) 109–122. DOI: 10.1007/s00397-013-0744-0
Chapman D.L., LI. A contribution to the theory of electrocapil-larity, The London, Edinburgh, and Dublin Philosophical Magazine and Journal of Science, 25 (1913) 475–481. DOI:
10.1080/14786440408634187Chen J.S., Cushman J.H., Low P.F., Rheological behavior of
Na-montmorillonite suspensions at low electrolyte concen-tration, Clays and Clay Minerals, 38 (1990) 57–62. DOI: 10.1346/CCMN.1990.0380108
Cipelletti L., Manley S., Ball R.C., Weitz D.A., Universal aging features in the restructuring of fractal colloidal gels, Physi-cal Review Letters, 84 (2000) 2275–2278. DOI: 10.1103/PhysRevLett.84.2275
Derjaguin B.V., Landau L.D., Theory of the stability of strongly charged lyophobic sols and of the adhesion of strongly charged particles in solution of electrolytes, Acta Physico-chimica U. R. S. S., 14 (1941) 633–662. DOI: 10.1016/0079-6816(93)90013-L
Dobias B., Schick M.J., Fowkes F.M., Dekker M., Coagulation and flocculation: Theory and application, Journal of Chemical Education, 70 (1993) A199. DOI: 10.1021/ed070pA199.9
Doi M., Chen D., Simulation of aggregating colloids in shear flow, Journal of Chemical Physics, 90 (1989) 5271–5279. DOI: 10.1063/1.456430
Dzuy N.Q., Boger D.V., Direct yield stress measurement with the vane method, Journal of Rheology, 29 (1985) 335–348. DOI: 10.1122/1.549794
Dzuy N.Q., Boger D.V., Yield stress measurement for concen-trated suspensions, Journal of Rheology, 27 (1983) 321–350. DOI: 10.1122/1.549709
Egashira K., Viscosities of allophane and imogolite clay suspen-sions, Clay Science, 5 (1977) 87–95. DOI: 10.11362/ jcssjclayscience1960.5.87
Ehrl L., Soos M., Morbidelli M., Dependence of aggregate strength, structure, and light scattering properties on pri-mary particles size under turbulent conditions in stirred tank. Langmuir, 24 (2008) 3070–3081. DOI: 10.1021/la7032302
Einstein A., Eine neue Bistimmung Der Molekueldimensionen, Annalen der Physik, 19 (1906) 289–306. DOI: 10.1002/andp.19063240204
Frappier G., Lartiges B.S., Skali-Lami S., Floc cohesive force in reversible aggregation: A Couette laminar flow investiga-tion, Langmuir, 26 (2010) 10475–10488. DOI: 10.1021/la9046947
Fujii K., Takahashi T., Nakaishi K., Shear flow characteristics and yield stress of montmorillonite suspensions, Transac-tions of The Japanese Society of Irrigation, Drainage and Reclamation Engineering, 186 (1996) 53–60. (in Japanese with English summary)
Ghazali M.E.B., Argo Y., Kyotoh H., Adachi Y., Effects of the concentration of NaCl and cylinder height on the sedimen-tation of flocculated suspension of Na-montmorillonite in the semi-dilute regime, Paddy and Water Environment, (2019). DOI: 10.1007/s10333-019-00779-2
Goodwin J.W., Hughes R.W., Rheology for Chemists, Royal Society of Chemistry (2000) DOI: 10.1039/9781847551832
Gouy M., Sur la constitution de la charge électrique à la surface d’un electrolyte, J. Phys. Theor. Appl., 9 (1910) 457–468. DOI: 10.1051/jphystap:019100090045700
Heath D., Tadros F., Influence of pH, electrolyte, and poly (vinyl

Yasuhisa Adachi et al. / KONA Powder and Particle Journal No. 37 (2020) 145–165
163
alcohol) addition on the rheological characteristics of aque-ous dispersions of sodium montmorillonite, Journal of Colloid and Interface Science, 93 (1983) 307–319. DOI: 10.1016/0021-9797(83)90415-0
Hiemenz P.C., Principles of colloid and surface chemistry (sec-ond ed.), Dekker, New York/Basel (1986)
Higashitani K., Iimura K., Sanda H., Simulation of deformation and breakup of large aggregates in flows of viscous fluid, Chemical Engineering Science, 56 (2001) 2927–2938. DOI: 10.1016/S0009-2509(00)00477-2
Higashitani K., Nakamura K., Shimamura T., Fukasawa T., Tsuchiya K., Mori Y., Orders of magnitude reduction of rapid coagulation rate with decreasing size of silica nanoparticles, Langmuir, 33 (2017) 5046–5051. DOI: 10.1021/acs.langmuir.7b00932
Imai G., Experimental studies on sedimentation mechanism and sediment formation of clay materials, Soils and Founda-tions, 21 (1981) 7–20. DOI: 10.3208/sandf1972.21.7
Imai G., Settling behavior of clay suspension, Soils and Foun-dations, 20 (1980) 61–77. DOI: 10.3208/sandf1972.20.2_61
Ishida T., Makino T., Wang C., Effects of pH on dielectric relax-ation of montmorillonite, allophane, and imogolite suspen-sions, Journal of Colloid and Interface Science, 212 (1999) 152–161. DOI: 10.1006/jcis.1998.6030
Jarvis P., Jefferson B., Gregory J., Parsons S.A., A review of floc strength and breakage, Water Research, 39 (2005) 3121–3137. DOI: 10.1016/j.watres.2005.05.022
Kao S.V., Mason S.G., Dispersion of particles by shear, Nature, 253 (1975) 619–621. DOI: 10.1038/253619a0
Kobayashi M., Adachi Y., Ooi S., Breakup of fractal flocs in a turbulent flow, Langmuir, 15 (1999) 4351–4356.
Kobayashi M., Adachi Y., Ooi S., On the steady shear viscosity of coagulated suspensions, Nihon Reoroji Gakkaishi, 28 (2000) 143–144. DOI: 10.1021/la980763o
Kobayashi M., Breakup and strength of polystyrene latex, flocs subjected to a converging flow, Colloids and Surfaces A: Physicochemical and Engineering Aspects, 235 (2004) 73–78. DOI: 10.1016/j.colsurfa.2004.01.008
Kobayashi M., Strength of natural soil flocs, Water Research, 39 (2005) 3273–3278. DOI: 10.1016/j.watres.2005.05.037
Kobayashi S., Adachi Y., Analysis of Na- and Ca- montmorillonite floc structure, Transactions of The Japa-nese Society of Irrigation, Drainage and Rural Engineering, 253 (2008) 21–26. DOI: 10.11408/jsidre2007.2008.21
Kobayashi S., Adachi Y., Development of a spiral-capillary- viscometer and its application for the analysis of flow prop-erties of dilute suspension of montmorillonite, Transactions of The Japanese Society of Irrigation, Drainage and Recla-mation Engineering, 2005 (2005) 407–412. DOI: 10.11408/jsidre1965.2005.407
Krieger I.M., Eguiluz M., The second electroviscous effect in polymer lattices, Transactions of the Society of Rheology, 20 (1976) 29–45. DOI: 10.1122/1.549428
Lagaly G., Ziesmer S., Colloid chemistry of clay minerals: The coagulation of montmorillonite dispersions, Advances in Colloid and Interface Science, 100-102 (2003) 105–128. DOI: 10.1016/S0001-8686(02)00064-7
Langmuir I., The role of attractive and repulsive forces in the
formation of tactoids, thixotropic gels, protein crystals and coacervates, Journal of Chemical Physics, 6 (1938) 873–896. DOI: 10.1063/1.1750183
Léa G., Christ F., Alain L., Carole C.S., Fractal dimensions and morphological characteristics of aggregates formed in dif-ferent physico-chemical and mechanical flocculation envi-ronments, Colloids and Surfaces A: Physicochemical and Engineering Aspects, 560 (2019) 213–222. DOI: 10.1016/j.colsurfa.2018.10.017
Maggi F., Mietta F., Winterwerp J.C., Effect of variable fractal dimension on the floc size distribution of suspended cohe-sive sediment, Journal of Hydrology, 343 (2007) 43–55. DOI: 10.1016/j.jhydrol.2007.05.035
Manley S., Skotheim J.M., Mahadevan L., Weitz D.A., Gravita-tional collapse of colloidal gels, Physical Review Letters, 94 (2005) 218302-1-218302-4. DOI: 10.1103/PhysRevLett. 94.218302
Michaels A.S., Bolger J.C., Settling rates and sediment volumes of flocculated kaolin suspensions, Industrial & Engineering Chemistry Fundamentals, 1 (1962) 24–33. DOI: 10.1021/i160001a004
Michot, L.J., Baravian C., Bihannic I., Maddi S., Moyne C., Duval J.F.L., Levitz P., Davidson P., Sol/gel and isotropic/nematic transitions in aqueous suspensions of natural non-tronite clay. Influence of particle anisotropy. 2. gel structure and mechanical properties, Langmuir, 25 (2009) 127–139. DOI: 10.1021/la801894a
Miyahara K., Adachi Y., Nakaishi K., Ohtsubo M., Settling velocity of a sodium montmorillonite floc under high ionic strength, Colloid and Surfaces A: Physicochemical and Engineering Aspects, 196 (2002) 87–91. DOI: 10.1016/S0927-7757(01)00798-1
Miyahara K., Adachi Y., Nakaishi K., The viscosity of a dilute suspension of sodium montmorillonite in an alkaline state, Colloids and Surfaces A: Physicochemical and Engineering Aspects, 131 (1-3) (1998) 69–75. DOI: 10.1016/S0927-7757(96)03961-1
Miyahara K., Ohtsubo M., Nakaishi K., Adachi Y., Sedimenta-tion rate of sodium montmorillonite suspension under high ionic strength, Journal of the Clay Science Society of Japan, 40 (2001) 179–184. (in Japanese with English abstract) DOI: 10.11362/jcssjnendokagaku1961.40.179
Miyahara K., Ooi S., Nakaishi K., Kobayashi M., Adachi Y., Capillary diameter effects on the apparent viscosity of the suspension of clay flocs, Nihon Reoroji Gakkaishi, 32 (2004) 277–284. DOI: 10.1678/rheology.32.277
Montoro M.A., Francisca F.M., Effect of ion type and concen-tration on rheological properties of natural sodium benton-ite dispersions at low shear rates, Applied Clay Science, 178 (2019) 105132. DOI: 10.1016/j.clay.2019.105132
Mori Y., Ototake N., About the viscosity of the suspension, Kagaku Kougaku, 20 (1956) 488 (in Japanese)
Norrish K., Crystalline swelling of montmorillonite: Manner of swelling of montmorillonite, Nature, 173 (1954) 256–257. DOI: 10.1038/173256a0
Pashley R.M., DLVO and hydration forces between mica sur-faces in Li+, Na+, K+, and Cs+ electrolyte solutions: A cor-relation of double-layer and hydration forces with surface
Yasuhisa Adachi et al. / KONA Powder and Particle Journal No. 37 (2020) 145–165
164
cation exchange properties, Journal of Colloid and Interface Science, 83 (1981) 531–546. DOI: 10.1016/0021-9797(81) 90348-9
Penner D., Lagaly G., Influence of anions on the rheological properties of clay mineral dispersions, Applied Clay Sci-ence, 19 (2001) 131–142. DOI: 10.1016/S0169-1317(01) 00052-7
Poon W.C.K., Starrs L., Meeker S.P., Moussaïd A., Evans R.M.L., Pusey P.N., Robins M.M., Delayed sedimentation of transient gels in colloid–polymer mixtures: dark-field observation, rheology and dynamic light scattering studies, Faraday Discussions, 112 (1999) 143–154. DOI: 10.1039/A900664H
Poon W.C.K., The physics of a model colloid–polymer mixture, Journal of Physics: Condensed Matter, 14 (2002) R859- R880. DOI: 10.1088/0953-8984/14/33/201
Pope S.B., Turbulent flows, Cambridge University Press (2000)Ramos-Tejada M.M., de Vicente J., Ontiveros A., Duran J.D.G.,
Effect of humic acid adsorption on the rheological proper-ties of sodium montmorillonite suspensions, Journal of Rheology, 45 (2001) 1159–1172. DOI: 10.1122/1.1392297
Richardson J.F., Zaki W.N., Sedimentation and fluidization: Part I, Trans. Instn. Chem. Engrs., 32 (1954) 35–53. DOI: 10.1016/S0263-8762(97)80006-8
Russel W.B., Low-shear limit of the secondary electroviscous effect, Journal of Colloid and Interface Science, 55 (1976) 590–604. DOI: 10.1016/0021-9797(76)90070-9
Russel W.B., The rheology of suspensions of charged rigid spheres, Journal of Fluid Mechanics, 85 (1978) 209–232. DOI: 10.1017/S0022112078000609
Sakairi N., Kobayashi M., Adachi Y.., Effects of salt concentra-tion on the yield stress of sodium montmorillonite suspen-sion, Journal of Colloid and Interface Science, 283 (2005) 245–250. DOI: 10.1016/j.jcis.2004.08.181
Secor R.B., Radke C.J., Spillover of the diffuse double layer on montmorillonite particles, Journal of Colloid and Interface Science., 103 (1985) 237–244. DOI: 10.1016/0021-9797(85) 90096-7
Sonntag R.C., Russel W.B., Structure and breakup of flocs sub-jected to fluid stresses: I. Shear experiments, Journal of Colloid and Interface Science, 113 (1989) 399–413. DOI: 10.1016/0021-9797(86)90175-X
Sonntag R.C., Russel W.B., Structure and breakup of flocs sub-jected to fluid stresses: II. Theory, Journal of Colloid and Interface Science, 115 (1987a) 378–389.
Sonntag R.C., Russel W.B., Structure and breakup of flocs sub-jected to fluid stresses. III. Converging flow, Journal of Colloid and Interface Science, 115 (1987b) 390–395. DOI: 10.1016/0021-9797(87)90054-3
Soos M., Moussa A.S., Ehrl L., Sefcik J., Wu H., Morbidelli M., Effect of shear rate on aggregate size and morphology investigated under turbulent conditions in stirred tank, Journal of Colloid and Interface Science, 319 (2008) 577–589. DOI: 10.1016/j.jcis.2007.12.005
Spicer P.T., Pratsinis S.E., Coagulation and fragmentation: Uni-versal steady state particle size distribution, AIChE Jour-nal, 42 (1996) 1616–1620. DOI: 10.1002/aic.690420612
Sudo S., Yasutomi R., Rheology of soil paste (I), Transactions
of The Agricultural Engineering Society, Japan (1961) 71–74. DOI: 10.11408/jsidre1960.1961.71
Sueto J., Nakaishi K., Thixotropic behaviors of sodium and cal-cium montmorillonites at salt concentrations in the vicinity of 0.3 n, Clay Science, 8 (1992) 349–353. DOI: 10.11362/jcssjclayscience1960.8.349
Takamura K., Van de Ven T.G.M., Shear thinning behavior of concentrated latex dispersions, Macromolecular Symposia, 288 (2010) 78–86. DOI: 10.1002/masy.201050210
Tombacz E., Gilde M., Ábrahám I., Szántó F., Effect of electro-lyte concentration on the interaction of humic-acid and humate with montmorillonite, Applied Clay Science, 3 (1988) 31–52. DOI: 10.1016/0169-1317(88)90004-X
Tombacz E., Szekeres M., Baranyi L., Micheli E., Surface mod-ification of clay minerals by organic polyions, Colloids and Surfaces A: Physicochemical and Engineering Aspects, 141 (1998) 379–384. DOI: 10.1016/S0927-7757(98)00241-6
Tombacz E., Szekeres M., Colloidal behavior of aqueous mont-morillonite suspensions: the specific role of pH in the pres-ence of indifferent electrolytes, Applied Clay Science, 27 (2004) 75–94. DOI: 10.1016/j.clay.2004.01.001
Tsujimoto Y., Adachi Y., Viscosity of dilute suspensions of weakly flocculated Na-montmorillonite under low pressure gradient, Colloids and Surfaces A: Physicochemical and Engineering Aspects, 379 (2011) 14–17. DOI: 10.1016/j. colsurfa.2010.11.076
Tsujimoto Y., Chassagne C., Adachi Y., Comparison between the electrokinetic properties of kaolinite and montmorillon-ite suspensions at different volume fractions, Journal of Colloid and Interface Science, 407 (2013) 109–115. DOI: 10.1016/j.jcis.2013.05.080
Tsujimoto Y., Kobayashi M., Adachi Y., Viscosity of dilute Na-montmorillonite suspensions in electrostatically stable condition under low shear stress, Colloids and Surfaces A: Physicochemical and Engineering Aspects, 440 (2014) 20–26. DOI: 10.1016/j.colsurfa.2012.11.005
Van de Ven T.G.M., Colloidal Hydrodynamics, Academic Press (1989).
Van de Ven T.G.M., Mason S.G., The microrheology of colloidal dispersions VII. Orthokinetic doublet formation of spheres, Colloid and Polymer Science, 255 (1977) 468–479. DOI: 10.1007/BF01536463
Van Olphen H, An introduction to clay colloid chemistry, sec-ond ed., John Wiley & sons, New York, London, Sydney, Toronto (1977).
Verwery E.J.W., Overbeek J.Th.G., Theory of the stability of lyophobic colloids, J. Phys. Chem., 51 (1947) 631–636. DOI: 10.1021/j150453a001
Wilkinson N., Metaxas A., Brichetto E., Wickramaratne S., Reineke T.M., Dutcher C.S., Ionic strength dependence of aggregate size and morphology on polymer-clay floccula-tion, Colloids and Surfaces A: Physicochemical and Engi-neering Aspects, 529 (2017) 1037–1046. DOI: 10.1016/j. colsurfa.2017.06.085
Winterwerp J.C., Kestern W.G.M.V., Introduction to the physics of cohesive sediment in the marine environment, Develop-ments in Sedimentology Series 56, Elsevier (2004)
Wu M., Adachi Y., Effects of electrolyte concentration and pH

Yasuhisa Adachi et al. / KONA Powder and Particle Journal No. 37 (2020) 145–165
165
on the sedimentation rate of coagulated suspension of sodium montmorillonite, Colloids and Surfaces A: Physico-chemical and Engineering Aspects, 506 (2016) 686–693. DOI: 10.1016/j.colsurfa.2016.07.027
Wu M., Adachi Y., Duration of initial flocculation stage in the sedimentation of sodium montmorillonite suspension in the
semi-dilute regime, Colloid and Polymer Science, 296 (2017) 71–76. DOI: 10.1007/s00396-017-4222-6
Yasutomi R., Sudo S., Rheology of soil paste (II), Transactions of The Agricultural Engineering Society, Japan Nougyou Doboku Kenkyu Bessatsu, 3 (1962) 40–45.
Authors’ Short Biographies
Yasuhisa Adachi
Yasuhisa Adachi is Professor of Life and Environmental Science in Tsukuba Univer-sity. He has diploma and PhD from the University of Tokyo (Agricultural Eng,). His re-search has focused on flocculation for more than 30 years. Currently he is the leader of research unit, Bio-resources Colloid Engineering in University of Tsukuba. Main sub-jects are kinetics of coagulation and flocculation, structure of resulted floc, sedimenta-tion and rheology of flocculated material. He was awarded an academic award from Japanese Society of Irrigation, Drainage and Rural Engineering in 2015.
Yoko (Tsujimoto) Kawashima
Yoko (Tsujimoto) Kawashima received her PhD from University of Tsukuba back in 2014. Her doctoral thesis is entittled “Electrokinetics and rheological behavior of clay suspensions in electrostatically dispersed state”. Currently, she works in the material section in Public Works Research Institute for the proper evaluation of asphalt.
Muhamad Ezral Bin Ghazali
Muhamad Ezral Bin Ghazali is a young researcher currently pursuing his doctoral degree at University of Tsukuba, Japan. He graduated with Master of Philosophy from Malaysia-Japan International Institute of Technology, University of Technology, Malaysia (UTM), and was awarded with Japanese Government (Monbakugakusho) Scholarship to further his studies in Japan. His area of studies include natural coagulant and floccula-tion in water treatment. Currently, his research focused on sedimentation behaviour of montmorillonite.
KONA Powder and Particle Journal No. 37 (2020) 166–175/Doi:10.14356/kona.2020004 Original Research Paper
166Copyright © 2020 The Authors. Published by Hosokawa Powder Technology Foundation. This is an open ac-cess article under the CC BY license (http://creativecommons.org/licenses/by/4.0/).
Shape Controllable Synthesis of Silver Particles by Selecting the Crystallization Routes †
Jianmei Liu 1,2, Qiang Lin 1, Yu Zhou 1, Jinhui Dai 2* and Yongsheng Han1 *1 State Key Laboratory of Multiphase Complex Systems, Institute of Process Engineering, Chinese Academy of Sciences, China2 Institute of Materials Science and Engineering, Ocean University of China, China
AbstractClassic crystallization describes a burst nucleation followed by a layer-by-layer atom deposition. The non-classic crystallization refers to particle mediated crystallization process. Different crystallization routes lead to the formation of diverse structured materials. Here we report a rational synthesis of silver particles by selecting the crystallization routes. Silver particles were synthesized by a solution reduction approach. The crystallization routes were regulated by adding amino acids to stabilize silver ions which leads to the decrease of the reduction rate. Without amino acids, silver dendrites were largely formed. With the addition of amino acids, flower-like (low concentration of amino acids) and spherical silver (high concentration of amino acid) particles were synthesized. Three kinds of amino acids were tested and the similar results were obtained. The time-dependent characterization on the evolution of silver particles showed that silver dendrites were formed by the classic atom deposition while the other two morphologies were formed by the combination of classic and non-classic crystallization. The silver particles synthesized were evaluated for ethylene epoxidation and the dendritic particles demonstrated a high selectivity.
Keywords: crystallization, silver particles, shape control, reaction kinetics, catalytic selectivity
1. Introduction
Crystallization starts from nucleation followed by the growth of nuclei. It is a key process in materials formation and industrial production (Zeng J. et al., 2012). For many years, the crystallization has been described through burst nucleation followed by layer by layer growth or Ostwald ripening (Li Y. et al., 2018; Zeng J. et al., 2012). However, this traditional description faces challenges recently be-cause more and more hierarchical structures synthesized in laboratories or found in nature, which could not be ex-plained by the classic crystallization. For example, well-faceted porous calcium carbonate particles have been synthesized by the diffusion of CO2 into the calcium chlo-ride solution (Wang T.X. et al., 2005). These porous parti-cles were built up by the perfectly 3D-aligned calcite nanocrystals superstructures. Based on these findings, the non-classic crystallization process is proposed, in which
particles coalescence plays a major role on the growth of products (Colfen H. and Antonietti M., 2008; Runkana V. et al., 2005). Except this different conception on crystalli-zation, Watzky and Finke (Watzky M.A. and Finke R.G., 1997) formulated a constant slow nucleation followed by autocatalytic growth, in which the nucleation lasts for a long time and competes with the growth of particles. The well-accepted Ostwald ripening also faces challenge by the Digestive ripening (Kalidindi S.B. and Jagirdar B.R., 2009). The former describes that big particles prefer to grow in solution on the cost of small particles while the later refers that small particles grow at the expense of large ones. Therefore, there are many debates in the field of crystallization, which leave the uncertainty but also the treasure to be discovered.
Although the traditional theory of crystallization faces challenges, scientists never stop their effort to synthesize crystals with controllable size and morphology. Different approaches have been developed to control the shape of crystals, which includes templating methods (Fuji M. et al., 2013), kinetic controlling methods (Xia Y.N. et al., 2015) and so on. Chemists have developed a fine shape-controlled method by adding surfactants or macro-molecules to interfere the growth of crystals (Ruditskiy A. and Xia Y.N., 2016). By this method, they have success-fully synthesized various morphological metal particles,
† Received 20 July 2018; Accepted 20 September 2018 J-STAGE Advance published online 17 November 2018
1 1 North 2nd Street, Zhongguancun, Haidian District, Beijing 100190, PR China
2 238 Songling Road, Qingdao, 266100, China* Corresponding author: Yongsheng Han; E-mail: [email protected], [email protected] TEL: +86-10-82544873
Jianmei Liu et al. / KONA Powder and Particle Journal No. 37 (2020) 166–175
167
including spheres (Han K.N. and Kim N.S., 2009), cubes (Zeng J. et al., 2010), tetrahedrons (Wiley B. et al., 2004), nanobars (Zhang Q. et al., 2012) and nanowires (Xiong W.W. et al., 2016). They ascribed the role of surfactants to their selective adsorption on the facets of crystals to block the growth of these facets. But different opinions also come up. David Wei and co-authors (Zhai Y.M. et al., 2016) proposed that the surfactant polyvinylpyrrolidone preferentially adsorbs along the perimeter and serves as a photochemical relay to direct the anisotropic growth.
Shape control of materials is a long-term interest of our group. We have developed a bubble templating method for one-step synthesis of hollow particles (Han Y.S. et al., 2007, 2009). Recently, we are focusing on the role of chemical diffusion and reaction kinetics in shaping parti-cles. By regulating the diffusion and reaction rates of chemicals, we have synthesized diverse morphologies of metal particles and oxide particles (Wang H. et al., 2013; Yang T. and Han Y.S., 2016; Yang T. et al., 2015; Yang Y. et al., 2014). It was found that the diffusion of chemicals could switch the crystallization from classic to non- classic modes, which led to the formation of diverse morphology of platinum particles (Yang Y. et al., 2014). In this paper, we attempted to investigate how the reaction rate influ-ences the crystallization process. Silver particles were syn-thesized by a solution-based reduction approach, in which hydroxylamine was used to reduce silver ions producing silver particles. The reduction rate was regulated by add-ing amino acid as complexation agents. With the addition of amino acid, the reduction rate was slowed down due to the complexation. In different reduction rates, the forma-tion process of silver products was monitored. Both the classic crystallization and non-classic crystallization were observed when the reduction rates changed, which led to the formation of diverse morphologies of silver particles.
2. Experimental sections
2.1 Materials
All chemicals used in this study are of analytical grade and used without further purification. They were purchased from Sigma-Aldrich. Deionized water with a resistivity higher than 18.2 MΩ used throughout the experiments was generated by a Mili-Q system (Millipore, USA).
2.2 Synthesis of silver particles with various morphologies
In a typical experiment, 2 ml silver nitrate (100 mM) and a defined amount of amino acid were dissolved in 40 ml deionized water, respectively, stirring for 10 min-utes to form a stable complex. Then 2 ml hydroxylamine
solution (200 mM) was added into the above mixture to initiate the reduction. To monitor the evolution of silver particles, the solution was taken out at different reaction time. The solution was immediately transferred to liquid nitrogen to terminate the reduction, and then the frozen samples were dried by freeze drier (Christ ALPHA 1-2 LD plus, Germany). The reactions were carried out in a thermos-stated water bath at 25 °C, and the concentration of amino acids varied from 0 to 40 mM.
2.3 Characterizations
The morphologies of silver products were characterized by a JSM-7001F Thermal Field Scanning Electron Micro-scope (JEOL, Japan) and a JEM-2100 (UHR) Transmission Electron Microscope (JEOL, Japan) at an accelerating voltage of 200 kV. Samples for SEM and TEM analysis were prepared by dipping solution on aluminum foils and carbon-coated copper grids, respectively.
2.4 Quantization of the reduction rates
When the silver ions are reduced by hydroxylamine, the hydrogen ions are the byproduct. The generation rate of Ag atoms is equal to the production rate of hydrogen ion, so the reduction rate can be quantified by measuring the increment of hydrogen ion, which corresponds to a drop of pH. The pH electrode (Mettler-Toledo S470 Seven Excellence pH/Conductivity meter) was placed in the solution to record the pH change during reaction.
2.5 Catalyst preparation and selectivity evaluation
The Ag/α-Al2O3 catalysts were prepared by an exces-sive impregnation method. Firstly, the silver slurry was prepared by dissolving cesium hydroxide (the mass frac-tion of Cs ion = 1000 ppm) and Ag2C2O4 into an ethylene-diamine (EDA) solution to form a diamine silver solution (the mole ratio of Ag2C2O4:EDA = 5:12). When the silver particles were added into the ethylenediamine solution, the amount of Ag2C2O4 was decreased to keep the same mole ratio of silver and EDA. Then the porous alumina supports were immersed in the slurry to load silver salt. The supports were heated by hot air at 300 °C for five minutes, generating the Ag/α-Al2O3 catalysts. The eth-ylene epoxidation was conducted in a stainless steel reac-tor with 4 mm inner diameter. The catalysts were broken and sieved to 0.9–1.4 mm, then 1 ml sample was loaded into the reactor. Quantitative analysis of inlet and outlet gas composition was performed on an online Prima dB mass spectrum produced by Thermo Scientific. The gas was ionized by the bombardment of electron current inion source. Stand Faraday detector was used to analyze the
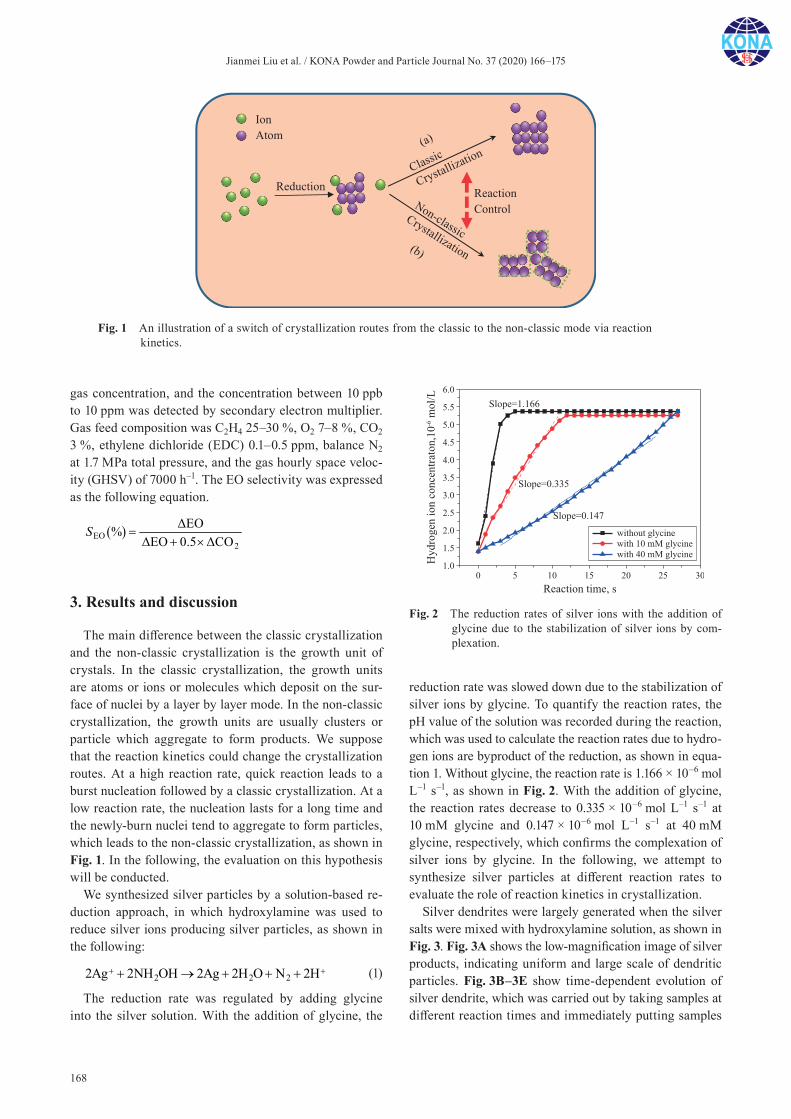
Jianmei Liu et al. / KONA Powder and Particle Journal No. 37 (2020) 166–175
168
gas concentration, and the concentration between 10 ppb to 10 ppm was detected by secondary electron multiplier. Gas feed composition was C2H4 25–30 %, O2 7–8 %, CO2 3 %, ethylene dichloride (EDC) 0.1–0.5 ppm, balance N2 at 1.7 MPa total pressure, and the gas hourly space veloc-ity (GHSV) of 7000 h–1. The EO selectivity was expressed as the following equation.
EO2
ΔEO%ΔEO 0.5 ΔCO
S
3. Results and discussion
The main difference between the classic crystallization and the non-classic crystallization is the growth unit of crystals. In the classic crystallization, the growth units are atoms or ions or molecules which deposit on the sur-face of nuclei by a layer by layer mode. In the non-classic crystallization, the growth units are usually clusters or particle which aggregate to form products. We suppose that the reaction kinetics could change the crystallization routes. At a high reaction rate, quick reaction leads to a burst nucleation followed by a classic crystallization. At a low reaction rate, the nucleation lasts for a long time and the newly-burn nuclei tend to aggregate to form particles, which leads to the non-classic crystallization, as shown in Fig. 1. In the following, the evaluation on this hypothesis will be conducted.
We synthesized silver particles by a solution-based re-duction approach, in which hydroxylamine was used to reduce silver ions producing silver particles, as shown in the following:
2 2 22Ag 2NH OH 2Ag 2H O N 2H (1)
The reduction rate was regulated by adding glycine into the silver solution. With the addition of glycine, the
reduction rate was slowed down due to the stabilization of silver ions by glycine. To quantify the reaction rates, the pH value of the solution was recorded during the reaction, which was used to calculate the reaction rates due to hydro-gen ions are byproduct of the reduction, as shown in equa-tion 1. Without glycine, the reaction rate is 1.166 × 10⁻⁶ mol L–1 s–1, as shown in Fig. 2. With the addition of glycine, the reaction rates decrease to 0.335 × 10⁻⁶ mol L–1 s–1 at 10 mM glycine and 0.147 × 10⁻⁶ mol L–1 s–1 at 40 mM glycine, respectively, which confirms the complexation of silver ions by glycine. In the following, we attempt to synthesize silver particles at different reaction rates to evaluate the role of reaction kinetics in crystallization.
Silver dendrites were largely generated when the silver salts were mixed with hydroxylamine solution, as shown in Fig. 3. Fig. 3A shows the low-magnification image of silver products, indicating uniform and large scale of dendritic particles. Fig. 3B–3E show time-dependent evolution of silver dendrite, which was carried out by taking samples at different reaction times and immediately putting samples
Fig. 1 An illustration of a switch of crystallization routes from the classic to the non-classic mode via reaction kinetics.
Fig. 2 The reduction rates of silver ions with the addition of glycine due to the stabilization of silver ions by com-plexation.
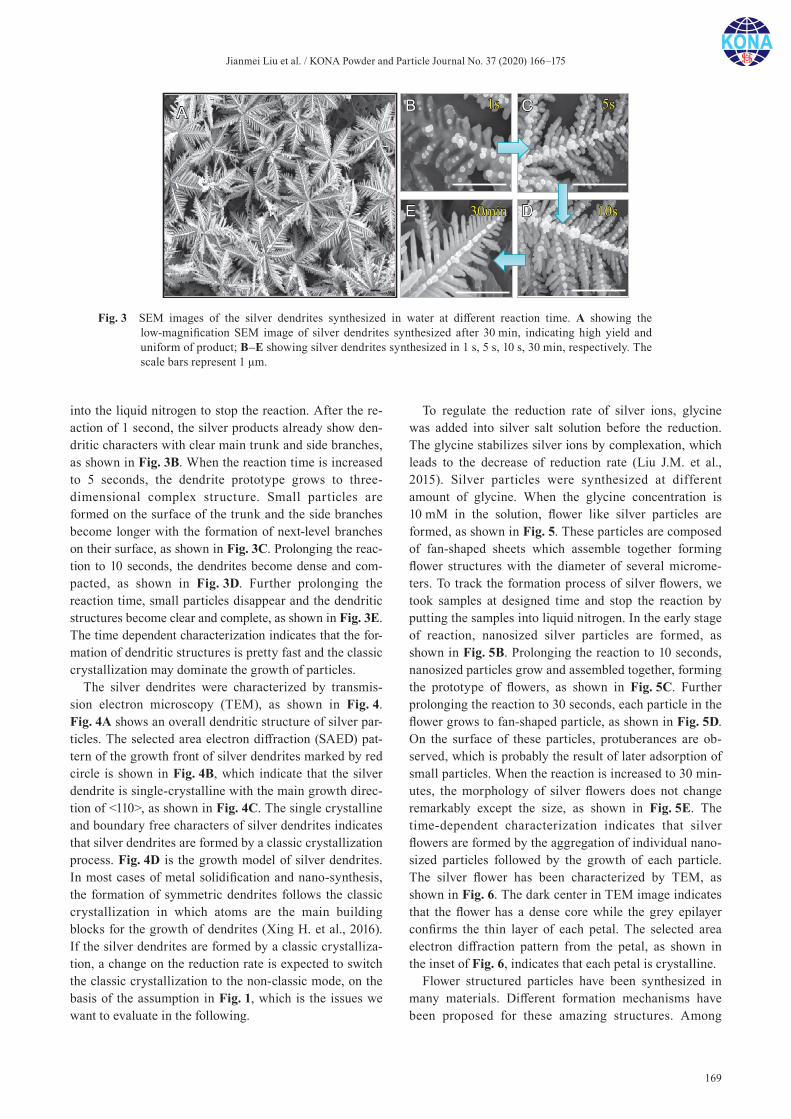
Jianmei Liu et al. / KONA Powder and Particle Journal No. 37 (2020) 166–175
169
into the liquid nitrogen to stop the reaction. After the re-action of 1 second, the silver products already show den-dritic characters with clear main trunk and side branches, as shown in Fig. 3B. When the reaction time is increased to 5 seconds, the dendrite prototype grows to three- dimensional complex structure. Small particles are formed on the surface of the trunk and the side branches become longer with the formation of next-level branches on their surface, as shown in Fig. 3C. Prolonging the reac-tion to 10 seconds, the dendrites become dense and com-pacted, as shown in Fig. 3D. Further prolonging the reaction time, small particles disappear and the dendritic structures become clear and complete, as shown in Fig. 3E. The time dependent characterization indicates that the for-mation of dendritic structures is pretty fast and the classic crystallization may dominate the growth of particles.
The silver dendrites were characterized by transmis-sion electron microscopy (TEM), as shown in Fig. 4. Fig. 4A shows an overall dendritic structure of silver par-ticles. The selected area electron diffraction (SAED) pat-tern of the growth front of silver dendrites marked by red circle is shown in Fig. 4B, which indicate that the silver dendrite is single-crystalline with the main growth direc-tion of <110>, as shown in Fig. 4C. The single crystalline and boundary free characters of silver dendrites indicates that silver dendrites are formed by a classic crystallization process. Fig. 4D is the growth model of silver dendrites. In most cases of metal solidification and nano-synthesis, the formation of symmetric dendrites follows the classic crystallization in which atoms are the main building blocks for the growth of dendrites (Xing H. et al., 2016). If the silver dendrites are formed by a classic crystalliza-tion, a change on the reduction rate is expected to switch the classic crystallization to the non-classic mode, on the basis of the assumption in Fig. 1, which is the issues we want to evaluate in the following.
To regulate the reduction rate of silver ions, glycine was added into silver salt solution before the reduction. The glycine stabilizes silver ions by complexation, which leads to the decrease of reduction rate (Liu J.M. et al., 2015). Silver particles were synthesized at different amount of glycine. When the glycine concentration is 10 mM in the solution, flower like silver particles are formed, as shown in Fig. 5. These particles are composed of fan-shaped sheets which assemble together forming flower structures with the diameter of several microme-ters. To track the formation process of silver flowers, we took samples at designed time and stop the reaction by putting the samples into liquid nitrogen. In the early stage of reaction, nanosized silver particles are formed, as shown in Fig. 5B. Prolonging the reaction to 10 seconds, nanosized particles grow and assembled together, forming the prototype of flowers, as shown in Fig. 5C. Further prolonging the reaction to 30 seconds, each particle in the flower grows to fan-shaped particle, as shown in Fig. 5D. On the surface of these particles, protuberances are ob-served, which is probably the result of later adsorption of small particles. When the reaction is increased to 30 min-utes, the morphology of silver flowers does not change remarkably except the size, as shown in Fig. 5E. The time-dependent characterization indicates that silver flowers are formed by the aggregation of individual nano-sized particles followed by the growth of each particle. The silver flower has been characterized by TEM, as shown in Fig. 6. The dark center in TEM image indicates that the flower has a dense core while the grey epilayer confirms the thin layer of each petal. The selected area electron diffraction pattern from the petal, as shown in the inset of Fig. 6, indicates that each petal is crystalline.
Flower structured particles have been synthesized in many materials. Different formation mechanisms have been proposed for these amazing structures. Among
Fig. 3 SEM images of the silver dendrites synthesized in water at different reaction time. A showing the low-magnification SEM image of silver dendrites synthesized after 30 min, indicating high yield and uniform of product; B–E showing silver dendrites synthesized in 1 s, 5 s, 10 s, 30 min, respectively. The scale bars represent 1 μm.
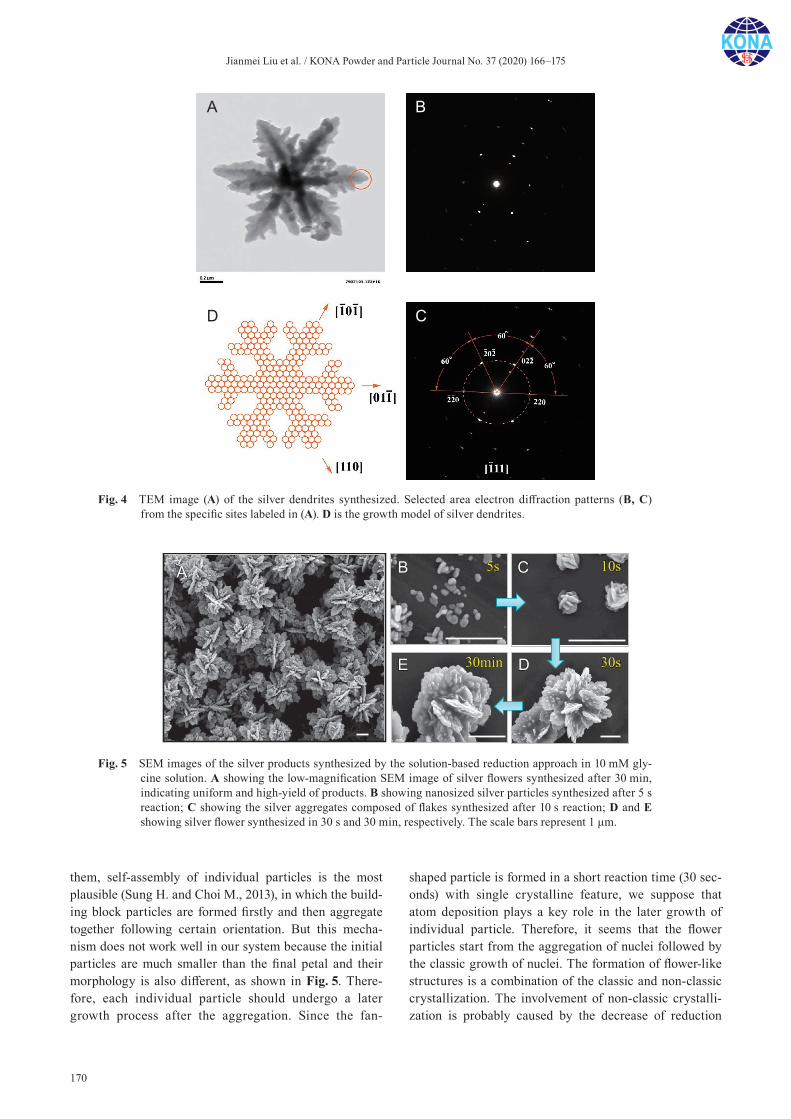
Jianmei Liu et al. / KONA Powder and Particle Journal No. 37 (2020) 166–175
170
them, self-assembly of individual particles is the most plausible (Sung H. and Choi M., 2013), in which the build-ing block particles are formed firstly and then aggregate together following certain orientation. But this mecha-nism does not work well in our system because the initial particles are much smaller than the final petal and their morphology is also different, as shown in Fig. 5. There-fore, each individual particle should undergo a later growth process after the aggregation. Since the fan-
shaped particle is formed in a short reaction time (30 sec-onds) with single crystalline feature, we suppose that atom deposition plays a key role in the later growth of individual particle. Therefore, it seems that the flower particles start from the aggregation of nuclei followed by the classic growth of nuclei. The formation of flower-like structures is a combination of the classic and non-classic crystallization. The involvement of non-classic crystalli-zation is probably caused by the decrease of reduction
Fig. 4 TEM image (A) of the silver dendrites synthesized. Selected area electron diffraction patterns (B, C) from the specific sites labeled in (A). D is the growth model of silver dendrites.
Fig. 5 SEM images of the silver products synthesized by the solution-based reduction approach in 10 mM gly-cine solution. A showing the low-magnification SEM image of silver flowers synthesized after 30 min, indicating uniform and high-yield of products. B showing nanosized silver particles synthesized after 5 s reaction; C showing the silver aggregates composed of flakes synthesized after 10 s reaction; D and E showing silver flower synthesized in 30 s and 30 min, respectively. The scale bars represent 1 μm.
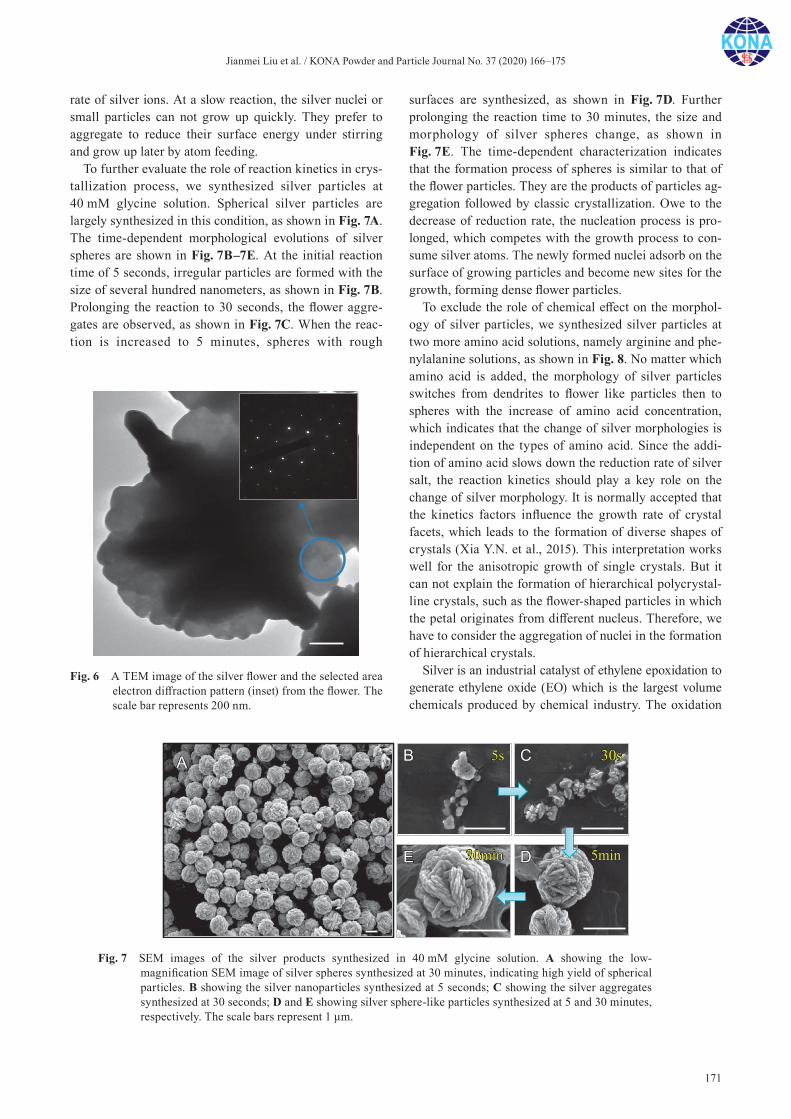
Jianmei Liu et al. / KONA Powder and Particle Journal No. 37 (2020) 166–175
171
rate of silver ions. At a slow reaction, the silver nuclei or small particles can not grow up quickly. They prefer to aggregate to reduce their surface energy under stirring and grow up later by atom feeding.
To further evaluate the role of reaction kinetics in crys-tallization process, we synthesized silver particles at 40 mM glycine solution. Spherical silver particles are largely synthesized in this condition, as shown in Fig. 7A. The time-dependent morphological evolutions of silver spheres are shown in Fig. 7B–7E. At the initial reaction time of 5 seconds, irregular particles are formed with the size of several hundred nanometers, as shown in Fig. 7B. Prolonging the reaction to 30 seconds, the flower aggre-gates are observed, as shown in Fig. 7C. When the reac-tion is increased to 5 minutes, spheres with rough
surfaces are synthesized, as shown in Fig. 7D. Further prolonging the reaction time to 30 minutes, the size and morphology of silver spheres change, as shown in Fig. 7E. The time-dependent characterization indicates that the formation process of spheres is similar to that of the flower particles. They are the products of particles ag-gregation followed by classic crystallization. Owe to the decrease of reduction rate, the nucleation process is pro-longed, which competes with the growth process to con-sume silver atoms. The newly formed nuclei adsorb on the surface of growing particles and become new sites for the growth, forming dense flower particles.
To exclude the role of chemical effect on the morphol-ogy of silver particles, we synthesized silver particles at two more amino acid solutions, namely arginine and phe-nylalanine solutions, as shown in Fig. 8. No matter which amino acid is added, the morphology of silver particles switches from dendrites to flower like particles then to spheres with the increase of amino acid concentration, which indicates that the change of silver morphologies is independent on the types of amino acid. Since the addi-tion of amino acid slows down the reduction rate of silver salt, the reaction kinetics should play a key role on the change of silver morphology. It is normally accepted that the kinetics factors influence the growth rate of crystal facets, which leads to the formation of diverse shapes of crystals (Xia Y.N. et al., 2015). This interpretation works well for the anisotropic growth of single crystals. But it can not explain the formation of hierarchical polycrystal-line crystals, such as the flower-shaped particles in which the petal originates from different nucleus. Therefore, we have to consider the aggregation of nuclei in the formation of hierarchical crystals.
Silver is an industrial catalyst of ethylene epoxidation to generate ethylene oxide (EO) which is the largest volume chemicals produced by chemical industry. The oxidation
Fig. 7 SEM images of the silver products synthesized in 40 mM glycine solution. A showing the low- magnification SEM image of silver spheres synthesized at 30 minutes, indicating high yield of spherical particles. B showing the silver nanoparticles synthesized at 5 seconds; C showing the silver aggregates synthesized at 30 seconds; D and E showing silver sphere-like particles synthesized at 5 and 30 minutes, respectively. The scale bars represent 1 μm.
Fig. 6 A TEM image of the silver flower and the selected area electron diffraction pattern (inset) from the flower. The scale bar represents 200 nm.
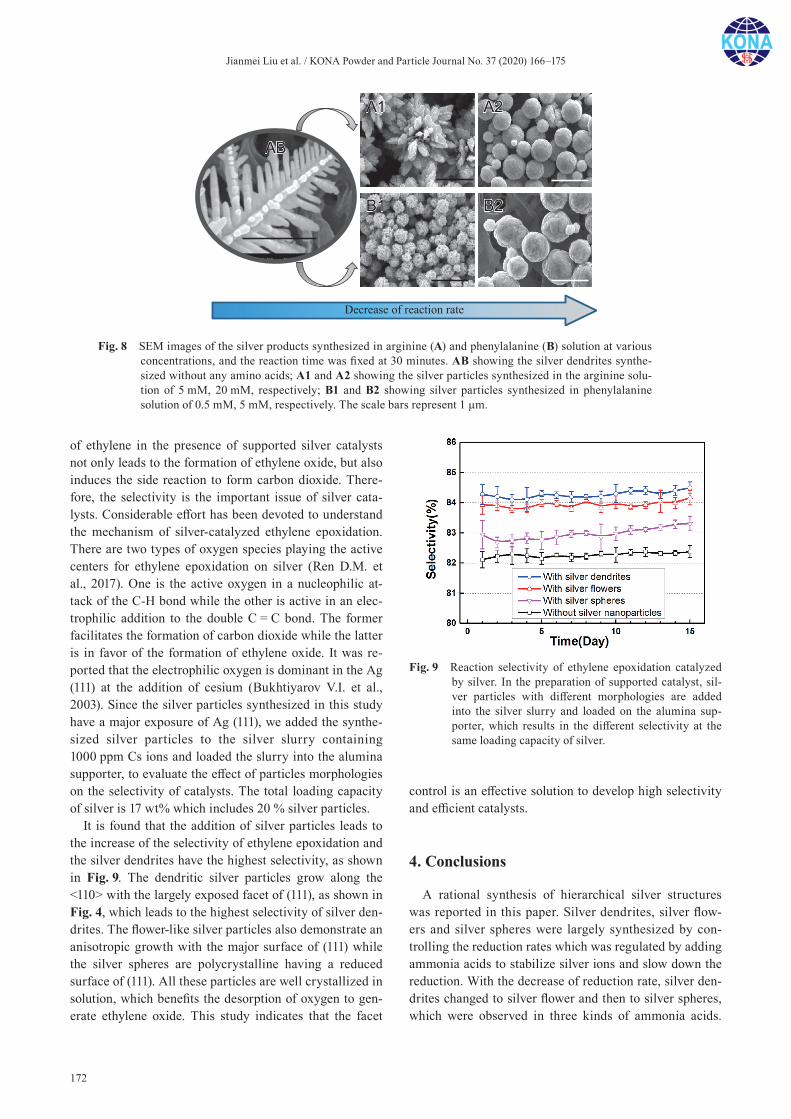
Jianmei Liu et al. / KONA Powder and Particle Journal No. 37 (2020) 166–175
172
of ethylene in the presence of supported silver catalysts not only leads to the formation of ethylene oxide, but also induces the side reaction to form carbon dioxide. There-fore, the selectivity is the important issue of silver cata-lysts. Considerable effort has been devoted to understand the mechanism of silver-catalyzed ethylene epoxidation. There are two types of oxygen species playing the active centers for ethylene epoxidation on silver (Ren D.M. et al., 2017). One is the active oxygen in a nucleophilic at-tack of the C-H bond while the other is active in an elec-trophilic addition to the double C = C bond. The former facilitates the formation of carbon dioxide while the latter is in favor of the formation of ethylene oxide. It was re-ported that the electrophilic oxygen is dominant in the Ag (111) at the addition of cesium (Bukhtiyarov V.I. et al., 2003). Since the silver particles synthesized in this study have a major exposure of Ag (111), we added the synthe-sized silver particles to the silver slurry containing 1000 ppm Cs ions and loaded the slurry into the alumina supporter, to evaluate the effect of particles morphologies on the selectivity of catalysts. The total loading capacity of silver is 17 wt% which includes 20 % silver particles.
It is found that the addition of silver particles leads to the increase of the selectivity of ethylene epoxidation and the silver dendrites have the highest selectivity, as shown in Fig. 9. The dendritic silver particles grow along the <110> with the largely exposed facet of (111), as shown in Fig. 4, which leads to the highest selectivity of silver den-drites. The flower-like silver particles also demonstrate an anisotropic growth with the major surface of (111) while the silver spheres are polycrystalline having a reduced surface of (111). All these particles are well crystallized in solution, which benefits the desorption of oxygen to gen-erate ethylene oxide. This study indicates that the facet
control is an effective solution to develop high selectivity and efficient catalysts.
4. Conclusions
A rational synthesis of hierarchical silver structures was reported in this paper. Silver dendrites, silver flow-ers and silver spheres were largely synthesized by con-trolling the reduction rates which was regulated by adding ammonia acids to stabilize silver ions and slow down the reduction. With the decrease of reduction rate, silver den-drites changed to silver flower and then to silver spheres, which were observed in three kinds of ammonia acids.
Fig. 9 Reaction selectivity of ethylene epoxidation catalyzed by silver. In the preparation of supported catalyst, sil-ver particles with different morphologies are added into the silver slurry and loaded on the alumina sup-porter, which results in the different selectivity at the same loading capacity of silver.
Fig. 8 SEM images of the silver products synthesized in arginine (A) and phenylalanine (B) solution at various concentrations, and the reaction time was fixed at 30 minutes. AB showing the silver dendrites synthe-sized without any amino acids; A1 and A2 showing the silver particles synthesized in the arginine solu-tion of 5 mM, 20 mM, respectively; B1 and B2 showing silver particles synthesized in phenylalanine solution of 0.5 mM, 5 mM, respectively. The scale bars represent 1 μm.
Jianmei Liu et al. / KONA Powder and Particle Journal No. 37 (2020) 166–175
173
Time- dependent characterizations on the evolution of particles showed that silver dendrites were formed by classic crystallization via atom deposition while the other two morphologies were formed by the combination of particles aggregation and atom deposition. At a high reac-tion rate, quick nucleation was followed by atomic layer growth on the surface of nuclei, forming silver dendrites. At a low reaction rate, the nucleation was prolonged. The later formed nuclei adsorbed on the growing particles and became new sites for the classic growth, which led to the formation of hierarchical polycrystals, such as silver flow-ers. This study confirmed the role of reaction kinetics in switching the crystallization routes, which is expected to improve our understanding on the growth of hierarchical structures and to enhance our ability for rational synthesis of material structures.
Acknowledgements
This study was supported by National Natural Science Foundation of China (91534123). The financial supports from the Hundreds Talent Program from the Chinese Academy of Sciences and the project from the State Key Laboratory of Multiphase Complex Systems are warmly appreciated. We thank Alexander von Humboldt founda-tion for a postdoctoral research scholarship in 2007 and a renewed research stay in 2015.
References
Bukhtiyarov V.I., Havecker M., Kaichev V.V., Knop-Gericke A., Mayer R.W., Schlogl R., Atomic oxygen species on silver: Photoelectron spectroscopy and X-ray absorption studies, Physical Review B, 67 (2003) 12. DOI: 10.1103/Phys-RevB.67.235422
Colfen H., Antonietti M., Mesocrystals and non-classical crys-tallization, Wiley, England, 2008, ISBN: 78-0-470-02981-7.
Fuji M., Han Y.S., Takai C., Synthesis and applications of hollow particles, KONA Powder and Particle Journal, 30 (2013) 47–68. DOI: 10.14356/kona.2013009
Han K.N., Kim N.S., Challenges and opportunities in direct write technology using nano-metal particles, KONA Pow-der and Particle Journal, 27 (2009) 73–83. DOI: 10.14356/kona.2009009
Han Y.S., Fuji M., Shehukin D., Mohwald H., Takahashi M., A new model for the synthesis of hollow particles via the bub-ble templating method, Crystal Growth & Design, 9 (2009) 3771–3775. DOI: 10.1021/cg900456t
Han Y.S., Lin L.W., Fuji M., Takahashi M., A novel one-step solution approach to synthesize tubular ZnO nanostruc-tures, Chemistry letters, 36 (2007) 1002–1003. DOI: 10.1246/cl.2007.1002
Kalidindi S.B., Jagirdar B.R., Highly monodisperse colloidal
magnesium nanoparticles by room temperature digestive ripening, Inorganic Chemistry, 48 (2009) 4524–4529. DOI: 10.1021/ic9003577
Li Y., Li X., Wang Z., Guo H., Wang J., An Ostwald ripening route towards Ni-rich layered cathode material with cobalt-rich surface for lithium ion battery, Science China-Materials, 61 (2018) 719–727. DOI: 10.1007/s40843-017-9162-3
Liu J.M., Yang T., Li C.X., Dai J.H., Han Y.S., Reversibly switching silver hierarchical structures via reaction kinetics, Scientific Reports, 5 (2015) 14942(pp8). DOI: 10.1038/srep14942
Ren D.M., Xu H.X., Li J.W., Li J.H., Cheng D.J., Origin of enhanced ethylene oxide selectivity by Cs-promoted silver catalyst, Molecular Catalysis, 441 (2017) 92–99. DOI: 10.1016/j.mcat.2017.08.007
Ruditskiy A., Xia Y.N., Toward the synthesis of sub-15 nm Ag nanocubes with sharp corners and edges: the roles of het-erogeneous nucleation and surface capping, Journal of the American Chemical Society, 138 (2016) 3161–3167. DOI: 10.1021/jacs.5b13163
Runkana V., Somasundaran P., Kapur P.C., Reaction-limited aggregation in presence of short-range structural forces, AIChE Journal, 51 (2005) 1233–1245. DOI: 10.1002/aic. 10375
Sung H., Choi M., Assembly of nanoparticles: towards multi-scale three-dimensional architecturing, KONA Powder and Particle Journal, 30 (2013) 31–46. DOI: 10.14356/kona. 2013008
Wang H., Han Y.S., Li J.H., Dominant role of compromise between diffusion and reaction in the formation of snow-shaped vaterite, Crystal Growth & Design, 13 (2013) 1820–1825. DOI: 10.1021/cg301241s
Wang T.X., Colfen H., Antonietti M., Nonclassical crystalliza-tion: Mesocrystals and morphology change of CaCO3 crys-tals in the presence of a polyelectrolyte additive, Journal of the American Chemical Society, 127 (2005) 3246–3247. DOI: 10.1021/ja045331g
Watzky M.A., Finke R.G., Nanocluster size-control and “magic number” investigations, experimental tests of the “living- metal polymer” concept and of mechanism-based size- control predictions leading to the syntheses of iridium(0) nanoclusters centering about four sequential magic num-bers, Chemistry of Materials, 9 (1997) 3083–3095. DOI: 10.1021/cm9704387
Wiley B., Herricks T., Sun Y.G., Xia Y.N., Polyol synthesis of silver nanoparticles: Use of chloride and oxygen to promote the formation of single-crystal, truncated cubes and tetra-hedrons, Nano Letters, 4 (2004) 1733–1739. DOI: 10.1021/nl048912c
Xia Y.N., Xia X.H., Peng H.C., Shape-controlled synthesis of colloidal metal nanocrystals: thermodynamic versus kinetic products, Journal of the American Chemical Society, 137 (2015) 7947–7966. DOI: 10.1021/jacs.5b04641
Xing H., Dong X.L., Wu H.J., Hao G.H., Wang J.Y., Chen C.L., Jin K.X., Degenerate seaweed to tilted dendrite transition and their growth dynamics in directional solidification of non-axially oriented crystals: a phase-field study, Scientific Reports, 6 (2016) 21. DOI: 10.1038/srep26625
Jianmei Liu et al. / KONA Powder and Particle Journal No. 37 (2020) 166–175
174
Xiong W.W., Liu H.L., Chen Y.Z., Zheng M.L., Zhao Y.Y., Kong X.B., Wang Y., Zhang X.Q., Kong X.Y., Wang P.F., Jiang L., Highly conductive, air-stable silver nanowire@iongel composite films toward flexible transparent electrodes, Advanced Materials, 28 (2016) 7167–7172. DOI: 10.1002/adma.201600358
Yang T., Han Y.S., Quantitatively relating diffusion and reaction for shaping particles, Crystal Growth & Design, 16 (2016) 2850–2859. DOI: 10.1021/acs.cgd.6b00171
Yang T., Han Y.S., Li J.H., Manipulating silver dendritic struc-tures via diffusion and reaction, Chemical Engineering Science, 138 (2015) 457–464. DOI: 10.1016/j.ces.2015.08. 017
Yang Y., Wang H., Ji Z., Han Y.S., Li J.H., A switch from classic crystallization to non-classic crystallization by controlling the diffusion of chemicals, Crystengcomm, 16 (2014) 7633–7637. DOI: 10.1039/c4ce00731j
Zeng J., Zheng Y.Q., Rycenga M., Tao J., Li Z.Y., Zhang Q.A., Zhu Y.M., Xia Y.N., Controlling the shapes of silver nano-
crystals with different capping agents, Journal of the American Chemical Society, 132 (2010) 8552–8553. DOI: 10.1021/ja103655f
Zeng J., Zhu C., Tao J., Jin M.S., Zhang H., Li Z.Y., Zhu Y.M., Xia Y.N., Controlling the nucleation and growth of silver on palladium nanocubes by manipulating the reaction kinetics, Angewandte Chemie-International Edition, 51 (2012) 2354–2358. DOI: 10.1002/anie.201107061
Zhai Y.M., DuChene J.S., Wang Y.C., Qiu J.J., Johnston-Peck A.C., You B., Guo W.X., DiCiaccio B., Qian K., Zhao E.W., Ooi F., Hu D.H., Su D., Stach E.A., Zhu Z.H., et al., Polyvinylpyrrolidone- induced anisotropic growth of gold nanoprisms in plasmon-driven synthesis, Nature Materials, 15 (2016) 889–895. DOI: 10.1038/nmat4683
Zhang Q., Moran C.H., Xia X.H., Rycenga M., Li N.X., Xia Y.N., Synthesis of Ag nanobars in the presence of single- crystal seeds and a bromide compound, and their surface- enhanced Raman scattering (SERS) properties, Langmuir, 28 (2012) 9047–9054. DOI: 10.1021/la300253a
Authors’ Short Biographies
Jianmei Liu
Jianmei Liu got her bachelor degree from Ocean University of China in 2013. As a highly distinctive graduate, she started her master at the same university, and as a joint student, she studied in Yongsheng Han’s group (Institute of Process Engineering, Chinese Academy of Sciences) for about three years until she got her master degree in 2016. Then in 2017, she started her PhD study in research school of chemistry, Australian National University, and works on functional materials, specially dielectric materials.
Qiang Lin
Mr. Qiang Lin got his bachelor degree in 2002 and master degree in 2005 from Tsinghua University. After his graduation, he joined Beijing Research Institute of Chemical Indus-try, Yanshan Branch, SINOPEC and worked there on the research and development of catalysts for ethylene epoxidation. In 2012, he began to pursue his PhD at the Institute of Process Engineering, Chinese Academy of Sciences and passed the doctoral dissertation defense in July, 2018. Now, He focuses on the preparation and improvement of silver catalysts.

Jianmei Liu et al. / KONA Powder and Particle Journal No. 37 (2020) 166–175
175
Authors’ Short Biographies
Yu Zhou
Yu Zhou graduated from China University of Petroleum (Beijing) in 2018 with the major of chemical engineering. He was an exchange student in Institute of Process Engi-neering, Chinese Academy of Science for 2 years starting from 2017. His research focus on the controllable synthesis of silver nanoparticles.
Jinhui Dai
Dr. Jinhui Dai holds a position of Professor in Ocean University of China. He was conferred doctor degree by Tsinghua University in 2003. His research mainly focuses on the preparation and application of solid buoyancy materials and inorganic nanostructures.
Yongsheng Han
Dr. Yongsheng Han is a Professor in the Institute of Process Engineering, Chinese Academy of Science, Beijing, China. He was conferred doctor degree from Tsinghua University in 2004. Immediately after his graduation, he went to Japan, Nagoya Institute of Technology as a postdoctoral researcher. In 2007, he was awarded Alexander von Humboldt fellowship and went to Germany, Max Planck Institute of Colloids and Inter-faces. In 2011, he succeeded in the application of Hundred-Talent Program and joined in Institute of Process Engineering. His current research interest is to discover the mecha-nism dominating the structure development of materials for the rational synthesis of cat-alysts and energy storage materials.
KONA Powder and Particle Journal No. 37 (2020) 176–186/Doi:10.14356/kona.2020006 Original Research Paper
176Copyright © 2020 The Authors. Published by Hosokawa Powder Technology Foundation. This is an open ac-cess article under the CC BY license (http://creativecommons.org/licenses/by/4.0/).
Real-time in-situ Rheological Assessment of Sticky Point Temperature and Humidity of Powdered Products †
Johan C. Groen 1*, Wim Kooijman 1, Djamilla van Belzen 1, Gabrie M.H. Meesters 2, Denis Schütz 3, Timothy Aschl 3 and Patrick Verolme 1
1 Delft Solids Solutions B.V., The Netherlands2 Department of Chemical Engineering, Delft University of Technology, The Netherlands3 Anton Paar, Austria
AbstractUnwanted changes in powder flow behavior can unexpectedly occur when a product is exposed to certain conditions of temperature and humidity. This can happen during production, but also during transport or storage. The work reported here demonstrates the novel approach of using an amended powder rheology set-up for measuring and predicting such changes in powder flow behavior. The developed methodology makes it possible to vary in-situ the temperature and the relative humidity of the air to which the product is exposed, thereby mimicking realistic conditions of production or related unit operations. An air flow capable of fluidizing the powder particles is controlled at a specific constant temperature and its relative humidity can be altered while measuring the torque in the fluidized powder bed in real time. The fluidization is necessary for generating a homogeneous introduction of temperature and relative humidity. Results obtained using citric acid and commercial coffee whitener products have proven this methodology to provide both similar and in certain instances dissimilar results compared to the more established methodology such as measuring the vapour adsorption isotherms. These observations are explained. In this way, it can be predicted under which combinations of temperature and humidity a product does or does not become sticky. The main advantages of our approach are that the flow properties are directly assessed, the interpretation of the obtained data is more straightforward and that the measurement times are shortened substantially.
Keywords: powders, stickiness, powder flow, caking, humidity
1. Introduction
A wide array of products is in powder or granular form. Quite often these products are available as free-flowing materials for easy transporting, packaging, dosing and handling by the customer. In this respect, the prediction and investigation of powder flow is an important measure (Schulze D., 2008). Different techniques are available for investigating powder flow, and measurement conditions can be varied from non-consolidated to highly consoli-dated systems. Leturia M. et al. (2014) have convincingly shown that one or more appropriate measurement tech-niques should often be applied in order to get an under-standing of the product’s flow properties under realistic
conditions. Surprisingly, Salehi H. et al. (2017) have re-cently shown that even similar methodologies working with the conventional Jenike shear and ring shear principle can provide inconsistent results. This all makes a reliable assessment of the powder flow properties a complicated task. To make it even more challenging, besides the in-trinsic characteristics of the product expressed as particle size, particle shape, porosity and surface area and density, also extrinsic conditions can be of vital importance.
The exposure of stable and non-stable granular prod-ucts to certain conditions of temperature and relative humidity can transform free-flowing and thus easy-to-handle products into more cohesive and sometimes even sticky materials, eventually leading to caking and clog-ging of machinery and packaging. Examples of materials that are sensitive towards stickiness are numerous and can be found throughout all industries, e.g. in the food indus-try (Juarez-Enriquez E. et al., 2017) but also in the phar-maceuticals (Lumay G. et al., 2016; Sandler N. et al., 2010) and chemicals industries (Stanford M.K. et al., 2002 and Sun C., 2009). This is considered a major issue in the powder handling industry and although these phenomena
† Received 12 May 2018; Accepted 21 February 2019 J-STAGE Advance published online 6 April 2019
1 Molenweer 2 B, 2291 NR Wateringen, The Netherlands2 van der Maasweg 9, 2629 HZ Delft, The Netherlands3 Anton Paar Strasse 20, 8054 Graz, Austria* Corresponding author: Johan C. Groen;
E-mail: [email protected] TEL: +31-174-271-460 FAX: +31-174-271-461

Johan C. Groen et al. / KONA Powder and Particle Journal No. 37 (2020) 176–186
177
are highly undesirable, they often come unexpectedly. The effect of temperature on the flow properties of mate-rials has already been investigated using a high-tempera-ture annular shear cell (Tomasetta I. et al., 2013). Here the changing flow properties of consolidated powders were compared while varying the temperature, yet the humid-ity was not regulated.
The prediction of stickiness due to interaction with water at a certain temperature is a complicated task and not easily feasible for newly developed or modified prod-ucts. Moreover, the fact that some quite recent publica-tions deal with the subject of powder flow in relation to extrinsic conditions such as moisture and temperature confirms the relevance of the topic (Lumay G. et al., 2016; Emery E. et al., 2009). In these studies, however, typically the water content of the material was studied as the main descriptor rather than the impact of the relative humidity in the air, although current literature by Juarez-Enriquez E. et al. (2017) strongly recommends that the latter option is much more appropriate.
The interaction of the material of interest with moisture from the environment can be studied by recording water vapor sorption isotherms (Mathlouthi M. et al., 2003). The uptake of water is then measured as a function of the relative humidity at a certain temperature and the iso-therm evidences when a certain interaction of water with the material is present. Often kinetic models, such as the two-parameter BET or the three-parameter GAB model (Goula A.M. et al., 2008), are applied to determine the monolayer coverage of the material, the latter model be-ing often used for food products. The models can be used to identify the possible presence of sticky behavior, yet they are not applicable for every material. Since it is not always clear what actually is causing the water uptake, these measurements are often complemented by tech-niques capable of determining the glass transition tem-perature (Emery E. et al., 2009). Below the glass transition temperature, an amorphous material behaves as being in a glassy state with a very high viscosity due to the limited molecular movement at low temperatures (Downton G.E. et al., 1982). However, above the glass transition temperature, a glassy material starts to trans-form into a ‘rubbery state’ and the viscosity of the mate-rial decreases considerably. A relationship between the glass transition temperature and stickiness was already established for a wide range of food powders. Interest-ingly, however, the glass transition temperature is highly dependent on the presence of water (vapor) in the system, and Bhandari B.R. and Howes T. (1999) as well as Goula A.M. et al. (2008) have convincingly shown that water vapor typically has a strongly depressing influence on the glass transition temperature. This means that techniques capable of measuring phase transitions while working with often a constant (inert) carrier gas flow are restricted
to adequately take into account the implication of water.Furthermore, a phase transition of an amorphous mate-
rial from a glassy state into a rubbery state does not nec-essarily have to occur in order to make a powder material sticky. Hygroscopic materials that interact with water can also display sticky-like properties, turning a free-flowing powder into a cake-like compound without being accom-panied by a phase transition. Even for materials that are not hygroscopic, an enhancement of inter-particle forces by liquid bridges due to an increased relative humidity has been proven, e.g. by measuring the onset of ava-lanches of glass beads (Soria-Hoyo et al., 2009). Even for glass beads up to 4 mm, this enhancement of inter-parti-cle forces could be seen. Furthermore, the particular liq-uid bridging behavior is highly dependent upon surface and solvent polarity as shown in recent work (Jarray et al., 2019). The complex admixture of different polarities in industrially relevant samples (such as the complex admix-ture of carbohydrates, fatty acids and proteins present in coffee creamer) increases the difficulties. From the ad-sorption isotherm only, it is often difficult to derive sticky point conditions, even despite the presence of different ki-netic models. An additional complicating factor is that stickiness also depends on particle morphology such as the size and the shape of the particles (Shi H. et al., 2018). This impressive set of variables means that assessment of the stickiness of a certain product preferably requires a study of the particular product under realistic conditions of temperature and (relative) humidity.
An attractive tool would thus allow a direct assessment of powder flow under varying conditions of moisture and temperature. First studies by Lazar M.E. et al. (1956) that already appeared in the 1950’s report on stickiness in which an impeller stirred by hand was used to identify changes in resistance in the powder material upon in-creasing the temperature. Though being an effective methodology, the sensitivity of the method was clearly too low to detect the early onset of stickiness.
More recently, Özkan N. et al. (2002) reported on the use of a powder rheometer to accurately measure the sticky point. In this study different variables—tempera-ture, time, and pressure of compaction—were investi-gated, however, only the moisture content in the product was altered and no study was done on the impact of the relative humidity of the surrounding atmosphere that would be realistic, e.g. during storage and transport. Other works reported so far have mostly used external cabinets to accommodate and equilibrate powder samples externally under certain conditions of temperature and/or relative humidity.
In the work reported here, we discuss the in-situ varia-tion and control of temperature and relative humidity during which changes in the flow of the powder materials are recorded in real time by a novel powder rheometer
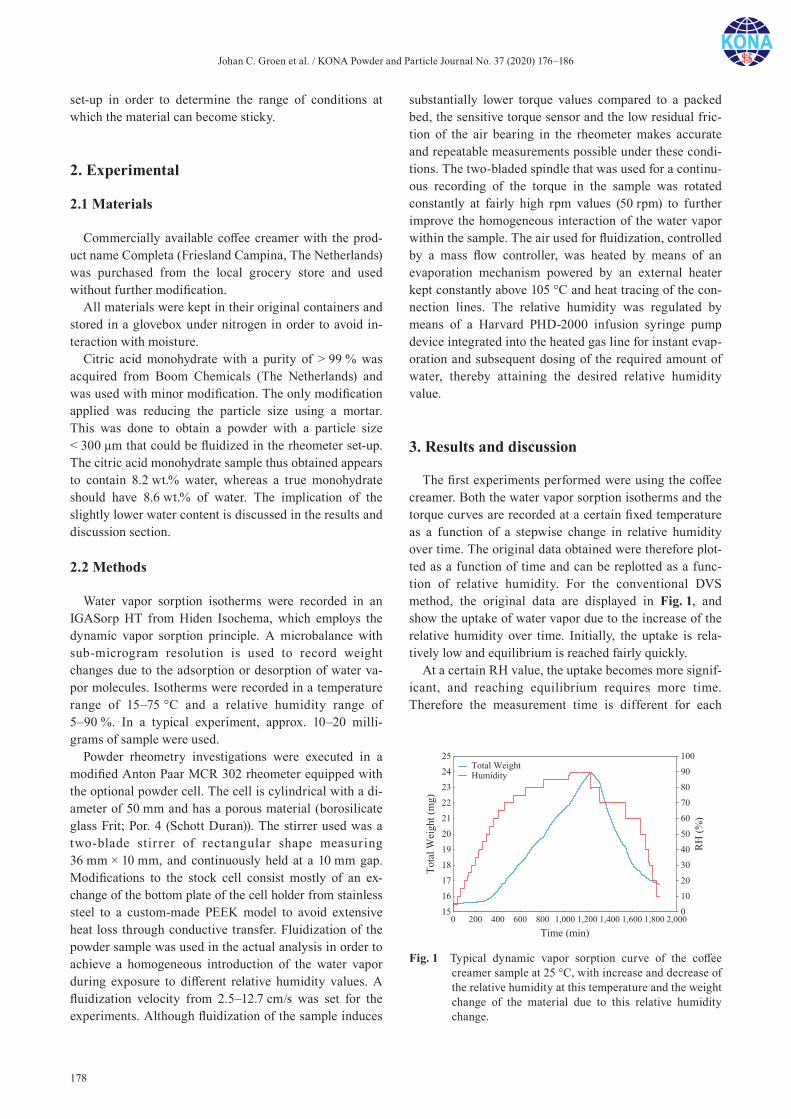
Johan C. Groen et al. / KONA Powder and Particle Journal No. 37 (2020) 176–186
178
set-up in order to determine the range of conditions at which the material can become sticky.
2. Experimental
2.1 Materials
Commercially available coffee creamer with the prod-uct name Completa (Friesland Campina, The Netherlands) was purchased from the local grocery store and used without further modification.
All materials were kept in their original containers and stored in a glovebox under nitrogen in order to avoid in-teraction with moisture.
Citric acid monohydrate with a purity of > 99 % was acquired from Boom Chemicals (The Netherlands) and was used with minor modification. The only modification applied was reducing the particle size using a mortar. This was done to obtain a powder with a particle size < 300 μm that could be fluidized in the rheometer set-up. The citric acid monohydrate sample thus obtained appears to contain 8.2 wt.% water, whereas a true monohydrate should have 8.6 wt.% of water. The implication of the slightly lower water content is discussed in the results and discussion section.
2.2 Methods
Water vapor sorption isotherms were recorded in an IGASorp HT from Hiden Isochema, which employs the dynamic vapor sorption principle. A microbalance with sub-microgram resolution is used to record weight changes due to the adsorption or desorption of water va-por molecules. Isotherms were recorded in a temperature range of 15–75 °C and a relative humidity range of 5–90 %. In a typical experiment, approx. 10–20 milli-grams of sample were used.
Powder rheometry investigations were executed in a modified Anton Paar MCR 302 rheometer equipped with the optional powder cell. The cell is cylindrical with a di-ameter of 50 mm and has a porous material (borosilicate glass Frit; Por. 4 (Schott Duran)). The stirrer used was a two-blade stirrer of rectangular shape measuring 36 mm × 10 mm, and continuously held at a 10 mm gap. Modifications to the stock cell consist mostly of an ex-change of the bottom plate of the cell holder from stainless steel to a custom-made PEEK model to avoid extensive heat loss through conductive transfer. Fluidization of the powder sample was used in the actual analysis in order to achieve a homogeneous introduction of the water vapor during exposure to different relative humidity values. A fluidization velocity from 2.5–12.7 cm/s was set for the experiments. Although fluidization of the sample induces
substantially lower torque values compared to a packed bed, the sensitive torque sensor and the low residual fric-tion of the air bearing in the rheometer makes accurate and repeatable measurements possible under these condi-tions. The two-bladed spindle that was used for a continu-ous recording of the torque in the sample was rotated constantly at fairly high rpm values (50 rpm) to further improve the homogeneous interaction of the water vapor within the sample. The air used for fluidization, controlled by a mass flow controller, was heated by means of an evaporation mechanism powered by an external heater kept constantly above 105 °C and heat tracing of the con-nection lines. The relative humidity was regulated by means of a Harvard PHD-2000 infusion syringe pump device integrated into the heated gas line for instant evap-oration and subsequent dosing of the required amount of water, thereby attaining the desired relative humidity value.
3. Results and discussion
The first experiments performed were using the coffee creamer. Both the water vapor sorption isotherms and the torque curves are recorded at a certain fixed temperature as a function of a stepwise change in relative humidity over time. The original data obtained were therefore plot-ted as a function of time and can be replotted as a func-tion of relative humidity. For the conventional DVS method, the original data are displayed in Fig. 1, and show the uptake of water vapor due to the increase of the relative humidity over time. Initially, the uptake is rela-tively low and equilibrium is reached fairly quickly.
At a certain RH value, the uptake becomes more signif-icant, and reaching equilibrium requires more time. Therefore the measurement time is different for each
Fig. 1 Typical dynamic vapor sorption curve of the coffee creamer sample at 25 °C, with increase and decrease of the relative humidity at this temperature and the weight change of the material due to this relative humidity change.
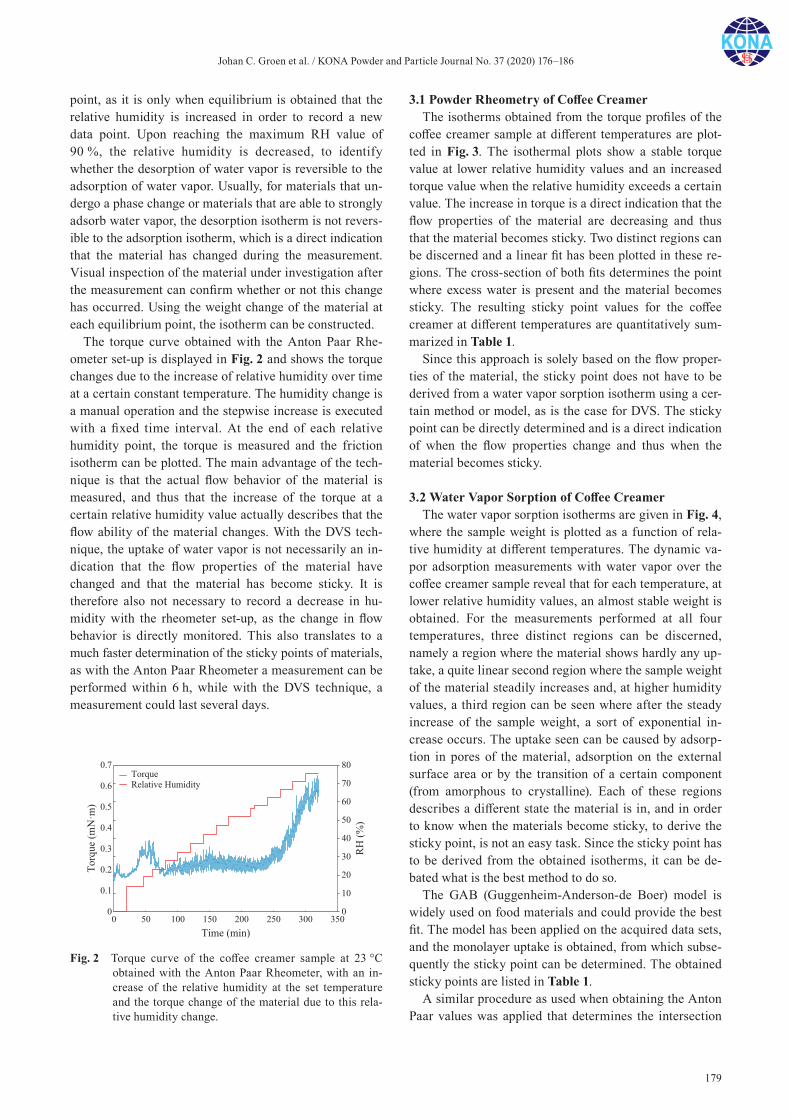
Johan C. Groen et al. / KONA Powder and Particle Journal No. 37 (2020) 176–186
179
point, as it is only when equilibrium is obtained that the relative humidity is increased in order to record a new data point. Upon reaching the maximum RH value of 90 %, the relative humidity is decreased, to identify whether the desorption of water vapor is reversible to the adsorption of water vapor. Usually, for materials that un-dergo a phase change or materials that are able to strongly adsorb water vapor, the desorption isotherm is not revers-ible to the adsorption isotherm, which is a direct indication that the material has changed during the measurement. Visual inspection of the material under investigation after the measurement can confirm whether or not this change has occurred. Using the weight change of the material at each equilibrium point, the isotherm can be constructed.
The torque curve obtained with the Anton Paar Rhe-ometer set-up is displayed in Fig. 2 and shows the torque changes due to the increase of relative humidity over time at a certain constant temperature. The humidity change is a manual operation and the stepwise increase is executed with a fixed time interval. At the end of each relative humidity point, the torque is measured and the friction isotherm can be plotted. The main advantage of the tech-nique is that the actual flow behavior of the material is measured, and thus that the increase of the torque at a certain relative humidity value actually describes that the flow ability of the material changes. With the DVS tech-nique, the uptake of water vapor is not necessarily an in-dication that the flow properties of the material have changed and that the material has become sticky. It is therefore also not necessary to record a decrease in hu-midity with the rheometer set-up, as the change in flow behavior is directly monitored. This also translates to a much faster determination of the sticky points of materials, as with the Anton Paar Rheometer a measurement can be performed within 6 h, while with the DVS technique, a measurement could last several days.
3.1 Powder Rheometry of Coffee CreamerThe isotherms obtained from the torque profiles of the
coffee creamer sample at different temperatures are plot-ted in Fig. 3. The isothermal plots show a stable torque value at lower relative humidity values and an increased torque value when the relative humidity exceeds a certain value. The increase in torque is a direct indication that the flow properties of the material are decreasing and thus that the material becomes sticky. Two distinct regions can be discerned and a linear fit has been plotted in these re-gions. The cross-section of both fits determines the point where excess water is present and the material becomes sticky. The resulting sticky point values for the coffee creamer at different temperatures are quantitatively sum-marized in Table 1.
Since this approach is solely based on the flow proper-ties of the material, the sticky point does not have to be derived from a water vapor sorption isotherm using a cer-tain method or model, as is the case for DVS. The sticky point can be directly determined and is a direct indication of when the flow properties change and thus when the material becomes sticky.
3.2 Water Vapor Sorption of Coffee CreamerThe water vapor sorption isotherms are given in Fig. 4,
where the sample weight is plotted as a function of rela-tive humidity at different temperatures. The dynamic va-por adsorption measurements with water vapor over the coffee creamer sample reveal that for each temperature, at lower relative humidity values, an almost stable weight is obtained. For the measurements performed at all four temperatures, three distinct regions can be discerned, namely a region where the material shows hardly any up-take, a quite linear second region where the sample weight of the material steadily increases and, at higher humidity values, a third region can be seen where after the steady increase of the sample weight, a sort of exponential in-crease occurs. The uptake seen can be caused by adsorp-tion in pores of the material, adsorption on the external surface area or by the transition of a certain component (from amorphous to crystalline). Each of these regions describes a different state the material is in, and in order to know when the materials become sticky, to derive the sticky point, is not an easy task. Since the sticky point has to be derived from the obtained isotherms, it can be de-bated what is the best method to do so.
The GAB (Guggenheim-Anderson-de Boer) model is widely used on food materials and could provide the best fit. The model has been applied on the acquired data sets, and the monolayer uptake is obtained, from which subse-quently the sticky point can be determined. The obtained sticky points are listed in Table 1.
A similar procedure as used when obtaining the Anton Paar values was applied that determines the intersection
Fig. 2 Torque curve of the coffee creamer sample at 23 °C obtained with the Anton Paar Rheometer, with an in-crease of the relative humidity at the set temperature and the torque change of the material due to this rela-tive humidity change.
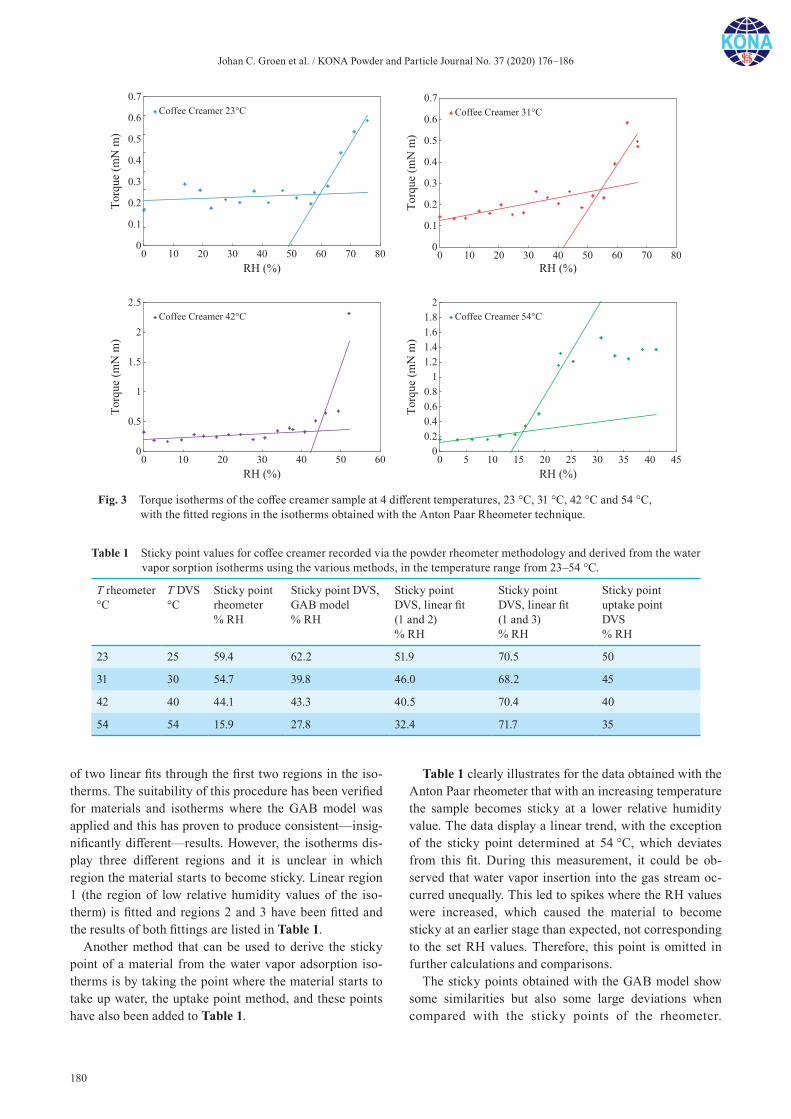
Johan C. Groen et al. / KONA Powder and Particle Journal No. 37 (2020) 176–186
180
of two linear fits through the first two regions in the iso-therms. The suitability of this procedure has been verified for materials and isotherms where the GAB model was applied and this has proven to produce consistent—insig-nificantly different—results. However, the isotherms dis-play three different regions and it is unclear in which region the material starts to become sticky. Linear region 1 (the region of low relative humidity values of the iso-therm) is fitted and regions 2 and 3 have been fitted and the results of both fittings are listed in Table 1.
Another method that can be used to derive the sticky point of a material from the water vapor adsorption iso-therms is by taking the point where the material starts to take up water, the uptake point method, and these points have also been added to Table 1.
Table 1 clearly illustrates for the data obtained with the Anton Paar rheometer that with an increasing temperature the sample becomes sticky at a lower relative humidity value. The data display a linear trend, with the exception of the sticky point determined at 54 °C, which deviates from this fit. During this measurement, it could be ob-served that water vapor insertion into the gas stream oc-curred unequally. This led to spikes where the RH values were increased, which caused the material to become sticky at an earlier stage than expected, not corresponding to the set RH values. Therefore, this point is omitted in further calculations and comparisons.
The sticky points obtained with the GAB model show some similarities but also some large deviations when compared with the sticky points of the rheometer.
Fig. 3 Torque isotherms of the coffee creamer sample at 4 different temperatures, 23 °C, 31 °C, 42 °C and 54 °C, with the fitted regions in the isotherms obtained with the Anton Paar Rheometer technique.
Table 1 Sticky point values for coffee creamer recorded via the powder rheometer methodology and derived from the water vapor sorption isotherms using the various methods, in the temperature range from 23–54 °C.
T rheometer °C
T DVS °C
Sticky point rheometer % RH
Sticky point DVS, GAB model % RH
Sticky point DVS, linear fit (1 and 2) % RH
Sticky point DVS, linear fit (1 and 3) % RH
Sticky point uptake point DVS % RH
23 25 59.4 62.2 51.9 70.5 50
31 30 54.7 39.8 46.0 68.2 45
42 40 44.1 43.3 40.5 70.4 40
54 54 15.9 27.8 32.4 71.7 35
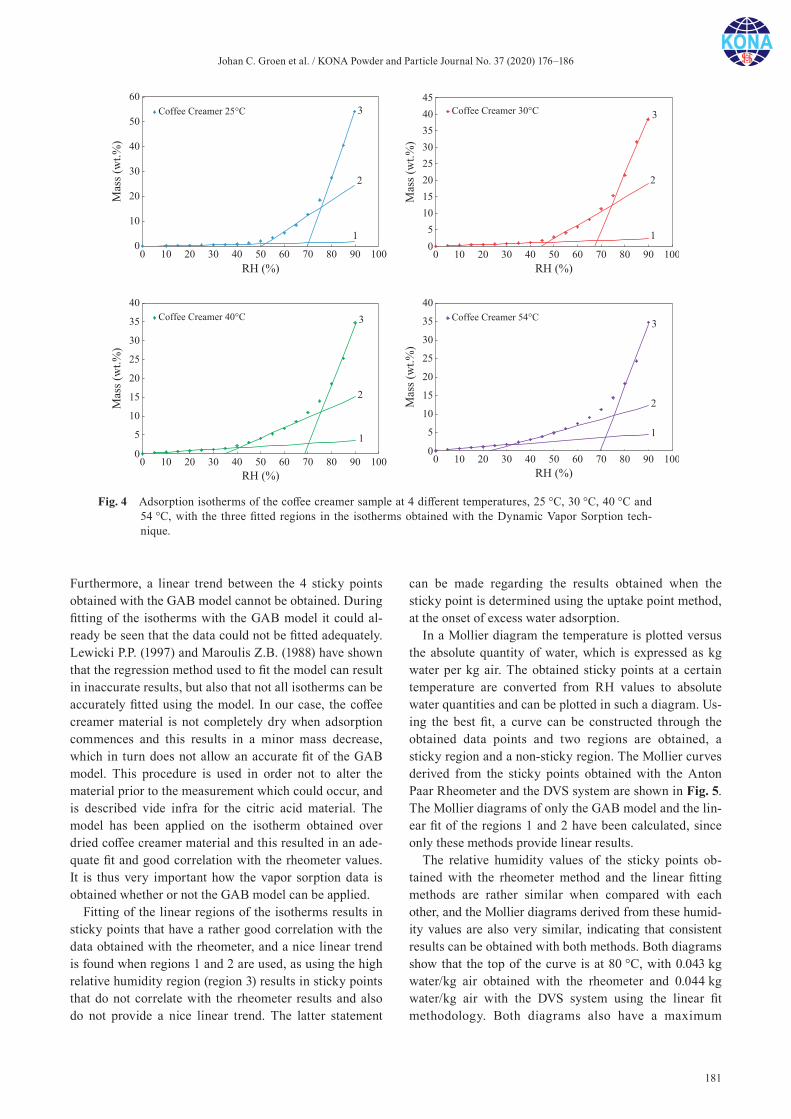
Johan C. Groen et al. / KONA Powder and Particle Journal No. 37 (2020) 176–186
181
Furthermore, a linear trend between the 4 sticky points obtained with the GAB model cannot be obtained. During fitting of the isotherms with the GAB model it could al-ready be seen that the data could not be fitted adequately. Lewicki P.P. (1997) and Maroulis Z.B. (1988) have shown that the regression method used to fit the model can result in inaccurate results, but also that not all isotherms can be accurately fitted using the model. In our case, the coffee creamer material is not completely dry when adsorption commences and this results in a minor mass decrease, which in turn does not allow an accurate fit of the GAB model. This procedure is used in order not to alter the material prior to the measurement which could occur, and is described vide infra for the citric acid material. The model has been applied on the isotherm obtained over dried coffee creamer material and this resulted in an ade-quate fit and good correlation with the rheometer values. It is thus very important how the vapor sorption data is obtained whether or not the GAB model can be applied.
Fitting of the linear regions of the isotherms results in sticky points that have a rather good correlation with the data obtained with the rheometer, and a nice linear trend is found when regions 1 and 2 are used, as using the high relative humidity region (region 3) results in sticky points that do not correlate with the rheometer results and also do not provide a nice linear trend. The latter statement
can be made regarding the results obtained when the sticky point is determined using the uptake point method, at the onset of excess water adsorption.
In a Mollier diagram the temperature is plotted versus the absolute quantity of water, which is expressed as kg water per kg air. The obtained sticky points at a certain temperature are converted from RH values to absolute water quantities and can be plotted in such a diagram. Us-ing the best fit, a curve can be constructed through the obtained data points and two regions are obtained, a sticky region and a non-sticky region. The Mollier curves derived from the sticky points obtained with the Anton Paar Rheometer and the DVS system are shown in Fig. 5. The Mollier diagrams of only the GAB model and the lin-ear fit of the regions 1 and 2 have been calculated, since only these methods provide linear results.
The relative humidity values of the sticky points ob-tained with the rheometer method and the linear fitting methods are rather similar when compared with each other, and the Mollier diagrams derived from these humid-ity values are also very similar, indicating that consistent results can be obtained with both methods. Both diagrams show that the top of the curve is at 80 °C, with 0.043 kg water/kg air obtained with the rheometer and 0.044 kg water/kg air with the DVS system using the linear fit methodology. Both diagrams also have a maximum
Fig. 4 Adsorption isotherms of the coffee creamer sample at 4 different temperatures, 25 °C, 30 °C, 40 °C and 54 °C, with the three fitted regions in the isotherms obtained with the Dynamic Vapor Sorption tech-nique.
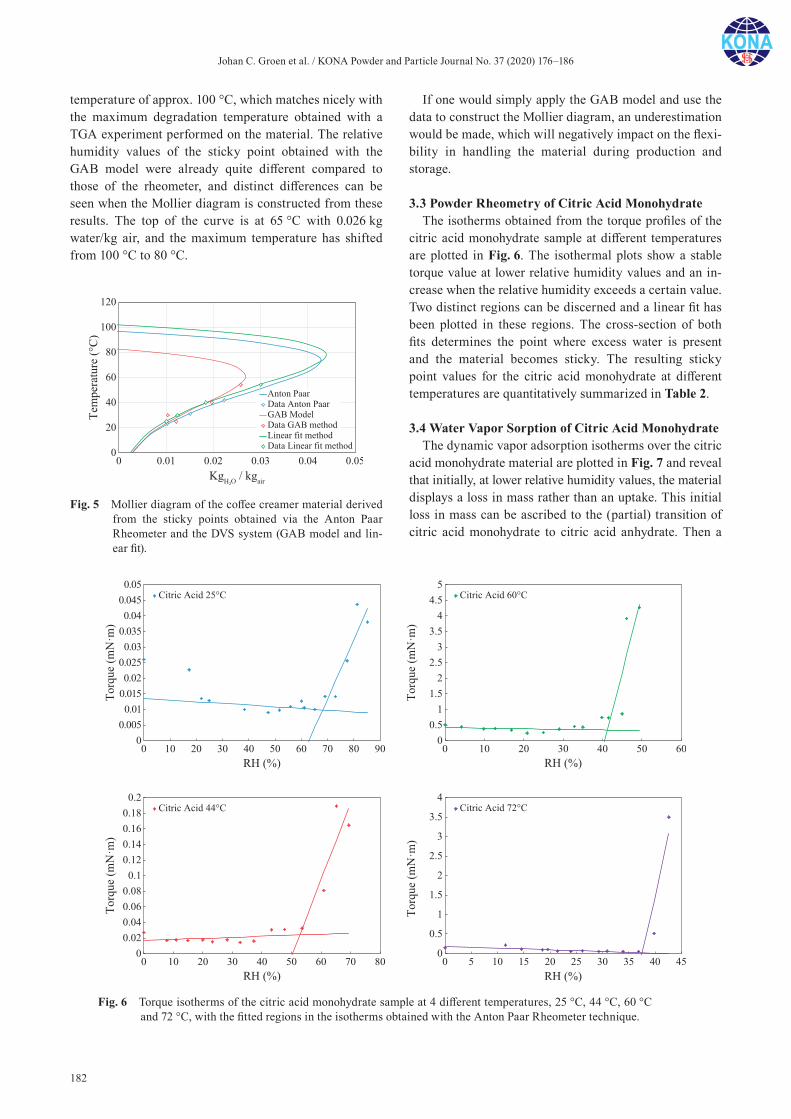
Johan C. Groen et al. / KONA Powder and Particle Journal No. 37 (2020) 176–186
182
temperature of approx. 100 °C, which matches nicely with the maximum degradation temperature obtained with a TGA experiment performed on the material. The relative humidity values of the sticky point obtained with the GAB model were already quite different compared to those of the rheometer, and distinct differences can be seen when the Mollier diagram is constructed from these results. The top of the curve is at 65 °C with 0.026 kg water/kg air, and the maximum temperature has shifted from 100 °C to 80 °C.
If one would simply apply the GAB model and use the data to construct the Mollier diagram, an underestimation would be made, which will negatively impact on the flexi-bility in handling the material during production and storage.
3.3 Powder Rheometry of Citric Acid MonohydrateThe isotherms obtained from the torque profiles of the
citric acid monohydrate sample at different temperatures are plotted in Fig. 6. The isothermal plots show a stable torque value at lower relative humidity values and an in-crease when the relative humidity exceeds a certain value. Two distinct regions can be discerned and a linear fit has been plotted in these regions. The cross-section of both fits determines the point where excess water is present and the material becomes sticky. The resulting sticky point values for the citric acid monohydrate at different temperatures are quantitatively summarized in Table 2.
3.4 Water Vapor Sorption of Citric Acid MonohydrateThe dynamic vapor adsorption isotherms over the citric
acid monohydrate material are plotted in Fig. 7 and reveal that initially, at lower relative humidity values, the material displays a loss in mass rather than an uptake. This initial loss in mass can be ascribed to the (partial) transition of citric acid monohydrate to citric acid anhydrate. Then a
Fig. 5 Mollier diagram of the coffee creamer material derived from the sticky points obtained via the Anton Paar Rheometer and the DVS system (GAB model and lin-ear fit).
Fig. 6 Torque isotherms of the citric acid monohydrate sample at 4 different temperatures, 25 °C, 44 °C, 60 °C and 72 °C, with the fitted regions in the isotherms obtained with the Anton Paar Rheometer technique.
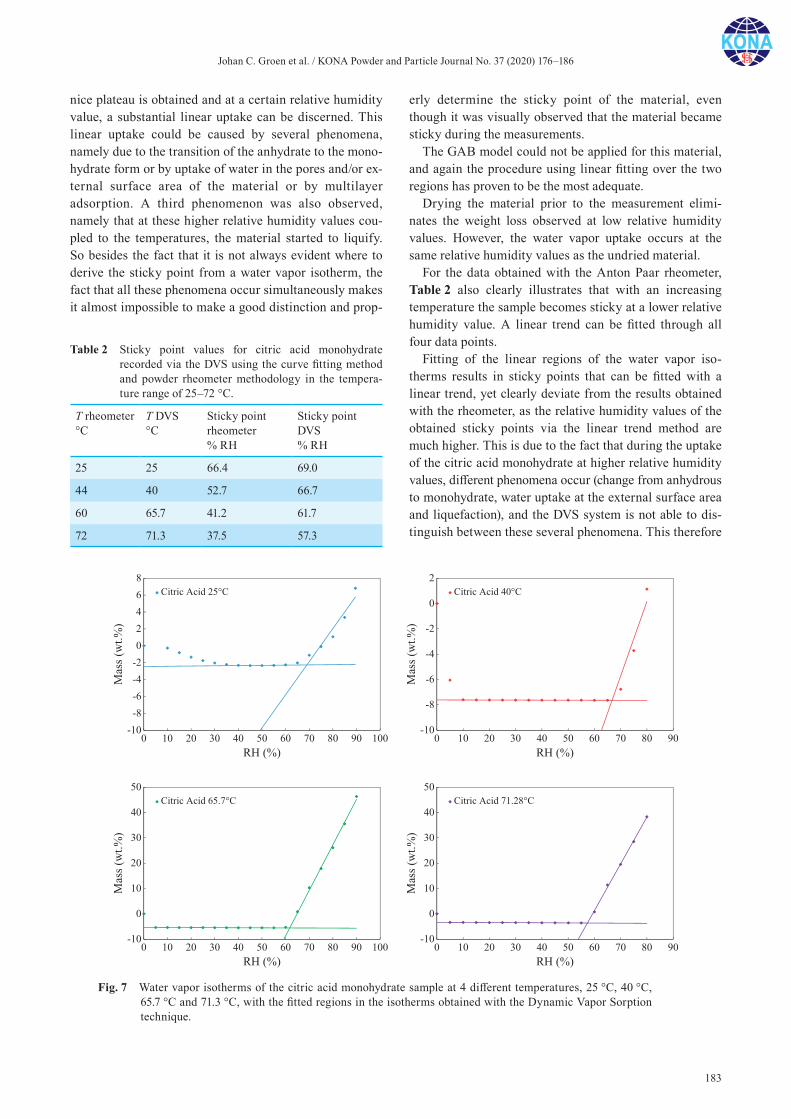
Johan C. Groen et al. / KONA Powder and Particle Journal No. 37 (2020) 176–186
183
nice plateau is obtained and at a certain relative humidity value, a substantial linear uptake can be discerned. This linear uptake could be caused by several phenomena, namely due to the transition of the anhydrate to the mono-hydrate form or by uptake of water in the pores and/or ex-ternal surface area of the material or by multilayer adsorption. A third phenomenon was also observed, namely that at these higher relative humidity values cou-pled to the temperatures, the material started to liquify. So besides the fact that it is not always evident where to derive the sticky point from a water vapor isotherm, the fact that all these phenomena occur simultaneously makes it almost impossible to make a good distinction and prop-
erly determine the sticky point of the material, even though it was visually observed that the material became sticky during the measurements.
The GAB model could not be applied for this material, and again the procedure using linear fitting over the two regions has proven to be the most adequate.
Drying the material prior to the measurement elimi-nates the weight loss observed at low relative humidity values. However, the water vapor uptake occurs at the same relative humidity values as the undried material.
For the data obtained with the Anton Paar rheometer, Table 2 also clearly illustrates that with an increasing temperature the sample becomes sticky at a lower relative humidity value. A linear trend can be fitted through all four data points.
Fitting of the linear regions of the water vapor iso-therms results in sticky points that can be fitted with a linear trend, yet clearly deviate from the results obtained with the rheometer, as the relative humidity values of the obtained sticky points via the linear trend method are much higher. This is due to the fact that during the uptake of the citric acid monohydrate at higher relative humidity values, different phenomena occur (change from anhydrous to monohydrate, water uptake at the external surface area and liquefaction), and the DVS system is not able to dis-tinguish between these several phenomena. This therefore
Fig. 7 Water vapor isotherms of the citric acid monohydrate sample at 4 different temperatures, 25 °C, 40 °C, 65.7 °C and 71.3 °C, with the fitted regions in the isotherms obtained with the Dynamic Vapor Sorption technique.
Table 2 Sticky point values for citric acid monohydrate recorded via the DVS using the curve fitting method and powder rheometer methodology in the tempera-ture range of 25–72 °C.
T rheometer °C
T DVS °C
Sticky point rheometer % RH
Sticky point DVS % RH
25 25 66.4 69.0
44 40 52.7 66.7
60 65.7 41.2 61.7
72 71.3 37.5 57.3
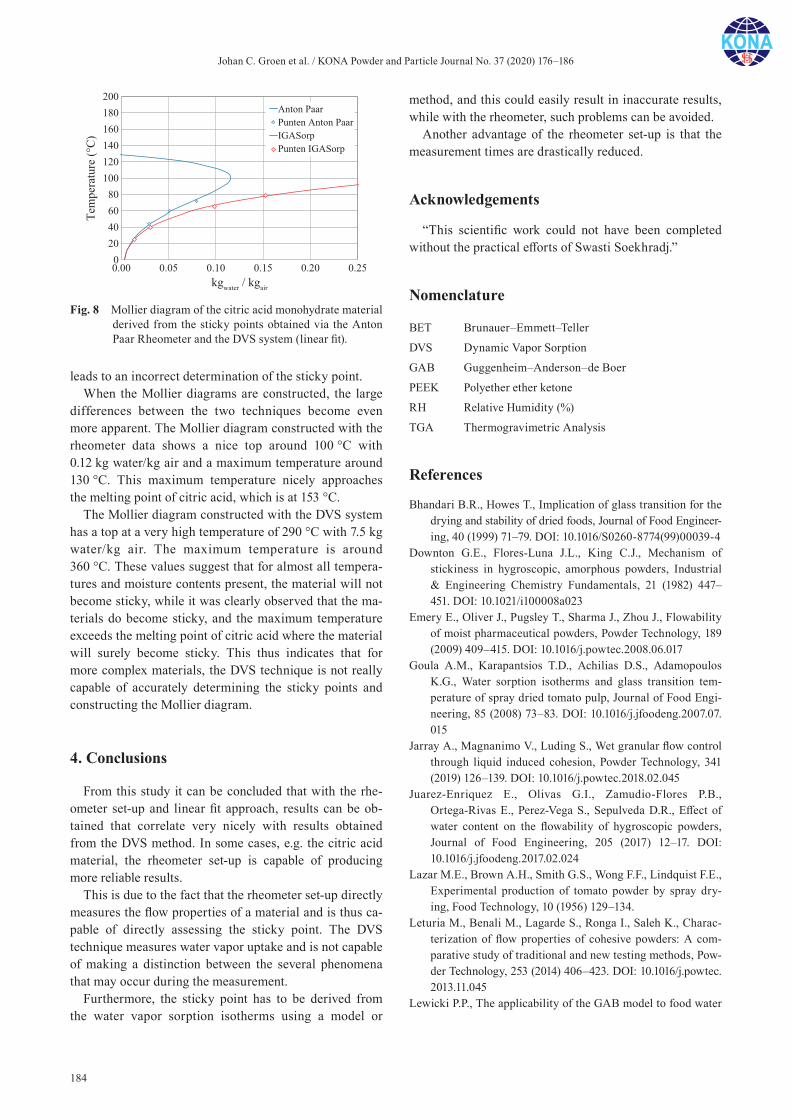
Johan C. Groen et al. / KONA Powder and Particle Journal No. 37 (2020) 176–186
184
leads to an incorrect determination of the sticky point.When the Mollier diagrams are constructed, the large
differences between the two techniques become even more apparent. The Mollier diagram constructed with the rheometer data shows a nice top around 100 °C with 0.12 kg water/kg air and a maximum temperature around 130 °C. This maximum temperature nicely approaches the melting point of citric acid, which is at 153 °C.
The Mollier diagram constructed with the DVS system has a top at a very high temperature of 290 °C with 7.5 kg water/kg air. The maximum temperature is around 360 °C. These values suggest that for almost all tempera-tures and moisture contents present, the material will not become sticky, while it was clearly observed that the ma-terials do become sticky, and the maximum temperature exceeds the melting point of citric acid where the material will surely become sticky. This thus indicates that for more complex materials, the DVS technique is not really capable of accurately determining the sticky points and constructing the Mollier diagram.
4. Conclusions
From this study it can be concluded that with the rhe-ometer set-up and linear fit approach, results can be ob-tained that correlate very nicely with results obtained from the DVS method. In some cases, e.g. the citric acid material, the rheometer set-up is capable of producing more reliable results.
This is due to the fact that the rheometer set-up directly measures the flow properties of a material and is thus ca-pable of directly assessing the sticky point. The DVS technique measures water vapor uptake and is not capable of making a distinction between the several phenomena that may occur during the measurement.
Furthermore, the sticky point has to be derived from the water vapor sorption isotherms using a model or
method, and this could easily result in inaccurate results, while with the rheometer, such problems can be avoided.
Another advantage of the rheometer set-up is that the measurement times are drastically reduced.
Acknowledgements
“This scientific work could not have been completed without the practical efforts of Swasti Soekhradj.”
Nomenclature
BET Brunauer–Emmett–Teller
DVS Dynamic Vapor Sorption
GAB Guggenheim–Anderson–de Boer
PEEK Polyether ether ketone
RH Relative Humidity (%)
TGA Thermogravimetric Analysis
References
Bhandari B.R., Howes T., Implication of glass transition for the drying and stability of dried foods, Journal of Food Engineer-ing, 40 (1999) 71–79. DOI: 10.1016/S0260-8774(99)00039-4
Downton G.E., Flores-Luna J.L., King C.J., Mechanism of stickiness in hygroscopic, amorphous powders, Industrial & Engineering Chemistry Fundamentals, 21 (1982) 447–451. DOI: 10.1021/i100008a023
Emery E., Oliver J., Pugsley T., Sharma J., Zhou J., Flowability of moist pharmaceutical powders, Powder Technology, 189 (2009) 409–415. DOI: 10.1016/j.powtec.2008.06.017
Goula A.M., Karapantsios T.D., Achilias D.S., Adamopoulos K.G., Water sorption isotherms and glass transition tem-perature of spray dried tomato pulp, Journal of Food Engi-neering, 85 (2008) 73–83. DOI: 10.1016/j.jfoodeng.2007.07. 015
Jarray A., Magnanimo V., Luding S., Wet granular flow control through liquid induced cohesion, Powder Technology, 341 (2019) 126–139. DOI: 10.1016/j.powtec.2018.02.045
Juarez-Enriquez E., Olivas G.I., Zamudio-Flores P.B., Ortega- Rivas E., Perez-Vega S., Sepulveda D.R., Effect of water content on the flowability of hygroscopic powders, Journal of Food Engineering, 205 (2017) 12–17. DOI: 10.1016/j.jfoodeng.2017.02.024
Lazar M.E., Brown A.H., Smith G.S., Wong F.F., Lindquist F.E., Experimental production of tomato powder by spray dry-ing, Food Technology, 10 (1956) 129–134.
Leturia M., Benali M., Lagarde S., Ronga I., Saleh K., Charac-terization of flow properties of cohesive powders: A com-parative study of traditional and new testing methods, Pow-der Technology, 253 (2014) 406–423. DOI: 10.1016/j.powtec. 2013.11.045
Lewicki P.P., The applicability of the GAB model to food water
Fig. 8 Mollier diagram of the citric acid monohydrate material derived from the sticky points obtained via the Anton Paar Rheometer and the DVS system (linear fit).
Johan C. Groen et al. / KONA Powder and Particle Journal No. 37 (2020) 176–186
185
sorption isotherms, International Journal of Food Science & Technology, 32 (1997) 553–557. DOI: 10.1111/j.1365-2621.1997.tb02131.x
Lumay G., Traina K., Boschini F., Delaval V., Rescaglio A., Cloots R., Vandewalle N., Effect of relative air humidity on the flowability of lactose powders, Journal of Drug Deliv-ery Science and Technology, 35 (2016) 207–212. DOI: 10.1016/j.jddst.2016.04.007
Maroulis Z.B., Tsami E., Marinos-Kouris D., Saravacos G.D., Application of the GAB model to the moisture sorption iso-therms for dried fruits, Journal of Food Engineering, 7 (1988) 63–78. DOI: 10.1016/0260-8774(88)90069-6
Mathlouthi M., Rogé B., Water vapour sorption isotherms and the caking of food powders, Food Chemistry, 82 (2003) 61–71. DOI: 10.1016/S0308-8146(02)00534-4
Özkan N., Walisinghe N., Chen X.D., Characterization of stick-iness and cake formation in whole and skim milk powders, Journal of Food Engineering, 55 (2002) 293–303. DOI: 10.1016/S0260-8774(02)00104-8
Salehi H., Barletta D., Poletto M., A comparison between pow-der flow property testers, Particuology, 32 (2017) 10–20. DOI: 10.1016/j.partic.2016.08.003
Sandler N., Reiche K., Heinämäki J., Yliruusi J., Effect of mois-ture on powder flow properties of theophylline, Pharmaceu-
tics, 2 (2010) 275–290. DOI: 10.3390/pharmaceutics2030275Schulze D., Powders and Bulk Solids: Behavior, Characteriza-
tion, Storage and Flow, Springer-Verlag, Berlin, 2008. DOI: 10.1007/978-3-540-73768-1
Shi H., Mohanty R., Chakravarty S., Cabiscol R., Morgeneyer M., Zetzener H., Ooi J.Y., Kwade A., Luding S., Magnanimo V., Effect of particle size and cohesion on powder yielding and flow, KONA Powder and Particle Journal, 35 (2018) 226–250. DOI: 10.14356/kona.2018014
Soria-Hoyo C., Valverde J.M., Castellanos A., Avalanches in moistened beds of glass beads, Powder Technology, 196 (2009) 257–262. DOI: 10.1016/j.powtec.2009.08.008
Stanford M.K., DellaCorte C., Effects of humidity on the flow characteristics of PS304 plasma spray feedstock powder blend, (2002) NASA/TM-2002-211549.
Sun C., Improving powder flow properties of citric acid by crys-tal hydration, Journal of Pharmaceutical Sciences, 98 (2009) 1744–1749. DOI: 10.1002/jps.21554
Tomasetta I., Barletta D., Poletto M., The High Temperature Annular Shear Cell: A modified ring shear tester to mea-sure the flow properties of powders at high temperature, Advanced Powder Technology, 24 (2013) 609–617. DOI: 10.1016/j.apt.2012.11.007
Authors’ Short Biographies
Johan GroenJohan Groen studied chemistry in Delft and obtained his PhD. in chemical technology
from the Delft University of Technology on the theme of zeolite catalysis. During his stay at the university, Johan published over 40 scientific papers and contributions in books, and he is the inventor of one patent. In 2008, Johan co-founded Delft Solids Solu-tions, a contract research institute in the Netherlands devoted to particle and powder en-gineering, of which he is co-owner and science & technology director. His interests lie in the coupling between fundamental properties of particles and powder behaviour typi-cally encountered in the powder handling industry.
Wim KooijmanWim Kooijman studied Chemistry in Rotterdam and obtained his BsC. in chemistry
from the Hogeschool Rotterdam in September 2017. Wim wrote his graduation thesis about powder stickiness as an intern at Delft Solids Solutions in Wateringen. After he graduated Wim joined Chevron Oronite Technology Netherlands as a Laboratory Tech-nician. In March 2019, Wim switched jobs, becoming a Project Technician for the devel-opment of Automotive Engine Oils at Chevron. He is interested in analytical and organic research in Chemistry, which results into the development of new, more environmentally friendly products.

Johan C. Groen et al. / KONA Powder and Particle Journal No. 37 (2020) 176–186
186
Authors’ Short Biographies
Djamilla van Belzen
Djamilla van Belzen studied Chemistry at the University of Applied Sciences in Leiden. Djamilla got her B.Sc. in 2018 after her internship at Delft Solids Solutions. Af-ter her internship Djamilla started to work for CarbonX, located in Delft, as a QA/QC technician. Her interests lie in the physical part of chemistry and technology.
Gabrie Meesters
Dr Gabrie Meesters has 27 years of industrial formulations experience at Gist- brocades, Genencor International and DSM. He has 23 years of experience as a part-time Professor at TU Delft in particle technology and product design. From January 2019, he became a full-time Assistant Professor at the TU Delft, Faculty of Applied Sciences, Product and Process Engineering. He is a contributor to several books on formulations. He is the editor of three books on product design and solids processing. He published over 70 refereed papers, has more than 20 patents and supervised more than 100 BSc, MSc and PhDs. He is a regular speaker at conferences and workshops. He was the organizer of the 2010 Partec and the 2010 World Congress on Particle Technology in Nuremberg, Germany.
Timothy Aschl
Timothy Aschl holds a PhD in chemistry from the École Polytechnique, France, and a Master’s degree in applied physics from the Technical University of Graz, Austria. His research was focused on biosensors and biofuels. Timothy joined Anton Paar as a global product manager for powder rheology, and in this role he is a frequent speaker at semi-nars and training courses for companies and universities for a wide range of branches and industries around the world.
Denis Schütz
Denis Schütz earned his Master’s degree in chemistry at the University of Graz in 2009 and afterwards joined the PhD programme for materials chemistry and chemical engineering at TU-Graz, finishing in 2013. He did postdoc research at Graz University of Technology and postdoc research at Jozef Stefan Institute. At present he is principal scientist for powder rheology and applied scientist for materials at Anton Paar GmbH. His current interests are in granular media and powder flow research as well as high-temperature processing and device building.
Patrick Verolme
Patrick Verolme studied chemistry in Rotterdam and received his Bachelor of Science degree from the Rotterdam Hogeschool, after performing his graduation study at Delft Solids Solutions on the topic of water vapor sorption studies. Since 2012, Patrick has been working at Delft Solids Solutions in the field of solid particle/powder research, with his main area of expertise being specific surface area, porosity and vapor sorption stud-ies. His role has expanded to the research of bulk powder characteristics, on which he is a frequent speaker at seminars and courses.
KONA Powder and Particle Journal No. 37 (2020) 187–194/Doi:10.14356/kona.2020007 Original Research Paper
187Copyright © 2020 The Authors. Published by Hosokawa Powder Technology Foundation. This is an open ac-cess article under the CC BY license (http://creativecommons.org/licenses/by/4.0/).
Development and Validation of a Simplified Laboratory Test to Design Vertical Stirred Mills †
Maurício G. Bergerman * and Homero Delboni Junior1 Mining and Petroleum Engineering Department, University of Sao Paulo, Brazil
AbstractThe use of vertical stirred mills in the mining industry has increased remarkably over the past few decades as a result of the growing demand for finer ore grinding. This equipment is recognized to deliver higher energy efficiency in fine grinding operations when compared to conventional tubular mills. Methods of designing vertical stirred mills involve operational experience, pilot plant tests and bench tests. An important issue is that the laboratory-scale test, conducted in the standard 8"×10" jar, requires at least 10–20 kg of material, depending on ore density, which is not available in many cases, particularly in the early stages of greenfield projects. For regrinding of flotation concentrates, several bench scale flotation tests are required to generate such a sample. The paper describes the development and validation with six different ore samples of a simplified laboratory jar mill test using a 6"×8" jar, which is smaller than the 8"×10" size, the latter commonly used which requires about one-tenth of the mass required in the standard test. The proposed test indicated similar results as compared to the standard procedure.
Keywords: grinding, regrinding, jar test, vertical stirred mill, scale-up
1. Introduction
A significant demand for finer grinding has been no-ticed in several mining projects over the past few decades to achieve adequate liberation, as required for the concen-tration of valuable minerals. However, the finer the prod-uct size, the greater the grinding energy consumption, resulting in an overall increase in operating costs, which may reach or even exceed 50 % of the mineral processing costs (Daniel and Lewis-Gray, 2001; Vieira and Peres, 2013). Comminution technology can have a major impact on subsequent ore concentration stages (Daniel and Lewis- Gray 2001; Marsden, 2009; Napier-Munn, 2012; Pease et al., 2010), which further underlines the importance of proper technology and equipment selection. Appropriate grinding circuit selection and design is thus a key aspect associated with successful mining projects.
Based on these trends, vertical stirred mills with low impeller speed, such as the VertimillTM, has been adopted throughout the mining industry since 1970s (Bergerman, 2013; Goto 2010; Mazzinghy et al., 2017; Toroman and
Katircioglu, 2011). These mills consist of a vertical cylin-drical chamber in which the charge is stirred by a low-speed impeller. In this paper, it is referred to as vertical stirred mill. Several authors have shown that grinding technology based on impeller stirred mills will be of fun-damental importance in minimizing energy consumption in regrind circuits (Bergerman and Delboni Jr., 2014; Hogg and Cho, 2000; Kawade and Schwedes, 1997; Marsden, 2009; Mazzinghy et al., 2017; Napier-Munn, 2012; Norgate and Jahanshahi, 2011; Rule and Neville, 2012; Valery Jr. and Jankovic, 2002).
The design of vertical stirred mill for specific applica-tions are generally based on laboratory tests. Accordingly, Metso, which is one of the main manufacturers of vertical stirred mills, adopts a standard batch grinding test using a 8" (203 mm) in diameter by 10" (254 mm) in length (8"×10") jar (Jankovic and Valery Jr., 2004). The test is carried out according to different grinding times until the target particle size is reached. Such a test provides a rela-tionship between specific energy consumed as a function of particle size, the latter referred as d80. The required en-ergy consumption is thus calculated using such a relation-ship, based on the target particle size. The specific energy obtained is then multiplied by a factor of 0.65. Such a fac-tor, referred to as the VertimillTM (VTM) factor, assumes a higher efficiency associated with VTMs (Wills and Finch, 2016). The above described procedure provides a good correlation with industrial mills and is used as an
† Received 20 December 2018; Accepted 11 March 2019 J-STAGE Advance published online 20 April 2019
1 Av. Prof. Mello Moraes, 2373, Butantan - CEP 05508-030, Sao Paulo, Brazil
* Corresponding author: Maurício G. Bergerman; E-mail : [email protected] TEL: +55-11-2648-6076 FAX: +55-11-2648-6076
Maurício G. Bergerman et al. / KONA Powder and Particle Journal No. 37 (2020) 187–194
188
industry standard for the design of this kind of equipment (Bergerman, 2013; Wills and Finch, 2016; Donda, 2003; Mazzinghy et al., 2014). The sample required to perform each grinding time is based on the calculated volume re-quired to entirely fill the voids within the steel ball charge, which for the standard tests is 1.381 L. For in-stance, for a material with a bulk density of 3.04 g/cm3, such as the iron ore concentrate used in this study, each grinding time will require 4,203 g of sample, which re-sults in a total of 21,105 g for all five grinding times.
A remarkable aspect of designing vertical stirred mills for industrial regrind circuits is the lack of sufficient mass for carrying out batch grinding tests that follow the stan-dard adopted by Metso. This is a serious hurdle for proj-ects in the early stages, as 100–1,000 kg of ore would be necessary to obtain the required amount of regrinding feed. Indeed, in a typical copper sulphide flotation proj-ect, a significant amount of rougher concentrate is re-quired for regrind testing. Such a situation becomes even more critical for low-grade ores, where rougher concen-trate mass recovery is low as well. One practical conse-quence is that a number of industrial regrind circuits are designed without any proper laboratory or pilot testing validation. Laboratory batch tests based on significant smaller sample mass would thus be particularly useful for designing vertical stirred mills.
This paper describes the development and validation of a laboratory jar mill test using a 6"×8" jar, requiring much less sample than a standard test, which is carried out with a 8"×10" jar, as described in Mazzinghy et al. (2014) and Wills and Finch (2016). The required specific energy is
based on the global specific energy method (Austin et al., 1984). The samples used in our tests represented the re-spective industrial regrind circuit in all cases.
2. Materials and methods
Tests were carried out with six different ore samples, including copper, phosphate, and iron ores obtained in in-dustrial grinding circuits from Brazil. The surveyed plants were as follows: Anglo American Minas Rio Proj-ect (iron ore), Vale Salobo (copper ore), Vale Sossego (copper ore), Mosaic Tapira (phosphate ore), and Vale Vi-toria Pelletizing plant (iron ore). Plant flow sheets and op-erating data may be found elsewhere (Bergerman et al., 2012; Guimarães, 2004; Mazzinghy et al., 2015; Meyer et al., 2015). Each sample was tested to determine the re-spective density of solids (using a pycnometer), the bulk density by using a graduated measuring cylinder, and the particle size distribution and specific surface area by laser scattering using a Malvern 2000 Mastersizer. Deionized water was used as a dispersion medium in the analysis carried out using Malvern. The refraction indexes of par-ticles were 1.45, 1.729, and 1.627, respectively for copper, iron, and phosphate ores, while it was 1.33 for the disper-sion medium. The Malvern analyser stirrer speed was 2,500 rpm and ultrasound was applied for one minute.
After the initial ore characterization tests, each sample was quartered for grinding in both 6"×8" and 8"×10" jars according to test conditions listed in Table 1. Both mills were fitted with smooth stainless-steel liners.
Table 1 Test conditions for each jar test.
Conditions and Characteristics 6"×8" jar 8"×10" jar
Jar volume (m3) 0.0037 0.0082
Ball filling, J (%) 42 42
Charge voids (%) 40 40
Grinding ball size (mm) 12.7 12.7
Solids (%) 70 70
Charge interstice filling, U (%) 100 100
Sample mass for each grinding cycle (g)
Anglo American Minas Rio 1,883 4,203
Vale Salobo 1,306 2,914
Vale Sossego—sample 1 1,386 3,094
Vale Sossego—sample 2 916 2,044
Mosaic Tapira 1,145 2,555
Vale Vitoria 1,838 4,102
Mill speed (rpm) 82.5 71.4
Mill rotation speed (% critical speed) 76.0 76.0
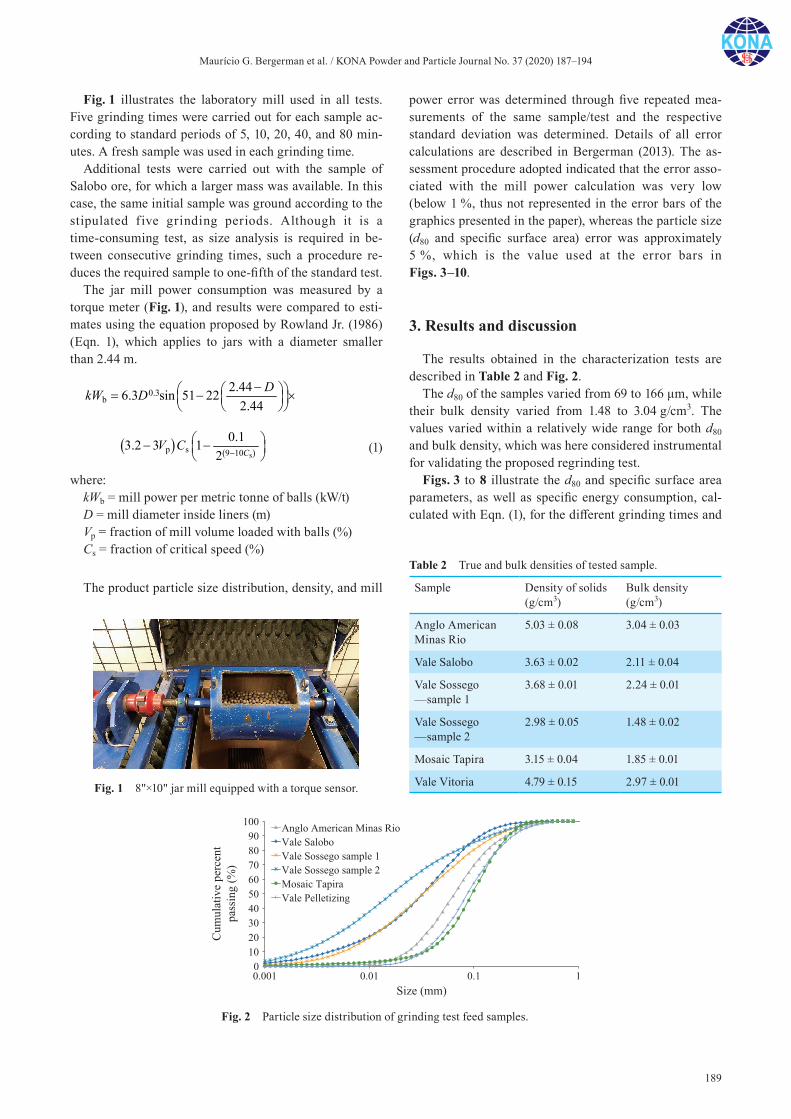
Maurício G. Bergerman et al. / KONA Powder and Particle Journal No. 37 (2020) 187–194
189
Fig. 1 illustrates the laboratory mill used in all tests. Five grinding times were carried out for each sample ac-cording to standard periods of 5, 10, 20, 40, and 80 min-utes. A fresh sample was used in each grinding time.
Additional tests were carried out with the sample of Salobo ore, for which a larger mass was available. In this case, the same initial sample was ground according to the stipulated five grinding periods. Although it is a time-consuming test, as size analysis is required in be-tween consecutive grinding times, such a procedure re-duces the required sample to one-fifth of the standard test.
The jar mill power consumption was measured by a torque meter (Fig. 1), and results were compared to esti-mates using the equation proposed by Rowland Jr. (1986) (Eqn. 1), which applies to jars with a diameter smaller than 2.44 m.
0.3b
2.446.3 sin 51 222.44
DkW D
sp s 9 10
0.13.2 3 12 C
V C
(1)
where:kWb = mill power per metric tonne of balls (kW/t)D = mill diameter inside liners (m)Vp = fraction of mill volume loaded with balls (%)Cs = fraction of critical speed (%)
The product particle size distribution, density, and mill
power error was determined through five repeated mea-surements of the same sample/test and the respective standard deviation was determined. Details of all error calculations are described in Bergerman (2013). The as-sessment procedure adopted indicated that the error asso-ciated with the mill power calculation was very low (below 1 %, thus not represented in the error bars of the graphics presented in the paper), whereas the particle size (d80 and specific surface area) error was approximately 5 %, which is the value used at the error bars in Figs. 3–10.
3. Results and discussion
The results obtained in the characterization tests are described in Table 2 and Fig. 2.
The d80 of the samples varied from 69 to 166 μm, while their bulk density varied from 1.48 to 3.04 g/cm3. The values varied within a relatively wide range for both d80 and bulk density, which was here considered instrumental for validating the proposed regrinding test.
Figs. 3 to 8 illustrate the d80 and specific surface area parameters, as well as specific energy consumption, cal-culated with Eqn. (1), for the different grinding times and
Fig. 1 8"×10" jar mill equipped with a torque sensor.
Fig. 2 Particle size distribution of grinding test feed samples.
Table 2 True and bulk densities of tested sample.
Sample Density of solids (g/cm3)
Bulk density (g/cm3)
Anglo American Minas Rio
5.03 ± 0.08 3.04 ± 0.03
Vale Salobo 3.63 ± 0.02 2.11 ± 0.04
Vale Sossego —sample 1
3.68 ± 0.01 2.24 ± 0.01
Vale Sossego —sample 2
2.98 ± 0.05 1.48 ± 0.02
Mosaic Tapira 3.15 ± 0.04 1.85 ± 0.01
Vale Vitoria 4.79 ± 0.15 2.97 ± 0.01
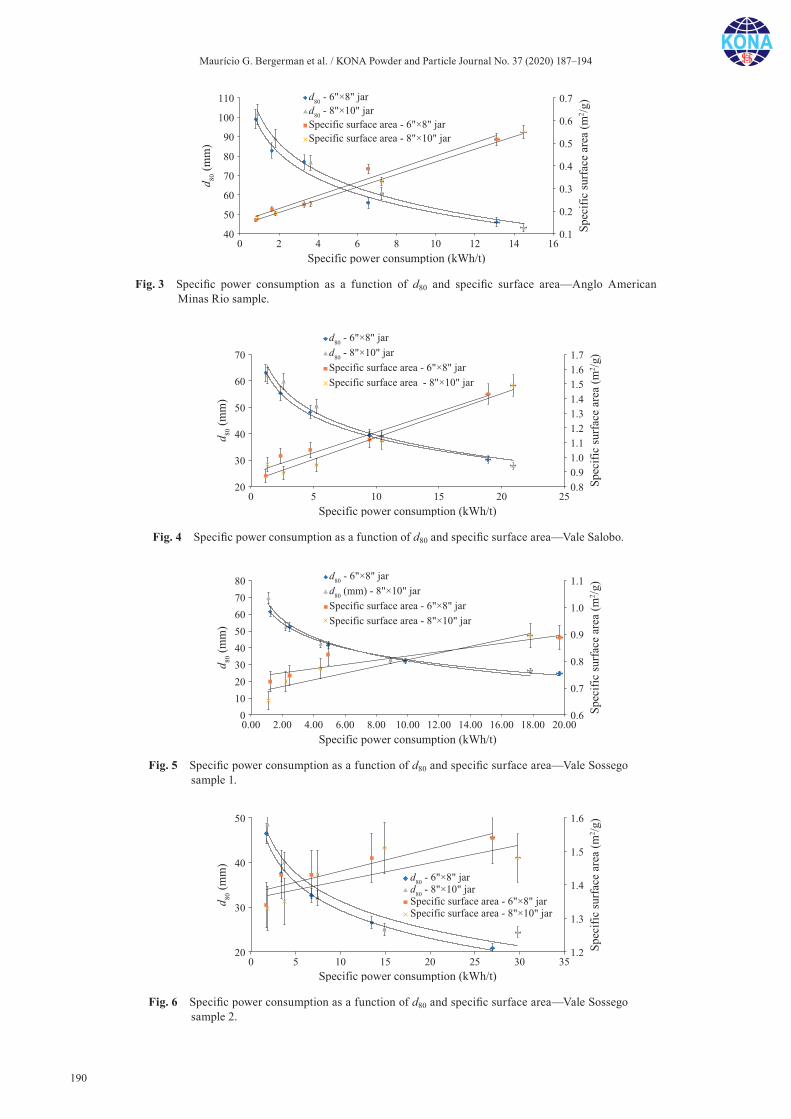
Maurício G. Bergerman et al. / KONA Powder and Particle Journal No. 37 (2020) 187–194
190
Fig. 5 Specific power consumption as a function of d80 and specific surface area—Vale Sossego sample 1.
Fig. 4 Specific power consumption as a function of d80 and specific surface area—Vale Salobo.
Fig. 6 Specific power consumption as a function of d80 and specific surface area—Vale Sossego sample 2.
Fig. 3 Specific power consumption as a function of d80 and specific surface area—Anglo American Minas Rio sample.
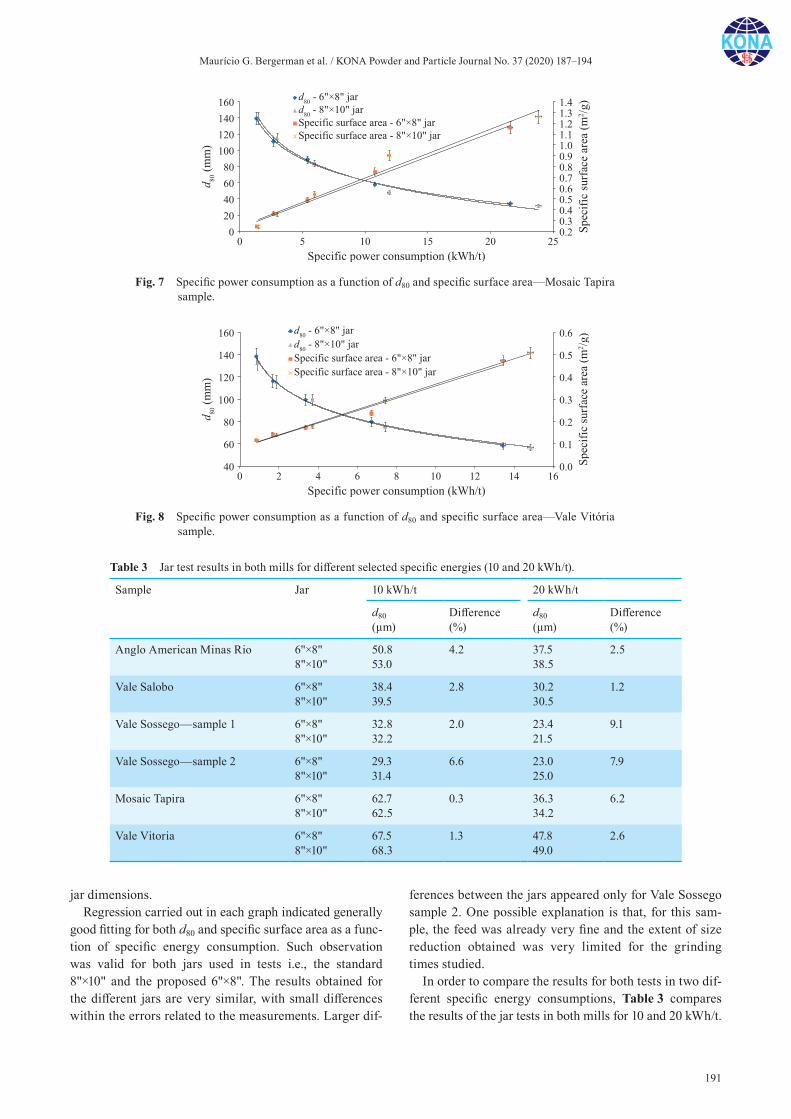
Maurício G. Bergerman et al. / KONA Powder and Particle Journal No. 37 (2020) 187–194
191
jar dimensions.Regression carried out in each graph indicated generally
good fitting for both d80 and specific surface area as a func-tion of specific energy consumption. Such observation was valid for both jars used in tests i.e., the standard 8"×10" and the proposed 6"×8". The results obtained for the different jars are very similar, with small differences within the errors related to the measurements. Larger dif-
ferences between the jars appeared only for Vale Sossego sample 2. One possible explanation is that, for this sam-ple, the feed was already very fine and the extent of size reduction obtained was very limited for the grinding times studied.
In order to compare the results for both tests in two dif-ferent specific energy consumptions, Table 3 compares the results of the jar tests in both mills for 10 and 20 kWh/t.
Table 3 Jar test results in both mills for different selected specific energies (10 and 20 kWh/t).
Sample Jar 10 kWh/t 20 kWh/t
d80 (μm)
Difference (%)
d80 (μm)
Difference (%)
Anglo American Minas Rio 6"×8"8"×10"
50.853.0
4.2 37.538.5
2.5
Vale Salobo 6"×8"8"×10"
38.439.5
2.8 30.230.5
1.2
Vale Sossego—sample 1 6"×8"8"×10"
32.832.2
2.0 23.421.5
9.1
Vale Sossego—sample 2 6"×8"8"×10"
29.331.4
6.6 23.025.0
7.9
Mosaic Tapira 6"×8"8"×10"
62.762.5
0.3 36.334.2
6.2
Vale Vitoria 6"×8"8"×10"
67.568.3
1.3 47.849.0
2.6
Fig. 7 Specific power consumption as a function of d80 and specific surface area—Mosaic Tapira sample.
Fig. 8 Specific power consumption as a function of d80 and specific surface area—Vale Vitória sample.
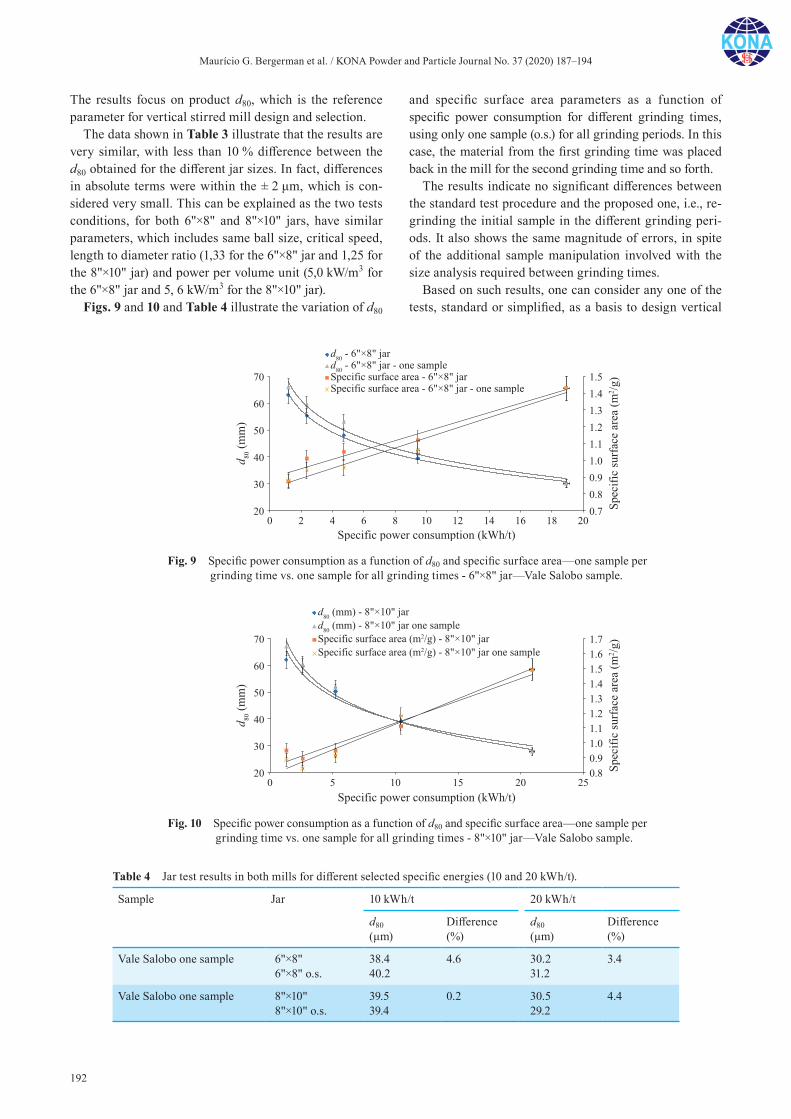
Maurício G. Bergerman et al. / KONA Powder and Particle Journal No. 37 (2020) 187–194
192
The results focus on product d80, which is the reference parameter for vertical stirred mill design and selection.
The data shown in Table 3 illustrate that the results are very similar, with less than 10 % difference between the d80 obtained for the different jar sizes. In fact, differences in absolute terms were within the ± 2 μm, which is con-sidered very small. This can be explained as the two tests conditions, for both 6"×8" and 8"×10" jars, have similar parameters, which includes same ball size, critical speed, length to diameter ratio (1,33 for the 6"×8" jar and 1,25 for the 8"×10" jar) and power per volume unit (5,0 kW/m3 for the 6"×8" jar and 5, 6 kW/m3 for the 8"×10" jar).
Figs. 9 and 10 and Table 4 illustrate the variation of d80
and specific surface area parameters as a function of specific power consumption for different grinding times, using only one sample (o.s.) for all grinding periods. In this case, the material from the first grinding time was placed back in the mill for the second grinding time and so forth.
The results indicate no significant differences between the standard test procedure and the proposed one, i.e., re-grinding the initial sample in the different grinding peri-ods. It also shows the same magnitude of errors, in spite of the additional sample manipulation involved with the size analysis required between grinding times.
Based on such results, one can consider any one of the tests, standard or simplified, as a basis to design vertical
Fig. 9 Specific power consumption as a function of d80 and specific surface area—one sample per grinding time vs. one sample for all grinding times - 6"×8" jar—Vale Salobo sample.
Fig. 10 Specific power consumption as a function of d80 and specific surface area—one sample per grinding time vs. one sample for all grinding times - 8"×10" jar—Vale Salobo sample.
Table 4 Jar test results in both mills for different selected specific energies (10 and 20 kWh/t).
Sample Jar 10 kWh/t 20 kWh/t
d80 (μm)
Difference (%)
d80 (μm)
Difference (%)
Vale Salobo one sample 6"×8"6"×8" o.s.
38.440.2
4.6 30.231.2
3.4
Vale Salobo one sample 8"×10"8"×10" o.s.
39.539.4
0.2 30.529.2
4.4
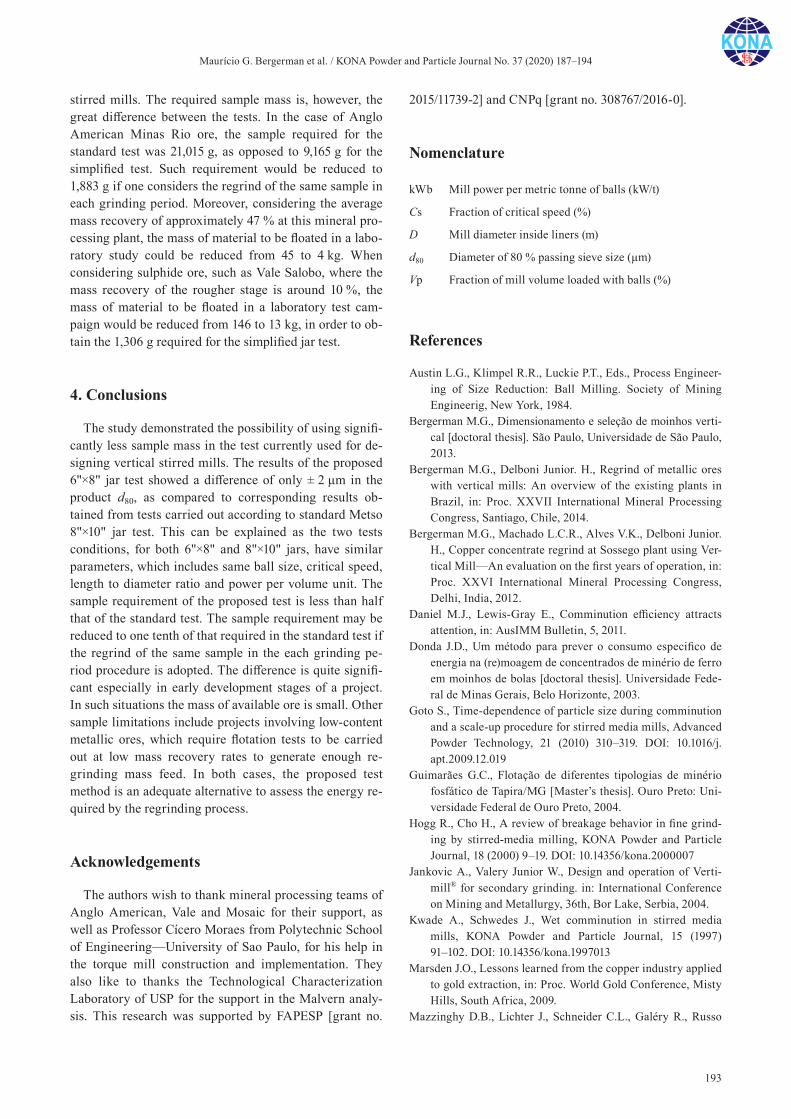
Maurício G. Bergerman et al. / KONA Powder and Particle Journal No. 37 (2020) 187–194
193
stirred mills. The required sample mass is, however, the great difference between the tests. In the case of Anglo American Minas Rio ore, the sample required for the standard test was 21,015 g, as opposed to 9,165 g for the simplified test. Such requirement would be reduced to 1,883 g if one considers the regrind of the same sample in each grinding period. Moreover, considering the average mass recovery of approximately 47 % at this mineral pro-cessing plant, the mass of material to be floated in a labo-ratory study could be reduced from 45 to 4 kg. When considering sulphide ore, such as Vale Salobo, where the mass recovery of the rougher stage is around 10 %, the mass of material to be floated in a laboratory test cam-paign would be reduced from 146 to 13 kg, in order to ob-tain the 1,306 g required for the simplified jar test.
4. Conclusions
The study demonstrated the possibility of using signifi-cantly less sample mass in the test currently used for de-signing vertical stirred mills. The results of the proposed 6"×8" jar test showed a difference of only ± 2 μm in the product d80, as compared to corresponding results ob-tained from tests carried out according to standard Metso 8"×10" jar test. This can be explained as the two tests conditions, for both 6"×8" and 8"×10" jars, have similar parameters, which includes same ball size, critical speed, length to diameter ratio and power per volume unit. The sample requirement of the proposed test is less than half that of the standard test. The sample requirement may be reduced to one tenth of that required in the standard test if the regrind of the same sample in the each grinding pe-riod procedure is adopted. The difference is quite signifi-cant especially in early development stages of a project. In such situations the mass of available ore is small. Other sample limitations include projects involving low-content metallic ores, which require flotation tests to be carried out at low mass recovery rates to generate enough re-grinding mass feed. In both cases, the proposed test method is an adequate alternative to assess the energy re-quired by the regrinding process.
Acknowledgements
The authors wish to thank mineral processing teams of Anglo American, Vale and Mosaic for their support, as well as Professor Cícero Moraes from Polytechnic School of Engineering—University of Sao Paulo, for his help in the torque mill construction and implementation. They also like to thanks the Technological Characterization Laboratory of USP for the support in the Malvern analy-sis. This research was supported by FAPESP [grant no.
2015/11739-2] and CNPq [grant no. 308767/2016-0].
Nomenclature
kWb Mill power per metric tonne of balls (kW/t)
Cs Fraction of critical speed (%)
D Mill diameter inside liners (m)
d80 Diameter of 80 % passing sieve size (μm)
Vp Fraction of mill volume loaded with balls (%)
References
Austin L.G., Klimpel R.R., Luckie P.T., Eds., Process Engineer-ing of Size Reduction: Ball Milling. Society of Mining Engineerig, New York, 1984.
Bergerman M.G., Dimensionamento e seleção de moinhos verti-cal [doctoral thesis]. São Paulo, Universidade de São Paulo, 2013.
Bergerman M.G., Delboni Junior. H., Regrind of metallic ores with vertical mills: An overview of the existing plants in Brazil, in: Proc. XXVII International Mineral Processing Congress, Santiago, Chile, 2014.
Bergerman M.G., Machado L.C.R., Alves V.K., Delboni Junior. H., Copper concentrate regrind at Sossego plant using Ver-tical Mill—An evaluation on the first years of operation, in: Proc. XXVI International Mineral Processing Congress, Delhi, India, 2012.
Daniel M.J., Lewis-Gray E., Comminution efficiency attracts attention, in: AusIMM Bulletin, 5, 2011.
Donda J.D., Um método para prever o consumo especifico de energia na (re)moagem de concentrados de minério de ferro em moinhos de bolas [doctoral thesis]. Universidade Fede-ral de Minas Gerais, Belo Horizonte, 2003.
Goto S., Time-dependence of particle size during comminution and a scale-up procedure for stirred media mills, Advanced Powder Technology, 21 (2010) 310–319. DOI: 10.1016/j.apt.2009.12.019
Guimarães G.C., Flotação de diferentes tipologias de minério fosfático de Tapira/MG [Master’s thesis]. Ouro Preto: Uni-versidade Federal de Ouro Preto, 2004.
Hogg R., Cho H., A review of breakage behavior in fine grind-ing by stirred-media milling, KONA Powder and Particle Journal, 18 (2000) 9–19. DOI: 10.14356/kona.2000007
Jankovic A., Valery Junior W., Design and operation of Verti-mill® for secondary grinding. in: International Conference on Mining and Metallurgy, 36th, Bor Lake, Serbia, 2004.
Kwade A., Schwedes J., Wet comminution in stirred media mills, KONA Powder and Particle Journal, 15 (1997) 91–102. DOI: 10.14356/kona.1997013
Marsden J.O., Lessons learned from the copper industry applied to gold extraction, in: Proc. World Gold Conference, Misty Hills, South Africa, 2009.
Mazzinghy D.B., Lichter J., Schneider C.L., Galéry R., Russo

Maurício G. Bergerman et al. / KONA Powder and Particle Journal No. 37 (2020) 187–194
194
J.F.C., Vertical stirred mill scale-up and simulation: Model validation by industrial samplings results, Minerals Engineering, 103–104 (2017) 127–133. DOI: 10.1016/j.mineng.2016.11.018
Mazzinghy D.B., Russo J.F.C., Lichter J., Schneider C.L., Sepúlveda J., Videla J.A., The grinding efficiency of the currently largest Vertimill installation in the world, in: Proc. SAG Conference, Vancouver, Canada, 2015.
Mazzinghy D.B., Schneider C.L., Alves V.K., Galéry R., Vertical agitated media mill scale-up and simulation, Minerals Engi-neering, 73 (2014) 69–76. DOI: 10.1016/j.mineng.2014.11.003
Meyer M., Casagrande C., Martin L.A., Zocatelli T., Influência da participação em maior escala do pellet feed da Mina de Brucutu no processo de pelotização Vale-Tubarão, in: Proc. 2° Simpósio Brasileiro de Aglomeração de Minério de Ferro, Belo Horizonte, MG, Brasil, 2015. DOI: 10.5151/2594-357X-25347
Napier-Munn T.J., Comminution energy and how to reduce it, in: Proc. 2012 CEEC Workshop, Australia, 2012.
Norgate T., Jahanshahi S., Reducing the greenhouse gas foot-print of primary metal production: where should the focus be? Minerals Engineering, 24 (2011) 1563–1570. DOI: 10.1016/j.mineng.2011.08.007.
Pease J.D., Young M.F., Curry D., Johnson N.W., Improving
fines recovery by grinding finer. Mineral Processing and Extractive Metallurgy, 119 (2010) 216–222. DOI: 10.1179/037195510X12816242170852
Rowland Junior C.A., Selection of rod mills, ball mills and regrind mills. in: Society for Mining, Metallurgy and Exploration, in: Somasundaran P. (ed.) Advances in Min-eral Processing: A Half-century of Progress in Application of Theory to Practice, SME, Littleton, 1986, pp. 393–438.
Rule C.M., Neville P., 2020: What will the typical PGM concen-trator flow sheet look like? in: Proc. Mei Conferences, Cape Town, South Africa, 2012.
Toraman O.Y., Katırcıoglu D., A study on the effect of process parameters in stirred ball mill, Advanced Powder Technol-ogy, 22 (2011) 26–30. DOI: 10.1016/j.apt.2010.02.018
Valery Junior W., Jankovic A., The future of comminution, in: Proc. of the 34th IOC on Mining and Metallurgy Confer-ence, Bor Lake, Yugoslavia, 2002.
Vieira M.G., Peres A.E.C., Effect of rheology and dispersion degree on the regrinding of an iron ore concentrate, Journal of Materials Research Technology 2 (2013) 332–339. DOI: 10.1016/j.jmrt.2013.07.002
Wills B.A., Finch J.A., Eds., Wills’ Mineral Processing Tech-nology, 6th ed., Butterworth-Heinemann, Boston, 2016.
Authors’ Short Biographies
Mauricio Guimarães Bergerman
Dr. Mauricio Guimarães Bergerman graduated in Mining and Mineral Processing En-gineering from The University of São Paulo (2003), obtaining his masters (2009) and doctoral (2013) degrees at the same university. He has worked for seven years at Vale, at the Sossego copper plant industrial operation, Pico iron ore processing plant, as well as developing new copper ore projects in Brazil and Africa. He has worked four year as As-sistant Professor at Alfenas Federal University and currently is Assistant Professor in the Mining and Mineral Processing Engineering Department of The University of Sao Paulo. His research is mainly focused on grinding, physical concentration, and mineral processing project development and optimization.
Homero Delboni
Dr. Homero Delboni, Junior graduated in Mining and Minerals Processing Engineer-ing from the University of São Paulo. In 1989, he obtained a M.Eng. degree in Minerals Engineering at the same university. He joined the Julius Kruttschnitt Mineral Research Centre of the University of Queensland, Australia, where he obtained his PhD degree in 1999. He is currently a Lecturer in the Department on Mining and Petroleum Engineer-ing at the University of São Paulo, where he is involved in both teaching and research in mineral processing, particularly in comminution.
KONA Powder and Particle Journal No. 37 (2020) 195–213/Doi:10.14356/kona.2020008 Original Research Paper
195Copyright © 2020 The Authors. Published by Hosokawa Powder Technology Foundation. This is an open ac-cess article under the CC BY license (http://creativecommons.org/licenses/by/4.0/).
Integrating Particle Microstructure, Surface and Mechanical Characterization with Bulk Powder Processing †
Rodolfo Pinal 1* and M. Teresa Carvajal 2
1 Department of Industrial and Physical Pharmacy, Purdue University, USA2 Department of Agricultural and Biological Engineering, Purdue University, USA
AbstractMultiple industrial applications, including pharmaceuticals, rely on the processing of powders. The current powder characterization framework is fragmented into two general areas. One deals with understanding powders from the standpoint of its constituting agents—particles. The other deals with understanding based on the bulk—the collective behavior of particles. While complementary, the two aspects provide distinct pieces of information. Whenever possible, experimental techniques should be used to predict powder behavior. However, it is equally important to recognize that because of the natural complexity of powders, existing predictive approaches will continue to be of limited success for predicting the collective behavior of particles. This article discusses the understanding of powder properties from two perspectives. One is the effect of surface energy at the bulk level (large collections of particles), which controls interactions between powders. This aspect is most useful if studied at the bulk-powder level, not at the single-particle level. Another perspective deals with the physico-mechanical properties of individual particles, responsible for the observed behavior of powders when subjected to mechanical stress from unit operations such as milling. This aspect, which controls the failure mechanism of powders subjected to milling, is most useful if assessed at the single-particle, not at the bulk level. Therefore, in order to fully understand, and eventually predict, or at least effectively model powder behavior, a good-judgement-based combination of microscopic and bulk-level analytical methods is necessary.
Keywords: powder, particle, surface energetics, surface composition, nanoindentation, flowability
1. Introduction
Imagine trying to obtain a wide-angle panoramic im-age of a particular view, using a regular photographic camera. The task requires multiple frames, where each frame provides detailed information about a small seg-ment of the whole picture. The panoramic image can then be obtained by “stitching” together the multiple frames captured by the camera. One important consideration is that in order to successfully stich the multiple frames into a faithful representation of the panoramic view, it is also necessary that each individual frame also exhibits some degree of overlap with the neighboring images. The pan-oramic image example just described, is analogous to that of the physical characterization of powders. Each analytical technique utilized provides a “snapshot” of a particular attribute of the powder, and a fundamental understanding
about the properties and behavior of the material, or pan-oramic view, comes from integrating the information ob-tained from the multiple analytical techniques. The wide-angle photograph notion provides a useful general starting point. However, for every analogy, there is always a point at which it ceases to be applicable, and this is no exception. One critical difference between the panoramic image situation and the characterization of a powder ma-terial, is that constructing the panoramic view is a mono- dimensional task, whereas the physical characterization of a powder material is a multi-dimensional one. In other words, in making the panoramic image, every single shot carries the same type of (exclusively visual) information, whereas in powder characterization, each single shot counterpart (analytical technique) provides different type (dimension) of information.
Handling and processing powders is an integral aspect in various industries, including pharmaceuticals, food and nutraceuticals, cement and ceramics, among others. This report focuses on pharmaceutical and food applications. However, the principles covered in the discussion pre-sented here are not necessarily limited to these industry segments, but should be valid for powders in general.
† Received 18 June 2018; Accepted 1 August 2018 J-STAGE Advance published online 8 June 2019
1,2 West Lafayette, Indiana 47907, USA* Corresponding author: Rodolfo Pinal;
E-mail: [email protected] TEL: +1-765-496-6247 FAX: +1-494-6545
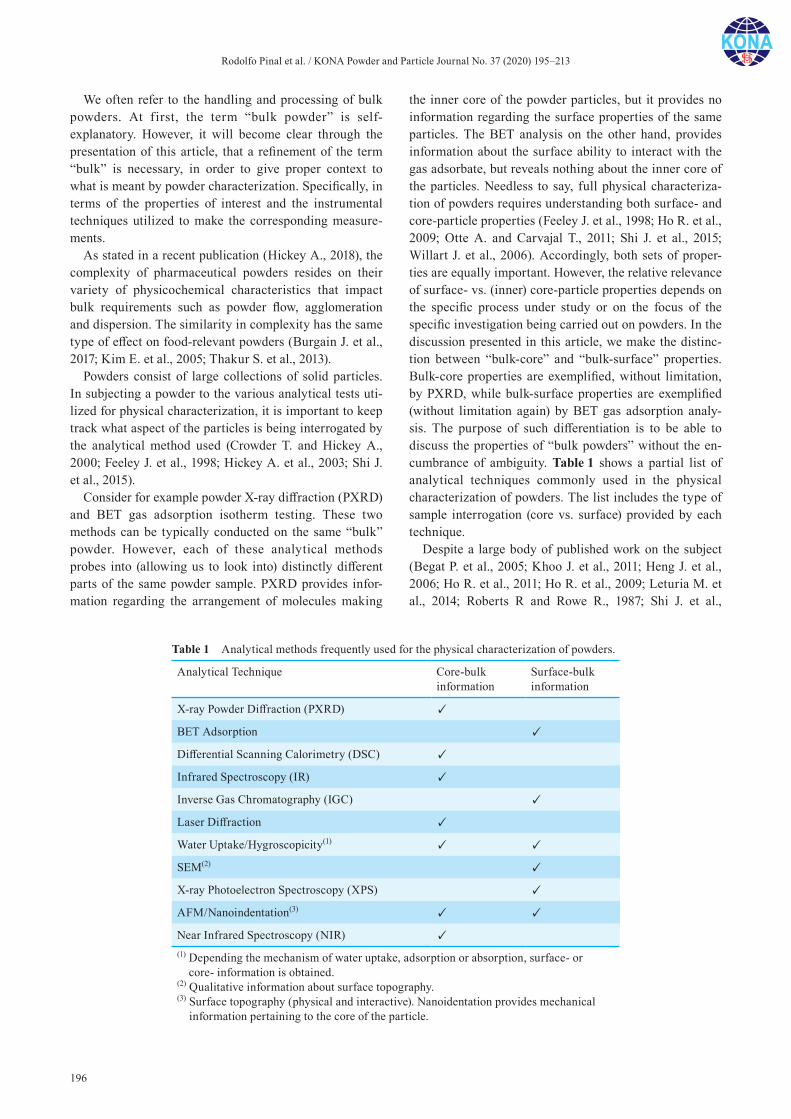
Rodolfo Pinal et al. / KONA Powder and Particle Journal No. 37 (2020) 195–213
196
We often refer to the handling and processing of bulk powders. At first, the term “bulk powder” is self- explanatory. However, it will become clear through the presentation of this article, that a refinement of the term “bulk” is necessary, in order to give proper context to what is meant by powder characterization. Specifically, in terms of the properties of interest and the instrumental techniques utilized to make the corresponding measure-ments.
As stated in a recent publication (Hickey A., 2018), the complexity of pharmaceutical powders resides on their variety of physicochemical characteristics that impact bulk requirements such as powder flow, agglomeration and dispersion. The similarity in complexity has the same type of effect on food-relevant powders (Burgain J. et al., 2017; Kim E. et al., 2005; Thakur S. et al., 2013).
Powders consist of large collections of solid particles. In subjecting a powder to the various analytical tests uti-lized for physical characterization, it is important to keep track what aspect of the particles is being interrogated by the analytical method used (Crowder T. and Hickey A., 2000; Feeley J. et al., 1998; Hickey A. et al., 2003; Shi J. et al., 2015).
Consider for example powder X-ray diffraction (PXRD) and BET gas adsorption isotherm testing. These two methods can be typically conducted on the same “bulk” powder. However, each of these analytical methods probes into (allowing us to look into) distinctly different parts of the same powder sample. PXRD provides infor-mation regarding the arrangement of molecules making
the inner core of the powder particles, but it provides no information regarding the surface properties of the same particles. The BET analysis on the other hand, provides information about the surface ability to interact with the gas adsorbate, but reveals nothing about the inner core of the particles. Needless to say, full physical characteriza-tion of powders requires understanding both surface- and core-particle properties (Feeley J. et al., 1998; Ho R. et al., 2009; Otte A. and Carvajal T., 2011; Shi J. et al., 2015; Willart J. et al., 2006). Accordingly, both sets of proper-ties are equally important. However, the relative relevance of surface- vs. (inner) core-particle properties depends on the specific process under study or on the focus of the specific investigation being carried out on powders. In the discussion presented in this article, we make the distinc-tion between “bulk-core” and “bulk-surface” properties. Bulk-core properties are exemplified, without limitation, by PXRD, while bulk-surface properties are exemplified (without limitation again) by BET gas adsorption analy-sis. The purpose of such differentiation is to be able to discuss the properties of “bulk powders” without the en-cumbrance of ambiguity. Table 1 shows a partial list of analytical techniques commonly used in the physical characterization of powders. The list includes the type of sample interrogation (core vs. surface) provided by each technique.
Despite a large body of published work on the subject (Begat P. et al., 2005; Khoo J. et al., 2011; Heng J. et al., 2006; Ho R. et al., 2011; Ho R. et al., 2009; Leturia M. et al., 2014; Roberts R and Rowe R., 1987; Shi J. et al.,
Table 1 Analytical methods frequently used for the physical characterization of powders.
Analytical Technique Core-bulk information
Surface-bulk information
X-ray Powder Diffraction (PXRD)
BET Adsorption
Differential Scanning Calorimetry (DSC)
Infrared Spectroscopy (IR)
Inverse Gas Chromatography (IGC)
Laser Diffraction
Water Uptake/Hygroscopicity(1)
SEM(2)
X-ray Photoelectron Spectroscopy (XPS)
AFM/Nanoindentation(3)
Near Infrared Spectroscopy (NIR) (1) Depending the mechanism of water uptake, adsorption or absorption, surface- or
core- information is obtained.(2) Qualitative information about surface topography.(3) Surface topography (physical and interactive). Nanoidentation provides mechanical
information pertaining to the core of the particle.
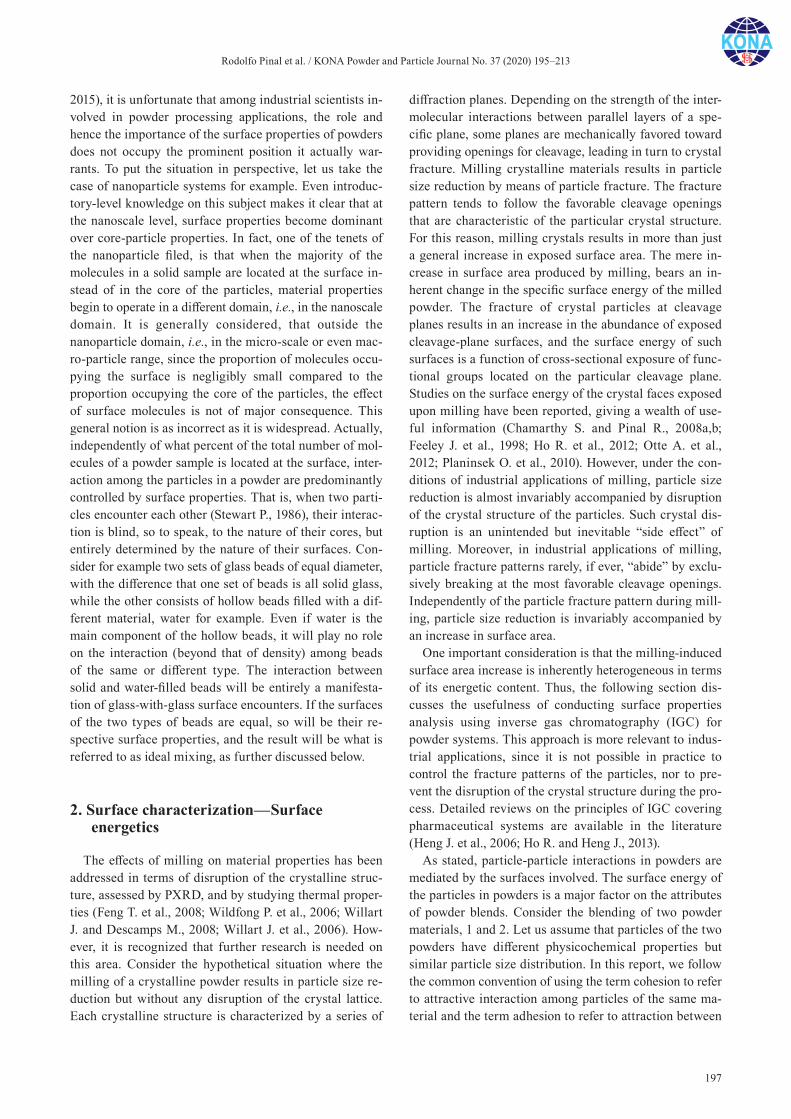
Rodolfo Pinal et al. / KONA Powder and Particle Journal No. 37 (2020) 195–213
197
2015), it is unfortunate that among industrial scientists in-volved in powder processing applications, the role and hence the importance of the surface properties of powders does not occupy the prominent position it actually war-rants. To put the situation in perspective, let us take the case of nanoparticle systems for example. Even introduc-tory-level knowledge on this subject makes it clear that at the nanoscale level, surface properties become dominant over core-particle properties. In fact, one of the tenets of the nanoparticle filed, is that when the majority of the molecules in a solid sample are located at the surface in-stead of in the core of the particles, material properties begin to operate in a different domain, i.e., in the nanoscale domain. It is generally considered, that outside the nanoparticle domain, i.e., in the micro-scale or even mac-ro-particle range, since the proportion of molecules occu-pying the surface is negligibly small compared to the proportion occupying the core of the particles, the effect of surface molecules is not of major consequence. This general notion is as incorrect as it is widespread. Actually, independently of what percent of the total number of mol-ecules of a powder sample is located at the surface, inter-action among the particles in a powder are predominantly controlled by surface properties. That is, when two parti-cles encounter each other (Stewart P., 1986), their interac-tion is blind, so to speak, to the nature of their cores, but entirely determined by the nature of their surfaces. Con-sider for example two sets of glass beads of equal diameter, with the difference that one set of beads is all solid glass, while the other consists of hollow beads filled with a dif-ferent material, water for example. Even if water is the main component of the hollow beads, it will play no role on the interaction (beyond that of density) among beads of the same or different type. The interaction between solid and water-filled beads will be entirely a manifesta-tion of glass-with-glass surface encounters. If the surfaces of the two types of beads are equal, so will be their re-spective surface properties, and the result will be what is referred to as ideal mixing, as further discussed below.
2. Surface characterization—Surface energetics
The effects of milling on material properties has been addressed in terms of disruption of the crystalline struc-ture, assessed by PXRD, and by studying thermal proper-ties (Feng T. et al., 2008; Wildfong P. et al., 2006; Willart J. and Descamps M., 2008; Willart J. et al., 2006). How-ever, it is recognized that further research is needed on this area. Consider the hypothetical situation where the milling of a crystalline powder results in particle size re-duction but without any disruption of the crystal lattice. Each crystalline structure is characterized by a series of
diffraction planes. Depending on the strength of the inter-molecular interactions between parallel layers of a spe-cific plane, some planes are mechanically favored toward providing openings for cleavage, leading in turn to crystal fracture. Milling crystalline materials results in particle size reduction by means of particle fracture. The fracture pattern tends to follow the favorable cleavage openings that are characteristic of the particular crystal structure. For this reason, milling crystals results in more than just a general increase in exposed surface area. The mere in-crease in surface area produced by milling, bears an in-herent change in the specific surface energy of the milled powder. The fracture of crystal particles at cleavage planes results in an increase in the abundance of exposed cleavage-plane surfaces, and the surface energy of such surfaces is a function of cross-sectional exposure of func-tional groups located on the particular cleavage plane. Studies on the surface energy of the crystal faces exposed upon milling have been reported, giving a wealth of use-ful information (Chamarthy S. and Pinal R., 2008a,b; Feeley J. et al., 1998; Ho R. et al., 2012; Otte A. et al., 2012; Planinsek O. et al., 2010). However, under the con-ditions of industrial applications of milling, particle size reduction is almost invariably accompanied by disruption of the crystal structure of the particles. Such crystal dis-ruption is an unintended but inevitable “side effect” of milling. Moreover, in industrial applications of milling, particle fracture patterns rarely, if ever, “abide” by exclu-sively breaking at the most favorable cleavage openings. Independently of the particle fracture pattern during mill-ing, particle size reduction is invariably accompanied by an increase in surface area.
One important consideration is that the milling-induced surface area increase is inherently heterogeneous in terms of its energetic content. Thus, the following section dis-cusses the usefulness of conducting surface properties analysis using inverse gas chromatography (IGC) for powder systems. This approach is more relevant to indus-trial applications, since it is not possible in practice to control the fracture patterns of the particles, nor to pre-vent the disruption of the crystal structure during the pro-cess. Detailed reviews on the principles of IGC covering pharmaceutical systems are available in the literature (Heng J. et al., 2006; Ho R. and Heng J., 2013).
As stated, particle-particle interactions in powders are mediated by the surfaces involved. The surface energy of the particles in powders is a major factor on the attributes of powder blends. Consider the blending of two powder materials, 1 and 2. Let us assume that particles of the two powders have different physicochemical properties but similar particle size distribution. In this report, we follow the common convention of using the term cohesion to refer to attractive interaction among particles of the same ma-terial and the term adhesion to refer to attraction between
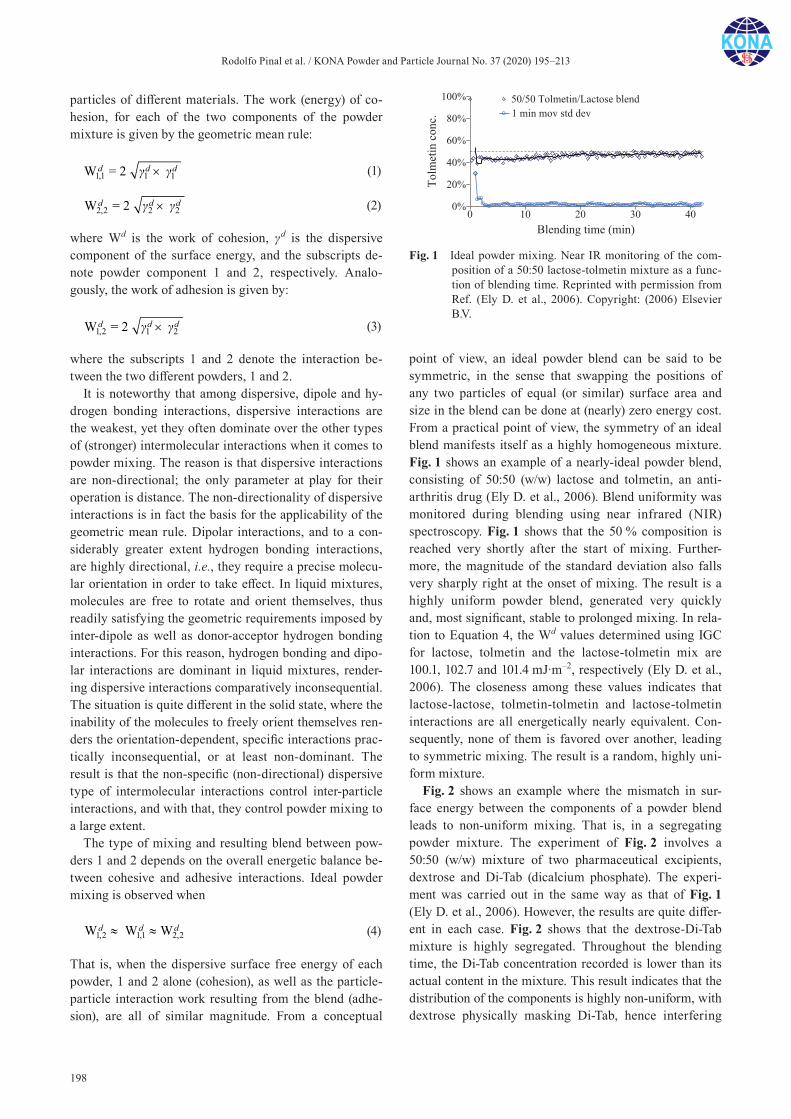
Rodolfo Pinal et al. / KONA Powder and Particle Journal No. 37 (2020) 195–213
198
particles of different materials. The work (energy) of co-hesion, for each of the two components of the powder mixture is given by the geometric mean rule:
1,1 1 1W = 2 d d dγ γ (1)
2,2 2 2W = 2 d d dγ γ (2)
where Wd is the work of cohesion, γd is the dispersive component of the surface energy, and the subscripts de-note powder component 1 and 2, respectively. Analo-gously, the work of adhesion is given by:
1,2 1 2W = 2 d d dγ γ (3)
where the subscripts 1 and 2 denote the interaction be-tween the two different powders, 1 and 2.
It is noteworthy that among dispersive, dipole and hy-drogen bonding interactions, dispersive interactions are the weakest, yet they often dominate over the other types of (stronger) intermolecular interactions when it comes to powder mixing. The reason is that dispersive interactions are non-directional; the only parameter at play for their operation is distance. The non-directionality of dispersive interactions is in fact the basis for the applicability of the geometric mean rule. Dipolar interactions, and to a con-siderably greater extent hydrogen bonding interactions, are highly directional, i.e., they require a precise molecu-lar orientation in order to take effect. In liquid mixtures, molecules are free to rotate and orient themselves, thus readily satisfying the geometric requirements imposed by inter-dipole as well as donor-acceptor hydrogen bonding interactions. For this reason, hydrogen bonding and dipo-lar interactions are dominant in liquid mixtures, render-ing dispersive interactions comparatively inconsequential. The situation is quite different in the solid state, where the inability of the molecules to freely orient themselves ren-ders the orientation-dependent, specific interactions prac-tically inconsequential, or at least non-dominant. The result is that the non-specific (non-directional) dispersive type of intermolecular interactions control inter-particle interactions, and with that, they control powder mixing to a large extent.
The type of mixing and resulting blend between pow-ders 1 and 2 depends on the overall energetic balance be-tween cohesive and adhesive interactions. Ideal powder mixing is observed when
1,2 1,1 2,2W W Wd d d (4)
That is, when the dispersive surface free energy of each powder, 1 and 2 alone (cohesion), as well as the particle- particle interaction work resulting from the blend (adhe-sion), are all of similar magnitude. From a conceptual
point of view, an ideal powder blend can be said to be symmetric, in the sense that swapping the positions of any two particles of equal (or similar) surface area and size in the blend can be done at (nearly) zero energy cost. From a practical point of view, the symmetry of an ideal blend manifests itself as a highly homogeneous mixture. Fig. 1 shows an example of a nearly-ideal powder blend, consisting of 50:50 (w/w) lactose and tolmetin, an anti- arthritis drug (Ely D. et al., 2006). Blend uniformity was monitored during blending using near infrared (NIR) spectroscopy. Fig. 1 shows that the 50 % composition is reached very shortly after the start of mixing. Further-more, the magnitude of the standard deviation also falls very sharply right at the onset of mixing. The result is a highly uniform powder blend, generated very quickly and, most significant, stable to prolonged mixing. In rela-tion to Equation 4, the Wd values determined using IGC for lactose, tolmetin and the lactose-tolmetin mix are 100.1, 102.7 and 101.4 mJ·m–2, respectively (Ely D. et al., 2006). The closeness among these values indicates that lactose-lactose, tolmetin-tolmetin and lactose-tolmetin interactions are all energetically nearly equivalent. Con-sequently, none of them is favored over another, leading to symmetric mixing. The result is a random, highly uni-form mixture.
Fig. 2 shows an example where the mismatch in sur-face energy between the components of a powder blend leads to non-uniform mixing. That is, in a segregating powder mixture. The experiment of Fig. 2 involves a 50:50 (w/w) mixture of two pharmaceutical excipients, dextrose and Di-Tab (dicalcium phosphate). The experi-ment was carried out in the same way as that of Fig. 1 (Ely D. et al., 2006). However, the results are quite differ-ent in each case. Fig. 2 shows that the dextrose-Di-Tab mixture is highly segregated. Throughout the blending time, the Di-Tab concentration recorded is lower than its actual content in the mixture. This result indicates that the distribution of the components is highly non-uniform, with dextrose physically masking Di-Tab, hence interfering
Fig. 1 Ideal powder mixing. Near IR monitoring of the com-position of a 50:50 lactose-tolmetin mixture as a func-tion of blending time. Reprinted with permission from Ref. (Ely D. et al., 2006). Copyright: (2006) Elsevier B.V.
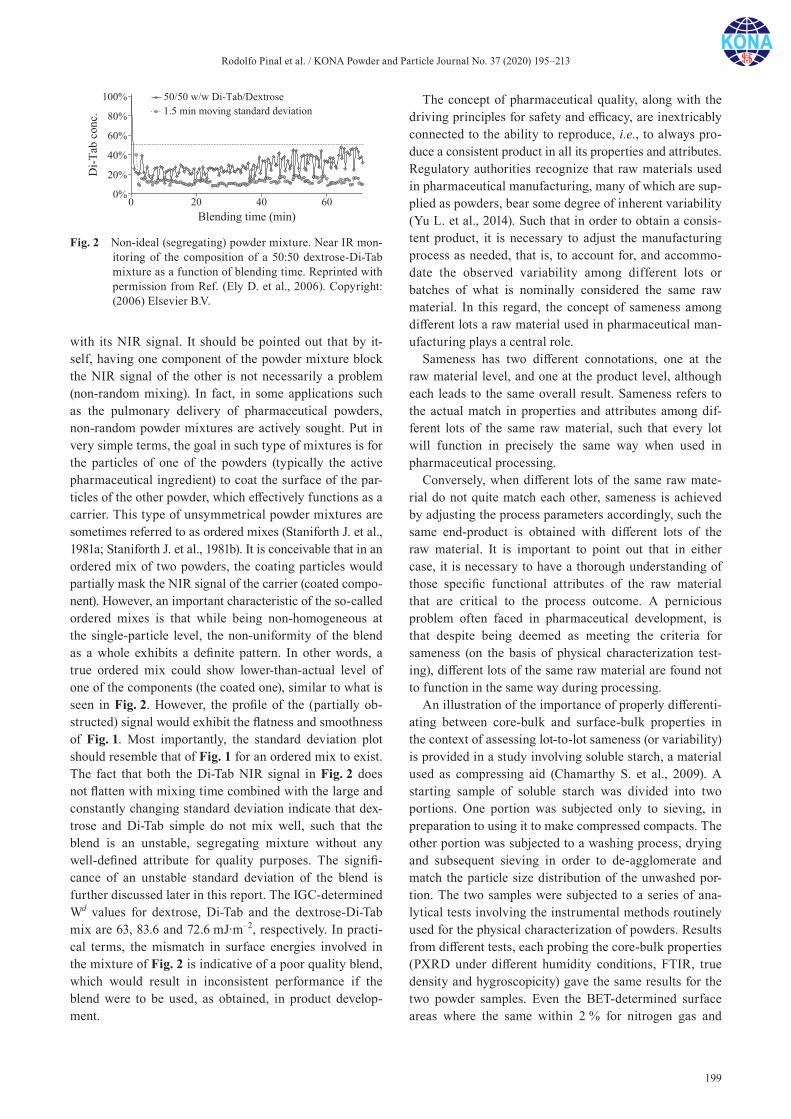
Rodolfo Pinal et al. / KONA Powder and Particle Journal No. 37 (2020) 195–213
199
with its NIR signal. It should be pointed out that by it-self, having one component of the powder mixture block the NIR signal of the other is not necessarily a problem (non-random mixing). In fact, in some applications such as the pulmonary delivery of pharmaceutical powders, non-random powder mixtures are actively sought. Put in very simple terms, the goal in such type of mixtures is for the particles of one of the powders (typically the active pharmaceutical ingredient) to coat the surface of the par-ticles of the other powder, which effectively functions as a carrier. This type of unsymmetrical powder mixtures are sometimes referred to as ordered mixes (Staniforth J. et al., 1981a; Staniforth J. et al., 1981b). It is conceivable that in an ordered mix of two powders, the coating particles would partially mask the NIR signal of the carrier (coated compo-nent). However, an important characteristic of the so-called ordered mixes is that while being non-homogeneous at the single- particle level, the non-uniformity of the blend as a whole exhibits a definite pattern. In other words, a true ordered mix could show lower -than-actual level of one of the components (the coated one), similar to what is seen in Fig. 2. However, the profile of the (partially ob-structed) signal would exhibit the flatness and smoothness of Fig. 1. Most importantly, the standard deviation plot should resemble that of Fig. 1 for an ordered mix to exist. The fact that both the Di-Tab NIR signal in Fig. 2 does not flatten with mixing time combined with the large and constantly changing standard deviation indicate that dex-trose and Di-Tab simple do not mix well, such that the blend is an unstable, segregating mixture without any well-defined attribute for quality purposes. The signifi-cance of an unstable standard deviation of the blend is further discussed later in this report. The IGC-determined Wd values for dextrose, Di-Tab and the dextrose-Di-Tab mix are 63, 83.6 and 72.6 mJ·m–2, respectively. In practi-cal terms, the mismatch in surface energies involved in the mixture of Fig. 2 is indicative of a poor quality blend, which would result in inconsistent performance if the blend were to be used, as obtained, in product develop-ment.
The concept of pharmaceutical quality, along with the driving principles for safety and efficacy, are inextricably connected to the ability to reproduce, i.e., to always pro-duce a consistent product in all its properties and attributes. Regulatory authorities recognize that raw materials used in pharmaceutical manufacturing, many of which are sup-plied as powders, bear some degree of inherent variability (Yu L. et al., 2014). Such that in order to obtain a consis-tent product, it is necessary to adjust the manufacturing process as needed, that is, to account for, and accommo-date the observed variability among different lots or batches of what is nominally considered the same raw material. In this regard, the concept of sameness among different lots a raw material used in pharmaceutical man-ufacturing plays a central role.
Sameness has two different connotations, one at the raw material level, and one at the product level, although each leads to the same overall result. Sameness refers to the actual match in properties and attributes among dif-ferent lots of the same raw material, such that every lot will function in precisely the same way when used in pharmaceutical processing.
Conversely, when different lots of the same raw mate-rial do not quite match each other, sameness is achieved by adjusting the process parameters accordingly, such the same end-product is obtained with different lots of the raw material. It is important to point out that in either case, it is necessary to have a thorough understanding of those specific functional attributes of the raw material that are critical to the process outcome. A pernicious problem often faced in pharmaceutical development, is that despite being deemed as meeting the criteria for sameness (on the basis of physical characterization test-ing), different lots of the same raw material are found not to function in the same way during processing.
An illustration of the importance of properly differenti-ating between core-bulk and surface-bulk properties in the context of assessing lot-to-lot sameness (or variability) is provided in a study involving soluble starch, a material used as compressing aid (Chamarthy S. et al., 2009). A starting sample of soluble starch was divided into two portions. One portion was subjected only to sieving, in preparation to using it to make compressed compacts. The other portion was subjected to a washing process, drying and subsequent sieving in order to de-agglomerate and match the particle size distribution of the unwashed por-tion. The two samples were subjected to a series of ana-lytical tests involving the instrumental methods routinely used for the physical characterization of powders. Results from different tests, each probing the core-bulk properties (PXRD under different humidity conditions, FTIR, true density and hygroscopicity) gave the same results for the two powder samples. Even the BET-determined surface areas where the same within 2 % for nitrogen gas and
Fig. 2 Non-ideal (segregating) powder mixture. Near IR mon-itoring of the composition of a 50:50 dextrose-Di-Tab mixture as a function of blending time. Reprinted with permission from Ref. (Ely D. et al., 2006). Copyright: (2006) Elsevier B.V.
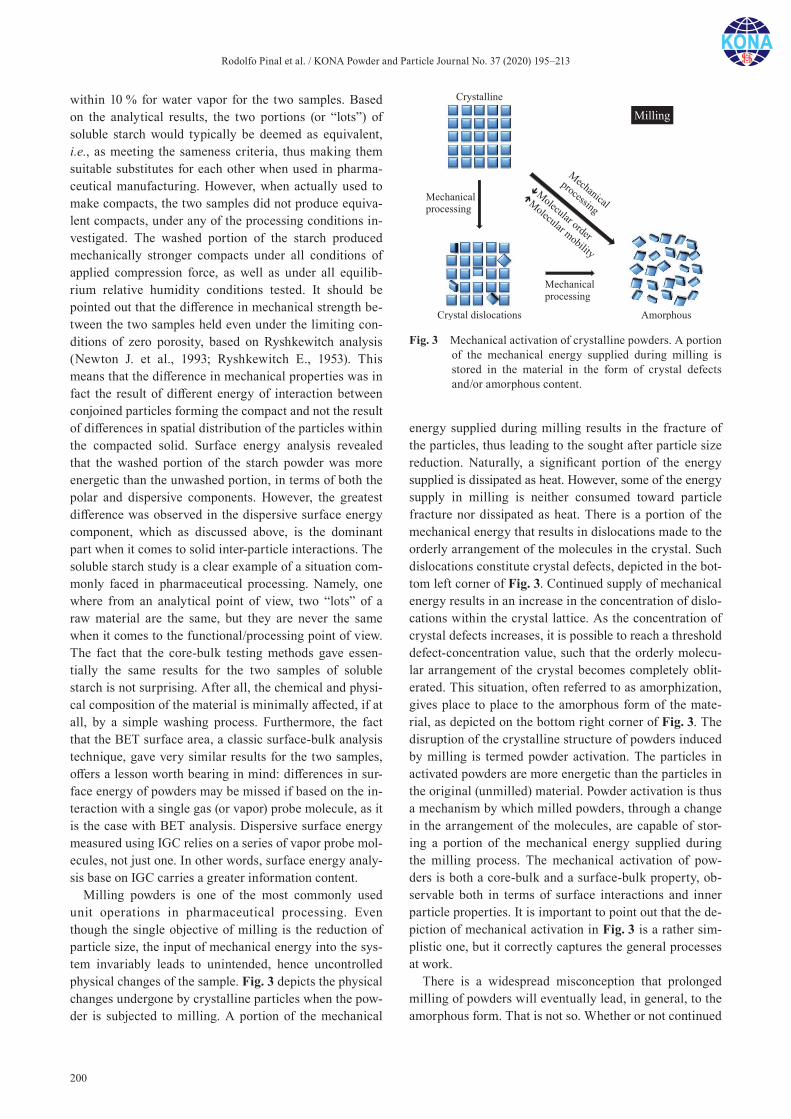
Rodolfo Pinal et al. / KONA Powder and Particle Journal No. 37 (2020) 195–213
200
within 10 % for water vapor for the two samples. Based on the analytical results, the two portions (or “lots”) of soluble starch would typically be deemed as equivalent, i.e., as meeting the sameness criteria, thus making them suitable substitutes for each other when used in pharma-ceutical manufacturing. However, when actually used to make compacts, the two samples did not produce equiva-lent compacts, under any of the processing conditions in-vestigated. The washed portion of the starch produced mechanically stronger compacts under all conditions of applied compression force, as well as under all equilib-rium relative humidity conditions tested. It should be pointed out that the difference in mechanical strength be-tween the two samples held even under the limiting con-ditions of zero porosity, based on Ryshkewitch analysis (Newton J. et al., 1993; Ryshkewitch E., 1953). This means that the difference in mechanical properties was in fact the result of different energy of interaction between conjoined particles forming the compact and not the result of differences in spatial distribution of the particles within the compacted solid. Surface energy analysis revealed that the washed portion of the starch powder was more energetic than the unwashed portion, in terms of both the polar and dispersive components. However, the greatest difference was observed in the dispersive surface energy component, which as discussed above, is the dominant part when it comes to solid inter-particle interactions. The soluble starch study is a clear example of a situation com-monly faced in pharmaceutical processing. Namely, one where from an analytical point of view, two “lots” of a raw material are the same, but they are never the same when it comes to the functional/processing point of view. The fact that the core-bulk testing methods gave essen-tially the same results for the two samples of soluble starch is not surprising. After all, the chemical and physi-cal composition of the material is minimally affected, if at all, by a simple washing process. Furthermore, the fact that the BET surface area, a classic surface-bulk analysis technique, gave very similar results for the two samples, offers a lesson worth bearing in mind: differences in sur-face energy of powders may be missed if based on the in-teraction with a single gas (or vapor) probe molecule, as it is the case with BET analysis. Dispersive surface energy measured using IGC relies on a series of vapor probe mol-ecules, not just one. In other words, surface energy analy-sis base on IGC carries a greater information content.
Milling powders is one of the most commonly used unit operations in pharmaceutical processing. Even though the single objective of milling is the reduction of particle size, the input of mechanical energy into the sys-tem invariably leads to unintended, hence uncontrolled physical changes of the sample. Fig. 3 depicts the physical changes undergone by crystalline particles when the pow-der is subjected to milling. A portion of the mechanical
energy supplied during milling results in the fracture of the particles, thus leading to the sought after particle size reduction. Naturally, a significant portion of the energy supplied is dissipated as heat. However, some of the energy supply in milling is neither consumed toward particle fracture nor dissipated as heat. There is a portion of the mechanical energy that results in dislocations made to the orderly arrangement of the molecules in the crystal. Such dislocations constitute crystal defects, depicted in the bot-tom left corner of Fig. 3. Continued supply of mechanical energy results in an increase in the concentration of dislo-cations within the crystal lattice. As the concentration of crystal defects increases, it is possible to reach a threshold defect-concentration value, such that the orderly molecu-lar arrangement of the crystal becomes completely oblit-erated. This situation, often referred to as amorphization, gives place to place to the amorphous form of the mate-rial, as depicted on the bottom right corner of Fig. 3. The disruption of the crystalline structure of powders induced by milling is termed powder activation. The particles in activated powders are more energetic than the particles in the original (unmilled) material. Powder activation is thus a mechanism by which milled powders, through a change in the arrangement of the molecules, are capable of stor-ing a portion of the mechanical energy supplied during the milling process. The mechanical activation of pow-ders is both a core-bulk and a surface-bulk property, ob-servable both in terms of surface interactions and inner particle properties. It is important to point out that the de-piction of mechanical activation in Fig. 3 is a rather sim-plistic one, but it correctly captures the general processes at work.
There is a widespread misconception that prolonged milling of powders will eventually lead, in general, to the amorphous form. That is not so. Whether or not continued
Fig. 3 Mechanical activation of crystalline powders. A portion of the mechanical energy supplied during milling is stored in the material in the form of crystal defects and/or amorphous content.
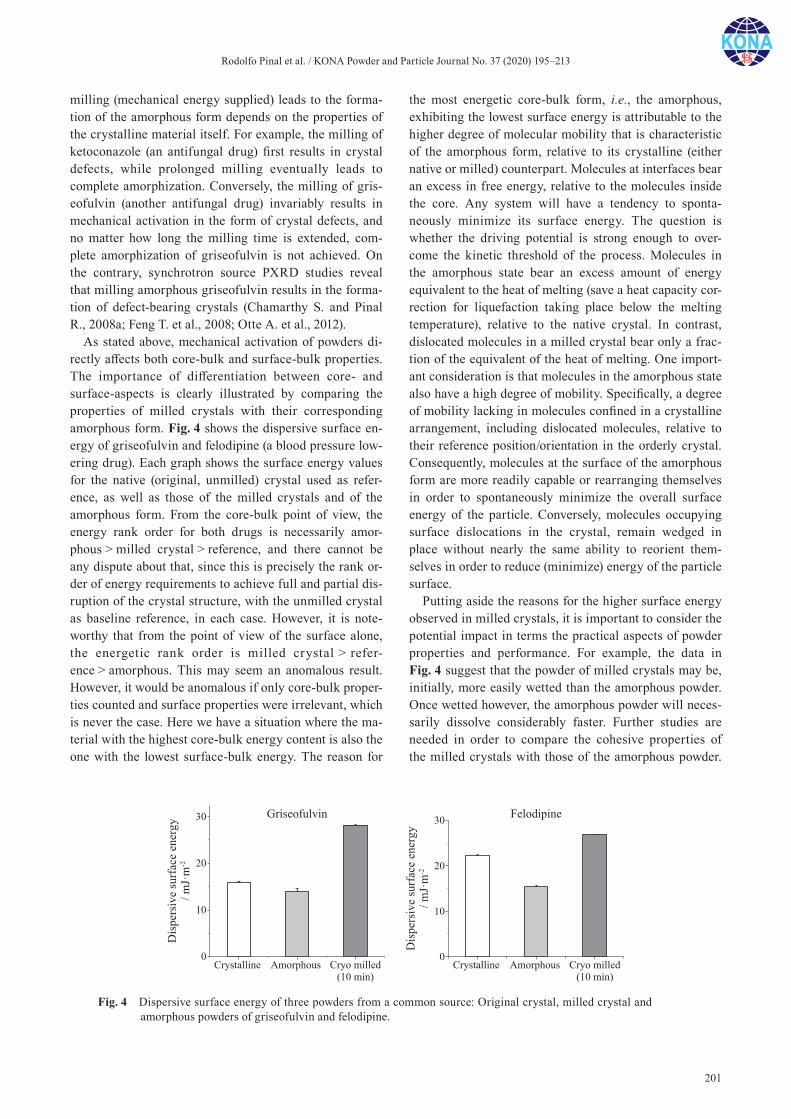
Rodolfo Pinal et al. / KONA Powder and Particle Journal No. 37 (2020) 195–213
201
milling (mechanical energy supplied) leads to the forma-tion of the amorphous form depends on the properties of the crystalline material itself. For example, the milling of ketoconazole (an antifungal drug) first results in crystal defects, while prolonged milling eventually leads to complete amorphization. Conversely, the milling of gris-eofulvin (another antifungal drug) invariably results in mechanical activation in the form of crystal defects, and no matter how long the milling time is extended, com-plete amorphization of griseofulvin is not achieved. On the contrary, synchrotron source PXRD studies reveal that milling amorphous griseofulvin results in the forma-tion of defect- bearing crystals (Chamarthy S. and Pinal R., 2008a; Feng T. et al., 2008; Otte A. et al., 2012).
As stated above, mechanical activation of powders di-rectly affects both core-bulk and surface-bulk properties. The importance of differentiation between core- and surface-aspects is clearly illustrated by comparing the properties of milled crystals with their corresponding amorphous form. Fig. 4 shows the dispersive surface en-ergy of griseofulvin and felodipine (a blood pressure low-ering drug). Each graph shows the surface energy values for the native (original, unmilled) crystal used as refer-ence, as well as those of the milled crystals and of the amorphous form. From the core-bulk point of view, the energy rank order for both drugs is necessarily amor-phous > milled crystal > reference, and there cannot be any dispute about that, since this is precisely the rank or-der of energy requirements to achieve full and partial dis-ruption of the crystal structure, with the unmilled crystal as baseline reference, in each case. However, it is note-worthy that from the point of view of the surface alone, the energetic rank order is milled crystal > refer-ence > amorphous. This may seem an anomalous result. However, it would be anomalous if only core-bulk proper-ties counted and surface properties were irrelevant, which is never the case. Here we have a situation where the ma-terial with the highest core-bulk energy content is also the one with the lowest surface-bulk energy. The reason for
the most energetic core-bulk form, i.e., the amorphous, exhibiting the lowest surface energy is attributable to the higher degree of molecular mobility that is characteristic of the amorphous form, relative to its crystalline (either native or milled) counterpart. Molecules at interfaces bear an excess in free energy, relative to the molecules inside the core. Any system will have a tendency to sponta-neously minimize its surface energy. The question is whether the driving potential is strong enough to over-come the kinetic threshold of the process. Molecules in the amorphous state bear an excess amount of energy equivalent to the heat of melting (save a heat capacity cor-rection for liquefaction taking place below the melting temperature), relative to the native crystal. In contrast, dislocated molecules in a milled crystal bear only a frac-tion of the equivalent of the heat of melting. One import-ant consideration is that molecules in the amorphous state also have a high degree of mobility. Specifically, a degree of mobility lacking in molecules confined in a crystalline arrangement, including dislocated molecules, relative to their reference position/orientation in the orderly crystal. Consequently, molecules at the surface of the amorphous form are more readily capable or rearranging themselves in order to spontaneously minimize the overall surface energy of the particle. Conversely, molecules occupying surface dislocations in the crystal, remain wedged in place without nearly the same ability to reorient them-selves in order to reduce (minimize) energy of the particle surface.
Putting aside the reasons for the higher surface energy observed in milled crystals, it is important to consider the potential impact in terms the practical aspects of powder properties and performance. For example, the data in Fig. 4 suggest that the powder of milled crystals may be, initially, more easily wetted than the amorphous powder. Once wetted however, the amorphous powder will neces-sarily dissolve considerably faster. Further studies are needed in order to compare the cohesive properties of the milled crystals with those of the amorphous powder.
Fig. 4 Dispersive surface energy of three powders from a common source: Original crystal, milled crystal and amorphous powders of griseofulvin and felodipine.
Rodolfo Pinal et al. / KONA Powder and Particle Journal No. 37 (2020) 195–213
202
Especially considering that the high molecular mobility in the amorphous form, responsible for its lowest relative surface energy, will also tend to promote inter-particle fusion. After all, inter-particle fusion provides a simple mechanism for surface energy minimization, which is the ultimate driving force. Conversely, in the absence of any annealing (which typically requires elevated temperatures or long inter-particle contact times), cohesion of particles in the milled powder will be mostly controlled by disper-sive surface interactions, with a comparatively minimal effect from molecular mobility.
It is pertinent to consider the impact of the interrogation scale of the analysis performed, on the type of information obtainable regarding powder properties. The advancement of nanotechnology along with its associated analytical tools, on multiple application fronts, has resulted in the ability to study particle (including surface) properties at ever higher levels of resolution. In parallel to these ad-vances, the notion that the higher the level of resolution on the analysis of particle surfaces provides the path to-ward complete understanding of the surface properties and behavior of powders, has been gaining popularity.
Consider the hypothetical situation where the physical and energetic properties of every constituent particle of a powder sample are perfectly uniform. Under such a sce-nario, the obtainable information would be essentially the same, whether the analysis method used probed one square meter or one square micron of surface. Accord-ingly, under this idealized situation, differences in bulk powder properties between different lots of the same ma-terial will be primarily the result of differences in their particle size distributions. In real systems however, sur-face heterogeneity is an inherent characteristic of pow-ders, and the lack of surface homogeneity is precisely one of the most important factors responsible for the observed behavior of bulk powders.
Let us now consider two surface analysis methods on opposite ends of the resolution spectrum. Before proceed-ing with this comparison, it is important to clearly differ-entiate between sensitivity and resolution. Atomic force microscopy (AFM) and IGC are both highly sensitive methods, in the sense that each gives distinctly different readings based on differences among samples that may be undetected by other methods. However, AFM and IGC have very different levels of resolution. AFM interrogates very small, localized sections of the surface, whereas IGC interrogates very large, unconfined sections of the same surface. As received, typical pharmaceutical powders of organic materials have specific surface area in the order of 1–3 m2·g–1. Accordingly, a typical IGC surface energy analysis test provides information on powder surface area in the order of 1 m2. That is, IGC reports on a sample of actual “bulk powder,” not simply on a collection of parti-cles (the significance of this point is further discussed
below). AFM analysis generates images typically of the order of 5 × 5 to 20 × 20 μm2. Consider a hypothetical powder sample with a specific surface area of 2 m2·g–1 subjected to analysis using both IGC and AFM. Since IGC is a non-destructive method, the analysis by both methods could conceivably be performed using the exact same set of particles. AFM provides highly detailed infor-mation, including unambiguous quantification of the magnitude and distribution of energetic heterogeneity present in the test specimen. This type of information has a level of resolution that is inaccessible by other analytical methods. Precisely because the high resolution however, full assessment of the powder surface using AFM would require collecting substantially more than 109 images. Al-ternatively, in order to reduce the number of collected AFM images to a practicable number that is nonetheless statistically representative, it would be necessary to know, a priori, the energy distribution of the surface from two points of view: the range of the magnitude of the surface energy, as well as the energy distribution across the pow-der surface, in order to select the appropriate physical locations that give a representative sample. But these two pieces of information are, precisely, what the surface analysis is meant to provide in the first place. The limita-tions of using IGC for surface analysis go in the opposite direction. IGC provides surface energy values based on probing the entirety of the sample, i.e., in the example discussed here, the entirety of 2 m2 of surface in 1 g of powder. The contrast between the capabilities of AFM and IGC embodies their complementarity. AFM provides exquisitely detailed information, capable of clearly differ-entiating between very small regions of surface in the same powder, but it would make it a formidable task to unambiguously differentiate between different lots of the same powder material. Conversely, IGC is exquisitely suited to differentiate between lots of the same powder material, but such a capability comes at the expense of not being able to provide any information about the energetic properties of specific regions in the sample. IGC provides a characteristic surface energy value but it provides no in-formation about surface energy in any particular region of the sample.
2.1 Powder complexity
Particle engineering applications deal with controlling the conditions of particle generation such that the attri-butes of the particles obtained can be made to meet spe-cific (desirable) parameters. We should take into account that the end-product of the majority of particle engineer-ing methods is a powder. One important question has to do with the connection between particle properties and bulk powder properties, as discussed below.
There is wide agreement that powders exhibit complex

Rodolfo Pinal et al. / KONA Powder and Particle Journal No. 37 (2020) 195–213
203
behavior, so it is necessary to discuss the complexity of powders, specifically, in connection to powder characteri-zation by analytical methods. We must point out that the term complexity has multiple connotations, spanning from lay usage to its informal and formal scientific use. In this report, the term complexity (or Complexity) is used in the context of emergent properties (or Emergent Prop-erties) from the point of view of classical systems theory.
Physically speaking, we can say without ambiguity that powders are solid materials. However, their dynamic properties, especially those involved in energy dissipa-tion, do not conform to the behavior of classical solids, liquids or gases. Even when viewed as collections of mul-tiple particles, powders stand apart from other multi-par-ticle systems such as suspensions or dense gases (Jaeger H. et al., 2000). The same is true when trying to treat the dynamic properties of solids in the same way as those of continuous systems. Compare for example the case of mixing two liquids, with that of mixing two powders. In the liquid, molecular thermal motions suffice to sponta-neously reduce to zero, hence eliminating, all concentra-tion gradients thus giving a homogeneous mixture. In a powder mixture on the other hand, thermal motions are essentially irrelevant, since external forces such as grav-ity dominate the behavior of the material. Furthermore, for particles at or below a critical, material-dependent size, electrostatic (coulombic) forces begin to compete with, and at sufficiently small size, eventually dominate over gravity. Consequently, the reduction of composition gradients necessary to obtain a homogeneous powder blend, requires the application of external energy, such as that provided by tumbling or by the action of a propeller. However, even when the energy supply requirement for gradient elimination is fully satisfied in each (liquid and solid) mixture case, powder mixtures exhibit distinctly different behavior. For example, thermal motions suffice to prevent segregation of components in liquid mixtures. In other words, thermal motions overcome any tendency toward segregation resulting from differences in molecu-lar dimensions or from differences in density (more ap-propr iately, par t ial molar volume) between the components in a liquid mixture. Conversely, in the case of powder mixtures, density differences not only can have an effect, but depending on the magnitude of the differ-ence, the same effect can actually operate in opposite di-rections (Oshitani J. et al., 2016). For this reason, the widely used V-blender type, so frequently used to blend pharmaceutical powders, often actually functions an ef-fective particle separator (Jaeger H. et al., 2000).
Let us consider the powder mixtures presented in Figs. 1 and 2 above. We can say that a tumble mixer is analogous to a kaleidoscope toy. Namely, each rotation of the tumbler gives place to one among an infinite number of possible different physical combinatorial arrangements
of the particles. As stated above, the mixture represented in Fig. 1 can be considered (energetically) symmetric. As a result, once the blend reaches the pre-established 50 % content for each component, each subsequent tumbling rotation will give place to a different physical arrange-ment of the particles. However, because of its symmetric nature, all different physical arrangements created will be energetically equivalent to each other, i.e., a different con-figuration of the same uniform blend.
The situation is different for the powder mixture repre-sented in Fig. 2. The lower-than-nominal (50 %) composi-tion detected indicates a non-uniform mixture throughout the mixing process. Even more telling is the unstable standard deviation value accompanying the fluctuating composition. These unstable values are rather superficial signs of the blend’s inability to reach equilibrium, either as a homogeneous or as a non-homogeneous but ordered mix, despite the continuous influx of mechanical energy. Therefore, the underlying issue here is one of energy dis-sipation. Energy dissipation is in fact the conduit respon-sible for bringing systems toward, or away from, equilibrium (Jaeger H. et al., 2000). These considerations point to a fundamental difference between the behavior of powder and liquid mixtures. In liquid mixtures, mechani-cal energy leads either to a uniform single-phase mixture (miscible components), or to two-phase system (partially miscible components). In either case, the end result is a dissipative system, i.e., at some point, any additional en-ergy influx does not alter the composition of the mixture. In contrast, some powder mixtures, like the one illus-trated in Fig. 2, do not reach equilibrium or even a steady state, despite continued energy influx.
Based on the above considerations, it is worth looking into the cause and effect of uniform vs. non-uniform mix-tures. We can say that the mixture of Fig. 1 is uniform because it is energetically stable, while the opposite is true for the mixture of Fig. 2. In a uniform powder mix-ture, continued influx of mechanical energy leads only to multiple configurations of the same zero gradient blend. The rest of the mechanical energy is very effectively dis-sipated as heat. In a unstable, hence non-uniform mixture, such as that of Fig. 2, the continued influx of mechanical energy does not have the same clean-cut partitioning. En-ergy dissipation is particularly different. In each reconfig-uration of the collection of particles, a portion of the energy supplied is chaotically absorbed and released, in the form of segregation and desegregation of the powder components, such that the mixture is never able to achieve full desegregation (uniform mix), nor full segregation into “two phases” (clean separation of the two powders). The unstable mixing of Fig. 2 should not be confused with the term “overmixing” often used in connection with lubrica-tion using magnesium stearate (MgSt), for example. Opti-mal lubrication of powders with MgSt usually relies on
Rodolfo Pinal et al. / KONA Powder and Particle Journal No. 37 (2020) 195–213
204
stopping the mixing process at a point where only partial coverage of the other powder has been achieved.
Generally speaking, powders are complex systems in terms of their properties and behavior. However, the type of complexity, or lack thereof, resides on the specific property in question and on the type of behavior it elicits on the powder. According to classical systems theory, sys-tems can be Simple, Complicated or Complex (Cotsaftis M., 2009)—the uppercase notation on this first instance is meant to reflect that, as used here, these terms carry spe-cific meanings. Accordingly, a simple system is one where each agent (particle in the case of powders) is weakly coupled with other agents. That is, each particle operates as an almost independent one-component subsystem. For example, consider a powder for which the microscopic characterization has been fully achieved down to the single- particle level. Taking the mass of the powder as a property of interest, it is simply the summation of the mass of every constituting particle. That is, the effect of one particle is completely unperturbed by the action of other particles.
A complicated system is one where the action of the constituting agents (particles) are somewhat, although weakly, coupled to the actions of other agents, but the system can still be decoupled for the most part. For exam-ple, for the hypothetical powder system described above, for which every single particle has been catalogued, it would be possible to predict the tapped density, with a reasonable level of confidence. That is, the action of one particle is somewhat perturbed by the action of other par-ticles, but not to the extent of obliterating its effect on the property of interest.
A complex system is one where the action of one agent (particle) is strongly coupled to other agents. That is, the dynamics of the system are determined by the inter-agent interactions, effectively placing a shield to the tracking of other constituting agents. Consider once more the case of a fully characterized powder at the microscopic level. No extent of single-particle characterization, no matter how exhaustive, would be able to lead to a prediction of the avalanching behavior of the powder. The avalanching be-havior of a powder is neither the total nor partial combi-nation of the avalanching properties of its constituting particles. The avalanching phenomenon is a cooperative (powder) property, not a particle property. We can there-fore say that avalanching is an example of an Emerging Property in powders (Corning P., 2002). Emergent proper-ties (or emergent phenomena) is one of the manifestations of systems complexity. Emergence refers to properties or behavior observable in arrangements of multi-agent sys-tems but not present in the individual agents making up the system (Corning P., 2002; Sitte R., 2009). The com-plex behavior of bulk powders is also observable in other properties. For example, the angle of repose (AOR) para-
meter, which has been widely used for decades, is an ex-ample of a deceptively simple, complex property. It is a very simple matter to experimentally measure the AOR. However, the usefulness of the AOR is severely limited as a design, control or operating tool, because its value de-pends on a multitude of parameters (Wouters I. and Geldart D., 1996). The AOR is another manifestation of complex-ity in powders; it is also an emergent property, and as such, it is the result of many variables operating all at once (Sitte R., 2009), some of which are not even trace-able to the individual particles.
It is not surprising that efforts to predict powder prop-erties have not been very successful for the most part. In predicting fluidized bed behavior for example, it is often assumed that particles behave independently from each other in the bed. More specifically, the equations and cor-relations carry the assumption that interactions among particles are exclusively collisional, and discrete elements models (DEM) rarely capture particle clustering for ex-ample. The reason is that no mechanistic model exists yet (McMillan J. et al., 2013). Paradoxically, it seems that the very strength of simulation models like DEM for exam-ple, i.e., their foundation on first-principles, is also at the root of their limitations in predicting the complex behav-ior of powders.
Simulation models inherently (perhaps unavoidably) bear the reductionist notion that a fundamental under-standing of the properties and behavior of the different parts of the system inevitably leads toward a thorough understanding of the whole. This view is not necessarily naive, but perhaps somewhat anachronistic. That is, a legacy from the reductionist hubris from the early 20th Century and subsequent decades. Specifically, from the period when physics could arguably be considered as the king of science. In the early 21st Century, it is biology the science that arguably occupies the pinnacle placement. It is impossible to describe the attributes of living entities without deliberately counting on Complexity and Emer-gent Properties, since it involves a wealth of properties of the system that cannot be induced (predicted) from an un-derstanding, even if thorough, of the constituting parts (Corning P., 2002). Accordingly, the last few decades have produced a resurgence in the study of complex systems and emergent properties, extending beyond living sys-tems, including physics (Cornacchio J., 1977; Corning P., 2002).
Computer simulations of powder properties are firmly based on first-principles. However, to the extent that the existing set of first-principles remains incapable of pre-dicting emergent properties, simulation-based description of powder behavior will continue to be limited. For in-stance, an elegant example of a first-principles based se-quential simulation of powder materials, starting with quantum mechanical modeling, followed by molecular
Rodolfo Pinal et al. / KONA Powder and Particle Journal No. 37 (2020) 195–213
205
mechanics simulation and subsequently DEM modeling, was very successful in predicting density, but not nearly as successful in predicting surface energy (Loh J. et al., 2013). We should point out that, like mass, density is the property of a simple or a complicated system (see defini-tions above). On the other hand, the surface energy of a powder is the property of a complex system. It is worth noting that the complexity of a system is not a single all-encompassing quality; a complex system is likely to have different types of complexity, depending on the property under consideration (e.g., density vs. surface en-ergy) (Sitte R., 2009). Moreover, it is unlikely that all emergent effects play a role in every case (i.e., property under consideration), or that one emergent force has the controlling effect in all cases (McMillan J. et al., 2013). It appears that the notion of being able to predict bulk pow-der properties through computer simulations firmly based on first-principles is by no means incorrect, it is rather in-complete.
Predicting emergent properties is, by definition, beyond the reach of the current modeling paradigm. In addition to the first-principles already in place, the successful simu-lation and prediction of emergent properties and behavior of powders will require a set of second-principles. More appropriately put, there is a need for a second set of first-principles for emergent properties, which as of today, are not yet established. One can venture to say that no amount of computing power or degree of refinement on existing first- principle-based equations, will suffice to fully describe the complex properties of bulk powders. Today, the first-principles conundrum posed by Complex-ity is amply recognized across different segments of the scientific community, and significant advances toward elucidating those novel first- principles that govern emer-gent properties are being made (Chen C. et al., 2009; Galla T. and Guhne O., 2012).
2.2 Powder processing and surface properties modification
Full prediction of powder properties is still in the fu-ture at this time, but correlations involving bulk powder properties relevant to processing such as flowability, blending and compactability have been reported using bulk-surface energy measurements based on IGC. This approach has been useful in explaining certain phenom-ena and behavior that typical analysis methods cannot elucidate. The graphical insets in Table 2 show examples where IGC-based surface energy analysis of various sys-tems help understand performance and associated re-sponses during processing. However, in order to ascertain the presence of process-induced structural alterations, microscopic-level information, such as that provided by AFM or SPM (scanning probe microscopy) are indeed
invaluable. The results show that a systematic characteri-zation of milled molecular crystals provides fundamental insight essential to potentially predict and control bulk powder behavior.
A study on the surface of mannitol (Ho R. et al., 2010) found agreement between surface energy values obtained from contact angle measurements and those obtained from IGC analysis. Furthermore, the study found that the heterogeneity of surface energy resides mainly on the po-lar groups populating the surface, such that surfaces become more homogeneous when the polar groups are capped with non-polar functional groups using silaniza-tion. It is important for the significance of this finding to be clear. The heterogeneity of surface energy resides mainly on the polar groups populating the surface. How-ever, the effect of such heterogeneity is mainly manifested through the dispersive (non-polar) component of the sur-face energy.
Table 3 lists powder materials that have been recently studied in our laboratory. The list includes two basic ma-terials, waxy corn starch and a food powder (not identified for confidentiality reasons). Subjecting the basic materials to different processes results in different powders, each identified on the first column of Table 3. The different powder samples identified in the table have been subjected to surface-property evaluation using different techniques, including IGC, scanning electron microscopy (SEM), and X-ray photoelectron spectroscopy (XPS). Subjecting the basic materials to different processes gives place to differ-ent surface-modified powders in each case. The result of surface modification is a change in powder properties, as discussed below.
Fig. 5 shows the effect of exposing starch to enzymatic reactions on the surface energy of the powder. One of the effects of the enzymatic treatment of starch is the devel-opment of fine pores on the surface of the particles. There is also an increase in the surface energy of the treated powders, relative to the native (untreated) material. The dispersive component surface energy values span from 36.71 (native) to 43.34 mJ·m–2, with AMG < CGT < AML. It is noteworthy that this magnitude of variation of the dispersive surface energy among the different starch pow-ders, is of similar magnitude as the range found to result in completely different compaction properties for soluble starch (Chamarthy S. et al., 2009).
It is expected for powders in general, that the chemical composition of the surface has a direct effect on surface energy. It is further expected that the surface energy of the powder will have a strong effect on bulk properties such as powder flow. The food powder material in Table 3 provides a clear example this type of chained relationship.
The chemical bond composition of the surface of the five food powders produced by different processes was determined using XPS. The XPS results are listed in
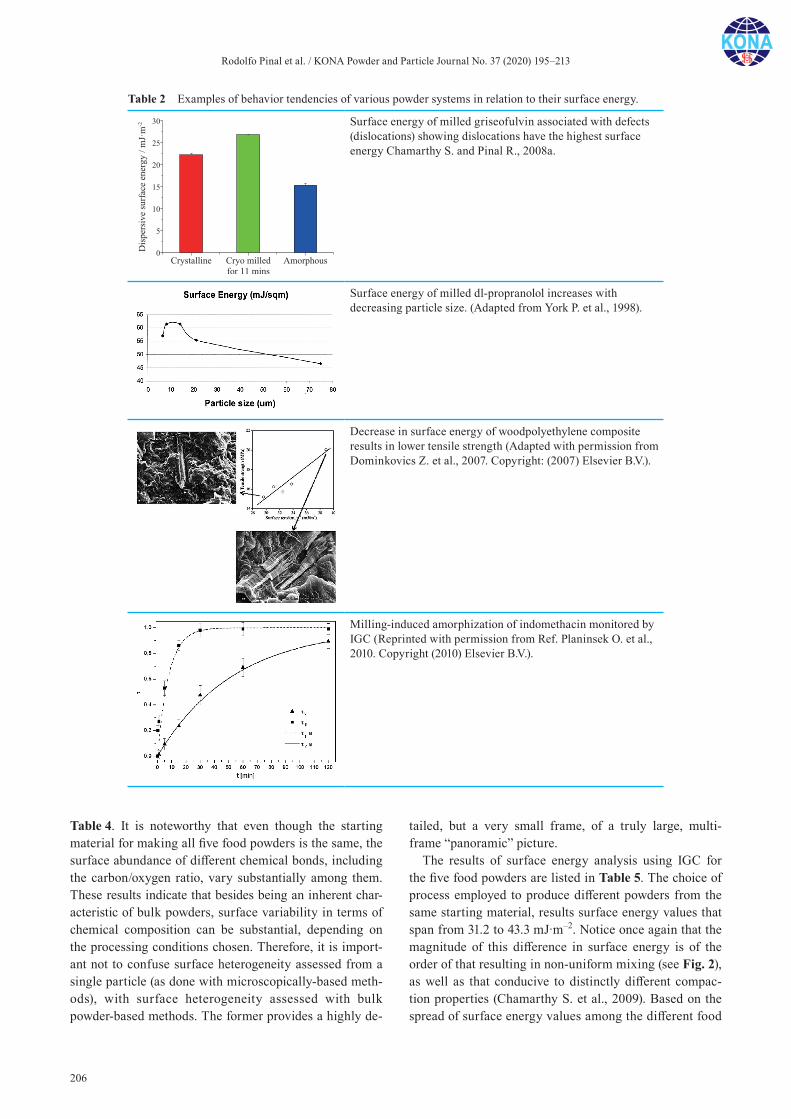
Rodolfo Pinal et al. / KONA Powder and Particle Journal No. 37 (2020) 195–213
206
Table 4. It is noteworthy that even though the starting material for making all five food powders is the same, the surface abundance of different chemical bonds, including the carbon/oxygen ratio, vary substantially among them. These results indicate that besides being an inherent char-acteristic of bulk powders, surface variability in terms of chemical composition can be substantial, depending on the processing conditions chosen. Therefore, it is import-ant not to confuse surface heterogeneity assessed from a single particle (as done with microscopically-based meth-ods), with surface heterogeneity assessed with bulk powder- based methods. The former provides a highly de-
tailed, but a very small frame, of a truly large, multi-frame “panoramic” picture.
The results of surface energy analysis using IGC for the five food powders are listed in Table 5. The choice of process employed to produce different powders from the same starting material, results surface energy values that span from 31.2 to 43.3 mJ·m–2. Notice once again that the magnitude of this difference in surface energy is of the order of that resulting in non-uniform mixing (see Fig. 2), as well as that conducive to distinctly different compac-tion properties (Chamarthy S. et al., 2009). Based on the spread of surface energy values among the different food
Table 2 Examples of behavior tendencies of various powder systems in relation to their surface energy.
Surface energy of milled griseofulvin associated with defects (dislocations) showing dislocations have the highest surface energy Chamarthy S. and Pinal R., 2008a.
Surface energy of milled dl-propranolol increases with decreasing particle size. (Adapted from York P. et al., 1998).
Decrease in surface energy of woodpolyethylene composite results in lower tensile strength (Adapted with permission from Dominkovics Z. et al., 2007. Copyright: (2007) Elsevier B.V.).
Milling-induced amorphization of indomethacin monitored by IGC (Reprinted with permission from Ref. Planinsek O. et al., 2010. Copyright (2010) Elsevier B.V.).
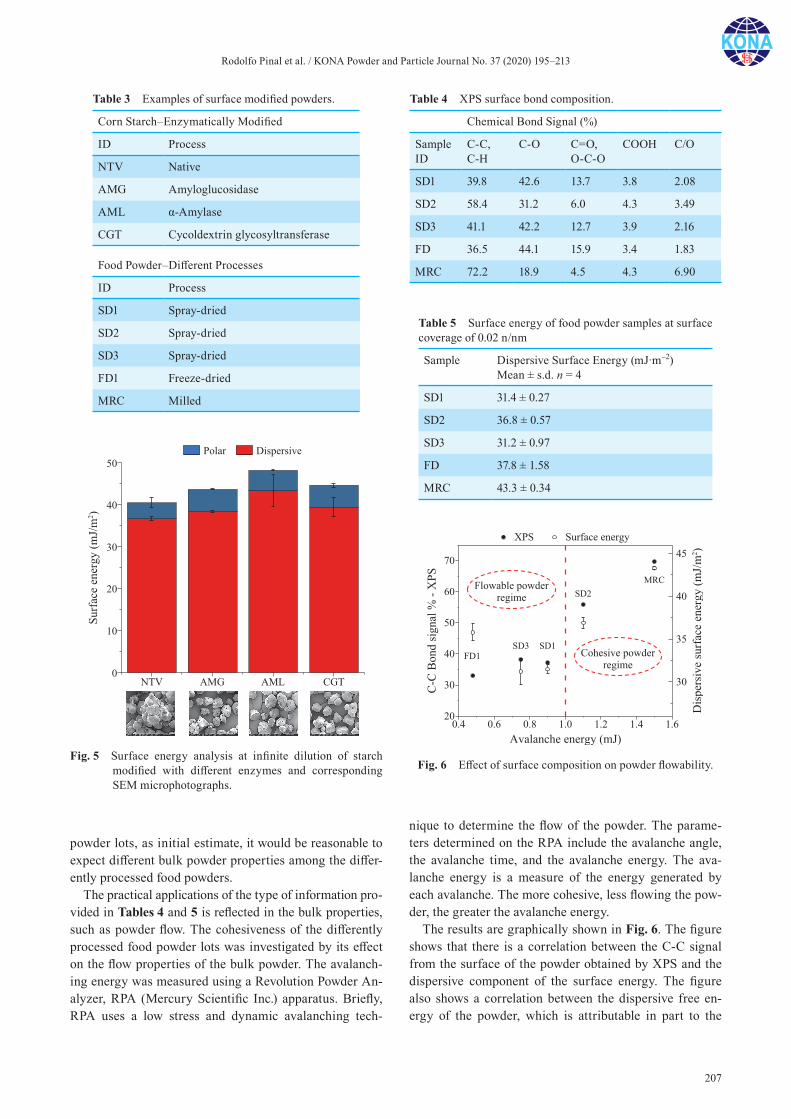
Rodolfo Pinal et al. / KONA Powder and Particle Journal No. 37 (2020) 195–213
207
powder lots, as initial estimate, it would be reasonable to expect different bulk powder properties among the differ-ently processed food powders.
The practical applications of the type of information pro-vided in Tables 4 and 5 is reflected in the bulk properties, such as powder flow. The cohesiveness of the differently processed food powder lots was investigated by its effect on the flow properties of the bulk powder. The avalanch-ing energy was measured using a Revolution Powder An-alyzer, RPA (Mercury Scientific Inc.) apparatus. Briefly, RPA uses a low stress and dynamic avalanching tech-
nique to determine the flow of the powder. The parame-ters determined on the RPA include the avalanche angle, the avalanche time, and the avalanche energy. The ava-lanche energy is a measure of the energy generated by each avalanche. The more cohesive, less flowing the pow-der, the greater the avalanche energy.
The results are graphically shown in Fig. 6. The figure shows that there is a correlation between the C-C signal from the surface of the powder obtained by XPS and the dispersive component of the surface energy. The figure also shows a correlation between the dispersive free en-ergy of the powder, which is attributable in part to the
Fig. 5 Surface energy analysis at infinite dilution of starch modified with different enzymes and corresponding SEM microphotographs.
Table 3 Examples of surface modified powders.
Corn Starch–Enzymatically Modified
ID Process
NTV Native
AMG Amyloglucosidase
AML α-Amylase
CGT Cycoldextrin glycosyltransferase
Food Powder–Different Processes
ID Process
SD1 Spray-dried
SD2 Spray-dried
SD3 Spray-dried
FD1 Freeze-dried
MRC Milled
Table 4 XPS surface bond composition.
Chemical Bond Signal (%)
Sample ID
C-C, C-H
C-O C=O, O-C-O
COOH C/O
SD1 39.8 42.6 13.7 3.8 2.08
SD2 58.4 31.2 6.0 4.3 3.49
SD3 41.1 42.2 12.7 3.9 2.16
FD 36.5 44.1 15.9 3.4 1.83
MRC 72.2 18.9 4.5 4.3 6.90
Table 5 Surface energy of food powder samples at surface coverage of 0.02 n/nm
Sample Dispersive Surface Energy (mJ·m–2) Mean ± s.d. n = 4
SD1 31.4 ± 0.27
SD2 36.8 ± 0.57
SD3 31.2 ± 0.97
FD 37.8 ± 1.58
MRC 43.3 ± 0.34
Fig. 6 Effect of surface composition on powder flowability.

Rodolfo Pinal et al. / KONA Powder and Particle Journal No. 37 (2020) 195–213
208
abundance of non-polar C-C bonds at the surface, and the tendency toward cohesiveness, or difficulty to flow of the powder.
The example in Fig. 6 is of great practical significance. It shows that subjecting the same starting material to the same unit operation (e.g., spray-drying), makes it is possi-ble to obtain a powder exhibiting easy flow, or one exhib-iting difficult flow, or even one with borderline flow behavior, all depending on the choice of process parame-ters.
The examples of Figs. 5 and 6, as well as the data for dispersive and composition on Tables 4 and 5, show the importance of the surface chemistry of excipients and food powders. Several reports on the effect of surface composition on the flowability and the nature of cohe-siveness of powders upon handling can be found in the literature (Begat P. et al., 2005; Burgain J. et al., 2017; Chamarthy S. et al., 2007; Heng J. et al., 2006; Kim E. et al., 2005; Leturia M. et al., 2014; Thakur S. et al., 2013).
3. Complementarity of bulk- and microscopic (mechanical)-based analysis methods
Microscopic-level techniques such as AFM or SPM and bulk-level techniques such as IGC are all high sensitivity methods, although with very different scales of analysis (resolution). The two types of techniques are complemen-tary toward the ability to fully understand powder proper-ties and behavior. Each of the two types of analysis methods provides different pieces of information, which together make a fuller picture. AFM and SPM inform about the individual agents (particles), while IGC informs about the cooperative (emerging) properties from such agents. It is important to point out that even though mi-croscopic, single- particle analysis methods make it a practically impossible task to ascertain surface heteroge-neity at the bulk (m2) scale, it does not mean that such methods are unsuitable for assessing bulk properties of powders in general. On the contrary, based on single- particle analysis, microscopic techniques are uniquely suited for informing about bulk behavior in processes such as milling.
Powder materials are prevalent in various industrial segments, and milling is equally almost ever-present as the unit operation of choice for particle size reduction. An important disadvantage is that as a rule, the milling pro-cess is difficult to control, making it almost impossible to tell much in advance about the response of the powder as its constituting particles undergo size reduction.
This section discusses a viable approach for probing the mechanical response, such as plastic-elastic properties and fracture phenomena of APIs (active pharmaceutical ingredients) molecular crystals, obtainable in advance to
subjecting powders to unit operations that involve me-chanical stress. The approach consists in using SPM-based nano- and micro-scale measurements, in order to establish the likely macroscopic-scale behavior. This type of single-particle approach provides the possibility of pre-dicting particle size outcome with minimal crystal dis-ruption, giving a level of confidence about the physical changes induced by milling without the need to conduct run-and-stop milling tests in order to ascertain the desired milling endpoint. The underlying concept is based on tak-ing advantage of the ability to microscopically measure the inherent mechanical properties of the crystal. This infor-mation is then used to predict particle fracture behavior during milling. The parameters obtained from this type of testing provide a new perspective toward the fundamental understanding of the complex bulk process of milling.
As mentioned earlier in this report, of the mechanical energy supplied during milling, a portion is consumed in particle fracture, a portion is dissipated as heat, and an-other portion gets incorporated into the activated powder. Activation, in turn, occurs both at the core-particle level, as disruptions to the crystal lattice, and at the surface level, as changes in the surface energy of the powder. The preceding sections of this article focused primarily on the surface activation effect. In this section, we focus on the energy portion first named above. Specifically, on the way microscopic analysis methods can provide specific infor-mation about particle fracture, and how this information can help in predicting some bulk properties of the result-ing powder.
The plastic-elastic properties of materials play a deter-mining role on their behavior during milling. Plasticity in crystals results from activating multiple slip systems to accommodate strains in multiple directions. In pharma-ceutically relevant crystals, the chance of activating a rather limited number of slip planes simultaneously, is significantly greater than in the case of cubic unit cell systems, common in easily deformed metals, for example. Studies on succinic acid (Jing Y. et al., 2011) using nanoindentation show the presence of a limited numbers of slip planes. A similar situation has been observed with other organic crystals, such as acetaminophen (Ho R. and Heng J., 2013). The abundance, or lack thereof, of slip planes in the crystal is critical in determining whether materials will deform plastically via slip, or if fracture will occur. Creation of dislocations or defect-induced amorphization (Ho R. and Heng J., 2013; Jing Y. et al., 2011) are possible with plastic deformation. Lower ten-dency toward amorphization is usually conducive to par-ticle fracture. Particle fracture, in turn, may be either a desirable (micronizing) or undesirable (tableting) response of a solid.
The mechanical properties profile curves for pharma-ceuticals is similar to that obtained with ceramic and

Rodolfo Pinal et al. / KONA Powder and Particle Journal No. 37 (2020) 195–213
209
energetic materials (explosives), measured using nanoin-dentation (Taw M. et al., 2017). Plastic deformation in these systems can be imparted during processing (milling and compaction), and the defect density subsequently in-fluences properties such as hardness and elastic modulus, as well as performance attributes (Nibur K. and Bahr D., 2003). A study on the deformation of a brittle molecular crystal such as sucrose using nanoindentation, allowed the identification of the onset of dislocation motion prior to fracture (Ramos K. and Bahr D. 2007). This type of experiments showed promising results on the applicability of nanoindentation to quantify plasticity of pharmaceuti-cal and food materials.
The crystal lattice of a solid is one of the dominant fac-tors for controlling the response of the material to an ap-plied stress. Nanoindentation allows mechanical testing of submillimeter crystals, in order to determine the stress-strain-fracture behavior of solids. This allows to quantify elastic, plastic, and fracture behavior tendencies. Nanoin-dentation is a technique that has been used to experimen-tally identify slip planes in inorganic materials like metals and semiconductors (Bradby J. et al., 2001; Nibur K. and Bahr D., 2003; Ramos K. et al., 2009; Stelmashenko N. et al., 1993).
Fig. 7 shows an example of force-displacement curves in-volving caffeine (Ghosh S. et al., 2013). The shift behavior can be related directly to both slip and fracture events, and provides insight into the way the competition between these two phenomena, determine how brittle a molecular crystal is.
The crack initiation threshold, subject to elastic/plastic indentation has been reported from indentation studies in ceramic materials (Lankford J. and Davidson D., 1979). The strength of particles was calculated based on the in-teraction between crystal flaws, where flaws play a domi-nant role in particle fracture, and the local stresses are significantly greater than the loading stress (Inglis C.,
1913). During particle fractionation in a mill, particles are first stressed, then cracks may propagate from preexisting flaws, leading to maximum the tensile stress (Wong R. et al., 2001). Following these reports, and recognizing that in the pharmaceutical industry crystalline APIs are rarely used without milling, de Vegt O. et al. (2009) studied the influence of flaws and crystal properties on particle frac-ture in a jet mill, using sodium chloride as model com-pound. It was concluded that impurities and pre-existing flaws in the crystals influence the fracture behavior of particles in a jet mill. Prediction of fracture behavior of molecular crystals has been proposed using the hardness to stress ratio as criterion (Burch A. et al., 2017a). Organic molecular crystals are more challenging; they exhibit much less symmetry, are anisotropic and with very com-plex structures compared to those of many metallic or ce-ramic inorganic materials.
A study on the characterization of the mechanical prop-erties of five pharmaceutical materials was conducted us-ing a similar fracture mechanics approach to that applied to ceramics and semi-brittle materials. The study was performed using large size crystals, providing differenti-ating information between brittle and semi-brittle materi-als (Taylor L. et al., 2004). This type of information can be used for cataloguing solids to be subjected to milling.
The study of mechanical deformation of molecular crystals is often challenging because of their brittle or ductile nature. Conventional methods of testing, including microindentation of compacts or microindentation of sin-gle crystals, leads more often than not to fracture (Bradby et al., 2001; Maughan et al., 2015). A further complication is that growing large size (millimiter) crystals of many pharmaceutical materials is difficult if not impossible.
More recently, a nanoindenter was used to test very small, submillimiter crystals, in the range of 50 to 200 μm. With this approach, a wide variety of crystalline solids can be examined, including those that are difficult to grow into larger single crystals. Studies on the me-chanical properties of griseofulvin (Maughan M. et al., 2015), idoxuridine and pentafluorobenzamimide (Burch A. et al., 2017b) demonstrated that brittleness of pharma-ceutical crystals can be determined by nanoindentation. The technique allows testing with a variety of tip geome-tries and very high local stresses at ultra-low loads, mak-ing it possible to identify the nucleation of dislocations and orientation dependent strength prior to fracture (Burch A. et al., 2017b; Maughan M. et al., 2015). Thus, the nanoindentation technique has excellent potential as a means for predicting the degree of size reduction upon milling.
Force-displacement curves provide information on the plastic-elastic deformation of materials. Assessing frac-ture behavior, elastic and plastic properties of molecular crystalline structures including pharmaceuticals, food
Fig. 7 Force-displacement curves for caffeine crystals (Form I). Reprinted with permission from Ref. Ghosh et al. 2009. Copyright: (2009) American Chemical Society.
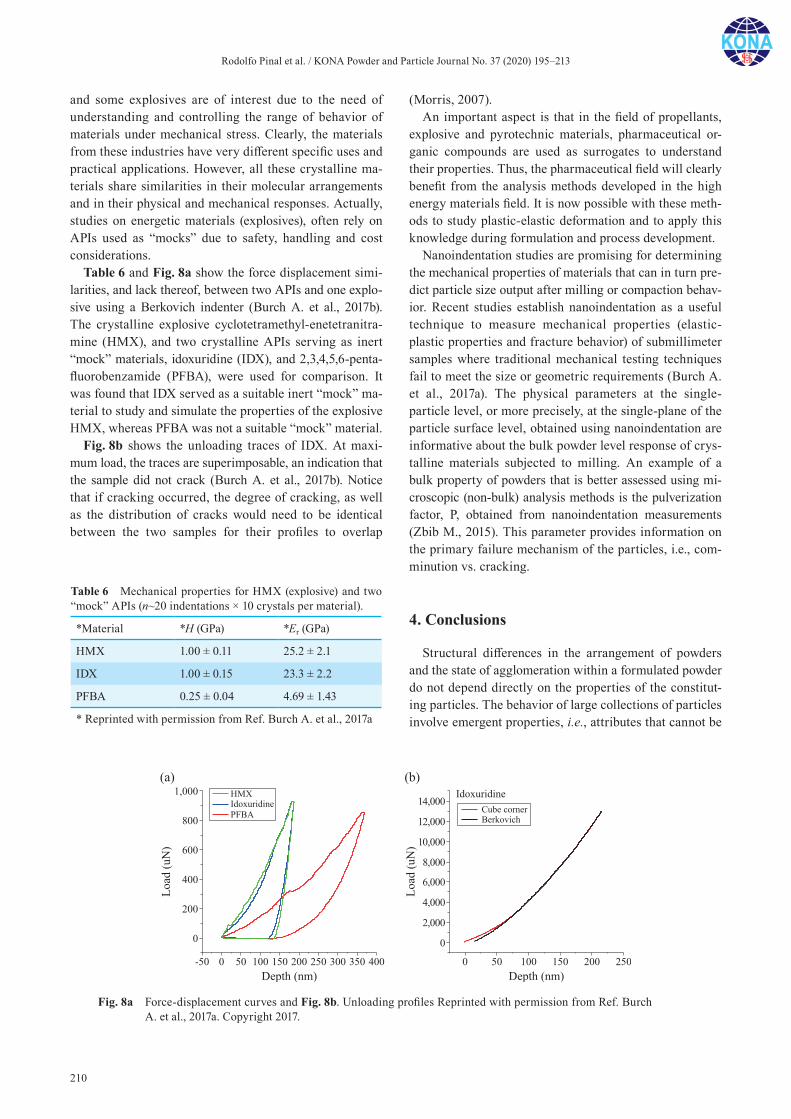
Rodolfo Pinal et al. / KONA Powder and Particle Journal No. 37 (2020) 195–213
210
and some explosives are of interest due to the need of understanding and controlling the range of behavior of materials under mechanical stress. Clearly, the materials from these industries have very different specific uses and practical applications. However, all these crystalline ma-terials share similarities in their molecular arrangements and in their physical and mechanical responses. Actually, studies on energetic materials (explosives), often rely on APIs used as “mocks” due to safety, handling and cost considerations.
Table 6 and Fig. 8a show the force displacement simi-larities, and lack thereof, between two APIs and one explo-sive using a Berkovich indenter (Burch A. et al., 2017b). The crystalline explosive cyclotetramethyl-enetetranitra-mine (HMX), and two crystalline APIs serving as inert “mock” materials, idoxuridine (IDX), and 2,3,4,5,6-penta- fluorobenzamide (PFBA), were used for comparison. It was found that IDX served as a suitable inert “mock” ma-terial to study and simulate the properties of the explosive HMX, whereas PFBA was not a suitable “mock” material.
Fig. 8b shows the unloading traces of IDX. At maxi-mum load, the traces are superimposable, an indication that the sample did not crack (Burch A. et al., 2017b). Notice that if cracking occurred, the degree of cracking, as well as the distribution of cracks would need to be identical between the two samples for their profiles to overlap
(Morris, 2007).An important aspect is that in the field of propellants,
explosive and pyrotechnic materials, pharmaceutical or-ganic compounds are used as surrogates to understand their properties. Thus, the pharmaceutical field will clearly benefit from the analysis methods developed in the high energy materials field. It is now possible with these meth-ods to study plastic-elastic deformation and to apply this knowledge during formulation and process development.
Nanoindentation studies are promising for determining the mechanical properties of materials that can in turn pre-dict particle size output after milling or compaction behav-ior. Recent studies establish nanoindentation as a useful technique to measure mechanical properties (elastic- plastic properties and fracture behavior) of submillimeter samples where traditional mechanical testing techniques fail to meet the size or geometric requirements (Burch A. et al., 2017a). The physical parameters at the single- particle level, or more precisely, at the single-plane of the particle surface level, obtained using nanoindentation are informative about the bulk powder level response of crys-talline materials subjected to milling. An example of a bulk property of powders that is better assessed using mi-croscopic (non-bulk) analysis methods is the pulverization factor, P, obtained from nanoindentation measurements (Zbib M., 2015). This parameter provides information on the primary failure mechanism of the particles, i.e., com-minution vs. cracking.
4. Conclusions
Structural differences in the arrangement of powders and the state of agglomeration within a formulated powder do not depend directly on the properties of the constitut-ing particles. The behavior of large collections of particles involve emergent properties, i.e., attributes that cannot be
Table 6 Mechanical properties for HMX (explosive) and two “mock” APIs (n~20 indentations × 10 crystals per material).
*Material *H (GPa) *Er (GPa)
HMX 1.00 ± 0.11 25.2 ± 2.1
IDX 1.00 ± 0.15 23.3 ± 2.2
PFBA 0.25 ± 0.04 4.69 ± 1.43
* Reprinted with permission from Ref. Burch A. et al., 2017a
Fig. 8a Force-displacement curves and Fig. 8b. Unloading profiles Reprinted with permission from Ref. Burch A. et al., 2017a. Copyright 2017.
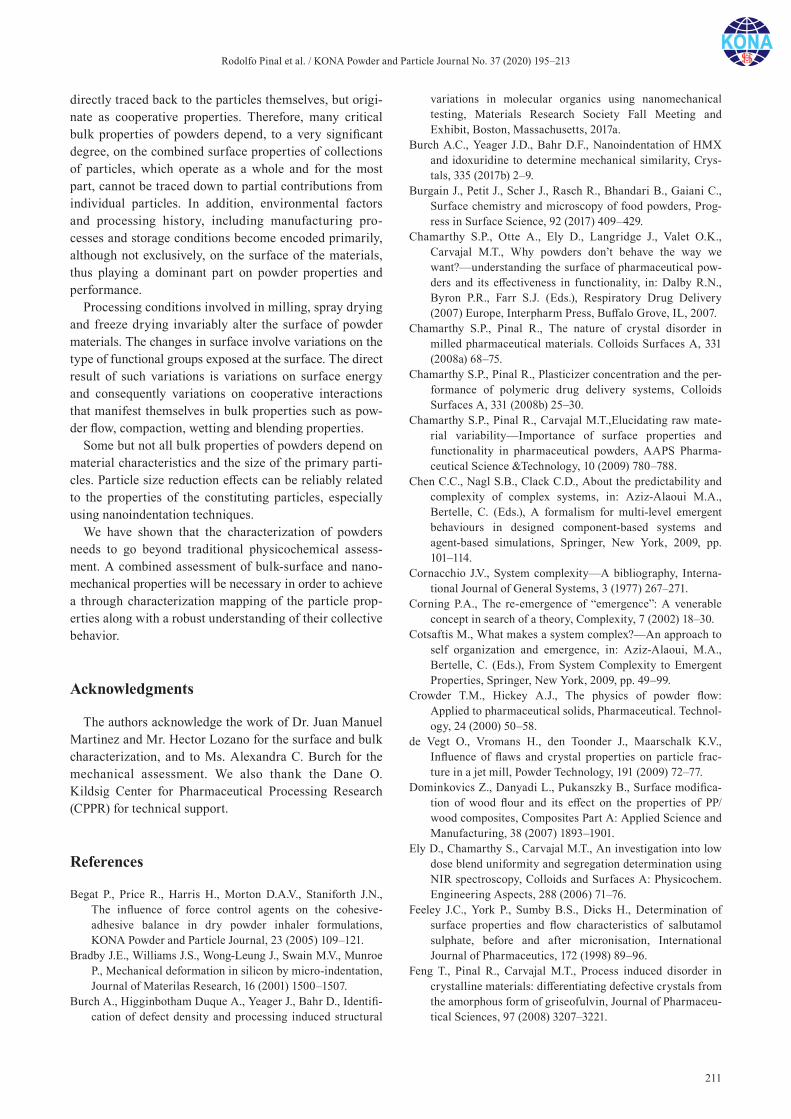
Rodolfo Pinal et al. / KONA Powder and Particle Journal No. 37 (2020) 195–213
211
directly traced back to the particles themselves, but origi-nate as cooperative properties. Therefore, many critical bulk properties of powders depend, to a very significant degree, on the combined surface properties of collections of particles, which operate as a whole and for the most part, cannot be traced down to partial contributions from individual particles. In addition, environmental factors and processing history, including manufacturing pro-cesses and storage conditions become encoded primarily, although not exclusively, on the surface of the materials, thus playing a dominant part on powder properties and performance.
Processing conditions involved in milling, spray drying and freeze drying invariably alter the surface of powder materials. The changes in surface involve variations on the type of functional groups exposed at the surface. The direct result of such variations is variations on surface energy and consequently variations on cooperative interactions that manifest themselves in bulk properties such as pow-der flow, compaction, wetting and blending properties.
Some but not all bulk properties of powders depend on material characteristics and the size of the primary parti-cles. Particle size reduction effects can be reliably related to the properties of the constituting particles, especially using nanoindentation techniques.
We have shown that the characterization of powders needs to go beyond traditional physicochemical assess-ment. A combined assessment of bulk-surface and nano- mechanical properties will be necessary in order to achieve a through characterization mapping of the particle prop-erties along with a robust understanding of their collective behavior.
Acknowledgments
The authors acknowledge the work of Dr. Juan Manuel Martinez and Mr. Hector Lozano for the surface and bulk characterization, and to Ms. Alexandra C. Burch for the mechanical assessment. We also thank the Dane O. Kildsig Center for Pharmaceutical Processing Research (CPPR) for technical support.
References
Begat P., Price R., Harris H., Morton D.A.V., Staniforth J.N., The influence of force control agents on the cohesive- adhesive balance in dry powder inhaler formulations, KONA Powder and Particle Journal, 23 (2005) 109–121.
Bradby J.E., Williams J.S., Wong-Leung J., Swain M.V., Munroe P., Mechanical deformation in silicon by micro-indentation, Journal of Materilas Research, 16 (2001) 1500–1507.
Burch A., Higginbotham Duque A., Yeager J., Bahr D., Identifi-cation of defect density and processing induced structural
variations in molecular organics using nanomechanical testing, Materials Research Society Fall Meeting and Exhibit, Boston, Massachusetts, 2017a.
Burch A.C., Yeager J.D., Bahr D.F., Nanoindentation of HMX and idoxuridine to determine mechanical similarity, Crys-tals, 335 (2017b) 2–9.
Burgain J., Petit J., Scher J., Rasch R., Bhandari B., Gaiani C., Surface chemistry and microscopy of food powders, Prog-ress in Surface Science, 92 (2017) 409–429.
Chamarthy S.P., Otte A., Ely D., Langridge J., Valet O.K., Carvajal M.T., Why powders don’t behave the way we want?—understanding the surface of pharmaceutical pow-ders and its effectiveness in functionality, in: Dalby R.N., Byron P.R., Farr S.J. (Eds.), Respiratory Drug Delivery (2007) Europe, Interpharm Press, Buffalo Grove, IL, 2007.
Chamarthy S.P., Pinal R., The nature of crystal disorder in milled pharmaceutical materials. Colloids Surfaces A, 331 (2008a) 68–75.
Chamarthy S.P., Pinal R., Plasticizer concentration and the per-formance of polymeric drug delivery systems, Colloids Surfaces A, 331 (2008b) 25–30.
Chamarthy S.P., Pinal R., Carvajal M.T.,Elucidating raw mate-rial variability—Importance of surface properties and functionality in pharmaceutical powders, AAPS Pharma-ceutical Science &Technology, 10 (2009) 780–788.
Chen C.C., Nagl S.B., Clack C.D., About the predictability and complexity of complex systems, in: Aziz-Alaoui M.A., Bertelle, C. (Eds.), A formalism for multi-level emergent behaviours in designed component-based systems and agent-based simulations, Springer, New York, 2009, pp. 101–114.
Cornacchio J.V., System complexity—A bibliography, Interna-tional Journal of General Systems, 3 (1977) 267–271.
Corning P.A., The re‐emergence of “emergence”: A venerable concept in search of a theory, Complexity, 7 (2002) 18–30.
Cotsaftis M., What makes a system complex?—An approach to self organization and emergence, in: Aziz-Alaoui, M.A., Bertelle, C. (Eds.), From System Complexity to Emergent Properties, Springer, New York, 2009, pp. 49–99.
Crowder T.M., Hickey A.J., The physics of powder flow: Applied to pharmaceutical solids, Pharmaceutical. Technol-ogy, 24 (2000) 50–58.
de Vegt O., Vromans H., den Toonder J., Maarschalk K.V., Influence of flaws and crystal properties on particle frac-ture in a jet mill, Powder Technology, 191 (2009) 72–77.
Dominkovics Z., Danyadi L., Pukanszky B., Surface modifica-tion of wood flour and its effect on the properties of PP/wood composites, Composites Part A: Applied Science and Manufacturing, 38 (2007) 1893–1901.
Ely D., Chamarthy S., Carvajal M.T., An investigation into low dose blend uniformity and segregation determination using NIR spectroscopy, Colloids and Surfaces A: Physicochem. Engineering Aspects, 288 (2006) 71–76.
Feeley J.C., York P., Sumby B.S., Dicks H., Determination of surface properties and flow characteristics of salbutamol sulphate, before and after micronisation, International Journal of Pharmaceutics, 172 (1998) 89–96.
Feng T., Pinal R., Carvajal M.T., Process induced disorder in crystalline materials: differentiating defective crystals from the amorphous form of griseofulvin, Journal of Pharmaceu-tical Sciences, 97 (2008) 3207–3221.
Rodolfo Pinal et al. / KONA Powder and Particle Journal No. 37 (2020) 195–213
212
Galla T., Gühne O., Complexity measures, emergence, and multiparticle correlations, Physical Review E, 85 (2012) 046209. DOI: 10.1103/PhysRevE.85.046209
Ghosh S., Mondal A., Kiran M., Ramamurty U., Reddy C.M., The role of weak interactions in the phase transition and distinct mechanical behavior of two structurally similar caffeine co-crystal polymorphs studied by nanoindentation, Crystal Growth & Design, 13 (2013) 4435–4441.
Heng J.Y.Y., Bismarck A., Williams D.R., Anisotropic surface chemistry of crystalline pharmaceutical solids, AAPS Pharmaceutical Science & Technology, 7(4) (2006) E12–E20.
Heng J.Y.Y., Bismarck A., Williams D.R., Anisotropic surface chemistry of crystalline pharmaceutical solids, AAPS PharmSciTech, 7 (2014) 84–84. DOI: 10.1208/pt070484
Hickey A.J., Complexity in pharmaceutical powders for inhala-tion: A perspective, KONA Powder and Particle Journal, 35 (2018) 3–13.
Hickey A.J., Crowder T.M., Louey M.D., Orr N., A Guide to Pharmaceutical Particulate Science, CRC Press, 2003.
Ho R., Dilworth S.E., Williams D.R., Heng J.Y.Y., Role of sur-face chemistry and energetics in high shear wet granula-tion, Industrial & Engineering Chemistry Research, 50 (2011) 9642–9649.
Ho R., Heng J.Y.Y., A review of inverse gas chromatography and its development as a tool to characterize anisotropic surface properties of pharmaceutical solids, KONA Powder and Particle Journal, 30 (2013) 164–180.
Ho,, R., Hinder, S.J., Watts, J.F., Dilworth S.E., Williams D.R., Heng J.Y.Y., Determination of surface heterogeneity of D-mannitol by sessile drop contact angle and finite concen-tration inverse gas chromatography, International Journal of Pharmaceutics, 387 (2010) 79–86.
Ho R., Naderi M., Heng J.Y.Y., Williams D.R., Thielmann F., Bouza P., Keith A.R., Thiele G., Burnett D.J., Effect of milling on particle shape and surface energy heterogeneity of needle-shaped crystals Pharmaceutical Research, 29 (2012) 2806–2816.
Ho R., Wilson D.A., Heng J.Y.Y., Crystal habits and the varia-tion in surface energy heterogeneity, Crystal Growth & Design, 9 (2009) 4907–4911.
Inglis C.E., Stresses in a plate due to the presence of cracks and sharp corners, Trans. Inst. Nav. Archit., 55 (1913) 219–223.
Jaeger H.M., Shinbrot T., Umbanhowar P.B., Does the granular matter?, Proceedings of the National Academy of Sciences of the United States of America, 97 (2000) 12959–12960.
Jing Y.Y., Zhang Y., Blendell J., Koslowski M., Carvajal M.T, Nanoindentation method to study slip planes in molecular crystals in a systematic manner, Crystal Growth & Design, 11 (2011) 5260–5267.
Kim E.H.J., Chen X.D., Pearce D., Effect of surface composition on the flowability of industrial spray-dried dairy powders, Colloid Surfaces B: Biointerfaces, 46 (2005) 182–187.
Khoo J., Naderi M., Burnett D., Freeman T., Armstrong B., Use of surface energy distributions to relate the effect of surface modification to powder flow properties, Surface Measure-ment Systems (SMS) and iGC SEA Case Study 611, (2011) <www.surfacemeasurementsystems.com>
Lankford J., Davidson D.L., Crack-initiation threshold in ceramic materials subject to elastic-plastic indentation, Journal of Material Sciences, 14 (1979) 1662–1668.
Leturia M., Benali M., Lagarde S., Ronga I., Saleh K., Charac-terization of flow properties of cohesive powders: A compar-ative study of traditional and new testing methods, Powder Technology, 253 (2014) 406–423.
Loh J., Ketterhagen W., Elliott J., Multiscale modelling of phar-maceutical powders: Macroscopic behaviour prediction, in: Yu, A., Dong, K., Yang, R., Luding, S. (Eds.), Powders and Grains 2013, American Institute Physics, Melville, 2013, pp. 161–164.
Maughan M.R., Carvajal M.T., Bahr D.F., Nanomechanical test-ing technique for millimeter-sized and smaller molecular crystals, International Journal of Pharmaceutics, 486 (2015) 324–330.
McMillan J., Shaffer F., Gopalan B., Chew J.W., Hrenya C., Hays R., Karri S.B.R., Cocco R., Particle cluster dynamics during fluidization, Chemical and Engineering Science, 100 (2013) 39–51.
Morris D.J., Instrumented indentation contact with sharp probes of varying acuity, Materials Research Society Symposium. Proceedings, 1049 (2007) 111–116.
Newton J.M., Mashadi A.B., Podczeck F., The mechanical prop-erties of an homologous series of benzoic-acid esters, Euro-pean Journal of Pharmaceutics and Biopharmaceutics, 39 (1993) 153–157.
Nibur K.A., Bahr D.F., Identifying slip systems around indenta-tions in FCC metals, Scripta Materialia, 49 (2003) 1055–1060.
Oshitani J., Sasaki T., Tsuji T., Higashida K., Chan D.Y.C., Anomalous sinking of spheres due to local fluidization of apparently fixed powder beds, Physical Review Letters, 116 (2016) 5.
Otte A., Carvajal M.T., Assessment of milling-induced disorder of two pharmaceutical compounds, Journal of Pharmaceu-tical Sciences, 100 (2011) 1793–1804.
Otte A., Zhang Y., Carvajal M.T., Pinal R. Milling induces dis-order in crystalline griseofulvin and order in its amorphous counterpart, Crystal Engineering Commons, 14 (2012) 2560–2570.
Planinsek O., Zadnik J., Kunaver M., Srcic S., Godec A., Struc-tural evolution of indomethacin particles upon milling: Time-resolved quantification and localization of disordered structure studied by IGC and DSC, Journal of Pharmaceu-tical Sciences, 99 (2010) 1968–1981.
Ramos K.J.; Bahr D.F., Mechanical behavior assessment of sucrose using nanoindentation, Journal of Materials Research, 22 (2007) 2037–2045.
Ramos K.J., Hooks D.E., Bahr D.F., Direct observation of plas-ticity and quantitative hardness measurements in single crystal cyclotrimethylene trinitramine by nanoindentation, Philosophical Magazine, 89 (2009) 2381–2402.
Roberts R.J., Rowe R.C., Brittle/ductile behavior in pharmaceu-tical materials used in tabletting, International Journal of Pharmaceutics, 36 (1987) 205–209.
Ryshkewitch E., Compression strength of porous sintered alu-mina and zirconia. 9th Communication to Ceramography, Journal of the American Ceramic Society, 36 (1953) 65–68.
Shi J., Das S., Morton D., Stewart P., The kinetics of de- agglomeration of magnesium stearate dry-coated salbu-tamol sulphate powders, KONA Powder and Particles Jour-nal, 32 (2015) 131–142.
Sitte R. About the predictability and complexity of complex
Rodolfo Pinal et al. / KONA Powder and Particle Journal No. 37 (2020) 195–213
213
systems, in: Aziz-Alaoui M.A., Bertelle, C. (Eds.), From System Complexity to Emergent Properties, Springer, New York 2009, pp. 23–48.
Staniforth J.N., Rees J.E., Kayes J.B., Relation between mixing time and segregation of ordered mixes, Journal of Phar-macy & Pharmacology, 33 (1981a) 175–176.
Staniforth J.N., Rees J.E., Lai F.K., Hersey J.A., Determination of interparticulate forces in ordered powder mixes, Journal of Pharmacy & Pharmacology, 33 (1981b) 485–490.
Stelmashenko N.A., Walls M.G., Brown L.M., Milman Y.V., Microindentations on W and Mo oriented single-crystals—an STM study, Acta Metallurgica et Materialia, 41 (1993) 2855–2865.
Stewart P.J., Particle interaction in pharmaceutical systems, Pharmacy International, 7 (1986) 146–149.
Taw M.R., Yeager J.D., Hooks D.E., Carvajal T.M., Bahr D.F., The mechanical properties of as-grown noncubic organic molecular crystals assessed by nanoindentation, Journal of Materials Research, 32 (2017) 2728–2737.
Taylor L.J., Papadopoulos D.G., Dunn P.J., Bentham A.C., Mitchell J.C., Snowden M.J., Mechanical characterisation of powders using nanoindentation, Powder Technology, 143 (2004) 179–185.
Thakur S.C., Ooi J.Y., Wojtkowski M.B., Imole O.I., Magnanimo V., Ahmadian H., Chávez Montes E., Ramaioli M., Charac-terisation of cohesive powders for bulk handling and DEM modelling. PARTICLES 2013: 3rd International Conference on Particle-based Methods—Fundamentals and Applica-tions. Stuttgart, Germany, in: Bischoff M., Oñate E., Owen D.R.J., Ramm E., Wriggers P. (Eds.). International Center for Numerical Methods in Engineering, 2013.
Wildfong P.L.D., Hancock B.C., Moore M.D., Morris K.R., Towards an understanding of the structurally based poten-tial for mechanically activated disordering of small mole-cule organic crystals, Journal of Pharmaceutical Sciences, 95 (2006) 2645–2656.
Willart J.F., Descamps M., Solid state amorphization of phar-maceuticals,. Molecular Pharmaceutics, 5 (2008) 905–920.
Willart J.F., Descamps N., Caron V., Capet F., Danede F., Descamps M., Formation of lactose-mannitol molecular alloys by solid state vitrification, Solid State Communica-tions, 138 (2006) 194–199.
Wong R.H.C., Chau K.T., Tang C.A., Lin P., Analysis of crack coalescence in rock-like materials containing three flaws—Part I: experimental approach, International Journal of Rock Mechanics and Mining Sciences, 38 (2001) 909–924.
Wouters I.M.F., Geldart D., Characterising semi-cohesive pow-ders using angle of repose, Particle & Particle Systems Characterization, 13 (1996) 254–259.
York P., Ticehurst M.D., Osborn J.C., Roberts R.J., Rowe R.C., Characterisation of the surface energetics of milled dl- propranolol hydrochloride using inverse gas chromatogra-phy and molecular modelling, International Journal of Pharmaceutics, 174 (1998) 179–186.
Yu L.X., Amidon G., Khan M.A., Hoag S.W., Polli J., Raju G.K., Woodcock J., Understanding pharmaceutical Quality by Design. American Association of Pharmaceutical Scientists Journal, 16 (2014) 771–783.
Zbib M.B., Characterization and mechanical properties of solar grade silicon in granular and nanopowder form, Disserta-tion, Purdue University, 2015.
Authors’ Short Biographies
Rodolfo PinalDr. Pinal is Associate Professor of Industrial and Physical Pharmacy and Director of
the Dane O. Kildsig Center for Pharmaceutical Processing Research (CPPR) at Purdue University. He obtained his PhD in Physical Pharmacy from the University of Arizona. Before joining Purdue, Rodolfo worked for thirteen years in the pharmaceutical industry. He was Research Leader at Hoffmann-La Roche, heading the Solid State Pharmaceutics/characterization group. His research focuses on solubility and solubilization of drugs from both the solid-state properties and solution chemistry perspectives. His research in-cludes studies on excipient functionality and he is currently working on formulation technologies for patient-centered medicine.
M. Teresa CarvajalDr. Carvajal is a Faculty Member at the Agricultural and Biological Engineering de-
partment at Purdue University. Prior to joining Purdue University, Dr. Carvajal worked in the pharmaceutical industry for 13 years, Hoffmann-LaRoche (NJ) and Bayer (CT). She obtained her Ph.D. in Powder Technology from the University of Bath, UK, M.S. in Physical Pharmacy, a minor in Physical chemistry from the University of Arizona, USA and B.S. in Chemical Pharmaceutical Biologist from the UNAM, México. Carvajal’s re-search approach is on surface-mechanical-processing relationships for understanding bulk properties and impact on formulation development, processing and performance of Food and Pharmaceutical powders.
KONA Powder and Particle Journal No. 37 (2020) 214–223/Doi:10.14356/kona.2020009 Original Research Paper
214Copyright © 2020 The Authors. Published by Hosokawa Powder Technology Foundation. This is an open ac-cess article under the CC BY license (http://creativecommons.org/licenses/by/4.0/).
Preparation and Properties of Spherical Natural Rubber/Silica Composite Powders via Spray Drying †
Siah Ying Tang 1,2, Prachaya Sopanon 1, Wiwut Tanthapanichakoon 1,3 and Apinan Soottitantawat 1*
1 Center of Excellence in Particle and Materials Processing Technology, Department of Chemical Engineering, Faculty of Engineering, Chulalongkorn University, Thailand
2 Advanced Engineering Platform, School of Engineering, Monash University Malaysia, Malaysia3 Academy of Science, Royal Society of Thailand, Thailand
AbstractIn this work, composite powders of natural rubber/silica (NR-SiO2) were prepared via sol-gel and spray drying method. The morphology and physical properties of resultant rubber composite powders were characterized by scanning electron microscopy with energy dispersive X-ray spectrometry, laser light scattering particle sizer and thermogravimetric analyzer. The results showed that spray-dried NR-SiO2 particles were spherical in shape with diameter of less than 10 μm, with silica on the outer layer. The particle size was found to increase gradually with the increase in NR/Si mass ratio. Marginal growth in particle size was observed with increasing feed flow rate. Increasing inlet air temperature improved the latex particle encapsulation by silica layer while maintaining the final particle size. The mechanical properties of NR-SiO2 powders-filled polylactic acid (PLA) composite increase gradually with the addition of dried particles of higher rubber content. However, the composite exhibited relatively lower or reduced tensile strength and elongation at break compared to the host PLA polymer. This could be attributed to poor filler dispersion associated with weak filler/matrix interaction effect occurring during melt-compounding process.
Keywords: natural rubber, silica, composite powder, spray drying, sol-gel
1. Introduction
Natural rubber (NR) is an important natural plant poly-mer that is widely applied in various industrial sectors such as automobile, tires, aerospace, sports and consumer products. In recent years, there is growing research inter-est towards the preparation of ultrafine NR powders (NRP) with better physical and mechanical properties. NRP represents an attractive alternative to conventional rubber sheets in some applications, especially as additives or impact modifier. The use of fine NRP offers greater convenience in use and transportation compared to rubber sheets that require additional processing.
Numerous efforts have been made on the synthesis of
dried rubber-based particles ranging from micrometer to nanometer scale. For instance, Thill A. et al. demon-strated that it is possible to prepare nanoporous composite powder based on polybromostyrene and silica nanoparti-cles using ultrasonic spray system (Thill A. et al., 2005). Sae-Oui et al. reported the preparation of rubber powders via spray drying of pre-vulcanized NR followed by subse-quent use as plastic additive in high-density polyethylene (HDPE) (Sae-Oui P. et al., 2010). Several powdered rub-bers were successfully synthesized through gamma radia-tion crosslinking and spray drying of rubber lattices (Li D. et al., 2007; Peng J. et al., 2002; Wang Q. et al., 2011). It has been reported that the formation of nano-powdered rubbers is closely linked to the use of rubber latex with suitable crosslinking degree (Li D. et al., 2007).
Instead of irradiation technology, Paiva et al. described a methodology to produce composite spherical rubber powder by the modification of styrene-butadiene latex with methyl methacrylate and colloidal silica followed by spray drying (Paiva L.B.d. et al., 2014). Dried particulate rubber with particle sizes of 1 μm to 10 μm were ob-tained. On the other hand, the preparation of spray dried styrene-butadiene latex powder containing carbon
† Received 2 April 2019; Accepted 3 June 2019 J-STAGE Advance published online 29 June 20191 Phayathai Road, Pathumwan, Bangkok 10330, Thailand2 Jalan Lagoon Selatan, Bandar Sunway, 47500 Subang Jaya,
Selangor, Malaysia3 Sanam Suapa, Dusit, Bangkok 10300, Thailand* Corresponding author: Apinan Soottitantawat; E-mail: [email protected] TEL: +66-8-8689-6226
Siah Ying Tang et al. / KONA Powder and Particle Journal No. 37 (2020) 214–223
215
nanotubes as reinforcing filler was demonstrated by Zhou et al. and his co-workers (Zhou X. et al., 2006). The above examples support the idea that spray drying is an attrac-tive, yet efficient tool of producing dried rubber powders with controllable size and morphology. Spray drying is in fact a well-established technique used in pharmaceutical sectors (Lee D.-J. et al., 2013; Okamoto H. et al., 2002; Tong H.H.Y. et al., 2006). Although the rubber powders can be obtained by irradiation or latex modification in a prior step to spray drying, the drawback associated with these technologies are cost and safety problems.
Hence, we explored the possibility of producing com-posite rubber powder without the use of irradiation or modifying agents. We reported a methodology of natural rubber/silica (NR-SiO2) composite powder preparation by spray drying a dispersion mixture containing silica sol and rubber latex. Silica is chosen because it is a kind of ceramic materials widely used in rubber reinforcement. In this study, the dried silica-coated rubber particles were formed via sol-gel reaction of siloxane on NR particles during spray drying. The effect of NR to silica mass ratio, spray-dryer feed rate and inlet air temperature on the properties of NR-SiO2 powders was investigated. As part of study, the spray dried composite powders were melt- extruded and incorporated as filler into thermoplastic polylactic acid (PLA) in order to evaluate their thermal and mechanical properties. The findings of present study offer a simple method to fabricate NR-based powders with tailorable mechanical properties that may have useful ap-plication as impact modifier in chemical and plastic in-dustries.
2. Materials and methods
2.1 Materials
Pre-vulcanized natural rubber latex with a total solid content of 60 wt% was obtained from Thai Rubber Latex Co. Ltd. Sodium silicate was procured from Fluka Chem-icals, Germany. The host polymer in this study was poly-lactic acid (PLA) 2002D supplied by Nature Works, USA. All other chemicals were of analytical grade.
2.2 Preparation of NR-SiO2 composite powders
The preparation of rubber composite powder was per-formed in 3 steps: (1) preparation of silica sol; (2) mixing of NR latex with silica sol; (3) spray drying process. First, silica sols were prepared by dispersing sodium silicate in a diluted aqueous solution of hydrochloric acid (HCI) at 50 °C for 5 min. The sodium silicate solution underwent hydrolysis and polycondensation reactions to form silica sols. Next, the as-prepared silica sols of 20 wt% silica
content were added to a diluted NR latex suspension and followed by sonication to constitute colloidal mixtures with varying NR/Si mass ratios ranging from 0.25:1 to 10:1. Finally, dry NR-SiO2 powders were obtained by sub-jecting the mixture of silica sols and diluted NR to spray drying (mini-spray dryer, Buchi 190 model, Switzerland) at inlet air temperature of 160 °C and feed flow rate of 9 mL/min. The effect of feed rate and air inlet tempera-ture on the final properties of resultant composite parti-cles was also investigated.
2.3 Preparation of NR-SiO2 particles filled PLA thermoplastic
The NR-SiO2 filled PLA specimens were prepared ac-cording to the following procedure. A fixed 5.0 wt% of spray dried NR-SiO2 powder was first blended and melt-compounded with PLA thermoplastic powder to ob-tain powdery mixture using a co-rotating twin screw ex-truder (LabTech LTE 20–40, LabTech Engineering Co., Ltd., Thailand) with temperature profile of 145–195 °C. The extrudates were then compression-molded at pressure of 50 bar and temperature of 165 °C for mechanical prop-erties investigation.
2.4 Characterizations
The as-synthesized rubber composite powders were characterized in terms of particle size distribution, mor-phology, thermal stability and elemental composition. Particle size distribution was measured with laser diffrac-tion analyzer (Mastersizer 2000, Malvern, UK). Prior to the size measurement, the NR-SiO2 powder was dispersed in distilled water under sonication to obtain a homoge-neous suspension without particle agglomeration. The morphological observation and elemental analysis of spray dried NR-SiO2 particles were performed using scanning electron microscopy with energy dispersive X-ray spectrometer (SEM-EDX, JSM-6400, JEOL Ltd., Tokyo, Japan). The weight loss measurement of silica (control) and spray dried NR-SiO2 particles was carried out in nitrogen gas with a thermogravimetric analyzer (TGA/DSC1, Mettler Toledo, Thailand).
The mechanical properties of the NR-SiO2 particles filled PLA specimens were investigated using an electro-mechanical tensile tester (INSTRON 4206 universal test-ing machine, USA) in accordance with ASTM D256 and ASTM D638 Type 1.
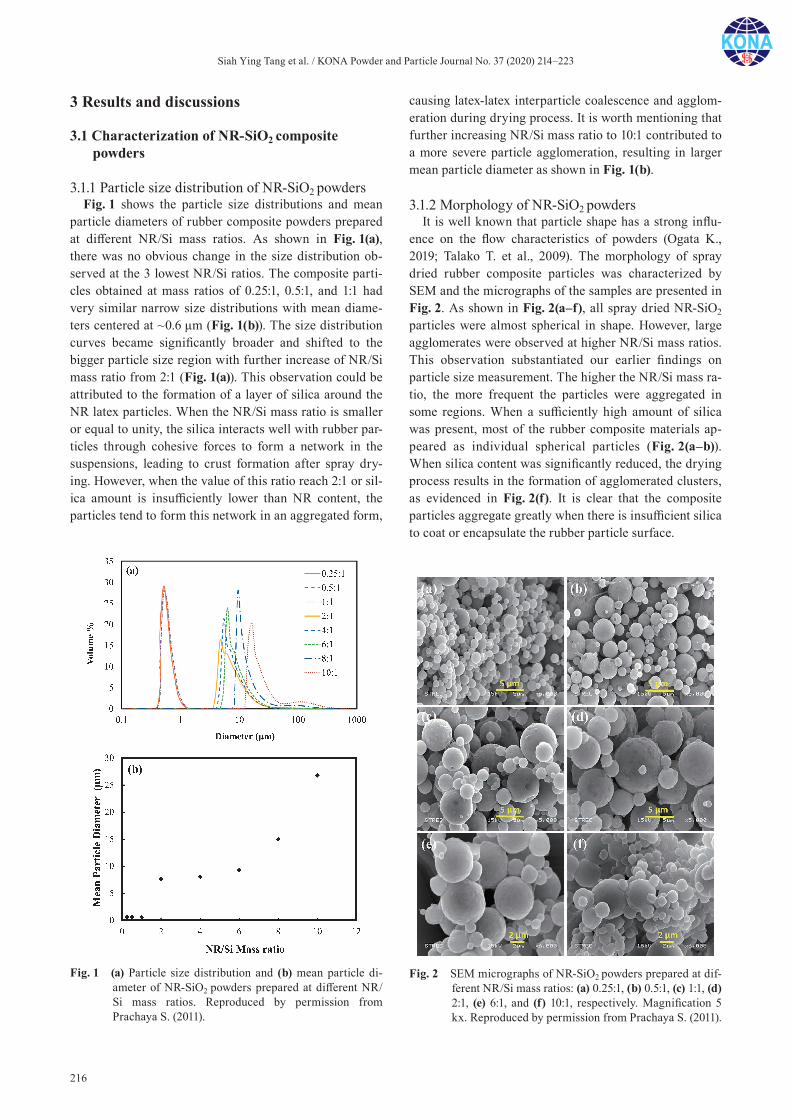
Siah Ying Tang et al. / KONA Powder and Particle Journal No. 37 (2020) 214–223
216
3 Results and discussions
3.1 Characterization of NR-SiO2 composite powders
3.1.1 Particle size distribution of NR-SiO2 powdersFig. 1 shows the particle size distributions and mean
particle diameters of rubber composite powders prepared at different NR/Si mass ratios. As shown in Fig. 1(a), there was no obvious change in the size distribution ob-served at the 3 lowest NR/Si ratios. The composite parti-cles obtained at mass ratios of 0.25:1, 0.5:1, and 1:1 had very similar narrow size distributions with mean diame-ters centered at ~0.6 μm (Fig. 1(b)). The size distribution curves became significantly broader and shifted to the bigger particle size region with further increase of NR/Si mass ratio from 2:1 (Fig. 1(a)). This observation could be attributed to the formation of a layer of silica around the NR latex particles. When the NR/Si mass ratio is smaller or equal to unity, the silica interacts well with rubber par-ticles through cohesive forces to form a network in the suspensions, leading to crust formation after spray dry-ing. However, when the value of this ratio reach 2:1 or sil-ica amount is insufficiently lower than NR content, the particles tend to form this network in an aggregated form,
causing latex-latex interparticle coalescence and agglom-eration during drying process. It is worth mentioning that further increasing NR/Si mass ratio to 10:1 contributed to a more severe particle agglomeration, resulting in larger mean particle diameter as shown in Fig. 1(b).
3.1.2 Morphology of NR-SiO2 powdersIt is well known that particle shape has a strong influ-
ence on the flow characteristics of powders (Ogata K., 2019; Talako T. et al., 2009). The morphology of spray dried rubber composite particles was characterized by SEM and the micrographs of the samples are presented in Fig. 2. As shown in Fig. 2(a–f), all spray dried NR-SiO2
particles were almost spherical in shape. However, large agglomerates were observed at higher NR/Si mass ratios. This observation substantiated our earlier findings on particle size measurement. The higher the NR/Si mass ra-tio, the more frequent the particles were aggregated in some regions. When a sufficiently high amount of silica was present, most of the rubber composite materials ap-peared as individual spherical particles (Fig. 2(a–b)). When silica content was significantly reduced, the drying process results in the formation of agglomerated clusters, as evidenced in Fig. 2(f). It is clear that the composite particles aggregate greatly when there is insufficient silica to coat or encapsulate the rubber particle surface.
Fig. 1 (a) Particle size distribution and (b) mean particle di-ameter of NR-SiO2 powders prepared at different NR/Si mass ratios. Reproduced by permission from Prachaya S. (2011).
Fig. 2 SEM micrographs of NR-SiO2 powders prepared at dif-ferent NR/Si mass ratios: (a) 0.25:1, (b) 0.5:1, (c) 1:1, (d) 2:1, (e) 6:1, and (f) 10:1, respectively. Magnification 5 kx. Reproduced by permission from Prachaya S. (2011).

Siah Ying Tang et al. / KONA Powder and Particle Journal No. 37 (2020) 214–223
217
3.1.3 Elemental composition of NR-SiO2 powdersThe results of elemental sample analysis by EDX are
presented in Table 1. The relative amount of silicon was decreased as the NR/Si mass ratio was increased. The re-sults indicated that the amount of silica in the form of SiO2 available for rubber particle encapsulation became insufficient at higher mass ratios. For NR/Si mass ratio of 0.25:1 and 0.5:1, the elemental ratio of C/Si was lower than 1 and most of the NR particles are sufficiently encap-sulated within the silica shell. As expected, the elemental ratio of C/Si increased as the mass ratio rose from 0.25:1 to 6:1. In this case, the amount of silica required for coat-ing rubber particles decreases significantly, leading to more particle aggregation as a result of insufficient sur-face coverage. It was considered that a plateau of silica encapsulation extent was reached at NR/Si mass ratio of 8:1, as evidenced by the essentially constant elemental ra-tio of C/Si.
3.1.4 Thermal stability of NR-SiO2 powdersThe TGA curves of spray dried NR-SiO2 powders are
shown in Fig. 3. All spray dried samples prepared at different NR/Si mass ratios showed a similar thermal deg-
radation trend. There was an apparent thermal decompo-sition step for NR macromolecular chains. The onset temperature of decomposition with pronounced weight loss was observed in the range of 220 °C to 240 °C. When more silica was incorporated into the rubber composite matrix, the main decomposition profile gradually shifted to a higher temperature. This indicated that the spray dried composite powder gradually possessed a more com-plex thermo-oxidative decomposition associated with no-ticeable improvement of thermal ageing resistance. Similar observations were reported in the literature (Paiva L. B. d. et al., 2014; Peng Z. et al., 2007; Sen D. et al., 2006). The thermal stability of as-prepared composite powders was greatly governed by the effective silica coat-ing of rubber particles.
3.1.5 Effect of feed rateThe effect of feed flow rate to the spray dryer on the
NR-SiO2 powder properties was determined. Fig. 4 and Table 2 show the effect on the particle size distribution and mean particle diameter of NR-SiO2 powders prepared at fixed NR/Si mass ratio of 2:1 and constant inlet air tem-perature of 160 °C. The results showed that increasing the feed flow rate produced a mild gradual increase in powder particle size. By increasing the feed rate, more latex com-posite dispersion was introduced and atomized during spraying, thus resulting in larger liquid droplets and in-ducing more collisions and subsequent fusion of small particles into larger ones, as shown in Fig. 5. The thin un-even silica coating and uncoated NR surface can, respec-tively, be distinguished by looking at the distribution of Si
Table 1 Elemental composition of NR-SiO2 powders prepared at different NR/Si mass ratios.
NR/Si mass ratio
% ElementC/Si ratio
C Si O Na
0.25:1 13.14 28.11 44.77 13.98 0.47
0.5:1 17.29 24.00 45.38 13.33 0.72
1:1 29.47 18.07 42.39 10.07 1.63
2:1 56.10 9.28 29.03 5.59 6.04
4:1 65.27 5.38 25.49 3.40 12.13
6:1 71.33 5.14 20.39 2.78 13.88
8:1 75.58 3.53 18.64 1.99 21.41
10:1 76.36 3.59 17.45 2.29 21.27
Reproduced by permission from Prachaya S. (2011).
Fig. 4 Particle size distribution of NR-SiO2 powders prepared at a different feed rates. Reproduced by permission from Prachaya S. (2011).
Table 2 Mean particle diameter (μm) of NR-SiO2 powders at a different feed rates.
NR/Si mass ratio
Feed rate (mL/min)
7 9 11 13
2:1 6.93 7.65 8.15 8.28
Reproduced by permission from Prachaya S. (2011).
Fig. 3 TGA curves of NR-SiO2 powders prepared at different NR/Si mass ratios. Reproduced by permission from Prachaya S. (2011).
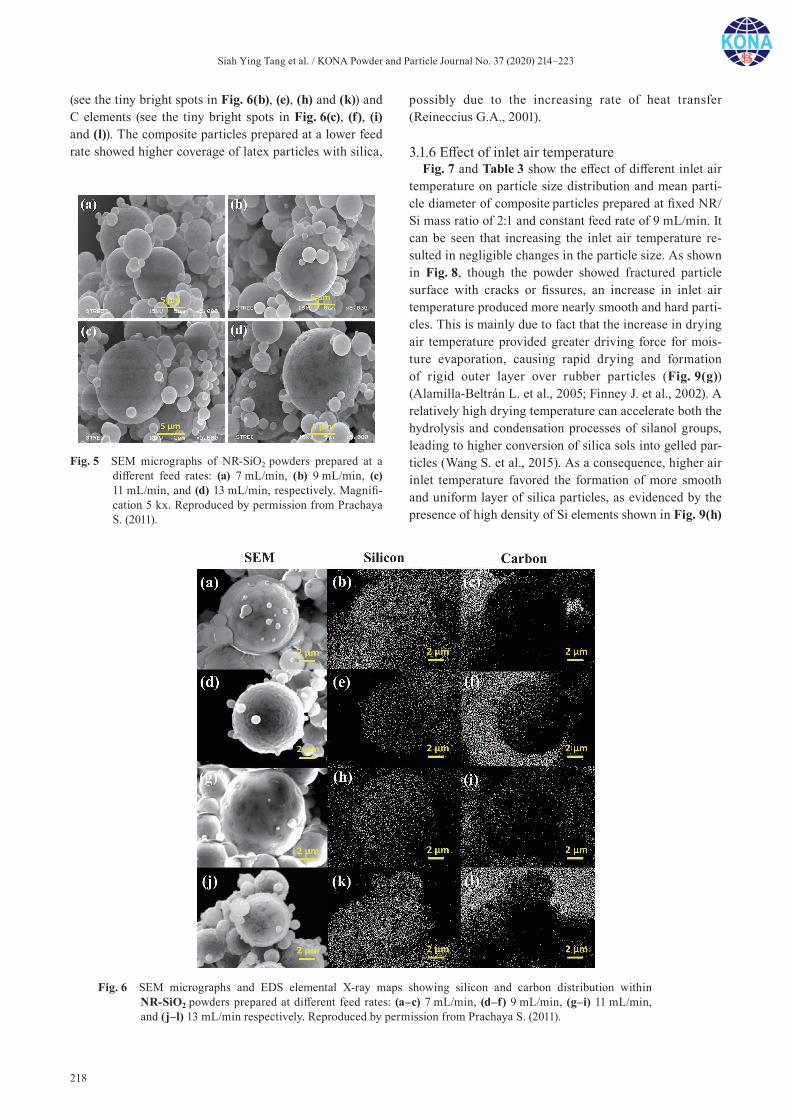
Siah Ying Tang et al. / KONA Powder and Particle Journal No. 37 (2020) 214–223
218
(see the tiny bright spots in Fig. 6(b), (e), (h) and (k)) and C elements (see the tiny bright spots in Fig. 6(c), (f), (i) and (l)). The composite particles prepared at a lower feed rate showed higher coverage of latex particles with silica,
possibly due to the increasing rate of heat transfer (Reineccius G.A., 2001).
3.1.6 Effect of inlet air temperatureFig. 7 and Table 3 show the effect of different inlet air
temperature on particle size distribution and mean parti-cle diameter of composite particles prepared at fixed NR/Si mass ratio of 2:1 and constant feed rate of 9 mL/min. It can be seen that increasing the inlet air temperature re-sulted in negligible changes in the particle size. As shown in Fig. 8, though the powder showed fractured particle surface with cracks or fissures, an increase in inlet air temperature produced more nearly smooth and hard parti-cles. This is mainly due to fact that the increase in drying air temperature provided greater driving force for mois-ture evaporation, causing rapid drying and formation of rigid outer layer over rubber particles (Fig. 9(g)) (Alamilla-Beltrán L. et al., 2005; Finney J. et al., 2002). A relatively high drying temperature can accelerate both the hydrolysis and condensation processes of silanol groups, leading to higher conversion of silica sols into gelled par-ticles (Wang S. et al., 2015). As a consequence, higher air inlet temperature favored the formation of more smooth and uniform layer of silica particles, as evidenced by the presence of high density of Si elements shown in Fig. 9(h)
Fig. 5 SEM micrographs of NR-SiO2 powders prepared at a different feed rates: (a) 7 mL/min, (b) 9 mL/min, (c) 11 mL/min, and (d) 13 mL/min, respectively. Magnifi-cation 5 kx. Reproduced by permission from Prachaya S. (2011).
Fig. 6 SEM micrographs and EDS elemental X-ray maps showing silicon and carbon distribution within NR-SiO2 powders prepared at different feed rates: (a–c) 7 mL/min, (d–f) 9 mL/min, (g–i) 11 mL/min, and (j–l) 13 mL/min respectively. Reproduced by permission from Prachaya S. (2011).
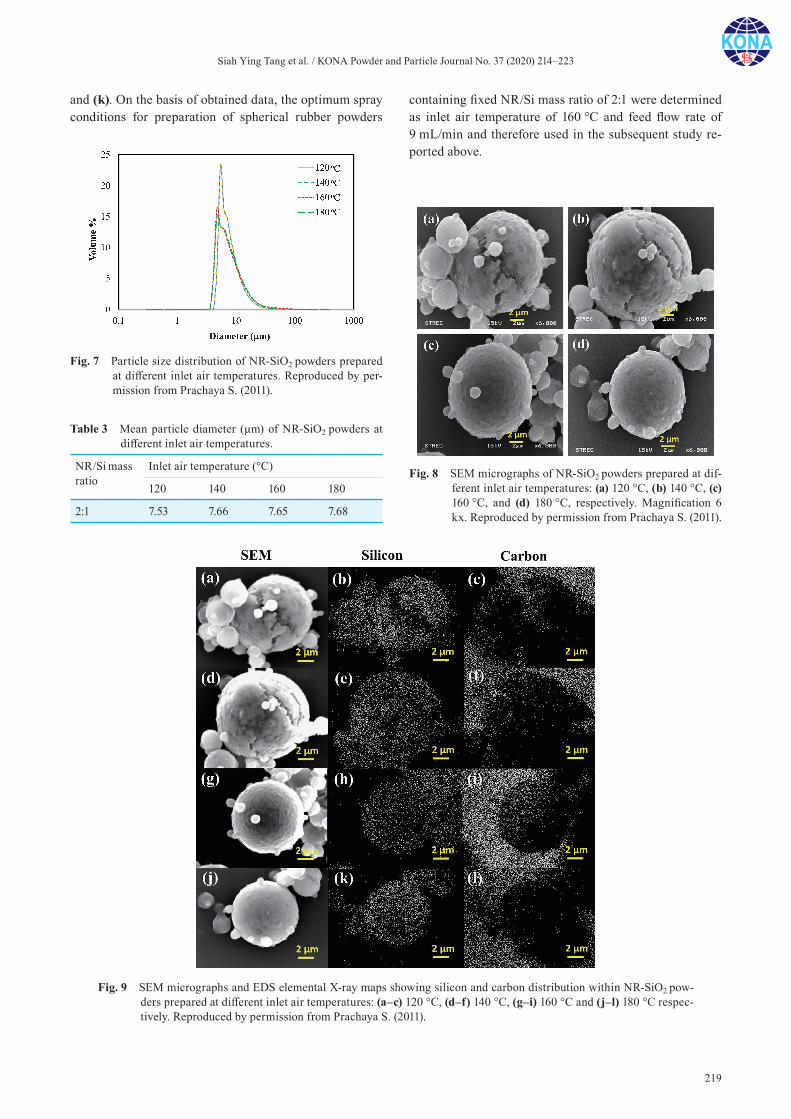
Siah Ying Tang et al. / KONA Powder and Particle Journal No. 37 (2020) 214–223
219
and (k). On the basis of obtained data, the optimum spray conditions for preparation of spherical rubber powders
containing fixed NR/Si mass ratio of 2:1 were determined as inlet air temperature of 160 °C and feed flow rate of 9 mL/min and therefore used in the subsequent study re-ported above.
Fig. 7 Particle size distribution of NR-SiO2 powders prepared at different inlet air temperatures. Reproduced by per-mission from Prachaya S. (2011).
Table 3 Mean particle diameter (μm) of NR-SiO2 powders at different inlet air temperatures.
NR/Si mass ratio
Inlet air temperature (°C)
120 140 160 180
2:1 7.53 7.66 7.65 7.68
Fig. 8 SEM micrographs of NR-SiO2 powders prepared at dif-ferent inlet air temperatures: (a) 120 °C, (b) 140 °C, (c) 160 °C, and (d) 180 °C, respectively. Magnification 6 kx. Reproduced by permission from Prachaya S. (2011).
Fig. 9 SEM micrographs and EDS elemental X-ray maps showing silicon and carbon distribution within NR-SiO2 pow-ders prepared at different inlet air temperatures: (a–c) 120 °C, (d–f) 140 °C, (g–i) 160 °C and (j–l) 180 °C respec-tively. Reproduced by permission from Prachaya S. (2011).
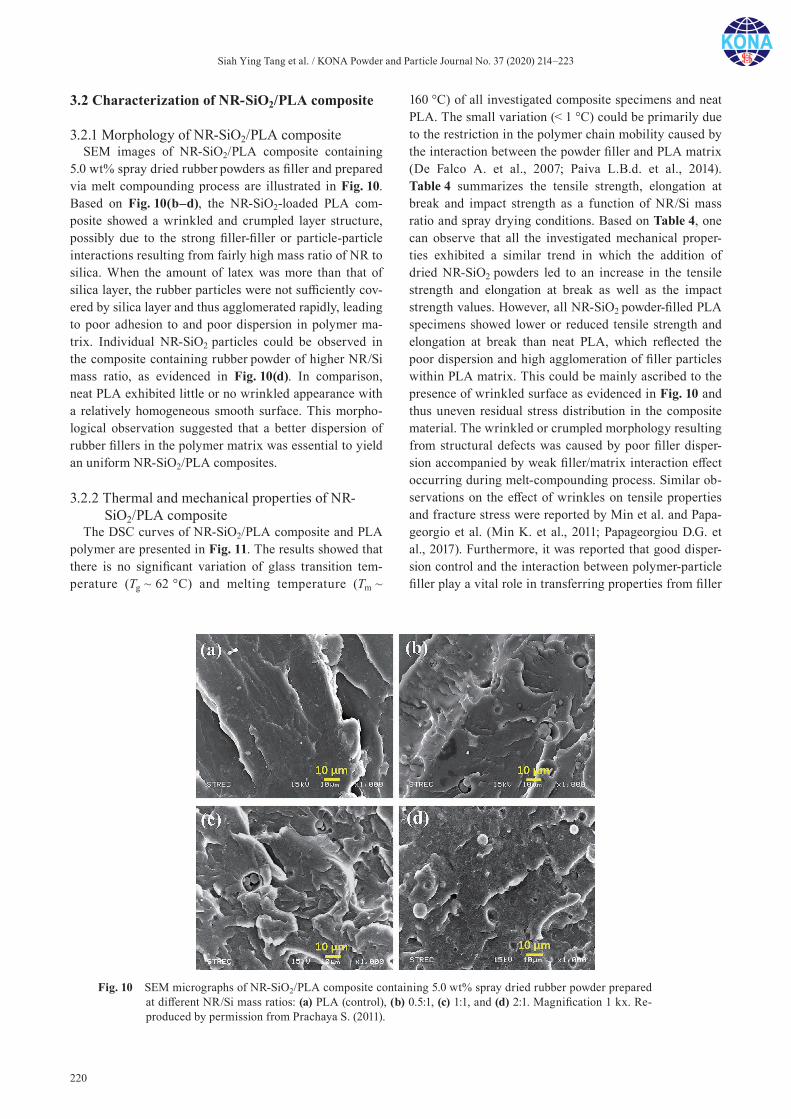
Siah Ying Tang et al. / KONA Powder and Particle Journal No. 37 (2020) 214–223
220
3.2 Characterization of NR-SiO2/PLA composite
3.2.1 Morphology of NR-SiO2/PLA compositeSEM images of NR-SiO2/PLA composite containing
5.0 wt% spray dried rubber powders as filler and prepared via melt compounding process are illustrated in Fig. 10. Based on Fig. 10(b–d), the NR-SiO2-loaded PLA com-posite showed a wrinkled and crumpled layer structure, possibly due to the strong filler-filler or particle-particle interactions resulting from fairly high mass ratio of NR to silica. When the amount of latex was more than that of silica layer, the rubber particles were not sufficiently cov-ered by silica layer and thus agglomerated rapidly, leading to poor adhesion to and poor dispersion in polymer ma-trix. Individual NR-SiO2 particles could be observed in the composite containing rubber powder of higher NR/Si mass ratio, as evidenced in Fig. 10(d). In comparison, neat PLA exhibited little or no wrinkled appearance with a relatively homogeneous smooth surface. This morpho-logical observation suggested that a better dispersion of rubber fillers in the polymer matrix was essential to yield an uniform NR-SiO2/PLA composites.
3.2.2 Thermal and mechanical properties of NR- SiO2/PLA composite
The DSC curves of NR-SiO2/PLA composite and PLA polymer are presented in Fig. 11. The results showed that there is no significant variation of glass transition tem-perature (Tg ~ 62 °C) and melting temperature (Tm ~
160 °C) of all investigated composite specimens and neat PLA. The small variation (< 1 °C) could be primarily due to the restriction in the polymer chain mobility caused by the interaction between the powder filler and PLA matrix (De Falco A. et al., 2007; Paiva L.B.d. et al., 2014). Table 4 summarizes the tensile strength, elongation at break and impact strength as a function of NR/Si mass ratio and spray drying conditions. Based on Table 4, one can observe that all the investigated mechanical proper-ties exhibited a similar trend in which the addition of dried NR-SiO2 powders led to an increase in the tensile strength and elongation at break as well as the impact strength values. However, all NR-SiO2 powder-filled PLA specimens showed lower or reduced tensile strength and elongation at break than neat PLA, which reflected the poor dispersion and high agglomeration of filler particles within PLA matrix. This could be mainly ascribed to the presence of wrinkled surface as evidenced in Fig. 10 and thus uneven residual stress distribution in the composite material. The wrinkled or crumpled morphology resulting from structural defects was caused by poor filler disper-sion accompanied by weak filler/matrix interaction effect occurring during melt-compounding process. Similar ob-servations on the effect of wrinkles on tensile properties and fracture stress were reported by Min et al. and Papa-georgio et al. (Min K. et al., 2011; Papageorgiou D.G. et al., 2017). Furthermore, it was reported that good disper-sion control and the interaction between polymer-particle filler play a vital role in transferring properties from filler
Fig. 10 SEM micrographs of NR-SiO2/PLA composite containing 5.0 wt% spray dried rubber powder prepared at different NR/Si mass ratios: (a) PLA (control), (b) 0.5:1, (c) 1:1, and (d) 2:1. Magnification 1 kx. Re-produced by permission from Prachaya S. (2011).
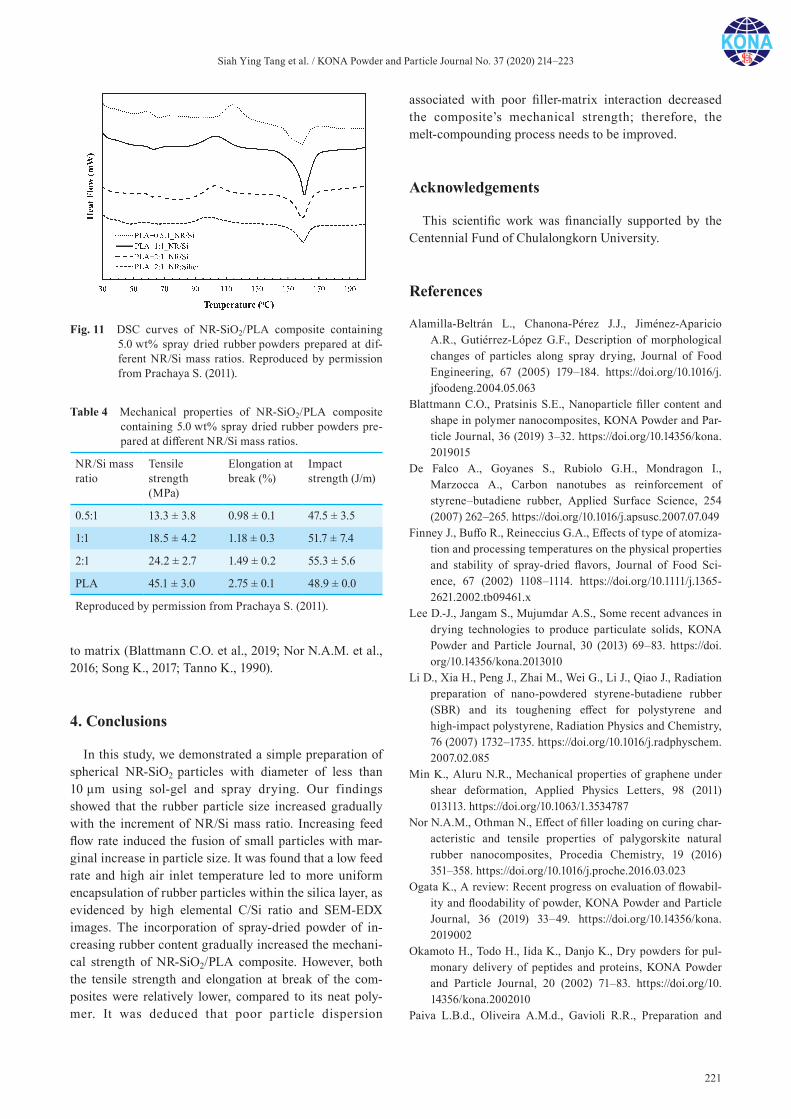
Siah Ying Tang et al. / KONA Powder and Particle Journal No. 37 (2020) 214–223
221
to matrix (Blattmann C.O. et al., 2019; Nor N.A.M. et al., 2016; Song K., 2017; Tanno K., 1990).
4. Conclusions
In this study, we demonstrated a simple preparation of spherical NR-SiO2 particles with diameter of less than 10 μm using sol-gel and spray drying. Our findings showed that the rubber particle size increased gradually with the increment of NR/Si mass ratio. Increasing feed flow rate induced the fusion of small particles with mar-ginal increase in particle size. It was found that a low feed rate and high air inlet temperature led to more uniform encapsulation of rubber particles within the silica layer, as evidenced by high elemental C/Si ratio and SEM-EDX images. The incorporation of spray-dried powder of in-creasing rubber content gradually increased the mechani-cal strength of NR-SiO2/PLA composite. However, both the tensile strength and elongation at break of the com-posites were relatively lower, compared to its neat poly-mer. It was deduced that poor particle dispersion
associated with poor filler-matrix interaction decreased the composite’s mechanical strength; therefore, the melt-compounding process needs to be improved.
Acknowledgements
This scientific work was financially supported by the Centennial Fund of Chulalongkorn University.
References
Alamilla-Beltrán L., Chanona-Pérez J.J., Jiménez-Aparicio A.R., Gutiérrez-López G.F., Description of morphological changes of particles along spray drying, Journal of Food Engineering, 67 (2005) 179–184. https://doi.org/10.1016/j. jfoodeng.2004.05.063
Blattmann C.O., Pratsinis S.E., Nanoparticle filler content and shape in polymer nanocomposites, KONA Powder and Par-ticle Journal, 36 (2019) 3–32. https://doi.org/10.14356/kona. 2019015
De Falco A., Goyanes S., Rubiolo G.H., Mondragon I., Marzocca A., Carbon nanotubes as reinforcement of styrene–butadiene rubber, Applied Surface Science, 254 (2007) 262–265. https://doi.org/10.1016/j.apsusc.2007.07.049
Finney J., Buffo R., Reineccius G.A., Effects of type of atomiza-tion and processing temperatures on the physical properties and stability of spray-dried flavors, Journal of Food Sci-ence, 67 (2002) 1108–1114. https://doi.org/10.1111/j.1365-2621.2002.tb09461.x
Lee D.-J., Jangam S., Mujumdar A.S., Some recent advances in drying technologies to produce particulate solids, KONA Powder and Particle Journal, 30 (2013) 69–83. https://doi.org/10.14356/kona.2013010
Li D., Xia H., Peng J., Zhai M., Wei G., Li J., Qiao J., Radiation preparation of nano-powdered styrene-butadiene rubber (SBR) and its toughening effect for polystyrene and high-impact polystyrene, Radiation Physics and Chemistry, 76 (2007) 1732–1735. https://doi.org/10.1016/j.radphyschem. 2007.02.085
Min K., Aluru N.R., Mechanical properties of graphene under shear deformation, Applied Physics Letters, 98 (2011) 013113. https://doi.org/10.1063/1.3534787
Nor N.A.M., Othman N., Effect of filler loading on curing char-acteristic and tensile properties of palygorskite natural rubber nanocomposites, Procedia Chemistry, 19 (2016) 351–358. https://doi.org/10.1016/j.proche.2016.03.023
Ogata K., A review: Recent progress on evaluation of flowabil-ity and floodability of powder, KONA Powder and Particle Journal, 36 (2019) 33–49. https://doi.org/10.14356/kona. 2019002
Okamoto H., Todo H., Iida K., Danjo K., Dry powders for pul-monary delivery of peptides and proteins, KONA Powder and Particle Journal, 20 (2002) 71–83. https://doi.org/10. 14356/kona.2002010
Paiva L.B.d., Oliveira A.M.d., Gavioli R.R., Preparation and
Table 4 Mechanical properties of NR-SiO2/PLA composite containing 5.0 wt% spray dried rubber powders pre-pared at different NR/Si mass ratios.
NR/Si mass ratio
Tensile strength (MPa)
Elongation at break (%)
Impact strength (J/m)
0.5:1 13.3 ± 3.8 0.98 ± 0.1 47.5 ± 3.5
1:1 18.5 ± 4.2 1.18 ± 0.3 51.7 ± 7.4
2:1 24.2 ± 2.7 1.49 ± 0.2 55.3 ± 5.6
PLA 45.1 ± 3.0 2.75 ± 0.1 48.9 ± 0.0
Reproduced by permission from Prachaya S. (2011).
Fig. 11 DSC curves of NR-SiO2/PLA composite containing 5.0 wt% spray dried rubber powders prepared at dif-ferent NR/Si mass ratios. Reproduced by permission from Prachaya S. (2011).
Siah Ying Tang et al. / KONA Powder and Particle Journal No. 37 (2020) 214–223
222
properties of rubber powder from modified-SBR latex by spray drying process, Powder Technology, 264 (2014) 507–513. https://doi.org/10.1016/j.powtec.2014.05.060
Papageorgiou D.G., Kinloch I.A., Young R.J., Mechanical prop-erties of graphene and graphene-based nanocomposites, Progress in Materials Science, 90 (2017) 75–127. https://doi.org/10.1016/j.pmatsci.2017.07.004
Peng J., Zhang X., Qiao J., Wei G., Radiation preparation of ultrafine carboxylated styrene–butadiene rubber powders and application for nylon 6 as an impact modifier, Journal of Applied Polymer Science, 86 (2002) 3040–3046. https://doi.org/10.1002/app.11323
Peng Z., Kong L.X., Li S.-D., Chen Y., Huang M.F., Self- assembled natural rubber/silica nanocomposites: Its prepa-ration and characterization, Composites Science and Technology, 67 (2007) 3130–3139. https://doi.org/10.1016/j.compscitech.2007.04.016
Prachaya S., Preparation of natural rubber/silica composite powder by spray drying, Master thesis, Department of Chemical Engineering, Chulalongkorn University, 2011.
Reineccius G.A. Multiple-core encapsulation—The Spray Dry-ing of Food Ingredients, Microencapsulation of Food Ingre-dients, Leatherhead Publishing Surrey, 2001, pp. 151–185.
Sae-Oui P., Sirisinha C., Sa-nguanthammarong P., Thaptong P., Properties and recyclability of thermoplastic elastomer pre-pared from natural rubber powder (NRP) and high density polyethylene (HDPE), Polymer Testing, 29 (2010) 346–351. https://doi.org/10.1016/j.polymertesting.2009.12.010
Sen D., Spalla O., Belloni L., Charpentier T., Thill A., Tempera-ture effects on the composition and microstructure of spray-dried nanocomposite powders, Langmuir, 22 (2006) 3798–3806. https://doi.org/10.1021/la052775x
Song K., Micro- and Nano-Fillers Used in the Rubber Industry, Progress in Rubber Nanocomposites, Woodhead Publish-ing, 2017, pp. 41–80.
Talako T., Ilyuschenko A., Letsko A., SHS powders for thermal spray coating, KONA Powder and Particle Journal, 27 (2009) 55–72. https://doi.org/10.14356/kona.2009008
Tanno K., Current status of the mechanofusion process for pro-ducing composite particles, KONA Powder and Particle Journal, 8 (1990) 74–82. https://doi.org/10.14356/kona. 1990014
Thill A., Spalla O., Influence of templating latex on spray dried nanocomposite powders studied by small angle scattering, Journal of Colloid and Interface Science, 291 (2005) 477–488. https://doi.org/10.1016/j.jcis.2005.05.070
Tong H.H.Y., Chow A.H.L., Control of physical forms of drug particles for pulmonary delivery by spray drying and supercritical fluid processing, KONA Powder and Particle Journal, 24 (2006) 27–40. https://doi.org/10.14356/kona. 2006007
Wang Q., Song Q., Qiao J., Zhang X., Zhang L., Song Z., Good dispersion of hydrophilic nanoscale calcium carbonate par-ticles in nitrile butadiene rubber matrix, Polymer, 52 (2011) 3496–3502. https://doi.org/10.1016/j.polymer.2011.05.037
Wang S., Wang D.K., Smart S., Diniz da Costa J.C., Ternary phase-separation investigation of sol-gel derived silica from ethyl silicate 40, Scientific Reports, 5 (2015) 14560. DOI: https://doi.org/10.1038/srep14560
Zhou X., Zhu Y., Gong Q., Liang J., Preparation and properties of the powder SBR composites filled with CNTs by spray drying process, Materials Letters, 60 (2006) 3769–3775. https://doi.org/10.1016/j.matlet.2006.03.147
Siah Ying Tang et al. / KONA Powder and Particle Journal No. 37 (2020) 214–223
223
Authors’ Short Biographies
Patrick Tang Siah Ying
Dr. Patrick Tang Siah Ying is a Senior Lecturer at School of Engineering, Monash University Malaysia. He received his BEng degree in Chemical Engineering from Uni-versity of Malaya, Malaysia in 2008. He obtained his PhD degree in Chemical Engineer-ing from The University of Nottingham in 2012. Between 2012–2014, he was as an Assistant Professor at University of Tunku Abdul Rahman (UTAR). In 2019, he did col-laboration research in Center of Excellence in Particle and Materials Processing Tech-nology supported by Centennial Fund of Chulalongkorn University. His current research focuses on micro/nano-encapsulation, cellulosic nanocomposite and cavitation technol-ogy.
Prachaya Sopanon
Prachaya Sopanon graduated from Center of Excellence in Particle and Materials Pro-cessing Technology under supervision of Assistant Prof. Apinan Soottitantawat. He re-ceived his BEng and MEng degree in Chemical Engineering from Chulalongkorn University in 2010 and 2012, respectively. He is now working as process engineer in Chevron Thailand Exploration and Production, Ltd.
Wiwut Tanthapanichakoon
Professor Wiwut Tanthapanichakoon is a Technology Adviser at SCG Chemicals Co. Ltd. in Thailand, Fellow of Academy of Science, Royal Society of Thailand, and Emeritus Professor of Tokyo Institute of Technology in Japan and also Chulalongkorn University in Thailand. He was the founding Executive Director of the National Nano-technology Center at the National Science and Technology Development Agency in Thailand. He holds a BEng degree in Chemical Engineering from Kyoto University in Japan, and a PhD degree in Chemical Engineering from The University of Texas at Austin. His current research focuses on particle technology, process analysis and simula-tion, and reaction engineering.
Apinan Soottitantawat
Assistant Prof. Apinan Soottitantawat is Head of Center of Excellent in Particle and Materials Processing Technology, Department of Chemical Engineering, Faculty of En-gineering, Chulalongkorn University. He received his BEng degree in Chemical Engi-neering from Chulalongkorn University, Thailand in 1998. He obtained his DEng degree in Molecular and Biochemical Engineering from Tottori University, Japan in 2005. He was researcher at National Institute of Advanced Industrial Science and Technology (AIST), Japan and National Science and Technology Development Agency (NSTDA), Thailand. His current research focuses on particle technology, encapsulation technology and chemical process scale-up.
KONA Powder and Particle Journal No. 37 (2020) 224–232/Doi:10.14356/kona.2020011 Original Research Paper
224Copyright © 2020 The Authors. Published by Hosokawa Powder Technology Foundation. This is an open ac-cess article under the CC BY license (http://creativecommons.org/licenses/by/4.0/).
Synthesis of Precision Gold Nanoparticles Using Turkevich Method †
Jiaqi Dong 1, Paul L. Carpinone 1, Georgios Pyrgiotakis 2, Philip Demokritou 2 and Brij M. Moudgil 1*
1 Center for Particulate and Surfactant Systems, Department of Materials Science and Engineering, University of Florida, USA2 HSPH-NIEHS Nanosafety Center, School of Public Health, Harvard University, USA
AbstractGold nanoparticles (AuNPs) exhibit unique size-dependent physiochemical properties that make them attractive for a wide range of applications. However, the large-scale availability of precision AuNPs has been minimal. Not only must the required nanoparticles be of precise size and morphology, but they must also be of exceedingly narrow size distribution to yield accurate and reliable performance. The present study aims to synthesize precision AuNPs and to assess the advantages and limitations of the Turkevich method—one of the common chemical synthesis technique. Colloidal AuNPs from 15 nm to 50 nm in diameter were synthesized using the Turkevich method. The effect of the molar ratio of the reagent mixture (trisodium citrate to gold chloride), the scaled-up batch size, the initial gold chloride concentration, and the reaction temperature was studied. The morphology, optical property, surface chemistry, and chemical composition of AuNPs were thoroughly characterized. It was determined that the as-synthesized AuNPs between 15 nm and 30 nm exhibit well-defined size and shape, and narrow size distribution (PDI < 0.20). However, the AuNPs became more polydispersed and less spherical in shape as the particle size increased.
Keywords: gold nanoparticles, nanomaterials, Turkevich Method, synthesis, characterization
1. Introduction
Gold nanoparticle (AuNP) is one of the most exten-sively studied engineered nanomaterials (ENMs). The original work of AuNP synthesis can be traced back to 1940 when the formation of colloidal gold upon reacting gold chloride (HAuCl4) and trisodium citrate (Na3C6H5O7 or NaCt) was first reported (Hauser E.A. and Lynn J.E., 1940). The detailed work of Turkevich and his coworkers (Turkevich J. et al., 1951) has become one of the mile-stones of AuNPs synthesis. Since then, the synthesis method has been modified and improved (Frens G., 1973) for a diverse area of interests including the development of chemical sensors for water quality analysis using sur-face enhanced Raman spectroscopy (SERS) (Tian F. et al., 2014), surface-induced catalytic activities (Lopez N. et al., 2004; Xie W. et al., 2012), drug delivery in biological sys-tems (Ghosh P. et al., 2008; Saallah S. and Lenggoro I.W.,
2018) and nano-toxicology studies (Beltran-Huarac J. et al., 2018; Somasundaran P. et al., 2010; Grobmyer S.R. and Moudgil B.M., 2010; Pyrgiotakis G. et al., 2018). The reason that AuNPs are attractive to a wide variety of ap-plications is because of the surface plasmon resonance (SPR), a size- and shape-dependent property (Haiss W. et al., 2007) and their biocompatibility (Sondi I. and Salopek-Sondi B., 2004; Zhang X., 2015).
Despite all the unique properties of AuNPs, the preci-sion control of the particle size and size distribution pres-ents a major challenge in this field often due to the fact of batch-to-batch variation in a local temperature gradient, the efficiency of reagent mixing and the resulting local concentration gradient (Kimling J. et al., 2006). For this reason, the availability of high precision AuNPs is rather limited and the price could easily go above $10,000 per gram. So far, only a few studies have discussed the method and effect of scaled-up AuNP synthesis. This study discusses the detailed procedure to synthesize pre-cision AuNPs with the mean particle size between 15 nm and 30 nm, polydispersity index (PDI) less than 0.20, and scale up the batch reactor size to 1.5 L.
† Received 25 April 2019; Accepted 6 June 2019 J-STAGE Advance published online 24 August 2019
1 Gainesville, FL 32611, United States2 Boston, MA, 02115, United States* Corresponding author: Brij M. Moudgil; E-mail: [email protected]; TEL: +1-352-846-1197
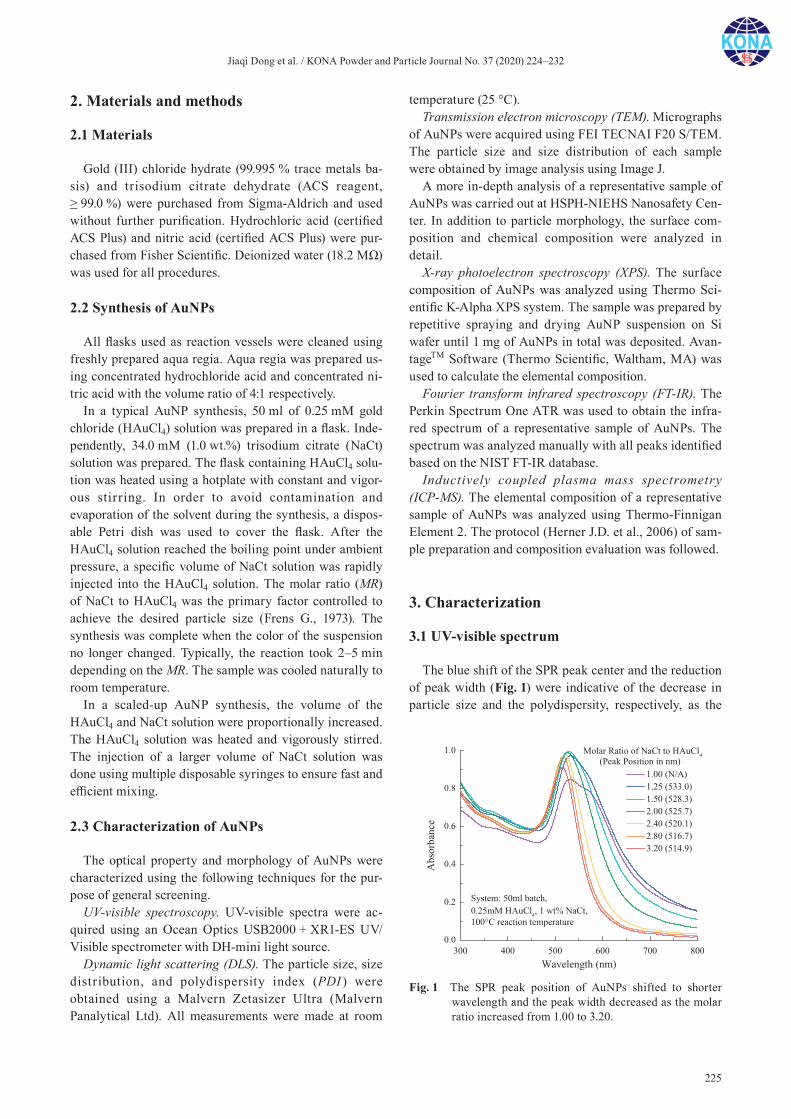
Jiaqi Dong et al. / KONA Powder and Particle Journal No. 37 (2020) 224–232
225
2. Materials and methods
2.1 Materials
Gold (III) chloride hydrate (99.995 % trace metals ba-sis) and trisodium citrate dehydrate (ACS reagent, ≥ 99.0 %) were purchased from Sigma-Aldrich and used without further purification. Hydrochloric acid (certified ACS Plus) and nitric acid (certified ACS Plus) were pur-chased from Fisher Scientific. Deionized water (18.2 MΩ) was used for all procedures.
2.2 Synthesis of AuNPs
All flasks used as reaction vessels were cleaned using freshly prepared aqua regia. Aqua regia was prepared us-ing concentrated hydrochloride acid and concentrated ni-tric acid with the volume ratio of 4:1 respectively.
In a typical AuNP synthesis, 50 ml of 0.25 mM gold chloride (HAuCl4) solution was prepared in a flask. Inde-pendently, 34.0 mM (1.0 wt.%) trisodium citrate (NaCt) solution was prepared. The flask containing HAuCl4 solu-tion was heated using a hotplate with constant and vigor-ous stirring. In order to avoid contamination and evaporation of the solvent during the synthesis, a dispos-able Petri dish was used to cover the flask. After the HAuCl4 solution reached the boiling point under ambient pressure, a specific volume of NaCt solution was rapidly injected into the HAuCl4 solution. The molar ratio (MR) of NaCt to HAuCl4 was the primary factor controlled to achieve the desired particle size (Frens G., 1973). The synthesis was complete when the color of the suspension no longer changed. Typically, the reaction took 2–5 min depending on the MR. The sample was cooled naturally to room temperature.
In a scaled-up AuNP synthesis, the volume of the HAuCl4 and NaCt solution were proportionally increased. The HAuCl4 solution was heated and vigorously stirred. The injection of a larger volume of NaCt solution was done using multiple disposable syringes to ensure fast and efficient mixing.
2.3 Characterization of AuNPs
The optical property and morphology of AuNPs were characterized using the following techniques for the pur-pose of general screening.
UV-visible spectroscopy. UV-visible spectra were ac-quired using an Ocean Optics USB2000 + XR1-ES UV/Visible spectrometer with DH-mini light source.
Dynamic light scattering (DLS). The particle size, size distribution, and polydispersity index (PDI ) were obtained using a Malvern Zetasizer Ultra (Malvern Panalytical Ltd). All measurements were made at room
temperature (25 °C).Transmission electron microscopy (TEM). Micrographs
of AuNPs were acquired using FEI TECNAI F20 S/TEM. The particle size and size distribution of each sample were obtained by image analysis using Image J.
A more in-depth analysis of a representative sample of AuNPs was carried out at HSPH-NIEHS Nanosafety Cen-ter. In addition to particle morphology, the surface com-position and chemical composition were analyzed in detail.
X-ray photoelectron spectroscopy (XPS). The surface composition of AuNPs was analyzed using Thermo Sci-entific K-Alpha XPS system. The sample was prepared by repetitive spraying and drying AuNP suspension on Si wafer until 1 mg of AuNPs in total was deposited. Avan-tageTM Software (Thermo Scientific, Waltham, MA) was used to calculate the elemental composition.
Fourier transform infrared spectroscopy (FT-IR). The Perkin Spectrum One ATR was used to obtain the infra-red spectrum of a representative sample of AuNPs. The spectrum was analyzed manually with all peaks identified based on the NIST FT-IR database.
Inductively coupled plasma mass spectrometry (ICP-MS). The elemental composition of a representative sample of AuNPs was analyzed using Thermo-Finnigan Element 2. The protocol (Herner J.D. et al., 2006) of sam-ple preparation and composition evaluation was followed.
3. Characterization
3.1 UV-visible spectrum
The blue shift of the SPR peak center and the reduction of peak width (Fig. 1) were indicative of the decrease in particle size and the polydispersity, respectively, as the
Fig. 1 The SPR peak position of AuNPs shifted to shorter wavelength and the peak width decreased as the molar ratio increased from 1.00 to 3.20.
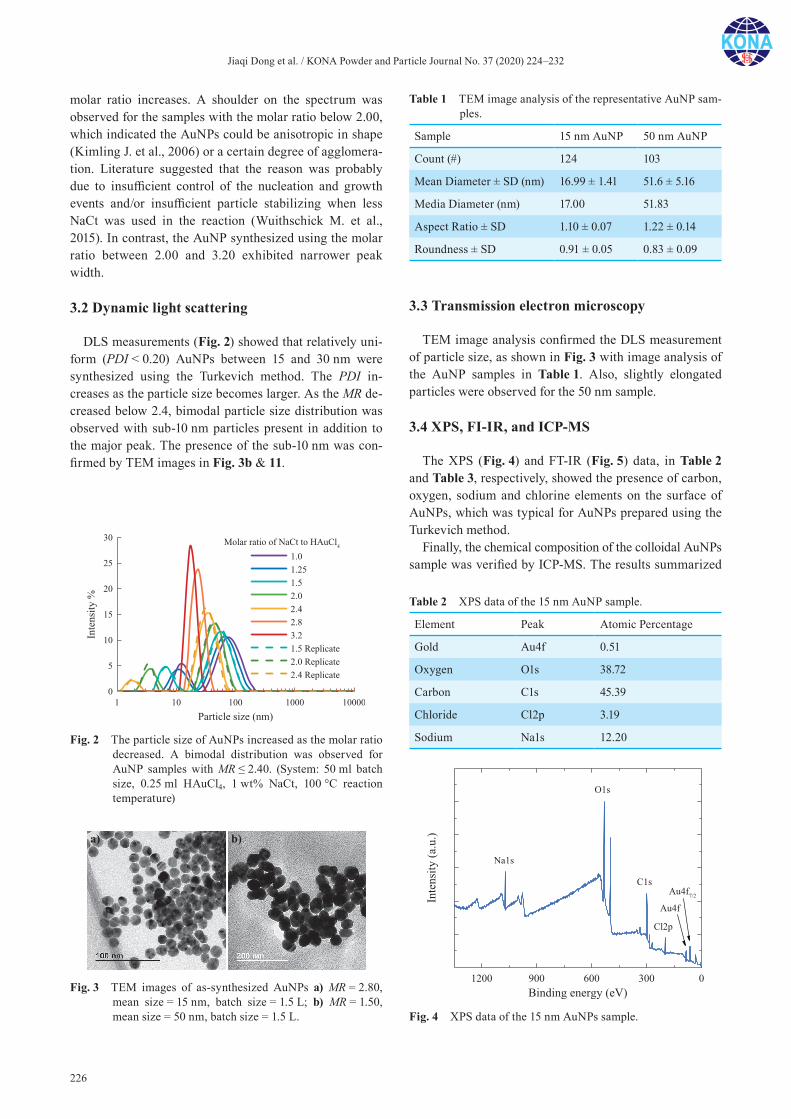
Jiaqi Dong et al. / KONA Powder and Particle Journal No. 37 (2020) 224–232
226
molar ratio increases. A shoulder on the spectrum was observed for the samples with the molar ratio below 2.00, which indicated the AuNPs could be anisotropic in shape (Kimling J. et al., 2006) or a certain degree of agglomera-tion. Literature suggested that the reason was probably due to insufficient control of the nucleation and growth events and/or insufficient particle stabilizing when less NaCt was used in the reaction (Wuithschick M. et al., 2015). In contrast, the AuNP synthesized using the molar ratio between 2.00 and 3.20 exhibited narrower peak width.
3.2 Dynamic light scattering
DLS measurements (Fig. 2) showed that relatively uni-form (PDI < 0.20) AuNPs between 15 and 30 nm were synthesized using the Turkevich method. The PDI in-creases as the particle size becomes larger. As the MR de-creased below 2.4, bimodal particle size distribution was observed with sub-10 nm particles present in addition to the major peak. The presence of the sub-10 nm was con-firmed by TEM images in Fig. 3b & 11.
3.3 Transmission electron microscopy
TEM image analysis confirmed the DLS measurement of particle size, as shown in Fig. 3 with image analysis of the AuNP samples in Table 1. Also, slightly elongated particles were observed for the 50 nm sample.
3.4 XPS, FI-IR, and ICP-MS
The XPS (Fig. 4) and FT-IR (Fig. 5) data, in Table 2 and Table 3, respectively, showed the presence of carbon, oxygen, sodium and chlorine elements on the surface of AuNPs, which was typical for AuNPs prepared using the Turkevich method.
Finally, the chemical composition of the colloidal AuNPs sample was verified by ICP-MS. The results summarized
Fig. 2 The particle size of AuNPs increased as the molar ratio decreased. A bimodal distribution was observed for AuNP samples with MR ≤ 2.40. (System: 50 ml batch size, 0.25 ml HAuCl4, 1 wt% NaCt, 100 °C reaction temperature)
Fig. 3 TEM images of as-synthesized AuNPs a) MR = 2.80, mean size = 15 nm, batch size = 1.5 L; b) MR = 1.50, mean size = 50 nm, batch size = 1.5 L.
Table 1 TEM image analysis of the representative AuNP sam-ples.
Sample 15 nm AuNP 50 nm AuNP
Count (#) 124 103
Mean Diameter ± SD (nm) 16.99 ± 1.41 51.6 ± 5.16
Media Diameter (nm) 17.00 51.83
Aspect Ratio ± SD 1.10 ± 0.07 1.22 ± 0.14
Roundness ± SD 0.91 ± 0.05 0.83 ± 0.09
Fig. 4 XPS data of the 15 nm AuNPs sample.
Table 2 XPS data of the 15 nm AuNP sample.
Element Peak Atomic Percentage
Gold Au4f 0.51
Oxygen O1s 38.72
Carbon C1s 45.39
Chloride Cl2p 3.19
Sodium Na1s 12.20
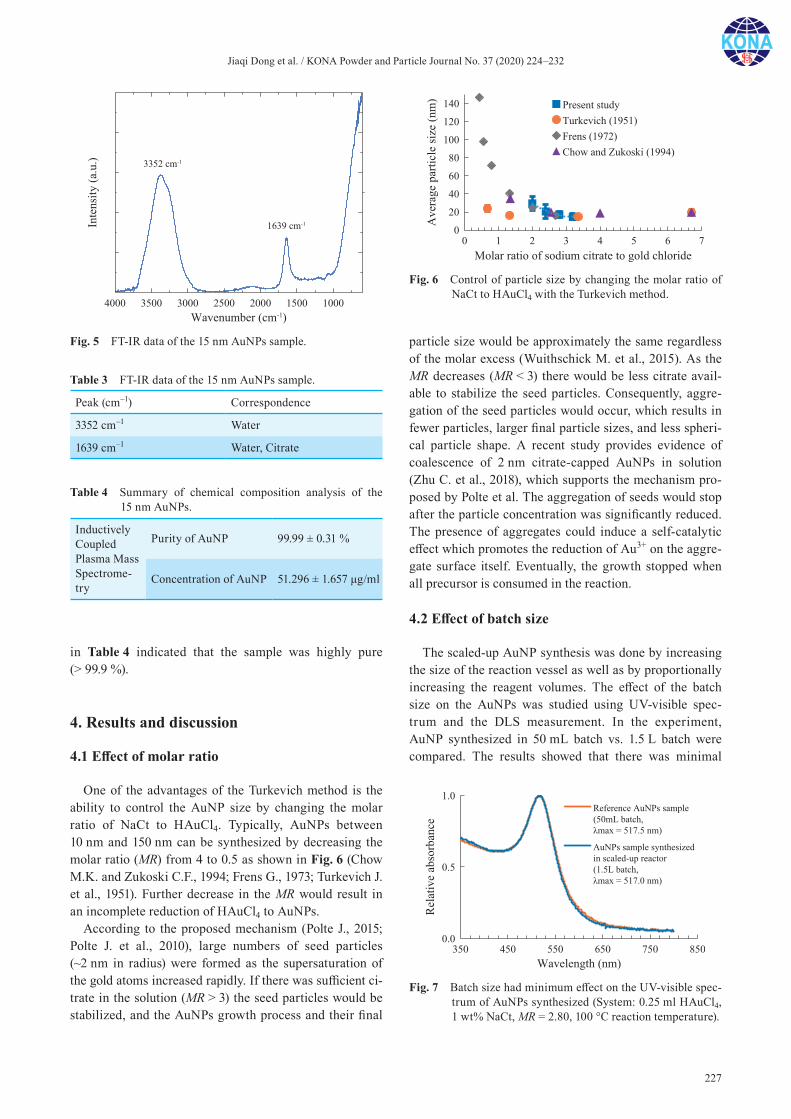
Jiaqi Dong et al. / KONA Powder and Particle Journal No. 37 (2020) 224–232
227
in Table 4 indicated that the sample was highly pure (> 99.9 %).
4. Results and discussion
4.1 Effect of molar ratio
One of the advantages of the Turkevich method is the ability to control the AuNP size by changing the molar ratio of NaCt to HAuCl4. Typically, AuNPs between 10 nm and 150 nm can be synthesized by decreasing the molar ratio (MR) from 4 to 0.5 as shown in Fig. 6 (Chow M.K. and Zukoski C.F., 1994; Frens G., 1973; Turkevich J. et al., 1951). Further decrease in the MR would result in an incomplete reduction of HAuCl4 to AuNPs.
According to the proposed mechanism (Polte J., 2015; Polte J. et al., 2010), large numbers of seed particles (~2 nm in radius) were formed as the supersaturation of the gold atoms increased rapidly. If there was sufficient ci-trate in the solution (MR > 3) the seed particles would be stabilized, and the AuNPs growth process and their final
particle size would be approximately the same regardless of the molar excess (Wuithschick M. et al., 2015). As the MR decreases (MR < 3) there would be less citrate avail-able to stabilize the seed particles. Consequently, aggre-gation of the seed particles would occur, which results in fewer particles, larger final particle sizes, and less spheri-cal particle shape. A recent study provides evidence of coalescence of 2 nm citrate-capped AuNPs in solution (Zhu C. et al., 2018), which supports the mechanism pro-posed by Polte et al. The aggregation of seeds would stop after the particle concentration was significantly reduced. The presence of aggregates could induce a self-catalytic effect which promotes the reduction of Au3+ on the aggre-gate surface itself. Eventually, the growth stopped when all precursor is consumed in the reaction.
4.2 Effect of batch size
The scaled-up AuNP synthesis was done by increasing the size of the reaction vessel as well as by proportionally increasing the reagent volumes. The effect of the batch size on the AuNPs was studied using UV-visible spec-trum and the DLS measurement. In the experiment, AuNP synthesized in 50 mL batch vs. 1.5 L batch were compared. The results showed that there was minimal
Table 3 FT-IR data of the 15 nm AuNPs sample.
Peak (cm–1) Correspondence
3352 cm–1 Water
1639 cm–1 Water, Citrate
Table 4 Summary of chemical composition analysis of the 15 nm AuNPs.
Inductively Coupled Plasma Mass Spectrome-try
Purity of AuNP 99.99 ± 0.31 %
Concentration of AuNP 51.296 ± 1.657 μg/ml
Fig. 6 Control of particle size by changing the molar ratio of NaCt to HAuCl4 with the Turkevich method.
Fig. 5 FT-IR data of the 15 nm AuNPs sample.
Fig. 7 Batch size had minimum effect on the UV-visible spec-trum of AuNPs synthesized (System: 0.25 ml HAuCl4, 1 wt% NaCt, MR = 2.80, 100 °C reaction temperature).

Jiaqi Dong et al. / KONA Powder and Particle Journal No. 37 (2020) 224–232
228
difference in the optical properties (Fig. 7) as well as the particle size, size distribution (Fig. 8) within the tested batch sizes.
4.3 Effect of initial HAuCl4 concentration
The effects of initial HAuCl4 concentration on AuNP size and distribution was investigated. In the experiment, the molar ratio of NaCt to HAuCl4 was held constant at 2.5. AuNP was synthesized under initial HAuCl4 concen-trations between 0.2 mM and 1 mM. The SPR peak posi-tions of the spectra in Fig. 9 stayed relatively constant as the concentration increased, which suggested that the AuNPs particle sizes were not significantly impacted by the initial concentration under the test conditions. How-ever, the peak breadth increased slightly as the initial concentration increased, which indicated that AuNPs be-came more polydispersed. The results agreed with the lit-erature (Zabetakis K. et al., 2012) that the polydispersity was reduced when the initial HAuCl4 concentration was low (< 0.8 mM). However, the AuNP size and size distri-bution would be impacted if the reagent concentration was sufficiently high due to increased ionic strength and
reduced electrostatic repulsion between AuNPs, thus re-duced colloidal stability.
4.4 Effect of reaction temperature
Turkevich showed that a decrease in temperature would result in a decrease in particle size (Turkevich J. et al., 1951). At relatively lower temperatures (< 90 °C), the overall reduction rate and thus the nucleation rate was lower, so that fewer seed particles would be initially pro-duced as compared to a higher temperature. Because the concentration of HAuCl4 was initially the same, the final particle size will be larger if there were fewer seed parti-cles assuming equivalent conversion rate at all tempera-tures tested.
In the present study, the effects of temperature was tested at two different molar ratios of citrate to gold as shown in Fig. 10. At the molar ratio of 2.5 to 1, the parti-cle size decreased with increasing reaction temperature. These results can be explained by the change in kinetics described above. However, at a higher molar ratio, e.g. 7.6:1, no measurable change in the particle size was ob-served.
4.5 Other factors in the Turkevich method
In recent years, the Turkevich method has been further investigated in order to achieve more precise control over the particle size and size distribution by adjusting the re-action conditions. Literature reports suggest that there are additional critical parameters in Turkevich method, such as pH (Li C. et al., 2011; Schulz F. et al., 2014), the order of reagent addition (Ojea-Jiménez I. et al., 2011; Schulz F. et al., 2014; Sivaraman S.K. et al., 2011) and the latent heat of the reaction (Ding W. et al., 2015).
The solution pH could play a critical role in the AuNPs formation. The precursor HAuCl4 exists as different com-plexes [AuCl4–x(OHx)]– depending on the solution pH (Wuithschick M. et al., 2015). As the pH of the solution
Fig. 8 Batch size had a minimum effect on the particle size and size distribution of AuNPs synthesized under the given conditions. (System: 0.25 ml HAuCl4, 1 wt% NaCt, MR = 2.80, 100 °C reaction temperature).
Fig. 9 UV-visible spectra of AuNPs samples synthesized with specific initial gold chloride concentration. (System: 50 ml batch size, MR = 2.5, 100 °C reaction tempera-ture)
Fig. 10 The change in AuNP diameter as a function of the re-action temperature in Turkevich synthesis. The diam-eter was calculated using the method described by Haiss et al. (Haiss W. et al., 2007)
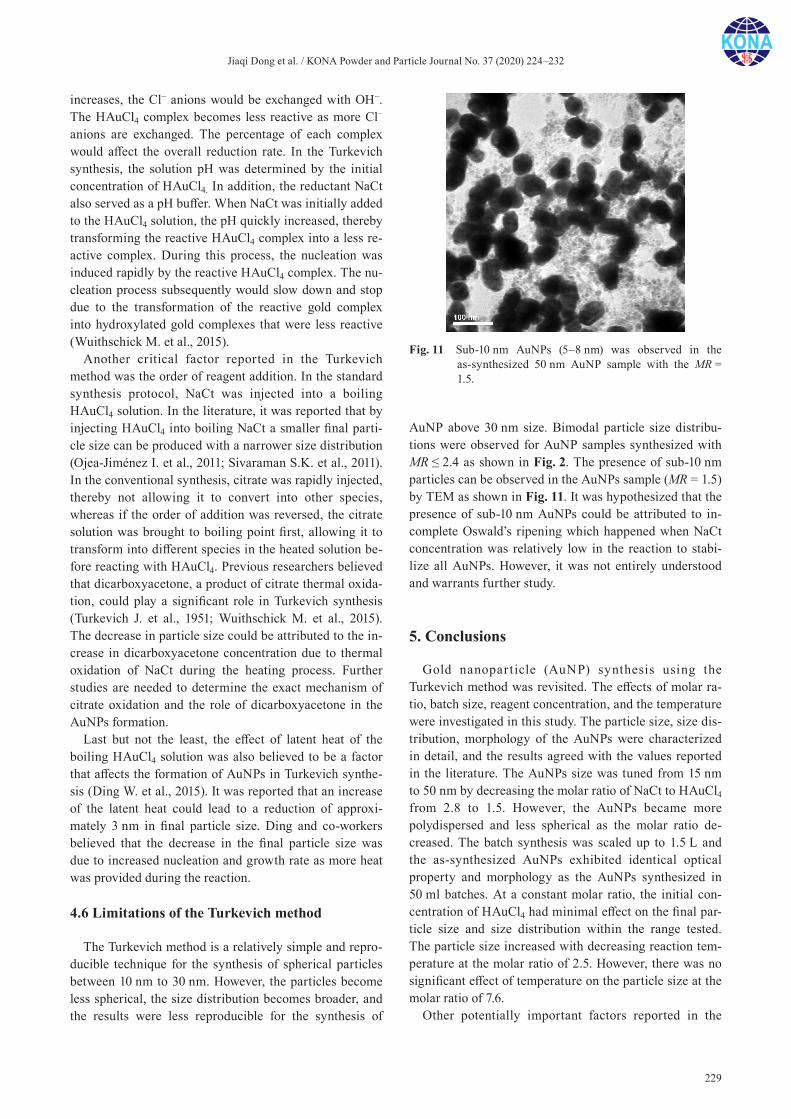
Jiaqi Dong et al. / KONA Powder and Particle Journal No. 37 (2020) 224–232
229
increases, the Cl– anions would be exchanged with OH–. The HAuCl4 complex becomes less reactive as more Cl– anions are exchanged. The percentage of each complex would affect the overall reduction rate. In the Turkevich synthesis, the solution pH was determined by the initial concentration of HAuCl4. In addition, the reductant NaCt also served as a pH buffer. When NaCt was initially added to the HAuCl4 solution, the pH quickly increased, thereby transforming the reactive HAuCl4 complex into a less re-active complex. During this process, the nucleation was induced rapidly by the reactive HAuCl4 complex. The nu-cleation process subsequently would slow down and stop due to the transformation of the reactive gold complex into hydroxylated gold complexes that were less reactive (Wuithschick M. et al., 2015).
Another critical factor reported in the Turkevich method was the order of reagent addition. In the standard synthesis protocol, NaCt was injected into a boiling HAuCl4 solution. In the literature, it was reported that by injecting HAuCl4 into boiling NaCt a smaller final parti-cle size can be produced with a narrower size distribution (Ojea-Jiménez I. et al., 2011; Sivaraman S.K. et al., 2011). In the conventional synthesis, citrate was rapidly injected, thereby not allowing it to convert into other species, whereas if the order of addition was reversed, the citrate solution was brought to boiling point first, allowing it to transform into different species in the heated solution be-fore reacting with HAuCl4. Previous researchers believed that dicarboxyacetone, a product of citrate thermal oxida-tion, could play a significant role in Turkevich synthesis (Turkevich J. et al., 1951; Wuithschick M. et al., 2015). The decrease in particle size could be attributed to the in-crease in dicarboxyacetone concentration due to thermal oxidation of NaCt during the heating process. Further studies are needed to determine the exact mechanism of citrate oxidation and the role of dicarboxyacetone in the AuNPs formation.
Last but not the least, the effect of latent heat of the boiling HAuCl4 solution was also believed to be a factor that affects the formation of AuNPs in Turkevich synthe-sis (Ding W. et al., 2015). It was reported that an increase of the latent heat could lead to a reduction of approxi-mately 3 nm in final particle size. Ding and co-workers believed that the decrease in the final particle size was due to increased nucleation and growth rate as more heat was provided during the reaction.
4.6 Limitations of the Turkevich method
The Turkevich method is a relatively simple and repro-ducible technique for the synthesis of spherical particles between 10 nm to 30 nm. However, the particles become less spherical, the size distribution becomes broader, and the results were less reproducible for the synthesis of
AuNP above 30 nm size. Bimodal particle size distribu-tions were observed for AuNP samples synthesized with MR ≤ 2.4 as shown in Fig. 2. The presence of sub-10 nm particles can be observed in the AuNPs sample (MR = 1.5) by TEM as shown in Fig. 11. It was hypothesized that the presence of sub-10 nm AuNPs could be attributed to in-complete Oswald’s ripening which happened when NaCt concentration was relatively low in the reaction to stabi-lize all AuNPs. However, it was not entirely understood and warrants further study.
5. Conclusions
Gold nanopar ticle (AuNP) synthesis using the Turkevich method was revisited. The effects of molar ra-tio, batch size, reagent concentration, and the temperature were investigated in this study. The particle size, size dis-tribution, morphology of the AuNPs were characterized in detail, and the results agreed with the values reported in the literature. The AuNPs size was tuned from 15 nm to 50 nm by decreasing the molar ratio of NaCt to HAuCl4 from 2.8 to 1.5. However, the AuNPs became more polydispersed and less spherical as the molar ratio de-creased. The batch synthesis was scaled up to 1.5 L and the as-synthesized AuNPs exhibited identical optical property and morphology as the AuNPs synthesized in 50 ml batches. At a constant molar ratio, the initial con-centration of HAuCl4 had minimal effect on the final par-ticle size and size distribution within the range tested. The particle size increased with decreasing reaction tem-perature at the molar ratio of 2.5. However, there was no significant effect of temperature on the particle size at the molar ratio of 7.6.
Other potentially important factors reported in the
Fig. 11 Sub-10 nm AuNPs (5–8 nm) was observed in the as-synthesized 50 nm AuNP sample with the MR = 1.5.
Jiaqi Dong et al. / KONA Powder and Particle Journal No. 37 (2020) 224–232
230
literature include the solution pH, the order of reagent ad-dition, and the latent heat. These factors were not exam-ined in the present study, and need further investigation. Overall, the Turkevich method was found to be reliable for producing precision gold nanoparticles (PDI < 0.20) between 15 nm and 30 nm.
Acknowledgment
This material was based upon the work supported by NSF (Award No. 1602032), OndaVia, Inc., Research re-ported in this publication was also supported by National Institute of Environmental Health Sciences under Award Number (NIH grant # U24ES026946). The engineered nanomaterial used in the research presented in this publi-cation have been synthesized, characterized, and pro-vided by the Engineered Nanomaterials Resource and Coordination Core established at Harvard T. H. Chan School of Public Health (NIH grant # U24ES026946) as part of the Nanotechnology Health Implications Research (NHIR) Consortium.
Any opinions, findings and conclusions or recommen-dations expressed in this material were those of the au-thor(s) and do not necessarily reflect the views of the National Science Foundation and the National Institutes of Health.
References
Beltran-Huarac J., Zhang Z., Pyrgiotakis G., DeLoid G., Vaze N., Demokritou P., Development of reference metal and metal oxide engineered nanomaterials for nanotoxicology research using high throughput and precision flame spray synthesis approaches, NanoImpact, 10 (2018) 26–37. DOI: 10.1016/j.impact.2017.11.007
Chow M.K., Zukoski C.F., Gold sol formation mechanisms: Role of colloidal stability, Journal of Colloid and Interface Science, 165 (1994) 97–109. DOI: 10.1006/jcis.1994.1210
Ding W., Zhang P., Li Y., Xia H., Wang D., Tao X., Effect of latent heat in boiling water on the synthesis of gold nanoparticles of different sizes by using the Turkevich method, ChemPhysChem, 16 (2015) 447–454. DOI: 10.1002/cphc.201402648
Frens G., Controlled nucleation for the regulation of the particle size in monodisperse gold suspensions, Nature Physical Science, 241 (1973) 20–22. DOI: 10.1038/physci241020a0
Ghosh P., Han G., De M., Kim C.K., Rotello V.M., Gold nanoparticles in delivery applications, Advanced Drug Delivery Reviews, 60 (2008) 1307–1315. DOI: 10.1016/j.addr.2008.03.016
Grobmyer S.R., Moudgil B.M., Cancer Nanotechnology Meth-ods and Protocols, Humana Press, New York, 2010, ISBN: 978-1-60761-608-5. DOI: 10.1007/978-1-60761-609-2
Haiss W., Thanh N.T., Aveyard J., Fernig D.G., Determination of size and concentration of gold nanoparticles from UV− Vis spectra, Analytical Chemistry, 79 (2007) 4215–4221. DOI: 10.1021/ac0702084
Hauser E.A., Lynn J.E., Experiments in Colloid Chemistry, McGraw-Hill Book Company, Incorporated, 1940. DOI: 10.1021/j150409a016
Herner J.D., Green P.G., Kleeman M.J., Measuring the trace elemental composition of size-resolved airborne particles, Environmental Science & Technology, 40 (2006) 1925–1933. DOI: 10.1021/es052315q
Kimling J., Maier M., Okenve B., Kotaidis V., Ballot H., Plech A., Turkevich method for gold nanoparticle synthesis revis-ited, The Journal of Physical Chemistry B, 110 (2006) 15700–15707. DOI: 10.1021/jp061667w
Li C., Li D., Wan G., Xu J., Hou W., Facile synthesis of concen-trated gold nanoparticles with low size-distribution in water: Temperature and pH controls, Nanoscale Research Letters, 6 (2011) 440–440. DOI: 10.1186/1556-276X-6-440
Lopez N., Janssens T.V.W., Clausen B.S., Xu Y., Mavrikakis M., Bligaard T., Nørskov J.K., On the origin of the catalytic activity of gold nanoparticles for low-temperature CO oxi-dation, Journal of Catalysis, 223 (2004) 232–235. DOI: 10.1016/j.jcat.2004.01.001
Ojea-Jiménez I., Bastús N.G., Puntes V., Influence of the sequence of the reagents addition in the citrate-mediated synthesis of gold nanoparticles, The Journal of Physical Chemistry C, 115 (2011) 15752–15757. DOI: 10.1021/jp2017242
Polte J., Fundamental growth principles of colloidal metal nanoparticles–a new perspective, CrystEngComm, 17 (2015) 6809–6830. DOI: 10.1039/c5ce01014d
Polte J., Ahner T.T., Delissen F., Sokolov S., Emmerling F., Thünemann A.F., Kraehnert R., Mechanism of gold nanoparticle formation in the classical citrate synthesis method derived from coupled in situ XANES and SAXS evaluation, Journal of the American Chemical Society, 132 (2010) 1296–1301. DOI: 10.1021/ja906506j
Pyrgiotakis G., Luu W., Zhang Z., Vaze N., DeLoid G., Rubio L., Graham W.A.C., Bell D.C., Bousfield D., Demokritou P., Development of high throughput, high precision synthesis platforms and characterization methodologies for toxico-logical studies of nanocellulose, Cellulose, 25 (2018) 2303–2319. DOI: 10.1007/s10570-018-1718-2
Saallah S., Lenggoro I.W., Nanoparticles carrying biological molecules: Recent advances and applications, KONA Pow-der and Particle Journal, 35 (2018) 89–111. DOI: 10. 14356/kona.2018015
Schulz F., Homolka T., Bastús N.G., Puntes V., Weller H., Vossmeyer T., Little adjustments significantly improve the Turkevich synthesis of gold nanoparticles, Langmuir, 30 (2014) 10779–10784. DOI: 10.1021/la503209b
Sivaraman S.K., Kumar S., Santhanam V., Monodisperse sub-10 nm gold nanoparticles by reversing the order of addition in Turkevich method—The role of chloroauric acid, Journal of Colloid and Interface Science, 361 (2011) 543–547. DOI: 10.1016/j.jcis.2011.06.015
Somasundaran P., Fang X., Ponnurangam S., Li B., Nanoparti-
Jiaqi Dong et al. / KONA Powder and Particle Journal No. 37 (2020) 224–232
231
cles: Characteristics, mechanisms and modulation of bio-toxicity, KONA Powder and Particle Journal, 28 (2010) 38–49. DOI: 10.14356/kona.2010007
Sondi I., Salopek-Sondi B., Silver nanoparticles as antimicrobial agent: A case study on E. coli as a model for Gram-negative bacteria, Journal of Colloid and Interface Science, 275 (2004) 177–182. DOI: 10.1016/j.jcis.2004.02.012
Tian F., Bonnier F., Casey A., Shanahan A.E., Byrne H.J., Surface-enhanced Raman scattering with gold nanoparticles: effect of particle shape, Analytical Methods, 6 (2014) 9116–9123. DOI: 10.1039/c4ay02112f
Turkevich J., Stevenson P.C., Hillier J., A study of the nucleation and growth processes in the synthesis of colloidal gold, Discussions of the Faraday Society, 11 (1951) 55–75. DOI: 10.1039/df9511100055
Wuithschick M., Birnbaum A., Witte S., Sztucki M., Vainio U., Pinna N., Rademann K., Emmerling F., Kraehnert R., Polte J., Turkevich in new robes: Key questions answered for the most common gold nanoparticle synthesis, ACS Nano, 9
(2015) 7052–7071. DOI: 10.1021/acsnano.5b01579Xie W., Walkenfort B., Schlücker S., Label-free SERS monitor-
ing of chemical reactions catalyzed by small gold nanopar-ticles using 3D plasmonic superstructures, Journal of the American Chemical Society, 135 (2012) 1657–1660. DOI: 10.1021/ja309074a
Zabetakis K., Ghann W.E., Kumar S., Daniel M.-C., Effect of high gold salt concentrations on the size and polydispersity of gold nanoparticles prepared by an extended Turkevich–Frens method, Gold Bulletin, 45 (2012) 203–211. DOI: 10.1007/s13404-012-0069-2
Zhang X., Gold Nanoparticles: Recent advances in the biomedi-cal applications, Cell Biochemistry and Biophysics, 72 (2015) 771–775. DOI: 10.1007/s12013-015-0529-4
Zhu C., Liang S., Song E., Zhou Y., Wang W., Shan F., Shi Y., Hao C., Yin K., Zhang T., In-situ liquid cell transmission electron microscopy investigation on oriented attachment of gold nanoparticles, Nature Communications, 9 (2018) 421. DOI: 10.1038/s41467-018-02925-6
Authors’ Short Biographies
Jiaqi Dong
Jiaqi Dong received his B.S. in Materials Science and Engineering from Illinois Insti-tute of Technology in 2013. He then attended the University of Florida as a graduate stu-dent and received his M.S. in Materials Science and Engineering in 2016. Currently, he is a Ph.D. candidate under the supervision of Dr. Brij Moudgil and Dr. Bahar Basim at the Center for Particulate and Surfactant Systems (CPaSS). His current research focus is metallic nanoparticle synthesis and functionalization using fluidics.
Paul Carpinone
Paul Carpinone received his BS in Chemical Engineering and Ph.D. in Materials Sci-ence and Engineering from the University of Florida. He joined the Particle Engineering Research Center (PERC) in 2006, and subsequently, the Center for Particulate and Sur-factant Systems (CPaSS), where he conducted his doctoral and subsequent academic re-search work. He has authored over sixteen publications, patents, and book chapters. His research interests include surface and interfacial chemistry, particle synthesis and char-acterization, nanotoxicology, analytical characterization, and X-ray diffraction.

Jiaqi Dong et al. / KONA Powder and Particle Journal No. 37 (2020) 224–232
232
Authors’ Short Biographies
Georgios Pyrgiotakis
Dr. Georgios Pyrgiotakis is a Research Scientist at the Harvard T. H. Chan School of Public Health and the Research Coordinator for the HSPH-NIEHS Nanosafety Center. He holds a Ph.D. degree and an MS degree in Materials Science and Engineering from the University of Florida. His research is focused on the health and environmental impli-cations of nanotechnology and how it correlates to the material properties. He also devel-oped a novel, nanotechnology-based, chemical-free method for air and surface disinfection that utilizes only water to kill dangerous pathogens. He authored more than 60 publications and book chapters. At the time of this publication, he is a Research In-vestigator II at Bristol-Myers Squibb.
Philip Demokritou
Philip Demokritou is an Associate Professor at T. H. Chan School of Public Health, Harvard University and Director of the Center for Nanotechnology and Nanotoxicology (www.hsph.harvard.edu/nano). His current research focuses on understanding, manipu-lating, and applying engineered nanomaterials and phenomena at the nanoscale with special emphasis on assessing the fundamental nano-bio interactions in biological sys-tems, nanosafety and potential applications of nanomaterials in environmental and life sciences. He is currently the Director of the NIH/NIEHS funded Nanosafety Center (www.hsph.harvard.edu/nanosafety) which is part of the NIH/NIEHS Nanotechnology Health Implications Research (NHIR) consortium. He is also a founding Co-Editor in Chief of NanoIMPACT.
Brij M. Moudgil
Dr. Brij M. Moudgil is a Distinguished Professor of Materials Science and Engineering at the University of Florida. He received his B.E from the Indian Institute of Science, Ban-galore, India, and his M.S. and Eng.Sc.D degrees from Columbia University, New York. His current research interests are in surfactant and polymer adsorption, dispersion and ag-gregation of fine particles, adhesion, and removal of microbes from surfaces, synthesis of functionalized nanoparticles, antiscaling and surfactant mediated corrosion inhibitors, photocatalytic degradation of hazardous microbes, and nanotoxicity. He has published more than 400 technical papers and has been awarded over 25 patents. He is a member of the U.S National Academy of Engineering.
KONA Powder and Particle Journal No. 37 (2020) 233–243/Doi:10.14356/kona.2020012 Original Research Paper
233Copyright © 2020 The Authors. Published by Hosokawa Powder Technology Foundation. This is an open ac-cess article under the CC BY license (http://creativecommons.org/licenses/by/4.0/).
NMR as a Tool to Characterize the Aggregation Structure of Silica Nanoparticles in a Liquid †
Chika Takai-Yamashita 1, Emiko Sato 2 and Masayoshi Fuji 2*1 Faculty of Engineering, Gifu University, Japan2 Advanced Ceramics Research Center, Nagoya Institute of Technology, Japan
AbstractThe NMR-based solvent relaxation technique, a non-invasive tool to characterize the surface of particles, which are dispersed in a liquid, was applied to characterize the nanoparticles’ aggregation structure. The liquid molecules in a dispersion undergo a rapid exchange between the bound states at the interface and highly mobile free states in a bulk liquid. The relaxation time of the liquid molecules bound on the particle surface is shorter than that of the free states liquid. By detecting how much liquid is bound on the particle surface, the wetted specific surface area (SNMR) can be determined. In this study, it was clarified that the water adsorbed at more than a 1.138 layer from the silica surface can be detected by the NMR and the maximum limitation ranged from 2.160 and 3.336 layers. The model aggregates with an artificial solid neck among the particles were mixed with the silica nanoparticle dispersion. Although the determined SNMR was underestimated compared to SBET from gas adsorption, even a low ratio (5 mass%) of the model aggregates in the dispersion can be detected.
Keywords: aggregation structure, wetted specific surface area, solvent relaxation NMR, adsorbed water, silica
1. Introduction
It is well known that nano-sized particles easily aggre-gate due to many active sites on their surface compared to micron-sized particles. It is also common knowledge that the excellent properties of the nanoparticles, such as me-chanical, thermal, magnetic, electrical, etc., are strongly affected by the structure of their aggregation in addition to their dispersion.
The three-dimensional silica nanoparticles network in rubber, linked by their secondary aggregates, encourages the wet grip performance of car tires on ice. These im-portant particle network structures were characterized by small-angle X-ray scattering (SAXS) in combination with transmission electron microscopy (TEM) (Baeza et al., 2013; Stauch et al., 2019). Song et al. (2019) proved that aggregation in a heat-transfer fluid called a nanofluid, which was obtained by suspending metallic nanoparticles in a conventional liquid, can increase the thermal conduc-tivity due to the formation of an “efficient heat channel,” using the Monte Carlo simulation considering phonon
transport. Yang et al. (2019) developed a self-healing sys-tem of a thermoplastic polymer in which the superpara-magnetic nanoparticle aggregations were embedded. Under the application of an oscillating magnetic field, the migrated nanoparticles generate a high local temperature which heals the electrical tree channels in the polymer. Ajmal et al. (2019) produced that a highly-conductive silver/polyvinyl alcohol nanocomposite fibers by adding silver ions to prevent aggregation of the originally dis-persed silver nanoparticles. The gaseous byproduct from the precursors dramatically increased the flexibility of the nanocomposite’s tensile strength.
Thus, understanding the aggregation structures, which are directly connected to the nanoparticles’ performance, is highly recommended. There have been several tech-niques to characterize them via microscopic observations, scattering of electromagnetic waves, sedimentation tests, rheological behaviors (Wang et al., 2012), differential scanning calorimetry (DSC) (Korobov et al., 2010), nitro-gen gas adsorption (Yoshida et al., 2016), etc. Some of the data were analyzed in combination with theoretical mod-els including fractal dimensions.
The interparticle bond energies can range from weak van der Waals forces (agglomerates) to stronger solid state necks (aggregates). Teleki et al. (2008) distinguished those of “as-prepared” flame-made TiO2 nanoparticles by the TEM observations before/after a high-pressure-dispersion, in combination with the particle size distributions
† Received 28 May 2019; Accepted 12 July 2019 J-STAGE Advance published online 10 August 2019
1 1-1 Yanagido, Gifu 501-1193, Japan2 3-101-1 Honmachi, Tajimi 507-0033, Japan* Corresponding author: Masayoshi Fuji; E-mail: [email protected] TEL: +81-572-24-8110 FAX: +81-572-24-8109
Chika Takai-Yamashita et al. / KONA Powder and Particle Journal No. 37 (2020) 233–243
234
measured by dynamic light scattering (DLS) and the spe-cific surface area calculated from the N2 adsorption iso-therm by applying the Brunauer–Emmett–Teller equation. When considering deformation of the aggregation struc-ture under vacuum during observation, some techniques to fix the aggregation structures of particles such as car-bon coating on the freeze-dried-thinned-samples called cryo-replica TEM (Tiarks F. et al., 2008) and direct visualization technique through polymerization of medium- soluble-monomers (Takahashi M. et al., 2004), were de-veloped. These visualization techniques are indeed effective for understanding, however, at the same time, they are time-consuming when manually obtained 100–1000 particles need to be counted for reliable determina-tion of the particle size distribution (Tsantilis S. et al., 2002).
The ultrasmall-angle X-ray scattering (USAXS) and the small-angle neutron scattering (SANS), as the scatter-ing techniques, detect a structure of 1000 nanometers at most which reflects the nanoparticles’ aggregation. The scattering profile as a function of the scattering vector q (q = 4π sin(θ)/λ, where 2θ and λ are the angle between the incident beam and the detector, and wavelength of the ra-diation) can be fitted with intensities calculated from dif-ferent model shapes when the size distribution is known (Kammler et al., 2004; Hurd et al., 1987). Gilbert B. et al. (2009) reported that low-aggregation (i.e., higher porosity) of iron oxyhydroxide nanoparticles improved the metal uptake performance due to physical loss of the accessible surface area, by a synchrotron SAXS analysis considering the fractal dimensions. Bharti et al. (2011) determined the lysozyme as a protein induced compact and a loose floc-culated silica nanoparticles network at low and high pHs, respectively, by the laboratory SAXS and proved by cryo-TEM and a sedimentation test which will be described later.
Korobov et al. (2010) estimated the aggregation struc-ture from the DSC traces by observing the melting behav-iors of water in the particles’ gap by means of the nanophase of water’s non-freezing property. Yoshida et al. (2016) combined N2 gas adsorption with a He gas pyc-nometer and DLS to characterize the primary and second-ary aggregation of carbon black, as an alternative to conventional ways such as the incorporation of chemicals (e.g., cetyl trimethyl ammonium bromide, di-butyl phthal-ate) into the particles’ gap. They warned that the pressure during the Hg intrusion into the particles’ gap probably deformed the aggregation structure.
The particle size distribution from the sedimentation test was determined by Stokes law. The sedimentation time is inversely proportional to the particle size to the second power. For the nanoparticles, of course, centrifu-gal force is required to reduce the time (Allain et al., 1995). Lerche et al. (2007, 2014 and 2019) proposed an
analytical centrifuge (AC) system for determination of the characteristic material properties related to the sedimen-tation and consolidation behavior of the dispersions. The STEPTM-Technology (Space and Time resolved Extinction Profiles) allows one to simultaneously measure the inten-sity of the transmitted light as a function of time and po-sition over the entire sample length. The data are displayed as a function of the radial position as the dis-tance from the center of rotation. The progression of the transmission profiles contains information on the kinetics of the separation process and allows particle characteriza-tion. They also showed that this technique was very ef-fective for dispersions of hard and soft micro- and nanoparticles (e.g., titania or lysozyme coated silica), ster-ical, electrosterical, and rheological stabilization (polye-lectrolyte coated nanoparticles), mixtures of different particle types (silica and iron oxide nanoparticles), at any pH value and ionic strength. Walter et al. (2015) devel-oped a new data evaluation technique by applying analyt-ical ultracentrifugation (AUC) which can detect particles less than one nanometer in size with Ångström resolution. They showed a very good correlation with an error of 10.65 % between atomic force microscopy AFM and AUC for the mean lateral diameter of the fully delaminated graphene oxide (GO) sheet, which was achieved using one single AUC measurement and hydrodynamic modeling based on an assumed sheet height and density.
Meanwhile, Nelson A. et al. (2002) monitored the indi-vidual adsorption of two different polyelectrolytes (PEO and PVP) on silica particles as well as the polymeric dis-placement of one polymer (PEO) by another (PVP) using nuclear magnetic resonance (NMR) at 200 MHz. This re-lies on the fact that mobile (liquid-like) and immobile (solid-like) protons have very different relaxation times. They also investigated the effect of electrolytes on ad-sorbed polymer layers on PEO adsorbed silica (Flood and Cosgrove, 2006), determined how many polymers per particles (Flood and Cosgrove, 2008) using NMR at 300 and 400 MHz.
According to Fairhurst et al. (2016), a portable bench-top NMR spectrometer operating at 13 MHz could possi-bility determine the particle size, wetted surface area, and porosity of the nanoparticles (nanocarbon) due to the fact that solvent molecules in a dispersion undergo a rapid ex-change between the bound states at the interface and highly mobile free states in the bulk solvent. The relax-ation time of the solvent molecules bound on the particle surface is shorter than that of the free states solvent. The observed single relaxation time, Tav, is determined from the reciprocal of the spin relaxation rate, Rav. As Eqn. 1 indicates, the relaxation rate is an average of the relax-ation rates of the molecules on the particle surface, Rs, and free solvent, Rb, weighted by their relative popula-tions as Ps and Pb.
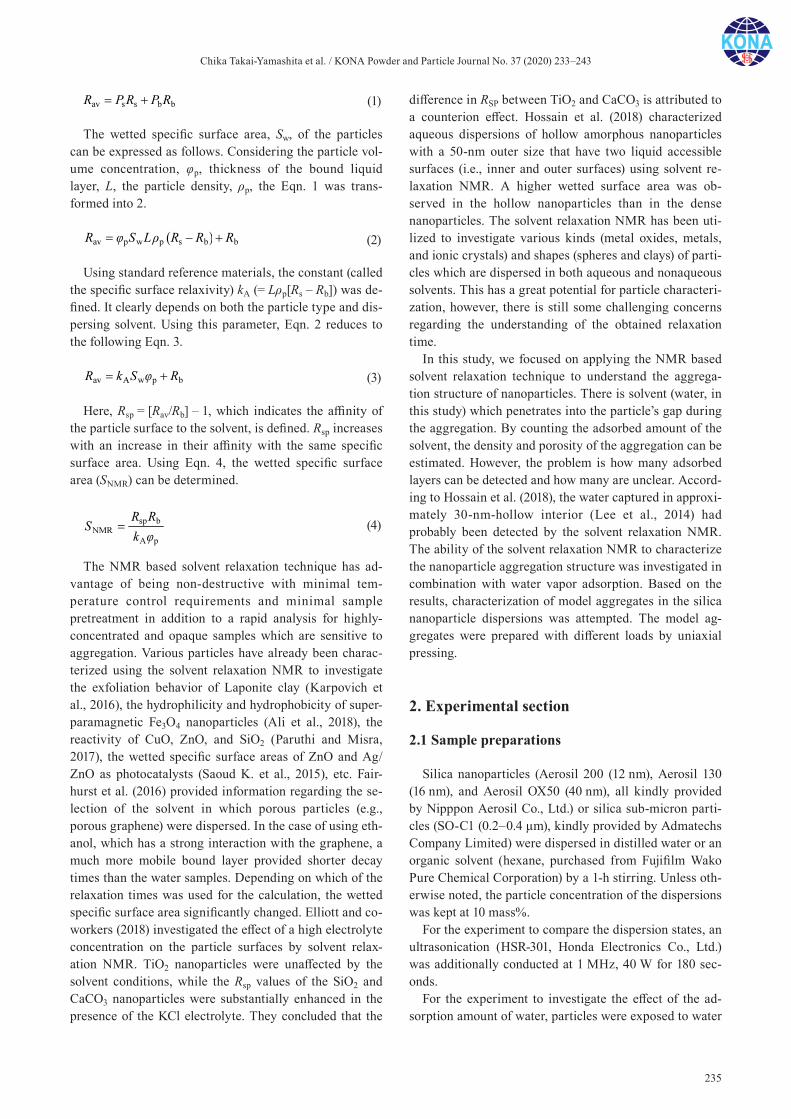
Chika Takai-Yamashita et al. / KONA Powder and Particle Journal No. 37 (2020) 233–243
235
av s s b bR PR P R= + (1)
The wetted specific surface area, Sw, of the particles can be expressed as follows. Considering the particle vol-ume concentration, φp, thickness of the bound liquid layer, L, the particle density, ρp, the Eqn. 1 was trans-formed into 2.
( )av p w p s b b
R S L R R Rϕ ρ= − + (2)
Using standard reference materials, the constant (called the specific surface relaxivity) kA (= Lρp[Rs – Rb]) was de-fined. It clearly depends on both the particle type and dis-persing solvent. Using this parameter, Eqn. 2 reduces to the following Eqn. 3.
av A w p b R k S Rϕ= + (3)
Here, Rsp = [Rav/Rb] – 1, which indicates the affinity of the particle surface to the solvent, is defined. Rsp increases with an increase in their affinity with the same specific surface area. Using Eqn. 4, the wetted specific surface area (SNMR) can be determined.
sp b
NMR
A p
R R
S
k ϕ
= (4)
The NMR based solvent relaxation technique has ad-vantage of being non-destructive with minimal tem-perature control requirements and minimal sample pretreatment in addition to a rapid analysis for highly- concentrated and opaque samples which are sensitive to aggregation. Various particles have already been charac-terized using the solvent relaxation NMR to investigate the exfoliation behavior of Laponite clay (Karpovich et al., 2016), the hydrophilicity and hydrophobicity of super-paramagnetic Fe3O4 nanoparticles (Ali et al., 2018), the reactivity of CuO, ZnO, and SiO2 (Paruthi and Misra, 2017), the wetted specific surface areas of ZnO and Ag/ZnO as photocatalysts (Saoud K. et al., 2015), etc. Fair-hurst et al. (2016) provided information regarding the se-lection of the solvent in which porous particles (e.g., porous graphene) were dispersed. In the case of using eth-anol, which has a strong interaction with the graphene, a much more mobile bound layer provided shorter decay times than the water samples. Depending on which of the relaxation times was used for the calculation, the wetted specific surface area significantly changed. Elliott and co-workers (2018) investigated the effect of a high electrolyte concentration on the particle surfaces by solvent relax-ation NMR. TiO2 nanoparticles were unaffected by the solvent conditions, while the Rsp values of the SiO2 and CaCO3 nanoparticles were substantially enhanced in the presence of the KCl electrolyte. They concluded that the
difference in RSP between TiO2 and CaCO3 is attributed to a counterion effect. Hossain et al. (2018) characterized aqueous dispersions of hollow amorphous nanoparticles with a 50-nm outer size that have two liquid accessible surfaces (i.e., inner and outer surfaces) using solvent re-laxation NMR. A higher wetted surface area was ob-served in the hollow nanoparticles than in the dense nanoparticles. The solvent relaxation NMR has been uti-lized to investigate various kinds (metal oxides, metals, and ionic crystals) and shapes (spheres and clays) of parti-cles which are dispersed in both aqueous and nonaqueous solvents. This has a great potential for particle characteri-zation, however, there is still some challenging concerns regarding the understanding of the obtained relaxation time.
In this study, we focused on applying the NMR based solvent relaxation technique to understand the aggrega-tion structure of nanoparticles. There is solvent (water, in this study) which penetrates into the particle’s gap during the aggregation. By counting the adsorbed amount of the solvent, the density and porosity of the aggregation can be estimated. However, the problem is how many adsorbed layers can be detected and how many are unclear. Accord-ing to Hossain et al. (2018), the water captured in approxi-mately 30-nm-hollow interior (Lee et al., 2014) had probably been detected by the solvent relaxation NMR. The ability of the solvent relaxation NMR to characterize the nanoparticle aggregation structure was investigated in combination with water vapor adsorption. Based on the results, characterization of model aggregates in the silica nanoparticle dispersions was attempted. The model ag-gregates were prepared with different loads by uniaxial pressing.
2. Experimental section
2.1 Sample preparations
Silica nanoparticles (Aerosil 200 (12 nm), Aerosil 130 (16 nm), and Aerosil OX50 (40 nm), all kindly provided by Nipppon Aerosil Co., Ltd.) or silica sub-micron parti-cles (SO-C1 (0.2–0.4 μm), kindly provided by Admatechs Company Limited) were dispersed in distilled water or an organic solvent (hexane, purchased from Fujifilm Wako Pure Chemical Corporation) by a 1-h stirring. Unless oth-erwise noted, the particle concentration of the dispersions was kept at 10 mass%.
For the experiment to compare the dispersion states, an ultrasonication (HSR-301, Honda Electronics Co., Ltd.) was additionally conducted at 1 MHz, 40 W for 180 sec-onds.
For the experiment to investigate the effect of the ad-sorption amount of water, particles were exposed to water
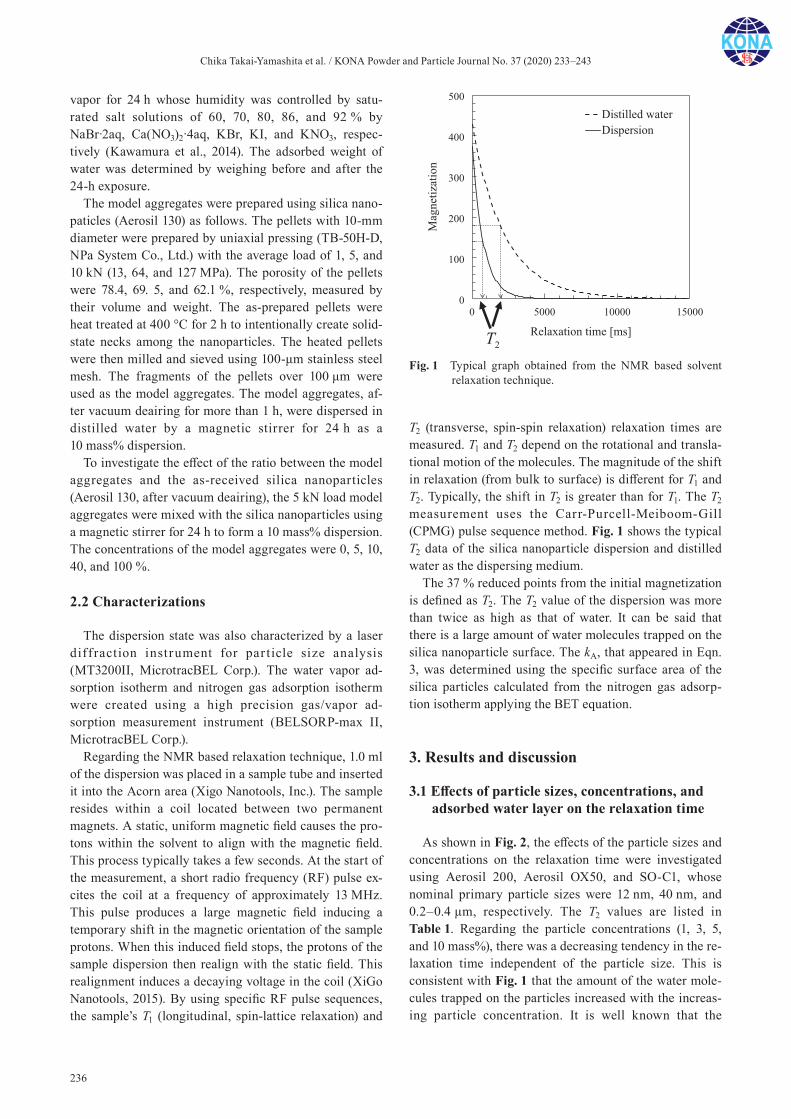
Chika Takai-Yamashita et al. / KONA Powder and Particle Journal No. 37 (2020) 233–243
236
vapor for 24 h whose humidity was controlled by satu-rated salt solutions of 60, 70, 80, 86, and 92 % by NaBr·2aq, Ca(NO3)2·4aq, KBr, KI, and KNO3, respec-tively (Kawamura et al., 2014). The adsorbed weight of water was determined by weighing before and after the 24-h exposure.
The model aggregates were prepared using silica nano-paticles (Aerosil 130) as follows. The pellets with 10-mm diameter were prepared by uniaxial pressing (TB-50H-D, NPa System Co., Ltd.) with the average load of 1, 5, and 10 kN (13, 64, and 127 MPa). The porosity of the pellets were 78.4, 69. 5, and 62.1 %, respectively, measured by their volume and weight. The as-prepared pellets were heat treated at 400 °C for 2 h to intentionally create solid- state necks among the nanoparticles. The heated pellets were then milled and sieved using 100-μm stainless steel mesh. The fragments of the pellets over 100 μm were used as the model aggregates. The model aggregates, af-ter vacuum deairing for more than 1 h, were dispersed in distilled water by a magnetic stirrer for 24 h as a 10 mass% dispersion.
To investigate the effect of the ratio between the model aggregates and the as-received silica nanoparticles (Aerosil 130, after vacuum deairing), the 5 kN load model aggregates were mixed with the silica nanoparticles using a magnetic stirrer for 24 h to form a 10 mass% dispersion. The concentrations of the model aggregates were 0, 5, 10, 40, and 100 %.
2.2 Characterizations
The dispersion state was also characterized by a laser diffraction instrument for par ticle size analysis (MT3200II, MicrotracBEL Corp.). The water vapor ad-sorption isotherm and nitrogen gas adsorption isotherm were created using a high precision gas/vapor ad-sorption measurement instrument (BELSORP-max II, MicrotracBEL Corp.).
Regarding the NMR based relaxation technique, 1.0 ml of the dispersion was placed in a sample tube and inserted it into the Acorn area (Xigo Nanotools, Inc.). The sample resides within a coil located between two permanent magnets. A static, uniform magnetic field causes the pro-tons within the solvent to align with the magnetic field. This process typically takes a few seconds. At the start of the measurement, a short radio frequency (RF) pulse ex-cites the coil at a frequency of approximately 13 MHz. This pulse produces a large magnetic field inducing a temporary shift in the magnetic orientation of the sample protons. When this induced field stops, the protons of the sample dispersion then realign with the static field. This realignment induces a decaying voltage in the coil (XiGo Nanotools, 2015). By using specific RF pulse sequences, the sample’s T1 (longitudinal, spin-lattice relaxation) and
T2 (transverse, spin-spin relaxation) relaxation times are measured. T1 and T2 depend on the rotational and transla-tional motion of the molecules. The magnitude of the shift in relaxation (from bulk to surface) is different for T1 and T2. Typically, the shift in T2 is greater than for T1. The T2 measurement uses the Carr-Purcell-Meiboom-Gill (CPMG) pulse sequence method. Fig. 1 shows the typical T2 data of the silica nanoparticle dispersion and distilled water as the dispersing medium.
The 37 % reduced points from the initial magnetization is defined as T2. The T2 value of the dispersion was more than twice as high as that of water. It can be said that there is a large amount of water molecules trapped on the silica nanoparticle surface. The kA, that appeared in Eqn. 3, was determined using the specific surface area of the silica particles calculated from the nitrogen gas adsorp-tion isotherm applying the BET equation.
3. Results and discussion
3.1 Effects of particle sizes, concentrations, and adsorbed water layer on the relaxation time
As shown in Fig. 2, the effects of the particle sizes and concentrations on the relaxation time were investigated using Aerosil 200, Aerosil OX50, and SO-C1, whose nominal primary particle sizes were 12 nm, 40 nm, and 0.2–0.4 μm, respectively. The T2 values are listed in Table 1. Regarding the particle concentrations (1, 3, 5, and 10 mass%), there was a decreasing tendency in the re-laxation time independent of the particle size. This is consistent with Fig. 1 that the amount of the water mole-cules trapped on the particles increased with the increas-ing particle concentration. It is well known that the
Fig. 1 Typical graph obtained from the NMR based solvent relaxation technique.
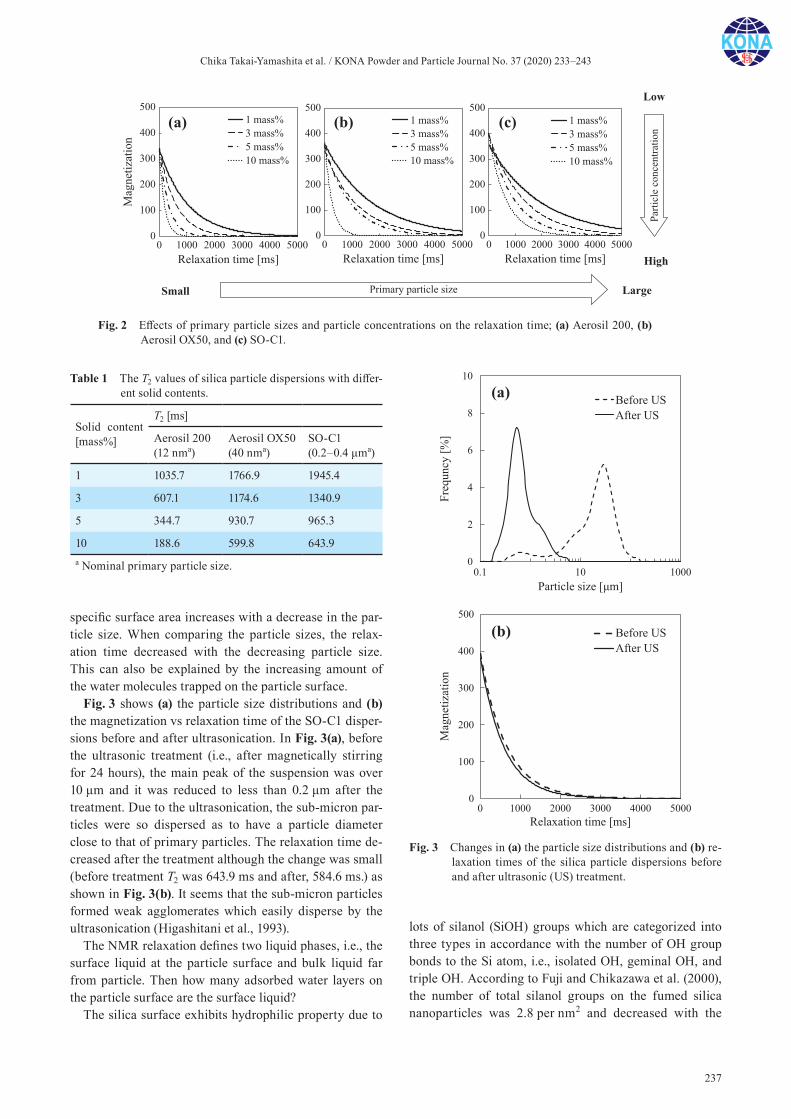
Chika Takai-Yamashita et al. / KONA Powder and Particle Journal No. 37 (2020) 233–243
237
specific surface area increases with a decrease in the par-ticle size. When comparing the particle sizes, the relax-ation time decreased with the decreasing particle size. This can also be explained by the increasing amount of the water molecules trapped on the particle surface.
Fig. 3 shows (a) the particle size distributions and (b) the magnetization vs relaxation time of the SO-C1 disper-sions before and after ultrasonication. In Fig. 3(a), before the ultrasonic treatment (i.e., after magnetically stirring for 24 hours), the main peak of the suspension was over 10 μm and it was reduced to less than 0.2 μm after the treatment. Due to the ultrasonication, the sub-micron par-ticles were so dispersed as to have a particle diameter close to that of primary particles. The relaxation time de-creased after the treatment although the change was small (before treatment T2 was 643.9 ms and after, 584.6 ms.) as shown in Fig. 3(b). It seems that the sub-micron particles formed weak agglomerates which easily disperse by the ultrasonication (Higashitani et al., 1993).
The NMR relaxation defines two liquid phases, i.e., the surface liquid at the particle surface and bulk liquid far from particle. Then how many adsorbed water layers on the particle surface are the surface liquid?
The silica surface exhibits hydrophilic property due to
lots of silanol (SiOH) groups which are categorized into three types in accordance with the number of OH group bonds to the Si atom, i.e., isolated OH, geminal OH, and triple OH. According to Fuji and Chikazawa et al. (2000), the number of total silanol groups on the fumed silica nanoparticles was 2.8 per nm2 and decreased with the
Table 1 The T2 values of silica particle dispersions with differ-ent solid contents.
Solid content [mass%]
T2 [ms]
Aerosil 200(12 nma)
Aerosil OX50(40 nma)
SO-C1(0.2–0.4 μma)
1 1035.7 1766.9 1945.4
3 607.1 1174.6 1340.9
5 344.7 930.7 965.3
10 188.6 599.8 643.9a Nominal primary particle size.
Fig. 2 Effects of primary particle sizes and particle concentrations on the relaxation time; (a) Aerosil 200, (b) Aerosil OX50, and (c) SO-C1.
Fig. 3 Changes in (a) the particle size distributions and (b) re-laxation times of the silica particle dispersions before and after ultrasonic (US) treatment.
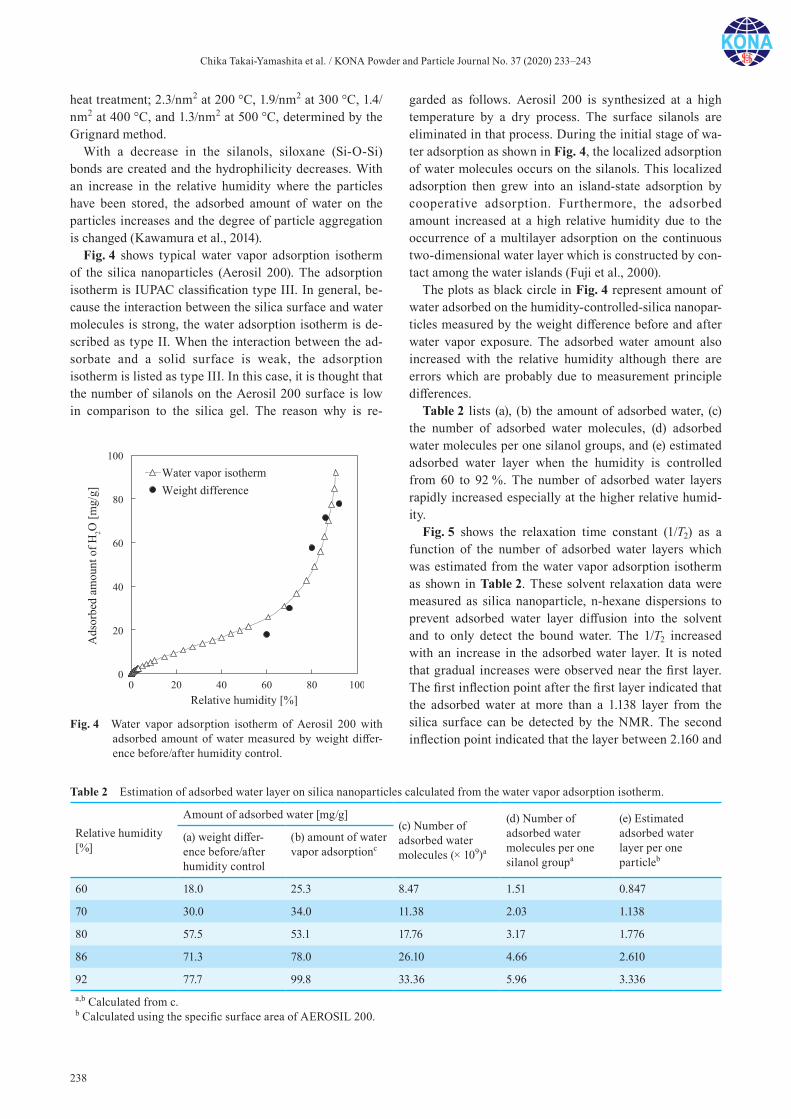
Chika Takai-Yamashita et al. / KONA Powder and Particle Journal No. 37 (2020) 233–243
238
heat treatment; 2.3/nm2 at 200 °C, 1.9/nm2 at 300 °C, 1.4/nm2 at 400 °C, and 1.3/nm2 at 500 °C, determined by the Grignard method.
With a decrease in the silanols, siloxane (Si-O-Si) bonds are created and the hydrophilicity decreases. With an increase in the relative humidity where the particles have been stored, the adsorbed amount of water on the particles increases and the degree of particle aggregation is changed (Kawamura et al., 2014).
Fig. 4 shows typical water vapor adsorption isotherm of the silica nanoparticles (Aerosil 200). The adsorption isotherm is IUPAC classification type III. In general, be-cause the interaction between the silica surface and water molecules is strong, the water adsorption isotherm is de-scribed as type II. When the interaction between the ad-sorbate and a solid surface is weak, the adsorption isotherm is listed as type III. In this case, it is thought that the number of silanols on the Aerosil 200 surface is low in comparison to the silica gel. The reason why is re-
garded as follows. Aerosil 200 is synthesized at a high temperature by a dry process. The surface silanols are eliminated in that process. During the initial stage of wa-ter adsorption as shown in Fig. 4, the localized adsorption of water molecules occurs on the silanols. This localized adsorption then grew into an island-state adsorption by cooperative adsorption. Furthermore, the adsorbed amount increased at a high relative humidity due to the occurrence of a multilayer adsorption on the continuous two-dimensional water layer which is constructed by con-tact among the water islands (Fuji et al., 2000).
The plots as black circle in Fig. 4 represent amount of water adsorbed on the humidity-controlled-silica nanopar-ticles measured by the weight difference before and after water vapor exposure. The adsorbed water amount also increased with the relative humidity although there are errors which are probably due to measurement principle differences.
Table 2 lists (a), (b) the amount of adsorbed water, (c) the number of adsorbed water molecules, (d) adsorbed water molecules per one silanol groups, and (e) estimated adsorbed water layer when the humidity is controlled from 60 to 92 %. The number of adsorbed water layers rapidly increased especially at the higher relative humid-ity.
Fig. 5 shows the relaxation time constant (1/T2) as a function of the number of adsorbed water layers which was estimated from the water vapor adsorption isotherm as shown in Table 2. These solvent relaxation data were measured as silica nanoparticle, n-hexane dispersions to prevent adsorbed water layer diffusion into the solvent and to only detect the bound water. The 1/T2 increased with an increase in the adsorbed water layer. It is noted that gradual increases were observed near the first layer. The first inflection point after the first layer indicated that the adsorbed water at more than a 1.138 layer from the silica surface can be detected by the NMR. The second inflection point indicated that the layer between 2.160 and
Fig. 4 Water vapor adsorption isotherm of Aerosil 200 with adsorbed amount of water measured by weight differ-ence before/after humidity control.
Table 2 Estimation of adsorbed water layer on silica nanoparticles calculated from the water vapor adsorption isotherm.
Relative humidity [%]
Amount of adsorbed water [mg/g](c) Number of adsorbed water molecules (× 109)a
(d) Number of adsorbed water molecules per one silanol groupa
(e) Estimated adsorbed water layer per one particleb
(a) weight differ-ence before/after humidity control
(b) amount of water vapor adsorptionc
60 18.0 25.3 8.47 1.51 0.847
70 30.0 34.0 11.38 2.03 1.138
80 57.5 53.1 17.76 3.17 1.776
86 71.3 78.0 26.10 4.66 2.610
92 77.7 99.8 33.36 5.96 3.336a,b Calculated from c.b Calculated using the specific surface area of AEROSIL 200.
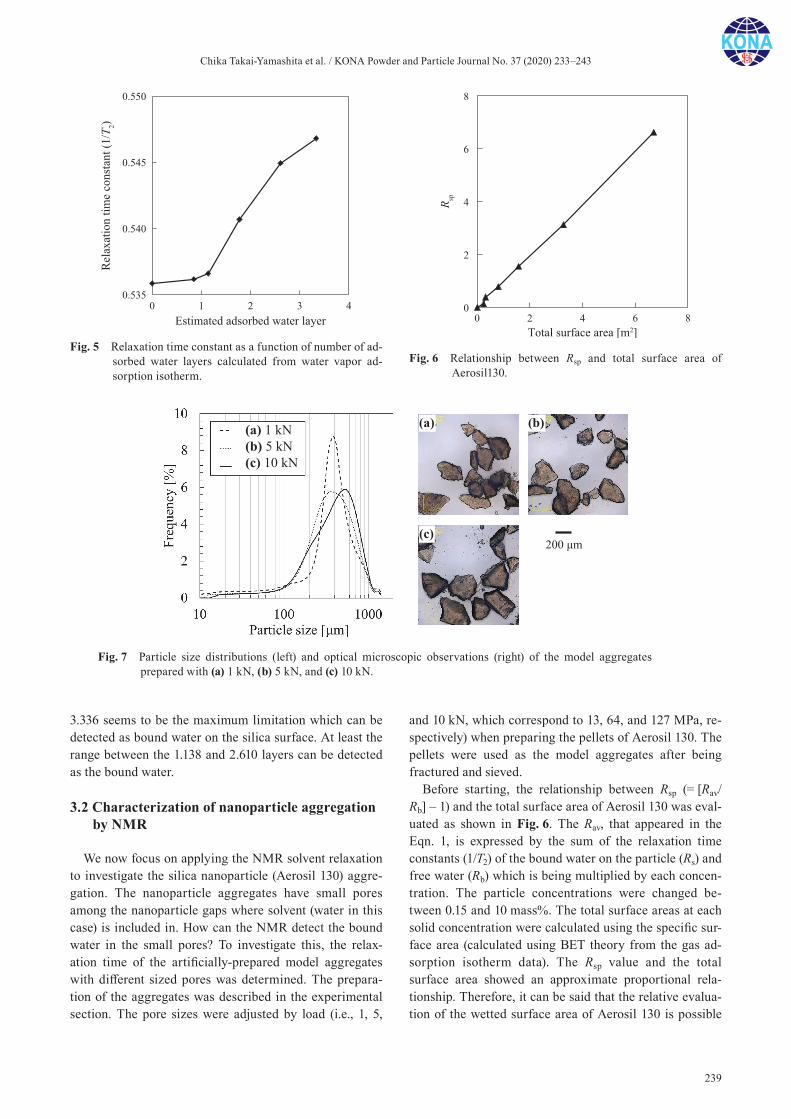
Chika Takai-Yamashita et al. / KONA Powder and Particle Journal No. 37 (2020) 233–243
239
3.336 seems to be the maximum limitation which can be detected as bound water on the silica surface. At least the range between the 1.138 and 2.610 layers can be detected as the bound water.
3.2 Characterization of nanoparticle aggregation by NMR
We now focus on applying the NMR solvent relaxation to investigate the silica nanoparticle (Aerosil 130) aggre-gation. The nanoparticle aggregates have small pores among the nanoparticle gaps where solvent (water in this case) is included in. How can the NMR detect the bound water in the small pores? To investigate this, the relax-ation time of the artificially-prepared model aggregates with different sized pores was determined. The prepara-tion of the aggregates was described in the experimental section. The pore sizes were adjusted by load (i.e., 1, 5,
and 10 kN, which correspond to 13, 64, and 127 MPa, re-spectively) when preparing the pellets of Aerosil 130. The pellets were used as the model aggregates after being fractured and sieved.
Before starting, the relationship between Rsp (= [Rav/Rb] – 1) and the total surface area of Aerosil 130 was eval-uated as shown in Fig. 6. The Rav, that appeared in the Eqn. 1, is expressed by the sum of the relaxation time constants (1/T2) of the bound water on the particle (Rs) and free water (Rb) which is being multiplied by each concen-tration. The particle concentrations were changed be-tween 0.15 and 10 mass%. The total surface areas at each solid concentration were calculated using the specific sur-face area (calculated using BET theory from the gas ad-sorption isotherm data). The Rsp value and the total surface area showed an approximate proportional rela-tionship. Therefore, it can be said that the relative evalua-tion of the wetted surface area of Aerosil 130 is possible
Fig. 5 Relaxation time constant as a function of number of ad-sorbed water layers calculated from water vapor ad-sorption isotherm.
Fig. 6 Relationship between Rsp and total surface area of Aerosil130.
Fig. 7 Particle size distributions (left) and optical microscopic observations (right) of the model aggregates prepared with (a) 1 kN, (b) 5 kN, and (c) 10 kN.
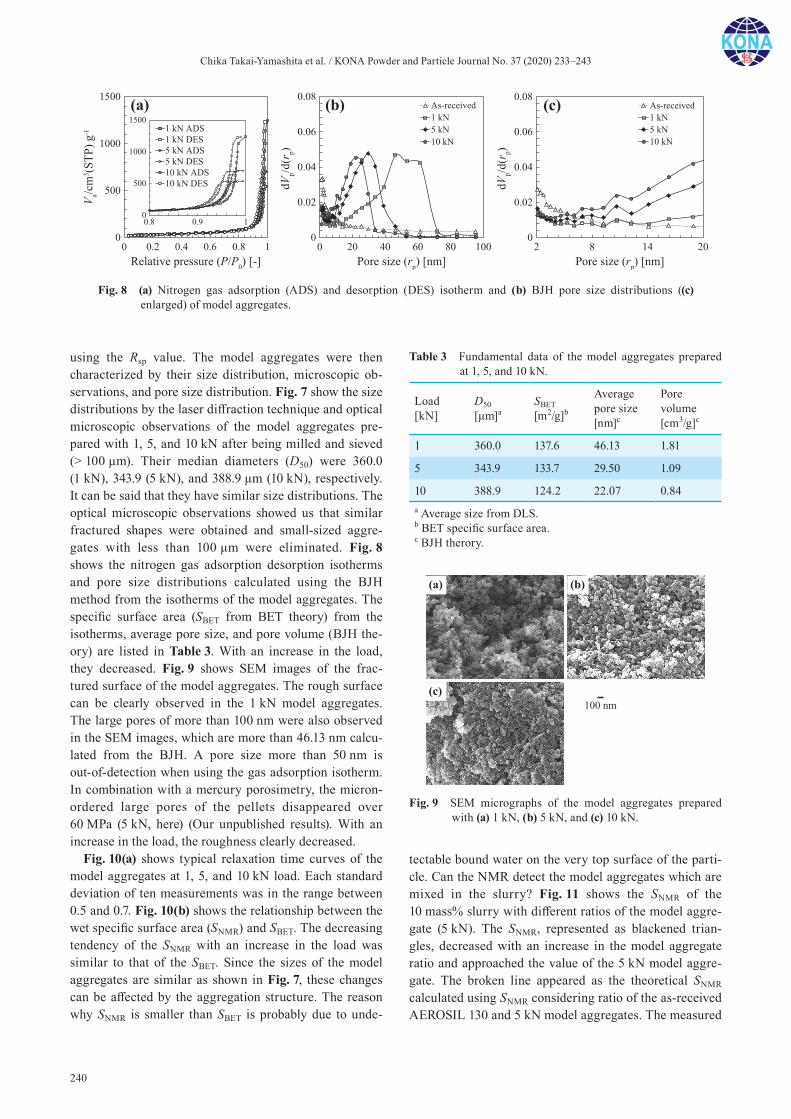
Chika Takai-Yamashita et al. / KONA Powder and Particle Journal No. 37 (2020) 233–243
240
using the Rsp value. The model aggregates were then characterized by their size distribution, microscopic ob-servations, and pore size distribution. Fig. 7 show the size distributions by the laser diffraction technique and optical microscopic observations of the model aggregates pre-pared with 1, 5, and 10 kN after being milled and sieved (> 100 μm). Their median diameters (D50) were 360.0 (1 kN), 343.9 (5 kN), and 388.9 μm (10 kN), respectively. It can be said that they have similar size distributions. The optical microscopic observations showed us that similar fractured shapes were obtained and small-sized aggre-gates with less than 100 μm were eliminated. Fig. 8 shows the nitrogen gas adsorption desorption isotherms and pore size distributions calculated using the BJH method from the isotherms of the model aggregates. The specific surface area (SBET from BET theory) from the isotherms, average pore size, and pore volume (BJH the-ory) are listed in Table 3. With an increase in the load, they decreased. Fig. 9 shows SEM images of the frac-tured surface of the model aggregates. The rough surface can be clearly observed in the 1 kN model aggregates. The large pores of more than 100 nm were also observed in the SEM images, which are more than 46.13 nm calcu-lated from the BJH. A pore size more than 50 nm is out-of-detection when using the gas adsorption isotherm. In combination with a mercury porosimetry, the micron- ordered large pores of the pellets disappeared over 60 MPa (5 kN, here) (Our unpublished results). With an increase in the load, the roughness clearly decreased.
Fig. 10(a) shows typical relaxation time curves of the model aggregates at 1, 5, and 10 kN load. Each standard deviation of ten measurements was in the range between 0.5 and 0.7. Fig. 10(b) shows the relationship between the wet specific surface area (SNMR) and SBET. The decreasing tendency of the SNMR with an increase in the load was similar to that of the SBET. Since the sizes of the model aggregates are similar as shown in Fig. 7, these changes can be affected by the aggregation structure. The reason why SNMR is smaller than SBET is probably due to unde-
tectable bound water on the very top surface of the parti-cle. Can the NMR detect the model aggregates which are mixed in the slurry? Fig. 11 shows the SNMR of the 10 mass% slurry with different ratios of the model aggre-gate (5 kN). The SNMR, represented as blackened trian-gles, decreased with an increase in the model aggregate ratio and approached the value of the 5 kN model aggre-gate. The broken line appeared as the theoretical SNMR calculated using SNMR considering ratio of the as-received AEROSIL 130 and 5 kN model aggregates. The measured
Table 3 Fundamental data of the model aggregates prepared at 1, 5, and 10 kN.
Load [kN]
D50[μm]a
SBET[m2/g]b
Average pore size [nm]c
Pore volume [cm3/g]c
1 360.0 137.6 46.13 1.81
5 343.9 133.7 29.50 1.09
10 388.9 124.2 22.07 0.84a Average size from DLS.b BET specific surface area.c BJH therory.
Fig. 9 SEM micrographs of the model aggregates prepared with (a) 1 kN, (b) 5 kN, and (c) 10 kN.
Fig. 8 (a) Nitrogen gas adsorption (ADS) and desorption (DES) isotherm and (b) BJH pore size distributions ((c) enlarged) of model aggregates.

Chika Takai-Yamashita et al. / KONA Powder and Particle Journal No. 37 (2020) 233–243
241
SNMR became smaller than the theoretical value, espe-cially for the higher ratio of the model aggregate (i.e., 0.4 in this case). This is probably due to the as-received AEROSIL 130 gathering together with the model aggre-gates. Note that even a low ratio (i.e., 0.05) of the model aggregate can be detected by the solvent relaxation NMR.
4. Conclusion
The effectiveness of the solvent relaxation NMR as a tool to characterize the nanoparticle aggregation structure was verified. The most important finding in this study is that the adsorbed water layer on the silica nanoparticles ranging between 1.138 and 2.610 can be detected as bound water to determine the wet specific surface area (SNMR). The SNMR of the artificially prepared model aggregates was underestimated compared to SBET due to undetectable water which was strongly bound on the particle surface. The SNMR could even show low ratio of the model aggre-gates in the silica nanoparticle dispersion. The required amount for the NMR experiment is only 1 mL and the measuring time is just few minutes regardless of the par-ticle concentration. In addition, not only the aqueous dis-persion, but also a nonaqueous dispersion can be measured. Indeed, there are still difficulties in under-standing the results, however, the proposed technique could be a simple and versatile tool to characterize the nanoparticle aggregation structure.
Acknowledgements
A part of this study was supported by JSPS KAKENHI 18K04699, Leading Initiative for Excellent Young Researchers (LEADER) of MEXT, and Hosokawa Powder Technology Foundation. The authors received helpful advice from Dr. S. Takeda, Takeda Colloid Techno- Consulting Co., Ltd. The authors thank to Admatechs Co., Ltd., and Nippon Aerosil Co., Ltd., for providing the silica particles.
References
Ajmal C.M., Bae S., Baik S., A superior method for construct-ing electrical percolation network of nanocomposite fibers: In situ thermally reduced silver nanoparticles, Small, 15 (2019) 1803255. DOI: 10.1002/smll.201803255
Allain C., Cloitre M., Wafra M., Aggregation and sedimentation in colloidal suspensions, Physics Review Letter, 74 (1995) 1478. DOI: 10.1103/PhysRevLett.74.1478
Ali S., Khan S.A., Eastoe J., Hussaini S.R., Morsy M.A., Yamani Z.H., Synthesis, characterization, and relaxometry
Fig. 11 SNMR of the 10 mass% slurry with different ratios of model aggregate (5 kN). The bold and broken lines are theoretical SBET and SNMR, respectively, which are calculated considering the model aggregate ratio.
Fig. 10 Typical results of model aggregates and wet specific surface area (SNMR) calculated using Eqn. 4. The break line in (b) means SNMR = SBET.
Chika Takai-Yamashita et al. / KONA Powder and Particle Journal No. 37 (2020) 233–243
242
studies of hydrophilic and hydrophobic superparamagnetic Fe3O4 nanoparticles for oil reservoir applications, Colloids and Surfaces A: Physicochemical and Engineering Aspects, 543 (2018) 133–143. DOI: 10.1016/j.colsurfa.2018.02.002
Baeza G.P., Genix A.-C., Degrandcourt C., Petitjean L., Gummel J., Couty M., Oberdisse J., Multiscale filler struc-ture in simplified industrial nanocomposite silica/SBR sys-tems studied by SAXS and TEM, Macromolecules, 46 (2013) 317–329. DOI: 10.1021/ma302248p
Bharti B., Meissner J., Findenegg G.H., Aggregation of silica nanoparticles directed by adsorption of lysozyme, Langmuir, 27 (2011) 9823–9833. DOI: 10.1021/la201898v
Elliott L.N., Bourne R.A., Hassanpour A., Edwards J.L., Sutcliffe S., Hunter T.N., Salt enhanced solvent relaxation and particle surface area determination via rapid spin- lattice NMR, Powder Technology, 333 (2018) 458–467. DOI: 10.1016/j.powtec.2018.04.050
Fairhurst D., Cosgrove T., Prescott S.W., Relaxation NMR as a tool to study the dispersion and formulation behavior of nanostructured carbon materials, Magnetic Resonance in Chemistry, 54 (2016) 521–526. DOI: 10.1002/mrc.4218
Flood C., Cosgrove T., Effect of electrolytes on adsorbed poly-mer layers: poly(ethylene oxide)-silica system, Langmuir, 22 (2006) 6923–6930. DOI: 10.1021/la060724+
Flood C., Cosgrove T., Espidel Y., Welfare E., Howell I., Revell P., Fourier-Transform Carr−Purcell−Meiboom−Gill NMR experiments on polymers in colloidal dispersions: How many polymer molecules per particle?, Langmuir, 24 (2008) 7875–7880. DOI: 10.1021/la800144c
Fuji M., Araki M., Takei T., Watanabe T., Chikazawa M., Struc-ture and wettability of various silica surfaces: Evaluation on the nano and macro levels, KONA Powder and Particle Journal, 18 (2000) 236–241. DOI: 10.14356/kona.2000031
Fuji M., Chikazawa M., Reactivity of water and alcohol of siloxane formed by heat-treatment on silica powder surface, Journal of the Society of Powder Technology, Japan, 47 (2000) 19–25. DOI: 10.4164/sptj.37.19
Gilbert B., Ono R.K., Ching K.A., Kim C.S., The effects of nanoparticle aggregation processes on aggregate structure and metal uptake, Journal of Colloid and Interface Science, 339 (2009) 285–295. DOI: 10.1016/j.jcis.2009.07.058
Higashitani K., Yoshida K., Tanise N., Murata H., Dispersion of coagulated colloids by ultrasonication, Colloids and Sur-faces A: Physicochemical and Engineering Aspects, 81 (1993) 167–175. DOI: 10.1016/0927-7757(93)80243-8
Hossain M.R., Wray D., Paul A., Griffiths P.C., Probing the sur-faces of core-shell and hollow nanoparticles by solvent relaxation NMR, Magnetic Resonance in Chemistry, 56 (2018) 251–256. DOI: 10.1002/mrc.4707
Hurd A.J., Schaefer D.W., Martin J.E., Surface and mass frac-tals in vapor-phase aggregates, Physics Review A, 35 (1987) 2361(R). DOI: 10.1103/PhysRevA.35.2361
Kammler H.K., Beaucage G., Mueller R., Pratsinis S.E., Struc-ture of flame-made silica nanoparticles by ultra-small-angle X-ray scattering, Langmuir, 20 (2004) 1915–1921. DOI: 10.1021/la030155v
Karpovich A., Vlasova M., Sapronova N., Sukharev V., Ivanov V., Exfoliation dynamics of laponite clay in aqueous sus-
pensions studied by NMR relaxometry, Oriental Journal of Chemistry, 32 (2016) 1679–1683. DOI: 10.13005/ojc/320346
Kawamura A., Takai C., Fuji M., Shirai T., Effects of water adsorption on dispersibility of fumed silica in mixed organic solvents of ethanol and hexane, Journal of the Soci-ety of Powder Technology, Japan, 48 (2014) 755–760. DOI: 10.4164/sptj.48.755
Korobov M.V., Batuk M.M., Avramenko N.V., Ivanova N.I., Rozhkova N.N., Ōsawa E., Aggregate structure of “single-nano buckydiamond” in gel and dried powder by differential scanning calorimetry and nitrogen adsorption, Diamond and Related Materials, 19 (2010) 665–671. DOI: 10.1016/j.diamond.2010.02.032
Lee J., Hwang S.H., Yun J., Jang J., Fabrication of SiO2/TiO2 double-shelled hollow nanospheres with controllable size via sol-gel reaction and sonication-mediated etching ACS Applied Materials Interfaces, 10;6 (2014) 15420–15426. DOI: 10.1021/am503957f
Lerche D., Sobisch T., Consolidation of concentrated disper-sions of nano- and microparticles determined by analytical centrifugation, Powder Technology, 174 (2007) 46–49. DOI: 10.1016/j.powtec.2006.10.020
Lerche D., Sobisch T., Evaluation of particle interactions by in situ visualization of separation behaviour, Colloids and Surfaces A: Physicochemical and Engineering Aspects, 440 (2014) 122–130. DOI: 10.1016/j.colsurfa.2012.10.015
Lerche D., Comprehensive characterization of nano- and micro-particles by in-situ visualization of particle movement using advanced sedimentation techniques, KONA Powder and Particle Journal, 36 (2019) 156–186. DOI: 10.14356/kona.2019012
Nelson A., Jack K.S., Cosgrove T., Kozak D., NMR solvent relaxation in studies of multicomponent polymer adsorp-tion, Langmuir, 18 (2002) 2750–2755. DOI: 10.1021/la0156863
Paruthi A., Misra S.K., Relaxation time: A proton NMR-based approach as a metric to measure reactivity of engineered nanomaterials, Journal of Nanoparticle Research, 19 (2017) 292. DOI: 10.1007/s11051-017-3962-z
Saoud K., Alsoubaihi R., Bensalah N., Bora T., Bertino M., Duttad J., Synthesis of supported silver nano-spheres on zinc oxide nanorods for visible light photocatalytic plica-tions, Materials Research Bulletin, 63 (2015) 134–140. DOI: 10.1016/j.materresbull.2014.12.001
Song D., Jing D., Ma W., Zhang X., Effect of particle aggrega-tion on thermal conductivity of nanofluids: Enhancement of phonon MFP, Journal of Applied Physics, 125 (2019) 015103. DOI: 10.1063/1.5062600
Stauch C., Ballweg T., Haas K.‐H., Jaeger R., Stiller S., Shmeliov A., Nicolosi V., Malebennur S., Wötzel J., Beiner M., Luxenhofer R., Mandel K., Silanization of silica nanoparticles and their processing as nanostructured micro-raspberry powders—A route to control the mechani-cal properties of isoprene rubber composites, Polymer Composites, 40 (2019) E732–E743. DOI: 10.1002/pc.24980
Takahashi M., Oya M., Fuji M., Transparent observation of par-ticle dispersion in alumina slurry using in situ solidifica-tion, Advanced Powder Technology, 15 (2004) 97–107.
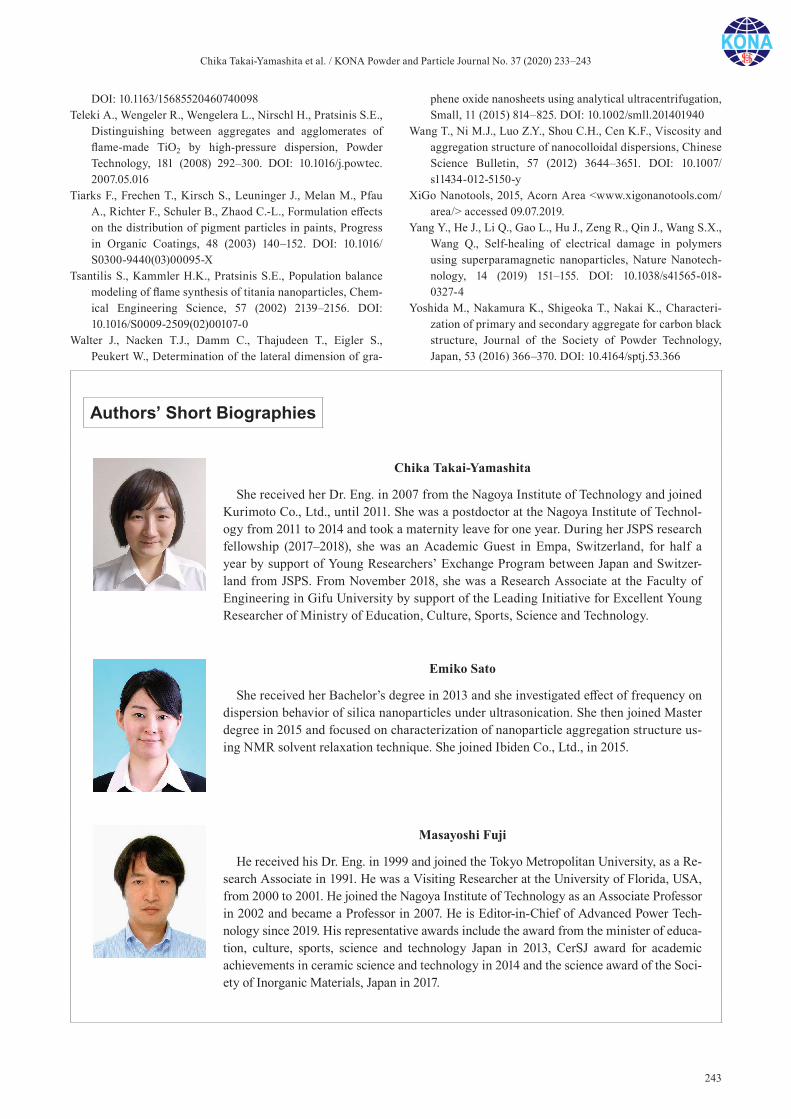
Chika Takai-Yamashita et al. / KONA Powder and Particle Journal No. 37 (2020) 233–243
243
DOI: 10.1163/15685520460740098Teleki A., Wengeler R., Wengelera L., Nirschl H., Pratsinis S.E.,
Distinguishing between aggregates and agglomerates of flame-made TiO2 by high-pressure dispersion, Powder Technology, 181 (2008) 292–300. DOI: 10.1016/j.powtec. 2007.05.016
Tiarks F., Frechen T., Kirsch S., Leuninger J., Melan M., Pfau A., Richter F., Schuler B., Zhaod C.-L., Formulation effects on the distribution of pigment particles in paints, Progress in Organic Coatings, 48 (2003) 140–152. DOI: 10.1016/S0300-9440(03)00095-X
Tsantilis S., Kammler H.K., Pratsinis S.E., Population balance modeling of flame synthesis of titania nanoparticles, Chem-ical Engineering Science, 57 (2002) 2139–2156. DOI: 10.1016/S0009-2509(02)00107-0
Walter J., Nacken T.J., Damm C., Thajudeen T., Eigler S., Peukert W., Determination of the lateral dimension of gra-
phene oxide nanosheets using analytical ultracentrifugation, Small, 11 (2015) 814–825. DOI: 10.1002/smll.201401940
Wang T., Ni M.J., Luo Z.Y., Shou C.H., Cen K.F., Viscosity and aggregation structure of nanocolloidal dispersions, Chinese Science Bulletin, 57 (2012) 3644–3651. DOI: 10.1007/s11434-012-5150-y
XiGo Nanotools, 2015, Acorn Area <www.xigonanotools.com/area/> accessed 09.07.2019.
Yang Y., He J., Li Q., Gao L., Hu J., Zeng R., Qin J., Wang S.X., Wang Q., Self-healing of electrical damage in polymers using superparamagnetic nanoparticles, Nature Nanotech-nology, 14 (2019) 151–155. DOI: 10.1038/s41565-018-0327-4
Yoshida M., Nakamura K., Shigeoka T., Nakai K., Characteri-zation of primary and secondary aggregate for carbon black structure, Journal of the Society of Powder Technology, Japan, 53 (2016) 366–370. DOI: 10.4164/sptj.53.366
Authors’ Short Biographies
Chika Takai-Yamashita
She received her Dr. Eng. in 2007 from the Nagoya Institute of Technology and joined Kurimoto Co., Ltd., until 2011. She was a postdoctor at the Nagoya Institute of Technol-ogy from 2011 to 2014 and took a maternity leave for one year. During her JSPS research fellowship (2017–2018), she was an Academic Guest in Empa, Switzerland, for half a year by support of Young Researchers’ Exchange Program between Japan and Switzer-land from JSPS. From November 2018, she was a Research Associate at the Faculty of Engineering in Gifu University by support of the Leading Initiative for Excellent Young Researcher of Ministry of Education, Culture, Sports, Science and Technology.
Emiko Sato
She received her Bachelor’s degree in 2013 and she investigated effect of frequency on dispersion behavior of silica nanoparticles under ultrasonication. She then joined Master degree in 2015 and focused on characterization of nanoparticle aggregation structure us-ing NMR solvent relaxation technique. She joined Ibiden Co., Ltd., in 2015.
Masayoshi Fuji
He received his Dr. Eng. in 1999 and joined the Tokyo Metropolitan University, as a Re-search Associate in 1991. He was a Visiting Researcher at the University of Florida, USA, from 2000 to 2001. He joined the Nagoya Institute of Technology as an Associate Professor in 2002 and became a Professor in 2007. He is Editor-in-Chief of Advanced Power Tech-nology since 2019. His representative awards include the award from the minister of educa-tion, culture, sports, science and technology Japan in 2013, CerSJ award for academic achievements in ceramic science and technology in 2014 and the science award of the Soci-ety of Inorganic Materials, Japan in 2017.
KONA Powder and Particle Journal No. 37 (2020) 244–257/Doi:10.14356/kona.2020014 Original Research Paper
244Copyright © 2020 The Authors. Published by Hosokawa Powder Technology Foundation. This is an open ac-cess article under the CC BY license (http://creativecommons.org/licenses/by/4.0/).
Production of Hematite Micro- and Nanoparticles in a Fluidized Bed Process—Mechanism Study †
Nadine Le Bolay *, Rihab Lakhal and Mehrdji Hemati1 University of Toulouse, France
AbstractA continuous, compact and simple process was developed to synthesize micro- and nanoparticles of iron oxide. The process combines the spraying (pulverization) of an aqueous solution of iron nitrate in a fluidized bed reactor containing coarse and hot glass beads (T = 200 °C) for the production of solids and a transported bed reactor for calcination (T = 490 °C). The intermediate product formed in the fluidized bed reactor is 2-line ferrihydrite, while the calcination reactor allows the production of hematite micro- and nanoparticles. These particles are characterized by a narrow size distribution, a mean size of 0.5 μm, a specific surface area of 24 m2 g–1 and a density of 4499 kg m–3. Particles are made up of small clusters of crystallites having an average size of 47 nm and a low internal porosity (0.12). The reaction mechanism was studied using a muffle furnace and a lab convective dryer. It was found that several steps are involved leading first to the production of iron nitrate dihydrate after the removal of the solution water, as well as two and then five molecules of water of hydration. After that, the elimination of nitrate leads to the production of ferrihydrite. Finally, ferrihydrite is transformed into hematite due to the removal of residual nitrate and water of hydroxylation.
Keywords: hematite nanoparticles, ferrihydrite, fluidized bed, properties, mechanisms
1. Introduction
The production of nanometric particles is of great inter-est for various industrial sectors since they have attractive properties. In particular, magnetite, hematite and mag-hemite nanoparticles present interesting magnetic, electri-cal and optical properties. They are used for wastewater treatment, biomedical and catalytic applications, or as pigments for painting. Moreover, they are intensively in-vestigated for applications in gas sensors, lithium batte-ries and cosmetic products.
Conventional processes for the synthesis of hematite nanoparticles, such as chemical precipitation (Lunin A.V. et al., 2019), hydrothermal synthesis (Zhu M. et al., 2012), forced hydrolysis (Wang W. et al., 2008), sol-gel (Pawar M.J. and Khajone A.D., 2012) and microemulsion (Housaindokht M.R. and Pour A.N., 2011), comprise nu-merous steps: precipitation and crystallization, filtration, washing, drying and dry grinding. All these operations need numerous devices which may lead to a high cost of
production and may affect the reproducibility of the pro-duct properties. Other methods such as thermal decompo-sition (Glasgow W. et al., 2016) or spray pyrolysis (Ozcelik B.K. and Ergun C., 2015) were proposed as a continuous process. However, the production capability of some of them is limited.
In previous studies carried out in our laboratory (Pont V. et al., 2001; Hémati M. et al., 2003), fine particles were produced using a hot fluidized bed reactor containing coarse and hydrophobic beads with a diameter of over 500 μm. Aqueous solutions containing organic or inor-ganic salts were pulverized within the reactor. The solu-tion was then dried at the contact of the hot beads, leading to the formation of nano- and microparticles which were then removed from the beads’ surface due to a strong mixing of the fluidized medium under the effect of the fluidizing gas. This operation led to the production of particles having a nature identical to that of the products in solution.
In the study presented here, we propose to add a step which allows transformation of the particles leaving the fluidized bed. For this purpose, we implemented calcina-tion after the particles’ production in the fluidized bed, in order to produce hematite particles using a precursor solution of iron nitrate nonahydrate dissolved in water.
The objectives are to characterize the products formed in the process, and to understand and analyze the various
† Received 4 May 2019; Accepted 26 July 2019 J-STAGE Advance published online 7 September 2019
1 INP-ENSIACET-LGC, 4 Allée Emile Monso, CP 44362, 31030 Toulouse Cedex 4, France
* Corresponding author: Nadine Le bolay; E-mail: [email protected] TEL: +33-5-34-32-36-82

Nadine Le Bolay et al. / KONA Powder and Particle Journal No. 37 (2020) 244–257
245
phenomena occurring in the generation and calcination reactors. The manner in which the particles are formed in the process is also explained. Finally, a mechanism is pro-posed, defining the different reaction steps appearing during the transformation of the iron nitrate solution.
2. Experimental
2.1 Equipment and procedures
2.1.1 Fluidized bed processThe process used in this study is presented in Fig. 1.
The fluidized bed reactor is a vertical stainless steel co-lumn with an inner diameter of 0.1 m and a height of 0.5 m, filled up to half its capacity with 1.5 kg of glass beads (diameter = 1.4–1.6 mm) and topped by a conical freeboard section. This conical section is closed by a lid equipped with a guide tube for the introduction of a spraying system and an exit for evacuating gas and parti-cles. The column is provided at its base with a vine box permitting air homogenization. The fluidization gas dis-tribution is ensured by a distributor made up of a perfo-rated stainless steel plate with a porosity of 2 %, under which a metallic grid of low opening is fixed, whose role is to prevent the fine particles from passing through the distributor. Before entering the bed, the fluidizing air flow rate is measured by means of rotameters and the air is preheated by an electrical heater (4 kW). The precursor solution (aqueous solution of iron nitrate nonahydrate) is stored in a reservoir placed on a balance in order to con-trol the flow rate of the solution. It is drawn up by a volu-metric pump from the reservoir to an internal mixing two-fluid spray nozzle (Spray System Co.). The atomizing gas (air) flow rate is controlled by a middle valve and measured by a rotameter. The atomizer is a downward
facing nozzle and is located in the bed. The bed tempera-ture is controlled by means of a PID regulator. Monitoring of temperature and pressure drop is achieved during ope-ration.
A cyclone (0.09 m in diameter and 0.15 m in height), with a cut diameter of around 10 μm for the operating conditions used in this study, is placed at the fluidized bed reactor outlet. It allows recovering particles larger than its cut diameter (large solid particles or broken beads), while fine particles are entrained in the gas current towards the end of the process.
Then, the gas-particle suspension supplies a second reac tor (calcinator). This reactor, made up of a heat resis-tant stainless steel tube (0.1 m in diameter and 1.7 m in length), is heated externally by an electrical furnace (8 kW). Prior to filtration, the suspension at the outlet of the calcinator is cooled at 150 °C by a cold air current to avoid any degradation of the filter. The filtration is carried out by a vibrated metallic sleeve filter containing four compartments, each of them including one cartridge. Iron oxide particles are recovered at the filter bottom. This fil-ter was preferred to a cyclone because of its greater effi-ciency to arrest fine particles (dp > 0.3 μm).
The experimental protocol is as follows. The fluidized bed reactor is charged with the glass beads and then closed. The bed is fluidized with preheated air, to reach the set point temperature. The second reactor is also heated and in parallel the cooling air is fed to its outlet side. In order to reduce the thermal disturbance caused by the liquid atomization, pure solvent (distilled water) is initially sprayed into the fluidized bed reactor at the same flow rate as the precursor solution. When the bed tempera-ture returns to the set value, the distilled water is switched with the iron nitrate solution, and 1.5 kg of solution is sprayed into the reactor. Particles are recovered at the bottom of the cyclone and the filter and are maintained in
Fig. 1 Schematic of the process.
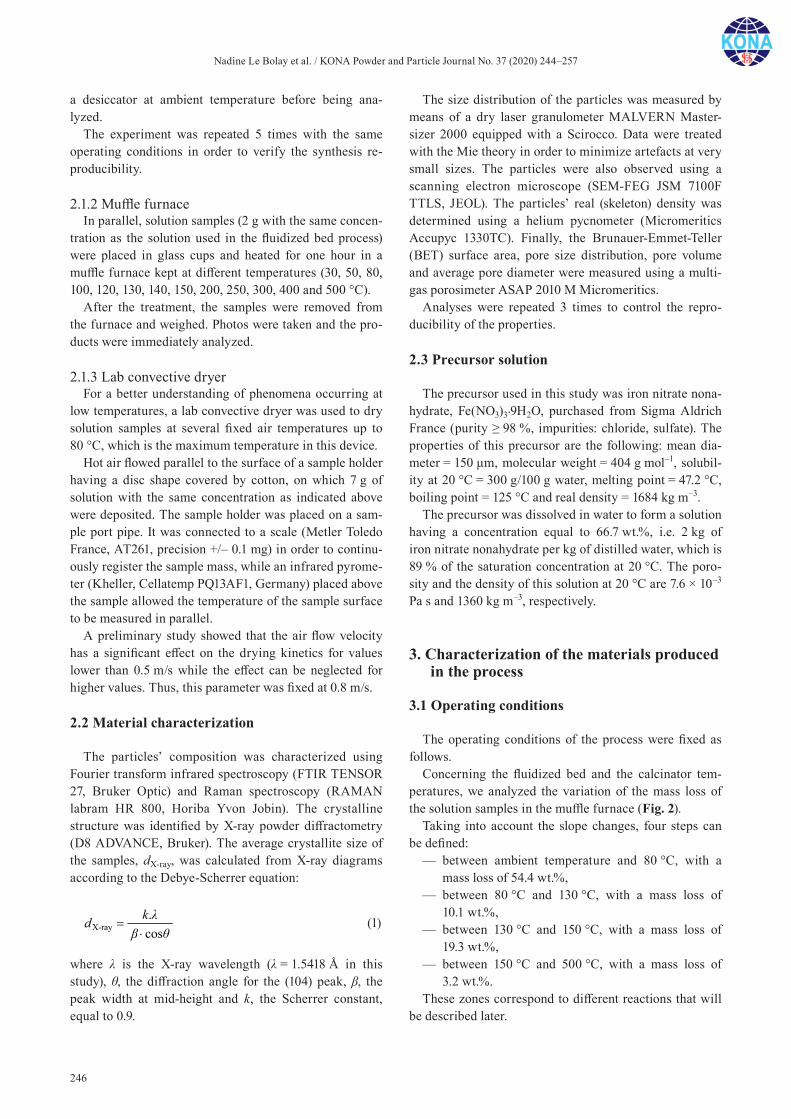
Nadine Le Bolay et al. / KONA Powder and Particle Journal No. 37 (2020) 244–257
246
a desiccator at ambient temperature before being ana-lyzed.
The experiment was repeated 5 times with the same operating conditions in order to verify the synthesis re-producibility.
2.1.2 Muffle furnaceIn parallel, solution samples (2 g with the same concen-
tration as the solution used in the fluidized bed process) were placed in glass cups and heated for one hour in a muffle furnace kept at different temperatures (30, 50, 80, 100, 120, 130, 140, 150, 200, 250, 300, 400 and 500 °C).
After the treatment, the samples were removed from the furnace and weighed. Photos were taken and the pro-ducts were immediately analyzed.
2.1.3 Lab convective dryerFor a better understanding of phenomena occurring at
low temperatures, a lab convective dryer was used to dry solution samples at several fixed air temperatures up to 80 °C, which is the maximum temperature in this device.
Hot air flowed parallel to the surface of a sample holder having a disc shape covered by cotton, on which 7 g of solution with the same concentration as indicated above were deposited. The sample holder was placed on a sam-ple port pipe. It was connected to a scale (Metler Toledo France, AT261, precision +/– 0.1 mg) in order to continu-ously register the sample mass, while an infrared pyrome-ter (Kheller, Cellatemp PQ13AF1, Germany) placed above the sample allowed the temperature of the sample surface to be measured in parallel.
A preliminary study showed that the air flow velocity has a significant effect on the drying kinetics for values lower than 0.5 m/s while the effect can be neglected for higher values. Thus, this parameter was fixed at 0.8 m/s.
2.2 Material characterization
The particles’ composition was characterized using Fourier transform infrared spectroscopy (FTIR TENSOR 27, Bruker Optic) and Raman spectroscopy (RAMAN labram HR 800, Horiba Yvon Jobin). The crystalline structure was identified by X-ray powder diffractometry (D8 ADVANCE, Bruker). The average crystallite size of the samples, dX-ray, was calculated from X-ray diagrams according to the Debye-Scherrer equation:
X-ray.coskd
(1)
where λ is the X-ray wavelength (λ = 1.5418 Å in this study), θ, the diffraction angle for the (104) peak, β, the peak width at mid-height and k, the Scherrer constant, equal to 0.9.
The size distribution of the particles was measured by means of a dry laser granulometer MALVERN Master-sizer 2000 equipped with a Scirocco. Data were treated with the Mie theory in order to minimize artefacts at very small sizes. The particles were also observed using a scanning electron microscope (SEM-FEG JSM 7100F TTLS, JEOL). The particles’ real (skeleton) density was determined using a helium pycnometer (Micromeritics Accupyc 1330TC). Finally, the Brunauer-Emmet-Teller (BET) surface area, pore size distribution, pore volume and average pore diameter were measured using a multi-gas porosimeter ASAP 2010 M Micromeritics.
Analyses were repeated 3 times to control the repro-ducibility of the properties.
2.3 Precursor solution
The precursor used in this study was iron nitrate nona-hydrate, Fe(NO3)3·9H2O, purchased from Sigma Aldrich France (purity ≥ 98 %, impurities: chloride, sulfate). The properties of this precursor are the following: mean dia-meter = 150 μm, molecular weight = 404 g mol–1, solubil-ity at 20 °C = 300 g/100 g water, melting point = 47.2 °C, boiling point = 125 °C and real density = 1684 kg m–3.
The precursor was dissolved in water to form a solution having a concentration equal to 66.7 wt.%, i.e. 2 kg of iron nitrate nonahydrate per kg of distilled water, which is 89 % of the saturation concentration at 20 °C. The poro-sity and the density of this solution at 20 °C are 7.6 × 10⁻³ Pa s and 1360 kg m–3, respectively.
3. Characterization of the materials produced in the process
3.1 Operating conditions
The operating conditions of the process were fixed as follows.
Concerning the fluidized bed and the calcinator tem-peratures, we analyzed the variation of the mass loss of the solution samples in the muffle furnace (Fig. 2).
Taking into account the slope changes, four steps can be defined:
— between ambient temperature and 80 °C, with a mass loss of 54.4 wt.%,
— between 80 °C and 130 °C, with a mass loss of 10.1 wt.%,
— between 130 °C and 150 °C, with a mass loss of 19.3 wt.%,
— between 150 °C and 500 °C, with a mass loss of 3.2 wt.%.
These zones correspond to different reactions that will be described later.
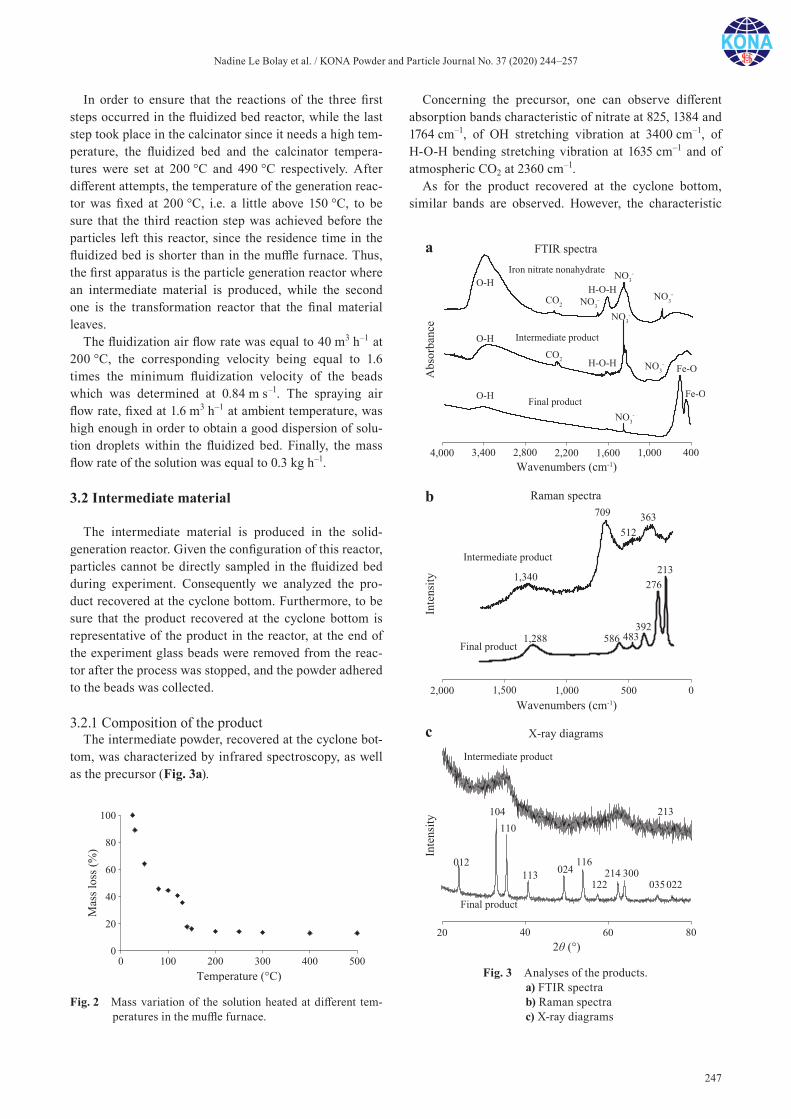
Nadine Le Bolay et al. / KONA Powder and Particle Journal No. 37 (2020) 244–257
247
In order to ensure that the reactions of the three first steps occurred in the fluidized bed reactor, while the last step took place in the calcinator since it needs a high tem-perature, the fluidized bed and the calcinator tempera-tures were set at 200 °C and 490 °C respectively. After different attempts, the temperature of the generation reac-tor was fixed at 200 °C, i.e. a little above 150 °C, to be sure that the third reaction step was achieved before the particles left this reactor, since the residence time in the fluidized bed is shorter than in the muffle furnace. Thus, the first apparatus is the particle generation reactor where an intermediate material is produced, while the second one is the transformation reactor that the final material leaves.
The fluidization air flow rate was equal to 40 m3 h–1 at 200 °C, the corresponding velocity being equal to 1.6 times the minimum fluidization velocity of the beads which was determined at 0.84 m s–1. The spraying air flow rate, fixed at 1.6 m3 h–1 at ambient temperature, was high enough in order to obtain a good dispersion of solu-tion droplets within the fluidized bed. Finally, the mass flow rate of the solution was equal to 0.3 kg h–1.
3.2 Intermediate material
The intermediate material is produced in the solid- generation reactor. Given the configuration of this reactor, particles cannot be directly sampled in the fluidized bed during experiment. Consequently we analyzed the pro-duct recovered at the cyclone bottom. Furthermore, to be sure that the product recovered at the cyclone bottom is representative of the product in the reactor, at the end of the experiment glass beads were removed from the reac-tor after the process was stopped, and the powder adhered to the beads was collected.
3.2.1 Composition of the productThe intermediate powder, recovered at the cyclone bot-
tom, was characterized by infrared spectroscopy, as well as the precursor (Fig. 3a).
Concerning the precursor, one can observe different absorption bands characteristic of nitrate at 825, 1384 and 1764 cm–1, of OH stretching vibration at 3400 cm–1, of H-O-H bending stretching vibration at 1635 cm–1 and of atmospheric CO2 at 2360 cm–1.
As for the product recovered at the cyclone bottom, similar bands are observed. However, the characteristic
Fig. 2 Mass variation of the solution heated at different tem-peratures in the muffle furnace.
Fig. 3 Analyses of the products.a) FTIR spectrab) Raman spectrac) X-ray diagrams
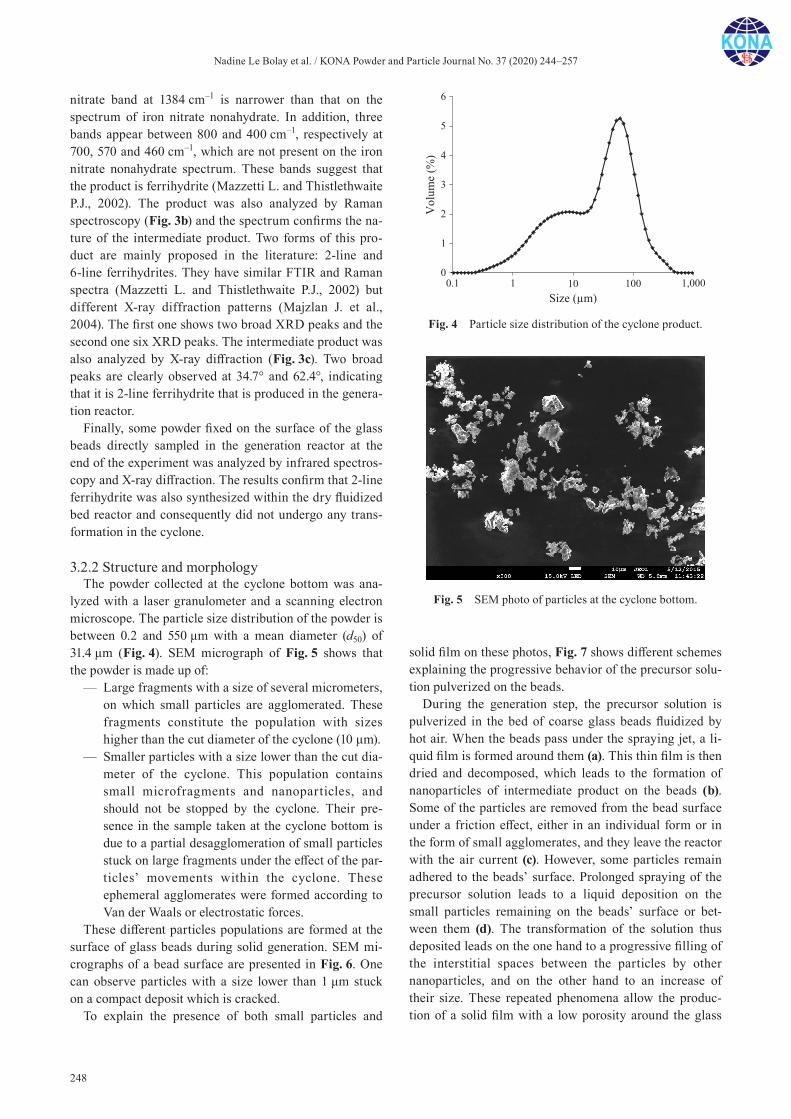
Nadine Le Bolay et al. / KONA Powder and Particle Journal No. 37 (2020) 244–257
248
nitrate band at 1384 cm–1 is narrower than that on the spectrum of iron nitrate nonahydrate. In addition, three bands appear between 800 and 400 cm–1, respectively at 700, 570 and 460 cm–1, which are not present on the iron nitrate nonahydrate spectrum. These bands suggest that the product is ferrihydrite (Mazzetti L. and Thistlethwaite P.J., 2002). The product was also analyzed by Raman spectroscopy (Fig. 3b) and the spectrum confirms the na-ture of the intermediate product. Two forms of this pro-duct are mainly proposed in the literature: 2-line and 6-line ferrihydrites. They have similar FTIR and Raman spectra (Mazzetti L. and Thistlethwaite P.J., 2002) but different X-ray diffraction patterns (Majzlan J. et al., 2004). The first one shows two broad XRD peaks and the second one six XRD peaks. The intermediate product was also analyzed by X-ray diffraction (Fig. 3c). Two broad peaks are clearly observed at 34.7° and 62.4°, indicating that it is 2-line ferrihydrite that is produced in the genera-tion reactor.
Finally, some powder fixed on the surface of the glass beads directly sampled in the generation reactor at the end of the experiment was analyzed by infrared spectros-copy and X-ray diffraction. The results confirm that 2-line ferrihydrite was also synthesized within the dry fluidized bed reactor and consequently did not undergo any trans-formation in the cyclone.
3.2.2 Structure and morphologyThe powder collected at the cyclone bottom was ana-
lyzed with a laser granulometer and a scanning electron microscope. The particle size distribution of the powder is between 0.2 and 550 μm with a mean diameter (d50) of 31.4 μm (Fig. 4). SEM micrograph of Fig. 5 shows that the powder is made up of:
— Large fragments with a size of several micrometers, on which small particles are agglomerated. These fragments constitute the population with sizes higher than the cut diameter of the cyclone (10 μm).
— Smaller particles with a size lower than the cut dia-meter of the cyclone. This population contains small microfragments and nanoparticles, and should not be stopped by the cyclone. Their pre-sence in the sample taken at the cyclone bottom is due to a partial desagglomeration of small particles stuck on large fragments under the effect of the par-ticles’ movements within the cyclone. These ephemeral agglomerates were formed according to Van der Waals or electrostatic forces.
These different particles populations are formed at the surface of glass beads during solid generation. SEM mi-crographs of a bead surface are presented in Fig. 6. One can observe particles with a size lower than 1 μm stuck on a compact deposit which is cracked.
To explain the presence of both small particles and
solid film on these photos, Fig. 7 shows different schemes explaining the progressive behavior of the precursor solu-tion pulverized on the beads.
During the generation step, the precursor solution is pulverized in the bed of coarse glass beads fluidized by hot air. When the beads pass under the spraying jet, a li-quid film is formed around them (a). This thin film is then dried and decomposed, which leads to the formation of nanoparticles of intermediate product on the beads (b). Some of the particles are removed from the bead surface under a friction effect, either in an individual form or in the form of small agglomerates, and they leave the reactor with the air current (c). However, some particles remain adhered to the beads’ surface. Prolonged spraying of the precursor solution leads to a liquid deposition on the small particles remaining on the beads’ surface or bet-ween them (d). The transformation of the solution thus deposited leads on the one hand to a progressive filling of the interstitial spaces between the particles by other nanoparticles, and on the other hand to an increase of their size. These repeated phenomena allow the produc-tion of a solid film with a low porosity around the glass
Fig. 4 Particle size distribution of the cyclone product.
Fig. 5 SEM photo of particles at the cyclone bottom.
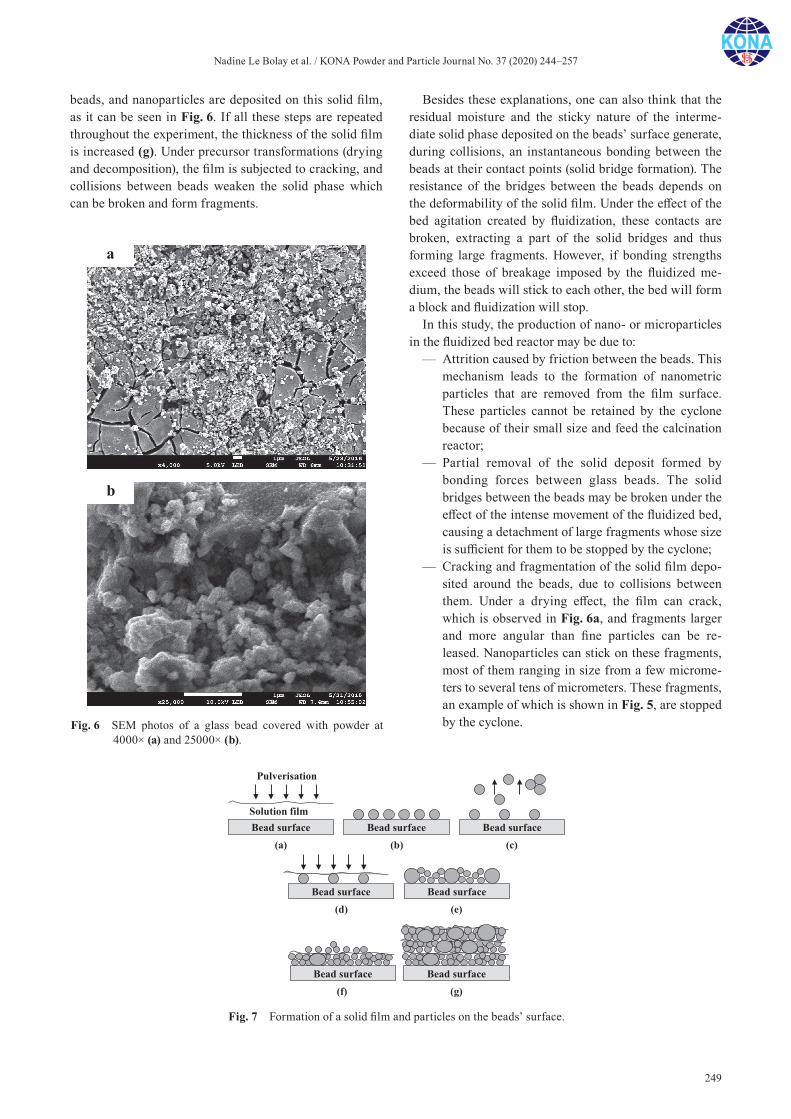
Nadine Le Bolay et al. / KONA Powder and Particle Journal No. 37 (2020) 244–257
249
beads, and nanoparticles are deposited on this solid film, as it can be seen in Fig. 6. If all these steps are repeated throughout the experiment, the thickness of the solid film is increased (g). Under precursor transformations (drying and decomposition), the film is subjected to cracking, and collisions between beads weaken the solid phase which can be broken and form fragments.
Besides these explanations, one can also think that the residual moisture and the sticky nature of the interme-diate solid phase deposited on the beads’ surface generate, during collisions, an instantaneous bonding between the beads at their contact points (solid bridge formation). The resistance of the bridges between the beads depends on the deformability of the solid film. Under the effect of the bed agitation created by fluidization, these contacts are broken, extracting a part of the solid bridges and thus forming large fragments. However, if bonding strengths exceed those of breakage imposed by the fluidized me-dium, the beads will stick to each other, the bed will form a block and fluidization will stop.
In this study, the production of nano- or microparticles in the fluidized bed reactor may be due to:
— Attrition caused by friction between the beads. This mechanism leads to the formation of nanometric particles that are removed from the film surface. These particles cannot be retained by the cyclone because of their small size and feed the calcination reactor;
— Partial removal of the solid deposit formed by bonding forces between glass beads. The solid bridges between the beads may be broken under the effect of the intense movement of the fluidized bed, causing a detachment of large fragments whose size is sufficient for them to be stopped by the cyclone;
— Cracking and fragmentation of the solid film depo-sited around the beads, due to collisions between them. Under a drying effect, the film can crack, which is observed in Fig. 6a, and fragments larger and more angular than fine particles can be re-leased. Nanoparticles can stick on these fragments, most of them ranging in size from a few microme-ters to several tens of micrometers. These fragments, an example of which is shown in Fig. 5, are stopped by the cyclone.Fig. 6 SEM photos of a glass bead covered with powder at
4000× (a) and 25000× (b).
Fig. 7 Formation of a solid film and particles on the beads’ surface.
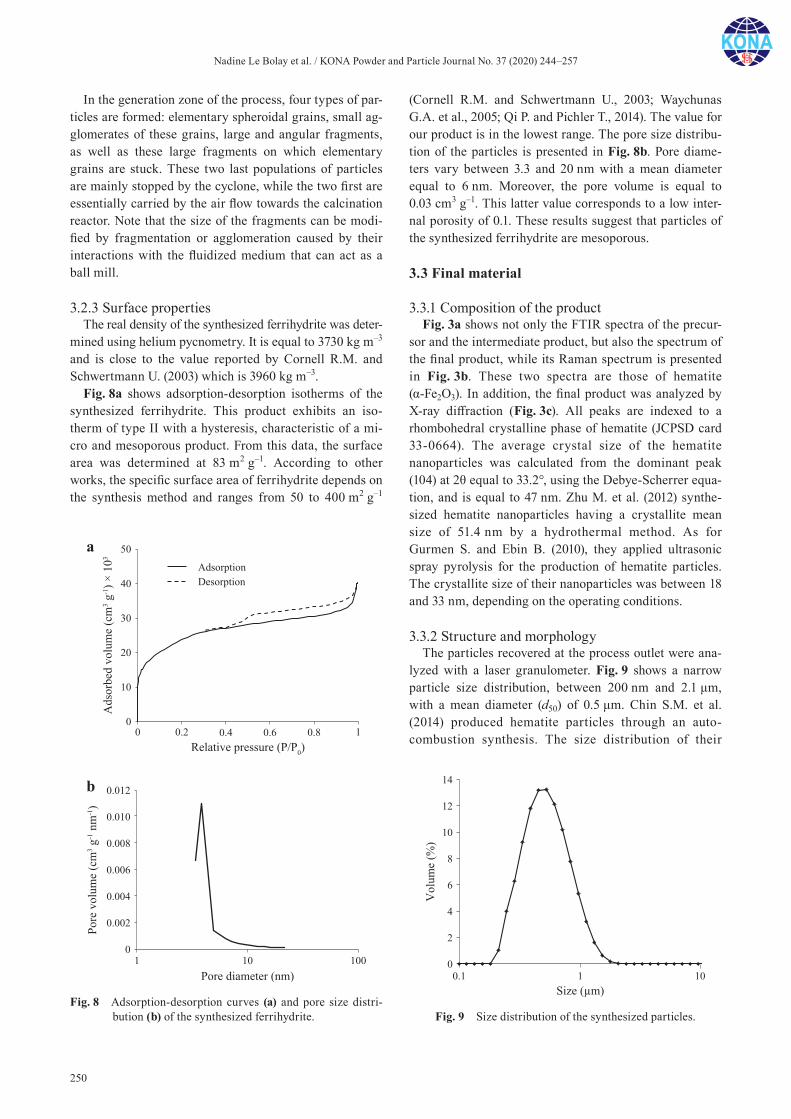
Nadine Le Bolay et al. / KONA Powder and Particle Journal No. 37 (2020) 244–257
250
In the generation zone of the process, four types of par-ticles are formed: elementary spheroidal grains, small ag-glomerates of these grains, large and angular fragments, as well as these large fragments on which elementary grains are stuck. These two last populations of particles are mainly stopped by the cyclone, while the two first are essentially carried by the air flow towards the calcination reactor. Note that the size of the fragments can be modi-fied by fragmentation or agglomeration caused by their interactions with the fluidized medium that can act as a ball mill.
3.2.3 Surface propertiesThe real density of the synthesized ferrihydrite was deter-
mined using helium pycnometry. It is equal to 3730 kg m–3 and is close to the value reported by Cornell R.M. and Schwertmann U. (2003) which is 3960 kg m–3.
Fig. 8a shows adsorption-desorption isotherms of the synthesized ferrihydrite. This product exhibits an iso-therm of type II with a hysteresis, characteristic of a mi-cro and mesoporous product. From this data, the surface area was determined at 83 m2 g–1. According to other works, the specific surface area of ferrihydrite depends on the synthesis method and ranges from 50 to 400 m2 g–1
(Cornell R.M. and Schwertmann U., 2003; Waychunas G.A. et al., 2005; Qi P. and Pichler T., 2014). The value for our product is in the lowest range. The pore size distribu-tion of the particles is presented in Fig. 8b. Pore diame-ters vary between 3.3 and 20 nm with a mean diameter equal to 6 nm. Moreover, the pore volume is equal to 0.03 cm3 g–1. This latter value corresponds to a low inter-nal porosity of 0.1. These results suggest that particles of the synthesized ferrihydrite are mesoporous.
3.3 Final material
3.3.1 Composition of the productFig. 3a shows not only the FTIR spectra of the precur-
sor and the intermediate product, but also the spectrum of the final product, while its Raman spectrum is presented in Fig. 3b. These two spectra are those of hematite (α-Fe2O3). In addition, the final product was analyzed by X-ray diffraction (Fig. 3c). All peaks are indexed to a rhombohedral crystalline phase of hematite (JCPSD card 33-0664). The average crystal size of the hematite nanoparticles was calculated from the dominant peak (104) at 2θ equal to 33.2°, using the Debye-Scherrer equa-tion, and is equal to 47 nm. Zhu M. et al. (2012) synthe-sized hematite nanoparticles having a crystallite mean size of 51.4 nm by a hydrothermal method. As for Gurmen S. and Ebin B. (2010), they applied ultrasonic spray pyrolysis for the production of hematite particles. The crystallite size of their nanoparticles was between 18 and 33 nm, depending on the operating conditions.
3.3.2 Structure and morphologyThe particles recovered at the process outlet were ana-
lyzed with a laser granulometer. Fig. 9 shows a narrow particle size distribution, between 200 nm and 2.1 μm, with a mean diameter (d50) of 0.5 μm. Chin S.M. et al. (2014) produced hematite particles through an auto- combustion synthesis. The size distribution of their
Fig. 9 Size distribution of the synthesized particles.Fig. 8 Adsorption-desorption curves (a) and pore size distri-
bution (b) of the synthesized ferrihydrite.
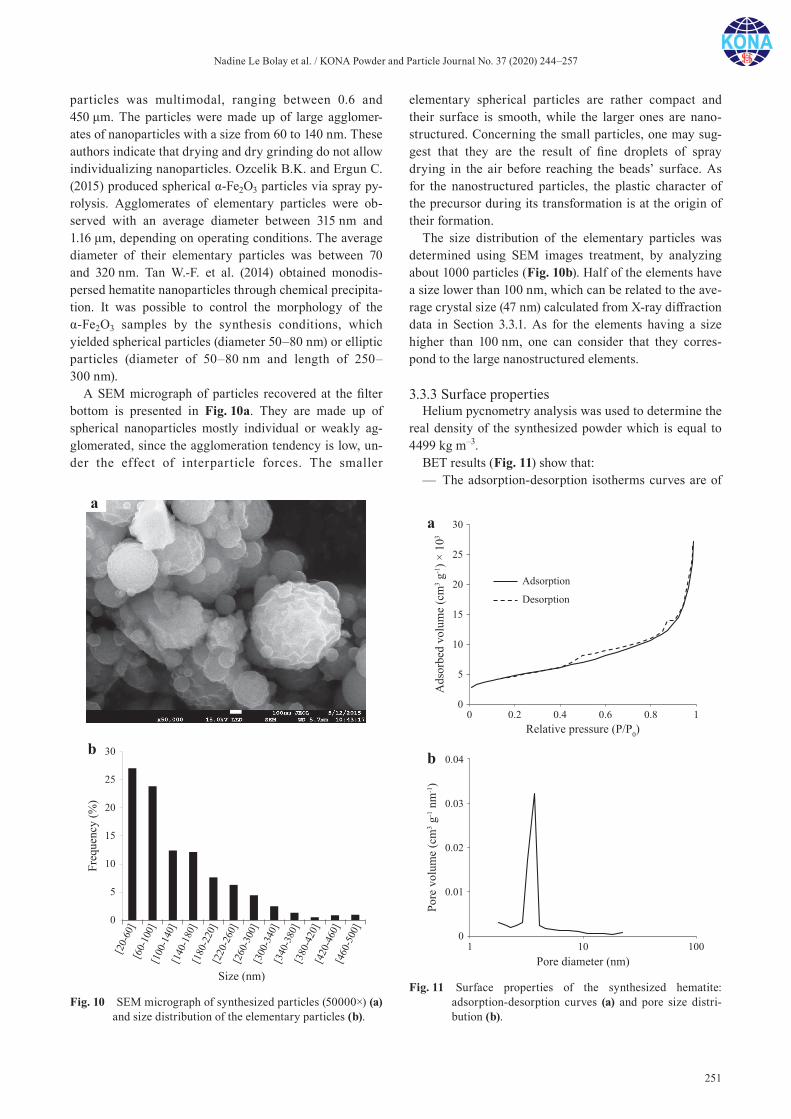
Nadine Le Bolay et al. / KONA Powder and Particle Journal No. 37 (2020) 244–257
251
particles was multimodal, ranging between 0.6 and 450 μm. The particles were made up of large agglomer-ates of nanoparticles with a size from 60 to 140 nm. These authors indicate that drying and dry grinding do not allow individualizing nanoparticles. Ozcelik B.K. and Ergun C. (2015) produced spherical α-Fe2O3 particles via spray py-rolysis. Agglomerates of elementary particles were ob-served with an average diameter between 315 nm and 1.16 μm, depending on operating conditions. The average diameter of their elementary particles was between 70 and 320 nm. Tan W.-F. et al. (2014) obtained monodis-persed hematite nanoparticles through chemical precipita-tion. It was possible to control the morphology of the α-Fe2O3 samples by the synthesis conditions, which yielded spherical particles (diameter 50–80 nm) or elliptic particles (diameter of 50–80 nm and length of 250–300 nm).
A SEM micrograph of particles recovered at the filter bottom is presented in Fig. 10a. They are made up of spherical nanoparticles mostly individual or weakly ag-glomerated, since the agglomeration tendency is low, un-der the effect of interparticle forces. The smaller
elementary spherical particles are rather compact and their surface is smooth, while the larger ones are nano-structured. Concerning the small particles, one may sug-gest that they are the result of fine droplets of spray drying in the air before reaching the beads’ surface. As for the nanostructured particles, the plastic character of the precursor during its transformation is at the origin of their formation.
The size distribution of the elementary particles was determined using SEM images treatment, by analyzing about 1000 particles (Fig. 10b). Half of the elements have a size lower than 100 nm, which can be related to the ave-rage crystal size (47 nm) calculated from X-ray diffraction data in Section 3.3.1. As for the elements having a size higher than 100 nm, one can consider that they corres-pond to the large nanostructured elements.
3.3.3 Surface propertiesHelium pycnometry analysis was used to determine the
real density of the synthesized powder which is equal to 4499 kg m–3.
BET results (Fig. 11) show that:— The adsorption-desorption isotherms curves are of
Fig. 10 SEM micrograph of synthesized particles (50000×) (a) and size distribution of the elementary particles (b).
Fig. 11 Surface properties of the synthesized hematite: adsorption-desorption curves (a) and pore size distri-bution (b).
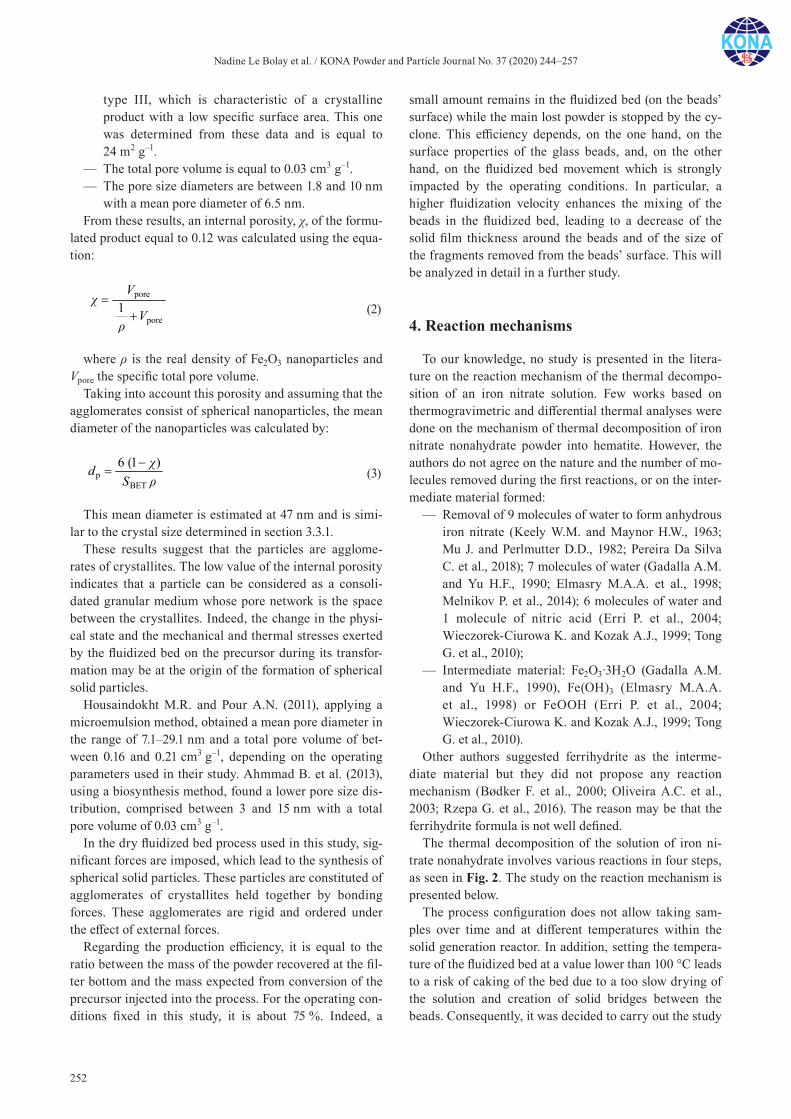
Nadine Le Bolay et al. / KONA Powder and Particle Journal No. 37 (2020) 244–257
252
type III, which is characteristic of a crystalline product with a low specific surface area. This one was determined from these data and is equal to 24 m2 g–1.
— The total pore volume is equal to 0.03 cm3 g–1.— The pore size diameters are between 1.8 and 10 nm
with a mean pore diameter of 6.5 nm.From these results, an internal porosity, χ, of the formu-
lated product equal to 0.12 was calculated using the equa-tion:
pore
pore1
V
V
(2)
where ρ is the real density of Fe2O3 nanoparticles and Vpore the specific total pore volume.
Taking into account this porosity and assuming that the agglomerates consist of spherical nanoparticles, the mean diameter of the nanoparticles was calculated by:
pBET
6 (1 )
dS
(3)
This mean diameter is estimated at 47 nm and is simi-lar to the crystal size determined in section 3.3.1.
These results suggest that the particles are agglome-rates of crystallites. The low value of the internal porosity indicates that a particle can be considered as a consoli-dated granular medium whose pore network is the space between the crystallites. Indeed, the change in the physi-cal state and the mechanical and thermal stresses exerted by the fluidized bed on the precursor during its transfor-mation may be at the origin of the formation of spherical solid particles.
Housaindokht M.R. and Pour A.N. (2011), applying a microemulsion method, obtained a mean pore diameter in the range of 7.1–29.1 nm and a total pore volume of bet-ween 0.16 and 0.21 cm3 g–1, depending on the operating parameters used in their study. Ahmmad B. et al. (2013), using a biosynthesis method, found a lower pore size dis-tribution, comprised between 3 and 15 nm with a total pore volume of 0.03 cm3 g–1.
In the dry fluidized bed process used in this study, sig-nificant forces are imposed, which lead to the synthesis of spherical solid particles. These particles are constituted of agglomerates of crystallites held together by bonding forces. These agglomerates are rigid and ordered under the effect of external forces.
Regarding the production efficiency, it is equal to the ratio between the mass of the powder recovered at the fil-ter bottom and the mass expected from conversion of the precursor injected into the process. For the operating con-ditions fixed in this study, it is about 75 %. Indeed, a
small amount remains in the fluidized bed (on the beads’ surface) while the main lost powder is stopped by the cy-clone. This efficiency depends, on the one hand, on the surface properties of the glass beads, and, on the other hand, on the fluidized bed movement which is strongly impacted by the operating conditions. In particular, a higher fluidization velocity enhances the mixing of the beads in the fluidized bed, leading to a decrease of the solid film thickness around the beads and of the size of the fragments removed from the beads’ surface. This will be analyzed in detail in a further study.
4. Reaction mechanisms
To our knowledge, no study is presented in the litera-ture on the reaction mechanism of the thermal decompo-sition of an iron nitrate solution. Few works based on thermogravimetric and differential thermal analyses were done on the mechanism of thermal decomposition of iron nitrate nonahydrate powder into hematite. However, the authors do not agree on the nature and the number of mo-lecules removed during the first reactions, or on the inter-mediate material formed:
— Removal of 9 molecules of water to form anhydrous iron nitrate (Keely W.M. and Maynor H.W., 1963; Mu J. and Perlmutter D.D., 1982; Pereira Da Silva C. et al., 2018); 7 molecules of water (Gadalla A.M. and Yu H.F., 1990; Elmasry M.A.A. et al., 1998; Melnikov P. et al., 2014); 6 molecules of water and 1 molecule of nitric acid (Erri P. et al., 2004; Wieczorek-Ciurowa K. and Kozak A.J., 1999; Tong G. et al., 2010);
— Intermediate material: Fe2O3·3H2O (Gadalla A.M. and Yu H.F., 1990), Fe(OH)3 (Elmasry M.A.A. et al., 1998) or FeOOH (Erri P. et al., 2004; Wieczorek-Ciurowa K. and Kozak A.J., 1999; Tong G. et al., 2010).
Other authors suggested ferrihydrite as the interme-dia te material but they did not propose any reaction mechanism (Bødker F. et al., 2000; Oliveira A.C. et al., 2003; Rzepa G. et al., 2016). The reason may be that the ferrihydrite formula is not well defined.
The thermal decomposition of the solution of iron ni-trate nonahydrate involves various reactions in four steps, as seen in Fig. 2. The study on the reaction mechanism is presented below.
The process configuration does not allow taking sam-ples over time and at different temperatures within the solid generation reactor. In addition, setting the tempera-ture of the fluidized bed at a value lower than 100 °C leads to a risk of caking of the bed due to a too slow drying of the solution and creation of solid bridges between the beads. Consequently, it was decided to carry out the study
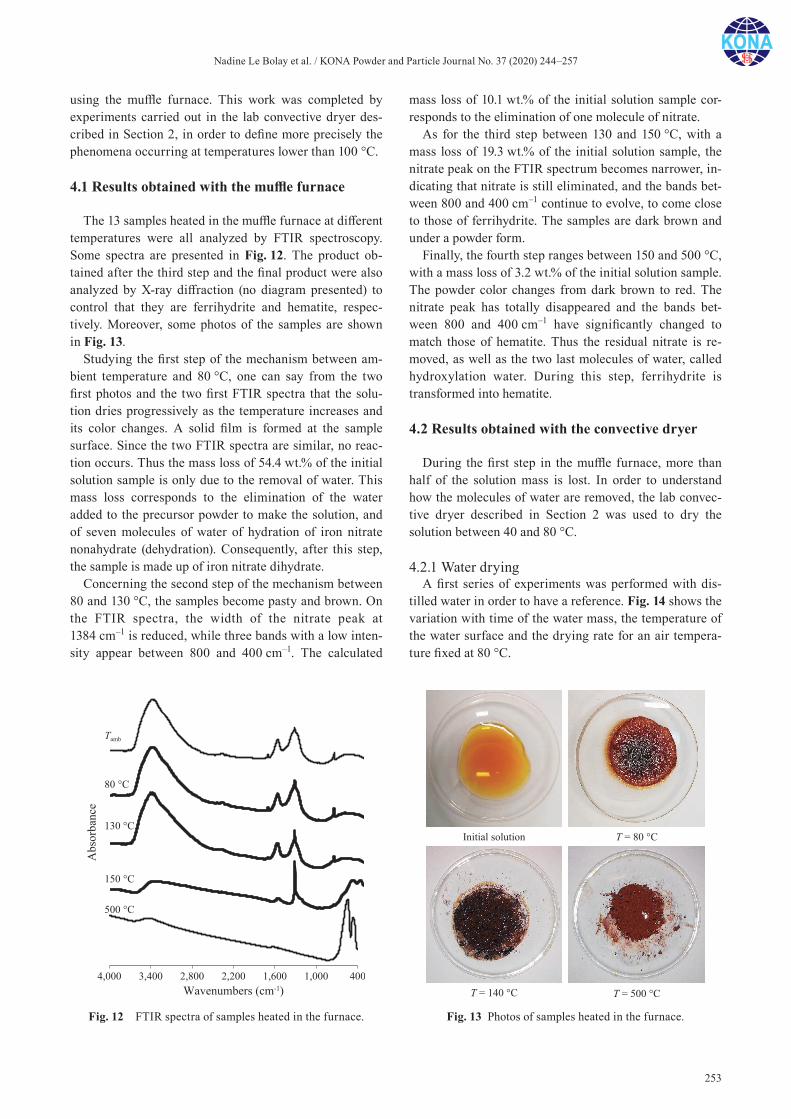
Nadine Le Bolay et al. / KONA Powder and Particle Journal No. 37 (2020) 244–257
253
using the muffle furnace. This work was completed by experiments carried out in the lab convective dryer des-cribed in Section 2, in order to define more precisely the phenomena occurring at temperatures lower than 100 °C.
4.1 Results obtained with the muffle furnace
The 13 samples heated in the muffle furnace at different temperatures were all analyzed by FTIR spectroscopy. Some spectra are presented in Fig. 12. The product ob-tained after the third step and the final product were also analyzed by X-ray diffraction (no diagram presented) to control that they are ferrihydrite and hematite, respec-tively. Moreover, some photos of the samples are shown in Fig. 13.
Studying the first step of the mechanism between am-bient temperature and 80 °C, one can say from the two first photos and the two first FTIR spectra that the solu-tion dries progressively as the temperature increases and its color changes. A solid film is formed at the sample surface. Since the two FTIR spectra are similar, no reac-tion occurs. Thus the mass loss of 54.4 wt.% of the initial solution sample is only due to the removal of water. This mass loss corresponds to the elimination of the water added to the precursor powder to make the solution, and of seven molecules of water of hydration of iron nitrate nonahydrate (dehydration). Consequently, after this step, the sample is made up of iron nitrate dihydrate.
Concerning the second step of the mechanism between 80 and 130 °C, the samples become pasty and brown. On the FTIR spectra, the width of the nitrate peak at 1384 cm–1 is reduced, while three bands with a low inten-sity appear between 800 and 400 cm–1. The calculated
mass loss of 10.1 wt.% of the initial solution sample cor-responds to the elimination of one molecule of nitrate.
As for the third step between 130 and 150 °C, with a mass loss of 19.3 wt.% of the initial solution sample, the nitrate peak on the FTIR spectrum becomes narrower, in-dicating that nitrate is still eliminated, and the bands bet-ween 800 and 400 cm–1 continue to evolve, to come close to those of ferrihydrite. The samples are dark brown and under a powder form.
Finally, the fourth step ranges between 150 and 500 °C, with a mass loss of 3.2 wt.% of the initial solution sample. The powder color changes from dark brown to red. The nitrate peak has totally disappeared and the bands bet-ween 800 and 400 cm–1 have significantly changed to match those of hematite. Thus the residual nitrate is re-moved, as well as the two last molecules of water, called hydroxylation water. During this step, ferrihydrite is transformed into hematite.
4.2 Results obtained with the convective dryer
During the first step in the muffle furnace, more than half of the solution mass is lost. In order to understand how the molecules of water are removed, the lab convec-tive dryer described in Section 2 was used to dry the solution between 40 and 80 °C.
4.2.1 Water dryingA first series of experiments was performed with dis-
tilled water in order to have a reference. Fig. 14 shows the variation with time of the water mass, the temperature of the water surface and the drying rate for an air tempera-ture fixed at 80 °C.
Fig. 12 FTIR spectra of samples heated in the furnace. Fig. 13 Photos of samples heated in the furnace.

Nadine Le Bolay et al. / KONA Powder and Particle Journal No. 37 (2020) 244–257
254
Three zones are observed on the figure:— Prior to 380 seconds, the water sample is heated by
hot air, and its temperature increases rapidly. This leads to an increase in equilibrium vapor pressure (i.e. saturating vapor pressure). This first zone is called initiation period.
— Between 380 and 3000 seconds, the water tempera-ture is constant and equal to 48.8 °C, the mass de-creases linearly and the drying rate is constant. Water is evaporated, and the water molecules have a low binding energy. The evaporation enthalpy of water is due to the energy supplied by hot air. The partial pressure of water vapor at the surface of the wet cotton (equilibrium pressure) is that of the satu-rating vapor of water at the sample temperature. This second zone is called drying period at constant rate.
— Above 3000 seconds, when almost all the weakly bound water is eliminated, the cotton temperature increases rapidly to reach the set point value fixed at 80 °C. An increase in binding forces between the last water molecules and cotton, as well as a combi-nation of convective transport and resistance of wa-ter transfer from the cotton inside to the surface lead to a decrease of the water partial pressure at the surface (equilibrium pressure), and conse-quently to a slowdown of the evaporation rate. The supplied heat is higher than that necessary for eva-poration, and thus the temperature of the cotton
surface increases to reach a new equilibrium state at which the cotton temperature becomes equal to that of the hot air. This third zone is called drying period at decreasing rate.
For other experiments on water drying, the air tem-perature was fixed at 40 and 53 °C. Similar curves were obtained, with a temperature of the cotton surface in the second zone at 27.8 and 34.8 °C respectively, i.e. the sam-ple temperature increases with air temperature. Further-more, when increasing this parameter, the drying rate is increased and the evaporation time is reduced.
4.2.2 Solution dryingThe precursor solution was then dried at different air
temperatures in the convective dryer. Fig. 15 shows the influence of this parameter on the mass and the tempera-ture of the sample surface during drying.
Different points are added on the curves, defining the mass loss corresponding to the removal of the solution water, of the solution water + 2 molecules of water of hy-dration in iron nitrate nonahydrate, of solution water + 4 molecules of water of hydration, and of solution water + 7 molecules of water of hydration. This last point is present only for the two highest temperatures since it was not possible to reach this level at 40 and 53 °C.
Based on these results and on the evolution of the dry-ing rates (curves not presented), it was possible to delimit 5 zones (Fig. 15b) whose time ranges decrease when the air temperature increases.
Fig. 15 Effect of the air temperature on the solution drying. Variation of (a) the mass and (b) the temperature of the sample surface during the treatment.
Fig. 14 Water drying in the convective dryer at 80 °C. Varia-tion of (a) the mass and the temperature of the cotton surface, and (b) the drying rate.
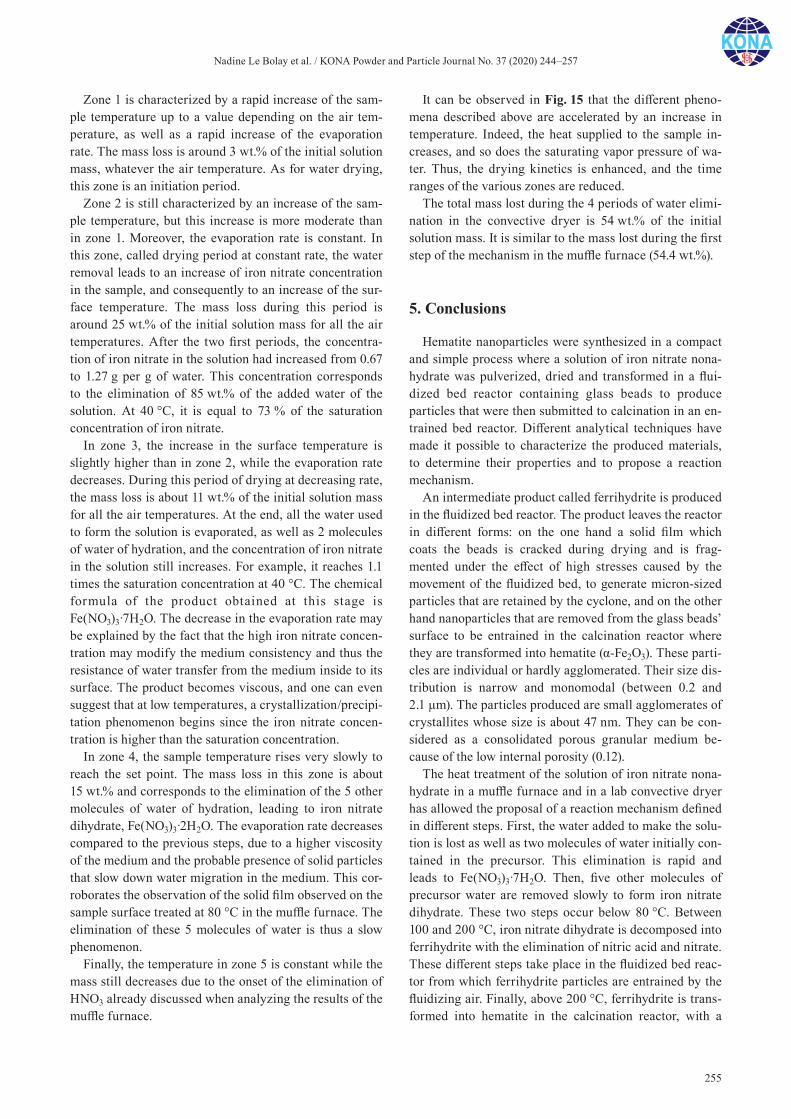
Nadine Le Bolay et al. / KONA Powder and Particle Journal No. 37 (2020) 244–257
255
Zone 1 is characterized by a rapid increase of the sam-ple temperature up to a value depending on the air tem-perature, as well as a rapid increase of the evaporation rate. The mass loss is around 3 wt.% of the initial solution mass, whatever the air temperature. As for water drying, this zone is an initiation period.
Zone 2 is still characterized by an increase of the sam-ple temperature, but this increase is more moderate than in zone 1. Moreover, the evaporation rate is constant. In this zone, called drying period at constant rate, the water removal leads to an increase of iron nitrate concentration in the sample, and consequently to an increase of the sur-face temperature. The mass loss during this period is around 25 wt.% of the initial solution mass for all the air temperatures. After the two first periods, the concentra-tion of iron nitrate in the solution had increased from 0.67 to 1.27 g per g of water. This concentration corresponds to the elimination of 85 wt.% of the added water of the solution. At 40 °C, it is equal to 73 % of the saturation concentration of iron nitrate.
In zone 3, the increase in the surface temperature is slightly higher than in zone 2, while the evaporation rate decreases. During this period of drying at decreasing rate, the mass loss is about 11 wt.% of the initial solution mass for all the air temperatures. At the end, all the water used to form the solution is evaporated, as well as 2 molecules of water of hydration, and the concentration of iron nitrate in the solution still increases. For example, it reaches 1.1 times the saturation concentration at 40 °C. The chemical formula of the product obtained at this stage is Fe(NO3)3·7H2O. The decrease in the evaporation rate may be explained by the fact that the high iron nitrate concen-tration may modify the medium consistency and thus the resistance of water transfer from the medium inside to its surface. The product becomes viscous, and one can even suggest that at low temperatures, a crystallization/precipi-tation phenomenon begins since the iron nitrate concen-tration is higher than the saturation concentration.
In zone 4, the sample temperature rises very slowly to reach the set point. The mass loss in this zone is about 15 wt.% and corresponds to the elimination of the 5 other molecules of water of hydration, leading to iron nitrate dihydrate, Fe(NO3)3·2H2O. The evaporation rate decreases compared to the previous steps, due to a higher viscosity of the medium and the probable presence of solid particles that slow down water migration in the medium. This cor-roborates the observation of the solid film observed on the sample surface treated at 80 °C in the muffle furnace. The elimination of these 5 molecules of water is thus a slow phenomenon.
Finally, the temperature in zone 5 is constant while the mass still decreases due to the onset of the elimination of HNO3 already discussed when analyzing the results of the muffle furnace.
It can be observed in Fig. 15 that the different pheno-mena described above are accelerated by an increase in temperature. Indeed, the heat supplied to the sample in-creases, and so does the saturating vapor pressure of wa-ter. Thus, the drying kinetics is enhanced, and the time ranges of the various zones are reduced.
The total mass lost during the 4 periods of water elimi-nation in the convective dryer is 54 wt.% of the initial solution mass. It is similar to the mass lost during the first step of the mechanism in the muffle furnace (54.4 wt.%).
5. Conclusions
Hematite nanoparticles were synthesized in a compact and simple process where a solution of iron nitrate nona-hydrate was pulverized, dried and transformed in a flui-dized bed reactor containing glass beads to produce particles that were then submitted to calcination in an en-trained bed reactor. Different analytical techniques have made it possible to characterize the produced materials, to determine their properties and to propose a reaction mechanism.
An intermediate product called ferrihydrite is produced in the fluidized bed reactor. The product leaves the reactor in different forms: on the one hand a solid film which coats the beads is cracked during drying and is frag-mented under the effect of high stresses caused by the movement of the fluidized bed, to generate micron-sized particles that are retained by the cyclone, and on the other hand nanoparticles that are removed from the glass beads’ surface to be entrained in the calcination reactor where they are transformed into hematite (α-Fe2O3). These parti-cles are individual or hardly agglomerated. Their size dis-tribution is narrow and monomodal (between 0.2 and 2.1 μm). The particles produced are small agglomerates of crystallites whose size is about 47 nm. They can be con-sidered as a consolidated porous granular medium be-cause of the low internal porosity (0.12).
The heat treatment of the solution of iron nitrate nona-hydrate in a muffle furnace and in a lab convective dryer has allowed the proposal of a reaction mechanism defined in different steps. First, the water added to make the solu-tion is lost as well as two molecules of water initially con-tained in the precursor. This elimination is rapid and leads to Fe(NO3)3·7H2O. Then, five other molecules of precursor water are removed slowly to form iron nitrate dihydrate. These two steps occur below 80 °C. Between 100 and 200 °C, iron nitrate dihydrate is decomposed into ferrihydrite with the elimination of nitric acid and nitrate. These different steps take place in the fluidized bed reac-tor from which ferrihydrite particles are entrained by the fluidizing air. Finally, above 200 °C, ferrihydrite is trans-formed into hematite in the calcination reactor, with a

Nadine Le Bolay et al. / KONA Powder and Particle Journal No. 37 (2020) 244–257
256
removal of the residual nitrate and of hydroxylation water.
Nomenclature
dp Particle mean diameter (m)dX-ray Average crystallite size (m)k Scherrer constant (–)SBET Specific surface area (m2 g–1)Vpore Total specific pore volume (m3 kg–1)β Peak width at mid-height (m)θ Diffraction angle (°)λ X-ray wavelength (Å)ρ Real density (kg m–3)χ Internal porosity (–)
References
Ahmmad B., Leonard K., Islam M.S., Kurawaki J., Muruganandham M., Ohkubo T., Kuroda Y., Green synthe-sis of mesoporous hematite (α-Fe2O3) nanoparticles and their photocatalytic activity, Advanced Powder Technology, 24 (2013) 160–167. DOI: 10.1016/j.apt.2012.04.005
Bødker F., Hansen M.F., Koch C.B., Lefmann K., Mørup S., Magnetic properties of hematite nanoparticles, Physical Review B, 61 (2000) 6826–6838. DOI: 10.1103/Phys-RevB.61.6826
Chin S.M., Suriati. S., Jeefferie Abdul Razak, Synthesis and characterization of hematite nanoparticles as active photo-catalyst for water splitting application, Key Engineering Materials, 594–595 (2014) 73–77. DOI: 10.4028/www. scientific.net/KEM.594-595.73
Cornell R.M., Schwertmann U., The iron oxides: Structure, properties, reactions, occurrences and uses, Second Ed., Wiley-VCH Verlag GmbH & Co. KGaA, Weinheim, 2003, ISBN: 3527302743
Elmasry M.A.A., Gaber A., Khater E.M.H. Thermal decompo-sition of Ni(II) and Fe(III) nitrates and their mixture, Jour-nal of Thermal Analysis, 52 (1998) 489–495. DOI: 10.1023/A:1010155203247
Erri P., Pranda P., Varma A., Oxidizer-fuel interactions in aque-ous combustion synthesis. 1. Iron (III) nitrate-model fuels, Industrial Engineering Chemistry Research, 43 (2004) 3092–3096. DOI: 10.1021/ie030822f
Gadalla A.M., Yu H.F., Thermal decomposition of Fe(III) nitrate and its aerosol, Journal of Materials Research, 5 (1990) 1233–1236. DOI: 10.1557/JMR.1990.1233
Glasgow W., Fellows B., Qi B., Darroudi T., Kitchens C., Ye L., Crawford T.M., Thompson Mefford O., Continuous synthe-sis of iron oxide (Fe3O4) nanoparticles via thermal decom-position, Particuology, 26 (2016) 47–53. DOI: 10.1016/j. partic.2015.09.011
Gurmen S., Ebin B., Production and characterization of the nanostructured hollow iron oxide spheres and nanoparticles
by aerosol route, Journal of Alloys and Compounds, 492 (2010) 585–589. DOI: 10.1016/j.jallcom.2009.11.186
Hémati M., Cherif R., Saleh K., Pont V., Fluidized bed coating and granulation: influence of process-related variables and physicochemical properties on the growth kinetics, Powder Technology, 130 (2003) 18–34. DOI: 10.1016/S0032-5910(02)00221-8
Housaindokht M.R., Pour A.N., Precipitation of hematite nanoparticles via reverse microemulsion process, Journal of Natural Gas Chemistry, 20 (2011) 687–692. DOI: 10. 1016/S1003-9953(10)60234-4
Keely W.M., Maynor H.W., Thermal studies of nickel, cobalt, iron, and copper oxides and nitrates, Journal of Chemical and Engineering Data, 8 (1963) 297–300. DOI: 10.1021/je60018a008
Lunin A.V., Kolycheva E.L., Mochalova E.N., Cherkasov V.R., Nikitin M.P., Synthesis of highly-specific stable nanocrys-talline goethite-like hydrous ferric oxide nanoparticles for biomedical applications by simple precipitation method, Journal of Colloid and Interface Science, 541 (2019) 143–149. DOI: 10.1016/j.jcis.2019.01.065
Majzlan J., Navrotsky A., Schwertmann U., Thermodynamics of iron oxides: Part III. E, thalpies of formation and stabi-lity of ferrihydrite (~Fe(OH)3), schwertmannite (~FeO(OH)3/4(SO4)1/8), and ε-Fe2O3, Geochimica et Cosmo-chimica Acta, 68 (2004) 1049–1059. DOI: 10.1016/S0016-7037(03)00371-5
Mazzetti L., Thistlethwaite P.J., Raman spectra and thermal transformations of ferrihydrite and schwertmannite, Jour-nal of Raman Spectroscopy, 33 (2002) 104–111. DOI: 10.1002/jrs.830
Melnikov P., Nascimento V.A., Arkhangelsky I.V., Zanoni Consolo L.Z., De Oliveira L.C.S., Thermal decomposition mechanism of iron(III) nitrate and characterization of intermediate products by the technique of computerized modeling, Journal of Thermal Analysis Calorimetry, 115 (2014) 145–151. DOI: 10.1007/s10973-012-2566-1
Mu J., Perlmutter D.D., Thermal decomposition of metal nitrates and their hydrates, Thermochimica Acta, 56 (1982) 253–260. DOI: 10.1016/0040-6031(82)87033-0
Oliveira A.C., Marchetti G.S., Do Carmo Rangel M., The effect of the starting material on the thermal decomposition of iron oxyhydroxides, Journal of Thermal Analysis Calori-metry, 73 (2003) 233–240. DOI: 10.1023/A:1025154112652
Ozcelik B.K., Ergun C., Synthesis and characterization of iron oxide particles using spray pyrolysis technique, Ceramics International, 41 (2, Part A) (2015) 1994–2005. DOI: 10.1016/j.ceramint.2014.09.103
Pawar M.J., Khajone A.D., Photodegradation of malachite green dye over sol–gel synthesized nanocrystalline α-Fe2O3, Jour-nal of Chemical and Pharmaceutical Research, 4 (4) (2012) 1880–1884. ISSN: 0975-7384
Pereira Da Silva C., Dos Santos A.V., Soares Oliveira A., Olivera Da Guarda Souza M., Synthesis of composites and study of the thermal behavior of sugarcane bagasse/iron nitrate mixtures in different proportions, Journal of Thermal Analysis Calorimetry, 131 (2018) 611–620. DOI: 10.1007/s10973-017-6260-1
Nadine Le Bolay et al. / KONA Powder and Particle Journal No. 37 (2020) 244–257
257
Pont V., Saleh K., Steinmetz D., Hémati M., Influence of the physicochemical properties on the growth of solid particles by granulation in fluidized bed, Powder Technology, 120 (2001) 97–104. DOI: 10.1016/S0032-5910(01)00355-2
Qi P., Pichler T., Closer look at As (III) and As (V) adsorption onto ferrihydrite under competitive conditions, Langmuir, 30 (2014) 11110–11116. DOI: 10.1021/Ia502740w
Rzepa G., Pieczara G., Gawel A., Tomczyk A., Zalecki R., The influence of silicate on transformation pathways of syn-thetic 2-line ferrihydrite, Journal of Thermal Analysis Calorimetry, 125 (2016) 407–421. DOI: 10.1007/s10973-016-5345-6
Tan W.-F., Yu Y.-T., Wang M.-X., Liu F., Koopal L.K., Shape evolution synthesis of monodisperse spherical, ellipsoidal, and elongated hematite (α-Fe2O3) nanoparticles using ascor-bic acid, Crystal Growth & Design, 14 (2014) 157–164. DOI: 10.1021/cg401334d
Tong G., Guan J., Xiao Z., Huang X., Guan Y., In situ generated gas bubble-assisted modulation of the morphologies, photo-catalytic, and magnetic properties of ferric oxide nano-
structures synthesized by thermal decomposition of iron nitrate, Journal of Nanoparticle Research, 12 (2010) 3025–3037. DOI: 10.1007/s11051-010-9897-2
Wang W., Howe J.Y., Gu B., Structure and morphology evolu-tion of hematite (α-Fe2O3) nanoparticles in forced hydroly-sis of ferric chloride, The Journal of Physical chemistry C, 112 (2008) 9203–9208. DOI: 10.1021/jp800683j
Waychunas G.A., Kim C.S., Banfield J.F., Nanoparticulate iron oxide minerals in soils and sediments: unique properties and contaminant scavenging mechanisms, Journal of Nanoparticle Research, 7 (2005) 409–433. DOI: 10.1007/s11051-005-6931-x
Wieczorek-Ciurowa K., Kozak A.J., The thermal decomposition of Fe(NO3)3·9H2O, Journal of Thermal Analysis and Calo-rimetry, 58 (1999) 647–651. DOI: 10.1023/A:1010112814013
Zhu M., Wang Y, Meng D., Qin X., Diao G., Hydrothermal syn-thesis of hematite nanoparticles and their electrochemical properties, The Journal of Physical chemistry C, 116 (2012) 16276–16285. DOI: 10.1021/jp304041m
Authors’ Short Biographies
Nadine Le Bolay
Nadine Le Bolay is Professor in chemical engineering in ENSIACET-INP at Toulouse. Her research focuses on particle technology and characterization of minerals and poly-mers, and was applied in different fields such as fluidized bed processes, electrochemical reactors, polymerization reactors, grinding and co-grinding processes, composite mate-rials.
Rihab Lakhal
Rihab Lakhal obtained a PhD in process engineering at the University of Toulouse in 2016. During her thesis, she worked on a new process for the synthesis of iron oxide nanoparticles based on a particle generation step in a fluidized bed reactor followed by a calcination step in an entrained reactor. She focused on the reaction mechanism and ki-netics and the powder characterization.
Mehrdji Hemati
Mehrdji HEMATI is Professor in chemical engineering in ENSIACET-INP at Toulouse. His research activities focused into three items:Hydrodynamic and transfers in dense and circulating fluidized bed. Two approaches
were developed: the experimental approach and the theoretical approach.Application of fluidized bed in the field of chemical reaction gathering catalytic reac-
tions, gas-solid reactions (biomass and sewage sludge pyrolysis, gasification and com-bustion).
Processes for elaboration of materials gathering: drying, mixing, size enlargement by spray coating and granulation, dry impregnation in F.B.
He is author and co-author of more than 100 publications in international scientific jour-nals.
KONA Powder and Particle Journal No. 37 (2020) 258–264/Doi:10.14356/kona.2020015 Original Research Paper
258Copyright © 2020 The Authors. Published by Hosokawa Powder Technology Foundation. This is an open ac-cess article under the CC BY license (http://creativecommons.org/licenses/by/4.0/).
Electrodynamic Sorting of Industrial Scrap Metal †
James R. Nagel, Dave Cohrs, Jacob Salgado and Raj K. Rajamani *1 Department of Metallurgical Engineering, University of Utah, USA
AbstractElectrodynamic sorting (EDX) is a new technology developed to sort industrial scrap metals. Under the present embodiment, an electromagnet is placed directly underneath a conveyor belt and then excited by an alternating electrical current to produce a time-varying magnetic field. As scrap particles pass through the field overhead, electrical eddy currents are induced throughout their volumes and then repelled away. If the frequency of excitation is very high (e.g., 12 kHz), then the lightweight aluminum particles tend to jump far more dramatically than heavier materials like copper, brass, and zinc. To demonstrate the principle, a small-scale prototype was assembled and tested. Using an 8-inch (20 cm) lane width, the system could process industrial scrap Zorba at a throughput of over 550 lbs/hour (225 kg/h) with an aluminum grade of 97.6 % and a recovery of 93 %.
Keywords: eddy currents, recycling, scrap metal waste
1. Introduction
One of the greatest challenges in the metal recycling industry is the problem of sorting. Scrap metals rarely present in a clean, high-purity state, but instead tend to manifest as dirty mixtures of several distinct metals bun-dled together. Such contamination can dramatically re-duce the economic value of an otherwise pure material, which means recyclers will often go to great lengths to separate metals down to their base constituents.
Depending on the specific material properties, some separation processes might be relatively straightforward to implement. Most notably, ferrous metals like iron and steel will strongly react to an applied magnetic field and can thus pull away from any other nonmagnetic materials nearby. Known simply as magnetic separation, the tech-nology is typically embodied as a special array of perma-nent magnets, and it is a popular method for extracting ferromagnetic metals from shredded automobile waste (Oberteuffer, 1974; Svoboda and Fujita, 2003).
Another widespread technology is called eddy current separation (ECS), which utilizes a time-varying magnetic field to extract nonferrous metals from nonmetallic fluff. Typically, ECS is embodied as a mechanically rotating drum of permanent magnets, though other configurations are possible as well. A comprehensive historical review of
ECS can be found in Smith et al. (2019) while Nagel (2018a) provides a detailed mathematical description of its underlying physics. In brief, the process works by induc-ing electrical eddy currents to flow throughout the interior of conductive particles as they pass through the time- varying magnetic field of the ECS. The relative motion between the electrical currents and the applied magnetic field then results in a net force of deflection that causes conductive particles to jump up and away from the ap-plied field. In contrast, low conductivity materials (most notably, nonmetals) do not allow any significant eddy cur-rents to flow throughout their interiors and thus experi-ence no significant force of deflection.
Due to the widespread use of ECS among auto-shredding facilities, there is a tendency to produce relatively similar mixtures throughout the industry. In particular, one of the more common products is called Zorba, which is loosely defined as any combination of nonferrous scrap metals that is predominantly aluminum (ISRI, 2016). At present, Zorba is an especially difficult material to sort, and there does not yet appear to be any clear technologi-cal solution to the problem. For example, dense media separation attempts to exploit the disparity in mass den-sity between so-called “light” metal fractions (e.g., alumi-num and magnesium) and the “heavies” (e.g., copper, brass, and zinc) (Lee et al., 1994). Unfortunately, the pro-cess is prohibitively expensive to implement, and so very few recycling facilities are willing to invest in such an operation. Alternatively, hand sorting can be a viable method of separating Zorba, but only when the cost of hu-man labor is very low (Taylor, 2017). It is also particularly difficult to sort the so-called “fine” materials with this
† Received 28 May 2019; Accepted 8 July 2019 J-STAGE Advance published online 18 September 2019
1 1135 S 1460 E, ROOM 412, Salt Lake City, UT 84112-0102, USA* Corresponding author: Raj K. Rajamani; E-mail: [email protected] TEL: +01-801-581-3107
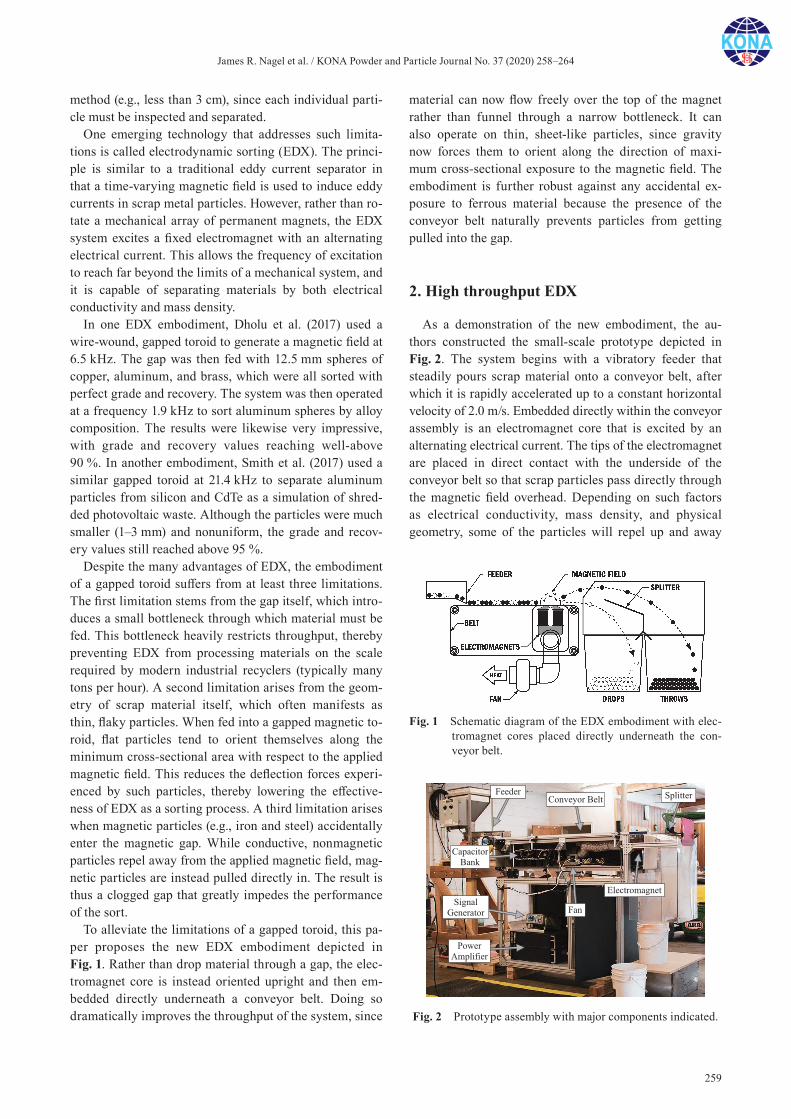
James R. Nagel et al. / KONA Powder and Particle Journal No. 37 (2020) 258–264
259
method (e.g., less than 3 cm), since each individual parti-cle must be inspected and separated.
One emerging technology that addresses such limita-tions is called electrodynamic sorting (EDX). The princi-ple is similar to a traditional eddy current separator in that a time-varying magnetic field is used to induce eddy currents in scrap metal particles. However, rather than ro-tate a mechanical array of permanent magnets, the EDX system excites a fixed electromagnet with an alternating electrical current. This allows the frequency of excitation to reach far beyond the limits of a mechanical system, and it is capable of separating materials by both electrical conductivity and mass density.
In one EDX embodiment, Dholu et al. (2017) used a wire-wound, gapped toroid to generate a magnetic field at 6.5 kHz. The gap was then fed with 12.5 mm spheres of copper, aluminum, and brass, which were all sorted with perfect grade and recovery. The system was then operated at a frequency 1.9 kHz to sort aluminum spheres by alloy composition. The results were likewise very impressive, with grade and recovery values reaching well-above 90 %. In another embodiment, Smith et al. (2017) used a similar gapped toroid at 21.4 kHz to separate aluminum particles from silicon and CdTe as a simulation of shred-ded photovoltaic waste. Although the particles were much smaller (1–3 mm) and nonuniform, the grade and recov-ery values still reached above 95 %.
Despite the many advantages of EDX, the embodiment of a gapped toroid suffers from at least three limitations. The first limitation stems from the gap itself, which intro-duces a small bottleneck through which material must be fed. This bottleneck heavily restricts throughput, thereby preventing EDX from processing materials on the scale required by modern industrial recyclers (typically many tons per hour). A second limitation arises from the geom-etry of scrap material itself, which often manifests as thin, flaky particles. When fed into a gapped magnetic to-roid, flat particles tend to orient themselves along the minimum cross-sectional area with respect to the applied magnetic field. This reduces the deflection forces experi-enced by such particles, thereby lowering the effective-ness of EDX as a sorting process. A third limitation arises when magnetic particles (e.g., iron and steel) accidentally enter the magnetic gap. While conductive, nonmagnetic particles repel away from the applied magnetic field, mag-netic particles are instead pulled directly in. The result is thus a clogged gap that greatly impedes the performance of the sort.
To alleviate the limitations of a gapped toroid, this pa-per proposes the new EDX embodiment depicted in Fig. 1. Rather than drop material through a gap, the elec-tromagnet core is instead oriented upright and then em-bedded directly underneath a conveyor belt. Doing so dramatically improves the throughput of the system, since
material can now flow freely over the top of the magnet rather than funnel through a narrow bottleneck. It can also operate on thin, sheet-like particles, since gravity now forces them to orient along the direction of maxi-mum cross-sectional exposure to the magnetic field. The embodiment is further robust against any accidental ex-posure to ferrous material because the presence of the conveyor belt naturally prevents particles from getting pulled into the gap.
2. High throughput EDX
As a demonstration of the new embodiment, the au-thors constructed the small-scale prototype depicted in Fig. 2. The system begins with a vibratory feeder that steadily pours scrap material onto a conveyor belt, after which it is rapidly accelerated up to a constant horizontal velocity of 2.0 m/s. Embedded directly within the conveyor assembly is an electromagnet core that is excited by an alternating electrical current. The tips of the electromagnet are placed in direct contact with the underside of the conveyor belt so that scrap particles pass directly through the magnetic field overhead. Depending on such factors as electrical conductivity, mass density, and physical geometry, some of the particles will repel up and away
Fig. 1 Schematic diagram of the EDX embodiment with elec-tromagnet cores placed directly underneath the con-veyor belt.
Fig. 2 Prototype assembly with major components indicated.
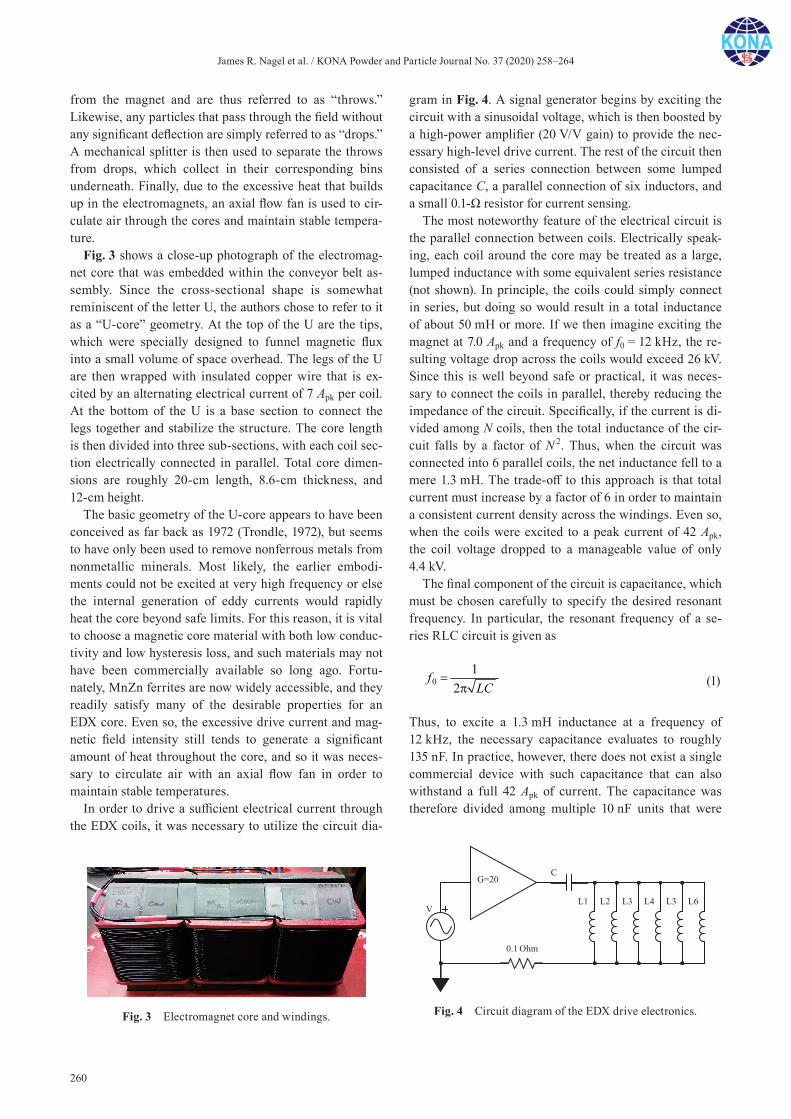
James R. Nagel et al. / KONA Powder and Particle Journal No. 37 (2020) 258–264
260
from the magnet and are thus referred to as “throws.” Likewise, any particles that pass through the field without any significant deflection are simply referred to as “drops.” A mechanical splitter is then used to separate the throws from drops, which collect in their corresponding bins underneath. Finally, due to the excessive heat that builds up in the electromagnets, an axial flow fan is used to cir-culate air through the cores and maintain stable tempera-ture.
Fig. 3 shows a close-up photograph of the electromag-net core that was embedded within the conveyor belt as-sembly. Since the cross-sectional shape is somewhat reminiscent of the letter U, the authors chose to refer to it as a “U-core” geometry. At the top of the U are the tips, which were specially designed to funnel magnetic flux into a small volume of space overhead. The legs of the U are then wrapped with insulated copper wire that is ex-cited by an alternating electrical current of 7 Apk per coil. At the bottom of the U is a base section to connect the legs together and stabilize the structure. The core length is then divided into three sub-sections, with each coil sec-tion electrically connected in parallel. Total core dimen-sions are roughly 20-cm length, 8.6-cm thickness, and 12-cm height.
The basic geometry of the U-core appears to have been conceived as far back as 1972 (Trondle, 1972), but seems to have only been used to remove nonferrous metals from nonmetallic minerals. Most likely, the earlier embodi-ments could not be excited at very high frequency or else the internal generation of eddy currents would rapidly heat the core beyond safe limits. For this reason, it is vital to choose a magnetic core material with both low conduc-tivity and low hysteresis loss, and such materials may not have been commercially available so long ago. Fortu-nately, MnZn ferrites are now widely accessible, and they readily satisfy many of the desirable properties for an EDX core. Even so, the excessive drive current and mag-netic field intensity still tends to generate a significant amount of heat throughout the core, and so it was neces-sary to circulate air with an axial flow fan in order to maintain stable temperatures.
In order to drive a sufficient electrical current through the EDX coils, it was necessary to utilize the circuit dia-
gram in Fig. 4. A signal generator begins by exciting the circuit with a sinusoidal voltage, which is then boosted by a high-power amplifier (20 V/V gain) to provide the nec-essary high-level drive current. The rest of the circuit then consisted of a series connection between some lumped capacitance C, a parallel connection of six inductors, and a small 0.1-Ω resistor for current sensing.
The most noteworthy feature of the electrical circuit is the parallel connection between coils. Electrically speak-ing, each coil around the core may be treated as a large, lumped inductance with some equivalent series resistance (not shown). In principle, the coils could simply connect in series, but doing so would result in a total inductance of about 50 mH or more. If we then imagine exciting the magnet at 7.0 Apk and a frequency of f0 = 12 kHz, the re-sulting voltage drop across the coils would exceed 26 kV. Since this is well beyond safe or practical, it was neces-sary to connect the coils in parallel, thereby reducing the impedance of the circuit. Specifically, if the current is di-vided among N coils, then the total inductance of the cir-cuit falls by a factor of N 2. Thus, when the circuit was connected into 6 parallel coils, the net inductance fell to a mere 1.3 mH. The trade-off to this approach is that total current must increase by a factor of 6 in order to maintain a consistent current density across the windings. Even so, when the coils were excited to a peak current of 42 Apk, the coil voltage dropped to a manageable value of only 4.4 kV.
The final component of the circuit is capacitance, which must be chosen carefully to specify the desired resonant frequency. In particular, the resonant frequency of a se-ries RLC circuit is given as
0
1
2
f
LC
=
π
(1)
Thus, to excite a 1.3 mH inductance at a frequency of 12 kHz, the necessary capacitance evaluates to roughly 135 nF. In practice, however, there does not exist a single commercial device with such capacitance that can also withstand a full 42 Apk of current. The capacitance was therefore divided among multiple 10 nF units that were
Fig. 3 Electromagnet core and windings. Fig. 4 Circuit diagram of the EDX drive electronics.

James R. Nagel et al. / KONA Powder and Particle Journal No. 37 (2020) 258–264
261
likewise connected in parallel (depicted as the single, lumped capacitance C in Fig. 4). Once assembled, the system was found to resonate at a frequency of 12.7 kHz.
3. Separation theory
The simplest mathematical model for a scrap metal particle is that of a sphere with radius a and a uniform conductivity σ. The sphere is then excited by a time- varying magnetic field in sinusoidal steady state with an-gular frequency ω and a peak field intensity B0 at the center. The magnetic field is also assumed to have a weak, linear gradient dB/dx along the x-direction, resulting in a net, time-averaged force Favg that points along the direc-tion of negative slope. Building on the work of Rony (1965) and Lohöfer (1989), we may calculate Favg using
30
avg0
3 1 1 sinh ( ) sin ( ) d3 cosh ( ) cos ( ) d
B R q q BFq q q x
, (2)
where q = √2μ0σωa2. Although Eqn. (2) is technically an approximate expression, Ray et al. (2018) measured the forces on metal spheres under magnetic excitation and showed it to be remarkably accurate.
Fig. 5 shows the calculated forces acting on 10 mm spheres with differing values of conductivity. In all cases, the applied magnetic field was set to B0 = 50 mT with a field gradient of dB/dx = 1.0 T/m. The top graph shows σ = 60 MS/m, which is typical for such metals as copper and silver. At the bottom end is σ = 10–20 MS/m, which is typical for such metals as cast aluminum, brass, and zinc.
The key insight from this analysis is that, in the limit as f→∞, all forces tend towards the same, asymptotic value that is independent of conductivity. Acceleration, how-ever, still depends on the overall mass of the particle,
which is a function of mass density and physical geome-try. For example, aluminum has a density of roughly 2.7 g/cm3 while copper has a density of about 9.0 g/cm3. The implication is that, with all other parameters held equally, a particle of aluminum will experience three times the acceleration of an equivalent copper particle. A high-frequency EDX assembly can thus be treated as a sophisticated density sorter.
Although the spherical model is very straightforward, there are many scrap particles that do not fit well into such a category. In particular, thin metal sheets are a common manifestation in any stream of fine Zorba, and it is necessary to apply complex numerical methods when calculating force and torque. Most notably, the work of Nagel (2018b) provides a simple finite-difference scheme that rapidly calculates of the eddy current density in thin rectangular sheets.
The most significant distinction between thin sheets and bulky spheres is that thin sheets throw far more dra-matically after passing through the field of an EDX core. The reason is primarily due to the way in which metal sheets lie flat on the conveyor assembly, thereby exposing them to a much greater magnetic field intensity. The result is a much greater excitation of eddy currents and thus a much greater throw length. A practical consequence of this effect is that the new EDX embodiment can also sort particles by physical geometry as well as electrical con-ductivity and mass density.
4. Test procedure
To demonstrate the new EDX configuration, the authors acquired a 6000-lbs (2700 kg) sample of fine Zorba from a local scrap recycling firm. Depicted in Fig. 6, the mate-rial was primarily distributed between 5–25 mm in size, thus earning it the nickname of “one inch minus.” The simplest separation that can be performed by EDX is a re-moval of the light aluminum fraction from the heavies, which is very similar to what a dense-media plant would attempt to perform. To divide the labor into manageable chunks, the material was hand-shoveled into 5-gallon buckets and then processed one bucket at a time. Each bucket of material was weighed, sorted, and then weighed again after collecting into the throw/drop bins. Finally, after every tenth bucket, we extracted a small sample of material (≈ 1 kg) from the initial mixture, the throw pile, and the drop pile. All samples were then analyzed for metal composition using a portable XRF analyzer, which were then averaged to give the final composition. The en-tire procedure took about 3 days to complete.
It is important to note that the use of XRF analysis is different from a direct chemical analysis. The reason is because most common metals are actually complex alloys
Fig. 5 Net force acting on a 10 mm conductive sphere as a function of excitation frequency. The peak magnetic field intensity is B0 = 50 mT with a field gradient of 1.0 T/m.
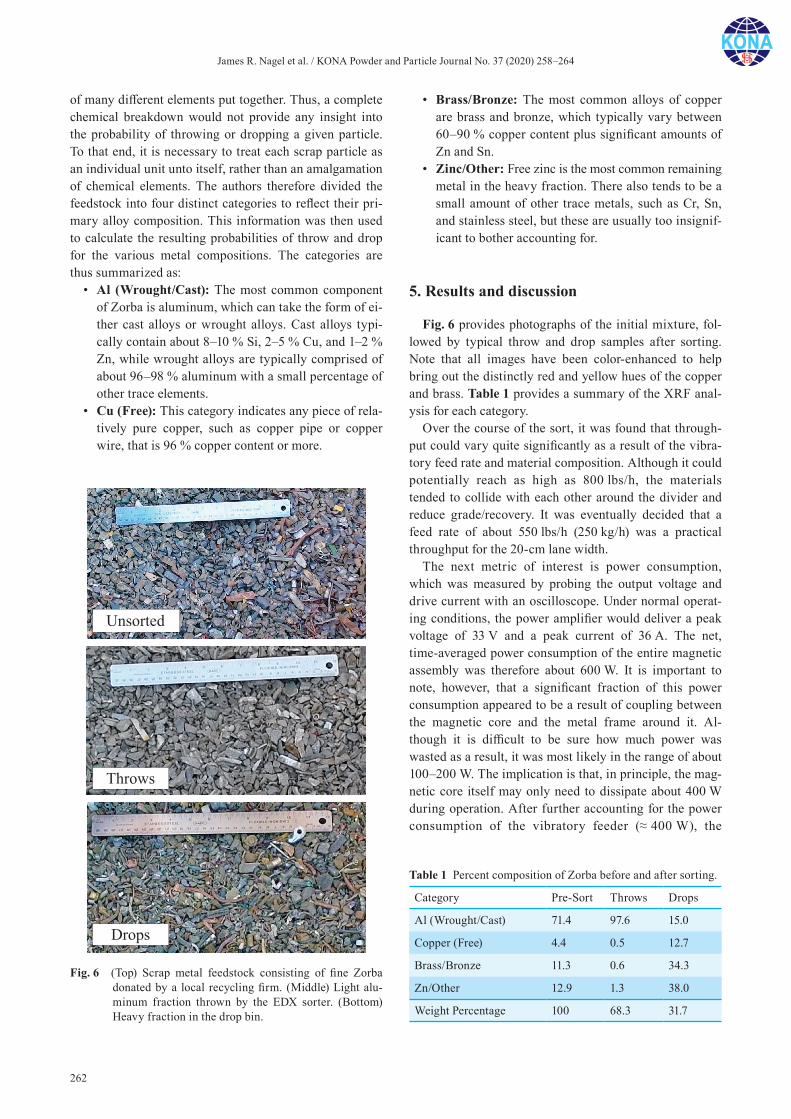
James R. Nagel et al. / KONA Powder and Particle Journal No. 37 (2020) 258–264
262
of many different elements put together. Thus, a complete chemical breakdown would not provide any insight into the probability of throwing or dropping a given particle. To that end, it is necessary to treat each scrap particle as an individual unit unto itself, rather than an amalgamation of chemical elements. The authors therefore divided the feedstock into four distinct categories to reflect their pri-mary alloy composition. This information was then used to calculate the resulting probabilities of throw and drop for the various metal compositions. The categories are thus summarized as:
• Al (Wrought/Cast): The most common component of Zorba is aluminum, which can take the form of ei-ther cast alloys or wrought alloys. Cast alloys typi-cally contain about 8–10 % Si, 2–5 % Cu, and 1–2 % Zn, while wrought alloys are typically comprised of about 96–98 % aluminum with a small percentage of other trace elements.
• Cu (Free): This category indicates any piece of rela-tively pure copper, such as copper pipe or copper wire, that is 96 % copper content or more.
• Brass/Bronze: The most common alloys of copper are brass and bronze, which typically vary between 60–90 % copper content plus significant amounts of Zn and Sn.
• Zinc/Other: Free zinc is the most common remaining metal in the heavy fraction. There also tends to be a small amount of other trace metals, such as Cr, Sn, and stainless steel, but these are usually too insignif-icant to bother accounting for.
5. Results and discussion
Fig. 6 provides photographs of the initial mixture, fol-lowed by typical throw and drop samples after sorting. Note that all images have been color-enhanced to help bring out the distinctly red and yellow hues of the copper and brass. Table 1 provides a summary of the XRF anal-ysis for each category.
Over the course of the sort, it was found that through-put could vary quite significantly as a result of the vibra-tory feed rate and material composition. Although it could potentially reach as high as 800 lbs/h, the materials tended to collide with each other around the divider and reduce grade/recovery. It was eventually decided that a feed rate of about 550 lbs/h (250 kg/h) was a practical throughput for the 20-cm lane width.
The next metric of interest is power consumption, which was measured by probing the output voltage and drive current with an oscilloscope. Under normal operat-ing conditions, the power amplifier would deliver a peak voltage of 33 V and a peak current of 36 A. The net, time-averaged power consumption of the entire magnetic assembly was therefore about 600 W. It is important to note, however, that a significant fraction of this power consumption appeared to be a result of coupling between the magnetic core and the metal frame around it. Al-though it is difficult to be sure how much power was wasted as a result, it was most likely in the range of about 100–200 W. The implication is that, in principle, the mag-netic core itself may only need to dissipate about 400 W during operation. After further accounting for the power consumption of the vibratory feeder (≈ 400 W), the
Fig. 6 (Top) Scrap metal feedstock consisting of fine Zorba donated by a local recycling firm. (Middle) Light alu-minum fraction thrown by the EDX sorter. (Bottom) Heavy fraction in the drop bin.
Table 1 Percent composition of Zorba before and after sorting.
Category Pre-Sort Throws Drops
Al (Wrought/Cast) 71.4 97.6 15.0
Copper (Free) 4.4 0.5 12.7
Brass/Bronze 11.3 0.6 34.3
Zn/Other 12.9 1.3 38.0
Weight Percentage 100 68.3 31.7

James R. Nagel et al. / KONA Powder and Particle Journal No. 37 (2020) 258–264
263
conveyor drive motors (≈ 200 W), and a 50 % efficiency within the power amplifier, the total power consumption for the entire EDX assembly reaches 1800 W. Thus, given a feed rate of 250 kg/h, we arrive at 7.2 kWh to sort one metric ton of material.
The final metrics of interest are aluminum grade in the throw bin and total aluminum recovery. Using the formal definitions of Dholu et al. (2017), the aluminum grade was found to reach an impressive 97.6 %. Of the small amount of contamination that also reached the throw bin, the ma-jority appeared to result from thin sheet geometries. For example, US coins are a common product in shredded au-tomobiles, and pennies in particular seemed to be the most prevalent. This resulted in a significant zinc contam-ination to the throws, since pennies are essentially thin disks of zinc with a thin copper coating.
To calculate the aluminum recovery, it is simply a mat-ter of measuring the total aluminum mass in the throw bin and then dividing it by the original aluminum mass. The result was about 93 % aluminum recovery from the original mixture, with the other 7 % landing in the drop bin with the heavies. After examining the material, it was surmised that the majority of errors were due to small particle sizes (e.g., 5 mm or less), which could not throw effectively in the 12.7 kHz field being applied. If the mag-netic field were instead excited to much higher frequency, however (e.g., 20 kHz or more), then is likely that recov-ery would have increased significantly as well.
On the other end of the size scale, many large particles of aluminum were simply too big to experience a proper throw by the magnet, but this can only be alleviated by redesigning the magnetic gap for a greater protrusion of field into the space above. Many other observed sources of error were also found to be purely kinematic in nature. For example, collisions between particles and the divider were common, and there is also a finite settling time for material as it drops onto the fast-moving conveyor belt. Fortunately, such errors can be corrected through revi-sions in the basic mechanical structure, which means fu-ture iterations are likely to yield even more reliable outcomes.
Acknowledgments
This work was funded by the United States Advanced Research Project Agency-Energy (ARPA-E) METALS Program under cooperative agreement grant DE- AR0000411.
Nomenclature
ECS Eddy Current Separator/Separation
EDX Electrodynamic Sorting
a Sphere Radius (m)
B0 Magnetic Field Intensity (T)
C Capacitance (F)
f0 Resonant Frequency (Hz)
F Force (N)
I Electric Current (A)
L Inductance (H)
μ0 Vacuum Permeability (H/m)
σ Electrical Conductivity (S/m)
ω Angular Frequency (rad/s)
References
Dholu N., Nagel J.R., Cohrs D., Rajamani R.K., Eddy current separation of nonferrous metals using a variable-frequency electromagnet, KONA Powder and Particle Journal, 34 (2017) 241–247. DOI: 10.14356/kona.2017012
ISRI (Institute of Scrap Recycling Industries), Scrap specifica-tions circular, Technical report, 2016. <scrap2.org/specs/> accessed 22.08.2019.
Lee C.H., Cheau T.C., Chen S.T., Separating aluminum from shredded automotive scrap, Journal of The Minerals, Met-als & Materials Society (TMS), 46 (1994) 40–42. DOI: 10.1007/BF03220695
Lohöfer G., Theory of an electromagnetically levitated metal sphere I: Absorbed power, SIAM Journal of Applied Math, 49 (1989) 567–581. DOI: 10.1137/0149032
Nagel J.R., An analytic model for eddy current separation, Minerals Engineering, 127 (2018a) 277–285. DOI: 10.1016/j.mineng.2018.08.025
Nagel J.R., Fast finite difference calculation of eddy currents in thin metal sheets, Applied Computational Electromagnetics Society Journal, 33 (2018b) 575–584.
Oberteuffer J.A., Magnetic separation: A review of principles, devices, and applications, IEEE Transactions on Magnetics, 10 (1974) 223–238. DOI: 10.1109/TMAG.1974.1058315
Ray J.D., Nagel J.R., Cohrs D., Rajamani R.K., Forces on particles in time-varying magnetic fields, KONA Powder and Particle Journal, 35 (2018) 251–257. DOI: 10.14356/kona.2018016
Rony P.R., The electromagnetic levitation of metals. in: Transactions of the Vacuum Metallurgy Conference 1964, American Vacuum Society, Boston, MA, 1965, pp.55-135.
Smith Y.R., Nagel J.R., Rajamani R.K., Electrodynamic eddy current separation of end-of-life PV materials, in: Lei Zhang et al. (Eds.) Energy Technology 2017: Carbon Diox-ide Management and Other Technologies, Springer Interna-tional Publishing, 2017, pp. 379–386. DOI: 10.1007/978-3-
James R. Nagel et al. / KONA Powder and Particle Journal No. 37 (2020) 258–264
264
319-52192-3_37Smith Y.R., Nagel J.R., Rajamani R.K., Eddy current separation
for recovery of non-ferrous metallic particles: A compre-hensive review, Minerals Engineering, 133 (2019) 149–159. DOI: 10.1016/j.mineng.2018.12.025
Svoboda J., Fujita T., Recent developments in magnetic methods of material separation, Minerals Engineering, 16 (2003) 785–792. DOI: 10.1016/S0892-6875(03)00212-7
Taylor B., Absorbing the zorba. Recycling Today, (2017) <recyclingtoday.com/ar t icle/absorbing-the-zorba/> accessed 22.08.2019.
Trondle H.M., Process for the separation of electrically conduc-tive or semiconducting mineral particles of electrically non-conductive mineral particles and device for carrying out this process, German Patent (1972) DE2059166A1.
Authors’ Short Biographies
James Nagel
James Nagel completed his PhD in 2011 from the University of Utah in Salt Lake City, Utah, where he was awarded the Stockham Medal of Excellence for conspicuously effec-tive teaching. His background is in electrical engineering with a specialty in applied electromagnetics and numerical methods. He now works as a research associate for the University of Utah and is a co-founder for EDX Magnetics, LLC.
Dave Cohrs
Dave Cohrs completed his Bachelor of Science in 2007 at the University of Maryland in Baltimore, Maryland, where he studied Environmental Science with an emphasis on Analytical Chemistry. He managed water quality laboratories at public aquariums for 16 years and has consulted for aquariums, zoos, and academia on water chemistry and life support topics. He now works for the University of Utah as a research associate and is a co-founder for EDX Magnetics, LLC.
Jacob Salgado
Jacob Salgado completed his Bachelor of Science in Metallurgical Engineering from the University of Utah in 2018. He is a decorated military veteran who served in the United States Army from 2010–2013 and deployed overseas in support of Operation Enduring Freedom. He has been working as a research associate at the University of Utah since 2015, and he has also worked as a product engineer for EDX Magnetics, LLC, since 2018.
Raj Rajamani
Raj Rajamani has been on the faculty of the Metallurgical Engineering Department of the University of Utah, Salt Lake City, Utah, USA since 1980. Currently he holds the posi-tion of Professor. His research interests include population balance modeling of tumbling mills, computational fluid dynamics of hydrocyclones, discrete element modeling of semi-autogenous grinding mills, eddy current sorting of metallic particles and modeling of high pressure grinding rolls. He received the Antoine M. Gaudin Award, presented by the Society of Mining, Metallurgy and Exploration Engineers Inc. in the year 2009.
KONA Powder and Particle Journal No. 37 (2020) 265–267/Doi:10.14356/kona.2020021 Information Article
265
Traditional powder (KONA) technology has described successfully powder processing, i.e. powdered material handling, as a mass-unit operation system such as comminution, classification, agglomeration and others. A para-digm shift has been occurred in modern powder technology by looking at carefully individual particle’s property it-self such as surface topography and even internal structure at molecular level. As a result, a new concept of particle design engineering has been arisen to modify or change the property or function of the raw particulate material to produce more valuable product. In general, there are two ways for particle designing, classified as break-down and built-up methods. We proposed a new built-up particle-design method, called the “spherical crystallization pro-cess,” which can open the door to unique crystallization engineering that could replace traditional micro- and nano-technology approaches. In this process, nano to micro crystals produced by crystallization are spherically agglomerated at the same time. Spherically agglomerated crystals can improve the micromeritic properties of original particles, which can be reliably formulated in pharmaceutical dosage forms. The paradigm shift of nano-to-microparticle design by spherical crystallization is overviewed by looking at the principle of spherical agglomeration in liquid and new particle design platform developed by the spherical crystallization system shown in the contents (Table 1).
In Chap. 2, it was described that the ultrafine crystals formed by antisolvent crystallization of an API (salicylic acid) are simultaneously self-agglomerated—spherically—by a small amount of bridging liquid produced from the crystallization solvent by phase separation. The agglomeration kinetics were described by a first order, followed to zero-order process with mass base after crystallization finished. In Chap. 3, the paradigm shifted pharmaceutical process provided by spherical crystallization is explained by direct-tableting API. The way how spherically ag-glomerated API crystals can be directly tableted without using a binder is explained owing to the paradigm shifted compaction behavior of spherically crystallized products appearing under static and dynamic compactions. In Chap. 4, it was explained how the spherical crystallization technique was developed as a novel particulate-design platform to create various functional particulate preparations. Spherical crystallization was originally carried out using a tri-solvent system, that is, a good solvent, a poor solvent, and a bridging liquid, in which the crystallized particles spherically agglomerated with the bridging liquid induced from the system simultaneously. It was recently found that if a good solvent solution is partially miscible in a poor solvent, the residual undissolved good solvent acts as a bridging liquid for the crystals, which can make the original spherical crystallization technique widely ap-plicable to any other API. Ascorbic acid crystals, as poorly compressible model crystals, are spherically agglomer-ated using a binary-solvent system, enabling direct tableting without requiring a binder. To improve the physicochemical properties of APIs, such as their solubility or therapeutic performance, a multi-component system was developed by combining a surfactant or hydrophilic polymer with a dispersing (poor) solvent. The solubility of the formulated drug can be enhanced by adding a specifically interacting API to the formulation. The solubility of the anti-inflammatory drug indomethacin is enhanced by combining it with epirizole to form a new spherically
Springer Singapore, ISBN: 978-981-13-6786-1, 1st ed. 2019, XVII, 118 p.
Book Review
Introduction of a new book entitled “Spherical Crystallization as a New Platform for Particle Design
Engineering” by Y. Kawashima
266
crystallized complex. Spherical crystallization using a double-component system such as theophylline and ethylene diamine can produce polymorphic aminophylline depending on the water content in the system. Polymeric spheri-cal crystallization has been developed for preparing drug carriers (microspheres and microballoons) for novel DDSs. Interestingly, the spherical crystallization process can be widely applied as a platform technique for semi-solid materials such as vitamin E, which is transformed into a solid powder and can be filled in a capsule or tableted using colloidal silica. In Chap. 5, it was described how an ethanol solution of an acrylic polymer, such as Eudragit (RS, S or L), and an API dispersed in water or polyvinyl alcohol (PVA) forms quasi-emulsion droplets in which the API and the polymer are co-precipitated to form a spherical micro-matrix. A controlled drug-releasing system was developed by using this process, termed “emulsion solvent diffusion (ESD)” method. Hollow microspheres (microb-alloons), which are used for multiple floating-controlled drug-delivery systems, are developed by the polymeric spherical crystallization process. To quantitatively describe the floating behavior of the microballoons in the stom-ach, a novel radio-scintigraphical method using Technetium-99m has been developed. In Chap. 6, the development of biocompatible and biodegradable polymeric micro/nanospheres using poly (D,L-lactide-co-glycolide) (PLGA), loaded with a bioactive substance by the ESD method, is described. It is difficult to directly formulate nanospheres in their final pharmaceutical form due to their strong aggregation tendency. To overcome those problems, the PLGA nanospheres are transformed into solid dispersed nanosphere composites containing a water-soluble excipient, such as a sugar alcohol, which can reproduce the original fresh nanospheres (NSs) dispersed at the applied site. Prepar-ing nanocomposite particles can allow to handle them in the same way for preparing solid-dosage forms, such as tablets, capsules, dry-powder inhalations (DPIs), and so on. PLGA nanospheres with chitosan-modified surfaces can improve the drug absorption at the target site due to a sustained stay and prolonged release of the drug. Trans-dermal DDSs containing PLGA-nanosphere composites have been developed for nanocosmetics, as discussed in Chap. 7. A whitening and anti-aging cosmetic containing ascorbyl tetraisopalmitate (VC-IP) loaded PLGA NSs, named “NanoCrysphere®,” was launched in 2004 by Hosokawa Co. Ltd. In Chap. 8, future perspectives of the plat-forms for designing new DDSs and manufacturing them at industrial scale with a new continuous pharmaceutical process are described.
[Author: Kawashima, Yoshiaki]
Table 1 Contents
1 Introduction ....................................................................................................................................................................................... 1
References ............................................................................................................................................................................................ 9
2 Concept of Spherical Crystallization ............................................................................................................................................ 11
2.1 Spherical Self-Organized Agglomeration of Fine Particles in a Liquid ................................................................................. 11
2.2 Spherical Crystallization of Salicylic Acid with Simultaneous Agglomeration and Crystallization .................................... 12
2.3 Spherical Crystallization Kinetics and Agglomeration Mechanism ....................................................................................... 15
References .......................................................................................................................................................................................... 18
3 Paradigm Shifted Pharmaceutical Process Introduced by Spherical Crystallization ............................................................ 19
3.1 Paradigm Shifted Primary Particle Properties of Spherical Crystallized Products ............................................................... 19
3.2 Critical Operating Parameters Determining the Secondary Particle Properties of Spherically Crystallized Products
for Direct Tableting .................................................................................................................................................................. 21
3.3 Paradigm Shifted Mechanical Properties of Spherically Agglomerated Crystals for Direct Tableting ................................ 23
3.4 Paradigm Shifted Static Compaction Properties of Spherically Agglomerated Crystals for Direct Tableting ..................... 26
3.5 Paradigm Shifted Dynamic-Compression Behavior of Spherically Agglomerated Crystals for Direct Tableting ............... 29
References .......................................................................................................................................................................................... 33
4 Particulate-Design Platform Developed by the Advanced Spherical Crystallization System ............................................... 35
4.1 Spherical Crystallization of a Poorly Soluble Drug (Enoxacin) with an Ammonia Diffusion System .................................. 35
4.2 Spherical Crystallization of a Poorly Compressible Powder for Direct Tableting Using Binary-Solvent Systems ............... 39
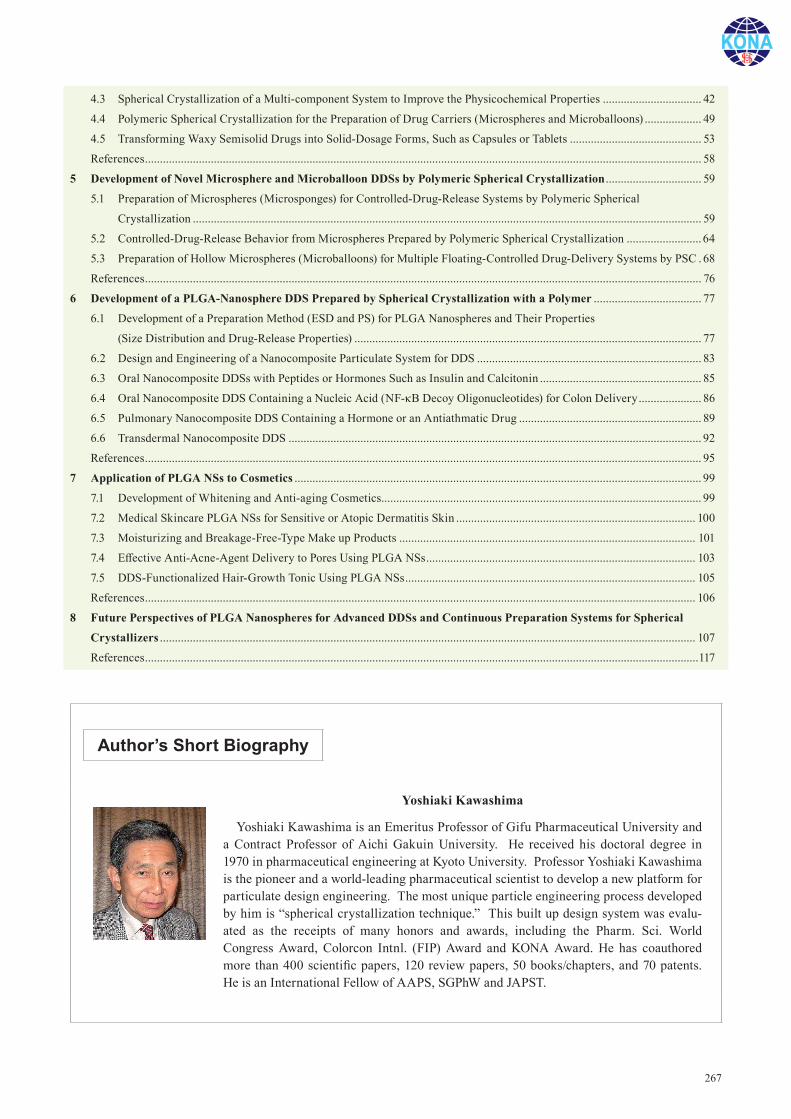
267
4.3 Spherical Crystallization of a Multi-component System to Improve the Physicochemical Properties ................................. 42
4.4 Polymeric Spherical Crystallization for the Preparation of Drug Carriers (Microspheres and Microballoons) ................... 49
4.5 Transforming Waxy Semisolid Drugs into Solid-Dosage Forms, Such as Capsules or Tablets ............................................ 53
References .......................................................................................................................................................................................... 58
5 Development of Novel Microsphere and Microballoon DDSs by Polymeric Spherical Crystallization ................................ 59
5.1 Preparation of Microspheres (Microsponges) for Controlled-Drug-Release Systems by Polymeric Spherical
Crystallization .......................................................................................................................................................................... 59
5.2 Controlled-Drug-Release Behavior from Microspheres Prepared by Polymeric Spherical Crystallization ......................... 64
5.3 Preparation of Hollow Microspheres (Microballoons) for Multiple Floating-Controlled Drug-Delivery Systems by PSC . 68
References .......................................................................................................................................................................................... 76
6 Development of a PLGA-Nanosphere DDS Prepared by Spherical Crystallization with a Polymer .................................... 77
6.1 Development of a Preparation Method (ESD and PS) for PLGA Nanospheres and Their Properties
(Size Distribution and Drug-Release Properties) .................................................................................................................... 77
6.2 Design and Engineering of a Nanocomposite Particulate System for DDS ........................................................................... 83
6.3 Oral Nanocomposite DDSs with Peptides or Hormones Such as Insulin and Calcitonin ...................................................... 85
6.4 Oral Nanocomposite DDS Containing a Nucleic Acid (NF-κB Decoy Oligonucleotides) for Colon Delivery ..................... 86
6.5 Pulmonary Nanocomposite DDS Containing a Hormone or an Antiathmatic Drug ............................................................. 89
6.6 Transdermal Nanocomposite DDS .......................................................................................................................................... 92
References .......................................................................................................................................................................................... 95
7 Application of PLGA NSs to Cosmetics ........................................................................................................................................ 99
7.1 Development of Whitening and Anti-aging Cosmetics ........................................................................................................... 99
7.2 Medical Skincare PLGA NSs for Sensitive or Atopic Dermatitis Skin ................................................................................ 100
7.3 Moisturizing and Breakage-Free-Type Make up Products ................................................................................................... 101
7.4 Effective Anti-Acne-Agent Delivery to Pores Using PLGA NSs .......................................................................................... 103
7.5 DDS-Functionalized Hair-Growth Tonic Using PLGA NSs ................................................................................................. 105
References ........................................................................................................................................................................................ 106
8 Future Perspectives of PLGA Nanospheres for Advanced DDSs and Continuous Preparation Systems for Spherical
Crystallizers ................................................................................................................................................................................... 107
References .........................................................................................................................................................................................117
Author’s Short Biography
Yoshiaki Kawashima
Yoshiaki Kawashima is an Emeritus Professor of Gifu Pharmaceutical University and a Contract Professor of Aichi Gakuin University. He received his doctoral degree in 1970 in pharmaceutical engineering at Kyoto University. Professor Yoshiaki Kawashima is the pioneer and a world-leading pharmaceutical scientist to develop a new platform for particulate design engineering. The most unique particle engineering process developed by him is “spherical crystallization technique.” This built up design system was evalu-ated as the receipts of many honors and awards, including the Pharm. Sci. World Congress Award, Colorcon Intnl. (FIP) Award and KONA Award. He has coauthored more than 400 scientific papers, 120 review papers, 50 books/chapters, and 70 patents. He is an International Fellow of AAPS, SGPhW and JAPST.
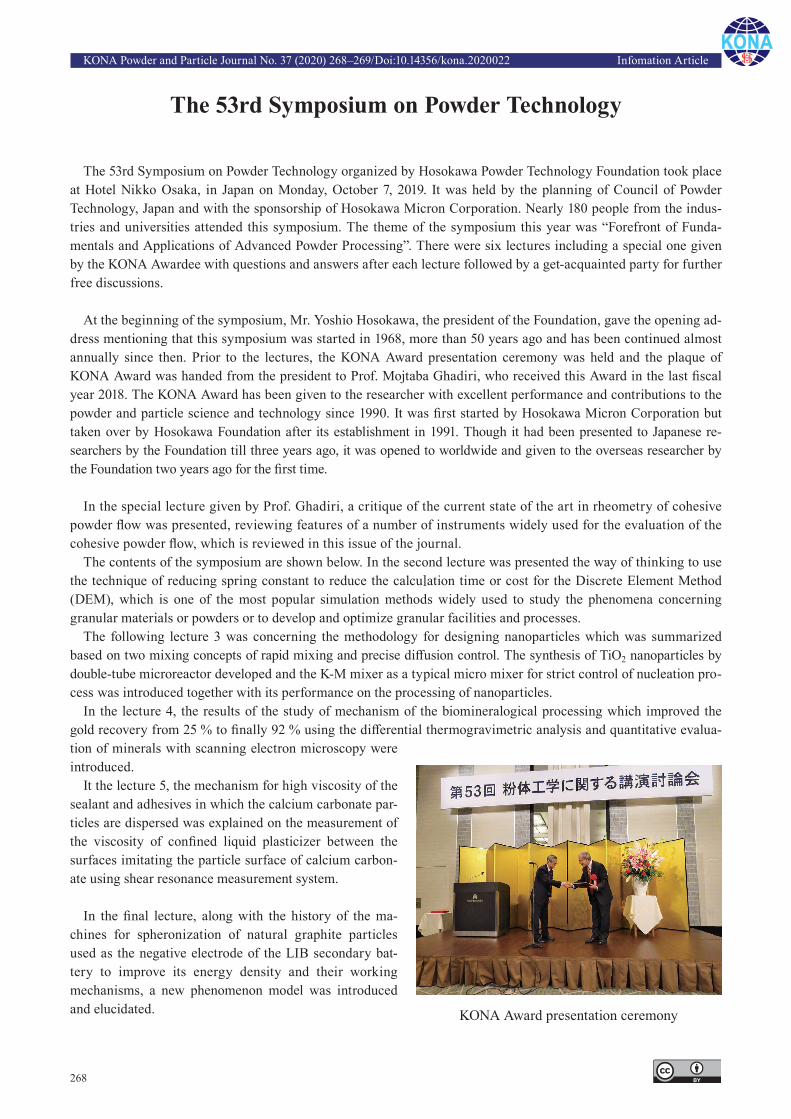
KONA Powder and Particle Journal No. 37 (2020) 268–269/Doi:10.14356/kona.2020022 Infomation Article
268
The 53rd Symposium on Powder Technology
The 53rd Symposium on Powder Technology organized by Hosokawa Powder Technology Foundation took place at Hotel Nikko Osaka, in Japan on Monday, October 7, 2019. It was held by the planning of Council of Powder Technology, Japan and with the sponsorship of Hosokawa Micron Corporation. Nearly 180 people from the indus-tries and universities attended this symposium. The theme of the symposium this year was “Forefront of Funda-mentals and Applications of Advanced Powder Processing”. There were six lectures including a special one given by the KONA Awardee with questions and answers after each lecture followed by a get-acquainted party for further free discussions.
At the beginning of the symposium, Mr. Yoshio Hosokawa, the president of the Foundation, gave the opening ad-dress mentioning that this symposium was started in 1968, more than 50 years ago and has been continued almost annually since then. Prior to the lectures, the KONA Award presentation ceremony was held and the plaque of KONA Award was handed from the president to Prof. Mojtaba Ghadiri, who received this Award in the last fiscal year 2018. The KONA Award has been given to the researcher with excellent performance and contributions to the powder and particle science and technology since 1990. It was first started by Hosokawa Micron Corporation but taken over by Hosokawa Foundation after its establishment in 1991. Though it had been presented to Japanese re-searchers by the Foundation till three years ago, it was opened to worldwide and given to the overseas researcher by the Foundation two years ago for the first time.
In the special lecture given by Prof. Ghadiri, a critique of the current state of the art in rheometry of cohesive powder flow was presented, reviewing features of a number of instruments widely used for the evaluation of the cohesive powder flow, which is reviewed in this issue of the journal.
The contents of the symposium are shown below. In the second lecture was presented the way of thinking to use the technique of reducing spring constant to reduce the calculation time or cost for the Discrete Element Method (DEM), which is one of the most popular simulation methods widely used to study the phenomena concerning granular materials or powders or to develop and optimize granular facilities and processes.
The following lecture 3 was concerning the methodology for designing nanoparticles which was summarized based on two mixing concepts of rapid mixing and precise diffusion control. The synthesis of TiO2 nanoparticles by double-tube microreactor developed and the K-M mixer as a typical micro mixer for strict control of nucleation pro-cess was introduced together with its performance on the processing of nanoparticles.
In the lecture 4, the results of the study of mechanism of the biomineralogical processing which improved the gold recovery from 25 % to finally 92 % using the differential thermogravimetric analysis and quantitative evalua-tion of minerals with scanning electron microscopy were introduced.
It the lecture 5, the mechanism for high viscosity of the sealant and adhesives in which the calcium carbonate par-ticles are dispersed was explained on the measurement of the viscosity of confined liquid plasticizer between the surfaces imitating the particle surface of calcium carbon-ate using shear resonance measurement system.
In the final lecture, along with the history of the ma-chines for spheronization of natural graphite particles used as the negative electrode of the LIB secondary bat-tery to improve its energy density and their working mechanisms, a new phenomenon model was introduced and elucidated. KONA Award presentation ceremony
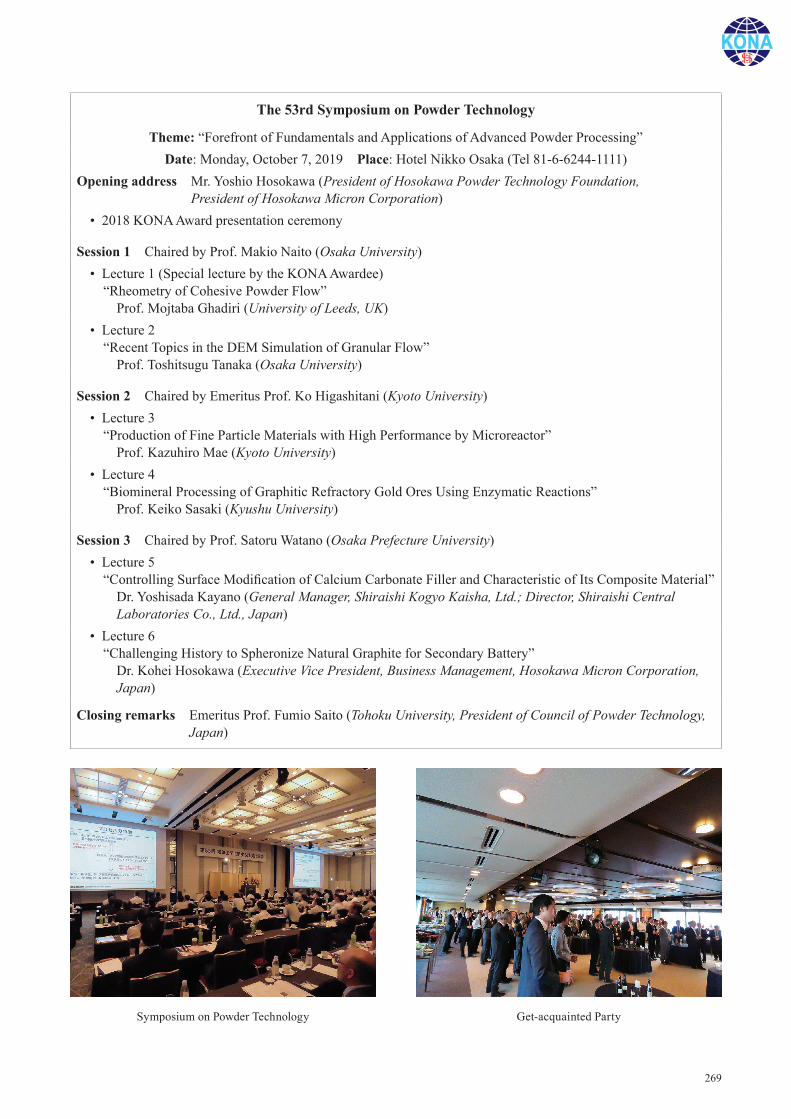
269
The 53rd Symposium on Powder Technology
Theme: “Forefront of Fundamentals and Applications of Advanced Powder Processing”Date: Monday, October 7, 2019 Place: Hotel Nikko Osaka (Tel 81-6-6244-1111)
Opening address Mr. Yoshio Hosokawa (President of Hosokawa Powder Technology Foundation,President of Hosokawa Micron Corporation)
• 2018 KONA Award presentation ceremony
Session 1 Chaired by Prof. Makio Naito (Osaka University)• Lecture 1 (Special lecture by the KONA Awardee)
“Rheometry of Cohesive Powder Flow”Prof. Mojtaba Ghadiri (University of Leeds, UK)
• Lecture 2“Recent Topics in the DEM Simulation of Granular Flow”
Prof. Toshitsugu Tanaka (Osaka University)
Session 2 Chaired by Emeritus Prof. Ko Higashitani (Kyoto University)• Lecture 3
“Production of Fine Particle Materials with High Performance by Microreactor”Prof. Kazuhiro Mae (Kyoto University)
• Lecture 4“Biomineral Processing of Graphitic Refractory Gold Ores Using Enzymatic Reactions”
Prof. Keiko Sasaki (Kyushu University)
Session 3 Chaired by Prof. Satoru Watano (Osaka Prefecture University)• Lecture 5
“Controlling Surface Modification of Calcium Carbonate Filler and Characteristic of Its Composite Material”Dr. Yoshisada Kayano (General Manager, Shiraishi Kogyo Kaisha, Ltd.; Director, Shiraishi Central Laboratories Co., Ltd., Japan)
• Lecture 6“Challenging History to Spheronize Natural Graphite for Secondary Battery”
Dr. Kohei Hosokawa (Executive Vice President, Business Management, Hosokawa Micron Corporation, Japan)
Closing remarks Emeritus Prof. Fumio Saito (Tohoku University, President of Council of Powder Technology, Japan)
Symposium on Powder Technology Get-acquainted Party
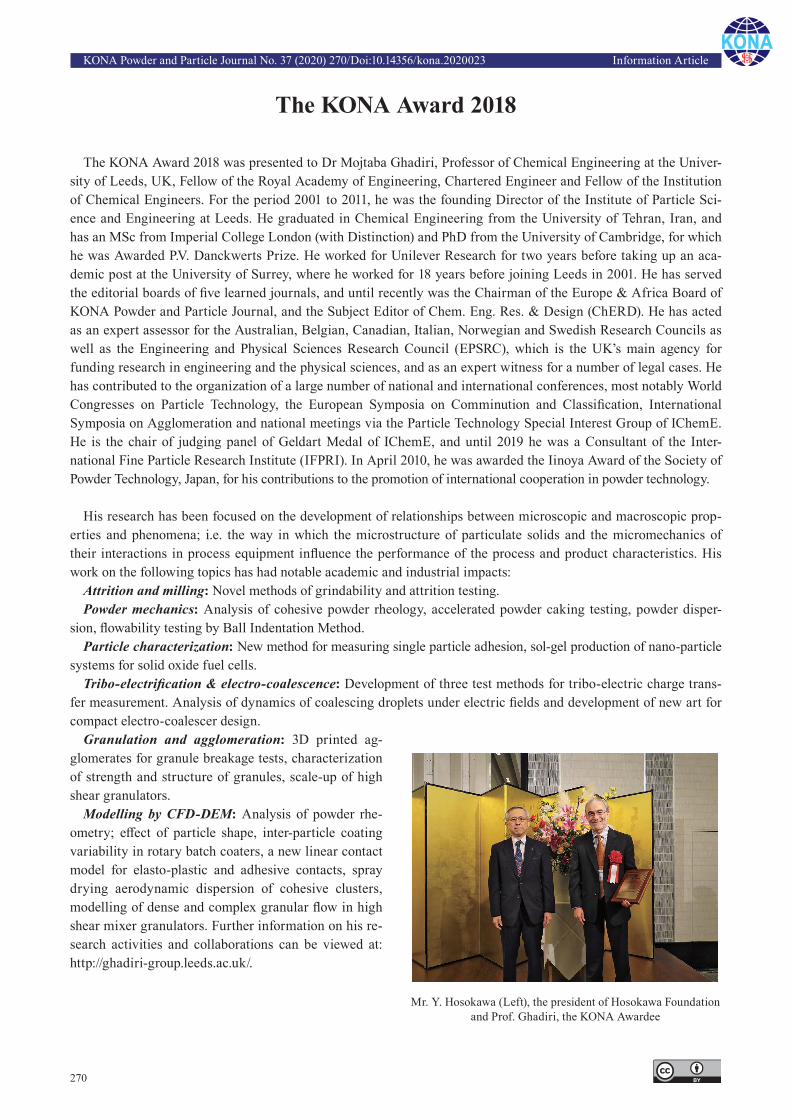
KONA Powder and Particle Journal No. 37 (2020) 270/Doi:10.14356/kona.2020023 Information Article
270
The KONA Award 2018
The KONA Award 2018 was presented to Dr Mojtaba Ghadiri, Professor of Chemical Engineering at the Univer-sity of Leeds, UK, Fellow of the Royal Academy of Engineering, Chartered Engineer and Fellow of the Institution of Chemical Engineers. For the period 2001 to 2011, he was the founding Director of the Institute of Particle Sci-ence and Engineering at Leeds. He graduated in Chemical Engineering from the University of Tehran, Iran, and has an MSc from Imperial College London (with Distinction) and PhD from the University of Cambridge, for which he was Awarded P.V. Danckwerts Prize. He worked for Unilever Research for two years before taking up an aca-demic post at the University of Surrey, where he worked for 18 years before joining Leeds in 2001. He has served the editorial boards of five learned journals, and until recently was the Chairman of the Europe & Africa Board of KONA Powder and Particle Journal, and the Subject Editor of Chem. Eng. Res. & Design (ChERD). He has acted as an expert assessor for the Australian, Belgian, Canadian, Italian, Norwegian and Swedish Research Councils as well as the Engineering and Physical Sciences Research Council (EPSRC), which is the UK’s main agency for funding research in engineering and the physical sciences, and as an expert witness for a number of legal cases. He has contributed to the organization of a large number of national and international conferences, most notably World Congresses on Particle Technology, the European Symposia on Comminution and Classification, International Symposia on Agglomeration and national meetings via the Particle Technology Special Interest Group of IChemE. He is the chair of judging panel of Geldart Medal of IChemE, and until 2019 he was a Consultant of the Inter-national Fine Particle Research Institute (IFPRI). In April 2010, he was awarded the Iinoya Award of the Society of Powder Technology, Japan, for his contributions to the promotion of international cooperation in powder technology.
His research has been focused on the development of relationships between microscopic and macroscopic prop-erties and phenomena; i.e. the way in which the microstructure of particulate solids and the micromechanics of their interactions in process equipment influence the performance of the process and product characteristics. His work on the following topics has had notable academic and industrial impacts:
Attrition and milling: Novel methods of grindability and attrition testing.Powder mechanics: Analysis of cohesive powder rheology, accelerated powder caking testing, powder disper-
sion, flowability testing by Ball Indentation Method.Particle characterization: New method for measuring single particle adhesion, sol-gel production of nano-particle
systems for solid oxide fuel cells.Tribo-electrification & electro-coalescence: Development of three test methods for tribo-electric charge trans-
fer measurement. Analysis of dynamics of coalescing droplets under electric fields and development of new art for compact electro-coalescer design.
Granulation and agglomeration: 3D printed ag-glomerates for granule breakage tests, characterization of strength and structure of granules, scale-up of high shear granulators.
Modelling by CFD-DEM: Analysis of powder rhe-ometry; effect of particle shape, inter-particle coating variability in rotary batch coaters, a new linear contact model for elasto-plastic and adhesive contacts, spray drying aerodynamic dispersion of cohesive clusters, modelling of dense and complex granular flow in high shear mixer granulators. Further information on his re-search activities and collaborations can be viewed at: http://ghadiri-group.leeds.ac.uk/.
Mr. Y. Hosokawa (Left), the president of Hosokawa Foundation and Prof. Ghadiri, the KONA Awardee
KONA Powder and Particle Journal No. 37 (2020) 271/Doi:10.14356/kona.2020024 Infomation Article
271
General Information
History of the JournalIn the history of KONA Powder and Particle Journal, two
organizations have been playing an important role. The one is the Council of Powder Technology, Japan (CPT) and the other is the Hosokawa Powder Technology Foundation (Hosokawa Foundation). The CPT was established in 1969 by Hosokawa Micron Corporation as a nonprofit organization to enhance the activities of research and development on powder science and technology. The Hosokawa Foundation was established in 1991 as a public-service corporation approved by the Ministry of Education, Culture, Sport, Science and Technology of Japan. The issues from No.1 (1983) to No.12 (1994) of KONA were published by CPT and the issues from No.13 (1995) by the Hosokawa Foundation.
The aim of KONA in the early days was to introduce excellent Japanese papers to the world and thus KONA consisted of papers recommended by some Japanese academic societies and translated from Japanese to English. From the issue of No.8, the CPT changed its editorial policy to internationalize the KONA and to incorporate papers by authors throughout the world in addition to translated papers. In response to this change, three editorial blocks have been organized in the world; Asian-Oceanian, American, and European. The policy and system have not changed even after the Hosokawa Foundation has taken over from the CPT. From the issue of No.27 (2009), publication of translated papers has been terminated and only original papers have been published. The CPT is still active today and is collaborating with the Hosokawa Foundation.
Aims and ScopeKONA publishes review and original research papers in a broad
field of powder & particle science and technology, ranging from fundamental principles to practical applications. The papers on criti-cal reviews of existing knowledge in special areas are very welcome.
The submitted papers are published only when they are judged by the Editor to contribute to the progress of powder science and technology, and approved by any of the three Editorial Committees.
The paper submitted to the Editorial Secretariat should not have been previously published.
Category of Papers• Invited articles Review papers and feature articles invited by the KONA
Editorial Committees.• Contributed papers Original review papers and some limited number of original
research papers of high quality submitted to the KONA Editorial Committees, and refereed by the reviewers and editors.
Submission of PapersIt is now possible to submit your paper online via Editorial
Manager® for KONA Online Paper Submission and Peer Review System. For all further information, please go to the journal’s homepage on http://www.kona.or.jp/jp/journal/info.html.
Publication in KONA is free of charge.
Publication ScheduleKONA is published annually. The publication date is around
January 10th.
SubscriptionKONA is distributed free of charge to senior researchers at
universities and laboratories as well as to institutions and libraries in the field throughout the world. The publisher is always glad to consider the addition of names of those, who want to obtain this journal regularly, to the mailing list.
Instructions to Authors(1) Language
All submissions should be written in good English. Authors may choose either British or American English, provided that the chosen style is used consistently. Authors from non-English-speaking countries are encouraged to use a professional English editing service to proofread their manuscript.
(2) Manuscript format• Electric files should be submitted to the Editorial Secretariat by
online. Authors’ short biography with less than 100 words per person and color photographs of all the authors should be attached to the final version.
• The structure of manuscripts should follow the following order; title, authors, affiliations, abstract, graphical abstract, keywords, main text, (acknowledgement), (appendix), (nomenclature), ref-erences. The items with parentheses are not mandatory.
• Full postal addresses must be given for all the authors. Indicate the corresponding author by the asterisk mark“*” after the name. Telephone and fax numbers and e-mail address should be provided for the corresponding author.
• Abstract should not exceed 200 words.• Graphical abstract should be a concise, visual summary of the
article which will be displayed in the contents list both online and print.
• The appropriate number of keywords is 5 or 6.• The maximum pages printed in KONA are supposed to be: 15 for an original paper and 25 for a review paper.• Symbols and units should be listed in alphabetical order with
their definition and dimensions in SI units.• The color figures will appear in color both on the KONA
Website (http://www.kona.or.jp) and also in the paper version.• Concerning references, the alphabetical system should be
adopted. Please use reference management software such as Endnote to manage references as far as possible. List: References should be arranged first alphabetically and then further sorted chronologically if necessary. More than one reference from the same author(s) in the same year must be identified by the letters “a”, “b”, “c”, etc., placed after the year of publication.Examples: - Reference to a book:
Strunk Jr. W., White E.B., The Elements of Style, fourth ed., Longman, New York, 2000.
- Reference to a chapter in an edited book: Mettam G.R., Adams L.B., How to prepare an electronic version of your article, in: Jones B.S., Smith R.Z. (Eds.), Introduction to the Electronic Age, E-Publishing Inc., New York, 2009, pp.281–304.
- Reference to a journal publication: Tsuji Y., Tanaka T., Ishida T., Lagrangian numerical simulation of plug flow of cohesionless particles in a horizontal pipe, Powder Technology, 71 (1992) 239–250. DOI: 10.1016/0032-5910(92)88030-L
Text: All citations in the text should refer to: 1. Single author: the author’s name (without initials, unless
there is ambiguity) and the year of publication; 2. Two authors: both authors’ names and the year of publication; 3. Three or more authors: first author’s name followed by “et
al.” and the year of publication. Citations may be made directly (or parenthetically). Groups of references should be listed first alphabetically, then chron-ologically. Examples:
“as demonstrated (Hidaka J. et al., 1995; Tsuji Y., 1992a, 1992b, 1993). Mori Y. and Fukumoto Y. (2002) have recently shown ....”
(3) Copyright and permission• The original paper to be submitted to KONA has not been
published before in any language or in any journals or media; it is not submitted and not under consideration for publication in whole or in part elsewhere.
• Authors are responsible for obtaining permission from the copyright holders to reproduce any figures, tables and photos for which copyright exists.
• The KONA Journal applies the Creative Commons Attribution License to all works published by the Journal. Copyright stays with the agreed copyright owner, and the Hosokawa Powder Technology Foundation is granted the exclusive right to publish and distribute the work, and to provide the work in all forms and media.
• Users of the journal will be able to reuse the contents in any way they like, provided they are accurately attributed. No permission is required from either the authors or the publisher.
Free electronic publication of KONA is available at http://www.kona.or.jp


A smarter way to optimise
your processplant’s capability
With Hosokawa GEN4’s flexible digital toolkit we convert live data from sensorsand controls to achieve measurable manufacturing improvements.
Hosokawa Micron Ltd - at the forefront of powder processing, containment anddigital technologies.
UNDERSTAND MONITOR CONTROLE. [email protected] www.hosokawa.co.uk
About this Journal
KONA Powder and Particle Journal is a refereed scientific journal that publishes articles in the field of powder and particle science and technology annually since 1983. This journal is distributed free of charge to the members of scien-tific communities and universities and research libraries throughout the world, by the Hosokawa Powder Technology Foundation (www.kona.or.jp/) established by Mr. Masuo Hosokawa in 1991.
The Chinese character “粉 ” in the cover is pronounced as “KONA” in Japanese, and means "Powder", which was hand-written by Mr. Eiichi Hosokawa, the founder of the Hosokawa Micron Corporation (www.hosokawamicron.co.jp/en/global.html).
Headquarters of Hosokawa Micron Corporation
Publication OfficeHosokawa Powder Technology Foundation (www.kona.or.jp)(in the headquarters building of Hosokawa Micron Corporation)1-9, Shodaitajika, Hirakata-shi, Osaka 573-1132, JapanE-mail: [email protected]
Printing Office: Nakanishi Printing Co., Ltd., Japan
Publication Date: 10 January 2020
About the CoverPhysical and chemical properties of cohesive powders need to be considered in the powder processing and manufactur-ing operations of the industries treating particulate solids. The dynamic behavior of the cohesive powder greatly de-pends on particle size and shape, degree of aggregation/ agglomeration, charge amount, wettability, friction, and con-ditions of exposed environment. In the characterization of cohesive powders, various types of quasi-static method have been established and widely used, especially for powder spreading in additive manufacturing and 3D printing. In con-trast, powder rheometry instrument, which is important to evaluate the dynamic behavior of flowing powders, is limit-ed. Review on this topic is discussed on pp. 3–18.
Editorial Board
Editor-in-Chief K. Okuyama (Hiroshima Univ., Japan)
Asian / Oceanian Editorial BoardS. Biggs (Univ. of Western Australia, Australia)X.S. Cai (Univ. of Shanghai for Sci. & Tech., China)T. Charinpanitkul (Chulalongkorn Univ., Thailand)Y.F. Chen (Chinese Academy of Sciences, China)J. Hidaka (Doshisha Univ., Japan)E. Iritani (Nagoya Univ., Japan)H. Kage (Kyushu Institute of Technology, Japan)Y. Kang (Chungnam National Univ., Korea)A. Kawasaki (Tohoku Univ., Japan)D.J. Lee (National Taiwan Univ., Taiwan)J.H. Li (Chinese Academy of Sciences, China)H. Makino (CRIEPI, Japan)S. Matsusaka (Kyoto Univ., Japan)M. Naito (Osaka Univ., Japan)Y. Otani (Kanazawa Univ., Japan)Pradip (TCS, India)F. Saito (Tohoku Univ., Japan)Y. Sakka (NIMS, Japan)H. Takeuchi (Gifu Pharmaceutical Univ., Japan)W. Tanthapanichakoon (Tokyo Institute of Technology, Japan)C.H. Wang (National Univ. of Singapore, Singapore)S. Watano (Osaka Pref. Univ., Japan)
Secretariat T. Yokoyama (Hosokawa Powder Tech. Foundation, Japan)L. Cui (Hosokawa Micron Corp., Japan)
European / African Editorial BoardChairman
G.M.H. Meesters (Delft Univ. of Technology, Netherlands) F. Bourgeois (Univ. of Toulouse, France)M.-O. Coppens (Univ. College London, UK)L. Gradon (Warsaw Univ. of Technology, Poland)A. Kwade (TU Braunschweig, Germany)P. Milani (Univ. of Milan, Italy)M.G. Rasteiro (Univ. of Coimbra, Portugal)J.M. Valverde (Univ. of Seville, Spain)
SecretariatS. Sander (KONA Europe e.V., Germany)S. Wilk (KONA Europe e.V., Germany)
American Editorial BoardChairman
B.M. Moudgil (Univ. of Florida., USA)A.J. Hickey (Univ. of North Carolina, USA)V. M. Puri (Pennsylvania State Univ., USA)R.K. Rajamani (Univ. of Utah, USA)A.D. Rosato (New Jersey Institute of Technology, USA)L.M. Tavares (UFRJ, Brazil)
SecretariatC.C. Huang (Hosokawa Micron Intl. Inc., USA)
KONA Powder and Particle Journal No. 37 (2020) www.kona.or.jp

Process Technologies for Tomorrow
CODEN: KPPJADISSN 0288-4534
available online-www.kona.or.jp
Powder and
Particle Journal
Powder and
Particle JournalKONA
Hosokawa Powder Technology Foundation
No.37 (2020)
No.37 (2020)
KO
NA
Po
wd
er and
Particle Jo
urn
al