KONA Powder and Particle Journal No. 38 (2021)
300
CODEN: KPPJAD ISSN 0288-4534 available online-www.kona.or.jp Powder and Particle Journal Powder and Particle Journal KONA Hosokawa Powder Technology Foundation No.38 (2021)
-
Upload
khangminh22 -
Category
Documents
-
view
0 -
download
0
Transcript of KONA Powder and Particle Journal No. 38 (2021)
Process Technologies for Tomorrow
CODEN: KPPJADISSN 0288-4534
available online-www.kona.or.jp
Powder and
Particle Journal
Powder and
Particle JournalKONA
Hosokawa Powder Technology Foundation
No.38 (2021)
No.38 (2021)
KO
NA
Po
wd
er and
Particle Jo
urn
al
About this Journal
KONA Powder and Particle Journal is a refereed scientific journal that publishes articles in the field of powder and particle science and technology annually since 1983. This journal is distributed free of charge to the members of scien-tific communities and universities and research libraries throughout the world by the Hosokawa Powder Technology Foundation (www.kona.or.jp/) established by Mr. Masuo Hosokawa in 1991.
The Chinese character “粉 ” in the cover is pronounced as “KONA” in Japanese, and means "Powder", which was hand-written by Mr. Eiichi Hosokawa, the founder of the Hosokawa Micron Corporation (www.hosokawamicron.co.jp/en/global.html).
Headquarters of Hosokawa Micron Corporation
■ Publication OfficeHosokawa Powder Technology Foundation (www.kona.or.jp)(in the headquarters building of Hosokawa Micron Corporation)1-9, Shodaitajika, Hirakata-shi, Osaka 573-1132, JapanE-mail: [email protected]
■ Printing Office: Nakanishi Printing Co., Ltd., Japan■ Publication Date: 10 January 2021
About the CoverIntermetallic compounds are homogeneously ordered, solid- state compounds of two or more metallic elements. They have distinctive electronic structures which are completely different from those of mixed metals. This characteristic leads to unique electrical, thermal, magnetic, semiconduct-ing, and chemical properties, which in the end, opens the door to a wide range of applications. Their highly ordered atomic structure, even at the surface, is favorable for solid- state catalysis. Studies related to the catalytic application of intermetallic compounds are usually focused on the binary systems. Recently, ternary metallic element systems in Heu-sler Alloys demonstrate promising features for catalysis be-cause of their novel fundamental catalytic properties. Review of this topic is discussed on pp. 110–121.
Editorial Board
Editor-in-Chief K. Okuyama (Hiroshima Univ., Japan)
Asian / Oceanian Editorial BoardS. Biggs (Univ. of Western Australia, Australia)X.S. Cai (Univ. of Shanghai for Sci. & Tech., China)T. Charinpanitkul (Chulalongkorn Univ., Thailand)Y.F. Chen (Chinese Academy of Sciences, China)H. Choi (Changwon National Univ., Korea)S. Das (Indian Institute of Technology, India)J. Hidaka (Doshisha Univ., Japan)E. Iritani (Nagoya Univ., Japan)H. Kage (Kyushu Institute of Technology, Japan)A. Kawasaki (Tohoku Univ., Japan)D.J. Lee (National Taiwan Univ., Taiwan)J.H. Li (Chinese Academy of Sciences, China)H. Makino (CRIEPI, Japan)S. Matsusaka (Kyoto Univ., Japan)M. Naito (Osaka Univ., Japan)Y. Otani (Kanazawa Univ., Japan)F. Saito (Tohoku Univ., Japan)Y. Sakka (NIMS, Japan)H. Takeuchi (Gifu Pharmaceutical Univ., Japan)W. Tanthapanichakoon (The Royal Society of Thailand, Thailand)C.H. Wang (National Univ. of Singapore, Singapore)S. Watano (Osaka Pref. Univ., Japan)
Secretariat T. Yokoyama (Hosokawa Powder Tech. Foundation, Japan)L. Cui (Hosokawa Micron Corp., Japan)
European / African Editorial BoardChairman
G.M.H. Meesters (Delft Univ. of Technology, Netherlands) F. Bourgeois (Univ. of Toulouse, France)M.-O. Coppens (Univ. College London, UK)L. Gradon (Warsaw Univ. of Technology, Poland)A. Kwade (TU Braunschweig, Germany)P. Milani (Univ. of Milan, Italy)M.G. Rasteiro (Univ. of Coimbra, Portugal)J.M. Valverde (Univ. of Seville, Spain)
SecretariatS. Sander (KONA Europe e.V., Germany)S. Wilk (KONA Europe e.V., Germany)
American Editorial BoardChairman
B.M. Moudgil (Univ. of Florida., USA)A.J. Hickey (Univ. of North Carolina, USA)V. M. Puri (Pennsylvania State Univ., USA)R.K. Rajamani (Univ. of Utah, USA)A.D. Rosato (New Jersey Institute of Technology, USA)L.M. Tavares (UFRJ, Brazil)R. Vehring (Univ. of Alberta, Canada) Q. Zhang (Univ. of Manitoba, Canada)
SecretariatC.C. Huang (Hosokawa Micron Intl. Inc., USA)
KONA Powder and Particle Journal No. 38 (2021) www.kona.or.jp
KONA Powder and Particle Journal No. 38 (2021) Contents
i
1 Editor's Preface
<Review Papers>
<Editorial>
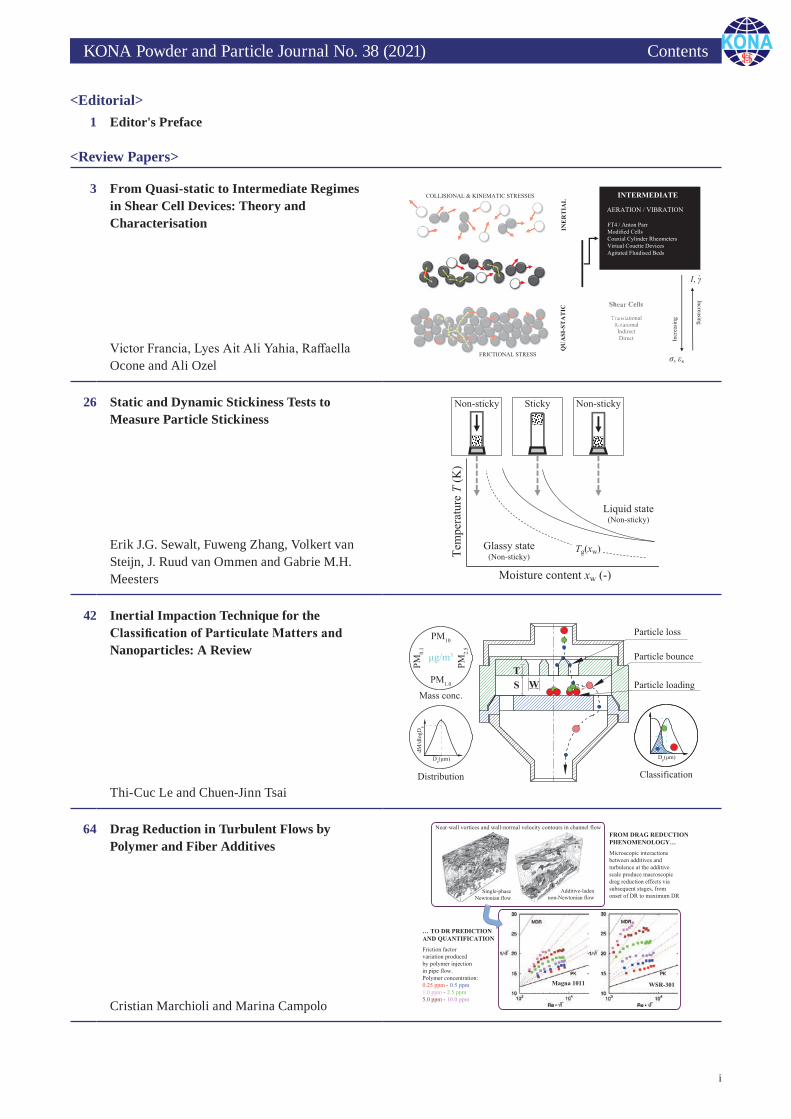
26 Static and Dynamic Stickiness Tests to Measure Particle Stickiness
Erik J.G. Sewalt, Fuweng Zhang, Volkert van Steijn, J. Ruud van Ommen and Gabrie M.H. Meesters
3 From Quasi-static to Intermediate Regimes in Shear Cell Devices: Theory and Characterisation
Victor Francia, Lyes Ait Ali Yahia, Raffaella Ocone and Ali Ozel
42 Inertial Impaction Technique for the Classification of Particulate Matters and Nanoparticles: A Review
Thi-Cuc Le and Chuen-Jinn Tsai
64 Drag Reduction in Turbulent Flows by Polymer and Fiber Additives
Cristian Marchioli and Marina Campolo
KONA Powder and Particle Journal No. 38 (2021) Contents
ii
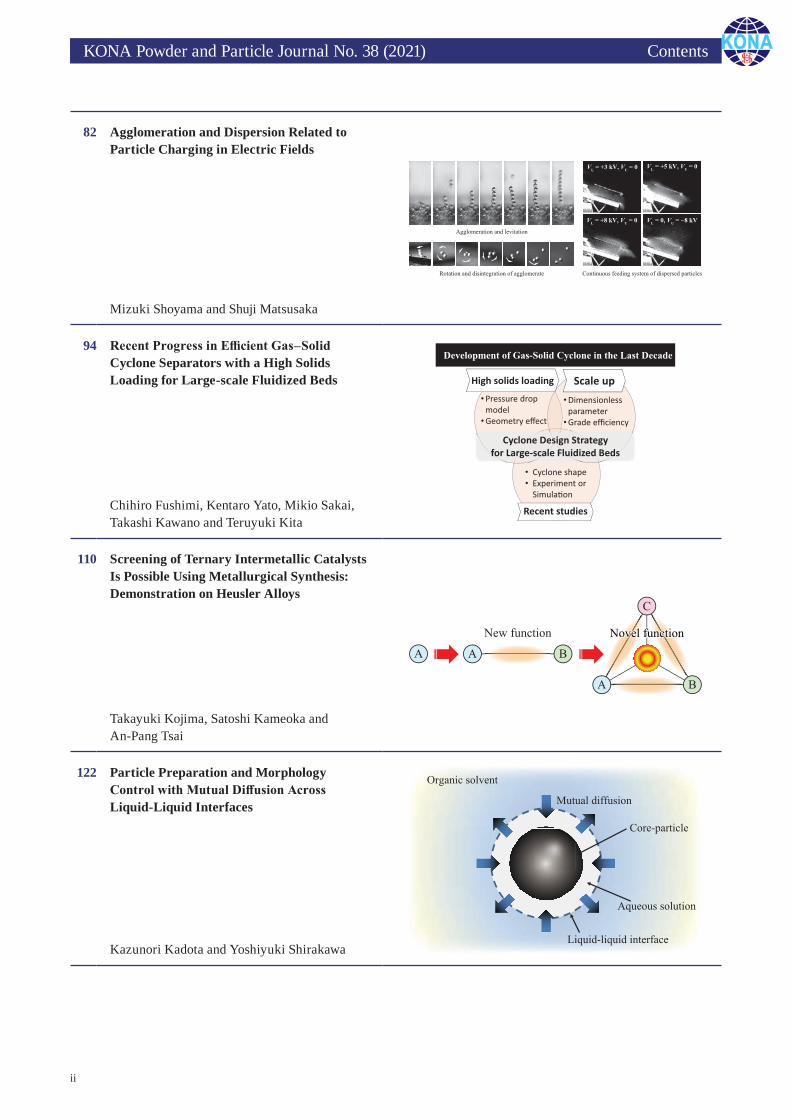
82 Agglomeration and Dispersion Related to Particle Charging in Electric Fields
Mizuki Shoyama and Shuji Matsusaka
94 Recent Progress in Efficient Gas–Solid Cyclone Separators with a High Solids Loading for Large-scale Fluidized Beds
Chihiro Fushimi, Kentaro Yato, Mikio Sakai, Takashi Kawano and Teruyuki Kita
110 Screening of Ternary Intermetallic Catalysts Is Possible Using Metallurgical Synthesis: Demonstration on Heusler Alloys
Takayuki Kojima, Satoshi Kameoka and An-Pang Tsai
122 Particle Preparation and Morphology Control with Mutual Diffusion Across Liquid-Liquid Interfaces
Kazunori Kadota and Yoshiyuki Shirakawa
KONA Powder and Particle Journal No. 38 (2021) Contents
iii
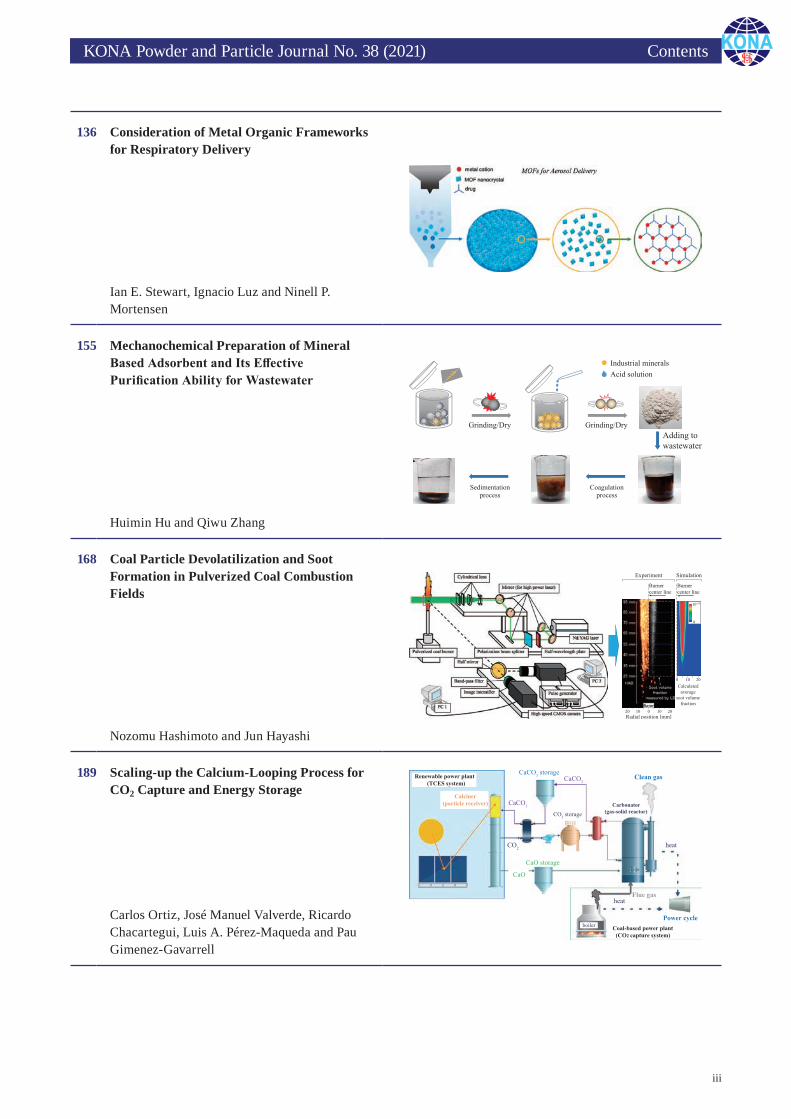
136 Consideration of Metal Organic Frameworks for Respiratory Delivery
Ian E. Stewart, Ignacio Luz and Ninell P. Mortensen
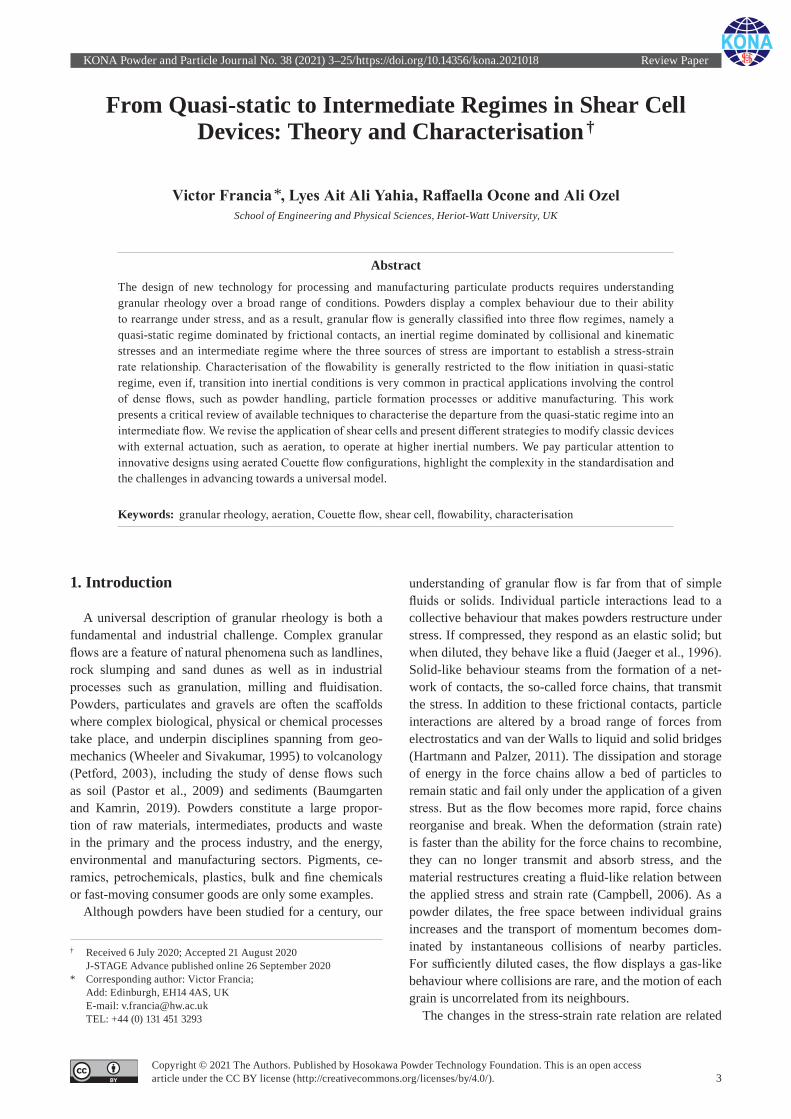
155 Mechanochemical Preparation of Mineral Based Adsorbent and Its Effective Purification Ability for Wastewater
Huimin Hu and Qiwu Zhang
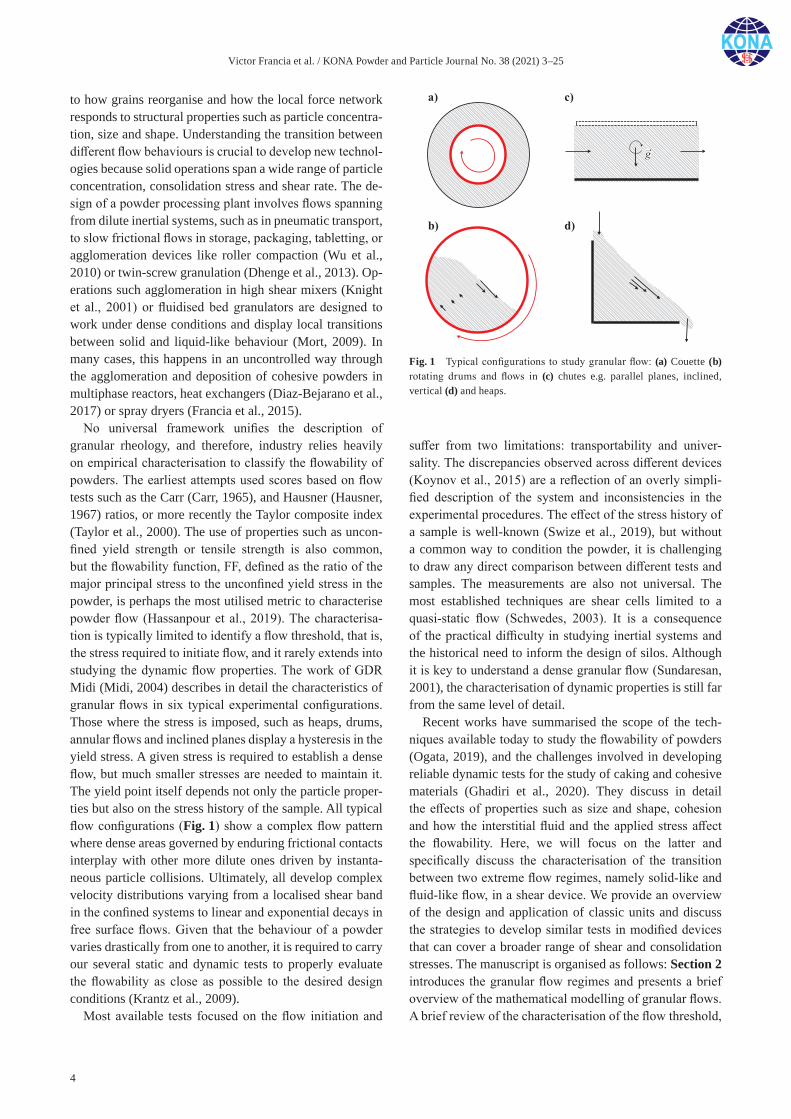
168 Coal Particle Devolatilization and Soot Formation in Pulverized Coal Combustion Fields
Nozomu Hashimoto and Jun Hayashi
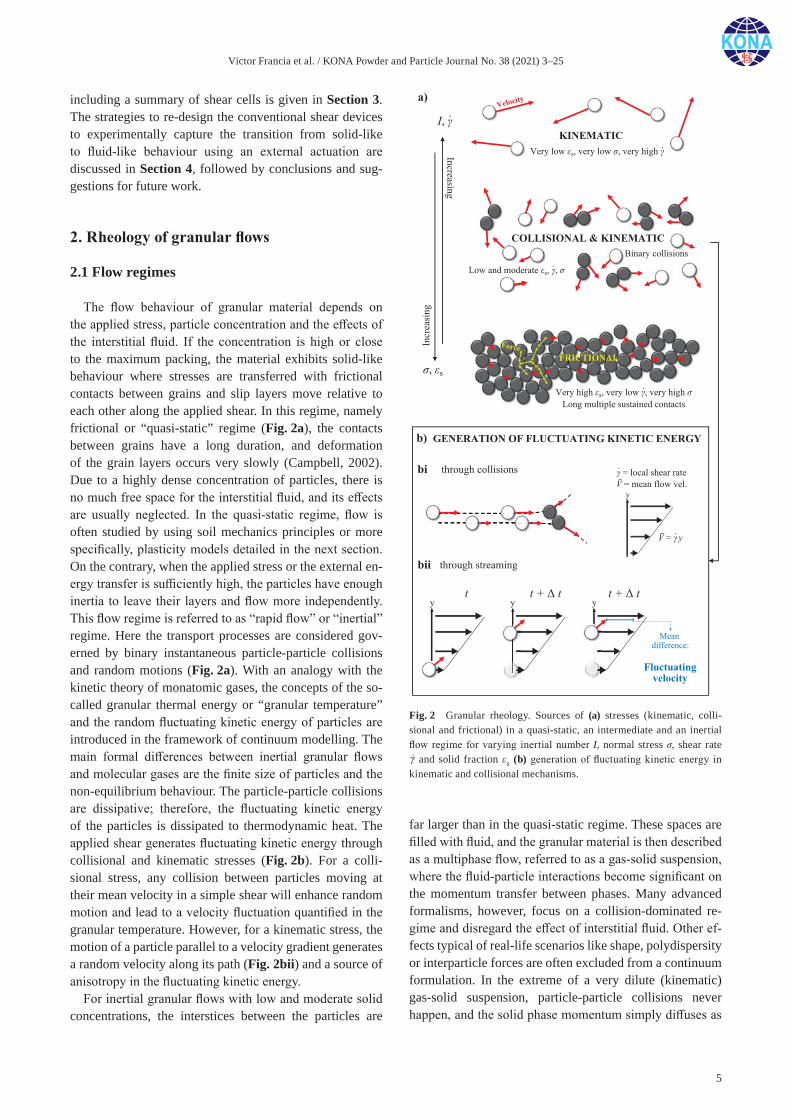
189 Scaling-up the Calcium-Looping Process for CO2 Capture and Energy Storage
Carlos Ortiz, José Manuel Valverde, Ricardo Chacartegui, Luis A. Pérez-Maqueda and Pau Gimenez-Gavarrell

KONA Powder and Particle Journal No. 38 (2021) Contents
iv
209 Modulated Uniaxial Compression Analysis of Respirable Pharmaceutical Powders
David Barona, Abouzar Shamsaddini, Maximilian Aisenstat, Kyrre Thalberg, David Lechuga-Ballesteros, Behzad Damadzadeh and Reinhard Vehring
226 Effects of Powder Vibration and Time Consolidation on Soft and Hard Wheat Flour Properties
Yumeng Zhao, Poonam Phalswal, Abhishek Shetty and R.P. Kingsly Ambrose
235 A Semi-Automated DEM Parameter Calibration Technique of Powders Based on Different Bulk Responses Extracted from Auger Dosing Experiments
Bilal El Kassem, Nizar Salloum, Thomas Brinz, Yousef Heider and Bernd Markert
251 The Properties of Kaolin from Different Locations and Their Impact on Casting Rate
Mervat Said Hassan Badr, Shuaishuai Yuan, Jiaqi Dong, Hassan El-Shall, Yamile A. Bermudez, Diana C. Ortega, Jorge E. Lopez-Rendon and Brij M. Moudgil
<Original Research Papers>

KONA Powder and Particle Journal No. 38 (2021) Contents
v
260 Fabrication and Characterization of Prussian Blue-Derived Iron Carbide-Iron Oxide Hybrid on Reduced Graphene Oxide Nanosheets
Alowasheeir Azhar, Jacob Earnshaw, Mohamed Barakat Zakaria, Ping Cheng, Yusuf Valentino Kaneti, Md. Shahriar A. Hossain, Saad M. Alshehri, Tansir Ahamad, Yusuke Yamauchi and Jongbeom Na
269 Polymer-Particle Enhanced Visible Light Range Photocatalytic Activity on Textile Applications
Asena Cerhan Haink and G. Bahar Basim
281 Book Review
285 3rd International Hosokawa Powder Technology Symposium Held in China
287 The KONA Award 2019 (Awardee: Prof. Dr. Makio Naito)
288 General Information
<Information Articles>
Selected research achievements for the KONA Award 2019: One-pot processing methods devel-oped by applying particle bonding principle. (p.287)

KONA Powder and Particle Journal No. 38 (2021) /https://doi.org/10.14356/kona.2021019 Editorial
viCopyright © 2021 The Author. Published by Hosokawa Powder Technology Foundation. This is an open access article under the CC BY license (http://creativecommons.org/licenses/by/4.0/).
Reviewer Appreciation
Kikuo Okuyama, Editor-in-ChiefHiroshima University, Japan
I would like to express my sincere gratitude to the reviewers for their hard work for the KONA Powder and Particle Journal. Thanks to the generous contributions of the volunteer reviewers as well as the interest of researchers in our journal, the number of submission to this journal is increasing after the registration on the major international journal platforms and its level is further improving. Thanks to their strong support and effort, I am pleased to inform that 2019 Impact Factor (JCR) of the KONA Powder and Particle Journal is increased to 2.326, with the CiteScore 2019 of 4.2. Because of the limited space of this annual journal, the number of papers published here is regrettably rather restricted. Therefore only the papers of good quality will be selected for the journal and further improved and refined by the reviewing process.
The editorial team of the KONA Journal would like to take this opportunity to gratefully acknowledge the reviewers here and deeply appreciate their valuable time and professional contributions to the KONA Journal. We apologize to any reviewers who may have been inadvertently omitted from this list. We are sincerely grateful to all who have been of any assistance to the publication of this journal.
BOURGEOIS, Florent MAKINO, Hisao SAKKA, Yoshio COPPENS, Marc-Olivier MATSUYAMA, Tatsushi TANAKA, Toshitsugu GRADOŃ, Leon MOUDGIL, Brij TOKORO, Chiharu HICKEY, Anthony OTANI, Yoshio YAMAMOTO, Hiromitsu KAGE, Hiroyuki PURI, Virendra YOKOYAMA, Toyokazu KANO, Junya RASTEIRO, Maria da Graça KWADE, Arno SAITO, Fumio
October 2020

Copyright © 2021 The Author. Published by Hosokawa Powder Technology Foundation. This is an open access article under the CC BY license (http://creativecommons.org/licenses/by/4.0/). 1
KONA Powder and Particle Journal No. 38 (2021) 1–2/https://doi.org/10.14356/kona.2021020 Editorial
Editor’s Preface
Brij M. MoudgilChairman of American Editorial Board
University of Florida, USA
As Chair of the American Editorial Board, I am pleased to introduce the KONA Powder & Particle Journal No. 38. In continuation of the past tradition, this issue presents high quality review articles and original research papers. The journal is reaching out to an ever-expanding cadre of researchers as illustrated by the diversity of disciplines represented by the authors of the articles. KONA continues to serve academic and industry researchers from physi-cal sciences to engineering and beyond. Furthermore, increased recognition of KONA as a high quality journal is a testimonial that recent changes in the review process, format and accessibility are moving in the right direction.
Powder technology continues to be recognized as an important business with tremendous global opportunity. Technological advances in the field are demanding more complex particle design and powder properties. An exam-ple would be advanced sensor technologies that require multifunctional particle platforms with high precision to meet lower and lower detection limits with high reliability. If designing such particles is a challenge, it is even a bigger challenge to manufacture them on large scale. Most often large-scale production of precision particles re-mains an empirical exercise. Hopefully, advances in simulation and modelling, which is fast approaching practical scale systems, would lead to new scale-up paradigms.
With diversification of the disciplinary base of particle and powder researchers, it is critical for KONA to reach out to young researchers with different professional backgrounds, and also to publish more state-of-the-art review articles – a hallmark tradition of KONA over the several decades. In this regard, KONA may invite academic and industry researchers, especially those who are at the forefront of scientific and technological advances, to publish comprehensive review articles in the journal. These articles will further reinforce KONA’s position as a reliable source for powder and particle related information. Additionally, KONA may also invite young researchers who are within a few years of receiving their advanced degrees to publish overview articles closely related to their particle and powder related research endeavors.
While many institutions of higher learning were already offering select degree programs and courses online, the sudden emergence of the pandemic compelled delivery of almost all courses online, practically overnight. As chal-lenging as it has been for instructors to suddenly shift to the online mode, it is equally if not more challenging for the students to be thrust into this new learning environment. That said, it is not all doom and gloom! This unique situation certainly provides an opportunity to rejuvenate and redesign the course materials in a way that is mean-ingful to the students without losing the rigor of learning the subject matter. Simply repackaging the old material into digital delivery mode will not do. We can expect that education’s new business model will drive the online de-livery mode for most courses, with in-person learning confined to only a handful of courses.
However, serious challenges exist with online learning platforms, accessibility being a critical one. Many univer-sity students, even in developed countries, lack the internet bandwidth and other resources which their peers may

2
have. Another serious challenge is almost assured disruptions due to future pandemics and climate change-related disasters. Mitigating such risks requires the design of flexible curriculum for completing coursework and degree programs on the academic front.
As there is a paradigm shift in knowledge creation and delivery from traditionally strong powder and particle re-search centers and institutes to individuals and smaller group efforts, acquisition of deep understanding of complex systems may be at risk. However, this challenge may be overcome to an extent with the availability of more power-ful and robust search engines and other IT mediated modalities. Such resources can hopefully enhance the existing curriculum and enable development of new teaching modes to train the next generation of powder and particle tech-nology professionals.
Overall, I believe that harnessing the application of AI/ML and advanced computational tools has the potential of revitalizing both the instruction and application of particle and powder technology.
I invite you to explore and enjoy this issue of KONA. Let us continue to work together and make KONA ever more relevant and reliable as a source of particle and powder technology knowledge and know-how.
Brij M. MoudgilChair, American Editorial BoardSeptember 23, 2020
KONA Powder and Particle Journal No. 38 (2021) 3–25/https://doi.org/10.14356/kona.2021018 Review Paper
3Copyright © 2021 The Authors. Published by Hosokawa Powder Technology Foundation. This is an open access article under the CC BY license (http://creativecommons.org/licenses/by/4.0/).
From Quasi-static to Intermediate Regimes in Shear Cell Devices: Theory and Characterisation †
Victor Francia *, Lyes Ait Ali Yahia, Raffaella Ocone and Ali OzelSchool of Engineering and Physical Sciences, Heriot-Watt University, UK
AbstractThe design of new technology for processing and manufacturing particulate products requires understanding granular rheology over a broad range of conditions. Powders display a complex behaviour due to their ability to rearrange under stress, and as a result, granular flow is generally classified into three flow regimes, namely a quasi-static regime dominated by frictional contacts, an inertial regime dominated by collisional and kinematic stresses and an intermediate regime where the three sources of stress are important to establish a stress-strain rate relationship. Characterisation of the flowability is generally restricted to the flow initiation in quasi-static regime, even if, transition into inertial conditions is very common in practical applications involving the control of dense flows, such as powder handling, particle formation processes or additive manufacturing. This work presents a critical review of available techniques to characterise the departure from the quasi-static regime into an intermediate flow. We revise the application of shear cells and present different strategies to modify classic devices with external actuation, such as aeration, to operate at higher inertial numbers. We pay particular attention to innovative designs using aerated Couette flow configurations, highlight the complexity in the standardisation and the challenges in advancing towards a universal model.
Keywords: granular rheology, aeration, Couette flow, shear cell, flowability, characterisation
1. Introduction
A universal description of granular rheology is both a fundamental and industrial challenge. Complex granular flows are a feature of natural phenomena such as landlines, rock slumping and sand dunes as well as in industrial processes such as granulation, milling and fluidisation. Powders, particulates and gravels are often the scaffolds where complex biological, physical or chemical processes take place, and underpin disciplines spanning from geo-mechanics (Wheeler and Sivakumar, 1995) to volcanology (Petford, 2003), including the study of dense flows such as soil (Pastor et al., 2009) and sediments (Baumgarten and Kamrin, 2019). Powders constitute a large propor-tion of raw materials, intermediates, products and waste in the primary and the process industry, and the energy, environmental and manufacturing sectors. Pigments, ce-ramics, petrochemicals, plastics, bulk and fine chemicals or fast-moving consumer goods are only some examples.
Although powders have been studied for a century, our
understanding of granular flow is far from that of simple fluids or solids. Individual particle interactions lead to a collective behaviour that makes powders restructure under stress. If compressed, they respond as an elastic solid; but when diluted, they behave like a fluid (Jaeger et al., 1996). Solid-like behaviour steams from the formation of a net-work of contacts, the so-called force chains, that transmit the stress. In addition to these frictional contacts, particle interactions are altered by a broad range of forces from electrostatics and van der Walls to liquid and solid bridges (Hartmann and Palzer, 2011). The dissipation and storage of energy in the force chains allow a bed of particles to remain static and fail only under the application of a given stress. But as the flow becomes more rapid, force chains reorganise and break. When the deformation (strain rate) is faster than the ability for the force chains to recombine, they can no longer transmit and absorb stress, and the material restructures creating a fluid-like relation between the applied stress and strain rate (Campbell, 2006). As a powder dilates, the free space between individual grains increases and the transport of momentum becomes dom-inated by instantaneous collisions of nearby particles. For sufficiently diluted cases, the flow displays a gas-like behaviour where collisions are rare, and the motion of each grain is uncorrelated from its neighbours.
The changes in the stress-strain rate relation are related
† Received 6 July 2020; Accepted 21 August 2020 J-STAGE Advance published online 26 September 2020
* Corresponding author: Victor Francia; Add: Edinburgh, EH14 4AS, UK E-mail: [email protected] TEL: +44 (0) 131 451 3293
Victor Francia et al. / KONA Powder and Particle Journal No. 38 (2021) 3–25
4
to how grains reorganise and how the local force network responds to structural properties such as particle concentra-tion, size and shape. Understanding the transition between different flow behaviours is crucial to develop new technol-ogies because solid operations span a wide range of particle concentration, consolidation stress and shear rate. The de-sign of a powder processing plant involves flows spanning from dilute inertial systems, such as in pneumatic transport, to slow frictional flows in storage, packaging, tabletting, or agglomeration devices like roller compaction (Wu et al., 2010) or twin-screw granulation (Dhenge et al., 2013). Op-erations such agglomeration in high shear mixers (Knight et al., 2001) or fluidised bed granulators are designed to work under dense conditions and display local transitions between solid and liquid-like behaviour (Mort, 2009). In many cases, this happens in an uncontrolled way through the agglomeration and deposition of cohesive powders in multiphase reactors, heat exchangers (Diaz-Bejarano et al., 2017) or spray dryers (Francia et al., 2015).
No universal framework unifies the description of granular rheology, and therefore, industry relies heavily on empirical characterisation to classify the flowability of powders. The earliest attempts used scores based on flow tests such as the Carr (Carr, 1965), and Hausner (Hausner, 1967) ratios, or more recently the Taylor composite index (Taylor et al., 2000). The use of properties such as uncon-fined yield strength or tensile strength is also common, but the flowability function, FF, defined as the ratio of the major principal stress to the unconfined yield stress in the powder, is perhaps the most utilised metric to characterise powder flow (Hassanpour et al., 2019). The characterisa-tion is typically limited to identify a flow threshold, that is, the stress required to initiate flow, and it rarely extends into studying the dynamic flow properties. The work of GDR Midi (Midi, 2004) describes in detail the characteristics of granular flows in six typical experimental configurations. Those where the stress is imposed, such as heaps, drums, annular flows and inclined planes display a hysteresis in the yield stress. A given stress is required to establish a dense flow, but much smaller stresses are needed to maintain it. The yield point itself depends not only the particle proper-ties but also on the stress history of the sample. All typical flow configurations (Fig. 1) show a complex flow pattern where dense areas governed by enduring frictional contacts interplay with other more dilute ones driven by instanta-neous particle collisions. Ultimately, all develop complex velocity distributions varying from a localised shear band in the confined systems to linear and exponential decays in free surface flows. Given that the behaviour of a powder varies drastically from one to another, it is required to carry our several static and dynamic tests to properly evaluate the flowability as close as possible to the desired design conditions (Krantz et al., 2009).
Most available tests focused on the flow initiation and
suffer from two limitations: transportability and univer-sality. The discrepancies observed across different devices (Koynov et al., 2015) are a reflection of an overly simpli-fied description of the system and inconsistencies in the experimental procedures. The effect of the stress history of a sample is well-known (Swize et al., 2019), but without a common way to condition the powder, it is challenging to draw any direct comparison between different tests and samples. The measurements are also not universal. The most established techniques are shear cells limited to a quasi-static flow (Schwedes, 2003). It is a consequence of the practical difficulty in studying inertial systems and the historical need to inform the design of silos. Although it is key to understand a dense granular flow (Sundaresan, 2001), the characterisation of dynamic properties is still far from the same level of detail.
Recent works have summarised the scope of the tech-niques available today to study the flowability of powders (Ogata, 2019), and the challenges involved in developing reliable dynamic tests for the study of caking and cohesive materials (Ghadiri et al., 2020). They discuss in detail the effects of properties such as size and shape, cohesion and how the interstitial fluid and the applied stress affect the flowability. Here, we will focus on the latter and specifically discuss the characterisation of the transition between two extreme flow regimes, namely solid-like and fluid-like flow, in a shear device. We provide an overview of the design and application of classic units and discuss the strategies to develop similar tests in modified devices that can cover a broader range of shear and consolidation stresses. The manuscript is organised as follows: Section 2 introduces the granular flow regimes and presents a brief overview of the mathematical modelling of granular flows. A brief review of the characterisation of the flow threshold,
Fig. 1 Typical configurations to study granular flow: (a) Couette (b) rotating drums and flows in (c) chutes e.g. parallel planes, inclined, vertical (d) and heaps.
Victor Francia et al. / KONA Powder and Particle Journal No. 38 (2021) 3–25
5
including a summary of shear cells is given in Section 3. The strategies to re-design the conventional shear devices to experimentally capture the transition from solid-like to fluid-like behaviour using an external actuation are discussed in Section 4, followed by conclusions and sug-gestions for future work.
2. Rheology of granular flows
2.1 Flow regimes
The flow behaviour of granular material depends on the applied stress, particle concentration and the effects of the interstitial fluid. If the concentration is high or close to the maximum packing, the material exhibits solid-like behaviour where stresses are transferred with frictional contacts between grains and slip layers move relative to each other along the applied shear. In this regime, namely frictional or “quasi-static” regime (Fig. 2a), the contacts between grains have a long duration, and deformation of the grain layers occurs very slowly (Campbell, 2002). Due to a highly dense concentration of particles, there is no much free space for the interstitial fluid, and its effects are usually neglected. In the quasi-static regime, flow is often studied by using soil mechanics principles or more specifically, plasticity models detailed in the next section. On the contrary, when the applied stress or the external en-ergy transfer is sufficiently high, the particles have enough inertia to leave their layers and flow more independently. This flow regime is referred to as “rapid flow” or “inertial” regime. Here the transport processes are considered gov-erned by binary instantaneous particle-particle collisions and random motions (Fig. 2a). With an analogy with the kinetic theory of monatomic gases, the concepts of the so-called granular thermal energy or “granular temperature” and the random fluctuating kinetic energy of particles are introduced in the framework of continuum modelling. The main formal differences between inertial granular flows and molecular gases are the finite size of particles and the non-equilibrium behaviour. The particle-particle collisions are dissipative; therefore, the fluctuating kinetic energy of the particles is dissipated to thermodynamic heat. The applied shear generates fluctuating kinetic energy through collisional and kinematic stresses (Fig. 2b). For a colli-sional stress, any collision between particles moving at their mean velocity in a simple shear will enhance random motion and lead to a velocity fluctuation quantified in the granular temperature. However, for a kinematic stress, the motion of a particle parallel to a velocity gradient generates a random velocity along its path (Fig. 2bii) and a source of anisotropy in the fluctuating kinetic energy.
For inertial granular flows with low and moderate solid concentrations, the interstices between the particles are
far larger than in the quasi-static regime. These spaces are filled with fluid, and the granular material is then described as a multiphase flow, referred to as a gas-solid suspension, where the fluid-particle interactions become significant on the momentum transfer between phases. Many advanced formalisms, however, focus on a collision-dominated re-gime and disregard the effect of interstitial fluid. Other ef-fects typical of real-life scenarios like shape, polydispersity or interparticle forces are often excluded from a continuum formulation. In the extreme of a very dilute (kinematic) gas-solid suspension, particle-particle collisions never happen, and the solid phase momentum simply diffuses as
Fig. 2 Granular rheology. Sources of (a) stresses (kinematic, colli-sional and frictional) in a quasi-static, an intermediate and an inertial flow regime for varying inertial number I, normal stress σ, shear rate
図キャプション:8pt (31)
and solid fraction εs (b) generation of fluctuating kinetic energy in kinematic and collisional mechanisms.
Victor Francia et al. / KONA Powder and Particle Journal No. 38 (2021) 3–25
6
the particles travel through the medium (Tsao and Koch, 1995). Their motion is mainly driven by the carrier fluid and the interstitial fluid contributes to the particle stresses with a covariance between particle and fluid fluctuations (Koch, 1990). Gas-solid suspensions are not within the scope of this review, and comprehensive discussions are available elsewhere (Fan and Zhu, 2005).
In between these two extreme regimes, there exists an intermediate regime with a characteristic particle contact time larger than the instantaneous collision time but lower than an enduring contact. It lies between the quasi-static state dominated by frictional forces and the inertial state dominated by collisional stresses, and therefore, affected by both. This work concerns with the experimental char-acterisation of such a system. From a phenomenological modelling view, the transition between regimes can be characterised by the inertial number, I, given by Jop et al. (2006), as a scaled shear rate quantifying the interplay of the consolidation and the shear stress acting on a particle:
/dI
(1)
(1)
/ /1 /
t dIt
(2)
(2)
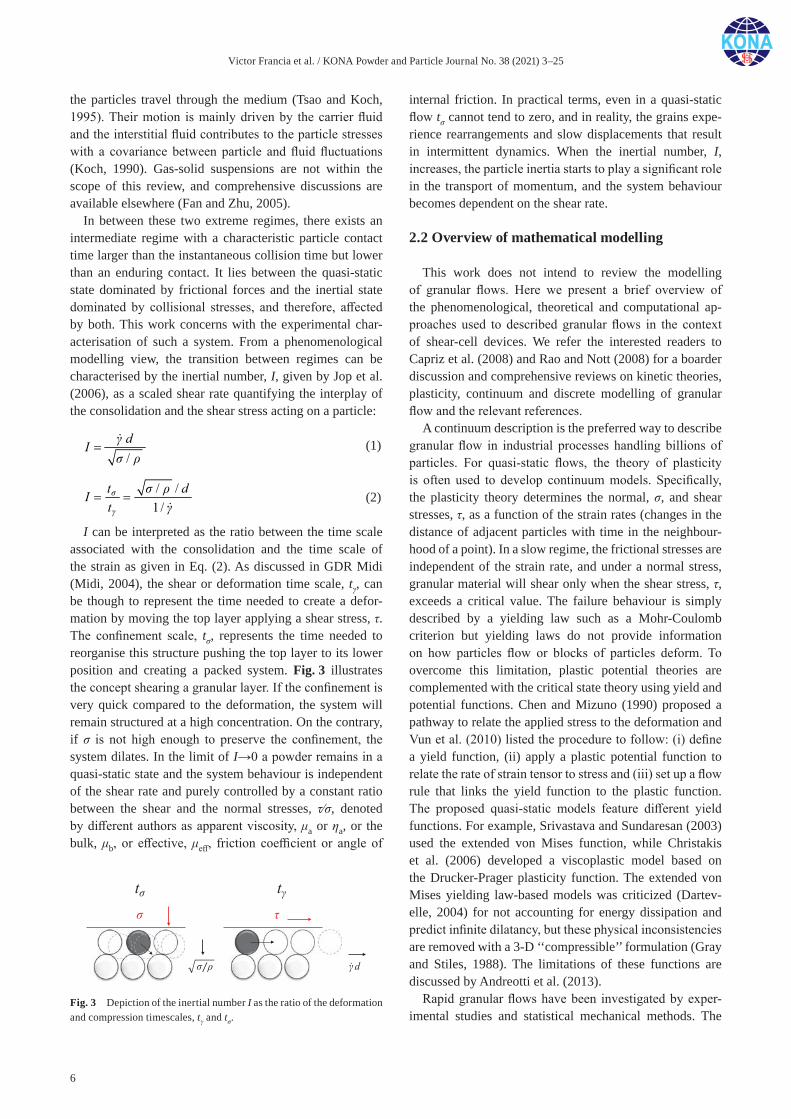
I can be interpreted as the ratio between the time scale associated with the consolidation and the time scale of the strain as given in Eq. (2). As discussed in GDR Midi (Midi, 2004), the shear or deformation time scale, tγ, can be though to represent the time needed to create a defor-mation by moving the top layer applying a shear stress, τ. The confinement scale, tσ, represents the time needed to reorganise this structure pushing the top layer to its lower position and creating a packed system. Fig. 3 illustrates the concept shearing a granular layer. If the confinement is very quick compared to the deformation, the system will remain structured at a high concentration. On the contrary, if σ is not high enough to preserve the confinement, the system dilates. In the limit of I→0 a powder remains in a quasi-static state and the system behaviour is independent of the shear rate and purely controlled by a constant ratio between the shear and the normal stresses, τ⁄σ, denoted by different authors as apparent viscosity, μa or ηa, or the bulk, μb, or effective, μeff, friction coefficient or angle of
internal friction. In practical terms, even in a quasi-static flow tσ cannot tend to zero, and in reality, the grains expe-rience rearrangements and slow displacements that result in intermittent dynamics. When the inertial number, I, increases, the particle inertia starts to play a significant role in the transport of momentum, and the system behaviour becomes dependent on the shear rate.
2.2 Overview of mathematical modelling
This work does not intend to review the modelling of granular flows. Here we present a brief overview of the phenomenological, theoretical and computational ap-proaches used to described granular flows in the context of shear-cell devices. We refer the interested readers to Capriz et al. (2008) and Rao and Nott (2008) for a boarder discussion and comprehensive reviews on kinetic theories, plasticity, continuum and discrete modelling of granular flow and the relevant references.
A continuum description is the preferred way to describe granular flow in industrial processes handling billions of particles. For quasi-static flows, the theory of plasticity is often used to develop continuum models. Specifically, the plasticity theory determines the normal, σ, and shear stresses, τ, as a function of the strain rates (changes in the distance of adjacent particles with time in the neighbour-hood of a point). In a slow regime, the frictional stresses are independent of the strain rate, and under a normal stress, granular material will shear only when the shear stress, τ, exceeds a critical value. The failure behaviour is simply described by a yielding law such as a Mohr-Coulomb criterion but yielding laws do not provide information on how particles flow or blocks of particles deform. To overcome this limitation, plastic potential theories are complemented with the critical state theory using yield and potential functions. Chen and Mizuno (1990) proposed a pathway to relate the applied stress to the deformation and Vun et al. (2010) listed the procedure to follow: (i) define a yield function, (ii) apply a plastic potential function to relate the rate of strain tensor to stress and (iii) set up a flow rule that links the yield function to the plastic function. The proposed quasi-static models feature different yield functions. For example, Srivastava and Sundaresan (2003) used the extended von Mises function, while Christakis et al. (2006) developed a viscoplastic model based on the Drucker-Prager plasticity function. The extended von Mises yielding law-based models was criticized (Dartev-elle, 2004) for not accounting for energy dissipation and predict infinite dilatancy, but these physical inconsistencies are removed with a 3-D ‘‘compressible’’ formulation (Gray and Stiles, 1988). The limitations of these functions are discussed by Andreotti et al. (2013).
Rapid granular flows have been investigated by exper-imental studies and statistical mechanical methods. The
Fig. 3 Depiction of the inertial number I as the ratio of the deformation and compression timescales, tγ and tσ.
Victor Francia et al. / KONA Powder and Particle Journal No. 38 (2021) 3–25
7
well-known experimental study of Bagnold (1954) where spherical spheres were sheared in a coaxial cylinder rheom-eter, is the pioneering work on the constitutive behaviour of inertial granular flows. This heuristic study showed that the solid stresses, σ and τ, were a function of the square of the applied shear rate,
(11)
, at high rotating velocities. From the view of the theoretical modelling, the Kinetic Theory of Granular Flow (KTGF), an extension of the classical ki-netic theory of gases to dense and inelastic granular flows, has been developed for forty years (Garzó and Dufty, 1999; Lun et al., 1984; Yang et al., 2016). In the KTGF approach, the granular material is modelled as a continuum medium, and the transport equations for solid concentration, mo-mentum and granular temperature are derived. The square relation between the solid stress and the shear rate has been theoretically confirmed by KTGF models. Early compar-isons of with annular-shear-cell test measurements were first reported by Lun et al. (1984) and later on several other studies (Hanes and Inman, 1985; Hsiau and Jang, 1998; Orlando and Shen, 2012). However, these experimental configurations provide information on the bulk behaviour of the granular material and not the motion of individual grains. Further comparisons of KTGF predictions with local granular measurements include the work of Wildman et al. (2008) where positron emission particle tracking (PEPT) was used to measure solid concentration and mean velocity profiles inside a three-dimensional annular shear cell.
Besides a continuum formulation, granular material can be studied by computational approaches such as Discrete Element Modelling (DEM) where individual particles are tracked via a Lagrangian approach solving Newton’s equa-tions of motion and describing particle-particle collisions with a soft sphere model (Guo and Curtis, 2015). These simulations are classified as highly resolved because they can provide flow properties at particle-scale such as veloc-ities, contact number and forces. Due to the high demand for computational resources, the method is applicable for academic studies and small-scale laboratory experiments. DEM simulations capture the persistence of a Bagnold regime (da Cruz et al., 2005) in homogeneous shearing of particles in fully periodic domains with Lees-Edwards boundary conditions, and are used to investigate bound-ary effects on confined geometries such as Couette flows (Vescovi et al., 2014).
The intermediate regime was first experimentally identi-fied in inclined plane chutes (Pouliquen, 1999) and later in a Couette shear cell (Tardos et al., 1998), where the shear stress τ was found to depend on the strain rate to a power of between 0 and 2 that is a function of the solid concentra-tion. While continuum models are available for quasi-static and inertial granular flows, the closures for the intermediate regime are still under debate. Johnson and Jackson (1987) proposed a semi-empirical model that super-imposed
collisional and frictional stresses modelled with a critical state and an algebraic function of solid concentration. A similar “additive” approach was applied by (Savage, 1998) with using von Mises yield criterion. From a more empirical point of view, Jop et al. (2006) unified these two extreme regimes with a simple visco-plastic constitutive law without any fitting parameter and validated their model with experiments of a granular pile flowing between rough sidewalls. The model is called the μ(I) model. It is based on the Coulomb criterion and a bulk friction coefficient function of the inertial number, I, Eq. 1. Similarly, da Cruz et al. (2005) performed DEM simulations of plane shearing with frictional, inelastic disks and found that small values of I correspond to the quasi-static regime of soil mechanics, while large values correspond to the collisional regime of the KTGF.
There have been different ways to incorporate the fric-tional contribution of a dense flow into the KTFG (Wu et al., 2020). For example, Chialvo et al. (2012) carried out homogeneous shear DEM simulations of frictional and frictionless particles in the quasi-static and inertial regimes, and proposed corrections to the model of Garzó and Dufty (1999) to bridge these regimes using the μ(I) rheology model. Similarly, Vescovi et al. (2014) performed DEM of wall-bounded plane shearing of particles and used the expression for the correlation length developed by Berzi (2014) to modify the model of Garzó and Dufty (1999). Jenkins (2006) proposed a phenomenological correction to the rate of collisional dissipation in the KTGF model that describes the decrease in dissipation of fluctuations during enduring contacts. There are several studies that attempt to expand the μ(I) models to a non-local rheology, for example, using additional transport equations to describe a weight function between fluid and solid-like parts of the stress tensor (Aranson and Tsimring, 2001; 2002), or proposing new closures for μb dependent on coordination number and the evolution of a fabric anisotropy tensor (Sun and Sundaresan, 2011). An application of non-local μ(I) rheology in quasi 2-D shear cell experiments has also been given by Tang et al. (2018).
3. Quasi-static characterisation: shear cells
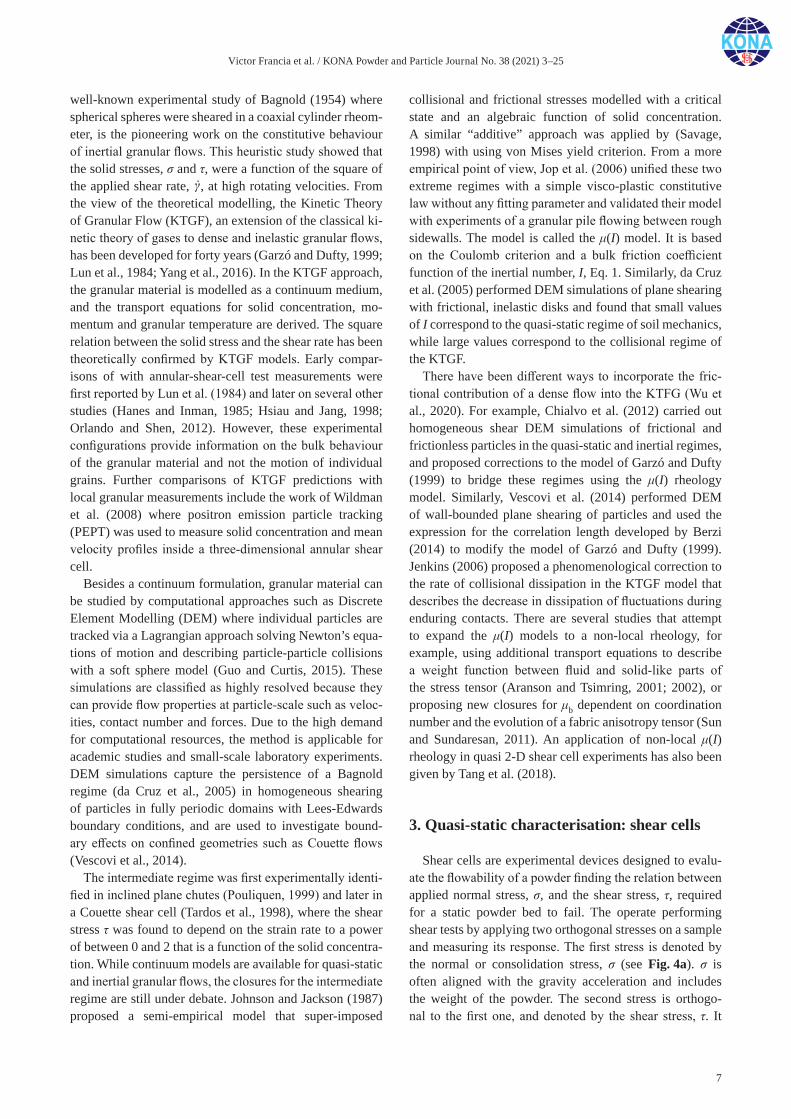
Shear cells are experimental devices designed to evalu-ate the flowability of a powder finding the relation between applied normal stress, σ, and the shear stress, τ, required for a static powder bed to fail. The operate performing shear tests by applying two orthogonal stresses on a sample and measuring its response. The first stress is denoted by the normal or consolidation stress, σ (see Fig. 4a). σ is often aligned with the gravity acceleration and includes the weight of the powder. The second stress is orthogo-nal to the first one, and denoted by the shear stress, τ. It
Victor Francia et al. / KONA Powder and Particle Journal No. 38 (2021) 3–25
8
is increased gradually until the sample reaches its yield point and starts flowing. Shear tests include two steps, a so-called pre-shearing test followed by the application of four to six different shear stresses. The objective of the pre-shearing test is to create a reproducible structure in the powder by applying a reference consolidation stress. The sample is consolidated at high normal stress, σpr, and then it is sheared until it fails and the recorded shear stress, τpr, reaches a constant value, denoted steady-state conditions. The pre-shearing normal and shear stresses (σpr,τpr) set a reference point for the study (blue point - Fig. 4b). At this point, if the shear stress is removed, the displacement ceases, but the sample reorganises into the same structure and so it exhibits the same response when it is sheared further. After the preparation stage, several experiments are conducted varying σ and τ, denoted “shear tests” or “shear points” (red - Fig. 4b). The sample is sheared to the failure point with a decrease in the consolidation stress (σ < σpr). For each value of σ, the shear stress corresponding to the bed failure, τ, is recorded and reported in a (τ,σ) diagram to build the yield locus line: τ = μ σ + C where μ is the angle of internal friction and C is the cohesive strength. The locus line describes the yield stress in quasi-static granular flow, it takes the form of a Coulomb behaviour where the yield stress is independent of the shear rate. It should be noted that the state of stress achieved in the sample after the pre-shearing is particular to each device, which introduces a degree of specificity to the method.
The angle of internal friction, μ, is reported as the slope of the yield locus line connecting all (τ,σ) pairs. In other words, the ratio between the shear and normal stresses τ/σ
required for a sample consolidated at (σpr,τpr) to yield. Mohr circles are used to derive other important parameters. The principal stresses are defined as the base of the stress tensor that creates no shear stress in the system and therefore, minor and major, MPS, principal stresses can be obtained as the intersection of a Mohr circle with the axis τ = 0. A Mohr circle tangent to any point in the yield locus line is a representation of the conditions for critical failure at that combination of σ and τ. The principal stresses that describe the structure of the powder sample are obtained from the Mohr circle that contains the reference (σpr,τpr) and is tan-gent to the yield locus. The unconfined yield stress, UYS, is defined as the normal stress required for the powder to yield under no shear. It is obtained from the Mohr circle that contains the origin (a sample sustaining no stress) and the yield locus line. There are other definitions of the locus line stemming from shear tests. The bulk (or effective) μb friction factor defined from a bulk yield locus line (τ = μb σ) that contains the origin and is tangent to the Mohr circle of the pre-sheared sample. The relation between the shear and the normal stress in the pre-shearing point is given by τ = μss σ with μss the steady-state angle of internal friction. The flowability function, FF, is reported as the ratio of MPS to UYS.
Shear cells, or testers, can be classified into two cat-egories: direct and indirect testers. In a direct tester the geometry of the device imposes a sheared region on the sample, whereas in an indirect tester, the sheared zone in the powder develops independently according to the stress applied. Many indirect testers such as the uniaxial, bi-axial and tri-axial testers were developed for specific applica-tions and are generally not commercially available (Feise and Schwedes, 1995; Jenike, 1970; Schwedes, 1996). This work will focus on describing succinctly direct units, par-ticularly examples of commercially available translational and recent rotational devices. More comprehensive details of the design and the historical development of shear cells can be found in the literature (Schwedes, 2003).
3.1 Jenike type translational testers
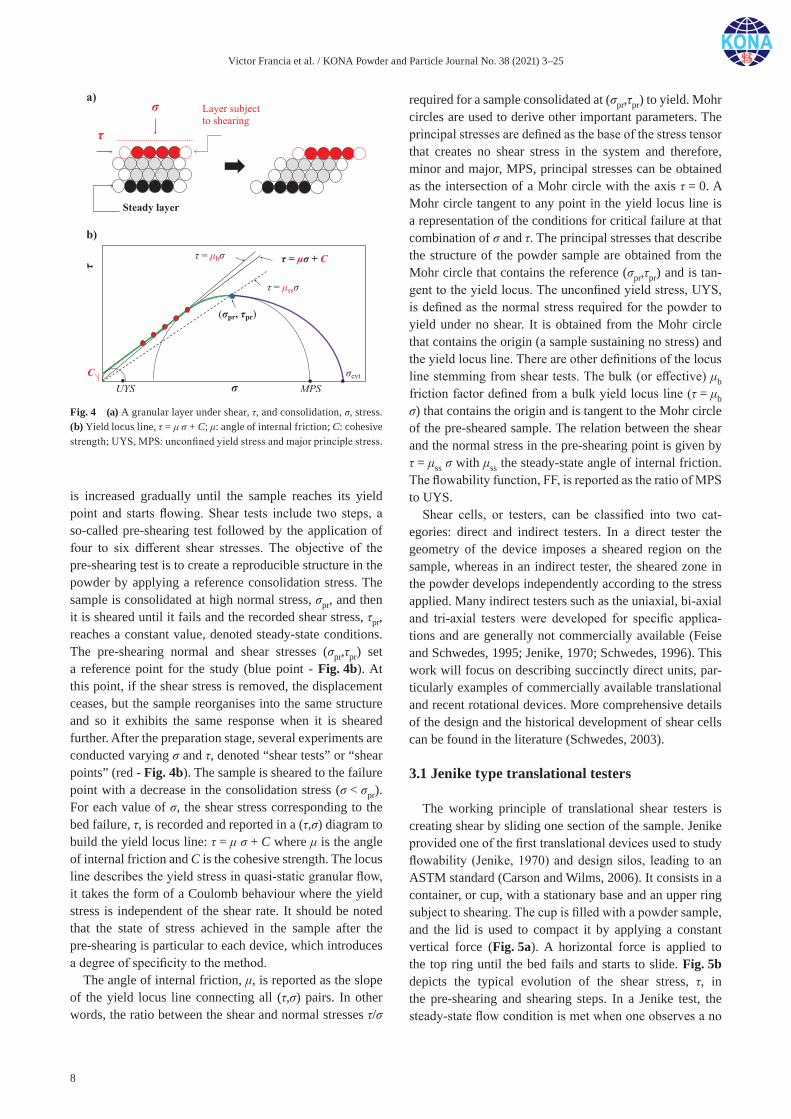
The working principle of translational shear testers is creating shear by sliding one section of the sample. Jenike provided one of the first translational devices used to study flowability (Jenike, 1970) and design silos, leading to an ASTM standard (Carson and Wilms, 2006). It consists in a container, or cup, with a stationary base and an upper ring subject to shearing. The cup is filled with a powder sample, and the lid is used to compact it by applying a constant vertical force (Fig. 5a). A horizontal force is applied to the top ring until the bed fails and starts to slide. Fig. 5b depicts the typical evolution of the shear stress, τ, in the pre-shearing and shearing steps. In a Jenike test, the steady-state flow condition is met when one observes a no
Fig. 4 (a) A granular layer under shear, τ, and consolidation, σ, stress. (b) Yield locus line, τ = μ σ + C; μ: angle of internal friction; C: cohesive strength; UYS, MPS: unconfined yield stress and major principle stress.
Victor Francia et al. / KONA Powder and Particle Journal No. 38 (2021) 3–25
9
changes in τpr under the pre-shearing normal stress, σpr. In a successive step, τ is set to zero removing the force and is σ is reduced. The sample is sheared gain, and the value of τ at the failure point is recorded as the first shearing point. Additional tests using new samples are required to obtain each point of the yield locus (Fig. 5b). The simplicity of the test made it widely accessible to industry as a way to rank powders and study the effects of environmental condi-tions, composition, moisture, size and shape. However, this simple configuration comes with a significant limitation. The cell has a short shearing path, limited by the maximum displacement, and for that reason, it does not allow for a continuous test. A new sample is needed to measure each shear point, which leads to a time-consuming process with a substantial intervention of the operator, and thus prone to error.
Several works tried to overcome this limitation intro-ducing a “constant volume methodology” (Duffy and Puri, 1999; Ladipo and Puri, 1997; Schulze, 2008; Tsunakawa and Aoki, 1982) whereby the Jenike tester is modified to operate continuously. After the steady-state flow is achieved at the prehearing test, σ is gradually reduced at a small speed releasing the load on the lid. The correspond-ing evolution of the shear stress, τ, is recorded to construct the yield locus line. The main advantage is the ability to perform a single continuous test measuring the evolution of the sample from the point (σpr,τpr) to the point C using one sample (green line - Fig. 4b). The early versions of the constant volume translational testers were subject of criti-cism (Schwedes, 2003) because of their complex configu-ration. It has been suggested that this methodology tends to
underestimate the unconfined yield stress, nevertheless, to the best of our knowledge, no detailed direct comparatives confirm such a feature.
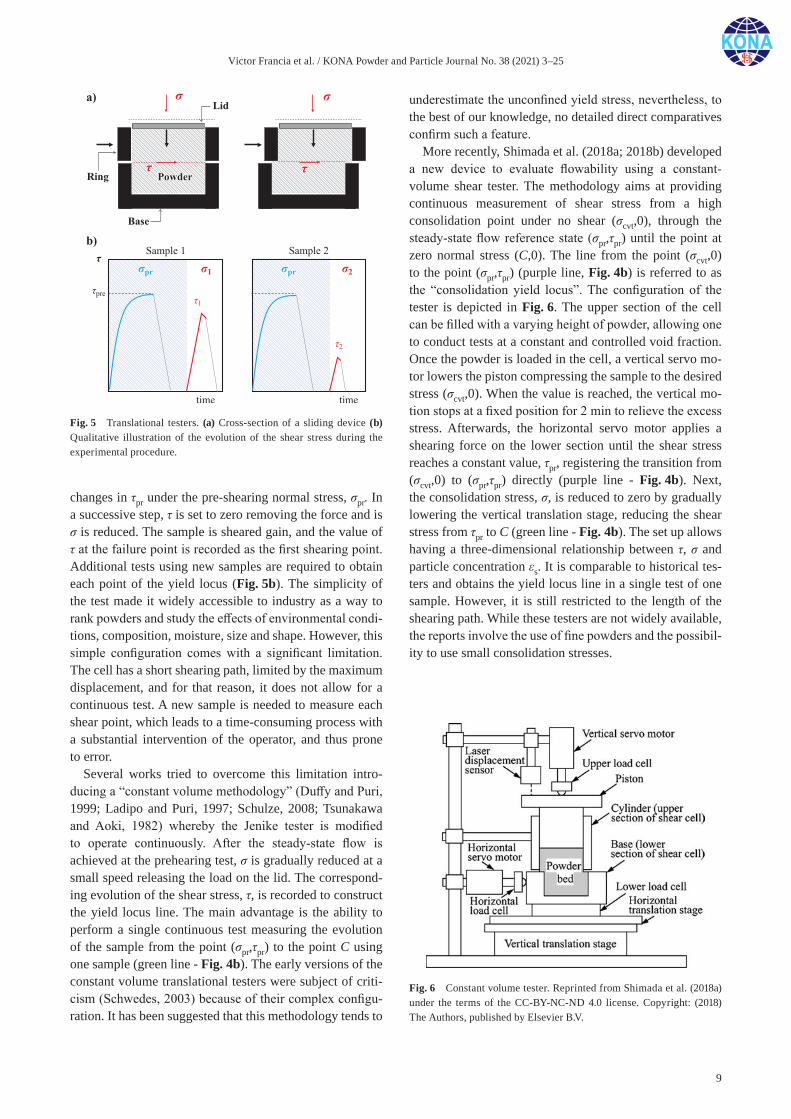
More recently, Shimada et al. (2018a; 2018b) developed a new device to evaluate flowability using a constant- volume shear tester. The methodology aims at providing continuous measurement of shear stress from a high consolidation point under no shear (σcvt,0), through the steady-state flow reference state (σpr,τpr) until the point at zero normal stress (C,0). The line from the point (σcvt,0) to the point (σpr,τpr) (purple line, Fig. 4b) is referred to as the “consolidation yield locus”. The configuration of the tester is depicted in Fig. 6. The upper section of the cell can be filled with a varying height of powder, allowing one to conduct tests at a constant and controlled void fraction. Once the powder is loaded in the cell, a vertical servo mo-tor lowers the piston compressing the sample to the desired stress (σcvt,0). When the value is reached, the vertical mo-tion stops at a fixed position for 2 min to relieve the excess stress. Afterwards, the horizontal servo motor applies a shearing force on the lower section until the shear stress reaches a constant value, τpr, registering the transition from (σcvt,0) to (σpr,τpr) directly (purple line - Fig. 4b). Next, the consolidation stress, σ, is reduced to zero by gradually lowering the vertical translation stage, reducing the shear stress from τpr to C (green line - Fig. 4b). The set up allows having a three-dimensional relationship between τ, σ and particle concentration εs. It is comparable to historical tes-ters and obtains the yield locus line in a single test of one sample. However, it is still restricted to the length of the shearing path. While these testers are not widely available, the reports involve the use of fine powders and the possibil-ity to use small consolidation stresses.
Fig. 5 Translational testers. (a) Cross-section of a sliding device (b) Qualitative illustration of the evolution of the shear stress during the experimental procedure.
Fig. 6 Constant volume tester. Reprinted from Shimada et al. (2018a) under the terms of the CC-BY-NC-ND 4.0 license. Copyright: (2018) The Authors, published by Elsevier B.V.
Victor Francia et al. / KONA Powder and Particle Journal No. 38 (2021) 3–25
10
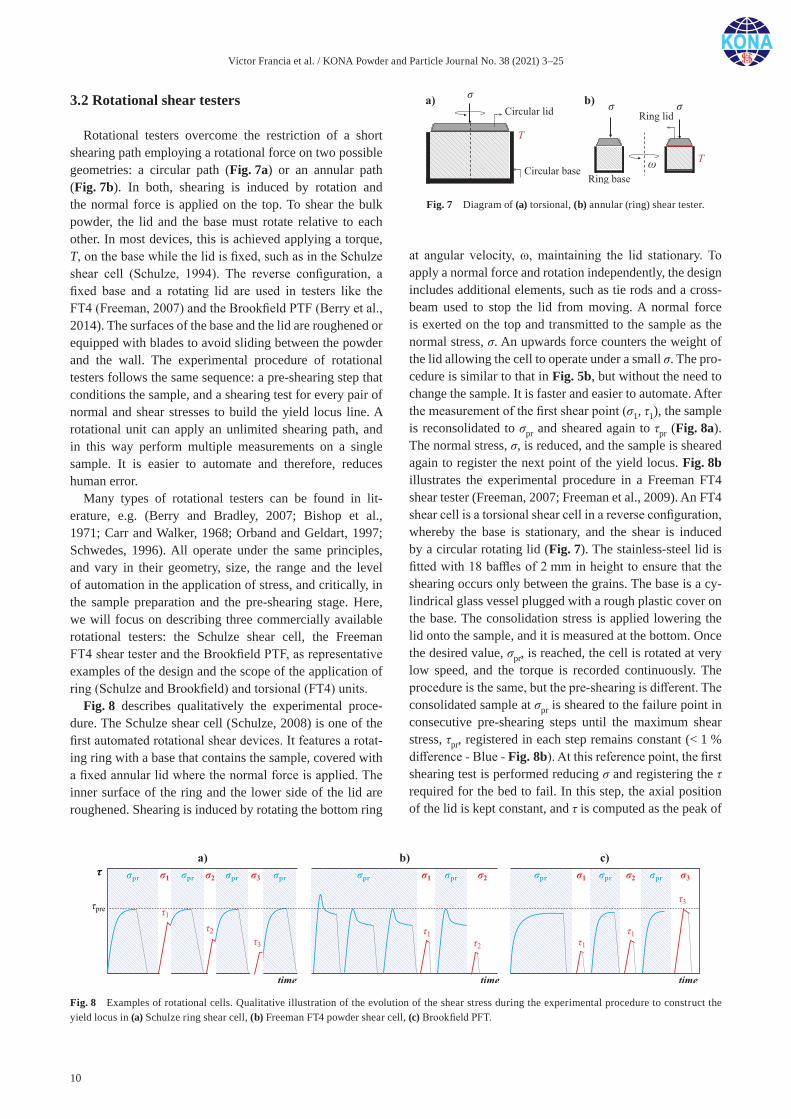
3.2 Rotational shear testers
Rotational testers overcome the restriction of a short shearing path employing a rotational force on two possible geometries: a circular path (Fig. 7a) or an annular path (Fig. 7b). In both, shearing is induced by rotation and the normal force is applied on the top. To shear the bulk powder, the lid and the base must rotate relative to each other. In most devices, this is achieved applying a torque, T, on the base while the lid is fixed, such as in the Schulze shear cell (Schulze, 1994). The reverse configuration, a fixed base and a rotating lid are used in testers like the FT4 (Freeman, 2007) and the Brookfield PTF (Berry et al., 2014). The surfaces of the base and the lid are roughened or equipped with blades to avoid sliding between the powder and the wall. The experimental procedure of rotational testers follows the same sequence: a pre-shearing step that conditions the sample, and a shearing test for every pair of normal and shear stresses to build the yield locus line. A rotational unit can apply an unlimited shearing path, and in this way perform multiple measurements on a single sample. It is easier to automate and therefore, reduces human error.
Many types of rotational testers can be found in lit-erature, e.g. (Berry and Bradley, 2007; Bishop et al., 1971; Carr and Walker, 1968; Orband and Geldart, 1997; Schwedes, 1996). All operate under the same principles, and vary in their geometry, size, the range and the level of automation in the application of stress, and critically, in the sample preparation and the pre-shearing stage. Here, we will focus on describing three commercially available rotational testers: the Schulze shear cell, the Freeman FT4 shear tester and the Brookfield PTF, as representative examples of the design and the scope of the application of ring (Schulze and Brookfield) and torsional (FT4) units.
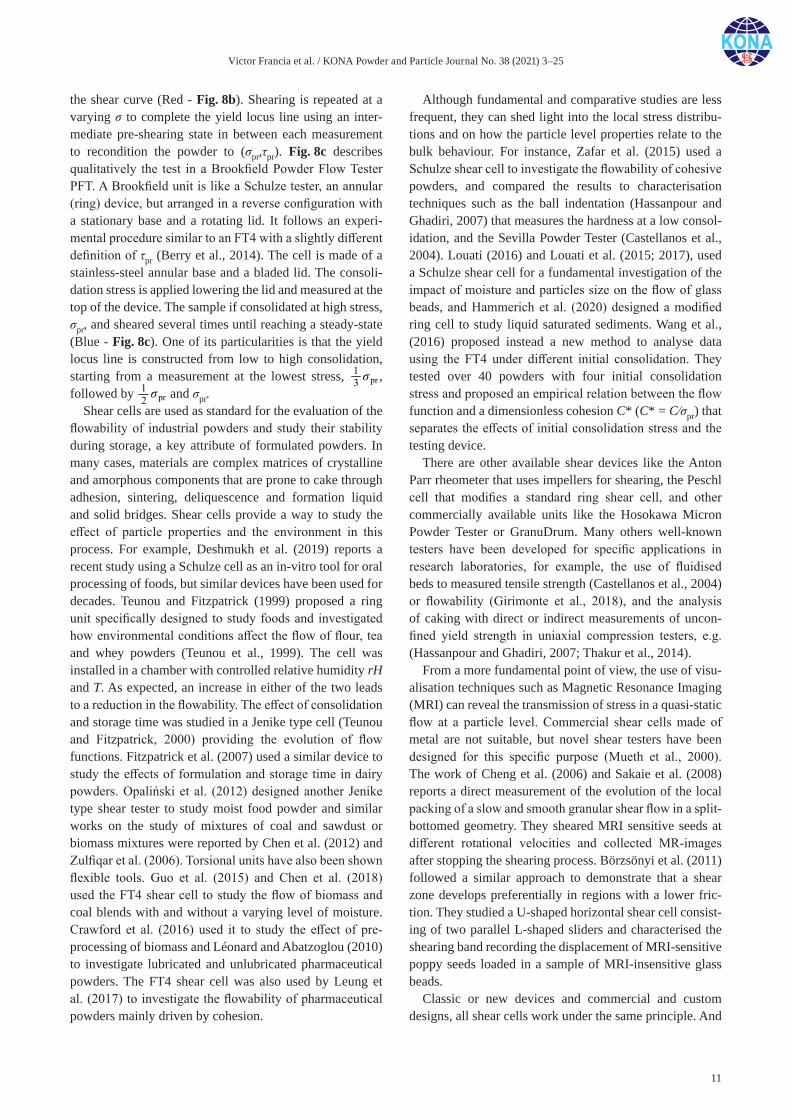
Fig. 8 describes qualitatively the experimental proce-dure. The Schulze shear cell (Schulze, 2008) is one of the first automated rotational shear devices. It features a rotat-ing ring with a base that contains the sample, covered with a fixed annular lid where the normal force is applied. The inner surface of the ring and the lower side of the lid are roughened. Shearing is induced by rotating the bottom ring
at angular velocity, ω, maintaining the lid stationary. To apply a normal force and rotation independently, the design includes additional elements, such as tie rods and a cross-beam used to stop the lid from moving. A normal force is exerted on the top and transmitted to the sample as the normal stress, σ. An upwards force counters the weight of the lid allowing the cell to operate under a small σ. The pro-cedure is similar to that in Fig. 5b, but without the need to change the sample. It is faster and easier to automate. After the measurement of the first shear point (σ1, τ1), the sample is reconsolidated to σpr and sheared again to τpr (Fig. 8a). The normal stress, σ, is reduced, and the sample is sheared again to register the next point of the yield locus. Fig. 8b illustrates the experimental procedure in a Freeman FT4 shear tester (Freeman, 2007; Freeman et al., 2009). An FT4 shear cell is a torsional shear cell in a reverse configuration, whereby the base is stationary, and the shear is induced by a circular rotating lid (Fig. 7). The stainless-steel lid is fitted with 18 baffles of 2 mm in height to ensure that the shearing occurs only between the grains. The base is a cy-lindrical glass vessel plugged with a rough plastic cover on the base. The consolidation stress is applied lowering the lid onto the sample, and it is measured at the bottom. Once the desired value, σpr, is reached, the cell is rotated at very low speed, and the torque is recorded continuously. The procedure is the same, but the pre-shearing is different. The consolidated sample at σpr is sheared to the failure point in consecutive pre-shearing steps until the maximum shear stress, τpr, registered in each step remains constant (< 1 % difference - Blue - Fig. 8b). At this reference point, the first shearing test is performed reducing σ and registering the τ required for the bed to fail. In this step, the axial position of the lid is kept constant, and τ is computed as the peak of
Fig. 7 Diagram of (a) torsional, (b) annular (ring) shear tester.
Fig. 8 Examples of rotational cells. Qualitative illustration of the evolution of the shear stress during the experimental procedure to construct the yield locus in (a) Schulze ring shear cell, (b) Freeman FT4 powder shear cell, (c) Brookfield PFT.
Victor Francia et al. / KONA Powder and Particle Journal No. 38 (2021) 3–25
11
the shear curve (Red - Fig. 8b). Shearing is repeated at a varying σ to complete the yield locus line using an inter-mediate pre-shearing state in between each measurement to recondition the powder to (σpr,τpr). Fig. 8c describes qualitatively the test in a Brookfield Powder Flow Tester PFT. A Brookfield unit is like a Schulze tester, an annular (ring) device, but arranged in a reverse configuration with a stationary base and a rotating lid. It follows an experi-mental procedure similar to an FT4 with a slightly different definition of τpr (Berry et al., 2014). The cell is made of a stainless-steel annular base and a bladed lid. The consoli-dation stress is applied lowering the lid and measured at the top of the device. The sample if consolidated at high stress, σpr, and sheared several times until reaching a steady-state (Blue - Fig. 8c). One of its particularities is that the yield locus line is constructed from low to high consolidation, starting from a measurement at the lowest stress, pr
13
(12)
, followed by pr
12
(13)
and σpr.Shear cells are used as standard for the evaluation of the
flowability of industrial powders and study their stability during storage, a key attribute of formulated powders. In many cases, materials are complex matrices of crystalline and amorphous components that are prone to cake through adhesion, sintering, deliquescence and formation liquid and solid bridges. Shear cells provide a way to study the effect of particle properties and the environment in this process. For example, Deshmukh et al. (2019) reports a recent study using a Schulze cell as an in-vitro tool for oral processing of foods, but similar devices have been used for decades. Teunou and Fitzpatrick (1999) proposed a ring unit specifically designed to study foods and investigated how environmental conditions affect the flow of flour, tea and whey powders (Teunou et al., 1999). The cell was installed in a chamber with controlled relative humidity rH and T. As expected, an increase in either of the two leads to a reduction in the flowability. The effect of consolidation and storage time was studied in a Jenike type cell (Teunou and Fitzpatrick, 2000) providing the evolution of flow functions. Fitzpatrick et al. (2007) used a similar device to study the effects of formulation and storage time in dairy powders. Opaliński et al. (2012) designed another Jenike type shear tester to study moist food powder and similar works on the study of mixtures of coal and sawdust or biomass mixtures were reported by Chen et al. (2012) and Zulfiqar et al. (2006). Torsional units have also been shown flexible tools. Guo et al. (2015) and Chen et al. (2018) used the FT4 shear cell to study the flow of biomass and coal blends with and without a varying level of moisture. Crawford et al. (2016) used it to study the effect of pre- processing of biomass and Léonard and Abatzoglou (2010) to investigate lubricated and unlubricated pharmaceutical powders. The FT4 shear cell was also used by Leung et al. (2017) to investigate the flowability of pharmaceutical powders mainly driven by cohesion.
Although fundamental and comparative studies are less frequent, they can shed light into the local stress distribu-tions and on how the particle level properties relate to the bulk behaviour. For instance, Zafar et al. (2015) used a Schulze shear cell to investigate the flowability of cohesive powders, and compared the results to characterisation techniques such as the ball indentation (Hassanpour and Ghadiri, 2007) that measures the hardness at a low consol-idation, and the Sevilla Powder Tester (Castellanos et al., 2004). Louati (2016) and Louati et al. (2015; 2017), used a Schulze shear cell for a fundamental investigation of the impact of moisture and particles size on the flow of glass beads, and Hammerich et al. (2020) designed a modified ring cell to study liquid saturated sediments. Wang et al., (2016) proposed instead a new method to analyse data using the FT4 under different initial consolidation. They tested over 40 powders with four initial consolidation stress and proposed an empirical relation between the flow function and a dimensionless cohesion C* (C* = C⁄σpr) that separates the effects of initial consolidation stress and the testing device.
There are other available shear devices like the Anton Parr rheometer that uses impellers for shearing, the Peschl cell that modifies a standard ring shear cell, and other commercially available units like the Hosokawa Micron Powder Tester or GranuDrum. Many others well-known testers have been developed for specific applications in research laboratories, for example, the use of fluidised beds to measured tensile strength (Castellanos et al., 2004) or flowability (Girimonte et al., 2018), and the analysis of caking with direct or indirect measurements of uncon-fined yield strength in uniaxial compression testers, e.g. (Hassanpour and Ghadiri, 2007; Thakur et al., 2014).
From a more fundamental point of view, the use of visu-alisation techniques such as Magnetic Resonance Imaging (MRI) can reveal the transmission of stress in a quasi-static flow at a particle level. Commercial shear cells made of metal are not suitable, but novel shear testers have been designed for this specific purpose (Mueth et al., 2000). The work of Cheng et al. (2006) and Sakaie et al. (2008) reports a direct measurement of the evolution of the local packing of a slow and smooth granular shear flow in a split- bottomed geometry. They sheared MRI sensitive seeds at different rotational velocities and collected MR-images after stopping the shearing process. Börzsönyi et al. (2011) followed a similar approach to demonstrate that a shear zone develops preferentially in regions with a lower fric-tion. They studied a U-shaped horizontal shear cell consist-ing of two parallel L-shaped sliders and characterised the shearing band recording the displacement of MRI-sensitive poppy seeds loaded in a sample of MRI-insensitive glass beads.
Classic or new devices and commercial and custom designs, all shear cells work under the same principle. And
Victor Francia et al. / KONA Powder and Particle Journal No. 38 (2021) 3–25
12
yet, different dimensions, sample volume and pre-shearing procedures lead to disparities in the measurements from different testers. The impact the history of a powder has in its response to stress is well documented (Swize et al., 2019), but the sample preparation procedures are still specific to each device. The work of Berry et al. (2014) and Salehi et al. (2017a) compares the measurements of Brook-field, Schulze and Jenike testers, and Koynov et al. (2015) reports on a comparative study of shear cells evaluating the flow of coarse (59 mm) and fine (4 mm) alumina powder. Salehi et al. (2017a) found no important disparities between testers, the largest differences being ascribed to highly compressible powders, but the observations of Berry et al. (2014) were consistent with the issues listed by Koynov et al. (2015). In their comparative work, all shear cells provided a good qualitative measurement of flowability, but they were found to be more efficient with fine, cohesive powders. In free-flowing powders, measurements could not be used in a quantitative way to rank the materials but only to identify them as free-flowing. Comparison across different cells showed that not only the consolidation stress during pre-shearing is important, but also the type of shear cell. Barletta et al. (2015) provided a similar comparative analysis in the context of biomass and identified important differences only in the wall friction coefficients. It is in line with the work of García-Triñanes et al. (2019), which finds minor differences in the measurement of tensile strength of cohesive powders in a Schulze and a Brookfield unit.
The full range of available devices to characterise the quasi-static flow of complex cohesive mixtures is described by Ghadiri et al. (2020), Ogata (2019), and Schwedes (2003). Here we provided the reader with an overview of the design of classic shear testers, their limitations and their scope for application. In the following sections, we de-scribe how the modification of the classic designs with the use of aeration and other external sources of actuation can lead to a new type of devices that are capable of performing measurements in an intermediate regime and providing a more complete picture of the granular rheology.
4. Beyond the quasi-static regime
In the quasi-static regime, the yield locus line describes the failure of a network of enduring contacts between par-ticles in a bed of powder. Under an applied normal stress, σ, the required shear stress τ = μ σ + C is purely a function of the bulk material properties and the structure of the sample created by the consolidation at (σpr, τpr). However, at higher shear rate, or lower consolidation stresses, the powder dilates, and as it transitions into an intermediate regime, the shear stress, τ, establishes a dependency on the shear rate,
(11)
. There are several ways to try to replicate and characterise this transition in a modified shear cell. In order
to depart from the quasi-static regime, one must operate at a higher inertial number, I, (see Eq. 1) by either operating at a sufficiently high shear rate,
(11)
, or at a sufficiently low (constant) consolidation stress, σ.
The operation at
(11)
simply by operating at a high rota-tional speed in indeed possible (Bagnold, 1954) but in prac-tice this can lead to attrition of fragile particles. Ghadiri et al. (2000) discuss in detail the importance of breakage and segregation in a annular cells using catalyst powder, and Hare et al. (2011) provide an example where measurements of the attrition of pharmaceutical powders in a shear cell are coupled with computational studies in an agitated bed.
Alternatively, the inertial number, I, can be reduced operating at low consolidation stress, σ. Doing so requires the application of an energy source to the bed that can over-come the action of the gravitational acceleration that would otherwise consolidate the sample. The additional energy in-put can be introduced by the action of a particle-fluid force using aeration or even complete fluidisation, or through mechanical acceleration, such as agitation or vibration of the sample. The following sections provide a summary of current strategies describing a selection of shear devices that use an external actuation to operate at low consolida-tion stresses. Modified classic shear cells are introduced in Section 4.1, and Sections 4.2 and 4.3 describe the design of Couette-type rheometers and the use of mechanically agitated aerated or fluidised beds.
4.1 Modified shear testers
One of the first modified shear testers was introduced by Klein et al. (2003). They developed an annular (ring) cell to shear a limestone powder (dp < 15 μm) at varying normal stress and a shear velocity between 0.07 to 4,200 mm/min. The design resembles a Schulze tester with the functional-ity of powder aeration. A motor is fixed to the base to rotate the shear cell at the desired velocity. The base and the lid are made of a permeable material, and feature 24 thin baf-fles to prevent the sample from sliding during the shearing process. The vertical normal stress, σ, is applied by the lid on the top of the sample. Aeration is modulated via a mass flow controller or through the measurement of air pressure in the exhaust. A fluidisation index, FI, is defined as ratio between the pressure drop of the gas flowing through a bed of powder ΔP, and the pressure drop required to counter the weight of the bed and reach the minimum fluidisation, ∆Pmf = W⁄A. Or in other words, the ratio between the gas superficial velocity, uɡ, and the minimum fluidisation ve-locity, umf, FI = ∆P⁄∆Pmf~u⁄umf. When particles are aerated by a gas velocity lower than umf, FI < 1, the bed of powder remains static but it sustains much lower normal stress, σ, due to the reduction of its effective weight under the action of a drag and buoyancy forces. Klein et al. (2003) studied the effect of aeration in the rheology of limestone.

Victor Francia et al. / KONA Powder and Particle Journal No. 38 (2021) 3–25
13
They observed no differences in the shear stress, τ, required for the bed to fail under a constant normal stress, σ, and a fluidisation index FI < 0.7, in an indication that the powder remains in a quasi-static regime. However, under a higher FI but still operating with a fixed bed, 0.7 < FI < 1, the shear stress, τ, was found to decrease for an increasing air velocity indicating the presence of an intermediate regime between the quasi-static and the collisional regime charac-teristic of a fully fluidised system at FI ≫ 1.
Another example of a classic tester with an aeration functionality was proposed by Johanson and Barletta (2004). They modified a Schulze device, to operate under a continuous counter air flow using a base of permeable media and a modified perforated lid. Air pressure was measured at the inlet and the flow was controlled with a rotameter. They performed shear experiments on a fine sil-ica powder (dp = 8 μm) and an FCC catalyst (dp = 50 μm) and with a range of aeration up to FI = 1. As expected, the unconfined yield strength of the bulk material was found to decrease with increasing aeration. The effective angle of internal friction decreased approaching full fluidisation. Other modified testers include the device developed by Barletta et al. (2007), which coupled a circular cell with the rotating plate of a Peschl shear test bench to investigate the effect of aeration in the flow of fine silica (dp = 7.6 μm) and magnesium carbonate (dp = 3.5 μm). The design resembles that of a short FT4 rheometer, featuring a circular fixed base and a bladed rotational lid. The base is 61.8 mm in inner diameter and 15 mm in height, and it consists of a porous bottom plate that ensures a homogeneous air distribution. The experimental procedure mimics that of Fig. 8b. Experiments were performed at low shear rates,
(11)
, and normal stress, σ, and below the minimum fluidisation (FI < 1). Their results confirm the observations of Klein et al. (2003): for a fluidisation index FI < 0.7 no significant differences appear in the angle of internal friction, in an indication that even when aerated, the samples remained in the quasi-static regime.
4.2 Couette-type shear testers
Annular cells are a classic arrangement to study the rhe-ology of Newtonian and non-Newtonian flows (Viswanath et al., 2007). Fig. 9a provides a generic description of the geometry. In these devices, the fluid is sheared in between two coaxial cylinders: an inner rotating one called bob and an external steady cylinder called cup. The viscosity and the shear stress are computed from the angular velocity, ω, and the torque, T, applied to the inner cylinder. Cou-ette-type shear testers have been often used to study gran-ular flows. Interested readers are referred to the overview by GDR Midi (Midi, 2004) for characteristic experimental velocity profiles. The evolution of the bulk or effective fric-tion coefficient μb in a Couette cell is given as a function of
a dimensionless characteristic shear rate, w /C d g
(14)
, where w
(15)
is the shear rate at the wall. The use of C
(16)
is a particular case of the general inertial number I (see Eq. 1) that considers a hydrostatic pressure as the source of the consolidation stress. Experimental velocity profiles in Cou-ette cells show the existence of localised shear bands on the wall of the rotating cylinder that depend on the conditions of the boundaries. In order to avoid sliding, the walls of the cylinders must be roughened mechanically or by glueing particles or sandpaper. Due to the simplicity in design and control, Couette cells are an excellent alternative to study the intermediate flow regime. The type of geometry described in Fig. 9a has been used for a long time to study powders and capture the stress–strain rate relationship (Craig et al., 1986; Hanes and Inman, 1985; Savage and Sayed, 1984). Modern devices without any actuation include the units proposed by Tardos et al. (1998) and a shorter, annular device described by Klausner et al. (2000). Every cell imposes a fixed shear rate and relies on the action
Fig. 9 Depiction of a generic geometry of a (a) Coaxial-Cylinder rhe-ometer applied to powders, and its use within a (b) flow and (c) aerated device. Nomenclature: Ri and Re: inner and outer radii, L: bed height subject to shear; ω: rotational speed.
Victor Francia et al. / KONA Powder and Particle Journal No. 38 (2021) 3–25
14
of gravitational acceleration to consolidate the sample. The earlier studies establish a dependency of the shear stress on the shear rate that simply by operating at high shear rate,
(11)
, increasing the rotational speed of the inner cylinder, and thus w
(15)
. The boundaries for the transition from the qua-si-static to the intermediate regime and inertial regimes are still under debate. Experimental values have been proposed by Tardos et al. (1998; 2003) for the departure of the qua-si-static regime, i.e. C ~ 0.15 / 0.25
(17)
, and the collisional re-gime C ~ 3
(18)
, and later confirmed in computational studies (Vidyapati et al., 2012). In order to achieve a more general description and reach a higher range of inertial numbers, I, one can also reduce the consolidation stress, σ, linked to the powder weight. In the following sections, we describe the design of Couette cells that introduce aeration or flow in a coaxial-cylinder configuration, Section 4.2.1, and virtual cells that minimise sliding effects, Section 4.2.2.
4.2.1 Aerated coaxial-cylinder rheometersTwo alternatives have been proposed in literature in
order to actuate a coaxial cylinder rheometer (Fig. 9a) and operate at higher inertial numbers. One can impose an axial particle flow in the annular section inserting the unit in flow device (Fig. 9b) or inject a counter-current stream of air to reduce the consolidation stress in an aerated or fluidised chamber (Fig. 9c).
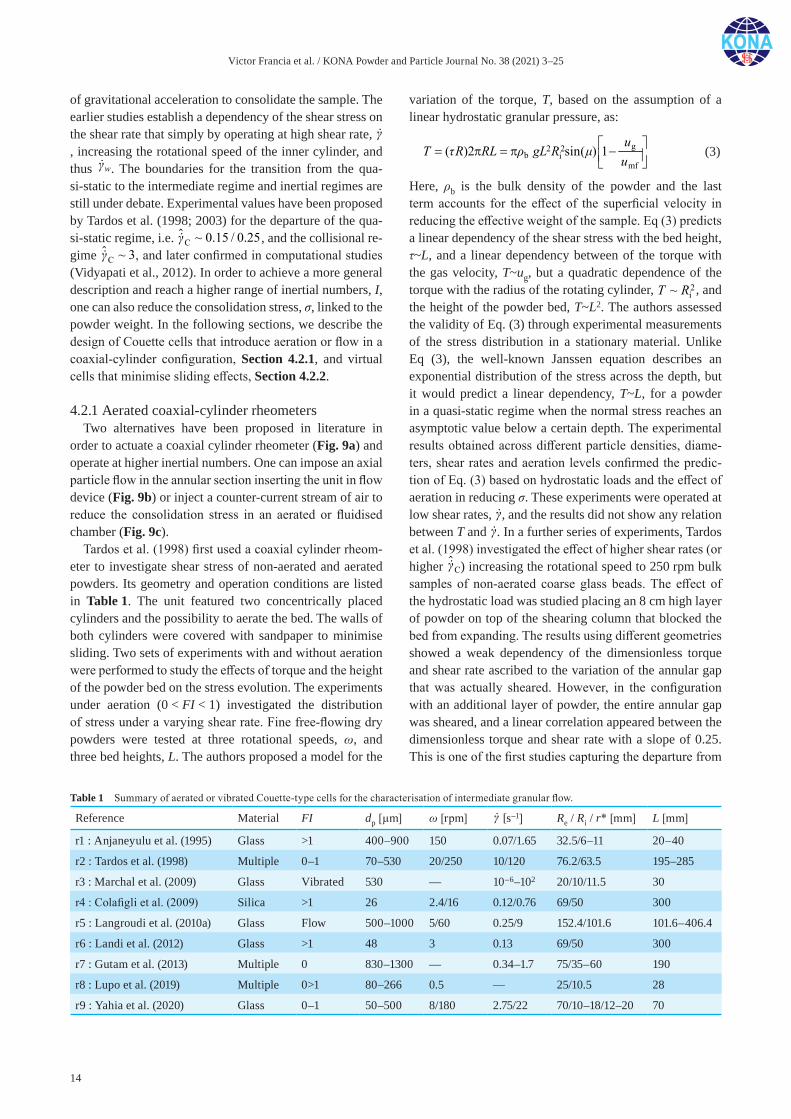
Tardos et al. (1998) first used a coaxial cylinder rheom-eter to investigate shear stress of non-aerated and aerated powders. Its geometry and operation conditions are listed in Table 1. The unit featured two concentrically placed cylinders and the possibility to aerate the bed. The walls of both cylinders were covered with sandpaper to minimise sliding. Two sets of experiments with and without aeration were performed to study the effects of torque and the height of the powder bed on the stress evolution. The experiments under aeration (0 < FI < 1) investigated the distribution of stress under a varying shear rate. Fine free-flowing dry powders were tested at three rotational speeds, ω, and three bed heights, L. The authors proposed a model for the
variation of the torque, T, based on the assumption of a linear hydrostatic granular pressure, as:
g2 2b i
mf( )2 sin( ) 1
uT R RL gL R
u
(3)
(3)
Here, ρb is the bulk density of the powder and the last term accounts for the effect of the superficial velocity in reducing the effective weight of the sample. Eq (3) predicts a linear dependency of the shear stress with the bed height, τ~L, and a linear dependency between of the torque with the gas velocity, T~ug, but a quadratic dependence of the torque with the radius of the rotating cylinder, 2
i~T R
(19)
, and the height of the powder bed, T~L2. The authors assessed the validity of Eq. (3) through experimental measurements of the stress distribution in a stationary material. Unlike Eq (3), the well-known Janssen equation describes an exponential distribution of the stress across the depth, but it would predict a linear dependency, T~L, for a powder in a quasi-static regime when the normal stress reaches an asymptotic value below a certain depth. The experimental results obtained across different particle densities, diame-ters, shear rates and aeration levels confirmed the predic-tion of Eq. (3) based on hydrostatic loads and the effect of aeration in reducing σ. These experiments were operated at low shear rates,
(11)
, and the results did not show any relation between T and
(11)
. In a further series of experiments, Tardos et al. (1998) investigated the effect of higher shear rates (or higher C
(20)
) increasing the rotational speed to 250 rpm bulk samples of non-aerated coarse glass beads. The effect of the hydrostatic load was studied placing an 8 cm high layer of powder on top of the shearing column that blocked the bed from expanding. The results using different geometries showed a weak dependency of the dimensionless torque and shear rate ascribed to the variation of the annular gap that was actually sheared. However, in the configuration with an additional layer of powder, the entire annular gap was sheared, and a linear correlation appeared between the dimensionless torque and shear rate with a slope of 0.25. This is one of the first studies capturing the departure from
Table 1 Summary of aerated or vibrated Couette-type cells for the characterisation of intermediate granular flow.
Reference Material FI dp [μm] ω [rpm]
表セル:9pt, 以下同 (41)
[s–1] Re / Ri / r* [mm] L [mm]
r1 : Anjaneyulu et al. (1995) Glass >1 400–900 150 0.07/1.65 32.5/6–11 20–40
r2 : Tardos et al. (1998) Multiple 0–1 70–530 20/250 10/120 76.2/63.5 195–285
r3 : Marchal et al. (2009) Glass Vibrated 530 — 10–6–102 20/10/11.5 30
r4 : Colafigli et al. (2009) Silica >1 26 2.4/16 0.12/0.76 69/50 300
r5 : Langroudi et al. (2010a) Glass Flow 500–1000 5/60 0.25/9 152.4/101.6 101.6–406.4
r6 : Landi et al. (2012) Glass >1 48 3 0.13 69/50 300
r7 : Gutam et al. (2013) Multiple 0 830–1300 — 0.34–1.7 75/35–60 190
r8 : Lupo et al. (2019) Multiple 0>1 80–266 0.5 — 25/10.5 28
r9 : Yahia et al. (2020) Glass 0–1 50–500 8/180 2.75/22 70/10–18/12–20 70
Victor Francia et al. / KONA Powder and Particle Journal No. 38 (2021) 3–25
15
a quasi-static flow and two distinct behaviours: quasi-static at a low shear rate and intermediate at higher shear rate.
The same linear relationship between the stresses and the height was confirmed across a broader set of experiments by Tardos et al. (2003) varying the size of the internal cylinder, and including measurements of normal stresses in the radial and axial directions with the use of piezoelectric sensors. In this work, a new constitutive equation was proposed to unify quasi-static, intermediate and inertial re-gimes on the basis of a 2D analysis of the Couette flow us-ing the additive approach of the stresses of Savage (1998).
Langroudi et al. (2010a; 2010b) were the first to propose the creation of a flow system to increase the inertial number in a coaxial-cylinder chamber. Fig. 9b depicts the general concept. These units offer some flexibility. They can be operated either in a batch or under a continuous axial flow of material in the annular space. The height of powder in the shearing band can be controlled with the powder flow rate, and an additional layer can be maintained above the shearing band, denoted overburden, to control the consol-idation. In the study of Langroudi et al. (2010a; 2010b), the behaviour of coarse glass beads was evaluated first without the presence of the overburden. Four bed heights, L, and four rotational speeds were tested. As described by others in aerated (Tardos et al., 1998) and fluidised devices (Anjaneyulu and Khakhar, 1995), shearing caused the stratification of the flow with two distinct layers of mobile and stagnant powder. Analysis of the torque was in agree-ment with Tardos et al. (1998) and confirmed the linear correlation between τ and the bed height, L. The analysis confirmed the presence of two regimes, a quasi-static flow at low shear rates where τ is independent of
(11)
, and an intermediate at higher values where τ increases with in-creasing
(11)
. The authors assumed a power-law for the stress and shear rate relation, n
(21)
, and found that the n-index ranges from 0.5 to 1 and increasing with higher shear rate. This work provided also important additional information by measuring the normal stress, σ, acting on the shearing surface of the material. Stress sensors were placed in both the surface of the outer and inner cylinders, and a further set of experiments was conducted with a fixed bed height at 406.6 mm, an overburden of 101.6 mm and increasing ω from 5 to 60 rpm. As expected, the normal stress σ measured at the wall increased linearly with the depth in the powder bed, and it was independent on the rotational speed, ω. Measuring both the shear stress (indirectly) and the normal stress (directly), they estimated the angle of internal friction, μ, and found that it was comparable to the one evaluated with classic shear testers at low
(11)
. The authors proposed a constitutive model based on the data that blends the Coulomb yield condition at zero shear with a power law at a higher shear rate, / tan nb
(22)
. In a later study, Langroudi et al. (2011) used the same device equipped with capacitance probes to study the effect of
polydispersity and shape in secondary flow patterns and the powder dilation.
Langroudi et al. (2010a) also studied the effects of the bed height, L, without overburden and confirmed a linear dependency of the average τ on L with a slope proportional to
(11)
. However, as pointed out by Ghadiri et al. (2020), there have been conflicting experimental observations. Mehandia et al. (2012) and Gutam et al. (2013) report evidence of an exponential behaviour studying in detail the axial distribution of the stress in slow regime on a similar arrangement (Table 1) including the direct measurement of radial and axial normal stresses. In their device, aeration was used only to homogenise the bed of powder, and the samples were pre-sheared during 20–30 min to remove any history effect. In contradiction with the observation of Tardos et al. (1998; 2003), all components of the stress tensor were seen to increase exponentially with the depth in the bed. The behaviour was found to be consistent with the Janssen equation across a range of conditions, which was ascribed to the inherent anisotropy of the bed fabric. In a later work, Krishnaraj and Nott (2016) associated the abnormal quadratic dependence of the stress with depth to the formation of a secondary vortex in a Couette geometry. The authors argue that the gravitational acceleration and its interplay with the confinement are responsible of causing a deviation from the expected liquid-like behaviour in isotropic plasticity models. These models disregard the transmission of stress to a boundary as the majority of computational DEM works do by imposing Lees Edwards boundary conditions. The role of geometrical constraints, particularly the size of the annular gap, therefore, requires further investigation.
Lupo et al. (2019) conducted a similar study using an Anton Paar cell featuring a pseudo-cylindrical impeller with a grooved surface. They carried out torque measure-ments on aerated and non-aerated samples by immersing the impeller at various bed depths. Experiments were per-formed below and above the minimum fluidisation using different powders (see Table 1). As expected, T decreased with the depth of the impeller for all the cases studied and decreased with increasing gas velocity. However, the more complex geometry of the cylinder/impeller requires further analysis to be able to compute the stresses.
Couette flow configurations have also used to investigate higher levels of aeration. For example, Anjaneyulu and Khakhar (1995) introduced an adapted Coaxial-cylinder rheometer to study of the rheology of a fluidised beds following an aerated arrangement, Fig. 9c. A viscometer (Brookfield, Synchro-Lectricas) was used to rotate an inner cylinder. Two geometries with varying internal radius were tested using glass beads with various sizes and reaching complete fluidisation FI > 1 (Table 1). For each airflow, the inner rotating cylinder was immersed in the glass beads sample at different elevations L. The experiments showed
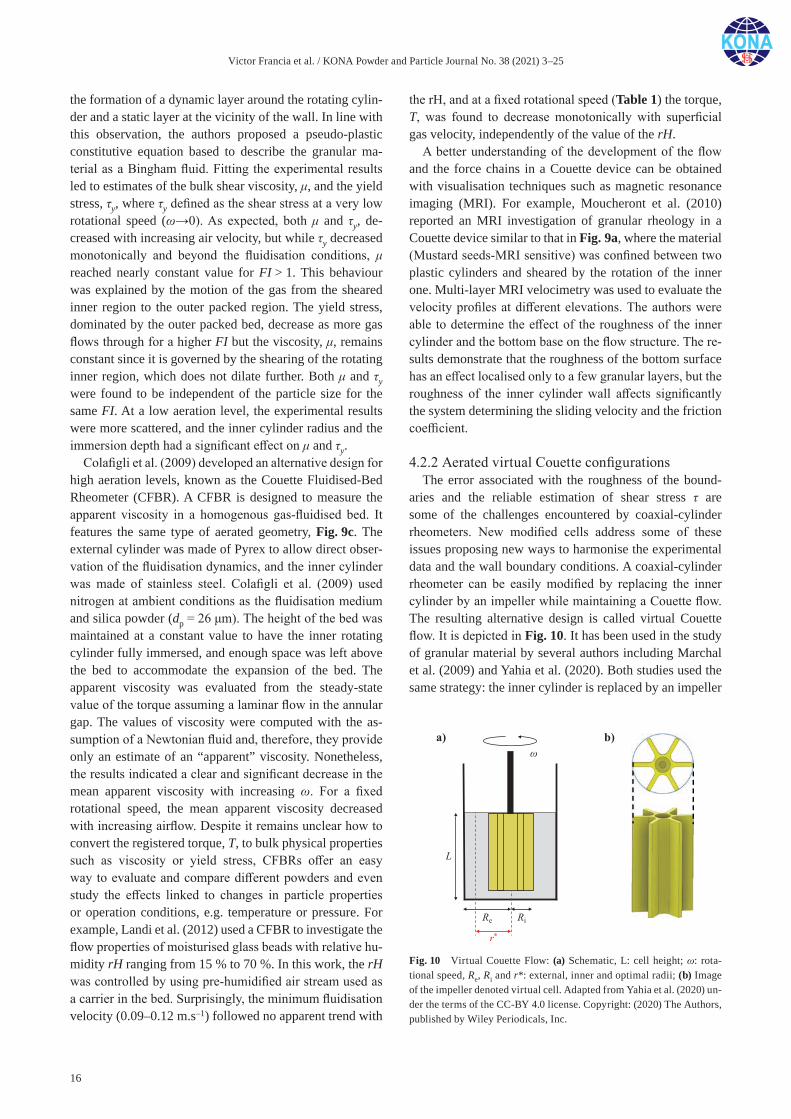
Victor Francia et al. / KONA Powder and Particle Journal No. 38 (2021) 3–25
16
the formation of a dynamic layer around the rotating cylin-der and a static layer at the vicinity of the wall. In line with this observation, the authors proposed a pseudo-plastic constitutive equation based to describe the granular ma-terial as a Bingham fluid. Fitting the experimental results led to estimates of the bulk shear viscosity, μ, and the yield stress, τy, where τy defined as the shear stress at a very low rotational speed (ω→0). As expected, both μ and τy, de-creased with increasing air velocity, but while τy decreased monotonically and beyond the fluidisation conditions, μ reached nearly constant value for FI > 1. This behaviour was explained by the motion of the gas from the sheared inner region to the outer packed region. The yield stress, dominated by the outer packed bed, decrease as more gas flows through for a higher FI but the viscosity, μ, remains constant since it is governed by the shearing of the rotating inner region, which does not dilate further. Both μ and τy were found to be independent of the particle size for the same FI. At a low aeration level, the experimental results were more scattered, and the inner cylinder radius and the immersion depth had a significant effect on μ and τy.
Colafigli et al. (2009) developed an alternative design for high aeration levels, known as the Couette Fluidised-Bed Rheometer (CFBR). A CFBR is designed to measure the apparent viscosity in a homogenous gas-fluidised bed. It features the same type of aerated geometry, Fig. 9c. The external cylinder was made of Pyrex to allow direct obser-vation of the fluidisation dynamics, and the inner cylinder was made of stainless steel. Colafigli et al. (2009) used nitrogen at ambient conditions as the fluidisation medium and silica powder (dp = 26 μm). The height of the bed was maintained at a constant value to have the inner rotating cylinder fully immersed, and enough space was left above the bed to accommodate the expansion of the bed. The apparent viscosity was evaluated from the steady-state value of the torque assuming a laminar flow in the annular gap. The values of viscosity were computed with the as-sumption of a Newtonian fluid and, therefore, they provide only an estimate of an “apparent” viscosity. Nonetheless, the results indicated a clear and significant decrease in the mean apparent viscosity with increasing ω. For a fixed rotational speed, the mean apparent viscosity decreased with increasing airflow. Despite it remains unclear how to convert the registered torque, T, to bulk physical properties such as viscosity or yield stress, CFBRs offer an easy way to evaluate and compare different powders and even study the effects linked to changes in particle properties or operation conditions, e.g. temperature or pressure. For example, Landi et al. (2012) used a CFBR to investigate the flow properties of moisturised glass beads with relative hu-midity rH ranging from 15 % to 70 %. In this work, the rH was controlled by using pre-humidified air stream used as a carrier in the bed. Surprisingly, the minimum fluidisation velocity (0.09–0.12 m.s–1) followed no apparent trend with
the rH, and at a fixed rotational speed (Table 1) the torque, T, was found to decrease monotonically with superficial gas velocity, independently of the value of the rH.
A better understanding of the development of the flow and the force chains in a Couette device can be obtained with visualisation techniques such as magnetic resonance imaging (MRI). For example, Moucheront et al. (2010) reported an MRI investigation of granular rheology in a Couette device similar to that in Fig. 9a, where the material (Mustard seeds-MRI sensitive) was confined between two plastic cylinders and sheared by the rotation of the inner one. Multi-layer MRI velocimetry was used to evaluate the velocity profiles at different elevations. The authors were able to determine the effect of the roughness of the inner cylinder and the bottom base on the flow structure. The re-sults demonstrate that the roughness of the bottom surface has an effect localised only to a few granular layers, but the roughness of the inner cylinder wall affects significantly the system determining the sliding velocity and the friction coefficient.
4.2.2 Aerated virtual Couette configurationsThe error associated with the roughness of the bound-
aries and the reliable estimation of shear stress τ are some of the challenges encountered by coaxial-cylinder rheometers. New modified cells address some of these issues proposing new ways to harmonise the experimental data and the wall boundary conditions. A coaxial-cylinder rheometer can be easily modified by replacing the inner cylinder by an impeller while maintaining a Couette flow. The resulting alternative design is called virtual Couette flow. It is depicted in Fig. 10. It has been used in the study of granular material by several authors including Marchal et al. (2009) and Yahia et al. (2020). Both studies used the same strategy: the inner cylinder is replaced by an impeller
Fig. 10 Virtual Couette Flow: (a) Schematic, L: cell height; ω: rota-tional speed, Re, Ri and r*: external, inner and optimal radii; (b) Image of the impeller denoted virtual cell. Adapted from Yahia et al. (2020) un-der the terms of the CC-BY 4.0 license. Copyright: (2020) The Authors, published by Wiley Periodicals, Inc.
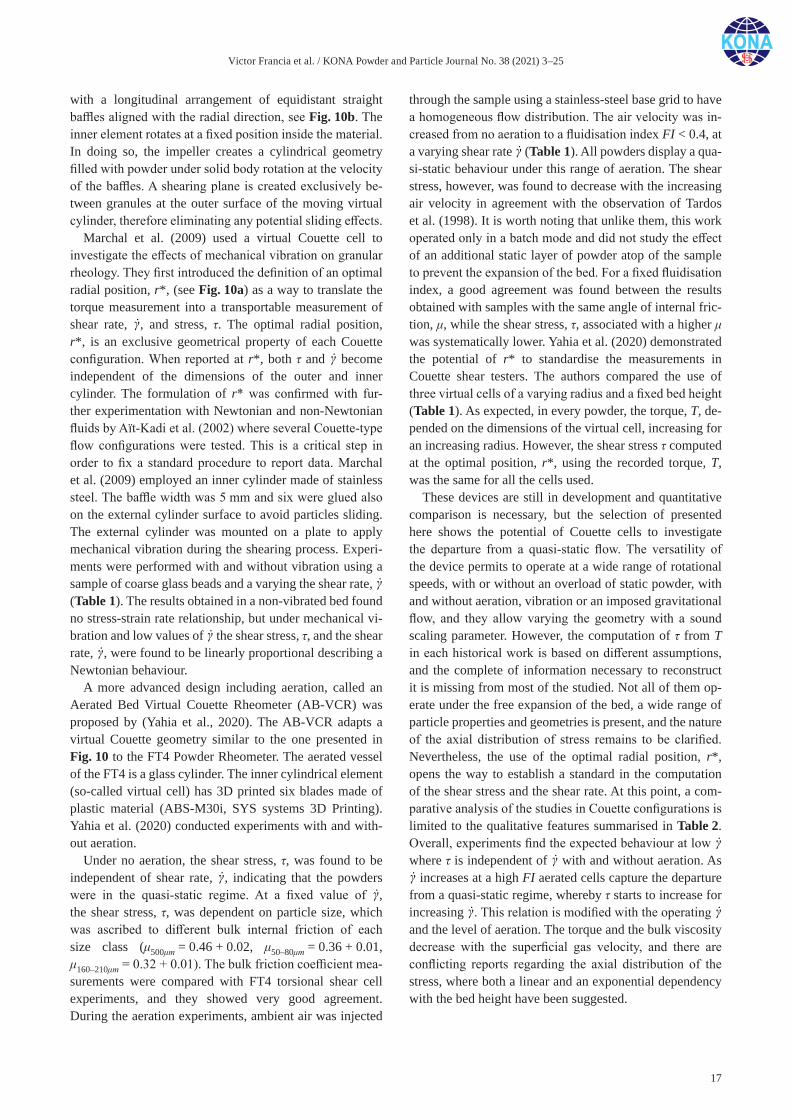
Victor Francia et al. / KONA Powder and Particle Journal No. 38 (2021) 3–25
17
with a longitudinal arrangement of equidistant straight baffles aligned with the radial direction, see Fig. 10b. The inner element rotates at a fixed position inside the material. In doing so, the impeller creates a cylindrical geometry filled with powder under solid body rotation at the velocity of the baffles. A shearing plane is created exclusively be-tween granules at the outer surface of the moving virtual cylinder, therefore eliminating any potential sliding effects.
Marchal et al. (2009) used a virtual Couette cell to investigate the effects of mechanical vibration on granular rheology. They first introduced the definition of an optimal radial position, r*, (see Fig. 10a) as a way to translate the torque measurement into a transportable measurement of shear rate,
(11)
, and stress, τ. The optimal radial position, r*, is an exclusive geometrical property of each Couette configuration. When reported at r*, both τ and
(11)
become independent of the dimensions of the outer and inner cylinder. The formulation of r* was confirmed with fur-ther experimentation with Newtonian and non-Newtonian fluids by Aït-Kadi et al. (2002) where several Couette-type flow configurations were tested. This is a critical step in order to fix a standard procedure to report data. Marchal et al. (2009) employed an inner cylinder made of stainless steel. The baffle width was 5 mm and six were glued also on the external cylinder surface to avoid particles sliding. The external cylinder was mounted on a plate to apply mechanical vibration during the shearing process. Experi-ments were performed with and without vibration using a sample of coarse glass beads and a varying the shear rate,
(11)
(Table 1). The results obtained in a non-vibrated bed found no stress-strain rate relationship, but under mechanical vi-bration and low values of
(11)
the shear stress, τ, and the shear rate,
(11)
, were found to be linearly proportional describing a Newtonian behaviour.
A more advanced design including aeration, called an Aerated Bed Virtual Couette Rheometer (AB-VCR) was proposed by (Yahia et al., 2020). The AB-VCR adapts a virtual Couette geometry similar to the one presented in Fig. 10 to the FT4 Powder Rheometer. The aerated vessel of the FT4 is a glass cylinder. The inner cylindrical element (so-called virtual cell) has 3D printed six blades made of plastic material (ABS-M30i, SYS systems 3D Printing). Yahia et al. (2020) conducted experiments with and with-out aeration.
Under no aeration, the shear stress, τ, was found to be independent of shear rate,
(11)
, indicating that the powders were in the quasi-static regime. At a fixed value of
(11)
, the shear stress, τ, was dependent on particle size, which was ascribed to different bulk internal friction of each size class (μ500μm = 0.46 + 0.02, μ50–80μm = 0.36 + 0.01, μ160–210μm = 0.32 + 0.01). The bulk friction coefficient mea-surements were compared with FT4 torsional shear cell experiments, and they showed very good agreement. During the aeration experiments, ambient air was injected
through the sample using a stainless-steel base grid to have a homogeneous flow distribution. The air velocity was in-creased from no aeration to a fluidisation index FI < 0.4, at a varying shear rate
(11)
(Table 1). All powders display a qua-si-static behaviour under this range of aeration. The shear stress, however, was found to decrease with the increasing air velocity in agreement with the observation of Tardos et al. (1998). It is worth noting that unlike them, this work operated only in a batch mode and did not study the effect of an additional static layer of powder atop of the sample to prevent the expansion of the bed. For a fixed fluidisation index, a good agreement was found between the results obtained with samples with the same angle of internal fric-tion, μ, while the shear stress, τ, associated with a higher μ was systematically lower. Yahia et al. (2020) demonstrated the potential of r* to standardise the measurements in Couette shear testers. The authors compared the use of three virtual cells of a varying radius and a fixed bed height (Table 1). As expected, in every powder, the torque, T, de-pended on the dimensions of the virtual cell, increasing for an increasing radius. However, the shear stress τ computed at the optimal position, r*, using the recorded torque, T, was the same for all the cells used.
These devices are still in development and quantitative comparison is necessary, but the selection of presented here shows the potential of Couette cells to investigate the departure from a quasi-static flow. The versatility of the device permits to operate at a wide range of rotational speeds, with or without an overload of static powder, with and without aeration, vibration or an imposed gravitational flow, and they allow varying the geometry with a sound scaling parameter. However, the computation of τ from T in each historical work is based on different assumptions, and the complete of information necessary to reconstruct it is missing from most of the studied. Not all of them op-erate under the free expansion of the bed, a wide range of particle properties and geometries is present, and the nature of the axial distribution of stress remains to be clarified. Nevertheless, the use of the optimal radial position, r*, opens the way to establish a standard in the computation of the shear stress and the shear rate. At this point, a com-parative analysis of the studies in Couette configurations is limited to the qualitative features summarised in Table 2. Overall, experiments find the expected behaviour at low
(11)
where τ is independent of
(11)
with and without aeration. As
(11)
increases at a high FI aerated cells capture the departure from a quasi-static regime, whereby τ starts to increase for increasing
(11)
. This relation is modified with the operating
(11)
and the level of aeration. The torque and the bulk viscosity decrease with the superficial gas velocity, and there are conflicting reports regarding the axial distribution of the stress, where both a linear and an exponential dependency with the bed height have been suggested.
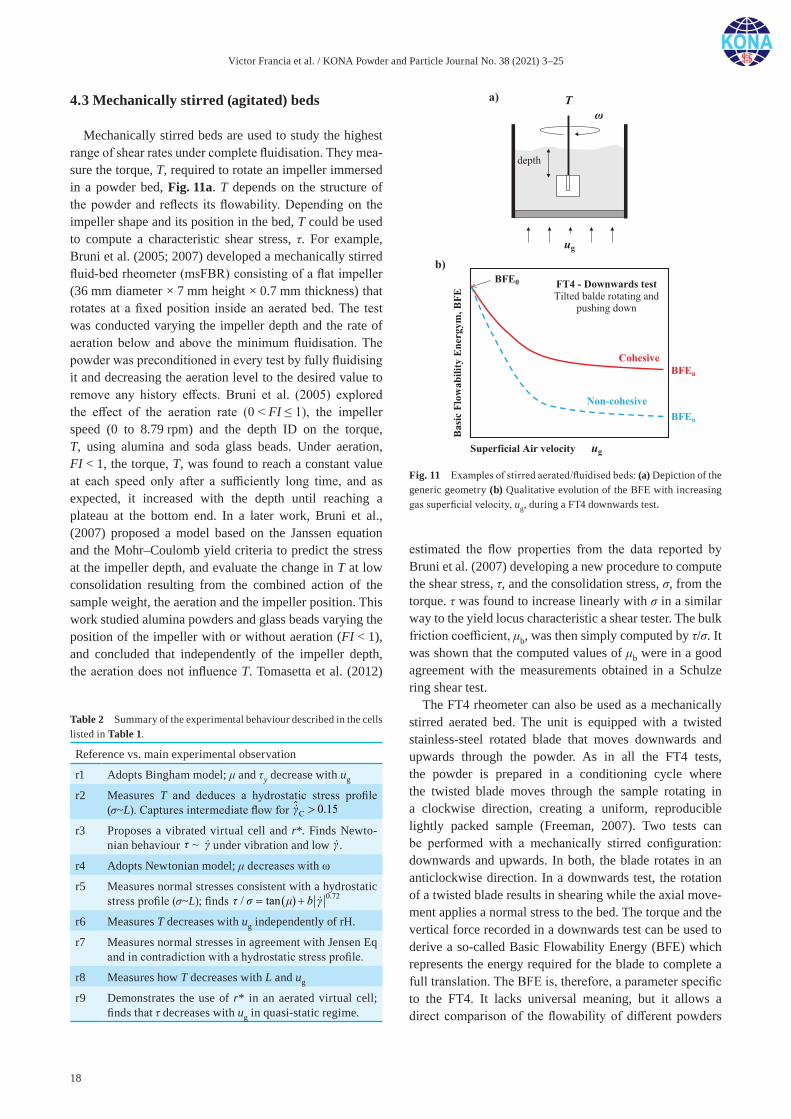
Victor Francia et al. / KONA Powder and Particle Journal No. 38 (2021) 3–25
18
4.3 Mechanically stirred (agitated) beds
Mechanically stirred beds are used to study the highest range of shear rates under complete fluidisation. They mea-sure the torque, T, required to rotate an impeller immersed in a powder bed, Fig. 11a. T depends on the structure of the powder and reflects its flowability. Depending on the impeller shape and its position in the bed, T could be used to compute a characteristic shear stress, τ. For example, Bruni et al. (2005; 2007) developed a mechanically stirred fluid-bed rheometer (msFBR) consisting of a flat impeller (36 mm diameter × 7 mm height × 0.7 mm thickness) that rotates at a fixed position inside an aerated bed. The test was conducted varying the impeller depth and the rate of aeration below and above the minimum fluidisation. The powder was preconditioned in every test by fully fluidising it and decreasing the aeration level to the desired value to remove any history effects. Bruni et al. (2005) explored the effect of the aeration rate (0 < FI ≤ 1), the impeller speed (0 to 8.79 rpm) and the depth ID on the torque, T, using alumina and soda glass beads. Under aeration, FI < 1, the torque, T, was found to reach a constant value at each speed only after a sufficiently long time, and as expected, it increased with the depth until reaching a plateau at the bottom end. In a later work, Bruni et al., (2007) proposed a model based on the Janssen equation and the Mohr–Coulomb yield criteria to predict the stress at the impeller depth, and evaluate the change in T at low consolidation resulting from the combined action of the sample weight, the aeration and the impeller position. This work studied alumina powders and glass beads varying the position of the impeller with or without aeration (FI < 1), and concluded that independently of the impeller depth, the aeration does not influence T. Tomasetta et al. (2012)
estimated the flow properties from the data reported by Bruni et al. (2007) developing a new procedure to compute the shear stress, τ, and the consolidation stress, σ, from the torque. τ was found to increase linearly with σ in a similar way to the yield locus characteristic a shear tester. The bulk friction coefficient, μb, was then simply computed by τ/σ. It was shown that the computed values of μb were in a good agreement with the measurements obtained in a Schulze ring shear test.
The FT4 rheometer can also be used as a mechanically stirred aerated bed. The unit is equipped with a twisted stainless-steel rotated blade that moves downwards and upwards through the powder. As in all the FT4 tests, the powder is prepared in a conditioning cycle where the twisted blade moves through the sample rotating in a clockwise direction, creating a uniform, reproducible lightly packed sample (Freeman, 2007). Two tests can be performed with a mechanically stirred configuration: downwards and upwards. In both, the blade rotates in an anticlockwise direction. In a downwards test, the rotation of a twisted blade results in shearing while the axial move-ment applies a normal stress to the bed. The torque and the vertical force recorded in a downwards test can be used to derive a so-called Basic Flowability Energy (BFE) which represents the energy required for the blade to complete a full translation. The BFE is, therefore, a parameter specific to the FT4. It lacks universal meaning, but it allows a direct comparison of the flowability of different powders
Table 2 Summary of the experimental behaviour described in the cells listed in Table 1.
Reference vs. main experimental observation
r1 Adopts Bingham model; μ and τy decrease with ug
r2 Measures T and deduces a hydrostatic stress profile (σ~L). Captures intermediate flow for C 0.15
(42)
r3 Proposes a vibrated virtual cell and r*. Finds Newto-nian behaviour ~
(43)
under vibration and low
表セル:9pt, 以下同 (41)
.
r4 Adopts Newtonian model; μ decreases with ω
r5 Measures normal stresses consistent with a hydrostatic stress profile (σ~L); finds 0.72/ tan b
(44)
r6 Measures T decreases with ug independently of rH.
r7 Measures normal stresses in agreement with Jensen Eq and in contradiction with a hydrostatic stress profile.
r8 Measures how T decreases with L and ug
r9 Demonstrates the use of r* in an aerated virtual cell; finds that τ decreases with ug in quasi-static regime.
Fig. 11 Examples of stirred aerated/fluidised beds: (a) Depiction of the generic geometry (b) Qualitative evolution of the BFE with increasing gas superficial velocity, ug, during a FT4 downwards test.
Victor Francia et al. / KONA Powder and Particle Journal No. 38 (2021) 3–25
19
at various aeration conditions. Fig. 11b illustrates the typical evolution of BFE with superficial gas velocity ug. A non-dimensional aeration ratio (AR) defined as the ratio of BFE at no aeration to BFE at a given air velocity has been proposed as a way to classify flowability. If AR ~ 1 the powder is not sensitive to aeration, which is typical of very cohesive powders or a higher binder content. If AR >> 20, the powder displays a low cohesive strength, it is very sen-sitive to aeration and likely to be fluidised. There are many examples where the FT4 aeration test has been able to rank the flowability of powders (Freeman, 2007). For example, Gnagne et al. (2017) reported the properties of flours, Ono and Yonemochi (2020) studied the effect of additives in the flowability of ibuprofen and Ludwig et al. (2020) evaluated its behaviour under fluidisation.
Although the method is clearly able to rank powders, it does not provide a transportable set of properties. The com-plex geometry of the blade makes it difficult to evaluate the characteristic strain rate and the shear stress, but the combi-nation of experimental and computational studies can help to address some of these limitations. The work of Hare et al. (2015; 2017) suggests that it is indeed possible to deter-mine a characteristic τ for a powder in the FT4 aeration test. Hare et al. (2015; 2017) combined experiments and DEM simulations to determine the shear stress profile in the bed. In order to estimate the strain rate and shear stress they analysed the dynamic behaviour of a bed of large cohesive glass beads (dp = 1.7–2.1 mm) during the FT4 aeration test and found that τ was be constant across the blade length and increased as the impeller penetrated the bed. Hare et al. (2017) later provided a similar framework to analyse the stress and strain rates, and Nan et al. (2017a; 2017b) com-bined computational and experimental work to study how aeration and shape affected the stress profiles in samples of soap roads, polyethylene and glass beads.
Oher commercially available stirred beds include the Anton Paar Powder Cell (APPC). This device works with the same principle as the msFBR (Bruni et al., 2005; 2007) recording the torque acting on an impeller immersed in an aerated powder bed. The bed can be operated either below or above the minimum fluidisation. The cell containing the powder is made of a glass cylinder with a porous bottom plate, and the unit is equipped with impellers of different shapes and wall conditions. Salehi et al. (2017b) used an APPC to study the effects of the impeller depth and the aeration rate on the torque acting on a flat blade impeller in samples of free-flowing powders, namely glass beads, alu-mina and sieved silica sand, up to the minimum fluidisation (0 < FI < 1). The dependency of T on the air velocity, the bed height and the impeller depth confirm the observations of Bruni et al. (2005; 2007). They proposed to use a fitting parameter as the “effectiveness” of the impeller to estimate T at different depths. The model is based on the assumption that the shearing occurs only within the cylindrical region
captured by the impeller rotation. In a later work, Salehi et al. (2018) measured T under different geometries in non-aerated glass beads of different sizes. In a similar fash-ion to the works in an FT4, a combination of computational and experimental data was used to evaluate internal flow parameters such as the bulk friction coefficient between particles and between particles and the blade.
5. Conclusions
Classic shear cell devices and a broad array of ad-hoc experimental tests have served for decades as the stan-dard to evaluate the flow threshold of cohesive industrial powders. However, looking only at the initiation of the flow is a rather simplistic view of the rheology of granular materials. It fails to capture their dynamic behaviour and the transition to intermediate and inertial regimes. These are fundamental aspects of the flow behaviour observed in natural systems and industrial units. In order to efficiently process powder, optimise unit operations and develop new technologies involving dense particle flows such as process, energy and additive manufacturing, one requires a precise understanding of all granular flow regimes. Dynamic tests and many flow configurations have been proposed as alternative ways to characterise the dynamic behaviour of a powder. However, even the simplest devices such as rotating drums, chutes or avalanches display a very complex flow pattern, and the resulting bulk properties are difficult to interpret.
It is important to move towards establishing a rigorous and transportable analysis of the data across different de-vices. This review provides an overview of the strategies developed in recent years to expand the usage of conven-tional shear cells from the quasi-static regime into the char-acterisation of intermediate and inertial flows by applying external actuation. However, the practical difficulties in operating at higher shear rates and the complex behaviour of granular matter make the development of flexible in-struments very difficult. Commercially available units such as the FT4 rheometer or the Anton Parr Powder Cell have tackled this challenge using a rotational cell under aeration to achieve very small consolidation stresses. Many other customised devices have followed similar principles using modified testers, flow devices, fluidised bed rheometers and mechanically agitated beds. The main drawback of these units is linked to the assumptions employed to estab-lish a relation between the registered torque and the charac-teristic stresses and shear rates. In this work, we have paid particular attention to the development of aerated Couette flow configurations to address some of these issues. Not only it is a flexible geometry with a tight and independent control normal and shear stress over a broad range of shear rates, but these units offer a direct way to harmonise the
Victor Francia et al. / KONA Powder and Particle Journal No. 38 (2021) 3–25
20
interpretation of data. They provide geometry-independent shear rates and stresses, and the introduction of the new virtual-cell concept removes most of the concerns associ-ated to earlier units. However, their application is still lim-ited, and further work is necessary to assess their viability as an industrial characterisation technique.
Acknowledgements
RO acknowledges financial support from the EPSRC (EP/N034066/1).
References
Aït-Kadi A., Marchal P., Choplin L., Chrissemant A.-S., Bousmina M., Quantitative analysis of mixer-type rheom-eters using the Couette analogy, The Canadian Journal of Chemical Engineering, 80 (2002) 1166–1174. DOI: 10.1002/cjce.5450800618
Andreotti B., Forterre Y., Pouliquen O., Granular media: between fluid and solid, Cambridge University Press, Cambridge, 2013. ISBN: 9781107034792
Anjaneyulu P., Khakhar D.V., Rheology of a gas-fluidized bed, Powder Technology, 83 (1995) 29–34. DOI: 10.1016/0032-5910(94)02922-b
Aranson I.S., Tsimring L.S., Continuum description of avalanches in granular media, Physical Review E, 64 (2001) 020301. DOI: 10.1103/physreve.64.020301
Aranson I.S., Tsimring L.S., Continuum theory of partially fluid-ized granular flows, Physical Review E, 65 (2002) 061303. DOI: 10.1103/physreve.65.061303
Bagnold R., Experiments on a gravity-free dispersion of large solid spheres in a Newtonian fluid under shear, Proceedings of the Royal Society of London. Series A. Mathematical and Physical Sciences, 225 (1954) 49–63. DOI: 10.1098/rspa.1954.0186
Barletta D., Berry R.J., Larsson S.H., Lestander T.A., Poletto M., Ramirez-Gómez Á., Assessment on bulk solids best practice techniques for flow characterization and storage/handling equipment design for biomass materials of different classes, Fuel Processing Technology, 138 (2015) 540–554. DOI: 10.1016/j.fuproc.2015.06.034
Barletta D., Donsì G., Ferrari G., Poletto M., A rotational tester for the characterization of aerated shear flow of powders, Particle & Particle Systems Characterization, 24 (2007) 259–270. DOI: 10.1002/ppsc.200701115
Baumgarten A.S., Kamrin K., A general fluid-sediment mixture model and constitutive theory validated in many flow regimes, Journal of Fluid Mechanics, 861 (2019) 721–764. DOI: 10.1017/jfm.2018.914
Berry R.J., Bradley M.S.A., Investigation of the effect of test pro-cedure factors on the failure loci and derived failure functions obtained from annular shear cells, Powder Technology, 174 (2007) 60–63. DOI: 10.1016/j.powtec.2006.10.023
Berry R.J., Bradley M.S.A., McGregor R.G., Brookfield powder flow tester. Results of round robin tests with CRM-116 lime-stone powder, Proceedings of the Institution of Mechanical Engineers, Part E: Journal of Process Mechanical Engineer-ing, 229 (2014) 215–230. DOI: 10.1177/0954408914525387
Berzi D., Extended kinetic theory applied to dense, granular, simple shear flows, Acta Mechanica, 225 (2014) 2191–2198. DOI: 10.1007/s00707-014-1125-1
Bishop A.W., Green G.E., Garga V.K., Andresen A., Brown J.D., A new ring shear apparatus and its application to the measurement of residual strength, Géotechnique, 21 (1971) 273–328. DOI: 10.1680/geot.1971.21.4.273
Börzsönyi T., Unger T., Szabó B., Wegner S., Angenstein F., Stannarius R., Reflection and exclusion of shear zones in inhomogeneous granular materials, Soft Matter, 7 (2011) 8330. DOI: 10.1039/c1sm05762f
Bruni G., Barletta D., Poletto M., Lettieri P., A rheological model for the flowability of aerated fine powders, Chemical Engineering Science, 62 (2007) 397–407. DOI: 10.1016/j.ces.2006.08.060
Bruni G., Colafigli A., Lettieri P., Elson T., Torque measurements in aerated powders using a mechanically stirred fluidized bed rheometer (msFBR), Chemical Engineering Research and Design, 83 (2005) 1311–1318. DOI: 10.1205/cherd.05092
Campbell C.S., Granular shear flows at the elastic limit, Journal of Fluid Mechanics, 465 (2002) 261–291. DOI: 10.1017/s002211200200109x
Campbell C.S., Granular material flows — an overview, Powder Technology, 162 (2006) 208–229. DOI: 10.1016/j.powtec. 2005.12.008
Capriz G., Giovine P., Mariano P.M., Mathematical Models of Granular Matter, Springer-Verlag Berlin Heidelberg, Berlin, 2008, ISBN: 9783540782773.
Carr J.F., Walker D.M., An annular shear cell for granular materials, Powder Technology, 1 (1968) 369–373. DOI: 10.1016/0032-5910(68)80019-1
Carr R.L., Evaluating flow properties of solids, Chemical Engi-neering., 18 (1965) 163–168.
Carson J.W., Wilms H., Development of an international standard for shear testing, Powder Technology, 167 (2006) 1–9. DOI: 10.1016/j.powtec.2006.04.005
Castellanos A., Valverde J.M., Quintanilla M.A.S., The Sevilla Powder Tester: A tool for characterizing the physical prop-erties of fine cohesive powders at very small consolidations, KONA Powder and Particle Journal, 22 (2004) 66–81. DOI: 10.14356/kona.2004011
Chen P., Yuan Z., Shen X., Zhang Y., Flow properties of three fuel powders, Particuology, 10 (2012) 438–443. DOI: 10.1016/j.partic.2011.11.013
Chen W.-K., Mizuno E., Nonlinear Analysis in Soil Mechan-ics: Theory and Implementation, Elsevier Science Ltd, Amsterdam, New York, NY, U.S.A., 1990.
Chen X., Xu Y., Lu H., Guo X., Effect of the moisture content of straw on the internal friction angle of a granular biomass-coal system, Fuel, 215 (2018) 266–271. DOI: 10.1016/j.fuel.2017.11.013
Cheng X., Lechman J.B., Fernandez-Barbero A., Grest G.S., Jaeger H.M., Karczmar G.S., Möbius M.E., Nagel S.R.,
Victor Francia et al. / KONA Powder and Particle Journal No. 38 (2021) 3–25
21
Three-Dimensional shear in granular flow, Physical Review Letters, 96 (2006) 038001. DOI: 10.1103/physrevlett. 96.038001
Chialvo S., Sun J., Sundaresan S., Bridging the rheology of gran-ular flows in three regimes, Physical Review E, 85 (2012) 021305. DOI: 10.1103/physreve.85.021305
Christakis N., Chapelle P., Patel M.K., Analysis and modeling of heaping behavior of granular mixtures within a computa-tional mechanics framework, Advanced Powder Technology, 17 (2006) 383–398. DOI: 10.1163/156855206777866173
Colafigli A., Mazzei L., Lettieri P., Gibilaro L., Apparent vis-cosity measurements in a homogeneous gas-fluidized bed, Chemical Engineering Science, 64 (2009) 144–152. DOI: 10.1016/j.ces.2008.08.036
Craig K., Buckholz R.H., Domoto G., An experimental study of the rapid flow of dry cohesionless metal powders, Journal of Applied Mechanics, Transactions ASME, 53 (1986) 935–942. DOI: 10.1115/1.3171884
Crawford N.C., Nagle N., Sievers D.A., Stickel J.J., The effects of physical and chemical preprocessing on the flowability of corn stover, Biomass and Bioenergy, 85 (2016) 126–134. DOI: 10.1016/j.biombioe.2015.12.015
da Cruz F., Emam S., Prochnow M., Roux J.-N., Chevoir F., Rheophysics of dense granular materials: discrete simulation of plane shear flows, Physical Review E, 72 (2005) 021309. DOI: 10.1103/physreve.72.021309
Dartevelle S., Numerical modeling of geophysical granular flows: 1. A comprehensive approach to granular rheologies and geophysical multiphase flows, Geochemistry, Geophysics, Geosystems, 5 (2004) Q08003. DOI: 10.1029/2003gc000636
Deshmukh O.S., Dhital S., Mantilla S.M.O., Smyth H.E., Boehm M.W., Baier S.K., Stokes J.R., Ring shear tester as an in- vitro testing tool to study oral processing of comminuted potato chips, Food Research International, 123 (2019) 208–216. DOI: 10.1016/j.foodres.2019.04.037
Dhenge R.M., Washino K., Cartwright J.J., Hounslow M.J., Salman A.D., Twin screw granulation using conveying screws: Effects of viscosity of granulation liquids and flow of powders, Powder Technology, 238 (2013) 77–90. DOI: 10.1016/j.powtec.2012.05.045
Diaz-Bejarano E., Behranvand E., Coletti F., Mozdianfard M.R., Macchietto S., Organic and inorganic fouling in heat exchangers – Industrial case study: Analysis of fouling state, Applied Energy, 206 (2017) 1250–1266. DOI: 10.1016/j.apenergy.2017.10.018
Duffy S.P., Puri V.M., Evaluation of the computer controlled dynamic yield locus tester, Powder Technology, 101 (1999) 257–265. DOI: 10.1016/s0032-5910(98)00181-8
Fan L.-S., Zhu C., Principles of Gas-Solid Flows, Cambridge University Press, Cambridge, 2005, ISBN: 9780511530142. DOI: 10.1017/CBO9780511530142
Feise H.J., Schwedes J., Investigation of the behaviour of cohe-sive powder in the biaxial tester, KONA Powder and Particle Journal, 13 (1995) 99–103. DOI: 10.14356/kona.1995014
Fitzpatrick J.J., Barry K., Cerqueira P.S.M., Iqbal T., O’Neill J., Roos Y.H., Effect of composition and storage conditions on the flowability of dairy powders, International Dairy Journal, 17 (2007) 383–392. DOI: 10.1016/j.idairyj.2006.04.010
Francia V., Martín L., Bayly A.E., Simmons M.J.H., The role of wall deposition and re-entrainment in swirl spray dryers, AIChE Journal, 61 (2015) 1804–1821. DOI: 10.1002/aic.14767
Freeman R., Measuring the flow properties of consolidated, conditioned and aerated powders — A comparative study using a powder rheometer and a rotational shear cell, Powder Technology, 174 (2007) 25–33. DOI: 10.1016/j.powtec.2006.10.016
Freeman R.E., Cooke J.R., Schneider L.C.R., Measuring shear properties and normal stresses generated within a rotational shear cell for consolidated and non-consolidated powders, Powder Technology, 190 (2009) 65–69. DOI: 10.1016/j.powtec.2008.04.084
García-Triñanes P., Luding S., Shi H., Tensile strength of cohe-sive powders, Advanced Powder Technology, 30, 12 (2019) 2868–2880. DOI: 10.1016/j.apt.2019.08.017
Garzó V., Dufty J.W., Dense fluid transport for inelastic hard spheres, Physical Review E, 59 (1999) 5895–5911. DOI: 10.1103/physreve.59.5895
Ghadiri M., Ning Z., Kenter S.J., Puik E., Attrition of granular solids in a shear cell, Chemical Engineering Science, 55-22 (2000) 5445–5456. DOI: 10.1016/S0009-2509(00)00168-8
Ghadiri M., Pasha Mehrdad, Nan W., Hare C., Vivacqua V., Zafar U., Nezamabadi S., Lopez A., Pasha Massih, Nadimi S., Cohesive powder flow: trends and challenges in characteri-sation and analysis, KONA Powder and Particle Journal, 37 (2020) 3–18. DOI: 10.14356/kona.2020018
Girimonte R., Bernardo P., Minnicelli A., Formisani B., Exper-imental characterization of the cohesive behaviour of fine powders by the raining bed test, Powder Technology, 325 (2018) 373–380. DOI: 10.1016/j.powtec.2017.11.038
Gnagne E.H., Petit J., Gaiani C., Scher J., Amani G.N., Character-isation of flow properties of foutou and foufou flours, staple foods in West Africa, using the FT4 powder rheometer, Jour-nal of Food Measurement and Characterization, 11 (2017) 1128–1136. DOI: 10.1007/s11694-017-9489-2
Gray D.D., Stiles J.M., On the constitutive relation for frictional flow of granular materials: Topical report (No. DOE/MC/21353-2584), Morgantown, WV (USA), 1988.
Guo Y., Curtis J.S., Discrete element method simulations for com-plex granular flows, Annual Review of Fluid Mechanics, 47 (2015) 21–46. DOI: 10.1146/annurev-fluid-010814-014644
Guo Z., Chen X., Xu Y., Liu H., Study of flow characteristics of biomass and biomass-coal blends, Fuel, 141 (2015) 207–213. DOI: 10.1016/j.fuel.2014.10.062
Gutam K.J., Mehandia V., Nott P.R., Rheometry of granular mate-rials in cylindrical Couette cells: Anomalous stress caused by gravity and shear, Physics of Fluids, 25 (2013) 070602. DOI: 10.1063/1.4812800
Hammerich S., Stickland A.D., Radel B., Gleiss M., Nirschl H., Modified shear cell for characterization of the rheolog-ical behavior of particulate networks under compression, Particuology, 51 (2020) 1–9. DOI: 10.1016/j.partic.2019. 10.005
Hanes D. M., Inman D.L., Observations of rapidly flowing gran-ular-fluid materials, Journal of Fluid Mechanics, 150 (1985) 357–380. DOI: 10.1017/s0022112085000167
Hare C., Ghadiri M., Stress and strain rate analysis of the FT4
Victor Francia et al. / KONA Powder and Particle Journal No. 38 (2021) 3–25
22
Powder Rheometer, EPJ Web of Conferences, 140 (2017) 3034. DOI: 10.1051/epjconf/201714003034
Hare C., Ghadiri M., Dennehy R., Prediction of attrition in agi-tated particle beds, Chemical Engineering Science, 66 (2011) 4757–4770. DOI: 10.1016/j.ces.2011.06.042
Hare C., Zafar U., Ghadiri M., Freeman T., Clayton J., Murtagh M.J., Analysis of the dynamics of the FT4 powder rheometer, Powder Technology, 285 (2015) 123–127. DOI: 10.1016/j.powtec.2015.04.039
Hare C., Zafar U., Ghadiri M., Freeman T., Clayton J., Murtagh M.J., Correction to “Analysis of the dynamics of the FT4 powder rheometer” [Powder Technol. 285 (2015) 123–127], Powder Technology, 315 (2017) 37–38. DOI: 10.1016/j.powtec.2017.02.061
Hartmann M., Palzer S., Caking of amorphous powders — Material aspects, modelling and applications, Powder Technology, 206-1-2 (2011) 112–121. DOI: 10.1016/j.powtec.2010.04.014
Hassanpour A., Ghadiri M., Characterisation of flowability of loosely compacted cohesive powders by indentation, Particle & Particle Systems Characterization, 24 (2007) 117–123. DOI: 10.1002/ppsc.200601111
Hassanpour A., Hare C., Pasha M., Powder Flow: Theory, Char-acterisation and Application, RSC Publishing, London, 2019. ISBN: 9781788018470.
Hausner H.H., Friction conditions in a mass of metal powder, International Journal of Powder Metallurgy, 3-14 (1967) 7–13.
Hsiau S.-S., Jang H.-W., Measurements of velocity fluctuations of granular materials in a shear cell, Experimental Thermal and Fluid Science, 17 (1998) 202–209. DOI: 10.1016/s0894-1777(97)10041-3
Jaeger H.M., Nagel S.R., Behringer R.P., Granular solids, liq-uids, and gases, Reviews of Modern Physics, 68-4 (1996) 1259–1273. DOI: 10.1103/revmodphys.68.1259
Jenike A.W., Storage and Flow of Solids, Rev. ed. Salt Lake City, Utah : University of Utah, 1970.
Jenkins J.T., Dense shearing flows of inelastic disks, Physics of Fluids, 18 (2006) 103307. DOI: 10.1063/1.2364168
Johanson K., Barletta D., The influence of air counter-flow through powder materials as a means of reducing cohesive flow problems, Particle & Particle Systems Characterization, 21 (2004) 316–325. DOI: 10.1002/ppsc.200400939
Johnson P.C., Jackson R., Frictional-collisional constitutive relations for granular materials, with application to plane shearing, Journal of Fluid Mechanics, 176 (1987) 67–93. DOI: 10.1017/s0022112087000570
Jop P., Forterre Y., Pouliquen O., A constitutive law for dense granular flows, Nature, 441 (2006) 727–730. DOI: 10.1038/nature04801
Klausner J.F., Chen D., Mei R., Experimental investigation of cohesive powder rheology, Powder Technology, 112 (2000) 94–101. DOI: 10.1016/S0032-5910(99)00310-1
Klein J., Höhne D., Husemann K., The influence of air permeation on the flow properties of bulk solids, Chemical Engineer-ing & Technology, 26 (2003) 139–146. DOI: 10.1002/ceat.200390020
Knight P.C., Seville J.P.K., Wellm A.B., Instone T., Prediction of
impeller torque in high shear powder mixers, Chemical Engi-neering Science, 56-15 (2001) 4457–4471. DOI: 10.1016/S0009-2509(01)00114-2
Koch D.L., Kinetic theory for a monodisperse gas-solid sus-pension, Physics of Fluids A: Fluid Dynamics, 2 (1990) 1711–1723. DOI: 10.1063/1.857698
Koynov S., Glasser B., Muzzio F., Comparison of three rotational shear cell testers: Powder flowability and bulk density, Powder Technology, 283 (2015) 103–112. DOI: 10.1016/j.powtec.2015.04.027
Krantz M., Zhang H., Zhu J., Characterization of powder flow: Static and dynamic testing, Powder Technology, 194 (2009) 239–245. DOI: 10.1016/j.powtec.2009.05.001
Krishnaraj K.P., Nott P.R., A dilation-driven vortex flow in sheared granular materials explains a rheometric anomaly, Nature Communications, 7 (2016) 10630. DOI: 10.1038/ncomms10630
Ladipo D.D., Puri V.M., Computer controlled shear cell for measurement of flow properties of particulate materials, Powder Technology, 92 (1997) 135–146. DOI: 10.1016/s0032-5910(97)03230-0
Landi G., Barletta D., Lettieri P., Poletto M., Flow properties of moisturized powders in a Couette fluidized bed rheometer, International Journal of Chemical Reactor Engineering, 10 (2012). DOI: 10.1515/1542-6580.2993
Langroudi M.K., Mort P.R., Tardos G.I., Study of powder flow patterns in a Couette cell with axial flow using tracers and solid fraction measurements, Granular Matter, 13 (2011) 541. DOI: 10.1007/s10035-011-0282-3
Langroudi M.K., Turek S., Ouazzi A., Tardos G.I., An investiga-tion of frictional and collisional powder flows using a unified constitutive equation, Powder Technology, 197 (2010a) 91–101. DOI: 10.1016/j.powtec.2009.09.001
Langroudi M.K., Turek S., Ouazzi A., Tardos G.I., Corrigendum to “An investigation of frictional and collisional powder flows using a unified constitutive equation” [Powder Tech-nology (197) 91–101], Powder Technology, 198 (2010b) 314. DOI: 10.1016/j.powtec.2009.11.020
Léonard G., Abatzoglou N., Stress distribution in lubricated vs unlubricated pharmaceutical powder columns and their con-tainer walls during translational and torsional shear testing, Powder Technology, 203 (2010) 534–547. DOI: 10.1016/j.powtec.2010.06.020
Leung L.Y., Mao C., Srivastava I., Du P., Yang C.-Y., Flow func-tion of pharmaceutical powders is predominantly governed by cohesion, not by friction coefficients, Journal of Pharma-ceutical Sciences, 106 (2017) 1865–1873. DOI: 10.1016/j.xphs.2017.04.012
Louati H., Experimental and numerical study of humid granular material : influence of liquid content in quasi-static regime, Ecole des Mines d’Albi-Carmaux, 2016.
Louati H., Oulahna D., de Ryck A., Apparent friction and cohe-sion of a partially wet granular material in steady-state shear, Powder Technology, 278 (2015) 65–71. DOI: 10.1016/j.powtec.2015.03.011
Louati H., Oulahna D., de Ryck A., Effect of the particle size and the liquid content on the shear behaviour of wet granular material, Powder Technology, 315 (2017) 398–409. DOI:
Victor Francia et al. / KONA Powder and Particle Journal No. 38 (2021) 3–25
23
10.1016/j.powtec.2017.04.030Ludwig B., Millington-Smith D., Dattani R., Adair J.H., Posatko
E.P., Mawby L.M., Ward S.K., Sills C.A., Evaluation of the hydrodynamic behavior of powders of varying cohesivity in a fluidized bed using the FT4 Powder Rheometer®, Powder Technology, 371 (2020) 106–114. DOI: 10.1016/j.powtec.2020.05.042
Lun C.K.K., Savage S.B., Jeffrey D.J., Chepurniy N., Kinetic theories for granular flow: inelastic particles in Couette flow and slightly inelastic particles in a general flowfield, Journal of Fluid Mechanics, 140 (1984) 223–256. DOI: 10.1017/s0022112084000586
Lupo M., Schütz D., Riedl E., Barletta D., Poletto M., Assessment of a powder rheometer equipped with a cylindrical impeller for the measurement of powder flow properties at low con-solidation, Powder Technology, 357 (2019) 281–290. DOI: 10.1016/j.powtec.2019.08.071
Marchal P., Smirani N., Choplin L., Rheology of dense-phase vibrated powders and molecular analogies, Journal of Rheol-ogy, 53 (2009) 1–29. DOI: 10.1122/1.3037266
Mehandia V., Gutam K.J., Nott P.R., Anomalous stress profile in a sheared granular column, Physical Review Letters, 109 (2012) 128002. DOI: 10.1103/PhysRevLett.109.128002
Midi G.D.R., On dense granular flows, European Physical Journal E, 14 (2004) 341–365. DOI: 10.1140/epje/i2003-10153-0
Mort P.R., Scale-up and control of binder agglomeration pro-cesses - Flow and stress fields, Powder Technology, 189 (2009) 313–317. DOI: 10.1016/j.powtec.2008.04.022
Moucheront P., Bertrand F., Koval G., Tocquer L., Rodts S., Roux J.-N., Corfdir A., Chevoir F., MRI investigation of granular interface rheology using a new cylinder shear apparatus, Magnetic Resonance Imaging, 28 (2010) 910–918. DOI: 10.1016/j.mri.2010.01.007
Mueth D.M., Debregeas G.F., Karczmar G.S., Eng P.J., Nagel S.R., Jaeger H.M., Signatures of granular microstructure in dense shear flows, Nature, 406 (2000) 385–389. DOI: 10.1038/35019032
Nan W., Ghadiri M., Wang Y., Analysis of powder rheometry of FT4: Effect of particle shape, Chemical Engineering Science, 173 (2017a) 374–383. DOI: 10.1016/j.ces.2017.08.004
Nan W., Ghadiri M., Wang Y., Analysis of powder rheometry of FT4: Effect of air flow, Chemical Engineering Science, 162 (2017b) 141–151. DOI: 10.1016/j.ces.2017.01.002
Ogata K., A review: Recent progress on evaluation of flowability and floodability of powder, KONA Powder and Particle Journal, 36 (2019) 33–49. DOI: 10.14356/kona.2019002
Ono T., Yonemochi E., Evaluation of the physical properties of dry surface-modified ibuprofen using a powder rheometer FT4 and analysis of the influence of pharmaceutical additives on improvement of the powder flowability, International Journal of Pharmaceutics, 579 (2020) 119165. DOI: 10.1016/j.ijpharm.2020.119165
Opaliński I., Chutkowski M., Stasiak M., Characterizing moist food-powder flowability using a Jenike shear-tester, Journal of Food Engineering, 108 (2012) 51–58. DOI: 10.1016/j.jfoodeng.2011.07.031
Orband J.L.R., Geldart D., Direct measurement of powder cohe-sion using a torsional device, Powder Technology, 92 (1997)
25–33. DOI: 10.1016/s0032-5910(97)03212-9Orlando A.D., Shen H.H., Effect of particle size and boundary
conditions on the shear stress in an annular shear cell, Granular Matter, 14 (2012) 423–431. DOI: 10.1007/s10035-012-0313-8
Pastor M., Blanc T., Pastor M.J., A depth-integrated viscoplastic model for dilatant saturated cohesive-frictional fluidized mixtures: Application to fast catastrophic landslides, Journal of Non-Newtonian Fluid Mechanics, 148 (2009) 142–153. DOI: 10.1016/j.jnnfm.2008.07.014
Petford N., Rheology of granitic magmas during ascent and emplacement, Annual Review of Earth and Planetary Sciences, 31 (2003) 399–427. DOI: 10.1146/annurev.earth.31.100901.141352
Pouliquen O., Scaling laws in granular flows down rough inclined planes, Physics of Fluids, 11 (1999) 542–548. DOI: 10.1063/1.869928
Rao K.K., Nott P.R., An Introduction to Granular Flow, Cam-bridge University Press, ISBN: 9780511611513, 2008. DOI: 10.1017/CBO9780511611513
Sakaie K., Fenistein D., Carroll T.J., van Hecke M., Umbanhowar P., MR imaging of Reynolds dilatancy in the bulk of smooth granular flows, EPL (Europhysics Letters), 84 (2008) 38001. DOI: 10.1209/0295-5075/84/38001
Salehi H., Barletta D., Poletto M., A comparison between powder flow property testers, Particuology, 32 (2017a) 10–20. DOI: 10.1016/j.partic.2016.08.003
Salehi H., Barletta D., Poletto M., Schütz D., Romirer R., On the use of a powder rheometer to characterize the powder flow-ability at low consolidation with torque resistances, AIChE Journal, 63 (2017b) 4788–4798. DOI: 10.1002/aic.15934
Salehi H., Sofia D., Schütz D., Barletta D., Poletto M., Experi-ments and simulation of torque in Anton Paar powder cell, Particulate Science and Technology, 36 (2018) 501–512. DOI: 10.1080/02726351.2017.1409850
Savage S.B., Analyses of slow high-concentration flows of gran-ular materials, Journal of Fluid Mechanics, 377 (1998) 1–26. DOI: 10.1017/s0022112098002936
Savage S.B., Sayed M., Stresses developed by dry cohesionless granular materials sheared in an annular shear cell, Journal of Fluid Mechanics, 142 (1984) 391–430. DOI: 10.1017/S0022112084001166
Schulze D., Development and application of a novel ring shear tester, Aufbereitungstechnik, 35 (1994) 524–535.
Schulze D., Practical determination of flow properties, in: Pow-ders and Bulk Solids: Behavior, Characterization, Storage and Flow, Springer Berlin Heidelberg, 2008, pp. 163–198. DOI: 10.1007/978-3-540-73768-1_6
Schwedes J., Measurement of flow properties of bulk solids, Powder Technology, 88 (1996) 285–290. DOI: 10.1016/s0032-5910(96)03132-4
Schwedes J., Review on testers for measuring flow properties of bulk solids, Granular Matter, 5 (2003) 1–43. DOI: 10.1007/s10035-002-0124-4
Shimada Y., Hatano S., Matsusaka S., A new method for evalu-ating powder flowability using constant-volume shear tester, Advanced Powder Technology, 29 (2018a) 3577–3583. DOI: 10.1016/j.apt.2018.08.028
Victor Francia et al. / KONA Powder and Particle Journal No. 38 (2021) 3–25
24
Shimada Y., Kawata T., Matsusaka S., Analysis of constant- volume shear tests based on precise measurement of stresses in powder beds, Advanced Powder Technology, 29 (2018b) 1372–1378. DOI: 10.1016/j.apt.2018.02.033
Srivastava A., Sundaresan S., Analysis of a frictional-kinetic model for gas-particle flow, Powder Technology, 129 (2003) 72–85. DOI: 10.1016/s0032-5910(02)00132-8
Sun J., Sundaresan S., A constitutive model with microstructure evolution for flow of rate-independent granular materials, Journal of Fluid Mechanics, 682 (2011) 590–616. DOI: 10.1017/jfm.2011.251
Sundaresan S., Some outstanding questions in handling of cohe-sionless particles, Powder Technology, 115 (2001) 2–7. DOI: 10.1016/S0032-5910(00)00423-X
Swize T., Osei-Yeboah F., Peterson M.L., Boulas P., Impact of shear history on powder flow characterization using a~ring shear tester, Journal of Pharmaceutical Sciences, 108 (2019) 750–754. DOI: 10.1016/j.xphs.2018.07.003
Tang Z., Brzinski T.A., Shearer M., Daniels K.E., Nonlocal rheol-ogy of dense granular flow in annular shear experiments, Soft Matter, 14 (2018) 3040–3048. DOI: 10.1039/c8sm00047f
Tardos G.I., Khan M.I., Schaeffer D.G., Forces on a slowly rotating, rough cylinder in a Couette device containing a dry, frictional powder, Physics of Fluids, 10 (1998) 335–341. DOI: 10.1063/1.869525
Tardos G.I., McNamara S., Talu I., Slow and intermediate flow of a frictional bulk powder in the Couette geometry, Powder Technology, 131 (2003) 23–39. DOI: 10.1016/s0032-5910(02)00315-7
Taylor M.K., Ginsburg J., Hickey A.J., Gheyas F., Composite method to quantify powder flow as a screening method in early tablet or capsule formulation development, AAPS PharmSciTech, 1 (2000) 20–30. DOI: 10.1208/pt010318
Teunou E., Fitzpatrick J.J., Effect of relative humidity and temperature on food powder flowability, Journal of Food Engineering, 42 (1999) 109–116. DOI: 10.1016/s0260-8774(99)00087-4
Teunou E., Fitzpatrick J.J., Effect of storage time and consolida-tion on food powder flowability, Journal of Food Engineering, 43 (2000) 97–101. DOI: 10.1016/s0260-8774(99)00137-5
Teunou E., Fitzpatrick J.J., Synnott E.C., Characterisation of food powder flowability, Journal of Food Engineering, 39 (1999) 31–37. DOI: 10.1016/s0260-8774(98)00140-x
Thakur S.C., Ahmadian H., Sun J., Ooi J.Y., An experimental and numerical study of packing, compression, and caking behaviour of detergent powders, Particuology, 12 (2014) 2–12. DOI: 10.1016/j.partic.2013.06.009
Tomasetta I., Barletta D., Lettieri P., Poletto M., The measurement of powder flow properties with a mechanically stirred aerated bed, Chemical Engineering Science, 69 (2012) 373–381. DOI: 10.1016/j.ces.2011.10.056
Tsao H.-K., Koch D.L., Simple shear flows of dilute gas-solid sus-pensions, Journal of Fluid Mechanics, 296 (1995) 211–245. DOI: 10.1017/s0022112095002114
Tsunakawa H., Aoki R., Measurements of the failure properties of granular materials and cohesive powders, Powder Technology, 33 (1982) 249–256. DOI: 10.1016/0032-5910(82)85063-8
Vescovi D., Berzi D., Richard P., Brodu N., Plane shear flows of frictionless spheres: Kinetic theory and 3D soft-sphere discrete element method simulations, Physics of Fluids, 26 (2014) 53305. DOI: 10.1063/1.4879267
Vidyapati V., Kheiripour Langroudi M., Sun J., Sundaresan S., Tardos G.I., Subramaniam S., Experimental and com-putational studies of dense granular flow: Transition from quasi-static to intermediate regime in a Couette shear device, Powder Technology, 220 (2012) 7–14. DOI: 10.1016/j.powtec.2011.09.032
Viswanath D.S., Ghosh T., Prasad D.H.L., Dutt N.V.K., Ran K.Y., Viscosity of liquids: Theory, estimation, experiment, and data, Springer Netherlands, Amsterdan, 2007. ISBN: 9781402054822
Vun S., Naser J., Witt P., Extension of the kinetic theory of granular flow to include dense quasi-static stresses, Powder Technology, 204 (2010) 11–20. DOI: 10.1016/j.powtec. 2010.07.001
Wang Y., Koynov S., Glasser B.J., Muzzio F.J., A method to analyze shear cell data of powders measured under different initial consolidation stresses, Powder Technology, 294 (2016) 105–112. DOI: 10.1016/j.powtec.2016.02.027
Wheeler S.J., Sivakumar V., An elasto-plastic critical state frame-work for unsaturated soil, Geotechnique, 45 (1995) 35–53. DOI: 10.1680/geot.1995.45.1.35
Wildman R.D., Martin T.W., Huntley J.M., Jenkins J.T., Viswanathan H., Fen X., Parker D.J., Experimental investiga-tion and kinetic-theory-based model of a rapid granular shear flow, Journal of Fluid Mechanics, 602 (2008) 63–79. DOI: 10.1017/s0022112008000700
Wu C.Y., Hung W.L., Miguélez-Morán A.M., Gururajan B., Seville J.P.K., Roller compaction of moist pharmaceutical powders, International Journal of Pharmaceutics, 391 (2010) 90–97. DOI: 10.1016/j.ijpharm.2010.02.022
Wu K., Francia V., Coppens M.O., Dynamic viscoplastic gran-ular flows: A persistent challenge in gas-solid fluidization, Powder Technology, 365 (2020) 172–185. DOI: 10.1016/j.powtec.2019.04.053
Yahia L.A.A., Piepke T.M., Barrett R., Ozel A., Ocone R., Devel-opment of a virtual Couette rheometer for aerated granular material, AIChE Journal, 66 (2020) e16945. DOI: 10.1002/aic.16945
Yang L., Padding J.T., Kuipers J.A.M, Modification of kinetic theory of granular flow for frictional spheres, Part I: Two-fluid model derivation and numerical implementation, Chemical Engineering Science, 152 (2016) 767–782. DOI: 10.1016/j.ces.2016.05.031
Zafar U., Hare C., Calvert G., Ghadiri M., Girimonte R., Formisani B., Quintanilla M.A.S., Valverde J.M., Compar-ison of cohesive powder flowability measured by Schulze shear cell, Raining bed method, Sevilla Powder Tester and new Ball Indentation Method, Powder Technology, 286 (2015) 807–816. DOI: 10.1016/j.powtec.2015.09.010
Zulfiqar M., Moghtaderi B., Wall T.F., Flow properties of biomass and coal blends, Fuel Processing Technology, 87 (2006) 281–288. DOI: 10.1016/j.fuproc.2004.10.007
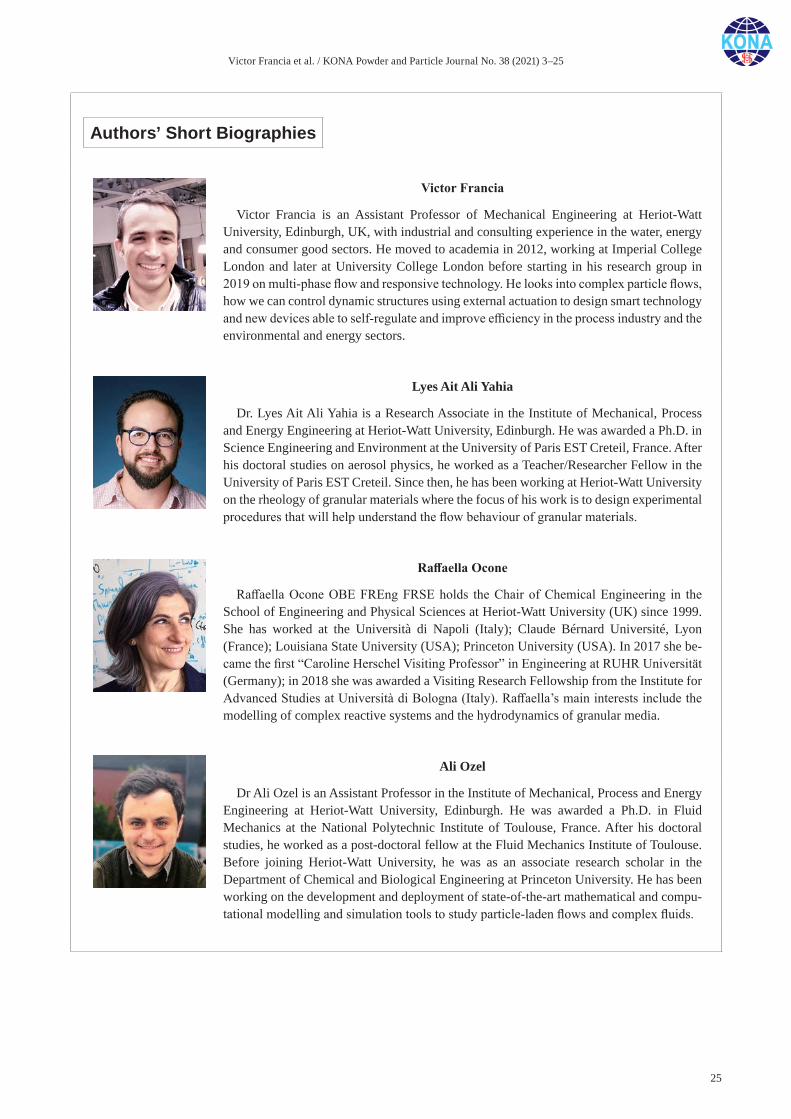
Victor Francia et al. / KONA Powder and Particle Journal No. 38 (2021) 3–25
25
Authors’ Short Biographies
Victor Francia
Victor Francia is an Assistant Professor of Mechanical Engineering at Heriot-Watt University, Edinburgh, UK, with industrial and consulting experience in the water, energy and consumer good sectors. He moved to academia in 2012, working at Imperial College London and later at University College London before starting in his research group in 2019 on multi-phase flow and responsive technology. He looks into complex particle flows, how we can control dynamic structures using external actuation to design smart technology and new devices able to self-regulate and improve efficiency in the process industry and the environmental and energy sectors.
Lyes Ait Ali Yahia
Dr. Lyes Ait Ali Yahia is a Research Associate in the Institute of Mechanical, Process and Energy Engineering at Heriot-Watt University, Edinburgh. He was awarded a Ph.D. in Science Engineering and Environment at the University of Paris EST Creteil, France. After his doctoral studies on aerosol physics, he worked as a Teacher/Researcher Fellow in the University of Paris EST Creteil. Since then, he has been working at Heriot-Watt University on the rheology of granular materials where the focus of his work is to design experimental procedures that will help understand the flow behaviour of granular materials.
Raffaella Ocone
Raffaella Ocone OBE FREng FRSE holds the Chair of Chemical Engineering in the School of Engineering and Physical Sciences at Heriot-Watt University (UK) since 1999. She has worked at the Università di Napoli (Italy); Claude Bérnard Université, Lyon (France); Louisiana State University (USA); Princeton University (USA). In 2017 she be-came the first “Caroline Herschel Visiting Professor” in Engineering at RUHR Universität (Germany); in 2018 she was awarded a Visiting Research Fellowship from the Institute for Advanced Studies at Università di Bologna (Italy). Raffaella’s main interests include the modelling of complex reactive systems and the hydrodynamics of granular media.
Ali Ozel
Dr Ali Ozel is an Assistant Professor in the Institute of Mechanical, Process and Energy Engineering at Heriot-Watt University, Edinburgh. He was awarded a Ph.D. in Fluid Mechanics at the National Polytechnic Institute of Toulouse, France. After his doctoral studies, he worked as a post-doctoral fellow at the Fluid Mechanics Institute of Toulouse. Before joining Heriot-Watt University, he was as an associate research scholar in the Department of Chemical and Biological Engineering at Princeton University. He has been working on the development and deployment of state-of-the-art mathematical and compu-tational modelling and simulation tools to study particle-laden flows and complex fluids.
KONA Powder and Particle Journal No. 38 (2021) 26–41/https://doi.org/10.14356/kona.2021017 Review Paper
26Copyright © 2021 The Authors. Published by Hosokawa Powder Technology Foundation. This is an open access article under the CC BY license (http://creativecommons.org/licenses/by/4.0/).
Static and Dynamic Stickiness Tests to Measure Particle Stickiness †
Erik J.G. Sewalt, Fuweng Zhang, Volkert van Steijn, J. Ruud van Ommen and Gabrie M.H. Meesters*
Department of Chemical Engineering, Delft University of Technology, The Netherlands
AbstractSticking of particles has a tremendous impact on powder-processing industries, especially for hygroscopic amorphous powders. A wide variety of experimental methods has been developed to measure at what combinations of temperature and moisture content material becomes sticky. This review describes, for each method, how so-called stickiness curves are determined. As particle velocity also plays a key role, we classify the methods into static and dynamic stickiness tests. Static stickiness tests have limited particle motion during the conditioning step prior to the measurement. Thus, the obtained information is particularly useful in predicting the long-term behavior of powder during storage or in packaging. Dynamic stickiness tests involve significant particle motion during conditioning and measurement. Stickiness curves strongly depend on particle velocity, and the obtained information is highly relevant to the design and operation of powder production and processing equipment. Virtually all methods determine the onset of stickiness using powder as a starting point. Given the many industrial processes like spray drying that start from a liquid that may become sticky upon drying, future effort should focus on developing test methods that determine the onset of stickiness using a liquid droplet as a starting point.
Keywords: stickiness, powders, caking, glass transition temperature, sintering
1. Introduction
Sticking of particles has a tremendous impact on numerous industries that process powders. Sticking can cause several issues, such as fouling and blockage of equipment, or caking of stored powder. It can also be used advantageously to produce agglomerates with beneficial properties. Why, how, and when particles stick together are critically important questions. In this review, we focus on the ‘when’ question by reviewing the experimental methods commonly used to determine the conditions under which sticking occurs. We hereby focus on the stickiness of hygroscopic amorphous powders, which play a major role in the food industry (Boonyai et al., 2004). Crystalline materials, which may also stick, but through a different mechanism (Kamyabi et al., 2017), are beyond this re-view’s scope.
Whether two particles stick depends on their material and a wide variety of parameters, including their tempera-ture, and moisture content. A common way to characterize
the stickiness of a material is to map the stickiness based on the environmental temperature and the moisture content. The moisture content can be described in terms of the par-ticle’s water mass fraction (xw), or the equilibrium environ-mental relative humidity (RH). The part of the parameter space for which the material is sticky is called the sticky region, which is bounded by the so-called sticky-point curve, T1(xw), and the so-called tack boundary, T2(xw), as illustrated in Fig. 1. Besides the environmental parameters, this map also illustrates the particle’s material properties in the form of a boundary between the glassy state and the rubbery state, known as the glass transition temperature, Tɡ(xw). The rubbery state has some overlap with the sticky region, and with further hydration becomes the liquid state (Roos, 2002). While particles are non-sticky in the glassy state, material properties, especially viscosity, drastically change upon transitioning to the rubbery state. Hence, the curves represented by the differences T1(xw) – Tɡ(xw) and T2(xw) – Tɡ(xw) are two meaningful measurements of the sticky-region that include the influence of temperature, moisture content, as well as the material. The distance be-tween the sticky-point curve T1(xw) and the glass transition curve Tɡ(xw) often slightly depends on xw (Palzer, 2005). Therefore, the onset of stickiness is commonly reported as a constant critical deviation from Tɡ(xw), denoted as (T – Tɡ)c.
† Received 5 June 2020; Accepted 11 August 2020 J-STAGE Advance published online 19 September 2020
* Corresponding author: Gabrie M.H. Meesters; Add: van der Maasweg 9, 2629HZ Delft, The Netherlands E-mail: [email protected] TEL: +31-15-278-5501
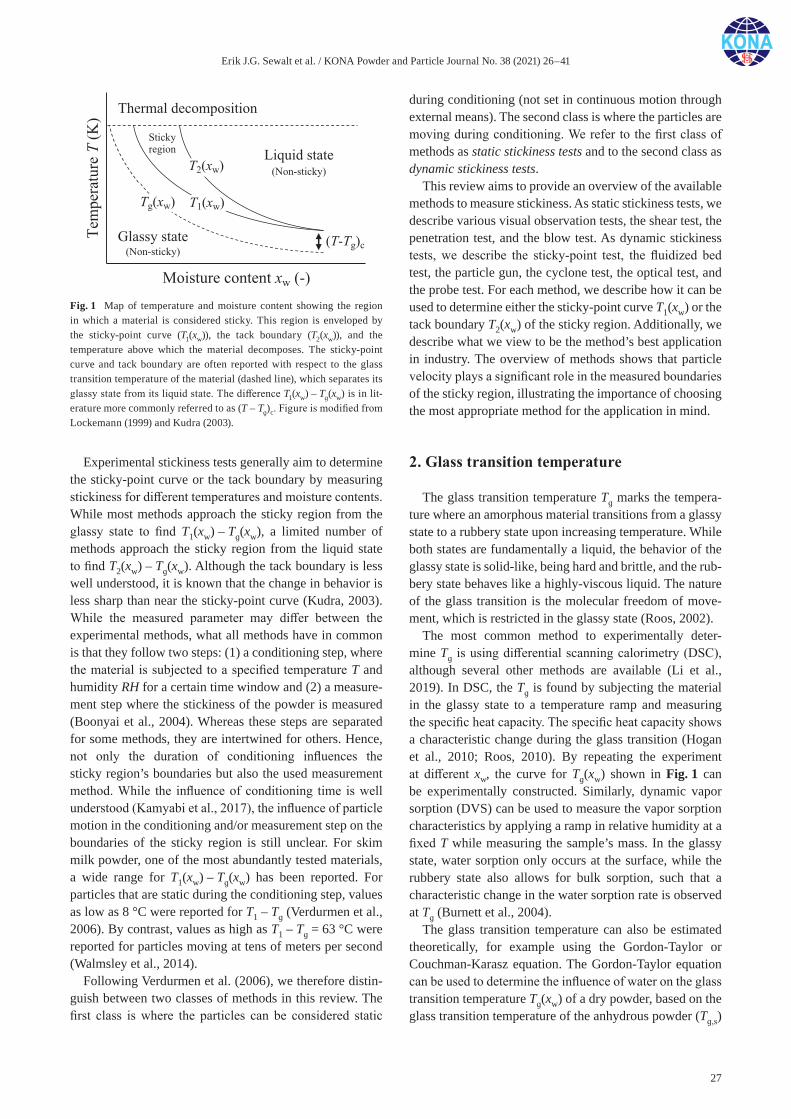
Erik J.G. Sewalt et al. / KONA Powder and Particle Journal No. 38 (2021) 26–41
27
Experimental stickiness tests generally aim to determine the sticky-point curve or the tack boundary by measuring stickiness for different temperatures and moisture contents. While most methods approach the sticky region from the glassy state to find T1(xw) – Tɡ(xw), a limited number of methods approach the sticky region from the liquid state to find T2(xw) – Tɡ(xw). Although the tack boundary is less well understood, it is known that the change in behavior is less sharp than near the sticky-point curve (Kudra, 2003). While the measured parameter may differ between the experimental methods, what all methods have in common is that they follow two steps: (1) a conditioning step, where the material is subjected to a specified temperature T and humidity RH for a certain time window and (2) a measure-ment step where the stickiness of the powder is measured (Boonyai et al., 2004). Whereas these steps are separated for some methods, they are intertwined for others. Hence, not only the duration of conditioning influences the sticky region’s boundaries but also the used measurement method. While the influence of conditioning time is well understood (Kamyabi et al., 2017), the influence of particle motion in the conditioning and/or measurement step on the boundaries of the sticky region is still unclear. For skim milk powder, one of the most abundantly tested materials, a wide range for T1(xw) – Tɡ(xw) has been reported. For particles that are static during the conditioning step, values as low as 8 °C were reported for T1 – Tɡ (Verdurmen et al., 2006). By contrast, values as high as T1 – Tɡ = 63 °C were reported for particles moving at tens of meters per second (Walmsley et al., 2014).
Following Verdurmen et al. (2006), we therefore distin-guish between two classes of methods in this review. The first class is where the particles can be considered static
during conditioning (not set in continuous motion through external means). The second class is where the particles are moving during conditioning. We refer to the first class of methods as static stickiness tests and to the second class as dynamic stickiness tests.
This review aims to provide an overview of the available methods to measure stickiness. As static stickiness tests, we describe various visual observation tests, the shear test, the penetration test, and the blow test. As dynamic stickiness tests, we describe the sticky-point test, the fluidized bed test, the particle gun, the cyclone test, the optical test, and the probe test. For each method, we describe how it can be used to determine either the sticky-point curve T1(xw) or the tack boundary T2(xw) of the sticky region. Additionally, we describe what we view to be the method’s best application in industry. The overview of methods shows that particle velocity plays a significant role in the measured boundaries of the sticky region, illustrating the importance of choosing the most appropriate method for the application in mind.
2. Glass transition temperature
The glass transition temperature Tɡ marks the tempera-ture where an amorphous material transitions from a glassy state to a rubbery state upon increasing temperature. While both states are fundamentally a liquid, the behavior of the glassy state is solid-like, being hard and brittle, and the rub-bery state behaves like a highly-viscous liquid. The nature of the glass transition is the molecular freedom of move-ment, which is restricted in the glassy state (Roos, 2002).
The most common method to experimentally deter-mine Tɡ is using differential scanning calorimetry (DSC), although several other methods are available (Li et al., 2019). In DSC, the Tɡ is found by subjecting the material in the glassy state to a temperature ramp and measuring the specific heat capacity. The specific heat capacity shows a characteristic change during the glass transition (Hogan et al., 2010; Roos, 2010). By repeating the experiment at different xw, the curve for Tɡ(xw) shown in Fig. 1 can be experimentally constructed. Similarly, dynamic vapor sorption (DVS) can be used to measure the vapor sorption characteristics by applying a ramp in relative humidity at a fixed T while measuring the sample’s mass. In the glassy state, water sorption only occurs at the surface, while the rubbery state also allows for bulk sorption, such that a characteristic change in the water sorption rate is observed at Tɡ (Burnett et al., 2004).
The glass transition temperature can also be estimated theoretically, for example using the Gordon-Taylor or Couchman-Karasz equation. The Gordon-Taylor equation can be used to determine the influence of water on the glass transition temperature Tɡ(xw) of a dry powder, based on the glass transition temperature of the anhydrous powder (Tɡ,s)
Fig. 1 Map of temperature and moisture content showing the region in which a material is considered sticky. This region is enveloped by the sticky-point curve (T1(xw)), the tack boundary (T2(xw)), and the temperature above which the material decomposes. The sticky-point curve and tack boundary are often reported with respect to the glass transition temperature of the material (dashed line), which separates its glassy state from its liquid state. The difference T1(xw) – Tɡ(xw) is in lit-erature more commonly referred to as (T – Tɡ)c. Figure is modified from Lockemann (1999) and Kudra (2003).
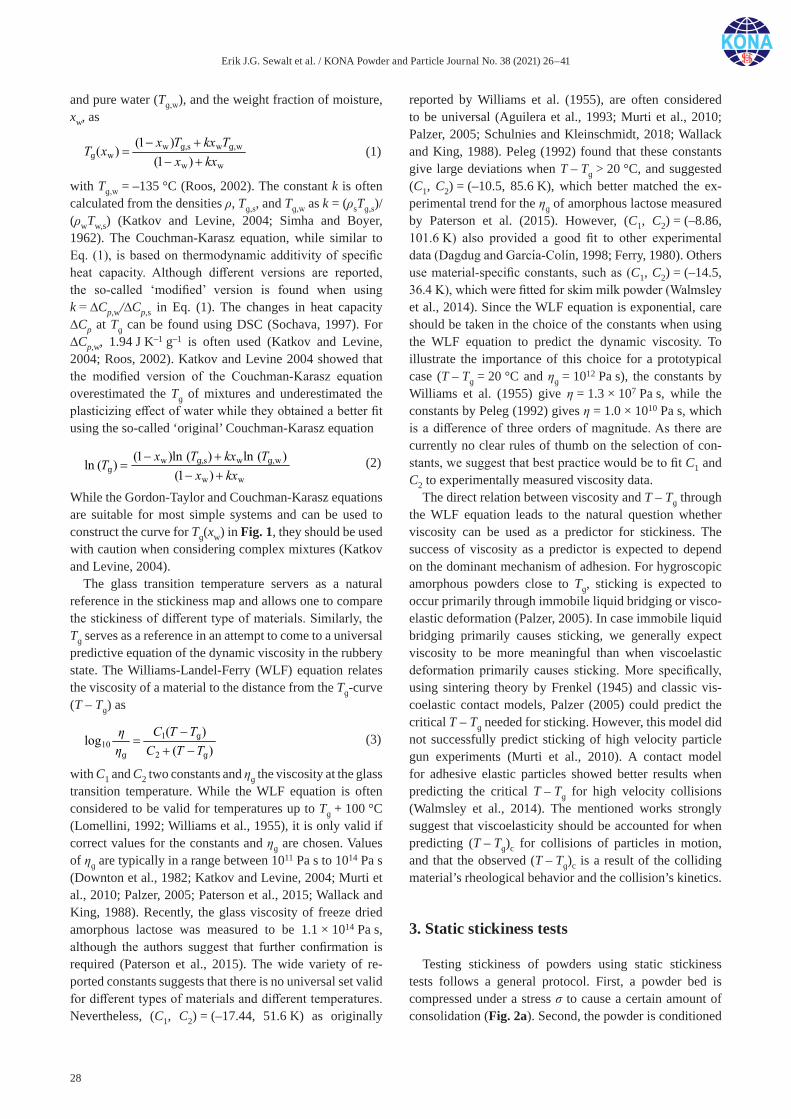
Erik J.G. Sewalt et al. / KONA Powder and Particle Journal No. 38 (2021) 26–41
28
and pure water (Tɡ,w), and the weight fraction of moisture, xw, as
w ,s w ,ww
w w
(1 )( )
(1 )x T kx T
T xx kx
g g
g
g: DejaVu Serif + サイズ小さく
(1)
(1)
with Tɡ,w = –135 °C (Roos, 2002). The constant k is often calculated from the densities ρ, Tɡ,s, and Tɡ,w as k = (ρsTɡ,s)/(ρwTw,s) (Katkov and Levine, 2004; Simha and Boyer, 1962). The Couchman-Karasz equation, while similar to Eq. (1), is based on thermodynamic additivity of specific heat capacity. Although different versions are reported, the so-called ‘modified’ version is found when using k = ∆Cp,w/∆Cp,s in Eq. (1). The changes in heat capacity ∆Cp at Tɡ can be found using DSC (Sochava, 1997). For ∆Cp,w, 1.94 J K–1 g–1 is often used (Katkov and Levine, 2004; Roos, 2002). Katkov and Levine 2004 showed that the modified version of the Couchman-Karasz equation overestimated the Tɡ of mixtures and underestimated the plasticizing effect of water while they obtained a better fit using the so-called ‘original’ Couchman-Karasz equation
w ,s w ,w
w w
(1 )ln ( ) ln ( )ln ( )
(1 )x T kx T
Tx kx
g g
g
(2)
(2)
While the Gordon-Taylor and Couchman-Karasz equations are suitable for most simple systems and can be used to construct the curve for Tɡ(xw) in Fig. 1, they should be used with caution when considering complex mixtures (Katkov and Levine, 2004).
The glass transition temperature servers as a natural reference in the stickiness map and allows one to compare the stickiness of different type of materials. Similarly, the Tɡ serves as a reference in an attempt to come to a universal predictive equation of the dynamic viscosity in the rubbery state. The Williams-Landel-Ferry (WLF) equation relates the viscosity of a material to the distance from the Tɡ-curve (T – Tɡ) as
110
2
( )log
( )C T TC T T
g
g g
(3)
(3)
with C1 and C2 two constants and ηɡ the viscosity at the glass transition temperature. While the WLF equation is often considered to be valid for temperatures up to Tɡ + 100 °C (Lomellini, 1992; Williams et al., 1955), it is only valid if correct values for the constants and ηɡ are chosen. Values of ηɡ are typically in a range between 1011 Pa s to 1014 Pa s (Downton et al., 1982; Katkov and Levine, 2004; Murti et al., 2010; Palzer, 2005; Paterson et al., 2015; Wallack and King, 1988). Recently, the glass viscosity of freeze dried amorphous lactose was measured to be 1.1 × 10¹⁴ Pa s, although the authors suggest that further confirmation is required (Paterson et al., 2015). The wide variety of re-ported constants suggests that there is no universal set valid for different types of materials and different temperatures. Nevertheless, (C1, C2) = (–17.44, 51.6 K) as originally
reported by Williams et al. (1955), are often considered to be universal (Aguilera et al., 1993; Murti et al., 2010; Palzer, 2005; Schulnies and Kleinschmidt, 2018; Wallack and King, 1988). Peleg (1992) found that these constants give large deviations when T – Tɡ > 20 °C, and suggested (C1, C2) = (–10.5, 85.6 K), which better matched the ex-perimental trend for the ηɡ of amorphous lactose measured by Paterson et al. (2015). However, (C1, C2) = (–8.86, 101.6 K) also provided a good fit to other experimental data (Dagdug and Garcıa-Colın, 1998; Ferry, 1980). Others use material-specific constants, such as (C1, C2) = (–14.5, 36.4 K), which were fitted for skim milk powder (Walmsley et al., 2014). Since the WLF equation is exponential, care should be taken in the choice of the constants when using the WLF equation to predict the dynamic viscosity. To illustrate the importance of this choice for a prototypical case (T – Tɡ = 20 °C and ηɡ = 1012 Pa s), the constants by Williams et al. (1955) give η = 1.3 × 10⁷ Pa s, while the constants by Peleg (1992) gives η = 1.0 × 10¹⁰ Pa s, which is a difference of three orders of magnitude. As there are currently no clear rules of thumb on the selection of con-stants, we suggest that best practice would be to fit C1 and C2 to experimentally measured viscosity data.
The direct relation between viscosity and T – Tɡ through the WLF equation leads to the natural question whether viscosity can be used as a predictor for stickiness. The success of viscosity as a predictor is expected to depend on the dominant mechanism of adhesion. For hygroscopic amorphous powders close to Tɡ, sticking is expected to occur primarily through immobile liquid bridging or visco-elastic deformation (Palzer, 2005). In case immobile liquid bridging primarily causes sticking, we generally expect viscosity to be more meaningful than when viscoelastic deformation primarily causes sticking. More specifically, using sintering theory by Frenkel (1945) and classic vis-coelastic contact models, Palzer (2005) could predict the critical T – Tɡ needed for sticking. However, this model did not successfully predict sticking of high velocity particle gun experiments (Murti et al., 2010). A contact model for adhesive elastic particles showed better results when predicting the critical T – Tɡ for high velocity collisions (Walmsley et al., 2014). The mentioned works strongly suggest that viscoelasticity should be accounted for when predicting (T – Tɡ)c for collisions of particles in motion, and that the observed (T – Tɡ)c is a result of the colliding material’s rheological behavior and the collision’s kinetics.
3. Static stickiness tests
Testing stickiness of powders using static stickiness tests follows a general protocol. First, a powder bed is compressed under a stress σ to cause a certain amount of consolidation (Fig. 2a). Second, the powder is conditioned
Erik J.G. Sewalt et al. / KONA Powder and Particle Journal No. 38 (2021) 26–41
29
by exposing it to an environment of controlled temperature and relative humidity (Fig. 2b). The duration of this con-ditioning step can be adjusted. When sufficiently long, the powder’s moisture content is in thermodynamic equilib-rium with the moisture in the environment such that xw and RH are related through a vapor sorption isotherm. Third, a measurement is performed on the conditioned powder (Fig. 2c). Prior to the measurement, the powder can be considered static with little movement of the particles. Therefore, we refer to this class of tests as static stickiness tests, which are deliberately different from the dynamic stickiness tests in which the particles are actively set in continuous motion during the conditioning and measure-ment step. Next, we describe the different static stickiness tests.
3.1 Visual observation
The most straightforward form of analysis is through visual observation. Typically, a sample with a specified dry matter content is placed in a closed container. After conditioning it at a given temperature, the container is turned upside down to see whether any particles are stuck to the bottom. This procedure is repeated at different temperatures until particles noticeably stick to the bottom, which is identified as the sticky-point temperature (Palzer, 2005). By repeating this procedure for different moisture contents, the sticky-point curve T1(xw) in Fig. 1 can be
constructed. An alternative visual observation test is one in which the powder’s temperature is increased stepwise while observing changes in the appearance of the powder bed (Tsourouflis et al., 1976; Verdurmen et al., 2006).
3.2 Shear test
Shear tests are used to characterize powder stickiness by measuring the powder’s response to shear stress. Two common approaches are uniaxial compression and shear-ing in shear cells. The uniaxial compression approach consolidates the bed with normal stress σ and then com-presses along one axis until failure. The failure stress σf for different values of σ gives a yield locus that can be used to find the unconfined yield strength σc by drawing a Mohr circle starting at σ = 0 Pa (Schulze, 2008). The unconfined yield strength σc is used as the parameter for bed strength and can be determined for different environmental T and RH (Fitzpatrick et al., 2007b; Hartmann and Palzer, 2011). In order to find a sticky-point curve T1(xw), a critical bed strength, which is characteristic for a sticky powder, must be determined first. It can be empirically determined before testing using the same or comparable materials (Palzer and Zürcher, 2004).
Similarly to uniaxial compression, shear cells can be used to determine σc and acquire T1(xw) by defining a critical σc for the bed strength of a sticky powder (Hart-mann and Palzer, 2011; Schulnies and Kleinschmidt,
Fig. 2 An overview of the static stickiness tests. a) In the consolidation step, the powder is compressed under a stress σ. b) In the conditioning step, the powder is subjected to temperature T and relative humidity RH for a specified duration. c) The measurement of stickiness proceeds differently per test.
Erik J.G. Sewalt et al. / KONA Powder and Particle Journal No. 38 (2021) 26–41
30
2018). However, shear cells improve on result consis-tency by preshearing before measuring the failure stress. Preshearing to steady-state at normal stress σ1 eliminates any stress history, for example, due to filling (Schulnies and Kleinschmidt, 2018). After preshearing, the shear stress is reversed to reduce the shear stress to zero. Subse-quently, the sample is sheared to failure while measuring shear stress στ under normal stress σ2 so that σ1 < σ2 (overconsolidation), which ensures a peak is observed for the failure stress (Schulze, 2008). By shearing to failure at different σ2 while preshearing at identical σ1 a yield locus can be found. From this point on, the acquisition of σc and T1(xw) is similar to uniaxial compression.
Besides acquiring the sticky-point curve, shear tests have other commonly used applications related to stickiness and powder cohesion. Shear tests are commonly used to quan-tify the powder flowability. The flowability is described in terms of the flow function, which is the inverse slope in a plot of unconfined yield strength σc versus normal stress σ (Fitzpatrick et al., 2007b; Jenike, 1964; Papadakis and Bahu, 1992; Schulze, 2008). Shear cells can also be used to measure wall friction. This is done by replacing the bottom ring of a shear cell with the wall material. When choosing the wall material similar to industrial surfaces or packaging materials, the adhesion of powder to these substrates can be measured (Papadakis and Bahu, 1992; Schulze, 2008).
Commonly used examples of shear cells are the manual Jenike shear cell (Jenike, 1964), the automated Schulze ring shear test (Schulnies and Kleinschmidt, 2018), or the more recent Freeman FT4 Powder Rheometer (Freeman, 2007) and Anton Paar MCR rheometers (Anton Paar GmbH, 2020; Groen et al., 2020). Conveniently, both the Freeman and Anton Paar powder rheometers can quickly change environmental T and RH independently through powder bed aeration with conditioned airflow (Freeman, 2007; Groen et al., 2020; Mitra et al., 2017). Besides uni-axial compression and shear cells, other types of shear tests for measuring flowability have been reported (e.g., Warren Spring cohesion tester, Peschl shear cell). These were not described as their application to find T1(xw) was not found in literature (Pasley et al., 1995).
3.3 Penetration test
Penetration tests are similar to the uniaxial compression tests, but use a puncher with a diameter of 1 mm to 2 mm to penetrate the powder bed to a preset depth (Knight and Johnson, 1988). Measurement of the required penetration force Fp, which is a measure for bed strength (Özkan et al., 2002; 2003), is done after conditioning at a fixed T and RH for a given time. Through repetition, while varying these conditions, the sticky-point curve T1(xw) is found for the combinations of T and RH, where the measured Fp equals a predetermined critical value for which the powder is
considered sticky (Özkan et al., 2003).
3.4 Blow test
The blow test uses a small thin tube to blow air at a powder bed surface. The tube is placed millimeters above the surface at an angle of 45°. The airflow through the tube is increased until particles dislodge from the surface of the conditioned powder bed, which is the endpoint of the blow test. The flow rate of air at which particles start dislodging is a measure for bed strength (Paterson et al., 2001). The sticky-point curve T1(xw) is found at the T and RH where the airflow to dislodge particles reaches a predetermined critical value for which the powder is considered sticky (Foster et al., 2005; Paterson et al., 2005).
A benefit of the blow test is the ability to test multiple times without needing to repeat the consolidation and con-ditioning step. The powder bed sits on a distributor plate, which sections the powder into multiple parts with an equal amount of powder. Each section of powder is conditioned with the same T and RH and can be measured separately by rotating the thin tube. Therefore, the blow test is con-venient when interested in temporal measurements, such as determining the rate of bed strength increase (Paterson et al., 2005).
3.5 Comparison of tests
While simplicity is a strength of the visual observation tests, it is also their greatest weakness. The accurate detec-tion of the sticky-point temperature relies on the observer’s experience. Based on caking theory, we expect that visible changes in powder properties occur after a high degree of agglomeration has taken place (Kamyabi et al., 2017). Hence, human observers can miss the onset of stickiness, which would cause an over-prediction of the sticky-point temperature. The onset of stickiness can be more precisely quantified with the other tests. Based on the literature, we find that shear tests are more accurate than penetration tests, with less scatter of data and time consolidation ef-fects that are easier to detect (Knight and Johnson, 1988; Schwedes, 2003). Based on these findings, we recommend using uniaxial compression or shear cells instead of pene-tration tests, in line with Knight and Johnson (1988), who recommended to only use penetrometry in support of shear cell experiments. While shear tests are applied to the bulk of the powder, the blow test is applied to the powder’s sur-face, suggesting that the blow test mostly tests the surface conditions. Blow tests nevertheless create channels in the powder bed (Billings et al., 2006; Paterson et al., 2005), indicating that the bulk is strongly affected by blow test. Hence, we expect that blow tests can be used to determine (bulk) stickiness, similarly to the shear tests. An advantage of the shear tests over the blow test is that the compression
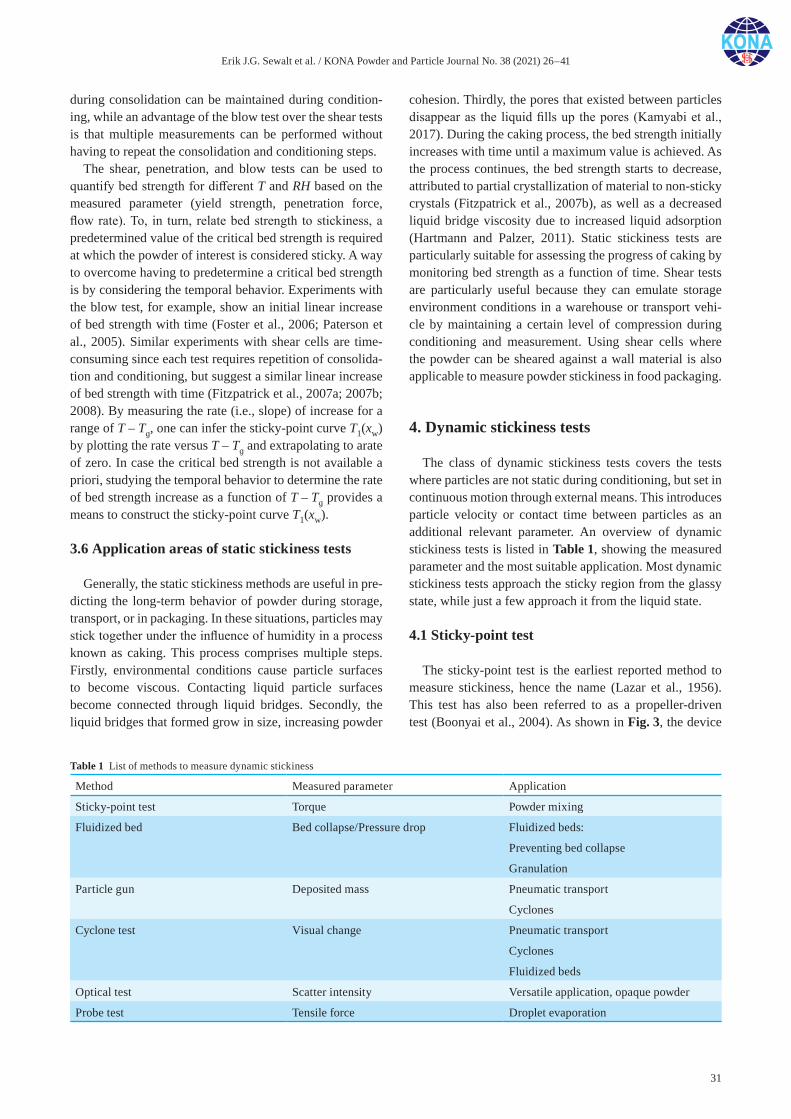
Erik J.G. Sewalt et al. / KONA Powder and Particle Journal No. 38 (2021) 26–41
31
during consolidation can be maintained during condition-ing, while an advantage of the blow test over the shear tests is that multiple measurements can be performed without having to repeat the consolidation and conditioning steps.
The shear, penetration, and blow tests can be used to quantify bed strength for different T and RH based on the measured parameter (yield strength, penetration force, flow rate). To, in turn, relate bed strength to stickiness, a predetermined value of the critical bed strength is required at which the powder of interest is considered sticky. A way to overcome having to predetermine a critical bed strength is by considering the temporal behavior. Experiments with the blow test, for example, show an initial linear increase of bed strength with time (Foster et al., 2006; Paterson et al., 2005). Similar experiments with shear cells are time- consuming since each test requires repetition of consolida-tion and conditioning, but suggest a similar linear increase of bed strength with time (Fitzpatrick et al., 2007a; 2007b; 2008). By measuring the rate (i.e., slope) of increase for a range of T – Tɡ, one can infer the sticky-point curve T1(xw) by plotting the rate versus T – Tɡ and extrapolating to arate of zero. In case the critical bed strength is not available a priori, studying the temporal behavior to determine the rate of bed strength increase as a function of T – Tɡ provides a means to construct the sticky-point curve T1(xw).
3.6 Application areas of static stickiness tests
Generally, the static stickiness methods are useful in pre-dicting the long-term behavior of powder during storage, transport, or in packaging. In these situations, particles may stick together under the influence of humidity in a process known as caking. This process comprises multiple steps. Firstly, environmental conditions cause particle surfaces to become viscous. Contacting liquid particle surfaces become connected through liquid bridges. Secondly, the liquid bridges that formed grow in size, increasing powder
cohesion. Thirdly, the pores that existed between particles disappear as the liquid fills up the pores (Kamyabi et al., 2017). During the caking process, the bed strength initially increases with time until a maximum value is achieved. As the process continues, the bed strength starts to decrease, attributed to partial crystallization of material to non-sticky crystals (Fitzpatrick et al., 2007b), as well as a decreased liquid bridge viscosity due to increased liquid adsorption (Hartmann and Palzer, 2011). Static stickiness tests are particularly suitable for assessing the progress of caking by monitoring bed strength as a function of time. Shear tests are particularly useful because they can emulate storage environment conditions in a warehouse or transport vehi-cle by maintaining a certain level of compression during conditioning and measurement. Using shear cells where the powder can be sheared against a wall material is also applicable to measure powder stickiness in food packaging.
4. Dynamic stickiness tests
The class of dynamic stickiness tests covers the tests where particles are not static during conditioning, but set in continuous motion through external means. This introduces particle velocity or contact time between particles as an additional relevant parameter. An overview of dynamic stickiness tests is listed in Table 1, showing the measured parameter and the most suitable application. Most dynamic stickiness tests approach the sticky region from the glassy state, while just a few approach it from the liquid state.
4.1 Sticky-point test
The sticky-point test is the earliest reported method to measure stickiness, hence the name (Lazar et al., 1956). This test has also been referred to as a propeller-driven test (Boonyai et al., 2004). As shown in Fig. 3, the device
Table 1 List of methods to measure dynamic stickiness
Method Measured parameter Application
Sticky-point test Torque Powder mixing
Fluidized bed Bed collapse/Pressure drop Fluidized beds:
Preventing bed collapse
Granulation
Particle gun Deposited mass Pneumatic transport
Cyclones
Cyclone test Visual change Pneumatic transport
Cyclones
Fluidized beds
Optical test Scatter intensity Versatile application, opaque powder
Probe test Tensile force Droplet evaporation
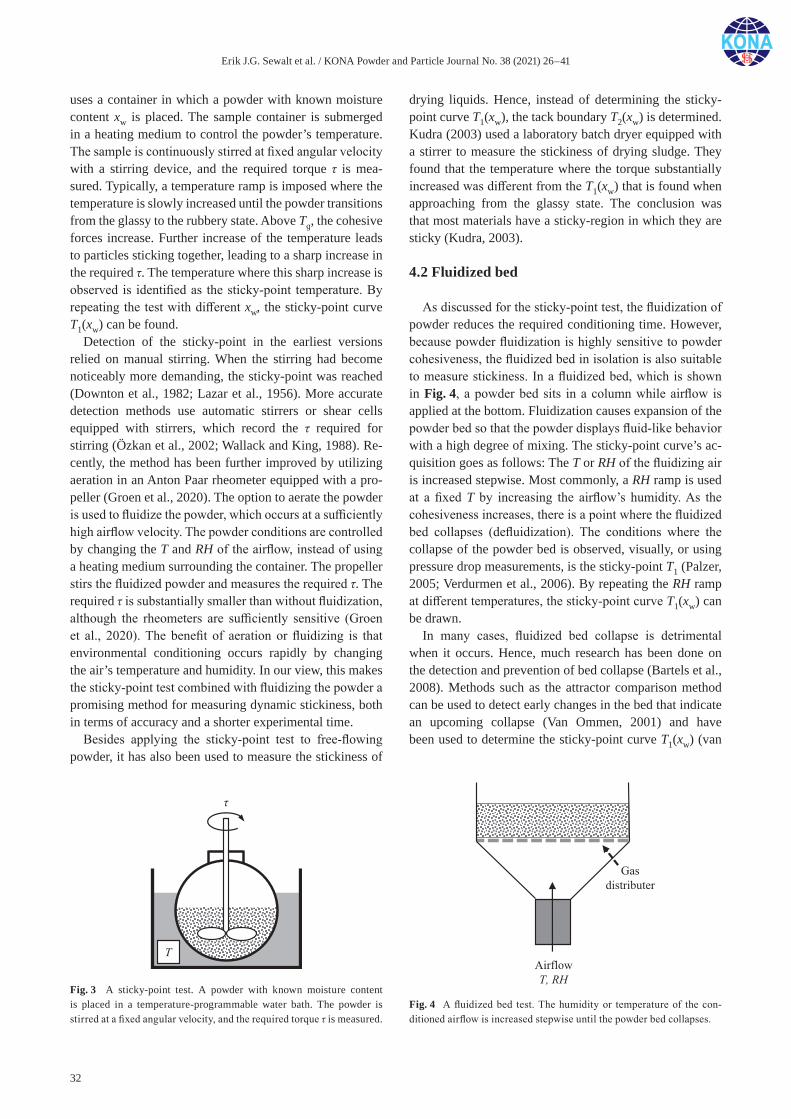
Erik J.G. Sewalt et al. / KONA Powder and Particle Journal No. 38 (2021) 26–41
32
uses a container in which a powder with known moisture content xw is placed. The sample container is submerged in a heating medium to control the powder’s temperature. The sample is continuously stirred at fixed angular velocity with a stirring device, and the required torque τ is mea-sured. Typically, a temperature ramp is imposed where the temperature is slowly increased until the powder transitions from the glassy to the rubbery state. Above Tɡ, the cohesive forces increase. Further increase of the temperature leads to particles sticking together, leading to a sharp increase in the required τ. The temperature where this sharp increase is observed is identified as the sticky-point temperature. By repeating the test with different xw, the sticky-point curve T1(xw) can be found.
Detection of the sticky-point in the earliest versions relied on manual stirring. When the stirring had become noticeably more demanding, the sticky-point was reached (Downton et al., 1982; Lazar et al., 1956). More accurate detection methods use automatic stirrers or shear cells equipped with stirrers, which record the τ required for stirring (Özkan et al., 2002; Wallack and King, 1988). Re-cently, the method has been further improved by utilizing aeration in an Anton Paar rheometer equipped with a pro-peller (Groen et al., 2020). The option to aerate the powder is used to fluidize the powder, which occurs at a sufficiently high airflow velocity. The powder conditions are controlled by changing the T and RH of the airflow, instead of using a heating medium surrounding the container. The propeller stirs the fluidized powder and measures the required τ. The required τ is substantially smaller than without fluidization, although the rheometers are sufficiently sensitive (Groen et al., 2020). The benefit of aeration or fluidizing is that environmental conditioning occurs rapidly by changing the air’s temperature and humidity. In our view, this makes the sticky-point test combined with fluidizing the powder a promising method for measuring dynamic stickiness, both in terms of accuracy and a shorter experimental time.
Besides applying the sticky-point test to free-flowing powder, it has also been used to measure the stickiness of
drying liquids. Hence, instead of determining the sticky-point curve T1(xw), the tack boundary T2(xw) is determined. Kudra (2003) used a laboratory batch dryer equipped with a stirrer to measure the stickiness of drying sludge. They found that the temperature where the torque substantially increased was different from the T1(xw) that is found when approaching from the glassy state. The conclusion was that most materials have a sticky-region in which they are sticky (Kudra, 2003).
4.2 Fluidized bed
As discussed for the sticky-point test, the fluidization of powder reduces the required conditioning time. However, because powder fluidization is highly sensitive to powder cohesiveness, the fluidized bed in isolation is also suitable to measure stickiness. In a fluidized bed, which is shown in Fig. 4, a powder bed sits in a column while airflow is applied at the bottom. Fluidization causes expansion of the powder bed so that the powder displays fluid-like behavior with a high degree of mixing. The sticky-point curve’s ac-quisition goes as follows: The T or RH of the fluidizing air is increased stepwise. Most commonly, a RH ramp is used at a fixed T by increasing the airflow’s humidity. As the cohesiveness increases, there is a point where the fluidized bed collapses (defluidization). The conditions where the collapse of the powder bed is observed, visually, or using pressure drop measurements, is the sticky-point T1 (Palzer, 2005; Verdurmen et al., 2006). By repeating the RH ramp at different temperatures, the sticky-point curve T1(xw) can be drawn.
In many cases, fluidized bed collapse is detrimental when it occurs. Hence, much research has been done on the detection and prevention of bed collapse (Bartels et al., 2008). Methods such as the attractor comparison method can be used to detect early changes in the bed that indicate an upcoming collapse (Van Ommen, 2001) and have been used to determine the sticky-point curve T1(xw) (van
Fig. 3 A sticky-point test. A powder with known moisture content is placed in a temperature-programmable water bath. The powder is stirred at a fixed angular velocity, and the required torque τ is measured.
Fig. 4 A fluidized bed test. The humidity or temperature of the con-ditioned airflow is increased stepwise until the powder bed collapses.
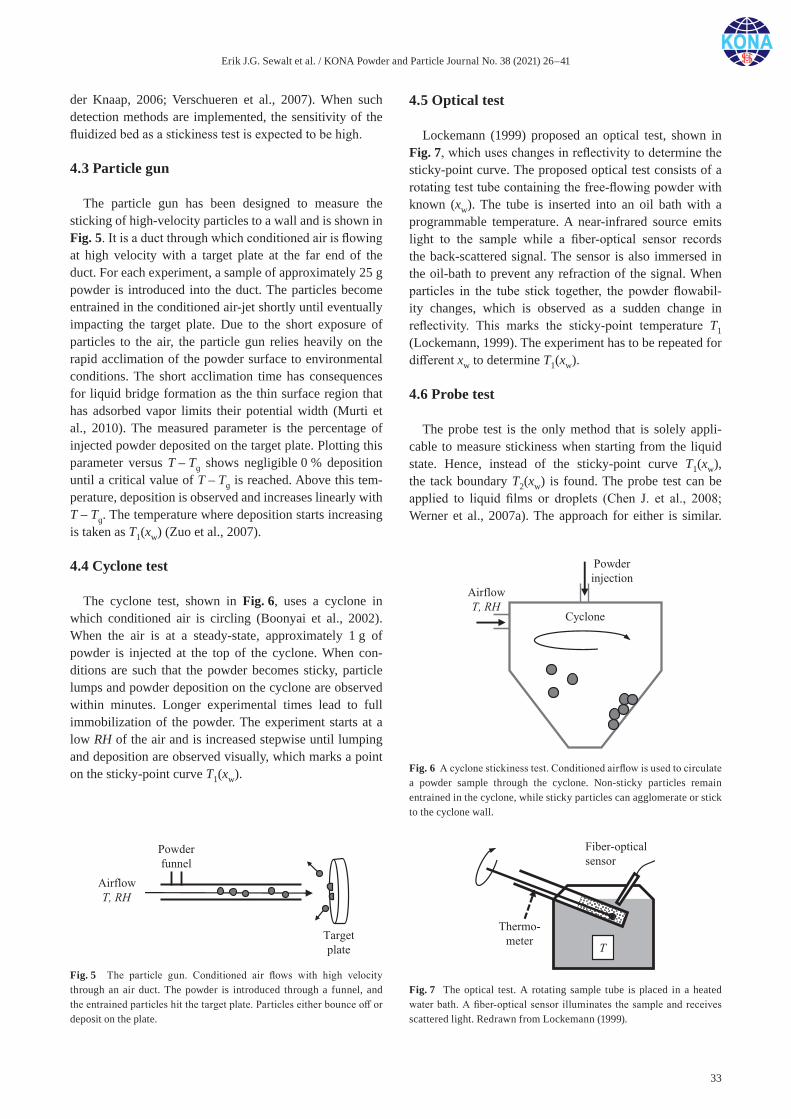
Erik J.G. Sewalt et al. / KONA Powder and Particle Journal No. 38 (2021) 26–41
33
der Knaap, 2006; Verschueren et al., 2007). When such detection methods are implemented, the sensitivity of the fluidized bed as a stickiness test is expected to be high.
4.3 Particle gun
The particle gun has been designed to measure the sticking of high-velocity particles to a wall and is shown in Fig. 5. It is a duct through which conditioned air is flowing at high velocity with a target plate at the far end of the duct. For each experiment, a sample of approximately 25 g powder is introduced into the duct. The particles become entrained in the conditioned air-jet shortly until eventually impacting the target plate. Due to the short exposure of particles to the air, the particle gun relies heavily on the rapid acclimation of the powder surface to environmental conditions. The short acclimation time has consequences for liquid bridge formation as the thin surface region that has adsorbed vapor limits their potential width (Murti et al., 2010). The measured parameter is the percentage of injected powder deposited on the target plate. Plotting this parameter versus T – Tɡ shows negligible 0 % deposition until a critical value of T – Tɡ is reached. Above this tem-perature, deposition is observed and increases linearly with T – Tɡ. The temperature where deposition starts increasing is taken as T1(xw) (Zuo et al., 2007).
4.4 Cyclone test
The cyclone test, shown in Fig. 6, uses a cyclone in which conditioned air is circling (Boonyai et al., 2002). When the air is at a steady-state, approximately 1 g of powder is injected at the top of the cyclone. When con-ditions are such that the powder becomes sticky, particle lumps and powder deposition on the cyclone are observed within minutes. Longer experimental times lead to full immobilization of the powder. The experiment starts at a low RH of the air and is increased stepwise until lumping and deposition are observed visually, which marks a point on the sticky-point curve T1(xw).
4.5 Optical test
Lockemann (1999) proposed an optical test, shown in Fig. 7, which uses changes in reflectivity to determine the sticky-point curve. The proposed optical test consists of a rotating test tube containing the free-flowing powder with known (xw). The tube is inserted into an oil bath with a programmable temperature. A near-infrared source emits light to the sample while a fiber-optical sensor records the back-scattered signal. The sensor is also immersed in the oil-bath to prevent any refraction of the signal. When particles in the tube stick together, the powder flowabil-ity changes, which is observed as a sudden change in reflectivity. This marks the sticky-point temperature T1 (Lockemann, 1999). The experiment has to be repeated for different xw to determine T1(xw).
4.6 Probe test
The probe test is the only method that is solely appli-cable to measure stickiness when starting from the liquid state. Hence, instead of the sticky-point curve T1(xw), the tack boundary T2(xw) is found. The probe test can be applied to liquid films or droplets (Chen J. et al., 2008; Werner et al., 2007a). The approach for either is similar.
Fig. 5 The particle gun. Conditioned air flows with high velocity through an air duct. The powder is introduced through a funnel, and the entrained particles hit the target plate. Particles either bounce off or deposit on the plate.
Fig. 6 A cyclone stickiness test. Conditioned airflow is used to circulate a powder sample through the cyclone. Non-sticky particles remain entrained in the cyclone, while sticky particles can agglomerate or stick to the cyclone wall.
Fig. 7 The optical test. A rotating sample tube is placed in a heated water bath. A fiber-optical sensor illuminates the sample and receives scattered light. Redrawn from Lockemann (1999).
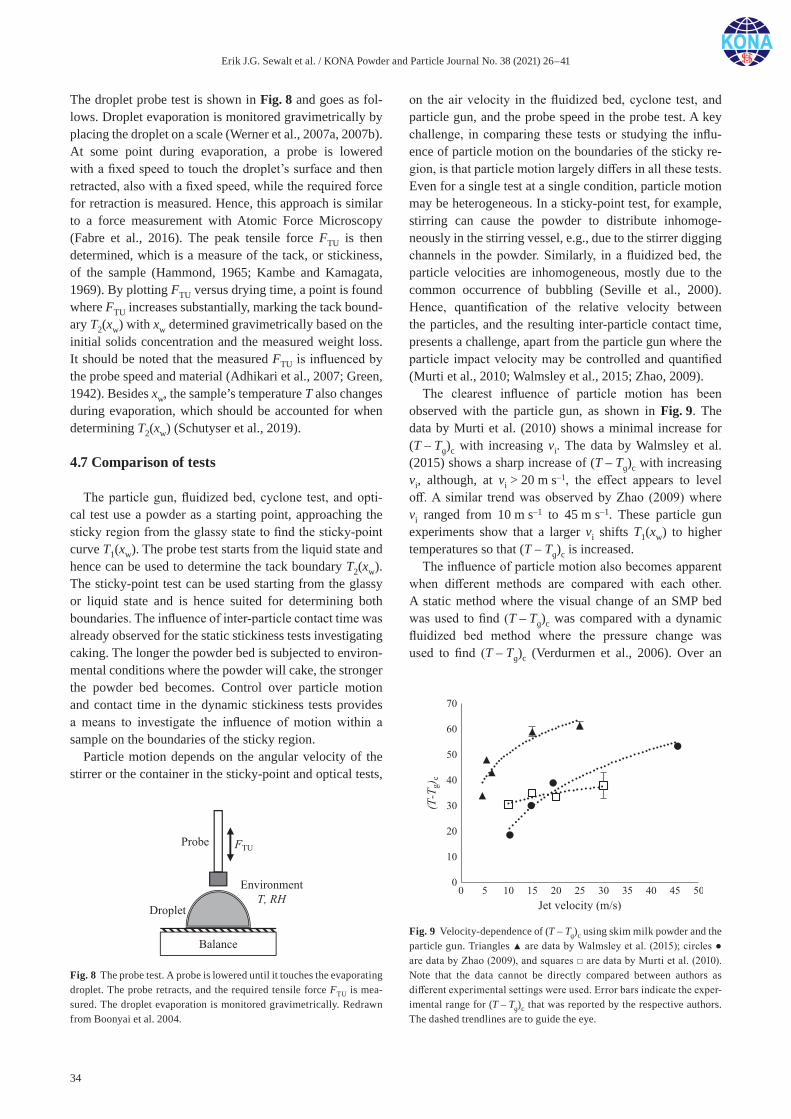
Erik J.G. Sewalt et al. / KONA Powder and Particle Journal No. 38 (2021) 26–41
34
The droplet probe test is shown in Fig. 8 and goes as fol-lows. Droplet evaporation is monitored gravimetrically by placing the droplet on a scale (Werner et al., 2007a, 2007b). At some point during evaporation, a probe is lowered with a fixed speed to touch the droplet’s surface and then retracted, also with a fixed speed, while the required force for retraction is measured. Hence, this approach is similar to a force measurement with Atomic Force Microscopy (Fabre et al., 2016). The peak tensile force FTU is then determined, which is a measure of the tack, or stickiness, of the sample (Hammond, 1965; Kambe and Kamagata, 1969). By plotting FTU versus drying time, a point is found where FTU increases substantially, marking the tack bound-ary T2(xw) with xw determined gravimetrically based on the initial solids concentration and the measured weight loss. It should be noted that the measured FTU is influenced by the probe speed and material (Adhikari et al., 2007; Green, 1942). Besides xw, the sample’s temperature T also changes during evaporation, which should be accounted for when determining T2(xw) (Schutyser et al., 2019).
4.7 Comparison of tests
The particle gun, fluidized bed, cyclone test, and opti-cal test use a powder as a starting point, approaching the sticky region from the glassy state to find the sticky-point curve T1(xw). The probe test starts from the liquid state and hence can be used to determine the tack boundary T2(xw). The sticky-point test can be used starting from the glassy or liquid state and is hence suited for determining both boundaries. The influence of inter-particle contact time was already observed for the static stickiness tests investigating caking. The longer the powder bed is subjected to environ-mental conditions where the powder will cake, the stronger the powder bed becomes. Control over particle motion and contact time in the dynamic stickiness tests provides a means to investigate the influence of motion within a sample on the boundaries of the sticky region.
Particle motion depends on the angular velocity of the stirrer or the container in the sticky-point and optical tests,
on the air velocity in the fluidized bed, cyclone test, and particle gun, and the probe speed in the probe test. A key challenge, in comparing these tests or studying the influ-ence of particle motion on the boundaries of the sticky re-gion, is that particle motion largely differs in all these tests. Even for a single test at a single condition, particle motion may be heterogeneous. In a sticky-point test, for example, stirring can cause the powder to distribute inhomoge-neously in the stirring vessel, e.g., due to the stirrer digging channels in the powder. Similarly, in a fluidized bed, the particle velocities are inhomogeneous, mostly due to the common occurrence of bubbling (Seville et al., 2000). Hence, quantification of the relative velocity between the particles, and the resulting inter-particle contact time, presents a challenge, apart from the particle gun where the particle impact velocity may be controlled and quantified (Murti et al., 2010; Walmsley et al., 2015; Zhao, 2009).
The clearest influence of particle motion has been observed with the particle gun, as shown in Fig. 9. The data by Murti et al. (2010) shows a minimal increase for (T – Tɡ)c with increasing vi. The data by Walmsley et al. (2015) shows a sharp increase of (T – Tɡ)c with increasing vi, although, at vi > 20 m s–1, the effect appears to level off. A similar trend was observed by Zhao (2009) where vi ranged from 10 m s–1 to 45 m s–1. These particle gun experiments show that a larger vi shifts T1(xw) to higher temperatures so that (T – Tɡ)c is increased.
The influence of particle motion also becomes apparent when different methods are compared with each other. A static method where the visual change of an SMP bed was used to find (T – Tɡ)c was compared with a dynamic fluidized bed method where the pressure change was used to find (T – Tɡ)c (Verdurmen et al., 2006). Over an
Fig. 8 The probe test. A probe is lowered until it touches the evaporating droplet. The probe retracts, and the required tensile force FTU is mea-sured. The droplet evaporation is monitored gravimetrically. Redrawn from Boonyai et al. 2004.
Fig. 9 Velocity-dependence of (T – Tɡ)c using skim milk powder and the particle gun. Triangles ▲ are data by Walmsley et al. (2015); circles ● are data by Zhao (2009), and squares □ are data by Murti et al. (2010). Note that the data cannot be directly compared between authors as different experimental settings were used. Error bars indicate the exper-imental range for (T – Tɡ)c that was reported by the respective authors. The dashed trendlines are to guide the eye.

Erik J.G. Sewalt et al. / KONA Powder and Particle Journal No. 38 (2021) 26–41
35
experimental range of RH = 12 % to 30 %, the average off-set of the sticky-point curve to the Tɡ was determined. The static test resulted in an average offset of T – Tɡ = 13 °C and the dynamic stickiness test resulted in an average offset of T – Tɡ = 18 °C. Another example is a comparison between the dynamic fluidized bed and particle gun tests. The (T – Tɡ)c was obtained for both methods using various types of skim and whole milk powder. While the results varied, for 6 out of 8 samples, the (T – Tɡ)c was lower for the fluidized bed by ≈ 10 °C to 15 °C. For the other two samples, the two methods provided similar results (Murti et al., 2010; Zuo, 2004). Based on these results, we strongly recommend matching the velocity of the particles in the dy-namic stickiness test to the application in mind to achieve the most accurate T1(xw).
In an attempt to further clarify the influence of particle motion on (T – Tɡ)c, data from dynamic stickiness tests was gathered in Table 2. No data was found for the optical test and data for the probe test could not be used to find (T – Tɡ)c. For each experiment, the impact velocity vi of particle col-lisions was estimated. For the particle gun, the vi was cho-sen as the air jet velocity. For the sticky-point test, vi was estimated as the maximum angular velocity of the stirrer. For the fluidized bed, an average particle velocity pv
[11]
was estimated using Eq. (4), with U the superficial velocity and Umf the minimum fluidization velocity (Ennis et al., 1991). The constant α was estimated from Seville et al. (2000) to be α = 0.53.
p mfˆ ( )v U U
(4)
(4)
For the data where vi could be estimated, no clear trend with (T – Tɡ)c could be found. Nonetheless, a wide range of (T – Tɡ)c = –5 °C to 90 °C has been reported. Further anal-ysis indicated that, besides vi, material and experimental differences can also play a substantial role in determining (T – Tɡ)c, some of which is highlighted below.
Some outliers can be explained by material differences, e.g. the (T – Tɡ)c = 90 °C is for a skim milk powder (SMP) with 80 % protein, which is known to decrease stickiness (Hogan and O’Callaghan, 2010). Another example is the low value of –5 °C for a fluidized bed experiment using amorphous lactose. Using a range of RH = 7 % to 32 %, the results were (T – Tɡ)c = –5 °C to 3.8 °C with a single outlier of (T – Tɡ)c = 21 °C for RH = 53 %, the highest humidity tested. Amorphous lactose is known for its early onset of stickiness (Zuo et al., 2007) and crystallization (Schulnies and Kleinschmidt, 2018). We expect the latter could have played a role in the outlier as crystallization reportedly reduces liquid bridge strength (Fitzpatrick et al., 2007b).
However, even for similar materials, the deviation can be quite large. Using SMP in a particle gun with a velocity of 15 m s–1 the (T – Tɡ)c was found to be 34 °C to 36 °C
by Murti et al. (2010) and 57 °C to 61 °C by Walmsley et al. (2014). Two experimental differences explained this deviation. In the experiment of Walmsley et al. (2014), the deposition was only measured for the air jet’s impingement location, not for the entire target plate. Particles that stray from the jet direction move through the air with undefined T and RH. Hence, the surface conditions of stray particles cannot be accurately determined. Additionally, the target plate was heated to match the temperature of the air jet. The plate temperature Tp can play an important role and is often a relevant industrial parameter, e.g., in dryers, pneumatic ducts, fluidized beds, and cyclones (Walmsley et al., 2014). A higher Tp is known to reduce the amount of wall deposition (Chen X.D. et al., 1993). Walmsley et al. (2014) found reduced deposition for higher Tp, which was consistent regardless of the used vi. Such wall temperature effects are also found outside of food processing, such as cold spray deposition (Khalkhali and Rothstein, 2020). The improvements of the particle gun made by Walmsley et al. (2014) show that the experimental conditions influence the resulting T1(xw). Hence, the experimental conditions need to be accurately chosen when stickiness tests are used for predicting powder processing parameters.
4.8 Application areas of dynamic stickiness tests
The moving nature of the particles in dynamic stickiness tests makes these tests useful for predicting the behavior of powder in most of powder production and processing equipment. However, it makes them unsuitable for mea-suring powder caking. The application of the dynamic tests will depend on the impact velocity vi of collisions and whether particle-particle or particle-wall collisions are tested.
The particle gun can measure the highest impact velocity of all the reviewed methods and involves particle-wall collisions. Initially, an impact velocity of 20 m s–1 was chosen for its similarity to industrial cyclones (Zuo et al., 2007). The high impact velocity makes it a useful method to predict stickiness for high-velocity pneumatic handling, dried material colliding with spray dryer walls, or indus-trial cyclones. Additionally, by changing the target plate’s material or dimensions, the influence of wall material or impact angle can also be investigated (Murti et al., 2010; Walmsley et al., 2015).
The sticky-point test and fluidized bed have contin-uously moving powder, making these tests useful for various industrial applications involving moving powders such as powder mixing, blending, and milling. Since many industrial processes incorporate a fluidized bed, a stickiness test using fluidized powder will be most appli-cable to the fluidized bed itself. Limitations of the stirrer’s angular velocity and the velocity of fluidization airflow make the sticky-point test and fluidized bed ill-suited for
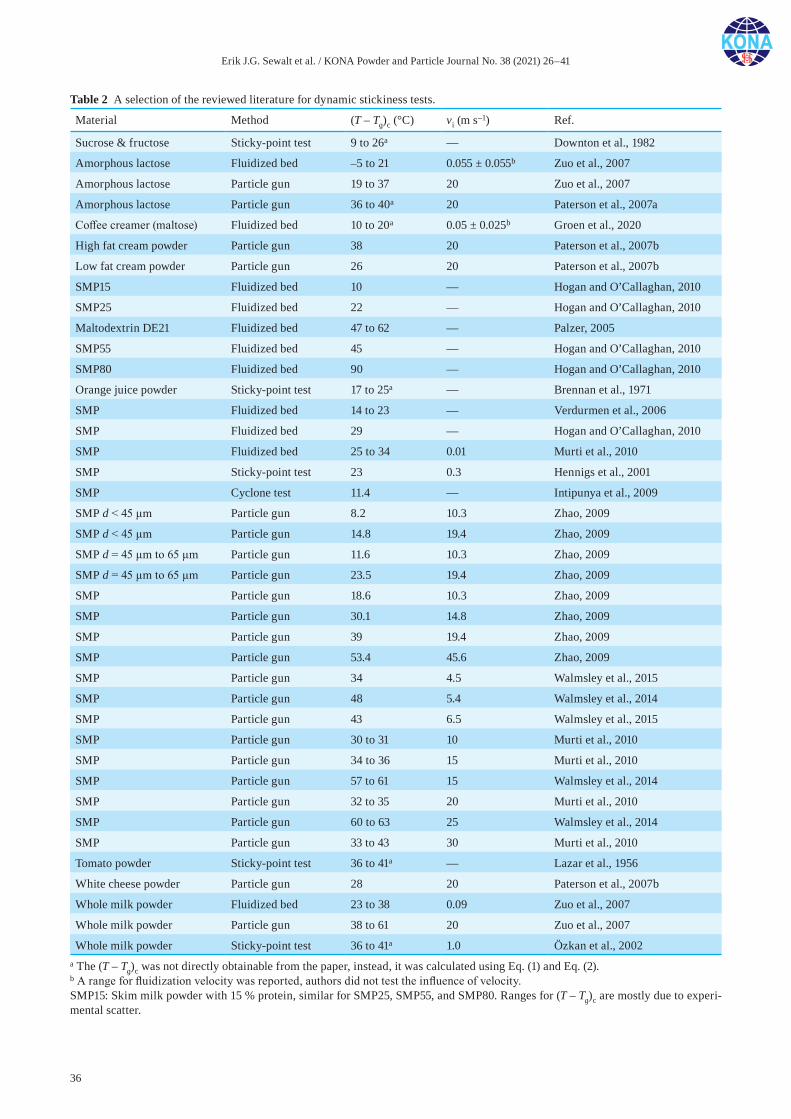
Erik J.G. Sewalt et al. / KONA Powder and Particle Journal No. 38 (2021) 26–41
36
Table 2 A selection of the reviewed literature for dynamic stickiness tests.
Material Method (T – Tɡ)c (°C) vi (m s–1) Ref.
Sucrose & fructose Sticky-point test 9 to 26a — Downton et al., 1982
Amorphous lactose Fluidized bed –5 to 21 0.055 ± 0.055b Zuo et al., 2007
Amorphous lactose Particle gun 19 to 37 20 Zuo et al., 2007
Amorphous lactose Particle gun 36 to 40a 20 Paterson et al., 2007a
Coffee creamer (maltose) Fluidized bed 10 to 20a 0.05 ± 0.025b Groen et al., 2020
High fat cream powder Particle gun 38 20 Paterson et al., 2007b
Low fat cream powder Particle gun 26 20 Paterson et al., 2007b
SMP15 Fluidized bed 10 — Hogan and O’Callaghan, 2010
SMP25 Fluidized bed 22 — Hogan and O’Callaghan, 2010
Maltodextrin DE21 Fluidized bed 47 to 62 — Palzer, 2005
SMP55 Fluidized bed 45 — Hogan and O’Callaghan, 2010
SMP80 Fluidized bed 90 — Hogan and O’Callaghan, 2010
Orange juice powder Sticky-point test 17 to 25a — Brennan et al., 1971
SMP Fluidized bed 14 to 23 — Verdurmen et al., 2006
SMP Fluidized bed 29 — Hogan and O’Callaghan, 2010
SMP Fluidized bed 25 to 34 0.01 Murti et al., 2010
SMP Sticky-point test 23 0.3 Hennigs et al., 2001
SMP Cyclone test 11.4 — Intipunya et al., 2009
SMP d < 45 μm Particle gun 8.2 10.3 Zhao, 2009
SMP d < 45 μm Particle gun 14.8 19.4 Zhao, 2009
SMP d = 45 μm to 65 μm Particle gun 11.6 10.3 Zhao, 2009
SMP d = 45 μm to 65 μm Particle gun 23.5 19.4 Zhao, 2009
SMP Particle gun 18.6 10.3 Zhao, 2009
SMP Particle gun 30.1 14.8 Zhao, 2009
SMP Particle gun 39 19.4 Zhao, 2009
SMP Particle gun 53.4 45.6 Zhao, 2009
SMP Particle gun 34 4.5 Walmsley et al., 2015
SMP Particle gun 48 5.4 Walmsley et al., 2014
SMP Particle gun 43 6.5 Walmsley et al., 2015
SMP Particle gun 30 to 31 10 Murti et al., 2010
SMP Particle gun 34 to 36 15 Murti et al., 2010
SMP Particle gun 57 to 61 15 Walmsley et al., 2014
SMP Particle gun 32 to 35 20 Murti et al., 2010
SMP Particle gun 60 to 63 25 Walmsley et al., 2014
SMP Particle gun 33 to 43 30 Murti et al., 2010
Tomato powder Sticky-point test 36 to 41a — Lazar et al., 1956
White cheese powder Particle gun 28 20 Paterson et al., 2007b
Whole milk powder Fluidized bed 23 to 38 0.09 Zuo et al., 2007
Whole milk powder Particle gun 38 to 61 20 Zuo et al., 2007
Whole milk powder Sticky-point test 36 to 41a 1.0 Özkan et al., 2002a The (T – Tɡ)c was not directly obtainable from the paper, instead, it was calculated using Eq. (1) and Eq. (2).b A range for fluidization velocity was reported, authors did not test the influence of velocity.SMP15: Skim milk powder with 15 % protein, similar for SMP25, SMP55, and SMP80. Ranges for (T – Tɡ)c are mostly due to experi-mental scatter.

Erik J.G. Sewalt et al. / KONA Powder and Particle Journal No. 38 (2021) 26–41
37
high-velocity processes such as spray drying or pneumatic handling. Further work on the influence of the intensity of continuous mixing on the sticky-point is required to choose experimental conditions for specific applications when using the sticky-point test and the fluidized bed. Using the sticky-point test with a fluidized powder solves some of the issues of the individual methods. However, sensitive equip-ment is necessary to measure the smaller increase of torque at the sticky-point, compared to without fluidization, which is possible with advanced rheometers (Groen et al., 2020).
The cyclone test was proposed as an alternative for the fluidized bed test, while we expect it to achieve sufficient particle motion to be an alternative for the particle gun as well. Boonyai et al. (2004) suggested that the cyclone test’s primary advantage over the fluidized bed is that the cyclone test measures both adhesion and cohesion while the fluid-ized bed measures only cohesion. Therefore, the cyclone test would be more suitable to predict stickiness in spray drying, fluidized beds, and pneumatic handling of powders (Boonyai et al., 2004). However, it is difficult to judge this statement since, besides the original paper by Boonyai et al. (2002), we only found one application of the cyclone test in literature (Intipunya et al., 2009).
The optical test can be used if the tested material scatters near-infrared light (Boonyai et al., 2004). Since it was proposed, no further experiments using this method have been reported to our knowledge. Hence, no judgment of its applicability can be made momentarily. Still, commonly tested powders such as amorphous lactose and various milk powders are all opaque, indicating that this method could be applied to these powders.
The most prominent application for the probe test is the droplet evaporation phase of spray drying. However, the use of a bulk moisture content severely limits this application. Werner et al. (2007a) measured the stickiness of an evaporating droplet with the probe test. The onset of stickiness occurred much earlier than expected based on the droplet’s bulk moisture content, which indicated solute had accumulated at the droplet surface. Hence, the gravimetrically determined droplet water content is an un-helpful parameter for determining T2(xw), which makes the probe test not applicable to industrial processes involving rapid evaporation. Crucially, this includes spray drying, for which there is no adequate method to predict droplet stickiness in the initial evaporation phase. Future methods should focus on the drying droplet’s surface conditions for finding the tack point T2(xw), either through direct mea-surement or by modeling the gradient formation under the influence of evaporation (Adhikari et al., 2005).
5. Conclusion
In this review, we provided an overview of methods that
measure the stickiness of amorphous powders relevant in the food industry. The reviewed methods included visual observation tests, shear tests, the penetration test, the blow test, the sticky-point test, the fluidized bed, the particle gun, the cyclone test, the optical test, and the probe test. For each method, we described how either the sticky-point temperature T1(xw) or the tack boundary T2(xw) can be determined. We have classified the methods based on the particle mobility during the conditioning and measurement steps into static stickiness tests and dynamic stickiness tests.
Static stickiness tests have limited particle motion during the conditioning step, which can be as long as desired. Therefore, these tests are particularly suitable to measure the caking rate of powder beds. Hence, industrial applicability is predominantly in predicting the long-term behavior of powder during storage or in packaging. Static stickiness tests have shown that the caking rate can be re-lated to T – Tɡ when T – Tɡ > (T – Tɡ)c, although the nature of the relation is dependent on the used method. Nonethe-less, this approach gives much insight into the stability of stored powders.
Dynamic stickiness tests involve particles with signifi-cant particle motion during the conditioning and measure-ment step. The particle gun is a good method to measure stickiness during particle-wall impacts, while the combi-nation of the sticky-point test and fluidized bed measure stickiness for particle-particle collisions and continuously mixed systems. A wide range of testing conditions can be achieved by varying the impact velocity or contact time between particles. Hence, information from dynamic stick-iness tests is highly relevant to the design and operation of powder production and processing equipment. Dynamic stickiness tests have shown that velocity plays an important role in the location of the sticky region, with larger velocity shifting the sticky-point curve T1(xw) to higher tempera-tures so that a larger (T – Tɡ)c is obtained.
An essential type of stickiness test that is lacking is a dy-namic test that measures particle stickiness when moving from the liquid state to the sticky-region, hence, finding the tack boundary T2(xw). Much unclarity exists for when evaporating solute containing droplets are sticky, while this is hugely relevant for spray drying, which is one of the most used processes in the food processing industry. The probe method does approach the sticky-region from the liquid state, but the reliance on the droplet’s bulk properties makes it unable to determine values for T2(xw). Further work in predicting the surface stickiness, either through direct measurement or by modeling the gradient formation under the influence of evaporation, is required to predict droplet stickiness.
Erik J.G. Sewalt et al. / KONA Powder and Particle Journal No. 38 (2021) 26–41
38
Acknowledgments
This scientific work is supported by the Netherlands Organization for Scientific Research (NWO) (grant num-ber 15459).
References
Adhikari B., Howes T., Lecomte D., Bhandari B.R., A glass transition temperature approach for the prediction of the surface stickiness of a drying droplet during spray drying, Powder Technology, 149 (2005) 168–179. DOI: 10.1016/j.powtec.2004.11.007
Adhikari B., Howes T., Shrestha A.K., Bhandari B.R., Devel-opment of stickiness of whey protein isolate and lactose droplets during convective drying, Chemical Engineering and Processing: Process Intensification, 46 (2007) 420–428. DOI: 10.1016/j.cep.2006.07.014
Aguilera J.M., Levi G., Karel M., Effect of water content on the glass transition and caking of fish protein hydrolyzates, Biotechnology Progress, 9 (1993) 651–654. DOI: 10.1021/bp00024a013
Anton Paar GmbH, 2020, Modular compact rheometer: MCR102/302/502, <www.anton-paar.com/corp-en/products/details/rheometer-mcr-102-302-502/> accessed 18.08.2020.
Bartels M., Lin W., Nijenhuis J., Kapteijn F., van Ommen J.R., Agglomeration in fluidized beds at high temperatures: mech-anisms, detection and prevention, Progress in Energy and Combustion Science, 34 (2008) 633–666. DOI: 10.1016/j.pecs.2008.04.002
Billings S.W., Bronlund J.E., Paterson A.H.J., Effects of capillary condensation on the caking of bulk sucrose, Journal of Food Engineering, 77 (2006) 887–895. DOI: 10.1016/j.jfoodeng. 2005.08.031
Boonyai P., Bhandari B.R., Howes T., Development of a novel testing device to characterize the sticky behavior of food powders-a preliminary study, in: Jindal V.K. (Ed.), Proceed-ings of the International Conference on Innovations in Food Processing Technology and Engineering, AIT, Bangkok, 11–13 December, 2002
Boonyai P., Bhandari B., Howes T., Stickiness measurement techniques for food powders: a review, Powder Technology, 145 (2004) 34–46. DOI: 10.1016/j.powtec.2004.04.039
Brennan J.G., Herrera J., Jowitt R., A study of some of the factors affecting the spray drying of concentrated orange juice, on a laboratory scale, International Journal of Food Science & Technology, 6 (1971) 295–307. DOI: 10.1111/j.1365-2621.1971.tb01618.x
Burnett D.J., Thielmann F., Booth J., Determining the critical relative humidity for moisture-induced phase transitions, International Journal of Pharmaceutics, 287 (2004) 123–133. DOI: 10.1016/j.ijpharm.2004.09.009
Chen J., Feng M., Gonzalez Y., Pugnaloni L.A., Application of probe tensile method for quantitative characterisation of the stickiness of fluid foods, Journal of Food Engineering, 87 (2008) 281–290. DOI: 10.1016/j.jfoodeng.2007.12.004
Chen X.D., Lake R., Jebson S., Study of milk powder deposition on a large industrial dryer, Food and Bioproducts Processing, 71 (1993) 180–186.
Dagdug L., García-Colín L.S., Generalization of the Williams–Landel–Ferry equation, Physica A: Statistical Mechanics and its Applications, 250 (1998) 133–141. DOI: 10.1016/S0378-4371(97)00542-6
Downton G.E., Flores-Luna J.L., King C.J., Mechanism of stickiness in hygroscopic, amorphous powders, Industrial & Engineering Chemistry Fundamentals, 21 (1982) 447–451. DOI: 10.1021/i100008a023
Ennis B.J., Tardos G., Pfeffer R., A microlevel-based character-ization of granulation phenomena, Powder Technology, 65 (1991) 257–272. DOI: 10.1016/0032-5910(91)80189-P
Fabre A., Salameh S., Ciacchi L.C., Kreutzer M.T., van Ommen J.R., Contact mechanics of highly porous oxide nanoparticle agglomerates, Journal of Nanoparticle Research, 18 (2016) 200. DOI: 10.1007/s11051-016-3500-4
Ferry J.D., Viscoelastic Properties of Polymers, 3rd Edition, John Wiley & Sons, Inc., 1980, ISBN: 978-0-471-04894-7
Fitzpatrick J.J., Barry K., Cerqueira P.S.M., Iqbal T., O’Neill J., Roos Y.H., Effect of composition and storage conditions on the flowability of dairy powders, International Dairy Journal, 17 (2007a) 383–392. DOI: 10.1016/j.idairyj.2006.04.010
Fitzpatrick J.J., Hodnett M., Twomey M., Cerqueira P.S.M., O’Flynn J., Roos Y.H., Glass transition and the flowability and caking of powders containing amorphous lactose, Powder Technology, 178 (2007b) 119–128. DOI: 10.1016/j.powtec.2007.04.017
Fitzpatrick J.J., O’Callaghan E., O’Flynn J., Application of a novel cake strength tester for investigating caking of skim milk powder, Food and Bioproducts Processing, 86 (2008) 198–203. DOI: 10.1016/j.fbp.2007.10.009
Foster K.D., Bronlund J.E., Paterson A.H.J., The contribution of milk fat towards the caking of dairy powders, Interna-tional Dairy Journal, 15 (2005) 85–91. DOI: 10.1016/j.idairyj.2004.05.005
Foster K.D., Bronlund J.E., Paterson A.H.J., Glass transition related cohesion of amorphous sugar powders, Journal of Food Engineering, 77 (2006) 997–1006. DOI: 10.1016/j.jfoodeng.2005.08.028
Freeman R., Measuring the flow properties of consolidated, conditioned and aerated powders — a comparative study using a powder rheometer and a rotational shear cell, Powder Technology, 174 (2007) 25–33. DOI: 10.1016/j.powtec.2006.10.016
Frenkel J., Viscous flow of crystalline bodies under the action of surface tension, Journal of Physics, 9 (1945) 385–391.
Green H., What is tack? Paper Trade Journal, 114 (1942) 39–42.Groen J.C., Kooijman W., van Belzen D., Meesters G.M.H.,
Schütz D., Aschl T., Verolme P., Real-time in-situ rheolog-ical assessment of sticky point temperature and humidity of powdered products, KONA Powder and Particle Journal, 37 (2020) 176–186. DOI: 10.14356/kona.2020006
Hartmann M., Palzer S., Caking of amorphous powders — Material aspects, modelling and applications, Powder Technology, 206 (2011) 112–121. DOI: 10.1016/j.powtec.2010.04.014
Hammond J.F.H., Tack testing apparatus, US Patent, (1965)
Erik J.G. Sewalt et al. / KONA Powder and Particle Journal No. 38 (2021) 26–41
39
US3214971A.Hennigs C., Kockel T.K., Langrish T.A.G., New measurements of
the sticky behavior of skim milk powder, Drying Technology, 19 (2001) 471–484. DOI: 10.1081/DRT-100103929
Hogan S.A., Famelart M.H., O’Callaghan D.J., Schuck P., A novel technique for determining glass–rubber transition in dairy powders, Journal of Food Engineering, 99 (2010) 76–82. DOI: 10.1016/j.jfoodeng.2010.01.040
Hogan S.A., O’Callaghan D.J., Influence of milk proteins on the development of lactose-induced stickiness in dairy powders, International Dairy Journal, 20 (2010) 212–221. DOI: 10.1016/j.idairyj.2009.11.002
Intipunya P., Shrestha A., Howes T., Bhandari B., A modified cyclone stickiness test for characterizing food powders, Journal of Food Engineering, 94 (2009) 300–306. DOI: 10.1016/j.jfoodeng.2009.03.024
Jenike A.W., Storage and flow of solids, bulletin no. 123, Bulletin of the University of Utah, 1964.
Kambe H., Kamagata K., A method of measuring tackiness, Jour-nal of Applied Polymer Science, 13 (1969) 493–504. DOI: 10.1002/app.1969.070130310
Kamyabi M., Sotudeh-Gharebagh R., Zarghami R., Saleh K., Principles of viscous sintering in amorphous powders: a critical review, Chemical Engineering Research and Design, 125 (2017) 328–347. DOI: 10.1016/j.cherd.2017.06.009
Katkov I.I., Levine F., Prediction of the glass transition temperature of water solutions: comparison of different models, Cryobiology, 49 (2004) 62–82. DOI: 10.1016/j.cryobiol.2004.05.004
Khalkhali Z., Rothstein J.P., Characterization of the cold spray deposition of a wide variety of polymeric powders, Sur-face and Coatings Technology, 383 (2020) 125251. DOI: 10.1016/j.surfcoat.2019.125251
Knight P.C., Johnson S.H., Measurement of powder cohesive strength with a penetration test, Powder Technology, 54 (1988) 279–283. DOI: 10.1016/0032-5910(88)80058-5
Kudra T., Sticky region in drying—definition and identification, Drying Technology, 21 (2003) 1457–1469. DOI: 10.1081/DRT-120024678
Lazar M.E., Brown A.H., Smith G.S., Wang F.F., Lindquist F.E., Experimental production of tomato powder by spray drying. Food Technology, 3 (1956) 129–134.
Li R., Lin D., Roos Y.H., Miao S., Glass transition, structural relaxation and stability of spray-dried amorphous food sol-ids: a review, Drying Technology, 37 (2019) 287–300. DOI: 10.1080/07373937.2018.1459680
Lockemann C.A., A new laboratory method to characterize the sticking properties of free-flowing solids, Chemical Engi-neering and Processing: Process Intensification, 38 (1999) 301–306. DOI: 10.1016/S0255-2701(99)00021-5
Lomellini P., Williams-Landel-Ferry versus Arrhenius behaviour: polystyrene melt viscoelasticity revised, Polymer, 33 (1992) 4983–4989. DOI: 10.1016/0032-3861(92)90049-3
Mitra H., Pushpadass H.A., Franklin M.E.E., Ambrose R.P.K., Ghoroi C., Battula S.N., Influence of moisture content on the flow properties of basundi mix, Powder Technology, 312 (2017) 133–143. DOI: 10.1016/j.powtec.2017.02.039
Murti R.A., Paterson A.H.J., Pearce D., Bronlund J.E., The
influence of particle velocity on the stickiness of milk pow-der, International Dairy Journal, 20 (2010) 121–127. DOI: 10.1016/j.idairyj.2009.08.005
Özkan N., Walisinghe N., Chen X.D., Characterization of stick-iness and cake formation in whole and skim milk powders, Journal of Food Engineering, 55 (2002) 293–303. DOI: 10.1016/S0260-8774(02)00104-8
Özkan N., Withy B., Dong Chen X., Effects of time, temperature, and pressure on the cake formation of milk powders, Journal of Food Engineering, 58 (2003) 355–361. DOI: 10.1016/S0260-8774(02)00419-3
Palzer S., The effect of glass transition on the desired and unde-sired agglomeration of amorphous food powders, Chemical Engineering Science, 60 (2005) 3959–3968. DOI: 10.1016/j.ces.2005.02.015
Palzer S., Zürcher U., Kinetik unerwünschter Agglomera-tionsprozesse bei der Lagerung und Verarbeitung amorpher Lebensmittelpulver, Chemie Ingenieur Technik, 76 (2004) 1594–1599. DOI: 10.1002/cite.200407009
Papadakis S.E., Bahu R.E., The sticky issues of drying, Drying Technology, 10 (1992) 817–837. DOI: 10.1080/ 07373939208916484
Pasley H., Haloulos P., Ledig S., Stickiness – a comparison of test methods and characterisation parameters, Drying Technology, 13 (1995) 1587–1601. DOI: 10.1080/07373939508917041
Paterson A.H.J., Bronlund J.E., Brooks G.F. The blow test for measuring the stickiness of powders, in AIChE 2001 Annual Meeting, 2001.
Paterson A.H., Bronlund J.E., Zuo J.Y., Chatterjee R., Analysis of particle-gun-derived dairy powder stickiness curves, Interna-tional Dairy Journal, 17 (2007a) 860–865. DOI: 10.1016/j.idairyj.2006.08.013
Paterson A.H.J., Brooks G.F., Bronlund J.E., Foster K.D., Devel-opment of stickiness in amorphous lactose at constant T–Tg levels, International Dairy Journal, 15 (2005) 513–519. DOI: 10.1016/j.idairyj.2004.08.012
Paterson A.H.J., Ripberger G.D., Bridges R.P., Measurement of the viscosity of freeze dried amorphous lactose near the glass transition temperature, International Dairy Journal, 43 (2015) 27–32. DOI: 10.1016/j.idairyj.2014.11.005
Paterson A.H., Zuo J.Y., Bronlund J.E., Chatterjee R., Stickiness curves of high fat dairy powders using the particle gun, International Dairy Journal, 17 (2007b) 998–1005. DOI: 10.1016/j.idairyj.2006.11.001
Peleg M., On the use of the WLF model in polymers and foods, Critical Reviews in Food Science and Nutrition, 32 (1992) 59–66. DOI: 10.1080/10408399209527580
Roos Y.H., Importance of glass transition and water activity to spray drying and stability of dairy powders, Lait, 82 (2002) 475–484. DOI: 10.1051/lait:2002025
Roos Y.H., Glass transition temperature and its relevance in food processing, Annual Review of Food Science and Technology, 1 (2010) 469–496. DOI: 10.1146/annurev.food.102308.124139
Schulnies F., Kleinschmidt T., Time consolidation of skim milk powder near the glass transition temperature, Interna-tional Dairy Journal, 85 (2018) 105–111. DOI: 10.1016/j.idairyj.2018.05.005

Erik J.G. Sewalt et al. / KONA Powder and Particle Journal No. 38 (2021) 26–41
40
Schulze D., Powders and Bulk Solids: Behavior, Characterization, Storage and Flow, Springer, 2008, ISBN: 978-3-540-73767-4. DOI: 10.1007/978-3-540-73768-1
Schutyser M.A.I., Both E.M., Siemons I., Vaessen E.M.J., Zhang L., Gaining insight on spray drying behavior of foods via single droplet drying analyses, Drying Technology, 37 (2019) 525–534. DOI: 10.1080/07373937.2018.1482908
Schwedes J., Review on testers for measuring flow properties of bulk solids, Granular Matter, 5 (2003) 1–43. DOI: 10.1007/s10035-002-0124-4
Seville J.P.K., Willett C.D., Knight P.C., Interparticle forces in fluidisation: a review, Powder Technology, 113 (2000) 261–268. DOI: 10.1016/S0032-5910(00)00309-0
Simha R., Boyer R.F., On a general relation involving the glass temperature and coefficients of expansion of polymers, The Journal of Chemical Physics, 37 (1962) 1003–1007. DOI: 10.1063/1.1733201
Sochava I.V., Heat capacity and thermodynamic characteristics of denaturation and glass transition of hydrated and anhydrous proteins, Biophysical Chemistry, 69 (1997) 31–41. DOI: 10.1016/S0301-4622(97)00072-0
Tsourouflis S., Flink J.M., Karel M., Loss of structure in freeze-dried carbohydrates solutions: effect of temperature, moisture content and composition, Journal of the Science of Food and Agriculture, 27 (1976) 509–519. DOI: 10.1002/jsfa.2740270604
van der Knaap J., On-line monitoring of dynamic stickiness and particle size distribution in a fluidized bed dryer by attractor comparison, MSc thesis, Delft University of Technology, 2006.
Van Ommen J.R., Monitoring fluidized bed hydrodynamics, Doctoral dissertation, Delft University of Technology, 2001.
Verdurmen R.E.M., van Houwelingen G., Gunsing M., Ver-schueren M., Straatsma J., Agglomeration in spray drying installations (the EDECAD project): stickiness measure-ments and simulation results, Drying Technology, 24 (2006) 721–726. DOI: 10.1080/07373930600684973
Verschueren M., Verdurmen R.E.M., van Houwelingen G., Backx A.C.P.M., van der Knaap J.E.A., Bartels M., van Ommen
J.R., Dynamic stickiness measurements by attractor compari-son: a feasibility study, in Proc. Int. Conf. Liquid Atomisation and Spray Systems (ICLASS), Kyoto, Japan Aug 27–Sept 1, 2007.
Wallack D.A., King C.J., Sticking and agglomeration of hygroscopic, amorphous carbohydrate and food powders, Biotechnology Progress, 4 (1988) 31–35. DOI: 10.1002/btpr.5420040106
Walmsley T.G., Walmsley M.R.W., Atkins M.J., Neale J.R., Analysis of skim milk powder deposition on stainless steel tubes in cross-flow, Applied Thermal Engineering, 75 (2015) 941–949. DOI: 10.1016/j.applthermaleng.2014.10.066
Walmsley T.G., Walmsley M.R.W., Atkins M.J., Neale J.R., Sellers C.M., An experimentally validated criterion for skim milk powder deposition on stainless steel surfaces, Journal of Food Engineering, 127 (2014) 111–119. DOI: 10.1016/j.jfoodeng.2013.11.025
Werner S.R.L., Jones J.R., Paterson A.H.J., Stickiness during drying of amorphous skin-forming solutions using a probe tack test, Journal of Food Engineering, 81 (2007a) 647–656. DOI: 10.1016/j.jfoodeng.2006.12.008
Werner S.R.L., Jones J.R., Paterson A.H.J., Stickiness of malto-dextrins using probe tack test during in-situ drying, Journal of Food Engineering, 80 (2007b) 859–868. DOI: 10.1016/j.jfoodeng.2006.08.008
Williams M.L., Landel R.F., Ferry J.D., The temperature depen-dence of relaxation mechanisms in amorphous polymers and other glass-forming liquids, Journal of the American Chemical Society, 77 (1955) 3701–3707. DOI: 10.1021/ja01619a008
Zhao S., Experimental and numerical investigations of skim milk powder stickiness and deposition mechanisms, MSc Thesis, University of Waikato, 2009.
Zuo J.Y., The stickiness curve of dairy powders, M. Tech. thesis, Massey University, 2004.
Zuo J.Y., Paterson A.H., Bronlund J.E., Chatterjee R., Using a particle-gun to measure initiation of stickiness of dairy pow-ders, International Dairy Journal, 17 (2007) 268–273. DOI: 10.1016/j.idairyj.2006.02.010
Authors’ Short Biographies
Erik J.G. Sewalt
Erik Sewalt MSc obtained his MSc in Food Technology at Wageningen University & Research. His specialization was Sustainable Food Process Engineering. His MSc thesis was about modeling the diffusion of pepsin in protein gels to understand food breakdown. He did an internship on in-vitro digestion of protein-rich food at University of California, Davis, USA. From October 2017, he became a PhD candidate at TU Delft, Faculty of Ap-plied Sciences, Product and Process Engineering. His research activities as PhD candidate revolve around understanding the agglomeration of evaporating droplets in spray drying.
Erik J.G. Sewalt et al. / KONA Powder and Particle Journal No. 38 (2021) 26–41
41
Authors’ Short Biographies
Fuweng Zhang
Dr. Fuweng Zhang is a postdoc working at Dept. Chemical Engineering, Delft Uni-versity of Technology (the Netherlands). He received his Ph.D. from the University of Sciences and Technology Beijing in 2014. After that, he was appointed as a post-doctoral researcher working at University College Cork, Ireland. He has 6 years of experience in the research area of multi-phase flow, pneumatic transportation, and fluidization of powder materials. He currently focuses his research on developing novel technologies to enhance the fluidization of the cohesive pharmaceutical powders.
Volkert van Steijn
Assistant Professor at the Department of Chemical Engineering at Delft University of Technology (the Netherlands). He obtained his PhD degree on droplet microfluidics in 2010, with honours. He worked as a postdoc at Harvard University in the lab of Prof. David Weitz on the development of droplet-based laboratories-on-a-chip for applications in the area of life sciences. With a strong background in soft matter, droplet flows, and transport phenomena, his group develops microfluidic tools that contribute to solving problems in the area of health and life sciences.
J. Ruud van Ommen
Professor of Chemical Enginering at Delft University of Technology (the Netherlands). He obtained his PhD degree at Delft in 2001. He has been visiting professor at Chalmers University of Technology (Gothenburg, Sweden) and the University of Colorado (Boul-der, USA). In recent years, he expanded his research from chemical reactor engineering to the scalable production of advanced, nanostructured materials. In 2011, he started an ambitious program (funded by an ERC Starting Grant) to investigate the interplay between agglomeration and coating of nanoparticles in the gas phase. He has published about 200 journal papers, of which a considerable part on powder technology.
Gabrie M.H. Meesters
Dr Gabrie Meesters has 27 years of industrial formulations experience at Gistbrocades, Genencor International and DSM. He has 23 years of experience as a part-time professor at TU Delft in particle technology and product design. From January 2019, he became a full-time assistant professor at the TU Delft, Faculty of Applied Sciences, Product and Process Engineering. He is a contributor to several books on formulation. He is the editor of three books on product design and solids processing. He published over 70 refereed papers, has more than 20 patents and supervised more than 100 BSc, MSc and PhDs. He is a regular speaker at conferences and workshops. He was the organizer of the 2010 Partec and the 2010 World Congress on Particle Technology in Nuremberg, Germany.

KONA Powder and Particle Journal No. 38 (2021) 42–63/https://doi.org/10.14356/kona.2021004 Review Paper
42Copyright © 2021 The Authors. Published by Hosokawa Powder Technology Foundation. This is an open access article under the CC BY license (http://creativecommons.org/licenses/by/4.0/).
Inertial Impaction Technique for the Classification of Particulate Matters and Nanoparticles: A Review †
Thi-Cuc Le and Chuen-Jinn Tsai *Institute of Environmental Engineering, National Chiao Tung University, Taiwan
AbstractInertial impactors are applied widely to classify particulate matters (PMs) and nanoparticles (NPs) with desired aerodynamic diameters for further analyses due to their sharp cutoff characteristics, simple design, easy operation, and high collection ability. A few hundred papers have been published since the 1860s that addressed the characteristics and applications of the inertial impactors. In the last 30 years, our group has also carried out lots of studies to contribute to the design and the improvement of inertial impactors. With our understanding of inertial impactors, this article reviews previous studies of some typical types of the inertial impactors including conventional impactors, cascade impactors, and virtual impactors and the parameters for design consideration of these devices. The article also reviews some applications of the inertial impactors, which are mass concentration measurement, mass and number distribution measurement, personal exposure measurement, particulate matter control, and powder classification. The synthesized knowledge of the inertial impactor in this study can help researchers to design an inertial impactor with an accurate cutoff diameter, a sharp collection efficiency curve, and no particle bounce and particle overloading effects for long-term use for PM classification and control purposes.
Keywords: inertial impactor, cascade impactor, virtual impactor, nanoparticles, sampling
1. Introduction
There was a great demand to develop devices for col-lecting airborne particles of different sizes to study the ef-fect of particulate matters (PMs) on human health (Anderson J.O. et al., 2012). In the period from 1860 to 1880, researchers discovered that inertial impactors can be used to collect airborne particles for further analysis (Marple V.A., 2004). The inertial impactors including the conventional impactor, cascade impactor, and virtual im-pactor can classify particles into different size ranges based on particle’s inertia. In the inertial impactors, when the airflow is forced to change the direction, the particles with sufficient inertia escape the turning flow while the particles with less inertia remain in the flow resulting in the particle size-based classification. A burst of develop-ment of the inertial impactors has exploded since 1945 when the first cascade impactor (a series of conventional impactors) was developed to collect size-fractionated air-borne particle samples with a high collection efficiency to obtain the particle mass distribution (May K.R., 1945).
Since the 1970s, researchers computed the flow field and particle trajectories within the impactor by using the finite difference methods and showed that the impactor has a sharp cutoff characteristic (McFarland A.R. et al., 1978). Thereafter, the impactor was considered as a standard de-vice for PM classification based on particle aerodynamic diameter.
The virtual impactor was developed later since 1966 (Conner W.D., 1966) with a feature not found in the con-ventional impactor, in which particles are collected in a probe instead of on the collection plate to avoid particle bounce. The virtual impactor also attracted lots of interest from researchers for PM classification since two particle size fractions can be collected for further analysis as the design theory was studied and better understood (Marple V.A. and Chien C.M., 1980; Zahir M.Z. et al., 2018). Since 1970 until now, inertial impactors have been used exten-sively for various purposes such as (i) size-based classifi-cation for mass concentration measurement (Le T.C. and Tsai C.J., 2017; Le T.C. et al., 2019), (ii) particle mass dis-tribution measurement (Marple V.A. et al., 1991; Demokritou P. et al., 2004a), (iii) chemical composition measurement (Marple V.A. et al., 1991), (iv) personal ex-posure measurement (Tsai C.J. et al., 2012b), and (v) nanoparticle (NP) measurement (Chow J.C. and Watson J.G., 2007).
The main reasons behind the diverse application of the
† Received 4 December 2019; Accepted 6 February 2020 J-STAGE Advance published online 31 March 2020
* Corresponding author: Chuen-Jinn Tsai; Add: University Road, Hsinchu 30010, Taiwan E-mail: [email protected] TEL: +886-3-5731880 FAX: +886-3-5727835
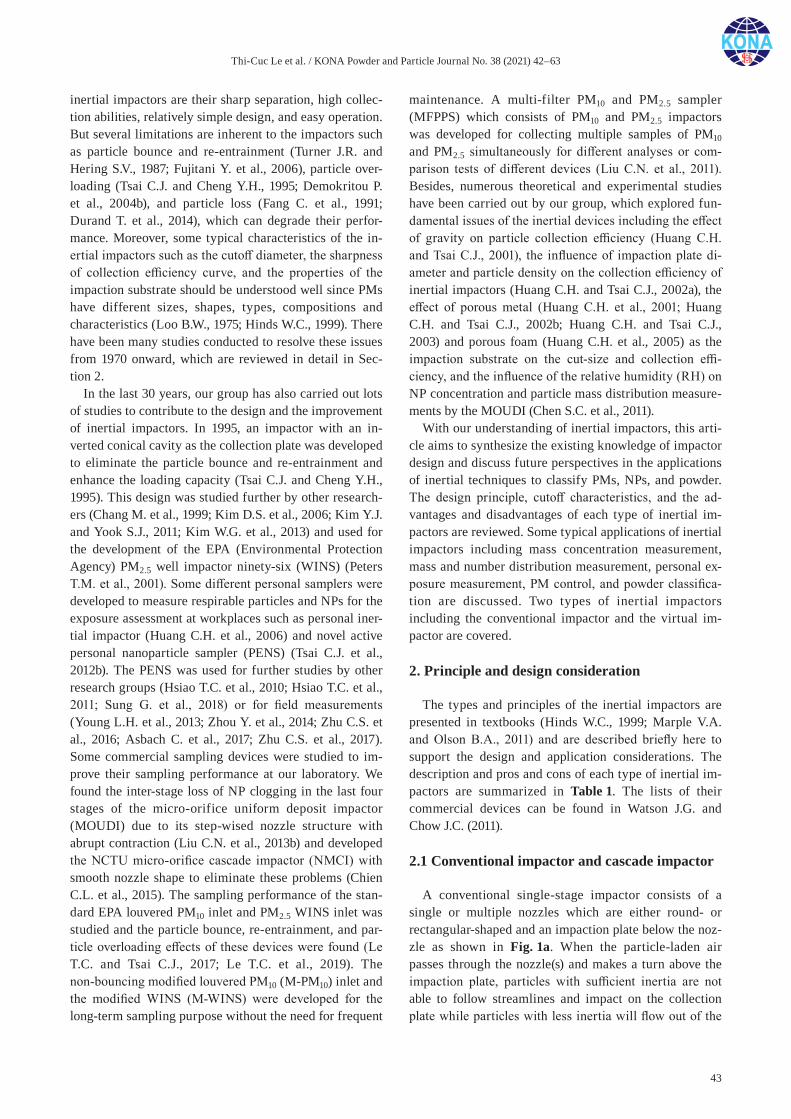
Thi-Cuc Le et al. / KONA Powder and Particle Journal No. 38 (2021) 42–63
43
inertial impactors are their sharp separation, high collec-tion abilities, relatively simple design, and easy operation. But several limitations are inherent to the impactors such as particle bounce and re-entrainment (Turner J.R. and Hering S.V., 1987; Fujitani Y. et al., 2006), particle over-loading (Tsai C.J. and Cheng Y.H., 1995; Demokritou P. et al., 2004b), and particle loss (Fang C. et al., 1991; Durand T. et al., 2014), which can degrade their perfor-mance. Moreover, some typical characteristics of the in-ertial impactors such as the cutoff diameter, the sharpness of collection efficiency curve, and the properties of the impaction substrate should be understood well since PMs have different sizes, shapes, types, compositions and characteristics (Loo B.W., 1975; Hinds W.C., 1999). There have been many studies conducted to resolve these issues from 1970 onward, which are reviewed in detail in Sec-tion 2.
In the last 30 years, our group has also carried out lots of studies to contribute to the design and the improvement of inertial impactors. In 1995, an impactor with an in-verted conical cavity as the collection plate was developed to eliminate the particle bounce and re-entrainment and enhance the loading capacity (Tsai C.J. and Cheng Y.H., 1995). This design was studied further by other research-ers (Chang M. et al., 1999; Kim D.S. et al., 2006; Kim Y.J. and Yook S.J., 2011; Kim W.G. et al., 2013) and used for the development of the EPA (Environmental Protection Agency) PM2.5 well impactor ninety-six (WINS) (Peters T.M. et al., 2001). Some different personal samplers were developed to measure respirable particles and NPs for the exposure assessment at workplaces such as personal iner-tial impactor (Huang C.H. et al., 2006) and novel active personal nanoparticle sampler (PENS) (Tsai C.J. et al., 2012b). The PENS was used for further studies by other research groups (Hsiao T.C. et al., 2010; Hsiao T.C. et al., 2011; Sung G. et al., 2018) or for field measurements (Young L.H. et al., 2013; Zhou Y. et al., 2014; Zhu C.S. et al., 2016; Asbach C. et al., 2017; Zhu C.S. et al., 2017). Some commercial sampling devices were studied to im-prove their sampling performance at our laboratory. We found the inter-stage loss of NP clogging in the last four stages of the micro-orifice uniform deposit impactor (MOUDI) due to its step-wised nozzle structure with abrupt contraction (Liu C.N. et al., 2013b) and developed the NCTU micro-orifice cascade impactor (NMCI) with smooth nozzle shape to eliminate these problems (Chien C.L. et al., 2015). The sampling performance of the stan-dard EPA louvered PM10 inlet and PM2.5 WINS inlet was studied and the particle bounce, re-entrainment, and par-ticle overloading effects of these devices were found (Le T.C. and Tsai C.J., 2017; Le T.C. et al., 2019). The non-bouncing modified louvered PM10 (M-PM10) inlet and the modified WINS (M-WINS) were developed for the long-term sampling purpose without the need for frequent
maintenance. A multi-filter PM10 and PM2.5 sampler (MFPPS) which consists of PM10 and PM2.5 impactors was developed for collecting multiple samples of PM10 and PM2.5 simultaneously for different analyses or com-parison tests of different devices (Liu C.N. et al., 2011). Besides, numerous theoretical and experimental studies have been carried out by our group, which explored fun-damental issues of the inertial devices including the effect of gravity on particle collection efficiency (Huang C.H. and Tsai C.J., 2001), the influence of impaction plate di-ameter and particle density on the collection efficiency of inertial impactors (Huang C.H. and Tsai C.J., 2002a), the effect of porous metal (Huang C.H. et al., 2001; Huang C.H. and Tsai C.J., 2002b; Huang C.H. and Tsai C.J., 2003) and porous foam (Huang C.H. et al., 2005) as the impaction substrate on the cut-size and collection effi-ciency, and the influence of the relative humidity (RH) on NP concentration and particle mass distribution measure-ments by the MOUDI (Chen S.C. et al., 2011).
With our understanding of inertial impactors, this arti-cle aims to synthesize the existing knowledge of impactor design and discuss future perspectives in the applications of inertial techniques to classify PMs, NPs, and powder. The design principle, cutoff characteristics, and the ad-vantages and disadvantages of each type of inertial im-pactors are reviewed. Some typical applications of inertial impactors including mass concentration measurement, mass and number distribution measurement, personal ex-posure measurement, PM control, and powder classifica-tion are discussed. Two types of inertial impactors including the conventional impactor and the virtual im-pactor are covered.
2. Principle and design consideration
The types and principles of the inertial impactors are presented in textbooks (Hinds W.C., 1999; Marple V.A. and Olson B.A., 2011) and are described briefly here to support the design and application considerations. The description and pros and cons of each type of inertial im-pactors are summarized in Table 1. The lists of their commercial devices can be found in Watson J.G. and Chow J.C. (2011).
2.1 Conventional impactor and cascade impactor
A conventional single-stage impactor consists of a single or multiple nozzles which are either round- or rectangular-shaped and an impaction plate below the noz-zle as shown in Fig. 1a. When the particle-laden air passes through the nozzle(s) and makes a turn above the impaction plate, particles with sufficient inertia are not able to follow streamlines and impact on the collection plate while particles with less inertia will flow out of the
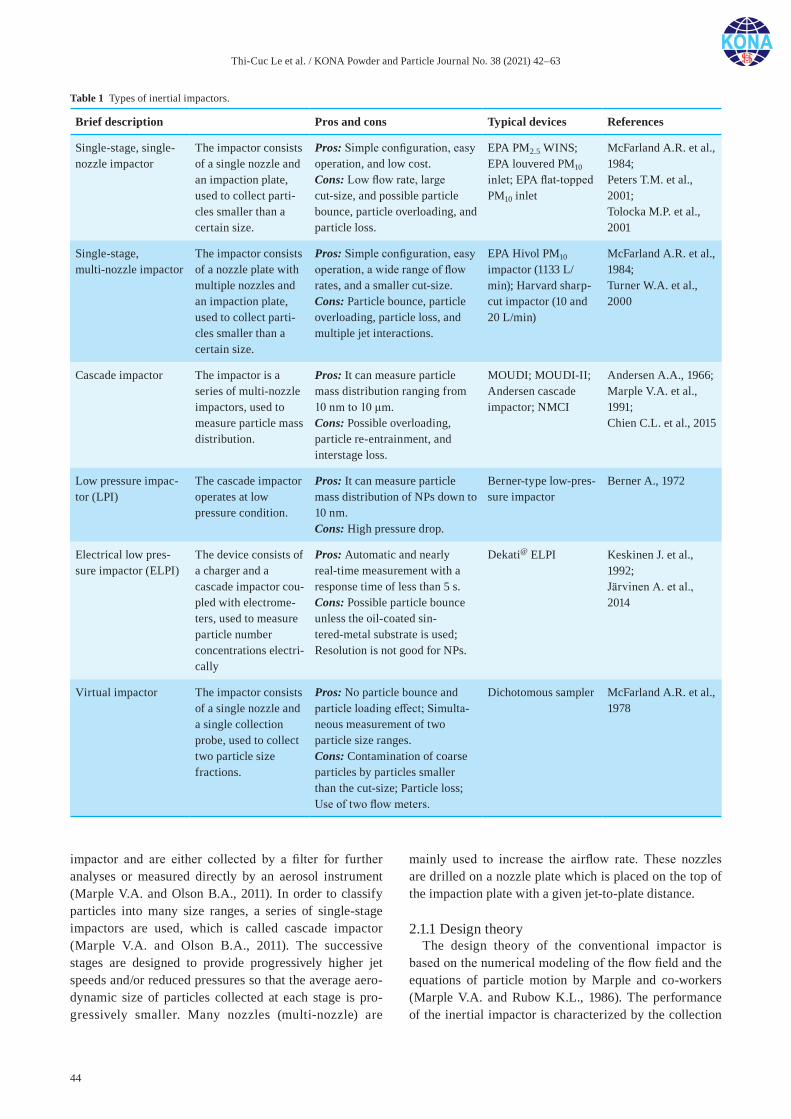
Thi-Cuc Le et al. / KONA Powder and Particle Journal No. 38 (2021) 42–63
44
impactor and are either collected by a filter for further analyses or measured directly by an aerosol instrument (Marple V.A. and Olson B.A., 2011). In order to classify particles into many size ranges, a series of single-stage impactors are used, which is called cascade impactor (Marple V.A. and Olson B.A., 2011). The successive stages are designed to provide progressively higher jet speeds and/or reduced pressures so that the average aero-dynamic size of particles collected at each stage is pro-gressively smaller. Many nozzles (multi-nozzle) are
mainly used to increase the airflow rate. These nozzles are drilled on a nozzle plate which is placed on the top of the impaction plate with a given jet-to-plate distance.
2.1.1 Design theoryThe design theory of the conventional impactor is
based on the numerical modeling of the flow field and the equations of particle motion by Marple and co-workers (Marple V.A. and Rubow K.L., 1986). The performance of the inertial impactor is characterized by the collection
Table 1 Types of inertial impactors.
Brief description Pros and cons Typical devices References
Single-stage, single- nozzle impactor
The impactor consists of a single nozzle and an impaction plate, used to collect parti-cles smaller than a certain size.
Pros: Simple configuration, easy operation, and low cost.Cons: Low flow rate, large cut-size, and possible particle bounce, particle overloading, and particle loss.
EPA PM2.5 WINS; EPA louvered PM10 inlet; EPA flat-topped PM10 inlet
McFarland A.R. et al., 1984; Peters T.M. et al., 2001; Tolocka M.P. et al., 2001
Single-stage, multi-nozzle impactor
The impactor consists of a nozzle plate with multiple nozzles and an impaction plate, used to collect parti-cles smaller than a certain size.
Pros: Simple configuration, easy operation, a wide range of flow rates, and a smaller cut-size.Cons: Particle bounce, particle overloading, particle loss, and multiple jet interactions.
EPA Hivol PM10 impactor (1133 L/min); Harvard sharp-cut impactor (10 and 20 L/min)
McFarland A.R. et al., 1984; Turner W.A. et al., 2000
Cascade impactor The impactor is a series of multi-nozzle impactors, used to measure particle mass distribution.
Pros: It can measure particle mass distribution ranging from 10 nm to 10 μm.Cons: Possible overloading, particle re-entrainment, and interstage loss.
MOUDI; MOUDI-II; Andersen cascade impactor; NMCI
Andersen A.A., 1966; Marple V.A. et al., 1991; Chien C.L. et al., 2015
Low pressure impac-tor (LPI)
The cascade impactor operates at low pressure condition.
Pros: It can measure particle mass distribution of NPs down to 10 nm.Cons: High pressure drop.
Berner-type low-pres-sure impactor
Berner A., 1972
Electrical low pres-sure impactor (ELPI)
The device consists of a charger and a cascade impactor cou-pled with electrome-ters, used to measure particle number concentrations electri-cally
Pros: Automatic and nearly real-time measurement with a response time of less than 5 s.Cons: Possible particle bounce unless the oil-coated sin-tered-metal substrate is used; Resolution is not good for NPs.
Dekati@ ELPI Keskinen J. et al., 1992; Järvinen A. et al., 2014
Virtual impactor The impactor consists of a single nozzle and a single collection probe, used to collect two particle size fractions.
Pros: No particle bounce and particle loading effect; Simulta-neous measurement of two particle size ranges.Cons: Contamination of coarse particles by particles smaller than the cut-size; Particle loss; Use of two flow meters.
Dichotomous sampler McFarland A.R. et al., 1978
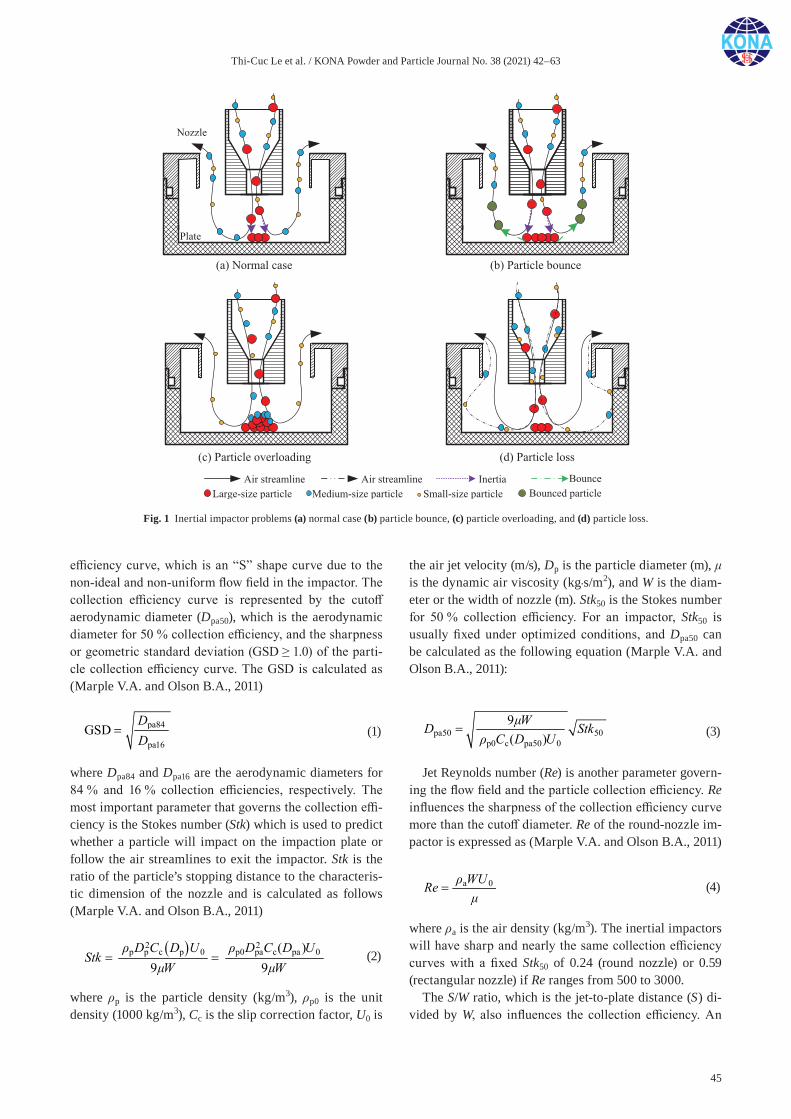
Thi-Cuc Le et al. / KONA Powder and Particle Journal No. 38 (2021) 42–63
45
efficiency curve, which is an “S” shape curve due to the non-ideal and non-uniform flow field in the impactor. The collection efficiency curve is represented by the cutoff aerodynamic diameter (Dpa50), which is the aerodynamic diameter for 50 % collection efficiency, and the sharpness or geometric standard deviation (GSD ≥ 1.0) of the parti-cle collection efficiency curve. The GSD is calculated as (Marple V.A. and Olson B.A., 2011)
pa84
pa16GSD
DD
(1)
where Dpa84 and Dpa16 are the aerodynamic diameters for 84 % and 16 % collection efficiencies, respectively. The most important parameter that governs the collection effi-ciency is the Stokes number (Stk) which is used to predict whether a particle will impact on the impaction plate or follow the air streamlines to exit the impactor. Stk is the ratio of the particle’s stopping distance to the characteris-tic dimension of the nozzle and is calculated as follows (Marple V.A. and Olson B.A., 2011)
2 2p p c p 0 p0 pa c pa 0( )
9 9
D C D U D C D UStk
W W
(2)
where ρp is the particle density (kg/m3), ρp0 is the unit density (1000 kg/m3), Cc is the slip correction factor, U0 is
the air jet velocity (m/s), Dp is the particle diameter (m), μ is the dynamic air viscosity (kg·s/m2), and W is the diam-eter or the width of nozzle (m). Stk50 is the Stokes number for 50 % collection efficiency. For an impactor, Stk50 is usually fixed under optimized conditions, and Dpa50 can be calculated as the following equation (Marple V.A. and Olson B.A., 2011):
pa50 50p0 c pa50 0
9 ( )WD Stk
C D U
(3)
Jet Reynolds number (Re) is another parameter govern-ing the flow field and the particle collection efficiency. Re influences the sharpness of the collection efficiency curve more than the cutoff diameter. Re of the round-nozzle im-pactor is expressed as (Marple V.A. and Olson B.A., 2011)
a 0ρ WUReμ
(4)
where ρa is the air density (kg/m3). The inertial impactors will have sharp and nearly the same collection efficiency curves with a fixed Stk50 of 0.24 (round nozzle) or 0.59 (rectangular nozzle) if Re ranges from 500 to 3000.
The S/W ratio, which is the jet-to-plate distance (S) di-vided by W, also influences the collection efficiency. An
Fig. 1 Inertial impactor problems (a) normal case (b) particle bounce, (c) particle overloading, and (d) particle loss.
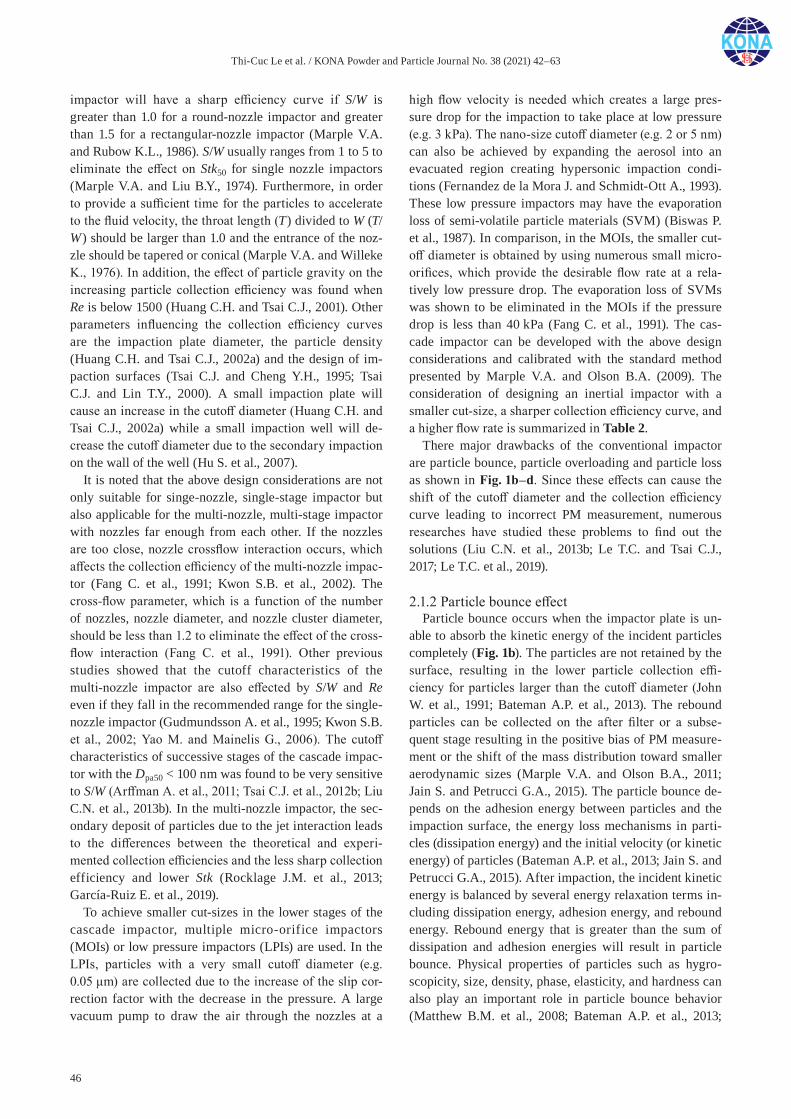
Thi-Cuc Le et al. / KONA Powder and Particle Journal No. 38 (2021) 42–63
46
impactor will have a sharp efficiency curve if S/W is greater than 1.0 for a round-nozzle impactor and greater than 1.5 for a rectangular-nozzle impactor (Marple V.A. and Rubow K.L., 1986). S/W usually ranges from 1 to 5 to eliminate the effect on Stk50 for single nozzle impactors (Marple V.A. and Liu B.Y., 1974). Furthermore, in order to provide a sufficient time for the particles to accelerate to the fluid velocity, the throat length (T) divided to W (T/W) should be larger than 1.0 and the entrance of the noz-zle should be tapered or conical (Marple V.A. and Willeke K., 1976). In addition, the effect of particle gravity on the increasing particle collection efficiency was found when Re is below 1500 (Huang C.H. and Tsai C.J., 2001). Other parameters influencing the collection efficiency curves are the impaction plate diameter, the particle density (Huang C.H. and Tsai C.J., 2002a) and the design of im-paction surfaces (Tsai C.J. and Cheng Y.H., 1995; Tsai C.J. and Lin T.Y., 2000). A small impaction plate will cause an increase in the cutoff diameter (Huang C.H. and Tsai C.J., 2002a) while a small impaction well will de-crease the cutoff diameter due to the secondary impaction on the wall of the well (Hu S. et al., 2007).
It is noted that the above design considerations are not only suitable for singe-nozzle, single-stage impactor but also applicable for the multi-nozzle, multi-stage impactor with nozzles far enough from each other. If the nozzles are too close, nozzle crossflow interaction occurs, which affects the collection efficiency of the multi-nozzle impac-tor (Fang C. et al., 1991; Kwon S.B. et al., 2002). The cross-flow parameter, which is a function of the number of nozzles, nozzle diameter, and nozzle cluster diameter, should be less than 1.2 to eliminate the effect of the cross-flow interaction (Fang C. et al., 1991). Other previous studies showed that the cutoff characteristics of the multi-nozzle impactor are also effected by S/W and Re even if they fall in the recommended range for the single- nozzle impactor (Gudmundsson A. et al., 1995; Kwon S.B. et al., 2002; Yao M. and Mainelis G., 2006). The cutoff characteristics of successive stages of the cascade impac-tor with the Dpa50 < 100 nm was found to be very sensitive to S/W (Arffman A. et al., 2011; Tsai C.J. et al., 2012b; Liu C.N. et al., 2013b). In the multi-nozzle impactor, the sec-ondary deposit of particles due to the jet interaction leads to the differences between the theoretical and experi-mented collection efficiencies and the less sharp collection efficiency and lower Stk (Rocklage J.M. et al., 2013; García-Ruiz E. et al., 2019).
To achieve smaller cut-sizes in the lower stages of the cascade impactor, multiple micro-orifice impactors (MOIs) or low pressure impactors (LPIs) are used. In the LPIs, particles with a very small cutoff diameter (e.g. 0.05 μm) are collected due to the increase of the slip cor-rection factor with the decrease in the pressure. A large vacuum pump to draw the air through the nozzles at a
high flow velocity is needed which creates a large pres-sure drop for the impaction to take place at low pressure (e.g. 3 kPa). The nano-size cutoff diameter (e.g. 2 or 5 nm) can also be achieved by expanding the aerosol into an evacuated region creating hypersonic impaction condi-tions (Fernandez de la Mora J. and Schmidt-Ott A., 1993). These low pressure impactors may have the evaporation loss of semi-volatile particle materials (SVM) (Biswas P. et al., 1987). In comparison, in the MOIs, the smaller cut-off diameter is obtained by using numerous small micro- orifices, which provide the desirable flow rate at a rela-tively low pressure drop. The evaporation loss of SVMs was shown to be eliminated in the MOIs if the pressure drop is less than 40 kPa (Fang C. et al., 1991). The cas-cade impactor can be developed with the above design considerations and calibrated with the standard method presented by Marple V.A. and Olson B.A. (2009). The consideration of designing an inertial impactor with a smaller cut-size, a sharper collection efficiency curve, and a higher flow rate is summarized in Table 2.
There major drawbacks of the conventional impactor are particle bounce, particle overloading and particle loss as shown in Fig. 1b–d. Since these effects can cause the shift of the cutoff diameter and the collection efficiency curve leading to incorrect PM measurement, numerous researches have studied these problems to find out the solutions (Liu C.N. et al., 2013b; Le T.C. and Tsai C.J., 2017; Le T.C. et al., 2019).
2.1.2 Particle bounce effectParticle bounce occurs when the impactor plate is un-
able to absorb the kinetic energy of the incident particles completely (Fig. 1b). The particles are not retained by the surface, resulting in the lower particle collection effi-ciency for particles larger than the cutoff diameter (John W. et al., 1991; Bateman A.P. et al., 2013). The rebound particles can be collected on the after filter or a subse-quent stage resulting in the positive bias of PM measure-ment or the shift of the mass distribution toward smaller aerodynamic sizes (Marple V.A. and Olson B.A., 2011; Jain S. and Petrucci G.A., 2015). The particle bounce de-pends on the adhesion energy between particles and the impaction surface, the energy loss mechanisms in parti-cles (dissipation energy) and the initial velocity (or kinetic energy) of particles (Bateman A.P. et al., 2013; Jain S. and Petrucci G.A., 2015). After impaction, the incident kinetic energy is balanced by several energy relaxation terms in-cluding dissipation energy, adhesion energy, and rebound energy. Rebound energy that is greater than the sum of dissipation and adhesion energies will result in particle bounce. Physical properties of particles such as hygro-scopicity, size, density, phase, elasticity, and hardness can also play an important role in particle bounce behavior (Matthew B.M. et al., 2008; Bateman A.P. et al., 2013;
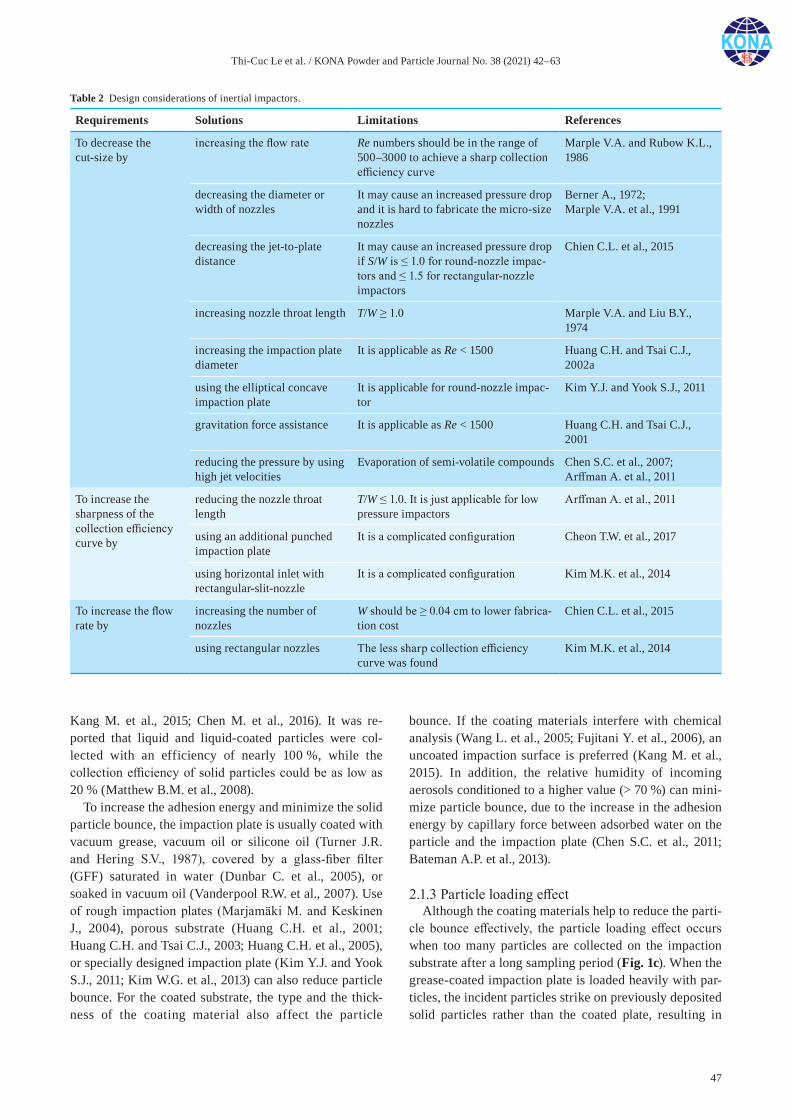
Thi-Cuc Le et al. / KONA Powder and Particle Journal No. 38 (2021) 42–63
47
Kang M. et al., 2015; Chen M. et al., 2016). It was re-ported that liquid and liquid-coated particles were col-lected with an efficiency of nearly 100 %, while the collection efficiency of solid particles could be as low as 20 % (Matthew B.M. et al., 2008).
To increase the adhesion energy and minimize the solid particle bounce, the impaction plate is usually coated with vacuum grease, vacuum oil or silicone oil (Turner J.R. and Hering S.V., 1987), covered by a glass-fiber filter (GFF) saturated in water (Dunbar C. et al., 2005), or soaked in vacuum oil (Vanderpool R.W. et al., 2007). Use of rough impaction plates (Marjamäki M. and Keskinen J., 2004), porous substrate (Huang C.H. et al., 2001; Huang C.H. and Tsai C.J., 2003; Huang C.H. et al., 2005), or specially designed impaction plate (Kim Y.J. and Yook S.J., 2011; Kim W.G. et al., 2013) can also reduce particle bounce. For the coated substrate, the type and the thick-ness of the coating material also affect the particle
bounce. If the coating materials interfere with chemical analysis (Wang L. et al., 2005; Fujitani Y. et al., 2006), an uncoated impaction surface is preferred (Kang M. et al., 2015). In addition, the relative humidity of incoming aerosols conditioned to a higher value (> 70 %) can mini-mize particle bounce, due to the increase in the adhesion energy by capillary force between adsorbed water on the particle and the impaction plate (Chen S.C. et al., 2011; Bateman A.P. et al., 2013).
2.1.3 Particle loading effectAlthough the coating materials help to reduce the parti-
cle bounce effectively, the particle loading effect occurs when too many particles are collected on the impaction substrate after a long sampling period (Fig. 1c). When the grease-coated impaction plate is loaded heavily with par-ticles, the incident particles strike on previously deposited solid particles rather than the coated plate, resulting in
Table 2 Design considerations of inertial impactors.
Requirements Solutions Limitations References
To decrease the cut-size by
increasing the flow rate Re numbers should be in the range of 500–3000 to achieve a sharp collection efficiency curve
Marple V.A. and Rubow K.L., 1986
decreasing the diameter or width of nozzles
It may cause an increased pressure drop and it is hard to fabricate the micro-size nozzles
Berner A., 1972; Marple V.A. et al., 1991
decreasing the jet-to-plate distance
It may cause an increased pressure drop if S/W is ≤ 1.0 for round-nozzle impac-tors and ≤ 1.5 for rectangular-nozzle impactors
Chien C.L. et al., 2015
increasing nozzle throat length T/W ≥ 1.0 Marple V.A. and Liu B.Y., 1974
increasing the impaction plate diameter
It is applicable as Re < 1500 Huang C.H. and Tsai C.J., 2002a
using the elliptical concave impaction plate
It is applicable for round-nozzle impac-tor
Kim Y.J. and Yook S.J., 2011
gravitation force assistance It is applicable as Re < 1500 Huang C.H. and Tsai C.J., 2001
reducing the pressure by using high jet velocities
Evaporation of semi-volatile compounds Chen S.C. et al., 2007; Arffman A. et al., 2011
To increase the sharpness of the collection efficiency curve by
reducing the nozzle throat length
T/W ≤ 1.0. It is just applicable for low pressure impactors
Arffman A. et al., 2011
using an additional punched impaction plate
It is a complicated configuration Cheon T.W. et al., 2017
using horizontal inlet with rectangular-slit-nozzle
It is a complicated configuration Kim M.K. et al., 2014
To increase the flow rate by
increasing the number of nozzles
W should be ≥ 0.04 cm to lower fabrica-tion cost
Chien C.L. et al., 2015
using rectangular nozzles The less sharp collection efficiency curve was found
Kim M.K. et al., 2014
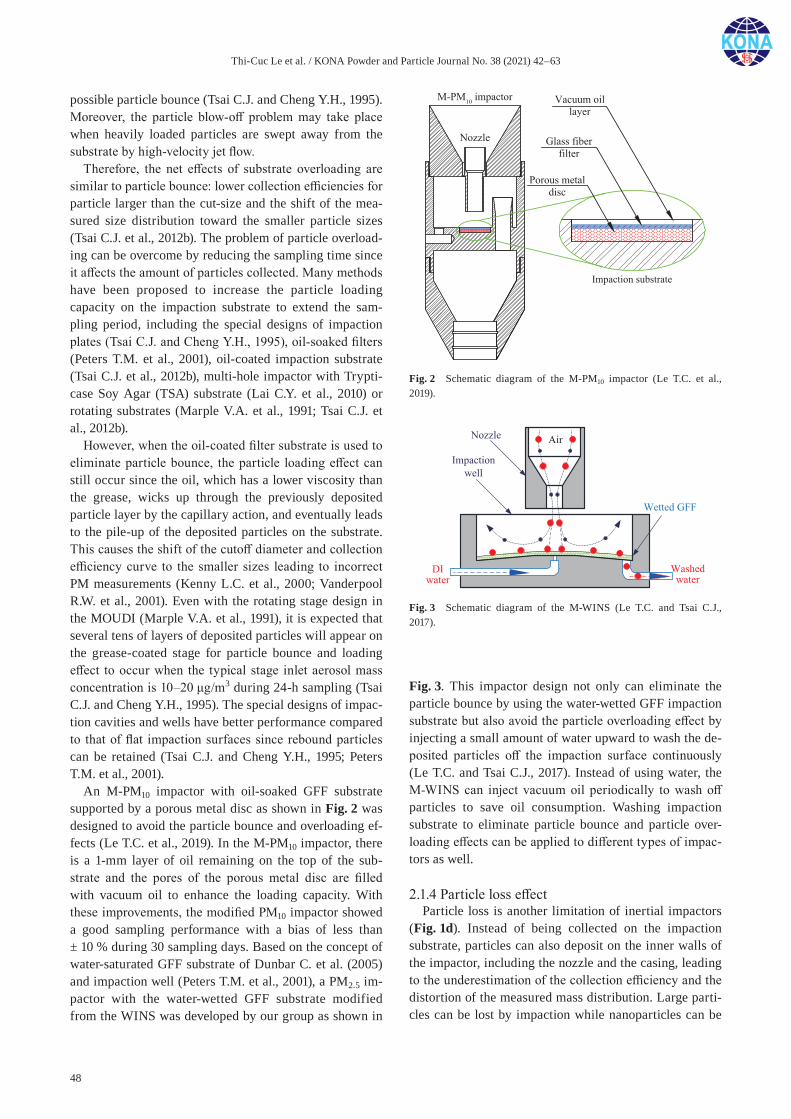
Thi-Cuc Le et al. / KONA Powder and Particle Journal No. 38 (2021) 42–63
48
possible particle bounce (Tsai C.J. and Cheng Y.H., 1995). Moreover, the particle blow-off problem may take place when heavily loaded particles are swept away from the substrate by high-velocity jet flow.
Therefore, the net effects of substrate overloading are similar to particle bounce: lower collection efficiencies for particle larger than the cut-size and the shift of the mea-sured size distribution toward the smaller particle sizes (Tsai C.J. et al., 2012b). The problem of particle overload-ing can be overcome by reducing the sampling time since it affects the amount of particles collected. Many methods have been proposed to increase the particle loading capacity on the impaction substrate to extend the sam-pling period, including the special designs of impaction plates (Tsai C.J. and Cheng Y.H., 1995), oil-soaked filters (Peters T.M. et al., 2001), oil-coated impaction substrate (Tsai C.J. et al., 2012b), multi-hole impactor with Trypti-case Soy Agar (TSA) substrate (Lai C.Y. et al., 2010) or rotating substrates (Marple V.A. et al., 1991; Tsai C.J. et al., 2012b).
However, when the oil-coated filter substrate is used to eliminate particle bounce, the particle loading effect can still occur since the oil, which has a lower viscosity than the grease, wicks up through the previously deposited particle layer by the capillary action, and eventually leads to the pile-up of the deposited particles on the substrate. This causes the shift of the cutoff diameter and collection efficiency curve to the smaller sizes leading to incorrect PM measurements (Kenny L.C. et al., 2000; Vanderpool R.W. et al., 2001). Even with the rotating stage design in the MOUDI (Marple V.A. et al., 1991), it is expected that several tens of layers of deposited particles will appear on the grease-coated stage for particle bounce and loading effect to occur when the typical stage inlet aerosol mass concentration is 10–20 μg/m3 during 24-h sampling (Tsai C.J. and Cheng Y.H., 1995). The special designs of impac-tion cavities and wells have better performance compared to that of flat impaction surfaces since rebound particles can be retained (Tsai C.J. and Cheng Y.H., 1995; Peters T.M. et al., 2001).
An M-PM10 impactor with oil-soaked GFF substrate supported by a porous metal disc as shown in Fig. 2 was designed to avoid the particle bounce and overloading ef-fects (Le T.C. et al., 2019). In the M-PM10 impactor, there is a 1-mm layer of oil remaining on the top of the sub-strate and the pores of the porous metal disc are filled with vacuum oil to enhance the loading capacity. With these improvements, the modified PM10 impactor showed a good sampling performance with a bias of less than ± 10 % during 30 sampling days. Based on the concept of water-saturated GFF substrate of Dunbar C. et al. (2005) and impaction well (Peters T.M. et al., 2001), a PM2.5 im-pactor with the water-wetted GFF substrate modified from the WINS was developed by our group as shown in
Fig. 3. This impactor design not only can eliminate the particle bounce by using the water-wetted GFF impaction substrate but also avoid the particle overloading effect by injecting a small amount of water upward to wash the de-posited particles off the impaction surface continuously (Le T.C. and Tsai C.J., 2017). Instead of using water, the M-WINS can inject vacuum oil periodically to wash off particles to save oil consumption. Washing impaction substrate to eliminate particle bounce and particle over-loading effects can be applied to different types of impac-tors as well.
2.1.4 Particle loss effectParticle loss is another limitation of inertial impactors
(Fig. 1d). Instead of being collected on the impaction substrate, particles can also deposit on the inner walls of the impactor, including the nozzle and the casing, leading to the underestimation of the collection efficiency and the distortion of the measured mass distribution. Large parti-cles can be lost by impaction while nanoparticles can be
Fig. 2 Schematic diagram of the M-PM10 impactor (Le T.C. et al., 2019).
Fig. 3 Schematic diagram of the M-WINS (Le T.C. and Tsai C.J., 2017).

Thi-Cuc Le et al. / KONA Powder and Particle Journal No. 38 (2021) 42–63
49
lost by convention-diffusion. The losses may vary with particle properties. If particles are liquid or sticky, they will adhere to any surface upon contact with it. Some of dry particles, however, may rebound when they hit the surface and remain airborne. Experimental and theoreti-cal studies have been conducted for determining the par-ticle losses by impaction and diffusion (Chen S.C. et al., 2007). The inertial loss of large particles normally occurs on the contractions which connect the big inlet tube to the small nozzle or on the surface of nozzle plate (Durand T. et al., 2014; Kumar A. and Gupta T., 2015a, 2015b).
Another particle loss in the cascade impactor is the inter-stage particle loss, which occurs in the inter-stage space above the intended stage to collect particles. The inter-stage loss is due to turbulent particle deposition when they pass through sharp corners or obstructions be-tween two adjacent stages (Marple V.A. et al., 1991). Typ-ically, significant particle loss occurs in the lower stages of the cascade impactors due to diffusion-convention (Demokritou P. et al., 2002b; Watson J.G. and Chow J.C., 2011). The NMCI with smooth nozzles could minimize the convection-diffusion particle deposition in the nozzle (Liu C.N. et al., 2013b). In another study, 80 % of particle loss was found to concentrate around the nozzles and 20 % on the impaction plate in a stage of the DLPI (Dekati® Low-Pressure Impactor) (Durand T. et al., 2014).
Some conventional impactors were designed by chang-ing the geometry of the impactor to enhance the collec-tion efficiency to obtain a lower cut-size, including using the horizontal inlet to concentrate particles in the central axis of nozzle (Kim M.K. et al., 2014; Kim W.G. et al., 2014; Heo J.E. et al., 2018), using an additional punched impaction plate installed between the nozzle outlet and impaction plate (Cheon T.W. et al., 2017), and the combi-nation of the impactor and the initial filter to achieve a sharp collection efficiency curve (Zhang T. et al., 2017; Zhang X. et al., 2018). Table 3 lists the design solutions to resolve the problems of conventional impactors.
2.2 Virtual impactors
The virtual impactor is another type of inertial impac-tors, which consists of the nozzle(s), and the collection probe(s) (Marple V.A. and Olson B.A., 2011). In the vir-tual impactor, the collection probe diameter (D), which is slightly larger than W, is used to replace the collection plate of the conventional impactor to eliminate particle bounce and particle overloading effects (Loo B.W., 1975). Particles with sufficient inertia are retained in a relatively stagnant air passing through the collection probe while particles with less inertia follow the airflow to exit the impactor. The minor flow (Q1) is about 5–20 % of the to-tal air flow (Q) or the major flow (Qo) is about 80–95 % of the total air flow (Hinds W.C., 1999).
Many studies have been conducted to examine the cut-off characteristics and the influencing parameters of the virtual impactor of the basic design (McFarland A.R. et al., 1978; Marple V.A. and Chien C.M., 1980; Lim K.S. and Lee K.W., 2006). They concluded that the theoretical cutoff characteristics of the virtual impactors are similar to those of conventional impactors, which are mainly gov-erned by Stk and Re (Marple V.A. and Chien C.M., 1980). The other parameters such as collection probe/nozzle di-ameter ratio, nozzle length, entrance cone angle, and noz-zle to collection probe distance do not have an important effect on the collection efficiency. Although the value of D/W does not affect the cutoff characteristic, it should be less than 1.49 to eliminate the flow field effect. The cutoff diameter increases as the minor and major flow ratio (Q1/Qo) decreases (McFarland A.R. et al., 1978; Marple V.A. and Chien C.M., 1980). The virtual impactor avoids the particle bounce effect without using the impaction plate, but an intrinsic disadvantage of the virtual impactor is the contaminations of coarse particles in the major flow by fine particles. That is, a portion of particles less than the cutoff diameter will remain in the minor flow or the so-called minor flow contamination. A virtual impactor with reduced fine particle contamination was designed by con-fining the aerosol flow within a central core enveloped by a sheath of clean air (Chein H. and Lundgren D.A., 1993). The opposing jets design and the introduction of a clean air core as the envelope around the particle-laden stream were also used to eliminate fine particle contamination.
Another major disadvantage of the virtual impactor is the particle internal losses which affect the cutoff diame-ter significantly (Xu Z., 1991). Particles are normally lost at the upper edge of the collection probe or on the back-side of the probe plate. The particle loss is affected by D/W, Re, Q1/Q, the nozzle protruding through the nozzle plate, the shape of the collection probe inlet, and the alignment of the axes of the nozzle and the collection probe. High particle losses occur for particles having a di-ameter close to the cutoff point (Marple V.A. and Chien C.M., 1980). The particle loss can be reduced by proper contouring of the probe entrance, decreasing Re, and in-creasing Q1/Qo and S/W ratio (Marple V.A. and Chien C.M., 1980). The particle loss can be reduced by increas-ing D/W but it may reduce the sharpness of the particle collection efficiency curve. Certain values of the throat length of the probe opening, the radius of the rounded shoulder of the probe opening, and the diameter of the lower surface of the nozzle required to reduce the particle loss were suggested (Marple V.A. and Chien C.M., 1980). It is summarized that D should be about 30–50 % larger than W, the radius on the inside of the collection probe in-let is about 30 % of W, the nozzle should protrude two to three times W through the nozzle plate, S should be about 1–1.8 times W, and the axes of the nozzle should be

Thi-Cuc Le et al. / KONA Powder and Particle Journal No. 38 (2021) 42–63
50
Table 3 Solutions of inertial device problems.
Problems Solutions Pros and cons References
Particle bounce Using glass fiber filter or Teflon filter as an impaction substrate
Pros: Simple and no chemical interferenceCons: Expensive
Marple V.A. et al., 1991
Greased substrate Pros: Easy implementerCons: Can’t be suitable for chemical analysis; Particle overloading effect
Turner J.R. and Hering S.V., 1987; John W. et al., 1991
Oiled substrate Pros: Cheap, high loaded mass, low viscosity, and uniform coatingCons: Particle loading effect and oil evaporation
Turner J.R. and Hering S.V., 1987; Peters T.M. et al., 2001; Le T.C. et al., 2019
Porous metal substrate Pros: No chemical interferenceCons: The shift of the collection efficiency curve and cutoff diameter; Less sharp curve
Huang C.H. et al., 2001; Huang C.H. and Tsai C.J., 2002b; 2003
Foam substrate Pros: No chemical interferenceCons: The shift of the collection efficiency curve and cutoff diameter; Less sharp curve
Huang C.H. et al., 2005
Water substrate and water washing
Pros: No chemical interference; Can be used to collect samples for chemical analysis; Long-term useCons: Pumps are needed to inject and drain water
Dunbar C. et al., 2005; Le T.C. and Tsai C.J., 2017
Cavity-type impaction substrate
Pros: No energy, solutions or materials are neededCons: The curve is not very sharp
Tsai C.J. and Cheng Y.H., 1995
Elliptical concave impaction plate
Pros: No chemical interferenceCons: The determination of dimensions is needed; It just helps trap some re-bound particles
Kim W.G. et al., 2013
Cup impactor Pros: No chemical interferenceCons: Special design; The cut-size can’t be pre-dicted
Kim D.S. et al., 2006
Using virtual impactor Pros: Two size fractionsCons: Fine particle contamination; High particle loss near the cut-size.
McFarland A.R. et al., 1978; Marple V.A. and Chien C.M., 1980
Particle over-loading
Oiled substrate Pros: Cheap and high loaded massCons: Short-term use and oil evaporation
Turner J.R. and Hering S.V., 1987
Porous metal substrate Pros: High loaded massCons: The shift of the collection efficiency curve and cutoff diameter; Less sharp curve
Huang C.H. et al., 2001
Continuous water washing
Pros: Long-term use without frequent maintenanceCons: Pumps are needed to inject and drain water
Le T.C. and Tsai C.J., 2017
Rotated impaction plate Pros: Long-term useCons: A motor is needed; Coated substrate; Complicated configuration
Marple V.A. et al., 1991; Tsai C.J. et al., 2012b
Particle loss Horizontal inlet in virtual impactor
Pros: High collection efficiencyCons: Complicated configuration
Heo J.E. et al., 2018
Smooth nozzles Pros: No particle cloggingCons: Need special technique to fabricate micro-size nozzles
Fang C. et al., 1991; Liu C.N. et al., 2013b; Chien C.L. et al., 2015
Multiple-jet interaction
The symmetrical arrangement of nozzles
Pros: Uniform depositionCons: Not enough study
Kwon H.B. et al., 2018

Thi-Cuc Le et al. / KONA Powder and Particle Journal No. 38 (2021) 42–63
51
aligned closely to that of the collection probe (Hinds W.C., 1999).
Some special designs of the virtual impactor to elimi-nate particle loss and improve the collection efficiency were developed. This includes the slit virtual impactor as-sembled with an orifice installed upstream of the acceler-ation nozzle to concentrate the minor flow at the center of the collection probe (Lim K.S. and Lee K.W., 2006; Lee H. et al., 2014) or the impactor with three-partitioned hor-izontal inlet (Zahir M.Z. et al., 2018). The virtual impac-tor with an ultrafine cutoff diameter at a moderate pressure drop was developed by using a very small round nozzle and at a low flow rate (Sioutas C. et al., 1994b) or slit nozzles to operate at a high flow rate (Sioutas C. et al., 1994a).
Since it is hard to control both minor and major flows, the virtual impactor is usually designed as a single-stage virtual impactor. The multi-stage virtual impactor to col-lect particles in different size ranges simultaneously was studied (Marple V.A. et al., 2013, 2014a; Wada M. et al., 2017). To increase the flow rate to 1000 L/min, the use of multi-nozzle virtual impactors was also designed to re-duce the pressure drop (Szymanski W.W. and Liu B.Y., 1989). It is noticed that the multi-nozzle virtual impactor may have multiple jet interaction problem leading to the degradation of the impactor’s performance (Fang C. et al., 1991). The virtual impactor with the rectangular nozzle can increase the flow rate without changing the cut-size as compared to the single round-nozzle virtual impactor (Masuda H. and Nakasita S., 1988). A slit-shaped nozzle virtual impactor in which the width of the slit is the same with the diameter of the round nozzle was developed to overcome the crossflow interaction problems of the multi-ple jets at a high flow rate (Ding Y. and Koutrakis P., 2000).
3. Application of inertial impactors
The development of the inertial impactor is in line with the need to develop PM measurement devices. PM mea-surement serves various purpose such as (i) the determi-nation of PM10 or PM2.5 concentrations to determine the compliance with the national ambient air quality standard (NAAQS), (ii) the determination of particle mass distri-bution, (iii) the determination of physical and chemical properties of particles, and (iv) the exposure assessment of PMs. Many studies were carried out by our group for ambient mass measurement of PM2.5 and ultrafine parti-cles using commercial inertial impactors for PM2.5 mass concentration measurement and the evaluation of the per-formance of PM2.5 monitors (Liu C.N. et al., 2013a), the measurement of mass concentration and chemical compo-sition of PM2.5 (Liu C.N. et al., 2014; Liu C.N. et al., 2015)
and ultrafine particles (Chen S.C. et al., 2010a; Chen S.C. et al., 2010b), long-term measurement for PM2.5 and ultra-fine particles mass concentrations (Lin G.Y. et al., 2015), and the measurement of PM10, PM2.5 and PM0.1 for source characterization and apportionment (Gugamsetty B. et al., 2012).
3.1 PM mass measurement
In order to measure the ambient PM mass concentra-tion to determine the compliance with NAAQS for PM10 and PM2.5, respectively, the PM FRM (Federal Reference Method) samplers and FEM (Federal Equivalent Method) monitors are used (U.S.EPA, 2017a; Le T.C. et al., 2020). The FRM samplers and FEM monitors use size-selective inlets to classify the desired particle sizes for collecting on the filter for further analysis. Due to the sharp cutoff characteristics of the inertial impactors, they are widely deployed for the size-selective inlets. The PM10 and PM2.5 size-selective inlets are designed based on the U.S. EPA requirements for the cutoff diameter, the sharpness of the collection efficiency curve, the flow rate, and the accuracy for long-term sampling. A list of PM10 and PM2.5 size- selective inlets including the conventional impactor and virtual impactor is shown in Table 26.1 in Watson J.G. and Chow J.C. (2011) and is not repeated here. U.S. EPA designated that the PM10 size-selective inlets should have the cut-size of 10 ± 0.5 μm and the sharpness of the sam-pling efficiency curve of 1.5 ± 0.1 (U.S.EPA, 2017a) and the PM2.5 size-selective inlets should have the cut-size of 2.5 ± 0.2 μm but the curve sharpness is not specified. The sharpness curve of the PM2.5 inlet needs to agree with that of the WINS (GSD = 1.18) (Peters T.M. et al., 2001) and very sharp-cut cyclone (VSCC, GSD = 1.16) (Kenny L.C. et al., 2004), which are the standard inlets specified in U.S.EPA (2017a). Other countries specified the curve sharpness of 1.2 ± 0.1 (MEPC, 2013; ECS, 2014).
3.1.1 The inlet for a single size fractionThe conventional impactors are used extensively as an
inlet to classify a single size fraction since they have sharper cutoff characteristics than that of the cyclone, which include AMI (Airmetrics) MiniVol™ impactors (AMI, 2020), Harvard sharp-cut impactors (Turner W.A. et al., 2000), Hi-vol PM10 samplers (McFarland A.R. et al., 1984), Med-vol (Medium volume) PM10 samplers (Olin J.G. and Bohn R.R., 1983), Flat Top Dichot PM10 inlet (McFarland A.R. et al., 1978), BGI FRM Louvered PM10 samplers (Tolocka M.P. et al., 2001), and EPA WINS PM2.5 inlet (Peters T.M. et al., 2001). These inlets are dif-ferent in the sampling flow rate, cutoff diameter, and sam-pling curve sharpness. The Hi-vol PM10 sampler is widely used for sample PM10 with a high flow rate of 1133 L/min (Fujitani Y. et al., 2017). The impaction plate of the Hi-vol

Thi-Cuc Le et al. / KONA Powder and Particle Journal No. 38 (2021) 42–63
52
PM10 sampler was suggested to be grease-coated to elimi-nate the particle bounce and re-entrainment to avoid PM10 overestimation as compared to other samplers (Lee S.J. et al., 2005). A slight difference in the cutoff characteristic of the PM10 inlet can cause a sensible difference in PM10 measurements between different PM10 inlets since the mode of many ambient mass-size distributions is nearly 10 μm (Ranade M.B. et al., 1990). The Med-vol PM10 sampler is the one used for sampling PM10 at the medium flow rate of 113 L/min (Gertler A.W. et al., 1993) but is not deployed widely. Some other impactors have been de-signed to operate at high flow rates that exceed hundreds of liters per minute (Misra C. et al., 2002) and even thou-sands of liters per minute (Fulghum M.R. et al., 2012; Staymates M. et al., 2013) to collect more mass of PM10, PM2.5, PM1 or PM0.1.
Nowadays, many FRM samplers and FEM monitors use low-volume flat-topped (McFarland A.R. et al., 1984) and louvered PM10 inlets (Tolocka M.P. et al., 2001) to classify particles smaller than 10 μm at the low flow rate of 16.7 L/min (U.S.EPA, 2017b). However, several studies found that the low-volume PM10 inlet has uncertainty in the measured sampling efficiency. These studies found that the sampling performance of PM10 inlet is very sensi-tive to variation of particle sources (Wang L. et al., 2005), particle size distribution (Buser M.D. et al., 2008), and TSP/PM10 ratio (Total suspended particulates) (Watson J.G. et al., 2011). The low-volume PM10 sampler overesti-mated PM10 when it was used to measure fly ash particles as compared to the Andersen cascade impactor (Park J.M. et al., 2009). When the particle source is dominant by particles larger than the cut-size, a small fraction of parti-cles larger than the cut-size may cause the overestimation (Faulkner W.B. et al., 2014). In the previous study, we found that the distortion of the sampling performance of the low-volume PM10 sampler could be due to particle bounce and re-entrainment from the uncoated surface of the PM10 inlet, and particle overloading of the PM10 im-pactor after a long sampling period, resulting in over-measurement and under-measurement, respectively. Thus, the PM10 inlet was required to be cleaned every day to eliminate these effects. Similarly, most of FRM sam-plers and FEM monitors (16.7 L/min) using PM2.5 WINS as the PM2.5 inlet (U.S.EPA, 2017b), whose impaction well have to be replaced after 3–5 days sampling to elimi-nate the particle overloading problems (Le T.C. and Tsai C.J., 2017). The M-PM10 inlet and PM2.5 M-WINS inlet developed by our group were tested for one month with-out frequent cleaning and maintenance. They can be used to replace the traditional PM10 inlets and PM2.5 WINS in-let for PM sampling.
The MiniVol impactor with the flow rate of 5 L/min is also used to determine the mass and chemical composi-tion of fine particles (Du W. et al., 2017; Fan Z.L. et al.,
2017; Thuy N.T.T. et al., 2018) or used as the reference for calibration (Begum B.A. and Hopke P.K., 2019). However, the previous studies showed that the MiniVol data did not agree well with the other collocated samplers and moni-tors (Kingham S. et al., 2006). This could be due to the particle bounce and particle loading effect. The impaction plate of the MiniVol impactor needs to be cleaned and re-coated grease after 5 sampling days or more often if over-loading is observed to recovery the good performance (AMI, 2020). The mini-volume (4 L/min) or low-volume (10–20 L/min) Harvard sharp-cut impactors with different cut-sizes of 10, 2.5 and 1.0 μm, which use the oil-coated impaction substrate to eliminate the particle bounce ef-fect, were mainly used for indoor measurement and out-door field tests (Rovelli S. et al., 2017).
3.1.2 The inlet for two size fractionsTo determine the compliance with NAAQS, it is often
desirable to fractionate particles into two size fractions simultaneously, one corresponding to the coarse particle mode (> 2.5 μm) and one corresponding to the fine parti-cle mode (≤ 2.5 μm). The virtual impactor is very suitable for this application (Lin G.Y. et al., 2015; Landis M.S. et al., 2017). The Andersen Dichotomous Virtual impactor (McFarland A.R. et al., 1978) is the most widely used for collecting coarse and fine particles at a low flow rate of 16.7 L/min (Gugamsetty B. et al., 2012). Other types of virtual impactors were developed and deployed for spe-cific measurement purposes. For instance, the PM1.0/2.5/10 trichotomous sampler (cascade virtual impactor) with the high sampling flow rate of 1133 L/min was developed to measure the mass and the ion concentrations of PM at Phoenix, Arizona, USA (Marple V.A. et al., 2013, 2014a).
3.2 Particle mass distribution measurement
The determination of the mass concentration of the particles less than a certain size is valuable but it is desir-able to determine the mass distribution of entire aerosol particles. In this case, the cascade impactor can be de-ployed to cover a very wide particle size range from a few nanometers to tens of micrometers (Marple V.A. et al., 1991; Fernandez de la Mora J. and Schmidt-Ott A., 1993; Arffman A. et al., 2015). It is desirable to have a cascade impactor for particle mass distribution measurement with a wide range of flow rates, a large range of particle sizes, a good size resolution (or number of channels), low pres-sure drop, uniform particle collection, less inter-stage loss, no particle bounce, high loaded mass, and easy as-sembly and disassembly of the stages (Marple V.A., 2004). The list of the commercially available cascade im-pactors is shown in Table 8-1 in Marple V.A. and Olson B.A. (2011). Some commonly used cascade impactors are Andersen cascade impactor (Andersen A.A., 1966), Mer-
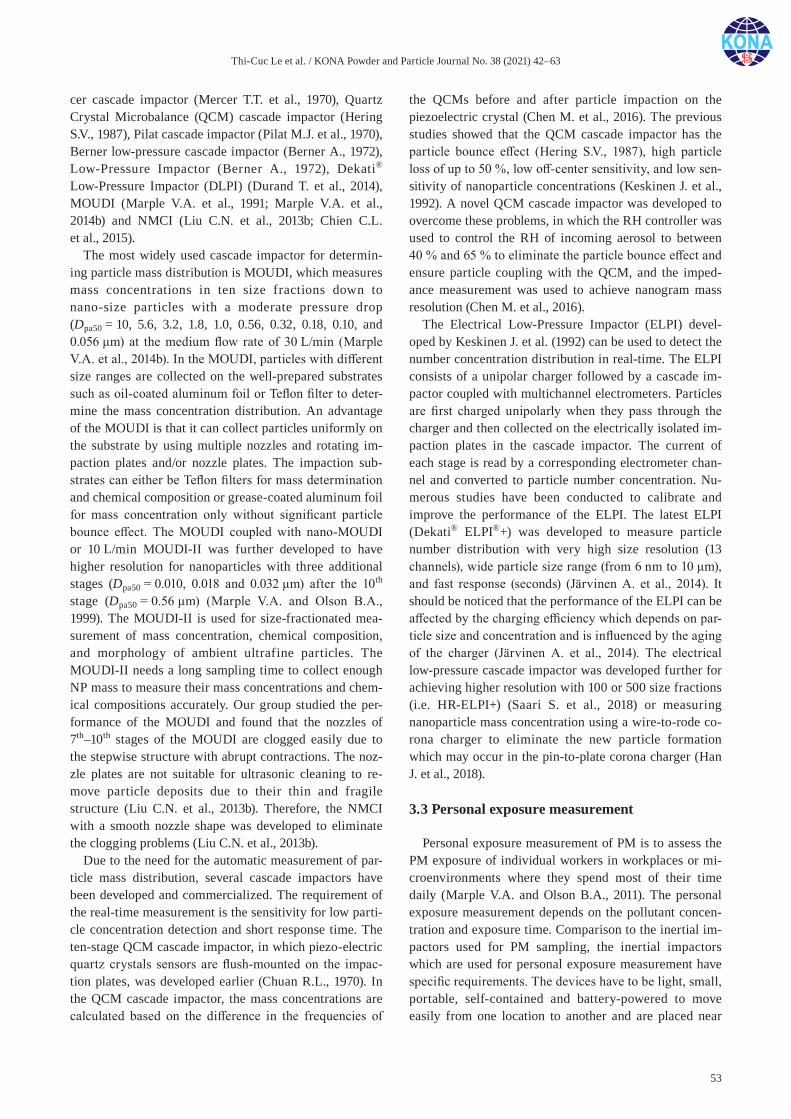
Thi-Cuc Le et al. / KONA Powder and Particle Journal No. 38 (2021) 42–63
53
cer cascade impactor (Mercer T.T. et al., 1970), Quartz Crystal Microbalance (QCM) cascade impactor (Hering S.V., 1987), Pilat cascade impactor (Pilat M.J. et al., 1970), Berner low-pressure cascade impactor (Berner A., 1972), Low-Pressure Impactor (Berner A., 1972), Dekati® Low-Pressure Impactor (DLPI) (Durand T. et al., 2014), MOUDI (Marple V.A. et al., 1991; Marple V.A. et al., 2014b) and NMCI (Liu C.N. et al., 2013b; Chien C.L. et al., 2015).
The most widely used cascade impactor for determin-ing particle mass distribution is MOUDI, which measures mass concentrations in ten size fractions down to nano-size particles with a moderate pressure drop (Dpa50 = 10, 5.6, 3.2, 1.8, 1.0, 0.56, 0.32, 0.18, 0.10, and 0.056 μm) at the medium flow rate of 30 L/min (Marple V.A. et al., 2014b). In the MOUDI, particles with different size ranges are collected on the well-prepared substrates such as oil-coated aluminum foil or Teflon filter to deter-mine the mass concentration distribution. An advantage of the MOUDI is that it can collect particles uniformly on the substrate by using multiple nozzles and rotating im-paction plates and/or nozzle plates. The impaction sub-strates can either be Teflon filters for mass determination and chemical composition or grease-coated aluminum foil for mass concentration only without significant particle bounce effect. The MOUDI coupled with nano-MOUDI or 10 L/min MOUDI-II was further developed to have higher resolution for nanoparticles with three additional stages (Dpa50 = 0.010, 0.018 and 0.032 μm) after the 10th stage (Dpa50 = 0.56 μm) (Marple V.A. and Olson B.A., 1999). The MOUDI-II is used for size-fractionated mea-surement of mass concentration, chemical composition, and morphology of ambient ultrafine particles. The MOUDI-II needs a long sampling time to collect enough NP mass to measure their mass concentrations and chem-ical compositions accurately. Our group studied the per-formance of the MOUDI and found that the nozzles of 7th–10th stages of the MOUDI are clogged easily due to the stepwise structure with abrupt contractions. The noz-zle plates are not suitable for ultrasonic cleaning to re-move particle deposits due to their thin and fragile structure (Liu C.N. et al., 2013b). Therefore, the NMCI with a smooth nozzle shape was developed to eliminate the clogging problems (Liu C.N. et al., 2013b).
Due to the need for the automatic measurement of par-ticle mass distribution, several cascade impactors have been developed and commercialized. The requirement of the real-time measurement is the sensitivity for low parti-cle concentration detection and short response time. The ten-stage QCM cascade impactor, in which piezo-electric quartz crystals sensors are flush-mounted on the impac-tion plates, was developed earlier (Chuan R.L., 1970). In the QCM cascade impactor, the mass concentrations are calculated based on the difference in the frequencies of
the QCMs before and after particle impaction on the piezoelectric crystal (Chen M. et al., 2016). The previous studies showed that the QCM cascade impactor has the particle bounce effect (Hering S.V., 1987), high particle loss of up to 50 %, low off-center sensitivity, and low sen-sitivity of nanoparticle concentrations (Keskinen J. et al., 1992). A novel QCM cascade impactor was developed to overcome these problems, in which the RH controller was used to control the RH of incoming aerosol to between 40 % and 65 % to eliminate the particle bounce effect and ensure particle coupling with the QCM, and the imped-ance measurement was used to achieve nanogram mass resolution (Chen M. et al., 2016).
The Electrical Low-Pressure Impactor (ELPI) devel-oped by Keskinen J. et al. (1992) can be used to detect the number concentration distribution in real-time. The ELPI consists of a unipolar charger followed by a cascade im-pactor coupled with multichannel electrometers. Particles are first charged unipolarly when they pass through the charger and then collected on the electrically isolated im-paction plates in the cascade impactor. The current of each stage is read by a corresponding electrometer chan-nel and converted to particle number concentration. Nu-merous studies have been conducted to calibrate and improve the performance of the ELPI. The latest ELPI (Dekati® ELPI®+) was developed to measure particle number distribution with very high size resolution (13 channels), wide particle size range (from 6 nm to 10 μm), and fast response (seconds) (Järvinen A. et al., 2014). It should be noticed that the performance of the ELPI can be affected by the charging efficiency which depends on par-ticle size and concentration and is influenced by the aging of the charger (Järvinen A. et al., 2014). The electrical low-pressure cascade impactor was developed further for achieving higher resolution with 100 or 500 size fractions (i.e. HR-ELPI+) (Saari S. et al., 2018) or measuring nanoparticle mass concentration using a wire-to-rode co-rona charger to eliminate the new particle formation which may occur in the pin-to-plate corona charger (Han J. et al., 2018).
3.3 Personal exposure measurement
Personal exposure measurement of PM is to assess the PM exposure of individual workers in workplaces or mi-croenvironments where they spend most of their time daily (Marple V.A. and Olson B.A., 2011). The personal exposure measurement depends on the pollutant concen-tration and exposure time. Comparison to the inertial im-pactors used for PM sampling, the inertial impactors which are used for personal exposure measurement have specific requirements. The devices have to be light, small, portable, self-contained and battery-powered to move easily from one location to another and are placed near
Thi-Cuc Le et al. / KONA Powder and Particle Journal No. 38 (2021) 42–63
54
the personal breathing zone, which is about 30 cm hemi-sphere around mouth and nose (Asbach C. et al., 2017). These devices need to collect an adequate amount of par-ticle mass with a uniform deposit on the substrate for sub-sequent PM mass concentration, chemical composition, morphological, and crystallographic analyses manually. The personal exposure devices are listed in Volkwein J.C. et al. (2011) for workplaces and in Rodes C.E. (2011) for non-occupational microenvironments. Personal exposure impactors measure PM10, PM2.5, and PM1.0, inhalable (Dpa50 = 100 μm, thoracic (Dpa50 = 10 μm), and respirable (Dpa50 = 4 μm) particles regulated by the National Institute for Occupational Safety and Health (NIOSH), Interna-tional Organization for Standardization (ISO), and Com-ite’ European de Normalisation (CEN) (Volkwein J.C. et al., 2011).
To meet the respirable aerosol sampling criteria, the in-ertial impactors are designed to have a less sharp effi-ciency curve (Volkwein J.C. et al., 2011). Personal single-stage impactor (Tsai C.J. et al., 2012b), two-stage impactor (Demokritou P. et al., 2001), three-stage per-sonal impactor (Tsai C.J. et al., 2008), and cascade impac-tor (Chen M. et al., 2018) and multipollutant samplers were developed for personal exposure measurement since 1970s and some which were widely used. These include Marple personal impactor, personal environmental moni-tor (PEM), mini-MOUDI, parallel particle impactor, per-sonal modular impactor, Sioutas cascade impactor, personal PUF pesticide sampler, and personal impactor filter pack (Marple V.A. and Olson B.A., 2011). The Marple personal impactor with 8 stages at the flow rate of 2 L/min and Sioutas cascade impactor at the flow rate of 9 L/min are the most frequently used samplers for mass distribution measurement (Tsai C.J. et al., 1997b; Sharma R. and Balasubramanian R., 2018).
The personal exposure measurement for nanoparticles has drawn serious concern due to the adverse health effect of nanoparticles released from nanopowders and nanoma-terial manufacturing processes. Nanopowders such as TiO2, SiO2, and ZnO are released to the workplaces de-pending on their dustiness or the property of a given ma-terial to generate dust (Tsai C.J. et al., 2009; Tsai C.J. et al., 2011). Some studies were carried out by our group (Tsai C.J. et al., 2011; Tsai C.J. et al., 2012a) to determine the generation and dispersion characteristics of nanoparti-cles.
Some commercialized personal cascade impactors can be used for the nanoparticle exposure measurement such as mini-MOUDI (13 stages with particle sizes ranging from 10 nm to 10 μm) operating at the flow rate of 2 L/min and Sioutas cascade impactor (4 stages with particle sizes ranging from 0.25 to 2.5 μm) operating at the flow rate of 9 L/min (Asbach C. et al., 2017). Due to the high pressure drop that is needed to classify nanoparticles,
only a few of personal exposure samplers were developed to collect nanoparticles. Besides, the nanoparticle sam-plers need to operate for a long sampling period to collect enough mass for further gravimetric analysis since nanoparticle mass is very small. The personal cascade impactors using inertial filters for nanoparticle collection were developed with a moderate pressure drop (< 5–10 kPa) (Kumsanlas N. et al., 2019) which is based on the design of inertial filter (Zhang T. et al., 2017).
Our group developed the PENS, which can be used to collect respirable particles and nanoparticles simultane-ously by using a cyclone as a pre-separator to remove par-ticles larger than 4 μm and a micro-orifice impactor with the Dpa50 of 101.4 nm followed by the filter cassette (Tsai C.J. et al., 2012b). The PENS eliminated the particle bounce and overloading effects by using a rotating, sili-cone oil-coated Teflon filter as the substrate. The PENS operates at a low flow rate of 2 L/min and slightly high pressure drop (< 14–15 kPa), which is still acceptable for a personal sampling pump of 21 kPa (AirChek XR5000, USA). The PENS are used for NP mass concertation mea-surement in workplaces (Young L.H. et al., 2013; Asbach C. et al., 2017) and ambient air as well (Zhu C.S. et al., 2016; Zhu C.S. et al., 2017). The field comparison test of the PENS with the collocated SKC respirable dust alumi-num cyclone (SKC Inc., PA, USA) and sequential mobility particle sizer (SMPS; GRIMM Aerosol Technik, Gmbh, Germany, Model 5.500) in metal working places showed that the PENS correlated well with the cyclone for PM4 and SMPS for PN0.1 (Young L.H. et al., 2013). The aspira-tion efficiency of the PENS was good and agreed well with that of NIOSH two-stage personal bioaerosol sam-plers (Zhou Y. et al., 2014).
The PENS is currently being studied further to enhance its performance at a higher flow rate of 3–5 L/min and a lower pressure drop of < 15 kPa. To achieve the same cut-size of lower than 100 nm at the higher flow rate and lower pressure drop, the PENS can be re-designed with more nozzles with larger diameter and smaller S/W. The wetted GFF substrate can be used in the PENS to wash off deposited particles continuously to achieve a long sampling period without particle bounce and overloading effects (Le T.C. and Tsai C.J., 2017).
3.4 PM control
Control of PM emission is critical to reduce airborne PM concentration and health risks. Major particle control devices include wet scrubber, electrostatic precipitators (ESPs), cyclones, and baghouses, each of which has the advantages and disadvantages in the application. The wet scrubbers remove particles by using water spray or water film, which causes a very high operating pressure drop, metal corrosion, and water pollution (Huang C.H. et al.,
Thi-Cuc Le et al. / KONA Powder and Particle Journal No. 38 (2021) 42–63
55
2007; Pui D.Y.H. et al., 2014). The ESPs which use elec-trostatic force to remove particles have the minimum re-moval efficiency for particles ranging from 0.1 to 1.0 μm due to the minimum electrical mobility in this sub- micrometer range (Hinds W.C., 1999; Pui D.Y.H. et al., 2014). The cyclones are used extensively for PM control due to its simple structure, low pressure drop, and low cost but the collection efficiency for fine particles is low (Pui D.Y.H. et al., 2014). The baghouses use fabric filters to remove particles based on dust cake filtration with a high pressure drop (Hinds W.C., 1999; Pui D.Y.H. et al., 2014). Thus, the baghouses are required to be cleaned and regenerated frequently. Special materials such as electret filters can be used to enhance the efficiency of the depth filtration with a low pressure drop (Tien C.Y. et al., 2020).
Our group developed successfully some control devices overcoming some drawbacks to achieve high removal ef-ficiency for fine and ultrafine particles including a wire-on-plate ESP (Li Z. et al., 2015), an efficient single-stage wet ESP (Lin G.Y. et al., 2010), an efficient venturi scrub-ber system (Tsai C.J. et al., 2005; Huang C.H. et al., 2007), and a wet electrocyclone (Lin G.Y. et al., 2013). The efficient venturi scrubber system uses a condensation device to grow sub-micron particles to super-micron sizes before they are removed by a traditional venturi scrubber operating at a moderate pressure drop of 4.3 kPa (Huang C.H. et al., 2007). The wet electrocyclone combining the cyclone with an electrostatic precipitator with wall clean-ing by water film was developed to enhance the collection efficiency for ultrafine particles for a long service period (Lin G.Y. et al., 2013). This combination technique was referred by other researchers (Titov A., 2015; Zhang X. et al., 2018).
The well-designed control devices can be used for PM and NP control in industries but they are not suitable for some circumstances such as the semiconductor industry with the coexisting residual gases and ultrafine particles (Tsai C.J. et al., 1997a). For instance, the ESPs may cause fire hazard or explosion. The inertial impactor is a poten-tial device to replace the conventional control devices for removing NPs with a smaller footprint than the wet scrubber, a higher efficiency than the cyclone, less costly than the ESP, and a longer service time than the baghouse since it can be designed to have ultrafine cut-sizes and can use water/oil-wetted impaction substrate to eliminate overloading effect without frequent maintenance. How-ever, the impactor requires a high operating pressure drop for NP control. This can be resolved by growing particles by condensation method. Recently, by coupling with par-ticle condensation growth method, the inertial impactors were deployed to control ultrafine particles as a filterless control method to save the cost (Pyo J. et al., 2017). This condensation technique was used in the past to enlarge ultrafine particles to submicron particles to increase the
collection efficiency of the impactor (Demokritou P. et al., 2002a). The combination of the inertial impactor with the particle growth device has the potential for ultrafine par-ticle removal with a high removal efficiency, small foot-print, moderate pressure drop and long-term use without frequent maintenance need.
3.5 Powder classification by inertial devices
Powder classification is different from PM sampling since powder sources generate high mass concentration and wide size range (0.01 to 1000 μm) (Lai W.H. et al., 2005). Powder classification is to separate powder smaller than a certain size from the source powder to obtain de-sired narrow powder distributions with high precision to use in bio-medicine, electronic information, fine ceram-ics, food industry, and coating industry (Guo L. et al., 2007; Wang D. et al., 2014). Powder classifiers can also be designed to classify coarse, fine, and nano-sized particles simultaneously with precise cutoff sizes and sharp cutoff characteristics to achieve high production rates (Liang S., 2010). Classification by inertial/centrifugal force such as cyclone is one of the popular methods since the cyclone has a simple structure and cheaper to make (Yoshida H. et al., 1991; Yoshida H. et al., 2008). It is found that large particles are repulsed or re-entrained if the inner wall of the cyclone is not oil-coated (Yoshida H. et al., 1991), and particles smaller than cut-size will be collected due to the turbulent eddies in hydrocyclone resulting in the so-called fishhook effect of the powder classification efficiency curve (i.e., the raise of curve in small particle size range) (Roldanvillasana E. et al., 1993; Lai W.H. et al., 2005). It is to be noted that the sharpness mentioned here refers to the ratio of Dpa75/Dpa25 (Morimoto H. and Shakouchi T., 2003; Lai W.H. et al., 2005).
Nowadays, powder classifiers are developed to separate nanopowder with a sharp classification efficiency (i.e., without contamination of coarse powders and fishhook ef-fect) to have a uniform powder to use in ultra-conductor, optical, thermal, electromagnetic, and biomedical fields (Morimoto H. and Shakouchi T., 2003; Wang D. et al., 2014). In comparison to the cyclones, the inertial impac-tors, which have sharp cutoff characteristics and accurate cut-size, have a good potential to be used for powder clas-sification with a narrow size range. The water/oil wetted inertial impactor in which the impaction substrate is washed clean by using water or oil can be used for powder classification at a high particle loading rate without parti-cle loading effect. Further investigation to use the impac-tors for power classification is worthwhile.
Thi-Cuc Le et al. / KONA Powder and Particle Journal No. 38 (2021) 42–63
56
4. Conclusions and future perspective
The study of the inertial devices has been an interest-ing topic since the 1860s when the first impactor was de-veloped to observe the relationship between the particles and health effects due to its simple principle and structure, easy operation, and low cost. The design theory was also developed numerically based on the critical experimental and field tests by Marple and his co-workers. As a result, many inertial impactors were commercialized to serve as the size-fractionators and samplers for mass concentration measurement, mass and number distribution measure-ment, particle collection for chemical analysis, and health exposure measurement. Numerous studies were conducted to resolve the particle bounce, particle loading, and particle loss effects to improve the performance of the inertial impactors. Therefore, the inertial impactors are deployed widely to measure a wide size range of particles with a wide range of concentration and different particle types.
Inertial impaction technique still attracts researchers to work on it since the application of inertial devices is di-verse. The impactors can be studied further to extend the cut-size to a very small size such as nano-size, provide real-time mass and number concentrations with very high sensitivity, fast response, and high resolution, and apply for specific applications in medical and pharmaceutical areas (Marple V.A., 2004). Besides sampling and mea-surement, the inertial impactors can potentially be used for PM control with a lower cut-size than the cyclone, a lower pressure drop than the baghouse and less costly than the electrostatic precipitator if they are coupled with condensation particle growth devices. The biggest chal-lenge of the inertial impactors for the control and powder classifications is how to scale up and extend the lifetime. To meet these challenges, this article has reviewed and provided the design considerations and applications of the inertial impactors for the benefit of aerosol and powder communities.
Acknowledgments
The authors gratefully acknowledge financial support from the Taiwan Ministry of Science and Technology via the contracts MOST 108-2622-8-009-012-TE5, 107-3011-F-009-002- and 107-2221-E-009-004-MY3 and the Higher Education Sprout Project of the National Chiao Tung University and Ministry of Education (MOE), Taiwan.
Nomenclature
Cc Slip correction factor
D Collection probe diameter (m)
Dp Particle diameter (m)
Dpa50 Cutoff aerodynamic diameter (m)
GSD Geometric standard deviation
μ Dynamic air viscosity (kg·s/m2)
ρa Air density (kg/m3)
ρp Particle density (kg/m3)
ρp0 Unit density (1000 kg/m3)
Q Total flow rate (L/min)
Qo Major flow rate (L/min)
Q1 Minor flow rate (L/min)
Re Reynolds number
S Jet-to-plate distance (m)
Stk Stokes number
Stk50 Stk for 50 % collection efficiency
T Throat length (m)
U0 Air jet velocity (m/s)
W Nozzle diameter/width (m)
References
AMI (Advanced Micro Instruments, Inc.) , MiniVol TAS (Tac-tical Air Sampler) Operation Manual, 2020, <d3pcsg2wjq 9izr.cloudfront.net/files/1356/download/311370/4.pdf> accessed 13.03.202020.
Andersen A.A., A sampler for respiratory health hazard assess-ment, American Industrial Hygiene Association Journal, 27 (1966) 160–165. DOI: 10.1080/00028896609342810
Anderson J.O., Thundiyil J.G., Stolbach A., Clearing the air: a review of the effects of particulate matter air pollution on human health, Journal of Medical Toxicology, 8 (2012) 166–175. DOI: 10.1007/s13181-011-0203-1
Arffman A., Marjamäki M., Keskinen J., Simulation of low pressure impactor collection efficiency curves, Journal of Aerosol Science, 42 (2011) 329–340. DOI: 10.1016/j. jaerosci.2011.02
Asbach C., Alexander C., Clavaguera S., Dahmann D., Dozol H., Faure B., Fierz M., Fontana L., Iavicoli I., Kaminski H., MacCalman L., Meyer-Plath A., Simonow B., van Tongeren M., Todea A.M., Review of measurement techniques and methods for assessing personal exposure to airborne nano-materials in workplaces, Science of the Total Environment, 603-604 (2017) 793–806. DOI: 10.1016/j.scitotenv.2017. 03.049
Bateman A.P., Belassein H., Martin S.T., Impactor apparatus for
Thi-Cuc Le et al. / KONA Powder and Particle Journal No. 38 (2021) 42–63
57
the study of particle rebound: relative humidity and capil-lary forces, Aerosol Science and Technology, 48 (2013) 42–52. DOI: 10.1080/02786826.2013.853866
Begum B.A., Hopke P.K., Identification of sources from chemi-cal characterization of fine particulate matter and assess-ment of ambient air quality in Dhaka, Bangladesh, Aerosol and Air Quality Research, 19 (2019) 118–128. DOI: 10.4209/aaqr.2017.12.0604
Berner A., Practical experience with 20-stage impactor, Staub Reinhalt Luft, 32 (1972) 1–8.
Biswas P., Jones C.L., Flagan R.C., Distortion of size distribu-tions by condensation and evaporation in aerosol instru-ments, Aerosol Science and Technology, 7 (1987) 231–246. DOI: 10.1080/02786828708959161
Buser M.D., Wanjura J.D., Whitelock D.P., Capareda S.C., Shaw B.W., Lacey R., Estimating FRM PM10 sampler perfor-mance characteristics using particle size analysis and collo-cated TSP and PM10 samplers: cotton gins, Transactions of the ASABE, 51 (2008) 695–702. DOI: 10.13031/2013. 24382
Chang M., Kim S., Sioutas C., Experimental studies on particle impaction and bounce: effects of substrate design and mate-rial, Atmospheric Environment, 33 (1999) 2313–2322. DOI: 10.1016/S1352-2310(99)00082-5
Chein H., Lundgren D.A., A virtual impactor with clean air core for the generation of aerosols with narrow size distri-butions, Aerosol Science and Technology, 18 (1993) 376–388. DOI: 10.1080/02786829308959611
Chen M., Romay F.J., Li L., Naqwi A., Marple V.A., A novel quartz crystal cascade impactor for real-time aerosol mass distribution measurement, Aerosol Science and Technol-ogy, 50 (2016) 971–983. DOI: 10.1080/02786826.2016. 1213790
Chen M., Romay F.J., Marple V.A., Design and evaluation of a low flow personal cascade impactor, Aerosol Science and Technology, 52 (2018) 192–197. DOI: 10.1080/02786826. 2017.1388498
Chen S.C., Tsai C.J., Chen H.D., Huang C.Y., Roam G.D., The influence of relative humidity on nanoparticle concentration and particle mass distribution measurements by the MOUDI, Aerosol Science and Technology, 45 (2011) 596–603. DOI: 10.1080/02786826.2010.551557
Chen S.C., Tsai C.J., Chou C.C.K., Roam G.D., Cheng S.S., Wang Y.N., Ultrafine particles at three different sampling locations in Taiwan, Atmospheric Environment, 44 (2010a) 533–540. DOI: 10.1016/j.atmosenv.2009.10.044
Chen S.C., Tsai C.J., Huang C.Y., Chen H.D., Chen S.J., Lin C.C., Tsai J.H., Chou C.C.K., Lung S.C.C., Huang W.R., Roam G.D., Wu W.Y., Smolik J., Dzumbova L., Chemical mass closure and chemical characteristics of ambient ultra-fine particles and other PM fractions, Aerosol Science and Technology, 44 (2010b) 713–723. DOI: 10.1080/02786826. 2010.486385
Chen S.C., Tsai C.J., Wu C.H., Pui D.Y.H., Onischuk A.A., Karasev V.V., Particle loss in a critical orifice, Journal of Aerosol Science, 38 (2007) 935–949. DOI: 10.1016/j.jaero sci.2007.06.010
Cheon T.W., Lee J.Y., Bae J.Y., Yook S.J., Enhancement of col-
lection efficiency of an inertial impactor using an additional punched impaction plate, Aerosol and Air Quality Research, 17 (2017) 2349–2357. DOI: 10.4209/aaqr.2017.01. 0018
Chien C.L., Tien C.Y., Liu C.N., Ye H., Huang W., Tsai C.J., Design and testing of the NCTU micro-orifice cascade impactor (NMCI) for the measurement of nanoparticle size distributions, Aerosol Science and Technology, 49 (2015) 1009–1018. DOI: 10.1080/02786826.2015.1089976
Chow J.C., Watson J.G., Review of measurement methods and compositions for ultrafine particles, Aerosol and Air Qual-ity Research, 7 (2007) 121–173. DOI: 10.4209/aaqr.2007. 05.0029
Chuan R.L., An instrument for the direct measurement of par-ticulate mass, Journal of Aerosol Science, 1 (1970) 111–113. DOI: 10.1016/0021-8502(70)90014-5
Conner W.D., An inertial-type particle separator for collecting large samples, Journal of the Air Pollution Control Associ-ation, 16 (1966) 35–38. DOI: 10.1080/00022470.1966. 10468438
Demokritou P., Gupta T., Koutrakis P., A high volume apparatus for the condensational growth of ultrafine particles for inhalation toxicological studies, Aerosol Science and Tech-nology, 36 (2002a) 1061–1072. DOI: 10.1080/027868202900 92230
Demokritou P., Kavouras I.G., Ferguson S.T., Koutrakis P., Development and laboratory performance evaluation of a personal multipollutant sampler for simultaneous measure-ments of particulate and gaseous pollutants, Aerosol Sci-ence and Technology, 35 (2001) 741–752. DOI: 10.1080/ 02786820152546789
Demokritou P., Kavouras I.G., Ferguson S.T., Koutrakis P., Development of a high volume cascade impactor for toxico-logical and chemical characterization studies, Aerosol Sci-ence and Technology, 36 (2002b) 925–933. DOI: 10.1080/02786820290092113
Demokritou P., Lee S.J., Ferguson S.T., Koutrakis P., A compact multistage (cascade) impactor for the characterization of atmospheric aerosols, Journal of Aerosol Science, 35 (2004a) 281–299. DOI: 10.1016/j.jaerosci.2003.09.003
Demokritou P., Lee S.J., Koutrakis P., Development and evalua-tion of a high loading PM2.5 speciation sampler, Aerosol Science and Technology, 38 (2004b) 111–119. DOI: 10.1080/ 02786820490249045
Ding Y., Koutrakis P., Development of a dichotomous slit nozzle virtual impactor, Journal of Aerosol Science, 31 (2000) 1421–1431. DOI: 10.1016/S0021-8502(00)00048-3
Du W., Zhang Y., Chen Y., Xu L., Chen J., Deng J., Hong Y., Xiao H., Chemical characterization and source apportion-ment of PM2.5 during spring and winter in the Yangtze River Delta, China, Aerosol and Air Quality Research, 17 (2017) 2165–2180. DOI: 10.4209/aaqr.2017.03.0108
Dunbar C., Kataya A., Tiangbe T., Reducing bounce effects in the Andersen cascade impactor, International Journal of Pharmaceutics, 301 (2005) 25–32. DOI: 10.1016/j.ijpharm. 2005.04.039
Durand T., Bau S., Morele Y., Matera V., Bémer D., Rousset D., Quantification of low pressure impactor wall deposits

Thi-Cuc Le et al. / KONA Powder and Particle Journal No. 38 (2021) 42–63
58
during zinc nanoparticle sampling, Aerosol and Air Quality Research, 14 (2014) 1812–1821. DOI: 10.4209/aaqr.2013. 10.0304
ECS, Ambient air, Standard gravimetric measurement method for the determination of the PM10 or PM2.5 mass concentra-tion of suspended particulate matter (EN 12341:2014), European Committee for Standardization, 2014.
Fan Z.L., Chen X.C., Lui K.H., Ho S.S.H., Cao J.J., Lee S.C., Huang H., Ho K.F., Relationships between outdoor and per-sonal exposure of carbonaceous species and polycyclic aro-matic hydrocarbons (PAHs) in fine particulate matter (PM2.5) at Hong Kong, Aerosol and Air Quality Research, 17 (2017) 666–679. DOI: 10.4209/aaqr.2016.08.0349
Fang C., Marple V., Rubow K., Influence of cross-flow on parti-cle collection characteristics of multi-nozzle impactors, Journal of Aerosol Science, 22 (1991) 403–415. DOI: 10.1016/0021-8502(91)90001-X
Faulkner W.B., Smith R., Haglund J., Large particle penetration during PM10 sampling, Aerosol Science and Technology, 48 (2014) 676–687. DOI: 10.1080/02786826.2014.915005
Fernandez de la Mora J., Schmidt-Ott A., Performance of a hypersonic impactor with silver particles in the 2 nm range, Journal of Aerosol Science, 24 (1993) 409–415. DOI: 10.1016/0021-8502(93)90012-X
Fujitani Y., Furuyama A., Tanabe K., Hirano S., Comparison of oxidative abilities of PM2.5 collected at traffic and residen-tial sites in Japan. Contribution of transition metals and pri-mary and secondary aerosols, Aerosol and Air Quality Research, 17 (2017) 574–587. DOI: 10.4209/aaqr.2016.07. 0291
Fujitani Y., Hasegawa S., Fushimi A., Kondo Y., Tanabe K., Kobayashi S., Kobayashi T., Collection characteristics of low-pressure impactors with various impaction substrate materials, Atmospheric Environment, 40 (2006) 3221–3229. DOI: 10.1016/j.atmosenv.2006.02.001
Fulghum M.R., Hargather M.J., Settles G.S., Integrated impactor/ detector for a high-throughput explosive-trace detection portal, IEEE Sensors Journal, 13 (2012) 1252–1258. DOI: 10.1109/JSEN.2012.2231671
García-Ruiz E., Romay F.J., García J.A., Iza J.M., Cambra J.F., Gangoiti G., Legarreta J.A., Effect of nozzle spacing in the formation of primary and secondary deposits in multi- nozzle inertial impactors part II: Numerical study, Journal of Aerosol Science, 136 (2019) 106–127. DOI: 10.1016/j. jaerosci.2019.06.009
Gertler A.W., Coulombe W.G., Watson J.G., Bowen J.L., Egami R.T., Marsh S., Comparison of PM10 concentrations in high-and medium-volume samplers in a desert environment, Environmental Monitoring and Assessment, 24 (1993) 13–25. DOI: 10.1007/BF00568796
Gudmundsson A., Bohgard M., Hansson H.C., Characteristics of multi-nozzle impactors with 50 μm laser-drilled nozzles, Journal of Aerosol Science, 26 (1995) 915–931. DOI: 10.1016/0021-8502(95)00023-6
Gugamsetty B., Wei H., Liu C.N., Awasthi A., Hsu S.C., Tsai C.J., Roam G.D., Wu Y.C., Chen C.F., Source characteriza-tion and apportionment of PM10, PM2.5 and PM0.1 by using positive matrix factorization, Aerosol and Air Quality
Research, 12 (2012) 476–491. DOI: 10.4209/aaqr.2012. 04.0084
Guo L., Liu J., Liu S., Wang J., Velocity measurements and flow field characteristic analyses in a turbo air classifier, Powder Technology, 178 (2007) 10–16. DOI: 10.1016/j.powtec.2007. 03.040
Han J., Seo J., Park D., Hyun J., Hwang J., Design and perfor-mance evaluation of a laboratory-made 200 nm precut elec-trical cascade impactor, Aerosol and Air Quality Research, 18 (2018) 1118–1130. DOI: 10.4209/aaqr.2017.11.0471
Heo J.E., Zahir M.Z., Park H., Seo J., Park H., Yook S.J., Effect of horizontal inlet on slit-nozzle virtual impactor perfor-mance, Journal of Mechanical Science and Technology, 32 (2018) 2419–2424. DOI: 10.1007/s12206-018-0454-8
Hering S.V., Calibration of the QCM impactor for stratospheric sampling, Aerosol Science and Technology, 7 (1987) 257–274. DOI: 10.1080/02786828708959163
Hinds W.C., Aerosol Technology: Properties, Behavior, and Measurement of Airborne Particles, John Wiley & Sons, 1999, ISBN: 0471194107.
Hsiao T.C., Chen D., Greenberg P.S., Street K.W., Effect of geo-metric configuration on the collection efficiency of axial flow cyclones, Journal of Aerosol Science, 42 (2011) 78–86. DOI: 10.1016/j.jaerosci.2010.11.004
Hsiao T.C., Chen D.R., Li L., Greenberg P., Street K.W., Devel-opment of a multi-stage axial flow cyclone, Aerosol Science and Technology, 44 (2010) 253–261. DOI: 10.1080/ 02786820903575394
Hu S., Seshadri S., McFarland A.R., CFD study on compound impaction in a jet-in-well impactor, Aerosol Science and Technology, 41 (2007) 1102–1109. DOI: 10.1080/ 02786820701777432
Huang C.H., Chang C.S., Chang S.H., Tsai C.J., Shih T.S., Tang D.T., Use of porous foam as the substrate of an impactor for respirable aerosol sampling, Journal of Aerosol Science, 36 (2005) 1373–1386. DOI: 10.1016/j.jaerosci.2005.03.008
Huang C.H., Chang C.S., Chang S.H., Tsai C.J., Shih T.S., Tang D.T., Development of a personal inertial impactor for respi-rable dust sampling, Journal of Occupational Safety and Health 14 (2006) 79–86. DOI: 10.7005/JOSH.200606.0079
Huang C.H., Tsai C.J., Effect of gravity on particle collection efficiency of inertial impactors, Journal of Aerosol Science, 32 (2001) 375–387. DOI: 10.1016/S0021-8502(00)00086-0
Huang C.H., Tsai C.J., Influence of impaction plate diameter and particle density on collection efficiency of round-nozzle inertial impactors, Aerosol Science and Technology, 36 (2002a) 714–720. DOI: 10.1080/0278682029003841
Huang C.H., Tsai C.J., The particle collection efficiency curves by the porous substrate of an inertial impactor, Aerosol and Air Quality Research, 2 (2002b) 1–8. DOI: 10.4209/2002. 06.0001
Huang C.H., Tsai C.J., Mechanism of particle impaction and fil-tration by the dry porous metal substrates of an inertial impactor, Aerosol Science and Technology, 37 (2003) 486–493. DOI: 10.1080/02786820390112641
Huang C.H., Tsai C.J., Shih T.S., Particle collection efficiency of an inertial impactor with porous metal substrates, Journal of Aerosol Science, 32 (2001) 1035–1044. DOI: 10.1016/
Thi-Cuc Le et al. / KONA Powder and Particle Journal No. 38 (2021) 42–63
59
S0021-8502(01)00038-6Huang C.H., Tsai C.J., Wang Y.M., Control efficiency of submi-
cron particles by an efficient venturi scrubber system, Jour-nal of Environmental Engineering, 133 (2007) 454–461. DOI: 10.1061/(ASCE)0733-9372(2007)133:4(454)
Jain S., Petrucci G.A., A new method to measure aerosol parti-cle bounce using a cascade electrical low pressure impactor, Aerosol Science and Technology, 49 (2015) 390–399. DOI: 10.1080/02786826.2015.1036393
Järvinen A., Aitomaa M., Rostedt A., Keskinen J., Yli-Ojanperä J., Calibration of the new electrical low pressure impactor (ELPI+), Journal of Aerosol Science, 69 (2014) 150–159. DOI: 10.1016/j.jaerosci.2013.12.006
John W., Winklmayr W., Wang H.C., Particle deagglomeration and reentrainment in a PM-10 sampler, Aerosol Science and Technology, 14 (1991) 165–176. DOI: 10.1080/ 02786829108959480
Kang M., Cho H.J., Kwak H., Park K., Evaluation of particle bounce in various collection substrates to be used as vaporizer in aerosol mass spectrometer, Aerosol Science and Technology, 49 (2015) 332–339. DOI: 10.1080/ 02786826.2015.1028518
Kenny L.C., Gussman R., Meyer M., Development of a sharp-cut cyclone for ambient aerosol monitoring applications, Aerosol Science and Technology, 32 (2000) 338-358. DOI: 10.1080/027868200303669
Kenny L.C., Merrifield T., Mark D., Gussman R., Thorpe A., The development and designation testing of a new USEPA-approved fine particle inlet: A study of the USEPA designation process, Aerosol Science and Technology, 38 (2004) 15–22. DOI: 10.1080/027868290502290
Keskinen J., Pietarinen K., Lehtimäki M., Electrical low pres-sure impactor, Journal of Aerosol Science, 23 (1992) 353–360.
Kim D.S., Lee K.W., Kim Y.J., Characterization of a particle trap impactor, Journal of Aerosol Science, 37 (2006) 1016–1023. DOI: 10.1016/j.jaerosci.2005.09.003
Kim M.K., Kim W.G., Lee K.S., Yook S.J., Collection efficiency of round-nozzle impactors with horizontal annular inlet, Journal of Aerosol Science, 74 (2014) 63–69. DOI: 10.1016/j.jaerosci.2014.04.007
Kim W.G., Lee H., Myoung J.H., Han S.K., Yook S.J., Ahn K.H., Effect of a horizontal inlet on the collection efficiency of a rectangular-slit-nozzle impactor, Aerosol Science and Technology, 48 (2014) 649–654. DOI: 10.1080/02786826. 2014.910592
Kim W.G., Yook S.J., Ahn K.H., Collection efficiency of rectan-gular slit-nozzle inertial impactors with impaction plates of elliptical concave curvature, Aerosol Science and Technol-ogy, 47 (2013) 99–105. DOI: 10.1080/02786826.2012.730162
Kim Y.J., Yook S.J., Enhancement of collection efficiency of inertial impactors using elliptical concave impaction plates, Journal of Aerosol Science, 42 (2011) 898–908. DOI: 10.1016/j.jaerosci.2011.08.006
Kingham S., Durand M., Aberkane T., Harrison J., Gaines Wilson J., Epton M., Winter comparison of TEOM, MiniVol and DustTrak PM10 monitors in a woodsmoke environment, Atmospheric Environment, 40 (2006) 336–
347. DOI: 10.1016/j.atmosenv.2005.09.042Kumar A., Gupta T., Development and field evaluation of a
multiple slit nozzle-based high volume PM2.5 inertial impactor assembly (HVIA), Aerosol and Air Quality Research, 15 (2015a) 1188–1200. DOI: 10.4209/aaqr.2015. 01.0050
Kumar A., Gupta T., Development and laboratory performance evaluation of a variable configuration PM1/PM2.5 impaction- based sampler, Aerosol and Air Quality Research, 15 (2015b) 768–775. DOI: 10.4209/aaqr.2014.11.0307
Kumsanlas N., Piriyakarnsakul S., Sok P., Hongtieab S., Ikemori F., Szymanski W.W., Hata M., Otani Y., Furuuchi M., A cascade air sampler with multi-nozzle inertial filters for PM0.1, Aerosol and Air Quality Research, 19 (2019) 1666–1677. DOI: 10.4209/aaqr.2019.02.0066
Kwon S.B., Kim M.C., Lee K.W., Effects of jet configuration on the performance of multi-nozzle impactors, Journal of Aerosol Science, 33 (2002) 859–869. DOI: 10.1016/S0021-8502(02)00040-X
Lai C.Y., Huang S.H., Chang C.P., Lin J.Y., Reducing particle bounce and loading effect for a multi-hole impactor, Aero-sol Science and Technology Aerosol Science and Technol-ogy, 42 (2010) 114–122. DOI: 10.1080/02786820701809045
Lai W.H., Lu W.F., Chen C.C., The new expression of the effec-tiveness of powder classification, Advanced Powder Technology, 16 (2005) 611–620. DOI: 10.1163/ 156855205774483352
Landis M.S., Patrick Pancras J., Graney J.R., White E.M., Edgerton E.S., Legge A., Percy K.E., Source apportionment of ambient fine and coarse particulate matter at the Fort McKay community site, in the Athabasca Oil Sands Region, Alberta, Canada, Science of the Total Environ-ment, 584-585 (2017) 105–117. DOI: 10.1016/j.scitotenv. 2017.01.110
Le T.C., Shukla K.K., Chen Y.-T., Chang S.-C., Lin T.-Y., Li Z., Pui D.Y.H., Tsai C.-J., On the concentration differences between PM2.5 FEM monitors and FRM samplers, Atmo-spheric Environment, 222 (2020) 117138. DOI: 10.1016/ j.atmosenv.2019.117138
Le T.C., Shukla K.K., Sung J.-C., Li Z., Yeh H., Huang W., Tsai C.-J., Sampling efficiency of low-volume PM10 inlets with different impaction substrates, Aerosol Science and Tech-nology, 53 (2019) 295–308. DOI: 10.1080/02786826.2018. 1559919
Le T.C., Tsai C.J., Novel non-bouncing PM2.5 impactor modified from well impactor ninety-six, Aerosol Science and Tech-nology, 51 (2017) 1287–1295. DOI: 10.1080/02786826. 2017.1341621
Lee H., Jo D.H., Kim W.G., Yook S.J., Ahn K.H., Effect of an orifice on collection efficiency and wall loss of a slit virtual impactor, Aerosol Science and Technology, 48 (2014) 121–127. DOI: 10.1080/02786826.2013.862333
Lee S.J., Demokritou P., Koutrakis P., Performance evaluation of commonly used impaction substrates under various loading conditions, Journal of Aerosol Science, 36 (2005) 881–895. DOI: 10.1016/j.jaerosci.2004.11.006
Li Z., Liu Y., Xing Y., Tran T.M.P., Le T.C., Tsai C.J., Novel wire-on-plate electrostatic precipitator (WOP-EP) for con-
Thi-Cuc Le et al. / KONA Powder and Particle Journal No. 38 (2021) 42–63
60
trolling fine particle and nanoparticle pollution, Environ-mental Science & Technology, 49 (2015) 8683–8690. DOI: 10.1021/acs.est.5b01844
Liang S., Numerical study of classification of ultrafine particles in a gas-solid field of elbow-jet classifier, Chemical Engi-neering Communications, 197 (2010) 1016–1032. DOI: 10.1080/00986440903359392
Lim K.S., Lee K.W., Collection efficiency and particle loss of virtual impactors with different methods of increasing pressure drop, Journal of Aerosol Science, 37 (2006) 1188–1197. DOI: 10.1016/j.jaerosci.2005.11.011
Lin G.Y., Cuc L.T., Lu W., Tsai C.J., Chein H.M., Chang F.T., High-efficiency wet electrocyclone for removing fine and nanosized particles, Separation and Purification Technol-ogy, 114 (2013) 99–107. DOI: 10.1016/j.seppur.2013.04.039
Lin G.Y., Lee G.R., Lin S.F., Hung Y.H., Li S.W., Wu G.J., Ye H., Huang W., Tsai C.J., Ultrafine particles and PM2.5 at three urban air monitoring stations in Northern Taiwan from 2011 to 2013, Aerosol and Air Quality Research, 15 (2015) 2305–2317. DOI: 10.4209/aaqr.2015.04.0271
Lin G.Y., Tsai C.J., Chen S.C., Chen T.M., Li S.N., An efficient single-stage wet electrostatic precipitator for fine and nano-sized particle control, Aerosol Science and Technology, 44 (2010) 38–45. DOI: 10.1080/02786820903338298
Liu C.N., Awasthi A., Hung Y.H., Gugamsetty B., Tsai C.J., Wu Y.C., Chen C.F., Differences in 24-h average PM2.5 concen-trations between the beta attenuation monitor (BAM) and the dichotomous sampler (Dichot), Atmospheric Environ-ment, 75 (2013a) 341–347. DOI: 10.1016/j.atmosenv. 2013.04.062
Liu C.N., Awasthi A., Hung Y.H., Tsai C.J., Collection effi-ciency and interstage loss of nanoparticles in micro- orifice-based cascade impactors, Atmospheric Environ-ment, 69 (2013b) 325–333. DOI: 10.1016/j.atmosenv. 2012.12.003
Liu C.N., Chen S.C., Tsai C.J., A novel multifilter PM10–PM2.5 sampler (MFPPS), Aerosol Science and Technology, 45 (2011) 1480-1487. DOI: 10.1080/02786826.2011.602135
Liu C.N., Lin S.F., Awasthi A., Tsai C.J., Wu Y.C., Chen C.F., Sampling and conditioning artifacts of PM2.5 in filter- based samplers, Atmospheric Environment, 85 (2014) 48-53. DOI: 10.1016/j.atmosenv.2013.11.075
Liu C.N., Lin S.F., Tsai C.J., Wu Y.C., Chen C.F., Theoretical model for the evaporation loss of PM2.5 during filter sam-pling, Atmospheric Environment, 109 (2015) 79–86. DOI: 10.1016/j.atmosenv.2015.03.012
Loo B.W., Jaklevic J.M., Goulding F.S., Dichotomous virtual impactors for large scale monitoring of airborne particulate matter, in: Liu B.Y.H. (Ed.), Fine Particles: Aerosol Genera-tion, Measurement, Sampling, and Analysis, Academic Press, New York, 1975, pp. 311–350.
Marjamäki M., Keskinen J., Effect of impaction plate roughness and porosity on collection efficiency, Journal of Aerosol Science, 35 (2004) 301–308. DOI: 10.1016/j.jaerosci.2003. 09.001
Marple V.A., History of impactors—the first 110 years, Aerosol Science and Technology, 38 (2004) 247–292. DOI: 10.1080/02786820490424347
Marple V.A., Chien C.M., Virtual impactors: a theoretical study, Environmental Science & Technology, 14 (1980) 976–985. DOI: 10.1021/es60168a019
Marple V.A., Liu B.Y., Characteristics of laminar jet impactors, Environmental Science & Technology, 8 (1974) 648–654. DOI: 10.1021/es60092a003
Marple V.A., Lundgren D., Olson B.A., A PM1.0/2.5/10 trichoto-mous virtual impactor based sampler: design and applied to arid southwest aerosols part I: design, KONA Powder and Particle Journal, 30 (2013) 15–21. DOI: 10.14356/kona.2013006
Marple V.A., Lundgren D., Olson B.A., A PM1.0/2.5/10 trichoto-mous virtual impactor based sampler: design and applied to arid southwest aerosols—part II: application to arid south-west aerosols, KONA Powder and Particle Journal, 31 (2014a) 2–9. DOI: 10.14356/kona.2014001
Marple V.A., Olson B.A., A micro-orifice impactor with cut sizes down to 10 nanometers for diesel exhaust sampling, Final Report for Generic Technology Center for Respirable Dust, State College, PX, 1999.
Marple V.A., Olson B.A., Good laboratory practice in particle measurement calibration: cascade impactor, KONA Powder and Particle Journal, 27 (2009) 206–216. DOI: 10.14356/kona.2009019
Marple V.A., Olson B.A., Sampling and measurement using inertial, gravitational, centrifugal, and thermal techniques, in: Kulkarni P., Baron P.A., Willeke K. (Eds.), Aerosol Measurement: Principles, Techniques, and Applications, Third Edition, John Wiley & Sons, Inc, 2011, pp. 129–151. ISBN:9780470387412. DOI: 10.1002/9781118001684.ch8
Marple V.A., Olson B.A., Romay F., Hudak G., Geerts S.M., Lundgren D., Second generation micro-orifice uniform deposit impactor, 120 MOUDI-II: design, evaluation, and application to long-term ambient sampling, Aerosol Science and Technology, 48 (2014b) 427–433. DOI: 10.1080/ 02786826.2014.884274
Marple V.A., Rubow K.L., Theory and design guidelines, in: Cascade impactors: Sampling and data analysis, American Industrial Hygiene Association, 1986, pp 79–101.
Marple V.A., Rubow K.L., Behm S.M., A microorifice uniform deposit impactor (MOUDI): description, calibration, and use, Aerosol Science and Technology, 14 (1991) 434–446. DOI: 10.1080/02786829108959504
Marple V.A., Willeke K., Impactor design, Atmospheric Envi-ronment (1967), 10 (1976) 891–896. DOI: 10.1016/0004- 6981(76)90144-X
Masuda H., Nakasita S., Classification performance of a rectan-gular jet virtual impactor—Effect of nozzle width ratio of collection nozzle to acceleration jet, Journal of Aerosol Sci-ence, 19 (1988) 243–252. DOI: 10.1016/0021-8502(88) 90226-1
Matthew B.M., Middlebrook A.M., Onasch T.B., Collection efficiencies in an aerodyne aerosol mass spectrometer as a function of particle phase for laboratory generated aerosols, Aerosol Science and Technology, 42 (2008) 884–898. DOI: 10.1080/02786820802356797
May K.R., The cascade impactor: an instrument for sampling coarse aerosols, Journal of Scientific Instruments, 22 (1945)
Thi-Cuc Le et al. / KONA Powder and Particle Journal No. 38 (2021) 42–63
61
187–195. DOI: 10.1088/0950-7671/22/10/303McFarland A.R., Ortiz C.A., Bertch R.W., Particle collection
characteristics of a single-stage dichotomous sampler, Environmental Science & Technology, 12 (1978) 679–682. DOI: 10.1021/es60142a006
McFarland A.R., Ortiz C.A., Bertch R.W., A 10 μm outpoint size selective inlet for Hi-Vol samplers, Journal of the Air Pollution Control Association, 34 (1984) 544–547. DOI: 10.1080/00022470.1984.10465773
MEPC, Specifications and test procedures for PM10 and PM2.5
sampler (HJ 93-2013), Ministry of Environment Protection of China, 2013.
Mercer T.T., Tillery M.I., Newton G.J., A multi-stage, low flow rate cascade impactor, Journal of Aerosol Science, 1 (1970) 9–15. DOI: 10.1016/0021-8502(70)90024-8
Misra C., Kim S., Shen S., Sioutas C., A high flow rate, very low pressure drop impactor for inertial separation of ultraf-ine from accumulation mode particles, Journal of Aerosol Science, 33 (2002) 735–752. DOI: 10.1016/S00218502(01) 00210-5
Morimoto H., Shakouchi T., Classification of ultra fine powder by a new pneumatic type classifier, Powder Technology, 131 (2003) 71–79. DOI: 10.1016/s0032-5910(02)00337-6
Olin J.G., Bohn R.R., A new PM10 medium flow sampler, pre-sented at: 76th annual meeting of the Air Pollution Control Association, Pittsburgh, PA, Air Pollution Control Associa-tion, (1983) paper no. 83-33.4.
Park J.M., Rock J.C., Wang L., Seo Y.C., Bhatnagar A., Kim S., Performance evaluation of six different aerosol samplers in a particulate matter generation chamber, Atmospheric Environment, 43 (2009) 280–289. DOI: 10.1016/j.atmosenv. 2008.09.028
Peters T.M., Vanderpool R.W., Wiener R.W., Design and cali-bration of the EPA PM2.5 well Impactor ninety-six (WINS), Aerosol Science and Technology, 34 (2001) 389–397. DOI: 10.1080/02786820120352
Pilat M.J., Ensor D.S., Bosch J.C., Source test cascade impactor, Atmospheric Environment (1967), 4 (1970) 671–679. DOI: 10.1016/0004-6981(70)90041-7
Pui D.Y.H., Chen S.-C., Zuo Z., PM2.5 in China: measurements, sources, visibility and health effects, and mitigation, Partic-uology, 13 (2014) 1–26. DOI: 10.1016/j.partic.2013.11.001
Pyo J., Ock Y., Jeong D., Park K., Lee D., Development of fil-ter-free particle filtration unit utilizing condensational growth: with special emphasis on high-concentration of ultrafine particles, Building and Environment, 112 (2017) 200–208. DOI: 10.1016/j.buildenv.2016.11.011
Ranade M.B., Woods M.C., Chen F.L., Purdue L.J., Rehme K.A., Wind tunnel evaluation of PM10 samplers, Aerosol Science and Technology, 13 (1990) 54–71. DOI: 10.1080/ 02786829008959424
Rocklage J.M., Marple V.A., Olson B.A., Study of secondary deposits in multiple round nozzle impactors, Aerosol Sci-ence and Technology, 47 (2013) 1144–1151. DOI: 10.1080/ 02786826.2013.823641
Rodes C.E., Indoor aerosol exposure assessment, in: Kulkarni P., Baron P.A., Willeke K. (Eds.), Aerosol Measurement: Principles, Techniques, and Applications, Third Edition
John Wiley & Sons, Inc., 2011 pp. 615–634. ISBN: 9780470387412. DOI:10.1002/9781118001684.ch27
Roldanvillasana E., Williams R.A., Dyakowski T., The origin of the fish-hook effect in hydrocyclone separators, Powder Technology, 77 (1993) 243–250. DOI: 10.1016/00325910(93) 85017-4
Rovelli S., Cattaneo A., Borghi F., Spinazzè A., Campagnolo D., Limbeck A., Cavallo D.M., Mass concentration and size-distribution of atmospheric particulate matter in an urban environment, Aerosol and Air Quality Research, 17 (2017) 1142–1155. DOI: 10.4209/aaqr.2016.08.0344
Saari S., Arffman A., Harra J., Rönkkö T., Keskinen J., Perfor-mance evaluation of the HR-ELPI + inversion, Aerosol Sci-ence and Technology, 52 (2018) 1037–1047. DOI: 10.1080/02786826.2018.1500679
Sharma R., Balasubramanian R., Size-fractionated particulate matter in indoor and outdoor environments during the 2015 haze in Singapore: Potential human health risk assessment, Aerosol and Air Quality Research, 18 (2018) 904–917.
Sioutas C., Koutrakis P., Burton R., Development of a low cut-point slit virtual impactor for sampling ambient fine parti-cles, Journal of Aerosol Science, 25 (1994a) 1321–1330. DOI: 10.1016/0021-8502(94)90128-7
Sioutas C., Koutrakis P., Olson B.A., Development and evalua-tion of a low cutpoint virtual impactor, Aerosol Science and Technology, 21 (1994b) 223–235. DOI: 10.1080/0278682940 8959711
Staymates M., Bottiger J., Schepers D., Staymates J., A stream-lined, high-volume particle impactor for trace chemical analysis, Aerosol Science and Technology, 47 (2013) 945–954. DOI: 10.1080/02786826.2013.804620
Sung G., Kim H.-U., Shin D., Shin W.G., Kim T., High effi-ciency axial wet cyclone air sampler, Aerosol and Air Qual-ity Research, 18 (2018) 2529–2537. DOI: 10.4209/aaqr.2017. 12.0596
Szymanski W.W., Liu B.Y., An airborne particle sampler for the space shuttle, Journal of Aerosol Science, 20 (1989) 1569–1572. DOI: 10.1016/0021-8502(89)90889-6
Thuy N.T.T., Dung N.T., Sekiguchi K., Thuy L.B., Hien N.T.T., Yamaguchi R., Mass concentrations and carbonaceous compositions of PM0., PM2.5, and PM10 at urban locations in Hanoi, Vietnam, Aerosol and Air Quality Research, 18 (2018) 1591–1605. DOI: 10.4209/aaqr.2017.11.0502
Tien C.Y., Chen J.P., Li S., Li Z., Zheng Y.M., Peng A.S., Zhou F., Tsai C.J., Chen S.C., Experimental and theoretical anal-ysis of loading characteristics of different electret media with various properties toward the design of ideal depth fil-tration for nanoparticles and fine particles, Separation and Purification Technology, 233 (2020) 116002. DOI: 10.1016/j.seppur.2019.116002
Titov A., The impact of re-entrainment on the electrocyclone effectiveness, Separation and Purification Technology, 156 (2015) 795–802. DOI: 10.1016/j.seppur.2015.11.004
Tolocka M.P., Peters T.M., Vanderpool R.W., Chen F.-L., Wiener R.W., On the modification of the low flow-rate PM10 dichot-omous sampler inlet, Aerosol Science and Technology, 34 (2001) 407–415. DOI: 10.1080/02786820119350
Tsai C.J., Chang C.S., Chen S.C., Chen P., Shih T.S., Pui D.Y.H.,
Thi-Cuc Le et al. / KONA Powder and Particle Journal No. 38 (2021) 42–63
62
Karasev V.V., Onischuk A.A., Li S.N., Laboratory and field tests of a novel three-stage personal dust sampler for sam-pling three dust fractions simultaneously, Aerosol Science and Technology, 42 (2008) 86–95. DOI: 10.1080/027868207 01697556
Tsai C.J., Cheng Y.H., Solid particle collection characteristics on impaction surfaces of different designs, Aerosol Science and Technology, 23 (1995) 96–106. DOI: 10.1080/ 02786829508965297
Tsai C.J., Huang C.Y., Chen S.C., Ho C.E., Huang C.H., Chen C.W., Chang C.P., Tsai S.J., Ellenbecker M.J., Exposure assessment of nano-sized and respirable particles at differ-ent workplaces, Journal of Nanoparticle Research, 13 (2011) 4161–4172. DOI: 10.1007/s11051-011-0361-8
Tsai C.J., Lin C.H., Wang Y.M., Hunag C.H., Li S.N., Wu Z.X., Wang F.C., An efficient venturi scrubber system to remove submicron particles in exhaust gas, Journal of the Air & Waste Management Association, 55 (2005) 319–325.
Tsai C.J., Lin G.Y., Liu C.N., He C.E., Chen C.W., Characteristic of nanoparticles generated from different nano-powders by using different dispersion methods, Journal of Nanoparticle Research, 14 (2012a) DOI: 10.1007/s11051-012-0777-9
Tsai C.J., Lin T.Y., Particle collection efficiency of different impactor designs, Separation Science and Technology, 35 (2000) 2639–2650. DOI: 10.1081/ss-100102360
Tsai C.J., Liu C.N., Hung S.M., Chen S.C., Uang S.N., Cheng Y.S., Zhou Y., Novel active personal nanoparticle sampler for the exposure assessment of nanoparticles in workplaces, Environmental Science & Technology, 46 (2012b) 4546–4552. DOI: 10.1021/es204580f
Tsai C.J., Miao C.C., Lu H.C., White smoke emission from a semiconductor manufacturing plant, Environment Interna-tional, 23 (1997a) 489–496. DOI: 10.1016/S01604120(97) 00036-6
Tsai C.J., Shih T.S., Sheu R.N., Characteristics of lead aerosols in different work environments, American Industrial Hygiene Association Journal, 58 (1997b) 650–656. DOI: 10.1080/15428119791012441
Tsai C.J., Wu C.H., Leu M.L., Chen S.C., Huang C.Y., Tsai P.J., Ko F.H., Dustiness test of nanopowders using a standard rotating drum with a modified sampling train, Journal of Nanoparticle Research, 11 (2009) 121–131. DOI: 10.1007/s11051-008-9453-5
Turner J.R., Hering S.V., Greased and oiled substrates as bounce-free impaction surfaces, Journal of Aerosol Sci-ence, 18 (1987) 215–224. DOI: 10.1016/0021-8502(87) 90057-7
Turner W.A., Olson B.A., Allen G.A., Calibration of sharp cut impactors for indoor and outdoor particle sampling, Journal of the Air & Waste Management Association, 50 (2000) 484–487. DOI: 10.1080/10473289.2000.10464043
U.S.EPA, Ambient air monitoring reference and equivalent methods, U.S. Government Printing Office, Washington, D.C, 2017a.
U.S.EPA, List of designated reference and equivalent methods, 2017b.
Vanderpool R.W., Byrd L.A., Wiener R.W., Hunike E.T., Labickas M., Leston A.R., Tolocka M.P., McElroy F.F.,
Murdoch R.W., Natarajan S., Noble C.A., Peters T.M., Lab-oratory and field evaluation of crystallized DOW 704 oil on the performance of the well impactor ninety-six fine partic-ulate matter fractionator Journal of the Air & Waste Man-agement Association, 57 (2007) 14–30. DOI: 10.1080/ 10473289.2007.10465299
Vanderpool R.W., Peters T.M., Natarajan S., Gemmill D.B., Wiener R.W., Evaluation of the loading characteristics of the EPA WINS PM2.5 separator, Aerosol Science and Tech-nology, 34 (2001) 444–456. DOI: 10.1080/ 02786820117739
Volkwein J.C., Maynard A.D., Harper M., Workplace aerosol measurement, in: Kulkarni P., Baron P.A., Willeke K. (Eds.), Aerosol Measurement: Principles, Techniques, and Applications, Third Edition, John Wiley & Sons, Inc., 2011, pp 571–590. ISBN:9780470387412. DOI: 10.1002/ 9781118001684.ch25
Wada M., Tsukada M., Namiki N., Szymanski W.W., Noda N., Makino H., Kanaoka C., Kamiya H., A two-stage virtual impactor for in-stack sampling of PM2.5 and PM10 in flue gas of stationary sources, Aerosol and Air Quality Research, 16 (2017) 36–45. DOI: 10.4209/aaqr.2015.06.0383
Wang D., Fan Z.M., Deng L.R., Wang X.G., Review on classifi-cation and application prospect of ultrafine powder mate-rial, Materials Science Forum, 809-810 (2014) 272–277. DOI: 10.4028/www.scientific.net/MSF.809-810.272
Wang L., Wanjura J., Parnell C., Lacey R., Shaw B., Perfor-mance characteristics of a low-volume PM10 sampler, Transactions of the ASAE, 48 (2005) 739–748.
Watson J.G., Chow J.C., Ambient aerosol sampling, in: Kulkarni P., Baron P.A., Willeke K. (Eds.), Aerosol Measurement: Principles, Techniques, and Applications, Third Edition, John Wiley & Sons, Inc. 2011, pp. 591–613. ISBN: 9780470387412. DOI: 10.1002/9781118001684.ch26
Watson J.G., Chow J.C., Chen L., Wang X., Merrifield T.M., Fine P.M., Barker K., Measurement system evaluation for upwind/downwind sampling of fugitive dust emissions, Aerosol and Air Quality Research, 11 (2011) 331–350. DOI: 10.4209/aaqr.2011.03.0028
Xu Z., A study of virtual impactor, University of Minnesota, 1991.
Yao M., Mainelis G., Investigation of cut-off sizes and collec-tion efficiencies of portable microbial samplers, Aerosol Science and Technology, 40 (2006) 595–606. DOI: 10.1080/02786820600729146
Yoshida H., Saeki T., Hashimoto K., Fujioka T., Size classifica-tion of submicron powder by air cyclone and three-dimensional analysis, Journal of Chemical Engineering of Japan, 24 (1991) 640–647. DOI: 10.1252/jcej.24.640
Yoshida H., Yoshikawa S., Fukui K., Yamamoto T., Effect of multi-inlet flow on particle classification performance of hydro-cyclones, Powder Technology, 184 (2008) 352–360. DOI: 10.1016/j.powtec.2007.09.008
Young L.H., Lin Y.H., Lin T.H., Tsai P.J., Wang Y.F., Hung S.M., Tsai C.J., Chen C.W., Field application of a newly developed personal nanoparticle sampler to selected metal-working operations, Aerosol and Air Quality Research, 13 (2013) 849–861. DOI: 10.4209/aaqr.2012.10.0270

Thi-Cuc Le et al. / KONA Powder and Particle Journal No. 38 (2021) 42–63
63
Zahir M.Z., Heo J.E., Yook S.J., Effects of Three-partitioned horizontal inlet and clean air on collection efficiency and wall loss of slit virtual impactors, Aerosol and Air Quality Research, 18 (2018) 1131–1140. DOI: 10.4209/aaqr.2017.12.0563
Zhang T., Takahashi H., Hata M., Toriba A., Ikeda T., Otani Y., Furuuchi M., Development of a sharp-cut inertial filter combined with an impactor, Aerosol and Air Quality Research, 17 (2017) 644–652. DOI: 10.4209/aaqr.2016.07. 0293
Zhang X., Zhang W., Yi M., Wang Y., Wang P., Xu J., Niu F., Lin F., High-performance inertial impaction filters for par-ticulate matter removal, Scientific Reports, 8 (2018) 4757. DOI: 10.1038/s41598-018-23257-x
Zhou Y., Irshad H., Tsai C.J., Hung S.M., Cheng Y.S., Evalua-tion of a novel personal nanoparticle sampler, Environmen-tal Science: Processes & Impacts, 16 (2014) 203–210. DOI: 10.1039/c3em00497j
Zhu C.S., Cao J.J., Tsai C.J., Shen Z.X., Liu S.X., Huang R.J., Zhang N.N., Wang P., The rural carbonaceous aerosols in coarse, fine, and ultrafine particles during haze pollution in northwestern China, Environmental Science and Pollution Research (international), 23 (2016) 4569–4575. DOI: 10.1007/s11356-015-5694-x
Zhu C.S., Cao J.J., Tsai C.J., Zhang Z.S., Tao J., Biomass burn-ing tracers in rural and urban ultrafine particles in Xi’an, China, Atmospheric Pollution Research, 8 (2017) 614–618. DOI: 10.1016/j.apr.2016.12.011
Authors’ Short Biographies
Thi-Cuc Le
Thi-Cuc Le received Ph.D degree in 2018 and is currently a postdoctoral fellow at the Institute of Environmental Engineering, National Chiao Tung university (NCTU), Taiwan. She is also a lecturer at Department of Environment, Hoa Sen University, Vietnam. Her current research interests are air quality sampling and instrumentation, air pollution control, and air quality management.
Chuen-Jinn Tsai
Chuen-Jinn Tsai is Chair Professor of the Institute of Environmental Engineering, Na-tional Chiao Tung University (NCTU), Taiwan. He received Ph.D. in the Particle Tech-nology Laboratory (PTL), Mechanical Engineering Department, University of Minnesota. His research interest is to apply aerosol technology in aerosol and air pollu-tion sampling, monitoring and control. He received the 2006 International Aerosol Fel-low (IAF) award from the IARA and 2015 Asian Aerosol Fellow from AARA to recognize his outstanding research, technical development, education and service contri-butions to aerosol science and technology.
KONA Powder and Particle Journal No. 38 (2021) 64–81/https://doi.org/10.14356/kona.2021009 Reiew Paper
64Copyright © 2021 The Authors. Published by Hosokawa Powder Technology Foundation. This is an open access article under the CC BY license (http://creativecommons.org/licenses/by/4.0/).
Drag Reduction in Turbulent Flows by Polymer and Fiber Additives †
Cristian Marchioli 1,2* and Marina Campolo 1
1 Department of Engineering and Architecture, University of Udine, Italy2 International Center of Mechanical Sciences, Italy
AbstractThis article provides a review of the recent progress in understanding and predicting additives-induced drag reduction (DR) in turbulent wall-bounded shear flows. We focus on the reduction in friction losses by the dilute addition of high-molecular weight polymers and/or fibers to flowing liquids. Although it has long been reasoned that the dynamical interactions between polymers/fibers and turbulence are responsible for DR, it was not until recently that progress was made in elucidating these interactions in detail. Advancements come largely from numerical simulations of viscoelastic turbulence and detailed measurements in turbulent flows of polymer/fiber solutions. Their impact on current understanding of the mechanics and prediction of DR is discussed, and perspectives for further advancement of knowledge are provided.
Keywords: turbulence, drag reduction, polymers, fibers
1. Introduction
Over the last decades, there has been a steady increase in the number of scientific events and publications dedi-cated to the phenomenon of Drag Reduction (DR) in tur-bulent wall-bounded flows. The reduction in turbulent friction losses by the dilute addition of high-molecular weight polymers, fibers or other types of additives (e.g. surfactants) to flowing liquids has been extensively stud-ied since the phenomenon was first observed over 70 years ago. One of the reasons is the huge practical impor-tance of turbulent DR in a wide range of process engi-neering applications that are commonly found in the food, pharmaceutical, and biomedical industries (Han et al., 2017; Bhambri et al., 2016; Jovanović et al., 2006). Indeed, almost all these applications, such as transport of crude oil in pipelines (Hart, 2014) or heat transfer and exchange (Tiong et al., 2015; Fsadni et al., 2016), involve the use of drag-reducing additives in gas-liquid/liquid-liquid flows.
It has long been argued that DR is determined by the dynamical interactions between additives and turbulence (see Lumley, 1969; Berman, 1978 for further details), yet it was not until recently that progress had been made in
understanding these interactions and predicting DR in turbulent shear flows. Advancements have been granted by the possibility to perform high-fidelity simulations of viscoelastic turbulent flows and detailed measurements of turbulence in dilute/semi-dilute additive solutions, mostly via non-invasive optical techniques. Facing the applica-tions quest for more quantitative information on DR mechanisms, numerical and experimental techniques characterized by unprecedented accuracy and access into the flow have been developed to disclose new features that are peculiar of additive-induced DR phenomena. In this review, we address precisely these phenomena, focus-ing on the case of polymer- and fiber-induced DR in tur-bulent wall-bounded shear flows. DR phenomena are discussed in connection with current physical understand-ing of how polymers and/or fibers interact with the vari-ous scales of turbulence: from the small scales resolving the flow in Lagrangian models to the large-scales of Euler-Euler models. Since the targeted field of research is extremely vast, we will cover only the issues relevant to the use of high-molecular weight polymers and fibers as Drag-Reducing Agents (DRA) in processes of industrial interest, leaving other types of additives (surfactants, micro-bubbles and compliant coatings) and applications out of the discussion.
2. Background: Phenomenology of DR
In this section, we will try to highlight current under-standing of the microscopic interactions that occur
† Received 9 June 2019; Accepted 2 December 2019 J-STAGE Advance published online 29 April 2020
1 Via delle Scienze 208, 33100 Udine, Italy2 Piazza Garibaldi 18, 33100 Udine, Italy* Corresponding author: Cristian Marchioli; E-mail: [email protected] TEL: +39-0432-558006 FAX: +39-0432-558027
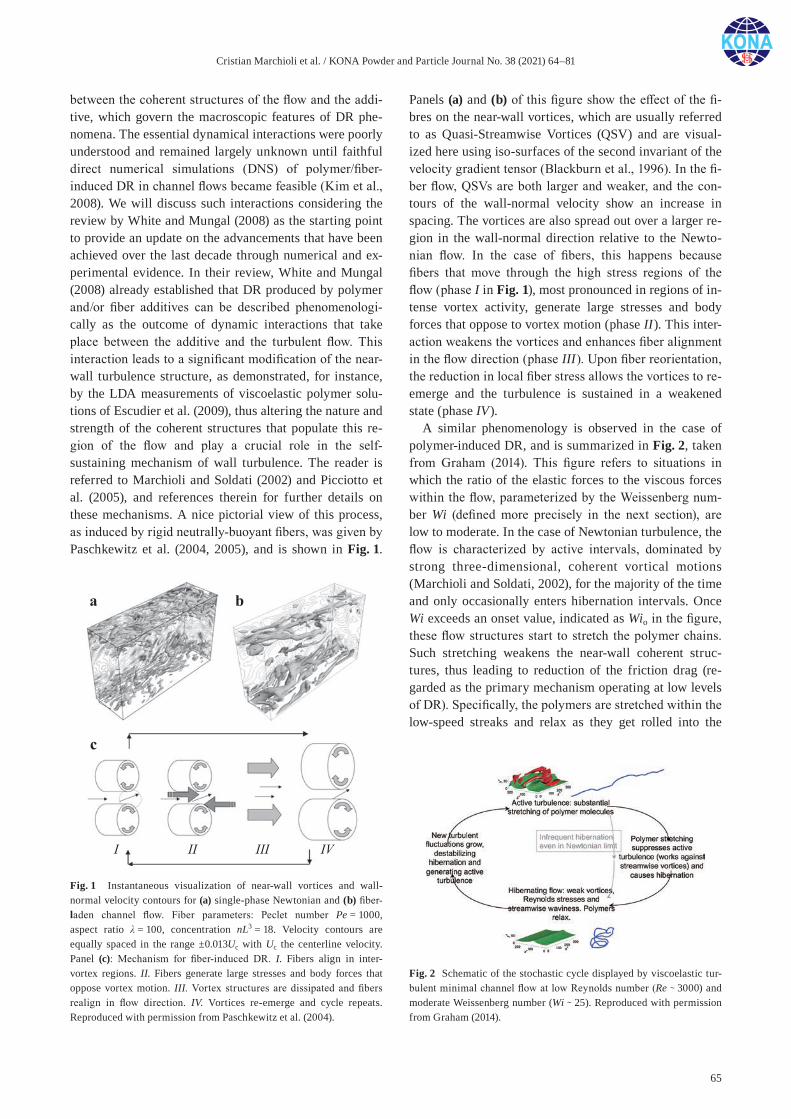
Cristian Marchioli et al. / KONA Powder and Particle Journal No. 38 (2021) 64–81
65
between the coherent structures of the flow and the addi-tive, which govern the macroscopic features of DR phe-nomena. The essential dynamical interactions were poorly understood and remained largely unknown until faithful direct numerical simulations (DNS) of polymer/fiber- induced DR in channel flows became feasible (Kim et al., 2008). We will discuss such interactions considering the review by White and Mungal (2008) as the starting point to provide an update on the advancements that have been achieved over the last decade through numerical and ex-perimental evidence. In their review, White and Mungal (2008) already established that DR produced by polymer and/or fiber additives can be described phenomenologi-cally as the outcome of dynamic interactions that take place between the additive and the turbulent flow. This interaction leads to a significant modification of the near-wall turbulence structure, as demonstrated, for instance, by the LDA measurements of viscoelastic polymer solu-tions of Escudier et al. (2009), thus altering the nature and strength of the coherent structures that populate this re-gion of the flow and play a crucial role in the self- sustaining mechanism of wall turbulence. The reader is referred to Marchioli and Soldati (2002) and Picciotto et al. (2005), and references therein for further details on these mechanisms. A nice pictorial view of this process, as induced by rigid neutrally-buoyant fibers, was given by Paschkewitz et al. (2004, 2005), and is shown in Fig. 1.
Panels (a) and (b) of this figure show the effect of the fi-bres on the near-wall vortices, which are usually referred to as Quasi-Streamwise Vortices (QSV) and are visual-ized here using iso-surfaces of the second invariant of the velocity gradient tensor (Blackburn et al., 1996). In the fi-ber flow, QSVs are both larger and weaker, and the con-tours of the wall-normal velocity show an increase in spacing. The vortices are also spread out over a larger re-gion in the wall-normal direction relative to the Newto-nian flow. In the case of fibers, this happens because fibers that move through the high stress regions of the flow (phase I in Fig. 1), most pronounced in regions of in-tense vortex activity, generate large stresses and body forces that oppose to vortex motion (phase II). This inter-action weakens the vortices and enhances fiber alignment in the flow direction (phase III). Upon fiber reorientation, the reduction in local fiber stress allows the vortices to re-emerge and the turbulence is sustained in a weakened state (phase IV).
A similar phenomenology is observed in the case of polymer-induced DR, and is summarized in Fig. 2, taken from Graham (2014). This figure refers to situations in which the ratio of the elastic forces to the viscous forces within the flow, parameterized by the Weissenberg num-ber Wi (defined more precisely in the next section), are low to moderate. In the case of Newtonian turbulence, the flow is characterized by active intervals, dominated by strong three-dimensional, coherent vortical motions (Marchioli and Soldati, 2002), for the majority of the time and only occasionally enters hibernation intervals. Once Wi exceeds an onset value, indicated as Wio in the figure, these flow structures start to stretch the polymer chains. Such stretching weakens the near-wall coherent struc-tures, thus leading to reduction of the friction drag (re-garded as the primary mechanism operating at low levels of DR). Specifically, the polymers are stretched within the low-speed streaks and relax as they get rolled into the
Fig. 1 Instantaneous visualization of near-wall vortices and wall- normal velocity contours for (a) single-phase Newtonian and (b) fiber- laden channel flow. Fiber parameters: Peclet number Pe = 1000, aspect ratio λ = 100, concentration nL3 = 18. Velocity contours are equally spaced in the range ±0.013Uc with Uc the centerline velocity. Panel (c): Mechanism for fiber-induced DR. I. Fibers align in inter- vortex regions. II. Fibers generate large stresses and body forces that oppose vortex motion. III. Vortex structures are dissipated and fibers realign in flow direction. IV. Vortices re-emerge and cycle repeats. Reproduced with permission from Paschkewitz et al. (2004).
Fig. 2 Schematic of the stochastic cycle displayed by viscoelastic tur-bulent minimal channel flow at low Reynolds number (Re ∼ 3000) and moderate Weissenberg number (Wi ∼ 25). Reproduced with permission from Graham (2014).

Cristian Marchioli et al. / KONA Powder and Particle Journal No. 38 (2021) 64–81
66
streamwise vortices. The resulting polymer force works to loosen the vortices. As Wi further increases, polymer stretching by turbulence becomes persistent and stresses accumulated over time reach: The polymer chain is de-formed more rapidly than it can relax, so a threshold value beyond which the active turbulence can no longer sustain itself is reached: Flow hibernation sets in and allows the polymer molecules to relax again. Once the turbulence becomes active again, the cycle repeats. Note that this scenario implies that DR is primarily a near-wall phenom-enon. Under these circumstances, a limiting state may be reached, in which turbulence must be entirely suppressed near the wall (Graham, 2014; Wang et al., 2014). The sce-nario just described is in accordance with several studies (see Paschkewitz et al. (2004), Dubief et al. (2004, 2005) and Gillissen et al. (2008) among others) which revealed that the body forces due to polymeric stresses oppose the vortical motions of the QSV that populate the buffer layer that mediates momentum exchange between the near-wall region and core fluid in channels and pipes.
The similarity between the phenomenological interpre-tations of Paschkewitz et al. (2004, 2005) and of Graham (2014) highlights the fact that polymer and fiber stress tensors show the same characteristics, at least in the low drag reduction regime as noted by Boelens and Muthukumar (2016). In particular, because fibers cannot store turbulent kinetic energy in their backbone, this mechanism has to be explained by viscosity effects. The macroscopic manifestation of the mechanism just dis-cussed is a reduced wall friction, namely a modified mean velocity profile, a redistribution of the shear stress inside the boundary layer and a reduction in the energy dissipa-tion rate at length scales close to the lower end of the en-ergy cascade yet still within the inertial range (de Chaumont Quitry and Ouellette, 2016; Xi et al., 2013; Ouellette et al., 2009).
Further evidence of the above-mentioned mechanisms has been provided by the analysis of the effect of elasticity on the coherent flow structures, which suggests that the self-sustaining process of wall turbulence becomes weaker because the additive is able to counteract both the biaxial and uniaxial extensional flow regions around QSVs (Roy and Larson, 2006). Above the buffer layer, however, hairpin vortices are more prevalent than QSV. In Newtonian flows, hairpins can regenerate to form hair-pin packets that produce large amounts of streamwise ki-netic energy, as well as multiple ejections resulting in turbulent bursts and formation of new QSVs (Adrian et al., 2000). Further, hairpin vortex packets significantly contribute to the mean Reynolds shear stress (Jodai and Elsinga, 2016; Ganapathisubramani et al., 2003), which has two parts: the coherent stress caused by non-linear in-teractions among individual vortices within the packet and incoherent stress originated from velocity fluctuations
induced by each vortex (Lee and Sung, 2011; Adrian et al., 2000). In drag-reduced flows, the hairpins in the log layer are weakened by the counter torques produced by the additive (Kim et al., 2007), similarly to what happens to QSV in the buffer layer. Kim et al. (2008) have exam-ined the time evolution of hairpin packets interacting with a polymer conformation field, showing that the non-linear threshold of initial vortex strength required to trigger auto-generation of new hairpins increases as the flow vis-coelasticity increases, especially in the buffer layer. In other words, the generation of new vortices is suppressed by the polymer stresses, thereby decreasing the turbulent drag. Similar findings were obtained by Guan et al. (2013) and Fu et al. (2014). Guan et al. (2013) used time-resolved particle image velocimetry to investigate the effect of DRA on the spatial topological character of coherent vor-tices in wall-bounded turbulence. Although the (polymer) additive solution was not found to affect the spatial topo-logical shape of these vortices, a drastic decrease of the associated fluctuating velocity and velocity derivatives in the solution was observed. The resulting reduction of the wall friction was ascribed to the suppression of vortex oc-currence and intensity. Fu et al. (2014) used particle image velocimetry in combination with planar laser induced flu-orescence to investigate DR in turbulent channel flow upon inhomogeneous injection of polymer solution from one channel wall. The focus of the study was polymer dif-fusion, which controls the local polymer concentration and was found to be suppressed due to turbulence inhibi-tion compared to the diffusion of a passive scalar in un-laden turbulence.
Very recently, Elsnab et al. (2019) have provided new experimental evidence of the effect of DR on the structure of turbulence in channel flow. These authors have shown that, for the DR between 6.5 % and 26 %, several fluid velocity statistics (e.g. the mean profile slope in the iner-tial sublayer or the peak value and peak position of the streamwise r.m.s.) tend to increase with DR in a continu-ous and essentially linear manner, whereas the relation-ship between the injected polymer concentration and the level of DR is nonlinear. According to Elsnab et al. (2019), a primary effect of polymer is that it limits near-wall vor-ticity stretching and reorientation, and thus attenuates/delays the three-dimensionalization of the vorticity field. This scenario is corroborated by the observed onset of the inertial layer at large-enough wall distance, as well as an increase in the scale of the organized vortical motions, and, finally, a reduction in the overall scale separation in the inertial range.
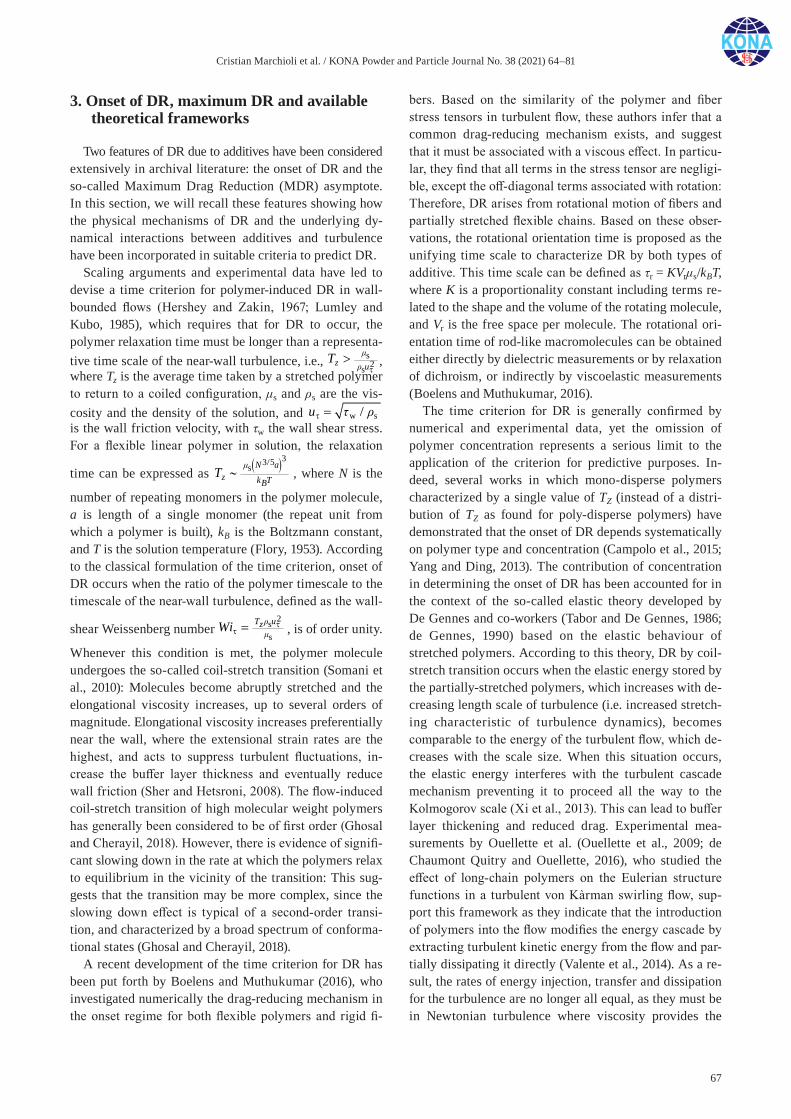
Cristian Marchioli et al. / KONA Powder and Particle Journal No. 38 (2021) 64–81
67
3. Onset of DR, maximum DR and available theoretical frameworks
Two features of DR due to additives have been considered extensively in archival literature: the onset of DR and the so-called Maximum Drag Reduction (MDR) asymptote. In this section, we will recall these features showing how the physical mechanisms of DR and the underlying dy-namical interactions between additives and turbulence have been incorporated in suitable criteria to predict DR.
Scaling arguments and experimental data have led to devise a time criterion for polymer-induced DR in wall-bounded flows (Hershey and Zakin, 1967; Lumley and Kubo, 1985), which requires that for DR to occur, the polymer relaxation time must be longer than a representa-tive time scale of the near-wall turbulence, i.e., s
2sz u
T
τ>
, where Tz is the average time taken by a stretched polymer to return to a coiled configuration, μs and ρs are the vis-cosity and the density of the solution, and w s/u τ =
is the wall friction velocity, with τw the wall shear stress. For a flexible linear polymer in solution, the relaxation
time can be expressed as ( )33/5s N az k TB
T
∼
, where N is the
number of repeating monomers in the polymer molecule, a is length of a single monomer (the repeat unit from which a polymer is built), kB is the Boltzmann constant, and T is the solution temperature (Flory, 1953). According to the classical formulation of the time criterion, onset of DR occurs when the ratio of the polymer timescale to the timescale of the near-wall turbulence, defined as the wall-
shear Weissenberg number 2s
s
T uzWi
ττ =
, is of order unity.
Whenever this condition is met, the polymer molecule undergoes the so-called coil-stretch transition (Somani et al., 2010): Molecules become abruptly stretched and the elongational viscosity increases, up to several orders of magnitude. Elongational viscosity increases preferentially near the wall, where the extensional strain rates are the highest, and acts to suppress turbulent fluctuations, in-crease the buffer layer thickness and eventually reduce wall friction (Sher and Hetsroni, 2008). The flow-induced coil-stretch transition of high molecular weight polymers has generally been considered to be of first order (Ghosal and Cherayil, 2018). However, there is evidence of signifi-cant slowing down in the rate at which the polymers relax to equilibrium in the vicinity of the transition: This sug-gests that the transition may be more complex, since the slowing down effect is typical of a second-order transi-tion, and characterized by a broad spectrum of conforma-tional states (Ghosal and Cherayil, 2018).
A recent development of the time criterion for DR has been put forth by Boelens and Muthukumar (2016), who investigated numerically the drag-reducing mechanism in the onset regime for both flexible polymers and rigid fi-
bers. Based on the similarity of the polymer and fiber stress tensors in turbulent flow, these authors infer that a common drag-reducing mechanism exists, and suggest that it must be associated with a viscous effect. In particu-lar, they find that all terms in the stress tensor are negligi-ble, except the off-diagonal terms associated with rotation: Therefore, DR arises from rotational motion of fibers and partially stretched flexible chains. Based on these obser-vations, the rotational orientation time is proposed as the unifying time scale to characterize DR by both types of additive. This time scale can be defined as τr = KVrμs/kBT, where K is a proportionality constant including terms re-lated to the shape and the volume of the rotating molecule, and Vr is the free space per molecule. The rotational ori-entation time of rod-like macromolecules can be obtained either directly by dielectric measurements or by relaxation of dichroism, or indirectly by viscoelastic measurements (Boelens and Muthukumar, 2016).
The time criterion for DR is generally confirmed by numerical and experimental data, yet the omission of polymer concentration represents a serious limit to the application of the criterion for predictive purposes. In-deed, several works in which mono-disperse polymers characterized by a single value of TZ (instead of a distri-bution of TZ as found for poly-disperse polymers) have demonstrated that the onset of DR depends systematically on polymer type and concentration (Campolo et al., 2015; Yang and Ding, 2013). The contribution of concentration in determining the onset of DR has been accounted for in the context of the so-called elastic theory developed by De Gennes and co-workers (Tabor and De Gennes, 1986; de Gennes, 1990) based on the elastic behaviour of stretched polymers. According to this theory, DR by coil-stretch transition occurs when the elastic energy stored by the partially-stretched polymers, which increases with de-creasing length scale of turbulence (i.e. increased stretch-ing characteristic of turbulence dynamics), becomes comparable to the energy of the turbulent flow, which de-creases with the scale size. When this situation occurs, the elastic energy interferes with the turbulent cascade mechanism preventing it to proceed all the way to the Kolmogorov scale (Xi et al., 2013). This can lead to buffer layer thickening and reduced drag. Experimental mea-surements by Ouellette et al. (Ouellette et al., 2009; de Chaumont Quitry and Ouellette, 2016), who studied the effect of long-chain polymers on the Eulerian structure functions in a turbulent von Kàrman swirling flow, sup-port this framework as they indicate that the introduction of polymers into the flow modifies the energy cascade by extracting turbulent kinetic energy from the flow and par-tially dissipating it directly (Valente et al., 2014). As a re-sult, the rates of energy injection, transfer and dissipation for the turbulence are no longer all equal, as they must be in Newtonian turbulence where viscosity provides the
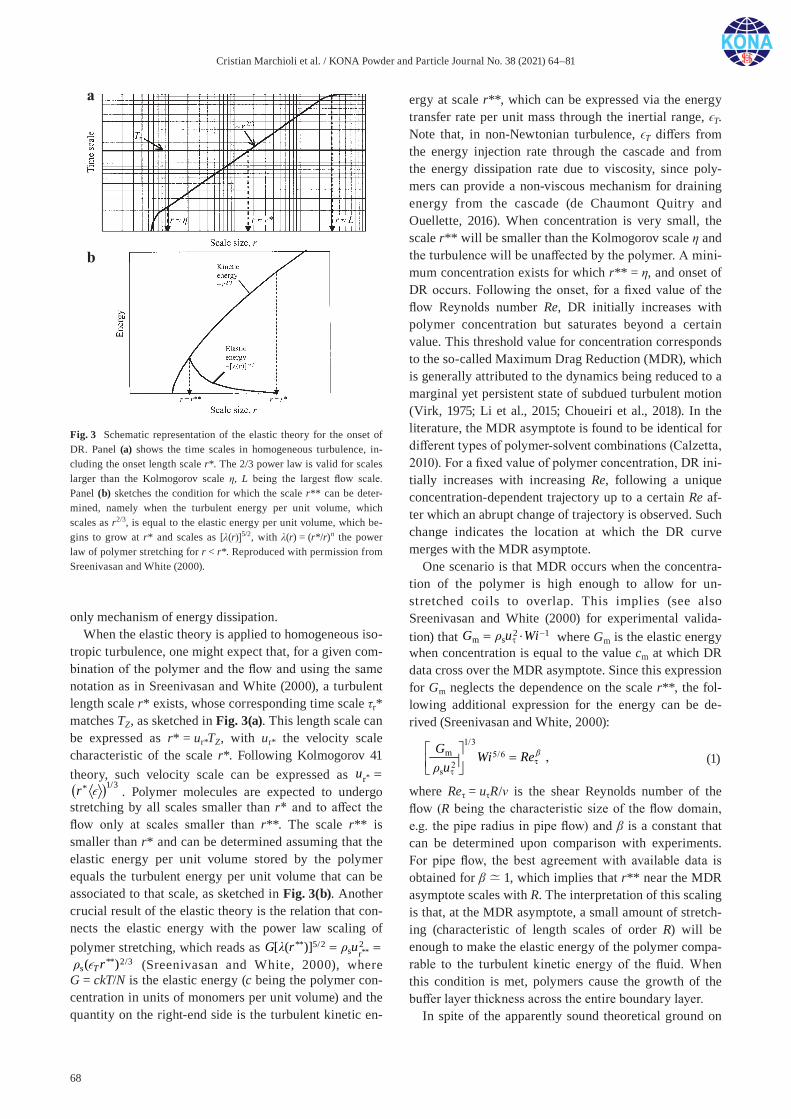
Cristian Marchioli et al. / KONA Powder and Particle Journal No. 38 (2021) 64–81
68
only mechanism of energy dissipation.When the elastic theory is applied to homogeneous iso-
tropic turbulence, one might expect that, for a given com-bination of the polymer and the flow and using the same notation as in Sreenivasan and White (2000), a turbulent length scale r* exists, whose corresponding time scale τr* matches TZ, as sketched in Fig. 3(a). This length scale can be expressed as r* = ur*TZ, with ur* the velocity scale characteristic of the scale r*. Following Kolmogorov 41 theory, such velocity scale can be expressed as ( )*
1/3*ru r=
( )*
1/3*ru r=
. Polymer molecules are expected to undergo stretching by all scales smaller than r* and to affect the flow only at scales smaller than r**. The scale r** is smaller than r* and can be determined assuming that the elastic energy per unit volume stored by the polymer equals the turbulent energy per unit volume that can be associated to that scale, as sketched in Fig. 3(b). Another crucial result of the elastic theory is the relation that con-nects the elastic energy with the power law scaling of polymer stretching, which reads as **
** 5/2 2 ** 2/3s sr[ ( )] ( )TG r u r = =
**** 5/2 2 ** 2/3
s sr[ ( )] ( )TG r u r = =
(Sreenivasan and White, 2000), where G = ckT/N is the elastic energy (c being the polymer con-centration in units of monomers per unit volume) and the quantity on the right-end side is the turbulent kinetic en-
ergy at scale r**, which can be expressed via the energy transfer rate per unit mass through the inertial range, ϵT. Note that, in non-Newtonian turbulence, ϵT differs from the energy injection rate through the cascade and from the energy dissipation rate due to viscosity, since poly-mers can provide a non-viscous mechanism for draining energy from the cascade (de Chaumont Quitry and Ouellette, 2016). When concentration is very small, the scale r** will be smaller than the Kolmogorov scale η and the turbulence will be unaffected by the polymer. A mini-mum concentration exists for which r** = η, and onset of DR occurs. Following the onset, for a fixed value of the flow Reynolds number Re, DR initially increases with polymer concentration but saturates beyond a certain value. This threshold value for concentration corresponds to the so-called Maximum Drag Reduction (MDR), which is generally attributed to the dynamics being reduced to a marginal yet persistent state of subdued turbulent motion (Virk, 1975; Li et al., 2015; Choueiri et al., 2018). In the literature, the MDR asymptote is found to be identical for different types of polymer-solvent combinations (Calzetta, 2010). For a fixed value of polymer concentration, DR ini-tially increases with increasing Re, following a unique concentration-dependent trajectory up to a certain Re af-ter which an abrupt change of trajectory is observed. Such change indicates the location at which the DR curve merges with the MDR asymptote.
One scenario is that MDR occurs when the concentra-tion of the polymer is high enough to allow for un-stretched coils to overlap. This implies (see also Sreenivasan and White (2000) for experimental valida-tion) that 2 1
m sG u Wi −τ= ⋅
where Gm is the elastic energy when concentration is equal to the value cm at which DR data cross over the MDR asymptote. Since this expression for Gm neglects the dependence on the scale r**, the fol-lowing additional expression for the energy can be de-rived (Sreenivasan and White, 2000):
1/3m 5/6
2s
,G Wi Reu
(1)
where Reτ = uτR/ν is the shear Reynolds number of the flow (R being the characteristic size of the flow domain, e.g. the pipe radius in pipe flow) and β is a constant that can be determined upon comparison with experiments. For pipe flow, the best agreement with available data is obtained for β≃ 1, which implies that r** near the MDR asymptote scales with R. The interpretation of this scaling is that, at the MDR asymptote, a small amount of stretch-ing (characteristic of length scales of order R) will be enough to make the elastic energy of the polymer compa-rable to the turbulent kinetic energy of the fluid. When this condition is met, polymers cause the growth of the buffer layer thickness across the entire boundary layer.
In spite of the apparently sound theoretical ground on
Fig. 3 Schematic representation of the elastic theory for the onset of DR. Panel (a) shows the time scales in homogeneous turbulence, in-cluding the onset length scale r*. The 2/3 power law is valid for scales larger than the Kolmogorov scale η, L being the largest flow scale. Panel (b) sketches the condition for which the scale r** can be deter-mined, namely when the turbulent energy per unit volume, which scales as r2/3, is equal to the elastic energy per unit volume, which be-gins to grow at r* and scales as [λ(r)]5/2, with λ(r) = (r*/r)n the power law of polymer stretching for r < r*. Reproduced with permission from Sreenivasan and White (2000).
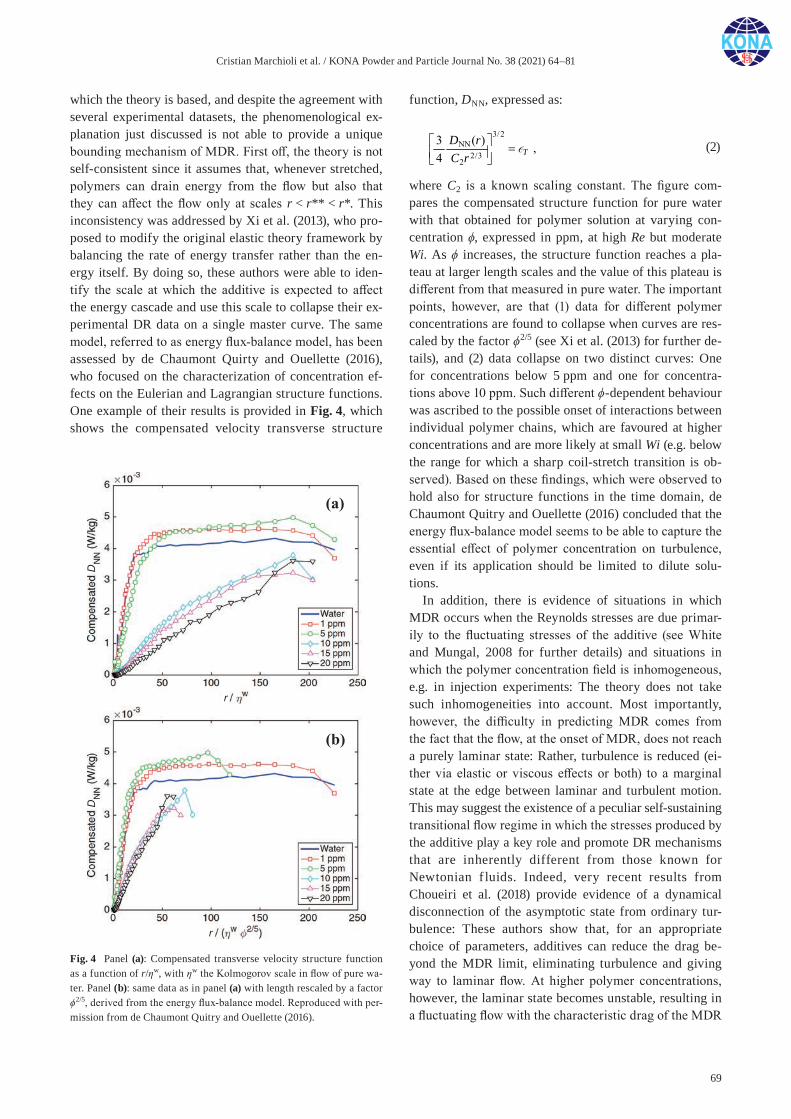
Cristian Marchioli et al. / KONA Powder and Particle Journal No. 38 (2021) 64–81
69
which the theory is based, and despite the agreement with several experimental datasets, the phenomenological ex-planation just discussed is not able to provide a unique bounding mechanism of MDR. First off, the theory is not self-consistent since it assumes that, whenever stretched, polymers can drain energy from the flow but also that they can affect the flow only at scales r < r** < r*. This inconsistency was addressed by Xi et al. (2013), who pro-posed to modify the original elastic theory framework by balancing the rate of energy transfer rather than the en-ergy itself. By doing so, these authors were able to iden-tify the scale at which the additive is expected to affect the energy cascade and use this scale to collapse their ex-perimental DR data on a single master curve. The same model, referred to as energy flux-balance model, has been assessed by de Chaumont Quirty and Ouellette (2016), who focused on the characterization of concentration ef-fects on the Eulerian and Lagrangian structure functions. One example of their results is provided in Fig. 4, which shows the compensated velocity transverse structure
function, DNN, expressed as:
3/2NN
2/32
3 ( ) ,4 T
D rC r
(2)
where C2 is a known scaling constant. The figure com-pares the compensated structure function for pure water with that obtained for polymer solution at varying con-centration ϕ, expressed in ppm, at high Re but moderate Wi. As ϕ increases, the structure function reaches a pla-teau at larger length scales and the value of this plateau is different from that measured in pure water. The important points, however, are that (1) data for different polymer concentrations are found to collapse when curves are res-caled by the factor ϕ2/5 (see Xi et al. (2013) for further de-tails), and (2) data collapse on two distinct curves: One for concentrations below 5 ppm and one for concentra-tions above 10 ppm. Such different ϕ-dependent behaviour was ascribed to the possible onset of interactions between individual polymer chains, which are favoured at higher concentrations and are more likely at small Wi (e.g. below the range for which a sharp coil-stretch transition is ob-served). Based on these findings, which were observed to hold also for structure functions in the time domain, de Chaumont Quitry and Ouellette (2016) concluded that the energy flux-balance model seems to be able to capture the essential effect of polymer concentration on turbulence, even if its application should be limited to dilute solu-tions.
In addition, there is evidence of situations in which MDR occurs when the Reynolds stresses are due primar-ily to the fluctuating stresses of the additive (see White and Mungal, 2008 for further details) and situations in which the polymer concentration field is inhomogeneous, e.g. in injection experiments: The theory does not take such inhomogeneities into account. Most importantly, however, the difficulty in predicting MDR comes from the fact that the flow, at the onset of MDR, does not reach a purely laminar state: Rather, turbulence is reduced (ei-ther via elastic or viscous effects or both) to a marginal state at the edge between laminar and turbulent motion. This may suggest the existence of a peculiar self-sustaining transitional flow regime in which the stresses produced by the additive play a key role and promote DR mechanisms that are inherently different from those known for Newtonian f luids. Indeed, very recent results from Choueiri et al. (2018) provide evidence of a dynamical disconnection of the asymptotic state from ordinary tur-bulence: These authors show that, for an appropriate choice of parameters, additives can reduce the drag be-yond the MDR limit, eliminating turbulence and giving way to laminar flow. At higher polymer concentrations, however, the laminar state becomes unstable, resulting in a fluctuating flow with the characteristic drag of the MDR
Fig. 4 Panel (a): Compensated transverse velocity structure function as a function of r/ηw, with ηw the Kolmogorov scale in flow of pure wa-ter. Panel (b): same data as in panel (a) with length rescaled by a factor ϕ2/5, derived from the energy flux-balance model. Reproduced with per-mission from de Chaumont Quitry and Ouellette (2016).
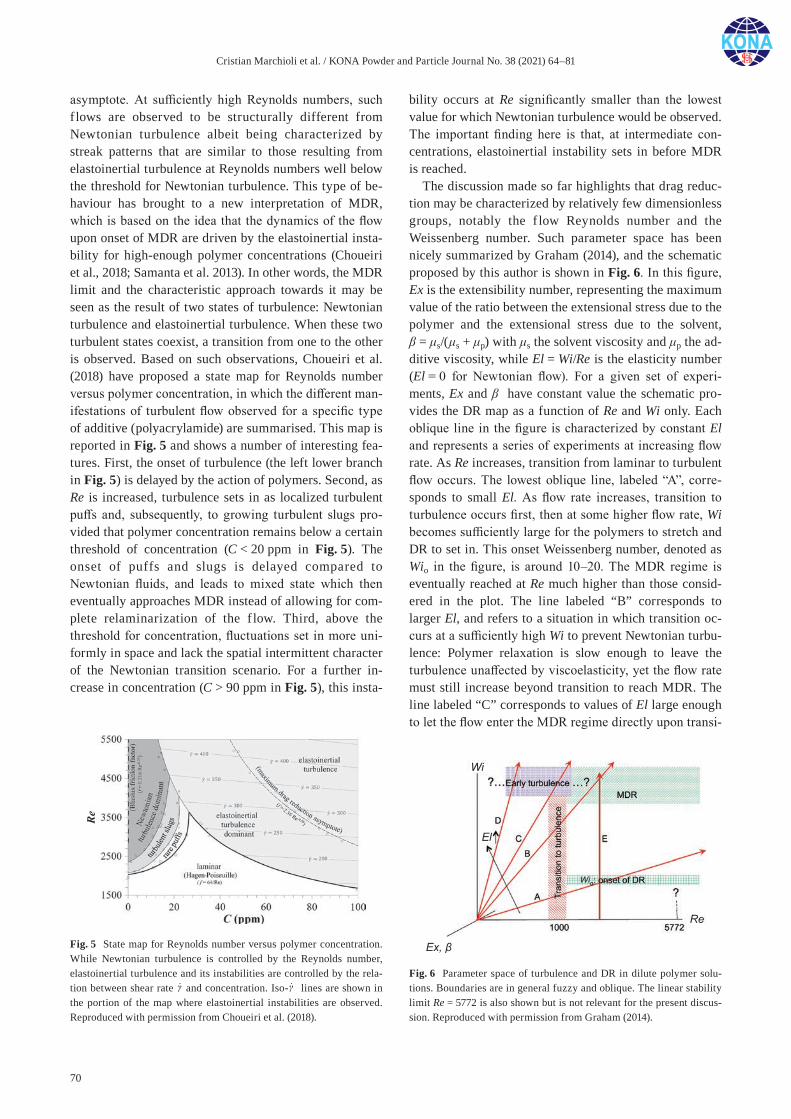
Cristian Marchioli et al. / KONA Powder and Particle Journal No. 38 (2021) 64–81
70
asymptote. At sufficiently high Reynolds numbers, such f lows are observed to be structurally different from Newtonian turbulence albeit being characterized by streak patterns that are similar to those resulting from elastoinertial turbulence at Reynolds numbers well below the threshold for Newtonian turbulence. This type of be-haviour has brought to a new interpretation of MDR, which is based on the idea that the dynamics of the flow upon onset of MDR are driven by the elastoinertial insta-bility for high-enough polymer concentrations (Choueiri et al., 2018; Samanta et al. 2013). In other words, the MDR limit and the characteristic approach towards it may be seen as the result of two states of turbulence: Newtonian turbulence and elastoinertial turbulence. When these two turbulent states coexist, a transition from one to the other is observed. Based on such observations, Choueiri et al. (2018) have proposed a state map for Reynolds number versus polymer concentration, in which the different man-ifestations of turbulent flow observed for a specific type of additive (polyacrylamide) are summarised. This map is reported in Fig. 5 and shows a number of interesting fea-tures. First, the onset of turbulence (the left lower branch in Fig. 5) is delayed by the action of polymers. Second, as Re is increased, turbulence sets in as localized turbulent puffs and, subsequently, to growing turbulent slugs pro-vided that polymer concentration remains below a certain threshold of concentration (C < 20 ppm in Fig. 5). The onset of puffs and slugs is delayed compared to Newtonian fluids, and leads to mixed state which then eventually approaches MDR instead of allowing for com-plete relaminarization of the f low. Third, above the threshold for concentration, fluctuations set in more uni-formly in space and lack the spatial intermittent character of the Newtonian transition scenario. For a further in-crease in concentration (C > 90 ppm in Fig. 5), this insta-
bility occurs at Re significantly smaller than the lowest value for which Newtonian turbulence would be observed. The important finding here is that, at intermediate con-centrations, elastoinertial instability sets in before MDR is reached.
The discussion made so far highlights that drag reduc-tion may be characterized by relatively few dimensionless groups, notably the f low Reynolds number and the Weissenberg number. Such parameter space has been nicely summarized by Graham (2014), and the schematic proposed by this author is shown in Fig. 6. In this figure, Ex is the extensibility number, representing the maximum value of the ratio between the extensional stress due to the polymer and the extensional stress due to the solvent, β = μs/(μs + μp) with μs the solvent viscosity and μp the ad-ditive viscosity, while El = Wi/Re is the elasticity number (El = 0 for Newtonian flow). For a given set of experi-ments, Ex and β have constant value the schematic pro-vides the DR map as a function of Re and Wi only. Each oblique line in the figure is characterized by constant El and represents a series of experiments at increasing flow rate. As Re increases, transition from laminar to turbulent flow occurs. The lowest oblique line, labeled “A”, corre-sponds to small El. As flow rate increases, transition to turbulence occurs first, then at some higher flow rate, Wi becomes sufficiently large for the polymers to stretch and DR to set in. This onset Weissenberg number, denoted as Wio in the figure, is around 10–20. The MDR regime is eventually reached at Re much higher than those consid-ered in the plot. The line labeled “B” corresponds to larger El, and refers to a situation in which transition oc-curs at a sufficiently high Wi to prevent Newtonian turbu-lence: Polymer relaxation is slow enough to leave the turbulence unaffected by viscoelasticity, yet the flow rate must still increase beyond transition to reach MDR. The line labeled “C” corresponds to values of El large enough to let the flow enter the MDR regime directly upon transi-
Fig. 5 State map for Reynolds number versus polymer concentration. While Newtonian turbulence is controlled by the Reynolds number, elastoinertial turbulence and its instabilities are controlled by the rela-tion between shear rate γ
and concentration. Iso-γ
lines are shown in the portion of the map where elastoinertial instabilities are observed. Reproduced with permission from Choueiri et al. (2018).
Fig. 6 Parameter space of turbulence and DR in dilute polymer solu-tions. Boundaries are in general fuzzy and oblique. The linear stability limit Re = 5772 is also shown but is not relevant for the present discus-sion. Reproduced with permission from Graham (2014).
Cristian Marchioli et al. / KONA Powder and Particle Journal No. 38 (2021) 64–81
71
tion to turbulence. Finally, the line labeled “D” corre-sponds to the case of elastoinertial turbulence (referred to as early turbulence): In this case, transition can occur at significantly lower Re than in Newtonian flow. As men-tioned by Graham (2014), the detailed correspondence be-tween this regime and the MDR regime is still poorly understood. Experiments suggest the existence of a con-tinuous transition from the laminar flow curve to the MDR curve, driven by the occurrence of some kind of linear instability of the laminar state at sufficiently high Re and El: To the best of our knowledge, however, no sim-ulation data obtained from available viscoelastic constitu-tive models has provided evidence of such linear instability yet.
4. Recent analyses of DR onset and MDR in wall-bounded turbulence
In this section, we provide a survey of both numerical and experimental analyses of DR onset and MDR in wall-bounded flows, with a twist towards viscoelastic effects, to highlight current trends and research pathlines in the study of turbulence-additives interaction. Shahmardi et al. (2019) investigated the turbulent flow of a polymer solution in non-axisymmetric square ducts, using the FENE-P model to simulate the presence of polymers. The main macroscopic effect associated to the presence of the polymers is to modify the secondary flow by increasing the circulation of the streamwise main vortices and mov-ing the location of the maximum vorticity towards the centre of the duct. In addition, the low- and high-speed streaks that characterize the fluid velocity distribution near the wall are found to grow in size and coherence. As far as the viscoelastic behaviour of the flow is concerned, the Weissenberg number is found to influence strongly the flow (as also shown in Zhou and Schroeder, 2016): The cross-stream vortical structures grow in size and the in-plane velocity fluctuations are reduced as flow elastic-ity increases. Overall, the viscoelastic flow is less uniform than its Newtonian counterpart, even if the direct contri-bution of the polymer stress term in the energy budget is found to be small in amplitude. The same type of numeri-cal approach, namely direct numerical simulation of an incompressible FENE-P fluid, was employed by Li et al. (2015) and Teng et al. (2018) to study DR in both turbulent Poiseuille and Couette flow in a plane channel. Focus of the analysis was the additive-induced modification of the near-wall flow structures. In Poiseuille flow, the ratio of polymer relaxation time to the time scale of vorticity fluc-tuations in the mean flow direction is found to remain close to unity in the near-wall region, from the onset of DR to MDR. Moreover, the average axial energetic vortex convection time is observed to increase with increasing
DR while its rotation speed decreases. Since the rate of decrease in the rotation speed is found to exceed the in-crease of the vortex convective time, MDR is achieved when these two time scales become nearly equal. A simi-lar DR mechanism is observed in Couette flow only in the near-wall region. In the core region of the flow, differ-ences are found, the most intriguing being the significant polymer stretching that arises from a more intense mutual exchange between the elastic potential energy and the turbulent kinetic energy of the flow (Teng et al., 2018). Also, the spanwise and wall-normal components of the conformation tensor are found to reach their peak value: Such finding is in contrast with that observed in Poiseuille flow, where polymer stretching and elastic/kinetic energy exchanges in the core region are negligible and peak val-ues of the conformation tensor components occur near the wall (Teng et al., 2018).
White et al. (2018) also investigated polymer drag- reduced flow in a wall-bounded domain, focusing on the redistribution of mean momentum and the mechanisms underlying the redistribution processes in channel flow. From a mechanistic perspective, the experimental obser-vations of White et al. (2018) indicate that polymers re-duce the intensity of near-wall vorticity stretching, thus leading to an outward migration of the peak in the Reyn-olds shear stress and its gradient. In turn, such migration leads to a reduced mean velocity gradient at the wall, a more gradual decay of the mean vorticity, and causes the wall-normal position where inertially dominated mean dynamics occurs to move outward from the wall. At high enough DR, the inertial sublayer runs out of physical space and ceases to exist: This implies that the state of MDR is attained only upon annihilation of the inertial sublayer.
Owolabi et al. (2017) investigated experimentally the turbulent DR mechanism in flow through ducts of circu-lar, rectangular and square cross-sections using two grades of polyacrylamide (a flexible linear polymer) in aqueous solution having different molecular weights and various semi-dilute concentrations. The authors explored the relationship between DR and fluid elasticity, exploit-ing the polymer mechanical degradation1 to vary the rhe-ological properties of the solution. Under controlled degradation conditions, streamwise velocity profiles at various levels of DR indicated a thickening of the buffer layer, up to the entire cross-section at MDR, in agreement with previous studies (Gillissen and Hoving, 2012; Paschkewitz et al., 2004). Based on their measurements, Owolabi et a. (2017) were able to derive a quantitative prediction of DR from the knowledge of polymer relax-ation time, flow rate and geometric length scale (using ei-
1Mechanical degradation and its effects on DR will be discussed in Sections 5 and 6.
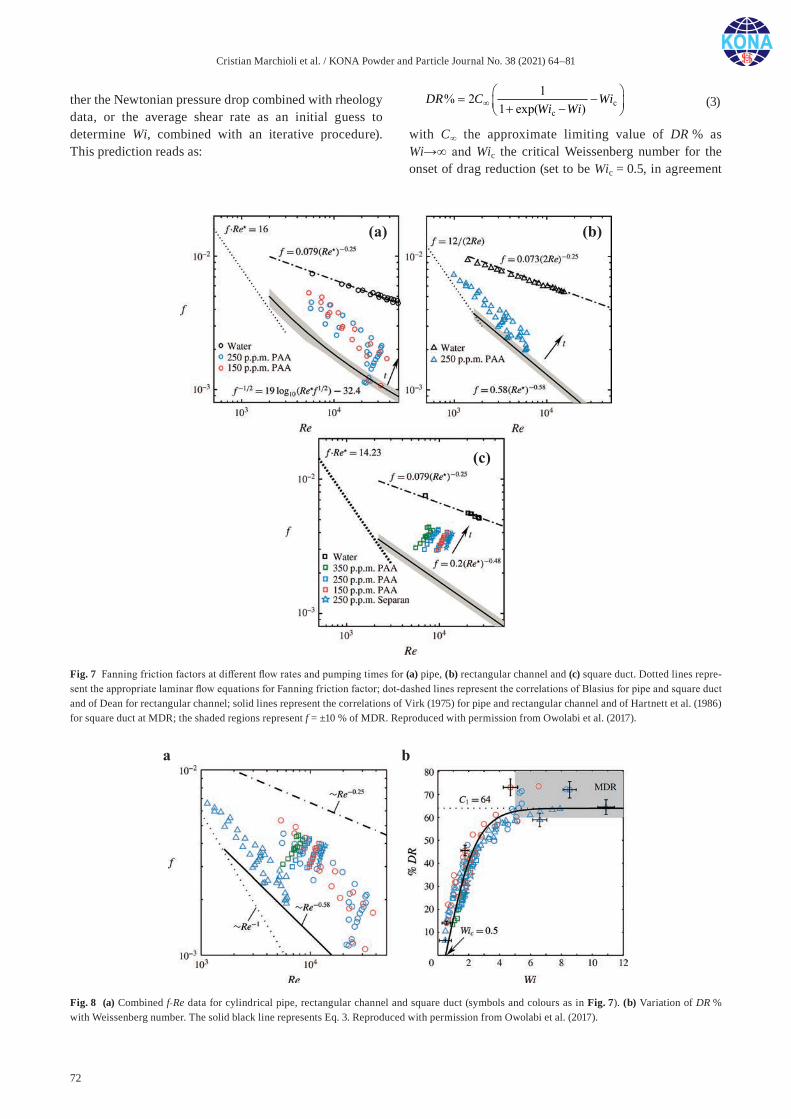
Cristian Marchioli et al. / KONA Powder and Particle Journal No. 38 (2021) 64–81
72
ther the Newtonian pressure drop combined with rheology data, or the average shear rate as an initial guess to determine Wi, combined with an iterative procedure). This prediction reads as:
cc
1% 21 exp( )
DR C WiWi Wi
(3)
with C∞ the approximate limiting value of DR % as Wi→∞ and Wic the critical Weissenberg number for the onset of drag reduction (set to be Wic = 0.5, in agreement
Fig. 7 Fanning friction factors at different flow rates and pumping times for (a) pipe, (b) rectangular channel and (c) square duct. Dotted lines repre-sent the appropriate laminar flow equations for Fanning friction factor; dot-dashed lines represent the correlations of Blasius for pipe and square duct and of Dean for rectangular channel; solid lines represent the correlations of Virk (1975) for pipe and rectangular channel and of Hartnett et al. (1986) for square duct at MDR; the shaded regions represent f = ±10 % of MDR. Reproduced with permission from Owolabi et al. (2017).
Fig. 8 (a) Combined f-Re data for cylindrical pipe, rectangular channel and square duct (symbols and colours as in Fig. 7). (b) Variation of DR % with Weissenberg number. The solid black line represents Eq. 3. Reproduced with permission from Owolabi et al. (2017).
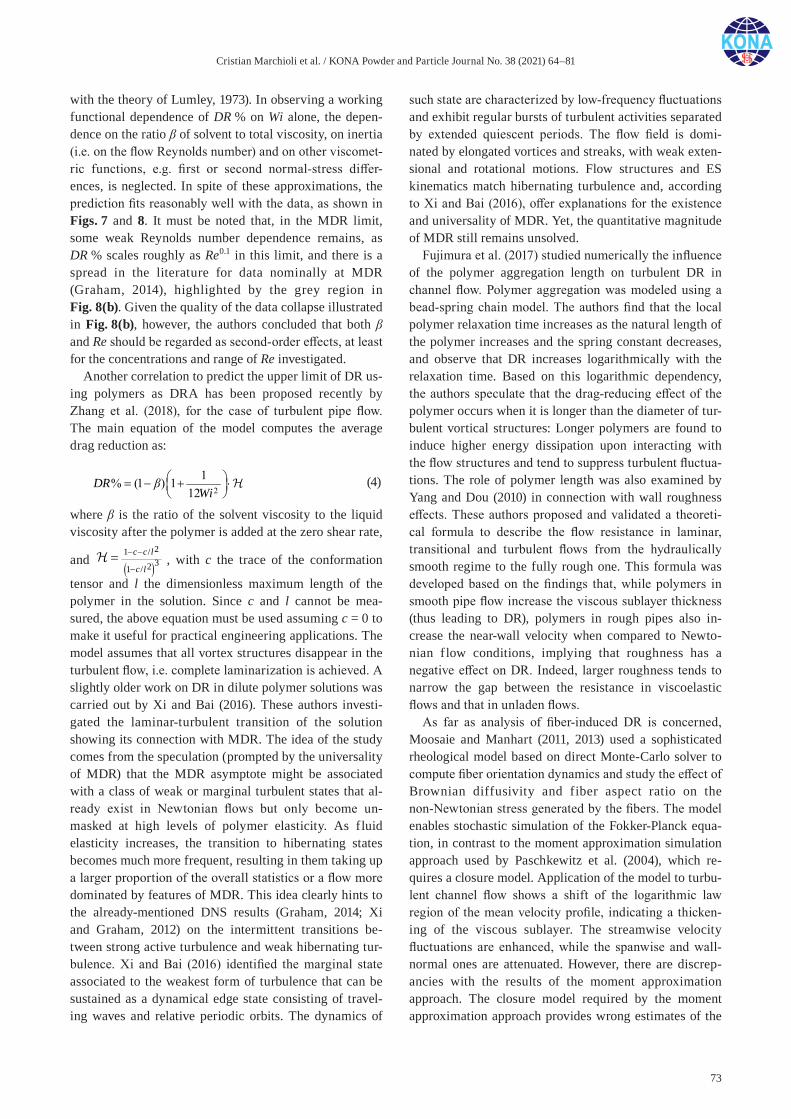
Cristian Marchioli et al. / KONA Powder and Particle Journal No. 38 (2021) 64–81
73
with the theory of Lumley, 1973). In observing a working functional dependence of DR % on Wi alone, the depen-dence on the ratio β of solvent to total viscosity, on inertia (i.e. on the flow Reynolds number) and on other viscomet-ric functions, e.g. first or second normal-stress differ-ences, is neglected. In spite of these approximations, the prediction fits reasonably well with the data, as shown in Figs. 7 and 8. It must be noted that, in the MDR limit, some weak Reynolds number dependence remains, as DR % scales roughly as Re0.1 in this limit, and there is a spread in the literature for data nominally at MDR (Graham, 2014), highlighted by the grey region in Fig. 8(b). Given the quality of the data collapse illustrated in Fig. 8(b), however, the authors concluded that both β and Re should be regarded as second-order effects, at least for the concentrations and range of Re investigated.
Another correlation to predict the upper limit of DR us-ing polymers as DRA has been proposed recently by Zhang et al. (2018), for the case of turbulent pipe flow. The main equation of the model computes the average drag reduction as:
2
1% (1 ) 112
DRWi
(4)
where β is the ratio of the solvent viscosity to the liquid viscosity after the polymer is added at the zero shear rate,
and ( )21 /321 /
c c l
c l
− −
−==
, with c the trace of the conformation
tensor and l the dimensionless maximum length of the polymer in the solution. Since c and l cannot be mea-sured, the above equation must be used assuming c = 0 to make it useful for practical engineering applications. The model assumes that all vortex structures disappear in the turbulent flow, i.e. complete laminarization is achieved. A slightly older work on DR in dilute polymer solutions was carried out by Xi and Bai (2016). These authors investi-gated the laminar-turbulent transition of the solution showing its connection with MDR. The idea of the study comes from the speculation (prompted by the universality of MDR) that the MDR asymptote might be associated with a class of weak or marginal turbulent states that al-ready exist in Newtonian flows but only become un-masked at high levels of polymer elasticity. As fluid elasticity increases, the transition to hibernating states becomes much more frequent, resulting in them taking up a larger proportion of the overall statistics or a flow more dominated by features of MDR. This idea clearly hints to the already-mentioned DNS results (Graham, 2014; Xi and Graham, 2012) on the intermittent transitions be-tween strong active turbulence and weak hibernating tur-bulence. Xi and Bai (2016) identified the marginal state associated to the weakest form of turbulence that can be sustained as a dynamical edge state consisting of travel-ing waves and relative periodic orbits. The dynamics of
such state are characterized by low-frequency fluctuations and exhibit regular bursts of turbulent activities separated by extended quiescent periods. The flow field is domi-nated by elongated vortices and streaks, with weak exten-sional and rotational motions. Flow structures and ES kinematics match hibernating turbulence and, according to Xi and Bai (2016), offer explanations for the existence and universality of MDR. Yet, the quantitative magnitude of MDR still remains unsolved.
Fujimura et al. (2017) studied numerically the influence of the polymer aggregation length on turbulent DR in channel flow. Polymer aggregation was modeled using a bead-spring chain model. The authors find that the local polymer relaxation time increases as the natural length of the polymer increases and the spring constant decreases, and observe that DR increases logarithmically with the relaxation time. Based on this logarithmic dependency, the authors speculate that the drag-reducing effect of the polymer occurs when it is longer than the diameter of tur-bulent vortical structures: Longer polymers are found to induce higher energy dissipation upon interacting with the flow structures and tend to suppress turbulent fluctua-tions. The role of polymer length was also examined by Yang and Dou (2010) in connection with wall roughness effects. These authors proposed and validated a theoreti-cal formula to describe the flow resistance in laminar, transitional and turbulent flows from the hydraulically smooth regime to the fully rough one. This formula was developed based on the findings that, while polymers in smooth pipe flow increase the viscous sublayer thickness (thus leading to DR), polymers in rough pipes also in-crease the near-wall velocity when compared to Newto-nian flow conditions, implying that roughness has a negative effect on DR. Indeed, larger roughness tends to narrow the gap between the resistance in viscoelastic flows and that in unladen flows.
As far as analysis of fiber-induced DR is concerned, Moosaie and Manhart (2011, 2013) used a sophisticated rheological model based on direct Monte-Carlo solver to compute fiber orientation dynamics and study the effect of Brownian diffusivity and fiber aspect ratio on the non-Newtonian stress generated by the fibers. The model enables stochastic simulation of the Fokker-Planck equa-tion, in contrast to the moment approximation simulation approach used by Paschkewitz et al. (2004), which re-quires a closure model. Application of the model to turbu-lent channel flow shows a shift of the logarithmic law region of the mean velocity profile, indicating a thicken-ing of the viscous sublayer. The streamwise velocity fluctuations are enhanced, while the spanwise and wall- normal ones are attenuated. However, there are discrep-ancies with the results of the moment approximation approach. The closure model required by the moment approximation approach provides wrong estimates of the
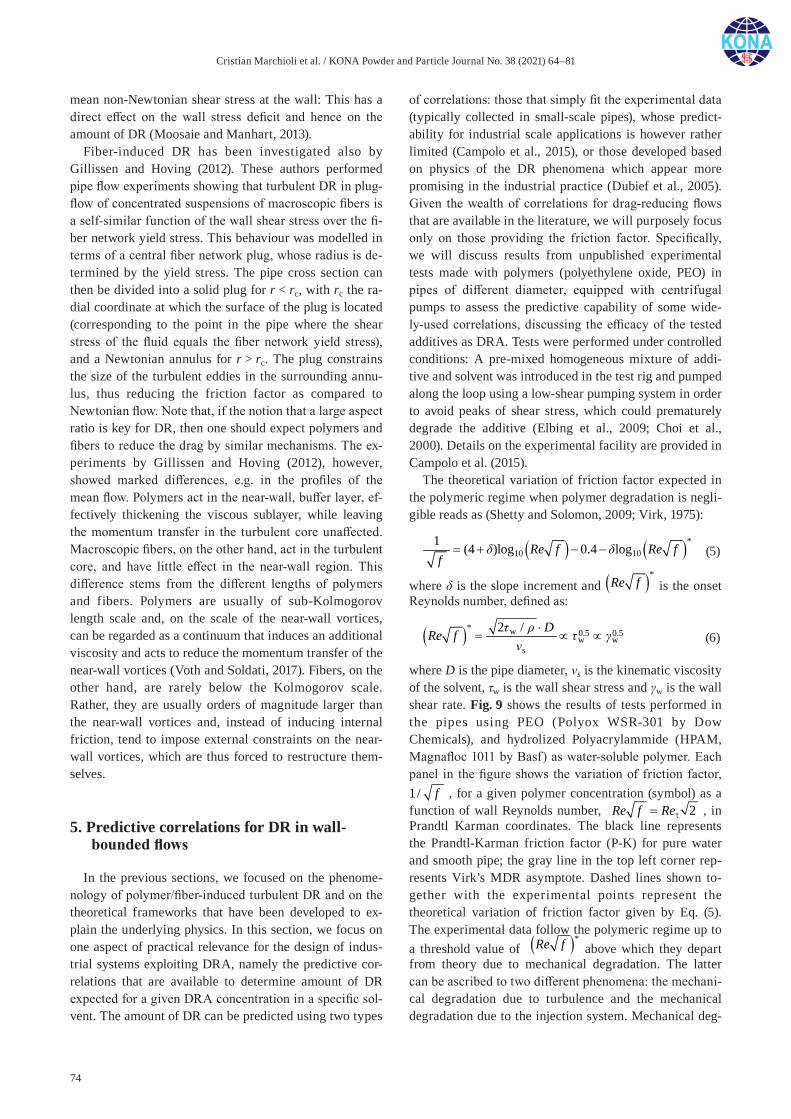
Cristian Marchioli et al. / KONA Powder and Particle Journal No. 38 (2021) 64–81
74
mean non-Newtonian shear stress at the wall: This has a direct effect on the wall stress deficit and hence on the amount of DR (Moosaie and Manhart, 2013).
Fiber-induced DR has been investigated also by Gillissen and Hoving (2012). These authors performed pipe flow experiments showing that turbulent DR in plug-flow of concentrated suspensions of macroscopic fibers is a self-similar function of the wall shear stress over the fi-ber network yield stress. This behaviour was modelled in terms of a central fiber network plug, whose radius is de-termined by the yield stress. The pipe cross section can then be divided into a solid plug for r < rc, with rc the ra-dial coordinate at which the surface of the plug is located (corresponding to the point in the pipe where the shear stress of the fluid equals the fiber network yield stress), and a Newtonian annulus for r > rc. The plug constrains the size of the turbulent eddies in the surrounding annu-lus, thus reducing the friction factor as compared to Newtonian flow. Note that, if the notion that a large aspect ratio is key for DR, then one should expect polymers and fibers to reduce the drag by similar mechanisms. The ex-periments by Gillissen and Hoving (2012), however, showed marked differences, e.g. in the profiles of the mean flow. Polymers act in the near-wall, buffer layer, ef-fectively thickening the viscous sublayer, while leaving the momentum transfer in the turbulent core unaffected. Macroscopic fibers, on the other hand, act in the turbulent core, and have little effect in the near-wall region. This difference stems from the different lengths of polymers and fibers. Polymers are usually of sub-Kolmogorov length scale and, on the scale of the near-wall vortices, can be regarded as a continuum that induces an additional viscosity and acts to reduce the momentum transfer of the near-wall vortices (Voth and Soldati, 2017). Fibers, on the other hand, are rarely below the Kolmogorov scale. Rather, they are usually orders of magnitude larger than the near-wall vortices and, instead of inducing internal friction, tend to impose external constraints on the near-wall vortices, which are thus forced to restructure them-selves.
5. Predictive correlations for DR in wall-bounded flows
In the previous sections, we focused on the phenome-nology of polymer/fiber-induced turbulent DR and on the theoretical frameworks that have been developed to ex-plain the underlying physics. In this section, we focus on one aspect of practical relevance for the design of indus-trial systems exploiting DRA, namely the predictive cor-relations that are available to determine amount of DR expected for a given DRA concentration in a specific sol-vent. The amount of DR can be predicted using two types
of correlations: those that simply fit the experimental data (typically collected in small-scale pipes), whose predict-ability for industrial scale applications is however rather limited (Campolo et al., 2015), or those developed based on physics of the DR phenomena which appear more promising in the industrial practice (Dubief et al., 2005). Given the wealth of correlations for drag-reducing flows that are available in the literature, we will purposely focus only on those providing the friction factor. Specifically, we will discuss results from unpublished experimental tests made with polymers (polyethylene oxide, PEO) in pipes of different diameter, equipped with centrifugal pumps to assess the predictive capability of some wide-ly-used correlations, discussing the efficacy of the tested additives as DRA. Tests were performed under controlled conditions: A pre-mixed homogeneous mixture of addi-tive and solvent was introduced in the test rig and pumped along the loop using a low-shear pumping system in order to avoid peaks of shear stress, which could prematurely degrade the additive (Elbing et al., 2009; Choi et al., 2000). Details on the experimental facility are provided in Campolo et al. (2015).
The theoretical variation of friction factor expected in the polymeric regime when polymer degradation is negli-gible reads as (Shetty and Solomon, 2009; Virk, 1975):
( ) ( )*10 101 (4 )log 0.4 logRe f Re ff
= + − −
(5)
where δ is the slope increment and ( )*Re f
is the onset Reynolds number, defined as:
( )* w 0.5 0.5w w
s
2 / DRe f
⋅
= ∝ ∝
(6)
where D is the pipe diameter, νs is the kinematic viscosity of the solvent, τw is the wall shear stress and γw is the wall shear rate. Fig. 9 shows the results of tests performed in the pipes using PEO (Polyox WSR-301 by Dow Chemicals), and hydrolized Polyacrylammide (HPAM, Magnafloc 1011 by Basf) as water-soluble polymer. Each panel in the figure shows the variation of friction factor, 1/ f
, for a given polymer concentration (symbol) as a function of wall Reynolds number, 2Re f Reτ=
, in Prandtl Karman coordinates. The black line represents the Prandtl-Karman friction factor (P-K) for pure water and smooth pipe; the gray line in the top left corner rep-resents Virk’s MDR asymptote. Dashed lines shown to-gether with the experimental points represent the theoretical variation of friction factor given by Eq. (5). The experimental data follow the polymeric regime up to a threshold value of ( )*Re f
above which they depart from theory due to mechanical degradation. The latter can be ascribed to two different phenomena: the mechani-cal degradation due to turbulence and the mechanical degradation due to the injection system. Mechanical deg-
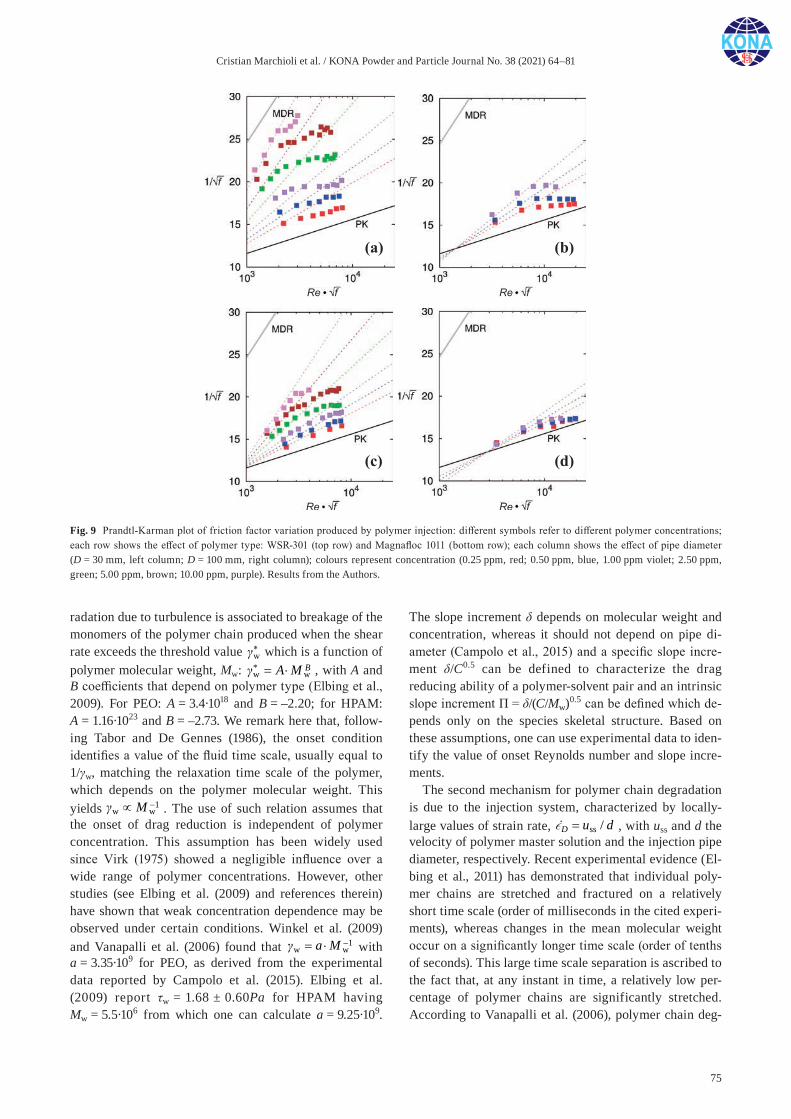
Cristian Marchioli et al. / KONA Powder and Particle Journal No. 38 (2021) 64–81
75
radation due to turbulence is associated to breakage of the monomers of the polymer chain produced when the shear rate exceeds the threshold value *
w
which is a function of polymer molecular weight, Mw: *
w wBA M = ⋅
, with A and B coefficients that depend on polymer type (Elbing et al., 2009). For PEO: A = 3.4·1018 and B = –2.20; for HPAM: A = 1.16·1023 and B = –2.73. We remark here that, follow-ing Tabor and De Gennes (1986), the onset condition identifies a value of the fluid time scale, usually equal to 1/γw, matching the relaxation time scale of the polymer, which depends on the polymer molecular weight. This yields 1
w wM −∝
. The use of such relation assumes that the onset of drag reduction is independent of polymer concentration. This assumption has been widely used since Virk (1975) showed a negligible influence over a wide range of polymer concentrations. However, other studies (see Elbing et al. (2009) and references therein) have shown that weak concentration dependence may be observed under certain conditions. Winkel et al. (2009) and Vanapalli et al. (2006) found that 1
w wa M −= ⋅
with a = 3.35·109 for PEO, as derived from the experimental data reported by Campolo et al. (2015). Elbing et al. (2009) report τw = 1.68 ± 0.60Pa for HPAM having Mw = 5.5·106 from which one can calculate a = 9.25·109.
The slope increment δ depends on molecular weight and concentration, whereas it should not depend on pipe di-ameter (Campolo et al., 2015) and a specific slope incre-ment δ/C0.5 can be defined to characterize the drag reducing ability of a polymer-solvent pair and an intrinsic slope increment Π = δ/(C/Mw)0.5 can be defined which de-pends only on the species skeletal structure. Based on these assumptions, one can use experimental data to iden-tify the value of onset Reynolds number and slope incre-ments.
The second mechanism for polymer chain degradation is due to the injection system, characterized by locally- large values of strain rate, ss /D u d=
, with uss and d the velocity of polymer master solution and the injection pipe diameter, respectively. Recent experimental evidence (El-bing et al., 2011) has demonstrated that individual poly-mer chains are stretched and fractured on a relatively short time scale (order of milliseconds in the cited experi-ments), whereas changes in the mean molecular weight occur on a significantly longer time scale (order of tenths of seconds). This large time scale separation is ascribed to the fact that, at any instant in time, a relatively low per-centage of polymer chains are significantly stretched. According to Vanapalli et al. (2006), polymer chain deg-
Fig. 9 Prandtl-Karman plot of friction factor variation produced by polymer injection: different symbols refer to different polymer concentrations; each row shows the effect of polymer type: WSR-301 (top row) and Magnafloc 1011 (bottom row); each column shows the effect of pipe diameter (D = 30 mm, left column; D = 100 mm, right column); colours represent concentration (0.25 ppm, red; 0.50 ppm, blue, 1.00 ppm violet; 2.50 ppm, green; 5.00 ppm, brown; 10.00 ppm, purple). Results from the Authors.

Cristian Marchioli et al. / KONA Powder and Particle Journal No. 38 (2021) 64–81
76
radation under elongational flow is triggered by strain rates exceeding a threshold given by: E
D wD M= ⋅
, where D and E are also coefficients, e.g. E = 4.2651·1010 and D = –1.23 for PEO; D = 1.64737·1011 and E = –1.27 for HPAM (Vanapalli et al., 2006). These data on polymer mechanical degradation can be used to identify and plot in P-K coordinates the limiting value of shear stress and elongational stress the polymer can be exposed to before being degraded by the flow. Fig. 10 shows these curves together with the experimental data collected for PEO (WSR-301) at 1 ppm concentration in the three different pipes. TC (red line) is the theoretical line corresponding to the polymeric regime (Eq. 5); OP (green line) is the curve corresponding to one-pass scission; SS (blue line) corresponds to steady state scission and INJ (purple line, visible only in the largest pipe) corresponds to degrada-tion produced by the injection system. The agreement be-tween experimental data (red symbols) and reference curves for degradation is quite good and indicates that drag reduction in real systems can be predicted with some confidence also for situations in which ( )*Re f Re f≥
. Mechanical degradation leads to the alteration of the mo-lecular weight (Yang and Ding, 2013). To determine the local molecular weight of the injected polymer, Elbing et al. (2011) proposed the following scaling:
w ws 5f w
woexp 8.6 10 ( )M M t
M
(7)
where Mw is the local molecular weight, Mws is the steady-state molecular weight (defined as the minimum Mw that can be obtained at a given γw), Mwo is the non-degraded value of Mw at the point of injection, and tf = (X – Xinj)/U∞ is the polymer residence time in the flow, (X – Xinj) being the distance travelled by the polymer, and U∞ the convec-tion velocity. Fig. 11 shows the accuracy of this scaling for different characteristics of polymer degradation within
a turbulent boundary layer. Changes in mean molecular weight occur on a time scale proportional to the polymer residence time. In addition, Mw tends to a finite level with increased residence time and shear rate, and the key pa-rameters that control the degradation process appear to be the shear rate, polymer residence time in the TBL flow, Mwo and Mws (Elbing et al., 2011).
6. Additive DR from a physico-chemical perspective
As mentioned in the previous section, mechanical deg-radation represents an important aspect of DR phenomena because of its practical implications for the design of ac-
Fig. 10 Reference curves for DR prediction in industrial loop. TC (red line) is the theoretical line corresponding to the polymeric regime; OP (green line) is the curve corresponding to one-pass scission; SS (blue line) and INJ (purple line, visible only in the largest pipe) correspond to steady state scission and degradation due to the injection system, respectively. Symbols correspond to WSR-301 solution at the reference concentration of 1 ppm. Results from the Authors.
Fig. 11 Normalized difference between measured and steady-state mo-lecular weights scaled with the product of residence time and wall shear rate. Results refer to rough (solid symbols) and smooth (open symbols) surfaces. The solid curve is the fit to the data and is provided by Eq. 7, namely Eq. (3.12) in Elbing et al. (2011). The error bars were deter-mined from standard error propagation analysis. Reproduced with per-mission from Elbing et al. (2011).
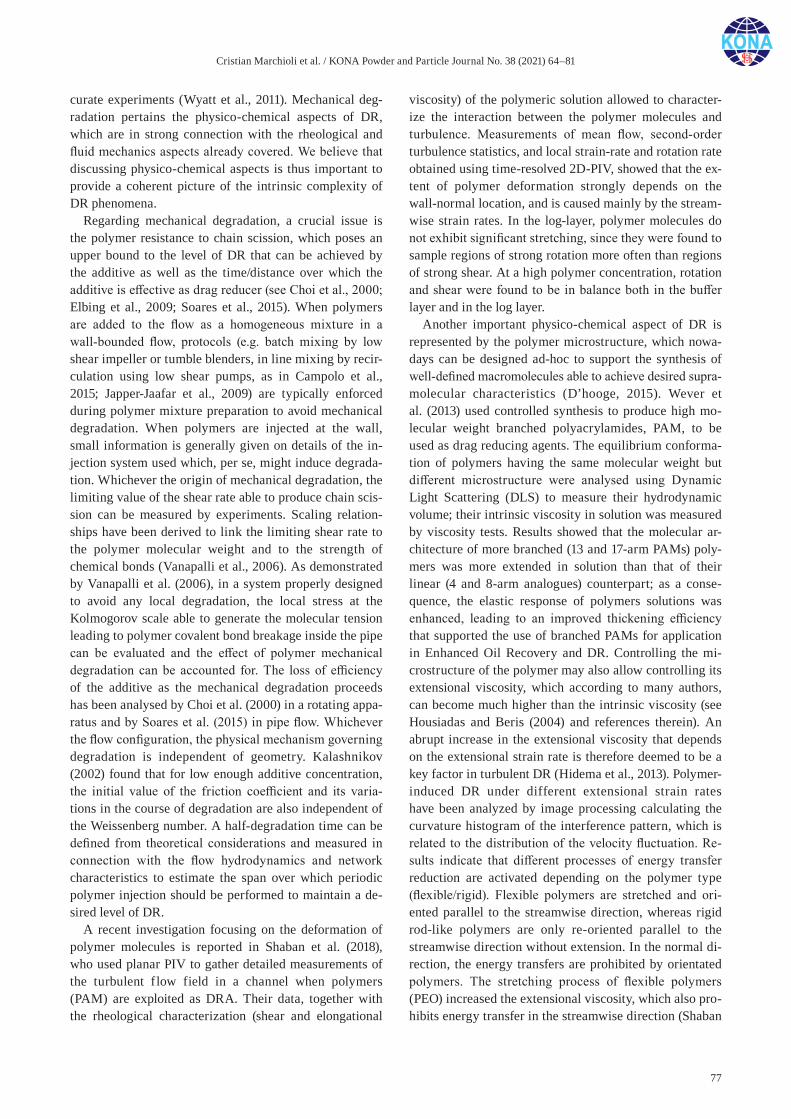
Cristian Marchioli et al. / KONA Powder and Particle Journal No. 38 (2021) 64–81
77
curate experiments (Wyatt et al., 2011). Mechanical deg-radation pertains the physico-chemical aspects of DR, which are in strong connection with the rheological and fluid mechanics aspects already covered. We believe that discussing physico-chemical aspects is thus important to provide a coherent picture of the intrinsic complexity of DR phenomena.
Regarding mechanical degradation, a crucial issue is the polymer resistance to chain scission, which poses an upper bound to the level of DR that can be achieved by the additive as well as the time/distance over which the additive is effective as drag reducer (see Choi et al., 2000; Elbing et al., 2009; Soares et al., 2015). When polymers are added to the flow as a homogeneous mixture in a wall-bounded flow, protocols (e.g. batch mixing by low shear impeller or tumble blenders, in line mixing by recir-culation using low shear pumps, as in Campolo et al., 2015; Japper-Jaafar et al., 2009) are typically enforced during polymer mixture preparation to avoid mechanical degradation. When polymers are injected at the wall, small information is generally given on details of the in-jection system used which, per se, might induce degrada-tion. Whichever the origin of mechanical degradation, the limiting value of the shear rate able to produce chain scis-sion can be measured by experiments. Scaling relation-ships have been derived to link the limiting shear rate to the polymer molecular weight and to the strength of chemical bonds (Vanapalli et al., 2006). As demonstrated by Vanapalli et al. (2006), in a system properly designed to avoid any local degradation, the local stress at the Kolmogorov scale able to generate the molecular tension leading to polymer covalent bond breakage inside the pipe can be evaluated and the effect of polymer mechanical degradation can be accounted for. The loss of efficiency of the additive as the mechanical degradation proceeds has been analysed by Choi et al. (2000) in a rotating appa-ratus and by Soares et al. (2015) in pipe flow. Whichever the flow configuration, the physical mechanism governing degradation is independent of geometry. Kalashnikov (2002) found that for low enough additive concentration, the initial value of the friction coefficient and its varia-tions in the course of degradation are also independent of the Weissenberg number. A half-degradation time can be defined from theoretical considerations and measured in connection with the flow hydrodynamics and network characteristics to estimate the span over which periodic polymer injection should be performed to maintain a de-sired level of DR.
A recent investigation focusing on the deformation of polymer molecules is reported in Shaban et al. (2018), who used planar PIV to gather detailed measurements of the turbulent flow field in a channel when polymers (PAM) are exploited as DRA. Their data, together with the rheological characterization (shear and elongational
viscosity) of the polymeric solution allowed to character-ize the interaction between the polymer molecules and turbulence. Measurements of mean flow, second-order turbulence statistics, and local strain-rate and rotation rate obtained using time-resolved 2D-PIV, showed that the ex-tent of polymer deformation strongly depends on the wall-normal location, and is caused mainly by the stream-wise strain rates. In the log-layer, polymer molecules do not exhibit significant stretching, since they were found to sample regions of strong rotation more often than regions of strong shear. At a high polymer concentration, rotation and shear were found to be in balance both in the buffer layer and in the log layer.
Another important physico-chemical aspect of DR is represented by the polymer microstructure, which nowa-days can be designed ad-hoc to support the synthesis of well-defined macromolecules able to achieve desired supra- molecular characteristics (D’hooge, 2015). Wever et al. (2013) used controlled synthesis to produce high mo-lecular weight branched polyacrylamides, PAM, to be used as drag reducing agents. The equilibrium conforma-tion of polymers having the same molecular weight but different microstructure were analysed using Dynamic Light Scattering (DLS) to measure their hydrodynamic volume; their intrinsic viscosity in solution was measured by viscosity tests. Results showed that the molecular ar-chitecture of more branched (13 and 17-arm PAMs) poly-mers was more extended in solution than that of their linear (4 and 8-arm analogues) counterpart; as a conse-quence, the elastic response of polymers solutions was enhanced, leading to an improved thickening efficiency that supported the use of branched PAMs for application in Enhanced Oil Recovery and DR. Controlling the mi-crostructure of the polymer may also allow controlling its extensional viscosity, which according to many authors, can become much higher than the intrinsic viscosity (see Housiadas and Beris (2004) and references therein). An abrupt increase in the extensional viscosity that depends on the extensional strain rate is therefore deemed to be a key factor in turbulent DR (Hidema et al., 2013). Polymer- induced DR under different extensional strain rates have been analyzed by image processing calculating the curvature histogram of the interference pattern, which is related to the distribution of the velocity fluctuation. Re-sults indicate that different processes of energy transfer reduction are activated depending on the polymer type (flexible/rigid). Flexible polymers are stretched and ori-ented parallel to the streamwise direction, whereas rigid rod-like polymers are only re-oriented parallel to the streamwise direction without extension. In the normal di-rection, the energy transfers are prohibited by orientated polymers. The stretching process of flexible polymers (PEO) increased the extensional viscosity, which also pro-hibits energy transfer in the streamwise direction (Shaban
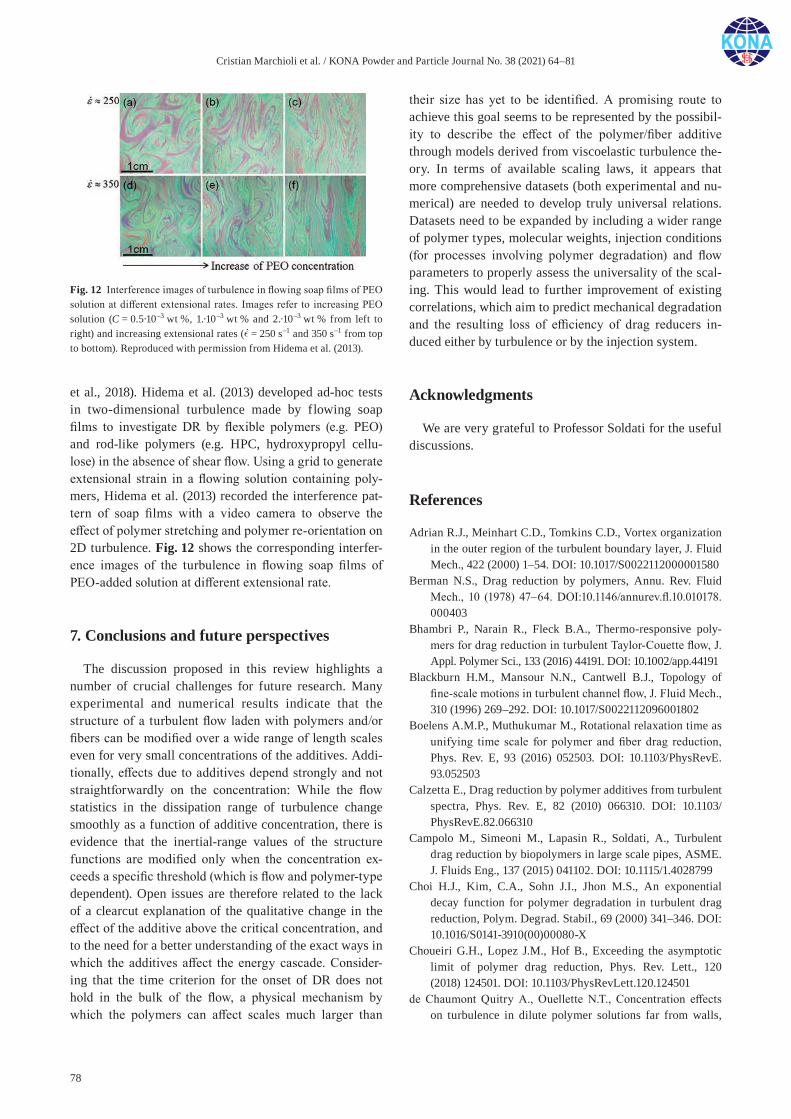
Cristian Marchioli et al. / KONA Powder and Particle Journal No. 38 (2021) 64–81
78
et al., 2018). Hidema et al. (2013) developed ad-hoc tests in two-dimensional turbulence made by flowing soap films to investigate DR by flexible polymers (e.g. PEO) and rod-like polymers (e.g. HPC, hydroxypropyl cellu-lose) in the absence of shear flow. Using a grid to generate extensional strain in a flowing solution containing poly-mers, Hidema et al. (2013) recorded the interference pat-tern of soap films with a video camera to observe the effect of polymer stretching and polymer re-orientation on 2D turbulence. Fig. 12 shows the corresponding interfer-ence images of the turbulence in flowing soap films of PEO-added solution at different extensional rate.
7. Conclusions and future perspectives
The discussion proposed in this review highlights a number of crucial challenges for future research. Many experimental and numerical results indicate that the structure of a turbulent flow laden with polymers and/or fibers can be modified over a wide range of length scales even for very small concentrations of the additives. Addi-tionally, effects due to additives depend strongly and not straightforwardly on the concentration: While the flow statistics in the dissipation range of turbulence change smoothly as a function of additive concentration, there is evidence that the inertial-range values of the structure functions are modified only when the concentration ex-ceeds a specific threshold (which is flow and polymer-type dependent). Open issues are therefore related to the lack of a clearcut explanation of the qualitative change in the effect of the additive above the critical concentration, and to the need for a better understanding of the exact ways in which the additives affect the energy cascade. Consider-ing that the time criterion for the onset of DR does not hold in the bulk of the flow, a physical mechanism by which the polymers can affect scales much larger than
their size has yet to be identified. A promising route to achieve this goal seems to be represented by the possibil-ity to describe the effect of the polymer/fiber additive through models derived from viscoelastic turbulence the-ory. In terms of available scaling laws, it appears that more comprehensive datasets (both experimental and nu-merical) are needed to develop truly universal relations. Datasets need to be expanded by including a wider range of polymer types, molecular weights, injection conditions (for processes involving polymer degradation) and flow parameters to properly assess the universality of the scal-ing. This would lead to further improvement of existing correlations, which aim to predict mechanical degradation and the resulting loss of efficiency of drag reducers in-duced either by turbulence or by the injection system.
Acknowledgments
We are very grateful to Professor Soldati for the useful discussions.
References
Adrian R.J., Meinhart C.D., Tomkins C.D., Vortex organization in the outer region of the turbulent boundary layer, J. Fluid Mech., 422 (2000) 1–54. DOI: 10.1017/S0022112000001580
Berman N.S., Drag reduction by polymers, Annu. Rev. Fluid Mech., 10 (1978) 47–64. DOI:10.1146/annurev.fl.10.010178. 000403
Bhambri P., Narain R., Fleck B.A., Thermo-responsive poly-mers for drag reduction in turbulent Taylor-Couette flow, J. Appl. Polymer Sci., 133 (2016) 44191. DOI: 10.1002/app.44191
Blackburn H.M., Mansour N.N., Cantwell B.J., Topology of fine-scale motions in turbulent channel flow, J. Fluid Mech., 310 (1996) 269–292. DOI: 10.1017/S0022112096001802
Boelens A.M.P., Muthukumar M., Rotational relaxation time as unifying time scale for polymer and fiber drag reduction, Phys. Rev. E, 93 (2016) 052503. DOI: 10.1103/PhysRevE. 93.052503
Calzetta E., Drag reduction by polymer additives from turbulent spectra, Phys. Rev. E, 82 (2010) 066310. DOI: 10.1103/PhysRevE.82.066310
Campolo M., Simeoni M., Lapasin R., Soldati, A., Turbulent drag reduction by biopolymers in large scale pipes, ASME. J. Fluids Eng., 137 (2015) 041102. DOI: 10.1115/1.4028799
Choi H.J., Kim, C.A., Sohn J.I., Jhon M.S., An exponential decay function for polymer degradation in turbulent drag reduction, Polym. Degrad. Stabil., 69 (2000) 341–346. DOI: 10.1016/S0141-3910(00)00080-X
Choueiri G.H., Lopez J.M., Hof B., Exceeding the asymptotic limit of polymer drag reduction, Phys. Rev. Lett., 120 (2018) 124501. DOI: 10.1103/PhysRevLett.120.124501
de Chaumont Quitry A., Ouellette N.T., Concentration effects on turbulence in dilute polymer solutions far from walls,
Fig. 12 Interference images of turbulence in flowing soap films of PEO solution at different extensional rates. Images refer to increasing PEO solution (C = 0.5·10–3 wt %, 1.·10–3 wt % and 2.·10–3 wt % from left to right) and increasing extensional rates ( = 250 s–1 and 350 s–1 from top to bottom). Reproduced with permission from Hidema et al. (2013).
Cristian Marchioli et al. / KONA Powder and Particle Journal No. 38 (2021) 64–81
79
Phys. Rev. E, 93 (2016) 063116. DOI: 10.1103/PhysRevE. 93.063116
de Gennes P.G., Introduction to Polymer Dynamics, Cambridge University Press, 1990. ISBN: 9780511569463. DOI: 10.1017/ CBO9780511569463
D’hooge D.R., Van Steenberge P.H.M.. Derboven P., Reyniers M.F., Marin G.B., Model-based design of the polymer microstructure: bridging the gap between polymer chemis-try and engineering, Polym. Chem., 6 (2015) 7081–7096. DOI: 10.1039/c5py01069a
Dubief Y., Terrapon V.E., White C.M., Shaqfeh E.S.G., Moin P., Lele S.K., New answers on the interaction between poly-mers and vortices in turbulent flows, Flow, Turbul. Com-bust., 74 (2005) 311–329. DOI: 10.1007/s10494-005-9002-6
Dubief Y., White C.M., Terrapon V.E., Shaqfeh E.S.G., Moin P., Lele S.K., On the coherent drag-reducing and turbulence- enhancing behaviour of polymers in wall flows, J. Fluid Mech., 514 (2004) 271Ð280. DOI: 10.1017/S0022112004000291
Elbing B.R., Solomon M.J., Perlin M., Dowling D.R., Ceccio S.L., Flow-induced degradation of drag-reducing polymer solutions within a high-Reynolds number turbulent bound-ary layer, J. Fluid Mech., 670 (2011) 337–364. DOI: 10.1017/S0022112010005331
Elbing B.R., Winkel E.S., Solomon M.J., Ceccio S.L., Degrada-tion of homogeneous polymer solutions in high shear turbu-lent pipe flow, Exp. Fluids, 47 (2009) 1033–1044. DOI: 10.1007/s00348-009-0693-7
Elsnab J.R., Monty J.P., White C.M., Koochesfahani M.M., Klewicki J.C., High-fidelity measurements in channel flow with polymer wall injections, J. Fluid Mech., 859 (2019) 851–886. DOI: 10.1017/jfm.2018.873
Escudier M.P., Nickson A.K., Poole R.J., Turbulent flow of vis-coelastic shear-thinning liquids through a rectangular duct: Quantification of turbulence anisotropy, J. Non-Newtonian Fluid Mech., 160 (2009) 2–10. DOI: 10.1016/j.jnnfm. 2009.01.002
Flory P.J., Principles of Polymer Chemistry, 1 edition, Cornell University Press, 1953, ISBN: 0801401348.
Fsadni A.M., Whitty J.P.M., Stables M.A., A brief review on frictional pressure drop reduction studies for laminar and turbulent flow in helically coiled tubes, Appl. Therm. Eng., 109 (2016) 334–343. DOI: 10.1016/j.applthermaleng.2016. 08.068
Fu Z., Otsuki T., Motozawa M., Kurosawa T., Yu B., Kawaguchi Y., Experimental investigation of polymer diffusion in the drag-reduced turbulent channel flow of inhomogeneous solution, Int. J. Heat Mass Tran., 77 (2014) 860–873. DOI: 10.1016/j.ijheatmasstransfer.2014.06.016
Fujimura M., Iwamoto K., Murata A., Masuda M., Ando H., Mamori H., Influence of length of polymer aggregation on turbulent friction drag reduction effect, J. Fluid Sci. Tech., 12 (2017). DOI: 10.1299/jfst.2017jfst0013
Ganapathisubramani B., Longmire E.K., Marusic I., Character-istics of vortex packets in turbulent boundary layers, J. Fluid Mech., 478 (2003) 35–46. DOI: 10.1017/S0022112002003270
Ghosal A., Cherayil B.J., Anomalies in the coil-stretch transi-
tion of flexible polymers, J. Chem. Phys., 148 (2018), 094903. DOI: 10.1063/1.5017555
Gillissen J.J.J., Boersma B.J., Mortensen P.H., Andersson H.I., Fibre-induced drag reduction, J. Fluid Mech., 602 (2008) 209–218. DOI: 10.1017/S0022112008000967
Gillissen J.J.J., Hoving J.P., Self-similar drag reduction in plug-flow of suspensions of macroscopic fibers, Phys. Fluids, 24 (2012) 111702. DOI: 10.1063/1.4766198
Graham M.D., Drag reduction and the dynamics of turbulence in simple and complex fluids, Phys. Fluids, 26 (2014) 101301. DOI: 10.1063/1.4895780
Guan X.L., Yao S.Y., Jiang N., A study on coherent structures and drag-reduction in the wall turbulence with polymer additives by TRPIV, Acta Mech. Sin., 29 (2013) 485–493. DOI: 10.1007/s10409-013-0035-0
Han W.J., Dong Y.Z., Choi H.J., Applications of water-soluble polymers in turbulent drag reduction, Processes, 5 (2017) 24. DOI: 10.3390/pr5020024
Hart A., A review of technologies for transporting heavy crude oil and bitumen via pipelines, J. Petrol. Explor. Prod. Technol., 4 (2014) 327–336. DOI:10.1007/s13202-013-0086-0
Hershey H.C., Zakin J.L., Existence of two types of drag reduc-tion in pipe flow of dilute polymer solutions, Ind. Eng. Chem. Fund., 6 (1967) 381–387. DOI: 10.1021/i160023a010
Hidema R., Suzuki H., Hisamatsu S., Komoda Y., Furukawa H., Effects of the extensional rate on two-dimensional turbu-lence of semi-dilute polymer solution flows, Rheol. Acta, 52 (2013) 949–961. DOI: 10.1007/s00397-013-0733-3
Housiadas K.D., Beris A.N., An efficient fully implicit spectral scheme for DNS of turbulent viscoelastic channel flow, J. Non-Newtonian Fluid Mech., 122 (2004) 243–262. DOI: 10.1016/j.jnnfm.2004.07.001
Japper-Jaafar A., Escudier M.P., Poole R.J., Turbulent pipe flow of a drag-reducing rigid “rod-like” polymer solution, J. Non-Newtonian Fluid Mech., 161 (2009) 86–93. DOI: 10.1016/j.jnnfm.2009.04.008
Jodai Y., Elsinga G.E., Experimental observation of hairpin auto-generation events in a turbulent boundary layer, J. Fluid Mech., 795 (2016) 611–633. DOI: 10.1017/jfm. 2016.153
Jovanović J., Pashtrapanska M., Frohnapfel B., Durst F., Koskinen J., Koskinen K., On the mechanism responsible for turbulent drag reduction by dilute addition of high poly-mers: theory, experiments, simulations, and predictions, Trans. ASME, 128 (2006) 118–130. DOI: 10.1115/1.2073227
Kalashnikov V.N., Degradation accompanying turbulent drag reduction by polymer additives, J. Non-Newtonian Fluid Mech., 103 (2002) 105–121. DOI: 10.1016/S0377-0257(01) 00156-2
Kim K., Adrian R.J., Balachandar S., Sureshkumar R., Dynam-ics of hairpin vortices and polymer-induced turbulent drag reduction, Phys. Rev. Lett., 100 (2008) 134504. DOI: 10.1103/PhysRevLett.100.134504
Kim K., Li C.F., Sureshkumar R., Balachandar S., Adrian R.J., Effects of polymer stresses on eddy structures in drag- reduced turbulent channel flow, J. Fluid Mech., 584 (2007) 281–299. DOI: 10.1017/S0022112007006611
Cristian Marchioli et al. / KONA Powder and Particle Journal No. 38 (2021) 64–81
80
Lee J.H., Sung H.J., Very-large-scale motions in a turbulent boundary layer, J. Fluid Mech., 673 (2011) 80–120. DOI: 10.1017/S002211201000621X
Li C.F., Sureshkumar R., Khomami B., Simple framework for understanding the universality of the maximum drag reduc-tion asymptote in turbulent flow of polymer solutions, Phys. Rev. E, 92 (2015) 043014. DOI: 10.1103/PhysRevE.92. 043014
Lumley J.L., Drag reduction by additives, Annu. Rev. Fluid Mech., 1 (1969) 367–384. DOI: 10.1146/annurev.fl.01.010169. 002055
Lumley J.L., Drag reduction in turbulent flow by polymer addi-tives, J. Polym. Sci. Macromol. Rev., 7 (1973) 263–290. DOI: 10.1002/pol.1973.230070104
Lumley J.L., Kubo I., Turbulent drag reduction by polymer additives: A survey. In: Gampert B. (eds) The Influence of Polymer Additives on Velocity and Temperature Fields. Springer, Berlin, Heidelberg, 1985, pp.3–21.
Marchioli C., Soldati A., Mechanisms for particle transfer and segregation in a turbulent boundary layer, J. Fluid Mech., 468 (2002) 283–315. DOI: 10.1017/S0022112002001738
Moosaie A., Manhart M., An algebraic closure for the DNS of fiber-induced turbulent drag reduction in a channel flow, J. Non-Newt. Fluid, 166 (2011) 1190–1197. DOI: 10.1016/ j.jnnfm.2011.07.006
Moosaie A., Manhart M., Direct Monte Carlo simulation of tur-bulent drag reduction by rigid fibers in a channel flow, Acta Mech., 224 (2013) 2385–2413. DOI: 10.1007/s00707-013-0919-x
Ouellette N.T., Xu H., Bodenschatz E., Bulk turbulence in dilute polymer solutions, J. Fluid Mech., 629 (2009) 375–385. DOI: 10.1017/S0022112009006697
Owolabi B.E., Dennis D.J.C., Poole R.J., Turbulent drag reduc-tion by polymer additives in parallel-shear flows, J. Fluid Mech., 827 (2017) R4. DOI: 10.1017/jfm.2017.544
Paschkewitz J.S., Dubief Y., Dimitropoulos C.D., Shaqfeh E.S.G., Moin P., Numerical simulation of turbulent drag reduction using rigid fibres, J. Fluid Mech., 518 (2004) 281–317. DOI: 10.1017/S0022112004001144
Paschkewitz J.S., Dubief Y., Shaqfeh E.S.G., The dynamic mechanism for turbulent drag reduction using rigid fibers based on Lagrangian conditional statistics, Phys. Fluids, 17 (2005) 1–18. DOI: 10.1063/1.1925447
Picciotto M., Marchioli C., Soldati A., Characterization of near-wall accumulation regions for inertial particles in turbulent boundary layers, Phys. Fluids, 17 (2005) 098101. DOI: 10.1063/1.2033573
Roy A., Larson R.G., A mean flow model for polymer and fiber turbulent drag reduction, Appl. Rheol., 15 (2006) 370–389. <https://www.ar.ethz.ch/ARONLINE_FREE/15_370.pdf> accessed 13.04.2020.
Samanta D., Dubief Y., Holzner M., Schafer C., Morozov A.N., Wagner C., Hof B., Elasto-inertial turbulence, Proc. Natl. Acad. Sci. USA, 110 (2013) 10557–10562. DOI: 10.1073/pnas.1311539110
Shaban S., Azad M., Trivedi J., Ghaemi S., Investigation of near-wall turbulence in relation to polymer rheology, Phys. Fluids, 30 (2018) 125111. DOI: 10.1063/1.5062156
Shahmardi A., Zade S., Ardekani M.N., Poole R.J., Lundell F., Rosti M.E., Brandt L., Turbulent duct flow with polymers, J. Fluid Mech., 859 (2019) 586–612. DOI: 10.1017/jfm.2018. 858
Sher I., Hetsroni G., A mechanistic model of turbulent drag reduction by additives, Chem. Eng. Sci., 63 (2008) 1771–1778. DOI: 10.1016/j.ces.2007.11.035
Shetty A.M., Solomon M.J., Aggregation in dilute solutions of high molar mass poly(ethylene) oxide and its effect on poly-mer turbulent drag reduction, Polymer, 50 (2009) 261–270. DOI: 10.1016/j.polymer.2008.10.026
Soares E.J., Sandoval G.A.B., Silveira L., Pereira A.S., Trevelin R., Thomazf F., Loss of efficiency of polymeric drag reduc-ers induced by high Reynolds number flows in tubes with imposed pressure, Phys. Fluids, 27 (2015) 125105. DOI: 10.1063/1.4937594
Somani S., Shaqfeh E.S.G., Prakash J.R., Effect of solvent qual-ity on the coil-stretch transition, Macromolecules, 43 (2010) 10679–10691. DOI: 10.1021/ma1019945
Sreenivasan K.R., White C., The onset of drag reduction by dilute polymer additives, and the maximum drag reduction asymptote, J. Fluid Mech., 409 (2000) 586–612. DOI: 10.1017/s0022112099007818
Tabor M., De Gennes P.G., A cascade theory of drag reduction, Europhys. Lett., 2 (1986) 519–522. DOI: 10.1209/0295-5075/2/7/005
Teng H., Liu N.S., Lu X.Y., Khomami B., Turbulent drag reduc-tion in plane Couette flow with polymer additives: a direct numerical simulation study, J. Fluid Mech., 846 (2018) 482–507. DOI: 10.1017/jfm.2018.242
Tiong A.N.T., Kumar P., Saptoro A., Reviews on drag reducing polymers, Korean J. Chem. Eng., 32 (2015) 1455–1476. DOI: 10.1007/s11814-015-0104-0
Valente P.C., da Silva C.B., Pinho F.T., The effect of viscoelas-ticity on the turbulent kinetic energy cascade, J. Fluid Mech., 760 (2014) 39–62. DOI: 10.1017/jfm.2014.585
Vanapalli S.A., Ceccio S.L., Solomon M.J., Universal scaling for polymer chain scission in turbulence, Proc. Natl. Acad. Sci. USA, 103 (2006) 16660–16665. DOI: 10.1073/pnas. 0607933103
Virk P.S., Drag reduction fundamentals, AIChE J., 21 (1975) 625–656. DOI: 10.1002/aic.690210402
Voth G.A., Soldati A., Anisotropic particles in turbulence, Annu. Rev. Fluid Mech., 49 (2017) 249–276. DOI: 10.1146/annurev-fluid-010816-060135
Wang S.N., Graham M.D., Hahn F.J., Xi L., Time-series and extended Karhunen-Loeve analysis of turbulent drag reduc-tion in polymer solutions, AIChE J., 60 (2014) 1460–1475. DOI: 10.1002/aic.14328
Wever D.A.Z., Picchioni F., Broekhuis A.A., Branched poly-acrylamides: synthesis and effect of molecular architecture on solution rheology, Eur. Polym. J., 49 (2013) 3289–3301. DOI: 10.1016/j.eurpolymj.2013.06.036
White C.M., Dubief Y., Klewicki, J. Properties of the mean momentum balance in polymer drag-reduced channel flow, J. Fluid Mech., 834 (2018) 409–433. DOI: 10.1017/jfm.2017.72
White C.M., Mungal M.G., Mechanics and prediction of turbu-
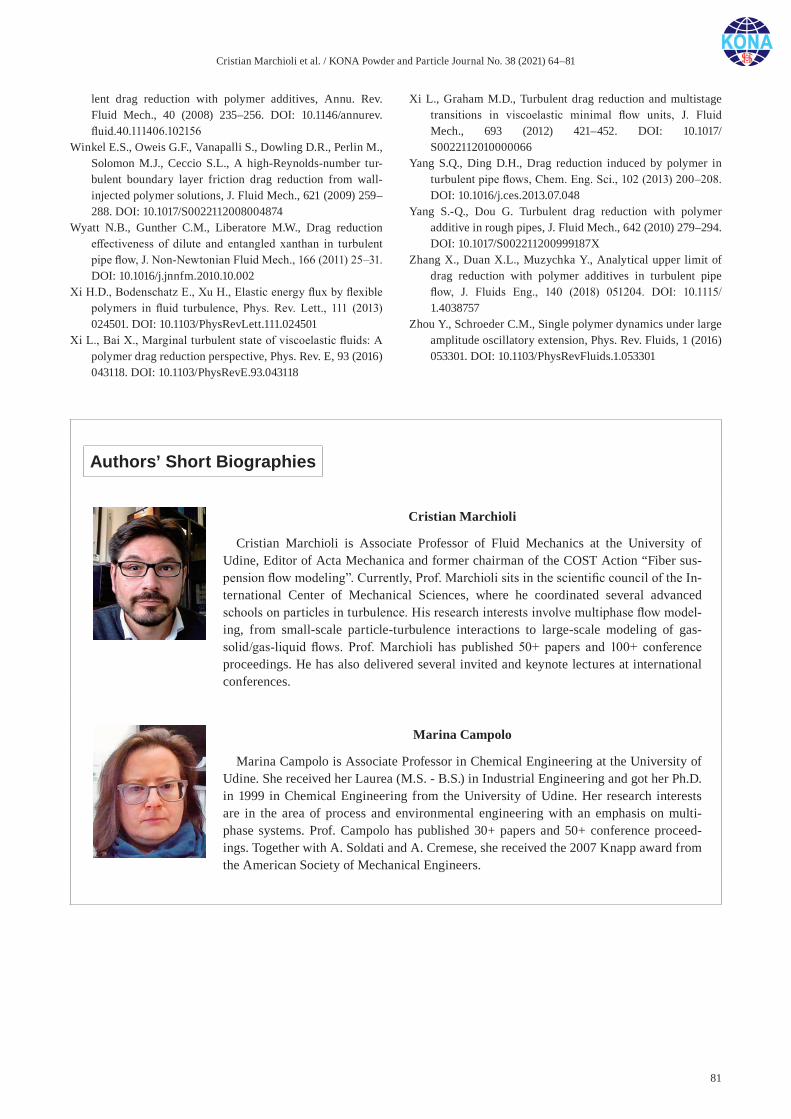
Cristian Marchioli et al. / KONA Powder and Particle Journal No. 38 (2021) 64–81
81
lent drag reduction with polymer additives, Annu. Rev. Fluid Mech., 40 (2008) 235–256. DOI: 10.1146/annurev.fluid.40.111406.102156
Winkel E.S., Oweis G.F., Vanapalli S., Dowling D.R., Perlin M., Solomon M.J., Ceccio S.L., A high-Reynolds-number tur-bulent boundary layer friction drag reduction from wall- injected polymer solutions, J. Fluid Mech., 621 (2009) 259–288. DOI: 10.1017/S0022112008004874
Wyatt N.B., Gunther C.M., Liberatore M.W., Drag reduction effectiveness of dilute and entangled xanthan in turbulent pipe flow, J. Non-Newtonian Fluid Mech., 166 (2011) 25–31. DOI: 10.1016/j.jnnfm.2010.10.002
Xi H.D., Bodenschatz E., Xu H., Elastic energy flux by flexible polymers in fluid turbulence, Phys. Rev. Lett., 111 (2013) 024501. DOI: 10.1103/PhysRevLett.111.024501
Xi L., Bai X., Marginal turbulent state of viscoelastic fluids: A polymer drag reduction perspective, Phys. Rev. E, 93 (2016) 043118. DOI: 10.1103/PhysRevE.93.043118
Xi L., Graham M.D., Turbulent drag reduction and multistage transitions in viscoelastic minimal flow units, J. Fluid Mech., 693 (2012) 421–452. DOI: 10.1017/S0022112010000066
Yang S.Q., Ding D.H., Drag reduction induced by polymer in turbulent pipe flows, Chem. Eng. Sci., 102 (2013) 200–208. DOI: 10.1016/j.ces.2013.07.048
Yang S.-Q., Dou G. Turbulent drag reduction with polymer additive in rough pipes, J. Fluid Mech., 642 (2010) 279–294. DOI: 10.1017/S002211200999187X
Zhang X., Duan X.L., Muzychka Y., Analytical upper limit of drag reduction with polymer additives in turbulent pipe flow, J. Fluids Eng., 140 (2018) 051204. DOI: 10.1115/ 1.4038757
Zhou Y., Schroeder C.M., Single polymer dynamics under large amplitude oscillatory extension, Phys. Rev. Fluids, 1 (2016) 053301. DOI: 10.1103/PhysRevFluids.1.053301
Authors’ Short Biographies
Cristian Marchioli
Cristian Marchioli is Associate Professor of Fluid Mechanics at the University of Udine, Editor of Acta Mechanica and former chairman of the COST Action “Fiber sus-pension flow modeling”. Currently, Prof. Marchioli sits in the scientific council of the In-ternational Center of Mechanical Sciences, where he coordinated several advanced schools on particles in turbulence. His research interests involve multiphase flow model-ing, from small-scale particle-turbulence interactions to large-scale modeling of gas-solid/gas-liquid flows. Prof. Marchioli has published 50+ papers and 100+ conference proceedings. He has also delivered several invited and keynote lectures at international conferences.
Marina Campolo
Marina Campolo is Associate Professor in Chemical Engineering at the University of Udine. She received her Laurea (M.S. - B.S.) in Industrial Engineering and got her Ph.D. in 1999 in Chemical Engineering from the University of Udine. Her research interests are in the area of process and environmental engineering with an emphasis on multi-phase systems. Prof. Campolo has published 30+ papers and 50+ conference proceed-ings. Together with A. Soldati and A. Cremese, she received the 2007 Knapp award from the American Society of Mechanical Engineers.

KONA Powder and Particle Journal No. 38 (2021) 82–93/https://doi.org/10.14356/kona.2021016 Review Paper
82Copyright © 2021 The Authors. Published by Hosokawa Powder Technology Foundation. This is an open access article under the CC BY license (http://creativecommons.org/licenses/by/4.0/).
Agglomeration and Dispersion Related to Particle Charging in Electric Fields †
Mizuki Shoyama and Shuji Matsusaka *Department of Chemical Engineering, Kyoto University, Japan
AbstractElectrostatic forces cause spontaneous movement of charged particles; subsequently, electrostatic technology is attracting attention because of its application in powder handling processes, such as separation, classification, dispersion, and collection. Dielectric and conductive particles are charged by induction in a strong electric field and moved by Coulomb forces. The magnitude and polarity of the transferred charges are controlled by the strength and direction of the electric field. The dielectric particles are also polarized in the electric field, and dipole interactions occur between particles or in the particle layers, complicating the particle behavior. This review paper presents induction charging, agglomeration, levitation, and other behaviors resulting from particle layers in electric fields. A series of particle phenomena occur in parallel electrode systems, which consist of a lower plate electrode and an upper mesh electrode. Charged agglomerates are formed on the particle layers, levitated by the Coulomb forces, and disintegrated with rotation when approaching the mesh electrode. The mechanisms of agglomeration and disintegration have been elucidated in multiple studies, including microscopic observations and theoretical analyses of particle motion, based on numerical calculations of the electric field. Furthermore, a new system is proposed for continuous feeding of dispersed particles using electric fields and vibration.
Keywords: particle, electric field, charging, agglomeration, levitation, dispersion
1. Introduction
In powder handling processes, the deposition of charged particles is a common phenomenon. The accumulation of charged particles on surfaces reduces operability and leads to lower productivity; thus, charged particles must be removed from the surfaces. Fluid flow (Masuda et al., 1994; Gotoh et al., 2015) and vibration (Kobayakawa et al., 2015; Adachi et al., 2017) are effective for removing particles. Another effective method is the application of external electric fields, which enables remote control of the motion of charged particles (Masuda et al., 1972; Calle et al., 2009; Kawamoto et al., 2011). Dielectric particles and conductive particles can be charged by induction in a strong electric field and moved by Coulomb forces. The magnitude and polarity of the transferred charge are controlled by the strength and direction of the electric field. The dielectric particles are also polarized in the electric field, and dipole interactions act between the particles or in the particle layers; thereby, the particle behavior becomes
more complicated.The induction charging, agglomeration, levitation, and
other behaviors resulting from particle layers in electric fields have been studied in detail (Shoyama and Matsusaka, 2017, 2019; Shoyama et al., 2019). Furthermore, a new system has been proposed for the continuous feeding of dispersed particles using electric fields and vibration (Shoyama et al., 2018). Based on previous studies, this review paper summarizes the mechanisms of induction charging, the control of particle behavior, and the concept of its application.
2. Induction charging of single particles
When a conductive particle comes into contact with an inside wall of a parallel electrode with a different polarity, the particle is charged to the same polarity as the electrode. This phenomenon is called induction charging (Blanchard, 1958; Cho, 1964). Charges cannot pass through ideal di-electric materials; however, dielectric materials have a low degree of conductivity on the surface or in the body. Thus, various types of particles can be charged by induction.
The equilibrium charge of a conductive particle by in-duction is represented by (Cho, 1964)
† Received 13 June 2020; Accepted 28 July 2020 J-STAGE Advance published online 5 September 2020
* Corresponding author: Shuji Matsusaka; Add: Kyoto 615-8510, Japan E-mail: [email protected] TEL: +81-75-383-3054 FAX: +81-75-383-3054
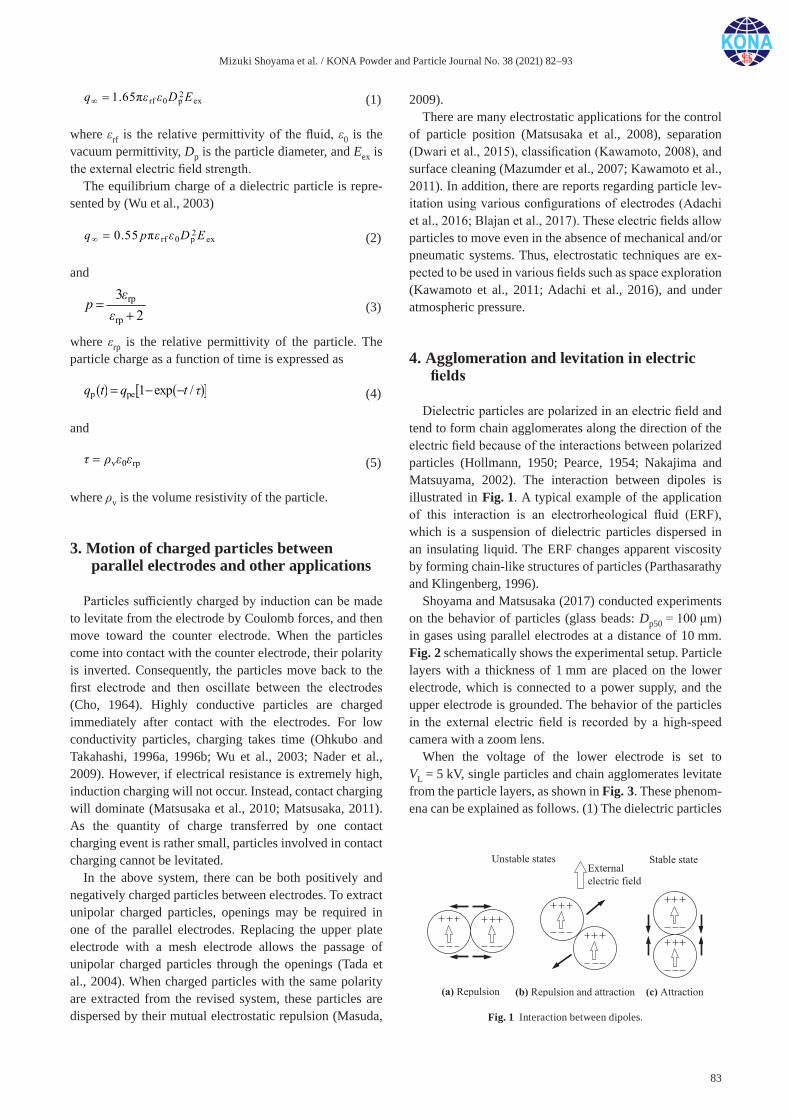
Mizuki Shoyama et al. / KONA Powder and Particle Journal No. 38 (2021) 82–93
83
2rf 0 p ex1.65πq D E ,
(1)
(1)
where εrf is the relative permittivity of the fluid, ε0 is the vacuum permittivity, Dp is the particle diameter, and Eex is the external electric field strength.
The equilibrium charge of a dielectric particle is repre-sented by (Wu et al., 2003)
2rf 0 p ex0.55 πq p D E ,
(2)
(2)
and
rp
rp
32
p
,
(3)
(3)
where εrp is the relative permittivity of the particle. The particle charge as a function of time is expressed as
p pe 1 exp /q t q t ,
(4)
(4)
and
v 0 rp
(5)
(5)
where ρv is the volume resistivity of the particle.
3. Motion of charged particles between parallel electrodes and other applications
Particles sufficiently charged by induction can be made to levitate from the electrode by Coulomb forces, and then move toward the counter electrode. When the particles come into contact with the counter electrode, their polarity is inverted. Consequently, the particles move back to the first electrode and then oscillate between the electrodes (Cho, 1964). Highly conductive particles are charged immediately after contact with the electrodes. For low conductivity particles, charging takes time (Ohkubo and Takahashi, 1996a, 1996b; Wu et al., 2003; Nader et al., 2009). However, if electrical resistance is extremely high, induction charging will not occur. Instead, contact charging will dominate (Matsusaka et al., 2010; Matsusaka, 2011). As the quantity of charge transferred by one contact charging event is rather small, particles involved in contact charging cannot be levitated.
In the above system, there can be both positively and negatively charged particles between electrodes. To extract unipolar charged particles, openings may be required in one of the parallel electrodes. Replacing the upper plate electrode with a mesh electrode allows the passage of unipolar charged particles through the openings (Tada et al., 2004). When charged particles with the same polarity are extracted from the revised system, these particles are dispersed by their mutual electrostatic repulsion (Masuda,
2009).There are many electrostatic applications for the control
of particle position (Matsusaka et al., 2008), separation (Dwari et al., 2015), classification (Kawamoto, 2008), and surface cleaning (Mazumder et al., 2007; Kawamoto et al., 2011). In addition, there are reports regarding particle lev-itation using various configurations of electrodes (Adachi et al., 2016; Blajan et al., 2017). These electric fields allow particles to move even in the absence of mechanical and/or pneumatic systems. Thus, electrostatic techniques are ex-pected to be used in various fields such as space exploration (Kawamoto et al., 2011; Adachi et al., 2016), and under atmospheric pressure.
4. Agglomeration and levitation in electric fields
Dielectric particles are polarized in an electric field and tend to form chain agglomerates along the direction of the electric field because of the interactions between polarized particles (Hollmann, 1950; Pearce, 1954; Nakajima and Matsuyama, 2002). The interaction between dipoles is illustrated in Fig. 1. A typical example of the application of this interaction is an electrorheological fluid (ERF), which is a suspension of dielectric particles dispersed in an insulating liquid. The ERF changes apparent viscosity by forming chain-like structures of particles (Parthasarathy and Klingenberg, 1996).
Shoyama and Matsusaka (2017) conducted experiments on the behavior of particles (glass beads: Dp50 = 100 μm) in gases using parallel electrodes at a distance of 10 mm. Fig. 2 schematically shows the experimental setup. Particle layers with a thickness of 1 mm are placed on the lower electrode, which is connected to a power supply, and the upper electrode is grounded. The behavior of the particles in the external electric field is recorded by a high-speed camera with a zoom lens.
When the voltage of the lower electrode is set to VL = 5 kV, single particles and chain agglomerates levitate from the particle layers, as shown in Fig. 3. These phenom-ena can be explained as follows. (1) The dielectric particles
Fig. 1 Interaction between dipoles.
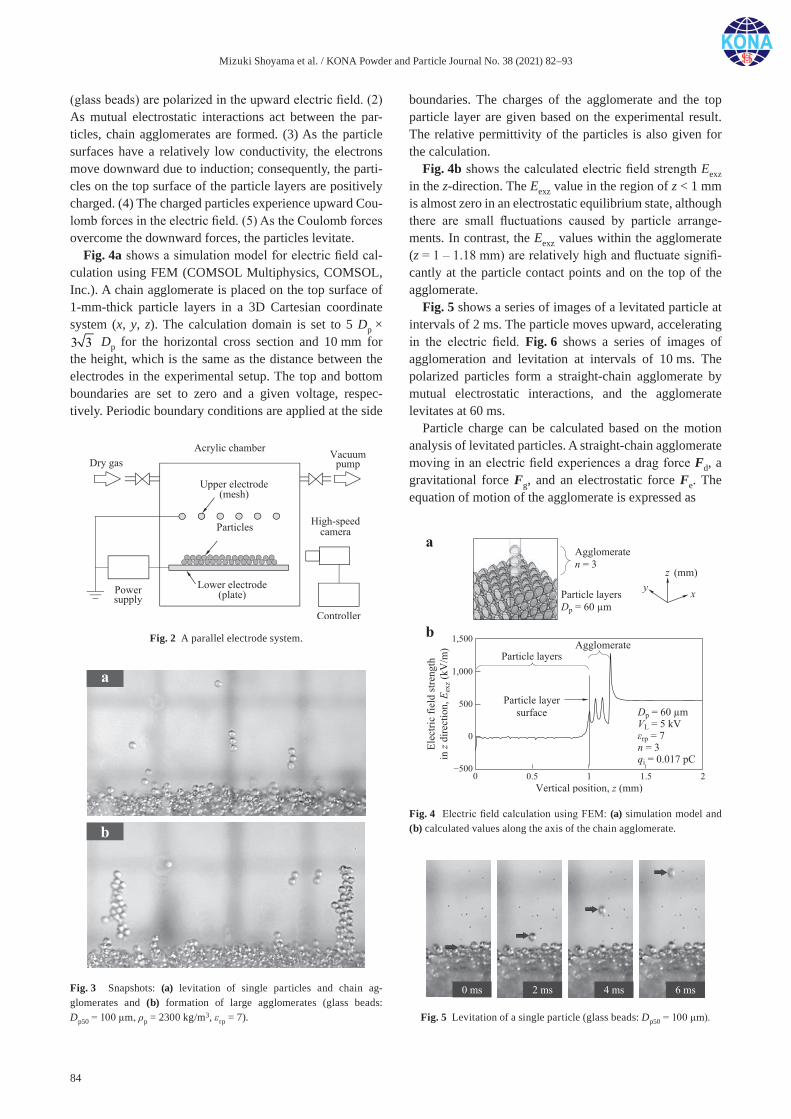
Mizuki Shoyama et al. / KONA Powder and Particle Journal No. 38 (2021) 82–93
84
(glass beads) are polarized in the upward electric field. (2) As mutual electrostatic interactions act between the par-ticles, chain agglomerates are formed. (3) As the particle surfaces have a relatively low conductivity, the electrons move downward due to induction; consequently, the parti-cles on the top surface of the particle layers are positively charged. (4) The charged particles experience upward Cou-lomb forces in the electric field. (5) As the Coulomb forces overcome the downward forces, the particles levitate.
Fig. 4a shows a simulation model for electric field cal-culation using FEM (COMSOL Multiphysics, COMSOL, Inc.). A chain agglomerate is placed on the top surface of 1-mm-thick particle layers in a 3D Cartesian coordinate system (x, y, z). The calculation domain is set to 5 Dp × 3 3
[51]
Dp for the horizontal cross section and 10 mm for the height, which is the same as the distance between the electrodes in the experimental setup. The top and bottom boundaries are set to zero and a given voltage, respec-tively. Periodic boundary conditions are applied at the side
boundaries. The charges of the agglomerate and the top particle layer are given based on the experimental result. The relative permittivity of the particles is also given for the calculation.
Fig. 4b shows the calculated electric field strength Eexz in the z-direction. The Eexz value in the region of z < 1 mm is almost zero in an electrostatic equilibrium state, although there are small fluctuations caused by particle arrange-ments. In contrast, the Eexz values within the agglomerate (z = 1 – 1.18 mm) are relatively high and fluctuate signifi-cantly at the particle contact points and on the top of the agglomerate.
Fig. 5 shows a series of images of a levitated particle at intervals of 2 ms. The particle moves upward, accelerating in the electric field. Fig. 6 shows a series of images of agglomeration and levitation at intervals of 10 ms. The polarized particles form a straight-chain agglomerate by mutual electrostatic interactions, and the agglomerate levitates at 60 ms.
Particle charge can be calculated based on the motion analysis of levitated particles. A straight-chain agglomerate moving in an electric field experiences a drag force Fd, a gravitational force Fg, and an electrostatic force Fe. The equation of motion of the agglomerate is expressed as
Fig. 2 A parallel electrode system.
Fig. 3 Snapshots: (a) levitation of single particles and chain ag-glomerates and (b) formation of large agglomerates (glass beads: Dp50 = 100 μm, ρp = 2300 kg/m3, εrp = 7).
Fig. 4 Electric field calculation using FEM: (a) simulation model and (b) calculated values along the axis of the chain agglomerate.
Fig. 5 Levitation of a single particle (glass beads: Dp50 = 100 μm).

Mizuki Shoyama et al. / KONA Powder and Particle Journal No. 38 (2021) 82–93
85
ap d g e
dd
nmt
v F F F ,
(6)
(6)
where n is the number of the primary particles constituting the agglomerate, mp is the mass of each primary particle, va is the velocity of the agglomerate, and t is time. The mass of each particle is defined as
3p p
pπ
6D
m
,
(7)
(7)
where ρp is particle density. For a stationary fluid, Fd is given by (Kasper et al., 1985; Niida and Ohtsuka, 1997)
d a a3 D F v ,
(8)
(8)
where μ is the viscosity of the fluid and Da is the volume equivalent diameter of the agglomerate, which is defined as
13a pD n D .
(9)
(9)
κ is the dynamic shape factor given by
2m
1 1 1 1 cos
,
(10)
(10)
where θm is the angle between the agglomerate axis and the moving direction.
[52]
and
[53]
are the dynamic shape factors perpendicular and parallel to the moving direction, respectively. That is,
1.00 ( 1)1.16 ( 2)1.26 ( 3)
nnn
(11)
(11)
and1.00 ( 1)1.03 ( 2)1.07 ( 3)
nnn
.
(12)
(12)
The gravitational force of the agglomerate is defined as
g pnmF g ,
(13)
(13)
where g is gravitational acceleration. When the agglomer-ate is close to an object, such as the surface of the particle
layers, the electrostatic force Fe consists of the Coulomb force Fex in the external electric field, the image force Fi, the interaction force Fp between polarized particles, and the gradient force Fgrad in a non-uniform electric field (Morgan and Green, 1997). That is,
e ex i p grad F F F F F .
(14)
(14)
Here, Fex is expressed as
ex q1
n
ii
F F ,
(15)
(15)
where Fqi is the Coulomb force acting on the i-th particle in the agglomerate, which is defined as
q exi iqF E ,
(16)
(16)
where qi is the charge of the i-th particle, and Eex is the external electric field. Fi is expressed as (Weber, 1950)
2rs rf
i 2rf 0 rs rf p1
116π
ni
ii
qz
F ,
(17)
(17)
where εrs is the relative permittivity of the particle layers, and zpi is the position of the i-th particle on the top surface of the particle layers in the z-direction. When the axis of the chain agglomerate is parallel to the external electric field, Fp is expressed as (Parthasarathy and Klingenberg, 1996)
2 4rp p 2 2
p 0 rf p exrp
13 π8 2
DD
d
F E ,
(18)
(18)
where εrp is the relative permittivity of the particle. Fgrad is expressed as (Hywel and Green, 1997)
rp 3 2grad 0 rf a ex
rp
11 π grad4 2
D
F E .
(19)
(19)
Fig. 7 shows the experimental data (circles) regarding the position of the levitated particle in the vertical direction z shown in Fig. 5. The solid lines in this figure are particle trajectories calculated using Eq. (6). The experimental data agree well with the solid line calculated with a charge of
Fig. 6 Agglomeration and levitation (glass beads: Dp50 = 100 μm).
Fig. 7 Particle position as a function of elapsed time with a parameter of particle charge (glass beads: Dp50 = 100 μm).
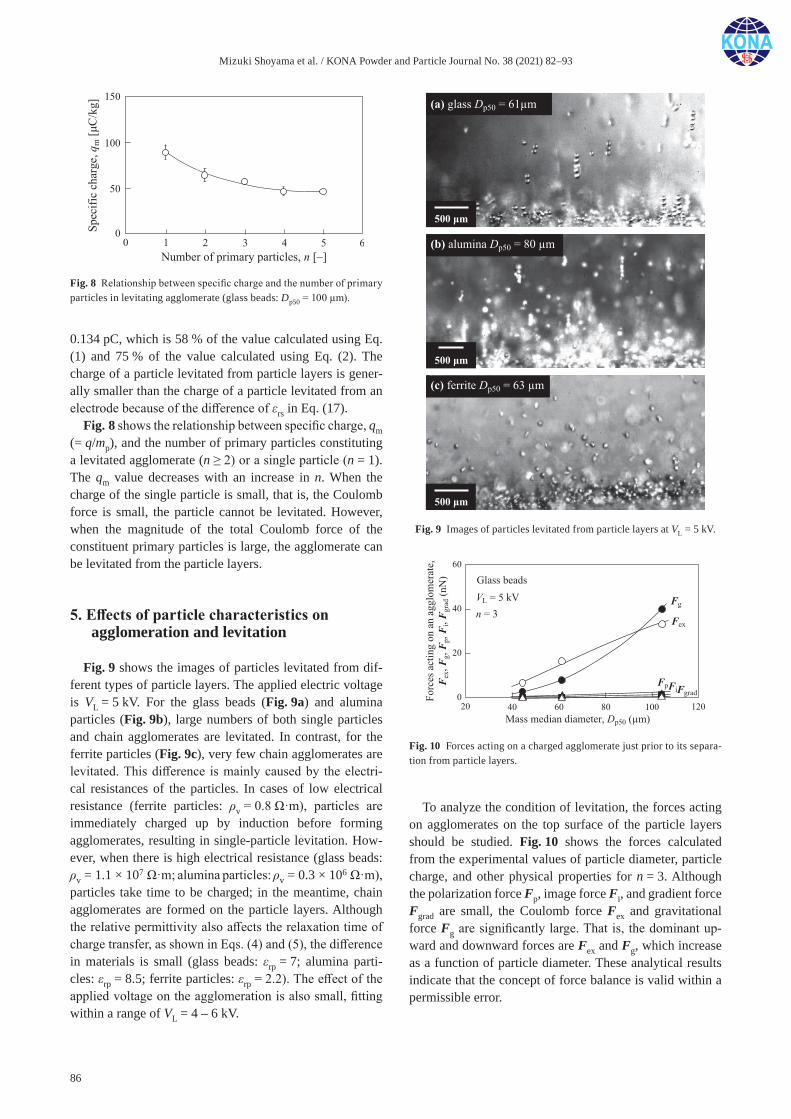
Mizuki Shoyama et al. / KONA Powder and Particle Journal No. 38 (2021) 82–93
86
0.134 pC, which is 58 % of the value calculated using Eq. (1) and 75 % of the value calculated using Eq. (2). The charge of a particle levitated from particle layers is gener-ally smaller than the charge of a particle levitated from an electrode because of the difference of εrs in Eq. (17).
Fig. 8 shows the relationship between specific charge, qm (= q/mp), and the number of primary particles constituting a levitated agglomerate (n ≥ 2) or a single particle (n = 1). The qm value decreases with an increase in n. When the charge of the single particle is small, that is, the Coulomb force is small, the particle cannot be levitated. However, when the magnitude of the total Coulomb force of the constituent primary particles is large, the agglomerate can be levitated from the particle layers.
5. Effects of particle characteristics on agglomeration and levitation
Fig. 9 shows the images of particles levitated from dif-ferent types of particle layers. The applied electric voltage is VL = 5 kV. For the glass beads (Fig. 9a) and alumina particles (Fig. 9b), large numbers of both single particles and chain agglomerates are levitated. In contrast, for the ferrite particles (Fig. 9c), very few chain agglomerates are levitated. This difference is mainly caused by the electri-cal resistances of the particles. In cases of low electrical resistance (ferrite particles: ρv = 0.8 Ω·m), particles are immediately charged up by induction before forming agglomerates, resulting in single-particle levitation. How-ever, when there is high electrical resistance (glass beads: ρv = 1.1 × 10⁷ Ω·m; alumina particles: ρv = 0.3 × 10⁶ Ω·m), particles take time to be charged; in the meantime, chain agglomerates are formed on the particle layers. Although the relative permittivity also affects the relaxation time of charge transfer, as shown in Eqs. (4) and (5), the difference in materials is small (glass beads: εrp = 7; alumina parti-cles: εrp = 8.5; ferrite particles: εrp = 2.2). The effect of the applied voltage on the agglomeration is also small, fitting within a range of VL = 4 – 6 kV.
To analyze the condition of levitation, the forces acting on agglomerates on the top surface of the particle layers should be studied. Fig. 10 shows the forces calculated from the experimental values of particle diameter, particle charge, and other physical properties for n = 3. Although the polarization force Fp, image force Fi, and gradient force Fgrad are small, the Coulomb force Fex and gravitational force Fg are significantly large. That is, the dominant up-ward and downward forces are Fex and Fg, which increase as a function of particle diameter. These analytical results indicate that the concept of force balance is valid within a permissible error.
Fig. 8 Relationship between specific charge and the number of primary particles in levitating agglomerate (glass beads: Dp50 = 100 μm).
Fig. 9 Images of particles levitated from particle layers at VL = 5 kV.
Fig. 10 Forces acting on a charged agglomerate just prior to its separa-tion from particle layers.
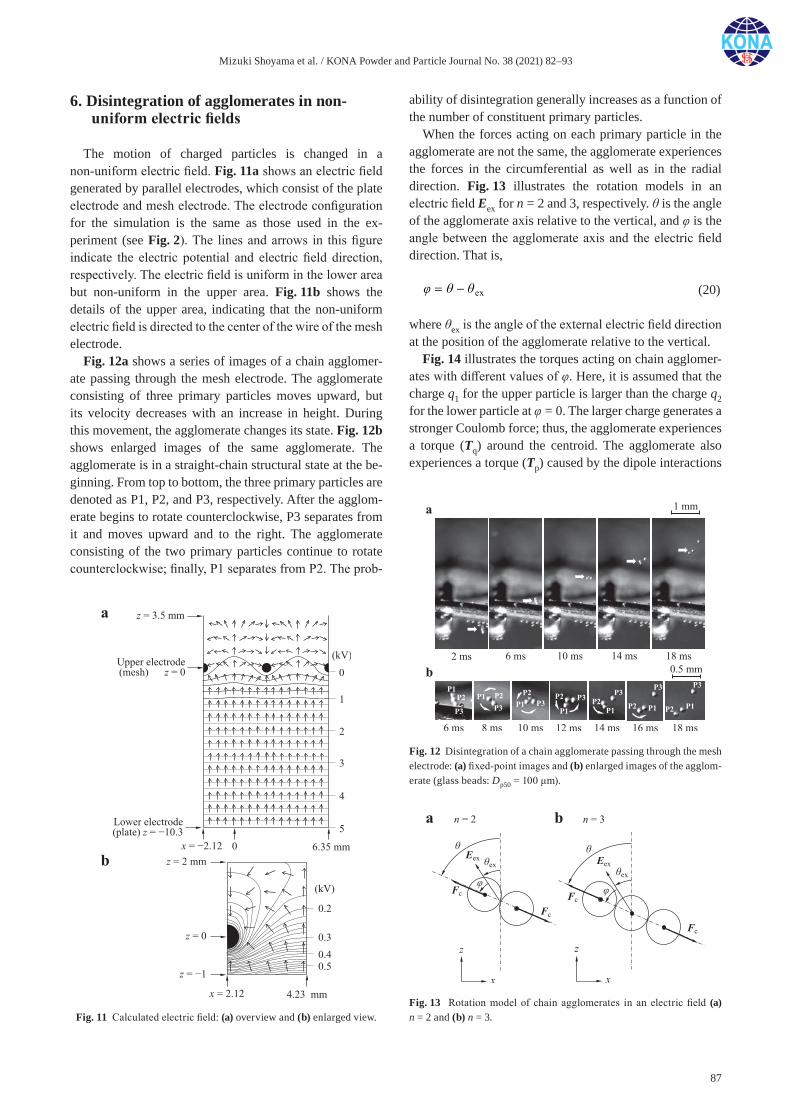
Mizuki Shoyama et al. / KONA Powder and Particle Journal No. 38 (2021) 82–93
87
6. Disintegration of agglomerates in non-uniform electric fields
The motion of charged particles is changed in a non-uniform electric field. Fig. 11a shows an electric field generated by parallel electrodes, which consist of the plate electrode and mesh electrode. The electrode configuration for the simulation is the same as those used in the ex-periment (see Fig. 2). The lines and arrows in this figure indicate the electric potential and electric field direction, respectively. The electric field is uniform in the lower area but non-uniform in the upper area. Fig. 11b shows the details of the upper area, indicating that the non-uniform electric field is directed to the center of the wire of the mesh electrode.
Fig. 12a shows a series of images of a chain agglomer-ate passing through the mesh electrode. The agglomerate consisting of three primary particles moves upward, but its velocity decreases with an increase in height. During this movement, the agglomerate changes its state. Fig. 12b shows enlarged images of the same agglomerate. The agglomerate is in a straight-chain structural state at the be-ginning. From top to bottom, the three primary particles are denoted as P1, P2, and P3, respectively. After the agglom-erate begins to rotate counterclockwise, P3 separates from it and moves upward and to the right. The agglomerate consisting of the two primary particles continue to rotate counterclockwise; finally, P1 separates from P2. The prob-
ability of disintegration generally increases as a function of the number of constituent primary particles.
When the forces acting on each primary particle in the agglomerate are not the same, the agglomerate experiences the forces in the circumferential as well as in the radial direction. Fig. 13 illustrates the rotation models in an electric field Eex for n = 2 and 3, respectively. θ is the angle of the agglomerate axis relative to the vertical, and φ is the angle between the agglomerate axis and the electric field direction. That is,
ex ,
(20)
(20)
where θex is the angle of the external electric field direction at the position of the agglomerate relative to the vertical.
Fig. 14 illustrates the torques acting on chain agglomer-ates with different values of φ. Here, it is assumed that the charge q1 for the upper particle is larger than the charge q2 for the lower particle at φ = 0. The larger charge generates a stronger Coulomb force; thus, the agglomerate experiences a torque (Tq) around the centroid. The agglomerate also experiences a torque (Tp) caused by the dipole interactions
Fig. 11 Calculated electric field: (a) overview and (b) enlarged view.
Fig. 12 Disintegration of a chain agglomerate passing through the mesh electrode: (a) fixed-point images and (b) enlarged images of the agglom-erate (glass beads: Dp50 = 100 μm).
Fig. 13 Rotation model of chain agglomerates in an electric field (a) n = 2 and (b) n = 3.
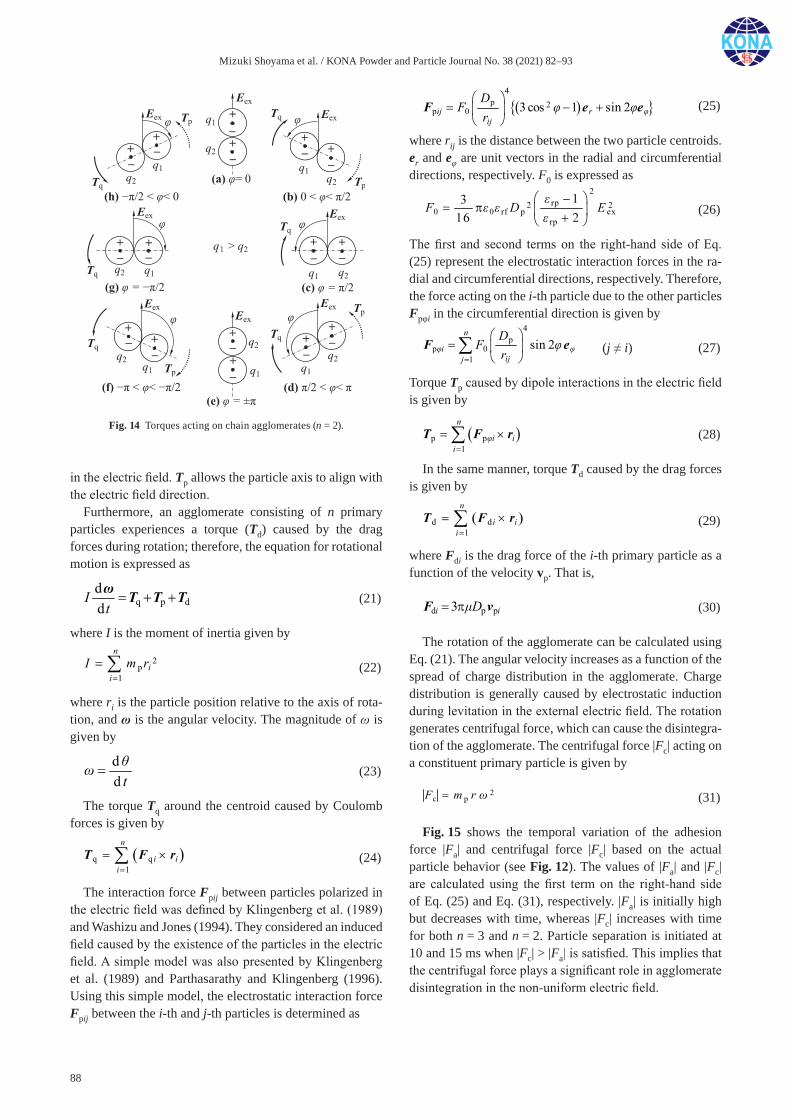
Mizuki Shoyama et al. / KONA Powder and Particle Journal No. 38 (2021) 82–93
88
in the electric field. Tp allows the particle axis to align with the electric field direction.
Furthermore, an agglomerate consisting of n primary particles experiences a torque (Td) caused by the drag forces during rotation; therefore, the equation for rotational motion is expressed as
q p ddd
It
ω T T T ,
(21)
(21)
where I is the moment of inertia given by
2p
1
n
ii
I m r
,
(22)
(22)
where ri is the particle position relative to the axis of rota-tion, and ω is the angular velocity. The magnitude of ω is given by
dd t
.
(23)
(23)
The torque Tq around the centroid caused by Coulomb forces is given by
q q1
n
i ii
T F r .
(24)
(24)
The interaction force Fpij between particles polarized in the electric field was defined by Klingenberg et al. (1989) and Washizu and Jones (1994). They considered an induced field caused by the existence of the particles in the electric field. A simple model was also presented by Klingenberg et al. (1989) and Parthasarathy and Klingenberg (1996). Using this simple model, the electrostatic interaction force Fpij between the i-th and j-th particles is determined as
4
p 2p 0 3 cos 1 sin 2ij r
ij
DF
r
F e e
(25) (27) より改変
元の(25)は使用せず
4
p 2p 0 3cos 1 sin 2ij r
ij
DF
r
F e e ,
(25)
(25)
where rij is the distance between the two particle centroids. er and eφ are unit vectors in the radial and circumferential directions, respectively. F0 is expressed as
2
rp2 2
0 0 rf p ex
rp
13
16 2
F D E
ε
ε ε
ε
⎛ ⎞−
= π ⎜ ⎟+
⎝ ⎠
.
(26)
(26)
The first and second terms on the right-hand side of Eq. (25) represent the electrostatic interaction forces in the ra-dial and circumferential directions, respectively. Therefore, the force acting on the i-th particle due to the other particles Fpφi in the circumferential direction is given by
4p
p 01
sin 2n
iijj
DF
r
F e
(j ≠ i).
(27)
(j ≠ i) (27)
Torque Tp caused by dipole interactions in the electric field is given by
p p1
n
i ii
T F r .
(28)
(28)
In the same manner, torque Td caused by the drag forces is given by
d d1
n
i ii
T F r
(29)
(29)
where Fdi is the drag force of the i-th primary particle as a function of the velocity vp. That is,
d p p3i iD F v ,
(30) (8) より改変
元の(30)は使用せず
d p p3 πi iμDF v .
(30)
(30)
The rotation of the agglomerate can be calculated using Eq. (21). The angular velocity increases as a function of the spread of charge distribution in the agglomerate. Charge distribution is generally caused by electrostatic induction during levitation in the external electric field. The rotation generates centrifugal force, which can cause the disintegra-tion of the agglomerate. The centrifugal force |Fc| acting on a constituent primary particle is given by
2c pF m r
(31)
(31)
Fig. 15 shows the temporal variation of the adhesion force |Fa| and centrifugal force |Fc| based on the actual particle behavior (see Fig. 12). The values of |Fa| and |Fc| are calculated using the first term on the right-hand side of Eq. (25) and Eq. (31), respectively. |Fa| is initially high but decreases with time, whereas |Fc| increases with time for both n = 3 and n = 2. Particle separation is initiated at 10 and 15 ms when |Fc| > |Fa| is satisfied. This implies that the centrifugal force plays a significant role in agglomerate disintegration in the non-uniform electric field.
Fig. 14 Torques acting on chain agglomerates (n = 2).
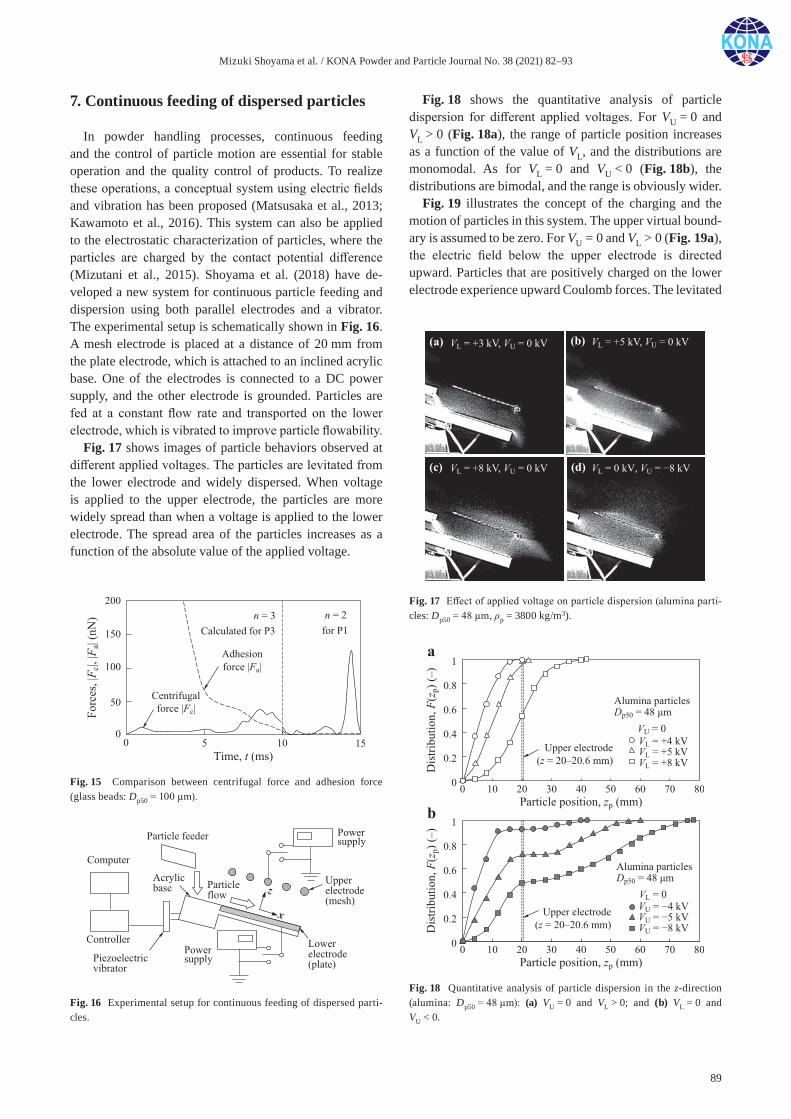
Mizuki Shoyama et al. / KONA Powder and Particle Journal No. 38 (2021) 82–93
89
7. Continuous feeding of dispersed particles
In powder handling processes, continuous feeding and the control of particle motion are essential for stable operation and the quality control of products. To realize these operations, a conceptual system using electric fields and vibration has been proposed (Matsusaka et al., 2013; Kawamoto et al., 2016). This system can also be applied to the electrostatic characterization of particles, where the particles are charged by the contact potential difference (Mizutani et al., 2015). Shoyama et al. (2018) have de-veloped a new system for continuous particle feeding and dispersion using both parallel electrodes and a vibrator. The experimental setup is schematically shown in Fig. 16. A mesh electrode is placed at a distance of 20 mm from the plate electrode, which is attached to an inclined acrylic base. One of the electrodes is connected to a DC power supply, and the other electrode is grounded. Particles are fed at a constant flow rate and transported on the lower electrode, which is vibrated to improve particle flowability.
Fig. 17 shows images of particle behaviors observed at different applied voltages. The particles are levitated from the lower electrode and widely dispersed. When voltage is applied to the upper electrode, the particles are more widely spread than when a voltage is applied to the lower electrode. The spread area of the particles increases as a function of the absolute value of the applied voltage.
Fig. 18 shows the quantitative analysis of particle dispersion for different applied voltages. For VU = 0 and VL > 0 (Fig. 18a), the range of particle position increases as a function of the value of VL, and the distributions are monomodal. As for VL = 0 and VU < 0 (Fig. 18b), the distributions are bimodal, and the range is obviously wider.
Fig. 19 illustrates the concept of the charging and the motion of particles in this system. The upper virtual bound-ary is assumed to be zero. For VU = 0 and VL > 0 (Fig. 19a), the electric field below the upper electrode is directed upward. Particles that are positively charged on the lower electrode experience upward Coulomb forces. The levitated
Fig. 16 Experimental setup for continuous feeding of dispersed parti-cles.
Fig. 17 Effect of applied voltage on particle dispersion (alumina parti-cles: Dp50 = 48 μm, ρp = 3800 kg/m3).
Fig. 15 Comparison between centrifugal force and adhesion force (glass beads: Dp50 = 100 μm).
Fig. 18 Quantitative analysis of particle dispersion in the z-direction (alumina: Dp50 = 48 μm): (a) VU = 0 and VL > 0; and (b) VL = 0 and VU < 0.
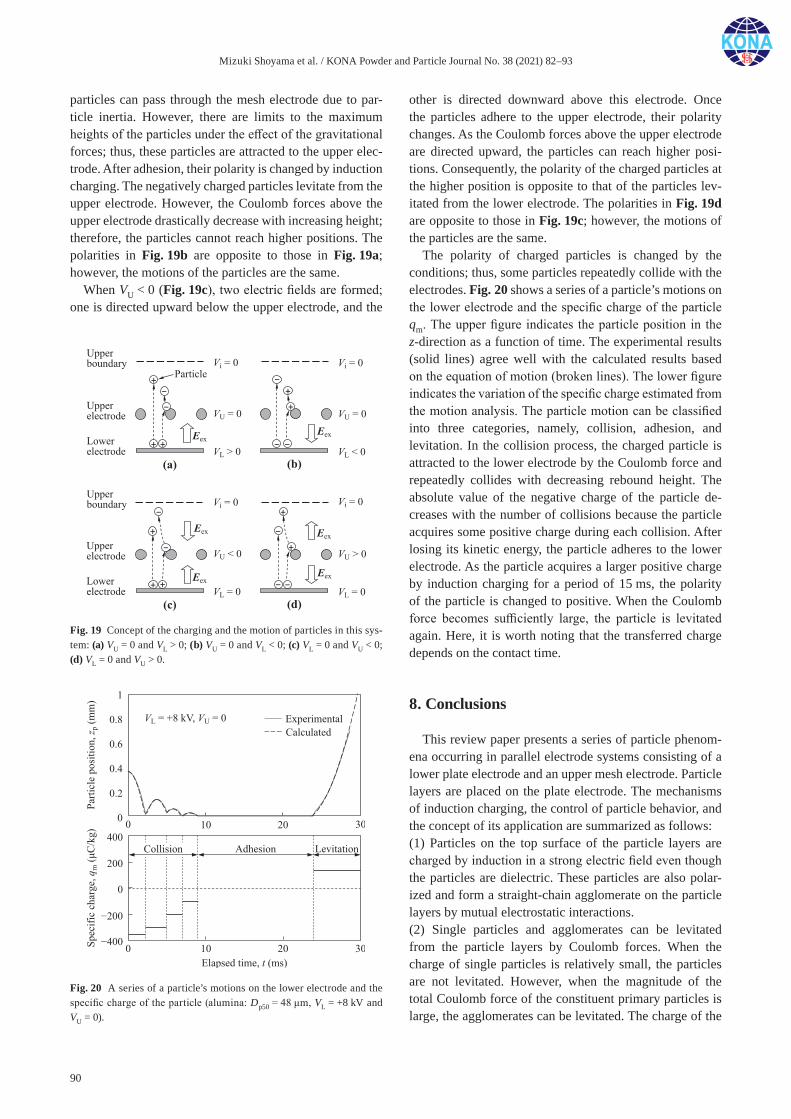
Mizuki Shoyama et al. / KONA Powder and Particle Journal No. 38 (2021) 82–93
90
particles can pass through the mesh electrode due to par-ticle inertia. However, there are limits to the maximum heights of the particles under the effect of the gravitational forces; thus, these particles are attracted to the upper elec-trode. After adhesion, their polarity is changed by induction charging. The negatively charged particles levitate from the upper electrode. However, the Coulomb forces above the upper electrode drastically decrease with increasing height; therefore, the particles cannot reach higher positions. The polarities in Fig. 19b are opposite to those in Fig. 19a; however, the motions of the particles are the same.
When VU < 0 (Fig. 19c), two electric fields are formed; one is directed upward below the upper electrode, and the
other is directed downward above this electrode. Once the particles adhere to the upper electrode, their polarity changes. As the Coulomb forces above the upper electrode are directed upward, the particles can reach higher posi-tions. Consequently, the polarity of the charged particles at the higher position is opposite to that of the particles lev-itated from the lower electrode. The polarities in Fig. 19d are opposite to those in Fig. 19c; however, the motions of the particles are the same.
The polarity of charged particles is changed by the conditions; thus, some particles repeatedly collide with the electrodes. Fig. 20 shows a series of a particle’s motions on the lower electrode and the specific charge of the particle qm. The upper figure indicates the particle position in the z-direction as a function of time. The experimental results (solid lines) agree well with the calculated results based on the equation of motion (broken lines). The lower figure indicates the variation of the specific charge estimated from the motion analysis. The particle motion can be classified into three categories, namely, collision, adhesion, and levitation. In the collision process, the charged particle is attracted to the lower electrode by the Coulomb force and repeatedly collides with decreasing rebound height. The absolute value of the negative charge of the particle de-creases with the number of collisions because the particle acquires some positive charge during each collision. After losing its kinetic energy, the particle adheres to the lower electrode. As the particle acquires a larger positive charge by induction charging for a period of 15 ms, the polarity of the particle is changed to positive. When the Coulomb force becomes sufficiently large, the particle is levitated again. Here, it is worth noting that the transferred charge depends on the contact time.
8. Conclusions
This review paper presents a series of particle phenom-ena occurring in parallel electrode systems consisting of a lower plate electrode and an upper mesh electrode. Particle layers are placed on the plate electrode. The mechanisms of induction charging, the control of particle behavior, and the concept of its application are summarized as follows:(1) Particles on the top surface of the particle layers are charged by induction in a strong electric field even though the particles are dielectric. These particles are also polar-ized and form a straight-chain agglomerate on the particle layers by mutual electrostatic interactions.(2) Single particles and agglomerates can be levitated from the particle layers by Coulomb forces. When the charge of single particles is relatively small, the particles are not levitated. However, when the magnitude of the total Coulomb force of the constituent primary particles is large, the agglomerates can be levitated. The charge of the
Fig. 19 Concept of the charging and the motion of particles in this sys-tem: (a) VU = 0 and VL > 0; (b) VU = 0 and VL < 0; (c) VL = 0 and VU < 0; (d) VL = 0 and VU > 0.
Fig. 20 A series of a particle’s motions on the lower electrode and the specific charge of the particle (alumina: Dp50 = 48 μm, VL = +8 kV and VU = 0).
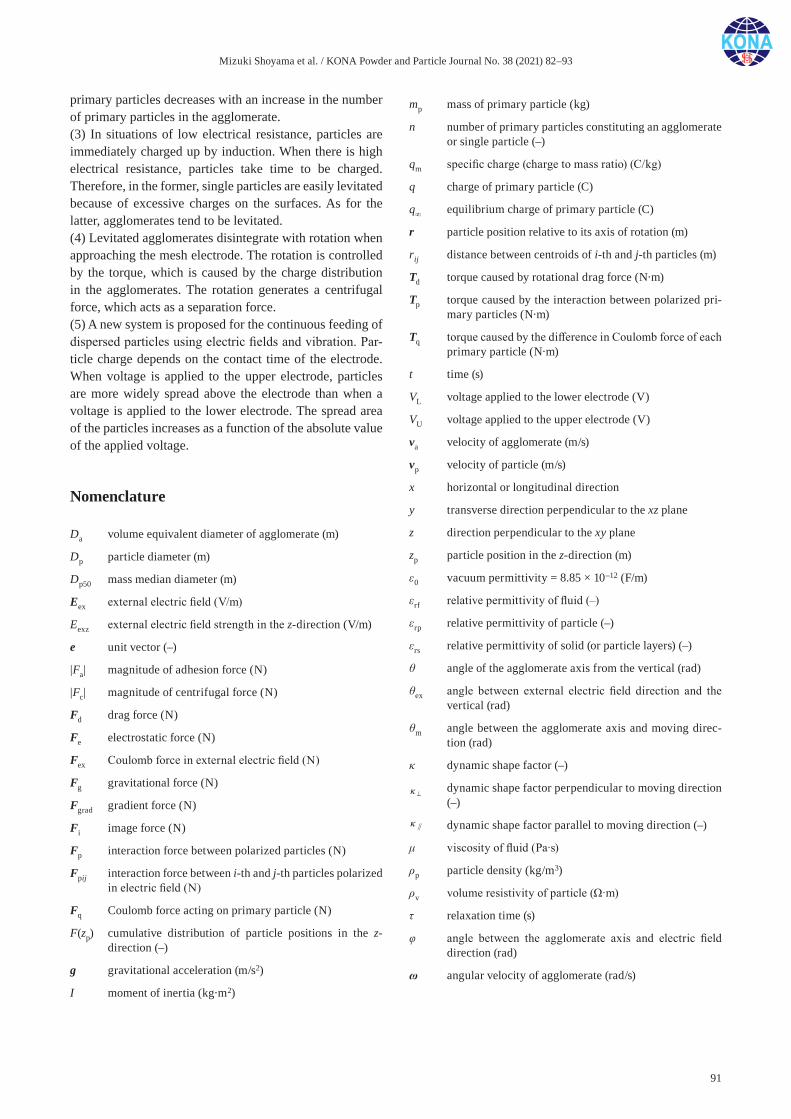
Mizuki Shoyama et al. / KONA Powder and Particle Journal No. 38 (2021) 82–93
91
primary particles decreases with an increase in the number of primary particles in the agglomerate.(3) In situations of low electrical resistance, particles are immediately charged up by induction. When there is high electrical resistance, particles take time to be charged. Therefore, in the former, single particles are easily levitated because of excessive charges on the surfaces. As for the latter, agglomerates tend to be levitated.(4) Levitated agglomerates disintegrate with rotation when approaching the mesh electrode. The rotation is controlled by the torque, which is caused by the charge distribution in the agglomerates. The rotation generates a centrifugal force, which acts as a separation force.(5) A new system is proposed for the continuous feeding of dispersed particles using electric fields and vibration. Par-ticle charge depends on the contact time of the electrode. When voltage is applied to the upper electrode, particles are more widely spread above the electrode than when a voltage is applied to the lower electrode. The spread area of the particles increases as a function of the absolute value of the applied voltage.
Nomenclature
Da volume equivalent diameter of agglomerate (m)
Dp particle diameter (m)
Dp50 mass median diameter (m)
Eex external electric field (V/m)
Eexz external electric field strength in the z-direction (V/m)
e unit vector (–)
|Fa| magnitude of adhesion force (N)
|Fc| magnitude of centrifugal force (N)
Fd drag force (N)
Fe electrostatic force (N)
Fex Coulomb force in external electric field (N)
Fg gravitational force (N)
Fgrad gradient force (N)
Fi image force (N)
Fp interaction force between polarized particles (N)
Fpij interaction force between i-th and j-th particles polarized in electric field (N)
Fq Coulomb force acting on primary particle (N)
F(zp) cumulative distribution of particle positions in the z- direction (–)
g gravitational acceleration (m/s2)
I moment of inertia (kg·m2)
mp mass of primary particle (kg)
n number of primary particles constituting an agglomerate or single particle (–)
qm specific charge (charge to mass ratio) (C/kg)
q charge of primary particle (C)
q∞ equilibrium charge of primary particle (C)
r particle position relative to its axis of rotation (m)
rij distance between centroids of i-th and j-th particles (m)
Td torque caused by rotational drag force (N·m)
Tp torque caused by the interaction between polarized pri-mary particles (N·m)
Tq torque caused by the difference in Coulomb force of each primary particle (N·m)
t time (s)
VL voltage applied to the lower electrode (V)
VU voltage applied to the upper electrode (V)
va velocity of agglomerate (m/s)
vp velocity of particle (m/s)
x horizontal or longitudinal direction
y transverse direction perpendicular to the xz plane
z direction perpendicular to the xy plane
zp particle position in the z-direction (m)
ε0 vacuum permittivity = 8.85 × 10⁻¹² (F/m)
εrf relative permittivity of fluid (–)
εrp relative permittivity of particle (–)
εrs relative permittivity of solid (or particle layers) (–)
θ angle of the agglomerate axis from the vertical (rad)
θex angle between external electric field direction and the vertical (rad)
θm angle between the agglomerate axis and moving direc-tion (rad)
κ dynamic shape factor (–)
[54]
dynamic shape factor perpendicular to moving direction (–)
[55]
dynamic shape factor parallel to moving direction (–)
μ viscosity of fluid (Pa·s)
ρp particle density (kg/m3)
ρv volume resistivity of particle (Ω·m)
τ relaxation time (s)
φ angle between the agglomerate axis and electric field direction (rad)
ω angular velocity of agglomerate (rad/s)

Mizuki Shoyama et al. / KONA Powder and Particle Journal No. 38 (2021) 82–93
92
subscripts
i index for primary particle
r radial direction
φ circumferential direction
References
Adachi M., Maezono H., Kawamoto H., Sampling of regolith on asteroids using electrostatic force, Journal of Aerospace Engineering, 29 (2016) 04015081. DOI: 10.1061/(ASCE)AS.1943-5525.0000583
Adachi M., Hamazawa K., Mimuro Y., Kawamoto H., Vibration transport system for lunar and Martian regolith using dielec-tric elastomer actuator, Journal of Electrostatics, 89 (2017) 88–98. DOI: 10.1016/j.elstat.2017.08.003
Blajan M., Mizuno Y., Ito A., Shimizu K., Microplasma actuator for EHD induced flow, IEEE Transactions on Industry Applications, 59 (2017) 2409–2415. DOI: 10.1109/TIA.2016.2645160
Blanchard D.C., Electrically charged drops from bubbles in sea water and their meteorological significance, Journal of Meteorology, 15 (1958) 383–396. DOI: 10.1175/1520- 0469(1958)015<0383:ECDFBI>2.0.CO;2
Calle C.I., Buhler C.R., McFall J.L., Snyder S.J., Particle removal by electrostatic and dielectrophoretic forces for dust control during lunar exploration missions, Journal of Electrostatics, 67 (2009) 89–92. DOI: 10.1016/j.elstat.2009.02.012
Cho A.Y.H., Contact charging of micron-sized particles in intense electric fields, Journal of Applied Physics, 35 (1964) 2561–2564. DOI: 10.1063/1.1713799
Dwari R.K., Mohanta S.K., Rout B., Soni R.K., Reddy P.S.R., Mishra B.K., Studies on the effect of electrode plate position and feed temperature on the tribo-electrostatic separation of high ash Indian coking coal, Advanced Powder Technology, 26 (2015) 31–41. DOI: 10.1016/j.apt.2014.08.001
Gotoh K., Mizutani K., Tsubota Y., Oshitani J., Yoshida M., Inenaga K., Enhancement of particle removal performance of high-speed air jet by setting obstacle in jet flow, Par-ticulate Science Technology, 33 (2015) 567–571. DOI: 10.1080/02726351.2015.1060653
Hollmann H.E., Semiconductive colloidal suspensions with non-linear properties, Journal of Applied Physics, 21 (1950) 402–413. DOI: 10.1063/1.1699674
Hywel M., Green N.G., Dielectrophoretic manipulation of rod-shaped viral particles, Journal of Electrostatics, 42 (1997) 279–293. DOI: 10.1016/S0304-3886(97)00159-9
Kasper G., Niida T., Yang M., Measurements of viscous drag on cylinders and chains of spheres with aspect ratios between 2 and 50, Journal of Aerosol Science, 16 (1985) 535–556. DOI: 10.1016/0021-8502(85)90006-0
Kawamoto H., Some techniques on electrostatic separation of particle size utilizing electrostatic traveling-wave field, Journal of Electrostatics, 66 (2008) 220–228. DOI: 10.1016/j.
elstat.2008.01.002Kawamoto H., Shigeta A., Adachi M., Utilizing electrostatic force
and mechanical vibration to obtain regolith sample from the moon and mars, Journal of Aerospace Engineering, 29 (2016) 04015031. DOI: 10.1061/(ASCE)AS.1943-5525.0000521
Kawamoto H., Uchiyama M., Cooper B.L., McKay D.S., Mitiga-tion of lunar dust on solar panels and optical elements utiliz-ing electrostatic traveling-wave, Journal of Electrostatics, 69 (2011) 370–379. DOI: 10.1016/j.elstat.2011.04.016
Klingenberg D.J., Swol F.V., Zukoski C.F., Dynamic simulation of electrorheological suspensions, The Journal of Chemical Physics, 91 (1989) 7888–7895. DOI: 10.1063/1.457256
Kobayakawa M., Kiriyama S., Yasuda M., Matsusaka S., Micro-scopic analysis of particle detachment from an obliquely oscillating plate, Chemical Engineering Science, 123 (2015) 388–394. DOI: 10.1016/j.ces.2014.11.046
Masuda H., Dry dispersion of fine particles in gaseous phase, Advanced Powder Technology, 20 (2009) 113–122. DOI: 10.1016/j.apt.2009.02.001
Masuda H., Gotoh K., Fukada H., Banba Y., The removal of par-ticles from flat surfaces using a high-speed air jet, Advanced Powder Technology, 5 (1994) 205–217. DOI: 10.1252/kakoronbunshu.20.693
Masuda S., Fujibayashi K., Ishida K., Inaba H., Confinement and transportation of charged aerosol clouds via electric curtain, Electrical Engineering in Japan, 92 (1972) 43–52. DOI: 10.1002/eej.4390920106
Matsusaka S., Control of particle tribocharging, KONA Powder and Particle Journal, 29 (2011) 27–38. DOI: 10.14356/kona.2011007
Matsusaka S., Iyota J., Mizutani M., Yasuda M., Characterization and control of particles triboelectrically charged by vibration and external electric field, Journal of the Society of Powder Technology, Japan, 50 (2013) 632–639. DOI: 10.4164/sptj.50. 632
Matsusaka S., Maruyama H., Matsuyama T., Ghadiri M., Triboelectric charging of powders: a review, Chemical Engineering Science, 65 (2010) 5781–5807. DOI: 10.1016/j.ces.2010.07.005
Matsusaka S., Yoshitani K., Tago H., Nii T., Masuda H., Iwamatsu T., Sampling of charged fine particles by motion control under AC field, Journal of the Society of Powder Technology, Japan, 45 (2008) 387–394. DOI: 10.4164/sptj.45.387
Mazumder M.K., Sharma R., Biris A.S., Zhang J., Calle C., Zahn M., Self-cleaning transparent dust shields for protecting solar panels and other devices, Particulate Science Technology, 25 (2007) 5–20. DOI: 10.1080/02726350601146341
Mizutani M., Yasuda M., Matsusaka S., Advanced characteri-zation of particles triboelectrically charged by a two-stage system with vibrations and external electric fields, Advanced Powder Technology, 26 (2015) 454–461. DOI: 10.1016/j.apt. 2014.11.021
Morgan H., Green N., Dielectrophoretic manipulation of rod-shaped viral particles, Journal of Electrostatics, 42 (1997) 279–293. DOI: 10.1016/S0304-3886(97)00159-9
Nader B.F., Castle G.S.P., Adamiak K., Effect of surface con-duction on the dynamics of induction charging of particles, Journal of Electrostatics, 67 (2009) 394–399. DOI: 10.1016/j.
Mizuki Shoyama et al. / KONA Powder and Particle Journal No. 38 (2021) 82–93
93
elstat.2008.12.017Nakajima Y., Matsuyama T., Electrostatic field and force calcula-
tion for a chain of identical dielectric spheres aligned parallel to uniformly applied electric field, Journal of Electrostatics, 55 (2002) 203–221. DOI: 10.1016/S0304-3886(01)00198-X
Niida T., Ohtsuka S., Dynamic shape factors of regular shaped agglomerates and estimation based on agglomerate symmetry – for rectangular parallelepiped, V-and W-shaped, hexagonal and H-shaped agglomerates, KONA Powder and Particle Journal, 15 (1997) 202–211. DOI: 10.14356/kona.1997024
Ohkubo Y., Takahashi Y., Lifting criteria of an induction-charged spherical particle in a field with horizontally set parallel plate electrodes, Kagaku Kogaku Ronbunshu, 22 (1996a) 113–119. DOI: 10.1252/kakoronbunshu.22.113
Ohkubo Y., Takahashi Y., Experimental investigation on lifting criteria of an induction-charged spherical particle in a field with horizontally set parallel plate electrodes, Kagaku Kogaku Ronbunshu, 22 (1996b) 603–609. DOI: 10.1252/kakoronbunshu.22.603
Parthasarathy M., Klingenberg D.J., Electrorheology: mecha-nisms and models, Materials Science and Engineering, R17 (1996) 57–103. DOI: 10.1016/0927-796X(96)00191-X
Pearce C.A.R., The mechanism of the resolution of water-in-oil emulsions by electrical treatment, British Journal of Applied Physics, 5 (1954) 136–143. DOI: 10.1088/0508-3443/5/4/304
Shoyama M., Kawata T., Yasuda M., Matsusaka S., Particle electrification and levitation in a continuous particle feed and dispersion system with vibration and external electric fields,
Advanced Powder Technology, 29 (2018) 1960–1967. DOI: 10.1016/j.apt.2018.04.022
Shoyama M., Matsusaka S., Electric charging of dielectric particle layers and levitation of particles in a strong electric field, Kagaku Kogaku Ronbunshu, 43 (2017) 319–326. DOI: 10.1252/kakoronbunshu.43.319
Shoyama M., Matsusaka S., Mechanism of disintegration of charged agglomerates in non-uniform electric field, Chemical Engineering Science, 198 (2019) 155–164. DOI: 10.1016/j.ces.2018.12.055
Shoyama M., Nishida S., Matsusaka S., Quantitative analysis of agglomerates levitated from particle layers in a strong electric field, Advanced Powder Technology, 30 (2019) 2052–2058. DOI: 10.1016/j.apt.2019.06.018
Tada T., Yamamoto T., Baba Y., Takeuchi M., Ion charging and electron charging to an insulating toner, Journal of the Society of Powder Technology, Japan, 41 (2004) 636–644. DOI: 10.4164/sptj.41.636
Washizu M., Jones T.B., Dielectrophoretic interaction of two spherical particles calculated by equivalent multipole- moment method, Conference Record of the 1994 IEEE, 2 (1994) 1483–1490. DOI: 10.1109/28.491470
Weber E., Electromagnetic Fields: Theory and Applications, Vol. I–Mapping of Fields, John Wiley & Sons, New York, 1950, pp. 215–233. DOI: 10.1063/1.3067394
Wu Y., Castle G.S.P., Inculet I.I., Petigny S., Swei G.S., Induction charge on freely levitating particles, Powder Technology, 135 (2003) 59–64. DOI: 10.1016/j.powtec.2003.08.004
Authors’ Short Biographies
Mizuki Shoyama
Mizuki Shoyama is a Researcher of Chemical Engineering at Kyoto University. She earned her PhD from Kyoto University. She has worked as a development engineer in the aerospace division, IHI Corporation, and at Nuclear Fuel Industries, Ltd. Dr. Shoyama’s current research interests include particle levitation on deposited particles with photoelec-tric charging and particle mixing using superimposed electric fields.
Shuji Matsusaka
Shuji Matsusaka is a Professor of Chemical Engineering at Kyoto University. He earned his PhD from Kyoto University. He has held important positions in academic organiza-tions in areas of powder technology, aerosol science, and electrostatics. He is an emeritus editor-in-chief of Advanced Powder Technology. Dr. Matsusaka’s current research interests include characterizing particle electrification, adhesion, and flowability, as well as the handling of micro-particles and nano-particles in gases.
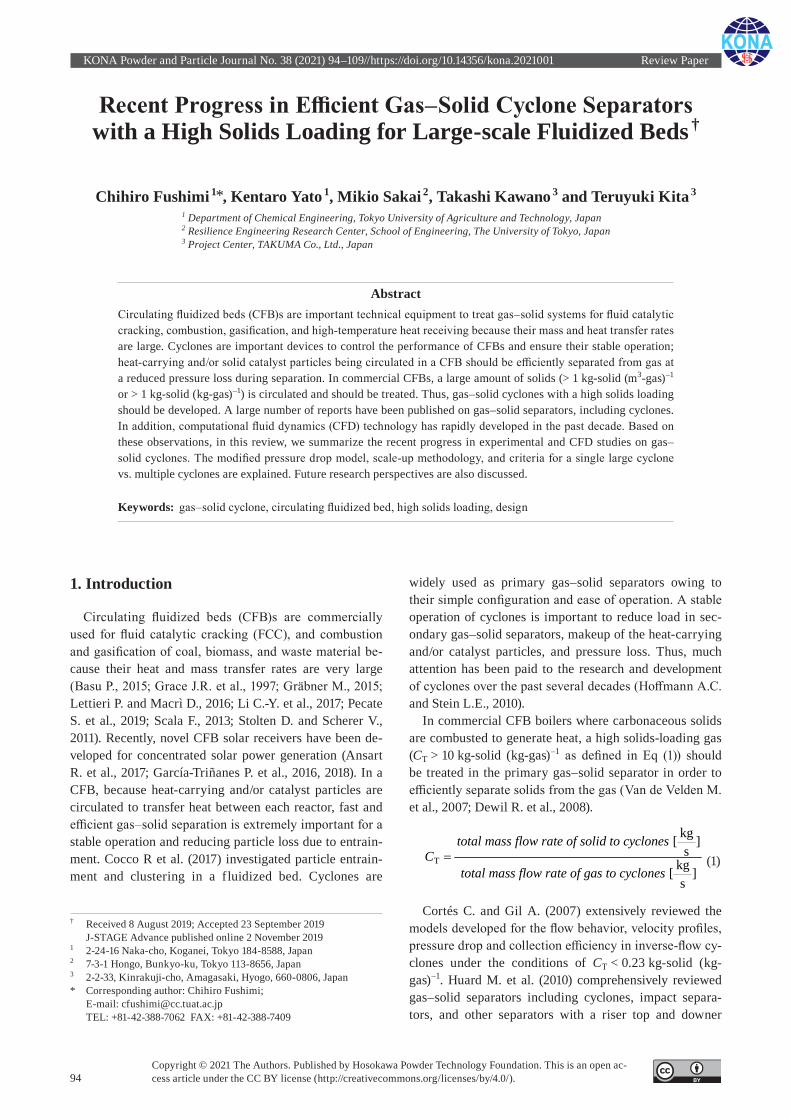
KONA Powder and Particle Journal No. 38 (2021) 94–109//https://doi.org/10.14356/kona.2021001 Review Paper
94Copyright © 2021 The Authors. Published by Hosokawa Powder Technology Foundation. This is an open ac-cess article under the CC BY license (http://creativecommons.org/licenses/by/4.0/).
Recent Progress in Efficient Gas–Solid Cyclone Separators with a High Solids Loading for Large-scale Fluidized Beds †
Chihiro Fushimi 1*, Kentaro Yato 1, Mikio Sakai 2, Takashi Kawano 3 and Teruyuki Kita 3
1 Department of Chemical Engineering, Tokyo University of Agriculture and Technology, Japan2 Resilience Engineering Research Center, School of Engineering, The University of Tokyo, Japan3 Project Center, TAKUMA Co., Ltd., Japan
AbstractCirculating fluidized beds (CFB)s are important technical equipment to treat gas–solid systems for fluid catalytic cracking, combustion, gasification, and high-temperature heat receiving because their mass and heat transfer rates are large. Cyclones are important devices to control the performance of CFBs and ensure their stable operation; heat-carrying and/or solid catalyst particles being circulated in a CFB should be efficiently separated from gas at a reduced pressure loss during separation. In commercial CFBs, a large amount of solids (> 1 kg-solid (m3-gas)–1 or > 1 kg-solid (kg-gas)–1) is circulated and should be treated. Thus, gas–solid cyclones with a high solids loading should be developed. A large number of reports have been published on gas–solid separators, including cyclones. In addition, computational fluid dynamics (CFD) technology has rapidly developed in the past decade. Based on these observations, in this review, we summarize the recent progress in experimental and CFD studies on gas–solid cyclones. The modified pressure drop model, scale-up methodology, and criteria for a single large cyclone vs. multiple cyclones are explained. Future research perspectives are also discussed.
Keywords: gas–solid cyclone, circulating fluidized bed, high solids loading, design
1. Introduction
Circulating fluidized beds (CFB)s are commercially used for fluid catalytic cracking (FCC), and combustion and gasification of coal, biomass, and waste material be-cause their heat and mass transfer rates are very large (Basu P., 2015; Grace J.R. et al., 1997; Gräbner M., 2015; Lettieri P. and Macrì D., 2016; Li C.-Y. et al., 2017; Pecate S. et al., 2019; Scala F., 2013; Stolten D. and Scherer V., 2011). Recently, novel CFB solar receivers have been de-veloped for concentrated solar power generation (Ansart R. et al., 2017; García-Triñanes P. et al., 2016, 2018). In a CFB, because heat-carrying and/or catalyst particles are circulated to transfer heat between each reactor, fast and efficient gas–solid separation is extremely important for a stable operation and reducing particle loss due to entrain-ment. Cocco R et al. (2017) investigated particle entrain-ment and clustering in a fluidized bed. Cyclones are
widely used as primary gas–solid separators owing to their simple configuration and ease of operation. A stable operation of cyclones is important to reduce load in sec-ondary gas–solid separators, makeup of the heat-carrying and/or catalyst particles, and pressure loss. Thus, much attention has been paid to the research and development of cyclones over the past several decades (Hoffmann A.C. and Stein L.E., 2010).
In commercial CFB boilers where carbonaceous solids are combusted to generate heat, a high solids-loading gas (CT > 10 kg-solid (kg-gas)–1 as defined in Eq (1)) should be treated in the primary gas–solid separator in order to efficiently separate solids from the gas (Van de Velden M. et al., 2007; Dewil R. et al., 2008).
T
kg [ ]s
kg [ ]s
total mass flow rate of solid to cyclonesC
total mass flow rate of gas to cyclones
(1)
Cortés C. and Gil A. (2007) extensively reviewed the models developed for the flow behavior, velocity profiles, pressure drop and collection efficiency in inverse-flow cy-clones under the conditions of CT < 0.23 kg-solid (kg-gas)–1. Huard M. et al. (2010) comprehensively reviewed gas–solid separators including cyclones, impact separa-tors, and other separators with a riser top and downer
† Received 8 August 2019; Accepted 23 September 2019 J-STAGE Advance published online 2 November 2019
1 2-24-16 Naka-cho, Koganei, Tokyo 184-8588, Japan2 7-3-1 Hongo, Bunkyo-ku, Tokyo 113-8656, Japan3 2-2-33, Kinrakuji-cho, Amagasaki, Hyogo, 660-0806, Japan* Corresponding author: Chihiro Fushimi; E-mail: [email protected] TEL: +81-42-388-7062 FAX: +81-42-388-7409
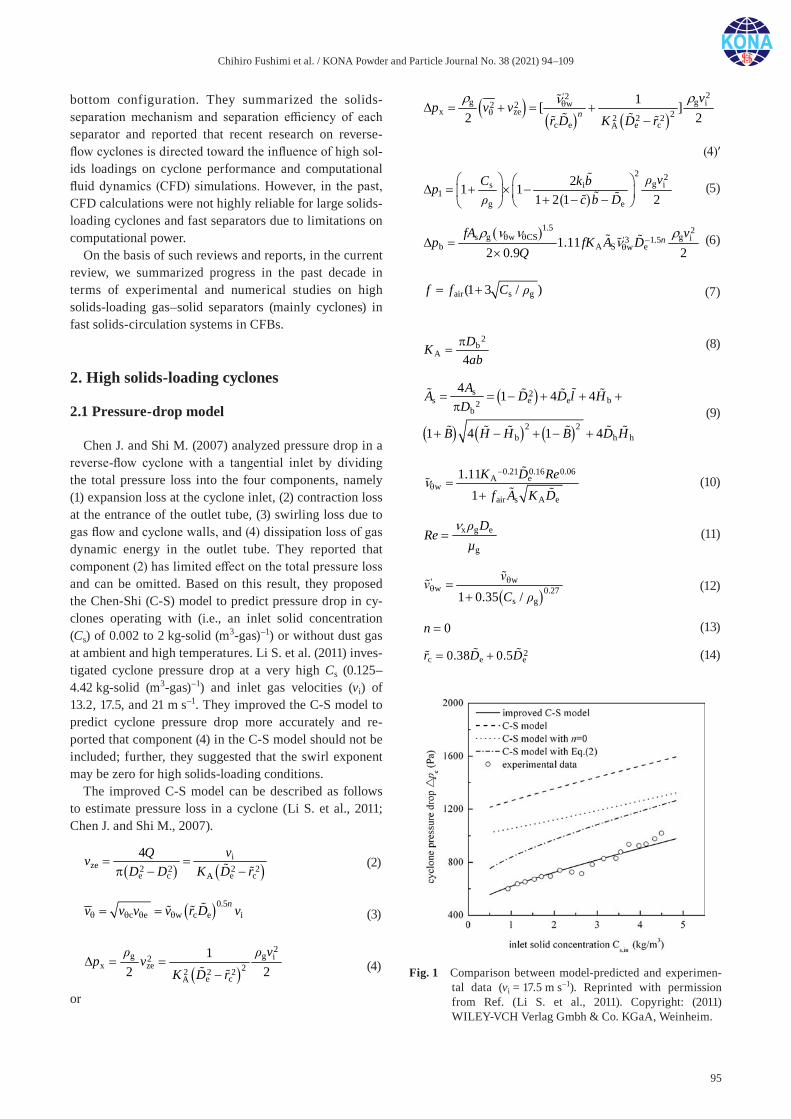
Chihiro Fushimi et al. / KONA Powder and Particle Journal No. 38 (2021) 94–109
95
bottom configuration. They summarized the solids- separation mechanism and separation efficiency of each separator and reported that recent research on reverse- flow cyclones is directed toward the influence of high sol-ids loadings on cyclone performance and computational fluid dynamics (CFD) simulations. However, in the past, CFD calculations were not highly reliable for large solids- loading cyclones and fast separators due to limitations on computational power.
On the basis of such reviews and reports, in the current review, we summarized progress in the past decade in terms of experimental and numerical studies on high solids- loading gas–solid separators (mainly cyclones) in fast solids-circulation systems in CFBs.
2. High solids-loading cyclones
2.1 Pressure-drop model
Chen J. and Shi M. (2007) analyzed pressure drop in a reverse-flow cyclone with a tangential inlet by dividing the total pressure loss into the four components, namely (1) expansion loss at the cyclone inlet, (2) contraction loss at the entrance of the outlet tube, (3) swirling loss due to gas flow and cyclone walls, and (4) dissipation loss of gas dynamic energy in the outlet tube. They reported that component (2) has limited effect on the total pressure loss and can be omitted. Based on this result, they proposed the Chen-Shi (C-S) model to predict pressure drop in cy-clones operating with (i.e., an inlet solid concentration (Cs) of 0.002 to 2 kg-solid (m3-gas)–1) or without dust gas at ambient and high temperatures. Li S. et al. (2011) inves-tigated cyclone pressure drop at a very high Cs (0.125–4.42 kg-solid (m3-gas)–1) and inlet gas velocities (vi) of 13.2, 17.5, and 21 m s–1. They improved the C-S model to predict cyclone pressure drop more accurately and re-ported that component (4) in the C-S model should not be included; further, they suggested that the swirl exponent may be zero for high solids-loading conditions.
The improved C-S model can be described as follows to estimate pressure loss in a cyclone (Li S. et al., 2011; Chen J. and Shi M., 2007).
i
ze 2 2 2 2e c e cA
4Q vvD D K D r
(2)
0.5c e w c e i
nv v v v r D v
(3)
2
g g i2x ze 22 2 2
e cA
12 2
vp v
K D r
(4)
or
2'2g g iw2 2x ze 22 2 2
c e e cA
1[ ]2 2n
vp v v
r D K D r
(4)′
2 2g is i
1g e
21 1 1 2 1 2
vC k bpc b D
(5)
1.5 2s g w CS g i'3 1.5
b A S ew1.112 0.9 2
nfA vp fK A D
Q
(6)
air s g(1 3 / )f f C
(7)
2b
A 4DKab
(8)
s 2s e e b2
b
2 2b h h
4 1 4 4
1 4 1 4
AA D D l HD
B H H B D H
(9)
0.21 0.16 0.06A e
wair s A e
1.111
K D Ref A K D
(10)
x g e
g
ρ DRe
µ
(11)
w'
w 0.27s g1 0.35 /C
(12)
0n
(13)
2c e e0.38 0.5r D D
(14)
Fig. 1 Comparison between model-predicted and experimen-tal data (vi = 17.5 m s–1). Reprinted with permission from Ref. (Li S. et al., 2011). Copyright: (2011) WILEY-VCH Verlag Gmbh & Co. KGaA, Weinheim.
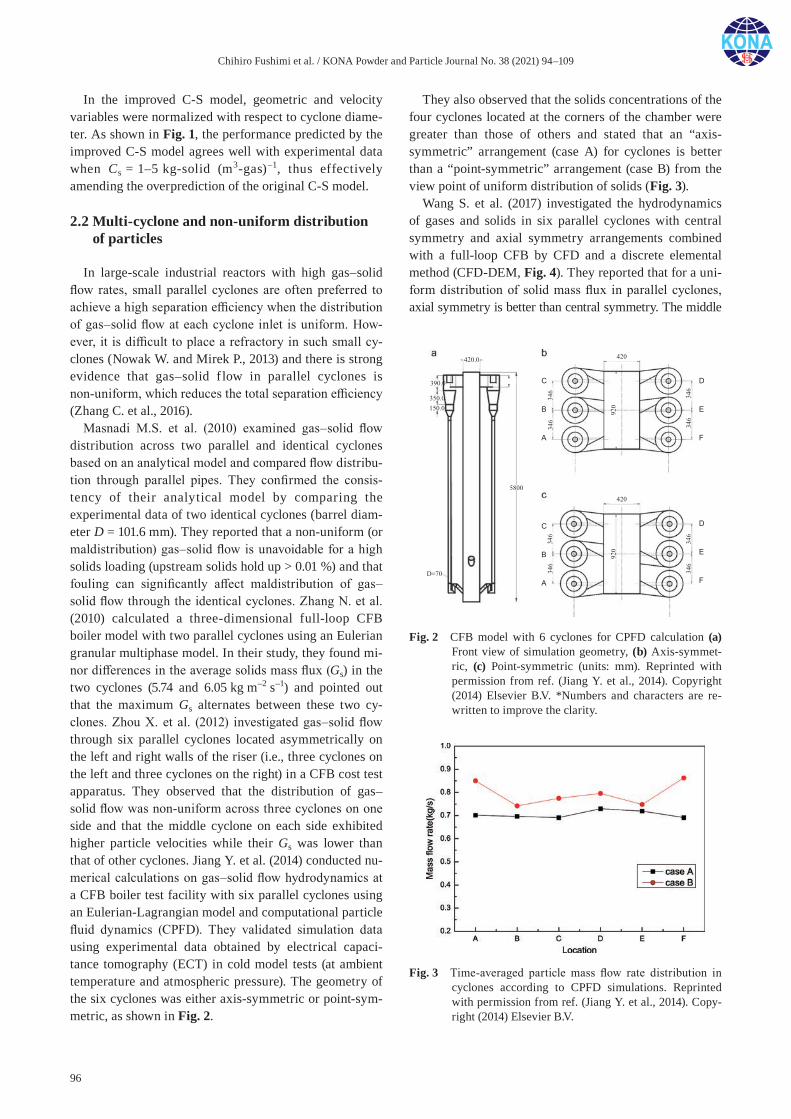
Chihiro Fushimi et al. / KONA Powder and Particle Journal No. 38 (2021) 94–109
96
In the improved C-S model, geometric and velocity variables were normalized with respect to cyclone diame-ter. As shown in Fig. 1, the performance predicted by the improved C-S model agrees well with experimental data when Cs = 1–5 kg-solid (m3-gas)–1, thus effectively amending the overprediction of the original C-S model.
2.2 Multi-cyclone and non-uniform distribution of particles
In large-scale industrial reactors with high gas–solid flow rates, small parallel cyclones are often preferred to achieve a high separation efficiency when the distribution of gas–solid flow at each cyclone inlet is uniform. How-ever, it is difficult to place a refractory in such small cy-clones (Nowak W. and Mirek P., 2013) and there is strong evidence that gas–solid f low in parallel cyclones is non-uniform, which reduces the total separation efficiency (Zhang C. et al., 2016).
Masnadi M.S. et al. (2010) examined gas–solid flow distribution across two parallel and identical cyclones based on an analytical model and compared flow distribu-tion through parallel pipes. They confirmed the consis-tency of their analytical model by comparing the experimental data of two identical cyclones (barrel diam-eter D = 101.6 mm). They reported that a non-uniform (or maldistribution) gas–solid flow is unavoidable for a high solids loading (upstream solids hold up > 0.01 %) and that fouling can significantly affect maldistribution of gas–solid flow through the identical cyclones. Zhang N. et al. (2010) calculated a three-dimensional full-loop CFB boiler model with two parallel cyclones using an Eulerian granular multiphase model. In their study, they found mi-nor differences in the average solids mass flux (Gs) in the two cyclones (5.74 and 6.05 kg m–2 s–1) and pointed out that the maximum Gs alternates between these two cy-clones. Zhou X. et al. (2012) investigated gas–solid flow through six parallel cyclones located asymmetrically on the left and right walls of the riser (i.e., three cyclones on the left and three cyclones on the right) in a CFB cost test apparatus. They observed that the distribution of gas–solid flow was non-uniform across three cyclones on one side and that the middle cyclone on each side exhibited higher particle velocities while their Gs was lower than that of other cyclones. Jiang Y. et al. (2014) conducted nu-merical calculations on gas–solid flow hydrodynamics at a CFB boiler test facility with six parallel cyclones using an Eulerian-Lagrangian model and computational particle fluid dynamics (CPFD). They validated simulation data using experimental data obtained by electrical capaci-tance tomography (ECT) in cold model tests (at ambient temperature and atmospheric pressure). The geometry of the six cyclones was either axis-symmetric or point-sym-metric, as shown in Fig. 2.
They also observed that the solids concentrations of the four cyclones located at the corners of the chamber were greater than those of others and stated that an “axis- symmetric” arrangement (case A) for cyclones is better than a “point-symmetric” arrangement (case B) from the view point of uniform distribution of solids (Fig. 3).
Wang S. et al. (2017) investigated the hydrodynamics of gases and solids in six parallel cyclones with central symmetry and axial symmetry arrangements combined with a full-loop CFB by CFD and a discrete elemental method (CFD-DEM, Fig. 4). They reported that for a uni-form distribution of solid mass flux in parallel cyclones, axial symmetry is better than central symmetry. The middle
Fig. 2 CFB model with 6 cyclones for CPFD calculation (a) Front view of simulation geometry, (b) Axis-symmet-ric, (c) Point-symmetric (units: mm). Reprinted with permission from ref. (Jiang Y. et al., 2014). Copyright (2014) Elsevier B.V. *Numbers and characters are re-written to improve the clarity.
Fig. 3 Time-averaged particle mass flow rate distribution in cyclones according to CPFD simulations. Reprinted with permission from ref. (Jiang Y. et al., 2014). Copy-right (2014) Elsevier B.V.
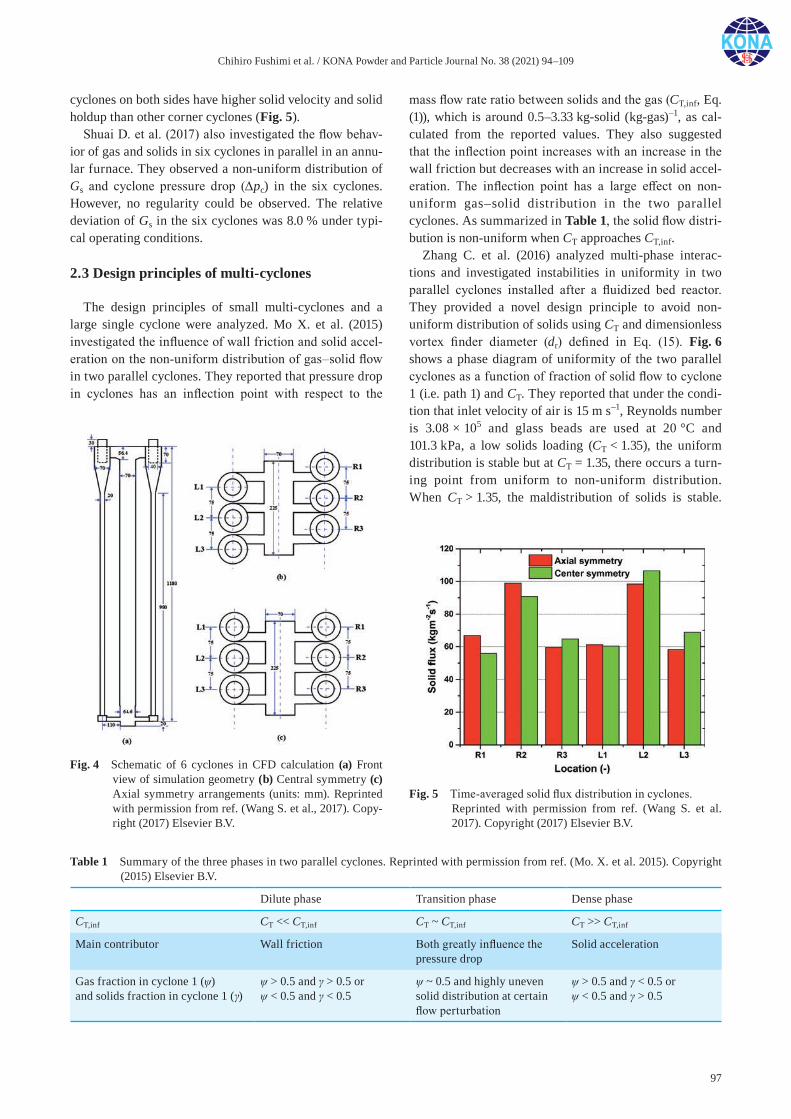
Chihiro Fushimi et al. / KONA Powder and Particle Journal No. 38 (2021) 94–109
97
cyclones on both sides have higher solid velocity and solid holdup than other corner cyclones (Fig. 5).
Shuai D. et al. (2017) also investigated the flow behav-ior of gas and solids in six cyclones in parallel in an annu-lar furnace. They observed a non-uniform distribution of Gs and cyclone pressure drop (Δpc) in the six cyclones. However, no regularity could be observed. The relative deviation of Gs in the six cyclones was 8.0 % under typi-cal operating conditions.
2.3 Design principles of multi-cyclones
The design principles of small multi-cyclones and a large single cyclone were analyzed. Mo X. et al. (2015) investigated the influence of wall friction and solid accel-eration on the non-uniform distribution of gas–solid flow in two parallel cyclones. They reported that pressure drop in cyclones has an inflection point with respect to the
mass flow rate ratio between solids and the gas (CT,inf, Eq. (1)), which is around 0.5–3.33 kg-solid (kg-gas)–1, as cal-culated from the reported values. They also suggested that the inflection point increases with an increase in the wall friction but decreases with an increase in solid accel-eration. The inflection point has a large effect on non- uniform gas–solid distribution in the two parallel cyclones. As summarized in Table 1, the solid flow distri-bution is non-uniform when CT approaches CT,inf.
Zhang C. et al. (2016) analyzed multi-phase interac-tions and investigated instabilities in uniformity in two parallel cyclones installed after a fluidized bed reactor. They provided a novel design principle to avoid non- uniform distribution of solids using CT and dimensionless vortex finder diameter (dr) defined in Eq. (15). Fig. 6 shows a phase diagram of uniformity of the two parallel cyclones as a function of fraction of solid flow to cyclone 1 (i.e. path 1) and CT. They reported that under the condi-tion that inlet velocity of air is 15 m s–1, Reynolds number is 3.08 × 10⁵ and glass beads are used at 20 °C and 101.3 kPa, a low solids loading (CT < 1.35), the uniform distribution is stable but at CT = 1.35, there occurs a turn-ing point from uniform to non-uniform distribution. When CT > 1.35, the maldistribution of solids is stable.
Fig. 4 Schematic of 6 cyclones in CFD calculation (a) Front view of simulation geometry (b) Central symmetry (c) Axial symmetry arrangements (units: mm). Reprinted with permission from ref. (Wang S. et al., 2017). Copy-right (2017) Elsevier B.V.
Fig. 5 Time-averaged solid flux distribution in cyclones. Reprinted with permission from ref. (Wang S. et al.
2017). Copyright (2017) Elsevier B.V.
Table 1 Summary of the three phases in two parallel cyclones. Reprinted with permission from ref. (Mo. X. et al. 2015). Copyright (2015) Elsevier B.V.
Dilute phase Transition phase Dense phase
CT,inf CT << CT,inf CT ~ CT,inf CT >> CT,inf
Main contributor Wall friction Both greatly influence the pressure drop
Solid acceleration
Gas fraction in cyclone 1 (ψ) and solids fraction in cyclone 1 (γ)
ψ > 0.5 and γ > 0.5 or ψ < 0.5 and γ < 0.5
ψ ~ 0.5 and highly uneven solid distribution at certain flow perturbation
ψ > 0.5 and γ < 0.5 or ψ < 0.5 and γ > 0.5

Chihiro Fushimi et al. / KONA Powder and Particle Journal No. 38 (2021) 94–109
98
They found that dr should be less than 0.32 and that dr strengthens the swirl in a cyclone for enhancing the sta-bility of uniformity and cyclone efficiency under this con-dition.
Fig. 7 shows a phase diagram of stability based on the data in literature (Zhang C. et al., 2016). For parallel cy-clones that treat high solids loading, dr should be small enough to ensure the stable operation. These criteria are very useful in the selection of single large cyclones or multi-cyclones for uniform and steady operation.
r [m] [m]
vortex finder dcyclone barrel diameter
diameter
(15)
2.4 Cyclones in series
Wu X. et al. (2011) experimentally measured and calcu-lated the pressure drop of two scroll-type cyclones con-nected in series for a wide range of solids loading (CT = 0–30 kg-solids (kg-gas)–1) and cyclone inlet velocity (vi = 16–24 m s–1). The experimental data showed that the cyclone pressure drop decreased dramatically as CT in-creased to 7.5 kg-solids (kg-gas)–1 after which it remained almost constant.
Fushimi C. and Guan G. et al. developed a triple bed- combined CFB for coal gasifiers (Fushimi C. et al., 2011, 2014; Guan G. et al., 2010, 2011) and experimentally in-vestigated the hydrodynamics of silica sand (average particle diameter of 126 μm) at a high flux (Gs in the range of 200–546 kg m–2 s–1) in cold model tests. In these experiments, three cyclones were connected in series to separate solids from air. Separation efficiency at the outlet of the third cyclone was 99.998 % when Gs was
Fig. 6 Phase diagram of stability of uniformity at different mass flow rate ratios (CT) when inlet velocity of air is 15 m s–1, Reynolds number is 3.08 × 10⁵ and glass beads are used at 20 °C and 101.3 kPa. Reprinted with permission from ref. (Zhang C. et al., 2016). Copyright (2016) John Wiley and Sons.
Fig. 7 Stability phase graph of the relationship between the stability of uniform distribution/maldistribution and dimensionless vortex finder diameter dr and mass flow rate ratio CT.
Ref. A: Jiang Y. et al. (2014) Ref. B: Liao L. et al. (2011) Ref. C: Zhou X. et al. (2012) Ref. D: Zhang N. et al. (2010) Ref. E: Wang F.J. et al. (2014) Ref. F: Liu F. et al. (2014) Reprinted with permission from ref. (Zhang C. et al.,
2016). Copyright (2016) John Wiley and Sons.
Fig. 8 Schematic diagram of the proposed iG-CLC system Reprinted with permission from ref. (Wang X. et al.,
2015). Copyright (2015) The American Chemical Soci-ety.

Chihiro Fushimi et al. / KONA Powder and Particle Journal No. 38 (2021) 94–109
99
490–510 kg m–2 s–1. Meanwhile, Hoffmann A.C. and Stein L.E. (2010) re commended that the underflow pipes of se-ries-connected cyclones should be independently sealed.
2.5 Combination of an inertial separator and a cyclone for a high-flux CFB
Wang X. et al. (2015) developed a high-flux CFB reac-tor, comprising of a fuel reactor, an air reactor, a J-valve, a downcomer, and solid separation systems, for in situ gasification chemical looping combustion (iG-CLC). They optimized the iG-CLC system by developing an inertial separator for primary gas-solids separation and a cyclone for secondary gas-char and remaining solids separation to improve operation stability and solid separation efficiency. They reported that the selective separation efficiency of coal particles in the first-stage inertial separator was 77.7 % when the mass f low rate of the solid was 1021 kg h–1 and the overall separation efficiency after the second-stage cyclone reached 99.5 % when the mass flow rate to cyclone was 35 kg h–1 in their cold model tests.
In their subsequent work (Shao Y. et al., 2017), they carried out three-dimensional full loop CFD calculation using an Eulerian-Eulerian two-fluid model combined with the standard k-ε turbulence model for the gas phase and the kinetic theory of granular flow for the solid phase to investigate the hydrodynamics of coal and iron ore par-ticles on the basis of the experimental results of cold model tests. They reported continuous and stable solid circulation in the iG-CLC model when Gs was around 400 kg m–2 s–1.
2.6 Design principles of the cyclone inlet and body for high solids-loading multi-cyclones
Hoffmann A.C. and Stein L.E. (2010) recommended
that 1) bends should be located at a distance of ten pipe diameters or its equivalent before cyclone inlets to avoid non-uniform distribution of gases and solids in the cy-clone inlet piping and 2) a scroll or wrap-around type of inlet should be used. At high solids or liquid loadings (> ~10 vol%), care must be taken not to restrict the dis-charge opening or the annular space around a vortex sta-bilizer.
2.7 Flow behavior of gas and solids in a dipleg below cyclone
Wei Z.G. et al. (2016) examined the pressure of a cata-lyst powder (Sauter mean particle diameter of 63.6 μm)
Fig. 9 (a) Schematic diagram of the experimental setup of a fluidized bed, a riser, and a dipleg connected with a cyclone, (b) the photograph of the fluidized bed and dipleg (non-operating status). Reprinted with per-mission from ref. (Wei Z.G. et al., 2016) under the terms of the CC-BY 4.0 license. Copyright: (2016) The Authors, published by Springer Nature.
Fig. 10 Diagram of fluidization regimes in a dipleg with the increase of solid mass flux (Gs) (a) and (b) the dilute–dense coexisting falling flow, (c) the dense conveying flow, (d) dense conveying flow with a high particle concentration. Reprinted with permission from ref. (Wei Z.G. et al., 2016) under the terms of the CC-BY 4.0 license. Copyright: (2016) The Authors, published by Springer Nature.

Chihiro Fushimi et al. / KONA Powder and Particle Journal No. 38 (2021) 94–109
100
flow in a dipleg (150 mm inner diameter and 9 m height) when Gs was in the range of 50.0 to 385.0 kg m–2 s–1. Fig. 9 shows the experimental apparatus consisting of setup of a fluidized bed (600 mm i.d. and 8 m height), a riser (200 mm i.d. and 12.5 m height), and a dipleg (150 mm i.d. and 9 m height) connected with a cyclone (400 mm i.d.). The bottom of the dipleg was immersed into the fluidized bed. Fig. 10 shows the observed fluid-ization pattern in the dipleg. At small Gs (Gs < 50.0 kg m–2 s–1) (cf. Fig. 3a, b), a dilute-dense coexisting falling flow. The swirl flow (just below the cyclone), the dilute particle falling flow (in the middle) and the dense flow (bottom) were observed. In the dense flow, some as-cending gas bubbles were observed like a bubbling fluid-ized bed. When Gs = 200.0–250.0 kg m–2 s–1 (cf. Fig. 3c), no interface between the dilute particle falling flow and the dense flow was observed. Pressure fluctuation inten-sity reached a maximum in the fluidization pattern being transformed. Further increase in Gs (Gs > 350.0 kg m–2 s–1) (cf. Fig. 3d), the fluidization regimes developed the dense conveying flow with a high particle concentration.
3. Scale-up methodology and grade efficiency
The scale-up of cyclones is important for reactor design and estimating separation efficiency. Mirek P. (2016, 2018) investigated the scaling rules of cyclones in CFB boilers and estimated the separation efficiency of cyclones by set-ting up the following model (Eqs. (16)–(21)). In this model, the total separation efficiency of a cyclone ηtot is the sum of the efficiency at the wall (ηwall) and in the inner vortex (ηvtx) (Eq. (16)). A portion of the incoming solids not collected by the wall is collected by the inner vortex, which is based on the Muschelknautz model (Muschelknautz E., 1972),
( )
lim
tot wall vtx
e
lim
F Ai
e 1
1
( )
m
j j
j
d R d
μ
η η η
μ
μ
η
μ=
= + = − +
Δ∑
(16)
where μlim is the limited loading ratio defined by Eq. (17).
( )e
lim lim e
50,A
( ) 10y
d
K
d
µ µ= ⋅ ⋅
(17)
Here, the constant Klim = 0.02 for fine particles and 0.03 for coarse particles. For initial load, μe < 2.2 × 10⁻⁵, the exponent y has a value of 0.81 and for μe > 0.1, y = 0.15. The value of de is calculated using Eq. 18 (Mirek P., 2018).
ge
W p g e
180.5 0.9VdA z
(18)
Wang J. et al. (2019) reported that when the solids load-ing is higher than the limit loading (μe > μlim), dense par-ticles cannot flow through the rotating/swirling stream because of their high inertia; in this case, these particles hit the outside wall of the cyclone and descend to the bot-tom.
Mirek P. also described the particle size distribution of the carryover, RF(d), and it can be determined using Eq. (19).
( )
( )lim F
F A
e tot
(1 )
( )
(1 )
d
R d R d
μ η
μ η
−
Δ = ⋅ ⋅Δ
−
(19)
The total separation efficiency is determined by Eq. (20).
FF tot
A1 (1 )
( )R ddR d
(20)
The same researcher summarized the scaling relation-ship using five dimensionless parameters sets shown in Table 2. They compared estimation curves based on the
Table 2 Scaling relationships and parameters used for the analysis of the cyclone performance in cold model tests (cf. Fig. 11). Reprinted with permission from ref. (Mirek P., 2018). Copyright (2018) Elsevier B.V.
Scaling relationships Parameters chosen independently Notation
0 s
T p 0, , U G PSD
u U
d32, ρp, ρg, Dr, μg, g Set (1)
0p
T, , , URe Ar PSD
u
ρp, ρg, Dr, μg, g Set (2)
0 s
T p 0, , , U G Fr PSD
u U
ρp, ρg, Dr, μg, g Set (3)
p0 s
T p 0 g, , , ,U G Fr PSD
u U
ρg, Dr, μg, g Set (4)
p sp
g p 0 r, , , , ,G dFr Re PSD
U D
ρg, μg, g Set (5)
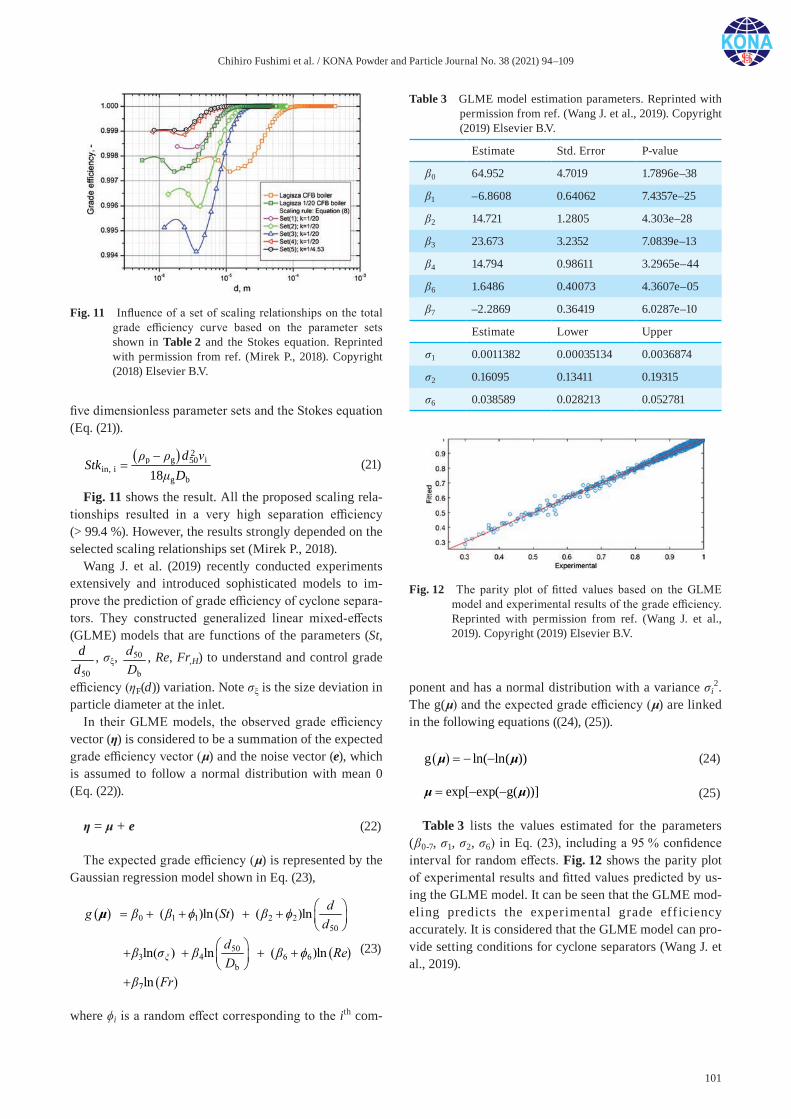
Chihiro Fushimi et al. / KONA Powder and Particle Journal No. 38 (2021) 94–109
101
five dimensionless parameter sets and the Stokes equation (Eq. (21)).
2p g i50
in, ig b18
dStk
D
(21)
Fig. 11 shows the result. All the proposed scaling rela-tionships resulted in a very high separation efficiency (> 99.4 %). However, the results strongly depended on the selected scaling relationships set (Mirek P., 2018).
Wang J. et al. (2019) recently conducted experiments extensively and introduced sophisticated models to im-prove the prediction of grade efficiency of cyclone separa-tors. They constructed generalized linear mixed-effects (GLME) models that are functions of the parameters (St,
50
dd
, σξ, 50
b
d
D
, Re, Fr,H) to understand and control grade
efficiency (ηF(d)) variation. Note σξ is the size deviation in particle diameter at the inlet.
In their GLME models, the observed grade efficiency vector (η) is considered to be a summation of the expected grade efficiency vector (μ) and the noise vector (e), which is assumed to follow a normal distribution with mean 0 (Eq. (22)).
η = μ + e (22)
The expected grade efficiency (μ) is represented by the Gaussian regression model shown in Eq. (23),
( ) ( )
( )
( )
0 1 1 2 2
50
50
3 4 6 6
b
7
ln ln
ln ln l
( ) ( )
( ) ( ) n
ln
d
g St
d
d
Re
D
Fr
ξ
β β φ β φ
β σ β β φ
β
⎛ ⎞
⎜ ⎟
⎝ ⎠
⎛
= + + +
⎞
⎜ ⎟
⎝ ⎠
+
+ + + +
+
µ
(23)
where ϕi is a random effect corresponding to the ith com-
ponent and has a normal distribution with a variance σi2.
The g(μ) and the expected grade efficiency (μ) are linked in the following equations ((24), (25)).
g ln( ln( )) μ μ
(24)
exp[ exp( g( ))] μ μ (25)
Table 3 lists the values estimated for the parameters (β0-7, σ1, σ2, σ6) in Eq. (23), including a 95 % confidence interval for random effects. Fig. 12 shows the parity plot of experimental results and fitted values predicted by us-ing the GLME model. It can be seen that the GLME mod-eling predicts the experimental grade eff iciency accurately. It is considered that the GLME model can pro-vide setting conditions for cyclone separators (Wang J. et al., 2019).
Fig. 11 Influence of a set of scaling relationships on the total grade efficiency curve based on the parameter sets shown in Table 2 and the Stokes equation. Reprinted with permission from ref. (Mirek P., 2018). Copyright (2018) Elsevier B.V.
Fig. 12 The parity plot of fitted values based on the GLME model and experimental results of the grade efficiency. Reprinted with permission from ref. (Wang J. et al., 2019). Copyright (2019) Elsevier B.V.
Table 3 GLME model estimation parameters. Reprinted with permission from ref. (Wang J. et al., 2019). Copyright (2019) Elsevier B.V.
Estimate Std. Error P-value
β0 64.952 4.7019 1.7896e–38
β1 –6.8608 0.64062 7.4357e–25
β2 14.721 1.2805 4.303e–28
β3 23.673 3.2352 7.0839e–13
β4 14.794 0.98611 3.2965e–44
β6 1.6486 0.40073 4.3607e–05
β7 –2.2869 0.36419 6.0287e–10
Estimate Lower Upper
σ1 0.0011382 0.00035134 0.0036874
σ2 0.16095 0.13411 0.19315
σ6 0.038589 0.028213 0.052781
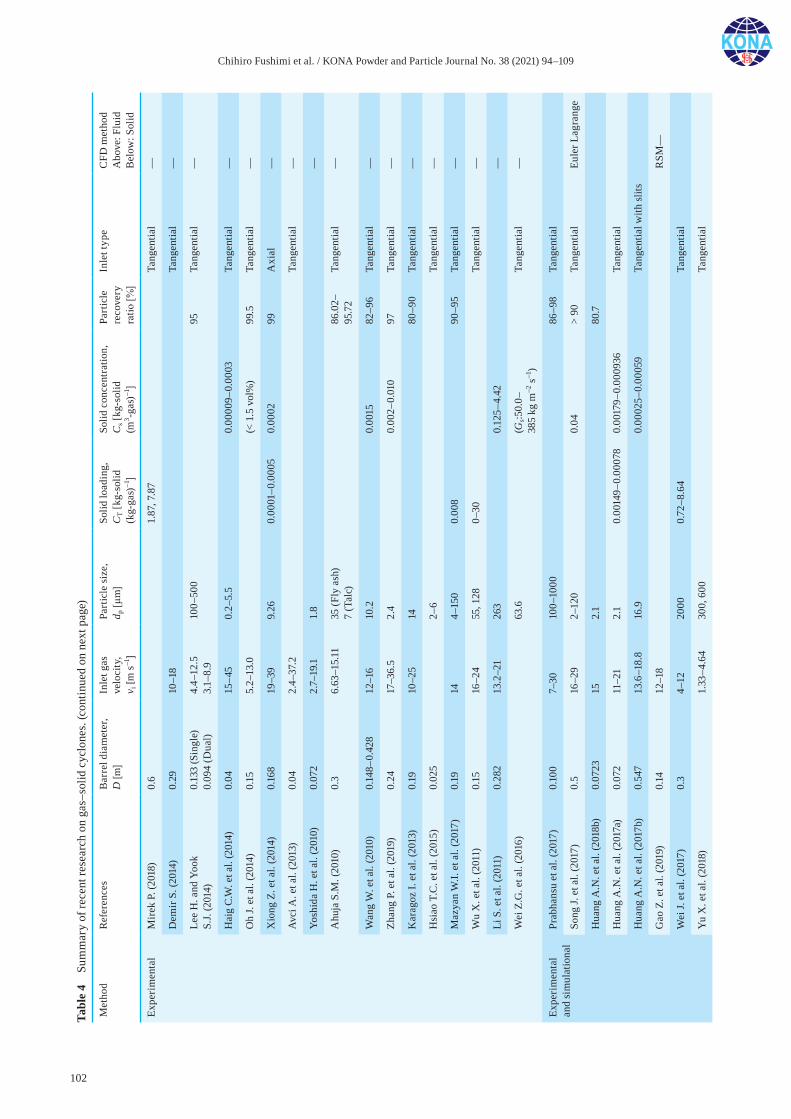
Chihiro Fushimi et al. / KONA Powder and Particle Journal No. 38 (2021) 94–109
102
Tabl
e 4
Sum
mar
y of
rece
nt re
sear
ch o
n ga
s–so
lid c
yclo
nes.
(con
tinue
d on
nex
t pag
e)
Met
hod
Ref
eren
ces
Bar
rel d
iam
eter
, D
[m]
Inle
t gas
ve
loci
ty,
v i [m
s–1
]
Part
icle
size
, d p
[μm
]So
lid lo
adin
g,
CT
[kg-
solid
(k
g-ga
s)–1
]
Solid
con
cent
ratio
n,
Cs [
kg-s
olid
(m
3 -gas
)–1]
Part
icle
re
cove
ry
ratio
[%]
Inle
t typ
eC
FD m
etho
d A
bove
: Flu
id
Bel
ow: S
olid
Expe
rim
enta
lM
irek
P. (2
018)
0.6
1.87
, 7.8
7Ta
ngen
tial
—
Dem
ir S.
(201
4)0.
2910
–18
Tang
entia
l—
Lee
H. a
nd Y
ook
S.
J. (2
014)
0.13
3 (S
ingl
e)0.
094
(Dua
l)4.
4–12
.53.
1–8.
910
0–50
095
Tang
entia
l—
Hai
g C
.W. e
t al.
(201
4)0.
0415
–45
0.2–
5.5
0.00
009–
0.00
03Ta
ngen
tial
—
Oh
J. et
al.
(201
4)0.
155.
2–13
.0(<
1.5
vol
%)
99.5
Tang
entia
l—
Xio
ng Z
. et a
l. (2
014)
0.16
819
–39
9.26
0.00
01–0
.000
50.
0002
99A
xial
—
Avc
i A. e
t al.
(201
3)0.
042.
4–37
.2Ta
ngen
tial
—
Yosh
ida
H. e
t al.
(201
0)0.
072
2.7–
19.1
1.8
—
Ahu
ja S
.M. (
2010
)0.
36.
63–1
5.11
35 (F
ly a
sh)
7 (T
alc)
86.0
2–95
.72
Tang
entia
l—
Wan
g W
. et a
l. (2
010)
0.14
8–0.
428
12–1
610
.20.
0015
82–9
6Ta
ngen
tial
—
Zhan
g P.
et a
l. (2
019)
0.24
17–3
6.5
2.4
0.00
2–0.
010
97Ta
ngen
tial
—
Kar
agoz
I. e
t al.
(201
3)0.
1910
–25
1480
–90
Tang
entia
l—
Hsi
ao T
.C. e
t al.
(201
5)0.
025
2–6
Tang
entia
l—
Maz
yan
W.I.
et a
l. (2
017)
0.19
144–
150
0.00
890
–95
Tang
entia
l—
Wu
X. e
t al.
(201
1)0.
1516
–24
55, 1
280–
30Ta
ngen
tial
—
Li S
. et a
l. (2
011)
0.28
213
.2–2
126
30.
125–
4.42
—
Wei
Z.G
. et a
l. (2
016)
63.6
(Gs:5
0.0–
385
kg m
–2 s
–1)
Tang
entia
l—
Expe
rim
enta
l an
d si
mul
atio
nal
Prab
hans
u et
al.
(201
7)0.
100
7–30
100–
1000
86–9
8Ta
ngen
tial
Song
J. e
t al.
(201
7)0.
516
–29
2–12
00.
04>
90Ta
ngen
tial
Eule
r Lag
rang
e
Hua
ng A
.N. e
t al.
(201
8b)
0.07
2315
2.1
80.7
Hua
ng A
.N. e
t al.
(201
7a)
0.07
211
–21
2.1
0.00
149–
0.00
078
0.00
179–
0.00
0936
Tang
entia
l
Hua
ng A
.N. e
t al.
(201
7b)
0.54
713
.6–1
8.8
16.9
0.00
025–
0.00
059
Tang
entia
l with
slits
Gao
Z. e
t al.
(201
9)0.
1412
–18
RSM
—
Wei
J. e
t al.
(201
7)0.
34–
1220
000.
72–8
.64
Tang
entia
l
Yu
X. e
t al.
(201
8)1.
33–4
.64
300,
600
Tang
entia
l

Chihiro Fushimi et al. / KONA Powder and Particle Journal No. 38 (2021) 94–109
103
Tabl
e 4
Sum
mar
y of
rece
nt re
sear
ch o
n ga
s–so
lid c
yclo
nes.
(con
tinue
d fr
om p
revi
ous p
age)
Met
hod
Ref
eren
ces
Bar
rel d
iam
eter
, D
[m]
Inle
t gas
ve
loci
ty,
v i [m
s–1
]
Part
icle
size
, d p
[μm
]So
lid lo
adin
g,
CT
[kg-
solid
(k
g-ga
s)–1
]
Solid
con
cent
ratio
n,
Cs [
kg-s
olid
(m
3 -gas
)–1]
Part
icle
re
cove
ry
ratio
[%]
Inle
t typ
eC
FD m
etho
d A
bove
: Flu
id
Bel
ow: S
olid
Sim
ulat
iona
lSu
Y. e
t al.
(201
1)0.
200
× 0.
200
(squ
are)
17.9
8, 2
0.21
0.00
84, 0
.008
8
Surm
en A
. et a
l. (2
011)
2–20
(L/D
)
Qiu
Y. e
t al.
(201
2)0.
338–
2212
.8>
92
Win
field
D. e
t al.
(201
3)0.
0066
16.7
0, 1
6.74
(< 1
.5 v
ol%
)99
.5
Shi B
. et a
l. (2
013)
0.04
3099
Bog
odag
e S.
G. a
nd L
eung
A
.Y.T
. (20
15)
0.33
0210
0–18
0.00
1Ta
ngen
tial
Hsi
ao T
.C. e
t al.
(201
5)0.
025
0.00
25–0
.01
2–6
Tang
entia
l
Mis
iulia
D. e
t al.
(201
5)4.
21–5
.07
(H/D
)3.
50.
2–30
0.00
3Ta
ngen
tial
De
Souz
a F.
J. et
al.
(201
5a,b
)0.
031
10.6
70.
5–6.
0Ta
ngen
tial,
axia
l
Yang
J. e
t al.
(201
5)0.
3, 1
.2, 0
.9, 0
.6,
0.18
6Ta
ngen
tial
Xu
W. e
t al.
(201
6)0.
2523
1088
Schn
eide
rbau
er S
. et a
l. (2
016)
2.5
13.4
0.6–
400
0.22
493
Tang
entia
lLa
gran
ge-E
uler
hy
brid
Koz
ołub
P. e
t al.
(201
7)0.
25.
55–9
.49
40–8
01.
0–2.
7Ta
ngen
tial
Eule
r Lag
rang
e
Maz
yan
W.I.
et a
l. (2
017)
0.19
14Ta
ngen
tial
Siad
aty
M. e
t al.
(201
7)0.
316
.04
2–6
(3 v
ol%
)>
91.11
Tang
entia
l
Sun
X. e
t al.
(201
7)0.
2916
.34
1–5
Tang
entia
l
Wan
g S.
et a
l. (2
017)
0.07
1600
(< 0
.03
vol%
)
Was
ilew
ski M
. and
Bra
r L.
S. (2
017)
3.35
8.84
80.4
–82
.4Ta
ngen
tial
Hua
ng A
.N. e
t al.
(201
8a)
0.07
2315
, 18
0.33
9–11
.565
0.00
16-0
.153
> 99
%
(> 3
μm
)
Safik
hani
H. a
nd M
ehra
bian
P.
(201
6)1,
1.7,
2.3
(L/D
)17
20, 2
1, 2
3, 1
9, 1
3A
xial
Safik
hani
H. e
t al.
(201
8)1.
7 (L
/D)
8.75
, 17.
5, 3
520
, 21,
23,
19,
13
60–6
2A
xial
Zhan
g N
. et a
l. (2
010)
8.08
200
(Gs:
4–8.
5 kg
m–2
s–1
)Ta
ngen
tial
Eule
r
Chu
K.W
. et a
l. (2
011)
0.2
2020
000–
2.5
Tang
entia
l
Chu
K.W
. et a
l. (2
017)
1,00
03.
920
0–60
0000
5–11
Med
ium
to
Coa
lTa
ngen
tial
Jang
K. e
t al.
(201
8)10
–30
0.4–
1057
–75
Tang
entia
l
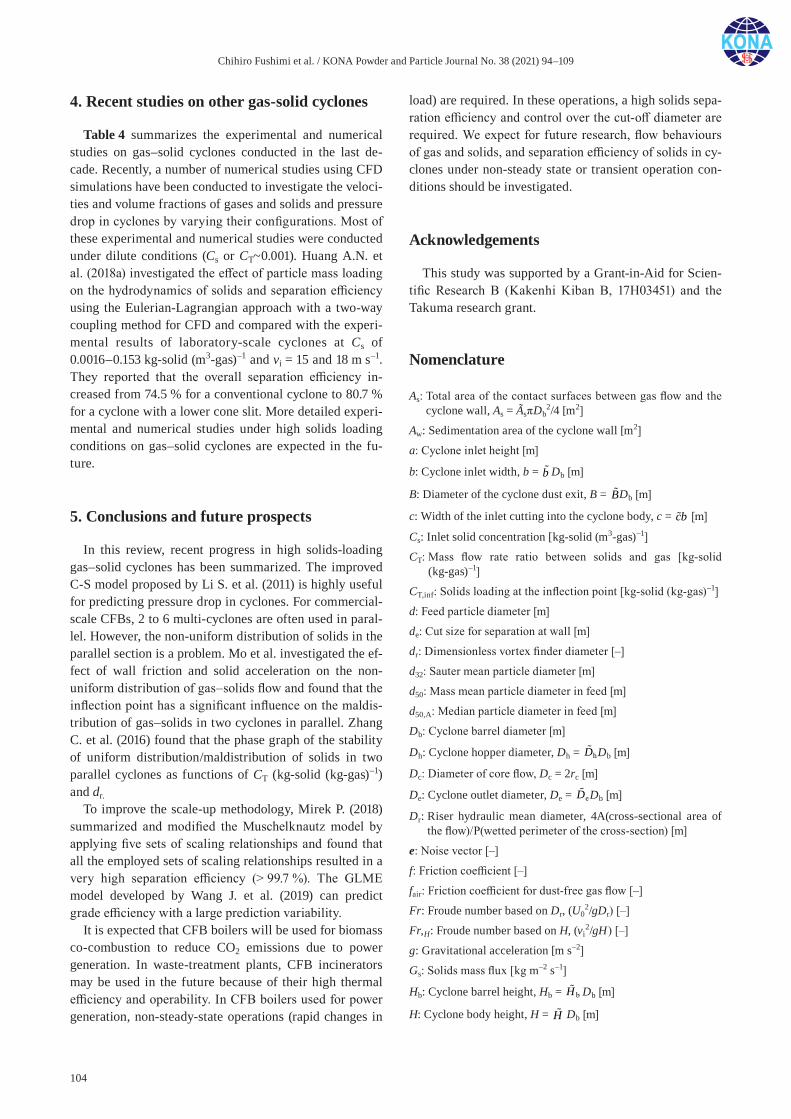
Chihiro Fushimi et al. / KONA Powder and Particle Journal No. 38 (2021) 94–109
104
4. Recent studies on other gas-solid cyclones
Table 4 summarizes the experimental and numerical studies on gas–solid cyclones conducted in the last de-cade. Recently, a number of numerical studies using CFD simulations have been conducted to investigate the veloci-ties and volume fractions of gases and solids and pressure drop in cyclones by varying their configurations. Most of these experimental and numerical studies were conducted under dilute conditions (Cs or CT~0.001). Huang A.N. et al. (2018a) investigated the effect of particle mass loading on the hydrodynamics of solids and separation efficiency using the Eulerian-Lagrangian approach with a two-way coupling method for CFD and compared with the experi-mental results of laboratory-scale cyclones at Cs of 0.0016–0.153 kg-solid (m3-gas)–1 and vi = 15 and 18 m s–1. They reported that the overall separation efficiency in-creased from 74.5 % for a conventional cyclone to 80.7 % for a cyclone with a lower cone slit. More detailed experi-mental and numerical studies under high solids loading conditions on gas–solid cyclones are expected in the fu-ture.
5. Conclusions and future prospects
In this review, recent progress in high solids-loading gas–solid cyclones has been summarized. The improved C-S model proposed by Li S. et al. (2011) is highly useful for predicting pressure drop in cyclones. For commercial- scale CFBs, 2 to 6 multi-cyclones are often used in paral-lel. However, the non-uniform distribution of solids in the parallel section is a problem. Mo et al. investigated the ef-fect of wall friction and solid acceleration on the non- uniform distribution of gas–solids flow and found that the inflection point has a significant influence on the maldis-tribution of gas–solids in two cyclones in parallel. Zhang C. et al. (2016) found that the phase graph of the stability of uniform distribution/maldistribution of solids in two parallel cyclones as functions of CT (kg-solid (kg-gas)–1) and dr.
To improve the scale-up methodology, Mirek P. (2018) summarized and modified the Muschelknautz model by applying five sets of scaling relationships and found that all the employed sets of scaling relationships resulted in a very high separation efficiency (> 99.7 %). The GLME model developed by Wang J. et al. (2019) can predict grade efficiency with a large prediction variability.
It is expected that CFB boilers will be used for biomass co-combustion to reduce CO2 emissions due to power generation. In waste-treatment plants, CFB incinerators may be used in the future because of their high thermal efficiency and operability. In CFB boilers used for power generation, non-steady-state operations (rapid changes in
load) are required. In these operations, a high solids sepa-ration efficiency and control over the cut-off diameter are required. We expect for future research, flow behaviours of gas and solids, and separation efficiency of solids in cy-clones under non-steady state or transient operation con-ditions should be investigated.
Acknowledgements
This study was supported by a Grant-in-Aid for Scien-tific Research B (Kakenhi Kiban B, 17H03451) and the Takuma research grant.
Nomenclature
As: Total area of the contact surfaces between gas flow and the cyclone wall, As = ÃsπDb
2/4 [m2]
Aw: Sedimentation area of the cyclone wall [m2]
a: Cyclone inlet height [m]
b: Cyclone inlet width, b = b
Db [m]
B: Diameter of the cyclone dust exit, B = B
Db [m]
c: Width of the inlet cutting into the cyclone body, c = cb
[m]
Cs: Inlet solid concentration [kg-solid (m3-gas)–1]
CT: Mass flow rate ratio between solids and gas [kg-solid (kg-gas)–1]
CT,inf: Solids loading at the inflection point [kg-solid (kg-gas)–1]
d: Feed particle diameter [m]
de: Cut size for separation at wall [m]
dr: Dimensionless vortex finder diameter [–]
d32: Sauter mean particle diameter [m]
d50: Mass mean particle diameter in feed [m]
d50,A: Median particle diameter in feed [m]
Db: Cyclone barrel diameter [m]
Dh: Cyclone hopper diameter, Dh = hD
Db [m]
Dc: Diameter of core flow, Dc = 2rc [m]
De: Cyclone outlet diameter, De = eD
Db [m]
Dr: Riser hydraulic mean diameter, 4A(cross-sectional area of the flow)/P(wetted perimeter of the cross-section) [m]
e: Noise vector [–]
f: Friction coefficient [–]
fair: Friction coefficient for dust-free gas flow [–]
Fr: Froude number based on Dr, (U02/gDr) [–]
Fr,H: Froude number based on H, (vi2/gH) [–]
g: Gravitational acceleration [m s–2]
Gs: Solids mass flux [kg m–2 s–1]
Hb: Cyclone barrel height, Hb = bH
Db [m]
H: Cyclone body height, H = H
Db [m]
Chihiro Fushimi et al. / KONA Powder and Particle Journal No. 38 (2021) 94–109
105
Hh: Cyclone hopper height, Hh = hH
Db [m]
ki: Correction coefficient of expansion loss [–]
Klim: Constant for calculating the limited load ratio [–]
l: Insert depth of the cyclone outlet, l = l
Db [m]
n: Swirl exponent [–]
Δp1: Expansion loss at the cyclone inlet [Pa]
Δpb: Cyclone body pressure drop [Pa]
Δpc: Cyclone pressure drop [Pa]
Δpx: Outlet pressure drop [Pa]
Q: Cyclone inlet gas flow rate [m3 s–1]
r: Radius of cyclone barrel [m]
rc: Radius of core flow, rc = cr
r [m]
RAi(d): Residue of the inner feed [–]
Re: Reynolds number, viDbρg/μg [–]
Rep: Particle Reynolds number, U0d32ρg/μg [–]
RF(d): Residue of the emitted dust [–]
Stkin,i: Stokes number [–]
uT: Terminal velocity of particles [m s–1]
U0: Superficial gas velocity [m s–1]
V
: Gas flow rate [m3 s–1]
vi: Gas velocity at the cyclone inlet [m s–1]
vz: Axial gas velocity [m s–1]
vze: Axial gas velocity in the outlet annular region [m s–1]
vzw: Axial gas velocity near the outlet wall [m s–1]
vθ: Tangential gas velocity, vθ = θv
vi [m s–1]
θv
: mean tangential velocity in the outlet tube [m s–1]
vθc: Tangential gas velocity at the radius [m s–1]
vθCS: Tangential gas velocity at the imagined control surface [m s–1]
vθe: Tangential gas velocity in outlet annular region [m s–1]
vθw: Tangential gas velocity near the cyclone wall, vθw = θwv vi [m s–1]
v’θw: Tangential gas velocity near the cyclone wall for dust-laden gases [m s–1]
y: Exponent for calculating the limited load ratio [–]
ez
: Mean centrifugal acceleration at the reference radius [m s–2]
Greek alphabets
μ: Expected grade-efficiency vector [–]
μe: Initial load [kg kg–1]
μg: Gas viscosity [Pa s]
μlim: Limited load ratio [kg kg–1]
ρg: Gas density [kg m–3]
ρp: Particle density [kg m–3]
η: Observed grade-efficiency vector [–]
ηF(d): Grade efficiency [–]
ηtot: Total separation efficiency [–]
ηvtx: Separation efficiency in cyclone vortex [–]
ηwall: Separation efficiency at wall [–]
ϕi: Random effect of the ith component [–]
σi: Standard deviation of ϕi [–]
σξ: Size deviation of particle diameter at inlet [–]
ψ: Gas fraction in cyclone 1 [–]
γ: Solids fraction in cyclone 1 [–]
Abbreviations
CFB: Circulating fluidized bed
CFD: Computational fluid dynamics
CPFD: Computational particle fluid dynamics
C-S: Chen and Shi
DEM: Discrete elemental method
ECT: Electrical capacitance tomography
FCC: Fluid catalytic cracking
GLME: Generalized linear mixed-effects
iG-CLC: In situ gasification chemical looping combustion
PSD: Particle size distribution
References
Ahuja S.M., Wetted wall cyclone—A novel concept, Powder Technology, 204 (2010) 48–53. DOI: 10.1016/j.powtec. 2010.07.005
Ansart R., García-Triñanes P., Boissière B., Benoit H., P.K. Seville J., Simonin O., Dense gas-particle suspension upward flow used as heat transfer fluid in solar receiver: PEPT experiments and 3D numerical simulations, Powder Technology, 307 (2017) 25–36. DOI: 10.1016/j.powtec. 2016.11.006
Avci A., Karagoz I., Surmen A., Development of a new method for evaluating vortex length in reversed flow cyclone sepa-rators, Powder Technology, 235 (2013) 460–466. DOI: 10.1016/j.powtec.2012.10.058
Basu P., Circulating Fluidized Bed Boilers Design, Operation and Maintenance, Chapter 7, Springer, Cham, 2015. ISBN: 9783319061726. DOI: https://doi.org/10.1007/978-3-319-06173-3
Bogodage S.G., Leung A.Y.T., CFD simulation of cyclone sepa-rators to reduce air pollution, Powder Technology, 286 (2015) 488–506. DOI: 10.1016/j.powtec.2015.08.023
Chen J., Shi M., A universal model to calculate cyclone pressure drop, Powder Technology, 171 (2007) 184–191. DOI: 10.1016/j.powtec.2006.09.014
Chu K.W., Chen J., Wang B., Yu A.B., Vince A., Barnett G.D., Barnett P.J., Understand solids loading effects in a dense medium cyclone: Effect of particle size by a CFD-DEM
Chihiro Fushimi et al. / KONA Powder and Particle Journal No. 38 (2021) 94–109
106
method, Powder Technology, 320 (2017) 594–609. DOI: 10.1016/j.powtec.2017.07.032.
Chu K.W., Wang B., Xu D.L., Chen Y.X., Yu A.B., CFD-DEM simulation of the gas-solid flow in a cyclone separator, Chemical Engineering Science, 66 (2011) 834–847. DOI: 10.1016/j.ces.2010.11.026
Cocco R., Issangya A., Karri S.B.R., Freeman T., Jaeger H.M., Knowlton T.M., Small-scale particle interactions are having significant effects on global fluidized bed behavior, KONA Powder and Particle Journal, 34 (2017) 155–167. DOI: 10.14356/kona.2017021
Cortés C., Gil A., Modeling the gas and particle flow inside cyclone separators, Progress in Energy and Combustion Science, 33 (2007) 409–452. DOI: 10.1016/j.pecs.2007. 02.001
Demir S., A practical model for estimating pressure drop in cyclone separators: An experimental study, Powder Tech-nology, 268 (2014) 329–338. DOI: 10.1016/j.powtec. 2014.08.024
De Souza F.J., Salvo R.D.V., Martins D.D.M., Simulation of the performance of small cyclone separators through the use of Post Cyclones (PoC) and annular overflow ducts, Separa-tion and Purification Technology, 142 (2015a) 71–82. DOI: 10.1016/j.seppur.2014.12.032
De Souza F.J., Salvo R.D.V., Martins D.D.M., Effects of the gas outlet duct length and shape on the performance of cyclone separators, Separation and Purification Technology, 142 (2015b) 90–100. DOI: 10.1016/j.seppur.2014.12.008
Dewil R., Baeyens J., Caerts B., CFB cyclones at high tempera-ture: Operational results and design assessment, Particuol-ogy, 6 (2008) 149–156. DOI: 10.1016/j.partic.2008.01.002
Fushimi C., Guan G., Nakamura Y., Ishizuka M., Tsutsumi A., Matsuda S., Hatano H., Suzuki Y., Hydrodynamic charac-teristics of a large-scale triple-bed combined circulating fluidized bed, Powder Technology, 209 (2011) 1–8. DOI: 10.1016/j.powtec.2011.01.018
Fushimi C., Ishizuka M., Guan G., Suzuki Y., Norinaga K., Hayashi J.-i., Tsutsumi A., Hydrodynamic behavior of binary mixture of solids in a triple-bed combined circulat-ing fluidized bed with high mass flux, Advanced Powder Technology, 25 (2014) 379–388. DOI: 10.1016/j.apt.2013. 06.007
Gao Z., Wang J., Wang J., Mao Y., Wei Y., Analysis of the effect of vortex on the flow field of a cylindrical cyclone separator, Separation and Purification Technology, 211 (2019) 438–447. DOI: 10.1016/j.seppur.2018.08.024
García-Triñanes P., Seville J.P.K., Ansart R., Benoit H., Leadbeater T.W., Parker D.J., Particle motion and heat transfer in an upward-flowing dense particle suspension: Application in solar receivers, Chemical Engineering Sci-ence, 177 (2018) 313–322. DOI: 10.1016/j.ces.2017.11.041
García-Triñanes P., Seville J.P.K., Boissière B., Ansart R., Leadbeater T.W., Parker D.J., Hydrodynamics and particle motion in upward flowing dense particle suspensions: Application in solar receivers, Chemical Engineering Sci-ence, 146 (2016) 346–356. DOI: 10.1016/j.ces.2016.03.006.
Grace J.R., Avidan A.A., Knowlton T.M. (Eds.), Circulating Fluidized Beds, Springer Netherlands, 1997. ISBN:
9789400900950. DOI: 10.1007/978-94-009-0095-0Gräbner M. Industrial Coal Gasification Technologies Covering
Baseline and High-Ash Coal, Wiley-VCH, Weinheim, 2015. ISBN:9783527336906. DOI:10.1002/9783527336913
Guan G., Fushimi C., Tsutsumi A., Prediction of flow behavior of the riser in a novel high solids flux circulating fluidized bed for steam gasification of coal or biomass, Chemical Engineering Journal, 164 (2010) 221–229. DOI: 10.1016/j.cej.2010.08.005
Guan G., Fushimi C., Ishizuka M., Nakamura Y., Tsutsumi A., Matsuda S., Suzuki Y., Hatano H., Cheng Y., Chuan Lim E.W., Wang C.H., Flow behaviors in the downer of a large-scale triple-bed combined circulating fluidized bed system with high solids mass fluxes, Chemical Engineering Sci-ence, 66 (2011) 4212–4220. DOI: 10.1016/j.ces.2011.06.006
Haig C.W., Hursthouse A., McIlwain S., Sykes D., The effect of particle agglomeration and attrition on the separation effi-ciency of a Stairmand cyclone, Powder Technology, 258 (2014) 110–124. DOI: 10.1016/j.powtec.2014.03.008
Hoffmann A.C., Stein L.E., Gas Cyclones and Swirl Tubes – Principles, Design, and Operation, second edition, Springer, Berlin, 2010. ISBN:9783642094163, DOI: 10.1007/978-3-540-74696-6
Hsiao T.C., Huang S.H., Hsu C.W., Chen C.C., Chang P.K., Effects of the geometric configuration on cyclone perfor-mance, Journal of Aerosol Science, 86 (2015) 1–12. DOI: 10.1016/j.jaerosci.2015.03.005
Huang A.N., Ito K., Fukasawa T., Fukui K., Kuo H.P., Effects of particle mass loading on the hydrodynamics and separation efficiency of a cyclone separator, Journal of the Taiwan Institute of Chemical Engineers, 90 (2018a) 61–67. DOI: 10.1016/j.jtice.2017.12.016
Huang A.N., Ito K., Fukasawa T., Yoshida H., Kuo H.P., Fukui K., Classification performance analysis of a novel cyclone with a slit on the conical part by CFD simulation, Separa-tion and Purification Technology, 190 (2018b) 25–32. DOI: 10.1016/j.seppur.2017.08.047
Huang A.N., Maeda N., Shibata D., Fukasawa T., Yoshida H., Kuo H.P., Fukui K., Influence of a laminarizer at the inlet on the classification performance of a cyclone separator, Separation and Purification Technology, 174 (2017a) 408–416. DOI: 10.1016/j.seppur.2016.09.053
Huang A.N., Maeda N., Sunada S., Fukasawa T., Yoshida H., Kuo H.P., Fukui K., Effect of cold air stream injection on cyclone performance at high temperature, Separation and Purification Technology, 183 (2017b) 293–303. DOI: 10.1016/j.seppur.2017.04.012
Huard M., Briens C., Berruti F., Gauthier T.A., A review of rapid gas-solid separation techniques, International Journal of Chemical Reactor Engineering, 8 (2010) 1–72. DOI: 10.2202/1542-6580.2069
Jang K., Lee G.G., Huh K.Y., Evaluation of the turbulence mod-els for gas flow and particle transport in URANS and LES of a cyclone separator, Computers and Fluids, 172 (2018) 274–283. DOI: 10.1016/j.compfluid.2018.04.032
Jiang Y., Qiu G., Wang H., Modelling and experimental investi-gation of the full-loop gas-solid flow in a circulating fluid-ized bed with six cyclone separators, Chemical Engineering
Chihiro Fushimi et al. / KONA Powder and Particle Journal No. 38 (2021) 94–109
107
Science, 109 (2014) 85–97. DOI: 10.1016/j.ces.2014.01.029Karagoz I., Avci A., Surmen A., Sendogan O., Design and per-
formance evaluation of a new cyclone separator, Journal of Aerosol Science, 59 (2013) 57–64. DOI: 10.1016/j.jaerosci. 2013.01.010
Kozołub P., Klimanek A., Białecki R.A., Adamczyk W.P., Numerical simulation of a dense solid particle flow inside a cyclone separator using the hybrid Euler–Lagrange approach, Particuology, 31 (2017) 170–180. DOI: 10.1016/J.PARTIC.2016.09.003
Lee H., Yook S.J., Cyclone performance on removing fibrous particles generated from terry-towels and cotton clothes, Powder Technology, 262 (2014) 36–41. DOI: 10.1016/j. powtec.2014.04.057
Lettieri P., Macrì D., Effect of process conditions on fluidiza-tion, KONA Powder and Particle Journal, 33 (2016) 86–108. DOI: 10.14356/kona.2016017
Li C-Y., Zhang L-X., Kudo S., Hayashi J-i., Norinaga K., Toward low-temperature coal gasification: Experimental and numerical studies of thermochemical coal conversion considering the interactions between volatiles and char par-ticles, KONA Powder and Particle Journal, 34 (2017) 70–79. DOI: 10.14356/kona.2017008
Li S., Yang H., Wu Y., Zhang H., Improved cyclone pressure drop model at high inlet solid concentrations, Chemical Engineering and Technology, 34 (2011) 1507–1513. DOI: 10.1002/ceat.201100087
Liao L., Na Y.J., Lu Q.G., Sun Y.K., Wang H.G. Experimental study on a circulating fluidized bed with six cyclone sepa-rators. In: Proceedings of the CSEE. 31 (2011) 11–16.
Liu F., Chen J.Y., Zhang A.Q., Wang X.D., Dong T., Perfor-mance and flow behavior of four identical parallel cyclones, Separation and Purification Technology, 134 (2014) 147–157. DOI: 10.1016/j.seppur.2014.07.030
Masnadi M.S., Grace J.R., Elyasi S., Bi X., Distribution of multi-phase gas-solid flow across identical parallel cyclones: Modeling and experimental study, Separation and Purification Technology, 72 (2010) 48–55. DOI: 10.1016/j.seppur.2009.12.027
Mazyan W.I., Ahmadi A., Ahmed H., Hoorfar M., Increasing efficiency of natural gas cyclones through addition of tan-gential chambers, Journal of Aerosol Science, 110 (2017) 36–42. DOI: 10.1016/j.jaerosci.2017.05.007
Mirek P., Influence of the model scale on hydrodynamic scaling in CFB boilers, Brazilian Journal of Chemical Engineering, 33 (2016) 885–896. DOI: 10.1590/0104-6632.20160334s20150348
Mirek P., The impact of scaling rules on parameters of the cyclone working with CFB boilers, Fuel Processing Tech-nology, 169 (2018) 71–76. DOI: 10.1016/j.fuproc.2017.09.012
Misiulia D., Andersson A.G., Lundström T.S., Effects of the inlet angle on the flow pattern and pressure drop of a cyclone with helical-roof inlet, Chemical Engineering Research and Design, 102 (2015) 307–321. DOI: 10.1016/j.cherd.2015.06.036
Mo X., Cai R., Huang X., Zhang M., Yang H., The effects of wall friction and solid acceleration on the mal-distribution of gas-solid flow in double identical parallel cyclones, Pow-der Technology, 286 (2015) 471–477. DOI: 10.1016/j.
powtec.2015.08.017Muschelknautz E. Die Berechnung von Zyklonabscheidern für
Gase, Chemie Ingenieur Technik, 44 (1972) 63–71. DOI: 10.1002/cite.330440112
Nowak W., Mirek P., Chapter 16. Circulating fluidized bed com-bustion (CFBC), in: F. Scala (Eds.), Fluidized Bed Technol-ogies for Near-zero Emission Combustion and Gasification. Woodhead Publishing, Cambridge, 2013, pp.701–764. ISBN: 9780857095411.
Oh J., Choi S., Kim J., Lee S., Jin G., Particle separation with the concept of uniflow cyclone, Powder Technology, 254 (2014) 500–507. DOI: 10.1016/j.powtec.2014.01.057
Pecate S., Morin M., Kessas S.A., Hemati M., Kara Y., Valin S., Hydrodynamic study of a circulating fluidized bed at high temperatures: Application to biomass gasification, KONA Powder and Particle Journal, 36 (2019) 271–293. DOI: 10.14356/kona.2019018
Prabhansu, Rajmistry S., Ganguli S., Chandra P., Karmakar M.K., Chatterjee P.K., Numerical analysis of gas-solid behavior in a cyclone separator for circulating fluidized bed system, Journal of Applied Fluid Mechanics, 10 (2017) 1167–1176. DOI: 10.18869/acadpub.jafm.73.241.26951
Qiu Y., Deng B., Kim C.N., Numerical study of the flow field and separation efficiency of a divergent cyclone, Powder Technology, 217 (2012) 231–237. DOI: 10.1016/j.powtec. 2011.10.031
Safikhani H., Mehrabian P., Numerical study of flow field in new cyclone separators, Advanced Powder Technology, 27 (2016) 379–387. DOI: 10.1016/j.apt.2016.01.011
Safikhani H., Zamani J., Musa M., Numerical study of flow field in new design cyclone separators with one, two and three tangential inlets, Advanced Powder Technology, 29 (2018) 611–622. DOI: 10.1016/j.apt.2017.12.002
Scala F. (Ed.), Fluidized Bed Technologies for Near-zero Emis-sion Combustion and Gasification. Woodhead Publishing, Cambridge, 2013. ISBN: 9780857095411.
Schneiderbauer S., Haider M.F., Hauzenberger F., Pirker S.A, Lagrangian-Eulerian hybrid model for the simulation of industrial-scale gas-solid cyclones, Powder Technology, 304 (2016) 229–240. DOI: 10.1016/j.powtec.2016.07.064.
Shao Y., Zhang Y., Wang X., Wang X., Jin B., Liu H., Three- dimensional full loop modeling and optimization of an in situ gasification chemical looping combustion system, Energy and Fuels, 31 (2017) 13859–13870. DOI: 10.1021/acs.energyfuels.7b02119
Shi B., Wei J., Chen P., 3D turbulent flow modeling in the sepa-ration column of a circumfluent cyclone, Powder Technol-ogy, 235 (2013) 82–90. DOI: 10.1016/j.powtec.2012.10.009
Shuai D., Wang X., Lyu Q., Hydrodynamics in a circulating flu-idized bed with annular furnace and six parallel cyclones, Journal of Thermal Science, 26 (2017) 273–281. DOI: 10.1007/s11630-017-0939-2
Siadaty M., Kheradmand S., Ghadiri F., Improvement of the cyclone separation efficiency with a magnetic field, Journal of Aerosol Science, 114 (2017) 219–232. DOI: 10.1016/j.jaerosci.2017.09.015
Song J., Wei Y., Sun G., Chen J., Experimental and CFD study of particle deposition on the outer surface of vortex finder
Chihiro Fushimi et al. / KONA Powder and Particle Journal No. 38 (2021) 94–109
108
of a cyclone separator, Chemical Engineering Journal, 309 (2017) 249–262. DOI: 10.1016/j.cej.2016.10.019
Stolten D., Scherer V. (Eds.), Efficient Carbon Capture for Coal Power Plants, Wiley-VCH, Weinheim, 2011. ISBN: 9783527330027.
Su Y., Zheng A., Zhao B., Numerical simulation of effect of inlet configuration on square cyclone separator perfor-mance, Powder Technology, 210 (2011) 293–303. DOI: 10.1016/j.powtec.2011.03.034
Sun X., Kim S., Yang S.D., Kim H.S., Yoon J.Y., Multi-objective optimization of a Stairmand cyclone separator using response surface methodology and computational fluid dynamics, Powder Technology, 320 (2017) 51–65. DOI: 10.1016/j.powtec.2017.06.065
Surmen A., Avci A., Karamangil M.I., Prediction of the maximum-efficiency cyclone length for a cyclone with a tangential entry, Powder Technology, 207 (2011) 1–8. DOI: 10.1016/j.powtec.2010.10.002
Van de Velden M., Baeyens J., Dougan B., McMurdo A., Inves-tigation of operational parameters for an industrial CFB combustor of coal, biomass and sludge, China Particuology, 5 (2007) 247–254. DOI: 10.1016/j.cpart.2007.05.001
Wang F.J., Song G.L., Wang X.F., Liu Z.C., Sun Y.K., Lu Q.G., Cold experimental study on a CFB with four cyclone sepa-rators on the same side, Power System Engineering, 30 (2014) 17–19.
Wang J., Guo Y., Pan J., Grade-efficiency modeling and robust parameter design for gas-solids cyclone separators, Powder Technology, 345 (2019) 457–467. DOI: 10.1016/j.powtec. 2019.01.020
Wang S., Luo K., Hu C., Fan J., CFD-DEM study of the effect of cyclone arrangements on the gas-solid flow dynamics in the full-loop circulating fluidized bed, Chemical Engineering Science, 172 (2017) 199–215. DOI: 10.1016/j.ces.2017. 05.052
Wang W., Zhang P., Wang L., Chen G., Li J., Li X., Structure and performance of the circumfluent cyclone, Powder Tech-nology, 200 (2010) 158–163. DOI: 10.1016/j.powtec. 2010.02.020
Wang X., Jin B., Liu H., Wang W., Liu X., Zhang Y., Optimiza-tion of in situ gasification chemical looping combustion through experimental investigations with a cold experimen-tal system, Industrial and Engineering Chemistry Research, 54 (2015) 5749–5758. DOI: 10.1021/acs.iecr.5b00471
Wasilewski M., Brar L.S., Optimization of the geometry of cyclone separators used in clinker burning process: A case study, Powder Technology, 313 (2017) 293–302. DOI: 10.1016/j.powtec.2017.03.025
Wei J., Zhang H., Wang Y., Wen Z., Yao B., Dong J., The gas-solid flow characteristics of cyclones, Powder Technology,
308 (2017) 178–192. DOI: 10.1016/j.powtec.2016.11.044Wei Z.G., Yan C.Y., Jia M. Da, Song J.F., Wei Y.D., Experimen-
tal analysis of pressure characteristics of catalyst powder flowing down a cyclone dipleg, Petroleum Science, 13 (2016) 348–355. DOI: 10.1007/s12182-016-0087-4
Winfield D., Cross M., Croft N., Paddison D., Craig I., Perfor-mance comparison of a single and triple tangential inlet gas separation cyclone: A CFD Study, Powder Technology, 235 (2013) 520–531. DOI: 10.1016/j.powtec.2012.10.026
Wu X., Liu J., Xu X., Xiao Y., Modeling and experimental vali-dation on pressure drop in a reverse-flow cyclone separator at high inlet solid loading, Journal of Thermal Science, 20 (2011) 343–348. DOI: 10.1007/s11630-011-0479-0
Xiong Z., Ji Z., Wu X., Development of a cyclone separator with high efficiency and low pressure drop in axial inlet cyclones, Powder Technology, 253 (2014) 644–649. DOI: 10.1016/j.powtec.2013.12.016
Xu W., Li Q., Wang J., Jin Y., Performance evaluation of a new cyclone separator—Part II simulation results, Separation and Purification Technology, 160 (2016) 112–116. DOI: 10.1016/j.seppur.2016.01.012
Yang J., Sun G., Zhan M., Prediction of the maximum-efficiency inlet velocity in cyclones, Powder Technology, 286 (2015) 124–131. DOI: 10.1016/j.powtec.2015.07.024
Yoshida H., Nishimura Y., Fukui K., Yamamoto T., Effect of apex cone shape on fine particle classification of gas- cyclone, Powder Technology, 204 (2010) 54–62. DOI: 10.1016/j.powtec.2010.07.006
Yu X., Blanco P.H., Makkawi Y., Bridgwater A.V., CFD and experimental studies on a circulating fluidised bed reactor for biomass gasification, Chemical Engineering and Pro-cessing—Process Intensification, 130 (2018) 284–295. DOI: 10.1016/j.cep.2018.06.018
Zhang C., Wang Q., Jia Z., Muhammad U., Qian W., Wei F., Design of parallel cyclones based on stability analysis. AIChE Journal, 62 (2016) 4251–4258. DOI: 10.1002/aic.15366
Zhang N., Lu B., Wang W., Li J., 3D CFD simulation of hydro-dynamics of a 150MWe circulating fluidized bed boiler, Chemical Engineering Journal, 162 (2010) 821–828. DOI: 10.1016/j.cej.2010.06.033
Zhang P., Chen G., Duan J., Wang W., Experimental evaluation of separation performance of fine particles of circulatory circumfluent cyclone separator system, Separation and Purification Technology, 210 (2019) 231–235. DOI: 10.1016/j.seppur.2018.08.008
Zhou X., Cheng L., Wang Q., Luo Z., Cen K., Non-uniform dis-tribution of gas-solid flow through six parallel cyclones in a CFB system: An experimental study, Particuology, 10 (2012) 170–175. DOI: 10.1016/j.partic.2011.10.006
Chihiro Fushimi et al. / KONA Powder and Particle Journal No. 38 (2021) 94–109
109
Authors’ Short Biographies
Chihiro Fushimi
Chihiro Fushimi is Associate Professor of Department of Chemical Engineering at Tokyo University of Agriculture and Technology. He obtained B.S. M.S. and Ph.D. in Chemical System Engineering from The University of Tokyo, Japan in 1999, 2001 and 2004, respectively. He was a visiting scholar at University of Hawaii at Manoa, USA, a researcher at the Research Institute of Innovative Technology for the Earth, Japan and Research Associate of Institute of Industrial Science at The University of Tokyo. He is also a Visiting Professor at Curtin University of Technology, Australia in 2019. He has 20 years of research experience related to thermochemical conversion of carbonaceous materials, fluidization, and process design and development of power generation and bio-chemicals plants with 75 refereed journal publications and 4 book chapters.
Kentaro Yato
Kentaro Yato is a master student of Department of Chemical Engineering at Tokyo University of Agriculture and Technology. He holds B.S. in Chemical Engineering from Tokyo University of Agriculture and Technology, Japan. His current research topic is de-velopment of an efficient gas-solid separator under high solids loading conditions.
Mikio Sakai
Dr. Mikio Sakai is currently Associate Professor in Resilience Engineering Research Center in The University of Tokyo. He earned his Ph.D. degree from The University of To-kyo in 2006. Then, he became Assistant Professor in 2007 and Associate Professor in 2008 in The University of Tokyo. He is Visiting Reader at Imperial College London since 2016. He extensively studies modelling of granular flows, multi-phase flows and the heat transfer, and besides the parallel computation techniques. He is a world-leading professor in compu-tational granular dynamics, and hence, has delivered lots of invited lectures in conferences. He holds important posts in powder technology community, such as Director of Society of Powder Technology of Japan and Head of Simulation & Modelling Division in Association of Powder Process Industry and Engineering, JAPAN. At present, he is also Associate Edi-tor of Chemical Engineering Science and Editor of Granular Matter.
Takashi KawanoTakashi Kawano currently works in Takuma Co.,Ltd. He obtained Ph.D. in Civil Engi-
neering from Tohoku University, Japan. He has experiences on research, design and devel-opment of anaerobic digestion and thermochemical conversion of biomass. He is now involved in biomass power plant design.
Teruyuki Kita
Teruyuki Kita is a section manager of the maintenance department in Takuma Co.,Ltd. He earned his Ph.D. degree from Tokyo University of Agriculture and Technol-ogy in 1999. He has about 25 years’ experience in design and development of the fluid-ized bed boiler. He has currently managed the section for maintenance and operation support of Boiler Power Generation plants.
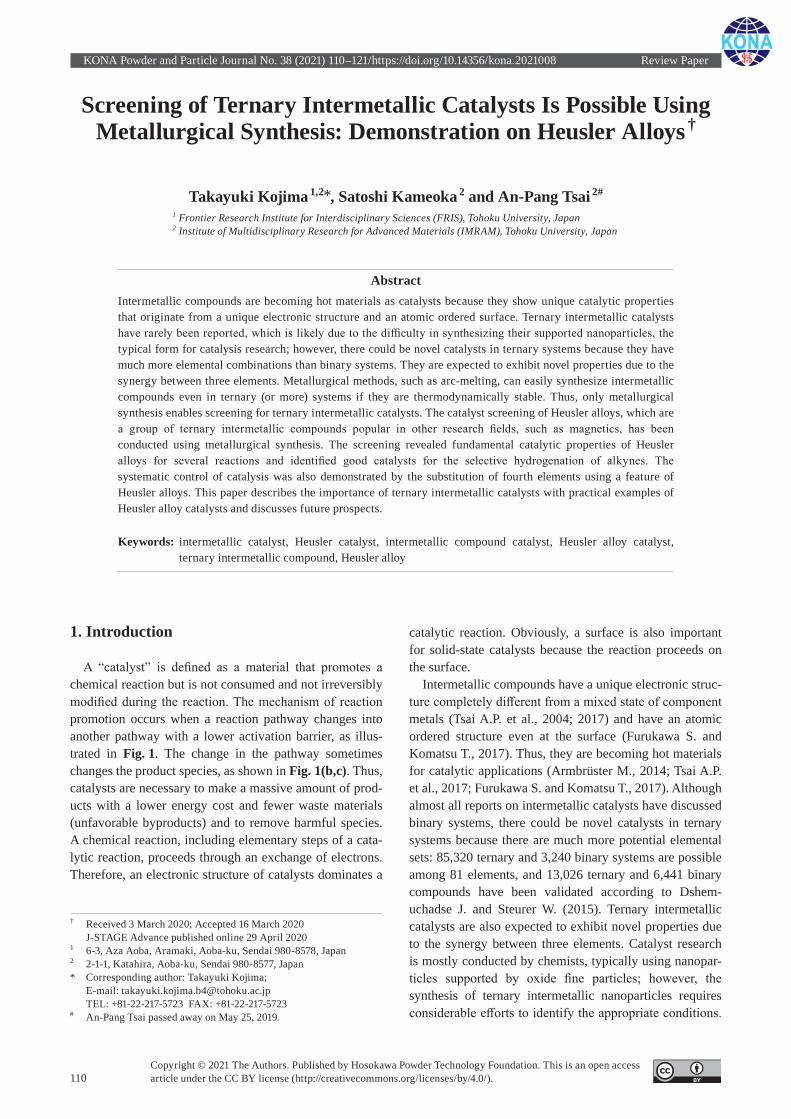
KONA Powder and Particle Journal No. 38 (2021) 110–121/https://doi.org/10.14356/kona.2021008 Review Paper
110Copyright © 2021 The Authors. Published by Hosokawa Powder Technology Foundation. This is an open access article under the CC BY license (http://creativecommons.org/licenses/by/4.0/).
Screening of Ternary Intermetallic Catalysts Is Possible Using Metallurgical Synthesis: Demonstration on Heusler Alloys †
Takayuki Kojima 1,2*, Satoshi Kameoka 2 and An-Pang Tsai 2#
1 Frontier Research Institute for Interdisciplinary Sciences (FRIS), Tohoku University, Japan2 Institute of Multidisciplinary Research for Advanced Materials (IMRAM), Tohoku University, Japan
AbstractIntermetallic compounds are becoming hot materials as catalysts because they show unique catalytic properties that originate from a unique electronic structure and an atomic ordered surface. Ternary intermetallic catalysts have rarely been reported, which is likely due to the difficulty in synthesizing their supported nanoparticles, the typical form for catalysis research; however, there could be novel catalysts in ternary systems because they have much more elemental combinations than binary systems. They are expected to exhibit novel properties due to the synergy between three elements. Metallurgical methods, such as arc-melting, can easily synthesize intermetallic compounds even in ternary (or more) systems if they are thermodynamically stable. Thus, only metallurgical synthesis enables screening for ternary intermetallic catalysts. The catalyst screening of Heusler alloys, which are a group of ternary intermetallic compounds popular in other research fields, such as magnetics, has been conducted using metallurgical synthesis. The screening revealed fundamental catalytic properties of Heusler alloys for several reactions and identified good catalysts for the selective hydrogenation of alkynes. The systematic control of catalysis was also demonstrated by the substitution of fourth elements using a feature of Heusler alloys. This paper describes the importance of ternary intermetallic catalysts with practical examples of Heusler alloy catalysts and discusses future prospects.
Keywords: intermetallic catalyst, Heusler catalyst, intermetallic compound catalyst, Heusler alloy catalyst, ternary intermetallic compound, Heusler alloy
1. Introduction
A “catalyst” is defined as a material that promotes a chemical reaction but is not consumed and not irreversibly modified during the reaction. The mechanism of reaction promotion occurs when a reaction pathway changes into another pathway with a lower activation barrier, as illus-trated in Fig. 1. The change in the pathway sometimes changes the product species, as shown in Fig. 1(b,c). Thus, catalysts are necessary to make a massive amount of prod-ucts with a lower energy cost and fewer waste materials (unfavorable byproducts) and to remove harmful species. A chemical reaction, including elementary steps of a cata-lytic reaction, proceeds through an exchange of electrons. Therefore, an electronic structure of catalysts dominates a
catalytic reaction. Obviously, a surface is also important for solid-state catalysts because the reaction proceeds on the surface.
Intermetallic compounds have a unique electronic struc-ture completely different from a mixed state of component metals (Tsai A.P. et al., 2004; 2017) and have an atomic ordered structure even at the surface (Furukawa S. and Komatsu T., 2017). Thus, they are becoming hot materials for catalytic applications (Armbrüster M., 2014; Tsai A.P. et al., 2017; Furukawa S. and Komatsu T., 2017). Although almost all reports on intermetallic catalysts have discussed binary systems, there could be novel catalysts in ternary systems because there are much more potential elemental sets: 85,320 ternary and 3,240 binary systems are possible among 81 elements, and 13,026 ternary and 6,441 binary compounds have been validated according to Dshem-uchadse J. and Steurer W. (2015). Ternary intermetallic catalysts are also expected to exhibit novel properties due to the synergy between three elements. Catalyst research is mostly conducted by chemists, typically using nanopar-ticles supported by oxide fine particles; however, the synthesis of ternary intermetallic nanoparticles requires considerable efforts to identify the appropriate conditions.
† Received 3 March 2020; Accepted 16 March 2020 J-STAGE Advance published online 29 April 2020
1 6-3, Aza Aoba, Aramaki, Aoba-ku, Sendai 980-8578, Japan2 2-1-1, Katahira, Aoba-ku, Sendai 980-8577, Japan* Corresponding author: Takayuki Kojima; E-mail: [email protected] TEL: +81-22-217-5723 FAX: +81-22-217-5723# An-Pang Tsai passed away on May 25, 2019.
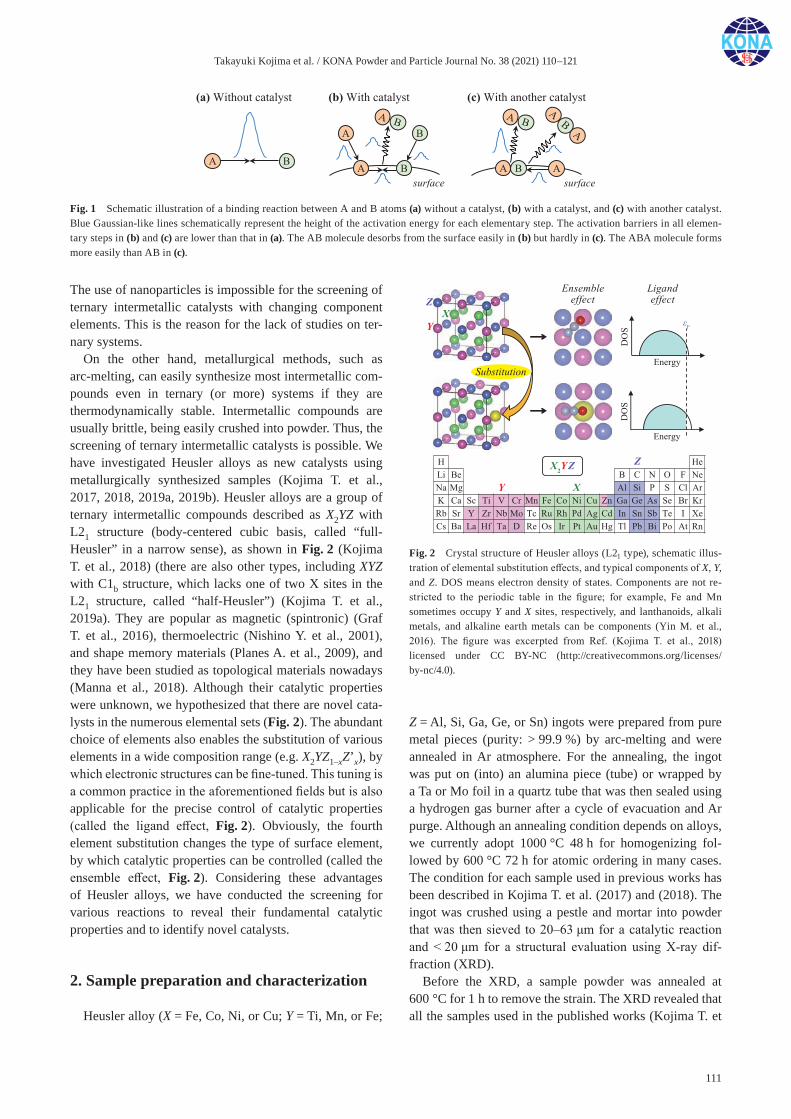
Takayuki Kojima et al. / KONA Powder and Particle Journal No. 38 (2021) 110–121
111
The use of nanoparticles is impossible for the screening of ternary intermetallic catalysts with changing component elements. This is the reason for the lack of studies on ter-nary systems.
On the other hand, metallurgical methods, such as arc-melting, can easily synthesize most intermetallic com-pounds even in ternary (or more) systems if they are thermodynamically stable. Intermetallic compounds are usually brittle, being easily crushed into powder. Thus, the screening of ternary intermetallic catalysts is possible. We have investigated Heusler alloys as new catalysts using metallurgically synthesized samples (Kojima T. et al., 2017, 2018, 2019a, 2019b). Heusler alloys are a group of ternary intermetallic compounds described as X2YZ with L21 structure (body-centered cubic basis, called “full- Heusler” in a narrow sense), as shown in Fig. 2 (Kojima T. et al., 2018) (there are also other types, including XYZ with C1b structure, which lacks one of two X sites in the L21 structure, called “half-Heusler”) (Kojima T. et al., 2019a). They are popular as magnetic (spintronic) (Graf T. et al., 2016), thermoelectric (Nishino Y. et al., 2001), and shape memory materials (Planes A. et al., 2009), and they have been studied as topological materials nowadays (Manna et al., 2018). Although their catalytic properties were unknown, we hypothesized that there are novel cata-lysts in the numerous elemental sets (Fig. 2). The abundant choice of elements also enables the substitution of various elements in a wide composition range (e.g. X2YZ1–xZ’x), by which electronic structures can be fine-tuned. This tuning is a common practice in the aforementioned fields but is also applicable for the precise control of catalytic properties (called the ligand effect, Fig. 2). Obviously, the fourth element substitution changes the type of surface element, by which catalytic properties can be controlled (called the ensemble effect, Fig. 2). Considering these advantages of Heusler alloys, we have conducted the screening for various reactions to reveal their fundamental catalytic properties and to identify novel catalysts.
2. Sample preparation and characterization
Heusler alloy (X = Fe, Co, Ni, or Cu; Y = Ti, Mn, or Fe;
Z = Al, Si, Ga, Ge, or Sn) ingots were prepared from pure metal pieces (purity: > 99.9 %) by arc-melting and were annealed in Ar atmosphere. For the annealing, the ingot was put on (into) an alumina piece (tube) or wrapped by a Ta or Mo foil in a quartz tube that was then sealed using a hydrogen gas burner after a cycle of evacuation and Ar purge. Although an annealing condition depends on alloys, we currently adopt 1000 °C 48 h for homogenizing fol-lowed by 600 °C 72 h for atomic ordering in many cases. The condition for each sample used in previous works has been described in Kojima T. et al. (2017) and (2018). The ingot was crushed using a pestle and mortar into powder that was then sieved to 20–63 μm for a catalytic reaction and < 20 μm for a structural evaluation using X-ray dif-fraction (XRD).
Before the XRD, a sample powder was annealed at 600 °C for 1 h to remove the strain. The XRD revealed that all the samples used in the published works (Kojima T. et
Fig. 1 Schematic illustration of a binding reaction between A and B atoms (a) without a catalyst, (b) with a catalyst, and (c) with another catalyst. Blue Gaussian-like lines schematically represent the height of the activation energy for each elementary step. The activation barriers in all elemen-tary steps in (b) and (c) are lower than that in (a). The AB molecule desorbs from the surface easily in (b) but hardly in (c). The ABA molecule forms more easily than AB in (c).
Fig. 2 Crystal structure of Heusler alloys (L21 type), schematic illus-tration of elemental substitution effects, and typical components of X, Y, and Z. DOS means electron density of states. Components are not re-stricted to the periodic table in the figure; for example, Fe and Mn sometimes occupy Y and X sites, respectively, and lanthanoids, alkali metals, and alkaline earth metals can be components (Yin M. et al., 2016). The figure was excerpted from Ref. (Kojima T. et al., 2018) licensed under CC BY-NC (http://creativecommons.org/licenses/by-nc/4.0).

Takayuki Kojima et al. / KONA Powder and Particle Journal No. 38 (2021) 110–121
112
al., 2017, 2018, 2019a, 2019b) were (almost) single phase with a highly ordered L21 structure, although few samples had a tiny amount of second phases, as shown in Fig. 3. Some Heusler alloys disorder their atomic arrangements by heating, transforming the phase from L21 to B2 (disorder-ing between Y and Z atoms) followed by A2 (disordering between all atoms), which is referred to as “ordered alloys” rather than “intermetallic compounds” (Kojima T. et al., 2019a). Thus, a degree of ordering should be evaluated. A long-range order parameter is typically used for the evalu-ation, which is estimated from an XRD intensity ratio of a superlattice and fundamental peaks (Warren B.E., 1990). Webster’s model using parameters of S and α is easily usable for Heusler alloys, where a high S means a high ordering of X atoms and a low α means a high ordering of Y and Z atoms (Webster P.J. and Ziebeck K.R.A., 1973). All the samples had high S and low α (Kojima T. et al., 2017). Note that the superlattice peaks, such as 111 and 200 peaks, are essentially weak when the atomic numbers of the components are close, such as Co2FeGe (Fig. 3), because an intensity in the superlattice peaks is proportional to the square of the difference of the atomic numbers.
A specific surface area of catalysts was estimated using the Brunauer-Emmett-Teller method for Kr adsorption isotherms at 77 K, which is a typical method for surface area estimation. Although the values per weight distributed from 0.047 to 0.13 m2 g–1 depending on atomic weights, the values per volume were similar (4.0–8.3 × 10⁵ m–1) due to the sieving into 20–63 μm, as shown in Table 1.
Catalytic tests were conducted using a flow reactor, as shown in Fig. 4. An appropriate amount of catalyst pow-
ders was set on quartz wool in a quartz tube. Before the reactions, the catalyst was heated at 600 °C for 1 h under H2 gas flow to remove surface oxides and strain. A gaseous reactant was introduced from a mass flow controller with an inert carrier gas. A liquidous reactant was introduced using a plunger pump with the carrier gas, followed by evaporated using an electric furnace surrounding the quartz tube so that the reaction took place in the gas phase. Unreacted and produced gaseous species and their concentrations were analyzed using a gas chromatograph. When the amount of gas products was large (e.g. > 10 % of carrier gas), a flow meter was used for analysis along with
Fig. 3 XRD patterns for Ni2TiAl (red) and Co2FeGe (blue) powders. Intensity was normalized by the height of a 220 peak. Co2FeGe showed a peak of a second phase, which was likely CoGe.
Table 1 Specific surface area of catalysts.
Catalyst Surface area per weight [10–2 m2·g–1]
Surface area per volume [105 m–1]
Fe2TiSn 7.1 6.0
Co2TiAl 11 7.3
Co2TiGe 8.4 6.8
Co2TiSn 7.0 5.9
Co2MnSi 8.8 6.5
Co2MnGa 6.1 5.1
Co2MnGe 6.7 5.7
Co2MnSn 5.6 5.1
Co2FeGa 4.7 4.0
Co2FeGe 5.4 4.7
Ni2TiAl 13 8.3
Ni2TiSn 9.5 7.9
Ni2MnSn 8.9 7.7
Cu2TiAl 12 7.4
Fig. 4 Schematic illustration of a catalytic reaction system. The illus-tration is highly simplified.
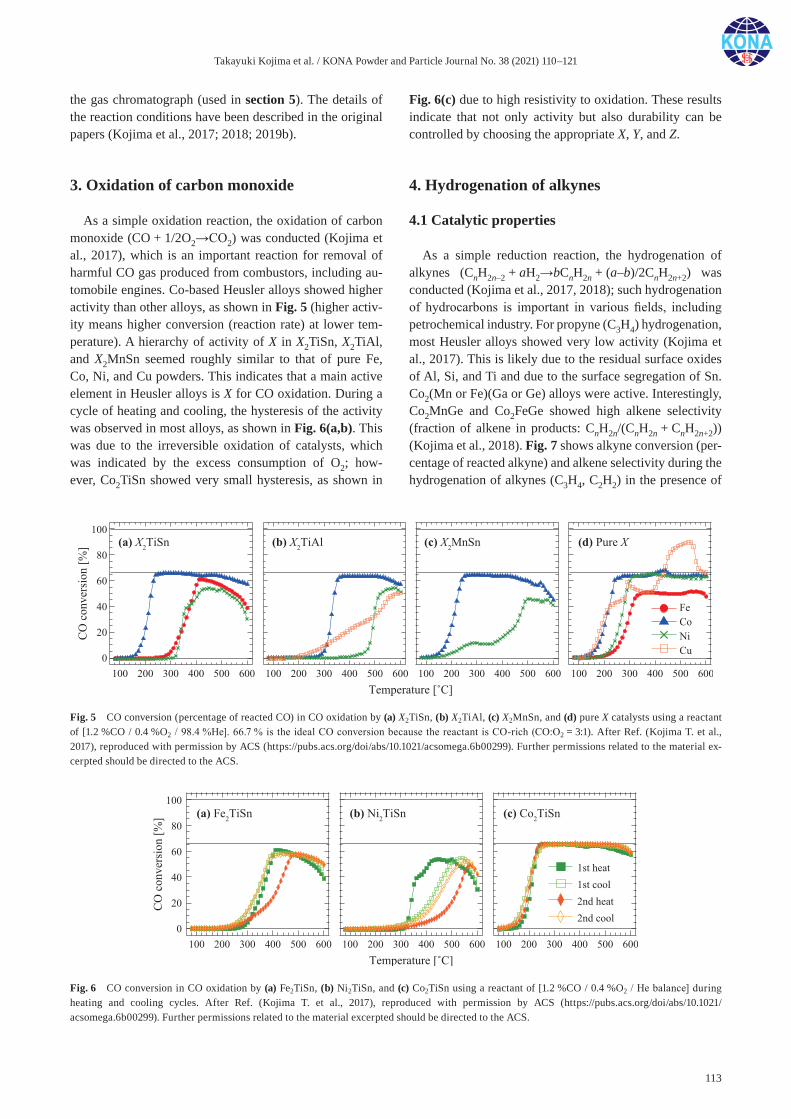
Takayuki Kojima et al. / KONA Powder and Particle Journal No. 38 (2021) 110–121
113
the gas chromatograph (used in section 5). The details of the reaction conditions have been described in the original papers (Kojima et al., 2017; 2018; 2019b).
3. Oxidation of carbon monoxide
As a simple oxidation reaction, the oxidation of carbon monoxide (CO + 1/2O2→CO2) was conducted (Kojima et al., 2017), which is an important reaction for removal of harmful CO gas produced from combustors, including au-tomobile engines. Co-based Heusler alloys showed higher activity than other alloys, as shown in Fig. 5 (higher activ-ity means higher conversion (reaction rate) at lower tem-perature). A hierarchy of activity of X in X2TiSn, X2TiAl, and X2MnSn seemed roughly similar to that of pure Fe, Co, Ni, and Cu powders. This indicates that a main active element in Heusler alloys is X for CO oxidation. During a cycle of heating and cooling, the hysteresis of the activity was observed in most alloys, as shown in Fig. 6(a,b). This was due to the irreversible oxidation of catalysts, which was indicated by the excess consumption of O2; how-ever, Co2TiSn showed very small hysteresis, as shown in
Fig. 6(c) due to high resistivity to oxidation. These results indicate that not only activity but also durability can be controlled by choosing the appropriate X, Y, and Z.
4. Hydrogenation of alkynes
4.1 Catalytic properties
As a simple reduction reaction, the hydrogenation of alkynes (CnH2n–2 + aH2→bCnH2n + (a–b)/2CnH2n+2) was conducted (Kojima et al., 2017, 2018); such hydrogenation of hydrocarbons is important in various fields, including petrochemical industry. For propyne (C3H4) hydrogenation, most Heusler alloys showed very low activity (Kojima et al., 2017). This is likely due to the residual surface oxides of Al, Si, and Ti and due to the surface segregation of Sn. Co2(Mn or Fe)(Ga or Ge) alloys were active. Interestingly, Co2MnGe and Co2FeGe showed high alkene selectivity (fraction of alkene in products: CnH2n/(CnH2n + CnH2n+2)) (Kojima et al., 2018). Fig. 7 shows alkyne conversion (per-centage of reacted alkyne) and alkene selectivity during the hydrogenation of alkynes (C3H4, C2H2) in the presence of
Fig. 5 CO conversion (percentage of reacted CO) in CO oxidation by (a) X2TiSn, (b) X2TiAl, (c) X2MnSn, and (d) pure X catalysts using a reactant of [1.2 %CO / 0.4 %O2 / 98.4 %He]. 66.7 % is the ideal CO conversion because the reactant is CO-rich (CO:O2 = 3:1). After Ref. (Kojima T. et al., 2017), reproduced with permission by ACS (https://pubs.acs.org/doi/abs/10.1021/acsomega.6b00299). Further permissions related to the material ex-cerpted should be directed to the ACS.
Fig. 6 CO conversion in CO oxidation by (a) Fe2TiSn, (b) Ni2TiSn, and (c) Co2TiSn using a reactant of [1.2 %CO / 0.4 %O2 / He balance] during heating and cooling cycles. After Ref. (Kojima T. et al., 2017), reproduced with permission by ACS (https://pubs.acs.org/doi/abs/10.1021/ acsomega.6b00299). Further permissions related to the material excerpted should be directed to the ACS.
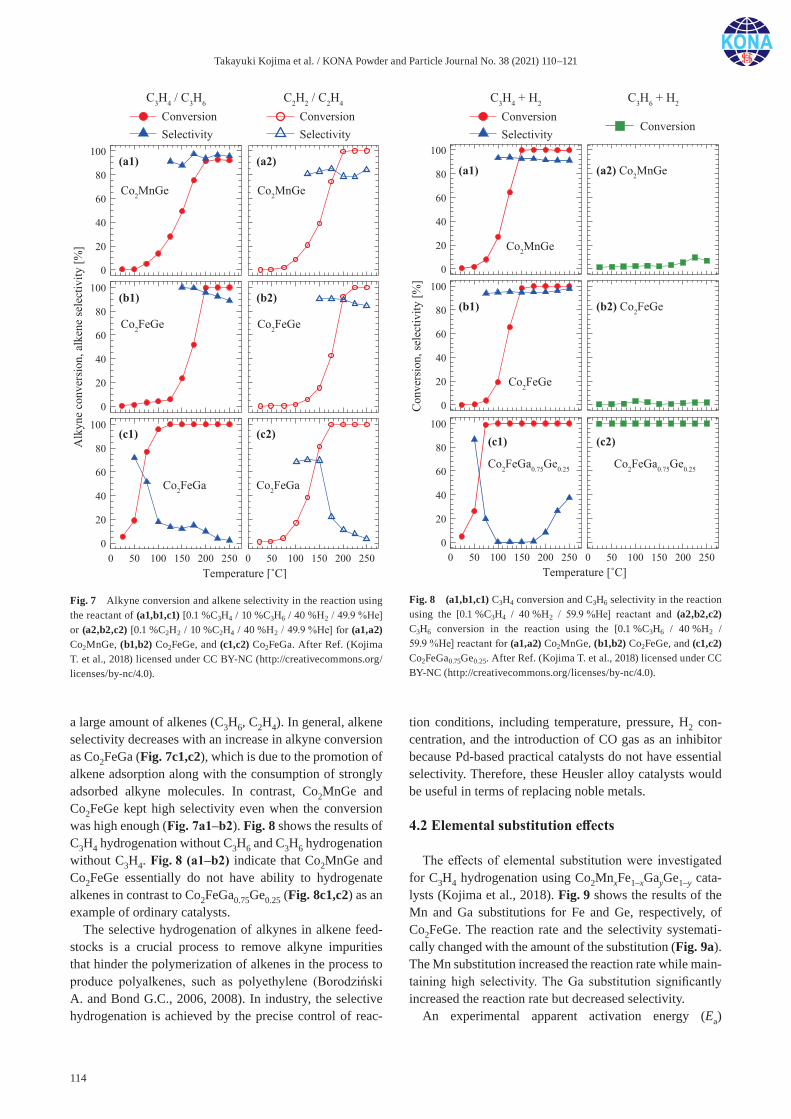
Takayuki Kojima et al. / KONA Powder and Particle Journal No. 38 (2021) 110–121
114
a large amount of alkenes (C3H6, C2H4). In general, alkene selectivity decreases with an increase in alkyne conversion as Co2FeGa (Fig. 7c1,c2), which is due to the promotion of alkene adsorption along with the consumption of strongly adsorbed alkyne molecules. In contrast, Co2MnGe and Co2FeGe kept high selectivity even when the conversion was high enough (Fig. 7a1–b2). Fig. 8 shows the results of C3H4 hydrogenation without C3H6 and C3H6 hydrogenation without C3H4. Fig. 8 (a1–b2) indicate that Co2MnGe and Co2FeGe essentially do not have ability to hydrogenate alkenes in contrast to Co2FeGa0.75Ge0.25 (Fig. 8c1,c2) as an example of ordinary catalysts.
The selective hydrogenation of alkynes in alkene feed-stocks is a crucial process to remove alkyne impurities that hinder the polymerization of alkenes in the process to produce polyalkenes, such as polyethylene (Borodziński A. and Bond G.C., 2006, 2008). In industry, the selective hydrogenation is achieved by the precise control of reac-
tion conditions, including temperature, pressure, H2 con-centration, and the introduction of CO gas as an inhibitor because Pd-based practical catalysts do not have essential selectivity. Therefore, these Heusler alloy catalysts would be useful in terms of replacing noble metals.
4.2 Elemental substitution effects
The effects of elemental substitution were investigated for C3H4 hydrogenation using Co2MnxFe1–xGayGe1–y cata-lysts (Kojima et al., 2018). Fig. 9 shows the results of the Mn and Ga substitutions for Fe and Ge, respectively, of Co2FeGe. The reaction rate and the selectivity systemati-cally changed with the amount of the substitution (Fig. 9a). The Mn substitution increased the reaction rate while main-taining high selectivity. The Ga substitution significantly increased the reaction rate but decreased selectivity.
An experimental apparent activation energy (Ea)
Fig. 7 Alkyne conversion and alkene selectivity in the reaction using the reactant of (a1,b1,c1) [0.1 %C3H4 / 10 %C3H6 / 40 %H2 / 49.9 %He] or (a2,b2,c2) [0.1 %C2H2 / 10 %C2H4 / 40 %H2 / 49.9 %He] for (a1,a2) Co2MnGe, (b1,b2) Co2FeGe, and (c1,c2) Co2FeGa. After Ref. (Kojima T. et al., 2018) licensed under CC BY-NC (http://creativecommons.org/licenses/by-nc/4.0).
Fig. 8 (a1,b1,c1) C3H4 conversion and C3H6 selectivity in the reaction using the [0.1 %C3H4 / 40 %H2 / 59.9 %He] reactant and (a2,b2,c2) C3H6 conversion in the reaction using the [0.1 %C3H6 / 40 %H2 / 59.9 %He] reactant for (a1,a2) Co2MnGe, (b1,b2) Co2FeGe, and (c1,c2) Co2FeGa0.75Ge0.25. After Ref. (Kojima T. et al., 2018) licensed under CC BY-NC (http://creativecommons.org/licenses/by-nc/4.0).
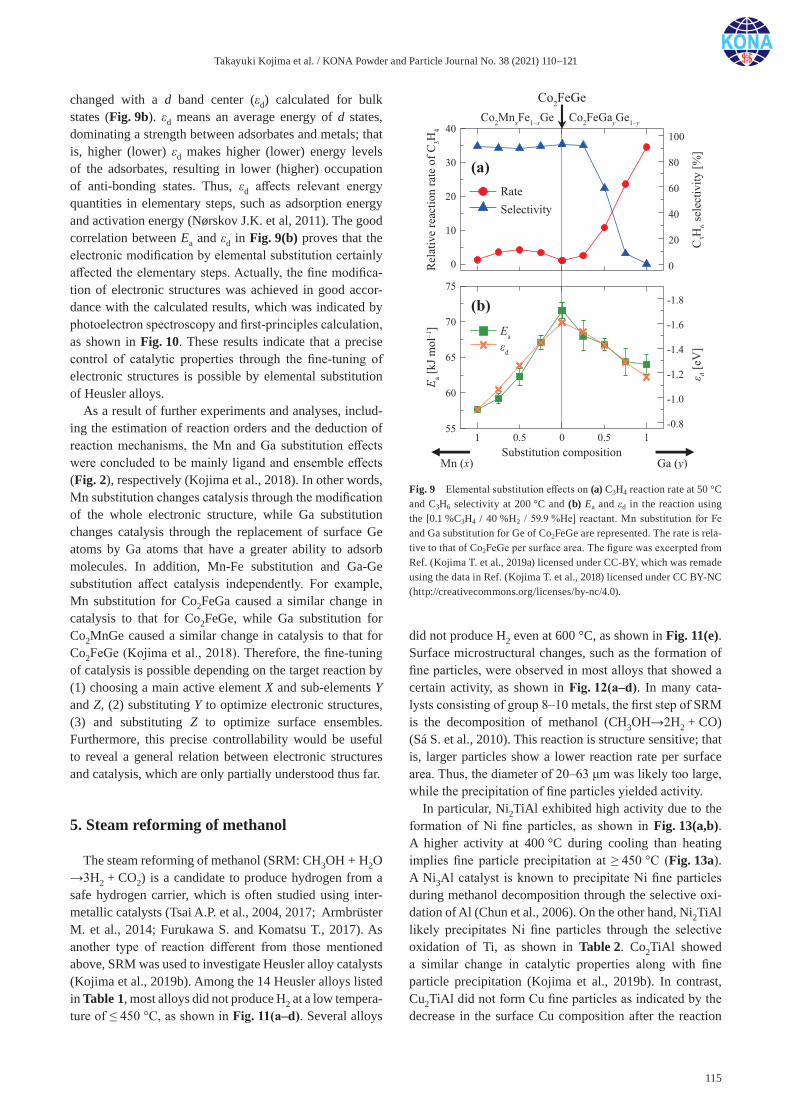
Takayuki Kojima et al. / KONA Powder and Particle Journal No. 38 (2021) 110–121
115
changed with a d band center (εd) calculated for bulk states (Fig. 9b). εd means an average energy of d states, dominating a strength between adsorbates and metals; that is, higher (lower) εd makes higher (lower) energy levels of the adsorbates, resulting in lower (higher) occupation of anti-bonding states. Thus, εd affects relevant energy quantities in elementary steps, such as adsorption energy and activation energy (Nørskov J.K. et al, 2011). The good correlation between Ea and εd in Fig. 9(b) proves that the electronic modification by elemental substitution certainly affected the elementary steps. Actually, the fine modifica-tion of electronic structures was achieved in good accor-dance with the calculated results, which was indicated by photoelectron spectroscopy and first-principles calculation, as shown in Fig. 10. These results indicate that a precise control of catalytic properties through the fine-tuning of electronic structures is possible by elemental substitution of Heusler alloys.
As a result of further experiments and analyses, includ-ing the estimation of reaction orders and the deduction of reaction mechanisms, the Mn and Ga substitution effects were concluded to be mainly ligand and ensemble effects (Fig. 2), respectively (Kojima et al., 2018). In other words, Mn substitution changes catalysis through the modification of the whole electronic structure, while Ga substitution changes catalysis through the replacement of surface Ge atoms by Ga atoms that have a greater ability to adsorb molecules. In addition, Mn-Fe substitution and Ga-Ge substitution affect catalysis independently. For example, Mn substitution for Co2FeGa caused a similar change in catalysis to that for Co2FeGe, while Ga substitution for Co2MnGe caused a similar change in catalysis to that for Co2FeGe (Kojima et al., 2018). Therefore, the fine-tuning of catalysis is possible depending on the target reaction by (1) choosing a main active element X and sub-elements Y and Z, (2) substituting Y to optimize electronic structures, (3) and substituting Z to optimize surface ensembles. Furthermore, this precise controllability would be useful to reveal a general relation between electronic structures and catalysis, which are only partially understood thus far.
5. Steam reforming of methanol
The steam reforming of methanol (SRM: CH3OH + H2O →3H2 + CO2) is a candidate to produce hydrogen from a safe hydrogen carrier, which is often studied using inter-metallic catalysts (Tsai A.P. et al., 2004, 2017; Armbrüster M. et al., 2014; Furukawa S. and Komatsu T., 2017). As another type of reaction different from those mentioned above, SRM was used to investigate Heusler alloy catalysts (Kojima et al., 2019b). Among the 14 Heusler alloys listed in Table 1, most alloys did not produce H2 at a low tempera-ture of ≤ 450 °C, as shown in Fig. 11(a–d). Several alloys
did not produce H2 even at 600 °C, as shown in Fig. 11(e). Surface microstructural changes, such as the formation of fine particles, were observed in most alloys that showed a certain activity, as shown in Fig. 12(a–d). In many cata-lysts consisting of group 8–10 metals, the first step of SRM is the decomposition of methanol (CH3OH→2H2 + CO) (Sá S. et al., 2010). This reaction is structure sensitive; that is, larger particles show a lower reaction rate per surface area. Thus, the diameter of 20–63 μm was likely too large, while the precipitation of fine particles yielded activity.
In particular, Ni2TiAl exhibited high activity due to the formation of Ni fine particles, as shown in Fig. 13(a,b). A higher activity at 400 °C during cooling than heating implies fine particle precipitation at ≥ 450 °C (Fig. 13a). A Ni3Al catalyst is known to precipitate Ni fine particles during methanol decomposition through the selective oxi-dation of Al (Chun et al., 2006). On the other hand, Ni2TiAl likely precipitates Ni fine particles through the selective oxidation of Ti, as shown in Table 2. Co2TiAl showed a similar change in catalytic properties along with fine particle precipitation (Kojima et al., 2019b). In contrast, Cu2TiAl did not form Cu fine particles as indicated by the decrease in the surface Cu composition after the reaction
Fig. 9 Elemental substitution effects on (a) C3H4 reaction rate at 50 °C and C3H6 selectivity at 200 °C and (b) Ea and εd in the reaction using the [0.1 %C3H4 / 40 %H2 / 59.9 %He] reactant. Mn substitution for Fe and Ga substitution for Ge of Co2FeGe are represented. The rate is rela-tive to that of Co2FeGe per surface area. The figure was excerpted from Ref. (Kojima T. et al., 2019a) licensed under CC-BY, which was remade using the data in Ref. (Kojima T. et al., 2018) licensed under CC BY-NC (http://creativecommons.org/licenses/by-nc/4.0).
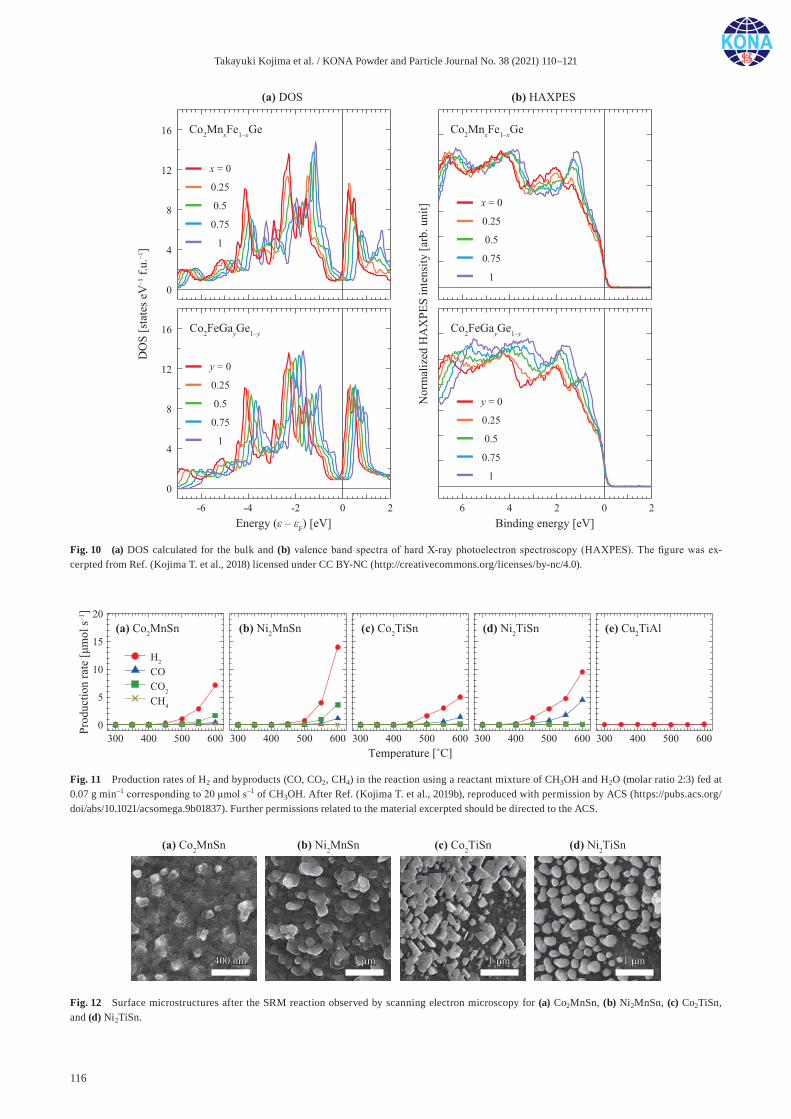
Takayuki Kojima et al. / KONA Powder and Particle Journal No. 38 (2021) 110–121
116
Fig. 11 Production rates of H2 and byproducts (CO, CO2, CH4) in the reaction using a reactant mixture of CH3OH and H2O (molar ratio 2:3) fed at 0.07 g min–1 corresponding to 20 μmol s–1 of CH3OH. After Ref. (Kojima T. et al., 2019b), reproduced with permission by ACS (https://pubs.acs.org/doi/abs/10.1021/acsomega.9b01837). Further permissions related to the material excerpted should be directed to the ACS.
Fig. 12 Surface microstructures after the SRM reaction observed by scanning electron microscopy for (a) Co2MnSn, (b) Ni2MnSn, (c) Co2TiSn, and (d) Ni2TiSn.
Fig. 10 (a) DOS calculated for the bulk and (b) valence band spectra of hard X-ray photoelectron spectroscopy (HAXPES). The figure was ex-cerpted from Ref. (Kojima T. et al., 2018) licensed under CC BY-NC (http://creativecommons.org/licenses/by-nc/4.0).
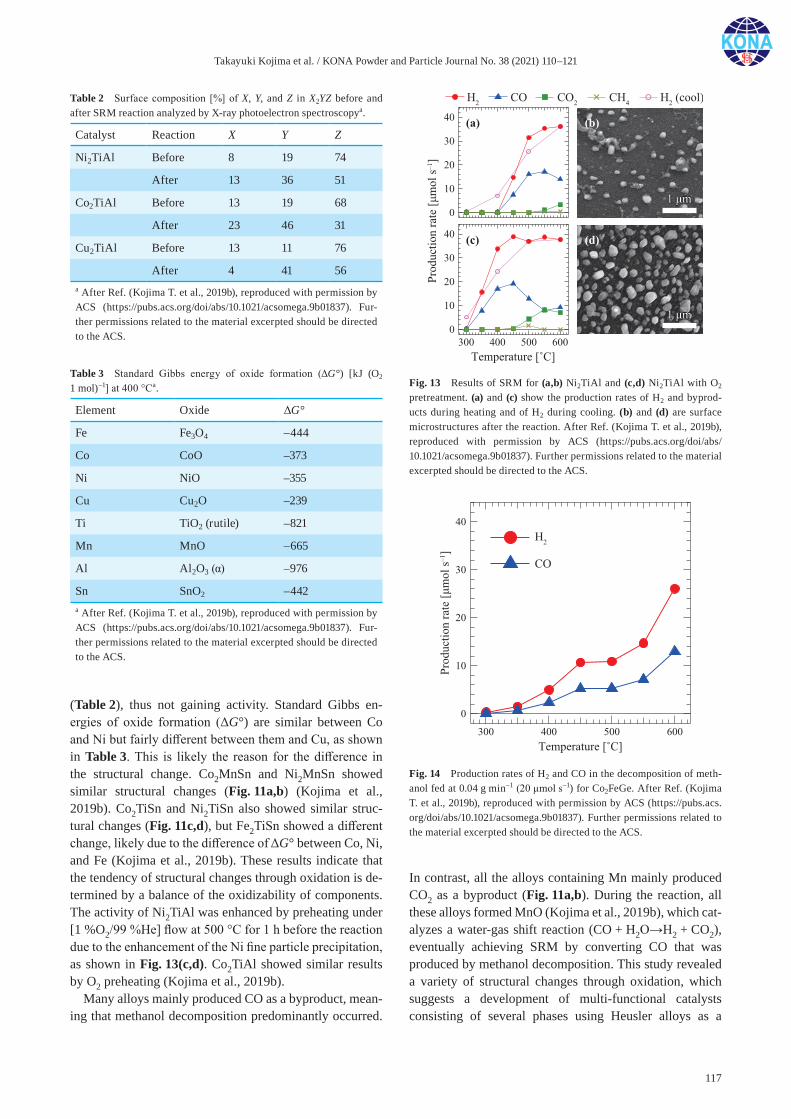
Takayuki Kojima et al. / KONA Powder and Particle Journal No. 38 (2021) 110–121
117
(Table 2), thus not gaining activity. Standard Gibbs en-ergies of oxide formation (ΔG°) are similar between Co and Ni but fairly different between them and Cu, as shown in Table 3. This is likely the reason for the difference in the structural change. Co2MnSn and Ni2MnSn showed similar structural changes (Fig. 11a,b) (Kojima et al., 2019b). Co2TiSn and Ni2TiSn also showed similar struc-tural changes (Fig. 11c,d), but Fe2TiSn showed a different change, likely due to the difference of ΔG° between Co, Ni, and Fe (Kojima et al., 2019b). These results indicate that the tendency of structural changes through oxidation is de-termined by a balance of the oxidizability of components. The activity of Ni2TiAl was enhanced by preheating under [1 %O2/99 %He] flow at 500 °C for 1 h before the reaction due to the enhancement of the Ni fine particle precipitation, as shown in Fig. 13(c,d). Co2TiAl showed similar results by O2 preheating (Kojima et al., 2019b).
Many alloys mainly produced CO as a byproduct, mean-ing that methanol decomposition predominantly occurred.
In contrast, all the alloys containing Mn mainly produced CO2 as a byproduct (Fig. 11a,b). During the reaction, all these alloys formed MnO (Kojima et al., 2019b), which cat-alyzes a water-gas shift reaction (CO + H2O→H2 + CO2), eventually achieving SRM by converting CO that was produced by methanol decomposition. This study revealed a variety of structural changes through oxidation, which suggests a development of multi-functional catalysts consisting of several phases using Heusler alloys as a
Table 2 Surface composition [%] of X, Y, and Z in X2YZ before and after SRM reaction analyzed by X-ray photoelectron spectroscopya.
Catalyst Reaction X Y Z
Ni2TiAl Before 8 19 74
After 13 36 51
Co2TiAl Before 13 19 68
After 23 46 31
Cu2TiAl Before 13 11 76
After 4 41 56a After Ref. (Kojima T. et al., 2019b), reproduced with permission by ACS (https://pubs.acs.org/doi/abs/10.1021/acsomega.9b01837). Fur-ther permissions related to the material excerpted should be directed to the ACS.
Table 3 Standard Gibbs energy of oxide formation (ΔG°) [kJ (O2 1 mol)–1] at 400 °Ca.
Element Oxide ΔG°
Fe Fe3O4 –444
Co CoO –373
Ni NiO –355
Cu Cu2O –239
Ti TiO2 (rutile) –821
Mn MnO –665
Al Al2O3 (α) –976
Sn SnO2 –442a After Ref. (Kojima T. et al., 2019b), reproduced with permission by ACS (https://pubs.acs.org/doi/abs/10.1021/acsomega.9b01837). Fur-ther permissions related to the material excerpted should be directed to the ACS.
Fig. 14 Production rates of H2 and CO in the decomposition of meth-anol fed at 0.04 g min–1 (20 μmol s–1) for Co2FeGe. After Ref. (Kojima T. et al., 2019b), reproduced with permission by ACS (https://pubs.acs.org/doi/abs/10.1021/acsomega.9b01837). Further permissions related to the material excerpted should be directed to the ACS.
Fig. 13 Results of SRM for (a,b) Ni2TiAl and (c,d) Ni2TiAl with O2 pretreatment. (a) and (c) show the production rates of H2 and byprod-ucts during heating and of H2 during cooling. (b) and (d) are surface microstructures after the reaction. After Ref. (Kojima T. et al., 2019b), reproduced with permission by ACS (https://pubs.acs.org/doi/abs/ 10.1021/acsomega.9b01837). Further permissions related to the material excerpted should be directed to the ACS.
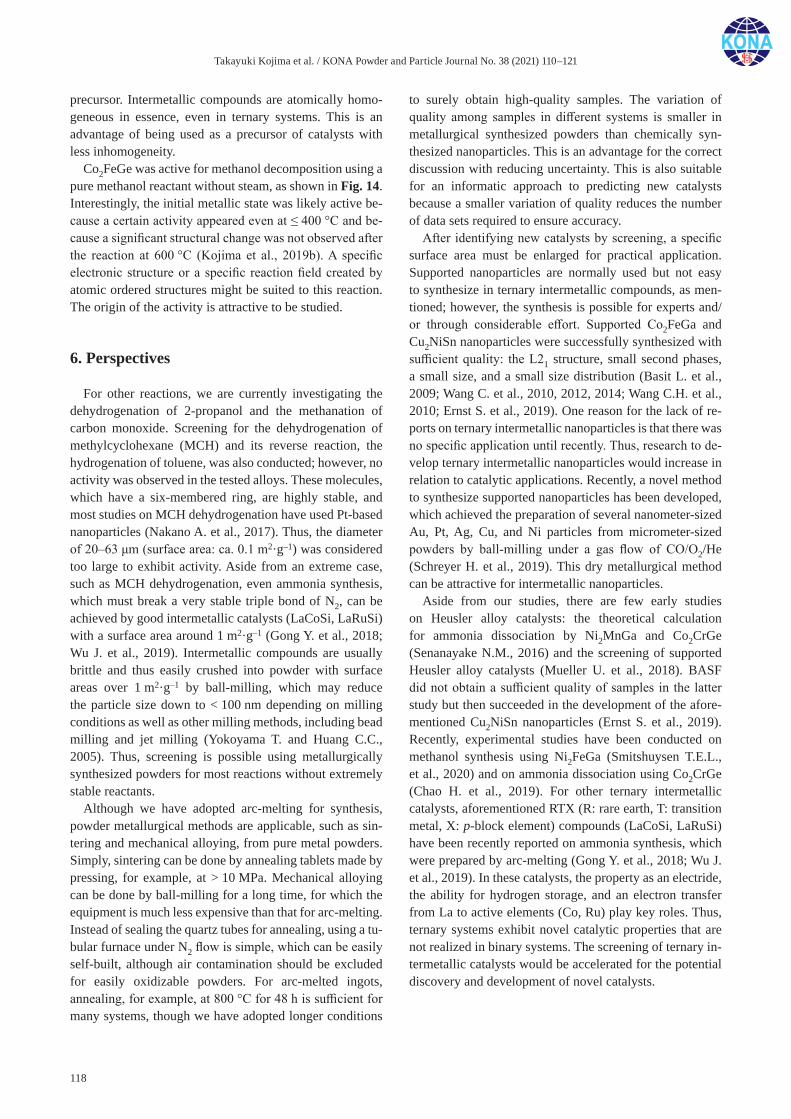
Takayuki Kojima et al. / KONA Powder and Particle Journal No. 38 (2021) 110–121
118
precursor. Intermetallic compounds are atomically homo-geneous in essence, even in ternary systems. This is an advantage of being used as a precursor of catalysts with less inhomogeneity.
Co2FeGe was active for methanol decomposition using a pure methanol reactant without steam, as shown in Fig. 14. Interestingly, the initial metallic state was likely active be-cause a certain activity appeared even at ≤ 400 °C and be-cause a significant structural change was not observed after the reaction at 600 °C (Kojima et al., 2019b). A specific electronic structure or a specific reaction field created by atomic ordered structures might be suited to this reaction. The origin of the activity is attractive to be studied.
6. Perspectives
For other reactions, we are currently investigating the dehydrogenation of 2-propanol and the methanation of carbon monoxide. Screening for the dehydrogenation of methylcyclohexane (MCH) and its reverse reaction, the hydrogenation of toluene, was also conducted; however, no activity was observed in the tested alloys. These molecules, which have a six-membered ring, are highly stable, and most studies on MCH dehydrogenation have used Pt-based nanoparticles (Nakano A. et al., 2017). Thus, the diameter of 20–63 μm (surface area: ca. 0.1 m2·g–1) was considered too large to exhibit activity. Aside from an extreme case, such as MCH dehydrogenation, even ammonia synthesis, which must break a very stable triple bond of N2, can be achieved by good intermetallic catalysts (LaCoSi, LaRuSi) with a surface area around 1 m2·g–1 (Gong Y. et al., 2018; Wu J. et al., 2019). Intermetallic compounds are usually brittle and thus easily crushed into powder with surface areas over 1 m2·g–1 by ball-milling, which may reduce the particle size down to < 100 nm depending on milling conditions as well as other milling methods, including bead milling and jet milling (Yokoyama T. and Huang C.C., 2005). Thus, screening is possible using metallurgically synthesized powders for most reactions without extremely stable reactants.
Although we have adopted arc-melting for synthesis, powder metallurgical methods are applicable, such as sin-tering and mechanical alloying, from pure metal powders. Simply, sintering can be done by annealing tablets made by pressing, for example, at > 10 MPa. Mechanical alloying can be done by ball-milling for a long time, for which the equipment is much less expensive than that for arc-melting. Instead of sealing the quartz tubes for annealing, using a tu-bular furnace under N2 flow is simple, which can be easily self-built, although air contamination should be excluded for easily oxidizable powders. For arc-melted ingots, annealing, for example, at 800 °C for 48 h is sufficient for many systems, though we have adopted longer conditions
to surely obtain high-quality samples. The variation of quality among samples in different systems is smaller in metallurgical synthesized powders than chemically syn-thesized nanoparticles. This is an advantage for the correct discussion with reducing uncertainty. This is also suitable for an informatic approach to predicting new catalysts because a smaller variation of quality reduces the number of data sets required to ensure accuracy.
After identifying new catalysts by screening, a specific surface area must be enlarged for practical application. Supported nanoparticles are normally used but not easy to synthesize in ternary intermetallic compounds, as men-tioned; however, the synthesis is possible for experts and/or through considerable effort. Supported Co2FeGa and Cu2NiSn nanoparticles were successfully synthesized with sufficient quality: the L21 structure, small second phases, a small size, and a small size distribution (Basit L. et al., 2009; Wang C. et al., 2010, 2012, 2014; Wang C.H. et al., 2010; Ernst S. et al., 2019). One reason for the lack of re-ports on ternary intermetallic nanoparticles is that there was no specific application until recently. Thus, research to de-velop ternary intermetallic nanoparticles would increase in relation to catalytic applications. Recently, a novel method to synthesize supported nanoparticles has been developed, which achieved the preparation of several nanometer-sized Au, Pt, Ag, Cu, and Ni particles from micrometer-sized powders by ball-milling under a gas flow of CO/O2/He (Schreyer H. et al., 2019). This dry metallurgical method can be attractive for intermetallic nanoparticles.
Aside from our studies, there are few early studies on Heusler alloy catalysts: the theoretical calculation for ammonia dissociation by Ni2MnGa and Co2CrGe (Senanayake N.M., 2016) and the screening of supported Heusler alloy catalysts (Mueller U. et al., 2018). BASF did not obtain a sufficient quality of samples in the latter study but then succeeded in the development of the afore-mentioned Cu2NiSn nanoparticles (Ernst S. et al., 2019). Recently, experimental studies have been conducted on methanol synthesis using Ni2FeGa (Smitshuysen T.E.L., et al., 2020) and on ammonia dissociation using Co2CrGe (Chao H. et al., 2019). For other ternary intermetallic catalysts, aforementioned RTX (R: rare earth, T: transition metal, X: p-block element) compounds (LaCoSi, LaRuSi) have been recently reported on ammonia synthesis, which were prepared by arc-melting (Gong Y. et al., 2018; Wu J. et al., 2019). In these catalysts, the property as an electride, the ability for hydrogen storage, and an electron transfer from La to active elements (Co, Ru) play key roles. Thus, ternary systems exhibit novel catalytic properties that are not realized in binary systems. The screening of ternary in-termetallic catalysts would be accelerated for the potential discovery and development of novel catalysts.
Takayuki Kojima et al. / KONA Powder and Particle Journal No. 38 (2021) 110–121
119
Acknowledgements
We are grateful to Prof. Shinpei Fujii of Kagoshima University and to Dr. Shigenori Ueda of National Institute for Materials Science for collaborating with us for the elec-tronic structure evaluation by first-principles calculation and HAXPES. The HAXPES was conducted at BL15XU at SPring-8 under the approval of NIMS Synchrotron X-ray Station (proposal no. 2017B4905). This work was partially supported by JSPS KAKENHI grant number JP19H02452, the Hattori Hokokai Foundation, the Iwatani Naoji Foun-dation, the Noguchi Institute, and NIMS microstructural characterization platform as a program of ‘Nanotechnology Platform’ (project no. 12024046) of MEXT, Japan. We also thank the supports from the Program for Creation of Interdisciplinary Research from FRIS, Tohoku University, and from Dynamic Alliance for Open Innovation Bridging Human, Environment and Materials.
Sections 3–6 were partly written based on the review paper in Japanese (Kojima T., 2020).
References
Armbrüster M., Schlögl R., Grin Y., Intermetallic compounds in heterogeneous catalysis—a quickly developing field, Science and Technology of Advanced Materials, 15 (2014) 034803 (17pp). DOI: 10.1088/1468-6996/15/3/034803
Basit L., Wang C., Jenkins C.A., Balke B., Ksenofontov V., Fecher G.H., Felser C., Mugnaioli E., Kolb U., Nepijko S.A., Schönhense G., Klimenkov M., Heusler compounds as ternary intermetallic nanoparticles: Co2FeGa, Journal of Physics D: Applied Physics, 42 (2009) 084018 (7pp). DOI: 10.1088/0022-3727/42/8/084018
Borodziński A., Bond G.C., Selective hydrogenation of ethyne in ethene-rich streams on palladium catalysts. part 1. effect of changes to the catalyst during reaction, Catalysis Reviews, 48 (2006) 91–144. DOI: 10.1080/01614940500364909
Borodziński A., Bond G.C., Selective hydrogenation of ethyne in ethene-rich streams on palladium catalysts, part 2: steady-state kinetics and effects of palladium particle size, carbon monoxide, and promoters, Catalysis Reviews, 50 (2008) 379–469. DOI: 10.1080/01614940802142102
Chao H., Yang T.C.K., Wang S.F., Lu S.Q., The sputtering of Heusler alloy catalyst onto the porous anode of the inter-mediate temperature solid oxide fuel cells for ammonia disassociation, ECS Transactions, 91 (2019) 361–365. DOI: 10.1149/09101.0361ecst
Chun D.H., Xu Y., Demura M., Kishida K., Wee D.M., Hirano T., Spontaneous catalytic activation of Ni3Al thin foils in methanol decomposition, Journal of Catalysis, 243 (2006) 99–107. DOI: 10.1016/j.jcat.2006.07.011
Dshemuchadse J., Steurer W., More statistics on intermetallic compounds – ternary phases, Acta Crystallographica, A71 (2015) 335–345. DOI: 10.1107/S2053273315004064
Ernst S., Malter O., Schuessler A., Braunsmann K., Trukhan
N., Mueller U. (inventors), BASF SE(assignee), Supported intermetallic compounds and use as catalyst, United States patent, (2019) US20190358613A1.
Furukawa S., Komatsu T., Intermetallic compounds: Promising inorganic materials for well-structured and electronically modified reaction environments for efficient catalysis, ACS Catalysis, 7 (2017) 735–765. DOI: 10.1021/acscatal.6b02603
Gong Y., Wu J., Kitano M., Wang J., Ye T.N., Li J., Kobayashi Y., Kishida K., Abe H., Niwa Y., Yang H., Tada T., Hosono H., Ternary intermetallic LaCoSi as a catalyst for N2 activation, Nature Catalysis, 1 (2018) 178–185. DOI: 10.1038/s41929-017-0022-0
Graf T., Felser C., Parkin S.S.P., Heusler Compounds: Applica-tions in Spintronics, in: Yongbing X., Awschalom D.D., Nitta J., (Eds.), Handbook of Spintronics, Springer Netherlands, 2016, pp. 335–364. ISBN: 978-94-007-6892-5. DOI: 10.1007/ 978-94-007-6892-5_17
Kojima T., Catalytic properties of ternary intermetallic com-pounds “Heusler alloys”, Materia Japan, 59 (2020) 354–360. DOI: 10.2320/materia.59.354.
Kojima T., Kameoka S., Fujii S., Ueda S., Tsai A.P., Catalysis- tunable Heusler alloys in selective hydrogenation of alkynes: a new potential for old materials, Science Advances, 4 (2018) eaat6063 (7pp). DOI: 10.1126/sciadv.aat6063
Kojima T., Kameoka S., Tsai A.P., Heusler alloys: a group of novel catalysts, ACS Omega, 2 (2017) 147–153. DOI: 10.1021/ acsomega.6b00299
Kojima T., Kameoka S., Tsai A.P., The emergence of Heusler alloy catalysts, Science and Technology of Advanced Materials, 20 (2019a) 445–455. DOI: 10.1080/14686996.2019.1598238
Kojima T., Kameoka S., Tsai A.P., Catalytic properties of Heusler alloys for steam reforming of methanol, ACS Omega, 4 (2019b) 21666–21674. DOI: 10.1021/acsomega.9b01837
Manna K., Sun Y., Muechler L., Kübler J., Felser C., Heusler, Weyl and Berry, Nature Reviews Materials, 3 (2018) 244–256. DOI: 10.1038/s41578-018-0036-5
Mueller U, Sundermann A, Trukhan N, Maurer S, Ernst S, Paluch N, Malter O, Schuessler A (inventors), BASF SE(assignee), Ternary intermetallic compound catalyst, United States patent, (2018) US20180243691A1.
Nakano A., Manabe S., Higo T., Seki H., Nagatake S., Yabe T., Ogo S., Nagatsuka T., Sugiura Y., Iki H., Sekine Y., Effects of Mn addition on dehydrogenation of methylcyclohexane over Pt/Al2O3 catalyst, Applied Catalysis A, General, 543 (2017) 75–81. DOI: 10.1016/j.apcata.2017.06.017
Nishino Y., Kato H., Kato M., Mizutani U., Effect of off- stoichiometry on the transport properties of the Heusler-type Fe2VAl compound, Physical Review B, 63 (2001) 233303 (4pp). DOI: 10.1103/PhysRevB.63.233303
Nørskov J.K., Abild-Pedersen F., Studt F., Bligaard T., Density functional theory in surface chemistry and catalysis, Pro-ceedings of the National Academy of Sciences of the United States of America, 108 (2011) 937–943. DOI: 10.1073/pnas.1006652108
Planes A., Mañosa L., Acet M., Magnetocaloric effect and its relation to shape-memory properties in ferromagnetic Heu-sler alloys, Journal of Physics: Condensed Matter 21 (2009) 233201 (29pp). DOI: 10.1088/0953-8984/21/23/233201
Takayuki Kojima et al. / KONA Powder and Particle Journal No. 38 (2021) 110–121
120
Sá S., Silva H., Brandao L., Sousa J.M., Mendes A., Catalysts for methanol steam reforming—a review, Applied Catal-ysis B: Environmental, 99 (2010) 43–57. DOI: 10.1016/j.apcatb.2010.06.015
Schreyer H., Eckert R., Immohr S., de Bellis J., Felderhoff M., Schüth F., Milling down to nanometers: a general process for the direct dry synthesis of supported metal catalysts, Angewandte Chemie International Edition, 58 (2019) 11262–11265. DOI: 10.1002/anie.201903545
Senanayake N.M., Exploring Heusler alloys as catalysts for ammonia dissociation, master’s thesis for Bowling Green State University, USA (2016).
Smitshuysen T.E.L., Nielsen M.R., Pruessmann T., Zimina A., Sheppard T.L., Grunwaldt J.-D., Chorkendorff I., Dams-gaard C.D., Optimizing Ni-Fe-Ga alloys into Ni2FeGa for the hydrogenation of CO2 into methanol, ChemCatChem, (2020). DOI: 10.1002/cctc.202000174
Tsai A.P., Kameoka S., Ishii Y., PdZn = Cu: Can an intermetallic compound replace an element?, Journal of the Physical Society of Japan, 73 (2004) 3270–3273. DOI: 10.1143/JPSJ.73.3270
Tsai A.P., Kameoka S., Nozawa K., Shimoda M., Ishii Y., Intermetallic: a pseudoelement for catalysis, Accounts of Chemical Research, 50 (2017) 2879–2885. DOI: 10.1021/acs.accounts.7b00476
Wang C., Basit L., Khalavka Y., Guo Y., Casper F., Gasi T., Ksenofontov V., Balke B., Fecher G.H., Sönnichsen C., Hwu Y.K., Lee J.J., Felser C., Probing the size effect of Co2FeGa- SiO2@C nanocomposite particles prepared by a chemical approach, Chemistry of Materials, 22 (2010) 6575–6582. DOI: 10.1021/cm1023579
Wang C.H., Guo Y.Z., Casper F., Balke B., Fecher G.H., Felser C., Hwu Y., Size correlated long and short range order of ternary Co2FeGa Heusler nanoparticles, Applied Physics Letters, 97 (2010) 103106 (3pp). DOI: 10.1063/1.3488805
Wang C., Casper F., Guo Y., Gasi T., Ksenofontov V., Balke B., Fecher G.H., Felser C., Hwu Y.K., Lee J.J., Resolving the phase structure of nonstoichiometric Co2FeGa Heusler nanoparticles. Journal of Applied Physics, 112 (2012) 124314 (8pp). DOI: 10.1063/1.4770477
Wang C., Meyer J., Teichert N., Auge A., Rausch E., Balke B., Hütten A., Fecher G.H., Felser C., Heusler nanoparticles for spintronics and ferromagnetic shape memory alloys, Journal of Vacuum Science and Technology B, 32 (2014) 020802 (13pp). DOI: 10.1116/1.4866418
Warren B.E., X-ray Diffraction, Dover Publications, New York, 1990, ISBN: 9780486663173.
Webster P.J., Ziebeck K.R.A., Magnetic and chemical order in Heusler alloys containing cobalt and titanium, Journal of Physics and Chemistry of Solids, 34 (1973) 1647–1654. DOI: 10.1016/S0022-3697(73)80130-1
Wu J., Li J., Gong Y., Kitano M., Inoshita T., Hosono H., Intermetallic electride catalyst as a platform for ammonia synthesis, Angewandte Chemie International Edition, 58 (2019) 825–829. DOI: 10.1002/anie.201812131
Yin M., Hasier J., Nash P., A review of phase equilibria in Heusler alloy systems containing Fe, Co or Ni, Journal of Materials Science, 51 (2016) 50–70. DOI: 10.1007/s10853-015-9389-y
Yokoyama T., Huang C.C., Nanoparticle technology for produc-tion of functional materials, KONA Powder and Particle Journal, 23 (2005) 7–17. DOI: 10.14356/kona.2005006
Authors’ Short Biographies
Takayuki Kojima
Dr. Kojima majored in materials science during his student career (2001–2006: Kurume National College of Technology; 2006–2013: Tohoku University for bachelor, master, doctoral). He researched magnetic material thin-films when he was a graduate student. He then came up with the idea of using Heusler alloys as catalysts, which are popular as magnetic materials, inspired by Prof. A.P. Tsai’s lecture on “like electronic structure, like catalysis”, and began conducting catalytic studies in Tsai’s group in 2014. He is currently researching catalysts and functional materials, including magnetic materials, through an interdisciplinary approach as an Assistant Professor of FRIS.

Takayuki Kojima et al. / KONA Powder and Particle Journal No. 38 (2021) 110–121
121
Authors’ Short Biographies
Satoshi Kameoka
Dr. Kameoka is an Associate Professor at the Institute of Multidisciplinary Research for Advanced Materials (IMRAM), Tohoku University. He received his PhD from University of Tsukuba in 1996. In 2004, he moved to IMRAM as a Research Associate. His research interests are catalysis by metals and alloys. He has performed collaborative research with Prof. Tsai and Dr. Kojima in studies on the metallurgy for advanced catalysis materials since 2002 and 2014, respectively.
An-Pang Tsai
Dr. Tsai was an outstanding researcher who is well-known for the first discoveries of a stable quasicrystal and a binary quasicrystal. Most quasicrystals were discovered by him. He received his PhD from Tohoku University and many honors, including the Medal of Honor with Purple Ribbon (Japan), and was elected as a member of Academia Sinica (Taiwan). He became a Professor of IMRAM in 2004 after working at the Institute for Materials Research of Tohoku University and the National Institute for Materials Science (NIMS). He began research on catalysis from a metallurgical viewpoint about 20 years ago. He passed away on May 25, 2019 (age 60).
KONA Powder and Particle Journal No. 38 (2021) 122–135/https://doi.org/10.14356/kona.2021006 Review Paper
122Copyright © 2021 The Authors. Published by Hosokawa Powder Technology Foundation. This is an open access article under the CC BY license (http://creativecommons.org/licenses/by/4.0/).
Particle Preparation and Morphology Control with Mutual Diffusion Across Liquid-Liquid Interfaces †
Kazunori Kadota 1 and Yoshiyuki Shirakawa 2*1 Department of Formulation Design and Pharmaceutical Technology, Osaka University of Pharmaceutical Sciences, Japan2 Department of Chemical Engineering and Material Science, Doshisha University, Japan
AbstractAdvanced functional materials require sophisticated control of particle characteristics. The bottom-up process has been extensively used to produce functional materials for controlling the particle properties of composite particles. We propose crystallization at liquid-liquid interfaces as an advanced particle formation method. This review introduces crystallization at a liquid-liquid interface based on several case studies used in various applications. Conventional crystallization has been generally used to produce crystals and particles with homogeneous particle properties. Liquid-liquid interfacial crystallization makes it possible to create composite particles with hetero-phase structures and interfaces. Liquid-liquid interfacial crystallization with an inkjet technique can control the droplet size accurately, and the shape and particle size distribution are successfully controlled in inorganic-organic composite particles. In addition, we succeed in creating organic-organic composite particles using the interfacial crystallization by an ultrasonic spray nozzle. The coating efficiency of organic particles on the particles is enhanced using the ultrasonic spray nozzle in comparison with anti-solvent crystallization. In this study, the fabrication of inorganic-organic composite particles using a coaxial tube reactor on the liquid-liquid interfacial crystallization is proven successful. These findings suggest that liquid-liquid interfacial crystallization is a promising means of efficiently producing composite particles because of their applicability to infusion in various processes.
Keywords: composite particles, crystallization, liquid-liquid interface, morphology, supersaturation
1. Introduction
Fine particular material is employed in various indus-trial applications such as chemical, pharmaceutical, cos-metics, and food products. The physicochemical properties of particles originally affect the performance or features of products composed of powder. The ability to control particle properties such as shape, morphology, size, and size distribution is indispensable to developing industrial fields (Provis et al., 2010; Saallah and Lenggoro, 2018; Fuji et al., 2013). Particle-generation approaches that create fine particles can mainly be divided into two processes: break-down and bottom-up (Yokoyama and Huang, 2005; Tavares, 2017; Opalski et al., 2019). The bottom-up approach is commonly used to control the par-ticle properties during fabrication processes. In particular, the bottom-up approach has recently gained attention due
to its several advantages such as lower energy processes, lower cost, and simpler instrumentation (Sinha et al., 2013; Vece, 2019). Previously, numerous bottom-up ap-proaches such as crystallization have been successful in controlling particle properties for the purpose of obtain-ing powder products with different features (Fuchs et al., 2008; Horn and Rieger, 2001; Kadota et al., 2006; Worlitschek and Mazzotti, 2004). The bottom-up ap-proach has been extensively used in producing composite materials in terms of controlling the particle properties of composite particles (Leon et al., 2014). Hetero-phase structures and interfaces in composite materials can pro-vide additional functions to products and approaches that creation of interfaces and structures have been regarded as a driving force of new innovative product development (Shirakawa et al., 2006; Shirakawa et al., 2010). Several composite materials such as inorganic-organic and organic-organic products have been developed. Inorganic- organic composite materials have gathered attention for use in catalysts and photoelectronic materials, whereas organic-organic composite materials are currently being developed as biomaterial and pharmaceutical products (Alam et al., 2018; Lazzara et al., 2018).
† Received 26 October 2019; Accepted 3 March 2020 J-STAGE Advance published online 29 April 2020
* Corresponding author: Yoshiyuki Shirakawa Add: 1-3 Miyakodani, Tatara, Kyotanabe, Kyoto 610-0321, Japan E-mail: [email protected] TEL/FAX: +81-774-65-6596
Kazunori Kadota et al. / KONA Powder and Particle Journal No. 38 (2021) 122–135
123
Composite materials using inorganic-organic or organic-organic materials have been proceeded for deliv-ering drugs and other bioactive molecules for over 30 years. Several products are ongoing or have been ap-proved worldwide as nanocarriers of drug delivery sys-tems (Natarajan et al., 2014). Most of these nanocarrier products have focused on target drug delivery such as cancer chemotherapy and effectively utilize the size ad-vantage of nanocarriers to provide a favorable distribution of the drug carrier to the human body. Several researchers have previously succeeded in generating sustained-release products to nanocarrier applications (D’souza and DeLuca, 2006; Washington, 1990). The accomplishment in sustained release of bioactive molecules has broken ground as nanotherapeutics. As a representative product of composite materials, nanocarriers that provide spatio-temporal control of drug release contributed to the im-provement in the therapeutic efficacy of drugs and the reduction in toxicity. Among composite materials, nano-carriers confront tough and original challenges in drug-release kinetics control because of the large surface area per volume ratio and small diffusion. For develop-ment of nanocarriers such as composite particles with fa-vorable release kinetics for drug delivery applications, understanding the mechanisms by which a carrier retains and releases a drug (Lee and Yeo, 2015) is crucial.
The silica nanoparticles with porous and hollow struc-tures for controlling release kinetics of drugs were previ-ously prepared using bottom-up approaches (Li Z. et al., 2004). Porous hollow silica nanoparticles with drugs were prepared through a sol-gel method and using a CaCO3 template method (Nakashima et al., 2018). The prepared porous hollow silica nanoparticles were utilized as a car-rier to investigate the controlled release kinetics of model substances. A drug injected into the inner core and fused onto the surfaces of the silica nanoparticles was released more gradually into a solution as compared to the general silica nanoparticles, exhibiting a typical sustained release without any burst phenomena. The results showed that porous hollow silica nanoparticles have a prospective po-tential in controlled drug delivery systems. Aw et al. (2012) also applied porous hollow silica as a biocarrier of drug delivery systems of indomethacin (IMC) as a model of a slightly water-soluble drug. The effectiveness of po-rous hollow silica as an oral-drug delivery system showed a high load capacity of drugs and sustained drug release over a long period. These natural materials based on silica can be successfully utilized as a biocarrier for both oral and implant drug delivery systems.
Except for silica, metal-organic frameworks (MOFs), which are hybrid materials formed by bottom-up ap-proaches such as the self-assembly of polydentate bridg-ing ligands and metal-connecting points, have been gathering attention as new drug delivery systems (Rocca
et al., 2011). The MOFs have been reduced in size to nanometer sizes, and the nanoscale MOFs were developed as biomedical applications because of several attractive advantages over conventional nanomedicines, including their chemical and structural diversity, intrinsic biode-gradability, and high loading capacity. Nano MOFs have been employed to deliver anticancer drugs and other che-motherapeutics. Nano MOFs are attractive as potential materials for the accurately effective delivery to targeted cells or organs in vivo. Murugan and Krishnan (2018) fo-cused renewed attention on mesoporous silica for the ap-plication of “on-demand” drug delivery because the conception of targeted and sustained delivery of therapeu-tic compounds has been oriented into a more effective and attractive approach of drug release. These drug delivery systems have been extensively examined for site-specific delivery of single and multiple therapeutic agents. Al-though various types of external stimuli have been widely examined to bring about triggered and sustained drug re-lease from mesoporous silica, chemo-responsive systems provide more therapeutic effectiveness with minimal col-lateral damage commonly associated with external stim-uli. Therefore, these systems have been interpreted as “on-demand” drug release in mesoporous silica carriers and could achieve different strategies in response to vari-ous types of chemical stimuli.
This review introduces several case studies for crystal-lization with mutual diffusion across liquid-liquid inter-faces used in various applications. Crystallization at a liquid-liquid interface was developed to synthesize asym-metric particles and composite particles. This liquid- liquid interfacial crystallization was applied to various advanced processes, which enabled finding a new possi-bility for creating advanced functional materials.
2. Crystallization at liquid-liquid interface
Crystallization at liquid-liquid interfaces was proposed as an advanced particle synthesis technique in our previ-ous works (Kadota et al., 2007a; 2007b). This technique is a production method used to precipitate solute particles at the interface in partially miscible liquids. As a represen-tative example, emulsions prepared as templates in liquid- liquid dispersion systems have been expanded in the biomedical applications as tissue engineering materials and drug carriers (Wu and Ma, 2016). Several studies conducted by Ramsden (1903) and Pickering (1907) re-vealed another means of stabilizing droplets using solid particles without surfactants (Fujii and Murakami, 2008). Pickering emulsions can be widely employed in various fields such as food, biomedicine, fine chemical products, and cosmetics (Linke and Drusch, 2018). We developed a liquid-liquid interfacial crystallization using mutual
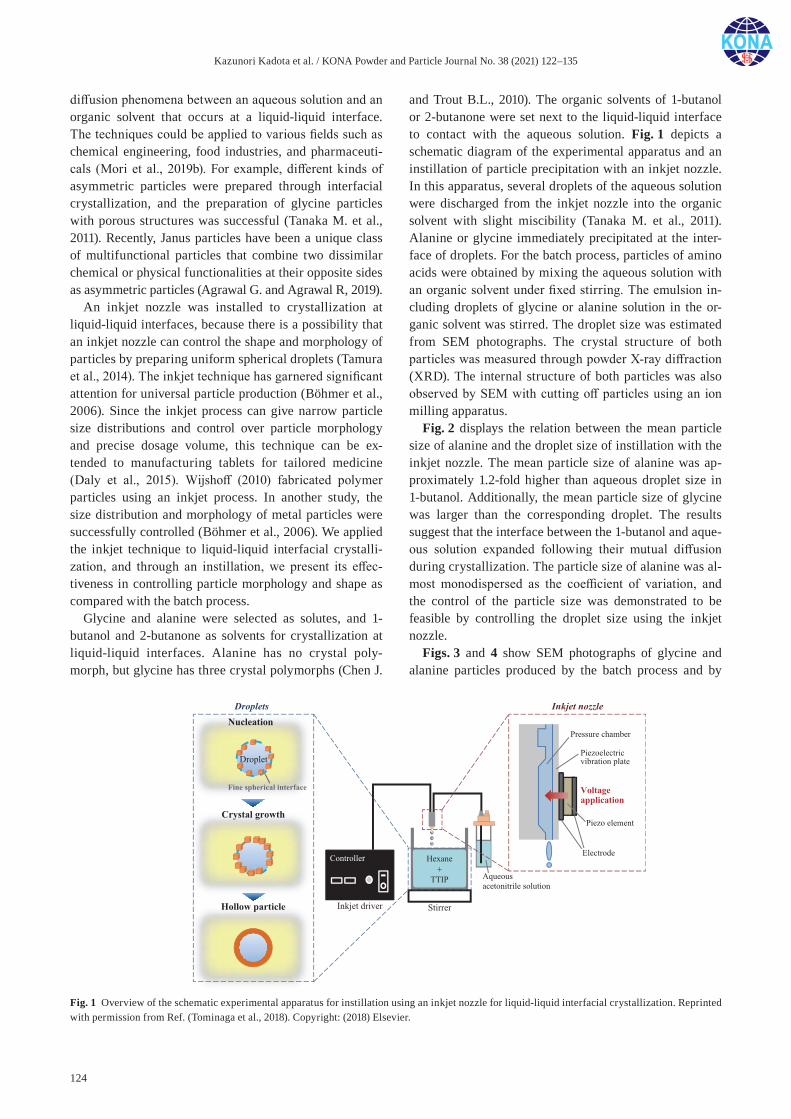
Kazunori Kadota et al. / KONA Powder and Particle Journal No. 38 (2021) 122–135
124
diffusion phenomena between an aqueous solution and an organic solvent that occurs at a liquid-liquid interface. The techniques could be applied to various fields such as chemical engineering, food industries, and pharmaceuti-cals (Mori et al., 2019b). For example, different kinds of asymmetric particles were prepared through interfacial crystallization, and the preparation of glycine particles with porous structures was successful (Tanaka M. et al., 2011). Recently, Janus particles have been a unique class of multifunctional particles that combine two dissimilar chemical or physical functionalities at their opposite sides as asymmetric particles (Agrawal G. and Agrawal R, 2019).
An inkjet nozzle was installed to crystallization at liquid-liquid interfaces, because there is a possibility that an inkjet nozzle can control the shape and morphology of particles by preparing uniform spherical droplets (Tamura et al., 2014). The inkjet technique has garnered significant attention for universal particle production (Böhmer et al., 2006). Since the inkjet process can give narrow particle size distributions and control over particle morphology and precise dosage volume, this technique can be ex-tended to manufacturing tablets for tailored medicine (Daly et al., 2015). Wijshoff (2010) fabricated polymer particles using an inkjet process. In another study, the size distribution and morphology of metal particles were successfully controlled (Böhmer et al., 2006). We applied the inkjet technique to liquid-liquid interfacial crystalli-zation, and through an instillation, we present its effec-tiveness in controlling particle morphology and shape as compared with the batch process.
Glycine and alanine were selected as solutes, and 1- butanol and 2-butanone as solvents for crystallization at liquid-liquid interfaces. Alanine has no crystal poly-morph, but glycine has three crystal polymorphs (Chen J.
and Trout B.L., 2010). The organic solvents of 1-butanol or 2-butanone were set next to the liquid-liquid interface to contact with the aqueous solution. Fig. 1 depicts a schematic diagram of the experimental apparatus and an instillation of particle precipitation with an inkjet nozzle. In this apparatus, several droplets of the aqueous solution were discharged from the inkjet nozzle into the organic solvent with slight miscibility (Tanaka M. et al., 2011). Alanine or glycine immediately precipitated at the inter-face of droplets. For the batch process, particles of amino acids were obtained by mixing the aqueous solution with an organic solvent under fixed stirring. The emulsion in-cluding droplets of glycine or alanine solution in the or-ganic solvent was stirred. The droplet size was estimated from SEM photographs. The crystal structure of both particles was measured through powder X-ray diffraction (XRD). The internal structure of both particles was also observed by SEM with cutting off particles using an ion milling apparatus.
Fig. 2 displays the relation between the mean particle size of alanine and the droplet size of instillation with the inkjet nozzle. The mean particle size of alanine was ap-proximately 1.2-fold higher than aqueous droplet size in 1-butanol. Additionally, the mean particle size of glycine was larger than the corresponding droplet. The results suggest that the interface between the 1-butanol and aque-ous solution expanded following their mutual diffusion during crystallization. The particle size of alanine was al-most monodispersed as the coefficient of variation, and the control of the particle size was demonstrated to be feasible by controlling the droplet size using the inkjet nozzle.
Figs. 3 and 4 show SEM photographs of glycine and alanine particles produced by the batch process and by
Fig. 1 Overview of the schematic experimental apparatus for instillation using an inkjet nozzle for liquid-liquid interfacial crystallization. Reprinted with permission from Ref. (Tominaga et al., 2018). Copyright: (2018) Elsevier.
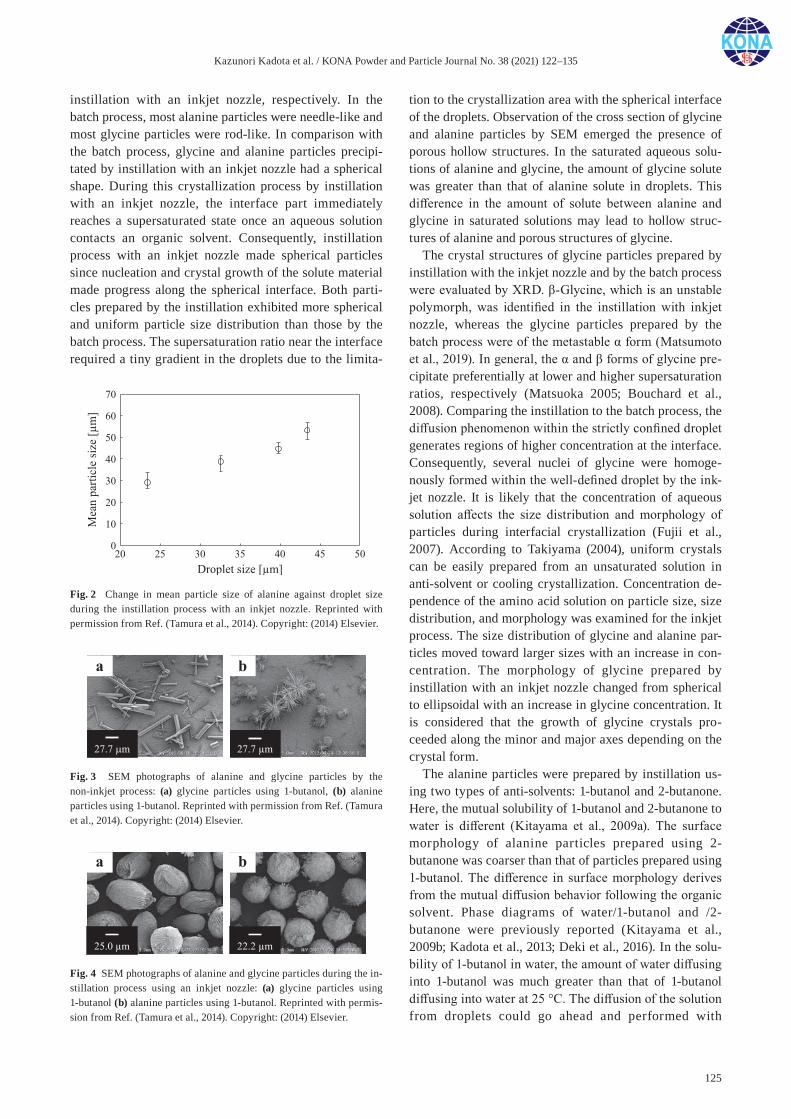
Kazunori Kadota et al. / KONA Powder and Particle Journal No. 38 (2021) 122–135
125
instillation with an inkjet nozzle, respectively. In the batch process, most alanine particles were needle-like and most glycine particles were rod-like. In comparison with the batch process, glycine and alanine particles precipi-tated by instillation with an inkjet nozzle had a spherical shape. During this crystallization process by instillation with an inkjet nozzle, the interface part immediately reaches a supersaturated state once an aqueous solution contacts an organic solvent. Consequently, instillation process with an inkjet nozzle made spherical particles since nucleation and crystal growth of the solute material made progress along the spherical interface. Both parti-cles prepared by the instillation exhibited more spherical and uniform particle size distribution than those by the batch process. The supersaturation ratio near the interface required a tiny gradient in the droplets due to the limita-
tion to the crystallization area with the spherical interface of the droplets. Observation of the cross section of glycine and alanine particles by SEM emerged the presence of porous hollow structures. In the saturated aqueous solu-tions of alanine and glycine, the amount of glycine solute was greater than that of alanine solute in droplets. This difference in the amount of solute between alanine and glycine in saturated solutions may lead to hollow struc-tures of alanine and porous structures of glycine.
The crystal structures of glycine particles prepared by instillation with the inkjet nozzle and by the batch process were evaluated by XRD. β-Glycine, which is an unstable polymorph, was identified in the instillation with inkjet nozzle, whereas the glycine particles prepared by the batch process were of the metastable α form (Matsumoto et al., 2019). In general, the α and β forms of glycine pre-cipitate preferentially at lower and higher supersaturation ratios, respectively (Matsuoka 2005; Bouchard et al., 2008). Comparing the instillation to the batch process, the diffusion phenomenon within the strictly confined droplet generates regions of higher concentration at the interface. Consequently, several nuclei of glycine were homoge-nously formed within the well-defined droplet by the ink-jet nozzle. It is likely that the concentration of aqueous solution affects the size distribution and morphology of particles during interfacial crystallization (Fujii et al., 2007). According to Takiyama (2004), uniform crystals can be easily prepared from an unsaturated solution in anti-solvent or cooling crystallization. Concentration de-pendence of the amino acid solution on particle size, size distribution, and morphology was examined for the inkjet process. The size distribution of glycine and alanine par-ticles moved toward larger sizes with an increase in con-centration. The morphology of glycine prepared by instillation with an inkjet nozzle changed from spherical to ellipsoidal with an increase in glycine concentration. It is considered that the growth of glycine crystals pro-ceeded along the minor and major axes depending on the crystal form.
The alanine particles were prepared by instillation us-ing two types of anti-solvents: 1-butanol and 2-butanone. Here, the mutual solubility of 1-butanol and 2-butanone to water is different (Kitayama et al., 2009a). The surface morphology of alanine particles prepared using 2- butanone was coarser than that of particles prepared using 1-butanol. The difference in surface morphology derives from the mutual diffusion behavior following the organic solvent. Phase diagrams of water/1-butanol and /2- butanone were previously reported (Kitayama et al., 2009b; Kadota et al., 2013; Deki et al., 2016). In the solu-bility of 1-butanol in water, the amount of water diffusing into 1-butanol was much greater than that of 1-butanol diffusing into water at 25 °C. The diffusion of the solution from droplets could go ahead and performed with
Fig. 2 Change in mean particle size of alanine against droplet size during the instillation process with an inkjet nozzle. Reprinted with permission from Ref. (Tamura et al., 2014). Copyright: (2014) Elsevier.
Fig. 3 SEM photographs of alanine and glycine particles by the non-inkjet process: (a) glycine particles using 1-butanol, (b) alanine particles using 1-butanol. Reprinted with permission from Ref. (Tamura et al., 2014). Copyright: (2014) Elsevier.
Fig. 4 SEM photographs of alanine and glycine particles during the in-stillation process using an inkjet nozzle: (a) glycine particles using 1-butanol (b) alanine particles using 1-butanol. Reprinted with permis-sion from Ref. (Tamura et al., 2014). Copyright: (2014) Elsevier.
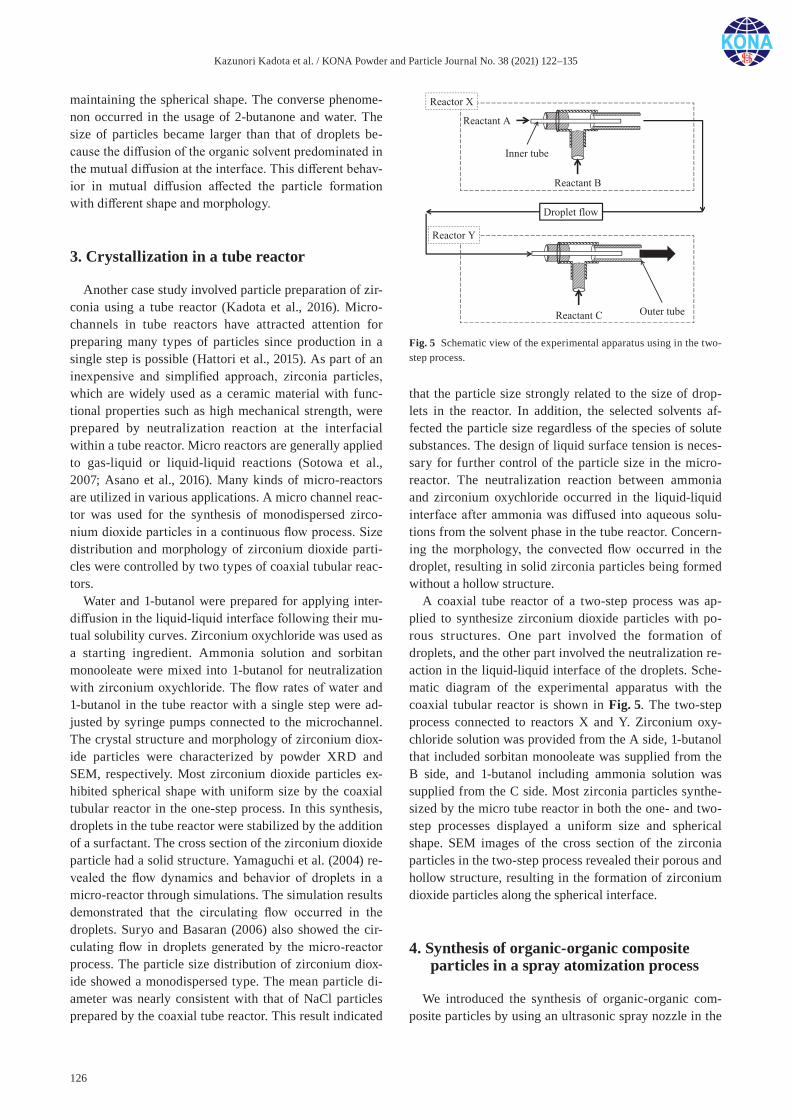
Kazunori Kadota et al. / KONA Powder and Particle Journal No. 38 (2021) 122–135
126
maintaining the spherical shape. The converse phenome-non occurred in the usage of 2-butanone and water. The size of particles became larger than that of droplets be-cause the diffusion of the organic solvent predominated in the mutual diffusion at the interface. This different behav-ior in mutual diffusion affected the particle formation with different shape and morphology.
3. Crystallization in a tube reactor
Another case study involved particle preparation of zir-conia using a tube reactor (Kadota et al., 2016). Micro-channels in tube reactors have attracted attention for preparing many types of particles since production in a single step is possible (Hattori et al., 2015). As part of an inexpensive and simplified approach, zirconia particles, which are widely used as a ceramic material with func-tional properties such as high mechanical strength, were prepared by neutralization reaction at the interfacial within a tube reactor. Micro reactors are generally applied to gas-liquid or liquid-liquid reactions (Sotowa et al., 2007; Asano et al., 2016). Many kinds of micro-reactors are utilized in various applications. A micro channel reac-tor was used for the synthesis of monodispersed zirco-nium dioxide particles in a continuous flow process. Size distribution and morphology of zirconium dioxide parti-cles were controlled by two types of coaxial tubular reac-tors.
Water and 1-butanol were prepared for applying inter- diffusion in the liquid-liquid interface following their mu-tual solubility curves. Zirconium oxychloride was used as a starting ingredient. Ammonia solution and sorbitan monooleate were mixed into 1-butanol for neutralization with zirconium oxychloride. The flow rates of water and 1-butanol in the tube reactor with a single step were ad-justed by syringe pumps connected to the microchannel. The crystal structure and morphology of zirconium diox-ide particles were characterized by powder XRD and SEM, respectively. Most zirconium dioxide particles ex-hibited spherical shape with uniform size by the coaxial tubular reactor in the one-step process. In this synthesis, droplets in the tube reactor were stabilized by the addition of a surfactant. The cross section of the zirconium dioxide particle had a solid structure. Yamaguchi et al. (2004) re-vealed the flow dynamics and behavior of droplets in a micro-reactor through simulations. The simulation results demonstrated that the circulating flow occurred in the droplets. Suryo and Basaran (2006) also showed the cir-culating flow in droplets generated by the micro-reactor process. The particle size distribution of zirconium diox-ide showed a monodispersed type. The mean particle di-ameter was nearly consistent with that of NaCl particles prepared by the coaxial tube reactor. This result indicated
that the particle size strongly related to the size of drop-lets in the reactor. In addition, the selected solvents af-fected the particle size regardless of the species of solute substances. The design of liquid surface tension is neces-sary for further control of the particle size in the micro- reactor. The neutralization reaction between ammonia and zirconium oxychloride occurred in the liquid-liquid interface after ammonia was diffused into aqueous solu-tions from the solvent phase in the tube reactor. Concern-ing the morphology, the convected flow occurred in the droplet, resulting in solid zirconia particles being formed without a hollow structure.
A coaxial tube reactor of a two-step process was ap-plied to synthesize zirconium dioxide particles with po-rous structures. One part involved the formation of droplets, and the other part involved the neutralization re-action in the liquid-liquid interface of the droplets. Sche-matic diagram of the experimental apparatus with the coaxial tubular reactor is shown in Fig. 5. The two-step process connected to reactors X and Y. Zirconium oxy-chloride solution was provided from the A side, 1-butanol that included sorbitan monooleate was supplied from the B side, and 1-butanol including ammonia solution was supplied from the C side. Most zirconia particles synthe-sized by the micro tube reactor in both the one- and two-step processes displayed a uniform size and spherical shape. SEM images of the cross section of the zirconia particles in the two-step process revealed their porous and hollow structure, resulting in the formation of zirconium dioxide particles along the spherical interface.
4. Synthesis of organic-organic composite particles in a spray atomization process
We introduced the synthesis of organic-organic com-posite particles by using an ultrasonic spray nozzle in the
Fig. 5 Schematic view of the experimental apparatus using in the two-step process.
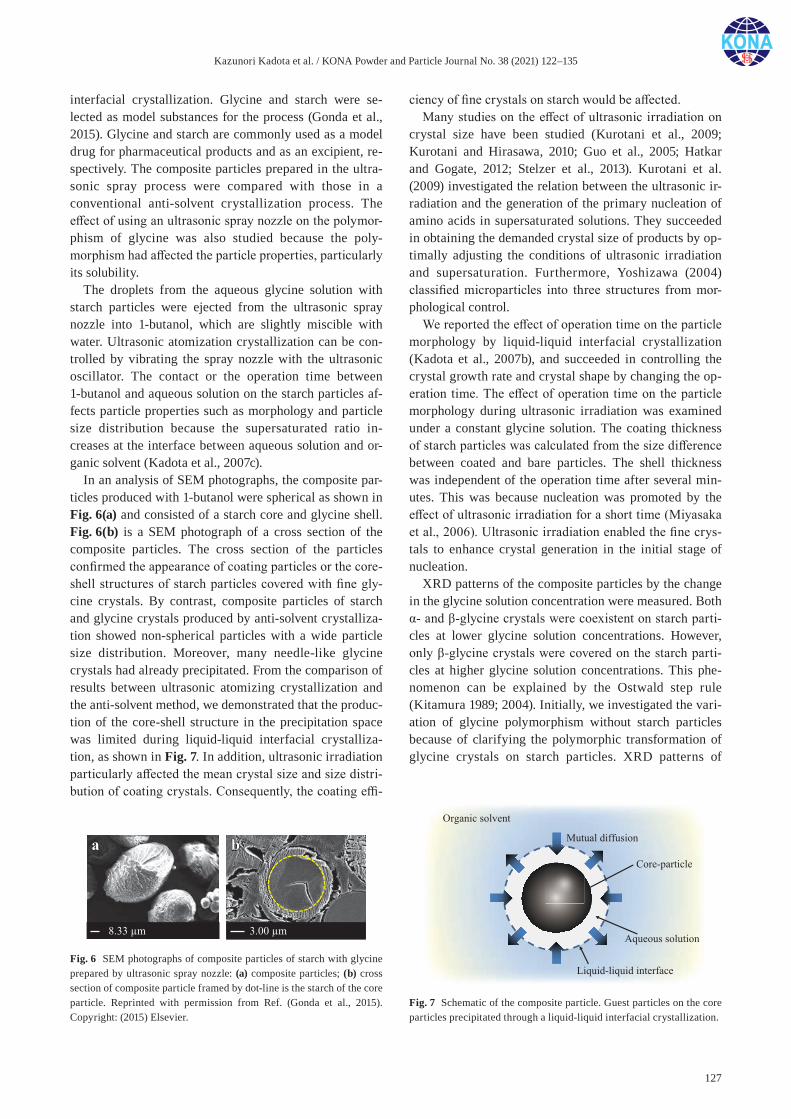
Kazunori Kadota et al. / KONA Powder and Particle Journal No. 38 (2021) 122–135
127
interfacial crystallization. Glycine and starch were se-lected as model substances for the process (Gonda et al., 2015). Glycine and starch are commonly used as a model drug for pharmaceutical products and as an excipient, re-spectively. The composite particles prepared in the ultra-sonic spray process were compared with those in a conventional anti-solvent crystallization process. The effect of using an ultrasonic spray nozzle on the polymor-phism of glycine was also studied because the poly-morphism had affected the particle properties, particularly its solubility.
The droplets from the aqueous glycine solution with starch particles were ejected from the ultrasonic spray nozzle into 1-butanol, which are slightly miscible with water. Ultrasonic atomization crystallization can be con-trolled by vibrating the spray nozzle with the ultrasonic oscillator. The contact or the operation time between 1-butanol and aqueous solution on the starch particles af-fects particle properties such as morphology and particle size distribution because the supersaturated ratio in-creases at the interface between aqueous solution and or-ganic solvent (Kadota et al., 2007c).
In an analysis of SEM photographs, the composite par-ticles produced with 1-butanol were spherical as shown in Fig. 6(a) and consisted of a starch core and glycine shell. Fig. 6(b) is a SEM photograph of a cross section of the composite particles. The cross section of the particles confirmed the appearance of coating particles or the core-shell structures of starch particles covered with fine gly-cine crystals. By contrast, composite particles of starch and glycine crystals produced by anti-solvent crystalliza-tion showed non-spherical particles with a wide particle size distribution. Moreover, many needle-like glycine crystals had already precipitated. From the comparison of results between ultrasonic atomizing crystallization and the anti-solvent method, we demonstrated that the produc-tion of the core-shell structure in the precipitation space was limited during liquid-liquid interfacial crystalliza-tion, as shown in Fig. 7. In addition, ultrasonic irradiation particularly affected the mean crystal size and size distri-bution of coating crystals. Consequently, the coating effi-
ciency of fine crystals on starch would be affected.Many studies on the effect of ultrasonic irradiation on
crystal size have been studied (Kurotani et al., 2009; Kurotani and Hirasawa, 2010; Guo et al., 2005; Hatkar and Gogate, 2012; Stelzer et al., 2013). Kurotani et al. (2009) investigated the relation between the ultrasonic ir-radiation and the generation of the primary nucleation of amino acids in supersaturated solutions. They succeeded in obtaining the demanded crystal size of products by op-timally adjusting the conditions of ultrasonic irradiation and supersaturation. Furthermore, Yoshizawa (2004) classified microparticles into three structures from mor-phological control.
We reported the effect of operation time on the particle morphology by liquid-liquid interfacial crystallization (Kadota et al., 2007b), and succeeded in controlling the crystal growth rate and crystal shape by changing the op-eration time. The effect of operation time on the particle morphology during ultrasonic irradiation was examined under a constant glycine solution. The coating thickness of starch particles was calculated from the size difference between coated and bare particles. The shell thickness was independent of the operation time after several min-utes. This was because nucleation was promoted by the effect of ultrasonic irradiation for a short time (Miyasaka et al., 2006). Ultrasonic irradiation enabled the fine crys-tals to enhance crystal generation in the initial stage of nucleation.
XRD patterns of the composite particles by the change in the glycine solution concentration were measured. Both α- and β-glycine crystals were coexistent on starch parti-cles at lower glycine solution concentrations. However, only β-glycine crystals were covered on the starch parti-cles at higher glycine solution concentrations. This phe-nomenon can be explained by the Ostwald step rule (Kitamura 1989; 2004). Initially, we investigated the vari-ation of glycine polymorphism without starch particles because of clarifying the polymorphic transformation of glycine crystals on starch particles. XRD patterns of
Fig. 6 SEM photographs of composite particles of starch with glycine prepared by ultrasonic spray nozzle: (a) composite particles; (b) cross section of composite particle framed by dot-line is the starch of the core particle. Reprinted with permission from Ref. (Gonda et al., 2015). Copyright: (2015) Elsevier.
Fig. 7 Schematic of the composite particle. Guest particles on the core particles precipitated through a liquid-liquid interfacial crystallization.
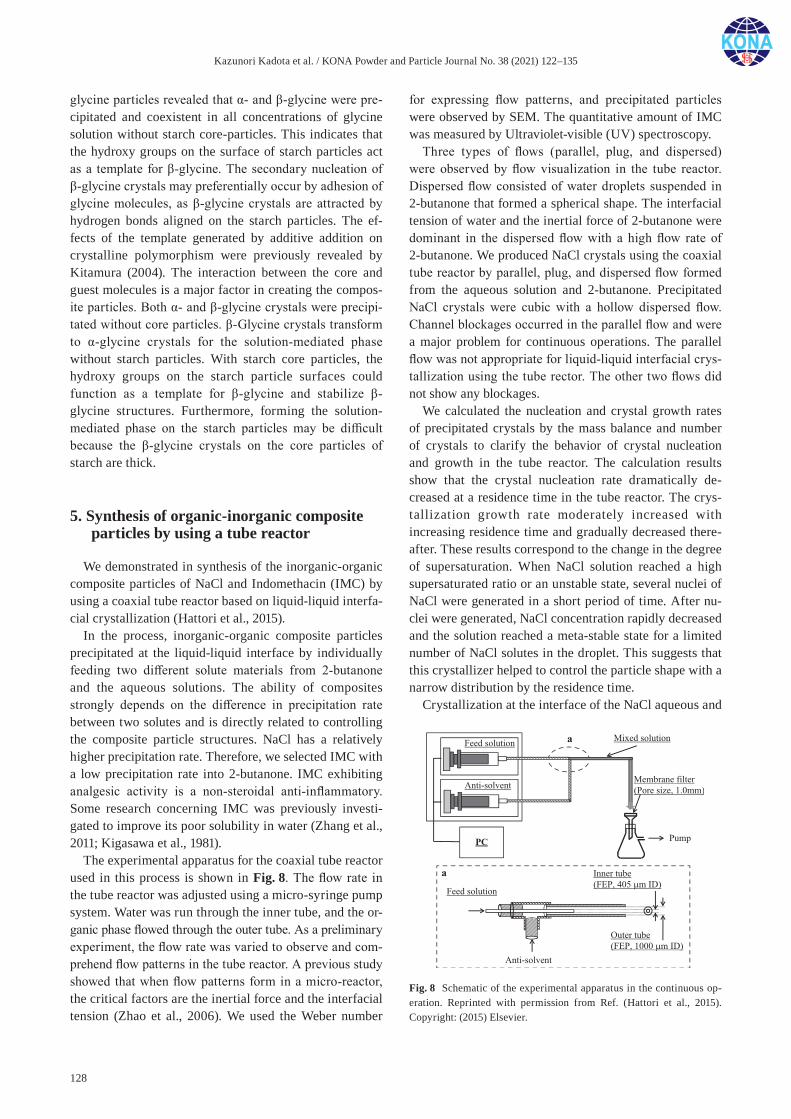
Kazunori Kadota et al. / KONA Powder and Particle Journal No. 38 (2021) 122–135
128
glycine particles revealed that α- and β-glycine were pre-cipitated and coexistent in all concentrations of glycine solution without starch core-particles. This indicates that the hydroxy groups on the surface of starch particles act as a template for β-glycine. The secondary nucleation of β-glycine crystals may preferentially occur by adhesion of glycine molecules, as β-glycine crystals are attracted by hydrogen bonds aligned on the starch particles. The ef-fects of the template generated by additive addition on crystalline polymorphism were previously revealed by Kitamura (2004). The interaction between the core and guest molecules is a major factor in creating the compos-ite particles. Both α- and β-glycine crystals were precipi-tated without core particles. β-Glycine crystals transform to α-glycine crystals for the solution-mediated phase without starch particles. With starch core particles, the hydroxy groups on the starch particle surfaces could function as a template for β-glycine and stabilize β- glycine structures. Furthermore, forming the solution- mediated phase on the starch particles may be difficult because the β-glycine crystals on the core particles of starch are thick.
5. Synthesis of organic-inorganic composite particles by using a tube reactor
We demonstrated in synthesis of the inorganic-organic composite particles of NaCl and Indomethacin (IMC) by using a coaxial tube reactor based on liquid-liquid interfa-cial crystallization (Hattori et al., 2015).
In the process, inorganic-organic composite particles precipitated at the liquid-liquid interface by individually feeding two different solute materials from 2-butanone and the aqueous solutions. The ability of composites strongly depends on the difference in precipitation rate between two solutes and is directly related to controlling the composite particle structures. NaCl has a relatively higher precipitation rate. Therefore, we selected IMC with a low precipitation rate into 2-butanone. IMC exhibiting analgesic activity is a non-steroidal anti-inflammatory. Some research concerning IMC was previously investi-gated to improve its poor solubility in water (Zhang et al., 2011; Kigasawa et al., 1981).
The experimental apparatus for the coaxial tube reactor used in this process is shown in Fig. 8. The flow rate in the tube reactor was adjusted using a micro-syringe pump system. Water was run through the inner tube, and the or-ganic phase flowed through the outer tube. As a preliminary experiment, the flow rate was varied to observe and com-prehend flow patterns in the tube reactor. A previous study showed that when flow patterns form in a micro-reactor, the critical factors are the inertial force and the interfacial tension (Zhao et al., 2006). We used the Weber number
for expressing flow patterns, and precipitated particles were observed by SEM. The quantitative amount of IMC was measured by Ultraviolet-visible (UV) spectroscopy.
Three types of flows (parallel, plug, and dispersed) were observed by flow visualization in the tube reactor. Dispersed flow consisted of water droplets suspended in 2-butanone that formed a spherical shape. The interfacial tension of water and the inertial force of 2-butanone were dominant in the dispersed flow with a high flow rate of 2-butanone. We produced NaCl crystals using the coaxial tube reactor by parallel, plug, and dispersed flow formed from the aqueous solution and 2-butanone. Precipitated NaCl crystals were cubic with a hollow dispersed flow. Channel blockages occurred in the parallel flow and were a major problem for continuous operations. The parallel flow was not appropriate for liquid-liquid interfacial crys-tallization using the tube rector. The other two flows did not show any blockages.
We calculated the nucleation and crystal growth rates of precipitated crystals by the mass balance and number of crystals to clarify the behavior of crystal nucleation and growth in the tube reactor. The calculation results show that the crystal nucleation rate dramatically de-creased at a residence time in the tube reactor. The crys-tallization growth rate moderately increased with increasing residence time and gradually decreased there-after. These results correspond to the change in the degree of supersaturation. When NaCl solution reached a high supersaturated ratio or an unstable state, several nuclei of NaCl were generated in a short period of time. After nu-clei were generated, NaCl concentration rapidly decreased and the solution reached a meta-stable state for a limited number of NaCl solutes in the droplet. This suggests that this crystallizer helped to control the particle shape with a narrow distribution by the residence time.
Crystallization at the interface of the NaCl aqueous and
Fig. 8 Schematic of the experimental apparatus in the continuous op-eration. Reprinted with permission from Ref. (Hattori et al., 2015). Copyright: (2015) Elsevier.
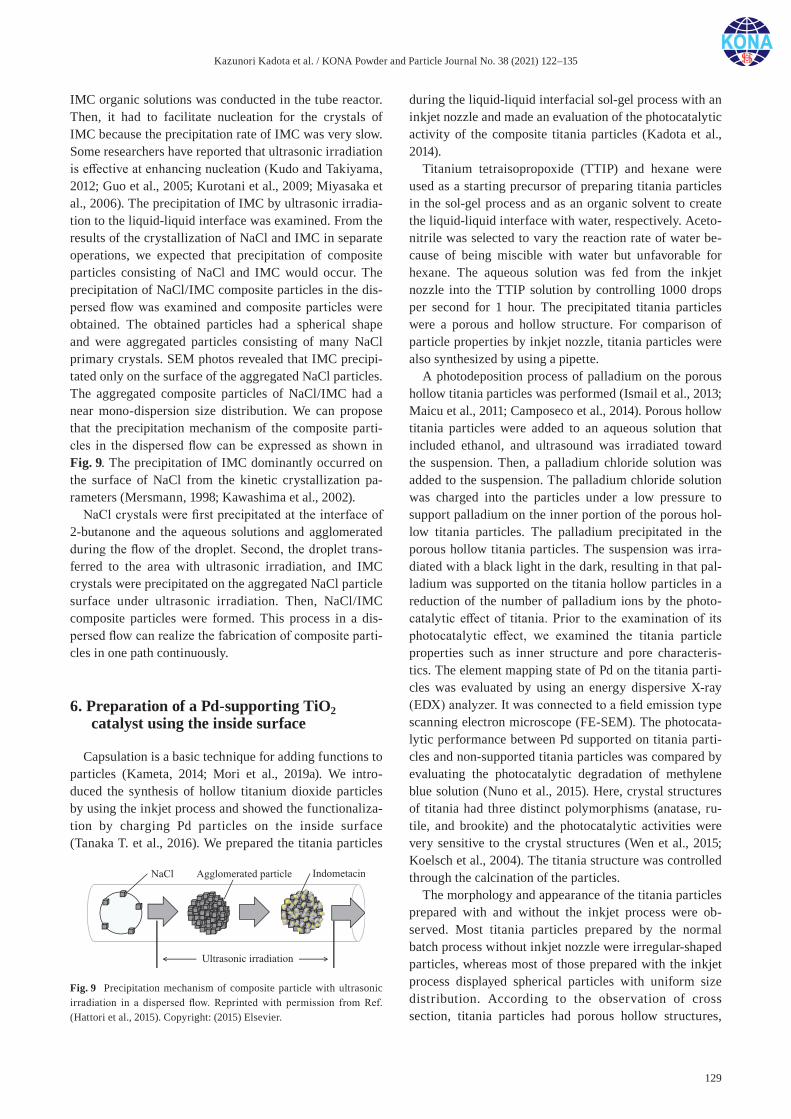
Kazunori Kadota et al. / KONA Powder and Particle Journal No. 38 (2021) 122–135
129
IMC organic solutions was conducted in the tube reactor. Then, it had to facilitate nucleation for the crystals of IMC because the precipitation rate of IMC was very slow. Some researchers have reported that ultrasonic irradiation is effective at enhancing nucleation (Kudo and Takiyama, 2012; Guo et al., 2005; Kurotani et al., 2009; Miyasaka et al., 2006). The precipitation of IMC by ultrasonic irradia-tion to the liquid-liquid interface was examined. From the results of the crystallization of NaCl and IMC in separate operations, we expected that precipitation of composite particles consisting of NaCl and IMC would occur. The precipitation of NaCl/IMC composite particles in the dis-persed flow was examined and composite particles were obtained. The obtained particles had a spherical shape and were aggregated particles consisting of many NaCl primary crystals. SEM photos revealed that IMC precipi-tated only on the surface of the aggregated NaCl particles. The aggregated composite particles of NaCl/IMC had a near mono-dispersion size distribution. We can propose that the precipitation mechanism of the composite parti-cles in the dispersed flow can be expressed as shown in Fig. 9. The precipitation of IMC dominantly occurred on the surface of NaCl from the kinetic crystallization pa-rameters (Mersmann, 1998; Kawashima et al., 2002).
NaCl crystals were first precipitated at the interface of 2-butanone and the aqueous solutions and agglomerated during the flow of the droplet. Second, the droplet trans-ferred to the area with ultrasonic irradiation, and IMC crystals were precipitated on the aggregated NaCl particle surface under ultrasonic irradiation. Then, NaCl/IMC composite particles were formed. This process in a dis-persed flow can realize the fabrication of composite parti-cles in one path continuously.
6. Preparation of a Pd-supporting TiO2 catalyst using the inside surface
Capsulation is a basic technique for adding functions to particles (Kameta, 2014; Mori et al., 2019a). We intro-duced the synthesis of hollow titanium dioxide particles by using the inkjet process and showed the functionaliza-tion by charging Pd particles on the inside surface (Tanaka T. et al., 2016). We prepared the titania particles
during the liquid-liquid interfacial sol-gel process with an inkjet nozzle and made an evaluation of the photocatalytic activity of the composite titania particles (Kadota et al., 2014).
Titanium tetraisopropoxide (TTIP) and hexane were used as a starting precursor of preparing titania particles in the sol-gel process and as an organic solvent to create the liquid-liquid interface with water, respectively. Aceto-nitrile was selected to vary the reaction rate of water be-cause of being miscible with water but unfavorable for hexane. The aqueous solution was fed from the inkjet nozzle into the TTIP solution by controlling 1000 drops per second for 1 hour. The precipitated titania particles were a porous and hollow structure. For comparison of particle properties by inkjet nozzle, titania particles were also synthesized by using a pipette.
A photodeposition process of palladium on the porous hollow titania particles was performed (Ismail et al., 2013; Maicu et al., 2011; Camposeco et al., 2014). Porous hollow titania particles were added to an aqueous solution that included ethanol, and ultrasound was irradiated toward the suspension. Then, a palladium chloride solution was added to the suspension. The palladium chloride solution was charged into the particles under a low pressure to support palladium on the inner portion of the porous hol-low titania particles. The palladium precipitated in the porous hollow titania particles. The suspension was irra-diated with a black light in the dark, resulting in that pal-ladium was supported on the titania hollow particles in a reduction of the number of palladium ions by the photo-catalytic effect of titania. Prior to the examination of its photocatalytic effect, we examined the titania particle properties such as inner structure and pore characteris-tics. The element mapping state of Pd on the titania parti-cles was evaluated by using an energy dispersive X-ray (EDX) analyzer. It was connected to a field emission type scanning electron microscope (FE-SEM). The photocata-lytic performance between Pd supported on titania parti-cles and non-supported titania particles was compared by evaluating the photocatalytic degradation of methylene blue solution (Nuno et al., 2015). Here, crystal structures of titania had three distinct polymorphisms (anatase, ru-tile, and brookite) and the photocatalytic activities were very sensitive to the crystal structures (Wen et al., 2015; Koelsch et al., 2004). The titania structure was controlled through the calcination of the particles.
The morphology and appearance of the titania particles prepared with and without the inkjet process were ob-served. Most titania particles prepared by the normal batch process without inkjet nozzle were irregular-shaped particles, whereas most of those prepared with the inkjet process displayed spherical particles with uniform size distribution. According to the observation of cross section, titania particles had porous hollow structures,
Fig. 9 Precipitation mechanism of composite particle with ultrasonic irradiation in a dispersed flow. Reprinted with permission from Ref. (Hattori et al., 2015). Copyright: (2015) Elsevier.
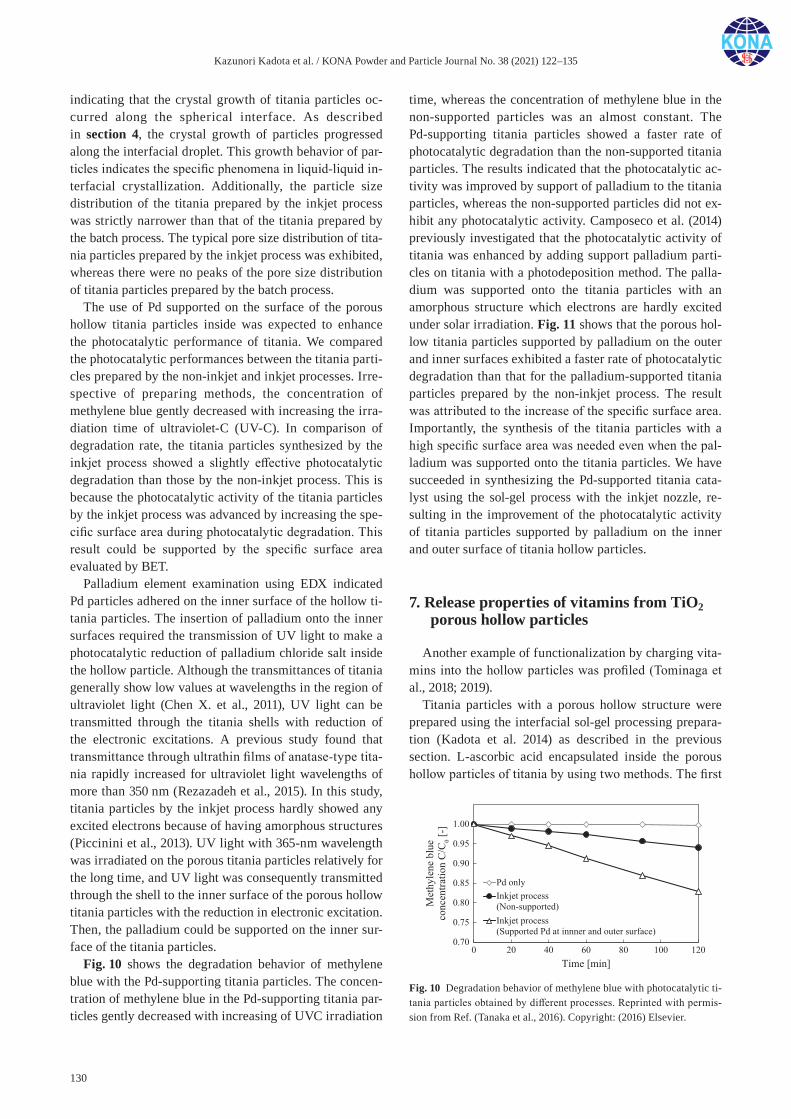
Kazunori Kadota et al. / KONA Powder and Particle Journal No. 38 (2021) 122–135
130
indicating that the crystal growth of titania particles oc-curred along the spherical interface. As described in section 4, the crystal growth of particles progressed along the interfacial droplet. This growth behavior of par-ticles indicates the specific phenomena in liquid-liquid in-terfacial crystallization. Additionally, the particle size distribution of the titania prepared by the inkjet process was strictly narrower than that of the titania prepared by the batch process. The typical pore size distribution of tita-nia particles prepared by the inkjet process was exhibited, whereas there were no peaks of the pore size distribution of titania particles prepared by the batch process.
The use of Pd supported on the surface of the porous hollow titania particles inside was expected to enhance the photocatalytic performance of titania. We compared the photocatalytic performances between the titania parti-cles prepared by the non-inkjet and inkjet processes. Irre-spective of preparing methods, the concentration of methylene blue gently decreased with increasing the irra-diation time of ultraviolet-C (UV-C). In comparison of degradation rate, the titania particles synthesized by the inkjet process showed a slightly effective photocatalytic degradation than those by the non-inkjet process. This is because the photocatalytic activity of the titania particles by the inkjet process was advanced by increasing the spe-cific surface area during photocatalytic degradation. This result could be supported by the specific surface area evaluated by BET.
Palladium element examination using EDX indicated Pd particles adhered on the inner surface of the hollow ti-tania particles. The insertion of palladium onto the inner surfaces required the transmission of UV light to make a photocatalytic reduction of palladium chloride salt inside the hollow particle. Although the transmittances of titania generally show low values at wavelengths in the region of ultraviolet light (Chen X. et al., 2011), UV light can be transmitted through the titania shells with reduction of the electronic excitations. A previous study found that transmittance through ultrathin films of anatase-type tita-nia rapidly increased for ultraviolet light wavelengths of more than 350 nm (Rezazadeh et al., 2015). In this study, titania particles by the inkjet process hardly showed any excited electrons because of having amorphous structures (Piccinini et al., 2013). UV light with 365-nm wavelength was irradiated on the porous titania particles relatively for the long time, and UV light was consequently transmitted through the shell to the inner surface of the porous hollow titania particles with the reduction in electronic excitation. Then, the palladium could be supported on the inner sur-face of the titania particles.
Fig. 10 shows the degradation behavior of methylene blue with the Pd-supporting titania particles. The concen-tration of methylene blue in the Pd-supporting titania par-ticles gently decreased with increasing of UVC irradiation
time, whereas the concentration of methylene blue in the non-supported particles was an almost constant. The Pd-supporting titania particles showed a faster rate of photocatalytic degradation than the non-supported titania particles. The results indicated that the photocatalytic ac-tivity was improved by support of palladium to the titania particles, whereas the non-supported particles did not ex-hibit any photocatalytic activity. Camposeco et al. (2014) previously investigated that the photocatalytic activity of titania was enhanced by adding support palladium parti-cles on titania with a photodeposition method. The palla-dium was supported onto the titania particles with an amorphous structure which electrons are hardly excited under solar irradiation. Fig. 11 shows that the porous hol-low titania particles supported by palladium on the outer and inner surfaces exhibited a faster rate of photocatalytic degradation than that for the palladium-supported titania particles prepared by the non-inkjet process. The result was attributed to the increase of the specific surface area. Importantly, the synthesis of the titania particles with a high specific surface area was needed even when the pal-ladium was supported onto the titania particles. We have succeeded in synthesizing the Pd-supported titania cata-lyst using the sol-gel process with the inkjet nozzle, re-sulting in the improvement of the photocatalytic activity of titania particles supported by palladium on the inner and outer surface of titania hollow particles.
7. Release properties of vitamins from TiO2 porous hollow particles
Another example of functionalization by charging vita-mins into the hollow particles was profiled (Tominaga et al., 2018; 2019).
Titania particles with a porous hollow structure were prepared using the interfacial sol-gel processing prepara-tion (Kadota et al. 2014) as described in the previous section. L-ascorbic acid encapsulated inside the porous hollow particles of titania by using two methods. The first
Fig. 10 Degradation behavior of methylene blue with photocatalytic ti-tania particles obtained by different processes. Reprinted with permis-sion from Ref. (Tanaka et al., 2016). Copyright: (2016) Elsevier.
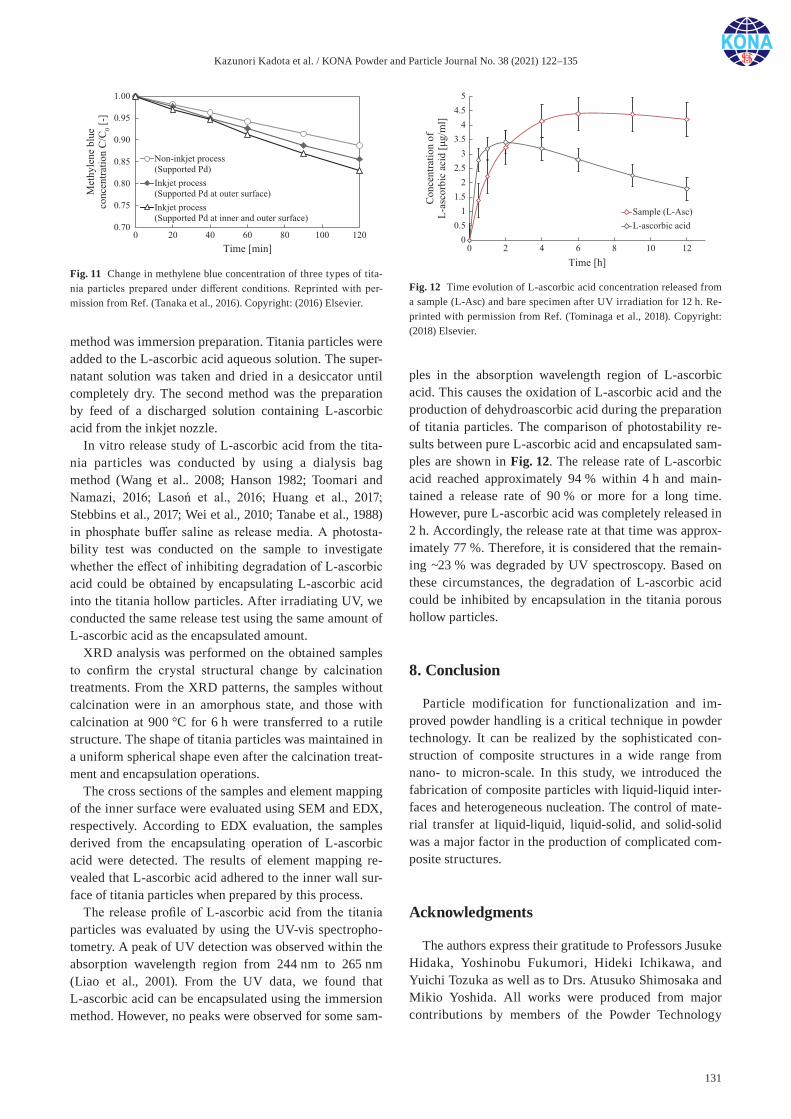
Kazunori Kadota et al. / KONA Powder and Particle Journal No. 38 (2021) 122–135
131
method was immersion preparation. Titania particles were added to the L-ascorbic acid aqueous solution. The super-natant solution was taken and dried in a desiccator until completely dry. The second method was the preparation by feed of a discharged solution containing L-ascorbic acid from the inkjet nozzle.
In vitro release study of L-ascorbic acid from the tita-nia particles was conducted by using a dialysis bag method (Wang et al.. 2008; Hanson 1982; Toomari and Namazi, 2016; Lasoń et al., 2016; Huang et al., 2017; Stebbins et al., 2017; Wei et al., 2010; Tanabe et al., 1988) in phosphate buffer saline as release media. A photosta-bility test was conducted on the sample to investigate whether the effect of inhibiting degradation of L-ascorbic acid could be obtained by encapsulating L-ascorbic acid into the titania hollow particles. After irradiating UV, we conducted the same release test using the same amount of L-ascorbic acid as the encapsulated amount.
XRD analysis was performed on the obtained samples to confirm the crystal structural change by calcination treatments. From the XRD patterns, the samples without calcination were in an amorphous state, and those with calcination at 900 °C for 6 h were transferred to a rutile structure. The shape of titania particles was maintained in a uniform spherical shape even after the calcination treat-ment and encapsulation operations.
The cross sections of the samples and element mapping of the inner surface were evaluated using SEM and EDX, respectively. According to EDX evaluation, the samples derived from the encapsulating operation of L-ascorbic acid were detected. The results of element mapping re-vealed that L-ascorbic acid adhered to the inner wall sur-face of titania particles when prepared by this process.
The release profile of L-ascorbic acid from the titania particles was evaluated by using the UV-vis spectropho-tometry. A peak of UV detection was observed within the absorption wavelength region from 244 nm to 265 nm (Liao et al., 2001). From the UV data, we found that L-ascorbic acid can be encapsulated using the immersion method. However, no peaks were observed for some sam-
ples in the absorption wavelength region of L-ascorbic acid. This causes the oxidation of L-ascorbic acid and the production of dehydroascorbic acid during the preparation of titania particles. The comparison of photostability re-sults between pure L-ascorbic acid and encapsulated sam-ples are shown in Fig. 12. The release rate of L-ascorbic acid reached approximately 94 % within 4 h and main-tained a release rate of 90 % or more for a long time. However, pure L-ascorbic acid was completely released in 2 h. Accordingly, the release rate at that time was approx-imately 77 %. Therefore, it is considered that the remain-ing ~23 % was degraded by UV spectroscopy. Based on these circumstances, the degradation of L-ascorbic acid could be inhibited by encapsulation in the titania porous hollow particles.
8. Conclusion
Particle modification for functionalization and im-proved powder handling is a critical technique in powder technology. It can be realized by the sophisticated con-struction of composite structures in a wide range from nano- to micron-scale. In this study, we introduced the fabrication of composite particles with liquid-liquid inter-faces and heterogeneous nucleation. The control of mate-rial transfer at liquid-liquid, liquid-solid, and solid-solid was a major factor in the production of complicated com-posite structures.
Acknowledgments
The authors express their gratitude to Professors Jusuke Hidaka, Yoshinobu Fukumori, Hideki Ichikawa, and Yuichi Tozuka as well as to Drs. Atusuko Shimosaka and Mikio Yoshida. All works were produced from major contributions by members of the Powder Technology
Fig. 11 Change in methylene blue concentration of three types of tita-nia particles prepared under different conditions. Reprinted with per-mission from Ref. (Tanaka et al., 2016). Copyright: (2016) Elsevier.
Fig. 12 Time evolution of L-ascorbic acid concentration released from a sample (L-Asc) and bare specimen after UV irradiation for 12 h. Re-printed with permission from Ref. (Tominaga et al., 2018). Copyright: (2018) Elsevier.
Kazunori Kadota et al. / KONA Powder and Particle Journal No. 38 (2021) 122–135
132
Laboratory at Doshisha University. Some works were partially supported by a grant from the Japan Society for the Promotion of Science KAKENHI (No. 16K06837) (Tokyo, Japan).
References
Agrawal G., Agrawal R., Janus Nanoparticles: Recent advances in their interfacial and biomedical applications, ACS Appl. Nano Mater. 2 (2019) 1738–1757. DOI: 10.1021/acsanm. 9b00283
Alam A.U., Qin Y., Nambiar S., Yeow J.T.W., Howlader M.M.R., Hu N.-X. Deen M.J., Polymers and organic materials-based pH sensors for healthcare applications, Prog. Mater. Sci., 96 (2018) 174–216. DOI:10.1016/j.pmatsci.2018.03.008
Asano S., Maki T., Mae K., Evaluation of mixing profiles for a new micromixer design strategy, AIChE J., 62 (2016) 1154–1161. DOI:10.1002/aic.15082
Aw M.S., Simovic S., Yu Y., Addai-Mensah J., Losic D., Porous silica microshells from diatoms as biocarrier for drug deliv-ery applications, Powder Technol., 223 (2012) 52–58. DOI:10.1016/j.powtec.2011.04.023
Bouchard A., Jovanovic N., Hofland G.W., Crommelin D.J.A., Jiskoot W., Witkamp G.J., Ways of manipulating the poly-morphism of glycine during supercritical fluid crystallisa-tion, J. Supercrit. Fluids, 44 (2008) 422–432. DOI: 10.1016/j.supflu.2007.09.016
Böhmer M.R., Schroeders R., Steenbakkers J.A.M., de Winter S.H.P.M., Duineveld P.A., Lub J., Nijssen W.P.M., Pikkemaat J.A., Stapert H.R., Preparation of monodisperse polymer particles and capsules by ink-jet printing, Colloids Surf., A, 289 (2006) 96–104. DOI: 10.1016/j.colsurfa.2006. 04.011
Camposeco R., Castillo S., Mejía-Centeno I., Navarrete J., Marín J., Characterization of physicochemical properties of Pd/TiO2 nanostructured catalysts prepared by the photode-position method, Mater. Charact., 95 (2014) 201–210. DOI: 10.1016/j.matchar.2014.06.017
Chen J., Trout B.L., A computational study of the mechanism of the selective crystallization of α- and β-glycine from water and methanol-water mixture, J. Phys. Chem. B, 114 (2010) 13764–13772. DOI: 10.1021/jp1039496
Chen X., Liu L., Yu P.Y., Mao S.S., Increasing solar absorption for photocatalysis with black hydrogenated titanium diox-ide nanocrystals, Science, 331 (2011) 746–750. DOI: 10.1126/science.1200448
D’Souza S.S., DeLuca P.P., Methods to assess in vitro drug release from injectable polymeric particulate systems, Pharm. Res., 23 (2006) 460–474. DOI: 10.1007/s11095-005-9397-8
Daly R., Harrington T.S., Martin G.D., Hutchings I.M., Inkjet printing for pharmaceutics – A review of research and manufacturing, Int. J. Pharm., 494 (2015) 554–567. DOI: 10.1016/j.ijpharm.2015.03.017
Deki Y., Kadota K., Tozuka Y., Shimosaka A., Shirakawa Y., Mutual diffusion diagram of liquid-liquid interfaces for
morphological control of NaCl crystals, J. Mol. Liq., 223 (2016) 462–468. DOI:10.1016/j.molliq.2016.08.071
Fuchs V.M., Soto E.L., Blanco M.N., Pizzio L.R., Direct modi-fication with tungstophosphoric acid of mesoporous titania synthesized by urea-templated sol–gel reactions, J. Colloid Interface Sci., 327 (2008) 403–411. DOI: 10.1016/j.jcis.2008.08.045
Fuji M., Han Y.S., Takai C., Synthesis and applications of hol-low particles, KONA Powder Part. J., 30 (2013) 47–68. DOI:10.14356/kona.2013009
Fujii S., Murakami R., Smart particles as foam and liquid mar-ble stabilizers, KONA Powder Part. J., 26 (2008) 153–166. DOI:10.14356/kona.2008014
Fujii S., Okada M., Furuzono T. Hydroxyapatite nanoparticles as stimulus-responsive particulate emulsifiers and building block for porous materials, J. Colloid Interf. Sci., 315 (2007) 287–296. DOI: 10.1016/j.jcis.2007.06.071
Gonda K., Kadota K., Deki Y., Tozuka Y., Shimosaka A., Shirakawa Y., Hidaka J., Fabrication of composite particles by liquid–liquid interfacial crystallization using an ultra-sonic spray nozzle, Powder Technol., 269 (2015) 401–408. DOI:10.1016/j.powtec.2014.09.042
Guo Z., Zhang M., Li H., Wang J., Kougoulos E., Effect of ultra-sound on anti-solvent crystallization process, J. Cryst. Growth, 273 (2005) 555–563. DOI:10.1016/j.jcrysgro. 2004.09.049
Hanson W.A., Theoretical concepts, in: Handbook of Dissolu-tion Testing, 1982, Pharmaceutical Technology Publica-tions, pp.13–26, ISBN: 9780943330006.
Hatkar U.N., Gogate P.R., Process intensification of anti-solvent crystallization of salicylic acid using ultrasonic irradia-tions, Chem. Eng. Process: Process Intensification, 57–58 (2012) 16–24. DOI: 10.1016/j.cep.2012.04.005
Hattori Y., Kadota K., Yano T., Shimosaka A., Ichikawa H., Fukumori Y., Shirakawa Y., Hidaka J., Fabrication of com-posite particles through single pass using a coaxial tube reactor, Chem. Eng. Process., 97 (2015) 233–241. DOI:10.1016/j.cep.2015.05.016
Horn D., Rieger J., Organic nanoparticles in the aqueous phase—Theory, experiment, and use, Angew. Chem., Int. Ed., 40 (2001) 4330–4361. DOI: 10.1002/1521-3773 (20011203)40:23<4330::aid-anie4330>3.0.co;2-w
Huang S., Wang J., Shang Q., Development and evaluation of a novel polymeric hydrogel of sucrose acrylate-co- polymethylacrylic acid for oral curcumin delivery, J. Bio-mater. Sci., Polym. Ed. 28 (2017) 194–206. DOI: 10.1080/ 09205063.2016.1262162
Ismail A.A., Ai-Sayari S.A., Bahnemann D.W., Photodeposition of precious metals onto mesoporous TiO2 nanocrystals with enhanced their photocatalytic activity for methanol oxida-tion, Catal. Today, 209 (2013) 2–7. DOI:10.1016/j.cattod. 2012.09.027
Kadota K., Matsumoto I., Shirakawa Y., Shimosaka A., Hidaka J., Morphology of particles precipitated by liquid-liquid interfacial crystallization and mutual diffusion of NaCl aqueous solution and organic liquid at the interface, J. Soc. Powder Technol., Jpn., 44 (2007a) 427–433. DOI: 10.4164/sptj.44.427
Kazunori Kadota et al. / KONA Powder and Particle Journal No. 38 (2021) 122–135
133
Kadota K., Shirakawa Y., Gonda K., Murata S., Tozuka Y., Shimosaka A., Hidaka J., Fabrication of organic/inorganic composite particles by atomizing crystallization, J. Soc. Powder Technol., Jpn., 50 (2013) 790–796. DOI: 10.4164/sptj.50.790
Kadota K., Shirakawa Y., Matsumoto I., Shimosaka A., Hidaka J., Formation and morphology of asymmetric NaCl parti-cles precipitated at the liquid-liquid interface, Adv. Powder Technol., 18 (2007b) 775–785. DOI: 10.1163/ 156855207782514969
Kadota K., Takase K., Shimosaka A., Shirakawa Y., Hidaka J., The influence of habit modifiers on particle shape in a crys-tallization process, KONA Powder Part. J., 24 (2006) 203–212. DOI: 10.14356/kona.2006022
Kadota K., Tamura H., Shirakawa Y., Tozuka Y., Shimosaka A., Hidaka J., Interfacial sol–gel processing for preparation of porous titania particles using a piezoelectric inkjet nozzle, Chem. Eng. Res. Des., 92 (2014) 2461–2469. DOI:10.1016/j.cherd.2014.03.004
Kadota K., Tanida S., Shirakawa Y., Shimosaka A., Hidaka J., Production of asymmetrical particles in a crystallization process using liquid-liquid interfaces, J. Chem. Eng. Jpn., 40 (2007c) 217–221. DOI:10.1252/jcej.40.217
Kadota K., Yoshimoto T., Deki Y., Shimosaka A., Shirakawa Y., Preparation of morphologically controlled zirconia particles using a coaxial tube reactor, J. Ceram. Soc. Jpn., 124 (2016) 1167–1170. DOI:10.2109/jcersj2.16118
Kameta N., Soft nanotube hosts for capsulation and release of molecules, macromolecules, and nanomaterials, J. Incl. Phenom. Macro., 79 (2014) 1–22. DOI: 10.1007/s10847-014-0397-3
Kawashima Y., Imai M., Takeuchi H., Yamamoto H., Kamiya K., Development of agglomerated crystals of ascorbic acid by the spherical crystallization technique for direct tablet-ing, and evaluation of their compactibilities, KONA Powder Part. J., 20 (2002) 251–262. DOI: 10.14356/kona.2002028
Kigasawa K., Maruyama K., Tanaka M., Watabe K., Koyama O., Biopharmaceutical studies of drugs. V. Dissolution properties and bioavailability of ground mixtures of poorly water soluble drugs and soluble proteins, Yakugaku Zasshi, 101 (1981) 733–739. DOI: 10.1248/yakushi1947.101.8_733
Kitamura M., Controlling factors and mechanism of polymor-phic crystallization, Cryst. Growth Des., 4 (2004) 1153–1159. DOI: 10.1021/cg0497795
Kitamura M., Polymorphism in the crystallization of L- glutamic acid, J. Cryst. Growth, 96 (1989) 541–546. DOI:10.1016/0022-0248(89)90049-3
Kitayama A., Yamanaka S., Kadota K., Shimosaka A., Shirakawa Y., Hidaka J., Diffusion behavior in a liquid– liquid interfacial crystallization by molecular dynamics simulations, J. Chem. Phys., 131 (2009b) 174707–174711. DOI:10.1063/1.3254517
Kitayama A., Yamanaka S., Kadota K., Shirakawa Y., Shimosaka A., Hidaka J., Diffusion and cluster formation near NaCl solution/organic solvent interface in a crystalli-zation process, J. Chem. Eng., Jpn., 42 (2009a) 346–350. DOI: 10.1252/jcej.08we312
Koelsch M., Cassaignon M., Minh C.T., Guillemoles J.-F.,
Jolivet J.-P., Electrochemical comparative study of titania (anatase, brookite and rutile) nanoparticles synthesized in aqueous medium, Thin Solid Films, 451 (2004) 86–92. DOI: 10.1016/j.tsf.2003.11.150
Kudo S., Takiyama H., Production of fine organic crystalline particles by using milli segmented flow crystallizer, J. Chem. Eng. Jpn., 45 (2012) 305–309. DOI: 10.1252/jcej.11we168
Kurotani M., Hirasawa I., Effect of ultrasonic on the selective polymorph control in sulfamerazine, Chem. Eng. Res. Des., 88 (2010) 1272–1278. DOI:10.1016/j.cherd.2010.02.014
Kurotani M., Miyasaka E., Ebihara S., Hirasawa I., Effect of ultrasonic irradiation on the behavior of primary nucleation of amino acids in supersaturated solutions, J. Cryst. Growth, 311 (2009) 2714–2721. DOI:10.1016/j.jcrysgro. 2009.03.009
Lasoń E., Sikora E., Ogonowski J., Tabaszewska M., Skoczylas Ł., Release study of selected terpenes from nanostructured lipid carriers, Colloids Surf., A, 510 (2016) 87–92. DOI: 10.1016/j.colsurfa.2016.06.021
Lazzara G., Cavallaro G., Panchal A., Fakhrullin R., Stavitskaya A., Vinokurov V., Lvov Y., An assembly of organic- inorganic composites using halloysite clay nanotubes, Curr. Opin. Colloid Interface Sci., 35 (2018) 42–50. DOI:10.1016/j.cocis.2018.01.002
Lee J.H., Yeo Y., Controlled drug release from pharmaceutical nanocarriers, Chem. Eng. Sci., 125 (2015) 75–84. DOI:10.1016/j.ces.2014.08.046
Leon R.A.L., Wan W.Y., Badruddoza A.Z.M., Hatton T.A., Khan S.A., Simultaneous spherical crystallization and co-formulation of drug(s) and excipient from microfluidic double emulsions, Cryst. Growth Des., 14 (2014) 140–146. DOI: 10.1021/cg4012982
Li Z., Wen Li., Shao L., Chen J., Fabrication of porous hollow silica nanoparticles and their applications in drug release control, J. Control. Release, 98 (2004) 245–254. DOI:10.1016/j.jconrel.2004.04.019
Liao T., Hwang J-Y., Chang H-M., Jiang C-M., Wu M-C., Quan-tification of L-ascorbic acid and total ascorbic acid in fruits and spinach by capillary zone electrophoresis, Electro-phoresis, 22 (2001) 1484–1488. DOI:10.1002/1522-2683(200105)22:8<1484::AID-ELPS1484>3.0.CO;2-9
Linke C., Drusch S., Pickering emulsions in foods - opportunities and limitations, Crit. Rev. Food Sci., 58 (2018) 1971–1985. DOI:10.1080/10408398.2017.1290578
Maicu M., Hidalgo M.C., Colon G., Navio J.A., Comparative study of the photodeposition of Pt, Au and Pd on pre- sulphated TiO2 for the photocatalytic decomposition of phenol, J. Photochem. Photobiol. A Chem., 217 (2011) 275–283. DOI:10.1016/j.jphotochem.2010.10.020
Matsumoto M., Wada Y., Maesawa S., Hiaki T., Onoe K., Expanding production regions of α-form and β-form gly-cine using an antisolvent crystallization method assisted by N2 fine bubbles, Adv. Powder Technol., 30 (2019) 707–713. DOI:10.1016/j.apt.2018.12.021
Matsuoka M., Advanced Technology, Application and Develop-ment of Polymorphic Crystals, 1st ed., CMC Publishing, 2005. ISBN: 4882315246
Kazunori Kadota et al. / KONA Powder and Particle Journal No. 38 (2021) 122–135
134
Mersmann A., Crystallization and precipitation, KONA Powder Part. J., 16 (1998) 60–67. DOI: 10.14356/kona.1998009
Miyasaka E., Ebihara S., Hirasawa I., Investigation of primary nucleation phenomena of acetylsalicylic acid crystals induced by ultrasonic irradiation—ultrasonic energy needed to activate primary nucleation, J. Cryst. Growth, 295 (2006) 97–101. DOI: 10.1016/j.jcrysgro.2006.07.020
Mori C., Kadota K., Shimosaka A., Yoshida M., Shirakawa Y., A powderization process for encapsulating with functional biomaterials using nozzleless electrostatic atomization, J. Food Sci., 84 (2019a) 2482–2489. DOI: 10.1111/1750-3841.14783
Mori C., Kadota K., Tozuka Y., Shimosaka A., Yoshida M., Shirakawa Y., Application of nozzleless electrostatic atomi-zation to encapsulate soybean oil with solid substances, J. Food Eng., 246 (2019b) 349–359. DOI:10.1016/j.jfoodeng. 2018.10.023
Murugan B., Krishnan U.M., Chemoresponsive smart meso-porous silica systems – An emerging paradigm for cancer therapy, Int. J. Pharm., 553 (2018) 310–326. DOI:10.1016/j.ijpharm.2018.10.026
Nakashima Y., Takai C., Razavi-Khosroshahi H., Suthabandit-pong W., Fuji M., Synthesis of ultra-small hollow silica nanoparticles using the prepared amorphous calcium car-bonate in one-pot process, Adv. Powder Technol., 29 (2018) 904–908. DOI:10.1016/j.apt.2018.01.006
Natarajan J.V., Nugraha C., Ng X.W., Venkatraman S., Sustained-release from nanocarriers: A review, J. Control. Release, 193 (2014) 122–138. DOI:10.1016/j.jconrel.2014. 05.029
Nuno M., Ball R.J., Bowen C.R., Kurchania R., Sharma G.D., Photocatalytic activity of electrophoretically deposited (EPD) TiO2 coatings, J. Mater. Sci., 50 (2015) 4822–4835. DOI:10.1007/s10853-015-9022-0
Opalski A.S., Kaminski T.S., Garstecki P., Droplet microfluidics as a tool for the generation of granular matters and func-tional emulsions, KONA Powder Part. J., 36 (2019) 50–71. DOI:10.14356/kona.2019004
Piccinini F., Levi M., Turri S., Photoactive sol–gel hybrid coat-ings from modified fluorocarbon polymers and amorphous titania, Prog. Org. Coat., 76 (2013) 1265–1272. DOI: 10.1016/j.porgcoat.2013.03.026
Pickering S.U., CXCVI.—Emulsions, J. Chem. Soc., Trans., 91 (1907) 2001–2021. DOI: 10.1039/CT9079102001
Provis J.L., Duxson P., van Deventer J.S.J., The role of particle technology in developing sustainable construction materi-als, Adv. Powder Technol., 21 (2010) 2–7. DOI:10.1016/j.apt.2009.10.006
Ramsden W., Separation of solids in the surface-layers of solutions and ‘suspensions’ (observations on surface- membranes, bubbles, emulsions, and mechanical coagula-tion).—Preliminary account, Proc. R. Soc. London, 72 (19031904) 156–164. DOI:10.1098/rspl.1903.0034
Rezazadeh S.M., Sadeghian Z., Nemati A., Mohammadi S.P., Mozafari M., Effects of processing conditions on the physico-chemical characteristics of titanium dioxide ultra-thin films deposited by DC magnetron sputtering, Ceram. Int., 41 (2015) 7977–7981. DOI:10.1016/j.ceramint.2015.
02.142Rocca D.R., Liu D., Lin W., Nanoscale metal–organic frame-
works for biomedical imaging and drug delivery, Acc. Chem. Res.., 44 (2010) 957–968. DOI: 10.1021/ar200028a
Saallah S., Lenggoro I.W., Nanoparticles carrying biological molecules: Recent advances and applications, KONA Pow-der Part. J., 35 (2018) 89–111. DOI:10.14356/kona.2018015
Shirakawa Y., Ii N., Yoshida M., Takashima R., Shimosaka A., Hidaka J., Quantum chemical calculation of electron trans-fer at metal/polymer interfaces, Adv. Powder Technol., 21 (2010) 500–505. DOI:10.1016/j.apt.2010.05.007
Shirakawa Y., Konishi A., Kadota K., Harada S., Shimosaka A., Hidaka J., Effect of interfacial structures on ionic conduc-tivity in particle-dispersed composite electrolytes, Adv. Powder Technol., 17 (2006) 257–275. DOI:10.1163/ 156855206777213429
Sinha B., Müller R.H., Möschwitzer J.P., Bottom-up approaches for preparing drug nanocrystals: formulations and factors affecting particle size, Int. J. Pharm., 453 (2013) 126–141. DOI:10.1016/j.ijpharm.2013.01.019
Sotowa K., Irie K., Fukumori T., Kusakabe K., Sugiyama S., Droplet formation by the collision of two aqueous solutions in a microchannel and application to particle synthesis, Chem. Eng. Technol., 30 (2007) 283–388. DOI: 10.1002/ceat.200600345
Stebbins N.D., Moy M.M., Faig J.J., Uhrich K.E., Sugar-based poly (anhydride-ester) containing natural antioxidants and antimicrobials: Synthesis and formulation into polymer blend, J. Bioact. Compat. Pol., 32 (2017)196–208. DOI:10. 1177/0883911516664819
Stelzer T., Pertig D., Ulrich J., Ultrasonic crystallization moni-toring technique for simultaneous in-line measurement of liquid and solid phase, J. Cryst. Growth, 362 (2013) 71–76. DOI: 10.1016/j.jcrysgro.2011.11.027
Suryo R., Basaran O.A., Tip streaming from a liquid drop form-ing from a tube in a co-flowing outer fluid, Phys. Fluids, 18 (2006) 082102. DOI:10.1063/1.2335621
Takiyama H., Control of crystal size distribution by using undersaturation operation, Bull. Soc. Sea Water Sci. Jpn., 58 (2004) 455–461. DOI:10.11457/swsj1965.58.455
Tamura H., Kadota K., Shirakawa Y., Tozuka Y., Shimosaka A., Hidaka J., Morphology control of amino acid particles in interfacial crystallization using inkjet nozzle, Adv. Powder Technol., 25 (2014) 847–852. DOI: 10.1016/j.apt.2013.12.010
Tanabe K., Yamamoto K., Yoshida S., Yamazaki H., Eiichi H., Itoh S., Yamazaki M., Design of drug release apparatus with dialysis tubing from suppository, Jpn. J. Hosp. Pharm., 14 (1988) 307–311. DOI:10.5649/jjphcs1975.14.307
Tanaka M., Yamanaka S., Shirakawa Y., Shimosaka A., Hidaka J., Preparation of porous particles by liquid-liquid interfa-cial crystallization, Adv. Powder Technol., 22 (2011) 125–130. DOI:10.1016/j.apt.2010.09.012
Tanaka T., Kadota K., Tozuka Y., Shimosaka A., Shirakawa Y., Improvement in photocatalytic activity of morphologically controlled Pd-supporting TiO2 particles via sol–gel process using inkjet nozzle, Ceram. Int., 42 (2016) 9963–9971. DOI:10.1016/j.ceramint.2016.03.098
Tavares L.M., A review of advanced ball mill modelling, KONA
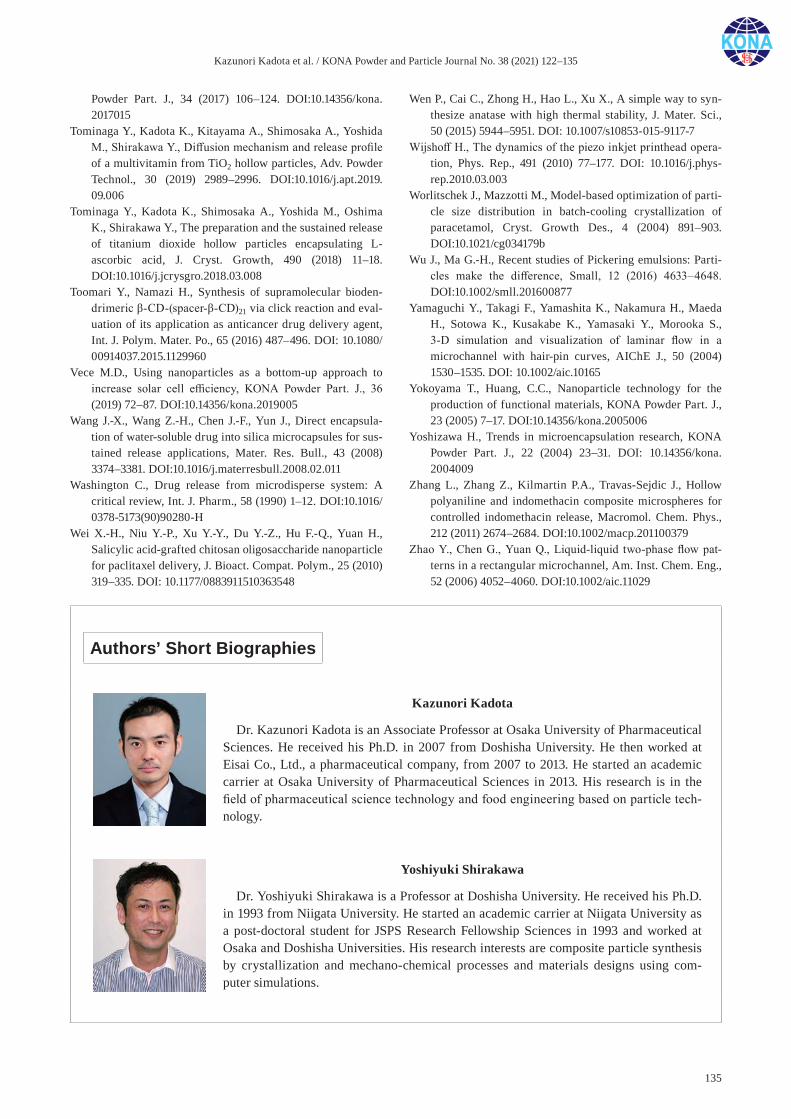
Kazunori Kadota et al. / KONA Powder and Particle Journal No. 38 (2021) 122–135
135
Powder Part. J., 34 (2017) 106–124. DOI:10.14356/kona. 2017015
Tominaga Y., Kadota K., Kitayama A., Shimosaka A., Yoshida M., Shirakawa Y., Diffusion mechanism and release profile of a multivitamin from TiO2 hollow particles, Adv. Powder Technol., 30 (2019) 2989–2996. DOI:10.1016/j.apt.2019. 09.006
Tominaga Y., Kadota K., Shimosaka A., Yoshida M., Oshima K., Shirakawa Y., The preparation and the sustained release of titanium dioxide hollow particles encapsulating L- ascorbic acid, J. Cryst. Growth, 490 (2018) 11–18. DOI:10.1016/j.jcrysgro.2018.03.008
Toomari Y., Namazi H., Synthesis of supramolecular bioden-drimeric β-CD-(spacer-β-CD)21 via click reaction and eval-uation of its application as anticancer drug delivery agent, Int. J. Polym. Mater. Po., 65 (2016) 487–496. DOI: 10.1080/ 00914037.2015.1129960
Vece M.D., Using nanoparticles as a bottom-up approach to increase solar cell efficiency, KONA Powder Part. J., 36 (2019) 72–87. DOI:10.14356/kona.2019005
Wang J.-X., Wang Z.-H., Chen J.-F., Yun J., Direct encapsula-tion of water-soluble drug into silica microcapsules for sus-tained release applications, Mater. Res. Bull., 43 (2008) 3374–3381. DOI:10.1016/j.materresbull.2008.02.011
Washington C., Drug release from microdisperse system: A critical review, Int. J. Pharm., 58 (1990) 1–12. DOI:10.1016/ 0378-5173(90)90280-H
Wei X.-H., Niu Y.-P., Xu Y.-Y., Du Y.-Z., Hu F.-Q., Yuan H., Salicylic acid-grafted chitosan oligosaccharide nanoparticle for paclitaxel delivery, J. Bioact. Compat. Polym., 25 (2010) 319–335. DOI: 10.1177/0883911510363548
Wen P., Cai C., Zhong H., Hao L., Xu X., A simple way to syn-thesize anatase with high thermal stability, J. Mater. Sci., 50 (2015) 5944–5951. DOI: 10.1007/s10853-015-9117-7
Wijshoff H., The dynamics of the piezo inkjet printhead opera-tion, Phys. Rep., 491 (2010) 77–177. DOI: 10.1016/j.phys-rep.2010.03.003
Worlitschek J., Mazzotti M., Model-based optimization of parti-cle size distribution in batch-cooling crystallization of paracetamol, Cryst. Growth Des., 4 (2004) 891–903. DOI:10.1021/cg034179b
Wu J., Ma G.-H., Recent studies of Pickering emulsions: Parti-cles make the difference, Small, 12 (2016) 4633–4648. DOI:10.1002/smll.201600877
Yamaguchi Y., Takagi F., Yamashita K., Nakamura H., Maeda H., Sotowa K., Kusakabe K., Yamasaki Y., Morooka S., 3-D simulation and visualization of laminar flow in a microchannel with hair-pin curves, AIChE J., 50 (2004) 1530–1535. DOI: 10.1002/aic.10165
Yokoyama T., Huang, C.C., Nanoparticle technology for the production of functional materials, KONA Powder Part. J., 23 (2005) 7–17. DOI:10.14356/kona.2005006
Yoshizawa H., Trends in microencapsulation research, KONA Powder Part. J., 22 (2004) 23–31. DOI: 10.14356/kona. 2004009
Zhang L., Zhang Z., Kilmartin P.A., Travas-Sejdic J., Hollow polyaniline and indomethacin composite microspheres for controlled indomethacin release, Macromol. Chem. Phys., 212 (2011) 2674–2684. DOI:10.1002/macp.201100379
Zhao Y., Chen G., Yuan Q., Liquid-liquid two-phase flow pat-terns in a rectangular microchannel, Am. Inst. Chem. Eng., 52 (2006) 4052–4060. DOI:10.1002/aic.11029
Authors’ Short Biographies
Kazunori Kadota
Dr. Kazunori Kadota is an Associate Professor at Osaka University of Pharmaceutical Sciences. He received his Ph.D. in 2007 from Doshisha University. He then worked at Eisai Co., Ltd., a pharmaceutical company, from 2007 to 2013. He started an academic carrier at Osaka University of Pharmaceutical Sciences in 2013. His research is in the field of pharmaceutical science technology and food engineering based on particle tech-nology.
Yoshiyuki Shirakawa
Dr. Yoshiyuki Shirakawa is a Professor at Doshisha University. He received his Ph.D. in 1993 from Niigata University. He started an academic carrier at Niigata University as a post-doctoral student for JSPS Research Fellowship Sciences in 1993 and worked at Osaka and Doshisha Universities. His research interests are composite particle synthesis by crystallization and mechano-chemical processes and materials designs using com-puter simulations.
KONA Powder and Particle Journal No. 38 (2021) 136–154/https://doi.org/10.14356/kona.2021013 Review Paper
136Copyright © 2021 The Authors. Published by Hosokawa Powder Technology Foundation. This is an open access article under the CC BY license (http://creativecommons.org/licenses/by/4.0/).
Consideration of Metal Organic Frameworks for Respiratory Delivery †
Ian E. Stewart 1*, Ignacio Luz 1* and Ninell P. Mortensen 2
1 Center for Engineered Systems, RTI International, USA2 Center for Analytical Chemistry and Pharmaceutics, RTI International, USA
AbstractMetal organic frameworks (MOFs) have garnered increased attention over the past 20 years. Due to their porosity, high surface area, and nearly limitless customization and tunability MOFs have been designed for applications ranging from gas storage and separation to catalysis to sensing to biomedical engineering. Within the latter category, MOFs offer an appealing function for drug delivery as they can be loaded with multiple therapeutic moieties tailored to target specific disorders with triggered and controlled release characteristics. However, there is an unmet need to assess their viability for pulmonary treatment via inhalation. Targeting pulmonary disorders including infectious diseases by delivering medication directly to the lungs attacks the primary site of infection rather than relying on systemic distribution. The inherent advantage of this strategy is maximizing local lung concentrations of the drug. An introduction to inhaled therapies is provided here as a preamble to a brief summary of the current development state of MOF drug delivery systems. This review is intended to highlight the relative disparity between research toward MOFs as pulmonary drug delivery vehicles compared to other delivery platforms. Prospective biomedical applications for inhalable MOFs are also discussed.
Keywords: metal organic frameworks, aerosol, coordination polymer, pulmonary delivery, dry powders
1. Introduction
Inhalation therapies continue to be important treatments for several pulmonary diseases including asthma, cystic fibrosis (CF), and chronic obstructive pulmonary disorder (COPD). Aerosol delivery can achieve a high local drug concentration in the lungs while minimizing systemic exposure, thus potentially resulting toxicity and patient adherence, generating promise as a therapeutic strategy for other pulmonary diseases and infections such as tuberculo-sis (TB). Metal organic frameworks (MOFs) are emerging drug delivery tools. MOFs offer, in addition to drug deliv-ery, the inclusion of metals, presenting multiple therapeutic moieties tailored to target specific disorders with triggered and controlled release characteristics.
Metals have a long history of being utilized to treat vari-ous ailments. Cu has been used for treating pulmonary dis-orders, sanitizing water, and treating wounds (Borkow G. and Gabbay J., 2005; Grass G. et al., 2011; Ladomersky E.
and Petris M.J., 2015). Eye ailments were treated with Zn compounds (Giachi G. et al., 2013). The Chinese had used gold to manage many disorders (Huaizhi Z. and Yuantao N., 2001). However, it was not until the 20th century that metals began to be better understood and utilized by the medical community.
As medicine has progressed into modern times and the essential biological processes associated with metals are known, the applications taking advantage of unique traits of metal (particularly transition metal) complexes as diag-nostic, treatment, and preventative medicinal components have opened up. Since the relatively recent discovery of the anticancer Pt-based complex cisplatin in the mid-20th century (Lippert B., 1999; Rosenberg B. et al., 1969), the use of metals in medicine is largely centered on anticancer activity (Franz K.J. and Metzler-Nolte N., 2019; Ndagi U. et al., 2017), though there are other promising applica-tions. Ag, Co, and Cu have antibacterial and antiviral uses (Borkow G. and Gabbay J., 2005; Chang E.L. et al., 2010; Clement J.L. and Jarrett P.S., 1994; Zhao G. and Stevens S.E., Jr., 1998), Ti and Ti-alloys are used for prosthetics and implants (Zhao L. et al., 2009), and Cu, Rh, Ru, and Zn have been explored for anti-malarial efficacy ( Navarro M. et al., 2005; 2010; Sánchez-Delgado R.A. et al., 1996). The nano-biotechnology research field has blossomed in recent decades: silver nanoparticles (Ag NPs) have
† Received 27 May 2020; Accepted 1 July 2020 J-STAGE Advance published online 21 August 2020
* The authors contributed equally to this work. Please direct correspondence to Ian Stewart;
Add: 3040 East Cornwallis Road, Research Triangle Park, NC, 27709, USA
E-mail: [email protected] TEL: +1-919-541-5933
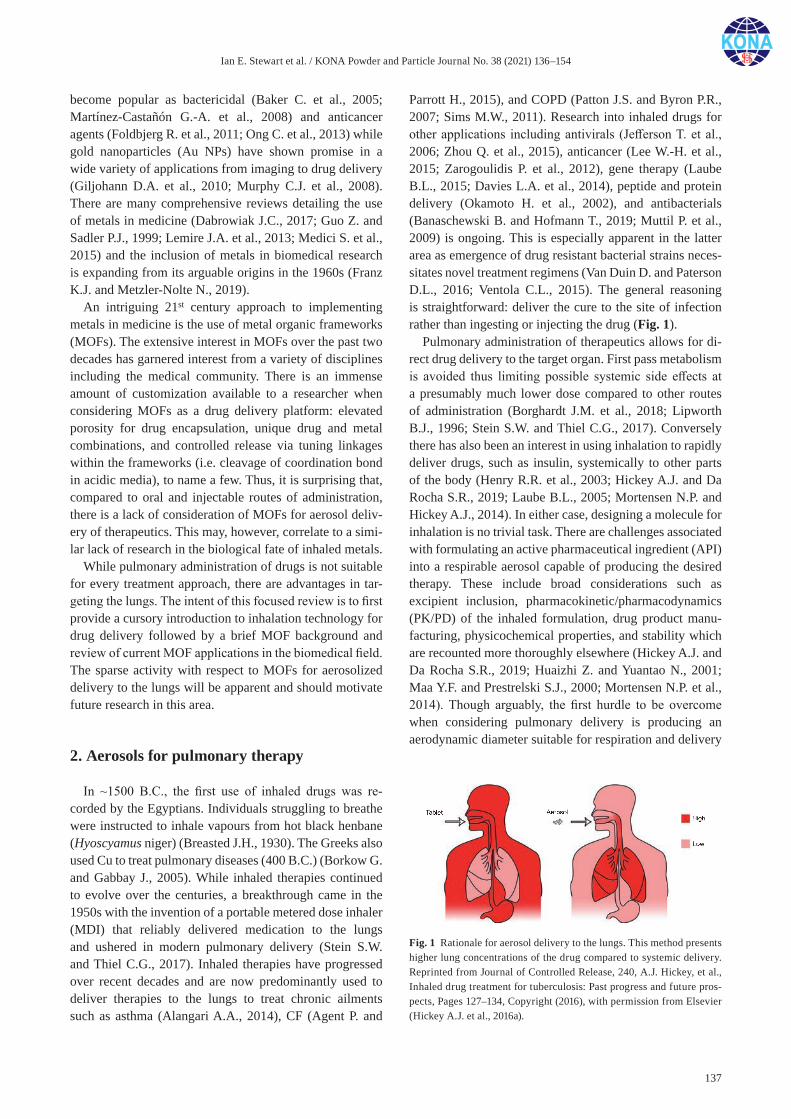
Ian E. Stewart et al. / KONA Powder and Particle Journal No. 38 (2021) 136–154
137
become popular as bactericidal (Baker C. et al., 2005; Martínez-Castañón G.-A. et al., 2008) and anticancer agents (Foldbjerg R. et al., 2011; Ong C. et al., 2013) while gold nanoparticles (Au NPs) have shown promise in a wide variety of applications from imaging to drug delivery (Giljohann D.A. et al., 2010; Murphy C.J. et al., 2008). There are many comprehensive reviews detailing the use of metals in medicine (Dabrowiak J.C., 2017; Guo Z. and Sadler P.J., 1999; Lemire J.A. et al., 2013; Medici S. et al., 2015) and the inclusion of metals in biomedical research is expanding from its arguable origins in the 1960s (Franz K.J. and Metzler-Nolte N., 2019).
An intriguing 21st century approach to implementing metals in medicine is the use of metal organic frameworks (MOFs). The extensive interest in MOFs over the past two decades has garnered interest from a variety of disciplines including the medical community. There is an immense amount of customization available to a researcher when considering MOFs as a drug delivery platform: elevated porosity for drug encapsulation, unique drug and metal combinations, and controlled release via tuning linkages within the frameworks (i.e. cleavage of coordination bond in acidic media), to name a few. Thus, it is surprising that, compared to oral and injectable routes of administration, there is a lack of consideration of MOFs for aerosol deliv-ery of therapeutics. This may, however, correlate to a simi-lar lack of research in the biological fate of inhaled metals.
While pulmonary administration of drugs is not suitable for every treatment approach, there are advantages in tar-geting the lungs. The intent of this focused review is to first provide a cursory introduction to inhalation technology for drug delivery followed by a brief MOF background and review of current MOF applications in the biomedical field. The sparse activity with respect to MOFs for aerosolized delivery to the lungs will be apparent and should motivate future research in this area.
2. Aerosols for pulmonary therapy
In ~1500 B.C., the first use of inhaled drugs was re-corded by the Egyptians. Individuals struggling to breathe were instructed to inhale vapours from hot black henbane (Hyoscyamus niger) (Breasted J.H., 1930). The Greeks also used Cu to treat pulmonary diseases (400 B.C.) (Borkow G. and Gabbay J., 2005). While inhaled therapies continued to evolve over the centuries, a breakthrough came in the 1950s with the invention of a portable metered dose inhaler (MDI) that reliably delivered medication to the lungs and ushered in modern pulmonary delivery (Stein S.W. and Thiel C.G., 2017). Inhaled therapies have progressed over recent decades and are now predominantly used to deliver therapies to the lungs to treat chronic ailments such as asthma (Alangari A.A., 2014), CF (Agent P. and
Parrott H., 2015), and COPD (Patton J.S. and Byron P.R., 2007; Sims M.W., 2011). Research into inhaled drugs for other applications including antivirals (Jefferson T. et al., 2006; Zhou Q. et al., 2015), anticancer (Lee W.-H. et al., 2015; Zarogoulidis P. et al., 2012), gene therapy (Laube B.L., 2015; Davies L.A. et al., 2014), peptide and protein delivery (Okamoto H. et al., 2002), and antibacterials (Banaschewski B. and Hofmann T., 2019; Muttil P. et al., 2009) is ongoing. This is especially apparent in the latter area as emergence of drug resistant bacterial strains neces-sitates novel treatment regimens (Van Duin D. and Paterson D.L., 2016; Ventola C.L., 2015). The general reasoning is straightforward: deliver the cure to the site of infection rather than ingesting or injecting the drug (Fig. 1).
Pulmonary administration of therapeutics allows for di-rect drug delivery to the target organ. First pass metabolism is avoided thus limiting possible systemic side effects at a presumably much lower dose compared to other routes of administration (Borghardt J.M. et al., 2018; Lipworth B.J., 1996; Stein S.W. and Thiel C.G., 2017). Conversely there has also been an interest in using inhalation to rapidly deliver drugs, such as insulin, systemically to other parts of the body (Henry R.R. et al., 2003; Hickey A.J. and Da Rocha S.R., 2019; Laube B.L., 2005; Mortensen N.P. and Hickey A.J., 2014). In either case, designing a molecule for inhalation is no trivial task. There are challenges associated with formulating an active pharmaceutical ingredient (API) into a respirable aerosol capable of producing the desired therapy. These include broad considerations such as excipient inclusion, pharmacokinetic/pharmacodynamics (PK/PD) of the inhaled formulation, drug product manu-facturing, physicochemical properties, and stability which are recounted more thoroughly elsewhere (Hickey A.J. and Da Rocha S.R., 2019; Huaizhi Z. and Yuantao N., 2001; Maa Y.F. and Prestrelski S.J., 2000; Mortensen N.P. et al., 2014). Though arguably, the first hurdle to be overcome when considering pulmonary delivery is producing an aerodynamic diameter suitable for respiration and delivery
Fig. 1 Rationale for aerosol delivery to the lungs. This method presents higher lung concentrations of the drug compared to systemic delivery. Reprinted from Journal of Controlled Release, 240, A.J. Hickey, et al., Inhaled drug treatment for tuberculosis: Past progress and future pros-pects, Pages 127–134, Copyright (2016), with permission from Elsevier (Hickey A.J. et al., 2016a).

Ian E. Stewart et al. / KONA Powder and Particle Journal No. 38 (2021) 136–154
138
to the lower airways.The lungs contain a vast network of internal branches
that confer an enormous canvas for particle deposition. Fig. 2 shows a diagram of adult lungs and corresponding cross-sectional areas of the 24 bifurcating airway genera-tions, increasing from 2.54 cm2 to 104 cm2. However, it is generally accepted that only particles with an aerodynamic diameter of roughly 1–5 μm will be respirable. The aero-dynamic diameter of a particle, which equates the particle to a sphere of unit density with the same settling velocity regardless of its actual shape and density, is defined, in simplified form from Stokes’ law, as
pae v = d d
(1)
where dae is the aerodynamic diameter, dv is the equivalent volume diameter equal to the non-spherical volume diam-eter of the particles in question (can be determined experi-mentally (DeCarlo P.F. et al., 2004)), ρp is the density of the particles and χ is the dynamic shape factor. Full derivations and considerations can be found in the literature (Crowder T.M. et al., 2002; DeCarlo P.F. et al., 2004; Hickey A.J. and Edwards D.A., 2018). One generally cannot rely on the geometric mean size of particles (found via optical techniques) and their bulk/tapped density to predict aero-dynamic diameter and size distributions without detailed knowledge of the particle’s density and considerations for any internal cavities and shape factors. Indeed, particle diameter and density do not need to both be explicitly specified (Edwards D.A. et al., 1997; Hickey A.J. and Edwards D.A., 2018). Rather, an experimentally deter-
mined descriptor of an aerosol’s aerodynamic particle size distributions (APSD) can be measured via inertial impaction. This mass based characterization will generate an APSD from which mass median aerodynamic diameter (MMAD or the median particle size at which 50 % of the aerosol mass lies below and above calculated from a lognormal cumulative distribution), geometric standard deviation (GSD), and fine particle fraction (FPF) can be determined. These are several basic standard quantifiable attributes for aerosol drug characterization prior to in vivo experiments that give the researcher a detailed idea of particle behaviour under the influence of an airstream. The theory and practice of inertial impaction can be found in the literature (Marple V.A. et al., 2003; Mitchell J.P. and Nagel M.W., 2003). The United States Pharmacopeia (USP), among other compendiums such as European Pharmaco-poeia (Ph. Eur.), contain several useful chapters detailing proper characterization of pharmaceutical aerosols to better anticipate performance prior to in vivo studies (see for example chapters <601> and <1601> in the USP). Finally, research regarding predicting in vitro – in vivo correlations and airway modelling is also available (Byron P.R. et al., 2010; Hofmann W., 2011; Olsson B. et al., 2013).
Many factors contribute to inhaled aerosol deposition including airway geometry, temperature and humidity, particle solubility and crystallinity, and the breathing pat-terns of the individual. However, there are three primary outcomes dictated by aerodynamic particle size which are summarized in Fig. 3 (Finlay W.H., 2019; Labiris N.R. and Dolovich M.B., 2003). Particles with MMAD larger than ~5 μm typically a) impact the back of the throat and
Fig. 2 a) Breakdown of lung branching generations and b) corresponding surface area. Compiled figure: a) adapted with permission from (Klein-streuer C. et al., 2008), Copyright 2008 by Annual Reviews; b) reprinted from xPharm: The Comprehensive Pharmacology Reference, Robert M. Lust, The Pulmonary System, Pages 1-6, Copyright (2007), with permission from Elsevier (Lust R.M., 2007).
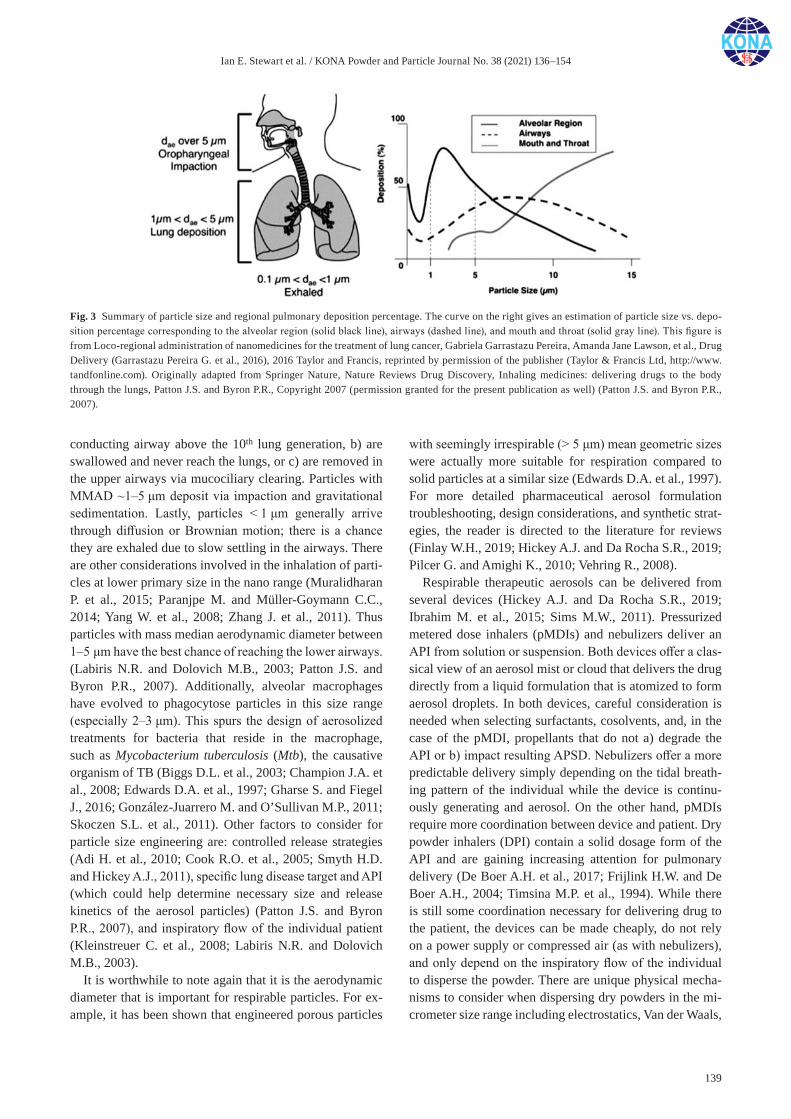
Ian E. Stewart et al. / KONA Powder and Particle Journal No. 38 (2021) 136–154
139
conducting airway above the 10th lung generation, b) are swallowed and never reach the lungs, or c) are removed in the upper airways via mucociliary clearing. Particles with MMAD ~1–5 μm deposit via impaction and gravitational sedimentation. Lastly, particles < 1 μm generally arrive through diffusion or Brownian motion; there is a chance they are exhaled due to slow settling in the airways. There are other considerations involved in the inhalation of parti-cles at lower primary size in the nano range (Muralidharan P. et al., 2015; Paranjpe M. and Müller-Goymann C.C., 2014; Yang W. et al., 2008; Zhang J. et al., 2011). Thus particles with mass median aerodynamic diameter between 1–5 μm have the best chance of reaching the lower airways. (Labiris N.R. and Dolovich M.B., 2003; Patton J.S. and Byron P.R., 2007). Additionally, alveolar macrophages have evolved to phagocytose particles in this size range (especially 2–3 μm). This spurs the design of aerosolized treatments for bacteria that reside in the macrophage, such as Mycobacterium tuberculosis (Mtb), the causative organism of TB (Biggs D.L. et al., 2003; Champion J.A. et al., 2008; Edwards D.A. et al., 1997; Gharse S. and Fiegel J., 2016; González-Juarrero M. and O’Sullivan M.P., 2011; Skoczen S.L. et al., 2011). Other factors to consider for particle size engineering are: controlled release strategies (Adi H. et al., 2010; Cook R.O. et al., 2005; Smyth H.D. and Hickey A.J., 2011), specific lung disease target and API (which could help determine necessary size and release kinetics of the aerosol particles) (Patton J.S. and Byron P.R., 2007), and inspiratory flow of the individual patient (Kleinstreuer C. et al., 2008; Labiris N.R. and Dolovich M.B., 2003).
It is worthwhile to note again that it is the aerodynamic diameter that is important for respirable particles. For ex-ample, it has been shown that engineered porous particles
with seemingly irrespirable (> 5 μm) mean geometric sizes were actually more suitable for respiration compared to solid particles at a similar size (Edwards D.A. et al., 1997). For more detailed pharmaceutical aerosol formulation troubleshooting, design considerations, and synthetic strat-egies, the reader is directed to the literature for reviews (Finlay W.H., 2019; Hickey A.J. and Da Rocha S.R., 2019; Pilcer G. and Amighi K., 2010; Vehring R., 2008).
Respirable therapeutic aerosols can be delivered from several devices (Hickey A.J. and Da Rocha S.R., 2019; Ibrahim M. et al., 2015; Sims M.W., 2011). Pressurized metered dose inhalers (pMDIs) and nebulizers deliver an API from solution or suspension. Both devices offer a clas-sical view of an aerosol mist or cloud that delivers the drug directly from a liquid formulation that is atomized to form aerosol droplets. In both devices, careful consideration is needed when selecting surfactants, cosolvents, and, in the case of the pMDI, propellants that do not a) degrade the API or b) impact resulting APSD. Nebulizers offer a more predictable delivery simply depending on the tidal breath-ing pattern of the individual while the device is continu-ously generating and aerosol. On the other hand, pMDIs require more coordination between device and patient. Dry powder inhalers (DPI) contain a solid dosage form of the API and are gaining increasing attention for pulmonary delivery (De Boer A.H. et al., 2017; Frijlink H.W. and De Boer A.H., 2004; Timsina M.P. et al., 1994). While there is still some coordination necessary for delivering drug to the patient, the devices can be made cheaply, do not rely on a power supply or compressed air (as with nebulizers), and only depend on the inspiratory flow of the individual to disperse the powder. There are unique physical mecha-nisms to consider when dispersing dry powders in the mi-crometer size range including electrostatics, Van der Waals,
Fig. 3 Summary of particle size and regional pulmonary deposition percentage. The curve on the right gives an estimation of particle size vs. depo-sition percentage corresponding to the alveolar region (solid black line), airways (dashed line), and mouth and throat (solid gray line). This figure is from Loco-regional administration of nanomedicines for the treatment of lung cancer, Gabriela Garrastazu Pereira, Amanda Jane Lawson, et al., Drug Delivery (Garrastazu Pereira G. et al., 2016), 2016 Taylor and Francis, reprinted by permission of the publisher (Taylor & Francis Ltd, http://www. tandfonline.com). Originally adapted from Springer Nature, Nature Reviews Drug Discovery, Inhaling medicines: delivering drugs to the body through the lungs, Patton J.S. and Byron P.R., Copyright 2007 (permission granted for the present publication as well) (Patton J.S. and Byron P.R., 2007).
Ian E. Stewart et al. / KONA Powder and Particle Journal No. 38 (2021) 136–154
140
and capillary forces (Dunber C.A. et al., 1998; Hickey A.J., 2018). However, a solid dosage form offers better chemical stability compared to those in solution. And while pMDIs and nebulizers are more or less dependent on the device to dictate APSD, dry powders can be manufactured to well controlled particle sizes as via milling, physical mixing, supercritical fluid, or spray drying (Telko M.J. and Hickey A.J., 2005; Vehring R., 2008).
Given the rise in impactful research in the fields of medicinal metals and inhalational therapies from the mid-1900s, there is very little overlapping study. Fe-chelates delivered via nebulization have been suggested as an option for CF treatment (Musk Jr. D.J. and Hergenrother P.J., 2008). However, there are not many groups suggesting delivering metals therapeutically to the lungs. This may be due to a lack of specific research into metals as a pulmonary therapy as well as a concern over inflammation and toxic-ity (Bierkandt F.S. et al., 2018; Borm P.J.A. et al., 2006; Donaldson K. et al., 2002; Jamuna B.A. and Ravishankar R.V., 2014; Nel A. et al., 2006; 2013). However, there is evidence that a variety of transition metals can be advanta-geous in the treatment of pulmonary bacterial ailments. Ag, Cu, Fe, Pd, and Zn have been suggested for tuberculosis (TB) (Chao A. et al., 2019; Ellis T. et al., 2018; Palazzo F. et al., 2013; Pieters J., 2008; Poole K., 2017), Ag and Pt for lung cancer (with some evidence of dose-dependent toxic-ity) (Foldbjerg R. et al., 2011; Ndagi U. et al., 2017), and Ag, Cu, and Zn for viruses, including coronavirus (Bright K.R. et al., 2008; Raha S. et al., 2020; Ranford J.D. et al., 1993; Shittu M.O. and Afolami O.I., 2020; Skalny A.V. et al., 2020). Indeed, with the emergence of drug resistance, novel therapeutics and unique drug delivery strategies are needed to overcome said resistance to traditional regimens. Utilizing metals may be an intriguing option provided toxicity concerns are addressed (Allahverdiyev A.M. et al., 2011; Chen C.-W. et al., 2014; Ong Y.C. et al., 2019; Sloan D.J. et al., 2013; Turner R.J., 2017; Van Duin D. and Paterson D.L., 2016). MOFs and coordination polymers are an emerging class of materials that may be suitable as a drug delivery vehicle to the lungs.
3. Biomedical applications of MOFs
MOFs are highly crystalline and porous coordination polymers that are assembled by the formation of multiple coordination bonds between inorganic metal nodes (ei-ther metal ions or metal oxide clusters) and multidentate organic ligands. MOFs offer structural designability at the molecular level together with tunable porosity and chemical functionalization. Due to their tailored features, especially elevated surface area and hybrid organic- inorganic compositions, MOFs have been studied for a myriad of applications such as gas storage and separations
(Sumida K. et al., 2012) , nonlinear optics (Yu J. et al., 2012), catalysis (Corma A. et al., 2010; He X. and Wang W.-N., 2019; Luz I. et al., 2010), sensing (Kreno L.E. et al., 2012), or molecular-based magnetisms (Coronado E. et al., 2013). During the last decade, MOFs have also been con-sidered for medical applications ranging from precisely- controlled release of drugs to imaging (Chen W. and Wu C., 2018; Della Rocca J. et al., 2011; He C. et al., 2015a; McKinlay A.C. et al., 2010).
Nano and micro sized MOF particles are required to exploit certain biologically relevant mechanisms (Novio F. and Ruiz-Molina D., 2017). For instance, particle sizes ~500 nm influence the circulating time in the blood stream and facilitate their introduction into cells by endocytosis. Particles smaller than 250 nm are most suitable for cross-ing the vascular endothelium (Giménez-Marqués M. et al., 2016). Fortunately, MOFs of many size ranges can be eas-ily prepared by conventional methods (i.e., solvothermal/hydrothermal synthesis, microwave-assisted, sonochemi-cal) (Stock N. and Biswas S., 2012) or alternative method-ologies ranging from microemulsion and templating (Luz I. et al., 2017; 2019) to spray-drying (Carne-Sanchez A. et al., 2013) and continuous-flow techniques (Friščić T., 2011). MOFs also exhibit a high external surface-area-to-volume ratio which aids in colloidal stability, biocompatibility, recognition capabilities, and biodistribution (Oh M. and Mirkin C.A., 2005). Showcasing their potential for sta-bility in biological pH, MOFs can be made to withstand pH as low as 1.2 (as in the gastrointestinal tract) (Ding M. et al., 2019; Rojas S. et al., 2018) and there have even been reports of manufacturing MOFs with local “buffer” environments that were appropriate for pH 1.5–12.5 (He H. et al., 2018).
The surface of MOF nano- and micro-metric crystals can be functionalized to address specific biological and medical needs via two attachment techniques: covalent (i.e. condensation, click chemistry, and conjugation reactions) or non-covalent (i.e. electrostatic interactions, dispersion forces, and hydrogen bonding) (Sapsford K.E. et al., 2013). On one hand, organic or inorganic nanomaterials have been considered to address the challenges related to the use of conventional treatments, diagnosis, monitoring, and con-trol of biological systems (i.e., drug resistance, systemic toxicity, poor treatment efficacy, and safety) (Patra J.K. et al., 2018). But MOFs are hybrid organic-inorganic materi-als that offer potential advantages compared to these purely organic or inorganic carriers for biomedical applications. These advantages are: size control over nano and mi-croscale and the ability to compose MOF superstructures of individual MOF sub-components; tailored structures (physicochemical properties including metal-ligand com-positions, crystallinity, particle size, and morphology) allowing for the incorporation of multiple functionalities that can demonstrate multi-stimuli-responsive controlled
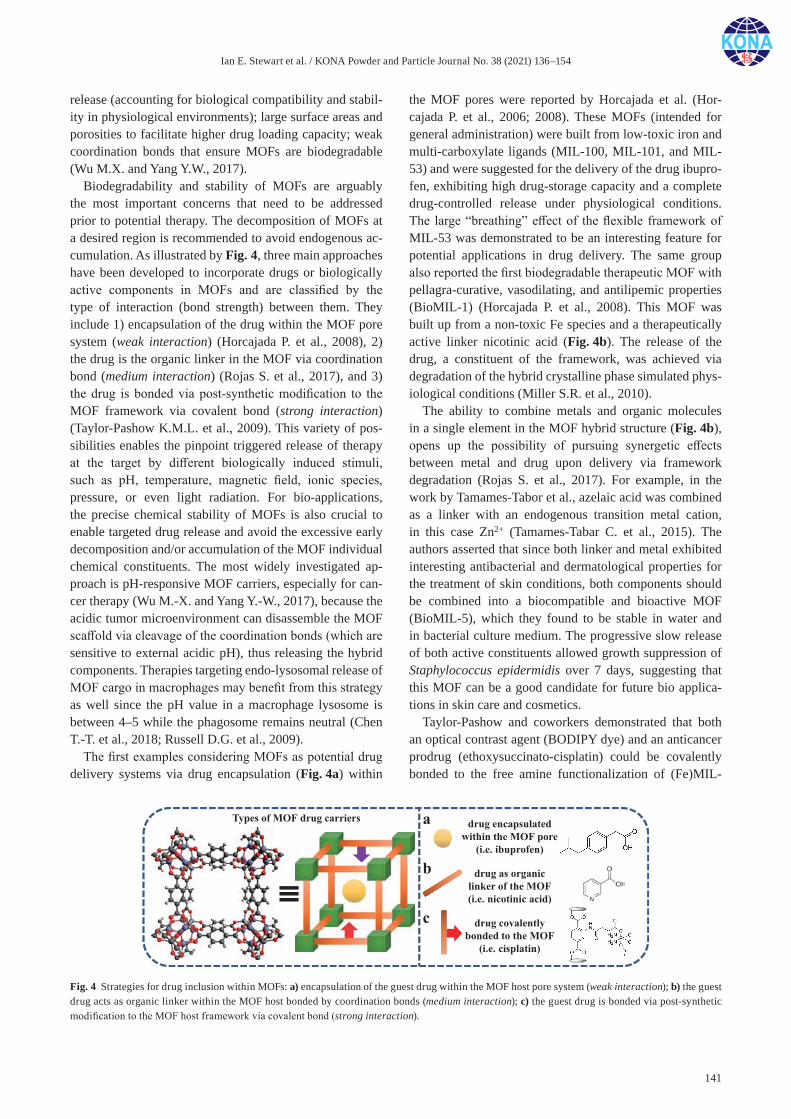
Ian E. Stewart et al. / KONA Powder and Particle Journal No. 38 (2021) 136–154
141
release (accounting for biological compatibility and stabil-ity in physiological environments); large surface areas and porosities to facilitate higher drug loading capacity; weak coordination bonds that ensure MOFs are biodegradable (Wu M.X. and Yang Y.W., 2017).
Biodegradability and stability of MOFs are arguably the most important concerns that need to be addressed prior to potential therapy. The decomposition of MOFs at a desired region is recommended to avoid endogenous ac-cumulation. As illustrated by Fig. 4, three main approaches have been developed to incorporate drugs or biologically active components in MOFs and are classified by the type of interaction (bond strength) between them. They include 1) encapsulation of the drug within the MOF pore system (weak interaction) (Horcajada P. et al., 2008), 2) the drug is the organic linker in the MOF via coordination bond (medium interaction) (Rojas S. et al., 2017), and 3) the drug is bonded via post-synthetic modification to the MOF framework via covalent bond (strong interaction) (Taylor-Pashow K.M.L. et al., 2009). This variety of pos-sibilities enables the pinpoint triggered release of therapy at the target by different biologically induced stimuli, such as pH, temperature, magnetic field, ionic species, pressure, or even light radiation. For bio-applications, the precise chemical stability of MOFs is also crucial to enable targeted drug release and avoid the excessive early decomposition and/or accumulation of the MOF individual chemical constituents. The most widely investigated ap-proach is pH-responsive MOF carriers, especially for can-cer therapy (Wu M.-X. and Yang Y.-W., 2017), because the acidic tumor microenvironment can disassemble the MOF scaffold via cleavage of the coordination bonds (which are sensitive to external acidic pH), thus releasing the hybrid components. Therapies targeting endo-lysosomal release of MOF cargo in macrophages may benefit from this strategy as well since the pH value in a macrophage lysosome is between 4–5 while the phagosome remains neutral (Chen T.-T. et al., 2018; Russell D.G. et al., 2009).
The first examples considering MOFs as potential drug delivery systems via drug encapsulation (Fig. 4a) within
the MOF pores were reported by Horcajada et al. (Hor-cajada P. et al., 2006; 2008). These MOFs (intended for general administration) were built from low-toxic iron and multi-carboxylate ligands (MIL-100, MIL-101, and MIL-53) and were suggested for the delivery of the drug ibupro-fen, exhibiting high drug-storage capacity and a complete drug-controlled release under physiological conditions. The large “breathing” effect of the flexible framework of MIL-53 was demonstrated to be an interesting feature for potential applications in drug delivery. The same group also reported the first biodegradable therapeutic MOF with pellagra-curative, vasodilating, and antilipemic properties (BioMIL-1) (Horcajada P. et al., 2008). This MOF was built up from a non-toxic Fe species and a therapeutically active linker nicotinic acid (Fig. 4b). The release of the drug, a constituent of the framework, was achieved via degradation of the hybrid crystalline phase simulated phys-iological conditions (Miller S.R. et al., 2010).
The ability to combine metals and organic molecules in a single element in the MOF hybrid structure (Fig. 4b), opens up the possibility of pursuing synergetic effects between metal and drug upon delivery via framework degradation (Rojas S. et al., 2017). For example, in the work by Tamames-Tabor et al., azelaic acid was combined as a linker with an endogenous transition metal cation, in this case Zn2+ (Tamames-Tabar C. et al., 2015). The authors asserted that since both linker and metal exhibited interesting antibacterial and dermatological properties for the treatment of skin conditions, both components should be combined into a biocompatible and bioactive MOF (BioMIL-5), which they found to be stable in water and in bacterial culture medium. The progressive slow release of both active constituents allowed growth suppression of Staphylococcus epidermidis over 7 days, suggesting that this MOF can be a good candidate for future bio applica-tions in skin care and cosmetics.
Taylor-Pashow and coworkers demonstrated that both an optical contrast agent (BODIPY dye) and an anticancer prodrug (ethoxysuccinato-cisplatin) could be covalently bonded to the free amine functionalization of (Fe)MIL-
Fig. 4 Strategies for drug inclusion within MOFs: a) encapsulation of the guest drug within the MOF host pore system (weak interaction); b) the guest drug acts as organic linker within the MOF host bonded by coordination bonds (medium interaction); c) the guest drug is bonded via post-synthetic modification to the MOF host framework via covalent bond (strong interaction).
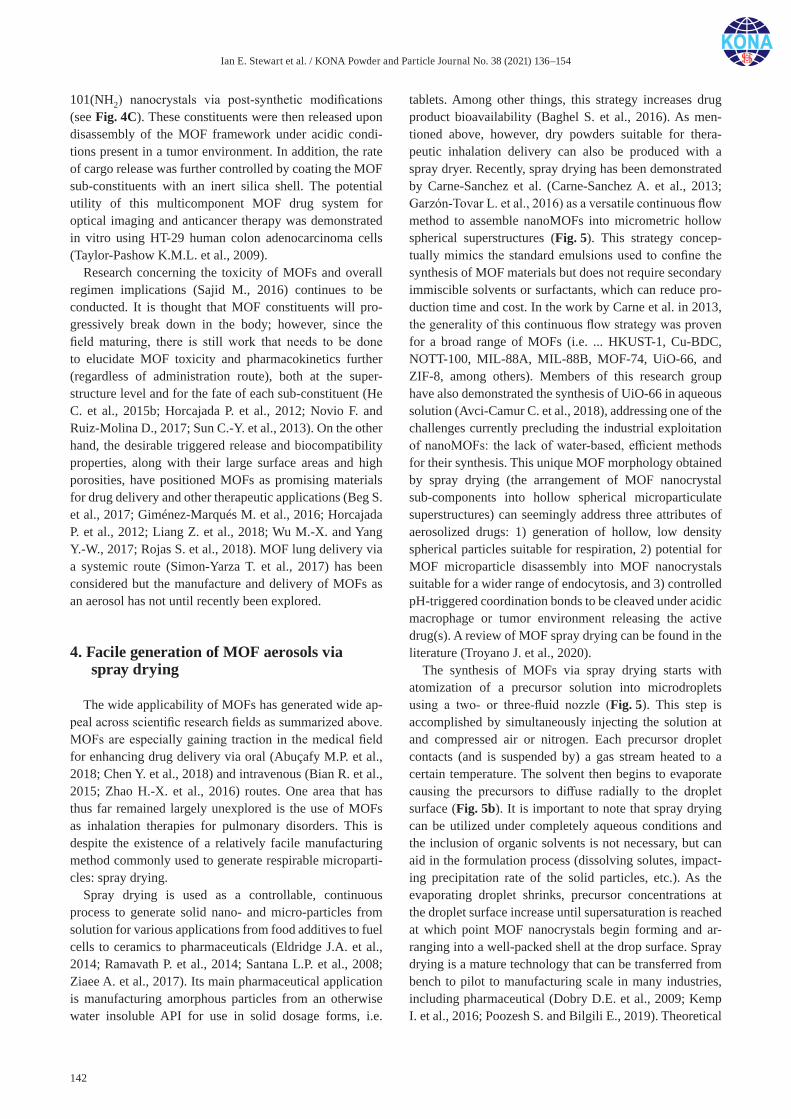
Ian E. Stewart et al. / KONA Powder and Particle Journal No. 38 (2021) 136–154
142
101(NH2) nanocrystals via post-synthetic modifications (see Fig. 4C). These constituents were then released upon disassembly of the MOF framework under acidic condi-tions present in a tumor environment. In addition, the rate of cargo release was further controlled by coating the MOF sub-constituents with an inert silica shell. The potential utility of this multicomponent MOF drug system for optical imaging and anticancer therapy was demonstrated in vitro using HT-29 human colon adenocarcinoma cells (Taylor-Pashow K.M.L. et al., 2009).
Research concerning the toxicity of MOFs and overall regimen implications (Sajid M., 2016) continues to be conducted. It is thought that MOF constituents will pro-gressively break down in the body; however, since the field maturing, there is still work that needs to be done to elucidate MOF toxicity and pharmacokinetics further (regardless of administration route), both at the super-structure level and for the fate of each sub-constituent (He C. et al., 2015b; Horcajada P. et al., 2012; Novio F. and Ruiz-Molina D., 2017; Sun C.-Y. et al., 2013). On the other hand, the desirable triggered release and biocompatibility properties, along with their large surface areas and high porosities, have positioned MOFs as promising materials for drug delivery and other therapeutic applications (Beg S. et al., 2017; Giménez-Marqués M. et al., 2016; Horcajada P. et al., 2012; Liang Z. et al., 2018; Wu M.-X. and Yang Y.-W., 2017; Rojas S. et al., 2018). MOF lung delivery via a systemic route (Simon-Yarza T. et al., 2017) has been considered but the manufacture and delivery of MOFs as an aerosol has not until recently been explored.
4. Facile generation of MOF aerosols via spray drying
The wide applicability of MOFs has generated wide ap-peal across scientific research fields as summarized above. MOFs are especially gaining traction in the medical field for enhancing drug delivery via oral (Abuçafy M.P. et al., 2018; Chen Y. et al., 2018) and intravenous (Bian R. et al., 2015; Zhao H.-X. et al., 2016) routes. One area that has thus far remained largely unexplored is the use of MOFs as inhalation therapies for pulmonary disorders. This is despite the existence of a relatively facile manufacturing method commonly used to generate respirable microparti-cles: spray drying.
Spray drying is used as a controllable, continuous process to generate solid nano- and micro-particles from solution for various applications from food additives to fuel cells to ceramics to pharmaceuticals (Eldridge J.A. et al., 2014; Ramavath P. et al., 2014; Santana L.P. et al., 2008; Ziaee A. et al., 2017). Its main pharmaceutical application is manufacturing amorphous particles from an otherwise water insoluble API for use in solid dosage forms, i.e.
tablets. Among other things, this strategy increases drug product bioavailability (Baghel S. et al., 2016). As men-tioned above, however, dry powders suitable for thera-peutic inhalation delivery can also be produced with a spray dryer. Recently, spray drying has been demonstrated by Carne-Sanchez et al. (Carne-Sanchez A. et al., 2013; Garzón-Tovar L. et al., 2016) as a versatile continuous flow method to assemble nanoMOFs into micrometric hollow spherical superstructures (Fig. 5). This strategy concep-tually mimics the standard emulsions used to confine the synthesis of MOF materials but does not require secondary immiscible solvents or surfactants, which can reduce pro-duction time and cost. In the work by Carne et al. in 2013, the generality of this continuous flow strategy was proven for a broad range of MOFs (i.e. ... HKUST-1, Cu-BDC, NOTT-100, MIL-88A, MIL-88B, MOF-74, UiO-66, and ZIF-8, among others). Members of this research group have also demonstrated the synthesis of UiO-66 in aqueous solution (Avci-Camur C. et al., 2018), addressing one of the challenges currently precluding the industrial exploitation of nanoMOFs: the lack of water-based, efficient methods for their synthesis. This unique MOF morphology obtained by spray drying (the arrangement of MOF nanocrystal sub-components into hollow spherical microparticulate superstructures) can seemingly address three attributes of aerosolized drugs: 1) generation of hollow, low density spherical particles suitable for respiration, 2) potential for MOF microparticle disassembly into MOF nanocrystals suitable for a wider range of endocytosis, and 3) controlled pH-triggered coordination bonds to be cleaved under acidic macrophage or tumor environment releasing the active drug(s). A review of MOF spray drying can be found in the literature (Troyano J. et al., 2020).
The synthesis of MOFs via spray drying starts with atomization of a precursor solution into microdroplets using a two- or three-fluid nozzle (Fig. 5). This step is accomplished by simultaneously injecting the solution at and compressed air or nitrogen. Each precursor droplet contacts (and is suspended by) a gas stream heated to a certain temperature. The solvent then begins to evaporate causing the precursors to diffuse radially to the droplet surface (Fig. 5b). It is important to note that spray drying can be utilized under completely aqueous conditions and the inclusion of organic solvents is not necessary, but can aid in the formulation process (dissolving solutes, impact-ing precipitation rate of the solid particles, etc.). As the evaporating droplet shrinks, precursor concentrations at the droplet surface increase until supersaturation is reached at which point MOF nanocrystals begin forming and ar-ranging into a well-packed shell at the drop surface. Spray drying is a mature technology that can be transferred from bench to pilot to manufacturing scale in many industries, including pharmaceutical (Dobry D.E. et al., 2009; Kemp I. et al., 2016; Poozesh S. and Bilgili E., 2019). Theoretical
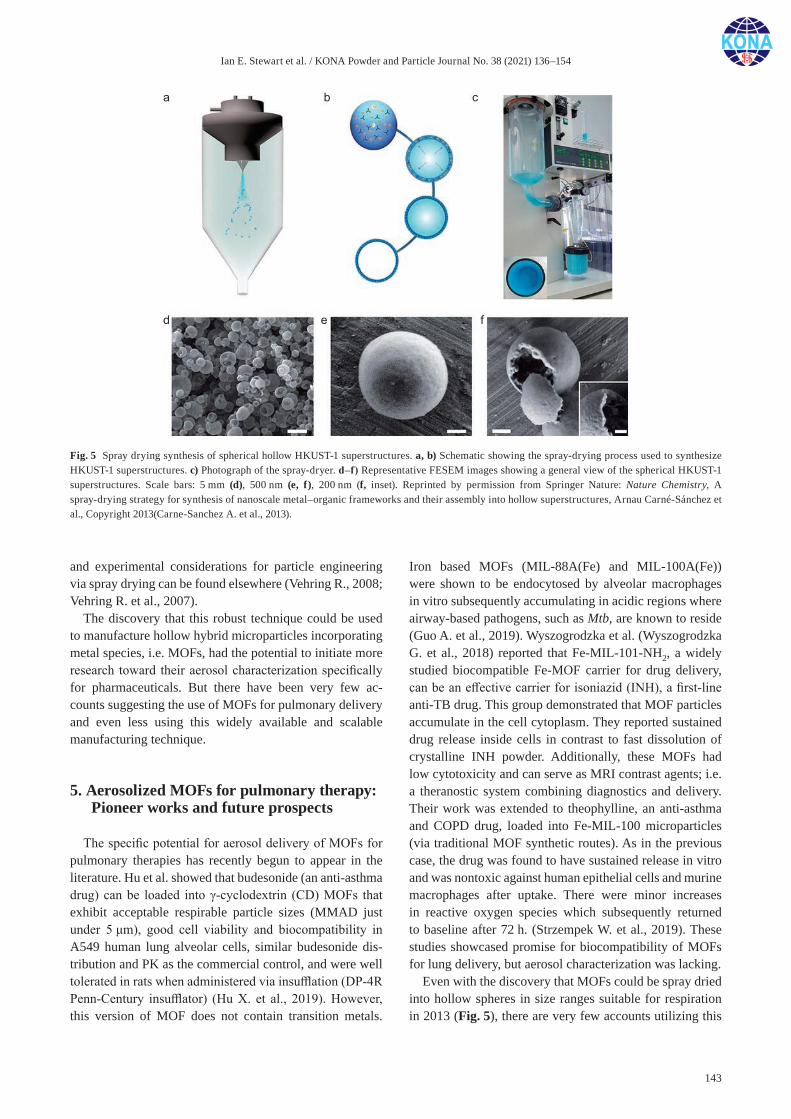
Ian E. Stewart et al. / KONA Powder and Particle Journal No. 38 (2021) 136–154
143
and experimental considerations for particle engineering via spray drying can be found elsewhere (Vehring R., 2008; Vehring R. et al., 2007).
The discovery that this robust technique could be used to manufacture hollow hybrid microparticles incorporating metal species, i.e. MOFs, had the potential to initiate more research toward their aerosol characterization specifically for pharmaceuticals. But there have been very few ac-counts suggesting the use of MOFs for pulmonary delivery and even less using this widely available and scalable manufacturing technique.
5. Aerosolized MOFs for pulmonary therapy: Pioneer works and future prospects
The specific potential for aerosol delivery of MOFs for pulmonary therapies has recently begun to appear in the literature. Hu et al. showed that budesonide (an anti-asthma drug) can be loaded into γ-cyclodextrin (CD) MOFs that exhibit acceptable respirable particle sizes (MMAD just under 5 μm), good cell viability and biocompatibility in A549 human lung alveolar cells, similar budesonide dis-tribution and PK as the commercial control, and were well tolerated in rats when administered via insufflation (DP-4R Penn-Century insufflator) (Hu X. et al., 2019). However, this version of MOF does not contain transition metals.
Iron based MOFs (MIL-88A(Fe) and MIL-100A(Fe)) were shown to be endocytosed by alveolar macrophages in vitro subsequently accumulating in acidic regions where airway-based pathogens, such as Mtb, are known to reside (Guo A. et al., 2019). Wyszogrodzka et al. (Wyszogrodzka G. et al., 2018) reported that Fe-MIL-101-NH2, a widely studied biocompatible Fe-MOF carrier for drug delivery, can be an effective carrier for isoniazid (INH), a first-line anti-TB drug. This group demonstrated that MOF particles accumulate in the cell cytoplasm. They reported sustained drug release inside cells in contrast to fast dissolution of crystalline INH powder. Additionally, these MOFs had low cytotoxicity and can serve as MRI contrast agents; i.e. a theranostic system combining diagnostics and delivery. Their work was extended to theophylline, an anti-asthma and COPD drug, loaded into Fe-MIL-100 microparticles (via traditional MOF synthetic routes). As in the previous case, the drug was found to have sustained release in vitro and was nontoxic against human epithelial cells and murine macrophages after uptake. There were minor increases in reactive oxygen species which subsequently returned to baseline after 72 h. (Strzempek W. et al., 2019). These studies showcased promise for biocompatibility of MOFs for lung delivery, but aerosol characterization was lacking.
Even with the discovery that MOFs could be spray dried into hollow spheres in size ranges suitable for respiration in 2013 (Fig. 5), there are very few accounts utilizing this
Fig. 5 Spray drying synthesis of spherical hollow HKUST-1 superstructures. a, b) Schematic showing the spray-drying process used to synthesize HKUST-1 superstructures. c) Photograph of the spray-dryer. d–f) Representative FESEM images showing a general view of the spherical HKUST-1 superstructures. Scale bars: 5 mm (d), 500 nm (e, f), 200 nm (f, inset). Reprinted by permission from Springer Nature: Nature Chemistry, A spray-drying strategy for synthesis of nanoscale metal–organic frameworks and their assembly into hollow superstructures, Arnau Carné-Sánchez et al., Copyright 2013(Carne-Sanchez A. et al., 2013).
Ian E. Stewart et al. / KONA Powder and Particle Journal No. 38 (2021) 136–154
144
proven aerosol generation technique as a possible drug product manufacturing mechanism. Anti-TB MOF delivery to the lungs would be a reasonable therapy target consider-ing that MOFs and MOF composites have been suggested for use as antimicrobial applications previously (Shen M. et al., 2020; Wyszogrodzka G. et al., 2016). To reach this end, designing MOFs to efficiently deposit in the lungs via dry powder aerosol to locally attack TB can be realized by spray drying. To the best of our knowledge, there are only three reports that characterize aerosolized spray dried MOFs for potential pulmonary delivery – all motivated by anti-TB potential. This strategy is understandable as DPIs have shown promise as an alternative treatment for TB with benefits over standard oral and intravenous regimens such as lower systemic toxicity, local access to the lung granulomas containing Mtb, and avoiding painful injections. Activity in this research area is well documented (Braunstein M. et al., 2019; Dharmadhikari A.S. et al., 2013; Hickey A. et al., 2016a, b; Mehta P. et al., 2018). In a more recent work using the same MOF-based delivery system as above, Wyszogrodzka et al. produced MOFs where INH was encapsulated in Fe-MIL-101-NH2. After-wards, it was combined with poly(lactide-co-glycolide) and leucine via spray-drying leading to a microparticle composite (Fig. 6a) (Wyszogrodzka-Gaweł G. et al., 2019). This MOF exhibited good aerodynamic properties, controlled release of INH, uptake by macrophages in vitro, low cytotoxicity, and extended their theranostic applica-tion. Importantly this was the first reported use of MOFs as a dry powder for inhalation. Similarly, Fernandez-Paz et al. recently produced nanoparticle aerosols from (Fe)MIL-100 MOFs and various biocompatible carbohydrates (i.e. mannitol) via spray drying (Fernández-Paz C. et al., 2020). Notably, these MOF composite particles did not result in an inflammatory response when delivered to rats intratracheally and the release of the intact MOF constitu-
ent nanoMOFs embedded within the superstructure carrier was determined to be uniform along the lungs, reaching the bronchioles and alveoli. Therefore, state-of-the-art MOFs can be spray dried, subsequently filled with drugs, and utilized as aerosolized microparticles using soluble glue-like excipient components. However, despite the existence of the initial work of Carne-Sanchez et al. (Carne-Sanchez A. et al., 2013) demonstrating the continuous-flow prepa-ration of several MOF compounds via spray drying, the utilization of “pure” MOF hollow spheres, i.e. where all metal and organic MOF components are considered active (bioMOFs), as aerosolized drug caariers was not consid-ered in these first publications (Horcajada P. et al., 2012; Rojas S. et al., 2017).
Our group has experience with the preparation of inhal-able anti-TB drugs via spay drying and the characterization of dry powder aerosols (Durham P.G. et al., 2016; Durham P.G. et al., 2015; Hickey A.J. et al., 2020; Mortensen N.P. et al., 2014; Pitner R.A. et al., 2019; Stewart I.E. et al., 2019). Given the rise in multi drug resistant (MDR) and exten-sively drug resistant (XDR) TB (Sloan D.J. et al., 2013; Van Duin D. and Paterson D.L., 2016), novel treatments are necessary including via a) inhalation, b) new drugs, and/or c) inclusion of metals. Therefore, we recently developed a spray drying procedure for preparing Cu-POA (pyrazinoic acid) hollow spherical microparticles (Fig. 6b). Our choice of Cu was based on evidence of its anti-TB potential (Festa R.A. et al., 2014; Neyrolles O. et al., 2015; Speer A. et al., 2013; Wolschendorf F. et al., 2011) as well as demonstrated in vitro synergy with other known anti-TB drugs (Manning T. et al., 2015a; 2015b; 2017; Speer A. et al., 2013). POA has been explored as an anti-TB candidate since it is considered a prodrug of pyrazinamide (PZA), a current first line TB drug experiencing drug resistance from Mtb (Durham P.G. et al., 2015; Via L.E. et al., 2015). Our results show that this potential anti-TB MOF can be spray dried in one step from a mostly aqueous solution, excipient-free, to produce a dry powder with APSD suitable for respiration (Luz I. et al., 2020). The use of pure metal-drug compounds linked by coordination bonds can enable the controlled local release of the organic drug and the metal “codrug” simultaneously, in this case Cu2+ and POA (Fig. 6b). This approach avoids the use of unnecessary inactive compo-nents, i.e. organic ligands or metal ions typically found in MOF carriers. These do not contribute to the therapeutic treatment and only provide structural roles, thus removing them can reduce possible toxic contributions. As well, since the polar functional groups of POA are coordinated to the Cu, moisture uptake can be avoided. However, that is not to say excipients are unnecessary during spray drying the formulation process in general; indeed excipients are a common formulation strategy to prevent moisture ingress, encapsulate particles, control release, or aid in dispersion (Bosquillon C. et al., 2001; Gordon M.S. et al., 2000;
Fig. 6 SEM images and schemes for two recent MOF-based aerosol drug delivery systems prepared via spray drying: a) active drug encap-sulated in inactive MOF and combined with excipient (drug@MOF/excipients), SEM extracted from reference (Wyszogrodzka-Gaweł G. et al., 2019); b) active metal and active drug are combined to form a metal-drug bioMOF, SEM extracted from reference (Luz I. et al., 2020).
Ian E. Stewart et al. / KONA Powder and Particle Journal No. 38 (2021) 136–154
145
Sarrate R. et al., 2015; Telko M.J. and Hickey A.J., 2005). Rather this is an alternative approach that designs inhal-able MOFs or coordination polymers composed of solely therapeutic metal and organic components. In addition to mitigating the risk of possible toxic responses higher doses can be achieved (no excipient).
To facilitate this design, non-essential MOF properties for drug release applications can be obviated depending on the requirements of the delivery system, i.e. porosity or crystallinity. This unleashes a myriad of possibilities for designing multifunctional drugs containing the suitable metal-drug components linked by stimuli-responsive co-ordination bonds widening the range of pulmonary disease targets. These materials may be considered as MOFs, if porous and crystalline, or simply as coordination polymer particles (CPP) if amorphous or non-porous (Novio F. et al., 2013).
Although TB has been the primary potential target for most of the early work on spray dried therapeutic aerosol-ized MOFs, it is certainly not the only potential pulmonary target. As mentioned above, lung cancer, other chronic conditions such as asthma, and viruses might benefit from a unique respirable therapy that includes coordination metal-organic components. As well, using the lungs as a strategy to deliver drugs via MOFs systemically can also be considered once more information on toxicity and phar-macology is discovered.
Considering MOFs can be fabricated to remain stable in neutral solution, it may be possible to formulate active spe-cies for inclusion in nebulizers and pMDIs as suspensions (Wang G.-Y. et al., 2014). Indeed, metal-phenolic (Fe) cap-sules have recently been explored as nebulized drug carri-ers for pulmonary delivery while not specifically defined as MOFs. Accumulation in alveolar macrophages with low inflammation was indicated in vivo which suggests that MOFs could be utilized in similar nebulizer applications (Ju Y. et al., 2020). MOFs can also be spray dried into aero-solized microparticles for use in DPIs. Since MOFs and traditional organic APIs are capable of being spray dried separately as well, this might enable combination therapy of several distinct inhaled (or otherwise administered) drugs; synergistic and additive effects might be possible with the inclusion MOFs. Additionally, several APIs and/or metals could be coordinated to the MOF scaffold. This may aid in controlled release and the well-triggered delivery of several medications at their appropriate time.
6. Conclusion
The goal of this review was to briefly present two promising individual areas of research (MOFs and aerosol drugs) whose potential intersection has not been, to our knowledge, thoroughly investigated. While there is risk
associated with utilizing inhaled metals as a therapeutic agent given toxicity concerns, there exists dose-dependent toxicity associated with almost any drug. Moreover, MOF metal and organic synthetic components can be diluted or concentrated to adjust their final concentration levels to reflect a desired therapeutic window. Therefore, expanding the use of metals in medicine to include pulmonary ad-ministration should not be discounted as there are inherent tradeoffs with any regimen once a toxicity threshold is established. To facilitate this work we believe MOFs, as an emerging class of drug delivery vehicles, offer a unique approach toward inhaled therapy. They are capable of being formulated into highly porous, hollow micropar-ticles or manufactured as low-density dry powders with appropriate aerodynamic diameters thus hurdling the first barrier for use as a pharmaceutical aerosol. However, there is a need for further contributions toward characterizing the aerodynamic performance of MOFs to ensure suitability for pulmonary delivery and assessing or connecting their activity and efficacy toward specific lung targets in vitro and in vivo. We believe considering this area of research offers great potential for collaboration and advancement over several disciplines including materials science, aero-sol physics, biology, pharmacology, and medicine.
Nomenclature
API active pharmaceutical ingredient
APSD aerodynamic particle size distribution
BDC benzene-1,4-dicarboxylate
BODIPY boron-dipyrromethene
CF cystic fibrosis
COPD chronic obstructive pulmonary disorder
CP coordination polymers
CPP coordination polymer particle
CD cyclodextrin
DPI dry powder inhaler
EPR enhanced permeability and retention effect
FPF fine particle fraction
GSD geometric standard deviation
HKUST Hong Kong University of Science and Technology
INH isoniazid
MMAD mass median aerodynamic diameter
MDI metered dose inhaler
MOF metal organic framework
MIL materials of Institute Lavoisier
MRI magnetic resonance imaging
NP nanoparticle
Ian E. Stewart et al. / KONA Powder and Particle Journal No. 38 (2021) 136–154
146
NOTT University of Nottingham
PD pharmacodynamic
PK pharmacokinetic
PLGA poly(lactide-co-glycolide) acid
pMDI pressurized metered dose inhaler
POA pyrazinoic acid
TB tuberculosis
UiO University of Oslo
USP United States Pharmacopeia
ZIF zeolitic imidazole framework
dae aerodynamic diameter
dv volume diameter
ρp particle density
χ dynamic shape factor
References
Abuçafy M.P., Caetano B.L., Chiari-Andréo B.G., Fonseca- Santos B., do Santos A.M., Chorilli M., Chiavacci L.A., Supramolecular cyclodextrin-based metal-organic frame-works as efficient carrier for anti-inflammatory drugs, European Journal of Pharmaceutics and Biopharmaceutics, 127 (2018) 112–119. DOI: 10.1016/j.ejpb.2018.02.009
Adi H., Young P.M., Chan H.-K., Salama R., Traini D., Controlled release antibiotics for dry powder lung delivery, Drug Devel-opment and Industrial Pharmacy, 36 (2010) 119–126. DOI: 10.3109/03639040903099769
Agent P., Parrott H., Inhaled therapy in cystic fibrosis: Agents, devices and regimens, Breathe (Sheffield, England), 11 (2015) 110–118. DOI: 10.1183/20734735.021014
Alangari A.A., Corticosteroids in the treatment of acute asthma, Annals of Thoracic Medicine, 9 (2014) 187–192. DOI: 10.4103/1817-1737.140120
Allahverdiyev A.M., Abamor E.S., Bagirova M., Rafailovich M., Antimicrobial effects of TiO2 and Ag2O nanoparticles against drug-resistant bacteria and Leishmania parasites, Future Microbiology, 6 (2011) 933–940. DOI: 10.2217/fmb.11.78
Avci-Camur C., Troyano J., Pérez-Carvajal J., Legrand A., Farrusseng D., Imaz I., Maspoch D., Aqueous production of spherical Zr-MOF beads via continuous-flow spray- drying, Green Chemistry, 20 (2018) 873–878. DOI: 10.1039/C7GC03132G
Baghel S., Cathcart H., O’Reilly N.J., Polymeric amorphous solid dispersions: a review of amorphization, crystallization, stabilization, solid-state characterization, and aqueous sol-ubilization of biopharmaceutical classification system class II drugs, Journal of Pharmaceutical Sciences, 105 (2016) 2527–2544. DOI: 10.1016/j.xphs.2015.10.008
Baker C., Pradhan A., Pakstis L., Pochan D.J., Shah S.I., Synthe-sis and antibacterial properties of silver nanoparticles, Jour-nal of Nanoscience and Nanotechnology, 5 (2005) 244–249. DOI: 10.1166/jnn.2005.034
Banaschewski B., Hofmann T., Inhaled antibiotics for myco-bacterial lung disease, Pharmaceutics, 11 (2019) 352. DOI: 10.3390/pharmaceutics11070352
Beg S., Rahman M., Jain A., Saini S., Midoux P., Pichon C., Ahmad F.J., Akhter S., Nanoporous metal organic frame-works as hybrid polymer–metal composites for drug delivery and biomedical applications, Drug Discovery Today, 22 (2017) 625–637. DOI: 10.1016/j.drudis.2016.10.001
Bian R., Wang T., Zhang L., Li L., Wang C., A combination of tri-modal cancer imaging and in vivo drug delivery by metal–organic framework based composite nanoparticles, Biomaterials Science, 3 (2015) 1270–1278. DOI: 10.1039/C5BM00186B
Bierkandt F.S., Leibrock L., Wagener S., Laux P., Luch A., The impact of nanomaterial characteristics on inhalation toxicity, Toxicology Research, 7 (2018) 321–346. DOI: 10.1039/c7tx00242d
Biggs D.L., Lengsfeld C.S., Hybertson B.M., Ng K.-y., Manning M.C., Randolph T.W., In vitro and in vivo evaluation of the effects of PLA microparticle crystallinity on cellular response, Journal of Controlled Release, 92 (2003) 147–161. DOI: 10.1016/s0168-3659(03)00325-0
Borghardt J.M., Kloft C., Sharma A., Inhaled therapy in respira-tory disease: the complex interplay of pulmonary kinetic pro-cesses, Canadian Respiratory Journal, 2018 (2018) 2732017. DOI: 10.1155/2018/2732017
Borkow G., Gabbay J., Copper as a biocidal tool, Current Medicinal Chemistry, 12 (2005) 2163–2175. DOI: 10.2174/0929867054637617
Borm P.J.A., Robbins D., Haubold S., Kuhlbusch T., Fissan H., Donaldson K., Schins R., Stone V., Kreyling W., Lademann J., Krutmann J., Warheit D., Oberdorster E., The potential risks of nanomaterials: a review carried out for ECETOC, Particle and Fibre Toxicology, 3 (2006) 11. DOI: 10.1186/1743-8977-3-11
Bosquillon C., Lombry C., Préat V., Vanbever R., Influence of for-mulation excipients and physical characteristics of inhalation dry powders on their aerosolization performance, Journal of Controlled Release, 70 (2001) 329–339. DOI: 10.1016/S0168-3659(00)00362-X
Braunstein M., Hickey A.J., Ekins S., Why wait? The case for treating tuberculosis with inhaled drugs, Pharmaceutical Research, 36 (2019) 166. DOI: 10.1007/s11095-019-2704-6
Breasted J.H., The Edwin Smith Surgical Papyrus: published in facsimile and hieroglyphic transliteration with translation and commentary in two volumes, Chic. UP, 1930, ISBN: 0918986737.
Bright K.R., Sicairos-Ruelas E.E., Gundy P.M., Gerba C.P., Assessment of the antiviral properties of zeolites containing metal ions, Food and Environmental Virology, 1 (2008) 37. DOI: 10.1007/s12560-008-9006-1
Byron P.R., Hindle M., Lange C.F., Longest P.W., McRobbie D., Oldham M.J., Olsson B., Thiel C.G., Wachtel H., Finlay W.H., In vivo–in vitro correlations: predicting pulmonary drug deposition from pharmaceutical aerosols, Journal of Aerosol Medicine and Pulmonary Drug Delivery, 23 (2010) S-59–S-69. DOI: 10.1089/jamp.2010.0846
Carne-Sanchez A., Imaz I., Cano-Sarabia M., Maspoch D., A
Ian E. Stewart et al. / KONA Powder and Particle Journal No. 38 (2021) 136–154
147
spray-drying strategy for synthesis of nanoscale metal- organic frameworks and their assembly into hollow super-structures, Nature Chemistry, 5 (2013) 203–211. DOI: 10.1038/nchem.1569
Champion J.A., Walker A., Mitragotri S., Role of particle size in phagocytosis of polymeric microspheres, Pharmaceutical Research, 25 (2008) 1815–1821. DOI: 10.1007/s11095-008-9562-y
Chang E.L., Simmers C., Knight D.A., Cobalt complexes as antiviral and antibacterial agents, Pharmaceuticals, 3 (2010) 1711–1728. DOI: 10.3390/ph3061711
Chao A., Sieminski P.J., Owens C.P., Goulding C.W., Iron acqui-sition in mycobacterium tuberculosis, Chemical Reviews, 119 (2019) 1193–1220. DOI: 10.1021/acs.chemrev.8b00285
Chen C.-W., Hsu C.-Y., Lai S.-M., Syu W.-J., Wang T.-Y., Lai P.-S., Metal nanobullets for multidrug resistant bacteria and biofilms, Advanced Drug Delivery Reviews, 78 (2014) 88–104. DOI: 10.1016/j.addr.2014.08.004
Chen T.-T., Yi J.-T., Zhao Y.-Y., Chu X., Biomineralized metal–organic framework nanoparticles enable intracellular delivery and endo-lysosomal release of native active pro-teins, Journal of the American Chemical Society, 140 (2018) 9912–9920. DOI: 10.1021/jacs.8b04457
Chen W., Wu C., Synthesis, functionalization, and applications of metal–organic frameworks in biomedicine, Dalton Trans-actions, 47 (2018) 2114–2133. DOI: 10.1039/C7DT04116K
Chen Y., Li P., Modica J.A., Drout R.J., Farha O.K., Acid-resistant mesoporous metal–organic framework toward oral insulin delivery: protein encapsulation, protection, and release, Journal of the American Chemical Society, 140 (2018) 5678–5681. DOI: 10.1021/jacs.8b02089
Clement J.L., Jarrett P.S., Antibacterial silver, Metal-Based Drugs, 1 (1994) 467–482. DOI: 10.1155/MBD.1994.467
Cook R.O., Pannu R.K., Kellaway I.W., Novel sustained release microspheres for pulmonary drug delivery, Journal of Controlled Release, 104 (2005) 79–90. DOI: 10.1016/j.jconrel.2005.01.003
Corma A., García H., Llabrés i Xamena F.X., Engineering metal organic frameworks for heterogeneous catalysis, Chemical Reviews, 110 (2010) 4606–4655. DOI: 10.1021/cr9003924
Coronado E., Giménez-Marqués M., Martí-Gastaldo C., Espallargas G.M., Navarro-Moratalla E., Waerenborgh J.C., Hybrid magnetic superconductors formed by TaS2 layers and spin crossover complexes, Inorganic Chemistry, 52 (2013) 8451–8460. DOI: 10.1021/ic400320g
Crowder T.M., Rosati J.A., Schroeter J.D., Hickey A.J., Martonen T.B., Fundamental effects of particle morphology on lung delivery: predictions of Stokes’ law and the particular relevance to dry powder inhaler formulation and develop-ment, Pharmaceutical Research, 19 (2002) 239–245. DOI: 10.1023/A:1014426530935
Dabrowiak J.C., Metals in Medicine, second edition, Wiley, 2017, ISBN: 9781119191315. DOI: 10.1002/9781119191377
Davies L.A., Nunez-Alonso G.A., McLachlan G., Hyde S.C., Gill D.R., Aerosol delivery of DNA/liposomes to the lung for cystic fibrosis gene therapy, Human Gene Therapy Clinical Development, 25 (2014) 97–107. DOI: 10.1089/humc.2014.019
De Boer A.H., Hagedoorn P., Hoppentocht M., Buttini F., Grasmeijer F., Frijlink H.W., Dry powder inhalation: past, present and future, Expert Opinion on Drug Delivery, 14 (2017) 499–512. DOI: 10.1080/17425247.2016.1224846
DeCarlo P.F., Slowik J.G., Worsnop D.R., Davidovits P., Jimenez J.L., Particle morphology and density characterization by combined mobility and aerodynamic diameter measure-ments. Part 1: Theory, Aerosol Science and Technology, 38 (2004) 1185–1205. DOI: 10.1080/027868290903907
Della Rocca J., Liu D., Lin W., Nanoscale metal–organic frame-works for biomedical imaging and drug delivery, Accounts of Chemical Research, 44 (2011) 957–968. DOI: 10.1021/ar200028a
Dharmadhikari A.S., Kabadi M., Gerety B., Hickey A.J., Fourie P.B., Nardell E., Phase I, Single-dose, dose-escalating study of inhaled dry powder capreomycin: a new approach to therapy of drug-resistant tuberculosis, Antimicrobial Agents and Chemotherapy, 57 (2013) 2613–2619. DOI: 10.1128/aac.02346-12
Ding M., Cai X., Jiang H.-L., Improving MOF stability: approaches and applications, Chemical Science, 10 (2019) 10209–10230. DOI: 10.1039/C9SC03916C
Dobry D.E., Settell D.M., Baumann J.M., Ray R.J., Graham L.J., Beyerinck R.A., A model-based methodology for spray- drying process development, Journal of Pharmaceutical Inno-vation, 4 (2009) 133–142. DOI: 10.1007/s12247-009-9064-4
Donaldson K., Brown D., Clouter A., Duffin R., MacNee W., Renwick L., Tran L., Stone V., The pulmonary toxicology of ultrafine particles, Journal of Aerosol Medicine, 15 (2002) 213–220. DOI: 10.1089/089426802320282338
Dunber C.A., Hickey A.J., Holzner P., Dispersion and character-ization of pharmaceutical dry powder aerosols, KONA Pow-der and Particle Journal, 16 (1998) 7–45. DOI: 10.14356/kona.1998007
Durham P.G., Young E.F., Braunstein M.S., Welch J.T., Hickey A.J., A dry powder combination of pyrazinoic acid and its n-propyl ester for aerosol administration to animals, Interna-tional Journal of Pharmaceutics, 514 (2016) 384–391. DOI: 10.1016/j.ijpharm.2016.04.063
Durham P.G., Zhang Y., German N., Mortensen N., Dhillon J., Mitchison D.A., Fourie P.B., Hickey A.J., Spray dried aerosol particles of pyrazinoic acid salts for tuberculosis therapy, Molecular Pharmaceutics, 12 (2015) 2574–2581. DOI: 10.1021/acs.molpharmaceut.5b00118
Edwards D.A., Hanes J., Caponetti G., Hrkach J., Ben-Jebria A., Eskew M.L., Mintzes J., Deaver D., Lotan N., Langer R., Large porous particles for pulmonary drug delivery, Science, 276 (1997) 1868–1872. DOI: 10.1126/science.276.5320.1868
Eldridge J.A., Repko D., Mumper R.J., Retention of polyphenolic species in spray-dried blackberry extract using mannitol as a thermoprotectant, Journal of Medicinal Food, 17 (2014) 1064–1069. DOI: 10.1089/jmf.2013.0177
Ellis T., Chiappi M., García-Trenco A., Al-Ejji M., Sarkar S., Georgiou T.K., Shaffer M.S.P., Tetley T.D., Schwander S., Ryan M.P., Porter A.E., Multimetallic microparticles increase the potency of rifampicin against intracellular mycobacte-rium tuberculosis, ACS Nano, 12 (2018) 5228–5240. DOI: 10.1021/acsnano.7b08264

Ian E. Stewart et al. / KONA Powder and Particle Journal No. 38 (2021) 136–154
148
Fernández-Paz C., Rojas S., Salcedo-Abraira P., Simón-Yarza T., Remuñán-López C., Horcajada P., Metal–organic framework microsphere formulation for pulmonary administration, ACS Applied Materials & Interfaces, 12 (2020) 25676–25682. DOI: 10.1021/acsami.0c07356
Festa R.A., Helsel M.E., Franz K.J., Thiele D.J., Exploiting innate immune cell activation of a copper-dependent antimicrobial agent during infection, Chemistry & Biology, 21 (2014) 977–987. DOI: 10.1016/j.chembiol.2014.06.009
Finlay W.H., The Mechanics of Inhaled Pharmaceutical Aerosols: An Introduction, second edition, Elsevier Science, 2019, ISBN: 9780081027868. DOI: 10.1016/C2018-0-00116-4
Foldbjerg R., Dang D.A., Autrup H., Cytotoxicity and genotoxic-ity of silver nanoparticles in the human lung cancer cell line, A549, Archives of Toxicology, 85 (2011) 743–750. DOI: 10.1007/s00204-010-0545-5
Franz K.J., Metzler-Nolte N., Introduction: metals in medicine, Chemical Reviews, 119 (2019) 727–729. DOI: 10.1021/acs.chemrev.8b00685
Frijlink H.W., De Boer A.H., Dry powder inhalers for pulmonary drug delivery, Expert Opinion on Drug Delivery, 1 (2004) 67–86. DOI: 10.1517/17425247.1.1.67
Friščić T., Metal-organic frameworks: mechanochemical synthe-sis strategies, Encyclopedia of Inorganic and Bioinorganic Chemistry, (2011) 1–19. DOI: 10.1002/9781119951438.eibc2202
Garrastazu Pereira G., Lawson A.J., Buttini F., Sonvico F., Loco-regional administration of nanomedicines for the treat-ment of lung cancer, Drug Delivery, 23 (2016) 2881–2896. DOI: 10.3109/10717544.2015.1114047
Garzón-Tovar L., Cano-Sarabia M., Carné-Sánchez A., Carbonell C., Imaz I., Maspoch D., A spray-drying continuous-flow method for simultaneous synthesis and shaping of micro-spherical high nuclearity MOF beads, Reaction Chemistry & Engineering, 1 (2016) 533–539. DOI: 10.1039/C6RE00065G
Gharse S., Fiegel J., Large porous hollow particles: lightweight champions of pulmonary drug delivery, Current Pharmaceu-tical Design, 22 (2016) 2463–2469. <https://www.ncbi.nlm.nih.gov/pmc/articles/PMC4978149/> accessed 02.07.2020.
Giachi G., Pallecchi P., Romualdi A., Ribechini E., Lucejko J.J., Colombini M.P., Mariotti Lippi M., Ingredients of a 2,000-y-old medicine revealed by chemical, mineralogical, and botanical investigations, Proceedings of the National Academy of Sciences, 110 (2013) 1193–1196. DOI: 10.1073/pnas.1216776110
Giljohann D.A., Seferos D.S., Daniel W.L., Massich M.D., Patel P.C., Mirkin C.A., Gold nanoparticles for biology and med-icine, Angewandte Chemie International Edition, 49 (2010) 3280–3294. DOI: 10.1002/anie.200904359
Giménez-Marqués M., Hidalgo T., Serre C., Horcajada P., Nano-structured metal–organic frameworks and their bio-related applications, Coordination Chemistry Reviews, 307 (2016) 342–360. DOI: 10.1016/j.ccr.2015.08.008
González-Juarrero M., O’Sullivan M.P., Optimization of inhaled therapies for tuberculosis: The role of macrophages and den-dritic cells, Tuberculosis, 91 (2011) 86–92. DOI: 10.1016/j.tube.2010.08.007
Gordon M.S., Clark A., Brewer T.K., Systems and processes for
spray drying hydrophobic drugs with hydrophilic excipients, US Patent, (2000) US6077543A.
Grass G., Rensing C., Solioz M., Metallic copper as an antimicro-bial surface, Applied and Environmental Microbiology, 77 (2011) 1541–1547. DOI: 10.1128/AEM.02766-10
Guo A., Durymanov M., Permyakova A., Sene S., Serre C., Reineke J., Metal organic framework (MOF) particles as potential bacteria-mimicking delivery systems for infectious diseases: characterization and cellular internalization in alveolar macrophages, Pharmaceutical Research, 36 (2019) 53. DOI: 10.1007/s11095-019-2589-4
Guo Z., Sadler P.J., Metals in medicine, Angewandte Chemie International Edition, 38 (1999) 1512–1531. DOI: 10.1002/(sici)1521-3773(19990601)38:11<1512::Aid-anie1512>3.0.Co;2-y
He C., Liu D., Lin W., Nanomedicine applications of hybrid nanomaterials built from metal-ligand coordination bonds: nanoscale metal-organic frameworks and nanoscale coordination polymers, Chemical Reviews, 115 (2015a) 11079–11108. DOI: 10.1021/acs.chemrev.5b00125
He C., Liu D., Lin W., Nanomedicine applications of hybrid nanomaterials built from metal–ligand coordination bonds: nanoscale metal–organic frameworks and nanoscale coordination polymers, Chemical Reviews, 115 (2015b) 11079–11108. DOI: 10.1021/acs.chemrev.5b00125
He H., Sun Q., Gao W., Perman J.A., Sun F., Zhu G., Aguila B., Forrest K., Space B., Ma S., A stable metal-organic framework featuring a local buffer environment for carbon dioxide fixation, Angewandte Chemie International Edition, 57 (2018) 4657–4662. DOI: 10.1002/anie.201801122
He X., Wang W.-N., Rational design of efficient semiconductor- based photocatalysts via microdroplets: a review, KONA Powder and Particle Journal, 36 (2019) 201–214. DOI: 10.14356/kona.2019014
Henry R.R., Mudaliar S.R.D., Howland III W.C., Chu N., Kim D., An B., Reinhardt R.R., Inhaled insulin using the AERx insulin diabetes management system in healthy and asthmatic subjects, Diabetes Care, 26 (2003) 764–769. DOI: 10.2337/diacare.26.3.764
Hickey A.J., Durham P.G., Dharmadhikari A., Nardell E.A., Inhaled drug treatment for tuberculosis: past progress and future prospects, Journal of Controlled Release, 240 (2016a) 127–134. DOI: 10.1016/j.jconrel.2015.11.018
Hickey A.J., Complexity in pharmaceutical powders for inhala-tion: a perspective, KONA Powder and Particle Journal, 35 (2018) 3–13. DOI: 10.14356/kona.2018007
Hickey A.J., Da Rocha S.R., Pharmaceutical Inhalation Aero-sol Technology, third edition, CRC Press, 2019, ISBN: 042905520X. DOI: 10.1201/9780429055201
Hickey A.J., Edwards D.A., Density and shape factor terms in stokes’ equation for aerodynamic behavior of aerosols, Jour-nal of Pharmaceutical Sciences, 107 (2018) 794–796. DOI: 10.1016/j.xphs.2017.11.005
Hickey A.J., Misra A., Fourie P.B., Drug Delivery Systems for Tuberculosis Prevention and Treatment, John Wiley & Sons, 2016b, ISBN: 1118943171. DOI: 10.1002/9781118943182
Hickey A.J., Stewart I.E., Jones A., Why we need to deliver large amounts of powder to the lungs and the concurrent
Ian E. Stewart et al. / KONA Powder and Particle Journal No. 38 (2021) 136–154
149
challenges, Journal of Aerosol Medicine and Pulmonary Drug Delivery, (2020) A22 (4pp). <https://ddl-conference. com/wp-content/uploads/2020/02/Hickey.Oral_.pdf> accessed 02.07.2020.
Hofmann W., Modelling inhaled particle deposition in the human lung—a review, Journal of Aerosol Science, 42 (2011) 693–724. DOI: 10.1016/j.jaerosci.2011.05.007
Horcajada P., Gref R., Baati T., Allan P.K., Maurin G., Couvreur P., Férey G., Morris R.E., Serre C., Metal–organic frame-works in biomedicine, Chemical Reviews, 112 (2012) 1232–1268. DOI: 10.1021/cr200256v
Horcajada P., Serre C., Maurin G., Ramsahye N.A., Balas F., Vallet-Regí M., Sebban M., Taulelle F., Férey G., Flexible porous metal-organic frameworks for a controlled drug deliv-ery, Journal of the American Chemical Society, 130 (2008) 6774–6780. DOI: 10.1021/ja710973k
Horcajada P., Serre C., Vallet-Regí M., Sebban M., Taulelle F., Férey G., Metal–organic frameworks as efficient materials for drug delivery, Angewandte Chemie International Edition, 45 (2006) 5974–5978. DOI: 10.1002/anie.200601878
Hu X., Wang C., Wang L., Liu Z., Wu L., Zhang G., Yu L., Ren X., York P., Sun L., Zhang J., Li H., Nanoporous CD-MOF par-ticles with uniform and inhalable size for pulmonary delivery of budesonide, International Journal of Pharmaceutics, 564 (2019) 153–161. DOI: 10.1016/j.ijpharm.2019.04.030
Huaizhi Z., Yuantao N., China’s ancient gold drugs, Gold Bulle-tin, 34 (2001) 24–29. DOI: 10.1007/BF03214805
Ibrahim M., Verma R., Garcia-Contreras L., Inhalation drug delivery devices: technology update, Medical Devices: Evidence and Research, 8 (2015) 131–139. DOI: 10.2147/MDER.S48888
Jamuna B.A., Ravishankar R.V., Environmental risk, human health, and toxic effects of nanoparticles, in: B.I. Kharisov, O.V. Kharissova and H.V.R. Dias (Eds), Nanomaterials for Environmental Protection, 2014, pp. 523–535. DOI: 10.1002/9781118845530.ch31
Jefferson T., Demicheli V., Rivetti D., Jones M., Di Pietrantonj C., Rivetti A., Antivirals for influenza in healthy adults: system-atic review, The Lancet, 367 (2006) 303–313. DOI: 10.1016/S0140-6736(06)67970-1
Ju Y., Cortez-Jugo C., Chen J., Wang T.-Y., Mitchell A.J., Tsantikos E., Bertleff-Zieschang N., Lin Y.-W., Song J., Cheng Y., Mettu S., Rahim M.A., Pan S., Yun G., Hibbs M.L., et al., Engineering of nebulized metal–phenolic capsules for controlled pulmonary deposition, Advanced Science, 7 (2020) 1902650. DOI: 10.1002/advs.201902650
Kemp I.C., Hartwig T., Herdman R., Hamilton P., Bisten A., Bermingham S., Spray drying with a two-fluid nozzle to produce fine particles: atomization, scale-up, and mod-eling, Drying Technology, 34 (2016) 1243–1252. DOI: 10.1080/07373937.2015.1103748
Kleinstreuer C., Zhang Z., Donohue J.F., Targeted drug-aerosol delivery in the human respiratory system, Annual Review of Biomedical Engineering, 10 (2008) 195–220. DOI: 10.1146/annurev.bioeng.10.061807.160544
Kreno L.E., Leong K., Farha O.K., Allendorf M., Van Duyne R.P., Hupp J.T., Metal–organic framework materials as chemical sensors, Chemical Reviews, 112 (2012) 1105–1125. DOI:
10.1021/cr200324tLabiris N.R., Dolovich M.B., Pulmonary drug delivery. Part
I: Physiological factors affecting therapeutic effectiveness of aerosolized medications, British Journal of Clinical Pharmacology, 56 (2003) 588–599. DOI: 10.1046/j.1365-2125.2003.01892.x
Ladomersky E., Petris M.J., Copper tolerance and virulence in bacteria, Metallomics, 7 (2015) 957–964. DOI: 10.1039/c4mt00327f
Laube B.L., The expanding role of aerosols in systemic drug delivery, gene therapy, and vaccination, Respiratory Care, 50 (2005) 1161–1176. <http://rc.rcjournal.com/ content/50/9/1161> accessed 02.07.2020.
Laube B.L., Aerosolized medications for gene and peptide ther-apy, Respiratory Care, 60 (2015) 806–824. DOI: 10.4187/respcare.03554
Lee W.-H., Loo C.-Y., Traini D., Young P.M., Inhalation of nanoparticle-based drug for lung cancer treatment: advan-tages and challenges, Asian Journal of Pharmaceutical Sci-ences, 10 (2015) 481–489. DOI: 10.1016/j.ajps.2015.08.009
Lemire J.A., Harrison J.J., Turner R.J., Antimicrobial activity of metals: mechanisms, molecular targets and applications, Nature Reviews Microbiology, 11 (2013) 371–384. DOI: 10.1038/nrmicro3028
Liang Z., Yang Z., Yuan H., Wang C., Qi J., Liu K., Cao R., Zheng H., A protein@metal–organic framework nanocomposite for pH-triggered anticancer drug delivery, Dalton Transactions, 47 (2018) 10223–10228. DOI: 10.1039/C8DT01789A
Lippert B., Cisplatin: Chemistry and Biochemistry of a Lead-ing Anticancer Drug, John Wiley & Sons, 1999, ISBN: 3906390209. DOI: 10.1002/9783906390420
Lipworth B.J., Pharmacokinetics of inhaled drugs, British Journal of Clinical Pharmacology, 42 (1996) 697–705. DOI: 10.1046/j.1365-2125.1996.00493.x
Lust R.M., The pulmonary system, in: Enna S.J., Bylund D.B. (Eds.), xPharm: The Comprehensive Pharmacology Reference, Elsevier, New York, 2007, pp. 1–6, ISBN: 9780080552323. DOI: 10.1016/B978-008055232-3.60307-1
Luz I., Llabrés i Xamena F.X., Corma A., Bridging homogeneous and heterogeneous catalysis with MOFs: “click” reactions with Cu-MOF catalysts, Journal of Catalysis, 276 (2010) 134–140. DOI: 10.1016/j.jcat.2010.09.010
Luz I., Soukri M., Lail M., Confining metal–organic framework nanocrystals within mesoporous materials: a general approach via “solid-state” synthesis, Chemistry of Materials, 29 (2017) 9628–9638. DOI: 10.1021/acs.chemmater.7b02042
Luz I., Stewart I.E., Mortensen N.P., Hickey A.J., Designing inhalable metal organic frameworks for pulmonary tubercu-losis treatment and theragnostics via spray drying, Chemical Communications, 56 (2020) 13339–13342. DOI: 10.1039/D0CC05471B
Luz I., Toy L., Rabie F., Lail M., Soukri M., Synthesis of soluble metal organic framework composites for mixed matrix membranes, ACS Applied Materials & Interfaces, 11 (2019) 15638–15645. DOI: 10.1021/acsami.9b02622
Maa Y.F., Prestrelski S.J., Biopharmaceutical powders par-ticle formation and formulation considerations, Current Pharmaceutical Biotechnology, 1 (2000) 283–302. DOI:
Ian E. Stewart et al. / KONA Powder and Particle Journal No. 38 (2021) 136–154
150
10.2174/1389201003378898Manning T., Mikula R., Wylie G., Phillips D., Jarvis J., Zhang
F., Structural measurements and cell line studies of the copper-PEG-Rifampicin complex against mycobacterium tuberculosis, Bioorganic & Medicinal Chemistry Letters, 25 (2015a) 451–458. DOI: 10.1016/j.bmcl.2014.12.053
Manning T., Patel H., Wylie G., Phillips D., Jarvis J., Structural measurements and cell line studies of the copper–PEG–Amikacin complex against Mycobacterium tuberculosis, Bioorganic & Medicinal Chemistry Letters, 25 (2015b) 5825–5830. DOI: 10.1016/j.bmcl.2015.08.012
Manning T.J., Wilkerson K., Holder T., Bartley A.C., Jackson C., Plummer S., Phillips D., Krajewski L., Wylie G., Pharmaco-kinetic studies of a three-component complex that repurposes the front line antibiotic isoniazid against Mycobacterium tuberculosis, Tuberculosis, 107 (2017) 149–155. DOI: 10.1016/j.tube.2017.08.011
Marple V.A., Roberts D.L., Romay F.J., Miller N.C., Truman K.G., Van Oort M., Olsson B., Holroyd M.J., Mitchell J.P., Hochrainer D., Next generation pharmaceutical impactor (a new impactor for pharmaceutical inhaler testing). Part I: design, Journal of Aerosol Medicine, 16 (2003) 283–299. DOI: 10.1089/089426803769017659
Martínez-Castañón G.A., Niño-Martínez N., Martínez-Gutierrez F., Martínez-Mendoza J.R., Ruiz F., Synthesis and antibac-terial activity of silver nanoparticles with different sizes, Journal of Nanoparticle Research, 10 (2008) 1343–1348. DOI: 10.1007/s11051-008-9428-6
McKinlay A.C., Morris R.E., Horcajada P., Férey G., Gref R., Couvreur P., Serre C., BioMOFs: metal–organic frameworks for biological and medical applications, Angewandte Chemie International Edition, 49 (2010) 6260–6266. DOI: 10.1002/anie.201000048
Medici S., Peana M., Nurchi V.M., Lachowicz J.I., Crisponi G., Zoroddu M.A., Noble metals in medicine: latest advances, Coordination Chemistry Reviews, 284 (2015) 329–350. DOI: 10.1016/j.ccr.2014.08.002
Mehta P., Bothiraja C., Kadam S., Pawar A., Potential of dry powder inhalers for tuberculosis therapy: facts, fidelity and future, Artificial Cells, Nanomedicine, and Biotechnology, 46 (2018) S791-S806. DOI: 10.1080/21691401.2018.1513938
Miller S.R., Heurtaux D., Baati T., Horcajada P., Grenèche J.M., Serre C., Biodegradable therapeutic MOFs for the delivery of bioactive molecules, Chemical Communications, 46 (2010) 4526–4528. DOI: 10.1039/c001181a
Mitchell J.P., Nagel M.W., Cascade impactors for the size char-acterization of aerosols from medical inhalers: their uses and limitations, Journal of Aerosol Medicine, 16 (2003) 341–377. DOI: 10.1089/089426803772455622
Mortensen N.P., Durham P., Hickey A.J., The role of particle physico-chemical properties in pulmonary drug delivery for tuberculosis therapy, Journal of Microencapsulation, 31 (2014) 785–795. DOI: 10.3109/02652048.2014.932029
Mortensen N.P., Hickey A.J., Targeting inhaled therapy beyond the lungs, Respiration, 88 (2014) 353–354. DOI: 10.1159/000367852
Muralidharan P., Malapit M., Mallory E., Hayes D., Mansour H.M., Inhalable nanoparticulate powders for respiratory
delivery, Nanomedicine: Nanotechnology, Biology and Medicine, 11 (2015) 1189–1199. DOI: 10.1016/j.nano.2015.01.007
Murphy C.J., Gole A.M., Stone J.W., Sisco P.N., Alkilany A.M., Goldsmith E.C., Baxter S.C., Gold nanoparticles in biology: beyond toxicity to cellular imaging, Accounts of Chemical Research, 41 (2008) 1721–1730. DOI: 10.1021/ar800035u
Musk Jr. D.J., Hergenrother P.J., Chelated iron sources are inhibitors of Pseudomonas aeruginosa biofilms and distribute efficiently in an in vitro model of drug delivery to the human lung, Journal of Applied Microbiology, 105 (2008) 380–388. DOI: 10.1111/j.1365-2672.2008.03751.x
Muttil P., Wang C., Hickey A.J., Inhaled drug delivery for tuberculosis therapy, Pharmaceutical Research, 26 (2009) 2401–2416. DOI: 10.1007/s11095-009-9957-4
Navarro M., Gabbiani C., Messori L., Gambino D., Metal-based drugs for malaria, trypanosomiasis and leishmaniasis: recent achievements and perspectives, Drug Discovery Today, 15 (2010) 1070–1078. DOI: 10.1016/j.drudis.2010.10.005
Navarro M., Goitia H., Silva P., Velásquez M., Ojeda L.E., Fraile G., Synthesis and characterization of new copper- and zinc-chloroquine complexes and their activities on respira-tory burst of polymorphonuclear leukocytes, Journal of Inor-ganic Biochemistry, 99 (2005) 1630–1636. DOI: 10.1016/j.jinorgbio.2005.05.002
Ndagi U., Mhlongo N., Soliman M.E., Metal complexes in cancer therapy—an update from drug design perspective, Drug Design, Development and Therapy, 11 (2017) 599–616. DOI: 10.2147/DDDT.S119488
Nel A., Xia T., Mädler L., Li N., Toxic potential of materials at the nanolevel, Science, 311 (2006) 622–627. DOI: 10.1126/science.1114397
Nel A., Xia T., Meng H., Wang X., Lin S., Ji Z., Zhang H., Nano-material toxicity testing in the 21st century: use of a predic-tive toxicological approach and high-throughput screening, Accounts of Chemical Research, 46 (2013) 607–621. DOI: 10.1021/ar300022h
Neyrolles O., Wolschendorf F., Mitra A., Niederweis M., Mycobacteria, metals, and the macrophage, Immunological Reviews, 264 (2015) 249–263. DOI: 10.1111/imr.12265
Novio F., Ruiz-Molina D., Coordination polymers for medical applications: amorphous versus crystalline materials, in: Delville M.H. and Taubert A. (Eds.), Hybrid Organic- Inorganic Interfaces: Towards Advanced Functional Mate-rials, 2017, pp. 661–694, ISBN: 9783527342556. DOI: 10.1002/9783527807130.ch15
Novio F., Simmchen J., Vázquez-Mera N., Amorín-Ferré L., Ruiz-Molina D., Coordination polymer nanoparticles in medicine, Coordination Chemistry Reviews, 257 (2013) 2839–2847. DOI: 10.1016/j.ccr.2013.04.022
Oh M., Mirkin C.A., Chemically tailorable colloidal particles from infinite coordination polymers, Nature, 438 (2005) 651–654. DOI: 10.1038/nature04191
Okamoto H., Todo H., Iida K., Danjo K., Dry powders for pulmonary delivery of peptides and proteins, KONA Powder and Particle Journal, 20 (2002) 71–83. DOI: 10.14356/kona.2002010
Olsson B., Borgström L., Lundbäck H., Svensson M., Validation
Ian E. Stewart et al. / KONA Powder and Particle Journal No. 38 (2021) 136–154
151
of a general in vitro approach for prediction of total lung deposition in healthy adults for pharmaceutical inhalation products, Journal of Aerosol Medicine and Pulmonary Drug Delivery, 26 (2013) 355–369. DOI: 10.1089/jamp.2012.0986
Ong C., Lim J.Z.Z., Ng C.T., Li J.J., Yung L.Y.L., Bay B.H., Sil-ver nanoparticles in cancer: therapeutic efficacy and toxicity, Current Medicinal Chemistry, 20 (2013) 772–781. DOI: 10.2174/092986713805076685
Ong Y.C., Roy S., Andrews P.C., Gasser G., Metal compounds against neglected tropical diseases, Chemical Reviews, 119 (2019) 730–796. DOI: 10.1021/acs.chemrev.8b00338
Palazzo F., Giovagnoli S., Schoubben A., Blasi P., Rossi C., Ricci M., Development of a spray-drying method for the formu-lation of respirable microparticles containing ofloxacin- palladium complex, International Journal of Pharmaceutics, 440 (2013) 273–282. DOI: 10.1016/j.ijpharm.2012.05.045
Paranjpe M., Müller-Goymann C.C., Nanoparticle-mediated pulmonary drug delivery: a review, International Journal of Molecular Sciences, 15 (2014) 5852–5873. DOI: 10.3390/ijms15045852
Patra J.K., Das G., Fraceto L.F., Campos E.V.R., Rodriguez-Torres M.d.P., Acosta-Torres L.S., Diaz-Torres L.A., Grillo R., Swamy M.K., Sharma S., Habtemariam S., Shin H.-S., Nano based drug delivery systems: recent developments and future prospects, Journal of Nanobiotechnology, 16 (2018) 71. DOI: 10.1186/s12951-018-0392-8
Patton J.S., Byron P.R., Inhaling medicines: delivering drugs to the body through the lungs, Nature Reviews Drug Discovery, 6 (2007) 67–74. DOI: 10.1038/nrd2153
Pieters J., Mycobacterium tuberculosis and the macrophage: maintaining a balance, Cell Host & Microbe, 3 (2008) 399–407. DOI: 10.1016/j.chom.2008.05.006
Pilcer G., Amighi K., Formulation strategy and use of excip-ients in pulmonary drug delivery, International Journal of Pharmaceutics, 392 (2010) 1–19. DOI: 10.1016/j.ijpharm.2010.03.017
Pitner R.A., Durham P.G., Stewart I.E., Reed S.G., Cassell G.H., Hickey A.J., Carter D., A spray-dried combination of cap-reomycin and CPZEN-45 for inhaled tuberculosis therapy, Journal of Pharmaceutical Sciences, 108 (2019) 3302–3311. DOI: 10.1016/j.xphs.2019.05.024
Poole K., At the nexus of antibiotics and metals: the impact of Cu and Zn on antibiotic activity and resistance, Trends in Micro-biology, 25 (2017) 820–832. DOI: 10.1016/j.tim.2017.04.010
Poozesh S., Bilgili E., Scale-up of pharmaceutical spray drying using scale-up rules: a review, International Journal of Pharmaceutics, 562 (2019) 271–292. DOI: 10.1016/j.ijpharm.2019.03.047
Raha S., Mallick R., Basak S., Duttaroy A.K., Is copper beneficial for COVID-19 patients?, Medical Hypotheses, 142 (2020) 109814–109814. DOI: 10.1016/j.mehy.2020.109814
Ramavath P., Biswas P., Rajeswari K., Suresh M.B., Johnson R., Padmanabham G., Kumbhar C.S., Chongdar T.K., Gokhale N.M., Optical and mechanical properties of compaction and slip cast processed transparent polycrystalline spinel ceram-ics, Ceramics International, 40 (2014) 5575–5581. DOI: 10.1016/j.ceramint.2013.10.149
Ranford J.D., Sadler P.J., Tocher D.A., Cytotoxicity and antiviral
activity of transition-metal salicylato complexes and crystal structure of Bis(diisopropylsalicylato)(1,10-phenanthroline)copper(II), Journal of the Chemical Society, Dalton Trans-actions, (1993) 3393–3399. DOI: 10.1039/DT9930003393
Rojas S., Baati T., Njim L., Manchego L., Neffati F., Abdeljelil N., Saguem S., Serre C., Najjar M.F., Zakhama A., Horcajada P., Metal–organic frameworks as efficient oral detoxifying agents, Journal of the American Chemical Society, (2018) DOI: 10.1021/jacs.8b04435
Rojas S., Devic T., Horcajada P., Metal organic frameworks based on bioactive components, Journal of Materials Chemistry B, 5 (2017) 2560–2573. DOI: 10.1039/C6TB03217F
Rosenberg B., Vancamp L., Trosko J.E., Mansour V.H., Platinum compounds: a new class of potent antitumour agents, Nature, 222 (1969) 385–386. DOI: 10.1038/222385a0
Russell D.G., Vanderven B.C., Glennie S., Mwandumba H., Heyderman R.S., The macrophage marches on its pha-gosome: dynamic assays of phagosome function, Nature Reviews Immunology, 9 (2009) 594–600. DOI: 10.1038/nri2591
Sajid M., Toxicity of nanoscale metal organic frameworks: a perspective, Environmental Science and Pollution Research, 23 (2016) 14805–14807. DOI: 10.1007/s11356-016-7053-y
Sánchez-Delgado R.A., Navarro M., Pérez H., Urbina J.A., Toward a novel metal-based chemotherapy against tropical diseases. 2. Synthesis and antimalarial activity in vitro and in vivo of new ruthenium- and rhodium-chloroquine complexes, Journal of Medicinal Chemistry, 39 (1996) 1095–1099. DOI: 10.1021/jm950729w
Santana L.P., Lazar D.R.R., Yoshito W.K., Ussui V., Paschoal J.O.A., Spray-dried YSZ ceramic powders: influence of slurry stability on physical characteristics of agglomerates, Materials Science Forum, 591–593 (2008) 465–470. DOI: 10.4028/www.scientific.net/MSF.591-593.465
Sapsford K.E., Algar W.R., Berti L., Gemmill K.B., Casey B.J., Oh E., Stewart M.H., Medintz I.L., Functionalizing nanopar-ticles with biological molecules: developing chemistries that facilitate nanotechnology, Chemical Reviews, 113 (2013) 1904–2074. DOI: 10.1021/cr300143v
Sarrate R., Ticó J.R., Miñarro M., Carrillo C., Fàbregas A., García-Montoya E., Pérez-Lozano P., Suñé-Negre J.M., Modification of the morphology and particle size of pharmaceutical excipients by spray drying technique, Powder Technology, 270 (2015) 244–255. DOI: 10.1016/j. powtec.2014.08.021
Shen M., Forghani F., Kong X., Liu D., Ye X., Chen S., Ding T., Antibacterial applications of metal–organic frameworks and their composites, Comprehensive Reviews in Food Science and Food Safety, (2020) 1–23. DOI: 10.1111/1541-4337.12515
Shittu M.O., Afolami O.I., Improving the efficacy of chloroquine and hydroxychloroquine against SARS-CoV-2 may require zinc additives—a better synergy for future COVID-19 clinical trials, Le Infezioni In Medicina, 28 (2020) 192–197. <https://pubmed.ncbi.nlm.nih.gov/32335560/> accessed 02.07.2020.
Simon-Yarza T., Giménez-Marqués M., Mrimi R., Mielcarek A., Gref R., Horcajada P., Serre C., Couvreur P., A smart
Ian E. Stewart et al. / KONA Powder and Particle Journal No. 38 (2021) 136–154
152
metal–organic framework nanomaterial for lung targeting, Angewandte Chemie International Edition, 56 (2017) 15565–15569. DOI: 10.1002/anie.201707346
Sims M.W., Aerosol therapy for obstructive lung diseases: device selection and practice management issues, Chest, 140 (2011) 781–788. DOI: 10.1378/chest.10-2068
Skalny A.V., Rink L., Ajsuvakova O.P., Aschner M., Grit-senko V.A., Alekseenko S.I., Svistunov A.A., Petrakis D., Spandidos D.A., Aaseth J., Zinc and respiratory tract infections: perspectives for COVID-19, International Journal of Molecular Medicine, 46 (2020) 17–26. DOI: 10.3892/ijmm.2020.4575
Skoczen S.L., Potter T.M., Dobrovolskaia M.A., In vitro analysis of nanoparticle uptake by macrophages using chemilumines-cence, in: McNeil S.E. (Ed), Characterization of Nanopar-ticles Intended for Drug Delivery. Methods in Molecular Biology (Methods and Protocols), Humana Press, 2011, pp. 255–261. ISBN: 978-1-60327-197-4. DOI: 10.1007/978-1-60327-198-1_27
Sloan D.J., Davies G.R., Khoo S.H., Recent advances in tuberculosis: new drugs and treatment regimens, Current Respiratory Medicine Reviews, 9 (2013) 200–210. DOI: 10.2174/1573398x113099990017
Smyth H.D., Hickey A.J., Controlled Pulmonary Drug Delivery, Springer, 2011, ISBN: 1441997458. DOI: 10.1007/978-1-4419-9745-6
Speer A., Shrestha T.B., Bossmann S.H., Basaraba R.J., Harber G.J., Michalek S.M., Niederweis M., Kutsch O., Wolschendorf F., Copper-boosting compounds: a novel concept for antimycobacterial drug discovery, Antimicrobial Agents and Chemotherapy, 57 (2013) 1089–1091. DOI: 10.1128/aac.01781-12
Stein S.W., Thiel C.G., The history of therapeutic aerosols: a chronological review, Journal of Aerosol Medicine and Pulmonary Drug Delivery, 30 (2017) 20–41. DOI: 10.1089/jamp.2016.1297
Stewart I.E., Lukka P.B., Liu J., Meibohm B., Gonzalez-Juarrero M., Braunstein M.S., Lee R.E., Hickey A.J., Development and characterization of a dry powder formulation for anti-tuberculosis drug spectinamide 1599, Pharmaceutical Research, 36 (2019) 136. DOI: 10.1007/s11095-019-2666-8
Stock N., Biswas S., Synthesis of metal-organic frameworks (MOFs): routes to various MOF topologies, morphologies, and composites, Chemical Reviews, 112 (2012) 933–969. DOI: 10.1021/cr200304e
Strzempek W., Menaszek E., Gil B., Fe-MIL-100 as drug delivery system for asthma and chronic obstructive pul-monary disease treatment and diagnosis, Microporous and Mesoporous Materials, 280 (2019) 264–270. DOI: 10.1016/j.micromeso.2019.02.018
Sumida K., Rogow D.L., Mason J.A., McDonald T.M., Bloch E.D., Herm Z.R., Bae T.-H., Long J.R., Carbon dioxide capture in metal–organic frameworks, Chemical Reviews, 112 (2012) 724–781. DOI: 10.1021/cr2003272
Sun C.-Y., Qin C., Wang X.-L., Su Z.-M., Metal-organic frameworks as potential drug delivery systems, Expert Opinion on Drug Delivery, 10 (2013) 89–101. DOI: 10.1517/17425247.2013.741583
Tamames-Tabar C., Imbuluzqueta E., Guillou N., Serre C., Miller S.R., Elkaïm E., Horcajada P., Blanco-Prieto M.J., A Zn azelate MOF: combining antibacterial effect, CrystEngComm, 17 (2015) 456–462. DOI: 10.1039/C4CE00885E
Taylor-Pashow K.M.L., Della Rocca J., Xie Z., Tran S., Lin W., Postsynthetic modifications of iron-carboxylate nanoscale metal−organic frameworks for imaging and drug delivery, Journal of the American Chemical Society, 131 (2009) 14261–14263. DOI: 10.1021/ja906198y
Telko M.J., Hickey A.J., Dry powder inhaler formulation, Respi-ratory Care, 50 (2005) 1209–1227. <http://rc.rcjournal.com/content/50/9/1209/tab-pdf> accessed 02.07.2020.
Timsina M.P., Martin G.P., Marriott C., Ganderton D., Yianneskis M., Drug delivery to the respiratory tract using dry powder inhalers, International Journal of Pharmaceutics, 101 (1994) 1–13. DOI: 10.1016/0378-5173(94)90070-1
Troyano J., Çamur C., Garzón-Tovar L., Carné-Sánchez A., Imaz I., Maspoch D., Spray-drying synthesis of MOFs, COFs, and related composites, Accounts of Chemical Research, 53 (2020) 1206–1217. DOI: 10.1021/acs.accounts.0c00133
Turner R.J., Metal-based antimicrobial strategies, Microbial biotechnology, 10 (2017) 1062–1065. DOI: 10.1111/1751-7915.12785
Van Duin D., Paterson D.L., Multidrug-resistant bacteria in the community: trends and lessons learned, Infectious Disease Clinics of North America, 30 (2016) 377–390. DOI: 10.1016/j.idc.2016.02.004
Vehring R., Pharmaceutical particle engineering via spray dry-ing, Pharmaceutical Research, 25 (2008) 999–1022. DOI: 10.1007/s11095-007-9475-1
Vehring R., Foss W.R., Lechuga-Ballesteros D., Particle forma-tion in spray drying, Journal of Aerosol Science, 38 (2007) 728–746. DOI: 0.1016/j.jaerosci.2007.04.005
Ventola C.L., The antibiotic resistance crisis: part 1: causes and threats, P & T: A Peer-Reviewed Journal for Formulary Management, 40 (2015) 277–283. <https://www.ncbi.nlm.nih.gov/pmc/articles/PMC4378521/> accessed 02.07.2020.
Via L.E., Savic R., Weiner D.M., Zimmerman M.D., Prideaux B., Irwin S.M., Lyon E., O’Brien P., Gopal P., Eum S., Lee M., Lanoix J.P., Dutta N.K., Shim T., Cho J.S., et al., Host- mediated bioactivation of pyrazinamide: implications for efficacy, resistance, and therapeutic alternatives, ACS Infec-tious Diseases, 1 (2015) 203–214. DOI: 10.1021/id500028m
Wang G.-Y., Song C., Kong D.-M., Ruan W.-J., Chang Z., Li Y., Two luminescent metal–organic frameworks for the sensing of nitroaromatic explosives and DNA strands, Journal of Materials Chemistry A, 2 (2014) 2213–2220. DOI: 10.1039/C3TA14199C
Wolschendorf F., Ackart D., Shrestha T.B., Hascall-Dove L., Nolan S., Lamichhane G., Wang Y., Bossmann S.H., Basaraba R.J., Niederweis M., Copper resistance is essential for virulence of Mycobacterium tuberculosis, Proceedings of the National Academy of Sciences, 108 (2011) 1621–1626. DOI: 10.1073/pnas.1009261108
Wu M.-X., Yang Y.-W., Metal–organic framework (MOF)-based drug/cargo delivery and cancer therapy, Advanced Materials, 29 (2017) 1606134. DOI: 10.1002/adma.201606134
Ian E. Stewart et al. / KONA Powder and Particle Journal No. 38 (2021) 136–154
153
Wyszogrodzka-Gaweł G., Dorożyński P., Giovagnoli S., Strzempek W., Pesta E., Węglarz W.P., Gil B., Menaszek E., Kulinowski P., An inhalable theranostic system for local tuberculosis treatment containing an isoniazid loaded metal organic framework Fe-MIL-101-NH2-from raw MOF to drug delivery system, Pharmaceutics, 11 (2019) 687. DOI: 10.3390/pharmaceutics11120687
Wyszogrodzka G., Dorożyński P., Gil B., Roth W.J., Strzempek M., Marszałek B., Węglarz W.P., Menaszek E., Strzempek W., Kulinowski P., Iron-based metal-organic frameworks as a theranostic carrier for local tuberculosis therapy, Pharmaceutical Research, 35 (2018) 144. DOI: 10.1007/s11095-018-2425-2
Wyszogrodzka G., Marszałek B., Gil B., Dorożyński P., Metal- organic frameworks: mechanisms of antibacterial action and potential applications, Drug Discovery Today, 21 (2016) 1009–1018. DOI: 10.1016/j.drudis.2016.04.009
Yang W., Peters J.I., Williams R.O., Inhaled nanoparticles—a current review, International Journal of Pharmaceutics, 356 (2008) 239–247. DOI: 10.1016/j.ijpharm.2008.02.011
Yu J., Cui Y., Wu C., Yang Y., Wang Z., O’Keeffe M., Chen B., Qian G., Second-order nonlinear optical activity induced by ordered dipolar chromophores confined in the pores of an anionic metal-organic framework, Angewandte Chemie International Edition, 51 (2012) 10542–10545. DOI: 10.1002/anie.201204160
Zarogoulidis P., Chatzaki E., Porpodis K., Domvri K., Hohenforst-Schmidt W., Goldberg E.P., Karamanos N., Zarogoulidis K., Inhaled chemotherapy in lung cancer: future
concept of nanomedicine, International Journal of Nanomed-icine, 7 (2012) 1551–1572. DOI: 10.2147/IJN.S29997
Zhang J., Wu L., Chan H.-K., Watanabe W., Formation, charac-terization, and fate of inhaled drug nanoparticles, Advanced Drug Delivery Reviews, 63 (2011) 441–455. DOI: 10.1016/j.addr.2010.11.002
Zhao G., Stevens S.E., Jr., Multiple parameters for the com-prehensive evaluation of the susceptibility of Escherichia coli to the silver ion, Biometals, 11 (1998) 27–32. DOI: 10.1023/a:1009253223055
Zhao H.-X., Zou Q., Sun S.-K., Yu C., Zhang X., Li R.-J., Fu Y.-Y., Theranostic metal–organic framework core–shell composites for magnetic resonance imaging and drug delivery, Chemical Science, 7 (2016) 5294–5301. DOI: 10.1039/C6SC01359G
Zhao L., Chu P.K., Zhang Y., Wu Z., Antibacterial coatings on titanium implants, Journal of Biomedical Materials Research Part B: Applied Biomaterials, 91B (2009) 470–480. DOI: 10.1002/jbm.b.31463
Zhou Q., Leung S.S.Y., Tang P., Parumasivam T., Loh Z.H., Chan H.-K., Inhaled formulations and pulmonary drug delivery systems for respiratory infections, Advanced Drug Delivery Reviews, 85 (2015) 83–99. DOI: 10.1016/j.addr.2014.10.022
Ziaee A., Albadarin A.B., Padrela L., Faucher A., O’Reilly E., Walker G., Spray drying ternary amorphous solid dispersions of ibuprofen–An investigation into critical formulation and processing parameters, European Journal of Pharmaceutics and Biopharmaceutics, 120 (2017) 43–51. DOI: 10.1016/j.ejpb.2017.08.005
Ian E. Stewart et al. / KONA Powder and Particle Journal No. 38 (2021) 136–154
154
Authors’ Short Biographies
Ian E. Stewart
Dr. Stewart is a Research Chemist in the Engineered Systems Center within the Tech-nology Advancement for Commercialization Division at RTI International. He has a background in materials chemistry, specifically oxidation resistant metal nanomaterials for electronic applications. Dr. Stewart’s present role involves the formulation and character-ization of inhalable solutions toward airway pathogen treatment. Dr. Stewart received his B.S (chemistry) from Randolph-Macon College and his Ph.D. (nanomaterials chemistry) from Duke University. Prior to his current position at RTI International, Dr. Stewart was a postdoctoral scientist at the same institution where he helped developing polymeric nano-materials and hydrophobic coatings.
Ignacio Luz
Dr. Luz is a Research Chemist at RTI International with over a decade of experience de-veloping novel advanced technologies and materials based on Metal Organic Frameworks (MOFs) to solve technological challenges in energy, health, and environmental applica-tions, including catalysis, electrocatalysis, photocatalysis, energy materials and storage, drug delivery as well as gas separations and storage. Dr. Luz received his B.S. (Chemical Engineering) from the Polytechnical University of Valencia, Spain, and his M.S. and Ph.D (Chemistry) from the Instituto de Tecnologia Quimica (Valencia, Spain). He also worked as Postdoctoral Researcher at Lawrence Berkeley National Laboratory Berkeley (Berkeley, California).
Ninell P. Mortensen
Dr. Mortensen is a Research Biologist in the Center for Analytical Chemistry and Phar-maceutics at RTI International. She has experience with nanomaterial in vitro and in vivo exposure studies and serves as a Principle Investigator on research programs investigating the biological impact of early life exposure to engineered nanomaterials and addressing the needs for reference materials in nano- and microplastics research. Dr. Mortensen received her B.S. and M.S. (Biology) from the University of Copenhagen, Denmark, and her Ph.D. (Biotechnology) from the Technical University of Denmark. She held a Postdoctoral Fel-lowships at University of Tennessee and Oak Ridge National Laboratory (Biotechnology).
KONA Powder and Particle Journal No. 38 (2021) 155–167/https://doi.org/10.14356/kona.2021012 Review Paper
155Copyright © 2021 The Authors. Published by Hosokawa Powder Technology Foundation. This is an open access article under the CC BY license (http://creativecommons.org/licenses/by/4.0/).
Mechanochemical Preparation of Mineral Based Adsorbent and Its Effective Purification Ability for Wastewater †
Huimin Hu and Qiwu Zhang*School of Resources & Environmental Engineering, Wuhan University of Technology, China
AbstractWith the economic development, environmental pollution is getting worse in many developing countries including China. Traditional processing as CaO neutralization of acidic solutions is still a burden to many local governments of China and development of new process with lower cost is highly required. Mining exploitation produces large amounts of tailings in which industrial minerals such as carbonates, silicates and others have been left without proper utilization. Based on the intensive investigations in the field of mechanochemistry, we propose to use these mineral samples to deal with the purification of heavy metal polluted water by enhancing their reactivity through mechanochemical activation. The industrial minerals such as silicates (serpentine and kaolinite), carbonates (calcite) have been studied for the purposes on removal of contaminants from solution. In addition, the synergistic effects from mixtures of calcite with other material have been investigated to give their excellent adsorbent performance for purification of the wastewater. This review summarizes the recent progresses for mechanochemical preparation of mineral based adsorbent and its effective purification ability for toxic matter-containing wastewater.
Keywords: mechanochemical preparation, non-metallic mineral, industrial minerals, adsorbent, purification, waste water, milling
1. Introduction
Industrialization of the human society may begin with the exploitation of various kinds of minerals. Mineral processing has been an important technique to support the development of civilization. The applicable minerals can be categorized mainly into two groups: the first one is me-tallic mineral resource such as hematite, magnetite, chalco-pyrite and galena, which are used to produce metals such as iron, copper and lead, and another one is non-metallic mineral resource, so called as industrial minerals, such as silica, gibbsite, clay, calcite, mica and talc, which are used particularly as additives and fillers in the productions of paper, plastic, paint, as well as raw materials in the pro-ductions of cement, ceramic, glass and so on. Metallurgical processing of metallic minerals is also a main source to emit heavy metals to pollute the environment, but strange though it may seem, the abandoned mines are actually the other source, seeping pollutant into the environment with underground water or raining.
A key technology enabling to develop new applications for processing these industrial minerals is mechanochem-
ical activation, mainly triggered by a simple operation of ball milling, which is widely used in mineral processing for concentration and enrichment of target minerals. When powder particles are trapped between balls colliding inside a mill pot, then the particles deform elastically and/or plas-tically, and are finally fractured into fine fragments, which are easily agglomerated due to the mechanical activation. The force of the impact during the grinding acts on the powder particles, leading to crystallographic bonds broken and new surface is produced. The new surfaces created enable the particles to aggregate and agglomerate each other easily and this leads to an increase in the degree in the activation of solid material. Profound changes affecting the surface as well as the chemical, physicochemical and structural properties may also take place. This is mani-fested by the presence of a variety of crystal defects such as increased number of grain boundaries, dislocations, vacancies and interstitial atoms, stacking faults, and defor-mation with rupture of chemical bonds. The presence of such crystal defects enhances the diffusivity of chemical components in the solid.
We have been doing investigations from the viewpoint of mechanochemistry, involving a wide range from mineral processing, materials synthesis, metallurgical extraction to detoxification of hazardous materials. Accumulations of our obtained knowledge and understanding of the nature of mechanochemistry allow the development of
† Received 22 May 2020; Accepted 22 June 2020 J-STAGE Advance published online 17 July 2020
* Corresponding author: Qiwu Zhang; Add: 430070 Wuhan, China E-mail: [email protected]
Huimin Hu et al. / KONA Powder and Particle Journal No. 38 (2021) 155–167
156
new mechanochemical route for preparing mineral based adsorbent and its effective purification ability for toxic matter-containing wastewater. This review gives brief points reflecting our recent issues in this field, with related publications listed.
2. Current status in heavy metal pollution and applications of industrial minerals activated and modified by mechanochemical treatment in order to purify wastewater
At the early stage of economic growth, developing coun-tries may face serious environmental problems, and one of them is the heavy metal pollution. The large amounts of metal sulfate wastewater produced in the mining and other industries are the major cause of heavy metal pollution to the environment. The solution to such problem requires im-minent action. In this regard, the action would be important to work out it by two approaches; one is a positive one improving the processing efficiency, reducing the amount of waste emissions, and the second is a passive one puri-fying and decontaminating wastewater. Lime precipitation is currently the main method for purification purpose, but it has brought us obvious disadvantages such as high pH of water, high water percentage to the sediment, difficult filtration and so on. The use of non-metallic minerals for the purification purpose does not cause normally signifi-cant negative problem, so that it would be recommended in practical application, if such disadvantages are improved. One of the methods for improving them would be chemical modification of adsorbents.
Heavy metal contamination is a growing concern in the world, inadequate polluted water and/or wastewater treatments, coupled with increased industrial activity, have brought about serious heavy metal contamination in rivers, lakes, water reservoirs and so on, spreading over the vast area. However, popular technological methods for remov - ing heavy metals from water sources such as membrane filtration, activated carbon adsorption and electro- coagulation are not always feasible for developing coun-tries due to the viewpoints of economy and infrastructure. As a result, many researches have been attempted for the applicability of low-cost adsorbents to remove heavy met-als in the solution. Several scientific papers discussed on the use of alternative adsorbents such as agricultural waste, soil, mineral deposits, aquatic and terrestrial biomass and waste materials.
On the other hand, clay minerals, which are typical non-metallic minerals, exhibiting the adsorbent character-istic, and have been excavated as sedimentary or residual deposit from the earth. This implies that the minerals are normally cheap and abundant natural resources found
easily in the world. The minerals have been examined as adsorbents of many contaminants in mainly aqueous solutions. Clay minerals are very reliable and an environ-mentally friendly remediation material for heavy metal contaminated media. Also, several methods are available for the modification of clay minerals in order to increase their adsorption capacity. However, in order to take first preference in the use of clay minerals as heavy metal reme-diation materials compared to other methods, further tech-nological investigations are required, leading to determine the best modification type for clay minerals as well as their least dosage required for the adsorption of heavy metals.
Similar to the clay minerals, carbonate minerals such as calcite and dolomite are also widely studied as economical adsorbents to dispose in heavy metal polluted water by neutralizing typical acidic wastewater. Due to the relatively low capacity in these raw minerals as absorbents, chemical modification is, in general, required to enhance the adsorp-tion ability as well as its regeneration and reduce the waste sludge amount after the disposal.
Grinding operation of the raw mineral samples has widely been used to reduce the particle size, to increase the specific surface area together with mechanical activation sites on the surfaces. This activation leads therefore to enhancement in the reactivity with heavy metals when it is suspended in the polluted water and its removal efficiency from the solutions. Besides the physical changes in particle size, structural deformation and so on, intense grinding a solid can induce its physicochemical changes, namely mechanochemical effects, by which high reactivity of the ground solid toward heavy metal removals in the solution may be expected. This result is, therefore, linked with con-siderable reduction in the amounts of the mineral samples with keeping efficient performance for environmental re-mediation. This special modifying method based on mech-anochemical effects particularly resulting from intense ball milling is fully investigated and discussed in our group and serves as the main contents of this review paper.
3. Activation and modification of non-metallic minerals by milling
3.1 Hydrated magnesium silicate: Serpentine
Serpentine, (Mg, Fe)3Si2O5(OH)4, is a generic term for a typical class of hydrous magnesium-rich phyllosilicate minerals. At present, serpentine is generally associated with some metal deposits in nature and often abandoned as a gangue mineral, which is not only a waste of serpentine resource, but also a serious impact on the environment. Serpentine has unique characteristics of phyllosilicate min-erals on the adsorption of heavy metal ions, however the raw sample gives limited capacity on heavy metal removal
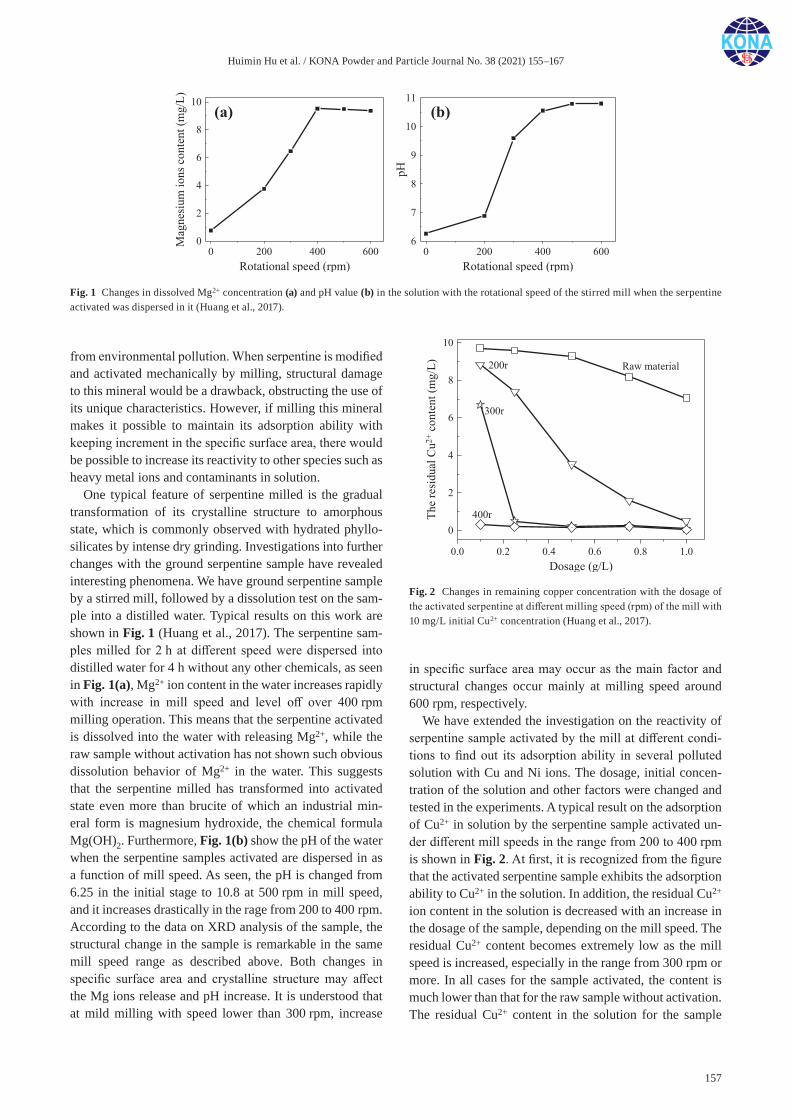
Huimin Hu et al. / KONA Powder and Particle Journal No. 38 (2021) 155–167
157
from environmental pollution. When serpentine is modified and activated mechanically by milling, structural damage to this mineral would be a drawback, obstructing the use of its unique characteristics. However, if milling this mineral makes it possible to maintain its adsorption ability with keeping increment in the specific surface area, there would be possible to increase its reactivity to other species such as heavy metal ions and contaminants in solution.
One typical feature of serpentine milled is the gradual transformation of its crystalline structure to amorphous state, which is commonly observed with hydrated phyllo-silicates by intense dry grinding. Investigations into further changes with the ground serpentine sample have revealed interesting phenomena. We have ground serpentine sample by a stirred mill, followed by a dissolution test on the sam-ple into a distilled water. Typical results on this work are shown in Fig. 1 (Huang et al., 2017). The serpentine sam-ples milled for 2 h at different speed were dispersed into distilled water for 4 h without any other chemicals, as seen in Fig. 1(a), Mg2+ ion content in the water increases rapidly with increase in mill speed and level off over 400 rpm milling operation. This means that the serpentine activated is dissolved into the water with releasing Mg2+, while the raw sample without activation has not shown such obvious dissolution behavior of Mg2+ in the water. This suggests that the serpentine milled has transformed into activated state even more than brucite of which an industrial min-eral form is magnesium hydroxide, the chemical formula Mg(OH)2. Furthermore, Fig. 1(b) show the pH of the water when the serpentine samples activated are dispersed in as a function of mill speed. As seen, the pH is changed from 6.25 in the initial stage to 10.8 at 500 rpm in mill speed, and it increases drastically in the rage from 200 to 400 rpm. According to the data on XRD analysis of the sample, the structural change in the sample is remarkable in the same mill speed range as described above. Both changes in specific surface area and crystalline structure may affect the Mg ions release and pH increase. It is understood that at mild milling with speed lower than 300 rpm, increase
in specific surface area may occur as the main factor and structural changes occur mainly at milling speed around 600 rpm, respectively.
We have extended the investigation on the reactivity of serpentine sample activated by the mill at different condi-tions to find out its adsorption ability in several polluted solution with Cu and Ni ions. The dosage, initial concen-tration of the solution and other factors were changed and tested in the experiments. A typical result on the adsorption of Cu2+ in solution by the serpentine sample activated un-der different mill speeds in the range from 200 to 400 rpm is shown in Fig. 2. At first, it is recognized from the figure that the activated serpentine sample exhibits the adsorption ability to Cu2+ in the solution. In addition, the residual Cu2+ ion content in the solution is decreased with an increase in the dosage of the sample, depending on the mill speed. The residual Cu2+ content becomes extremely low as the mill speed is increased, especially in the range from 300 rpm or more. In all cases for the sample activated, the content is much lower than that for the raw sample without activation. The residual Cu2+ content in the solution for the sample
Fig. 1 Changes in dissolved Mg2+ concentration (a) and pH value (b) in the solution with the rotational speed of the stirred mill when the serpentine activated was dispersed in it (Huang et al., 2017).
Fig. 2 Changes in remaining copper concentration with the dosage of the activated serpentine at different milling speed (rpm) of the mill with 10 mg/L initial Cu2+ concentration (Huang et al., 2017).
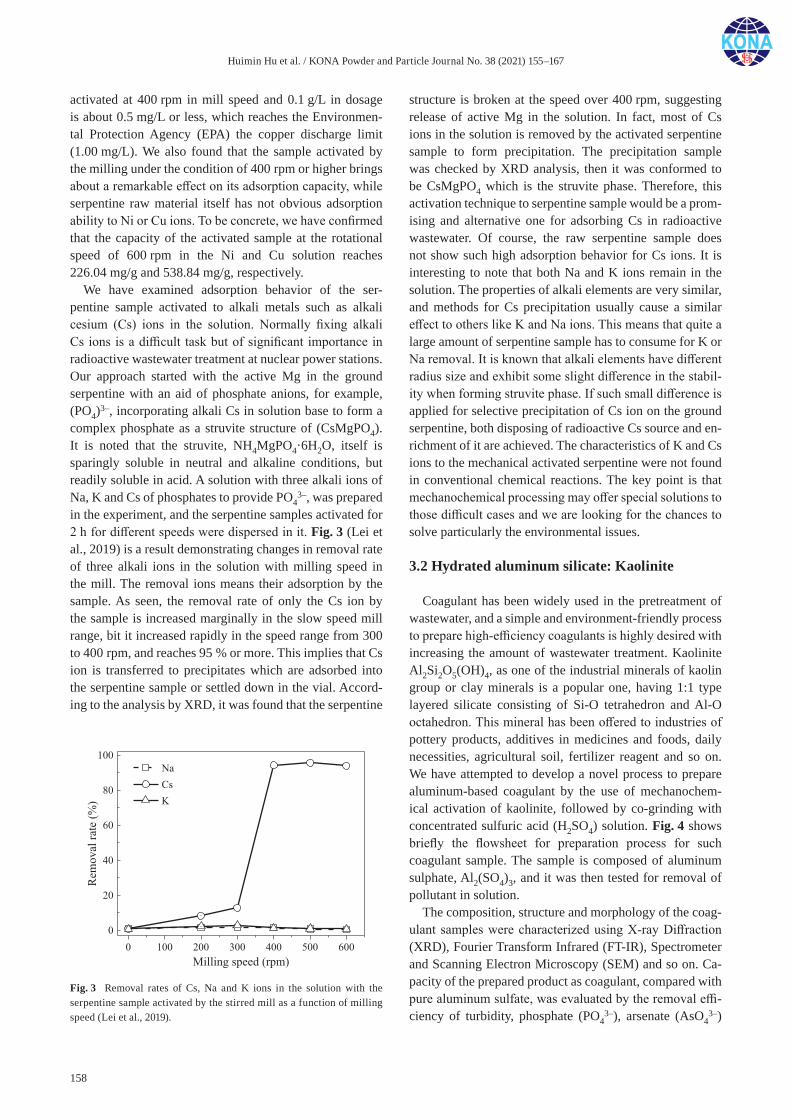
Huimin Hu et al. / KONA Powder and Particle Journal No. 38 (2021) 155–167
158
activated at 400 rpm in mill speed and 0.1 g/L in dosage is about 0.5 mg/L or less, which reaches the Environmen-tal Protection Agency (EPA) the copper discharge limit (1.00 mg/L). We also found that the sample activated by the milling under the condition of 400 rpm or higher brings about a remarkable effect on its adsorption capacity, while serpentine raw material itself has not obvious adsorption ability to Ni or Cu ions. To be concrete, we have confirmed that the capacity of the activated sample at the rotational speed of 600 rpm in the Ni and Cu solution reaches 226.04 mg/g and 538.84 mg/g, respectively.
We have examined adsorption behavior of the ser-pentine sample activated to alkali metals such as alkali cesium (Cs) ions in the solution. Normally fixing alkali Cs ions is a difficult task but of significant importance in radioactive wastewater treatment at nuclear power stations. Our approach started with the active Mg in the ground serpentine with an aid of phosphate anions, for example, (PO4)3–, incorporating alkali Cs in solution base to form a complex phosphate as a struvite structure of (CsMgPO4). It is noted that the struvite, NH4MgPO4·6H2O, itself is sparingly soluble in neutral and alkaline conditions, but readily soluble in acid. A solution with three alkali ions of Na, K and Cs of phosphates to provide PO4
3–, was prepared in the experiment, and the serpentine samples activated for 2 h for different speeds were dispersed in it. Fig. 3 (Lei et al., 2019) is a result demonstrating changes in removal rate of three alkali ions in the solution with milling speed in the mill. The removal ions means their adsorption by the sample. As seen, the removal rate of only the Cs ion by the sample is increased marginally in the slow speed mill range, bit it increased rapidly in the speed range from 300 to 400 rpm, and reaches 95 % or more. This implies that Cs ion is transferred to precipitates which are adsorbed into the serpentine sample or settled down in the vial. Accord-ing to the analysis by XRD, it was found that the serpentine
structure is broken at the speed over 400 rpm, suggesting release of active Mg in the solution. In fact, most of Cs ions in the solution is removed by the activated serpentine sample to form precipitation. The precipitation sample was checked by XRD analysis, then it was conformed to be CsMgPO4 which is the struvite phase. Therefore, this activation technique to serpentine sample would be a prom-ising and alternative one for adsorbing Cs in radioactive wastewater. Of course, the raw serpentine sample does not show such high adsorption behavior for Cs ions. It is interesting to note that both Na and K ions remain in the solution. The properties of alkali elements are very similar, and methods for Cs precipitation usually cause a similar effect to others like K and Na ions. This means that quite a large amount of serpentine sample has to consume for K or Na removal. It is known that alkali elements have different radius size and exhibit some slight difference in the stabil-ity when forming struvite phase. If such small difference is applied for selective precipitation of Cs ion on the ground serpentine, both disposing of radioactive Cs source and en-richment of it are achieved. The characteristics of K and Cs ions to the mechanical activated serpentine were not found in conventional chemical reactions. The key point is that mechanochemical processing may offer special solutions to those difficult cases and we are looking for the chances to solve particularly the environmental issues.
3.2 Hydrated aluminum silicate: Kaolinite
Coagulant has been widely used in the pretreatment of wastewater, and a simple and environment-friendly process to prepare high-efficiency coagulants is highly desired with increasing the amount of wastewater treatment. Kaolinite Al2Si2O5(OH)4, as one of the industrial minerals of kaolin group or clay minerals is a popular one, having 1:1 type layered silicate consisting of Si-O tetrahedron and Al-O octahedron. This mineral has been offered to industries of pottery products, additives in medicines and foods, daily necessities, agricultural soil, fertilizer reagent and so on. We have attempted to develop a novel process to prepare aluminum-based coagulant by the use of mechanochem-ical activation of kaolinite, followed by co-grinding with concentrated sulfuric acid (H2SO4) solution. Fig. 4 shows briefly the flowsheet for preparation process for such coagulant sample. The sample is composed of aluminum sulphate, Al2(SO4)3, and it was then tested for removal of pollutant in solution.
The composition, structure and morphology of the coag-ulant samples were characterized using X-ray Diffraction (XRD), Fourier Transform Infrared (FT-IR), Spectrometer and Scanning Electron Microscopy (SEM) and so on. Ca-pacity of the prepared product as coagulant, compared with pure aluminum sulfate, was evaluated by the removal effi-ciency of turbidity, phosphate (PO4
3–), arsenate (AsO43–)
Fig. 3 Removal rates of Cs, Na and K ions in the solution with the serpentine sample activated by the stirred mill as a function of milling speed (Lei et al., 2019).

Huimin Hu et al. / KONA Powder and Particle Journal No. 38 (2021) 155–167
159
and humic acid (Zhao et al., 2019). The final values of these efficiencies are 99.9 % for turbidity clearing up, 91.2 % for phosphate, 89.6 % for arsenate and 92.3 % for humic acid, respectively. Moreover, during the preparation process, the formation of alum, was observed over a wide pH range from 4.3 to 9.0. XRD analysis has demonstrated that a reaction between kaolinite and sulfuric acid occurs during the milling operation and Al sulfate is formed to work as coagulant for the effectiveness confirmed as above.
Instead of the sulfuric acid addition, phosphoric acid (H3PO4) was added to the kaolinite sample activated in or-der to modify kaolinite. In this case, the final product sam-ple was formed as aluminum phosphate, Al-PO4, and was also tested for removal of pollution in the solution. Since Al phosphate is not water soluble, the sample keeps phosphate anions inside even in solution for adsorbing some target substances. In the case of modifying kaolinite by phos-phoric acid, part of the free hydrogen ion of phosphoric acid is combined with the hydroxyl groups in the kaolinite structure, leading to the production of water molecules, so that phosphoric acid is fixed onto amorphous kaolinite to form Si-O-Al-P binding, which offers good adsorption sites for potassium ion (K+) (Lei et al., 2018).
The adsorbent through phosphoric acid modification of kaolinite provides a new option for recovering potassium from seawater and tailing wastewater. Further improve-ments may be obtained by together use with Mg-Al layered double hydroxide or the Mg silicate of serpentine activated as an example and the detailed information may be referred to other publications. The coagulant sample would be a promising one for pre-treatment process of sewage as well as a new route to rich tailings of coal mining gangue etc.
3.3 Calcium carbonate: Calcite
As described, the conventional precipitation method is not enough to solve the problems, due to large amount of chemical reagents needed in order to neutralize wastewater,
besides difficulty in separation and recovery of precipitated metals and poor record for processing wastewater with low-concentration of heavy metals. One of the important issues would be to develop a sample exhibiting excellent capability of removal amount for pollutants such as heavy metal ions.
We have proposed a new method for preparation of such samples by using wet stirred ball milling a calcite sample (CaCO3) with solutions containing Pb2+, Cu2+. Since precipitations of heavy metal ions are expected, a wetting grinding rather than dry grinding was used for such purpose. A systematic exploration was done to investigate effects of several factors such as calcite dosage, milling time and ball volume ratio in the milling on adsorbent capacity of calcite activated for Pb2+ and Cu2+ in the waste-water. It is not easy to analyze in situ the samples in the solutions directly, calcite activated by the milling as well as the precipitates of heavy metals from the water were characterized by XRD, TG-DSC, FTIR and other analytical methods. Fig. 5 shows the lead (Pb) removal rate (%) in the solution on the added ball volume to the solution (a) and the copper (Cu) removal rate (%) on the Ca/Cu molar ratio (b), respectively. The initial concentrations were 0.5 mM for Pb solution, and 1 mM for Cu solution, respectively, and the pH was fixed at 6.51. In the experimental work on Pb removal, shown in Fig. 5(a), the conditions were as follows; CaCO3/Pb2+ = 1 in moral ratio, 120 min in milling time, 10 % in ball material ratio, and 200 rpm in rotation speed of the stirred mill. As shown in Fig. 5(a), the initial Pb2+ removal rate in the solution is 23.3 % at the agitation test (0 % in ball volume ratio), but it increased rapidly with an increase in the ball volume ratio, and reaches to almost 100 % is at 8 in the ball volume ratio, then levelled off. This suggests that the precipitation in the solution happens during the wet milling of calcite and Pb ions in its mill pot, even under low ball volume ratios in the range of 1 to 2 %. This precipitation happens more and more in the higher ball volume range from 5 to 13 %. The precipitates
Fig. 4 Flowsheet for preparation process for kaolinite base coagulant sample (Zhao et al., 2019).
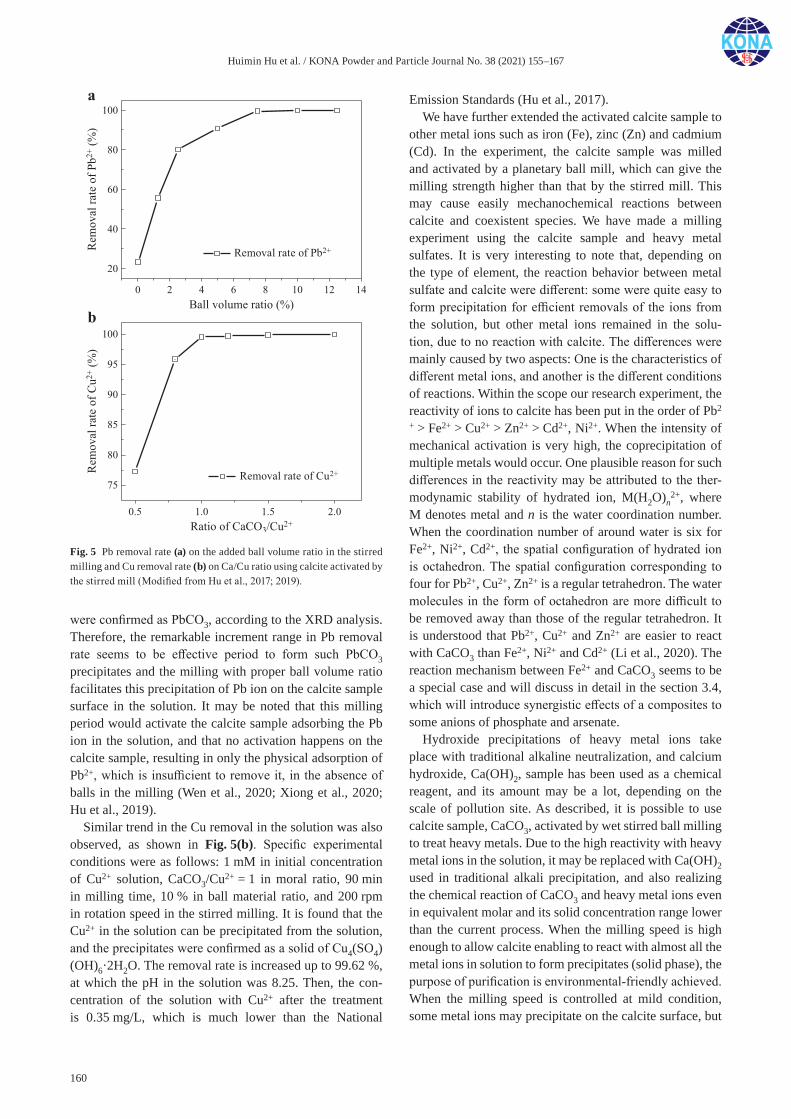
Huimin Hu et al. / KONA Powder and Particle Journal No. 38 (2021) 155–167
160
were confirmed as PbCO3, according to the XRD analysis. Therefore, the remarkable increment range in Pb removal rate seems to be effective period to form such PbCO3 precipitates and the milling with proper ball volume ratio facilitates this precipitation of Pb ion on the calcite sample surface in the solution. It may be noted that this milling period would activate the calcite sample adsorbing the Pb ion in the solution, and that no activation happens on the calcite sample, resulting in only the physical adsorption of Pb2+, which is insufficient to remove it, in the absence of balls in the milling (Wen et al., 2020; Xiong et al., 2020; Hu et al., 2019).
Similar trend in the Cu removal in the solution was also observed, as shown in Fig. 5(b). Specific experimental conditions were as follows: 1 mM in initial concentration of Cu2+ solution, CaCO3/Cu2+ = 1 in moral ratio, 90 min in milling time, 10 % in ball material ratio, and 200 rpm in rotation speed in the stirred milling. It is found that the Cu2+ in the solution can be precipitated from the solution, and the precipitates were confirmed as a solid of Cu4(SO4)(OH)6·2H2O. The removal rate is increased up to 99.62 %, at which the pH in the solution was 8.25. Then, the con-centration of the solution with Cu2+ after the treatment is 0.35 mg/L, which is much lower than the National
Emission Standards (Hu et al., 2017).We have further extended the activated calcite sample to
other metal ions such as iron (Fe), zinc (Zn) and cadmium (Cd). In the experiment, the calcite sample was milled and activated by a planetary ball mill, which can give the milling strength higher than that by the stirred mill. This may cause easily mechanochemical reactions between calcite and coexistent species. We have made a milling experiment using the calcite sample and heavy metal sulfates. It is very interesting to note that, depending on the type of element, the reaction behavior between metal sulfate and calcite were different: some were quite easy to form precipitation for efficient removals of the ions from the solution, but other metal ions remained in the solu-tion, due to no reaction with calcite. The differences were mainly caused by two aspects: One is the characteristics of different metal ions, and another is the different conditions of reactions. Within the scope our research experiment, the reactivity of ions to calcite has been put in the order of Pb2
+ > Fe2+ > Cu2+ > Zn2+ > Cd2+, Ni2+. When the intensity of mechanical activation is very high, the coprecipitation of multiple metals would occur. One plausible reason for such differences in the reactivity may be attributed to the ther-modynamic stability of hydrated ion, M(H2O)n
2+, where M denotes metal and n is the water coordination number. When the coordination number of around water is six for Fe2+, Ni2+, Cd2+, the spatial configuration of hydrated ion is octahedron. The spatial configuration corresponding to four for Pb2+, Cu2+, Zn2+ is a regular tetrahedron. The water molecules in the form of octahedron are more difficult to be removed away than those of the regular tetrahedron. It is understood that Pb2+, Cu2+ and Zn2+ are easier to react with CaCO3 than Fe2+, Ni2+ and Cd2+ (Li et al., 2020). The reaction mechanism between Fe2+ and CaCO3 seems to be a special case and will discuss in detail in the section 3.4, which will introduce synergistic effects of a composites to some anions of phosphate and arsenate.
Hydroxide precipitations of heavy metal ions take place with traditional alkaline neutralization, and calcium hydroxide, Ca(OH)2, sample has been used as a chemical reagent, and its amount may be a lot, depending on the scale of pollution site. As described, it is possible to use calcite sample, CaCO3, activated by wet stirred ball milling to treat heavy metals. Due to the high reactivity with heavy metal ions in the solution, it may be replaced with Ca(OH)2 used in traditional alkali precipitation, and also realizing the chemical reaction of CaCO3 and heavy metal ions even in equivalent molar and its solid concentration range lower than the current process. When the milling speed is high enough to allow calcite enabling to react with almost all the metal ions in solution to form precipitates (solid phase), the purpose of purification is environmental- friendly achieved. When the milling speed is controlled at mild condition, some metal ions may precipitate on the calcite surface, but
Fig. 5 Pb removal rate (a) on the added ball volume ratio in the stirred milling and Cu removal rate (b) on Ca/Cu ratio using calcite activated by the stirred mill (Modified from Hu et al., 2017; 2019).

Huimin Hu et al. / KONA Powder and Particle Journal No. 38 (2021) 155–167
161
others may remain in the solution. In this case, a mutual separation for metal ions would be possible. More interest-ingly, it is possible to change the activation strength on the industrial minerals like calcite (CaCO3) by a mill operated under different conditions, the CaCO3 sample activated shows different reactivity against the heavy metals in the solution. By applying the difference in the reactivity, we designed a new process to conduct a mutual separation of these metals by the use of calcite sample activated by a mill with solution containing the ions.
Fig. 6 shows the experimental data on mutual separation of different ions in the solutions with Cu-Ni (a), Cu-Co (b), Cu-Cd (c), Pb-Zn (d), Fe-Cu (e) and Fe-Mn (f) systems, re-spectively. In the case of (a) Cu-Ni separation, a mixture of CaCO3, CuSO4, NiSO4 and few amount of distilled water (3 mL) was put into a pot of a planetary mill, and milled for 30 min. The milling speed, Ca/Metal molar ratio and so on were changed, and the products after milling was taken out for evaluation. CuSO4 and NiSO4 are the component of the solution, therefore no use of other chemicals is an advantage of our method, and the same procedure was done for other systems such as Cu-Co (b), Cu-Cd (c), Pb-Zn (d), Fe-Cu (e) and Fe-Mn (f). As seen in Fig. 6(a), with wide range of Ca/Cu molar ratio, the residual ratio in Cu2+ is al-most zero, implying that they are completely precipitated, while Ni2+ remains at 90 % or more in the solution over the wide range of Ca/Cu ratio. Therefore, our sample pre-pared by wet milling of calcite and phosphates is possible to separate mutually Cu2+ and Ni2+ in the solution. If one would try this mutual separation by the traditional alkaline neutralization process using a chemical reagent, Ca(OH)2,
it would not be achieved the purpose, and more than this, enormous amount of reagent would need to precipitate these ions (Li et al., 2017a).
Similar results are seen in Fig. 6(b) and (c). As for the case of selective precipitation of Cu from the solutions con-taining Co and Cu, the separation efficiency is not high in comparison with that in Cu-Ni system shown in Fig. 6(a), but the residual ratio in Cu is very low over the whole range of Ca/Cu ratio. This means most of Cu2+ is precipitated, while most of Co2+ ion is still remained in the solution (Li et al., 2016). In the case of Cd-Cu-Fe ions in the solution, Cu and Fe ions are precipitated, while large amount of Cd ion is remained in the solution, as seen in Fig. 6(c) (Li et al., 2017b). It is, therefore, recognized that the proposed method could achieve mutual separation among Cd, Cu and Fe ions at fairly high possibility, although the separa-tion efficiency is not so high as the case of Cu-Ni system, as shown in Fig. 6(a).
Selective lead (Pb) removal from metal-containing wastewater such as acid mine drainage (AMD) is an im-portant issue in environmental purification and secondary resources recovery. Similar test on copper (Cu) or iron (Fe) removal was done using CaCO3 activated by wet ball milling with the solution containing Pb2+. The Pb2+ in the solution is precipitated to form PbCO3, and this is achieved based on the reaction between Pb2+ and CO3
2– in the solu-tion, as shown in Fig. 6(d) (Zeng et al., 2020). The removal efficiency of Pb2+ from the solution is increased with an increase in the molar ratio of CaCO3/Pb2+, and it reaches over 99 % at 1.0 in the molar ratio of CaCO3/Pb2+, while more than 99 % Zn2+ is remaining in the solutions. During
Fig. 6 Summarized six groups of mutual separations between heavy metals by the use of CaCO3 sample activated (Modified form Hu et al., 2020; Li et al., 2016, 2017a, 2017b; Wang et al., 2019; Zeng et al., 2020).
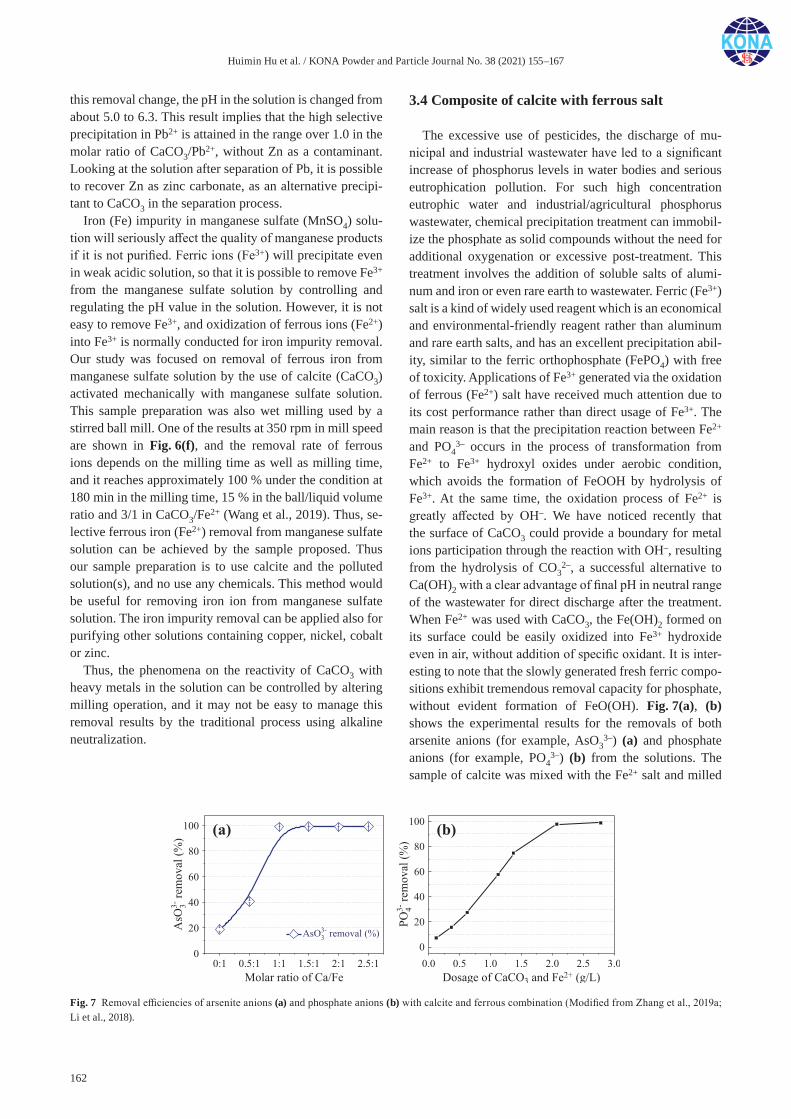
Huimin Hu et al. / KONA Powder and Particle Journal No. 38 (2021) 155–167
162
this removal change, the pH in the solution is changed from about 5.0 to 6.3. This result implies that the high selective precipitation in Pb2+ is attained in the range over 1.0 in the molar ratio of CaCO3/Pb2+, without Zn as a contaminant. Looking at the solution after separation of Pb, it is possible to recover Zn as zinc carbonate, as an alternative precipi-tant to CaCO3 in the separation process.
Iron (Fe) impurity in manganese sulfate (MnSO4) solu-tion will seriously affect the quality of manganese products if it is not purified. Ferric ions (Fe3+) will precipitate even in weak acidic solution, so that it is possible to remove Fe3+ from the manganese sulfate solution by controlling and regulating the pH value in the solution. However, it is not easy to remove Fe3+, and oxidization of ferrous ions (Fe2+) into Fe3+ is normally conducted for iron impurity removal. Our study was focused on removal of ferrous iron from manganese sulfate solution by the use of calcite (CaCO3) activated mechanically with manganese sulfate solution. This sample preparation was also wet milling used by a stirred ball mill. One of the results at 350 rpm in mill speed are shown in Fig. 6(f), and the removal rate of ferrous ions depends on the milling time as well as milling time, and it reaches approximately 100 % under the condition at 180 min in the milling time, 15 % in the ball/liquid volume ratio and 3/1 in CaCO3/Fe2+ (Wang et al., 2019). Thus, se-lective ferrous iron (Fe2+) removal from manganese sulfate solution can be achieved by the sample proposed. Thus our sample preparation is to use calcite and the polluted solution(s), and no use any chemicals. This method would be useful for removing iron ion from manganese sulfate solution. The iron impurity removal can be applied also for purifying other solutions containing copper, nickel, cobalt or zinc.
Thus, the phenomena on the reactivity of CaCO3 with heavy metals in the solution can be controlled by altering milling operation, and it may not be easy to manage this removal results by the traditional process using alkaline neutralization.
3.4 Composite of calcite with ferrous salt
The excessive use of pesticides, the discharge of mu-nicipal and industrial wastewater have led to a significant increase of phosphorus levels in water bodies and serious eutrophication pollution. For such high concentration eutrophic water and industrial/agricultural phosphorus wastewater, chemical precipitation treatment can immobil-ize the phosphate as solid compounds without the need for additional oxygenation or excessive post-treatment. This treatment involves the addition of soluble salts of alumi-num and iron or even rare earth to wastewater. Ferric (Fe3+) salt is a kind of widely used reagent which is an economical and environmental-friendly reagent rather than aluminum and rare earth salts, and has an excellent precipitation abil-ity, similar to the ferric orthophosphate (FePO4) with free of toxicity. Applications of Fe3+ generated via the oxidation of ferrous (Fe2+) salt have received much attention due to its cost performance rather than direct usage of Fe3+. The main reason is that the precipitation reaction between Fe2+ and PO4
3– occurs in the process of transformation from Fe2+ to Fe3+ hydroxyl oxides under aerobic condition, which avoids the formation of FeOOH by hydrolysis of Fe3+. At the same time, the oxidation process of Fe2+ is greatly affected by OH–. We have noticed recently that the surface of CaCO3 could provide a boundary for metal ions participation through the reaction with OH–, resulting from the hydrolysis of CO3
2–, a successful alternative to Ca(OH)2 with a clear advantage of final pH in neutral range of the wastewater for direct discharge after the treatment. When Fe2+ was used with CaCO3, the Fe(OH)2 formed on its surface could be easily oxidized into Fe3+ hydroxide even in air, without addition of specific oxidant. It is inter-esting to note that the slowly generated fresh ferric compo-sitions exhibit tremendous removal capacity for phosphate, without evident formation of FeO(OH). Fig. 7(a), (b) shows the experimental results for the removals of both arsenite anions (for example, AsO3
3–) (a) and phosphate anions (for example, PO4
3–) (b) from the solutions. The sample of calcite was mixed with the Fe2+ salt and milled
Fig. 7 Removal efficiencies of arsenite anions (a) and phosphate anions (b) with calcite and ferrous combination (Modified from Zhang et al., 2019a; Li et al., 2018).
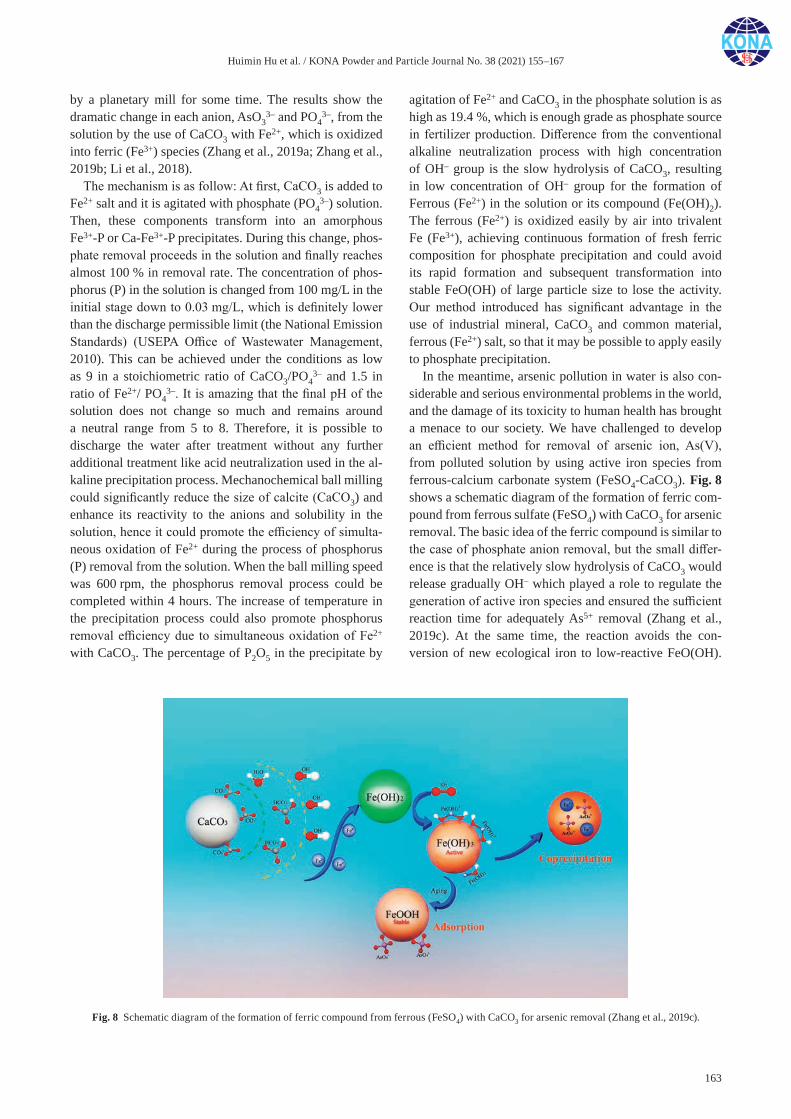
Huimin Hu et al. / KONA Powder and Particle Journal No. 38 (2021) 155–167
163
by a planetary mill for some time. The results show the dramatic change in each anion, AsO3
3– and PO43–, from the
solution by the use of CaCO3 with Fe2+, which is oxidized into ferric (Fe3+) species (Zhang et al., 2019a; Zhang et al., 2019b; Li et al., 2018).
The mechanism is as follow: At first, CaCO3 is added to Fe2+ salt and it is agitated with phosphate (PO4
3–) solution. Then, these components transform into an amorphous Fe3+-P or Ca-Fe3+-P precipitates. During this change, phos-phate removal proceeds in the solution and finally reaches almost 100 % in removal rate. The concentration of phos-phorus (P) in the solution is changed from 100 mg/L in the initial stage down to 0.03 mg/L, which is definitely lower than the discharge permissible limit (the National Emission Standards) (USEPA Office of Wastewater Management, 2010). This can be achieved under the conditions as low as 9 in a stoichiometric ratio of CaCO3/PO4
3– and 1.5 in ratio of Fe2+/ PO4
3–. It is amazing that the final pH of the solution does not change so much and remains around a neutral range from 5 to 8. Therefore, it is possible to discharge the water after treatment without any further additional treatment like acid neutralization used in the al-kaline precipitation process. Mechanochemical ball milling could significantly reduce the size of calcite (CaCO3) and enhance its reactivity to the anions and solubility in the solution, hence it could promote the efficiency of simulta-neous oxidation of Fe2+ during the process of phosphorus (P) removal from the solution. When the ball milling speed was 600 rpm, the phosphorus removal process could be completed within 4 hours. The increase of temperature in the precipitation process could also promote phosphorus removal efficiency due to simultaneous oxidation of Fe2+ with CaCO3. The percentage of P2O5 in the precipitate by
agitation of Fe2+ and CaCO3 in the phosphate solution is as high as 19.4 %, which is enough grade as phosphate source in fertilizer production. Difference from the conventional alkaline neutralization process with high concentration of OH– group is the slow hydrolysis of CaCO3, resulting in low concentration of OH– group for the formation of Ferrous (Fe2+) in the solution or its compound (Fe(OH)2). The ferrous (Fe2+) is oxidized easily by air into trivalent Fe (Fe3+), achieving continuous formation of fresh ferric composition for phosphate precipitation and could avoid its rapid formation and subsequent transformation into stable FeO(OH) of large particle size to lose the activity. Our method introduced has significant advantage in the use of industrial mineral, CaCO3 and common material, ferrous (Fe2+) salt, so that it may be possible to apply easily to phosphate precipitation.
In the meantime, arsenic pollution in water is also con-siderable and serious environmental problems in the world, and the damage of its toxicity to human health has brought a menace to our society. We have challenged to develop an efficient method for removal of arsenic ion, As(V), from polluted solution by using active iron species from ferrous-calcium carbonate system (FeSO4-CaCO3). Fig. 8 shows a schematic diagram of the formation of ferric com-pound from ferrous sulfate (FeSO4) with CaCO3 for arsenic removal. The basic idea of the ferric compound is similar to the case of phosphate anion removal, but the small differ-ence is that the relatively slow hydrolysis of CaCO3 would release gradually OH– which played a role to regulate the generation of active iron species and ensured the sufficient reaction time for adequately As5+ removal (Zhang et al., 2019c). At the same time, the reaction avoids the con-version of new ecological iron to low-reactive FeO(OH).
Fig. 8 Schematic diagram of the formation of ferric compound from ferrous (FeSO4) with CaCO3 for arsenic removal (Zhang et al., 2019c).
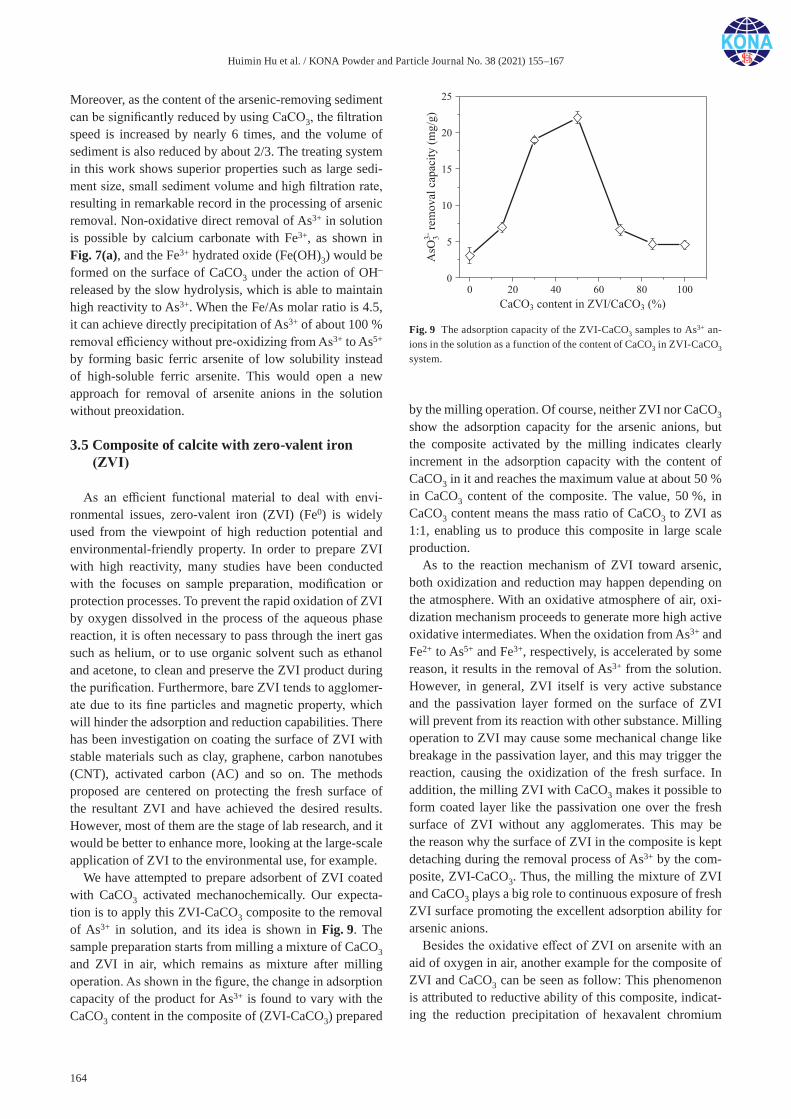
Huimin Hu et al. / KONA Powder and Particle Journal No. 38 (2021) 155–167
164
Moreover, as the content of the arsenic-removing sediment can be significantly reduced by using CaCO3, the filtration speed is increased by nearly 6 times, and the volume of sediment is also reduced by about 2/3. The treating system in this work shows superior properties such as large sedi-ment size, small sediment volume and high filtration rate, resulting in remarkable record in the processing of arsenic removal. Non-oxidative direct removal of As3+ in solution is possible by calcium carbonate with Fe3+, as shown in Fig. 7(a), and the Fe3+ hydrated oxide (Fe(OH)3) would be formed on the surface of CaCO3 under the action of OH– released by the slow hydrolysis, which is able to maintain high reactivity to As3+. When the Fe/As molar ratio is 4.5, it can achieve directly precipitation of As3+ of about 100 % removal efficiency without pre-oxidizing from As3+ to As5+ by forming basic ferric arsenite of low solubility instead of high-soluble ferric arsenite. This would open a new approach for removal of arsenite anions in the solution without preoxidation.
3.5 Composite of calcite with zero-valent iron (ZVI)
As an efficient functional material to deal with envi-ronmental issues, zero-valent iron (ZVI) (Fe0) is widely used from the viewpoint of high reduction potential and environmental-friendly property. In order to prepare ZVI with high reactivity, many studies have been conducted with the focuses on sample preparation, modification or protection processes. To prevent the rapid oxidation of ZVI by oxygen dissolved in the process of the aqueous phase reaction, it is often necessary to pass through the inert gas such as helium, or to use organic solvent such as ethanol and acetone, to clean and preserve the ZVI product during the purification. Furthermore, bare ZVI tends to agglomer-ate due to its fine particles and magnetic property, which will hinder the adsorption and reduction capabilities. There has been investigation on coating the surface of ZVI with stable materials such as clay, graphene, carbon nanotubes (CNT), activated carbon (AC) and so on. The methods proposed are centered on protecting the fresh surface of the resultant ZVI and have achieved the desired results. However, most of them are the stage of lab research, and it would be better to enhance more, looking at the large-scale application of ZVI to the environmental use, for example.
We have attempted to prepare adsorbent of ZVI coated with CaCO3 activated mechanochemically. Our expecta-tion is to apply this ZVI-CaCO3 composite to the removal of As3+ in solution, and its idea is shown in Fig. 9. The sample preparation starts from milling a mixture of CaCO3 and ZVI in air, which remains as mixture after milling operation. As shown in the figure, the change in adsorption capacity of the product for As3+ is found to vary with the CaCO3 content in the composite of (ZVI-CaCO3) prepared
by the milling operation. Of course, neither ZVI nor CaCO3 show the adsorption capacity for the arsenic anions, but the composite activated by the milling indicates clearly increment in the adsorption capacity with the content of CaCO3 in it and reaches the maximum value at about 50 % in CaCO3 content of the composite. The value, 50 %, in CaCO3 content means the mass ratio of CaCO3 to ZVI as 1:1, enabling us to produce this composite in large scale production.
As to the reaction mechanism of ZVI toward arsenic, both oxidization and reduction may happen depending on the atmosphere. With an oxidative atmosphere of air, oxi-dization mechanism proceeds to generate more high active oxidative intermediates. When the oxidation from As3+ and Fe2+ to As5+ and Fe3+, respectively, is accelerated by some reason, it results in the removal of As3+ from the solution. However, in general, ZVI itself is very active substance and the passivation layer formed on the surface of ZVI will prevent from its reaction with other substance. Milling operation to ZVI may cause some mechanical change like breakage in the passivation layer, and this may trigger the reaction, causing the oxidization of the fresh surface. In addition, the milling ZVI with CaCO3 makes it possible to form coated layer like the passivation one over the fresh surface of ZVI without any agglomerates. This may be the reason why the surface of ZVI in the composite is kept detaching during the removal process of As3+ by the com-posite, ZVI-CaCO3. Thus, the milling the mixture of ZVI and CaCO3 plays a big role to continuous exposure of fresh ZVI surface promoting the excellent adsorption ability for arsenic anions.
Besides the oxidative effect of ZVI on arsenite with an aid of oxygen in air, another example for the composite of ZVI and CaCO3 can be seen as follow: This phenomenon is attributed to reductive ability of this composite, indicat-ing the reduction precipitation of hexavalent chromium
Fig. 9 The adsorption capacity of the ZVI-CaCO3 samples to As3+ an-ions in the solution as a function of the content of CaCO3 in ZVI-CaCO3 system.
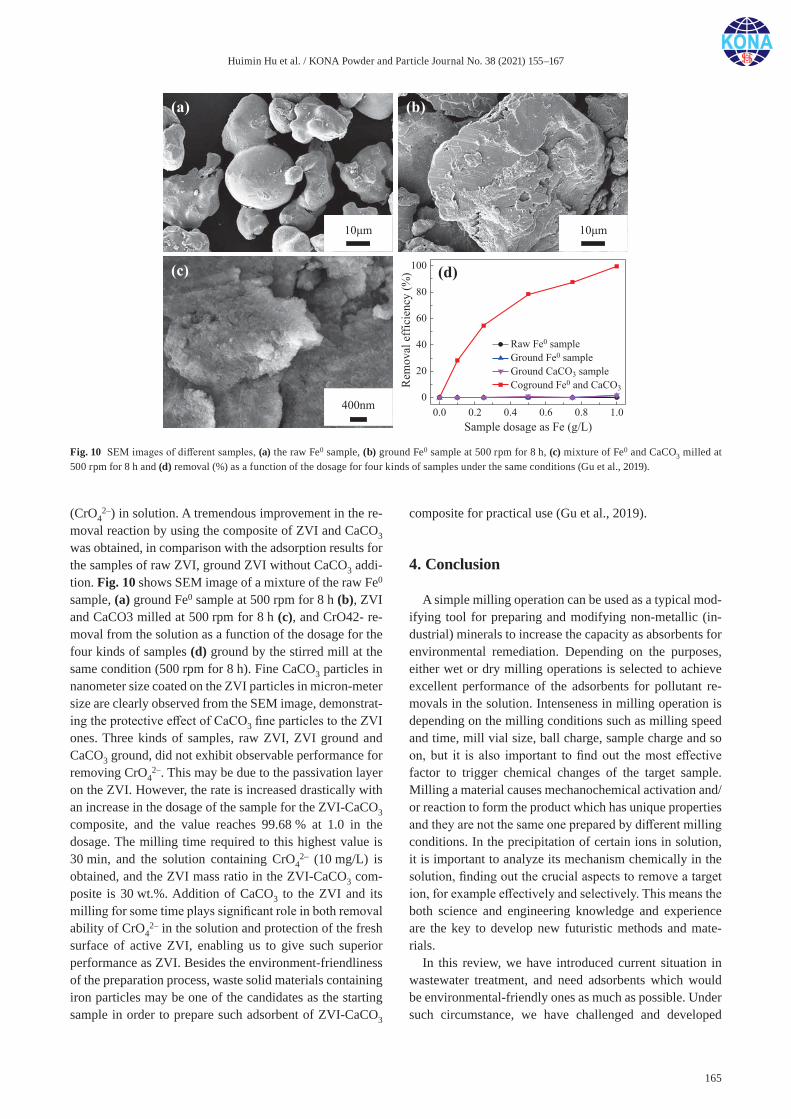
Huimin Hu et al. / KONA Powder and Particle Journal No. 38 (2021) 155–167
165
(CrO42–) in solution. A tremendous improvement in the re-
moval reaction by using the composite of ZVI and CaCO3 was obtained, in comparison with the adsorption results for the samples of raw ZVI, ground ZVI without CaCO3 addi-tion. Fig. 10 shows SEM image of a mixture of the raw Fe0 sample, (a) ground Fe0 sample at 500 rpm for 8 h (b), ZVI and CaCO3 milled at 500 rpm for 8 h (c), and CrO42- re-moval from the solution as a function of the dosage for the four kinds of samples (d) ground by the stirred mill at the same condition (500 rpm for 8 h). Fine CaCO3 particles in nanometer size coated on the ZVI particles in micron-meter size are clearly observed from the SEM image, demonstrat-ing the protective effect of CaCO3 fine particles to the ZVI ones. Three kinds of samples, raw ZVI, ZVI ground and CaCO3 ground, did not exhibit observable performance for removing CrO4
2–. This may be due to the passivation layer on the ZVI. However, the rate is increased drastically with an increase in the dosage of the sample for the ZVI-CaCO3 composite, and the value reaches 99.68 % at 1.0 in the dosage. The milling time required to this highest value is 30 min, and the solution containing CrO4
2– (10 mg/L) is obtained, and the ZVI mass ratio in the ZVI-CaCO3 com-posite is 30 wt.%. Addition of CaCO3 to the ZVI and its milling for some time plays significant role in both removal ability of CrO4
2– in the solution and protection of the fresh surface of active ZVI, enabling us to give such superior performance as ZVI. Besides the environment-friendliness of the preparation process, waste solid materials containing iron particles may be one of the candidates as the starting sample in order to prepare such adsorbent of ZVI-CaCO3
composite for practical use (Gu et al., 2019).
4. Conclusion
A simple milling operation can be used as a typical mod-ifying tool for preparing and modifying non-metallic (in-dustrial) minerals to increase the capacity as absorbents for environmental remediation. Depending on the purposes, either wet or dry milling operations is selected to achieve excellent performance of the adsorbents for pollutant re-movals in the solution. Intenseness in milling operation is depending on the milling conditions such as milling speed and time, mill vial size, ball charge, sample charge and so on, but it is also important to find out the most effective factor to trigger chemical changes of the target sample. Milling a material causes mechanochemical activation and/or reaction to form the product which has unique properties and they are not the same one prepared by different milling conditions. In the precipitation of certain ions in solution, it is important to analyze its mechanism chemically in the solution, finding out the crucial aspects to remove a target ion, for example effectively and selectively. This means the both science and engineering knowledge and experience are the key to develop new futuristic methods and mate-rials.
In this review, we have introduced current situation in wastewater treatment, and need adsorbents which would be environmental-friendly ones as much as possible. Under such circumstance, we have challenged and developed
Fig. 10 SEM images of different samples, (a) the raw Fe0 sample, (b) ground Fe0 sample at 500 rpm for 8 h, (c) mixture of Fe0 and CaCO3 milled at 500 rpm for 8 h and (d) removal (%) as a function of the dosage for four kinds of samples under the same conditions (Gu et al., 2019).
Huimin Hu et al. / KONA Powder and Particle Journal No. 38 (2021) 155–167
166
several new mechanochemical routes for preparing mineral based adsorbent with effective purification ability for toxic matter-containing wastewater. The minerals chosen in the experiments are non-metallic minerals such as hydrated magnesium silicate (serpentine), hydrated aluminum sil-icate (kaolinite), carbonate (calcite), calcite with ferrous compound and calcite with zero-valent iron. The mills used are mainly stirred mill and planetary mill in laboratory scale. The direction to prepare the adsorbent sample acti-vated by the mill was shown in each section, and the main results are also introduced.
We have applied some adsorbents prepared by our methods to real and actual spots where solutions are con-taminated with toxic substances and heavy metal ions in China. We have also obtained good data as a practical use so far, and in the near future, other spots will be selected for the removal of contaminants in solution by the use of the adsorbents. In the meanwhile, based on the requirement, it would be possible to prepare the adsorbent samples in large scale.
Acknowledgement
The authors are grateful to Emeritus Prof. Fumio Saito, Tohoku University, for his invaluable comments and sug-gestion on this paper.
References
Gu W., Zhang Q., Qu J., Li Z., Hu H., Liu Y., Li Y., Ai Z., For-mation of active zero-valent iron by simple co-grinding with CaCO3 to protect fresh active surface for efficient removal of hexavalent chromium, Applied Surface Science, 490 (2019) 81–88. DOI: 10.1016/j.apsusc.2019.06.062
Hu H., Li X., Huang P., Zhang Q., Yuan W., Efficient removal of copper from wastewater by using mechanically activated calcium carbonate, Journal of Environmental Management, 203 (2017) 1–7. DOI: 10.1016/j.jenvman.2017.07.066
Hu H., Zhang Q., Yuan W., Li Z., Zhao Y., Gu W., Efficient Pb removal through the formations of (basic) carbonate precip-itates from different sources during wet stirred ball milling with CaCO3, Science of the Total Environment, 664 (2019) 53–59. DOI: 10.1016/j.scitotenv.2019.01.424
Hu H., Zhang Q., Li X., Wu L., Liu Y., Efficient heterogeneous precipitation and separation of iron in copper-containing solution using dolomite, Separation and Purification Technol-ogy, 248 (2020) 117021. DOI: 10.1016/j.seppur.2020.117021
Huang P., Li Z., Chen M., Hu H., Lei Z., Zhang Q., Yuan W., Mechanochemical activation of serpentine for recovering Cu (II) from wastewater, Applied Clay Science, 149 (2017) 1–7. DOI: 10.1016/j.clay.2017.08.030
Lei Z., Cagnetta G., Li X., Qu J., Li Z., Zhang Q., Huang J., Enhanced adsorption of potassium nitrate with potassium
cation on H3PO4 modified kaolinite and nitrate anion into Mg-Al layered double hydroxide, Applied Clay Science, 154 (2018) 10–16. DOI: 10.1016/j.clay.2017.12.040
Lei Z., Li X., Huang P., Hu H., Li Z., Zhang Q., Mechanochem-ical activation of antigorite to provide active magnesium for precipitating cesium from the existences of potassium and sodium, Applied Clay Science, 168 (2019) 223–229. DOI: 10.1016/j.clay.2018.11.015
Li X., Lei Z., Qu J., Hu H., Zhang Q., Separation of copper from nickel in sulfate solutions by mechanochemical activation with CaCO3, Separation and Purification Technology, 172 (2017a) 107–112. DOI: 10.1016/j.seppur.2016.08.010
Li X., Lei Z., Qu J., Li Z., Zhang Q., Separation of copper from cobalt in sulphate solutions by using CaCO3, Separation Science and Technology, 51 (2016) 2772–2779. DOI: 10.1080/01496395.2016.1217886
Li X., Lei Z., Qu J., Zhou X., Li Z., Zhang Q., Separation of Cu(ii) from Cd(ii) in sulfate solution using CaCO3 and FeSO4 based on mechanochemical activation, RSC Advances, 7 (2017b) 2002–2008. DOI: 10.1039/C6RA25412H
Li X., Zhang Q., Yang B., Co-precipitation with CaCO3 to remove heavy metals and significantly reduce the moisture content of filter residue, Chemosphere, 239 (2020) 124660. DOI: 10.1016/j.chemosphere.2019.124660
Li Y., He X., Hu H., Zhang T., Qu J., Zhang Q., Enhanced phos-phate removal from wastewater by using in situ generated fresh trivalent Fe composition through the interaction of Fe(II) on CaCO3, Journal of Environmental Management, 221 (2018) 38–44. DOI: 10.1016/j.jenvman.2018.05.018
USEPA Office of Wastewater Management, NPDES Permit Writers’ Manual-2010, Washington DC: DIANE Publishing, (2010) EPA-833-K-10-001. <https://www3.epa.gov/npdes/pubs/pwm_2010.pdf> accessed 06.18.2020.
Wang K., Zhang Q., Hu H., Liu Y., Efficient removal of iron(II) from manganese sulfate solution by using mechanically acti-vated CaCO3, Hydrometallurgy, 188 (2019) 169–173. DOI: 10.1016/j.hydromet.2019.07.003
Wen T., Zhao Y., Zhang T., Xiong B., Hu H., Zhang Q., Song S., Selective recovery of heavy metals from wastewater by mechanically activated calcium carbonate: inspiration from nature, Chemosphere, 246 (2020) 125842. DOI: 10.1016/j.chemosphere.2020.125842
Xiong B., Zhang T., Zhao Y., Wen T., Zhang Q., Bao S., Song S., Utilization of carbonate-based tailings to remove Pb(II) from wastewater through mechanical activation, Science of the Total Environment, 698 (2020) 134270. DOI: 10.1016/j.scitotenv.2019.134270
Zeng C., Hu H., Feng X., Wang K., Zhang Q., Activating CaCO3 to enhance lead removal from lead-zinc solution to serve as green technology for the purification of mine tailings, Chemosphere, 249 (2020) 126227. DOI: 10.1016/j. chemosphere.2020.126227
Zhang T., Zhao Y., Bai H., Liu Y., Liu Y., Zhang Q., Efficient As(III) removal directly as basic iron arsenite by in-situ gen-erated Fe(III) hydroxide from ferrous sulfate on the surface of CaCO3, Applied Surface Science, 493 (2019a) 569–576. DOI: 10.1016/j.apsusc.2019.07.048
Zhang T., Zhao Y., Bai H., Wang W., Zhang Q., Enhanced
Huimin Hu et al. / KONA Powder and Particle Journal No. 38 (2021) 155–167
167
arsenic removal from water and easy handling of the pre-cipitate sludge by using FeSO4 with CaCO3 to Ca(OH)2, Chemosphere, 231 (2019b) 134–139. DOI: 10.1016/j.chemosphere.2019.05.117
Zhang T., Zhao Y., Kang S., Li Y., Zhang Q., Formation of active Fe(OH)3 in situ for enhancing arsenic removal from water by the oxidation of Fe(II) in air with the presence of CaCO3, Journal of Cleaner Production, 227 (2019c) 1–9. DOI:
10.1016/j.jclepro.2019.04.199Zhao Y., Zhang Q., Yuan W., Hu H., Li Z., Ai Z., Li Y., High
efficient coagulant simply by mechanochemically acti-vating kaolinite with sulfuric acid to enhance removal efficiency of various pollutants for wastewater treatment, Applied Clay Science, 180 (2019) 105187. DOI: 10.1016/j.clay.2019.105187
Authors’ Short Biographies
Huimin Hu
Ph.D student, Wuhan University of Technology, China.She received her Master’s degree (2015) in Environmental Science and Engineering
from Wuhan University of Technology, where she specialized in purification of heavy metal wastewater through mechanically activated non-metallic minerals. She is now pur-suing her Ph.D. in Environmental Science and Engineering under the supervision of Prof. Qiwu Zhang at the Wuhan University of Technology. Her research is currently focused on the development of perovskite-type oxide for wet catalytic oxidation of organic wastewa-ter.
Qiwu Zhang
Professor, Wuhan University of Technology, China.He obtained his bachelor and master degrees in 1984 from Wuhan University of Tech-
nology and 1987 from the graduate school in Beijing of Wuhan University of Technology, China. He worked as an engineer in Zhengzhou Institute of Multipurpose Utilization of Mineral Resources, China. He obtained his Ph.D degree in 1997 from Tohoku University, Japan. He worked as a faculty member in Tohoku University from 1997 to 2014. In 2004 he visited Ames Laboratory, Iowa State University as a research fellow. From 2015, he joined the Wuhan University of Technology. His research interest is in the field of mechanochem-istry, covering various applications of mineral processing, environmental purification, material science and energy transformation by applying the discovered phenomena from mechanical activation.
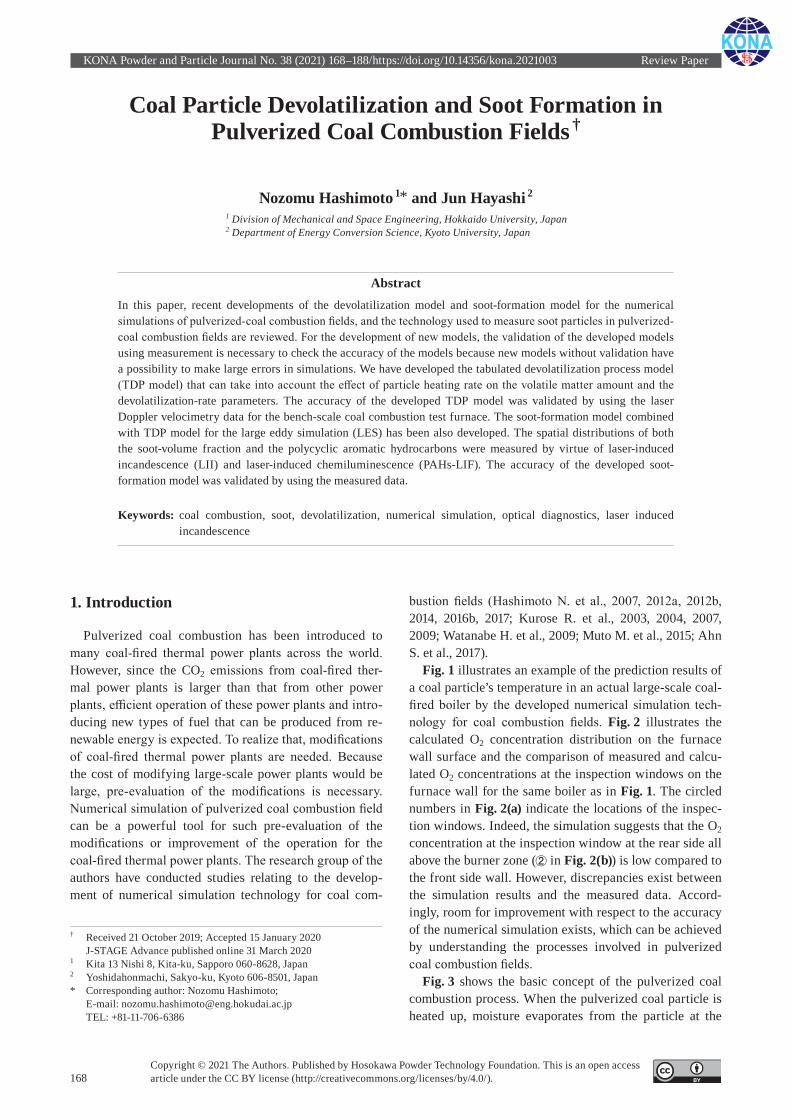
KONA Powder and Particle Journal No. 38 (2021) 168–188/https://doi.org/10.14356/kona.2021003 Review Paper
168Copyright © 2021 The Authors. Published by Hosokawa Powder Technology Foundation. This is an open access article under the CC BY license (http://creativecommons.org/licenses/by/4.0/).
Coal Particle Devolatilization and Soot Formation in Pulverized Coal Combustion Fields †
Nozomu Hashimoto 1* and Jun Hayashi 2
1 Division of Mechanical and Space Engineering, Hokkaido University, Japan2 Department of Energy Conversion Science, Kyoto University, Japan
AbstractIn this paper, recent developments of the devolatilization model and soot-formation model for the numerical simulations of pulverized-coal combustion fields, and the technology used to measure soot particles in pulverized-coal combustion fields are reviewed. For the development of new models, the validation of the developed models using measurement is necessary to check the accuracy of the models because new models without validation have a possibility to make large errors in simulations. We have developed the tabulated devolatilization process model (TDP model) that can take into account the effect of particle heating rate on the volatile matter amount and the devolatilization-rate parameters. The accuracy of the developed TDP model was validated by using the laser Doppler velocimetry data for the bench-scale coal combustion test furnace. The soot-formation model combined with TDP model for the large eddy simulation (LES) has been also developed. The spatial distributions of both the soot-volume fraction and the polycyclic aromatic hydrocarbons were measured by virtue of laser-induced incandescence (LII) and laser-induced chemiluminescence (PAHs-LIF). The accuracy of the developed soot-formation model was validated by using the measured data.
Keywords: coal combustion, soot, devolatilization, numerical simulation, optical diagnostics, laser induced incandescence
1. Introduction
Pulverized coal combustion has been introduced to many coal-fired thermal power plants across the world. However, since the CO2 emissions from coal-fired ther-mal power plants is larger than that from other power plants, efficient operation of these power plants and intro-ducing new types of fuel that can be produced from re-newable energy is expected. To realize that, modifications of coal-fired thermal power plants are needed. Because the cost of modifying large-scale power plants would be large, pre-evaluation of the modifications is necessary. Numerical simulation of pulverized coal combustion field can be a powerful tool for such pre-evaluation of the modifications or improvement of the operation for the coal-fired thermal power plants. The research group of the authors have conducted studies relating to the develop-ment of numerical simulation technology for coal com-
bustion fields (Hashimoto N. et al., 2007, 2012a, 2012b, 2014, 2016b, 2017; Kurose R. et al., 2003, 2004, 2007, 2009; Watanabe H. et al., 2009; Muto M. et al., 2015; Ahn S. et al., 2017).
Fig. 1 illustrates an example of the prediction results of a coal particle’s temperature in an actual large-scale coal-fired boiler by the developed numerical simulation tech-nology for coal combustion fields. Fig. 2 illustrates the calculated O2 concentration distribution on the furnace wall surface and the comparison of measured and calcu-lated O2 concentrations at the inspection windows on the furnace wall for the same boiler as in Fig. 1. The circled numbers in Fig. 2(a) indicate the locations of the inspec-tion windows. Indeed, the simulation suggests that the O2 concentration at the inspection window at the rear side all above the burner zone (➁ in Fig. 2(b)) is low compared to the front side wall. However, discrepancies exist between the simulation results and the measured data. Accord-ingly, room for improvement with respect to the accuracy of the numerical simulation exists, which can be achieved by understanding the processes involved in pulverized coal combustion fields.
Fig. 3 shows the basic concept of the pulverized coal combustion process. When the pulverized coal particle is heated up, moisture evaporates from the particle at the
† Received 21 October 2019; Accepted 15 January 2020 J-STAGE Advance published online 31 March 2020
1 Kita 13 Nishi 8, Kita-ku, Sapporo 060-8628, Japan2 Yoshidahonmachi, Sakyo-ku, Kyoto 606-8501, Japan* Corresponding author: Nozomu Hashimoto;
E-mail: [email protected] TEL: +81-11-706-6386
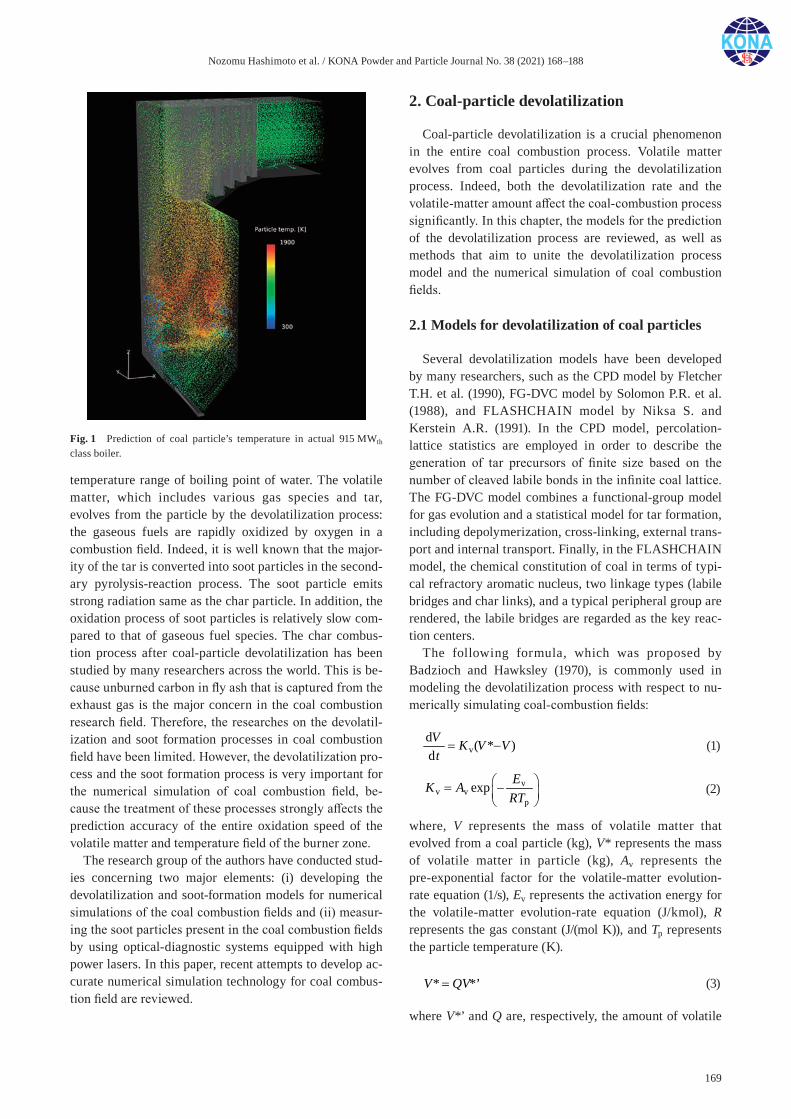
Nozomu Hashimoto et al. / KONA Powder and Particle Journal No. 38 (2021) 168–188
169
temperature range of boiling point of water. The volatile matter, which includes various gas species and tar, evolves from the particle by the devolatilization process: the gaseous fuels are rapidly oxidized by oxygen in a combustion field. Indeed, it is well known that the major-ity of the tar is converted into soot particles in the second-ary pyrolysis-reaction process. The soot particle emits strong radiation same as the char particle. In addition, the oxidation process of soot particles is relatively slow com-pared to that of gaseous fuel species. The char combus-tion process after coal-particle devolatilization has been studied by many researchers across the world. This is be-cause unburned carbon in fly ash that is captured from the exhaust gas is the major concern in the coal combustion research field. Therefore, the researches on the devolatil-ization and soot formation processes in coal combustion field have been limited. However, the devolatilization pro-cess and the soot formation process is very important for the numerical simulation of coal combustion field, be-cause the treatment of these processes strongly affects the prediction accuracy of the entire oxidation speed of the volatile matter and temperature field of the burner zone.
The research group of the authors have conducted stud-ies concerning two major elements: (i) developing the devolatilization and soot-formation models for numerical simulations of the coal combustion fields and (ii) measur-ing the soot particles present in the coal combustion fields by using optical-diagnostic systems equipped with high power lasers. In this paper, recent attempts to develop ac-curate numerical simulation technology for coal combus-tion field are reviewed.
2. Coal-particle devolatilization
Coal-particle devolatilization is a crucial phenomenon in the entire coal combustion process. Volatile matter evolves from coal particles during the devolatilization process. Indeed, both the devolatilization rate and the volatile-matter amount affect the coal-combustion process significantly. In this chapter, the models for the prediction of the devolatilization process are reviewed, as well as methods that aim to unite the devolatilization process model and the numerical simulation of coal combustion fields.
2.1 Models for devolatilization of coal particles
Several devolatilization models have been developed by many researchers, such as the CPD model by Fletcher T.H. et al. (1990), FG-DVC model by Solomon P.R. et al. (1988), and FLASHCHAIN model by Niksa S. and Kerstein A.R. (1991). In the CPD model, percolation- lattice statistics are employed in order to describe the generation of tar precursors of finite size based on the number of cleaved labile bonds in the infinite coal lattice. The FG-DVC model combines a functional-group model for gas evolution and a statistical model for tar formation, including depolymerization, cross-linking, external trans-port and internal transport. Finally, in the FLASHCHAIN model, the chemical constitution of coal in terms of typi-cal refractory aromatic nucleus, two linkage types (labile bridges and char links), and a typical peripheral group are rendered, the labile bridges are regarded as the key reac-tion centers.
The following formula, which was proposed by Badzioch and Hawksley (1970), is commonly used in modeling the devolatilization process with respect to nu-merically simulating coal-combustion fields:
vd ( * )dV K V Vt
(1)
vv v
pexp EK A
RT = −
(2)
where, V represents the mass of volatile matter that evolved from a coal particle (kg), V* represents the mass of volatile matter in particle (kg), Av represents the pre-exponential factor for the volatile-matter evolution- rate equation (1/s), Ev represents the activation energy for the volatile-matter evolution-rate equation (J/kmol), R represents the gas constant (J/(mol K)), and Tp represents the particle temperature (K).
* *’V QV=
(3)
where V*’ and Q are, respectively, the amount of volatile
Fig. 1 Prediction of coal particle’s temperature in actual 915 MWth class boiler.
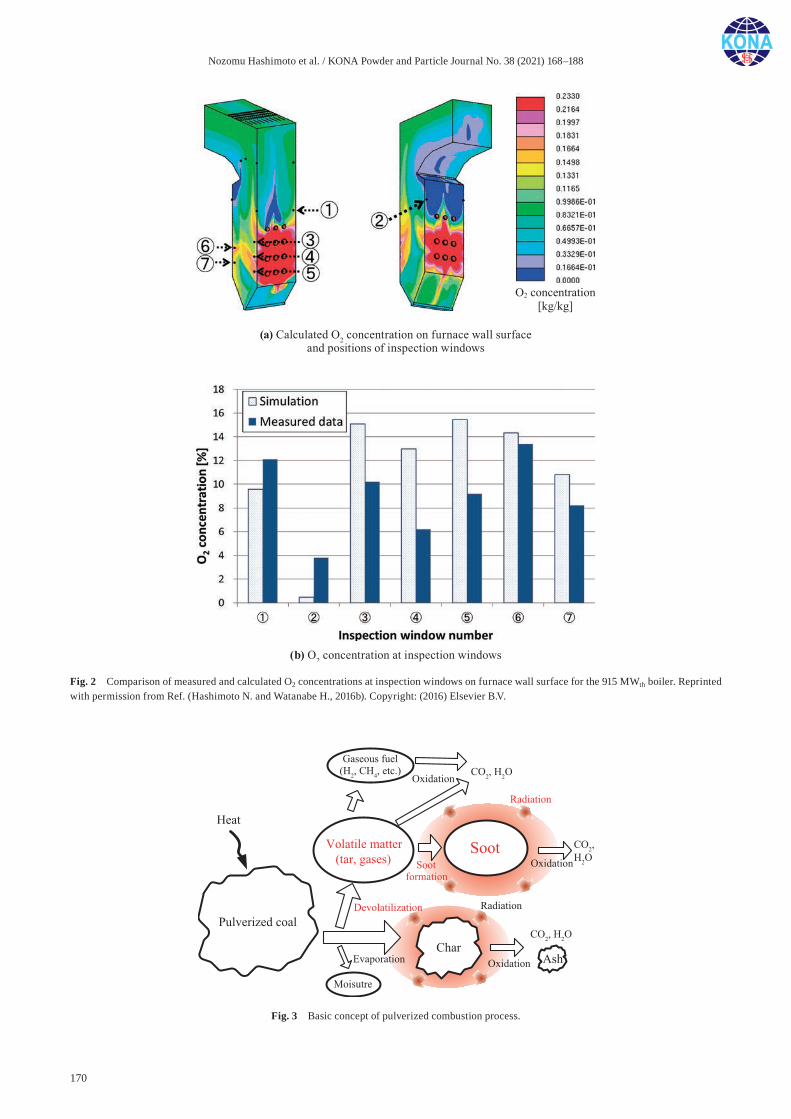
Nozomu Hashimoto et al. / KONA Powder and Particle Journal No. 38 (2021) 168–188
170
Fig. 3 Basic concept of pulverized combustion process.
Fig. 2 Comparison of measured and calculated O2 concentrations at inspection windows on furnace wall surface for the 915 MWth boiler. Reprinted with permission from Ref. (Hashimoto N. and Watanabe H., 2016b). Copyright: (2016) Elsevier B.V.
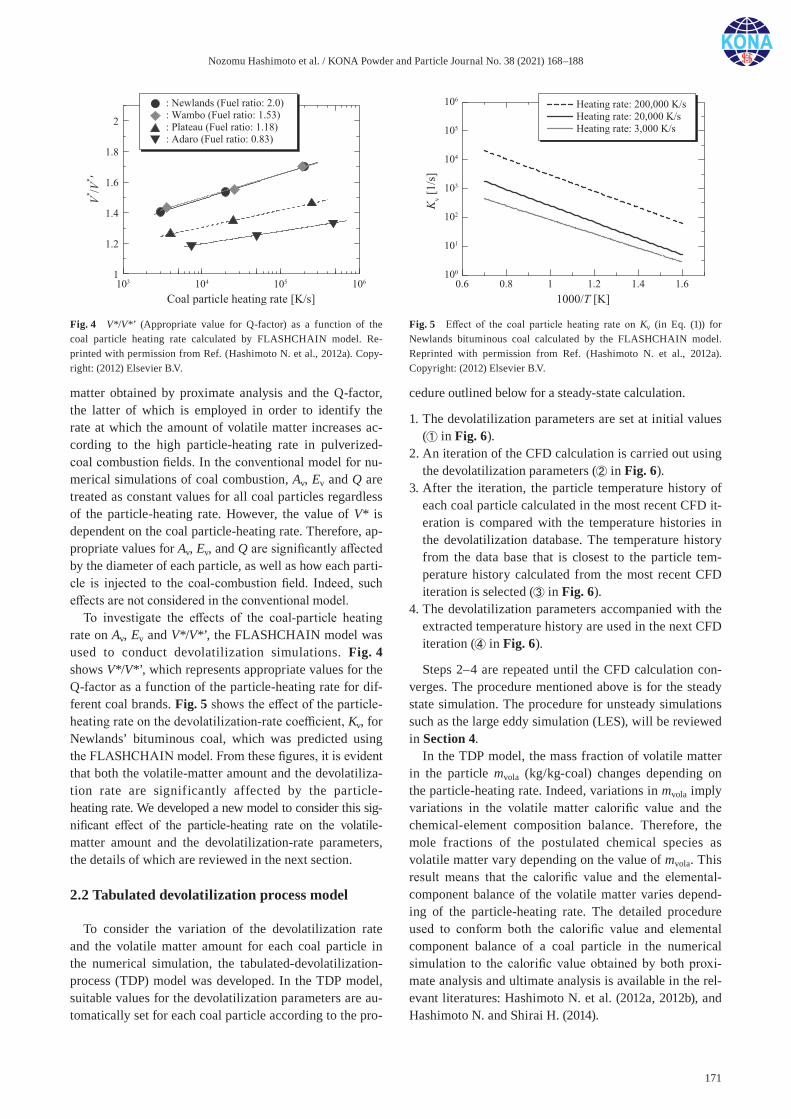
Nozomu Hashimoto et al. / KONA Powder and Particle Journal No. 38 (2021) 168–188
171
matter obtained by proximate analysis and the Q-factor, the latter of which is employed in order to identify the rate at which the amount of volatile matter increases ac-cording to the high particle-heating rate in pulverized- coal combustion fields. In the conventional model for nu-merical simulations of coal combustion, Av, Ev and Q are treated as constant values for all coal particles regardless of the particle-heating rate. However, the value of V* is dependent on the coal particle-heating rate. Therefore, ap-propriate values for Av, Ev, and Q are significantly affected by the diameter of each particle, as well as how each parti-cle is injected to the coal-combustion field. Indeed, such effects are not considered in the conventional model.
To investigate the effects of the coal-particle heating rate on Av, Ev and V*/V*’, the FLASHCHAIN model was used to conduct devolatilization simulations. Fig. 4 shows V*/V*’, which represents appropriate values for the Q-factor as a function of the particle-heating rate for dif-ferent coal brands. Fig. 5 shows the effect of the particle- heating rate on the devolatilization-rate coefficient, Kv, for Newlands’ bituminous coal, which was predicted using the FLASHCHAIN model. From these figures, it is evident that both the volatile-matter amount and the devolatiliza-tion rate are significantly affected by the particle- heating rate. We developed a new model to consider this sig-nificant effect of the particle-heating rate on the volatile- matter amount and the devolatilization-rate parameters, the details of which are reviewed in the next section.
2.2 Tabulated devolatilization process model
To consider the variation of the devolatilization rate and the volatile matter amount for each coal particle in the numerical simulation, the tabulated-devolatilization- process (TDP) model was developed. In the TDP model, suitable values for the devolatilization parameters are au-tomatically set for each coal particle according to the pro-
cedure outlined below for a steady-state calculation.
1. The devolatilization parameters are set at initial values (➀ in Fig. 6).
2. An iteration of the CFD calculation is carried out using the devolatilization parameters (➁ in Fig. 6).
3. After the iteration, the particle temperature history of each coal particle calculated in the most recent CFD it-eration is compared with the temperature histories in the devolatilization database. The temperature history from the data base that is closest to the particle tem-perature history calculated from the most recent CFD iteration is selected (➂ in Fig. 6).
4. The devolatilization parameters accompanied with the extracted temperature history are used in the next CFD iteration (➃ in Fig. 6).
Steps 2–4 are repeated until the CFD calculation con-verges. The procedure mentioned above is for the steady state simulation. The procedure for unsteady simulations such as the large eddy simulation (LES), will be reviewed in Section 4.
In the TDP model, the mass fraction of volatile matter in the particle mvola (kg/kg-coal) changes depending on the particle-heating rate. Indeed, variations in mvola imply variations in the volatile matter calorific value and the chemical-element composition balance. Therefore, the mole fractions of the postulated chemical species as volatile matter vary depending on the value of mvola. This result means that the calorific value and the elemental- component balance of the volatile matter varies depend-ing of the particle-heating rate. The detailed procedure used to conform both the calorific value and elemental component balance of a coal particle in the numerical simulation to the calorific value obtained by both proxi-mate analysis and ultimate analysis is available in the rel-evant literatures: Hashimoto N. et al. (2012a, 2012b), and Hashimoto N. and Shirai H. (2014).
Fig. 4 V*/V*’ (Appropriate value for Q-factor) as a function of the coal particle heating rate calculated by FLASHCHAIN model. Re-printed with permission from Ref. (Hashimoto N. et al., 2012a). Copy-right: (2012) Elsevier B.V.
Fig. 5 Effect of the coal particle heating rate on Kv (in Eq. (1)) for Newlands bituminous coal calculated by the FLASHCHAIN model. Reprinted with permission from Ref. (Hashimoto N. et al., 2012a). Copyright: (2012) Elsevier B.V.
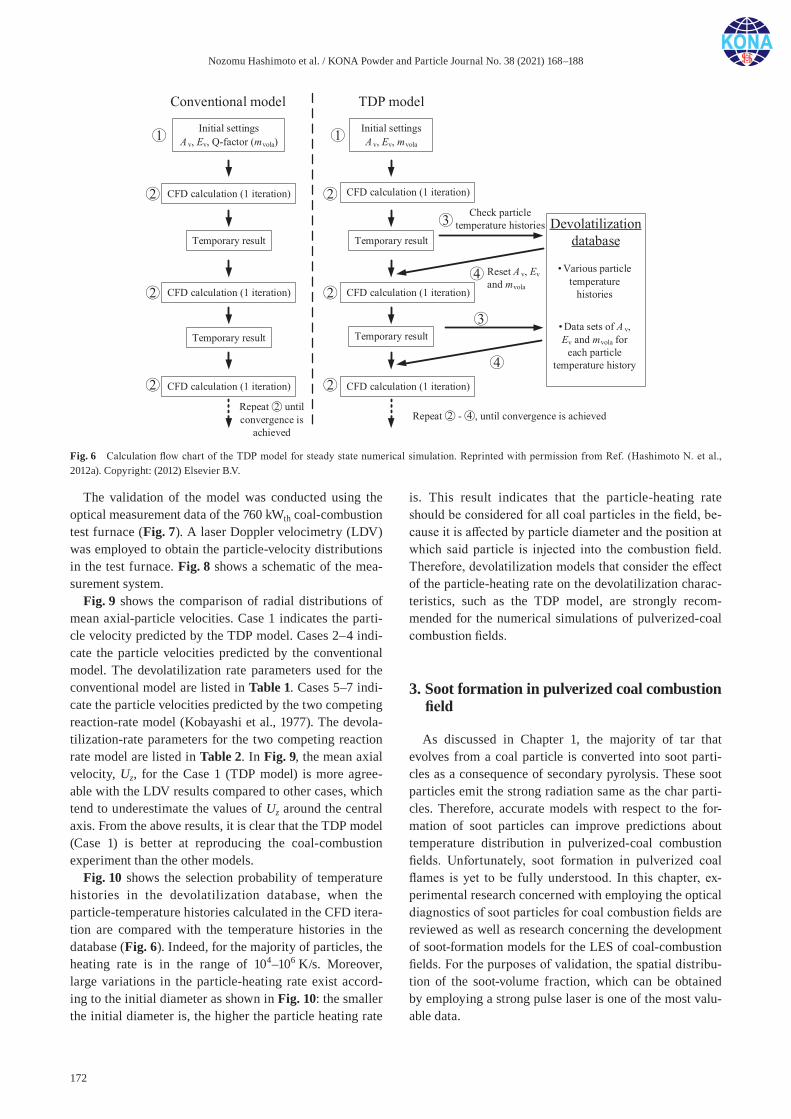
Nozomu Hashimoto et al. / KONA Powder and Particle Journal No. 38 (2021) 168–188
172
The validation of the model was conducted using the optical measurement data of the 760 kWth coal-combustion test furnace (Fig. 7). A laser Doppler velocimetry (LDV) was employed to obtain the particle-velocity distributions in the test furnace. Fig. 8 shows a schematic of the mea-surement system.
Fig. 9 shows the comparison of radial distributions of mean axial-particle velocities. Case 1 indicates the parti-cle velocity predicted by the TDP model. Cases 2–4 indi-cate the particle velocities predicted by the conventional model. The devolatilization rate parameters used for the conventional model are listed in Table 1. Cases 5–7 indi-cate the particle velocities predicted by the two competing reaction-rate model (Kobayashi et al., 1977). The devola-tilization-rate parameters for the two competing reaction rate model are listed in Table 2. In Fig. 9, the mean axial velocity, Uz, for the Case 1 (TDP model) is more agree-able with the LDV results compared to other cases, which tend to underestimate the values of Uz around the central axis. From the above results, it is clear that the TDP model (Case 1) is better at reproducing the coal-combustion experiment than the other models.
Fig. 10 shows the selection probability of temperature histories in the devolatilization database, when the particle-temperature histories calculated in the CFD itera-tion are compared with the temperature histories in the database (Fig. 6). Indeed, for the majority of particles, the heating rate is in the range of 104–106 K/s. Moreover, large variations in the particle-heating rate exist accord-ing to the initial diameter as shown in Fig. 10: the smaller the initial diameter is, the higher the particle heating rate
is. This result indicates that the particle-heating rate should be considered for all coal particles in the field, be-cause it is affected by particle diameter and the position at which said particle is injected into the combustion field. Therefore, devolatilization models that consider the effect of the particle-heating rate on the devolatilization charac-teristics, such as the TDP model, are strongly recom-mended for the numerical simulations of pulverized-coal combustion fields.
3. Soot formation in pulverized coal combustion field
As discussed in Chapter 1, the majority of tar that evolves from a coal particle is converted into soot parti-cles as a consequence of secondary pyrolysis. These soot particles emit the strong radiation same as the char parti-cles. Therefore, accurate models with respect to the for-mation of soot particles can improve predictions about temperature distribution in pulverized-coal combustion fields. Unfortunately, soot formation in pulverized coal flames is yet to be fully understood. In this chapter, ex-perimental research concerned with employing the optical diagnostics of soot particles for coal combustion fields are reviewed as well as research concerning the development of soot-formation models for the LES of coal-combustion fields. For the purposes of validation, the spatial distribu-tion of the soot-volume fraction, which can be obtained by employing a strong pulse laser is one of the most valu-able data.
Fig. 6 Calculation flow chart of the TDP model for steady state numerical simulation. Reprinted with permission from Ref. (Hashimoto N. et al., 2012a). Copyright: (2012) Elsevier B.V.
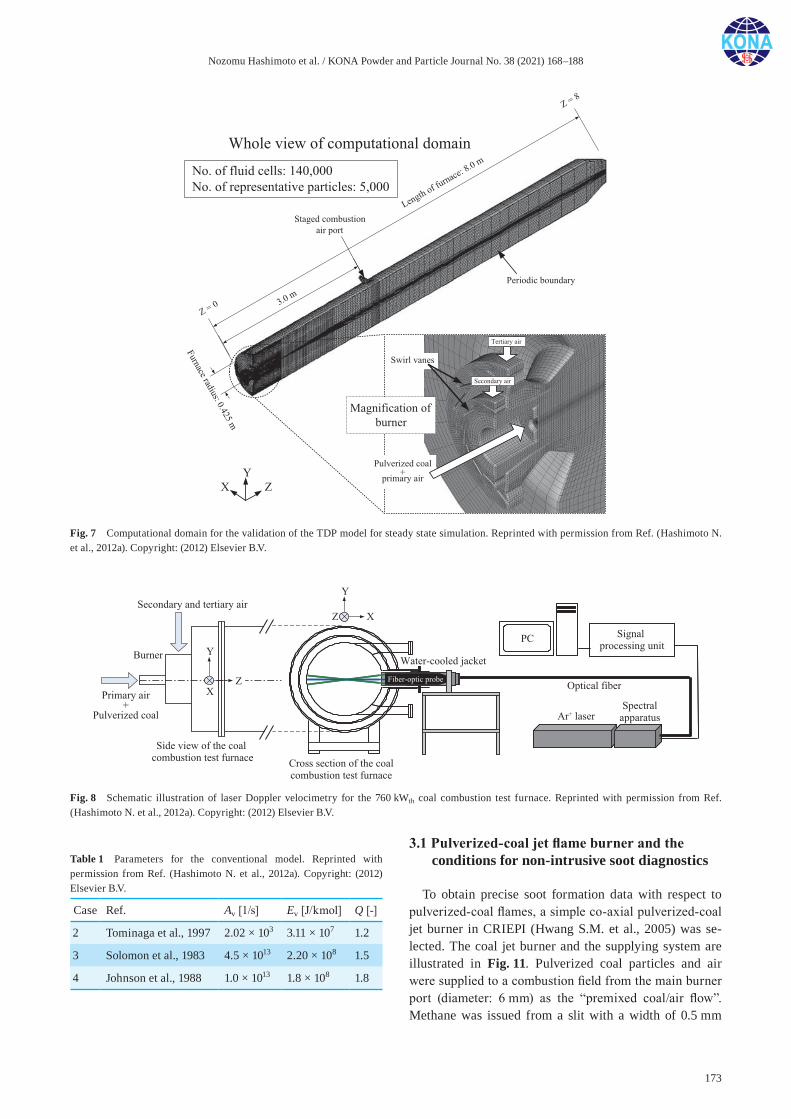
Nozomu Hashimoto et al. / KONA Powder and Particle Journal No. 38 (2021) 168–188
173
3.1 Pulverized-coal jet flame burner and the conditions for non-intrusive soot diagnostics
To obtain precise soot formation data with respect to pulverized-coal flames, a simple co-axial pulverized-coal jet burner in CRIEPI (Hwang S.M. et al., 2005) was se-lected. The coal jet burner and the supplying system are illustrated in Fig. 11. Pulverized coal particles and air were supplied to a combustion field from the main burner port (diameter: 6 mm) as the “premixed coal/air flow”. Methane was issued from a slit with a width of 0.5 mm
Fig. 7 Computational domain for the validation of the TDP model for steady state simulation. Reprinted with permission from Ref. (Hashimoto N. et al., 2012a). Copyright: (2012) Elsevier B.V.
Fig. 8 Schematic illustration of laser Doppler velocimetry for the 760 kWth coal combustion test furnace. Reprinted with permission from Ref. (Hashimoto N. et al., 2012a). Copyright: (2012) Elsevier B.V.
Table 1 Parameters for the conventional model. Reprinted with permission from Ref. (Hashimoto N. et al., 2012a). Copyright: (2012) Elsevier B.V.
Case Ref. Av [1/s] Ev [J/kmol] Q [-]
2 Tominaga et al., 1997 2.02 × 10³ 3.11 × 10⁷ 1.2
3 Solomon et al., 1983 4.5 × 10¹³ 2.20 × 10⁸ 1.5
4 Johnson et al., 1988 1.0 × 10¹³ 1.8 × 10⁸ 1.8
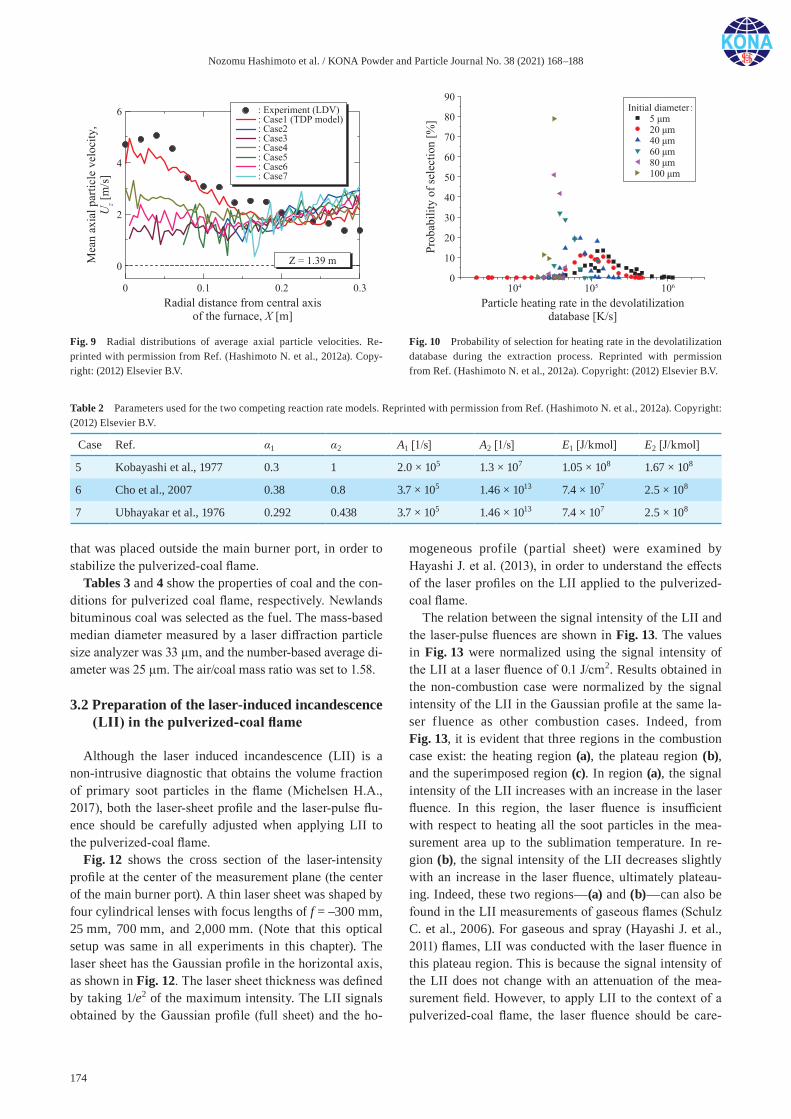
Nozomu Hashimoto et al. / KONA Powder and Particle Journal No. 38 (2021) 168–188
174
that was placed outside the main burner port, in order to stabilize the pulverized-coal flame.
Tables 3 and 4 show the properties of coal and the con-ditions for pulverized coal flame, respectively. Newlands bituminous coal was selected as the fuel. The mass-based median diameter measured by a laser diffraction particle size analyzer was 33 μm, and the number-based average di-ameter was 25 μm. The air/coal mass ratio was set to 1.58.
3.2 Preparation of the laser-induced incandescence (LII) in the pulverized-coal flame
Although the laser induced incandescence (LII) is a non-intrusive diagnostic that obtains the volume fraction of primary soot particles in the flame (Michelsen H.A., 2017), both the laser-sheet profile and the laser-pulse flu-ence should be carefully adjusted when applying LII to the pulverized-coal flame.
Fig. 12 shows the cross section of the laser-intensity profile at the center of the measurement plane (the center of the main burner port). A thin laser sheet was shaped by four cylindrical lenses with focus lengths of f = –300 mm, 25 mm, 700 mm, and 2,000 mm. (Note that this optical setup was same in all experiments in this chapter). The laser sheet has the Gaussian profile in the horizontal axis, as shown in Fig. 12. The laser sheet thickness was defined by taking 1/e2 of the maximum intensity. The LII signals obtained by the Gaussian profile (full sheet) and the ho-
mogeneous profile (partial sheet) were examined by Hayashi J. et al. (2013), in order to understand the effects of the laser profiles on the LII applied to the pulverized- coal flame.
The relation between the signal intensity of the LII and the laser-pulse fluences are shown in Fig. 13. The values in Fig. 13 were normalized using the signal intensity of the LII at a laser fluence of 0.1 J/cm2. Results obtained in the non-combustion case were normalized by the signal intensity of the LII in the Gaussian profile at the same la-ser f luence as other combustion cases. Indeed, from Fig. 13, it is evident that three regions in the combustion case exist: the heating region (a), the plateau region (b), and the superimposed region (c). In region (a), the signal intensity of the LII increases with an increase in the laser fluence. In this region, the laser fluence is insufficient with respect to heating all the soot particles in the mea-surement area up to the sublimation temperature. In re-gion (b), the signal intensity of the LII decreases slightly with an increase in the laser fluence, ultimately plateau-ing. Indeed, these two regions—(a) and (b)—can also be found in the LII measurements of gaseous flames (Schulz C. et al., 2006). For gaseous and spray (Hayashi J. et al., 2011) flames, LII was conducted with the laser fluence in this plateau region. This is because the signal intensity of the LII does not change with an attenuation of the mea-surement field. However, to apply LII to the context of a pulverized-coal flame, the laser fluence should be care-
Fig. 9 Radial distributions of average axial particle velocities. Re-printed with permission from Ref. (Hashimoto N. et al., 2012a). Copy-right: (2012) Elsevier B.V.
Fig. 10 Probability of selection for heating rate in the devolatilization database during the extraction process. Reprinted with permission from Ref. (Hashimoto N. et al., 2012a). Copyright: (2012) Elsevier B.V.
Table 2 Parameters used for the two competing reaction rate models. Reprinted with permission from Ref. (Hashimoto N. et al., 2012a). Copyright: (2012) Elsevier B.V.
Case Ref. α1 α2 A1 [1/s] A2 [1/s] E1 [J/kmol] E2 [J/kmol]
5 Kobayashi et al., 1977 0.3 1 2.0 × 10⁵ 1.3 × 10⁷ 1.05 × 10⁸ 1.67 × 10⁸
6 Cho et al., 2007 0.38 0.8 3.7 × 10⁵ 1.46 × 10¹³ 7.4 × 10⁷ 2.5 × 10⁸
7 Ubhayakar et al., 1976 0.292 0.438 3.7 × 10⁵ 1.46 × 10¹³ 7.4 × 10⁷ 2.5 × 10⁸

Nozomu Hashimoto et al. / KONA Powder and Particle Journal No. 38 (2021) 168–188
175
fully controlled according to region (c). While region (c) is evident in pulverized-coal flames, it does not appear in the LII measurements for the flames of both gaseous and liquid fuels. As shown in region (c) of Fig. 13, the signal intensity of the LII re-increases with an increase in the la-ser fluence. This result is because the signals of the LII from the pulverized-coal particles are superimposed onto the signals of the LII from the soot particles. Indeed, the LII signal in the non-combustion case, in which there are no soot formation, increases in the range of laser fluence with higher than 0.2 J/cm2 (shown as the solid square in Fig. 13).
These results suggest that sufficient fluence of the laser is required to heat all the soot particles up to the sublima-
tion temperature so that all the soot particles emit enough LII signals for the evaluation of the soot particle volume fraction in pulverized coal flames. At the same time, it should be mentioned that too high fluence of laser may cause the overestimation of the volume fraction of soot particles in pulverized coal flame due to the signals of LII from the pulverized coal particles.
3.3 Simultaneous measurements of LII and Mie scattering, and comparisons with OH-PLIF
In this section, the simultaneous measurements of Mie scattering and the LII in the pulverized coal flame are discussed in order to understand how the coal particles and soot formation are related. Two-dimensional images of Mie scattering and the LII with OH-PLIF (Hwang S.M. et al., 2005) are shown in Fig. 14, from which it is evident that the signals of Mie scattering are strong near the burner port and it decreases with an increase in height above the burner port (HAB). Contrastingly, the LII and the OH-PLIF signals increase with an increase in HAB. It is noteworthy that the full sheet (Gaussian) is adopted in Fig. 14 for visualizing all signals. Moreover, from
Fig. 11 Schematic of the coal jet burner and supplying system. Reprinted with permission from Ref. (Hayashi J. et al., 2019). Copyright: (2019) El-sevier B.V.
Table 4 Experimental conditions. Reprinted with permission from Ref. (Hayashi J. et al., 2013). Copyright: (2013) Elsevier B.V.
Item Value
Pulverized coal feed rate 1.49 × 10⁻⁴ kg/s
Thermal input of coala 4.19 kW
Thermal input of CH4a 0.83 kW
Air flow rate 1.80 × 10⁻⁴ m3/s
CH4 flow rate 2.33 × 10⁻⁵ m3/s
Bulk equivalence ratio ϕ = 6.09
Reynolds number, Re 2,544a Based on the lower heating value
Table 3 Properties of coal. Reprinted with permission from Ref. (Hayashi J. et al., 2013). Copyright: (2013) Elsevier B.V.
Item Value
Higher heating valuea 29.1 MJ/kg
Lower heating valuea 28.1 MJ/kg
Proximate analysis
Moistureb 2.60 wt%
Asha 15.20 wt%
Volatile mattera 26.90 wt%
Fixed carbona 57.90 wt%
Ultimate analysis
Carbona 71.90 wt%
Hydrogena 4.40 wt%
Nitrogena 1.50 wt%
Oxygena 6.53 wt%
Total sulfura 0.44 wt%
Combustible sulfura 0.39 wt%a Dry basis, b As received
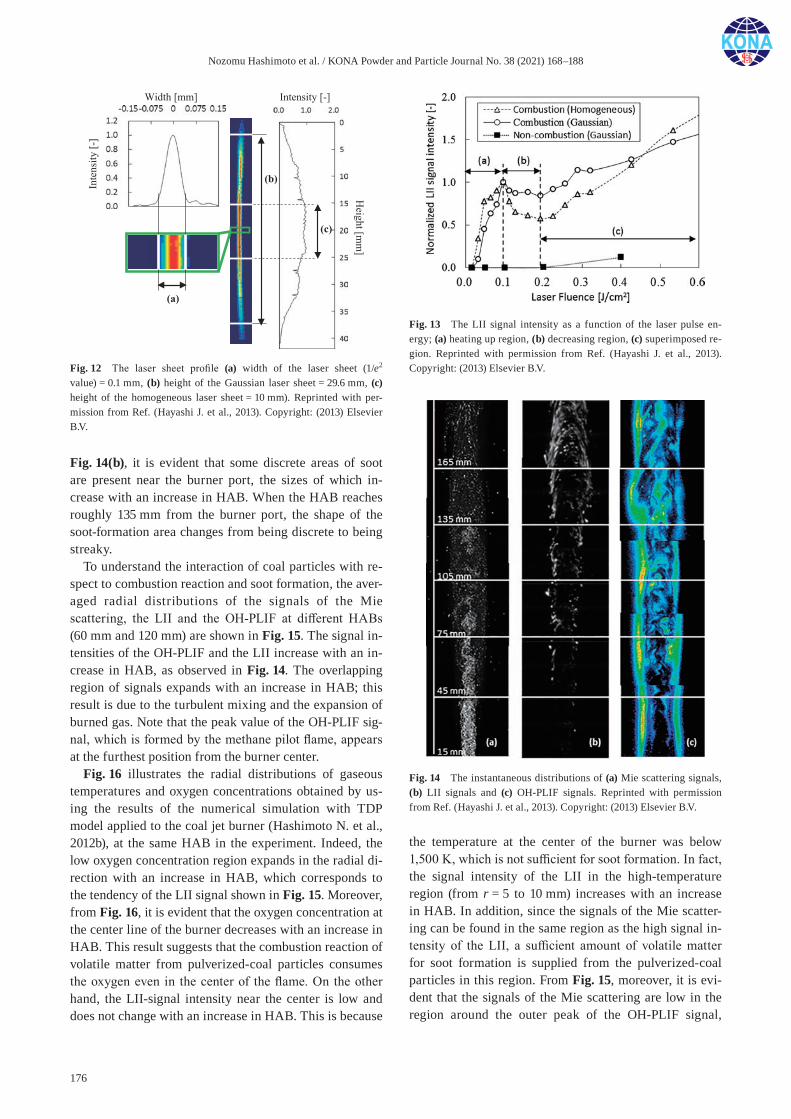
Nozomu Hashimoto et al. / KONA Powder and Particle Journal No. 38 (2021) 168–188
176
Fig. 14(b), it is evident that some discrete areas of soot are present near the burner port, the sizes of which in-crease with an increase in HAB. When the HAB reaches roughly 135 mm from the burner port, the shape of the soot-formation area changes from being discrete to being streaky.
To understand the interaction of coal particles with re-spect to combustion reaction and soot formation, the aver-aged radial distributions of the signals of the Mie scattering, the LII and the OH-PLIF at different HABs (60 mm and 120 mm) are shown in Fig. 15. The signal in-tensities of the OH-PLIF and the LII increase with an in-crease in HAB, as observed in Fig. 14. The overlapping region of signals expands with an increase in HAB; this result is due to the turbulent mixing and the expansion of burned gas. Note that the peak value of the OH-PLIF sig-nal, which is formed by the methane pilot flame, appears at the furthest position from the burner center.
Fig. 16 illustrates the radial distributions of gaseous temperatures and oxygen concentrations obtained by us-ing the results of the numerical simulation with TDP model applied to the coal jet burner (Hashimoto N. et al., 2012b), at the same HAB in the experiment. Indeed, the low oxygen concentration region expands in the radial di-rection with an increase in HAB, which corresponds to the tendency of the LII signal shown in Fig. 15. Moreover, from Fig. 16, it is evident that the oxygen concentration at the center line of the burner decreases with an increase in HAB. This result suggests that the combustion reaction of volatile matter from pulverized-coal particles consumes the oxygen even in the center of the flame. On the other hand, the LII-signal intensity near the center is low and does not change with an increase in HAB. This is because
the temperature at the center of the burner was below 1,500 K, which is not sufficient for soot formation. In fact, the signal intensity of the LII in the high-temperature region (from r = 5 to 10 mm) increases with an increase in HAB. In addition, since the signals of the Mie scatter-ing can be found in the same region as the high signal in-tensity of the LII, a sufficient amount of volatile matter for soot formation is supplied from the pulverized-coal particles in this region. From Fig. 15, moreover, it is evi-dent that the signals of the Mie scattering are low in the region around the outer peak of the OH-PLIF signal,
Fig. 12 The laser sheet profile (a) width of the laser sheet (1/e2 value) = 0.1 mm, (b) height of the Gaussian laser sheet = 29.6 mm, (c) height of the homogeneous laser sheet = 10 mm). Reprinted with per-mission from Ref. (Hayashi J. et al., 2013). Copyright: (2013) Elsevier B.V.
Fig. 13 The LII signal intensity as a function of the laser pulse en-ergy; (a) heating up region, (b) decreasing region, (c) superimposed re-gion. Reprinted with permission from Ref. (Hayashi J. et al., 2013). Copyright: (2013) Elsevier B.V.
Fig. 14 The instantaneous distributions of (a) Mie scattering signals, (b) LII signals and (c) OH-PLIF signals. Reprinted with permission from Ref. (Hayashi J. et al., 2013). Copyright: (2013) Elsevier B.V.
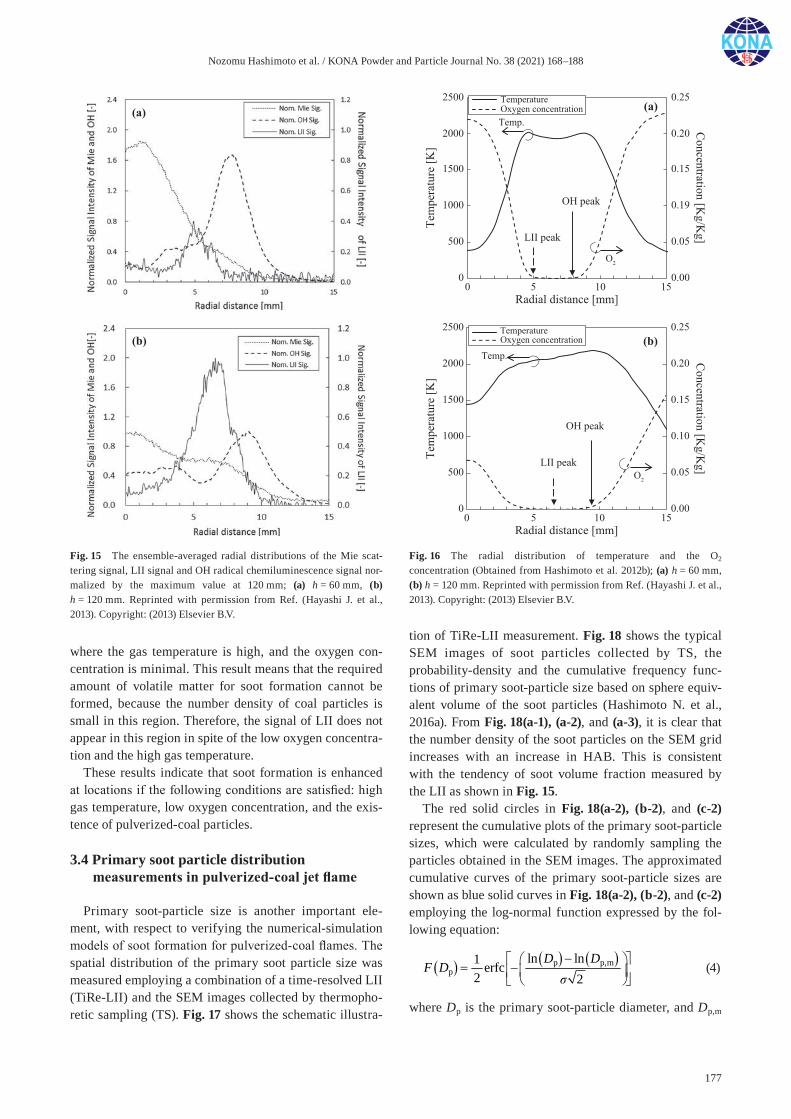
Nozomu Hashimoto et al. / KONA Powder and Particle Journal No. 38 (2021) 168–188
177
where the gas temperature is high, and the oxygen con-centration is minimal. This result means that the required amount of volatile matter for soot formation cannot be formed, because the number density of coal particles is small in this region. Therefore, the signal of LII does not appear in this region in spite of the low oxygen concentra-tion and the high gas temperature.
These results indicate that soot formation is enhanced at locations if the following conditions are satisfied: high gas temperature, low oxygen concentration, and the exis-tence of pulverized-coal particles.
3.4 Primary soot particle distribution measurements in pulverized-coal jet flame
Primary soot-particle size is another important ele-ment, with respect to verifying the numerical-simulation models of soot formation for pulverized-coal flames. The spatial distribution of the primary soot particle size was measured employing a combination of a time-resolved LII (TiRe-LII) and the SEM images collected by thermopho-retic sampling (TS). Fig. 17 shows the schematic illustra-
tion of TiRe-LII measurement. Fig. 18 shows the typical SEM images of soot particles collected by TS, the probability-density and the cumulative frequency func-tions of primary soot-particle size based on sphere equiv-alent volume of the soot particles (Hashimoto N. et al., 2016a). From Fig. 18(a-1), (a-2), and (a-3), it is clear that the number density of the soot particles on the SEM grid increases with an increase in HAB. This is consistent with the tendency of soot volume fraction measured by the LII as shown in Fig. 15.
The red solid circles in Fig. 18(a-2), (b-2), and (c-2) represent the cumulative plots of the primary soot-particle sizes, which were calculated by randomly sampling the particles obtained in the SEM images. The approximated cumulative curves of the primary soot-particle sizes are shown as blue solid curves in Fig. 18(a-2), (b-2), and (c-2) employing the log-normal function expressed by the fol-lowing equation:
p p,mp
ln ln1 erfc2 2
D DF D
σ
(4)
where Dp is the primary soot-particle diameter, and Dp,m
Fig. 15 The ensemble-averaged radial distributions of the Mie scat-tering signal, LII signal and OH radical chemiluminescence signal nor-malized by the maximum value at 120 mm; (a) h = 60 mm, (b) h = 120 mm. Reprinted with permission from Ref. (Hayashi J. et al., 2013). Copyright: (2013) Elsevier B.V.
Fig. 16 The radial distribution of temperature and the O2 concentration (Obtained from Hashimoto et al. 2012b); (a) h = 60 mm, (b) h = 120 mm. Reprinted with permission from Ref. (Hayashi J. et al., 2013). Copyright: (2013) Elsevier B.V.

Nozomu Hashimoto et al. / KONA Powder and Particle Journal No. 38 (2021) 168–188
178
is the median diameter based on the particle volume. The parameters σ and Dp,m are determined by the least-squares method in order to fit the curves to the measured diameter distributions. The green dashed curves indicate the prob-ability density function converted from the blue cumula-tive frequency curves, which are expressed by the following equation:
2p p,m
pp
ln ln1 1exp22π
D DP D
σσD
(5)
Indeed, the primary soot-particle size distribution shifts to the larger side with an increase in HAB. This result indicates that primary soot-particle size increases as said particles move downstream. Moreover, it is also evident that the distribution of the primary soot-particle size widens with an increase in HAB. This result means that the maximum value of the probability density func-tion of primary soot-particle size decreases with an in-crease in HAB.
Fig. 19 shows the distributions of the primary soot- particle size and the soot-volume fraction. As shown in Fig. 19, while the primary soot-particle size increases and the region of soot expands in the radial direction, the ra-dial position of the peak value of the soot-volume fraction does not significantly change with an increase in HAB.
3.5 Simultaneous imaging of Mie scattering, polycyclic aromatic hydrocarbons laser-induced fluorescence, and soot LII with respect to a lab-scale turbulent jet pulverized-coal flame
Since polycyclic aromatic hydrocarbons (PAHs) are known as a soot precursor, information relating to their formation is crucial with respect to the soot-formation processes (Michelsen H.A., 2017 and Desgroux P. et al.,
2013). In order to understand the transitional soot forma-tion processes in the pulverized-coal flame, Hayashi et al. (2019) conducted two different simultaneous measure-ments (“Mie scattering for coal particles with LIF for PAHs” and “LIF for PAHs with LII for soot”) in the coal jet burner.
In the following reviewed work, LIF measurement for PAHs using a laser with a wavelength of 355 nm, which is referred to the results reported by Bejaoui S. et al., 2014 and Aizawa T. and Kosaka H., 2008, were conducted. Mie scattering and LII were conducted using the same wave-length as LIF, in order to achieve simultaneous measure-ments. Laser fluence was set to 0.25 J/cm2, in order to ensure sufficient signal intensity. Two-dimensional distri-butions of the signals of Mie scattering, LIF, and LII are shown in Fig. 20. The signal intensities of the pulverized- coal particles (Mie scattering), PAHs (LIF signal), and soot particles (LII signal) are represented in green, blue, and red, respectively. Indeed, PAHs exist at the center axis due to the turbulent mixing as shown in Fig. 20(b). This occurs because the PAHs measured according to the LIF are gaseous, and therefore, they follow the gaseous flow. This trend is similar to that of the OH-LIF signal (Hwang S.M. et al., 2005). Conversely, the discrete re-gions of LII are observed apart from the center line as shown in Fig. 20(c).
The overlaid images of both the Mie scattering and the LIF are shown in Fig. 21, from which it is evident that the existing regions of pulverized-coal particles and PAHs slightly overlap. Due to the configuration of this work, the devolatilization tends to begin from the outer side of the main coal/air premixed flow. As a result, a continuous and high-intensity LIF signal can be found in the surrounding area of the Mie-scattering signals. Subsequently, the LIF-signal region expands toward the central region due
Fig. 17 Schematic of measurement set up for time-resolved laser incandescence (TiRe-LII). Reprinted with permission from Ref. (Hashimoto N. et al., 2016a). Copyright: (2016) Japan Society of Mechanical Engineers.

Nozomu Hashimoto et al. / KONA Powder and Particle Journal No. 38 (2021) 168–188
179
to the mixing of the surrounding gases. This result is con-sistent with the numerical results obtained by Hara et al. (2015). Here, it is known that the volatile matter of PAHs with two to three aromatic rings can be formed directly from coal particles (e.g., Zhang L. et al., 2017). This result means that PAHs can exist wherever coal particles exist, so long as the temperature is sufficiently high for devola-tilization.
In essence, the existing regions of LIF and LII do not correspond with each other—see Fig. 21(bottom). It is noteworthy that the interference of the LII signal and PAHs-LIF signal cannot be excluded during the scheme of excitation and detection in this work. On the other hand, the LII signal collected at 400 nm with the gate de-layed by around 70 ns from the laser incident is unambig-
uously issued from soot incandescence. The signals of the LII shown in Fig. 21(bottom) are well separated from the prompt signal of the LIF. While only a few overlapping locations of LIF and LII are observed, which require care-ful interpretation, no ambiguity in assigning the prompt signal to the LIF from PAHs exists in any other location. The existing soot region (the regions of LII signal) is lim-ited and discrete at the bottom of the jet flame; moreover, the relative soot-volume fraction increases with an in-crease in HAB. However, the soot formation was inhib-ited in the center axis. This occurs because the temperature in this region was relatively low and, more-over, because oxygen was still present at the relevant HAB. Lee S.M. et al. (2004) measured the LIF of PAHs using different wavelengths, showing that the displace-
Fig. 18 Typical SEM images of soot particles, probability density and cumulative frequency functions for primary soot particle diameter. Reprinted with permission from Ref. (Hashimoto N. et al., 2016a). Copyright: (2016) Japan Society of Mechanical Engineers.
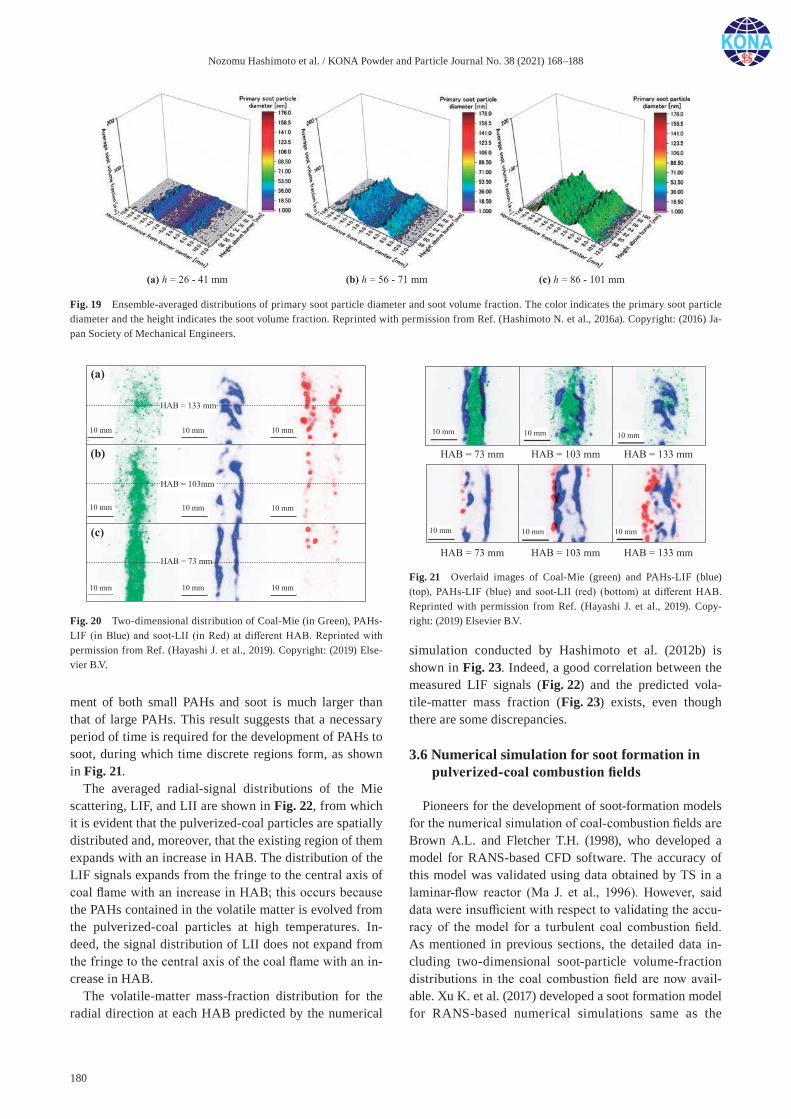
Nozomu Hashimoto et al. / KONA Powder and Particle Journal No. 38 (2021) 168–188
180
ment of both small PAHs and soot is much larger than that of large PAHs. This result suggests that a necessary period of time is required for the development of PAHs to soot, during which time discrete regions form, as shown in Fig. 21.
The averaged radial-signal distributions of the Mie scattering, LIF, and LII are shown in Fig. 22, from which it is evident that the pulverized-coal particles are spatially distributed and, moreover, that the existing region of them expands with an increase in HAB. The distribution of the LIF signals expands from the fringe to the central axis of coal flame with an increase in HAB; this occurs because the PAHs contained in the volatile matter is evolved from the pulverized-coal particles at high temperatures. In-deed, the signal distribution of LII does not expand from the fringe to the central axis of the coal flame with an in-crease in HAB.
The volatile-matter mass-fraction distribution for the radial direction at each HAB predicted by the numerical
simulation conducted by Hashimoto et al. (2012b) is shown in Fig. 23. Indeed, a good correlation between the measured LIF signals (Fig. 22) and the predicted vola-tile-matter mass fraction (Fig. 23) exists, even though there are some discrepancies.
3.6 Numerical simulation for soot formation in pulverized-coal combustion fields
Pioneers for the development of soot-formation models for the numerical simulation of coal-combustion fields are Brown A.L. and Fletcher T.H. (1998), who developed a model for RANS-based CFD software. The accuracy of this model was validated using data obtained by TS in a laminar-flow reactor (Ma J. et al., 1996). However, said data were insufficient with respect to validating the accu-racy of the model for a turbulent coal combustion field. As mentioned in previous sections, the detailed data in-cluding two-dimensional soot-particle volume-fraction distributions in the coal combustion field are now avail-able. Xu K. et al. (2017) developed a soot formation model for RANS-based numerical simulations same as the
Fig. 19 Ensemble-averaged distributions of primary soot particle diameter and soot volume fraction. The color indicates the primary soot particle diameter and the height indicates the soot volume fraction. Reprinted with permission from Ref. (Hashimoto N. et al., 2016a). Copyright: (2016) Ja-pan Society of Mechanical Engineers.
Fig. 20 Two-dimensional distribution of Coal-Mie (in Green), PAHs-LIF (in Blue) and soot-LII (in Red) at different HAB. Reprinted with permission from Ref. (Hayashi J. et al., 2019). Copyright: (2019) Else-vier B.V.
Fig. 21 Overlaid images of Coal-Mie (green) and PAHs-LIF (blue) (top), PAHs-LIF (blue) and soot-LII (red) (bottom) at different HAB. Reprinted with permission from Ref. (Hayashi J. et al., 2019). Copy-right: (2019) Elsevier B.V.
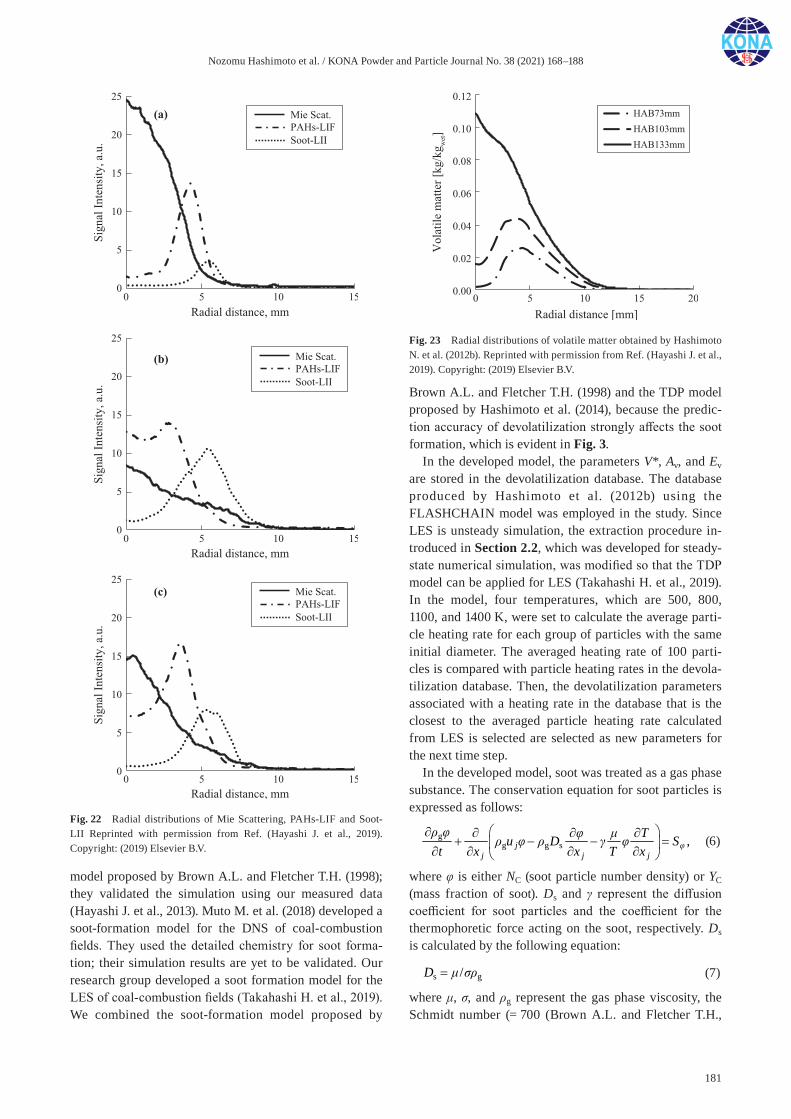
Nozomu Hashimoto et al. / KONA Powder and Particle Journal No. 38 (2021) 168–188
181
model proposed by Brown A.L. and Fletcher T.H. (1998); they validated the simulation using our measured data (Hayashi J. et al., 2013). Muto M. et al. (2018) developed a soot-formation model for the DNS of coal-combustion fields. They used the detailed chemistry for soot forma-tion; their simulation results are yet to be validated. Our research group developed a soot formation model for the LES of coal-combustion fields (Takahashi H. et al., 2019). We combined the soot-formation model proposed by
Brown A.L. and Fletcher T.H. (1998) and the TDP model proposed by Hashimoto et al. (2014), because the predic-tion accuracy of devolatilization strongly affects the soot formation, which is evident in Fig. 3.
In the developed model, the parameters V*, Av, and Ev are stored in the devolatilization database. The database produced by Hashimoto et al. (2012b) using the FLASHCHAIN model was employed in the study. Since LES is unsteady simulation, the extraction procedure in-troduced in Section 2.2, which was developed for steady-state numerical simulation, was modified so that the TDP model can be applied for LES (Takahashi H. et al., 2019). In the model, four temperatures, which are 500, 800, 1100, and 1400 K, were set to calculate the average parti-cle heating rate for each group of particles with the same initial diameter. The averaged heating rate of 100 parti-cles is compared with particle heating rates in the devola-tilization database. Then, the devolatilization parameters associated with a heating rate in the database that is the closest to the averaged particle heating rate calculated from LES is selected are selected as new parameters for the next time step.
In the developed model, soot was treated as a gas phase substance. The conservation equation for soot particles is expressed as follows:
gg g s ,j φ
j j j
ρ φ φ μ Tρ u φ ρ D γ φ St x x T x
(6)
where φ is either NC (soot particle number density) or YC (mass fraction of soot). Ds and γ represent the diffusion coefficient for soot particles and the coefficient for the thermophoretic force acting on the soot, respectively. Ds is calculated by the following equation:
s g/D μ σρ
(7)
where μ, σ, and ρg represent the gas phase viscosity, the Schmidt number (= 700 (Brown A.L. and Fletcher T.H.,
Fig. 22 Radial distributions of Mie Scattering, PAHs-LIF and Soot-LII Reprinted with permission from Ref. ( Hayashi J. et al., 2019). Copyright: (2019) Elsevier B.V.
Fig. 23 Radial distributions of volatile matter obtained by Hashimoto N. et al. (2012b). Reprinted with permission from Ref. (Hayashi J. et al., 2019). Copyright: (2019) Elsevier B.V.
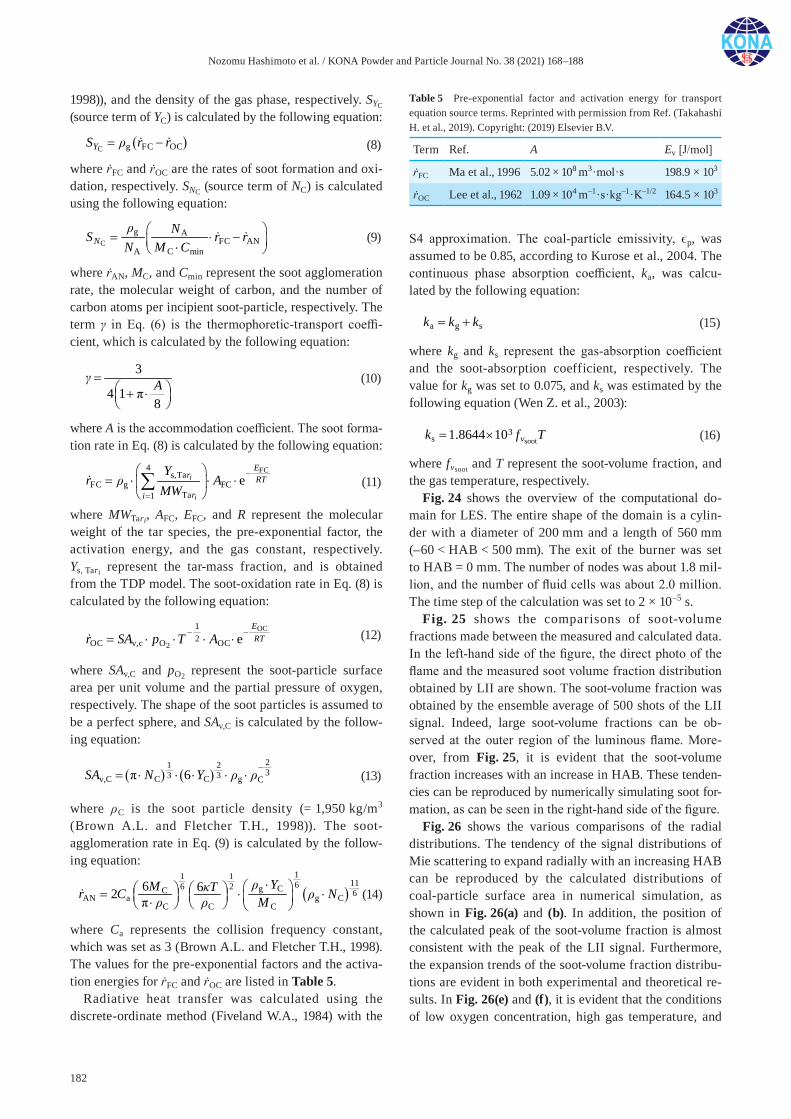
Nozomu Hashimoto et al. / KONA Powder and Particle Journal No. 38 (2021) 168–188
182
1998)), and the density of the gas phase, respectively. SYC (source term of YC) is calculated by the following equation:
( )C g FC OCYS ρ r r= −
(8)
where ṙFC and ṙOC are the rates of soot formation and oxi-dation, respectively. SNC (source term of NC) is calculated using the following equation:
Cg A
FC ANA C min
NNS r r
N M C = ⋅ − ⋅
(9)
where ṙAN, MC, and Cmin represent the soot agglomeration rate, the molecular weight of carbon, and the number of carbon atoms per incipient soot-particle, respectively. The term γ in Eq. (6) is the thermophoretic-transport coeffi-cient, which is calculated by the following equation:
3
4 1 π8
γ A
(10)
where A is the accommodation coefficient. The soot forma-tion rate in Eq. (8) is calculated by the following equation:
FC4s, Ta
FC g FCTa1
ei
i
Er RT
ri
Yr A
MW
−
=
⋅ ⋅
= ⋅ ∑
(11)
where MWTari, AFC, EFC, and R represent the molecular weight of the tar species, the pre-exponential factor, the activation energy, and the gas constant, respectively. Ys, Tari represent the tar-mass fraction, and is obtained from the TDP model. The soot-oxidation rate in Eq. (8) is calculated by the following equation:
OC
2
12OC v,c O OC e
ERTr SA p T A− −
⋅ ⋅= ⋅ ⋅
(12)
where SAv,C and pO2 represent the soot-particle surface area per unit volume and the partial pressure of oxygen, respectively. The shape of the soot particles is assumed to be a perfect sphere, and SAv,C is calculated by the follow-ing equation:
2233v,C C C g
13 Cπ 6SA N Y ρ ρ
(13)
where ρC is the soot particle density (= 1,950 kg/m3 (Brown A.L. and Fletcher T.H., 1998)). The soot- agglomeration rate in Eq. (9) is calculated by the follow-ing equation:
( )11 1
1166 2 g CC 6AN a g CC C C
6 62 πρ YM κTr C ρ Nρ ρ M
= ⋅ ⋅
⋅⋅
(14)
where Ca represents the collision frequency constant, which was set as 3 (Brown A.L. and Fletcher T.H., 1998). The values for the pre-exponential factors and the activa-tion energies for ṙFC and ṙOC are listed in Table 5.
Radiative heat transfer was calculated using the discrete-ordinate method (Fiveland W.A., 1984) with the
S4 approximation. The coal-particle emissivity, ϵp, was assumed to be 0.85, according to Kurose et al., 2004. The continuous phase absorption coefficient, ka, was calcu-lated by the following equation:
a g sk k k
(15)
where kg and ks represent the gas-absorption coefficient and the soot-absorption coefficient, respectively. The value for kg was set to 0.075, and ks was estimated by the following equation (Wen Z. et al., 2003):
soot3
s 1.8644 10 vk f T= × (16)
where fvsoot and T represent the soot-volume fraction, and the gas temperature, respectively.
Fig. 24 shows the overview of the computational do-main for LES. The entire shape of the domain is a cylin-der with a diameter of 200 mm and a length of 560 mm (–60 < HAB < 500 mm). The exit of the burner was set to HAB = 0 mm. The number of nodes was about 1.8 mil-lion, and the number of fluid cells was about 2.0 million. The time step of the calculation was set to 2 × 10⁻⁵ s.
Fig. 25 shows the comparisons of soot-volume fractions made between the measured and calculated data. In the left-hand side of the figure, the direct photo of the flame and the measured soot volume fraction distribution obtained by LII are shown. The soot-volume fraction was obtained by the ensemble average of 500 shots of the LII signal. Indeed, large soot-volume fractions can be ob-served at the outer region of the luminous flame. More-over, from Fig. 25, it is evident that the soot-volume fraction increases with an increase in HAB. These tenden-cies can be reproduced by numerically simulating soot for-mation, as can be seen in the right-hand side of the figure.
Fig. 26 shows the various comparisons of the radial distributions. The tendency of the signal distributions of Mie scattering to expand radially with an increasing HAB can be reproduced by the calculated distributions of coal-particle surface area in numerical simulation, as shown in Fig. 26(a) and (b). In addition, the position of the calculated peak of the soot-volume fraction is almost consistent with the peak of the LII signal. Furthermore, the expansion trends of the soot-volume fraction distribu-tions are evident in both experimental and theoretical re-sults. In Fig. 26(e) and (f), it is evident that the conditions of low oxygen concentration, high gas temperature, and
Table 5 Pre-exponential factor and activation energy for transport equation source terms. Reprinted with permission from Ref. (Takahashi H. et al., 2019). Copyright: (2019) Elsevier B.V.
Term Ref. A Ev [J/mol]
ṙFC Ma et al., 1996 5.02 × 10⁸ m3 ∙ mol ∙ s 198.9 × 10³
ṙOC Lee et al., 1962 1.09 × 10⁴ m–1 ∙ s ∙ kg–1 ∙ K–1/2 164.5 × 10³
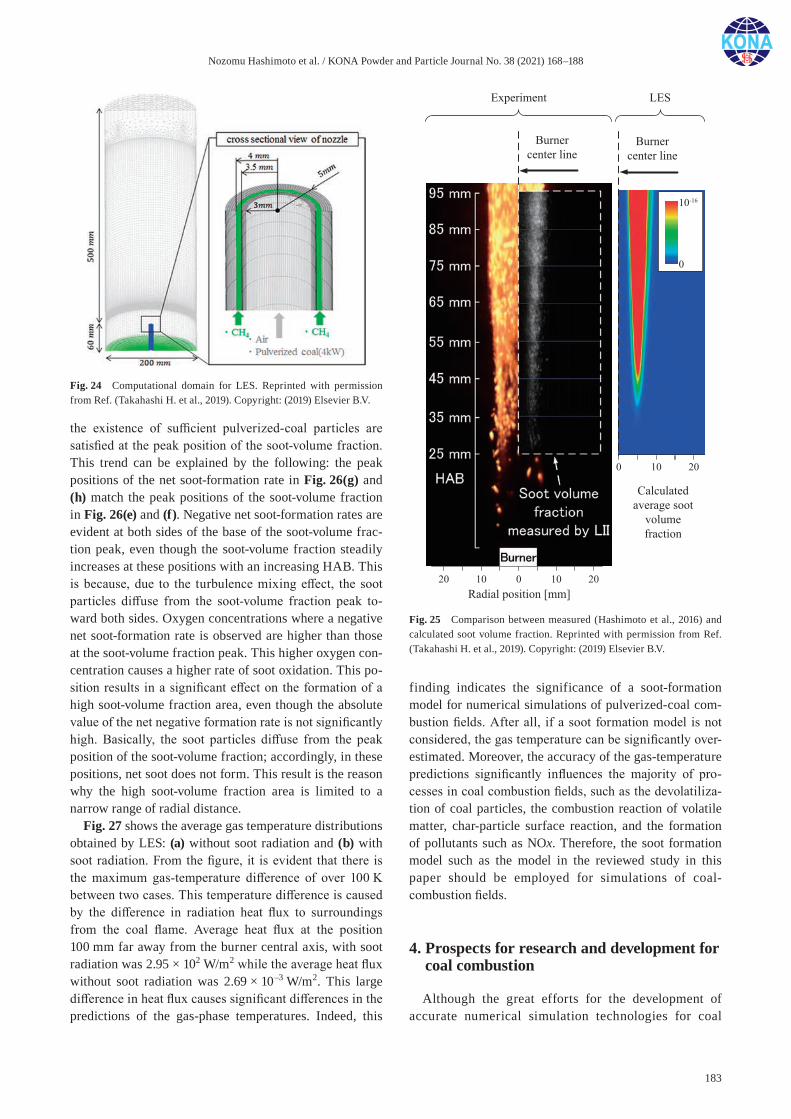
Nozomu Hashimoto et al. / KONA Powder and Particle Journal No. 38 (2021) 168–188
183
the existence of sufficient pulverized-coal particles are satisfied at the peak position of the soot-volume fraction. This trend can be explained by the following: the peak positions of the net soot-formation rate in Fig. 26(g) and (h) match the peak positions of the soot-volume fraction in Fig. 26(e) and (f). Negative net soot-formation rates are evident at both sides of the base of the soot-volume frac-tion peak, even though the soot-volume fraction steadily increases at these positions with an increasing HAB. This is because, due to the turbulence mixing effect, the soot particles diffuse from the soot-volume fraction peak to-ward both sides. Oxygen concentrations where a negative net soot-formation rate is observed are higher than those at the soot-volume fraction peak. This higher oxygen con-centration causes a higher rate of soot oxidation. This po-sition results in a significant effect on the formation of a high soot-volume fraction area, even though the absolute value of the net negative formation rate is not significantly high. Basically, the soot particles diffuse from the peak position of the soot-volume fraction; accordingly, in these positions, net soot does not form. This result is the reason why the high soot-volume fraction area is limited to a narrow range of radial distance.
Fig. 27 shows the average gas temperature distributions obtained by LES: (a) without soot radiation and (b) with soot radiation. From the figure, it is evident that there is the maximum gas-temperature difference of over 100 K between two cases. This temperature difference is caused by the difference in radiation heat flux to surroundings from the coal flame. Average heat flux at the position 100 mm far away from the burner central axis, with soot radiation was 2.95 × 10² W/m2 while the average heat flux without soot radiation was 2.69 × 10⁻³ W/m2. This large difference in heat flux causes significant differences in the predictions of the gas-phase temperatures. Indeed, this
finding indicates the significance of a soot-formation model for numerical simulations of pulverized-coal com-bustion fields. After all, if a soot formation model is not considered, the gas temperature can be significantly over-estimated. Moreover, the accuracy of the gas-temperature predictions significantly influences the majority of pro-cesses in coal combustion fields, such as the devolatiliza-tion of coal particles, the combustion reaction of volatile matter, char-particle surface reaction, and the formation of pollutants such as NOx. Therefore, the soot formation model such as the model in the reviewed study in this paper should be employed for simulations of coal- combustion fields.
4. Prospects for research and development for coal combustion
Although the great efforts for the development of accurate numerical simulation technologies for coal
Fig. 24 Computational domain for LES. Reprinted with permission from Ref. (Takahashi H. et al., 2019). Copyright: (2019) Elsevier B.V.
Fig. 25 Comparison between measured (Hashimoto et al., 2016) and calculated soot volume fraction. Reprinted with permission from Ref. (Takahashi H. et al., 2019). Copyright: (2019) Elsevier B.V.
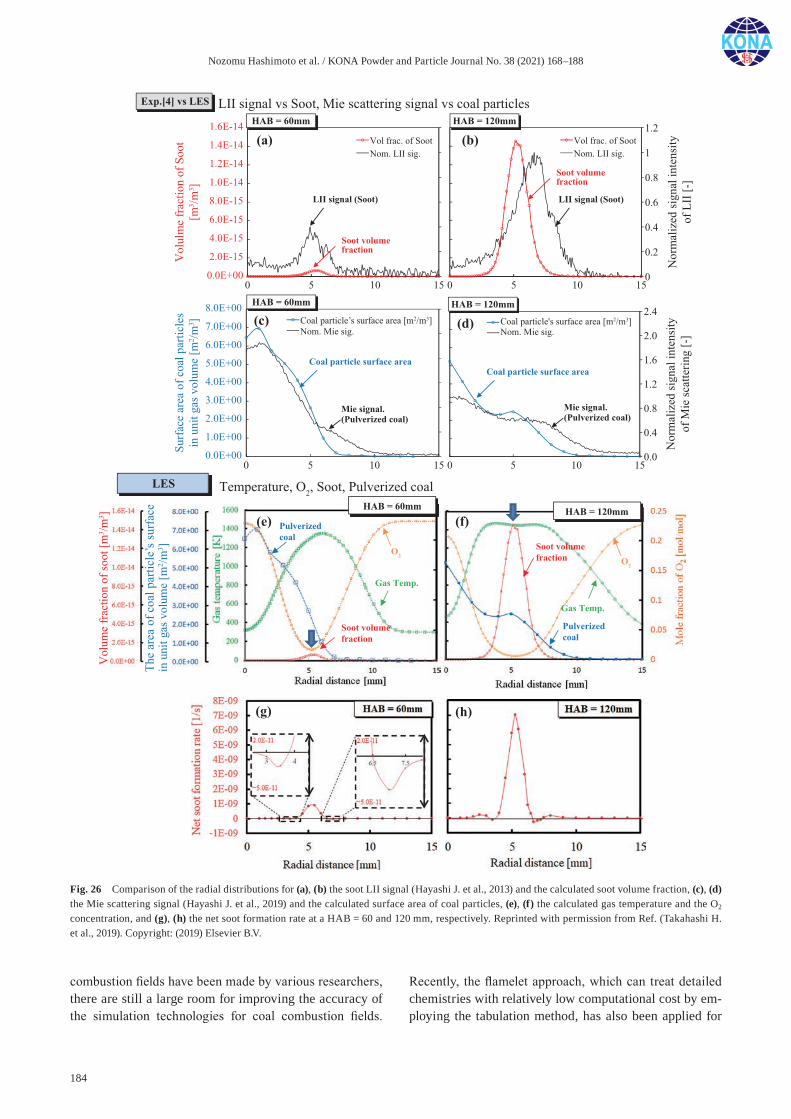
Nozomu Hashimoto et al. / KONA Powder and Particle Journal No. 38 (2021) 168–188
184
combustion fields have been made by various researchers, there are still a large room for improving the accuracy of the simulation technologies for coal combustion fields.
Recently, the flamelet approach, which can treat detailed chemistries with relatively low computational cost by em-ploying the tabulation method, has also been applied for
Fig. 26 Comparison of the radial distributions for (a), (b) the soot LII signal (Hayashi J. et al., 2013) and the calculated soot volume fraction, (c), (d) the Mie scattering signal (Hayashi J. et al., 2019) and the calculated surface area of coal particles, (e), (f) the calculated gas temperature and the O2 concentration, and (g), (h) the net soot formation rate at a HAB = 60 and 120 mm, respectively. Reprinted with permission from Ref. (Takahashi H. et al., 2019). Copyright: (2019) Elsevier B.V.

Nozomu Hashimoto et al. / KONA Powder and Particle Journal No. 38 (2021) 168–188
185
numerical simulations of coal combustion fields (e.g., Watanabe J. et al., 2017, Wen X. et al., 2019). However, the detailed chemistry for volatile matter combustion has not been developed yet, because detailed molecular for heavy species such as tar cannot be identified due to its complexity. Therefore, the postulated substances such as C6H6 are employed as volatile matter, although actual tar species are much heavier species than C6H6. Although the methods for flamelet approach have been already devel-oped, the accuracy of numerical simulations cannot be improved until the detailed chemistries for volatile matter and soot particles will be developed. Thus, the clarifica-tion of detailed chemistries for volatile matter and soot particles is expected in the future. The accurate prediction technologies for NOx emission from coal combustion fields is another important issue. Although the NOx emis-sion can be qualitatively predicted by the existing NOx models (e.g., Hashimoto N. et al., 2017), developments of more accurate NOx formation/reduction models are ex-pected to improve the accuracy of the prediction. The prediction of ash behavior in boilers is also important is-sue (e.g., Matsui Y. et al. 2019).
In addition to those issues mentioned above, the plants themselves require efficient use; moreover, new types of fuel, such those produced from using renewable energy is expected, because the CO2 emissions per unit of obtained energy from coal-fired plants are larger than those from other energy plants. One of possible new type fuels for coal-fired boiler is ammonia, which is promising energy carrier in the future. Since ammonia does not have carbon in its molecule, the direct combustion of ammonia can be
an option. Many researches have been conducted on the fundamental combustion characteristics of ammonia (Kobayashi et al., 2019, Okafor E.C. et al., 2019, Ichimura R. et al., 2019, Hayakawa A. et al., 2015). Although verifi-cation tests and bench-scale tests using large-scale burn-ers have been conducted for the mixed combustion of ammonia and pulverized-coal particles (Kobayashi et al., 2019), research is currently lacking with respect to the fundamental characteristics of mixed combustion of am-monia with pulverized coal particles.
Accordingly, our research group recently started to conduct the fundamental research on the mixed combus-tion characteristics of ammonia with pulverized coal par-ticle cloud (Hashimoto N. et al, 2019a, 2019b). The flame propagation characteristics of an ammonia-coal particle cloud in turbulent fields has been investigated by using a fan-stirred constant volume vessel (Hadi K. et al., 2019). The developments of the mixing combustion models us-ing the experimental results from these researches for the ammonia-coal particle cloud mixture for numerical simu-lations is expected in the near future.
5. Conclusions
In this review paper, recent progress of research con-cerning coal-particle devolatilization model and the soot formation in pulverized coal combustion fields is re-viewed. Employing the developed models for coal particle devolatilization and the soot formation can greatly im-prove the accuracy of numerical simulations for coal combustion fields. The accuracy of the models has been validated by the experimental data measured by various optical diagnostics, such as LDV, LII, TiRe-LII, and LIF. Since non-validated models can cause significant errors in numerical simulations, the use of our measured data by various researchers will be welcomed.
Acknowledgements
Reviewed work in this paper were partly supported by JSPS KAKENHI Grant Number 15637712, MEXT as “Priority issue on Post-K computer” (Accelerated Devel-opment of Innovative Clean Energy Systems), JST re-search promotion program Sakigake (PRESTO) Grant Number JPMJPR1542 and JSPS KAKENHI Grant Num-ber JP19180646.
References
Ahn S., Tanno K., Watanabe H., Numerical analysis of particle dispersion and combustion characteristics on a piloted coax-
Fig. 27 Effect of soot radiation on the ensemble-averaged gas tem-perature distribution. Reprinted with permission from Ref. (Takahashi H. et al., 2019). Copyright: (2019) Elsevier B.V.
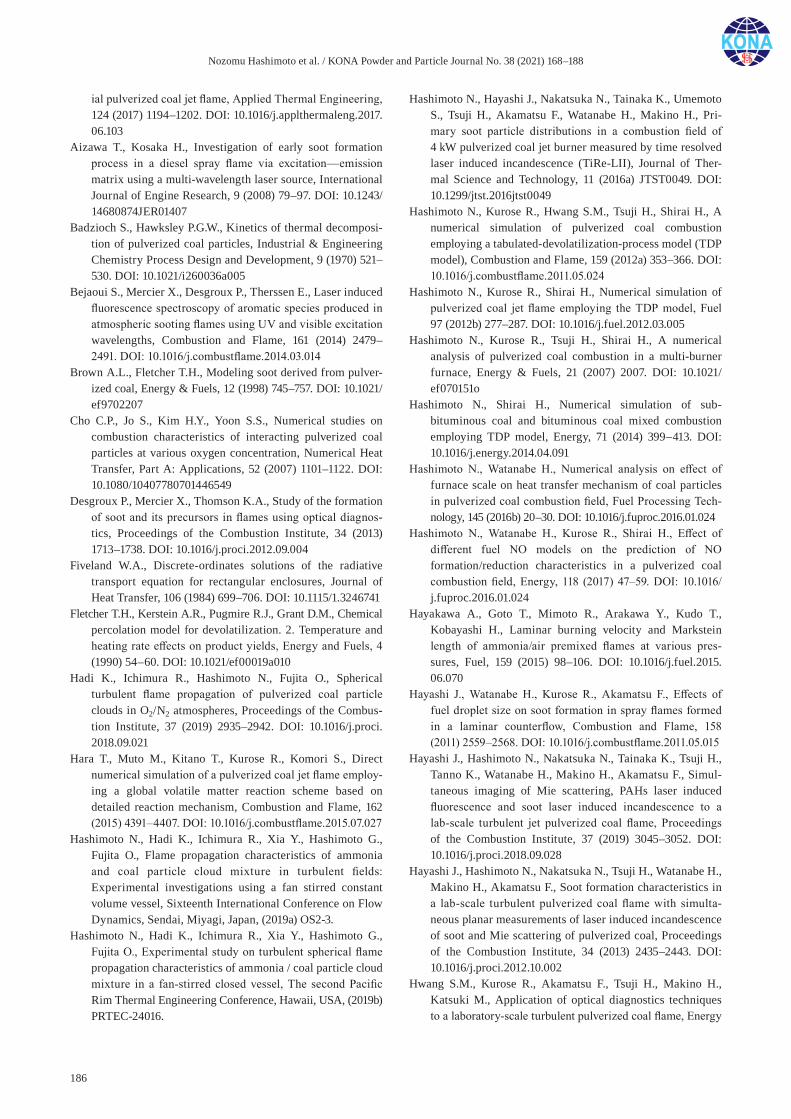
Nozomu Hashimoto et al. / KONA Powder and Particle Journal No. 38 (2021) 168–188
186
ial pulverized coal jet flame, Applied Thermal Engineering, 124 (2017) 1194–1202. DOI: 10.1016/j.applthermaleng.2017. 06.103
Aizawa T., Kosaka H., Investigation of early soot formation process in a diesel spray flame via excitation—emission matrix using a multi-wavelength laser source, International Journal of Engine Research, 9 (2008) 79–97. DOI: 10.1243/ 14680874JER01407
Badzioch S., Hawksley P.G.W., Kinetics of thermal decomposi-tion of pulverized coal particles, Industrial & Engineering Chemistry Process Design and Development, 9 (1970) 521–530. DOI: 10.1021/i260036a005
Bejaoui S., Mercier X., Desgroux P., Therssen E., Laser induced fluorescence spectroscopy of aromatic species produced in atmospheric sooting flames using UV and visible excitation wavelengths, Combustion and Flame, 161 (2014) 2479–2491. DOI: 10.1016/j.combustflame.2014.03.014
Brown A.L., Fletcher T.H., Modeling soot derived from pulver-ized coal, Energy & Fuels, 12 (1998) 745–757. DOI: 10.1021/ ef9702207
Cho C.P., Jo S., Kim H.Y., Yoon S.S., Numerical studies on combustion characteristics of interacting pulverized coal particles at various oxygen concentration, Numerical Heat Transfer, Part A: Applications, 52 (2007) 1101–1122. DOI: 10.1080/10407780701446549
Desgroux P., Mercier X., Thomson K.A., Study of the formation of soot and its precursors in flames using optical diagnos-tics, Proceedings of the Combustion Institute, 34 (2013) 1713–1738. DOI: 10.1016/j.proci.2012.09.004
Fiveland W.A., Discrete-ordinates solutions of the radiative transport equation for rectangular enclosures, Journal of Heat Transfer, 106 (1984) 699–706. DOI: 10.1115/1.3246741
Fletcher T.H., Kerstein A.R., Pugmire R.J., Grant D.M., Chemical percolation model for devolatilization. 2. Temperature and heating rate effects on product yields, Energy and Fuels, 4 (1990) 54–60. DOI: 10.1021/ef00019a010
Hadi K., Ichimura R., Hashimoto N., Fujita O., Spherical turbulent flame propagation of pulverized coal particle clouds in O2/N2 atmospheres, Proceedings of the Combus-tion Institute, 37 (2019) 2935–2942. DOI: 10.1016/j.proci. 2018.09.021
Hara T., Muto M., Kitano T., Kurose R., Komori S., Direct numerical simulation of a pulverized coal jet flame employ-ing a global volatile matter reaction scheme based on detailed reaction mechanism, Combustion and Flame, 162 (2015) 4391–4407. DOI: 10.1016/j.combustflame.2015.07.027
Hashimoto N., Hadi K., Ichimura R., Xia Y., Hashimoto G., Fujita O., Flame propagation characteristics of ammonia and coal particle cloud mixture in turbulent fields: Experimental investigations using a fan stirred constant volume vessel, Sixteenth International Conference on Flow Dynamics, Sendai, Miyagi, Japan, (2019a) OS2-3.
Hashimoto N., Hadi K., Ichimura R., Xia Y., Hashimoto G., Fujita O., Experimental study on turbulent spherical flame propagation characteristics of ammonia / coal particle cloud mixture in a fan-stirred closed vessel, The second Pacific Rim Thermal Engineering Conference, Hawaii, USA, (2019b) PRTEC-24016.
Hashimoto N., Hayashi J., Nakatsuka N., Tainaka K., Umemoto S., Tsuji H., Akamatsu F., Watanabe H., Makino H., Pri-mary soot particle distributions in a combustion field of 4 kW pulverized coal jet burner measured by time resolved laser induced incandescence (TiRe-LII), Journal of Ther-mal Science and Technology, 11 (2016a) JTST0049. DOI: 10.1299/jtst.2016jtst0049
Hashimoto N., Kurose R., Hwang S.M., Tsuji H., Shirai H., A numerical simulation of pulverized coal combustion employing a tabulated-devolatilization-process model (TDP model), Combustion and Flame, 159 (2012a) 353–366. DOI: 10.1016/j.combustflame.2011.05.024
Hashimoto N., Kurose R., Shirai H., Numerical simulation of pulverized coal jet flame employing the TDP model, Fuel 97 (2012b) 277–287. DOI: 10.1016/j.fuel.2012.03.005
Hashimoto N., Kurose R., Tsuji H., Shirai H., A numerical analysis of pulverized coal combustion in a multi-burner furnace, Energy & Fuels, 21 (2007) 2007. DOI: 10.1021/ef070151o
Hashimoto N., Shirai H., Numerical simulation of sub-bituminous coal and bituminous coal mixed combustion employing TDP model, Energy, 71 (2014) 399–413. DOI: 10.1016/j.energy.2014.04.091
Hashimoto N., Watanabe H., Numerical analysis on effect of furnace scale on heat transfer mechanism of coal particles in pulverized coal combustion field, Fuel Processing Tech-nology, 145 (2016b) 20–30. DOI: 10.1016/j.fuproc.2016.01.024
Hashimoto N., Watanabe H., Kurose R., Shirai H., Effect of different fuel NO models on the prediction of NO formation/reduction characteristics in a pulverized coal combustion field, Energy, 118 (2017) 47–59. DOI: 10.1016/j.fuproc.2016.01.024
Hayakawa A., Goto T., Mimoto R., Arakawa Y., Kudo T., Kobayashi H., Laminar burning velocity and Markstein length of ammonia/air premixed flames at various pres-sures, Fuel, 159 (2015) 98–106. DOI: 10.1016/j.fuel.2015. 06.070
Hayashi J., Watanabe H., Kurose R., Akamatsu F., Effects of fuel droplet size on soot formation in spray flames formed in a laminar counterflow, Combustion and Flame, 158 (2011) 2559–2568. DOI: 10.1016/j.combustflame.2011.05.015
Hayashi J., Hashimoto N., Nakatsuka N., Tainaka K., Tsuji H., Tanno K., Watanabe H., Makino H., Akamatsu F., Simul-taneous imaging of Mie scattering, PAHs laser induced fluorescence and soot laser induced incandescence to a lab-scale turbulent jet pulverized coal flame, Proceedings of the Combustion Institute, 37 (2019) 3045–3052. DOI: 10.1016/j.proci.2018.09.028
Hayashi J., Hashimoto N., Nakatsuka N., Tsuji H., Watanabe H., Makino H., Akamatsu F., Soot formation characteristics in a lab-scale turbulent pulverized coal flame with simulta-neous planar measurements of laser induced incandescence of soot and Mie scattering of pulverized coal, Proceedings of the Combustion Institute, 34 (2013) 2435–2443. DOI: 10.1016/j.proci.2012.10.002
Hwang S.M., Kurose R., Akamatsu F., Tsuji H., Makino H., Katsuki M., Application of optical diagnostics techniques to a laboratory-scale turbulent pulverized coal flame, Energy
Nozomu Hashimoto et al. / KONA Powder and Particle Journal No. 38 (2021) 168–188
187
and Fuels, 19 (2005) 382–392. DOI: 10.1021/ef049867zIchimura R., Hadi K., Hashimoto N., Hayakawa A., Kobayashi
H., Fujita O., Extinction limits of an ammonia/air flame propagating in a turbulent field, Fuel, 246 (2019) 178–186. DOI: 10.1016/j.fuel.2019.02.110
Johnson G.R., Murdoch P., Williams A., A study of the mecha-nism of the rapid pyrolysis of single particles of coal, Fuel, 67 (1988) 834–832. DOI: 10.1016/0016-2361(88)90159-7
Kobayashi H., Hayakawa A., Somarathne K.D.K.A., Okafor E.C., Science and technology of ammonia combustion, Proceedings of the Combustion Institute, 37 (2019) 109–133. DOI: 10.1016/j.proci.2018.09.029
Kobayashi H., Howard J.B., Sarofim A.F., Coal devolatilization at high temperatures, Proceedings of the Combustion Institute, 16 (1977) 411–425. DOI: 10.1016/S0082-0784(77) 80341-X
Kurose R., Makino H., Large eddy simulation of a solid-fuel jet flame, Combustion and Flame, 135 (2003) 1–16. DOI: 10.1016/S0010-2180(03)00141-X
Kurose R., Makino H., Hashimoto N., Suzuki A., Application of percolation model to particulate matter formation in pressurized coal combustion, Powder Technology, 172 (2007) 50–56. DOI: 10.1016/j.powtec.2006.10.030
Kurose R., Makino H., Suzuki A., Numerical analysis of pul-verized coal combustion characteristics using advanced low-NOx burner, Fuel, 83 (2004) 693–703. DOI: 10.1016/j.fuel.2003.07.003
Kurose R., Watanabe H., Makino H., Numerical simulations of pulverized coal combustion, KONA Powder and Particle Journal, 27 (2009) 144–156. DOI: 10.14356/kona.2009014
Lee K.B., Thring M.W., Beér J.M., On the rate of combustion of soot in a laminar soot flame, Combustion and Flame, 6 (1962) 137–145. DOI: 10.1016/0010-2180(62)90082-2
Lee S.M., Yoon S.S., Chung S.H., Synergistic effect on soot for-mation in counterflow diffusion flames of ethylene–propane mixtures with benzene addition, Combustion and Flame, 136 (2004) 493–500. DOI: 10.1016/j.combustflame.2003.12.005
Ma J., Fletcher T.H., Webb B.W., Conversion of coal tar to soot during coal pyrolysis in a post-flame environment, Pro-ceedings of the Combustion Institute, 26 (1996) 3161–3167. DOI: 10.1016/S0082-0784(96)80161-5
Matsui Y., Wakabayashi N., Evaluation of ash melting behavior in pulverized coal-fired furnace from proportion of amor-phous phase in fly ash, Fuel, 257 (2019) 116002, DOI: 10.1016/j.fuel.2019.116002
Michelsen H.A., Probing soot formation, chemical and physical evolution, and oxidation: A review of in situ diagnostic techniques and needs, Proceedings of the Combustion Insti-tute, 36 (2017) 717–735. DOI: 10.1016/j.proci.2016.08.027
Muto M., Watanabe H., Kurose R., Komori S., Balusamy S., Hochgreb S., Large-eddy simulation of pulverized coal jet flame–Effect of oxygen concentration on NOx formation, Fuel, 142 (2015) 152–163. DOI: 10.1016/j.fuel.2014.10.069
Muto M., Yuasa K., Kurose R., Numerical simulation of soot formation in pulverized coal combustion with detailed chemical reaction mechanism, Advanced Powder Technol-ogy, 29 (2018) 1119–1127. DOI: 10.1016/j.apt.2018.02.002
Niksa S., Kerstein A.R., FLASHCHAIN theory for rapid coal
devolatilization kinetics. 1. Formulation, Energy & Fuels, 5 (1991) 647–665. DOI: 10.1021/ef00029a006
Okafor E.C., Naito Y., Colson S., Ichikawa A., Kudo T., Hayakawa A., Kobayashi H., Measurement and modelling of the laminar burning velocity of methane-ammonia-air flames at high pressures using a reduced reaction mecha-nism, Combustion and Flame, 204 (2019) 162–175. DOI: 10.1016/j.combustflame.2019.03.008
Schulz C., Kock B.F., Michelsen H., Will S., Bougie B., Suntz R., Smallwood G., Laser-induced incandescence: recent trends and current questions, Applied Physics B, 83 (2006) 333–354. DOI: 10.1007/s00340-006-2260-8
Solomon P.R., Hamblen D.G., Finding order in coal pyrolysis kinetics, Progress in Energy and Combustion Science, 9 (1983) 323–361. DOI: 10.1016/0360-1285(83)90012-6
Solomon P.R., Hamblen D.G., Carangelo D.G., Serio M.A., Deshpande G.V., General model of coal devolatilization, Energy & Fuels, 2 (1988) 405–420. DOI: 10.1021/ef00010a006
Takahashi H., Hashimoto N., Watanabe H., Kurose R., Fujita O., Soot formation prediction in a pulverized coal combustion field by large eddy simulation with TDP model, Pro-ceedings of the Combustion Institute, 37 (2019) 2883–2891. DOI: 10.1016/j.proci.2018.08.019
Tominaga H., Harada M., Ando T., Suzuki Y., The development of pulverized coal combustion simulator, Journal of NIRE Shigen to kankyo, 6 (1997) 333–343 (in Japanese).
Ubhayakar S.K., Stickler D.B., von Rosenberg C.W., Gannon R.E., Rapid devolatilization of pulverized coal in hot com-bustion gases, Proceedings of the Combustion Institute, 16 (1976) 427–436. DOI: 10.1016/S0082-0784(77)80342-1
Watanabe H., Kurose R., Komori S., Large-eddy simulation of swirling flows in a pulverized coal combustion furnace with a complex burner, Journal of Environment and Engi-neering, 4 (2009) 1–11. DOI: 10.1299/jee.4.1
Watanabe J., Okazaki T., Yamamoto K., Kuramashi K., Baba A., Large-eddy simulation of pulverized coal combustion using flamelet model, Proceedings of the Combustion Institute, 36 (2017) 2155–2163. DOI: 10.1016/j.proci.2016.06.031
Wen X., Luo Y., Wang H., Luo K., Jin H., Fan J., A three mixture fraction flamelet model for multi-stream laminar pulverized coal combustion, Proceedings of the Combu-stion Institute, 37 (2019) 2901–2910, DOI: 10.1016/j.proci. 2018.05.147
Wen Z., Yun S., Thomson M.J., Lightstone M.F., Modeling soot formation in turbulent kerosene/air jet diffusion flames, Combustion and Flame, 135 (2003) 323–340. DOI: 10.1016/S0010-2180(03)00179-2
Xu K., Wu Y., Shen H., Zhang Q., Zhang H., Predictions of soot formation and its effect on the flame temperature of a pul-verized coal-air turbulent jet, Fuel, 194 (2017) 297–305. DOI: 10.1016/j.fuel.2017.01.032
Zhang L., Qi S-C., Iwanaga K., Uemura K., Zhang L-X., Kudo S., Hayashi J., Furuya K., Norinaga K., An approach for on-line analysis of multi-component volatiles from coal pyrolysis with Li+-attachment ionization mass spectrometry, Fuel Processing Technology, 158 (2017) 141–145. DOI: 10.1016/j.fuproc.2016.12.001

Nozomu Hashimoto et al. / KONA Powder and Particle Journal No. 38 (2021) 168–188
188
Authors’ Short Biographies
Nozomu Hashimoto
Dr. Nozomu Hashimoto is an Associate Professor of Division of Mechanical and Space Engineering, Graduate School of Engineering at Hokkaido University. He received a Ph.D. in Mechanical Engineering from Hokkaido University in 2004. He was previously employed at CRIEPI (Central Research Institute of Electric Power Industry) in Kanagawa, Japan as a Research Associate. His research interests are in multi-phase combustion phenomena such as coal combustion, spray combustion, and flame spread over solid material. Current main subjects are modelling and experiment for coal com-bustion, droplet evaporation, flame spreading over electric wire, and ammonia flame propagation in turbulent fields.
Jun Hayashi
Dr. Jun Hayashi is an Associate Professor of Department of Energy Conversion Sci-ence at Kyoto University and is a Visiting Associate Professor at Osaka University. He received a Ph.D. in Mechanical Engineering from Osaka University. He worked for Osaka University as an Assistant Professor and a Lecturer. His current research interests are in multi-phase combustion phenomena appearing in the industrial combustion facili-ties including internal combustion engines. His current subjects are a soot formation in the multiphase combustion, a plasma assisted ignition/combustion and a flame structure of hypergolic fuels.
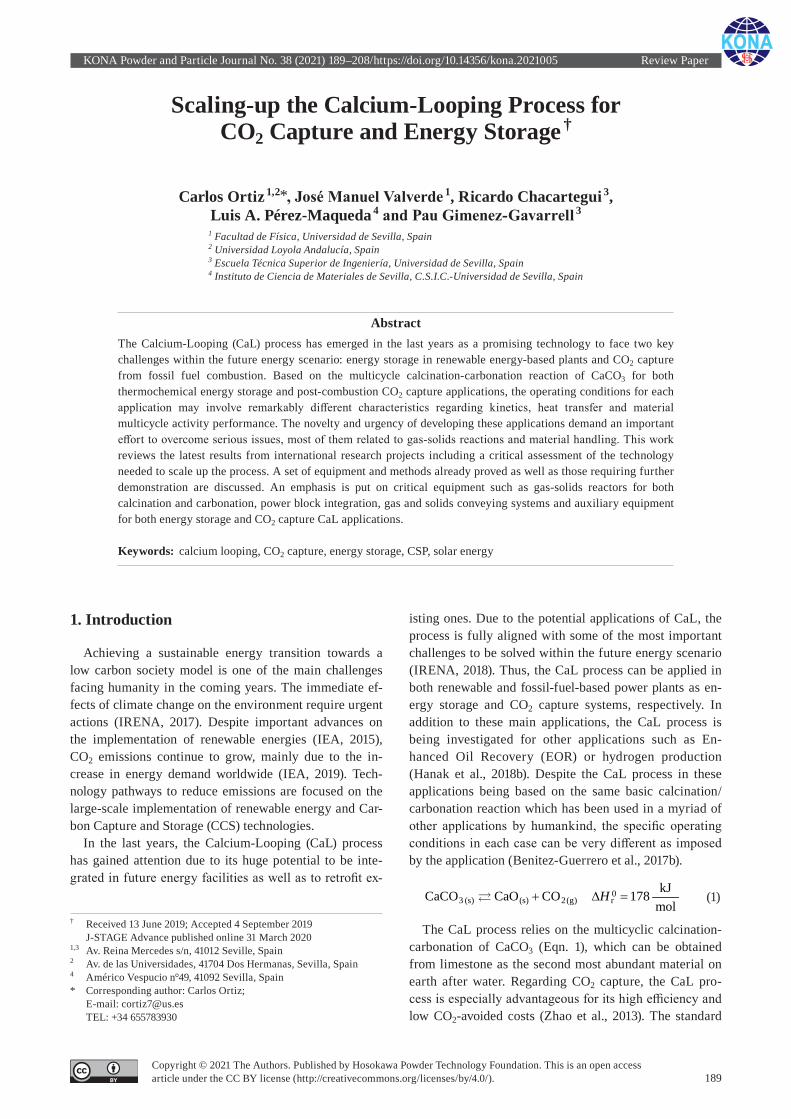
KONA Powder and Particle Journal No. 38 (2021) 189–208/https://doi.org/10.14356/kona.2021005 Review Paper
189Copyright © 2021 The Authors. Published by Hosokawa Powder Technology Foundation. This is an open access article under the CC BY license (http://creativecommons.org/licenses/by/4.0/).
Scaling-up the Calcium-Looping Process for CO2 Capture and Energy Storage †
Carlos Ortiz 1,2*, José Manuel Valverde 1, Ricardo Chacartegui 3, Luis A. Pérez-Maqueda 4 and Pau Gimenez-Gavarrell 3
1 Facultad de Física, Universidad de Sevilla, Spain2 Universidad Loyola Andalucía, Spain3 Escuela Técnica Superior de Ingeniería, Universidad de Sevilla, Spain4 Instituto de Ciencia de Materiales de Sevilla, C.S.I.C.-Universidad de Sevilla, Spain
AbstractThe Calcium-Looping (CaL) process has emerged in the last years as a promising technology to face two key challenges within the future energy scenario: energy storage in renewable energy-based plants and CO2 capture from fossil fuel combustion. Based on the multicycle calcination-carbonation reaction of CaCO3 for both thermochemical energy storage and post-combustion CO2 capture applications, the operating conditions for each application may involve remarkably different characteristics regarding kinetics, heat transfer and material multicycle activity performance. The novelty and urgency of developing these applications demand an important effort to overcome serious issues, most of them related to gas-solids reactions and material handling. This work reviews the latest results from international research projects including a critical assessment of the technology needed to scale up the process. A set of equipment and methods already proved as well as those requiring further demonstration are discussed. An emphasis is put on critical equipment such as gas-solids reactors for both calcination and carbonation, power block integration, gas and solids conveying systems and auxiliary equipment for both energy storage and CO2 capture CaL applications.
Keywords: calcium looping, CO2 capture, energy storage, CSP, solar energy
1. Introduction
Achieving a sustainable energy transition towards a low carbon society model is one of the main challenges facing humanity in the coming years. The immediate ef-fects of climate change on the environment require urgent actions (IRENA, 2017). Despite important advances on the implementation of renewable energies (IEA, 2015), CO2 emissions continue to grow, mainly due to the in-crease in energy demand worldwide (IEA, 2019). Tech-nology pathways to reduce emissions are focused on the large-scale implementation of renewable energy and Car-bon Capture and Storage (CCS) technologies.
In the last years, the Calcium-Looping (CaL) process has gained attention due to its huge potential to be inte-grated in future energy facilities as well as to retrofit ex-
isting ones. Due to the potential applications of CaL, the process is fully aligned with some of the most important challenges to be solved within the future energy scenario (IRENA, 2018). Thus, the CaL process can be applied in both renewable and fossil-fuel-based power plants as en-ergy storage and CO2 capture systems, respectively. In addition to these main applications, the CaL process is being investigated for other applications such as En-hanced Oil Recovery (EOR) or hydrogen production (Hanak et al., 2018b). Despite the CaL process in these applications being based on the same basic calcination/carbonation reaction which has been used in a myriad of other applications by humankind, the specific operating conditions in each case can be very different as imposed by the application (Benitez-Guerrero et al., 2017b).
03 (s) (s) 2(g) r kJCaCO CaO CO 178
molH+ ∆ =o (1)
The CaL process relies on the multicyclic calcination- carbonation of CaCO3 (Eqn. 1), which can be obtained from limestone as the second most abundant material on earth after water. Regarding CO2 capture, the CaL pro-cess is especially advantageous for its high efficiency and low CO2-avoided costs (Zhao et al., 2013). The standard
† Received 13 June 2019; Accepted 4 September 2019 J-STAGE Advance published online 31 March 2020
1,3 Av. Reina Mercedes s/n, 41012 Seville, Spain2 Av. de las Universidades, 41704 Dos Hermanas, Sevilla, Spain4 Américo Vespucio n°49, 41092 Sevilla, Spain* Corresponding author: Carlos Ortiz; E-mail: [email protected] TEL: +34 655783930
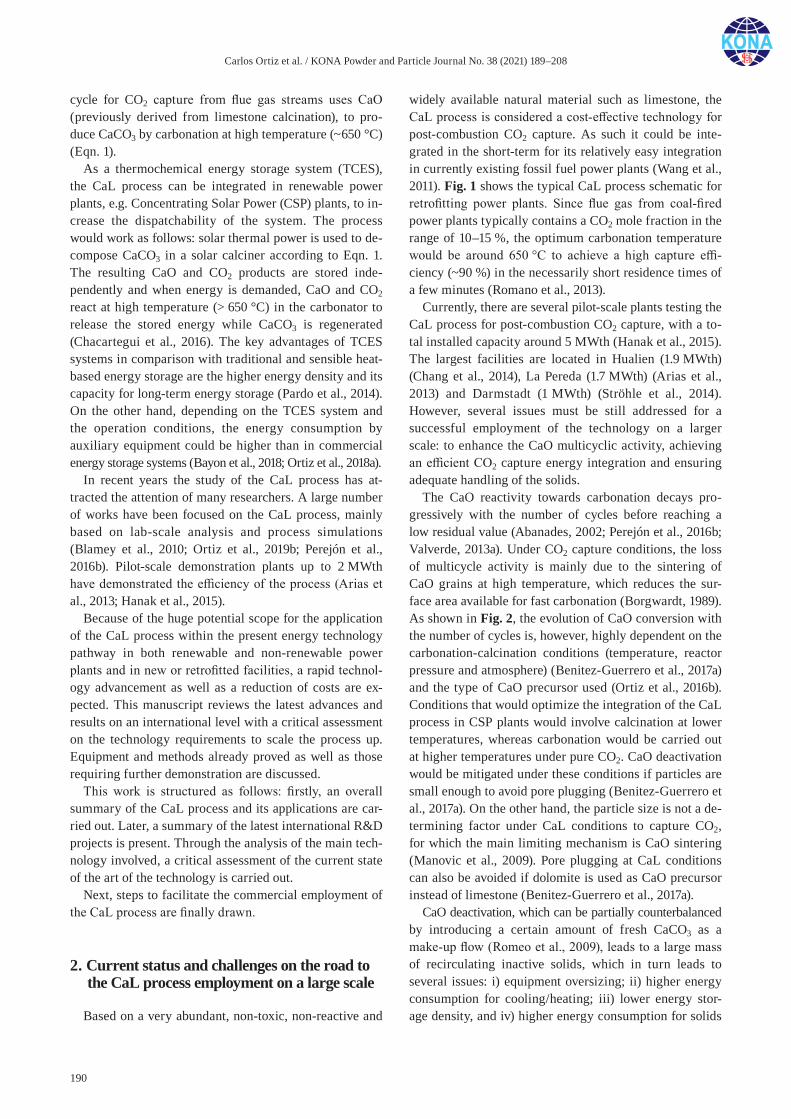
Carlos Ortiz et al. / KONA Powder and Particle Journal No. 38 (2021) 189–208
190
cycle for CO2 capture from flue gas streams uses CaO (previously derived from limestone calcination), to pro-duce CaCO3 by carbonation at high temperature (~650 °C) (Eqn. 1).
As a thermochemical energy storage system (TCES), the CaL process can be integrated in renewable power plants, e.g. Concentrating Solar Power (CSP) plants, to in-crease the dispatchability of the system. The process would work as follows: solar thermal power is used to de-compose CaCO3 in a solar calciner according to Eqn. 1. The resulting CaO and CO2 products are stored inde-pendently and when energy is demanded, CaO and CO2 react at high temperature (> 650 °C) in the carbonator to release the stored energy while CaCO3 is regenerated (Chacartegui et al., 2016). The key advantages of TCES systems in comparison with traditional and sensible heat-based energy storage are the higher energy density and its capacity for long-term energy storage (Pardo et al., 2014). On the other hand, depending on the TCES system and the operation conditions, the energy consumption by auxiliary equipment could be higher than in commercial energy storage systems (Bayon et al., 2018; Ortiz et al., 2018a).
In recent years the study of the CaL process has at-tracted the attention of many researchers. A large number of works have been focused on the CaL process, mainly based on lab-scale analysis and process simulations (Blamey et al., 2010; Ortiz et al., 2019b; Perejón et al., 2016b). Pilot-scale demonstration plants up to 2 MWth have demonstrated the efficiency of the process (Arias et al., 2013; Hanak et al., 2015).
Because of the huge potential scope for the application of the CaL process within the present energy technology pathway in both renewable and non-renewable power plants and in new or retrofitted facilities, a rapid technol-ogy advancement as well as a reduction of costs are ex-pected. This manuscript reviews the latest advances and results on an international level with a critical assessment on the technology requirements to scale the process up. Equipment and methods already proved as well as those requiring further demonstration are discussed.
This work is structured as follows: firstly, an overall summary of the CaL process and its applications are car-ried out. Later, a summary of the latest international R&D projects is present. Through the analysis of the main tech-nology involved, a critical assessment of the current state of the art of the technology is carried out.
Next, steps to facilitate the commercial employment of the CaL process are finally drawn.
2. Current status and challenges on the road to the CaL process employment on a large scale
Based on a very abundant, non-toxic, non-reactive and
widely available natural material such as limestone, the CaL process is considered a cost-effective technology for post-combustion CO2 capture. As such it could be inte-grated in the short-term for its relatively easy integration in currently existing fossil fuel power plants (Wang et al., 2011). Fig. 1 shows the typical CaL process schematic for retrofitting power plants. Since flue gas from coal-fired power plants typically contains a CO2 mole fraction in the range of 10–15 %, the optimum carbonation temperature would be around 650 °C to achieve a high capture effi-ciency (~90 %) in the necessarily short residence times of a few minutes (Romano et al., 2013).
Currently, there are several pilot-scale plants testing the CaL process for post-combustion CO2 capture, with a to-tal installed capacity around 5 MWth (Hanak et al., 2015). The largest facilities are located in Hualien (1.9 MWth) (Chang et al., 2014), La Pereda (1.7 MWth) (Arias et al., 2013) and Darmstadt (1 MWth) (Ströhle et al., 2014). However, several issues must be still addressed for a successful employment of the technology on a larger scale: to enhance the CaO multicyclic activity, achieving an efficient CO2 capture energy integration and ensuring adequate handling of the solids.
The CaO reactivity towards carbonation decays pro-gressively with the number of cycles before reaching a low residual value (Abanades, 2002; Perejón et al., 2016b; Valverde, 2013a). Under CO2 capture conditions, the loss of multicycle activity is mainly due to the sintering of CaO grains at high temperature, which reduces the sur-face area available for fast carbonation (Borgwardt, 1989). As shown in Fig. 2, the evolution of CaO conversion with the number of cycles is, however, highly dependent on the carbonation-calcination conditions (temperature, reactor pressure and atmosphere) (Benitez-Guerrero et al., 2017a) and the type of CaO precursor used (Ortiz et al., 2016b). Conditions that would optimize the integration of the CaL process in CSP plants would involve calcination at lower temperatures, whereas carbonation would be carried out at higher temperatures under pure CO2. CaO deactivation would be mitigated under these conditions if particles are small enough to avoid pore plugging (Benitez-Guerrero et al., 2017a). On the other hand, the particle size is not a de-termining factor under CaL conditions to capture CO2, for which the main limiting mechanism is CaO sintering (Manovic et al., 2009). Pore plugging at CaL conditions can also be avoided if dolomite is used as CaO precursor instead of limestone (Benitez-Guerrero et al., 2017a).
CaO deactivation, which can be partially counterbalanced by introducing a certain amount of fresh CaCO3 as a make-up flow (Romeo et al., 2009), leads to a large mass of recirculating inactive solids, which in turn leads to several issues: i) equipment oversizing; ii) higher energy consumption for cooling/heating; iii) lower energy stor-age density, and iv) higher energy consumption for solids
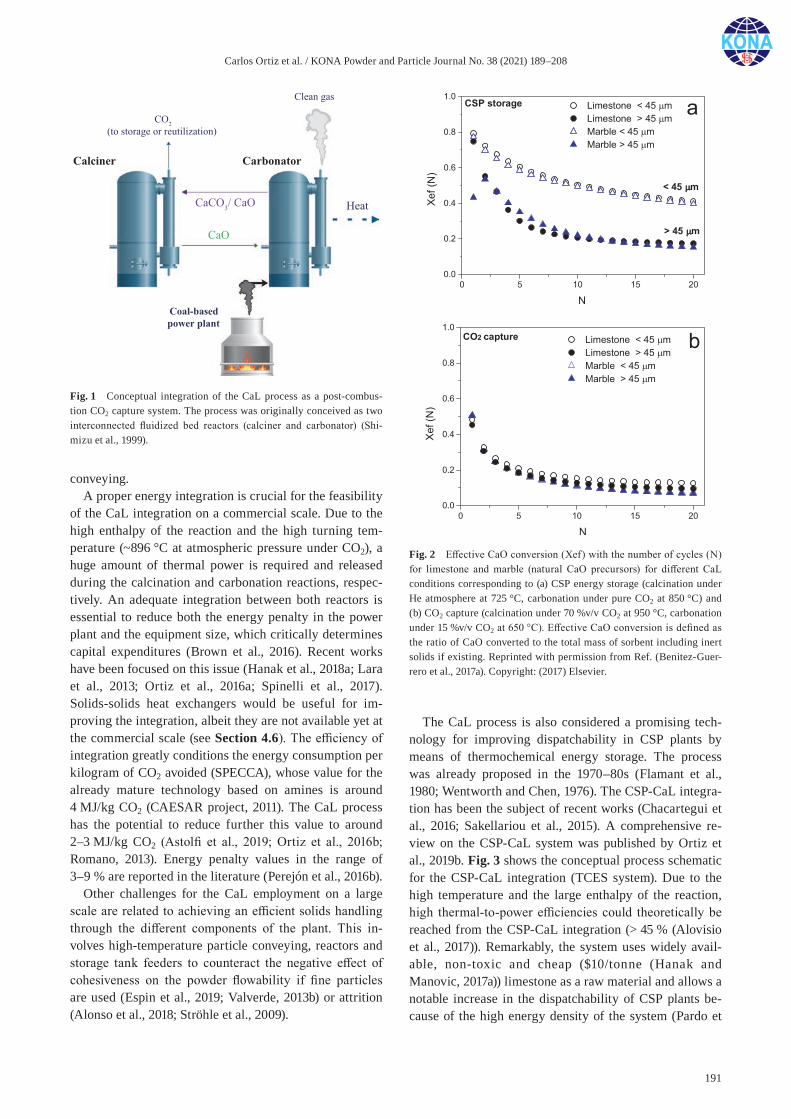
Carlos Ortiz et al. / KONA Powder and Particle Journal No. 38 (2021) 189–208
191
conveying.A proper energy integration is crucial for the feasibility
of the CaL integration on a commercial scale. Due to the high enthalpy of the reaction and the high turning tem-perature (~896 °C at atmospheric pressure under CO2), a huge amount of thermal power is required and released during the calcination and carbonation reactions, respec-tively. An adequate integration between both reactors is essential to reduce both the energy penalty in the power plant and the equipment size, which critically determines capital expenditures (Brown et al., 2016). Recent works have been focused on this issue (Hanak et al., 2018a; Lara et al., 2013; Ortiz et al., 2016a; Spinelli et al., 2017). Solids- solids heat exchangers would be useful for im-proving the integration, albeit they are not available yet at the commercial scale (see Section 4.6). The efficiency of integration greatly conditions the energy consumption per kilogram of CO2 avoided (SPECCA), whose value for the already mature technology based on amines is around 4 MJ/kg CO2 (CAESAR project, 2011). The CaL process has the potential to reduce further this value to around 2–3 MJ/kg CO2 (Astolfi et al., 2019; Ortiz et al., 2016b; Romano, 2013). Energy penalty values in the range of 3–9 % are reported in the literature (Perejón et al., 2016b).
Other challenges for the CaL employment on a large scale are related to achieving an efficient solids handling through the different components of the plant. This in-volves high-temperature particle conveying, reactors and storage tank feeders to counteract the negative effect of cohesiveness on the powder flowability if fine particles are used (Espin et al., 2019; Valverde, 2013b) or attrition (Alonso et al., 2018; Ströhle et al., 2009).
The CaL process is also considered a promising tech-nology for improving dispatchability in CSP plants by means of thermochemical energy storage. The process was already proposed in the 1970–80s (Flamant et al., 1980; Wentworth and Chen, 1976). The CSP-CaL integra-tion has been the subject of recent works (Chacartegui et al., 2016; Sakellariou et al., 2015). A comprehensive re-view on the CSP-CaL system was published by Ortiz et al., 2019b. Fig. 3 shows the conceptual process schematic for the CSP-CaL integration (TCES system). Due to the high temperature and the large enthalpy of the reaction, high thermal-to-power efficiencies could theoretically be reached from the CSP-CaL integration (> 45 % (Alovisio et al., 2017)). Remarkably, the system uses widely avail-able, non-toxic and cheap ($10/tonne (Hanak and Manovic, 2017a)) limestone as a raw material and allows a notable increase in the dispatchability of CSP plants be-cause of the high energy density of the system (Pardo et
Fig. 2 Effective CaO conversion (Xef) with the number of cycles (N) for limestone and marble (natural CaO precursors) for different CaL conditions corresponding to (a) CSP energy storage (calcination under He atmosphere at 725 °C, carbonation under pure CO2 at 850 °C) and (b) CO2 capture (calcination under 70 %v/v CO2 at 950 °C, carbonation under 15 %v/v CO2 at 650 °C). Effective CaO conversion is defined as the ratio of CaO converted to the total mass of sorbent including inert solids if existing. Reprinted with permission from Ref. (Benitez-Guer-rero et al., 2017a). Copyright: (2017) Elsevier.
Fig. 1 Conceptual integration of the CaL process as a post-combus-tion CO2 capture system. The process was originally conceived as two interconnected fluidized bed reactors (calciner and carbonator) (Shi-mizu et al., 1999).
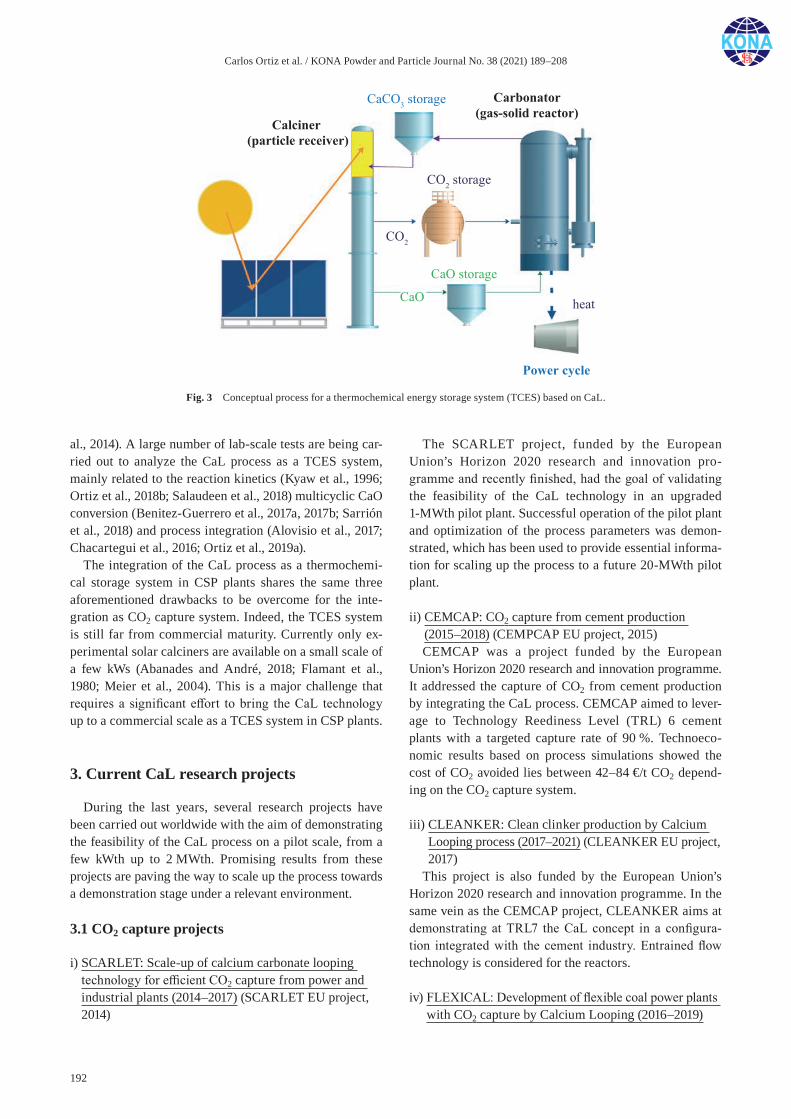
Carlos Ortiz et al. / KONA Powder and Particle Journal No. 38 (2021) 189–208
192
al., 2014). A large number of lab-scale tests are being car-ried out to analyze the CaL process as a TCES system, mainly related to the reaction kinetics (Kyaw et al., 1996; Ortiz et al., 2018b; Salaudeen et al., 2018) multicyclic CaO conversion (Benitez-Guerrero et al., 2017a, 2017b; Sarrión et al., 2018) and process integration (Alovisio et al., 2017; Chacartegui et al., 2016; Ortiz et al., 2019a).
The integration of the CaL process as a thermochemi-cal storage system in CSP plants shares the same three aforementioned drawbacks to be overcome for the inte-gration as CO2 capture system. Indeed, the TCES system is still far from commercial maturity. Currently only ex-perimental solar calciners are available on a small scale of a few kWs (Abanades and André, 2018; Flamant et al., 1980; Meier et al., 2004). This is a major challenge that requires a significant effort to bring the CaL technology up to a commercial scale as a TCES system in CSP plants.
3. Current CaL research projects
During the last years, several research projects have been carried out worldwide with the aim of demonstrating the feasibility of the CaL process on a pilot scale, from a few kWth up to 2 MWth. Promising results from these projects are paving the way to scale up the process towards a demonstration stage under a relevant environment.
3.1 CO2 capture projects
i) SCARLET: Scale-up of calcium carbonate looping technology for efficient CO2 capture from power and industrial plants (2014–2017) (SCARLET EU project, 2014)
The SCARLET project, funded by the European Union’s Horizon 2020 research and innovation pro-gramme and recently finished, had the goal of validating the feasibility of the CaL technology in an upgraded 1-MWth pilot plant. Successful operation of the pilot plant and optimization of the process parameters was demon-strated, which has been used to provide essential informa-tion for scaling up the process to a future 20-MWth pilot plant.
ii) CEMCAP: CO2 capture from cement production (2015–2018) (CEMPCAP EU project, 2015)CEMCAP was a project funded by the European
Union’s Horizon 2020 research and innovation programme. It addressed the capture of CO2 from cement production by integrating the CaL process. CEMCAP aimed to lever-age to Technology Reediness Level (TRL) 6 cement plants with a targeted capture rate of 90 %. Technoeco-nomic results based on process simulations showed the cost of CO2 avoided lies between 42–84 €/t CO2 depend-ing on the CO2 capture system.
iii) CLEANKER: Clean clinker production by Calcium Looping process (2017–2021) (CLEANKER EU project, 2017)
This project is also funded by the European Union’s Horizon 2020 research and innovation programme. In the same vein as the CEMCAP project, CLEANKER aims at demonstrating at TRL7 the CaL concept in a configura-tion integrated with the cement industry. Entrained flow technology is considered for the reactors.
iv) FLEXICAL: Development of flexible coal power plants with CO2 capture by Calcium Looping (2016–2019)
Fig. 3 Conceptual process for a thermochemical energy storage system (TCES) based on CaL.
Carlos Ortiz et al. / KONA Powder and Particle Journal No. 38 (2021) 189–208
193
(FlexiCaL EU project, 2016)FLEXICAL project, funded by the European Research
Fund for the Coal and Steel Commission, aims to develop novel flexible calcium looping systems that can work under several flue gas loads. To this end, two process options are tested on a pilot-scale: a highly load-flexible plant concept and an energy storage system using CaO/CaCO3 silos.
v) LEILAC: Low emissions intensity lime & cement (2016–2020) (LEILAC EU project, 2016)This project is funded by the European Union’s Horizon
2020 research and innovation programme. The LEILAC project is based on the use of an entrained flow reactor to enable an efficient capture of CO2 from lime and cement production.
3.2 Energy storage projects
Below, several interesting projects about integrating the CaL process as TCES are summarized:
i) SOCRATCES: Solar calcium-looping integration for thermochemical energy storage (2018–2020) (Socratces Project, 2018)The SOCRATCES project, funded by the European
Union’s Horizon 2020 research and innovation pro-gramme, aims at exploring the feasibility of the CSP-CaL integration by erecting a pilot-scale plant that will serve to reduce the core risks of scaling up the technology as well as allow further understanding of the process inte-gration.
ii) Carbon Dioxide Shuttling Thermochemical Storage Using Strontium (2014–2015) (Mei, 2015)This project was awarded under the ELEMENTS pro-
gram supported by the USA SunShot Initiative (DOE). The project was based on the calcination/carbonation of strontium-based carbonates, which would allow discharg-ing the stored solar energy at very high temperatures (over 1000 °C), however, this can hardly be achieved with current CSP with tower technology. The much higher cost of the sorbent precursor (SrCO3) –$580/tonne (Jin et al., 2018) – as compared to a price of around $10/ton for natu-ral limestone (Hanak and Manovic, 2017a) is a serious drawback for commercial expansion on a large scale.
iii) Regenerative Carbonate-Based Thermochemical Energy Storage System for Concentrating Solar Power (2015–2016) (Gangwal and Muto, 2017)
Within the ELEMENTS program, the Regenerative Carbonate-Based Thermochemical Energy Storage Sys-tem for Concentrating Solar Power project was aimed at developing a TCES for CSP based on reversible gas-solids
reactions of carbonate and silicate sorbent-based mate-rials on a bench scale. Overcoming the multicyclic CaO deactivation was a key point of the project. A synthetic, highly refined and tailored reinforced CaO sorbent ex-hibited a very stable multicycle behavior with a residual sorbent capacity of around 0.3, although its use in practice would be conditioned by a considerable increase of mate-rial costs and technical issues in the Ca-based synthetic material fabrication.
iv) Demonstration of High-Temperature Calcium-Based Thermochemical Storage System for use with Concentrating Solar Power Facilities (2014–2018) (Muto and Hansen, 2019)
This project, funded by the APOLLO program (DOE), aimed to demonstrate a novel high-temperature calcium- based thermochemical storage system for use in CSP fa-cilities, which is directly related to the CSP-CaL system. The results obtained are described in Muto and Hansen, 2019.
v) SOLPART: High-temperature Solar-Heated Reactors for Industrial Production of Reactive Particulates (2016–2019) (Flamant et al., 2018)This project is funded by the European Union’s Horizon
2020 research and innovation programme. The main ob-jective of the SOLPART project is to develop, at high temperature (800–1000 °C), a pilot-scale (30–50 kW) 24 h/day solar process suitable for supplying the thermal energy requirement for CaCO3 calcination by high-tem-perature solar heat (Flamant et al., 2018). Although this project does not consider thermochemical energy storage, its results are of utmost interest for the CaL process as they would expand the knowledge on solar calcination, high- temperature solar reactors, the transport of high-tem-perature solid materials and high-temperature thermal storage, all of which are fundamental for further develop-ment of the CaL process as a TCES.
4. Technology scale-up
The CaL process has been widely tested on a pilot scale (~2 MWth) as a post-combustion CO2 capture system (Hanak et al., 2015), while the first facilities are being de-veloped to test it as a TCES system (Muto and Hansen, 2019; Socratces Project, 2018). Despite the promising pre-liminary results achieved on the pilot scale, several tech-nological challenges must be overcome to permit scaling up the technology. The main technologies needed that are already available at commercial level as well as those under development are reviewed next.
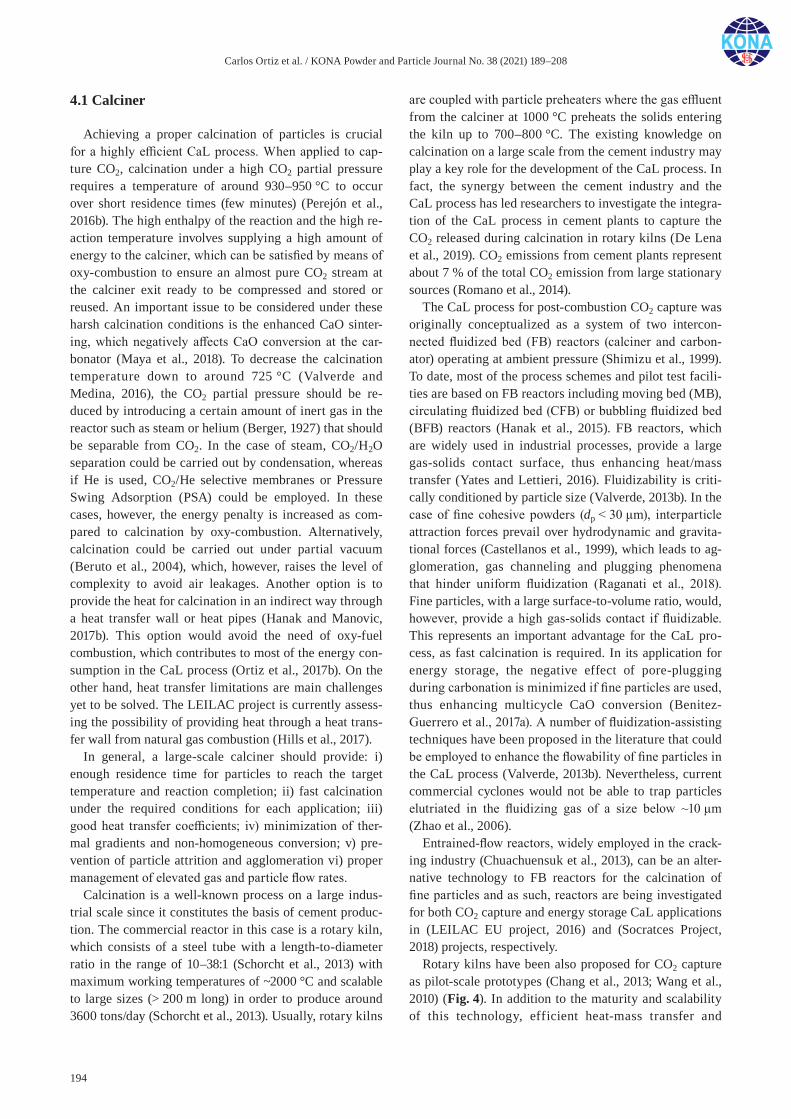
Carlos Ortiz et al. / KONA Powder and Particle Journal No. 38 (2021) 189–208
194
4.1 Calciner
Achieving a proper calcination of particles is crucial for a highly efficient CaL process. When applied to cap-ture CO2, calcination under a high CO2 partial pressure requires a temperature of around 930–950 °C to occur over short residence times (few minutes) (Perejón et al., 2016b). The high enthalpy of the reaction and the high re-action temperature involves supplying a high amount of energy to the calciner, which can be satisfied by means of oxy-combustion to ensure an almost pure CO2 stream at the calciner exit ready to be compressed and stored or reused. An important issue to be considered under these harsh calcination conditions is the enhanced CaO sinter-ing, which negatively affects CaO conversion at the car-bonator (Maya et al., 2018). To decrease the calcination temperature down to around 725 °C (Valverde and Medina, 2016), the CO2 partial pressure should be re-duced by introducing a certain amount of inert gas in the reactor such as steam or helium (Berger, 1927) that should be separable from CO2. In the case of steam, CO2/H2O separation could be carried out by condensation, whereas if He is used, CO2/He selective membranes or Pressure Swing Adsorption (PSA) could be employed. In these cases, however, the energy penalty is increased as com-pared to calcination by oxy-combustion. Alternatively, calcination could be carried out under partial vacuum (Beruto et al., 2004), which, however, raises the level of complexity to avoid air leakages. Another option is to provide the heat for calcination in an indirect way through a heat transfer wall or heat pipes (Hanak and Manovic, 2017b). This option would avoid the need of oxy-fuel combustion, which contributes to most of the energy con-sumption in the CaL process (Ortiz et al., 2017b). On the other hand, heat transfer limitations are main challenges yet to be solved. The LEILAC project is currently assess-ing the possibility of providing heat through a heat trans-fer wall from natural gas combustion (Hills et al., 2017).
In general, a large-scale calciner should provide: i) enough residence time for particles to reach the target temperature and reaction completion; ii) fast calcination under the required conditions for each application; iii) good heat transfer coefficients; iv) minimization of ther-mal gradients and non-homogeneous conversion; v) pre-vention of particle attrition and agglomeration vi) proper management of elevated gas and particle flow rates.
Calcination is a well-known process on a large indus-trial scale since it constitutes the basis of cement produc-tion. The commercial reactor in this case is a rotary kiln, which consists of a steel tube with a length-to-diameter ratio in the range of 10–38:1 (Schorcht et al., 2013) with maximum working temperatures of ~2000 °C and scalable to large sizes (> 200 m long) in order to produce around 3600 tons/day (Schorcht et al., 2013). Usually, rotary kilns
are coupled with particle preheaters where the gas effluent from the calciner at 1000 °C preheats the solids entering the kiln up to 700–800 °C. The existing knowledge on calcination on a large scale from the cement industry may play a key role for the development of the CaL process. In fact, the synergy between the cement industry and the CaL process has led researchers to investigate the integra-tion of the CaL process in cement plants to capture the CO2 released during calcination in rotary kilns (De Lena et al., 2019). CO2 emissions from cement plants represent about 7 % of the total CO2 emission from large stationary sources (Romano et al., 2014).
The CaL process for post-combustion CO2 capture was originally conceptualized as a system of two intercon-nected fluidized bed (FB) reactors (calciner and carbon-ator) operating at ambient pressure (Shimizu et al., 1999). To date, most of the process schemes and pilot test facili-ties are based on FB reactors including moving bed (MB), circulating fluidized bed (CFB) or bubbling fluidized bed (BFB) reactors (Hanak et al., 2015). FB reactors, which are widely used in industrial processes, provide a large gas-solids contact surface, thus enhancing heat/mass transfer (Yates and Lettieri, 2016). Fluidizability is criti-cally conditioned by particle size (Valverde, 2013b). In the case of fine cohesive powders (dp < 30 μm), interparticle attraction forces prevail over hydrodynamic and gravita-tional forces (Castellanos et al., 1999), which leads to ag-glomeration, gas channeling and plugging phenomena that hinder uniform fluidization (Raganati et al., 2018). Fine particles, with a large surface-to-volume ratio, would, however, provide a high gas-solids contact if fluidizable. This represents an important advantage for the CaL pro-cess, as fast calcination is required. In its application for energy storage, the negative effect of pore-plugging during carbonation is minimized if fine particles are used, thus enhancing multicycle CaO conversion (Benitez- Guerrero et al., 2017a). A number of fluidization-assisting techniques have been proposed in the literature that could be employed to enhance the flowability of fine particles in the CaL process (Valverde, 2013b). Nevertheless, current commercial cyclones would not be able to trap particles elutriated in the fluidizing gas of a size below ~10 μm (Zhao et al., 2006).
Entrained-flow reactors, widely employed in the crack-ing industry (Chuachuensuk et al., 2013), can be an alter-native technology to FB reactors for the calcination of fine particles and as such, reactors are being investigated for both CO2 capture and energy storage CaL applications in (LEILAC EU project, 2016) and (Socratces Project, 2018) projects, respectively.
Rotary kilns have been also proposed for CO2 capture as pilot-scale prototypes (Chang et al., 2013; Wang et al., 2010) (Fig. 4). In addition to the maturity and scalability of this technology, efficient heat-mass transfer and
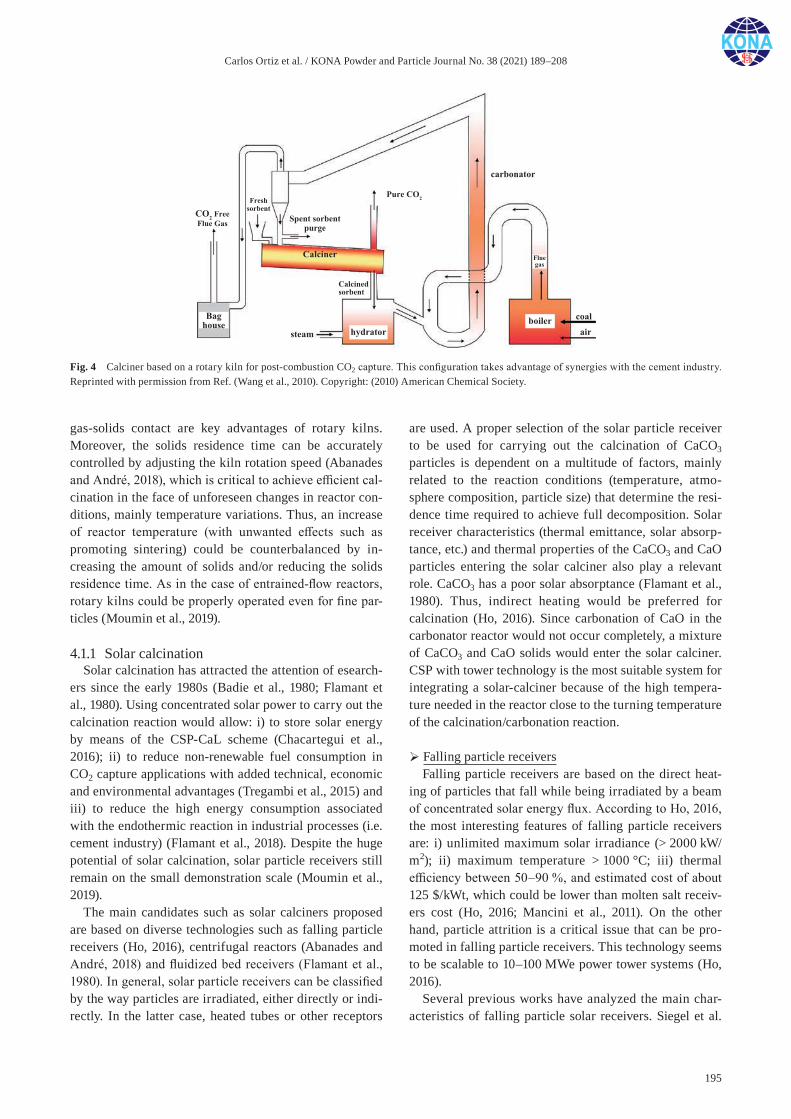
Carlos Ortiz et al. / KONA Powder and Particle Journal No. 38 (2021) 189–208
195
gas-solids contact are key advantages of rotary kilns. Moreover, the solids residence time can be accurately controlled by adjusting the kiln rotation speed (Abanades and André, 2018), which is critical to achieve efficient cal-cination in the face of unforeseen changes in reactor con-ditions, mainly temperature variations. Thus, an increase of reactor temperature (with unwanted effects such as promoting sintering) could be counterbalanced by in-creasing the amount of solids and/or reducing the solids residence time. As in the case of entrained-flow reactors, rotary kilns could be properly operated even for fine par-ticles (Moumin et al., 2019).
4.1.1 Solar calcinationSolar calcination has attracted the attention of esearch-
ers since the early 1980s (Badie et al., 1980; Flamant et al., 1980). Using concentrated solar power to carry out the calcination reaction would allow: i) to store solar energy by means of the CSP-CaL scheme (Chacartegui et al., 2016); ii) to reduce non-renewable fuel consumption in CO2 capture applications with added technical, economic and environmental advantages (Tregambi et al., 2015) and iii) to reduce the high energy consumption associated with the endothermic reaction in industrial processes (i.e. cement industry) (Flamant et al., 2018). Despite the huge potential of solar calcination, solar particle receivers still remain on the small demonstration scale (Moumin et al., 2019).
The main candidates such as solar calciners proposed are based on diverse technologies such as falling particle receivers (Ho, 2016), centrifugal reactors (Abanades and André, 2018) and fluidized bed receivers (Flamant et al., 1980). In general, solar particle receivers can be classified by the way particles are irradiated, either directly or indi-rectly. In the latter case, heated tubes or other receptors
are used. A proper selection of the solar particle receiver to be used for carrying out the calcination of CaCO3 particles is dependent on a multitude of factors, mainly related to the reaction conditions (temperature, atmo-sphere composition, particle size) that determine the resi-dence time required to achieve full decomposition. Solar receiver characteristics (thermal emittance, solar absorp-tance, etc.) and thermal properties of the CaCO3 and CaO particles entering the solar calciner also play a relevant role. CaCO3 has a poor solar absorptance (Flamant et al., 1980). Thus, indirect heating would be preferred for calcination (Ho, 2016). Since carbonation of CaO in the carbonator reactor would not occur completely, a mixture of CaCO3 and CaO solids would enter the solar calciner. CSP with tower technology is the most suitable system for integrating a solar-calciner because of the high tempera-ture needed in the reactor close to the turning temperature of the calcination/carbonation reaction.
Falling particle receiversFalling particle receivers are based on the direct heat-
ing of particles that fall while being irradiated by a beam of concentrated solar energy flux. According to Ho, 2016, the most interesting features of falling particle receivers are: i) unlimited maximum solar irradiance (> 2000 kW/m2); ii) maximum temperature > 1000 °C; iii) thermal efficiency between 50–90 %, and estimated cost of about 125 $/kWt, which could be lower than molten salt receiv-ers cost (Ho, 2016; Mancini et al., 2011). On the other hand, particle attrition is a critical issue that can be pro-moted in falling particle receivers. This technology seems to be scalable to 10–100 MWe power tower systems (Ho, 2016).
Several previous works have analyzed the main char-acteristics of falling particle solar receivers. Siegel et al.
Fig. 4 Calciner based on a rotary kiln for post-combustion CO2 capture. This configuration takes advantage of synergies with the cement industry. Reprinted with permission from Ref. (Wang et al., 2010). Copyright: (2010) American Chemical Society.
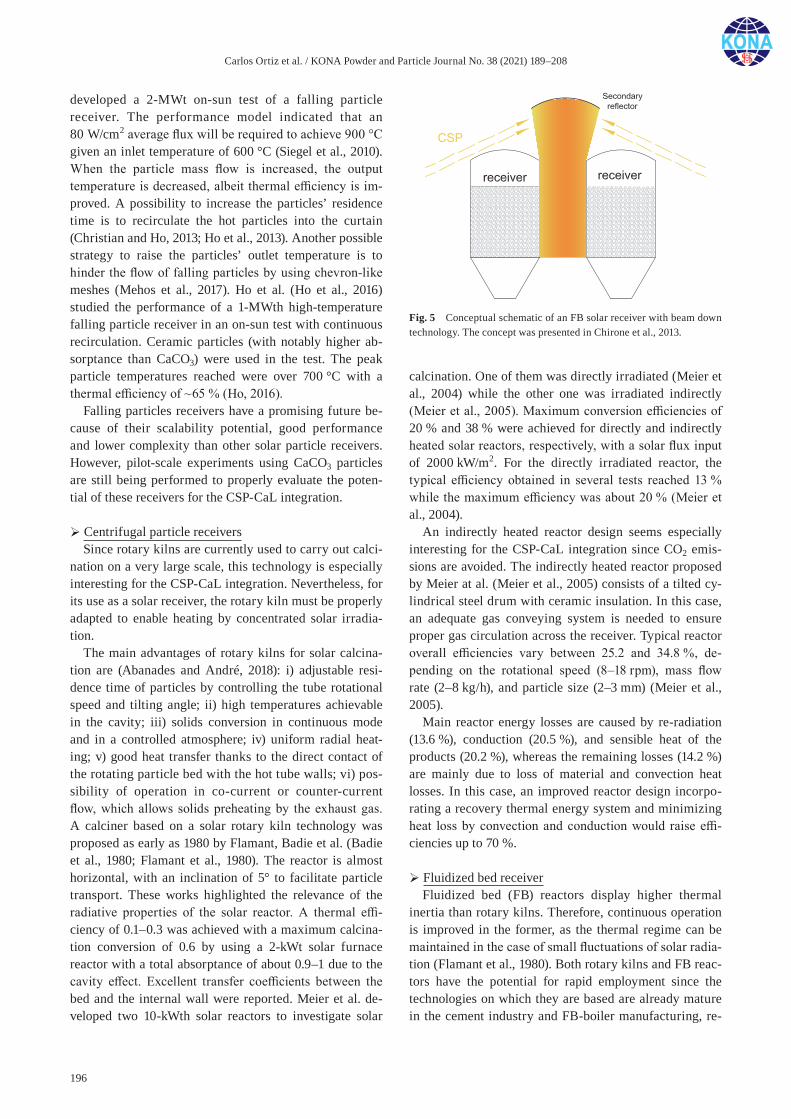
Carlos Ortiz et al. / KONA Powder and Particle Journal No. 38 (2021) 189–208
196
developed a 2-MWt on-sun test of a falling particle receiver. The performance model indicated that an 80 W/cm2 average flux will be required to achieve 900 °C given an inlet temperature of 600 °C (Siegel et al., 2010). When the particle mass flow is increased, the output temperature is decreased, albeit thermal efficiency is im-proved. A possibility to increase the particles’ residence time is to recirculate the hot particles into the curtain (Christian and Ho, 2013; Ho et al., 2013). Another possible strategy to raise the particles’ outlet temperature is to hinder the flow of falling particles by using chevron-like meshes (Mehos et al., 2017). Ho et al. (Ho et al., 2016) studied the performance of a 1-MWth high-temperature falling particle receiver in an on-sun test with continuous recirculation. Ceramic particles (with notably higher ab-sorptance than CaCO3) were used in the test. The peak particle temperatures reached were over 700 °C with a thermal efficiency of ~65 % (Ho, 2016).
Falling particles receivers have a promising future be-cause of their scalability potential, good performance and lower complexity than other solar particle receivers. However, pilot-scale experiments using CaCO3 particles are still being performed to properly evaluate the poten-tial of these receivers for the CSP-CaL integration.
Centrifugal particle receiversSince rotary kilns are currently used to carry out calci-
nation on a very large scale, this technology is especially interesting for the CSP-CaL integration. Nevertheless, for its use as a solar receiver, the rotary kiln must be properly adapted to enable heating by concentrated solar irradia-tion.
The main advantages of rotary kilns for solar calcina-tion are (Abanades and André, 2018): i) adjustable resi-dence time of particles by controlling the tube rotational speed and tilting angle; ii) high temperatures achievable in the cavity; iii) solids conversion in continuous mode and in a controlled atmosphere; iv) uniform radial heat-ing; v) good heat transfer thanks to the direct contact of the rotating particle bed with the hot tube walls; vi) pos-sibility of operation in co-current or counter-current flow, which allows solids preheating by the exhaust gas. A calciner based on a solar rotary kiln technology was proposed as early as 1980 by Flamant, Badie et al. (Badie et al., 1980; Flamant et al., 1980). The reactor is almost horizontal, with an inclination of 5° to facilitate particle transport. These works highlighted the relevance of the radiative properties of the solar reactor. A thermal effi-ciency of 0.1–0.3 was achieved with a maximum calcina-tion conversion of 0.6 by using a 2-kWt solar furnace reactor with a total absorptance of about 0.9–1 due to the cavity effect. Excellent transfer coefficients between the bed and the internal wall were reported. Meier et al. de-veloped two 10-kWth solar reactors to investigate solar
calcination. One of them was directly irradiated (Meier et al., 2004) while the other one was irradiated indirectly (Meier et al., 2005). Maximum conversion efficiencies of 20 % and 38 % were achieved for directly and indirectly heated solar reactors, respectively, with a solar flux input of 2000 kW/m2. For the directly irradiated reactor, the typical efficiency obtained in several tests reached 13 % while the maximum efficiency was about 20 % (Meier et al., 2004).
An indirectly heated reactor design seems especially interesting for the CSP-CaL integration since CO2 emis-sions are avoided. The indirectly heated reactor proposed by Meier at al. (Meier et al., 2005) consists of a tilted cy-lindrical steel drum with ceramic insulation. In this case, an adequate gas conveying system is needed to ensure proper gas circulation across the receiver. Typical reactor overall efficiencies vary between 25.2 and 34.8 %, de-pending on the rotational speed (8–18 rpm), mass flow rate (2–8 kg/h), and particle size (2–3 mm) (Meier et al., 2005).
Main reactor energy losses are caused by re-radiation (13.6 %), conduction (20.5 %), and sensible heat of the products (20.2 %), whereas the remaining losses (14.2 %) are mainly due to loss of material and convection heat losses. In this case, an improved reactor design incorpo-rating a recovery thermal energy system and minimizing heat loss by convection and conduction would raise effi-ciencies up to 70 %.
Fluidized bed receiverFluidized bed (FB) reactors display higher thermal
inertia than rotary kilns. Therefore, continuous operation is improved in the former, as the thermal regime can be maintained in the case of small fluctuations of solar radia-tion (Flamant et al., 1980). Both rotary kilns and FB reac-tors have the potential for rapid employment since the technologies on which they are based are already mature in the cement industry and FB-boiler manufacturing, re-
Fig. 5 Conceptual schematic of an FB solar receiver with beam down technology. The concept was presented in Chirone et al., 2013.
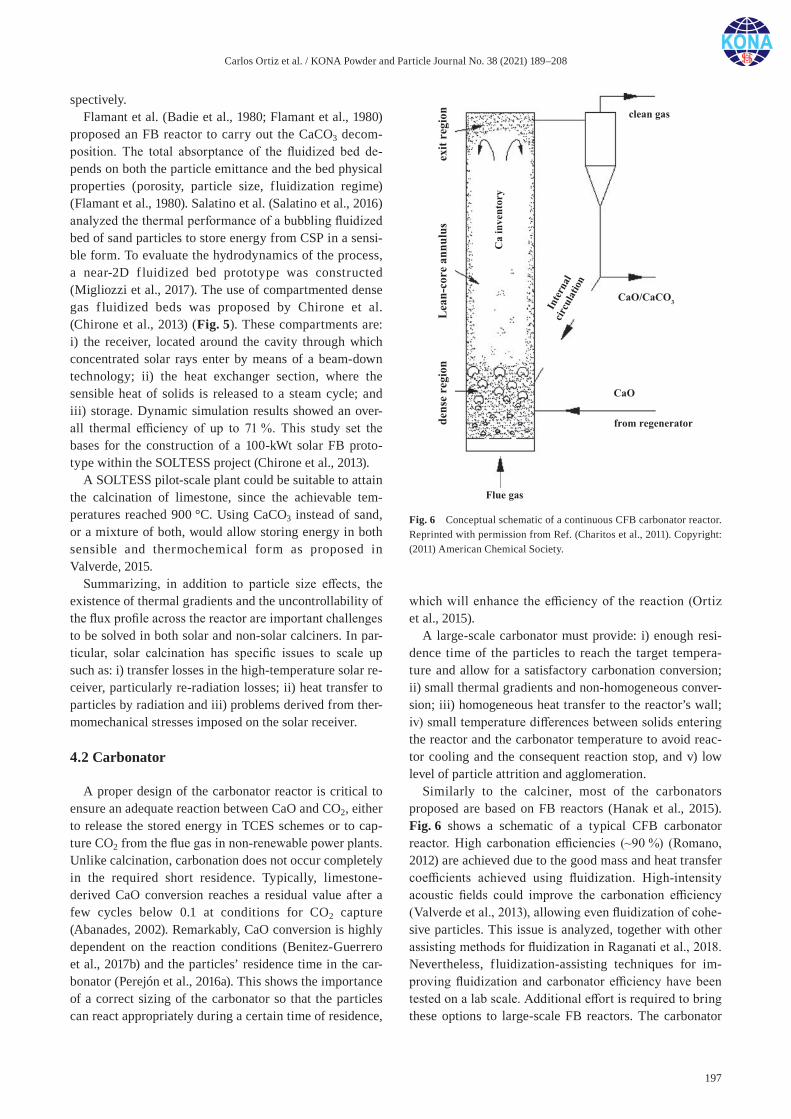
Carlos Ortiz et al. / KONA Powder and Particle Journal No. 38 (2021) 189–208
197
spectively.Flamant et al. (Badie et al., 1980; Flamant et al., 1980)
proposed an FB reactor to carry out the CaCO3 decom-position. The total absorptance of the fluidized bed de-pends on both the particle emittance and the bed physical properties (porosity, particle size, fluidization regime) (Flamant et al., 1980). Salatino et al. (Salatino et al., 2016) analyzed the thermal performance of a bubbling fluidized bed of sand particles to store energy from CSP in a sensi-ble form. To evaluate the hydrodynamics of the process, a near-2D f luidized bed prototype was constructed ( Migliozzi et al., 2017). The use of compartmented dense gas f luidized beds was proposed by Chirone et al. ( Chirone et al., 2013) (Fig. 5). These compartments are: i) the receiver, located around the cavity through which concentrated solar rays enter by means of a beam-down technology; ii) the heat exchanger section, where the sensible heat of solids is released to a steam cycle; and iii) storage. Dynamic simulation results showed an over-all thermal efficiency of up to 71 %. This study set the bases for the construction of a 100-kWt solar FB proto-type within the SOLTESS project (Chirone et al., 2013).
A SOLTESS pilot-scale plant could be suitable to attain the calcination of limestone, since the achievable tem-peratures reached 900 °C. Using CaCO3 instead of sand, or a mixture of both, would allow storing energy in both sensible and thermochemical form as proposed in Valverde, 2015.
Summarizing, in addition to particle size effects, the existence of thermal gradients and the uncontrollability of the flux profile across the reactor are important challenges to be solved in both solar and non-solar calciners. In par-ticular, solar calcination has specific issues to scale up such as: i) transfer losses in the high-temperature solar re-ceiver, particularly re-radiation losses; ii) heat transfer to particles by radiation and iii) problems derived from ther-momechanical stresses imposed on the solar receiver.
4.2 Carbonator
A proper design of the carbonator reactor is critical to ensure an adequate reaction between CaO and CO2, either to release the stored energy in TCES schemes or to cap-ture CO2 from the flue gas in non-renewable power plants. Unlike calcination, carbonation does not occur completely in the required short residence. Typically, limestone- derived CaO conversion reaches a residual value after a few cycles below 0.1 at conditions for CO2 capture (Abanades, 2002). Remarkably, CaO conversion is highly dependent on the reaction conditions (Benitez-Guerrero et al., 2017b) and the particles’ residence time in the car-bonator (Perejón et al., 2016a). This shows the importance of a correct sizing of the carbonator so that the particles can react appropriately during a certain time of residence,
which will enhance the efficiency of the reaction (Ortiz et al., 2015).
A large-scale carbonator must provide: i) enough resi-dence time of the particles to reach the target tempera-ture and allow for a satisfactory carbonation conversion; ii) small thermal gradients and non-homogeneous conver-sion; iii) homogeneous heat transfer to the reactor’s wall; iv) small temperature differences between solids entering the reactor and the carbonator temperature to avoid reac-tor cooling and the consequent reaction stop, and v) low level of particle attrition and agglomeration.
Similarly to the calciner, most of the carbonators proposed are based on FB reactors (Hanak et al., 2015). Fig. 6 shows a schematic of a typical CFB carbonator reactor. High carbonation efficiencies (~90 %) (Romano, 2012) are achieved due to the good mass and heat transfer coefficients achieved using fluidization. High-intensity acoustic fields could improve the carbonation efficiency (Valverde et al., 2013), allowing even fluidization of cohe-sive particles. This issue is analyzed, together with other assisting methods for fluidization in Raganati et al., 2018. Nevertheless, fluidization-assisting techniques for im-proving fluidization and carbonator efficiency have been tested on a lab scale. Additional effort is required to bring these options to large-scale FB reactors. The carbonator
Fig. 6 Conceptual schematic of a continuous CFB carbonator reactor. Reprinted with permission from Ref. (Charitos et al., 2011). Copyright: (2011) American Chemical Society.
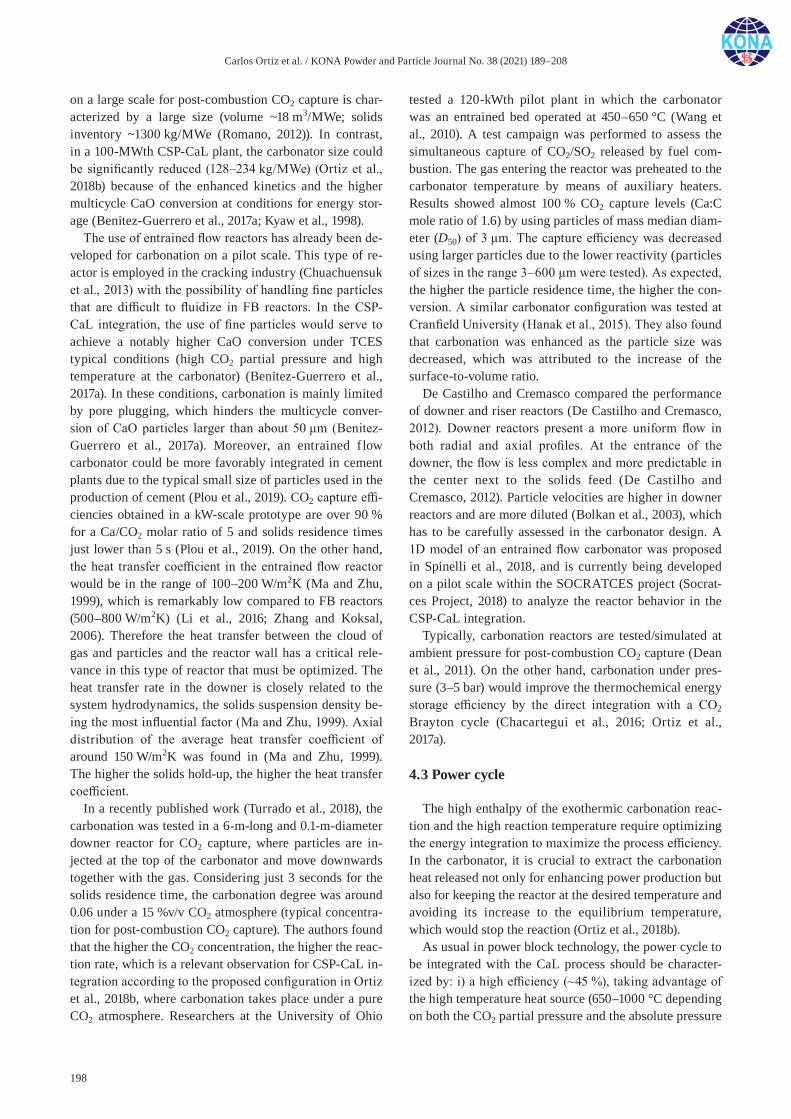
Carlos Ortiz et al. / KONA Powder and Particle Journal No. 38 (2021) 189–208
198
on a large scale for post-combustion CO2 capture is char-acterized by a large size (volume ~18 m3/MWe; solids inventory ~1300 kg/MWe (Romano, 2012)). In contrast, in a 100-MWth CSP-CaL plant, the carbonator size could be significantly reduced (128–234 kg/MWe) (Ortiz et al., 2018b) because of the enhanced kinetics and the higher multicycle CaO conversion at conditions for energy stor-age (Benitez-Guerrero et al., 2017a; Kyaw et al., 1998).
The use of entrained flow reactors has already been de-veloped for carbonation on a pilot scale. This type of re-actor is employed in the cracking industry (Chuachuensuk et al., 2013) with the possibility of handling fine particles that are difficult to fluidize in FB reactors. In the CSP-CaL integration, the use of fine particles would serve to achieve a notably higher CaO conversion under TCES typical conditions (high CO2 partial pressure and high temperature at the carbonator) (Benitez-Guerrero et al., 2017a). In these conditions, carbonation is mainly limited by pore plugging, which hinders the multicycle conver-sion of CaO particles larger than about 50 μm (Benitez- Guerrero et al., 2017a). Moreover, an entrained flow carbonator could be more favorably integrated in cement plants due to the typical small size of particles used in the production of cement (Plou et al., 2019). CO2 capture effi-ciencies obtained in a kW-scale prototype are over 90 % for a Ca/CO2 molar ratio of 5 and solids residence times just lower than 5 s (Plou et al., 2019). On the other hand, the heat transfer coefficient in the entrained flow reactor would be in the range of 100–200 W/m2K (Ma and Zhu, 1999), which is remarkably low compared to FB reactors (500–800 W/m2K) (Li et al., 2016; Zhang and Koksal, 2006). Therefore the heat transfer between the cloud of gas and particles and the reactor wall has a critical rele-vance in this type of reactor that must be optimized. The heat transfer rate in the downer is closely related to the system hydrodynamics, the solids suspension density be-ing the most influential factor (Ma and Zhu, 1999). Axial distribution of the average heat transfer coefficient of around 150 W/m2K was found in (Ma and Zhu, 1999). The higher the solids hold-up, the higher the heat transfer coefficient.
In a recently published work (Turrado et al., 2018), the carbonation was tested in a 6-m-long and 0.1-m-diameter downer reactor for CO2 capture, where particles are in-jected at the top of the carbonator and move downwards together with the gas. Considering just 3 seconds for the solids residence time, the carbonation degree was around 0.06 under a 15 %v/v CO2 atmosphere (typical concentra-tion for post-combustion CO2 capture). The authors found that the higher the CO2 concentration, the higher the reac-tion rate, which is a relevant observation for CSP-CaL in-tegration according to the proposed configuration in Ortiz et al., 2018b, where carbonation takes place under a pure CO2 atmosphere. Researchers at the University of Ohio
tested a 120-kWth pilot plant in which the carbonator was an entrained bed operated at 450–650 °C (Wang et al., 2010). A test campaign was performed to assess the simultaneous capture of CO2/SO2 released by fuel com-bustion. The gas entering the reactor was preheated to the carbonator temperature by means of auxiliary heaters. Results showed almost 100 % CO2 capture levels (Ca:C mole ratio of 1.6) by using particles of mass median diam-eter (D50) of 3 μm. The capture efficiency was decreased using larger particles due to the lower reactivity (particles of sizes in the range 3–600 μm were tested). As expected, the higher the particle residence time, the higher the con-version. A similar carbonator configuration was tested at Cranfield University (Hanak et al., 2015). They also found that carbonation was enhanced as the particle size was decreased, which was attributed to the increase of the surface-to-volume ratio.
De Castilho and Cremasco compared the performance of downer and riser reactors (De Castilho and Cremasco, 2012). Downer reactors present a more uniform flow in both radial and axial profiles. At the entrance of the downer, the flow is less complex and more predictable in the center next to the solids feed (De Castilho and Cremasco, 2012). Particle velocities are higher in downer reactors and are more diluted (Bolkan et al., 2003), which has to be carefully assessed in the carbonator design. A 1D model of an entrained flow carbonator was proposed in Spinelli et al., 2018, and is currently being developed on a pilot scale within the SOCRATCES project (Socrat-ces Project, 2018) to analyze the reactor behavior in the CSP-CaL integration.
Typically, carbonation reactors are tested/simulated at ambient pressure for post-combustion CO2 capture (Dean et al., 2011). On the other hand, carbonation under pres-sure (3–5 bar) would improve the thermochemical energy storage efficiency by the direct integration with a CO2 Brayton cycle (Chacartegui et al., 2016; Ortiz et al., 2017a).
4.3 Power cycle
The high enthalpy of the exothermic carbonation reac-tion and the high reaction temperature require optimizing the energy integration to maximize the process efficiency. In the carbonator, it is crucial to extract the carbonation heat released not only for enhancing power production but also for keeping the reactor at the desired temperature and avoiding its increase to the equilibrium temperature, which would stop the reaction (Ortiz et al., 2018b).
As usual in power block technology, the power cycle to be integrated with the CaL process should be character-ized by: i) a high efficiency (~45 %), taking advantage of the high temperature heat source (650–1000 °C depending on both the CO2 partial pressure and the absolute pressure
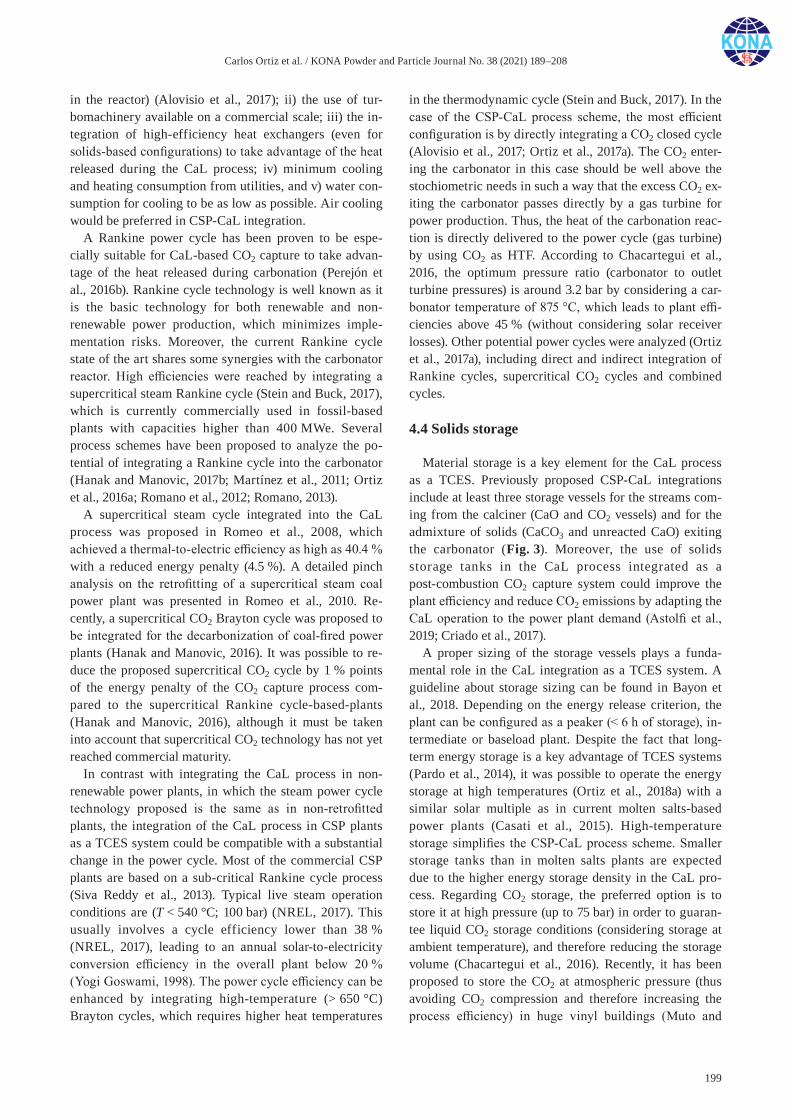
Carlos Ortiz et al. / KONA Powder and Particle Journal No. 38 (2021) 189–208
199
in the reactor) (Alovisio et al., 2017); ii) the use of tur-bomachinery available on a commercial scale; iii) the in-tegration of high-efficiency heat exchangers (even for solids-based configurations) to take advantage of the heat released during the CaL process; iv) minimum cooling and heating consumption from utilities, and v) water con-sumption for cooling to be as low as possible. Air cooling would be preferred in CSP-CaL integration.
A Rankine power cycle has been proven to be espe-cially suitable for CaL-based CO2 capture to take advan-tage of the heat released during carbonation (Perejón et al., 2016b). Rankine cycle technology is well known as it is the basic technology for both renewable and non- renewable power production, which minimizes imple-mentation risks. Moreover, the current Rankine cycle state of the art shares some synergies with the carbonator reactor. High efficiencies were reached by integrating a supercritical steam Rankine cycle (Stein and Buck, 2017), which is currently commercially used in fossil-based plants with capacities higher than 400 MWe. Several process schemes have been proposed to analyze the po-tential of integrating a Rankine cycle into the carbonator (Hanak and Manovic, 2017b; Martínez et al., 2011; Ortiz et al., 2016a; Romano et al., 2012; Romano, 2013).
A supercritical steam cycle integrated into the CaL process was proposed in Romeo et al., 2008, which achieved a thermal-to-electric efficiency as high as 40.4 % with a reduced energy penalty (4.5 %). A detailed pinch analysis on the retrofitting of a supercritical steam coal power plant was presented in Romeo et al., 2010. Re-cently, a supercritical CO2 Brayton cycle was proposed to be integrated for the decarbonization of coal-fired power plants (Hanak and Manovic, 2016). It was possible to re-duce the proposed supercritical CO2 cycle by 1 % points of the energy penalty of the CO2 capture process com-pared to the supercritical Rankine cycle-based-plants (Hanak and Manovic, 2016), although it must be taken into account that supercritical CO2 technology has not yet reached commercial maturity.
In contrast with integrating the CaL process in non- renewable power plants, in which the steam power cycle technology proposed is the same as in non-retrofitted plants, the integration of the CaL process in CSP plants as a TCES system could be compatible with a substantial change in the power cycle. Most of the commercial CSP plants are based on a sub-critical Rankine cycle process (Siva Reddy et al., 2013). Typical live steam operation conditions are (T < 540 °C; 100 bar) (NREL, 2017). This usually involves a cycle efficiency lower than 38 % (NREL, 2017), leading to an annual solar-to-electricity conversion efficiency in the overall plant below 20 % (Yogi Goswami, 1998). The power cycle efficiency can be enhanced by integrating high-temperature (> 650 °C) Brayton cycles, which requires higher heat temperatures
in the thermodynamic cycle (Stein and Buck, 2017). In the case of the CSP-CaL process scheme, the most efficient configuration is by directly integrating a CO2 closed cycle (Alovisio et al., 2017; Ortiz et al., 2017a). The CO2 enter-ing the carbonator in this case should be well above the stochiometric needs in such a way that the excess CO2 ex-iting the carbonator passes directly by a gas turbine for power production. Thus, the heat of the carbonation reac-tion is directly delivered to the power cycle (gas turbine) by using CO2 as HTF. According to Chacartegui et al., 2016, the optimum pressure ratio (carbonator to outlet turbine pressures) is around 3.2 bar by considering a car-bonator temperature of 875 °C, which leads to plant effi-ciencies above 45 % (without considering solar receiver losses). Other potential power cycles were analyzed (Ortiz et al., 2017a), including direct and indirect integration of Rankine cycles, supercritical CO2 cycles and combined cycles.
4.4 Solids storage
Material storage is a key element for the CaL process as a TCES. Previously proposed CSP-CaL integrations include at least three storage vessels for the streams com-ing from the calciner (CaO and CO2 vessels) and for the admixture of solids (CaCO3 and unreacted CaO) exiting the carbonator (Fig. 3). Moreover, the use of solids storage tanks in the CaL process integrated as a post-combustion CO2 capture system could improve the plant efficiency and reduce CO2 emissions by adapting the CaL operation to the power plant demand (Astolfi et al., 2019; Criado et al., 2017).
A proper sizing of the storage vessels plays a funda-mental role in the CaL integration as a TCES system. A guideline about storage sizing can be found in Bayon et al., 2018. Depending on the energy release criterion, the plant can be configured as a peaker (< 6 h of storage), in-termediate or baseload plant. Despite the fact that long-term energy storage is a key advantage of TCES systems (Pardo et al., 2014), it was possible to operate the energy storage at high temperatures (Ortiz et al., 2018a) with a similar solar multiple as in current molten salts-based power plants (Casati et al., 2015). High-temperature storage simplifies the CSP-CaL process scheme. Smaller storage tanks than in molten salts plants are expected due to the higher energy storage density in the CaL pro-cess. Regarding CO2 storage, the preferred option is to store it at high pressure (up to 75 bar) in order to guaran-tee liquid CO2 storage conditions (considering storage at ambient temperature), and therefore reducing the storage volume (Chacartegui et al., 2016). Recently, it has been proposed to store the CO2 at atmospheric pressure (thus avoiding CO2 compression and therefore increasing the process efficiency) in huge vinyl buildings (Muto and
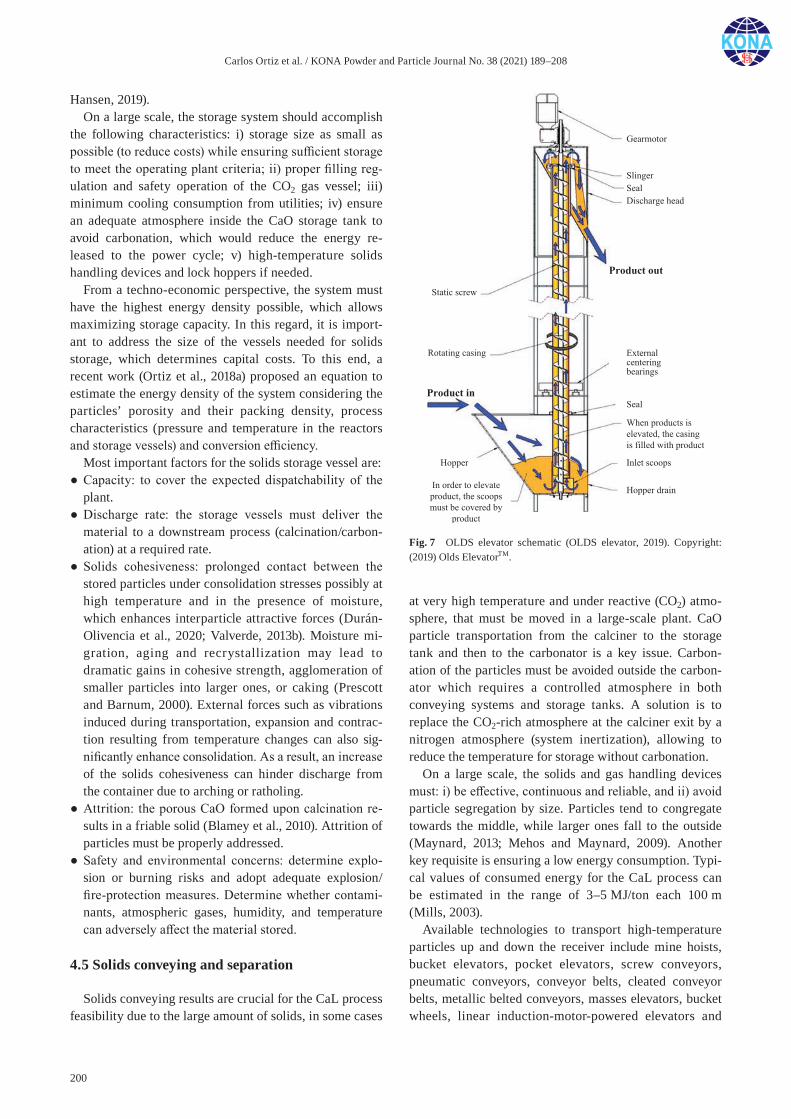
Carlos Ortiz et al. / KONA Powder and Particle Journal No. 38 (2021) 189–208
200
Hansen, 2019).On a large scale, the storage system should accomplish
the following characteristics: i) storage size as small as possible (to reduce costs) while ensuring sufficient storage to meet the operating plant criteria; ii) proper filling reg-ulation and safety operation of the CO2 gas vessel; iii) minimum cooling consumption from utilities; iv) ensure an adequate atmosphere inside the CaO storage tank to avoid carbonation, which would reduce the energy re-leased to the power cycle; v) high-temperature solids handling devices and lock hoppers if needed.
From a techno-economic perspective, the system must have the highest energy density possible, which allows maximizing storage capacity. In this regard, it is import-ant to address the size of the vessels needed for solids storage, which determines capital costs. To this end, a recent work (Ortiz et al., 2018a) proposed an equation to estimate the energy density of the system considering the particles’ porosity and their packing density, process characteristics (pressure and temperature in the reactors and storage vessels) and conversion efficiency.
Most important factors for the solids storage vessel are:● Capacity: to cover the expected dispatchability of the
plant.● Discharge rate: the storage vessels must deliver the
material to a downstream process (calcination/carbon-ation) at a required rate.
● Solids cohesiveness: prolonged contact between the stored particles under consolidation stresses possibly at high temperature and in the presence of moisture, which enhances interparticle attractive forces (Durán- Olivencia et al., 2020; Valverde, 2013b). Moisture mi-gration, aging and recrystallization may lead to dramatic gains in cohesive strength, agglomeration of smaller particles into larger ones, or caking (Prescott and Barnum, 2000). External forces such as vibrations induced during transportation, expansion and contrac-tion resulting from temperature changes can also sig-nificantly enhance consolidation. As a result, an increase of the solids cohesiveness can hinder discharge from the container due to arching or ratholing.
● Attrition: the porous CaO formed upon calcination re-sults in a friable solid (Blamey et al., 2010). Attrition of particles must be properly addressed.
● Safety and environmental concerns: determine explo-sion or burning risks and adopt adequate explosion/fire-protection measures. Determine whether contami-nants, atmospheric gases, humidity, and temperature can adversely affect the material stored.
4.5 Solids conveying and separation
Solids conveying results are crucial for the CaL process feasibility due to the large amount of solids, in some cases
at very high temperature and under reactive (CO2) atmo-sphere, that must be moved in a large-scale plant. CaO particle transportation from the calciner to the storage tank and then to the carbonator is a key issue. Carbon-ation of the particles must be avoided outside the carbon-ator which requires a controlled atmosphere in both conveying systems and storage tanks. A solution is to replace the CO2-rich atmosphere at the calciner exit by a nitrogen atmosphere (system inertization), allowing to reduce the temperature for storage without carbonation.
On a large scale, the solids and gas handling devices must: i) be effective, continuous and reliable, and ii) avoid particle segregation by size. Particles tend to congregate towards the middle, while larger ones fall to the outside (Maynard, 2013; Mehos and Maynard, 2009). Another key requisite is ensuring a low energy consumption. Typi-cal values of consumed energy for the CaL process can be estimated in the range of 3–5 MJ/ton each 100 m (Mills, 2003).
Available technologies to transport high-temperature particles up and down the receiver include mine hoists, bucket elevators, pocket elevators, screw conveyors, pneumatic conveyors, conveyor belts, cleated conveyor belts, metallic belted conveyors, masses elevators, bucket wheels, linear induction-motor-powered elevators and
Fig. 7 OLDS elevator schematic (OLDS elevator, 2019). Copyright: (2019) Olds ElevatorTM.
Carlos Ortiz et al. / KONA Powder and Particle Journal No. 38 (2021) 189–208
201
electromagnetic field conveyors (Ho et al., 2013). An OLDS elevator (Fig. 7) is a vertical screw conveyor which seems suitable to be integrated in the CaL process for high-temperature solids elevation, especially if the cal-ciner is located at the top of a solar tower receiver.
Mechanical systems normally have a higher investment cost but a much lower operating cost than pneumatic transport systems (Schorcht et al., 2013). Pneumatic con-veying is a well-known technology used in many applica-tions such as the cement and lime industry (Mills, 2003). Therefore, it could expect to be feasible for the CaL pro-cess, even if fine particles are employed.
Belt conveyors are cost-effective only when there is a relatively high production rate and the transport distance is long (De La Vergne and Mcintosh, 2000). Many types of feeders exist for belt conveyors, but the most common is the vibrating feeder. Screw feeders have been proposed for the CaL process (European Commission, 2016; Hilz et al., 2017; Zhao et al., 2013), with particles size as small as ~30 μm. One of the key parameters to calculate the volu-metric characteristic curve of the screw conveyor is the trajectory angle of particle motion, which affects the fill-ing rate and the theoretical maximum mass flow rate. Several correlations, validated against commercial screw conveyors, predict the fill rate as a function of the rotation velocities and pitches, as well as the outlet mass flow rate as a function of the inclination angles, rotation velocities and pitches (Li et al., 2018).
Solids feeders (hoppers) are critical when using fines due to agglomeration (Turrado et al., 2018). Typical prob-lems with solids hoppers when using cohesive particles are arching or ratholing (Maynard, 2013; Mehos and Maynard, 2009). These effects might give rise to the pulsed inputs of solids (erratic flow) instead of stable flows. According to Turrado et al., 2018, 50 μm is the minimum size of the particles that allows a continuous and controlled flow of solids to be fed into the drop-tube reactor. An option to improve the feeder performance could be to introduce a fluidizing gas at the bottom of the hoppers to ensure mass flow operation by avoiding core flow. Rotary airlocks are important for a dilute-phase sys-tem. They enable solids to be fed at a controlled rate into the gas stream (Mehos and Maynard, 2009). This system could be used in the calciner and carbonator to bring into contact both streams (gas and solid particles).
Since gas and solids are stored separately, a separation system must be considered in the plant. At the outlet of the calciner and carbonator, cyclone separators could be used as primary separation devices for relatively coarse particles, with a fabric filter downstream (depending on the particle temperature) in order to remove fine particles (< 20 μm) from the CO2 flow.
4.6 Heat exchangers
An efficient use of the heat from the different hot streams is critical for the process efficiency. In the case of the hot CO2 stream exiting the calciner, a gas-gas heat ex-changer as a heat recovery steam generator (HRGS) within a secondary steam cycle could be employed, which would generate enough power to carry out CO2 compres-sion (Ortiz et al., 2018a). Another possibility is to use solids-gas heat exchangers to release energy from the hot CO2 stream for preheating the CaCO3 particles entering the calciner (Chacartegui et al., 2016).
Suspension preheaters are well-known technology in the cement industry as gas-solids heat exchangers. The exhaust gases from the calciner flow through the cyclone stages from bottom to top. Particles are added to the ex-haust gas just before the uppermost cyclone stage. They are separated from the gas in the cyclones and re-join it before the next cyclone stage (Schorcht et al., 2013). By using this solids-gas heat exchanger, the same exit tem-perature of the gas and solids streams is achieved from a co-flow arrangement with a considerably high contact surface. Suspension preheaters usually have between four and six cyclone stages, which are arranged one above the other in a 50–120-m-high tower (Schorcht et al., 2013). Due to high level of maturity of this technology, it seems an optimum choice to carry out both CaCO3 particle pre-heating in the calciner side and particle cooling in the carbonator side.
The grate preheater is another well-known technique in the cement industry. Particles are fed onto a horizontal grate which travels through a closed tunnel. A fan draws the exhaust gas from the calciner into the top of the pre-heater. The temperature of the gas could be reduced from > 1000 °C to 150 °C while solids would be heated up to 700–800 °C (Schorcht et al., 2013). Another possible solids- gas direct heat exchanger was proposed by Shimizu et al. (Shimizu et al., 2004). This heat exchanger is an axial flow cyclone in which a quasi-counterflow heat exchange is realized to recover the heat carried by the particles. By using this design, an outlet gas temperature much higher than the particle outlet temperature could be attained. Fluidized bed designs are also a possibility to perform solids-gas heating with high heat transfer coeffi-cients (up to ~600 W/m2-K), but have a higher parasitic power consumption and heat losses associated to fluidiza-tion (Ho et al., 2017).
Several solids-solids heat exchangers have been pro-posed to transfer heat between the CaO solids stream ex-iting the calciner and the CaCO3/CaO mixture coming from the carbonator, such as a cyclonic preheater (Martínez et al., 2013) or a mixing seal valve (Martínez et al., 2014). To avoid recarbonation of CaO during the cool-ing process, which notably affects the multicyclic conver-
Carlos Ortiz et al. / KONA Powder and Particle Journal No. 38 (2021) 189–208
202
sion (Valverde et al., 2014), an indirect contact solids–solids heat exchanger with one intermediate heat transfer fluid recirculated within the bulk of both solids could be employed, although this equipment is not fully developed yet on a large commercial scale.
5. Next steps and remarks
The CaL process plays a central role in the next- generation post-combustion CO2 capture technologies. The main improvements are related to enhance the multi-cyclic CaO conversion, ensure proper solids handling and efficiently recover the high-temperature heat released during the process. As shown in sections 2–3, important advances have been accomplished and the technology has already been demonstrated on the MWt scale. No major technical barriers have been found for its employment on a commercial scale. Retrofitting coal-fired power plants with the CaL process is considered a viable and competitive technology (Abanades et al., 2015). Next research projects must aim at reaching a Technology Readiness Level (TRL) of 7–8, which implies a commercial demonstration at full scale (IEA, 2014).
The CaL process for energy storage lies at a lower level of maturity. Despite important advances to properly de-fine and test the integration of the CaL process in CSP plants (sections 2–3), the solar calciner (particle receiver) remains as a major technological challenge. Current proj-ects aim to reduce the technological risks progressing from a TRL-4 (technology validated in lab) to a TRL-5 level (technology validated in a relevant environment) (Flamant et al., 2018; Socratces Project, 2018). The huge interest for increasing dispatchability in CSP plants, the high technology development of the CaL process for CO2 capture as well as the important efforts for developing so-lar particle receivers (Ho et al., 2017) should contribute to accelerating the employment of CSP-CaL integration on a commercial scale.
Acknowledgements
The research leading to these results has received fund-ing from the European Union’s Horizon 2020 research and innovation programme under grant agreement No 727348, project SOCRATCES and by the Spanish Gov-ernment Agency Ministerio de Economía y Competitivi-dad (MINECO-FEDER funds) under contracts CTQ2017-83602-C2 (-1-R and -2-R).
References
Abanades J.C., The maximum capture efficiency of CO2 using a carbonation/calcination cycle of CaO/CaCO3, Chemical Engineering Journal, 90 (2002) 303–306. DOI: 10.1016/S1385-8947(02)00126-2
Abanades J.C., Arias B., Lyngfelt A., Mattisson T., Wiley D.E., Li H., Ho M.T., Mangano E., Brandani S., Emerging CO2 capture systems, International Journal of Greenhouse Gas Control, 40 (2015) 126–166. DOI: 10.1016/j.ijggc.2015.04.018
Abanades S., André L., Design and demonstration of a high temperature solar-heated rotary tube reactor for continuous particles calcination, Applied Energy, 212 (2018) 1310–1320. DOI: 10.1016/j.apenergy.2018.01.019
Alonso M., Arias B., Fernández J.R., Bughin O., Abanades C., Measuring attrition properties of calcium looping materials in a 30 kW pilot plant, Powder Technology, 336 (2018) 273–281. DOI: 10.1016/j.powtec.2018.06.011
Alovisio A., Chacartegui R., Ortiz C., Valverde J.M., Verda V., Optimizing the CSP-calcium looping integration for ther-mochemical energy storage, Energy Conversion and Man-agement, 136 (2017) 85–98. DOI: 10.1016/j.enconman. 2016.12.093
Arias B., Diego M.E., Abanades J.C., Lorenzo M., Diaz L., Martínez D., Alvarez J., Sánchez-Biezma A., Demonstra-tion of steady state CO2 capture in a 1.7 MWth calcium looping pilot, International Journal of Greenhouse Gas Control, 18 (2013) 237–245. DOI: 10.1016/j.ijggc.2013.07.014
Astolfi M., De Lena E., Romano M.C., Improved flexibility and economics of calcium looping power plants by thermo-chemical energy storage, International Journal of Green-house Gas Control, 83 (2019) 140–155. DOI: 10.1016/j.ijggc. 2019.01.023
Badie J.M., Bonet C., Faure M., Flamant G., Foro R., Hernandez D., 52 Decarbonation of calcite and phosphate rock in solar chemical reactors., Chemical Engineering Science, 35 (1980) 413–420. DOI: 10.1016/0009-2509(80)80114-X
Bayon A., Bader R., Jafarian M., Fedunik-Hofman L., Sun Y., Hinkley J., Miller S., Lipiński W., Techno-economic assessment of solid–gas thermochemical energy storage systems for solar thermal power applications, Energy, 149 (2018) 473–484. DOI: 10.1016/j.energy.2017.11.084
Benitez-Guerrero M., Sarrion B., Perejon A., Sanchez-Jimenez P.E., Perez-Maqueda L.A., Valverde J.M., Large-scale high-temperature solar energy storage using natural min-erals, Solar Energy Materials and Solar Cells, 168 (2017a) 14–21. DOI: 10.1016/j.solmat.2017.04.013
Benitez-Guerrero M., Valverde J.M., Sanchez-Jimenez P.E., Perejon A., Perez-Maqueda L.A., Multicycle activity of natural CaCO3 minerals for thermochemical energy stor-age in Concentrated Solar Power Plants, Solar Energy, 153 (2017b) 188–199. DOI: 10.1016/j.solener.2017.05.068
Berger E.E., Effect of steam on the decomposition of limestone, Industrial and Engineering Chemistry, 19 (1927) 594–596. DOI: 10.1021/ie50209a026
Beruto D.T., Searcy A.W., Kim M.G., Microstructure, kinetic, structure, thermodynamic analysis for calcite decomposi-
Carlos Ortiz et al. / KONA Powder and Particle Journal No. 38 (2021) 189–208
203
tion: free-surface and powder bed experiments, Thermo-chimica Acta, 424 (2004) 99–109. DOI: 10.1016/j.tca.2004. 05.027
Blamey J., Anthony E.J., Wang J., Fennell P.S., The calcium looping cycle for large-scale CO2 capture, Progress in Energy and Combustion Science, 36 (2010) 260–279. DOI: 10.1016/j.pecs.2009.10.001
Bolkan Y., Berruti F., Zhu J., Milne B., Hydrodynamic model-ing of CFB risers and downers, International Journal of Chemical Reactor Engineering, 1 (2003) 1–15. DOI: 10.2202/1542-6580.1115
Borgwardt R.H., Sintering of nascent calcium oxide, Chemical Engineering Science, 44 (1989) 53–60. DOI: 10.1016/0009-2509(89)85232-7
Brown S., Campbell K.S., Gadikota G., Howe A., Dowell N. Mac, CCS Forum Report, London, 2016. <www.icheme.org/media/1807/ccs-forum-report-full-report-july-2016.pdf> accessed03.09.2019.
CAESAR project, European Best Practice Guidelines for Assessment of CO2 Capture Technologies, 2011. <https://www.ctc-n.org/sites/www.ctc-n.org/files/resources/d_4_9_best_practice_guide.pdf> accessed03.09.2019.
Casati E., Casella F., Colonna P., Design of CSP plants with optimally operated thermal storage, Solar Energy, 116 (2015) 371–387. DOI: 10.1016/j.solener.2015.03.048
Castellanos A., Valverde J.M., Pérez A.T., Ramos A., Watson P.K., Flow regimes in fine cohesive powders, Physical Review Letters, 82 (1999) 1156–1159. DOI: 10.1103/Phys-RevLett.82.1156
CEMPCAP EU project, 2015. <https://www.sintef.no/projectweb/cemcap/> accessed 03092019.
Chacartegui R., Alovisio A., Ortiz C., Valverde J.M., Verda V., Becerra J.A., Thermochemical energy storage of concen-trated solar power by integration of the calcium looping process and a CO2 power cycle, Applied Energy, 173 (2016) 589–605. DOI: 10.1016/j.apenergy.2016.04.053
Chang M.-H., Huang C.-M., Liu W.-H., Chen W.-C., Cheng J.-Y., Chen W., Wen T.-W., Ouyang S., Shen C.-H., Hsu H.-W., Design and experimental investigation of calcium looping process for 3-kWth and 1.9-MWth facilities, Chemical Engi-neering & Technology, 36 (2013) 1525–1532. DOI: 10.1002/ceat.201300081
Chang M.H., Chen W.C.W.W.C., Huang C.M., Liu W.H., Chou Y.C., Chang W.C., Chen W.C.W.W.C., Cheng J.Y., Huang K.E., Hsu H.W., Design and experimental testing of a 1.9 MWth calcium looping pilot plant, Energy Procedia, 63 (2014) 2100–2108. DOI: 10.1016/j.egypro.2014.11.226
Charitos A., Rodríguez N., Hawthorne C., Alonso M., Zieba M., Arias B., Kopanakis G., Scheffknecht G., Abanades J.C., Experimental Validation of the Calcium looping CO2 cap-ture process with two circulating fluidized bed carbonator reactors, Industrial & Engineering Chemistry Research, 50 (2011) 9685–9695. DOI: 10.1021/ie200579f
Chirone R., Salatino P., Ammendola P., Solimene R., Magaldi M., Sorrenti R., Michele G. De, Donatini F., Development of a novel concept of solar receiver/thermal energy storage system based on compartmented dense gas fluidized beds, The 14th International Conference on Fluidization, 2013.
Christian J., Ho C., Alternative designs of a high efficiency, north-facing, solid particle receiver, Energy Procedia, 49 (2013) 314–323. DOI: 10.1016/j.egypro.2014.03.034
Chuachuensuk A., Paengjuntuek W., Kheawhom S., Arporn-wichanop A., A systematic model-based analysis of a downer regenerator in fluid catalytic cracking processes, Computers & Chemical Engineering, 49 (2013) 136–145. DOI: 10.1016/j.compchemeng.2012.10.003
CLEANKER EU project, 2017. <http://www.cleanker.eu/home-page-it> accessed 03.09.2019.
Criado Y.A., Arias B., Abanades J.C., Calcium looping CO2 capture system for back-up power plants, Energy & Envi-ronmental Science, 10 (2017) 1994–2004. DOI: 10.1039/C7EE01505D
De Castilho G.J., Cremasco M.A., Comparison of downer and riser flows in a circulating bed by means of optical fiber probe signals measurements, Procedia Engineering, 42 (2012) 295–302. DOI: 10.1016/j.proeng.2012.07.420
De La Vergne J., Mcintosh S., Hard Rock Miner’s Handbook, McIntosh Engineering, 2000, ISBN: 0-9687006-1-6.
De Lena E., Spinelli M., Gatti M., Scaccabarozzi R., Campanari S., Consonni S., Cinti G., Romano M.C., Techno-economic analysis of calcium looping processes for low CO2 emission cement plants, International Journal of Greenhouse Gas Control, (2019) 244–260. DOI: 10.1016/j.ijggc.2019.01.005
Dean C.C., Blamey J., Florin N.H., Al-Jeboori M.J., Fennell P.S., The calcium looping cycle for CO2 capture from power generation, cement manufacture and hydrogen production, Chemical Engineering Research and Design, 89 (2011) 836–855. DOI: 10.1016/j.cherd.2010.10.013
Durán-Olivencia F.J., Espín M.J., Valverde J.M., Cross effect between temperature and consolidation on the flow behav-ior of granular materials in thermal energy storage systems, Powder Technology, 363 (2020) 135–145. DOI: 10.1016/j.powtec.2019.11.125
Espin M.J., Ebri J.M.P., Valverde J.M., Tensile strength and compressibility of fine CaCO3 powders. Effect of nanosilica addition, Chemical Engineering Journal, 378 (2019) 122166. DOI: 10.1016/j.cej.2019.122166
European Commission, Carbon Capture by Means of Indirectly Heated Carbonate Looping Process, The Publications Office of the European Union, Luxembourg, 2016. DOI: 10.2777/708428
Flamant G., Benoit H., Jenke M., Santos A.F., Tescari S., Moumin G., Rodriguez A., Azapagic A., Stamford L., Baeyens J., Boes Y., Pron F., Prouteau M., Dumont P., Abdenouri N., Mazouz H., Solar processing of reactive particles up to 900 °C, the SOLPART project, Proceedings, 2033 (2018) 40015. DOI: 10.1063/1.5067013
Flamant G., Hernandez D., Bonet C., Traverse J.P., Experi-mental aspects of the thermochemical conversion of solar energy; Decarbonation of CaCO3, Solar Energy, 24 (1980) 385–395. DOI: 10.1016/0038-092X(80)90301-1
FlexiCaL EU project, 2016 <https://www.flexical.eu/> accessed 03.09.2019.
Gangwal S., Muto A., Regenerative Carbonate-Based Thermo-chemical Energy Storage System for Concentrating Solar Power, United States, 2017. DOI: 10.2172/1377395
Carlos Ortiz et al. / KONA Powder and Particle Journal No. 38 (2021) 189–208
204
Hanak D.P., Anthony E.J., Manovic V., A review of develop-ments in pilot-plant testing and modelling of calcium looping process for CO2 capture from power generation systems, Energy & Environmental Science, 8 (2015) 2199–2249. DOI: 10.1039/C5EE01228G
Hanak D.P., Erans M., Nabavi S.A., Jeremias M., Romeo L.M., Manovic V., Technical and economic feasibility evaluation of calcium looping with no CO2 recirculation, Chemical Engineering Journal, 335 (2018a) 763–773. DOI: 10.1016/j.cej.2017.11.022
Hanak D.P., Manovic V., Calcium looping with supercritical CO2 cycle for decarbonisation of coal-fired power plant, Energy, 102 (2016) 343–353. DOI: 10.1016/j.energy.2016. 02.079
Hanak D.P., Manovic V., Economic feasibility of calcium looping under uncertainty, Applied Energy, 208 (2017a) 691–702. DOI: 10.1016/j.apenergy.2017.09.078
Hanak D.P., Manovic V., Calcium looping combustion for high-efficiency low-emission power generation, Journal of Cleaner Production, 161 (2017b) 245–255. DOI: 10.1016/j.j-clepro.2017.05.080
Hanak D.P., Michalski S., Manovic V., From post-combustion carbon capture to sorption-enhanced hydrogen production: a state-of-the-art review of carbonate looping process feasi-bility, Energy Conversion and Management, 177 (2018b) 428–452. DOI: 10.1016/j.enconman.2018.09.058
Hills T.P., Sceats M., Rennie D., Fennell P., LEILAC: low cost CO2 capture for the cement and lime industries, Energy Procedia, 114 (2017) 6166–6170. DOI: 10.1016/j.egypro. 2017.03.1753
Hilz J., Helbig M., Haaf M., Daikeler A., Ströhle J., Epple B., Long-term pilot testing of the carbonate looping process in 1 MWth scale, Fuel, 210 (2017) 892–899. DOI: 10.1016/j.fuel.2017.08.105
Ho C., Christian J., Gill D., Moya A., Jeter S., Abdel-Khalik S., Sadowski D., Siegel N., Al-Ansary H., Amsbeck L., Gobereit B., Buck R., Technology advancements for next generation falling particle receivers, Energy Procedia, 49 (2013) 398–407. DOI: 10.1016/j.egypro.2014.03.043
Ho C.K., A review of high-temperature particle receivers for concentrating solar power, Applied Thermal Engineering, 109 (2016) 958–969. DOI: 10.1016/j.applthermaleng.2016. 04.103
Ho C.K., Christian J., Yellowhair J., Jeter S., Golob M., Nguyen C., Repole K., Abdel-Khalik S., Siegel N., Al-Ansary H., El-Leathy A., Gobereit B., Highlights of the high-tempera-ture falling particle receiver project: 2012–2016, in: AIP Conference Proceedings, 2017. DOI: 10.1063/1.4984370
Ho C.K., Christian J.M., Yellowhair J., Siegel N., Jeter S., Golob M., Abdel-Khalik S.I., Nguyen C., Al-Ansary H., On-sun testing of an advanced falling particle receiver system, AIP Conference Proceedings, 1734 (2016) 030022. DOI: 10.1063/1.4949074
IEA (International Energy Agency), Assessment of Emerging CO2 Capture Technologies and Their Potential to Reduce Costs, IEAGHG, 2014, 183pp. <https://ieaghg.org/docs/General_Docs/Reports/2014-TR4.pdf> accessed 03.09.2019.
IEA (International Energy Agency), Energy and Climate
Change, World Energy Outlook Special Report, 2015, 200pp. <https://webstore.iea.org/weo-2015-special-report-energy-and-climate-change> accessed 03.09.2019.
IEA (International Energy Agency), Global Energy & CO2 Status Report: The latest trends in energy and emissions in 2018, IEA, 2019, 29pp. <https://webstore.iea.org/global-energy-co2- status-report-2018> accessed 03.09.2019.
IRENA (International Renewable Energy Agency), REthinking Energy 2017: Accelerating the global energy transforma-tion, IRENA, 2017, 130pp. ISBN: 978-92-9260-006-8.
IRENA, Global Energy Transformation—A Roadmap to 2050 (2018 edition), IRENA, 2018, 76pp. ISBN: 978-92-9260-059-4
Jin S., Dong G., Luo J., Ma F., Wang C., Improved photocata-lytic NO removal activity of SrTiO3 by using SrCO3 as a new co-catalyst, Applied Catalysis B: Environmental, 227 (2018) 24–34. DOI: 10.1016/j.apcatb.2018.01.020
Kyaw K., Kubota M., Watanabe F., Matsuda H., Hasatani M., Study of carbonation of CaO for high temperature thermal energy storage, Journal of Chemical Engineering of Japan, 31 (1998) 281–284. DOI: 10.1252/jcej.31.281
Kyaw K., Matsuda H., Hasatani M., Applicability of carbonation/decarbonation reactions to high-temperature thermal energy storage and temperature upgrading, Journal of Chemical Engineering of Japan, 29 (1996) 119–125. DOI: 10.1252/jcej.29.119
Lara Y., Lisbona P., Martínez A., Romeo L.M., Design and analysis of heat exchanger networks for integrated Ca- looping systems, Applied Energy, 111 (2013) 690–700. DOI: 10.1016/j.apenergy.2013.05.044
LEILAC EU project, 2016 <www.project-leilac.eu/> accessed 03.09.2019.
Li M., Luo J., Wu B., Hua J., Experimental research of the mechanism and particle flow in screw conveyer, Interna-tional Journal of Heat and Technology, 36 (2018) 173–181. DOI: 10.18280/ijht.360123
Li Z., van Sint Annaland M., Kuipers J.A.M., Deen N.G., Effect of superficial gas velocity on the particle temperature dis-tribution in a fluidized bed with heat production, Chemical Engineering Science, 140 (2016) 279–290. DOI: 10.1016/j.ces.2015.10.020
Ma Y., Zhu J.X., Experimental study of heat transfer in a co- current downflow fluidized bed (downer), Chemical Engi-neering Science, 54 (1999) 41–50. DOI: 10.1016/S0009-2509(98)00233-4
Mancini T.R., Gary J.A., Kolb G.J., Ho C.K., Power Tower Technology Roadmap and Cost Reduction Plan, United States, 2011, 38pp. DOI: 10.2172/1011644
Manovic V., Charland J.P., Blamey J., Fennell P.S., Lu D.Y., Anthony E.J., Influence of calcination conditions on carry-ing capacity of CaO-based sorbent in CO2 looping cycles, Fuel, 88 (2009) 1893–1900. DOI: 10.1016/j.fuel.2009.04.012
Martínez A., Lara Y., Lisbona P., Romeo L.M., Operation of a cyclonic preheater in the Ca-looping for CO2 capture, Envi-ronmental Science and Technology, 47 (2013) 11335–11341. DOI: 10.1021/es401601k
Martínez A., Lara Y., Lisbona P., Romeo L.M., Operation of a mixing seal valve in calcium looping for CO2 capture, Energy and Fuels, 28 (2014) 2059–2068. DOI: 10.1021/
Carlos Ortiz et al. / KONA Powder and Particle Journal No. 38 (2021) 189–208
205
ef402487eMartínez I., Murillo R., Grasa G., Abanades J.C., Integration of
a Ca-looping system for CO2 capture in an existing power plant, Energy Procedia, 4 (2011) 1699–1706. DOI: 10.1016/j.egypro.2011.02.043
Maya J.C., Chejne F., Gómez C.A., Bhatia S.K., Effect of the CaO sintering on the calcination rate of CaCO3 under atmo-spheres containing CO2, AIChE Journal, 64 (2018) 3638–3648. DOI: 10.1002/aic.16326
Maynard E., Ten steps to an effective bin design, American Institute of Chemical Engineers, (2013) 25–32. <www.aiche.org/sites/default/files/cep/20131125_1.pdf> accessed 03.09.2019.
Mehos G., Maynard E., Handle bulk solids safely and effec-tively, Chemical Engineering Progress, 105 (2009) 38–42.
Mehos M., Turchi C., Vidal J., Wagner M., Ma Z., Ho C., Kolb W., Andraka C., Mehos M., Turchi C., Vidal J., Wagner M., Ma Z., Ho C., Kolb W., Andraka C., Kruizenga A., Concen-trating Solar Power Gen3 Demonstration Roadmap, United States, 2017, 140pp. DOI: 10.2172/1338899
Mei R., Carbon Dioxide Shuttling Thermochemical Storage Using Strontium Carbonate, United States, 2015, 57pp. DOI: 10.2172/1347721
Meier A., Bonaldi E., Cella G.M., Lipinski W., Multitube rotary kiln for the industrial solar production of lime, Journal of Solar Energy Engineering, 127 (2005) 386. DOI: 10.1115/ 1.1979517
Meier A., Bonaldi E., Cella G.M., Lipinski W., Wuillemin D., Palumbo R., Design and experimental investigation of a horizontal rotary reactor for the solar thermal production of lime, Energy, 29 (2004) 811–821. DOI: 10.1016/S0360-5442(03)00187-7
Migliozzi S., Paulillo A., Chirone R., Salatino P., Solimene R., Hydrodynamics of compartmented fluidized beds under uneven fluidization conditions, Powder Technology, 316 (2017) 476–491. DOI: 10.1016/j.powtec.2016.12.052
Mills D., Pneumatic Conveying Design Guide, Elsevier Butterworth-Heinemann, Oxford, 2003, 650pp. ISBN: 9780750654715
Moumin G., Tescari S., Sundarraj P., de Oliveira L., Roeb M., Sattler C., Solar treatment of cohesive particles in a directly irradiated rotary kiln, Solar Energy, 182 (2019a) 480–490. DOI: 10.1016/j.solener.2019.01.093
Muto A., Hansen T., Demonstration of High-Temperature Calcium-Based Thermochemical Energy Storage System for Use with Concentrating Solar Power Facilities, Golden, CO (United States), 2019. DOI: 10.2172/1501361
NREL (National Renewable Energy Laboratory), 2017, Concen-trating Solar Power Projects, <solarpaces.nrel.gov/> accessed 03.09.2019.
OLDS elevator, 2019. <www.oldsusa.com/index.html> accessed 03.09.2019.
Ortiz C., Binotti M., Romano M.C., Valverde J.M., Chacartegui R., Off-design model of concentrating solar power plant with thermochemical energy storage based on calcium- looping, AIP Conference Proceedings, 2126 (2019) 210006. DOI: 10.1063/1.5117755
Ortiz C., Chacartegui R., Valverde J.M., Alovisio A., Becerra
J.A., Power cycles integration in concentrated solar power plants with energy storage based on calcium looping, Energy Conversion and Management, 149 (2017a) 815-829. DOI: 10.1016/j.enconman.2017.03.029
Ortiz C., Chacartegui R., Valverde J.M., Becerra J.A., Perez- Maqueda L.A., A new model of the carbonator reactor in the calcium looping technology for post-combustion CO2 capture, Fuel, 160 (2015) 328–338. DOI: 10.1016/j.fuel.2015. 07.095
Ortiz C., Chacartegui R., Valverde J.M., Becerra J.A., A new integration model of the calcium looping technology into coal fired power plants for CO2 capture, Applied Energy, 169 (2016a) 408-420. DOI: 10.1016/j.apenergy.2016.02.050
Ortiz C., Romano M.C., Valverde J.M., Binotti M., Chacartegui R., Process integration of Calcium-Looping thermochemical energy storage system in concentrating solar power plants, Energy, 155 (2018a) 535–551. DOI: 10.1016/j.energy.2018. 04.180
Ortiz C., Valverde J.M., Chacartegui R., Energy consumption for CO2 capture by means of the calcium looping process: a comparative analysis using limestone, Dolomite, and Steel Slag, Energy Technology, 4 (2016b) 1–12. DOI: 10.1002/ente.201600390
Ortiz C., Valverde J.M., Chacartegui R., Benítez-Guerrero M., Perejón A., Romeo L.M., The Oxy-CaL process: a novel CO2 capture system by integrating partial oxy-combustion with the Calcium-Looping process, Applied Energy, 196 (2017b) 1–17. DOI: 10.1016/j.apenergy.2017.03.120
Ortiz C., Valverde J.M., Chacartegui R., Perez-Maqueda L.A., Carbonation of limestone derived CaO for thermochemical energy storage: from kinetics to process integration in concentrating solar plants, ACS Sustainable Chemistry and Engineering, 6 (2018b) 6404–6417. DOI: 10.1021/ acssuschemeng.8b00199
Ortiz C., Valverde J.M., Chacartegui R., Perez-Maqueda L.A., Giménez P., The Calcium-Looping (CaCO3/CaO) process for thermochemical energy storage in concentrating solar power plants, Renewable and Sustainable Energy Reviews, 113 (2019b) 109252. DOI: 10.1016/j.rser.2019.109252
Pardo P., Deydier A., Anxionnaz-Minvielle Z., Rougé S., Cabassud M., Cognet P., A review on high temperature thermochemical heat energy storage, Renewable and Sus-tainable Energy Reviews, 32 (2014) 591–610. DOI: 10.1016/j.rser.2013.12.014
Perejón A., Miranda-Pizarro J., Pérez-Maqueda L.A., Valverde J.M., On the relevant role of solids residence time on their CO2 capture performance in the Calcium Looping technol-ogy, Energy, 113 (2016a) 160–171. DOI: 10.1016/j.energy. 2016.07.028
Perejón A., Romeo L.M., Lara Y., Lisbona P., Martínez A., Valverde J.M., The Calcium-Looping technology for CO2 capture: on the important roles of energy integration and sorbent behavior, Applied Energy, 162 (2016b) 787–807. DOI: 10.1016/j.apenergy.2015.10.121
Plou J., Martínez I., Grasa G.S., Murillo R., Experimental car-bonation of CaO in an entrained flow reactor, Reaction Chemistry & Engineering, 4 (2019) 899–908. DOI: 10.1039/C9RE00015A
Carlos Ortiz et al. / KONA Powder and Particle Journal No. 38 (2021) 189–208
206
Prescott J., Barnum R., On powder flowability, Pharmaceutical Technology, 24 (2000) 60–84. DOI: 10.1016/j.partic.2011. 11.003
Raganati F., Chirone R., Ammendola P., Gas–solid fluidization of cohesive powders, Chemical Engineering Research and Design, 133 (2018) 347–387. DOI: 10.1016/j.cherd.2018.03.034
Romano M.C., Modeling the carbonator of a Ca-looping process for CO2 capture from power plant flue gas, Chemical Engi-neering Science, 69 (2012) 257–269. DOI: 10.1016/j.ces. 2011.10.041
Romano M.C., Ultra-high CO2 capture efficiency in CFB oxy-fuel power plants by calcium looping process for CO2 recovery from purification units vent gas, International Journal of Greenhouse Gas Control, 18 (2013) 57–67. DOI: 10.1016/j.ijggc.2013.07.002
Romano M., Martínez I., Murillo R., Arstad B., Blom R., Ozcan D.C., Ahn H., Brandani S., Guidelines for modeling and simulation of Ca-looping processes, Prepared for the Euro-pean Energy Research Alliance, Sintef. No, 2012, 52pp. <www.sintef.no/globalassets/project/eera-ccs/eera---ca-looping-simulation-guidelines.pdf> accessed 03.09.2019.
Romano M.C., Martínez I., Murillo R., Arstad B., Blom R., Ozcan D.C., Ahn H., Brandani S., Process simulation of Ca-looping processes: review and guidelines, Energy Pro-cedia, 37 (2013) 142–150. DOI: 10.1016/j.egypro.2013.05.095
Romano M.C., Spinelli M., Campanari S., Consonni S., Marchi M., Pimpinelli N., Cinti G., The Calcium looping process for low CO2 emission cement plants, Energy Procedia, 61 (2014) 500–503. DOI: 10.1016/j.egypro.2014.11.1158
Romeo L.M., Abanades J.C., Escosa J.M., Paño J., Giménez A., Sánchez-Biezma A., Ballesteros J.C., Oxyfuel carbonation/calcination cycle for low cost CO2 capture in existing power plants, Energy Conversion and Management, 49 (2008) 2809–2814. DOI: 10.1016/j.enconman.2008.03.022
Romeo L.M., Lara Y., Lisbona P., Escosa J.M., Optimizing make-up flow in a CO2 capture system using CaO, Chemi-cal Engineering Journal, 147 (2009) 252–258. DOI: 10.1016/j.cej.2008.07.010
Romeo L.M., Usón S., Valero A., Escosa J.M., Exergy analysis as a tool for the integration of very complex energy systems: the case of carbonation/calcination CO2 systems in existing coal power plants, International Journal of Greenhouse Gas Control, 4 (2010) 647–654. DOI: 10.1016/j.ijggc.2009.12.012
Sakellariou K.G., Karagiannakis G., Criado Y.A., Konstandopoulos A.G., Calcium oxide based materials for thermochemical heat storage in concentrated solar power plants, Solar Energy, 122 (2015) 215–230. DOI: 10.1016/j.solener.2015.08.011
Salatino P., Ammendola P., Bareschino P., Chirone R., Solimene R., Improving the thermal performance of fluidized beds for concentrated solar power and thermal energy storage, Powder Technology, 290 (2016) 97–101. DOI: 10.1016/j.powtec.2015.07.036
Salaudeen S.A., Acharya B., Dutta A., CaO-based CO2 sor-bents: a review on screening, enhancement, cyclic stability, regeneration and kinetics modelling, Journal of CO2 Utili-zation, 23 (2018) 179–199. DOI: 10.1016/j.jcou.2017.11.012
Sarrión B., Perejón A., Sánchez-Jiménez P.E., Pérez-Maqueda L.A., Valverde J.M., Role of calcium looping conditions on
the performance of natural and synthetic Ca-based materi-als for energy storage, Journal of CO2 Utilization, 28 (2018) 374–384. DOI: 10.1016/j.jcou.2018.10.018
SCARLET EU project, 2014 <http://www.project-scarlet.eu> accessed 03.09.2019.
Schorcht F., Kourti I., Scalet B.M., Roudier S., Sancho L.D., Best Available Techniques (BAT) Reference Document for the Production of Cement, Lime and Magnesium Oxide, Industrial Emissions Directive 2010/75/EU (Integrated Pol-lution Prevention and Control), European Union, 2013, ISBN 978-92-79-32944-9. DOI: 10.2788/12850
Shimizu A., Yokomine T., Nagafuchi T., Development of gas- solid direct contact heat exchanger by use of axial flow cyclone, International Journal of Heat and Mass Transfer, 47 (2004) 4601–4614. DOI: 10.1016/j.ijheatmasstransfer. 2003.10.045
Shimizu T., Hirama T., Hosoda H., Kitano K., Inagaki M., Tejima K., A twin fluid-bed reactor for removal of CO2 from combustion processes, Chemical Engineering Research and Design, 77 (1999) 62–68. DOI: 10.1205/026387699525882
Siegel N.P., Ho C.K., Khalsa S.S., Kolb G.J., Development and evaluation of a prototype solid particle receiver: on-sun testing and model validation, Journal of Solar Energy Engi-neering, 132 (2010) 021008. DOI: 10.1115/1.4001146
Siva Reddy V., Kaushik S.C., Ranjan K.R., Tyagi S.K., State- of-the-art of solar thermal power plants—A review, Renew-able and Sustainable Energy Reviews, 27 (2013) 258–273. DOI: 10.1016/j.rser.2013.06.037
Socratces Project, 2018 <https://socratces.eu/> accessed 03.09.2019.Spinelli M., Martínez I., De Lena E., Cinti G., Hornberger M.,
Spörl R., Abanades J.C., Becker S., Mathai R., Fleiger K., Hoenig V., Gatti M., Scaccabarozzi R., Campanari S., Con-sonni S., Romano M.C., Integration of Ca-Looping systems for CO2 capture in cement plants, Energy Procedia, 114 (2017) 6206–6214. DOI: 10.1016/j.egypro.2017.03.1758
Spinelli M., Martínez I., Romano M.C., One-dimensional model of entrained-flow carbonator for CO2 capture in cement kilns by Calcium looping process, Chemical Engineering Sci-ence, 191 (2018) 100–114. DOI: 10.1016/j.ces.2018.06.051
Stein W.H., Buck R., Advanced power cycles for concentrated solar power, Solar Energy, 152 (2017) 91–105. DOI: 10.1016/j.solener.2017.04.054
Ströhle J., Galloy A., Epple B., Feasibility study on the carbon-ate looping process for post-combustion CO2 capture from coal-fired power plants, Energy Procedia, 1 (2009) 1313–1320. DOI: 10.1016/j.egypro.2009.01.172
Ströhle J., Junk M., Kremer J., Galloy A., Epple B., Carbonate looping experiments in a 1 MWth pilot plant and model val-idation, Fuel, 127 (2014) 13–22. DOI: 10.1016/j.fuel.2013. 12.043
Tregambi C., Montagnaro F., Salatino P., Solimene R., A model of integrated calcium looping for CO2 capture and concen-trated solar power, Solar Energy, 120 (2015) 208–220. DOI: 10.1016/j.solener.2015.07.017
Turrado S., Arias B., Fernández J.R., Abanades J.C., Carbon-ation of fine CaO particles in a drop tube reactor, Industrial & Engineering Chemistry Research, 57 (2018) 13372–13380. DOI: 10.1021/acs.iecr.8b02918
Carlos Ortiz et al. / KONA Powder and Particle Journal No. 38 (2021) 189–208
207
Valverde J.M., A model on the CaO multicyclic conversion in the Ca-looping process, Chemical Engineering Journal, 228 (2013a) 1195–1206. DOI: 10.1016/j.cej.2013.05.023
Valverde J.M., Fluidization of Fine Powders, Cohesive versus Dynamical Aggregation, Springer, Dordrecht, 2013b, ISBN: 978-94-007-5586-4. DOI: 10.1007/978-94-007-5587-1
Valverde J.M., Thermochemical method for the transfer and storage of concentrated solar energy, WIPO (PCT) (2015) WO2015197885A1.
Valverde J.M., Medina S., Reduction of calcination temperature in the calcium looping process for CO2 capture by using helium: in situ XRD analysis, ACS Sustainable Chemistry & Engineering, 4 (2016) 7090–7097. DOI: 10.1021/acssus-chemeng.6b01966
Valverde J.M., Raganati F., Quintanilla M.A.S., Ebri J.M.P., Ammendola P., Chirone R., Enhancement of CO2 capture at Ca-looping conditions by high-intensity acoustic fields, Applied Energy, 111 (2013) 538–549. DOI: 10.1016/j.apen-ergy.2013.05.012
Valverde J.M., Sanchez-Jimenez P.E., Perez-Maqueda L.A., Role of precalcination and regeneration conditions on postcombustion CO2 capture in the Ca-looping technology, Applied Energy, 136 (2014) 347–356. DOI: 10.1016/j.apen-ergy.2014.09.052
Wang M., Lawal A., Stephenson P., Sidders J., Ramshaw C., Hill W., Park B., Sn S., Post-combustion CO2 capture with chemical absorption: A state-of-the-art review, Chemical Engineering Research and Design, 89 (2011) 1609–1624. DOI: 10.1016/j.cherd.2010.11.005
Wang W., Ramkumar S., Li S., Wong D., Iyer M., Sakadjian B.B., Statnick R.M., Fan L.S., Subpilot demonstration of the carbonation-calcination reaction (CCR) process: high-temperature CO2 and sulfur capture from coal-fired power plants, Industrial and Engineering Chemistry Research, 49 (2010) 5094–5101. DOI: 10.1021/ie901509k
Wentworth W.E., Chen E., Simple thermal decomposition reac-tions for storage of solar thermal energy, Solar Energy, 18 (1976) 205–214. DOI: 10.1016/0038-092X(76)90019-0
Yates J.G., Lettieri P., Fluidized-Bed Reactors: Processes and Operating Conditions, Springer, Cham, 2016. ISBN:978-3-319-39591-3 DOI: 10.1007/978-3-319-39593-7
Yogi Goswami D., Solar thermal power technology: present status and ideas for the future, Energy Sources, 20 (1998) 137–145. DOI: 10.1080/00908319808970052
Zhang D., Koksal M., Heat transfer in a pulsed bubbling fluid-ized bed, Powder Technology, 168 (2006) 21–31. DOI: 10.1016/j.powtec.2006.06.017
Zhao B., Su Y., Zhang J., Simulation of gas flow pattern and separation efficiency in cyclone with conventional single and spiral double inlet configuration, Chemical Engineer-ing Research and Design, 84 (2006) 1158–1165. DOI: 10.1205/cherd06040
Zhao M., Minett A.I., Harris A.T., A review of techno- economic models for the retrofitting of conventional pulverised-coal power plants for post-combustion capture (PCC) of CO2, Energy and Environmental Science, 6 (2013) 25–40. DOI: 10.1039/c2ee22890d
Carlos Ortiz et al. / KONA Powder and Particle Journal No. 38 (2021) 189–208
208
Authors’ Short Biographies
Carlos Ortiz
Assistant Professor at Universidad Loyola Andalucia. PhD in energy engineering (2018). His research activity is focused on the CaL process for both CO2 capture and thermochemical energy storage applications. It comprises energetic and chemicals sys-tems modelling. He has published over 25 papers mostly in Q1 journals with more than 600 citations.
José Manuel Valverde
Professor of electromagnetism and materials engineering. PhD in physics (1997). His research activity has been focused on the study of fluidization and the mechanical prop-erties of granular materials. A main subject of current interest is development of novel techniques to enhance the CO2 capture efficiency of CaO-based materials by means of the Ca-looping technology based on carbonation/calcination of natural limestone in fluidized beds. He has published over 100 papers mostly in Q1 journals with over 1000 citations.
Ricardo Chacartegui
Professor of the Energy Engineering Department of the University of Seville. PhD in energy engineering. His research is focused on thermal energy systems: design, develop-ment, and optimization. It comprises the analysis of novel cycle concepts and thermal systems (supercritical CO2 cycle, HAT cycle, high-temperature fuel cell hybrid systems, organic Rankine cycles, Stirling engines) combined with the improvement of existing technologies (boilers, thermosolar, gas turbines, combined cycles, compressors) and sys-tems development. He has an intense R&D activity with more than 40 papers published in Q1 and Q2 peer review journals since 2006 and more than 60 papers in international congresses.
Luis A. Pérez-Maqueda
Senior scientist in the Institute of Materials Science of Seville, a joint research center belonging to the Spanish National Bureau of Science and to the University of Seville. His research is focused on the field of reactivity of solids. He is interested in solids-solids and solids-gas reactions of interest in fields such as materials science, energy and envi-ronment. He has published about 190 scientific papers in international journals.
Pablo Gímenez-Gavarrell
Industrial and biomedical engineer (Polytechnic University of Valencia) and PhD on thermal energy storage (University of Seville), with 4 years of experience in CSP. He currently works at the University of Seville (PSI) teaching heat transfer and thermal en-gineering.
KONA Powder and Particle Journal No. 38 (2021) 209–225/https://doi.org/10.14356/kona.2021014 Original Research Paper
209Copyright © 2021 The Authors. Published by Hosokawa Powder Technology Foundation. This is an open access article under the CC BY license (http://creativecommons.org/licenses/by/4.0/).
Modulated Uniaxial Compression Analysis of Respirable Pharmaceutical Powders †
David Barona 1, Abouzar Shamsaddini 1, Maximilian Aisenstat 1, Kyrre Thalberg 2, David Lechuga-Ballesteros 3, Behzad Damadzadeh 3 and Reinhard Vehring 1*1 Department of Mechanical Engineering, University of Alberta, Canada2 Inhalation Product Development, Pharmaceutical Technology & Development, Operations, AstraZeneca AB, Sweden3 Inhalation Product Development, Pharmaceutical Technology & Development, Operations, AstraZeneca PLC, USA
AbstractWe describe a new instrument and method for measuring compressed bulk density of respirable pharmaceutical powders under low compression pressure: the modulated compression tester. The instrument modulates compression and decompression steps, allowing scrutiny of the overall compression response of samples. Compared to established methods for the determination of density and related parameters for pharmaceutical powders, this instrument has the capability of measuring smaller samples. The relative humidity can also be controlled in the instrument (3 % to 95 % RH), allowing assessment of the effect of moisture on compression response. We have used the instrument to determine the compressed bulk density of Trehalose, Leucine, Trileucine, and Mannitol powders of varying crystalline and amorphous compositions and particle size and size distribution, demonstrating that the new modulated compression tester is suitable for low pressure (< 1200 kPa) density measurement of respirable powders (< 10 μm) and expensive active pharmaceutical ingredients available in limited quantities (typical sample mass requirement of < 100 mg). In addition, the modulation feature of the instrument allows the analysis of the transition from plastic to semi-elastic compression response. The outputs and features of this instrument are useful for formulation development, quality control measurements, discerning between different or similar powders due to differences in the compression response, and optimizing powder compression parameters for pharmaceutical applications.
Keywords: compressed bulk density, respirable powders, powder compression, powder elasticity, dry powder inhalers
1. Introduction
Evaluation of the compression response of fine and respirable pharmaceutical powders is of prime importance because of the implications it has on formulation devel-opment, manufacturing and quality of the final product. Adequate characterization of the bulk powder properties is needed through the entire product development lifecycle (de Boer et al., 2017; Sørensen et al., 2005). For solid dos-age forms, knowledge of the particle density and powder bulk density are necessary for assessing the aerodynamic properties (Feng et al., 2011), dispersibility (Boraey et al., 2013; Weiler et al., 2010) and parameters that influence powder filling processes, such as flowability (Faulhammer
et al., 2014; Osorio and Muzzio, 2013). In order to assess the quality of a final product, the properties of powdered excipients and active ingredients must be precisely and accurately characterized. It is therefore important to characterize the bulk density and compression response of powders for manufacturing and quality control of final pharmaceutical products.
Providing an unambiguous definition of powder density is not straightforward because of the presence of voids within particles and between neighboring particles in a powder. This fact gives rise to a family of density defini-tions for pharmaceutical powders: true density, particle density, bulk density and tapped density, among others. The true density of a solid object excludes internal and external voids that are not a fundamental part of the molecular packing; thus, true density can be measured reproducibly because it does not include pore volume in its determination (Brockhaus and Carlozzo, 1995). Particle density is the ratio of the particle mass over the volume of the particle with external and internal voids, also known as the hydrodynamic volume (Vehring, 2008). Bulk density is
† Received 30 May 2020; Accepted 8 July 2020 J-STAGE Advance published online 29 August 2020
* Correspopnding author: Reinhard Vehring; Add: 116 Street and 85 Avenue, Edmonton, Alberta, Canada, T6G
2G8 E-mail: [email protected] TEL: +1-780-492-5180 FAX: +1-780-492-2200
David Barona et al. / KONA Powder and Particle Journal No. 38 (2021) 209–225
210
the mass of the powder in a column divided by its volume, where its volume is the hydrodynamic volume of the par-ticle plus interstitial spaces between particles (USP, 2015). Tapped density is obtained by mechanically tapping the powder in a column at a specified frequency, duration and amplitude until no further volume change can be observed (USP, 2015).
Bulk density and tapped density are routinely used in the pharmaceutical industry to characterize powders (Sørensen et al., 2005). However, bulk density of a powder sample depends on how the sample was handled (USP, 2015). For instance, disturbing the powder sample can result in rearrangement of the particles and a change in the bulk density. In contrast, the tapped density technique deliberately disturbs the powder bed to improve sample packing so that more repeatable density measurements can be made. However, an inaccurate reading of the vol-ume from the measuring cylinder can introduce errors. In addition, bulk and tapped density measurements usually require large amounts of powder, typically using tens of grams (Sørensen et al., 2005; USP, 2015). This becomes a major drawback if expensive, rare, limited-quantity or difficult-to-make samples require analysis. Furthermore, bulk and tapped density techniques are better suited for large particles and where the interparticle forces are small compared to inertial forces. This way, when the powder is handled or tapped, the particles can easily rearrange, and the powder can achieve a repeatable bulk density.
The compression response of fine and respirable pow-ders, which have a mean particle size of less than 10 μm, is dominated by interparticle forces (Sarkar et al., 2017; Shamsaddini-Shahrbabak and Vehring, 2012). The inter-particle forces influencing the bulk density of powders are also the interactions that interfere with powder flow (USP, 2015). Particle size and shape are also known to be important determinants of powder flow and compression response (Adeoye and Alebiowu, 2014; Kaerger et al., 2004; McKenna and McCafferty, 1982; Patel et al., 2007). Assessing the compressibility of fine respirable powders is uniquely challenging given the increased influence of cohesive forces (Thalberg et al., 2004; Weiler et al., 2010) relative to inertial forces (Desai et al., 2001). The cohesive forces in fine powders may also be influenced by surface characteristics (e.g. rugosity, contact area), intermolecular forces (e.g. Van der Waals interactions), electrostatics, ma-terial properties and environmental conditions, in addition to particle size and shape (Baldelli and Vehring, 2016; Sarkar et al., 2017; Weiler et al., 2010). As a result, when compared to powders with larger particles, fine powders are typically more cohesive and display relatively poor flowability and dispersibility; thus, they are not well suited for bulk or tapped density measurements.
The cohesive nature of fine and respirable powders likewise holds implications for powder handling during
manufacturing as well as for delivery efficiency from inha-lation devices (Elia et al., 2016; Rudén et al., 2018; Weiler et al., 2010). Powder products that are meant for inhalation (e.g. dry powder inhalers) are compressed at low pressures and packaged into capsules that require additional energy upon use to disperse them for inhalation (de Boer et al., 2017; Faulhammer et al., 2014; Prime et al., 1997). In such a case, it is important to use low compression pressures when packaging the powder product to achieve particle re-arrangement, resulting in a loose powder compact. Utiliz-ing low pressures when plastically compressing respirable powders can also mitigate the deformation or fracturing of the particles (Chen et al., 2017; Raut et al., 2016; Sørensen et al., 2005; Vu et al., 2020), preserving the aerodynamic properties of the particles, while minimizing the volume of powder needed for each capsule. As a result, single-value density measurements, such as bulk and tapped density, are unsuitable for relatively cohesive respirable powders, so new methods are required for accurate and reproducible Compressed Bulk Density (CBD) measurements.
For the overall compression response of fine powders to be described, they must be actively compressed, taking into consideration the entire compression curves and elasticity of the powders (Vu et al., 2020). Assuming there is no moisture, a powder column is mostly a two-phase system that consists of air and particles. Generally speaking, when a powder is subjected to a compression force, it will go through a series of either reversible or irreversible com-pression stages. The former occurs as a result of material elasticity and the latter is due to plasticity of the powder (Chen et al., 2017; Vu et al., 2020). The first stage of the compression process is seen as the displacement of the gaseous phase by the solid phase (powder packing and particle rearrangement) within the bulk as a result of the compression force, leading to the reduction of the bed volume (Klevan et al., 2009; York, 1978). After this stage, many air gaps between particles are filled, yet the particles themselves have not fractured or deformed. Once the bed has reached a sufficiently close packing, it starts showing elastic response to the applied force. At higher compression force, non-elastic materials or those elastic materials that have yielded may show permanent, plastic deformation, and particle fracture and further packing become possible. At very high pressures, the powder bed acts like a solid body.
A powder’s compression response strongly depends on the way that particles pack together. When powder is sub-jected to an axial force, this external force brings the parti-cles closer to one another and causes the volume to reduce. This stage may be referred to as the particle rearrangement stage (Bolhuis et al., 1996; Tousey, 2002; Vu et al., 2020; Yap et al., 2008). It is therefore possible, experimentally, to determine the pressure at which the powder is compressed and starts showing significant reversible response; this is
David Barona et al. / KONA Powder and Particle Journal No. 38 (2021) 209–225
211
the transition pressure from plastic to elastic deformation.In general, CBD measurements are based on uniaxially
compressing a powder sample and measuring its density under a defined pressure. A number of studies involving low-pressure compression of pharmaceutical powders have been reported (Faulhammer et al., 2014; Heda et al., 1999; Kostelnik et al., 1968; Llusa et al., 2014; Nikolakakis et al., 1998; Podczeck and Lee-Amies, 1996; Sheikh-Salem and Fell, 1981; Sørensen et al., 2005, 2006). A previous report has also used a commercial compression instrument that can accommodate milligram powder quantities for bulk density measurements (Sørensen et al., 2005). While these studies have demonstrated the use of low-pressure compression for bulk density measurements and the use of small sample quantities, none has experimentally differ-entiated the compression response of respirable powders between densification due primarily to particle rearrange-ment, i.e. plastic deformation, from densification due to semi-elastic particle or powder deformation. The ability to experimentally identify these compression responses is only achievable at low pressures and is important for establishing suitable compression pressures for packaging or processing respirable powders. The instrument in this paper is similar to the commercially available Geopyc 1360 (Micromeritics, Norcross, GA), which can only han-dle larger sample masses, as well as the Texture Analyzer (Stable Micro Systems, Surrey, UK), which is designed for a variety of uses, but is not specifically for density mea-surements of fine respirable powders and does not have RH control capabilities.
We report here the development of a uniaxial low-pressure and modulated compression instrument for CBD measure-ments of fine and respirable pharmaceutical powders. The
focus of this paper is to demonstrate the capabilities of the new instrument and its ability to differentiate between very similar respirable powders at low compression pressures. We also show details of the modulation compression tech-nique and introduce a new parameter for powder elasticity, which can be used to easily distinguish between plastic and semi-elastic compression response.
2. Materials and methods
2.1 Materials
With the exception of crystalline Leucine (raw ma-terial), all powder samples used in this study were produced by spray drying and contain particles with mass median aerodynamic diameters (MMAD) in the respirable range (≤ 10 μm). D-(+)-trehalose dihydrate (177,613, Fisher Scientific Co., Ottawa, ON, Canada), Trileucine (BCBP2254V, Sigma-Aldrich Corp., St. Louis, MO, USA), L-Leucine (AC125121000, Acros Organics, New Hampshire, NH), and D-mannitol (SLBH1429V, Sigma-Aldrich Corp., St. Louis, MO, USA) are pharma-ceutical excipients and were used to produce the powder samples for this study. These excipients were chosen on the basis of their different effects on particle formation, cohesiveness and mechanical properties (Vehring, 2008).
Most of these excipients were spray-dried by themselves or in mixtures to produce the samples shown in Table 1 and to allow CBD measurements of different formulations, particle sizes and particle size distributions. Monodisperse samples had a particle size distribution with a geometric standard deviation (GSD) of 1.1 while polydisperse
Table 1 Materials and formulations used for compressed bulk density tests, including fully crystalline and fully amorphous materials, different par-ticle sizes and different particle size distribution. The Mass column shows the range of masses needed for a measurement; the geometric standard devi-ation (GSD) and mass median aerodynamic diameter (MMAD) columns correspond to the size distributions of the spray dried powders (note that the 100 % Leucine sample was the raw material and was not spray dried); and ρt,mix corresponds to the calculated true density of each material or mixture.
# Trehalose[% w/w]
Leucine[% w/w]
Trileucine[% w/w]
Mannitol[% w/w]
Mass [mg] GSD MMAD[μm]
ρt,mix[g/cm3]
1 100 78.7–79.5 (raw material)
1.29
2 100 58.9–59.3 1.6 2.5 1.53
3 99.6 0.4 86.4–91.7 1.1 9 1.53
4 99 1 103.9–110.2 1.1 9 1.52
5 95 5 72.8–77.3 1.1 9 1.50
6 80 20 63.2–68.5 1.6 2.5 1.48
7 75 25 40.0–42.6 1.6 2 1.47
8 75 25 38.2–40.3 1.6 4.5 1.47
9 55 45 34.6–37.4 1.6 3.6 1.42
10 100 68.3–69.7 1.1 10 1.51
11 100 64.4–65.7 1.6 3.5 1.51

David Barona et al. / KONA Powder and Particle Journal No. 38 (2021) 209–225
212
samples had a particle size distribution with a GSD of 1.6. The median sample mass of the materials and formulations listed in Table 1 was 66 mg. All samples were stored at a relative humidity (RH) below 5 % and between 22 and 23 °C in a desiccator for several weeks before being used for measurements.
Field Emission Scanning Electron Microscopy (Zeiss Sigma FE-SEM; Carl Zeiss, Oberkochen, Germany) was used to assess particle size and morphology. Powder samples were mounted directly onto aluminum Scanning Electron Microscope (SEM) stubs (Product 16111; Ted Pella, Inc.; Redding, CA, USA). Subsequently, the samples were sputtered with a gold coating (Denton Vacuum Desk II; Moorestown, NJ, USA) to a thickness of 10 to 15 nm. Images ranging from magnifications of 500× to 20000× were taken at a working distance of 5.3 to 6.3 mm using an accelerating voltage of 3 to 4 kV. Scanning Electron
Microscope images of these samples are shown in Fig. 1 to show the differences in particle sizes and morphologies.
The experimental set-up for monodisperse and polydisperse spray drying has been discussed elsewhere (Ivey et al., 2018b; Wang et al., 2019). The aerodynamic particle size distributions were measured in-line with the spray drying process using a time-of-flight aerodynamic particle sizer (3321, TSI, Shoreview, MN, USA) (Ivey et al., 2018a).
The solid phase of the powder samples was assessed using Raman spectroscopy to determine whether they were amorphous, crystalline or a mixture of the two. A custom dispersive Raman spectroscopy system was utilized for this purpose. The system included a 671 nm diode-pumped solid-state laser (Ventus Solo MPC6000; Laser Quantum, Stockport, UK). A detailed description of a similar appa-ratus has been published elsewhere (Wang et al., 2017).
Fig. 1 SEM images of the materials and formulations tested and reported in this paper. The numbering of the images corresponds to the materials and formulations listed in Table 1. For direct comparison, all images are at the same magnification and show a scale bar of 2 μm. An SEM image for sample #8 was not available; however, it was expected to have similar morphologies to those shown for sample #7 since the composition was the same and the size difference was small. These formulations show a range of particle sizes and morphologies ranging from spherical and smooth to highly rugose and wrinkled.
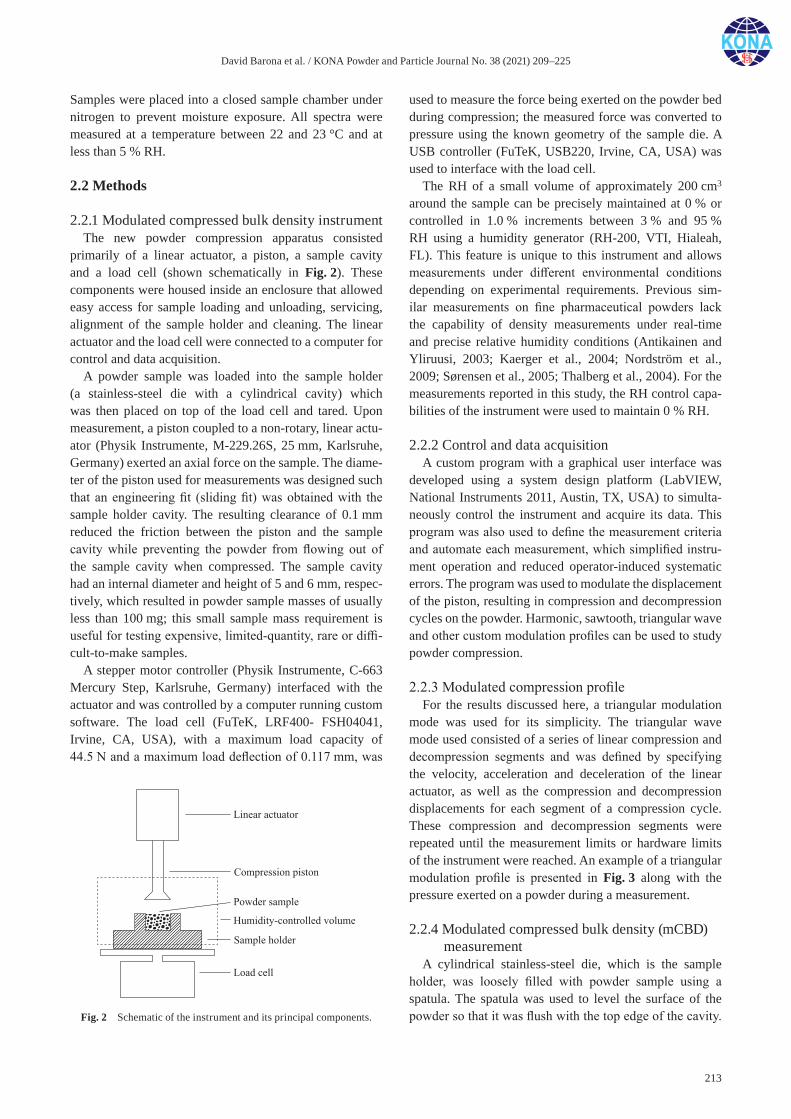
David Barona et al. / KONA Powder and Particle Journal No. 38 (2021) 209–225
213
Samples were placed into a closed sample chamber under nitrogen to prevent moisture exposure. All spectra were measured at a temperature between 22 and 23 °C and at less than 5 % RH.
2.2 Methods
2.2.1 Modulated compressed bulk density instrumentThe new powder compression apparatus consisted
primarily of a linear actuator, a piston, a sample cavity and a load cell (shown schematically in Fig. 2). These components were housed inside an enclosure that allowed easy access for sample loading and unloading, servicing, alignment of the sample holder and cleaning. The linear actuator and the load cell were connected to a computer for control and data acquisition.
A powder sample was loaded into the sample holder (a stainless-steel die with a cylindrical cavity) which was then placed on top of the load cell and tared. Upon measurement, a piston coupled to a non-rotary, linear actu-ator (Physik Instrumente, M-229.26S, 25 mm, Karlsruhe, Germany) exerted an axial force on the sample. The diame-ter of the piston used for measurements was designed such that an engineering fit (sliding fit) was obtained with the sample holder cavity. The resulting clearance of 0.1 mm reduced the friction between the piston and the sample cavity while preventing the powder from flowing out of the sample cavity when compressed. The sample cavity had an internal diameter and height of 5 and 6 mm, respec-tively, which resulted in powder sample masses of usually less than 100 mg; this small sample mass requirement is useful for testing expensive, limited-quantity, rare or diffi-cult-to-make samples.
A stepper motor controller (Physik Instrumente, C-663 Mercury Step, Karlsruhe, Germany) interfaced with the actuator and was controlled by a computer running custom software. The load cell (FuTeK, LRF400- FSH04041, Irvine, CA, USA), with a maximum load capacity of 44.5 N and a maximum load deflection of 0.117 mm, was
used to measure the force being exerted on the powder bed during compression; the measured force was converted to pressure using the known geometry of the sample die. A USB controller (FuTeK, USB220, Irvine, CA, USA) was used to interface with the load cell.
The RH of a small volume of approximately 200 cm3 around the sample can be precisely maintained at 0 % or controlled in 1.0 % increments between 3 % and 95 % RH using a humidity generator (RH-200, VTI, Hialeah, FL). This feature is unique to this instrument and allows measurements under different environmental conditions depending on experimental requirements. Previous sim-ilar measurements on fine pharmaceutical powders lack the capability of density measurements under real-time and precise relative humidity conditions (Antikainen and Yliruusi, 2003; Kaerger et al., 2004; Nordström et al., 2009; Sørensen et al., 2005; Thalberg et al., 2004). For the measurements reported in this study, the RH control capa-bilities of the instrument were used to maintain 0 % RH.
2.2.2 Control and data acquisitionA custom program with a graphical user interface was
developed using a system design platform (LabVIEW, National Instruments 2011, Austin, TX, USA) to simulta-neously control the instrument and acquire its data. This program was also used to define the measurement criteria and automate each measurement, which simplified instru-ment operation and reduced operator-induced systematic errors. The program was used to modulate the displacement of the piston, resulting in compression and decompression cycles on the powder. Harmonic, sawtooth, triangular wave and other custom modulation profiles can be used to study powder compression.
2.2.3 Modulated compression profileFor the results discussed here, a triangular modulation
mode was used for its simplicity. The triangular wave mode used consisted of a series of linear compression and decompression segments and was defined by specifying the velocity, acceleration and deceleration of the linear actuator, as well as the compression and decompression displacements for each segment of a compression cycle. These compression and decompression segments were repeated until the measurement limits or hardware limits of the instrument were reached. An example of a triangular modulation profile is presented in Fig. 3 along with the pressure exerted on a powder during a measurement.
2.2.4 Modulated compressed bulk density (mCBD) measurement
A cylindrical stainless-steel die, which is the sample holder, was loosely filled with powder sample using a spatula. The spatula was used to level the surface of the powder so that it was flush with the top edge of the cavity. Fig. 2 Schematic of the instrument and its principal components.
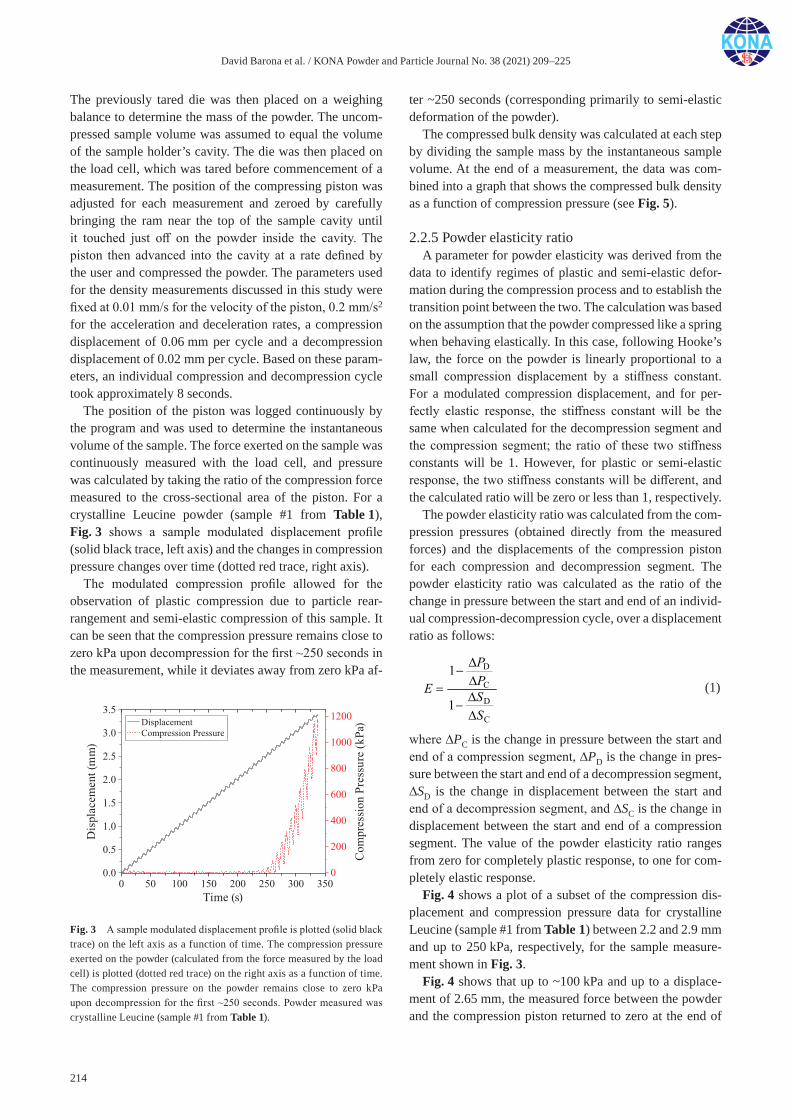
David Barona et al. / KONA Powder and Particle Journal No. 38 (2021) 209–225
214
The previously tared die was then placed on a weighing balance to determine the mass of the powder. The uncom-pressed sample volume was assumed to equal the volume of the sample holder’s cavity. The die was then placed on the load cell, which was tared before commencement of a measurement. The position of the compressing piston was adjusted for each measurement and zeroed by carefully bringing the ram near the top of the sample cavity until it touched just off on the powder inside the cavity. The piston then advanced into the cavity at a rate defined by the user and compressed the powder. The parameters used for the density measurements discussed in this study were fixed at 0.01 mm/s for the velocity of the piston, 0.2 mm/s2 for the acceleration and deceleration rates, a compression displacement of 0.06 mm per cycle and a decompression displacement of 0.02 mm per cycle. Based on these param-eters, an individual compression and decompression cycle took approximately 8 seconds.
The position of the piston was logged continuously by the program and was used to determine the instantaneous volume of the sample. The force exerted on the sample was continuously measured with the load cell, and pressure was calculated by taking the ratio of the compression force measured to the cross-sectional area of the piston. For a crystalline Leucine powder (sample #1 from Table 1), Fig. 3 shows a sample modulated displacement profile (solid black trace, left axis) and the changes in compression pressure changes over time (dotted red trace, right axis).
The modulated compression profile allowed for the observation of plastic compression due to particle rear-rangement and semi-elastic compression of this sample. It can be seen that the compression pressure remains close to zero kPa upon decompression for the first ~250 seconds in the measurement, while it deviates away from zero kPa af-
ter ~250 seconds (corresponding primarily to semi-elastic deformation of the powder).
The compressed bulk density was calculated at each step by dividing the sample mass by the instantaneous sample volume. At the end of a measurement, the data was com-bined into a graph that shows the compressed bulk density as a function of compression pressure (see Fig. 5).
2.2.5 Powder elasticity ratioA parameter for powder elasticity was derived from the
data to identify regimes of plastic and semi-elastic defor-mation during the compression process and to establish the transition point between the two. The calculation was based on the assumption that the powder compressed like a spring when behaving elastically. In this case, following Hooke’s law, the force on the powder is linearly proportional to a small compression displacement by a stiffness constant. For a modulated compression displacement, and for per-fectly elastic response, the stiffness constant will be the same when calculated for the decompression segment and the compression segment; the ratio of these two stiffness constants will be 1. However, for plastic or semi-elastic response, the two stiffness constants will be different, and the calculated ratio will be zero or less than 1, respectively.
The powder elasticity ratio was calculated from the com-pression pressures (obtained directly from the measured forces) and the displacements of the compression piston for each compression and decompression segment. The powder elasticity ratio was calculated as the ratio of the change in pressure between the start and end of an individ-ual compression-decompression cycle, over a displacement ratio as follows:
D
C
D
C
1
1
PPE SS
(1)
where ∆PC is the change in pressure between the start and end of a compression segment, ∆PD is the change in pres-sure between the start and end of a decompression segment, ∆SD is the change in displacement between the start and end of a decompression segment, and ∆SC is the change in displacement between the start and end of a compression segment. The value of the powder elasticity ratio ranges from zero for completely plastic response, to one for com-pletely elastic response.
Fig. 4 shows a plot of a subset of the compression dis-placement and compression pressure data for crystalline Leucine (sample #1 from Table 1) between 2.2 and 2.9 mm and up to 250 kPa, respectively, for the sample measure-ment shown in Fig. 3.
Fig. 4 shows that up to ~100 kPa and up to a displace-ment of 2.65 mm, the measured force between the powder and the compression piston returned to zero at the end of
Fig. 3 A sample modulated displacement profile is plotted (solid black trace) on the left axis as a function of time. The compression pressure exerted on the powder (calculated from the force measured by the load cell) is plotted (dotted red trace) on the right axis as a function of time. The compression pressure on the powder remains close to zero kPa upon decompression for the first ~250 seconds. Powder measured was crystalline Leucine (sample #1 from Table 1).

David Barona et al. / KONA Powder and Particle Journal No. 38 (2021) 209–225
215
each decompression segment; the calculated powder elas-ticity ratio was zero and the powder compressed plastically. However, as the pressure on the powder increased beyond ~100 kPa, the measured force between the powder and the compression piston was not zero at the end of each decom-pression segment. Hence, the calculated powder elasticity ratio was greater than zero and the powder compressed semi-elastically.
The powder elasticity ratio was calculated discretely for each cycle in the modulation profile. Because of this, the transition pressure from plastic to semi-elastic compression response was estimated at the mid-point of the two com-pression pressures measured at the end of two consecutive compression segments, where the first value corresponds to the maximum compression pressure measured during the last plastic cycle and the second value corresponds to the maximum compression pressure measured during the first semi-elastic cycle. The transition density was estimated by calculating the average value of the densities measured at the maximum compression pressures and the minimum de-compression pressures and then finding the average density at the estimated transition pressure (see Fig. 5, top). The accuracy of the transition pressures and densities can be improved by using finer modulation profiles.
As can be seen in the amorphous Trehalose sample measurement shown in Fig. 5 (bottom), the powder elas-ticity ratio clearly shows the transition from plastic to semi-elastic compression when compared to the smooth profiles of the CBD data (Fig. 5, top).
2.2.6 Data processingThe data collected from each measurement was pro-
cessed to calculate the powder elasticity ratio, the com-pression pressure at which the powder transitions from the plastic to semi-elastic compression regime, and the corresponding powder density. Graphs were generated for the powder elasticity ratio and mCBD as shown in
Fig. 5, where the CBD profile was bound by the densities measured at the maximum and minimum displacements for each cycle in the modulation profile (labeled as Max Compression Pressure and Min Compression Pressure, re-spectively). An average density for the powder, calculated as the average of the maximum and minimum compression pressures was also included with the CBD data. Pressure data below 10 kPa were not plotted in the results as they were highly variable and had been determined to be strongly linked to previous powder handling (USP, 2015) as well as piston-die friction (measured to be below 0.1 N or 3 kPa when the instrument is aligned properly).
From the measurement of the powder elasticity ratio of 100 % amorphous Trehalose (sample #2 from Table 1) shown in Fig. 5 (bottom), it can be concluded that the compression response was entirely plastic up to a pres-sure of ~80 kPa. In this range the compression overcame
Fig. 4 A subset of the compression displacement from 2.2 to 2.9 mm and compression pressure data up to 250 kPa for crystalline Leucine (sample #1 from Table 1) shown in Fig. 3. Plastic response is seen for pressures up to ~100 kPa; semi-elastic response starts at pressures > ~100 kPa.
Fig. 5 Sample data for spray dried 100 % amorphous Trehalose (sample #2 from Table 1). This sample measurement shows the outputs of the data processing, which includes powder density (yellow trace, top) and the powder elasticity ratio (black circles, bottom) as a function of compression pressure in a logarithmic scale to clearly show powder response at low pressures. Transition pressure denoting the change from plastic to semi-elastic compression response is indicated by the black solid vertical line. Average density (black dotted trace, top) is calculated from the densities at the maximum and minimum compression pressures and is used to estimate the powder density at the transition pressure.
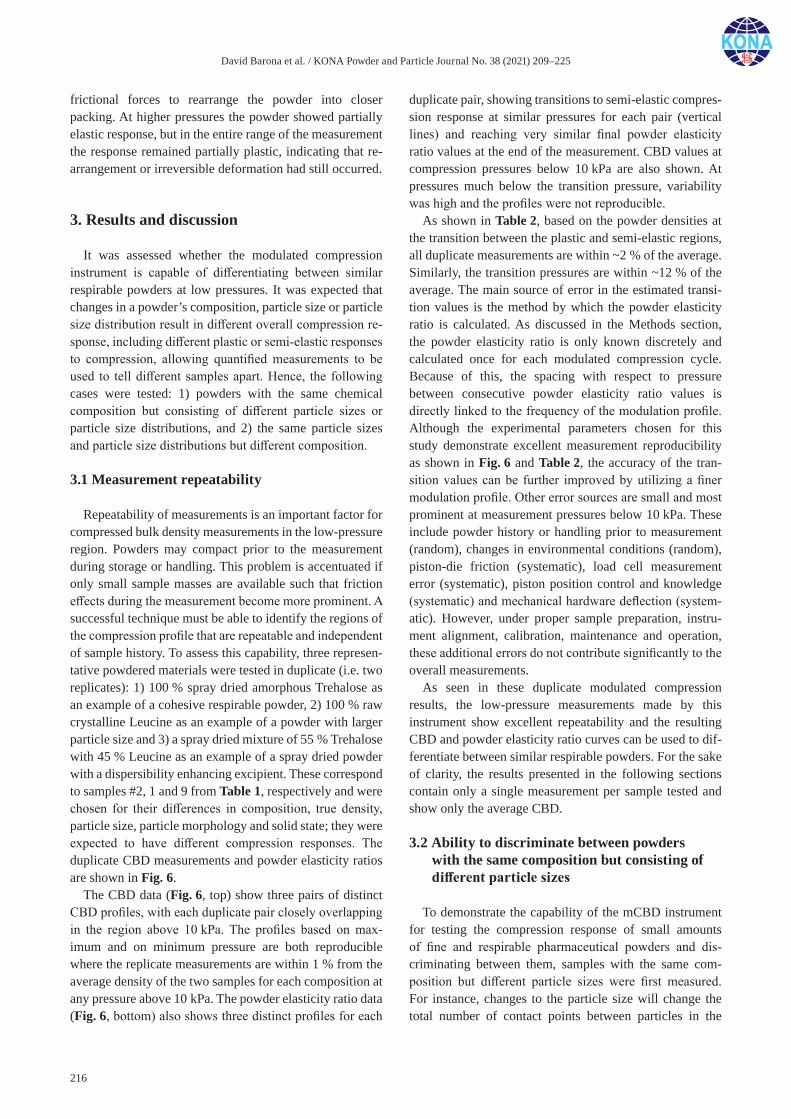
David Barona et al. / KONA Powder and Particle Journal No. 38 (2021) 209–225
216
frictional forces to rearrange the powder into closer packing. At higher pressures the powder showed partially elastic response, but in the entire range of the measurement the response remained partially plastic, indicating that re-arrangement or irreversible deformation had still occurred.
3. Results and discussion
It was assessed whether the modulated compression instrument is capable of differentiating between similar respirable powders at low pressures. It was expected that changes in a powder’s composition, particle size or particle size distribution result in different overall compression re-sponse, including different plastic or semi-elastic responses to compression, allowing quantified measurements to be used to tell different samples apart. Hence, the following cases were tested: 1) powders with the same chemical composition but consisting of different particle sizes or particle size distributions, and 2) the same particle sizes and particle size distributions but different composition.
3.1 Measurement repeatability
Repeatability of measurements is an important factor for compressed bulk density measurements in the low-pressure region. Powders may compact prior to the measurement during storage or handling. This problem is accentuated if only small sample masses are available such that friction effects during the measurement become more prominent. A successful technique must be able to identify the regions of the compression profile that are repeatable and independent of sample history. To assess this capability, three represen-tative powdered materials were tested in duplicate (i.e. two replicates): 1) 100 % spray dried amorphous Trehalose as an example of a cohesive respirable powder, 2) 100 % raw crystalline Leucine as an example of a powder with larger particle size and 3) a spray dried mixture of 55 % Trehalose with 45 % Leucine as an example of a spray dried powder with a dispersibility enhancing excipient. These correspond to samples #2, 1 and 9 from Table 1, respectively and were chosen for their differences in composition, true density, particle size, particle morphology and solid state; they were expected to have different compression responses. The duplicate CBD measurements and powder elasticity ratios are shown in Fig. 6.
The CBD data (Fig. 6, top) show three pairs of distinct CBD profiles, with each duplicate pair closely overlapping in the region above 10 kPa. The profiles based on max-imum and on minimum pressure are both reproducible where the replicate measurements are within 1 % from the average density of the two samples for each composition at any pressure above 10 kPa. The powder elasticity ratio data (Fig. 6, bottom) also shows three distinct profiles for each
duplicate pair, showing transitions to semi-elastic compres-sion response at similar pressures for each pair (vertical lines) and reaching very similar final powder elasticity ratio values at the end of the measurement. CBD values at compression pressures below 10 kPa are also shown. At pressures much below the transition pressure, variability was high and the profiles were not reproducible.
As shown in Table 2, based on the powder densities at the transition between the plastic and semi-elastic regions, all duplicate measurements are within ~2 % of the average. Similarly, the transition pressures are within ~12 % of the average. The main source of error in the estimated transi-tion values is the method by which the powder elasticity ratio is calculated. As discussed in the Methods section, the powder elasticity ratio is only known discretely and calculated once for each modulated compression cycle. Because of this, the spacing with respect to pressure between consecutive powder elasticity ratio values is directly linked to the frequency of the modulation profile. Although the experimental parameters chosen for this study demonstrate excellent measurement reproducibility as shown in Fig. 6 and Table 2, the accuracy of the tran-sition values can be further improved by utilizing a finer modulation profile. Other error sources are small and most prominent at measurement pressures below 10 kPa. These include powder history or handling prior to measurement (random), changes in environmental conditions (random), piston-die friction (systematic), load cell measurement error (systematic), piston position control and knowledge (systematic) and mechanical hardware deflection (system-atic). However, under proper sample preparation, instru-ment alignment, calibration, maintenance and operation, these additional errors do not contribute significantly to the overall measurements.
As seen in these duplicate modulated compression results, the low-pressure measurements made by this instrument show excellent repeatability and the resulting CBD and powder elasticity ratio curves can be used to dif-ferentiate between similar respirable powders. For the sake of clarity, the results presented in the following sections contain only a single measurement per sample tested and show only the average CBD.
3.2 Ability to discriminate between powders with the same composition but consisting of different particle sizes
To demonstrate the capability of the mCBD instrument for testing the compression response of small amounts of fine and respirable pharmaceutical powders and dis-criminating between them, samples with the same com-position but different particle sizes were first measured. For instance, changes to the particle size will change the total number of contact points between particles in the
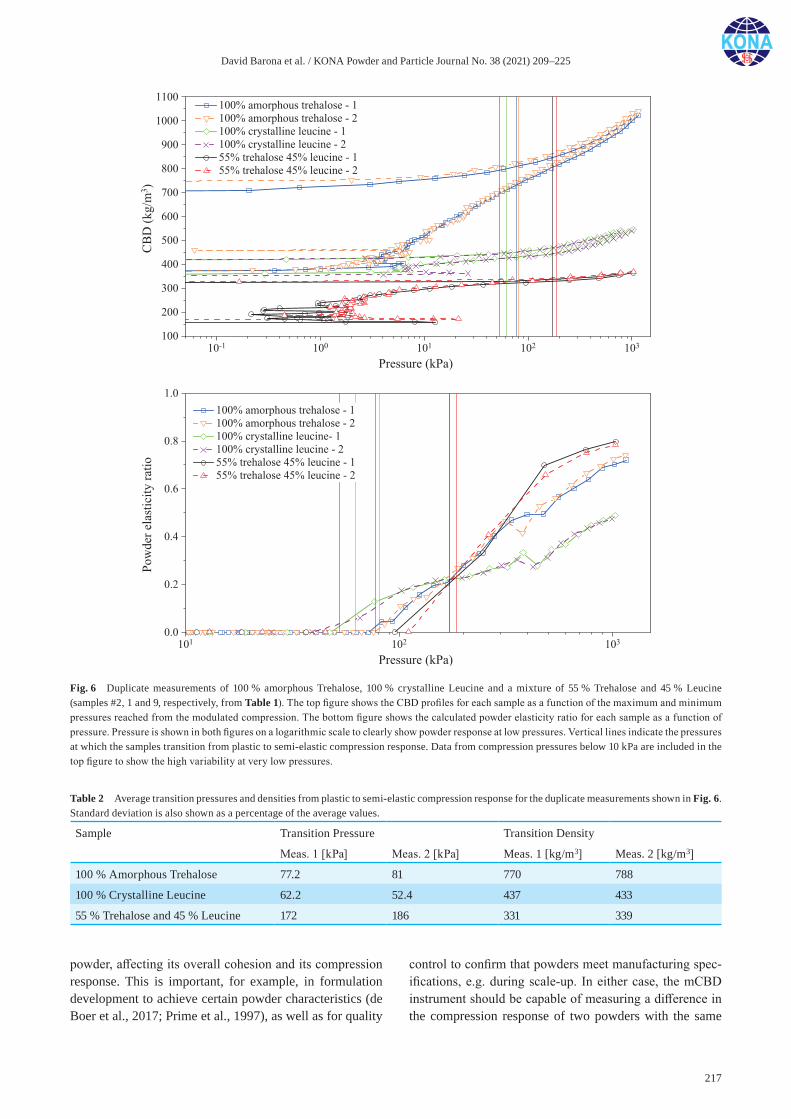
David Barona et al. / KONA Powder and Particle Journal No. 38 (2021) 209–225
217
powder, affecting its overall cohesion and its compression response. This is important, for example, in formulation development to achieve certain powder characteristics (de Boer et al., 2017; Prime et al., 1997), as well as for quality
control to confirm that powders meet manufacturing spec-ifications, e.g. during scale-up. In either case, the mCBD instrument should be capable of measuring a difference in the compression response of two powders with the same
Fig. 6 Duplicate measurements of 100 % amorphous Trehalose, 100 % crystalline Leucine and a mixture of 55 % Trehalose and 45 % Leucine (samples #2, 1 and 9, respectively, from Table 1). The top figure shows the CBD profiles for each sample as a function of the maximum and minimum pressures reached from the modulated compression. The bottom figure shows the calculated powder elasticity ratio for each sample as a function of pressure. Pressure is shown in both figures on a logarithmic scale to clearly show powder response at low pressures. Vertical lines indicate the pressures at which the samples transition from plastic to semi-elastic compression response. Data from compression pressures below 10 kPa are included in the top figure to show the high variability at very low pressures.
Table 2 Average transition pressures and densities from plastic to semi-elastic compression response for the duplicate measurements shown in Fig. 6. Standard deviation is also shown as a percentage of the average values.
Sample Transition Pressure Transition Density
Meas. 1 [kPa] Meas. 2 [kPa] Meas. 1 [kg/m3] Meas. 2 [kg/m3]
100 % Amorphous Trehalose 77.2 81 770 788
100 % Crystalline Leucine 62.2 52.4 437 433
55 % Trehalose and 45 % Leucine 172 186 331 339
David Barona et al. / KONA Powder and Particle Journal No. 38 (2021) 209–225
218
composition but different particle size distributions.Shown in Fig. 7 are two spray-dried powder samples
of 100 % Mannitol. The first sample was polydisperse (sample #11 from Table 1; GSD of 1.6 and a MMAD of 3.5 μm), while the second sample was monodisperse (sample #10 from Table 1; GSD of 1.1 and an MMAD of 10 μm). Both samples were found to be crystalline using Raman spectroscopy.
The mean mCBD measurements (Fig. 7, top) and the powder elasticity ratio curves (Fig. 7, bottom) show two very distinct compression profiles. Although the chemical composition and solid phases were the same for both samples, the compression responses were different. On the other hand, the transition from plastic to semi-elastic response was very similar at ~99 kPa and ~475 kg/m3 for the polydisperse sample and ~101 kPa and ~468 kg/m3 for the monodisperse sample. The polydisperse sample can achieve higher compressed bulk density with increasing pressure while compressing less elastically than the mono-disperse sample. Since the polydisperse sample consists of
particles of different sizes, these differences in compression response might be attributed to the smaller particles filling the interstitial spaces, resulting in a reduction in the void space in the powder bed and higher bulk density (York, 1978). This can also be seen in the powder elasticity ratio curves (Fig. 7, bottom), where after the transition point, the elasticity of the polydisperse powder increased less sharply, indicating that some of its particles can continue to rearrange as the pressure increases. Conversely, the sharper increase in the powder elasticity ratio for the monodisperse powder is an indication that most particle rearrangement has already occurred.
In this specific example, there was also a sudden decrease in the elasticity of the polydisperse powder at ~300 kPa of pressure. This decrease corresponds to a release of stress in the powder that could be due to particle deformation or fragmentation (Chen et al., 2017; Vu et al., 2020), or could also be due to breakage of bridges or other structures formed by the particles and which were previously held in place by interparticle forces. This is further indication that the polydisperse powder may be undergoing further rearrangement as the pressure increases, although it is not currently possible to decouple this from particle damage in the semi-elastic response region.
A second example shown in Fig. 8 compares the mean mCBD measurements for a two-component formulation (75 % Trehalose and 25 % Leucine) spray dried into two separate polydisperse powders with GSD of 1.6 and MMAD of 2 μm and 4.5 μm, respectively (samples # 7 and 8 from Table 1). In both samples Trehalose was fully amorphous and Leucine was fully crystalline under Raman spectroscopy.
As can be seen in Fig. 8 (top), the sample with the smaller particle sizes (MMAD of 2 μm) achieved higher densities than the sample with larger particle sizes (MMAD of 4.5 μm); similarly to the previous example shown in Fig. 7, these higher densities could be attributed to the smaller particles being better at filling any interstitial spaces as the powder is compressed. From the particle mor-phologies shown in Fig. 1, it can be seen that the particles were not spherical and had a significant external void frac-tion. Even though the compositions were the same and the overall morphologies for particles from both samples were very similar, the surface features of the smaller particles had sharper curvatures, which may lead to smaller contact points between particles, reducing particle cohesion (York, 1978). An alternative explanation to the CBD of these two samples is that particles with a larger MMAD have a lower particle density because Leucine takes a longer time to crystallize (Baldelli et al., 2016), resulting in an overall lower density powder. In either case, whether it is the dif-ference in particle density or the change in the particle co-hesion due to the changes in particle size, the CBD profiles are different for both samples, with the larger particle size
Fig. 7 Comparison of two powders of 100 % crystalline Mannitol but with different particle size distributions. Semi-logarithmic profiles of the average mCBD (top) and powder elasticity ratios (bottom) vs. compression pressure show two different compression responses. The pressures at which the powders transition from plastic to semi-elastic compression response are indicated by vertical lines in both plots.
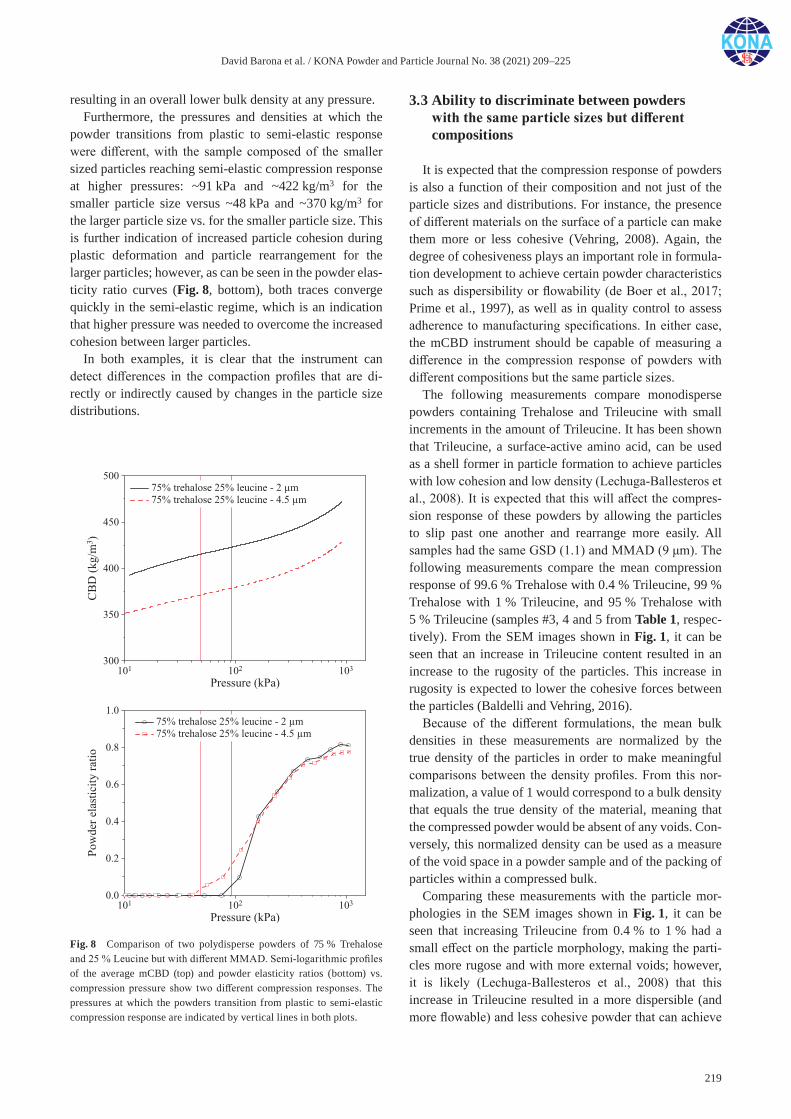
David Barona et al. / KONA Powder and Particle Journal No. 38 (2021) 209–225
219
resulting in an overall lower bulk density at any pressure.Furthermore, the pressures and densities at which the
powder transitions from plastic to semi-elastic response were different, with the sample composed of the smaller sized particles reaching semi-elastic compression response at higher pressures: ~91 kPa and ~422 kg/m3 for the smaller particle size versus ~48 kPa and ~370 kg/m3 for the larger particle size vs. for the smaller particle size. This is further indication of increased particle cohesion during plastic deformation and particle rearrangement for the larger particles; however, as can be seen in the powder elas-ticity ratio curves (Fig. 8, bottom), both traces converge quickly in the semi-elastic regime, which is an indication that higher pressure was needed to overcome the increased cohesion between larger particles.
In both examples, it is clear that the instrument can detect differences in the compaction profiles that are di-rectly or indirectly caused by changes in the particle size distributions.
3.3 Ability to discriminate between powders with the same particle sizes but different compositions
It is expected that the compression response of powders is also a function of their composition and not just of the particle sizes and distributions. For instance, the presence of different materials on the surface of a particle can make them more or less cohesive (Vehring, 2008). Again, the degree of cohesiveness plays an important role in formula-tion development to achieve certain powder characteristics such as dispersibility or flowability (de Boer et al., 2017; Prime et al., 1997), as well as in quality control to assess adherence to manufacturing specifications. In either case, the mCBD instrument should be capable of measuring a difference in the compression response of powders with different compositions but the same particle sizes.
The following measurements compare monodisperse powders containing Trehalose and Trileucine with small increments in the amount of Trileucine. It has been shown that Trileucine, a surface-active amino acid, can be used as a shell former in particle formation to achieve particles with low cohesion and low density (Lechuga‐Ballesteros et al., 2008). It is expected that this will affect the compres-sion response of these powders by allowing the particles to slip past one another and rearrange more easily. All samples had the same GSD (1.1) and MMAD (9 μm). The following measurements compare the mean compression response of 99.6 % Trehalose with 0.4 % Trileucine, 99 % Trehalose with 1 % Trileucine, and 95 % Trehalose with 5 % Trileucine (samples #3, 4 and 5 from Table 1, respec-tively). From the SEM images shown in Fig. 1, it can be seen that an increase in Trileucine content resulted in an increase to the rugosity of the particles. This increase in rugosity is expected to lower the cohesive forces between the particles (Baldelli and Vehring, 2016).
Because of the different formulations, the mean bulk densities in these measurements are normalized by the true density of the particles in order to make meaningful comparisons between the density profiles. From this nor-malization, a value of 1 would correspond to a bulk density that equals the true density of the material, meaning that the compressed powder would be absent of any voids. Con-versely, this normalized density can be used as a measure of the void space in a powder sample and of the packing of particles within a compressed bulk.
Comparing these measurements with the particle mor-phologies in the SEM images shown in Fig. 1, it can be seen that increasing Trileucine from 0.4 % to 1 % had a small effect on the particle morphology, making the parti-cles more rugose and with more external voids; however, it is likely (Lechuga‐Ballesteros et al., 2008) that this increase in Trileucine resulted in a more dispersible (and more flowable) and less cohesive powder that can achieve
Fig. 8 Comparison of two polydisperse powders of 75 % Trehalose and 25 % Leucine but with different MMAD. Semi-logarithmic profiles of the average mCBD (top) and powder elasticity ratios (bottom) vs. compression pressure show two different compression responses. The pressures at which the powders transition from plastic to semi-elastic compression response are indicated by vertical lines in both plots.

David Barona et al. / KONA Powder and Particle Journal No. 38 (2021) 209–225
220
higher densities upon compression more easily.A further increase in Trileucine to 5 % resulted in an
even clearer difference between the mean compression response of these powders as shown in Fig. 9 (top), where a difference in the mCBD and powder elasticity ratio curves can be easily observed. However, increasing Trileucine from 1 % to 5 % resulted in a decrease in powder density upon compression. Comparing these measurements to the SEM images shown in Fig. 1, it can be seen that such an increase in Trileucine caused a strong change to the particle morphology. The particles were much more rugose at 5 % Trileucine and the increased number and size of external voids resulted in lower particle density. While the transition pressures and densities calculated for both powders were very similar, the increase in Trileucine (from 1 % to 5 %), and the corresponding change in the particle morphology, resulted in a lower final powder elasticity ratio (Fig. 9 bottom). This means that the reduction in compressed bulk
density of the powder with 5 % Trileucine is not entirely due to changes in particle cohesion but to a decrease in par-ticle density caused by the increase of external void space in the more rugose particles.
A similar comparison of two polydisperse powders with the same particle size distributions and particle di-ameters (GSD of 1.6 and an MMAD of 2.5 μm), 100 % Trehalose versus 80 % Trehalose and 20 % Leucine, is shown in Fig. 10. Similar to Trileucine, Leucine is also a surface-active amino acid used as a shell former in particle formation to achieve particles with low cohesion and low density (Feng et al., 2011). From the comparison of these two powders, it is expected that the sample containing Leucine will have enhanced powder dispersibility and reduced particle cohesion.
From these measurements, the mean compression re-sponse of both samples (Fig. 10, top) can be quantitatively distinguished, where the presence of Leucine resulted in an
Fig. 9 Comparison of three monodisperse powders (GSD 1.1) with the same particle sizes (MMAD 9 μm) of 99.6 % Trehalose with 0.4 % Trileucine, 99 % Trehalose with 1 % Trileucine and 95 % Trehalose with 5 % Trileucine (samples #3, 4 and 5 from Table 1, respectively). Semi-logarithmic profiles of the average mCBD normalized by true density (top) and powder elasticity ratios (bottom) vs. compression pres-sure show different compression responses. The pressures at which the powders transition from plastic to semi-elastic compression response are indicated by vertical lines in both plots.
Fig. 10 Comparison of two polydisperse powders (GSD 1.6) with the same particle sizes (MMAD 2.5 μm) of 100 % Trehalose and 80 % Tre-halose with 20 % Leucine (samples #2 and 6 from Table 1, respectively). Semi-logarithmic profiles of the average mCBD normalized by true density (top) and powder elasticity ratios (bottom) vs. compression pres-sure show different compression responses. The pressures at which the powders transition from plastic to semi-elastic compression response are indicated by vertical lines in both plots.
David Barona et al. / KONA Powder and Particle Journal No. 38 (2021) 209–225
221
increase in the powder’s bulk density at a given pressure and also resulted in an increased transition pressure and transition density. The Leucine-containing powder is easier to compress. This is an indication that powder dispersibility is enhanced and particle cohesion is reduced, as expected.
Overall, the measurements show that small amounts of different respirable powders can be differentiated reliably using the modulated compression technique. The com-pression behavior is determined by a variety of competing factors including size distribution, cohesiveness and rugos-ity of the particles and their particle density. Being able to assess both bulk density and elasticity of the powder under low pressure aids in the interpretation of the results.
4. Conclusions
Using modulated compression, this new density tester is capable of distinguishing whether a compression step is re-versible or irreversible and is therefore useful in revealing the compression response of fine and respirable pharmaceu-tical powders under low applied pressures. By using mod-ulated compression, bulk density measurements can reveal transitions between plastic and semi-elastic compression responses, something not possible with non-modulated or entirely linear compression methods.
Quantification of this transition can be used to determine a pressure at which it can be assumed that the powder handling history has been erased and reproducible results can be obtained, e.g. for the purposes of selecting a suitable level of compaction for powder filling operations. Addi-tionally, the ability to identify the transition point between these two regimes can aid in making modifications to a powder’s formulation (e.g. adding a dispersibility enhancer to improve flowability) so that the resulting powder can achieve a desired bulk density at a given pressure before the physical integrity of the particles is compromised. This is especially important for fine pharmaceutical powders with a mean particle size smaller than 25 μm and in par-ticular for respirable powders with a mean particle size < 10 μm.
Selected tests presented in this paper demonstrate that the instrument can be used to easily discriminate between similar fine and respirable powders with slight changes in composition, particle size or particle size distribution, based entirely on their compression response. This capa-bility is particularly useful in quality control applications where defined product attributes need to be maintained, or in formulation development where certain properties need to be achieved.
The instrument, the control software and data process-ing have been designed and implemented such the tester produces repeatable and reproducible measurements at low pressures. The small sample mass requirement of
typically less than 100 mg is particularly useful in early product development for performing CBD measurements of expensive, limited-quantity, and rare or difficult-to-make powders.
Acknowledgements
The authors acknowledge the support of AstraZeneca, the Canada Foundation for Innovation, Alberta Advanced Education and Technology, and the Natural Sciences and Engineering Research Council of Canada. The authors thank Isobel Tetreau for help with producing the final figures.
References
Adeoye O., Alebiowu G., Flow, packing and compaction proper-ties of novel coprocessed multifunctional directly compress-ible excipients prepared from tapioca starch and mannitol, Pharmaceutical Development and Technology, 19 (2014) 901–910. DOI: 10.3109/10837450.2013.840843
Antikainen O., Yliruusi J., Determining the compression behaviour of pharmaceutical powders from the force–distance compression profile, International Journal of Pharmaceutics, 252 (2003) 253–261. DOI: 10.1016/S0378-5173(02)00665-8
Baldelli A., Power R.M., Miles R.E.H., Reid J.P., Vehring R., Effect of crystallization kinetics on the properties of spray dried microparticles, Aerosol Science and Technology, 50 (2016) 693–704. DOI: 10.1080/02786826.2016.1177163
Baldelli A., Vehring R., Analysis of cohesion forces between monodisperse microparticles with rough surfaces, Colloids and Surfaces A: Physicochemical and Engineering Aspects, 506 (2016) 179–189. DOI: 10.1016/j.colsurfa.2016.06.009
Bolhuis G.K., Chowhan Z.T., Alderborn E.G., Nyström C., Mate-rials for direct compaction, in: Göran Alderborn and Christer Nyström (Eds.), Pharmaceutical Powder Compaction Tech-nology, Marcel Dekker, New York, 1996, pp. 419–501. DOI: 10.1021/np960305k
Boraey M.A., Hoe S., Sharif H., Miller D.P., Lechuga-Ballesteros D., Vehring R., Improvement of the dispersibility of spray-dried budesonide powders using leucine in an ethanol–water cosolvent system, Powder Technology, 236 (2013) 171–178. DOI: 10.1016/j.powtec.2012.02.047
Brockhaus R.D., Carlozzo B.J., Density and Specific Gravity, in: Koleske J. (Ed.) ASTM International, West Conshohocken, PA, 2012, pp. 375–388, ISBN: 978-0-8031-8891-4. DOI: 10.1016/j.powtec.2012.02.047
Chen T., Fang Q., Wang Z., Zhu W., Numerical simulation of compression breakage of spherical particle, Chemical Engineering Science, 173 (2017) 443–454. DOI: 10.1016/j.ces.2017.08.003
de Boer A.H., Hagedoorn P., Hoppentocht M., Buttini F., Gras-meijer F., Frijlink H.W., Dry powder inhalation: past, present and future, Expert Opinion on Drug Delivery, 14 (2017) 499–512. DOI: 10.1080/17425247.2016.1224846
David Barona et al. / KONA Powder and Particle Journal No. 38 (2021) 209–225
222
Desai T.R., Li D., Finlay W.H., Wong J.P., Determination of surface free energy of interactive dry powder liposome for-mulations using capillary penetration technique, Colloids and Surfaces B: Biointerfaces, 22 (2001) 107–113. DOI: 10.1016/S0927-7765(01)00146-1
Elia A., Cocchi M., Cottini C., Riolo D., Cafiero C., Bosi R., Lutero E., Multivariate data analysis to assess dry powder inhalers performance from powder properties, Powder Technology, 301 (2016) 830–838. DOI: 10.1016/j.powtec. 2016.07.002
Faulhammer E., Fink M., Llusa M., Lawrence S.M., Biserni S., Calzolari V., Khinast J.G., Low-dose capsule filling of inhalation products: critical material attributes and process parameters, International Journal of Pharmaceutics, 473 (2014) 617–626. DOI: 10.1016/j.ijpharm.2014.07.050
Feng A.L., Boraey M.A., Gwin M.A., Finlay P.R., Kuehl P.J., Vehring R., Mechanistic models facilitate efficient devel-opment of leucine containing microparticles for pulmonary drug delivery, International Journal of Pharmaceutics, 409 (2011) 156–163. DOI: 10.1016/j.ijpharm.2011.02.049
Heda P.K., Muller F.X., Augsburger L.L., Capsule filling machine simulation. I. Low-force powder compression physics relevant to plug formation, Pharmaceutical Development and Technology, 4 (1999) 209–219. DOI: 10.1081/PDT-100101355
Ivey J.W., Barona D., Gomez M., Kuan L., McAllister R., Ober-hagemann L., D’Sa D.J., Lechuga-Ballesteros D., Ajmera A., Gracin S., Vehring R., Isokinetic in-line sampling enables rapid characterization of atomizers and cyclones for spray drying process development, Respiratory Drug Delivery, (2018a) 6pp.
Ivey J.W., Bhambri P., Church T.K., Lewis D.A., Vehring R., Experimental investigations of particle formation from propellant and solvent droplets using a monodisperse spray dryer, Aerosol Science and Technology, 52 (2018b) 702–716. DOI: 10.1080/02786826.2018.1451818
Kaerger J.S., Edge S., Price R., Influence of particle size and shape on flowability and compactibility of binary mixtures of paracetamol and microcrystalline cellulose, European Journal of Pharmaceutical Sciences, 22 (2004) 173–179. DOI: 10.1016/j.ejps.2004.03.005
Klevan I., Nordström J., Bauer-Brandl A., Alderborn G., On the physical interpretation of the initial bending of a Shapiro–Konopicky–Heckel compression profile, European Journal of Pharmaceutics and Biopharmaceutics, 71 (2009) 395–401. DOI: 10.1016/j.ejpb.2008.09.014
Kostelnik M.C., Kludt F.H., Beddow J.K., The initial stage of compaction of metal powders in a die, International Journal of Powder Metallurgy, 4 (1968) 19–28.
Lechuga‐Ballesteros D., Charan C., Stults C.L.M., Stevenson C.L., Miller D.P., Vehring R., Tep V., Kuo M., Trileucine improves aerosol performance and stability of spray‐dried powders for inhalation, Journal of Pharmaceutical Sciences, 97 (2008) 287–302. DOI: 10.1002/jps.21078
Llusa M., Faulhammer E., Biserni S., Calzolari V., Lawrence S., Bresciani M., Khinast J., The effects of powder compress-ibility, speed of capsule filling and pre-compression on plug densification, International Journal of Pharmaceutics, 471
(2014) 182–188. DOI: 10.1016/j.ijpharm.2014.04.073McKenna A., McCafferty D.F., Effect of particle size on the com-
paction mechanism and tensile strength of tablets, Journal of Pharmacy and Pharmacology, 34 (1982) 347–351. DOI: 10.1111/j.2042-7158.1982.tb04727.x
Nikolakakis I., Aragon O.B., Malamataris S., Resistance to den-sification, tensile strength and capsule-filling performance of some pharmaceutical diluents, Journal of Pharmacy and Pharmacology, 50 (1998) 713–721. DOI: 10.1111/j.2042-7158.1998.tb07131.x
Nordström J., Klevan I., Alderborn G., A particle rearrangement index based on the Kawakita powder compression equation, Journal of Pharmaceutical Sciences, 98 (2009) 1053–1063. DOI: 10.1002/jps.21488
Osorio J.G., Muzzio F.J., Effects of powder flow properties on capsule filling weight uniformity, Drug Development and Industrial Pharmacy, 39 (2013) 1464–1475. DOI: 10.3109/03639045.2012.728227
Patel S., Kaushal A.M., Bansal A.K., Effect of particle size and compression force on compaction behavior and derived mathematical parameters of compressibility, Pharmaceutical Research, 24 (2007) 111–124. DOI: 10.1007/s11095-006-9129-8
Podczeck F., Lee-Amies G., The bulk volume changes of powders by granulation and compression with respect to capsule filling, International Journal of Pharmaceutics, 142 (1996) 97–102. DOI: 10.1016/0378-5173(96)04662-5
Prime D., Atkins P.J., Slater A., Sumby B., Review of dry powder inhalers, Advanced Drug Delivery Reviews, 26 (1997) 51–58. DOI: 10.1016/S0169-409X(97)00510-3
Raut N.S., Jamaiwar S., Umekar M.J., Kotagale N.R., Effect of compression pressure on inhalation grade lactose as carrier for dry powder inhalations, International Journal of Pharmaceutical Investigation, 6 (2016) 39–46. DOI: 10.4103/2230-973X.176474
Rudén J., Frenning G., Bramer T., Thalberg K., Alderborn G., Relationships between surface coverage ratio and powder mechanics of binary adhesive mixtures for dry powder inhalers, International Journal of Pharmaceutics, 541 (2018) 143–156. DOI: 10.1016/j.ijpharm.2018.02.017
Sarkar S., Mukherjee R., Chaudhuri B., On the role of forces governing particulate interactions in pharmaceutical systems: a review, International Journal of Pharmaceutics, 526 (2017) 516–537. DOI: 10.1016/j.ijpharm.2017.05.003
Shamsaddini-Shahrbabak A., Vehring R., The compression behavior of respirable powders at different relative humidity measured by a compressed bulk density tester for small sam-ple masses, Respiratory Drug Delivery, 3 (2012) 777–780.
Sheikh-Salem M., Fell J.T., The influence of initial packing on the compression of powders, Journal of Pharmacy and Pharma-cology, 33 (1981) 491–494. DOI: 10.1111/j.2042-7158.1981.tb13846.x
Sørensen A.H., Sonnergaard J.M., Hovgaard L., Bulk char-acterization of pharmaceutical powders by low-pressure compression, Pharmaceutical Development and Technology, 10 (2005) 197–209. DOI: 10.1081/PDT-54412
Sørensen A.H., Sonnergaard J.M., Hovgaard L., Bulk char-acterization of pharmaceutical powders by low-pressure
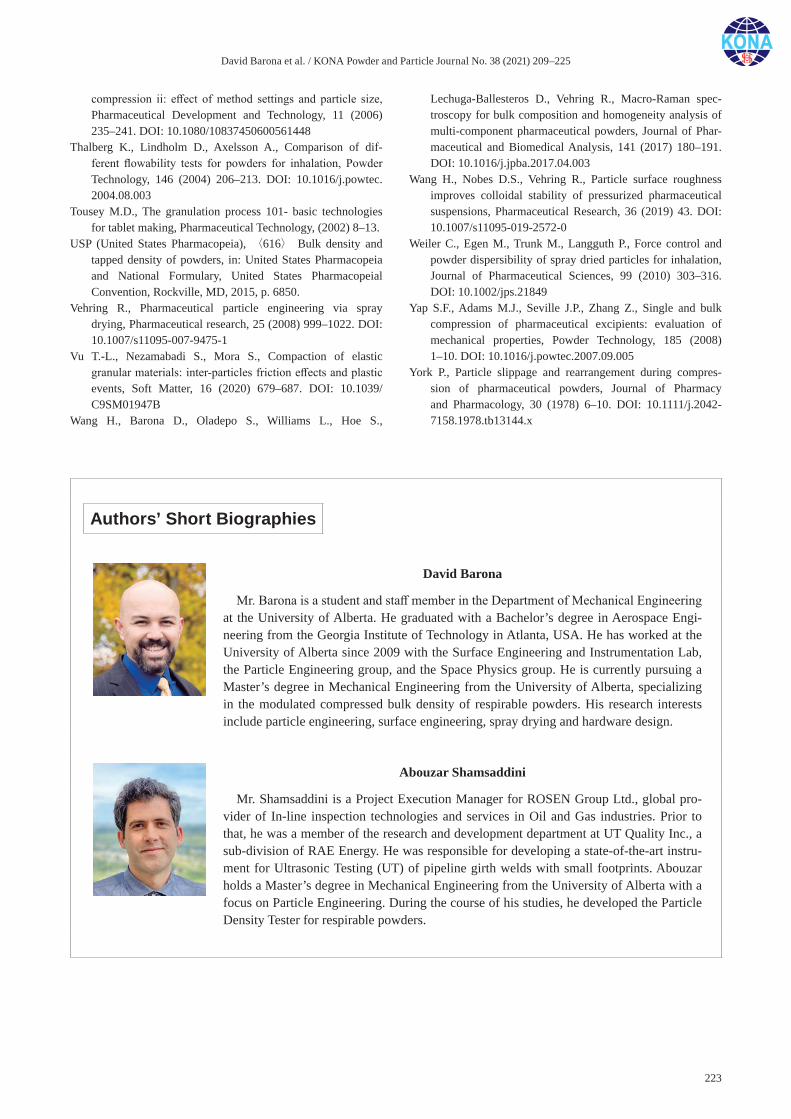
David Barona et al. / KONA Powder and Particle Journal No. 38 (2021) 209–225
223
compression ii: effect of method settings and particle size, Pharmaceutical Development and Technology, 11 (2006) 235–241. DOI: 10.1080/10837450600561448
Thalberg K., Lindholm D., Axelsson A., Comparison of dif-ferent flowability tests for powders for inhalation, Powder Technology, 146 (2004) 206–213. DOI: 10.1016/j.powtec. 2004.08.003
Tousey M.D., The granulation process 101- basic technologies for tablet making, Pharmaceutical Technology, (2002) 8–13.
USP (United States Pharmacopeia), 〈616〉 Bulk density and tapped density of powders, in: United States Pharmacopeia and National Formulary, United States Pharmacopeial Convention, Rockville, MD, 2015, p. 6850.
Vehring R., Pharmaceutical particle engineering via spray drying, Pharmaceutical research, 25 (2008) 999–1022. DOI: 10.1007/s11095-007-9475-1
Vu T.-L., Nezamabadi S., Mora S., Compaction of elastic granular materials: inter-particles friction effects and plastic events, Soft Matter, 16 (2020) 679–687. DOI: 10.1039/C9SM01947B
Wang H., Barona D., Oladepo S., Williams L., Hoe S.,
Lechuga-Ballesteros D., Vehring R., Macro-Raman spec-troscopy for bulk composition and homogeneity analysis of multi-component pharmaceutical powders, Journal of Phar-maceutical and Biomedical Analysis, 141 (2017) 180–191. DOI: 10.1016/j.jpba.2017.04.003
Wang H., Nobes D.S., Vehring R., Particle surface roughness improves colloidal stability of pressurized pharmaceutical suspensions, Pharmaceutical Research, 36 (2019) 43. DOI: 10.1007/s11095-019-2572-0
Weiler C., Egen M., Trunk M., Langguth P., Force control and powder dispersibility of spray dried particles for inhalation, Journal of Pharmaceutical Sciences, 99 (2010) 303–316. DOI: 10.1002/jps.21849
Yap S.F., Adams M.J., Seville J.P., Zhang Z., Single and bulk compression of pharmaceutical excipients: evaluation of mechanical properties, Powder Technology, 185 (2008) 1–10. DOI: 10.1016/j.powtec.2007.09.005
York P., Particle slippage and rearrangement during compres-sion of pharmaceutical powders, Journal of Pharmacy and Pharmacology, 30 (1978) 6–10. DOI: 10.1111/j.2042-7158.1978.tb13144.x
Authors’ Short Biographies
David Barona
Mr. Barona is a student and staff member in the Department of Mechanical Engineering at the University of Alberta. He graduated with a Bachelor’s degree in Aerospace Engi-neering from the Georgia Institute of Technology in Atlanta, USA. He has worked at the University of Alberta since 2009 with the Surface Engineering and Instrumentation Lab, the Particle Engineering group, and the Space Physics group. He is currently pursuing a Master’s degree in Mechanical Engineering from the University of Alberta, specializing in the modulated compressed bulk density of respirable powders. His research interests include particle engineering, surface engineering, spray drying and hardware design.
Abouzar Shamsaddini
Mr. Shamsaddini is a Project Execution Manager for ROSEN Group Ltd., global pro-vider of In-line inspection technologies and services in Oil and Gas industries. Prior to that, he was a member of the research and development department at UT Quality Inc., a sub-division of RAE Energy. He was responsible for developing a state-of-the-art instru-ment for Ultrasonic Testing (UT) of pipeline girth welds with small footprints. Abouzar holds a Master’s degree in Mechanical Engineering from the University of Alberta with a focus on Particle Engineering. During the course of his studies, he developed the Particle Density Tester for respirable powders.

David Barona et al. / KONA Powder and Particle Journal No. 38 (2021) 209–225
224
Authors’ Short Biographies
Maximilian Aisenstat
Mr. Aisenstat was a co-op student in the Particle Engineering group in 2019. He gradu-ated with a Bachelor’s degree in Mechanical Engineering with Biomedical Option from the University of Alberta, and he will be returning to the Particle Engineering group to pursue a Master’s degree in Mechanical Engineering in Fall 2020. His research interests include particle engineering and spray drying.
Kyrre Thalberg
Kyrre Thalberg obtained a Master’s degree in Chemical Engineering 1981 from Lund University, Sweden, and a Ph. D. in Physical Chemistry from the same university in 1990. Since 1991, Kyrre has been working with AstraZeneca, first at the site in Lund originally called Draco, now in Mölndal, both in Sweden. He has provided key contributions to sev-eral inhalation products on the market, in particular the Turbuhaler® dry powder inhalers. His current position has a focus on fundamental understanding, application and scale up of dry powder formulations. Kyrre has authored or co-authored more than 30 publications in international journals.
David Lechuga-Ballesteros
Dr. David Lechuga-Ballesteros, Research Fellow at AstraZeneca, is a leading scientist in the area of pharmaceutical material sciences and particle engineering. Dr. Lechuga has co-authored over 100 publications including peer-reviewed articles, book chapters and ab-stracts, co-edited a special issue on respiratory and nasal drug delivery, and a book on dry-ing technologies for biotechnology and pharmaceutical applications. Dr. Lechuga is named as an inventor in over fifteen patents describing new drug crystal forms, novel formula-tions, or specialty particle engineering processing equipment. Dr. Lechuga currently serves in the Editorial Advisory Board of several leading Journals in the area of Pharmaceutics.
Behzad Damadzadeh
Behzad Damadzadeh is an Associate Scientist at AstraZeneca currently working in the Inhalation Product Development (IPD) group in South San Francisco, California. Behzad is an experienced scientist in the pharmaceuticals industry and his main expertise is on for-mulation and spray drying. He graduated with a Master’s degree in Chemical Engineering from the Chalmers University of Technology in Gothenburg Sweden. He also obtained a Master’s degree in Biomedical Engineering from Arizona State University (Tempe, Ari-zona). His area of interest includes formulation for pulmonary delivery of small molecules, proteins and genetic material as well as physical and solid-state characterization of spray dried products.

David Barona et al. / KONA Powder and Particle Journal No. 38 (2021) 209–225
225
Authors’ Short Biographies
Reinhard Vehring
Dr. Vehring is a Professor in the Mechanical Engineering Department at the University of Alberta and holds the George Ford Chair in Materials Engineering. He graduated with a diploma in Mechanical Engineering from the Gerhard Merkator University in Duisburg, Germany, and received a doctorate from the University of Bochum in the field of molecular spectroscopy on microparticles. Dr. Vehring has held positions in academia and industry advancing aerosol science and particle technology for more than 26 years. Before returning to academia, he worked on pulmonary delivery of peptides, proteins, and small molecules at Nektar Therapeutics and was part of the team developing Exubera, the first inhalable insulin. Subsequently, he developed solid dosage forms for virus vaccines, monoclonal antibodies, and oncology therapeutics at Medimmune, and supported FluMist, the first nasally administered live attenuated influenza vaccine. Dr. Vehring was the lead inventor for the co-suspension formulation technology which is used by Pearl Therapeutics to de-velop metered dose inhaler based therapeutics for respiratory diseases. At the University of Alberta, Dr. Vehring directs the Particle Engineering facility focusing on advanced micro and nanoparticle design and analysis.

KONA Powder and Particle Journal No. 38 (2021) 226–234/https://doi.org/10.14356/kona.2021007 Original Research Paper
226Copyright © 2021 The Authors. Published by Hosokawa Powder Technology Foundation. This is an open access article under the CC BY license (http://creativecommons.org/licenses/by/4.0/).
Effects of Powder Vibration and Time Consolidation on Soft and Hard Wheat Flour Properties †
Yumeng Zhao 1, Poonam Phalswal 2, Abhishek Shetty 3 and R.P. Kingsly Ambrose 1*1 Department of Agricultural and Biological Engineering, Purdue University, USA2 National Dairy Research Institute, India3 Rheology Department, Anton Paar USA, USA
AbstractConsistency and reliable flow are of great concern during the handling and processing of flour. In this study, wheat flour was consolidated by normal stress and vibration, and rheological factors including bulk solid compressibility, Warren-Spring cohesion strength, permeability, and wall friction were evaluated. Soft red winter (SRW) and hard red spring (HRS) wheat flours were vibrated for 5 and 10 minutes and compressed under 10 and 20 kPa for 12 and 24 h. After vibration, wall friction increased from 10.87° to 14.13° for SRW flour and decreased from 11.00° to 7.10° for HRS flour, and the permeability decreased for both the flours. Consolidation time and stress had a significant effect (P < 0.05) on wall friction and compressibility. The HRS Carr index increased from 25.77 to 38.48 when consolidated under 20 kPa for 24 hours, but the SRW Carr index decreased slightly from 46.60 to 44.24. The SRW flour permeability decreased significantly (P < 0.05) when compression pressure was increased from 10 to 20 kPa. while HRS permeability was less affected by consolidation. The consolidation and vibration effects on bulk flour properties differed likely due to inherent differences in the composition and hardness of HRS and SRW.
Keywords: flour, time consolidation, plastic-elasticity, storage, vibration
1. Introduction
Wheat flour is one of the most important food products in the world. The bulk powder properties of wheat flour, including cohesiveness, flowability, wall friction, and per-meability, are important for processing and handling, such as silo unloading and pneumatic transportation. These properties are highly dependent on particle size, shape, surface roughness, and composition (Molerus and Nywlt, 1984). The U.S. has differentiated wheat into 6 classes based on its composition and hardness. The flours from different wheat classes differ in particle size, surface fat and protein contents (Bian et al., 2015). Soft wheat flour has less protein and more fat content, and smaller particle size. Therefore, soft wheat flour is always cohe-sive than hard wheat flour (Bian et al., 2015). Studies also have found that the soft wheat flour shows higher cohe-siveness than hard wheat flour due to the particle’s rough surface characteristics (Kuakpetoon et al., 2001). Due to
flour particle size and compositional differences, soft and hard wheat flours could behave differently under similar consolidation or vibration conditions. During storage and transportation, minor changes in particle property con-tribute to significant changes in bulk powder properties. Besides environmental conditions such as humidity and/ or temperature changes causing consolidation, stress ap-plied to the particle will affect bulk flour properties. Con-solidation caused by the powder’s own weight has been found to reduce flowability (Teunou and Fitzpatrick, 2000). During consolidation, with the variable of time and deformation rate, particle surface contact and defor-mation can be distinguished as reversible elastic, irrevers-ible plastic deformation, and viscoelastic deformation (Tomas, 2000). Many studies have reported that these bulk powder property changes are mainly due to interpar-ticle force changes (Domian and Poszytek, 2005; Teunou and Fitzpatrick, 2000).
Discrete taps, or vibration, always exists during trans-portation or handling, which could lead to the segregation of granular materials (Jain et al., 2013). Studies have shown that in particulate systems which are made of coarse and fine fractions, the coarse powder fraction shifts upwards and fine powder fraction shifts downwards during vibration. The particle size distribution affects the
† Received 2 February 2020; Accepted 2 March 2020 J-STAGE Advance published online 29 April 2020
* Corresponding author: Kingsly Ambrose; Add: 225 S University St, West Lafayette, Indiana 47907, USA E-mail: [email protected] TEL/FAX: +1-7654946599
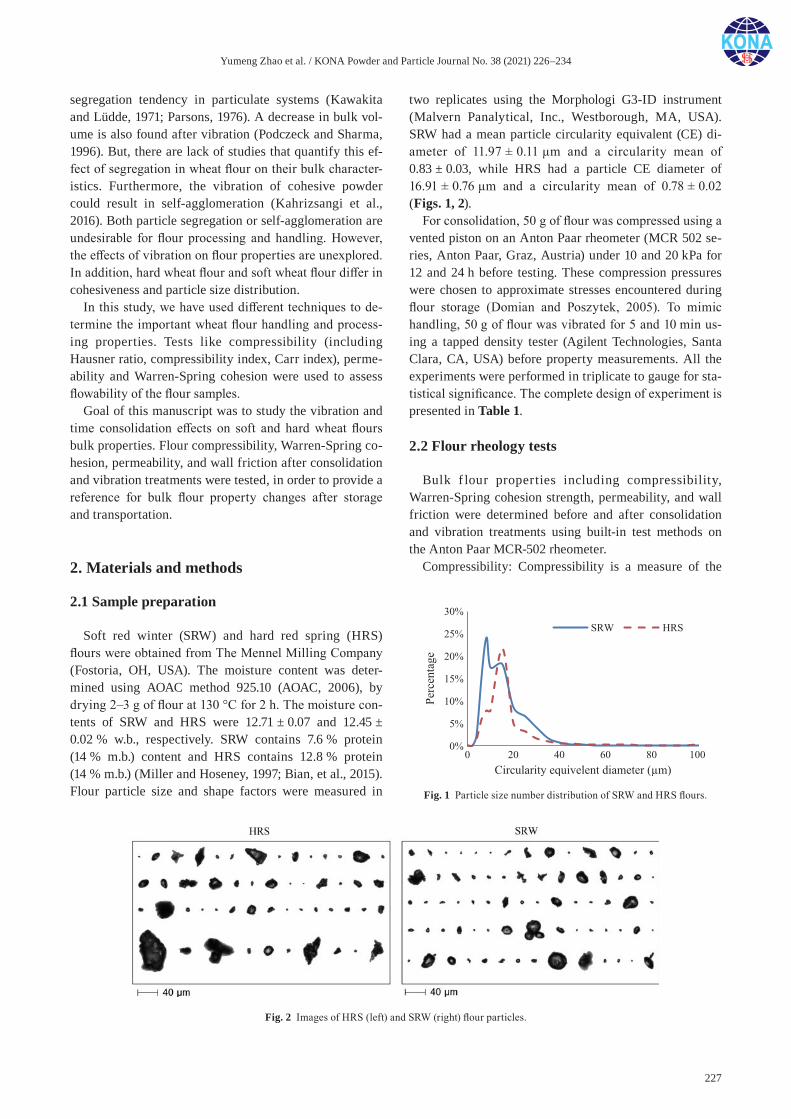
Yumeng Zhao et al. / KONA Powder and Particle Journal No. 38 (2021) 226–234
227
segregation tendency in particulate systems (Kawakita and Lüdde, 1971; Parsons, 1976). A decrease in bulk vol-ume is also found after vibration (Podczeck and Sharma, 1996). But, there are lack of studies that quantify this ef-fect of segregation in wheat flour on their bulk character-istics. Furthermore, the vibration of cohesive powder could result in self-agglomeration (Kahrizsangi et al., 2016). Both particle segregation or self-agglomeration are undesirable for flour processing and handling. However, the effects of vibration on flour properties are unexplored. In addition, hard wheat flour and soft wheat flour differ in cohesiveness and particle size distribution.
In this study, we have used different techniques to de-termine the important wheat flour handling and process-ing properties. Tests like compressibility (including Hausner ratio, compressibility index, Carr index), perme-ability and Warren-Spring cohesion were used to assess flowability of the flour samples.
Goal of this manuscript was to study the vibration and time consolidation effects on soft and hard wheat flours bulk properties. Flour compressibility, Warren-Spring co-hesion, permeability, and wall friction after consolidation and vibration treatments were tested, in order to provide a reference for bulk flour property changes after storage and transportation.
2. Materials and methods
2.1 Sample preparation
Soft red winter (SRW) and hard red spring (HRS) flours were obtained from The Mennel Milling Company (Fostoria, OH, USA). The moisture content was deter-mined using AOAC method 925.10 (AOAC, 2006), by drying 2–3 g of flour at 130 °C for 2 h. The moisture con-tents of SRW and HRS were 12.71 ± 0.07 and 12.45 ± 0.02 % w.b., respectively. SRW contains 7.6 % protein (14 % m.b.) content and HRS contains 12.8 % protein (14 % m.b.) (Miller and Hoseney, 1997; Bian, et al., 2015). Flour particle size and shape factors were measured in
two replicates using the Morphologi G3-ID instrument (Malvern Panalytical, Inc., Westborough, MA, USA). SRW had a mean particle circularity equivalent (CE) di-ameter of 11.97 ± 0.11 μm and a circularity mean of 0.83 ± 0.03, while HRS had a particle CE diameter of 16.91 ± 0.76 μm and a circularity mean of 0.78 ± 0.02 (Figs. 1, 2).
For consolidation, 50 g of flour was compressed using a vented piston on an Anton Paar rheometer (MCR 502 se-ries, Anton Paar, Graz, Austria) under 10 and 20 kPa for 12 and 24 h before testing. These compression pressures were chosen to approximate stresses encountered during flour storage (Domian and Poszytek, 2005). To mimic handling, 50 g of flour was vibrated for 5 and 10 min us-ing a tapped density tester (Agilent Technologies, Santa Clara, CA, USA) before property measurements. All the experiments were performed in triplicate to gauge for sta-tistical significance. The complete design of experiment is presented in Table 1.
2.2 Flour rheology tests
Bulk f lour properties including compressibility, Warren-Spring cohesion strength, permeability, and wall friction were determined before and after consolidation and vibration treatments using built-in test methods on the Anton Paar MCR-502 rheometer.
Compressibility: Compressibility is a measure of the
Fig. 1 Particle size number distribution of SRW and HRS flours.
Fig. 2 Images of HRS (left) and SRW (right) flour particles.

Yumeng Zhao et al. / KONA Powder and Particle Journal No. 38 (2021) 226–234
228
relative volume change when a pressure (normal stress) is applied and represents the density change under the ap-plied normal stress. Carr index was used as an indicator to describe the compaction mechanism in this study. Low Carr index indicates low compressibility and a free- flowing powder. The Carr index is a characteristic of a powder’s compressibility and is often used as an indica-tion of a powder’s flowability and is defined by the pow-der density before compression (ρ0) and after compression (ρt):
t 0
tCarr Index
(1)
Flour was compressed to 50 N. A Carr Index of 1 indi-cates an incompressible bulk solid (ρt = ρ0). This is inter-preted as the best possible flowability a granular material can have. The larger the value of Carr Index, the poorer the flowability of the material (Abdullah and Geldart 1999). In this study, the Carr index was obtained at 50 N (25 kPa) load in order to mimic the normal load in a flour storage silo.
Warren-Spring (WS) cohesion strength: This measure-ment is used to determine the cohesion of powders as a function of applied normal stress. A homogenous powder bed is created by consolidation at different normal stresses of 3, 6 and 9 kPa using a vented piston and then the Warren-Spring geometry was used to measure the torque at a very small rotational speed of 0.1 rpm. The co-hesion strength can be derived from the torque (M) via a simple moment balance by correlating the shear resistance to the torque measured (Mohammed et al., 2011):
3 30 i
3WS Cohesion Strength 2π( )
MR R
(2)
where Ri and R0 are the radius of Warren-Spring geome-try shown in Fig. 3. The maximum cohesion strength ob-tained during the rotation of probe is known as Warren-Spring cohesion strength.
Permeability: Permeability is defined as the resistance of fluid (air) through a compacted bed of powder. The permeability was determined by measuring the pressure gradient of air across a packed bed of length (L) at an air-flow velocity (U) using the powder cell accessory at-
tached to the rheometer (Mishra et al., 2020) and is given by Darcy’s law (Whitaker, 1986):
ΔU LPermeability
p
(3)
where Δp is the pressure drop in the compacted powder bed, and η is the air dynamic viscosity. Consolidation of flour reduces the porosity; thus, permeability is an im-portant factor when developing unloading strategies for wheat flour. Flour permeability was tested under 3, 6, and 9 kPa pressure by measuring the resistance to airflow at 0.15 L/min.
Wall friction: This property measures the resistance between powder and the container wall material. In this study, the wall friction of flour on stainless-steel was measured. A stainless-steel probe was used to measure the wall friction at a rotational speed of 0.05 rpm under 3, 6, and 9 kPa pressure. Normal stress (σ) and shear stress (τ) were used to calculate the wall friction angle (Bian et al., 2015):
1Wall Fricition tan ( )
(4)
2.3 Data analysis
Each test used fresh samples and all the measurements were conducted in triplicate. One-way ANOVA was used
Table 1 Summary of experimental parameter values used in the study.
Sl. No Sample
Treatment
Parameters measuredVibration (min)
Time-consolidation
Consolidation time (h) Pressure (kPa)
1 SRW 5, 10 12, 24 10, 20 Carr index, WS cohesion strength, Permeability, Wall friction
2 HRS 5, 10 12, 24 120, 20 Carr index, WS cohesion strength, Permeability, Wall friction
Fig. 3 Schematic diagram of a Warren-Spring geometry.
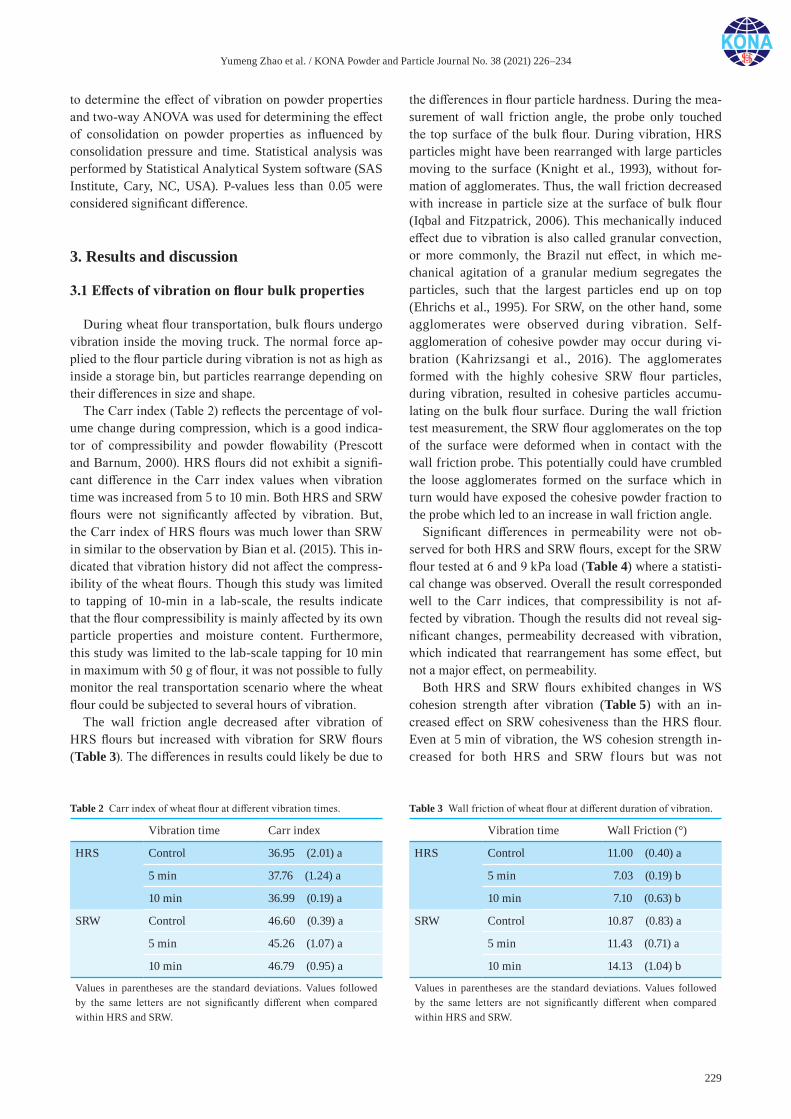
Yumeng Zhao et al. / KONA Powder and Particle Journal No. 38 (2021) 226–234
229
to determine the effect of vibration on powder properties and two-way ANOVA was used for determining the effect of consolidation on powder properties as influenced by consolidation pressure and time. Statistical analysis was performed by Statistical Analytical System software (SAS Institute, Cary, NC, USA). P-values less than 0.05 were considered significant difference.
3. Results and discussion
3.1 Effects of vibration on flour bulk properties
During wheat flour transportation, bulk flours undergo vibration inside the moving truck. The normal force ap-plied to the flour particle during vibration is not as high as inside a storage bin, but particles rearrange depending on their differences in size and shape.
The Carr index (Table 2) reflects the percentage of vol-ume change during compression, which is a good indica-tor of compressibility and powder flowability (Prescott and Barnum, 2000). HRS flours did not exhibit a signifi-cant difference in the Carr index values when vibration time was increased from 5 to 10 min. Both HRS and SRW flours were not significantly affected by vibration. But, the Carr index of HRS flours was much lower than SRW in similar to the observation by Bian et al. (2015). This in-dicated that vibration history did not affect the compress-ibility of the wheat flours. Though this study was limited to tapping of 10-min in a lab-scale, the results indicate that the flour compressibility is mainly affected by its own particle properties and moisture content. Furthermore, this study was limited to the lab-scale tapping for 10 min in maximum with 50 g of flour, it was not possible to fully monitor the real transportation scenario where the wheat flour could be subjected to several hours of vibration.
The wall friction angle decreased after vibration of HRS flours but increased with vibration for SRW flours (Table 3). The differences in results could likely be due to
the differences in flour particle hardness. During the mea-surement of wall friction angle, the probe only touched the top surface of the bulk flour. During vibration, HRS particles might have been rearranged with large particles moving to the surface (Knight et al., 1993), without for-mation of agglomerates. Thus, the wall friction decreased with increase in particle size at the surface of bulk flour (Iqbal and Fitzpatrick, 2006). This mechanically induced effect due to vibration is also called granular convection, or more commonly, the Brazil nut effect, in which me-chanical agitation of a granular medium segregates the particles, such that the largest particles end up on top (Ehrichs et al., 1995). For SRW, on the other hand, some agglomerates were observed during vibration. Self- agglomeration of cohesive powder may occur during vi-bration (Kahrizsangi et al., 2016). The agglomerates formed with the highly cohesive SRW flour particles, during vibration, resulted in cohesive particles accumu-lating on the bulk flour surface. During the wall friction test measurement, the SRW flour agglomerates on the top of the surface were deformed when in contact with the wall friction probe. This potentially could have crumbled the loose agglomerates formed on the surface which in turn would have exposed the cohesive powder fraction to the probe which led to an increase in wall friction angle.
Significant differences in permeability were not ob-served for both HRS and SRW flours, except for the SRW flour tested at 6 and 9 kPa load (Table 4) where a statisti-cal change was observed. Overall the result corresponded well to the Carr indices, that compressibility is not af-fected by vibration. Though the results did not reveal sig-nificant changes, permeability decreased with vibration, which indicated that rearrangement has some effect, but not a major effect, on permeability.
Both HRS and SRW flours exhibited changes in WS cohesion strength after vibration (Table 5) with an in-creased effect on SRW cohesiveness than the HRS flour. Even at 5 min of vibration, the WS cohesion strength in-creased for both HRS and SRW flours but was not
Table 3 Wall friction of wheat flour at different duration of vibration.
Vibration time Wall Friction (°)
HRS Control 11.00 (0.40) a
5 min 7.03 (0.19) b
10 min 7.10 (0.63) b
SRW Control 10.87 (0.83) a
5 min 11.43 (0.71) a
10 min 14.13 (1.04) b
Values in parentheses are the standard deviations. Values followed by the same letters are not significantly different when compared within HRS and SRW.
Table 2 Carr index of wheat flour at different vibration times.
Vibration time Carr index
HRS Control 36.95 (2.01) a
5 min 37.76 (1.24) a
10 min 36.99 (0.19) a
SRW Control 46.60 (0.39) a
5 min 45.26 (1.07) a
10 min 46.79 (0.95) a
Values in parentheses are the standard deviations. Values followed by the same letters are not significantly different when compared within HRS and SRW.
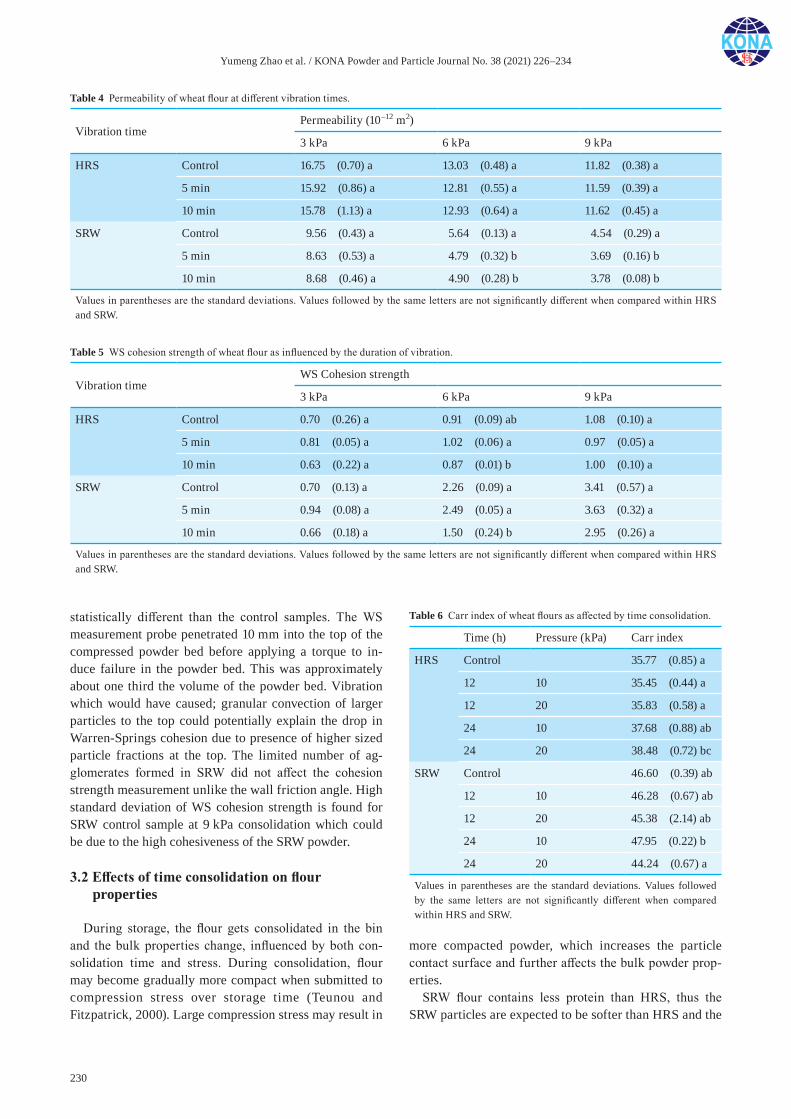
Yumeng Zhao et al. / KONA Powder and Particle Journal No. 38 (2021) 226–234
230
statistically different than the control samples. The WS measurement probe penetrated 10 mm into the top of the compressed powder bed before applying a torque to in-duce failure in the powder bed. This was approximately about one third the volume of the powder bed. Vibration which would have caused; granular convection of larger particles to the top could potentially explain the drop in Warren-Springs cohesion due to presence of higher sized particle fractions at the top. The limited number of ag-glomerates formed in SRW did not affect the cohesion strength measurement unlike the wall friction angle. High standard deviation of WS cohesion strength is found for SRW control sample at 9 kPa consolidation which could be due to the high cohesiveness of the SRW powder.
3.2 Effects of time consolidation on flour properties
During storage, the flour gets consolidated in the bin and the bulk properties change, influenced by both con-solidation time and stress. During consolidation, flour may become gradually more compact when submitted to compression stress over storage time (Teunou and Fitzpatrick, 2000). Large compression stress may result in
more compacted powder, which increases the particle contact surface and further affects the bulk powder prop-erties.
SRW flour contains less protein than HRS, thus the SRW particles are expected to be softer than HRS and the
Table 4 Permeability of wheat flour at different vibration times.
Vibration timePermeability (10–12 m2)
3 kPa 6 kPa 9 kPa
HRS Control 16.75 (0.70) a 13.03 (0.48) a 11.82 (0.38) a
5 min 15.92 (0.86) a 12.81 (0.55) a 11.59 (0.39) a
10 min 15.78 (1.13) a 12.93 (0.64) a 11.62 (0.45) a
SRW Control 9.56 (0.43) a 5.64 (0.13) a 4.54 (0.29) a
5 min 8.63 (0.53) a 4.79 (0.32) b 3.69 (0.16) b
10 min 8.68 (0.46) a 4.90 (0.28) b 3.78 (0.08) b
Values in parentheses are the standard deviations. Values followed by the same letters are not significantly different when compared within HRS and SRW.
Table 6 Carr index of wheat flours as affected by time consolidation.
Time (h) Pressure (kPa) Carr index
HRS Control 35.77 (0.85) a
12 10 35.45 (0.44) a
12 20 35.83 (0.58) a
24 10 37.68 (0.88) ab
24 20 38.48 (0.72) bc
SRW Control 46.60 (0.39) ab
12 10 46.28 (0.67) ab
12 20 45.38 (2.14) ab
24 10 47.95 (0.22) b
24 20 44.24 (0.67) a
Values in parentheses are the standard deviations. Values followed by the same letters are not significantly different when compared within HRS and SRW.
Table 5 WS cohesion strength of wheat flour as influenced by the duration of vibration.
Vibration timeWS Cohesion strength
3 kPa 6 kPa 9 kPa
HRS Control 0.70 (0.26) a 0.91 (0.09) ab 1.08 (0.10) a
5 min 0.81 (0.05) a 1.02 (0.06) a 0.97 (0.05) a
10 min 0.63 (0.22) a 0.87 (0.01) b 1.00 (0.10) a
SRW Control 0.70 (0.13) a 2.26 (0.09) a 3.41 (0.57) a
5 min 0.94 (0.08) a 2.49 (0.05) a 3.63 (0.32) a
10 min 0.66 (0.18) a 1.50 (0.24) b 2.95 (0.26) a
Values in parentheses are the standard deviations. Values followed by the same letters are not significantly different when compared within HRS and SRW.
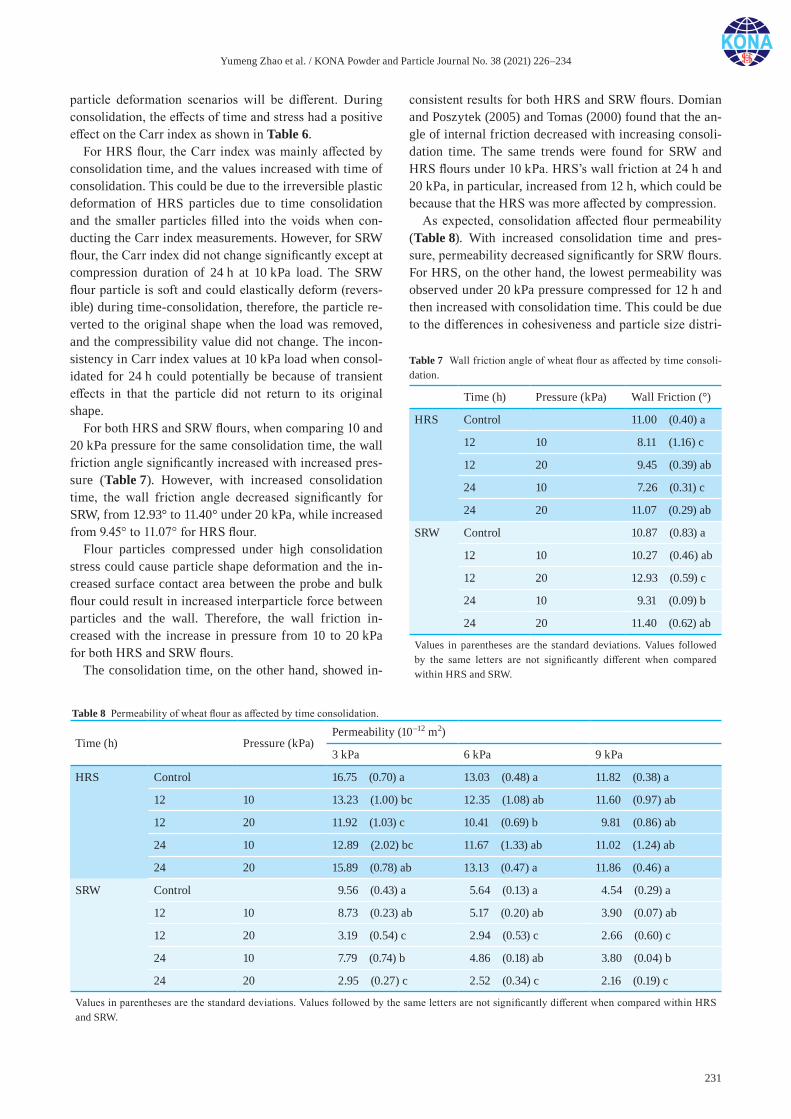
Yumeng Zhao et al. / KONA Powder and Particle Journal No. 38 (2021) 226–234
231
particle deformation scenarios will be different. During consolidation, the effects of time and stress had a positive effect on the Carr index as shown in Table 6.
For HRS flour, the Carr index was mainly affected by consolidation time, and the values increased with time of consolidation. This could be due to the irreversible plastic deformation of HRS particles due to time consolidation and the smaller particles filled into the voids when con-ducting the Carr index measurements. However, for SRW flour, the Carr index did not change significantly except at compression duration of 24 h at 10 kPa load. The SRW flour particle is soft and could elastically deform (revers-ible) during time-consolidation, therefore, the particle re-verted to the original shape when the load was removed, and the compressibility value did not change. The incon-sistency in Carr index values at 10 kPa load when consol-idated for 24 h could potentially be because of transient effects in that the particle did not return to its original shape.
For both HRS and SRW flours, when comparing 10 and 20 kPa pressure for the same consolidation time, the wall friction angle significantly increased with increased pres-sure (Table 7). However, with increased consolidation time, the wall friction angle decreased significantly for SRW, from 12.93° to 11.40° under 20 kPa, while increased from 9.45° to 11.07° for HRS flour.
Flour particles compressed under high consolidation stress could cause particle shape deformation and the in-creased surface contact area between the probe and bulk flour could result in increased interparticle force between particles and the wall. Therefore, the wall friction in-creased with the increase in pressure from 10 to 20 kPa for both HRS and SRW flours.
The consolidation time, on the other hand, showed in-
consistent results for both HRS and SRW flours. Domian and Poszytek (2005) and Tomas (2000) found that the an-gle of internal friction decreased with increasing consoli-dation time. The same trends were found for SRW and HRS flours under 10 kPa. HRS’s wall friction at 24 h and 20 kPa, in particular, increased from 12 h, which could be because that the HRS was more affected by compression.
As expected, consolidation affected flour permeability (Table 8). With increased consolidation time and pres-sure, permeability decreased significantly for SRW flours. For HRS, on the other hand, the lowest permeability was observed under 20 kPa pressure compressed for 12 h and then increased with consolidation time. This could be due to the differences in cohesiveness and particle size distri-
Table 8 Permeability of wheat flour as affected by time consolidation.
Time (h) Pressure (kPa)Permeability (10–12 m2)
3 kPa 6 kPa 9 kPa
HRS Control 16.75 (0.70) a 13.03 (0.48) a 11.82 (0.38) a
12 10 13.23 (1.00) bc 12.35 (1.08) ab 11.60 (0.97) ab
12 20 11.92 (1.03) c 10.41 (0.69) b 9.81 (0.86) ab
24 10 12.89 (2.02) bc 11.67 (1.33) ab 11.02 (1.24) ab
24 20 15.89 (0.78) ab 13.13 (0.47) a 11.86 (0.46) a
SRW Control 9.56 (0.43) a 5.64 (0.13) a 4.54 (0.29) a
12 10 8.73 (0.23) ab 5.17 (0.20) ab 3.90 (0.07) ab
12 20 3.19 (0.54) c 2.94 (0.53) c 2.66 (0.60) c
24 10 7.79 (0.74) b 4.86 (0.18) ab 3.80 (0.04) b
24 20 2.95 (0.27) c 2.52 (0.34) c 2.16 (0.19) c
Values in parentheses are the standard deviations. Values followed by the same letters are not significantly different when compared within HRS and SRW.
Table 7 Wall friction angle of wheat flour as affected by time consoli-dation.
Time (h) Pressure (kPa) Wall Friction (°)
HRS Control 11.00 (0.40) a
12 10 8.11 (1.16) c
12 20 9.45 (0.39) ab
24 10 7.26 (0.31) c
24 20 11.07 (0.29) ab
SRW Control 10.87 (0.83) a
12 10 10.27 (0.46) ab
12 20 12.93 (0.59) c
24 10 9.31 (0.09) b
24 20 11.40 (0.62) ab
Values in parentheses are the standard deviations. Values followed by the same letters are not significantly different when compared within HRS and SRW.
Yumeng Zhao et al. / KONA Powder and Particle Journal No. 38 (2021) 226–234
232
bution of the flours. SRW is softer and more cohesive than HRS, thus under consolidation, the bulk density in-creased, and bonding occurred between particles (Bian et al., 2015). With increasing bulk density and fewer voids between particles, the permeability decreased. HRS parti-cles are harder than SRW particles, thus the voids during consolidation remained, and the effect of pressure was not significant.
Table 9 shows the WS cohesion strength values after consolidation. Only SRW flour, after 24 h of consolidation at 10 kPa pressure, exhibited a significant difference. This indicated that consolidation has a limited effect on WS cohesion strength. Similar to permeability, the SRW bulk properties are more affected by consolidation because of the flour particle’s own properties, and after 12 h and 10 kPa consolidation, cohesiveness increased signifi-cantly. This result agrees with Iqbal and Fitzpatrick (2006), that the time consolidation does not have an effect on flour’s effective angle of internal friction, which repre-sented the cohesiveness of the powder.
4. Conclusions
HRS and SRW have different compositions, therefore consolidation and vibration effects on the bulk flour prop-erties differed. Vibration rearranges the particles inside the container and helps cohesive flour powder form ag-glomerates, thus the compressibility, cohesiveness, per-meability, and wall friction changed. After vibration, smaller particles filled the interparticle voids and formed a denser bulk with decreased permeability. Wall friction demonstrated significant changes before and after vibra-tion. Thus, rearrangement and uniformity of the flour
after transportation are attention-worthy. The rearrange-ment possibly changed the particle size at the location where WS cohesion strength was measured, which re-sulted in a decreased WS cohesion strength for SRW flours. With vibration, segregation of flour can cause in-consistency of flour quality for downstream processing. But the effect of vibration time on flour segregation is still an unexplored area of research.
Time consolidation increases interparticle interactions. Due to the differences in flour hardness, the effect of time and pressure were not the same for SRW and HRS flours. SRW flour was affected by pressure change while HRS flour was affected by storage time. Because SRW flour is softer and more cohesive than HRS, the flour particles tended to deform, and SRW flour was more compacted under high pressure.
Particle size and shape, as well as surface chemical composition, could also have changed after consolidation, thus further studies on single-particle changes are needed in order to better understand the bulk property changes under time consolidation.
Nomenclature
CE Circular equivalent
HRS Hard red spring flour
L Packed bed of length
M Torque by Warren-Spring geometry
Q Airflow rate
Ri Inner radii of WS geometry (Fig. 3)
Table 9 WS cohesion strength of wheat flour as affected by time consolidation.
Time (h) Pressure (kPa)WS Cohesion Strength
3 kPa 6 kPa 9 kPa
HRS Control 0.70 (0.26) a 0.91 (0.09) a 1.08 (0.10) a
12 10 0.98 (0.42) a 1.14 (0.04) a 1.18 (0.14) a
12 20 1.17 (0.30) a 1.18 (0.17) a 1.18 (0.10) a
24 10 1.08 (0.40) a 1.11 (0.19) a 1.04 (0.15) a
24 20 0.78 (0.04) a 1.04 (0.10) a 1.08 (0.06) a
SRW Control 0.70 (0.13) a 2.26 (0.09) a 3.41 (0.57) ab
12 10 0.91 (0.05) a 2.58 (0.16) a 4.66 (0.18) a
12 20 0.86 (0.36) a 2.33 (0.36) a 4.10 (0.37) ab
24 10 0.55 (0.07) a 1.96 (0.66) a 3.25 (0.79) b
24 20 0.72 (0.26) a 1.98 (0.40) a 3.66 (0.23) ab
Values in parentheses are the standard deviations. Values followed by the same letters are not significantly different when compared within HRS and SRW.
Yumeng Zhao et al. / KONA Powder and Particle Journal No. 38 (2021) 226–234
233
R0 Outer radii of WS geometry (Fig. 3)
SRW Soft red winter flour
WS Warren-Spring
σ Normal stress
τ Shear stress
Δp Pressure drop in the compacted powder bed
η Air dynamic viscosity
ρ0 Powder density before compression
ρt Powder density after compression
References
Abdullah E.C., Geldart D., The use of bulk density measure-ments as flowability indicators, Powder Technology, 102 (1999) 151–165. DOI: 10.1016/S0032-5910(98)00208-3
AOAC International, Official Methods of Analysis (18 Edition), Gaithersburg Maryland, 2006, ISBN: 0935584757.
Bian Q., Sittipod S., Garg A., Ambrose R.P.K., Bulk flow prop-erties of hard and soft wheat flours, Journal of Cereal Sci-ence, 63 (2015) 88–94. DOI: 10.1016/j.jcs.2015.03.010
Domian E., Poszytek K., Wheat flour flowability as affected by water activity, storage time and consolidation, International Agrophysics, 19 (2005) 119–124.
Ehrichs E.E., Jaeger H.M., Karczmar G.S., Knight J.B., Kuper-man V.Y., Nagel S.R., Granular convection observed by magnetic resonance imaging, Science, 267 (1995) 1632–1634. DOI: 10.1126/science.267.5204.1632
Iqbal T., Fitzpatrick J.J., Effect of storage conditions on the wall friction characteristics of three food powders, Journal of Food Engineering, 72 (2006) 273–280. DOI: 10.1016/j.jfoodeng.2004.12.007
Jain A., Metzger M.J., Glasser B.J., Effect of particle size distri-bution on segregation in vibrated systems, Powder Technol-ogy, 237 (2013) 543–553. DOI: 10.1016/j.powtec.2012.12. 044
Kahrizsangi H.S., Barletta D., Poletto M., Mechanical proper-ties of agglomerates produced by the mechanical vibration of cohesive powders, KONA Powder and Particle Journal, 33 (2016) 287–295. DOI: 10.14356/kona.2016011
Kawakita K., Lüdde K.-H., Some considerations on powder
compression equations, Powder Technology, 4 (1971) 61–68. DOI: 10.1016/0032-5910(71)80001-3
Knight J.B., Jaeger H.M., Nagel S.R., Vibration-induced size separation in granular media: the convection connection, Physical Review Letters, 70 (1993) 3728–3731. DOI: 10.1103/PhysRevLett.70.3728
Kuakpetoon D., Flores R.A., Milliken G.A., Dry mixing of wheat flours: effect of particle properties and blending ratio, LWT - Food Science and Technology, 34 (2001) 183–193. DOI: 10.1006/fstl.2001.0756
Miller R.A., Hoseney R.C., Factors in hard wheat flour respon-sible for reduced cookie spread, Cereal Chemistry, 74 (1997) 330–336. DOI: 10.1094/cchem.1997.74.3.330
Mishra I., Liu P., Shetty A., Hrenya C.M., On the use of a pow-der rheometer to probe defluidization of cohesive particles, Chemical Engineering Science, 214 (2020) 115422. DOI: 10.1016/j.ces.2019.115422
Mohammed S.A., Abdullah E.C., Geldart D., Raman A.A.A., Measuring powder flowability with a modified Warren Spring cohesion tester, Particuology, 9 (2011) 148–154. DOI: 10.1016/j.partic.2010.10.004
Molerus O., Nywlt M., The influence of the fine particle content of the flow behaviour of bulk materials, Powder Technol-ogy, 37 (1984) 145–154. DOI: 10.1016/0032-5910(84) 80013-3
Parsons D.S., Particle segregation in fine powders by tapping as simulation of jostling during transportation, Powder Tech-nology, 13 (1976) 269–277. DOI: 10.1016/0032-5910(76) 85013-9
Podczeck F., Sharma M., The influence of particle size and shape of components of binary powder mixtures on the maximum volume reduction due to packing, International Journal of Pharmaceutics, 137 (1996) 41–47. DOI: 10.1016/ 0378-5173(95)04420-5
Prescott J.K., Barnum R.A., On powder flowability, Pharmaceu-tical Technology, 24 (2000) 60–85.
Teunou E., Fitzpatrick J.J., Effect of storage time and consolida-tion on food powder flowability, Journal of Food Engineer-ing, 43 (2000) 97–101. DOI: 10.1016/S0260-8774(99) 00137-5
Tomas J., Particle adhesion fundamentals and bulk powder con-solidation, KONA Powder and Particle Journal, 18 (2000) 157–169. DOI: 10.14356/kona.2000022
Whitaker S., Flow in porous media I: a theoretical derivation of Darcy’s law, Transport in Porous Media, 1 (1986) 3–25. DOI: 10.1007/BF01036523
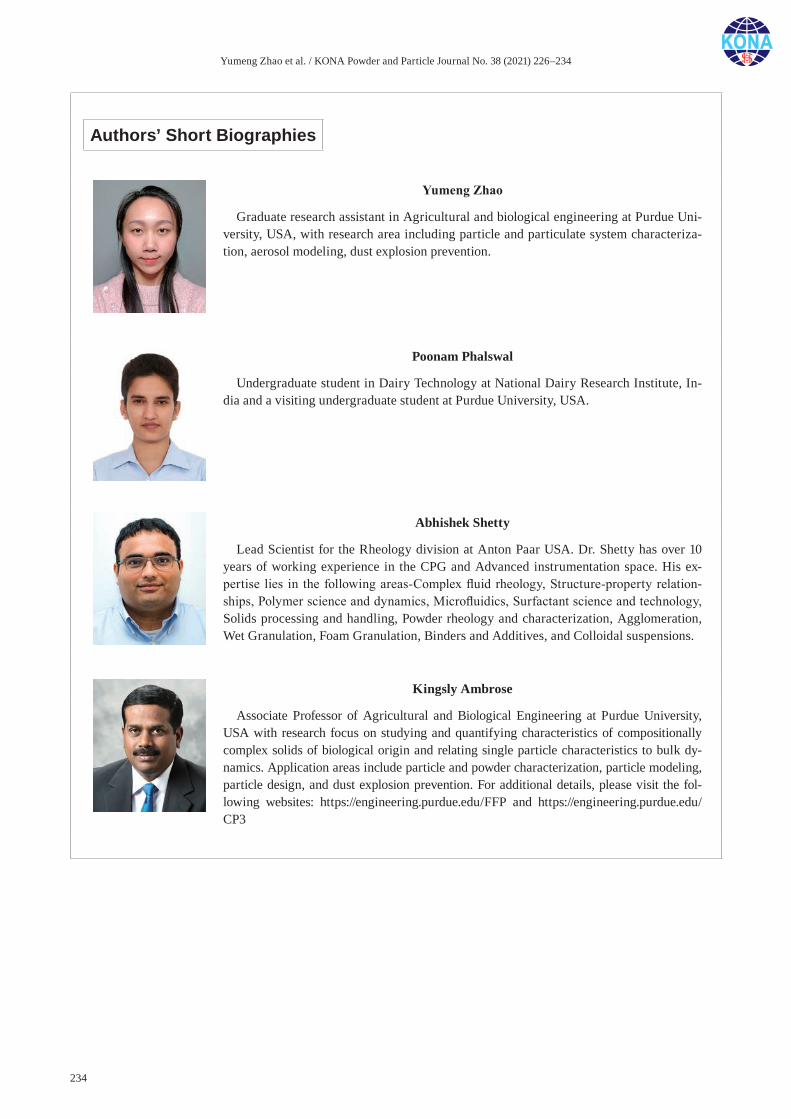
Yumeng Zhao et al. / KONA Powder and Particle Journal No. 38 (2021) 226–234
234
Authors’ Short Biographies
Yumeng Zhao
Graduate research assistant in Agricultural and biological engineering at Purdue Uni-versity, USA, with research area including particle and particulate system characteriza-tion, aerosol modeling, dust explosion prevention.
Poonam Phalswal
Undergraduate student in Dairy Technology at National Dairy Research Institute, In-dia and a visiting undergraduate student at Purdue University, USA.
Abhishek Shetty
Lead Scientist for the Rheology division at Anton Paar USA. Dr. Shetty has over 10 years of working experience in the CPG and Advanced instrumentation space. His ex-pertise lies in the following areas-Complex fluid rheology, Structure-property relation-ships, Polymer science and dynamics, Microfluidics, Surfactant science and technology, Solids processing and handling, Powder rheology and characterization, Agglomeration, Wet Granulation, Foam Granulation, Binders and Additives, and Colloidal suspensions.
Kingsly Ambrose
Associate Professor of Agricultural and Biological Engineering at Purdue University, USA with research focus on studying and quantifying characteristics of compositionally complex solids of biological origin and relating single particle characteristics to bulk dy-namics. Application areas include particle and powder characterization, particle modeling, particle design, and dust explosion prevention. For additional details, please visit the fol-lowing websites: https://engineering.purdue.edu/FFP and https://engineering.purdue.edu/CP3
KONA Powder and Particle Journal No. 38 (2021) 235–250/https://doi.org/10.14356/kona.2021010 Original Research Paper
235Copyright © 2021 The Authors. Published by Hosokawa Powder Technology Foundation. This is an open access article under the CC BY license (http://creativecommons.org/licenses/by/4.0/).
A Semi-Automated DEM Parameter Calibration Technique of Powders Based on Different Bulk Responses Extracted from
Auger Dosing Experiments †
Bilal El Kassem 1,2, Nizar Salloum 2, Thomas Brinz 2, Yousef Heider 1* and Bernd Markert 1
1 Institute of General Mechanics, RWTH Aachen University, Germany2 Robert Bosch Packaging Technology GmbH, Germany
AbstractDiscrete Element Method (DEM) proved to be an essential tool to optimize the industrial auger dosing process for pharmaceutical powders. During the DEM parameter calibration process of a certain powder, several parameter combinations might lead to a similar bulk response, which could also vary for other bulk responses. Therefore, a methodology is needed in order to narrow down the number of combinations and be at once close to reality representation. In this study, a vertical auger dosing setup is used as a standard calibration device to extract three different bulk responses, i.e., angle of repose, bulk density, and mass flow rate. Simulations using LIGGGHTS software package are performed based on Design of Experiments (DoE) by varying four input factors, i.e., auger speed, particle-particle and particle-wall static friction coefficients, and particle-particle rolling friction coefficient. The successful application of multivariate regression analysis (MVRA) results in predicting the bulk behavior within the studied ranges of parameters. In this regard, clustering the different predicted behaviors of the three responses together allows to dramatically reduce the admissible parameter combinations. Consequently, an optimized set of calibrated DEM parameters is chosen, where the simulation results accurately match the experimental reference data. This simple dynamic calibration tool proves to strongly verify and predict the flowability of free-flowing bulk materials.
Keywords: discrete element method, design of experiment, auger dosing, mass flow rate, multivariate regression analysis, calibration
1. Introduction
Screw conveyors are utilized extensively in process en-gineering as mechanisms to transport bulk materials (e.g., granular materials). As the screw rotates, bulk materials are dispensed from the container and conveyed along the screw casing. Although the mechanical system is quite sim-ple, understanding and controlling the material behavior towards an optimal process might be challenging (Moysey and Thompson, 2005; Owen and Cleary, 2009; Roberts, 1999). In fact, several problems might be experienced if the machine is not designed properly in connection with the conveyed material’s nature and mechanical behavior (Clearly, 2007; Owen and Cleary, 2009). These problems can be defined, for instance, as surging and unsteady flow rates, inhomogeneity of the product, inaccurate metering
and dosing, product degradation, high start-up torques, ex-cessive power consumption, high equipment wear, variable residence time, and segregation.
1.1 Screw feeding and DEM
Particle simulation is a popular approach to model and predict the behavior of bulk materials involved in different systems. These systems may include several applications such as storing, transporting or processing granular mate-rials, for instance, sand, semolina, pigments, pharmaceu-tical powders, crystallized products such as ammonium sulfate, fertilizers, polyethylene powder, harvest products or other bulk materials in food, chemical, mining or phar-maceutical industries. In this study, the DEM (Cundall and Strack, 1979) is utilized to model granular flow at the particle level. DEM has proven to be an effective and well- established approach to study stress and motion of par-ticulate systems (Börner et al., 2016). In fact, DEM is applied to simulate particle systems in different industrial applications (Zhu et al., 2008) as e.g., in connection with screw feeding process. In particular, DEM is used to model
† Received 20 December 2019; Accepted 26 March 2020 J-STAGE Advance published online 30 May 2020
* Corresponding author: Yousef Heider; Add: Templergraben 64, 52062 Aachen, Germany E-mail: [email protected] TEL: +49-241-80-98282 FAX: +49-241-80-92231
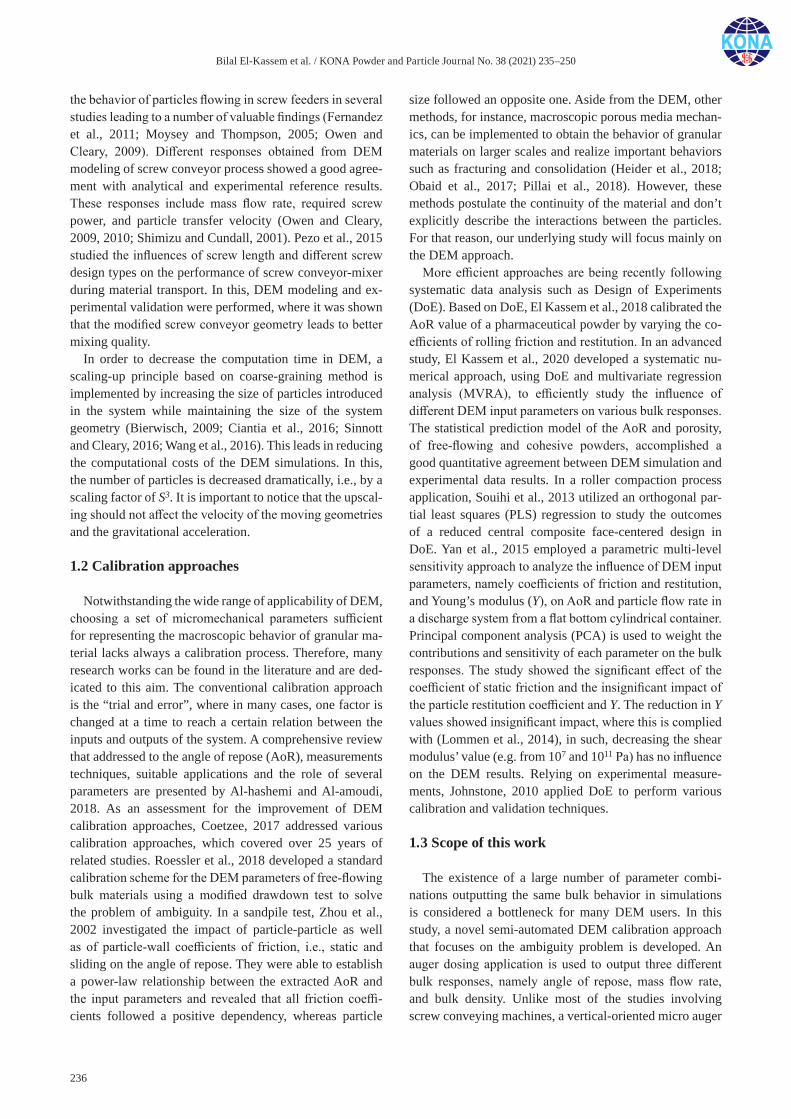
Bilal El-Kassem et al. / KONA Powder and Particle Journal No. 38 (2021) 235–250
236
the behavior of particles flowing in screw feeders in several studies leading to a number of valuable findings (Fernandez et al., 2011; Moysey and Thompson, 2005; Owen and Cleary, 2009). Different responses obtained from DEM modeling of screw conveyor process showed a good agree-ment with analytical and experimental reference results. These responses include mass flow rate, required screw power, and particle transfer velocity (Owen and Cleary, 2009, 2010; Shimizu and Cundall, 2001). Pezo et al., 2015 studied the influences of screw length and different screw design types on the performance of screw conveyor-mixer during material transport. In this, DEM modeling and ex-perimental validation were performed, where it was shown that the modified screw conveyor geometry leads to better mixing quality.
In order to decrease the computation time in DEM, a scaling-up principle based on coarse-graining method is implemented by increasing the size of particles introduced in the system while maintaining the size of the system geometry (Bierwisch, 2009; Ciantia et al., 2016; Sinnott and Cleary, 2016; Wang et al., 2016). This leads in reducing the computational costs of the DEM simulations. In this, the number of particles is decreased dramatically, i.e., by a scaling factor of S3. It is important to notice that the upscal-ing should not affect the velocity of the moving geometries and the gravitational acceleration.
1.2 Calibration approaches
Notwithstanding the wide range of applicability of DEM, choosing a set of micromechanical parameters sufficient for representing the macroscopic behavior of granular ma-terial lacks always a calibration process. Therefore, many research works can be found in the literature and are ded-icated to this aim. The conventional calibration approach is the “trial and error”, where in many cases, one factor is changed at a time to reach a certain relation between the inputs and outputs of the system. A comprehensive review that addressed to the angle of repose (AoR), measurements techniques, suitable applications and the role of several parameters are presented by Al-hashemi and Al-amoudi, 2018. As an assessment for the improvement of DEM calibration approaches, Coetzee, 2017 addressed various calibration approaches, which covered over 25 years of related studies. Roessler et al., 2018 developed a standard calibration scheme for the DEM parameters of free-flowing bulk materials using a modified drawdown test to solve the problem of ambiguity. In a sandpile test, Zhou et al., 2002 investigated the impact of particle-particle as well as of particle-wall coefficients of friction, i.e., static and sliding on the angle of repose. They were able to establish a power-law relationship between the extracted AoR and the input parameters and revealed that all friction coeffi-cients followed a positive dependency, whereas particle
size followed an opposite one. Aside from the DEM, other methods, for instance, macroscopic porous media mechan-ics, can be implemented to obtain the behavior of granular materials on larger scales and realize important behaviors such as fracturing and consolidation (Heider et al., 2018; Obaid et al., 2017; Pillai et al., 2018). However, these methods postulate the continuity of the material and don’t explicitly describe the interactions between the particles. For that reason, our underlying study will focus mainly on the DEM approach.
More efficient approaches are being recently following systematic data analysis such as Design of Experiments (DoE). Based on DoE, El Kassem et al., 2018 calibrated the AoR value of a pharmaceutical powder by varying the co-efficients of rolling friction and restitution. In an advanced study, El Kassem et al., 2020 developed a systematic nu-merical approach, using DoE and multivariate regression analysis (MVRA), to efficiently study the influence of different DEM input parameters on various bulk responses. The statistical prediction model of the AoR and porosity, of free-flowing and cohesive powders, accomplished a good quantitative agreement between DEM simulation and experimental data results. In a roller compaction process application, Souihi et al., 2013 utilized an orthogonal par-tial least squares (PLS) regression to study the outcomes of a reduced central composite face-centered design in DoE. Yan et al., 2015 employed a parametric multi-level sensitivity approach to analyze the influence of DEM input parameters, namely coefficients of friction and restitution, and Young’s modulus (Y), on AoR and particle flow rate in a discharge system from a flat bottom cylindrical container. Principal component analysis (PCA) is used to weight the contributions and sensitivity of each parameter on the bulk responses. The study showed the significant effect of the coefficient of static friction and the insignificant impact of the particle restitution coefficient and Y. The reduction in Y values showed insignificant impact, where this is complied with (Lommen et al., 2014), in such, decreasing the shear modulus’ value (e.g. from 107 and 1011 Pa) has no influence on the DEM results. Relying on experimental measure-ments, Johnstone, 2010 applied DoE to perform various calibration and validation techniques.
1.3 Scope of this work
The existence of a large number of parameter combi-nations outputting the same bulk behavior in simulations is considered a bottleneck for many DEM users. In this study, a novel semi-automated DEM calibration approach that focuses on the ambiguity problem is developed. An auger dosing application is used to output three different bulk responses, namely angle of repose, mass flow rate, and bulk density. Unlike most of the studies involving screw conveying machines, a vertical-oriented micro auger
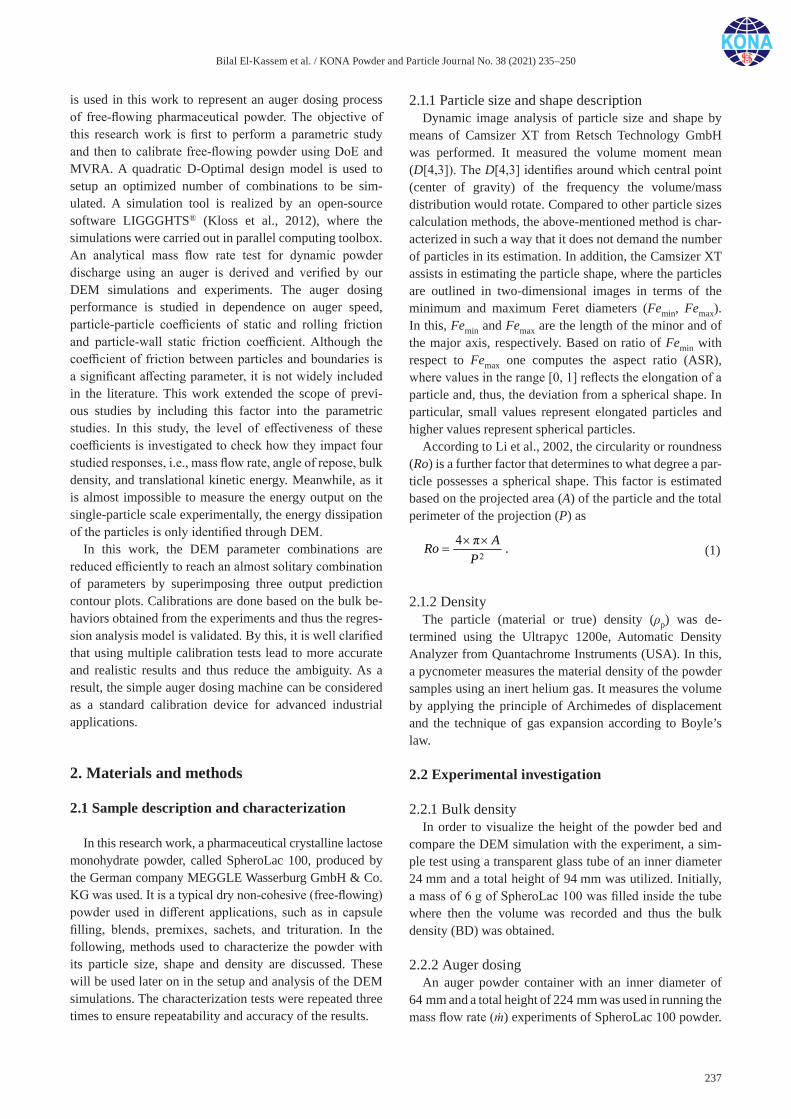
Bilal El-Kassem et al. / KONA Powder and Particle Journal No. 38 (2021) 235–250
237
is used in this work to represent an auger dosing process of free-flowing pharmaceutical powder. The objective of this research work is first to perform a parametric study and then to calibrate free-flowing powder using DoE and MVRA. A quadratic D-Optimal design model is used to setup an optimized number of combinations to be sim-ulated. A simulation tool is realized by an open-source software LIGGGHTS® (Kloss et al., 2012), where the simulations were carried out in parallel computing toolbox. An analytical mass flow rate test for dynamic powder discharge using an auger is derived and verified by our DEM simulations and experiments. The auger dosing performance is studied in dependence on auger speed, particle-particle coefficients of static and rolling friction and particle-wall static friction coefficient. Although the coefficient of friction between particles and boundaries is a significant affecting parameter, it is not widely included in the literature. This work extended the scope of previ-ous studies by including this factor into the parametric studies. In this study, the level of effectiveness of these coefficients is investigated to check how they impact four studied responses, i.e., mass flow rate, angle of repose, bulk density, and translational kinetic energy. Meanwhile, as it is almost impossible to measure the energy output on the single-particle scale experimentally, the energy dissipation of the particles is only identified through DEM.
In this work, the DEM parameter combinations are reduced efficiently to reach an almost solitary combination of parameters by superimposing three output prediction contour plots. Calibrations are done based on the bulk be-haviors obtained from the experiments and thus the regres-sion analysis model is validated. By this, it is well clarified that using multiple calibration tests lead to more accurate and realistic results and thus reduce the ambiguity. As a result, the simple auger dosing machine can be considered as a standard calibration device for advanced industrial applications.
2. Materials and methods
2.1 Sample description and characterization
In this research work, a pharmaceutical crystalline lactose monohydrate powder, called SpheroLac 100, produced by the German company MEGGLE Wasserburg GmbH & Co. KG was used. It is a typical dry non-cohesive (free-flowing) powder used in different applications, such as in capsule filling, blends, premixes, sachets, and trituration. In the following, methods used to characterize the powder with its particle size, shape and density are discussed. These will be used later on in the setup and analysis of the DEM simulations. The characterization tests were repeated three times to ensure repeatability and accuracy of the results.
2.1.1 Particle size and shape descriptionDynamic image analysis of particle size and shape by
means of Camsizer XT from Retsch Technology GmbH was performed. It measured the volume moment mean (D[4,3]). The D[4,3] identifies around which central point (center of gravity) of the frequency the volume/mass distribution would rotate. Compared to other particle sizes calculation methods, the above-mentioned method is char-acterized in such a way that it does not demand the number of particles in its estimation. In addition, the Camsizer XT assists in estimating the particle shape, where the particles are outlined in two-dimensional images in terms of the minimum and maximum Feret diameters (Femin, Femax). In this, Femin and Femax are the length of the minor and of the major axis, respectively. Based on ratio of Femin with respect to Femax one computes the aspect ratio (ASR), where values in the range [0, 1] reflects the elongation of a particle and, thus, the deviation from a spherical shape. In particular, small values represent elongated particles and higher values represent spherical particles.
According to Li et al., 2002, the circularity or roundness (Ro) is a further factor that determines to what degree a par-ticle possesses a spherical shape. This factor is estimated based on the projected area (A) of the particle and the total perimeter of the projection (P) as
2
4 π ARoP
.
(1)
2.1.2 DensityThe particle (material or true) density (ρp) was de-
termined using the Ultrapyc 1200e, Automatic Density Analyzer from Quantachrome Instruments (USA). In this, a pycnometer measures the material density of the powder samples using an inert helium gas. It measures the volume by applying the principle of Archimedes of displacement and the technique of gas expansion according to Boyle’s law.
2.2 Experimental investigation
2.2.1 Bulk densityIn order to visualize the height of the powder bed and
compare the DEM simulation with the experiment, a sim-ple test using a transparent glass tube of an inner diameter 24 mm and a total height of 94 mm was utilized. Initially, a mass of 6 g of SpheroLac 100 was filled inside the tube where then the volume was recorded and thus the bulk density (BD) was obtained.
2.2.2 Auger dosingAn auger powder container with an inner diameter of
64 mm and a total height of 224 mm was used in running the mass flow rate (ṁ) experiments of SpheroLac 100 powder.
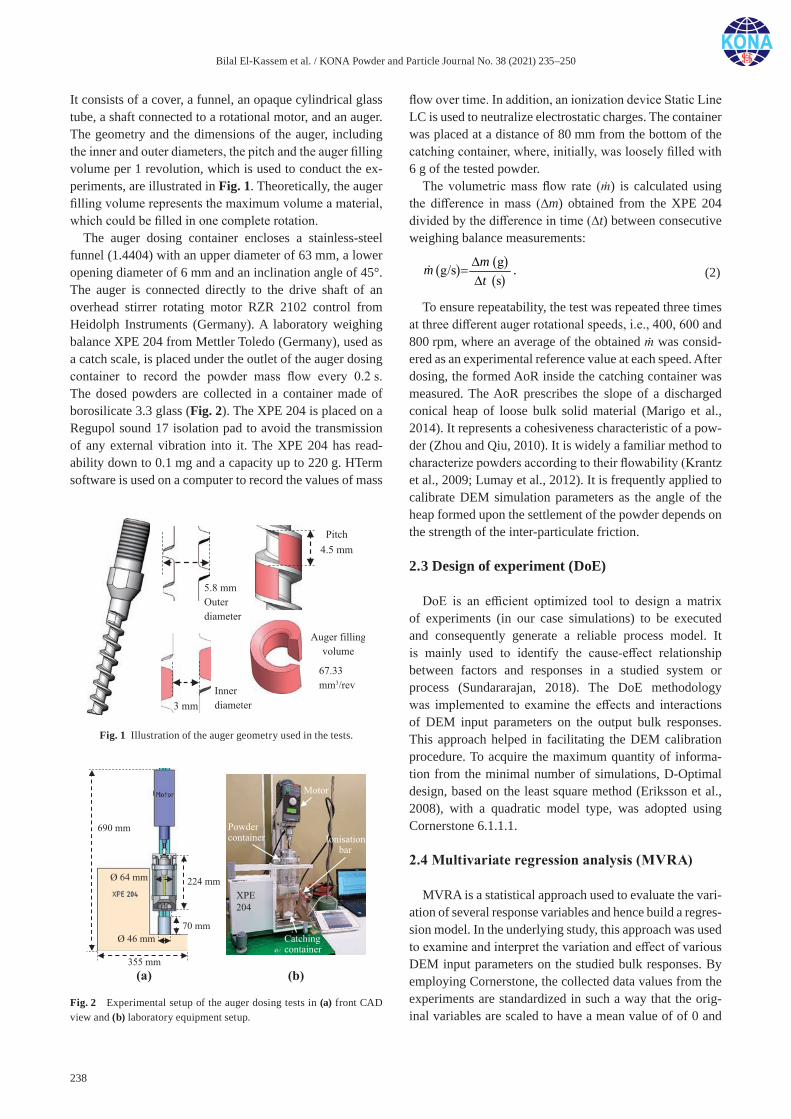
Bilal El-Kassem et al. / KONA Powder and Particle Journal No. 38 (2021) 235–250
238
It consists of a cover, a funnel, an opaque cylindrical glass tube, a shaft connected to a rotational motor, and an auger. The geometry and the dimensions of the auger, including the inner and outer diameters, the pitch and the auger filling volume per 1 revolution, which is used to conduct the ex-periments, are illustrated in Fig. 1. Theoretically, the auger filling volume represents the maximum volume a material, which could be filled in one complete rotation.
The auger dosing container encloses a stainless-steel funnel (1.4404) with an upper diameter of 63 mm, a lower opening diameter of 6 mm and an inclination angle of 45°. The auger is connected directly to the drive shaft of an overhead stirrer rotating motor RZR 2102 control from Heidolph Instruments (Germany). A laboratory weighing balance XPE 204 from Mettler Toledo (Germany), used as a catch scale, is placed under the outlet of the auger dosing container to record the powder mass flow every 0.2 s. The dosed powders are collected in a container made of borosilicate 3.3 glass (Fig. 2). The XPE 204 is placed on a Regupol sound 17 isolation pad to avoid the transmission of any external vibration into it. The XPE 204 has read-ability down to 0.1 mg and a capacity up to 220 g. HTerm software is used on a computer to record the values of mass
flow over time. In addition, an ionization device Static Line LC is used to neutralize electrostatic charges. The container was placed at a distance of 80 mm from the bottom of the catching container, where, initially, was loosely filled with 6 g of the tested powder.
The volumetric mass flow rate (ṁ) is calculated using the difference in mass (∆m) obtained from the XPE 204 divided by the difference in time (∆t) between consecutive weighing balance measurements:
gg/s s
mmt
.
(2)
To ensure repeatability, the test was repeated three times at three different auger rotational speeds, i.e., 400, 600 and 800 rpm, where an average of the obtained ṁ was consid-ered as an experimental reference value at each speed. After dosing, the formed AoR inside the catching container was measured. The AoR prescribes the slope of a discharged conical heap of loose bulk solid material (Marigo et al., 2014). It represents a cohesiveness characteristic of a pow-der (Zhou and Qiu, 2010). It is widely a familiar method to characterize powders according to their flowability (Krantz et al., 2009; Lumay et al., 2012). It is frequently applied to calibrate DEM simulation parameters as the angle of the heap formed upon the settlement of the powder depends on the strength of the inter-particulate friction.
2.3 Design of experiment (DoE)
DoE is an efficient optimized tool to design a matrix of experiments (in our case simulations) to be executed and consequently generate a reliable process model. It is mainly used to identify the cause-effect relationship between factors and responses in a studied system or process (Sundararajan, 2018). The DoE methodology was implemented to examine the effects and interactions of DEM input parameters on the output bulk responses. This approach helped in facilitating the DEM calibration procedure. To acquire the maximum quantity of informa-tion from the minimal number of simulations, D-Optimal design, based on the least square method (Eriksson et al., 2008), with a quadratic model type, was adopted using Cornerstone 6.1.1.1.
2.4 Multivariate regression analysis (MVRA)
MVRA is a statistical approach used to evaluate the vari-ation of several response variables and hence build a regres-sion model. In the underlying study, this approach was used to examine and interpret the variation and effect of various DEM input parameters on the studied bulk responses. By employing Cornerstone, the collected data values from the experiments are standardized in such a way that the orig-inal variables are scaled to have a mean value of of 0 and
Fig. 1 Illustration of the auger geometry used in the tests.
Fig. 2 Experimental setup of the auger dosing tests in (a) front CAD view and (b) laboratory equipment setup.
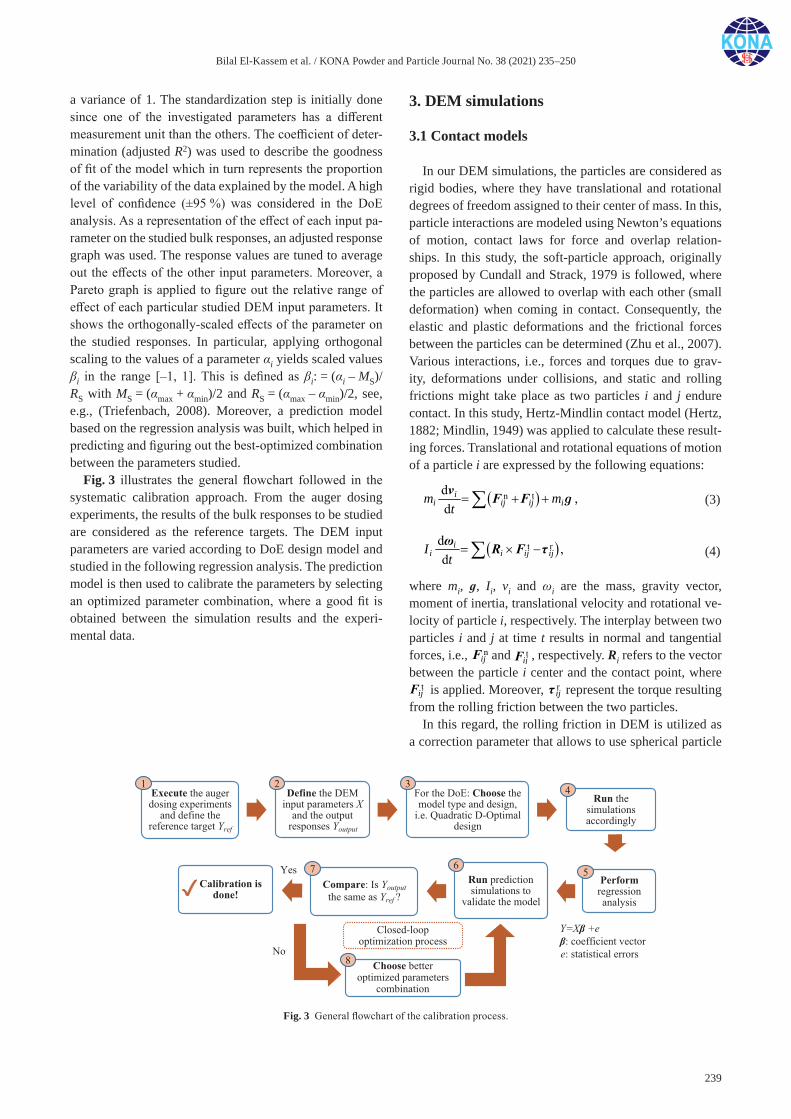
Bilal El-Kassem et al. / KONA Powder and Particle Journal No. 38 (2021) 235–250
239
a variance of 1. The standardization step is initially done since one of the investigated parameters has a different measurement unit than the others. The coefficient of deter-mination (adjusted R2) was used to describe the goodness of fit of the model which in turn represents the proportion of the variability of the data explained by the model. A high level of confidence (±95 %) was considered in the DoE analysis. As a representation of the effect of each input pa-rameter on the studied bulk responses, an adjusted response graph was used. The response values are tuned to average out the effects of the other input parameters. Moreover, a Pareto graph is applied to figure out the relative range of effect of each particular studied DEM input parameters. It shows the orthogonally-scaled effects of the parameter on the studied responses. In particular, applying orthogonal scaling to the values of a parameter αi yields scaled values βi in the range [–1, 1]. This is defined as βi: = (αi – MS)/RS with MS = (αmax + αmin)/2 and RS = (αmax – αmin)/2, see, e.g., (Triefenbach, 2008). Moreover, a prediction model based on the regression analysis was built, which helped in predicting and figuring out the best-optimized combination between the parameters studied.
Fig. 3 illustrates the general flowchart followed in the systematic calibration approach. From the auger dosing experiments, the results of the bulk responses to be studied are considered as the reference targets. The DEM input parameters are varied according to DoE design model and studied in the following regression analysis. The prediction model is then used to calibrate the parameters by selecting an optimized parameter combination, where a good fit is obtained between the simulation results and the experi-mental data.
3. DEM simulations
3.1 Contact models
In our DEM simulations, the particles are considered as rigid bodies, where they have translational and rotational degrees of freedom assigned to their center of mass. In this, particle interactions are modeled using Newton’s equations of motion, contact laws for force and overlap relation-ships. In this study, the soft-particle approach, originally proposed by Cundall and Strack, 1979 is followed, where the particles are allowed to overlap with each other (small deformation) when coming in contact. Consequently, the elastic and plastic deformations and the frictional forces between the particles can be determined (Zhu et al., 2007). Various interactions, i.e., forces and torques due to grav-ity, deformations under collisions, and static and rolling frictions might take place as two particles i and j endure contact. In this study, Hertz-Mindlin contact model (Hertz, 1882; Mindlin, 1949) was applied to calculate these result-ing forces. Translational and rotational equations of motion of a particle i are expressed by the following equations:
n td d
ii ij ij im m
t v F F g ,
(3)
t r
d ,d
ii i ij ijI
t ω R F τ
(4)
where mi, ɡ, Ii, vi and ωi are the mass, gravity vector, moment of inertia, translational velocity and rotational ve-locity of particle i, respectively. The interplay between two particles i and j at time t results in normal and tangential forces, i.e., n
ijF
and tijF
, respectively. Ri refers to the vector between the particle i center and the contact point, where
tijF
is applied. Moreover, rijτ
represent the torque resulting from the rolling friction between the two particles.
In this regard, the rolling friction in DEM is utilized as a correction parameter that allows to use spherical particle
Fig. 3 General flowchart of the calibration process.

Bilal El-Kassem et al. / KONA Powder and Particle Journal No. 38 (2021) 235–250
240
shapes instead of representing the real shapes of the par-ticles (Iwashita and Oda, 2000; Wensrich and Katterfeld, 2012). To represent the rolling friction in our study, the alternative elastic-plastic spring-dashpot (EPSD2) rolling resistance model was used, which is initially proposed by Ai et al., 2011 and extended by Iwashita and Oda, 2000. The mentioned model is implemented to compute the torque r
,ij t tτ at an incremental time step as
r * n,| | | |ij t t r ijR τ F ,
(5)
where μr is the rolling coefficient and R* is the equivalent radius. In this model, the damping torque is disabled for simplicity.
For the purpose of having a stable integration scheme, the time step (∆t) was set to a value less than 20 % of the critical time step (Rayleigh time, TR). TR is calculated based on the Rayleigh wave propagation, where the elastic wave propagation from one particle to the adjacent contact-ing particle can be computed according to the following equation (Li et al., 2005).
R 0.1631 0.8766
RGt T
ν
.
(6)
In this, R, ρ, G and ν are the particle’s radius, density, shear modulus and Poisson’s ratio, respectively.
3.2 Simulation procedure and parameters
3.2.1 Simulation setupThe DEM numerical simulations were carried out using
LIGGGHTS® -Premium 4.X, which is an open-source software from DCS Computing GmbH (Linz, Austria). They were conducted on an eight-node high-performance cluster that uses 64 CPUs (Intel Xeon 2.60 GHz). The post-processing of the simulations was carried out us-ing the open-access ParaView software, version 5.4.1 64-bit from Kitware Inc. (New York, NY, USA). Solid-Works version Premium 2016 from Dassault Sysèmes (Vélizy-Villacoublay, France) was used to model the 3D CAD parts applied in the DEM simulations. Thereafter, the 3D models were spatially discretized using the open-access Gmsh, version 3.0.6 (Geuzaine and Remacle, 2009).
3.2.2 Simulation conditions and input parametersThe Young’s modulus and Poisson’s ratio values of the
funnel and the auger, as they are considered stainless steel, and the catching container (borosilicate 3.3 glass) were selected from the literature (Geuzaine and Remacle, 2009; MakeItFrom, 2019a). Following the recommendations (Govender et al., 2015; Marigo and Stitt, 2015), Young’s modulus for the particle was reduced within a certain per-
missible limit in order to reduce computational costs. The boundary conditions, like coefficients of restitution and rolling friction between the particle and the walls (stainless steel and glass) were assumed to be constant throughout the simulations. The particle size was scaled-up six times using the coarse-graining method identified by Bierwisch et al., 2009. Table 1 presents the applied DEM input parameters in the auger dosing DEM simulations.
On the other hand, one process parameter and three-particle properties were varied (Table 2) in the con-text of the DoE: auger rotational speed (ω), coefficient of static friction (μs,pp) and coefficient of rolling friction (μr,pp) between particle-particle and coefficient of static friction (μs,pw) between particle-wall. Three values were selected for each of the parameter, which include a low, a center, and a high value, see, (Roessler and Katterfeld, 2019; Wilkinson et al., 2017) for reference. Based on the DoE, only 20 simulation runs were required.
Table 1 The considered DEM input parameters throughout the study.
Material parameter/con-tact model
Symbol Unit Value
Young’s modulus funnel and augera
YF GPa 200
Young’s modulus catching containerb
YC GPa 67.8
Young’s modulus particle Yp GPa 0.026
Poisson’s ratio funnel and augera
ν 0.28
Poisson’s ratio catching containerb
ν 0.21
Poisson’s ratio particle ν 0.3
Particle diameter (after coarse-graining)
dp μm 690
Contact law parameters
Coefficient of restitution particle-particle
epp 0.2
Coefficient of restitution particle-wall
epw 0.2
Coefficient of rolling friction particle-wall
μr,pw 0.2
Coefficients of restitution and friction wall-wall
0.2
Factory settings
Filling mass g 6
Number of particles 22705
Simulation time step s 2.62 × 10⁻⁶
Acceleration due to gravity
ɡ m/s2 9.81
a (MakeItFrom, 2019a), b (MakeItFrom, 2019b)
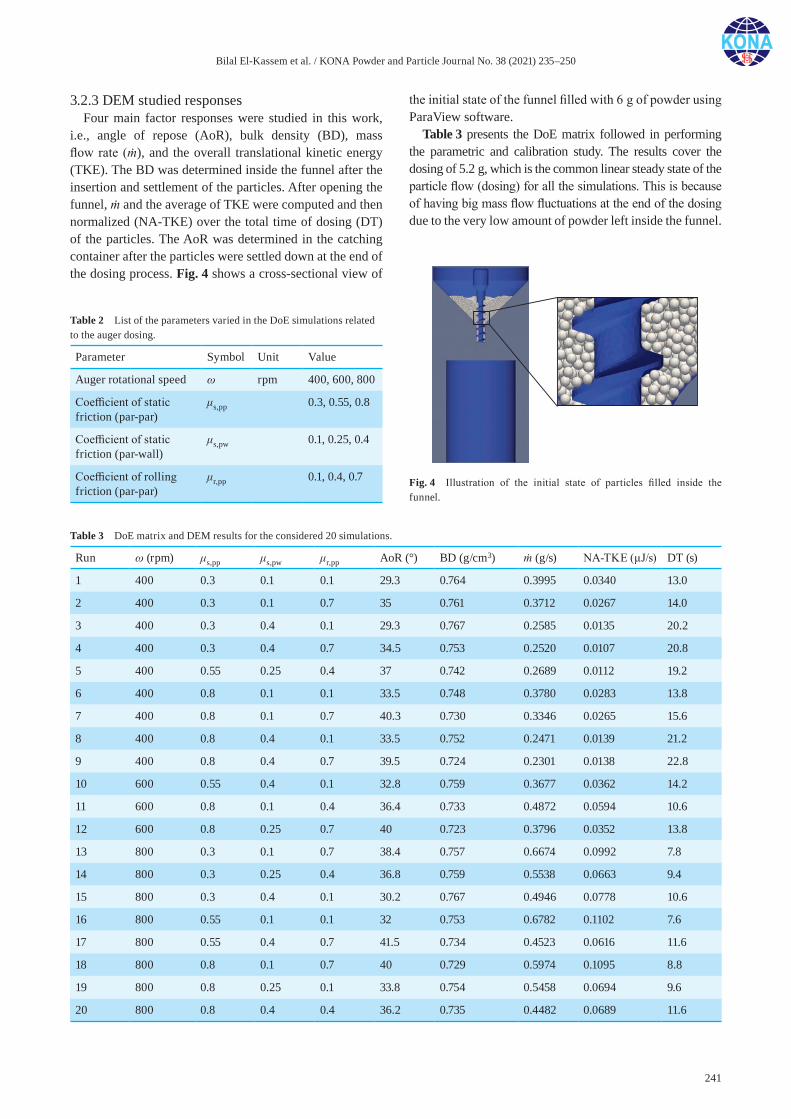
Bilal El-Kassem et al. / KONA Powder and Particle Journal No. 38 (2021) 235–250
241
3.2.3 DEM studied responsesFour main factor responses were studied in this work,
i.e., angle of repose (AoR), bulk density (BD), mass flow rate (ṁ), and the overall translational kinetic energy (TKE). The BD was determined inside the funnel after the insertion and settlement of the particles. After opening the funnel, ṁ and the average of TKE were computed and then normalized (NA-TKE) over the total time of dosing (DT) of the particles. The AoR was determined in the catching container after the particles were settled down at the end of the dosing process. Fig. 4 shows a cross-sectional view of
the initial state of the funnel filled with 6 g of powder using ParaView software.
Table 3 presents the DoE matrix followed in performing the parametric and calibration study. The results cover the dosing of 5.2 g, which is the common linear steady state of the particle flow (dosing) for all the simulations. This is because of having big mass flow fluctuations at the end of the dosing due to the very low amount of powder left inside the funnel.
Table 3 DoE matrix and DEM results for the considered 20 simulations.
Run ω (rpm) μs,pp μs,pw μr,pp AoR (°) BD (g/cm3) ṁ (g/s) NA-TKE (μJ/s) DT (s)
1 400 0.3 0.1 0.1 29.3 0.764 0.3995 0.0340 13.0
2 400 0.3 0.1 0.7 35 0.761 0.3712 0.0267 14.0
3 400 0.3 0.4 0.1 29.3 0.767 0.2585 0.0135 20.2
4 400 0.3 0.4 0.7 34.5 0.753 0.2520 0.0107 20.8
5 400 0.55 0.25 0.4 37 0.742 0.2689 0.0112 19.2
6 400 0.8 0.1 0.1 33.5 0.748 0.3780 0.0283 13.8
7 400 0.8 0.1 0.7 40.3 0.730 0.3346 0.0265 15.6
8 400 0.8 0.4 0.1 33.5 0.752 0.2471 0.0139 21.2
9 400 0.8 0.4 0.7 39.5 0.724 0.2301 0.0138 22.8
10 600 0.55 0.4 0.1 32.8 0.759 0.3677 0.0362 14.2
11 600 0.8 0.1 0.4 36.4 0.733 0.4872 0.0594 10.6
12 600 0.8 0.25 0.7 40 0.723 0.3796 0.0352 13.8
13 800 0.3 0.1 0.7 38.4 0.757 0.6674 0.0992 7.8
14 800 0.3 0.25 0.4 36.8 0.759 0.5538 0.0663 9.4
15 800 0.3 0.4 0.1 30.2 0.767 0.4946 0.0778 10.6
16 800 0.55 0.1 0.1 32 0.753 0.6782 0.1102 7.6
17 800 0.55 0.4 0.7 41.5 0.734 0.4523 0.0616 11.6
18 800 0.8 0.1 0.7 40 0.729 0.5974 0.1095 8.8
19 800 0.8 0.25 0.1 33.8 0.754 0.5458 0.0694 9.6
20 800 0.8 0.4 0.4 36.2 0.735 0.4482 0.0689 11.6
Table 2 List of the parameters varied in the DoE simulations related to the auger dosing.
Parameter Symbol Unit Value
Auger rotational speed ω rpm 400, 600, 800
Coefficient of static friction (par-par)
μs,pp 0.3, 0.55, 0.8
Coefficient of static friction (par-wall)
μs,pw 0.1, 0.25, 0.4
Coefficient of rolling friction (par-par)
μr,pp 0.1, 0.4, 0.7 Fig. 4 Illustration of the initial state of particles filled inside the funnel.
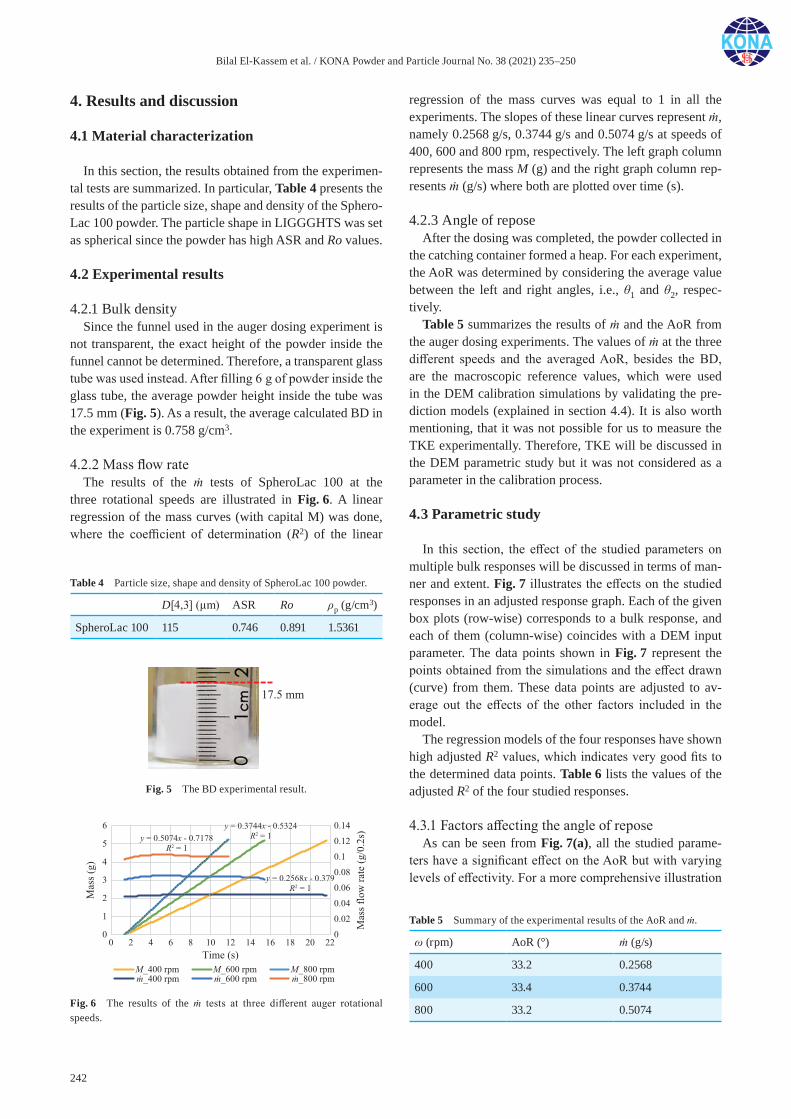
Bilal El-Kassem et al. / KONA Powder and Particle Journal No. 38 (2021) 235–250
242
4. Results and discussion
4.1 Material characterization
In this section, the results obtained from the experimen-tal tests are summarized. In particular, Table 4 presents the results of the particle size, shape and density of the Sphero-Lac 100 powder. The particle shape in LIGGGHTS was set as spherical since the powder has high ASR and Ro values.
4.2 Experimental results
4.2.1 Bulk densitySince the funnel used in the auger dosing experiment is
not transparent, the exact height of the powder inside the funnel cannot be determined. Therefore, a transparent glass tube was used instead. After filling 6 g of powder inside the glass tube, the average powder height inside the tube was 17.5 mm (Fig. 5). As a result, the average calculated BD in the experiment is 0.758 g/cm3.
4.2.2 Mass flow rateThe results of the ṁ tests of SpheroLac 100 at the
three rotational speeds are illustrated in Fig. 6. A linear regression of the mass curves (with capital M) was done, where the coefficient of determination (R2) of the linear
regression of the mass curves was equal to 1 in all the experiments. The slopes of these linear curves represent ṁ, namely 0.2568 g/s, 0.3744 g/s and 0.5074 g/s at speeds of 400, 600 and 800 rpm, respectively. The left graph column represents the mass M (g) and the right graph column rep-resents ṁ (g/s) where both are plotted over time (s).
4.2.3 Angle of reposeAfter the dosing was completed, the powder collected in
the catching container formed a heap. For each experiment, the AoR was determined by considering the average value between the left and right angles, i.e., θ1 and θ2, respec-tively.
Table 5 summarizes the results of ṁ and the AoR from the auger dosing experiments. The values of ṁ at the three different speeds and the averaged AoR, besides the BD, are the macroscopic reference values, which were used in the DEM calibration simulations by validating the pre-diction models (explained in section 4.4). It is also worth mentioning, that it was not possible for us to measure the TKE experimentally. Therefore, TKE will be discussed in the DEM parametric study but it was not considered as a parameter in the calibration process.
4.3 Parametric study
In this section, the effect of the studied parameters on multiple bulk responses will be discussed in terms of man-ner and extent. Fig. 7 illustrates the effects on the studied responses in an adjusted response graph. Each of the given box plots (row-wise) corresponds to a bulk response, and each of them (column-wise) coincides with a DEM input parameter. The data points shown in Fig. 7 represent the points obtained from the simulations and the effect drawn (curve) from them. These data points are adjusted to av-erage out the effects of the other factors included in the model.
The regression models of the four responses have shown high adjusted R2 values, which indicates very good fits to the determined data points. Table 6 lists the values of the adjusted R2 of the four studied responses.
4.3.1 Factors affecting the angle of reposeAs can be seen from Fig. 7(a), all the studied parame-
ters have a significant effect on the AoR but with varying levels of effectivity. For a more comprehensive illustration
Table 4 Particle size, shape and density of SpheroLac 100 powder.
D[4,3] (μm) ASR Ro ρp (g/cm3)
SpheroLac 100 115 0.746 0.891 1.5361
Table 5 Summary of the experimental results of the AoR and ṁ.
ω (rpm) AoR (°) ṁ (g/s)
400 33.2 0.2568
600 33.4 0.3744
800 33.2 0.5074
Fig. 5 The BD experimental result.
Fig. 6 The results of the ṁ tests at three different auger rotational speeds.
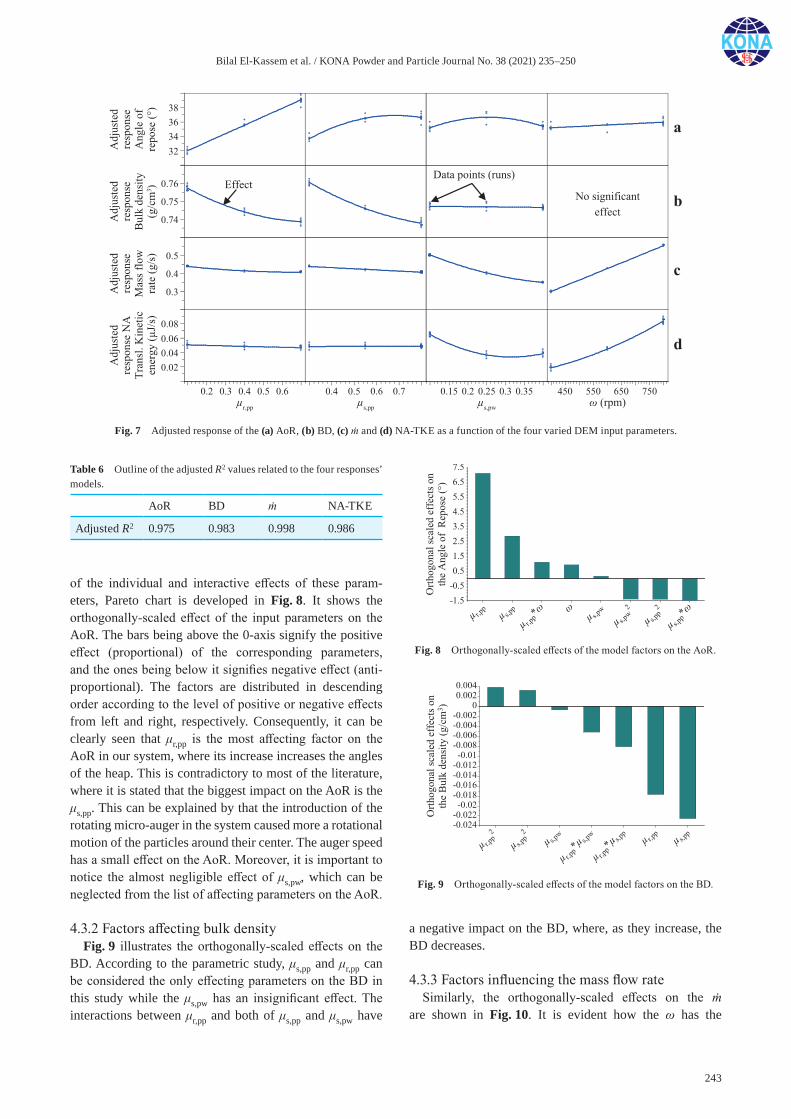
Bilal El-Kassem et al. / KONA Powder and Particle Journal No. 38 (2021) 235–250
243
of the individual and interactive effects of these param-eters, Pareto chart is developed in Fig. 8. It shows the orthogonally-scaled effect of the input parameters on the AoR. The bars being above the 0-axis signify the positive effect (proportional) of the corresponding parameters, and the ones being below it signifies negative effect (anti- proportional). The factors are distributed in descending order according to the level of positive or negative effects from left and right, respectively. Consequently, it can be clearly seen that μr,pp is the most affecting factor on the AoR in our system, where its increase increases the angles of the heap. This is contradictory to most of the literature, where it is stated that the biggest impact on the AoR is the μs,pp. This can be explained by that the introduction of the rotating micro-auger in the system caused more a rotational motion of the particles around their center. The auger speed has a small effect on the AoR. Moreover, it is important to notice the almost negligible effect of μs,pw, which can be neglected from the list of affecting parameters on the AoR.
4.3.2 Factors affecting bulk densityFig. 9 illustrates the orthogonally-scaled effects on the
BD. According to the parametric study, μs,pp and μr,pp can be considered the only effecting parameters on the BD in this study while the μs,pw has an insignificant effect. The interactions between μr,pp and both of μs,pp and μs,pw have
a negative impact on the BD, where, as they increase, the BD decreases.
4.3.3 Factors influencing the mass flow rateSimilarly, the orthogonally-scaled effects on the ṁ
are shown in Fig. 10. It is evident how the ω has the
Fig. 7 Adjusted response of the (a) AoR, (b) BD, (c) ṁ and (d) NA-TKE as a function of the four varied DEM input parameters.
Table 6 Outline of the adjusted R2 values related to the four responses’ models.
AoR BD ṁ NA-TKE
Adjusted R2 0.975 0.983 0.998 0.986
Fig. 8 Orthogonally-scaled effects of the model factors on the AoR.
Fig. 9 Orthogonally-scaled effects of the model factors on the BD.

Bilal El-Kassem et al. / KONA Powder and Particle Journal No. 38 (2021) 235–250
244
largest positive significance on ṁ, whereas μs,pw has the largest negative impact on it. As the particle-wall friction increases, the tendency of particle flow decreases dramat-ically leading to low mass output. It is important to notice that although the major effect μs,pw is having on ṁ, it has not been considered before as a calibration parameter in many other studies which now reveals its importance to be more widely studied.
4.3.4 Factors influencing the kinetic energyIn Fig. 11, the influence of the studied DEM input fac-
tors on the NA-TKE, is demonstrated in a Pareto graph of effects. Once more, ω has the highest positive significant effect followed by μs,pw, which has the largest negative impact on the NA-TKE. It is noticeable that the μs,pp is showing a negligible effect on the NA-TKE. The reason for this is that the particles are basically being exposed to a rotary motion by the auger, therefore, the translational contact between the particles was almost not existing. Moreover, the rotation of the auger caused the particles to rotate around themselves, rather than rotating around one common axis. This can be seen by the presence of μr,pp as having some impact. Although the particles are not showing a translational relative motion with respect to each other, the μs,pw is still proven to be a very affecting parameter on the NA-TKE. This means that the particles
are sliding on the boundary during dosing. Therefore, it is important to draw attention to the importance of calibrating the roughness of the boundaries in DEM. Moreover, as the NA-TKE basically represents the dynamics of the particles, the AoR was measured when the NA-TKE reached the value of 0. This is because the AoR should be measured when the particles get in rest (Qi et al., 2019).
4.4 Experimental validation of predictive models
A prediction model, based on the MVRA results, is built and used to validate the robustness of the model. As μr,pp and μs,pp have the highest significant impact on the AoR and the BD, the contour plots were illustrated based on these two parameters (Fig. 12a and Fig. 12b). Although, as explained in subsection 4.3.3, ω and μs,pw have the highest impact on the ṁ, but due to the aim of finding the optimal parameter combination between the calibrated parameters by superimposing three contour plots together, μr,pp and μs,pp were varied on the predicted contour plot of the ṁ (Fig. 12c) as well. As an illustration example to find out the best optimized DEM parameter combination, the predicted contour plots were generated at ω = 800 rpm and μs,pw = 0.347 (as an optimized value resulting from the optimization algorithms in Cornerstone) as fixed values.
As can be seen from the above figures, wide ranges of combinations between μr,pp and μs,pp in each response lead to delivering the experimental reference values which are the underlined values in the graphs. Therefore, considering a single experimental bulk behavior highlights the problem of ambiguous parameter combinations in the calibration process. Consequently, the three predicted contour plots in Fig. 12 were superimposed. By this, the number of admissible combinations is dramatically minimized, where a very small intersecting region between the reference target values was found (see Fig. 13). Taking into account the minimized area of permissible combinations, the valid range for μr,pp is between 0.1 and 0.2 combined with μs,pp between 0.34 and 0.5. For more clarity, the intersecting contour lines away from our reference target values are blurred in the graph. The contour lines of the BD and the ṁ evidently intersect, whereas the contour line of the AoR (33.2°) is shifted around 0.3° ahead, which is accepted and within the range of the prediction model. In the context of the superimposing approach, one of the problems that may occur is the non-intersection between the contour lines (Derakhshani et al., 2015). Roessler et al., 2018 added that the measurement error needs to be taken into consideration to enable a significant overlap of the test results.
Cornerstone software offers an integrated optimization algorithm to select an optimal unique set of parameters combination that predicts the response values based on the experimental reference target values. Based on the optimization feature algorithm, that aims to match the
Fig. 10 Orthogonally-scaled effects of the model factors on the ṁ.
Fig. 11 Orthogonally-scaled effects of the model factors on the NA-TKE.
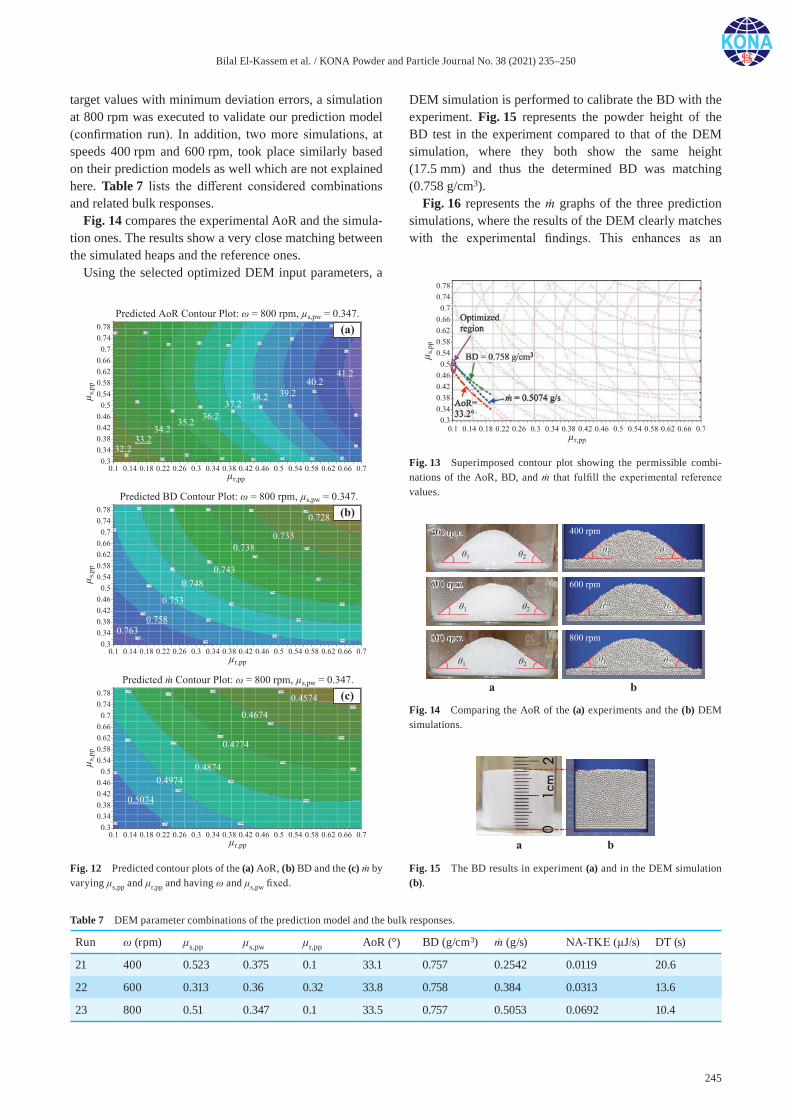
Bilal El-Kassem et al. / KONA Powder and Particle Journal No. 38 (2021) 235–250
245
target values with minimum deviation errors, a simulation at 800 rpm was executed to validate our prediction model (confirmation run). In addition, two more simulations, at speeds 400 rpm and 600 rpm, took place similarly based on their prediction models as well which are not explained here. Table 7 lists the different considered combinations and related bulk responses.
Fig. 14 compares the experimental AoR and the simula-tion ones. The results show a very close matching between the simulated heaps and the reference ones.
Using the selected optimized DEM input parameters, a
DEM simulation is performed to calibrate the BD with the experiment. Fig. 15 represents the powder height of the BD test in the experiment compared to that of the DEM simulation, where they both show the same height (17.5 mm) and thus the determined BD was matching (0.758 g/cm3).
Fig. 16 represents the ṁ graphs of the three prediction simulations, where the results of the DEM clearly matches with the experimental findings. This enhances as an
Fig. 12 Predicted contour plots of the (a) AoR, (b) BD and the (c) ṁ by varying μs,pp and μr,pp and having ω and μs,pw fixed.
Table 7 DEM parameter combinations of the prediction model and the bulk responses.
Run ω (rpm) μs,pp μs,pw μr,pp AoR (°) BD (g/cm3) ṁ (g/s) NA-TKE (μJ/s) DT (s)
21 400 0.523 0.375 0.1 33.1 0.757 0.2542 0.0119 20.6
22 600 0.313 0.36 0.32 33.8 0.758 0.384 0.0313 13.6
23 800 0.51 0.347 0.1 33.5 0.757 0.5053 0.0692 10.4
Fig. 13 Superimposed contour plot showing the permissible combi-nations of the AoR, BD, and ṁ that fulfill the experimental reference values.
Fig. 14 Comparing the AoR of the (a) experiments and the (b) DEM simulations.
Fig. 15 The BD results in experiment (a) and in the DEM simulation (b).
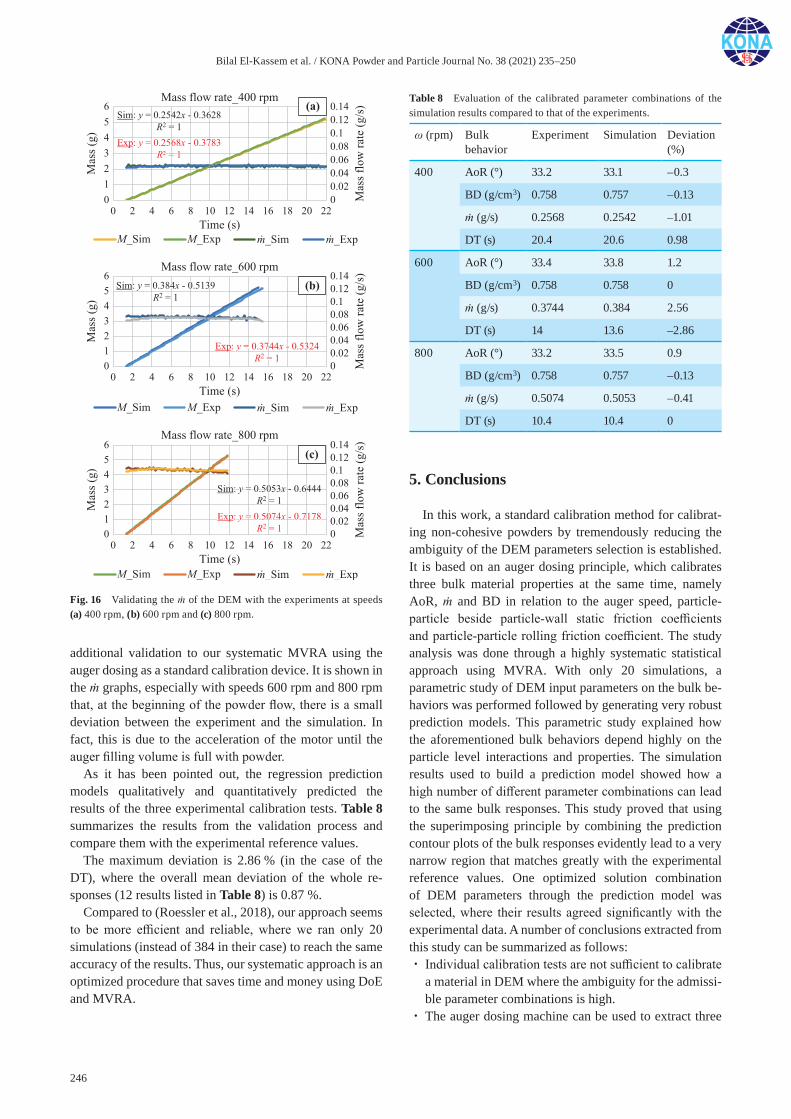
Bilal El-Kassem et al. / KONA Powder and Particle Journal No. 38 (2021) 235–250
246
additional validation to our systematic MVRA using the auger dosing as a standard calibration device. It is shown in the ṁ graphs, especially with speeds 600 rpm and 800 rpm that, at the beginning of the powder flow, there is a small deviation between the experiment and the simulation. In fact, this is due to the acceleration of the motor until the auger filling volume is full with powder.
As it has been pointed out, the regression prediction models qualitatively and quantitatively predicted the results of the three experimental calibration tests. Table 8 summarizes the results from the validation process and compare them with the experimental reference values.
The maximum deviation is 2.86 % (in the case of the DT), where the overall mean deviation of the whole re-sponses (12 results listed in Table 8) is 0.87 %.
Compared to (Roessler et al., 2018), our approach seems to be more efficient and reliable, where we ran only 20 simulations (instead of 384 in their case) to reach the same accuracy of the results. Thus, our systematic approach is an optimized procedure that saves time and money using DoE and MVRA.
5. Conclusions
In this work, a standard calibration method for calibrat-ing non-cohesive powders by tremendously reducing the ambiguity of the DEM parameters selection is established. It is based on an auger dosing principle, which calibrates three bulk material properties at the same time, namely AoR, ṁ and BD in relation to the auger speed, particle- particle beside particle-wall static friction coefficients and particle-particle rolling friction coefficient. The study analysis was done through a highly systematic statistical approach using MVRA. With only 20 simulations, a parametric study of DEM input parameters on the bulk be-haviors was performed followed by generating very robust prediction models. This parametric study explained how the aforementioned bulk behaviors depend highly on the particle level interactions and properties. The simulation results used to build a prediction model showed how a high number of different parameter combinations can lead to the same bulk responses. This study proved that using the superimposing principle by combining the prediction contour plots of the bulk responses evidently lead to a very narrow region that matches greatly with the experimental reference values. One optimized solution combination of DEM parameters through the prediction model was selected, where their results agreed significantly with the experimental data. A number of conclusions extracted from this study can be summarized as follows:・ Individual calibration tests are not sufficient to calibrate
a material in DEM where the ambiguity for the admissi-ble parameter combinations is high.
・ The auger dosing machine can be used to extract three
Fig. 16 Validating the ṁ of the DEM with the experiments at speeds (a) 400 rpm, (b) 600 rpm and (c) 800 rpm.
Table 8 Evaluation of the calibrated parameter combinations of the simulation results compared to that of the experiments.
ω (rpm) Bulk behavior
Experiment Simulation Deviation(%)
400 AoR (°) 33.2 33.1 –0.3
BD (g/cm3) 0.758 0.757 –0.13
ṁ (g/s) 0.2568 0.2542 –1.01
DT (s) 20.4 20.6 0.98
600 AoR (°) 33.4 33.8 1.2
BD (g/cm3) 0.758 0.758 0
ṁ (g/s) 0.3744 0.384 2.56
DT (s) 14 13.6 –2.86
800 AoR (°) 33.2 33.5 0.9
BD (g/cm3) 0.758 0.757 –0.13
ṁ (g/s) 0.5074 0.5053 –0.41
DT (s) 10.4 10.4 0

Bilal El-Kassem et al. / KONA Powder and Particle Journal No. 38 (2021) 235–250
247
reference bulk responses, i.e., AoR, BD, ṁ.・ Using the D-optimal design model, the superimposing
principle of three predicted contour plots from the MVRA and the optimization algorithm in Cornerstone proved to be a robust approach to eliminate ambiguity.
・ μr,pp was shown to have an overwhelmed effect over μs,pp.
・ Using the presented auger dosing machine, a unique optimized parameter combination was identified and experimentally validated.For the future work, process optimization should be
carried out by studying and validating more material prop-erties and bulk behaviors. In addition, the study should be extended to cover cohesive powders.
Acknowledgements
This research did not receive any specific grant from funding agencies in the public, commercial, or not-for-profit sectors.
References
Ai J., Chen J.F., Rotter J.M., Ooi J.Y., Assessment of rolling resistance models in discrete element simulations, Powder Technology, 206 (2011) 269–282. DOI: 10.1016/j.powtec. 2010.09.030
Al-hashemi H.M.B., Al-amoudi O.S.B., A review on the angle of repose of granular materials, Powder Technology, 330 (2018) 397–417. DOI: 10.1016/j.powtec.2018.02.003
Bierwisch C., Kraft T., Riedel H., Moseler M., Three-dimensional discrete element models for the granular statics and dynam-ics of powders in cavity filling, Journal of the Mechanics and Physics of Solids, 57 (2009) 10–31. DOI: 10.1016/j.jmps.2008.10.006
Bierwisch C.S., Numerical Simulations of Granular Flow and Filling, Shaker Verlag GmbH, Germany, 2009, ISBN: 3832283382.
Börner M., Michaelis M., Siegmann E., Radeke C., Schmidt U., Impact of impeller design on high-shear wet granulation, Powder Technology, 295 (2016) 261–271. DOI: 10.1016/j.powtec.2016.03.023
Ciantia M.O., Arroyo M., Butlanska J., Gens A., DEM modelling of cone penetration tests in a double-porosity crushable granular material, Computers and Geotechnics, 73 (2016) 109–127. DOI: 10.1016/j.compgeo.2015.12.001
Clearly P.W., DEM modelling of particulate flow in a screw feeder Model description, Progress in Computational Fluid Dynamics, An International Journal, 7 (2007). DOI: 10.1504/PCFD.2007.013005
Coetzee C.J., Review: Calibration of the discrete element method, Powder Technology, 310 (2017) 104–142. DOI: 10.1016/j.powtec.2017.01.015
Cundall P.A., Strack O.D.L., A discrete numerical model for
granular assemblies, Géotechnique, 29 (1979) 47–65. DOI: 10.1192/bjp.115.526.1065
Derakhshani S.M., Schott D.L., Lodewijks G., Micro – macro properties of quartz sand : Experimental investigation and DEM simulation, Powder Technology, 269 (2015) 127–138. DOI: 10.1016/j.powtec.2014.08.072
El Kassem B., Brinz T., Heider Y., Markert B., Experimental study and discrete element simulation of auger dosing of different pharmaceutical powders, Proceedings in Applied Mathematics and Mechanics PAMM, 18 (2018). DOI: 10.1002/pamm.201800261
El Kassem B., Salloum N., Brinz T., Heider Y., Markert B., A Multivariate regression parametric study on DEM input parameters of free-flowing and cohesive powders with experimental data-based validation, Computational Particle Mechanics, (2020). DOI: 10.1007/s40571-020-00315-8
Eriksson L., Johansson E., Kettaneh-Wold N., WikstrÄom C., Wold S., Design of Experiments: Principles and Applica-tions, third edition, Umetrics AB, 2008, ISBN: 9197373044.
Fernandez J.W., Cleary P.W., McBride W., Effect of screw design on hopper drawdown of spherical particles in a horizontal screw feeder, Chemical Engineering Science, 66 (2011) 5585–5601. DOI: 10.1016/j.ces.2011.07.043
Geuzaine C., Remacle J.-F., Gmsh: A 3-D finite element mesh generator with built-in pre- and post-processing facilities, International Journal for Numerical Methods in Engineering, 79 (2009) 1309–1331. DOI: 10.1002/nme.2579
Govender N., Pizette P., Wilke D.N., Abriak N.-E., Validation of the GPU based blaze-DEM framework for hopper dis-charge, Proceedings of the 4th International Conference on Particle-Based Methods — Fundamentals and Applications, PARTICLES 2015, (2015).
Heider Y., Reiche S., Siebert P., Markert B., Modeling of hydrau-lic fracturing using a porous-media phase-field approach with reference to experimental data, Engineering Fracture Mechanics, (2018) 116–134. DOI: 10.1016/j.engfracmech. 2018.09.010.
Hertz H., Ueber die Berührung fester elastischer Körper (“On the contact of elastic bodies”), Journal für die reine und angewandte Mathematik, 92 (1882) 156–171. DOI: 10.1515/crll.1882.92.156
Iwashita K., Oda M., Micro-deformation mechanism of shear banding process based on modified distinct element method, Powder Technology, 109 (2000) 192–205. DOI: 10.1016/S0032-5910(99)00236-3
Johnstone M.W., Calibration of DEM models for granular materi-als using bulk physical tests, Doctoral Thesis, The University of Edinburgh, Philosophy, (2010).
Kloss C., Goniva C., Hager A., Amberger S., Pirker S., Mod-els, algorithms and validation for opensource DEM and CFD-DEM, Progress in Computational Fluid Dynamics, International Journal, 12 (2012) 140. DOI: 10.1504/PCFD. 2012.047457
Krantz M., Zhang H., Zhu J., Characterization of powder flow: Static and dynamic testing, Powder Technology, 194 (2009) 239–245. DOI: 10.1016/j.powtec.2009.05.001
Li Y., Xu Y., Thornton C., A comparison of discrete element simulations and experiments for “sandpiles” composed of
Bilal El-Kassem et al. / KONA Powder and Particle Journal No. 38 (2021) 235–250
248
spherical particles, Powder Technology, 160 (2005) 219–228. DOI: 10.1016/j.powtec.2005.09.002
Li Z., Yang J., Xu X., Xu X., Yu W., Yue X., Sun C., Particle shape characterization of fluidized catalytic cracking catalyst powders using the mean value and distribution of shape factors, Advanced Powder Technology, 13 (2002) 249–263. DOI: 10.1163/156855202320252435
Lommen S., Schott D., Lodewijks G., DEM speedup: Stiffness effects on behavior of bulk material, Particuology, 12 (2014) 107–112. DOI: 10.1016/j.partic.2013.03.006
Lumay G., Boschini F., Traina K., Bontempi S., Remy J.C., Cloots R., Vandewalle N., Measuring the flowing properties of powders and grains, Powder Technology, 224 (2012) 19–27. DOI: 10.1016/j.powtec.2012.02.015
MakeItFrom, 2019a, EN 1.4404 (X2CrNiMo17-12-2) Stainless Steel <www.makeitfrom.com/material-properties/EN-1.4404-X2CrNiMo17-12-2-Stainless-Steel> accessed 19.01.2019.
MakeItFrom, 2019b, Borosilicate Glass <www.makeitfrom.com/material-properties/Borosilicate-Glass> accessed 19.01.2019.
Marigo M., Cairns D.L., Bowen J., Ingram A., Stitt E.H., Rela-tionship between single and bulk mechanical properties for zeolite ZSM5 spray-dried particles, Particuology, 14 (2014) 130–138. DOI: 10.1016/j.partic.2013.05.006
Marigo M., Stitt E.H., Discrete element method (DEM) for industrial applications: Comments on calibration and valida-tion for the modelling of cylindrical pellets, KONA Powder and Particle Journal, 32 (2015) 236–252. DOI: 10.14356/kona.2015016
Mindlin R.D., Compliance of elastic bodies in contact, Journal of Applied Mechanics, 16 (1949) 259–268.
Moysey P.A., Thompson M.R., Modelling the solids inflow and solids conveying of single-screw extruders using the discrete element method, Powder Technology, 153 (2005) 95–107. DOI: 10.1016/j.powtec.2005.03.001
Obaid A., Turek S., Heider Y., Markert B., A new monolithic Newton-multigrid-based FEM solution scheme for large strain dynamic poroelasticity problems, International Journal for Numerical Methods in Engineering, 109 (2017) 1103–1129. DOI: 10.1002/nme.5315
Owen P.J., Cleary P.W., Prediction of screw conveyor perfor-mance using the Discrete Element Method (DEM), Powder Technology, 193 (2009) 274–288. DOI: 10.1016/j.powtec. 2009.03.012
Owen P.J., Cleary P.W., Screw conveyor performance: com-parison of discrete element modelling with laboratory experiments, Progress in Computational Fluid Dynamics, An International Journal, 10 (2010) 327–333. DOI: 10.1504/PCFD.2010.035366
Pezo L., Jovanović A., Pezo M., Čolović R., Lonćar B., Modified screw conveyor-mixers – Discrete element mod-eling approach, Advanced Powder Technology, 26 (2015) 1391–1399. DOI: https://doi.org/10.1016/j.apt.2015.07.016.
Pillai U., Heider Y., Markert B., A diffusive dynamic brittle fracture model for heterogeneous solids and porous mate-rials with implementation using a user-element subroutine, Computational Materials Science, 153 (2018) 36–47. DOI:
10.1016/j.commatsci.2018.06.024.Qi L., Chen Y., Sadek M., Simulations of soil flow properties
using the discrete element method (DEM), Computers and Electronics in Agriculture, 157 (2019) 254–260. DOI: 10.1016/j.compag.2018.12.052
Roberts A.W., The influence of granular vortex motion on the vol-umetric performance of enclosed screw conveyors, Powder Technology, 104 (1999) 56–67. DOI: 10.1016/S0032- 5910(99)00039-X
Roessler T., Katterfeld A., DEM parameter calibration of cohesive bulk materials using a simple angle of repose test, Particuology, 45 (2019) 105–115. DOI: 10.1016/j.partic.2018.08.005
Roessler T., Richter C., Katterfeld A., Will F., Development of a standard calibration procedure for the DEM parameters of cohesionless bulk materials – part I: Solving the problem of ambiguous parameter combinations, Powder Technology, 343 (2018) 803–812. DOI: 10.1016/j.powtec.2018.11.034
Shimizu Y., Cundall P., Three-dimensional DEM simula-tions of bulk handling by screw conveyors, Journal of Engineering Mechanics, 127 (2001) 864–872. DOI: 10.1061/(ASCE)0733-9399(2001)127:9(864)
Sinnott M.D., Cleary P.W., The effect of particle shape on mixing in a high shear mixer, Computational Particle Mechanics, 3 (2016) 477–504. DOI: 10.1007/s40571-015-0065-4
Souihi N., Josefson M., Tajarobi P., Gururajan B., Trygg J., Design space estimation of the roller compaction process, Industrial & Engineering Chemistry Research, 52 (2013) 12408–12419. DOI: 10.1021/ie303580y
Sundararajan K., 2018, Design of Experiments- A Primer <www.isixsigma.com/tools-templates/design-of-experiments-doe/design-experiments-␓-primer/> accessed 22.04.2020.
Triefenbach F., Design of experiments: The D-optimal approach and its implementation as a computer algorithm, Bachelor’s Thesis, Umea University and South Westphalia University of Applied Sciences, 2008.
Wang Z., Jacobs F., Ziegler M., Experimental and DEM inves-tigation of geogrid-soil interaction under pullout loads, Geotextiles and Geomembranes, 44 (2016) 230–246. DOI: 10.1016/j.geotexmem.2015.11.001
Wensrich C.M., Katterfeld A., Rolling friction as a technique for modelling particle shape in DEM, Powder Technology, 217 (2012) 409–417. DOI: 10.1016/j.powtec.2011.10.057
Wilkinson S.K., Turnbull S.A., Yan Z., Stitt E.H., Marigo M., A parametric evaluation of powder flowability using a Free-man rheometer through statistical and sensitivity analysis: A discrete element method (DEM) study, Computers and Chemical Engineering, 97 (2017) 161–174. DOI: 10.1016/j.compchemeng.2016.11.034
Yan Z., Wilkinson S.K., Stitt E.H., Marigo M., Discrete element modelling (DEM) input parameters: Understanding their impact on model predictions using statistical analysis, Computational Particle Mechanics, 2 (2015) 283–299. DOI: 10.1007/s40571-015-0056-5
Zhou D., Qiu Y., Understanding material properties in pharma-ceutical product development and manufacturing: Powder flow and mechanical properties, Journal of Validation tech-nology, 73 (2010) 65–77. DOI: 10.6061/clinics/2018/e264

Bilal El-Kassem et al. / KONA Powder and Particle Journal No. 38 (2021) 235–250
249
Zhou Y.C., Xu B.H., Yu B., Zulli P., An experimental and numerical study of the angle of repose of coarse spheres, Powder Technology, 125 (2002) 45–54. DOI: 10.1109/MACE.2011.5986910
Zhu H.P., Zhou Z.Y., Yang R.Y., Yu A.B., Discrete particle simulation of particulate systems: Theoretical developments,
Chemical Engineering Science, 62 (2007) 3378–3396. DOI: 10.1016/j.ces.2006.12.089
Zhu H.P., Zhou Z.Y., Yang R.Y., Yu A.B., Discrete particle simu-lation of particulate systems: A review of major applications and findings, Chemical Engineering Science, 63 (2008) 5728–5770. DOI: 10.1016/j.ces.2008.08.006
Authors’ Short Biographies
Bilal El Kassem
Bilal El Kassem, M.Sc., is a PhD candidate at Robert Bosch Packaging Technology GmbH, in Stuttgart, Germany, under the supervision of Prof. Bernd Markert from RWTH Aachen University. He received his B.Sc. degree in Mechatronics Engineering from Rafic Hariri University, Lebanon in 2012, and received his M.Sc. degree in Computer Aided Production in Mechanical Engineering from RWTH Aachen University, Germany, in 2016. His current research focuses on optimizing auger dosing process using discrete element methods and analyzing the experimental powder flow behavior using regression analysis.
Nizar Salloum
Nizar Salloum, M.Sc., is a PhD candidate at Robert Bosch Packaging Technology GmbH, in Stuttgart, Germany, under the supervision of Prof. Stefan Heinrich from Hamburg Univer-sity of Technology. He received his B.Sc. degree in Mechanical Engineering from Lebanese International University in 2016, and received his M.Sc. degree in Computational Mechanics of Materials and Structures from University of Stuttgart, in 2019. His current research fo-cuses on optimizing mixing and filling processes of pharmaceutical powders using discrete element methods.
Thomas Brinz
Dr. Thomas Brinz is a department leader at Robert Bosch Packaging Technology GmbH, in Stuttgart. He received his Diploma degree in Chemistry from University of Ulm, in 1999, and received his PhD degree in Chemistry at the same university, in 2003. His has 16 years of industrial expertise in lab automation solutions and high throughput technologies in pharmaceutical applications.
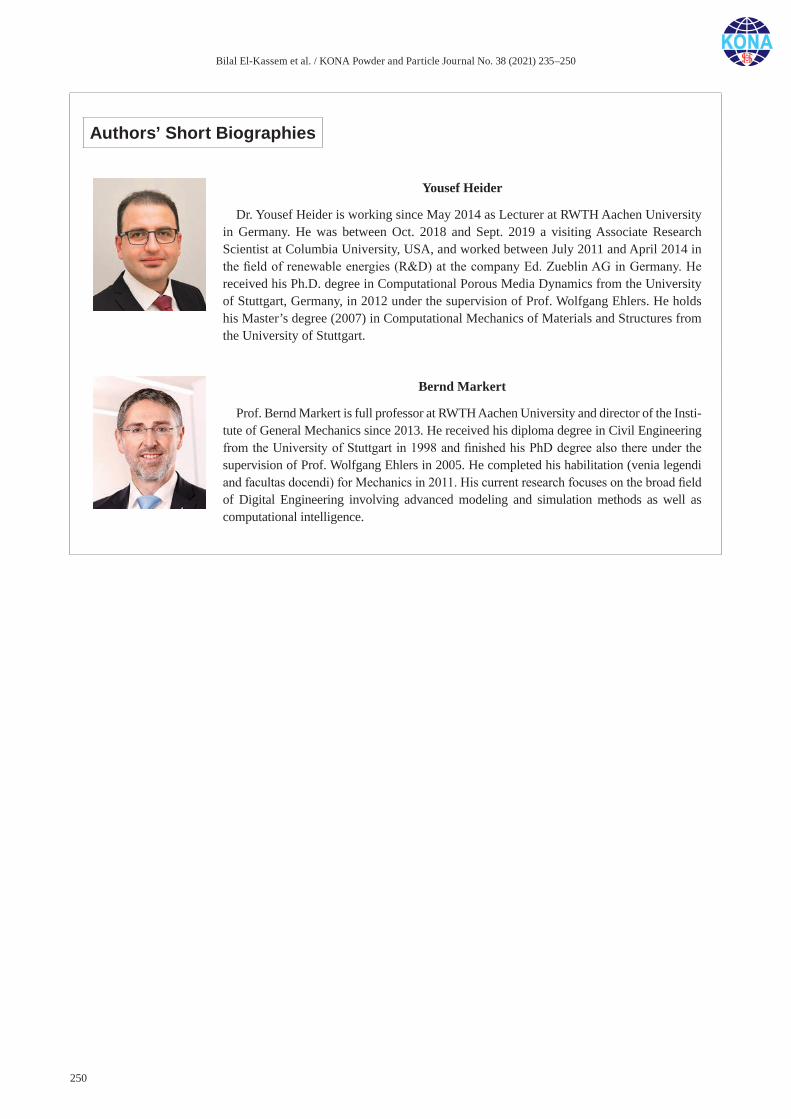
Bilal El-Kassem et al. / KONA Powder and Particle Journal No. 38 (2021) 235–250
250
Authors’ Short Biographies
Yousef Heider
Dr. Yousef Heider is working since May 2014 as Lecturer at RWTH Aachen University in Germany. He was between Oct. 2018 and Sept. 2019 a visiting Associate Research Scientist at Columbia University, USA, and worked between July 2011 and April 2014 in the field of renewable energies (R&D) at the company Ed. Zueblin AG in Germany. He received his Ph.D. degree in Computational Porous Media Dynamics from the University of Stuttgart, Germany, in 2012 under the supervision of Prof. Wolfgang Ehlers. He holds his Master’s degree (2007) in Computational Mechanics of Materials and Structures from the University of Stuttgart.
Bernd Markert
Prof. Bernd Markert is full professor at RWTH Aachen University and director of the Insti-tute of General Mechanics since 2013. He received his diploma degree in Civil Engineering from the University of Stuttgart in 1998 and finished his PhD degree also there under the supervision of Prof. Wolfgang Ehlers in 2005. He completed his habilitation (venia legendi and facultas docendi) for Mechanics in 2011. His current research focuses on the broad field of Digital Engineering involving advanced modeling and simulation methods as well as computational intelligence.
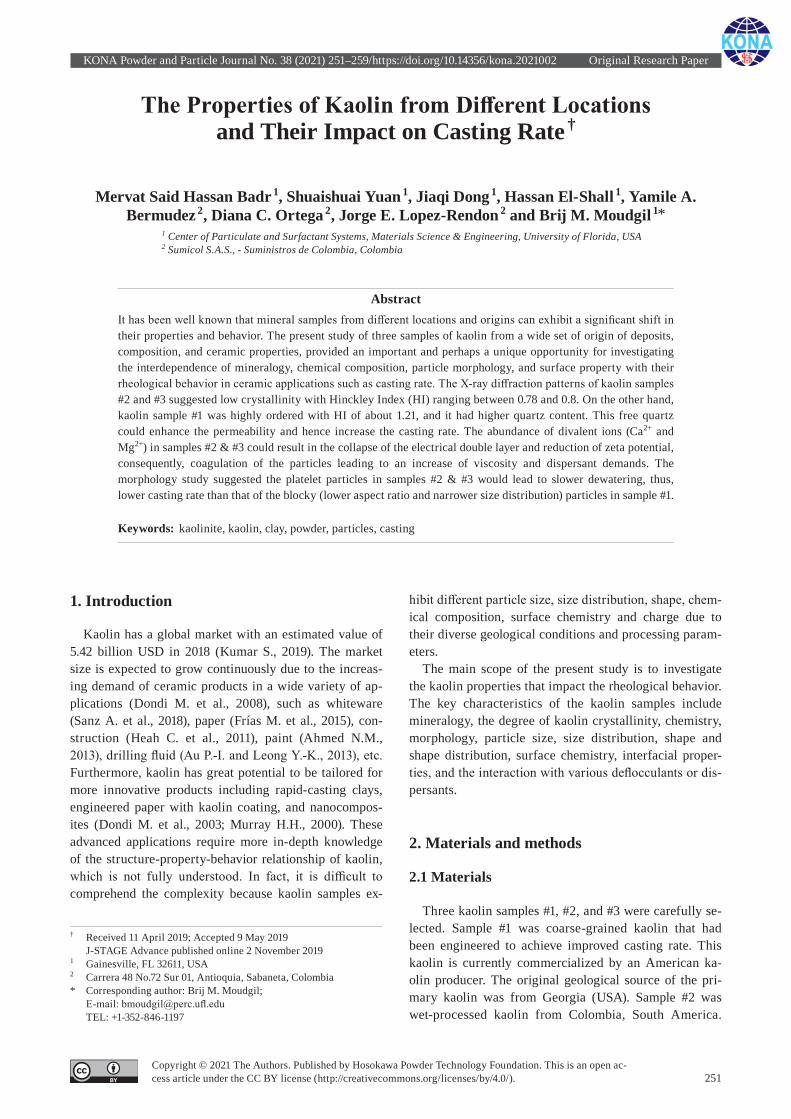
KONA Powder and Particle Journal No. 38 (2021) 251–259/https://doi.org/10.14356/kona.2021002 Original Research Paper
251Copyright © 2021 The Authors. Published by Hosokawa Powder Technology Foundation. This is an open ac-cess article under the CC BY license (http://creativecommons.org/licenses/by/4.0/).
The Properties of Kaolin from Different Locations and Their Impact on Casting Rate †
Mervat Said Hassan Badr 1, Shuaishuai Yuan 1, Jiaqi Dong 1, Hassan El-Shall 1, Yamile A. Bermudez 2, Diana C. Ortega 2, Jorge E. Lopez-Rendon 2 and Brij M. Moudgil 1*
1 Center of Particulate and Surfactant Systems, Materials Science & Engineering, University of Florida, USA2 Sumicol S.A.S., - Suministros de Colombia, Colombia
AbstractIt has been well known that mineral samples from different locations and origins can exhibit a significant shift in their properties and behavior. The present study of three samples of kaolin from a wide set of origin of deposits, composition, and ceramic properties, provided an important and perhaps a unique opportunity for investigating the interdependence of mineralogy, chemical composition, particle morphology, and surface property with their rheological behavior in ceramic applications such as casting rate. The X-ray diffraction patterns of kaolin samples #2 and #3 suggested low crystallinity with Hinckley Index (HI) ranging between 0.78 and 0.8. On the other hand, kaolin sample #1 was highly ordered with HI of about 1.21, and it had higher quartz content. This free quartz could enhance the permeability and hence increase the casting rate. The abundance of divalent ions (Ca2+ and Mg2+) in samples #2 & #3 could result in the collapse of the electrical double layer and reduction of zeta potential, consequently, coagulation of the particles leading to an increase of viscosity and dispersant demands. The morphology study suggested the platelet particles in samples #2 & #3 would lead to slower dewatering, thus, lower casting rate than that of the blocky (lower aspect ratio and narrower size distribution) particles in sample #1.
Keywords: kaolinite, kaolin, clay, powder, particles, casting
1. Introduction
Kaolin has a global market with an estimated value of 5.42 billion USD in 2018 (Kumar S., 2019). The market size is expected to grow continuously due to the increas-ing demand of ceramic products in a wide variety of ap-plications (Dondi M. et al., 2008), such as whiteware (Sanz A. et al., 2018), paper (Frías M. et al., 2015), con-struction (Heah C. et al., 2011), paint (Ahmed N.M., 2013), drilling fluid (Au P.-I. and Leong Y.-K., 2013), etc. Furthermore, kaolin has great potential to be tailored for more innovative products including rapid-casting clays, engineered paper with kaolin coating, and nanocompos-ites (Dondi M. et al., 2003; Murray H.H., 2000). These advanced applications require more in-depth knowledge of the structure-property-behavior relationship of kaolin, which is not fully understood. In fact, it is difficult to comprehend the complexity because kaolin samples ex-
hibit different particle size, size distribution, shape, chem-ical composition, surface chemistry and charge due to their diverse geological conditions and processing param-eters.
The main scope of the present study is to investigate the kaolin properties that impact the rheological behavior. The key characteristics of the kaolin samples include mineralogy, the degree of kaolin crystallinity, chemistry, morphology, particle size, size distribution, shape and shape distribution, surface chemistry, interfacial proper-ties, and the interaction with various deflocculants or dis-persants.
2. Materials and methods
2.1 Materials
Three kaolin samples #1, #2, and #3 were carefully se-lected. Sample #1 was coarse-grained kaolin that had been engineered to achieve improved casting rate. This kaolin is currently commercialized by an American ka-olin producer. The original geological source of the pri-mary kaolin was from Georgia (USA). Sample #2 was wet-processed kaolin from Colombia, South America.
† Received 11 April 2019; Accepted 9 May 2019 J-STAGE Advance published online 2 November 20191 Gainesville, FL 32611, USA2 Carrera 48 No.72 Sur 01, Antioquia, Sabaneta, Colombia* Corresponding author: Brij M. Moudgil; E-mail: [email protected] TEL: +1-352-846-1197
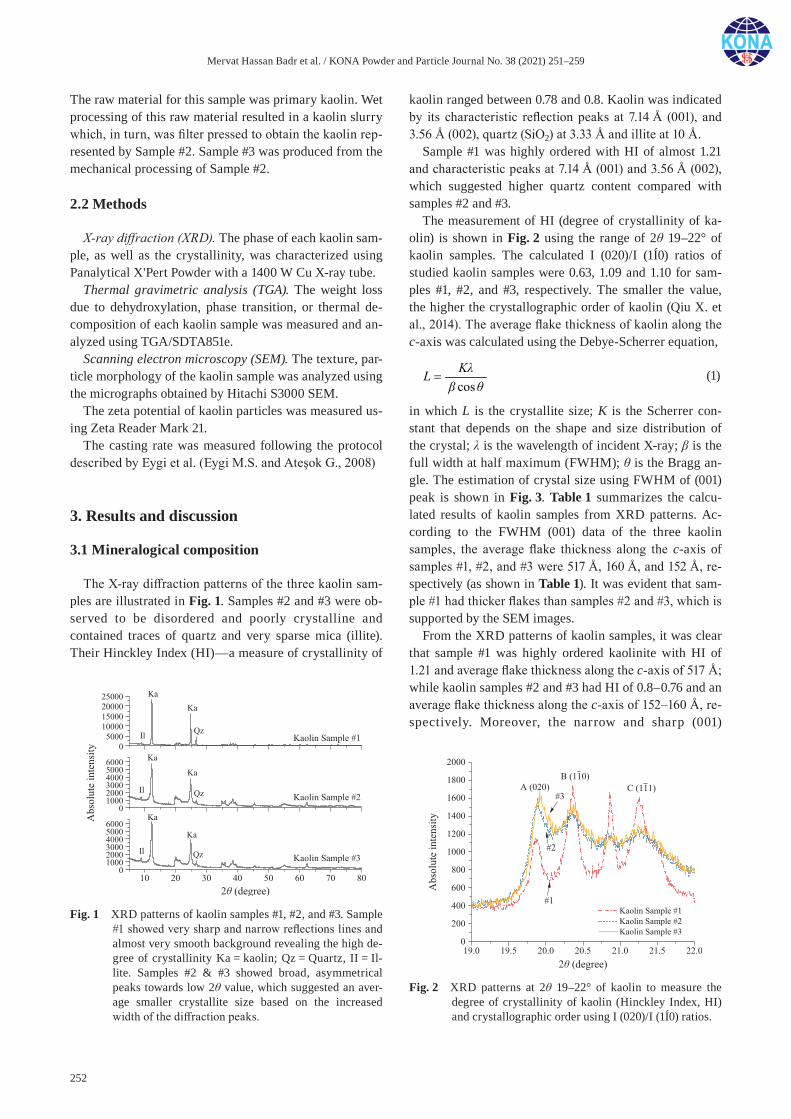
Mervat Hassan Badr et al. / KONA Powder and Particle Journal No. 38 (2021) 251–259
252
The raw material for this sample was primary kaolin. Wet processing of this raw material resulted in a kaolin slurry which, in turn, was filter pressed to obtain the kaolin rep-resented by Sample #2. Sample #3 was produced from the mechanical processing of Sample #2.
2.2 Methods
X-ray diffraction (XRD). The phase of each kaolin sam-ple, as well as the crystallinity, was characterized using Panalytical X'Pert Powder with a 1400 W Cu X-ray tube.
Thermal gravimetric analysis (TGA). The weight loss due to dehydroxylation, phase transition, or thermal de-composition of each kaolin sample was measured and an-alyzed using TGA/SDTA851e.
Scanning electron microscopy (SEM). The texture, par-ticle morphology of the kaolin sample was analyzed using the micrographs obtained by Hitachi S3000 SEM.
The zeta potential of kaolin particles was measured us-ing Zeta Reader Mark 21.
The casting rate was measured following the protocol described by Eygi et al. (Eygi M.S. and Ateşok G., 2008)
3. Results and discussion
3.1 Mineralogical composition
The X-ray diffraction patterns of the three kaolin sam-ples are illustrated in Fig. 1. Samples #2 and #3 were ob-served to be disordered and poorly crystalline and contained traces of quartz and very sparse mica (illite). Their Hinckley Index (HI)—a measure of crystallinity of
kaolin ranged between 0.78 and 0.8. Kaolin was indicated by its characteristic reflection peaks at 7.14 Å (001), and 3.56 Å (002), quartz (SiO2) at 3.33 Å and illite at 10 Å.
Sample #1 was highly ordered with HI of almost 1.21 and characteristic peaks at 7.14 Å (001) and 3.56 Å (002), which suggested higher quartz content compared with samples #2 and #3.
The measurement of HI (degree of crystallinity of ka-olin) is shown in Fig. 2 using the range of 2θ 19–22° of kaolin samples. The calculated I (020)/I (1Í0) ratios of studied kaolin samples were 0.63, 1.09 and 1.10 for sam-ples #1, #2, and #3, respectively. The smaller the value, the higher the crystallographic order of kaolin (Qiu X. et al., 2014). The average flake thickness of kaolin along the c-axis was calculated using the Debye- Scherrer equation,
cosKλL
β θ (1)
in which L is the crystallite size; K is the Scherrer con-stant that depends on the shape and size distribution of the crystal; λ is the wavelength of incident X-ray; β is the full width at half maximum (FWHM); θ is the Bragg an-gle. The estimation of crystal size using FWHM of (001) peak is shown in Fig. 3. Table 1 summarizes the calcu-lated results of kaolin samples from XRD patterns. Ac-cording to the FWHM (001) data of the three kaolin samples, the average flake thickness along the c-axis of samples #1, #2, and #3 were 517 Å, 160 Å, and 152 Å, re-spectively (as shown in Table 1). It was evident that sam-ple #1 had thicker flakes than samples #2 and #3, which is supported by the SEM images.
From the XRD patterns of kaolin samples, it was clear that sample #1 was highly ordered kaolinite with HI of 1.21 and average flake thickness along the c-axis of 517 Å; while kaolin samples #2 and #3 had HI of 0.8–0.76 and an average flake thickness along the c-axis of 152–160 Å, re-spectively. Moreover, the narrow and sharp (001)
Fig. 1 XRD patterns of kaolin samples #1, #2, and #3. Sample #1 showed very sharp and narrow reflections lines and almost very smooth background revealing the high de-gree of crystallinity Ka = kaolin; Qz = Quartz, II = Il-lite. Samples #2 & #3 showed broad, asymmetrical peaks towards low 2θ value, which suggested an aver-age smaller crystallite size based on the increased width of the diffraction peaks.
Fig. 2 XRD patterns at 2θ 19–22° of kaolin to measure the degree of crystallinity of kaolin (Hinckley Index, HI) and crystallographic order using I (020)/I (1Í0) ratios.
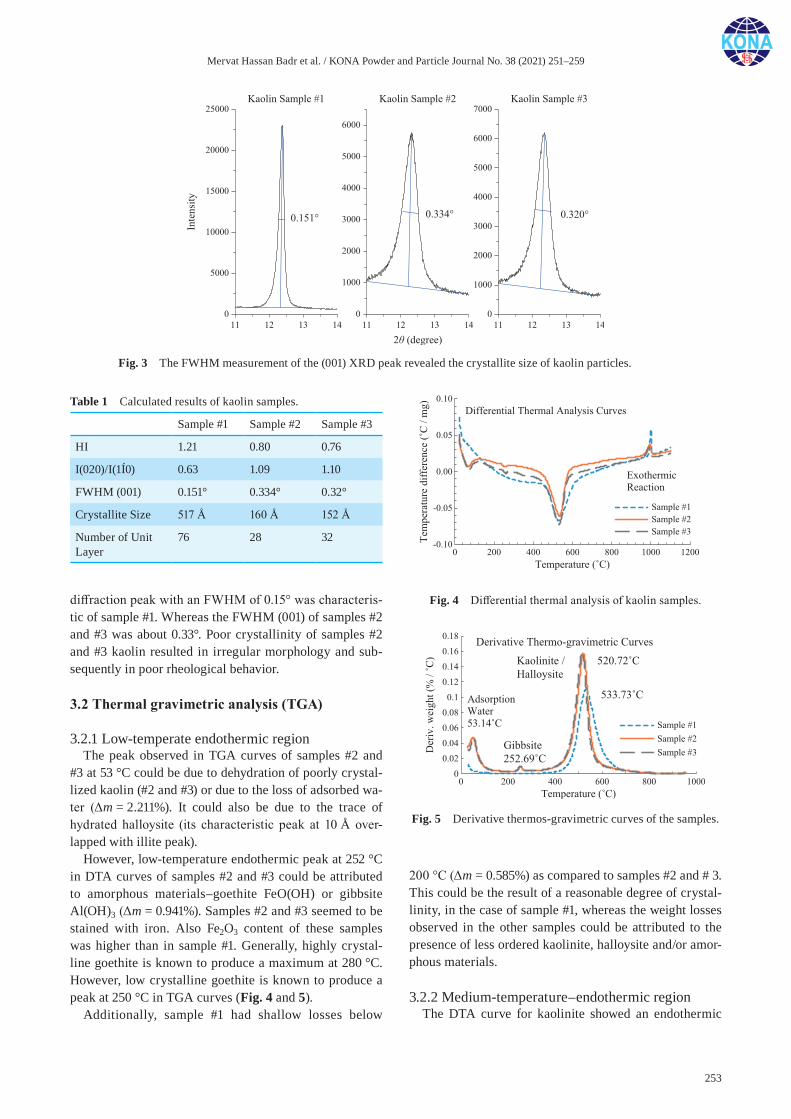
Mervat Hassan Badr et al. / KONA Powder and Particle Journal No. 38 (2021) 251–259
253
diffraction peak with an FWHM of 0.15° was characteris-tic of sample #1. Whereas the FWHM (001) of samples #2 and #3 was about 0.33°. Poor crystallinity of samples #2 and #3 kaolin resulted in irregular morphology and sub-sequently in poor rheological behavior.
3.2 Thermal gravimetric analysis (TGA)
3.2.1 Low-temperate endothermic regionThe peak observed in TGA curves of samples #2 and
#3 at 53 °C could be due to dehydration of poorly crystal-lized kaolin (#2 and #3) or due to the loss of adsorbed wa-ter (Δm = 2.211%). It could also be due to the trace of hydrated halloysite (its characteristic peak at 10 Å over-lapped with illite peak).
However, low-temperature endothermic peak at 252 °C in DTA curves of samples #2 and #3 could be attributed to amorphous materials–goethite FeO(OH) or gibbsite Al(OH)3 (Δm = 0.941%). Samples #2 and #3 seemed to be stained with iron. Also Fe2O3 content of these samples was higher than in sample #1. Generally, highly crystal-line goethite is known to produce a maximum at 280 °C. However, low crystalline goethite is known to produce a peak at 250 °C in TGA curves (Fig. 4 and 5).
Additionally, sample #1 had shallow losses below
200 °C (Δm = 0.585%) as compared to samples #2 and # 3. This could be the result of a reasonable degree of crystal-linity, in the case of sample #1, whereas the weight losses observed in the other samples could be attributed to the presence of less ordered kaolinite, halloysite and/or amor-phous materials.
3.2.2 Medium-temperature–endothermic regionThe DTA curve for kaolinite showed an endothermic
Table 1 Calculated results of kaolin samples.
Sample #1 Sample #2 Sample #3
HI 1.21 0.80 0.76
I(020)/I(1Í0) 0.63 1.09 1.10
FWHM (001) 0.151° 0.334° 0.32°
Crystallite Size 517 Å 160 Å 152 Å
Number of Unit Layer
76 28 32
Fig. 4 Differential thermal analysis of kaolin samples.
Fig. 5 Derivative thermos-gravimetric curves of the samples.
Fig. 3 The FWHM measurement of the (001) XRD peak revealed the crystallite size of kaolin particles.
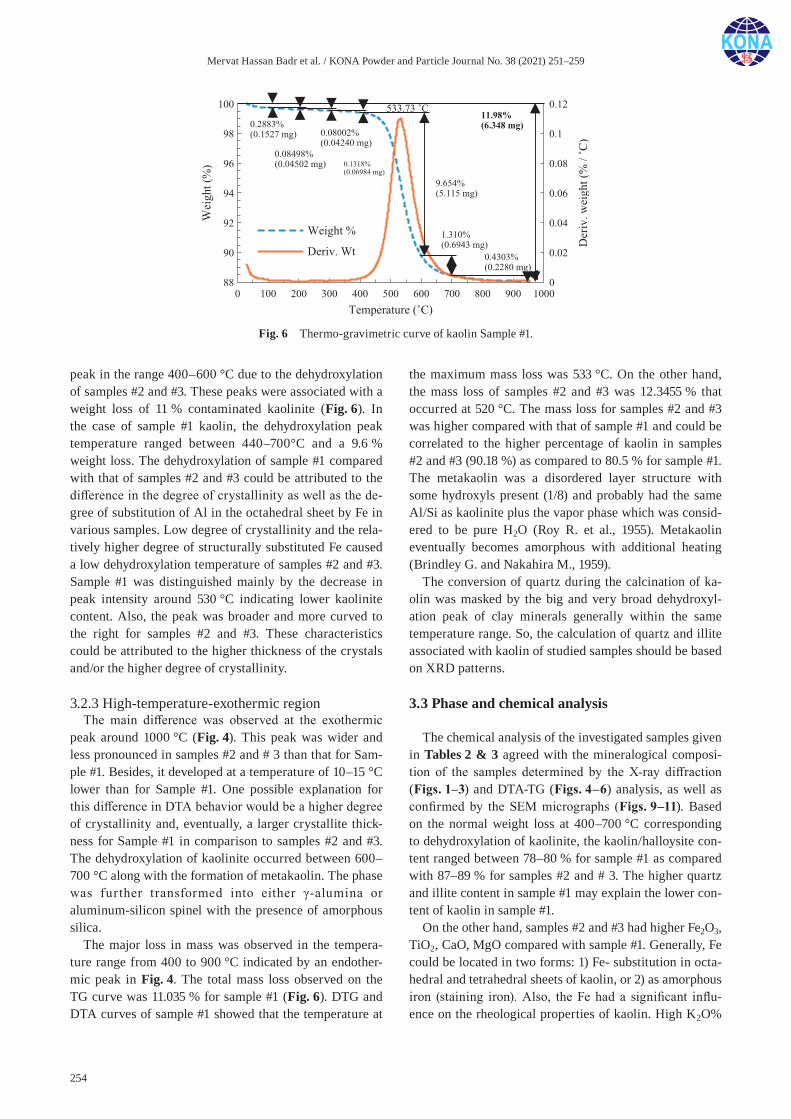
Mervat Hassan Badr et al. / KONA Powder and Particle Journal No. 38 (2021) 251–259
254
peak in the range 400–600 °C due to the dehydroxylation of samples #2 and #3. These peaks were associated with a weight loss of 11 % contaminated kaolinite (Fig. 6). In the case of sample #1 kaolin, the dehydroxylation peak temperature ranged between 440–700°C and a 9.6 % weight loss. The dehydroxylation of sample #1 compared with that of samples #2 and #3 could be attributed to the difference in the degree of crystallinity as well as the de-gree of substitution of Al in the octahedral sheet by Fe in various samples. Low degree of crystallinity and the rela-tively higher degree of structurally substituted Fe caused a low dehydroxylation temperature of samples #2 and #3. Sample #1 was distinguished mainly by the decrease in peak intensity around 530 °C indicating lower kaolinite content. Also, the peak was broader and more curved to the right for samples #2 and #3. These characteristics could be attributed to the higher thickness of the crystals and/or the higher degree of crystallinity.
3.2.3 High-temperature-exothermic regionThe main difference was observed at the exothermic
peak around 1000 °C (Fig. 4). This peak was wider and less pronounced in samples #2 and # 3 than that for Sam-ple #1. Besides, it developed at a temperature of 10–15 °C lower than for Sample #1. One possible explanation for this difference in DTA behavior would be a higher degree of crystallinity and, eventually, a larger crystallite thick-ness for Sample #1 in comparison to samples #2 and #3. The dehydroxylation of kaolinite occurred between 600–700 °C along with the formation of metakaolin. The phase was further transformed into either γ-alumina or aluminum- silicon spinel with the presence of amorphous silica.
The major loss in mass was observed in the tempera-ture range from 400 to 900 °C indicated by an endother-mic peak in Fig. 4. The total mass loss observed on the TG curve was 11.035 % for sample #1 (Fig. 6). DTG and DTA curves of sample #1 showed that the temperature at
the maximum mass loss was 533 °C. On the other hand, the mass loss of samples #2 and #3 was 12.3455 % that occurred at 520 °C. The mass loss for samples #2 and #3 was higher compared with that of sample #1 and could be correlated to the higher percentage of kaolin in samples #2 and #3 (90.18 %) as compared to 80.5 % for sample #1. The metakaolin was a disordered layer structure with some hydroxyls present (1/8) and probably had the same Al/Si as kaolinite plus the vapor phase which was consid-ered to be pure H2O (Roy R. et al., 1955). Metakaolin eventually becomes amorphous with additional heating (Brindley G. and Nakahira M., 1959).
The conversion of quartz during the calcination of ka-olin was masked by the big and very broad dehydroxyl-ation peak of clay minerals generally within the same temperature range. So, the calculation of quartz and illite associated with kaolin of studied samples should be based on XRD patterns.
3.3 Phase and chemical analysis
The chemical analysis of the investigated samples given in Tables 2 & 3 agreed with the mineralogical composi-tion of the samples determined by the X-ray diffraction (Figs. 1–3) and DTA-TG (Figs. 4–6) analysis, as well as confirmed by the SEM micrographs (Figs. 9–11). Based on the normal weight loss at 400–700 °C corresponding to dehydroxylation of kaolinite, the kaolin/halloysite con-tent ranged between 78–80 % for sample #1 as compared with 87–89 % for samples #2 and # 3. The higher quartz and illite content in sample #1 may explain the lower con-tent of kaolin in sample #1.
On the other hand, samples #2 and #3 had higher Fe2O3, TiO2, CaO, MgO compared with sample #1. Generally, Fe could be located in two forms: 1) Fe- substitution in octa-hedral and tetrahedral sheets of kaolin, or 2) as amorphous iron (staining iron). Also, the Fe had a significant influ-ence on the rheological properties of kaolin. High K2O%
Fig. 6 Thermo-gravimetric curve of kaolin Sample #1.
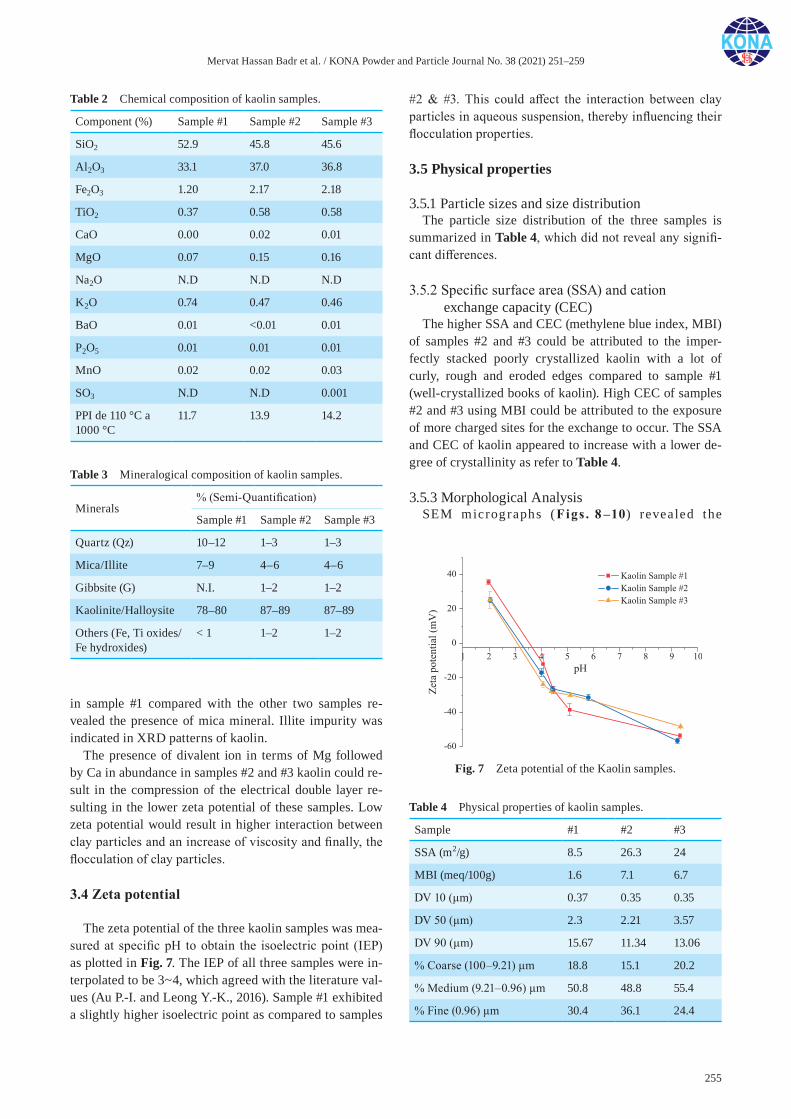
Mervat Hassan Badr et al. / KONA Powder and Particle Journal No. 38 (2021) 251–259
255
in sample #1 compared with the other two samples re-vealed the presence of mica mineral. Illite impurity was indicated in XRD patterns of kaolin.
The presence of divalent ion in terms of Mg followed by Ca in abundance in samples #2 and #3 kaolin could re-sult in the compression of the electrical double layer re-sulting in the lower zeta potential of these samples. Low zeta potential would result in higher interaction between clay particles and an increase of viscosity and finally, the flocculation of clay particles.
3.4 Zeta potential
The zeta potential of the three kaolin samples was mea-sured at specific pH to obtain the isoelectric point (IEP) as plotted in Fig. 7. The IEP of all three samples were in-terpolated to be 3~4, which agreed with the literature val-ues (Au P.-I. and Leong Y.-K., 2016). Sample #1 exhibited a slightly higher isoelectric point as compared to samples
#2 & #3. This could affect the interaction between clay particles in aqueous suspension, thereby influencing their flocculation properties.
3.5 Physical properties
3.5.1 Particle sizes and size distributionThe particle size distribution of the three samples is
summarized in Table 4, which did not reveal any signifi-cant differences.
3.5.2 Specific surface area (SSA) and cation exchange capacity (CEC)
The higher SSA and CEC (methylene blue index, MBI) of samples #2 and #3 could be attributed to the imper-fectly stacked poorly crystallized kaolin with a lot of curly, rough and eroded edges compared to sample #1 (well-crystallized books of kaolin). High CEC of samples #2 and #3 using MBI could be attributed to the exposure of more charged sites for the exchange to occur. The SSA and CEC of kaolin appeared to increase with a lower de-gree of crystallinity as refer to Table 4.
3.5.3 Morphological AnalysisSEM microg raphs (Figs . 8 –10) revealed the
Table 2 Chemical composition of kaolin samples.
Component (%) Sample #1 Sample #2 Sample #3
SiO2 52.9 45.8 45.6
Al2O3 33.1 37.0 36.8
Fe2O3 1.20 2.17 2.18
TiO2 0.37 0.58 0.58
CaO 0.00 0.02 0.01
MgO 0.07 0.15 0.16
Na2O N.D N.D N.D
K2O 0.74 0.47 0.46
BaO 0.01 <0.01 0.01
P2O5 0.01 0.01 0.01
MnO 0.02 0.02 0.03
SO3 N.D N.D 0.001
PPI de 110 °C a 1000 °C
11.7 13.9 14.2
Fig. 7 Zeta potential of the Kaolin samples.
Table 3 Mineralogical composition of kaolin samples.
Minerals% (Semi-Quantification)
Sample #1 Sample #2 Sample #3
Quartz (Qz) 10–12 1–3 1–3
Mica/Illite 7–9 4–6 4–6
Gibbsite (G) N.I. 1–2 1–2
Kaolinite/Halloysite 78–80 87–89 87–89
Others (Fe, Ti oxides/Fe hydroxides)
< 1 1–2 1–2
Table 4 Physical properties of kaolin samples.
Sample #1 #2 #3
SSA (m2/g) 8.5 26.3 24
MBI (meq/100g) 1.6 7.1 6.7
DV 10 (μm) 0.37 0.35 0.35
DV 50 (μm) 2.3 2.21 3.57
DV 90 (μm) 15.67 11.34 13.06
% Coarse (100–9.21) μm 18.8 15.1 20.2
% Medium (9.21–0.96) μm 50.8 48.8 55.4
% Fine (0.96) μm 30.4 36.1 24.4
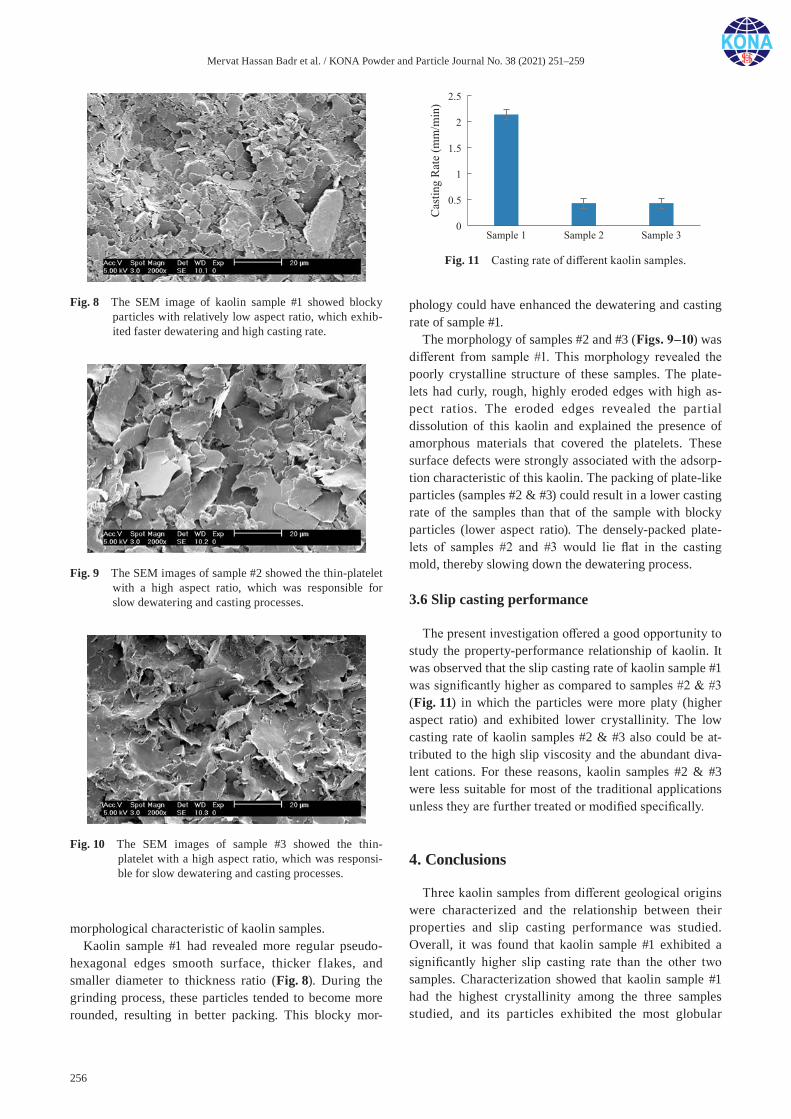
Mervat Hassan Badr et al. / KONA Powder and Particle Journal No. 38 (2021) 251–259
256
morphological characteristic of kaolin samples.Kaolin sample #1 had revealed more regular pseudo-
hexagonal edges smooth surface, thicker f lakes, and smaller diameter to thickness ratio (Fig. 8). During the grinding process, these particles tended to become more rounded, resulting in better packing. This blocky mor-
phology could have enhanced the dewatering and casting rate of sample #1.
The morphology of samples #2 and #3 (Figs. 9–10) was different from sample #1. This morphology revealed the poorly crystalline structure of these samples. The plate-lets had curly, rough, highly eroded edges with high as-pect ratios. The eroded edges revealed the partial dissolution of this kaolin and explained the presence of amorphous materials that covered the platelets. These surface defects were strongly associated with the adsorp-tion characteristic of this kaolin. The packing of plate-like particles (samples #2 & #3) could result in a lower casting rate of the samples than that of the sample with blocky particles (lower aspect ratio). The densely-packed plate-lets of samples #2 and #3 would lie flat in the casting mold, thereby slowing down the dewatering process.
3.6 Slip casting performance
The present investigation offered a good opportunity to study the property-performance relationship of kaolin. It was observed that the slip casting rate of kaolin sample #1 was significantly higher as compared to samples #2 & #3 (Fig. 11) in which the particles were more platy (higher aspect ratio) and exhibited lower crystallinity. The low casting rate of kaolin samples #2 & #3 also could be at-tributed to the high slip viscosity and the abundant diva-lent cations. For these reasons, kaolin samples #2 & #3 were less suitable for most of the traditional applications unless they are further treated or modified specifically.
4. Conclusions
Three kaolin samples from different geological origins were characterized and the relationship between their properties and slip casting performance was studied. Overall, it was found that kaolin sample #1 exhibited a significantly higher slip casting rate than the other two samples. Characterization showed that kaolin sample #1 had the highest crystallinity among the three samples studied, and its particles exhibited the most globular
Fig. 9 The SEM images of sample #2 showed the thin-platelet with a high aspect ratio, which was responsible for slow dewatering and casting processes.
Fig. 10 The SEM images of sample #3 showed the thin- platelet with a high aspect ratio, which was responsi-ble for slow dewatering and casting processes.
Fig. 11 Casting rate of different kaolin samples.
Fig. 8 The SEM image of kaolin sample #1 showed blocky particles with relatively low aspect ratio, which exhib-ited faster dewatering and high casting rate.
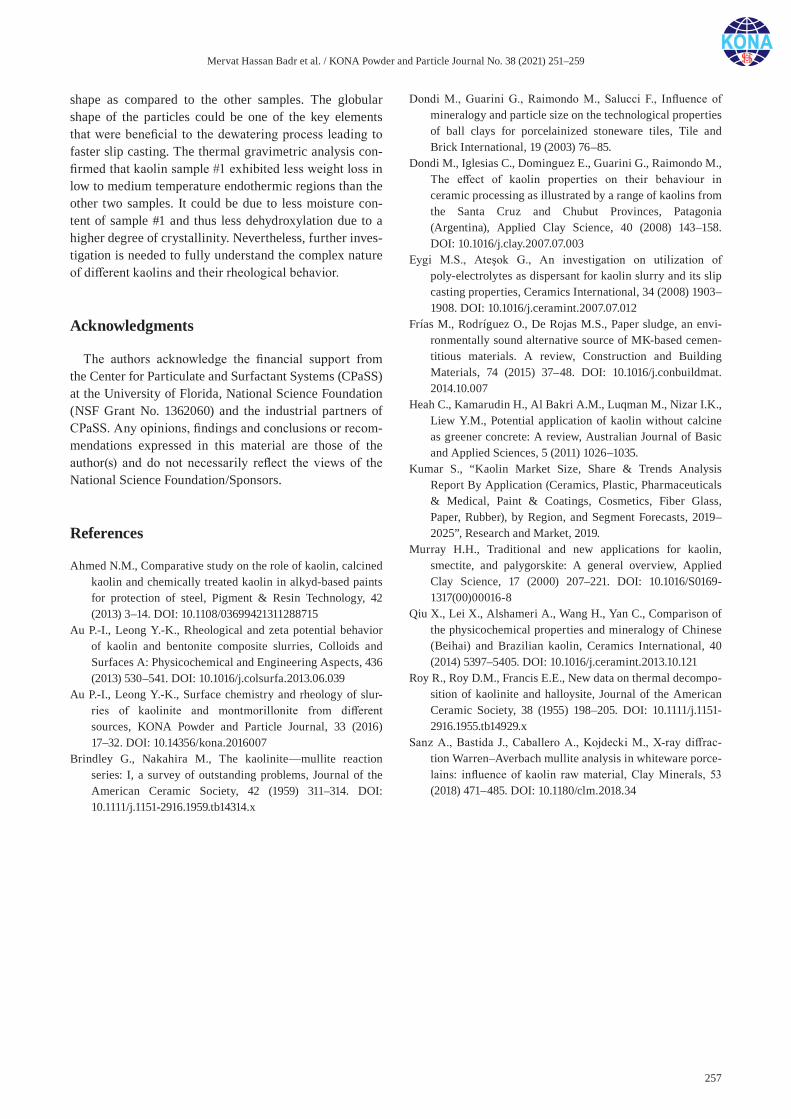
Mervat Hassan Badr et al. / KONA Powder and Particle Journal No. 38 (2021) 251–259
257
shape as compared to the other samples. The globular shape of the particles could be one of the key elements that were beneficial to the dewatering process leading to faster slip casting. The thermal gravimetric analysis con-firmed that kaolin sample #1 exhibited less weight loss in low to medium temperature endothermic regions than the other two samples. It could be due to less moisture con-tent of sample #1 and thus less dehydroxylation due to a higher degree of crystallinity. Nevertheless, further inves-tigation is needed to fully understand the complex nature of different kaolins and their rheological behavior.
Acknowledgments
The authors acknowledge the financial support from the Center for Particulate and Surfactant Systems (CPaSS) at the University of Florida, National Science Foundation (NSF Grant No. 1362060) and the industrial partners of CPaSS. Any opinions, findings and conclusions or recom-mendations expressed in this material are those of the author(s) and do not necessarily reflect the views of the National Science Foundation/Sponsors.
References
Ahmed N.M., Comparative study on the role of kaolin, calcined kaolin and chemically treated kaolin in alkyd-based paints for protection of steel, Pigment & Resin Technology, 42 (2013) 3–14. DOI: 10.1108/03699421311288715
Au P.-I., Leong Y.-K., Rheological and zeta potential behavior of kaolin and bentonite composite slurries, Colloids and Surfaces A: Physicochemical and Engineering Aspects, 436 (2013) 530–541. DOI: 10.1016/j.colsurfa.2013.06.039
Au P.-I., Leong Y.-K., Surface chemistry and rheology of slur-ries of kaolinite and montmorillonite from different sources, KONA Powder and Particle Journal, 33 (2016) 17–32. DOI: 10.14356/kona.2016007
Brindley G., Nakahira M., The kaolinite—mullite reaction series: I, a survey of outstanding problems, Journal of the American Ceramic Society, 42 (1959) 311–314. DOI: 10.1111/j.1151-2916.1959.tb14314.x
Dondi M., Guarini G., Raimondo M., Salucci F., Influence of mineralogy and particle size on the technological properties of ball clays for porcelainized stoneware tiles, Tile and Brick International, 19 (2003) 76–85.
Dondi M., Iglesias C., Dominguez E., Guarini G., Raimondo M., The effect of kaolin properties on their behaviour in ceramic processing as illustrated by a range of kaolins from the Santa Cruz and Chubut Provinces, Patagonia (Argentina), Applied Clay Science, 40 (2008) 143–158. DOI: 10.1016/j.clay.2007.07.003
Eygi M.S., Ateşok G., An investigation on utilization of poly-electrolytes as dispersant for kaolin slurry and its slip casting properties, Ceramics International, 34 (2008) 1903–1908. DOI: 10.1016/j.ceramint.2007.07.012
Frías M., Rodríguez O., De Rojas M.S., Paper sludge, an envi-ronmentally sound alternative source of MK-based cemen-titious materials. A review, Construction and Building Materials, 74 (2015) 37–48. DOI: 10.1016/j.conbuildmat. 2014.10.007
Heah C., Kamarudin H., Al Bakri A.M., Luqman M., Nizar I.K., Liew Y.M., Potential application of kaolin without calcine as greener concrete: A review, Australian Journal of Basic and Applied Sciences, 5 (2011) 1026–1035.
Kumar S., “Kaolin Market Size, Share & Trends Analysis Report By Application (Ceramics, Plastic, Pharmaceuticals & Medical, Paint & Coatings, Cosmetics, Fiber Glass, Paper, Rubber), by Region, and Segment Forecasts, 2019–2025”, Research and Market, 2019.
Murray H.H., Traditional and new applications for kaolin, smectite, and palygorskite: A general overview, Applied Clay Science, 17 (2000) 207–221. DOI: 10.1016/S0169-1317(00)00016-8
Qiu X., Lei X., Alshameri A., Wang H., Yan C., Comparison of the physicochemical properties and mineralogy of Chinese (Beihai) and Brazilian kaolin, Ceramics International, 40 (2014) 5397–5405. DOI: 10.1016/j.ceramint.2013.10.121
Roy R., Roy D.M., Francis E.E., New data on thermal decompo-sition of kaolinite and halloysite, Journal of the American Ceramic Society, 38 (1955) 198–205. DOI: 10.1111/j.1151-2916.1955.tb14929.x
Sanz A., Bastida J., Caballero A., Kojdecki M., X-ray diffrac-tion Warren–Averbach mullite analysis in whiteware porce-lains: influence of kaolin raw material, Clay Minerals, 53 (2018) 471–485. DOI: 10.1180/clm.2018.34

Mervat Hassan Badr et al. / KONA Powder and Particle Journal No. 38 (2021) 251–259
258
Authors’ Short Biographies
Mervat Said Hassan Badr
Dr. Mervat S. Hassan Badr is a retired Professor and Head of Ore Evaluation Labora-tory at the Central Metallurgical Research and Development Institute (CMRDI), Cairo, Egypt. Dr. Hassan has expertise in the field of applied mineralogy and rheology, specifi-cally synthesis, modification, and characterization of clay minerals and advanced ce-ramic materials. She has done extensive work on the clay minerals for environmental and agricultural applications, as well as for advanced paper and drilling industries.
Shuaishuai Yuan
Shuaishuai Yuan is currently a Ph.D. candidate at McGill University, Canada. She re-ceived her B.Eng. in Materials Science and Engineering from Jiangsu University, China in 2014, and M.S. degree in Materials Science and Engineering from the University of Florida, USA in 2016. During May 2015–April 2016, she worked under the supervision of Prof. Brij Moudgil and Dr. Parvesh Sharma at the Center for Particulate and Surfac-tant Systems (CPaSS), UF focusing on engineering functionalized clay particles for value- added products.
Jiaqi Dong
Jiaqi Dong received his B.S. in Materials Science and Engineering from Illinois Institute of Technology in 2013. He then attended University of Florida as a graduate student and received his M.S. in Materials Science and Engineering in 2016. Currently, he is a Ph.D. candidate under the supervision of Dr. Brij Moudgil and Dr. Bahar Basim at the Center for Particulate and Surfactant Systems (CPaSS). His current research focus is metallic nanoparticle synthesis and functionalization using fluidics.
Hassan El-Shall
Dr. Hassan El-Shall was a Professor Emeritus, until his passing away in 2017, at the De-partment of Materials Science and Engineering, University of Florida. He had been serving as Associate Director for Research at the Particle Engineering Research Center, since 1994. He also served as Associate Director at the Florida Institute of Phosphate Research from 1986–1992. Dr. El-Shall possessed 39 years of diverse experience in research, teaching, management and industry experience in the areas of applied surface and colloid chemistry, mineral processing, chemical and engineering. Dr. El-Shall had published over 165 techni-cal papers in prestigious journals including Powder Technology, Mineral and Metallurgical Processing, and Journal of Mineral Processing.

Mervat Hassan Badr et al. / KONA Powder and Particle Journal No. 38 (2021) 251–259
259
Authors’ Short Biographies
Yamile A. Bermudez
Yamile A. Bermudez studied chemical engineering at Antioquia University, Colombia and received her M. Sc. in Materials and Processes from the National University of Colombia. She joined Sumicol S.A.S., one of the companies of the Corona Ceramic Group in Colombia in 2006 as a lab technician and was promoted to R&D engineer in 2010. After spending eight years in this position, she was transferred to the sanitary ware division of Corona, where she is currently a process engineer in charge of technical as-pects of sanitary ware production.
Diana C. Ortega
Dr. Diana C. Ortega studied geology at EAFIT University, Medellín, Colombia and received her M.Sc. in Minerals Engineering from Camborne School of Mines, UK and her Ph. D. in Materials Science and Engineering from the National University of Colombia. Diana joined Sumicol S.A.S., an industrial minerals producer, in 1993 as a re-searcher in industrial minerals applications and has been with Sumicol since then. She is currently head of the recently created Minerals Technical Center at Sumicol S.A.S. and director of IDIMAP, Industrial Research Group on Materials Design from Minerals and Processes.
Jorge E. Lopez-Rendon
Jorge E. Lopez-Rendon studied Geology at the Mining Faculty, National University of Colombia. Then he joined Sumicol S.A.S., an industrial minerals producer and spent a ten-year period as an exploration geologist and head of the minerals research lab, after which time he founded the Geology Department of EAFIT University and was there for ten years as Director and researcher. Subsequently, he came back to Sumicol as Manager of the R&D Division and was in charge of several industrial minerals processing and industrial application projects for fifteen years. He currently is a consultant in industrial minerals for Sumicol and other companies.
Brij M. Moudgil
Dr. Brij M. Moudgil is a Distinguished Professor of Materials Science and Engineering at the University of Florida. He received his B.E from the Indian Institute of Science, Ban-galore, India and his M.S and Eng.Sc.D degrees from Columbia University, New York. His current research interests are in surfactant and polymer adsorption, dispersion and aggre-gation of fine particles, adhesion and removal of microbes from surfaces, synthesis of functionalized nanoparticles, antiscaling and surfactant mediated corrosion inhibitors, photocatalytic degradation of hazardous microbes, and nanotoxicity. He has published more than 400 technical papers and has been awarded over 25 patents. He is a member of the U.S National Academy of Engineering.
KONA Powder and Particle Journal No. 38 (2021) 260–268/https://doi.org/10.14356/kona.2021015 Original Research Paper
260Copyright © 2021 The Authors. Published by Hosokawa Powder Technology Foundation. This is an open access article under the CC BY license (http://creativecommons.org/licenses/by/4.0/).
Fabrication and Characterization of Prussian Blue-Derived Iron Carbide-Iron Oxide Hybrid on Reduced Graphene
Oxide Nanosheets †
Alowasheeir Azhar 1‡, Jacob Earnshaw 2‡, Mohamed Barakat Zakaria 1,2*, Ping Cheng 2, Yusuf Valentino Kaneti 1, Md. Shahriar A. Hossain 2,3, Saad M. Alshehri 4,
Tansir Ahamad 4, Yusuke Yamauchi 2,5,6 and Jongbeom Na 1,2*1 International Center for Materials Nanoarchitectonics (MANA), National Institute for Materials Science (NIMS), Japan2 Australian Institute for Bioengineering and Nanotechnology (AIBN), The University of Queensland, Australia3 School of Mechanical & Mining Engineering, Faculty of Engineering, Architecture and Information Technology (EAIT), The University of Queensland, Australia4 Department of Chemistry, College of Science, King Saud University, Saudi Arabia5 School of Chemical Engineering, The University of Queensland, Australia6 Department of Plant & Environmental New Resources, Kyung Hee University, South Korea
AbstractThis work demonstrates the fabrication of a nanoporous iron carbide-iron oxide/reduced graphene oxide (IC-IO/rGO) hybrid via a controlled one-step thermal treatment of Prussian blue (PB)/GO hybrid at 450 °C under N2 flow. The PB/GO hybrid is initially prepared through the in-situ deposition of PB nanoparticles on the GO sheets through electrostatic interactions. The morphological analysis of the hybrid reveals the uniform coverage of the rGO sheets by IC-IO nanoparticles and the even distribution of carbon (C), oxygen (O), and iron (Fe) on the rGO nanosheets. As a result of the hybrid composition and controlled morphology, the surface area of the obtained IC-IO/rGO hybrid (~40 m2/g) is significantly enhanced compared to those of the calcined GO sheets and PB nanoparticles (without GO).
Keywords: metal-organic frameworks, porous coordination polymers, metal oxides, metal carbides, graphene oxide
1. Introduction
Metal-organic frameworks (MOFs) or porous coordi-nation polymers (PCPs) have attracted significant interest as porous materials because of their high surface area, large pore volume, controllable composition and pore size, etc. (Wang Z.-L. et al., 2018; Salunkhe R. R. et al., 2016; Kaneti Y. V. et al., 2017). Prussian blue (PB) and its analogues (PBAs) exhibit several attractive characteristics, such as open framework structures, high thermal stability, and good redox activity. These CPs have been employed in numerous applications, including drug delivery (Lin W. et al., 2009), energy storage (Paolella A. et al., 2017), sep-
aration (Bureekaew S. et al., 2008), and so on (Doty F. et al., 2009; Ishizaki M. et al., 2013). Nevertheless, the poor conductivity and low chemical stability of PB presents major challenges for their practical applications (Salunkhe R. R. et al., 2015). Therefore, extensive efforts are needed to enhance the stability and conductivity of PB and its de-rived materials. To date, PB and PBAs have been employed as novel precursors for obtaining various transition metal compounds, including metal oxides and metal carbides (Azhar A. et al., 2019a). Generally, the calcination of PB in air produces iron oxide (IO) as a result of the removal of the cyano-group and the oxidation of the iron species. Our group previously synthesized PB and completely trans-formed it into nanoporous iron oxide hybrids (Azhar A. et al., 2019b), such as β-Fe2O3 (Machala L. et al., 2013), and mixed crystalline phases of iron oxide (α, γ and β- phases) (Roy X. et al., 2011). On the contrary, when pure PB was heated under inert atmosphere, the formation of metallic iron and iron carbide (IC) (Fe7C3, Fe2C, and Fe3C) was observed (Zakaria M. B. et al., 2016). Very recently, pure nickel carbide (Ni3C) was successfully prepared from
† Received 27 May 2020; Accepted 21 July 2020 J-STAGE Advance published online 29 August 2020
‡ Authors with equal contribution1 1-1 Namiki, Tsukuba, Ibaraki 305-0044, Japan2 Brisbane, Queensland 4072, Australia* Corresponding authors: Mohamed Barakat Zakaria and Jongbeom
Na; E-mail: [email protected]; [email protected]
Alowasheeir Azhar et al. / KONA Powder and Particle Journal No. 38 (2021) 260–268
261
cyano-bridged CPs through a thermal treatment under inert atmosphere at 450 °C (Zakaria M. B. et al., 2019). Despite some progress, the construction of PB-derived metal car-bide/carbon hybrids are still rarely reported.
Recently, carbonaceous materials, such as graphite, graphene oxide (GO), reduced graphene oxide (rGO), and carbon nanotubes (CNTs) have been widely used to enhance the functional performance of PB-based materials (Daneshvar F. et al., 2018; Azhar A. et al., 2018). The oxygen-containing functional groups on the surface of the two-dimensional (2D) GO nanosheets can serve as excel-lent sites for the in-situ growth of PB nanostructures (Lee T. et al., 2015). Our group has demonstrated the fabrication of several cyano-bridged CPs grown on GO nanosheets by a variety of methods (Zakaria M. B. et al., 2019). Herein, we report the synthesis of a hybrid material combining GO sheets with PB nanoparticles which can be subsequently transformed into a nanoporous IC-IO/rGO hybrid under nitrogen atmosphere at 450 °C. The obtained IC-IO/rGO hybrid has been thoroughly characterized in terms of its composition, morphology, thermal decomposition behav-ior, and textural properties.
2. Experimental
2.1 Chemicals
Sodium ferrocyanide(II) decahydrate (Na4[Fe(CN)6]·10H2O, ≥ 99 %) was purchased from Sigma-Aldrich (Japan). The sulfuric acid solution (H2SO4, 98 %) was obtained from Nacalai Tesque (Japan). Potas-sium hydroxide (KOH), sodium nitrate (NaNO3, ≥ 99 %), and ferric chloride hexahydrate (FeCl3·6H2O, ≥ 98 %) were sourced from FUJIFILM Wako Corporation (Japan). Graphite nanoplatelets (N008-100-N, thickness ~100 nm) were obtained from Angstron materials (USA). Potassium permanganate (KMnO4, ≥ 99 %) and hydrogen peroxide solution (H2O2, 30 wt.% in H2O) were purchased from Kanto Chemicals (Japan). All chemicals were utilized as received without further purification.
2.2 Preparation of GO nanosheets
The thin GO nanosheets were fabricated by employing the modified Hummer’s approach (Tanaka S. et al., 2017). In the first step, 0.33 g of graphite powder and 0.17 g of NaNO3 were mixed together and stirred. Following this, 7.67 mL of concentrated H2SO4 solution was slowly poured into this suspension and then stirred for 1 h. Next, 1.0 g of KMnO4 was added into the mixture solution which was placed in an ice bath below 20 °C. The mixture was subsequently stirred at 35 °C for 2 h and distilled water (83 mL) was added into this mixture solution under strong
stirring. After that, 1.67 mL of aqueous H2O2 solution (30 % w/w) was added into the suspension. The final GO suspension was washed a number of times with a diluted HCl solution and distilled water. Finally, this GO suspen-sion was sonicated in distilled water to exfoliate the GO sheets. The GO sheets were collected by centrifugation and subjected to repeated washing with distilled water, before being dried at ambient temperature, followed by a final drying in vacuum at 60 °C overnight. The as-prepared GO powder was dispersed in water to prepare an aqueous GO solution (2 mg mL–1) to be used in subsequent steps.
2.3 In-situ deposition of PB nanoparticles on GO nanosheets (PB/GO hybrid) and conversion to iron carbide-iron oxide/rGO hybrid
Typically, 40 mL of 0.299 mM FeCl3·6H2O solution was poured into the GO solution (20 mL, 2 mg mL–1) and stirred for 0.5 h. The mixture solution was slowly mixed with 40 mL of Na4[Fe(CN)6]·10H2O solution (0.358 mM) and stirred for further 0.5 h, before being aged for two days. The product was isolated via centrifugation and washed multiple times with water and ethanol, and finally dried at room temperature. The porous IC-IO/rGO hybrid was achieved by calcining the PB/GO hybrid at 450 °C for an hour under nitrogen (N2) flow with a ramping rate of 5 °C min–1. For comparison, pristine PB nanoparticles without GO sheets were also prepared and heated under the same conditions.
2.4 Characterization
The purity and compositions of the samples were checked by X-ray diffraction (XRD) with a Rigaku RINT 2500X diffractometer utilizing Cu Kα (1.5406 Å) radiation. Nitrogen sorption isotherms were collected using a Quantachrome Autosorb at 77 K. To dehydrate the samples, they were subjected to degassing at 250 °C for 16 h prior to the BET measurement. Morphological observations of the products were conducted using both scanning electron microscope (SEM, Hitachi SU8000) and transmission electron microscope (TEM, JEOL JEM-2100F). The infrared (IR) spectra of the samples were col-lected using a Thermoscientific Nicolet 4700 spectrometer (Waltham, MA, USA). Raman spectroscopy measurements were performed using a Horiba-Jovin Yvon T64000 Raman spectrometer. Thermogravimetry (TG) measurements were carried out with a Hitachi HT-Seiko Instrument Exter 6300 under N2 atmosphere from 30 to 550 °C at a ramping rate of 5 °C min–1.
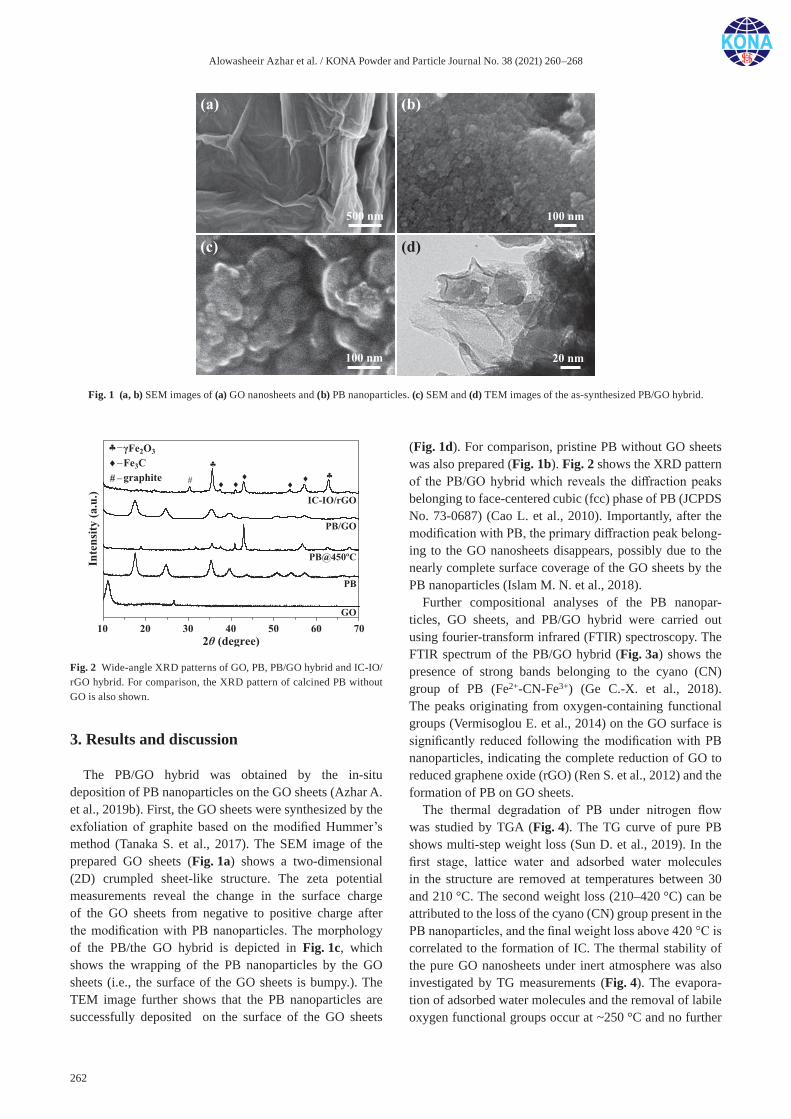
Alowasheeir Azhar et al. / KONA Powder and Particle Journal No. 38 (2021) 260–268
262
3. Results and discussion
The PB/GO hybrid was obtained by the in-situ deposition of PB nanoparticles on the GO sheets (Azhar A. et al., 2019b). First, the GO sheets were synthesized by the exfoliation of graphite based on the modified Hummer’s method (Tanaka S. et al., 2017). The SEM image of the prepared GO sheets (Fig. 1a) shows a two-dimensional (2D) crumpled sheet-like structure. The zeta potential measurements reveal the change in the surface charge of the GO sheets from negative to positive charge after the modification with PB nanoparticles. The morphology of the PB/the GO hybrid is depicted in Fig. 1c, which shows the wrapping of the PB nanoparticles by the GO sheets (i.e., the surface of the GO sheets is bumpy.). The TEM image further shows that the PB nanoparticles are successfully deposited on the surface of the GO sheets
(Fig. 1d). For comparison, pristine PB without GO sheets was also prepared (Fig. 1b). Fig. 2 shows the XRD pattern of the PB/GO hybrid which reveals the diffraction peaks belonging to face-centered cubic (fcc) phase of PB (JCPDS No. 73-0687) (Cao L. et al., 2010). Importantly, after the modification with PB, the primary diffraction peak belong-ing to the GO nanosheets disappears, possibly due to the nearly complete surface coverage of the GO sheets by the PB nanoparticles (Islam M. N. et al., 2018).
Further compositional analyses of the PB nanopar-ticles, GO sheets, and PB/GO hybrid were carried out using fourier-transform infrared (FTIR) spectroscopy. The FTIR spectrum of the PB/GO hybrid (Fig. 3a) shows the presence of strong bands belonging to the cyano (CN) group of PB (Fe2+-CN-Fe3+) (Ge C.-X. et al., 2018). The peaks originating from oxygen-containing functional groups (Vermisoglou E. et al., 2014) on the GO surface is significantly reduced following the modification with PB nanoparticles, indicating the complete reduction of GO to reduced graphene oxide (rGO) (Ren S. et al., 2012) and the formation of PB on GO sheets.
The thermal degradation of PB under nitrogen flow was studied by TGA (Fig. 4). The TG curve of pure PB shows multi-step weight loss (Sun D. et al., 2019). In the first stage, lattice water and adsorbed water molecules in the structure are removed at temperatures between 30 and 210 °C. The second weight loss (210–420 °C) can be attributed to the loss of the cyano (CN) group present in the PB nanoparticles, and the final weight loss above 420 °C is correlated to the formation of IC. The thermal stability of the pure GO nanosheets under inert atmosphere was also investigated by TG measurements (Fig. 4). The evapora-tion of adsorbed water molecules and the removal of labile oxygen functional groups occur at ~250 °C and no further
Fig. 1 (a, b) SEM images of (a) GO nanosheets and (b) PB nanoparticles. (c) SEM and (d) TEM images of the as-synthesized PB/GO hybrid.
Fig. 2 Wide-angle XRD patterns of GO, PB, PB/GO hybrid and IC-IO/rGO hybrid. For comparison, the XRD pattern of calcined PB without GO is also shown.
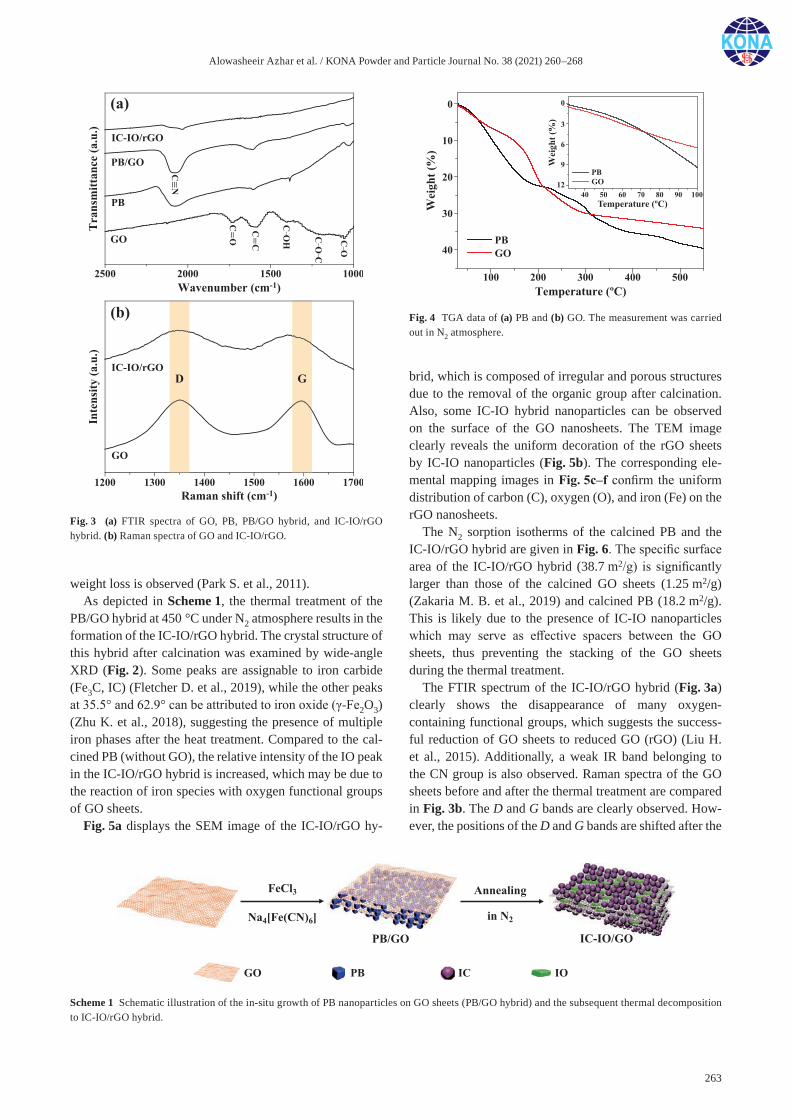
Alowasheeir Azhar et al. / KONA Powder and Particle Journal No. 38 (2021) 260–268
263
weight loss is observed (Park S. et al., 2011).As depicted in Scheme 1, the thermal treatment of the
PB/GO hybrid at 450 °C under N2 atmosphere results in the formation of the IC-IO/rGO hybrid. The crystal structure of this hybrid after calcination was examined by wide-angle XRD (Fig. 2). Some peaks are assignable to iron carbide (Fe3C, IC) (Fletcher D. et al., 2019), while the other peaks at 35.5° and 62.9° can be attributed to iron oxide (γ-Fe2O3) (Zhu K. et al., 2018), suggesting the presence of multiple iron phases after the heat treatment. Compared to the cal-cined PB (without GO), the relative intensity of the IO peak in the IC-IO/rGO hybrid is increased, which may be due to the reaction of iron species with oxygen functional groups of GO sheets.
Fig. 5a displays the SEM image of the IC-IO/rGO hy-
brid, which is composed of irregular and porous structures due to the removal of the organic group after calcination. Also, some IC-IO hybrid nanoparticles can be observed on the surface of the GO nanosheets. The TEM image clearly reveals the uniform decoration of the rGO sheets by IC-IO nanoparticles (Fig. 5b). The corresponding ele-mental mapping images in Fig. 5c–f confirm the uniform distribution of carbon (C), oxygen (O), and iron (Fe) on the rGO nanosheets.
The N2 sorption isotherms of the calcined PB and the IC-IO/rGO hybrid are given in Fig. 6. The specific surface area of the IC-IO/rGO hybrid (38.7 m2/g) is significantly larger than those of the calcined GO sheets (1.25 m2/g) (Zakaria M. B. et al., 2019) and calcined PB (18.2 m2/g). This is likely due to the presence of IC-IO nanoparticles which may serve as effective spacers between the GO sheets, thus preventing the stacking of the GO sheets during the thermal treatment.
The FTIR spectrum of the IC-IO/rGO hybrid (Fig. 3a) clearly shows the disappearance of many oxygen- containing functional groups, which suggests the success-ful reduction of GO sheets to reduced GO (rGO) (Liu H. et al., 2015). Additionally, a weak IR band belonging to the CN group is also observed. Raman spectra of the GO sheets before and after the thermal treatment are compared in Fig. 3b. The D and G bands are clearly observed. How-ever, the positions of the D and G bands are shifted after the
Fig. 3 (a) FTIR spectra of GO, PB, PB/GO hybrid, and IC-IO/rGO hybrid. (b) Raman spectra of GO and IC-IO/rGO.
Fig. 4 TGA data of (a) PB and (b) GO. The measurement was carried out in N2 atmosphere.
Scheme 1 Schematic illustration of the in-situ growth of PB nanoparticles on GO sheets (PB/GO hybrid) and the subsequent thermal decomposition to IC-IO/rGO hybrid.
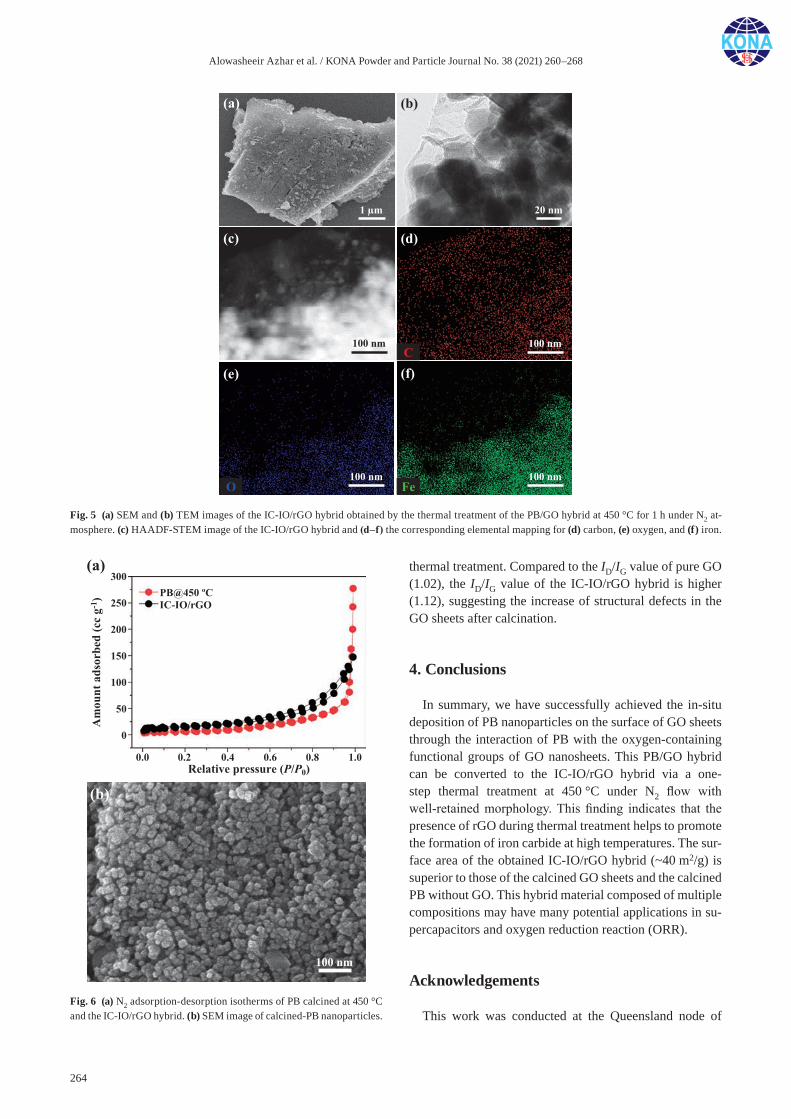
Alowasheeir Azhar et al. / KONA Powder and Particle Journal No. 38 (2021) 260–268
264
thermal treatment. Compared to the ID/IG value of pure GO (1.02), the ID/IG value of the IC-IO/rGO hybrid is higher (1.12), suggesting the increase of structural defects in the GO sheets after calcination.
4. Conclusions
In summary, we have successfully achieved the in-situ deposition of PB nanoparticles on the surface of GO sheets through the interaction of PB with the oxygen-containing functional groups of GO nanosheets. This PB/GO hybrid can be converted to the IC-IO/rGO hybrid via a one-step thermal treatment at 450 °C under N2 flow with well-retained morphology. This finding indicates that the presence of rGO during thermal treatment helps to promote the formation of iron carbide at high temperatures. The sur-face area of the obtained IC-IO/rGO hybrid (~40 m2/g) is superior to those of the calcined GO sheets and the calcined PB without GO. This hybrid material composed of multiple compositions may have many potential applications in su-percapacitors and oxygen reduction reaction (ORR).
Acknowledgements
This work was conducted at the Queensland node of Fig. 6 (a) N2 adsorption-desorption isotherms of PB calcined at 450 °C and the IC-IO/rGO hybrid. (b) SEM image of calcined-PB nanoparticles.
Fig. 5 (a) SEM and (b) TEM images of the IC-IO/rGO hybrid obtained by the thermal treatment of the PB/GO hybrid at 450 °C for 1 h under N2 at-mosphere. (c) HAADF-STEM image of the IC-IO/rGO hybrid and (d–f) the corresponding elemental mapping for (d) carbon, (e) oxygen, and (f) iron.
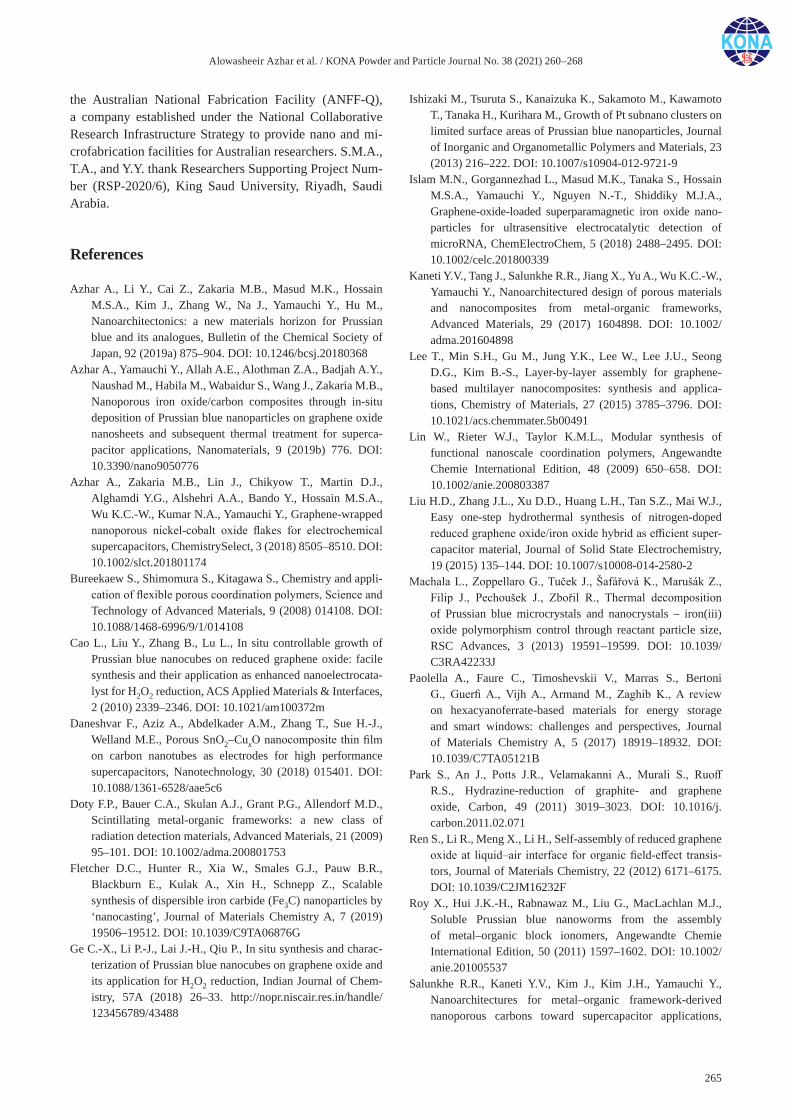
Alowasheeir Azhar et al. / KONA Powder and Particle Journal No. 38 (2021) 260–268
265
the Australian National Fabrication Facility (ANFF-Q), a company established under the National Collaborative Research Infrastructure Strategy to provide nano and mi-crofabrication facilities for Australian researchers. S.M.A., T.A., and Y.Y. thank Researchers Supporting Project Num-ber (RSP-2020/6), King Saud University, Riyadh, Saudi Arabia.
References
Azhar A., Li Y., Cai Z., Zakaria M.B., Masud M.K., Hossain M.S.A., Kim J., Zhang W., Na J., Yamauchi Y., Hu M., Nanoarchitectonics: a new materials horizon for Prussian blue and its analogues, Bulletin of the Chemical Society of Japan, 92 (2019a) 875–904. DOI: 10.1246/bcsj.20180368
Azhar A., Yamauchi Y., Allah A.E., Alothman Z.A., Badjah A.Y., Naushad M., Habila M., Wabaidur S., Wang J., Zakaria M.B., Nanoporous iron oxide/carbon composites through in-situ deposition of Prussian blue nanoparticles on graphene oxide nanosheets and subsequent thermal treatment for superca-pacitor applications, Nanomaterials, 9 (2019b) 776. DOI: 10.3390/nano9050776
Azhar A., Zakaria M.B., Lin J., Chikyow T., Martin D.J., Alghamdi Y.G., Alshehri A.A., Bando Y., Hossain M.S.A., Wu K.C.-W., Kumar N.A., Yamauchi Y., Graphene-wrapped nanoporous nickel-cobalt oxide flakes for electrochemical supercapacitors, ChemistrySelect, 3 (2018) 8505–8510. DOI: 10.1002/slct.201801174
Bureekaew S., Shimomura S., Kitagawa S., Chemistry and appli-cation of flexible porous coordination polymers, Science and Technology of Advanced Materials, 9 (2008) 014108. DOI: 10.1088/1468-6996/9/1/014108
Cao L., Liu Y., Zhang B., Lu L., In situ controllable growth of Prussian blue nanocubes on reduced graphene oxide: facile synthesis and their application as enhanced nanoelectrocata-lyst for H2O2 reduction, ACS Applied Materials & Interfaces, 2 (2010) 2339–2346. DOI: 10.1021/am100372m
Daneshvar F., Aziz A., Abdelkader A.M., Zhang T., Sue H.-J., Welland M.E., Porous SnO2–CuxO nanocomposite thin film on carbon nanotubes as electrodes for high performance supercapacitors, Nanotechnology, 30 (2018) 015401. DOI: 10.1088/1361-6528/aae5c6
Doty F.P., Bauer C.A., Skulan A.J., Grant P.G., Allendorf M.D., Scintillating metal-organic frameworks: a new class of radiation detection materials, Advanced Materials, 21 (2009) 95–101. DOI: 10.1002/adma.200801753
Fletcher D.C., Hunter R., Xia W., Smales G.J., Pauw B.R., Blackburn E., Kulak A., Xin H., Schnepp Z., Scalable synthesis of dispersible iron carbide (Fe3C) nanoparticles by ‘nanocasting’, Journal of Materials Chemistry A, 7 (2019) 19506–19512. DOI: 10.1039/C9TA06876G
Ge C.-X., Li P.-J., Lai J.-H., Qiu P., In situ synthesis and charac-terization of Prussian blue nanocubes on graphene oxide and its application for H2O2 reduction, Indian Journal of Chem-istry, 57A (2018) 26–33. http://nopr.niscair.res.in/handle/ 123456789/43488
Ishizaki M., Tsuruta S., Kanaizuka K., Sakamoto M., Kawamoto T., Tanaka H., Kurihara M., Growth of Pt subnano clusters on limited surface areas of Prussian blue nanoparticles, Journal of Inorganic and Organometallic Polymers and Materials, 23 (2013) 216–222. DOI: 10.1007/s10904-012-9721-9
Islam M.N., Gorgannezhad L., Masud M.K., Tanaka S., Hossain M.S.A., Yamauchi Y., Nguyen N.-T., Shiddiky M.J.A., Graphene-oxide-loaded superparamagnetic iron oxide nano-particles for ultrasensitive electrocatalytic detection of microRNA, ChemElectroChem, 5 (2018) 2488–2495. DOI: 10.1002/celc.201800339
Kaneti Y.V., Tang J., Salunkhe R.R., Jiang X., Yu A., Wu K.C.-W., Yamauchi Y., Nanoarchitectured design of porous materials and nanocomposites from metal-organic frameworks, Advanced Materials, 29 (2017) 1604898. DOI: 10.1002/adma.201604898
Lee T., Min S.H., Gu M., Jung Y.K., Lee W., Lee J.U., Seong D.G., Kim B.-S., Layer-by-layer assembly for graphene-based multilayer nanocomposites: synthesis and applica-tions, Chemistry of Materials, 27 (2015) 3785–3796. DOI: 10.1021/acs.chemmater.5b00491
Lin W., Rieter W.J., Taylor K.M.L., Modular synthesis of functional nanoscale coordination polymers, Angewandte Chemie International Edition, 48 (2009) 650–658. DOI: 10.1002/anie.200803387
Liu H.D., Zhang J.L., Xu D.D., Huang L.H., Tan S.Z., Mai W.J., Easy one-step hydrothermal synthesis of nitrogen-doped reduced graphene oxide/iron oxide hybrid as efficient super-capacitor material, Journal of Solid State Electrochemistry, 19 (2015) 135–144. DOI: 10.1007/s10008-014-2580-2
Machala L., Zoppellaro G., Tuček J., Šafářová K., Marušák Z., Filip J., Pechoušek J., Zbořil R., Thermal decomposition of Prussian blue microcrystals and nanocrystals – iron(iii) oxide polymorphism control through reactant particle size, RSC Advances, 3 (2013) 19591–19599. DOI: 10.1039/C3RA42233J
Paolella A., Faure C., Timoshevskii V., Marras S., Bertoni G., Guerfi A., Vijh A., Armand M., Zaghib K., A review on hexacyanoferrate-based materials for energy storage and smart windows: challenges and perspectives, Journal of Materials Chemistry A, 5 (2017) 18919–18932. DOI: 10.1039/C7TA05121B
Park S., An J., Potts J.R., Velamakanni A., Murali S., Ruoff R.S., Hydrazine-reduction of graphite- and graphene oxide, Carbon, 49 (2011) 3019–3023. DOI: 10.1016/j.carbon.2011.02.071
Ren S., Li R., Meng X., Li H., Self-assembly of reduced graphene oxide at liquid–air interface for organic field-effect transis-tors, Journal of Materials Chemistry, 22 (2012) 6171–6175. DOI: 10.1039/C2JM16232F
Roy X., Hui J.K.-H., Rabnawaz M., Liu G., MacLachlan M.J., Soluble Prussian blue nanoworms from the assembly of metal–organic block ionomers, Angewandte Chemie International Edition, 50 (2011) 1597–1602. DOI: 10.1002/anie.201005537
Salunkhe R.R., Kaneti Y.V., Kim J., Kim J.H., Yamauchi Y., Nanoarchitectures for metal–organic framework-derived nanoporous carbons toward supercapacitor applications,
Alowasheeir Azhar et al. / KONA Powder and Particle Journal No. 38 (2021) 260–268
266
Accounts of Chemical Research, 49 (2016) 2796–2806. DOI: 10.1021/acs.accounts.6b00460
Salunkhe R.R., Tang J., Kamachi Y., Nakato T., Kim J.H., Yam-auchi Y., Asymmetric supercapacitors using 3D nanoporous carbon and cobalt oxide electrodes synthesized from a single metal–organic framework, ACS Nano, 9 (2015) 6288–6296. DOI: 10.1021/acsnano.5b01790
Sun D., Wang H., Deng B., Zhang H., Wang L., Wan Q., Yan X., Qu M., A Mn-Fe based Prussian blue Analogue@Reduced graphene oxide composite as high capacity and superior rate capability anode for lithium-ion batteries, Carbon, 143 (2019) 706–713. DOI: 10.1016/j.carbon.2018.11.078
Tanaka S., Salunkhe R.R., Kaneti Y.V., Malgras V., Alshehri S.M., Ahamad T., Zakaria M.B., Dou S.X., Yamauchi Y., Hossain M.S.A., Prussian blue derived iron oxide nanoparticles wrapped in graphene oxide sheets for electrochemical super-capacitors, RSC Advances, 7 (2017) 33994–33999. DOI: 10.1039/C7RA03179C
Vermisoglou E.C., Devlin E., Giannakopoulou T., Romanos G., Boukos N., Psycharis V., Lei C., Lekakou C., Petridis D., Trapalis C., Reduced graphene oxide/iron carbide nanocom-posites for magnetic and supercapacitor applications, Journal of Alloys and Compounds, 590 (2014) 102–109. DOI:
10.1016/j.jallcom.2013.11.087Wang Z.-L., Sun K., Henzie J., Hao X., Ide Y., Takei T., Bando Y.,
Yamauchi Y., Electrochemically in situ controllable assembly of hierarchically-ordered and integrated inorganic–carbon hybrids for efficient hydrogen evolution, Materials Horizons, 5 (2018) 1194–1203. DOI: 10.1039/C8MH00773J
Zakaria M.B., Nanostructuring of nanoporous iron carbide spheres via thermal degradation of triple-shelled Prussian blue hol-low spheres for oxygen reduction reaction, RSC Advances, 6 (2016) 10341–10351. DOI: 10.1039/C5RA24357B
Zakaria M.B., Tan H., Kim J., Badjah A.Y., Naushad M., Habila M., Wabaidur S., Alothman Z.A., Yamauchi Y., Lin J., Structurally controlled layered Ni3C/graphene hybrids using cyano-bridged coordination polymers, Electrochemistry Communications, 100 (2019) 74–80. DOI: 10.1016/j.elecom. 2019.01.004
Zhu K., Chen C., Xu M., Chen K., Tan X., Wakeel M., Alharbi N.S., In situ carbothermal reduction synthesis of Fe nano-crystals embedded into N-doped carbon nanospheres for highly efficient U(VI) adsorption and reduction, Chemical Engineering Journal, 331 (2018) 395–405. DOI: 10.1016/j.cej.2017.08.126
Authors’ Short Biographies
Alowasheeir Azhar
Dr. Alowasheeir Azhar received her BSc in Energy Engineering (2013), MSc in Applied Science and Chemistry (2015) from Tokai University (Japan), and Ph.D. (2019) in Depart-ment of Nanoscience and Nanoengineering at Waseda University (Japan). She received the Custodian of The Two Holy Mosques’ overseas scholarship program (2007 to 2019) from Kingdom of Saudi Arabia. Her current research interest is the design for hybrid materials and nanoporous materials.
Jacob Earnshaw
Jacob Earnshaw received his BSc (Chemistry) degree from the School of Chemistry and Molecular Biosciences at the University of Queensland, Australia in 2018. Currently, he is an Honours student under the supervision of Professor Yusuke Yamauchi, and his research pursues the synthesis of nanoarchitectured materials for energy storage and electrocataly-sis.

Alowasheeir Azhar et al. / KONA Powder and Particle Journal No. 38 (2021) 260–268
267
Authors’ Short Biographies
Mohamed B. Zakaria
Dr. Mohamed B. Zakaria is a senior researcher at Australian Institute for Bioengineering and Nanotechnology (AIBN), the University of Queensland, Australia and a Lecturer of Physical Chemistry, Department of Chemistry, Faculty of Science, Tanta University, Egypt. He received his BSc in Chemistry and MSc in Physical Chemistry from Tanta Uni-versity. Then, he received his PhD in Engineering in 2016 from Waseda University, Japan. He did his postdoctoral research at NIMS-MANA, Tsukuba, Japan as a JSPS Fellow from 2016–2018. His area of interest is in the fields of Chemistry, Materials Design, Hybrid Materials, Energy, Catalysis, Dielectric Capacitors, Ferroelectric Materials, and Applied Nanomaterials.
Ping Cheng
Ping Cheng received a MSc in biotechnology in 2019 at the University of Queensland. He is currently studying for Ph.D. in the group of Prof. Yusuke Yamauchi, Australian Insti-tute for Bioengineering and Nanotechnology. His research interests include environmental applications and biological applications of porous materials.
Yusuf Valentino Kaneti
Dr. Yusuf Valentino Kaneti received his PhD from the University of New South Wales in July 2014 under the supervision of Prof. Aibing Yu. He joined the group of Prof. Yusuke Yamauchi at the National Institute of Materials Science as a JSPS Postdoctoral Fellow in September 2016. He is now working as a MANA Research Associate at NIMS. His research interest is focused on the fabrication of functional porous materials for energy and environmental applications.
Md. Shahriar A. Hossain
Dr. Md Shahriar A. Hossain is currently a Senior Lecturer in the School of Mechanical and Mining Engineering at UQ. He obtained his Ph.D degree in Materials Science and Engineering, The University of Wollongong (UoW), Australia in 2008. He was then em-ployed as a Postdoctoral Research Fellow at the University of Geneva, Switzerland. He was awarded the prestigious DECRA Fellowship from the Australian Research Council (ARC) in 2013. His research experience in various institutes and in industry around the world has been mainly focused on fabrication and characterization of superconducting materials and magnetically triggered nanoparticles for medical and energy applications.
Alowasheeir Azhar et al. / KONA Powder and Particle Journal No. 38 (2021) 260–268
268
Authors’ Short Biographies
Saad M. Alshehri
Prof. Saad M Alshehri received his Ph.D. in Inorganic Chemistry from the Leicester University, England in 1992. He worked at Northeastern University, Boston and the Leicester University as a post-doctoral fellow. Prior to join to King Saud University, Prof. Saad was an Assistant Professor of Chemistry at King Khalid Military Academy, Riyadh, Saudi Arabia. His research interests are in synthesis of inorganic materials and their indus-trial applications. He has synthesized heat resistant and thermally stable material. He has also investigated inorganic and hybrid materials for electro-catalyst and for energy storage devices such as electrodes for lithium ions batteries and supercapacitors.
Tansir Ahamad
Dr. Tansir Ahamad received his PhD degree in 2006 from Jamia Millia Islamia, New Delhi (INDIA). After his graduation, he was employed as a post-doc at the University of Western cape (South Africa). At the conclusion of his post-doc position he joined King Saud University, Saudi Arab in 2008 and was employed as an Assistant Professor. From March 2020, he has started his academic employment as a full professor in the department of Chemistry at King Saud University. His major research interest is in the fabrication of porous nanomaterials, organic-inorganic hybrid materials, and their applications in energy and environments.
Yusuke Yamauchi
Prof. Yusuke Yamauchi received his bachelor’s degree (2003), master’s degree (2004), and PhD degree (2007) from Waseda University, Japan. After that, he joined the National Institute for Materials Science to start his research group. Currently, he is a full professor at the School of Chemical Engineering and a senior group leader at AIBN in The University of Queensland. He concurrently serves as an associate editor of J Mater Chem A (RSC) and Chem Eng J (Elsevier). He has published over 750 papers with >36,000 citations (h-index 97, Web of Science®). He was selected as the Highly Cited Researchers in Chemistry in 2016–2019.
Jongbeom Na
Dr. Jongbeom Na received his Ph.D. degree (2017) from the Department of Chemical and Biomolecular Engineering at Yonsei University (Republic of Korea). Until 2018, he worked as a Research Engineer at Chemical Laboratory of SK Chemicals Co., Ltd. Currently, he is working as a research fellow at AIBN, the University of Queensland and MANA, NIMS. His major research interest is in the design and synthesis of functional nanomaterials, organic-inorganic hybrid materials, and their applications.
KONA Powder and Particle Journal No. 38 (2021) 269–280/https://doi.org/10.14356/kona.2021011 Original Research Paper
269Copyright © 2021 The Authors. Published by Hosokawa Powder Technology Foundation. This is an open access article under the CC BY license (http://creativecommons.org/licenses/by/4.0/).
Polymer-Particle Enhanced Visible Light Range Photocatalytic Activity on Textile Applications †
Asena Cerhan Haink 1,2 and G. Bahar Basim 3*1 Department of Electrical and Computer Engineering, Technical University of Munich, Germany2 Department of Mechanical Engineering, Ozyegin University, Turkey3 Department of Materials Science and Engineering, University of Florida, USA
AbstractExtension of photocatalytic activity within the visible light range has an immense importance on the ability of manufacturing self-cleaning textiles that are active indoors. This study focuses on assisting problems, which have delayed the commercialization of the photo-catalytically active textiles by following innovative technological developments in nanotechnology. Polymeric additives are utilized to prepare composite photocatalytic particles with the ability of extending light absorption in the visible light range. Techniques are introduced to avoid the deterioration of the composite particles during their application on textiles in addition to uniform coating strategies to enable an optimized concentration for improved photocatalytic efficiency. It is demonstrated that the titania (TiO2) particles in anatase form extended absorption in the visible light range in the presence of branched titania particles. Correspondingly, an optimized dip coating process is evaluated for textile manufacturing, providing a systematic methodology to enable the production of self-cleaning textiles to be able to manufacture them with commercialization potential.
Keywords: self-cleaning textiles, visible light range photocatalytic activity, polymer titania composites
1. Introduction
Increasing environmental pollution, inevitable mass consumption of raw materials and, the most recently faced challenges in hygiene standards due to the Covid-19 pandemic keep forcing societies to make smart use of resources, including textiles. Notably, the high ecological cost of the conventional cleaning methods utilized for textiles encourages the market to introduce new and more technologically smart products. Photocatalytically active materials are known for their efficiency in self-cleaning, and their implementation can promote fast sanitization in the cases of efficient cleaning as well as sanitization against the spread of diseases (Saunders-Hastings et al., 2017). One fundamental challenge remains to be promot-ing the photocatalytic activity in the visible light range to enable applications indoors through understanding nano-technology principles and the photocatalytic activity of the selected additives.
Catalysts are substances that can accelerate reactions
through lowering the free activation enthalpy of the re-action (Wubbels, 1983). Accordingly, photocatalysis can be defined as a photoreaction in the presence of a catalyst where a chemical modification of one molecular entity results from the initial absorption of radiation by another molecular entity called a photosensitizer. The catalyst might speed up the photoreaction by interaction with the substrate in its ground state or with a primer photoproduct (Castellote and Bengtsson, 2011). The nature of photoca-talysis is based on solid-state chemistry and knowledge on the crystal structure. Hence, nonstoichiometric and any other alternative imperfections such as impurities that can act as dopants that change the electronic properties affect the photocatalysis functionality of materials (Castellote and Bengtsson, 2011). The most commonly utilized photo-catalytic materials are zinc oxide (ZnO), cadmium sulfide (CdS), iron(III)oxide (Fe2O3), tungsten trioxide (WO3), tin oxide (SnO2), zinc sulfide (ZnS) and titanium dioxide (TiO2) (Cerhan et al., 2018; Dumitrescu et al., 2015). It is also common to use blends of these primary compounds in manufacturing. Among all the alternatives, titanium diox-ide (TiO2) is the most commonly used photocatalyst for the textiles due to its superior performance and light color that is the most suitable for the manufacturing of the optic white textile products (Patra and Gouda, 2013). TiO2 has three polymorph forms varying in crystal structures as rutile,
† Received 19 April 2020; Accepted 9 June 2020 J-STAGE Advance published online 17 July 2020
* Corresponding author: G. Bahar Basim; Add: Gainesville, FL 32611, USA E-mail: [email protected] TEL: +001-352-846-3557 FAX: +001-352-846-1196
Asena Cerhan Haink et al. / KONA Powder and Particle Journal No. 38 (2021) 269–280
270
brookite, and anatase. When considering the enhancement of the photocatalytic activity, surface structure, composi-tion, atomic and molecular scale surface dynamics, as well as the electronic properties play an important role. It is necessary to evaluate the adsorption and bonding of atoms and molecules on the surfaces to understand the mecha-nisms of self-cleaning ability. Among the polymorphs of titanium dioxide, anatase is the most thermodynamically stable form of titania amid the three nanocrystal types. The anatase powders with higher crystallinity are favored for photocatalysis since higher crystallinity provides a smaller quantity of defects acting as recombination sites in the middle of photogenerated electron and hole combination (Filippo et al., 2015). It is more active than the rutile phase as a photocatalyst, although its band gap value, 3.27 eV, is higher than the rutile’s bandgap, which is 3.05 eV (Filippo et al., 2015; Hümmelgen, 2012; López and Gómez, 2012). Anatase powders tend to agglomerate despite the high photocatalytic performance (Kiwi and Rtimi, 2016; Qiu et al., 2012). The commercial Degussa-P25 powder contains anatase and rutile forms blended in a ratio of 3:1 and has a bandgap energy of 3.26 eV (López and Gómez, 2012). P-25 titania is commonly used as a benchmark for photo-catalysts (Ohtani, 2008; Rui et al., 2014).
The challenge of standard photocatalytic semiconductor activity is known to be the fact that it takes place in the ultraviolet light range. In order to enhance the photocat-alytic activity into the visible spectrum the formation of bonds between photocatalytic particles and pure elemental dopants or synthesized particles are needed. Beyond the standard dopants (Cerhan et al., 2018; Dumitrescu et al., 2015) advanced particles are introduced in this study named as branched particles with controlled synthesis and particle size distribution. The core-shell particle decorated with polymeric branches can actively control the binding event by pairing ion, metal complex recognition, and hydrogen-bond recognition (Randazzo et al., 2012).
Application of the visible light range photocatalytic activity enhancing nano-systems on textiles requires mod-ifications to the textile manufacturing processes. Man-ufacturing of self-cleaning textiles at an industrial scale requires the integration of the selected photocatalytic system to the standard coating processes. Traditionally, this will be performed by following two steps; (i) de-velopment of photocatalytic additives that can be added into the selected finishing solutions without settling and, (ii) enabling their effective and homogeneous coating on the textiles at the optimized dosages. It is agreed that self-cleaning textiles with photocatalytic activity should maintain high-quality textile standards with the applica-tion of functionalized films promoting the increase in the potential market applications and meeting the variations in demands. Self-cleaning textiles decorated with photo-catalytic materials possess the self-cleaning property, and
hence they can actively clean themselves without a need for conventional laundry. This attribute provides significant benefits concerning the prevention of environmental pollu-tion and cost savings in addition to the spontaneous active cleaning of the textiles even throughout their utilization before and after washing. Consequently, many scientific studies conducted on the textiles are linked to the desire to produce eco-friendly photocatalysis reactions. Although there are potential solutions proposed to widen the diver-sity of applicable photocatalytic materials, there is still room to perfect the applications due to the variation in the demand and the limitations in the activity within the visible light range (Kiwi and Rtimi, 2016).
In this study, photocatalytic materials and self-cleaning textiles are evaluated in the context of composite nano- scale additives promoting secondary bonds to adjust initial energy levels for enhanced photocatalysis action. Titanium oxide particles in anatase crystalline structure were made into composite photocatalytic agents through polymeric additives names as branched titania were coated on textiles in DI-water as well as standard finishing solution to sup-port the implementation of the final combination suitable for self-cleaning textile standards. A commercial titania (Degussa P25) coating was compared to the anatase with and without the polymeric branching at various selected concentrations to optimize photocatalytic activity, particu-larly under visible light. The branched titania particles were synthesized and characterized for particle size and stability in addition to optimization of the most effective coating concertation for photocatalytic activity by analyzing absor-bance and stain removal ability in solutions as well as post coating on textiles.
2. Experimental approach
2.1 Materials
The procedure for the synthesis of branch titania par-ticles is adapted from an earlier study by S.A. Simakov and Y. Tsur. The technique is based on the hydrolysis- precipitation procedure, by using TiOSO4・2H2O as a pre-cursor and water as a hydrolyzed preparation medium. Diethy lene glycol monomethyl ether (DEGME) was used as a surface modifier to form the desired branches utilized for stability as well as an enhanced attachment onto the textile surface. The necessary chemicals were obtained from Sigma-Aldrich and used as received to conduct the particle synthesis reactions.
The advanced textiles utilizing nanotechnology in the coating processes, including the self-cleaning textiles, are generally preferred to be manufactured from either cotton or elastin type fibers and their blends (Akbar and Bahar Basim, 2019). Thus, the textile was selected
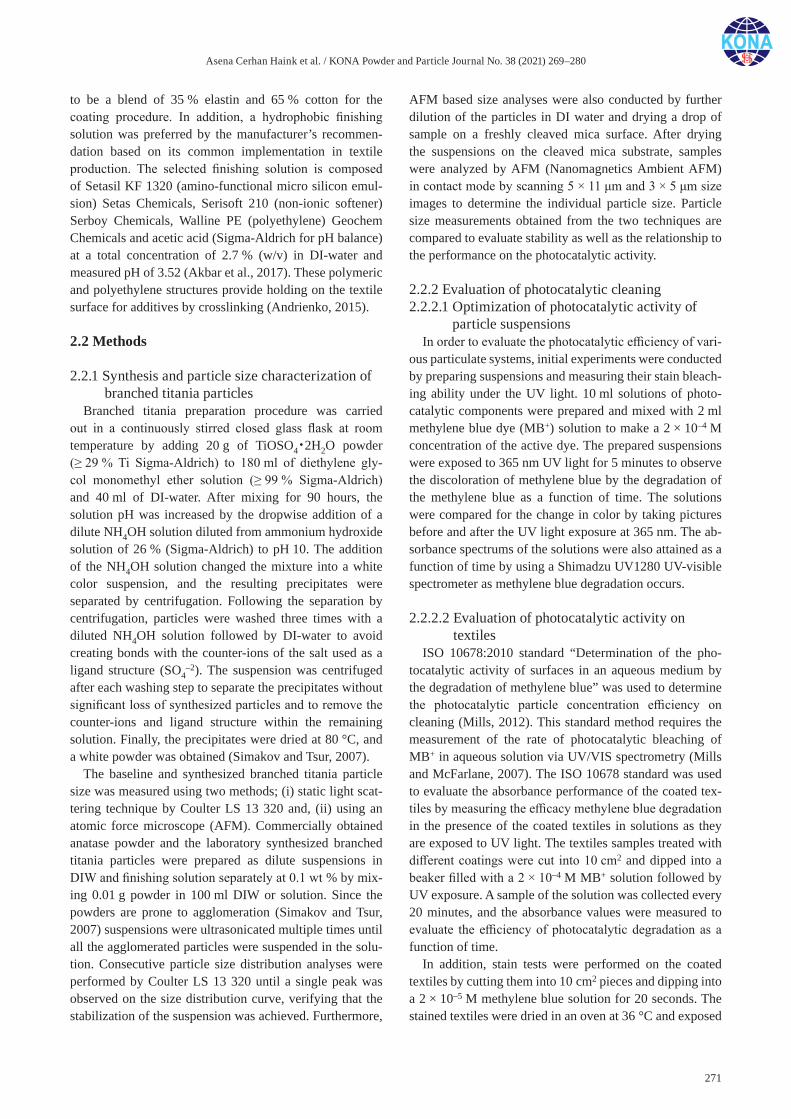
Asena Cerhan Haink et al. / KONA Powder and Particle Journal No. 38 (2021) 269–280
271
to be a blend of 35 % elastin and 65 % cotton for the coating procedure. In addition, a hydrophobic finishing solution was preferred by the manufacturer’s recommen-dation based on its common implementation in textile production. The selected finishing solution is composed of Setasil KF 1320 (amino-functional micro silicon emul-sion) Setas Chemicals, Serisoft 210 (non-ionic softener) Serboy Chemicals, Walline PE (polyethylene) Geochem Chemicals and acetic acid (Sigma-Aldrich for pH balance) at a total concentration of 2.7 % (w/v) in DI-water and measured pH of 3.52 (Akbar et al., 2017). These polymeric and polyethylene structures provide holding on the textile surface for additives by crosslinking (Andrienko, 2015).
2.2 Methods
2.2.1 Synthesis and particle size characterization of branched titania particles
Branched titania preparation procedure was carried out in a continuously stirred closed glass flask at room temperature by adding 20 g of TiOSO4・2H2O powder (≥ 29 % Ti Sigma-Aldrich) to 180 ml of diethylene gly-col monomethyl ether solution (≥ 99 % Sigma-Aldrich) and 40 ml of DI-water. After mixing for 90 hours, the solution pH was increased by the dropwise addition of a dilute NH4OH solution diluted from ammonium hydroxide solution of 26 % (Sigma-Aldrich) to pH 10. The addition of the NH4OH solution changed the mixture into a white color suspension, and the resulting precipitates were separated by centrifugation. Following the separation by centrifugation, particles were washed three times with a diluted NH4OH solution followed by DI-water to avoid creating bonds with the counter-ions of the salt used as a ligand structure (SO4
–2). The suspension was centrifuged after each washing step to separate the precipitates without significant loss of synthesized particles and to remove the counter-ions and ligand structure within the remaining solution. Finally, the precipitates were dried at 80 °C, and a white powder was obtained (Simakov and Tsur, 2007).
The baseline and synthesized branched titania particle size was measured using two methods; (i) static light scat-tering technique by Coulter LS 13 320 and, (ii) using an atomic force microscope (AFM). Commercially obtained anatase powder and the laboratory synthesized branched titania particles were prepared as dilute suspensions in DIW and finishing solution separately at 0.1 wt % by mix-ing 0.01 g powder in 100 ml DIW or solution. Since the powders are prone to agglomeration (Simakov and Tsur, 2007) suspensions were ultrasonicated multiple times until all the agglomerated particles were suspended in the solu-tion. Consecutive particle size distribution analyses were performed by Coulter LS 13 320 until a single peak was observed on the size distribution curve, verifying that the stabilization of the suspension was achieved. Furthermore,
AFM based size analyses were also conducted by further dilution of the particles in DI water and drying a drop of sample on a freshly cleaved mica surface. After drying the suspensions on the cleaved mica substrate, samples were analyzed by AFM (Nanomagnetics Ambient AFM) in contact mode by scanning 5 × 11 μm and 3 × 5 μm size images to determine the individual particle size. Particle size measurements obtained from the two techniques are compared to evaluate stability as well as the relationship to the performance on the photocatalytic activity.
2.2.2 Evaluation of photocatalytic cleaning2.2.2.1 Optimization of photocatalytic activity of
particle suspensionsIn order to evaluate the photocatalytic efficiency of vari-
ous particulate systems, initial experiments were conducted by preparing suspensions and measuring their stain bleach-ing ability under the UV light. 10 ml solutions of photo-catalytic components were prepared and mixed with 2 ml methylene blue dye (MB+) solution to make a 2 × 10⁻⁴ M concentration of the active dye. The prepared suspensions were exposed to 365 nm UV light for 5 minutes to observe the discoloration of methylene blue by the degradation of the methylene blue as a function of time. The solutions were compared for the change in color by taking pictures before and after the UV light exposure at 365 nm. The ab-sorbance spectrums of the solutions were also attained as a function of time by using a Shimadzu UV1280 UV-visible spectrometer as methylene blue degradation occurs.
2.2.2.2 Evaluation of photocatalytic activity on textiles
ISO 10678:2010 standard “Determination of the pho-tocatalytic activity of surfaces in an aqueous medium by the degradation of methylene blue” was used to determine the photocatalytic particle concentration efficiency on cleaning (Mills, 2012). This standard method requires the measurement of the rate of photocatalytic bleaching of MB+ in aqueous solution via UV/VIS spectrometry (Mills and McFarlane, 2007). The ISO 10678 standard was used to evaluate the absorbance performance of the coated tex-tiles by measuring the efficacy methylene blue degradation in the presence of the coated textiles in solutions as they are exposed to UV light. The textiles samples treated with different coatings were cut into 10 cm2 and dipped into a beaker filled with a 2 × 10⁻⁴ M MB+ solution followed by UV exposure. A sample of the solution was collected every 20 minutes, and the absorbance values were measured to evaluate the efficiency of photocatalytic degradation as a function of time.
In addition, stain tests were performed on the coated textiles by cutting them into 10 cm2 pieces and dipping into a 2 × 10⁻⁵ M methylene blue solution for 20 seconds. The stained textiles were dried in an oven at 36 °C and exposed
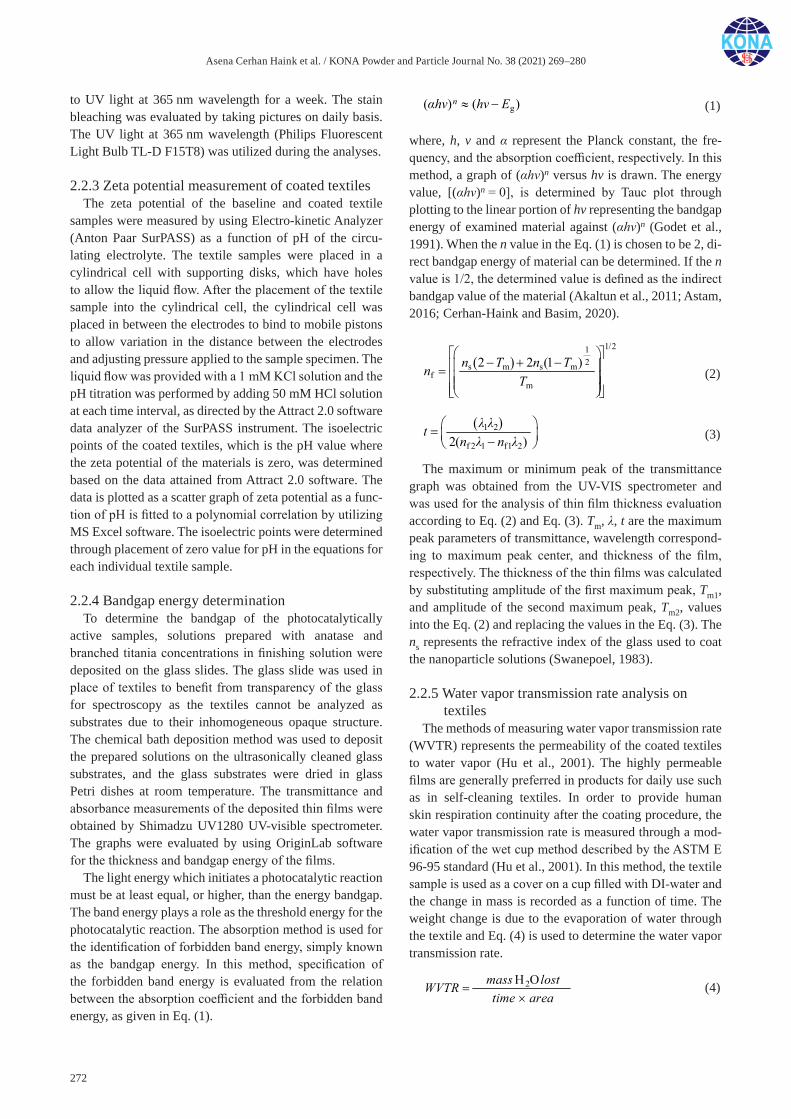
Asena Cerhan Haink et al. / KONA Powder and Particle Journal No. 38 (2021) 269–280
272
to UV light at 365 nm wavelength for a week. The stain bleaching was evaluated by taking pictures on daily basis. The UV light at 365 nm wavelength (Philips Fluorescent Light Bulb TL-D F15T8) was utilized during the analyses.
2.2.3 Zeta potential measurement of coated textilesThe zeta potential of the baseline and coated textile
samples were measured by using Electro-kinetic Analyzer (Anton Paar SurPASS) as a function of pH of the circu-lating electrolyte. The textile samples were placed in a cylindrical cell with supporting disks, which have holes to allow the liquid flow. After the placement of the textile sample into the cylindrical cell, the cylindrical cell was placed in between the electrodes to bind to mobile pistons to allow variation in the distance between the electrodes and adjusting pressure applied to the sample specimen. The liquid flow was provided with a 1 mM KCl solution and the pH titration was performed by adding 50 mM HCl solution at each time interval, as directed by the Attract 2.0 software data analyzer of the SurPASS instrument. The isoelectric points of the coated textiles, which is the pH value where the zeta potential of the materials is zero, was determined based on the data attained from Attract 2.0 software. The data is plotted as a scatter graph of zeta potential as a func-tion of pH is fitted to a polynomial correlation by utilizing MS Excel software. The isoelectric points were determined through placement of zero value for pH in the equations for each individual textile sample.
2.2.4 Bandgap energy determinationTo determine the bandgap of the photocatalytically
active samples, solutions prepared with anatase and branched titania concentrations in finishing solution were deposited on the glass slides. The glass slide was used in place of textiles to benefit from transparency of the glass for spectroscopy as the textiles cannot be analyzed as substrates due to their inhomogeneous opaque structure. The chemical bath deposition method was used to deposit the prepared solutions on the ultrasonically cleaned glass substrates, and the glass substrates were dried in glass Petri dishes at room temperature. The transmittance and absorbance measurements of the deposited thin films were obtained by Shimadzu UV1280 UV-visible spectrometer. The graphs were evaluated by using OriginLab software for the thickness and bandgap energy of the films.
The light energy which initiates a photocatalytic reaction must be at least equal, or higher, than the energy bandgap. The band energy plays a role as the threshold energy for the photocatalytic reaction. The absorption method is used for the identification of forbidden band energy, simply known as the bandgap energy. In this method, specification of the forbidden band energy is evaluated from the relation between the absorption coefficient and the forbidden band energy, as given in Eq. (1).
g( ) ( )nhv hv E
(1)
where, h, v and α represent the Planck constant, the fre-quency, and the absorption coefficient, respectively. In this method, a graph of (αhv)n versus hv is drawn. The energy value, [(αhv)n = 0], is determined by Tauc plot through plotting to the linear portion of hv representing the bandgap energy of examined material against (αhv)n (Godet et al., 1991). When the n value in the Eq. (1) is chosen to be 2, di-rect bandgap energy of material can be determined. If the n value is 1/2, the determined value is defined as the indirect bandgap value of the material (Akaltun et al., 2011; Astam, 2016; Cerhan-Haink and Basim, 2020).
1/21
2s m s mf
m
2 2 (1 )n T n TnT
(2)
1 2
f 2 1 f1 2
2( ) t
n n
(3)
The maximum or minimum peak of the transmittance graph was obtained from the UV-VIS spectrometer and was used for the analysis of thin film thickness evaluation according to Eq. (2) and Eq. (3). Tm, λ, t are the maximum peak parameters of transmittance, wavelength correspond-ing to maximum peak center, and thickness of the film, respectively. The thickness of the thin films was calculated by substituting amplitude of the first maximum peak, Tm1, and amplitude of the second maximum peak, Tm2, values into the Eq. (2) and replacing the values in the Eq. (3). The ns represents the refractive index of the glass used to coat the nanoparticle solutions (Swanepoel, 1983).
2.2.5 Water vapor transmission rate analysis on textiles
The methods of measuring water vapor transmission rate (WVTR) represents the permeability of the coated textiles to water vapor (Hu et al., 2001). The highly permeable films are generally preferred in products for daily use such as in self-cleaning textiles. In order to provide human skin respiration continuity after the coating procedure, the water vapor transmission rate is measured through a mod-ification of the wet cup method described by the ASTM E 96-95 standard (Hu et al., 2001). In this method, the textile sample is used as a cover on a cup filled with DI-water and the change in mass is recorded as a function of time. The weight change is due to the evaporation of water through the textile and Eq. (4) is used to determine the water vapor transmission rate.
2 H O
=
×
mass lost
WVTR
time area
(4)

Asena Cerhan Haink et al. / KONA Powder and Particle Journal No. 38 (2021) 269–280
273
The textiles were prepared for water transmittance tests by cutting 10 cm square samples to cover the top of the beakers after adding 100 ml DI-water in each beaker. The system was weighed to follow the change in mass in weekly periods under ambient conditions (22 °C and 20 % humidity-winter and the 35 °C and 50 % humidity-summer). The system mass change was recorded for 700 hours (~30 days).
3. Result and discussion
3.1 Characterization of nano-particle systems in DI-water and textile finishing solution
The size distribution and shape of powders change the total surface area of the particles and affect the rate of re-actions, stability as well as product appearance and texture. Hence, particle size measurement is one of the indicators of quality and performance of suspensions for a successful implementation of the nanoparticles on textiles. Fine par-ticles with high total surface area speed up chemical reac-tions and dissolution rates while simultaneously becoming more prone to settling due to the loss of suspension stabil-ity. Unstable suspensions lead to inhomogeneous coatings since the photocatalytic particles settle out of liquid sus-pension and cannot hold on to the textile surface properly. Therefore, the particle size of anatase and branched titania were measured in DI-water as well as finishing solution by using static light scattering via Coulter LS 13 320 as well as through AFM scanning.
Table 1 summarizes the mean particle size measure-ments obtained by Coulter LS 13 320. It can be seen that the anatase particles were similar in size both in DI-water and finishing solution with 0.087 ∓ 0.005 μm and 0.084 ∓ 0.001 μm mean diameter, respectively. The consis-tency in the measured mean size with a controlled standard deviation indicates the stability of the anatase particles in both environments. We have demonstrated in the earlier studies that the titania particles are more stable in the fin-ishing solution which has a pH of 3.52 as compared to the DI water which has a pH of ~6 (Cerhan-Haink and Basim, 2020). This is due to the fact that the isoelectric point of anatase is at pH 5.8 (McNamee et al., 2005) and hence
retains more positive surface charge in the finishing solu-tion with pH 3.52 as compared to the DI water with pH of 6. Stability of the suspensions is expected to reduce when the pH is close to the iso electric point (i.e.p) of the system due to the fact that the particles retain no surface charge at the i.e.p (Ney, 1973). If the suspension is to be stabilized, one of the ways to do this is to change the pH away from the i.e.p to increase the electrical repulsion in between the particles (Salopek et al., 1992). Alternatively, mechanical vibration can be induced through effective ultrasonication. In this case, titania particles were stabilized in both suspen-sions through rigorous ultrasonication as can be seen from the consistent mean size measurement values.
In the case of branched titania, measurements showed a mean size of 0.55 ∓ 0.003 μm with tight control on the stan-dard deviation for the solutions prepared in the DI-water background. In the presence of the finishing solution, on the other hand, the mean size increased almost twice and measured to be 1.029 ∓ 0.058 μm. It is believed that in the presence of the ingredients of the finishing solution, such as the silicon particles, the branches created on the titania par-ticles attach to these additives and measure larger in mean size as compared to the DI-water based measurements. The increase in the variance of the measurement also supports the proposed concept in the finishing solution environment.
In order to understand the stability and verify the proper size of the synthesized branched titania particles, mor-phological particle size analyses were conducted by AFM scanning. Particles deposited on mica substrates were char-acterized and summarized in Table 2. The scanning of the anatase versus the branched titania particles with the AFM technique allows the characterization of the particles in their dried form. It can be seen that the mean sizes of the anatase and the branched titania particles are much closer measured as 0.277 ∓ 0.035 μm for anatase and 0.244 ∓ 0.118 μm branched titania. This is an indication that the branched titania particles have similar size cores but measure larger due to the presence of polymeric branches in the solution background. Furthermore, the standard deviation of par-ticle size measurements obtained with light scattering on branched silica particles is lower as compared to the AFM measurements, while the particle sizes measured with AFM are almost half of the mean size measured by the Coulter LS 13 320. The smaller size measurement by AFM can be attributed to the fact that the branches attached to the main
Table 1 Change of material stability depending on zeta-potential size.
Photocatalytic particle Mean Particle size (μm)
Standard Deviation (μm)
Anatase in DIW 0.087 0.005
Anatase in F.S. 0.084 0.001
Branched titania in DIW 0.541 0.003
Branched titania in F.S. 1.029 0.058
Table 2 AFM scanning results for mean particle size evaluations of anatase and branched titania.
Photocatalytic particle Mean Particle size (μm)
Standard Deviation (μm)
Anatase 0.277 0.035
Branched titania 0.244 0.118
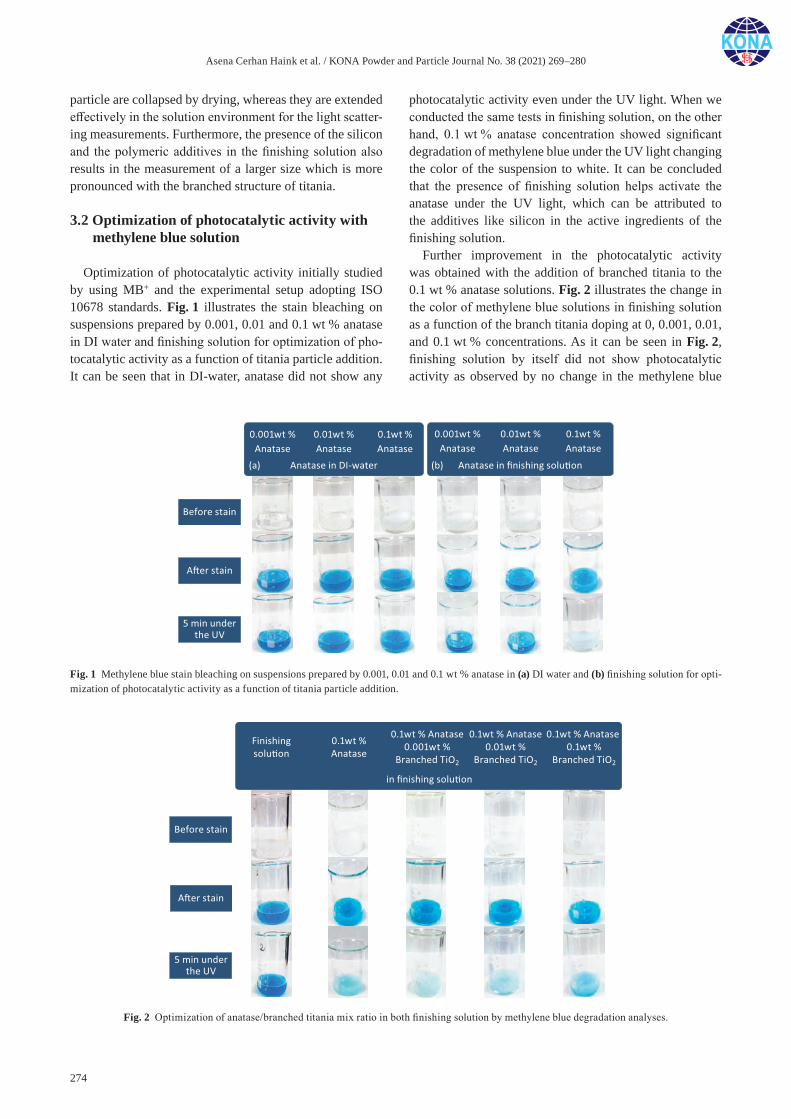
Asena Cerhan Haink et al. / KONA Powder and Particle Journal No. 38 (2021) 269–280
274
particle are collapsed by drying, whereas they are extended effectively in the solution environment for the light scatter-ing measurements. Furthermore, the presence of the silicon and the polymeric additives in the finishing solution also results in the measurement of a larger size which is more pronounced with the branched structure of titania.
3.2 Optimization of photocatalytic activity with methylene blue solution
Optimization of photocatalytic activity initially studied by using MB+ and the experimental setup adopting ISO 10678 standards. Fig. 1 illustrates the stain bleaching on suspensions prepared by 0.001, 0.01 and 0.1 wt % anatase in DI water and finishing solution for optimization of pho-tocatalytic activity as a function of titania particle addition. It can be seen that in DI-water, anatase did not show any
photocatalytic activity even under the UV light. When we conducted the same tests in finishing solution, on the other hand, 0.1 wt % anatase concentration showed significant degradation of methylene blue under the UV light changing the color of the suspension to white. It can be concluded that the presence of finishing solution helps activate the anatase under the UV light, which can be attributed to the additives like silicon in the active ingredients of the finishing solution.
Further improvement in the photocatalytic activity was obtained with the addition of branched titania to the 0.1 wt % anatase solutions. Fig. 2 illustrates the change in the color of methylene blue solutions in finishing solution as a function of the branch titania doping at 0, 0.001, 0.01, and 0.1 wt % concentrations. As it can be seen in Fig. 2, finishing solution by itself did not show photocatalytic activity as observed by no change in the methylene blue
Fig. 1 Methylene blue stain bleaching on suspensions prepared by 0.001, 0.01 and 0.1 wt % anatase in (a) DI water and (b) finishing solution for opti-mization of photocatalytic activity as a function of titania particle addition.
Fig. 2 Optimization of anatase/branched titania mix ratio in both finishing solution by methylene blue degradation analyses.
Asena Cerhan Haink et al. / KONA Powder and Particle Journal No. 38 (2021) 269–280
275
color. This is consistent with the observation of no stain bleaching on the textiles which were coated only with the
finishing solution in our earlier studies (Cerhan Haink and Basim, 2020). The optimal photocatalytic performance was obtained with 0.1 wt % anatase with 0.001 wt % branched titania doping as per the visual observations. Nevertheless, the determination of the photocatalytic activity according to the color change can be misleading a better quantifica-tion is needed. As an example, appearances of 0.1 wt % anatase doped with 0.001 wt % 0.01 wt % branched titania after UV exposure are similar. Therefore, the methylene blue degradation for these solutions was also evaluated by UV spectrophotometer absorbance tests as a function of time, as can be seen in Fig. 3. The decrease in the absorp-tion is an indication of better transmittance in the solution and hence indicates the cleaning of the solution by the photocatalytic activity. Comparing the absorption peaks of the 0.1 wt % anatase (Fig. 3a), 0.1 wt % anatase doped with 0.001 wt % branched titania (Fig. 3b) and 0.1 wt % anatase doped with 0.01 wt % branched titania (Fig. 3c) show that the UV absorption peaks representing methylene blue degrades fastest for the combination of 0.001 wt % branched titania with anatase. Consequently, better pho-tocatalytic cleaning efficiency is observed in the presence of 0.001 wt % branched titania in 0.1 wt % anatase. The speed of photocatalytic degradation can also be seen in Ta-ble 3, where the absorption delta is tabulated as a function of time for the selected three treatments. This observation highlights the fact that the ingredients in the finishing solu-tion can enhance the kinetics of the photocatalytic activity when the polymeric branches interact with the silicon in the environment. It can be suggested that the polymeric branches on the titania particles can induce the synergistic effect of better particle attachment on the textile surfaces while simultaneously enhancing the photocatalysis.
3.3 Evaluation of photocatalytic efficiency on the textiles coated with the optimized nano-particle systems
In order to observe the photocatalytic performance of the textiles coated with the optimized particulate systems, absorbance tests were also conducted on the textiles coated with the selected optimal nano-particle combinations and compared to the industrial standards. Fig. 4 illustrates the
Fig. 3 Absorbance versus wavelength representing the MB+ degrada-tion under the cool light as a function of time for, (a) 0.1 wt % anatase, (b) 0.1 wt % anatase doped with 0.001 wt % branched titania and (c) 0.1 wt % anatase doped with 0.01 wt % branched titania in finishing solution.
Table 3 Absorption delta for methylene blue degradation in finishing solution with 0.1 wt % anatase, 0.1 wt % anatase doped with 0.001 wt % branched titania and 0.1 wt % anatase doped with 0.01 wt % branched titania as a function of time.
Solutions Time (minute)
0 2 3 4 6 8 9 10 12
0.1 wt % Anatase0.01 wt % Branched titania
3.985 3.929 3.142 2.703
0.1 wt % Anatase0.001 wt % Branched titania
3.863 3.801 3.100 2.497
0.1 wt % Anatase 3.898 3.789 3.313 2.857 2.571 2.504
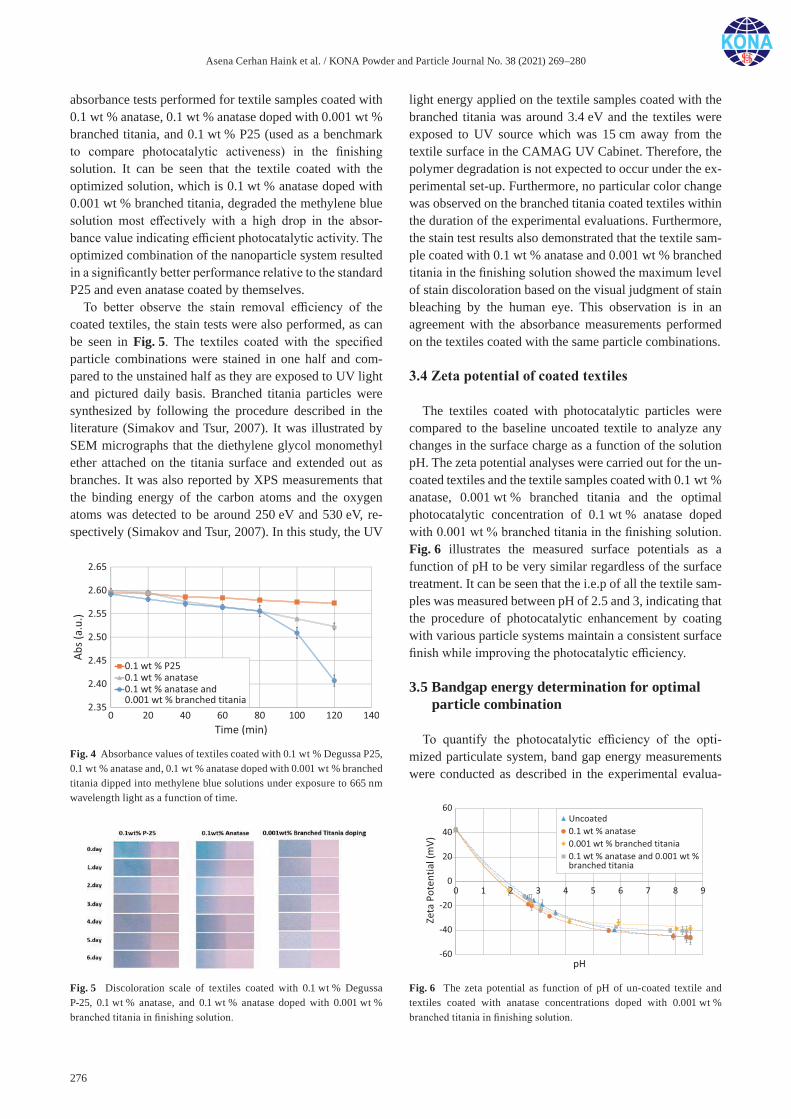
Asena Cerhan Haink et al. / KONA Powder and Particle Journal No. 38 (2021) 269–280
276
absorbance tests performed for textile samples coated with 0.1 wt % anatase, 0.1 wt % anatase doped with 0.001 wt % branched titania, and 0.1 wt % P25 (used as a benchmark to compare photocatalytic activeness) in the finishing solution. It can be seen that the textile coated with the optimized solution, which is 0.1 wt % anatase doped with 0.001 wt % branched titania, degraded the methylene blue solution most effectively with a high drop in the absor-bance value indicating efficient photocatalytic activity. The optimized combination of the nanoparticle system resulted in a significantly better performance relative to the standard P25 and even anatase coated by themselves.
To better observe the stain removal efficiency of the coated textiles, the stain tests were also performed, as can be seen in Fig. 5. The textiles coated with the specified particle combinations were stained in one half and com-pared to the unstained half as they are exposed to UV light and pictured daily basis. Branched titania particles were synthesized by following the procedure described in the literature (Simakov and Tsur, 2007). It was illustrated by SEM micrographs that the diethylene glycol monomethyl ether attached on the titania surface and extended out as branches. It was also reported by XPS measurements that the binding energy of the carbon atoms and the oxygen atoms was detected to be around 250 eV and 530 eV, re-spectively (Simakov and Tsur, 2007). In this study, the UV
light energy applied on the textile samples coated with the branched titania was around 3.4 eV and the textiles were exposed to UV source which was 15 cm away from the textile surface in the CAMAG UV Cabinet. Therefore, the polymer degradation is not expected to occur under the ex-perimental set-up. Furthermore, no particular color change was observed on the branched titania coated textiles within the duration of the experimental evaluations. Furthermore, the stain test results also demonstrated that the textile sam-ple coated with 0.1 wt % anatase and 0.001 wt % branched titania in the finishing solution showed the maximum level of stain discoloration based on the visual judgment of stain bleaching by the human eye. This observation is in an agreement with the absorbance measurements performed on the textiles coated with the same particle combinations.
3.4 Zeta potential of coated textiles
The textiles coated with photocatalytic particles were compared to the baseline uncoated textile to analyze any changes in the surface charge as a function of the solution pH. The zeta potential analyses were carried out for the un-coated textiles and the textile samples coated with 0.1 wt % anatase, 0.001 wt % branched titania and the optimal photocatalytic concentration of 0.1 wt % anatase doped with 0.001 wt % branched titania in the finishing solution. Fig. 6 illustrates the measured surface potentials as a function of pH to be very similar regardless of the surface treatment. It can be seen that the i.e.p of all the textile sam-ples was measured between pH of 2.5 and 3, indicating that the procedure of photocatalytic enhancement by coating with various particle systems maintain a consistent surface finish while improving the photocatalytic efficiency.
3.5 Bandgap energy determination for optimal particle combination
To quantify the photocatalytic efficiency of the opti-mized particulate system, band gap energy measurements were conducted as described in the experimental evalua-
Fig. 4 Absorbance values of textiles coated with 0.1 wt % Degussa P25, 0.1 wt % anatase and, 0.1 wt % anatase doped with 0.001 wt % branched titania dipped into methylene blue solutions under exposure to 665 nm wavelength light as a function of time.
Fig. 5 Discoloration scale of textiles coated with 0.1 wt % Degussa P-25, 0.1 wt % anatase, and 0.1 wt % anatase doped with 0.001 wt % branched titania in finishing solution.
Fig. 6 The zeta potential as function of pH of un-coated textile and textiles coated with anatase concentrations doped with 0.001 wt % branched titania in finishing solution.
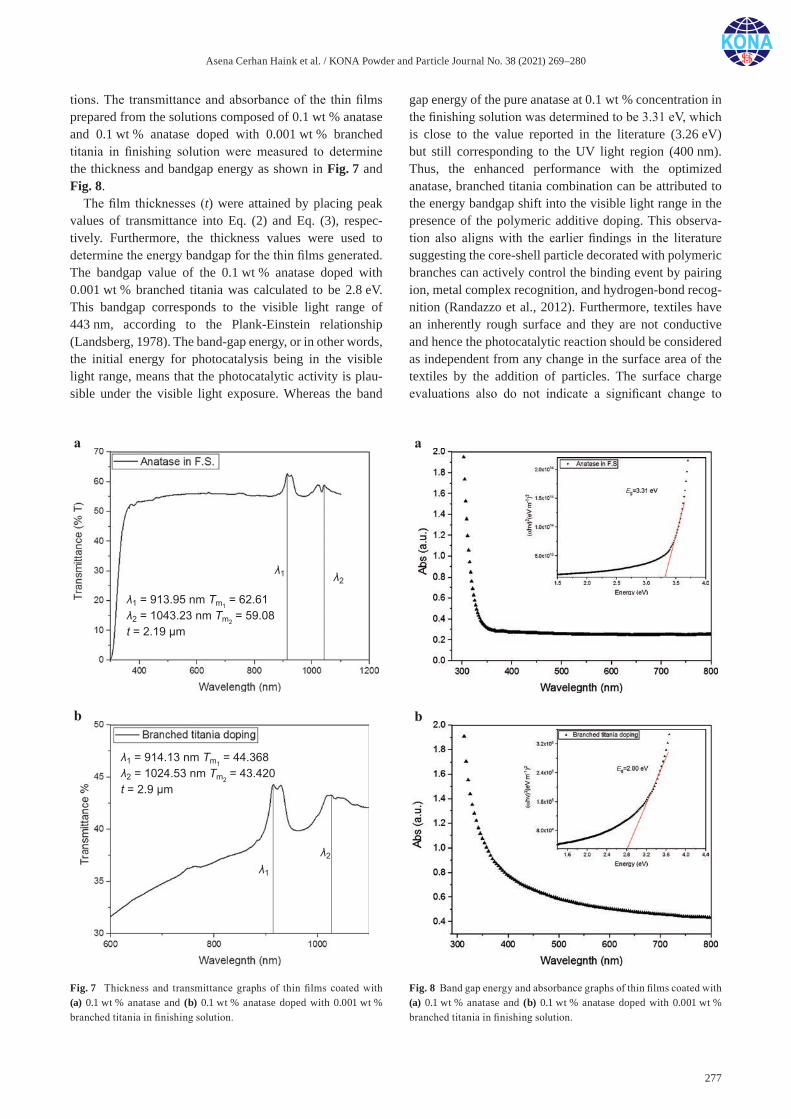
Asena Cerhan Haink et al. / KONA Powder and Particle Journal No. 38 (2021) 269–280
277
tions. The transmittance and absorbance of the thin films prepared from the solutions composed of 0.1 wt % anatase and 0.1 wt % anatase doped with 0.001 wt % branched titania in finishing solution were measured to determine the thickness and bandgap energy as shown in Fig. 7 and Fig. 8.
The film thicknesses (t) were attained by placing peak values of transmittance into Eq. (2) and Eq. (3), respec-tively. Furthermore, the thickness values were used to determine the energy bandgap for the thin films generated. The bandgap value of the 0.1 wt % anatase doped with 0.001 wt % branched titania was calculated to be 2.8 eV. This bandgap corresponds to the visible light range of 443 nm, according to the Plank-Einstein relationship (Landsberg, 1978). The band-gap energy, or in other words, the initial energy for photocatalysis being in the visible light range, means that the photocatalytic activity is plau-sible under the visible light exposure. Whereas the band
gap energy of the pure anatase at 0.1 wt % concentration in the finishing solution was determined to be 3.31 eV, which is close to the value reported in the literature (3.26 eV) but still corresponding to the UV light region (400 nm). Thus, the enhanced performance with the optimized anatase, branched titania combination can be attributed to the energy bandgap shift into the visible light range in the presence of the polymeric additive doping. This observa-tion also aligns with the earlier findings in the literature suggesting the core-shell particle decorated with polymeric branches can actively control the binding event by pairing ion, metal complex recognition, and hydrogen-bond recog-nition (Randazzo et al., 2012). Furthermore, textiles have an inherently rough surface and they are not conductive and hence the photocatalytic reaction should be considered as independent from any change in the surface area of the textiles by the addition of particles. The surface charge evaluations also do not indicate a significant change to
Fig. 7 Thickness and transmittance graphs of thin films coated with (a) 0.1 wt % anatase and (b) 0.1 wt % anatase doped with 0.001 wt % branched titania in finishing solution.
Fig. 8 Band gap energy and absorbance graphs of thin films coated with (a) 0.1 wt % anatase and (b) 0.1 wt % anatase doped with 0.001 wt % branched titania in finishing solution.
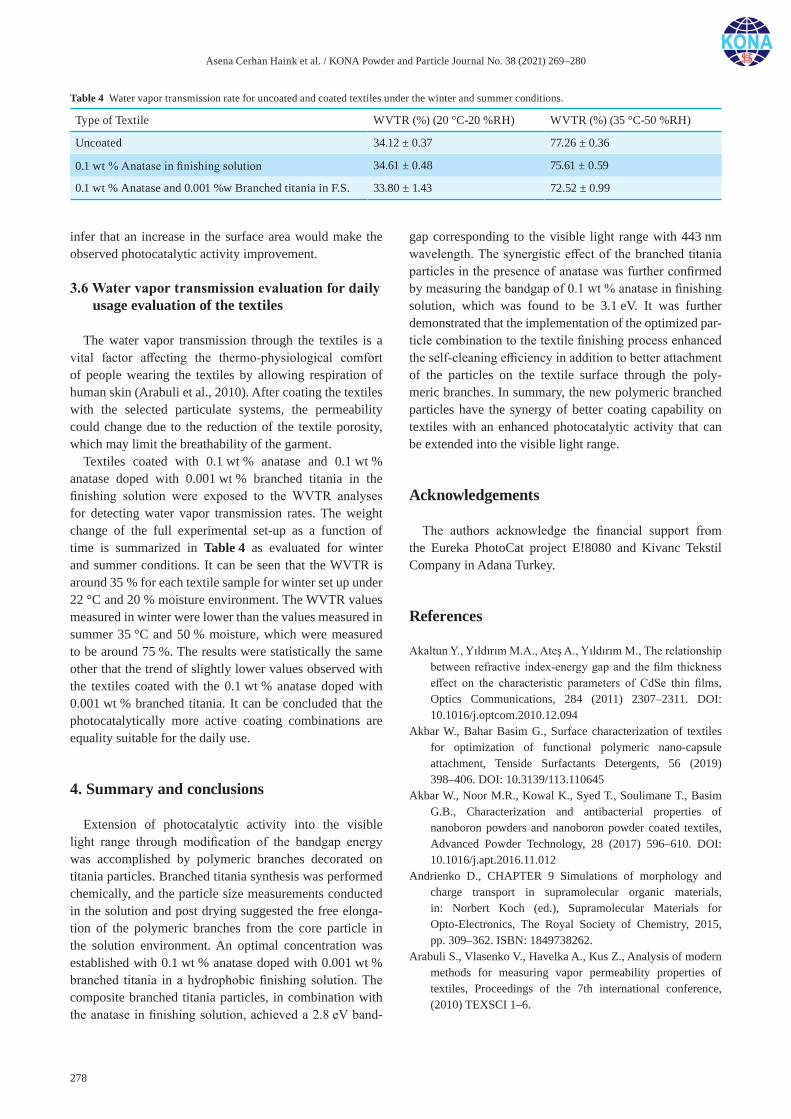
Asena Cerhan Haink et al. / KONA Powder and Particle Journal No. 38 (2021) 269–280
278
infer that an increase in the surface area would make the observed photocatalytic activity improvement.
3.6 Water vapor transmission evaluation for daily usage evaluation of the textiles
The water vapor transmission through the textiles is a vital factor affecting the thermo-physiological comfort of people wearing the textiles by allowing respiration of human skin (Arabuli et al., 2010). After coating the textiles with the selected particulate systems, the permeability could change due to the reduction of the textile porosity, which may limit the breathability of the garment.
Textiles coated with 0.1 wt % anatase and 0.1 wt % anatase doped with 0.001 wt % branched titania in the finishing solution were exposed to the WVTR analyses for detecting water vapor transmission rates. The weight change of the full experimental set-up as a function of time is summarized in Table 4 as evaluated for winter and summer conditions. It can be seen that the WVTR is around 35 % for each textile sample for winter set up under 22 °C and 20 % moisture environment. The WVTR values measured in winter were lower than the values measured in summer 35 °C and 50 % moisture, which were measured to be around 75 %. The results were statistically the same other that the trend of slightly lower values observed with the textiles coated with the 0.1 wt % anatase doped with 0.001 wt % branched titania. It can be concluded that the photocatalytically more active coating combinations are equality suitable for the daily use.
4. Summary and conclusions
Extension of photocatalytic activity into the visible light range through modification of the bandgap energy was accomplished by polymeric branches decorated on titania particles. Branched titania synthesis was performed chemically, and the particle size measurements conducted in the solution and post drying suggested the free elonga-tion of the polymeric branches from the core particle in the solution environment. An optimal concentration was established with 0.1 wt % anatase doped with 0.001 wt % branched titania in a hydrophobic finishing solution. The composite branched titania particles, in combination with the anatase in finishing solution, achieved a 2.8 eV band-
gap corresponding to the visible light range with 443 nm wavelength. The synergistic effect of the branched titania particles in the presence of anatase was further confirmed by measuring the bandgap of 0.1 wt % anatase in finishing solution, which was found to be 3.1 eV. It was further demonstrated that the implementation of the optimized par-ticle combination to the textile finishing process enhanced the self-cleaning efficiency in addition to better attachment of the particles on the textile surface through the poly-meric branches. In summary, the new polymeric branched particles have the synergy of better coating capability on textiles with an enhanced photocatalytic activity that can be extended into the visible light range.
Acknowledgements
The authors acknowledge the financial support from the Eureka PhotoCat project E!8080 and Kivanc Tekstil Company in Adana Turkey.
References
Akaltun Y., Yıldırım M.A., Ateş A., Yıldırım M., The relationship between refractive index-energy gap and the film thickness effect on the characteristic parameters of CdSe thin films, Optics Communications, 284 (2011) 2307–2311. DOI: 10.1016/j.optcom.2010.12.094
Akbar W., Bahar Basim G., Surface characterization of textiles for optimization of functional polymeric nano-capsule attachment, Tenside Surfactants Detergents, 56 (2019) 398–406. DOI: 10.3139/113.110645
Akbar W., Noor M.R., Kowal K., Syed T., Soulimane T., Basim G.B., Characterization and antibacterial properties of nanoboron powders and nanoboron powder coated textiles, Advanced Powder Technology, 28 (2017) 596–610. DOI: 10.1016/j.apt.2016.11.012
Andrienko D., CHAPTER 9 Simulations of morphology and charge transport in supramolecular organic materials, in: Norbert Koch (ed.), Supramolecular Materials for Opto-Electronics, The Royal Society of Chemistry, 2015, pp. 309–362. ISBN: 1849738262.
Arabuli S., Vlasenko V., Havelka A., Kus Z., Analysis of modern methods for measuring vapor permeability properties of textiles, Proceedings of the 7th international conference, (2010) TEXSCI 1–6.
Table 4 Water vapor transmission rate for uncoated and coated textiles under the winter and summer conditions.
Type of Textile WVTR (%) (20 °C-20 %RH) WVTR (%) (35 °C-50 %RH)
Uncoated 34.12 ± 0.37 77.26 ± 0.36
0.1 wt % Anatase in finishing solution 34.61 ± 0.48 75.61 ± 0.59
0.1 wt % Anatase and 0.001 %w Branched titania in F.S. 33.80 ± 1.43 72.52 ± 0.99
Asena Cerhan Haink et al. / KONA Powder and Particle Journal No. 38 (2021) 269–280
279
Astam A., Structural and optical characterization of Cu2SnSe3 thin films prepared by SILAR method, Thin Solid Films, 615 (2016) 324–328. DOI: 10.1016/j.tsf.2016.07.027
Castellote M., Bengtsson N., Principles of TiO2 photocatalysis, in: Ohama Y., Van Gemert D. (Eds.), Applications of Titanium Dioxide Photocatalysis to Construction Materials. RILEM State of the Art Reports, vol 5, Springer, Dordrecht, 2011, pp. 5–10. DOI: 10.1007/978-94-007-1297-3_2
Cerhan-Haink A., Basim G.B., Promoting photocatalytic cleaning efficiency of textile finishing solutions with nanoboron as a p-type dopant, Journal of Surfactants and Detergents, 23 (2020) 433–444. DOI: 10.1002/jsde.12380
Cerhan A., Ozdemir Z., Basim G.B., Self-Cleaning ability quan-tization of textiles with Degussa P-25, Materials Science Forum, 915 (2018) 129–134. DOI: 10.4028/www.scientific.net/msf.915.129
Dumitrescu I., Iordache O., Popescu A., Varzaru E., Kim S., Ükelge G., The photocatalytic effects of textile materials treated with TiO2 and Fe/TiO2, Industria Textila, 66(5) (2015) 297–305.
Filippo E., Carlucci C., Capodilupo A.L., Perulli P., Conciauro F., Corrente G.A., Gigli G., Ciccarella G., Enhanced photocatalytic activity of pure anatase TiO2 and Pt-TiO2 nanoparticles synthesized by green microwave assisted route, Materials Research, 18 (2015) 473–481. DOI: 10.1590/1516-1439.301914
Godet C., Schmirgeld L., Zuppiroli L., Sardin G., Gujrathi S., Oxorn K., Optical properties and chemical reactivity of hydrogenated amorphous boron thin films, Journal of Materials Science, 26 (1991) 6408–6418. DOI: 10.1007/BF02387822
Hu Y., Topolkaraev V., Hiltner A., Baer E., Measurement of water vapor transmission rate in highly permeable films, Journal of Applied Polymer Science, 81 (2001) 1624–1633. DOI: 10.1002/app.1593
Hümmelgen I.A., “Oxide semiconductors for solar energy con-version—titanium dioxide”. author: Janusz Nowotny, Journal of Solid State Electrochemistry, 16 (2012) 2287–2287. DOI: 10.1007/s10008-012-1650-6
Kiwi J., Rtimi S., 3-Environmentally mild self-cleaning processes on textile surfaces under daylight irradiation: critical issues, in: Hu J. (Ed.) Active Coatings for Smart Textiles, Woodhead Publishing, 2016, pp. 35–54. ISBN: 0081002637.
Landsberg P.T., Thermodynamics and Statistical Mechanics, Oxford UK: Oxford University Press, 1978, ISBN: 0198511426.
López R., Gómez R., Band-gap energy estimation from diffuse reflectance measurements on sol–gel and commercial TiO2: a comparative study, Journal of Sol-Gel Science and Technology, 61 (2012) 1–7. DOI: 10.1007/s10971-011-2582-9
McNamee C.E., Tsujii Y., Matsumoto M., Physicochemical char-
acterization of an anatase TiO2 surface and the adsorption of a nonionic surfactant: an atomic force microscopy study, Langmuir, 21 (2005) 11283–11288. DOI: 10.1021/la0517890
Mills A., An overview of the methylene blue ISO test for assess-ing the activities of photocatalytic films, Applied Catalysis B: Environmental, 128 (2012) 144–149. DOI: 10.1016/j.apcatb.2012.01.019
Mills A., McFarlane M., Current and possible future methods of assessing the activities of photocatalyst films, Catalysis Today, 129 (2007) 22–28. DOI: 10.1016/j.cattod.2007.06.046
Ney P., Zeta-Potentiale und Flotierbarkeit von Mineralen, Vienna: Springer-Verlag Wien, 1973, ISBN: 3709183243. DOI: 10.1007/978-3-7091-8324-3
Ohtani B., Preparing articles on photocatalysis—beyond the illu-sions, misconceptions, and speculation, Chemistry Letters, 37 (2008) 216–229. DOI: 10.1246/cl.2008.216
Patra J.K., Gouda S., Application of nanotechnology in textile engineering: an overview, Journal of Engineering and Technology Research, 5 (2013) 104–111. DOI: 10.5897/JETR2013.0309
Qiu X., Miyauchi M., Sunada K., Minoshima M., Liu M., Lu Y., Li D., Shimodaira Y., Hosogi Y., Kuroda Y., Hashimoto K., Hybrid CuxO/TiO2 nanocomposites as risk-reduction materi-als in indoor environments, ACS Nano, 6 (2012) 1609–1618. DOI: 10.1021/nn2045888
Randazzo A, Spada GP, Webba da Silva M, Circular dichroism of quadruplex structures, in: Topics in Current Chemistry, Springer, Berlin / Heidelberg, 2012, pp. 1–20. DOI: 10.1007/ 128_2012_331
Rui Z., Wu S., Peng C., Ji H., Comparison of TiO2 Degussa P25 with anatase and rutile crystalline phases for methane com-bustion, Chemical Engineering Journal, 243 (2014) 254–264. DOI: 10.1016/j.cej.2014.01.010
Salopek B., Krasic D., Filipovic S., Measurement and application of zeta-potential, Rudarsko-Geolosko-Naftni Zbornik, 4 (1992) 147–151.
Saunders-Hastings P., Crispo J.A.G., Sikora L., Krewski D., Effectiveness of personal protective measures in reducing pandemic influenza transmission: a systematic review and meta-analysis, Epidemics, 20 (2017) 1–20. DOI: 10.1016/j.epidem.2017.04.003
Simakov S.A., Tsur Y., Surface stabilization of nano-sized titanium dioxide: improving the colloidal stability and the sintering morphology, Journal of Nanoparticle Research, 9 (2007) 403–417. DOI: 10.1007/s11051-006-9099-0
Swanepoel R., Determination of the thickness and optical con-stants of amorphous silicon, Journal of Physics E: Scientific Instruments, 16 (1983) 1214–1222. DOI: 10.1088/0022-3735/16/12/023
Wubbels G.G., Catalysis of photochemical reactions, Accounts of Chemical Research, 16 (1983) 285–292. DOI: 10.1021/ar00092a004

Asena Cerhan Haink et al. / KONA Powder and Particle Journal No. 38 (2021) 269–280
280
Authors’ Short Biographies
Asena Cerhan Haink
Asena Cerhan Haink is a second-year PhD student in Electrical and Computer Engineer-ing at the Technical University of Munich. She holds two masters degrees in Physics and Mechanical Engineering. She has a MSc Thesis, from Physics, on the characterization of the photovoltaic semiconductor. For her second MSc Thesis, she wanted to have a better understanding of the photocatalytic efficiency at the textiles. To do so, she focused on the photocatalysis mechanism in terms of optical characterization besides to self-cleaning textiles quality characterization. For her PhD Thesis, her research focusses on the mor-phological characterization of organic thin film systems. She can be contacted at: [email protected]
G. Bahar Basim
Dr. Bahar Basim is a Professor of Practice at the University of Florida Department of Materials Science and Engineering. She is an expert on electronic materials and particle science and technology. She has received the European Commission Marie Curie People Award in 2010 for her research on nanoscale protective oxide film. She has numerous inter-national patents and applications on nanotechnology, microelectronics, coatings, and sur-face science in addition to many technical papers, books, and presentations. Her research continues on chemical mechanical planarization, thin films, interfaces, novel nanoparticle development and nano-structuring of biomaterials.
KONA Powder and Particle Journal No. 38 (2021) 281–284/https://doi.org/10.14356/kona.2021021 Information Article
281
A “powder”, which is an assemblage of small solid particles, exhibits very unique behavior. For example, depend-ing on the circumstances, a powder can behave like a gas, a liquid, or a solid. Furthermore, because of the larger specific surface area relative to its bulk counterpart, powders can have very distinct properties. This is especially true for “nanoparticles”. The unique behavior and properties of particle and powder give them a wide range of industrial applications that makes them ubiquitous in our daily lives. Particles and powder are also building blocks to make promising materials for creating scientific and technical innovations in the future.
Mr. Masuo Hosokawa, the chief editor of the first edition of this Handbook, was a pioneer in this industry. When he was the President of Hosokawa Micron Corp., he founded Hosokawa Powder Technology Foundation in 1991 to con-tribute to the advancement of powder technology on a global scale, and published the first issue of “KONA Powder and Particle Journal” in 1983. Since then, KONA has been published annually, and distributed worldwide.
Mr. Hosokawa proposed the concept of “nanoparticle technology” long before the United States President Bill Clinton’s National Nanotechnology Initiative in 2000. One of the activities of the Foundation was to publish the Nanoparticle Technology Handbook in Japanese in 2006, which was translated into English and published its first edi-tion of this Handbook in 2007. Nanoparticle technology advanced considerably after 2007, prompting Mr. Hosokawa to start preparing an updated second edition of the Handbook. He unfortunately passed away on March 31, 2010 before the second edition was published in 2012.
Because nanoparticle technology has rapidly evolved since 2012, and has been applied more broadly in new areas, Mr. Yoshio Hosokawa, the second President of Hosokawa Powder Technology Foundation and President of Hosokawa Micron Corporation decided to publish a third edition of the Handbook. In this third edition, the appli-cations section of the Handbook has been updated to include the most recent advances in nanoparticle technology. Nineteen chapters have been added. The 79 chapters in the applications section are organized into four categories as shown in Table 1. The third edition has totally 877 pages including fundamental part as shown in Table 1. Over 140 experts in nanotechology and/or powder technology contributed to this new edition.
Nanoparticle technology is a new and revolutionary technology. It handles the preparation, processing, application and characterization of nanoparticles and has become the core of nanotechnology as an extension of conventional fine particle/powder technology. Nanoparticle technology plays an important role in the implementation of nano-technology in many engineering and industrial fields.
I hope the third edition will give readers state-of-the-art information and knowledge to develop their own innovative technologies and new products, further enhancing our understanding of the fundamentals of nanoparticle technology.
Book Review
“Nanoparticle Technology Handbook (third edition)” edited by Makio Naito, Toyokazu
Yokoyama, Kouhei Hosokawa and Kiyoshi Nogi
Elsevier B.V., 3rd ed. 2018, 904 p. ISBN: 978-0-444-64110-6, DOI: 10.1016/C2017-0-01011-X
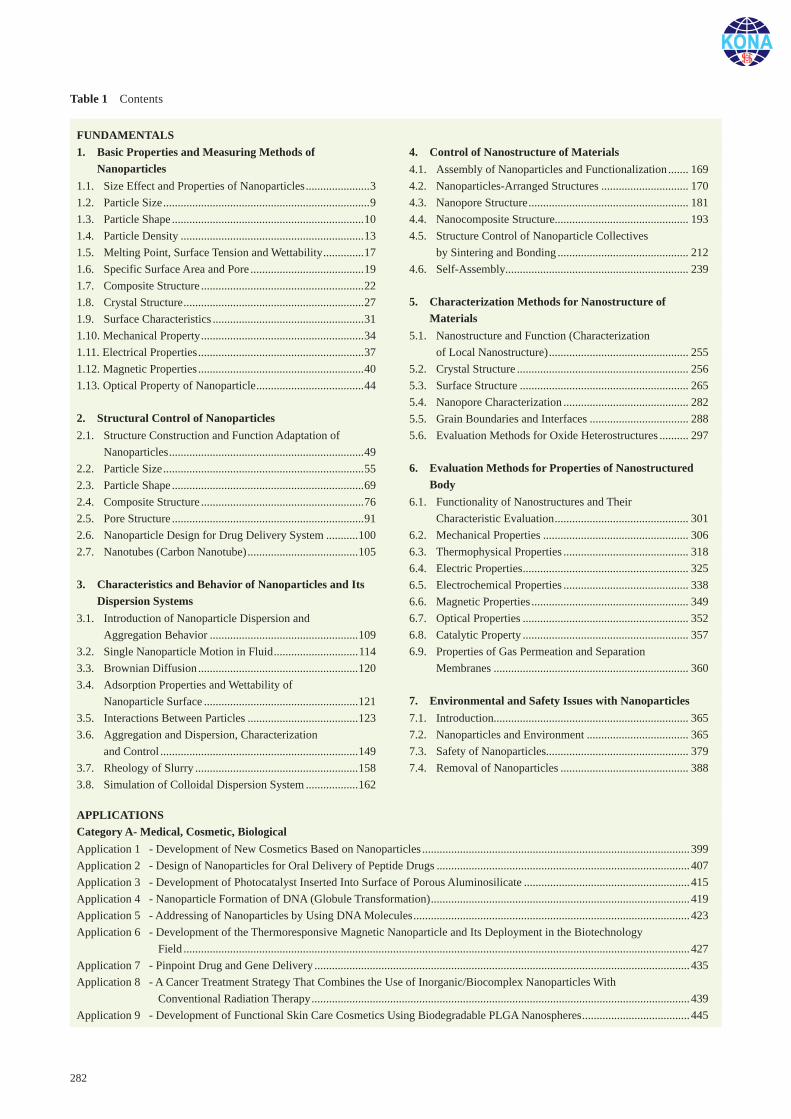
282
Table 1 Contents
FUNDAMENTALS1. Basic Properties and Measuring Methods of
Nanoparticles1.1. Size Effect and Properties of Nanoparticles ......................31.2. Particle Size .......................................................................91.3. Particle Shape ..................................................................101.4. Particle Density ...............................................................131.5. Melting Point, Surface Tension and Wettability ..............171.6. Specific Surface Area and Pore .......................................191.7. Composite Structure ........................................................221.8. Crystal Structure ..............................................................271.9. Surface Characteristics ....................................................311.10. Mechanical Property ........................................................341.11. Electrical Properties .........................................................371.12. Magnetic Properties .........................................................401.13. Optical Property of Nanoparticle .....................................44
2. Structural Control of Nanoparticles2.1. Structure Construction and Function Adaptation of
Nanoparticles ...................................................................492.2. Particle Size .....................................................................552.3. Particle Shape ..................................................................692.4. Composite Structure ........................................................762.5. Pore Structure ..................................................................912.6. Nanoparticle Design for Drug Delivery System ...........1002.7. Nanotubes (Carbon Nanotube) ......................................105
3. Characteristics and Behavior of Nanoparticles and Its Dispersion Systems
3.1. Introduction of Nanoparticle Dispersion and Aggregation Behavior ...................................................109
3.2. Single Nanoparticle Motion in Fluid .............................1143.3. Brownian Diffusion .......................................................1203.4. Adsorption Properties and Wettability of
Nanoparticle Surface .....................................................1213.5. Interactions Between Particles ......................................1233.6. Aggregation and Dispersion, Characterization
and Control ....................................................................1493.7. Rheology of Slurry ........................................................1583.8. Simulation of Colloidal Dispersion System ..................162
4. Control of Nanostructure of Materials4.1. Assembly of Nanoparticles and Functionalization ....... 1694.2. Nanoparticles-Arranged Structures .............................. 1704.3. Nanopore Structure ....................................................... 1814.4. Nanocomposite Structure.............................................. 1934.5. Structure Control of Nanoparticle Collectives
by Sintering and Bonding ............................................. 2124.6. Self-Assembly............................................................... 239
5. Characterization Methods for Nanostructure of Materials
5.1. Nanostructure and Function (Characterization of Local Nanostructure) ................................................ 255
5.2. Crystal Structure ........................................................... 2565.3. Surface Structure .......................................................... 2655.4. Nanopore Characterization ........................................... 2825.5. Grain Boundaries and Interfaces .................................. 2885.6. Evaluation Methods for Oxide Heterostructures .......... 297
6. Evaluation Methods for Properties of Nanostructured Body
6.1. Functionality of Nanostructures and Their Characteristic Evaluation .............................................. 301
6.2. Mechanical Properties .................................................. 3066.3. Thermophysical Properties ........................................... 3186.4. Electric Properties ......................................................... 3256.5. Electrochemical Properties ........................................... 3386.6. Magnetic Properties ...................................................... 3496.7. Optical Properties ......................................................... 3526.8. Catalytic Property ......................................................... 3576.9. Properties of Gas Permeation and Separation
Membranes ................................................................... 360
7. Environmental and Safety Issues with Nanoparticles7.1. Introduction................................................................... 3657.2. Nanoparticles and Environment ................................... 3657.3. Safety of Nanoparticles................................................. 3797.4. Removal of Nanoparticles ............................................ 388
APPLICATIONSCategory A- Medical, Cosmetic, BiologicalApplication 1 - Development of New Cosmetics Based on Nanoparticles ............................................................................................399Application 2 - Design of Nanoparticles for Oral Delivery of Peptide Drugs .......................................................................................407Application 3 - Development of Photocatalyst Inserted Into Surface of Porous Aluminosilicate .........................................................415Application 4 - Nanoparticle Formation of DNA (Globule Transformation) .........................................................................................419Application 5 - Addressing of Nanoparticles by Using DNA Molecules ...............................................................................................423Application 6 - Development of the Thermoresponsive Magnetic Nanoparticle and Its Deployment in the Biotechnology
Field ..............................................................................................................................................................................427Application 7 - Pinpoint Drug and Gene Delivery .................................................................................................................................435Application 8 - A Cancer Treatment Strategy That Combines the Use of Inorganic/Biocomplex Nanoparticles With
Conventional Radiation Therapy ..................................................................................................................................439Application 9 - Development of Functional Skin Care Cosmetics Using Biodegradable PLGA Nanospheres .....................................445
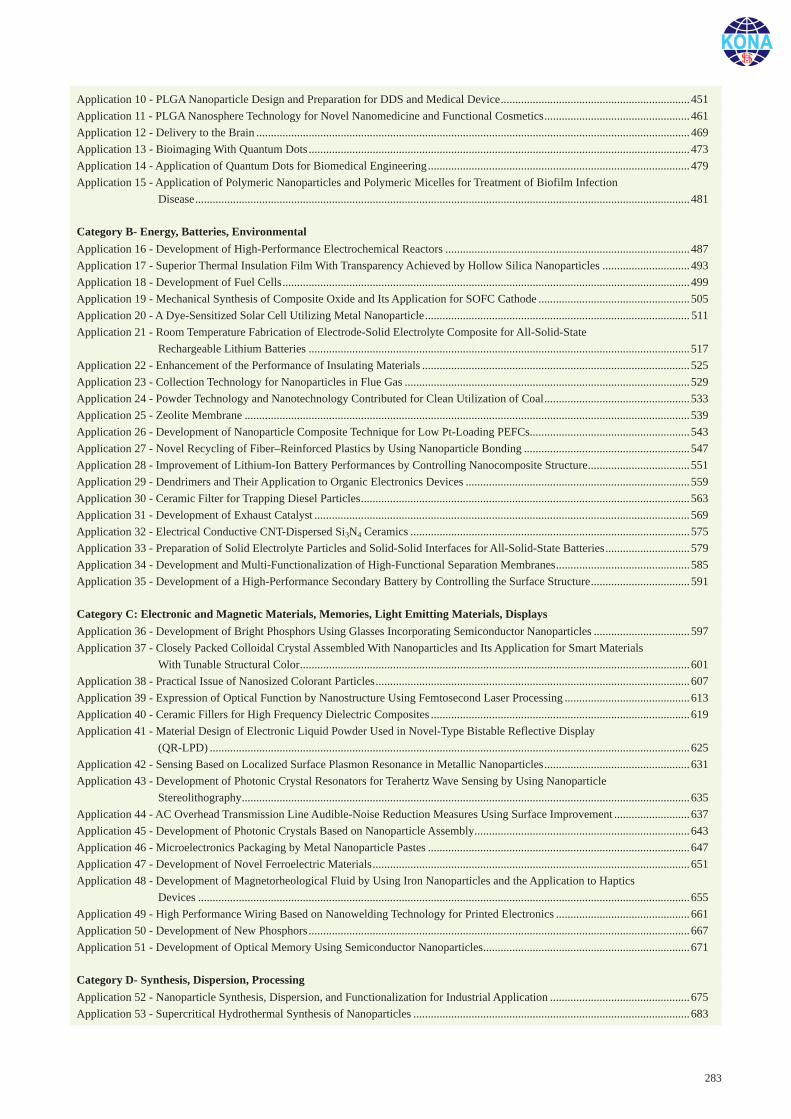
283
Application 10 - PLGA Nanoparticle Design and Preparation for DDS and Medical Device .................................................................451Application 11 - PLGA Nanosphere Technology for Novel Nanomedicine and Functional Cosmetics ..................................................461Application 12 - Delivery to the Brain .....................................................................................................................................................469Application 13 - Bioimaging With Quantum Dots ...................................................................................................................................473Application 14 - Application of Quantum Dots for Biomedical Engineering ..........................................................................................479Application 15 - Application of Polymeric Nanoparticles and Polymeric Micelles for Treatment of Biofilm Infection
Disease ..........................................................................................................................................................................481
Category B- Energy, Batteries, EnvironmentalApplication 16 - Development of High-Performance Electrochemical Reactors ....................................................................................487Application 17 - Superior Thermal Insulation Film With Transparency Achieved by Hollow Silica Nanoparticles ..............................493Application 18 - Development of Fuel Cells ............................................................................................................................................499Application 19 - Mechanical Synthesis of Composite Oxide and Its Application for SOFC Cathode ....................................................505Application 20 - A Dye-Sensitized Solar Cell Utilizing Metal Nanoparticle ........................................................................................... 511Application 21 - Room Temperature Fabrication of Electrode-Solid Electrolyte Composite for All-Solid-State
Rechargeable Lithium Batteries ...................................................................................................................................517Application 22 - Enhancement of the Performance of Insulating Materials ............................................................................................525Application 23 - Collection Technology for Nanoparticles in Flue Gas ..................................................................................................529Application 24 - Powder Technology and Nanotechnology Contributed for Clean Utilization of Coal ..................................................533Application 25 - Zeolite Membrane .........................................................................................................................................................539Application 26 - Development of Nanoparticle Composite Technique for Low Pt-Loading PEFCs.......................................................543Application 27 - Novel Recycling of Fiber–Reinforced Plastics by Using Nanoparticle Bonding .........................................................547Application 28 - Improvement of Lithium-Ion Battery Performances by Controlling Nanocomposite Structure ...................................551Application 29 - Dendrimers and Their Application to Organic Electronics Devices .............................................................................559Application 30 - Ceramic Filter for Trapping Diesel Particles .................................................................................................................563Application 31 - Development of Exhaust Catalyst .................................................................................................................................569Application 32 - Electrical Conductive CNT-Dispersed Si3N4 Ceramics ................................................................................................575Application 33 - Preparation of Solid Electrolyte Particles and Solid-Solid Interfaces for All-Solid-State Batteries .............................579Application 34 - Development and Multi-Functionalization of High-Functional Separation Membranes ..............................................585Application 35 - Development of a High-Performance Secondary Battery by Controlling the Surface Structure ..................................591
Category C: Electronic and Magnetic Materials, Memories, Light Emitting Materials, DisplaysApplication 36 - Development of Bright Phosphors Using Glasses Incorporating Semiconductor Nanoparticles .................................597Application 37 - Closely Packed Colloidal Crystal Assembled With Nanoparticles and Its Application for Smart Materials
With Tunable Structural Color ......................................................................................................................................601Application 38 - Practical Issue of Nanosized Colorant Particles ............................................................................................................607Application 39 - Expression of Optical Function by Nanostructure Using Femtosecond Laser Processing ...........................................613Application 40 - Ceramic Fillers for High Frequency Dielectric Composites .........................................................................................619Application 41 - Material Design of Electronic Liquid Powder Used in Novel-Type Bistable Reflective Display
(QR-LPD) .....................................................................................................................................................................625Application 42 - Sensing Based on Localized Surface Plasmon Resonance in Metallic Nanoparticles ..................................................631Application 43 - Development of Photonic Crystal Resonators for Terahertz Wave Sensing by Using Nanoparticle
Stereolithography ..........................................................................................................................................................635Application 44 - AC Overhead Transmission Line Audible-Noise Reduction Measures Using Surface Improvement ..........................637Application 45 - Development of Photonic Crystals Based on Nanoparticle Assembly ..........................................................................643Application 46 - Microelectronics Packaging by Metal Nanoparticle Pastes ..........................................................................................647Application 47 - Development of Novel Ferroelectric Materials .............................................................................................................651Application 48 - Development of Magnetorheological Fluid by Using Iron Nanoparticles and the Application to Haptics
Devices .........................................................................................................................................................................655Application 49 - High Performance Wiring Based on Nanowelding Technology for Printed Electronics ..............................................661Application 50 - Development of New Phosphors ...................................................................................................................................667Application 51 - Development of Optical Memory Using Semiconductor Nanoparticles .......................................................................671
Category D- Synthesis, Dispersion, ProcessingApplication 52 - Nanoparticle Synthesis, Dispersion, and Functionalization for Industrial Application ................................................675Application 53 - Supercritical Hydrothermal Synthesis of Nanoparticles ...............................................................................................683
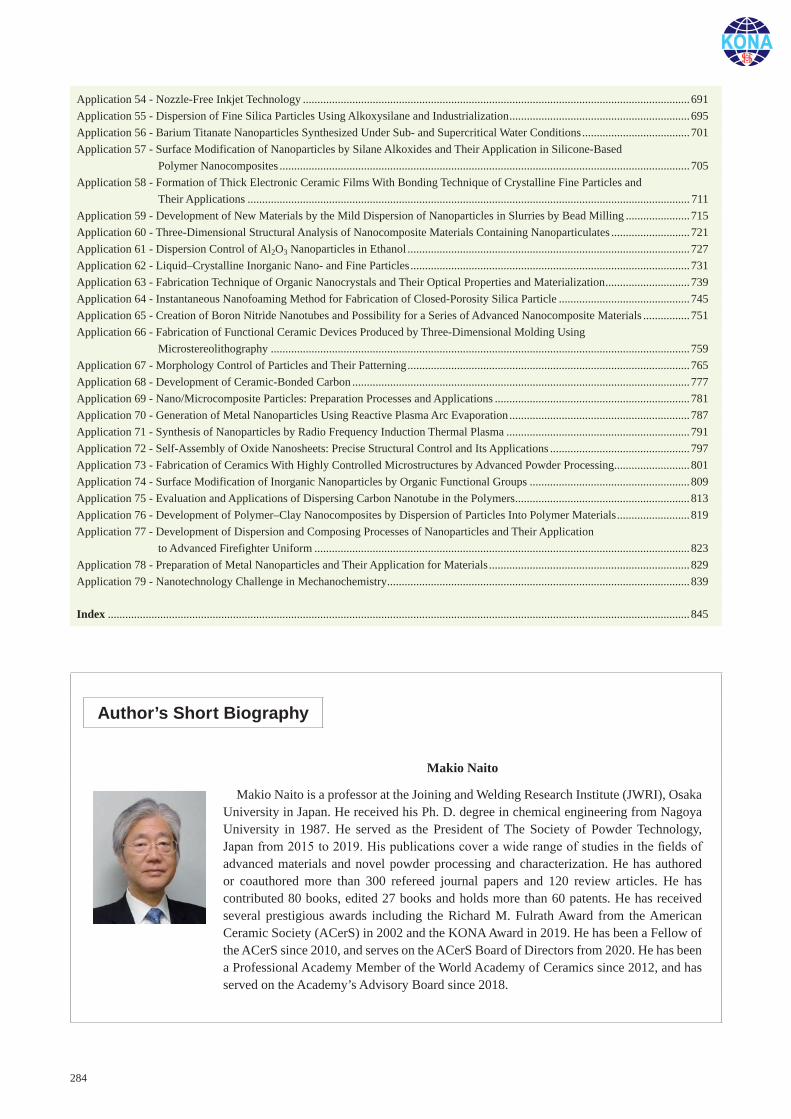
284
Application 54 - Nozzle-Free Inkjet Technology .....................................................................................................................................691Application 55 - Dispersion of Fine Silica Particles Using Alkoxysilane and Industrialization ..............................................................695Application 56 - Barium Titanate Nanoparticles Synthesized Under Sub- and Supercritical Water Conditions .....................................701Application 57 - Surface Modification of Nanoparticles by Silane Alkoxides and Their Application in Silicone-Based
Polymer Nanocomposites .............................................................................................................................................705Application 58 - Formation of Thick Electronic Ceramic Films With Bonding Technique of Crystalline Fine Particles and
Their Applications ........................................................................................................................................................ 711Application 59 - Development of New Materials by the Mild Dispersion of Nanoparticles in Slurries by Bead Milling ......................715Application 60 - Three-Dimensional Structural Analysis of Nanocomposite Materials Containing Nanoparticulates ...........................721Application 61 - Dispersion Control of Al2O3 Nanoparticles in Ethanol .................................................................................................727Application 62 - Liquid–Crystalline Inorganic Nano- and Fine Particles ................................................................................................731Application 63 - Fabrication Technique of Organic Nanocrystals and Their Optical Properties and Materialization .............................739Application 64 - Instantaneous Nanofoaming Method for Fabrication of Closed-Porosity Silica Particle .............................................745Application 65 - Creation of Boron Nitride Nanotubes and Possibility for a Series of Advanced Nanocomposite Materials ................751Application 66 - Fabrication of Functional Ceramic Devices Produced by Three-Dimensional Molding Using
Microstereolithography ................................................................................................................................................759Application 67 - Morphology Control of Particles and Their Patterning .................................................................................................765Application 68 - Development of Ceramic-Bonded Carbon ....................................................................................................................777Application 69 - Nano/Microcomposite Particles: Preparation Processes and Applications ...................................................................781Application 70 - Generation of Metal Nanoparticles Using Reactive Plasma Arc Evaporation ..............................................................787Application 71 - Synthesis of Nanoparticles by Radio Frequency Induction Thermal Plasma ...............................................................791Application 72 - Self-Assembly of Oxide Nanosheets: Precise Structural Control and Its Applications ................................................797Application 73 - Fabrication of Ceramics With Highly Controlled Microstructures by Advanced Powder Processing..........................801Application 74 - Surface Modification of Inorganic Nanoparticles by Organic Functional Groups .......................................................809Application 75 - Evaluation and Applications of Dispersing Carbon Nanotube in the Polymers ............................................................813Application 76 - Development of Polymer–Clay Nanocomposites by Dispersion of Particles Into Polymer Materials .........................819Application 77 - Development of Dispersion and Composing Processes of Nanoparticles and Their Application
to Advanced Firefighter Uniform .................................................................................................................................823Application 78 - Preparation of Metal Nanoparticles and Their Application for Materials .....................................................................829Application 79 - Nanotechnology Challenge in Mechanochemistry ........................................................................................................839
Index ........................................................................................................................................................................................................845
Author’s Short Biography
Makio Naito
Makio Naito is a professor at the Joining and Welding Research Institute (JWRI), Osaka University in Japan. He received his Ph. D. degree in chemical engineering from Nagoya University in 1987. He served as the President of The Society of Powder Technology, Japan from 2015 to 2019. His publications cover a wide range of studies in the fields of advanced materials and novel powder processing and characterization. He has authored or coauthored more than 300 refereed journal papers and 120 review articles. He has contributed 80 books, edited 27 books and holds more than 60 patents. He has received several prestigious awards including the Richard M. Fulrath Award from the American Ceramic Society (ACerS) in 2002 and the KONA Award in 2019. He has been a Fellow of the ACerS since 2010, and serves on the ACerS Board of Directors from 2020. He has been a Professional Academy Member of the World Academy of Ceramics since 2012, and has served on the Academy’s Advisory Board since 2018.
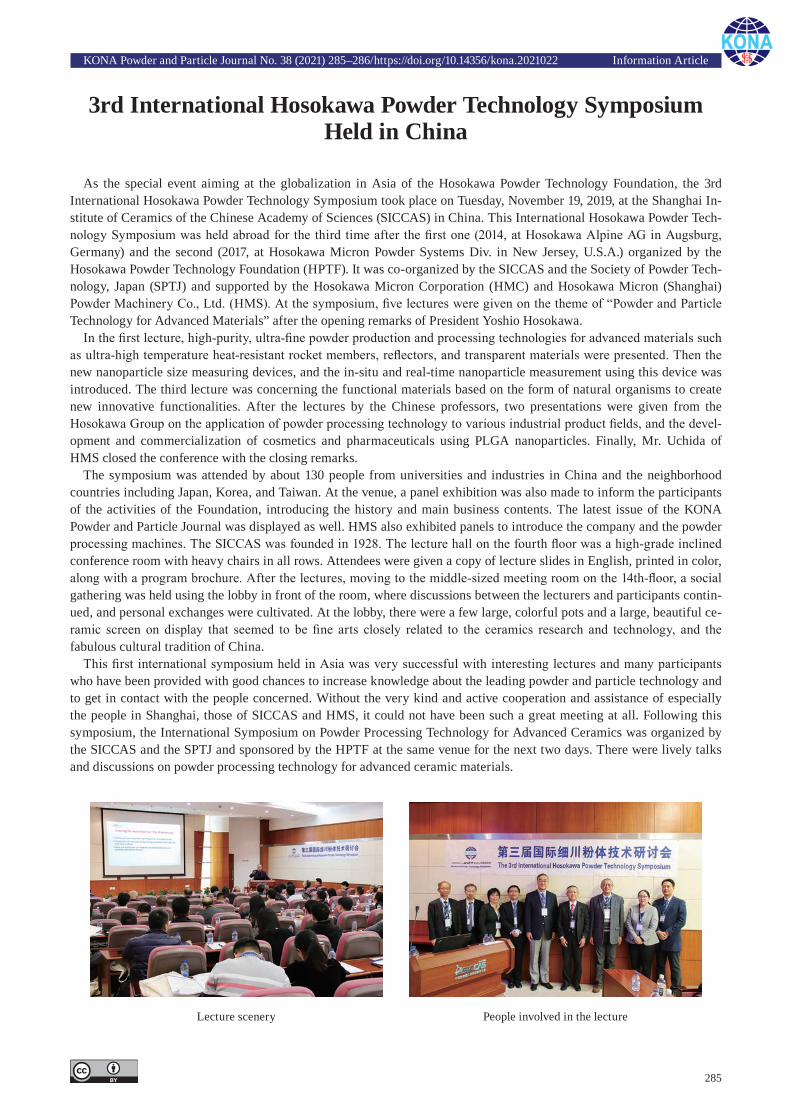
KONA Powder and Particle Journal No. 38 (2021) 285–286/https://doi.org/10.14356/kona.2021022 Information Article
285
3rd International Hosokawa Powder Technology Symposium Held in China
As the special event aiming at the globalization in Asia of the Hosokawa Powder Technology Foundation, the 3rd International Hosokawa Powder Technology Symposium took place on Tuesday, November 19, 2019, at the Shanghai In-stitute of Ceramics of the Chinese Academy of Sciences (SICCAS) in China. This International Hosokawa Powder Tech-nology Symposium was held abroad for the third time after the first one (2014, at Hosokawa Alpine AG in Augsburg, Germany) and the second (2017, at Hosokawa Micron Powder Systems Div. in New Jersey, U.S.A.) organized by the Hosokawa Powder Technology Foundation (HPTF). It was co-organized by the SICCAS and the Society of Powder Tech-nology, Japan (SPTJ) and supported by the Hosokawa Micron Corporation (HMC) and Hosokawa Micron (Shanghai) Powder Machinery Co., Ltd. (HMS). At the symposium, five lectures were given on the theme of “Powder and Particle Technology for Advanced Materials” after the opening remarks of President Yoshio Hosokawa.
In the first lecture, high-purity, ultra-fine powder production and processing technologies for advanced materials such as ultra-high temperature heat-resistant rocket members, reflectors, and transparent materials were presented. Then the new nanoparticle size measuring devices, and the in-situ and real-time nanoparticle measurement using this device was introduced. The third lecture was concerning the functional materials based on the form of natural organisms to create new innovative functionalities. After the lectures by the Chinese professors, two presentations were given from the Hosokawa Group on the application of powder processing technology to various industrial product fields, and the devel-opment and commercialization of cosmetics and pharmaceuticals using PLGA nanoparticles. Finally, Mr. Uchida of HMS closed the conference with the closing remarks.
The symposium was attended by about 130 people from universities and industries in China and the neighborhood countries including Japan, Korea, and Taiwan. At the venue, a panel exhibition was also made to inform the participants of the activities of the Foundation, introducing the history and main business contents. The latest issue of the KONA Powder and Particle Journal was displayed as well. HMS also exhibited panels to introduce the company and the powder processing machines. The SICCAS was founded in 1928. The lecture hall on the fourth floor was a high-grade inclined conference room with heavy chairs in all rows. Attendees were given a copy of lecture slides in English, printed in color, along with a program brochure. After the lectures, moving to the middle-sized meeting room on the 14th-floor, a social gathering was held using the lobby in front of the room, where discussions between the lecturers and participants contin-ued, and personal exchanges were cultivated. At the lobby, there were a few large, colorful pots and a large, beautiful ce-ramic screen on display that seemed to be fine arts closely related to the ceramics research and technology, and the fabulous cultural tradition of China.
This first international symposium held in Asia was very successful with interesting lectures and many participants who have been provided with good chances to increase knowledge about the leading powder and particle technology and to get in contact with the people concerned. Without the very kind and active cooperation and assistance of especially the people in Shanghai, those of SICCAS and HMS, it could not have been such a great meeting at all. Following this symposium, the International Symposium on Powder Processing Technology for Advanced Ceramics was organized by the SICCAS and the SPTJ and sponsored by the HPTF at the same venue for the next two days. There were lively talks and discussions on powder processing technology for advanced ceramic materials.
People involved in the lectureLecture scenery
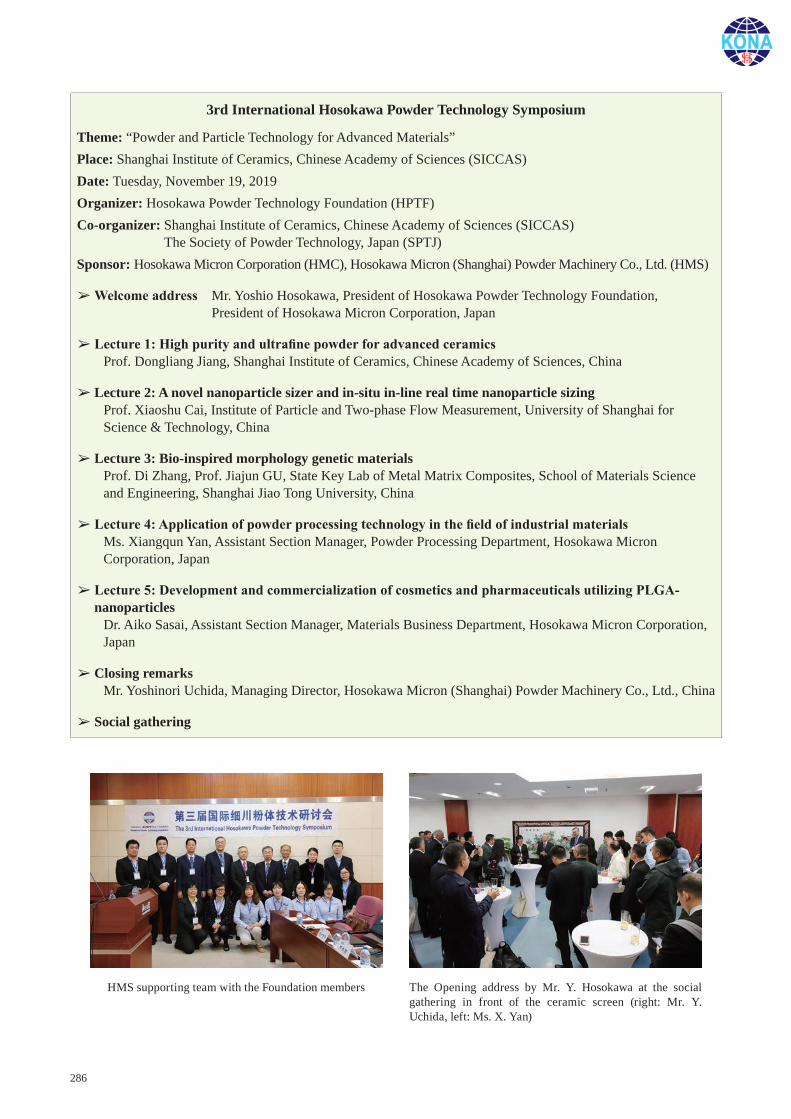
286
3rd International Hosokawa Powder Technology Symposium
Theme: “Powder and Particle Technology for Advanced Materials”Place: Shanghai Institute of Ceramics, Chinese Academy of Sciences (SICCAS)Date: Tuesday, November 19, 2019Organizer: Hosokawa Powder Technology Foundation (HPTF)Co-organizer: Shanghai Institute of Ceramics, Chinese Academy of Sciences (SICCAS)
The Society of Powder Technology, Japan (SPTJ)Sponsor: Hosokawa Micron Corporation (HMC), Hosokawa Micron (Shanghai) Powder Machinery Co., Ltd. (HMS)
➢ Welcome address Mr. Yoshio Hosokawa, President of Hosokawa Powder Technology Foundation, President of Hosokawa Micron Corporation, Japan
➢ Lecture 1: High purity and ultrafine powder for advanced ceramicsProf. Dongliang Jiang, Shanghai Institute of Ceramics, Chinese Academy of Sciences, China
➢ Lecture 2: A novel nanoparticle sizer and in-situ in-line real time nanoparticle sizingProf. Xiaoshu Cai, Institute of Particle and Two-phase Flow Measurement, University of Shanghai for Science & Technology, China
➢ Lecture 3: Bio-inspired morphology genetic materialsProf. Di Zhang, Prof. Jiajun GU, State Key Lab of Metal Matrix Composites, School of Materials Science and Engineering, Shanghai Jiao Tong University, China
➢ Lecture 4: Application of powder processing technology in the field of industrial materialsMs. Xiangqun Yan, Assistant Section Manager, Powder Processing Department, Hosokawa Micron Corporation, Japan
➢ �Lecture 5: Development and commercialization of cosmetics and pharmaceuticals utilizing PLGA-nanoparticles
Dr. Aiko Sasai, Assistant Section Manager, Materials Business Department, Hosokawa Micron Corporation, Japan
➢ Closing remarksMr. Yoshinori Uchida, Managing Director, Hosokawa Micron (Shanghai) Powder Machinery Co., Ltd., China
➢ Social gathering
The Opening address by Mr. Y. Hosokawa at the social gathering in front of the ceramic screen (right: Mr. Y. Uchida, left: Ms. X. Yan)
HMS supporting team with the Foundation members
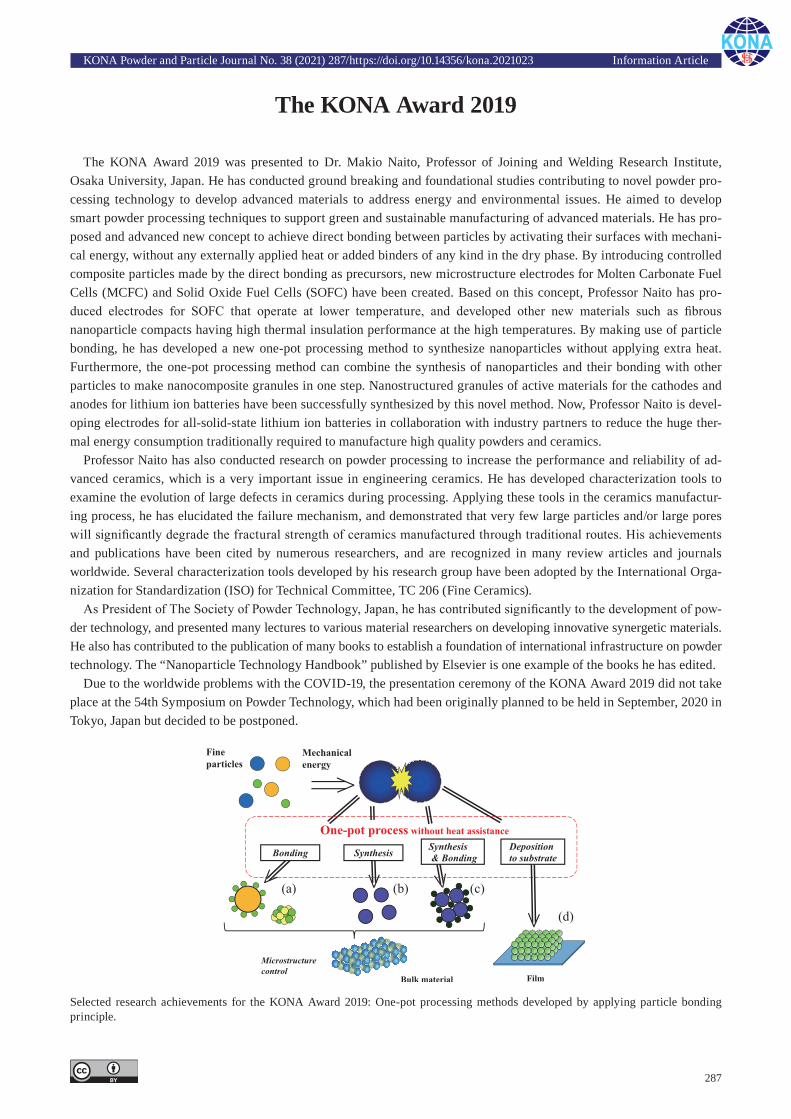
KONA Powder and Particle Journal No. 38 (2021) 287/https://doi.org/10.14356/kona.2021023 Information Article
287
The KONA Award 2019
The KONA Award 2019 was presented to Dr. Makio Naito, Professor of Joining and Welding Research Institute, Osaka University, Japan. He has conducted ground breaking and foundational studies contributing to novel powder pro-cessing technology to develop advanced materials to address energy and environmental issues. He aimed to develop smart powder processing techniques to support green and sustainable manufacturing of advanced materials. He has pro-posed and advanced new concept to achieve direct bonding between particles by activating their surfaces with mechani-cal energy, without any externally applied heat or added binders of any kind in the dry phase. By introducing controlled composite particles made by the direct bonding as precursors, new microstructure electrodes for Molten Carbonate Fuel Cells (MCFC) and Solid Oxide Fuel Cells (SOFC) have been created. Based on this concept, Professor Naito has pro-duced electrodes for SOFC that operate at lower temperature, and developed other new materials such as fibrous nanoparticle compacts having high thermal insulation performance at the high temperatures. By making use of particle bonding, he has developed a new one-pot processing method to synthesize nanoparticles without applying extra heat. Furthermore, the one-pot processing method can combine the synthesis of nanoparticles and their bonding with other particles to make nanocomposite granules in one step. Nanostructured granules of active materials for the cathodes and anodes for lithium ion batteries have been successfully synthesized by this novel method. Now, Professor Naito is devel-oping electrodes for all-solid-state lithium ion batteries in collaboration with industry partners to reduce the huge ther-mal energy consumption traditionally required to manufacture high quality powders and ceramics.
Professor Naito has also conducted research on powder processing to increase the performance and reliability of ad-vanced ceramics, which is a very important issue in engineering ceramics. He has developed characterization tools to examine the evolution of large defects in ceramics during processing. Applying these tools in the ceramics manufactur-ing process, he has elucidated the failure mechanism, and demonstrated that very few large particles and/or large pores will significantly degrade the fractural strength of ceramics manufactured through traditional routes. His achievements and publications have been cited by numerous researchers, and are recognized in many review articles and journals worldwide. Several characterization tools developed by his research group have been adopted by the International Orga-nization for Standardization (ISO) for Technical Committee, TC 206 (Fine Ceramics).
As President of The Society of Powder Technology, Japan, he has contributed significantly to the development of pow-der technology, and presented many lectures to various material researchers on developing innovative synergetic materials. He also has contributed to the publication of many books to establish a foundation of international infrastructure on powder technology. The “Nanoparticle Technology Handbook” published by Elsevier is one example of the books he has edited.
Due to the worldwide problems with the COVID-19, the presentation ceremony of the KONA Award 2019 did not take place at the 54th Symposium on Powder Technology, which had been originally planned to be held in September, 2020 in Tokyo, Japan but decided to be postponed.
Selected research achievements for the KONA Award 2019: One-pot processing methods developed by applying particle bonding principle.
KONA Powder and Particle Journal No. 38 (2020) 288/Doi:10.14356/kona.2021024 Infomation Article
288
General Information
History of the JournalIn the history of KONA Powder and Particle Journal, two
organizations have been playing an important role. The one is the Council of Powder Technology, Japan (CPT) and the other is the Hosokawa Powder Technology Foundation (Hosokawa Foundation). The CPT was established in 1969 by Hosokawa Micron Corporation as a nonprofit organization to enhance the activities of research and development on powder science and technology. The Hosokawa Foundation was established in 1991 as a public-service corporation approved by the Ministry of Education, Culture, Sport, Science and Technology of Japan. The issues from No.1 (1983) to No.12 (1994) of KONA were published by CPT and the issues from No.13 (1995) by the Hosokawa Foundation.
The aim of KONA in the early days was to introduce excellent Japanese papers to the world and thus KONA consisted of papers recommended by some Japanese academic societies and translated from Japanese to English. From the issue of No.8, the CPT changed its editorial policy to internationalize the KONA and to incorporate papers by authors throughout the world in addition to translated papers. In response to this change, three editorial blocks have been organized in the world; Asian-Oceanian, American, and European. The policy and system have not changed even after the Hosokawa Foundation has taken over from the CPT. From the issue of No.27 (2009), publication of translated papers has been terminated and only original papers have been published. The CPT is still active today and is collaborating with the Hosokawa Foundation.
Aims and ScopeKONA publishes review and original research papers in a broad
field of powder & particle science and technology, ranging from fundamental principles to practical applications. The papers on criti-cal reviews of existing knowledge in special areas are very welcome.
The submitted papers are published only when they are judged by the Editor to contribute to the progress of powder science and technology, and approved by any of the three Editorial Committees.
The paper submitted to the Editorial Secretariat should not have been previously published.
Category of Papers• Invited articles Review papers and feature articles invited by the KONA
Editorial Committees.• Contributed papers Original review papers and some limited number of original
research papers of high quality submitted to the KONA Editorial Committees, and refereed by the reviewers and editors.
Submission of PapersIt is now possible to submit your paper online via Editorial
Manager® for KONA Online Paper Submission and Peer Review System. For all further information, please go to the journal’s homepage on http://www.kona.or.jp/jp/journal/info.html.
Publication in KONA is free of charge.
Publication ScheduleKONA is published annually. The publication date is around
January 10th.
SubscriptionKONA is distributed free of charge to senior researchers at
universities and laboratories as well as to institutions and libraries in the field throughout the world. The publisher is always glad to consider the addition of names of those, who want to obtain this journal regularly, to the mailing list.
Instructions to Authors(1) Language
All submissions should be written in good English. Authors may choose either British or American English, provided that the chosen style is used consistently. Authors from non-English-speaking countries are encouraged to use a professional English editing service to proofread their manuscript.
(2) Manuscript format• Electric files should be submitted to the Editorial Secretariat by
online. Authors’ short biography with less than 100 words per person and color photographs of all the authors should be attached to the final version.
• The structure of manuscripts should follow the following order; title, authors, affiliations, abstract, graphical abstract, keywords, main text, (acknowledgement), (appendix), (nomenclature), ref-erences. The items with parentheses are not mandatory.
• Full postal addresses must be given for all the authors. Indicate the corresponding author by the asterisk mark“*” after the name. Telephone and fax numbers and e-mail address should be provided for the corresponding author.
• Abstract should not exceed 200 words.• Graphical abstract should be a concise, visual summary of the
article which will be displayed in the contents list both online and print.
• The appropriate number of keywords is 5 or 6.• The maximum pages printed in KONA are supposed to be: 15 for an original paper and 25 for a review paper.• Symbols and units should be listed in alphabetical order with
their definition and dimensions in SI units.• The color figures will appear in color both on the KONA
Website (http://www.kona.or.jp) and also in the paper version.• Concerning references, the alphabetical system should be
adopted. Please use reference management software such as Endnote to manage references as far as possible. List: References should be arranged first alphabetically and then further sorted chronologically if necessary. More than one reference from the same author(s) in the same year must be identified by the letters “a”, “b”, “c”, etc., placed after the year of publication.Examples: - Reference to a book:
Strunk Jr. W., White E.B., The Elements of Style, fourth ed., Longman, New York, 2000.
- Reference to a chapter in an edited book: Mettam G.R., Adams L.B., How to prepare an electronic version of your article, in: Jones B.S., Smith R.Z. (Eds.), Introduction to the Electronic Age, E-Publishing Inc., New York, 2009, pp.281–304.
- Reference to a journal publication: Tsuji Y., Tanaka T., Ishida T., Lagrangian numerical simulation of plug flow of cohesionless particles in a horizontal pipe, Powder Technology, 71 (1992) 239–250. DOI: 10.1016/0032-5910(92)88030-L
Text: All citations in the text should refer to: 1. Single author: the author’s name (without initials, unless
there is ambiguity) and the year of publication; 2. Two authors: both authors’ names and the year of publication; 3. Three or more authors: first author’s name followed by “et
al.” and the year of publication. Citations may be made directly (or parenthetically). Groups of references should be listed first alphabetically, then chron-ologically. Examples:
“as demonstrated (Hidaka J. et al., 1995; Tsuji Y., 1992a, 1992b, 1993). Mori Y. and Fukumoto Y. (2002) have recently shown ....”
(3) Copyright and permission• The original paper to be submitted to KONA has not been
published before in any language or in any journals or media; it is not submitted and not under consideration for publication in whole or in part elsewhere.
• Authors are responsible for obtaining permission from the copyright holders to reproduce any figures, tables and photos for which copyright exists.
• The KONA Journal applies the Creative Commons Attribution License to all works published by the Journal. Copyright stays with the agreed copyright owner, and the Hosokawa Powder Technology Foundation is granted the exclusive right to publish and distribute the work, and to provide the work in all forms and media.
• Users of the journal will be able to reuse the contents in any way they like, provided they are accurately attributed. No permission is required from either the authors or the publisher.
Free electronic publication of KONA is available at http://www.kona.or.jp
HOSOKAWA Powder Technology Foundation (HPTF)
URL: http://www.kona.or.jp/
Impact factor: CiteScore: Indexed in Scopus, Web of Science and DOAJ
<Diamond Open Access> 1983(No.1) First publication 1990(No.8) 3 editorial blocks worldwide2009(No.27) Registered in Web of Science2013(No.31) Registered and published on J-STAGEURL: https://www.jstage.jst.go.jp/browse/kona
Online ISSN : 2187-5537Print ISSN : 0288-4534
This journal has been publishedannually since 1983 and is distributedfree of charge to researchers, membersof the scientific communities,universities and research librariesthroughout the world, by HosokawaPowder Technology Foundationestablished by Mr. Masuo Hosokawain 1991.
About the journalKONA Powder and Particle Journal is a peer-reviewed, international, interdisciplinary andDiamond OA journal that publishes articles onpowder and particle science and technology.
• Characterization• Computer simulation • Nanotechnology • Material science• Powder process• Particle formation• Dry powders & granules• Aerosols & Colloids & Slurry• Metals & Ceramics & Minerals • Organic-inorganic composites• Biomaterials & Pharmaceuticals• Secondary battery, Fuel cell• Electronic materials• 3D printer• Recyclingetc.
Powder andParticle Journal


A smarter way to optimise
your processplant’s capability
With Hosokawa GEN4’s flexible digital toolkit we convert live data from sensorsand controls to achieve measurable manufacturing improvements.
Hosokawa Micron Ltd - at the forefront of powder processing, containment anddigital technologies.
UNDERSTAND MONITOR CONTROLE. [email protected] www.hosokawa.co.uk
About this Journal
KONA Powder and Particle Journal is a refereed scientific journal that publishes articles in the field of powder and particle science and technology annually since 1983. This journal is distributed free of charge to the members of scien-tific communities and universities and research libraries throughout the world by the Hosokawa Powder Technology Foundation (www.kona.or.jp/) established by Mr. Masuo Hosokawa in 1991.
The Chinese character “粉 ” in the cover is pronounced as “KONA” in Japanese, and means "Powder", which was hand-written by Mr. Eiichi Hosokawa, the founder of the Hosokawa Micron Corporation (www.hosokawamicron.co.jp/en/global.html).
Headquarters of Hosokawa Micron Corporation
■ Publication OfficeHosokawa Powder Technology Foundation (www.kona.or.jp)(in the headquarters building of Hosokawa Micron Corporation)1-9, Shodaitajika, Hirakata-shi, Osaka 573-1132, JapanE-mail: [email protected]
■ Printing Office: Nakanishi Printing Co., Ltd., Japan■ Publication Date: 10 January 2021
About the CoverIntermetallic compounds are homogeneously ordered, solid- state compounds of two or more metallic elements. They have distinctive electronic structures which are completely different from those of mixed metals. This characteristic leads to unique electrical, thermal, magnetic, semiconduct-ing, and chemical properties, which in the end, opens the door to a wide range of applications. Their highly ordered atomic structure, even at the surface, is favorable for solid- state catalysis. Studies related to the catalytic application of intermetallic compounds are usually focused on the binary systems. Recently, ternary metallic element systems in Heu-sler Alloys demonstrate promising features for catalysis be-cause of their novel fundamental catalytic properties. Review of this topic is discussed on pp. 110–121.
Editorial Board
Editor-in-Chief K. Okuyama (Hiroshima Univ., Japan)
Asian / Oceanian Editorial BoardS. Biggs (Univ. of Western Australia, Australia)X.S. Cai (Univ. of Shanghai for Sci. & Tech., China)T. Charinpanitkul (Chulalongkorn Univ., Thailand)Y.F. Chen (Chinese Academy of Sciences, China)H. Choi (Changwon National Univ., Korea)S. Das (Indian Institute of Technology, India)J. Hidaka (Doshisha Univ., Japan)E. Iritani (Nagoya Univ., Japan)H. Kage (Kyushu Institute of Technology, Japan)A. Kawasaki (Tohoku Univ., Japan)D.J. Lee (National Taiwan Univ., Taiwan)J.H. Li (Chinese Academy of Sciences, China)H. Makino (CRIEPI, Japan)S. Matsusaka (Kyoto Univ., Japan)M. Naito (Osaka Univ., Japan)Y. Otani (Kanazawa Univ., Japan)F. Saito (Tohoku Univ., Japan)Y. Sakka (NIMS, Japan)H. Takeuchi (Gifu Pharmaceutical Univ., Japan)W. Tanthapanichakoon (The Royal Society of Thailand, Thailand)C.H. Wang (National Univ. of Singapore, Singapore)S. Watano (Osaka Pref. Univ., Japan)
Secretariat T. Yokoyama (Hosokawa Powder Tech. Foundation, Japan)L. Cui (Hosokawa Micron Corp., Japan)
European / African Editorial BoardChairman
G.M.H. Meesters (Delft Univ. of Technology, Netherlands) F. Bourgeois (Univ. of Toulouse, France)M.-O. Coppens (Univ. College London, UK)L. Gradon (Warsaw Univ. of Technology, Poland)A. Kwade (TU Braunschweig, Germany)P. Milani (Univ. of Milan, Italy)M.G. Rasteiro (Univ. of Coimbra, Portugal)J.M. Valverde (Univ. of Seville, Spain)
SecretariatS. Sander (KONA Europe e.V., Germany)S. Wilk (KONA Europe e.V., Germany)
American Editorial BoardChairman
B.M. Moudgil (Univ. of Florida., USA)A.J. Hickey (Univ. of North Carolina, USA)V. M. Puri (Pennsylvania State Univ., USA)R.K. Rajamani (Univ. of Utah, USA)A.D. Rosato (New Jersey Institute of Technology, USA)L.M. Tavares (UFRJ, Brazil)R. Vehring (Univ. of Alberta, Canada) Q. Zhang (Univ. of Manitoba, Canada)
SecretariatC.C. Huang (Hosokawa Micron Intl. Inc., USA)
KONA Powder and Particle Journal No. 38 (2021) www.kona.or.jp

Process Technologies for Tomorrow
CODEN: KPPJADISSN 0288-4534
available online-www.kona.or.jp
Powder and
Particle Journal
Powder and
Particle JournalKONA
Hosokawa Powder Technology Foundation
No.38 (2021)
No.38 (2021)
KO
NA
Po
wd
er and
Particle Jo
urn
al