Задорин И.В._Чего больше всего боятся россияне (Мониторинг общественного мнения, 2006, №4)
Upload
khangminh22Category
view
3download
0
VO
L.37, NO
.4, Au
tum
n 2006
VOL.37, No.4, AUTUMN 2006
ISSN 0084-5841


Yoshisuke Kishida, Publisher & Chief EditorContributing Editors and Cooperators
- AFRICA -Kayombo, Benedict (Botswana)Fonteh, Fru Mathias (Cameroon)
El Behery, A.A.K. (Egypt)El Hossary, A.M. (Egypt)
Pathak, B.S. (Ethiopia)Bani, Richard Jinks (Ghana)Djokoto, Israel Kofi (Ghana)
Some, D. Kimutaiarap (Kenya)Houmy, Karim (Morocco)Igbeka, Joseph C. (Nigeria)
Odigboh, E.U. (Nigeria)Oni, Kayode C. (Nigeria)
Kuyembeh, N.G. (Sierra Leone)Abdoun, Abdien Hassan (Sudan)
Saeed, Amir Bakheit (Sudan)Khatibu, Abdisalam I. (Tanzania)Baryeh, Edward A. (Zimbabwe)Tembo, Solomon (Zimbabwe)
- AMERICAS -Cetrangolo, Hugo Alfredo (Argentina)
Naas, Irenilza de Alencar (Brazil)Ghaly, Abdelkader E. (Canada)
Hetz, Edmundo J. (Chile)Valenzuela, A.A. (Chile)
Aguirre, Robert (Colombia)Ulloa-Torres, Omar (Costa Rica)Magana, S.G. Campos (Mexico)
Ortiz-Laurel, H. (Mexico)Chancellor, William J. (U.S.A.)
Goyal, Megh Raj (U.S.A.)Mahapatra, Ajit K. (U.S.A.)Philips, Allan L. (U.S.A.)
- ASIA and OCEANIA -Quick, G.R. (Australia)
Farouk, Shah M. (Bangladesh)Hussain, Daulat (Bangladesh)
Mazed, M.A. (Bangladesh)Wangchen, Chetem (Bhutan)
Wang, Wanjun (China)Illangantileke, S. (India)
Ilyas, S. M. (India)Michael, A.M. (India)
Ojha, T.P. (India)
Verma, S.R. (India)Soedjatmiko (Indonesia)
Behroozi-Lar, Mansoor (Iran)Minaei, Saeid (Iran)Sakai, Jun (Japan)
Snobar, Bassam A. (Jordan)Chung, Chang Joo (Korea)
Lee, Chul Choo (Korea)Bardaie, Muhamad Zohadie (Malaysia)
Pariyar, Madan (Nepal)Ampratwum, David Boakye (Oman)
Eldin, Eltag Seif (Oman)Chaudhry, Allah Ditta (Pakistan)
Mughal, A.Q. (Pakistan)Rehman, Rafiq ur (Pakistan)
Devrajani, Bherular T. (Pakistan)Abu-Khalaf, Nawaf A. (Palestine)Nath, Surya (Papua New Guinea)Lantin, Reynaldo M. (Philippines)Venturina, Ricardo P. (Philippines)
Al-suhaibani, Saleh Abdulrahman (Saudi Arabia)Al-Amri, Ali Mufarreh Saleh (Saudi Arabia)
Chang, Sen-Fuh (Taiwan)Peng, Tieng-song (Taiwan)
Krishnasreni, Suraweth (Thailand)Phongsupasamit, Surin (Thailand)
Rojanasaroj. C. (Thailand)Salokhe, Vilas M. (Thailand)Singh, Gajendra (Thailand)
Pinar, Yunus (Turkey)Haffar, Imad (United Arab Emirates)
Lang, Pham Van (Viet Nam)Nguyen Hay (Viet Nam)
Hazza’a, Abdulsamad Abdulmalik (Yemen)
- EUROPE -Kaloyanov, Anastas P. (Bulgaria)
Kic, Pavel (Czech)Have, Henrik (Denmark)Pellizzi, Giuseppe (Italy)
Wanders, A. Anne (Netherlands)Pawlak, Jan (Poland)
Marchenko, Oleg S. (Russia)Kilgour, John (U.K.)
Martinov, Milan (Yugoslavia)
EDITORIAL STAFF(Tel.+81-(0)3-3291-5718)
Yoshisuke Kishida, Chief EditorShinjiro Tetsuka, Managing Editor
Noriyuki Muramatsu, Assistant EditorZachary A. Henry, Editorial Consultant
ADVERTISING(Tel.+81-(0)3-3291-3672)
Yoshito Nakajima, Manager (Head Office)Hiroshi Yamamoto, Manager (Branch Office)Advertising Rate: 300 thousand yen per page
CIRCULATION(Tel.+81-(0)3-3291-5718)(Fax.+81-(0)3-3291-5717)
Editorial, Advertising and Circulation Headquarters7, 2-chome, Kanda Nishikicho, Chiyoda-ku, Tokyo 101-0054, Japan
URL: http://www.shin-norin.co.jpE-Mail: [email protected]
Copylight © 2006 byFARM MACHINERY INDUSTRIAL RESEACH CORP.
SHIN-NORIN Building7, 2-chome, Kanda Nishikicho, Chiyoda-ku, Tokyo 101-0054, Japan
Printed in Japan
This is the 129th issue since its maiden isue in the Spring of 1971

EDITORIAL
A sudden rise in the price gas is hitting the car drivers all over the world. There is a good demand for small, econom-ical cars especially in the countries like the U. S. A. where people depend heavily on cars. Asia is the most populated area on the globe. Especially, China and India have an enormous population that is likely to continue to grow. Both these countries are enjoying continued economic growth toward catching up with developed countries. Many people there buy deluxe cars, the symbol of a wealthy life. Oil consumption is going to increase geometrically in those coun-tries. Growing purchasing power by the large population will have a great impact on world economy.
As in the case of global warming brought about by CO2 gas emission, increasing pollution of the environment caused by our economic activities has expanded to the point that it can not be readily absorbed in the natural life system. Moreover, there is every indication that natural resources like energy, fresh water and farming land are rapidly running out. With a gradually dropping food supply on a global basis, another serious concern is future food supply to support the expanding population, the key item for our survival. The food situation in developing countries has not been im-proved for decades and many people are still threatened with starvation. The riches and power are unevenly distributed in the world. Most resources are monopolized and consumed by the people of a small number of rich countries.
Under such world structure, we who are involved in agriculture are striving to achieve sufficient food production. Despite its importance, the social status of the agricultural profession is not very high. It is a world trend that young people drift away from agriculture. The term “agriculture” might somehow have a negative image and does not at-tract people as long as “agriculture” is used as a key word. Agriculture was originally intended to achieve harmoniza-tion between mankind and other life systems. In other words, mankind will be unable to survive on the earth without continual harmonization with the surrounding eco-system, which is also the only workable solution to the problems of natural resources and environment. Wishing lasting continuation of mankind, we should promote mechanization of agriculture to raise land productivity. AMA will continue to support every effort for that objective.
Yoshisuke KishidaChief Editor
Tokyo, JapanNovember 2006

Yoshisuke Kishida
Jagvir Dixit, A. S. JeenaN. C. Shahi, Tahir Wahid
Nguyen Hay, Le Quang Giang
Gbabo Agidi
O. T. Mandiringana, M. MabiT. E. Simalenga
M. P. Sharma, S. R. MisraAshutosh Mishra
Adamu U. Dzivama, J. C. IgbekaI. Audu
Rao Xiuqin, Ying Yibin
M. Balakrishnan, V. ThirupathiV. V. Sree Narayanan
Mohamad I. Al-WidyanHind M. Al-QutobAhmad H. Hajeer
Edmundo J. HetzFernando A. Venegas
Marco A. López
F. A. Babarinsa
V. Thirupathi, R. ViswanathanK. Thangavel
William S. Kisaalita, Allyson TippieWilliam Faircloth, Justin Franklin
Brad Boyer
Julius K. Tangka
Md. Wali Ullah
A. Senanarong, K. Wannaronk
NewsBook Review
7
9
15
21
27
33
36
42
46
49
52
60
66
69
76
81
87
9091
Editorial
Potential of Farm Mechanization in Jammu and Kashmir State of India - a Review
Case Study in the Conversion of Fired-Wood Fuel to other Suitable ones in the Rural Areas of Vietnam
Establishment and Performance of an Indegeneous Small Scale Rice Processing Plant in Nigeria
Evaluation of Soil-Water Conservation Tillage Systems for Com-munal Farmers in the Eastern Cape, South Africa
Recent Developments in Sugarcane Mechanisation in India
Performance Efficiency of an Active Evaporative Cooling System for the Storage of Fruits and Vegetables in a Semi Arid Environment
Inspection of Watermelon Maturity by Testing Transmitting Veloc-ity of Acoustic Wave
Development and Testing of a Chilli Seed Extractor
Design and Fabrication of a Small-Scale Fruit Picker of Adjustable Height
Non Polluting Pesticide Application Windows for Fruit Orchards in South Central Chile
Performance Evaluation of an Evaporative Cooling System for Fruits and Vegitable Storage in the Tropics
Development and Testing of a Tomato Pulper Cum Straner
Comparative Feasibility Analysis of Alternative Renewable Energy Sources for Small Milk Cooling Plants of Southwestern Uganda
Development of a Simple Pulper for Leaves of Green Plants
Constraints and Prospects of Agricultural Mechanisation in Samoa
Design and Development of an Off-Set Rotary Cultivator for Use with a Two-Wheel Tractor for Fruit Tree Cultivation
CONTENTS
AGRICULTURAL MECHANIZATION IN ASIA, AFRICA AND LATIN AMERICAVol.37, No.4, November 2006
Instructions to AMA Contributors .......................4Co-operating Editor ............................................94
Back Issues ..........................................................97★ ★ ★

AGRICULTURAL MECHANIZATION IN ASIA, AFRICA, AND LATIN AMERICA 2006 VOL.37 NO.4 9
Potential of Farm Mechanization in Jammu andKashmir State of India - a Review
byJagvir DixitAssistant ProfessorDivision of Agricultural Engineering,SKUAST-K, Wadura, Sopore (J&K) INDIA
N. C. ShahiDivision of Agricultural Engineering,SKUAST-K, Wadura, Sopore (J&K) INDIA
A. S. JeenaRice Research and Regional Station,SKUAST-K, Khudwani, Anantag INDIA
Tahir WahidRice Research and Regional Station,SKUAST-K, Khudwani, Anantag INDIA
AbstractJammu and Kashmir, being a hilly
state, is blessed with naturally oc-curring micro agro-climatic regions suitable for cultivation of a wide range of agri-horticultural crops with a great potential for develop-ment. But the level of farm mecha-nization in the state is very poor with respect to mechanical power, efficient implements, water manage-ment, land reclamation, renewable energy and post harvest technology sectors. The farm mechanization is badly hampered by stepped, small and ir regular f ields, undulating topography, lack of skilled man-power, poor facilities of repair, maintenance and manufacture of implements and high cost solar gadgets. Immediate attention of the state government and other funding agencies is required to strengthen the agricultural engineering wing in Jammu and Kashmir. A strong cell of agricultural engineering should be created to handle the farm mechanization problems. Despite various constraints, there is a great scope for increasing productivity of land and farmer’s economy through
creation of small water resources for irrigation, land development, use of efficient farm power and imple-ments, rain water harvest, dissemi-nating renewable energy gadgets and introducing small scale agro based industries employing post harvest engineering principles.
IntroductionJammu and Kashmir are situ-
ated in the northern region of the Great Himalayan range, spreading over 33-37 ºN latitude and 72-80 ºE longitude. The state comprises 6.7 % of the total geographical area of the country, covering over 2.22 lakh square km, of which about 30 % is under cultivation. Despite small geographical area, the state is blessed with diverse agro-climatic conditions, topography and natural resources for cultivation of a wide range of agro-horticultural crops. Agro-climatic conditions vary from subtropical in outer plains and outer hills of Jammu division; subtropical to temperate in mid to high altitude zone including major parts of dis-trict Udhampur, Poonch, Rajori and
Doda; temperate to cold temperate in Kashmir valley and cold arid in Ladakh-Kargil area. Each agro-climatic zone can be further divided into various micro-agro-climatic zones based on variation in slope, topography and soil and water avail-ability. These numerous micro-agro-climatic zones make feasible the cultivation of almost all types of agricultural as well as horticultural crops in the state, which include cereals, pulses, oilseed, vegetables, fruits, dry fruits, spices and orna-mentals.
The weather conditions also vary greatly with the topography and el-evation. The mean annual tempera-ture ranges from 24.5 ºC in Jammu, 13.3 ºC in Srinagar to 5.3 ºC in Leh. Similarly, the annual precipitation ranges from a minimum of 92 mm in Leh to 662 mm in Srinagar to a maximum of 1,200 mm in Jammu. The later receives most of the rain-fall during monsoon season while Kashmir division receives it in winter. The distribution pattern of rainfall varies greatly with time and space over the year and generally it is erratic in nature, which creates water stress conditions at various

VOL.37 NO.4 2006 AGRICULTURAL MECHANIZATION IN ASIA, AFRICA, AND LATIN AMERICA10
stages of crop growth. These climat-ic and other edaphically conditions have given rise to different agricul-tural practices and crop sequences in this geographical area.
The state has a total population of 7,718,000, with 1,217,000 land hold-ings. The area wise classification of available land in the state is given in Table 1 which also indicates utiliza-tion of only 30.34 % area for crop cultivation while the rest of the area lies under forest, permanent pasture, and fallow land. The operational land holding and percent distribu-tion of area operated by major size groups in J & K are presented in Table 2. The average size of operat-ed land holding in J & K is 0.83 ha, which is half the average operated holding size in India. The fragmen-tation of land holding is expected to be greater, especially under small and marginal farmers’ categories in the state. The majority of the farm-ers in the state are marginal having less than 1 ha land holding.
There is an abundance of water in the state received through precipita-tion (snowfall and rainfall) but the major portion goes to waste and is utilized in the lower states and in Pakistan. Only a small fraction of available water is utilized in the state and farmers are deprived of irrigation as well as domestic use. Only 37.38 % of the total cultivated area is irrigated by different sources (Table 3) and the remaining area is rain fed. The major source of ir-rigation is through canals (90.73 %). Similarly, the natural energy sources like sunshine, wind, vegeta-tion, water flow and other biological wastes which are abundantly avail-able in the state are not being har-nessed properly, resulting in very low per capita energy availability, deforestation and poor health.
The post harvest losses, poor marketing and traditional farming systems also restrict farmers from using improved inputs. There has been a general increase in the aver-age yield of important food crops
during the preceding years, but it is relatively far less than the require-ments of vehemently increasing population. Also the potential yield achieved in experimental fields are not realized in the farmer's field. Thus, a large gap in potential yield and actual yield of most of the crops in the valley is witnessed. Still the main farm power sources for car-rying out different farming opera-tions are animal or human power. High waste of perishable food and fruit products occur every year due to limited agro-processing in-dustries and difficult transport and marketing system in the state. It was focused at the national level in 1998-99 that apart from the use of high yielding varieties and chemi-cal fertilizers, farm mechaniza-tion plays a vital role in increasing agricultural productivity, which is more relevant in the valley. Timeli-ness and efficient energy utilization in various farm operations along with other inputs are key factors in improving agricultural productivity. Mechanization enables the farmers
to change their cropping pattern and to shift towards more profit-able crops as they can efficiently use their inputs and enjoy various advantages of f lexibility available with respect to cropping season, resources and marketing. There is a positive relationship between farm power and productivity. A delay of 15 to 20 days can drastically reduce the crop yield, especially in this state, where weather conditions limit the cropping season. Farm mechanization is not a luxury but a necessity. Repeated ploughing over a long period with the traditional plough/tine cultivator have resulted in the formation of hard compact layers beneath the root zone, which restrict the infiltration of water into the soil and its movement. In the long run, this causes soil erosion as the upper layer of the soil is eroded during heavy rainfall. With the use of modern farm equipment, the input use efficiency can be greatly improved and crop cultivation may be converted into more profitable venture. There is a great scope of
Classification Area, 1000 haJ & K India
Total geographical area 2,220 328,759Forest 658 -Net area sown 733 140,149Uncultivated area 582 -Permanent pasture and other grazing land 126 -Land under misc. crops and trees 72 -Culturable waste land 140 -Fallow land 105 -Source: Digest of statics of Jammu and Kashmir (1996-97)
Table 1 Land use in Kashmr valley
ClassSize of
holding, ha
No. of operational holding, lakh
Percent distribut-ion operated
Av. size of opera-tional holding, ha
J & K India J & K India J & K IndiaMarginal < 1 9.01 567.48 74.04 58.07 - 0.38Small 1 - 2 1.97 178.81 16.19 18.29 - 1.43Semi-medium 2 - 4 0.98 132.54 8.04 13.56 - 2.76Medium 4 - 10 0.19 79.20 1.64 8.10 - 5.94Large > 10 0.01 19.25 0.08 1.97 - 17.20
Total - 12.17 977.28 100.00 100.00 0.83 1.68Source: Digest of statics of Jammu and Kashmir (1996-97) and Statics Abstract India (1990)
Table 2 Operational holding and percentage distribution

AGRICULTURAL MECHANIZATION IN ASIA, AFRICA, AND LATIN AMERICA 2006 VOL.37 NO.4 11
farm mechanization in the state of Jammu and Kashmir, but small holdings limit the use of large ma-chinery. However, many agro-horti-cultural and cash crops like saffron, black cumin, dry fruits, apple and vegetables can encourage the de-velopment and utilization of small, handy power equipment in the re-gion. Development and adoption of appropriate engineering based tech-nology in farm power implements, land development and irrigation systems, renewable energy and post harvest sectors will certainly benefit the farming community. This paper describes the present status of farm mechanization, its potential and limitations in the state with special emphasis to Kashmir valley.
Present Level of Farm MechanizationFarm Power, Tools and Implements
The use of improved farm tools and implements is very limited in the state as compared to many other
states of India. The traditional tools and implements are still in use with farmers. They carry out preparatory tillage operations, sowing, intercul-tural and harvesting operations by traditional methods, which are more energy and time consuming. The present status of farm implements/machines under use in J & K is shown in Table 5.
It can be clearly understood from the Table 5 that the indigenous (wooden) and soil stir r ing (SS) ploughs are being used in the prepa-ration of fields and sowing. Broad-casting or kera method (dropping seed behind plough) is normally adopted for sowing of various crops, which not only consumes more man-power but also affects the crop stand, resulting in poor yield. The clod breaking is a severe problem in some of the regions particularly in paddy harvested fields, which is usually carried out by women and
children with the wooden hammer. This again consumes more energy for non-productive cause. Tangroo (local name of small spade like tool) and rumbas are used by majority of the farmers in the state for execut-ing weeding and intercultural op-erations. However, knapsack spray-ers and wheat threshers are adopted by some of the medium and large farmers. They also use a tractor for different agricultural operations in their fields as well as on custom hir-ing basis to other farms otherwise, animal and human power are the main source of farm power. Very few farmers of the hilly region utilize power tillers for field prepa-ration. In Jammu region, very lim-ited use of manually operated maize sheller was reported in recent past. Harvesting of crops and fodder is be-ing done by plain sickles because of their lower cost and local availabil-ity. However, plucking of fruits and vegetables is still executed manually with great risk of impairing quality of the product.
Land Use and Water Management Practices
The state has four major rivers and a number of perennial streams. Besides its 1,335.75 mm average rainfall, only 42.74 % cropped area is brought under irrigation, while the state has exorbitant potential water for irrigation. The most com-mon method of irrigation is through open gravity channels. Approxi-mately 3,678 diesel and electric
Source of irrigation
J & K Area, 1000 ha
% distri-bution
Canals 284.25 90.73Tanks 2.57 0.82Wells 1.42 0.45Other source 25.02 7.98
Total 313.26 -
Table 3 Area irrigated fromdifferent sources
Source: Digest of statics of Jammu and Kashmir (1996-97)
Crops Area, 1000 ha Production, 1000 qRice 275.33 4,290Maize 304.88 4,544Wheat 246.88 4,125Horticultural 133.00 10,210Oil seeds 71.03 449.63Vegetable 41.4 5,844Pulses 31.36 170Millets 24.40 175Barley 7.77 -Condiments & Spices 2.06 -
Implements NumberPlough 1,075,454Chaff - cutter 83,890Pruning scissors -Orchard ladders -Pump - sets 3,678Tractors 5,765Paddy thresher 156Wheat thresher 987Maize - sheller 35Sprayer 2,286
Livestock Number, lakhJ & K India
Cattle 30.550 1,924.530Buffalo 7.325 697.830Sheep 29.469 487.650Goats 17.655 952.550Horses & Ponies 1.215 9.160Donkey/mules (others) 0.876 99.140
Total 87.066 3,695.260
Source: Digest of statics of Jammu and Kashmir (1996-97)
Table 4 Area and production of various crops in J & K Table 6 Principal livestock population in the state
Source: Digest of statics of Jammu and Kashmir (1996-97)
Source: Digest of statics of Jammu and Kashmir (1996-97)
Table 5 Agricultural implementsand tools in the state
VOL.37 NO.4 2006 AGRICULTURAL MECHANIZATION IN ASIA, AFRICA, AND LATIN AMERICA12
driven pump sets are available with the farmers throughout the state for lifting water from a surface stream. The state receives abundant quantity of water through precipitation in the form of rainfall and snowfall, which is many times greater than the water requirement of the state. But a major portion of water flows down to other states like Punjab and Himachal Pradesh or even to another country (i.e. Pakistan), through the rivers and their tributaries. A lot of fertile soil is also carried away by runoff water f lowing through the rivers. Despite plenty of water resources in the state, irrigation and domestic water availability is very meager due to undulating topography, poor management of water resources and un-exploitation of ground water. It is shocking to know that about 2/3rd of the cultivable area is rain fed in the state, whereas, the down streams are being a potential source of irri-gation in other states and Pakistan.
The land is quite fragile and dis-sected into hills and valleys through numerous streams/gullies. The land slopes are quite high and soil depth is very low at some places. Convey-ance of irrigation water through undulating topography to patchy agricultural f ields is a complex problem in the hilly region. Small sized and scattered fields in small land holding category and absence of path between two fields restrict the use of tractors, power tillers and improved machine operated imple-ments. The whole state is under se-vere soil erosion due to high slopes, deforestation, road construction and traditional cultivation practices. The terraced lands are not properly de-veloped for safe water disposal and irrigation.
Post Harvest TechnologyThe fa r mers have thei r own
traditional ways of storing and processing the farm produce for their daily consumption. Gener-ally, harvested crops are kept in a heap for long duration to facilitate
threshing. Food grains are stored in kuch (local name) made of wood and iron bins. Very high post har-vest losses occur in terms of qual-ity and quantity of perishable fruits and vegetables due to lack of sole market, efficient transportation and processing and packaging facilities. Hence, many promising high value crops/vegetables/fruits are not being grown on a commercial scale. Small scale industries for value addition and canning are also scanty.
Renewable EnergyThe state government has pro-
vided electricity to almost all the villages for lighting but due to in-adequate supply of electricity and severe cold, particularly in Kashmir and Ladakh region, fuel wood and coal is also being utilized by the vil-lagers, resulting in deforestation and degradation of land. As a result of special emphasis by the government through several schemes, some of the farmers in the state have ad-opted renewable energy sources for meeting their domestic energy requirements (Table 7). About 1,105 family bio-gas plants of different sizes have been installed in the state, particularly in Jammu region up to March, 1995. Existence of bio-gas plants is negligible in Kashmir and Ladakh region due to very low ambient temperature in winter. The solar water heater, solar lantern, solar photovoltaic pumping system, domestic and streetlight and solar salination system are also in use. More farmers are coming forward for their adoption due to subsidy of-fered by the government. Few farm-ers in hilly regions are using water mills for flour and rice milling but, still, those mills are of old tradi-tional types.
Mechanization PotentialFarm Power, Tools and Implements
There is a great need to develop small tools and implements for till-
age, sowing, intercultural, harvest-ing and threshing operations, so that the requirement of about 74 % marginal farmers (Table 2) could be met. Some farmers have trac-tors to execute tillage operations in their own fields as well as on cus-tom hiring basis however the use of tractors is limited to the plains and valleys only. This compels farm-ers of neighboring fields to adjust their cropping system with those using a tractor, as the land holdings are small and scattered. There is a tremendous scope for light weight power tillers with efficient matching equipment for various agricultural operations like tillage, sowing, in-tercultural, puddling, harvesting, threshing, water lifting and trans-portation, which can be carried by the help of 2-3 men from one field to another field. This mechanical pow-er equipment will suit only medium and large category farmers but other farmers may also use this power on co-operative or custom hiring basis. Declining trend has been observed in the use of animal power as their maintenance for taking only 40 to 50 days field work per year is not as beneficial as maintaining a milk cow. However, it is not possible to fully replace animal power with mechanical power. To maintain an eco-friendly system, there is a need to enhance the use of animal power by development of suitable and ef-ficient matching equipment. The present level of land productivity and area under cultivation can only be increased satisfactorily by adopt-ing efficient farm power and acces-
Sources NumberBio-gas plant 1,105Solar lantern 2,625Home lighting system 1,051Street lighting 889Solar water heating system 115Solar desalination system 70Source: Digest of statics of Jammu and Kashmir (1996-97)
Table 7 Status of renewable energy sources in the state
AGRICULTURAL MECHANIZATION IN ASIA, AFRICA, AND LATIN AMERICA 2006 VOL.37 NO.4 13
sories.
Land and Water ManagementThe state is presently utilizing
only 30.3 % of its total geographi-cal area for cultivation of different agri-horticultural crops. Hence, bringing additional area under cul-tivation is the need of the day to feed an increasing population of the state. This can be achieved through reclamation measures and conver-sion of fallow land with the help of deep tillage, leveling and bunding. Of course, considering the alarming rate of soil erosion from cultivated fields and, in order to maintain eco-friendship, conversion of forest land or well-vegetated pasture land is not advisable. Conversion of non-agricultural or wasteland also opens scope for increasing cultivable area in the state. These opportunities can only be realized with the help of farm mechanization and efficient land use practices. Besides this, in depth study for water manage-ment is an urgent need in the state, because more than 2/3 of the culti-vatable area is rain fed, in spite of the fact that plenty of water f lows through rivers to neighboring states and Pakistan. Adoption of small ir-rigation schemes and exploitation of ground water may be possible solution of the problem. There is a serious threat to the surface water, which is depleting at an alarming rate. J & K State is rich in ground water resources of which only 3 % has been utilized so far. Attention should be given to embark upon a massive ground water exploration program under which a network of tube-wells, hand-pumps and shal-low wells should be installed. Prac-tically, about 80 % of cropped area may be possibly brought under irri-gation by virtue of excess rain har-vest and ground water exploitation. In hilly areas, the possible ways to bring more cropped area under ir-rigation include rain water harvest-ing in tanks and its recycling, lifting water from perennial streams and
conveying it through pipelines to the nearby fields, diverting perennial flow at a higher point of the stream and conveying the water through gravity channels to the fields and collection of small subsurface seep-age water in tanks and using it for irrigation. However, lift irrigation system is not economically viable in some of the cases, where more pipe length and lift energy per unit area irrigated is required due to deep and distant water source. Further, it is possible to save water through minimization of water losses during conveyance, which can be utilized to expand near about 10 % of the present irrigated area. Sprinkler and micro-irrigation systems can also be exploited wherever possible, par-ticularly in high value horticultural crops.
Soil and water engineering re-search is prerequisite for adoption of other improved farm inputs in the development of rain fed watersheds. Inter-disciplinary approaches of agricultural engineers with soil sci-entist and agronomist in this sector are likely to increase 100 to 150 % biomass production in the rain fed area of the state.
Post Harvest and Agro-ProcessingAccording to an estimate, about
10 % grain losses in the case of ce-reals, pulses and oilseeds and up to 40 % in case of fruits and vegetables occur at the country level every year due to lack of storage and post har-vest processing facilities. Therefore, raising agricultural and horticultural production always necessitates im-proved post harvest processing fa-cilities to reduce post harvest losses, so that the improvement in produc-tion can be realized and in turn in-crease the net return to the growers. As far as quality is concerned, the state ranks first in case of fruits like apple, pears and dry fruits, but due to lack of nearby markets, storage facilities, very few agro-processing industries and difficult transporta-tion pose constraints to the farmers
to get more remunerative prices for their produce. Losses of perishable items are comparatively greater in the state. Plastic storage struc-tures and vacuum storage of foods including controlled atmospheric packaging have vast potential in the state especially for fruit growers. Farmers are deprived of growing various high valued and off-season vegetables due to lack of post har-vest technology for value addition and preservation. Similarly, estab-lishing food industries would also be helpful for the state, which could enhance the farmer’s income as well as state's revenue.
Renewable EnergyAn estimate shows availability of
8,706,600 livestock in the state (Ta-ble 6), which reflects vast potential for biogas generation. If 60 % of the livestock at 5 kg dung/livestock/day is utilized for this purpose, about 326,000 family size biogas plants of size 2 cu. meters could be run in the state. Consequently, the biogas gen-erated will serve the needs of more than 4,257,000 persons. This energy production will also save more than 1,087.23 m tones of fuel wood/day and also provide a huge amount of biogas from digested manure. Thus, biogas itself will be a milestone in self-reliance on energy and save the forest. Development of appropriate designs of biogas plant to suit the hilly conditions and minimization of low temperature problem are of more concern to the agricultural en-gineers.
The mean ambient temperature throughout the year ranges from 13 to 28 ºC in the state. Low ambient temperature gives rise to the energy requirement, which is usually met by coal/electricity/firewood or a combination. The state has about 225 days of sunshine. If only 10 % of solar radiation (1 kw/m2 surface) is harnessed in the state at 10 % conversion efficiency, 0.01 % sur-face area of total geographical area has the potential to generate 2.22 x

VOL.37 NO.4 2006 AGRICULTURAL MECHANIZATION IN ASIA, AFRICA, AND LATIN AMERICA14
109 MW energy, which will be suf-ficient for domestic energy require-ment of the farmers in the state. The vast and endless source of solar en-ergy can be effectively adopted for heating, cooking, lighting, refrig-eration, drying of grain and farm produce. The state also has a huge quantity of biomass by-products, which can be utilized for electricity generation by the use of gasifies.
Hydropower has also great poten-tial among the energy resources in the state. The major rivers and their perennial tributaries can effectively be utilized for domestic energy re-quirements through water mills and small-scale hydroelectric units. At present, the age-old techniques of water mill operating are prevailing in the state. It is urged that coop-erative and constructive efforts are required for efficient harnessing of renewable energy. The agricultural engineers/scientists and develop-mental agencies of government and NGO’s should work on this aspect of non traditional energy resources for the development of eco-friendly, farmer friendly and user friendly power generation system.
Skilled Man-PowerAt present, the state does not
have any agricultural engineer-ing college. Hence, the state has a negligible number of agricultural engineers. To meet the above men-tioned challenges and for efficient harnessing of available potential in agriculture, horticulture, power and marketing sectors, the state must produce adequate agricultural engi-neers, diploma holders and skilled man power. The state agricultural universities need to establish full-f ledged agricultural engineering colleges in order to produce special-ized trained personnel in different agricultural engineering fields to cater to the future needs of farm mechanization in hill agriculture of the state. In addition, to develop skilled manpower, the college can also impart training in farm power,
farm machinery, land use and de-velopment, irrigation and drainage, water shed management, renewable energy and post harvest technology sectors to the development/ exten-sion workers and entrepreneurs.
Conclusion and Sugges-tions
The review of the agricultural mechanization in J & K State re-vealed poor adaptability by the farmers due to various reasons as well as negligence of the state gov-ernment. It is seemed to be in the early stage of development. Further, its potential encourages more in depth research and extension activi-ties in this sector for which immedi-ate attention of the government and other funding agencies, NGO’s are needed. Some suggestions for en-hancing the pace of mechanization in the state are given below:
• There is first and foremost need to produce adequate agricultural engineering graduates, diploma holders and skilled manpower and their placement by the state government.
• Development of an agricultural engineering package for hill ag-riculture.
• Mechanization study for the en-tire state to identify mechaniza-tion gaps
• Equipment developed elsewhere needs to be tested, evaluated and modified for better use and adoption in lower and upper hills of the state.
• Introduction of women friendly technology for socio-economic development in the state.
• Light-weight power source (pow-er tiller) for hill agriculture.
• Fallow land and unused land should be brought under culti-vation.
• Development of water harvest-i ng t an ks /smal l ponds for collecting surface/subsurface runoff should be under taken on
community basis for irrigation basis.
• There is need to develop new models of biogas plants, prefer-ably prefabricated and suitable to produce biogas under low temperature conditions also.
• Eco-friendly renewable energy technologies for conservation of energy and time saving.
• Upgrading the present technol-ogy of water mills and their use for domestic electricity produc-tion with small turbines.
• Availability of spare parts and small-scale machinery manu-facturing facilities at local mar-kets.
• There is need to strengthen the research and development activ-ities in post harvest and agro-processing sectors.
• Government should provide nec-essary facilities and subsidies for establishing small-scale agro-processing industries.
• There is need to encourage farmers to avail farm mechani-zation aid on co-operative basis.
• There is also need to introduce custom hiring system through state government agency.
REFERENCES
Anonymous. 1990. Statistical Ab-stract, India Central Statistical Organization, Dept. of Statistics, Ministry of Planning, Govt. of In-dia.
Anonymous. 1996. FAO Year book United Nation, Rome Italy.
Anonymous. 1996-97. Digest of Sta-tistics of J & K. Dept. of Statics, J & K. India.
Joshi, Veena. 1993. Demand of en-ergy in rural area. Urja Bharati. Vol. 3(3): 19-23. India.
Singh, S. P. and H. N. Verma. 2001. Scope of Farm Mechanization in Shivalik hills of India. Agril. Mech. Asia, Africa and Latin Am (AMA), Japan. Vol. 32(1): 59-64
■■

AGRICULTURAL MECHANIZATION IN ASIA, AFRICA, AND LATIN AMERICA 2006 VOL.37 NO.4 15
Case Study in the Conversion of Fired-Wood Fuel to other Suitable ones in the Rural Areas of Vietnam
byNguyen HayAssociate ProfessorFaculty of Engineering,Nong Lam University,Ho Chi Minh CityVIET [email protected]
Le Quang GiangEngineerFaculty of Engineering,Nong Lam University,Ho Chi Minh CityVIET NAM
AbstractBurning agricultural wastes for
energy was considered and encour-aged by the government because agricultural wastes would be con-ver ted the to useful energy for agricultural product drying. It also helped decrease the contamination caused by these wastes. For these purposes, we have designed and tested a tobacco dryer using rice husk for burning energy. It was very useful for the areas having an avail-able source of rice husk.
Tobacco drying is an important factor in producing a quality prod-uct. To pre-process the product of 9,000 ha we need 3,500 dryers that currently use 40-50 % fired-wood fuel for drying. This activity has been causing the exhaustion of forestry resource and affecting the ecology. So, it is urgent to find a completely alternate fuel that in-creases the drying quality as well as decreases the drying cost. To obtain this goal, it was necessary to rede-sign the heat-supply system and the drying bin.
The tobacco dryer structure was
changed from a single to a double combustion chamber. The results of the research showed that the double combustion chamber dryer was able to use coal and produce high quality post-drying tobacco of the first and second type and, at the same time, reduce the drying cost.
Using coal fuel to process an-chovy has created practical profits, increased the living standards of the peasants in the coastal areas and contributed to the development of the agricultural and fishery econo-my. This was accomplished by us-ing a new type of steam room which maintained a high quality at an ac-ceptable cost. Also, the use of coal for anchovy steaming will preserve our safe and firm environment.
IntroductionMost dryers in Vietnam use wood
and coal fuel for tobacco drying. Among them, coal makes up 50-60 %. Thus, it has remarkably contrib-uted to the forestry exploitation that has adversley affected the environ-ment. It would be desirable to rede-
sign the heat-supply and the dry-ing bin so that we could use coal, reduce the drying cost and increase the quality of the dryed tobacco.
For many years, we have re-searched many tobacco dryer mod-els to acquire the final aim that is to completely substitute coal for wood. This substitution has initialy obtained satisfactory results. After doing research and constructing the tobacco dryer using coal fuel with heat from a double combustion chamber, we have done the experi-mental research to determine the best operating parameters and the technical and economic norms of this dryer type.
We also made and tested a tobacco dryer using rice husk for burning en-ergy. It was very useful for the areas having available rice husk source.
The annual anchovy yield of Ninh Thuan province is very high. It is necessary to steam and dry them before exporting. To meet this de-mand, anchovy processing areas in Ninh Thuan province have about 200 steam rooms which mainly use fired wood as fuel. Because of the depleting forests, it is desirable

VOL.37 NO.4 2006 AGRICULTURAL MECHANIZATION IN ASIA, AFRICA, AND LATIN AMERICA16
to find another appropriate fuel as compared to wood.
The Purposes of our Research- Use coal exclusively to decrease
the deforestation.- Find a fuel that is less expensive.- Produce a higher quality of post-
drying tobacco of the first and sec-ond type.
- Improve the quality of steaming anchovy so that they will meet the export criteria.
Experimental MethodExperimental Design
We have used the Completely Randomized Design (CRD) Meth-od: All elements of the experiment were randomly selected.
Experimental Plan Choosing the researched param-
eters: The choosing of input param-eters is based on the transcendental information, the suggestions of experts and the theory researched results of the basic science. Any unreliable parameter must be deter-mined by monoparameter experi-ment.
Setting up the experimental plan: Experimental plan is built correla-tively with the second-degree ex-perimental plan and nonlinear plan.
Experimental data processing, constructing and verifying the ex-perimental regression model: - Ap-plying the variance analysis method (ANOVA). - Applying the rough odd suppression method of Aknazarova (1982). - Using Statgraphics-vers 7.0 software to construct and verify the experimental regression model,
based on Fisher criteria.Seeking the extremum of the ob-
jective function in the experimental plan: Multi-object optimized prob-lems are completely solved on the computer. Multi-object Optimized Method is solved by the Great Num-ber Method of Gass.S.I.
DiscussionThe Heat Exchanger Using Hon-eycomb Coal
We calculated and designed the heat exchanger so that the heat that radiates around the burner and the heat exchanging pipe will be greater than the heat quantity lost through the wall, the floor and absorbed by
the drying air. It means:Q’ ≥ Q1 + Q2 + Q3 + Q4 + Q5,
where Q’ is the heat quantity sup-plied by the heat exchanger, Q1 is the useful heat quantity of evaporat-ing water, Q2 is the heat quantity releasing out, Q3 is the heat quantity lost through the wall, Q4 is the heat quantity lost through the floor and Q5 is equipment accumulated heat quantity.
To obtain the desired results for the post-drying tobacco quality and the fuel expenditure, We have re-searched, manufactured and tested two types of heat exchangers (Fig. 2 and 4).
Fig. 2 is the heat exchanger with 2 burners (two-layer type), with 4 sub-heat conducting pipes. The diameter of the main heat conduct-ing pipe is 280 mm. There are seven 900 angles on every heat conducting pipe. This heat exchanger uses 100 % honeycomb coal.
Fig. 4 is the current heat exchang-er with 3 heat conducting pipes and 1 combustion chamber. The diam-eter of the heat conducting pipes is
Fig. 1 Honeycomb coal
Fig. 3 Transportation of fresh tobaccoleaf to dryer group
Fig. 2 The double combustion chamber heat exchanger (two-layer type)
Fig. 4 The 3 heat conductingpipes heat exchanger
ElementLevels Variable
interval+ 1 0 - 1 + α - αN 6 5 4 7 3 1G 4 3 2 5 1 1T 110 100 90 120 80 10S 1.8 1.6 1.4 2.0 1.2 0.2
Table 1 Levels and the variable intervals of the researchelements in the experiment design

AGRICULTURAL MECHANIZATION IN ASIA, AFRICA, AND LATIN AMERICA 2006 VOL.37 NO.4 17
320 mm. This heat exchanger uses 60-70 % coal and 30-40 % fired-wood.
The Heat Exchanger Using Rice Husk as Fuel
Dimension: length x width: 1 m x 0.6 m; Combustion chamber’s
volume: 0.441 m3; The materials of combustion chamber: Refractory-brick with thickness of 20 cm.; Cylinder-shaped combustion cham-ber, horizontal (Fig. 5); The length of heat exchanger (the pipe): 19.7 m; The height of chimney: 5 m.
Anchovy Steam Room Combustion Chamber Volume De-sign; The Basic Parameters of the Anchovy Steam Room
The steam room: (square-shaped room top)
Length = width = 0.9 m and height: 0.62 m
Combustion chamber:The volume of the combustion
chamber: (0.9 x 0.9) x 0.45 = 0.36 m3
The fired-grate area: 0.8 x 0.75 = 0.6 m2
The anchovy steam room is de-signed as the following Fig. 6.
Case Study ResultsTobacco Drying Results Case Study to Determine the Math-ematical Equation Model
The Researched Elements: The number of tobacco stories in the dryer: n (stories); The declination of the heat exchanging system: g (de-gree); Fuel supply cycle: t (minute); Exhausting door area: S (m2)
The Output Norms: Product qual-ity: L (%); Specific fuel expenditure for 1 kg product: Ar kg (coal)/ kg (dry tobacco)
Experimental Results: After pro-cessing the attained data and elimi-nating the regression coefficients that are not reliable out of the mod-el, we have acquired the results. The regression function was determined as follows:
+ The function of specific fuel
Fig. 5 Rice husk combustion chamber used for tobacco drying
Drying bin Combustion chamber
1600
500
1000
Ordinal number
Dryer with 1 burner Dryer with 2 burners Dryer with rice husk burner
Coal fuel, kg Wood fuel, m3 Tobacco production, kg Coal fuel, kg Tobacco
production, kgRice husk fuel,
kgTobacco
production, kg1 1,220 5.5 566 2,110 546 3,215 5302 1,110 7.0 580 2,215 577 3,250 5403 1,350 4.5 571 2,012 529 3,210 5344 1,315 4.5 528 2,340 641 3,306 5625 1,260 5.0 543 2,305 629 3,290 5356 1,410 4.0 555 2,284 616 3,312 5587 1,387 4.0 510 2,256 585 3,285 5168 1,256 5.0 531 2,140 555 3,285 5209 1,365 4.0 522 2,262 601 3,296 527
Average 1,297 4.8 545 2,214 587 3,272 536
Table 2 Fuel expenditure results and dry tobacco production

VOL.37 NO.4 2006 AGRICULTURAL MECHANIZATION IN ASIA, AFRICA, AND LATIN AMERICA18
consuming level (Ar):A r = 32.23334 - 12.07680.n +
3.20386.g - 1.25417(E-3)t + 2.74323.S + 0.0132687.nt - 0.0265063.g t - 0.484062.gS + 0.953537.n 2 + 0.116537.g2
+ The function of product quality (L):
L = -127.245 + 12 .3828.n + 0.153244.g + 1.74362.t + 78.5707.S + 0.103313.nt + 4.30313.gS - 2.40353.n2 + 0.937277.g 2 - 0.0121613.t 2 - 25.2757.S2 The Results of the Two-Object Op-timal Problem
The function of specific fuel con-suming level (Ar) is minimum at the value Armin = 5.9 kg (coal)/kg (prod-uct) and the function of product quality (L) is maximum at the value Lmax = 56.64 % when the operating parameters of the dryer is satisfied: The number of tobacco stories in the dryer: n = 5 stories; The declina-tion of the heat exchanging system: g = 3º 6'; Fuel supply cycle: t = 97 minutes; Exhausting door area: S = 1.64 m2
The Experimental Results of Dryer with one Burner, Two Burners Us-ing Coal as Fuel and Dryer Using Rice Husk as Fuel
Comment: The average consump-tion of the tobacco dryer with 1 burner is 1,297 kg of honey-comb coal and 4.8 ster of wood for every drying batch and the average pro-duction is 545 kg dry tobacco. The average consumption of the tobacco dryer with 2 burners is 2,214 kg honey-comb coal for every drying batch and the average production is 587 kg of dry tobacco, (not use fired wood). The average consumption of the rice husk burner tobacco dryer is 3,272 kg rice husk for every dry-ing batch and the average produc-tion is 536 kg of dry tobacco (Table 2).The Comparison of Experimental Results among the Dryers with 1 Burner, 2 Burners and Rice Husk Burner
From Table 2, we have the fuel expenditure, the dry tobacco pro-
duction and the price of honeycomb coal fuel is 0.038 USD/kg; rice husk is 0.019 USD/kg and fired-wood is 9.47 USD/ster. We have calculated the fuel expenditure for 1 kg dry to-bacco leaf when dried in three heat exchangers mentioned above (Table 3).
Comment: We used the statistical analysis method when comparing the above data and the result of the comparison shows the difference of the drying expenditure among the three dryers.
The average drying expenditure of 1 kg dry tobacco leaf when dried by dryer (1 burner) is 0.174 USD/kg, (2 burners) is 0.143 USD/kg and (rice husk burner) is 0.115 USD/kg.
Thus, the drying expenditure of the dryer (2 burner) is 0.031 USD/kg lower than (1 burner) and 0.027 USD/kg higher than the (rice husk burner) dryer.
Practically, we use coal for to-
bacco drying. The source of supply is very abundant and does not effect on our environment. For rice husk fuel, its source is finite because it is often concentrated in the plains where rice is cultivated plentifully, while in the tobacco cultivated ar-eas, rice husk is very scarce. There-fore, if we transport rice husk to these areas, the transport costs will be very high. As a result, the drying expenditure is higher than coal dry-ing.The Result of Dry Tobacco Leaf Ra-tio among the 1 Burner, 2 Burner and Rice Husk Burner Dryers
According to the experimental results and the classified results of post-drying tobacco, we have the following ratios:
Comment: The Table 4 shows that the ratio of the 1st + 2nd type of the 1 burner dryer is 56.7 %, of the 2 burner dryer is 68.2 % and of the rice husk burner dryer is 58.1 %.
Fig. 6 Anchovy steam room
1: Steam room, 2: Burner door, 3: Centrifugal fan, 4: Burner grate, 5: Coal pieces in the combustion
Ordinal number
1 burner, drying expenditure USD/kg
2 burner, drying expenditure USD/kg
Rice husk burner, dry-ing expenditure USD/kg
1 0.174 0.146 0.1152 0.187 0.145 0.1143 0.164 0.144 0.1144 0.175 0.138 0.1115 0.175 0.139 0.1166 0.164 0.140 0.1127 0.177 0.146 0.1208 0.179 0.146 0.1199 0.172 0.145 0.118
Average 0.174 0.143 0.115
Table 3 The comparison of the drying expenditure amongthe dryers with 1 burner, 2 burner and rice husk burner

AGRICULTURAL MECHANIZATION IN ASIA, AFRICA, AND LATIN AMERICA 2006 VOL.37 NO.4 19
Ordinal number
1 burner dryer,tobacco leaf ratio %
2 burner dryer,tobacco leaf ratio %
Rice husk burner dryer,tobacco leaf ratio %
1st type 2nd type 3rd type 4th type 1st type 2nd type 3rd type 4th type 1st type 2nd type 3rd type 4th type1 28.5 25.4 25.6 20.5 36.5 30.2 18.8 14.5 28.6 25.4 25.6 20.42 27.6 28.3 24.4 19.7 38.2 28.3 19.7 13.8 30.6 28.3 21.4 19.73 25.7 28.5 25.5 20.3 40.5 29.6 17.5 12.4 32.7 26.5 22.5 18.34 30.2 27.6 22.8 19.4 38.6 31.4 17.5 12.5 30.6 27.2 22.5 19.75 30.5 28.4 25.2 15.9 36.4 32.8 20.6 10.2 29.5 28.4 25.2 16.96 28.4 28.7 25.3 17.6 37.5 30.8 22.2 9.5 33.2 24.7 24.6 17.57 31.3 26.6 22.7 19.4 35.8 31.6 21.4 11.2 31.3 27.6 21.4 19.78 29.6 26.5 26.4 17.5 38.2 28.6 20.8 12.4 32.6 27.4 23.5 16.59 30.7 27.3 26.4 15.6 39.4 29.5 18.6 12.5 31.7 26.4 26.3 15.6
Average 29.2 27.5 24.9 18.4 37.9 30.3 19.7 12.1 31.2 26.9 23.7 18.3
Table 4 The ratio of tobacco quality among the 1 burner, 2 burner and rice husk burner dryers
Fig. 8 The relative graph of L with every two-element couple
Fig. 7 The relative graph of Ar with every two-element couple
We have used the statistical analy-sis method to compare the differ-ences of the tobacco leaf ratio of the 1st + 2nd type among the 1 burner, 2
burner and rice husk burner dryers. The results show that the tobacco dryer with 2 burner heat exchanger operates well with honeycomb coal
fuel and the quality of the post-drying production of the 1st + 2nd type is higher than the 1 burner and rice husk burner.
Anchovy Steaming ExperimentExperimental Results
We have tested the anchov y steaming in three times and realized that the anchovy steam room can absolutely use coal as fuel instead of fired-wood.Anchovy Steaming with Honey-comb Coal
We have calculated the fuel ex-penditure for 8-hour steaming per day as follow: The fuel costs for starting up the furnace: 50 pieces of honeycomb coal; The fuel consum-ing costs for 8 hour operating: 25 pieces x 8 hours = 200 pieces; The total quantity of fuel consumed per day: 250 pieces; In cash: 250 pieces x 0.038 USD/piece = 9.47 USD; The fuel expenditure for 1 kg of prod-uct is 9.47 USD/2000 kg = 0.0047 USD/kg.Anchovy Steaming with Fired-Wood
The expenditure for 1.2 ster of fired-wood is 11.36 USD and the obtained production is 2,000 kg.
The fuel expenditure for 1 kg of product is 11.36 USD/2000 kg = 0.0057 USD/kg
Comment: Anchovy steaming us-ing coal as fuel obtain the economic effect as well as preserve the envi-ronment.

VOL.37 NO.4 2006 AGRICULTURAL MECHANIZATION IN ASIA, AFRICA, AND LATIN AMERICA20
Evaluating the Quality of Post-Steaming Anchovy
According to the experimental results, the anchovy quality in color and hardness steamed by coal is analogous with steamed by wood as well.
The steaming process with coal is completely the same as with wood.
Conclusion1. With the structure of the dryer
changing from 1 to 2 burners, the experimental results show that the tobacco dryer with 2 burner heat ex-changer operates well with coal fuel and the quality of the post-drying products of the 1st and 2nd type is higher than the 1 burner.
The experimental results also de-termined the mathematical equation describing the effects of the dryer operating parameters on the two economic and technical norms. In addition, they have defined the op-erating zone and the optimal norms for the 2 burner dryer.
From the experimental results of the fuel, the fuel expenditure, the heat efficiency and the quality of tobacco after drying, we have cho-sen the 2 burner heat exchanger for mass production. This new heat exchanger has the following strong points:
- The heat exchanger has many pipes spreading heat well in the dry-ing bin making heat uniform in the drying bin.
- Transporting coal to the dryer is easier and the labor cost is less than when using wood for drying.
- Safer in fire in comparison with the former.
- Using coal decreasing the defor-estation, environmental pollution.
- Heat uniform in the drying bin and the quality of products of the 1st and 2nd type being high.
2. According to the experimental results, using rice husk for tobacco drying is absolutely possible. The
quality of post-drying production is maintained. The drying expenditure is lower than that of wood or coal as fuel. However, we also affirm that using rice husk as fuel for the tobac-co dryer is profitable when the dryer groups are close to the rice process-ing plants; Furthermore, we must be careful in preserving rice husk (the rice husk's weight is very little; it is very easy to cause fire).
3. The anchovy steam room has been suitably designed for using coal as fuel, which helps completely replace fired-wood fuel.
The expenditure of coal steaming is 0.09 cents/kg lower than when we use fired-wood as fuel. We are sure that the using of coal for anchovy steaming will attain the desired eco-nomic efficiency as well as preserve our firm environment.
REFERENCES
Nguyen Canh. 1993. Experimental project. Technical University, HCM City.
Nguyen Hay. 1995. Improving the wood combustion chamber of the tobacco dryer for using coal as fuel. MSc Thesis- Nong Lam University, HCM City.
Nguyen Hay. 1998. Doing research on natural convection technology of the dryer to increase the quality of pre-processed tobacco.- PhD Thesis - Nong Lam University, HCM City.
Phan Hieu Hien. 2001. Experimen-tal design method and data pro-cessing. (Experimental statistics). Agricultural Publishing House-HCM City.
Hoang Dinh Tin. 1996. Heat transfer and caculating heat exchanging equipment. Heat-Refrigeration Engineering Department, Me-chanical faculty - HCMC Univer-sity of Technology.
A. Hirun and A. Promwungkwa. Flue Curet Tobacco. Department of mechanical Engineering Chi-
ang Mai University, Chiang Mai 50002, Thailand.
■■

AGRICULTURAL MECHANIZATION IN ASIA, AFRICA, AND LATIN AMERICA 2006 VOL.37 NO.4 21
Establishment and Performance of an Indegeneous Small Scale Rice Processing Plant in Nigeria
byGbabo AgidiNational Cereals Research Institute,Badeggi, P.M.B. 8, Bida NIGERIA
AbstractA small scale Rice Processing
Plant with 3 tons per day capac-ity was established for the Burma Rice farm in Bayelsa State by the National Cereals Research Institute, Badeggi. All the machines were fab-ricated in the Institute while the Ni-gerian Agip Oil Company Ltd, Port-Harcourt provided the funds for the whole project including the factory building and other farm structures. The factory was divided into five main sections: threshing and win-nowing area, parboiling bay, dry-ing and tempering section, milling section and quality control/bagging unit. The machines installed in the factory were: one rice thresher, one winnower, three rice parboilers, one rotary steam dryer, four milling ma-chines and one pneumatic cleaner. The overall milling recovery of the plant was about 97 %. The perfor-mances of the various components were also highlighted.
IntroductionRice (Oryza sativa L), believed to
have originated from ancient China,
was one of the most important sta-ple food crops for more than half of the world’s population (Bandyopad-hay and Roy, 1992). The rice seed contains about 66.4 % starch, 12 % iron and 26.3 % amylose (Ressur-rection et al, 1979) while its energy and protein contents are 3.75 % and 7.5 % respectively (IRRI, 1993).
The potential of Nigeria in rice production in terms of availability of land, human resources and weather is so enormous but the actual rice production level of the nation is so low that the country imports rice valued at 600-700 million dollars annually (Guardian, 2002). Also, in spite of the huge rice requirement of the country, the per-capita rice pro-duction of 21 kg is very low com-pared to what is obtained in other West African sub-regions such as Guinea, Gambia and Sierra-Leone which have 135 kg, 110 kg and 108 kg, respectively (NCRI, 1997).
In order for the nation to be self sufficient in local rice production, individuals, corporate organizations and the state and federal govern-ment need to utilize the available land potential of 4.6-4.9 million hectares (Kehinde, 1997 and In-dachaba, 1985) available in the
country. Recently, the federal gov-ernment of Nigeria inaugurated a committee to come up with a blue print on increase rice production in Nigeria by the year 2004.
However, as part of an effort by the Bayelsa state government of Nigeria to encourage rice produc-tion, the Burma Rice Farm was established through a collaborative effort by the Nigeria Agip Oil Com-pany limited, Port Harcourt and the National Cereals Research Institute, Badeggi. The aim of the project was to establish a 3 tons per day rice processing plant to augment the existing rice production capa-bility of the state, provide a source of revenue for local rice farmers to process their crop, provide rural employment for the unemployed youths and generally contribute to rural development in the state.
The Nigerian Agip Oil Company limited, Port Harcourt undertakes oil prospecting activities in Bayelsa state and provided the funds for the whole project while the National Cereals Research Institute, Badeggi provided the processing equipment.
This paper highlights the compo-nents of the Burma Rice Processing Factory and gives an overview of

VOL.37 NO.4 2006 AGRICULTURAL MECHANIZATION IN ASIA, AFRICA, AND LATIN AMERICA22
the general performance of the fac-tory.
Factory LayoutThe rice processing plant layout
at the Burma Rice farm has the fol-lowing five main sections:
i . Threshing and Winnowing Area: This is the area where har-vested rice from the field is threshed and cleaned. The harvested rice, tied in bundles, is loaded into trucks on the farm road by labours and transported to the threshing area of the factory. The threshed rice is collected and cleaned with a recip-rocating winnower before weighing and bagging. The straw, which is the major by-product of the threshed rice, is spread on the field in order to improve the fertility of the soil.
ii. Parboiling Bay: The cleaned rice is treated hydrothermally in this section. Thus, this area basically houses the parboilers and the wet cleaners. Ample space is provided to accommodate bags of rice and allow movement of people while working.
A piping network that conveys wa-ter from the over head water storage tank into the boilers, and also serves the wet cleaners, is accommodated in this area.
iii. Drying and Tempering Sec-tion: The dryer units are installed in this section. The two units of the dryer, rotary drying chamber and brick wall insulated boiler sections, are conveniently accommodated. A tempering area is also provided in this area to allow for equilibration of moisture between and within rice kernels after parboiling and the first and second pass drying.
iv. Milling Section: Tempered rice is milled in this area before taken for f inal cleaning. A husk collection point is provided outside the milling area where they are con-veyed and deposited with the aid of 3 inch PVC pipes and cyclones.
v. Quality Control and Bagging area: This is the finishing section where milled rice is cleaned by the pneumatic cleaner before weighing and bagging in varying categories of satchets and bags.
Production ProcessThe production process of the
small scale processing plant at Bur-ma is explained in Fig. 1.
Bundles of harvested rice from the field are left for about 2-4 days depending on the wetness and ma-turity of the seeds so that the field moisture content will be adequately reduced. They are then threshed
by throwing in a handful (3-5 kg) of the panicles into the machine at intervals of about 30-60 seconds depending on the load. The threshed rice, which is collected with a fab-ricated rectangular container of 70 cm x 85 cm is poured onto a tarpau-lin. They are then introduced into the winnower with the aid of a ba-sin. The chaff, stones, sand and dust are separated by different screens in a reciprocating assembly while the cleaned seeds are collected through a different spout. The winnowed seeds are further cleaned to remove the chaff and minute impurities and dust that adhere firmly to the husks. About 30-40 kg of paddy are cleaned per 10 minute cycle and discharged into the parboiling tanks where they are soaked in water at a temperature of 70 ºC from the boiler for a period of 8-12 hours. The wa-ter is then drained through valves and is passed on to the rice in 45-60 minutes intervals. The parboiled rice (which is indicated by cracking of over 95 % of the steamed rice) is discharged at about 45 % moisture content and tempered to 25-30 % moisture content within 1½-2 hours before drying.
The tempered parboiled rice is dried with the rotary steam dryer for 3 hours before discharging at 25-30 % moisture content and tem-pered for about 3-6 hours. The first pass of tempered rice at a moisture content of 20-22 % is loaded into the dryer for a second pass for about 2 hours. It is discharged at about 16 % moisture content and tempered in
S/No.Quantity of
threshed rice per hr.(Tr), kg
Quantity ofthreshed rice per
day (Trd), kg
Quantity of unthreshed rice
(Tu), kg
Threshingefficiency (ηcy),
%1 400 3,200 0.1 99.982 370 2,960 0.5 99.993 405 3,240 0.2 99.954 420 3,360 0.08 99.985 415 3,320 0.1 99.98
Threshing efficiencyηcy = Tr / (Tr x Tu) x 100 %Where: Tr = Quantity of threshed rice (kg), Tu = Quantity of unthreshed rice (kg),ηcy = Efficiency of thresher (%)
Table 1 Threshing data
Rice straw and other foreign objectsThreshing
Chaffs, stone, sand and dustWinnowing
Chaffs, fine sand and dustWet cleaning
Parboiling
Drying
Tempering
Rice husk and branMilling
Pneumaticcleaning Sand and stone
Milled rice
Weighing
Baggingand Storage
▼▼
▼▼
▼
▼
▼
▼
▼
▼
▼
▼
▼
▼
▼
Fig. 1 Flow chart of the burma rice processing factory
Production Process

AGRICULTURAL MECHANIZATION IN ASIA, AFRICA, AND LATIN AMERICA 2006 VOL.37 NO.4 23
the tempering area for 18-24 hours before milling.
The milled rice is finally cleaned and graded with the reciprocating pneumatic cleaner before bagging and storage.
Plant's Components and Performance Assessment
The fol lowing machines and equipment were installed at the Burma Rice farm:
Rice ThresherThe thresher is made up of a trap-
ezoidal hopper, threshing assembly, straw outlet, frame and power unit. The threshing assembly is com-prised of the threshing drum that ro-tates within a concave made of steel rods. The drum is mainly composed of studs bolted to flat bars that are arranged longitudinally at a distance of 10 cm from one another. The cy-lindrical threshing drum is powered by a 10 hp air cooled diesel engine.
About 5 kg was fed into the thresh-er through the hopper. The impact force of the drum (rotating at an av-erage speed of 500 rpm) on the rice panicles dislodged the seed from the straw. The rice straw and chaff were discharged through the straw outlet due to the spiral arrangement of the bars on the rotating drum while the threshed rice seed and some chaff were collected by gravity through
the concave into the collector. The few unthreshed rice grains were dis-lodged from the panicles manually. The total threshed rice after winnow-ing and the unthreshed rice dislodged manually were weighed and recorded as shown in Table 1. The efficiency of the thresher was observed to range from 99.5-99.99 %.
Reciprocating WinnowerOne winnower was installed. It
was composed of a hopper, recipro-cating sieve assembly, chaff outlet, fine impurities, spout and seed out-let. The sieve assembly was essen-tially made of three metal screens of 15 mm, 5 mm and 2.5 mm diameter hole sizes. They are arranged at an inclination angle of 45 % to the horizontal plane. A reciprocating cam, which was attached to this as-sembly obtained power from a 5 hp single phase electric motor through pulleys and belts.
Centrifugal blower which ob-tained power from the pulley of the reciprocating assembly is incorpo-rated at the rear end of the recip-rocating system to expel chaff and other lighter impurities.
About 1,000 kg of threshed rice per batch was fed into the machine through the hopper with the aid of a shutter. The reciprocating action of the screens enabled cleaned seed to pass through the upper and middle screens and be discharged through the seed outlet while the straw, chaff
and stones were trapped and dis-charged at the front of the machine due to the combined effect of the screen movement and the centrifu-gal air blower. The fine impurities (sand) and rice seeds were trapped below the upper and middle screens and discharged through different outlets. The winnowed rice was weighed and further cleaned manu-ally. As shown Table 2, the cleaning efficiency of the machine ranged between 87.0-94.0 %.
Wet CleanersThree wet cleaners were provided.
These were cylindrical vessels hav-ing removable stirring assembly and drain valves. Cleaning was done by introducing winnowed rice of differ-ent mass into the vessel containing water. The stirrer was then turned vigorously at an average speed of 30 rpm for 2 minutes. The difference in specific gravity of the, chaff and other impurities enabled them to be separated from one another. The lighter impurities that floated on the water were removed with a plastic mesh and the stirrer was turned on again for one more minute for light-er materials to be removed before discharging the filled grains.
The time taken for removal of the impurities was also recorded. This operational procedure was repeated with subsequent batches for about 5 to 7 times before draining the water and washing off the sand that
Ricevariety
Initial mass of paddy (Mi), kg
Final mass of paddy after winnowing
(Mf), kg
Time spent on
winnowing (t), min
Mass of fore-ign separated
materials using machine
(Ms), kg
Mass of sepa-rated materials using manual machine (Ms),
kg
Mass of lost paddy using
machine (Mop)
Cleaning efficiency of
machine(ηcy), %
Seed retention efficiency(ηry), %
Output capacity of machine (Cmo), kg/day
Faro 52 1,000 992.0 90 7.0 0.5 0.5 93.33 99.95 5,290.6Faro 35 1,000 991.7 83 7.2 0.7 0.4 91.4 99.97 5,735.13DA 29 1,000 993.7 75 5.4 0.6 0.3 90.0 99.97 5,746.7Faro 43 1,000 990.3 92 8.5 0.75 0.45 91.89 99.98 5,166.78Faro 29 1,000 995.0 80 4.0 0.6 0.4 86.96 99.94 5,970.0Faro 24 1,000 899.0 76 9.2 0.62 0.38 93.69 99.94 5,677.89Ms = Mi - Mf, ηcy = Ms / (Ms + Mm) x 100 %, ηry = Mcp / (Mcp + Mlp) x 100 %, Cmo = Mf / t (mins) x 60 mins x 8 hr/dayWhere: Mi = Initial mass of paddy (kg), Mf = Final mass of paddy (kg), T = Time spent on machine winnowing (mm), Ms = Mass of foreign separated materials (kg), Mm = Mass of manually separated materials (kg), Mf = Final mass of paddy (kg), Mlp = Mass of lost paddy (kg), ηcy = Cleaning efficiency, ηry = Seed (%) retention efficiency (%), Cmo = Output capacity of machine (kg/day)
Table 2 Winnowing data

VOL.37 NO.4 2006 AGRICULTURAL MECHANIZATION IN ASIA, AFRICA, AND LATIN AMERICA24
deposited on the base of the vessel. The time taken for each operation was recorded as shown in Table 3. Although the capacity of the cleaner increased with increasing load per batch, the 45 kg load per batch, which resulted in an average clean-ing capacity of 1,167.57 kg per 8 hr working day, was found to be the optimum loading capacity. This was because it yielded the desired capac-ity of 1,000 kg per day and was also easier to operate compared to the 60 kg and 75 kg load per batch.
Rice ParboilersThree rice parboilers were fabri-
cated for the farm. The equipment had two main sections: boiler and parboiling units, which were inter-connected by a network of 50 mm diameter pipes. The boiler, which was made of 2.5 mm mild steel sheet, had a pressure relief sys-tem, drain valve, cold water inlet and hot water and steam outlets. It was placed over a furnace made of bricks. The steaming unit was rect-angular in shape and made of 2.5 mm galvanized sheet. A cover was provided to prevent loss of steam while a false bottom was placed 15
cm away from the base of the tank.One thousand kg of rice from the
wet cleaner was introduced into the soaking/steaming tank with water from the boiler at 70 ºC. The water was drained after 8 hours and steam was passed on to the tank from the boiler and left until the husks crack. They were then unloaded and tem-pered for about 3-12 hours before feeding into the rotary steam dryer. The duration taken for the rice to crack during the steaming opera-tion, quantity of white belly rice and colour difference of the rice were recorded as shown in Table 4. The parboiling efficiency of the equip-ment was approximately 100 % as the percent white belly was either very negligible or totally absent in all the rice varieties. The colour dif-ference for Faro 52 was lower while that of DA 29 was highest.
Rotary Steam dryerThis machine dried about 1.5 tons
of parboiled rice per day. Two of these dryers were provided in the factory. It was composed of the boil-er placed over a brick furnace and rotary drying unit which were inter-connected with a 4 mm diameter
pipe. The rotary drying unit was a double wall insulated vessel having a jacket between the two walls for steam circulation. It also had pro-vision for condensation outlet and sets of screens that permitted exit of moist air from the drying rice. Power of rotation of the drum was obtained from a 20 hp electric mo-tor while firewood or gas was used as source of heat.
About 600 kg of parboiled and tempered rice are fed into the rotary drying unit through a detachable hopper. The dryer was turned on while water was heated in the boiler to raise steam. The drum with the content was allowed to rotate at 5 revolutions per minute until the moisture content was reduced from about 30 % to 18 % before it was discharged. The rice was then left to temper for 24 hours and re-intro-duced for the second pass drying for the moisture to be reduced from about 16.5 % to 13.5 %. The content was finally released and tempered for another 12-24 hours before mill-ing. The drying time for the first and second pass for each variety were noted. As shown in Table 5, the average drying time varied from
Ricevariety
Mass of paddy (Mp),
kg
Time spent on first
agitation (ta1), mins
Time taken for removal of lighter impurities (tl1), mins
Time spent on second agitation
(ta2), mins
Time spent on removal of more lighter impurities (tl2), mins
Cleaned grains
discharging time (td),
mins
Total time per cycle of
cleaning (tT), mins
Average time per cycle of
cleaning (ta), mins
Average capacity of
cleaner (Ca), kg/day
Faro 5225 2.0 1.0 2.0 2.0 2.0 9.025 2.0 3.0 2.0 3.0 2.0 12.0 10.33 1,161.6725 2.0 2.0 2.0 2.0 2.0 10.0
Faro 3535 2.0 3.0 2.0 3.0 2.0 12.035 2.0 2.0 2.0 2.0 2.0 10.0 11.0 1,527.2735 2.0 3.0 2.0 2.0 2.0 11.0
Faro 4345 2.0 2.0 2.0 3.0 3.5 12.545 2.0 3.0 2.0 3.0 3.0 13.0 12.83 1,683.5545 2.0 3.0 2.0 3.0 3.0 13.0
Faro 2960 2.0 3.0 2.0 3.0 4.5 14.560 2.0 2.0 2.0 3.0 4.0 13.0 13.83 2,082.4360 2.0 3.0 2.0 3.0 4.0 14.0
Faro 2475 2.0 4.0 2.0 4.0 6.0 18.075 2.0 3.0 2.0 4.0 7.0 18.0 17.17 2,096.6875 2.0 2.0 2.0 4.0 5.5 15.5
Caw = Mp / Ta x 60 mins x 8 hr/dayWhere Caw = Average capacity of wet cleaner (kg/day), Ta = Average cleaning time per batch (mins), Mp = Mass of paddy
Table 3 Wet cleaning data

AGRICULTURAL MECHANIZATION IN ASIA, AFRICA, AND LATIN AMERICA 2006 VOL.37 NO.4 25
150-190 minutes during the first pass and 123.33-160 minutes for the second pass.
Rice MillsRice mills were installed in the
factory. Each pair dehusked and pol-ished the parboiled dried rice. They were made up of a frustrum hopper, milling chamber, husk aspiration unit, milled rice, spout and power unit.
The milling chamber, which ro-tated at about 650-750 rpm, was comprised of a milling cylinder that was enclosed within a half cylindri-cal casing and sets of screens at the upper and lower sides. Power to the
Ricevariety
Mass of parboiled paddy (M), kg
Initial drying time from 30 %
m.c. to 18 % m.c. (ti), mins
Final drying time from 16 % m.c. to 13.5 % m.c. (tf),
mins
Tempering duration between initial and final drying (tt), mins
Tempering duration after
final drying (tta)
Initial average drying time (tia),
mins
Final average drying time (tfa),
mins
Faro 52600 150 120 12 24600 150 120 12 24 150 123.33600 120 130 12 24
DA 29600 180 140 12 24600 190 135 12 24 190 131.67600 200 120 12 24
ROK 5600 150 140 12 24600 150 120 12 24 160 131.67600 180 135 12 24
CK 77-3-2-2
600 200 150 12 24600 150 180 12 24 176.67 160600 210 150 12 24
Table 5 Drying data for rotary steam dryer
milling and husk aspiration units were supplied by a 15 hp electric motor through pulleys and belts.
The dried rice was put into the ma-chine through the hopper while the shutter was closed. The machine was then turned on for 2-3 minutes before releasing the shutter slowly for the rice to be dehusked in the first mill of each set. Proper dehusking was ensured by adjusting the pressure de-vice at the spout. The dehusked rice was then polished in the second set of rice mills using the same proce-dure. The dehusking efficiency of the rice mill was found to be about 100 % while the whole grain efficiency varied between 99.74 and 99.97 % as
the percent broken grains were very minimal as shown in Table 6.
Pneumatic CleanerThis machine cleaned milled rice
to ensure that fine sand and bran that still accompanied the rice after the initial winnowing and wet clean-ing operations were removed. The machine was somehow similar to the winnower except that the recip-rocating assembly of the pneumatic cleaner was suspended with four flat spring iron bars while the one in the pneumatic cleaner was suspended with spiral spring iron. Three sets of screens inclined at different angles of 15º, 25º and 45º and different
Ricevariety
Mass of rice (Mr), kg
Soaking duration (td), mins
Streaming duration (ts),
mins
Mass of white belly rice (Mwb),
kgPercent white
belly (Wv)Colour difference
(E)Parboling
efficiency (c), %
Faro 521,000 480 60 0 0 6.3 1001,000 480 60 0 0 6.1 1001,000 480 60 0 0 6.5 100
DA 291,000 480 75 0 0 9.3 1001,000 480 75 0 0 9.7 1001,000 480 75 0 0 8.4 100
ROK 51,000 480 60 0 0 7.5 1001,000 480 60 0 0 7.0 1001,000 480 60 0 0 6.8 100
CK 77-3-2-2
1,000 480 90 0 0 8.2 1001,000 480 90 0 0 7.9 1001,000 480 90 0 0 8.5 100
Wb = Mwb / Mr x 100 %, ηpcy = (Mr - Mwb) / Mr x 100 %Where: Wb = Percent white belly (%), Mwb = Mass white belly rice, Mr = Total mass of parboiled rice, ηpcy = Parboiling efficiency of machine (%)
Table 4 Rice parboiling data

VOL.37 NO.4 2006 AGRICULTURAL MECHANIZATION IN ASIA, AFRICA, AND LATIN AMERICA26
directions were incorporated in the reciprocating unit. Also spouts for collection of cleaned rice, fine sand, dust and broken grains were provid-ed within the same assembly. Power to the reciprocating and blower units was proved by a 5 hp single phase electric motor.
Milled rice was introduced into the reciprocating screen assembly through the hopper after switching on the machine. The shutter in the hopper was released to regulate the f low rate of the material into the screen assembly. The reciprocating action of this unit, which moved at 1.2 m/sec, resulted in separation of the fine sand, broken grains and whole grains which were collected through different spouts. The rice bran and other l ighter impur i-ties were separated by a forced air stream at a velocity of 7.5 m/sec generated by the blower.
Production Input and Raw Materials
The major raw material in the plant was rice. Other inputs includ-ed water, firewood, diesel, engine and gear oils. Water was used in wet cleaning, parboiling of rice and heating medium in the rotary driers. Diesel engine and gear oils were
used as fuel for the 150 KVA elec-tricity generating plant. They were also used as the source of fuel for the engine of the rice thresher and lubricant for the gear boxes of the rotary dryers.
Sources of Raw MaterialsRice, the major raw material, is
obtained from the Burma Rice farm, which is located around the factory. Currently about 20 hectares of the farm has been cultivated. Since it is to be expanded to 50 hectares within a three year period, enough raw material is expected to be ob-tained from the farm. An outgrowth scheme proposed by the Bayelsa State government after handing over the project by NAOC is expected to ensure the availability of raw mate-rials in the factory.
Products/by-Products and their Utilization
The main product was milled rice while rice straw, husk and bran were the by-products generated from the factory. The milled rice was packaged in 2 kg polyethylene sachets and 10 kg, 25 kg and 50 kg transparent nylon bags for sale. The rice bran was sold to fish and poul-try farmers while the rice straw was spread and worked into the field as
organic manure to supplement the soil nutrients.
ConclusionThe Burma Rice Processing Fac-
tory is the first complete indigenous rice processing machinery pack-age that has been established in the country by the National Cereals Research Institute after elaborate research work on the development of all components of the plant.
Results on performances of the various machines and equipment in the plant clearly showed high effi-ciencies. The whole - grain efficien-cy of over 99 % and over-all milling recovery of about 69.0-71.5 % were very ideal since it compared favour-ably with the milling recovery of 70-72 % recorded by the modern rice mills in the world.
The equipment was also observed to be sturdy, compact and rugged as breakdown recorded during the test-run period was very negligible. All the equipment was simple to operate and maintain. The federal govern-ment of Nigeria is therefore urged to utilize this opportunity by encour-aging individuals and co-operative farmers and agricultural business
Ricevariety
Mass of dried rice (Md), kg
Mass of milled rice (Mm), kg
Mass of whole grain rice (Mw),
kg
Mass of broken grains
(Mb), kg
Mass of unmilled rice (Mu),
kg
Avegrage mass of
milled rice (Ma), kg
Average mass of
whole grain (Maw), kg
Whole grain
efficiency (Wcy), %
Dehusking efficiency (Dcy), %
Milling recovery
(Mr)
Faro 521,000.0 696.8 696.4 0.3 - 68.68 99.94 100.01,000.0 711.3 711.1 0.2 - 71.13 99.97 100.0 704.53 70.431,000.0 705.5 705.2 0.2 - 70.55 99.96 100.0
DA 291,000.0 690.1 689.1 0.9 - 69.01 99.86 100.01,000.0 703.1 702.3 0.7 - 70.31 99.89 100.0 696.30 695.401,000.0 695.7 694.8 0.8 - 69.57 99.87 100.0
ROK 51,000.0 715.3 714.8 0.4 - 71.53 99.93 100.01,000.0 708.6 708.1 0.4 - 70.86 99.93 100.0 706.37 70.581,000.0 695.2 694.6 0.5 - 69.50 99.91 100.0
CK 73-3-2-2
1,000.0 699.9 698.1 0.8 - 69.99 99.74 100.01,000.0 685.4 684.6 0.8 - 68.54 99.90 100.0 69.60 694.871,000.0 702.6 701.9 0.6 - 70.26 99.90 100.0
Mr = Mm / Md x 100 %, Dcy = Mu / Mm x 100 %, Wcy = Mw / (Mw + Mb) x 100 %Where: Mr = Milling recovery of rice (%), Mm = Mass of milled rice (kg), Md = Mass parboiled dried rice (kg), Mw = Mass of whole grain (kg), Mb = Mass of broken grains (kg)
Table 6 Milling data
(continued on page32)

AGRICULTURAL MECHANIZATION IN ASIA, AFRICA, AND LATIN AMERICA 2006 VOL.37 NO.4 27
Evaluation of Soil-Water Conservation TillageSystems for Communal Farmers in the EasternCape, South Africa
byO. T. MandiringanaDepartment of Agronomy,University of Fort Hare,Pvt. Bag X1314, Alice 5700SOUTH AFRICA
T. E. SimalengaProfessorDept. of Agricultural and Rural Engineering,University of Venda for Science and Technology,Pvt. Bag X5050, Thohoyandou 0950SOUTH AFRICA
M. MabiDepartment of Agronomy,University of Fort Hare,Pvt. Bag X1314, Alice 5700SOUTH AFRICA
AbstractThree tillage systems, viz. tie-
ridging, pot-holing and ripping were evaluated to assess their potential as water conservation techniques on four small-scale farms in two districts in the central Eastern Cape Province of South Africa. The con-servation treatments were compared to the farmer’s normal or conven-tional practice (as the control) and they were replicated twice on each farm. All tillage systems were based on the use of animal draught power.
Soil moisture content measure-ments were taken at the 0-10, 15-25 and 30-40 cm depths at the time of planting, at first weeding and at tas-seling stage. Moisture content sig-nificantly increased with depth for all treatments at all times, but tillage treatments did not have consistent nor significant effect on soil profile moisture contents. Plant height mea-
Acknowledgements: Authors are grateful to the Agrarian Research Development Programme (ARDP) for South Africa for financial sup-port given to the second author to work on the project for Masters degree and to the Animal Traction Centre (ATC) at University of Fort Hare for logistical support and to various individuals, including the farmers, who made the work pos-sible.
surements taken at first weeding, at tasseling and at harvest also did not show any tillage treatment effects. However, grain, stover and biomass yields were higher under tie-ridge and pot-hole treatments compared to the rip and conventional treat-ments, indicating a possible re-sponse to better water conservation and use efficiency.
Labour requirements for vari-ous field operations increased dra-matically under each tillage system whenever there was a reduction in the utilization of animal draught power. Thus, total labour input demand increased in the order: rip-ping = conventional << tie-ridging << pot-holing. The latter two till-age techniques have a potential for water conservation and increasing yields, but were not readily accept-able to farmers because of their very high labour input requirements. On the other hand, farmers indicated
that they would favourably consider adoption of ripping as a labour sav-ing option.
IntroductionMost areas of the Eastern Cape
Province (Fig. 1), receive low and erratic rainfall. Production of sum-mer crops is usually risky as a result of this low and erratic rainfall com-

VOL.37 NO.4 2006 AGRICULTURAL MECHANIZATION IN ASIA, AFRICA, AND LATIN AMERICA28
bined with the hot dry spells, which are a normal part of the weather pattern during the most important months of the crop’s development. Despite the harsh weather condi-tions most farmers in the region, especially those in communal areas, still endeavour to produce food crops under dryland conditions. Yields are usually very low and only at subsistence levels.
It is generally acknowledged that one way to improve dryland crop production in the arid and semi-arid regions is retain all rainfall received by techniques that reduce surface runoff, improve inf iltration and increase the water storage capacity of the soil (FAO, 1984; FAO, 1994). Such techniques have long been used traditionally in various countries in Africa (Reij et al, 1996), for exam-ple, the trus system (U-shaped earth bunds) in the Sudan, the zai system (planting pits dug out with tradition-al hoes) in Mali and Burkina Faso, and the tassa system (planting pits) in Niger. Other systems of soil and water conservation that have been widely tested and used on the conti-nent include tied ridges (Nyagumbo, 1999; Kayombo et al, 1999), clean ripping and mulch ripping (Chuma and Hagmann, 1997; Nyagumbo, 1999); hillside terraces or stone bunds (Reij et al, 1996; Kayombo et al, 1999), micro-basins (Reij et
al, 1996) and trash-lines (Reij et al, 1996; Kayombo et al, 1999).
During the participatory rural appraisal, several soil and water conservation systems were identi-fied as being practised in the prov-ince (Simalenga et al, 2000). These include terracing, use of vetiver grass, mulching etc. (Figs. 2 and 3). Although these conservation tillage practices have long been practised in arid and semi-arid regions else-where with some success, they have not been widely tested and demon-strated to small-scale farmers in the communal areas of South Africa. Their application here has thus been very limited.
The objectives of this work were:• To test on-farm the effective-
ness of the three tillage systems of tie-ridging, pot-holing and ripping as water conservation techniques,
• To demonstrate the conserva-tion tillage systems to small-scale farmers in central Eastern Cape, and
• To assess farmers’ response and their evaluation of the systems for possibility of adoption and use.
Materials and MethodsThe potential of using three tillage
systems, viz. tie-ridging, pot-holing and ripping, as water conserva-tion techniques on four small-scale farms in the central Eastern Cape Province were evaluated during the two cropping seasons i.e.1999-2000. Two of the farms were located in a relatively dry district, Peddie, with a long-term rainfall average of 570 mm per annum, whilst the other two farms were locates in a wetter district, Middledrift, with a long-term rainfall average of 703 mm per annum. The conservation till-age treatments were compared with the farmer’s normal practice as the control. The normal practice in the area is to plough the fields using mouldboard plough, either by trac-tor or animal traction, during the autumn or winter months (a practice locally known as winter fallowing) followed by another ploughing at the beginning of the new cropping season. The tillage treatments were therefore applied on “winter fal-lowed” lands and were replicated twice on each farm. The plot size was 10 m by 25 m, giving a working area of 250 m2 for each plot.
All treatments, except for pot-holing which was completely done by hand, were based on the use of animal draft power, usually a span of two oxen. Conventional plough-ing was by the ox-drawn plough, tied-ridges were constructed by
Percentage, %
0
10
20
30
40
50
60
70
80
90
Furrow ridgingWinter fallowing
Stone bundingMulching
ManuringInter cropping
Crop rotationTerraces
Control bunds
Fig. 1 Map showing the location of Eastern Cape Province Fig. 2 Percentage of farmers practising conservationfarming in central region, Eastern Cape

AGRICULTURAL MECHANIZATION IN ASIA, AFRICA, AND LATIN AMERICA 2006 VOL.37 NO.4 29
ridging with a winged ridger at 1 m intervals then cross-tying the ridges at regular intervals by hand, and ripping was done at 1 m intervals by a ripper made from a modified plough.
Pot-holes were constructed by scooping soil with hand hoes to make shallow circular basins about 1m in diameter at regular intervals. In conventional system, fertilizer and maize seed are placed in the ap-
propriate furrow behind the plough and covered by the next pass of the plough. In the rip system, the fertil-izer and maize seed were placed in the ripper line and covered by a light harrowing of each plot after planting all plots. In the tie-ridge and pot-hole systems, planting sta-tions were opened individually by the hand hoe, fertilizer dropped and lightly covered by soil, then maize seed was dropped and covered man-
ually. Planting was done on the side of the ridges or pot-hills. Fertilizer mixture 2:3:2(22) + 5 g/kg Zn (con-taining 6.5 % N, 9.4 % P, 6.3 % K, 12.5 % Ca, 6.3 % S + 0.5 % Zn) was applied at the rate of 300 kg per ha in each case. No top dressing was applied. The crops were weeded twice, first at about 10 days after germination and second about four weeks later.
A number of measurements were taken during the season as follows. Soil profile moisture content was measured by taking samples with an auger at the 0-10, 15-25 and 30-40 cm depths at two places in each plot prior to planting, at first weeding and at tasseling stage. The samples were kept in air-tight cans, taken to the lab, weighed fresh and again af-ter drying at 101 ºC overnight. Crop heights of six plants in middle rows of plots were measured at three dif-ferent stages of the crop cycle, viz. at first weeding, at tasseling and finally at harvest.
Labour inputs were measured by recording the number of people and actual time it took them to complete each of the following operations per plot, irrespective of use of ani-mal draft power: land preparation, fertilizer application immediately followed by planting, and for weed-ing. The labour input timings were converted to man hours per ha for
Treat-ment
Middledrift district Peddie districtDepth Treat Depth Treat
0-10 15-25 30-40 Mean 0-10 15-25 30-40 MeanProfile moisture at plantingControl 8.11 12.55 15.08 11.50a 5.36 8.01 7.43 6.93a
Tie ridge 7.45 12.32 14.42 12.39a 5.12 7.27 10.82 7.74a
Pot hole 9.63 12.90 15.48 12.67a 3.80 6.86 8.42 6.36a
Rip 8.21 12.96 16.07 12.41a 4.66 7.73 9.55 7.31a
Mean 8.35c 12.55b 15.08a 11.99 4.74c 7.47b 9.05a 7.08Profile moisture at weedingControl 10.45 13.31 17.06 13.61b 11.88 16.68 18.66 15.74a
Tie ridge 13.48 15.18 19.09 15.92a 10.61 13.84 20.65 15.03a
Pot hole 10.36 14.18 15.11 13.21b 9.26 15.08 19.65 14.66a
Rip 10.06 13.75 15.84 13.22b 11.82 21.37 23.89 19.02a
Mean 11.09c 14.11b 16.77a 13.99 10.89c 16.74b 20.71a 16.12Profile moisture at tasselingControl 9.09 13.86 16.07 13.00b 9.76 14.40 15.33 13.16ab
Tie ridge 11.61 15.36 20.43 15.80a 9.03 10.39 14.84 11.42b
Pot hole 9.72 14.90 21.47 15.36ab 9.13 12.27 14.10 11.83b
Rip 13.32 14.92 18.54 15.59a 11.35 15.46 17.87 14.89a
Mean 10.93c 14.76b 19.13a 14.49 9.82c 13.13b 15.53a 12.83
Table 1 Soil moisture contents (% w/w) at three depths (cm) at three differentstages of crop development in middledrift and peddie districts
Note: Means with the same letter in a row or column are not significantly different at P <0.05
Percentage, %
0
10
20
30
40
50
60
70
Furrow ridgingWinter fallowing
Stone bundingMulching
ManuringIntercropping
Crop rotationTerraces
Control bunds
Fig. 3 Percentage of farmers practising conservationfarming in the northern region of Eastern Cape
Soil moisture, % w/w
10
11
12
13
14
15
16
17
18 TasselingWeedingPlanting
RippingPotholeTie ridgeControl
Fig. 4 Comparison of moisture content for different treatments

VOL.37 NO.4 2006 AGRICULTURAL MECHANIZATION IN ASIA, AFRICA, AND LATIN AMERICA30
each operation for the different tillage systems. Grain and stover yields were measured at the end of the season. Rainfall in each district was recorded by a simple rain gauge placed at each farmer’s homestead whereby the farmer was responsible for taking the daily readings.
Results and DiscussionThe average total rainfall record-
ed in Middledrift district for the months of September 1999 to April 2000 was 504.5 mm compared to a long-term (66 year) average of 474.8 mm from the nearest station at Blaney (ARDRI, 1989). Rainfall recorded at farms in Peddie district averaged 445.0 mm for the same months compared to a long-term (25 year) average of 341.4 mm at near by Lime Drift station. Overall then, it seems this was an above average rain fall season.
Soil profile moisture contents sig-nificantly increased with depth for all treatments at all times of mea-surement (Table 1). This is to be ex-pected as a result of increase in clay with depth. The soils in Peddie were significantly drier than Middledrift soils at time of planting but the dif-ferent was obliterated by the time of the first weeding. Moisture was also slightly lower in Peddie by tasseling stage as compared to Middledrift sites.
From the data given by Hensely and de Jager (1982), it is estimated that the gravimetric moisture hold-ing capacities of soils in the region lie between 15 to 20 % at f ield capacity (FC) and 6 to 14 % at per-manent wilting point (PWP) for top-soils (0-20 cm depth) and between 15 to 18% at field capacity (FC) and 7 to 11% at permanent wilting point (PWP) for upper subsoils (20-40 cm depth). By this comparison, the soil profiles in Peddie were very dry at planting, and this, in fact, affected crop establishment. The surface 10 cm in Middledrift were also dry at planting but the rest of the profile was well recharged.
Fig. 4 is a summary of typical moisture content during planting, weeding and tasseling for the three treatments. The results have shown that tillage treatments did not have a consistent effect on soil profile moisture contents. Of note, however, is that in Middledrift district the tie-ridging treatment had a significantly
higher profile moisture content than the other treatments both at weed-ing and tasseling stages though the effect was non significant at plant-ing. The inconsistence of the data may be attributed to sampling er-rors as well as delays between sam-pling and the laboratory weightings (sometimes samples were only pro-cessed the following day). This kind of data is best collected by means of neutron moisture probes in “perma-nently” installed access tubes.
Measurement of crop heights as an indicator of crop performance showed that , general ly, bigger plants were found in control plots and smaller ones in ripped plots throughout the season, though the effect was not always significant (Table 2). Plants increased in height considerably from an average of 52 cm at weeding to 130 cm at tassel-ing with little further increase to about 160 cm at harvest.
Average grain, stover and total biomass yields under the differ-
kg/ha
0
500
1000
1500
2000
2500
3000
3500
RippingPotholeTie ridgeControl bunds
Fig. 5 Grain yield for different treatmentsManhours per ha
0
1000
2000
3000
4000
5000
6000
7000
8000
RippingPotholeTie ridgeControl bunds
Fig. 6 Labour requirement for different tillage systems
TreatmentMiddledrift district Peddie district
Height at weeding
Height at tasseling
Height at harvest
Height at weeding
Height at 2nd weed*
Height at harvest
Control 53a 138a 160a 51a 82a 177a
Tie ridge 53a 120b 155a 55a 81a 175ab
Pot hole 52a 124b 152a 55a 80a 176ab
Rip 48b 124b 157a 47a 69b 165b
Mean 52 126 156 52 79 173
Table 2 Height of plants (in cm) taken at three different stages ofcrop development in middledrift and peddie districts
Note: Means with the same letter in a column are not significantly different at P <0.05, *Crops replanted and were not yet at tasseling stage at time of sampling

AGRICULTURAL MECHANIZATION IN ASIA, AFRICA, AND LATIN AMERICA 2006 VOL.37 NO.4 31
ent tillage treatments in the two districts are shown in Table 3. Sig-nificantly (p <0.05) higher yields were obtained under the tie-ridge and pot-hole systems than with the rip and farmer’s systems, although the effects were non-significant for grain in Peddie district. This result is significant in that it demonstrates the potential of the tie-ridge and pot-hole system to concentrate rain water with better utilization by the crop (Fig. 5).
Average labour requirements for the field operations of land prepa-ration, fertilizer application plus planting, and weeding are given in Table 4. Labour requirements were virtually identical in both districts for each of the operations, giving some measure of confidence in the accuracy of the data collected. Of the three operations, fertilizer appli-cation taken together with planting (seed placement and covering) de-mands the least labour input under all the tillage systems, except the rip system which has least labour demand at stage of land preparation (Fig. 6).
Weeding had the highest labour
demand, especially under the two water conservation systems of tie-ridging and pot-poling in which all the work was done manually in order to conserve the structures of each. Pot-holing demanded a lot of labour at the land preparation stage because this was done completely by hand without resort to use of animal draught power. This demand could be considerably reduced by the development and use of appro-priate animal-drawn equipment as in case of ridging. Since tying of ridges was done by hand, the labour input went slightly up, but this op-eration could also easily be mecha-nised. Labour demand for weeding was significantly reduced in conven-tional (control) and rip systems by, first, use of the animal-drawn culti-vator between crop rows, followed by hand hoeing within the rows.
ConclusionTie-ridging and pot-holing sys-
tems were effective in water conser-vation and utilization by plants as reflected in increased yields; howev-
er, this former function could not be verified by corresponding increases in soil profile moisture contents, possibly due to sampling errors or a limited depth of sampling. In spite of these advantages, the two tillage systems incurred a very high labour input demand because of the associ-ated reduction in, or complete lack of, use of animal draught power. Small-scale farmers who already face acute labour constraints viewed the high labour requirements of these conservation tillage systems negatively. This poses a consider-able hindrance to their adoption and use by the farmers.
REFERENCES
Institute (ARDR), University of Fort Hare, ARDRI. 1989. An Agricul-tural Guide Book for Ciskei. Ag-ricultural and Rural Development Research Alice.
Chuma, E. and J. Hagmann. 1997. Conservation tillage techniques for semi-arid Zimbabwe: Results and experiences from on-station and on-farm interactive innova-tions in Masvingo (1988-1994). The Zimbabwe Science News, 31(2): 34-41.
FAO. 1984. Tillage Systems for Soil and Water Conservation. FAO Soils Bulletin 54. Food and Ag-ricultural Organization (FAO), Rome, Italy.
FAO. 1994. Soil Tillage in Africa: Needs and Challenges. FAO Soils Bulletin 69. Food and Agricul-tural Organization (FAO), Rome, Italy.
Hensley, M. and J. M. de Jager. 1982. The determination of the water profile available water capacities of soils. Report on a Water Re-search Commission funded proj-ect, Department of Soil Science, University of Fort Hare, Alice. 284 pp.
Kayombo, R., J. Ellis-Jones, and H. L. Martin. 1999. Indigenous con-servation tillage systems in East
TreatmentMiddledrift district Peddie district
Grain, kg/ha
Stover, kg/ha
Biomass, kg/ha
Grain, kg/ha
Stover, kg/ha
Biomass, kg/ha
Control 2,680b 3,960ab 6,640 2,467a 3,520b 5,987Tie ridge 3,268a 4,626a 7,894 2,621a 3,991a 6,612Pot hole 3,220a 3,946ab 7,166 2,563a 3,954ab 6,517Rip 2,813b 3,446b 6,259 2,387a 3,498b 5,885
Mean 2,995 3,995 6,990 2,510 3,741 6,251
Table 3 Average grain, stover and biomass yields underthe different tillage treatments in the two districts
Note: Means with the same letter in a column are not significantly different at P <0.05
TreatmentMiddledrift district Peddie district
Land prepa-ration
Fertiliser & plant
First weeding
Total labour
Land prepa-ration
Fertiliser & plant
First weeding
Total labour
Control 133c 30c 4,649b 4,812 147c 33c 4,573d 4,752Tie ridge 270b 126a 5,572a 5,967 229b 123a 5,306a 5,657Pot hole 1,717a 137a 5,511a 7,365 1,701a 132a 5,669a 7,503Rip 38d 84b 4,875b 4,997 34d 83b 4,629b 4,746
Mean 539 94 5,152 528 93 5,044
Table 4 Labour requirements (in manhours per ha) for different operationsunder different tillage systems measured in the two districts
Note: Means with the same letter in a column are not significantly different at P <0.05

VOL.37 NO.4 2006 AGRICULTURAL MECHANIZATION IN ASIA, AFRICA, AND LATIN AMERICA32
Africa with an example of their evaluation from South West Tan-zania. In: Kaumbutho, P. G., and T. E. Simalenga (eds.). Conserva-tion Tillage With Animal Traction: A Resource Book of the Animal Traction Network of Eastern and Southern Africa (ATNESA), Ha-rare, Zimbabwe. Pp. 89-106.
Nyagumbo, I. 1999. Conservation tillage for sustainable crop pro-duction systems: Experiences from on-station and on-farm re-search in Zimbabwe (1988-1997). In: Kaumbutho, P. G., and T. E.
Simalenga (eds.). Conservation Tillage With Animal Traction: A Resource Book of the Animal Traction Network of Eastern and Southern Africa (ATNESA), Ha-rare, Zimbabwe. Pp. 107-114.
Reij, C., I. Scoones, and C. Toulmin. 1996. Sustaining the Soil: Indige-nous Soil and Water Conservation in Africa. Earthscan Publications Ltd, London. 260 pp.
Simalenga, T. E., O. T. Mandirin-gana, and M. Mabi. 2002. Conser-vation Farming for Soil Water
Management under Smallholder
Farming in Eastern Cape Prov-ince, South Africa. Paper present-ed at the International workshop on Modernization of Agriculture and Conservation Tillage held in Uganda.
■■
oriented entrepreneurs to adopt this technology in order to boost rice production.
REFERENCES
Bandyopadhay, S. and C. N. Roy. 1992. Rice Processing Technology. Ibtt Publishing Co. PVT id, 66 Ja-path, New Delhi.
Idachaba, F. S. 1985. Priorities of Nigeria Agriculture. In The Fifth national Development Plan in Ni-geria, 1975-1985. pp 85-88.
IRRI. 1993. Rice in Human. FAO 1993.
Kehinde, J. K. 1987. Advances in Rice Production. In Rice Produc-tion and Processing Workshop. National Cereals Research In-stitute, Badeggi pp 1-14, NCRI-Printing Press, Badeggi.
National Cereals Research Institute. 1997. Training Manual on Rice Production and processing Work-shop pp 2. NCRI printing Press, Badeggi.
Resurrection, A. P., B. O. Juliano, and Y. Tanaka. 1999. Nutrient Content and Distribution in Mill-ing Fractions of Rice Grain. Jour-nal of Science, Food and Agric. 30:475-481.
The Guardian. 2002. Rice Projects Abandoned Despite Prospects. In Agrocare - The Guardian News-paper Pp. 53, 27th October, 2002. Guardian Newspaper Ltd., Rutan House, Isolo, Lagos.
■■
(Continued from page26)
Establishment and Performance of an IndegeneousSmall Scale Rice processing Plant in Nigeria

AGRICULTURAL MECHANIZATION IN ASIA, AFRICA, AND LATIN AMERICA 2006 VOL.37 NO.4 33
Recent Developments in Sugarcane Mechanisation in IndiabyM. P. SharmaPrincipal ScientistIndian Institute of Sugarcane Research,Lucknow - 226 002INDIA
S. R. MisraDirectorIndian Institute of Sugarcane Research,Lucknow - 226 002INDIA
IntroductionSugarcane is the most important
agro industrial crop next to cotton which is being cultivated in ap-proximately 4.2 million hectares area in India. The country has pro-duced more than 300 million tonnes of cane at a national average of 70 tonnes per hectare. In the present context of globalisation, ways and means have to be further evolved to produce more sugar per unit area, time and input in order to keep pace with the population growth while preserving the soil and water resources. The challenges in the millennium can be met effectively by way of adopting the appropriate mechanical alternatives not only for increasing the productivity but inculcating cost efficiency in sugar-cane production system. The farm mechanisation in the context of sugarcane cultivation should aim at introducing timeliness of operation and reducing human drudgery on one side and improving overall pro-duction efficiency on the other.
Present Scenario of Farm Mechanisation
Indian agriculture is characterised
by small and scattered holdings and sugarcane cultivation is no excep-tion. Sugarcane crop remains in the field for almost a year and right from land preparation to harvesting of the crop and its timely supply to the mill, there is a heavy demand of labour and machinery throughout its crop cycle. Sugarcane accounts for 60-70 % of the cost of sugar pro-duction and thus has a vital role to make sugar industry a commercially viable venture.
In a true sense, if we look at the prevailing degree of mechanisa-tion, it is observed that so called mechanisation is confined to tracto-risation, only in general and use of land preparation equipment, mainly cultivator and harrow in particular. As regards planting of sugarcane, inspite of the fact that a number of useful machines have been de-veloped at the Indian Institute of Sugarcane Research, Lucknow, the adoption level has not been en-couraging. The mechanisation of cane planting has been, till recently, confined to the use of tractor drawn ridgers for opening the furrows and the remainder of the opera-tions involved in cane planting were done manually. Use of improved equipment in accomplishing other cultural operations required in cane
cultivation, is almost non existent.A brief description of some of the
newly developed equipments for sugarcane cultivation has been giv-en and ways and means have been suggested so as to take these useful labour and cost efficient devices to the farmers with a view to sustain sugarcane productivity.
Mechanisation of Sugarcane Planting
After land preparation, sugarcane planting is the major operation to be mechanised first. This is essential to pave the way for mechanising sub-sequent cultural operations.
Various types of animal drawn and tractor drawn sugarcane plant-ers have been developed and suc-cessfully tested and demonstrated at the farmer’s fields. These planters are drop type planters where whole cane is cut separately into three bud sets either manually or by a power operated set cutting machine. These sets are fed manually and the rest of the operations, such as opening of furrows, application of fertilizer, insecticide and fungicide, giving a soil cover over the sets and compac-tion of the soil cover, are carried out automatically with the help of the planter. Various types of set type planters, - semiautomatic and
Ashutosh MishraResearch AssociateIndian Institute of Sugarcane Research,Lucknow - 226 002INDIA

VOL.37 NO.4 2006 AGRICULTURAL MECHANIZATION IN ASIA, AFRICA, AND LATIN AMERICA34
automatic, have been developed. In case of automatic planters, dropping of the set is also automatic besides other operations involved in cane planting.
With the advent of sugarcane cutter planters on the scene, where cutting of whole cane in to sets is also done simultaneously, planting through machine has become a vi-able proposition. Ridger type/Disc t y pe sugarcane cut te r planter have been developed and success-fully tested and demonstrated in the farmer’s fields. These planters have now become popular among the cane growers and, as a result, a number of commercial manufactur-ers have come forward and taken up the manufacturing of the IISR design sugarcane planters on a com-mercial scale. Presently the latest model of sugarcane planter costs Rs.30,000.00. The cost of sugarcane planting with the use of this ma-chine may be reduced by about 50 % as compared to conventional sys-tem of cane planting. Fig. 1 shows the IISR Sugarcane Cutter Planter in operation.
Timeliness of operation and ef-ficient utilization of critical inputs, such as fertilizer, insecticide and fungicide, is also made possible. In order to increase the utilization in-dex, multipurpose equipment taking care of planting, interculture, earth-ingup, puddling, seeding, etc. can be undertaken by making minor al-terations in the machine. Sugarcane planters seem to have a bright future and an important role in managing
sustainable sugarcane production.
Mechanisation of Interculture and Earthingup Operation
About 4-5 interculture operations are quite common in sugarcane and each operation, if carried out manually, requires 15-20 man days/hectare. Tractor drawn cultivators can effectively be used by adjusting the spacing between the tynes as per conventional row spacing. Tractor drawn earthingup devices have also been developed and can be used effectively untill the plant growth does not hamper with the operation. Engine operated power weeders have also been developed for inter-culture purposes and can be used by the small cane growers.
Mechanisation of Sugarcane Har-vesting
Gradually, timely harvesting of sugarcane at affordable cost is be-coming a problem particularly in the tropical region. Managing a big fleet of labourers to give timely supply of cane to the mill is not easy any more. Under these circumstances, the sugar industry is looking for alternate mechanical means for harvesting the sugarcane crop at a reasonable wage rate.
In subtropical India, normally, sugarcane harvesting is free of cost in exchange for green tops and, as such, in near future the problem does not appear to be of a major concern. Efforts may be made to develop eff icient hand tools for harvesting sugarcane crop so as to
improve the quality of cutting and output/man/day with reduced en-ergy input. Partial mechanisation seems to be a suitable answer for the time being particularly in the subtropical belt.
The available sugarcane harvest-ing systems can be grouped into:
1. Whole stalk linear windrowing2. Whole stalk transverse wind-
rowing3. Whole stalk bundling machine4. Hand controlled self propelled
harvester5. Chopper type cane harvesters.
Whole Stalk Harvesting a. Manual Cutting
Proper manual cutting results in minimum loss of cane and the highest quality of the product. The productivity of manual cutters can be improved by giving them proper training, the use of correct cane knife, balanced diet, etc.
Fig. 2 shows manual harvesting of sugarcane in India.b. Mechanical Cutting
Cane cut t ing at tachments for agricultural tractors have been de-veloped. This harvesting system still requires an appreciable amount of labour as cane stalks have to be detrashed, detopped and bundled and, subsequently, loaded into the wagons. Heavy recumbent cane is difficult to handle with these aids and dry leaves are removed only partially.c. Whole Cane Harvester
More advanced machines are now available (CAMECO Harvester),
Fig. 1 IISR sugarcane cutterplanter in operation
Fig. 2 Manual harvesting of sugarcane- a common sence on Indian farms
Fig. 3 IISR sugarcane windrowerharvester in operation

AGRICULTURAL MECHANIZATION IN ASIA, AFRICA, AND LATIN AMERICA 2006 VOL.37 NO.4 35
which cut the cane stalk at the base and detop. The cut canes are placed in a single windrow from 4-6 rows. Subsequently, depending upon the availability of the labour, mechani-cal loaders/manual loaders can be employed for loading purposes. Eight to ten percent of the trash remains in the harvested cane. At a later stage, use of separate detrash-ers can be explored for minimizing the level of trash in the cane to be supplied to the mills. Fig. 3 shows the IISR model of sugarcane wind-rower harvester in operation.d. Chopper Type Harvester
With the increasing labour prob-lem, pace of mechanised harvesting may be accelerated and imported models of chopper harvesters may be tried and introduced with the modifications suiting to local needs. Efforts have been initiated in parts of Tamil Nadu and Maharashtra
where imported models of chop-per harvesters have been tried on a limited scale. There is no doubt that handl ing of even a heavy tonnage recumbent crop can eas-ily be handled and out put of 25-30 tonnes/field/hour can be achieved but trash percentage in the billets (7-8 %), small size of the fields, high initial cost of the machine, wider row spacing required (1.5 m) and sophisticated systems are the major constraints in successful adoption of these imported machines under Indian conditions. Delays from harvest to crush further aggravate the problem. Efforts are being made to develop an indigenous model of sugarcane harvester suited to Indian conditions. Fig. 4 shows a modern combine sugarcane Chopper har-vester during trials in India.
Trash ManagementHandling of trash is another area
requiring attention of the research-ers in the present scenario where manual harvesting is in vogue.
Research conducted at other places, has indicated that applica-tion of vinasse and filter cake to the residue, promotes decomposition of the dry matter so that resulting compost can be harrowed into the soil within 30 days. Nutrients de-rived from the trash may include 32 kg N/ha, 6 kg P2O5/ha and 30 kg K2O/ha. At IISR, an equipment for in-situ incorporation of sugar-cane trash has been developed and is under extensive field trials. The equipment is mounted with the trac-tor and is operated by PTO shaft.
The system picks up trash, passes it on to the chopping unit where trash is chopped into small bits which ultimately gets mixed up and buried under the soil with the help of a pair of discs provided at the rear end. Provision has also been made for applying chemical/other substances for quick decomposition of trash.
Burning of trash may be avoided in select areas where insect pests are not a major problem and this precious material can be put to ef-fective use either as a mulch to conserve soil moisture or as organic matter, thereby improving the soil health. Figs. 5 and 6 show the newly developed equipment.
Machinery for Ratoon ManagementRatoons play an important role in
improving overall economics of sug-arcane production. A multipurpose machine has been developed which takes care of the important cultural operations required to be performed for raising a good ratoon crop.
The machine takes care of:1. Stubble shaving2. Off barring or dismantling of
ridges3. Interculture operation4. Fertilizer application.Proper use of this machine will
lead to improved ratoon productiv-ity. Fig. 7 shows the equipment in operation.
Future Strategy for Mechanisa-tion of Sugarcane Cultivation
A number of useful machines for sugarcane culture have been devel-
Fig. 4 Modern sugarcane chopperharvester suring trials in India
Fig. 5 IISR trash handling equipment Fig. 7 IISR multipurpose equipmentfor sugarcane ratoon in operation
Fig. 6 Equipment for in-situ incorpora-tion of sugarcane trash in operation (continued on page59)

VOL.37 NO.4 2006 AGRICULTURAL MECHANIZATION IN ASIA, AFRICA, AND LATIN AMERICA36
Performance Efficiency of an Active EvaporativeCooling System for the Storage of Fruits andVegetables in a Semi Arid Environment
byAdamu U. DzivamaDepartment of Agricultural Engineering,University of MaiduguriNIGERIA
I. AuduDepartment of Agricultural Engineering,University of MaiduguriNIGERIA
J. C. IgbekaProfessorDepartment of Agricultural Engineering,University of Ibadan, Oyo StateNIGERIA
AbstractAn active evaporative cooler was
constructed with a local sponge material as the pad-end and tested under varied parameters of: water flow rate (WR), 3.5 L/min, 4.5 L/min and 5 L/min); pad thickness (PT), 30 mm, 60 mm and 90 mm); and air velocity (AV), 0.8 m/s, 1.3 m/s, 1.8 m/s, 2.3 m/s and 2.8 m/s. Under the settings of WR (4.5 L/min), PT (60 mm) and AV (2.3 m/s), the highest saturation efficiency of 84.6 % was obtained at a temperature of 21.5 ºC and 85 % relative humidity at the pad-end, from ambient conditions of 38 ºC and 15 %, temperature and relative humidity, respectively. At this condition, the cooler was evalu-ated for the storage of Mango (Man-gifera indica), banana (Musa sa-
pientum) and tomato (Lycopersicum esculentum). The products were stored in the cooler at a temperature of 22.5 ºC and relative humidity of 80 % and, were found to be in good physical conditions after 18 days for mango and 14 days each for banana and tomato, as compared to only 7 days for those stored under ambi-ent conditions of 38 ºC and 15 %, temperature and relative humidity, respectively.
IntroductionFresh fruits and vegetables have
flavour, aroma, and colour and are essential for normal health (Duck-worth, 1979). They are sources of dietary fibre, vitamins and miner-als (Pyke, 1986; Fox and Cameron,
1978). For maximum usefulness and optimum nutritive value, fruits and vegetables should therefore, be consumed in a fresh form. However, fresh fruits and vegetables deterio-rate easily when stored under ambi-ent condition, mainly due to physi-ological and microbial activities, which are accelerated at high tem-perature and low relative humidity of the storage environment (Anon, 1978; Wills et al, 1981).
Post harvest losses of fruits and vegetables can be greatly minimized by storing them at low temperature and high relative humidity (Hall, 1981; Wills et al, 1981; FAO/SIDA, 1986). This storage condition can be achieved through techniques such as refrigeration and ice-bank cool-ing, which are very expensive to acquire and maintain in developing

AGRICULTURAL MECHANIZATION IN ASIA, AFRICA, AND LATIN AMERICA 2006 VOL.37 NO.4 37
countries.FAO (1983) has advocated a stor-
age system based on the principle of evaporative cooling for the stor-age of fruits and vegetables, which is simple, relatively efficient and of low running cost. Evaporative cool-ing occurs when air that is not satu-rated is blown across a wet surface. Heat in the air is utilized to evapo-rate the water, resulting in a drop in the air temperature and increase in relative humidity (Harper, 1976; Henderson and Perry, 1976; Kays, 1979; FAO/SIDA, 1986; Brooker et al, 1992).
According to Rusten (1985), evap-orative cooling is generally more efficient where air temperatures are high, relative humidity very low water is available for the purpose and air movement is conducive. In Northern Nigeria, a semi arid re-
gion, these conditions are typical.An active evaporative cooling
system consists of a pad (moist material), fan, storage cabin and water pump. Apart from the gen-eral requirements for the efficient operation of an evaporative cooling system, the efficiency of an active evaporative cooler depends on the rate and amount of evaporation of water from the pad. This is depen-dent upon the air velocity through the pad, pad thickness and the de-gree of saturation of the pad, which is a function of the water flow rate wetting the pad (Hanan et al, 1978; Wiersma, 1983; Thakur and Dh-ingra, 1983).
The objective of this study was to evaluate the performance of an active evaporative cooler in a semi arid environment for the storage of fruits and vegetables under the best
combination levels of the parame-ters required for the efficient opera-tion of the cooler.
Materials and MethodsAn active evaporative cooler as in
Dzivama et al (1999) was construct-ed and tested under varied levels of water flow rate, pad thickness and air velocity. The cooler consisted of a pad-end 1000 mm x 1500 mm made of local stem sponge, a storage cabin 1000 mm x 1300 mm x 1500 mm made of plywood and internally insulated with 50 mm polystyrene, a 20 watt suction fan and a 150 watt water pump with a discharge ca-pacity of 7.5 L/min. The complete schematic diagram of the cooler is presented in Fig. 1.
To determine the best operating
Fig. 1 Schematic diagram of the evaporative cooler
Water flow rate, l/min
Saturation efficiency, %
(a) Pad thickness of: PT = 30 mm
C: PT = 90 mm
40
50
60
70
80
90 AV = 2.8 m/s
AV = 2.3 m/s
AV = 1.8 m/s
AV = 1.3 m/s
AV = 0.8 m/s
5.554.543.53
40
50
60
70
80
90 AV = 2.8 m/s
AV = 2.3 m/s
AV = 1.8 m/s
AV = 1.3 m/s
AV = 0.8 m/s
5.554.543.53
AV = 1.8 m/sAV = 1.3 m/sAV = 0.8 m/sAV = 2.8 m/sAV = 2.3 m/s
Water flow rate, l/min
Saturation efficiency, %
(b) Pad thickness of: PT = 60 mm
(c) Pad thickness of: PT = 90 mm
40
50
60
70
80
90 AV = 2.8 m/s
AV = 2.3 m/s
AV = 1.8 m/s
AV = 1.3 m/s
AV = 0.8 m/s
5.554.543.53
40
50
60
70
80
90 AV = 2.8 m/s
AV = 2.3 m/s
AV = 1.8 m/s
AV = 1.3 m/s
AV = 0.8 m/s
5.554.543.53
AV = 1.8 m/sAV = 1.3 m/sAV = 0.8 m/sAV = 2.8 m/sAV = 2.3 m/s
Fig. 2b, c Saturation efficiency for the various WR and AV
Water flow rate, l/min
Saturation efficiency, %
A: PT = 30 mm
B: PT = 60 mm
C: PT = 90 mm
40
50
60
70
80
90 AV = 2.8 m/s
AV = 2.3 m/s
AV = 1.8 m/s
AV = 1.3 m/s
AV = 0.8 m/s
5.554.543.53
40
50
60
70
80
90 AV = 2.8 m/s
AV = 2.3 m/s
AV = 1.8 m/s
AV = 1.3 m/s
AV = 0.8 m/s
5.554.543.53
40
50
60
70
80
90 AV = 2.8 m/s
AV = 2.3 m/s
AV = 1.8 m/s
AV = 1.3 m/s
AV = 0.8 m/s
5.554.543.53
AV = 1.8 m/sAV = 1.3 m/sAV = 0.8 m/s AV = 2.8 m/sAV = 2.3 m/s
Fig. 2a Saturation efficiency for the various WR and AV
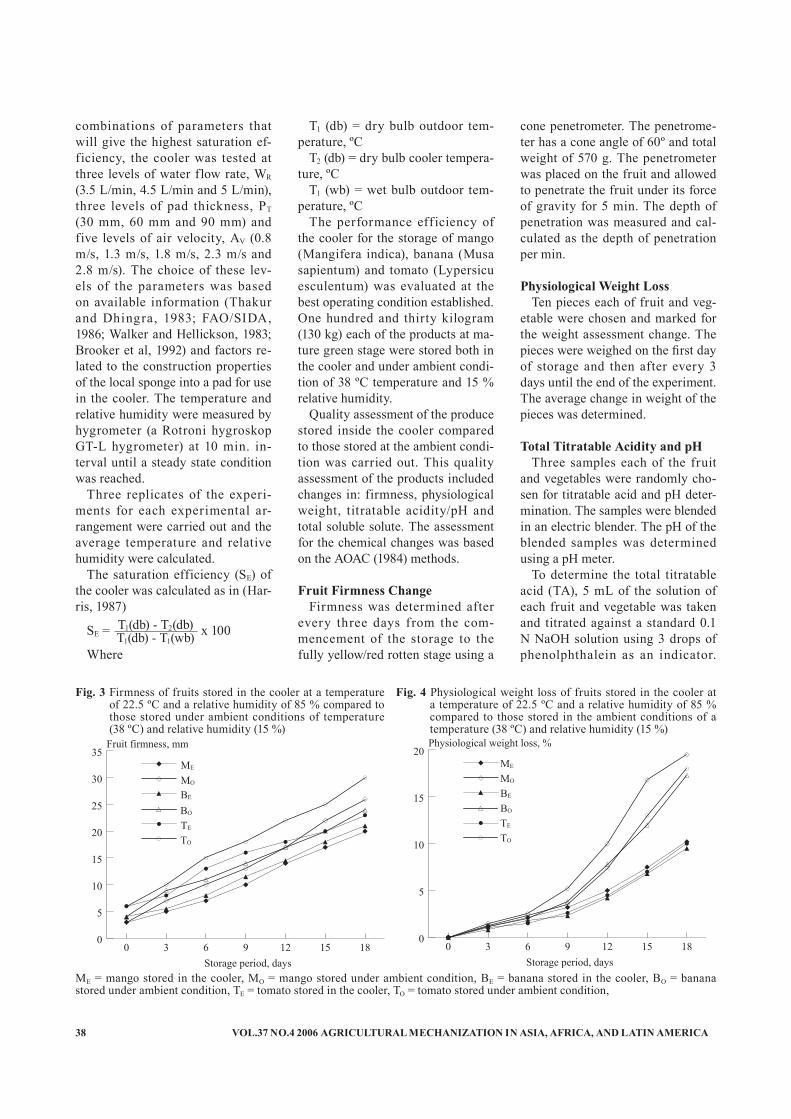
VOL.37 NO.4 2006 AGRICULTURAL MECHANIZATION IN ASIA, AFRICA, AND LATIN AMERICA38
combinations of parameters that will give the highest saturation ef-ficiency, the cooler was tested at three levels of water flow rate, WR (3.5 L/min, 4.5 L/min and 5 L/min), three levels of pad thickness, PT (30 mm, 60 mm and 90 mm) and five levels of air velocity, AV (0.8 m/s, 1.3 m/s, 1.8 m/s, 2.3 m/s and 2.8 m/s). The choice of these lev-els of the parameters was based on available information (Thakur and Dhingra, 1983; FAO/SIDA, 1986; Walker and Hellickson, 1983; Brooker et al, 1992) and factors re-lated to the construction properties of the local sponge into a pad for use in the cooler. The temperature and relative humidity were measured by hygrometer (a Rotroni hygroskop GT-L hygrometer) at 10 min. in-terval until a steady state condition was reached.
Three replicates of the experi-ments for each experimental ar-rangement were carried out and the average temperature and relative humidity were calculated.
The saturation efficiency (SE) of the cooler was calculated as in (Har-ris, 1987)
SE = x 100
Where
T1 (db) = dry bulb outdoor tem-perature, ºC
T2 (db) = dry bulb cooler tempera-ture, ºC
T1 (wb) = wet bulb outdoor tem-perature, ºC
The performance efficiency of the cooler for the storage of mango (Mangifera indica), banana (Musa sapientum) and tomato (Lypersicu esculentum) was evaluated at the best operating condition established. One hundred and thirty kilogram (130 kg) each of the products at ma-ture green stage were stored both in the cooler and under ambient condi-tion of 38 ºC temperature and 15 % relative humidity.
Quality assessment of the produce stored inside the cooler compared to those stored at the ambient condi-tion was carried out. This quality assessment of the products included changes in: firmness, physiological weight, titratable acidity/pH and total soluble solute. The assessment for the chemical changes was based on the AOAC (1984) methods.
Fruit Firmness ChangeFirmness was determined after
every three days from the com-mencement of the storage to the fully yellow/red rotten stage using a
cone penetrometer. The penetrome-ter has a cone angle of 60º and total weight of 570 g. The penetrometer was placed on the fruit and allowed to penetrate the fruit under its force of gravity for 5 min. The depth of penetration was measured and cal-culated as the depth of penetration per min.
Physiological Weight LossTen pieces each of fruit and veg-
etable were chosen and marked for the weight assessment change. The pieces were weighed on the first day of storage and then after every 3 days until the end of the experiment. The average change in weight of the pieces was determined.
Total Titratable Acidity and pHThree samples each of the fruit
and vegetables were randomly cho-sen for titratable acid and pH deter-mination. The samples were blended in an electric blender. The pH of the blended samples was determined using a pH meter.
To determine the total titratable acid (TA), 5 mL of the solution of each fruit and vegetable was taken and titrated against a standard 0.1 N NaOH solution using 3 drops of phenolphthalein as an indicator.
Storage period, days
Fruit firmness, mm
0
5
10
15
20
25
30
35
TO
TE
BO
BE
MO
ME
1815129630Storage period, days
Physiological weight loss, %
0
5
10
15
20TO
TE
BO
BE
MO
ME
1815129630
ME
MO
BE
BO
TE
TO
Fig. 3 Firmness of fruits stored in the cooler at a temperature of 22.5 ºC and a relative humidity of 85 % compared to those stored under ambient conditions of temperature (38 ºC) and relative humidity (15 %)
Fig. 4 Physiological weight loss of fruits stored in the cooler at a temperature of 22.5 ºC and a relative humidity of 85 % compared to those stored in the ambient conditions of a temperature (38 ºC) and relative humidity (15 %)
ME = mango stored in the cooler, MO = mango stored under ambient condition, BE = banana stored in the cooler, BO = banana stored under ambient condition, TE = tomato stored in the cooler, TO = tomato stored under ambient condition,
T1(db) - T2(db)T1(db) - T1(wb)

AGRICULTURAL MECHANIZATION IN ASIA, AFRICA, AND LATIN AMERICA 2006 VOL.37 NO.4 39
The titration was stopped at a pH of 8.3 when a faint pink colour was noticed. The volume of Na0H used was recorded and the TA was calcu-lated as:
% TA = volume of NaOH x nor-mality of NaOH x 6.706 x 10-3 x 100/volume of sample.
Where6.706 x 10-3 = milligram equiva-
lent of malic acid.
Total Soluble Solids (ºBrix)Total soluble solids were deter-
mined using the Bellingham and Starley refractometer No. A85172. From the blended samples, two drops were taken using a glass rod, and placed on the refractometer, and the value of the total soluble solids in ºBrix was read directly from the scale.
On the first day of the experiment, one quality analysis was carried out for each of the products. Three samples of the products were used for each quality assessment, and the experiments were done in three rep-licates. Subsequent analyses were carried out at three day intervals until visible spoilage of the products was noticed. The maximum shelf life of each of the products stored in the cooler compared to those under
the ambient conditions were also recorded.
Results and DiscussionSaturation Efficiency
The result of the saturation ef-ficiency of the cooler is presented in Fig. 2. Generally the saturation ef-ficiency increased with increase in the parameters until optimum levels were reached: The optimum levels of WR, PT and AV obtained were: 4.5 L/min, 60mm and 2.3 m/s., respec-tively, beyond which points the effi-ciency declined (Graph a, b, and c). The performance efficiency at this optimum condition was 84.6 % at the pad end. This could be explained by the fact that, at PT of 60 mm and WR of 4.5 L/min, the pad was suffi-ciently moist, and at the same time, there was enough pore space within the pad for the air movement. Fur-thermore, at AV of 2.3 m/s, the ve-locity was fairly high, and, because of the fairly large pad thickness of 60 mm, the air-water contact time was increased. This allowed for an increase in heat and mass transfer, thus, an increase in efficiency.
It is possible to obtain saturation efficiency in the cooler approach-
ing 85 % to 100 % for a region with very low outdoor relative humid-ity and high temperature (Rusten, 1985). Thus, the 84.6 % performance efficiency obtained in the cooler, in Maiduguri with an average ambient condition of 38 ºC and a wet bulb depression of 18.5 ºC compared to 21.5 ºC for the evaporative cooler is considered efficient.
Quality Changes of the Products Fruit Firmness
The results for the fruit firmness change stored under both the evapo-rative cooler and ambient conditions are presented in Fig. 3. Fruit firm-ness changes are more under ambi-ent conditions, especially with a storage period in excess of 10 days. Fruit firmness change, which is a biochemical change, occurs during the ripening process. Fruit ripening is accelerated at high temperatures (Wills et al, 1981). This explains the significant change in fruit firmness for the fruits stored under ambient conditions, which is at higher tem-peratures than that of the evapora-tive cooler.
Fig. 5 pH of fruits stored in the cooler at a temperature of 21.5 ºC and relative humidity of 85 % compared to those stored in the ambient conditions of 38 ºC and 15 ºC temperature and relative humidity respectively
Storage period, days
pH
2
3
4
5
6TO
TE
BO
BE
MO
ME
1815129630
ME
MO
BE
BO
TE
TO
Storage period, days
% titratable acid
0
2
4
6
8TO
TE
BO
BE
MO
ME
1815129630
ME
MO
BE
BO
TE
TO
Fig. 6 Percentage titritable acid of fruits stored in the cooler at a temperature of 21.5 ºC and a relative humidity of 85 % compared to those stored in the ambient conditions of 38 ºC and 15 % temperature and relative humidity respectively
ME = mango stored in the cooler, MO = mango stored under ambient condition, BE = banana stored in the cooler, BO = banana stored under ambient condition, TE = tomato stored in the cooler, TO = tomato stored under ambient condition,

VOL.37 NO.4 2006 AGRICULTURAL MECHANIZATION IN ASIA, AFRICA, AND LATIN AMERICA40
Physiological Weight LossThe results of the physiological
loss in weight for the produce stored under both, ambient condition and the evaporative cooler are presented in Fig. 4. Fruits and vegetables stored in the cooler had lower physi-ological weight loss compared to those stored in the ambient condi-tions. The trend in the physiological weight loss in the cooler was simi-lar for all the produce without any sharp increase in weight loss. Under ambient conditions, the produce showed sharp increase in weight loss after 8 days of storage com-pared to those stored in the evapora-tive cooler.
Physiological loss in weight of fruit and vegetables is due to both evaporation of water and respiratory losses. Evaporation of water from the produce and the respiratory losses are dependent on the temper-ature and relative humidity of the air surrounding the produce. Low temperature reduces the respiratory activity and high relative humidity reduces the rate of evaporation from the produce.
The slight losses in weight of the fruit and vegetables recorded in the evaporative cooler with an average storage condition of 21 ºC and 84.6 % temperature and relative humid-ity, respectively could therefore be attributed to the low temperature and high relative humidity in the evaporative cooler. High loss in weight for the ambient storage could also be attributed to the high tem-perature (38 ºC) and low relative humidity (15 %).
Titratable Acidity and pHThe results of the change in ti-
tratable acid and pH for the fruits and vegetables stored in the cooler compared to the ones stored under ambient condition are presented in Figs. 5 and 6 respectively. The re-sults show that, there was a general reduction in the acidity and increase in pH of the produce, except in the case of banana. For banana, pH de-
clined with storage. The decline was greater for banana stored under am-bient conditions compared to those stored in the evaporative cooler. For mango and tomato, pH increased with storage and the increase was less in the produce stored in the cooler compared to those stored un-der ambient conditions.
Ripening process brings about change in pH of fruit. During rip-ening, the acids are converted into sugars; hence increase in pH, except in banana, where the highest level is attained at the fully ripened stage (Wills et al, 1981).
Changes in acidity and pH are generally related, but there is no clear relationship. Acids are consid-ered as reserve source of energy for the fruit. At greater metabolic ac-tivity, they are expected to decline, since the fruits use them for meta-bolic activity (Wills et al, 1981). This explains the slight change in results of the produce stored in the evaporative cooler that were at low temperatures, which slows down the metabolic activity. The greater change in titratable acid obtained for the produce stored under the am-bient condition could therefore be attributed to the high temperature of the ambient condition, which ac-
celerated the metabolic activity.
Total Soluble Solids (ºBrix)The results of the changes in the
total soluble solids (ºBrix) of the produce stored in both the evapo-rative cooler and under ambient conditions are shown in Fig. 7. Total soluble solids increased slightly with storage. The produce stored in the evaporative cooler had a lower increases in soluble solids compared to the produce stored under ambi-ent conditions. The slight variation of the total soluble solids for the produce stored in the evaporative cooler could be attributed again to the low temperature and high relative humidity in the evaporative cooler. No significant change in to-tal soluble solids has been reported in all varieties of mango, ripened at 16 to 28 ºC (Vasquez-Salinas and Lakshminarayana, 1985).
The possible explanation in the slight changes in the total soluble solids may be related to the physi-ological loss in weight of produce. The physiological weight is slightly affected at low temperature and high relative humidity, hence less change in total soluble solids. This explains the relatively significant variation in the total soluble solids
Storage period, days
Total soluble solids, ºBrixME
MO
BE
BO
TE
TO
0
5
10
15
20
25 TOTEBOBEMOME
1815129630
Fig. 7 Total soluble solids (ºBrix) of fruits stored in the cooler at a temperature of 21.5 ºC and relative humidity of 85 % compared to those stored in the ambient conditions of 38 ºC temperature and 15 % relative humidity
ME = mango stored in the cooler, MO = mango stored under ambient condition, BE = banana stored in the cooler, BO = banana stored under ambient condition, TE = tomato stored in the cooler, TO = tomato stored under ambient condition,
AGRICULTURAL MECHANIZATION IN ASIA, AFRICA, AND LATIN AMERICA 2006 VOL.37 NO.4 41
for those products stored under the ambient condition, which are at high temperature and low relative humid-ity of 38 ºC and 15 %, respectively.
ConclusionFrom this investigation, the fol-
lowing conclusions could be made:1. Fruits and vegetables dete-
riorate easily when stored under ambient conditions, mainly due physiological and microbial ac-tivities, which are accelerated at high temperature and low relative humidity and the spoil-age can be greatly minimize by lowering temperature and increasing relative humidity of the storage environment.This evaporative cooling system of-fers an inexpensive approach to achieve this.
2. It is evident that in an evapora-tive cooler, fruits and vegetables could be stored for a longer per iod without appreciable damage than those stored under ambient condition.
3. Further investigations are rec-ommended on the construction materials and orientation of the cooling chamber and the water application system to see if there will be an increase in the efficiency of the cooler for the storage of fruits and vegetables.
REFERENCES
Anon. 1978. Post-harvest food losses in developing countries. National Academy of Sciences, Washington D.C.
AOAC. 1984. Official methods of analysis (13th edition). Association of Official Analytical Chemists, Washington D.C.
Brooker, D. B., F. W. Bakker-Arke-ma, and W. H. Hall. 1992. Drying of cereal grains. AVI Publishing. Co. West Port, Connecticut, USA.
Duckworth, R.B. 1979. Fruit and
vegetables. Pergamon Press, Ox-ford.
Dzivama, A. U., U. B. Bindir, and F. O. Aboaba. 1999. Evaluation of pad materials in construction of active evaporative cooler for storage of fruits and vegetables in arid environments. Agricultural Mechanization in Asia, Africa and Latin America, Vol. 30 No. 3.
FAO/SIDA. 1986. Farm structures in tropical climates, 6 FAO/SIDA, Rome.
FAO. 1983. FAO production year-book, vol. 34. FAO, Rome.
Fox, B. A. and A. C. Cameron. 1978. Food Science: A Chemical Approach. Fletcher and London.
Hall, E. G. 1981. An introduction to physiology and handling of fruits and vegetables. AVI pub. Co. Westport.
Hanan, J. J., W. D. Holley, and K. L. Goldsberry. 1978. Greenhouse Management. Pub. Springer Ver-lag, New York, pp. 187-197.
Harper, J. C. 1976. Elements of Foiod Engineering, AV Publish-ing Co. Inc. Connecticut, USA.
Harris, N. C. 1987. Modern air con-ditioning practice, 3rd edition, Mc-Graw-Hill Book Co., New York.
Henderson, S. M. and R. L. Perry. 1976. Agricultural process engi-neering, 3rd edition. AVI publish-ing. Co. Westport, Connecticut, USA.
Kays, M. 1979. Convective heat and mass transfer. McGraw-Hill Book Co., India.
Pyke, M. 1986. Food Science and Technology, 4th Edition, John Murray, London.
Rusten, E. 1985. Understanding evaporative cooling. VITA techni-cal paper.
Thakur, B. C. and D. P. Dhingra. 1983. Parameters influencing the saturation efficiency of an evapo-rative cooler, Res. J., Punjab Uni-versity, 20(3): 345-352.
Vasquez-Salinas, C. and S. Laksh-mina Rayana. 1985. Compositional Changes in Mango Fruit ripening at different Storage temperatures.
Journal of Food science 50(6): 1646-1648
Wiersma, F. 1983. Evaporative cool-ing. In ventilation of agricultural structures, an American Society of Agricultural Engineers mono-graph 6th series, Michigan, USA.
Walker, J. N. and M. A. Hellickson. 1983. Ventilation of agricultural structures. ASAE Monograph 6th series. Pub. ASAE Michigan, USA.
Wills, R. H. H., T. H. Lee, D. Gra-ham, W. B. McGlasson, and E. G. Hall. 1981. Post-harvest: an introduction to the physiology and handling of fruit and vegetables. Granada Pub. Co.
■■

VOL.37 NO.4 2006 AGRICULTURAL MECHANIZATION IN ASIA, AFRICA, AND LATIN AMERICA42
Inspection of Watermelon Maturity by TestingTransmitting Velocity of Acoustic Wave
byRao XiuqinPh. D. CandidateCollege of Biosystems Engineeringand Food Science,Zhejiang University,Hangzhou, Zhejiang 310029P.R. [email protected]
Ying YibinExecutive Dean and ProfessorCollege of Biosystems Engineeringand Food Science,Zhejiang University,Hangzhou, Zhejiang 310029P.R. [email protected]
AbstractFourteen “QiLing” watermelons
were tested with a system that con-sisted of an electromagnet, a strik-ing ball, a sensor with two micro-phones at a distance of 6 cm, a set of signal processing circuits, a com-puter with a data acquisition board, and a set of sof tware. The test results showed that it is possible to test sugar content of watermelon by testing acoustic wave transmitting velocity. The correlation coefficient of the model was 0.81208 when the test position is at the S position. The model is dependent on testing posi-tion, inner defect and growth status of the sample. The coefficients and the correlation coefficient are not sensitive to inner defect for testing at the pedicel. But, for testing at the peduncle, the coefficients are sensitive, while the correlation coef-ficient is not. The model is very sen-sitive to the growth status. A good result is expected when the testing is at the S position.
IntroductionSome acoustical properties of
fruits can infer the quality of the fruits. Delwiche et al (1989 and 1996) and Jarén et al (1992) evalu-ated firmness of fruits with impact techniques. McGlone et al (1993), Younce et al (1995) detected firm-ness by dropping the fruit on a force sensor and measuring the force. Chen et al (1996) developed a low-mass, impact-type firmness sensor for high-speed, on-line sorting of fruits. Pearson (2001) developed an acoustical sor ting system to separate pistachio nuts with closed shells from those with open shells. The classification accuracy of this system was approximately 97 %. Terasaki et al (2001) studied the re-sponse of apples placed on a vibrat-ing table with sine wave vibrations. Luz et al (2001) studied the acousti-cal characteristics of four soybean varieties. Mizrach et al (2001) sug-gested a system based on an ultra-sonic energy absorbance method for nondestructive measurements of Cox apples.
Very few studied have been made on the maturity of watermelon in the past. In the maturating of wa-termelon, the water content and the texture will change. Such change may result in the change of trans-
mission velocity of the acoustic wave, which may be an indication of the quality of the watermelon. Since sugar content is an index of matu-rity, the relationship between sugar content and velocity of the acoustic wave was setup to evaluate the qual-ity of the watermelon.
Materials and MethodsMaterials
Fourteen “QiLing” watermelons, the primary watermelon variety in Zhejiang province, China, were tested. The test positions are shown in Fig. 1.
Test SystemThe testing was conducted with
the system shown in Fig. 2 and was based on acoustic properties. The system consisted of an electromag-net, a striking ball, a sensor with two microphones at a distance of
Acknowlegements: The authors gratefully acknowledge the financial support provided by the Ministry of Education of China and Zhejiang Provincial Natural Science Founda-tion (No. 301267).

AGRICULTURAL MECHANIZATION IN ASIA, AFRICA, AND LATIN AMERICA 2006 VOL.37 NO.4 43
0.06 m, a signal processing circuit, a computer with a data acquisition board, and software. The sound wave was produced by striking with a steel ball wrapped in rubber, was sensed by two microphones, and then transformed into an electric signal. The signal was amplified and filtered by a processing circuit which passes frequencies from 3 to 3000 Hz. The processed signal was sampled at a rate of 10 kHz with a PCL-1800 data acquisition board (Advantech Co., Ltd.).
The sensor was put on the water-melon, and then the power to the electromagnet was turned off by the computer. The striking ball was free to strike the sample, and a sound wave produced. The sound wave was sensed by microphones and translated into an electric signal. The signal was amplified, filtered, and then translated into a digital signal by the data acquisition board. The distance between the two mi-crophones resulted in a time differ-ence of the acoustic wave transmit-tance that permitted a calculation of the transmitting velocity, which was a function of sugar content of the tested watermelon.
Test ProcedureThe test was conducted as fol-
lows:1. A watermelon was placed on
the system. An acoustic wave was introduced, and the wave
was collected by sensors and processed. The processed sig-nal was sampled and stored in the computer. Five points on the surface of the sample were tested as shown in Fig. 1.
2. The sample was cut. A sugar content test was made at the five points with a sugar content me-ter (WYT-4).
3. The sugar content data were put into the computer.
4. The data were analyzed with a MATLAB program.
5. A model was setup to show the relationship between acoustic character and sugar content.
Data ProcessingData processing was done with
a MATLAB program as shown in Fig. 3. A digital filter model was designed for noise filtering, and a self-correlation model was pro-grammed to calculate the transmis-sion velocity of the sound wave. At the end, a statistical analysis was made to establish a model between sugar content of the watermelon and transmission velocity with a third degree POLYFIT function.
Results and AnalysisThe relationship between acous-
tic wave transmitting velocity and sugar content at a test point was described by equation 1, which cor-
responded to the POLYFIT function of MATLAB.
V = a0sc3 + a1sc
2 + a2sc + a3, .......(1)where
V = transmitting velocity at a test point,
Sc = sugar content at a test point, and a0, a1, a2, a3 are coefficients
Effect of Test PositionsThe relationship between acoustic
wave transmitting velocity at posi-tion S and sugar content is shown in Fig. 4, and the result at position Z is shown in Fig. 5. The models of both are shown in equations 2 and 3. The model differed for the two test positions, as well as the correla-tion coefficient of the model. The R2 of the model at position S is higher than at position Z. This means that a better result is expect when the test is made at the S position.
The model at the S position was (Fig. 1):
V = -5.5175sc3 + 133.15sc
2 - 1064sc + 2833.4 ............................................(2)
R2 = 0.81208where
R2 is the correlation coefficient of the model.
The model at the Z position was (Fig. 1):
V = 1.6073s c3 - 40.4672s c
2 + 336.7457sc - 904.9022 .....................(3)
R2 = 0.64902.
Effect of the Inner Defects The relationship between acoustic
Fig. 1 Test positions and the names
Fig. 2 Schematic diagram of the test-bedFig. 3 Data processing
Star Digit Filter Self-correlation
Statistics Analysis
▲ ▲ ▲
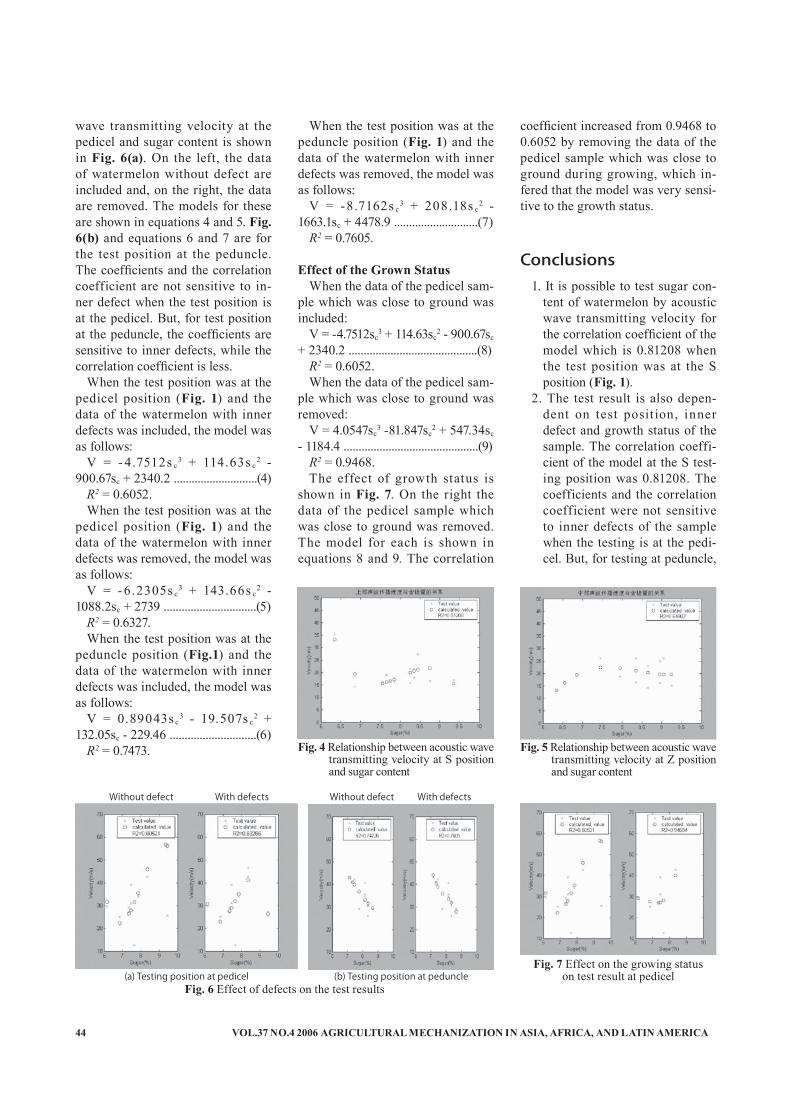
VOL.37 NO.4 2006 AGRICULTURAL MECHANIZATION IN ASIA, AFRICA, AND LATIN AMERICA44
wave transmitting velocity at the pedicel and sugar content is shown in Fig. 6(a). On the left, the data of watermelon without defect are included and, on the right, the data are removed. The models for these are shown in equations 4 and 5. Fig. 6(b) and equations 6 and 7 are for the test position at the peduncle. The coefficients and the correlation coefficient are not sensitive to in-ner defect when the test position is at the pedicel. But, for test position at the peduncle, the coefficients are sensitive to inner defects, while the correlation coefficient is less.
When the test position was at the pedicel position (Fig. 1) and the data of the watermelon with inner defects was included, the model was as follows:
V = - 4.7512s c3 + 114.63s c
2 - 900.67sc + 2340.2 ............................(4)
R2 = 0.6052.When the test position was at the
pedicel position (Fig. 1) and the data of the watermelon with inner defects was removed, the model was as follows:
V = - 6.2305s c3 + 143.66s c
2 - 1088.2sc + 2739 ...............................(5)
R2 = 0.6327.When the test position was at the
peduncle position (Fig.1) and the data of the watermelon with inner defects was included, the model was as follows:
V = 0.89043s c3 - 19.507s c
2 + 132.05sc - 229.46 .............................(6)
R2 = 0.7473.
When the test position was at the peduncle position (Fig. 1) and the data of the watermelon with inner defects was removed, the model was as follows:
V = -8.7162s c3 + 208.18s c
2 - 1663.1sc + 4478.9 ............................(7)
R2 = 0.7605.
Effect of the Grown StatusWhen the data of the pedicel sam-
ple which was close to ground was included:
V = -4.7512sc3 + 114.63sc
2 - 900.67sc + 2340.2 ...........................................(8)
R2 = 0.6052.When the data of the pedicel sam-
ple which was close to ground was removed:
V = 4.0547sc3 -81.847sc
2 + 547.34sc - 1184.4 .............................................(9)
R2 = 0.9468.The effect of growth status is
shown in Fig. 7. On the right the data of the pedicel sample which was close to ground was removed. The model for each is shown in equations 8 and 9. The correlation
coefficient increased from 0.9468 to 0.6052 by removing the data of the pedicel sample which was close to ground during growing, which in-fered that the model was very sensi-tive to the growth status.
Conclusions1. It is possible to test sugar con-
tent of watermelon by acoustic wave transmitting velocity for the correlation coefficient of the model which is 0.81208 when the test position was at the S position (Fig. 1).
2. The test result is also depen-dent on test posit ion, inner defect and growth status of the sample. The correlation coeffi-cient of the model at the S test-ing position was 0.81208. The coefficients and the correlation coefficient were not sensitive to inner defects of the sample when the testing is at the pedi-cel. But, for testing at peduncle,
Without defect Without defectWith defects With defects
Fig. 6 Effect of defects on the test results(a) Testing position at pedicel (b) Testing position at peduncle
Fig. 7 Effect on the growing statuson test result at pedicel
Fig. 4 Relationship between acoustic wave transmitting velocity at S position and sugar content
Fig. 5 Relationship between acoustic wave transmitting velocity at Z position and sugar content

AGRICULTURAL MECHANIZATION IN ASIA, AFRICA, AND LATIN AMERICA 2006 VOL.37 NO.4 45
the coefficients were sensitive to inner defects while the cor-relation coefficient was not. The model was very sensitive to the growth status.
3. Best results were expected when the testing was at the S position.
REFERENCES
Abbott, J. A., D. R. Massie, B. L. Upchurch, and W. R. Hrushka. 1995. Nondestructive sonic firm-ness measurement of apples. Trans of the ASAE. 38(5): 1461- 1466.
Armstrong, P. R., M. L. Stone, and G. H. Brusewitz. Nondestruc-tive Acoustic and Compression Measurements of Watermelon for Internal Damage Detection. J. Ap-plied Engineering in Agriculture, 1997, (5): 641-645.
Chen, P. et al. 1996. Effects of im-pacting mass on firmness sens-ing of fruits. Transactions of the ASAE 39(3): 1019-1023.
Delwiche et al. 1996. Second gener-ation impact force response fruit firmness sorter. Transactions of the ASAE. 39(3): 1019-1023.
Delwiche et al. 1989. An impact force response fruit f irmness sorter. Transactions of the ASAE. 32(1): 321-326.
Ge, Tun, Xu Ling, and Xia Heng. 1998. Non-destructive Evaluation for maturity of watermelon by vibration method. Transaction of the CSAE. 14(2): 231-234.
Jarén, C. et al. 1992. Sensing physi-cal stage of fruits by their response to non-destructive impacts. AG ENG 92, Paper No. 9211 113.
Luz Laura et al. 2001. Acoustical frequency spectrum method to predict moisture content in soy-bean. ASAE Annual Meeting Pa-per No. 011074.
McGlone et al. 1993. The applica-tion of impact response analysis in the New Zealand fruit industry. ASAE Paper No. 93-6537.
Mizrach, A. et al. 2001. Ultrasonic mealiness classification of apples. ASAE Annual Meeting Paper No. 016039.
Nahir, D. et al. 1986. Tomato grad-ing by impact force response. ASAE Paper No. 86-3028.
Pearson, T. C. 2001. Detection of pistachio nuts with closed shells using impact acoustics. Applied Engineering in Agriculture. 17(2): 249-253.
Terasaki S. et al. 2001. Analysis of the vibration mode of apple tissue using electronic speckle pattern interferometry. Transactions of the ASAE. 44(6): 1697-1705.
Stone, M. L., P. R. Armstrong, and X. Zhang. 1996. Watermelon Ma-turity Determination in the Field Using Acoustic Impulse Imped-ance Techniques. Trans of the ASAE, 39(6): 2325-2330.
Wang Shumao, Jiao Qunyin, and JI. Junjie. 1999. An impulse response method nondestructive inspection of the ripeness of watermelon. Transaction of the CSAE. 15(3): 241-245.
Ying Yibin, Cai Dongpind, He Weiguo, and Jing Junqin. 1997. Acoust ic proper t ies of f resh agricultural products and its ap-plication in non-destructive qual-ity evaluation. Transaction of the CSAE. 13(3): 208-212.
Younce, F. L. et al. 1995. A dy-namic sensor for cherry firmness. Transactions of the ASAE. 38(5): 1467-1476.
■■

VOL.37 NO.4 2006 AGRICULTURAL MECHANIZATION IN ASIA, AFRICA, AND LATIN AMERICA46
Development and Testing of a Chilli Seed ExtractorbyM. BalakrishnanResearch AssociateDepartment of Agricultural Processing,Tamil Nadu Agricultural University,Coimbatore - 641 003INDIA
V. V. Sree NarayananDeanDepartment of Agricultural Processing,Tamil Nadu Agricultural University,Coimbatore - 641 003INDIA
V. ThirupathiAssistant ProfessorDepartment of Agricultural Processing,Tamil Nadu Agricultural University,Coimbatore - 641 003INDIA
AbstractA seed extraction machine for
chillies has been developed to over-come human drudgery by manual seed extraction process. The unit consisted of a beater for extraction of seeds and a perforated concave sieve for separation of seeds. It was operated by a one hp single-phase electric motor. Trials were con-ducted at various peripheral speeds and extraction efficiency and ger-mination were determined. The test results of the machine showed that a maximum seed extraction efficiency of 94 % and the germination of 92 % were attained at 480 m/min pe-ripheral speeds.
IntroductionChillies are dried ripe fruits of the
species of genus capsicum. Chillies are also called red peppers or cap-sicum and constitute an important well-known commercial crop used as condiment and culinary supple-ment. India is the largest producer
of chillies in the world, accounting for over 45 % of the total area under cultivation (Pruthi, 1993). The seed from dried chillies are extracted and used for crop propagation. The extraction of seed practiced with la-bour is highly time consuming and costly besides involving drudgery. The chilly seed extraction machine has been developed and evaluated to overcome the drudgery due to the
pungent nature of the chillies and to increase the productivity of seed processing industries.
The seed extraction machine, consisting of a fixed cylindrical cas-ing with sieve and rotating shaft that had cutting, crushing and convey-ing blades, was used for extracting seeds from vegetables (Mohanty, 1997). The capacity of the machine was 210 kg/h for tomatoes at 370
Fig. 1 Chilli Seed Extractor

AGRICULTURAL MECHANIZATION IN ASIA, AFRICA, AND LATIN AMERICA 2006 VOL.37 NO.4 47
rpm with an average seed extraction efficiency of 84.7 %. Germination percentage of the seed was 82.8 % without any visible damaged seeds.
The manually operated seed ex-tractor with a rotary hollow metallic cylinder with corrugations and helix fixed on its surface, and with a sta-tionary expanded metal concave and feed hopper was used for tomato seed extraction (Karla, 1983).
A mechanical seed extraction machine, consisting of a rotary shaft with beaters rotating inside a horizontal fixed drum, was used for tomato fruits (Nicholos, 1971).
The machine has a seed-separat-ing screen holding frame, seed and pulp outlet and water pipe attach-ment. The capacity of the machine was 2,000 kg/h of tomatoes.
Materials and MethodsThe Chilli seed extraction ma-
chine consisted of a feed hopper, beater with auger assembly, concave with cover, stand and electric motor as shown in the Fig. 1.
The concave was made of 3 mm thick mild steel with 230 mm depth and 270 mm width and 850 mm length. A cover having the same dimensions was hinged to one edge of the concave assembly for easy opening and closing. A shaft of 20
mm diameter was housed inside the concave and mounted on bearings at both ends. Beaters of 6 mm thick-ness with 851 mm length and 25 mm width numbering 45 were fixed on the periphery of the shaft at 90 degrees at a predetermined interval in the helical fashion in order to en-able forward movement of the mate-rial as the seed were extracted by beating action. A screw auger was fixed on both ends of the shaft for the length of 30 cm for easy convey-ance of the material. The equipment was powered by 1 hp single-phase electric motor and the power from the motor was transmitted through a belt to beater.
Design of the Shaft:
hp = ,
wherehp is the horse power of motor
(0.5 hp),T is the Torque in kg-m, T = (T1 -
T2) R, andT = 0.511 kg-m, andN is the speed, rpm (700 rpm).T1 - T2 = 10.22 kg ........................(1)
where T1 and T2 are tensions on the tight side and slack side respective-ly, kg, and R is the radius of pulley (0.05 m).
Also, = eμ θ ,
where
μ = coefficient of friction between belt and pulley (0.3), and
θ = angle of lap of belt, radians (П radians).
= 2.57 ....................................(2)
Solving Equations (1) and (2), T1 = 16.7 kg and T2 = 6.5 kg.
M = Bending moment acting on shaft, kg-cm, and
M= (T1 + T2 + W) L = 423 kg cm, where
W= weight of pulley, kg (5 kg), and
L =distance between pulley and bearing, cm (15 cm).
Te = √ (Km x M) 2 + (Kt x T) 2,where
Km = combined shock and fatigue factor for bending for gradually ap-plied load (1.5), and
Kt = combined shock and fatigue factor for torsion for gradually ap-plied load (1.0).
Te = 636.55 kg-cm.
Also, Te = fsd3,
wherefs is the allowable shear stress for
mild steel shaft (350 kg/cm2),d is the diameter of shaft, cm, andd = 2.0 cm.The dried Chilli fruit fed through
the feed hopper was subjected to the beating action of the beaters and macerated into pieces without cell rupture and, there by, the seeds were
Peripheral speed, m/min
Extraction efficiency, %
85
90
95
10080 kg/h
60 kg/h
50 kg/h
560520480
50 kg/h60 kg/h80 kg/h
Peripheral speed, m/min
Brokens, %
0
2
4
6
8
1080 kg/h
60 kg/h
50 kg/h
560520480
50 kg/h60 kg/h80 kg/h
Fig. 2 Seed extraction efficiency with differentperipheral speeds at indicated feed rate
Fig. 3 Percentage of brokens at differentperipheral speeds at indicated feed rate
2∏NT4500
T1T2
T1T2
∏16

VOL.37 NO.4 2006 AGRICULTURAL MECHANIZATION IN ASIA, AFRICA, AND LATIN AMERICA48
separated from the fruits. The seeds were separated through separate outlet. Seed extraction was carried out for feed rates of 50, 60, and 80 kg/h and peripheral speeds of 480, 520, and 560 m/min of the beater. For calculation of extraction ef-ficiency and percentage of brokens, the following formulae were used:
E = ,
whereE = Extraction efficiency (%),S1 = Seed coming out of seed out-
let, kg,and
S2 = Seed coming out of skin out-let, kg.
B = Brokens (%) = ,
whereS3 = Broken seeds, kg. According to the International
Standards for seed testing, the top of paper method of germination was adapted for chilli seeds.
Results and DiscussionThe results obtained by testing
the chill seed extractor for differ-ent feed rates and peripheral speeds is illustrated in Figs. 2 and 3. The maximum seed extraction efficiency of 95.5 % was obtained at 480 m/min and at a feed rate of 80 kg/h. The minimum brokens of 3.25 % was obtained at 480 m/min and at a feed rate of 50 kg/h. The maximum breakage of 9.54 % was obtained at
Feed rate, kg/h
Peripheral speed, m/min
Germi-nation, %
480 92.0050 520 91.00
560 91.00480 91.00
60 520 90.00560 90.00480 90.00
80 520 88.00560 85.00
Table 1 Germination of chilli seeds at different feed rates and peripheral speeds
560 m/min and at 80 kg/h. This was due to more speed and higher feed rate. Germination of chilli seeds at different feed rates and peripheral speeds are given in Table 1.
ConclusionsAn optimum peripheral speed of
480 m/min and feed rate of 60 kg/h was selected to obtain a maximum extraction efficiency of 94 % with 91 % of germination.
REFERENCES
Karla, M. S., R. Srivastava, and K. K. Kaul. 1983. Development of to-mato seed extractor J. Agrl. Engg. ISAE, 20(3): 183-186.
Mohanty, S. K., S. K. Nanda, and D. K. Das. 1997. Design, develop-ment and testing of low-cost veg-etable seed extraction machine. Agricultural Mechanization in Asia, Africa and Latin America, 28(4): 53-56.
Nicholos, L. 1971. A machine for vegetable seed extraction. J. Agrl. Engg. ISAE, 8(3): 87-91.
Pruthi, J. S. 1993. Major spices of India, Crop management and Post Harvest Technology, ICAR, New Delhi: 180-181.
■■
S1S1 + S2
S3S1 + S2

AGRICULTURAL MECHANIZATION IN ASIA, AFRICA, AND LATIN AMERICA 2006 VOL.37 NO.4 49
Design and Fabrication of a Small-Scale Fruit Picker of Adjustable Height
byMohamad I. Al-WidyanAssociate ProfessorDepartment of Byosystems Engineering- Faculty of Enginnering,Jordan University of Science and Technology,P.O. Box 3030, Irbid [email protected]
Ahmad H. HajeerFormerly Undergraduate StudentsDepartment of Byosystems Engineering- Faculty of Enginnering,Jordan University of Science and Technology,P.O. Box 3030, Irbid 22110JORDAN
Hind M. Al-QutobFormerly Undergraduate StudentsDepartment of Byosystems Engineering- Faculty of Enginnering,Jordan University of Science and Technology,P.O. Box 3030, Irbid 22110JORDAN
AbstractA fruit picker with adjustable
height for picking t ree-top and high-to-reach fruits was designed and fabricated. It can pick high fruits of most common tree varieties and weighs about 5 kg. Limited field trials indicated that the picker sat-isfactorily controlled the height, yet was made of simple components. Its low cost of about US$ 100 makes it economical for reducing losses due to unpicked fruits and injuries resulting from primitive means of fruit picking. The device is also multi-purpose; it can be used for other small-scale operations includ-ing pruning and spraying by fitting the appropriate attachment.
IntroductionHarvesting of fruits is an impor-
tant operation in agricultural prac-tice. Economics as related to time-liness, competition for labor, and good market prices have pushed for mechanization of almost all agri-cultural operations. In fruit harvest-ing, most of the efforts have been devoted to large-scale operations yet with limited success. However, it seems that very little attention has been given to small-scale fruit har-vesting including small farms typi-cal of most developing countries, in addition to the all-popular home gardens.
In the developing countries, due to the unavailability of an adequate machine, people have devised and adapted different ways to pick their fruits including hand picking, us-ing a ladder, using a pole to hit the fruits, or using a barrel in an attempt to reach high tree-top fruits. Obvi-ously, these primitive methods are inefficient and, more importantly,
inflict substantial loss to fruit qual-ity as well as trees due to inevitable injuries. Moreover, relevant agen-cies report numerous incidents of injuries to people falling from trees with young children and old people being the most vulnerable. In many cases, the other most common al-ternative is to leave the unreachable portion of fruits un-picked. Clearly, this latter portion is counted as loss to the farm or garden, which can be substantial to a family’s income and when considered at the national level.
The traditional and most popular mechanized means for fruit harvest-ing is by shaking. This method, in addition to being expensive to most small farmers and home garden-ers, has proven to be harmful to trees, especially in regions where trees have shallow root zones as in Jordan. Consequently, this work is an attempt to make available a

VOL.37 NO.4 2006 AGRICULTURAL MECHANIZATION IN ASIA, AFRICA, AND LATIN AMERICA50
simple, reasonably priced, f lexible and effective piece of equipment that would suit mainly the fruit harvesting of small farms and home gardens.
Materials and MethodsDesign Considerations
The basic criteria considered in the design of this device included:
1. Easy to use and handle,2. Reasonably priced,3. Convenient in the sense that it
is extendable and flexible,4. Rugged yet light-weight,5. Operated by DC power (bat-
tery) for mobility,6. Simple modification would be
sufficient to convert it into an efficient manual operation,
7. Multi-purpose, and8. Simple design so that it can be
fabricated locally.The component selection was
based on a set of assumptions based on estimation and testing. In select-ing the gear-motor assembly, it was assumed that the gear would be subjected to and capable of carrying a load of 50 N, which was estimated from the weight of the moving bar. Thus, the DC motor should provide enough torque to move this load. From the gear specif ication and desired speed the motor power was calculated.
The pruner (cutter) and cutting cord were chosen based on experi-mental measurement of the shear force required to cut numerous fruit varieties. A special attachment de-
signed for this purpose (Fig. 1) was attached to an Instron Universal Testing Machine (UTM). The stems of several popular fruit varieties were placed in the attachment and the UTM was operated. The results are shown in Table 1.
Constructional DetailsThe major components of the
picker include a DC Motor-driven extendable bar enclosed in a main frame bar, an extension mechanism, a cutting mechanism and head with a flexible basket for fruit collection. An overall view and details of the device are shown in Figs. 2 and 3. Following is a detailed description of the device parts:
The Main Frame: This is simply a fixed rugged, light-weight U-beam to which other components are at-tached.
The Extendable Bar: is a bar en-closed within the frame bar with a rack grooved on its upper side. The extendable bar extends inward or outward relative to the frame bar, thus, providing for variable length (height) of the device. It moves over rollers to minimize friction and pro-vide stability.
The Extension Mechanism: con-sists of a DC motor, which drives a gear that is permanently meshed to
the rack of the extendable bar. The motor is hooked to a switch that can reverse the direction of rotation of the motor to allow for the extension or retraction of the extendable bar.
The Cutting Head: includes a spring-loaded cutter (conventional pruner) that is normally open. The rear end of the cutter is connected to the user by a cord that can be pulled against the spring to effect the cut-ting.
The Collection Basket: the basket is placed under the cutter to receive harvested fruits. It is attached to the frame by a f lexible joint so that it receives the harvested fruits. This aspect adds the advantage of mini-mal or even no fruit damage upon harvesting.
Finally, the picker is equipped with a flexible belt for ease of use and safety. The device was fabri-cated in the Engineering Workshops at Jordan University of Science and Technology (J.U.S.T.).
Results and DiscussionThe picker proved to provide
excellent and smooth control over the desirable height to be reached. Assuming an average user height of 1.65 m, the picker can be utilized
Tree typeMax.cutting shear force required, N
Approx. stem dia-
meter, mmApples 35.4 4.4Apricots 36.5 4.9Citrus 49.2 4.4Peaches 62.3 4.9Pears 97.7 5.4
Table 1 Measured values of the maximum shear force required for cutting different fruit stems along with measured stem diameter
Fig. 1 The attachment used withthe instron testing machine
Fig. 2 The detailed view ofpicker main components

AGRICULTURAL MECHANIZATION IN ASIA, AFRICA, AND LATIN AMERICA 2006 VOL.37 NO.4 51
to reach fruits at 4 to 5 meter high. This height includes almost all fruit varieties that are common locally.
According to the experimental tests, the maximum shear force re-quired for cutting the stems of the fruits of most local varieties fell within 100 N. Consequently, the spring of the cutting mechanism was selected with a constant of 4,000 N/m assuming the spring will extend (depress) at least 2.5 cm. Further, the material of the cutting cord was plastic with 5 mm diam-eter.
Based on the estimated load of 50 N on the gear and a desirable linear speed of 15 cm/sec, the motor should provide 10 watts. Including a safety factor of 2 for stability and to account for friction effects, a motor that secured more than 20 watts was selected. Aluminum with a modulus of elasticity of 71 GPa was selected to make the gear, frame, and rack to satisfy the criteria of rugged and light-weight device. The bending effect of extending the bar was ac-counted for.
The elementary cost assessment of the technical personnel at the Engineering Workshops at J.U.S.T. indicated that the device costs about
Fig. 3 Overall view of the picker show-ing the holding belt and cutting cord
US $100, which is within the finan-cial capacity of almost all Jordanian households and farmers.
Conclusions and Recom-mendations
Based on preliminary search and observations, making a fruit picker available with adjustable height fills a gap and fulfills a need. Prelimi-nary tests showed that the device is simple yet effective. Testing also showed that the device performed satisfactorily and will make a suit-able tool for cut ting almost all losses of tree-top and high-to-reach fruits for the majority of fruit vari-eties common in Jordan. The cost of the device of about US$ 100 makes it affordable to almost all Jordanian home gardeners and farmers. The device is equipped with a f lexible belt for convenience and can also be utilized for pruning and spraying simply by attaching the appropriate tool at the end instead of the cutter. A sound quantitative study of losses suffered by small farmers due to leaving high fruits unpicked in ad-dition to statistics on injuries due to attempts to hand-pick them is needed.
REFERENCES
Thompson, B. 1984. How to grow fruits, nuts, and berries. Lane Publishing Co.
Sitkei, G. 1986. Mechanics of Agri-cultural materials. Elsevier Pub-lishing Co., Hungary.
Timothy, G. Hand-held fruit picker tool. U.S. Patent and Trademark Office, Patent No. 5,937,626.
Kepner, R. A., R. Bainer, and E. Barger. 1984. Principle of farm machinery. AVI Publishing Co., Inc.
■■

VOL.37 NO.4 2006 AGRICULTURAL MECHANIZATION IN ASIA, AFRICA, AND LATIN AMERICA52
Non Polluting Pesticide Application Windows forFruit Orchards in South Central Chile
byEdmundo J. HetzProfessorFaculty of Agricultural Engineering,University of Concepción,P.O. Box 537, Chilá[email protected]
Marco A. LópezAssistant ProfessorFaculty of Agricultural Engineering,University of Concepción,P.O. Box 537, ChilánCHILE
Fernando A. VenegasProfessorFaculty of Agronomy,University of Concepción,P.O. Box 537, ChilánCHILE
AbstractThe objectives of this research
work were to establish non pollut-ing pesticide application windows (PAW) for apple, kiwi, red raspberry and blueberry orchards located in the provinces of Linares, Ñuble and BioBio, in south central Chile; and to compare them with the time de-mands of the annual spraying sched-ules, with the effective work capac-ity (EWC) of the foggers available, and with the area of the orchards. In order to achieve these objec-tives, four long term meteorological data bases including daily rainfall, wind speed, temperature and rela-tive humidity were probabilistically processed. Criteria conforming to an appropriate day for spraying (PAW) each of the orchard species were agreed upon and applied to the daily data bases. The results showed that, in general, there was enough time to carry out these applications,
since the annual means go from 15.7 to 19.0 days/month for raspberry and kiwi orchards, respectively. The months with the larger number of appropriate days are March and April, with 22.8 and 22.7 days for kiwi orchards; however, this time is much smaller in January and Febru-ary (11.5 and 12.9 days for raspberry orchards) due to high temperatures and wind speed and in the months of May (15.0 days for blueberry orchards), June and July (14.5 days and 15.1 days for apple orchards) due to high rainfall and wind speed. The comparison of the application schedules with the magnitude of the PAW shows an adequate relation-ship. Given the magnitude of the PAW, the EWC (0.36-0.98 ha/h) of the foggers and the area of the ma-jority of the orchards, it can be con-cluded that the applications can be carried out in a timely way during the existing windows.
IntroductionFruit production in Chile is a very
important agricultural activity giv-ing jobs to thousands of workers and earning millions of dollars in return as export commodities. There are about 235.000 hectares planted with fruit orchards, of which 39,700 hectares are covered by apple trees (Malus domestica)); 7,400 by kiwi
Acknowledgements: The authors are indebted with the Research Di-vision of the University of Concepción, Chile, which financed this work through Project Nº 201.131.001.1.0. Thanks are also due to Miss Susana Sepúlveda, Miss Loreto Moreno, Messrs. Marco González and Mau-ricio Saavedra, who carried out most of the field work, and to the Agricultural Research Institute and the General Division of Waters for the access to their meteorological data bases.

AGRICULTURAL MECHANIZATION IN ASIA, AFRICA, AND LATIN AMERICA 2006 VOL.37 NO.4 53
(Actinidia deliciosa); 5,500 by red raspberry (Rubus idaeus) and 2,000 by blueberry (Vaccinium sp), espe-cially in the south central part of the country (INE, 2002).
To be successfull in fruit exporta-tion it is all important to offer very high quality products, free of any plague or disease. This is achieved through the rational use of pes-ticides, applying the concepts of Good Agricultural Practices, which are all the actions utilized in the production, processing and trans-port of foods in order to offer prod-ucts of high quality, produced with minimum environmental impact, and preventing contamination to workers and consumers (FAO, 1996; ACHS, 1994; SAG, 1996). The spraying of pesticides must be carry out according to the standards set
up in the Green Code, which states that the objectives are to protect the consumers of products treated with pesticides, to provide for the safety of all the persons related to the productive process, and to avoid the pollution of the environment, protecting wildlife, soil, water and air (MAFF, 1998).
In order to achieve efficacious, non polluting, pesticide applications it is necessary to verify that foggers are in optimum mechanical working conditions, generating droplets with a volume median diameter of 200 to 400 microns to avoid evaporation, drift and runoff from the target. The foggers should be operated at 4 to 8 bar pressure, with nozzles whose number, location and flow, in com-bination with the calculated travel speed, will assure the recommended
litres per hectare. The droplets are to be transported by a wind f low and direction that is appropriate to the size of the sprayed trees, aim-ing at a 20-30 % target coverage if the pesticide is of the systemic type, or a 40-50 % target cover-age if the pesticide is of the contact type (Matthews, 2000; Wilkinson et al, 1999; Baldoin, 2001; Fox et al, 1993).
However, atmospheric conditions are often such that the performance of the sprayers is very negatively affected causing loss of the chemi-cal product, low plague control efficaccy and efficiency, severe pol-lution, acid rain, phytotoxicity and operator's health hazzard. Among these factors are rainfall, wind, air temperature and relative humidity. It has been pointed out by Matthews (2000), Miller et al (2000), Holt-mann and Salyani (1996), Wilkinson et al (1999), Baldoin (2001), Baldoin et al (2001), and FAO (1996) that when certain values are exceeded (rain > 1-3 mm/day; wind speed > 1-4 m/s, temperature > 28-30 ºC, and relative humidity < 40 % or > 95 %), the applications become inefficient and/or polluting due to dilution and product wash down, evaporation and drift. It has been estimated by Riquelme (1997) that these losses range from 25 to 50 % in normal conditions and can reach up to 90 % in dormant trees.
The situation just described has led several authors (Matthews, 2000; Miller et al, 2000; Holtmann and Salyani, 1996; Wilkinson et al, 1999; Magdalena et al, 1997; Bal-doin et al, 2001; Fox et al, 1993) to develop the concept of “Pesticide Application Window” (PAW), which considers all the factors related to an efficaccious application of the chemical product avoiding environ-mental pollution. A PAW is the time period when atmospheric conditions are such that pesticide applications can be carried out with minimum risk of environmental pollution.
Given all the previous consid-
Fig. 1 Monthly mean of hourly temperatures and relative humidity fot the months with the greatest pesticide applications demand in fruit orchards of south central Chile
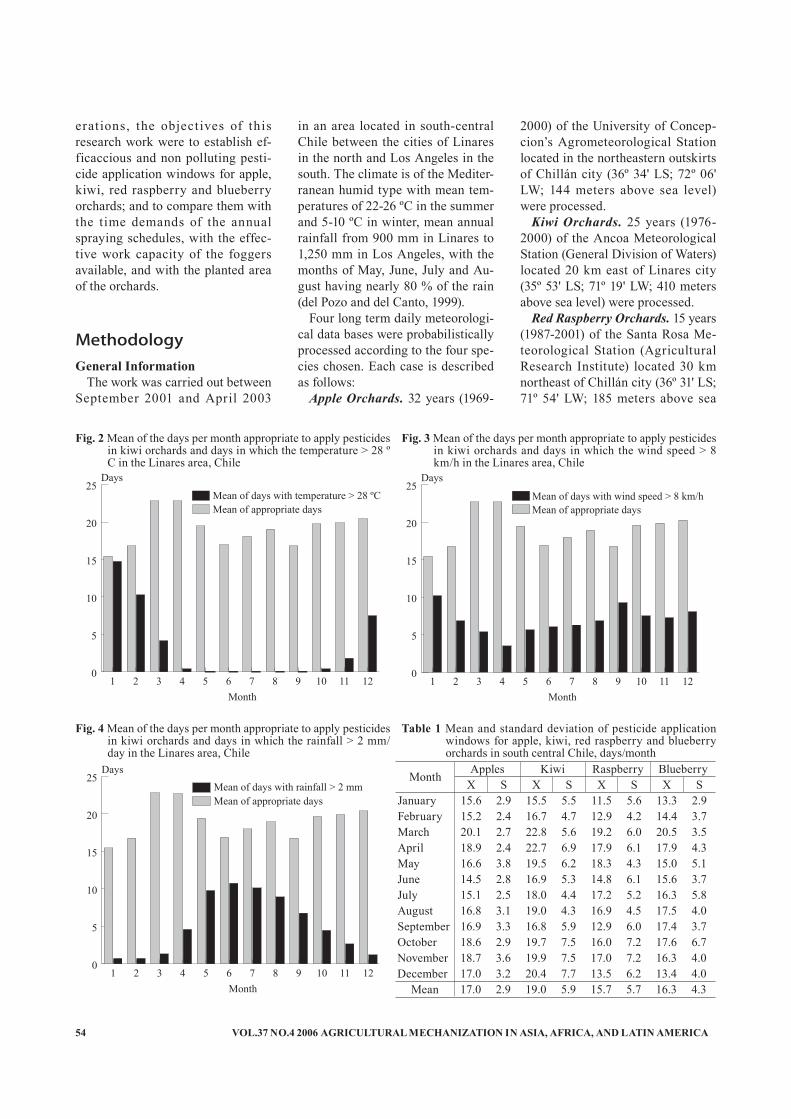
VOL.37 NO.4 2006 AGRICULTURAL MECHANIZATION IN ASIA, AFRICA, AND LATIN AMERICA54
erat ions, the object ives of this research work were to establish ef-ficaccious and non polluting pesti-cide application windows for apple, kiwi, red raspberry and blueberry orchards; and to compare them with the time demands of the annual spraying schedules, with the effec-tive work capacity of the foggers available, and with the planted area of the orchards.
MethodologyGeneral Information
The work was carried out between September 2001 and April 2003
in an area located in south-central Chile between the cities of Linares in the north and Los Angeles in the south. The climate is of the Mediter-ranean humid type with mean tem-peratures of 22-26 ºC in the summer and 5-10 ºC in winter, mean annual rainfall from 900 mm in Linares to 1,250 mm in Los Angeles, with the months of May, June, July and Au-gust having nearly 80 % of the rain (del Pozo and del Canto, 1999).
Four long term daily meteorologi-cal data bases were probabilistically processed according to the four spe-cies chosen. Each case is described as follows:
Apple Orchards. 32 years (1969-
2000) of the University of Concep-cion’s Agrometeorological Station located in the northeastern outskirts of Chillán city (36º 34' LS; 72º 06' LW; 144 meters above sea level) were processed.
Kiwi Orchards. 25 years (1976- 2000) of the Ancoa Meteorological Station (General Division of Waters) located 20 km east of Linares city (35º 53' LS; 71º 19' LW; 410 meters above sea level) were processed.
Red Raspberry Orchards. 15 years (1987-2001) of the Santa Rosa Me-teorological Station (Agricultural Research Institute) located 30 km northeast of Chillán city (36º 31' LS; 71º 54' LW; 185 meters above sea
Month
Days
0
5
10
15
20
25
Mean of appropriate daysMean of days with temperature > 28 ºC
121110987654321
Month
Days
0
5
10
15
20
25
Mean of appropriate daysMean of days with wind speed > 8 km/h
121110987654321
Fig. 2 Mean of the days per month appropriate to apply pesticides in kiwi orchards and days in which the temperature > 28 ºC in the Linares area, Chile
Fig. 3 Mean of the days per month appropriate to apply pesticides in kiwi orchards and days in which the wind speed > 8 km/h in the Linares area, Chile
Month Apples Kiwi Raspberry BlueberryX S X S X S X S
January 15.6 2.9 15.5 5.5 11.5 5.6 13.3 2.9February 15.2 2.4 16.7 4.7 12.9 4.2 14.4 3.7March 20.1 2.7 22.8 5.6 19.2 6.0 20.5 3.5April 18.9 2.4 22.7 6.9 17.9 6.1 17.9 4.3May 16.6 3.8 19.5 6.2 18.3 4.3 15.0 5.1June 14.5 2.8 16.9 5.3 14.8 6.1 15.6 3.7July 15.1 2.5 18.0 4.4 17.2 5.2 16.3 5.8August 16.8 3.1 19.0 4.3 16.9 4.5 17.5 4.0September 16.9 3.3 16.8 5.9 12.9 6.0 17.4 3.7October 18.6 2.9 19.7 7.5 16.0 7.2 17.6 6.7November 18.7 3.6 19.9 7.5 17.0 7.2 16.3 4.0December 17.0 3.2 20.4 7.7 13.5 6.2 13.4 4.0
Mean 17.0 2.9 19.0 5.9 15.7 5.7 16.3 4.3Month
Days
0
5
10
15
20
25
Mean of appropriate daysMean of days with rainfall > 2 mm
121110987654321
Fig. 4 Mean of the days per month appropriate to apply pesticides in kiwi orchards and days in which the rainfall > 2 mm/day in the Linares area, Chile
Table 1 Mean and standard deviation of pesticide application windows for apple, kiwi, red raspberry and blueberry orchards in south central Chile, days/month
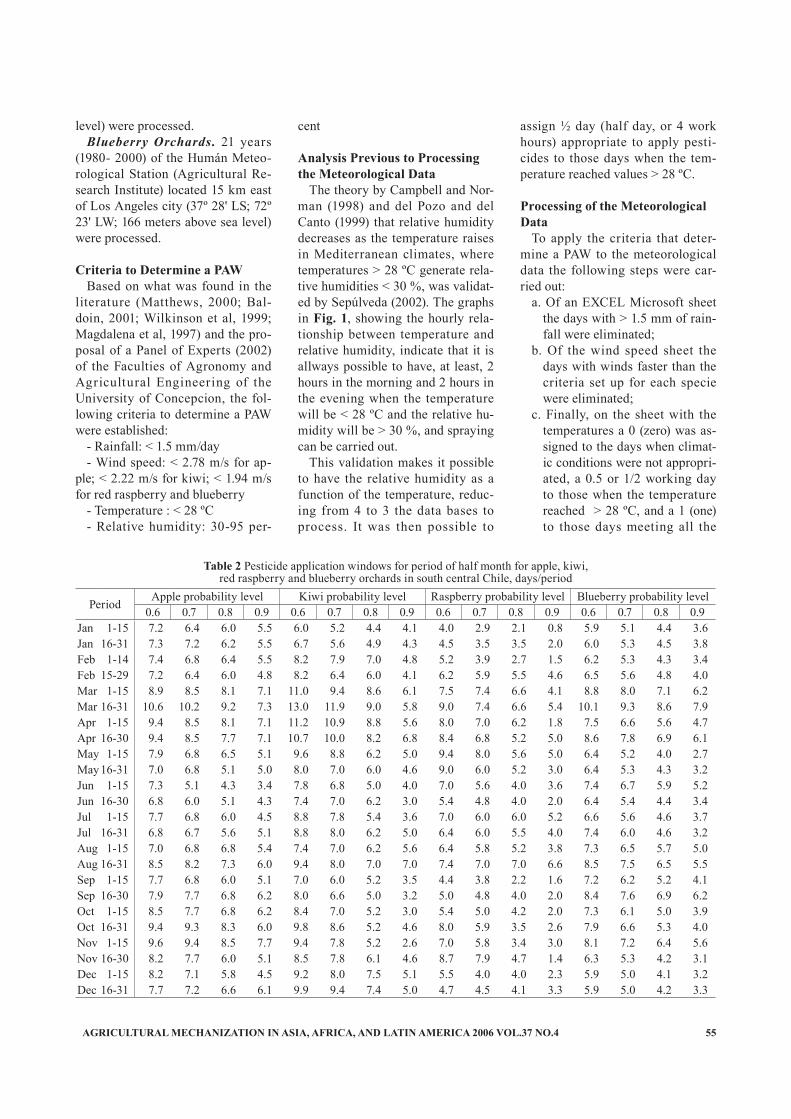
AGRICULTURAL MECHANIZATION IN ASIA, AFRICA, AND LATIN AMERICA 2006 VOL.37 NO.4 55
level) were processed.Blueberry Orchards. 21 years
(1980- 2000) of the Humán Meteo-rological Station (Agricultural Re-search Institute) located 15 km east of Los Angeles city (37º 28' LS; 72º 23' LW; 166 meters above sea level) were processed.
Criteria to Determine a PAWBased on what was found in the
literature (Matthews, 2000; Bal-doin, 2001; Wilkinson et al, 1999; Magdalena et al, 1997) and the pro-posal of a Panel of Experts (2002) of the Faculties of Agronomy and Agricultural Engineering of the University of Concepcion, the fol-lowing criteria to determine a PAW were established:
- Rainfall: < 1.5 mm/day- Wind speed: < 2.78 m/s for ap-
ple; < 2.22 m/s for kiwi; < 1.94 m/s for red raspberry and blueberry
- Temperature : < 28 ºC- Relative humidity: 30-95 per-
cent
Analysis Previous to Processing the Meteorological Data
The theory by Campbell and Nor-man (1998) and del Pozo and del Canto (1999) that relative humidity decreases as the temperature raises in Mediterranean climates, where temperatures > 28 ºC generate rela-tive humidities < 30 %, was validat-ed by Sepúlveda (2002). The graphs in Fig. 1, showing the hourly rela-tionship between temperature and relative humidity, indicate that it is allways possible to have, at least, 2 hours in the morning and 2 hours in the evening when the temperature will be < 28 ºC and the relative hu-midity will be > 30 %, and spraying can be carried out.
This validation makes it possible to have the relative humidity as a function of the temperature, reduc-ing from 4 to 3 the data bases to process. It was then possible to
assign ½ day (half day, or 4 work hours) appropriate to apply pesti-cides to those days when the tem-perature reached values > 28 ºC.
Processing of the Meteorological Data
To apply the criteria that deter-mine a PAW to the meteorological data the following steps were car-ried out:
a. Of an EXCEL Microsoft sheet the days with > 1.5 mm of rain-fall were eliminated;
b. Of the wind speed sheet the days with winds faster than the criteria set up for each specie were eliminated;
c. Finally, on the sheet with the temperatures a 0 (zero) was as-signed to the days when climat-ic conditions were not appropri-ated, a 0.5 or 1/2 working day to those when the temperature reached > 28 ºC, and a 1 (one) to those days meeting all the
Period Apple probability level Kiwi probability level Raspberry probability level Blueberry probability level0.6 0.7 0.8 0.9 0.6 0.7 0.8 0.9 0.6 0.7 0.8 0.9 0.6 0.7 0.8 0.9
Jan 1-15 7.2 6.4 6.0 5.5 6.0 5.2 4.4 4.1 4.0 2.9 2.1 0.8 5.9 5.1 4.4 3.6Jan 16-31 7.3 7.2 6.2 5.5 6.7 5.6 4.9 4.3 4.5 3.5 3.5 2.0 6.0 5.3 4.5 3.8Feb 1-14 7.4 6.8 6.4 5.5 8.2 7.9 7.0 4.8 5.2 3.9 2.7 1.5 6.2 5.3 4.3 3.4Feb 15-29 7.2 6.4 6.0 4.8 8.2 6.4 6.0 4.1 6.2 5.9 5.5 4.6 6.5 5.6 4.8 4.0Mar 1-15 8.9 8.5 8.1 7.1 11.0 9.4 8.6 6.1 7.5 7.4 6.6 4.1 8.8 8.0 7.1 6.2Mar 16-31 10.6 10.2 9.2 7.3 13.0 11.9 9.0 5.8 9.0 7.4 6.6 5.4 10.1 9.3 8.6 7.9Apr 1-15 9.4 8.5 8.1 7.1 11.2 10.9 8.8 5.6 8.0 7.0 6.2 1.8 7.5 6.6 5.6 4.7Apr 16-30 9.4 8.5 7.7 7.1 10.7 10.0 8.2 6.8 8.4 6.8 5.2 5.0 8.6 7.8 6.9 6.1May 1-15 7.9 6.8 6.5 5.1 9.6 8.8 6.2 5.0 9.4 8.0 5.6 5.0 6.4 5.2 4.0 2.7May16-31 7.0 6.8 5.1 5.0 8.0 7.0 6.0 4.6 9.0 6.0 5.2 3.0 6.4 5.3 4.3 3.2Jun 1-15 7.3 5.1 4.3 3.4 7.8 6.8 5.0 4.0 7.0 5.6 4.0 3.6 7.4 6.7 5.9 5.2Jun 16-30 6.8 6.0 5.1 4.3 7.4 7.0 6.2 3.0 5.4 4.8 4.0 2.0 6.4 5.4 4.4 3.4Jul 1-15 7.7 6.8 6.0 4.5 8.8 7.8 5.4 3.6 7.0 6.0 6.0 5.2 6.6 5.6 4.6 3.7Jul 16-31 6.8 6.7 5.6 5.1 8.8 8.0 6.2 5.0 6.4 6.0 5.5 4.0 7.4 6.0 4.6 3.2Aug 1-15 7.0 6.8 6.8 5.4 7.4 7.0 6.2 5.6 6.4 5.8 5.2 3.8 7.3 6.5 5.7 5.0Aug 16-31 8.5 8.2 7.3 6.0 9.4 8.0 7.0 7.0 7.4 7.0 7.0 6.6 8.5 7.5 6.5 5.5Sep 1-15 7.7 6.8 6.0 5.1 7.0 6.0 5.2 3.5 4.4 3.8 2.2 1.6 7.2 6.2 5.2 4.1Sep 16-30 7.9 7.7 6.8 6.2 8.0 6.6 5.0 3.2 5.0 4.8 4.0 2.0 8.4 7.6 6.9 6.2Oct 1-15 8.5 7.7 6.8 6.2 8.4 7.0 5.2 3.0 5.4 5.0 4.2 2.0 7.3 6.1 5.0 3.9Oct 16-31 9.4 9.3 8.3 6.0 9.8 8.6 5.2 4.6 8.0 5.9 3.5 2.6 7.9 6.6 5.3 4.0Nov 1-15 9.6 9.4 8.5 7.7 9.4 7.8 5.2 2.6 7.0 5.8 3.4 3.0 8.1 7.2 6.4 5.6Nov 16-30 8.2 7.7 6.0 5.1 8.5 7.8 6.1 4.6 8.7 7.9 4.7 1.4 6.3 5.3 4.2 3.1Dec 1-15 8.2 7.1 5.8 4.5 9.2 8.0 7.5 5.1 5.5 4.0 4.0 2.3 5.9 5.0 4.1 3.2Dec 16-31 7.7 7.2 6.6 6.1 9.9 9.4 7.4 5.0 4.7 4.5 4.1 3.3 5.9 5.0 4.2 3.3
Table 2 Pesticide application windows for period of half month for apple, kiwi,red raspberry and blueberry orchards in south central Chile, days/period

VOL.37 NO.4 2006 AGRICULTURAL MECHANIZATION IN ASIA, AFRICA, AND LATIN AMERICA56
criteria for a PAW.
Evaluation PeriodsThe calculation of the different
probabilities of occurrence of PAW was carried out for periods of one month and ½ month, given that these are the lengths of the periods most frequently utilized by the producer or the orchard manager to make decisions about spraying. On the other hand, a working day of 8 hours was utilized.
Statistical AnalysisGiven that the weather is a sto-
chastic variable changing from one year to the next, a probability study was performed in the following manner. Once the zeros, 0.5 and ones were assigned to each of the days of the years in the data base, the Accumulated Empirical Prob-abilities Distribution was used to build the corresponding probability distribution. To do this the follow-ing steps were carried out (Canavos, 1988):
a. The number of days appropri-ate to apply pesticides in each period of each year were added up to form observations of the appropriate number of spraying days in each period;
b. The frequencies of spraying days were ordered from largest to smallest;
c. Probabilities were assigned us-ing the rule that the ordered ob-servation k is a measure of the probability (k/(n+1));
d. The number of appropriate days at each probability level was obtained through linear interpo-lation. In this way, a probability of 0.8 represents the minimum number of appropriate days that can be expected to occur in 80 out of 100 years.
Pesticide Application SchedulesThe annual pesticide application
schedules for apple, kiwi, red rasp-berry and blueberry orchards were established for each of their pheno-
logical stages according to the infor-mation presented by AFIPA (1999); ANASAC (2000); SAG (1996) and the Panel of Experts (2002) previ-ously mentioned.
Foggers Available in the MarketThe cadastre created by Sepú
lveda (2002) was utilized. This ca-dastre shows there are 6 registered trade marks with a total of 20 mod-els of foggers, with tanks whose volumes hold from 400 to 2,200 L and pumps with a 75 to 150 L/min flow capacity.
Effective Work Capacity (EWC) of the Foggers
The EWC, in hectares per hour (ha/h), of each model was calculated using the following equation (Ibáñez and Abarzúa, 1995):
EWC = W x V x (1 - Lt) / 10where
W = working width, mV = working speed, km/h
Lt = lost time, decimal fraction10 = conversion factor to obtain
ha/hThe calculation of the EWC con-
sidered the most common planta-tion distances between the rows for apple, kiwi, red raspberry and blue-berry orchards. The working speeds used were 3, 4 and 5 km/h accord-ing to the difficulties presented by the terrain and the amount of foli-age presented by the trees. The lost time was assigned according to the tank capacity of the foggers consid-ering that the bigger the tank the smaller the lost time, in the follow-ing manner: 35 %; 45 %; 50 %; and 60 % of lost time to tank capacities 2,000 L or more; 1,000 L; 700 L; and 400 L, respectively (Ibañez and Abarzúa, 1995; Panel of Experts, 2002).
The size of the orchards, in hect-ares, that can be sprayed timely with the foggers was calculated with the PAW available at the different
Plague, disease or application Application periodPAW size
(days) at 0.5 prob. level
Europian canker July 15.1
Wholly apple aphid, weevils larvae nematodes August, bud break 16.8
Apple scab September 1-15,green tips 8.3
Apple scab, powdery mildew September 16-30,open cluster 8.6
Apple scab October 1-15, pink blossom to king bloom 8.9
Apple scab, powdery mildew, aphids, tussock moth, weevils, moths, mites
October 16-31,fruit set, 1 cm 9.7
Chemical thinning November 1-15,fruit 3 cm 10.0
Apple scab, moths, tussock moth November 16-30,fruit 5 cm 8.7
Apple scab December 17.0
San Jose scale, moth January 15.6
Moths February 15.2
Moths March 20.1
Europian canker April, 50 % leaf fall 18.9
Table 3 Pesticide applications schedule for apple orchards and size ofthe pestcide application window (PAW) in south central Chile

AGRICULTURAL MECHANIZATION IN ASIA, AFRICA, AND LATIN AMERICA 2006 VOL.37 NO.4 57
Make Model Apple Kiwi Raspberry Blueberry
A Smallest 0.7-1.1 0.9-1.3 0.45-0.75 0.45-0.75Largest 1.0-1.6 1.2-1.6 0.59-0.98 0.59-0.98
B Smallest 0.7-1.2 1.0-1.4 0.50-0.83 0.50-0.83Largest 0.9-1.5 1.2-1.6 0.59-0.98 0.59-0.98
C Smallest 0.7-1.2 1.0-1.4 0.50-0.83 0.50-0.83Largest 0.9-1.5 1.2-1.6 0.59-0.98 0.59-0.98
D Smallest 0.6-1.0 0.7-1.0 0.36-0.60 0.36-0.60Largest 0.9-1.5 1.2-1.6 0.59-0.98 0.59-0.98
E Smallest 0.8-1.4 1.0-1.4 0.50-0.83 0.50-0.83Largest 0.9-1.5 1.2-1.6 0.59-0.98 0.59-0.98
F Smallest 0.7-1.3 0.7-1.0 0.36-0.60 0.36-0.60Largest 0.9-1.5 1.2-1.6 0.59-0.98 0.59-0.98
Table 4 Ranges of effective work capacity (ha/h) of foggers in apple, kiwi, red raspberry and blueberry orchards in south central Chile, according to working speed and distance between the row
probability levels. Only the areas to be worked at 0.8 probability level are presented here, given that this is an appropriate level for agricultural decision-taking of this kind.
Results and Discussion Pesticide Application Windows (PAW)
Table 1 presents the average size of the PAW (days) during each month of the year. It can be seen there that the annual mean goes from 15.7 to 19.0 days/month for red raspberry and kiwi orchards, respec-tively, with extremes of 11.5 days for raspberry in January to 22.8 days for kiwi in March. This seems to be a fair amount of time appropriate to carry out the pesticide applications, without causing undue environmen-tal pollution. The smallest PAW oc-curs during the months of January and February (extremes of 11.5 and 12.9 days for raspberry) due to high temperature and wind speed, as it is shown for kiwi orchards in Figs. 2 and 3, and in the months of May, June and July due to high rainfall and some wind, as it is shown, also for kiwi orchards, in Figs. 3 and 4. On the other hand, the largest PAW occurs during the months of March (22.8 days) and April (22.7 days) when the air temperatures are lower, the Autumn-Winter rains have not
started and the wind speeds are low to moderate (del Pozo and del Canto, 1999). These PAW are espe-cially large for apple orchards with 22.8 days in March and 22.7 days in April.
Table 2 show the sizes of the PAW for periods of half month for the different fruit orchards at four probability levels. It is also seen there that, in general, there are fair amounts of t ime appropriate to carry out non polluting pesticide ap-plications. It should be emphasized that as the probability level goes up from 0.6 to 0.9 the sizes of the VAP decrease notably, which is due to the concept of probability and how it is calculated (Canavos, 1988). This is especially true for red raspberry orchards during the first halves of January, February, September and November.
Relationship between Effective Work Capacity (EWC) of the Fog-gers, the PAW and Size of the Or-chards
Table 3 presents, as an example, the pesticide application schedule for apple orchards and the sizes of the PAW associated with each control. It should be pointed out that these schedules are subject to changes from one year to the next according to the occurrence of cli-matic conditions that dominate each growing season. In this schedule it
is possible to see that most of the applications are to be carried out from September to January, that is from the beginnig of green tips until the accelerated development of the fruit. Among the plagues and dis-eases that attack the Royal Gala and Granny Smith apple varieties are apple scab, San Jose scale, moths, and mites. The permanent presence of Apple scab through all the devel-opment period of the fruit, from the first half of September to December, is emphasized.
Effective Work Capacity (EWC) of the Foggers, PAW Sizes, and Areas of the Orchards
Table 4 shows that the EWC of the foggers available goes from 0.36 to 0.98 ha/h, according to the model size, row distances for the 4 species, and forward speed. Given these factores, the smallest EWC of 0.36 ha/h is obtained with the small-est model which has the largest lost time due to the small capacity of its tank, only 400 L, at the lowest for-ward speed of 3 km/h, in raspberry and blueberry which have only 3 m of distance between the rows.
Table 5, on the other hand, shows the areas of the orchards that can be sprayed in the worst situation; that is, with the model with the smallest EWC and at the recomended prob-ability level of 0.8 insuring that the task will be carried out on time. The 0.8 probability level insures that in 8 out of 10 years the task will be performed timely; in the other 2 years it may be necessary to work more than 8 hours daily. Table 5 shows that, in general, the areas of the apple and kiwi orchards that can be worked in these conditions are larger than 20 hectares; in the case of raspberry and blueberry orchards the areas that can de sprayed timely are, in most cases, larger than 10 hectares. On the other hand, the National Statistics Institute (INE, 2002) has established that there are few red raspberry and blueberry orchards in Chile with areas larger

VOL.37 NO.4 2006 AGRICULTURAL MECHANIZATION IN ASIA, AFRICA, AND LATIN AMERICA58
Period Apple Kiwi Raspberry BlueberryJan 1-15 29-48 26-32 6-10 12-21Jan 16-31 30-50 29-35 10-17 13-22Feb 1-14 31-51 42-50 8-13 12-21Feb 15-29 29-48 36-43 16-26 14-23Mar 1-15 39-65 52-62 19-32 20-34Mar 16-31 44-74 54-65 19-32 25-41Apr 1-15 39-65 60-72 18-30 16-27Apr 16-30 37-62 49-59 15-25 20-33May 1-15 31-52 37-45 16-27 11-19May16-31 25-41 36-43 15-25 12-20Jun 1-15 21-34 30-36 11-19 17-28Jun 16-30 25-41 37-45 11-19 13-21Jul 1-15 29-48 32-39 17-29 13-22Jul 16-31 27-45 37-45 17-29 13-22Aug 1-15 33-54 37-45 15-25 16-28Aug 16-31 35-59 42-50 20-34 19-31Sep 1-15 29-48 31-37 6-11 15-25Sep 16-30 33-54 30-36 11-19 20-33Oct 1-15 33-54 31-37 12-20 14-24Oct 16-31 40-66 31-37 10-17 15-25Nov 1-15 41-68 31-37 10-16 18-31Nov 16-30 29-48 37-44 13-23 12-20Dec 1-15 28-46 45-54 12-19 12-20Dec 16-31 35-58 44-53 12-20 12-20
Table 5 Ranges of sizes (ha) of the apple, kiwi, red raspberry and blueberry orchards in south central Chile that can be timely sprayed with the smallest fogger, at 0.8 probability level
than 10 hectares. Timeliness prob-lems could arise in raspberry or-chards larger than 8 hectares during the first half of January, February and September when the pesticide application schedule for this species demands the spraying of products. Producers of red raspberry would be wise to purchase a sprayer model larger than the smallest one avail-able.
ConclusionsThere are appropriate size non
polluting pesticide application win-dows for apple, kiwi, red raspberry and blueberry orchards in south central Chile. The largest size win-dows occur during March and April and the smallest size windows occur during the months of January and February and May, June and July. The probability analysis of number of days appropriate to carry out non
polluting spraying in these orchards shows smaller numbers at higher probability levels (0.8; 0.9), espe-cially during the months of June and July.
The individual Effective Work Capacity of sprayers available in Chile is appropriate to timely carry out the annual demands of the spraying schedules, considering the area of the great majority of the orchards and the size of the estab-lished windows. The worse situation occurs in red raspberry orchards during the first halves of January, February and September.
REFERENCES
ACHS. 1994. Risk prevention man-ual in the use of pesticides. Chil-ean Safety Association. Santiago. (Spanish)
AFIPA. 1999. Phytosanitary Manu-al. National Association of Manu-
facturers and Importers of Phytos-anitary Products. Santiago, Chile. (Spanish)
ANASAC. 2002. Phytosanitary Manual National Agricultural and Commercial Inc. Santiago, Chile. (Spanish)
Baldoin, C. 2001. User’s guide for the antiparasitary treatment ma-chines. Università di Padova, Ita-lia. (Italian)
Baldoin, C., F. Amista, S. Berla, and A. Zelante. 2001. Quality of dis-tribution, drift and ground losses from four low-volume orchard sprayers on apple. Parasitica 57 (1-2-3): 115-125.
Campbell, G. and J. Norman. 1998. An introduction to environmental biophysics. Springer Verlag, New York, USA.
Canavos, A. 1988. Probability and statistics; applications and meth-ods. McGraw-Hill, México. (Span-ish)
Del Pozo, and A y P Del Canto. 1999. Agroclimatic areas and production systems of the VII y VIII Regions. INIA, CRI Quilamapu, Chillán, Chile. (Spanish)
FAO. 1996. International code of conduct for the distribution and utilization of pesticides. Rome, Italy.
Fox, R., D. Reichhard, R. Brazee, C. Krause, and F. Hall. 1993. Down-wind residues from spraying a semi-dwarf apple orchard. T of the ASAE 36(2): 333-340.
González, M. 2002. Pesticide appli-cation windows for kiwi orchards in the Linares area. Agricultural Engineer thesis. University of Con-cepción, Chillán, Chile. (Spanish)
Holtmann, W. and M. Salyani. 1996. Spray deposition on citrus cano-pies under different meteorological conditions. T of the ASAE 39(1): 17-22.
Ibáñez, M. and C. Abarzúa. 1995. Work capacity and field efficiency of agricultural machines. Univer-sity de Concepción, Agricultural Engineering Faculty, Ext. Bull. Nº35. Chillán; Chile. (Spanish)

AGRICULTURAL MECHANIZATION IN ASIA, AFRICA, AND LATIN AMERICA 2006 VOL.37 NO.4 59
INE. 2002. National master agricul-tural survey. National Statistics Institute. Santiago, Chile. (Span-ish)
MAFF. 1998. Green Code; Code of Practice for the Safe Use of Pes-ticides on Farms and Holdings. HMS Stationary, London, Eng-land.
Magdalena, J., A. di Prinzio, S. Behmer, and C. Ayala. 1997. Fac-tors affecting the application of agrochemicals in fruit orchards. Proceed. of the II Chilean Agri-cultural Engineering Congress:1-41p. University of Concepción, Chillán. (Spanish)
Matthews, G. A. 2000. Pesticide Ap-plication Methods. Blackwell Sci-ence. London, England.
Miller, D., T. Stoughton, W. Steinke, E. Huddleston, and J. Ross. 2000. Atmospheric stability effects on pesticide drift from an irrigated orchard. T of the ASAE 43(5): 1057-1066.
Riquelme, J. 1997. Optimization of pneumatic spraying with a ma-chine in arc in high density apple orchards. Doctoral thesis. Madrid Polytechnic University (ETSIA), Spain. (Spanish)
SAG. 1996. Agricultural Pesticides Manual. Agricultural and Animal
Husbandry Service. Santiago, Chile. (Spanish)
Sepúlveda, S. 2002. Pesticide appli-cation windows for apple orchards in central Ñuble. Agricultural En-gineer thesis. University of Con-cepción, Chillán, Chile. (Spanish)
Wilkinson, R., P. Balsari, and R. Oberti. 1999. Pest control equip-ment. IN: CIGR/ASAE Hand-book of agricultural engineering: 269-310 p. ASAE, USA.
■■
oped and demonstrated on a limited scale at different places. There is no doubt these pieces of equipment are labour and cost saving and will defi-nitely make sugarcane cultivation more profitable in addition to reduc-ing human drudgery. There is a need for concerted efforts by different or-ganisations including sugar industry, State Agricultural Universities, Re-search Organisations, Cane depart-ments, etc. for popularising these machines. All these useful time, labour and cost saving devices can be taken to the farmer fields with the joint efforts of all those involved in the pursuit of increasing sugarcane
productivity. Suitable liaison with the implement manufacturing indus-tries must be developed and proto-types be fabricated and demonstrated on a large scale in order to create awareness among the farmers. Later on, private entrepreneurs could be encouraged to provide these useful machines to the farmers on custom hiring service basis.
The next phase of revolution in Indian agriculture is bound to come through the use of improved agri-cultural machinery adapted to local conditions. Concerted efforts are required to formulate a strategy for mechanising sugarcane production
in India with the sole aim of increas-ing production and productivity per unit time, area and input at reduced cost of unit operation. This is a must if we survive in the highly competi-tive international sugar market.
■■
(Continued from page35)
Recent Developments in Sugarcane Mechanisation in India

VOL.37 NO.4 2006 AGRICULTURAL MECHANIZATION IN ASIA, AFRICA, AND LATIN AMERICA60
Performance Evaluation of an Evaporative Cooling System for Fruits and Vesitable Storage in the Tropics
byF. A. BabarinsaEngineerNigerian Stored Products Research Institute,P.M.B. 1489, IlorinNIGERIA
AbstractA brick walled evaporative cooler
was tested, without loading, to in-vestigate the potential for preserv-ing fruits and vegetables under a semi-arid climate. The cooler is a rectangular double-walled structure enclosing a chamber of 1.38 m3 ca-pacity. Each double wall of burnt bricks enclosed an interspace filled with water saturated riverbed sand. The test assessed the capacity of the cooler for generating a storage atmosphere of reduced temperature and elevated relative humidity in the enclosed chamber.
Air temperature and relative hu-midity within the unloaded chamber f luctuated with changes in local climatic conditions. The cooler had an average cooling efficiency of 69 % on a typical cold dry day and ef-fected reductions in temperature to 1.5 and 10.0 ºC when respective temperatures were 14.0 and 26.0 ºC. On a hot dry day, the average cooling efficiency was 71 % and reductions in temperature to 8.0 and 12.5 ºC were achieved at ambient temperatures of 26.5 and 35.0 ºC
respectively. The cooling chamber's relative humidity was consistently raised to between 82 and 100 %. The cooler extended the shelf life of stored tomatoes by 10 days
IntroductionThe enormous post harvest losses
of fruits and vegetables which occur in the tropics can be attributed to a general lack of adaptable storage fa-cilities. An effective storage facility should avoid the adverse effects of the hot and dry tropical climate on these commodities.
Storage temperatures and relative humidity requirements of various tropical commodities (IIR, 1967; ASHRAE, 1978; and The Packer, 1988) are given in Table 1. Most documented recommendations (Ta-ble 1) include 0 ºC but some tropi-cal fruits such as bananas, pawpaw and avocado cannot be stored below 12-15 ºC without incurring losses through “chilling injury” (Jamieson, 1981). Relative humidity from 85 % to 95 % is generally recommended. To be acceptable, the storage facility
should also be economically feasible and fit the production system of small-scale producers and traders, particularly in the developing coun-tries.
In meeting these basic require-ments, the application of a passive cooling system, as an alternative to mechanical refrigeration, is becom-ing more relevant to the needs of perishable commodity storage. Sim-ple evaporative coolers constructed of cheap and readily available mate-rials have been developed for low-cost preservation of perishable com-modities. Gundry’s cooling method (Gundry, 1948) consists of wetted charcoal which is cooled without electricity. Those of Hall (1975) and Thompson and Kasmire (1981) em-ployed fans for drawing air through wetted wall surfaces of charcoal and aspen pads respectively. The “zero energy cool chamber” (Roy and Khurdiya, 1985) consists of double walls of bricks interspaced by moist sand. The practical applications of this and other simple low-cost cool-ing devices have been thoroughly discussed by Sharma and Rathi (1991).

AGRICULTURAL MECHANIZATION IN ASIA, AFRICA, AND LATIN AMERICA 2006 VOL.37 NO.4 61
This paper investigates the effec-tiveness of a brick walled evapora-tive cooler (Babarinsa and Nwang-wa, 1988 and Babarinsa, 1990) for generating a storage atmosphere that will extend the shelf-life of fruits and vegetables in Kano, Nigeria.
Kano is climatically typical of a semi-arid zone and the cooler effec-tively prolonged shelf life of carrot there (Babarinsa et al, 1997).
Materials and MethodThe Cooling SystemDescription of the Brick Walled Cooler
The evaporative cooler under test (Fig. 1) consisted of a double-walled rectangular brick construction with the interspace filled with riverbed sand saturated with water. The clay brick used in the wall construction was factory baked (at 600 ºC) and was of dimensions 25.5 cm x 12.0
cm x 6 cm thick. The sand was pervious to water. The water used was clean and free of foreign matter so as to maintain perviousness and avoid clogging of the sand.
The interior surfaces of the cool-ing chamber walls were given a smooth finish with 1.2 cm thick ce-ment plaster, while a heat insulating cover of 1.9 cm thick particleboard closed the top. The walls were built on a short plinth of concrete to pre-vent water seepage into the soil. Two framed doors of sawn wood were fixed one to each of the adjacent walls on a side to provide access to the 1.38 m3 capacity chamber. These two doors were considered adequate for the needed thermal insulation against heat influx but an additional polystyrene foam board could be in-stalled for more insulation. The per-manent structure was erected in an open space exposed to free air but shaded from direct solar radiation with an open sided shed of thatch.
Operation of the SystemIndirect evaporative cooling has
two stages. The first stage is direct evaporative cooling whereby ambi-ent air passing over the wetted (out-er) surface is cooled. This results in continuous evaporation of moisture from the wall surface to the ambi-ent f lowing air and the latent heat of vaporization is extracted from the water-saturated sand. This stage thus involves simultaneous heat and mass transfer from the wet sand to the ambient atmosphere through the porous wall.
Cooled wet sand cools the inner chamber air by conduction in the second stage and the internal air temperature is reduced and the air relative humidity is raised simulta-neously.
Performance IndexThe maximum possible tempera-
ture reduction that can be achieved in the chamber is that given by the "wet bulb depression" (defined as the difference between the ambient
Commodity Tempreature,ºC r.h.,% Expected
shelf lifeInformation source Ref number***
Avocado 7-13 85-90 2-4 weeks 14-13 2-4 weeks 221.1 3
Banana 21.1 95 2green* 14.4-17.8 3coloured** 11.5-14.5 90-95 10-20 days 1
13-16 85-90 5-10 days 1Cucumber 7-10 90-95 up to 2 weeks 1
12 85-95 2 weeks 1Eggplant 7-10 85-90 10 days 1Grapefruit 4-16 4 weeks 2
12.8-14.4 30 85-90 1
10-15.5 85-90 3-12 weeks 1Lemon 0-14 1-6 months 2
12.8-14.4 3green* 11-14.5 85-90 1-4 months 1coloured** 4-10 85-90 3-6 months 1
Lime 12.8 39-10 85-90 3 weeks 1
Mango 13 2-3 weeks 28-10 85-90 up to 4 weeks 112.8 3
Orange 0-9 3-12 weeks 20-1 85-90 2-3 months 1
5.5-7 85-90 up to 18 weeks 10-7.2 3
Pawpaw 4-10 85-90 2-5 weeks 112.8-18.3 3
Pumpkin 10-13 70-75 2-6 months 112.8 1-3 weeks 3
Tomato 13.8-21 3coloured** 7 85-90 2 weeks 1green* 11.5-13 85-90 3-5 weeks 1
Table 1 Storage and relative humidity requirementsfor some tropical fruits and vegetables
*Fruits at mature green stage**Firm fruit with skin colour developed to level acceptable for consumption or use***1. IIR (1967), 2. ASHRAE (1978), 3. The Packer (1988)

VOL.37 NO.4 2006 AGRICULTURAL MECHANIZATION IN ASIA, AFRICA, AND LATIN AMERICA62
dry bulb temperature and the am-bient wet bulb temperature). With this, the lowest temperature that can be achieved theoretically is the wet bulb temperature, when the cooler operates at 100 percent effective-ness (Hall, 1975 and Landsberg et al, 1979).
The index of performance for an evaporative cooler is termed the cooling efficiency (CE) and is de-fined as:
CE = x 100 %
Ta = dry bulb temperature of am-bient air, ºC
Ts = dry bulb temperature of the cooled space air, ºC
Tw = wet bulb temperature of am-bient air, ºC
The cooling eff iciency of the cooler, as given by Eqn (1), indi-cates that portion of the “wet bulb depression” by which chamber air is cooled. This depends on environ-mental factors such as the ambient temperature and humidity.
Test ProcedureThe experimental procedures fo-
cused on the cooler’s performance within 24h periods and over 31d pe-riod. In each study case the patterns of temperature and relative humid-ity changes in both the ambient and
the cooling chamber of the cooler were investigated. Commodity stor-age trials were conducted with to-mato fruits.
During operation, the cooling chamber was tightly closed and the riverbed sand was kept continuously wet by gently adding water manu-ally three times daily at 09.00h, 12.00h and 15.00h to ensure con-stant saturation of the sand with water.
Effects of Changes in Weather Con-ditions on Chamber Performance
The effects of changes in local weather conditions on the cooling chamber were investigated to study the effects of diurnal temperature and relative humidity in the course of 24h periods. Another test was conducted in two runs of 31 days in the two months of January and May to investigate the effects of season on the performance of the chamber. The months of January and May were chosen for the second perfor-mance study because, very often, they are the coldest and the hottest months, respectively, in Kano.
Variations of temperature and relative humidity inside the cool-ing chamber and in ambient air were continuously monitored with thermohydrographs. One thermo-
hydrograph was mounted inside the chamber and another was outside in close proximity to the cooler. A glass thermometer and a wall hy-grometer were positioned near each thermohydrograph for occasional checking of readings. Measurements continued for the 31 days of each test run while numerical data for hourly consideration were extracted from the 7 day recording charts.
Storage of ProduceThe cooling system was used to
store tomatoes harvested fresh from a market garden in Kano, Nigeria. Tomato fruits were harvested at “breaker point” (at the verge of co-lour change from green), washed, drip-dried and pre-cooled overnight in an air-conditioned room at 21 ± 1 ºC. In practical use of the cooler, harvested produce would be pre-cooled to within this temperature range under farm shed condition possibly by water-cooling before being taken into the cool chamber.
Before loading, the storage cham-ber was cleaned and sterilized with fumes generated from a mixture of formaldehyde and potassium per-manganate crystals. In the storage trial, the commodity was loaded on a wooden shelf mounted in the closed chamber. The test consisted of the same quantity of commod-ity placed on a laboratory bench at room temperature.
Storage characteristics of the stored commodity were monitored at specified intervals and practical
Fig. 1 The brick walled cooler, (a) Isometric view and (b) Sectional view
(a)
(b)
Ta - TsTa - Tw

AGRICULTURAL MECHANIZATION IN ASIA, AFRICA, AND LATIN AMERICA 2006 VOL.37 NO.4 63
shelf life was considered terminated at 20 % spoilage level caused by rot-ting.
Results Chamber Temperature and Tem-perature Reduction
Temperatures recorded within each 24h period of the 62 days of test varied with the hour of the day but reduced chamber temperature when compared with ambient for the test period. Fig. 2 shows the hourly variations in ambient and chamber air temperatures for a typical cold dry, harmattan day (January 4), and a hot dry day (May 19).
On January 4, ambient tempera-tures ranging from 14.0 to 26.0 ºC were reduced in the cooling cham-ber to 12.5 and 16.0 ºC, respectively. Similarly, on May 19, ambient tem-
perature of 26.0 to 35.5 ºC dropped in the chamber to 17.5 to 23.0 ºC. Temperature reductions were thus higher on the hot day of May 19 (8.0 to 12.5 ºC) than on the cold day of January 4 (1.5 to 10.0 ºC). On both days as in other days of the test, temperature reductions were higher during hot times of the day.
Chamber Humidity ElevationThe cooling chamber consistently
recorded higher relative humidity than ambient on both days (Fig. 3). Elevation in relative humidity in the chamber was to the range of 88 to 99 % on January 4 and 82 to 92 % on May 19.
Cooling EfficiencyHourly temperatures were used
to calculate hourly cooling efficien-cies for each day (Table 2 using Eqn 1). In using this equation, the
respective wet bulb temperatures of ambient air were derived from a psychrometric chart. An aver-age cooling efficiency for each day was then computed using Eqn (1). Sample values of calculated cooling efficiencies and average cooling ef-ficiency obtained for January 4 and May 19 are as tabulated in Table 2. During the cold dry day of January 4 the cooler recorded hourly cool-ing efficiencies of 60 to 82 % with an average cooling efficiency of 69 %. During the hot dry day of May 19 the cooling efficiencies were 64 to 82 % with an average cooling ef-ficiency of 71 %.
Effects of Season on Performance of Chamber
The daily records of temperatures, relative humidity and cooling effi-ciencies obtained during the 31-day run of January were analyzed. The
Time of the day, h
Air temperature, ºC
(A)
0
5
10
15
20
25
30
35
40 Chamber
Ambient
06040224222018161412100806
0
5
10
15
20
25
30
35
40 Chamber
Ambient
06040224222018161412100806
AV = 2.8 m/s
(B)
Ambient
Chamber
Chamber
Ambient
Time of the day, h
Air relative humidity, %
(A)
0
10
20
30
40
50
60
70
80
90
100 Chamber
Ambient
06040224222018161412100806
0
10
20
30
40
50
60
70
80
90
100 Chamber
Ambient
06040224222018161412100806
AV = 2.8 m/s
(B)
Ambient
Chamber
Chamber
Ambient
Fig. 2 Hourly variation of temperature for ambient andcooling chamber on (A) January 4, (B) May 19
Fig. 3 Hourly variation of relative humidity for ambient and cooling chamber on (A) January 4, (B) May 19

VOL.37 NO.4 2006 AGRICULTURAL MECHANIZATION IN ASIA, AFRICA, AND LATIN AMERICA64
chamber consistently maintained lower air temperature and higher relative humidity than ambient in all daily measurements. Fluctua-tion in ambient air temperature was reduced in the cooling chamber. In January, daily average temperatures of between 15.5 and 28.0 ºC in am-bient were reduced to between 12.3 and 16.7 ºC and in May, from 29.0 to 38.0 ºC to between 18.2 and 24.5 ºC in chamber. Drops in average temperatures in the chamber ranged between 2.1 and 10.3 ºC in January and between 7.2 and 13.2 ºC in May.
Cooler Application for Product Storage
Table 3 shows the response of the fresh tomatoes to storage conditions in the evaporative cooler. Storage of tomatoes in the cooling chamber extended their shelf life. The shelf
life of tomatoes, for examples, was 10 days in ambient air but was ex-tended by 11 days in the cooling chamber.
The cooling chamber demon-strated a remarkable potential for reduction of physiological weight loss (PWL) in the stored commod-ity (Table 3). This accounted for the observed extension of shelf life.
DiscussionChamber Temperature
Air temperatures attained in the cooling chamber generally exceed those values recommended for op-timum shelf life of most tropical fruits and vegetable by refrigeration (Table 1). The chamber tempera-tures are therefore not of optimum benef it if commodities must be stored at established values for re-frigeration cooling. However, aver-age chamber temperatures of 12.6 to 16.7 ºC obtained during the test days of January met some require-ments of certain commodities such as bananas, pawpaw and tomatoes. Useful application of the evapora-tive cooler will depend on the daily duration for which the occurrence of such low temperatures prevails.
Relevance of Temperature Reduc-tion
During the hotter times of the day, the attained chamber tempera-tures rarely meet optimum storage requirements. However, the large drops in ambient temperatures achieved within these hot periods are capable of cutting down com-
modity losses appreciably in stor-age.
The considerable air tempera-ture reductions of 9.0 to 11.8 ºC obtained in the chamber on the hot day of May 19 indicate an apparent capability of the chamber to reduce spoilage loss in stored commodi-ties. Considering the relevance of such minor temperature reduc-tions in spoilage control, Jamieson (1981) noted that for most perish-able commodities the relationship between temperature and spoilage rate is non-linear so that relative minor reduction in temperature can bring about disproportionately large increase in storage life. In all daily test situations, maximum tem-perature reductions in the chamber occurred during the daytime at rela-tively high ambient temperatures. This period of the day therefore has a potential for use of evaporative cooling and the system becomes feasible for preserving perishable commodities. Daytime evaporative cooling is also more promising in hot weather which are usually the most are usually the most liable to spoilage. Such periods of beneficial temperature reduction (of at least 10 ºC) prevailed for a longer dura-tion per day during the hot month of May than during the colder month of January when temperature reduc-tions became lower.
Relative Humidity ElevationThe cooler effect ively raised
ambient relative humidity to op-timum levels (82 to 99 %), which adequately meet the relative humid-ity requirements (of 85 to 95 %)
Time ofday, h
Cooling efficiency, %January 4 May 19
06:00 61 6707:00 63 6608:00 65 7109:00 62 7310:00 66 7411:00 68 7212:00 74 7513:00 74 7614:00 73 7915:00 82 8216:00 77 7717:00 73 7618:00 82 7419:00 70 7020:00 72 7021:00 70 6922:00 72 6823:00 67 6524:00 62 6601:00 71 6402:00 60 6503:00 64 6704:00 65 6905:00 61 68
Average 69 71Minimum 60 64Maximum 82 82
Table 2 Hourly cooling efficiencies of evaporative cooler for two days
Ambient ChamberTest month March MarchAir temperature, ºC 18 to 35 15 to 24Relative humidity, % 59 to 79 78 to 100Stored mass, kg 50 50Ripening period, day 10 17Shelf life, day 12 21Weight loss (after 12 days), % 9.7 2.2
Table 3 Storage conditions and characteristics of tomatoesstored in cooling chamber and ambient

AGRICULTURAL MECHANIZATION IN ASIA, AFRICA, AND LATIN AMERICA 2006 VOL.37 NO.4 65
for storing most tropical fruits and vegetables. The chamber relative humidity levels are known to be optimal in retarding water loss and preventing wilting to the benefit of commodities in storage. This useful range of relative humidity remained reliably continuous even during pe-riods of wide variations in ambient temperature and relative humidity.
Cooler Application for Product Storage
From the experimental storage re-sults, the tested cooler demonstrated a remarkable potential for extending the normal shelf life of fresh toma-toes (Table 3). Extension of shelf life in the chamber-stored commod-ity may be attributed to the com-bined effect of the chamber cooling and humidification.
ConclusionAn evaporative cooler effected
considerable temperature reduction and elevation of relative humid-ity of ambient air under semi-arid conditions. Storage application of the cooler extended the shelf life of stored tomatoes.
As an inexpensive alternative of mechanical refrigeration, the evapo-rative cooler has potential for ap-plication in small-scale preservation of fruits and vegetables and by rural farmers in semi-arid regions.
Effectiveness of the cooler for commodity storage depends on pre-vailing climatic conditions and the time of the year during which it is to be used.
REFERENCES
ASHRAE. ASHRAE Hand Book and Product Directory 1978 Ap-plication. American Society of Heating, Refrigeration and Air-conditioning Engineers; New York 1978.
Babarinsa, F. A. 1990. A brick cooler
for storage of fruits and vegetables. Appropriate Technology Vol. 16 No. 4 pp 6-7.
Babarinsa, F. A. and S. C. Nwang-wan. 1988. Development of an evaporative coolant structure for low-cost storage of fruits and veg-etables. Nigerian Stored Products Research Institute Annual Report for 1984. Technical Report No. 8 pp 75-87.
Babarinsa, F., A. Williams, and F. C. Osanu. 1997. Storage of carrots in a brick wall cooler under semi-arid conditions. Tropical Science 1997 Vol. 37 No. 1 pp 21-27.
Gundry, B. G. 1948. A charcoal safe or cooler. The Rhodesia Agricul-tural Journal Vol. 45 pp 302-306.
Hall, E. G. 1975. Evaporative cool-ers. Food Technology in Australia Vol. 27 No. II pp 485-486.
IIR. 1972. Recommended condi-tions for cold storage of perishable produce International Institute of Refrigeration Paris (2nd edn.).
Jamieson, M. F. S. 1981. Post harvest losses in perishable crops. Paper presented for the workshop on the Prevention of Post Harvest losses in the Caribbean, held at the St. Augustine campus of the Univer-sity of West Indies, in Trinidad.
Lansbery, J. J., B. White, and M. B. Thorpe. 1979. Computer analy-sis of the efficacy of evaporative cooling for glass houses in high environments. Journal for Agri-cultural Engineering Research Vol. 24 No. 1 pp 29-39.
Roy, S. K. and D. S. Khrdiya. 1985. Zero Energy Cool Chamber. Indi-an Agricultural Research Institute, New Delhi Research Bulletin No. 43.
Sharma, M. and R. B. Rathi. 1991. Few more steps towards under-standing direct evaporative cool-ing and promoting its use in rural/tribal areas. A technical Report, Regional (Gram-Sheetak) Center for Appropriate Rural Technology.
The Packer. 1988. The Produce Availability and Merchandising Guide. The Packer, CIV. No. 53,
B-1.Thompson, J. K. and R. F. Kasmire.
1981. An evaporative cooler for vegetable crops. California Agri-cultural. Vol. 35 No. 3 pp 20-21.
■■

VOL.37 NO.4 2006 AGRICULTURAL MECHANIZATION IN ASIA, AFRICA, AND LATIN AMERICA66
Development and Testing of a Tomato Pulper CumStrainer
byV. ThirupathiAssistant ProfessorDepartment of Agricultural Processing,Agricultural Engineering Collegeand Research Institute,Coimbatore - 641 003INDIA
K. ThangavelProfessor and HeadDepartment of Agricultural Processing,Agricultural Engineering Collegeand Research Institute,Coimbatore - 641 003INDIA
R. ViswanathanProfessorDepartment of Agricultural Processing,Agricultural Engineering Collegeand Research Institute,Coimbatore - 641 003INDIA
AbstractA unit for pulping and straining
tomato fruits was developed and tested for its performance. Local and hybrid varieties were used for testing. Cold and hot pulping were carried out at different peripheral speeds. The maximum pulp extrac-tion efficiency for the local variety was 91.0 % by hot pulping at a peripheral speed of 47.1 m/s. The maximum pulp extraction efficiency for the hybrid variety was 92.3 % by hot pulping at a peripheral speed of 47.1 m/s. The capacity of the unit is 110 kg/h.
IntroductionFruits and vegetables are an im-
portant supplement to the human diet as they provide the essential
Acknowledgement: The authors are grateful to the Post Harvest Technology Scheme, Indian Council of Agricultural Research (ICAR) for providing financial assistance to undertake this research work.
minerals, vitamins and fibre re-quired for maintaining health. In India, the production of vegetables is about 68.7 million tonnes annu-ally. However, for various reasons, this abundance of production is not fully utilized and about 30-40 % of it is wasted due to post harvest spoilage (Thangavel et al, 1998). Most of the fruits and vegetables are seasonal and perishable in nature. In a good season, there may be a local glut, particularly of fruit, but because of insufficient transport fa-cilities, lack of good roads and poor availability of packaging materials, the surplus cannot be taken quickly enough to the wholesale markets in urban areas. Moreover, the surplus often cannot be stored for sale in the off-season because of inadequate local cold storage facilities.
Tomato, as a processing crop, ranks first among vegetables grown
all over the world (Vijay Sethi, 1994). Tomato is grown in India abundantly both in summer and in winter seasons but those grown in winter are superior in quality be-cause they contain more total solids (Srivastava and Sanjeev kumar, 1994). They are a good source of vitamin A, B1 and ascorbic acid (Pairat and Ranganna, 1976). It contains 15 to 25 mg/100 gm of vitamin C and has four times the vitamin A content of orange juice (Gould, 1974). Fresh tomatoes are very refreshing and appetizing but cannot be stored for a long period. Often they are sold at distress prices

AGRICULTURAL MECHANIZATION IN ASIA, AFRICA, AND LATIN AMERICA 2006 VOL.37 NO.4 67
during the peak harvest season and nearly 25 % of the produce is spoiled due to mishandling. Con-verting tomatoes into concentrated products such as tomato sauce, ketchup and soup powder can avoid such losses. Though tomatoes are available practically throughout the year, the surplus available dur-ing the peak harvest season can be pulped and preserved in the form of concentrate for off-season usage and also the wastage can be avoided to a certain extent. For pulping tomato fruits a unit has been developed and evaluated.
Materials and MethodsDevelopment of a Tomato Pulper Cum Strainer
A tomato pulper cum strainer unit was fabricated for pulping the tomato fruits (110 kg/h) and extrac-tion of juice. The unit was mounted on frame made of mild steel angle iron section 38 x 38 x 6 mm. The unit was kept at an inclination of 25 degrees to facilitate flow of tomato
juice after pulping. The pulper cum strainer unit consisted of following components
1. Feed Hopper: The feed hopper was made of stainless steel sheet of 1 mm thickness to induct tomato fruits into inner perforated stainless steel cylinder.
2. Stainless Steel Rotor Shaft: The rotor shaft was the key compo-nent of tomato pulper cum strainer unit. Stainless steel blade and nylon brushes were mounted on the shaft.
3. Design of Shaft: The formula and for designing the shaft was,
fsd3 = T ...3.1
wherefs = maximum allowable shear
stress, kg/cm2 [350 kg/cm2]d = diameter of the shaft, cmT = torque, kg cm
Calculation of TorqueLength of flat = 7.62 cm(c/c distance from shaft and flat)Width of flat = 2.5 cmCrushing strength of tomato fruits
= 3.1 kg/cm2
Force required to crush the fruits = 58.86 kg
It is assumed that the force is act-ing on the middle of the rod.
Torque on the shaft = 58.86 x 7.62/2 = 224.2 kg cm
By using equation (3.1)d = 1.5 cmConsidering factor of safety 1.5,d = 1.5 x 1.5d = 2.25 cmThe rotor shaft of diameter 25 mm
and 800 mm length was mounted on pillow block bearing at one end and gunmetal bush at other end.
4. Outer Stainless Steel Cylinder: An outer 1 mm thickness stainless steel cylinder with 250 mm diame-ter and 500 mm length was coupled with inner stainless steel perforated cylinder by stainless steel plate of 4 mm thickness.
5. Inner Stainless Steel Perfo-rated Cylinder: The inner 1 mm thickness perforated stainless steel cylinder of 150 mm diameter and 480 mm length was welded with outer stainless steel cylinder with stainless steel plate and the bottom portion of the stainless steel plate was fixed on the frame. The perfo-ration size was 2 mm diameter, so that only juice is filtered.
6. Stainless Steel Blade and Ny-lon Brush: A stainless steel blade of 470 mm length, 25 mm breadth and 6 mm thick was mounted on the ro-tor shaft by means of stainless steel flat of 76.2 mm length and 25 mm thickness. A nylon brush was pro-vided in the opposite side of stain-less steel blade, to avoid clogging of perforated screen.
7. Discharge Outlet: Discharge outlet was provided at the bottom and lower end of the stainless steel sheet to collect the tomato juice. The skin and seeds were collected from the stainless steel perforated cylinder separately by opening the door provided at the discharge end of the cylinder.
8. Motor: Calculation of horse-power requirement
hp =
Where N = speed of rotor shaft,
�16
2�NT4500
Fig. 1 Schematic diagram of tomato pulper cum strainer
1. Pulper outlet, 2. Inner drum (SS), 3. Nylon brush, 4. Outer drum (SS), 5. Knife, 6. Screw auger, 7. Feed hopper, 8. S.S. shaft, 9. Motor, 10. Frame

VOL.37 NO.4 2006 AGRICULTURAL MECHANIZATION IN ASIA, AFRICA, AND LATIN AMERICA68
rpmT = Torque, kg-mThe speed of rotor shaft is select-
ed to be 300 rpmT = 2.24 kg m
hp = = 0.94
Hence, an electric motor of 1 hp was selected to drive the rotor shaft. Power was transmitted from the motor to the rotor by means of ‘V’belts and pulleys. The schematic diagram of pulper cum strainer is shown in Fig. 1. Testing of tomato pulper cum strainer unit was carried out by varying the rpm of the rotor shaft. Extraction efficiency of juice has been computed for hot pulping (boiled in steam jacketed stainless steel pans for 3 min before pulping) and cold pulping of tomato fruits.
Results and DiscussionThe tomato pulper was tested
for local and hybrid varieties. The results of the experiment are pre-sented in Table 1. Juice recovery by hot pulping is higher than cold pulp-ing (Gridhari lal et al, 1998). Hot pulping sterilizes the juice partly, thereby checking to some extent the growth of microorganisms, which cause fermentation in the juice. Ca-pacity of the pulper increases with peripheral speed, however extrac-tion efficiency initially increases with peripheral speed and then decreases. This was due increase in rate of pulping to a certain ex-tent and then fruits were conveyed without pulping as the contact time between blade and the fruits were
Capacity, kg/h
Peripheral speed, m/s
Extraction efficiency, %(local variety)
Extraction efficiency, %(hybrid variety)
Cold pulping Hot pulping Cold pulping Hot pulping85.2 33.3 70.5 70.5 74.7 76.591.7 39.0 78.0 78.0 76.3 79.5110.0 47.1 90.0 91.0 90.4 92.3120.5 59.9 83.0 83.5 85.2 88.5135.0 63.2 80.5 81.6 81.8 86.3
Table 1 Evaluation of tomato pulper cum strainer at different peripheral speeds
minimum.
ConclusionsThe maximum pulp extraction ef-
ficiency for local variety was 91.0 % by hot pulping at a peripheral speed of 47.1 m/s. The maximum pulp extraction efficiency for hybrid va-riety was 92.3 % by hot pulping at a peripheral speed of 47.1 m/s. The capacity of the unit was 110 kg/h.
REFERENCES
Girdharilal, G., S. Siddappa, and G. L. Tandon. 1998. Preservation of fruits and vegetables. Indian Council of Agricultural Research. NewDelhi, 216-217.
Gould, W. A. 1974. Tomato juice manufacture, Tomato Production, Processing and Quality Evalua-tion, The AVI Publishing Com-pany, Inc. Westport. 150-162.
Parirat Narkviroj and S. Ranganna. 1976. Manufacture and quality control of Tomato products. In-dian food packer, 30(1): 44-82.
Srivastava, R. P and Sanjeev Ku-mar. 1994. Tomato processing, Fruits and Vegetable Preservation (Principles and Practices). Inter-national Book Distributing Co., Lucknow, 255-263.
Thangavel, K., V. Thirupathi, R. Viswanathan, and R. Kailappan. 1998. Status reports on post har-vest management of tomato. Pre-sented at XXII Annual workshop of PHTS held at Rajasthan Agri-cultural University, Udaipur, 1-6.
Vijaysethi. 1994. Efficiency of vari-ous preservatives for preserving whole tomato concentrates, 48(1): 11-15.
■■2 x � x 300 x 2.24
4500

AGRICULTURAL MECHANIZATION IN ASIA, AFRICA, AND LATIN AMERICA 2006 VOL.37 NO.4 69
Comparative Feasibility Analysis of AlternativeRenewable Energy Sources for Small Milk CoolingPlants of Southwestern Uganda
byWilliam S. KisaalitaAssociate ProfessorBiological and Agricultural Engr. Dept.,University of Georgia,Driftmier Engineering Center,Athens, Georgia 30602USA
Justin FranklinStudentBiological and Agricultural Engr. Dept.,University of Georgia,Driftmier Engineering Center,Athens, Georgia 30602USA
Allyson TippieStudentDept. of Economics,University of Georgia,Brooks Hall,Athens, Georgia 30602USA
Brad BoyerStudentBiological and Agricultural Engr. Dept.,University of Georgia,Driftmier Engineering Center,Athens, Georgia 30602USA
William FairclothStudentBiological and Agricultural Engr. Dept.,University of Georgia,Driftmier Engineering Center,Athens, Georgia 30602USA
AbstractThe dairy industry in Uganda
faces numerous challenges, one of which is the high cost associated with fossil fuel-driven milk cooling processes at locations without grid electricity. In this paper, alternative renewable energy sources, including solar and biogas, are compared to the existing diesel generator power source for a 3,000 L-capacity plant. Based on several economic indi-cators, the solar (evacuated tube) source coupled to an absorption refrigeration unit was found to be the most economical alternative for southwestern locations.
IntroductionIn Uganda, agriculture accounts
for over 40 % of GDP and more
Acknowledgements: Funding from United Stated Department of Agriculture and the Engineering Information Foundation is acknowl-edged. The authors are grateful to Mr. Phillipe Simonis (Energy Advi-sor, GTZ Office, Ministry of Energy and Mineral Development) who brought the problem to their atten-tion and Mr. Ignatius Ngobi (Field Manager, DCL of Uganda) for ar-ranging visits to numerous small milk cooling plants and providing access to economic data. Mention of brand names is for information only and does not imply endorsement.
than 90 % of export earnings. Ad-ditionally, agriculture contributes over 60 % of total revenue and em-ploys more than 80 % of the labor force, providing half of the income for the poorest three quarters of the population. The livestock sub-sector contributes approximately 20 % of the agricultural GDP and approxi-mately 50 % of this is attributed to the dairy industry. Cattle dominate the livestock species in terms of numbers and monetary value and account for almost 90 % of the do-mestic animal biomass. It has been estimated that 90 % of the national cattle herd is in the hands of mixed farm smallholders and pastoralists, who individually can not afford any form of modern processing. Of Uganda’s 2001 estimated total milk production of 900 million liters, only 10 % was processed into liquid milk and milk products.
To process the milk, the Uganda Government set up approximately 200 small cooling plant centers scattered around the country, with capacities ranging from 1,800-5,000 liters. In the past, the centers bought the milk from farmers and pastoral-
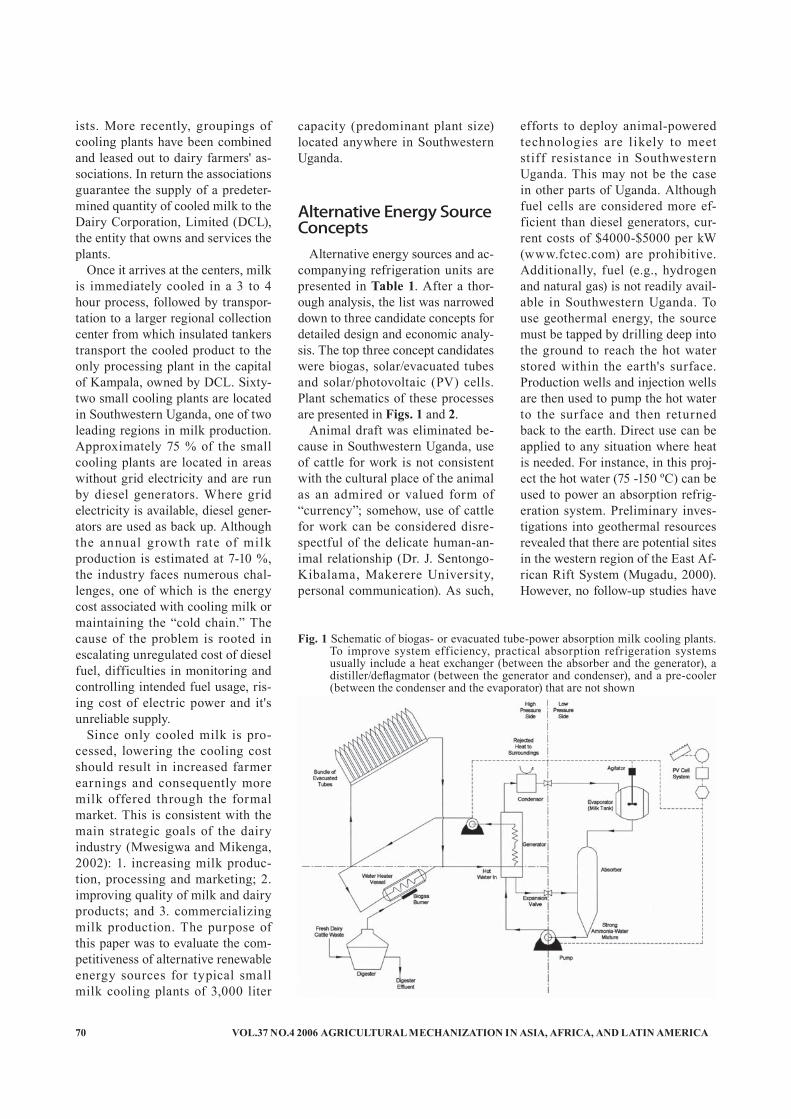
VOL.37 NO.4 2006 AGRICULTURAL MECHANIZATION IN ASIA, AFRICA, AND LATIN AMERICA70
ists. More recently, groupings of cooling plants have been combined and leased out to dairy farmers' as-sociations. In return the associations guarantee the supply of a predeter-mined quantity of cooled milk to the Dairy Corporation, Limited (DCL), the entity that owns and services the plants.
Once it arrives at the centers, milk is immediately cooled in a 3 to 4 hour process, followed by transpor-tation to a larger regional collection center from which insulated tankers transport the cooled product to the only processing plant in the capital of Kampala, owned by DCL. Sixty-two small cooling plants are located in Southwestern Uganda, one of two leading regions in milk production. Approximately 75 % of the small cooling plants are located in areas without grid electricity and are run by diesel generators. Where grid electricity is available, diesel gener-ators are used as back up. Although the annual growth rate of milk production is estimated at 7-10 %, the industry faces numerous chal-lenges, one of which is the energy cost associated with cooling milk or maintaining the “cold chain.” The cause of the problem is rooted in escalating unregulated cost of diesel fuel, difficulties in monitoring and controlling intended fuel usage, ris-ing cost of electric power and it's unreliable supply.
Since only cooled milk is pro-cessed, lowering the cooling cost should result in increased farmer earnings and consequently more milk offered through the formal market. This is consistent with the main strategic goals of the dairy industry (Mwesigwa and Mikenga, 2002): 1. increasing milk produc-tion, processing and marketing; 2. improving quality of milk and dairy products; and 3. commercializing milk production. The purpose of this paper was to evaluate the com-petitiveness of alternative renewable energy sources for typical small milk cooling plants of 3,000 liter
capacity (predominant plant size) located anywhere in Southwestern Uganda.
Alternative Energy Source Concepts
Alternative energy sources and ac-companying refrigeration units are presented in Table 1. After a thor-ough analysis, the list was narrowed down to three candidate concepts for detailed design and economic analy-sis. The top three concept candidates were biogas, solar/evacuated tubes and solar/photovoltaic (PV) cells. Plant schematics of these processes are presented in Figs. 1 and 2.
Animal draft was eliminated be-cause in Southwestern Uganda, use of cattle for work is not consistent with the cultural place of the animal as an admired or valued form of “currency”; somehow, use of cattle for work can be considered disre-spectful of the delicate human-an-imal relationship (Dr. J. Sentongo-Kibalama, Makerere University, personal communication). As such,
efforts to deploy animal-powered technologies are likely to meet stiff resistance in Southwestern Uganda. This may not be the case in other parts of Uganda. Although fuel cells are considered more ef-ficient than diesel generators, cur-rent costs of $4000-$5000 per kW (www.fctec.com) are prohibitive. Additionally, fuel (e.g., hydrogen and natural gas) is not readily avail-able in Southwestern Uganda. To use geothermal energy, the source must be tapped by drilling deep into the ground to reach the hot water stored within the earth's surface. Production wells and injection wells are then used to pump the hot water to the surface and then returned back to the earth. Direct use can be applied to any situation where heat is needed. For instance, in this proj-ect the hot water (75 -150 ºC) can be used to power an absorption refrig-eration system. Preliminary inves-tigations into geothermal resources revealed that there are potential sites in the western region of the East Af-rican Rift System (Mugadu, 2000). However, no follow-up studies have
Fig. 1 Schematic of biogas- or evacuated tube-power absorption milk cooling plants. To improve system efficiency, practical absorption refrigeration systems usually include a heat exchanger (between the absorber and the generator), a distiller/deflagmator (between the generator and condenser), and a pre-cooler (between the condenser and the evaporator) that are not shown

AGRICULTURAL MECHANIZATION IN ASIA, AFRICA, AND LATIN AMERICA 2006 VOL.37 NO.4 71
been reported. Pico hydro units are small sys-
tems (up to 5 kW) that require small water flows. This has made pico hy-dro units desirable because they can be used at many sites (Maher and Smith, 2001). The maximum refrig-eration capacity (RC) for the target system was estimated as follows. RC = V x p x Cp x ΔT/t = 26.52 x 10³ W = 7.54 tons, where V = milk volume (3,000 L), p = milk density (1.02 kg/L), Cp = milk specific heat capacity (3.9 x 10³ J/kg.K), ΔT = dif-ference in milk temperature before and after cooling (28 - 4 = 24 K), t = time required to cool the milk (3 h x 3,600 sec/h = 10,800 sec). As dem-onstrated above, the required RC far
exceeded the maximum capacity of pico hydro systems.
According to Atuheire (2002), the average yearly wind speed (U) in Uganda at a height of 22 m is ap-proximately 5.5 m/s (~12.3 mph). The available yearly wind power per unit area (P/A) can be calculated from: P/A = 0.5 pU3, where p is the air density (equal to 1.0514 kg/m3 at the area of interest). Substituting the above values, P/A comes to 87.96 W/m2. Locations with P/A values less than 100 W/m2 are unsuitable for continuous sustainable power generation due to the fact that the maximum power producing po-tential obtainable from the kinetic energy contained in the wind is ap-
proximately 60 % of the theoretical maximum power. In reality, this percentage is only about 40 % due to the efficiency of even the best wind turbines available (Manwell et al, 2002).
Design Details and Cost Estimates
Biogas-Absorption Refrigeration Plant
A design procedure published by Sun (1997) for ammonia-water ab-sorption refrigeration systems was followed with the following assump-tions: 1) evaporator temperature, -8 ºC > TE > -5 ºC; sink temperature, TS = 30 ºC; concentration of the re-frigerant at entrance to the evapora-tor, x15 = 0.99 kg NH3/kg solution; generator temperature, T8 = 100 ºC. For a desired final milk temperature of 4 ºC, the energy balance for the ammonia-water absorption refrig-eration system is presented in Table 2. The cost of the ammonia-water refrigeration unit was estimated to be $8,000 based on the indus-try experience of $1,000/ton (Mr. Hidekazu “KURI” Kurihara, HIJC USA, personal communication). As shown in Table 2, the biogas burner must deliver 43.39 kJ/sec either directly or via a hot water vessel. Assuming a biogas energy content of 11,821 kJ/m3, an overall biogas burner efficiency of 55 % (Gunnerson and Stuckey, 1986) and two 3-hour cooling cycles per day, the daily biogas demand comes to 144 m3/day [(6 h/day x 3600 sec/h x 43.39 kJ/sec)/(0.55 x 11,821 kJ/m3)]. This biogas demand value can be used to either size a digester fol-lowing well established procedures (e.g., Ward, 1986; Gunnerson and Stuckey, 1986; Marchaim, 1992), or estimate the digester cost using published unit cost, e.g., per cubic meter of biogas produced. The float-ing-drum biogas plant is the most popular for domestic applications in Uganda. Typical productivity (bio-
Fig. 2 Schematic of grid electricity-, photovoltaic cell-, or dieselgenerator-powered vapor compression milk cooling plant
Fig. 3 Schematic of an evacuated-tube collector

VOL.37 NO.4 2006 AGRICULTURAL MECHANIZATION IN ASIA, AFRICA, AND LATIN AMERICA72
gas) and plant construction costs are 0.2 m3/m3/day and US$100/m3, respectively (Agricultural Engineer-ing and Appropriate Technology Institute files, Namalere). Assuming linear scaling, the plant size needed came to 720 m3 [(144 m3 biogas/day)/(0.2 m3/m3/day)]. A simpler digesters made up of a pit in the soil without coating or plastering with a synthetic rubber as a variable gas-holder (Henning, 1986) was considered, but not adopted due to anticipated maintenance problems at the proposed scale. As shown in Fig. 1, electricity is needed to run all pumps as well the controller (not shown). The PV cells system selected in the next section should be adequate. The cost breakdown for all units considered is shown in Table 3. There may be opportuni-ties to capture some of the lost heat and use it to heat the digester. This would increase the biogas produc-tivity, reducing the digester size and consequently reducing the capital cost.
Solar-Absorption Refrigeration Plant
To deliver 43.39 kW to the gen-erator via conventional f lat plate collectors would require an unman-ageable surface area. A choice was made to use evacuated tube col-lectors. Use of vacuum allows this type of solar collector to insulate against heat loss and to prevent the absorber coating from deteriorating. As shown in Fig. 3, the basic design of an evacuated tube is an upside-down vacuum bottle that contains a liquid-filled tube that runs through the middle of the tube in a hairpin like fashion. The bottle is a double-glass design that has an absorber coating on its inner glass. To heat the inner liquid, the sun's radiation travels through the outer glass layer and makes contact with the absorber coating. This traps the radiation in the bottle and heats the air inside of the bottle. The air then heats the liquid in the tube. At the end of the
tube is a manifold in which the liq-uid filled tube is connected to. The manifold collects the liquid in the tubes from several bottles. From the manifold, the liquid can then be pumped for a direct heat use ap-plication. For this project, the liquid will be pumped into the absorption machine to supply the generator with its required heat input. The required energy of 260.43 kWh/day
(43.39 kW x 2 cooling cycles/day x 3 h/cycle) and the minimum average insolation for Uganda of 4.5 kWh/m2/day (16,200 kJ/m2/day) were used in the calculator at www.focus-solar.com to estimate the number of tubes required of 1,408.021 (47 bundles of 30). With a specific area of 3.52 m2/bundle, the resultant to-tal area of 165 m2 was considered reasonable. At $620/bundle, total
Concept Number
Energy source Energy conversion/production
Accompanying refrigeration
unit typeSample reference
1 Animal draft Electric generator coupled to a gear box
Vapor-compression
Dasa and Dasa (1987)
2 Biogas Animal waste anaerobic digester Absorption Sasse (1984)
3 Chemical Electricity from hydrogen and air reaction in a fuel cell
Vapor-compression www.fctec.com
4 Geothermal Direct hot water use Absorption Mugadu (2000)
5 Pico hydro Electricity from pico generator
Vapor-compression
Maher and Smith (2001)
6 Solar Hot water from evacuated tubes Absorption www.focus-
solar.com
7 Solar Electricity from photovoltaic (PV) cells
Vapor-compression
www.mrsolar.com
8 Wind Electricity generated by a wind mill
Vapor-compression
Manwell et al (2002)
Item Quantity UnitsRefrigeration capacity 26.50 kWHeat input to the generator 43.39 kWWork done by the pump 0.13 kWHeat rejected from the condenser 26.45 kWHeat rejected from the deflegmator 2.23 kWHeat rejected from the absorber 41.83 kWRefrigeration effect 1,191.39 KJ/kgCoefficient of performance 0.61
Table 2 Energy balance for the optimal ammonia-water absorption refrigeration system
Table 1 Alternative energy sources and accompanying refrigeration modalities
Battery82 %
Inverter87.5 %
Photovoltaic Collector
14 %
Charge Regulator
98 %
Vapor Compression
SystemCOP = 3.88
Tank90 %
Sun16,200 KJ[(m)(day)]
Fig. 4 Energy conversion efficiencies for PV vapor compression refrigeration system
▲
▲ ▲
▲
▲ ▲

AGRICULTURAL MECHANIZATION IN ASIA, AFRICA, AND LATIN AMERICA 2006 VOL.37 NO.4 73
cost came to $29,140. To move the liquid through the evacuated tube system (including the tubes, mani-fold, and piping) and the generator, a small pump with a flow rate of ap-proximately 2 L/min (40 W, $330) was recommended. Other system pumps include the agitator (124 W) and the absorption unit pump (130 W). Total energy came to 6,350,400 J/day ([940 J/sec + 124 J/sec + 40 J/sec] x 6 h/day x 3,600 sec/h). By dividing this energy demand by the isolation and the applicable efficien-cies shown in Fig. 4, the required PV panel area came to 4.336 m2
(6,350.4 kJ/day)/(16,200 kJ/m2/day x 0.9 x 0.875 x 0.82 x 0.14). This area can be accommodated by 32-15” by 14” PV panels at a total cost of $1,920. The associated cost for bat-teries, regulator and inverter are shown in Table 3. Existing solar data indicates that solar energy re-source in Uganda is high throughout the year with yearly variation (max month/min month) of only 20 %. This lack of variability has been at-tributed to location near the equator and eliminates the need for back-up systems.
Diesel Generator-Powered Vapor Compression Plamt:Tank $18,720.00Compressor $5,000.00Diesel generator (27 kVA) $8,750.00Overall process controller $2,000.00
Total $34,470.00Biogas-Powered Absorption Plant:
Tank $18,720.00Ammonia-water absorption unit including the burner $8,000.00Cattle waste digester $72,000.00PV cells $1,920.00Batteries, regulator and inverter $1,551.00Extra pump $330.00Additional piping $240.00Overall process controller $2,000.00
Total $104,761.00Solar (Evacuated Tube)-Powered Absorption Plant:
Tank $18,720.00Ammonia-water absorption unit $8,000.00Evacuate tubes $29,140.00PV cells $1,920.00Batteries, regulator and inverter $1,551.00Extra pump $330.00Additional piping $1,114.00Overall process controller $2,000.00
Total $62,775.00Solar (PV Cell)-Powered Vapor Compression Plant:
Tank $18,720.00Compressor $5,000.00PV cells $46,800.00Charge regulators $4,576.00Batteries $14,872.00Inverters $3,192.00Overall process controller $2,000.00
Total $95,160.00
Table 3 Breakdown of cooling plant equipment costs1
1All costs are in 2003 US$
Solar-Vapor Compression Refrig-eration Plant
Based on the amount of energy to be removed from the milk per day (two cooling cycles) of 2 x 286,416 kJ and the efficiencies of the system components shown in Fig. 3, the required PV cell area came to 100.8 m2 (2 x 286,417 kJ)/(3.88 x 0.9 x 0.875 x 0.82 x 0.14 x 16,200 kJ/m2). This area of collection, which is ap-proximately the size of the rooftops of the facilities, was considered reasonable. The typical total cost for PV cells came to $46,800. The inverter was sized primarily on the demand of the vapor compression subsystem of 3,730 W (5 Hp). For this load, a 4,500 W inverter was selected to account for the agitator motor demand of 124 W and any other lighting or small applications that might be needed. The input for the inverter of 48 V dc is generated by the series connection of four 12 V batteries. In total, the system re-quired 13 of the 48-volt arrays that are connected in parallel for addi-tive current at the same voltage. The inverter was also selected to deliver the specified single phase, 220 V, 50 Hz current needed to power the 3.73 kW (5 Hp) vapor compression unit.
Economic ComparisonThe economic information used
and the results of the financial com-parison are summarized in Table 4. Actual interest rate (*i) was calculated from *i = [100 x (100 + market interest rate)/(100 + inflation rate)] - 100. *i of 12.91 was obtained with market interest and inf lation rates of 19.57 and 5.90, respectively (The Economist Intelligence Unit Country Report, Uganda, 1st quar-ter, 1999 - www.eiu.com/schedule). Service life (T) of all the equipment was assumed to be 20 years. The break down of investment expendi-tures (IE) for each system is shown in Table 3. It was assumed that the residual value (L) after service years

VOL.37 NO.4 2006 AGRICULTURAL MECHANIZATION IN ASIA, AFRICA, AND LATIN AMERICA74
was zero, as the equipment should be fully depreciated. Manpower costs were based on two employees (plant manager and operator) for the evacuated tube and PV cell plants. An additional digester attendant was deemed necessary for the biogas plant. Maintenance & repair costs, auxiliary materials, and adminis-trative costs were based on current experience and were assumed to be the independent of plant type.
Energy cost for the diesel plant was based on records from a typical plant. On average 150 L of diesel fuel was consumed per week. The annual cost was computed at a rate of 0.80 US$/liter. The energy cost under the biogas plant is a reflection of the cost of collection from nearby facilities by 4 to 5 laborers on bi-
cycles. The total operating cost (Ko) is the sum of the manpower, energy, maintenance/repair, auxiliary mate-rials, and administrative costs. Op-erating income (IO) was based on 50 % capacity (1500 L/cycle/day) and 30 Uganda Shillings (US$ 0.015873) income per liter cooled, which came to $17,143.00 (2 cycles/day x 1500 L/cycle x 360 days/year x $0.015873). Total income (IT) is the sum of savings on energy (IE) and operating income (IO). Return (R) is the difference between total income (IT) and total operating costs (IO). Straight-line depreciation was as-sumed.
The concepts were compared with respect to total cost (K) per kWh, cost-annuity (AK) per kWh, Return on Investment (ROI), payback peri-
od (n) and Net Present Value (NPV). Formulas from Finck and Oelert (1985) were used and are brief ly shown in Table 4. The total kWh needed to cool 3,000 liters of milk is 57,877.2 kWh/year (26.795 kW x 6 h x 360 days/year). Cost annuity is different from costs per year in that it is a conversion of the investment cost to equal annual payments (an-nuities). It is done using a recovery factor (RF) that is obtained using the applicable interest rate and ser-viceable years. In this project RF was 0.134. NPV of an investment is the sum of all cash inflows and outflows discounted to the present. NPV = -Investment costs + (Re-turns per year x PF) + (Liquidation yield x discounting factor). A higher number is preferred. The Present
Diesel generator
Evacuated tubes PV cells Biogas
Project Data:Actual interest rate (*i, %) 12.91 12.91 12.91 12.91Investment expenditure (CI, US$) 34,470.00 62,775.00 95,160.00 104,761.00Residual value (L, US$) 0.00 0.00 0.00 0.00Serviceable life (T, years) 20 20 20 20Manpower costs (CM, US$) 1,579.00 1,579.00 1,579.00 2,211.00Maintenance and repair (CMR, US$) 500.00 500.00 500.00 500.00Auxiliary materials cost (CAM, US$) 100.00 100.00 100.00 100.00Administrative costs, excluding manpower (CA, US$) 300.00 300.00 300.00 300.00Energy costs (CE, US$) 6,000.00 0.00 0.00 650.00Taxes and levied not dependent on profit (CT, US$) 0.00 0.00 0.00 0.00Other expenditures (CO, US$) 0.00 0.00 0.00 0.00Total operating costs (KO, US$); KO=CM+CMR+CAM+CA+CE+CO 8,379.00 2,479.00 2,479.00 5,350.00Savings on energy (ISE, US$); ISE=Diesel Gen. CE-CE 0.00 6,000.00 6,000.00 5,350.00Operating income (IO, US$) 17,143.00 17,143.00 17,143.00 17,243.00Other incomes (IOT, US$) 0.00 0.00 0.00 0.00Subsidies (IS, US$) 0.00 0.00 0.00 0.00Total income (IT, US$); IT=ISE+IO+IOT+IS 17,143.00 23,143.00 23,143.00 22,593.00Return (R, US$); R=IT-KO 8,764.00 20,664.00 20,664.00 17,243.00Depreciation (D, US$) 1,724.00 3,139.00 4,758.00 5,238.00Net profit (P, US$); P=R-D 7,040.00 17,525.00 15,906.00 12,005.00
Economic Evaluation:Total cost per year (K, US$), K=KO+(CI/T)+(CI*i/2) 12,328.00 9,670.00 13,380.00 17,350.00Cost per kWh (US$/kWh); K/57,877.2 0.21 0.17 0.23 0.30Cost-Annuity (AK, US$); AK=KO+(CI-L)RF+L*i; RF=0.134 12,998.00 10,891.00 15,230.00 19,388.00Cost annuity per kWh (US$/kWh); AK/57,877.2 0.22 0.19 0.26 0.34Return on investment (ROI, %); ROI=100(P/0.5CI) 40.8 55.8 33.3 22.9Pay-Back period (n, years); n=CI/R 3.9 3.0 4.6 6.1Net present value (NPV, US$); NPV=-CI+[R(PF)]+l(q-1); PF=7.469 30,988 91,564 59,179 24,027
1All dollar amounts are in 2003 US$
Table 4 Economic data and evaluation per annum1
AGRICULTURAL MECHANIZATION IN ASIA, AFRICA, AND LATIN AMERICA 2006 VOL.37 NO.4 75
Factor (PF) is obtained using the applicable serviceable life and the interest rate. The PF in this project was 7.469. Because the liquidation yield is zero, the last term is zero.
Discussion and Conclud-ing Remarks
The biogas and current diesel-driven systems were the most eco-nomically unattractive options; they exhibited the lowest NPVs. The cost to implement the Photovoltaic sys-tem greatly affects its economic vi-ability. While the NPV and annuity seem competitive, the cost per kWh is greater than even the current sys-tem. Evacuated tubes turned out to be the most economical alternative with the shortest pay back period of 3.0 years, and an impressive ROI of 55.8 %. It should be pointed out that this evaluation is considered con-servative due to the fact that while operating expenses are based on full plant capacity, income is based of 50 % capacity.
There are two main uncertainties associated with the evacuated tube choice. First, the scale of absorp-tion refrigeration proposed is not widely practiced. Most installed absorption refrigeration plants are in developed countries, with capaci-ties greater than 100 kW (versus the proposed capacity of approximately 30 kW). The changes in scale may affect the assumed scale-capacity relationships used in the economic calculations. Second, there are no known evacuated tube applications in Uganda. Most solar energy ap-plications employ PV cells or f lat panel collectors. However, specific industry focus with proven indig-enous technical expertise and ser-vice network that is in place for the current vapor compression systems are strengths expected to overcome any potential technology adoption bottlenecks.
The current hydroelectric cost in Uganda is approximately 0.10 US$/
kWh, well below the cost for the recommended energy source in this study of 0.17 US$/kWh. The recom-mendation is therefore for locations without hydroelectric grid. There are national plans to extend the grid, however, the targets are high population density locations or high volume industry consumers; the capital cost for remote agricultural locations are considered prohibitive. It would be prudent to study the grid extension plans and timetable for a given location before investing in a solar plant.
The two most important factors in the success of any alternate tech-nology in the Sub-Saharan Africa environment are cost, reliability and appropriateness. While cost can be reliably predicted, the remaining two attributes can only be conclu-sively established by practice. It is hereby recommended that a full sale evacuated tube plant be pilot tested before wide spread technology de-ployment is attempted.
REFERENCES
Atuheire, A. R. 2002. Wind Resourc-es Analysis for Electricity Gen-eration: A case of Musonzi Island - Kalangala District, Final Year Project Report, Makerere Univer-sity Library, Kampala, Uganda.
Dasa, P. and V. Dasa. 1987. Gita-nagari’d Ox Power Unit. Ox Power Alternative Energy Club, Top-sham, Maine, USA.
Finck, H. and G. Oelert. 1985. A Guide to the Financial Evaluation of Investment Projects in Energy Supply, Schriffenreihe der GTZ, No. 163, Eschborn, Germany.
Gunnerson, C. and D. Stuckey. 1986. Integrated Resource Recovery-Anaerobic Digestion. The Interna-tional Bank For Reconstruction, Washington, D.C., USA.
Henning, R. 1986. Biogas plant in Ivory Coast. In: El- Halwagi, M. (Ed.) Biogas Technology, Transfer and Diffusion, Elservier Applied
Science Publishers, NY, pp 608.Mugandu, E. I. 2000. Geothermal
energy in the development of Uganda, Proceedings of the World Geothermal Congress, Kyushu-Tohoku, Japan, May 10.
Maher, P. and N. Smith. 2001. Pico Hydro Power: A Practical Manual for Schemes Up to 5 kW in Hilly Areas. The Nottingham Trent Uni-versity, Nottingham, UK.
Manwell, J. F., J. G. McGowan, and A. L. Rogers. 2002. Wind Energy Explained: Theory, Design and Application. John Wiley & Sons, New York, NY.
Marchaim, U. 1992. Biogas process-es for sustainable development. FAO Agricultural Services Bulle-tin 95, FAO, Rome, Italy.
Mwesigwa, V. T. and S. Mikenga (Editors). 2002. Dairy Develop-ment Authority Annual Report - 2001/2002. Dairy Development Authority, Kampala, Uganda.
Sasse, L. 1984. Biogas Plants: De-sign and Details of Simple Bio-gas Plants. Vieweg and Sohn, Braenschweig/Wiesbaden, Ger-many.
Sun, D. W. 1997. Computer simula-tion and optimization of ammo-nia-water absorption refrigeration systems. Energy Sources 17(3): 211-221.
Ward, R. F. 1986. Engineering de-sign of biogas units for developing countries. In: El- Halwagi, M. (Ed.) Biogas Technology, Trans-fer and Diffusion. Elservier Ap-plied Science Publishers, NY, pp 178-212.
■■

VOL.37 NO.4 2006 AGRICULTURAL MECHANIZATION IN ASIA, AFRICA, AND LATIN AMERICA76
Development of a Simple Pulper for Leaves of Green Plants
byJulius K. TangkaAssistant ProfessorDepartment of Agricultural Engineering,University of Dschang,P.O. Box 497, Dschang, West [email protected]
AbstractA simple vegetable pulper was de-
signed and fabricated. The machine consists mainly of a 1,450 rpm rotor and chopper operating in a large hopper. Driven by a one horse power single phase motor the machine has a capacity of about 17 kg per batch. In evaluating the performance of the machine, the leaves of four plant species were used including; cassava (Manihot esculenta), bit-ter leaf (Vernonia amydalina), and Siam weed (Chromlaena odorata) and glircidia (Gliricidia maculata). The leaves of the plant species were macerated in the machine for six minutes with particle size analysis being done after each minute using the ASAE Standard S424 (1989).
Results indicated that the coarsest material, vernonia, after six minutes of pulping, reduced to a size of 3.5 mm while the finest material after the same period, manihot leaves, attained a size of 2 mm. Compared to the manual method, the machine reduced chopping time per batch of 17 kg by about four hours. Plots of duration of pulping versus feed size indicate a good relationship between the two, the best given by vernonia (R2 = 0.9892 and the least by chro-molaena (R2 = 0.9598).
IntroductionSize reduction of the leaves of
green plants is an important step in their processing. Most leaves of veg-etable plants and medicinal plants are chopped before cooking, drying or consumption. In the extraction of leaf protein concentrate from the leaves of green plants, the leaves are first macerated to smaller particles.
There are several reasons why the size reduction of the leaves of some green plants prior to their processing into other products is important. The maceration of the leaves of green plants prior to leaf protein concentrate extraction is important because maceration de-stroys the cell wall material thereby liberating the protein containing cells (Mciejewiez-Rys & Hancza-kovwski, 1990; Pirie, 1987; Taylor, 1983; Faskin, 1999; Donnelly & McDonald; 1979). Maceration of the leaves of vegetable plants before drying increases the surface area available for moisture extraction and this makes the drying process faster. Also, chopping of the leaves of green plants results in densifica-tion leading to a reduction in bulk volume which facilitates transporta-tion (Aboaba, 1971).
In West and Central Africa, the
leaves of so many vegetable species are first chopped before cooking. Some vegetable leaves such as co-coa yam leaves have very large sur-face areas (up to 1 m2) and for these leaves to be easily cooked, they have to be chopped into smaller particles. Other vegetables such as Gnetum africanum (eru) must first be in-tensely chopped before cooking and eating because the high fibre content makes the chewing of un-chopped leaves very difficult.
The importance of chopping the
Discharge port
Hopper
Electricmotor
Electricbracket
Belt tensioning device
Drive belt
Fig. 1a Pulper mounted in the laboratory for use
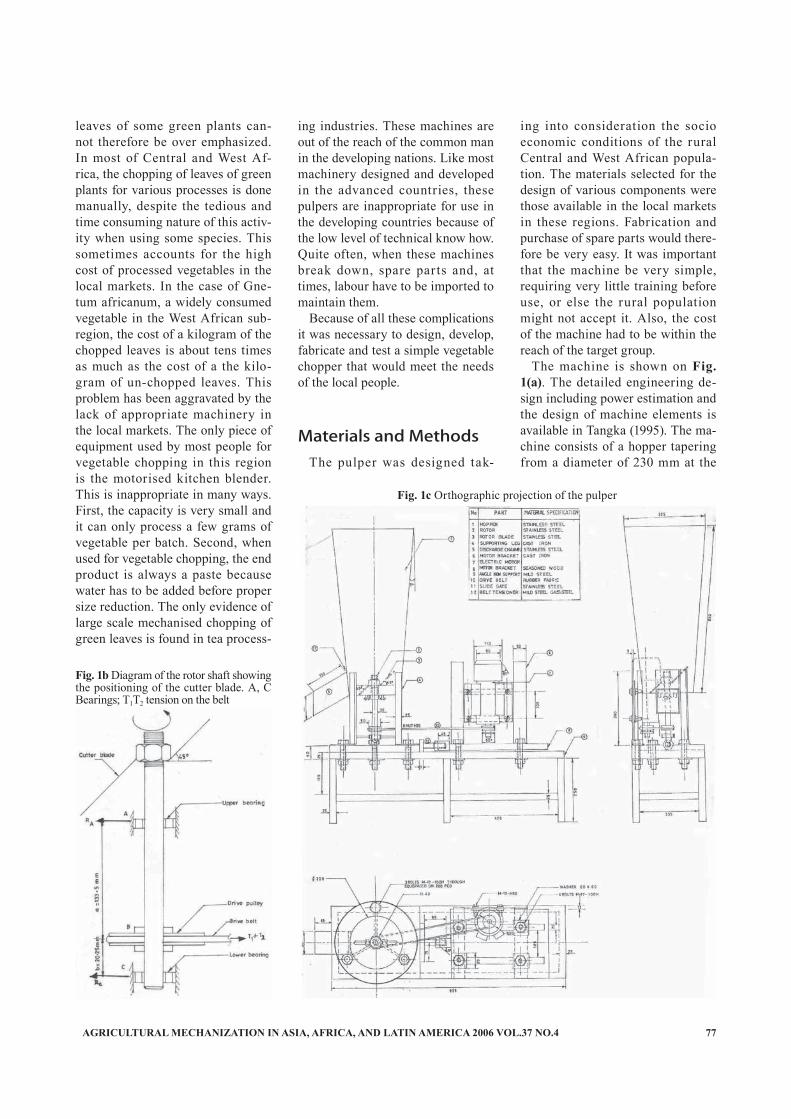
AGRICULTURAL MECHANIZATION IN ASIA, AFRICA, AND LATIN AMERICA 2006 VOL.37 NO.4 77
leaves of some green plants can-not therefore be over emphasized. In most of Central and West Af-rica, the chopping of leaves of green plants for various processes is done manually, despite the tedious and time consuming nature of this activ-ity when using some species. This sometimes accounts for the high cost of processed vegetables in the local markets. In the case of Gne-tum africanum, a widely consumed vegetable in the West African sub-region, the cost of a kilogram of the chopped leaves is about tens times as much as the cost of a the kilo-gram of un-chopped leaves. This problem has been aggravated by the lack of appropriate machinery in the local markets. The only piece of equipment used by most people for vegetable chopping in this region is the motorised kitchen blender. This is inappropriate in many ways. First, the capacity is very small and it can only process a few grams of vegetable per batch. Second, when used for vegetable chopping, the end product is always a paste because water has to be added before proper size reduction. The only evidence of large scale mechanised chopping of green leaves is found in tea process-
ing industries. These machines are out of the reach of the common man in the developing nations. Like most machinery designed and developed in the advanced countries, these pulpers are inappropriate for use in the developing countries because of the low level of technical know how. Quite often, when these machines break down, spare parts and, at times, labour have to be imported to maintain them.
Because of all these complications it was necessary to design, develop, fabricate and test a simple vegetable chopper that would meet the needs of the local people.
Materials and MethodsThe pulper was designed tak-
ing into consideration the socio economic conditions of the rural Central and West African popula-tion. The materials selected for the design of various components were those available in the local markets in these regions. Fabrication and purchase of spare parts would there-fore be very easy. It was important that the machine be very simple, requiring very little training before use, or else the rural population might not accept it. Also, the cost of the machine had to be within the reach of the target group.
The machine is shown on Fig. 1(a). The detailed engineering de-sign including power estimation and the design of machine elements is available in Tangka (1995). The ma-chine consists of a hopper tapering from a diameter of 230 mm at the
Fig. 1b Diagram of the rotor shaft showing the positioning of the cutter blade. A, C Bearings; T1T2 tension on the belt
Fig. 1c Orthographic projection of the pulper

VOL.37 NO.4 2006 AGRICULTURAL MECHANIZATION IN ASIA, AFRICA, AND LATIN AMERICA78
top to 200 mm at the bottom over a span of 660 mm. The bottom is sealed with a 3 mm thick stainless steel plate. A 22 mm diameter open-ing is made at the centre of the base plate through which a rotor shaft is inserted into the hopper. The shaft of diameter 20 mm and length 243 mm is threaded at the top along a length of 30 mm. The threaded sec-tion has a slot of thickness 7 mm, enough to receive the connecting rod of a chopper element shown in Fig. 1(b). The cutter element is made of two stainless steel knives each 150 mm long by 40 mm wide by 2 mm thick. In operation, the cutting edges are sharpened down to a thickness of 0.3 mm. The two knives are welded in a slanting position on opposite ends of a con-necting rod making an angle of 45ºto the vertical when mounted. The connecting rod is 6 mm by 6 mm by 22 mm long. The cutter element is then fitted onto the rotor shaft where it is held firm as shown in Fig. 1(b) by a nut (M 23). The shaft is held in position by two bearings of internal diameter 20 mm. The housing of the upper bearing is bolted unto the bottom of plate of the hopper by two bolts and nuts (M 10). The shaft is driven through a pulley of diameter 50 mm by a 1.12 kW (1.5 hp) elec-tric motor. The hopper has a square section discharge channel of length 150 mm. The channel slopes at an angle of 35º to the horizontal to ensure easy discharge of macerated matter when a slide gate located at the entrance is opened.
The above arrangement is sus-pended on three angle bar supports of height 130 mm. The supports are bolted onto a rectangular wooden bracket 295 mm x 290 mm by 25 mm thick. This wooden bracket is bolted to a supporting wooden member 290 x 947 by 25 mm thick. This basal member contains two slots 360 mm x 17 mm separated by a distance of 150 mm. The slots en-able the electric motor bracket to be moved to or from the hopper using
four bolts each (M17), thereby ten-sioning the belt.
Performance Evaluation of the Pupler
The leaves of some vegetable species consumed widely in West and Central African region were used to test the performance of the pulper. Also, the leaves of other use-ful plants were used. These were: cassava (Manihot esculenta) leaves, bitter leaf (vernonia amydalina), Siam weed (chromlaena odorata) and Gliricidia (Gliricidia maculata). Each leaf sample was fed into the hopper until full. With compaction, the hopper could contain up to 17 kg of leaves. The discharge port of the machine was blocked with the slide gate. The machine was set into operation and timed with a stop clock. As pulping continued, the particle size of the resulting pulp was analysed periodically through the use of a slight modification of the ASAE Standard S424 (1989). The slight modification included the use of eight sieves instead of the five proposed by the standard. The eight sieves had the following sizes 13.2
mm, 6.7 mm, 4.75 mm, 2.36 mm, 1.7 mm, 1.18 mm, 850 µm, 600 µm, and the pan. The advantage of this modification was that it gave a more detailed representation of the feed size than would have been possible using the ASAE Standard S424 (1989) without modification.
The sieves were fitted together in order of coarseness from the most coarse down to the pan and covered with a lid. The sieve arrangement was then clamped onto a Ro-Tap sieving machine and sieved for five minutes or until there was no noticeable change in weight of the contents of each sieve. The material retained in each of the eight sieves was weighed. It is important to note that with the material being sieved after five minutes of pulping, it be-came necessary to agitate the mate-rial in the sieves after some time, to prevent clogging. After six minutes of pulping, it was not possible to de-termine the size using this method because of the wetness of the feed and the consequent clogging of the sieves.
Size determination was first done after two minutes of pulping for all
Duration of pulping in minutes
Geometric mean length of leaf particles Xgm, mm
2.0
2.5
3.0
3.5
4.0
4.5
5.0
5.5
6.0
6.5
Gliricidia m
Manihot e
Vernonia a
Chromolaena
765432
y = 8.4652x-0.4496
R2 = 0.966
y = 9.2713x-0.5984
R2 = 0.9892
y = 7.0593x-0.4966
R2 = 0.9598y = 6.6493x-0.6146
R2 = 0.9612
Fig. 2 Variation of the geometric mean length Xgmof leaf particles with duration of pulping

AGRICULTURAL MECHANIZATION IN ASIA, AFRICA, AND LATIN AMERICA 2006 VOL.37 NO.4 79
the leaves of the plant species. The sample was thoroughly mixed and put back into the machine. The ma-chine was operated for six minutes with particle size analysis being done after each one minute. The particle size was determined using the equation,
..............(1)
.....................(2)
..................................(3)
Where Xi = the diagonal of the screen
opening of the ith screen in mmXgm = the geometric mean length
of the whole sample in mmXgmT = geometric mean length
(in mm) of particles after time T in minutes
χi = the geometric mean length of particles on the ith screen in mm
T = time of pulping in minutesMi = mass of feed retained on the
ith screen (percent total) X(i-1) = diagonal of screen open-
ings in the next larger than ith screen (starting from the smallest) in mm
Sgm = Standard deviationΦ = the maceration rate of the
leaves mm/minn = the number of sievesThe grindability (defined here as
the rate of grinding of material in a particular mill or the rate of de-crease of the geometric mean length of the particles with respect to time) was evaluated from the following equation.
Particle size, mm
Percentage distribution, %
(a) Chromolaena Odorata macerated
0 2 4 6 8 10 12 140
10
20
30
40
50
60
Six minsFive minsFour minsThree minsTwo mins
0 2 4 6 8 10 12 140
10
20
30
40
50
60 Six mins
Five mins
Four mins
Three mins
Two mins
AV = 2.8 m/s
(b) Manihot Esculenta leaves macerated
Particle size, mm
Percentage distribution with time, %
(c) Gliricida maculata leaves macerated
0 2 4 6 8 10 12 140
10
20
30
40
50
60Six mins
Five mins
Four mins
Three mins
Two mins
0 2 4 6 8 10 12 140
10
20
30
40
50
60 Six mins
Five mins
Four mins
Three mins
Two mins
AV = 2.8 m/s
(d) Veronica Amgdalia macerated
Particle size, mm
Percentage distribution, %
(a) Chromolaena Odorata macerated
0 2 4 6 8 10 12 140
10
20
30
40
50
60
Six minsFive minsFour minsThree minsTwo mins
0 2 4 6 8 10 12 140
10
20
30
40
50
60 Six mins
Five mins
Four mins
Three mins
Two mins
AV = 2.8 m/s
(b) Manihot Esculenta leaves macerated
Fig. 3 Particle size distribution for (a) Chromolaena Odorata, (b) Manihot Esculenta leaves,(c) Gliricida maculata leaves, and (d) Veronica Amgdalia macerated through six minutes
Φ = .....................................(4)
The minus sign indicates that the Xgm is decreasing.
Equation 3 can also be written as mm/min
Φ = ...........................(5)
Results, Analysis and Discussion
Fig. 2 shows the variation of the geometric mean length of leaf particles with time. It can be seen that the size of the feed decreases rapidly during the fi rst four minutes of pulping after which size reduc-tion continues at a very slow rate. For leaves of Gliricidia maculate, the size of 2.4 mm seems to be the smallest achievable with this
dXgmdt
Xgm0 - XgmTT

VOL.37 NO.4 2006 AGRICULTURAL MECHANIZATION IN ASIA, AFRICA, AND LATIN AMERICA80
Plant species Grindability, mm/min
Chromolaena Odorata 0.36Veronica amygdalina 0.38Manihot esculenta 0.51Gliricidia maculata 0.36
machine while the curve for Cho-molaena odorata flattens out at 3.1 mm size. For Manihot esculanta and Vernonia amygdalina, size reduction continues after six minutes but, due to juice flow from the pulped matter, it was difficult to accurately deter-mine the size of the feed after this period. The relationship between the time of pulping and the size of the feed shows some good correlation; the best being for Manihot esculenta with an R2, of 0.99 and the least be-ing Chromolaena with an R2 of 0.96.
From these plots it can also be seen that it is possible to estimate the size of the feed by just measur-ing the time of pulping. This can be very useful because the method of sieving, although the most accurate, is very tedious when clogging of the sieves starts. Figs. 3(a) to 3(d) show the behaviour of the different plant samples in the machine. The curves are all skewed to the left showing that as the material gets finer, the rate of grinding reduces.
Results of grindability tests cal-culated from equation (4) are shown on Table 1. The highest rate is given by manihot 0.51 mm/min and the lowest shown by 0.36 mm/min. The higher the grindability, the faster it is for the material to be reduced to a smaller size. Tangka (1995) attri-butes the differences in grindability of plant leaves to the differences in cell densities of the various plant species. The more cells per unit area on the cross section of a leaf, the more the cell wall material has to be destroyed during grinding and the lower the grindability. Perry and Green (1984), state that the main purpose of the grindability study is to evaluate the size and type of mill
needed to produce a specified ton-nage and the power requirement for grinding. The results obtained here could not be compared to any other because there is no other machine available in this region for chopping of vegetable matter.
The machine was judged very effective in chopping the leaves of green plants when compared to the manual method and traditional method. For some traditional ap-plications, it was just necessary to operate the machine for two min-utes to transform 17 kg of the feed to the required size. Tests using the traditional method showed that it took about four hours for a person working at average speed, to chop 17 kg of vernonia to a size of about 6 mm. This was only possible if the manual chopping was accompanied by pounding using a traditional mortar and pestle. Otherwise at the end of the two hours, the product would not be fine enough to pass through the 6 mm sieve.
The total cost of the machine was about $500 but this could be considerably reduced if it was mass produced.
ConclusionsA machine was successful ly
designed and fabricated. The ma-chine could macerate 17 kg of green leaves to a size of 2.5 mm in two minutes. There was a limit to which the size of each plant leaf could be reduced using this machine. There was a good correlation between the time of pulping and the size of the feed for the materials tested. The cost of the machine was about $500. The price of most small scale food processing machinery in this region was around this amount and as such the price was appropriate.
REFERENCES
Aboaba, F. O. 1971. Physical process
characteristics of some aquatic machrophytes as related to me-chanical harvesting. Ph.D thesis University of Wisconsin, depart-ment of Agricultural engineering, Wisconsin, U.S.A.
ASAE. 1989. Methods of determin-ing and expressing particle size of chopped forage materials by siev-ing. American Society of Agricul-tural Engineers Standards S424. Michigan.
Faskin, E. A. 1999. Nutrient qual-ity of leaf protein concentrates p r o d u c e d f r o m w a t e r f e r n (Azolla africana Desv) and duck-weed (Spirodela polyrrhiza L. Schleiden). Bioresource Technol-ogy. 69(2),185-187.
Donnelly, P. E. and R. M. McDonald. 1979. Leaf protein concentrate quality: The effect of pasture species and reducing agent. Pro-ceedings of the New Zealand Society of Animal Production, 39, 275-280.
Oke, O. L. 1973. Leaf protein re-search in Nigeria. A review. Trop-ical Science 15, 139-314
Perry, R. H. and D. W. Green. 1984. Perry’s Chemical engineers hand book. McGraw-Hill Book Com-pany New York.
Pirie, N. W. 1987. Leaf protein and its byproducts on human and ani-mal nutrition. 2nd ed. Cambridge University press London.
Tangka, J. K. 1995. A comparative analysis of the energy require-ments for the extraction of leaf protein concent rate f rom the leaves of five Nigerian plant spe-cies. Unpublished PH. D thesis, Department of Agricultural En-gineering, University of Ibadan, Nigeria.
Taylor, O. O. 1983. The Nutrient Composition and Nutritive Value of the Leaf Protein Concentrate from Two Solanaceous Vegetables, Acta Horticultura, 123, 117-124
■■
Table 1 Grindability test for different plant species using the pulper

AGRICULTURAL MECHANIZATION IN ASIA, AFRICA, AND LATIN AMERICA 2006 VOL.37 NO.4 81
Constraints and Prospects of AgriculturalMechanisation in Samoa
byMd. Wali UllahProfessorDepartment of Soil Science andAgricultural Enginnering,The University of the South Pacific,Alafua Campus, [email protected]
AbstractThis paper discusses the Samoan
topography, soil type, climate, farming systems preferred by farm-ers and crops cultivated. The con-straints and potential of mechaniza-tion have been pointed out. Some suggestions have been put forward to encourage the farmers to adopt mechanised cultivation in order to increase agricultural production for both subsistence and commercial farmers. Agricultural mechanisation will gain a positive momentum if, at least, some of the suggested policies are adopted.
IntroductionSamoa comprises of a group of
islands in the South Pacific Ocean located between 13º and 15º South latitude and 168º and 173º West longitude. It consists of two large islands, Upolu and Savaii along with seven smaller islands. It covers 3,039 square kilometers of land area with a population of about 176,848 people of which 90 % are ethnic Samoans (Government of Samoa,
2001) and a literacy rate of 98 %. The population density is 58.19 per square kilometer. The natural rate of population growth is around 2.4 %. However, emigration has reduced the actual population growth to less than 1 % per annum. Most people live in villages near the coast and normally farm the coastal strips. There is a strong trend among peo-ple to move from rural areas to the capital, Apia, seeking better work and more income opportunities. Annual rainfall varies from 2000 to 5000 mm, the lowest rainfall being experienced in the rain shadow ar-eas in the North Western and West-ern coasts of both islands. Average temperature in the lowland is about 26 ºC and remains fairly constant throughout the year. In the high-lands the average temperature var-ies from 16 ºC to 21 ºC. The mean annual relative humidity is 83.6 % ranging from 80.4 % in August to 84.8 % in February and March.
Traditionally, agriculture has been the backbone of Samoa’s economy and remains so today, primarily in terms of subsistence food supply and security (Ullah and Malaki, 2000). Agricultural farming in Sa-
moa ranges from small subsistence farming to large commercial farm-ing the latter comprising of only a handful of commercial entrepre-neurs. Majority of farmers in Sa-moa are small subsistence to semi-subsistence who produce mainly for own consumption (26.35 %). About 66.38 % produce mainly for home consumption and to sell the excess produce for cash.
Agricultural mechanization is an important component for increasing agricultural production. However, farming is not only a question of labour and machinery but also is a system determined by many factors, such as, kind of crops, weather, soil type, capital, technical know-how, etc. To obtain benefits from the uti-lization of agricultural machinery it is essential to have knowledge about management, operations, mainte-nance and cost of operation. Mecha-nization can be used to increase the productivity of existing agricultural holdings and schemes or it can be the means of establishing some new project. Although mechanization is an important component for im-provement of agricultural produc-tion, it is important to recognize

VOL.37 NO.4 2006 AGRICULTURAL MECHANIZATION IN ASIA, AFRICA, AND LATIN AMERICA82
it in perspective as one of several methods and one that requires con-siderable capital (Rijk, 1989). The adoption of mechanization inputs into farming practices has had mini-mal success in Samoa’s farming history. Currently, various types of farm cultivation methods are prac-ticed in Samoa. Mechanization level varies depending on the methods and cultivation areas. These include land preparation, leveling, planting, plant protection, weed control and harvesting. But not many farmers are adopting mechanization inputs to the extent they need.
It has been of interest to study the reasons why far mers have little interest in adopting agricul-tural mechanisation facilities for increased production. The specific objectives of this study were:
1. to find the constraints of agri-cultural mechanization in Sa-moa.
2. to find the prospect of mecha-nization under Samoan agricul-ture, and
3. to suggest strategies that could be adopted to promote mecha-nization.
TopographyOf the two main islands of Samoa,
Upolu is a rugged chain of volcanic cones forming a crested ridge rising to 1,100 m. Savaii consists of broad coalescing domes topped by numer-ous cones, the highest of which rise to 1,800 m (Kear and Wood, 1959). The landmass of each island rises gently from the mean sea level (with the exception of Eastern Upolu, which rises very steeply). There-fore, in most areas there is a flat to gently undulating coastal plain (1-2 degrees) which passes into gently rolling slopes (2-5 degrees). These in turn merge into steeper foothills (5-15 degrees) which cont inue sometimes steeply (15-25 degrees) until the upland plateau level is reached at about 600 m in Upolu
and Eastern Savaii and at 1,200 m in central Savaii (Wright, 1963). The slopes are often dissected by almost vertical sided valleys. In general, the upland plateau is rolling and surmounted by extinct volcanic cones. The land surface is uneven due to the boundaries between dif-ferent lava flows which have caused steep pitches in slopes due to large pits and rifts caused by obstructions to lava f lows and collapsed steam tunnels (Wright, 1963).
Type of SoilHamilton and Grange (1938) con-
ducted the first scientific study on the soils of Samoa. They indicated that the Samoan soil is relatively shallow with plenty of stones, and boulders, and contains oxide-rich minerals derived from olivine ba-salt. Soils are almost entirely of volcanic origin, except for a few small areas of coastal (coral) sand. Perhaps the most immediate obvious characteristic of Samoan soils is that they are mostly rocky to extremely rocky. There are 55 different types of soil. Soils are predominantly stony latosols of varying fertility (Kear and Wood, 1959). There are a lesser number and smaller areas of tuff derived soil and even fewer alluvial and colluvial soil derived from basalt (Wright, 1963). Samoan soil is generally low in potassium and or phosphate. Equitable rainfall, temperature and good soil properties tend to minimize the impact of rela-tively low fertility on plant produc-tion. Some soils are clay to silty clay loam in the deeper regions to sandy gravel silt loam in the lava field ar-eas. The volcanic soils of Samoa are very young with stones and boulders found just below the surface in ag-riculture viable land and exposed boulders in the lava fields. These young volcanic soils have made use of machinery cultivation very dif-ficult and expensive to maintain. So, the use of machinery cultivation
method is almost non-existent.
Crops ProducedSamoa’s economy is based pri-
marily on agricultural production much of it being at subsistence level. Crops, livestock, fisheries and forestry account for 42 % of GDP. The main cash crops are coconuts (Cocos nucifera), cocoa (Theobro-ma cacao) and banana (Musa spp.). A major staple as well as export crop was Taro (Colocasia esculenta) which has been virtually wiped out by the taro leaf blight disease (Phy-tophera colocasia) since December 1993. Banana and breadfruit have become major staples since then. Another destructive cyclone caused food shortage and Samoa had to im-port rice. Due to the rolling terrain and the loose, rocky and volcanic soil, wetland rice cultivation is not suitable. However, upland or dry land rice could be grown due to fa-vorable soil and climate conditions. Trees like coconuts, bananas and breadfruits are planted by making individual holes similar to taro and are the predominant crops. Other crops like cucumber, gourd, pine-apple and lots of vegetables are be-ing planted in small patches of land and, also, by depositing individual seeds or seed pieces, in most cases, rather than cultivating the area to be planted. However, the planted area is first cleared of weeds using the
CropArea in
acres house-hold sector
Total areain acres
Coconut 46,300 53,200Cocoa 9,900 10,400Taro 10,500 10,500Taamu 11,900 11,900Banana 10,700 10,700Yam 1,300 1,300Kava 3,000 3,000Other crops 6,700 6,700
Total 100,300 107,700
Table 1 Single crop equivalent area of major crops (Govt. of Samoa, 2000)

AGRICULTURAL MECHANIZATION IN ASIA, AFRICA, AND LATIN AMERICA 2006 VOL.37 NO.4 83
hoe or the bushknife (Lantin, 1994). Recently, due to the destructive effects of cyclones and Taro leaf blight, farmers have sought to diver-sify to taamu (Alocasia microrhiza), kava (Piper methysticum) and cattle production. Other crops grown in Samoa are yams and breadfruits. Table 1 shows the land area used for individual crops. Area under major crops grown in 1999 and 1989 are presented in Fig. 1. A significant variation in the cultivation of differ-ent crops in these two years can be seen.
Farming SystemsFarming systems represent an
appropriate combination of farm enterprises, cropping systems, live-stock, fisheries, forestry, poultry and the resources available to the farmer to raise them for food and/or profitability. Powell (2002) studied the different types of farming sys-tems preferred by Samoan farmers. These may be stated as mixed crop-ping, mono-cropping, agroforestry, mixed farming and shifting cultiva-tion. A brief description of each fol-lows:
(i) Mixed CroppingMixed cropping is described as
the growing of two or more crops simultaneously on the same piece of land with or without distinct row arrangement. Studies have shown that planting crops in mixtures have proven to be beneficial to the producer. Mixed cropping is popu-lar among smallholders. In mixed cropping the farmers grow banana, taro, taamu and breadfruit under coconut. Other situations include growing plantains, taro and yams under coconuts. According to the 1999 Census of Agriculture report, crops, such as, banana, taro and taamu were commonly grown with coconut as a mixed crop. Mixed cropping also might constitute mix-tures of tree crops, such as, cocoa, coconut, breadfruit, banana, citrus and vegetables, such as, cabbage, lettuce, cucumber, tomatoes, beans, okra, water cress, etc. for home con-sumption.
(ii) Mono-croppingMono-cropping basically refers to
the growing of a single crop on the same parcel of land. These include bananas/plantains, vegetables/spices, fruit trees, coconuts, etc. The census of Agriculture (Govt. of Samoa, 1989) stated that nearly four-fifths of 36,500 acre was under taro as a single crop.
(iii) AgroforestryAgroforestry can be described as
any sustainable land use system that maintains or increases total yield by combining food crops and/or pas-ture with tree crops, with or without livestock, on the same land. Because of the anticipated benefits of agro-forestry, namely, windbreaks, recy-cling of nutrients, erosion control and moisture conservation, some farmers prefer to go for this type of farming system.
(iv) Mixed FarmingMixed farming describes a crop-
ping system which involves the rais-ing of crops, animals, and/or trees. In other words, it involves the grow-ing of crops as well as the rearing of livestock. Mixed farming is benefi-cial to many small holders from the viewpoint of diverse nutrition that are available to them. Many farm-ers, apart from growing crops, rear pigs and chickens that are free rang-ing.
(v) Shifting CultivationShif t ing cult ivat ion refers to
farming or agricultural systems in which a short but variable cultiva-tion phase of slash-and-burn cleared land alternates with a long, equally variable fallow period. Under this system, forests, secondary bush,
Different crops grown
Cultivation area, acres
0
20000
40000
60000
80000
19891999
Other cropsKava
YamBanana
TaamuTaro
CocoaCoconut
Farm size, acres
Total land area, acres
0
5000
10000
15000
20000
25000
30000
35000
100 acreand up
50-99.9acres
20-49.9acres
10-19.9acres
5-9.9acres
2-4.9acres
1-1.9acres
Less than1 acre
Fig. 1 Comparison of different crops cultivated in 1989 and 1999 (Govt. of Samoa, 2000)
Fig. 2 Size of different farms with the total area shown(Govt. of Samoa, 1991)

VOL.37 NO.4 2006 AGRICULTURAL MECHANIZATION IN ASIA, AFRICA, AND LATIN AMERICA84
woodland or grassland vegetation is cleared with simple hand tools. Shifting cultivation is an extensive system of agriculture evolved and practiced with good results in areas of relatively low population density where the farmer has enough land at his disposal and freedom to culti-vate anywhere he chooses in a spec-ified geo-political unit or region.
Farm SizeFarmers cultivate over 75 % of
the total land area in many ways. Of the remaining area, 17 % is in non-agriculture use, 2 % is fallow and 3 % is bush. The average agricultural holding size is 15 acres per house-hold with a range from less than 1 acre to about 100 or more acres un-der agriculture. The majority (72 %) of holdings fall between 2 acres and 20 acres (20 % at 2 to 4.9 acres, 27 % at 5 to 9.9 acres and 25 % at 10 to 19.9 acres) of agricultural activity. Crop farms are located away from the settlements while livestock are kept around the household dwellings except for larger cattle farms. Cus-tomary land ownership allows mem-bers of extended families access to land for subsistence farming. Most village land is under customary land ownership. With land reforms for access to land under way, access to free hold land has occurred in some rural areas. According to the Agriculture Census (Government of Samoa, 1999) the total area under agricultural activities is estimated at 166,485 acres (67,426.4 ha).
Agricultural Equipment/Machinery Used
Agricultural mechanization em-braces the use of tools, implements and machines for agricultural land development, production, harvest-ing and on-farm processing. It in-cludes three main power sources: human, animals and mechanical.
Natural power (wind and water) has been included under mechanical power, since a mechanical device is required to transfer this power into useful work. As a discipline, agricultural mechanization covers the manufacture, distribution and utilization of tools, implements and machines. Farm mechanization is a sub-category within the agricultural mechanization discipline address-ing the power sources, tools, imple-ments and machinery used on farms for crop production and processing (Rijk, 1989).
Samoa depends largely on tools imported from overseas countries like New Zealand, Australia, Ger-many and the United Kingdom for use in agricultural development. About ten years ago, all the tools needed for farming had to be im-ported. Now, some of the easier to make tools are being made locally. There is, currently, no policy on agricultural tools and implements. It is not known whose responsibility it is to devise a policy on tools and implements as this is left more or less entirely to the private sector to handle (Imo, 1992).
Each crop production and process-ing system uses tools and machin-ery, which may be either common with other crops or specialized for the crop depending upon operation and level of technology used. Samo-an farmers use several implements. The traditional tools are bushknife,
hoe, rakes, picks, forks, secateurs, spades, planting sticks with steel heads, locally called ‘oso’, stick crowbars, desuckering tool, shovels, axes, wheelbarrows, coconut de-huskers and bushknives (Atkinson, 1993). The modern implements for land clearing are chainsaws, mist blower, knapsack sprayers and brush cutters. Smaller hand tools like spades, bushknife, hoes, garden rakes, shovels and bush knives are common with farmers who have backyard vegetable crops. Vegetables including peanuts and gingers are cultivated using the pick as the main tool for breaking up the ground. Rakes and shovels or spade are used to complete the cultivation work. Weed control is done by either hand weeding with the bush knife as the main tool for cutting and dislodg-ing the root system before uprooting by hand or by the use of weedicide. Commercial farmers use tractors to power different implements such as disc ploughs, disc harrows, rotava-tors and chisel ploughs. Information on major items of equipment owned, hired and or borrowed by agricul-tural holdings was collected in the agricultural census. Detailed infor-mation is given in the Table 2.
Potentiality of Mechani-sation
Mechanisation has the potential
Type of equipment Number of holdings
Number of items owned
Number of holdings hiring/
borrowingTractor 38 42 14Roto tiller 191 356 27Copra dryer 1,013 1,037 478Banana injector 1,378 1,489 342Knapsack sprayer 5,755 6,501 2,312Mist blower 468 513 185Power slasher 3,099 3,514 1,181Chain saw 1,412 1,578 480Irrigation water pump 49 55 15Electric generator 141 145 26
Table 2 Equipment owned, hired/borrowed, by type of equipment(Govt. of Samoa, 1999)

AGRICULTURAL MECHANIZATION IN ASIA, AFRICA, AND LATIN AMERICA 2006 VOL.37 NO.4 85
to assist a large number of small farmers in the area of cultivation by designing and developing simple and inexpensive farm machinery and equipment. The soil is full of rocks, boulders and scattered trees. It is possible to take measures to make the soil rock free and clean from unnecessary trees which have no timbre value. Once these jobs are done it will be possible to bring more land under cultivation and use of machinery will be feasible. There is plenty of fallow land which can be brought under cultivation after clearing the land. The Ministry of Agriculture in Samoa already has in place a scheme whereby farmers can hire the tractor and driver plus an implement such as ripper, ridges, harrow or disc plough at a subsi-dised rate of WST 40.00 per hour (US$13). Farmers’ response to this scheme is growing steadily.
Constraints of Mechani-sation
At this moment, government has very little to do with respect to the promotion of agricultural tools and implements. This is entirely left to the private sector to handle. Perhaps, later on, the government might decide to involve in devising a policy for the promotion of appro-priate tools and implements for use locally. Many Samoan farmers are not aware of the benefits of agricul-tural mechanization. For them to re-alize the benefits of mechanization it is very important to know about the available technologies. To lessen the constraints that hinder the devel-opment of agricultural mechaniza-tion, and develop ways to promote or encourage the farmers to practice agricultural mechanization, it is necessary to take measures for cre-ation of public awareness. The fol-lowing are some of the major prob-lems and constraints that need to be addressed for rapid development of the agricultural mechanization for
subsistence farms and commercial farms in Samoa:
• The presence of rocks and boul-ders above and just below the soil surface in large parts of the two main islands of Upolu and Savaii limit the use of machin-ery.
• High cost of farm machinery like tractors and implements.
• The initial cost of removing rocks, stones and boulders by using heavy machinery such as bulldozers or rippers, before using tillage machinery for cul-tivation, could be possible even though it is an expensive exer-cise but it is advisable.
• Lack of awareness campaign to apprise farmers about the avail-ability of machinery and equip-ment, its use and proper main-tenance, and the benefits gained from using such machinery.
• The cultural system, such as customary land ownership, in-hibits commercial type farming in some ways.
• Cultural barriers in the promo-tion of cattle rearing which is essential in promoting animal draft power for pulling imple-ments and carts in flat land.
• Industrial skills dwindling due to migration of people who have opportunity to acquire educa-tion and develop mechanical skills and knowledge.
• Lack of entrepreneurial skills to start metal working enter-prises to produce simple tools and implements, for example, blacksmithing could be initiated at least by those who have been exposed to metal working (Lan-tin, 1994).
• Less dependence on agricultural land because of low popula-tion and assured remittance from family members, relatives working and residing overseas, because of strong family ties.
• Two-wheeled tractors are of limited use under certain soil conditions such as, rocky, and
heavy soils etc.
ConclusionsTradit ional technology is not
sufficient to keep pace with the de-mands of commercial agriculture. To fulfill this demand agricultural mechanisation should be chosen in selective ways for both commercial and subsistence production. Some strategies or policies to the solution of the aforementioned problems to promote mechanisation both at sub-sistence and commercial levels are suggested. These are as follow:
• Availability of soft loans.• Availability of appropriate and
reasonably priced machines, preferably of local origin with adequate ar rangements for maintenance faci l it ies and spares.
• Train agricultural extension of-ficers about the positive benefits of mechanization.
• Organize training workshop for local farmers whereby the extension officers will train the farmers about machinery opera-tion and maintenance.
• Improved land tenure system will make mechanisation more attractive to farmers.
• Adopt appropriate implements for land preparation, such as a ripper for rocky soil conditions to remove rocks and boulders, and secondary tillage imple-ments when the soil is rock free.
• There is limited information and awareness of farmers on ben-efits and potential of irrigation application. Creation of public awareness on irrigation meth-ods, opportunities, technologies and benefits through informa-t ion and t raining programs should be a part and parcel of mechanization programme.
• There is scope of sprinkler and drip irrigation systems largely due to the scarcity of irrigable water and uneven terrain condi-

VOL.37 NO.4 2006 AGRICULTURAL MECHANIZATION IN ASIA, AFRICA, AND LATIN AMERICA86
tion (Pillay, 2002).• Government should provide in-
centive to the interested farmers (exemption of import duty on equipments, power units etc) so that they feel encouraged to import appropriate agricultural machinery for mechanization purpose.
• Proper strategies of land owner-ship system can be used to an advantage as there is land con-solidation in the extended fam-ily.
REFERENCES
Atkinson, W. D. 1993. Research and Development possibilities for ag-ricultural tools and implements in the South Pacific islands. Pacific Island Farm Tools. RAPA Pub-lication:1993/10. Food and Agri-cultural Organization the United Nations, Bangok, Thailand.
Governtment of Samoa. 1989. Min-istry of Agriculture. Department of Statistics: Agricultural Survey, Ministry of Agriculture, Apia, Samoa.
Governtment of Samoa. 1991. Min-istry of Agriculture. Department of Statistics: Agricultural Survey, Ministry of Agriculture, Apia, Samoa.
Governtment of Samoa. 1999. Min-istry of Agriculture. Department of Statistics: Census of Agricul-tural Report, Ministry of Agricul-ture, Apia, Samoa.
Governtment of Samoa, 2000. Min-istry of Agriculture. Department of Statistics: Agricultural Survey, Ministry of Agriculture, Apia, Samoa.
Governtment of Samoa. 2001. Min-istry of Agriculture. Department of Statistics: Agricultural Survey, Ministry of Agriculture, Apia, Samoa.
Hamilton, W. M. and L. I. Grange. 1938. The Soils and Agriculture of Western Samoa. New Zealand Department of Science and Indus-
try Res. Bull. 61.Imo, S. 1992. Country paper West-
ern Samoa. Report of FAO Re-gional Expert Consultation on Ag-ricultural Implements and Tools of the South Pacific Islands. FAO Regional Office for Asia and the Pacific, Bangkok, Thailand.
Kear, D. and B. Wood. 1959. The geology and hydrology of Western Samoa. New Zealand geological survey. Bull. 63. p 92.
Lantin, R. M. 1994. Promotion and Development of Agro-related metalworking Industries (Phase 1), US/R AS/92/072. Western Samoa, Country Report. United Nations Industrial Development Organization, Vienna.
Powell, L. 2002. Study of the differ-ent farming systems preferred by Samoan farmers. Undergraduate project report submitted in partial fulfillment of the requirements for the B. Ag. degree. The University of the South Pacific, Alafua Cam-pus, Samoa.
Pillay, N. S. 2002. A study on the suitability of different irrigation systems for Samoa’s agriculture. Undergraduate project report sub-mitted in partial fulfillment of the requirements for the B. Ag. de-gree. The University of the South Pacific, Alafua Campus, Samoa.
Rijk. A. G. 1989. Agricultural Mech-anization Policy and Strategy. The case study of Thailand. Asian Productivity Organization, Tokyo 107, Japan.
Ullah, M. W. and I. Malaki. 2000. Mechanisation of Agriculture in Samoa. Journal of South Pacific Agriculture, 7(2): 35-40.
Wright, A. C. S. 1963. Soil and land use of Western Samoa. Soil-Bureau Bulletin 22. R. E. Govern-ment Printer, Wellington, New Zealand.
■■

AGRICULTURAL MECHANIZATION IN ASIA, AFRICA, AND LATIN AMERICA 2006 VOL.37 NO.4 87
Design and Development of an Off-Set RotaryCultivator for Use with a Two-Wheel Tractor forFruit Tree Cultivation
byA. SenanarongHeadCrop Production Enginnering Research Group,Agricultural Engineering Research Institute,Bangkok, [email protected]
K. WannaronkAgricultural EngineerCrop Production Enginnering Research Group,Agricultural Engineering Research Institute,Bangkok, 10900THAILAND
AbstractAn off-set rotary tiller for use
with a basic Thai design two-wheel tractor was designed and developed for cultivating an orchard. Results from the test with 7 kW two-wheel tractor in a mango orchard with 178 rpm rotor speed and 1.8 km/h trav-elling speed indicated a field capac-ity of 0.12 ha/h with 92 % weeding efficiency. After the test, soil prop-erties appeared to be 23.49 mm in clod diameter with 0.96 g/cc in bulk density and 371.41 kPa cone index on the average.
IntroductionIn Thailand, from 1991 to 2002,
the agricultural land use for or-chards was increasing by 34.2 % while the land use for paddy field was decreasing by 5.4 % (OAE,
2002). Since the land used for orchards was increasing rapidly, along with the government policy to strengthen the organic agriculture, there was a need to develop suitable machines for these orchards espe-cially for mechanical weed control. Kwangwaropas (1999) reported that weeds eliminated by mechanical cultivation recovered slower than by herbicides. Even though the local made 3-4 kW wheel-less cultivator has been widely used for this pur-pose, its application is only suitable for light soil such as in vegetable cultivation. It is not suitable for hard soil such as in the orchard because of its light weight and high vibration at the handle.
The import 8-9 kW power til-ler could not easily work near the trees because of lower branches. To overcome these problems, an off-set rotary cultivator was designed and developed at the Agricultural Engi-
neering Research Institute.
Design and DevelopmentThe off-set rotary cultivator used
with a two-wheel tractor was a new design concept. It was different from the conventional rotary culti-vator. There are two types of con-ventional rotary cultivators; one is a center-drive type and the other one is a side-drive type (Sakai, 1999). The off-set type was a new design which could achieve acultivation area further from the outer rim of the wheel, so it could cultivate clos-er to the tree without the operator or two-wheel tractor being blocked by the lower branches. From Fig. 1, the center-drive type leaves a ridge at the center of the width of cut, while the side-drive type can not be attached to the typical Thai two-wheel tractor.

VOL.37 NO.4 2006 AGRICULTURAL MECHANIZATION IN ASIA, AFRICA, AND LATIN AMERICA88
This off-set rotary cultivator was attached to a Siam Kubota NC-Short handle two-wheel tractor with a 7 kW diesel engine. The PTO shaft was at the right hand side of the operator. Fig. 2 shows a schematic view of the off-set rotary cultivator attached to a two-wheel tractor. The important design details are as fol-lows:
• The rotary cultivator was off-set 30 cm from the outer rim of the left wheel. The cutting width of the rotary was 80 cm while the wheel track of the two-wheel tractor was 115 cm.
• Power f rom PTO shaf t was transmitted to rotary gearbox by mean of chain and sprocket.
• According to the results of the test, the optimum speed of the rotor was 178 rpm with engine speed of 1,800 rpm. The travel-ling speed was 1.78 km/h at first forward gear and the pitch of the blade was 5.5 cm.
• There were four disk holder flanges on the tiller shaft. Each flange was fitted with six C-L type blades. The f langes were located to attain a 15 degree spiral form of the blade.
Result and DiscussionA field test was conducted in a
mango orchard in Nakornrachsima Province. For preliminary tests to observe ease of control, it was found
that the travelling direction of the two-wheel tractor was easily con-trolled. The clockwise moment pro-duced by greater traction of the left cage wheel and pushing force from the rotary could be absorbed by soil side force reacting to the cage wheels of the two-wheel tractor. A performance test was conducted under RNAM Test Code for rotary tillers with an engine speed of 1,800 rpm.
Field Performance of the Off-Set Rotary CultivatorWeeding Efficiency:
The weeding efficiency was 92.09 % with an initial weed population of 609.7 g/m2. The actual field capac-ity was found to be 0.12 ha/h with
88.3 % field efficiency. This capac-ity was about six times faster than one man with a hoe. The actual field capacity of manual weeding was 30 trees/day by one man (Kwangwaro-pas, 1999) or 53.3 h/ha for the same plant density of 200 trees/ha. The fuel consumption of the two-wheel tractor was 0.8 L/h or 6.7 L/ha. Fig. 3 shows the operation of the off-set rotary cultivator.Soil Properties:
Soil moisture content: Soil mois-ture content of the test field was 23.38 % (db).
Soil bulk density: Before testing, the average soil bulk density was 1.115 g/cc. After testing, the average bulk density was 0.963 g/cc.
Soil pulverization: After the test
Fig. 2 A schematic view of the off-set rotary cultivatorimplementing with a two-wheel tractor
Fig. 1 The power transmission line of the rotary cultivator
A. Center-drive type B. Side-drive type C. Off-set type

AGRICULTURAL MECHANIZATION IN ASIA, AFRICA, AND LATIN AMERICA 2006 VOL.37 NO.4 89
soil clod size was 23.49 mm by av-erage.
Soil cone index: Cone index of the soil up to 10.5 cm depth was ob-served before and after test. It was found to be 1134.86 kPa before the test, after the test it was 371.41 kPa. Fig. 4 shows the average cone index value at different depths before and after the test.
ConclusionThe off-set rotary cultivator used
with a two-wheel tractor has many distinct advantages over the wheel-less cultivators and the ordinary power tiller for cultivating fruit trees. It is more comfortable and can access around the base of tree effectively. Results of the test satis-fied the farmer. For further study, the off-set rotary cultivator should
Fig. 3 Operation of the off-setrotary cultivator
Cone index, kPa
Depth, cm
Before cultivation
0 500 1000 1500 2000
-10.5
-7.0
-3.5
0.0 After cultivationBefore cultivation
After cultivation
Fig. 4 Average cone index values at different depths before and after cultivation
be developed for cultivation as well as weeding in the field crop such as sugar cane.
REFERENCES
Kwangwaropas, M. 1999. Study and research of the equipment used for weeding under mango trees. Paper presented at the Fourth National Plant Protection Confer-ence, Chonburi, 27-29 October 1999.
Office of Agricultural Economics. 2000. Agricultural Statistics of Thailand-Crop Year 2001/2002, Bangkok, Thailand.
RNAM. 1995. Test Codes and Pro-cedures for Farm Machinery. Technical Series, No. 12, Regional Network for Agricultural Machin-ery, Bangkok, Thailand.
Sakai, J. 1999. Two-Wheel Tractor Engineering for Asia Wet Land Farming. Shin-Norinsha Co. Ltd., Tokyo, Japan.
■■

AGRICULTURAL MECHANIZATION IN ASIA, AFRICA, AND LATIN AMERICA 2006 VOL.37 NO.490
NEWSagriChina in Beijing from 26 to 28 April 2007
Agricultural Exhibition - New: ‘Potato Special’ - Technical Forum and Excur-sion Programme - Deadline for Stand Bookings is 15 December 2006
(DLG). The agricultural exhibition agriChina will be held in Beijing for the third time from 26 to 28 April 2007. agriChina is the only international plat-form for the entire agribusiness segment in China. After being held only twice before, it has established itself as an indispensable meeting place for China’s professional farmers and agricultural specialists. The agriChina concept of international agricultural exhibition, top-f light technical programme and agricultural excursion caters equally to the needs of investors from China and of exhibitors from all over the world. The venue in Beijing has proved suc-cessful thanks to its nearness to policy-makers and the large-scale farms in the North and Northeast of China. The organisers are DLG-Agriservice GmbH, a subsidiary of the German Agricultural Society (DLG), and Deutsche Messe AG (Hanover) with its subsidiary firm Han-nover Fairs China Ltd. (Shanghai). Their local partner is the China Association of Machinery Manufacturers (CAAMM). agriChina is further supported by the Chinese Ministry of Agriculture, the manufacturers’ federation VDMA Ag-ricultural Machinery Association, and the American Equipment Manufacturers (AEM). The deadline for stand bookings for exhibitors is 15 December 2006.
agriChina 2007 will be divided into the following sectors:
• Agricultural machinery and plant production with machinery for sow-ing and drilling, fertilising, plant protection, irrigation, harvesting, harvest processing and conditioning, harvest storage, tractors, special trac-tors and transport technology
• Livestock production and manage-ment for poultry, pigs, cattle and dairy cattle with livestock breeding, animal husbandry, animal nutrition and animal health, as well as process-
ing and marketing • Fruit and vegetable cropping with
cultivation machinery, greenhouse equipment, harvesting machinery, processing, packing and preservation
New: “ Potato Special” with CongressChina is the world’s second largest
potato producer. In order to cater to the technical requirements of the strongly growing Chinese potato market, the organisers of agriChina 2007 are orga-nising a “Potato Special”. This special show will address the entire potato chain with seed material, planting, lift-ing, transport, storage and processing. An advisory centre will supplement the exhibition segment. This will be backed up additionally by an international po-tato congress.
National Community StandsThe Federal Ministry for Economics
and Technology (BMWi) has promised to promote a German community stand at agriChina 2007. This will provide German firms with the possibility of taking part in the exhibition on favour-able terms, as well as allowing them a prestigious exhibition stand with a jointly usable service area and services. Companies interested in participating in the community stand can obtain further information from the organisers. Nation-al community stands from France and the USA have already been announced.
The core target group on the visitor side at agriChina 2007 consists of the managers of large-scale farm units and of vegetable, fruit and horticultural cen-tres, agricultural machinery dealers, and specialists from the Chinese ministries as well as government and administra-tive bodies. These include in particular the areas of mechanisation and technical progress, livestock production, service centres for advisory services and ag-riculture, as well as the department of state-run enterprises.
Further information on agriChina 2007 and registration forms are avail-able from DLG-Agriservice GmbH, Büro Frankfurt am Main, Eschborner Landstr. 122, D-60489 Frankfurt am Main, Fax: +49/69/24788-113. The con-
tact persons are Karl-Martin Lüth Tel: +49/69/24788-257, E-mail: k-m.lueth @DLG.org, and Ulrike Schmidt-Ma-chinek. Tel: +49/69/24788-268, E-mail: [email protected]. Informa-tion on agriChina 2006 is also available from Deutsche Messe AG, Messegelände, D-30521 Hanover, contact person Anja Marhauer, Tel: +49/511-8932132, Fax: +49/511-8932109, E-mail: anja. [email protected].
■■

VOL.37 NO.4 2006 AGRICULTURAL MECHANIZATION IN ASIA, AFRICA, AND LATIN AMERICA 91
Book ReviewModeling Software with Finite State Machines: A Practical Ap-proach
Author(s):Ferdinand Wagner - Schwaebisch Hall,
GermanyRuedi Schmuki - Unaxis, Balzers,
SwitzerlandThomas Wagner - Nortel Networks,
Friedrichshafen, GermnyPeter Wolstenholme - Six-Fours les
Plages, FranceDetailed Description:
Modeling Software with Finite State Machines: A Practical Approach ex-plains how to apply finite state machines to software development. It provides a critical analysis of using finite state ma-chines as a foundation for executable specifications to reduce software devel-opment effort and improve quality. This book discusses the design of a state ma-chine and of a system of state machines. It also presents a detailed analysis of de-velopment issues relating to behavior modeling with design examples and de-sign rules for using finite state machines.
This volume describes a coherent and well-tested framework for generating re-liable software for even the most com-plex tasks. The authors demonstrate that the established practice of using a spec-ification as a basis for coding is wrong. Divided into three parts, this book opens by delivering the authors’ expert opin-ions on software, covering the evolution of development as well as costs, meth-ods, programmers, and the development cycle. The remaining two parts encour-age the use of state machines: promoting the virtual finite state machine (Vfsm) method and StateWORKS development tools.List Price: $89.95, Number of Pages: 392Published by: Auerbach Publications / Taylor & Francis Group, 6000 Broken Sound Parkway, NW, Suite 300, Boca Raton, FL33487, USA
Control and Automation of Elec-trical Power Distribution Systems
Author(s):James Northcote - Green - ABB Power
technologies AB Vasteras, SwadenRobert Wilson - Abasis Consulting
Limited Whitchurch, Shropshire, UKDetailed Description:
Implementing the automation of elec-tric distribution networks, from sim-ple remote control to the application of software-based decision tools, requires many considerations, such as assessing costs, selecting the control infrastructure type and automation level, deciding on the ambition level, and justifying the so-lution through a business case. Control and Automation of Electric Power Dis-tribution Systems addresses all of these issues to aid you in resolving automation problems and improving the manage-ment of your distribution network.
Bringing together automation concepts as they apply to utility distribution sys-tems, this volume presents the theoreti-cal and practical details of a control and automation solution for distribution sub-stations and feeders. By discussing dis-tribution planning, performance calcu-lations, and protection, the authors show how to meet specific performance goals. The book also provides two case studies that illustrate the business case for dis-tribution automation (DA) and methods for calculating benefits, including the as-sessment of clew time saving.
Using Control and Automation of Elec-tric Power Distribution Systems, you can embark on the automation best suit-ed for your needs.List Price: $139.95Number of Pages: 464Published by: CRC Press / Taylor & Francis Group, 6000 Broken Sound Parkway, NW, Suite 300, Boca Raton, FL33487, USA
Food Processing: Principles and Applications
Author(s):Hosahalli S. Ramaswamy - McGill
University, Ste-Anne-de-Bellevue, Que-bec, Canada
Michele Marcotte - Agriculture & Agri-Food Canada, Saint-Hyacinthe, Quebec, CanadaDetailed Description:
Food Processing: Principles and Ap-plications is a comprehensive resource
that explores the basic and applied as-pects of food processing. It describes the physical, chemical, and microbiological basis for each method of preservation. Particular emphasis is placed on the ap-plication of three of the most universal-ly used commercial processes: thermal processing, freezing, and dehydration.
Thermal processing - perhaps the most widely used technology in the world - is examined in thorough discussions of the microbial basis of the process and on microbial destruction kinetics. Also described is the characterization of the heating behavior of foods and the equip-ment used for thermal processing.
Low temperature preservation is also demonstrated with a focus on freezing. The fundamentals of the freezing pro-cess, and the techniques and equipment used in commercial freezing operations are also explained. The thermophysical properties and the modeling of freeze times are meticulously addressed in se-quence.
Aspects of dehydration are detailed from drying fundamentals to drying equipment, modeling, and storage sta-bility. In the final section, separation processes are highlighted: evaporation, membrane processing, freeze concentra-tion, extraction, and osmotic dehydra-tion.
This book is ideal for undergraduate students in food science who are taking courses in food processing. It is also a must have resource for food process en-gineers and researchers to forecast re-sults of food processing methods.List Price: $99.95Number of Pages: 440Published by: CRC Press / Taylor & Francis Group, 6000 Broken Sound Parkway, NW, Suite 300, Boca Raton, FL33487, USA
Damage Mechanics
Author(s):George Z. Voyiadjis - Louisiana State
University, Baton Rouge, USAPeter I. Kattan - Louisiana State Uni-
versity, Baton Rouge, USADetailed Description:
Before a structure or component can be completed, before any analytical

AGRICULTURAL MECHANIZATION IN ASIA, AFRICA, AND LATIN AMERICA 2006 VOL.37 NO.492
model can be constructed, and even be-fore the design can be formulated, you must have a fundamental understand-ing of damage behavior in order to pro-duce a safe and effective design. Dam-age Mechanics presents the underly-ing principles of continuum damage me-chanics along with the latest research. The authors consider both isotropic and anisotropic theories as well as elastic and elasto-plastic damage analyses us-ing a self-contained, easily understood approach.
Beginning with the requisite math-ematics, Damage Mechanics guides you from the very basic concepts to ad-vanced mathematical and mechanical models. The first chapter offers a brief MAPLE® tutorial and supplies all of the MAPLE commands needed to solve the various problems throughout the chap-ter. The authors then discuss the ba-sics of elasticity theory within the con-tinuum mechanics framework, the sim-ple case of isotropic damage, effec-tive stress, damage evolution, kinemat-ic description of damage, and the gen-eral case of anisotropic damage. The re-mainder of the book includes a review of plasticity theory, formulation of a cou-pled elasto-plastic damage theory devel-oped by the authors, and the kinematics of damage for finite-strain elasto-plastic solids.
From fundamental concepts to the lat-est advances, this book contains every-thing that you need to study the damage mechanics of metals and homogeneous materials.List Price: $119.95Number of Pages: 280Published by: CRC Press / Taylor & Francis Group, 6000 Broken Sound Parkway, NW, Suite 300, Boca Raton, FL33487, USA
Environmentally Friendly Tech-nologies for Agricultural Produce Quality
Author(s):Shimshon Ben Yeoshua - The Volcani
Center, ARO, Bet Dagan, IsraelDetailed Description:
While ecology as a whole continues to receive considerable attention, posthar-vest food handling, until recently, had not been examined from a green per-spective. This has changed as health-conscious consumers look to improve
both their diets and their environment. Environmentally Friendly Technologies for Agricultural Produce Quality is the first book to take a focused look from an ecological point of view at the way produce is preserved, packaged, and shipped. The book’s editor, Shimshon Ben-Yehoshua, a leader in the interna-tional scientific community, presents a framework he refers to as the triple bot-tom line, which takes into consideration economic and societal issues and an en-vironmental perspective.
Experts and eminent researchers dis-cuss recent developments, such as the use of genetic engineering, modified at-mosphere packaging, pest control for durable and perishable produce, all de-signed to reduce spoilage without com-promising quality or negatively im-pacting the environment. Keeping faith with the triple bottom line, the book ex-plores related topics such as innovations in transportation and the value of pro-duce to human health. This book makes an excellent handbook for postharvest professionals and others handlers of pro-duce as well as a textbook for students preparing to meet the needs of a health and ecology conscious society.List Price: $169.95Number of Pages: 552Published by: CRC Press / Taylor & Francis Group, 6000 Broken Sound Parkway, NW, Suite 300, Boca Raton, FL33487, USA
Novel Food Processing Technol-ogies
Author(s):Gustavo V. Barbosa - Canovas - Wash-
ington State University, Pullman, USAMaria Soledad Tapia - Central Univer-
sity of Venezuela, Caracas Apartado, Venezuela
Maria Pilar Cano - Instituto del Frio-CSIC, Madrid, SpainDetailed Description:
Reflecting current trends in alternative food processing and preservation, this reference explores the most recent appli-cations in pulsed electric field (PEF) and high-pressure technologies, food micro-biology, and modern thermal and non-thermal operations to prevent the occur-rence of food-borne pathogens, extend the shelf-life of foods, and improve the safety, quality, and nutritional value of various food products.
Documents the results of the Emerging Technologies for the Food Industry sym-posium held in Madrid, Spain.
Spanning the most influential break-throughs in food engineering, this guide demonstrates the successful application of PEF technology to products such as fruit juices, eggs, and milk. It also stud-ies factors affecting the PEF resistance of microorganisms, analyzes methods in predictive microbiology and its impact on food safety systems, and examines advances in the use of freezing technol-ogies, ultraviolet light, supercritical fluid extraction, and commercial high-pres-sure equipment.List Price: $179.95Number of Pages: 720Published by: CRC Press / Taylor & Francis Group, 6000 Broken Sound Parkway, NW, Suite 300, Boca Raton, FL33487, USA
Trace Elements in the Environ-ment: Biogeochemistry, Biotech-nology, and Bioremediation
Author(s):M.N.V. Prasad - University of Hyder-
abad, IndiaKenneth S. Sajwan - Savanah State
University, Georgia, USARavi Naidu - University of South Aus-
tralia, Mawson Lakes, AustraliaDetailed Description:
New analytical techniques have en-hanced current understanding of the be-havior of trace and ultratrace elements in the biogeochemical cycling, chemical speciation, bioavailability, bioaccumu-lation, and as applied to the phytoreme-diation of contaminated soils. Address-ing worldwide regulatory, scientific, and environmental issues, Trace Elements in the Environment explores these fron-tiers, including biotechnological aspects of metal-binding proteins and peptides and phytoremediation strategies using trees, grasses, crop plants, aquatics, and risks to ecological and human health. Discussing trace elements in the holistic environment, this book covers advances in state-of-the-art analytical techniques, molecular biotechology, and contempo-rary biotechnology that enhances knowl-edge of the behavior of trace elements in the biogeosphere and at the cellular and molecular level.
The editors and their hand-picked pan-el of contributors provide authoritative

VOL.37 NO.4 2006 AGRICULTURAL MECHANIZATION IN ASIA, AFRICA, AND LATIN AMERICA 93
coverage of trace elements in the envi-ronment. They highlight cutting-edge applications of emerging strategies and technologies to the problems of trace el-ements in the environment. The editors discuss emerging areas such as bacterial biosorption of trace elements, processes, and applications of electroremediation of heavy metals-contaminated soils, ap-plication of novel nanoporous sorbents for the removal of heavy metals, metal-loids, and radionuclides. The book fo-cuses on the effects of increasing levels of trace elements on ecological and hu-man health, evaluates the effectiveness of methods of phytoremediation, and covers risk assessment, pathways, and trace element toxicity.
Containing more than 150 illustrations, tables, photographs, and equations, the book’s coverage spans the entire body of knowledge available about how and why plants interact with metals and oth-er trace elements.List Price: $159.95Number of Pages: 744Published by: CRC Press / Taylor & Francis Group, 6000 Broken Sound Parkway, NW, Suite 300, Boca Raton, FL33487, USA
Natural Products from Plants, Second Edition
Author(s):Leland J. Cseke - The University of
Alabama, Huntsville, USAAra Kirakosyan - University of Michi-
gan, Ann Arbor, MI, USAPeter B. Kaufman - University of
Michigan, Ann Arbor, USASara Warber - University of Michigan,
Ann Arbor, USAJames A. Duke - Green Farmacy Gar-
den, Fulton, Maryland, USAHarry L. Brielmann - Glastonbury
Highschool, Connecticut, USADetailed Description:
From medicinal, industrial, and cu-linary uses to cutting-edge laboratory techniques in modern research and plant conservation strategies, Natural Prod-ucts from Plants, Second Edition reveals a vastly expanded understanding of the natural products that plants produce. In a single volume, this book offers a thor-ough inventory of the various types of plant-derived compounds. It covers their chemical composition, structure, and properties alongside the most effective
ways to identify, extract, analyze, and characterize new plant-derived com-pounds.
The authors examine new information on the chemical mechanisms plants use to deter predators and pathogens, attract symbiotic organisms, and defend them-selves against environmental stress-in-sights which are key for adapting such mechanisms to human health. Along with updated and revised information from the highly acclaimed first edition, the second edition presents seven new chapters and features more than 50% new material relating to plant constitu-ents, natural product biochemistry, and molecular biology. The book incorpo-rates in-depth treatment of natural prod-uct biosynthesis with new collection and extraction protocols, advanced separa-tion and analytical techniques, up-to-date bioassays, as well as modern mo-lecular biology and plant biotechnology for the production of natural products.
Unique in its breadth and coverage, Natural Products from Plants, Second Edition belongs on the shelf of interested researchers, policymakers, and consum-ers- particularly those involved in dis-ease prevention, treatment, and pharma-ceutical applications-who need a com-plete guide to the properties, uses, and study of plant natural products.List Price: $149.95Number of Pages: 611Published by: CRC Press / Taylor & Francis Group, 6000 Broken Sound Parkway, NW, Suite 300, Boca Raton, FL33487, USA
■■

AGRICULTURAL MECHANIZATION IN ASIA, AFRICA, AND LATIN AMERICA 2006 VOL.37 NO.494
-AFRICA-Benedict KayomboAssociate Professor of Soil and Water Engineering, Dept. of Agric. Engineering and Land Planning, Botswana College of Agriculture, University of Bo-tswana, Private Bag 0027, Gaborone, BOTSWANA.TEL(+267)-3650125, FAX(+267)-328753E-mail: [email protected]
Mathias Fru FontehAsst. Professor and Head, Dept. of Agric. Engineer-ing, Faculty of Agriculture, University of Dschang, P.O. Box 447, Dschang, West Province, CAMEROONTEL+237-45-1701/1994, FAX+237-45-2173/1932E-mail: [email protected]
Ahmed Abdel Khalek El BeheryAgric Engineering Research Institute, Agricultural Reserch Center, Nadi El-Said St. P.O. Box 256, Dokki 12311, Giza, EGYPT
Ali Mahmoud El HossarySenior Advisor to the Ministry of Agriculture and Chairman of (AGES)-Agengineering Consulting Group, Ministry of Agriculture - P.O.Box 195 Zama-lek 11211 Cairo, EGYPTTEL00-202-335-9304, FAX00-202-3494-132
B.S. PathakProject Manager, Agric. Implements Research and Improvement Centre, Melkassa, ETHIOPIA
Richard Jinks BaniLecturer & Co-ordinator, Agric. Engineering Div., Faculty of Agriculture, University of Ghana, Legon, GHANA
Israel Kofi DjokotoSenior Lecturer, University of Science and Technol-ogy, Kumasi, GHANA
David Kimutaiarap SomeProfessor, Deputy Vice-chancellor. Moi University, P.O. Box: 2405, Eldoret, KENYA
Karim HoumyProfessor and head of the Farm Mechanization Dept., Institute of Agronomy and Velerinary Medi-cine II, Secteur 13 Immeuble 2 Hay Riad, Rabat, MOROCCO, Tel+212-7-68-05-12, Fax+212-7-775801E-mail: [email protected]
Joseph Chukwugotium IgbekaProfessor, Dept. of Agricultural Engineering, Univ. of Ibadan,, Ibadan, NIGERIATEL+234-2-8101100-4, FAX+234-281030118E-mail: [email protected]
E.U, OdigbohProfessor, Agricultural Engg Dept., Faculty of En-gineering, University of Nigeria, Nsukka, Enugu state, NIGERIA, TEL+234-042-771676, FAX042- 770644/771550, E-mail: [email protected]
Kayode C. OniDirector/Chief Executive, National Centre for Agric. Mechanization (NCAM), P.M.B.1525, Ilorin, Kwara State, NIGERIATEL+234-031-224831, FAX+234-031-226257E-mail: [email protected]
N.G. KuyembehAssociate Professor, Njala University Colle, Univer-sity of Sierra Leone, Private Mail Bag, Free Town, SIERRA LEONETEL+249-778620-780045, FAX+249-11-771779
Abdien Hassan AbdounMember of Board, Amin Enterprises Ltd., P.O. Box 1333, Khartoum, SUDAN
Amir Bakheit SaeedAssoc. Professor, Dept. of Agric. Engineering, Fac-ulty of Agriculture, University of Khartoum, 310131 Shambat, SUDAN, TEL+249-11-310131
Abdisalam I. KhatibuNational Prolect Coordinafor and Direcror, FAO Ir-rigated Rice Production, Zanzibar, TANZANIA
Edward A. BaryehProfessor, Africa University, P.O.Box 1320, Mutare, ZIMBABWE
Solomon Tembo52 Goodrington Drive, PO Mabelreign,Sunridge, Harare, ZIMBABWE
-AMERICAS-Hugo Alfredo CetrangoloFull Professor and Director of Food and Agribusi-ness Program Agronomy College Buenos Aires University, Av. San Martin4453, (1417) Capital Fed-
eral, ARGENTINATEL+54-11-4524-8041/93, FAX+54-11-4514-8737/39E-mail: [email protected]
Irenilza de Alencar NääsProfessor, Agricultural Engineering College, UNI-CAMP, Agricultural Construction Dept.,P.O. Box 6011, 13081 -Campinas- S.P.,BRAZILTEL+55-19-7881039, FAX+55-19-7881010E-mail: [email protected]
A.E. GhalyProfessor, Biological Engineering Deparment Dalhousie University, P.O. Box 1000, Halifax, Nova Scotia, B3J2X4, CANADATEL+1-902-494-6014, FAX+1-902-423-2423E-mail: [email protected]
Edmundo J. HetzProfessor, Dept. of Agric. Eng. Univ. of Concepcion, Av. V.Mendez 595, P.O. Box 537, Chillan, CHILETEL+56-42-216333, FAX+56-42-275303E-mail: [email protected]
A.A. ValenzuelaEmeritus Professor, Ag. Eng. Fac., University of Concepcion,Casilla537Chillan, CHILETEL+56-42-223613, FAX+56-42-221167
Roberto AguirreAssociate Professor, National University of Colom-bia, A.A. 237, Palmira, COLOMBIATEL+57-572-2717000, FAX+57-572-2714235E-mail: [email protected]
Omar Ulloa-TorresProfessor, Escuela de Agricultura de la Region, Tropical Humeda(EARTH), Apdo. 4442- 1000, San Jose, COSTA RICA, TEL+506-255-2000, FAX +506-255-2726, E-mail: [email protected]
S.G. Campos MaganaLeader of Agric. Engineering Dept. of the Gulf of Mexico Region of the National Institute of Forestry and Agricultural Research, Apdo. Postal 429. Vera-cruz, Ver. MEXICO
Hipolito Ortiz-LaurelHead of Agric. Engineering and Mechanization Dept./ Postgraduate College, Iturbide 73, Salinas de Hgo, S.L.P., C.P. 78600, MEXICOTEL+52-496-30448, FAX+52-496-30240
B Kayombo M F Fonteh A A KEl Behery
A MEl Hossary
B S Pathak R J Bani I K Djokoto D K Some K Houmy J C Igbeka
E U-Odigboh K C Oni N GKuyembeh
A HAbdoun
A B Saeed A I Khatibu E A Baryeh S Tembo H ACetrangolo
I de A Nääs
A E Ghaly E J Hetz A AValenzuela
R Aguirre O Ulloa-Torres S G CMagana
H Ortiz-Laurel W JChancellor
M R Goyal A KMahapatra
Co-operating Editors

VOL.37 NO.4 2006 AGRICULTURAL MECHANIZATION IN ASIA, AFRICA, AND LATIN AMERICA 95
William J. ChancellorProfessor Emeritus, Bio. and Agr. Eng. Dept., Univ. of California, Davis, CA, 95616, U.S.A.TEL+1-530-753-4292, FAX+1-530-752-2640E-mail: [email protected]
Megh R. GoyalProf./Agric & Biomedical Engineering, Univer-sity of Puerto Rico, P.O.Box 5984, Mayaguez PR, 006815984, U.S.A., TEL+1-787-265-4702E-mail: [email protected]
Ajit K. MahapatraPresent add: Agric. & Biosystems Eng. Dept., South Dakota State Univ., P.O. Box2120 Brook-ings, SD 57007-1496, U.S.A., TEL605-6885291, FAX 605-6886764, E-mail: [email protected]
-ASIA and OCEANIA-Graeme R. QuickConsulting Enginner, 83 Morrisons Road, Peaches-ter, Queensland, 4519, AUSTRALIA
Shah M. FaroukProfessor (Retd.),Farm Power & Machinery Dept., Bangladesh Agricultural University, Mymensingh 2200, BANGLADESH, TEL+880-91-5695ext.2596, FAX91-55810, E-mail: [email protected]
Daulat HussainDean, Faculty of Agric. Engineering and Tech-nology, Bangladesh Agricultural University, My-mensingh-2202, BANGLADESH, TEL+880-91-52245, FAX91-55810, E-mail: [email protected]
Mohammed A. MazedMember-Director, Bangladesh Agri. Res. Council, Farmgate, Dhaka, BANGLADESHE-mail: [email protected]
Chetem WangchenProgramme Director Agricultural Machinery Centre Ministry of Agriculture Royal Government of Bhutan, Bondey Paro Bhutan 1228, BHUTAN, E-mail: [email protected]
Wang WanjunPast Vice Director and Chief Engineer/Chinese Academy of Agricultural Mechanization Sciences, 1 Beishatan, Beijing, 100083, CHINATEL+86-(0)83-001-6488-2710, FAX001-6488-2710E-mail: [email protected]
Sarath IllangantilekeRegional Representative for South and West
Asia, International Potato Center (CIP), Regional Office for CIP-South & West Asia, IARI (Indian Ag-ric. Res. Institute) Campus, Pusa, New Delhe-12, 110002, INDIA, TEL+91-11-5719601/5731481, FAX./5731481, E-mail: [email protected]
S.M. IlyasDirector of Central Institute of Post Harvest Engi-neering and Technology (CIPHET), Ludhiana. P.O., P.A.U, Ludhiana - 121004, INDIA, Tel+91-161-808669, Fax:+91-161-808670, E-mail: [email protected]
A.M. Michael1/64, Vattekunnam, Methanam Road, Edappally North P.O., Cochin, 682024, Kerala State, S. INDIA
Gajendra SinghProfessor, Vice Chancellor, Doon University 388/2, India Nagar, Dehradun - 248006, INDIATEL+91-989-738-4111, FAX+91-135-320-1920Email: [email protected]
T.P. OjhaDirector General(Engg.) Retd., ICAR, 110, Vineet Kung Akbarpur, Kolar Road, Bhopal, 462 023, INDIATEL+91-755-290045
S.R. VermaProf. of Agr. Eng, & Dean Eng.(Retd), 14, Good Friends Colony, Barewal Road , Via Ayoli Kalan, Lud-hiana 142027 Punjab, INDIA, TEL+91-(0)161-463096E-mail: [email protected]
SoedjatmikoPresident, MMAI(Indonesian Soc. of Agric. Eng. & Agroindustry), Menara Kadin Indonesia Lt.29 Jl. HR. Rasuna Said X-5/2-3 Jakarta, 12940, INDONESIATEL+62-(0)21-9168137/7560544, FAX(0)21-5274485/5274486/7561109
Mansoor Behroozi-LarProfessor, Agr. Machinery, Ph.D, Tehran University Faculty of Agriculture, Karaj, IRANTEL+98-21-8259240, E-mail: [email protected]
Saeid MinaeiAssistant Professor, Dept. of Agr. Machinery Eng., Tarbiat Modarres Univ., P.O.Box 14115-111, Tehran, IRANTEL+9821-6026522-3(office ext.2060, lab ext.2168)FAX+9821-6026524, E-mail: [email protected]
Jun SakaiProfessor Emeritus, Kyushu University, 2-31-1 Chi-haya, Higashi-ku, Fukuoka city, 813, JAPANTEL+81-92-672-2929, FAX+81-92-672-2929E-mail: [email protected]
Bassam A. SnobarProfessor and Vice President, Jordan University of Science and Technology, P.O.Box 3030 Irbid, 22110, JORDAN, TEL+962-2-295111, FAX+962-2-295123E-mail: [email protected]
Chang Joo ChungEmeritus Professor, Seoul National University, Ag-ricutural Engineering Department, College of Agri-culture and Life Sciences, Suwon, 441-744, KOREATEL+82-(0)331-291-8131, FAX+82-(0)331-297-7478E-mail: [email protected]
Chul Choo LeeMailing Address: Rm. 514 Hyundate Goldentel Bld. 76-3 Kwang Jin Ku,Seoul, KOREATEL+82-(0)2-446-3473, FAX+82-(0)2-446-3473E-mail: [email protected]
Muhamad Zohadie BardaieProfessor, Department of Agricultural and Biosys-tems Engineering, University Putra Malaysia, 43400 upm, Serdang, Serdangor, MALAYSIATEL+60-3-89466410Email: [email protected]
Madan P. PariyarConsultant, Rural Development through Selfhelp Promotion Lamjung Project, German Technical Cooperation. P.O. Box 1457, Kathmandu, NEPAL
David Boakye AmpratwumAssociate Professor, Dept.of Bioresource and Agri-cultural Engineering, College of Agriculture, Sultan Qaboos University, P.O. Box 34, Post Code 123, Muscat, Sultanate of Oman, OMANTEL+968-513866, FAX513866E-mail: [email protected]
EITag Seif Eldin Mailling Address: Dept. of Agric. Mechanization, College of Agriculture, P.O. Box 32484, Al-Khod, Sultan Qaboos University, Muscat, Sultanate of Oman, OMAN
Linus U. OperaAssociate Professor, Agricultural Engineering & Postharvest technology, Director, Agricultural Experiment Station, Sultan Qaboos University, Muscat, Sultanate of Oman, OMAN
Allah Ditta ChaudhryProfessor and Dean Faculty of Agric. Engineering and Technology, University of Agriculture, Faisala-bad, PAKISTAN
G R Quick S M Farouk DaoulatHussain
M A Mazed Chetem Wangchen
Wang Wanjun
S Illangantileke S M Ilyas A M Michael
T P Ojha S R Verma Soedjatmiko M Behroozi-Lar
Saeid Minaei
J Sakai B A Snorbar C J Chung C C Lee M ZBardaie
M P Pariyar D BAmpratwum
E S Eldin A DChaudhry
A Q Mughal R ur Rehmen B TDevrajani
N AAbu-Khalaf
Surya NathL U Opera
G Singh

AGRICULTURAL MECHANIZATION IN ASIA, AFRICA, AND LATIN AMERICA 2006 VOL.37 NO.496
R PVenturina
A.Q.A. MughalVice Chancellor, Sindh Agriculture University, Tan-dojam, PAKISTAN
Rafiq ur RehmanDirector, Agricultural Mechanization Reserch Insti-tute, P.O. Box No. 416 Multan, PAKISTAN
Bherulal T. DevrajaniProfessor and Chairman, Faculty of Agricultural En-gineering, Sindh Agriculture University, Tandojam, Sindh, PAKISTANTEL+92-2233-5594
Nawaf A. Abu-KhalafEngineer, the Project Directorate in Palestinian Ag-ricultural Ministry, P.O.Box 405, Hebron, PALESTINETelfax: 972-2-2227846/7E-mail: [email protected]
Surya NathAssoci. Prof., Dept. of Agriculture, Papua New Guinea University of Technology, Private Mail Basg, Lae, PAPUA NEW GUINEA, TEL+675-475-5162, FAX473-4477, E-mail: [email protected]
Reynaldo M. LantinProfessor, College of Engineering and Agro-Indus-trial Technology University of the Philippines Los Banos, Laguna 4031, PHILIPPINESTEL+63-(0)49-536-2792, FAX+63-(0)49-536-2873E-mail: [email protected]
Ricardo P. VenturinaPresident & General Manager, Rivelisa publishing House, 215 F, Angeles St. cor Taft Ave. Ext., 1300 Pasay City, Metro Manila,PHILIPPINES
Saleh Abdulrahman Al-suhaibaniProfessor, Agricultural Engineering Dept.,College of Agriculture, King Saud University,P.O. Box 2460 Riyadh 11451, SAUDI ARABIA
Ali Mufarreh Saleh Al-AmriProfessor, Dept. of Agric. Engineering, Colleg of Agricultural and Food Sciences, King Faisal Univer-sity, Al-Ahsa,SAUDI ARABIAE-Mail: [email protected],[email protected]
Sen-Fuh ChangProfessor, Agric.-Machinery Dept. National Taiwan University, Taipei, TAIWAN
Tieng-song PengDeputy Director, Taiwan Agricultural Mechaniza-tion Research and Development Center. FL. 9-6, No. 391 Sinyi Road, Sec. 4, TAIWAN
Suraweth KrishnasreniSenior Expert in Agricultural En-gineering, Depart-ment of Agricul-ture, Chatuchak, Bangkok 10900, Thailand, Tel5792153,5794497,5798520,Ext.124, Fax9405791, E-mail: [email protected]
Surin PhongsupasamitProfessor of Agricultural Engineering, Dept. of Me-chanical Engineering, Faculty of Engineering, Chu-lalongkom University, Phyathai Road, Patumwan, Bangkok 10330, THAILAND
Chanchai RojanasarojResearch and Development Engineer, Dept. of Ag-riculture, Ministry of Agriculture and Cooperatives, Gang-Khen, Bangkok 10900, THAILAND
Vilas M. SalokheProfessor, AFE Program, Asian Institute of Technol-ogy, P.O. Box 4, Klang Luang. Pathumthani 12120, THAILAND, TEL+66-2-5245479, FAX+66-2-5246200E-mail: [email protected]
Yunus PinarProfessor, and Head, Agric. Machinery Dept, Fac-ulty of Agriculture, University of Ondokuz Mayis, Kurupelit, Samsun, TURKEY
Imad HaffarAssociate Professor of Agric. Engineering, Faculty of Agricultural Sciences, United Arab Emirates Uni-versity, Al Ain, P.O. Box 17555, UAETEL+971-506436385, FAX+971-3-632384E-mail: [email protected]
Nguyen HayAssociate Professor, Dean of Faculty of Engineering, Nonglam University, Linh Trung Ward, Thu Duc Dis-trict, Ho Chi Minh City, VIET NAME-mail: [email protected]
Pham Van LangDirector, Vietnam Institute of Agricultural Engineer-ing, A2-Phuong Mai, Dong Da Hanoi, VIET NAM
Abdulsamad Abdulmalik Hazza,aProfessor and Head of Agricultural Engineering Department, Faculty of Agriculture, Sana,a Univer-sity, P.O.Box 12355, Sana,a YEMENTel+9671-407300, Fax:9671-217711E-mail: [email protected]
-EUROPE-Anastas Petrov KaloyanovProfessor & Head, Research Laboratory of Farm
Mechanization, Higher Institute of Economics, So-fia, BULGARIA
Pavel KicVice-Dean/Technical Faculty, Czech University of Agriculture Prague, 16521 Prague 6-Suchdol, CZECH, Tel+420-2-24383141, Fax+420-2-20921361Email: [email protected]
Henrik HaveProf. of Agric. Machinery and Mechanization at In-stitute of Agric. Engineering, Royal Veterinan/- and Agricultural University, Agrovej 10DK2630 Tastrup, DENMARK
Giuseppe PellizziDirector of the Institute of Agric. Engineering of the University of Milano and Professor of Agric. Machinery and Mechanization, Via G. Celoria, 2-20133 Milano, ITALYTel+39-02-503-16871, Fax+39-02-503-168459E-mail: [email protected]
Aalbert Anne WandersStaff Member, Dept. of Development Cooperation, Netherlands Agricultural Engineering Research Insti-tute (IMAG), Wageningen, NETHERLANDS
Jan PawlakProfessor, head of the Dept. of Economics and Utilization of Farm Machines at IBMER, Professor at the Univ. of Warmia and Mazury in Olsztyn, Fac. of Tech. Sci., POLAND
Oleg S. MarchenkoProfessor and agricultural engineer, Department Head in All-Russia Research Institute for Mechani-zation in Agriculture (VIM), 1st Institutsky proezd, 5, Moscow 109428, RUSSIATel+7(095)174-8700, Fax+7(095)171-4349E-mail: [email protected]
John KilgourSenior Lecturer in Farm Machinery Design at Silsoe College, Silsoe Campus, Silsoe, Bedford, MK45 4DT, UK
Milan MartinovFull Professor on Agricultural Machinery, Univer-sity of Novi Sad, Faculty of Engineering, Institute of mechanization and machine design, TRG D. Obra-dovica 6, 21 121 Novi Sad, PF55, YUGOSLAVIATEL+381-21-350-122(loc.298), FAX+381-21-350-592E-mail: [email protected]
J Kilgour M Martinov
S AAl-Suhaibani
A M SAl-Amri
S F Chang T S Peng S Krishnasreni S Phong-supasamit
C Rojanasaroj V M Salokhe
Y Pinar I Haffar P V Lang A A Hazza,a A P
KaloyanovP Kic H Have G Pellizzi A A
Wanders
Jan Pawlak O SMarchenko
N Hay
R M Lantin

VOL.37 NO.4 2006 AGRICULTURAL MECHANIZATION IN ASIA, AFRICA, AND LATIN AMERICA 97
Back Issues
AGRICULTURAL MECHANIZATION IN ASIA, AFRICA AND LATIN AMERICA
(Vol.35, No.1, Winter, 2004)Determining Soil Inversion Tillage Interval
in Rice Production (Abdul Razzaq, Liaqat Ali,Bashir Ahmad Sabir) ............................
An Opto-electronic System for Assessing Seed Drop Spacing of Planters (D. Dhalin, C.Divaker Durairaj,V.J.F. Kumar) ..............
No-till Seed-cum Fertilizer Drill in Wheat Crop Production after Paddy Harvesting (Jagvir Dixit, R.S.R. Gupta, V.P. Behl, Sukhbir Singh) .............................................
Slip-on-ring Spraying Devices for Spot Application of Chemicals to Control Eriophyid Mite in Coconut (R. Manian, K.Kathirvel, T.Senthilkumar, Binisam) .....
Development and Testing of a Tractor-mount-ed Positioner for Mango Harvesting (R.A. Gupta, R.M. Satasiya, Pramod Mohnot, N.K. Gontia) .................................................
Manual Sugarcane Harvesting System vs. Mechanical Harvesting System in Thailand (Ding Qishuo, Borpit Tangwongkit, Ratana Tangwongki) ................................................
Efficiency of Cotton Stalk Puller as Influ-enced by Forward Speed, Wheel Rotational Speed and Wheel Tilt Angle (R. Manian, M.K. Rao, K. Kathirvel, T. Senthilkuamr)
A Batch Dryer for Un-peeled Longan Drying (W. Phaphuangwittayakul, S. Limpiti, Z. Alikhan) .......................................................
Spherical Biogas Plants for Rural Develop-ment (Er. Purnendu Kumar Mohanty, Mrs.Minati Mohanty) ..................................
A Method for Determining the Center of Gravity of a Tractor (Nidal H. Abu-Ham-deh) ...............................................................
Energy Requirement in Lac Production (Ni-ranjan Prasad, K. K. Kumar, A. K. Jaiswal)
Status and Trend of Farm Mechanization in Thailand (Suraweth Krishnasreni, Pinai Thongsawatwong) .......................................
Studies on Murrah He-buffaloes Using Im-proved Rotary Appratus (Sushil Sharma, M. P. Singh) ..................................................
The Present State of Farm Machinery Indus-try (Shin-Norinsha Co., Ltd.) ......................
The Tokyo University of Agriculture and Technology in Brief (Akira Sasao) .............
Higher Educational Programs of the Univer-sity of Tsukuba (Masayuki Koike) .............
Main Products of Agricultural Machinery Manufactures in Japan (Shin-Norinsha Co., Ltd.) ......................................................
◇ ◇ ◇
AGRICULTURAL MECHANIZATION IN ASIA, AFRICA AND LATIN AMERICA
(Vol.35, No.2, Spring, 2004)On-Farm Evaluation of Current Wheat Till-
age Systems on Irrigated Vertisols in New Scheme, Sudan (Sheikh El Din Abdel Ga-dir El-Awad) .................................................
Development and Testing of a Seed-Cum-
Fertilizer Drilling Attachment to Tractor-Driven Cultivator (R.A. Gupta, Paramond Mohnot, R.M. Satasiya, R.B. Marvia) .......
Development and Evaluation of Weeding Cum Earthing up Equipment for Cotton (R. Manian, K. Kathirvel, Aravinda Red-dy, T.Senthikuamr) .......................................
Design Parameters for Cocoa Pod Breaker (A Issac Bamgboye, Odima-Ojoh) ...................
A Solar Tunnel Dryer for Natural Convection Drying of Vegetables and Other Commodi-ties in Cameroon (Joseph E. Berinyuy) ......
Rural Vegetable Oil Processing in Kenya Sta-tus and Reseach Priorities (D. Shitanda) ....
Design and Development of Agricultural Wastes Shredder (J.B. Savani, V.R. Vaga-dia, R.K. Kathiria) ........................................
Dynamometer Design for Traction Forces Measurement on Draught Horses (H. Ortiz-laurel, P.A. Cowell) ............................
Reduction of Greenhouse Temperature Using Reflector Sheet (V.P. Seth, Y.P. Gupta, V. S. Hans) .........................................................
Farm Accidents in South India: A Critical Analysis (K. Kathirvel, R. Manian, D. Ananathakrishnan, T. Senthikumar) ..........
Present Status and Future Strategy on Farm Mechanization and Postharvest Technolo-gies for Rice Production and Processing in Bangladesh (Md Sydul Islam, Md Abdul Baqui, M Abul Quasem) ..............................
Mechanization of Polish Agriculture in the Transition Period (Jan Pawlak) ....................
◇ ◇ ◇
AGRICULTURAL MECHANIZATION IN ASIA, AFRICA AND LATIN AMERICA
(Vol.36, No.1, Spring, 2005)Para-Ploghing Effect on Soil Retention (P.R.
Jayan, C. Divaker Durairaj, V.F.J. Kumar) .Effect of Storage Conditions on Emergence of
Helthy Seeding of Soyabeen (G. H . Jamro, L.A. Jamali, M. hatim, S.K. Agha) .............
Development of a Check Valve Mechanism as an Attachment to a Power Tiller Operated Seeder (D. Dhalin, C. Divaker Durairaj, V. F.J. Kumar) ....................................................
Freely Rear Converging Linkage System for No-Till Planter (Santos G. Campos Magna, Brian M.D. Wills) .........................................
Fablication and Performance Evaluation of Pre-Rasping Unit for Cassava Industries (R. Kailappan, S. Kaleemullah, I.P. Suda-gar, C.T. Devadas, M. Jawaharlal) ...............
Agricultural Tractor Ownership and Off-Season Utilisation in the Kgatleng District of Botsuwana (Cecil Patric, Edward A. Bayeh, Mataba Tapela) .................................
Tillage Systems and Their Effect on Some Soil Properties, Crop Growth and Shoot Yield of Grain-Amaranth (S.O. Afolayan, J.C. Igbeka, O. Babalola) ..............................
Effect of Concave Hole Size, Concave Clear-ance and Drum Speed on Rasp-Bar Drum Performance for Threshing Sunf lower
(Somposh Sudajan, Vilas M. Salokhe, Somnuk Chusilp) ..........................................
Performance Evaluation of Planters for Cot-ton Crop (K. Kathirvel, Aravinda Reddy, R. Manian, T. Senthilkuamr) .......................
Spatial Distribution of the No-Till Opener In-duce Seed Row Incorporated Crop Residue and Soil Loosing (E.M.H. Tola, K. Koeller)
Farm Mechanization in Lalgudi Taluk of Southern India (S. Ganapathy, R. Karu-nanithi) .........................................................
Comparative Evaluation of Field Performance of a Tractor Drawn Straw Reaper and a Flail Harvesting of Wheat Straw .................
Study on the Development of Agricultural Machines for Small-Scale Farmers “Pt. 1, Applied Technology for Morocco and Af-rica” (Toshiyuki Tsujimoto, Hai Sakurai, Koichi Hashiguchi, Eiji Inoue) ....................
◇ ◇ ◇
AGRICULTURAL MECHANIZATION IN ASIA, AFRICA AND LATIN AMERICA
(Vol.36, No.2, Autumn, 2005)A Mathematical Model for Predicting Output
Capacity of Selected Stationary Grain Threshers (V.I.O. Ndirika) ...........................
Study on the Development of Agricultural Machines for Small-Scale Farmers Pt. 2, “Applied Technology to the Improvement of an Animal-Drawn Plow for Morocco and Africa” (Toshiyuki Tsujimoto, Hai Saku-rai, Koichi Hashiguchi, Eiji Inoue) ..............
Development an Indsutrial Yam Peeler (A. C. Ukatu) ..........................................................
Design and Development of a Low-Cost Po-tato Grader (K.C. Roy, M.A. Wohab, A.D. M. Gulam Mustafa) ......................................
Extensive Review of Crop Drying and Dri-ers Developed in India (A. Alam, Harpal Singh, Ranjan Mohnot, H.L. Kushwaha) ....
Insect Inhibitive Properties of Some Consum-able Local Plant Materials on Grains in Storage (D.S. Zibokere) ................................
Evaluation and Performance of Raw Mango Grader (Syed Zameer Hussain, S.C. Man-dhar, S. Javare Gowda) .................................
Engineering the Crop Establishment System for Paddy Wet Seeding (Eden C. Gage-lonia, B.D. Tadeo, E.G. Bautista, J.C. Cordero, J.A. Damian, W.B. Collado, H. Monobe, S. Ishihara, N. Sawamura, M. Daikoku, R. Otani) .......................................
Performance of Cage Wheel with Opposing Circumferential Lugs amd Normal Cage Wheel in Wet Clay Soil (S. Soekarno, V. M. Salokhe) ...................................................
Fabrication and Testing of Tomato Seed Ex-tractor (R. Kailappan, Parveen Kasur Baig, N. Varadharaju, K. Appavu, V. Krishna-samy) ............................................................
Computer-Aided Analysis of Forces Acting on a Trailed Plough (Ying Yibin, Zhao Yun, Jin Juanqin) ..........................................
The Effects of Some Operational Parameters
(Vol.35, No.1, Winter, 2004-)
11
14
19
23
28
33
37
41
45
49
54
59
67
71
75
79
81
9
15
21
26
31
36
41
47
51
55
59
67
9
15
18
24
33
41
46
52
61
66
71
76
79
9
14
21
28
32
43
46
49
55
62
67

AGRICULTURAL MECHANIZATION IN ASIA, AFRICA, AND LATIN AMERICA 2006 VOL.37 NO.498
on Potato Planter’s Performance (Ebubekir Altuntas) .......................................................
The Use of Hot Air from Room Type Coolers for Drying Agricultural Products (Turhan Koyuncu, Yunas Pinar) ................................
Effect of Mechanization level and Crop Rota-tion on Yield Energy Requirements (S.K. Dash, D.K. Das) ............................................
Simple Quality Evaluation of Chili Pepper Based on Continuous Weight Measure-ment During Dehydration Process (T.W. Widodo, H. Ishida, J. Tatsuno, K, Tajima, E. Sakaguchi, K. Tamaki) ............................
◇ ◇ ◇
AGRICULTURAL MECHANIZATION IN ASIA, AFRICA AND LATIN AMERICA
(Vol.37, No.1, Winter, 2006)Evaluation of Solar Drying for Post Harvest
Curing of Turmeric: Curcuma longa L. (J. John Gunasekar, S. Kaleemullah, P. Do-raisamy, S. Kamaraj) ....................................
Front Wheel Drive Effect on the Performance of the Agricultural Tractor (H. Ortiz-Laurel, D. Rössel, J.G. Hermosilo-Nieto) ...
Development and Performance Evaluation of a Test Rig for Mechanical Metering of Sunf lower Seeds (Sukhbir Singh, D.N. Sharama, Jagvir Dixit, Dinesh Kumar Vasta) ............................................................
Design Development and Performance Evalu-ation of a Saw Cylinder Cleaner for Me-chanically Picked Cotton (S.K. Shukla, P. G. Patil, V.G. Arude) ....................................
Design Development and Performance Evalu-ation of Portable Cotton Ginning Machines (P.G. Patil, V.G. Arude, S.K. Shukla) ..........
Design and Development of Power Operated Roller Type Lac Scraper (Niranjan Prased, K.K. Kumar, S.K. Panday, M.L. Bhagat) ....
The Impact of Power Tillers on Small Farm Productivity and Employment in Bangla-desh (R.I. Sarker, D. Barton) .......................
Field Performance Evaluation od Power Tiller Operated Air Assisted Spraying System (A.G. Powar, V.V. Aware, S.K. Jain, A.P. Jaiswal) .........................................................
Effect of Cone Angle on Droplet Spectrum of Hollow Cone Hydraulic Nozzles (S. K. Jain, K.G. Dhande, V.V. Aware, A.P. Jaiswal) .........................................................
Feasibility of Using Yield Monitors for the Development of Soil Management Maps (Jay Radhakrishnan, V. Anbumozhi, Rob-ert H. Hill, Raymond J. Miller) ...................
Improving Whole Kernel Recoverly in Ca-shew Nut Processing Specific to Nigeria Nuts (D. Balasubramanian) .........................
Processing Factor Affecting the Yield and Physicochemical Properties of Starches from Cassava Chips and Flour (O.V. Olo-mo, O.O. Ajibola) ..........................................
Influence of Seeding Depth and Compaction on Germination (P.R. Jayan, V.J.F. Kumar, C. Divaker Durairaj) ....................................
Testing, Evaluation and Modification of Manual Coiler for Drip Lateral (S.S. Taley, S.M Bhende, V.P. Tale) .................................
Single Hydrocyclone for Cassava Starch Milk (A. Manickavasagan, K. Thangavel) ...........
Utilization Pattern of Power Tillers in Tamil
71
75
80
84
9
14
18
25
30
35
38
46
51
54
58
65
70
75
80
Nadu (B. Shridar, P.K. Padmanathan, R. Manian) ........................................................
◇ ◇ ◇
AGRICULTURAL MECHANIZATION IN ASIA, AFRICA AND LATIN AMERICA
(Vol.37, No.2, Spring, 2006)Perfomance Evaluation of Bullock Drawn
Puddlers (S.K. Dash, D.K. Das) ..................Design of a Knapsack Sprayer for Local Fa-
blication (R.F. Orge, R.B. Benito) ...............Current and Future Trends and Constraints in
Iranian Agricultural Mechanization (Ah-mad Tabatabaeefar, Ali Hajeiahmad) .........
Comparative Evaluation of the Performance of Intermadiate Agricultural Processing Technologies with Traditional Processing Techniques for Cereal Crops in South Af-rica (V.I.O. Ndirika, A.J. Buys) ...................
Computer-Aided Design of Extended Oc-tagonal Ring Transducer for Agricultural Implements (H. Raheman, R.K. Sahu) .......
Optimization of Seed Rate of Direct Rice Seeder as Influenced by Machine and Op-erational Parameters (S.S. Sivakumar, R. Manian, K. Kathirvel) ..................................
Reliability Analysis of Different Makes of Power Tillers (B. Shridar, P.K. Padmana-than, R. Manian) ...........................................
Design and Development of a Two-Raw Saf-fron Bulb Planter (Mohammad-H. Saiedi Rad) ..............................................................
Determination of the Optimum Moisture Contents for Shelling Maize Using Lo-cal Shellers (I.K. Tastra, Erliana Ginting, Richard Merx) ..............................................
The Influence of Various Factors on Tractor Selection (Ali Aybek, Ismet Boz) ................
Effect of Impeller Materials on Centrifugal Pump Characteristics (Bahattin Akdemir, Birol kayisoglu, Senel Kocoglu) ..................
Performance Evaluation of a Safflower Har-vester (Devanand Maski, T. Guruswamy) ..
Semi-Automatic VRT-Based Fertilization System Utilizing GPS (Moustafa A. Fadel, Ahmad El-Mowafy, Abdul Elghaffar Jo-maa) ..............................................................
The Effect of Dilution Volume, Water Tem-perature and Pressing Time on Oil Yield from Thevetia Kernel during Extraction (A.F. Alonge, A.M. Olaniyan) .....................
Postharvest Losses of Tomatoes in Transit (R. J. Bani, M.N. Josiah, E.Y. Kra) ....................
The Present State of Farm Machinery Indus-try (Shin-Norinsha Co., Ltd) ........................
◇ ◇ ◇
AGRICULTURAL MECHANIZATION IN ASIA, AFRICA AND LATIN AMERICA
(Vol.37, No.3, Summer, 2006)Optimisation of Machine Parameters of Pnue-
matic Knapsack Cotton Pikker (K. Ran-gasamy, M. Muthamilselvan, C. Divaker Durairaj) .......................................................
Tractor and Implement Ownership and Uti-lization of Haryana (Sandeep Yadav, S. Kumar Lohan) ..............................................
Study on Different Tillage Treatments for Rice-Residue Incorporation and its Effect on Wheat Yield in Tarai Region of Ut-
85
9
12
17
24
29
34
42
48
51
58
62
68
72
79
84
87
9
15
taranchal (T.P. Singh, Jayant Singh, Raj Kumar) .........................................................
A Comparative Study on the Crop Establish-ment Technologies for Lowland Rice (T. Pandiarajan, U. Solaiappan, K. Rubapathi)
Design of Tractor Operated Rotary Cultivator - a Computer Simulation (H. Raheman, R. K. Sahu) ........................................................
Machine-Crop Parameters Affecting Per-formance of an Axial-Flow Soya Been Thresher (Anusorn Vejasit, Vilas M. Sa-lokhe) ............................................................
Prospects and Problems of Power Tillers in Selected Districts of North Eastern Hilly Region in India - a Case Study (E.V. Thomas, C.S. Sahay, K.K. Satapathy) .........
Design and Development of Cylinder Type Cot ton Pre-Cleaner (P.G. Patil, V.G. Arude, G.R. Anap) .......................................
The Effect of a Fogging System on Sensible and Latent Heat Transfer in a Rose Green-house (H.H. Öztürk) .....................................
Evaluation of Wheat Bed Planting System in Irrigated Vertisols of Sudan (Adbelhadi A. W., El Awad S.E.A., Bashir M.A., Takeshi Hata) .............................................................
Subsoiling - a Strategy to Combat Water Scarcity and Enhanced Productivity of Groundnut Crop (K.K. Jain, V.R. Vagadia, L.P. Singh, A.H. Memon) .............................
Evaluation of Practical Training in Uganda’s Agricultural Engineering Carriculum (W. S. Kisaalita, J.B. Kawongolo, J.S. Kibala-ma) ................................................................
Performance Evaluation of a Tractor-Operat-ed Sugarcane Harvester (H.M. Al Sharief, M.A. Haque, N.A. Aviara) ...........................
Role of Computers in Eco-Friendly and Sus-tainable Agriculture of the 21th Century (Madan K. Jha, V.M. Salokhe, Satish K. Jain) ..............................................................
■■
18
25
27
32
39
46
52
62
68
71
79
85
Copyright © 2022 FDOKUMEN


![Starbucks Am Sci 2021;17(4):37-47]. ISSN 15451003 (print)](https://static.fdokumen.com/doc/165x107/6334af9f62e2e08d4902bbea/starbucks-am-sci-202117437-47-issn-15451003-print.jpg)