
Iron-Mediated Anaerobic Oxidation of Methane in Brackish Coastal Sediments
Upload
khangminh22Category
view
3download
0
University of Windsor University of Windsor
Scholarship at UWindsor Scholarship at UWindsor
Electronic Theses and Dissertations Theses, Dissertations, and Major Papers
8-22-1966
Kinetics of catalytic oxidation of methane application of initial Kinetics of catalytic oxidation of methane application of initial
rate technique for mechanism determination. rate technique for mechanism determination.
Om Parkash Ahuja University of Windsor
Follow this and additional works at: https://scholar.uwindsor.ca/etd
Recommended Citation Recommended Citation Ahuja, Om Parkash, "Kinetics of catalytic oxidation of methane application of initial rate technique for mechanism determination." (1966). Electronic Theses and Dissertations. 6411. https://scholar.uwindsor.ca/etd/6411
This online database contains the full-text of PhD dissertations and Masters’ theses of University of Windsor students from 1954 forward. These documents are made available for personal study and research purposes only, in accordance with the Canadian Copyright Act and the Creative Commons license—CC BY-NC-ND (Attribution, Non-Commercial, No Derivative Works). Under this license, works must always be attributed to the copyright holder (original author), cannot be used for any commercial purposes, and may not be altered. Any other use would require the permission of the copyright holder. Students may inquire about withdrawing their dissertation and/or thesis from this database. For additional inquiries, please contact the repository administrator via email ([email protected]) or by telephone at 519-253-3000ext. 3208.

KINETICS OF CATALYTIC OXIDATION OF METHANE APPLICATION OF INITIAL RATE TECHNIQUE
FOR MECHANISM DETERMINATION
A THESISSubmitted to the Faculty of Graduate Studies through the
Department of Chemical Engineering in Partial Fulfilment of the requirements for the degree of Master of Applied Science at
University of Windsor
oyCm Parkash Ahuja
Windsor, Ontario, Canada April, 1966
Reproduced with permission o f the copyright owner. Further reproduction prohibited w ithout permission.

UMI Number: EC52592
INFORMATION TO USERS
The quality of this reproduction is dependent upon the quality of the copy submitted. Broken or indistinct print, colored or poor quality illustrations and photographs, print bleed-through, substandard margins, and improper alignment can adversely affect reproduction.
In the unlikely event that the author did not send a complete manuscript and there are missing pages, these will be noted. Also, if unauthorized copyright material had to be removed, a note will indicate the deletion.
UMIUMI Microform EC52592
Copyright 2008 by ProQuest LLC.
All rights reserved. This microform edition is protected against
unauthorized copying under Title 17, United States Code.
ProQuest LLC 789 E. Eisenhower Parkway
PC Box 1346 Ann Arbor, Ml 48106-1346
Reproduced with permission o f the copyright owner. Further reproduction prohibited w ithout permission.

flfiv
Approved by:
147497
Reproduced with permission of the copyright owner. Further reproduction prohibited w ithout permission.

ABSTRACTA kinetic investigation on the oxidation of methane using
a palladium catalyst was conducted. A differential bed reactor was used, and the conversions of methane were limited to about 10^.The small conversions facilitated the use of the initial rate approach to find the reaction mechanism. Plots of initial rate against total pressure were used to interpret the data qualitatively. Linearised rate equations were used to find the regression coefficients for various plausible mechanisms. The criteria of best fit to experimental data eliminated meiny improbable mechanisms.
Data on the variation of initial rate with feed composition were very helpful in arriving at a definite mechanism for the oxidation reaction. The experimental results indicated that the reaction rate was controlled by surface reaction in which the adsorbed oxygen and adsorbed methane react to produce adsorbed carbon dioxide and adsorbed water. The corresponding rate equation has the form:
Cr a
[p.,
(i)
Reproduced with permission o f the copyright owner. Further reproduction prohibited w ithout permission.

ACKNOWLEDGEMENTS
The author wishes to express his sincere gratitude to Dr. G.P. Mathur for his able guidance, valuable suggestions and constructive criticism, to Dr. A.W. Gnyp for his guidance and direction, to Dr. S.J.W. Price, who provided his valuable time and guidance for operation of the gas chromatograph.
The financial assistance offered by National Research Council of Canada, in gratefully acknowledged.
(ii)
Reproduced with permission o f the copyright owner. Further reproduction prohibited w ithout permission.

TABLE OF CONTENTS
ABSTRACT ACKITOWLEDGEMENTS TABLE OF CONTENTS LIST OF TABLES LIST OF FIGURES
(i)(ii)(iii)(v)(vi)
CHAPTER
I INTRODUCTION-------------------------------------IX LITERATURE REVIEW — - — — - — •—
A. Survey of Oxidation Catalysts for --------Exhaust Gases
B. Kinetic Studies of Oxidation of -Hydrocarbons
C. Important Considerations for Design of - - Catalytic Converter
III THEORETICAL CONSIDERATIONS---------------------IV EXPERIMENTAL EQUIPMENT AlfD M A T E R I A L ---------
A. Reactor, Preheater and Accessories - - - -B. Flow Measurement Devices - - - - - - - - -C. Analytical Set-up - - - - - - - - - - - - -
D. Catalyst Choice - - - - - - - - - - - - -E. Selection of Gases - - - - - - - - - - - -
V . 'OPERATIONAL DETAILS AND RESULTS - '----------- - -A, Calibration Procedures - - - - - - - - - -B, Operations Procedure - - - - - - - - - - -C, Results - - - - - - - - - - - - - - - - -
VI AlfALYSIS OF R E S U L T S ---------------------------VII CONCLUSIONS ----- -----
Page
14 4-
5
7
10151519191920 21 21.
2425 29 59
Reproduced with permission o f the copyright owner. Further reproduction prohibited w ithout permission.

„xv
LOiIGKCLÀTURE 6l2I3LIGJlb'.P:IY 63APPENDIX I Tables 6, ?, 8, 9, 10 and 11 65APPEI'DIvI II Calibration Curves 72APPENDIX III Sample Calculation of Initial 8l
Rate from I:-a:erimental DatalA- PAcDIX IV Sample Calculation for Heat 84
and Mass Transfer EffectsAPPEI\DIX V Computer Programmes and 92
ResultsVITA AUCTORIS 99
Reproduced with permission of the copyright owner. Further reproduction prohibited w ithout permission.
L]
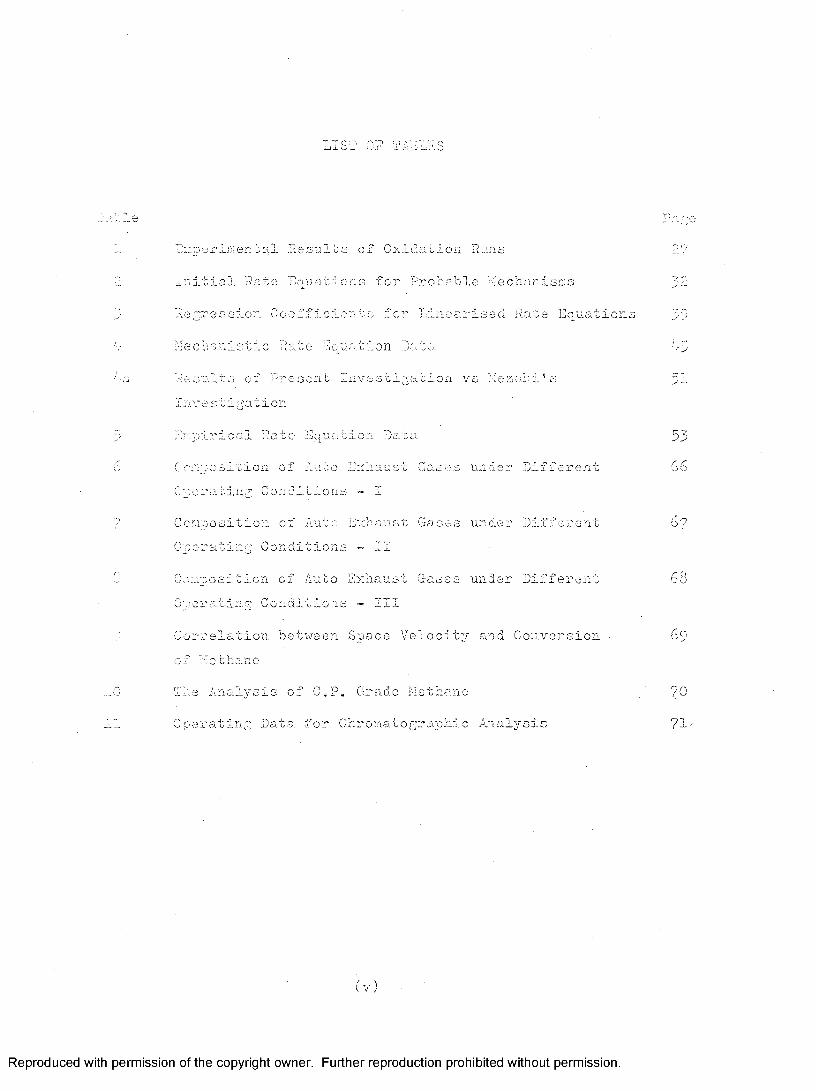
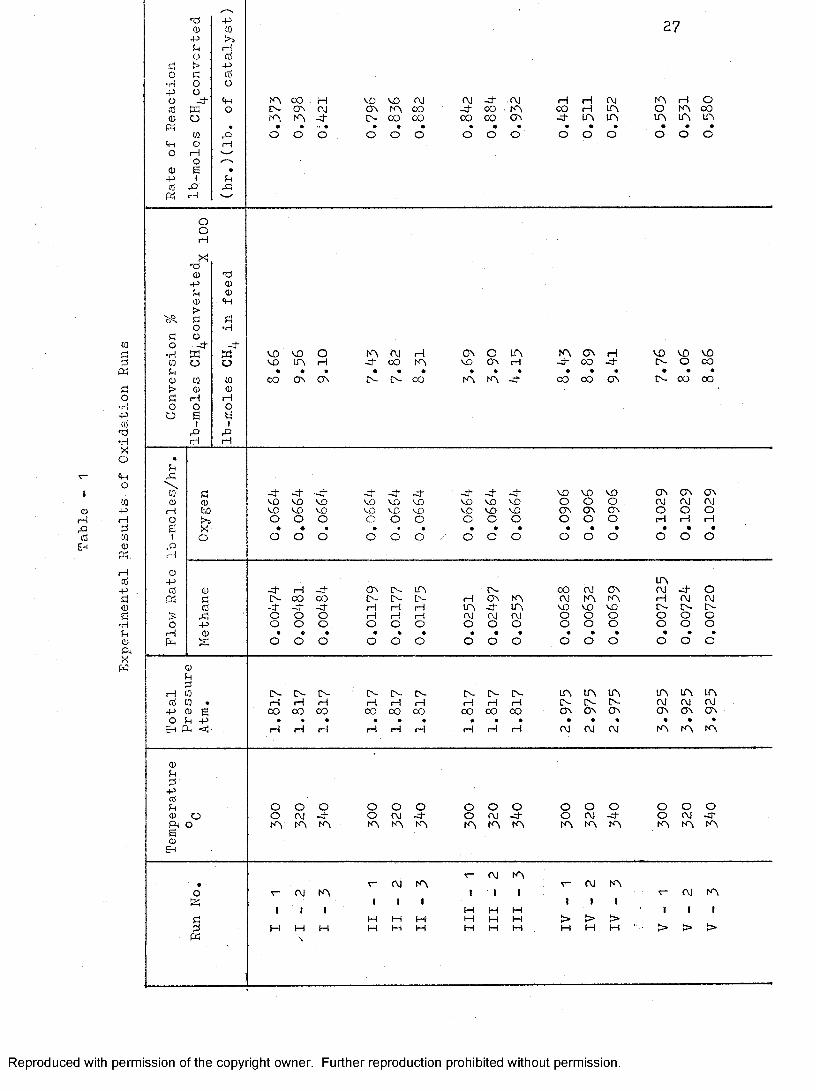
Experimental Results of Oxidation Runs 27
Initie.l Rate Enus.tions for Probable i-lecbanisms 32
Regression Coefficients for Lineaz'ised Rate Eo^uations 39
Kechanistic Rate Equation Eo-to. 43
Results of Present Investigation vs Xezs.l:i's 31Investigation
Empirical Rate Equation Data 33
Ccmposition of Auco E::naust Oases under Different 56Operating Conditions - I
Composition of Aut'. E::haust Gases unde:' Different 67Operating Conditions - II
Composition of Auto Exhaust Gases under Different 63Operating Conditions - III
Correlation between Space Velocity and Conversion - 69of Methane
The Analysis of C.P. Grade Methane 70Operating Data for Chromatographic Analysis 71'
(v)
Reproduced with permission o f the copyright owner. Further reproduction prohibited w ithout permission.

LIST OF FIGURES
Figure Page
1 Schematic Diagram of Experimental Equipment 162 Sectional View of Reactor tube and Differential Bed 173 Initial Rate of Reaction Vs Total Pressure 300°C 3^4 Initial Rate of Reaction Vs Total Pressure 320“C 355 Initial Rate of Reaction Vs Total Pressure 340“C 366 Initial Rate of Reaction Vs Feed Composition 4l
300“C, 1.817 Atm.7 Initial Rate of Reaction Vs Feed Composition 42
320“C, 1.817 Atm.8 Initial Rate of Reaction Vs Feed Composition 43
340“C, 1.817 Atm.9 Initial Rate of Reaction from Mechanistic 48
Equation 300“C10 Initial Rate of Reaction from Mechanistic 49
Equation 320“C11 Initial Rate of Reaction from Mechanistic 30
Equation 340“C12 Initial Rate of Reaction from Empirical 56
Equation 300“C13 Initial Rate of Reaction from Empirical 57
Equation 320“C14 Initial Rate of Reaction from Empirical 58
Equation 340“C15 Calibration Curves for Oxygen Rotameter 73
(vi)
Reproduced with permission o f the copyright owner. Further reproduction prohibited w ithout permission.

\ V* .X. j_ )
LIST OF FIGURES (Cont'd)
Lgure Pag
l3 Calibration Curves for Methane Rotameter 741? Arrangeaant of Columns for S-port Detector 75It Clironatographic Calibration for Carbon Dioxide 7619 Chromatographic Calibration for Oxygen 7720 Chromatographic Calibration for Nitrogen 7 321 Chromatographic Calibration for Methane22 Chromatographic Calibration for Carbon Monoxide
79
80
Reproduced with permission o f the copyright owner. Further reproduction prohibited w ithout permission.

CHAPTER I
INTRODUCTION
Air pollution, in general, is a direct result of smoke, dust or fumes from a variety of sources. Processes like combustion, roasting, mining and querying contribute greatly to air pollution.
The objectionable components from incomplete combustion of fuels in industry and automobiles are the hydrocarbons and oxides of nitrogen. Hydrocarbons and nitrogen oxides are present.in such small concentrations that they probably have no direct effect on health. But, as reported by ïocom^^^ the hydrocarbons react photochemically with nitrogen oxides to produce unstable peroxides which act as a nuclei in smog production. In major industrial cities, high concentrations of carbon monoxide, coming from combustion processes and automobiles, can cause toxic effect on humans.
At present the world's use of fuels is rising rapidly because of industrialisation and development. As a result the pollution hazard is growing. Reduction of smog forming components and carbon monoxide in tail gases would be a necessary step towards reducing air pollution.
Many devices^^^have been advanced so far for the prevention of these undesirable components in tail gases of automobiles.The following devices have been examined critically from a commercial point of view:
Reproduced with permission o f the copyright owner. Further reproduction prohibited w ithout permission.
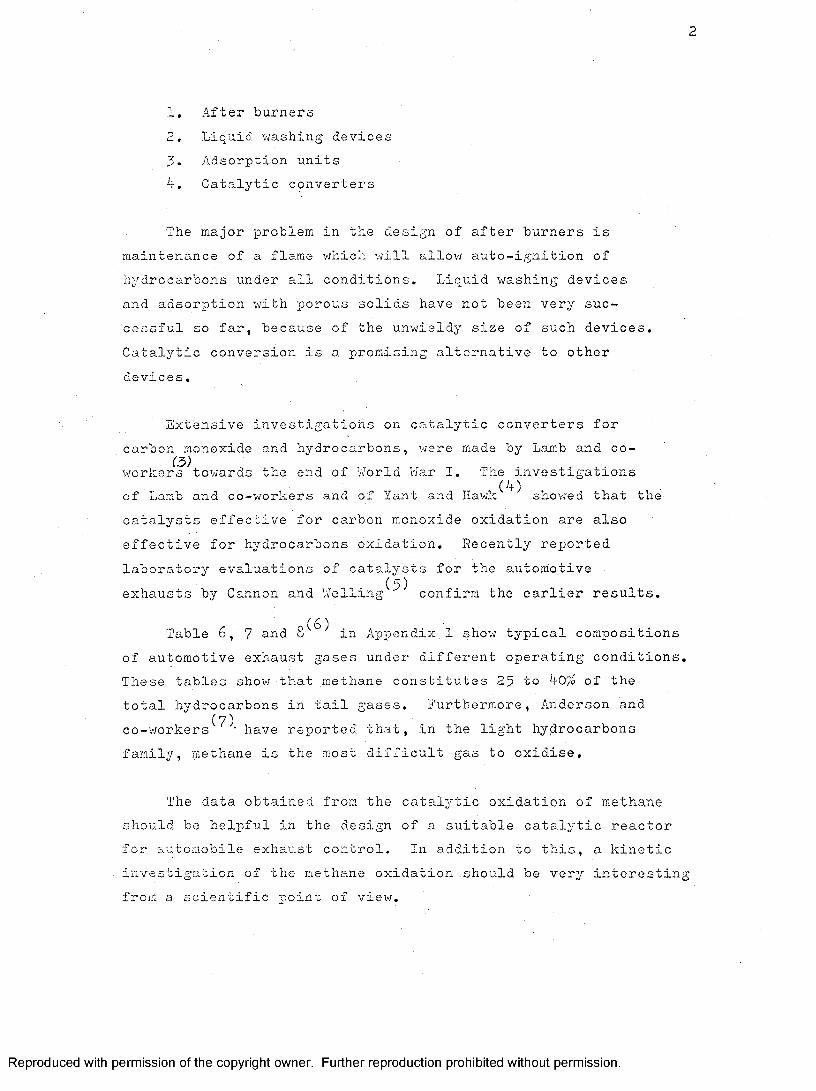
1. After ‘burners2. Liquid washing devices 3- Adsorption units4. Catalytic converters
The major problem in the design of after burners is maintenance of a flame which will allow auto-ignition of hydrocarbons under all conditions. Liquid washing devices and adsorption with porous solids have not been very successful so far, because of the unwieldy size of such devices. Catalytic conversion is a promising alternative to other devices.
Extensive investigations on catalytic converters forcarbon monoxide and hydrocarbons, were made by Lamb and co-
(5)workers towards the end of World War I. The investigationsof Lamb and co-workers and of Yant and Hawk^^^ showed that the catalysts effective for carbon monoxide oxidation are also effective for hydrocarbons oxidation. Recently reported laboratory evaluations of catalysts for the automotive
(5)exhausts by Cannon and Welling confirm the earlier results.
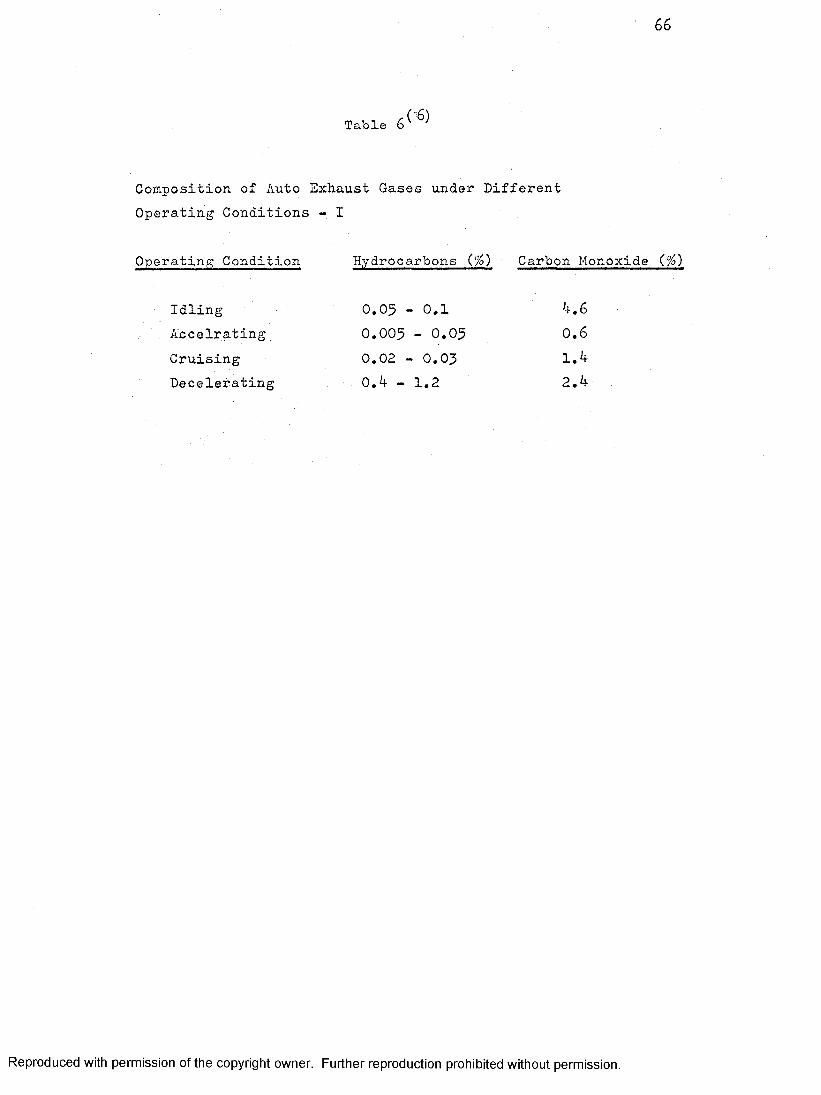
(6 )Table 6, 7 and 8 in Appendix 1 show typical compositionsof automotive exhaust gases under different operating conditions. These tables show that methane constitutes 25 to 40/o of thetotal hydrocarbons in tail gases. Furthermore, Anderson and
(7)co-workers ' have reported that, in the light hydrocarbons family, methane is the most difficult gas to oxidise.
The data obtained from the catalytic oxidation of methane should be helpful in the design of a suitable catalytic reactor for automobile exhaust control. In addition to this, a kinetic investigation of the methane oxidation should be very interesting from a scientific noint of view.
Reproduced with permission o f the copyright owner. Further reproduction prohibited w ithout permission.

In the present investigation the objective was to establish the mechanism of catalytic oxidation of methane by using an initial rate approach. Obviously, the initial rate technique limited to low conversion experiments, does not provide data for design of catalytic converters for auto exhausts. Experiments at nearly complete conversion would be necessary to provide such information. However, integral rate data are difficult to evaluate from a mechanistic point of view.
For a study of a catalytic reaction, a two step process is recommended
(i) Initial rate analysis to establish the mechanistic equation,
(ii) High conversion study to fit the mechanistic equation in the desired conversion range.
The assumption that is inherent in the above scheme is that the adsorption characteristics of the components do not change over the range of conversion. This is considered a reasonable assumption for most catalytic reactions. The equilibrium quantities being function of temperature only, do not change with composition.
This investigation is concerned with the first stage of the scheme -discussed above. Data at low conversion and varying pressure would be employed to establish the mechanistic equation. The rate equation obtained by initial rate approach, after addition of the proper product terms should be applicable for high conversion range.
Reproduced with permission o f the copyright owner. Further reproduction prohibited w ithout permission.

CHAPTER II
LITEEATHP2 REVIEW
A . Survey of Oxidation Catalysts for Exhaust Gases
(8)Many investigations have been reported on the partial oxidation of hydrocarbons to valuable organic substances as acids, aldehydes, alcohols, esters and ketones. In addition to this, a large amount of work has been done on the catalytic oxidation of exhaust gases and individual hydrocarbon constituents,
As early as 1825, the effect of platinum on the combustionth;(4)
of methane at 290°C was investigated by H e n r y . Yant andHawk found that platinum had a catalytic effect at temperatures between 150 to 300°C for approximately k% methane in air. Conversion was less than 107 in this temperature range.
The catalytic activity of copper oxide for methane oxidation has been studied by C a m p b e l l ^ \ Wheeler^^^^ and A r a k i ^ \ According to them, copper oxide has a catalytic activity at rather elevated temperatures, in the range of 400 - ?00°C.
(4) (14) (7)Yant and Hawk , Thompson , and Anderson and co-workersfound oxides of Ni, Or, Mn, V and Go quite effective for methaneoxidation. In particular, Go^O^ gave promising results withrespect to conversion and catalyst life. According to recent
(15)experiments of Kazarnovskya and Dykhno , the most effective catalyst for oxidation of methane is manganic ore enriched with silver. The complete combustion of 0.10 - 0.15% methane in oxygen was observed at 300°C. The detailed description of this catalyst is not given.
Reproduced with permission o f the copyright owner. Further reproduction prohibited w ithout permission.

Towards the end of World War I, a commercial materialcalled Eopcalite was discovered for carbon monoxide gasmasks, Eopcalite is a registered trade name v;ith the MineSafety Appliance Company, and is really a mixture ofcompounds which indlude, among others, manganese dioxideand cuprous oxide. After extensive investigations, Lamb and
(3)co-workers found that the mixture of oxides of copper,manganese, silver and cobalt was most effective for oxidation
(4)of carbon monoxide. Yant and Hawk have reported that commercial Eopcalite could oxidise h-% methane in air to carbon dioxide and water with 10 - oO% conversion over the temperature range 200 - 350°C. This catalyst is quite effective for dry gas, but poisoned very rapidly in presence of water vapour. It also loses activity on prolonged heating at temperatures above 230°C, due to sintering.
(7 )Anderson and co-workers have concluded that the catalytic activity of metals and their oxides, decreases in the following order: Pd, Pt, Or, Mn, Cu, Ce, Co, Fe, Ni, and kg. This order of effectiveness was the same as previously reported by Cohn and H a l e y ^ .
B . Kinetic Studies on the Oxidation of Hydrocarbons
(7)Anderson and co-workers did a kinetic study on the oxidation of methane. The catalyst bed was 7 to 7.5 cc. deep with a cross section of 2.435 sq. cm., methane concentration was 1% and air flow 2 liters/min. at room temperature.Thirty kinds of catalysts were tested over the temperature range 450 - 800°K, using a constant value of space velocity. The experimental data were approximated by an empirical equation with respect to methane concentration.
Reproduced with permission o f the copyright owner. Further reproduction prohibited w ithout permission.

( 17 )Rosenbaum worked on the oxidation of verydilute methane (51 ppm in air) at 1075°F by using the pelletized catalyst supplied by Engelhard Industries. The relationship between space velocity and conversion is given in Table 9 in Appendix I. The volume of catalyst used was 0.0005 cu, ft. No details were given for the size and composition of the catalyst.
Mezaki^^^^ used vanadia, cobalt, dopper-chromite, chrome alumina, hopcalite and palladium catalysts for methane oxidation. He found palladium to be the most effective catalyst from the stand point of ignition temperature, stability, freedom from side reactions, and good conversion. However, palladium is not necessarily free from objectionable features. It has a reported tendency of poisoning by.lead compounds.
Mezaki studied the catalytic oxidation of methane using 0.5% palladium on alumina catalyst. Methane concentrations in feed were 1 to 2%. The reaction temperature was varied between 320 to 380°C and the pressure was kept atmospheric.The feed in addition to reactants contained reaction products as well. In this connection, Mezaki has correctly pointed out that when the feed to reactor contains the reaction products, one cannot use the initial rate - total pressure correlation to screen the postulated mechanisms.
In ah initial survey, Mezaki*'^^^ used 84 models in which adsorption of reactants or desorption of products was the postulated rate-controlling step. The linearised models were fitted to the experimental rate-data by least square, technique, but this fitting resulted in ;two or more negative constants. This led to the rejection of these models.
Reproduced with permission o f the copyright owner. Further reproduction prohibited w ithout permission.

Then, assuming that surface reaction is the ratecontrolling step, Mezaki Used integral kinetic equationsfor fitting the experimental data to postulated models.He eventually concluded that the controlling step in theoxidation of methane is surface reaction between adsorbedoxygen and gaseous methane to give adsorbed carbon dioxideand water. There is no apriori reason to suspect that ina catalytic reaction, at different temperatures, the samestep is rate controlling. Recent applications of theinitial rate technique have established that for the samecatalytic reaction at different temperatures, differentsteps could be rate controlling. Thaller and Thodos^^*^^
(21)and Mathur have reported changes in controlling step at different temperatures for two quite different types of catalytic reactions. In view of this, Mezaki's treatment of kinetic data appears to be somewhat empirical,
C. Important Considerations in the design of a Catalytic Converter
Many factors have to be considered for the design of a catalytic converter for auto exhausts. Different makes and life of automobiles, fuels and wide range of operating conditions lead to great variation in physical and chemical properties of exhaust gases. A brief review of the current situation follows.
(i ) Exhaust Gas Temperature
Exhaust gas temperatures are changed by operating conditions. Temperatures from 150 to 1500°? have been observed depending on engine operation and location of measurement in tail gas pipe. Therefore, it is essential to determine the lowest temperature at which the
Reproduced with permission o f the copyright owner. Further reproduction prohibited w ithout permission.

catalytic conversion starts and highest working temperature of catalyst.
(ii) Exhaust Gas Flow Rate
From measured air intakes of passenger cars, computed exhaust volumes, at 1 Atm, and ?0°F, range from 6 to 10 cfm. at idle, to 50 cfm. at 50 mph. The flow rate at accelration might reach 250 cfm,
(iii) Exhaust Gas Composition
Hydrocarbons, hydrogen and carbon monoxide are the major combustible components in the exhaust gases.The concentrations of these components vary greatly depending on operating conditions and air-fuel ratio. Tables 6, 7 and 8^^^ in Appendix I show some typical compositions of automobile exhaust gases under different operating conditions.
If automobiles were running at fairly constant rates, the kinetics of exhaust gas oxidation could be solved for a steady state condition. When an automobile starts to run, the oxidation process gives a complicated unsteady state problem. Generally, an automobile starts in a residential area, goes through more.populated zones at variable engine conditions, and runs through sparsely populated areas at rather constant conditions. When the engine starts, it stays at a rather low temperature and the exhaust contains a large amount of carbon monoxide and hydrocarbons. Therefore, the oxidation catalyst needs to be specially active at low temperature.
Reproduced with permission o f the copyright owner. Further reproduction prohibited w ithout permission.

It should also have good conversion, good life, and inertness to lead compounts.
The pressure drop through the catalytic converter should be low to reduce power cost for compression of gases. The converter should also be compact in construction.
Reproduced with permission o f the copyright owner. Further reproduction prohibited w ithout permission.
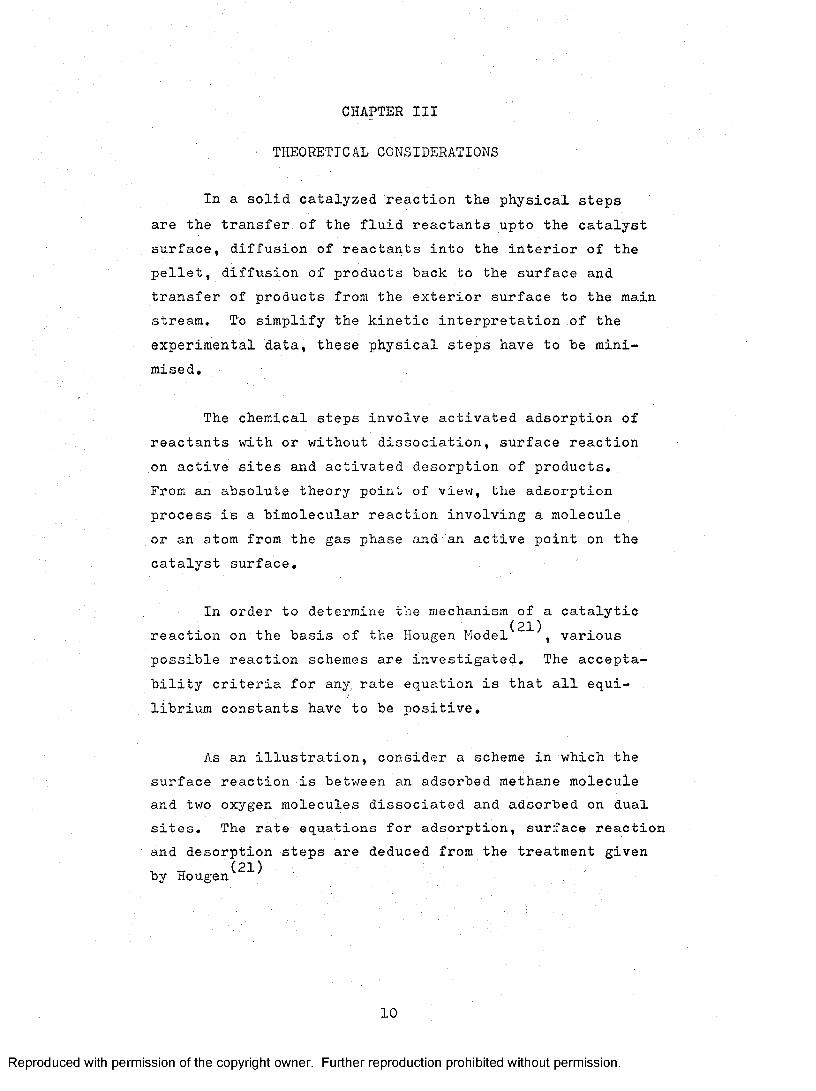
CHAPTER III
THEORETICAL CONSIDERATIONS
In a solid catalyzed reaction the physical steps are the transfer of the fluid reactants upto the catalyst surface, diffusion of reactants into the interior of the pellet, diffusion of products back to the surface and transfer of products from the exterior surface to the main stream. To simplify the kinetic interpretation of the experimental data, these physical steps have to be minimised.
The chemical steps involve activated adsorption of reactants with or without dissociation, surface reaction on active sites and activated desorption of products.From an absolute theory point of view, the adsorption process is a bimolecular reaction involving a molecule or an atom from the gas phase and an active point on the catalyst surface.
In order to determine the mechanism of a catalytic(21)reaction on the basis of the Hougen Model , various
possible reaction schemes are investigated. The acceptability criteria for any rate equation is that all equilibrium constants have to be positive.
As an illustration, consider a scheme in which the surface reaction is between an adsorbed methane molecule and two oxygen molecules dissociated and adsorbed on dual sites. The rate equations for adsorption, surface reaction and desorption steps are deduced from the treatment given by Hougen
10
Reproduced with permission o f the copyright owner. Further reproduction prohibited w ithout permission.

ADSORPTION STEPS
11
(i) Adsorption of oxygen;
2 0_ + 2 1_2 cL
2 Ogl + 4 1
2 Oglg
4 01 + 2 1.
(1)(2)
Eq. (1) is rate controlling and equilibrium maintained in (2), net rate of adsorption of oxygen
2R ads. = k a^_ - k'O
°2 2 2
(ii) Adsorption of methane
— — 4 ' —1C C01 ■12
K'O.
CH, + 1 CE^lnet rate of adsorption of methane
^CE^ ^1 " ^'CE^ ^CE^l
(4)
(5)
- (3)
SURFACE REACTION
Surface reaction between four adsorbed oxygen atoms and adsorbed methane molecule to give activated complex involving one carbon dioxide molecule and two water molecules and two active centres
- (6 )4 01 + CE, 1 .00 1 + 2 E^Ol + 2 1
net rate of surface reaction
s(s-l) ks.r.R s.r.= ^CH^l ^ 01^COgl HgOl /^1
K's.r.
(7)
Reproduced with permission o f the copyright owner. Further reproduction prohibited w ithout permission.

DESORPTION STEPS
12
(i) Desorption of Carbon dioxideCO 1 CO2 + (8)
net rate of desorption of CO.
r des. = k' C , - k a C.CO^ COpl CO^ COg 1 (9)
(ii) Desorption of water2Hg01 2E^0 + 2 1
net rate of desorption of E_0
r des. = k C - k^^^ a
(10)
(11)
If the adsorption of oxygen is rate controlling step andthe adsorption of methane, the surface reaction, the desorptionof CO. and E^O are equilibrium steps. The rate of reactionwould be
(k) A a - 1 ^CO aK
E_0* -km,
C^, total concentrations of vacant active centres, is given by
^1^ ^ " ^CE^l ^COgl ^HgOl - ^01
(12)
(13)
or, C^ = " CE CEj ^COg ^COg ^E^O ^EgO ^ / Og^CO^ ^ E^O
L K aCE4(14)
Reproduced with permission o f the copyright owner. Further reproduction prohibited w ithout permission.
13
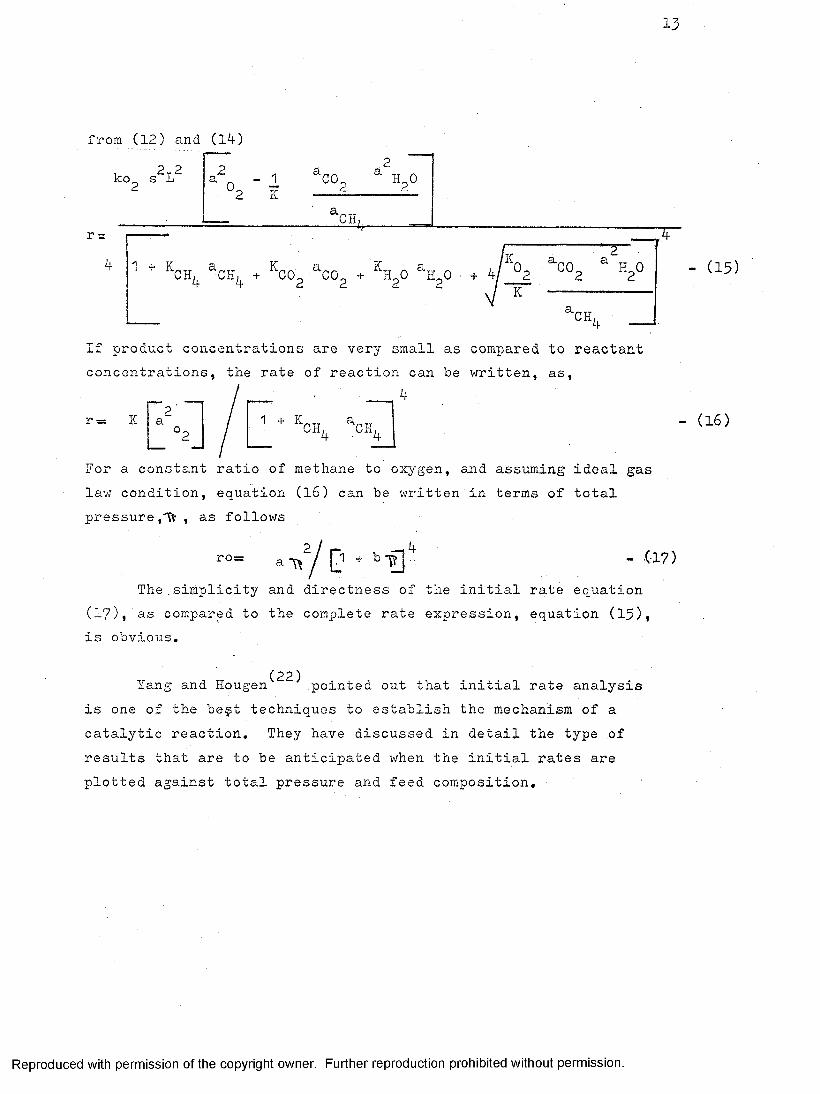
from (12) and (14)
2kOg ^CO ^ H.,0
aGEr =
^CE^ ^CE^ + ^GOg ^COg + ^EgO ^E^O + 4^ °2 ^°2 ^2°V ^ “'I
GE4
F
- (15)
If product concentrations are very small as compared to reactant concentrations, the rate of reaction can be written, as,
I 4
ll'°2 J / L I 'For a constant ratio of methane to oxygen, and assuming ideal gas law condition, equation (16) can be written in terms of total p r e s s u r e , , as follows
,4
- (16)
ro= T < y D + ’=■3 ' - (17)The ,simplicity and directness of the initial rate equation
(17), as compared to the complete rate expression, equation (15), is obvious.
(22)Yang and Hougen pointed out that initial rate analysis is one of the begt techniques to establish the mechanism of a catalytic reaction. They have discussed in detail the type of results that are to be anticipated when the initial rates are plotted against total pressure and feed composition.
Reproduced with permission o f the copyright owner. Further reproduction prohibited w ithout permission.

14
By systematic and independent variations in total pressure and feed composition, the plots of initial rates against total pressure and feed composition are obtained. Through an interpretation of these plots, it is possible to establish the rate controlling step or steps of the catalytic reaction with assurance. Moreover, initial rate approach does not assume that the same controlling step or steps are operative at all temperatures.
As pointed out in the introduction the initial rate equations are hot complete rate equations for a catalytic reaction. The initial rate approach nevertheless provides for a much more direct determination of the mechanism of a catalytic reaction.
In this investigation the objective is to establish the mechanism of methane oxidation at different temperatures. The overwhelming advantages of the initial rate technique, as apposed to the conventional approaches, recommended for this investigation.
Reproduced with permission o f the copyright owner. Further reproduction prohibited w ithout permission.

CHAPTER IV
EXPERIMENTAL EQUIPMENT AND MATERIALS
The reaction rate data for the oxidation of methane was obtained using a differential bed reactor confined in a cylinderical tube. A schematic diagram of the set up is shown in Figure 1. The details of the equipment and materials used are given below:-
(a ) Reactor, Preheater and Accessories .
The reactor tube and the differential bed are shown in Figure 2. The reactor tube was made of 1)4 inch I.D, , schedule 40, 304 stainless steel tubing. The ends of the tube were fitted with 300 psig. welding neck flanges and matching blind flanges. Copper gaskets of 1/8 inch thickness were used for leakproof closure of the tube. Thermowells were welded to top and bottom flanges. To facilitate insertion of berl saddles, 3/8" O.D.S.S. tube was also welded to top and bottom flanges.
The differential bed consisted of a 1 3/8" O.D., 1/8" thick, 5 1/2" long S.S.. cartridge. Its ends were closed by screens and washers. The screens fitted snugly with the inside of the reactor tube with little clearance.Catalyst mixed with ceramic berl saddles was charged into the cartridge. This minimised the non-uniformity of bed and channeling effects. The catalyst bed occupied the space between the ends of the thermowells, rest of reactor space was packed with 1/4" ceramic berl saddles.
15
Reproduced with permission o f the copyright owner. Further reproduction prohibited w ithout permission.

r/3 90^ U N
PIG. 1 SCnmATIC DIAGRAM OF EXPERIMENTAL EQUIPMENT
Reproduced with permission o f the copyright owner. Further reproduction prohibited w ithout permission.

6
î U
1
O)
E/J
X
//
_Z)//:fjFX?ZF///r%4Z
{/V /D//4 (7/4.9
3/%2 /C(2/3
Reproduced with permission o f the copyright owner. Further reproduction prohibited w ithout permission.

18
The preheater construction was basically identical to that of the reactor, A minor difference was that reactor tube was 5 inches shorter than the preheater tube. The.preheater was packed with 1/4" ceramic berl saddles.
The tubing connecting the gas cylinders to preheater was 1/4" O.D. Copper, From preheater exit to sampling connection, the tubing was 1/4" O.D. S.S. Standard screwed swagelok fittings were used for all connections.
The preheater was heated by 12" long, l400 watts cylinderical heating units. The reactor had three independently controlled heating sections of lengths 3 1/2",3" and 3 1/2" rated at 700, ll60 and 700 watts respectively. The furnaces were insulated with refractory fibre felt supplied by Johns Manville, To prevent condensation of water vapours in the system, the tubing from preheater exit to sampling connection was heated with electric heating tape,
Ghroitiel-alumel thermocouples in l/l6" O.D. stainless steel sheaths were used for temperature measurement.
A' pressure gauge of range 0-400 psig, with valve connections at the inlet and the outlet of the reactor, was used to measure the operating pressure of the system,A spring loaded pressure relief valve set at 500 pounds, was used as the safety device.
Reproduced with permission o f the copyright owner. Further reproduction prohibited w ithout permission.

19
(B) Flow Measurement Devices
Rotameters were used to measure the flow rates of oxygen and methane. These were equipped with dual floats, one of pyrex, the other of stainless steel.The maximum flow ranges with the two floats were 4.4 and 8.8 SCFH of air. The rotameters for oxygen and methane were identical in all respects. These were supplied by Matheson Co.
(C) Analytical Equipment
The analytical equipment for reactants and products was a gas chromatograph. It was a 5000 series selects system model supplied by Barber Colman Ltd. It had dual column bath and six port thermal conductivity detector.The arrangement of the columns connected to the six ports is given in Figure 17 of Appendix II. The first columnwas a 1/4" O.D.; 1 ft. silica gel type followed by 1/4"O.D. 7 ft. molecular sieve column. The second column was 1/8" O.D.; 15 ft. carbowax 1500,
Other major parts of the chromatograph were carrier gas supply regulators, injector bath, column bath, detector filaments current supply and the recorder. All syringes were gas tight.
(D) The catalyst, 0.5% palladium on alumina supplied byEngelhard .Industries Inc., had the following physical properties
Bulk density $6 pounds per cu. ft.Surface area 120 square metres per gram.Size 1/8" X 1/8" cylinderical pellets
Reproduced with permission o f the copyright owner. Further reproduction prohibited w ithout permission.

20
(E) Selection of Gases
(i) Oxygen gas was supplied by Liquid Carbonic Corporation and was of 99*9% purity,
(ii) Methane gas was of chemically pure grade supplied by Matheson Co. It was of minimum 99% purity. The typical average composition of the gas in given in Table 10, Appendix I.
(ill) Nitrogen and carbon dioxide used for calibration were of 99.9% purity and supplied by Liquid Carbonic Corporation.
(iv) Carbon monoxide used for calibration was of C.P. grade supplied by Matheson Co. It was of minimum 99.5% purity.
(v) The helium gas used as carrier in the chromatograph was of 99*99% purity. It was supplied by Liquid Carbonic Corporation. An alumina packed filter was used in the helium line to prevent, any trace of water vapour in the helium gas from entering the system.
Reproduced with permission o f the copyright owner. Further reproduction prohibited w ithout permission.

CHAPTER V
OPERATIONAL DETAILS AND RESULTS
The operational procedure for conduction of kineticruns is summarised in this chapter,
(a ) Calibration Procedure
(i) Calibration of Rotameters
For rotameters operating under a constant pressuredifference but with a constriction of variable area,the mass flow rate is related to the scale reading by
(23)the following expression
(18)Since the float density is normally an order of magnitude larger than the density of the fluid whose flow is being measured, equation (l8) can be approximated to
W _ Cr X (19)i f
The coefficient of discharge Cr is sensitive to the viscosity and to the flow lines through the constriction. For high flow rates, Cr tends to assume.a constant value, and for this reason it is convenient to calibrate the flow meters according to the procedure suggested by equation (19).
21
Reproduced with permission o f the copyright owner. Further reproduction prohibited w ithout permission.

2 2
The calibration of methane and oxygen rotameters was done by measuring actual flow rates with a precision wet-test meter. The upstream pressures and temperatures of the gases were measured by pressure gauges and thermometers installed in the lines before the rotameters inlet. Since neither of the gases is soluble in water, the presaturator of the wet test meter was filled with distilled water. The calibration curves for the rotameters over the complete range of investigation are given by Figures 15 and l6 in Appendix II
(ii) Calibration of Thermocouples
The chromel-alumel thermocouples used to measure temperatures were calibrated against the boiling point of distilled water and the melting points of chemically pure tin and zinc. The observed temperatures were extremely close to standard temperatures. Therefore, the error involved in measurement of experimental temperatures, is negligible.
(iii) Calibration of Chromatograph
(a) Principle,
The carrier gas is introduced into the system at a specified flow rate. The column, injector and detector baths are heated to the required isothermal temperatures. These temperatures are chosen to prevent condensation of any component at any stage of the process. Another operational consideration is that separation of different components should be explicit. A sample mixture is then injected into the
Reproduced with permission o f the copyright owner. Further reproduction prohibited w ithout permission.

23
injector part. As the sample is carried through the columns, the components are separated according to their respective solubilities in the column charge.The components having little affinity for the column material pass through the column rapidly, while those with greater affinities are retained in the column for longer periods.
As each component emerges from the column, it is driven into the sensing side of the detector located immediately after the column exit. The other side of the detector which is the reference side is upstream of the sample injection block and is filled with carrier gas prior to the point at which the sample is Jnjected. Thermistors in each chamber of the detector are connected to a balanced bridge circuit and are cooled by the gases to which they are exposed. When a component enters the sensing chamber, the thermistor bridge circuit is unbalanced and generates a signal. The signal is proportional to the difference in thermal conductivities of the carrier gas and the component. The signal drives a recorder pen to produce, in graphic form, a quantitative and qualitative description of the component.
'(3;) Calibration
Due to large number of components to be analyzed, the silica gel column, followed by molecular gieve column, were found to give explicit separation of all the desired components. The silica gel column gave combined peak and peak for carbon dioxide.
Reproduced with permission o f the copyright owner. Further reproduction prohibited w ithout permission.

24
The molecular sieve column gave separation for oxygen, nitrogen, methane and carbon monoxide.
The operating conditions for the analytical set-up are given by Table 11, in Appendix I.
The concentration of any component is directly proportional to the peak area. However, in this case, a measurement of peak height gave a reasonably accurate .proportionality to component concentration. This relation was valid for pure components as well as for the mixtures used. The calibration curves for different components are given by figures l8 to 22, in Appendix II. The concentration of water was found by difference. Absence of,alcohol and aldehydes was established during the trial runs of methane oxidation, thus calibrations for these components were not done.
(B) Operational Procedure
The preheater and reactor furnaces were switched on and variacs adjusted to heat the system to the desired temperature. Oxygen gas was fed through the rotameter, with the feed rate and.reactor exit valve being adjusted for the desired working pressure. After the temperatures had stabilised, methane gas was slowly fed to the system through the rotameter. The flow- rates of oxygen and methane, the reactor exit valve and the variacs- were adjusted for desired working pressure and isothermal temperature of the differential bed.
The reaction was allowed to proceed for about one hour, at the desired conditions, before the first sample was taken for analysis. Three samples were taken for each run. The average
Reproduced with permission o f the copyright owner. Further reproduction prohibited w ithout permission.

25
of the three readings was used to calculate the product composition. It took about fifteen minutes for analysis of each product sample. Therefore, each sample was withdrawn at an interval of fifteen to twenty minutes after the attainment of equilibrium conditions.
Preliminary runs confirmed Mezaki's Observations that the catalyst achieved uniform activity after twenty hours of service. Therefore, for each séries of runs, the catalyst was first allowed to attain uniform activity.
Prior to the start of the runs, with the catalyst, blank runs were made with different oxygen methane ratios within the range of operating temperatures and pressures. These blank runs confirmed that no parts of the equipment contributed to the conversion.
(C) Results
Following the procedure outlined above, two series of runs were made. For both series the catalyst charge was0.498 gm. One series of runs was with about 6% to 30% methane, at about 1.8 atmospheres total pressure and at temperatures of 300, 320 and 340^0. The second series of runs was made at almost constant feed composition of about 6.5% methane. The total pressure was varied from 1.8 to 9.7 atmospheres. The runs were at isothermal temperatures of 300, 320 and 340°C.
^ 7 4 9 7
UNIVERSITY OF WINDSOR LIBRARY
Reproduced with permission o f the copyright owner. Further reproduction prohibited w ithout permission.

26
The percentage of products was 0,4 to 1.2%, and conversions were 3.69 to 9.10%. For such small conversions, it is accurate enough to consider the reaction to be differential. Initial rates of reaction were computed from the expression
ro = 4l0 . (20)
The method of computation of initial rate from experimental data, is given in Appendix III. The results of the experimental runs are given by Table 1.
Reproduced with permission o f the copyright owner. Further reproduction prohibited w ithout permission.
oH
'SEH
wddPh
do•ri-Pnj'd•riXO
«HO
w
H0CQOJPi.
H
-Pd0•Hd0P
'■d 4..)0 mÎN
d r-i0 0d > -Po d fiS•rl o Ü-P ÜÜ -d- (H Ad W o IN0 Ü Ap;
w O«H 0 r-4o !—1O
0 a-p 1 dml A rdK 1—1
do•HMd<D>doo
ooH
CD-PÎH(D>GOü-4*
u
îûCDrHOaîrÛ
> (V /—i0 S1
(U
dM
Tla>
0«Hd•H
-d -WO
tQ0H0a1
,QH
0dd
H Wcts m •-p 0 So d •pEh •=<'
0dd-p
«
27
en c\j NO NO f\J (M Pi AJ r4 H (NJ A r4 OA A OO -d- co ■ A 00 H A O A OOIN 00 00 00 00 A •d- A A A A A
O o o o o O o O O O O O
NO NO O A O) r4 A O A lA A H NO NO NONO A r4 -d- OO A NO A H ~d- OO -d- IN O CO
CO A A CN IN OO A A -d- OO CO A CN OO OO
d -d" PI ■-d- p ■d- PI pf- Pt pT NO NO NO A A A0 NO NO NO NO NO NO NO NO NO o o o CO fVJ (\Jho NO NO NO NO NO NO NO NO NO A A A o O Oo o o o o o o o o O O o rH H HXo o o o o o o ' o o o o o o o O O
A0 -d- p4 pT A IN A • IN OO OJ A OJ pj- Od IN CO CO IN CN IN H A A rvj A A H (M fd(0 -d- -d- -d- rH H H A pf A NO NO NO IN IN IN43 o O O H rH rH OJ <M rvj o O o O O O-P o O O O o o O O O o o o O O O0S ' o o o O o o O O o o o o O o o
r- tN [Nr4 r-i r400 00 00
r-| 1-4 r4
I>- IN l>- H H H 00 OO OO
IN IN IN r4 r4 f—I00 OO OO
lA lA UXIN IN INen ON ON
(M (\I OJ
A A A (M f\J OJ A A AA A A
d o o o o o o o o o o o o o O O0 U o CM pj- o CM pf o OJ Ph o CM pj- o CM PhA O A A A A A A A A A A A A A A AS0EH
r- CM Av CM A V- CM Ao r- CM A 1 1 1 ?— CM A
iz; 1 1 1 1 1 11 1 1 M M M 1 1 1d M M 1—1 H M M > > >d H H H H M M M M M M M M ■ > > >
Reproduced with permission o f the copyright owner. Further reproduction prohibited w ithout permission.

-ps:oo
(DiH'SEh
•P
-P
C\J r4 H l>- O- |>-
LTN ^ lAlA ON Pf VO VD O-
-d- OO O<M lA COVD VO [N-ON <H OA OO -d- A A Vû
tAVO
■P
A A- M3 H A H
Pt- A OA CX3 Nû
NO \0 A-I> A- OOA - A - CO
'H
VOO O A - OO VO A IN.4J
iH (0
<M AMM
MM M MM M M M MMM
M
Reproduced with permission o f the copyright owner. Further reproduction prohibited w ithout permission.

CHAPTER V I
ANALYSIS OF RESULTS
In the interpretation of experimental kinetic data,many experimental errors might be encountered. A detailedconsideration of the errors that might affect the observedrate of reaction is essential to a valid interpretation of
(24)experimental results. Hougen has discussed theseerrors, arranged below in the order of decreasing importance:
1, Variation in catalyst activity.2. Departure from unity in effectiveness factor of catalyst.3. External resistance due to mass and heat transfer.4, Neglect of pressure drop due to flow.
Besides these, the following sources of experimental errors should also be considered.
3. Side reactions.6. Homogenised reaction and catalyzed reaction by reactor wall.7. Errors associated with analysis, flow measurement and
temperature measurement.
1. Variation in Catalyst Activity
Mezaki^^^^, who used the same catalyst as the one employed in this investigation, reported that catalystactivity decreases considerably during the twenty hourservices period. After this period the activity reached a fairly constant value. Therefore for each series of runs, the catalyst was first allowed to attain uniform activity.
29
Reproduced with permission o f the copyright owner. Further reproduction prohibited w ithout permission.

30
2. Departure from unity in effectiveness factor of Catalyst
The effectiveness factor of a catalyst pellet is (24)defined by Hougen as follows:
"The effectiveness factor of a catalyst pellet is the ratio of the actual reaction rate per unit mass of catalyst when the catalyst is distributed throughout a porous pellet to the rate where the available catalyst is restricted to the exterior surface.of the surface." The catalyst used in this investigation consisted of small pellets, 1/8" x 1/8". In this catalyst, the penetration of palladium into alumina pallets was only superficial. The most active part of the catalyst was distributed on the surface or located near enough the surface. Therefore, it was assumed that the effectiveness factor was very close to unity.
3. External resistance due to mass and heat transfer
(22)Yang and Hougen have detailed the equations forcalculating heat and mass transfer effects for different operating conditions. The calculations for run 1 - 1 are given in Appendix III.
Results of these calculations indicate that for all runs, the heat and mass transfer effects were negligible.
4. Neglect of pressure drop due to flow
To take into account pressure drop due.to flow, the operating pressure was taken as the mean of reactor inlet and outlet pressures.
Reproduced with permission o f the copyright owner. Further reproduction prohibited w ithout permission.

31
5. Side reactions
In the trial runs over the range of operating conditions, no side products were detected by the chromatographic analysis.
6. Homogenized reaction and catalyzed reaction by reactor walls
In the blank runs over the range of operating conditions, no reaction products were detected by the chromatographic analysis.
7. Errors associated with analysis, flow measurement and temperature measurement
The errors due to analysis of feed streams and product streams were less than 0.3/. The errors due to flow measurement and temperature measurement were negligible.
KINETIC INTERPRETATION OF RESULTS
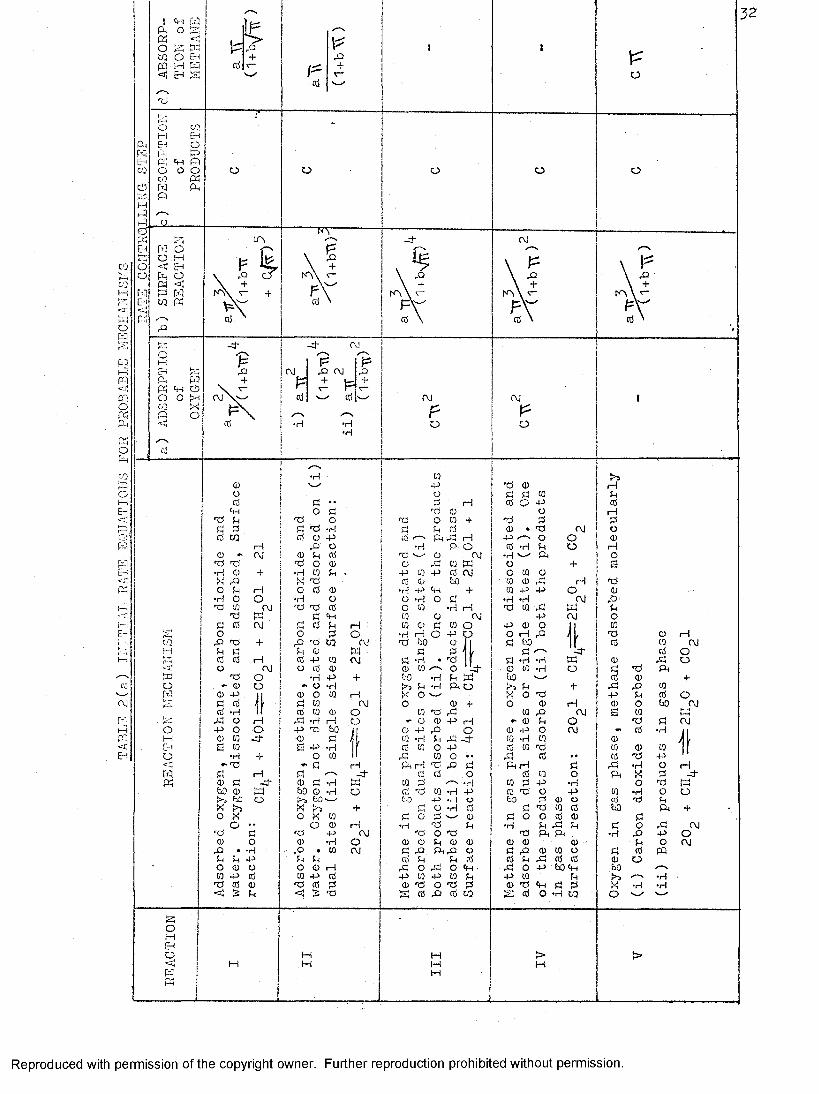
The interpretation of the initial rate results consists usually of two parts, first, a qualitative interpretation based on the nature of results obtained, and second, a statistical interpretation to obtain a quantitative rate expression. The acceptability criteria for statistical interpretation is that for any rate equation,.all equilibrium constants have to be positive. The various plausible mechanisms for the reaction are given in Table 2.
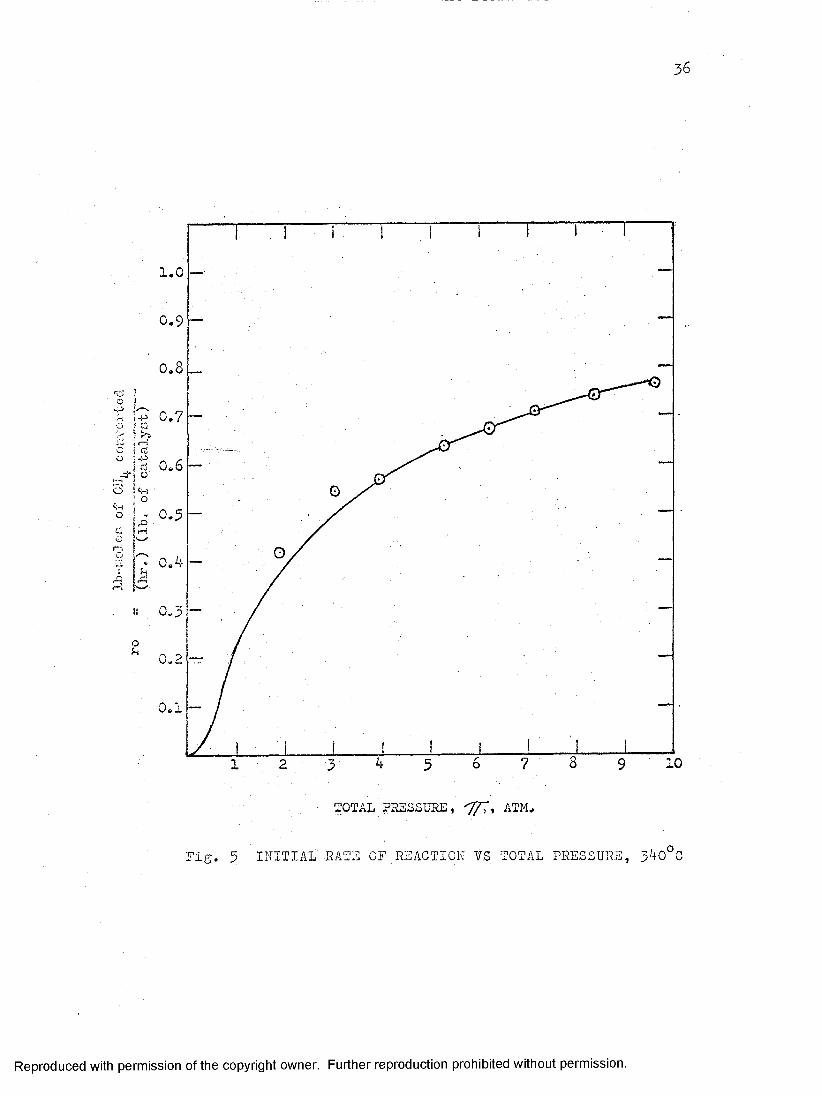
The initial rates obtained in this experimental study were plotted against the total pressure value. The plots for the three temperatures 300, 320 and 340°C are given in figures 3, 4 and 5.
Reproduced with permission o f the copyright owner. Further reproduction prohibited w ithout permission.
oC O
M
H O O H < H k O M < O H W Mo
-4-
O
COH
« H -P •rl *ri•rl H(M•H H O -P O Tj ÜO ü I OJ
HOJ
l>3 f-1 *rl À O U<D Pm ■‘d jd r 0) (U p Ha) p ,Q om -rl k Æ Pt-d m o p
OJrd 'H (H op "d 60 1 (U p W -rlH S P -HA H ' d p S
HPd H W H p
t O p -rl oP
O o
o t3 PPd p A P üOJ
d) H o d d S ns P d w
H
H HH
Reproduced with permission o f the copyright owner. Further reproduction prohibited w ithout permission.

:ÆBLE 2(b) DESIGNATION OF INITIAL RATE EQUATIONS
33
INITIALRATEEQUATION
NO.
REACTIONS INITIAL RATE EQUATION
(I) II a (ii) a (1 + b;/ )^
(II) II b a (1 + b77' )^
(III) IV b (1 + b;/" )^
(IV) V b a;/-^/ (1 + b;/ )
(V) II d a;y/ (1 + b ^ )
(VI) la, II a (i) a;/^/ (1 + b ^ )^
(VII) 'III b a;r^/ (1 + b ^ ) ^
(VIII) I d a%r/ (1 + b /^ )
(IX) I b a ^ / (1 + b + Ct/f )^
(X) Ic, lie, IIIc, IVc, Vc C
(XI) V d 0:7'
(XII) Ilia, IVa
Reproduced with permission o f the copyright owner. Further reproduction prohibited w ithout permission.

34
1.0
0.9
0.8
- P 0.7
"S 0.6o«HO. 0.5
0.4
0.3
0.2
0.1
10
TOTAL PRESSURE, ATM.
Fig. 5 INITIAL RATE OF REACTION VS TOTAL PRESSURE,300 C
Reproduced with permission o f the copyright owner. Further reproduction prohibited w ithout permission.

35
1.0
0.9
0.8
o
10
TOTAL PEESSUE2, ATM.
Fig. 4 INITIAL RATE OF REACTION' VS TOTAL PRESSURE, 320 C
Reproduced with permission o f the copyright owner. Further reproduction prohibited w ithout permission.
36
1.0
0.9
0.8i
Ii
ou
0.1
10
TOTAL PSSSSUEE, ATM.
i'ig. 5 INITIAL RATE OF REACTION Vg TOTAL PRESSURE, 340°C
Reproduced with permission o f the copyright owner. Further reproduction prohibited w ithout permission.

37
From these figures, the reaction mechanisms represented2by equations ro C, ro^s-C/f and ro= can be rejected, as
their plots would be grossly different from the plots of figures 3, 4 and 5.
To examine the validity of other possibilities, coefficientsof the remaining nine theoretical rate equations were estimatedfrom the experimental data for three temperatures. The non- .linear rate equations were transformed to linear equations byalgebric manipulation. The coefficients of these linearisedrate equations were estimated from the statistical methods of
(25)linear regression . Considering the rate equation (I)
ro - a"U^/ (1 + b Rearranging, this becomes
or, an expression of the type I- A + BXThe regression coefficients A and B are given by
Z:X^ z:Y - z:X zXYA — p Pn ZX - (^X)
n XY - zX zY® ~ n - ( a=X)^
For an expression involving three coefficients, 'as in case of rate equation (IX)
r. ___________-(1 + blt+ Cn/tD ^
Rearranging, this becomes
"n _ 1 f b T t + c V7T
Reproduced with permission o f the copyright owner. Further reproduction prohibited w ithout permission.
38
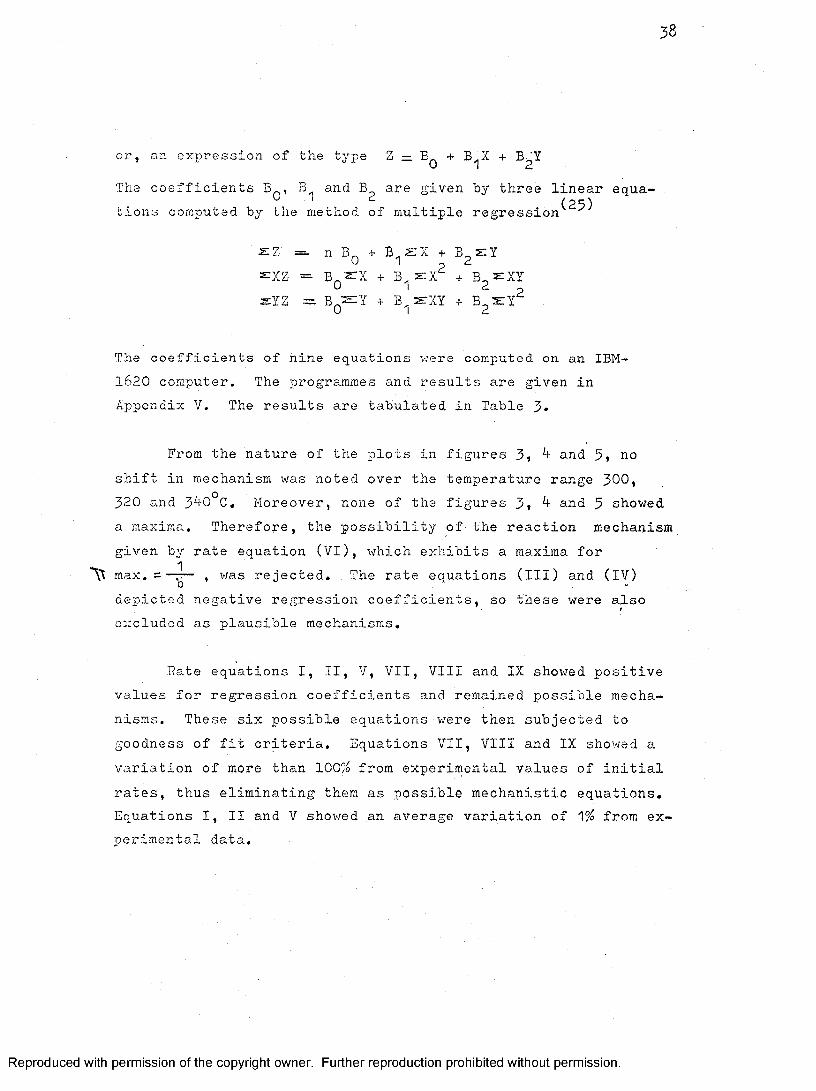
or, an expression of the type Z = + B^X + B^Y
The coefficients B , B and B are given by three linear equa-1 c. (2 5 )tions computed by the method of multiple regression
JEZ =. n + B Z X + B z Y
zXZ = Bg^zrX + B zx^ + B r X Y zYZ = B^ZZY + B Z X Y + B Z Y ^
The coefficients of nine equations were computed on an IBM- 1620 computer. The programmes and results are given in Appendix V, The results are tabulated in Table 3»
From the nature of the plots in figures 3, 4 and 5, no shift in mechanism was noted over the temperature range 300,320 and 340°C. Moreover, none of the figures 3, 4 and 5 showed a maxima. Therefore, the possibility of the reaction mechanism given by rate equation (VI), which exhibits a maxima for max. = —ry- , was rejected. , The rate equations (III) and (IV) depicted negative regression coefficients, so these were also excluded as plausible mechanisms.
Rate equations I, II, V, VII, VIII and IX showed positive values for regression coefficients and remained possible mechanisms. These six possible equations were then subjected to goodness of fit criteria. Equations VII, VIII and IX showed a variation of more than 100% from experimental values of initial rates, thus eliminating them as possible mechanistic equations. Equations I, II and V showed an average variation of from experimental data.
Reproduced with permission o f the copyright owner. Further reproduction prohibited w ithout permission.

CO
o
<ca:
o
oweg
t) q) * hJ 3 O «J orz 02 Ui
<rscn<r\o
a I «0
k.
(Io
rs.cmcmO
crs
VO
cr\00
gCO
CTN
eg\o
f.
M
CF\k
-t"
Csi
wja•fcmte:(tf
g)IT\O
CO
CO
V OVO
CO
CO
T Tcm
I
VO
VO
SI
te ,
%It2
CTNVO
COo
CO00CM
%CM
Ourn
<vio
kJ34CMte;<0ts2.
UNStVO
(O
OO
CM
crste;
Ito
H*
te;
I#O
crso
cr\VO
T "CTN
f .
-M,
ts ItJÛ
cmat
39
Reproduced with permission o f the copyright owner. Further reproduction prohibited w ithout permission.

40
(22)As proposed by Yang and Hougen , the effect of feed composition upon rate of reaction was utilised to eliminate further implausible mechanisms. Plots of rate of reaction against methane percent in feed composition are given by figures 6, 7 and 8. Interpretation from these plots, rules out the survival of reaction mechanisms given by equations I and V. The plots of equations I and V would be entirely different from the plots of figures 6, 7 and 8.
Further more, as a check, values of initial rates from equations I, II and V were computed for the varying feed composition runs, by using the corresponding linear regression coefficients. The experimental data showed a variation of more than 100% from that predicted by equation I, about 23% from that predicted by equation V, only about 4% from that obtained by equation II.
Hence, from qualitative view points, equation II is the probable mechanism for methane oxidation. Also, from quantitative interpretations, it is the most accurate fit both for constant feed and varying feed composition runs.
Therefore, it is proposed that following is the rate controlling mechanism for methane oxidation.
" Oxygen and methane adsorbed on the catalyst surface, the surface is:
2 Ogl + CH^l -nzzptzr. 2 H^Ol + GO 1
surface reaction is rate controlling ".
Reproduced with permission o f the copyright owner. Further reproduction prohibited w ithout permission.

4 1
1.0
0.9
^ 0.8+>M3 0.7- P
% 0.60.5r4
0.4
0.3
0.2
0.1
0.8 0.9 1.0
MOLE FRACTION OF CH. -
Fig. 6 INITIAL RATE OF REACTION VS FEED COMPOSITION, 300 C, 1.8l? ATM.
Reproduced with permission o f the copyright owner. Further reproduction prohibited w ithout permission.

42
0.9
0.8
0.^
0.3
0.1
0.8
MOLE FRACTION OP CE, - N,4 A
^ig. 7 INITIAL RATE OP REACTION VS FEED'COMPOSITION,320°C, 1.8l7 ATM,
Reproduced with permission o f the copyright owner. Further reproduction prohibited w ithout permission.

43
1.0
0.9
0.8
0.2
0.1
0.4 0.5 0.6 0.7 0.80 0.1 0.2 0.5 0.9 1.0
MOLS FRACTION OF CH, - N,4 A
8 INITIAI RAIE OF REACTION VS FEED,COMPOSITION, 5.40°C, 1.8l? ATM.
Reproduced with permission o f the copyright owner. Further reproduction prohibited w ithout permission.

4 4
The corresponding rate equation has the form
2 2 —
C I ^ °2 " ^ ^2° ^^°2 ^
the corresponding initial rate equation is:
ro z a ~^ / (1 + b'^
at 500°C ro= 4.144'^/ (1 + 1.737'VT)^at 520°C ro = 4.206 -^/ (1 + 1.714'^)^at 540°C ro = 4.644 (l + 1.72jT^)^
The initial rates computed from the proposed mechanistic equation and their variation from experimental data are given in Table 4.
Figures 9, 10 and 11 graphically illustrate the agreement of the computed rates with the observed reaction rate. .
Mezaki's rate equation gives a deviation of about 1?^, as compared to the deviation of 4% based on the equation arrived at in this investigation. Table 4 -a gives the results based on proposed mechanistic equation as compared to results based on Mezaki's investigation.
Reproduced with permission o f the copyright owner. Further reproduction prohibited w ithout permission.

45
-d"
0rH
'SEH
ao lA3«H k3 rO3- O3 tA *H +44 lA 443 Ü rHO rH 311 CD \3 « hA0•H Ch44 O 333 ♦ CD 11O' 44pq 3W o«3-P
I
Ü•H-PW•H:.cu«
oooo-paiCOdguc!o•H+>•HtoOASooCD<D-Pg(0oo
-zrrH-zfCÜ
So444O♦H•P(0•H)h>
C)pHoj>rHCd-Pd0e•Hu , 0I
dc•H-pÜd0«HO0-P
rH(Ü4-)d0G•HU0A
0)ÎH3(0ra0)6(d•poEH
N
a4H
VO CO INPh l A t A l A l A H O J O J l ^ H r A O O t N -1 > . M ^ P J - P l - C \ ) 0 0 0+ + I I I I + I
rA AJ LA lA OO AI pf HVO LA -3- tA VO VO OV VO4t VO Al oo O A -d- VOlA -d- LA LT\ VO VO vo VOO O O O o o o o
lA H rA OV -d- -d- LA rHA- CO O LA Ov A LA A-lA -d- LA LA LA VO VO vo
O O O O O O o O
A- LA LArH A- A A -d- LA (—i ■ oOO OV OV A A H -d- A-rH A lA LA VO A- OO OV
o H H rH I—I 1—1 H H rHB
33
1
H
1
>
1
>
1
H
1
M
1
H
1
X
1
XK M > M
>MM>
H
ir\lAdII
mbOcdk0)
[>-(A[>-H
00rAH[NIIcd
a4HtNH00H
OOoolA-PcdM33O*H-P'Hrao
aoo<r}CD,m(pbo3•HK-3p>
pq
o3a pHO 33 >«HH■ 3 3
o 44*H 344 CD3 a•H ■H3 33 CD> P4
XH
aO CMu'H3 O •ri -P Ü Id 0)«
A)' O A
O,ACh - O 33-P3K
-3-mÜA
3O*H r4-P 3 o P> 3 3 (U CDA a*H 3CD A CD X -P H3CÜ
ChO
34o3O•H44, 3 ovÜ "iH VO A- VO3 VO rH 03 CD •V3 VO LA COPh 3 CD 0 rH A3 CDCD 43 k 0 0 0rH 440 CDs s
3«
VO A- OVH rH PfA- OV A+ + 1
lAVO lA lA-d- A VOlA A- 000 0 0
A VO AA- Ov -d-A A- 000 0 0
rH rH rH
t 1 1
M M MM M
M
rHVC
0bOdd0><
Reproduced with permission o f the copyright owner. Further reproduction prohibited w ithout permission.

46
<D3a rH0 ■ 33 >44 rH3 30 44 Ht 0 00 A A 0 A VO•H 3 0 A A -t A A A A44 03 a A Ht A Ht A 0 H rH*H •H3 3 4- + 1 1 1 1 1 I3 4)> &M
a03 A44Ht k;rH 3 rP3 A 044 •H ■ +3 . rH 44 rH H A« II Ü rH A 00 rH A 00 0 A 03 VO CO A 0 A VO CO 03 A Q> A Ht A VO VO VO VO A0 \*H A 0 0 0 0 0 0 0 0443 440 k3 3o-' 0 11
0H VO0 4430 A ■ « K-PCÜPIÜ•rl•P(0•HgrdOQ)
-Pdoo
0r4E-i
It3
3O•H44•H3OOo00k•Pd-pwdoo
30 H•H 30 44 440 Ü 30 3 <aA <D aA •rl344 44 ' <D3 0w 03 443 ■ 3K K
0ddco 2k,3H S3 44 44 <:oEh
00ONA
rH rH Vû A 00 H 00 -4-A O NA A A vû vû VO
INHOO
A A (N . A A A AA -d-A A H H -4-
M '
ArHA-O O O O O O O O
OINr H A A A V D A - O O A
0B A A A A A A A A3 1 1 1 I 1 1 1 1« H > > H H H X X
M M H > M >
OI!0bûU0
pj-rHA -
rH
IIÂAA
a44<A -rH
O O
üAA4433O•H44•HraoAaOo>3<DOkbo3•HX33>
CQ
ao3«H3o*H443•H
• 3 t>
<u3rH3>H34430a•H30)1
So3443o•H44O3OK
44o,CD443K
AA
O34-4"m
3o•H44O3<t>K44OO443K44o3O•H44Ü36O 43 rH 44 O OS s
no(Uo443•H
OB33M
AOP4
■4-KO344-iHilO
HcîS-Pd0 S •H d 01
Ht A A O A rHA A- H+ + I
AvûAA -4 A A A 00
0 0 0
00 VO 4- A A 00A 00 000 0 0
AvûAvoo
A rH A O A 00 rH A0 0 0
A A AI I IH N H
MH
V DOÀIIobO33(D>«3
Reproduced with permission o f the copyright owner. Further reproduction prohibited w ithout permission.

47
rà4
do•H-Pddcr*W0-PdKü♦HPCO•Hd05cdü0
Id-0rH-S
AAA
II
HtHtVD
HtII3
ÜOoH tA-P3ra§33O•H-P•HraoA0ü•o(U(D
■p33-Pra3oo
<
a33rH3o >3«H rH
3 3-Po 3•rl 3•P a3 •H•H 33 33 A> ,XH
a A o3<H kl3 O •H-P ü33K A
+rH
O0
3
ooA H t O A V Û V O A A A V Û A A A rH A OV O A A A A O O H+ + I -r I + + +
CO A A A VO CO A H-t H O rH A CO A AA A O VO A H H t VOA A VO VO VO A A AO O O o o O O O
3 o • 3 IIo«
K « a444K
A1—1CO 33 oO H •H•rl H -P44 3 Ü HO 44 Ü 3 33 3 o 3 -P3 3 o B 3A a H t 3•H H A o O A O A H A 44 a )— 1 A A44 3 A A CO H t A A H t A O •rl A CO AO 3 H t A, xA VO VO A A A 44 3 H t CO AA 3 3 33 X o O O o o O O O 44 B o o O•P M W 3 X• 3 3 « M.W 33
3O 44•H O 3■P 3•H 3 3; 3 m O BW o •H O
w B •P o A rH3 A A A a O •rH oo A H3 k rH A A A H t A H O o 3 VO A COA CO A A A A rH H t A o 3 3 O rH AB 3 »H rH A A A VO A oo A •3 3 O O O3 3 3 r344 a 3 rH 44O •p B O 3E4 <4 bo3
B s•rl3o 3 oB A A A A A A A A > B A A A3 I I I 1 1 1 1 1 33 3 t I 1P5 H >M > H> HM>
HMMXM X CQ K 1— 1 M
MMrH
AH
bO333 AAArHIl ■
HtvoooA
ao3(H3o•ri-P3•ri33>
33H3>rH3-p33S•H33A
CH A
3 3
AA O AO H tVO vo Ht+ + I
00 H tA A rcN, 00O O
A A A A A
I—î
OvoAII
3hO3335
Reproduced with permission o f the copyright owner. Further reproduction prohibited w ithout permission.

48
-Pwo i44-) Hk ctSe -P> cda ooo «Ho-d"tüÜ (Hra0iHOH1 ShX>1—i
II
34
Experimental Values Mechanistic Equation Values1.0
0.9
0.8
0.5
0.4
0.5
0.2
0.1
10
TOTAL PRESSURE ATM,
^ig. 9 INITIAL RATE OF REACTION FROM MECHANISTIC EQUATION, 500 C
Reproduced with permission o f the copyright owner. Further reproduction prohibited w ithout permission.

49
oo
Exporimontal Values Mechanistic Equation Values1.0
0.9
0.8
0.7
0.5
0.2
1 2 4 6 87 10
TOTAL PRESSURE, // , ATM,
Fis. 10 INITIAL RATE OF REACTION FROM MEGEAIfISTIC EQUATION, 520 C
Reproduced with permission o f the copyright owner. Further reproduction prohibited w ithout permission.

5 0
p:f-t I o hi
! Üo to .Job Î-Oi;l>f—'l !O • “JDr4
11
o
r*tal ValuesiiXperxrieu'cal Values Mechanistic Equation Values1.0
0.7
1 2 4 6 83 10
TOTAL PRESSURE, 97", ATM,
Fig. 11 INITIAL RATE.OF REACTION FROM MECHANISTIC EQUATION, 540 C
Reproduced with permission o f the copyright owner. Further reproduction prohibited w ithout permission.

I-4"
OH
E-i
o•H4->
ho4^CÛ
M
•H
Cs]O
CO>P:o
•H•P05bO•H4-)COQ)>
M
-PPÎOCOoupH
CrtC
CO -p H • P COo
«
«HO
HCÎ S cdo o •p 0)*(H Pc P! 0-P «H 0) rHCd r; tC
•H >Pc
cd (!)>
M
Pi 04
0)
«HO
rHa s cd .o o •p
•H Hi Pi o VO A- CAtn 0) pj rH rH -Ct*
cd g H• H .O •H cd A . CA 04
P >Cd 0 + + 1
>
M
C <M
r405•P
0) <Da 0»H rHU Cd 0) A X
W
0
1
d)iHÿ
■P«S!hOA
$EH
00 MD VO
O OJ <\J C\J 04 H
I I I
LAhO
LAH
o'tidc6UO>-a;
LT\ -4- H -4-
VO VO VO0\ r4 K\CM V D ( N
o o o
rHVO
-4-*
ogqdIHo>
tAVO tA LA -4- 04 VO lA A-CO
O O O
lAvO 04 A-LA A- CO
O O O
rH rH rH
I I I
M H M M M
M
04 LA04 rH
I I I
04LAI
CA
OV rH A O lA V OLA VO A-
O O O
-4- CA tA C OJ H
CA A- H
+ H- I
VOoLA
d)hnjkd)>
04 VO - j - VO LA 00tACO CO
O O O
0 0 VO -4-CA LACO LA 00 00
o o o
04 A 04
I I I
t-H M M M 1-H H
Ü O Üo o Oo o Oo 04 4-LA LA LA
04 VO CO
CA O
I I I
t AACO
VOH
0)bo(4U<D
51
VO CA rH LA O LALA A 00
O O O
04- 4
vo VO -4
H* H* +
OVO
04
d)bO(Üu<D>
rH 04 0404 00 A-4 OO CA
O o O
rH 04 04 04 0 0 LA-4 CO CA.
O O O
LA LA LA
I I ILH t-H t-H H H H
Reproduced with permission o f the copyright owner. Further reproduction prohibited w ithout permission.

5 2
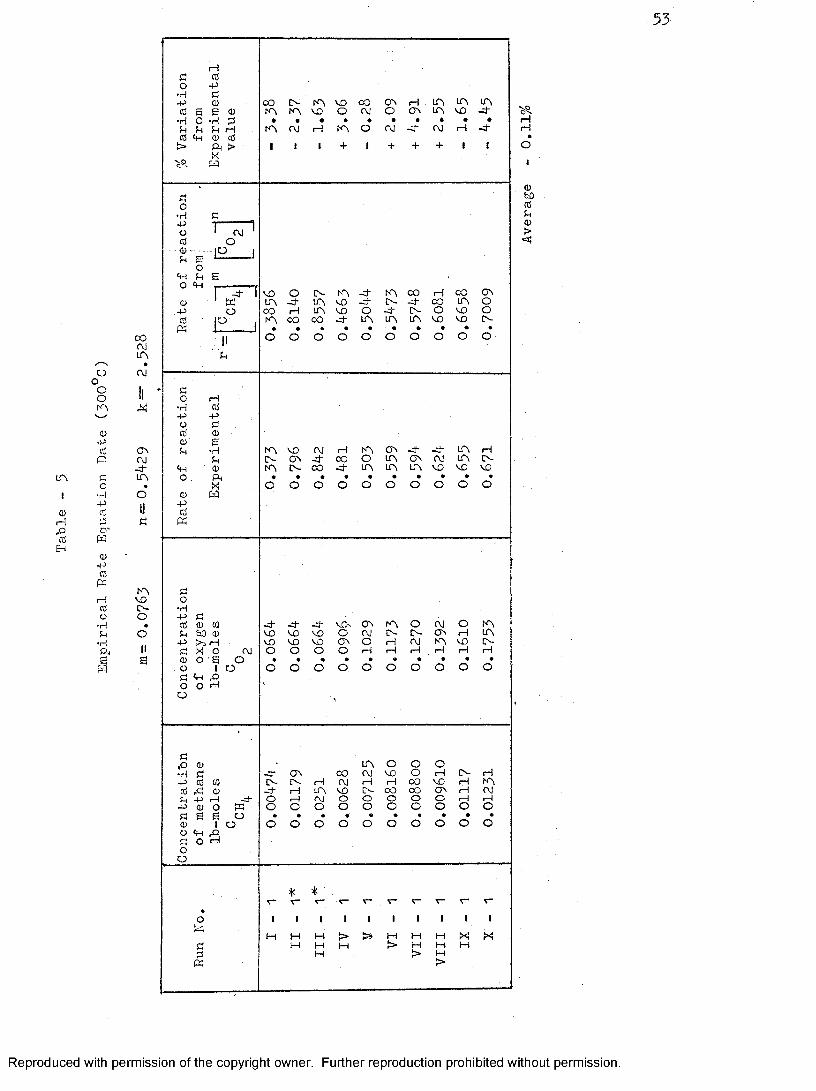
EMPIRICAL APPROACH
From the reactor design point of view, it is of interest to subj.ect the oxidation data to a power law model. The following rate equation was used to find the empirical power law coefficients.
m n(21)C *c= k CHy _ ° 2 _
Empirical coefficients for equation (21) were found by multi-(25)pie regression technique . The computer programme and'
results are given in Appendix V. The values of empirical coefficients are given in table 5. The average order of reaction was found to be 0.62.
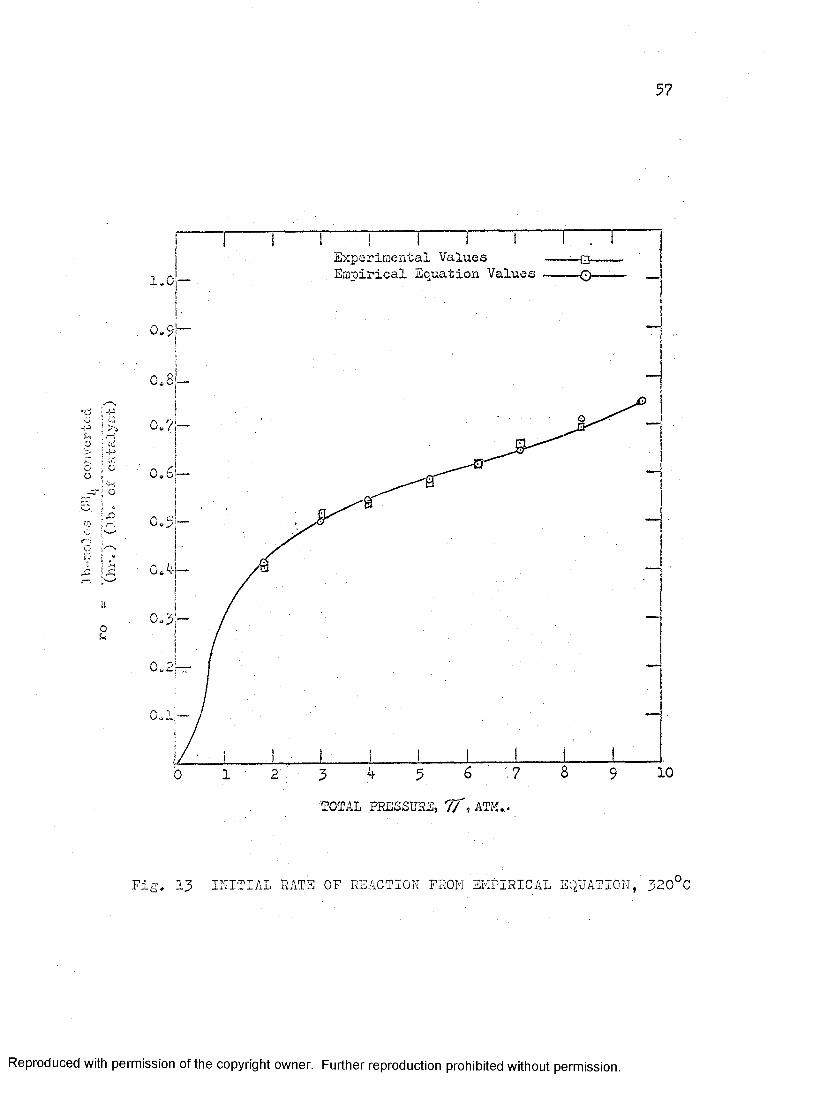
The initial rates computed from the empirical equation (21), and their variation from experimental data, are given in table 5. The average deviation was found to be less than '1%. Figures 12,13 and 14 graphically illustrate the agreement of computed rates v/ith the observed reaction rates.
The proposed empirical rate equations have the form::
at 300°C, ro = 2.528
at 320 Cy, ro = 2.635
at 340 C, ro = 2.772
S '].06726 0
^0-H, -c.05952
S0
— — T-
0.5518
UNIVERSITY or WINDSOR LIBRARY
Reproduced with permission o f the copyright owner. Further reproduction prohibited w ithout permission.
53
LA
(DH
EH
OOCo
0+>CdPao•f-i
-p0553crM0-PCdPr~iCd0 •H U •H A1
oo(\JlA
AI
CAAJ- 4lA
6ufl
hAVOA -OOIIS
Hc cBo P
-p 0) OO A - LA VO CO OA p LA LA LAcC S a o LA LA VO O A o CA LA VO 4•H 0 •H ri •
r i ri rH LA A I P LA O A 4 A P 4(p (U ri> A > 1 1 1 + 1 + + + 1 1
XH
Ao•H ri-P 1------------Ü 1 A I 'ci Ook e P J
o(p ri ao «H 1 -d- r VO O A - LA 4 LA CO P OO CA(D ' w LA 4 LA VO 4 A - 4 OO LA OÜ CO P LA VO O 4 A - o VO o
a iO , LA CO CO 4 LA LA LA VO VO A -K I 1
II O o O O O O O o o O■ 'r i
rto H
• rl ri-P
Ü rinS CD -IH
8•H LA VO A rH LA CA 4 4 LA Pri A - CA 4 CO O LA CA A LA A -(p <D LA CO 4 LA LA LA VO VO vo
O ri,X O o O O O O O O o o
<D w-P(Ü
«
r io
•H+> rinS <D ra 4 - 4 4 VCk CA LA o A o LAr i fco CD VO VO VO o A !A A - CA p LA-P !> rH VO VO VO CA O P A LA VO A -r i X O AI o o o o P P P , rH p P0) o a o. Ü 1 o o o o o o o O o o Or i tpo o rH
u
r i.o 0) LA o O O•H r i 4 CA oo A VO o P A - PP cB m A - lA H A P p o o VO P LA(d p ! CD 4 P LA VO A - o o o o CA P Ari P P - 4 O «-1 o O o o O 1—4 1—)p <u O W O O O o o o o o o Ori a a oo 1 Ü o o O o o o o o o oo p rOri o rHo
o
* %o 1 1 1 1 1 1 1 1 1 1
Iz; M H M > > p p p X Xri P M H t> p p pr i H > p
K >
%H
COI
&CdU0>
Reproduced with permission o f the copyright owner. Further reproduction prohibited w ithout permission.

5 4
"ü•ririoo
LA
I(D
H
-SEH
Ooocvi
(d-pcdOa0
•H -PcdrdcdH0-PcdK
rHCdÜ•Hk♦HPh1
LALAVD
AIIrit
00PLALA
'Iri
VOAA-vooo11a
aori
P1—1
o p - 4 A LA A oo VO VO 1—1 P 0•H ri LA VO CO LA LA LA LA LA LA LAP ri riri a ri LA P p A p 0 0 P A LA
•H •H pri ri ri 1 1 4 4 1 1 4 4 4 1ri r i i>> A'iR H ,
ri1• A
O1 o ......
r i ap o r ”— .... “ 1o •H a 1 - 4 P LA A - P 4 LA oO 4 4 CO
P o w A CA A - OO CA 4 LA CA P CAri Ü ri Ü P - 4 VD CA LA 00 P 4 P 4
p r i P I o : 1 - 4 CO OO 4 LA LA VD VO A - lAri ri
« ri ll O o O O O 0 0 0 0 0ori
Pr ipr i
r i r ip o ao •H •H CO VD • 4 P P - P VO 00 4 A
P r i CA LA OO P LA CO p LA CA Pr i O r i LA 00 0 0 LA LA LA VD VO VD A -
p r i r i,r i r i X O O o O O 0 0 0 0 0
« r i M
r io•ri
, Pr i ri (0 CA LA 0 A 0 LAr i r i r i - 4 - 4 4 VO A A - A - CA P LA
P bo P VO VD VO o O P A LA VO A -ri >5 o A VO VD VD CA P P P P p Pr i X a. O o O O O O 0 0 0 0 0Ü o 1 Ür i •ri o O o o o 0 0 0 0 0o p p
Ü o
r i■o•rlP r i p A - A - A 4 ' A A - 00 LA LAri r i to 00 A - CA LA A ,—1 A - LA A Ar i nj r i -4 P 4 VO lA- oo 00 ON P AP •ri p -4 o P A O 0 0 0 ■ 0 ,—1 Pr i P o W o O o O 0 0 0 0 0 0r i r i a o *u a 1 o o O o o 0 0 0 0 0 0ri •rio p p
u o* . i
A A A A A A A A A A
• 1 1 I 1 1 “ 1 1 1 1 1
s H P P > > P P P X XH P P > P P P
ri P > Pri >
«
t—I CA
ObOririri
Reproduced with permission of the copyright owner. Further reproduction prohibited w ithout permission.

55
LA
orHrOCdEH
ooo-4"
cd-pcdA4O
•H4Jcd
CdM0CdAcdü
«HU•HI
AA-A-
AIIX
LAHVOLA
Oilri
ALACALAO<DIIa
Hri riO -P .•H r i r i•p S r i r ir i o a H A A LA•H r i "H ri H 4 VO> P ri >ri ri A A H'ri A
X 1 1 +M
ri o
•H-P ütC eup .(H «HO
I A O
£ L _
1
<u■pkSK
JO.4
mo
H Ci •priri ri
o a•H *H •P ri ri ü r i
-P (B A ri ri X M ri'M
(HO
rio
•H■Pr i r i r i r i r i -p bO ri ri X H r i X oü o ari I o «H f l
o O H
A
ü
rio•H-p riri ri ri ri œ4 ri r i -P H ri ri Og A ?O «Hü o H
4müo
o ooVO 4
LA O
+ +
A- 4 H A
A A- 4 LA A A
A
+A
+LA A
+ I
OH A A AA OO LA LA CD
O4
LA OA- A
4 0 0 Ov LA LA VO VO A -
* . i
4
I
A A LA H A rH ON H ON AH O A A A VO A VO rH LALA VO 4 LA A A LA ov VO O4 oo CA LA LA VO VO VO A OO
O o O O O O O o O o
LA4A -
HlAA-
o o o o o o o o o o
4 4 4 VO ON LA o A O LAVO VO VO O A A A On H LAVO VO VO ON O rH A LA VO Ao o O o H rH H H H H
o o O o o o O O O O
4 LA H ON O ON VO rH ACO A LA LA A H 00 A A LA-4 1—1 UN VO IN- oo oo ON H <\jo H A O O O o O H rHo O O O o O o O O O
o O O O o o o o O O
b LA LA LA LA LA LA LA LA LA L A
§«1 1 1 1 1 1 1 1 I 1
H HH
HMM
>P
> p!> pp>
PPP
Xp
X
VOA
oI
bOririri
-P(0•HCdbÛcd
0-pcdU
•H•P•Hri•H
«HoW
-POrH
ri•H
Hricori-poriwririririri•ri■p«HOri-p
mriririririri•riEh
r iO•rl-P•rimOPHaoo
*riri riri OP •ri•P•p •rl
ri Wri O-p PHCQ ar i oo oÜ •o-p riri ripri -pri riP <uw ri00 rir i pr i pA •rH'OHr i r i•p >o r i•p •ri
Reproduced with permission o f the copyright owner. Further reproduction prohibited w ithout permission.

56
5 No , K,,> j
Expérimentai Values ' ,—Empirical Equation Values1.0
v.O
V.
0.1
10■'TOTAL PHSOSURE, 7/ , ATM...
Fig. 12 INITIAI, RATE OF REACTION FROM EMPIRICAl EQUATION, 500 C
Reproduced with permission o f the copyright owner. Further reproduction prohibited w ithout permission.
57
"3to ' m' >o : ü<;-f o6 i .
5ailo
Experimental Values Empirical Equation Values1.0
0.9
0.8-
0.7
10TOTAI, PRESSURE, ?/, ATM..
Fig. 13 INITIAI RATE OF REACTION FROM EMPIRICAL EQUATION, 320 C
Reproduced with permission o f the copyright owner. Further reproduction prohibited w ithout permission.

58
1-PU01ü
to<0r4O?
1q
-P
O
E
Experimental Values Empirical Equation Values1.0
0.9
0.8
0.7
0.6
0.5
0.4
0.3
0.2
0.1
10TOTAL PRESSURE, 7, ATM.,.
Fig. 14 INITIAL RATE OF REACTION FROM E^iPIRICAL EQUATION, 340°C
Reproduced with permission o f the copyright owner. Further reproduction prohibited w ithout permission.

CHAPTER VII
CONCLUSIONS
The mechanism», for the catalytic oxidation of methane has been established experimentally by applying the inital rate approach.
The plots of initial rate against total pressure gave useful qualitative information and thus some implausible mechanisms could be rejected. The determination of linearised regression coefficients and application of the criteria of best fit was then used to reject mechanisms showing wide variation from experimental data. Negative coefficients for some rate mechanisms also helped to eliminate them as possible mechanisms.
The data of initial rates at varying pressures and constant feed composition was not sufficient to establish the- controlling mechanism. Plots of initial rate against varying feed composition served as a very useful tool in finding the controlling mechanism. The experimental results showed that there is no shift in mechanism within the range of operating temperature and other operating conditions. The proposed reaction mechanism is as follows;
"Oxygen not~dissociated and adsorbed molecularly on dual or single sites, methane adsorbed, carbon dioxide and water adsorbed, surface^ reaction rate controlling,"
Reproduced with permission o f the copyright owner. Further reproduction prohibited w ithout permission.

6o
The rate equation based on the mechanism asdeduced in the present investigation is only inpartial agreement with the- mechanistic equation ar-
(19)rived at by Mezaki
Reproduced with permission o f the copyright owner. Further reproduction prohibited w ithout permission.

NOMENCLATURE
a, b, c constants in initial rate equationsA, E, C constants for linearised rate equationsai activity coefficient for the species i .apV surface area per single catalyst pelletam surface area of pellets per unit massAp ' area of constriction 'Op heat capacity at constant pressureOr coefficient of discharge for a flowmeterCv heat capacity at constant volumeD m mean diffusivity of component A in a gas mixtureDp effective particle diameterV feed rate, moles per unit time
2G mass velocity lb/(hr.)(ft )^ HA molar heat of reaction of component Aksr reaction velocity constant where surface reaction
is rate controlling ki reaction velocity constant where adsorption of
component i is controlling K overall equilibrium constantKi adsorption equilibrium constant for component iL total number of available active sitesm, n constants in empirical rate equationpi partial pressure of component ipf pressure factorpc critical pressurepr reduced pressurer rate of reaction, lb moles/(hr.)(lb, of catalyst)
6l
Reproduced with permission o f the copyright owner. Further reproduction prohibited w ithout permission.

62
ro initial rate of reaction' referred to methaneR gas constantRe Reynolds numberT absolute temperaturet temperature, CTc critical temperature, K°W flow rate, lb,/hr.w mass àî catalystXi fraction of i converted
Greek
^ visocity^ total pressure, atm,
density constants
Reproduced with permission o f the copyright owner. Further reproduction prohibited w ithout permission.

BIBLIOGRAPHY
(1) Yocom, John E., Chemical Engineering, page 104,July 23, 1962.
(2) Faith, W.L., "Air Pollution Control", Wiley and sons Inc., N.Y., 1959.
(3) Lamb, A.B., et. al., Ind. and Eng. Chem., 3^, 213 (1920).
(4) Yant, W.P. and Hawk, C.O., J. Am. Chem. Soc. l4$4 (192?).
(5) Cannon, W.A., and Welling, C.E., Ind. and Eng. Chem.Product Research and Development, 1, No. 3. 152 (I962).
(6) Automobile Manufacturers Association, Exhaust System Task Group, Reprint 173, August 1957.
(7) Anderson, R.B., et. al. , Ind. and Eng. Chem. , 809 (19^1).(8) Emmet, P.H., Catalysis, Vol. VII, Reinhold Publishing
Corporation, I96O.(9) Henry, G., Phil. Mag., 269,(1825).
(10) Campbell, J.R., and Thomas, G., J. Soc. Chem, Ind., 49,432 (1930).
(11) Wheeler, T.S., Rec. Trav. Chim. ^ , 874 (1931).
(12) -Arneil, A., J. Soc. Chem. Ind., 53, 899 (1934).
(13) Araki, S., Japan Analyst, 2, 3^5 (1953).
(14) Thompson, G.P., et. al. J. Air Pollution Control Assoc.,275 (i960).
(15) Kazarnovskya, L.K. and Dykhno, N.M., Kislorod 12, No. 2,28 (1959).
(16) Cohn, J.G.E. and Haley, A.J., Can. Patent 597, 459, May 3 (1940),
(17) Rosenbaum, E.J. et. al., Anal. Chem. IOO6 (1959).
63
Reproduced with permission o f the copyright owner. Further reproduction prohibited w ithout permission.

64
(18) Mezaki, Reiji, "Kinetics of Catalytic Oxidation of Methane", Ph. D Thesis, University of Wisconsin,Chem. Engg. Deptt., Jan., I963.
(19) Mezaki, Reiji and Watson Charles C., Ind. and Engg. Chem. Process Design and Development, 5, No. 1, 62 (1966).
(20) Thaller, L.H. and George Thodos, A.E. Ch. E. Journal,6, 369 (1960),
(21) Mathur, G.P,, "Initial Rate Approach to the Kinetics of Heterogenous Catalytic Reaction", Ph. D. Thesis, Northwestren University, Evanston, June19ô5.
(22) Hougen, O'.A. and Watson K.M., "Chemical Process Principles", part III, John Wiley and Sons.^ N»,Y.., 1950.
(23) Yang K.H. and Hougen, O.A., Chem. Eng. Prog., I56 (1950).(24) Brown, G.G., et. al., "Unit Operations" John Wiley and Sons,
New York, (1950).
(25) Hougen, 0.A., Ind. and Eng. Chem., 5^, 309 (I96I).(26) Neville Adam M. and Kennedy John B., "Basic Statistical
Methods for Engineers and Scientists", International Textbook Co., Scranton (Pa.), 1964.
Reproduced with permission o f the copyright owner. Further reproduction prohibited w ithout permission.

APPENDIX I
Tables 6, 7, 8, 9> 10 and 11
65
Reproduced with permission o f the copyright owner. Further reproduction prohibited w ithout permission.
66
Table 6^^^
Composition of Auto Exhaust Gases under DifferentOperating Conditions - I
Operating Condition Hydrocarbons (%) Carbon Monoxide (%)
Idling 0.05 - 0.1 4.6A'ccelrating 0.005 - 0.05 0.6Cruising 0.02 - 0.03 1.4Decelerating 0,4 - 1.2 2.4
Reproduced with permission o f the copyright owner. Further reproduction prohibited w ithout permission.

6 7
Table 7 (6)
Composition of Auto Exhaust Gases under DifferentOperating Conditions - III
Constituent (Volume dry basis)
Hydrocarbons C^ and higherCarbon Dioxide Carbon Monoxide Hydrogen Oxygen Nitrogen
Operating Condition Idling Cruise 30-50m.p.h.
0.08 - 0.15 5 - 10 3 - 1 0 0 - 4 0 - 2 78 - 85
0.02 - 0.08 3 - 14 0.2 - 5 0 - 2 0 - 2 78 - 85
Water vapour generally varies from 5 - 15^
Reproduced with permission o f the copyright owner. Further reproduction prohibited w ithout permission.

68
Table
Composition of Auto Exhaust Gases under DifferentOperating Conditions - II
Constituent Concentration p.p.m.
Methane 63 - 292Ethane 1 5 - 2 8Ethylene ll4 - I30Acetylene 4l - I96Propylene and n-Butane 3 5 - 8 3Butene 0 - 61
Car Condition 30 m.p.h.
Reproduced with permission o f the copyright owner. Further reproduction prohibited w ithout permission.

69
Table 9
Correlation between Space Velocity and Conversion(13)of Methane
Space Velocity (hr. ^) Conversion (%)
4.000 1006.000 1008,000 9210,000 8820,000 61
Reproduced with permission o f the copyright owner. Further reproduction prohibited w ithout permission.

70
Table 10
The Analysis of O.P. Grade Methane
Constituent Percentage
Methane 99*05Ethane 0.12Carbon Dioxide 0.20Nitrogen O.éOPropane 0.05Oxygen 50 p.p.m.
Reproduced with permission o f the copyright owner. Further reproduction prohibited w ithout permission.

7 1
Table 11
Operating Data for Chromatographic Analysis
Column Bath Temperature Injector Bath Temperature Detector Bath Temperature Detector Filament Current Helium Gas Flow-rate
60°C110°C110°C250 milliammeters 0,25 CO. per second
Reproduced with permission o f the copyright owner. Further reproduction prohibited w ithout permission.

APPENDIX II
Calibration Curves
72
Reproduced with permission o f the copyright owner. Further reproduction prohibited w ithout permission.

73
ON
CO
oHI—Ï OrH
CO VO CM
H
^Ë/sqi D
Fig. 15 CALIBRATION CURVES FOR OXYGEN ROTAMETER
Reproduced with permission o f the copyright owner. Further reproduction prohibited w ithout permission.

74
o'
iH
1 CO
1 VD
1
Csf~î CO <o
9 «JH/sqi
Fig. 16 CALIBRATION CURVES FOR METEANE ROTAI^ETER
Cl
Reproduced with permission o f the copyright owner. Further reproduction prohibited w ithout permission.

75"
— O-,WA7%%:77A4//%kP;rjf/
yd 6 ^QRT O-
j 7%Q----------- J^_CONÙUcr/V/T'/ j
cA /zâoh 'A y rsoo c o l u m n
WjECTioN Pû/^r
/4/?/5//2 vk%vvr fx?/&yk?Kf /go/? d/ver
Reproduced with permission o f the copyright owner. Further reproduction prohibited w ithout permission.
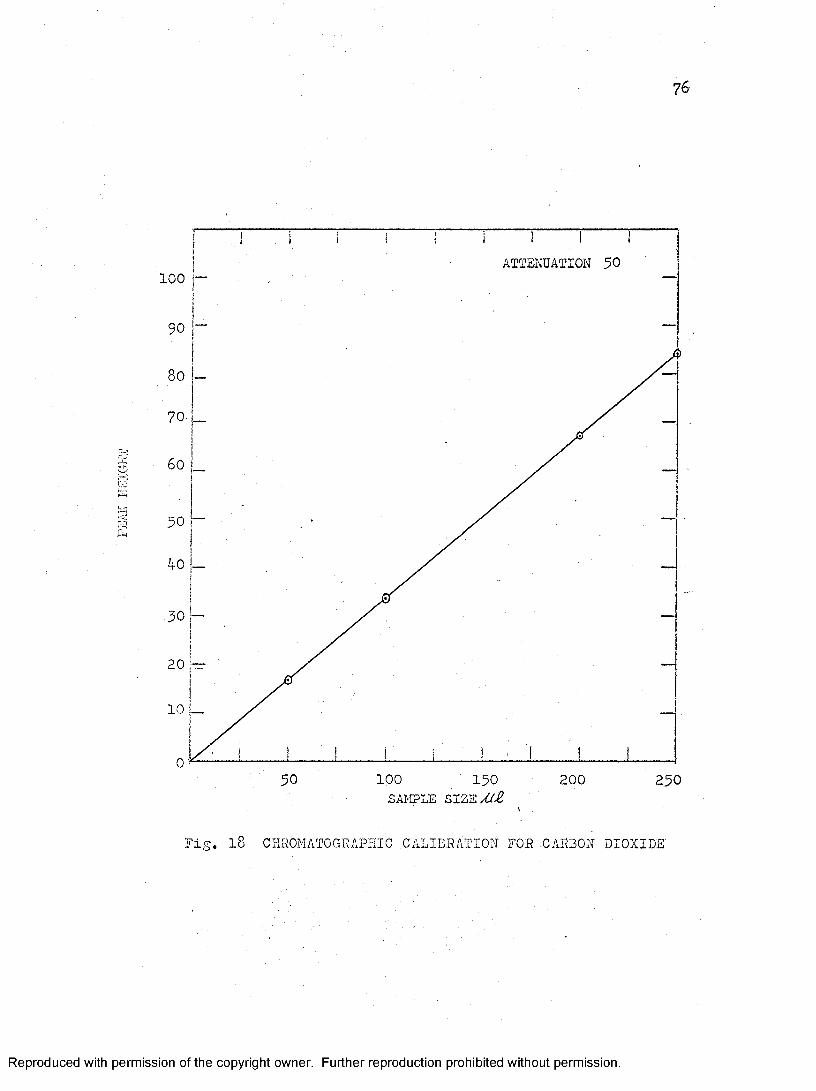
76
H
ATTENUATION 50100»
70
50
50 1-
20
10
10050 150 250200SAMPLE SIZE/ùÜ?
Fig. 18 CHROMATOGRAPHIC CALIBRATION FOR CARBON DIOXIDE
Reproduced with permission o f the copyright owner. Further reproduction prohibited w ithout permission.
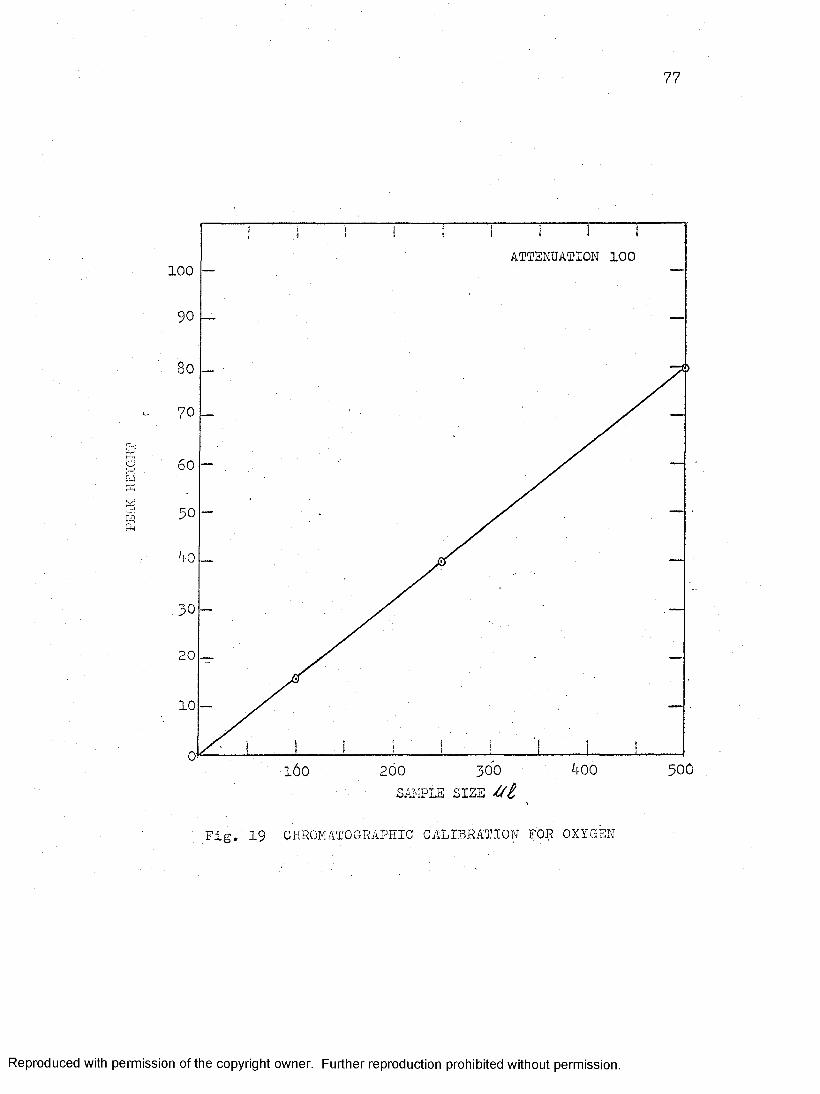
77
o
g
ATTENUATION 100100
20
10
400200
Fig. 19 CHROMATOGRAPHIC CALIBRATION FOR OXYGEN
Reproduced with permission o f the copyright owner. Further reproduction prohibited w ithout permission.
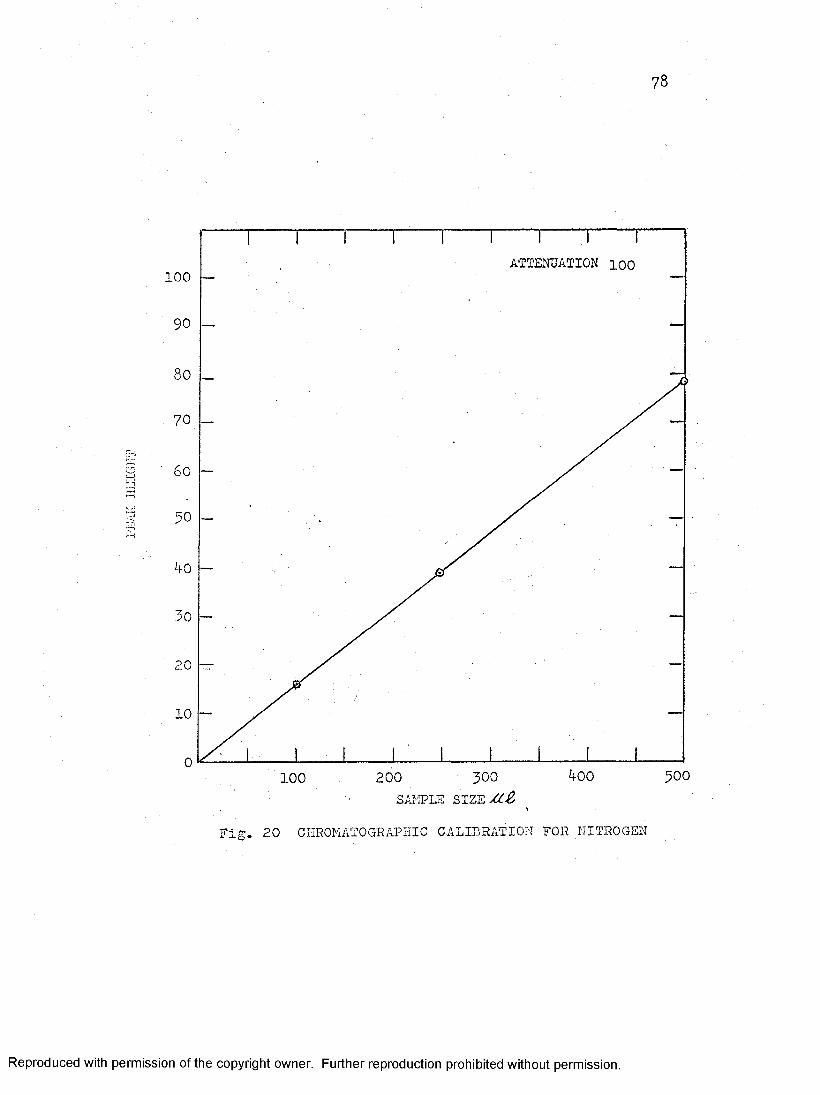
7 8
54aci)
ATTENUATION loO100
40
20
10
400 500200100SAMPLE SIZEv<Z^
Fig. 20 CHROMATOGRAPHIC CALIBRATION FOR NITROGEN
Reproduced with permission o f the copyright owner. Further reproduction prohibited w ithout permission.

79
o
I
ATTENUATION 50100
70
20
10
400 500300SAMPLE SIZE
200: 100
Fig. 21 CHROMATOGRAPHIC CALIBRATION FOR METHANE
Reproduced with permission o f the copyright owner. Further reproduction prohibited w ithout permission.

80
a
T4
ATTENUATION 5050
40
35
30
25
20
15
10
0 2502001501000SAMPLE SIZE
Fig. 22 CEROMATOGRAPEIC CALIBRATION FOR CARBON MONOXIDE
Reproduced with permission o f the copyright owner. Further reproduction prohibited w ithout permission.

APPENDIX III
Sample Calculation of Initial Rate from Experimental Data
UNIVERSITY OF WINDSOR imRARY
81
Reproduced with permission o f the copyright owner. Further reproduction prohibited w ithout permission.

AP PE N D IX I I I
The sample calculation is illustrated for run 1-1, at1.817 Atm. and 300°C
OXYGEN ROTAMETER
Rotameter reading Upstream pressure Temperature
=: 9.0= 40 psig = 25°C
G from calibration chart (fig.l$) = 3.80
G - 3.80 % 0.332 lbs/hr.
= ?" — , = 0.0664 lb moles/hr.
weight of catalyst used — 0,498 gm.
W = 0.498/433,6 = 1.10 X 10“^ lb.
Product Analysis
Carbon Dioxide peak height = 24.2 Oxygen peak height = 7 6 . 1 Nitrogen peak height = 0.8 Methane peak height = 31.4
(Attenuation 2) (Attenuation 100) (Attenuation 100) (Attenuation 10)
Volumes of indiviual gases in productsCarbon dioxide = 24.2 x 230 •= 2.985 MB
m b
84 X 'Oxygen = 76.1 x 500 — 470
"IBiNitrogen — 0.8 x 500 =5.08 M B
Methane = 31.4 x 500 =31.4 Ml100 X 5
82
Reproduced with permission o f the copyright owner. Further reproduction prohibited w ithout permission.
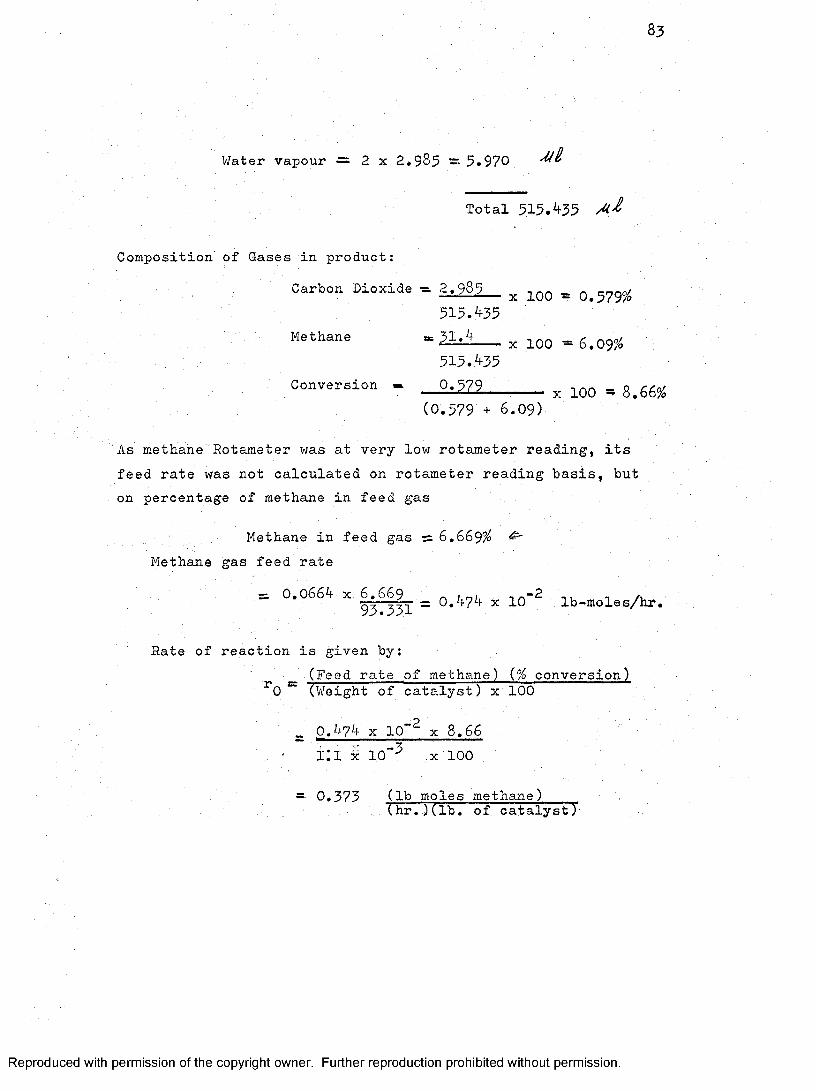
83
Water vapour ~ 2 x 2,985 =• 5.970 M B
Total 515.435
Composition of Gases in product:
Carbon Dioxide * & 9 8 2 _ ^ iQQ ^ 0,579%5)15.435
Methane “ 31jl4--- % IQO -6,09%5x15.435
Conversion . ^ 100 #8.66%(0.579 + 6,09)
As methaneRotameter was at very low rotameter reading, its feed rate was not calculated on rotameter reading basis, but on percentage of methane in feed gas
Methane in feed gas = 6,669% ^Methane gas feed rate
- 0,0664 X |..§6|_ _ 0,474 X 10'^ Ib-moles/hr.
Rate of reaction is given by:_ (Feed rate of methane) (% conversion)
'0 “ (Weight of catalyst) x 100
_ 0.474 X 10"^ X 8,66 1:1 k 10"^ X 100
— 0,373 (lb moles methane)(hr,)(lb, of catalyst)
Reproduced with permission o f the copyright owner. Further reproduction prohibited w ithout permission.

APPENDIX IV
Sample Calculation for Heat' and Mass Transfer Effects
84
Reproduced with permission o f the copyright owner. Further reproduction prohibited w ithout permission.
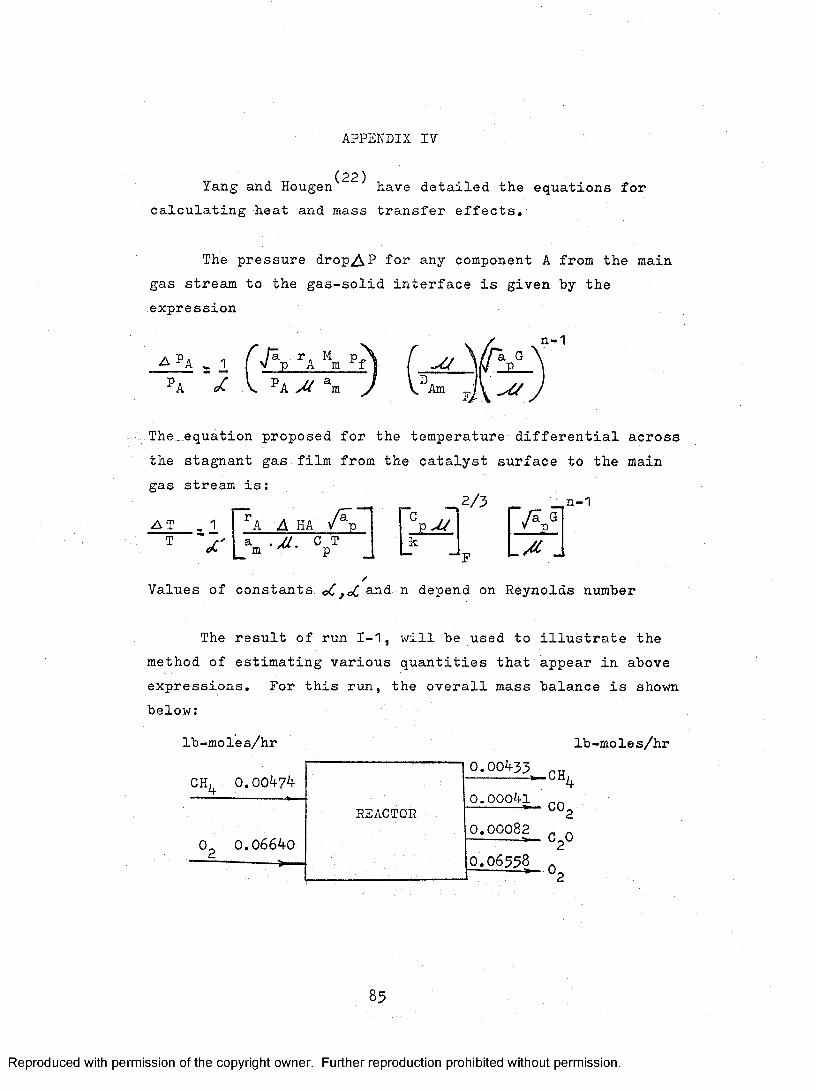
APPENDIX IV
(22)Yang and Hougen have detailed the equations for calculating heat and mass transfer effects.
The pressure drop/^P for any component A from the main gas stream to the gas-solid interface is given by the expression
n-1A P A . 1 ( A \ P A f U (
V ^A M m DAm
The_ equation proposed for the temperature differential across the stagnant gas film from the catalyst surface to the main gas stream is:
A T _ 1 ' ’ a a haL"---"- V J k
F L a j
Values of constants oC,oC and n depend on Reynolds numberThe result of run 1-1, will be used to illustrate the
method of estimating various quantities that appear in above expressions. For this run, the overall mass balance is shown below:
Ib-moles/hr
CH. 0,00474
0^ 0,06640
lb-moles/hr
REACTOR
0.00433
0.00041.CH,GO,
0.00082 ^ ^ 20.06558_
85
Reproduced with permission o f the copyright owner. Further reproduction prohibited w ithout permission.

86
Partial PressuresInlet
Pen X 1.817 _ 0.1210 atm..4 . 0.0714
^0- _ X 1.817 _ 1.6960 atm.0.07114
Outlet^COg _ X 1.817 = 0.01045 atm.
0.07114
^H„0 _ ’0-QQQ82 ^ 1,817 = 0.0209 atm.3:07114
. ^ 1.817 = 0.1105 atm.0.07114
Po,. 0.06558 ^ ^. ' ^ -■ “ r '0.07114
Average
POH^ = 0.1157 atm.
% ~ 1.6857 atm.
0.00523 atm
0.01045 atm
Physical PropertiesCritical Temperature
^cm~ i ^i ^Ci
T - (0.0658)(190.7)+(0.9275K154.4)+(0.00279)(504.2)+cm(0.00579)(647.4)
= 159.97° K
Reproduced with permission o f the copyright owner. Further reproduction prohibited w ithout permission.

8 7
Molecular Weight
M m r ^ X. M. I l l
Mm (0.o638)(l6)+(0.9275)(32)+(0.00279)(44)+(0.00579)(18)= 30.7235
ViscosityM qvh ~ ^ X. /</ .1 1 Cl
cm (0.0638)(159)+(0.9275)(250)+(0.00279)(343)+(0.00579)(495)=• 245.84 micropoise
The value of/^rm can be read from figure 175, page 87I, Reference (21)
, Tr . 573/^^39.97 3.58- Pr. 0./^rm s- 1.2 M-Si s (1.2)(245.84) = 295.01 micropoise
■» 0.0956 lbs/(hr. )(ft. )
Density, / 30.7235 X 1.817
0.7302 X 1032■ = 0.0741 lbs/ft^
Diffusivity
”a« = ^ ®AB " = 0 ”aC + — — — - X.
m3/2= 0.0043 T-"' /_! 4- _l“ ' f ( V 7 r 7 v 7 5 ) / Mg
Reproduced with permission o f the copyright owner. Further reproduction prohibited w ithout permission.

88
Dnn n T ( 0.00^3 )( 5731.817 (29.6^/^ + 25.6^/^)- °2 = 1 Riv Zoo <1/3 ^ .l/3\ \/ï^ 32
1 + 1
2= 0.48 cm / sec, - 1.856 ft^/hr.
\3/2
2» 0.417 cm /sec.- 1.615 ft^/hr.
=CE, . E,0 . (0.0043X573^/"---- . 11.817(29.6 + 18.9^^)'/
2■=. 0.598 cm /sec.= 2.313 ft^/hr.
(1 - 0.0638) - m » (1.856)(0.9275)+(l.615)(0.00279)+(2.313)(0.00579)
®CH, - m s 1.85 ft^/hr.
Pressure Film Factor
& = % •
- + 0 = 1.817 atm.
Modified Reynolds Number
G * = 0i004^1_xl6_ ^ ^.91 lbs/(hr.)(ft^)
Reproduced with permission o f the copyright owner. Further reproduction prohibited w ithout permission.

89
D > (I.3A “ 0.0127 ft.
a JT' : 0.000507 ft^ P P
Modified Reynolds Number
N'/%e i _ (0.000507)^ (5.91)0.0936
« 1.391
Schmidt Number
(T /y _ 0.0956p DAm (7.41 X 10"^)(l.85)
= 0.698
A^ % 120 (metre) /gm (Suppliers Datâ)
' — - 5.8 X 10^ (ft)V ib.
Pressure Drop
The pressure drop for methane from the main gas stream to the gas-solid interface is given as
A P. A t, Pa \ Pf” A ' /apG
, f
n-1
for N' re 620, 2.44 and n = O.5I
(0.000507)^(0.373)(30.7235)(1.817)(0.1157)(0.0956)(5.8 x 10^) (0.698)^^^(1.39i3"°‘"
Reproduced with permission o f the copyright owner. Further reproduction prohibited w ithout permission.

9 0
A p ^ 2.01 X lO”^P
ZIP » 2.01 X 10"^ X 0.1157 - 2.33 X 10“^ atm.
Specific Heat
0 - x; cpm 1 1 p^
»(0.o638)C12.32)+(0.9275)(7.68)+(0.00279)(11.2)+(0.00579)(3.96)
- 7.957 B.tu/(lb-mole)(R°)
= 7.957 Cal/(gm-mole)(K°)
Prandtl Number
P r.
A relation recommended by Hougen and Watson page 990, equation (51).
(21), IS given on
4_________' F ^ ]
Cp/Cn 2/3
42/3
X AI
3. 0.844
Heat of Reaction
A Hr =' - 191 K. Cal/g-mole at 500 K
Reproduced with permission o f the copyright owner. Further reproduction prohibited w ithout permission.
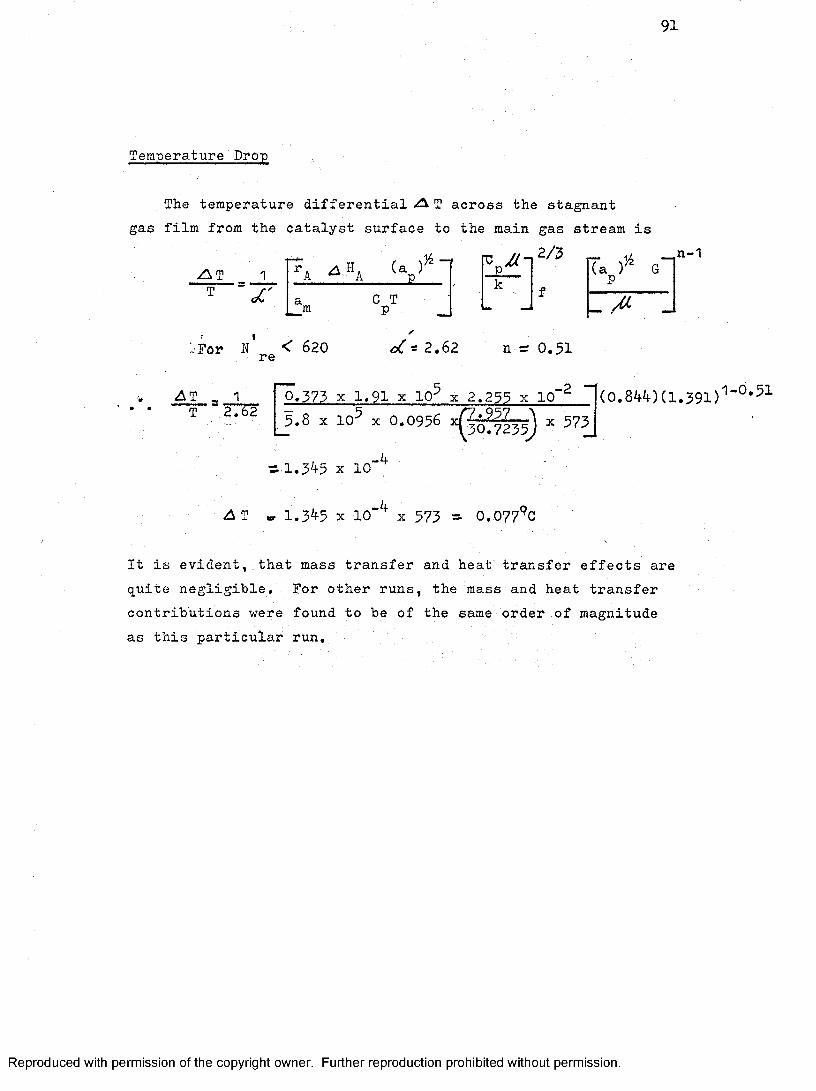
9 1
Temperature Drop
The temperature differential /A T across the stagnant gas film from the catalyst surface to the main gas stream is
Z\T 1V 'T
m C T P
-2/3k
Ta g“ I
- A J
n-1
IFor N < 620 re c{ = 2.62 n = 0.51
A T , 1T 2762
"0.373 X 1.91 X 10^ X 2.255 X 10"2X 5735.8 X 10-" X 0.0956
_4 -=.1.345 X 10
A T » 1.345 X 10"^ X 573 - 0.077°C
It is evident,,that mass transfer and heat transfer effects are quite negligible. For other runs, the mass and heat transfer contributions were found to be of the same order of magnitude as this particular run.
Reproduced with permission o f the copyright owner. Further reproduction prohibited w ithout permission.

APPENDIX V
Computer Programmes and Results
92
Reproduced with permission o f the copyright owner. Further reproduction prohibited w ithout permission.

93
c c 0. p. AHUJAC REGRESSION COEFFICIENTS FOR THE MECHANISM EQUATIONS NO. 1
DIMENSION X ( 10) . S IGY(10) .S IGYY(10) *X Y (10)» A (10) 18 < 10) «P( 10• 1R(10)«Y(10»10)1 READ 2» (P(K)«K=l,8)I(R<K)»K=1»8)
C = 8 F = 1./3.DO 3 K = 1,8 X(K) = P(K)
P(K)/SQRTF(R(K))P(K)/R(K)**F (P(K)**1.5)/SQRTF(R(K))(P(K)**3.)/R(K)P(K)/R(K)(SQRTF(P(K)))/R(K)**.2S ( P {K )*•«•. 75 ) /R ( K )**. 25 P(K)/R(K)
6
92
108
Y ( 1»K)Y { 2 » K )Y(3»K)Y(4,K)Y(5»K)Y(6»K)Y(7,K)Y(8»K)SIGX = 0 'SIGXX = 0 DO 4 J = 1,8 SIGY(O) = 0 XY(J) = 0 DO 5 J = 1,8 DO 5 K ,= 1,8SIGY(J) = SIGY(J) + Y(J,K)XY(J) = XY(J) + X(K) * Y(J,K)DO 6 K = 1,8 SIGX = SIGX + X(K)SIGXX = SIGXX + X(K)*X(K)DO 7 J = 1,8A(J) = (SIGXX*SIGY(U)-SIGX*XY(U))/(C*SIGXX-SIGX*SIGX)B(J) = (C*XY(J)-SIGX*SIGY(J))/(C*SIGXX-SIGX*SIGX)PUNCH 10DO 9 J = 1,8PUNCH 8 , J,A<J),B(J)F0RMAT(8F8.3/(8F8.3))F0RMAT(5X,1HN,15 X ,1 H A ,2 0 X ,1H B / / )F0RMAT(5X,I1, 2(1O X , F 12.6))GO TO 1 END
1817 2975 3925 5220 6240 7130 84.10 97373 481 503 559 594 624 655 671
1817 2975 3925 5220 6240 7130 8410 97398 511 531 581 616 658 694 712
1817 2975 3925 5220 6240 7130 84 10 97421 552 580 640 673 720 745 771
Reproduced with permission o f the copyright owner. Further reproduction prohibited w ithout permission.

A H U JA
94
REGRESSION COEFFICIENTS FOR THE MECHANISM EQUATIONS NO. 1
TEMPRATURE 300 DEGREES C
N A B
1 1.034149 1.1199092 .622627 1.0820353 -4.980518 4.1726774 -471.924620 164.6760805 2.818439 1 .2082956 1.448114 .2140247 1.218984 .5118108 2.818439 1.208295
TEMPRATURE 320 DEGREES C ,
N A B
1 1.018676 f 1.0889792 .619577 1.0619493 -4.797862 4.0551104 -443.534080 155.3997705 2.692498 1.1434256 1.429209 .2112307 1.205102 .5047988 2.692498 1 . 143425
TEMPRATURE. 340 DEGREES CN A B
1 .973950 1 .0456762 .599482 1.0337543 -4.642242 3.8980434 , -411.557960 143.7245105 2.484799 1.0523556 1.402137 .2066157 1.180958 .4944578 2.484799 1.052355
Reproduced with permission o f the copyright owner. Further reproduction prohibited w ithout permission.

9 5
C 0. P. AHUJA 'C REGRESSION COEFFICIENTS FOR MECHANISM EQUATION NO. 9
DIMENSI0NX(15), Y( 15),Z < 15READ 5, (P<K) ,K =1, 8 ) ,(R(KDO 1 J= 1 ,8X( J) = P(J)Y ( J) = SQRTF(P(J))Z( J) = (P(J)**0 .6)/(R(J)*SIGX = 0SI GY = 0SIGZ = 0SIGXX = 0SIGYY = 0SIGXY = 0SIGYZ = 0SIGZX = 0DO 2 J = 1,8SIGX = SIGX + X ( J)SI GY = SIGY + Y ( J)SIGZ = SIGZ + Z < J)SIGXX s SIGXX + X(J)*X(J)SIGYY = SIGYY + Y(J)*Y(J)SIGXY = SIGXY + X(J)*Y(J)SIGYZ = SIGYZ + Y(J)*Z(J)SIGZX = SIGZX + Z(J)*X(J)PUNCH 3, SIGZ,:SIGX,SIGYPUNCH 4, SIGZX ,SIGX,SIGXX,;PUNCH 4,SIGYZ ,SIGY,SIGXY,;
3 F0RMAT(F9.4,2H =,6H 8 80,3H + ,2H8 1 ,F 9 .4,2H +,3H B 2 ,F 9 .4//)4 F0RMAT(F9.4,5H =,3H B0,F9.4,2H +,3H B1,F9.4,3H + ,2HB2,F9.4//)5 F0RMAT<8F8.-3/(8F8.3) )
GO TO 6END
817 2975 3925 5220 6240 7130 8410 97373 481 503 559 594 624 655 671817 2975 3925 5220 6240 7130 84 10 97398 511 531 581 616 658 694 712817 2975 3925 5220 6240 7130 8410 97421 552 580 640 673 720 745 771
Reproduced with permission o f the copyright owner. Further reproduction prohibited w ithout permission.

96
0 . p . A H U JA
REGRESSION COEFFICIENTS FOR MECHANISM EQUATION NO. 9
TEMPRATURE = 300 DEGREES C
24.6427 = 8 BO + B1 45.4170 + 82 18.5213
155.9711 = BO 45.4170 + 81 309.3987 + B2 116.5084
60.6336 = BO 18.5213 + 81 116.5084 + 82 45.4169
TEMPRATURE = 320 DEGREES C
24.3854 = 8 80 + 81 45.4170 + 8 2 18.5213
154.3376 = 8 0 45.4170 + 81 309.3987 + 82 116.5084
60.0016 = BO 18.5213 + 81 116.5084 + 82 45.4169
TEMPRATURE = 340 DEGREES C 23.9883 = 8 BO + Bl 45.4170 + 82 18.5213
151.8152 = 80 45.4170 + Bl 309.3987 + 82 116.5084
59.0200 = 80 18.5213 + Bl 116.5084 + 82 45.4169
Reproduced with permission o f the copyright owner. Further reproduction prohibited w ithout permission.

97
0 . p . A H U JA 93COEFFICIENTS FOR THE EMPIRICAL RATE EQUATION DIMENSION X(15),Y(15)*Z(15),A(15),B(15),R(15)
6 READ 5 , (A(J),J = 1 410).(B(J)»J = 1 ♦10),(R(J),J = 1 ♦10)DO r j= 1410,X(J) = LOG F ( A ( J ) )Y(J) = LOG F ( B ( J ) )
1 Z(J) = L O G F (R (J ))SIGX = 0 SIGY = 0 SIGZ = 0 SIGXX = 0 SIGYY = 0 SIGXY = 0 SIGYZ = 0 SIGZX = 0DO 2 J = 14 10S I G X St S I G X + X < J )S I G Y a S I G Y + Y( J)S I G Z S I G Z + Z ( J)S I G X X S I G X X + X ( J ) * X ( JS I G Y Y S I G Y Y + Y(J)*Y(JS I G X Y S I G X Y + X ( J ) * Y ( JS I G Y Z S I G Y Z + Y ( J ) * Z ( JS I G Z X s S I G Z X + Z ( J ) * X ( JPUNCH 3 4 S I G Z 4 S I G X 4 S I G YPUNCH 4 4 S I G Z X , S I G X , S I G X XPUNCH 4 ,S I G Y Z , S I G Y , S I G X Y
3 F0RMAT(F9.4,2H =,6H 10 B043H + 42 H B 1,F 9 .442H +,3H B24F9.4//)4 F0RMAT(F9.4,5H =,3H B0,F9.4,2H +43H Bl4F9.4,3H + 42HB2,F9.4//)5 FORMAT!10F6.6/(10F6.4)/(10F6.3))
GO TO 6END
4740 6280 7125 8160 8800 9610 11171 12310 1 1793 251664 906 1029 1 173 1270 1392 1610 1753 664 664373 481 503 559 594 624 655 671 796 842
481 632 724 812 877 958 1 123 1225 1177 2497664 906 1029 1 173 1270 1392 1610 1753 664 664398 51 1 531 581 616 658 694 712 836 884
484 639 72 819 886 971 112 1232 1 175 2531664 906 1029 1 173 1270 1 392 1610 1753 664 664421 552 580 640 673 720 745 771 882 932
Reproduced with permission o f the copyright owner. Further reproduction prohibited w ithout permission.

9 8
0» p . A H U JA
COEFFICIENTS FOR THE EMPIRICAL RATE EQUATION
TEMPRATURE = 300 DEGREES C
-5.2015 = 10 BO + 81 -46.5696 + 82 -22 .5575
25.1416 = BO -46.5696 + 81 218.7236 + 82 105. 0645
11.7985 = 80 -22.5575 + 81 105.0645 + 82 52. 1096
TEMPRATURE =; 320 DEGREE C
-4.6791 = 10 80 + 81 -46.5508 + 82 -22 .5575
22.6762 = 80 -46.5508 + 81 218.5045 + 82 105. 0151
10.6178 = 80 -22.5575 + 81 105.0151 + 82 52, 10 96
TEMPRATURE = 340 DEGREES C-3.9252 = 1 0 80 + 81 -46.4920 + 82 -22 .5575
19.1,228 = 80 -46.4920 + 8 1 217.9665 + 82 104. 8812
8.9551 . = 80 -22.5575 + 81 104.8812 + 82 52, 1096
Reproduced with permission o f the copyright owner. Further reproduction prohibited w ithout permission.

yiTA. AUCTORIS
1937 Born Om Parkash Ahuja on June 8, 1937, in Bhera,Surffodha, India.
1953 Completed science matriculation at Arya HighSchool, Panipat, India..
1957 Graduated in science, D.S. College, Karnal, India,
1961 Graduated in Chemical Engineering, Indian Instituteof Technology, Kharagpur, India,
1961-64 Employed in Design and Development section of OCM Chemical Works, New Delhi, India,
1964 Accepted into the Graduate School of University ofWindsor as Candidate for the degree of M. A. Sc, in Chemical Engineering,
1966 Working as project Engineer, Canadian Celanese,Drummondville (Quebec),
99
Reproduced with permission o f the copyright owner. Further reproduction prohibited w ithout permission.
Copyright © 2022 FDOKUMEN