Nickel-dimethylglyoxime complex modified graphite and carbon paste electrodes: preparation and...
10
ORIGINAL PAPER Nickel-dimethylglyoxime complex modified graphite and carbon paste electrodes: preparation and catalytic activity towards methanol/ethanol oxidation William S. Cardoso Vera L. N. Dias Wendell M. Costa Isaide de Araujo Rodrigues Edmar P. Marques Antonio G. Sousa J. Boaventura Cicero W. B. Bezerra Chaojie Song Hansan Liu Jiujun Zhang Aldale ´a L. B. Marques Received: 10 March 2008 / Accepted: 8 July 2008 / Published online: 25 July 2008 Ó Springer Science+Business Media B.V. 2008 Abstract Nickel-dimethylglyoxime complex (abbreviated as Ni(II)(DMG) 2 ) modified carbon paste and graphite elec- trodes were prepared by mixing Ni(II)(DMG) 2 with graphite paste, and coating Ni(II)(DMG) 2 to the graphite surface. It is necessary to cycle the electrode potential to a high value (e.g. 0.8 V versus SCE) for the preparation of the modified elec- trodes. The electrochemical reaction was originally assumed to be a one-electron process converting Ni(II)(DMG) 2 to [(DMG) 2 (H 2 O)Ni(III)ONi(III)(OH)(DMG) 2 ] - . [(DMG) 2 (H 2 O) Ni(III)ONi(III)(OH)(DMG) 2 ] - showed a strong catalytic activity toward electro-oxidation of methanol and ethanol. The electrocatalytic oxidation currents consistently increase with the increase in Ni(II)(DMG) 2 loading, OH - , and alcohol concentrations. Rotating disk electrode results obtained with a Ni(II)(DMG) 2 coated graphite disk electrode showed that the electrocatalytic oxidation of alcohol is a 4-electron process producing formate anion (methanol oxi- dation) or acetate anion (ethanol oxidation). A mechanism for the electrocatalytic oxidation of methanol/ethanol was proposed, and a rate-determining step was also discussed. Keywords Ethanol Methanol Electro-oxidation Electrocatalysts Nickel-dimethylglyoxime Carbon paste Graphite electrodes 1 Introduction Methanol and ethanol are important bio-fuels that can be generated from renewable bioresources. They have many industrial applications, especially in renewable energy technologies such as direct liquid fuel cells. However, the kinetics of electrochemical oxidation of these alcohols is slow. Efforts have been devoted to catalyst development for the electrooxidation of these alcohols. The most extensively investigated catalysts are Pt based catalysts including Pt, as well as both Pt transition metal binary and ternary alloys. These works have been reviewed by several authors recently [1–3]. Other noble metal based materials such as Pd based catalysts [4], and Ir based catalysts have also been studied [5]. However, the high cost and limited resources for these materials greatly restrict their application. Nickel and nickel compounds have attracted interest in catalyzing electrooxidation of small organic molecules. Recently hollow nickel spheres have been used as catalysts for methanol and ethanol oxidation [6], and kinetic studies of ethanol oxidation on CuNi alloy supported PtRu and PtMo catalysts have also been investigated [7]. Nickel W. S. Cardoso I. de Araujo Rodrigues E. P. Marques C. W. B. Bezerra Department of Chemistry, Federal University of Maranha ˜o, Av. dos Portugueses, S/N, Campus do Bacanga, Sa ˜o Luis, MA 65080-040, Brazil V. L. N. Dias W. M. Costa A. L. B. Marques (&) Department of Technology Chemistry, Federal University of Maranha ˜o, Av. dos Portugueses, S/N, Campus do Bacanga, Sa ˜o Luis, MA 65080-040, Brazil e-mail: [email protected] A. G. Sousa Department of Chemistry, Federal University of Paraiba, Cidade Universitaria, Joao Pessoa, PB 58051-970, Brazil J. Boaventura Institute of Chemistry, Federal University of Bahia, Barao de Jeremoado, S/N, Campus Universitario de, Ondina, Salvador, BA 40170-115, Brazil C. Song H. Liu J. Zhang (&) Institute for Fuel Cell Innovation, National Research Council Canada, Vancouver, BC, Canada V6T 1W5 e-mail: [email protected] 123 J Appl Electrochem (2009) 39:55–64 DOI 10.1007/s10800-008-9636-x
Transcript of Nickel-dimethylglyoxime complex modified graphite and carbon paste electrodes: preparation and...
ORIGINAL PAPER
Nickel-dimethylglyoxime complex modified graphite and carbonpaste electrodes: preparation and catalytic activity towardsmethanol/ethanol oxidation
William S. Cardoso Æ Vera L. N. Dias Æ Wendell M. Costa Æ Isaide de Araujo Rodrigues ÆEdmar P. Marques Æ Antonio G. Sousa Æ J. Boaventura Æ Cicero W. B. Bezerra ÆChaojie Song Æ Hansan Liu Æ Jiujun Zhang Æ Aldalea L. B. Marques
Received: 10 March 2008 / Accepted: 8 July 2008 / Published online: 25 July 2008
� Springer Science+Business Media B.V. 2008
Abstract Nickel-dimethylglyoxime complex (abbreviated
as Ni(II)(DMG)2) modified carbon paste and graphite elec-
trodes were prepared by mixing Ni(II)(DMG)2 with graphite
paste, and coating Ni(II)(DMG)2 to the graphite surface. It is
necessary to cycle the electrode potential to a high value (e.g.
0.8 V versus SCE) for the preparation of the modified elec-
trodes. The electrochemical reaction was originally assumed
to be a one-electron process converting Ni(II)(DMG)2 to
[(DMG)2(H2O)Ni(III)ONi(III)(OH)(DMG)2]-. [(DMG)2(H2O)
Ni(III)ONi(III)(OH)(DMG)2]- showed a strong catalytic
activity toward electro-oxidation of methanol and ethanol.
The electrocatalytic oxidation currents consistently increase
with the increase in Ni(II)(DMG)2 loading, OH-, and
alcohol concentrations. Rotating disk electrode results
obtained with a Ni(II)(DMG)2 coated graphite disk electrode
showed that the electrocatalytic oxidation of alcohol is a
4-electron process producing formate anion (methanol oxi-
dation) or acetate anion (ethanol oxidation). A mechanism
for the electrocatalytic oxidation of methanol/ethanol was
proposed, and a rate-determining step was also discussed.
Keywords Ethanol � Methanol � Electro-oxidation �Electrocatalysts � Nickel-dimethylglyoxime �Carbon paste � Graphite electrodes
1 Introduction
Methanol and ethanol are important bio-fuels that can be
generated from renewable bioresources. They have many
industrial applications, especially in renewable energy
technologies such as direct liquid fuel cells. However, the
kinetics of electrochemical oxidation of these alcohols is
slow. Efforts have been devoted to catalyst development for
the electrooxidation of these alcohols. The most extensively
investigated catalysts are Pt based catalysts including Pt, as
well as both Pt transition metal binary and ternary alloys.
These works have been reviewed by several authors recently
[1–3]. Other noble metal based materials such as Pd based
catalysts [4], and Ir based catalysts have also been studied
[5]. However, the high cost and limited resources for these
materials greatly restrict their application.
Nickel and nickel compounds have attracted interest in
catalyzing electrooxidation of small organic molecules.
Recently hollow nickel spheres have been used as catalysts
for methanol and ethanol oxidation [6], and kinetic studies
of ethanol oxidation on CuNi alloy supported PtRu
and PtMo catalysts have also been investigated [7]. Nickel
W. S. Cardoso � I. de Araujo Rodrigues �E. P. Marques � C. W. B. Bezerra
Department of Chemistry, Federal University of Maranhao,
Av. dos Portugueses, S/N, Campus do Bacanga, Sao Luis,
MA 65080-040, Brazil
V. L. N. Dias � W. M. Costa � A. L. B. Marques (&)
Department of Technology Chemistry, Federal University
of Maranhao, Av. dos Portugueses, S/N, Campus do Bacanga,
Sao Luis, MA 65080-040, Brazil
e-mail: [email protected]
A. G. Sousa
Department of Chemistry, Federal University of Paraiba,
Cidade Universitaria, Joao Pessoa, PB 58051-970, Brazil
J. Boaventura
Institute of Chemistry, Federal University of Bahia,
Barao de Jeremoado, S/N, Campus Universitario de,
Ondina, Salvador, BA 40170-115, Brazil
C. Song � H. Liu � J. Zhang (&)
Institute for Fuel Cell Innovation, National Research Council
Canada, Vancouver, BC, Canada V6T 1W5
e-mail: [email protected]
123
J Appl Electrochem (2009) 39:55–64
DOI 10.1007/s10800-008-9636-x
oxide/hydroxides and nickel-tetraazamacrocyclic com-
plexes are known to be capable of catalyzing alcohol
oxidation in an alkaline medium. Taraszewska [8], El-
Shafei [9], and Fleischmann et al. [10] have reported the
electro-oxidation of methanol catalyzed by Ni hydroxide
coated on glassy carbon electrodes or on Ni electrodes.
NiOOH was found to be the active species responsible for
the catalytic activity. This catalytic activity has been used
in liquid chromatographic detection of aliphatic alcohols
[11]. Ni complexes demonstrated higher catalytic activity
than NiOOH. Roslonek and Taraszewska [12] and Bae
et al. [13] investigated catalytic activity of Ni tetraaza
macrocycle towards alcohol and L-ascorbic oxidations, and
found that Ni tetraaza macrocyclic complexes showed
lower overpotential (0.1 V lower) than NiOOH, and that
the oxidation current is approximately five times higher
than NiOOH. Nickel porphyrine-catalyzed methanol elec-
tro-oxidation has been reported by Golabi and Nozad [14],
and Ciszewski and Milczarek [15]. Other nickel coordi-
nation compounds such as Ni-1-(2-pyridylazo)-naphthol
have also been investigated [16].
Diamethyglyoxime is one of the most commonly used
ligands coordinating nickel ions, which forms nickel-
dimethyglyoxime complexes due to its sensitivity and
stability. The ligand can adsorb on an electrode surface
and significantly enhance the electrochemical response of
Ni ions. This property has been used in the detection of
Ni ions in natural water [17–19]. Most recently, the cat-
alytic activity of the nickel-dimethylglyoxime complex
towards the electro-oxidation of methanol has been
reported [20, 21], where the catalytically active site is
ascribed to NiOOH and the dimethylglyoxime ligand was
not considered.
In earlier works, nickel hydroxide, or nickel complex,
modified electrodes, were prepared usually by oxidizing
nickel electrodes in an alkaline solution [10], running scans
with the nickel rod in solutions which contain the ligand
[20, 21], running scans with the working electrode in nickel
complex alkaline solutions [12, 13, 15, 22, 23], deposit
nickel salt solutions to the electrode surface followed by
cycling it in alkaline solution [9, 11], alternate immersion
of the working electrode in nickel salt and then alkaline
solutions [8], or directly depositing nickel complex solu-
tions onto the electrode surface [14]. Alternatively,
modified electrodes were also prepared by consecutive
deposition of nickel salt solution and ligand solution onto
the electrode surface [16]. In all these methods, cycling the
working electrode potential is required. However, how the
cycling potential affects the formation of the modified
electrode was not reported.
In this work, we prepared thinly layered Ni(DMG)2
modified electrodes by using consecutive drop deposition
of Ni salt and DMG solutions, followed by cycling the
potential to a certain value. The effect of oxidation
potential on the preparation of nickel-dimethylglyoxime
was investigated. Carbon paste electrodes (CPEs) are
popular because carbon pastes are easily obtained at min-
imal costs and CPEs can be easily prepared. However,
Ni-dimethylglyoxime modified carbon paste electrodes
have not yet been reported in literature. We also prepared
3-D Ni-dimethylglyoxime modified carbon paste electrodes
by mixing the Ni-dimethylglyoxime complex with the
graphite paste. These modified electrodes showed strong
catalytic activity toward the ethanol/methanol oxidation.
2 Experimental
2.1 Reagents
Dimethylglyoxime (CH3C(=NOH)C(=NOH)CH3, abbrevi-
ated as DMG), nickel(II) sulphate, sodium hydroxide, and
ethanol and methanol were obtained from Merck, and used as
received. All aqueous solutions were prepared with doubly
distilled water purified through a NANOPURE system.
Bis-(dimethylglyoxime) nickel(II) complex (abbreviated as
Ni(II)(DMG)2)) was prepared according to a literature pro-
cedure [24]. Briefly, 50 mL of 0.02 mol L-1 DMG in an
alcoholic solution were mixed with 50 mL of Ni(II) sulfate
aqueous solution, immediately followed by the addition
of 5 mL of 1.0 mol L-1 NaOH aqueous solution. The
addition of OH- anions was to facilitate the formation of
Ni(II)(DMG)2, a rose-red precipitate. The reaction of such a
synthesis can be described as reaction (I):
Ni(II) + 2CH3Cð¼NOH)Cð¼NOH)CH3
! Ni(II)(CH3Cð¼NO)Cð¼NOH)CH3Þ2 + 2Hþ ðIÞ
This Ni(II)(DMG)2 was filtered, exhaustively washed with
deionized water, and then dried at room temperature. The
product was characterized using a Bomen MB series infrared
spectrophotometer. Pressed KBr pellets containing 1% (wt%)
of the product were measured with a 4 cm-1 resolution and 50
cumulative scans. Figure 1 shows the infrared spectra of the
reaction precursor dimethylglyoxime and the reaction product
(Ni(II)(DMG)2), respectively. As shown in Fig. 1a, there is a
broad absorption band around 3,200 cm-1 superimposed with
a number of weak side bands, which can be attributed to the N–
O–H stretching mode. In the spectrum of Ni(II)(DMG)2 as
shown in Fig. 1b, this absorption band almost disappeared,
suggesting the N–O–H stretching mode becomes very weak
after the coordination with Ni(II). This indicates that this bond
is significantly weak due to the formation of the Ni–N bond in
the complex. A new weak band at 1,790 cm-1 indicates a
strong intramolecular hydrogen bonding in the Ni(II)(DMG)2
complex [25]. Another characteristic absorption band appears
56 J Appl Electrochem (2009) 39:55–64
123
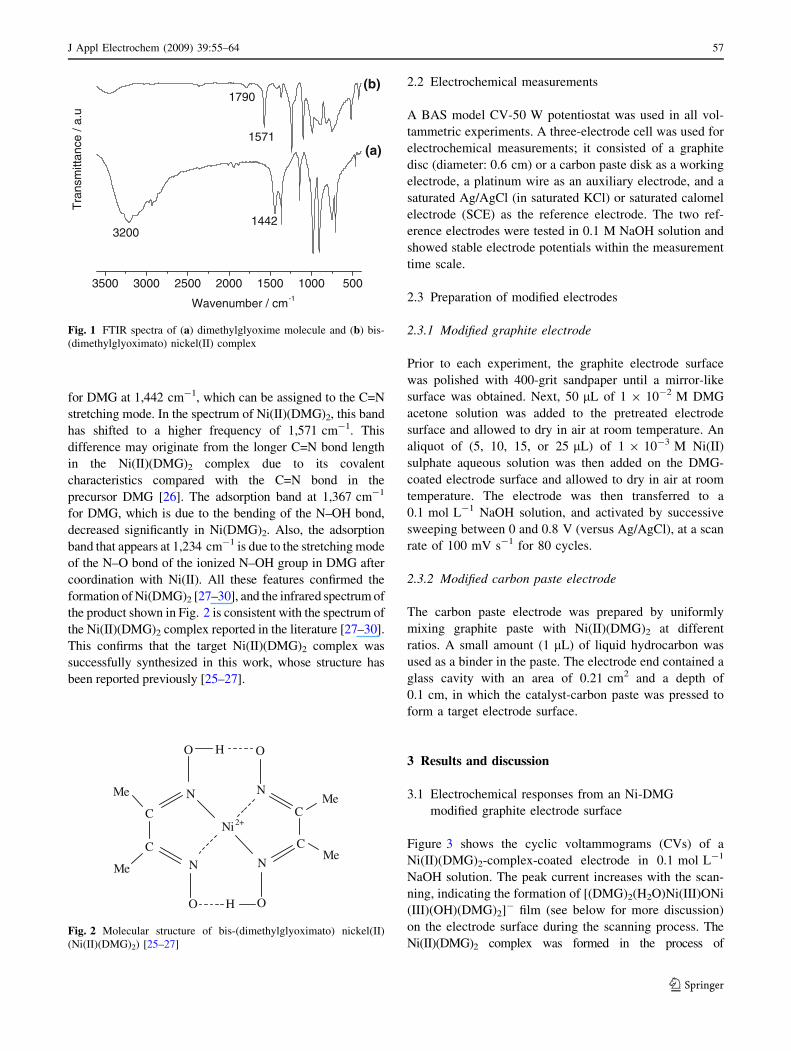
for DMG at 1,442 cm-1, which can be assigned to the C=N
stretching mode. In the spectrum of Ni(II)(DMG)2, this band
has shifted to a higher frequency of 1,571 cm-1. This
difference may originate from the longer C=N bond length
in the Ni(II)(DMG)2 complex due to its covalent
characteristics compared with the C=N bond in the
precursor DMG [26]. The adsorption band at 1,367 cm-1
for DMG, which is due to the bending of the N–OH bond,
decreased significantly in Ni(DMG)2. Also, the adsorption
band that appears at 1,234 cm-1 is due to the stretching mode
of the N–O bond of the ionized N–OH group in DMG after
coordination with Ni(II). All these features confirmed the
formation of Ni(DMG)2 [27–30], and the infrared spectrum of
the product shown in Fig. 2 is consistent with the spectrum of
the Ni(II)(DMG)2 complex reported in the literature [27–30].
This confirms that the target Ni(II)(DMG)2 complex was
successfully synthesized in this work, whose structure has
been reported previously [25–27].
2.2 Electrochemical measurements
A BAS model CV-50 W potentiostat was used in all vol-
tammetric experiments. A three-electrode cell was used for
electrochemical measurements; it consisted of a graphite
disc (diameter: 0.6 cm) or a carbon paste disk as a working
electrode, a platinum wire as an auxiliary electrode, and a
saturated Ag/AgCl (in saturated KCl) or saturated calomel
electrode (SCE) as the reference electrode. The two ref-
erence electrodes were tested in 0.1 M NaOH solution and
showed stable electrode potentials within the measurement
time scale.
2.3 Preparation of modified electrodes
2.3.1 Modified graphite electrode
Prior to each experiment, the graphite electrode surface
was polished with 400-grit sandpaper until a mirror-like
surface was obtained. Next, 50 lL of 1 9 10-2 M DMG
acetone solution was added to the pretreated electrode
surface and allowed to dry in air at room temperature. An
aliquot of (5, 10, 15, or 25 lL) of 1 9 10-3 M Ni(II)
sulphate aqueous solution was then added on the DMG-
coated electrode surface and allowed to dry in air at room
temperature. The electrode was then transferred to a
0.1 mol L-1 NaOH solution, and activated by successive
sweeping between 0 and 0.8 V (versus Ag/AgCl), at a scan
rate of 100 mV s-1 for 80 cycles.
2.3.2 Modified carbon paste electrode
The carbon paste electrode was prepared by uniformly
mixing graphite paste with Ni(II)(DMG)2 at different
ratios. A small amount (1 lL) of liquid hydrocarbon was
used as a binder in the paste. The electrode end contained a
glass cavity with an area of 0.21 cm2 and a depth of
0.1 cm, in which the catalyst-carbon paste was pressed to
form a target electrode surface.
3 Results and discussion
3.1 Electrochemical responses from an Ni-DMG
modified graphite electrode surface
Figure 3 shows the cyclic voltammograms (CVs) of a
Ni(II)(DMG)2-complex-coated electrode in 0.1 mol L-1
NaOH solution. The peak current increases with the scan-
ning, indicating the formation of [(DMG)2(H2O)Ni(III)ONi
(III)(OH)(DMG)2]- film (see below for more discussion)
on the electrode surface during the scanning process. The
Ni(II)(DMG)2 complex was formed in the process of
3500 3000 2500 2000 1500 1000 500
1790
14423200
1571
(b)
(a)
Tra
nsm
ittan
ce /
a.u
Wavenumber / cm-1
Fig. 1 FTIR spectra of (a) dimethylglyoxime molecule and (b) bis-
(dimethylglyoximato) nickel(II) complex
C
C
Me
Me
N
O H O
N
Ni
O H O
N N
C
C
Me
Me
2+
Fig. 2 Molecular structure of bis-(dimethylglyoximato) nickel(II)
(Ni(II)(DMG)2) [25–27]
J Appl Electrochem (2009) 39:55–64 57
123
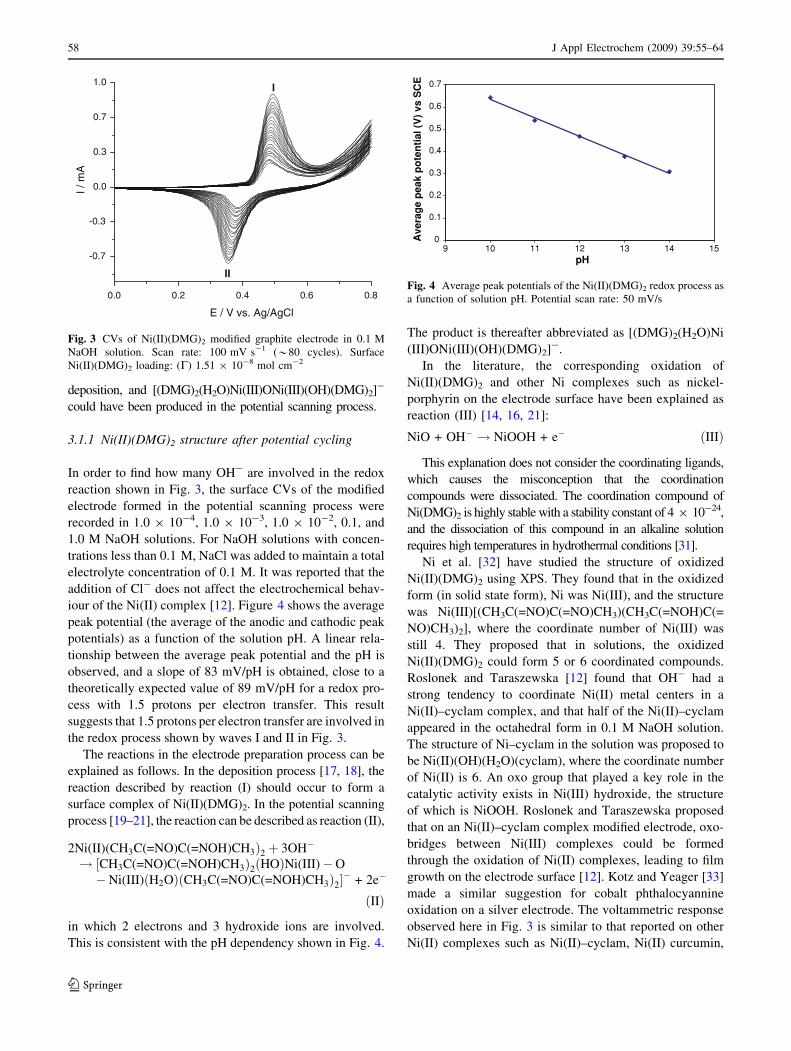
deposition, and [(DMG)2(H2O)Ni(III)ONi(III)(OH)(DMG)2]-
could have been produced in the potential scanning process.
3.1.1 Ni(II)(DMG)2 structure after potential cycling
In order to find how many OH- are involved in the redox
reaction shown in Fig. 3, the surface CVs of the modified
electrode formed in the potential scanning process were
recorded in 1.0 9 10-4, 1.0 9 10-3, 1.0 9 10-2, 0.1, and
1.0 M NaOH solutions. For NaOH solutions with concen-
trations less than 0.1 M, NaCl was added to maintain a total
electrolyte concentration of 0.1 M. It was reported that the
addition of Cl- does not affect the electrochemical behav-
iour of the Ni(II) complex [12]. Figure 4 shows the average
peak potential (the average of the anodic and cathodic peak
potentials) as a function of the solution pH. A linear rela-
tionship between the average peak potential and the pH is
observed, and a slope of 83 mV/pH is obtained, close to a
theoretically expected value of 89 mV/pH for a redox pro-
cess with 1.5 protons per electron transfer. This result
suggests that 1.5 protons per electron transfer are involved in
the redox process shown by waves I and II in Fig. 3.
The reactions in the electrode preparation process can be
explained as follows. In the deposition process [17, 18], the
reaction described by reaction (I) should occur to form a
surface complex of Ni(II)(DMG)2. In the potential scanning
process [19–21], the reaction can be described as reaction (II),
2Ni(II)(CH3C(=NO)C(=NOH)CH3Þ2 þ 3OH�
! ½CH3C(=NO)C(=NOH)CH3Þ2ðHOÞNi(III)�O
�Ni(III) H2Oð ÞðCH3C(=NO)C(=NOH)CH3Þ2��
+ 2e�
ðIIÞ
in which 2 electrons and 3 hydroxide ions are involved.
This is consistent with the pH dependency shown in Fig. 4.
The product is thereafter abbreviated as [(DMG)2(H2O)Ni
(III)ONi(III)(OH)(DMG)2]-.
In the literature, the corresponding oxidation of
Ni(II)(DMG)2 and other Ni complexes such as nickel-
porphyrin on the electrode surface have been explained as
reaction (III) [14, 16, 21]:
NiO + OH� ! NiOOH + e� ðIIIÞ
This explanation does not consider the coordinating ligands,
which causes the misconception that the coordination
compounds were dissociated. The coordination compound of
Ni(DMG)2 is highly stable with a stability constant of 4 9 10-24,
and the dissociation of this compound in an alkaline solution
requires high temperatures in hydrothermal conditions [31].
Ni et al. [32] have studied the structure of oxidized
Ni(II)(DMG)2 using XPS. They found that in the oxidized
form (in solid state form), Ni was Ni(III), and the structure
was Ni(III)[(CH3C(=NO)C(=NO)CH3)(CH3C(=NOH)C(=
NO)CH3)2], where the coordinate number of Ni(III) was
still 4. They proposed that in solutions, the oxidized
Ni(II)(DMG)2 could form 5 or 6 coordinated compounds.
Roslonek and Taraszewska [12] found that OH- had a
strong tendency to coordinate Ni(II) metal centers in a
Ni(II)–cyclam complex, and that half of the Ni(II)–cyclam
appeared in the octahedral form in 0.1 M NaOH solution.
The structure of Ni–cyclam in the solution was proposed to
be Ni(II)(OH)(H2O)(cyclam), where the coordinate number
of Ni(II) is 6. An oxo group that played a key role in the
catalytic activity exists in Ni(III) hydroxide, the structure
of which is NiOOH. Roslonek and Taraszewska proposed
that on an Ni(II)–cyclam complex modified electrode, oxo-
bridges between Ni(III) complexes could be formed
through the oxidation of Ni(II) complexes, leading to film
growth on the electrode surface [12]. Kotz and Yeager [33]
made a similar suggestion for cobalt phthalocyannine
oxidation on a silver electrode. The voltammetric response
observed here in Fig. 3 is similar to that reported on other
Ni(II) complexes such as Ni(II)–cyclam, Ni(II) curcumin,
-0.7
-0.3
0.0
0.3
0.7
1.0
II
II /
mA
E / V vs. Ag/AgCl
0.80.60.40.20.0
Fig. 3 CVs of Ni(II)(DMG)2 modified graphite electrode in 0.1 M
NaOH solution. Scan rate: 100 mV s-1 (*80 cycles). Surface
Ni(II)(DMG)2 loading: (C) 1.51 9 10-8 mol cm-2
0
0.1
0.2
0.3
0.4
0.5
0.6
0.7
9 10pH
Ave
rag
e p
eak
po
ten
tial
(V
) vs
SC
E
1514131211
Fig. 4 Average peak potentials of the Ni(II)(DMG)2 redox process as
a function of solution pH. Potential scan rate: 50 mV/s
58 J Appl Electrochem (2009) 39:55–64
123

and polymerized Ni(II) tetrakis(3-methoxy-4-hydroxy-
phenyl) porphyrin (poly-Ni(II)TMHPP) [12, 15, 22, 23].
Therefore, the formation of an oxo-bridge between two
adjacent Ni(III) centers is believed to be a product of
Ni(II)(DMG)2 electro-oxidation. The proposed structure of
[(DMG)2(H2O)Ni(III)ONi(III)(OH)(DMG)2]- is shown in
Fig. 5.
3.1.2 Cycling potential effect
Scanning the Ni(II)(DMG)2 coated graphite electrode to a
high potential is necessary to form [(DMG)2(H2O)
Ni(III)ONi(III)(OH)(DMG)2]-. Figure 6 shows the 30th
CV scan of Ni(DMG)2 coated graphite electrodes cycling
in a 0.1 M NaOH solution in potential ranges of -0.1 to
0.5 V, -0.1 to 0.6 V, -0.1 to 0.7 V, and -0.1 to 0.8 V
versus SCE. A freshly polished graphite electrode was used
for each experiment. The redox peak current increases as
the potential range positively increases, indicating that
more [(DMG)2(H2O)Ni(III)ONi(III)(OH)(DMG)2]- com-
plex is produced. There is almost no distinguishable redox
peak when the CV is scanned to 0.5 V. However, a very
small peak was observed when it was scanned to 0.6 V,
and a medium redox peak was found when it was scanned
to 0.7 V. The highest peak current was observed when
potential was scanned to 0.8 V.
3.1.3 Graphite surface effect
Figure 7 shows the 30th CV scan of Ni(II)(DMG)2 coated on a
pre-polarized graphite electrode in the potential range of -0.1
to 0.5 V (versus SCE). The electrode was held at 0.8 V (versus
SCE) for 10 min before coating it with Ni(II)(DMG)2. The
redox peak of [(DMG)2(H2O)Ni(III)ONi(III)(OH)(DMG)2]-
could be seen on the Ni(II)(DMG)2 coated pre-polarized
graphite electrode. The pre-polarization of the graphite sur-
face resulted in the formation of surface functional groups and
radicals, which facilitated the formation of [(DMG)2(H2O)
Ni(III)ONi(III)(OH)(DMG)2]-. For comparison, the curve
was also measured in the same potential range but the elec-
trode had not been held at any potential before coating it with
Ni(II)(DMG)2. On the non-polarized surface, there were few
functional groups and radicals. Therefore, [(DMG)2(H2O)
Ni(III)ONi(III)(OH)(DMG)2]- could not be produced. More
work is necessary to determine the formation mechanism.
3.1.4 Surface concentration of the Ni(II)(DMG)2 complex
Assuming that all the films formed on the electrode surface
are electroactive, the surface concentration can be calcu-
lated according to Eq. 1,
C ¼ Q=nFA ð1Þ
where C is the surface concentration of [(DMG)2(H2O)
Ni(III)ONi(III)(OH)(DMG)2]- in mol cm-2, Q is the charge
under the oxidation peak (Ipa) for the voltammogram recor-
ded in 0.1 mol L-1 NaOH, A is the geometric surface area of
NN
Ni
N N
NN
Ni
N NO OH
MeMe
Me
MeMe
Me
Me
Me
H2O
Fig. 5 Proposed molecular structure of [(DMG)2(H2O)Ni(III)O-
Ni(III)(OH)(DMG)2]-, Me in the structure represents (CH3)
-40.00
-20.00
0.00
20.00
40.00
60.00
80.00
100.00
120.00
Potential (V) vs SCE
Cu
rren
t (µ
A)
0.90.80.70.60.50.40.30.20.10-0.1-0.2
Fig. 6 The 30th scan of CV of Ni(II)(DMG)2 modified graphite
electrodes in different potential range (-0.1 to 0.5, 0.6, 0.7, and 0.8 V
versus SCE). Potential scan rate: 100 mV/s
-15.00
-10.00
-5.00
0.00
5.00
10.00
15.00
20.00
25.00
Potential (V) vs SCE
a
bC
urr
ent
(µA
)
0.60.50.40.30.20.10-0.1-0.2
Fig. 7 The 30th scan of CV of Ni(II)(DMG)2 coated on (a) a non-
polarized (freshly polished) graphite electrode, and (b) on a pre-
polarized graphite electrode which was held at 0.8 V for 10 min
before coated with the catalyst. Scan rate: 100 mV/s
J Appl Electrochem (2009) 39:55–64 59
123

the graphite electrode, and n is the electron number trans-
ferred in the redox reaction, which is 1 per nickel.
The surface concentrations of the Ni(II)(DMG)2 com-
plex were calculated to be 7.57 9 10-9, 1.51 9 10-8,
2.27 9 10-8, and 3.78 9 10-8 mol cm-2, respectively,
for the aliquot of 5, 10, 15, and 25 lL Ni (II) solutions
used. The surface concentration increases linearly with the
increase in the amount of Ni(II) added.
3.1.5 Potential scan rate dependency of the peak
currents
The surface CVs were recorded at various scan rates in
0.10 mol L-1 NaOH solution. It was observed that the peak
current did not increase linearly with an increase in the
square root of the potential scan rate, as shown in Fig. 8.
Rather, a linear relationship of Ip versus m was observed.
These features suggest that the electrochemical process of
reaction (II), within the film, follows thin layer behaviour.
3.2 Ni(II)(DMG)2 modified carbon paste electrode
CV and a plot of peak current versus square root of scan rate
obtained with a Ni(II)(DMG)2 carbon paste electrode (not
shown) are different from that obtained with the modified
graphite electrode. A linear relationship was observed,
suggesting that the redox process of the [(DMG)2(H2O)
Ni(III)ONi(III)(OH)(DMG)2]- complex within the carbon
paste layer is a diffusion process. This process could be
related to counter-anion diffusion into and out of the modi-
fied electrode during the oxidation and reduction processes
[8, 16]. This is reasonable, as in a carbon paste electrode,
some of the catalyst is buried deep in the electrode, and
diffusion of the counter anion to all the catalyst is more
difficult than on a modified graphite surface electrode.
3.3 Electrocatalytic activity of Ni(II)(DMG)2 modified
carbon paste electrode towards methanol
and ethanol oxidation
3.3.1 Cyclic voltammograms
Figure 9a and b shows the CVs of catalyzed methanol and
ethanol oxidation, respectively, on a Ni(II)(DMG)2 complex
modified carbon paste electrode. For comparison, the CVs in
the absence of alcohol on the same electrode are also plotted in
the same figure. The alcohol oxidation currents starting from
*0.25 V clearly demonstrate that the [(DMG)2(H2O)Ni(III)
ONi(III)(OH)(DMG)2]- modified electrode shows catalytic
activity toward both methanol and ethanol oxidation. The
onset potentials for both methanol and ethanol oxidation are
very close to that of Ni(II)(DMG)2 oxidation, indicating that
the oxidation product of Ni(II)(DMG)2, which is [(DMG)2
(H2O)Ni(III)ONi(III)(OH)(DMG)2]-, should be responsible
for the catalytic activity. The shape of the oxidation CVs in
Fig. 8 are similar to those reported for electrocatalytic alcohol
oxidation [21, 34].
3.3.2 Catalyst loading effect
Ni(II)(DMG)2 loading in the carbon paste layer represents the
concentration of the catalyst active site. Increasing the loading
should affect the catalytic current of the alcohol oxidation. To
examine this effect, four separate carbon paste layers con-
taining 2.5, 5.0, 10.0, and 20.0 (wt%) of Ni(II)(DMG)2 with
respect to moles of carbon were prepared. The results obtained
in a 1.0 mol L-1 NaOH + 0.3 mol L-1 methanol solution
are plotted in Fig. 10. A monotonic increase in the peak cur-
rent of methanol electrocatalytic oxidation with increasing
Ni(II)(DMG)2 loading can be observed, as shown in the inset
of Fig. 10. For ethanol, similar behavior was observed.
However, the results show that the oxidation current reaches a
plateau after the Ni(II)(DMG)2 loading becomes larger than
10%, as shown in the insert of Fig. 10. This may be due to
diffusion limitations of either methanol or OH- to the elec-
trode. As the catalyst loading increased, more catalyst was
buried inside the electrode, and diffusion of reactants to these
catalytic sites becomes more challenging.
3.3.3 OH- concentration effect
It is expected that the concentration of OH- ions in the
electrolyte solution should play a role in the catalytic
oxidation of both methanol and ethanol. Thermodynami-
cally, an increase in OH- concentration should cause a
shift in the alcohol oxidation potential to more negative
values. Figure 11 shows the catalytic oxidation of ethanol
in three solutions containing 0.1, 0.5, and 1.0 mol L-1 of
0.0 0.1 0.2 0.3 0.4-1.5
-1.0
-0.5
0.0
0.5
1.0
1.5
2.0
I / m
A
v1/2 / (V s-1)1/2
Fig. 8 Plots of anodic and cathodic peak currents versus the square root
of potential scan rate. Data was taken from the CVs of a Ni(II)(DMG)2
modified graphite electrode in a 0.1 mol L-1 NaOH solution with
potential scan rates of 10, 20, 30, 40, 50, 60, 80 and 160 mV s-1.
Surface Ni(II)(DMG)2 loading: C = 1.51 9 10-8 mol cm-2
60 J Appl Electrochem (2009) 39:55–64
123

NaOH. A negative shift in peak potential can be observed
when the OH- concentration is changed from 0.1 to
1.0 mol L-1, as shown in the insert of Fig. 11. However,
the catalytic current of the alcohol oxidation also increases
with increasing OH- concentration, indicating that the
OH- ion participates in the oxidation. Therefore, the pro-
posed reaction mechanism should reflect this OH-
participation (see below).
3.3.4 Potential scan rate effect
CVs for the catalytic oxidation of both methanol and eth-
anol on a carbon paste electrode modified by Ni(II)(DMG)2
were also recorded at different potential scan rates. The
current peaks of both methanol and ethanol oxidation
increased linearly with the square root of the scan rate,
suggesting a reactant diffusion-controlled process [35].
3.3.5 Alcohol concentration effect
The effect of methanol (or ethanol) concentration on the
CV peak current and the peak potential of a Ni(II)(DMG)2
modified carbon paste electrode were also investigated in a
solution of 1.0 mol L-1 NaOH. The results are shown in
Fig. 12. It can be seen that in Fig. 12a the peak current for
the catalytic oxidation of both alcohols increases with
increasing concentration. Linear relationships between the
CV peak current and the reactant concentration for both
methanol and ethanol can be observed in the concentration
range of 0–0.5 mol L-1. In Fig. 12b, it can be also
observed that the peak potentials for both alcohols shift
positively with increasing alcohol concentration. These
results suggest that the catalytic oxidation of both alcohols
is controlled by the diffusion of the reactant. The consistent
increase in the oxidation peak currents of both methanol
and ethanol with reactant concentration, shown in Fig. 12b,
could be employed in the analysis of alcohol concentration.
0.0 0.2 0.4 0.6 0.8-2
0
2
4
6
8
10 (a)
I / m
A
E / mV vs. Ag/AgCl
0.0 0.2 0.4 0.6 0.8
0
2
4
6 (b)
I / m
A
E / V vs. Ag/AgCl
Fig. 9 CVs for Ni(II)(DMG)2
complex in 1.0 mol L-1 NaOH
in the absence (- - -) and
presence (—) of 0.1 mol L-1 of
alcohol. (a) Methanol and (b)
ethanol. Potential scan rate:
5 mV s-1. Loading of
Ni(II)(DMG)2: 10 wt%
-0.2 0.0 0.2 0.4 0.6 0.8
-4
0
4
8
12
16
20
24
0.0 0.1 0.2 0.39
12
15
18
21 (d)
(c)
(b)
(a)
I/ m
A
E / V vs. Ag/AgCl
Ipa
/ mA
(Ni(DMG)2:Graphite) Ratio / (m/m)
Fig. 10 CVs of carbon paste electrodes loaded by different quantities
of Ni(II)(DMG)2: (a) 0.5%, (b) 5.0%, (c) 10.0%, and (d) 20.0 (wt%) of
Ni(II)(DMG)2. Testing solution: 1.0 mol L-1 NaOH + 0.3 mol L-1
methanol. Potential scan rate: 0.01 V s-1. Inserted figure: Effect of the
catalyst loading on the peak current of methanol oxidation
0.0 0.2 0.4 0.6 0.8
0
2
4
6
8
0.0 0.2 0.4 0.6 0.8 1.0
2.5
3.0
3.5
4.0
4.5 (c)
(b)
(a)I/ m
A
E / V vs. Ag/AgCl
Ip /
mA
[OH-] / mol l-1
Fig. 11 CVs of a carbon paste electrode modified by Ni(II)(DMG)2
in solutions containing (a) 0.1, (b) 0.5, and (c) 1.0 mol L-1 of NaOH,
respectively. Methanol concentration in each solution was
0.1 mol L-1. Inserted figure: Effect of OH- concentration on the
peak current of methanol oxidation. Potential can rate: 0.005 V s-1.
Loading of Ni(II)(DMG)2: 10 wt%
J Appl Electrochem (2009) 39:55–64 61
123

Therefore, the carbon paste electrode modified by the
Ni(II)(DMG)2 complex might be able to serve as a sensor
probe for methanol and ethanol analysis.
At very low OH- concentrations, the alcohol oxidation
current did not increase linearly with alcohol concentra-
tion. For example, Fig. 13 shows the dependency of the
oxidation peak current on methanol concentration at dif-
ferent OH- concentrations. In 1.0 M NaOH solution
containing methanol, methanol oxidation current increases
linearly with methanol concentration in the range of
0–0.5 M; in 0.5 M NaOH solution containing methanol,
the oxidation current-methanol concentration relationship
became a curve with a plateau after methanol concentration
is larger than 0.4 M, and in 0.1 M NaOH solution con-
taining methanol, the oxidation current remained
unchanged after methanol concentration is larger than
0.1 M. These results strongly suggest that the OH- ion
plays an important role in the catalytic oxidation of both
methanol and ethanol, and that the alcohol oxidation is
diffusion limited in these solutions. The literature has also
shown this behavior for methanol and ethanol electro-
oxidation in a basic medium on a nickel oxide electrode,
which was explained by the direct participation of the OH-
ion in the oxidation process [18, 21].
3.4 Discussion of the mechanism of electrocatalytic
oxidation of both methanol and ethanol
It is generally agreed that the Ni-based catalysts such as
nickel oxides and complexes in a basic aqueous medium
can catalyze methanol and ethanol oxidation through an
overall four-electron process producing formate anion
(methanol oxidation) and acetate anion (ethanol oxidation):
CH3OH + 5OH� ! HCOO�
+ 4H2O + 4e�ðmethanoloxidationÞðIVÞ
CH3CH2OH + 5OH� ! CH3COO�
+ 4H2O + 4e�ðethanoloxidationÞðVÞ
In order to confirm this four-electron process, experiments
with a [(DMG)2(H2O)Ni(III)ONi(III)(OH)(DMG)2]- coated
graphite rotating disk electrode (RDE) were carried out in a
1.0 mol L-1 NaOH solution containing either 0.1 mol L-1 of
ethanol or 0.1 mol L-1 of methanol. Theoretically, RDE is
accurate with a smooth electrode, rather than with a rough or
film coated surface. However, if the surface roughness is much
lower than the diffusion layer thickness, this method may be a
good approximation for the reaction kinetic estimation. The
curves of the current density versus electrode potential were
recorded at different electrode rotation rates. According to
rotating disk electrode theory [35], the current density (i) at
each electrode potential (E) should contain two contributions,
one from the kinetics current density (ik) and the other from the
diffusion current density (id). The relationship among these
three current densities can be expressed as Eq. 2:
ik ¼ iid
id � i
� �ð2Þ
According to the Koutecky–Levich theory [35], the
diffusion current density in Eq. 2 can be expressed as
Eq. 3,
0.0 0.1 0.2 0.3 0.4 0.5
0
3
6
9
12
15
18 (a) ethanol
methanol
Ip /
mA
[Alcohol] / mol l-10.0 0.1 0.2 0.3 0.4 0.5
0.16
0.32
0.48
0.64
0.80 (b)
ethanol
methanol
Ep /
V v
s. A
g/A
gCl
[alcohol] / mol l-1
Fig. 12 (a) Peak currents and
(b) peak potentials of methanol
and ethanol catalytic oxidation
as a function of alcohol
concentration. Carbon paste
electrode modified with 10 wt%
of Ni(II)(DMG)2. CVs recorded
in 1.0 mol L-1 of NaOH with a
potential scan rate of
0.005 V s-1
0.0 0.1 0.2 0.3 0.4 0.5
0
3
6
9
12
15
18 (c)
(b)
(a)
Ip /
mA
[CH3OH] / mol l-1
Fig. 13 Peak currents of methanol concentration range 0.1 to
0.5 mol L-1 as a function of different OH- concentrations
(mol L-1): (a) 0.1, (b) 0.5, and (c) 1.0. Carbon paste electrode
modified with 10 wt% of Ni(II)(DMG)2. CVs recorded with a
potential scan rate of 0.005 V s-1
62 J Appl Electrochem (2009) 39:55–64
123
id ¼ 0:62nFACD2=3m�1=6x1=2 ð3Þ
where x is the rotation rate of the disk electrode, n is the
number of transferred electrons in the overall reduction
process, F is the Faraday constant, C is the concentration of
ethanol (or methanol), D is the diffusion coefficient of the
ethanol (or methanol), and m is the kinematic viscosity.
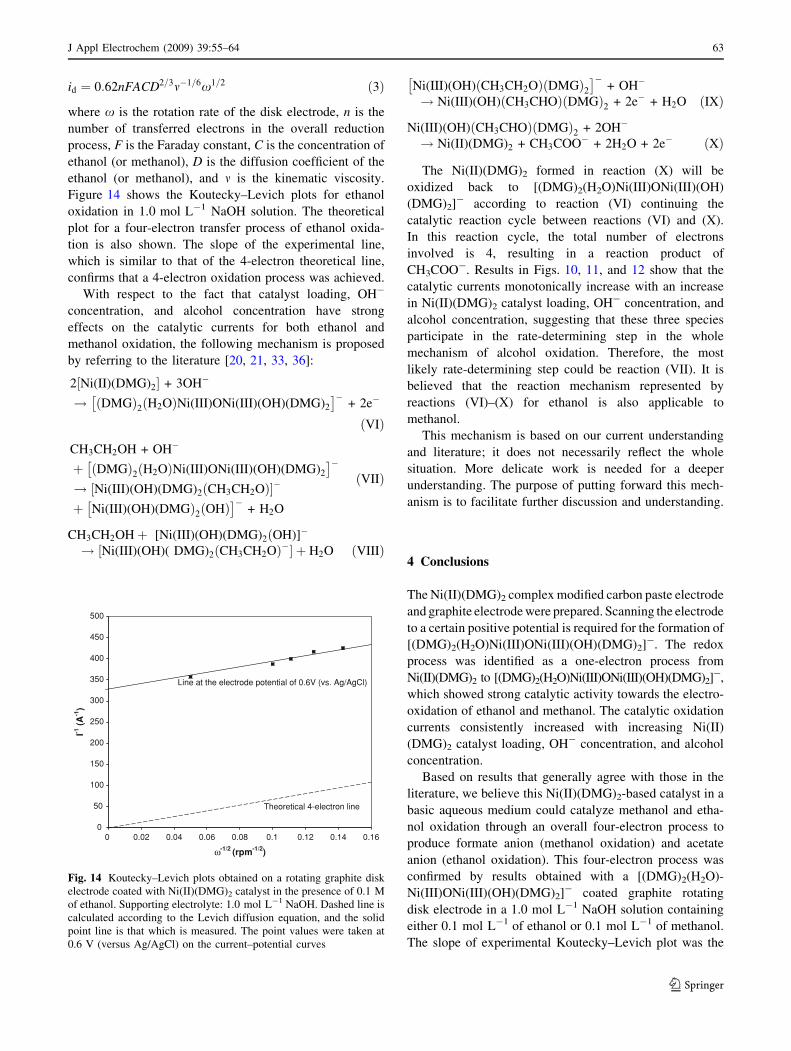
Figure 14 shows the Koutecky–Levich plots for ethanol
oxidation in 1.0 mol L-1 NaOH solution. The theoretical
plot for a four-electron transfer process of ethanol oxida-
tion is also shown. The slope of the experimental line,
which is similar to that of the 4-electron theoretical line,
confirms that a 4-electron oxidation process was achieved.
With respect to the fact that catalyst loading, OH-
concentration, and alcohol concentration have strong
effects on the catalytic currents for both ethanol and
methanol oxidation, the following mechanism is proposed
by referring to the literature [20, 21, 33, 36]:
2½Ni(II)(DMG)2� + 3OH�
! ðDMGÞ2 H2Oð ÞNi(III)ONi(III)(OH)(DMG)2
� ��+ 2e�
ðVIÞ
CH3CH2OH + OH�
þ ðDMGÞ2 H2Oð ÞNi(III)ONi(III)(OH)(DMG)2
� ��! Ni(III)(OH)(DMG)2 CH3CH2Oð Þ½ ��
þ Ni(III)(OH)(DMGÞ2ðOHÞ� ��
+ H2O
ðVIIÞ
CH3CH2OHþ [Ni(III)(OH)(DMG)2ðOH)]�
! Ni(III)(OH)( DMG)2 CH3CH2Oð Þ�½ � þ H2O ðVIIIÞ
Ni(III)(OH) CH3CH2Oð ÞðDMGÞ2� ��
+ OH�
! Ni(III)(OH) CH3CHOð ÞðDMGÞ2 + 2e� + H2O ðIXÞ
Ni(III)(OH) CH3CHOð ÞðDMGÞ2 + 2OH�
! Ni(II)(DMG)2 + CH3COO� + 2H2O + 2e� ðXÞ
The Ni(II)(DMG)2 formed in reaction (X) will be
oxidized back to [(DMG)2(H2O)Ni(III)ONi(III)(OH)
(DMG)2]- according to reaction (VI) continuing the
catalytic reaction cycle between reactions (VI) and (X).
In this reaction cycle, the total number of electrons
involved is 4, resulting in a reaction product of
CH3COO-. Results in Figs. 10, 11, and 12 show that the
catalytic currents monotonically increase with an increase
in Ni(II)(DMG)2 catalyst loading, OH- concentration, and
alcohol concentration, suggesting that these three species
participate in the rate-determining step in the whole
mechanism of alcohol oxidation. Therefore, the most
likely rate-determining step could be reaction (VII). It is
believed that the reaction mechanism represented by
reactions (VI)–(X) for ethanol is also applicable to
methanol.
This mechanism is based on our current understanding
and literature; it does not necessarily reflect the whole
situation. More delicate work is needed for a deeper
understanding. The purpose of putting forward this mech-
anism is to facilitate further discussion and understanding.
4 Conclusions
The Ni(II)(DMG)2 complex modified carbon paste electrode
and graphite electrode were prepared. Scanning the electrode
to a certain positive potential is required for the formation of
[(DMG)2(H2O)Ni(III)ONi(III)(OH)(DMG)2]-. The redox
process was identified as a one-electron process from
Ni(II)(DMG)2 to [(DMG)2(H2O)Ni(III)ONi(III)(OH)(DMG)2]-,
which showed strong catalytic activity towards the electro-
oxidation of ethanol and methanol. The catalytic oxidation
currents consistently increased with increasing Ni(II)
(DMG)2 catalyst loading, OH- concentration, and alcohol
concentration.
Based on results that generally agree with those in the
literature, we believe this Ni(II)(DMG)2-based catalyst in a
basic aqueous medium could catalyze methanol and etha-
nol oxidation through an overall four-electron process to
produce formate anion (methanol oxidation) and acetate
anion (ethanol oxidation). This four-electron process was
confirmed by results obtained with a [(DMG)2(H2O)-
Ni(III)ONi(III)(OH)(DMG)2]- coated graphite rotating
disk electrode in a 1.0 mol L-1 NaOH solution containing
either 0.1 mol L-1 of ethanol or 0.1 mol L-1 of methanol.
The slope of experimental Koutecky–Levich plot was the
0
50
100
150
200
250
300
350
400
450
500
0
ω-1/2 (rpm-1/2)
I-1 (
A-1
)
Theoretical 4-electron line
Line at the electrode potential of 0.6V (vs. Ag/AgCl)
0.160.140.120.10.080.060.040.02
Fig. 14 Koutecky–Levich plots obtained on a rotating graphite disk
electrode coated with Ni(II)(DMG)2 catalyst in the presence of 0.1 M
of ethanol. Supporting electrolyte: 1.0 mol L-1 NaOH. Dashed line is
calculated according to the Levich diffusion equation, and the solid
point line is that which is measured. The point values were taken at
0.6 V (versus Ag/AgCl) on the current–potential curves
J Appl Electrochem (2009) 39:55–64 63
123

same with that of the theoretical one calculated under the
same conditions.
Acknowledgements The authors are grateful for the support of
CNPq (Project ETACOMB, Proc. 505167/2004-2) and PETRO-
BRAS, Brazil, and the Institute for Fuel Cell Innovation, National
Research Council of Canada.
References
1. Liu H, Song C, Zhang L, Zhang J, Wang H, Wilkinson DP (2006)
J Power Sources 155:95
2. Antolini E (2007) J Power Sources 170:1
3. Spendelow JS, Wieckowski A (2007) Phys Chem Chem Phys
9:2654
4. Wang H, Xu C, Cheng F, Jiang S (2007) Electrochem Commun
9:1212
5. Cao L, Sun G, Li H, Xin Q (2007) Electrochem Commun 9:2541
6. Xu C, Hu Y, Rong J, Jiang S (2007) Electrochem Commun
9:2009
7. Gupta SS, Data J (2005) J Power Sources 145:124
8. Taraszewska J, Roslonek G (1994) J Electroanal Chem 364:209
9. El-Shafei AA (1999) J Electroanal Chem 471:89
10. Fleischmann M, Korinek K, Pletcher D (1971) J Electroanal
Chem 31:39
11. Casella IG, Cataldi TRI, Salvi AM, Desimoni E (1993) Anal
Chem 65:3143
12. Roslonek G, Taraszewska J (1992) J Electroanal Chem 325:285
13. Bae ZU, Park JH, Lee SH, Chang HY (1999) J Electroanal Chem
468:85
14. Golabi SM, Nozad A (2004) Electroanalysis 16:199
15. Ciszewski A, Milczarek G (1997) J Electroanal Chem 426:125
16. Golikand AN, Maragheh MG, Irannejad L, Asgari M (2006) Russ
J Electrochem 42:167
17. Flora CJ, Nieboer E (1980) Anal Chem 52:1013
18. Pihlar B, Valenta P, Nurnberg HW (1986) J Electroanal Chem
214:157
19. Korolczuk M (2000) Talanta 53:679
20. Golikand AN, Asgari M, Maragheh MG, Shahrokhian S (2006) J
Electroanal Chem 588:155
21. Golikand AN, Shahrokhian S, Asgari M, Maragheh MG, Ir-
annejad L, Khanchi A (2005) J Power Sources 144:21
22. Ciszewski A, Milczarek G (1996) J Electroanal Chem 413:137
23. Malinski T, Ciszewski A, Benett J, Fish JR, Czuchajowski L
(1991) J Electrochem Soc 138:2008
24. Malati MA (1999) Experimental inorganic physical chemistry,
harwood series in chemical science. Harwood Publishing,
Chichester, p 214
25. Ponnuswamy T, Chyan O (2002) Anal Sci 18:449
26. Xavier KO, Chacko J, Yussuf KKM (2004) Appl Catal A 258:251
27. Szabo A, Kovacs A (2003) J Mol Struct 651–653:615
28. Nayak SC, Das PK, Sahoo KK (2003) Chem Pap 57:91
29. Nakamoto K (1970) Infrared spectra of inorganic and coordina-
tion compounds. Wiley, New York, p 230
30. Bellamy LJ (1968) Advances in infrared group frequencies.
Methuen, London, p 105
31. Young VY, Chang FC, Cheng KL (1987) Appl Spectrosc 41:994
32. Ni X, Zhao Q, Zhang Y, Song J, Zheng H, Yang K (2006) Solid
State Sci 8:1312
33. Kotz R, Yeager E (1979) J Electroanal Chem 113:113
34. Pereira MG, Jimenez MD, Elizalde MP, Manzo-Robledo A,
Alonso-Vante N (2004) Electrochim Acta 49:3917
35. Bard AJ, Faulkner LR (2001) Electrochemical methods, funda-
mentals and applications. Wiley, New York
36. Kim JW, Park SM (2005) J Korean Electrochem Soc 8:117
64 J Appl Electrochem (2009) 39:55–64
123