a spray reactor concept for catalytic oxidation of p-xylene - KU ...
203
A SPRAY REACTOR CONCEPT FOR CATALYTIC OXIDATION OF P-XYLENE TO PRODUCE HIGH-PURITY TEREPHTHALIC ACID By Meng Li Submitted to the graduate degree program in Chemical & Petroleum Engineering and the Graduate Faculty of the University of Kansas in partial fulfillment of the requirements for the degree of Doctor of Philosophy. ________________________________ Bala Subramaniam (Chairperson) ________________________________ Daryle H. Busch ________________________________ Raghunath V. Chaudhari ________________________________ Peter D. Metelski ________________________________ Laurence R. Weatherley Date Defended: July 18, 2013
-
Upload
khangminh22 -
Category
Documents
-
view
1 -
download
0
Transcript of a spray reactor concept for catalytic oxidation of p-xylene - KU ...
A SPRAY REACTOR CONCEPT FOR CATALYTIC OXIDATION OF P-XYLENE TO PRODUCE HIGH-PURITY TEREPHTHALIC ACID
By
Meng Li
Submitted to the graduate degree program in Chemical & Petroleum Engineering and the Graduate Faculty of the University of Kansas in partial fulfillment of the requirements for the
degree of Doctor of Philosophy.
________________________________ Bala Subramaniam (Chairperson)
________________________________ Daryle H. Busch
________________________________ Raghunath V. Chaudhari
________________________________ Peter D. Metelski
________________________________ Laurence R. Weatherley
Date Defended: July 18, 2013

! ii
The Dissertation Committee for Meng Li certifies that this is the approved version of the following dissertation:
A SPRAY REACTOR CONCEPT FOR CATALYTIC OXIDATION OF P-XYLENE TO PRODUCE HIGH-PURITY TEREPHTHALIC ACID
________________________________ Bala Subramaniam (Chairperson)
Date approved: July 20, 2013
! iii
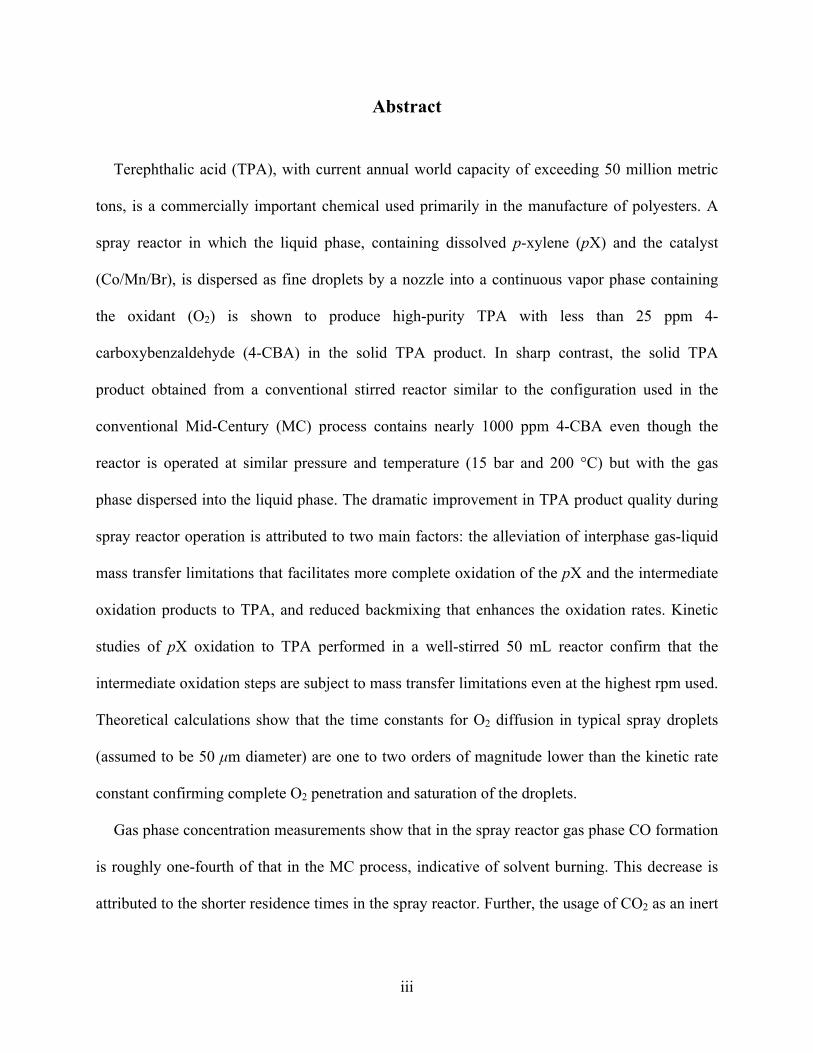
Abstract
Terephthalic acid (TPA), with current annual world capacity of exceeding 50 million metric
tons, is a commercially important chemical used primarily in the manufacture of polyesters. A
spray reactor in which the liquid phase, containing dissolved p-xylene (pX) and the catalyst
(Co/Mn/Br), is dispersed as fine droplets by a nozzle into a continuous vapor phase containing
the oxidant (O2) is shown to produce high-purity TPA with less than 25 ppm 4-
carboxybenzaldehyde (4-CBA) in the solid TPA product. In sharp contrast, the solid TPA
product obtained from a conventional stirred reactor similar to the configuration used in the
conventional Mid-Century (MC) process contains nearly 1000 ppm 4-CBA even though the
reactor is operated at similar pressure and temperature (15 bar and 200 °C) but with the gas
phase dispersed into the liquid phase. The dramatic improvement in TPA product quality during
spray reactor operation is attributed to two main factors: the alleviation of interphase gas-liquid
mass transfer limitations that facilitates more complete oxidation of the pX and the intermediate
oxidation products to TPA, and reduced backmixing that enhances the oxidation rates. Kinetic
studies of pX oxidation to TPA performed in a well-stirred 50 mL reactor confirm that the
intermediate oxidation steps are subject to mass transfer limitations even at the highest rpm used.
Theoretical calculations show that the time constants for O2 diffusion in typical spray droplets
(assumed to be 50 µm diameter) are one to two orders of magnitude lower than the kinetic rate
constant confirming complete O2 penetration and saturation of the droplets.
Gas phase concentration measurements show that in the spray reactor gas phase CO formation
is roughly one-fourth of that in the MC process, indicative of solvent burning. This decrease is
attributed to the shorter residence times in the spray reactor. Further, the usage of CO2 as an inert

! iv
gas and the dominance of acetic acid (>50 mol%) in the vapor phase under reaction conditions
create a gas phase environment that falls outside of the flammability envelope.
Mathematical modeling of the stirred reactor using MC process conditions accurately predicts
the steady state temperatures observed in industrial reactors (195 °C). The model also clearly
divulges that the cooling provided by partial evaporation of the acetic acid solvent, upon
absorbing the heat of reaction at the set reactor pressure, is vital to maintain stable steady state
operation. Experimental results clearly attest to the significance of reliable pressure control to
prevent undesired temperature rises. Comparative economic analyses and gate-to-gate and
cradle-to-gate life cycle assessments show that the spray process significantly reduces capital and
operating costs by 55% and 16% respectively, and also imposes less adverse environmental
impacts than the MC process. These benefits of the CEBC spray process are mainly derived from
the non-requirement of the hydrogenation step required in the conventional process for purifying
the crude TPA. Thus, the spray reactor concept has the potential to be a greener and more
sustainable process for making polymer-grade dicarboxylic acids in one step. The results from
this dissertation provide valuable guidance for the rational design and development of a
continuous spray reactor.

! v
Graphical Abstract

! vi
“The way ahead is long and has no ending; yet high and low I'll search with my will unbending.”
— Qu Yuan
(Warring States Period of Ancient China)
Dedicated to my parents, Yuefang Hao and Zhicai Li, for thirty-one years of love and support,
without which this work would not have been possible

! vii
Acknowledgements
I would like to express my most sincere gratitude and appreciation to my advisor, Prof. Bala
Subramaniam, for his guidance and support throughout my graduate study. Prof. Subramaniam
provided me with the great opportunity to work on this project, and offered excellent technical
and professional advice whenever I had difficulties in my research. This project has long
captured my fascination and imagination, including chemical reactor design and operation,
catalysis and kinetics, and chemical process simulation and modeling. It was Prof.
Subramaniam’s encouragement and support that sustained my interest. In addition to his
guidance on my dissertation work, Prof. Subramaniam has taught me a lot of things. He has
taught me about critical thinking, about developing an idea, about analyzing and solving
problems, about perseverance and staying positive when research hits a snag. Prof. Subramaniam
has been and will always be a great mentor and an invaluable asset to me.
Special thanks are also due to Prof. Daryle Busch, Prof. Raghunath Chaudhari, Dr. Peter
Metelski and Prof. Laurence Weatherley for serving on my PhD committee, and for providing
valuable instruction and guidance throughout my time in the program.
I would like to acknowledge and thank Dr. Fenghui Niu and Dr. Xiaobin Zuo, for their
generous assistance in experiments. Without their hard work and input I would not have been
able to complete this dissertation to my satisfaction. I would like to thank Dr. Todd Williams and
Dr. Robert Drake for their help with the analytical methods. Thanks are also due to Mr. Edwin
Atchison and Mr. Thomas Ruddy for their valuable input to the equipment design and economic
and environmental impact analyses.
In addition, I would like to thank my colleagues at CEBC (past and present): Dr. Darryl
Fahey, Dr. Chris Lyon, Dr. Claudia Bode, Mr. James Busse, Ms. Deanna Bieberly, Ms. Nancy

! viii
Crisp, Ms. Rhonda Partridge, Ms. Megan Gannon, Mr. Alan Walker, Ms. Rebecca Meyer, Dr.
William Kirk Snavely, Dr. Jing Fang, Dr. Jackson Ford, Dr. Andrew Danby, Dr. Michael
Lundin, Dr. Hyun-Jin Lee, Dr. Debdut Roy, Dr. Suparna Roy, Dr. Juan Bravo, Dr. Bibhas
Sarkar, Dr. Haijun Wan, Dr. Swarup Maiti, Dr. Ramanathan Anand, Dr. Maheswari
Rajamanickam, Dr. Amit Chaudhari, Dr. Shengwei Tang, Dr. Chad Johnson, Dr. Kening Gong,
Dr. Wei Ren, Dr. Azita Ahosseini, Dr. Sylvia Johnson, Dr. Madhav Ghanta, Dr. Zhuanzhuan
Xie, Ms. Arely Torres, Mr. Faisal Baksh, Ms. Yuanchun Li, Mr. Xin Jin, Ms. Wenjuan Yan, Ms.
Xiaohui Hu, Mr. Steve Tang, Ms. Qing Pan, Ms. Xuchao Li, Mr. Dupeng Liu, and Mr. He for
their friendship and help.
In short, I am grateful to all of the above incredible people I met during this journey who
contributed to my academic and personal development.
The majority of the research in this dissertation was funded by National Science Foundation
and U.S. Department of Agriculture.
Finally, I own so much to my parents, Yuefang Hao and Zhicai Li, for their unconditional
love and support, and for respecting my decision to go to another country for my continued
education. I have to compensate for not being with them for all these years and find a balance
between career and family, which will be another life project of mine. I would also like to thank
my aunt Junyue Hao and my uncle-in-law Huanbing Zhai, for their continued care and support.
! ix
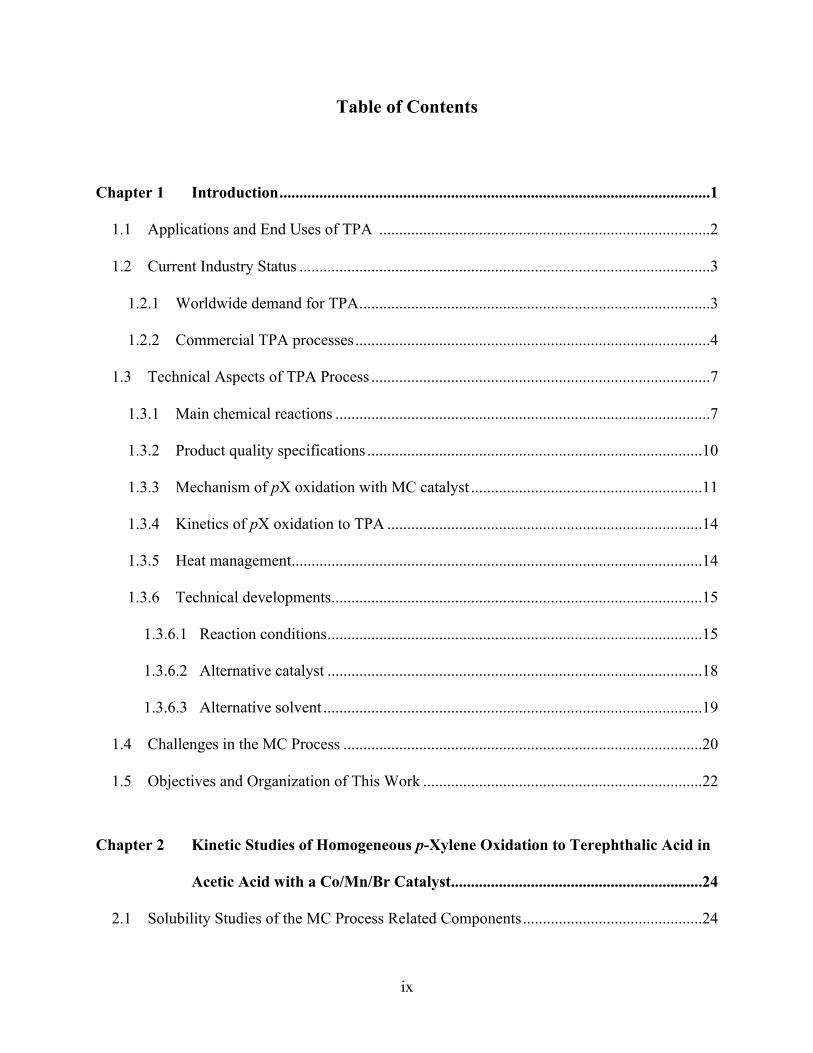
Table of Contents
!
Chapter 1 Introduction ............................................................................................................1
1.1 Applications and End Uses of TPA ...................................................................................2 !
1.2 Current Industry Status .......................................................................................................3 !
1.2.1 Worldwide demand for TPA ........................................................................................3
1.2.2 Commercial TPA processes .........................................................................................4
1.3 Technical Aspects of TPA Process .....................................................................................7 !
1.3.1 Main chemical reactions ..............................................................................................7
1.3.2 Product quality specifications ....................................................................................10
1.3.3 Mechanism of pX oxidation with MC catalyst ..........................................................11
1.3.4 Kinetics of pX oxidation to TPA ...............................................................................14
1.3.5 Heat management .......................................................................................................14
1.3.6 Technical developments .............................................................................................15
1.3.6.1 Reaction conditions ..............................................................................................15
1.3.6.2 Alternative catalyst ..............................................................................................18
1.3.6.3 Alternative solvent ...............................................................................................19
1.4 Challenges in the MC Process ..........................................................................................20 !
1.5 Objectives and Organization of This Work ......................................................................22 !!Chapter 2 Kinetic Studies of Homogeneous p-Xylene Oxidation to Terephthalic Acid in
Acetic Acid with a Co/Mn/Br Catalyst ...............................................................24
2.1 Solubility Studies of the MC Process Related Components .............................................24 !

! x
2.1.1 Motivation ..................................................................................................................24
2.1.2 Experimental method .................................................................................................26
2.1.3 Experimental results ...................................................................................................27
2.2 Previous Work on Kinetics of pX Oxidation to TPA .......................................................29 !
2.3 Motivation and Significance of This Work ......................................................................33 !
2.4 Experimental .....................................................................................................................34 !
2.4.1 Materials ....................................................................................................................34
2.4.2 Experimental setup and procedure .............................................................................34
2.4.3 Analytical techniques .................................................................................................36
2.5 Lumped Kinetic Scheme and Semi-Batch Reactor Model ...............................................37 !
2.6 Results and Discussion .....................................................................................................41 !
2.6.1 T & P profile ..............................................................................................................41
2.6.2 Effect of stirring rate ..................................................................................................42
2.6.3 Comparison of estimated rate constants with literature data .....................................44
2.6.4 Effect of bromide concentration ................................................................................45
2.6.5 Effect of substrate concentration ...............................................................................49
2.7 Summary ...........................................................................................................................50 !!Chapter 3 A Spray Reactor Concept for Catalytic Oxidation of p-Xylene to Produce
High-Purity Terephthalic Acid ...........................................................................52
3.1 Theoretical Considerations ...............................................................................................54 !
3.1.1 Rationale for choosing spray reactor as an alternative to a stirred reactor ................54
3.1.2 Droplet/reactor stability considerations .....................................................................56
3.1.3 Vapor phase flammability considerations ..................................................................61

! xi
!3.2 Experimental Demonstration ............................................................................................62
!3.2.1 Materials ....................................................................................................................62
3.2.2 Oxidation experiments in spray reactor .....................................................................63
3.2.3 Benchmark oxidation experiments in a stirred reactor ..............................................65
3.2.4 Product analysis .........................................................................................................66
3.3 Experimental results and discussion .................................................................................67 !
3.3.1 Roles of liquid sparger ...............................................................................................67
3.3.2 Performance of spray reactor .....................................................................................69
3.3.3 Comparison of product from spray and stirred reactors ............................................74
3.3.4 CO formation as a measure of burning reactions .......................................................77
3.4 Summary ...........................................................................................................................78 !!Chapter 4 Development of A Continuous Spray Process for Terephthalic Acid
Production ............................................................................................................80
4.1 Continuous Spray Reactor: Initial Efforts .........................................................................80 !
4.2 Preliminary Experimental Results from Continuous operation of the 4 L Spray Reactor ...........................................................................................................................................83
!4.3 Summary ...........................................................................................................................87
!!Chapter 5 Economic and Environmental Impact Assessment of the Spray Process for
Terephthalic Acid Production ............................................................................88
5.1 Introduction .......................................................................................................................89 !
5.2 Methodology .....................................................................................................................90 !
5.3 Process Simulations ..........................................................................................................91

! xii
!5.3.1 Process simulation basis ............................................................................................91
5.3.2 Process descriptions ...................................................................................................93
5.3.2.1 Conventional MC process ....................................................................................96
5.3.2.2 CEBC spray process ..........................................................................................100
5.4 Economic Analysis .........................................................................................................101 !
5.4.1 Capital investment ...................................................................................................101
5.4.1.1 Purchased equipment costs ................................................................................101
5.4.1.2 Estimate of capital investment ...........................................................................102
5.4.2 Total production cost ...............................................................................................103
5.4.2.1 Utilities and raw material costs ..........................................................................103
5.4.2.2 Estimate of total production cost .......................................................................106
5.4.3 Sensitivity analysis...................................................................................................106
5.5 Environmental Impact Analysis ......................................................................................107 !
5.5.1 Introduction to LCA .................................................................................................108
5.5.2 Methodology ............................................................................................................110
5.5.3 Environmental impact analysis of TPA processes ...................................................112
5.5.3.1 Goal and scope definition ..................................................................................112
5.5.3.2 Life cycle inventory ...........................................................................................117
5.5.3.3 Life cycle impact assessment .............................................................................119
5.5.3.4 Data interpretation .............................................................................................125
5.6 Summary .........................................................................................................................130 !!Chapter 6 Conclusions and Recommendations .................................................................132

! xiii
6.1 Conclusions .....................................................................................................................132 !
6.2 Recommendations ...........................................................................................................137 !!Nomenclature .............................................................................................................................140
Bibliography ...............................................................................................................................141
Appendices ..................................................................................................................................153
Appendix A: Numerical Data of the Experimental Solubilities ..............................................153
Appendix B: HYSYS Simulation for Saturated Acetic Acid ..................................................154
Appendix C: HYSYS Simulation of MC and CEBC Processes ..............................................155 !
Appendix D: Economic Analysis .............................................................................................160 !
Appendix E: Environmental Impact Analysis .........................................................................182 !!!!!!!!!

! xiv
List of Tables
!Table 1.1 Oxidation reaction conditions and technology characteristics of major commercial
TPA processes ..........................................................................................................6
Table 1.2 TPA product specifications ....................................................................................11
Table 2.1 Temperature ranges of available literature solubility data .....................................26
Table 2.2 Various kinetic models for pX oxidation to TPA from literature ..........................31
Table 2.3 Operating conditions of the pX oxidation experiments ........................................36
Table 2.4 Estimated reaction rate constants at different stirring rates (initial [pX] = 0.025 M;
all other experimental conditions are as shown in Table 2.3) ................................44
Table 2.5 Comparison of estimated rate constants with literature data .................................45
Table 2.6 Estimated reaction rate constants at different bromide concentrations (initial [pX]
= 0.025 M; stirring rate = 1000 rpm; all other experimental conditions are as
shown in Table 2.3) ................................................................................................48
Table 2.7 Estimated reaction rate constants at different pX concentrations (P = 15 bar; T =
200 (°C; stirring rate = 1000 rpm; all other experimental conditions are as shown
in Table 2.3) ...........................................................................................................50
Table 3.1 Estimation of Hatta number for simultaneous O2 diffusion and reaction in a
droplet ....................................................................................................................56
Table 3.2 Purity of solid TPA product obtained from the spray reactor ...............................69
Table 3.3 Product specifications from run #1 of Table 3.2 ...................................................73
Table 3.4 Comparison of product purity and yields from spray and stirred reactors ...........74
Table 3.5 CO analysis during the pX oxidation in the spray reactor .....................................77

! xv
Table 4.1 Gas sparger effects on solid TPA product quality from the 4-L spray reactor .....82
Table 4.2 Acetic acid amounts from the top (gas stream) and bottom (liquid stream) of the
spray reactor (operating conditions same as in Table 4.1) .....................................84
Table 4.3 Solid TPA product quality during 25-min continuous run in 4 L spray reactor ....86
Table 5.1 Key operating parameters for the simulation of the MC and CEBC spray
processes ................................................................................................................92
Table 5.2 Assumed acetic acid use and loss for the MC process and the CEBC spray process
................................................................................................................................93
Table 5.3 Comparison of capital costs for both MC and spray processes ...........................103
Table 5.4 Utilities and raw material costs for both processes ..............................................105
Table 5.5 Comparison of conventional MC process VOC emissions obtained from U.S.
EPA Toxic Release Inventory (TRI) data for commercial facility with GaBi®-
estimated emissions ............................................................................................119
Table 5.6 Comparison of conventional MC process CO2 emissions obtained from U.S. EPA
GHG data for commercial facility with GaBi®-estimated emissions .................120
Table A1 Experimental solubilities of TPA, 4-CBA and p-TA in acetic acid or aqueous
acetic acid .............................................................................................................153
Table C1 Simulation parameters for the oxidation section of both processes .....................155
Table C2 Simulation parameters for the hydrogenation section of conventional MC process
..............................................................................................................................159
Table D1 Purchased equipment cost estimation details of conventional MC process ........160
Table D2 Purchased equipment cost estimation details of CEBC spray process ................175
Table D3 Total production cost for both processes .............................................................181

! xvi
Table E1 Predicted gate-to-gate environmental impact potentials for conventional and
CEBC processes ...................................................................................................182
Table E2 Predicted cradle-to-gate environmental impact potentials for conventional and
CEBC processes ...................................................................................................183!
!!!!

! xvii
List of Figures
!Figure 1.1 Major applications of polyethylene terephthalate (PET) .........................................3
Figure 1.2 Projected growth in demand for TPA in various geographic regions [6] ................4
Figure 1.3 Sequential reaction network for pX oxidation to TPA ............................................8
Figure 1.4 Structures of major impurities formed during pX oxidation to TPA .......................9
Figure 1.5 Structures of fluorenones and fluorenes ...............................................................10
Figure 1.6 Model for redox activity of MC catalyst components [6] ......................................12
Figure 1.7 Initiation, propagation and termination steps of free radical chain reactions during
pX oxidation to TPA with Co/Mn/Br system [44].................................................12
Figure 2.1 Typical T & P profiles during solubility studies (T & P rise and fall due to stirrer
turned on and off deliberately) ...............................................................................27
Figure 2.2 Solubilities of the MC process related components (14.5-15.5 bar in N2): (a) TPA;
(b) 4-CBA and p-TA ..............................................................................................28
Figure 2.3 Experimental apparatus for pX oxidation to TPA .................................................35
Figure 2.4 Typical HPLC chromatogram of a product sample (after 15 sec. of pX oxidation
showing initial product + intermediates) ...............................................................37
Figure 2.5 Proposed lumped kinetic scheme for pX oxidation to TPA ..................................38
Figure 2.6 Formation and oxidation of BPTA ........................................................................39
Figure 2.7 Temporal temperature and pressure profiles during intrinsic kinetic studies of pX
oxidation in a stirred reactor .................................................................................41

! xviii
Figure 2.8 Experimental and simulated product distributions at different stirring rates
(Reaction conditions: T = 200 °C, P = 15 bar; Initial pX = 25 mM, Co = 12.5 mM,
Mn = 12.5 mM, Br = 32.5 mM; O2:CO2 (mol:mol) = 1:1) ....................................42
Figure 2.9 Figure 2.9: Color changes of the reaction solution due to the formation of various
cobalt bromides [104] at various bromide concentrations in acetic acid. [Co(II)] =
12.5 mM .................................................................................................................46
Figure 2.10 Experimental and simulated product distributions with various bromide
concentrations (initial [pX] = 0.025 M; stirring rate = 1000 rpm; all other
experimental conditions are as shown in Table 2.3) ..............................................48
Figure 2.11 Proposed Scheme for the autoxidation of benzyl bromide [105] ..........................49
Figure 2.12 Effect of initial concentration of pX on the reaction rate [99] ...............................50
Figure 3.1 Factors that dictate reactor performance [109] ......................................................52
Figure 3.2 Variation of acetic acid boiling point and heat of vaporization with pressure ......57
Figure 3.3 Schematic of oxidation reactor at typical MC process conditions [13, 14, 20] .....58
Figure 3.4 Predicted heat generation (QG) and heat removal (QR) rates for pX oxidation
reactor (conditions noted in Figure 3.3) .................................................................60
Figure 3.5 Effects of water content on reactor temperature in MC process ............................61
Figure 3.6 Schematic of the spray reactor: The four thermocouple locations (black dots) are
evenly spaced and numbered from the bottom to the top as follows: T1,bottom (in the
liquid phase), T2 (above T1,bottom), T3 (above T2) and T4,top (above T3) ..........64
Figure 3.7 Schematic of the liquid sparger ..............................................................................68
Figure 3.8 Measurement of acetic acid condensed from gas phase during black run (Left:
without sparger; Right: with sparger) ....................................................................68

! xix
Figure 3.9 SEM (scanning electron microscope) image of TPA crystals produced from the
spray reactor ...........................................................................................................70
Figure 3.10 Temporal temperature and pressure profiles during spray reactor operation: (a)
with gas outlet (operating conditions correspond to run 1, Table 3.2); (b) without
gas outlet (operating conditions correspond to run 4, Table 3.2); (c) with gas
outlet (operating conditions correspond to run 3, Table 3.2) .................................72
Figure 3.11 Temperature profiles during the cool down phase: (a) stirred reactor; (b) spray
reactor ....................................................................................................................76
Figure 4.1 Dimensions of 700 mL and 4 L spray reactors ......................................................81
Figure 4.2 T & P profiles during a 25-min blank run with manual control of micro-metering
valve .......................................................................................................................85
Figure 4.3 30-min blank run with stepper motor controlled micro-metering valve ................86
Figure 5.1 Process flow diagram for the conventional MC process .......................................94
Figure 5.2 Process flow diagram for the CEBC spray process ...............................................95
Figure 5.3 Comparison of purchased equipment costs for MC and spray processes ............102
Figure 5.4 Comparison of total production costs for both processes (Others include other
direct, indirect costs and general expenses such as labor, research, plant overhead,
operating supplies and maintenance, details are provided in Table D3 of Appendix
D) .........................................................................................................................106
Figure 5.5 Capital and operating cost rise with acetic acid throughput in CEBC spray process
..............................................................................................................................107
Figure 5.6 Methodological framework for LCA of TPA processes. .....................................110
! xx
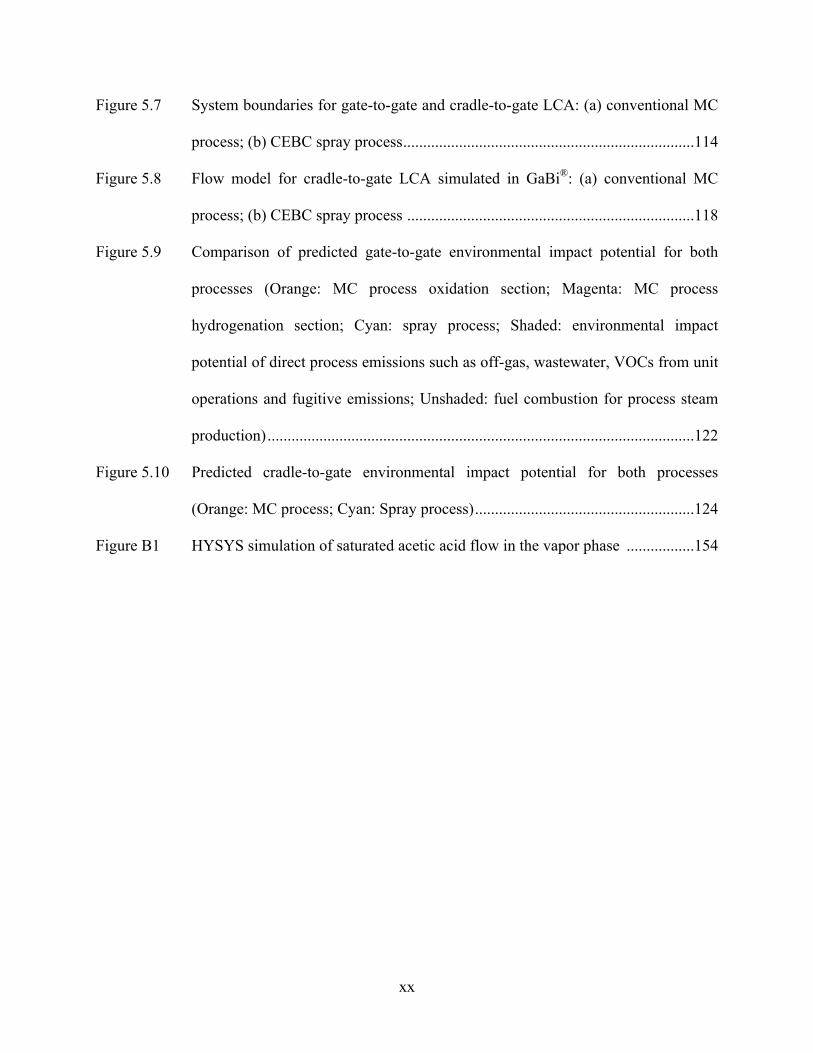
Figure 5.7 System boundaries for gate-to-gate and cradle-to-gate LCA: (a) conventional MC
process; (b) CEBC spray process .........................................................................114
Figure 5.8 Flow model for cradle-to-gate LCA simulated in GaBi®: (a) conventional MC
process; (b) CEBC spray process ........................................................................118
Figure 5.9 Comparison of predicted gate-to-gate environmental impact potential for both
processes (Orange: MC process oxidation section; Magenta: MC process
hydrogenation section; Cyan: spray process; Shaded: environmental impact
potential of direct process emissions such as off-gas, wastewater, VOCs from unit
operations and fugitive emissions; Unshaded: fuel combustion for process steam
production) ...........................................................................................................122
Figure 5.10 Predicted cradle-to-gate environmental impact potential for both processes
(Orange: MC process; Cyan: Spray process) .......................................................124
Figure B1 HYSYS simulation of saturated acetic acid flow in the vapor phase .................154
!!
! 1
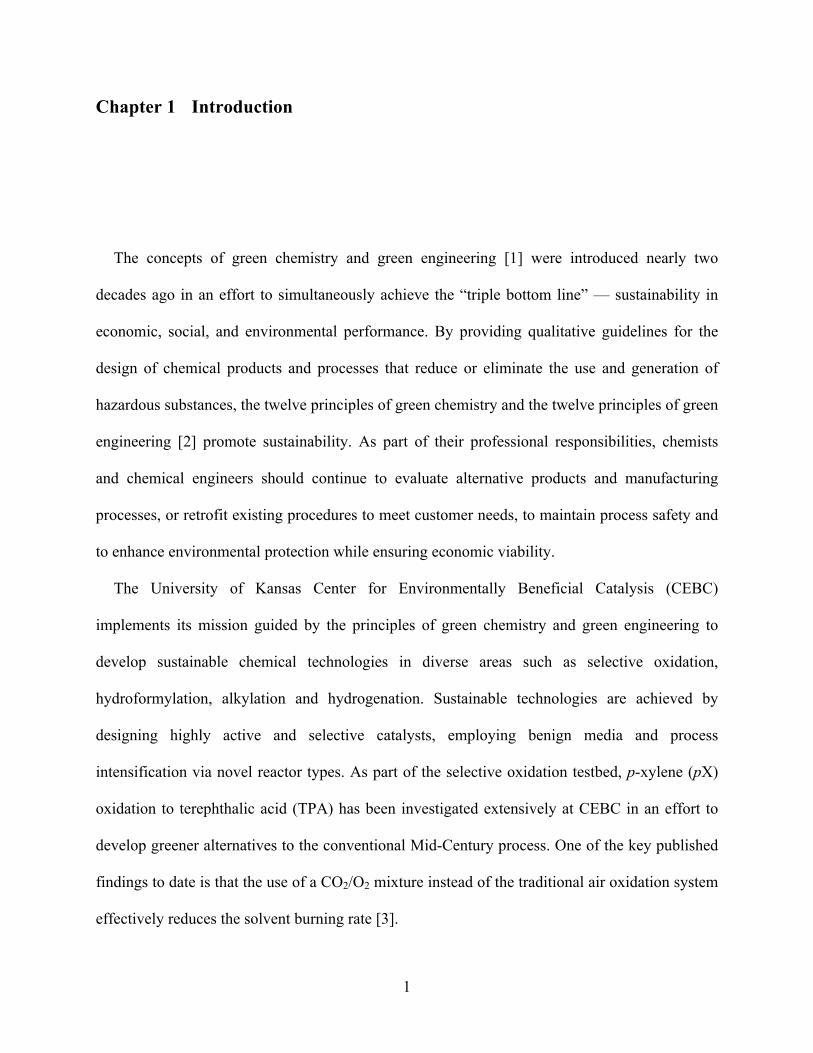
Chapter 1 Introduction
The concepts of green chemistry and green engineering [1] were introduced nearly two
decades ago in an effort to simultaneously achieve the “triple bottom line” — sustainability in
economic, social, and environmental performance. By providing qualitative guidelines for the
design of chemical products and processes that reduce or eliminate the use and generation of
hazardous substances, the twelve principles of green chemistry and the twelve principles of green
engineering [2] promote sustainability. As part of their professional responsibilities, chemists
and chemical engineers should continue to evaluate alternative products and manufacturing
processes, or retrofit existing procedures to meet customer needs, to maintain process safety and
to enhance environmental protection while ensuring economic viability.
The University of Kansas Center for Environmentally Beneficial Catalysis (CEBC)
implements its mission guided by the principles of green chemistry and green engineering to
develop sustainable chemical technologies in diverse areas such as selective oxidation,
hydroformylation, alkylation and hydrogenation. Sustainable technologies are achieved by
designing highly active and selective catalysts, employing benign media and process
intensification via novel reactor types. As part of the selective oxidation testbed, p-xylene (pX)
oxidation to terephthalic acid (TPA) has been investigated extensively at CEBC in an effort to
develop greener alternatives to the conventional Mid-Century process. One of the key published
findings to date is that the use of a CO2/O2 mixture instead of the traditional air oxidation system
effectively reduces the solvent burning rate [3].

! 2
This dissertation research complements previous work by CEBC researchers and addresses
some of the sustainability challenges associated with industrial processes for TPA production. In
this chapter, the state-of-the-art of TPA technologies is reviewed.
1.1 Applications and End Uses of TPA
TPA is a commercially important aromatic compound used mainly as a major precursor of
polyethylene terephthalate (PET) polymer, which is produced by polycondensation of ethylene
glycol with TPA. More than 90% of the worldwide production of TPA is used to make PET,
consumed primarily for the manufacture of polyester fibers, solid-state resins (also known as
bottle-grade resins) and polyester film.
Figure 1.1 shows the major applications of PET. Polyester fiber application accounts for a
majority of TPA consumption. End products of polyester fibers include industrial filaments and
polyester filament yarns for consumer products such as apparel, carpets, home textiles and
fiberfill. PET solid-state resins are the next major market for TPA. The end-use applications are
for packaging and plastic bottles as food and beverage containers. The third major TPA
application is polyester film mostly used for magnetic tape and packaging. Remaining minor
TPA uses include production of polybutylene terephthalate, polytrimethylene terephthalate and
aramid fibers.

! 3
Figure 1.1: Major applications of polyethylene terephthalate (PET)
1.2 Current Industry Status
1.2.1 Worldwide demand for TPA
TPA is a growing industry worldwide and the demand is driven by the polyester markets.
Global TPA supply and demand was approximately 42 million metric tons in 2009 [4]. From
1999 to 2009, the global TPA demand grew at a rate of 7-8%/yr. This growth rate decreased
following the global economic recession in 2008.
The current global TPA growth is largely driven by the Asia region, which accounts for about
70% of the world TPA capacity. Asian TPA market is primarily driven by PET fibers, while in
North America and Western Europe, TPA growth is associated primarily with PET bottle resin
market [5]. The TPA demand by geographic regions is shown in Figure 1.2 [6].
PET

! 4
Figure 1.2: Projected growth in demand for TPA in various geographic regions [6]
1.2.2 Commercial TPA processes
Most of the commercial TPA processes are based on the core technology originally developed
by Mid-Century Corporation — a liquid phase bromine-promoted catalytic oxidation of p-xylene
(pX) by means of air or molecular oxygen [7]. Less than 1% of the world capacity of TPA
production is based on the DMT (dimethyl terephthalate) hydrolysis technology. Based on the
impurity levels of the TPA product, the commercial TPA processes are categorized into Purified
TPA (PTA) process and Medium Quality TPA (MTA) process.
The well-known Amoco (acquired by BP in 1997) Mid-Century (MC) process is currently the
leading TPA technology. It involves an oxidation reactor system in which air is dispersed into
the stirred liquid phase containing pX and Co/Mn/Br based catalyst dissolved in aqueous acetic
acid. The reactors are lined with titanium to withstand the highly corrosive hydrobromic acid in

! 5
the reaction mixture. A downstream hydrogenation reactor is deployed to remove 4-
carboxybenzaldehyde (4-CBA), the main and most troublesome impurity. The crude TPA solid
from the oxidation reactor contains 1000-4000 ppm of 4-CBA [8] due to incomplete oxidation.
Most polyester applications require stringent TPA purity specifications of less than 25 ppm 4-
CBA and 150 ppm p-toluic acid (p-TA) each [9] because 4-CBA and p-TA are polymerization
terminators in the polymerization process for PET production. The erstwhile Amoco Company
developed the hydrogenation purification step to upgrade the resulting crude TPA to high purity
polymer-grade TPA or purified TPA (PTA) [10]. BP, DuPont, Dow Chemical, Mitsubishi
Chemical, Eastman Chemical, Mitsui Chemicals, Interquisa, Hitachi and Grupo Petromex are
currently the main commercial TPA technology license holders and licensors. BP is currently the
world’s largest TPA producer with an annual capacity of 7.5 million metric tons in 2011 [11].
By eliminating the hydrogenation step and adding one or more post-oxidation reactors, a
Medium Quality Terephthalic Acid (MTA) process has been developed and commercialized
[12]. Eastman Chemical is the original licensor of this technology. The TPA product from the
MTA process has higher 4-CBA levels (~500 ppm) compared to the MC process, which prevents
its use in some polyester applications.
Generally, the variations of the MC process technology are related to reaction conditions,
catalysts, off-gas treatment method, energy recovery method, acetic acid separation and
recycling, and solid-liquid separation techniques. Table 1.1 summarizes the oxidation reaction
conditions and technology characteristics of major commercial TPA processes assembled from a
large number of patents.

! 6
Table 1.1: Oxidation reaction conditions and technology characteristics of major commercial
TPA processes
Process Oxidation reaction conditions Technology characteristics References
MC Process (BP Amoco)
T: 190-205 °C P: 15-30 bar catalyst: Co/Mn/Br solvent: acetic acid
Leading TPA technology; New-generation TPA process (X Technology): involves improvements in water recycle and solid-liquid separation
7, 13-21
INVISTA Process
(ICI-DuPont)
MC Process conditions
TOUGH MaxTM process: involves improved plant layout and solid-liquid separation methods; R2R technology of residue recovery
8, 22-26
Dow-Inca Process MC Process conditions
COMPRESS™ PTA technology: involves pressure filtration technology and a novel agitation system (to increase mass transfer coefficient)
27-29
Eastman-Kodak Process
T: 120-175 °C P: 7.5-15 bar catalyst: Co/acetaldehyde solvent: acetic acid
Acetic acid is a co-product in the process; Use of acetaldehyde in place of bromide allows the use of conventional material of construction such as stainless steel and carbon steel; Product purity ~ 99%.
13, 14, 30, 31
Toray Process
T: 110-140 °C P: 30 bar catalyst: Co/paraldehyde solvent: acetic acid
Paraldehyde is effective at relatively mild reaction conditions resulting in less colored impurities; Use of acetaldehyde in place of bromide allows the use of conventional material of construction such as stainless steel and carbon steel; Product purity ~ 99%.
13, 14, 32, 33
Teijin Process
T: 100-130 °C P: 10 bar catalyst: Co solvent: acetic acid
High concentrations of Co are used under mild conditions with no promotors; Conventional material of construction such as stainless steel and carbon steel can be used for the apparatus; No coloring impurities such as biphenyl ketone compounds are present so good color tone is easily achieved; Product purity ~ 99%.
14, 34, 35

! 7
1.3 Technical Aspects of TPA Process
1.3.1 Main chemical reactions
The commercial MC process involves a TPA synthesis step by the oxidation of pX and a TPA
purification step by the hydrogenation of 4-CBA. The overall stoichiometric equation for pX
oxidation and 4-CBA hydrogenation is shown in eqns. 1.1 and 1.2, respectively.
(eqn. 1.1)
(eqn. 1.2)
pX oxidation
The pX oxidation is typically conducted at 190-205 °C and 15-30 bar [13]. A catalyst mixture
of cobalt and manganese acetates is employed and hydrobromic acid or sodium bromide acts as
the catalyst promoter reducing the induction period [14, 36]. Aqueous acetic acid is used as the
reaction medium. The oxidation reaction is highly exothermic with the heat of reaction of
approximately 1,300 kJ/mol for pX conversion to TPA [37, 38]. The reaction involves a complex
free radical chain mechanism [36] and is believed to proceed through the sequential reactions
shown in Figure 1.3.
CH3
CH3 COOH
COOH
+ 3O2 + 2H2O
pX TPA
CHO
COOH COOH
CH3
+ 2H2 + H2O
4-CBA p-TA

! 8
Figure 1.3: Sequential reaction network for pX oxidation to TPA
In addition to the intermediates shown in Figure 1.3, there are many other byproducts formed
in the pX oxidation process to TPA. These impurities can be grouped into the derivatives of
benzoic acid, phenol, terephthalic acid, diphenyl, fluorenone, benzophenone, anthraquinone,
aromatic esters and bromine-substituted intermediates [39]. The formation of these compounds is
due to the side reactions, radical and/or ionic, occurring among pX, the oxidation intermediates,
reaction solvent, and the catalytic system. The major impurities are 4-CBA, p-TA, p-
tolualdehyde (TALD), benzoic acid, 1,4-benzenedimethanol diacetate and 4-hydroxymethyl
benzoic acid (4-HMBA), the structures of which are shown in Figure 1.4. These byproducts are
mostly present in the mother liquor and can be easily separated from the solid TPA product by
crystallization under specified conditions. Some troublesome impurities such as 4-CBA tend to
co-precipitate during the reaction and be embodied in the solid product obtained from the final
step of the mother liquor separation. Hence, a subsequent purification step is needed to reduce
these impurities to acceptable levels.
terephthalic acid
COOH
COOH
4-carboxybenzaldehyde
CHO
COOHCOOH
CH3
p-toluic acidp-tolualdehyde
CH3
CHO
p-xylene
CH3
CH3
(TPA)(4-CBA)
+ O2
- H2O+ 1/2 O2
- H2O+ O2 + 1/2 O2

! 9
Figure 1.4: Structures of major impurities formed during pX oxidation to TPA
Over-oxidation of hydrocarbon reactant, intermediates and solvent (also termed as “burning”
[40]) along with decarboxylation and decarbonylation form the undesired products such as CO,
CO2, water, benzoic acid, methyl acetate and methyl bromide. The formation of COx (CO and
CO2) provides a measure of burning reactions and the CO2/CO molar ratio (the so-called
“burning index”) is typically around 3 [3] in the TPA process. It is estimated that 70% of acetic
acid produced worldwide is used to manufacture TPA. Approximately 5% of the acetic acid is
burned per pass [3]. This is equivalent to approximately 0.07 lb of acetic acid burned per pound
of TPA produced [6]. Another important byproduct during TPA production is methyl acetate,
which is formed by the oxidation of acetic acid solvent (eqn. 1.3). Roffia et al. [41] studied the
formation of methyl acetate and found that methyl acetate can be conveniently hydrolyzed over
ion exchange catalysts, for example, to convert methyl acetate to methanol and acetic acid,
which is then recycled.
2 CH3COOH + ½ O2 ! CH3COOCH3 + H2O + CO2 (eqn. 1.3)
4-CBA hydrogenation
The 4-CBA is dissolved with the crude TPA in water and then selectively converted to p-TA.
The TPA re-dissolved in water is recrystallized from aqueous solution. The hydrogenation of 4-
CBA is typically carried out in a fixed-bed reactor containing a carbon-supported palladium
4-CBA
CHO
COOH p-TA
COOH
CH3
TALD
CH3
CHO benzoic acid
COOH
1,4-benzenedimethanol
H2COOCCH3
diacetate
H2COOCCH3CH2OH
COOH
4-HMBA

! 10
catalyst to quantitatively convert 4-CBA to p-TA at 275-290 °C and 70-90 bar [8, 10]. The p-TA
produced is then removed from the recrystallized TPA product by solid-liquid separation. The
hydrogenation step also removes coloring in the TPA product by converting the yellow-colored
fluorenones to the colorless fluorenes. The examples of structures of fluorenones and fluorenes
are shown in Figure 1.5.
Figure 1.5: Structures of fluorenones and fluorenes
1.3.2 Product quality specifications
The TPA product that is used in the polyester industry must satisfy stringent product
specifications. Impurities with only one carboxylic acid group, such as 4-CBA, p-TA and
benzoic acid, are polymerization terminators in the polymerization process for PET production
and must be limited to very low levels. Trifunctional carboxylic acids can cause chain branching
resulting in undesirable rheological and spinning properties. Inorganic impurities such as residual
Co and Mn contents must also be restricted to < 10 ppm. Color and particle size are also
important specification parameters. Colored impurities such as 4-CBA and fluorenones can be
incorporated into the polyester. In particular, it is believed that 4-CBA levels of 1000-4000 ppm
in the crude TPA have a major impact on the polyester color. However, 4-CBA levels below 300
ppm are less of color concern. Particle size determines the flow and the handling of the crystal
TPA product as well as the viscosity of the slurry when mixed with ethylene glycol. Table 1.2
O
COOH
COOH
fluorenone
COOH
COOH
fluorene

! 11
lists the quantitative TPA product specifications on impurity levels, color and particle size [42].
The acid number is typically determined by titration. A perfectly pure TPA sample will have an
acid number of 675.5 mg KOH/g, but the extremely low impurity levels make the acid number
meaningless as a quantitative indication of purity, and it is being phased out [42].
Table 1.2: TPA product specifications
Item Specification Typical value
PTA MTA Acid number, mg KOH/g 675±2 673-675 673-675 Organic impurities, ppm 4-CBA ≤ 25 15 250-500 p-TA ≤ 125±45 100-250 < 50 Benzoic acid — < 5 15-40 Acetic acid — Trace 400-800 Trimellitic acid — 10-20 40-100 Inorganic impurities aMetals, ppm ≤ 9 < 2 < 2 bAsh, ppm ≤ 15 < 3 < 3 Water, wt% ≤ 0.2 0.1 < 0.1 cColor-L, % — 98.7-99.1 97.5-99 Color-b — 0.7-1.7 2-3 Particle size, µm — 100-150 65-85 aCo+Mn+Fe+Cr+Ni+Mo+Ti. bTrace metal oxides. cThe color of TPA crystals is measured in terms of a tristimulus color scale such as the CIE
L*a*b scale [43]. The L* value measures dark to light and ranges from 0 to 100. The b* value
measures yellow to blue, with higher values indicating higher yellow intensity.
1.3.3 Mechanism of pX oxidation with MC catalyst
The liquid-phase catalytic oxidation of pX with the MC catalytic system (Co/Mn/Br) is
generally believed to follow a free radical chain mechanism [36]. As other free radical chain
reactions generally have, the oxidation reaction of pX to TPA involves initiation, propagation

! 12
and termination steps. The model for redox activity of the MC catalyst [6] and the three steps of
free radical chain reactions [44] are shown in Figures 1.6 and 1.7, respectively. In Figure 1.7, M
denotes metal catalyst such as Co or Mn, R denotes aromatic reactants and I denotes radicals
produced.
Figure 1.6: Model for redox activity of MC catalyst components [6]
Figure 1.7: Initiation, propagation and termination steps of free radical chain reactions
during pX oxidation to TPA with Co/Mn/Br system [44]
O2 or

! 13
The initiation step involves the formation of a highly unstable radical of pX by hydrogen atom
abstraction. Even though Co(III) is capable of performing hydrogen abstraction to make the
radical of pX, using cobalt as the sole catalyst is inefficient because the hydrogen abstraction is
very slow. It is well accepted that the initiation mechanism is predominantly due to bromine
radicals originated from bromine ions that are oxidized by Co(III) and Mn(III). The formation of
the radical of pX invokes the classical chain reaction scheme and greatly amplifies the initiation
sequence via a propagation step. The propagation steps consist of oxidation of the substrates by
molecular oxygen, metal ion, and bromine radical, and the reduction of radicals and
hydroperoxides by metal ion. A substance of interest is the peroxy acid that is formed from
oxygenated radicals like benzaldehydes, which is the basis of the Eastman-Kodak process and
the Toray process (refer to Table 1.1), in which aldehydes are added as promoters due to their
ability to form the peroxy acid as the radical initiating specie. In addition, owing to the electron-
withdrawing nature of the carboxyl group, the oxidation of the second methyl group (i.e., the
methyl group on the p-TA) is more challenging. Heiba et al. [45] found that the rate of reaction
of Co(III) in acetic acid of p-TA is 26 times slower than that of pX. The addition of acetaldehyde
in the Eastman-Kodak process and the Toray process can effectively resolve the problem of the
termination of oxygenation caused by the electronic deactivation of the ring. The termination
step consists of the reactions between two radicals to form the TPA product and the byproducts.
Partenheimer [46] illustrated the functions of the Co/Mn/Br catalyst in the oxidation of pX to
TPA. Generally, according to his chemical model, cobalt appears unique among the first row
transition metals in its weak reaction with acetic acid, which produces a small amount of Co(III)
to initiate the reaction. When bromide is added, there is a large increase in activity and selectivity
due to the rapid electron transfer from cobalt to bromide. In addition, there is a competition for

! 14
Co(III) by methylbenzene (to make the radical of p-TA) and decarboxylation of acetic acid. At
high temperatures, most of the Co(III) is being wasted in the decarboxylation of the solvent. The
addition of bromide raises the temperature barrier to increase the reaction rate of the oxidation of
the second methyl group. Manganese operates in much the same way as bromide by rapid
electron transfer between cobalt and manganese species. The synergy effect between manganese
and cobalt further increases the activity and selectivity as well as decreases decarboxylation
reactions. In addition, given that manganese costs less than cobalt there is an economic incentive
to reduce the cobalt usage.
1.3.4 Kinetics of pX oxidation to TPA
The intrinsic kinetic rates of the sequential steps during pX oxidation under MC process
conditions (200 °C, 15 bar) are extremely fast and tend to be limited by gas-liquid mass transfer
resistance. Due to this reason, obtaining reliable kinetics of pX oxidation to TPA is a challenge.
Some reported kinetic studies are under low temperatures or under conditions that are far away
from the industrial reaction conditions to slow down the reactions. To the best of our knowledge,
all the reported kinetic studies of pX oxidation to TPA are based on relatively high pX
concentrations at which the TPA product will exceed its solubility and precipitate resulting in a
gas-liquid-solid reaction system. Literature review of kinetic study of liquid phase pX oxidation
to TPA will be summarized in section 2.2 of Chapter 2.
1.3.5 Heat management
The reaction of pX oxidation is highly exothermic and the heat of reaction can reach
approximately 1,300 kJ/mol at the total conversion of pX to TPA [37, 38]. Heat removal with
the use of jacket cooling or cooling coils in the reactor or an external heat exchanger could be
ineffective because fouling is important in this case due to the precipitation of TPA. Here

! 15
evaporative cooling is a preferable heat removal method compared to the others. Evaporative
cooling reactors, also known as autorefrigerated reactors, are chemical reactors in which the
cooling of the liquid phase where the reaction takes place is achieved by partial evaporation of
the liquid [47]. The heat generation due to the oxidation of pX to TPA in industrial oxidation
reactors is partly controlled by the evaporative cooling of the solvent (acetic acid) [48]. The
latent heat of evaporation of acetic acid plays a significant role in thermal management as large
quantities of the solvent are used in this process. A mathematical model of an evaporative
cooling reactor operated at typical MC process conditions will be developed to quantify the
effect of the solvent evaporation as a main source of reactor cooling in section 2.1.2.
1.3.6 Technical developments
Incremental technical developments have been made during the last several decades to
improve the TPA process. Efforts towards developing greener TPA technologies have focused
on several fronts such as the elimination of the hydrogenation step (the aforementioned MTA
process is a typical example), an alternative solvent that is less susceptible than acetic acid to
burning, milder reaction conditions and less corrosive catalytic system that avoids the use of
bromine. This section reviews the developments of significance in this area.
1.3.6.1 Reaction conditions
Acetic acid to pX ratio in the feed
The typical acetic acid solvent to pX weight ratio in the reactor feed is 2-4 in the MC process.
Mitsui Petrochemical [49] reported a TPA process wherein this ratio falls in the range of 6.5-15,
leading to a solid TPA concentration in the oxidation reactor below 20 wt%. The residence time
was reported to be in the range of 4.5-45 minutes. This set of operating conditions is claimed to

! 16
facilitate the diffusion of oxygen into the reaction medium and to allow operation at a shorter
residence time than that in the conventional MC process resulting in increased volumetric
productivity in the reactor and an efficient production of aromatic carboxylic acids. However, the
higher acetic acid throughput will require greater equipment sizing and higher energy input,
resulting in an adverse economic and environmental impact. The effects of acetic acid to pX ratio
in the feed on temperature control and on process economics and environmental impacts will be
discussed in Chapters 2 and 4, respectively.
Co/Mn/Br ratio
As explained in section 1.3.3, cobalt and manganese exhibit synergy in the overall mechanism.
Cheng et al. [50] reported that the variation of the Co/Mn ratio had a strong effect on the activity
and selectivity of the catalyst system. For the main reaction (pX ! TPA), Cheng et al. reported
an optimum Co/Mn ratio at which the rates of the two intermediate oxidation steps of p-TA and
4-CBA (Figure 1.3) attained a maximum. The optimum Co/Mn ratio decreased with an increase
of reaction temperature. However, for the side reactions, the rate increased monotonically with
the increase of Co/Mn ratio. In addition, since cobalt is more expensive than manganese, more
manganese is typically used than cobalt. The molar Mn/Co ratio in the MC process is typically
between 1 and 3.
The role of bromide in the MC catalyst system has also been described in section 1.3.3.
Kamiya et al. [51] investigated the effect of bromine/metals ratio on the reaction rate and found
that at a cobalt concentration of 0.05 M, the pX ! TPA oxidation rate rapidly increased to a
maximum value as the molar Br/Co ratio was increased to 1 and remained constant up to a ratio
of 9. The optimum Br/Co ratio, at which the pX ! TPA oxidation rate attains a maximum,
increased when lowering the cobalt concentration. However, considering the equipment

! 17
corrosion issue and the production of methyl bromide, an ozone depleting gas, high levels of
bromide should be avoided. The operating molar Br/Co ratio is typically 0.5-1 in the MC process
[52]. On the other hand, too low a concentration of bromide can cause precipitation of the
manganese resulting in MnO2, leading to a grey color in the solid TPA product. Incorporating
one or more types of transition or lanthanide metal components as additives to the MC catalyst
can effectively alleviate this problem. Further, most of these additives were reported to also
increase catalytic activity [53-59].
Amoco Corporation [53] reported that the addition of hafnium [<250 ppmw (parts per million
by weight) of the total reactor mother liquor] to the Co/Mn/Br catalyst system could increase the
catalytic activity and allow a reduction in the net catalyst amounts required, leading to a
reduction in bromine emissions. In one of their more recent patents [54], cerium was used as a
catalyst additive and the molar ratio of bromine to total cobalt and manganese could be reduced
to <0.3 by adding 0.1-0.3 mole of cerium per mole of cobalt. The addition of molybdenum [55]
has also been shown to enhance catalytic activity as manifested by higher yields of aromatic
acids. In addition, zirconium [56-58] has also been proven to activate a Co/Mn/Br catalyst and to
enhance the rate of oxidation of pX. Samsung General Chemicals [59] reported an alkali metal or
alkaline earth metal (preferably K, Na, or Cs) as additives to the Co/Mn/Br catalyst system and
found that such additives enhanced both the yield as well as purity of the TPA product. Thus, in
addition to alleviating Mn precipitation, the aforementioned catalyst additives are to some extent
able to also improve the catalytic activity allowing the use of reduced amounts of catalytic
components. The reduction in Br usage should significantly alleviate the environmental and
equipment corrosion problems.

! 18
Co-feeds
Use of hydrocarbon additives as co-feeds with pX has been reported. Mitsubishi Chemical [60]
incorporated 3-35 wt% of p-tolualdehyde in the pX feed and reported that the additive could
reduce the acetic acid solvent burning rate and improve the solid TPA product quality. Mitsui
Petrochemical [61] claimed that adding 0.5 ppm to 1 wt% of n-eicosane to the pX feed prevented
foaming of the reaction mixture and improved the volumetric production efficiency in the
oxidation reactor. Use of CO2 additive as co-feed was first reported by Samsung General
Chemicals [62]. In their patent, a feed gas containing oxygen and at least 4 vol% of CO2 was
used to oxidize pX to TPA. It was reported that the addition of CO2 enhanced the TPA yield by
nearly 8%.
Oxygen-enriched feed gas
A number of patents [48, 63-66] deal with the use of pure or nearly pure oxygen or oxygen-
enriched air as the feed gas for pX oxidation. This method was aimed to reduce the compressor
energy, the amount of vent gas treated and the operating pressure. However, the inventions do
not address gas-phase flammability and associated safety issues. The use of oxygen-enriched gas
has not yet been commercialized.
Zuo et al. [3] investigated the use of CO2-expanded liquids (CXLs) for pX oxidation to TPA
and found that the reaction with a CO2/O2 mixture (with the maximum O2 content being 50 vol%)
instead of the traditional air oxidation system at lower temperatures (around 160 °C) increases
the yield and purity of the TPA product while significantly reducing solvent burning. Since CO2
has higher heat capacity and superior flame inhibition properties relative to nitrogen, oxygen-
enriched gas could be used as the reaction oxidant. The reduction in the flammability envelope in
the pressure of CO2 will be addressed in more detail in Chapter 2.

! 19
1.3.6.2 Alternative catalyst
Efforts have been studied over the years to seek alternative catalyst to the halide promoters in
order to resolve the environmental and equipment corrosion problems. Shell Oil Company [67]
reported that using a Co-Zr catalyst system between 80 and 130 °C and 2-3 atm in a stainless
steel stirred tank reactor gave the pX conversion and TPA selectivity exceeding 90%. Chester et
al. [68] found that the optimum Co/Zr ratio in neat acetic acid was 6-7 for maximum TPA yield
and minimum induction period. Promotors such as CoBr2-MnBr2 [69, 70] instead of HBr as a
bromine source, N-hydroxyphthalimide [71, 72], and N-hydroxy succinimide [73, 74] have also
been reported for pX oxidation to TPA under milder conditions (~100 °C), but the pX conversion
and TPA selectivity are below the typical industrial values.
1.3.6.3 Alternative solvent
Another promising alternative is to carry out the reaction of pX oxidation to TPA in a solvent
other than acetic acid. The use of either supercritical or high-temperature liquid water as a benign
substitute for acetic acid has been reported [75-78]. The reaction systems were necessarily
operated at high temperatures (330-450 °C) and high pressures (250-270 bar) with TPA yields of
>90%. The absence of acetic acid reduced the methyl bromide formation and CO2 emissions, and
also eliminated the distillation column for acetic acid/water separation. A solvent comprising of
benzoic acid and water has been reported by BP for the oxidation of pX to TPA [79]. Benzoic
acid is easier to separate from water than acetic acid. Further, the use of benzoic acid allowed
solid-liquid separation at elevated temperatures, leading to reduced co-crystallization of the
product impurities. Dow chemical [80] reported an aqueous medium containing at least 30 wt%
water and preferably up to 30 wt% surfactant such as stearic acid or α-olefin sulfonate and a low
molecular weight material containing a hydrophilic end group as co-surfactant such as acetic

! 20
acid or benzoic acid for pX oxidation. To the best of our knowledge, none of these alternative
solvents have been applied commercially yet.
The above literature review outlined only the major technical developments regarding the
oxidation reactor. In addition, a great number of patent applications deal with reactor design, unit
operations for crystallization, product drying, acetic acid solvent dehydration, off-gas treatment,
hydrogenation reactor, energy recovery method, and solid-liquid separation techniques. One
should note that this literature review is by no means exhaustive as the volume of work reported
on the TPA process is quite extensive.
1.4 Challenges in the MC Process
Although the MC process for TPA production has been practiced since the 1950s and has long
been considered to be a mature technology, there are several challenges that remain to be
addressed or improved. The major issues of the MC process are as follows.
Hydrogenation step
The polymer grade TPA product is achieved following complex purification steps involving
hydrogenation under harsh reaction conditions (high temperature and pressure) using expensive
metal catalysts as well as a number of additional solid-liquid separation steps. The TPA
purification by hydrogenation doubles capital investment and increases operating costs by
several cents/lb TPA [81]. Further, the fossil fuel-based hydrogen production and energy
generation required for the hydrogenation step increases the environmental burdens.
Solvent burning
Roughly 5% of the acetic acid is destroyed by oxidative burning per pass, resulting in
significant solvent loss and CO2 emissions. The burning of acetic acid is considered to be one of

! 21
the primary contributors to the variable cost in the production of TPA [6]. Therefore, solvent
burning is a significant factor in the economics of the MC process.
Corrosion issues
Due to the corroding capability of acetic acid and hydrogen bromide at high operating
temperatures toward the conventional material of construction apparatus such as stainless steel,
titanium-lining is required for the oxidation reactor and some of the columns and heat
exchangers, resulting in higher capital costs. Besides, the use of titanium only alleviates the
corrosion and has limitations of its own.
Safety issues
The use of a flammable organic solvent (acetic acid) during the pX oxidation to TPA gives
rise to vapor phase flammability concerns. Air is used as the primary oxidant instead of pure O2
or oxygen-enriched air for safety reasons. The upper flammability limit (UFL) for acetic acid in
air under ambient or elevated pressure (above 30 bar) is below 25 vol% and the lower
flammability limit (LFL) is approximately 3 vol% [6, 82]. The oxidation reaction should be
operated outside the flammability envelope. In addition, there exists an inherent safety concern,
owning to titanium burning under oxygen-enriched atmospheres at high temperatures [6]. Both
of these safety concerns necessitate monitoring and control of the oxygen content in the vapor
phase.
Off-Gas treatment
Gaseous emissions from the TPA process are mostly the oxygen-depleted air from the
oxidation step [83]. Volumes are large and the vent gas contaminated with VOCs (volatile
organic compounds), COx and NOx must be cleansed via catalytic combustion followed by

! 22
scrubbing to meet the most demanding regulations for process vents. The large volumes of off-
gases requiring treatment increases process costs.
1.5 Objectives and Organization of This Work
This dissertation is aimed at developing a new process concept for TPA production that
promotes process sustainability by solving some of the existing process challenges explained
above. Toward this end, this dissertation introduces a novel spray reactor system for the
oxidation of pX to TPA. The overall project goal is to investigate the feasibility and potential
benefits of the spray reactor for TPA production — in terms of rational reactor design and safe
operation, superior product yield and purity, economic viability and environmental sustainability
— employing complementary experimental and theoretical approaches for process development.
Specific objectives are to:
(1) Perform kinetic study of pX liquid phase oxidation to TPA in a stirred reactor under
homogeneous conditions (i.e., low pX concentrations employed to avoid TPA
precipitation);
(2) Develop and demonstrate a laboratory-scale spray reactor system for pX oxidation to
TPA, benchmarking the process with performance metrics (pX conversion, TPA yield
and purity, etc.) from a conventional stirred reaction configuration;
(3) Develop and demonstrate a laboratory-scale continuous spray process.
(4) Perform comparative economic and environmental impact assessments of the MC process
and spray process for TPA production, based on plant-scale process simulations.
The various chapters following this introductory chapter are organized as follows. In the next
chapter of this dissertation, the kinetic study of pX liquid phase oxidation to TPA is investigated
in a stirred reactor under homogeneous conditions employing low pX concentrations at which

! 23
product precipitation is avoided. A pseudo first-order kinetic model is proposed and kinetic rate
constants are determined based on the experimental data. In Chapter 3, a semi-batch spray
reactor is developed and demonstrated to produce high-purity TPA in one step. Theoretical
analyses based on reactor engineering fundamentals such as O2 availability throughout the liquid
phase, reactor stability and vapor phase flammability issues are considered in order to rationally
design the reactor. Reaction parameters such as pX conversion, TPA yield and purity are
examined to test the performance of the spray reactor. Chapter 4 describes the methodology and
procedures to develop a continuous spray process. Some preliminary experimental results from
the continuous spray reactor are reported. Chapter 5 covers the economic and environmental
aspects of the conceptual spray process based on plant-scale simulation to assess the economic
viability and the environmental benignity of the alternative spray process for TPA production.
Finally, in Chapter 6, a summary of the conclusions of the current work and recommendations
for future work are provided.

! 24
Chapter 2 Kinetic Studies of Homogeneous p-Xylene Oxidation to
Terephthalic Acid in Acetic Acid with a Co/Mn/Br Catalyst
In this chapter, the intrinsic kinetics of pX liquid phase oxidation to TPA is investigated in a
stirred reactor under homogeneous conditions without product precipitation by employing low
initial pX concentrations in order to avoid interphase gas-liquid and gas-solid mass transfer
limitations. The kinetic study is important to the rational design and optimization of the CEBC
spray process as well as to aid in reactor modeling studies. Before getting started, solubility
studies are first performed to determine the homogeneous reaction conditions at which the TPA
remains dissolved in solution.
2.1 Solubility Studies of the MC Process Related Components
2.1.1 Motivation
The intrinsic solubilities of TPA, 4-CBA, and p-TA are generally considered in industrial
TPA purification by crystallization. TPA is purified from the mixture of acetic acid and water as
follows. In the oxidation section, the crude TPA product is recovered by a series of flash
crystallizers (3-6 stages) with stepwise cooling [20]. In the subsequent hydrogenation section, the
crude TPA is re-dissolved in water at elevated temperature of 275-290 °C [8, 10], then purified
by hydrotreating and finally passed through a series of 3-6 stage crystallizers [10, 84] with
stepwise cooling to recover the purified TPA product from aqueous solution. Measurements of
solubilities of the aforementioned compounds in aqueous acetic acid are important for the

! 25
rational choice of operating conditions and for rational equipment design for the separation and
purification steps.
In the case of the spray reactor, reliable solubility data are important to determine the
concentrations at which the TPA remains dissolved in solution at the reaction conditions. If the
TPA and impurities precipitate, the solid particles could trap liquid reaction mixture and give rise
to O2 diffusion limitations resulting in incomplete oxidation. Intrinsic solubility studies will help
determine the maximum pX concentration that may be used to maintain TPA dissolved in the
liquid phase. These results will guide the choice of operating conditions that avoid solids
formation during the kinetic studies (discussed in the next section) and during continuous
operation to minimize O2 diffusion limitations as well as the possibility of valve plugging during
continuous operation.
The solubilities of TPA, 4-CBA and p-TA in acetic acid/water solvent mixtures have been
investigated by several research groups [85-89]. Most of these studies followed the procedure of
first experimentally measuring the solubility using one of the following techniques: (a) steady
state method by sampling and analyzing the saturated solution, or (b) laser technique by
observing the equilibrium temperature, and then correlating the experimental data to various
phase equilibrium models. Table 2.1 outlines the temperature ranges of the reported solubility
data. These literature data were obtained in relatively limited temperature ranges that do not
provide adequate guidance for our experiments. Hence, it was decided to perform solubility
studies covering a relatively wide temperature range.

! 26
Table 2.1: Temperature ranges of available literature solubility data
Solute Solvent T Range Ref.
TPA HOAc/H2O (HOAc = 0-100 wt%) 150 – 240 °C 85-89
4-CBA HOAc/H2O (HOAc = 84.2 wt% or 100 wt%) 15 – 56 °C 87
p-TA HOAc/H2O (HOAc = 84.2 wt% or 100 wt%) 18 – 76 °C 87
2.1.2 Experimental method
The solubility studies were performed in a 50 mL stirred vessel (Parr Instrument Company,
Series 4560 Mini Bench Top Reactor) with view windows. The experimental method is similar
to that reported by Chen and Ma [87], except that instead of using a laser technique, we observed
the dissolving process visually, which is more common and simpler. The experimental procedure
for a typical run is as follows: (a) A certain amount of TPA and 20 g of solvent (pure acetic acid
or acetic acid/water solvent mixture with 95 wt% acetic acid) are loaded in the 50 mL vessel; (b)
The vessel is pressurized with N2 to 15 bar; (c) The vessel is heated and the T at which
dissolution and reprecipitation occurs is visually noted. Figure 2.1 shows the typical T & P
profiles during the solubility studies. The vessel was heated very slowly and the stirring was
started and stopped alternatively until no solute was precipitated from the solution, at which
point the temperature would be the solubility temperature. The apparent oscillations in
temperature and pressure rise and fall are due to the stirrer being turned on and off during the
experiments.

! 27
Figure 2.1: Typical T & P profiles during solubility studies
(T & P rise and fall due to stirrer turned on and off deliberately)
2.1.3 Experimental results
Solubility data of TPA, 4-CBA and p-TA in a wide temperature range were obtained (Figure
2.2). Numerical data of the experimental solubilities are shown in Table A1 of Appendix A. The
measured TPA solubility matches well with the literature data (Figure 2.2a) thus validating the
experimental method. It was found that while water addition enhances TPA solubility in acetic
acid at temperatures above 130 °C, the solubility is unaffected below this temperature. The
solubilities in acetic acid follow the order p-TA > 4-CBA > TPA, with each successive increase
or decrease being approximately one order of magnitude. The reaction was carried out at P and T
such that TPA remains soluble in the liquid phase at reactor conditions during kinetic studies and
continuous runs. The TPA was precipitated post reactor by cooling.
0 2 4 6 8 10 12 14 16 18 20 22 24 26 28 30100110120130140150160170180190200210220
temperature pressure
time (min)
tem
pera
ture
(o C
)
180
190
200
210
220
230
240
250
260
Pressure (psia)

! 28
Figure 2.2: Solubilities of the MC process related components (14.5-15.5 bar in N2)
(a) TPA; (b) 4-CBA and p-TA
120 140 160 180 200 2200.0
0.4
0.8
1.2
1.6
2.0
2.4
2.8
Sol
ubili
ty (g
TP
A/1
00 g
sol
vent
)
Temperature (oC)
acetic acid, this work acetic acid, Wang, et al 95 wt% aqueous acetic acid, this work 95 wt% aqueous acetic acid, Wang, et al
(a)
80 100 120 140 160 180 2000
40
80
120
160
200
240
280
4-CBA p-toluic acid
Solu
bilit
y (g
/100
g H
OAc
)
Temperature (oC)
(b)

! 29
2.2 Previous Work on Kinetics of pX Oxidation to TPA
Due to its industrial importance, the kinetics of liquid-phase pX oxidation to TPA has been
the subject of several reports [90-99]. The catalytic oxidation of pX to TPA with Co/Mn/Br
catalyst system is known to proceed via a free radical chain mechanism (refer to section 1.3.3 for
details of the reaction mechanism) involving a large number of radical and molecular species. A
detailed kinetic scheme including all the elementary reactions and intermediates has not been
possible primarily due to the difficulties in detecting and monitoring the highly reactive radicals
over time. Because of this, “lumped” kinetic schemes and models [93, 97-99] have been adopted
to simplify this complex reaction by taking into account only the most important molecular
intermediates and relatively stable intermediate products such as p-tolualdehyde (TALD), p-
toluic acid (p-TA), 4-carboxybenzaldehyde (4-CBA) and TPA.
The reported kinetic models of pX oxidation to TPA were developed based on the power law
assumption or derived from the simplified radical chain reaction mechanisms. Cao and co-
workers [94-97] investigated the kinetics of pX oxidation at low temperatures (80-130 °C) and
low pressure (1 atm) using methyl benzoate as the solvent and cobalt naphthenate and TALD as
the catalyst and promoter, respectively. The rate of each oxidation step was assumed to be zero
order in oxygen (when the oxygen partial pressure was greater than 50-100 Torr) and first-order
with respect to the reactants being oxidized. A semi-batch reactor model which accounts for
inter- and intra-phase gas-liquid mass transfer processes was presented and the agreement
between model predictions and experimental data was shown to be satisfactory. Wang and co-
workers [44, 98] developed a fractional kinetic model based on the complicated radical chain
reaction mechanism and determined that the apparent reaction order was <<1 based on pX
oxidation to TPA experiments performed under industrial oxidation conditions. Model
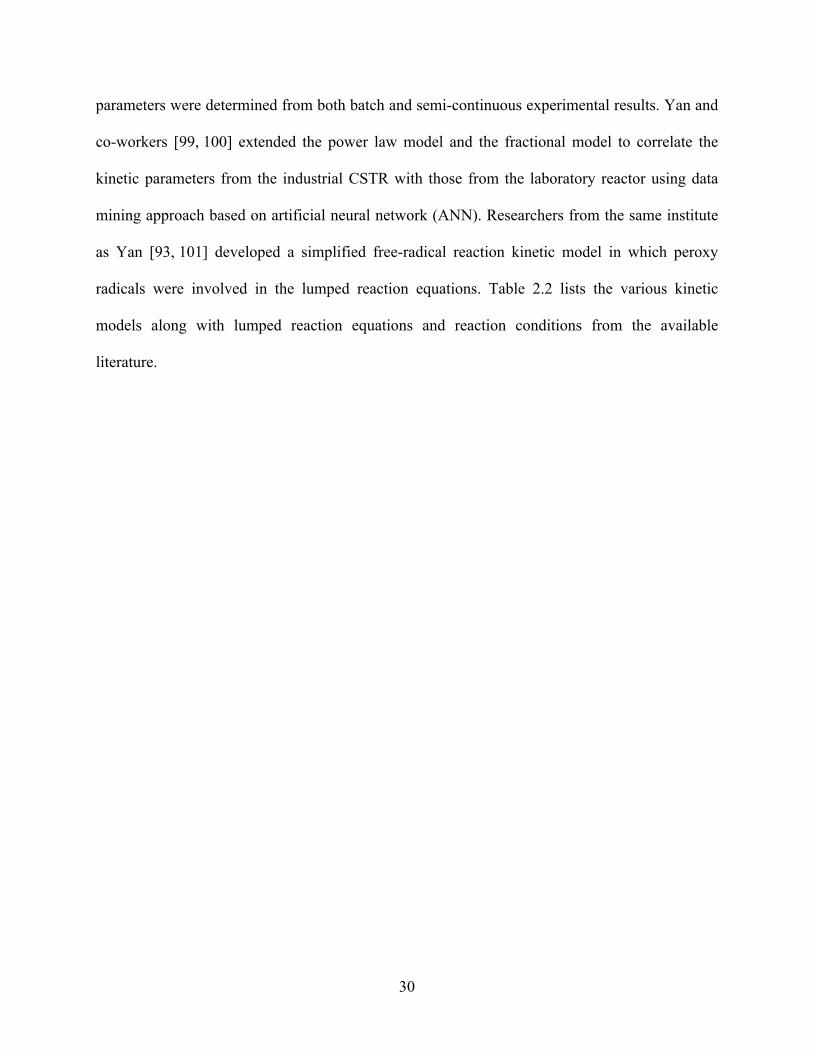
! 30
parameters were determined from both batch and semi-continuous experimental results. Yan and
co-workers [99, 100] extended the power law model and the fractional model to correlate the
kinetic parameters from the industrial CSTR with those from the laboratory reactor using data
mining approach based on artificial neural network (ANN). Researchers from the same institute
as Yan [93, 101] developed a simplified free-radical reaction kinetic model in which peroxy
radicals were involved in the lumped reaction equations. Table 2.2 lists the various kinetic
models along with lumped reaction equations and reaction conditions from the available
literature.

!31
Tabl
e 2.
2: V
ario
us k
inet
ic m
odel
s for
pX
oxi
datio
n to
TPA
from
lite
ratu
re
Inst
itutio
n R
eact
ion
cond
ition
s pX
con
c.
(M)
Lum
ped
kine
tic sc
hem
e K
inet
ic m
odel
R
ef.
The
Uni
vers
ity
of C
aglia
ri,
Italy
T: 8
0-13
0 °C
P:
1 a
tm
cata
lyst
: co
balt
naph
then
ate
(1.6
7-33
.3*1
0-4 m
ol/k
gl)
prom
oter
: TA
LD (0
.11
mol
/kg l
) so
lven
t: m
ethy
l ben
zoat
e pu
re O
2 or a
ir
4.33
-9.7
5
r j=
k jcj
97
Zhej
iang
U
nive
rsity
, C
hina
T: 1
85-1
97 °
C
P: P
O2=
12-4
0 kP
a ca
taly
st:
Co
(2.5
-5.5
*10-2
mol
/kg H
Ac)
Mn
(2.3
3-5.
12*1
0-2 m
ol/k
g HA
c) B
r (3.
39-9
.49*
10-2
mol
/kg H
Ac)
solv
ent:
acet
ic a
cid
air
0.50
– 3
.30
r j
=k j
c j
d iCi+θ
i=14 ∑⎛ ⎝⎜
⎞ ⎠⎟βj
98
East
Chi
na
Uni
vers
ity o
f Sc
ienc
e an
d Te
chno
logy
, C
hina
T: 1
80-1
95 °
C
cata
lyst
: C
o (0
.01-
0.08
wt%
) M
n (0
.01-
0.08
wt%
) B
r (0
.01-
0.1
wt%
) so
lven
t: ac
etic
aci
d ai
r
0.21
– 3
.68
r j=
k jcjm
m
= 0
.65
whe
n j
repr
esen
ts p
X; m
= 1
w
hen j r
epre
sent
s ot
her l
iqui
d re
acta
nts
99
pXk 1
k 2TA
LDk 5
p-TA
k 64-
CB
ATP
A
p-to
luic
alc
ohol
k 4k 3
k 7k 8
4-ca
rbox
yben
zyla
lcoh
ol
tere
phth
alic
ald
ehyd
ek 9
k 10
TPA
4-CBA
k 4p-TA
k 3TALD
k 2k 1
pX
TPA
4-CBA
k 4p-TA
k 3TALD
k 2k 1
pX
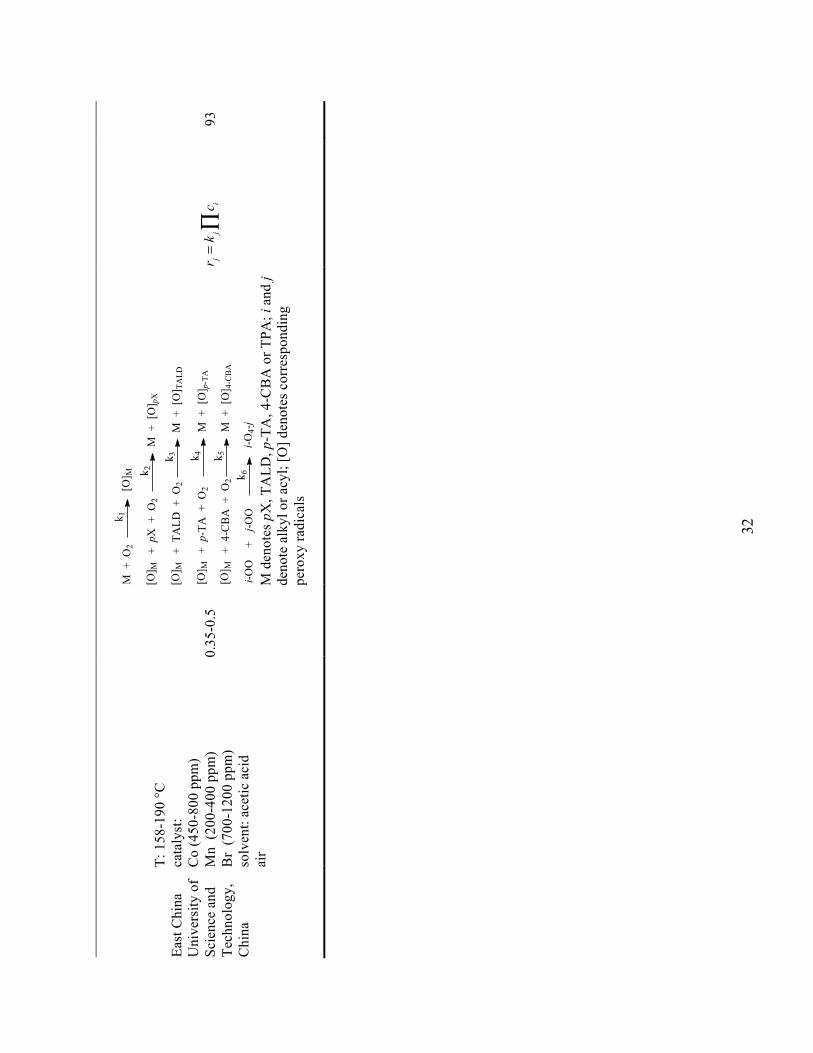
!32
East
Chi
na
Uni
vers
ity o
f Sc
ienc
e an
d Te
chno
logy
, C
hina
T: 1
58-1
90 °
C
cata
lyst
: C
o (4
50-8
00 p
pm)
Mn
(200
-400
ppm
) B
r (7
00-1
200
ppm
) so
lven
t: ac
etic
aci
d ai
r
0.35
-0.5
M
den
otes
pX
, TA
LD, p
-TA
, 4-C
BA
or T
PA; i
and
j de
note
alk
yl o
r acy
l; [O
] den
otes
cor
resp
ondi
ng
pero
xy ra
dica
ls
r j=
k jc i
∏
93
M +
O2
[O] M
k 1
[O] M
+ p
X +
O2
k 2M
+ [
O] p
X
M +
[O
] TA
LDk 3
+ T
ALD
+ O
2[O
] M
[O] M
+ p
-TA
+ O
2k 4
M +
[O
] p-T
A
[O] M
+ 4
-CB
A +
O2
k 5M
+ [
O] 4
-CB
A
i-OO
k 6j-O
O+
i-O4-j

! 33
2.3 Motivation and Significance of This Work
To the best of our knowledge, all the reported kinetic studies of pX oxidation to TPA are
based on relatively high pX concentrations (Table 2.2) at which the TPA product will exceed its
solubility and precipitate resulting in a gas-liquid-solid reaction system. The kinetic parameters
obtained under these reaction conditions could be subject to interphase mass transfer limitations.
If TPA precipitates as a solid, it traps some of the reaction intermediates into its solid structure
removing the intermediates from solution. The trapped intermediates would then react slower.
By eliminating the formation of solids in the liquid phase (lower pX concentrations are used to
prevent TPA precipitation) gas-solid and liquid-solid mass transfer steps can be eliminated.
Further, the various dissolved products can be more accurately sampled and analyzed.
In this work, the intrinsic kinetics of pX liquid phase oxidation to TPA was investigated in a
stirred reactor under homogeneous conditions employing low pX concentrations at which
product precipitation is avoided even at total pX conversion to TPA. In this manner, interphase
gas-liquid and gas-solid mass transfer resistances that are prevalent in most reported kinetic
studies are avoided. A first order kinetic model was assumed based on a lumped reaction scheme
in which the oxygen concentration is maintained constant in stoichiometric excess for complete
pX oxidation to TPA. Kinetic rate constants were obtained by non-linear regression of the
experimental data to fit the model. Such a kinetic model is essential for the rational design,
optimization and scale-up of the spray reactor.

! 34
2.4 Experimental
2.4.1 Materials
The following chemicals were used as obtained from Sigma-Aldrich without further
purification: pX (substrate), cobalt(II) acetate tetrahydrate (catalyst), manganese(II) acetate
tetrahydrate (catalyst), hydrobromic acid (48% in water) (promoter), acetic acid (solvent),
biphenyl (internal standard). Ultra high purity (UHP) grade oxygen and industrial grade CO2
were purchased from Airgas and Linweld, respectively.
2.4.2 Experimental setup and procedure
The experimental apparatus employed in this work is shown in Figure 2.3. The 50 mL
titanium stirred vessel (Parr Instrument Company, Series 4560 Mini Bench Top Reactor) was
equipped with a magnetically driven impeller for stirring, a dual probe J-type thermocouple and
an OMEGA transducer for measuring the reactor temperature and pressure. The temperature and
pressure were continuously recorded and controlled with the help of a LabVIEW® data
acquisition system. The reactor was modified to accommodate multiple inlet/outlet ports for (a)
introducing O2 via a dip tube/sparger, (b) sampling the liquid phase via a 1/16” titanium dip tube,
(c) withdrawing the vapor phase, and (d) providing a pressure relief valve.

! 35
Figure 2.3: Experimental apparatus for pX oxidation to TPA
In a typical experimental run, the reactor was initially charged with a 35 mL solution of pX,
Co/Mn/Br catalyst and biphenyl in acetic acid. This homogeneous mixture is pressurized with
CO2 to 2.5 bar, and then heated to the desired temperature. After the temperature and pressure
stabilized, O2 was added to the reactor to initiate the oxidation reaction. The O2 consumed in the
liquid phase by reaction was continuously replenished from an external reservoir such that O2
partial pressure (and therefore reactor pressure) was maintained constant. To avoid sampling
errors due to product flashing and the TPA sticking to the inner wall of the tubing, the liquid
phase was directly sampled into 15 mL DMF (N,N-dimethylformamide) solvent. The titanium
sampling line was heated to 200 °C to avoid TPA precipitation. The unheated line was flushed
by DMF after each sampling to remove residual reactants and products from the line. Table 2.3
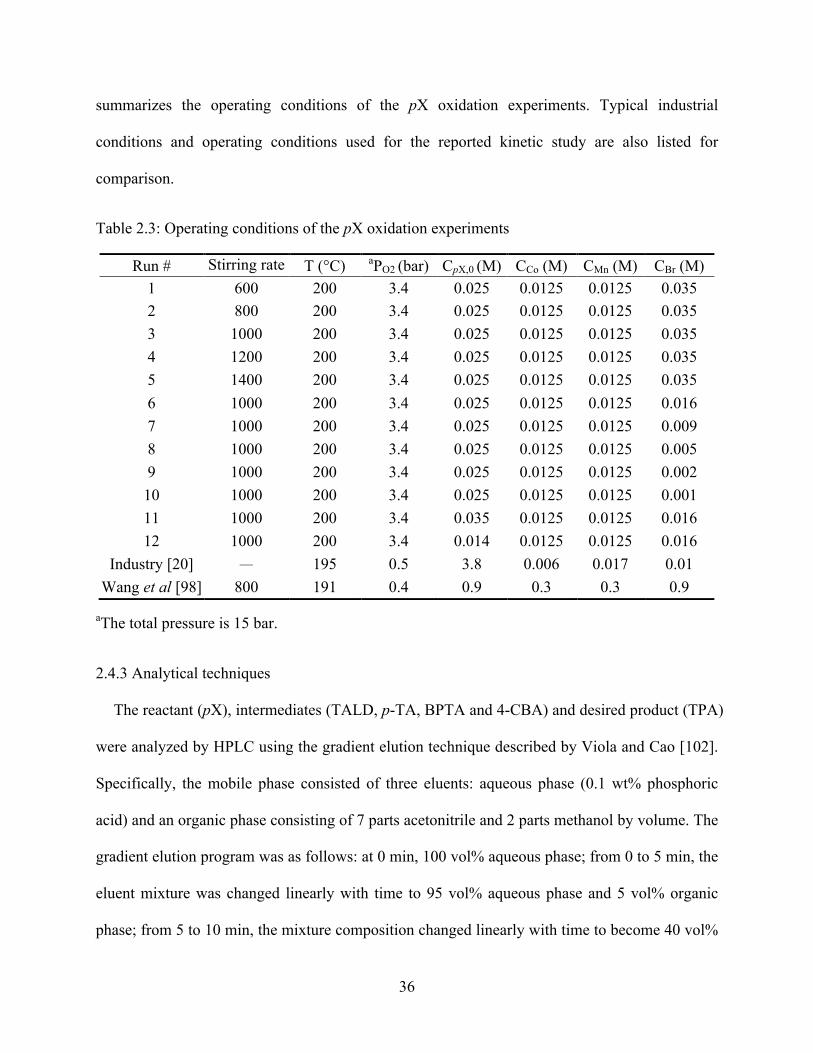
! 36
summarizes the operating conditions of the pX oxidation experiments. Typical industrial
conditions and operating conditions used for the reported kinetic study are also listed for
comparison.
Table 2.3: Operating conditions of the pX oxidation experiments
Run # Stirring rate (rpm)
T (°C) aPO2 (bar) CpX,0 (M) CCo (M) CMn (M) CBr (M) 1 600 200 3.4 0.025 0.0125 0.0125 0.035 2 800 200 3.4 0.025 0.0125 0.0125 0.035 3 1000 200 3.4 0.025 0.0125 0.0125 0.035 4 1200 200 3.4 0.025 0.0125 0.0125 0.035 5 1400 200 3.4 0.025 0.0125 0.0125 0.035 6 1000 200 3.4 0.025 0.0125 0.0125 0.016 7 1000 200 3.4 0.025 0.0125 0.0125 0.009 8 1000 200 3.4 0.025 0.0125 0.0125 0.005 9 1000 200 3.4 0.025 0.0125 0.0125 0.002 10 1000 200 3.4 0.025 0.0125 0.0125 0.001 11 1000 200 3.4 0.035 0.0125 0.0125 0.016 12 1000 200 3.4 0.014 0.0125 0.0125 0.016
Industry [20] — 195 0.5 3.8 0.006 0.017 0.01 Wang et al [98] 800 191 0.4 0.9 0.3 0.3 0.9
aThe total pressure is 15 bar.
2.4.3 Analytical techniques
The reactant (pX), intermediates (TALD, p-TA, BPTA and 4-CBA) and desired product (TPA)
were analyzed by HPLC using the gradient elution technique described by Viola and Cao [102].
Specifically, the mobile phase consisted of three eluents: aqueous phase (0.1 wt% phosphoric
acid) and an organic phase consisting of 7 parts acetonitrile and 2 parts methanol by volume. The
gradient elution program was as follows: at 0 min, 100 vol% aqueous phase; from 0 to 5 min, the
eluent mixture was changed linearly with time to 95 vol% aqueous phase and 5 vol% organic
phase; from 5 to 10 min, the mixture composition changed linearly with time to become 40 vol%

! 37
aqueous phase and 60 vol% organic phase; from 10 to 24 min, the mixture composition was kept
constant. The total flow rate of the mobile phase was 1 mL/min. A UV detector was used to
quantify the products using biphenyl as internal standard (215 nm for pX and 254 nm for all
other products). The HPLC samples were prepared from those collected during the reaction and
adding 15 mL acetic acid to each sample. Figure 2.4 shows a typical chromatogram obtained
from HPLC analysis of a sample. The carbon balance estimated from only the concentrations of
the aromatic compounds was found to be >95%. In this work, the combustion reactions and
volatilization were neglected.
Figure 2.4: Typical HPLC chromatogram of a product sample
(after 15 sec. of pX oxidation showing initial product + intermediates)
2.5 Lumped Kinetic Scheme and Semi-Batch Reactor Model
None of the reported lumped kinetic models for pX oxidation to TPA account for 4-
bromomethyl benzoic acid (BPTA), significant amounts of which are detected in our
TPA
4-CBA
p-TA
BPTA
TALD
biphenyl

! 38
experiments. Considering its possible important role in the process, the formation and
disappearance of BPTA are also included in our proposed lumped kinetic scheme as a parallel
reaction, as shown in Figure 2.5. BPTA is formed by the substitution reaction involving p-TA
and HBr, and is oxidized in the presence of oxygen to 4-CBA. The proposed chemical reaction
equations associated with the formation and oxidation of BPTA are shown in Figure 2.6.
Figure 2.5: Proposed lumped kinetic scheme for pX oxidation to TPA
CH3
CH3 COOH
COOH
CHO
CH3 CH3
COOH
COOH
CH2Br
COOH
CHO
pX (1) TALD (2) p-TA (3) 4-CBA (5) TPA (6)
BPTA (4)
r6k6k5
r5
k4r4r3
k3k2r2r1
k1

! 39
Figure 2.6: Formation and oxidation of BPTA
The reported power law kinetic models for pX oxidation to TPA mainly assume pseudo-first
order oxidation kinetics (in excess of O2). Cao et al. [95] applied the first order kinetic model at
low pX conversions wherein no solid phase was formed; i.e., the system was considered
homogeneous. Wang et al. [44] also deduced from their fractional model that when the reactant
(pX) concentration was low enough compared to O2, the first order kinetic model was valid. In
our experiments, we chose to operate at low enough initial pX concentrations such that even at
total conversion to TPA, there would not be any TPA precipitation. Further, the O2
concentrations relative to the pX concentration was maintained in excess (at least 5-fold). Based
on these experimental conditions, we adopted the pseudo-first order kinetic model for the
sequential reactions involving O2, with the O2 concentration partial pressure (and therefore its
activity in the liquid phase dominated by acetic acid) being maintained constant. The model
equations based on these assumptions are given below:
COOH
CH3
+ HBr + RCOOOH
CH2Br
COOH
+ H2O + RCOOH
COOH
CH2Br
+ 1/2O2
CHO
COOH
+ HBr

! 40
dc1
dt= −k1c1
dc2
dt= k1c1 − k2c2
dc3
dt= k2c2 − k3c3 − k5c3
dc4
dt= k5c3 − k6c4
dc5
dt= k3c3 + k6c4 − k4c5
dc6
dt= k4c5
(eqn. 2.1)
with the initial conditions:
c1 = c10 ,c2 = c3 = c4 = c5 = c6 = 0 (eqn. 2.2)
Athena Visual Studio [103] was used to estimate the kinetic parameters. The non-linear least
squares method was employed. The optimization method was implemented in the software and
encoded using Fortran. The convergence criteria is based on the evaluation of an experimental
variance, σ2, defined as:
σ 2 =
(YE −YP )2
1
n
∑n− p
<10−3 (eqn. 2.3)
where YE and YP are experimental and predicted functions (in this case, concentration), n is the
number of experimental points and p is the number of parameters.
The following observations based on published literature provide valuable guidance for our
experimental and modeling studies. It is generally believed that the p-TA ! 4-CBA reaction is
the slowest step in the overall oxidation sequence [97, 98]. If this is indeed the case in our
experiments, then the estimated first-order rate constant for this step (k3) should be several-fold
less than the other rate constants in the sequential oxidation. The overall oxidation rate would

! 41
then be the rate of the slowest step in the sequence. In such a case, it should be possible to assess
the presence or absence of gas-liquid mass transfer limitations associated with the slowest step
from the influence of stirrer speed on the estimated rate constant for that step. The estimated rate
constants associated with the non-rate determining steps could be merely mass transfer
coefficients, recognizing that the O2 transport into the liquid phase is also a first-order rate
process.
2.6 Results and Discussion
2.6.1 T & P profile
Figure 2.7 shows the temperature and pressure profiles corresponding to run 3 (Table 2.3).
Since low enough initial pX concentration (0.025 M) was charged in the reactor, the reactor
temperature rise was within 1 °C caused by the generated heat of reaction, which allowed us to
consider that the reactor was operated under isothermal conditions. The reactor pressure was
maintained constant (15 bar) except for brief, insignificant pressure fluctuations during sampling.
Figure 2.7: Temporal temperature and pressure profiles during intrinsic kinetic studies of pX
oxidation in a stirred reactor
0 3 6 9 12 15 18 21 24 27 30160
180
200
220
240
1460
1480
1500
1520
1540
Reactor Pressure Reservoir Pressure Temperature
Time (min)
Pre
ssur
e (p
si)
150
160
170
180
190
200
210
Temperature ( oC
)

! 42
2.6.2 Effect of stirring rate
The intrinsic kinetic rates of the sequential steps during pX oxidation under MC process
conditions (200 °C, 15 bar) are very fast and tend to be limited by gas-liquid mass transfer
resistance. The experiments (Runs 1-5 of Table 2.3) were carried out in the stirred reactor to
evaluate the effect of stirring speed on the reaction rates. Figure 2.8 shows the temporal product
distributions at various stirring speeds. Effective rate constants were obtained from the reactant
and product concentration profiles as explained previously.
Figure 2.8: Experimental and simulated product distributions at different stirring rates
(Reaction conditions: T = 200 °C, P = 15 bar; Initial pX = 25 mM, Co = 12.5 mM, Mn = 12.5
mM, Br = 32.5 mM; O2:CO2 (mol:mol) = 1:1)
The estimated rate constants are shown in Table 2.4. Clearly, the slowest step in the series
reaction sequence is the formation of 4-CBA from p-TA, and that in the parallel reaction is the
oxidation of BPTA to 4-CBA. At all stirrer speeds ranging from 600-1400 rpm, the rate
constants associated with these steps (k3 and k6) are several-fold lower than those associated with
the other steps. The uncertainties associated with the higher rate constants are greater, as might
be anticipated with the measurement of faster reaction rates. For example, because the first two
0 5 10 15 20 250.000
0.005
0.010
0.015
0.020
0.025
0.030
Con
cent
ratio
n (M
)
Time (min)
pX, 600, 800, 1000, 1200, 1400 rpmTPA, 600, 800, 1000, 1200, 1400 rpmBPTA, 600, 800, 1000, 1200, 1400 rpm
model (1000 rpm)
0 2 4 6 10 15 20 250.000
0.002
0.004
0.006
0.008
Con
cent
ratio
n (M
)
Time (min)
p-TA, 600, 800, 1000, 1200, 1400 rpm4-CBA, 600, 800, 1000, 1200, 1400 rpmTALD, 600, 800, 1000, 1200, 1400 rpm
model (1000 rpm)

! 43
reaction rates in the oxidation sequence are so fast, the sampling errors associated with TALD
and p-TA will be substantially more. This also manifests in the uncertainties of the estimated rate
constants. In contrast, the uncertainties associated with the rate constants of the slowest steps (k3,
k5 and k6) are much lower. For the sequential oxidation steps, the rate constant associated with 4-
CBA formation form p-TA (k3) increases from 600 to 800 rpm (beyond the range of uncertainty)
and tends to level off around 1000 rpm. In contrast, the other rate constants in the oxidation
sequence (k1, k2 and k4) do not vary in this stirrer speed range. These observations suggest that
while it is possible to overcome gas-liquid mass transfer limitations associated with the p-TA !
4-CBA step in the stirred reactor, the kinetics associated with other rates are much faster to
eliminate gas-liquid mass transfer limitations. In addition, the lowest rate constant (k6) is
invariant in this stirrer rpm range suggesting that it is not influenced by gas-liquid mass transfer
limitations. Note that there is an apparent decrease in rate constants with a further increase in the
stirring rate to 1400 rpm. This is probably due to the formation of a deep meniscus at the higher
agitation speed that decreases the liquid level below that of the sparger (either partly or fully)
used for introducing O2 into the reactor. Hence, we conclude that the maximum rate of TPA
formation in this stirred reactor occurs beyond 1000 rpm and that it is likely not possible to
completely eliminate the mass transfer limitations associated with the formation of the
intermediates, TALD and p-TA, in a conventional stirred reactor. In other words, the saturation
of the liquid phase with oxygen is most likely the rate-limiting step. Any further increase in the
overall TPA formation rate must involve another reactor configuration in which the gas-liquid
mass transfer limitations associated with the formation of these intermediates are better
alleviated.

! 44
Table 2.4: Estimated reaction rate constants at different stirring rates (initial [pX] = 0.025 M; all
other experimental conditions are as shown in Table 2.3)
Stirring rate
(rpm)
k1 (min-1)
k2 (min-1)
k3 (min-1)
k4 (min-1)
k5 (min-1)
k6 (min-1)
600 11.7 (1.72)a 33.2 (18.9) 3.90 (0.548) 17.5 (4.78) 4.12 (0.568) 0.421 (0.0405) 800 11.8 (1.96) 37.1 (26.0) 4.45 (0.764) 18.6 (5.24) 4.71 (0.799) 0.423 (0.0450) 1000 11.7 (1.85) 39.0 (27.1) 5.89 (1.10) 22.5 (6.83) 6.00 (1.10) 0.414 (0.0406) 1200 13.6 (2.31) 42.1 (32.9) 5.56 (1.03) 23.2 (6.77) 5.81 (1.05) 0.435 (0.0364) 1400 13.9 (2.75) 36.8 (28.9) 4.49 (0.793) 20.5 (5.91) 4.88 (0.844) 0.401 (0.0369)
aIn parenthesis: 95% confidence level.
Figure 2.8 also shows the experimentally observed concentrations at various stirrer rpms. The
fitted concentration profiles at 1000 rpm (solid line) match the experimental observations quite
well.
2.6.3 Comparison of estimated rate constants with literature data
Table 2.5 compares the estimated reaction rate constants in this work with the reported data
from literature. Only those employing the lumped reaction scheme (Figure 1.3) are compared
here. Even though different reaction conditions and kinetic models are employed, the relative
rate constants of the various steps follow the same trend: k3<k1<k4<k2. Our investigations concur
with previous reports that the slowest step is the oxidation of p-TA to 4-CBA. The estimated
reaction rate constants in this work are at least one order of magnitude greater than those
reported in the referenced studies. We attribute this to the fact that the reaction was performed
under homogeneous conditions in this work, avoiding product precipitation in the liquid phase
and thereby eliminating gas-solid and liquid-solid mass transfer limitations.

! 45
Table 2.5: Comparison of estimated rate constants with literature data
Model type k1 (min-1)
k2 (min-1)
k3 (min-1)
k4 (min-1) Ref. Remarks
Fractional model derived from reaction
mechanism
0.176 0.725 0.0361 0.338 [98]
0.732 1.422 0.139 0.873 [100] Parameter re-estimated for Wang’s model
Power law assumption
1.9*10-3 7.6*10-2 6.6*10-4 1.86*10-2 [95] first-order to liquid
0.38 0.99 0.123 0.44 [99] 0.65-order to pX, first-order to others
11.74 39.03 5.889 22.50 this work* Run # 3 in Table 2.3
*Stirring rate = 1000 rpm; initial [pX] = 0.025 M; all other operating conditions listed in Table
2.3.
2.6.4 Effect of bromide concentration
Different bromide concentrations (Runs 3 & 6-10 of Table 2.3) were used in the kinetic study
experiments for pX oxidation to TPA to investigate the effect of bromide concentration on the
reaction rate. Figure 2.9 shows the color change of the reaction solution corresponding to the
various bromide concentrations in Runs 3 & 6-10 of Table 3.2, respectively. The solution
changes color from blue to pink with bromide concentration from 34.8 mM to 0.91 mM.

! 46
Figure 2.9: Color changes of the reaction solution due to the formation of various cobalt
bromides [104] at various bromide concentrations in acetic acid. [Co(II)] = 12.5 mM
Figure 2.10 shows the component concentrations with different bromide concentrations.
Surprisingly high concentrations of BPTA were detected during the pX oxidation. Although it is
well recognized that the p-TA to 4-CBA conversion is the rate determining step, the slowest step
is BPTA oxidation according to the estimated rate constants (Table 2.6). The decrease of the
bromide concentration will slow down the BPTA disappearance rate. It is reported as much as
99% of the initial inorganic bromide is converted to benzylic bromide and its concentration
remains about the same until the oxidation of the hydrocarbon is nearly complete [105].
Partenheimer [106, 107], Saha and Espenson [108] also found that a decrease in Co/Mn/Br
catalytic activity is attributed to the benzylic bromide formation and benzylic bromide has
virtually no activity or promotional effect in Co/Mn/Br autoxidations whereas the inorganic ionic
bromide is active. The mechanism of BPTA oxidation has not been well studied. Metelski et al.
[105] developed a proposed mechanism for benzyl bromide oxidation (Figure 2.11). According

! 47
to this, benzyl bromide is oxidized in the presence of Co(III), leading to the recovery of bromide
ions. Simultaneously, Co(III) is reduced to Co(II) by hydrogen bromide (faster) and also by
benzyl bromide, albeit at a much slower rate. Partenheimer [106] reported that the competing
mechanisms of oxidation and solvolysis for the disappearance of benzylic bromide occur at
approximately the same rates under the studied experimental conditions.
0 1 2 20 250.000
0.005
0.010
0.015
0.020
0.025
0.030
pX C
once
ntra
tion
(M)
Time (min)
[Br]=34.8 mM [Br]=15.8 mM [Br]=9.44 mM [Br]=4.93 mM [Br]=2.40 mM [Br]=0.91 mM Modle ([Br]=15.8 mM)
0 1 2 20 250.0000
0.0005
0.0010
0.0015
0.0020
TALD
Con
cent
ratio
n (M
)
Time (min)
[Br]=34.8 mM [Br]=15.8 mM [Br]=9.44 mM [Br]=4.93 mM [Br]=2.40 mM [Br]=0.91 mM
a Modle ([Br]=15.8 mM)
0 5 10 15 20 250.000
0.003
0.006
0.009
0.012
0.015
p-TA
Con
cent
ratio
n (M
)
Time (min)
[Br]=34.8 mM [Br]=15.8 mM [Br]=9.44 mM [Br]=4.93 mM [Br]=2.40 mM [Br]=0.91 mM
a Modle ([Br]=15.8 mM)
0 5 10 15 20 250.000
0.002
0.004
0.006
0.008
0.010
0.012
BP
TA C
once
ntra
tion
(M)
Time (min)
[Br]=34.8 mM [Br]=15.8 mM [Br]=9.44 mM [Br]=4.93 mM [Br]=2.40 mM [Br]=0.91 mM
a Modle ([Br]=15.8 mM)

! 48
Figure 2.10: Experimental and simulated product distributions with various bromide
concentrations (initial [pX] = 0.025 M; stirring rate = 1000 rpm; all other experimental
conditions are as shown in Table 2.3)
Table 2.6: Estimated reaction rate constants at different bromide concentrations (initial [pX] =
0.025 M; stirring rate = 1000 rpm; all other experimental conditions are as shown in Table 2.3)
CBr (mM)
k1 (min-1)
k2 (min-1)
k3 (min-1)
k4 (min-1)
k5 (min-1)
k6 (min-1)
34.8 11.7 (1.91)a 39.0 (27.1) 5.89 (1.10) 22.5 (6.83) 6.00 (1.10) 0.414 (0.0405) 15.8 11.8 (1.60) 39.6 (25.1) 7.75 (1.45) 29.3 (10.3) 7.69 (1.42) 0.307 (0.0227) 9.44 11.6 (2.28) 45.6 (43.2) 5.64 (1.27) 25.4 (12.8) 4.17 (0.955) 0.261 (0.0359) 4.93 8.25 (2.36) 56.3 (48.2) 2.43 (0.648) 11.8 (6.51) 1.17 (0.413) 0.205 (0.0913) 2.40 6.45 (1.70) 17.6 (11.0) 0.927 (0.183) 7.84 (4.08) 0.223 (0.119) 0.152 (0.125) 0.91 7.80 (2.66) 14.5 (8.92) 0.419 (0.0719) 3.87 (1.93) 0.0585 (0.0477) 0.0658 (0.0599)
aIn parenthesis: 95% confidence level.
0 5 10 15 20 250.000
0.001
0.002
0.003
0.004
4-
CB
A C
once
ntra
tion
(M)
Time (min)
[Br]=34.8 mM [Br]=15.8 mM [Br]=9.44 mM [Br]=4.93 mM [Br]=2.40 mM [Br]=0.91 mM
a Modle ([Br]=15.8 mM)
0 5 10 15 20 250.000
0.005
0.010
0.015
0.020
0.025
0.030
TPA
Con
cent
ratio
n (M
)
Time (min)
[Br]=34.8 mM [Br]=15.8 mM [Br]=9.44 mM [Br]=4.93 mM [Br]=2.40 mM [Br]=0.91 mM
a Modle ([Br]=15.8 mM)

! 49
Figure 2.11: Proposed Scheme for the autoxidation of benzyl bromide [105]
2.6.5 Effect of substrate concentration
Experiments with different pX concentrations (Runs 6, 11 & 12 of Table 2.3) were carried out
to study the effect of substrate concentration on the regressed rate constants. Table 2.7 shows the
estimated rate constants. It was found that the rate constants at the different concentrations are
invariant when the confidence intervals are taken into account. This invariance is to be expected
in the case of intrinsic rate constants. However, as shown in Figure 2.12, the rate constants are
reported to decrease with the increase of initial pX concentration in a three-phase reaction system
[99]. This suggests that the formation of a solid phase introduces mass transfer resistances that
lower the rates and therefore the rate constants.
!!

! 50
Table 2.7: Estimated reaction rate constants at different pX concentrations (P = 15 bar; T = 200
(°C; stirring rate = 1000 rpm; all other experimental conditions are as shown in Table 2.3)
Run # CpX,0 (mM)
k1 (min-1)
k2 (min-1)
k3 (min-1)
k4 (min-1)
k5 (min-1)
k6 (min-1)
12 14 11.8 (2.56)a 40.1 (42.0) 5.20 (1.27) 18.73 (6.60) 5.64 (1.37) 0.225 (0.0255) 6 25 11.8 (1.60) 39.6 (25.1) 7.75 (1.45) 29.3 (10.3) 7.69 (1.42) 0.307 (0.0227) 11 35 11.0 (2.10) 38.9 (29.9) 8.81 (2.36) 30.3 (16.9) 5.87 (1.61) 0.302 (0.0445)
aIn parenthesis: 95% confidence level.
Figure 2.12: Effect of initial concentration of pX on the reaction rate [99]
2.7 Summary
In order to provide guidelines for the rational design and optimization of the spray process for
TPA production as well as reactor modeling studies, the kinetic study of pX liquid phase
oxidation to TPA was investigated in a stirred reactor under homogeneous conditions (i.e., low
pX concentrations employed to avoid TPA precipitation). Solubility data of MC process related

! 51
components such as TPA, 4-CBA and p-TA in acetic acid over a wide temperature range were
obtained experimentally and verified with reported data. Based on the solubility data, appropriate
reaction conditions were determined for investigating the kinetics of the oxidation reaction. A
first order kinetic model was developed based on a lumped reaction scheme that includes a
parallel step describing the formation of 4-(bromomethyl)benzoic acid (BPTA). Kinetic rate
constants regressed from the experimental data are shown to be at least one order of magnitude
greater than those reported in the literature. This is attributed to the fact that the conversion data
were operated under homogeneous conditions in this study (unlike the literature data that were
obtained in gas-liquid-solid systems) avoiding solid formation in the liquid phase and thereby
eliminating gas-solid and liquid-solid mass transfer limitations. Our investigations concur with
previous reports that the slowest step is the oxidation of p-TA to 4-CBA. Systematic
investigations of the effects of stirring rate reveal that it is not possible to completely eliminate
the gas-liquid mass transfer limitations in even a laboratory scale stirred reactor. This further
confirms that other reactor configurations (such as a spray reactor in which the liquid is the
dispersed phase) are needed to overcome gas-liquid mass transfer limitations. The effects of
bromide and initial pX concentrations on the reaction rate were also investigated. Bromide
concentration accelerates the reaction rate significantly up to a certain concentration level and
shows zero order dependence at high concentrations where the intermediate BPTA elimination is
favored. Decreasing reaction rate constants with an increase of initial pX concentration reported
in traditional three-phase reaction systems were not observed in the homogeneous system, which
further confirms that the solid phase hinders the reaction rate and the literature reported kinetic
rate constants are not intrinsic kinetic parameters.
! 52
Chapter 3 A Spray Reactor Concept for Catalytic Oxidation of p-Xylene
to Produce High-Purity Terephthalic Acid
Knowledge of intrinsic kinetics and the type of internal contacting pattern employed for the
reactants are key factors among many that dictate chemical reactor performance (Figure 3.1).
Kinetics provides information on the speed of the various steps in the overall reaction as a
function of reactant concentrations and temperature. The contacting pattern determines how
materials flow through and contact each other in the reactor, how early or late they mix, their
clumpiness or state of aggregation [109].
Figure 3.1: Factors that dictate reactor performance [109]
Kinetic studies of liquid phase pX oxidation to TPA in the previous chapter reveal that it is
not possible to completely eliminate the gas-liquid mass transfer limitations in even a laboratory
scale stirred reactor. Any further increase in the overall TPA formation rate must involve another
reactor configuration in which the gas-liquid mass transfer limitations associated with the
Reactor Input Output
Contacting pattern Kinetics
Performance equation output = f (input, kinetics, contacting)

! 53
formation of these intermediates are better alleviated. This is the issue of internal contacting
pattern of the reactants in the reactor configuration.
Contacting pattern is especially important in the case of gas-liquid reaction systems, due
primarily to possible gas-liquid mass transfer resistance. The commercial MC process for TPA
production employs either a CSTR or a bubble column reactor where air is bubbled through the
liquid phase. Given that the rates of the sequential oxidation reaction steps are extremely rapid,
the presence of gas-liquid mass transfer limitations will cause O2 starvation in the liquid phase
resulting in incomplete oxidation. A number of patents deal with improving the agitation system
to maximize the O2/liquid mass transfer coefficient, thereby improving the oxidation rates and
obtaining a purer TPA product [110, 111]. In addition, Osada and Savage [112] found that the
oxygen introduction method has a profound influence on the course of pX partial oxidation
reaction in high-temperature water as reaction medium. Adding oxygen in quick, discrete, small
incremental bursts led to dramatically higher yields and selectivities of TPA than continuous
addition of oxygen. They hypothesized that the rapid step-wise O2 introduction provided
additional turbulence and better mixing as well as higher local O2 concentrations compared to
steady introduction of an identical amount of O2 in a given time. The authors suggested that an
optimal reactor configuration is a tubular reactor in which a stream of high-temperature water
containing dissolved catalyst and substrate (pX) is flowed with intermittent introduction of
oxygen bursts through side-stream jets placed along the tube length.
This chapter describes a spray reactor concept with a different gas/liquid contacting pattern
compared to the conventional MC process reactor for TPA production. A theoretical basis guide
by reactor engineering fundamentals is provided to justify this contacting pattern and to
rationally design the spray reactor. A mathematical model of the conventional reactor provides

! 54
valuable insights into how effective temperature control and safe operation of the exothermic
oxidation system are achieved in industrial practice. These insights provide rational guidance for
experimental demonstration of safe operation of a laboratory scale spray reactor whose
performance is compared with a stirred tank reactor with respect to product yield and purity.
3.1 Theoretical Considerations
3.1.1 Rationale for choosing spray reactor as an alternative to a stirred reactor
At the operating temperature of the MC process, the gas phase containing the oxidant is
dispersed through the liquid phase containing the substrate (pX). The TPA formation involves a
series of partial oxidation steps in which the methyl groups in pX are sequentially oxidized to
yield TALD, p-TA, 4-CBA and finally TPA. However, the oxidation rates are so fast such that,
even if the O2 in the bulk gas phase is present in stoichiometric amounts for TPA formation, the
overall conversion is limited by severe gas-to-liquid mass transfer limitations. This in turn causes
O2 starvation in the bulk of the liquid phase containing the substrate and the intermediate
oxidation products. If one envisions spherical droplets, the outermost liquid layer in each droplet
that is in contact with the oxygen will be easily oxidized causing the TPA to precipitate with
incomplete oxidation products trapped in the inner core of the particles. In order to overcome the
O2-to-liquid mass transfer limitations, we conceptualized a spray-reactor concept in which the
liquid phase is dispersed as micron sized droplets into a continuous gas phase containing the
oxidant (oxygen). Each of these droplets may be envisioned to function as a microreactor. In this
manner, the gas-liquid interfacial area is significantly enhanced relative to the stirred reactor in
which the gas is the dispersed phase.
If the oxygen surrounding each droplet is able to completely penetrate the droplet [i.e., if the
O2 diffusion time scale (Rp2/D) is shorter than the kinetic time scale (1/k)], then the oxidation

! 55
should progress uniformly throughout the droplet. Such a scenario provides the potential for
complete p-xylene conversion to produce the ultimate product (TPA) at relatively high purity. In
contrast, if the droplet size is large such that the oxygen diffusion time scale is much longer than
the kinetic time scale, the resulting gradient in the O2 concentration within the droplet could give
rise to non-uniform oxidation of the p-xylene leading to a less pure TPA product contaminated
by intermediates, lower product yield and quality. Clearly therefore, smaller droplets should
favor the production of TPA product with higher purity and yield.
Table 3.1 provides quantitative estimates of the O2 diffusion time scale (Rp2/D) and the kinetic
time scale (1/k). For this estimation, we assumed an average droplet size of 50 µm that is typical
for the nozzles (BETE PJ6, BETE Fog Nozzle, Inc.) employed in our experiments. The O2
diffusivity (D) in acetic acid (the dominant specie in the droplet) at 200 °C and 15 bar is
estimated from the Wilke-Chang correlation [113]. The first-order rate constant (k) corresponds
to the slowest step in the consecutive oxidation sequence (typically p-TA oxidation to 4-CBA).
Values reported in the literature [94-99] vary widely depending on the catalyst and operating
conditions used. We used all these values as well as the rate constants determined in this work
(Chapter 2) to estimate the square of Hatta number (Hatta number, MH, is defined by eqn. 3.1
[109]) for this gas-liquid reaction at various operating conditions as summarized in Table 3.1.
The fact that the square of Hatta number is far less than unity at all the conditions allows us to
conclude that it is possible to eliminate O2 starvation in typical spray droplets.
MH
2 = max possible conversion in filmmax diffusional transport through the film
(eqn. 3.1)

! 56
Table 3.1: Estimation of Hatta number for simultaneous O2 diffusion and reaction in a droplet
Operating conditions k (min-1)
kRp2/D
(analogous to Hatta number
square)
Reference (for k)
T = 130 °C, P = 1 atm CpX, 0 = 3.8 mol/kgsol Ccatalyst (cobalt naphtenate) = 0.001 mol/ kgsol
6.6(10-4) 2.3(10-7) 94
T = 191 °C, PO2 = 40 kPa CpX, 0 = 0.943 mol/kgHAc CCo = 0.055 kg/kgHAc, CMn = 0.0512 kg/kgHAc CBr = 0.0746 kg/kgHAc
0.0568 2.0(10-5) 98
T = 187 °C CpX, 0 = 0.2 mol/kgHAc CCo = 0.04 wt%, CMn = 0.02 wt%, CBr = 0.08 wt%
0.123 4.3(10-5) 99
T = 200 °C CpX, 0 = 0.025 M CCo = 12.5 mM, CMn = 12.5 mM, CBr = 16 mM
7.75 2.7(10-3) This work
3.1.2 Droplet/reactor stability considerations
The oxidation of pX to TPA is highly exothermic with ΔHR = 1,300 kJ/mol [37, 38]. The
droplet temperature rise due to reaction is partly controlled by the evaporative cooling of the
solvent (acetic acid). At typical operating conditions, the latent heat of vaporization provides
enough heat capacity to absorb the heat of reaction and maintain the maximum droplet
temperature at the acetic acid boiling point. As shown in Figure 3.2, the heat of vaporization of
acetic acid decreases and the boiling point increases with an increase in pressure. Clearly, proper
choice and control of the operating pressure are essential to limit the droplet temperature rise to
the boiling point of acetic acid and thereby prevent temperature overshoot that can lead to
undesired reactions (burning of acetic acid, for example) and a thermal runaway situation.

! 57
!
Figure 3.2: Variation of acetic acid boiling point and heat of vaporization with pressure
To better understand temperature control by evaporative cooling, we chose to mathematically
model the continuous stirred tank reactor configuration (Figure 3.3) in the MC process. In
addition to the feed and recycle streams, the latent heat of evaporation of the mixed solvent
(acetic acid and water) at the reactor P and T is also a potential coolant source. Note in Figure
3.3 that the acetic acid and water vapor steams are condensed in an external separator and
recycled back to the reactor. Based on these assumptions, the energy balance equation for the
oxidation reactor is given by:
Fj0
H j0− H j( ) + riV
ν ij=1
n
∑ −ΔHR( ) = N jCp, j
dTdtj=1
n
∑ (eqn. 3.2)
0 10 20 30 40 50 600
4
8
12
16
20
Pressure (bar)
ΔHva
p (kJ
/mol
)
200
220
240
260
280
300
320
Tb ( oC
)

! 58
The first term of the left hand side of eqn. 3.2 represents the heat removal rate (-QR) and the
second term represents the heat generation rate (QG). These individual terms are further
elaborated in eqns. 3.3 and 3.4.
Fj0H j0
− H j( ) = −QR = Fj0Cp, j dT
T
Tj0∫j=1
n
∑j=1
n
∑ − FjvapΔHvap, j
j=1
m
∑ = FfeedCp, feed T0 −T( ) + FairCp,air T0 −T( ) + FHAc,condensedCp,HAc Trecycle −T( ) + FH2O ,condensedCp,H2O Trecycle −T( ) − FHAc,vapΔHvap,HOAc − FH2O ,vapΔHvap,H2O
(eqn. 3.3)
riVν i
−ΔHR( ) = QG = FpX X −ΔHR( ) (eqn. 3.4)
Figure 3.3: Schematic of oxidation reactor at typical MC process conditions [13, 14, 20]
For this analysis, the exothermic heat effects from the intermediate oxidation products
(TALD, p-TA, 4-CBA) and from solvent burning are neglected as being insignificant compared
to the heat effects associated with the predominant TPA formation reaction. Since the pX

! 59
conversion is complete under typical MC process conditions (with TPA being the dominant
product), the heat generation rate is constant at all simulated conditions. The physical property
data required to evaluate the various enthalpies in eqn. 3.3 are taken from HYSYS® database
[37] and other sources [38]. The vapor phase compositions in the reactor at various T and fixed
reactor P are also estimated using the HYSYS® database.
Figure 3.4 shows the heat generation rate (QG) and heat removal rate (QR) as a function of
temperature for the MC process oxidation reactor at two different reactor operating pressures:
15.2 bar and 12.5 bar. Note the exponential increase in QR as the boiling point of the acetic acid
(dominant component in the reaction mixture) is approached at the two pressures. At the typical
MC process operating pressure of 15.2 bar, the steady state temperature (where QG = QR) is
approximately 195 °C. This is remarkably close to the steady state operating temperature
reported for industrial reactors [13, 14]. The evaporative cooling effect accounts for 65% of the
total heat removed. As seen in Figure 3.4, the steady state temperature decreases as pressure
decreases. This is because the boiling point of the solvent (acetic acid/water is a tangentially
zeotropic system [114]) decreases while the latent heat of evaporation increases with pressure.
Further, the slope of heat removal curve is greater than that of heat generation curve, implying
that the steady states are open-loop stable. This analysis should clearly hold even when the
dispersed and continuous phases are switched: i.e., when the liquid phase exists as droplets (i.e.,
as microreactors) surrounded by a continuous gas phase containing the oxidant, implying that a
spray reactor operated under similar conditions should also be open-loop stable.

! 60
Figure 3.4: Predicted heat generation (QG) and heat removal (QR) rates for pX oxidation reactor
(conditions noted in Figure 3.3)
Effect of water content in feed on reactor temperature
Modeling of the stirred reactor at MC process conditions clearly shows that a substantial
portion of the heat generated by the oxidation reactions is removed by the evaporation of the
solvent. The modeling results also reveal that proper control of the reactor operating pressure is
essential to limit the reactor temperature to the boiling point of the solvent and thereby prevent
temperature overshoot.
The feed stream in the MC process typically contains about 5 wt% water. Since water has a
lower boiling point and a higher value of heat of vaporization compared to acetic acid, water
content in the solvent affects the steady state reactor temperature at a given operating pressure.
165 170 175 180 185 190 195 200 2050
5
10
15
20
25
30
35
40
QR o
r QG (*
108 k
J/h)
Temperature (oC)
QR 15.2 bar
QR 12.5 bar
QG

! 61
To quantify this effect, the mathematical model developed previously is applied to the MC
oxidation reactor conditions at various water contents in the feed. Figure 3.5 shows the results of
such an analysis. Higher water content in the solvent results in lower reactor temperature.
Figure 3.5: Effects of water content on reactor temperature in MC process
3.1.3 Vapor phase flammability considerations
In both the MC process and the spray process, the use of a flammable organic solvent (acetic
acid) during pX oxidation gives rise to vapor phase flammability concerns. The upper
flammability limit (UFL) for acetic acid in air under ambient or elevated pressure (above 30 bar)
is below 25 vol% [6, 82]. In the spray reactor, an O2/CO2 mixture (instead of air) is used as the
oxidant source with the maximum O2 content being 50 vol%. Carbon dioxide is used as the
180 185 190 195 200 205 210 215123456789
10111213141516
MC Process
Water(wt%) = 0, 1%, 2%,..., 6%
Water(wt%) = 6%
Water(wt%) = 0QG
QR o
r QG (*
108 k
J/h)
Temperature (oC)
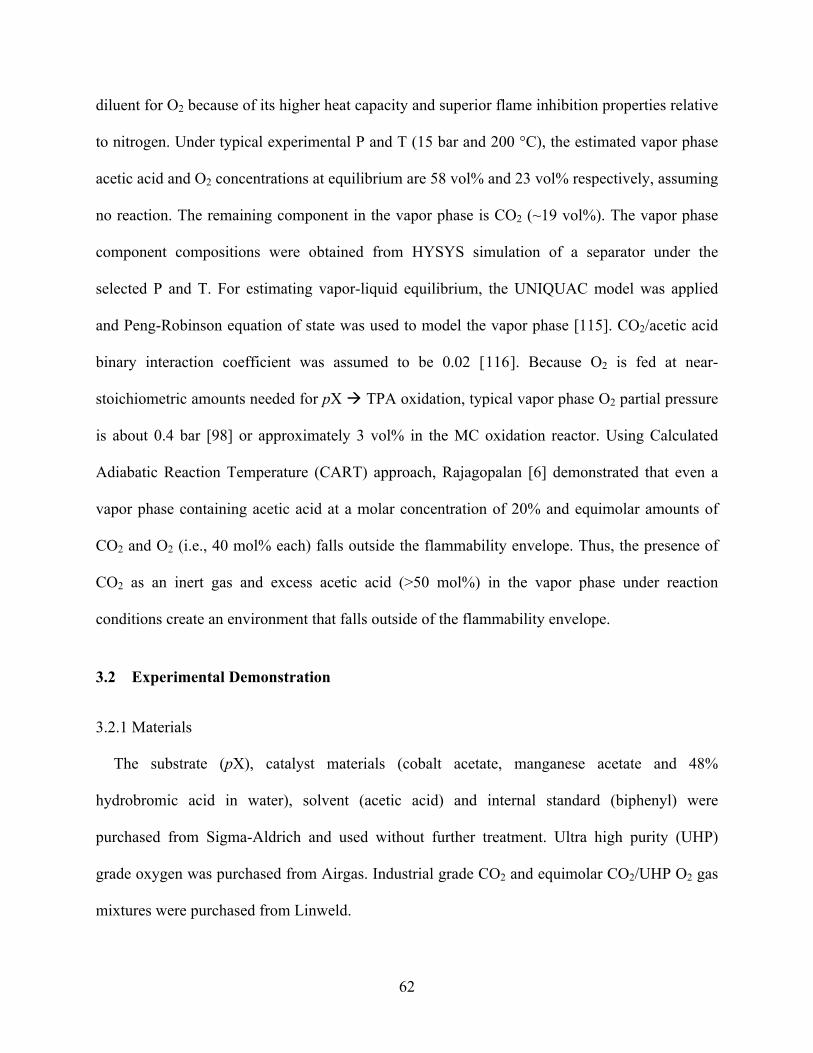
! 62
diluent for O2 because of its higher heat capacity and superior flame inhibition properties relative
to nitrogen. Under typical experimental P and T (15 bar and 200 °C), the estimated vapor phase
acetic acid and O2 concentrations at equilibrium are 58 vol% and 23 vol% respectively, assuming
no reaction. The remaining component in the vapor phase is CO2 (~19 vol%). The vapor phase
component compositions were obtained from HYSYS simulation of a separator under the
selected P and T. For estimating vapor-liquid equilibrium, the UNIQUAC model was applied
and Peng-Robinson equation of state was used to model the vapor phase [115]. CO2/acetic acid
binary interaction coefficient was assumed to be 0.02 [116]. Because O2 is fed at near-
stoichiometric amounts needed for pX ! TPA oxidation, typical vapor phase O2 partial pressure
is about 0.4 bar [98] or approximately 3 vol% in the MC oxidation reactor. Using Calculated
Adiabatic Reaction Temperature (CART) approach, Rajagopalan [6] demonstrated that even a
vapor phase containing acetic acid at a molar concentration of 20% and equimolar amounts of
CO2 and O2 (i.e., 40 mol% each) falls outside the flammability envelope. Thus, the presence of
CO2 as an inert gas and excess acetic acid (>50 mol%) in the vapor phase under reaction
conditions create an environment that falls outside of the flammability envelope.
3.2 Experimental Demonstration
3.2.1 Materials
The substrate (pX), catalyst materials (cobalt acetate, manganese acetate and 48%
hydrobromic acid in water), solvent (acetic acid) and internal standard (biphenyl) were
purchased from Sigma-Aldrich and used without further treatment. Ultra high purity (UHP)
grade oxygen was purchased from Airgas. Industrial grade CO2 and equimolar CO2/UHP O2 gas
mixtures were purchased from Linweld.

! 63
3.2.2 Oxidation experiments in spray reactor
Figure 3.6 shows the schematic of a 700 mL titanium spray reactor equipped with a 4-point
thermocouple and a transducer for measuring axial reactor temperatures and the reactor pressure,
respectively. Four profile thermocouples are located inside the reactor, with intervals of 1.5
inches. The temperature and pressure are continuously recorded and controlled with the help of a
LabVIEW® data acquisition system. The reactor lid accommodates multiple inlet/outlet ports for
(a) liquid injection via a custom-made titanium nozzle (BETE®, Model PJ), (b) continuously
introducing an O2/CO2 gas mixture to the gas sparger immersed in the liquid phase at the bottom
of the spray tower, (c) continuously withdrawing the vapor phase, and (d) a safety pressure relief
valve.

! 64
Figure 3.6: Schematic of the spray reactor:!The four thermocouple locations (black dots) are
evenly spaced and numbered from the bottom to the top as follows: T1,bottom (in the liquid phase),
T2 (above T1,bottom), T3 (above T2) and T4,top (above T3).
The spray reactor was operated in a semi-batch mode with and without gas withdrawal. In a
typical experimental run, the reactor was initially charged with 50 mL of acetic acid (97 wt%
purity, used as received) and pressurized with an equimolar O2/CO2 gas mixture, and then heated
to the desired temperature (approximately 200 °C) such that the eventual pressure is 15 bar. After
the temperature and pressure stabilized, the O2/CO2 gas mixture was preheated to the reactor
temperature by means of an oil bath and continuously introduced into the reactor at a flow rate of
606 std cm3/min. Simultaneously, the pre-mixed and pre-heated feed solution (containing
T1
T2
T3
T4

! 65
specific concentrations of pX, cobalt acetate, manganese acetate and hydrobromic acid dissolved
in acetic acid) was sprayed into the reactor for 3 minutes at a rate of 35 mL/min. For a typical
run, the O2/pX (mol:mol) is approximately 3.26 which is sufficient to fully convert the pX to
TPA. In the constant pressure operation mode, the gas was also continuously withdrawn from the
vapor phase to maintain the reactor pressure constant at the desired value (15 bar) with a back-
pressure regulator (DRESSER®, Model SD91LW) connected to the gas-effluent line. In the
experiments without gas withdrawal, the pressure was allowed to rise continuously during the 3-
minute duration of the spray. In both cases, the liquid volume increased by approximately 105
mL during the 3-minute spray duration. At the end of a run, the spray as well as the O2 addition
was stopped and the reactor was allowed to cool down with any further reaction occurring
mostly in the liquid phase in the presence of residual O2. Both the spray and the stirred reactors
were typically allowed to cool down to room temperature in a programmed fashion ensuring that
any observed differences in product quality in the two reactors are not due to temperature
differences during the cooling step.
3.2.3 Benchmark oxidation experiments in a stirred reactor
To enable comparisons with the spray reactor performance, experiments were also performed
in a 50 mL titanium stirred vessel (Parr Instrument Company, Series 4560 Mini Bench Top
Reactor). Details of this reactor unit and operation are provided elsewhere [3]. Briefly, 25 mL of
acetic acid (~97 wt% in water) solution containing the catalyst components, whose
concentrations were identical to those in the spray reactor experiments, was initially charged into
the Parr reactor. The reactor was then pressurized with an equimolar O2/CO2 mixture to the
desired operating pressure (15 bar) and temperature (200 °C). The stirred reactor was operated in
a semi-batch mode in which pX was continuously pumped into the reactor at a rate of 0.067

! 66
mL/min for 3 minutes. The molar O2/pX ratio based on the pX added and the O2 partial pressure
of 3.2 bar is 2.5. To ensure that there was always sufficient stoichiometric O2 supply to complete
the pX oxidation to TPA, the O2 consumed during reaction is continuously replenished from an
external O2 reservoir to maintain a constant partial pressure of 3.2 bar. There is about 58 mol%
acetic acid vapor in the gas phase. The total 15 bar pressure consists of 58% acetic acid and
equimolar O2 and CO2 in the gas phase. The O2 pressure profile in the external reservoir was
continuously monitored to maintain the desired rate of O2 consumption and total O2
consumption.
3.2.4 Product analysis
The solid product was filtered, washed, dried and analyzed by HPLC using the gradient
elution technique described by Viola and Cao [102]. The sample preparation procedure and the
chromatographic column used in this work are identical to those used in the work by Zuo et al.
[3]. Specifically, the mobile phase consisted of three eluents: aqueous phase (0.1 wt%
phosphoric acid) and organic phase (consisting of 7 parts acetonitrile and 2 parts methanol by
volume). The gradient elution program was as follows: starting with an aqueous phase, the eluent
mixture composition was changed linearly during a five minute span to 95 vol% aqueous phase
and 5 vol% organic phase. From 5 to 10 min, the mixture composition was altered linearly with
time to 15 vol% aqueous phase and 85 vol% organic phase and kept constant thereafter until 16
min. The total flow rate of the mobile phase was 1 mL/min. A UV detector was used to quantify
the products using biphenyl as internal standard (215 nm for pX and 254 nm for all other
products).
The 4-CBA detection limit is 200 ppm for the aforementioned HPLC method. In order to
increase the 4-CBA detection sensitivity to less than 25 ppm in the TPA solid (and thereby
! 67
enable assessment of polymer-grade purity), the following sensitive HPLC method was
developed: a 20 mg solid sample was dissolved in 20 mL of water with 150 µL ammonium
hydroxide and analyzed by HPLC. The gradient elution program is the same as explained above
except that during the time period of 10-16 min, a mobile phase composition of 60 vol% aqueous
phase and 40 vol% organic phase was used with a total flow rate of 1 mL/min. The detection
limit of this sensitive analytical method is down to 1 ppm 4-CBA. The overall carbon balance
based on analysis of pX and the oxidation products (in the liquid and solid phases) is around
95% in all experiments.
3.3 Experimental results and discussion
3.3.1 Roles of liquid sparger
A high surface area 4-blade titanium sparger immersed into the liquid phase for introducing
the O2/CO2 gas mixture into the liquid (Figure 3.7) was attempted to maintain acetic acid
saturation and sufficient O2 availability in the vapor and liquid phases. To test the liquid sparger
in a blank run, the amounts of acetic acid condensed from the reactor overhead stream (vapor
phase) were measured. As shown in Figure 3.8, without sparger, the acetic acid flow rate
decayed with time and the vapor phase tended to dry out (undesired). Further, temperature
gradients were observed in the reactor. With sparger, however, acetic acid collected from
overhead condenser fluctuated around 1.4 g/min and temperature gradients were minimized.

! 68
Figure 3.7: Schematic of the liquid sparger
Figure 3.8: Measurement of acetic acid condensed from gas phase during blank run
Left: without sparger; Right: with sparger
Reaction Mixture
O2/CO2
BPR Sparger
1.0
1.5
2.0
2.5
3.0
3.5
4.0
4.5
5.00 4 8 12 16 20 24 28
1.0
1.5
2.0
2.5
3.0
3.5
4.0
4.5
5.0
HO
Ac
colle
cted
(g)
0 4 8 12 16 20 24 28140
150
160
170
180
190
200
210
2200 4 8 12 16 20 24 28
T1,bottom
T2
T3
T4,top
P
Time (min)
Tem
pera
ture
(o C)
190
200
210
220
230
240
250
Pressure (psia)
0.0
0.1
0.2
0.3
0.4
0.50 4 8 12 16 20 24 28
0.0
0.1
0.2
0.3
0.4
0.5
HO
Ac c
olle
cted
(g)
0 4 8 12 16 20 24 28140
150
160
170
180
190
200
210
2200 4 8 12 16 20 24 28
T1,bottom
T2
T3
T4,top
P
Time (min)
Tem
pera
ture
(o C)
190
200
210
220
230
240
250
Pressure (psia)

! 69
3.3.2 Performance of spray reactor
Table 3.2 shows a summary of the solid TPA product purities from the spray reactor. The
experimental procedure was described in section 3.2.2. In addition to the main product and
intermediates shown in Figure 1.3, the presence of 4-(bromomethyl)benzoic acid (BPTA) was
also checked during product analysis. It was found that the spray reactor produced high-purity
solid TPA product with 4-CBA at concentrations of less than 25 ppm (Table 3.2) being the only
impurity detected. The TPA crystals produced from the spray reactor were white and needle-like
with particles in the 600-1500 µm size range, as seen from SEM (scanning electron microscope)
image (Figure 3.9). A UV-Vis spectrometer was used to determine the optical density of the
solid TPA product as an indicator of the extent of colored compounds present. The measurement
of optical density and details of associated calculations are provided elsewhere [3]. The typical
OD340 (optical density at 340 nm) values of the obtained solid TPA product from the spray
reactor are in the range of 0.013-0.018. These values meet the specification required for a
polymer-grade TPA product (< 0.08) [6].
Table 3.2: Purity of solid TPA product obtained from the spray reactor
Run # Operation mode T (°C)
P (bar)
pX added (mmol)
Solid product quality 4-CBA (ppm)
BPTA (ppm)
p-TA (ppm)
1 With gas outlet (P constant) 200 15 13.8 3±1 n.d.a n.d.
2b With gas outlet (P constant) 200 15 20.7 <1 n.d. n.d.
3c With gas outlet (P constant) 200 15 27.6 <1 n.d. n.d.
4 No gas outlet (P increases) 200-235 30-38 27.5 13±1 n.d. n.d.
Co = 12.5 mM, Mn = 12.5 mM, Br = 32.5 mM; spray rate = 35 mL/min, spray time = 3 min;
gas mixture flow rate (O2:CO2 = 1:1) = 606 std cm3/min; an.d.: not detected; bO2/CO2 gas mixture
flow rate = 1,009 std cm3/min; cO2/CO2 gas mixture flow rate = 1,045 std cm3/min.

! 70
Figure 3.9: SEM (scanning electron microscope) image of TPA crystals
produced from the spray reactor
Figures 3.10a and 3.10b show the temperature and pressure profiles corresponding to runs 1
and 4 (Table 3.2). During operation without gas outlet (Figure 3.10b), the reactor pressure
increased by up to approximately 7.5 bar (from 30 to 38 bar) and the temperature increased by up
to 35 °C with the maximum temperature occurring in the liquid phase at the bottom of the spray
reactor. In sharp contrast, when the reactor pressure was maintained at a constant value during
reactor operation with gas outlet (Figure 3.10a), the temperature profiles were nearly flat and the
temperature rise was within a few degrees. The significant temperature rise in Figure 3.10b is
partly attributed to the greater amount of heat generated at the higher pX concentrations and
partly to the increasing pressure (30-38 bar) during the run that increases the boiling point of the
solvent and lowers the evaporative cooling effect. When an experiment using the same pX
concentration as that in run 4 was performed at 15 bar with gas outlet (run 3), similar T & P
profiles as in run 1 (Figure 3.10c) were obtained. This indicates that the increasing reactor

! 71
pressure in run 4 was the main reason for the increasing T during that run. The increase in T
enhances the possibility of not only solvent burning but also titanium which partially burns in
pure O2 at 200 °C and O2 partial pressure of roughly 25 bar [6, 117]. Clearly, a reactor pressure
of 15 bar is preferred to take better advantage of evaporative cooling due to acetic acid boiling at
lower T (232.5 °C at 15 bar, Figure 3.2), as explained in section 3.1.2.
!
0.0 0.5 1.0 1.5 2.0 2.5 3.0140
160
180
200
220
240
260
T1,bottom
T2
T3
T4,top
P
Time (min)
Tem
pera
ture
(o C)
10
12
14
16
18(a)
Pressure (bar)

! 72
!
!
Figure 3.10: Temporal temperature and pressure profiles during spray reactor operation:
(a) with gas outlet (operating conditions correspond to run 1, Table 3.2);
(b) without gas outlet (operating conditions correspond to run 4, Table 3.2);
(c) with gas outlet (operating conditions correspond to run 3, Table 3.2).
0.0 0.5 1.0 1.5 2.0 2.5 3.0140
160
180
200
220
240
260
T1,bottom
T2
T3
T4,top
P
Time (min)
Tem
pera
ture
(o C)
28
30
32
34
36
38(b)
Pressure (bar)
0.0 0.5 1.0 1.5 2.0 2.5 3.0140
160
180
200
220
240
260
T1,bottom
T2
T3
T4,top
P
Time (min)
Tem
pera
ture
(o C)
10
12
14
16
18(c)
Pressure (bar)

! 73
It is important to point out that the reaction solution was preheated to the desired temperature
via a two-stage oil bath before being sprayed into the reactor. During the development phase of
the spray reactor, a single stage oil bath was used resulting in an inlet temperature of <150 °C
just before the liquid stream passed through the nozzle. Even though the entire reactor was
heated to 200 °C and other reaction conditions stayed the same as those aforementioned
experiments, the solid TPA produced under low inlet temperatures was yellowish and the 4-CBA
content was on the order of tens of thousands of ppm, clearly confirming the importance of
preheating the reaction mixture to 200 °C before contacting with O2 to avoid the kinetic
limitations at the lower temperatures and take full advantage of the increased O2/liquid mass
transfer area.
Table 3.3 summarizes the results of analyses of the solid and liquid phases from run #1 (Table
3.2). The majority of the TPA product exists in the solid phase. The high-purity solid TPA
product harvested following a 3-minute spray is approximately 2.07 g, translating to an overall
productivity of 394 kg m-3 h-1 based on the liquid phase volume. While only minor amounts of 4-
CBA and TALD intermediates were detected in the liquid, a significant amount of BPTA was
also found. It was found that this intermediate can be completely eliminated (i.e., oxidized to
TPA) if the reactor temperature was maintained at 200 °C for 30 minutes following the spray.
Further, p-TA, a major impurity in industrial grade purified TPA, was not detected in either the
solid or liquid phases. In this study, only the concentrations of the aromatic compounds were
used to calculate carbon balance, which was found to be around 95%, which is within
experimental error.
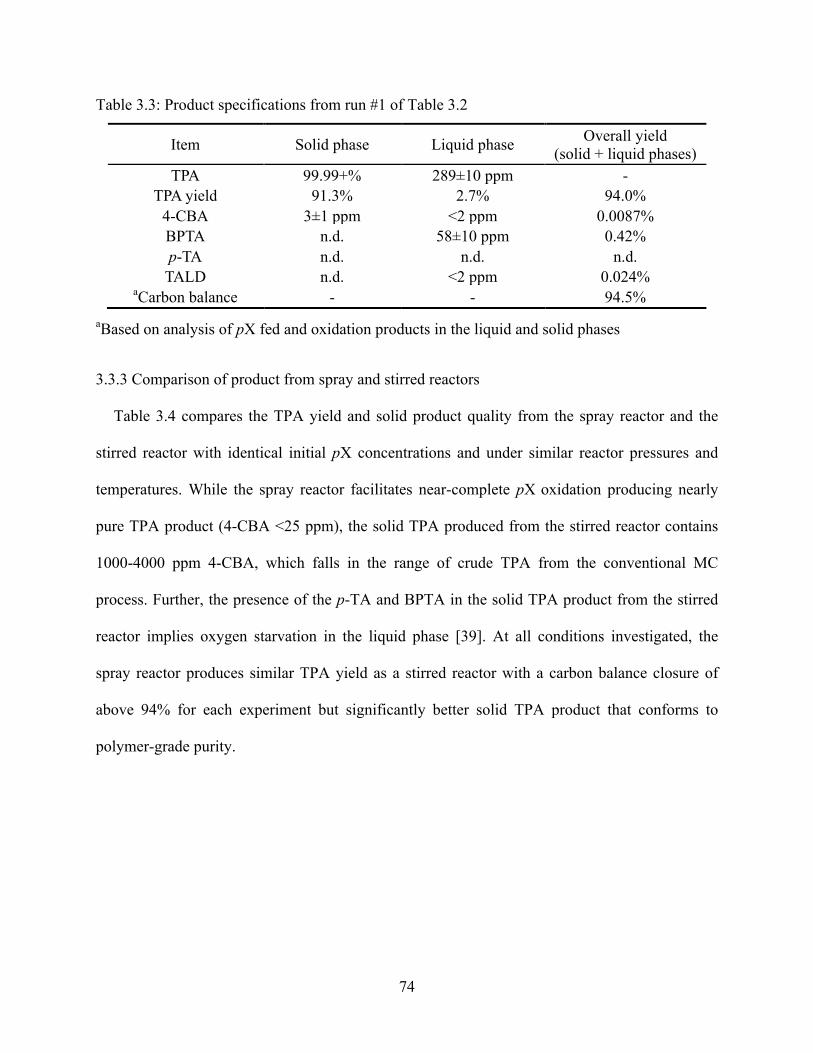
! 74
Table 3.3: Product specifications from run #1 of Table 3.2
Item Solid phase Liquid phase Overall yield (solid + liquid phases)
TPA 99.99+% 289±10 ppm - TPA yield 91.3% 2.7% 94.0% 4-CBA 3±1 ppm <2 ppm 0.0087% BPTA n.d. 58±10 ppm 0.42% p-TA n.d. n.d. n.d. TALD n.d. <2 ppm 0.024%
aCarbon balance - - 94.5% aBased on analysis of pX fed and oxidation products in the liquid and solid phases
3.3.3 Comparison of product from spray and stirred reactors
Table 3.4 compares the TPA yield and solid product quality from the spray reactor and the
stirred reactor with identical initial pX concentrations and under similar reactor pressures and
temperatures. While the spray reactor facilitates near-complete pX oxidation producing nearly
pure TPA product (4-CBA <25 ppm), the solid TPA produced from the stirred reactor contains
1000-4000 ppm 4-CBA, which falls in the range of crude TPA from the conventional MC
process. Further, the presence of the p-TA and BPTA in the solid TPA product from the stirred
reactor implies oxygen starvation in the liquid phase [39]. At all conditions investigated, the
spray reactor produces similar TPA yield as a stirred reactor with a carbon balance closure of
above 94% for each experiment but significantly better solid TPA product that conforms to
polymer-grade purity.

! 75
Table 3.4: Comparison of product purity and yields from spray and stirred reactors
Run # Reactor T
(°C) P
(bar)
Initial pX
conc. (M)
Impurities in solid TPA product
Overall yield (%) (solid + liquid phases)
4-CBA (ppm)
p-TA (ppm)
BPTA (ppm) TALD p-TA BPTA 4-CBA TPA
4 Spray 200-235
30-37 0.264 13±1 n.d. n.d. 0.12 0.46 0.64 0.10 97.6
5 Stirred 200 30 0.264 1,621±10 1,062±10 n.d. 0.36 1.57 0.96 0.61 96.0
6 Spray 200 15 0.066 46±1 n.d. n.d. 0.015 − 0.072 0.0044 94.8
7 Stirred 200 15 0.066 924±10 n.d. 986±10 0.21 0.68 5.23 0.36 92.7
8 Spraya 200 15 0.066 <1 n.d. n.d. − − − − 95.6 9 Stirreda 200 15 0.066 112±1 n.d. n.d. 0.11 0.27 − 0.07 93.7
Reaction conditions:
Co = 12.5 mM, Mn = 12.5 mM, Br = 32.5 mM;
O2:CO2 (mol:mol) = 1:1
spray rate = 35 mL/min, spray time = 3 min;
gas mixture flow rate (O2:CO2 = 1:1) = 606 std cm3/min; aReactors were maintained at 200 °C for 1 hour after completion of pX introduction.
Typically, the products were removed from the reactor following a cool-down phase after a
run. It was found that the stirred reactor cooled down faster than the spray reactor. While the
stirred reactor cooled from 200 °C to approximately 160 °C in 10 minutes (Figure 3.11a), the
temperature of the liquid phase in the spray reactor was nearly 190 °C after 10 minutes of natural
cooling (Figure 3.11b). To rule out the effects of higher temperatures during the cool-down
phase in promoting more complete oxidation of the intermediates, experiments were conducted
wherein the stirred reactor temperature was maintained at 200 °C for 1 h following completion of
pX introduction. In this manner, the average temperatures during the cool-down phase were
much higher in the stirred reactor compared to the spray reactor. Despite the higher temperatures,
the 4-CBA content in the TPA product from the stirred reactor was still 112 ppm, several-fold
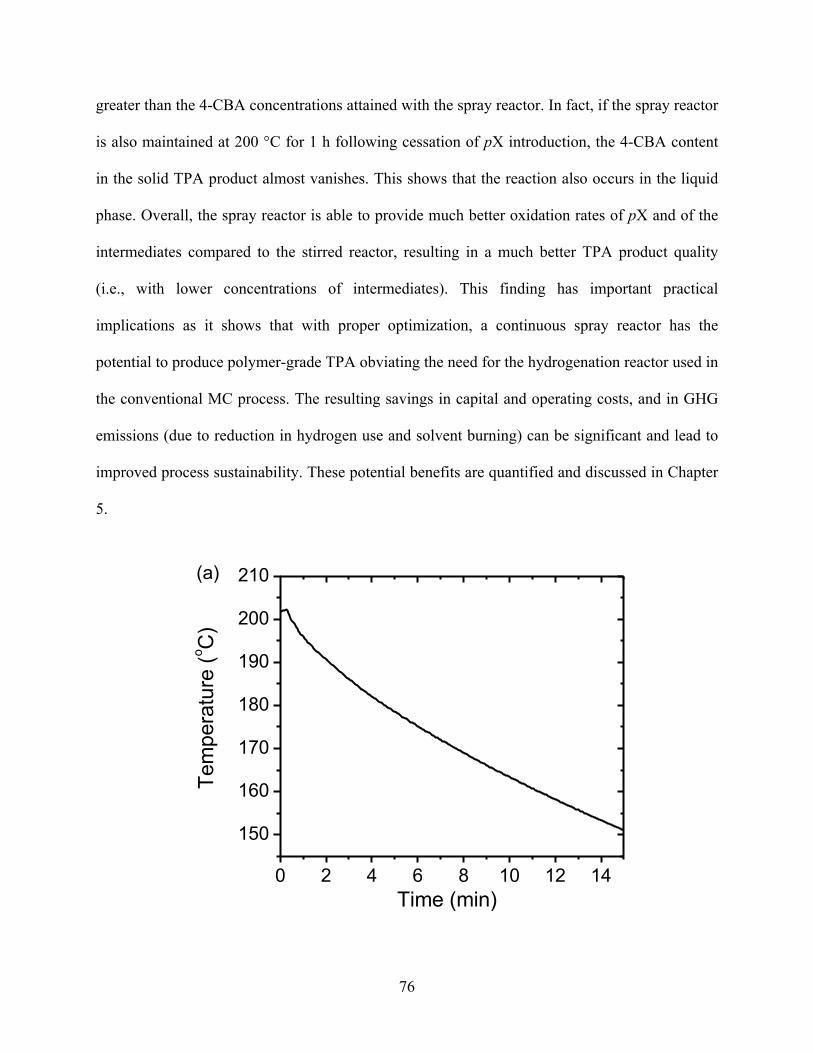
! 76
greater than the 4-CBA concentrations attained with the spray reactor. In fact, if the spray reactor
is also maintained at 200 °C for 1 h following cessation of pX introduction, the 4-CBA content
in the solid TPA product almost vanishes. This shows that the reaction also occurs in the liquid
phase. Overall, the spray reactor is able to provide much better oxidation rates of pX and of the
intermediates compared to the stirred reactor, resulting in a much better TPA product quality
(i.e., with lower concentrations of intermediates). This finding has important practical
implications as it shows that with proper optimization, a continuous spray reactor has the
potential to produce polymer-grade TPA obviating the need for the hydrogenation reactor used in
the conventional MC process. The resulting savings in capital and operating costs, and in GHG
emissions (due to reduction in hydrogen use and solvent burning) can be significant and lead to
improved process sustainability. These potential benefits are quantified and discussed in Chapter
5.
!
0 2 4 6 8 10 12 14
150
160
170
180
190
200
210(a)
Tem
pera
ture
(o C)
Time (min)

! 77
!Figure 3.11: Temperature profiles during the cool down phase
(a) stirred reactor; (b) spray reactor.
3.3.4 CO formation as a measure of burning reactions
The increase in the concentration of CO2 in the gas phase is typically measured to assess the
extent of burning reactions during pX oxidation. Because we use a CO2/O2 mixture, it is difficult
to accurately measure incremental CO2 concentrations in the gas phase due to burning reactions.
Hence, we chose to measure the CO concentration in the gas phase as an approximate measure of
the extent of burning reactions. The gas mixture was analyzed by GC (column: Shin Carbon ST
100/120 mesh) to determine the CO formation from solvent burning. Preliminary experimental
results from the spray process (Table 3.5) show that at identical feed conditions, the observed
CO formation during spray reactor operation was approximately one fourth or less of that
observed during stirred reactor operation [CO/pX (mol/mol) ~ 0.045]. The reduced burning is
0 5 10 15 20 25 30 35
150
160
170
180
190
200
210(b)
Tem
pera
ture
(o C)
Time (min)
T1,bottom
T2
T3
T4,top

! 78
presumably because the residence time in the spray reactor (~1.5 min) is much shorter than that
in the MC reactor (~35 min). Further experiments encompassing longer spray durations and
14CO2-labeling studies are needed to confirm the extent of solvent burning during spray reactor
operation.
Table 3.5: CO analysis during the pX oxidation in the spray reactor
Run # Time duration for vapor sample collection CO/pX (mol/mol) 10 1’25” ~ 2’45” 0.0112
11 40” ~ 2’15” 0.0048
12 1’ ~ 3’05” 0.0114
Reaction conditions:
T = 200 °C, P = 15 bar;
Co = 12.5 mM, Mn = 12.5 mM, Br = 32.5 mM;
pX added = 6.9 mmol, spray rate = 35 mL/min.
3.4 Summary
For p-xylene oxidation to TPA, a spray reactor in which the liquid phase is dispersed as fine
droplets into the gas phase containing oxygen produces high-purity TPA (<25 ppm 4-CBA) in
one step at 200 °C and 15 bar pressure. This result is in sharp contrast to the performance of the
conventional stirred reactor in which the solid TPA product contains >1000 ppm 4-CBA
requiring further purification steps. We attribute the superior performance of the spray reactor to
increased O2-liquid mass transfer area thus avoiding starvation that can occur when gas is
sparged into a continuous liquid phase, as in the stirred reactor. In addition, the reduced
backmixing in the spray reactor has also contributed to enhanced conversion. Another advantage
of the spray reactor is that the solvent (acetic acid) burning rate is reduced due to the shorter
residence times in the spray reactor, which was demonstrated by our preliminary experimental

! 79
results of CO formation rate. Theoretical calculations confirm that in typical spray droplets, the
O2 diffusion time constants are one to two orders of magnitude lower than the kinetic time
constant (associated with the rate determining step) implying facile penetration of the O2
throughout the liquid phase and elimination of O2 starvation. Further, mathematical modeling of
a stirred reactor operated at typical Mid-Century process conditions shows that solvent
evaporation is a main source of cooling that results in steady states that are open-loop stable. The
modeling also shows that control of reactor operating pressure around 15 bar is critical to
achieving stable operation without temperature overshoot that might lead to solvent and titanium
burning in the presence of oxygen. These model predictions were verified experimentally. Spray
reactor operation in which the reactor pressure is maintained constant results in constant pressure
and temperatures whereas operation in which the reactor pressure is allowed to rise during
continuous gas introduction results in a steadily rising temperature in the reactor. In addition,
higher water content in the solvent results in lower reactor temperature in both the MC and spray
processes because water has a lower boiling point and a higher value of heat of vaporization
compared to acetic acid. Further, the presence of CO2 and acetic acid vapor in the gas phase in
sufficiently high concentrations is shown to maintain the reaction outside the flammability
envelope. The elimination of the hydrogenation step and reduction of solvent burning (due to
smaller residence times compared to the stirred reactor) provide potential economic and
environmental benefits that would make a continuous spray process a greener alternative to the
conventional Mid-Century process. Furthermore, this work also suggests that the spray process
may be extended to other fast gas-liquid reactions to overcome gas-liquid mass transfer
limitations in conventional stirred reactors.

! 80
Chapter 4 Development of a Continuous Spray Process
for Terephthalic Acid Production
In the previous chapter, a semi-batch spray process concept for the oxidation of pX to TPA
was successfully demonstrated. This chapter is intended to demonstrate the spray process
concept in continuous operation mode. Some preliminary experimental results from the
continuous spray process are reported.
4.1 Continuous Spray Reactor: Initial Efforts
A major goal of this research program is to develop and demonstrate a continuous, laboratory-
scale spray reactor process in which polymer-grade (<25 ppm 4-CBA) TPA is produced as a
solid product in one step at high yields (comparable to the Mid-Century process) while
simultaneously reducing the solvent (acetic acid) burn rate. In Chapter 3, it was demonstrated
that a 700 mL spray reactor operated in semi-batch mode (i.e., gas phase is continuously
introduced in and withdrawn from the spray reactor while liquid phase remains in the reactor
during the 3-min spray duration) produces high-purity TPA (<25 ppm 4-CBA). The next
challenge to address is whether the high-purity product can be continuously withdrawn from the
reactor in order to demonstrate a continuous process. The progress to date is described in this
section.
The intrinsic kinetic studies of the homogeneous reaction system indicate that pX oxidation to
TPA requires several minutes of reaction time in the liquid phase to convert the partial oxidation
products to TPA. Given that the minimum spray rate of 35 mL/min required by the nozzle to

! 81
generate micron sized droplets, the 700 mL spray reactor with 50 mL of liquid phase (initially)
would provide only 1-3 minutes of residence time (based on the liquid phase holdup) during
continuous operation. In order to provide flexibility in allowing longer residence times, it was
decided to construct a longer (2 ft.) 4 L spray reactor. In addition to allowing larger liquid
holdups (and therefore longer residence times), the larger vessel also increases the zone in which
the oxidations occur without backmixing, which is particularly important for achieving purity
levels of 99.99%. The dimensions of the two generations of spray reactors are shown in Figure
4.1.
Figure 4.1: Dimensions of 700 mL and 4 L spray reactors
Table 4.1 shows the solid TPA product quality obtained from the 4 L spray reactor operated in
semi-batch mode. The reaction conditions were identical to those employed in the 700 mL
reactor (Table 3.3) except that 300 mL of acetic acid (instead of 50 mL) were loaded in the 4 L
reactor. The 4-CBA content in the solid TPA product was 93 ppm and significant amounts of
BPTA (449 ppm) were detected (run #2). The higher impurity levels observed in the 4 L reactor
700 mL, 6-in height 4 L, 2-ft height

! 82
compared to the 700 mL reactor were probably due to the faster cool-down resulting in unequal
post-oxidation times in the two reactors. Indeed, polymer-grade TPA product was obtained given
15-min post-oxidation time at 200 °C (run #4). Based on these results, we can conclude that high
purity TPA is also obtainable in the longer 4 L reactor.
The experimental results shown in Table 4.1 also demonstrated the significant role of sparger
by which O2/CO2 gas mixture was introduced into the liquid phase. Without sparger, polymer-
grade TPA product could not be obtained even given 1-hour post-oxidation time at 200 °C (run
#3). With sparger, however, the impurity contents of 4-CBA and BPTA are greatly reduced (run
#2). Further, polymer-grade TPA product is obtained given 15-min post-oxidation time at 200 °C
(run #4). All this evidence shows that the vapor and liquid phases are better saturated with acetic
acid and O2 with the help of the liquid sparger.
Table 4.1: Gas sparger effects on solid TPA product quality from the 4-L spray reactor
Run
# Sparger
Solid product quality
TPA purity (wt%) 4-CBA (ppm) BPTA (ppm) p-TA
(ppm)
1 No 99.59±0.01 1689±1 2367±1 n.d.a
2 Yes 99.95±0.01 93±1 449±1 n.d.
3b No 99.97±0.01 278±1 n.d. n.d.
4c Yes 99.99+ 19±1 n.d. n.d.
Reaction conditions:
T = 200 °C; P = 15 bar; pX added = 6.9 mmol; Co = 12.5 mM, Mn = 12.5 mM, Br = 32.5 mM;
spray time = 3 min; spray rate = 35 mL/min; O2:CO2 (mol:mol) = 1:1; gas mixture flow rate =
600 scc/min; an.d.: not detected; bReactor was maintained at 200 °C for 1 hour after spray; cReactor was maintained at 200 °C for 15 min after spray.

! 83
4.2 Preliminary Experimental Results from Continuous operation of the 4 L Spray
Reactor
The performance of the sparged continuous spray reactor was investigated initially using a
manually controlled micro-metering valve in the liquid effluent stream. The experimental setup
is similar to the semi-batch spray reactor setup (Figure 3.6) with the only difference being that
there is an outlet at the bottom of the reactor and a manually controlled micro-metering valve is
used to control the liquid effluent flow rate. In a typical experimental run, the reactor was
initially pressurized with an equimolar O2/CO2 gas mixture, and then heated to the desired
temperature (approximately 200 °C). After the temperature stabilized, the O2/CO2 gas mixture
was preheated to the reactor temperature by means of heating tape and continuously introduced
into the reactor at a flow rate of 600 std cm3/min. Simultaneously, the gas was also continuously
withdrawn on the top of the reactor from the vapor phase to maintain the reactor pressure
constant at the desired value (15 bar) with a back-pressure regulator (DRESSER®, Model
SD91LW) connected to the gas-effluent line. Approximately 300 mL of acetic acid was first
sprayed into the reactor (approximately 8 minutes and 40 seconds with a flow rate of 35
mL/min). Then the pre-mixed and pre-heated feed solution (containing specific concentrations of
pX, cobalt acetate, manganese acetate and hydrobromic acid dissolved in acetic acid; [pX] = 66
mM; [Co] = 12.5 mM, [Mn] = 12.5 mM, [Br] = 32.5 mM;) was sprayed into the reactor at a rate
of 35 mL/min, while simultaneously opening the micro-metering valve to withdraw the liquid
phase from the bottom of the reactor. For a typical run, the O2/pX (mol:mol) is approximately
5.8 which is sufficient to fully convert the pX to TPA. The initial pX concentration (0.066 M) is
low enough to maintain the produced TPA completely dissolved in the liquid phase.

! 84
Excellent T & P control and constant acetic acid flow rate from the bottom of the reactor
were obtained during a 25-min blank run. T & P profiles and collected acetic acid amounts (from
the bottom liquid phase and the gas stream exiting at the top of the reactor) are shown in Figure
4.2 and Table 4.2. HYSYS simulation (Figure B1 in Appendix B) gave a flow rate of the
overhead acetic acid vapor stream of approximately 1.8 g/min (~9 g for 5 min duration) in a
continuous reactor with vapor phase reaching equilibrium. The condensed acetic acid from
overhead, obtained from the blank experiment, is shown to be 7.3-8.1 g during 5 minutes.
Considering the possible acetic acid loss from the overhead condenser, it is surmised that the
vapor phase is most probably saturated with acetic acid. This needs to be verified more
thoroughly in future work.
Table 4.2: Acetic acid amounts from the top (gas stream) and bottom (liquid stream) of the spray
reactor (operating conditions same as in Table 4.1)
Time duration (min) Condensed HOAc from
overhead (g) HOAc from bottom (g)
0 – 5 8.01 207
5 – 10 6.30 206
10 – 15 8.08 205
15 – 20 7.40 203
20 – 25 7.36 204

! 85
!Figure 4.2: T & P profiles during a 25-min blank run
with manual control of micro-metering valve
However, in the preliminary reaction run, manual control led to varying liquid holdup in the
reactor with time as shown in Table 4.3, as well as high concentrations of intermediates probably
due to low catalyst concentration and/or inadequate residence time in the liquid phase. To get
better liquid level control (and therefore more constant residence time in the liquid phase),
automated liquid level control of the liquid level was implemented. A stepper-motor-controlled
micro-metering valve for liquid level control was designed by Mr. Edwin Atchison (Electronics
Technician, CEBC), employing the instantaneous reactor mass as feedback. Constant T & P
profiles and acetic acid weight in the reactor were obtained during a 30-min blank run (Figure
4.3). This should permit further testing and development of the continuous spray reactor by
future researchers.
0 4 8 12 16 20 24 28120130140150160170180190200210220230
25-min spray
T1,bottom
T2
T3
T4
T5
T6,top
P
Time (min)
Tem
pera
ture
(o C
)
180
200
220
240
260
280
Pressure (psia)

! 86
Table 4.3: Solid TPA product quality during 25-min continuous run in 4 L spray reactor
Time duration
(min)
Liquid Holdup
(mL)
Solid product quality
TPA purity
(wt%)
4-CBA
(ppm) BPTA (ppm) p-TA (ppm)
0 – 5 125 98.15 5,423 13,065 n.d.
5 – 10 127 98.87 3,294 8,012 n.d.
10 – 15 116 99.08 1,821 7,339 n.d.
15 – 20 176 99.03 1,489 8,217 n.d.
20 – 25 ~ 300 98.92 1,489 9,304 n.d.
pX = 0.066 M; other reaction conditions are the same as those for Table 4.1.
!
!
Figure 4.3: 30-min blank run with stepper motor controlled micro-metering valve
190 192 194 196 198 200 202 204 206 208 210
0 5 10 15 20 25 30
Rea
ctio
n te
mpe
ratu
re (C
)
Time (min)
T1 T2 T3 T4 T5
120 140 160 180 200 220 240 260 280 300 320
0 5 10 15 20 25 30
Rea
ctor
pre
ssur
e (p
si)
Time (min)
reactor'bo)om'
needle'valve'
on/off'valve,'to'product'collector''
step'motor'
200
220
240
260
280
300
0 5 10 15 20 25 30
HO
Ac
wei
ght (
g)
Spray time (min)
Actual HOAc weight in reactor

! 87
4.3 Summary
Preliminary experimental results of pX oxidation from a 4 L continuous spray reactor during a
25-min experimental run using a manually controlled micro-metering valve show high
concentrations of undesirable intermediates products, which could be due to several reasons such
as non-steady state operation with varying liquid holdup in the reactor caused by the manual
control, low catalyst concentration and inadequate residence time in the liquid phase. To get a
steady state continuous operation, automatic control of the bottom liquid phase flow rate must be
used. A stepper-motor-controlled micro-metering valve was successfully designed and
implemented in the 4-L continuous spray reactor. Excellent T & P control as well as constant
acetic acid weight in the reactor were obtained during a 30-min blank run. This should permit
testing and development of the continuous spray reactor for pX oxidation by future researchers.

! 88
Chapter 5 Economic and Environmental Impact Assessment of the Spray
Process for Terephthalic Acid Production
With dwindling natural resources and increasing global population, sustainable development
has assumed increased importance in this new millennium. The well-accepted definition of
sustainability is “development that meets the needs of the present without compromising the
ability of future generations to meet their own needs” [118]. Sustainability indicators include
economic, environmental and social issues [119, 120]. A sustainable process is one that covers
all of these three dimensions.
As stated by the International Council of Chemical Associations (ICCA) in the United Nations
Environmental Programme’s GEO-2002, the chemical industry has laid a solid platform for
moving toward becoming a sustainable sector. Many companies are continuing to evaluate
resource-efficient manufacturing processes, and substituting more sustainable products as
alternatives, where appropriate [121]. The CEBC mission is well aligned with this sustainability
goal. The development of the CEBC spray process as a potentially more sustainable substitute
for the conventional stirred process is exemplary of its efforts to promote sustainability in the
chemical industry sector. The technical feasibility of the spray process concept has been
demonstrated in Chapter 3. This chapter deals with quantitative comparison of the economics
and potential environmental impacts of the CEBC spray process and the conventional MC
process to assess the practical viability and the environmental benignity of the alternative spray
process for terephthalic acid production.

! 89
5.1 Introduction
It has been demonstrated in Chapter 3 that the CEBC spray process in which the liquid phase
containing dissolved pX and the catalyst is dispersed as fine droplets into the gas phase
containing oxygen produces high-purity TPA (<25 ppm 4-CBA) in one step at 200 °C and 15 bar
pressure. The elimination of the hydrogenation step and the reduction of solvent burning provide
economic and environmental benefits that make a continuous spray process as a potentially more
sustainable alternative to the conventional Mid-Century process. The non-requirement of the
energy-intensive hydrogenation section obviates a number of processing steps resulting in the
reduction in energy requirements as well as capital and operating costs. The lower solvent
burning rate reduces not only the cost for make-up acetic acid but also CO2 emissions. By
conserving material and energy, and also reducing CO2 emissions, the spray process satisfies
several principles of green chemistry [122]. However, quantitative sustainability assessment is
essential to not only numerically determine the economic and environmental benefits but,
equally importantly, to also identify areas for further improvement in sustainability-related
metrics. Such a quantitative assessment is especially insightful when process conditions are
different. For example, the pX concentration in the demonstrated spray process is 10 times lower
compared to the industrial process. This means that the acetic acid that must be processed to
meet a certain production requirement is ten times higher in the spray process. The processing of
such large quantities of acetic acid increases not only equipment and energy costs, but also the
CO2 emissions associated with solvent burning. These adverse effects could either partially or
totally offset the potential economic and environmental benefits anticipated by eliminating the
hydrogenation step. Clearly, quantitative comparative assessment of the economics and

! 90
environmental impact assessments of the two processes are essential to unambiguously address
and resolve such issues.
Several reported case studies of quantitative economic and environmental impact assessments
of process design alternatives provide valuable guidance for the evaluation of this particular
spray process. Dunn and Savage [123 , 124] examined the economic feasibility and the
environmental impact of a terephthalic acid process using high-temperature water (HTW) as the
reaction medium. They found that a subcritical HTW-based process was equally capital
intensive, less energy intensive, and more environmentally benign than the current acetic-acid-
based process (MC process). Similar methodology of economic and environmental impact
analyses have been employed to evaluate alternative chemical processes such as CO2-based
hydroformylation process [125], solid-acid catalyzed alkylation process in supercritical CO2
[126], liquid-phase H2O2-based ethylene oxide process [127] and H2O2-based propylene oxide
process [128], all of which were developed by CEBC researchers. The work presented herein is a
relatively thorough quantitative evaluation of the CEBC spray technology for TPA production,
from both economic and environmental points of view. The conventional MC process is
employed as the industrial benchmark, against which the economics and environmental impacts
of four different spray reactor case studies using varying amount of acetic acid in the feed are
simulated and compared. The results reveal key operating factors that affect the economics and
environmental impacts, and provide valuable guidance for process design and optimization.
5.2 Methodology
The methodology employed here generally includes three steps as follows. First, both the MC
process and the CEBC spray process (4 cases with various acetic acid/p-xylene ratios in the feed)
are simulated by the HYSYS® software assuming a certain TPA production capacity for the

! 91
plant. Process flow diagrams (PFDs), developed for each technology with various operating
parameters/variables and product specifications as inputs, provide the relevant mass and energy
flow rates associated with the process streams. These values are used in process equipment
design and sizing. Secondly, comparative economic analyses are performed by estimating capital
investment and total production cost for each technology. The capital investment is estimated
following the percentage of purchased-equipment cost method [129], in which the cost for
purchased equipment is treated as the estimation basis. Other direct costs or indirect costs are
estimated by multiplying the purchased equipment cost with a corresponding factor. The
purchased equipment costs are estimated based on attributes such as equipment size, material of
construction, weight or surface area [129, 130]. For determining the production costs, the
amounts of utilities and chemicals consumed are estimated from the HYSYS®-estimated stream
properties. The costs associated with utilities and raw materials labor are obtained from specified
current sources. Finally, comparative gate-to-gate LCA (life cycle assessment) and cradle-to-gate
LCA of both processes are performed to evaluate the relative environmental impacts [127, 128].
The stream flows and compositions from the PFDs are used to estimate the potential
environmental impacts associated with the emitted streams from both processes. More details of
the methodologies are provided in the following sections.
5.3 Process Simulations
5.3.1 Process simulation basis
The design basis for both of the conventional MC process and the CEBC spray process is a
production rate of 500,000 t/yr of purified terephthalic acid (PTA) at a 0.9 stream factor (i.e., 328
on-stream days). Plant-scale data for the simulated conventional MC process were obtained from
published patent data [27, 28, 132-134]. Data for simulating the spray process were obtained

! 92
from laboratory scale data reported in Chapter 3. Simulations of both processes were carried out
with Aspen HYSYS® V7.3 software. For estimating vapor-liquid equilibrium, the UNIQUAC
model was used to simulate the liquid phase composition and Peng-Robinson equation of state
was used to model the vapor phase. CO2/acetic acid binary interaction coefficient [116] was set
as 0.02, and other binary interaction coefficients are based on the HYSYS database. Tables 5.1
and 5.2 summarize the key operating parameters for process simulation basis and the
assumptions, respectively, associated with acetic acid use and loss for the four cases of the
CEBC spray process.
Table 5.1: Key operating parameters for the simulation of the MC and CEBC spray processes
MC Process Spray Process Oxidation reactor conditions Temperature (°C) 195 200 Pressure (psia) 220 220 Water concentration in reaction solvent feed (wt%) 5 5 p-xylene conversion (%) 98.1 99.6 Solid product quality 4-CBA concentration (ppmw) 1375 23 p-TA concentration (ppmw) 608 2 Hydrogenation reactor conditions Temperature (°C) 267 ― Pressure (psia) 975 ― 4-CBA conversion (%) 90 ― Solid product quality 4-CBA concentration (ppmw) 7 ― p-TA concentration (ppmw) 100 ― Overall TPA yield (%) 95 97 !

! 93
Table 5.2: Assumed acetic acid use and loss for the MC process and the CEBC spray process
MC process Spray process
Case 1 Case 2 Case 3 Case 4 HAc/pX feed ratio (wt/wt) 2.3 20.8 14.4 8.1 2.3
HAc loss from oxidation reactor (%) 5.3 1.3 1.3 1.3 1.3 !
5.3.2 Process descriptions
The process flow diagrams of the conventional MC process and the CEBC spray process
simulated by HYSYS® are shown in Figures 5.1 & 5.2. Details of the simulation parameters,
operating conditions of major unit operations and flow rates of key streams are provided in
Tables C1 & C2 of Appendix C.

!94
Figu
re 5
.1: P
roce
ss fl
ow d
iagr
am fo
r the
con
vent
iona
l MC
pro
cess
Oxi
datio
n re
acto
r (C
STR
) O
ff-ga
s tre
atm
ent
Cat
alys
t rec
over
y
Sol
id-li
quid
sep
arat
ion
Ace
tic a
cid
dehy
drat
ion
MC
Pro
cess
— O
xida
tion
Sect
ion
MC
Pro
cess
— H
ydro
gena
tion
Sect
ion

!95
Figu
re 5
.2: P
roce
ss fl
ow d
iagr
am fo
r the
CEB
C s
pray
pro
cess
Spr
ay re
acto
r O
ff-ga
s tre
atm
ent
Cat
alys
t rec
over
y
Sol
id-li
quid
sep
arat
ion
Ace
tic a
cid
dehy
drat
ion
Spr
ay P
roce
ss

! 96
5.3.2.1 Conventional MC process
Oxidation section
Oxidation reactor (CSTR)
The feed solution pumped into the oxidation reactor contains p-xylene, catalyst (cobalt
acetate, manganese acetate and hydrogen bromide) and solvent. Cobalt acetate and manganese
acetate are mostly recovered in the catalyst recovery unit, so that hydrogen bromide is the only
significant makeup component. Acetic acid is the solvent of choice in the TPA process primarily
due to its unique interaction with Co to produce Co(III) that initiates the oxidation reaction [46].
In the MC process, the acetic acid solvent contains approximately 5 wt% of water [134]. The
oxidation reactor requires a substantial amount of acetic acid, most of which is recycled via the
solvent dehydration column where acetic acid is separated from water. The fresh (makeup) acetic
acid accounts for approximately 3% of the amount of acetic acid fed to the oxidation reactor.
Air (oxidant) passes though two stages of compressors and is then also fed into the oxidation
reactor. The oxidation reactor in the MC process is usually a stirred vessel in which pX is
oxidized to TPA by the oxygen in the air. The reactor is assumed to be adiabatic and maintained
at 200 °C and 15 bar under steady operation. A substantial amount of the heat generated from the
highly exothermic reaction (the heat of reaction is 1,300 kJ/mol at total pX conversion to TPA) is
removed by the evaporative cooling of the solvent (see Chapter3, section 3.1.2). The liquid level
is maintained at about 70% of the reactor volume to provide sufficient vapor disengaging space.
The exit gas oxygen concentration is limited to approximately 3 mol% to prevent the formation
of explosive vapor phase mixtures [20]. Acetic acid combustion rate is estimated to be 5.4 wt%
of the acetic acid fed, resulting in significant solvent loss owing to CO2, CO and methyl acetate

! 97
formation (most of the methyl acetate formed from the oxidation reactor is converted to acetic
acid via ion exchange catalyst and recovered).
Solid-liquid separation
The reactor effluent flows through three-stage flash crystallizers (refer to Table C1 in
Appendix C for operating conditions), each of which has a condenser and a separator. The slurry
from the third crystallizer is sent to a centrifuge, where the mother liquor containing the
dissolved impurities in acetic acid are separated from crude TPA crystals. Approximately 20% of
the heavies (acetic acid) from the solvent dehydration column (described in a later section) is
diverted to the centrifuge to wash the crude TPA crystals. After leaving the centrifuge, the crude
TPA is then sent to a dryer to remove the volatile acetic acid, yielding dry crude TPA, which
contains about 1,400 ppmw 4-CBA and 600 ppmw p-TA. Over the past several decades, efforts
have been made to eliminate the drying step prior to purification by hydrogenation (described in
a subsequent section) in order to reduce the capital and operating costs [27, 28,132]. The related
alternative technology is to introduce the crude TPA from the centrifuge into a rotary drum filter
or belt filter and pressurize with water to remove the acetic acid (pressure filtration). More
particularly, a filter cake is built up through the rotary drum filter or belt filter and the filter cake
is covered with a layer of water, and then the water is pressured through the cake to displace the
acetic acid.
Catalyst recovery
Most of the mother liquor from the centrifuge is fed to a reboiled stripper, in which almost all
of the acetic acid is vaporized and the heavy ends containing the uncrystallized TPA,
intermediates and catalysts are formed in the bottom. The heavies are pumped to the catalyst
recovery unit, which is not simulated in this work because this would be common to both of the

! 98
MC process and the spray process. Briefly, the heavies containing the catalysts from the reboiled
stripper are sent to an incinerator where the metal acetate catalysts are converted to metal oxide
by pyrolysis. Then the metal oxides are converted to metal acetate tetrahydrates by reaction with
hydrazine and acetic acid [135].
Off-gas treatment
In addition to nitrogen, oxygen and combustion gases (CO2 and CO), the exhaust gas from the
oxidation reactor contains significant amounts of acetic acid and methyl acetate, and minor
amounts of unreacted pX and methyl bromide. A high-pressure scrubber is used to recover
acetic acid by countercurrent contact with a water stream derived from the overhead stream of
the dehydration column [20]. The scrubber has a bed of cation exchange resin that converts most
of the methyl acetate into acetic acid and methanol. In other words, the scrubber is used to
recover acetic acid from other VOCs. The acetic acid is then sent to the solvent dehydration
column for recycle while the VOCs are let to a fixed bed combustion reactor [136] in which the
VOCs are burned to CO2 and water over a supported palladium catalyst. The high temperature
treated gas (above 400 °C) then passes through an expander where the energy content of the gas
is converted to mechanical power that is used to either drive one of the air compressors or for
electric power generation. Before being vented to the atmosphere, the effluent gas from the
expander is usually fed to a scrubber (not considered in this work) to remove the residual
bromine components by countercurrent contact with a caustic solution [136].
Acetic acid dehydration
The overhead vapor from the reboiled stripper, the liquid and uncondensed streams from
crystallizer separators, the bottom stream from the high-pressure scrubber and the vaporized
solvents from the dryer are all fed to a distillation column to remove the water generated in the

! 99
oxidation reactor. About 80% of the dehydrated acetic acid (~98 wt%) is then recycled to the
oxidation reactor. Azeotropic distillation is generally used for acetic acid/water separation and
methyl acetate is used as the entrainer in this case. Water and the entrainer are distilled overhead
and separated in a decanter, with only the organic phase being totally refluxed to the column
[134].
Hydrogenation unit
The crude TPA from the oxidation section is mixed with the recycled steam from the solvent
evaporator (described in a later section) and the recycled water to form a slurry of about 20 wt%
TPA in water [133]. The slurry is pumped to a dissolver that operates at 267 °C and 63 bar and is
agitated for approximately 15 minutes to dissolve all of the TPA in water. The liquid is then
pumped to a hydrogenation reactor in which 4-CBA is converted to p-TA by H2. The
hydrogenation reactor has two catalyst beds: a top (main) Pd/C catalyst bed and a bottom
(smaller) Rh/C catalyst bed [137]. The TPA/water solution leaving the hydrogenation reactor
flows through two-stage crystallizers, a centrifuge and then to a final stage of crystallization
followed by a rotary vacuum filter and a PTA (purified TPA) dryer. The dry PTA includes 7
ppmw 4-CBA and 100 ppmw p-TA.
A major problem associated with the crystallization recovery process is the potential
contamination of the purified TPA crystals with p-TA. Shock or sudden cooling is avoided and
gradual cooling is achieved in a series of crystallizers to minimize the co-precipitation of the
impurities. A subsequent “water reslurry” step is used to remove the impurities (mainly p-TA)
dissolved in the mother liquor, and thus the p-TA content in the purified TPA is lowered to 100
ppmw. It should be noted that the previously described pressure filtration technology can also be
applied to effect solid-liquid separation for obtaining purified TPA. This technology can

! 100
eliminate the need for a second stage of reslurrying and filtration of the purified TPA crystals
[27, 28].
About 51% of the mother liquor from the centrifuge is recycled to the hydrogenation reactor
such that the p-TA concentration in the feed is about 3000 ppmw (assumed basis). The rest of the
mother liquor is concentrated in the solvent evaporator and the heavy-ends are recycled to the
oxidation reactor, in which the p-TA is converted back to TPA. Approximately half of the steam
from the top of the solvent evaporator is directly mixed with the crude TPA slurry and the rest is
used to heat up the reslurry water.
5.3.2.2 CEBC spray process
The spray process layout looks similar to the MC process oxidation section. Instead of a
CSTR in the MC process, the oxidation reaction occurs in a spray reactor in which the liquid
phase containing dissolved pX and the catalyst (cobalt acetate, manganese acetate and hydrogen
bromide) in acetic acid is dispersed as fine droplets by a nozzle into a continuous vapor phase
containing the oxidant (O2). Compressed air is used as the oxidant in the simulation of the spray
process and the O2/pX molar feed ratio is 3.5:1. Note that equimolar CO2/O2 gas mixture rather
than air was used in the laboratory-scale spray reactor. It has been demonstrated that the use of
equimolar amounts of CO2 and O2 and excess acetic acid in the vapor phase falls outside the
flammability envelope under the experimental conditions (section 3.1.2). It must be noted that
using air as the oxidant source in the spray reactor also falls outside the flammability envelope.
In the MC process, typical vapor phase O2 partial pressure is about 0.4 bar [98] or approximately
3 vol% in the MC oxidation reactor to prevent explosions. In the HYSYS simulation of the spray
reactor, O2 concentration in the off-gas is also limited to 3 mol%. In addition, the acetic acid
amount employed in the spray process is more than or equal to that in the MC process, resulting

! 101
in a higher acetic acid composition in the vapor phase. Given that the acetic acid is above the
upper flammability limit in the MC oxidation reactor, it follows that the acetic acid should also
be above the flammability limit in the spray reactor.
The reaction temperature and pressure are very close to those in the MC oxidation reactor, i.e.,
200 °C and 15 bar, respectively. As outlined in Table 5.2, four alternative spray processes using
varying amounts of acetic acid in the feed are simulated with Case 1 having the highest acid feed
rate (10-fold more than that in the MC process) and Case 4 having the least (acetic acid feed rate
comparable to that in the MC process). In all of the four spray cases employed in the simulation,
the acetic acid combustion is assumed to be 1.3 wt% of what is fed. This assumption is based on
our preliminary experimental results from the 700 mL semi-batch spray reactor showing that the
CO formed is approximately one-fourth compared to the MC process (section 3.2.5.4). The
reactor product stream flows through three-stage crystallizers, a centrifuge and then a dryer to
yield dry TPA, which is composed of 23 ppmw 4-CBA and 2 ppmw p-toluic acid. The purity of
the solid TPA meets the polymer-grade TPA requirement and therefore no further purification
was deemed necessary. The off-gas treatment part and the distillation part are similar to those
employed in the MC process oxidation.
5.4 Economic Analysis
5.4.1 Capital investment
5.4.1.1 Purchased equipment costs
The estimates of purchased equipment costs are determined by equipment parameters such as
equipment size, weight, surface area, and material of construction [129, 130] that are in turn
based on the material and energy balances obtained from HYSYS simulation. Cost estimation

! 102
details including equipment design parameters and correlating equations for both processes are
provided in Tables D1 & D2 of Appendix D. All the costs are adjusted to June 2012 figures
using Chemical Engineering Plant Cost Index (CEPCI) [138]. Figure 5.3 shows the purchased
costs (f.o.b., free on board, meaning that the purchaser pays the freight) of major equipment in
both processes. Special equipment costs such as crystallizers, solid-liquid separation units, dryers
and storage silos account for about 40% of the costs in both processes. Miscellaneous equipment
costs mainly consist of the Pd and Rh catalysts for the hydrogenation reaction in the MC process.
Figure 5.3: Comparison of purchased equipment costs for MC and spray processes
5.4.1.2 Estimate of capital investment
The estimate of capital investment is based on the “purchased equipment cost” method, in
which the purchased equipment cost is treated as the basis, and other cost (direct, indirect and
0
20
40
60
80
100
120
Total
HydrogenationOxidation
Case 4Case 3
Case 2Case 1
MC process Spray process
Cos
t, $M
illion
s
Pumps Miscellaneous equipment Special equipment Vessels and tanks Heat exchangers Compressors Columns Reactors

! 103
working capital) are estimated by multiplying the purchased equipment cost with a
corresponding factor [129]. Table 5.3 compares the capital investments for both MC and spray
processes. The estimated total capital investments of the spray process case 1 ($241 million
when nearly 10 times more acetic acid is used in the feed compared to the MC process) and case
4 ($136 million when similar amounts of acetic acid feed is used as in the MC process) are
approximately 80% and 45%, respectively, of those estimated for the MC process ($302 million).
Thus, the capital cost benefit margin in the CEBC spray process (due to non-requirement of
hydrogenation section) is progressively diminished from 55% at case 4 to 20% at the highest
acetic acid throughputs of case 1.
Table 5.3: Comparison of capital costs for both MC and spray processes
MC Process ($Million)
Spray Process ($Million) Case 1 Case 2 Case 3 Case 4
Purchased equipment costs (f.o.b.) 79.7 63.6 54.8 45.8 35.9 Direct installation costs 98.1 78.2 67.4 56.4 44.2 Direct costs (others) 35.9 28.6 24.7 20.6 16.2 Total direct costs 213.8 170.4 146.9 122.9 96.3 Indirect costs 58.2 46.4 40.0 33.5 26.2 Fixed capital investment (FCI) 272.0 216.8 186.9 156.3 122.6 Working capital 30.2 24.1 20.8 17.4 13.6 Total capital investment (TCI) 302.2 240.9 207.7 173.7 136.2
5.4.2 Total production cost
5.4.2.1 Utilities and raw material costs
The utilities and raw material costs (variable costs) for both MC process and spray process are
summarized in Table 5.4. The p-xylene makes up the bulk of the raw material costs for both
processes. Steam and electricity, used mainly in the heat exchangers and special equipment,

! 104
compressors and pumps, account for the large part of the utilities. Note that the estimated utility
costs for the MC process (¢7.37/lb of TPA) are more compared to even case 1 of the CEBC
process (¢6.46/lb of TPA), wherein maximum energy input is needed to handle the higher acetic
acid throughputs (cases 1-3).
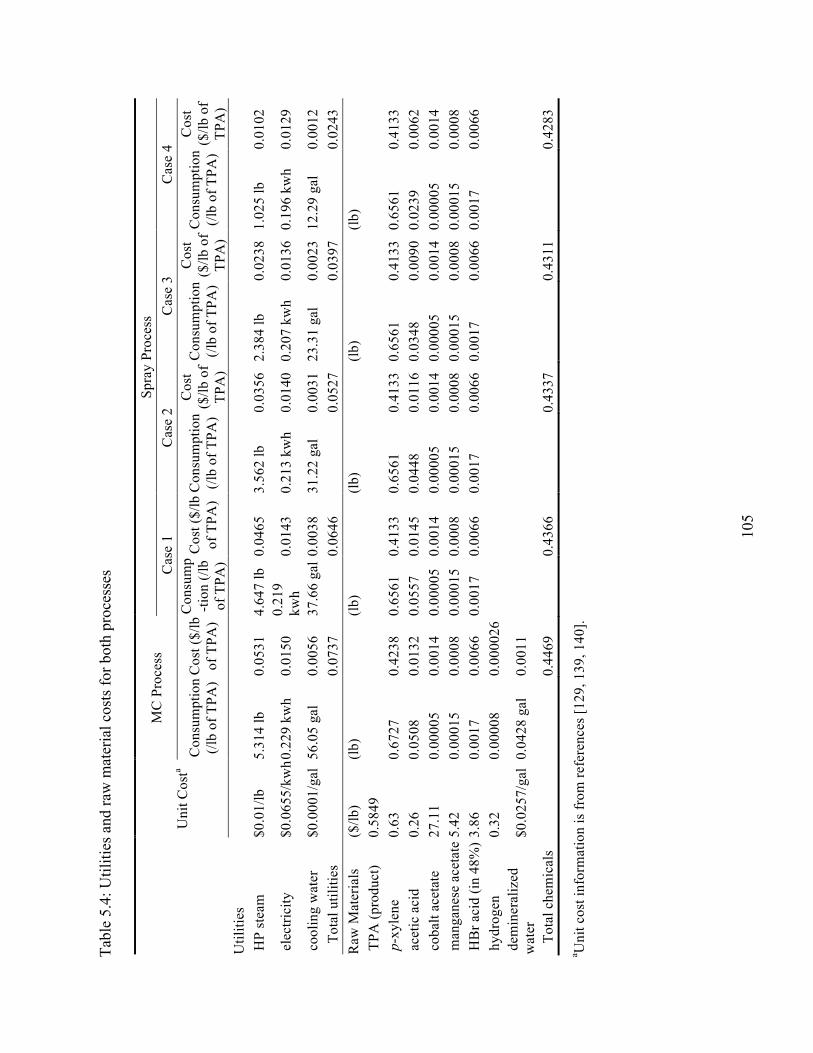
!10
5
Tabl
e 5.
4: U
tiliti
es a
nd ra
w m
ater
ial c
osts
for b
oth
proc
esse
s
U
nit C
osta
MC
Pro
cess
Sp
ray
Proc
ess
Cas
e 1
Cas
e 2
Cas
e 3
Cas
e 4
Con
sum
ptio
n (/l
b of
TPA
) C
ost (
$/lb
of
TPA
)
Con
sum
p-ti
on (/
lb
of T
PA)
Cos
t ($/
lb
of T
PA)
Con
sum
ptio
n (/l
b of
TPA
)
Cos
t ($
/lb o
f TP
A)
Con
sum
ptio
n (/l
b of
TPA
)
Cos
t ($
/lb o
f TP
A)
Con
sum
ptio
n (/l
b of
TPA
)
Cos
t ($
/lb o
f TP
A)
Util
ities
H
P st
eam
$0
.01/
lb
5.31
4 lb
0.
0531
4.
647
lb
0.04
65
3.56
2 lb
0.
0356
2.
384
lb
0.02
38
1.02
5 lb
0.
0102
ele
ctric
ity
$0.0
655/
kwh 0
.229
kw
h 0.
0150
0.
219
kwh
0.01
43
0.21
3 kw
h 0.
0140
0.
207
kwh
0.01
36
0.19
6 kw
h 0.
0129
coo
ling
wat
er
$0.0
001/
gal
56.0
5 ga
l 0.
0056
37
.66
gal
0.00
38
31.2
2 ga
l 0.
0031
23
.31
gal
0.00
23
12.2
9 ga
l 0.
0012
Tota
l util
ities
0.
0737
0.06
46
0.
0527
0.03
97
0.
0243
R
aw M
ater
ials
($
/lb)
(lb)
(lb
)
(lb)
(lb
)
(lb)
T
PA (p
rodu
ct)
0.58
49
p-x
ylen
e 0.
63
0.67
27
0.42
38
0.65
61
0.41
33
0.65
61
0.41
33
0.65
61
0.41
33
0.65
61
0.41
33
ace
tic a
cid
0.26
0.
0508
0.
0132
0.
0557
0.
0145
0.
0448
0.
0116
0.
0348
0.
0090
0.
0239
0.
0062
c
obal
t ace
tate
27
.11
0.00
005
0.00
14
0.00
005
0.00
14
0.00
005
0.00
14
0.00
005
0.00
14
0.00
005
0.00
14
man
gane
se a
ceta
te 5
.42
0.00
015
0.00
08
0.00
015
0.00
08
0.00
015
0.00
08
0.00
015
0.00
08
0.00
015
0.00
08
HB
r aci
d (in
48%
) 3.
86
0.00
17
0.00
66
0.00
17
0.00
66
0.00
17
0.00
66
0.00
17
0.00
66
0.00
17
0.00
66
hyd
roge
n 0.
32
0.00
008
0.00
0026
dem
iner
aliz
ed
wat
er
$0.0
257/
gal
0.04
28 g
al
0.00
11
To
tal c
hem
ical
s 0.
4469
0.43
66
0.
4337
0.43
11
0.
4283
a Uni
t cos
t inf
orm
atio
n is
from
refe
renc
es [1
29, 1
39, 1
40].

! 106
5.4.2.2 Estimate of total production cost
Figure 5.4 compares the total product cost for both processes (cost details of each item are
provided in Table D3 of Appendix D). The total cost of the polymer-grade TPA product from the
MC process is estimated to be $0.67/lb. The total TPA cost from CEBC process case 1 and case
4 is estimated to be $0.635/lb and $0.56/lb, respectively.
!Figure 5.4: Comparison of total production costs for both processes
(Others include other direct, indirect costs, depreciation and general expenses such as labor,
research, plant overhead, operating supplies and maintenance,
details are provided in Table D3 of Appendix D)
5.4.3 Sensitivity analysis
Using lower pX concentration (higher acetic acid throughput) partly offsets the economic
benefits accrued by the elimination of the hydrogenation step in the CEBC spray process. Figure
5.5 plots the capital and operating costs of the CEBC process as a function of acetic acid/pX
0
10
20
30
40
50
60
70
TotalOthersUtilitiesRaw materials
Prod
uctio
n C
ost,
cent
s/lb
of T
PA MC Process CEBC Spray Process Case 1 CEBC Spray Process Case 2 CEBC Spray Process Case 3 CEBC Spray Process Case 4

! 107
weight ratio. The capital investment and production cost of the spray process can increase by
120% and 13% respectively when acetic acid amounts increase nearly 10-fold, and this change is
linear. Clearly, as high a pX concentration as practically feasible should be used to maximize the
savings in the CEBC spray process.
!Figure 5.5: Capital and operating cost rise with acetic acid throughput in CEBC spray process
5.5 Environmental Impact Analysis
A sustainable process should demonstrate not only clear economic advantages, but also
superiority in terms of of environmental stewardship and social progress [141, 142]. To this end,
comparative environmental impacts of the MC and spray processes are evaluated in this section.
There are several techniques for environmental assessment such as input-output analysis,
environmental impact assessment (EIA), environmental impact indices, environmental risk
assessment and life cycle assessment (LCA) [143]. Among the various environmental assessment
0 5 10 15 20 25120
160
200
240
280
Capital investment Total production cost
Acetic acid/pX (wt/wt)
Cap
ital i
nves
tmen
t ($M
illio
n)
56
58
60
62
64
Total production cost (cents/lb TPA
)
! 108
approaches, LCA has become increasingly attractive and widely adopted in environmental
impact analysis for making environmental decisions.
5.5.1 Introduction to LCA
LCA is a developing scientific methodology for identifying, quantifying and assessing
environmental impacts throughout the life cycle of a product, process, or activity. The full LCA
considers the material and energy uses and releases to the environment of the entire life cycle
from cradle-to-grave (from raw material extraction through manufacturing, use and disposal
phase) [144]. In fact, the user is free to select any of the following type of LCA: cradle-to-gate
(from raw material extraction to factory gate, i.e., before transported to the consumer), gate-to-
gate (an assessment when the product is at the manufacturing facility), gate-to-grave (evaluation
of the environmental impact when the product leaves manufacturing facility to final product
disposal).
Efforts have been made to develop and standardize the LCA methodology for decades, with
inputs from important active organizations including the Society for Environmental Toxicology
and Chemistry (SETAC), the United Nations Environmental Program (UNEP) and the
International Organization for Standardization (ISO) [145-147]. An international standard for
LCA developed by ISO suggests the four main phases in LCA in ISO 14040 series: a) goal and
scope definition (ISO 14040); b) life cycle inventory (ISO 14041); c) life cycle impact
assessment (ISO 14042) and d) life cycle assessments and interpretation (ISO 14043). [148, 149]
Since the standard must be applicable to many industrial and consumer sectors, it is rather
general. Nonetheless, it includes a comprehensive set of terms and definitions, a methodological
framework for each of the four components, reporting considerations, approaches for critical
review, and an appendix describing the application of LCA [150].

! 109
One key question during the practical application of LCA to processes is how to translate the
inventory results of material, energy, waste and toxic emissions into category indicators for
directly assessing the environmental burdens. There are several category-specific
characterization models such as TRACI (the Tool for the Reduction and Assessment of Chemical
and other environmental Impacts), CML 2001 [CML stands for Centrum voor
Milieuwetenschappen (Dutch: Leiden University Institute of Environmental Sciences)] and Eco-
indicator 99 to accomplish this translation efficiently. Generally, these LCA models can be
grouped into two categories: mid-point approaches (problem-oriented approach or classical
impact assessment method) which translates the category impact into real phenomenon such as
acidification and ozone depletion and end-point approaches (damage-oriented approach) which
translates the category impact based on the area of protection such as human health, natural
resources and natural and human made environment in a cause-effect chain or network [151].
TRACI, CML 2001, EDIP 97 are typical of mid-point models while Eco-indicator 95 and 99,
EPS 92, 96 and 2000 and LIME 2003 are examples of end-point approaches [151].
LCA is a powerful tool used for collecting and analyzing inventory data, weighing and
ranking the environmental burdens of products, processes, or activities in a transparent and
scientific way. It can help identify the hot spots that cause the greatest environmental impacts of
the life cycle and thus provide decision makers with the resulting information to make
improvements. It can also offer a link between the environmental impacts and economics of
processes to help select an optimized application. CEBC researchers have employed LCA
methodology for performing comparative environmental impacts of process concepts (ethylene
and propylene epoxidations) developed at CEBC with conventional processes [127, 128].
5.5.2 Methodology

! 110
Comparative gate-to-gate LCA and cradle-to-gate LCA of the conventional MC process and
the CEBC spray process (4 cases) were performed. The approach employed in this analysis
follows the four phases (goal and scope definition, life cycle inventory, impact assessment and
interpretation) suggested by ISO. Figure 5.6 depicts the methodological framework for LCA of
the TPA processes. Life cycle inventory database of the material and energy flows associated
with the conventional and CEBC processes was provided by the Aspen HYSYS simulations
which were also used for performing the comparative economic analysis. The life cycle impact
assessment was accomplished using GaBi 6 software [152] developed by PE International jointly
with University of Stuttgart LBP (former IKP). TRACI, incorporated in GaBi® with U.S.
professional and extension databases, was used to translate the inventory results into category
indicators for environmental impact assessment.
Figure 5.6: Methodological framework for LCA of TPA processes
GaBi® is a commercial LCA software tool for product sustainability solution by creating life
cycle balances. This software is accompanied by an inventory database in compliance with the
ISO 14044, ISO 14064 and ISO 14025 standards. For example, the datasets cover thousands of
Interpretation of the results
Life Cycle Assessment (gate-to-gate; cradle-to-gate)
HYSYS®
Goal and scope definition
Inventory analysis
Impact assessment
GaB
i®
TPA Processes
MC process
Spray process (4 cases)

! 111
production processes such as chemicals, power generation and transport over the supply chain of
the represented cradle-to-gate inventory according to individual country/region specific situation.
GaBi® incorporates various LCA models such as TRACI, CML 2001 and Eco-indicator 99.
While most of these models have been developed for use in specific country/region particularly
in Europe or Japan, TRACI was developed by United States Environmental Production Agency
(US EPA) in 2002. The underlying methodologies in TRACI reflect state-of-the-art
developments for LCA in the US, and are using input parameters that are specific to US
locations [153-156]. TRACI facilitates the characterization of the following environmental
categories: ozone depletion, global warming, acidification, eutrophication, tropospheric ozone
(smog) formation, ecotoxicity, human particulate effects, human carcinogenic effects, human
non-carcinogenic effects, fossil fuel depletion, and land use effects. Consistent with EPA’S
decision not to aggregate between environmental impact categories, many of the impact
assessment methodologies within TRACI are based on mid-point characterization approaches
[154].
In order to validate the methodologies employed in the Aspen HYSYS simulations as well as
in the GaBi® LCA software, a gate-to-gate environmental impact assessment of the simulated
conventional MC process was first performed and the predictions were compared with the total
and released chemical wastes and green house gas emissions from a commercial plant (BP
Amoco Chemical Company Cooper River Plant). The actual commercial plant emission data are
available from public databases such as the annual toxic release inventory data reported to US
EPA [157] and EPA’s facility level information on Green House Gases Tool [158].
Fugitive emissions (unintentional releases of process fluid from equipment and evaporation
of volatile liquids from open areas) are an important environmental intervention [143]. It was

! 112
reported that 70-90% of air emissions for some plants in the United States resulted from the
fugitive emissions [159]. Siegell [160] also claimed that in almost all cases, fugitive emissions
from equipment leaks were the largest source of volatile organic compounds (VOCs) emissions
in refineries, typically accounting for 40-60% of total VOC emissions. However, GaBi® fails to
reveal these emissions from mass and energy balances based on process flowsheets for the LCA
study. To the best of our knowledge, most LCA software tools don’t include estimates for
fugitive emissions. To execute a thorough gate-to-gate environmental impact analysis, the
method used for gate-to-gate emission estimation was based on the Environmental Fate and Risk
Assessment Tool (EFRAT) developed by Shonnard and Hiew [161]. Specifically, the emission
rates from process unit operations were calculated by the throughput of VOCs in each piece of
equipment multiplied by the average emission factors for that particular type of chemical process
unit. Emission sources considered in the gate-to-gate environmental impact analysis include the
unit operations such as reactors, distillation columns and strippers, the fugitive emissions from
valves, flanges and pump seals, as well as the fuel combustion emissions for utility production.
The estimate of utility emissions was based on the GaBi® database. In the cradle-to-gate
environmental impact analysis, the fugitive emissions would also be considered.
5.5.3 Environmental impact analysis of TPA processes
5.5.3.1 Goal and scope definition
Goal
The major project goal is to quantitatively benchmark the environmental impacts of TPA
production by the CEBC spray process against the conventional MC process. Such a comparison

! 113
should provide a clear picture of potential environmental advantages of the spray process and
also identify the hot spots and opportunities for improvements.
Scope definition (LCA assumptions and system boundaries)
Functional unit
Functional unit for this analysis is the production of 63450 kg/h (500,000 metric tons/year) of
purified TPA (i.e., polymer-grade TPA quality specifications) by both the conventional MC
process and the CEBC spray process.
System boundaries
The scope of the evaluation is limited to gate-to-gate and cradle-to-gate analyses. The use and
disposal phases are not considered. For gate-to-gate analysis, the system boundaries of both
processes are limited to factory entry gate to exit gate (Figure 5.7). In other words, only the
environmental impacts during TPA manufacture at the production facility stemming from
emissions from unit operations, fugitive emissions, and utility emissions are considered.
Electricity is assumed to be obtained from U.S. power grid from a portfolio of energy sources.
Steam is assumed to be produced from natural gas. In contrast, the cradle-to-gate analysis
assessment includes gate-to-gate scope and also the environmental impact from the extraction,
manufacture and transportation of the raw materials.

! 114
Figure 5.7a: System boundaries of conventional MC process
for gate-to-gate and cradle-to-gate LCA
TPA = 63,450 kg
pX = 42,680 kg
Conventional MC process
Raw materials extraction, manufacture,
and transportation
p-Xylene from reformate
Acetic acid from methanol HOAc = 3,226 kg
Crude TPA manufacture and separation
Treatment of wastes
Catalytic combustion
Raw materials extraction, manufacture,
and transportation
H2 from steam reforming H2 = 5 kg
Demineralized water from ion exchange
Water = 21,902 kg
Purified TPA formation and separation
Oxidation Hydrogenation
Thermal energy from natural gas
Electricity from power grid
Purified TPA product
Gate-to-Gate
Cradle-to-Gate

! 115
Figure 5.7b: System boundaries of CEBC spray process
for gate-to-gate and cradle-to-gate LCA
Raw material sources
The main raw materials used in the CEBC spray process and MC process oxidation section
are p-xylene and acetic acid. The production of cobalt acetate, manganese acetate and
hydrobromic acid is not considered since the usage amounts of these catalysts are small
compared to the other raw materials. Hydrogen and demineralized water are also important raw
materials for the MC process hydrogenation section. Besides, the environmental impacts due to
energy production such as electricity and steam from fossil fuel sources are also considered.
Petroleum is practically the only natural source of xylenes. p-Xylene is primarily separated
from reformates, in which naphtha fractions (from naphthenic crude oils or produced by oil
pX = 41,650 kg
CEBC spray process
Raw materials extraction, manufacture,
and transportation
p-Xylene from reformate
Acetic acid from methanol
Treatment of wastes
Catalytic combustion
Purified TPA manufacture and separation
Thermal energy from natural gas
Electricity from power grid
Gate-to-Gate
Cradle-to-Gate
Purified TPA product
TPA = 63,450 kg
! 116
hydrocracking) are used as the raw materials for the catalytic reforming process [162]. The C8
and heavier aromatics (C8+ fraction) produced from the reformates pass through a distillation
column where p-xylene is first separated (from o-xylene and C9+ aromatics. m-Xylene, which has
a nearly identical boiling point to p-xylene, is mostly isomerized to o- and p-xylenes before fed
to the distillation column). The p-xylene is further purified from the isomer mixture by
adsorption on a molecular sieve [163].
The major synthetic routes to acetic acid are methanol carbonylation and liquid-phase
oxidation of butane, naphtha, or acetaldehyde, with methanol carbonylation being the preferred
route for large-scale production [164]. A rhodium catalyst is usually used for the one-step
methanol carbonylation process, in which methanol and carbon monoxide are fed into a stirred
reactor and the reaction is conducted at 200 °C and 35 bar [165]. Methanol is generally produced
from synthesis gas, which in turn is produced from natural gas by either steam reforming or
partial combustion.
Steam reforming of natural gas or heavy fuel oil is the main technology used for the industrial
scale production of hydrogen [166]. Electrolysis of water and hydrocracking of hydrocarbons are
relatively minor sources of industrial hydrogen. In steam reforming, the natural gas or heavy fuel
oil and steam are passed over a nickel-based catalyst to form hydrogen and carbon monoxide.
There are usually three methods to obtain demineralized water: distillation, ion exchange and
reverse osmosis [167]. Ion exchange, in which cations and anions are exchanged with protons
and hydroxide ions, is modeled in the GaBi dataset.
In the GaBi dataset, the electricity used is modeled according to the individual country-
specific situation. Specifically in our case, the power plants in service are based on the US power
grid from a portfolio of energy sources. In this model, the net losses and imported electricity as

! 117
well as the import, transport, mining and exploration processes for the energy carrier supply
chain are all considered. The steam used for heat exchangers is assumed to be produced from
natural gas.
Allocation
Since no valuable byproducts are obtained from either the MC process or the spray process,
the allocation rule need not be considered in this evaluation.
5.5.3.2 Life cycle inventory
For both the MC process and the CEBC process, the inventory of the LCA system includes
the inputs and outputs for the processes within the system boundaries (Figure 5.5), including the
raw material and energy inputs, products and co-products outputs, and generated wastes released
to air, water and soil. In this particular analysis, the foreground inventory data associated with
the material and energy balances during TPA production at the facility are identical to those used
for the comparative economic analysis (obtained from Aspen HYSYS simulations, refer to
Appendix C). The background inventory data associated with raw material extraction, utility
production and transportation are obtained from GaBi U.S. professional and extension databases.
Flow models for cradle-to-gate LCA consistent with the system boundaries defined in Figure 5.7
are shown in Figure 5.8a (MC process) and Figure 5.8b (CEBC spray process). Flow models for
gate-to-gate LCA (not shown here) look similar to those for cradle-to-gate LCA except that the
section related to raw material extraction, manufacture and transportation is omitted.

! 118
Figure 5.8a: Flow model of conventional MC process for cradle-to-gate LCA simulated in GaBi®
Figure 5.8b: Flow model of CEBC spray process for cradle-to-gate LCA simulated in GaBi®

! 119
5.5.3.3 Life cycle impact assessment
Methodology validation by gate-to-gate LCA of MC process
Comparison of VOC emissions
As described in section 5.5.2, the gate-to-gate VOC emission rate from a unit operation is
estimated by the VOC mass flow rate passing through the equipment multiplied by an average
emission factor. The industry emission factors for various unit operations are summarized in the
textbook by Allen and Shonnard [168] which also provides average emission factors for
estimating fugitive emissions from valves, pump seals, flanges and other connections. The
estimates of air emissions of two VOCs, p-xylene and methanol, are given in Table 5.5. These
estimated emissions are compared with the waste quantity report of a commercial TPA plant,
namely, BP Amoco Chemical Company Cooper River Plant in South Carolina with an annual
production capacity of 1.345 million metric tons of purified TPA [11] The report was obtained
from EPA public database [157], and the data therein are also included in Table 5.5.
Table 5.5: Comparison of conventional MC process VOC emissions obtained from U.S. EPA
Toxic Release Inventory (TRI) data for commercial facility with GaBi®-estimated emissions
Chemical
Reported total and released chemical wasteb (lb) by BP Amoco Chemical Co., 2011 Gate-to-gate
emissions (lb), this work Total waste Adjusted total
wastea Released waste Adjusted released wastea
p-xylene 1,125,800 418,513 25,794 9,589 228,713 methanol 1,703,100 633,123 103,100 38,327 298,332
aAdjusted wastes corresponded to the simulated annual capacity (500,000 metric tons PTA); bThe TRI reported waste is the chemical waste emissions (pX and methanol VOC emissions) to
air.
As shown in Table 5.5, the estimated VOC emissions are approximately half of those reported
by BP (total wastes). The TRI data are generally higher probably because the BP facility has two

! 120
other chemical production sites in addition to the purified TPA site [11]. Nevertheless, the
predicted and reported waste quantities are of the same order of magnitude, implying the method
used for the process simulation and gate-to-gate VOC emission estimation is generally
satisfactory on this level of analysis. One can also observe from Table 5.5 that more than 90% of
the generated wastes are treated at the facility and the rest of them are released to the
atmosphere.
Comparison of CO2 emissions
Major sources for direct gate-to-gate CO2 emissions to air are CO2 generated from solvent
burning in the oxidation reactor, the combustion reactor for VOCs treatment as well as the on-
site boilers for steam production by fuel combustion. Table 5.6 compares the estimated CO2-
equiv. for the conventional MC process obtained from GaBi® with the reported facility CO2
emissions by BP Amoco Chemical Company Cooper River Plant (SC) for year 2011 [158].
Clearly, less than 10% of the total CO2 emission equivalent is emitted as direct CO2 emissions to
air at the facility. The predicted and reported CO2-equiv. quantities are of the same order of
magnitude, which provides a measure of the predictive ability of the TRACI tool incorporated in
GaBi®.
Table 5.6: Comparison of conventional MC process CO2 emissions obtained from U.S. EPA
GHG data for commercial facility with GaBi®-estimated emissions
Reported total facility CO2 emissions (in metric tons CO2-equiv.), by BP Amoco Chemical Co.,
2011
Gate-to-gate CO2 emissions (in metric tons CO2-equiv.), this work
Reported Adjusteda Off-gas Fuel
combustion Total
101,458 37,717 60,625 327,833 388,458
aAdjusted emissions corresponded to the simulated annual capacity (500,000 metric tons purified
TPA).

! 121
Comparative gate-to-gate life cycle impact assessment
Figure 5.9 compares the gate-to-gate environmental impact potentials of TPA production by
the conventional MC and CEBC spray processes (only the major impact categories are shown in
Figure 5.9). The numerical data and a complete list of all impact potentials are provided in Table
E1 of Appendix E. The estimated environmental impact potential of direct process emissions
such as off-gas, wastewater, VOCs from unit operations and fugitive emissions (fuel combustion
effect for steam production excluded) are also provided in Figure 5.9 (shaded regions). The
interpretation of the results will be discussed in detail in next section. As expected, the adverse
environmental impact potentials in the CEBC spray process decreases with a lower substrate
(pX) concentration, i.e., smaller amounts of acetic acid employed. Table 5.2 copied the HYSYS
simulation parameters associated with acetic acid for the MC process and CEBC spray process
(case 1 to case 4).
Table 5.2: Simulation parameters associated with acetic acid for both processes
MC process Spray process
Case 1 Case 2 Case 3 Case 4 HAc/pX feed ratio (wt/wt) 2.3 20.8 14.4 8.1 2.3
HAc loss through oxidation reactor (%) 5.3 1.3 1.3 1.3 1.3

! 122
Figure 5.9: Comparison of predicted gate-to-gate environmental impact potential for both
processes
(Orange: MC process oxidation section; Magenta: MC process hydrogenation section; Cyan:
spray process; Shaded: environmental impact potential of direct process emissions such as off-
gas, wastewater, VOCs from unit operations and fugitive emissions;
Unshaded: fuel combustion for process steam production)
0
1
2
3
4
5Global Warming Potential
Case 4
Case 3
Case 2
Case 1
MC process Spray process
104 kg
CO
2-equ
iv.
0
4
8
12
16
20Acidification Potential
Case 4
Case 3
Case 2
Case 1
MC process Spray process
102 m
ol H
+ -equ
iv.
0
5
10
15
20
25
30
35Ecotoxicity Air Potential
Case 4
Case 3
Case 2
Case 1
MC process Spray process
103 P
AF
m3 d
ay/k
g
0
3
6
9
Human Health Non-Cancer Air Potential
Case 4
Case 3
Case 2
Case 1
MC process Spray process
103 kg
tolu
ene-
equi
v.
0
80
160
240
320
400
480
560 Ecotoxicity Water Potential
Case 4
Case 3
Case 2
Case 1
MC process Spray process
102 P
AF
m3 d
ay/k
g
0
4
8
12
16
20
24
28
32Smog Air Potential
Case 4
Case 3
Case 2
Case 1
MC process Spray process
102 kg
O3-e
quiv
.

! 123
Comparative cradle-to-gate life cycle impact assessment
The predicted cradle-to-gate environmental impact potential for both processes are shown in
Figure 5.10. The numerical data and a complete list of all impact potentials are provided in Table
E2 of Appendix E. The predicted cradle-to-gate environmental impact potential for most of the
impact categories are generally an order of magnitude greater than the gate-to-gate impact
potentials, while they are of the same order of magnitude with respect to ecotoxicity air and
ecotoxicity water potential, the major contributors to which are VOC emissions to air and the
organic solvents contained in wastewater. The contributors to the various environmental impact
categories are described in the following sections.

! 124
Figure 5.10: Predicted cradle-to-gate environmental impact potential for both processes
(Orange: MC process; Cyan: Spray process)
0
5
10
15
20
Global Warming Potential
Case 4Case 3
Case 2Case 1
MC process Spray process
104 kg
CO
2-equ
iv.
0
50
100
150
200
250Acidification Potential
Case 4Case 3Case 2Case 1
MC process Spray process
102 m
ol H
+ -equ
iv.
0
6
12
18
24
30
36Human Health Non-Cancer Air Potential
Case 4Case 3
Case 2Case 1
MC process Spray process
103 kg
tolu
ene-
equi
v.
0
5
10
15
20
25
30
35Ecotoxicity Air Potential
Case 4
Case 3
Case 2
Case 1
MC process Spray process
103 P
AF
m3 d
ay/k
g
0
15
30
45
60
75Smog Air Potential
Case 4
Case 3Case 2
Case 1
MC process Spray process
102 kg
O3-e
quiv
.
0
100
200
300
400
500
600Ecotoxicity Water Potential
Case 4
Case 3
Case 2
Case 1
MC process Spray process
102 P
AF
m3 d
ay/k
g

! 125
5.5.3.4 Data interpretation
Environmental impact potential contributors in the TPA processes
Global warming potential
Global warming potential arises from CO2 emissions and other greenhouse gases that trap the
sun’s heat. As shown in Figure 5.9, the CO2 emissions for a TPA plant that employs the MC
process technology are primarily associated with the fuel combustion for steam production by
on-site boilers, accounting for nearly 85% of the total CO2 emissions. The hydrogenation section
alone accounts for approximately 57% of the total on site CO2 emissions, primarily due to the
large energy input for the hydrogenation reactor. The other CO2 emission source is the solvent
burning in the oxidation reactor and the combustion reactor for VOCs treatment. For the gate-to-
gate CO2 emissions in the CEBC spray process, the fuel combustion for energy input contributes
to approximately 80% of the total on site CO2 emissions in each of the four cases. The global
warming potential in CEBC spray process Case 4 (similar acetic acid throughput to the MC
process) is only approximately 23% of that in the MC process. In contrast, the global warming
potential in the CEBC spray process that uses tenfold more acetic acid than the MC process
(Case 1) is still approximately 91% of that for the MC process. The environmental benefits of
eliminating the hydrogenation step in the spray process is partially offset by higher acetic acid
usage, which leads to higher energy requirements for the separation columns as well as the larger
off-gas CO2 emissions from solvent burning and the VOCs treatment reactor.
The conventional MC process cradle-to-gate global warming potential is about fourfold
greater than that for gate-to-gate analysis (Figure 5.10), due primarily to CO2 emissions from
fossil fuel-based energy required for pX production. Interestingly, the impact associated with H2
production from natural gas is minor because very small amounts of H2 are used for the

! 126
hydrogenation reaction. Since similar amounts of pX are employed in the spray process, the
increased emissions for cradle-to-gate LCA compared to gate-to-gate LCA in the spray process
are about the same as those in the MC process.
Acidification potential
The acidification potential from on-site emissions is attributed to SOx and NOx emissions
from the natural gas-based energy production (Figure 5.9). The gate-to-gate acidification
potential correlates with the steam usage in the process. When cradle-to-gate assessment is
considered, the acidification potential results primarily from the coal-based electrical power
generation for producing pX and other raw materials. Compared to the MC process, the on-site
acidification potential for case 1 (tenfold more acetic acid than the MC process) and case 4 (same
acetic acid usage as the MC process) of the spray process are approximately 88% and 19%,
respectively, while the cradle-to-gate impacts for the two cases are approximately 96% and 85%,
respectively. These results show that while acetic acid usage dictate the acidification potential
from on-site emissions, coal-based power generation is a major contributor to the overall
acidification potential stemming from cradle-to-gate emissions.
Human health non-cancer air potential
Heavy metals (arsenic, cadmium, lead, mercury, etc.) and halogenated organic substances
emitted during the fossil fuel-based energy generation (electricity and steam) contribute to this
category. When compared to the MC process, the human health non-cancer air potentials of the
spray process (case 1 and case 4) are approximately 88% and 19%, respectively, based on on-site
emissions, and, 94% and 69%, respectively, when considering cradle-to-gate LCA. These
comparisons again show the dominant effect of increased acetic acid usage on site and the use of
coal-based power generation for producing the raw materials.

! 127
Ecotoxicity air potential
Fugitive VOC emissions and VOCs emitted from various unit operations contribute primarily
to the ecotoxicity air potential. The emitted VOCs associated with the TPA processes are mainly
acetic acid, methyl acetate and methanol. Partitioning of inorganic chemicals into the air phase
during fossil-fuel based energy generation has a relatively minor contribution compared to VOC
emissions. As can be seen from Figure 5.9, for the MC process, the ecotoxicity air potential
based on on-site emissions mainly stems from the fugitive acetic acid emissions from the
oxidation section. The impact from the hydrogenation section, in which the relevant VOCs are
mainly methanol, is relatively insignificant compared to the oxidation section (Appendix E1).
There is a reflection of the fact that the solvent used in the hydrogenation process is water. The
ecotoxicity air potential of the spray process that uses tenfold greater acetic acid (case 1) is
greater (by approximately four times) based on both gate-to-gate and cradle-to-gate LCA results.
These results show that the extent of acetic acid usage is by far the major contributor to the air
toxicity potential in both processes.
Smog air potential
Smog air potential is attributed to chemicals released to air that cause smog via photochemical
reactions [155]. Both the VOC emissions during the on-site TPA processes and the inorganic
chemical emissions (NOx) to air during the fossil-fuel based energy generation are primary
contributors to this type of air pollution. The smog air potential of the spray process case 1 is
approximately 2-fold greater than that in the MC process based on on-site emissions and 1.2
times based on cradle-to-gate LCA. This trend is consistent with the greater VOC emission
potential associated with acetic acid usage (see previous section).

! 128
Ecotoxicity water potential
Organic solvents such as acetic acid, methanol and methyl acetate, as well as trace amounts of
benzoic acid contained in the wastewater released to fresh water, are the primary causes of water
contamination. Partitioning of metal emissions (mercury, lead, chromium, etc.) and inorganic
chemicals into the water phase during the fossil-fuel based energy generation has a relatively
small impact on the ecotoxicity water potential compared with the emissions/disposal of process
wastewater. In the conventional MC process, the wastewater release occurs in the hydrogenation
section, in which a solvent evaporator is used to concentrate the mother liquor from a centrifuge
and the heavies are recycled back to the oxidation reactor while part of the lights containing trace
amounts of acetic acid, methanol and benzoic acid are emitted to the water phase as process
wastewater. The overhead water phase from the distillation column in the oxidation section is
sent to the hydrogenation reactor for use as solvent. In the spray process, however, since the
hydrogenation section is eliminated, the corresponding aqueous phase from the distillation
column is released as wastewater directly, resulting in significant discharge of acetic acid,
methanol and methyl acetate into the wastewater stream. This explains why the ecotoxicity water
potential of the spray process is dramatically higher than that of the MC process in either gate-to-
gate or cradle-to-gate LCA (Figures 5.9 & 5.10).
Potential opportunities for improvements in the CEBC spray process
Substrate concentration (acetic acid throughput)
The use of lower substrate (pX) concentration in the CEBC spray process necessitates higher
acetic acid throughput (e.g., nearly 10 times of acetic acid amounts in case 1 compared to the
MC process). This is definitely undesirable, from both economic and environmental points of
view. The higher acetic acid throughput requires bigger equipment, higher energy input, higher
! 129
CO2 emission rates (the base number is huge despite of a lower solvent burning rate), higher
makeup acetic acid amount and higher VOC emissions. The benefits of eliminating the
purification step are either partially or almost totally offset (as in case 1) with respect to capital
investment, operating costs and almost all the potential environmental impacts except ecotoxicity
water potential, which is primarily caused by the directly released wastewater from the
distillation column. To gain benefits in both the economic a well as environmental factors, as
high a pX concentration as practically possible should be used for the alternative spray
processes. The CEBC spray process would provide significant improvements in economic and
environmental performances if it is able to employ the same pX concentration as the
conventional MC process and produce polymer-grade TPA product in one step. This analysis
also shows that the conventional MC process itself can be improved with respect to both
economics and environmental performance if the acetic acid amount can be reduced at constant
production capacity.
Wastewater treatment
Instead of directly releasing the corresponding aqueous stream (containing mainly acetic acid,
methanol and methyl acetate) from the distillation column to fresh water, the wastewater stream
should first be treated by passing through an absorber followed by burning the off-gas containing
VOCs to CO2. Adding one or two unit operations will place a small burden on the capital and
operating costs but will play an important role in minimizing the environmental impact.
p-Xylene sourcing
Comparisons of the gate-to-gate LCA and the cradle-to-gate LCA (Figures 5.9 & 5.10)
indicate that the major contributors to the overall environmental impact potential stem from the
fossil fuel-based energy for raw material production (primarily for p-xylene). Being able to use

! 130
bio-sourced p-xylene as renewable feedstock instead of pX sourced from petroleum reformates
will reduce the adverse environmental impacts, not only for the CEBC spray process, but also for
the conventional MC process.
5.6 Summary
The spray process for producing high purity TPA from pX has the potential to provide both
economic and environmental benefits when compared to the conventional MC process. Both
benefits accrue mostly from the non-requirement of the hydrogenation step required in the
conventional process for purifying the crude TPA. The estimated capital cost of the CEBC spray
process is 20% lower than that of the conventional MC process even assuming tenfold more
acetic acid is used in the spray process to achieve the TPA production rate. In contrast, when an
identical amount of acetic acid is used in both processes, the capital cost in the spray process is
55% lower than the MC process. The corresponding costs for producing polymer-grade TPA are
lower than the MC process by 3.5 ¢/lb (when using tenfold greater acetic acid) and 10.5 ¢/lb
(when using an identical amount of acetic acid), respectively, in the two cases. The lower acetic
acid usage decreases both equipment and energy costs.
The GaBi® software predicts cradle-to-grave environmental impacts for both processes that
are, for most of the impact categories, generally an order of magnitude greater than the on-site
(gate-to-gate) impacts. The environmental impacts are dominated by coal-based electricity
generation required for producing the raw materials (pX, in particular). Even though acetic acid
is the dominant component in the feed, >97 wt% of the acetic acid used in the process is recycled
such that the net usage of acetic acid per pound of product is much less than that of pX. The
emissions from coal-based electricity generation contribute to global warming, acidification
potential and air pollution that cause adverse but non-cancerous human health hazards. With
! 131
respect to both on-site emissions as well as cradle-to-gate emissions, the predicted environmental
impacts for the spray process are lower than those of the MC process, even in the case where the
acetic acid usage is tenfold greater compared to the MC process. However, such acetic acid
usage contributes to greater fugitive VOC emissions that result in more air toxicity (non
carcinogenic) and smog formation potential. Potential opportunities for improvements in the
CEBC spray process are to lower the acetic acid throughput at fixed TPA production rate and to
treat process wastewater before discharging to fresh water. The use of bio-sourced p-xylene as
feedstock will improve the environmental performance of both the conventional and spray
processes.

! 132
Chapter 6 Conclusions and Recommendations
6.1 Conclusions
This dissertation research presents a comprehensive investigation of the oxidation of p-xylene
to terephthalic acid in a spray reactor process. The design and development of an alternative
process to the conventional Mid-Century (MC) process for terephthalic acid production that
admits the principles of green chemistry and green engineering motivated this research work.
Several aspects of terepthalic acid synthesis in a spray reactor were addressed, including: the
acquisition of kinetic data under homogenous reaction conditions avoiding TPA precipitation;
theoretical analyses and experimental demonstration of one step high-purity terephthalic acid
production in a semi-batch spray reactor; rational design and preliminary demonstration of a
continuous spray reactor process; and the economic and environmental impact assessments of a
simulated spray process for terephthalic acid production.
Intrinsic kinetics of pX liquid phase oxidation to TPA was investigated in a stirred reactor
under homogeneous conditions without TPA precipitation by using low p-xylene concentrations
to provide guidelines for the rational design and optimization of the spray process for TPA
production as well as reactor modeling studies. A first order kinetic model was developed and
kinetic rate constants obtained based on the experimental data. The estimated rate constants are
shown to be at least one order of magnitude greater than those literature reported data, probably
because the reaction was operated under homogeneous conditions avoiding solid formation in the
liquid phase and thereby eliminating gas-solid and liquid-solid mass transfer limitations. Our

! 133
investigations concur with previous reports that the slowest step is the oxidation of p-toluic acid
to 4-carboxybezaldehyde. However, our investigations show that it is not possible to completely
eliminate the gas-liquid mass transfer limitations associated with the fast intermediate oxidation
steps in a conventional stirred reactor, even when operating under homogeneous conditions at
high rpm. This confirms that other reactor configurations (such as spray reactor) are needed to
overcome gas-liquid mass transfer limitations. The effects of bromide and initial p-xylene
concentrations on the reaction rate were also investigated. Bromide concentration shows zero
order dependence at high concentrations where the intermediate 4-bromomethyl benzoic acid
elimination is favored. Decreasing reaction rates with an increase of initial p-xylene
concentration shown in the traditional three-phase reaction system were not observed in the
homogeneous system (wherein the intrinsic rate constants were invariant within the respective
confidence intervals), which further confirms that the solid phase hinders the reaction rate and
the literature reported kinetic rate constants are not intrinsic kinetic parameters.
The spray reactor is configured to disperse the liquid phase containing the dissolved p-xylene
and Co/Mn/Br based catalyst in acetic acid as fine droplets (by means of a nozzle) into a
continuous vapor phase containing the oxidant (O2). Each of these droplets is envisioned to
function as a microreactor. The switching dispersed and continuous phases in the conventional
MC process [in which the gas phase (air) is dispersed into the continuous liquid phase] was
aimed at maximizing the gas/liquid interfacial mass transfer area and eliminating O2 starvation in
the liquid phase, thereby avoiding incomplete oxidation to achieve improved TPA selectivity and
purity, as well as reducing the solvent burning by shortening the reactor residence times.
A spray process concept for terephthalic acid production was successfully demonstrated in a
700 mL semi-batch spray reactor, custom designed and built in house at CEBC, in which high-

! 134
purity terephthalic acid (<25 ppm 4-carboxybenzaldehyde) was produced in one step at 200 °C
and 15 bar pressure. This result is in sharp contrast to the performance of the conventional stirred
reactor in which the solid terephthalic acid product contains >1000 ppm 4-carboxybenzaldehyde
requiring further purification steps. We attribute the superior performance of the spray reactor to
our initial hypothesis that the increased gas-liquid mass transfer area avoids O2 starvation that
can occur when gas is sparged into a continuous liquid phase, as in the stirred reactor. In addition,
the reduced backmixing in the spray reactor has also contributed to enhanced conversion.
Theoretical calculations confirm that in typical spray droplets (50 µm diameter), the O2 diffusion
time constants are one to two orders of magnitude lower than the kinetic time constant
(associated with the rate determining step) confirming the complete penetration of the O2
throughout the liquid phase and the elimination of O2 starvation.
Mathematical modeling of a stirred reactor operated at typical MC process conditions shows
that solvent evaporation is a main source of cooling that results in steady states that are open-
loop stable. Based on steady state heat generation and heat removal rates, the stirred reactor
model accurately predicts the reactor temperature reported in conventional reactors. In addition,
the modeling also shows that control of reactor operating pressure around 15 bar is critical to
achieving stable operation without temperature overshoot that might lead to solvent and titanium
burning in the presence of oxygen. These model predictions were verified experimentally. Spray
reactor operation in which the reactor pressure is maintained constant results in constant pressure
and temperatures whereas operation in which the reactor pressure is allowed to rise during
continuous gas introduction results in a steadily rising pressure and temperature in the reactor.
Gas phase concentration measurements show that CO formation (an indicator of solvent
burning reaction) in the spray reactor is roughly one-fourth of that formed in the MC process.

! 135
This suggests that the shorter residence times in the spray reactor could also reduce solvent
burning. Further, the use of CO2 as an inert gas has the advantage of higher heat capacity and
superior flame inhibition properties compared to nitrogen. The presence of CO2 and acetic acid
vapor in the gas phase in sufficiently high concentrations is shown to maintain the vapor phase
outside the flammability envelope.
The promising results from the semi-batch spray reactor led us to the more challenging task of
demonstrating continuous spray reactor operation and its benefits. Preliminary experimental
results from a larger 4 L continuous spray reactor during a 25-min experimental run using a
manually controlled micro-metering valve show high concentrations of intermediates. This is
attributed to various factors such unsteady state operation with varying liquid holdup in the
reactor, low catalyst concentration and inadequate residence time in the liquid phase. A stepper-
motor-controlled micro-metering valve was successfully designed and implemented in the 4 L
continuous spray reactor. Excellent T & P control as well as constant acetic acid holdup in the
reactor were demonstrated during a 30-min blank run. Further process optimization, guided by
modeling of the spray reactor, is essential to rationally address the challenging task of
demonstrating continuous/stable spray reactor operation that produces high-purity TPA as
observed in the semi-batch spray reactor.
Comparative economic analyses of the conventional MC process and CEBC spray process
(four alternative spray cases using varying amount of acetic acid in the feed) for terephthalic acid
production were performed assuming a production rate of 500,000 t/yr of purified terephthalic
acid. The estimated capital cost of the CEBC spray process is 20% lower than that of the
conventional MC process even though tenfold more acetic acid is used in the spray process to
achieve the TPA production rate. In contrast, when an identical amount of acetic acid is fed in

! 136
both processes, the capital cost in the spray process is 55% lower than the MC process. The
corresponding costs for producing polymer-grade TPA are lower than the MC process by 3.5
¢/lb (when using tenfold greater acetic acid) and 10.5 ¢/lb (when using an identical amount of
acetic acid), respectively, in the two cases. The economic benefits of the CEBC spray process
are mainly derived from the non-requirement of the hydrogenation step required in the
conventional process for purifying the crude TPA.
Gate-to-gate and cradle-to-gate life cycle assessments of the conventional MC process and
CEBC spray process for terephthalic acid production were performed and potential
environmental impacts were estimated based on the TRACI model incorporated in GaBi®
software. The predicted cradle-to-grave environmental impacts for both processes are, for most
of the impact categories, generally an order of magnitude greater than the on-site (gate-to-gate)
impacts. Cradle-to-gate LCA reveals that the overall environmental impacts in both processes are
dominated by coal-based electricity generation required for producing the raw materials (p-
xylene, in particular). Even though acetic acid is the dominant component in the feed, >97 wt%
of the acetic acid used in the process is recycled such that the net usage of acetic acid per pound
of product is much less than that of p-xylene. The emissions from coal-based electricity
generation contribute to global warming, acidification potential and air pollution that cause
adverse but non-cancerous human health hazards. With respect to both on-site emissions as well
as cradle-to-gate emissions, the predicted environmental impacts for the spray process are lower
than those of the MC process, even in the case where the acetic acid usage is tenfold greater
compared to the MC process. However, such acetic acid usage contributes to greater fugitive
VOC emissions that result in more air toxicity (non carcinogenic) and smog formation potential.
Potential opportunities for improvements in the CEBC spray process are to lower the acetic acid

! 137
throughput at fixed TPA production rate and to treat process wastewater before discharging to
fresh water. The use of bio-sourced p-xylene as feedstock will improve the environmental
performance of both the conventional and spray processes.
In summary, the spray concept for p-xylene oxidation to terephthalic acid has the potential to
be an alternative greener process concept for making polymer-grade dicarboxylic acids in one
step. The several potential green attributes (no need for hydrogenation step, reduced solvent
burning, and reduced capital and operating costs as well as environmental burdens) make this
process especially eminent for making chemical intermediates for renewable plastics. This spray
concept could also be applied to other fast gas-liquid reaction systems.
6.2 Recommendations
The following studies are recommended as extensions of the research project on the spray
process for terephthalic acid production.
1. This work successfully demonstrated the spray process concept to produce high-purity
terephthalic acid in one step in a 700 mL semi-batch spray reactor (with continuous gas phase
flow but the liquid phase remained in the reactor) for a 3-min duration. Even though significant
efforts were made to scale up the spray reactor from 700 mL to 4 L and to make the process
continuous, the demonstration of the continuous spray process under steady state operation for a
longer duration (at least several hours) turned out to be more challenging than expected and has
not yet been achieved. The major roadblock to the steady state continuous operation at a suitable
large scale is the automatic control of the liquid effluent flow rate to achieve constant liquid
holdup in the reactor. This has been partially achieved in this work with a stepper-motor driven
micro-metering valve but a robust, corrosion resistant valve needs to be demonstrated for
extended operation lasting days. In addition, solubility studies show that terephthalic acid has

! 138
low solubility in acetic acid (1.6 g terephthalic acid/100 g acetic acid at 200 °C and 15 bar),
resulting in product precipitation at reactor conditions. Hence, future reactor design should take
into account the challenge of continuously flowing solids-containing liquid slurry across the
valve and tubing without plugging. Lessons from high-pressure industrial polymerization
reactors provide guidance for overcoming this problem [169].
2. One of the important advantages of the spray process is to reduce the solvent (acetic acid)
burning due to the shorter residence times as we claimed. The solvent burning rate has not been
fully investigated in this work and only CO formation was measured from the 700 mL semi-
batch spray reactor during a 3-min spray duration. Once the 4 L spray reactor setup for steady
state continuous operation is ready, the quantification of CO/CO2 formation should be
implemented. Isotope-labeled studies with mass spectroscopy could help distinguish the CO2
formation from the burning side reactions against the CO2 used as the inert gas for the reaction
system [3].
3. As the scalability and the steady state continuous operation are demonstrated and more data
from the continuous runs become available, the comparative economic and environmental impact
assessments of the spray process for terephthalic acid production should be continually updated
to evaluate the economic viability and the environmental benefits as well as to guide process
development. In addition, the plant-scale simulation of the CEBC spray process used air for the
oxidant source, which was not the case in our laboratory experiments in which CO2/O2 was used
instead of air. It is strongly recommended to investigate the p-xylene oxidation with air as the O2
source in the spray reactor and update the economic and environmental analyses based on these
experimental data. Additionally, the analyses based on the process simulation using CO2 as the
inert gas should also be performed for comparison.

! 139
4. Modeling of the spray process for terephthalic acid production is essential for rational
optimization and scale-up of the continuous process. The initial model could focus on
representing the spray reactor as a series of mixed cells in the vapor phase followed by the well-
mixed liquid phase at the bottom, incorporating the kinetics obtained in this work. Such a model
should clearly bring out the importance of back-mixing and liquid phase residence times on the
observed product purity profiles, and could provide guidance for the development of a more
comprehensive model that incorporates nozzle geometry, spray pattern and detailed fluid
dynamics in addition to the kinetics of the reaction system. The availability of advanced
computational fluid dynamics (CFD) software, such as COMSOL Multiphysics® [170] software,
makes it easier to perform such detailed reactor simulations.

! 140
Nomenclature
Cp,j heat capacity of species j, kJ/(mol °C)
D diffusivity of O2 in the acetic acid-dominated reaction mixture, cm2/s
Fj0 molar feed rate for species j, mol/h
Fjvap evaporative molar rate for species j, mol/h
Hj0 partial molar enthalpy for species j in feed stream, kJ/mol
Hj partial molar enthalpy for species j in effluent stream, kJ/mol
∆HR heat of reaction, kJ/mol
∆Hvap,j heat of vaporization for species j, kJ/mol
k kinetic rate constant for the rate-determining step, s-1
Nj moles of species j inside reactor at any instant of time, mol
QG heat generation rate, kJ/h
QR heat removal rate, kJ/h
Rp radius of the droplet, m
ri rate of formation of species i, mol/(h m3)
T temperature of reaction mixture or effluent stream, °C
t time, h
V volume of reaction mixture, m3
X conversion of p-xylene to TPA

! 141
Bibliography
![1] Chemistry Explained: Green Chemistry, 2013. (http://www.chemistryexplained.com/Ge-Hy/Green-Chemistry.html, accessed May 2013)
[2] Anastas, P. T., Warner, J. C., 1998. Green Chemistry: Theory and Practice. Oxford University Press: Oxford, UK.
[3] Zuo, X., Niu, F., Snavely, K., Subramaniam, B., Busch, D.H., 2010. Liquid phase oxidation of p-xylene to terephthalic acid at medium-high temperatures: multiple benefits of CO2 expanded liquids. Green Chemistry 12, 260-267.
[4] Kwak, J. W., Lee, J. S., Lee, K. H., 2009. Co-oxidation of p-xylene and p-toluic acid to terephthalic acid in water solvent: kinetics and additive effects. Applied Catalysis A: General 358, 54-58.
[5] ICIS.com, 2010. (http://www.icis.com/Articles/2007/11/06/9076461/purified-terephthalic-acid-pta-uses-
and-market-data.html, accessed Feb. 2013)
[6] Rajagopalan, B., 2007. Investigation of dense carbon dioxide as a solvent medium for the catalytic oxidation of hydrocarbons. University of Kansas, PhD Dissertation.!
[7] Landau, R., Heights, R., Saffer, A., 1958. Process for the preparation of terephthalic acid. US 2833818.
[8] Ure, A.M., Parker, D., 2010. Methods, processes, and system for treating and purifying crude terephthalic acid and associated process streams. WO 2010/122304 A1.
[9] Hashmi, S.M.A., Al-Luhaidan, S., 2006. Process for preparing purified terephthalic acid. EP 1671938 A1.
[10] Meyer, D. H., 1971. Fiber-grade terephthalic acid by catalytic hydrogen treatment of dissolved impure terephthalic acid. US 3584039.
[11] BP, 2011. Annual report and form 20-F 2011 (bp.com/annualreport)
[12] Lin, R., De Vreede, M., Sluijmers, J.W., De Boer, M., Woodruff, T.E., 2006. Method for oxidizing a slurry composition in a post oxidation zone in the presence of added steam. US 20060084824 A1.
[13] Weissermel, K., Arpe, H.-J., 1997. Industrial Organic Chemistry. VCH Publishers, Inc., New York.
[14] Raghavendrachar, P., Ramachandran, S., 1992. Liquid-phase catalytic oxidation of p-xylene. Industrial & Engineering Chemistry Research 31, 453-462.
[15] Packer, L. G., James, D. E., 1986. Purification of terephthalic acid. US 4626598 A.
[16] Schroeder, H., 1986. Purification of terephthalic acid to relatively low levels of 4-carboxybenzaldehyde and catalyst therefor. US 4629715 A.

! 142
![17] Schroeder, H., 1989. Recovery of terephthalic acid from its recycle streams. US 4833269
A.
[18] Bartos, T. M., 2006. Process and apparatus for manufacturing pure forms of aromatic carboxylic acids. WO 2006/102336 A2.
[19] Bartos, T. M., Leung, L. K., 2006. Process and apparatus for manufacturing aromatic carboxylic acids including pure forms thereof. WO 2006/102459 A1.
[20] Abrams, K. J., 1996. Process for preparing aromatic carboxylic acids with efficient energy recovery by the oxidation of aromatic hydrocarbon feedstocks. WO 96/11899 A1.
[21] Seslar, T., 2003. Finding the X factor. Frontiers, 25-29.
[22] Graham, D. A., Hamley, P. A., Ilkenhans, T., Poliakoff, M., Woodcock, D. C., 2002. Production of aromatic carboxylic acids. WO 2002006201 A1.
[23] Turner, J. A., Royall, D. J., Hugall, D. S., Jones, G. H., Woodcock, D. C., 1998. Production of terephthalic acid by liquid-phase oxidation. WO 9838150 A1.
[24] Bickham, D. R., 1999. Hydrogenation-centrifugation process for separating pure terephthalic acid from crude reaction products. WO 9908990 A1.
[25] INVISTA, 2012. INVISTA’s Spring 2013 fabric concepts for denim — reinvent, renew, recover. (http://www.invista.com/en/news/pr-invista-spring-2013-denim-fabric-concepts.html, accessed Mar. 2013)
[26] INVISTA, 2009. INVISTA acquires unique residue recovery technology for terephthalic acid industry. (http://www2.invista.com/news_releases/2009/pr_ipt_acquisition.shtml, accessed Mar. 2013)
[27] Piras, L., Schena, S., Chiarelli, M., Soro, L., 2001. Filtration and washing process and apparatus for the recovery of purified terephthalic acid. WO 2001/049647 A1.
[28] Piras, L., Schena, S., Chiarelli, M., Soro, L., 2001. Filtration and washing process for the recovery of crude terephthalic acid using a rotary filter. WO 2001/055075 A2.
[29] Dow, 2010. Dow technology licensing — COMPRESS™ PTA technology process. (http://www.dow.com/licensing/offer/pta.htm, accessed Mar. 2013)
[30] Kiefer, J. E., Phillips, W. V., Woodruff, T. E., 1986. Purification of terephthalic acid. US 4605763 A.
[31] Johnson, G. I., Kiefer, J. E., 1984. Purification of terephthalic acid. US 4447646 A.![32] Nakaoka, K., Miyama, Y., Matsuhisa, S., Wakamatsu, S., 1973. Preparation of
terephthalic acid using paraldehyde promotor. Industrial & Engineering Chemistry Product Research and Development 12(2), 150-155.!

! 143
![33] Nakaoka, K., Kato, T., Matsuhisa, S., 1972. Catalytic preparation of aromatic carboxylic
acids. US 3636095 A.![34] Yoshimura, T., 1969. New process can reduce terephthalic acid costs. Chemical
Engineering 76(10), 78-80.
[35] Ichikawa, Y., Yamashita, G., Tokashiki, M., Yamaji, T., New oxidation process for production of terephthalic acid from p-xylene. Industrial and Engineering Chemistry 62(4), 38-42.!
[36] Partenheimer, W., 1995. Methodology and scope of metal/bromide autoxidation of hydrocarbons. Catalysis Today 23, 69-158.
[37] Aspen HYSYS®, 2009. Version 7.1, Aspen Technologies: Calgary, Alberta, Canada.
[38] Lange, N., 1999. Lange’s Handbook of Chemistry, fifteenth ed. McGraw-Hill, New York.
[39] Roffia, P., Callni, P., Motta, L., 1984. Byproduct identification in the terephthalic acid production process and possible mechanisms of their formation. Industrial and Engineering Chemistry Product Research and Development 23, 629-634.
[40] Cheng, Y., Peng, G., Wang, L., Li, X., 2009. Kinetics of burning side reaction in the liquid-phase oxidation of p-xylene. Chinese Journal of Chemical Engineering 17(2), 181-188.
[41] Roffia, P., Calini, P., Tonti, S., 1988. Methyl acetate: by-product in the terephthalic acid production process. Mechanisms and rates of formation and decomposition in oxidation. Industrial & Engineering Chemistry Research 27(5), 765-770.
[42] Sheehan, R. J., 2003. Terephthalic Acid, Dimethyl Terephthalate, and Isophthalic Acid. Ullmann’s Encyclopedia of Industrial Chemicstry, WILEY-VCH: Weinheim. 6th Edition, volume 35, 639-651.
[43] Hunter, R. S., 1975. The Measurement of Appearance. John Wiley & Sons, New York.
[44] Wang, Q., Cheng, Y., Wang, L., Li, X., 2007. Semicontinuous studies on the reaction mechanism and kinetics for the liquid-phase oxidation of p-xylene to terephthalic acid. Industrial & Engineering Chemistry Research 46, 8980-8992.
[45] Heiba, E. I., Dessau, R. M., Koehl, W J., Jr., 1969. Oxidation by metal salts. V. Cobaltic acetate oxidation of alkylbenzenes. Journal of the American Chemical Society 91(24), 6830-6837.
[46] Partenheimer, W., 1990. A chemical model for the Amoco "MC" oxygenation process to produce terephthalic acid. Chemical Industries (Dekker) 40 (Catalysis of Organic Reactions), 321-346.
[47] Solorzano, M. Z., 2000. Modeling, dynamic behavior and control of chemical reactors with evaporative cooling. University of Wisconsin-Madison, PhD Dissertation.

! 144
![48] Kingsley, J. P., Roby, A. K., 1996. Terephthalic acid production using evaporative
cooling. US 5523474 A.
[49] Fukuhara, H., 1998. Process for producing aromatic carboxylic acids, such as terephthalic acid, by oxidation of alkyl aromatics using heavy metal and bromine compound catalysts. EP 818433 A2.
[50] Cheng, Y., Li, X., Wang, L., Wang, Q., 2006. Optimum Ratio of Co/Mn in the liquid-phase catalytic oxidation of p-xylene to terephthalic acid. Industrial & Engineering Chemistry Research 45(12), 4156-4162.
[51] Kamiya, Y., Nakajima, T., Sakoda, K., 1966. Autoxidation of p-xylene catalyzed with cobalt monobromide in acetic acid. Bulletin of the Chemical Society of Japan 39(10), 2211-2215.
[52] Wang, Q., Li, X., Wang, L., Cheng, Y., Xie, G., 2005. Kinetics of p-xylene liquid-phase catalytic oxidation to terephthalic acid. Industrial & Engineering Chemistry Research 44, 261-266.
[53] Belmonte, F. G., Fjare, K. A., Partenheimer, W., 1992. Process and catalyst for production of benzene polycarboxylic acids by liquid-phase oxidation of polymethylbenzenes. US 5112992 A.
[54] Broeker, J. L., Partenheimer, W., Rosen, B. I., 1995. Manufacture of aromatic dicarboxylic acids using cerium to facilitate a low bromine/metal ratio in the oxidation catalyst. US 5453538 A.
[55] Partenheimer, W., 1991. Production of polycarboxylic acids with a molybdenum-activated cobalt catalyst. US 4992580 A.
[56] Partenheimer, W., 2003. The effect of zirconium in metal/bromide catalysts on the autoxidation of p-xylene. Part II. Alternative metals to zirconium and the effect of zirconium on manganese(IV) dioxide formation and precipitation with pyromellitic acid. Journal of Molecular Catalysis A: Chemical 206(1-2), 131-144.
[57] Codignola, F., Moro, A., 2000. Preparation and purification of aromatic mono- and polycarboxylic acids. WO 2000063146 A1.
[58] Hronec, M., Al Ghatta, H., Ruggieri, R., 2007. Preparation of terephthalic acid with high purity. WO 2007066365 A1.
[59] Jhung, S., Park, Y., Lee., K., Yoo, J. S., Chae, J., 2001. Method of producing aromatic carboxylic acids by oxidizing alkyl aromatic hydrocarbons or partially oxidized intermediates thereof. US 6194607 B1.
[60] Inary, M., Ohkoshi, F., Zaima, F., 1997. Process for producing terephthalic acid. US 5679847 A.
[61] Fukuhara, H., Oikawa, H., 1997. Method for producing aromatic carboxylic acids. US 5663428 A.

! 145
![62] Jhung, S., Lee, K., Park, Y., Yoo, J. S., 2001. Method of producing aromatic carboxylic
acids by oxidizing alkyl aromatic compounds or partially oxidized intermediates thereof with carbon dioxide containing gas. US 6180822 B1.
[63] Roby, A. K., 1997. Production of terephthalic acid with excellent optical properties through the use of pure or nearly pure oxygen as the oxidant in p-xylene oxidation. US 5696285.
[64] Roby, A. K., Kingsley, J. P., 1997. Process for producing an aromatic carboxylic acid. EP 796837 A1.
[65] Ramachandran, R., Sethna, R. H., Tamhankar, S. S., 1997. Production of terephthalic acid. US 5693856 A.
[66] Jhung, S., Park, Y., 2001. Method of producing aromatic carboxylic acids by oxidizing alkyl aromatic compounds or partially oxidized intermediates thereof with oxygen-enriched gas. US 6175038 B1.
[67] Edwards, C. L., June, R. L., Potter, M. W., Simpson, E. J., 2000. Method to produce aromatic dicarboxylic acids using cobalt and zirconium catalysts. US 6153790 A.
[68] Chester, A. W., Scott, E. J. Y., Landis, P. S., 1977. Zirconium cocatalysis of the cobalt-catalyzed autoxidation of alkylaromatic hydrocarbons. Journal of Catalysis 46(3), 308-319.
[69] Yen, D., 2003. Catalytic solution system for manufacturing terephthalic acid and a method for same. US 20030078451 A1.
[70] Li, K., Li, S., 2008. CoBr2-MnBr2 containing catalysts for catalytic oxidation of p-xylene to terephthalic acid. Applied Catalysis, A: General 340, 271-277.
[71] Tashiro, Y., Iwahama, T., Sakaguchi, S., Ishii, Y., 2001. A new strategy for the preparation of terephthalic acid by the aerobic oxidation of p-xylene using N-hydroxyphthalimide as a catalyst. Advanced Synthesis & Catalysis 343, 220-225.
[72] Saha, B., Koshino, N., Espenson, J. H., 2004. N-hydroxyphthalimides and metal cocatalysts for the autoxidation of p-xylene to terephthalic acid. Journal of Physical Chemistry 108(3), 425–431.
[73] Koshino, N., Saha, B., Espenson, J. H., 2003. Kinetic study of the phthalimide N-oxyl radical in acetic acid. Hydrogen abstraction from substituted toluenes, benzaldehydes, and benzyl alcohols. Journal of Organic Chemistry 68(24), 9364-9370.
[74] Cai, Y., Koshino, N., Saha, B., Espenson, J. H., 2005. Kinetics of self-decomposition and hydrogen atom transfer reactions of substituted phthalimide N-oxyl radicals in acetic acid. Journal of Organic Chemistry 70(1), 238-243.
[75] Graham, D. A., Hamley, P. A., Oliver, R., Poliakoff, M., Woodcock, D., Ilkenhans, K., 2004. Production of aromatic carboxylic acids. US 6765113.

! 146
![76] Dunn, J. B., Urquhart, D. I., Savage, P. E., 2002. Terephthalic acid synthesis in
supercritical water. Advanced Synthesis & Catalysis 344, 385-392.
[77] Dunn, J. B., Savage, P. E., 2002. Terephthalic acid synthesis in high-temperature liquid water. Industrial & Engineering Chemistry Research 41, 4460-4465.
[78] Fraga-Dubreuil, J., Poliakoff, M., 2006. Organic reactions in high-temperature and supercritical water. Pure and Applied Chemistry 78, 1971-1982.
[79] Sikkenga, D. L., Pandya, A. K., Zaenger, I. C., Abrams, K. J., Bartos, T. M., 2003. Production of high purity aromatic carboxylic acid by oxidation in benzoic acid and water solvent. US 6562997 B2.
[80] Klier, J., Tucker, C. J., Kalantar, T. H., Burdett, K. A., Green, D. P., Piras, L., Schena, S., Lee, G. J., 2004. Oxidation of alkyl aromatic compounds to aromatic acids in an aqueous medium. US 6759550 B1.
[81] Nexant, Inc., 2005. Squeezing profitability from the PTA/PET value chain: impact of the latest technology advances. (http://www.chemsystems.com/reports/search/docs/prospectus/mc-polyester-pros.pdf, accessed Dec. 2012)
[82] Melhem, G. A., 1997. A detailed method for estimating mixture flammability limits using chemical equilibrium. Process Safety Progress 16, 203-218.
[83] Sheehan, R. J., 2003. Terephthalic acid, dimethyl terephthalate, and isophthalic acid. Ullmann’s Encyclopedia of Industrial Chemicstry, WILEY-VCH: Weinheim. 6th Edition, volume 35, 639-651.
[84] Izumisawa, T., Kawahara, T., Toyosawa, A., 1996. Process for producing terephthalic acid. US 5567842 A.
[85] Wang, Q., Xu, H., Li, X., 2005. Solid-liquid equilibria of 1,4-benzenedicarboxylic acid in binary acetic acid + water solvent mixtures at elevated temperatures. Journal of Chemical and Engineering Data 50(1), 258-260.
[86] Wang, Q., Xu, H., Li, X., 2005. Solubility of terephthalic acid in aqueous acetic acid from 423.15 to 513.15K. Fluid Phase Equilibria 233(1), 81-85.
[87] Chen, M., Ma, P., 2004. Solid-liquid equilibria of several systems containing acetic acid. Journal of Chemical and Engineering Data 49(4), 756-759.
[88] Ma, P., Chen, M., 2003. Solid-liquid equilibrium of terephthalic acid in several solvents. Chinese Journal of Chemical Engineering 11(3), 334-337.
[89] Han, N., Zhu, L., Wang, L., Fu, R., 1999. Aqueous solubility of m-phthalic acid, o-phthalic acid and p-phthalic acid from 298 to 483 K. Separation and Purification Technology 16(2), 175-180.
[90] D'oro, P. C., Danoczy, E., Roffia, P., 1980. Low temperature oxidation of p-xylene. Oxidation Communications 1(2), 153-162.

! 147
![91] Morbidelli, M., Paludetto, R., Carra, S., 1986. Gas-liquid autoxidation reactors. Chemical
Engineering Science 41, 2299-2307.
[92] Jacobi, R., Baerns, M., 1983. The effect of oxygen transfer limitation at the gas-liquid interphase. Kinetics and product distribution of the p-xylene oxidation. Erdoel & Kohle, Erdgas, Petrochemie 36 (7), 322-326.
[93] Sun, W., Pan, Y., Zhao, L., Zhou, X., 2008. Simplified free-radical reaction kinetics for p-xylene oxidation to terephthalic acid. Chemical Engineering & Technology 31 (10), 1402-1409.
[94] Cao, G., Pisu, M., Morbidelli, M., 1994. A lumped kinetic model for liquid-phase catalytic oxidation of p-xylene to terephthalic acid. Chemical Engineering Science 49 (24B), 5775-5783.
[95] Cao, G., Servida, A., Pisu, M., 1994. Kinetics of p-xylene liquid-phase catalytic oxidation. AIChE Journal 40 (7), 1156-1166.
[96] Cincotti, A., Orrù, A., Cao, G., 1997. Effect of catalyst concentration and simulation of precipitation processes on liquid-phase catalytic oxidation of p-xylene to terephthalic acid. Chemical Engineering Science 52 (21/22), 4205-4213.
[97] Cincotti, A., Orrù, A., Cao, G., 1999. Kinetics and related engineering aspects of catalytic liquid-phase oxidation of p-xylene to terephthalic acid. Catalysis today 52, 331-347.
[98] Wang, Q., Li, X., Wang, L., Cheng, Y., Xie, G., 2005. Kinetics of p-xylene liquid-phase catalytic oxidation to terephthalic acid. Industrial & Engineering Chemistry Research 44, 261-266.
[99] Yan, X., 2007. Data mining macrokinetic approach based on ANN and its application to model industrial oxidation of p-xylene to terephthalic acid. Chemical Engineering Science 62, 2641-2651.
[100] Dong, Y., Yan, X., 2013. Hybrid model of industrial p-xylene oxidation incorporated fractional kinetic model with intelligent models. Industrial & Engineering Chemistry Research 52, 2537-2547.
[101] Qian, F., Tao, L., Sun, W., Du, W., 2012. Development of a free radical kinetic model for industrial oxidation of p-xylene based on artificial neural network and adaptive immune genetic algorithm. Industrial & Engineering Chemistry Research 51, 3229-3237.
[102] Viola, A., Cao, G., 1996. A rapid direct analysis of p-xylene oxidation products by reverse phase HPLC. Journal of Chromatographic Science 34, 27-33.
[103] Athena Visual Studio, 2012. Athena Visual Studio v 14.2, Athena Visual Software, Inc.
[104] Sawada, K., Tanaka, M., 1977. Formation of bromo complexes of cobalt(II) in acetic acid. Journal of Inorganic and Nuclear Chemistry 39(2), 339-344.
[105] Metelski, P. D., Adamian, V. A., Espenson, J. H., 2000. Mechanistic role of benzylic bromides in the catalytic autoxidation of methylarenes. Inorg. Chem. 39, 2434-2439.

! 148
![106] Partenheimer, W., 2004. The complex synergy of water in the metal/bromide
autoxidation of hydrocarbons caused by benzylic bromide formation. Adv. Synth. Catal. 346, 297-306.
[107] Patenheimer, W., 2005. The complex synergy of water in the metal/bromide autoxidations. Part II. Effect of water and catalyst on the aerobic oxidation of benaldehydes and the effect of water on the elementary catalytic pathways. Adv. Synth. Catal. 347, 580-590.
[108] Saha, B., Espenson, J. H., 2007. Low-bromide containing MC catalyst for the autoxidation of para-xylene. Journal of Molecular Catalysis A: Chemical 271, 1-5.
[109] Levenspiel, O., 1999. Chemical Reaction Engineering. 3rd ed. John Wiley & Sons, Inc., New York.
[110] O'Meadhra, Ruairi S., Lin, R., 2007. Apparatus and process for preparation and purification of terephthalic acid by oxidative digestion with optimized agitation. US 20070155987 A1.
[111] Gnagnetti, A., Piras, L., Kar, K., 2002. Impeller agitation system for dialkylbenzene oxidation reactors used for the manufacture of benzenedicarboxylic acids. WO 2002092549 A1.
[112] Osada, M., Savage, P. E., Terephthalic acid synthesis at higher concentrations in high-temperature liquid water. 1. Effect of oxygen feed method. AIChE Journal 55(3), 710-716.
[113] Cussler, E.L., 2009. Diffusion: Mass Transfer in Fluid Systems, third ed. Cambridge University Press, New York.
[114] Hilmen, E.K., 2000. Separation of azeotropic mixtures: tools for analysis and studies on batch distillation operation. Norwegian University of Science and Technology, PhD Dissertation.
[115] Carlson, E. C., 1996. Don’t gamble with physical properties for simulations. Chemical Engineering Progress 92 (10), 35-46.
[116] Houndonougbo, Y., Jin, H., Rajagopalan, B., Wong, K., Kuczera, K., Subramaniam, B., Laird, B., 2006. Phase equilibria in carbon dioxide expanded solvents: experiments and molecular simulations. Journal of Physical Chemistry B 110, 13195-13202.
[117] Krag, P. W., Henson, H. R., 1993. Materials selection for sulfide pressure oxidation autoclaves. Flammability and Sensitivity of Materials in Oxygen-Enriched Atmospheres: 6th Volume ASTM STP 1197, American Society for Testing and Materials, Philadelphia.
[118] Brundtland, G. H., 1987. Our common future: report of the world commission on environment and development. United Nations.
[119] Shadiya, O. O., 2010. Social, economic and environmental metrics for the sustainable optimization of chemical and petroleum processes. Oklahoma State University, PhD Dissertation.
! 149
![120] Adams, W. M., 2006. The future of sustainability: re-thinking environment and
development in the twenty-first century. Report of the IUCN Renowned Thinkers Meeting, 29–31.
[121] ICCA, 2002. On the road to sustainability: a contribution from the global chemical industry to the world summit on sustainable development. A summary of ICCA Chemical Sector Report to UNEP.
[122] Schwarz, J., Beloff, B., Beaver, E., 2002. Use sustainability metrics to guide decision-making. Chemical Engineering Progress 98(7), 58-63.
[123] Dunn, J. B., Savage, P. E., 2003. Economic and environmental assessment of high-temperature water as a medium for terephthalic acid synthesis. Green Chemistry 5(5), 649-655.
[124] Dunn, J. B., Savage, P. E., 2002. Economic and environmental assessment of terephthalic acid synthesis in high-temperature water. Annual Meeting Archive - American Institute of Chemical Engineers, Indianapolis, IN, United States, 158-160.
[125] Fang, J., Jin, H., Ruddy, T., Pennybaker, K., Fahey, D., Subramaniam, B., 2007. Economic and environmental impact analyses of catalytic olefin hydroformylation in CO2-expanded Liquid (CXL) media. Industrial & Engineering Chemistry Research 46(25), 8687-8692.
[126] Gong, K., Chafin, S., Pennybaker, K., Fahey, D., Subramaniam, B., 2008. Economic and environmental impact analyses of solid acid catalyzed isoparaffin/olefin alkylation in supercritical carbon dioxide. Industrial & Engineering Chemistry Research 47(23), 9072-9080.
[127] Ghanta, M., Ruddy, T., Fahey, D. R., Busch, D. H., Subramaniam, B., 2013. Is the liquid-phase H2O2-based ethylene oxide process more economical and greener than the gas-phase O2-based silver-catalyzed process. Industrial & Engineering Chemistry Research 52, 18-29.
[128] Ghanta, M., Fahey, D. R., Busch, D. H., Subramaniam, B., 2013. Comparative economic and environmental assessments of H2O2-based and tertiary butyl hydroperoxide-based propylene oxide technologies. ACS Sustainable Chemistry & Engineering 1(2), 268-277.!
[129] Peters, M. S., Timmerhaus, K. D., West, R. E., 2004. Plant Design and Economics for Chemical Engineers. 5th ed., McGraw Hill: Boston, MA.
[130] Walas, S. M., 1988. Chemical Process Equipment: Selection and Design. Butterworth Publishers: Stoneham, MA.
[131] Banker, J. G., Forrest, A. L., 1996. Titanium/steel explosion bonded clad for autoclaves and reactors. Advances in the Science and Technology of Titanium Alloy Processing, Proceedings of an International Symposium held at the 125th TMS Annual Meeting and Exhibition, Anaheim, Calif., 549-559.

! 150
![132] Donaldson, P. A., Milne, I. P., Hollins, A. M., Usher, G. W., Gardner, M. W., Ward, P.
N., 1998. Production of aromatic carboxylic acids. WO 9818749.
[133] Hsu, Y., Lin, C., 2001. Process for producing highly pure aromatic carboxylic acids. US 6245939.
[134] Parten, W. D., Ure, A. M., 1999. Dehydration of acetic acid by azeotropic distillation in the production of an aromatic acid. US 5980696.
[135] Royall, D. J., Bartlett, J. A., Fairhurst, R. G., 2001. Production of aromatic carboxylic acids and recovery of Co/Mn catalyst from ash. US 6255510.
[136] Turner, J. A., Jeffery, I. C., 1996. Effluent gas treatment. WO 9639595.
[137] Romanenko, A. V., Likholobov, V. A., Timofeeva, M. N., Hva, J. S., Seok, P. J., 2004. Catalytic composition, method for manufacturing thereof and method for the purification of terephthalic acid. US 6753290.
[138] CEPCI. “Chemical engineering plant cost index,” Chemical Engineering 2012 Oct. 64.
[139] http://apps.catalysts.basf.com/apps/eibprices/mp/ (BASF Catalysts—Metal Prices) (accessed Feb. 2013).
[140] ICIS Pricing, personal contact.
[141] Beloff, B., Lines, M., Tanzil, D., 2005. Transforming Sustainability Strategy into Action. John Wiley & Sons, Inc., Hoboken, New Jersey.
[142] Darton, R. C., 2003. Scenarios and metrics as guides to a sustainable future the case of energy supply. Trans IChemE Part B 81, 295-302.
[143] Burgess, A. A., Brennan, D. J., 2001. Application of life cycle assessment to chemical processes. Chemical Engineering Science 56, 2589-2604.
[144] Wikipedia, 2013. (http://en.wikipedia.org/wiki/Life-cycle_assessment, accessed March 2013)
[145] Huppes, G., 1996. LCA yesterday, today and tomorrow. Institute of Environmental Sciences (CML), Leiden University, Leiden, the Netherlands, 29-49.
[146] Udo de Haes, H. A., 1993. Applications of life cycle assessment: expectations, drawbacks and perspectives. Journal of Cleaner Production 1(3-4), 131-137.
[147] Voet, E. Van der, 1996. Substances from cradle to grave: development of a methodology for the analysis of substances flows through the economy and the environment of a region: with case studies on cadmium and nitrogen compounds. Leiden University, Leiden, the Netherlands, PhD Dissertation.
[148] ISO 14040, 2006. Environmental management — Life cycle assessment — Principles and framework, International Organization for Standardization, ISO, Geneva.
[149] ISO 14044, 2006. Environmental management — Life cycle assessment — Requirements and guidelines, International Organization for Standardization, ISO, Geneva.

! 151
![150] Elock, D., 2007. Life-cycle thinking for the oil and gas exploration and production
industry. Argonne National Laboratory, Argonne, IL.
[151] Sharaai, A. H., Mahmood, N. Z., Sulaiman, A. H., 2010. Life cycle impact assessment (LCIA) using TRACI methodology: an analysis of potential impact on potable water production. Australian Journal of Basic and Applied Sciences 4(9), 4313-4322.
[152] GaBi, 2012. Version 6. PE International, Germany.
[153] Bare, J. C., Hofstetter, P., Pennington, D. W., Udo de Haes, H. A., 2000. Life cycle impact assessment workshop summary: Midpoints versus endpoints: The sacrifices and benefits. Int. J. Life Cycle Assess. 5 (6), 319-326.
[154] Bare, J. C., 2002. Developing a consistent decision-making framework by using the U.S. EPA’s TRACI. US Environmental Protection Agency, Cincinnati, OH.
[155] Bare, J. C., Norris, G. A., Pennington, D. W., McKone, T., 2002. TRACI: The tool for the reduction and assessment of chemical and other environmental impacts. Journal of Industrial Ecology 6 (3-4), 49-78.
[156] Curran, M. A., 2004. The status of life-cycle assessment as an environmental management tool. Environmental Progress 23 (4) 277-283.
[157] TRI Explorer, 2013. (http://iaspub.epa.gov/triexplorer/tri_release.chemical, accessed March 2013)
[158] GHG data publication tool, 2013. (http://ghgdata.epa.gov/ghgp/main.do, accessed March 2013)
[159] Schaich, J. R., 1991. Estimate fugitive emissions from process equipment. Chemical Engineering Progress, 31-35.
[160] Siegell, J. H., 1997. Improve VOC emission predictions. Hydrocarbon Processing, 119-121.
[161] Shonnard, D., Hiew, D., 2000. Comparative environmental assessments of VOC recovery and recycle design alternatives for a gaseous waste stream. Environmental Science and Technology 34(24), 5222-5228.
[162] Fabri, J., Graeser, U., Simo, T. A., 2003. Xylenes. Ullmann’s Encyclopedia of Industrial Chemicstry, WILEY-VCH: Weinheim. 6th Edition, volume 39, 583-603.
[163] GaBi Database Content, 2013a. (http://gabi-dataset-documentation.gabi-software.com/xml_data/processes/29b2ba8c-4200-4d3c-a671-53f264b0bf2b_05.00.000.xml, accessed March 2013)
[164] Cheung, H., Tanke, R., Torrence, G. P., 2003. Acetic acid. Ullmann’s Encyclopedia of Industrial Chemicstry, WILEY-VCH: Weinheim. 6th Edition, volume 1, 149-178.
[165] GaBi Database Content, 2013b. (http://gabi-6-lci-documentation.gabi-software.com/xml-data/processes/80c0f36b-9089-4058-9940-3fa073e8bfc5.xml, accessed March 2013)

! 152
![166] GaBi Database Content, 2013c.
(http://gabi-6-lci-documentation.gabi-software.com/xml-data/processes/bdb79573-3872-4dc2-9bc7-41a4c624c37b.xml, accessed March 2013)
[167] GaBi Database Content, 2013d. (http://gabi-6-lci-documentation.gabi-software.com/xml-data/processes/300e0734-6b74-4225-a078-d64108783da3.xml, accessed March 2013)
[168] Allen, D. T., Shonnard, D. R., 2002. Green Engineering: Environmentally Conscious Design of Chemical Processes. Prentice-Hall, Inc., Upper Saddle River, NJ.
[169] Burns, D. H., Hein, J. E., Rajaendran, G. K., Verser, D. W., 2011. Continuous withdrawal from high solids slurry polymerization. EP 1554317 B1.
[170] COMSOL Multiphysics, 2013. Version 4.3b, COMSOL, Inc.: Los Angeles, CA, US.

153
Appendices
Appendix A: Numerical Data of the Experimental Solubilities
Table A1. Experimental solubilities of TPA, 4-CBA and p-TA in acetic acid or aqueous acetic acid
Solubilities of TPA in acetic acid T (°C) S (g TPA/100 g HOAc) 118.5 0.243 134.5 0.318 153.1 0.392 171.3 0.646 180.1 1.061 202.4 1.618 214.5 2.038
Solubilities of TPA in 95 wt% aqueous acetic acid T (°C) S (g TPA/100 g solvent) 117.5 0.242 137.2 0.389 149.5 0.584 171.2 0.963 187 1.406
202.7 1.968 208.5 2.219
Solubilities of 4-CBA in acetic acid T (°C) S (g 4-CBA/100 g HOAc)
112 6.238 124 10.18 148 23.09 179 45.25 196 68.71
Solubilities of p-TA in acetic acid T (°C) S (g p-TA/100 g HOAc)
79 31.45 97 63.26 112 125.6 127 261.7
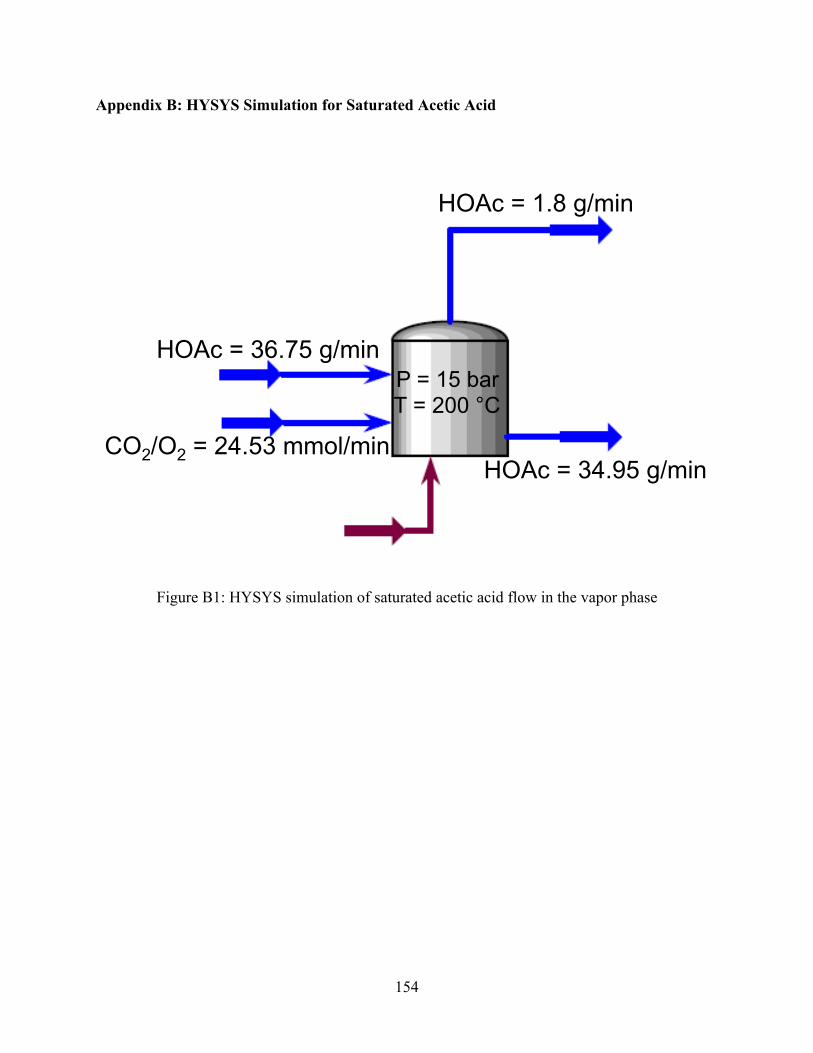
154
Appendix B: HYSYS Simulation for Saturated Acetic Acid
Figure B1: HYSYS simulation of saturated acetic acid flow in the vapor phase
HOAc = 36.75 g/min
CO2/O2 = 24.53 mmol/min
HOAc = 1.8 g/min
HOAc = 34.95 g/min
P = 15 bar T = 200 °C

15
5
App
endi
x C
: HY
SYS
Sim
ulat
ion
of M
C a
nd C
EB
C P
roce
sses
Tabl
e C
1. S
imul
atio
n pa
ram
eter
s for
the
oxid
atio
n se
ctio
n of
bot
h pr
oces
ses
Ope
ratin
g Pa
ram
eter
s M
C P
roce
ss
Spra
y Pr
oces
s C
ase
1 C
ase
2 C
ase
3 C
ase
4
Feed
ent
erin
g re
acto
r Su
bstra
te
p-
xyle
ne
Solv
ent
ac
etic
aci
d
wat
er
Cat
alys
t
coba
lt ac
etat
e
man
gane
se a
ceta
te
hy
drog
en b
rom
ide
Air
ox
ygen
nitro
gen
42,6
79 k
g/h
100,
066
kg/h
5,
486
kg/h
10
9 kg
/h
311
kg/h
86
kg/
h 45
,203
kg/
h 14
8,87
1 kg
/h
41,6
49 k
g/h
867,
142
kg/h
44
,534
kg/
h 10
9 kg
/h
311
kg/h
86
kg/
h 44
,161
kg/
h 14
5,43
0 kg
/h
41,6
48 k
g/h
598,
588
kg/h
32
,782
kg/
h 10
9 kg
/h
311
kg/h
86
kg/
h 44
,161
kg/
h 14
5,43
0 kg
/h
41,6
48 k
g/h
335,
517
kg/h
20
,548
kg/
h 10
9 kg
/h
311
kg/h
86
kg/
h 44
,161
kg/
h 14
5,43
0 kg
/h
41,6
48 k
g/h
97,8
71 k
g/h
5,37
1 kg
/h
109
kg/h
31
1 kg
/h
86 k
g/h
44,1
61 k
g/h
145,
430
kg/h
pX :
O2 (
mol
:mol
) 1:
3.5
1:3.
5 1:
3.5
1:3.
5 1:
3.5
Wat
er c
onte
nt in
solv
ent
5.2
wt%
4.
9 w
t%
5.2
wt%
5.
8 w
t%
5.2
wt%
C
atal
yst m
olar
ratio
C
o:M
n:B
r = 1
:2.9
:1.7
C
o:M
n:B
r = 1
:2.9
:1.7
Co:
Mn:
Br =
1:2
.9:1
.7
Co:
Mn:
Br =
1:2
.9:1
.7
Co:
Mn:
Br =
1:2
.9:1
.7
pX c
onc.
(mol
/kg
sol)
3.8
0.43
0.
62
1.1
3.8
Br c
onc.
(mol
/kg
sol)
0.01
0.
0012
0.
0017
0.
003
0.01
B
r:pX
(mol
:mol
) 1:
378
1:36
9 1:
369
1:36
9 1:
369
Co:
pX (m
ol:m
ol)
1:65
3 1:
637
1:63
7 1:
637
1:63
7
Solv
ent
Fr
esh
(mak
eup)
ace
tc a
cid
R
ecyc
le so
lven
t fro
m
dehy
drat
ion
colu
mn
and
mot
her
liquo
r tan
k
ac
etic
aci
d
w
ater
3,22
6 kg
/h
96,5
96 k
g/h
4,93
4 kg
/h
3,53
5 kg
/h
863,
377
kg/h
44
,456
kg/
h
2,84
5 kg
/h
595,
513
kg/h
32
,704
kg/
h
2,21
2 kg
/h
333,
075
kg/h
20
,470
kg/
h
1,51
9 kg
/h
96,1
22 k
g/h
5,29
3 kg
/h

15
6
Cat
alys
t
Fres
h (m
akeu
p) c
atal
yst
coba
lt ac
etat
e
m
anga
nese
ace
tate
hy
drog
en b
rom
idea
R
ecyc
le c
atal
yst f
rom
cat
alys
t re
cove
ry u
nitb
coba
lt ac
etat
e
m
anga
nese
ace
tate
hy
drog
en b
rom
ide
R
ecyc
le c
atal
yst f
rom
mot
her
liquo
r
co
balt
acet
ate
man
gane
se a
ceta
te
hydr
ogen
bro
mid
e
4 kg
/h
9 kg
/h
60 k
g/h
73 k
g/h
210
kg/h
0 32
kg/
h 93
kg/
h 26
kg/
h
4 kg
/h
9 kg
/h
60 k
g/h
73 k
g/h
210
kg/h
0 32
kg/
h 93
kg/
h 26
kg/
h
4 kg
/h
9 kg
/h
60 k
g/h
73 k
g/h
210
kg/h
0 32
kg/
h 93
kg/
h 26
kg/
h
4 kg
/h
9 kg
/h
60 k
g/h
73 k
g/h
210
kg/h
0 32
kg/
h 93
kg/
h 26
kg/
h
4 kg
/h
9 kg
/h
60 k
g/h
73 k
g/h
210
kg/h
0 32
kg/
h 93
kg/
h 26
kg/
h O
xida
tion
reac
tor
Pr
essu
re
Te
mpe
ratu
re
R
eact
ion
conv
ersi
on
M
ain
reac
tions
pX
+O2=
TALD
+H2O
TA
LD+0
.5O
2=p-
TA
p-TA
+O2=
4-C
BA
+H2O
4-
CB
A+0
.5O
2=TP
A
Si
de re
actio
ns
2HA
c+3.
5O2=
3CO
2+C
O+4
H2O
2H
Ac+
0.5O
2=C
O2+
H2O
+M-
acet
ate
pX+3
O2=
Ben
zoic
ac
id+C
O2+
2H2O
pX
+9.5
O2=
6CO
2+2C
O+5
H2O
pX c
onve
rsio
n
Sele
ctiv
ity to
TPA
Sele
ctiv
ity to
4-C
BA
Sele
ctiv
ity to
p-T
A
220
psia
19
4.3
°C
89.5
5%
100%
99
.44%
99
.74%
0.
016%
1.
4%
0.5%
1.
4%
98.1
%
98.8
%
0.25
4%
0.53
3%
220
psia
19
9.9
°C
98.3
5%
99.9
8%
100%
99
.99%
0.
0069
%
0.77
%
0.21
%
0.6%
99
.6%
99
.2%
0.
008%
0.
0008
%
220
psia
19
9.7
°C
98.2
3%
99.9
8%
100%
99
.99%
0.
0069
%
0.66
%
0.21
%
0.6%
99
.6%
99
.2%
0.
008%
0.
0008
%
220
psia
19
9.5
°C
97.9
6%
99.9
8%
100%
99
.99%
0.
0069
%
0.5%
0.
21%
0.
6%
99.6
%
99.2
%
0.00
8%
0.00
08%
220
psia
19
9.8
°C
97.1
3%
99.9
8%
100%
99
.99%
0.
0069
%
0.29
%
0.21
%
0.6%
99
.6%
99
.2%
0.
008%
0.
0008
%

15
7
So
lven
t eva
pora
tive
rate
ac
etic
aci
d
w
ater
acet
ic a
cid
com
bust
ion
279,
705
kg/h
13
5,39
4 kg
/h
5.3%
583,
678
kg/h
10
0,12
6 kg
/h
1.3%
564,
064
kg/h
10
9,10
8 kg
/h
1.3%
521,
235
kg/h
12
1,03
6 kg
/h
1.3%
353,
669
kg/h
14
5,90
5 kg
/h
1.3%
C
ryst
alliz
er o
pera
ting
cond
ition
s
1st-s
tage
cry
stal
lizer
Pr
essu
re
Tem
pera
ture
2nd-s
tage
cry
stal
lizer
Pr
essu
re
Tem
pera
ture
3rd-s
tage
cry
stal
lizer
Pr
essu
re
Tem
pera
ture
139
psia
18
7 °C
77
psi
a 17
0 °C
17
psi
a 11
7 °C
139
psia
18
7 °C
77
psi
a 17
0 °C
17
psi
a 11
7 °C
139
psia
18
7 °C
77
psi
a 17
0 °C
17
psi
a 11
7 °C
139
psia
18
7 °C
77
psi
a 17
0 °C
17
psi
a 11
7 °C
139
psia
18
7 °C
77
psi
a 17
0 °C
17
psi
a 11
7 °C
C
rude
TPA
c spec
ifica
tions
Cru
de T
PA p
rodu
ctio
n ra
te
4-
CB
A c
onte
nt
p-
TA c
onte
nt
64,3
05 k
g/h
1,37
3 pp
m
607
ppm
63,4
75 k
g/h
23 p
pm
2 pp
m
63,4
80 k
g/h
23 p
pm
2 pp
m
63,4
79 k
g/h
23 p
pm
2 pp
m
63,4
73 k
g/h
23 p
pm
2 pp
m
Hig
h pr
essu
re sc
rubb
erd
oper
atio
n
Pres
sure
180
psia
180
psia
180
psia
180
psia
180
psia
C
ombu
stio
n re
acto
re ope
ratin
g co
nditi
ons
Pre
ssur
e
Tem
pera
ture
Rea
ctio
n co
nver
sion
M
-ace
tate
+3.5
O2=
3CO
2+3H
2O
HA
c+2O
2=2C
O2+
2H2O
2M
eOH
+3O
2=2C
O2+
4H2O
pX
+10.
5O2=
8CO
2+5H
2O
180
psia
44
1.4
°C
100%
10
0%
100%
10
0%
180
psia
45
2.1
°C
100%
10
0%
100%
10
0%
180
psia
40
1.5
°C
100%
10
0%
100%
10
0%
180
psia
39
1.6
°C
100%
10
0%
100%
10
0%
180
psia
38
6.9
°C
100%
10
0%
100%
10
0%
a. S
ince
cob
alt a
ceta
te a
nd m
anga
nese
ace
tate
are
mos
tly re
cove
red,
hyd
roge
n br
omid
e is
the
only
sign
ifica
nt m
akeu
p ca
taly
st;

15
8
b. In
cat
alys
t rec
over
y un
it, th
e m
othe
r liq
uor a
fter c
ryst
alliz
ers
and
cent
rifug
e pa
sses
thro
ugh
a re
boile
d st
rippe
r, in
whi
ch a
lmos
t all
the
acet
ic a
cid
is v
apor
ized
, and
the
hea
vies
con
tain
ing
the
cata
lyst
s fr
om o
xida
tion
are
sent
to
an i
ncin
erat
or w
here
the
met
al
acet
ate
cata
lyst
s ar
e co
nver
ted
to m
etal
oxi
de b
y py
roly
sis.
Then
the
met
al o
xide
s ar
e co
nver
ted
to m
etal
ace
tate
tetra
hydr
ates
by
reac
tion
with
hyd
razi
ne a
nd a
cetic
aci
d;
c. T
he T
PA p
rodu
ct p
rodu
ced
from
the
spra
y pr
oces
s mee
ts th
e po
lym
er-g
rade
pro
duct
pur
ity;
d. T
he u
ncon
dens
ed v
apor
s fro
m th
e ox
idat
ion
reac
tor c
onta
in si
gnifi
cant
am
ount
of a
cetic
aci
d an
d m
ethy
l ace
tate
. A sc
rubb
er is
use
d
to s
crub
ace
tic a
cid
by c
ount
ercu
rren
t con
tact
with
a w
ater
stre
am w
hich
is fr
om th
e ov
erhe
ad s
tream
of t
he d
ehyd
ratio
n co
lum
n.
The
scru
bber
has
a b
ed o
f ca
tion
exch
ange
res
in t
hat
conv
erts
mos
t of
the
met
hyl
acet
ate
into
ace
tic a
cid
and
met
hano
l. In
sum
mar
y, th
e sc
rubb
er is
use
d to
recy
cle
acet
ic a
cid
from
oth
er V
OC
s. Th
e ac
etic
aci
d is
then
sen
t to
the
dehy
drat
ion
colu
mn
for
recy
cle
and
the
VO
Cs g
o to
off
-gas
trea
tmen
t.
e. T
he V
OC
s co
ntai
ning
met
hano
l, ac
etic
aci
d, m
ethy
l ace
tate
and
p-x
ylen
e ar
e bu
rned
in th
e ca
taly
tic c
ombu
stio
n re
acto
r, w
hich
cont
ains
a fi
xed
bed
of p
alla
dium
cat
alys
t on
an in
ert s
uppo
rt.

15
9
Tabl
e C
2. S
imul
atio
n pa
ram
eter
s for
the
hydr
ogen
atio
n se
ctio
n of
con
vent
iona
l MC
pro
cess
Hyd
roge
natio
n re
acto
ra
Pre
ssur
e
Tem
pera
ture
Rea
ctio
n:
4-C
BA
+2H
2=p-
TA+H
2O
4-C
BA
con
vers
ion
4
-CB
A:H
2 (m
ol:m
ol)
975
psia
26
7 °C
90
.2%
1:
3.6
Cry
stal
lizer
ope
ratin
g co
nditi
ons
1
st-s
tage
cry
stal
lizer
Pres
sure
Tem
pera
ture
2nd
-sta
ge c
ryst
alliz
er
Pr
essu
re
Te
mpe
ratu
re
3
rd-s
tage
cry
stal
lizer
Pres
sure
Tem
pera
ture
114
psia
17
0 °C
69
psi
a 15
0 °C
17
psi
a 10
4 °C
So
lven
t eva
pora
tor o
pera
tion
cond
ition
sb
Pre
ssur
e
Tem
pera
ture
150
psia
18
1 °C
(ove
rhea
d)
Purif
ied
TPA
spec
ifica
tions
Pur
ified
TPA
pro
duct
ion
rate
4-C
BA
con
tent
p-T
A c
onte
nt
63,4
48 k
g/h
7 pp
m
100
ppm
a. T
he h
ydro
gena
tion
reac
tion
has
a to
p (m
ain)
Pd/
C c
atal
yst b
ed a
nd a
bot
tom
(sm
alle
r) R
h/C
cat
alys
t bed
. The
inpu
t stre
am c
onta
ins
20 w
t% sl
urry
of T
PA c
ompl
etel
y di
ssol
ved
in w
ater
at 2
67 °C
.
b. T
he s
olve
nt e
vapo
rato
r is
used
to c
once
ntra
te th
e fil
trate
from
the
cent
rifug
e to
pro
duce
a h
eavy
end
stre
am c
onta
inin
g m
ainl
y TP
A
and p-
TA a
nd re
cycl
e it
back
to th
e ox
idat
ion
reac
tor w
here
the p-
TA c
an b
e co
nver
ted
to T
PA.

16
0
App
endi
x D
: Eco
nom
ic A
naly
sis
Tabl
e D
1. P
urch
ased
equ
ipm
ent c
ost e
stim
atio
n de
tails
of c
onve
ntio
nal M
C p
roce
ss
Equi
pmen
t M
ater
ial o
f co
nstru
ctio
n D
esig
n pa
ram
eter
s C
orre
latin
g eq
uatio
ns fo
r cos
t est
imat
e C
ost (
$100
0)
(yea
r)/U
tility
(hou
r)
Rem
arks
Oxi
datio
n Se
ctio
n
Oxi
datio
n re
acto
r (C
STR
)
316
SS
titan
ium
cl
addi
ng
resi
denc
e tim
e: τ
= 3
5 m
in
feed
liqu
id fl
ow ra
te: F
= 5
99.6
m
3 /h
liqui
d le
vel:
q =
70%
re
acto
r siz
e: V
= F
*τ/q
= 4
99.7
m
3
diam
eter
: D =
6.8
26 m
ra
idiu
s: R
= D
/2
leng
th: L
= 1
3.65
3 m
pr
essu
re: P
= 1
517
kPa
12
98.9
(200
2)
Ref
for c
ost
estim
atio
n m
etho
d:
[129
] A
redu
ced
fact
or to
co
nver
t the
cos
t of
titan
ium
reac
tor t
o th
e co
st o
f tita
nium
cl
addi
ng re
acto
r: 0.
6 [1
31]
The
tota
l rea
ctor
w
eigh
t inc
lude
s 15
% in
crea
se fo
r no
zzle
s, m
anho
les,
and
sadd
les
t: w
all t
hick
ness
, m
S: st
ress
, 945
00 k
Pa
E: jo
int e
ffic
ienc
y, 0
.85
C: a
llow
ance
for c
orro
sion
, 0.0
032
m
W
s: w
eigh
t of s
hell,
kg
ρ: d
ensi
ty o
f car
bon
stee
l, 78
40 k
g/m
3
W
h: w
eigh
t of t
wo
hem
isph
eric
al h
eads
, kg
W
: tot
al w
eigh
t, (W
s + W
h)*1
.15,
kg
f: co
st fa
ctor
to c
onve
rt ca
rbon
stee
l to
titan
ium
, 7.7
O
xida
tion
reac
tor
agita
tor
titan
ium
po
wer
= 5
74 k
W
estim
ate
from
a c
ost-p
ower
cha
rt 17
5 (1
976)
el
ectri
city
: 574
kw
h R
ef: [
129]
Com
bust
ion
reac
tor
316
SS
reac
tor s
ize:
V =
17.
5 m
3 m
etho
d id
entic
al to
the
oxid
atio
n re
acto
r cos
t es
timat
e 10
9.8
(200
2)
Ref
: [12
9]
diam
eter
: D =
2.2
35 m
st
ress
: 756
15 k
Pa
raid
ius:
R =
D/2
co
st fa
ctor
to c
onve
rt ca
rbon
stee
l to
316
SS:
3.3
leng
th: L
= 4
.469
m
pr
essu
re: P
= 1
241
kPa
t=PR
SE−
0.6P
+C
Ws=π
DLtρ
Wh=
2πR2 tρ
×2
Cos
t=W
×73
×W
−0.3
4×
f

16
1
So
lven
t de
hydr
atio
n co
lum
n
shel
l: 31
6 SS
tra
y: 3
16 S
S tra
y ty
pe:
valv
e
diam
eter
: D =
18.
5 ft
10
19.7
(198
4)
Ref
: [13
0]
raid
ius:
R =
D/2
le
ngth
: L =
156
ft
tray
num
ber:
N =
70
t p: w
all t
hick
ness
of t
he s
hell,
inch
pres
sure
: P =
110
.3 k
Pa
S: s
tress
, 109
563
kPa
C
: allo
wan
ce fo
r cor
rosi
on, 0
.158
in
t p: w
all t
hick
ness
at t
he b
otto
m, i
nch
W: t
otal
wei
ght,
lb
ρ: d
ensi
ty o
f 316
SS,
499
lb/ft
3
flang
ed a
nd d
ishe
d he
ads
wei
gh 3
25 lb
eac
h
Cos
t, $
in y
ear 1
984
f 1 =
2.1
, for
316
SS
f 2 =
1.4
01+0
.072
4D, f
or 3
16 S
S
f 3 =
1, f
or v
alve
tray
s
t p
=PR
SE−
0.6P
+C
Cb=
exp
7.12
3+0.
1478
lnW
()+
0.02
488
lnW
()2+
0.15
8L
/D(
)lnt b
/tp
()
⎡ ⎣⎢⎤ ⎦⎥
f 4=
2.25
/(1.
0414
)N
C t=
375.
8exp
0.17
39D
()
Cp1=
204.
9D0.
6332
L0.80
16
t b=
1.5t
p
W=π
Dt p
Lρ+
2×
325
Cos
t=f 1C
b+
Nf 2
f 3f 4C
t+
Cp1

16
2
Reb
oile
d st
rippe
r sh
ell:
316
SS
titan
ium
cl
addi
ng
tray:
316
SS
tray
type
: va
lve
diam
eter
: D =
9 ft
to
tal w
eigh
t of t
he c
olum
n is
iden
tical
to th
e di
still
atio
n co
lum
n 18
3.9
(198
4)
Ref
: [13
0]
raid
ius:
R =
D/2
st
ress
: 945
00 k
Pa
A
redu
ced
fact
or to
co
nver
t the
cos
t of
titan
ium
col
umn
to
the
cost
of t
itani
um
clad
ding
reac
tor:
0.6
[131
]
leng
th: L
= 3
8 ft
tra
y nu
mbe
r: N
= 1
4 pr
essu
re: P
= 1
72.4
kPa
C
ost,
$ in
yea
r 198
4
f 1
= 7
.7, f
or ti
tani
um
f 2
= 2
.306
+0.1
12D
, for
tita
nium
Ct,
f 3 a
nd f 4
as
for d
istil
latio
n co
lum
n
Hig
h pr
essu
re
scru
bber
shel
l: 31
6 SS
dia
met
er: D
= 7
.5 ft
co
st e
stim
atio
n ($
, 198
4) a
s fo
r the
rebo
iled
strip
per
138.
0 (1
984)
R
ef: [
130]
tray:
316
SS
raid
ius:
R =
D/2
st
ress
: 116
699
kPa
tray
type
: va
lve
leng
th: L
= 3
0 ft
f 1 =
2.1
, for
316
SS
tray
num
ber:
N =
6
f 2 =
1.4
01+0
.072
4D, f
or 3
16 S
S pr
essu
re: P
= 1
241
kPa
Rea
ctor
co
mpr
esso
r (s
tage
1)
carb
on s
teel
po
wer
: HP
= 13
455.
3 hp
=
1003
3.7
kW
23
55.9
(1
981)
/ele
ctric
ity:
1003
3.7
kwh
Ref
: [13
0]
Cos
t, k$
in y
ear 1
981
Rea
ctor
co
mpr
esso
r (s
tage
2)
carb
on s
teel
po
wer
: HP
= 13
401.
7 hp
=
9993
.64
kW
cost
as
for c
ompr
esso
r (st
age
1)
2350
.1
(198
1)/e
lect
ricity
: 99
93.6
4 kw
h
Ref
: [13
0]
Cp1=
246.
4D0.
7396
L0.70
68
Cb=
exp
6.62
9+
0.18
26ln
W(
)+0.
0229
7ln
W(
)2⎡ ⎣⎢
⎤ ⎦⎥
Cos
t=f 1C
b+
Nf 2
f 3f 4C
t+
Cp1
Cos
t=6.
49H
P(
)0.62

16
3
Oxi
datio
n re
acto
r co
nden
ser
type
: air
cool
er
shel
l: ca
rbon
st
eel
tube
: 316
SS
heat
flow
: q =
494
.9 M
Btu
/hr =
5.
22*1
08 kJ/
hr
assu
me
air i
nlet
T: 1
6 °C
, out
let
T: 5
0 °C
ΔT
log
mea
n =
89 °
C
over
all h
eat t
rans
fer c
oeff
icie
nt:
U =
250
W/m
2 K
q =
UAΔT
log
mea
n he
at e
xcha
nger
are
a: A
= 7
0132
sq
ft
13
4.7
(198
1)
Ref
: [12
9, 1
30]
Cos
t, k$
in y
ear 1
981
Cry
stal
lizer
A
co
nden
ser
type
: she
ll-an
d-tu
be
shel
l: ca
rbon
st
eel
tube
: tit
aniu
m
heat
flow
: q =
8.3
8 M
Btu
/hr =
8.
84*1
06 kJ/
hr
assu
me
wat
er in
let T
: 25
°C,
outle
t T: 4
5 °C
ΔT
log
mea
n =
69 °
C
over
all h
eat t
rans
fer c
oeff
icie
nt:
U =
500
W/m
2 K
q =
UAΔT
log
mea
n he
at e
xcha
nger
are
a: A
= 7
63 sq
ft
99
.5 (1
979)
/coo
ling
wat
er: 4
.23*
105 k
g R
ef: [
129,
130
]
Cos
t, $
in y
ear 1
979
g 1 =
1.1
81, g
2 = 0
.294
5 C
ryst
alliz
er
B
cond
ense
r
type
: she
ll-an
d-tu
be
shel
l: ca
rbon
st
eel
tube
: 316
SS
heat
flow
: q =
8.2
3 M
Btu
/hr =
8.
69*1
06 kJ/
hr
assu
me
wat
er in
let T
: 25
°C,
outle
t T: 4
5 °C
ΔT
log
mea
n =
64 °
C
over
all h
eat t
rans
fer c
oeff
icie
nt:
U =
500
W/m
2 K
q =
UAΔT
log
mea
n he
at e
xcha
nger
are
a: A
= 8
12 sq
ft
cost
as f
or c
ryst
alliz
er A
con
dens
er
g 1 =
0.8
603,
g2 =
0.2
3296
, for
316
SS
80.5
(197
9)/c
oolin
g w
ater
: 4.1
5*10
5 kg
Ref
: [12
9, 1
30]
Cos
t=24
.6(A
/100
0)0.
40
Cos
t=f d
f mf pC
b
Cb=
exp
8.82
1−0.
3086
3ln
A(
)+0.
0681
lnA
()2
⎡ ⎣⎢⎤ ⎦⎥
f d=
exp
−1.1
156+
0.09
06ln
A(
)⎡ ⎣
⎤ ⎦
f p=
exp
0.77
71+
0.04
981
lnA
()
⎡ ⎣⎤ ⎦
f m=
g 1+
g 2ln
A(
)

16
4
Cry
stal
lizer
C
co
nden
ser
type
: she
ll-an
d-tu
be
shel
l: ca
rbon
st
eel
tube
: 316
SS
heat
flow
: q =
17.
66 M
Btu
/hr =
1.
86*1
07 kJ/
hr
assu
me
wat
er in
let T
: 25
°C,
outle
t T: 4
5 °C
ΔT
log
mea
n =
46 °
C
over
all h
eat t
rans
fer c
oeff
icie
nt:
U =
500
W/m
2 K
q =
UAΔT
log
mea
n
heat
exc
hang
er a
rea:
A =
242
3 sq
ft
cost
as
for c
ryst
alliz
er B
con
dens
er
217.
8 (1
979)
/coo
ling
wat
er: 8
.91*
105 k
g R
ef: [
129,
130
]
Dis
tilla
tion
colu
mn
cond
ense
r
type
: she
ll-an
d-tu
be
shel
l: ca
rbon
st
eel
tube
: 316
SS
heat
flow
: q =
206
.4 M
Btu
/hr
heat
exc
hang
er a
rea:
A =
833
0 sq
ft
cost
as
for c
ryst
alliz
er B
con
dens
er
806.
3 (1
979)
/coo
ling
wat
er: 1
.04*
107 k
g R
ef: [
129,
130
]
Dis
tilla
tion
colu
mn
rebo
iler
type
: she
ll-an
d-tu
be
shel
l: 31
6 SS
tu
be:
titan
ium
heat
flow
: q =
165
.9 M
Btu
/hr =
1.
75*1
08 kJ/
hr
ΔT =
19
°C
over
all h
eat t
rans
fer c
oeff
icie
nt:
U =
390
0 W
/m2 K
q
= U
AΔT
he
at e
xcha
nger
are
a: A
= 7
058
sqft
cost
as
for c
ryst
alliz
er A
con
dens
er
g 1 =
1.2
012,
g2 =
0.3
311
945.
5 (1
979)
/HP
stea
m: 2
.27*
105 lb
he
at in
tegr
atio
n w
ith
oxid
atio
n re
acto
r co
nden
ser
Ref
: [12
9, 1
30]
Reb
oile
d st
rippe
r re
boile
r
type
: she
ll-an
d-tu
be
shel
l: tit
aniu
m
tube
: tit
aniu
m
heat
flow
: q =
49.
82 M
Btu
/hr =
5.
26*1
07 kJ/
hr
ΔT =
40
°C
over
all h
eat t
rans
fer c
oeff
icie
nt:
U =
110
0 W
/m2 K
q
= U
AΔT
he
at e
xcha
nger
are
a: A
= 3
546
sqft
cost
as
for c
ryst
alliz
er A
con
dens
er
g 1 =
1.5
42, g
2 = 0
.429
13 fo
r tita
nium
58
3.3
(197
9)/H
P st
eam
: 6.8
1*10
4 lb
Ref
: [12
9, 1
30]
Com
pres
sor
cool
er
type
: she
ll-an
d-tu
be
shel
l: ca
rbon
st
eel
tube
: 316
SS
heat
flow
: q =
34.
39 M
Btu
/hr =
3.
63*1
07 kJ/
hr
heat
exc
hang
er a
rea:
A =
683
0 sq
ft
cost
as
for c
ryst
alliz
er B
con
dens
er
644.
6 (1
979)
/coo
ling
wat
er: 1
.73*
106 k
g R
ef: [
129,
130
]

16
5
Off
-gas
he
ater
ty
pe: s
hell-
and-
tube
sh
ell:
carb
on
stee
l tu
be: 3
16 S
S
heat
flow
: q =
15.
07 M
Btu
/hr =
1.
59*1
07 kJ/
hr
ΔT =
91
°C
over
all h
eat t
rans
fer c
oeff
icie
nt:
U =
90
W/m
2 K
q =
UAΔT
he
at e
xcha
nger
are
a: A
= 5
802
sqft
cost
as f
or c
ryst
alliz
er B
con
dens
er
538.
4 (1
979)
/HP
stea
m: 2
.06*
104 lb
R
ef: [
129,
130
]
Ace
tic a
cid
tank
31
6 SS
ta
nk si
ze: V
= 4
0000
gal
61.6
(197
9)
Ref
: [13
0]
Cos
t, $
in y
ear 1
979
F M =
2.7
for 3
16 S
S
p-X
ylen
e ta
nk
304
SS
tank
size
: V =
100
000
gal
100.
9 (1
979)
R
ef: [
130]
Cos
t, $
in y
ear 1
979
F M
= 2
.4 fo
r 304
SS
Ace
tic a
cid
stor
age
tank
316
SS
tank
size
: V =
140
000
gal
cost
as f
or p
-xyl
ene
tank
F M
= 2
.7 fo
r 316
SS
132.
1 (1
979)
R
ef: [
130]
p-X
ylen
e st
orag
e ta
nk 31
6 SS
ta
nk si
ze: V
= 7
5000
0 ga
l co
st a
s for
ace
tic a
cid
stor
age
tank
32
7.4
(197
9)
Ref
: [13
0]
Cat
alys
t m
ixer
31
6 SS
ve
ssel
size
: V =
110
0 ga
l di
amet
er: D
= 4
.998
ft
raid
ius:
R =
D/2
le
ngth
: L =
7.4
96 ft
pr
essu
re: P
= 1
01.3
25 k
Pa
tem
pera
ture
: T =
25
°C
shel
l wei
ght:
W, l
b, a
s for
the
shel
l wei
ght o
f th
e di
still
atio
n co
lum
n 25
.4 (1
979)
R
ef: [
130]
stre
ss: 1
2173
9 kP
a
Cos
t, $
in y
ear 1
979
F M =
2.7
for 3
16 S
S
Cos
t=F M
exp
2.63
1+1.
3673
lnV
()−
0.06
309
lnV
()2
⎡ ⎣⎢⎤ ⎦⎥
Cos
t=F M
exp
11.6
62−
0.61
04ln
V(
)−0.
0453
6ln
V(
)2⎡ ⎣⎢
⎤ ⎦⎥
Cb=
exp
9.10
0−
0.28
89ln
W(
)+0.
0457
6ln
W(
)2⎡ ⎣⎢
⎤ ⎦⎥
Ca=
246D
0.73
96L0.
7068
Cos
t=F M
Cb+
Ca

16
6
Cat
alys
t m
ixer
ag
itato
r
316
SS
pow
er: H
P =
17 h
p es
timat
e fr
om a
cos
t-pow
er c
hart
15 (2
002)
/ele
ctric
ity:
12.6
8 kw
h R
ef: [
129]
Feed
mix
ta
nk
316
SS
vess
el si
ze: V
= 1
0650
gal
di
amet
er: D
= 1
0.65
ft
raid
ius:
R =
D/2
le
ngth
: L =
15.
98 ft
pr
essu
re: P
= 1
03.4
kPa
te
mpe
ratu
re: T
= 9
4 °C
cost
as f
or c
atal
yst m
ixer
st
ress
: 112
588
kPa
54.6
(197
9)
Ref
: [13
0]
Oxi
datio
n re
acto
r se
para
tor
316
SS
vess
el si
ze: V
= 1
1300
gal
di
amet
er: D
= 1
0.86
ft
raid
ius:
R =
D/2
le
ngth
: L =
16.
3 ft
pres
sure
: P =
151
7 kP
a te
mpe
ratu
re: T
= 6
6 °C
cost
as f
or c
atal
yst m
ixer
st
ress
: 116
301
kPa
126.
0 (1
979)
R
ef: [
130]
Cry
stal
lizer
A
sepa
rato
r 316
SS
vess
el si
ze: V
= 6
50 g
al
diam
eter
: D =
4.1
94 ft
ra
idiu
s: R
= D
/2
leng
th: L
= 6
.291
ft
pres
sure
: P =
958
.4 k
Pa
tem
pera
ture
: T =
52
°C
cost
as f
or c
atal
yst m
ixer
st
ress
: 118
158
kPa
28.1
(197
9)
Ref
: [13
0]
Cry
stal
lizer
B
sepa
rato
r 316
SS
vess
el si
ze: V
= 3
50 g
al
diam
eter
: D =
3.4
12 ft
ra
idiu
s: R
= D
/2
leng
th: L
= 5
.118
ft
pres
sure
: P =
530
.9 k
Pa
tem
pera
ture
: T =
52
°C
cost
as f
or c
ryst
alliz
er A
sepa
rato
r 21
.3 (1
979)
R
ef: [
130]
Cry
stal
lizer
C
sepa
rato
r 316
SS
vess
el si
ze: V
= 5
00 g
al
diam
eter
: D =
3.8
43 ft
ra
idiu
s: R
= D
/2
leng
th: L
= 5
.764
ft
pres
sure
: P =
117
.2 k
Pa
tem
pera
ture
: T =
52
°C
cost
as f
or c
ryst
alliz
er A
sepa
rato
r 20
.9 (1
979)
R
ef: [
130]

16
7
Slur
ry ta
nk
(bef
ore
cent
rifug
e) 31
6 SS
ve
ssel
siz
e: V
= 3
200
gal
diam
eter
: D =
7.1
34 ft
ra
idiu
s: R
= D
/2
leng
th: L
= 1
0.7
ft pr
essu
re: P
= 1
17.2
kPa
te
mpe
ratu
re: T
= 1
17 °
C
cost
as
for c
atal
yst m
ixer
st
ress
: 109
538
kPa
35.7
(197
9)
Ref
: [13
0]
Slur
ry ta
nk
agita
tor
316
SS
pow
er: H
P =
14 h
p es
timat
e fr
om a
cos
t-pow
er c
hart
15 (2
002)
/ele
ctric
ity:
10.4
4 kw
h R
ef: [
129]
Ace
tic a
cid
was
h ta
nk
(bef
ore
cent
rifug
e) 31
6 SS
ve
ssel
siz
e: V
= 4
50 g
al
diam
eter
: D =
3.7
1 ft
raid
ius:
R =
D/2
le
ngth
: L =
5.5
65 ft
pr
essu
re: P
= 1
10.3
kPa
te
mpe
ratu
re: T
= 1
19 °
C
cost
as
for c
atal
yst m
ixer
st
ress
: 109
272
kPa
20.4
(197
9)
Ref
: [13
0]
Mot
her
liquo
r tan
k (a
fter
cent
rifug
e) 31
6 SS
ve
ssel
siz
e: V
= 2
450
gal
diam
eter
: D =
6.5
27 ft
ra
idiu
s: R
= D
/2
leng
th: L
= 9
.79
ft pr
essu
re: P
= 1
17.2
kPa
te
mpe
ratu
re: T
= 1
17 °
C
cost
as
for c
atal
yst m
ixer
st
ress
: 109
538
kPa
32.7
(197
9)
Ref
: [13
0]
Cry
stal
lizer
A
31
6 SS
tit
aniu
m
clad
ding
crys
talli
zer s
ize:
V =
400
00 g
al =
54
37 c
uft
11
15.6
(197
5)
Ref
: [13
0]
A re
duce
d fa
ctor
to
conv
ert t
he c
ost o
f tit
aniu
m
crys
talli
zer t
o th
e co
st o
f tita
nium
cl
addi
ng
crys
talli
zer:
0.6
[130
]
Cos
t, k$
in y
ear 1
975
f = 4
.0 fo
r tita
nium
Cry
stal
lizer
A
agi
tato
r 31
6 SS
po
wer
: HP
= 45
hp
estim
ate
from
a c
ost-p
ower
cha
rt/el
ectri
city
: 33
.56
kwh
15 (2
002)
/ele
ctric
ity:
33.5
6 kw
h R
ef: [
129]
Cry
stal
lizer
B
31
6 SS
cr
ysta
llize
r siz
e: V
= 3
2000
gal
=
4278
cuf
t co
st a
s fo
r cry
stal
lizer
A
f = 2
.0 fo
r SS
316
830.
6 (1
975)
R
ef: [
130]
Cry
stal
lizer
B
agi
tato
r 31
6 SS
po
wer
: HP
= 45
hp
estim
ate
from
a c
ost-p
ower
cha
rt/el
ectri
city
: 33
.56
kwh
15 (2
002)
/ele
ctric
ity:
33.5
6 kw
h R
ef: [
130]
Cos
t=8.
16fV
0.47

16
8
Cry
stal
lizer
C
31
6 SS
cr
ysta
llize
r siz
e: V
= 3
2000
gal
=
4278
cuf
t co
st a
s for
cry
stal
lizer
B
830.
6 (1
975)
R
ef: [
130]
Cry
stal
lizer
C
agi
tato
r 31
6 SS
po
wer
: HP
= 45
hp
estim
ate
from
a c
ost-p
ower
cha
rt/el
ectri
city
: 33
.56
kwh
15 (2
002)
/ele
ctric
ity:
33.5
6 kw
h R
ef: [
129]
Cen
trifu
ge 3
16 S
S so
lid fl
ow ra
te: W
= 7
3 to
ns/h
r so
lid
pow
er: H
P =
260
hp
46
7.4
(197
5)/e
lect
ricity
: 19
3.9
kwh
Ref
: [13
0]
Cos
t, k$
in y
ear 1
975
a =
98, b
= 5
.06,
for 3
16 S
S C
rude
TPA
dr
yer
316
SS
surf
ace
area
: A =
910
0 sq
ft
868.
8 (1
975)
R
ef: [
130]
Cos
t, k$
in y
ear 1
975
F =
2.0
for 3
16 S
S C
rude
TPA
st
rora
ge b
in 30
4 SS
bi
n si
ze: V
= 3
0000
cuf
t =
2244
30 g
al
cost
as f
or p
-xyl
ene
tank
14
7.7
(197
9)
Ref
: [13
0]
Off
-gas
ex
pand
er
carb
on st
eel
pow
er: H
P =
1359
0 hp
690.
7 (1
981)
/ele
ctric
ity:
9633
kw
h
Ref
: [13
0]
Cos
t, k$
in y
ear 1
981
Ace
tic a
cid
pum
p ty
pe: o
ne-
stag
e, 3
550
rpm
, HSC
31
6 SS
flow
rate
: Q =
3.0
43 m
3 /h =
13.
4 ga
l/min
he
ad: H
= 6
0 m
= 1
96.8
ft
pow
er: H
P =
3.17
*10-3
hp
4.
9 (1
979)
R
ef: [
130]
Cos
t, $
in y
ear 1
979
F M =
1.1
5 fo
r 316
SS
p-
Xyl
ene
pum
p ty
pe: o
ne-
stag
e, 3
550
rpm
, HSC
31
6 SS
flow
rate
: Q =
49.
73 m
3 /h =
219
ga
l/min
he
ad: H
= 6
0 m
= 1
96.8
ft
pow
er: H
P =
5.18
*10-2
hp
cost
as f
or a
cetic
aci
d pu
mp
5.2
(197
9)
Ref
: [13
0]
Cos
t=a+
bW
Cos
t=1.
83FA
0.60
Cos
t=0.
31H
P(
)0.81
F T=
exp
0.06
32+
0.27
44ln
QH
()−0
.025
3ln
QH
()2
⎡ ⎣⎢⎤ ⎦⎥
Cb=
1.55
exp
8.83
3−0.
6019
lnQ
H(
)+0.0
519
lnQ
H(
)2⎡ ⎣⎢
⎤ ⎦⎥
Cos
t=F M
F TC
b

16
9
Feed
pum
p ty
pe: o
ne-
stag
e, 3
550
rpm
, HSC
tit
aniu
m
flow
rate
: Q =
149
.1 m
3 /h =
656
.5
gal/m
in
head
: H =
60
m =
196
.8 ft
po
wer
: HP
= 10
4.8
hp
cost
as
for a
cetic
aci
d pu
mp
F M =
9.7
0 fo
r tita
nium
50
.7
(197
9)/e
lect
ricity
: 78
.13
kwh
Ref
: [13
0]
Pd
com
bust
ion
cata
lyst
Pd-C
cat
alys
t siz
e: 1
50 c
uft
75
4.0
(201
2)
Ref
: [13
9]
Pd u
nit p
rice:
$75
8 pe
r tro
y ou
nce
Hyd
roge
natio
n se
ctio
n
H
ydro
gena
tio
n re
acto
r 31
6 SS
re
acto
r siz
e: V
= 6
8.9
m3
diam
eter
: D =
3.5
27 m
ra
idiu
s: R
= D
/2
leng
th: L
= 7
.053
m
pres
sure
: P =
672
2 kP
a te
mpe
ratu
re: T
= 2
67.2
°C
cost
est
imat
ion
as fo
r oxi
datio
n re
acto
r st
ress
: 896
31 k
Pa
cost
fact
or to
con
vert
carb
on s
teel
to 3
16 S
S:
3.3
700.
6 (2
002)
R
ef: [
129]
Pd
hydr
ogen
ati
on c
atal
yst
Pd-C
cat
alys
t siz
e: 1
800
cuft
90
47 (2
012)
R
ef: [
139]
in
itial
cha
rge:
804
34 lb
(Pd-
C c
atal
yst b
ed)
Pd =
0.9
3 w
t%
R
h hy
drog
enat
ion
cat
alys
t
Rh-
C c
atal
yst s
ize:
200
cuf
t
504.
9 (2
012)
R
ef: [
139]
R
h un
it pr
ice:
$1
250
per t
roy
ounc
e
initi
al c
harg
e: 1
7427
lb (R
h-C
cat
alys
t bed
)
Solv
ent
evap
orat
or sh
ell:
316
SS
tray:
316
SS
tray
type
: va
lve
diam
eter
: D =
7.5
ft
raid
ius:
R =
D/2
le
ngth
: L =
25
ft tra
y nu
mbe
r: N
= 7
pr
essu
re: P
= 1
034
kPa
Cos
t est
imat
ion
as fo
r sol
vent
deh
ydra
tion
colu
mn
stre
ss: 1
0051
9 kP
a
190.
0 (1
984)
R
ef: [
130]
TPA
slu
rry
heat
er
(bef
ore
ente
ring
diss
olve
r)
type
: she
ll-an
d-tu
be
shel
l: ca
rbon
st
eel
tube
: 316
SS
heat
flow
: q =
124
.2 M
Btu
/hr =
1.
31*1
08 kJ/
hr
ΔT =
105
.4 °
C
over
all h
eat t
rans
fer c
oeff
icie
nt:
U =
650
W/m
2 K
q =
UAΔT
he
at e
xcha
nger
are
a: A
= 5
714
sqft
cost
est
imat
ion
as fo
r off
-gas
hea
ter
529.
6 (1
979)
/HP
stea
m: 1
.70*
105 lb
R
ef: [
129,
130
]

17
0
Cry
stal
lizer
A
co
nden
ser
type
: she
ll-an
d-tu
be
shel
l: ca
rbon
st
eel
tube
: 316
SS
heat
flow
: q =
173
.5 M
Btu
/hr =
1.
83*1
08 kJ/
hr
assu
me
wat
er in
let T
: 25
°C,
outle
t T: 4
5 °C
ΔT
log
mea
n =
64 °
C
over
all h
eat t
rans
fer c
oeff
icie
nt:
U =
135
0 W
/m2 K
q
= U
AΔT
log
mea
n
heat
exc
hang
er a
rea:
A =
633
5 sq
ft
cost
est
imat
ion
as fo
r TPA
slu
rry
heat
er
593.
0 (1
979)
/coo
ling
wat
er: 8
.75*
106 k
g R
ef: [
129,
130
]
Cry
stal
lizer
B
co
nden
ser
type
: she
ll-an
d-tu
be
shel
l: ca
rbon
st
eel
tube
: 316
SS
heat
flow
: q =
20.
32 M
Btu
/hr =
2.
143*
107 k
J/hr
as
sum
e w
ater
inle
t T: 2
5 °C
, ou
tlet T
: 45
°C
ΔTlo
g m
ean =
57.4
°C
ov
eral
l hea
t tra
nsfe
r coe
ffic
ient
: U
= 1
350
W/m
2 K
q =
UAΔT
log
mea
n
heat
exc
hang
er a
rea:
A =
826
sqf
t cost
est
imat
ion
as fo
r cry
stal
lizer
A
cond
ense
r 81
.7 (1
979)
/coo
ling
wat
er: 1
.02*
106 k
g R
ef: [
129,
130
]
Cry
stal
lizer
C
co
nden
ser
type
: she
ll-an
d-tu
be
shel
l: ca
rbon
st
eel
tube
: 316
SS
heat
flow
: q =
26.
99 M
Btu
/hr =
2.
848*
107 k
J/hr
as
sum
e w
ater
inle
t T: 2
5 °C
, ou
tlet T
: 45
°C
ΔTlo
g m
ean =
40.9
°C
ov
eral
l hea
t tra
nsfe
r coe
ffic
ient
: U
= 1
350
W/m
2 K
q =
UAΔT
log
mea
n he
at e
xcha
nger
are
a: A
= 1
540
sqft
cost
est
imat
ion
as fo
r cry
stal
lizer
A
cond
ense
r 14
1.5
(197
9)/c
oolin
g w
ater
: 1.3
6*10
6 kg
Ref
: [12
9, 1
30]
Was
h w
ater
he
ater
ty
pe: s
hell-
and-
tube
sh
ell:
316
SS
tube
: 316
SS
heat
flow
: q =
31.
15 M
Btu
/hr
heat
exc
hang
er a
rea:
A =
117
0 sq
ft
cost
est
imat
ion
as fo
r cry
stal
lizer
A
cond
ense
r 11
0.4
(197
9)/H
P st
eam
: 4.2
6*10
4 lb
Ref
: [12
9, 1
30]

17
1
Rec
ycle
w
ater
co
oler
type
: she
ll-an
d-tu
be
shel
l: ca
rbon
st
eel
tube
: 316
SS
heat
flow
: q =
38.
39 M
Btu
/hr
heat
exc
hang
er a
rea:
A =
228
0 sq
ft
cost
est
imat
ion
as fo
r cry
stal
lizer
A
cond
ense
r 20
5.2
(197
9)/c
oolin
g w
ater
: 1.9
4*10
6 kg
Ref
: [12
9, 1
30]
Was
tew
ater
co
oler
ty
pe: s
hell-
and-
tube
sh
ell:
carb
on
stee
l tu
be: 3
16 S
S
heat
flow
: q =
54.
51 M
Btu
/hr
heat
exc
hang
er a
rea:
A =
187
0 sq
ft
cost
est
imat
ion
as fo
r cry
stal
lizer
A
cond
ense
r 16
9.7
(197
9)/c
oolin
g w
ater
: 2.7
5*10
6 kg
Ref
: [12
9, 1
30]
Solv
ent
evap
orat
or
rebo
iler
type
: she
ll-an
d-tu
be
shel
l: ca
rbon
st
eel
tube
: tit
aniu
m
heat
flow
: q =
157
.1 M
Btu
/hr =
1.
657*
108 k
J/hr
ΔT
= 3
4.9
°C
over
all h
eat t
rans
fer c
oeff
icie
nt:
U =
215
0 W
/m2 K
q
= U
AΔT
he
at e
xcha
nger
are
a: A
= 6
599
sqft
cost
est
imat
ion
as fo
r cry
stal
lizer
A
cond
ense
r g 1
= 1
.181
, g2 =
0.2
945
804.
3 (1
979)
/HP
stea
m: 2
.15*
105 lb
R
ef: [
129,
130
]
Wat
er ta
nk 3
04 S
S ta
nk s
ize:
V =
230
000
gal
cost
est
imat
ion
as fo
r p-x
ylen
e ta
nk
149.
5 (1
979)
R
ef: [
130]
Fe
ed s
lurr
y ve
ssel
31
6 SS
ve
ssel
siz
e: V
= 1
2350
gal
di
amet
er: D
= 1
1.19
ft
raid
ius:
R =
D/2
le
ngth
: L =
16.
79 ft
pr
essu
re: P
= 1
01.3
25 k
Pa
tem
pera
ture
: T =
25
°C
cost
as
for c
atal
yst m
ixer
st
ress
: 121
739
kPa
57.3
(197
9)
Ref
: [12
9]
Feed
slu
rry
vess
el
agita
tor
316
SS
pow
er: H
P =
37 h
p es
timat
e fr
om a
cos
t-pow
er c
hart
15 (2
002)
/ele
ctric
ity:
27.5
9 kw
h R
ef: [
129]
Dis
solv
er
316
SS
vess
el s
ize:
V =
374
50 g
al
diam
eter
: D =
16.
2 ft
raid
ius:
R =
D/2
le
ngth
: L =
24.
3 ft
pres
sure
: P =
630
9 kP
a te
mpe
ratu
re: T
= 2
67 °
C
cost
as
for c
atal
yst m
ixer
st
ress
: 896
44 k
Pa
1025
.1 (1
979)
R
ef: [
130]

17
2
Dis
solv
er
agita
tor
316
SS
pow
er: H
P =
91 h
p es
timat
e fr
om a
cos
t-pow
er c
hart
15 (2
002)
/ele
ctric
ity:
67.8
6 kw
h R
ef: [
129]
Cry
stal
lizer
A
sep
arat
or 31
6 SS
ve
ssel
siz
e: V
= 1
700
gal
diam
eter
: D =
5.7
78 ft
ra
idiu
s: R
= D
/2
leng
th: L
= 8
.667
ft
pres
sure
: P =
786
kPa
te
mpe
ratu
re: T
= 5
2 °C
cost
as
for c
atal
yst m
ixer
st
ress
: 118
158
kPa
38.2
(197
9)
Ref
: [13
0]
Cry
stal
lizer
B
sep
arat
or 31
6 SS
ve
ssel
siz
e: V
= 2
00 g
al
diam
eter
: D =
2.8
31 ft
ra
idiu
s: R
= D
/2
leng
th: L
= 4
.247
ft
pres
sure
: P =
475
.7 k
Pa
tem
pera
ture
: T =
52
°C
cost
as
for c
atal
yst m
ixer
st
ress
: 118
158
kPa
18.4
(197
9)
Ref
: [13
0]
Cry
stal
lizer
C
sep
arat
or 31
6 SS
ve
ssel
siz
e: V
= 3
00 g
al
diam
eter
: D =
3.2
41 ft
ra
idiu
s: R
= D
/2
leng
th: L
= 4
.861
ft
pres
sure
: P =
117
.2 k
Pa
tem
pera
ture
: T =
52
°C
cost
as
for c
atal
yst m
ixer
st
ress
: 118
158
kPa
18.7
(197
9)
Ref
: [13
0]
Cen
trifu
ge
tank
31
6 SS
ve
ssel
siz
e: V
= 1
1400
gal
di
amet
er: D
= 1
0.9
ft ra
idiu
s: R
= D
/2
leng
th: L
= 1
6.34
ft
pres
sure
: P =
475
.7 k
Pa
tem
pera
ture
: T =
150
°C
cost
as
for c
atal
yst m
ixer
st
ress
: 105
161
kPa
80.3
(197
9)
Ref
: [13
0]
Cen
trifu
ge
tank
ag
itato
r
316
SS
pow
er: H
P =
30 h
p es
timat
e fr
om a
cos
t-pow
er c
hart
15 (2
002)
/ele
ctric
ity:
22.3
7 kw
h R
ef: [
129]
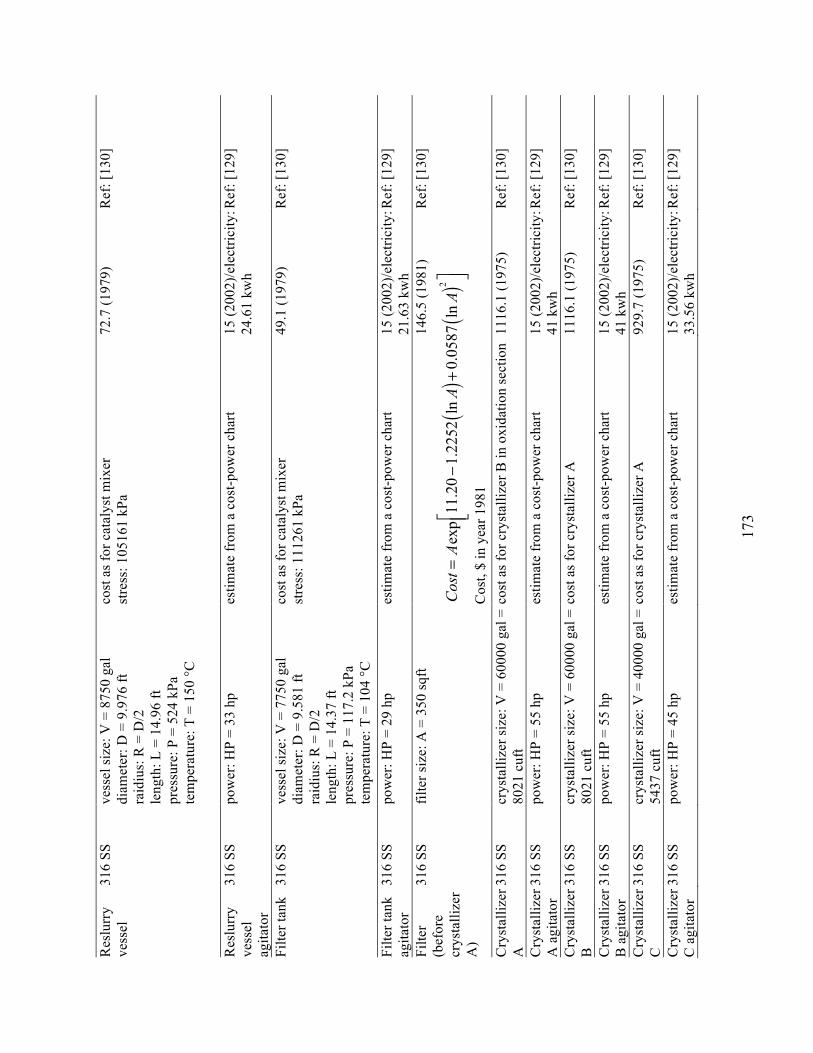
17
3
Res
lurr
y ve
ssel
31
6 SS
ve
ssel
siz
e: V
= 8
750
gal
diam
eter
: D =
9.9
76 ft
ra
idiu
s: R
= D
/2
leng
th: L
= 1
4.96
ft
pres
sure
: P =
524
kPa
te
mpe
ratu
re: T
= 1
50 °
C
cost
as
for c
atal
yst m
ixer
st
ress
: 105
161
kPa
72.7
(197
9)
Ref
: [13
0]
Res
lurr
y ve
ssel
ag
itato
r
316
SS
pow
er: H
P =
33 h
p es
timat
e fr
om a
cos
t-pow
er c
hart
15 (2
002)
/ele
ctric
ity:
24.6
1 kw
h R
ef: [
129]
Filte
r tan
k 31
6 SS
ve
ssel
siz
e: V
= 7
750
gal
diam
eter
: D =
9.5
81 ft
ra
idiu
s: R
= D
/2
leng
th: L
= 1
4.37
ft
pres
sure
: P =
117
.2 k
Pa
tem
pera
ture
: T =
104
°C
cost
as
for c
atal
yst m
ixer
st
ress
: 111
261
kPa
49.1
(197
9)
Ref
: [13
0]
Filte
r tan
k ag
itato
r 31
6 SS
po
wer
: HP
= 29
hp
estim
ate
from
a c
ost-p
ower
cha
rt 15
(200
2)/e
lect
ricity
: 21
.63
kwh
Ref
: [12
9]
Filte
r (b
efor
e cr
ysta
llize
r A
)
316
SS
filte
r siz
e: A
= 3
50 s
qft
14
6.5
(198
1)
Ref
: [13
0]
Cos
t, $
in y
ear 1
981
C
ryst
alliz
er
A
316
SS
crys
talli
zer s
ize:
V =
600
00 g
al =
80
21 c
uft
cost
as
for c
ryst
alliz
er B
in o
xida
tion
sect
ion
1116
.1 (1
975)
R
ef: [
130]
Cry
stal
lizer
A
agi
tato
r 31
6 SS
po
wer
: HP
= 55
hp
estim
ate
from
a c
ost-p
ower
cha
rt 15
(200
2)/e
lect
ricity
: 41
kw
h R
ef: [
129]
Cry
stal
lizer
B
31
6 SS
cr
ysta
llize
r siz
e: V
= 6
0000
gal
=
8021
cuf
t co
st a
s fo
r cry
stal
lizer
A
1116
.1 (1
975)
R
ef: [
130]
Cry
stal
lizer
B
agi
tato
r 31
6 SS
po
wer
: HP
= 55
hp
estim
ate
from
a c
ost-p
ower
cha
rt 15
(200
2)/e
lect
ricity
: 41
kw
h R
ef: [
129]
Cry
stal
lizer
C
31
6 SS
cr
ysta
llize
r siz
e: V
= 4
0000
gal
=
5437
cuf
t co
st a
s fo
r cry
stal
lizer
A
929.
7 (1
975)
R
ef: [
130]
Cry
stal
lizer
C
agi
tato
r 31
6 SS
po
wer
: HP
= 45
hp
estim
ate
from
a c
ost-p
ower
cha
rt 15
(200
2)/e
lect
ricity
: 33
.56
kwh
Ref
: [12
9]
Cos
t=A
exp
11.2
0−
1.22
52ln
A(
)+0.
0587
lnA
()2
⎡ ⎣⎢⎤ ⎦⎥

17
4
Cen
trifu
ge 3
16 S
S so
lid fl
ow ra
te: W
= 7
0 to
ns/h
r so
lid
pow
er: H
P =
260
hp
cost
est
imat
ing
as fo
r cen
trifu
ge in
oxi
datio
n se
ctio
n 45
2.2
(197
5)/e
lect
ricity
: 19
3.9
kwh
Ref
: [13
0]
Rot
ary
vacu
um
filte
r
po
wer
: HP
=45
hp
cost
est
imat
e id
entic
al to
the
filte
r bef
ore
crys
talli
zer A
14
6.5
(198
1)/e
lect
ricity
: 33
.56
kwh
Ref
: [13
0]
Purif
ied
TPA
dry
er
316
SS
surf
ace
area
: A =
910
0 sq
ft co
st e
stim
ate
iden
tical
to c
rude
TPA
dry
er in
ox
idat
ion
sect
ion
868.
8 (1
975)
R
ef: [
130]
Purif
ied
TPA
st
rora
ge b
in 31
6 SS
bi
n si
ze: V
= 2
3000
cuf
t =
1720
63 g
al
cost
as
for c
rude
TPA
sto
rage
bin
F M
= 2
.7 fo
r 316
SS
145.
7 (1
979)
R
ef: [
130]
Cru
de T
PA
pum
p ty
pe: o
ne-
stag
e, 3
550
rpm
, HSC
tit
aniu
m
flow
rate
: Q =
295
.3 m
3 /h =
130
0 ga
l/min
he
ad: H
= 6
0 m
= 1
96.8
ft
pow
er: H
P =
136.
8 hp
cost
as
for f
eed
pum
p in
oxi
datio
n se
ctio
n 57
.2
(197
9)/e
lect
ricity
: 10
2 kw
h
Ref
: [13
0]
TPA
slu
rry
pum
p ty
pe: o
ne-
stag
e, 3
550
rpm
, HSC
tit
aniu
m
flow
rate
: Q =
370
m3 /h
= 1
629
gal/m
in
head
: H =
60
m =
196
.8 ft
po
wer
: HP
= 96
9.3
hp
cost
as
for f
eed
pum
p in
oxi
datio
n se
ctio
n 59
.8
(197
9)/e
lect
ricity
: 72
2.8
kwh
Ref
: [13
0]
Hyd
roge
nat
ion
feed
pu
mp
type
: one
-st
age,
355
0 rp
m, H
SC
titan
ium
flow
rate
: Q =
424
.8 m
3 /h =
187
0 ga
l/min
he
ad: H
= 6
0 m
= 1
96.8
ft
pow
er: H
P =
87.3
hp
cost
as
for f
eed
pum
p in
oxi
datio
n se
ctio
n 61
.6
(197
9)/e
lect
ricity
: 65
.11
kwh
Ref
: [13
0]
Solv
ent
evap
orat
or
pum
p
type
: one
-st
age,
355
0 rp
m, H
SC
titan
ium
flow
rate
: Q =
88.
82 m
3 /h =
391
ga
l/min
he
ad: H
= 6
0 m
= 1
96.8
ft
pow
er: H
P =
23.4
hp
cost
as
for f
eed
pum
p in
oxi
datio
n se
ctio
n 47
.0
(197
9)/e
lect
ricity
: 17
.45
kwh
Ref
: [13
0]

17
5
Tabl
e D
2. P
urch
ased
equ
ipm
ent c
ost e
stim
atio
n de
tails
of C
EBC
spra
y pr
oces
s
Equi
pmen
t D
esig
n pa
ram
eter
s C
ase
1 C
ase
2 C
ase
3 C
ase
4 O
xida
tion
reac
tor
(spr
ay)
nozz
le: t
itani
um
spra
y ra
te fo
r eac
h no
zzle
: Q =
5 L
/min
resi
denc
e tim
e: τ
= 1
0 m
in
feed
liqu
id fl
ow ra
te th
roug
h th
e no
zzle
(F1)
11
72 m
3 /h
829.
8 m
3 /h
493.
8 m
3 /h
185.
1 m
3 /h
recy
cle
solv
ent f
low
rate
(F2)
71
7.6
m3 /h
70
5.2
m3 /h
67
1.2
m3 /h
51
5.7
m3 /h
to
tal f
eed
liqui
d flo
w ra
te (F
= F
1 + F
2)
1889
.6 m
3 /h
1535
m3 /h
11
65 m
3 /h
700.
8 m
3 /h
liqui
d le
vel:
q =
70%
re
acto
r siz
e: V
= F
*τ/q
44
9.9
m3
365.
5 m
3 27
7.4
m3
166.
9 m
3
diam
eter
: D
6.59
2 m
6.
151
m
5.61
0 m
4.
736
m
raid
ius:
R =
D/2
le
ngth
: L
13.1
8 m
12
.30
m
11.2
2 m
9.
473
m
pres
sure
: P =
151
7 kP
a
st
ress
: S =
945
00 k
Pa
nozz
le n
umbe
r: F 1
/Q
3907
27
66
1646
61
7 no
zzle
uni
t cos
t: $1
50 e
ach
(ven
dor)
re
acto
r cos
t ($1
000)
(yea
r)
1213
.3 (2
002)
10
60.2
(200
2)
886.
7 (2
002)
63
8.4
(200
2)
nozz
le c
ost (
$100
0) (y
ear)
58
6.1
(201
2)
414.
9 (2
012)
24
6.9
(201
2)
92.6
(201
2)
Com
bust
ion
reac
tor
iden
tical
to c
ombu
stio
n re
acto
r in
oxid
atio
n se
ctio
n 10
9.8
(200
2)
Solv
ent d
ehyd
ratio
n co
lum
n va
por p
hase
flow
rate
73
.32
m3 /h
63
.89
m3 /h
49
.66
m3 /h
22
.96
m3 /h
di
amet
er: D
26
.88
ft 25
.09
ft 22
.12
ft 15
.04
ft le
ngth
: L =
156
ft
tray
num
ber:
N =
70
pres
sure
: P =
110
.3 k
Pa
colu
mn
cost
($10
00) (
year
)
2240
.8 (1
984)
18
23.0
(198
4)
1356
.5 (1
984)
83
2.8
(198
4)
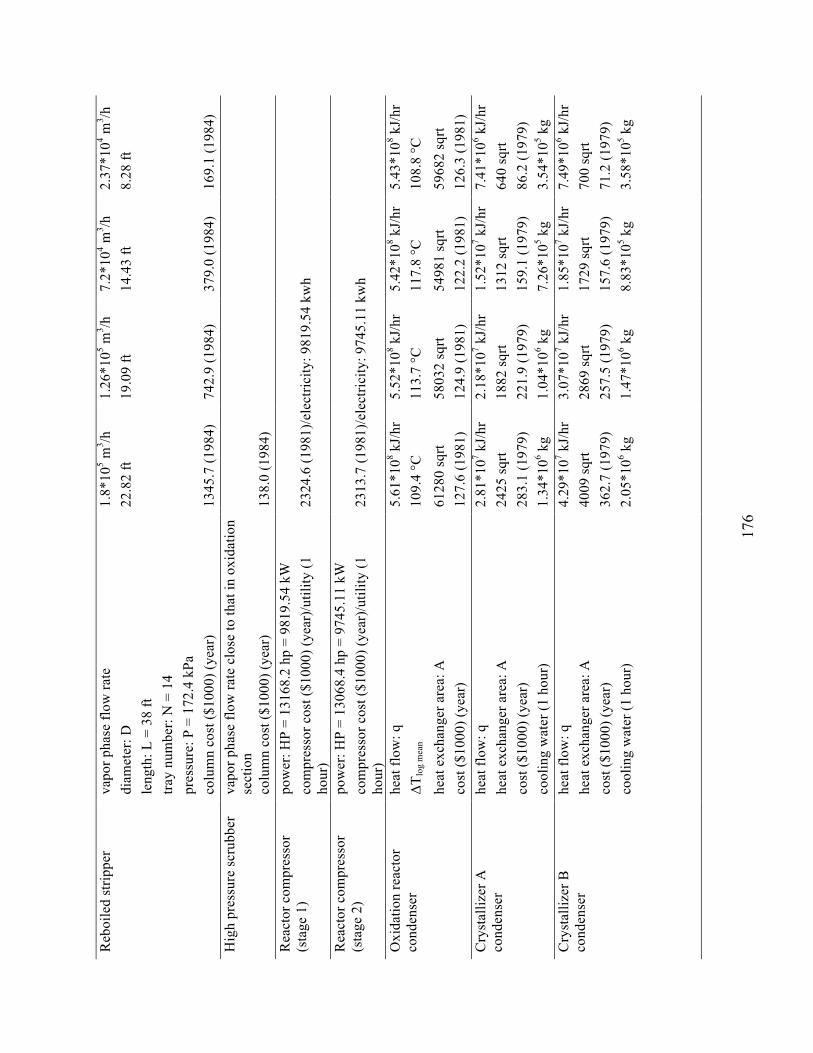
17
6
Reb
oile
d st
rippe
r va
por p
hase
flow
rate
1.
8*10
5 m3 /h
1.
26*1
05 m3 /h
7.
2*10
4 m3 /h
2.
37*1
04 m3 /h
di
amet
er: D
22
.82
ft 19
.09
ft 14
.43
ft 8.
28 ft
le
ngth
: L =
38
ft
tra
y nu
mbe
r: N
= 1
4
pr
essu
re: P
= 1
72.4
kPa
co
lum
n co
st ($
1000
) (ye
ar)
1345
.7 (1
984)
74
2.9
(198
4)
379.
0 (1
984)
16
9.1
(198
4)
Hig
h pr
essu
re sc
rubb
er
vapo
r pha
se fl
ow ra
te c
lose
to th
at in
oxi
datio
n se
ctio
n
colu
mn
cost
($10
00) (
year
) 13
8.0
(198
4)
R
eact
or c
ompr
esso
r (s
tage
1)
pow
er: H
P =
1316
8.2
hp =
981
9.54
kW
com
pres
sor c
ost (
$100
0) (y
ear)
/util
ity (1
ho
ur)
2324
.6 (1
981)
/ele
ctric
ity: 9
819.
54 k
wh
Rea
ctor
com
pres
sor
(sta
ge 2
) po
wer
: HP
= 13
068.
4 hp
= 9
745.
11 k
W
co
mpr
esso
r cos
t ($1
000)
(yea
r)/u
tility
(1
hour
) 23
13.7
(198
1)/e
lect
ricity
: 974
5.11
kw
h
Oxi
datio
n re
acto
r co
nden
ser
heat
flow
: q
5.61
*108 k
J/hr
5.
52*1
08 kJ/
hr
5.42
*108 k
J/hr
5.
43*1
08 kJ/
hr
ΔTlo
g m
ean
10
9.4
°C
113.
7 °C
11
7.8
°C
108.
8 °C
he
at e
xcha
nger
are
a: A
61
280
sqrt
5803
2 sq
rt 54
981
sqrt
5968
2 sq
rt co
st ($
1000
) (ye
ar)
127.
6 (1
981)
12
4.9
(198
1)
122.
2 (1
981)
12
6.3
(198
1)
Cry
stal
lizer
A
cond
ense
r he
at fl
ow: q
2.
81*1
07 kJ/
hr
2.18
*107 k
J/hr
1.
52*1
07 kJ/
hr
7.41
*106 k
J/hr
he
at e
xcha
nger
are
a: A
24
25 sq
rt 18
82 sq
rt 13
12 sq
rt 64
0 sq
rt co
st ($
1000
) (ye
ar)
283.
1 (1
979)
22
1.9
(197
9)
159.
1 (1
979)
86
.2 (1
979)
co
olin
g w
ater
(1 h
our)
1.
34*1
06 kg
1.04
*106 k
g 7.
26*1
05 kg
3.54
*105 k
g C
ryst
alliz
er B
co
nden
ser
heat
flow
: q
4.29
*107 k
J/hr
3.
07*1
07 kJ/
hr
1.85
*107 k
J/hr
7.
49*1
06 kJ/
hr
heat
exc
hang
er a
rea:
A
4009
sqrt
2869
sqrt
1729
sqrt
700
sqrt
cost
($10
00) (
year
) 36
2.7
(197
9)
257.
5 (1
979)
15
7.6
(197
9)
71.2
(197
9)
cool
ing
wat
er (1
hou
r)
2.05
*106 k
g 1.
47*1
06 kg
8.83
*105 k
g 3.
58*1
05 kg
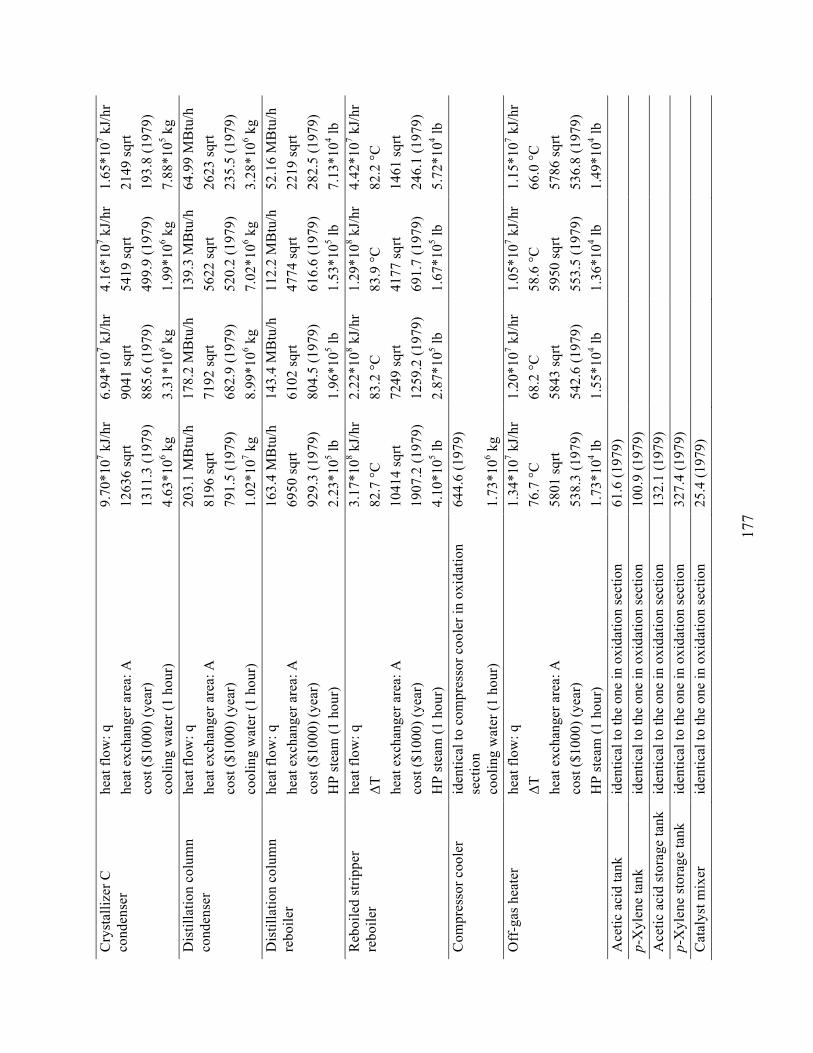
17
7
Cry
stal
lizer
C
cond
ense
r he
at fl
ow: q
9.
70*1
07 kJ/
hr
6.94
*107 k
J/hr
4.
16*1
07 kJ/
hr
1.65
*107 k
J/hr
he
at e
xcha
nger
are
a: A
12
636
sqrt
9041
sqrt
5419
sqrt
2149
sqrt
cost
($10
00) (
year
) 13
11.3
(197
9)
885.
6 (1
979)
49
9.9
(197
9)
193.
8 (1
979)
co
olin
g w
ater
(1 h
our)
4.
63*1
06 kg
3.31
*106 k
g 1.
99*1
06 kg
7.88
*105 k
g D
istil
latio
n co
lum
n co
nden
ser
heat
flow
: q
203.
1 M
Btu
/h
178.
2 M
Btu
/h
139.
3 M
Btu
/h
64.9
9 M
Btu
/h
heat
exc
hang
er a
rea:
A
8196
sqrt
7192
sqrt
5622
sqrt
2623
sqrt
cost
($10
00) (
year
) 79
1.5
(197
9)
682.
9 (1
979)
52
0.2
(197
9)
235.
5 (1
979)
co
olin
g w
ater
(1 h
our)
1.
02*1
07 kg
8.99
*106 k
g 7.
02*1
06 kg
3.28
*106 k
g D
istil
latio
n co
lum
n re
boile
r he
at fl
ow: q
16
3.4
MB
tu/h
14
3.4
MB
tu/h
11
2.2
MB
tu/h
52
.16
MB
tu/h
he
at e
xcha
nger
are
a: A
69
50 sq
rt 61
02 sq
rt 47
74 sq
rt 22
19 sq
rt co
st ($
1000
) (ye
ar)
929.
3 (1
979)
80
4.5
(197
9)
616.
6 (1
979)
28
2.5
(197
9)
HP
stea
m (1
hou
r)
2.23
*105 lb
1.
96*1
05 lb
1.53
*105 lb
7.
13*1
04 lb
Reb
oile
d st
rippe
r re
boile
r he
at fl
ow: q
3.
17*1
08 kJ/
hr
2.22
*108 k
J/hr
1.
29*1
08 kJ/
hr
4.42
*107 k
J/hr
ΔT
82
.7 °
C
83.2
°C
83
.9 °
C
82.2
°C
he
at e
xcha
nger
are
a: A
10
414
sqrt
7249
sqrt
4177
sqrt
1461
sqrt
cost
($10
00) (
year
) 19
07.2
(197
9)
1259
.2 (1
979)
69
1.7
(197
9)
246.
1 (1
979)
H
P st
eam
(1 h
our)
4.
10*1
05 lb
2.87
*105 lb
1.
67*1
05 lb
5.72
*104 lb
C
ompr
esso
r coo
ler
iden
tical
to c
ompr
esso
r coo
ler i
n ox
idat
ion
sect
ion
644.
6 (1
979)
cool
ing
wat
er (1
hou
r)
1.73
*106 k
g
Off
-gas
hea
ter
heat
flow
: q
1.34
*107 k
J/hr
1.
20*1
07 kJ/
hr
1.05
*107 k
J/hr
1.
15*1
07 kJ/
hr
ΔT
76.7
°C
68
.2 °
C
58.6
°C
66
.0 °
C
heat
exc
hang
er a
rea:
A
5801
sqrt
5843
sqrt
5950
sqrt
5786
sqrt
cost
($10
00) (
year
) 53
8.3
(197
9)
542.
6 (1
979)
55
3.5
(197
9)
536.
8 (1
979)
H
P st
eam
(1 h
our)
1.
73*1
04 lb
1.55
*104 lb
1.
36*1
04 lb
1.49
*104 lb
A
cetic
aci
d ta
nk
iden
tical
to th
e on
e in
oxi
datio
n se
ctio
n 61
.6 (1
979)
p-X
ylen
e ta
nk
iden
tical
to th
e on
e in
oxi
datio
n se
ctio
n 10
0.9
(197
9)
A
cetic
aci
d st
orag
e ta
nk
iden
tical
to th
e on
e in
oxi
datio
n se
ctio
n 13
2.1
(197
9)
p-
Xyl
ene
stor
age
tank
id
entic
al to
the
one
in o
xida
tion
sect
ion
327.
4 (1
979)
Cat
alys
t mix
er
iden
tical
to th
e on
e in
oxi
datio
n se
ctio
n 25
.4 (1
979)

17
8
Cat
alys
t mix
er a
gita
tor
iden
tical
to th
e on
e in
oxi
datio
n se
ctio
n 15
(200
2)
el
ectri
city
(1 h
our)
12
.68
kwh
Fe
ed m
ix ta
nk
feed
flow
rate
: F
1172
m3 /h
82
9.8
m3 /h
49
3.8
m3 /h
18
5.1
m3 /h
ve
ssel
size
: V
7738
0 ga
l 54
788
gal
3260
0 ga
l 12
220
gal
diam
eter
: D =
10.
65 ft
20
.63
ft 18
.38
ft 15
.46
ft 11
.15
ft le
ngth
: L =
15.
98 ft
30
.95
ft 27
.59
ft 23
.20
ft 16
.73
ft co
st ($
1000
) (ye
ar)
134.
3 (1
979)
11
2.9
(197
9)
88.2
(197
9)
57.7
4 (1
979)
O
xida
tion
reac
tor
sepa
rato
r flo
w ra
te c
lose
to th
at in
oxi
datio
n se
ctio
n 12
6.0
(197
9)
Cry
stal
lizer
A se
para
tor
feed
flow
rate
: F
114
m3 /h
81
.88
m3 /h
50
.45
m3 /h
24
.76
m3 /h
ve
ssel
size
: V
2730
gal
19
60 g
al
1210
gal
59
0 ga
l di
amet
er: D
6.
772
ft 6.
065
ft 5.
161
ft 4.
071
ft le
ngth
: L
10.1
6 ft
9.09
7 ft
7.74
1 ft
6.10
6 ft
cost
($10
00) (
year
) 49
.3 (1
979)
42
.7 (1
979)
35
.1 (1
979)
27
.2 (1
979)
C
ryst
alliz
er B
sepa
rato
r fe
ed fl
ow ra
te: F
53
.48
m3 /h
37
.21
m3 /h
21
.17
m3 /h
7.
176
m3 /h
ve
ssel
size
: V
1750
gal
12
20 g
al
690
gal
230
gal
diam
eter
: D
5.84
1 ft
5.17
6 ft
4.28
9 ft
2.99
0 ft
leng
th: L
8.
761
ft 7.
764
ft 6.
433
ft 4.
485
ft co
st ($
1000
) (ye
ar)
35.4
(197
9)
31.1
(197
9)
25.9
(197
9)
19.3
(197
9)
Cry
stal
lizer
C se
para
tor
feed
flow
rate
: F
142
m3 /h
98
.55
m3 /h
55
.67
m3 /h
18
.13
m3 /h
ve
ssel
size
: V
3700
gal
25
70 g
al
1450
gal
47
0 ga
l di
amet
er: D
7.
493
ft 6.
634
ft 5.
484
ft 3.
773
ft le
ngth
: L
11.2
4 ft
9.95
0 ft
8.22
5 ft
5.65
9 ft
cost
($10
00) (
year
) 37
.3 (1
979)
33
.0 (1
979)
27
.7 (1
979)
20
.7 (1
979)

17
9
Slur
ry ta
nk (b
efor
e ce
ntrif
uge)
Sl
urry
tank
agi
tato
r
feed
flow
rate
: F
734.
6 m
3 /h
534.
7 m
3 /h
345.
2 m
3 /h
166.
5 m
3 /h
vess
el s
ize:
V
1380
0 ga
l 10
040
gal
6480
gal
31
20 g
al
diam
eter
: D
11.6
1 ft
10.4
5 ft
9.02
9 ft
7.08
1 ft
leng
th: L
17
.42
ft 15
.67
ft 13
.54
ft 10
.62
ft co
st ($
1000
) (ye
ar)
62.0
(197
9)
54.5
(197
9)
45.9
(197
9)
35.5
(197
9)
iden
tical
to th
e on
e in
oxi
datio
n se
ctio
n 15
(200
2)
el
ectri
city
(1 h
our)
10
.44
kwh
A
cetic
aci
d w
ash
tank
(b
efor
e ce
ntrif
uge)
fe
ed fl
ow ra
te: F
80
.72
m3 /h
56
.12
m3 /h
31
.58
m3 /h
8.
928
m3 /h
ve
ssel
siz
e: V
65
10 g
al
4520
gal
25
40 g
al
720
gal
diam
eter
: D
9.04
2 ft
8.01
0 ft
6.61
3 ft
4.34
0 ft
leng
th: L
13
.56
ft 12
.02
ft 9.
920
ft 6.
510
ft co
st ($
1000
) (ye
ar)
45.7
(197
9)
40.1
(197
9)
33.0
(197
9)
22.9
(197
9)
Mot
her l
iquo
r tan
k (a
fter c
entri
fuge
) fe
ed fl
ow ra
te: F
1.
709*
105 m
3 /h
1.44
8*10
5 m3 /h
1.
09*1
05 m3 /h
4.
5*10
4 m3 /h
ve
ssel
siz
e: V
17
00 g
al
1440
gal
10
90 g
al
450
gal
diam
eter
: D
9.56
0 ft
9.04
6 ft
8.22
9 ft
6.12
7 ft
leng
th: L
14
.34
ft 13
.57
ft 12
.34
ft 9.
191
ft co
st ($
1000
) (ye
ar)
49.0
(197
9)
46.0
(197
9)
41.5
(197
9)
30.8
(197
9)
Cry
stal
lizer
A
feed
flow
rate
: F
1600
m3 /h
11
65 m
3 /h
723.
2 m
3 /h
316.
7 m
3 /h
crys
talli
zer s
ize:
V
1987
9 cu
ft 14
475
cuft
8985
cuf
t 39
35 c
uft
cost
($10
00) (
year
) 20
51.9
(197
5)
1767
.6 (1
975)
14
12.7
(197
5)
958.
4 (1
975)
C
ryst
alliz
er A
agi
tato
r id
entic
al to
the
one
in o
xida
tion
sect
ion
15 (2
002)
elec
trici
ty (1
hou
r)
33.5
6 kw
h
Cry
stal
lizer
B
feed
flow
rate
: F
994.
7 m
3 /h
699.
8 m
3 /h
425.
3 m
3 /h
193.
9 m
3 /h
crys
talli
zer s
ize:
V
2258
7 cu
ft 15
890
cuft
9657
cuf
t 44
03 c
uft
cost
($10
00) (
year
) 18
15.7
(197
5)
1539
.0 (1
975)
12
17.9
(197
5)
841.
9 (1
975)
C
ryst
alliz
er B
agi
tato
r id
entic
al to
the
one
in o
xida
tion
sect
ion
15 (2
002)
elec
trici
ty (1
hou
r)
33.5
6 kw
h
Cry
stal
lizer
C
iden
tical
to c
ryst
alliz
er B
18
15.7
(197
5)
1539
.0 (1
975)
12
17.9
(197
5)
841.
9 (1
975)

18
0
Cry
stal
lizer
C a
gita
tor
iden
tical
to th
e on
e in
oxi
datio
n se
ctio
n 15
(200
2)
el
ectri
city
(1 h
our)
33
.56
kwh
Pu
rifie
d TP
A d
ryer
id
entic
al to
the
TPA
dry
er in
oxi
datio
n se
ctio
n 86
8.8
(197
5)
Pu
rifie
d TP
A st
rora
ge
bin
iden
tical
to th
e on
e in
oxi
datio
n se
ctio
n 14
5.7
(197
9)
Off
-gas
exp
ande
r po
wer
: HP
13
800
hp
1290
0 hp
11
920
hp
1009
0 hp
co
st ($
1000
) (ye
ar)
699.
3 (1
981)
66
2.1
(198
1)
621.
1 (1
981)
54
2.6
(198
1)
elec
trici
ty (1
hou
r)
1029
2 kw
h 96
19 k
wh
8889
kw
h 75
25 k
wh
Ace
tic a
cid
pum
p po
wer
: HP
3.
47*1
0-3 h
p 2.
79*1
0-3 h
p 2.
17*1
0-3 h
p 1.
49*1
0-3 h
p co
st id
entic
al to
the
one
in o
xida
tion
sect
ion
4.9
(197
9)
p-
Xyl
ene
pum
p po
wer
: HP
3.
77*1
0-2 h
p
co
st id
entic
al to
the
one
in o
xida
tion
sect
ion
5.2
(197
9)
Fe
ed p
ump
pow
er: H
P
644.
0 hp
45
6.1
hp
271.
5 hp
10
1.8
hp
feed
flow
rate
: Q
916
m3 /h
64
8.8
m3 /h
38
6.2
m3 /h
14
4.9
m3 /h
co
st ($
1000
) (ye
ar)
73.7
(197
9)
67.7
(197
9)
60.4
(197
9)
50.5
(197
9)
elec
trici
ty (1
hou
r)
480.
3 kw
h 34
0 kw
h 20
2.4
kwh
75.9
2 kw
h Pd
com
bust
ion
cata
lyst
co
st id
entic
al to
the
one
in o
xida
tion
sect
ion
754.
0 (2
012)
Cen
trifu
ge
iden
tical
to th
e on
e in
oxi
datio
n se
ctio
n 46
7.4
(197
5)
el
ectri
city
(1 h
our)
19
3.9
kwh

18
1
Tabl
e D
3. T
otal
pro
duct
ion
cost
for b
oth
proc
esse
s
M
C P
roce
ss
Spra
y Pr
oces
s C
ase
1 C
ase
2 C
ase
3 C
ase
4 Fi
xed
capi
tal,
CFC
$2
71.9
6 M
$2
16.8
0 M
$1
86.8
9 M
$1
56.3
2 M
$1
22.5
7 M
W
orki
ng c
apita
l (11
.1 %
of f
ixed
cap
ital),
CW
C
$30.
22 M
$2
4.09
M
$20.
77 M
$1
7.37
M
$13.
62 M
To
tal c
apita
l inv
estm
ent,
CTC
$3
02.1
8 M
$2
40.8
9 M
$2
07.6
6 M
$1
73.6
9 M
$1
36.1
9 M
$/lb
of T
PA
$/lb
of T
PA
$/lb
of T
PA
$/lb
of T
PA
$/lb
of T
PA
Dire
ct
R
aw m
ater
ials
0.
4469
0.
4366
0.
4337
0.
4311
0.
4283
O
pera
ting
labo
r 0.
0019
0.
0012
0.
0012
0.
0012
0.
0012
D
irect
supe
rvis
ory
and
cler
ical
labo
r (15
% o
f ope
ratin
g la
bor)
0.
0003
0.
0002
0.
0002
0.
0002
0.
0002
U
tiliti
es
0.07
37
0.06
46
0.05
27
0.03
97
0.02
43
Mai
nten
ance
and
repa
irs (2
% o
f fix
ed c
apita
l inv
estm
ent)
0.00
49
0.00
39
0.00
34
0.00
28
0.00
22
Ope
ratin
g su
pplie
s (10
% o
f mai
nten
ance
and
repa
irs )
0.00
05
0.00
04
0.00
03
0.00
03
0.00
02
Lab
orat
ory
char
ges (
10%
of o
pera
ting
labo
r)
0.00
02
0.00
01
0.00
01
0.00
01
0.00
01
Pat
ents
and
roya
lties
(1%
of t
otal
exp
ense
) 0.
0068
0.
0064
0.
0061
0.
0059
0.
0056
Tot
al d
irect
man
ufac
turin
g ex
pens
es (e
xclu
ding
dep
reci
atio
n), A
DM
E 0.
5352
0.
5134
0.
4978
0.
4813
0.
4622
In
dire
ct
O
verh
ead
(pay
roll
and
plan
t), p
acka
ging
, and
stor
age
(50%
of t
he su
m o
f op
erat
ing
labo
r, su
perv
isio
n, a
nd m
aint
enan
ce)
0.00
35
0.00
26
0.00
24
0.00
21
0.00
18
Loc
al ta
xes (
1% o
f fix
ed c
apita
l inv
estm
ent)
0.00
25
0.00
20
0.00
17
0.00
14
0.00
11
Ins
uran
ce (0
.5%
of f
ixed
cap
ital i
nves
tmen
t) 0.
0012
0.
0010
0.
0008
0.
0007
0.
0006
Tot
al in
dire
ct m
anuf
actu
ring
expe
nses
, AIM
E 0.
0072
0.
0056
0.
0049
0.
0042
0.
0035
Tota
l man
ufac
turin
g ex
pens
es (e
xclu
ding
dep
reci
atio
n), A
ME
0.54
24
0.51
90
0.50
27
0.48
56
0.46
56
Dep
reci
atio
n (1
0% o
f fix
ed c
apita
l inv
estm
ent),
AB
D
0.02
47
0.01
97
0.01
70
0.01
42
0.01
11
Gen
eral
Exp
ense
s
Adm
inis
trativ
e co
sts (
25%
of o
verh
ead)
0.
0009
0.
0007
0.
0006
0.
0005
0.
0004
D
istri
butio
n an
d se
lling
exp
ense
s (10
% o
f tot
al e
xpen
se)
0.06
76
0.06
35
0.06
12
0.05
89
0.05
62
Res
earc
h an
d de
velo
pmen
t (5%
of t
otal
exp
ense
) 0.
0338
0.
0318
0.
0306
0.
0295
0.
0281
Tot
al g
ener
al e
xpen
ses,
AG
E 0.
1023
0.
0959
0.
0924
0.
0889
0.
0847
Tota
l exp
ense
(tot
al p
rodu
ctio
n co
st),
ATE
0.
6694
0.
6346
0.
6120
0.
5886
0.
5615

18
2
App
endi
x E
: Env
iron
men
tal I
mpa
ct A
naly
sis
Tabl
e E1
. Pre
dict
ed g
ate-
to-g
ate
envi
ronm
enta
l im
pact
pot
entia
ls fo
r con
vent
iona
l and
CEB
C p
roce
sses
Impa
ct
Uni
ts
Con
vent
iona
l MC
pro
cess
C
EBC
spra
y pr
oces
s O
xida
tion
sect
ion
Hyd
roge
natio
n se
ctio
n To
tal
Cas
e 1
Cas
e 2
Cas
e 3
Cas
e 4
Glo
bal w
arm
ing
[104 kg
CO
2-eq
uiv.
] 2.
54 (1
.77)
a 2.
39 (2
.39)
4.
93 (4
.16)
4.
53 (3
.65)
3.
49 (2
.79)
2.
38 (1
.87)
1.
11 (0
.803
) A
cidi
ficat
ion
[102 m
ol H
+ -equ
iv.]
8.15
(8.1
5)
11.0
(11.
0)
19.2
(19.
2)
16.8
(16.
8)
12.9
(12.
9)
8.63
(8.6
3)
3.71
(3.7
1)
Hum
an h
ealth
non
-ca
ncer
air
[103 kg
tolu
ene-
equi
v.]
4.24
(4.2
4)
5.74
(5.7
4)
9.98
(9.9
8)
8.76
(8.7
6)
6.71
(6.7
1)
4.49
(4.4
9)
1.93
(1.9
3)
Ecot
oxic
ity a
ir [1
03 PAF
m3 d
ay/k
g]
7.16
(0.0
15)
0.04
4 (0
.021
) 7.
20 (0
.036
) 31
.3 (0
.032
) 24
.3 (0
.024
) 17
.0 (0
.016
) 8.
29 (0
.007
) O
zone
dep
letio
n [1
0-7kg
CFC
11-
equi
v.]
4.06
(4.0
6)
5.50
(5.5
0)
9.56
(9.5
6)
8.38
(8.3
8)
6.43
(6.4
3)
4.30
(4.3
0)
1.85
(1.8
5)
Eutro
phic
atio
n [1
0-1kg
N-e
quiv
.] 8.
83 (8
.83)
11
.9 (1
1.9)
20
.7 (2
0.7)
18
.2 (1
8.2)
14
.0 (1
4.0)
9.
35 (9
.35)
4.
01 (4
.01)
Sm
og a
ir [1
02 kg O
3-eq
uiv.
] 9.
03 (4
.07)
5.
60 (5
.51)
14
.6 (9
.58)
29
.2 (8
.4)
22.6
(6.4
4)
15.6
(4.3
1)
7.41
(1.8
5)
Hum
an h
ealth
non
-ca
ncer
wat
er
[10-5
kg to
luen
e-eq
uiv.
] 1.
35 (1
.35)
2.
23 (1
.83)
3.
58 (3
.18)
3.
74 (2
.79)
2.
68 (2
.14)
1.
67 (1
.43)
0.
71 (0
.62)
Hum
an h
ealth
ca
ncer
air
[10-6
kg b
enze
ne-e
quiv
.] 1.
23 (1
.23)
1.
66 (1
.66)
2.
89 (2
.89)
2.
54 (2
.54)
1.
95 (1
.95)
1.
30 (1
.30)
0.
56 (0
.56)
Ecot
oxic
ity w
ater
[1
02 PAF
m3 d
ay/k
g]b
7.68
(7.6
8)
105
(10.
4)
113
(18.
1)
503
(15.
9)
434
(12.
1)
332
(8.1
3)
227
(3.4
9)
a In p
aren
thes
is: e
nviro
nmen
tal i
mpa
ct p
oten
tials
from
fuel
com
bust
ion
for p
roce
ss st
eam
pro
duct
ion;
b [P
AF
m3 d
ay/k
g]: p
oten
tially
aff
ecte
d fr
actio
n of
spec
ies (
PAF)
inte
grat
ed o
ver t
ime
and
volu
me
per u
nit m
ass o
f a c
hem
ical
em
itted
.

18
3
Tabl
e E2
. Pre
dict
ed c
radl
e-to
-gat
e en
viro
nmen
tal i
mpa
ct p
oten
tials
for c
onve
ntio
nal a
nd C
EBC
pro
cess
es
Impa
ct
Uni
ts
Con
vent
iona
l M
C p
roce
ss
CEB
C sp
ray
proc
ess
Cas
e 1
Cas
e 2
Cas
e 3
Cas
e 4
Glo
bal w
arm
ing
[104 kg
CO
2-eq
uiv.
] 19
.6
18.8
17
.6
16.4
14
.9
Aci
dific
atio
n [1
02 mol
H+ -e
quiv
.] 24
2 23
2 22
5 21
6 20
5 H
uman
hea
lth n
on-c
ance
r air
[103 kg
tolu
ene-
equi
v.]
33.3
31
.4
28.9
26
.2
23
Ecot
oxic
ity a
ir [1
03 PAF
m3 d
ay/k
g]
8.1
32.2
25
.2
17.9
9.
14
Ozo
ne d
eple
tion
[10-7
kg C
FC 1
1-eq
uiv.
] 43
.8
41.7
38
.8
35.9
32
.5
Eutro
phic
atio
n [1
0-1kg
N-e
quiv
.] 12
1 11
6 11
0 10
4 96
.2
Smog
air
[102 kg
O3-
equi
v.]
61.8
75
67
.7
60
50.6
H
uman
hea
lth n
on-c
ance
r wat
er
[10-5
kg to
luen
e-eq
uiv.
] 45
.8
44.9
43
.4
41.9
40
.4
Hum
an h
ealth
can
cer a
ir [1
0-6kg
ben
zene
-equ
iv.]
17.5
16
.7
15.9
15
.1
14
Ecot
oxic
ity w
ater
[1
02 PAF
m3 d
ay/k
g]a
176
565
493
391
283
a [PA
F m
3 day
/kg]
: pot
entia
lly a
ffec
ted
frac
tion
of sp
ecie
s (PA
F) in
tegr
ated
ove
r tim
e an
d vo
lum
e pe
r uni
t mas
s of a
che
mic
al e
mitt
ed.