Kinetic modelling of the esterification of rosin and glycerol: Application to industrial operation
10
Chemical Engineering Journal 169 (2011) 319–328 Contents lists available at ScienceDirect Chemical Engineering Journal journal homepage: www.elsevier.com/locate/cej Kinetic modelling of the esterification of rosin and glycerol: Application to industrial operation Miguel Ladero a,∗ , Miguel de Gracia a , Juan Jose Tamayo a , Inmaculada Lopez de Ahumada b , Fernando Trujillo b , Felix Garcia-Ochoa a a Dpt. Ingeniería Química. Fac. CC. Químicas, Universidad Complutense, 28040-Madrid, Spain b La Unión Resinera Espa˜ nola S.A., 28001-Madrid, Spain article info Article history: Received 9 December 2009 Received in revised form 20 January 2011 Accepted 7 March 2011 Keywords: Rosin Glycerol Esterification Kinetic model Gel permeation chromatography Industrial scale abstract The esterification of glycerol and rosin is a reaction of importance in the coating and adhesive industries, main consumers of the triglyceride of rosin acids. While this chemical transformation has led to some of the most useful products of rosin, kinetics of the reactions involved have not been studied in depth. In this study, a new analytical method based on gel permeation chromatography (GPC) is applied and compared to classical acid titration, the industrial standard. Experimental data on rosin esterification with glycerol were obtained at laboratory scale, covering a wide range of operational conditions, changing rosin to glycerol molar ratio (between 2 and 4) and temperature (between 240 and 280 ◦ C). Afterwards, different kinetic models were fitted to experimental data to select between first- and second-order potential and hyperbolic kinetic models. Linear and non-linear regression techniques with numerical integration of the differential equations were used to fit the proposed kinetic models. A hyperbolic model coupled with glycerol mass balance that considered stripping of this polyalcohol proportional to the global reaction rate and to glycerol concentration proved to be the most adequate both at a given temperature and in all the temperature intervals studied. On the other hand, samples were analysed by H NMR and ionic chromatography to determine the glycerol amount in the reaction medium and in the distillate, respec- tively, observing the stripping of the polyalcohol. Finally, the selected model was used to simulate and fit runs executed at the usual industrial mode, a transient temperature operation followed by an isothermal operation with gradual addition of glycerol (fed-batch operation). These runs were performed at lab and at industrial scale, and the selected kinetic model and glycerol mass balance were adequate to simulate rosin conversion. © 2011 Elsevier B.V. All rights reserved. 1. Introduction Rosin or colophony is the non-volatile part of the resin of pines and some other conifers. It is mainly composed (∼70%) of abietic acid, pimaric acid and their isomers (as well as some hydrogenated and dehydrogenated acids of the same family). Some neutral com- pounds (alcohols, aldehydes, esters) are also present [1]. There are several kinds of rosin. The most pure comes from the secretion of pine trees that are bled to obtain resin, subject to a further distilla- tion process at 170–180 ◦ C. The heavier fraction of such process is gum rosin. A similar process beginning with chipping the trunk of pines when they are cut down leads to the wood rosin. Purification processes of the black liquor in the Kraft paper manufacture give rise to the so-called tall-oil rosin. All of them have qualitative simi- larities in their composition, but the highest concentration of rosin ∗ Corresponding author. Tel.: +34 913944164; fax: +34 913944179. E-mail address: [email protected] (M. Ladero). acids is found in gum rosin (∼70% rosin acids and ∼30% terpenic hydrocarbons), whose main world producer is the People’s Repub- lic of China (approx. 90% world production: 450,000 ton/year gum rosin) [2]. Rosin (and most of its products) is used in the paper, coating (varnishes, wax, and adhesives), polymer and food industries, as well as a precursor for flux in soldering [3–6]. With bases, rosinates are obtained, being extensively used as soaps. With dicarboxilic acids (maleic and fumaric acids, mainly), some adducts are pro- duced, to gain stability towards oxidation [1,7]. Dimerization of rosin acids is another strategy to reduce the number of double bonds and to enhance oxidative stability [1,8]. By using hydrogen and medium pressures, or simple heating with or without some catalysts, hydrogenated and disproportionated rosin are manufac- tured (for the polymer industry) [1,9]. Esterification with methanol yields ethylene-glycol, glycerol, and pentaerythritol, esters for a variety of applications [1,10]. These are used as tackifiers for hot- melt and pressure adhesives, in solder fluxes, as crystallization promoters in the production of polypropylene, as neutralizers n 1385-8947/$ – see front matter © 2011 Elsevier B.V. All rights reserved. doi:10.1016/j.cej.2011.03.012
-
Upload
independent -
Category
Documents
-
view
1 -
download
0
Transcript of Kinetic modelling of the esterification of rosin and glycerol: Application to industrial operation

Ki
MFa
b
a
ARRA
KRGEKGI
1
aaapsptgpprl
1d
Chemical Engineering Journal 169 (2011) 319–328
Contents lists available at ScienceDirect
Chemical Engineering Journal
journa l homepage: www.e lsev ier .com/ locate /ce j
inetic modelling of the esterification of rosin and glycerol: Application tondustrial operation
iguel Laderoa,∗, Miguel de Graciaa, Juan Jose Tamayoa, Inmaculada Lopez de Ahumadab,ernando Trujillob, Felix Garcia-Ochoaa
Dpt. Ingeniería Química. Fac. CC. Químicas, Universidad Complutense, 28040-Madrid, SpainLa Unión Resinera Espanola S.A., 28001-Madrid, Spain
r t i c l e i n f o
rticle history:eceived 9 December 2009eceived in revised form 20 January 2011ccepted 7 March 2011
eywords:osinlycerolsterificationinetic modelel permeation chromatography
ndustrial scale
a b s t r a c t
The esterification of glycerol and rosin is a reaction of importance in the coating and adhesive industries,main consumers of the triglyceride of rosin acids. While this chemical transformation has led to some ofthe most useful products of rosin, kinetics of the reactions involved have not been studied in depth. In thisstudy, a new analytical method based on gel permeation chromatography (GPC) is applied and comparedto classical acid titration, the industrial standard. Experimental data on rosin esterification with glycerolwere obtained at laboratory scale, covering a wide range of operational conditions, changing rosin toglycerol molar ratio (between 2 and 4) and temperature (between 240 and 280 ◦C). Afterwards, differentkinetic models were fitted to experimental data to select between first- and second-order potential andhyperbolic kinetic models. Linear and non-linear regression techniques with numerical integration ofthe differential equations were used to fit the proposed kinetic models. A hyperbolic model coupled withglycerol mass balance that considered stripping of this polyalcohol proportional to the global reactionrate and to glycerol concentration proved to be the most adequate both at a given temperature and in
all the temperature intervals studied. On the other hand, samples were analysed by H NMR and ionicchromatography to determine the glycerol amount in the reaction medium and in the distillate, respec-tively, observing the stripping of the polyalcohol. Finally, the selected model was used to simulate and fitruns executed at the usual industrial mode, a transient temperature operation followed by an isothermaloperation with gradual addition of glycerol (fed-batch operation). These runs were performed at lab andat industrial scale, and the selected kinetic model and glycerol mass balance were adequate to simulate rosin conversion.. Introduction
Rosin or colophony is the non-volatile part of the resin of pinesnd some other conifers. It is mainly composed (∼70%) of abieticcid, pimaric acid and their isomers (as well as some hydrogenatednd dehydrogenated acids of the same family). Some neutral com-ounds (alcohols, aldehydes, esters) are also present [1]. There areeveral kinds of rosin. The most pure comes from the secretion ofine trees that are bled to obtain resin, subject to a further distilla-ion process at 170–180 ◦C. The heavier fraction of such process isum rosin. A similar process beginning with chipping the trunk of
ines when they are cut down leads to the wood rosin. Purificationrocesses of the black liquor in the Kraft paper manufacture giveise to the so-called tall-oil rosin. All of them have qualitative simi-arities in their composition, but the highest concentration of rosin∗ Corresponding author. Tel.: +34 913944164; fax: +34 913944179.E-mail address: [email protected] (M. Ladero).
385-8947/$ – see front matter © 2011 Elsevier B.V. All rights reserved.oi:10.1016/j.cej.2011.03.012
© 2011 Elsevier B.V. All rights reserved.
acids is found in gum rosin (∼70% rosin acids and ∼30% terpenichydrocarbons), whose main world producer is the People’s Repub-lic of China (approx. 90% world production: 450,000 ton/year gumrosin) [2].
Rosin (and most of its products) is used in the paper, coating(varnishes, wax, and adhesives), polymer and food industries, aswell as a precursor for flux in soldering [3–6]. With bases, rosinatesare obtained, being extensively used as soaps. With dicarboxilicacids (maleic and fumaric acids, mainly), some adducts are pro-duced, to gain stability towards oxidation [1,7]. Dimerization ofrosin acids is another strategy to reduce the number of doublebonds and to enhance oxidative stability [1,8]. By using hydrogenand medium pressures, or simple heating with or without somecatalysts, hydrogenated and disproportionated rosin are manufac-
tured (for the polymer industry) [1,9]. Esterification with methanolyields ethylene-glycol, glycerol, and pentaerythritol, esters for avariety of applications [1,10]. These are used as tackifiers for hot-melt and pressure adhesives, in solder fluxes, as crystallizationpromoters in the production of polypropylene, as neutralizers n
320 M. Ladero et al. / Chemical Engineerin
Nomenclature
AG glycerol area in H-RMN spectraAE ester area in H-RMN spectraAC colophony or rosin area in gel permeation chro-
matographsAIC Akaike’s information criterionAICc Akaike’s information criterion for small set of data%A percentual area of peaks in gel permeation chro-
matographs˛1, ˛2, t0 parameters in Boltzmann equation for the fitting
of temperature with timeˇ1, ˇ2, ˇ3 parameters in a modified hyperbola for the fitting
of temperature with timeCC colophony or rosin concentration (mol L−1)CG glycerol concentration (mol L−1)CG0 initial glycerol concentration (mol L−1)13C NMR carbon-nuclear magnetic resonance spectroscopyı chemical shift in NMR (ppm)Ea activation energy (J mol−1)F95 Fischer’s F value at 95% confidenceFG glycerol addition flow in transient temperature runs
(mol min−1)GPC gel permeation chromatographyH NMR hydrogen-nuclear magnetic resonance spec-
troscopyHPLC high performance liquid chromatographyk′ first-order kinetic constant (min−1)k′
0 pre-exponential term of the first-order kinetic con-stant (min−1)
k′ ′ second-order kinetic constant (L mol−1 min−1)k′ ′
0 pre-exponential term of the second-order kineticconstant (L mol−1 min−1)
k1 second-order kinetic constant of the hyperbolicmodel (L mol−1 min−1)
k10 pre-exponential term of the second-order kineticconstant of the hyperbolic model (L mol−1 min−1)
kst coefficient for the stripping of glycerol in glycerolmass balances 2 and 3
K2 denominator constant of the hyperbolic model(L mol−1)
K number of parameters in a given modelM molar concentration ratio between glycerol and
rosinN number of experimental datanC rosin amount of substance (mol)nC0 rosin initial amount of substance in transient tem-
perature runs and in Eq. (8) (mol)SQR sum of squares of weighted errorsSSQWPV sum of squares of weighted predicted valuesPID proportional-integral-differential controllerr reaction rate (mol L−1 min−1)RC disappearance rate of rosin (mol L−1 min−1)RG disappearance rate of glycerol (mol L−1 min−1)T temperature (◦C)t time (min)T0 initial temperature in a transient temperature run
(◦C)V reaction mixture volume (L)XC rosin conversionXC 240 rosin conversion at time = 240 min.XG 240 glycerol conversion at time = 240 min.XG glycerol conversion
g Journal 169 (2011) 319–328
the paper industry, in the formulation of chewing gum, and forthe manufacture of polymeric coatings used in the controlled dis-persion of drugs and fitosanitary products, and some other minorapplications [3,6,11,12].
Glycerol is a highly hygroscopic polyalcohol (1,2,3-propanetriol), with a high viscosity and relatively high density, andwith several applications in the cosmetic, food, pharmaceutical,and chemical industries (polymers, triacetin, and more). However,it is used in relatively small amounts in every application soits production has remained relatively low (600,000 ton/year).In the last years, glycerol has been produced as a by-productin the biodiesel industry, resulting in a significant increase inits production and the build-up of large stocks of this chemical.Consequently, the price of this polyalcohol has drastically dropped.Despite the crisis of the biodiesel sector, mainly due to the origin,production and supply of the raw oily material for such process, theglycerol production is expected to rise and applications are soughtin a variety of fields, including the energy and chemical sectors.Thus, glycerol is regarded as a building block for the productionof a variety of chemicals, including glycols and epychlorhydrin,and applications of such polyalcohol will benefit from the currentmarket situation [13].
The esterification of glycerol and the carboxylic acids from rosin(mainly abietic acid) is a very usual reaction in industry (for up to80–90 years) [1,3]. Even in the latest years, hundreds of patentsregarding the production of rosin triglyceride and its applicationshave been registered.
Rosin triglyceride is a standardized product, with a series ofASTM-based standards that the product must fulfil before its com-mercialization. Those ASTM standards refer to its colour (Gardnerand USRG colour scales), its viscosity behaviour with temper-ature (“softening-point”, ASTM-E 28-92), its acid composition(“acid number”, ASTM-D 465-92), the presence of inorganics orash (ASTM-D 1063-51), the saponificable compounds to controldecarboxilation during the esterification process (“saponificationnumber”, ASTM-D 464-92), among others. In contrast to the clas-sical analytical methodology used in the industrial standards, thequalitative and quantitative chemical analysis of rosin and its prod-ucts also include the newest technologies nowadays: SPE and HPLC,MALDI-TOF, and capillary electrophoresis [14–16].
However, knowledge regarding the process kinetics, i.e. the pro-duction rate of the involved chemical species and its mathematicalmodelling, is scarce. In fact, information in literature refers to theevolution of acidity (“acid number”) with time, with some studieson the applied kinetics of similar esterifications [17–20]. In theseworks, kinetic information refers to other acids used (includingfatty acids) as well as some other polyalcohols. In any case, potentialkinetic models are selected. For esterification of simple acids andalcohols, a potential second-order kinetic model with partial first-order for alcohol and acid, respectively, was proposed. For fattyacids, this model is considered in some cases, whereas, in othercases, a first-order kinetic model is also used to fit experimentaldata [20].
Recently, Salmi et al. [21] worked on data obtained by Flory [18]for the reaction between adipic acid and ethyleneglycol. They pro-posed a potential kinetic model whose total order depends on theconversion of the acid. In fact, it depends on the acid concentration,as the authors claimed, just like the proposed reaction mechanism.At high acid concentration, the carbocation is formed in a relativelypolar liquid, and is thus stabilized: the order with respect to theacid is one. At lower concentration, this intermediate is not stable
as the reaction medium is non-polar and ionic pairs are formed,instead of the carbocation. Thus, a second order with respect to theacid has to be considered. Therefore, the total order changes fromtwo to three as the reaction proceeds. The model also includes anempirical parameter, q, which is related to the number of hydroxyl
neering Journal 169 (2011) 319–328 321
gaoi
iptcuoaes
aoacosaAcb(magdgat
2
2
rwca
2
cbI5ac(btwrmKmd2At
M. Ladero et al. / Chemical Engi
roups of the alcohol being used (in this work, both lauric alcoholnd ethyleneglycol were considered) and, moreover, to the polarityf the alcohols. The higher the value of this parameter, the longert takes to change from second to third order in the kinetic model.
Smith and Eliot [22] proposed a kinetic model for the ester-fication of rosin acids with lauric alcohol at 230–260 ◦C andentaerythritol at 260–300 ◦C. The kinetic model considered a par-ial second order for rosin, accounting only for the evolution of suchompound in the first reacting system. When pentaerythritol wassed, the order depended somehow on temperature, being secondrder at low temperatures and third order at the highest values. Thectivation energy values, considering second-order kinetic mod-ls, were 64 KJ mol−1 and 88 KJ mol−1, for the lauric alcohol–rosinystem and for the pentaerythritol–rosin system, respectively.
In this work, the kinetics of the esterification of rosin acidsnd glycerol are studied and used to simulate industrial fed-batchperation runs. For such purpose, a first step was to develop anutomatic and robust analytical method based on gel permeationhromatography, more informative but able to be used insteadf the classic acid number titration method (ASTM-D 465-92). Totudy the evolution of glycerol in such a complex system, H NMRnd ionic chromatography methods were developed and employed.fter studying the temporal evolution of the involved chemicalompounds, kinetic models (first-order, second-order and a hyper-olic model) coupled with different mass balances for glycerolwith or without stripping of glycerol) were proposed, being the
odels fitted to acid conversion data utilized to select the mostdequate one. Finally, considering the results on the evolution oflycerol concentration with time in the liquid phase and in theistillate, as well as the temporal evolution of temperature andlycerol addition during the industrial runs, a model that takes intoccount the reaction kinetics and the stripping of glycerol was usedo simulate industrial operations.
. Experimental
.1. Materials
Rosin and glycerol were of technical and pharmaceutical grade,espectively, and were kindly supplied by LURESA. Deuteratedater and chloroform for glycerol analysis by H NMR were pur-
hased to SDS. Tetrahydrofuran for the GPC–HPLC analysis of rosincids and their glycerides was purchased to SDS, too.
.2. Esterification runs and sample analysis
The kinetic runs were performed between 240 and 280 ◦C,hanging the initial concentration of glycerol between 9 and 15%ased on rosin weight (glycerol concentration = 0.9–1.5 mol L−1).
n a typical isothermal run, 100 g of rosin were charged into a00 mL three-necked round-bottom flask with upper agitation bymarine helix and a distillation head attached so as to totally
ondensate the water from the reaction together with trementinewhich contains mainly pinenes), thus the distillate volume cane accurately measured (the set-up is depicted in Fig. 1). Whenhe temperature of reaction was reached, a time zero sample wasithdrawn with a glass pipette and glycerol was added. During the
eaction time other samples were withdrawn and stored in alu-inium capsules. These samples were analysed by titration with
OH and using GPC–HPLC on a Phenogel 300 × 7.5 column for low
olecular weight compounds (5 �m particle diameter, 50 A poreiameter) using tetrahydrofuran as eluent and a DAD-detector at54 nm wavelength. The direct basic titration used is based on theSTM D-465 standard and uses a freshly made KOH 0.06 N solu-
ion in ethanol standardized with a 0.1 M HCl solution, to titrate
Fig. 1. Experimental set-up for rosin and glycerol esterification at lab and pilot plantscales.
0.3 g of the sample solubilised in 10 mL toluene with a drop of phe-nolphthalein (10 g L−1 in ethanol). The reaction samples, as well asdistillate samples, were also analysed by H NMR using a BRUKERAVANCE DPX 300 Mhz-BACS60 spectrometer. Glycerol content indistillates was also analysed by ionic-GPC HPLC with RI detection ofcompounds using a H+-Rezex column for acids as stationary phaseand acidified mille-Q water (pH 2.2) as eluent.
In a typical temperature gradient run at laboratory scale, theentire procedure was similar to the one used in isothermal runswith some changes. On one hand, the equipment or set-up used waslarger, using a cylindrical reactor able to contain up to 1 L reactionmedium with a thermostated vessel located above for the additionof glycerol. On the other hand, a temperature gradient simulatingthe ones used at industrial scale was programmed by means ofthe same PID temperature controller (E5CN of OMRON electron-ics) used for the isothermal runs. When a temperature of 240 ◦Cwas reached, a time zero sample was withdrawn using a valve atthe bottom of the reactor and glycerol was added at 230–250 ◦C.All the samples withdrawn during the course of the run were anal-ysed by GPC–HPLC and by H NMR. Temperature was also monitoredduring the run. Industrial runs at LURESA were carried out in asimilar manner and samples were analysed by the mentioned titra-tion procedure (an industrial standard test) and some of them byGPC–HPLC.
2.3. Kinetic modelling and simulation
Several kinetic models were fitted to experimental data from theisothermal runs: order 1, order 2 and the hyperbolic model. The firstorder model is a pseudo-first order kinetic model that considers aconstant concentration of the glycerol in the reaction liquid. Thesecond order kinetic model is first partial order with respect tothe alcohol and to the acid, as is typical in esterification reactions.The hyperbolic model represents an intermediate situation where
the kinetics of the reacting system follows first-order behaviour atthe beginning of the reaction and evolves towards a second-ordermodel at the end of each run. Coupled with the kinetic model, threemass balances for glycerol have been considered: in the first one,glycerol concentration decreases in the liquid phase only due to the
3 ineerin
et(oictr
acataec
mteutwrtrskd
3
3G
wtwwitwtNad
sspqwawstThetbgbg
22 M. Ladero et al. / Chemical Eng
sterification reaction; in the second mass balance, a second termaking into account stripping of glycerol due to evaporation of waterproduct of the reaction) is added. In the latter case, the amountf stripped glycerol is proportional to the rate of reaction. Finally,n the last mass balance, glycerol concentration decreases due tohemical reactions and to a stripping phenomenon proportionalo both reaction rate and the concentration of glycerol at a giveneaction time.
The fitting was performed using the Marquardt–Levenberglgorithm coupled with a Runge-Kutta method for the numeri-al integration of the kinetic equations. The selection of the mostppropriate model was based on usual physical (positive value ofhe kinetic parameters and values for the activation energies withindequate ranges) and statistical criteria (Standard error value forach kinetic parameter, Fischer’s F, Akaike’s modified informationriterion and SQR values for each kinetic model).
For the non-isothermal (transient) runs, simulations with theost adequate kinetic model were performed considering the
emporal evolution of the liquid temperature. Depending on thevolution of the temperature during the run, the temperature val-es were fitted by a hyperbolic or a sigmoid (Boltzmann) functiono take into account this variable in each simulation. Simulationsere performed considering both a fast addition of glycerol (for the
un performed in the laboratory) and a linear addition with respecto time (for industrial runs). Moreover, and considering the resultsegarding glycerol in lab scale isothermal runs, simulations of tran-ient runs at laboratory and industrial scale included not only theinetics of the chemical reaction but also the stripping of glycerolue to the production of water during esterification.
. Results and discussion
.1. Temporal evolution of isothermal runs analysed byPC–HPLC and H NMR
Runs were performed in a batch reactor whose temperatureas controlled by a PID device. When the system was stabilized at
he working temperature, being the rosin totally melted, glycerolas added and samples were withdrawn from the liquid medium,hile turpentine remaining in the rosin and the water formed dur-
ng esterification condensed and were collected in a graduated testube. Due to the low solubility of turpentine in water, the latteras easily separated and analysed by H NMR and ionic HPLC, and
he samples taken from the reacting liquid were analysed by HMR. The distillate was analysed by H NMR using deuterated waternd the samples withdrawn from the rosin-glycerol mixture wereissolved in deuterated chloroform.
Analyses on the distillates by H NMR showed that a very con-iderable amount of glycerol was present on the water. Whenubjecting these samples to ionic HPLC analysis, a distinct glyceroleak was observed and glycerol was quantified by using the ade-uate calibration equation and knowing the amount of collectedater. In the case of H NMR spectra, a signal at ı = 5.1 ppm can be
scribed undoubtedly to hydrogen atoms in water and alcohols,hile a very rough signal is observed at ı = 3.4–3.5 ppm. The latter
ignal can be in first instance ascribed to hydrogen atoms linked tohe methylene and methylene carbons in the molecule of glycerol.he Signal is so rough, apparently, due to coupling of the differentydrogen atoms in adjacent carbon atoms. Quantification of glyc-rol concentration was performed in this case from the values of
he areas of both signals, correcting the area of signal at ı = 5.1 ppmy subtracting the amount of this area due to hydrogen atoms inlycerol hydroxyl moieties. All calculations were performed on thease of one hydrogen atom (thus, on a molar base for water and forlycerol) and, thus, the apparent concentration of glycerol in waterg Journal 169 (2011) 319–328
was calculated. When comparing these results from H NMR anal-ysis to the results from ionic HPLC, where a distinct peak clearlydue to glycerol is obtained, the concentration of glycerol seemedto be 50–60% higher in the former case. These results are prob-ably due to the fact that turpentine is mainly composed by �-and �-pinene, but it also contains alcohols, aldehydes and otherpolar compounds. The mentioned compounds could be observedin the chromatograms, where six peaks at longer times than thatof glycerol were present, though their signals were not significant.Hydrogen atoms of these compounds could give signal in H NMR atı = 3.4–3.5 ppm, so that concentration of glycerol based on H NMRanalysis is higher than that calculated from HPLC analysis of thedistillates. As a consequence, the percentage of glycerol in the dis-tillates stripped during the runs was calculated in each of themusing the ionic HPLC analysis. Such results are shown in the lastcolumn in Table 1.
The H NMR analysis of the samples from the liquid in the reac-tor was used to quantify the conversion of glycerol in the reactingmixture by using the following equation:
XG = 1 − AG(ı = 3.5ppm)AG(ı = 3.5ppm) + AE(ı = 3.7ppm)
(1)
This equation considers the signals due to hydrogen atoms inall carbons of the glycerol molecule (signal at ı = 3.5 ppm) and tothe methylene carbons in the ester molecules. Esterification of thehydroxyl groups in such positions leads to the decrease of the sig-nal at ı = 3.5 ppm with the concomitant increase of the signal at3.7 ppm. However, signal at ı = 3.5 ppm cannot be ascribed with-out doubt to glycerol and, thus, final values for the conversion ofglycerol are only of a semi-quantitative nature. Moreover, quan-tification of glycerol signal at high conversion values is prone to beerroneous due to the low ratio signal/noise in H NMR spectra.
NMR techniques have also been employed to observe whetheracrolein was present in distillates, since the high temperaturesused in the runs could be adequate for its production, even if nostrong acid catalyst is used. 13C and H NMR spectra of distillatesin D2O and deuterated DMSO show evidence of the inexistence ofthis compound, as there are no signals at high displacement values(ı = 6–7 ppm and ı = 9.6 ppm in the H NMR DMSO spectrum, andı = 138 ppm and ı = 196 ppm in the 13C NMR DMSO spectrum), asexpected if acrolein is formed, stripped and condensed.
The other analytical tool used is based on the separation of theesters in a gel permeation chromatographic column of a very nar-row pore diameter (50 A). Such procedure leads to separation of theesters and the rosin acids (considering the latter as a whole: abietic,pimaric and their isomers). In Fig. 2, a comparison of traditionalstandards of polystyrene used in these kinds of chromatogra-phy and rosin and its esterification products is made and a goodagreement in elution time (and volume) is observed between thestandards and the analytes, considering their molecular weights.
UV–vis-spectrophotometric scanning of several rosin acid stan-dards resulted in the adscription of the signal at 254 nm to abieticacid and its isomers; therefore the absorbance at this wavelengthis due to the terpenic moiety of the different rosin acids, neitherto the carboxylic acid group nor to the ester bond [1]. Consider-ing this fact Fig. 3 shows the percentage of rosin acids in its acidform and being part of the several esters in the mixture as thesecompounds appear and disappear from the reaction mixture withtime. The run herein shown was conducted at 240 ◦C and the resultshows that rosin evolves towards its triglyceride rapidly, with littleincrease of the diglyceride and an even lower amount of monoglyc-
eride in the mixture. In fact, at higher temperatures, the amountsof monoglyceride and diglyceride were even lower. Thus, in indus-trial operation (at 275 ◦C), these esters are in minor concentration.It should be taken into account that the conversion of rosin hasa similar trend to the conversion of glycerol, on one hand, and
M. Ladero et al. / Chemical Engineering Journal 169 (2011) 319–328 323
Table 1Isothermal runs at lab scale: conditions, rosin and glycerol conversion at 240 min reaction time and stripped glycerol (in percentage of the initial amount of the polyalcohol).
Run CGo (M) M T0 (◦C) XC 240 XG 240 Stripped glycerol (% w/w)
1 1.5 0.50 270 0.91 0.73 12.42 1.3 0.43 270 0.84 0.80 11.43 1.1 0.37 270 0.82 0.87 10.74 1.0 0.33 270 0.83 0.88 9.65 0.9 0.30 270 0.77 0.88 7.76 0.7 0.23 270 0.62 0.93 6.57 1.0 0.33 240 0.64 0.68 8.08 1.0 0.33 260 0.80 0.83 6.19 1.0 0.33 265 0.81 0.85 9.110 1.0 0.33 270 0.82 0.88 11.311 1.0 0.33 275 0.84 0.90 9.512 1.0 0.33 280 0.91 0.99 10.7
0
200
400
600
800
1000
1200
6 7 8 9 10 11 12 13
Elution time (min)
Mol
ecul
ar w
eigh
t (D)
polystyrene standardsrosin and its esters
Fig. 2. HPLC–GPC standard curve of rosin and rosin esters in the Phenogel 50 Acolumn: comparison to GPC polystyrene standards.
0
20
40
60
80
100
0 50 100 150 200 250 300 350 400
% w
eigh
t
rosinmonoglyceridediglyceridetriglyceride
Fa
t(qsbst
0
0.1
0.2
0.3
0.4
0.5
0.6
0.7
0.8
0.9
1
0 0.1 0.2 0.3 0.4 0.5 0.6 0.7 0.8 0.9 1
Xc
by ti
trat
ion
-10%
+10%
from H NMR analysis of samples from the reacting liquid and the
time (min)
ig. 3. Temporal evolution of weight percentage of rosin acids and esters at M = 0.30nd T = 240 ◦C.
hat concentrations of intermediates are low and almost constantespecially in the case of monoglyceride). The application of theuasi-steady state hypothesis to monoglycerides and diglycerides
hows that all reactions take place at the rate of the first reaction,eing the latter the controlling step. In this situation, the kineticcheme of the reacting system can be simplified from a scheme withhree-reactions in series to a one reaction scheme where 1 mol ofXc by GPC-HPLC
Fig. 4. Comparison of the rosin conversion data obtained by the traditional acidnumber method (ASTM D 465-92) and those obtained by the HPLC–GPC method.
rosin triglyceride is formed directly from 3 mol of rosin and 1 molof glycerol.
When comparing the areas of the peaks in the chromatogramsto the result of the titration using the “acid number” standard, arelatively good agreement was observed (data not shown). Whenall the areas of the peaks corresponding to the compounds of inter-est where summed and each area was divided by the total sum,relative areas (%A) were calculated and they were in good agree-ment with the acid measured by titration (as shown in Fig. 4). Thus,GPC–HPLC is a robust and automatic method eligible to utilizationinstead of the more cumbersome titration analysis, and the datathence obtained can be used for further statistical analysis. Thus,the conversion of rosin was calculated as:
XC = 1 − %Ac (t)%Ac (t = 0)
(2)
Results from the runs performed under isothermal conditions,at several glycerol concentrations and temperatures, are shown inTable 1. Herein, the conversion of rosin and glycerol at 240 min canbe seen for all the runs, being the conversion of glycerol obtained
percentage of stripped glycerol to the glycerol added at time zerocalculated from ionic HPLC measurements. Though it is not shown,conversion values were calculated for all the withdrawn samples.Regarding the conversion of rosin (only due to esterification reac-

3 ineerin
tlipucoiccm
3
bcwik
•
•
•
Tcc
•
•
•
r
24 M. Ladero et al. / Chemical Eng
ions) and that of glycerol, glycerol concentration in the reactingiquid decreases at a higher rate than expected because of the ester-fication process, by means of which the evaporating water beingroduced strips off some of this polyalcohol from the reacting liq-id. This phenomenon seems to be in according with the initialoncentration of glycerol: the higher it is, the higher the percentagef stripped glycerol. This fact, together with the necessity of reach-ng acid numbers below 7 in the final product, explains why theommon industrial practice is to add more glycerol than that stoi-hiometrically needed (a 30–40% in excess to the 1:3 glycerol:rosinolar ratio).
.2. Kinetic modelling of the esterification reaction
As the evolution of the reacting mixture can be well representedy the evolution of the acid, data from the GPC–HPLC analysis con-erning the mixture of rosin acids (peak at 9.8 min elution time)ere corrected relating its area to the sum of areas of all the
nvolved compounds. These data were thereafter used to fit threeinetic models:
Model A: A first-order model, which is quite usual in the esterifi-cation of glycerol and fatty acids.
r = 13
dCC
dt= k′CC (3)
Model B: A second-order model with partial first-order both forthe alcohol and the acid, commonly used to model the esterifica-tion of monoacids and monoalcohols.
r = 13
dCC
dt= k′′CGCC (4)
Model C: A hyperbolic model whose numerator corresponds tothe second-order model, and whose denominator includes theconcentration of glycerol. It may be simplified to one of the afore-mentioned models at an adequate glycerol concentration.
r = 13
dCC
dt= k1CGCC
1 + K2CG(5)
he second order potential model and the hyperbolic model wereoupled with mass balances of glycerol where its concentrationhanges with time considering three possibilities:
Mass balance A: Glycerol concentration decreases only due to thechemical reaction in which it is involved. Thus, glycerol evolutionrate is a third of rosin evolution rate.
dCG
dt= 1
3dCC
dt(6)
Mass balance B: The decrease in glycerol concentration is due tothe reaction rate and stripping of the polyalcohol driven by thewater formed during the reaction. Thus, a second term directlyproportional to rosin disappearance rate is added.
dCG
dt= 1
3dCC
dt(1 + kst) (7)
Mass balance C: The third possibility considers that the strippingof the polyalcohol not only is proportional to the rosin disappear-ance rate, but also to the initial concentration of glycerol.
dCG
dt= 1
3dCC
dt(1 + kstCG) (8)
Combinations of the kinetic models and glycerol mass balancesyield the models that have been fitted to the experimental data.
A first set of runs (1–6) was performed at 270 ◦C changing theatio of the polyalcohol to the major component, rosin. In a first
g Journal 169 (2011) 319–328
instance, all runs were fitted to reach optimised values of thekinetic parameters for each model at 270 ◦C. As shown in Table 2,all parameters were sound from a statistical point of view, havingall standard errors smaller than the parameter value. The sum ofresidual squares (SQR) decreased steeply from the first order modelwithout stripping of glycerol to the hyperbolic model with strip-ping of glycerol proportional to rosin global disappearance rate andglycerol initial concentration. However, the number of parameterschanges from one to three, so SQR decrease is also influenced by thisfact. Thus, two other criteria were used to select the best model:Fischer’s F95 value (based on a null hypothesis on the suitability ofthe model–mass balance to fit data) and Akaike’s information crite-rion corrected for a ratio number of data to number of parameters<40 (AICc). The Fischer’s F value is a null hypothesis analysis at 95%confidence which has been applied in the discrimination of kineticmodels (and in regression techniques in general) for a long time. Inthis work, F95 value is calculated by Eq. (9), hence a high numberof parameters implies a great reduction in its value:
F95 = SSQWPV/K
SQR/ (N − K)(9)
The Akaike’s information criterion also places a penalty on theuse of excessive parameters in any model used to fit data. Infor-mation criteria were created in the first seventies [23] and havecontinuously been developed, probed into and applied in a vari-ety of fields in the last twenty years [24–26]. The original Akaike’sinformation criterion (AIC) was devised for very large sets of dataand can be calculated from:
AIC = NLn(
SQRN
)+ 2K (10)
However, when the ratio of number of data to number of param-eter is lower than 40, it is better to use a modified version of thisinformation criteria, the AICc (Saha et al., 2008), according to:
AICc = AIC + 2K (K + 1)N − K − 1
(11)
The higher the F and the lower the AICc parameter values, themore prone the model is to be correct. In Table 2, the F95 value sug-gests that the best model is the hyperbolic model without strippingof glycerol (model 5), while the corrected Akaike’s information cri-terion supports hyperbolic models with stripping of glycerol, morein accordance with the existence of glycerol in the distillates (mod-els 6 and 7).
For further discrimination among the proposed kinetic modelsand glycerol mass balances, a second set of isothermal runs (7–12)was executed, with temperatures ranging from 240 ◦C (when glyc-erol is usually added in an industrial run) to 280 ◦C (the uppertemperature in industrial practice). Afterwards, data from all theruns were used in a multivariable fitting to select the most appro-priate kinetic model with the same criteria used in the previousset. As it can be seen in Table 3, all the tested models are reason-able considering the standard errors of their parameters and theF value (always higher than that needed at 95% confidence for thegiven number of data and parameters), while the AICc value aids inthe selection of the most adequate one. However, the model whichagain best fits the experimental data is the hyperbolic model, whoseconstant (K2) in the denominator is not temperature dependent. Inthis model, glycerol is stripped from the reaction liquid at a rateproportional to rosin disappearance rate and to the concentrationof glycerol (model 7). When fitting this model to all data, both thehighest value for F and the lowest value for the AICc parameters
were obtained. Fig. 5a–c depicts the fitting of the selected model(lines) to the experimental data (points), proving to be an adequatefitting for all the tested conditions.The hyperbolic model considers a situation in all runs whereat short times the reaction evolves following first-order kinetics,

M. Ladero et al. / Chemical Engineering Journal 169 (2011) 319–328 325
Table 2Comparison among the proposed kinetic models: kinetic and statistical parameters at a given temperature (270 ◦C).
Runs 1–6 (M = 0.25–0.5; T = 270 ◦C)
Model reference-equations Parameters Value ± error SQR AICc F95
Model 1 (Eqs. (3) and (6)) k′ 3.33 × 10⁻³ ± 1.34 × 10⁻⁴ 0.813 −4.75 70Model 2 (Eqs. (4) and (6)) k′ ′ 4.98 × 10⁻³ ± 1.36 × 10⁻⁴ 0.315 −5.70 160Model 3 (Eqs. (4) and (7)) k′ ′ 4.04 × 10⁻³ ± 1.67 × 10⁻⁴ 0.235 −5.89 105
kst −5.98 × 10⁻² ± 3.35 × 10⁻⁴
Model 4 (Eqs. (4) and (8)) k′ ′ 4.55 × 10⁻³ ± 2.17 × 10⁻⁴ 0.239 −5.87 104kst −7.84 × 10⁻² ± 5.53 × 10⁻⁴
Model 5 (Eqs. (5) and (6)) k1 7.61 × 10⁻³ ± 1.18 × 10⁻³ 0.155 −6.31 163K2 1.01 ± 2.38 × 10⁻¹
Model 6 (Eqs. (5) and (7)) k1 5.99 × 10⁻³ ± 5.23 × 10⁻⁴ 0.119 −6.42 137K2 4.28 × 10⁻¹ ± 1.01 × 10⁻¹
kst 1.13 × 10⁻¹ ± 1.63 × 10⁻²
Model 7 (Eqs. (5) and (8)) k1 5.58 × 10⁻³ ± 4.09 × 10⁻⁴ 0.119 −6.42 136K2 4.28 × 10⁻¹ ± 1.01 × 10⁻¹
kst 2.37 × 10⁻¹ ± 3.51 × 10⁻²
Note: k′ (min−1); k′ ′ , k1 (L mol−1 min−1); K2 (L mol−1); kst (dimensionless).
Table 3Comparison among the proposed kinetic models: kinetic and statistical parameters from multi-temperature fitting.
Runs 1–6 (M = 0.25–0.5; T = 270 ◦C) Runs 7–12 (M = 0.33; T = 240–280 ◦C)
Model reference-equations Parameters Value ± error SQR AICc F95
Model 1 (Eqs. (3) and (6)) ln k′0 6.98 ± 1.41 1.47 −4.59 58
Ea 6579 ± 925Model 2 (Eqs. (4) and (6)) ln k′ ′
0 7.09 ± 1.08 0.33 −6.08 225Ea (J mol−1) 6678 ± 578
Model 3 (Eqs. (4) and (7)) ln k′ ′0 7.20 ± 1.08 0.32 −6.02 144
Ea 6683 ± 592kst −1.84 × 10⁻² ± 2.25 × 10⁻²
Model 4 (Eqs. (4) and (8)) ln k′ ′0 8.17 ± 1.11 0.32 −6.02 143
Ea 6733 ± 599kst −6.21 × 10⁻³ ± 3.81 × 10⁻²
Model 5A (Eqs. (5) and (6)) ln k10 7.68 ± 0.83 0.25 −6.27 209Ea 6723 ± 448K2 7.73 × 10⁻¹ ± 1.55 × 10⁻¹
Model 5B (Eqs. (5) and (6)) ln k10 5.17 ± 4.62 0.24 −6.19 127Ea1 5241 ± 2620ln K20 −7.40 ± 11.26Ea2 −3878 ± 6702
Model 6 (Eqs. (5) and (7)) ln k10 8.14 ± 0.69 0.16 −6.60 238Ea 7209 ± 374K2 3.87 × 10⁻¹ ± 6.47 × 10⁻²
kst 1.32 × 10⁻¹ ± 1.02 × 10⁻²
Model 7 (Eqs. (5) and (8)) ln k10 8.22 ± 0.67 0.15 −6.66 253Ea 7268 ± 364
0−1 ±0−1 ±
N
afccsaimbmpIamhormk
K2 3.39 × 1kst 2.81 × 1
ote: Ea (J mol−1); K2 (L mol−1); T (K); kst (dimensionless).
nd at longer times second-order kinetics is able to fit well data. Inact, the first order model constant shows an inverse trend whenompared to the second order one, while no trend with glyceroloncentration is observed in the hyperbolic model numerator con-tant. In this kind of models, the denominator constant usuallyccounts for a physical phenomenon: adsorption in LHHW models,ntermediate complex formation in Michaelis–Menten kinetics, to
ention a couple. In this case, where the system is not catalyticy nature, the constant K2 in the denominator could be reflectingass transfer or solubilization phenomena, being this an empirical
arameter (thus, it is not deduced from any reaction mechanism).n fact, rosin acids and glycerol, as well as other alcohols usu-lly employed to produce esters of such acids may be not totallyiscible with each other due to their difference in polarity. The
yperbolic model suggests that, at the initial reaction period, firstrder with respect to rosin is enough to fit data, while at longereaction times a second order model is needed. The second orderodel (first order with respect to each reagent) is the classical
inetic model in esterification when both reagents are in the same
5.65 × 10⁻²
2.11 × 10⁻²
phase. The first order model suggest that glycerol concentration isnot changing at the beginning of the reaction, so the liquid phasewhere the reaction takes place seems to be saturated with glycerol.In this situation, a high glycerol concentration at the beginning ofeach run implies that the second term in the denominator prevailsover the first one. This means that not all of the added glycerol issolubilized into the rosin phase, where the reaction proceeds. Actu-ally, as shown by the evolution of monoglycerides and diglycerides,once the hydroxyl moieties are solubilized into the acid phase, reac-tions occur at a very fast rate, yielding triglycerides, especially inwhat concerns monoglycerides. Thus, the hyperbolic model leadsto a better fit because it can reflect empirically this transition froma pseudo-first order model to the classical second order model.
The parameter in the denominator, K2, could reflect the sol-
ubility of the glycerol into the rosin phase. Its variation withtemperature supports this, as fittings of hyperbolic kinetic modelsconsidering or not change with temperature to experimental datastrongly suggest that this parameter is not a function of tempera-ture (higher value of F, lower value of AICc). While kinetic constants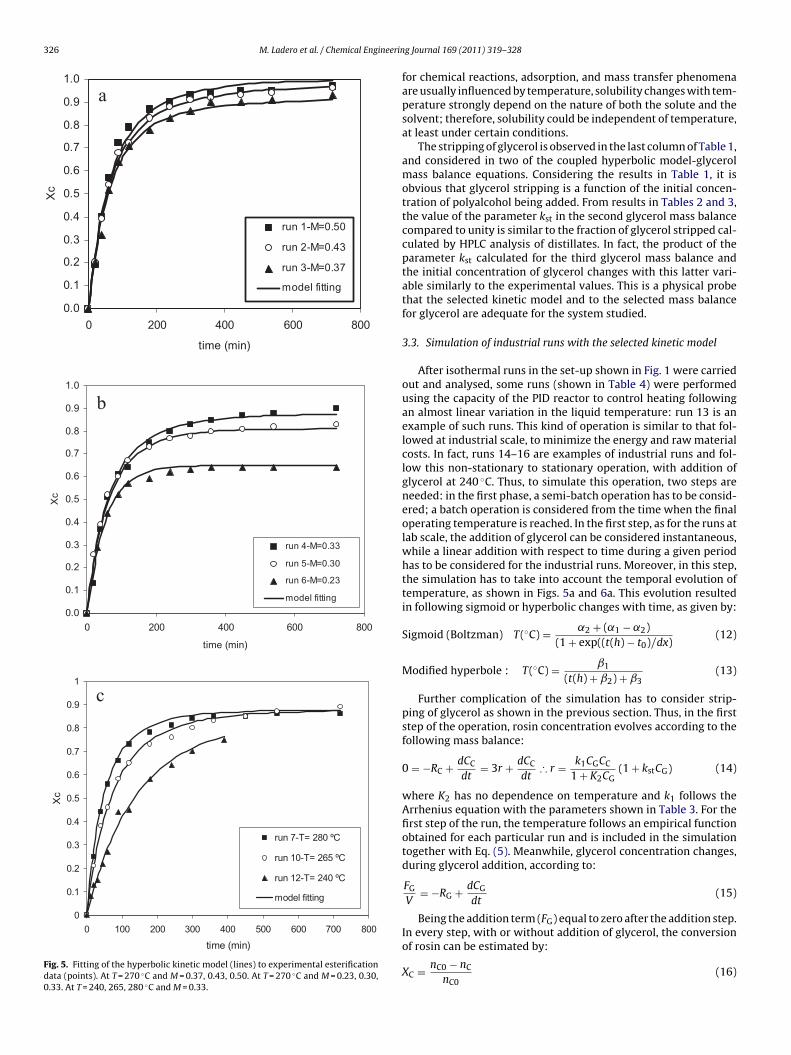
326 M. Ladero et al. / Chemical Engineerin
0.0
0.1
0.2
0.3
0.4
0.5
0.6
0.7
0.8
0.9
1.0
0 200 400 600 800
time (min)
Xc
run 1-M=0.50
run 2-M=0.43
run 3-M=0.37
model fitting
a
0.0
0.1
0.2
0.3
0.4
0.5
0.6
0.7
0.8
0.9
1.0
0 200 400 600 800
time (min)
Xc
run 4-M=0.33
run 5-M=0.30
run 6-M=0.23
model fitting
b
0
0.1
0.2
0.3
0.4
0.5
0.6
0.7
0.8
0.9
1
0 100 200 300 400 500 600 700 800
time (min)
Xc
run 7-T= 280 ºC
run 10-T= 265 ºC
run 12-T= 240 ºC
model fitting
c
Fig. 5. Fitting of the hyperbolic kinetic model (lines) to experimental esterificationdata (points). At T = 270 ◦C and M = 0.37, 0.43, 0.50. At T = 270 ◦C and M = 0.23, 0.30,0.33. At T = 240, 265, 280 ◦C and M = 0.33.
g Journal 169 (2011) 319–328
for chemical reactions, adsorption, and mass transfer phenomenaare usually influenced by temperature, solubility changes with tem-perature strongly depend on the nature of both the solute and thesolvent; therefore, solubility could be independent of temperature,at least under certain conditions.
The stripping of glycerol is observed in the last column of Table 1,and considered in two of the coupled hyperbolic model-glycerolmass balance equations. Considering the results in Table 1, it isobvious that glycerol stripping is a function of the initial concen-tration of polyalcohol being added. From results in Tables 2 and 3,the value of the parameter kst in the second glycerol mass balancecompared to unity is similar to the fraction of glycerol stripped cal-culated by HPLC analysis of distillates. In fact, the product of theparameter kst calculated for the third glycerol mass balance andthe initial concentration of glycerol changes with this latter vari-able similarly to the experimental values. This is a physical probethat the selected kinetic model and to the selected mass balancefor glycerol are adequate for the system studied.
3.3. Simulation of industrial runs with the selected kinetic model
After isothermal runs in the set-up shown in Fig. 1 were carriedout and analysed, some runs (shown in Table 4) were performedusing the capacity of the PID reactor to control heating followingan almost linear variation in the liquid temperature: run 13 is anexample of such runs. This kind of operation is similar to that fol-lowed at industrial scale, to minimize the energy and raw materialcosts. In fact, runs 14–16 are examples of industrial runs and fol-low this non-stationary to stationary operation, with addition ofglycerol at 240 ◦C. Thus, to simulate this operation, two steps areneeded: in the first phase, a semi-batch operation has to be consid-ered; a batch operation is considered from the time when the finaloperating temperature is reached. In the first step, as for the runs atlab scale, the addition of glycerol can be considered instantaneous,while a linear addition with respect to time during a given periodhas to be considered for the industrial runs. Moreover, in this step,the simulation has to take into account the temporal evolution oftemperature, as shown in Figs. 5a and 6a. This evolution resultedin following sigmoid or hyperbolic changes with time, as given by:
Sigmoid (Boltzman) T(◦C) = ˛2 + (˛1 − ˛2)(1 + exp((t(h) − t0)/dx)
(12)
Modified hyperbole : T(◦C) = ˇ1
(t(h) + ˇ2) + ˇ3(13)
Further complication of the simulation has to consider strip-ping of glycerol as shown in the previous section. Thus, in the firststep of the operation, rosin concentration evolves according to thefollowing mass balance:
0 = −RC + dCC
dt= 3r + dCC
dt∴ r = k1CGCC
1 + K2CG(1 + kstCG) (14)
where K2 has no dependence on temperature and k1 follows theArrhenius equation with the parameters shown in Table 3. For thefirst step of the run, the temperature follows an empirical functionobtained for each particular run and is included in the simulationtogether with Eq. (5). Meanwhile, glycerol concentration changes,during glycerol addition, according to:
FG
V= −RG + dCG
dt(15)
Being the addition term (F ) equal to zero after the addition step.
GIn every step, with or without addition of glycerol, the conversionof rosin can be estimated by:XC = nC0 − nC
nC0(16)

M. Ladero et al. / Chemical Engineering Journal 169 (2011) 319–328 327
Table 4Non isothermal runs (transient temperature) at pilot plant and industrial scale: operational conditions and values of the stripping coefficient.
Run Scale nC0 (kmol) FG (mol min−1) � (h) T0 (◦C) kst
13 Pilot plant 0.001 – – 180 4.91 × 10⁻² ± 1.03 × 10⁻²
14 Industry 26.2 63 3 255.5 4.13 × 10⁻¹ ± 5.62 × 10⁻²
15 Industry 26.6 94 2 240 4.01 × 10⁻¹ ± 6.15 × 10⁻²
16 Industry 27.6 98 2 225.7 3.32 × 10⁻¹ ± 28 × 10−2
150
170
190
210
230
250
270
290
0 50 100 150 200 250 300time (min)
T (º
C)
T profile
Boltzmann function fit
0.00.10.20.30.40.50.60.70.80.91.0
0 50 100 150 200 250 300time (min)
Xc
data run 13simulation run 13
a
b
FBeb
bsoiovpi
aompp
200
220
240
260
280
0 200 400 600 800 1000time (min)
T (º
C)
T profile data run 14
T profile data run 15
T profile data run 16
T profile fitting
0.00
0.10
0.20
0.30
0.40
0.50
0.60
0.70
0.80
0.90
1.00
0 200 400 600 800time (min)
Xc
Data run 14Data run 15Data run 16Simulation run 14Simulation run 15Simulation run 16
a
b
ig. 6. Transient operation at laboratory pilot plant scale (run 13): (a) fitting tooltzmann function of the temporal temperature profile; (b) simulation (line) ofxperimental data (points) with the selected hyperbolic model and glycerol massalance.
To simplify the simulation, the volume of the reacting liquid haseen considered to be that of the added rosin. This is so because iteems that reactions proceed in the rosin phase (at the beginningf each run, it seems that not all the added glycerol is solubilizednto the rosin phase). Other reasons are the relatively low volumef glycerol compared to that of rosin and the reduction of the totalolume due to water and turpentine evaporation, linked to strip-ing of some of the added glycerol. Thus, a maximum error of 5% is
ntroduced in the simulation due to this simplification.In Fig. 6, the fitting of temperature (◦C) with time is shown
long with a simulation of transient temperature for run 13, at lab-ratory scale, where the selected couple kinetic model–glycerolass balance is taken into account. In this case, as in the runs
erformed at industrial scale, the term accounting for the strip-ing of glycerol is calculated as the reactor is different from the
Fig. 7. Transient operation at industrial scale: (a) fitting of functions to the tempo-ral temperature profiles in runs 14–16; (b) simulation (line) of experimental data(points) with the selected hyperbolic model and glycerol mass balance.
former, as reflux of condensates returning into the reaction liq-uid could depend on the reactor set up used in each occasion. Forthe runs performed at industrial scale (in the plant of LURESA inCoca, Segovia) identical simulations have been performed, as canbe seen in Fig. 7. In all cases, considering a stripping of glycerolproportional to the glycerol concentration in the reacting liquidand to the rate of consumption of rosin (or production of water)led to an adequate simulation of the transient process. For all thecases, results are shown in Table 4, showing that little stripping
of glycerol is observed in the laboratory bench pilot plant, whilethis phenomenon is much more important in the industrial reac-tor. This could be due to the fact that in the pilot plant reactor, refluxof condensates is partly allowed, while no reflux is observed in the
3 ineerin
ia
4
ewiiupwtnei
tceastsA
ailso
A
afr0
R
[
[
[
[
[
[
[
[[
[
[
[
[
[
[
28 M. Ladero et al. / Chemical Eng
ndustrial reactor (only a 20% free volume over the reacting liquidnd no condenser attached to the head of the reactor).
. Conclusions
The kinetic study of the esterification of rosin acids and glyc-rol was performed at laboratory and industrial scale. For obtainingider information of the temporal evolution of chemical species
n the reaction mixture, NMR, ionic HPLC and GPC–HPLC analyt-cal methods have been successfully employed. The latter, whensing relative areas of the peaks of rosin acids and esters, hasroved that the amount of mono- and di-ester species in the liquidas always low enough to consider that glycerol evolves directly
o triglycerides. Moreover, when compared to the standard “acidumber” titration method, GPC–HPLC has proved to be robustnough, while being more automatic and, thus, less prone to exper-mental error.
A set of runs at several glycerol to rosin molar ratio values andemperatures have allowed to select a hyperbolic kinetic modeloupled with a glycerol mass balance in which stripping of glyc-rol occurs after a discrimination between several kinetic modelsnd glycerol mass balances. In the selected glycerol mass balance,tripping of the polyalcohol was proportional to reaction rate ando the concentration of the polyalcohol at a given time. Physical andtatistical criteria (standard error of parameters, Fischer’s F95 andkaike’s AICc) were used for such discrimination.
Afterwards, transient temperature runs have been performedt lab and industrial scale and fitting of the selected model (leav-ng kst as fitting parameter) led to their adequate simulations. Atab scale, glycerol stripping was reduced, while at industrial scale,tripping of glycerol was of importance. This could be due to refluxf condensates inside each reactor set-up.
cknowledgments
Financial support from the Spanish Ministry of Educationnd from LURESA (through project PETRI 95-0821.OP) is grate-ully acknowledged. Moreover, the authors want to extent thisecognition to the Spanish Ministry of Environment (project MMA-392063-11.2) for further financial support.
eferences
[1] E.J. Soltes, D.F. Zinkel, Chemistry of rosin, in: D.F. Zinkel, J. Russell (Eds.), NavalStores: Production, Chemistry, Utilization, Pulp Chemicals Association, NewYork, 1989, pp. 261–320.
[2] S. Zhaobang, Production and Standards for Chemican Non-Wood Forest Prod-ucts in China, CIFOR report no. 6, 1995, ISSN 0854-9818.
[
[
g Journal 169 (2011) 319–328
[3] D.F. Zinkel, J. Russell (Eds.), Naval Stores: Production, Chemistry, Utilization.Section 5: Rosin Utilization, Pulp Chemicals Association, New York, 1989.
[4] V.T. Dhanorkar, R.S. Gawande, B.B. Gogte, A.K. Dorle, Development and char-acterization of rosin-based polymer and its application as a cream base, J.Cosmetic Sci. 53 (2002) 199–208.
[5] C. Li, W. Li, H. Wang, D. Zhang, Z. Li, Effects of rosin-type nucleating agent andlow density polyethylene on the crystallization process of polypropylene, J.Appl. Polym. Sci. 88 (2003) 2804–2809.
[6] S.V. Fulzele, P.M. Satturwar, A.K. Dorle, Polymerized rosin: novel film formingpolymer for drug delivery, Int. J. Pharma 249 (2002) 175–184.
[7] N. Yuanmei, Y. Xingdong, L. Fuhou, Sonochemical synthesis of maleated rosin,Chin. J. Chem. Eng. 16 (2008) 365–368.
[8] S. Liu, C. Xie, S. Yu, F. Liu, Dimerization of rosin using Brønsted–Lewis acidicionic liquid as catalyst, Catal. Commun. 9 (2008) 2030–2034.
[9] L. Wang, X. Chen, J. Liang, Y. Chen, X. Pu, Z. Tong, Kinetics of the catalytic iso-merization and disproportionation of rosin over carbon-supported palladium,Chem. Eng. J. 152 (2009) 242–250.
10] Y. Caili, Z. Faai, Preparation and characterization of rosin glycerin ester and itsbromide, Front. Chem. China 2 (2006) 158–160.
11] F. Wang, T. Kitaoka, H. Tanaka, Supramolecular structure and sizing per-formance of rosin based emulsion size microparticles, Colloids Surf. A:Physicochem. Eng. Aspects 221 (2003) 19–28.
12] F. Aran-Ais, A.M. Torro-Palau, A.C. Orgiles-Barcelo, J.M. Martin Martinez, Syn-thesis and characterization of new thermoplastic polyurethane adhesivescontaining rosin resin as an internal tackifier, J. Adhes. Sci. Technol. 14 (2000)1557–1573.
13] M. Pagliaro, M. Rossi, The future of glycerol: new uses of a versatile raw material,in: RSC Green Chemistry Book Series, RSC Publishing, Cambridge, 2008.
14] U. Nilsson, N. Berglund, F. Lindahl, S. Axelsson, T. Redeby, P. Lassen, A.-T. Karl-berg, SPE and HPLC/UV of resin acids in colophonium-containing products, J.Sep. Sci. 31 (2008) 2784–2790.
15] A. Findeisen, V. Kolivoska, I. Kaml, W. Baatz, E. Kenndler, Analysis of diterpenoiccompounds in natural resins applied as binders in museum objects by capillaryelectrophoresis, J. Chromatogr. A 1157 (2007) 454–461.
16] Y. Kumooka, Analysis of rosin and modified rosin esters in adhesives by matrix-assisted laser desorption/ionization time-of-flight mass spectrometry (MALDI-TOF-MS), Forensic Sci. Int. 176 (2008) 111–120.
17] R.P. Carter, Rosin ester development, Ind. Eng. Chem. 37 (1945) 448–465.18] P. Flory, Kinetics of condensation polymerization: the reaction of ethylene gly-
col with succinic acid, J. Am. Chem. Soc. 59 (1937) 466–470.19] A.T. Williamson, C.N. Hinselwood, The kinetics of esterification. The reaction
between acetic acid and methyl alcohol catalysed by hydrions, J. Chem. Soc. 23(1934) 587–590.
20] M. Berrios, J. Siles, M.A. Martin, A. Martin, A kinetic study of the esterificationof free fatty acids (FFA) in sunflower oil, Fuel 86 (2007) 2383–2388.
21] T. Salmi, E. Paatero, P. Nyholma, Kinetic model for the increase of reaction orderduring polyesterification, Chem. Eng. Process. 43 (2004) 1487–1493.
22] T.L. Smith, J.H. Elliot, The kinetics of esterification of resin acids, J. Am. Oil Chem.Soc. 35 (1958) 692–699.
23] H. Akaike, Canonical correlation analysis of time series and the use of an infor-mation criterion, in: R.K. Mehra, D.G. Lainotis (Eds.), System Identification:Advances and Case Studies. Academic Press, New York, NY. 1976, pp 27–96.
24] B. Saha, P. Chowdhry, A.K. Ghoshal, Al-MCM-41 catalyzed decomposition ofpolypropylene and hybrid genetic algorithm for kinetics analysis, Appl. Catal.B: Environ. 83 (2008) 265–276.
25] B. Saha, P.K. Reddy, A.K. Ghoshal, Hybrid genetic algorithm to find the bestmodel and the globally optimized overall kinetics parameters for thermaldecomposition of plastics, Chem. Eng. J. 138 (2008) 20–29.
26] J.J. Knol, J.P.H. Linssen, M.A.J.S. van Boekel, Unravelling the kinetics of the for-mation of acrylamide in the Maillard reaction of fructose and asparagine bymultiresponse modelling, Food Chem. 120 (2010) 1047–1057.