Kinematic Analysis of Speech Sound Sequencing Errors ...
17
JSLHR Research Article Kinematic Analysis of Speech Sound Sequencing Errors Induced by Delayed Auditory Feedback Gabriel J. Cler, a,b Jackson C. Lee, c Talia Mittelman, d Cara E. Stepp, a,b,d,e and Jason W. Bohland a,b,c Purpose: Delayed auditory feedback (DAF) causes speakers to become disfluent and make phonological errors. Methods for assessing the kinematics of speech errors are lacking, with most DAF studies relying on auditory perceptual analyses, which may be problematic, as errors judged to be categorical may actually represent blends of sounds or articulatory errors. Method: Eight typical speakers produced nonsense syllable sequences under normal and DAF (200 ms). Lip and tongue kinematics were captured with electromagnetic articulography. Time-locked acoustic recordings were transcribed, and the kinematics of utterances with and without perceived errors were analyzed with existing and novel quantitative methods. Results: New multivariate measures showed that for 5 participants, kinematic variability for productions perceived to be error free was significantly increased under delay; these results were validated by using the spatiotemporal index measure. Analysis of error trials revealed both typical productions of a nontarget syllable and productions with articulatory kinematics that incorporated aspects of both the target and the perceived utterance. Conclusions: This study is among the first to characterize articulatory changes under DAF and provides evidence for different classes of speech errors, which may not be perceptually salient. New methods were developed that may aid visualization and analysis of large kinematic data sets. Supplemental Material: https://doi.org/10.23641/asha.5103067 This special issue contains selected papers from the March 2016 Conference on Motor Speech held in Newport Beach, CA. F luent speech incorporates the reception of speakers’ own productions via auditory feedback. When external auditory feedback is delayed by approxi- mately 200 ms, speakers reduce their speech rates and produce errors in speech output, including disfluencies and phonological sequencing errors (Fairbanks, 1955; Yates, 1963). However, the delayed auditory feedback (DAF) effects remain poorly understood and cannot be readily explained by contemporary models of speech motor control (e.g., Guenther, Ghosh, & Tourville, 2006; Hickok, 2012; Hickok, Houde, & Rong, 2011; Houde & Nagarajan, 2011; Saltzman & Munhall, 1989; Tilsen, 2013). These models tend to lack either the specification of mechanisms for sequenc- ing multiple sounds in a speech plan (Guenther et al., 2006; Hickok, 2012; Hickok et al., 2011; Houde & Nagarajan, 2011), which are essential to explaining the observed discrete serial order errors, or do not explicitly address the use of online auditory feedback (Saltzman & Munhall, 1989; Tilsen, 2013). Although the Gradient Order DIVA model (Direc- tions Into Velocities of Articulators; Bohland, Bullock, & Guenther, 2010) extends the DIVA speech motor control framework (Guenther et al., 2006) to address how the brain may plan and produce sequences of speech sounds, it does not yet account for the effects of DAF due to an incom- plete treatment of the auditory-perceptual system. Speech Sequencing and Auditory Feedback: Theoretical Framework The production of speech sequences is thought to involve a phonological encoding stage, in which the con- tent of the planned utterance is represented at an abstract level (i.e., a phoneme sequence), which is then used to address and select learned motor programs for articulation a Graduate Program for Neuroscience–Computational Neuroscience, Boston University, MA b Department of Speech, Language, and Hearing Sciences, Boston University, MA c Department of Health Sciences, Boston University, MA d Department of Biomedical Engineering, Boston University, MA e School of Medicine, Department of Otolaryngology–Head and Neck Surgery, Boston University, MA Correspondence to Gabriel J. Cler: [email protected] Editor: Yana Yunusova Associate Editor: Jeffrey Berry Received June 14, 2016 Revision received October 7, 2016 Accepted November 16, 2016 https://doi.org/10.1044/2017_JSLHR-S-16-0234 Disclosure: The authors have declared that no competing interests existed at the time of publication. Journal of Speech, Language, and Hearing Research • Vol. 60 • 1695–1711 • June 2017 • Copyright © 2017 American Speech-Language-Hearing Association 1695 Special Issue: Selected Papers From the 2016 Conference on Motor Speech—Basic and Clinical Science and Technology Complimentary Author PDF: Not for Broad Dissemination
-
Upload
khangminh22 -
Category
Documents
-
view
2 -
download
0
Transcript of Kinematic Analysis of Speech Sound Sequencing Errors ...

Complimentary Author PDF: Not for Broad Dissemination
JSLHR
Research Article
Kinematic Analysis of Speech Sound SequencingErrors Induced by Delayed Auditory Feedback
Gabriel J. Cler,a,b Jackson C. Lee,c Talia Mittelman,d
Cara E. Stepp,a,b,d,e and Jason W. Bohlanda,b,c
Purpose: Delayed auditory feedback (DAF) causesspeakers to become disfluent and make phonologicalerrors. Methods for assessing the kinematics of speecherrors are lacking, with most DAF studies relying onauditory perceptual analyses, which may be problematic,as errors judged to be categorical may actually representblends of sounds or articulatory errors.Method: Eight typical speakers produced nonsensesyllable sequences under normal and DAF (200 ms). Lipand tongue kinematics were captured with electromagneticarticulography. Time-locked acoustic recordings weretranscribed, and the kinematics of utterances with andwithout perceived errors were analyzed with existing andnovel quantitative methods.
aGraduate Program for Neuroscience–Computational Neuroscience,Boston University, MAbDepartment of Speech, Language, and Hearing Sciences, BostonUniversity, MAcDepartment of Health Sciences, Boston University, MAdDepartment of Biomedical Engineering, Boston University, MAeSchool of Medicine, Department of Otolaryngology–Head and NeckSurgery, Boston University, MA
Correspondence to Gabriel J. Cler: [email protected]
Editor: Yana YunusovaAssociate Editor: Jeffrey Berry
Received June 14, 2016Revision received October 7, 2016Accepted November 16, 2016https://doi.org/10.1044/2017_JSLHR-S-16-0234
Journal of Speech, Language, and Hearing Research • Vol. 60 • 1695–1711 • June 2017
Special Issue: Selected Papers From the 2016 Conference on M
Results: New multivariate measures showed that for5 participants, kinematic variability for productions perceivedto be error free was significantly increased under delay;these results were validated by using the spatiotemporalindex measure. Analysis of error trials revealed both typicalproductions of a nontarget syllable and productions witharticulatory kinematics that incorporated aspects of both thetarget and the perceived utterance.Conclusions: This study is among the first to characterizearticulatory changes under DAF and provides evidencefor different classes of speech errors, which may not beperceptually salient. New methods were developed that mayaid visualization and analysis of large kinematic data sets.Supplemental Material: https://doi.org/10.23641/asha.5103067
pecial issue contains selected papers from the March 2016rence on Motor Speech held in Newport Beach, CA.
This sConfe
F luent speech incorporates the reception of speakers’own productions via auditory feedback. Whenexternal auditory feedback is delayed by approxi-
mately 200 ms, speakers reduce their speech rates andproduce errors in speech output, including disfluenciesand phonological sequencing errors (Fairbanks, 1955; Yates,1963). However, the delayed auditory feedback (DAF)effects remain poorly understood and cannot be readilyexplained by contemporary models of speech motor control(e.g., Guenther, Ghosh, & Tourville, 2006; Hickok, 2012;
Hickok, Houde, & Rong, 2011; Houde & Nagarajan, 2011;Saltzman & Munhall, 1989; Tilsen, 2013). These models tendto lack either the specification of mechanisms for sequenc-ing multiple sounds in a speech plan (Guenther et al., 2006;Hickok, 2012; Hickok et al., 2011; Houde & Nagarajan,2011), which are essential to explaining the observed discreteserial order errors, or do not explicitly address the use ofonline auditory feedback (Saltzman & Munhall, 1989; Tilsen,2013). Although the Gradient Order DIVA model (Direc-tions Into Velocities of Articulators; Bohland, Bullock, &Guenther, 2010) extends the DIVA speech motor controlframework (Guenther et al., 2006) to address how the brainmay plan and produce sequences of speech sounds, it doesnot yet account for the effects of DAF due to an incom-plete treatment of the auditory-perceptual system.
Speech Sequencing and Auditory Feedback:Theoretical Framework
The production of speech sequences is thought toinvolve a phonological encoding stage, in which the con-tent of the planned utterance is represented at an abstractlevel (i.e., a phoneme sequence), which is then used toaddress and select learned motor programs for articulation
Disclosure: The authors have declared that no competing interests existed at the timeof publication.
• Copyright © 2017 American Speech-Language-Hearing Association 1695otor Speech—Basic and Clinical Science and Technology
Complimentary Author PDF: Not for Broad Dissemination
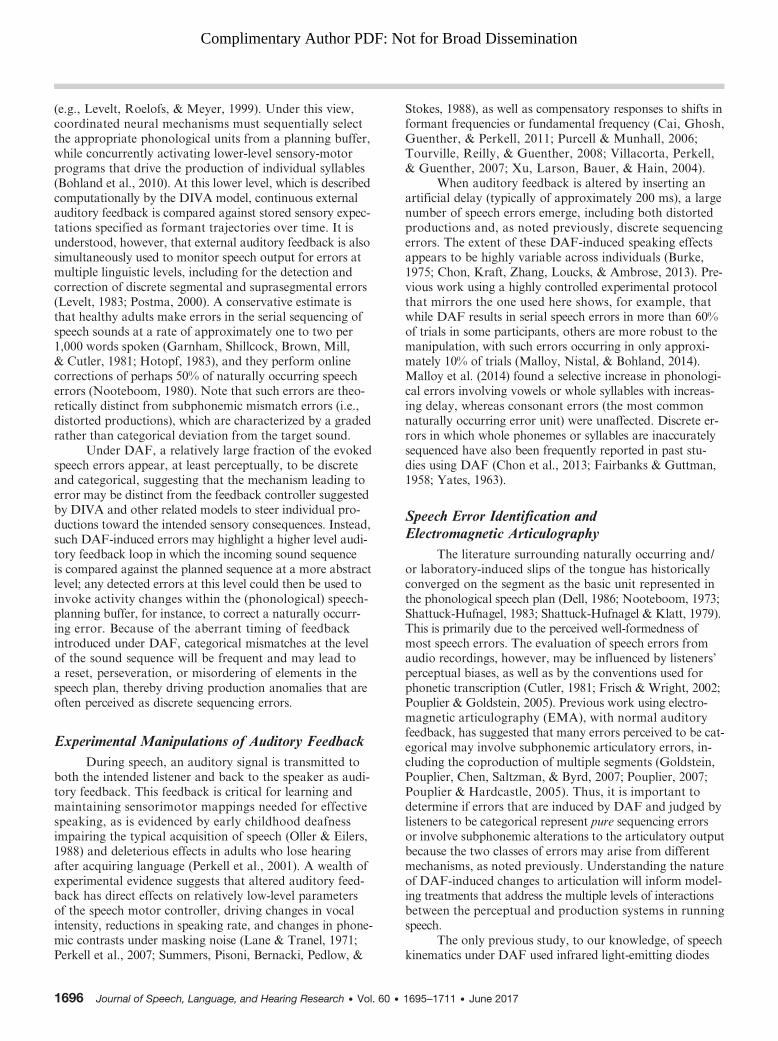
(e.g., Levelt, Roelofs, & Meyer, 1999). Under this view,coordinated neural mechanisms must sequentially selectthe appropriate phonological units from a planning buffer,while concurrently activating lower-level sensory-motorprograms that drive the production of individual syllables(Bohland et al., 2010). At this lower level, which is describedcomputationally by the DIVA model, continuous externalauditory feedback is compared against stored sensory expec-tations specified as formant trajectories over time. It isunderstood, however, that external auditory feedback is alsosimultaneously used to monitor speech output for errors atmultiple linguistic levels, including for the detection andcorrection of discrete segmental and suprasegmental errors(Levelt, 1983; Postma, 2000). A conservative estimate isthat healthy adults make errors in the serial sequencing ofspeech sounds at a rate of approximately one to two per1,000 words spoken (Garnham, Shillcock, Brown, Mill,& Cutler, 1981; Hotopf, 1983), and they perform onlinecorrections of perhaps 50% of naturally occurring speecherrors (Nooteboom, 1980). Note that such errors are theo-retically distinct from subphonemic mismatch errors (i.e.,distorted productions), which are characterized by a gradedrather than categorical deviation from the target sound.
Under DAF, a relatively large fraction of the evokedspeech errors appear, at least perceptually, to be discreteand categorical, suggesting that the mechanism leading toerror may be distinct from the feedback controller suggestedby DIVA and other related models to steer individual pro-ductions toward the intended sensory consequences. Instead,such DAF-induced errors may highlight a higher level audi-tory feedback loop in which the incoming sound sequenceis compared against the planned sequence at a more abstractlevel; any detected errors at this level could then be used toinvoke activity changes within the (phonological) speech-planning buffer, for instance, to correct a naturally occurr-ing error. Because of the aberrant timing of feedbackintroduced under DAF, categorical mismatches at the levelof the sound sequence will be frequent and may lead toa reset, perseveration, or misordering of elements in thespeech plan, thereby driving production anomalies that areoften perceived as discrete sequencing errors.
Experimental Manipulations of Auditory FeedbackDuring speech, an auditory signal is transmitted to
both the intended listener and back to the speaker as audi-tory feedback. This feedback is critical for learning andmaintaining sensorimotor mappings needed for effectivespeaking, as is evidenced by early childhood deafnessimpairing the typical acquisition of speech (Oller & Eilers,1988) and deleterious effects in adults who lose hearingafter acquiring language (Perkell et al., 2001). A wealth ofexperimental evidence suggests that altered auditory feed-back has direct effects on relatively low-level parametersof the speech motor controller, driving changes in vocalintensity, reductions in speaking rate, and changes in phone-mic contrasts under masking noise (Lane & Tranel, 1971;Perkell et al., 2007; Summers, Pisoni, Bernacki, Pedlow, &
1696 Journal of Speech, Language, and Hearing Research • Vol. 60 •
Stokes, 1988), as well as compensatory responses to shifts informant frequencies or fundamental frequency (Cai, Ghosh,Guenther, & Perkell, 2011; Purcell & Munhall, 2006;Tourville, Reilly, & Guenther, 2008; Villacorta, Perkell,& Guenther, 2007; Xu, Larson, Bauer, & Hain, 2004).
When auditory feedback is altered by inserting anartificial delay (typically of approximately 200 ms), a largenumber of speech errors emerge, including both distortedproductions and, as noted previously, discrete sequencingerrors. The extent of these DAF-induced speaking effectsappears to be highly variable across individuals (Burke,1975; Chon, Kraft, Zhang, Loucks, & Ambrose, 2013). Pre-vious work using a highly controlled experimental protocolthat mirrors the one used here shows, for example, thatwhile DAF results in serial speech errors in more than 60%of trials in some participants, others are more robust to themanipulation, with such errors occurring in only approxi-mately 10% of trials (Malloy, Nistal, & Bohland, 2014).Malloy et al. (2014) found a selective increase in phonologi-cal errors involving vowels or whole syllables with increas-ing delay, whereas consonant errors (the most commonnaturally occurring error unit) were unaffected. Discrete er-rors in which whole phonemes or syllables are inaccuratelysequenced have also been frequently reported in past stu-dies using DAF (Chon et al., 2013; Fairbanks & Guttman,1958; Yates, 1963).
Speech Error Identification andElectromagnetic Articulography
The literature surrounding naturally occurring and/or laboratory-induced slips of the tongue has historicallyconverged on the segment as the basic unit represented inthe phonological speech plan (Dell, 1986; Nooteboom, 1973;Shattuck-Hufnagel, 1983; Shattuck-Hufnagel & Klatt, 1979).This is primarily due to the perceived well-formedness ofmost speech errors. The evaluation of speech errors fromaudio recordings, however, may be influenced by listeners’perceptual biases, as well as by the conventions used forphonetic transcription (Cutler, 1981; Frisch & Wright, 2002;Pouplier & Goldstein, 2005). Previous work using electro-magnetic articulography (EMA), with normal auditoryfeedback, has suggested that many errors perceived to be cat-egorical may involve subphonemic articulatory errors, in-cluding the coproduction of multiple segments (Goldstein,Pouplier, Chen, Saltzman, & Byrd, 2007; Pouplier, 2007;Pouplier & Hardcastle, 2005). Thus, it is important todetermine if errors that are induced by DAF and judged bylisteners to be categorical represent pure sequencing errorsor involve subphonemic alterations to the articulatory outputbecause the two classes of errors may arise from differentmechanisms, as noted previously. Understanding the natureof DAF-induced changes to articulation will inform model-ing treatments that address the multiple levels of interactionsbetween the perceptual and production systems in runningspeech.
The only previous study, to our knowledge, of speechkinematics under DAF used infrared light-emitting diodes
1695–1711 • June 2017

Figure 1. Positions of electromagnetic articulography (EMA) sensors.Reference (REF) sensors were placed on left and right mastoids andgingiva of upper incisors. Articulatory sensors were placed on thetongue tip (TT), tongue dorsum (TD), upper lip (UL), lower lip (LL), andleft corner of the mouth (LC).
Complimentary Author PDF: Not for Broad Dissemination
placed on the lips and jaw only (Sasisekaran, 2012). In thisstudy, participants read nonwords with typical auditoryfeedback, under delay of 200 ms, or with gated feedback inwhich the auditory feedback was turned off and on at 2 Hz.Lip aperture was evaluated in the different conditions,and aperture variability was higher under delay than in non-delay or gated conditions. Note that only trials withoutperceptual errors were evaluated, and the participants withthe highest error rates were excluded. Indeed, most exist-ing articulographic studies employ measures of the kine-matics of speech (e.g., spatiotemporal index [STI]) thatdisregard speech error data, with a few notable exceptions(Goldstein et al., 2007; Pouplier, 2007); as such, quantita-tive methods for conducting kinematic analyses of errorfulspeech are currently lacking.
The primary goals of this study were to develop andapply data-driven methods to determine how DAF affectssyllable articulations in a highly controlled speaking task andto determine how articulations varied during productionsdeemed by listeners to be correct productions, distorted ver-sions of correct syllables, or syllables that involved categoricalsound errors. Though limited in the number of participants(eight), this approach produced hundreds of speech tokensper participant, enabling meaningful within-participantanalyses. Listeners transcribed the speech produced, andsyllables were classified as correct productions, graded dis-tortions, or categorical errors. We examined nonerror trialsusing STI and used a multivariate approach to analyze bothnonerror and errorful speech tokens. We examined the“landscape” of these productions reflecting trial-to-trialarticulatory variability and compared productions perceivedto be error free with and without DAF. We also examinedthe articulatory kinematics of distortion and categoricalerrors in relation to canonical productions of the target andtranscribed syllables. Although aspects of this work areexploratory in nature and will require further study, herewe have demonstrated a novel approach to assessing errorsunder DAF, while providing results that demonstrate amixture of both graded and strictly categorical speech errors.
MethodParticipants
Eight healthy young adults (three women, five men;M age = 24.5 years, range 19–33 years), participated in theexperiment. All participants were native American Englishspeakers and reported no history of speech, language, orhearing impairments. Participants provided written consentin compliance with the Boston University InstitutionalReview Board.
Data CollectionSimultaneous speech acoustics and articulator posi-
tion data were recorded by using the NDI Wave SpeechResearch System (Northern Digital Inc., Waterloo, Ontario,Canada) in a sound-attenuating booth. Acoustic data weresampled at 22 kHz, and kinematic data were sampled at
Cle
100 Hz. Eight EMA sensors were used, each of which cap-tured 5 df measurements. Three sensors used for head cor-rection were placed on the gingiva of the upper incisors andthe left and right mastoid processes. The position of eachparticipant’s maxillary occlusal plane with respect to thereference sensors was recorded by using a plastic mouthguard with three sensors attached: one at the front centerdirectly beneath the diastema of the front teeth and twoplaced symmetrically on either side, in the back of themouth guard, to fit beneath the molars. After the maxillaryocclusal plane was measured, the mouth guard was removed,and five EMA sensors were attached to articulators: tonguetip (TT), tongue dorsum (TD), upper lip (UL), lower lip(LL), and left corner of the mouth (see Figure 1). The sen-sor locations were chosen a priori to maximally differenti-ate between the six phonemes (/a/, /i/, /u/ and /b/, /d/, /z/; seeExperimental Protocol section for more details). The TTwas placed approximately 5 mm from the actual anteriortip of tongue. The TD was placed as far back as was feasi-ble, with individual variation, but at least 2 cm from TT.
The reference sensor on the gingiva and the five articu-latory sensors were attached with dental adhesive (high-viscosity PeriAcryl, GluStitch Inc., Delta, BC, Canada),whereas the two sensors on the mastoid processes wereattached with double-sided tape and medical tape. Aftersensors were attached, participants were fitted with a head-worn condenser microphone (Shure WH30XLR, ShureIncorporated, Niles, IL), electrostatic insert earphones(Sensimetrics S14, Sensimetrics Corporation, Malden,MA), and dielectric earmuffs (Howard Leight ThunderT3, Honeywell Safety Products, Smithfield, RI) that hada noise reduction rating of 30 dB.
Experimental ProtocolAcoustic signals were transmitted from the head-
mounted microphone to an external sound device (M-AudioFast Track Ultra, M-Audio, Cumberland, RI) connected toa laptop computer. The signal was amplified by +8 dB toattempt to overcome bone conduction (Cornelisse, Gagne,& Seewald, 1991) and transmitted to the earphones afterbeing temporally modified by an experimentally speci-fied delay. Auditory feedback delays were implemented
r et al.: Speech Sound Sequencing Errors Induced by DAF 1697
Complimentary Author PDF: Not for Broad Dissemination
using PsychPortAudio (Brainard, 1997), a software soundinterface available for the MATLAB Psychophysics Tool-box (MathWorks, Natick, MA), which utilizes AudioStream Input/Output drivers to obtain high temporal preci-sion and low latency playback. The feedback provided tothe participant in each trial was either presented in nearreal time (sound processors introduced an approximately14-ms delay; 25% of trials) or delayed by 200 ms (pseudo-random selection of 75% of the trials).
Participants repeated nonsense syllable sequences ata constrained pace. In each of the trials, participants re-peatedly produced one of 12 pseudorandomly chosenC1V1C2V2C3V3 nonsense sequences, with vowels chosenfrom /a/, /i/, and /u/ and voiced consonants chosen from /b/,/d/, and /z/. No phonemes were repeated in a given sequence.The 12 sequences were a priori chosen from the possibleset to constrain productions to six consonant–vowel (CV)syllables and 12 vowel–consonant–vowel (VCV) transitionsto produce as many repetitions of each utterance as possi-ble; the stimuli sequences were /biduza/, /bizadu/, /budazi/,/buzida/, /dabuzi/, /dazibu/, /dubiza/, /duzabi/, /zabidu/,/zadubi/, /zibuda/, and /zidabu/. Stimuli were orthographi-cally displayed on a monitor (e.g., “dah boo zee”) for 2 sbefore being removed and replaced with a visual metronome.One of the most commonly observed effects of DAF is anear immediate reduction in speech rate, a potential com-pensatory strategy (Black, 1951) that speakers use to reduceerror occurrences (i.e., trading off speed for accuracy). Suchrate reductions, however, may obscure the direct effect DAFhas on serial speech at typical speaking rates. The visualmetronome was, therefore, used to cue participants to pro-duce syllables at a steady rate in an attempt to counteractthis compensatory strategy. This cue appeared as three cir-cles positioned horizontally on the screen, sequentiallychanging colors at 5 Hz, and remaining on the screen forthe duration of a 3-s production period. During this produc-tion period, participants repeatedly produced the CVCVCVsequence with or without DAF.
Participants completed 360 trials across six runs, inbetween each of which was approximately a 3- to 5-minrest period. Three participants had sensors detach duringthe experiment; in these cases, the run was halted, and thesensor was reattached. During analysis, the larger set ofdata (i.e., before or after reattachment), was retained foranalysis and the remaining data were excluded. Reattach-ment of the sensor, even when placed within millimetersof its original position, generally introduced significantartifacts during analysis.
Data AnalysisTranscription
Authors used the speech analysis software Praat(Boersma & Weenink, 1996) to transcribe and mark onsetsof syllables, the primary unit of transcription and analysishere, within the recorded audio for each trial by viewingthe waveform and spectrogram and listening to the sample.Syllable onsets were located by marking the onset of high
1698 Journal of Speech, Language, and Hearing Research • Vol. 60 •
energy in the frequency spectrum, due to the burst of /d/and /b/ or the onset of the frication of /z/. Listeners thentranscribed each syllable heard with a closed set of pho-netic symbols in which productions of the set of phonemes(/b/, /d/, /z/, /a/, /i/, /u/ ) that were considered typical weremarked. Any atypical productions (of either consonantsor vowel segments) were marked with a separate symbol(@). Custom MATLAB software was used to automati-cally compare the transcription to the stimulus presentedto the participant to identify and classify errors.
Auditory-Perceptual Analysis andAutomated Error Identification
The second author transcribed recordings for all tri-als (consisting of three to four repetitions of C1V1C2V2C3V3
sequences) and participants, blinded to the stimulus. Anytrials in which transcriptions matched the stimulus exactly(i.e., the trial contained multiple correct productions ofthe entire sequence only) were marked (using automatedscripts as noted previously) as nonerrors. Trials in whichthe transcription differed from the stimulus within the firstthree syllables were defined as misremember errors anddiscarded; these discrepancies could be caused by the delay(and indeed their frequency of occurrence did increaseunder DAF) or by the participant forgetting which sequencethey had been prompted to produce.
All remaining trials in which the first transcriptiondiffered from the stimulus, suggesting an error occurred,were transcribed by the third author. Trials in which thefirst and second transcriptions differed in the identified typeof error were transcribed by the first author. Any errortrials that did not then have agreement between two of thethree transcribers were discarded. Any transcribed syllablesbefore the occurrence of an error syllable were considerednonerrors, and all syllables in the trial after the first tran-scribed error syllable were discarded. All transcribers werenative English speakers.
Errors were automatically detected and denoted ascontaining within-set phonemes or out-of-set phonemes.All syllables that were marked with an out-of-set character(@) were separately recategorized by the second transcriberinto two groups: (a) syllables containing an ill-formedin-set phoneme (i.e., a distortion) or (b) syllables contain-ing a well-formed out-of-set phoneme. All error produc-tions were categorized as in Table 1, including categoricalerrors, distortions, out-of-set errors, and artificial stutters.Two main classes of errors were selected for further analy-sis. The first were considered categorical errors, in whichtranscribers perceived the syllable as a properly formedCV with phonemes from the stimulus set, but these per-ceived phonemes did not match the target syllable withinthe prescribed stimulus. The second class of errors weredistortions, in which either the consonant or the vowel wasperceptibly distorted but did not cross perceptual catego-ries to be perceived as a different vowel. Well-formed ver-sions of out-of-set phonemes (e.g., d^) were not examinedfurther, as there were no nonerror data for such syllables.
1695–1711 • June 2017

Table 1. Types of discrepancies between stimulus and transcription.
Error type Description Example stimulus: bi du za
Categorical A produced syllable contains two phonemes from the stimuli set (/b/, /d/, /z/, /a/, /i/,/u/) but is different from the stimulus syllable. Can include vowel, consonant, orfull syllable repetitions, anticipations, or exchanges
bi bu zabi da za
Distortion A syllable contains a phoneme that is not clearly identifiable bi d@ zaOut of set a A syllable contains a phoneme that is perceptibly well-formed but was not present
in the stimulus setbi du z^
Artificial stuttera A disfluency where two consonants are produced without a clear vowel production bi d-du zaNo agreementa No two out of three transcriptions agreed on the nature of the errorMisrememberb An error in the first three syllables of a trial; could be caused by DAF or by the
participant forgetting which sequence to produce
Note. Categories of errors detected and analyzed under DAF in this study, with an example errorful sequence of each type.aThis type of error was not analyzed further in this study. bTrials classified as misremembers were discarded and not counted as errors ornonerrors.
Complimentary Author PDF: Not for Broad Dissemination
Analysis of Syllable DurationsThe duration for each syllable was calculated from
the marked onset (see the data analysis section of Methodfor more details) to the onset of the subsequent syllable.To determine whether average syllable duration was af-fected by experimental factors, durations of nonerror syl-lables were analyzed by using an analysis of variance withmain factors of delay (0 or 200 ms), syllable (/bi/, /bu/, /da/,/du/, /za/, /zi/), syllable order in the stimulus sequence (oneto three), and Participants 1–8 (random factor), with allpossible interactions.
1The average syllable duration under no delay was 203 ms and underdelay was 235 ms. Using 30% of the previous syllable incorporateshold periods consisting of 60–70 ms, which is well within the range oftypical hold periods (Hixon, Weismer, & Hoit, 2008).2This was surprising given that the corner of the mouth sensor locationwas chosen specifically to capture movement in the left and rightdimension between /i/ and the other vowels.
EMA Data PreprocessingEMA data were exported from the NDI WaveFront
software and imported into MATLAB. Data were low-passfiltered with a third-order Butterworth filter with a 5-Hzcutoff for the reference sensors and 20-Hz cutoff for thearticulatory sensors, following Tiede et al. (2010). To cor-rect for head motion, the kinematic data were rereferencedto each individual’s articulatory space, with the origin betweenthe back molars and behind the diastema of the upper cen-tral incisors.
For STI. EMA data corresponding to each of the12 sequence types (e.g., /dazibu/) were extracted beginningat the first marked syllable onset and ending after the finalsyllable offset, which was also the onset of the followingsequence. Sequences were amplitude normalized and thentime normalized to 1,000 data points per sequence via splineinterpolation (Smith, Johnson, McGillem, & Goffman,2000).
For all other measures. EMA data corresponding toindividual syllable productions were extracted starting atthe marked syllable onset and ending at the subsequent syl-lable onset. To accommodate different syllable durations,the EMA data for each syllable were then time normalizedby resampling and linearly interpolating data such thateach was 100 time samples long. Syllable boundaries werethen shifted to incorporate 30% of the previous syllableand 70% of the current syllable to ensure that all articula-tory movements related to the onset consonant were included
Cle
in the sample;1 thus, the first syllable of each trial was alsodiscarded. Syllables transcribed as correct productions werediscarded if they were longer in duration than 4 SDs abovethe mean (for that participant) or if they had kinematicexcursions greater than 100 mm within the syllable in anysensor or had missing data, indicating a measurement errorby the EMA device. Although kinematic data were capturedin three dimensions (posterior and anterior, left and right,and inferior and superior), qualitative comparisons of anal-yses with and without the left and right dimension indicatedthat little information was provided by this dimension, andthus all further analyses were completed with measurementdata from only the posterior and anterior and inferior andsuperior dimensions.2 EMA data from syllables wereconverted (through simple concatenation) from a matrixof Time (100 samples) × Space (posterior-anterior andinferior-superior) × Sensor (TT, TD, UL, LL, LC) intoone high-dimensional feature vector in which each fea-ture (element in the vector) corresponded to the datafrom one sensor at one time point from one spatial di-mension. Figure 2 shows an example of the data used,including the transcription time-aligned to kinematic andacoustic data, and illustrates how the kinematic data werereordered into a feature vector.
Kinematic AnalysesAnalyses included calculating the difference in STI
between nonerror sequences with and without delay, calcu-lations of distance between syllables in high-dimensionalspace, visualizing the variability of articulation in nonerrorand error syllables, and classifying errors into different
r et al.: Speech Sound Sequencing Errors Induced by DAF 1699

Figure 2. Data preprocessing methods (trial segment fromParticipant 4 [P4]). Top panel shows acoustic signal overlaidwith transcription, with grey vertical lines indicating where thetranscriber marked the syllable onsets. Second and third panelsshow kinematic data time-aligned to acoustic signal (second panel:five articulatory sensors in superior and inferior dimension; thirdpanel: five articulatory sensors in posterior and anterior dimension).The bottom panel shows how kinematic data are extracted on thebasis of marked onset boundaries, time normalized to 100 pointsper syllable, and restructured into one vector per syllable in whicheach of the 1,000 features represents one sensor’s position in onedimension at a particular time in the syllable. TD = tongue dorsum;UL = upper lip; TT = tongue tip; LC = left corner of the mouth;LL = lower lip.
Complimentary Author PDF: Not for Broad Dissemination
error profiles. All analyses were performed within-participantonly.
Differences in spatiotemporal index. Sequences underdelay and not under delay were evaluated separately withinutterance type, sensor, and dimension. STI was calculatedas the sum of standard deviations at 2% intervals oversequences time normalized to 1,000 data points. As there
1700 Journal of Speech, Language, and Hearing Research • Vol. 60 •
were different numbers of sequences in the delay and no-delayconditions, the larger category was bootstrapped. If therewere, for example, 30 /dazibu/ sequences under delay and20 /dazibu/ sequences without delay, one STI value was cal-culated over the smaller category (in this case, without delay)for each dimension of each sensor. The STI for the largercategory was calculated as the mean of 100 bootstrappedSTI values. That is, random sets of sequences (equal to thesize of the smaller category) were drawn from the larger cate-gory; STI was calculated over each set and averaged. Withinutterance, sensor, and dimension, the STI of sequences pro-duced with no delay were subtracted from the STI of thoseproduced under DAF. The resultant differences in STI(ΔSTIs) were averaged over utterance type and then overdimension and sensor to provide an overall measure of thedifference in articulatory variability between delay and non-delay trials for each participant.
Distance calculations. A global measure of distancewas used to characterize the differences between individualsyllable productions. The distance between any two sylla-ble feature vectors represents how different the kinematictraces are by comparing a value representing a single time,dimension, and sensor to another trace’s value at that sametime, dimension, and sensor. The larger the distance be-tween two traces, the more different they are. Distancemeasures were calculated with the Manhattan (L1-norm)distance formula. Thus, the distance between two syllableproductions (e.g., →x, →y ), each represented by a vector withN = 1,000 elements is given by
d1→x
→; y
� �¼ ∑
N
i¼1
→xi �→
yi
������:
For each participant, a mean nonerror feature vec-tor representation was calculated across all nonerror pro-ductions for each of the six syllable classes. These classcentroids were used as a representation of a prototypicalproduction. Distances were calculated from each individ-ual syllable vector to the mean feature vector (centroid)corresponding to its perceived syllable class. One-tailed,two-sample Kolmogorov–Smirnov tests were completedto compare the distributions of these distances for syllablesproduced with and without DAF; these tested the hypothesisthat the mean and/or variance of the distance from centroid(i.e., articulatory variability) was larger for syllables producedunder delay than those with no delay.
Visualization of articulatory variability. The distancesbetween all pairs of syllable feature vectors were calculated,and nonmetric multidimensional scaling (MDS; Kruskal,1964) was used to visualize these relationships in twodimensions. In these plots, the distance between datapoints (each representing one syllable production) in two-dimensional space is monotonically related to the distancebetween all data points in the high-dimensional featurespace (see Distance calculations section). Data were plottedwithout reference to the transcribed syllable identity, butthe color and marker for each production was indicatedpost hoc to reflect their perceived class. Thus, any groupings
1695–1711 • June 2017

Figure 3. Distribution of errors with and without DAF for the eightparticipants. Left column for Participants 1–8 (P1–P8) shows theerror rates for each of the error types with no delay, and the rightcolumn shows the error rates under 200-ms delayed feedback.
Complimentary Author PDF: Not for Broad Dissemination
of syllables are due purely to their differences and distancesin high-dimensional space, rather than to any explicit dataclustering process.
Classification of error profiles. To broadly categorizeerror productions into a set of error profiles (e.g., alike onlythe stimulus class, alike only the produced class, alike both,or other), we performed classification of the kinematic databy using machine learning tools. For each of the six cano-nical syllable classes in each participant, one quadraticdiscriminant analysis classifier was trained to discriminatenonerror syllables labeled as in class (target syllable) fromthose labeled as out of class (remaining five syllables). Totest reliability of the classifiers on nonerror productions,fivefold cross-validation was performed on each syllableclass and then averaged across syllables within participant.Six quadratic discriminant analysis classifiers were thenretrained by using a participant’s entire set of nonerror syl-lables, as noted previously. Each syllable production tran-scribed as a categorical error was then classified by eachof the six classifiers as in class or out of class and assignedto an error profile. For example, if an error was classifiedas in class of its stimulus syllable and out of class of the re-maining five syllables, it was assigned the error profile alikeonly stimulus. If it was in class for both the stimulus syll-able and perceived syllable and out of class for the remainingfour syllables, it was assigned alike stimulus and perceived.Distortion errors were similarly classified and assigned toerror profiles. Error profile types were then tallied acrossparticipants to determine the overall distribution of theseprofiles in the entire data set.
Table 2. Statistical differences in delay and nondelay kinematicvariability.
Participant
Error rate under delay;percentage increase
from nondelayKS teststatistic
1 0.65; 1,230 .23**2 0.06; 115 .033 0.13; 130 .004 0.66; 1,278 .25**5 0.51; 1,106 .16**6 0.52; 522 .057 0.19; 867 .05*8 0.71; 937 .23**
Note. Error rates under delay and percentage increase in errorrate under delay for each participant. The right-most column showsresults of one-tailed, two-sample Kolmogorov–Smirnov (KS) teststhat compared the distributions of distances from the categorycentroid for syllables produced with and without DAF.
*p < .05 and **p < .001 indicate that the kinematics of delay trialsare significantly farther from the mean and/or have more variabilityfrom the mean than nondelay trials.
ResultsAuditory-Perceptual Analysis
Participants completed 240–360 trials. After pre-processing data as described previously, participants hadbetween 2,453 and 3,948 (M = 2939, SD = 615) syllablesin which transcriptions matched the target stimuli (non-errors) and between 11 and 133 (M = 85, SD = 47) syllablesmarked as errors. Each participant had an additional fourto 70 trials discarded as misremember errors (225 trialstotal, with nine to 12 syllables each), as well as one to21 syllables (52 total) in which two of three transcriberscould not agree and were thus not analyzed further. We notethat although our design required participants to producesequences from memory and thus required discarding sometrials due to these ambiguous misremember errors, it elimi-nates uncontrolled variables related to how participantsuse visual inputs when stimuli can be directly read. Fur-ther, the effects of DAF have been shown to differ underreading and conversational speech conditions (e.g., Coreyand Cuddapah, 2008), so to focus our analysis exclusivelyon speech motor mechanisms, we opted to remove the visualaspect of this task during the experimental manipulation.
The overall number of errors and the distributionof the types of errors produced varied between partici-pants, as has been previously reported (Malloy et al., 2014).
Cle
Figure 3 shows the distribution of errors among partici-pants. Error rates and percentage increase in error rate un-der delay are summarized in the second column of Table 2;note that while raw error rate is lowest in Participants 2, 3,and 7 (P2, P3, and P7), the percentage increase in error rateunder delay was lowest in P2, P3, and Participant 6 (P6),suggesting that these participants were least affected by de-lay. Although the visual metronome was intended to helpparticipants maintain a consistent syllable rate, an analysisof variance showed main effects of delay (0 or 200 ms), syl-lable (/bi/, /bu/, /da/, /du/, /za/, /zi/), and syllable order inthe sequence (one to three) on syllable duration, with mul-tiple significant interactions (see Table 3). The mean dura-tion of syllables with no delay was 203 ms (SD = 46 ms),
r et al.: Speech Sound Sequencing Errors Induced by DAF 1701

Table 3. ANOVA results for syllable duration.
Effect df Adjusted sum of squares ηp2 F
Delay 1 5.79 0.19 18.12*Order 2 10.87 0.30 21.79**Participant 7 3.65 0.13 0.93Syllable 5 18.79 0.42 88.60**Delay × Order 2 0.78 0.03 7.68*Delay × Participant 7 2.30 0.08 5.24*Delay × Syllable 5 0.47 0.02 6.68**Order × Participant 14 3.60 0.12 4.74*Order × Syllable 10 0.14 0.01 2.70*Participant × Syllable 35 1.53 0.06 2.69*Delay × Order × Participant 14 0.73 0.03 14.95**Delay × Order × Syllable 10 0.08 0.00 2.25*Delay × Participant × Syllable 35 0.51 0.02 4.16**Order × Participant × Syllable 70 0.37 0.01 1.52*Delay × Order × Participant × Syllable 70 0.25 0.01 2.74**Total 19,772
Note. Durations of nonerror syllables were analyzed by using an analysis of variance (ANOVA) with main factors ofdelay (0 or 200 ms), syllable (/bi/, /bu/, /da/, /du/, /za/, /zi/), syllable order in the stimulus sequence (one to three), andParticipants 1–8 (random factor), with all possible interactions. Shown are the degrees of freedom, adjusted sum ofsquares error, partial eta-squared value, and F value for each effect.
*p < .05. **p < .001.
Complimentary Author PDF: Not for Broad Dissemination
while the mean duration under DAF was 235 ms (SD =72 ms). This change in production rate under delay is ap-proximately 0.7 syllables/s; this is smaller than changesobserved in studies without a metronome. For example,Stuart, Kalinowski, Rastatter, and Lynch (2002) found thatparticipants’ speaking rate slowed down at 200-ms delayby approximately 1.2 syllables/s in a normal speaking paceand approximately 1.3 syllables/s in a fast speaking pace.
Kinematic AnalysesDistribution of Nonerror Productions
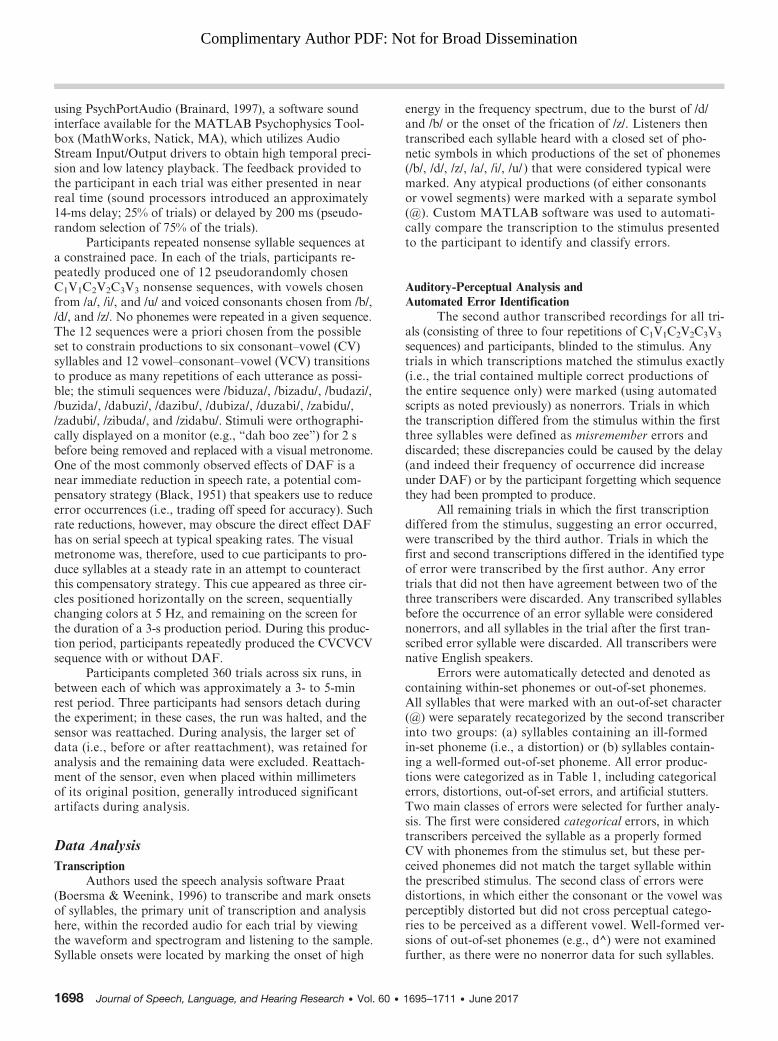
Figure 4 shows nonmetric MDS representations ofthe landscape of syllable productions for three exampleParticipants 8 (P8), 4 (P4), and P2 (all participants includedin Supplemental Material S1). These plots show all nonerrorproductions for each participant, and the distances betweenthe markers in this two-dimensional plot are monotonicallyrelated to the dissimilarity of syllable productions in thehigh-dimensional feature space. Note that the degree of clus-tering by syllable differs across participants, with some clus-ters overlapping more than others. Clusters with commonvowels are often nearest, although some participants’ dataresulted in clusters in which the consonant was more domi-nant in determining cluster overlap. Figures 4A and 4B showtwo participants in which clusters are largely segregated bysyllable class. Figure 4C shows a participant in which clus-ters overlap somewhat in the two-dimensional representationand in which the overlap is primarily governed by vowel;for example, note that clusters for the syllables /za/ and /da/overlap slightly, as do clusters for /zi/ and /bi/.
In addition to color coding by syllable, color intensityis used to denote whether the syllable was produced withDAF (lighter) or without (darker). In Figures 4A and Fig-ure 4B, note that the syllables produced under DAF appear
1702 Journal of Speech, Language, and Hearing Research • Vol. 60 •
to show much more variation from their class centroidsthan the nondelay syllables. This suggests that there may bemore articulatory variability in the productions under delayeven in utterances that are perceived as error free. The par-ticipant in Figure 4C, however, shows no apparent differencein variability under delay and nondelay. The participant inFigure 4C was one who did not show large differences inerror production under delay (see Figure 3). Statistical test-ing shows that five out of eight participants had produc-tions under DAF that had larger and/or more variabledistances from the mean than productions without DAF(see Table 2). It is interesting to note that the three partici-pants who did not show statistically significant differencesin these distributions (P2, P3, and P6) were those withthe smallest percentage increase in error rate under delay.
STISTI was also calculated for CVCVCV sequences to
compare variability in productions made with and with-out DAF and for comparison with our current approach.Figure 5 shows the difference in STI between delay andnondelay sequences (differences calculated within utter-ance type, sensor, and dimension before being averaged).Note that the participants with higher error rate increasesunder delay also tend to have higher STIs under DAF, whilethose participants with lower error rate increases have simi-lar STIs regardless of delay. Four of the five participantswho had a significant increase in articulatory variability(see Table 2) also had an increased STI under DAF.
Distribution of Error ProductionsFigure 6 shows syllables transcribed as errors plot-
ted on nonerror syllable clusters for Participant 1 (P1).Figure 6A shows all distortions color coded by the target
1695–1711 • June 2017
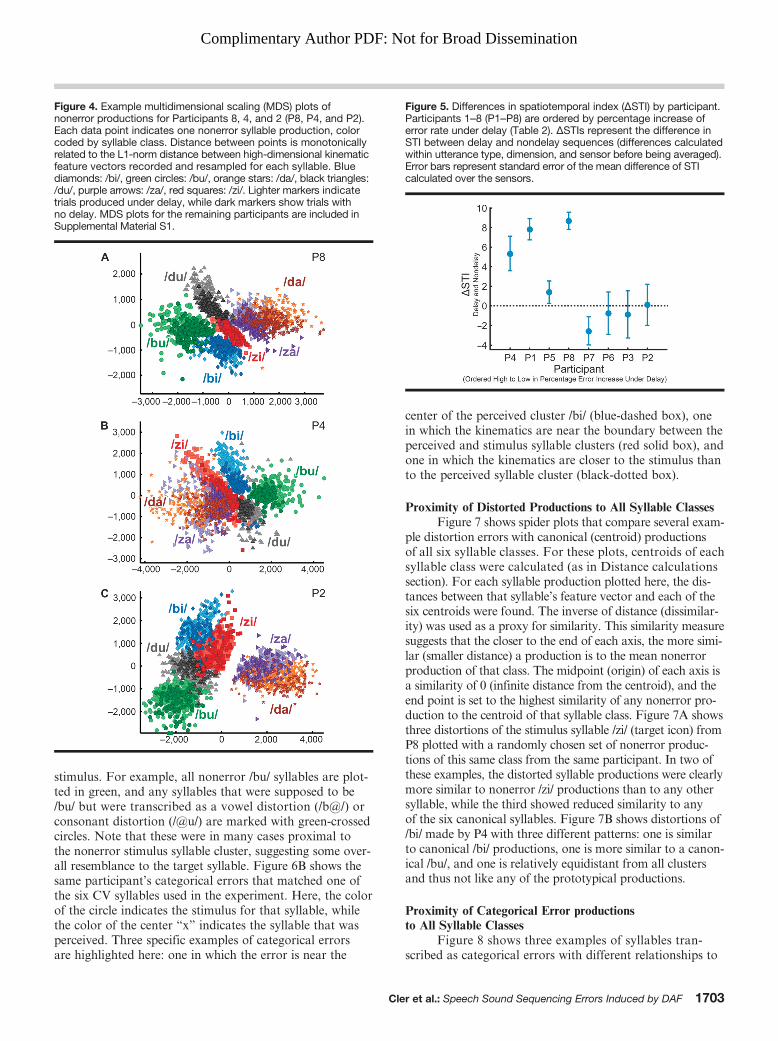
Figure 4. Example multidimensional scaling (MDS) plots ofnonerror productions for Participants 8, 4, and 2 (P8, P4, and P2).Each data point indicates one nonerror syllable production, colorcoded by syllable class. Distance between points is monotonicallyrelated to the L1-norm distance between high-dimensional kinematicfeature vectors recorded and resampled for each syllable. Bluediamonds: /bi/, green circles: /bu/, orange stars: /da/, black triangles:/du/, purple arrows: /za/, red squares: /zi/. Lighter markers indicatetrials produced under delay, while dark markers show trials withno delay. MDS plots for the remaining participants are included inSupplemental Material S1.
Figure 5. Differences in spatiotemporal index (ΔSTI) by participant.Participants 1–8 (P1–P8) are ordered by percentage increase oferror rate under delay (Table 2). ΔSTIs represent the difference inSTI between delay and nondelay sequences (differences calculatedwithin utterance type, dimension, and sensor before being averaged).Error bars represent standard error of the mean difference of STIcalculated over the sensors.
Complimentary Author PDF: Not for Broad Dissemination
stimulus. For example, all nonerror /bu/ syllables are plot-ted in green, and any syllables that were supposed to be/bu/ but were transcribed as a vowel distortion (/b@/) orconsonant distortion (/@u/) are marked with green-crossedcircles. Note that these were in many cases proximal tothe nonerror stimulus syllable cluster, suggesting some over-all resemblance to the target syllable. Figure 6B shows thesame participant’s categorical errors that matched one ofthe six CV syllables used in the experiment. Here, the colorof the circle indicates the stimulus for that syllable, whilethe color of the center “x” indicates the syllable that wasperceived. Three specific examples of categorical errorsare highlighted here: one in which the error is near the
Cle
center of the perceived cluster /bi/ (blue-dashed box), onein which the kinematics are near the boundary between theperceived and stimulus syllable clusters (red solid box), andone in which the kinematics are closer to the stimulus thanto the perceived syllable cluster (black-dotted box).
Proximity of Distorted Productions to All Syllable ClassesFigure 7 shows spider plots that compare several exam-
ple distortion errors with canonical (centroid) productionsof all six syllable classes. For these plots, centroids of eachsyllable class were calculated (as in Distance calculationssection). For each syllable production plotted here, the dis-tances between that syllable’s feature vector and each of thesix centroids were found. The inverse of distance (dissimilar-ity) was used as a proxy for similarity. This similarity measuresuggests that the closer to the end of each axis, the more simi-lar (smaller distance) a production is to the mean nonerrorproduction of that class. The midpoint (origin) of each axis isa similarity of 0 (infinite distance from the centroid), and theend point is set to the highest similarity of any nonerror pro-duction to the centroid of that syllable class. Figure 7A showsthree distortions of the stimulus syllable /zi/ (target icon) fromP8 plotted with a randomly chosen set of nonerror produc-tions of this same class from the same participant. In two ofthese examples, the distorted syllable productions were clearlymore similar to nonerror /zi/ productions than to any othersyllable, while the third showed reduced similarity to anyof the six canonical syllables. Figure 7B shows distortions of/bi/ made by P4 with three different patterns: one is similarto canonical /bi/ productions, one is more similar to a canon-ical /bu/, and one is relatively equidistant from all clustersand thus not like any of the prototypical productions.
Proximity of Categorical Error productionsto All Syllable Classes
Figure 8 shows three examples of syllables tran-scribed as categorical errors with different relationships to
r et al.: Speech Sound Sequencing Errors Induced by DAF 1703

Figure 6. Relative location of error productions for Participant 1(P1). (A) shows errors perceived to be distortions along with allnonerror syllables; the color of the distortion marker indicates thestimulus syllable for that production. (B) shows categorical errors inwhich the transcription matched one of the six stimulus syllables.The circle color indicates the stimulus for that syllable, while thecolor of the center “x” indicates what syllable was perceived. Threeexamples are highlighted. The blue-dashed box shows an error inwhich the stimulus was /du/, the perceived syllable was /bi/, andthe kinematic data results in this production lying within the clusterof nonerror productions of /bi/. The red solid box shows a syllablewhere the stimulus was /za/ and transcribers perceived /da/, andthe kinematics are on the boundary between the two categories.The black-dotted box highlights syllables in which the stimulus was/du/, but transcribers perceived /da/; the kinematics here are closerto the stimulus than to the perceived cluster.
Figure 7. Similarity of distortion errors to canonical productions forthe six syllables used in this study. Three contours indicating thesimilarity between productions transcribed as distortions and centroidsof each of the syllable classes (each axis) are plotted with 100 randomlyselected examples of nonerrors from the same stimulus class. Theorigin of each axis is 0 similarity (infinite distance from clustercentroid) and the end point is the highest similarity of any nonerrorto the mean of all nonerrors in that class. (A) shows several distortionswith the stimulus of /zi/ (target icon) from Participant 8 (P8) plottedin black on top of nonerror productions of the same class; thesedistortions all are most similar to /zi/. (B) shows three distortionsof /bi/ from Participant 4 (P4) plotted on nonerror /bi/ productions;one production is similar to a canonical /bi/ (i.e., is very near theend point of the /bi/ axis), one is more similar to a canonical /bu/than the nonerror /bi/ productions are, and one is dissimilar from allcanonical classes (i.e., each distance from class centroids is largeand thus near the origin of all axes).
3Although there is a difference between the trajectories of thecategorical error and the perceived sequence in the first 30 timepoints, this is consistent with initial coarticulation differences that arenot indicative of an error; due to the organization of the stimuli, allnonerror sequences were /ubiza/, whereas this error sequence wasproduced as /abiza/.
Complimentary Author PDF: Not for Broad Dissemination
canonical productions. Figure 8A shows a categorical errorthat had a stimulus of /du/ (target icon) and a perceivedclass of /bi/ (ear icon), plotted with randomly selected non-error productions of both /du/ and /bi/. Note that this errorprimarily resembles canonical productions of the perceivedclass, /bi/. However, Figure 8B shows a categorical errorthat more closely resembles the stimulus class, /du/, thanthe perceptually determined class (/da/). In addition, Fig-ure 8C shows a categorical error that had a stimulus classof /bu/ and a perceived class of /bi/; note that although thiserror is similar to both classes, the nonerror productionsof these two classes are more distinct, suggesting this pro-duction may be a blend of the two articulation patterns.
Kinematic Traces of a Categorical Error ComparedWith Distortion and Nonerror Traces
While a detailed analysis of the specific kinematic ab-normalities observed in error production is beyond the scopeof the present study, we highlight a particularly interestingexample that illustrates the complexity of characterizing
1704 Journal of Speech, Language, and Hearing Research • Vol. 60 •
DAF related effects. Figure 9 shows the articulograph(three sensors in one dimension) for an example categoricalerror plotted against kinematic traces for corresponding non-errors and distortions. This error was classified as a syllableanticipation in which the intended stimulus sequence was/zabiduza/, and the participant instead produced /zabiza/.Thus, we compare this production to nonerror productionsof the perceived sequence /biza/, the stimulus sequence /bidu/,and distortions of the /a/ in /biza/. Note that these distor-tions appear within the error bars (1 SD) provided by non-error productions of the stimulus sequence until the finalvowel. The trace of the sensor on the TD shows that thecategorical error follows the perceived sequence /biza/ asexpected (see Figure 9A).3 The TT, however (see Figure 9B;red box), follows a movement trajectory appropriate for thestimulus sequence /bidu/ for some time before switching to
1695–1711 • June 2017

Figure 8. Similarity of three example categorical errors (in black)to all six canonical syllable classes, plotted with 100 randomlyselected nonerror productions of their stimulus class (solid; targeticon) and their perceived class (dashed; ear icon). Origin of axesis 0 similarity (infinite distance from cluster), and end point isthe similarity of the nonerror that is most similar to the meanof all nonerrors in that class. (A) shows a categorical error fromParticipant 8 (P8) with a stimulus of /du/ and a perceived class of/bi/, plotted on top of nonerror productions of /du/ and /bi/; thiserror closely resembles canonical productions of the perceivedclass. (B) shows a categorical error produced by Participant 1 (P1)with a stimulus class of /du/ and a perceived class of /da/; thiserror closely resembles the stimulus class. (C) shows an error fromParticipant 7 (P7), which had the stimulus /bu/ and was perceivedas /bi/; this error is more similar to both /bu/ and /du/ than nonerrorproductions.
Figure 9. Kinematic traces for an illustrative categorical errorplotted with traces for corresponding nonerrors and distortions.This categorical error, plotted in black in all three panels, was asyllable anticipation by Participant 6 (P6), in which the stimuluswas /zabiduza/ and the participant instead produced /zabiza/. Threesensors are plotted showing the inferior and superior dimension.In orange is the mean ± 1 SD of all nonerror productions of thestimulus sequence /bidu/, whereas all nonerror productions of theperceived sequence, /biza/, are in purple. Distortions plotted indashed gray lines were all intended productions of /biza/ with aperceived distortion on the final vowel. (A) shows the tongue dorsumposition in the inferior and superior dimension, and (B) shows thetongue tip, in which the red box indicates where this sensor’smovement initially matched the stimulus syllable and then veeredinto the perceived syllable. (C) shows the lower lip sensor, in whichthe green-dotted box indicates a time in which the lip movementdoes not appear to match either the stimulus or perceived nonerrorsequences.
Complimentary Author PDF: Not for Broad Dissemination
a trajectory that follows the trace for the perceived sequence/biza/. In the LL trace (see Figure 9C; green-dotted box),the trajectory of the categorical error does not clearly matcheither the perceived or the stimulus sequence.
Error ProfilesErrors were categorized within participant and then
pooled to determine the distribution of the types of errorsin the entire data set (see Table 4). Overall cross-validationclassification accuracy of nonerrors, averaged across sylla-ble classes within participant, varied from 91.5% to 99.7%by participant (M = 94.6%, SD = 2.5%). Table 4 showsthe percentage of error productions that were sorted, on the
Cle
basis of the responses of the six syllable-specific classifiers,into each of a set of error profiles. Of the 372 total distor-tion errors, 341 were transcribed as having one correct pho-neme and one distorted phoneme and were submitted tothe classifier. Of those, 47% were classified as matchingthe stimulus syllable only, 16% were classified as matchingexactly one nonstimulus syllable, and 18% were classified
r et al.: Speech Sound Sequencing Errors Induced by DAF 1705

Table 4. Summary of error profiles across participants.
Distortions Categorical
Parameter Value Parameter Value
Total number of errors 372 Total number of errors 143One phoneme-matched stimulusa 341 Perceived as one of six canonical syllablesa 81Classified asb Classified asb
Stimulus only 47% Stimulus only 5%One other only 16% Perceived only 43%Stimulus plus one other 18% Stimulus and perceived only 20%Multiple 1% Other combination or multiple 18%None 18% None 15%
Note. Shown are the total counts of errors of various types (across participants) and the percentage of errors that wereclassified into different error profiles using a quadratic discriminant analysis classifier.aProductions that contained a combination of distortions and categorical errors (e.g., target /du/, transcribed /b@/) or inwhich the entire syllable was distorted (/@/) and categorical errors that were transcribed as a legal syllable but not one of thesix in the entire stimuli set (e.g., /di/) were removed, as there were no canonical, nonerror productions to compare against.bErrors were classified via six classifiers per participant, each trained to recognize one syllable as in class and all othersyllables as out of class. These were then used to create error profiles. For example, if a distortion error were classified asin class for only the stimulus syllable and out of class for the remaining syllables, it was denoted here in the left column asstimulus only.
Complimentary Author PDF: Not for Broad Dissemination
as matching the stimulus and exactly one other syllable.The remaining syllables consisted of those classified as mul-tiple syllables (1%) and those classified as not matchingany canonical syllables (18%). Of the 143 total categoricalerrors, 81 were perceived as one of the six canonical sylla-bles and thus could be directly compared with nonerrors;the remaining syllables were not contained in the stimuli(e.g., /ba/ or /di/) and thus could not be analyzed further.Of the syllables analyzed, 5% were classified as matchingthe stimulus syllable only, 43% were classified as matchingthe perceived syllable only, and 20% were classified asmatching both the stimulus and perceived syllables only.The remaining syllables were either classified as a differentcombination of syllables and/or multiple syllables (18%) orclassified as not matching any of the canonical syllables (15%).
DiscussionIn this study, we developed and applied multivariate
methods to examine the effects of DAF on articulatorykinematics of simple syllable sequences. We sought to firstdetermine how, if at all, the kinematics of individualsyllable productions judged by listeners to be correct (i.e.,matching the stimulus) differed under DAF. Then, wecompared syllable productions judged as errors (either dis-tortions of the stimulus syllable or productions of a cleanversion of a nonstimulus syllable) to nonerror syllableproductions from an articulatory perspective. The results,while preliminary, suggest the impact of altered timingof feedback on speech output can occur at either a sub-phonemic level (i.e., resulting in imprecise articulations) orat a categorical or phonological level (i.e., resulting in theselection and clean production of a nontarget syllable).We hypothesize that these qualitatively distinct error typesare evoked by mechanisms that compare external auditory
1706 Journal of Speech, Language, and Hearing Research • Vol. 60 •
feedback with expectations either continuously (to deter-mine if the articulation of a single syllable is correct)or discretely (to determine if the correct phonemes arebeing produced in the proper order). In the former case,artificially induced mismatches due to DAF may result inattempts to continuously adjust output of the current sylla-ble, resulting in the observed distortions. In the latter case,errors (i.e., recognition of a planned sound at an unex-pected time) may cause resetting or other changes in anabstract or phonological representation of the sequence ina speech-planning buffer, resulting in discrete sequencingerrors. Because our study demonstrates variability in sylla-ble productions that were not apparent to listeners, it alsoemphasizes the importance of studying articulatory kine-matics to more precisely determine the nature of DAF-induced speech errors.
Nonerror ProductionsThe articulatory kinematics of nonerror syllable pro-
ductions largely clustered by perceived syllable using a class-blind distance measure and nonmetric MDS (see Figure 4and Supplemental Material S1). MDS plots were informativein demonstrating the global landscape of productions butare limited by the requirement to capture very high dimen-sional relationships in a two-dimensional space. Still, theseplots illustrate a general (within-participant) consistency inarticulating individual syllables within the repeated produc-tion of memory-guided CVCVCV sequences.
Five out of eight participants had statistically signifi-cant differences in the distribution of distances betweenindividual productions and the cluster centroid for nonerrorproductions with and without DAF. For these participants,this suggests that articulations were still affected by DAFand were presumably less stable than those made withnormal feedback, even when judged to be error free by a
1695–1711 • June 2017

Complimentary Author PDF: Not for Broad Dissemination
listener. This builds on the results of Sasisekaran (2012), whofound that lip aperture measured during the production ofnonerror syllable sequences with DAF was more variablethan those produced with typical or gated auditory feed-back. The three participants who did not show statisticallysignificant differences between kinematics for productionswith and without DAF were those who made the lowestpercentage of additional errors under delay (see Table 4).Although individual differences in susceptibility to DAFhave been previously established (e.g., Burke, 1975; Chonet al., 2013), this result indicates that even subtle DAF-induced effects on the sensory-motor control of speech thatare not apparent perceptually have differential effects onspeakers; preliminary indications suggest that susceptibilityto these subtle, graded alterations of articulatory outputmirror susceptibility to more perceptually salient effectsthat clearly alter the output sound sequence. This sug-gests that the kinematic distance measure used here is sen-sitive to articulation changes under delay that were notevident to listeners, as all productions here were perceivedas nonerrors.
These results were echoed by those using an adapta-tion of the well-established spatiotemporal index measure(Smith et al., 2000; here, ΔSTI is the difference in STIbetween delay and nondelay conditions); namely, thoseparticipants with the highest increase in error rates, aswell as the highest difference in distribution of distancesbetween individual productions and the cluster centroidalso showed larger variability under delay rather than non-delay. There was one participant (P7) who showed a nega-tive ΔSTI value but a statistically significant (p < .05)increase in variability under DAF using our new approach.This may indicate an increased sensitivity to articulatoryvariability using our method, but we should note that STIcalculations were performed over CVCVCV sequences,while results shown in Table 4 were based on individualsyllable productions.
Error ProductionsDistortions
Errors judged to be distorted versions of the stimulussyllable tended to appear on the MDS plots near the stimu-lus (intended) syllable but often were further away from thecluster centroids than nonerrors (see Figure 6A). This reflectsin many cases, as expected, the target syllables were likelycorrectly planned and released for execution but were alteredduring the articulation process due to mismatching con-tinuous, external auditory feedback. When compared withnonerror productions via distances to class centroids (see Fig-ure 7A) or via classification (see Table 4), distortions wereoften most similar to their stimulus syllable or to their stim-ulus plus one other canonical syllable, although examplesin which distortions were more similar to a different ca-nonical syllable (see Figure 7B), unlike all syllables (see Fig-ure 7C), or alike more than one canonical syllable couldalso be found. Still, nearly half (47%) of the distortionerrors, when submitted to classifiers trained on error-free
Cle
productions of each stimulus, could only be considered tomatch the target stimulus syllable. Although speculative,this again suggests that a large fraction of these errors werealtered by low-level interactions of feedback with the motoroutput system, resulting in graded, continuous changes tothe articulatory output. Interpretation of other exampleswill require a detailed analysis of the articulatory move-ments in relation to the surrounding phonetic context andwill likely show large variability across the small number ofexamples available.
Categorical ErrorsCategorical errors often appeared on MDS plots (see
Figure 6B) near the perceived syllable cluster, as expectedif the participant had articulated a clean (but incorrect)syllable. Such productions represent examples in whichthe speech planning system appears to have selected andreleased the produced sounds in the improper order. Suchserial ordering errors might resemble many normally occur-ring slips of the tongue, which can be, in part, explainedby various models that include an abstract phonologicalrepresentation of the forthcoming speech plan (Bohlandet al., 2010; e.g., Dell, 1986; Hartley & Houghton, 1996;Vousden, Brown, & Harley, 2000). We hypothesize thatthese errors may arise due to mechanisms normally usedfor detection and correction of such discrete errors in speechoutput, which must enact changes to the speech planningbuffer (i.e., a reordering of planned sounds) to interruptand correct running speech. In the case of DAF, mistimedfeedback may mimic the detection of such errors and artifi-cially drive changes to the (phonological) speech planningbuffer, directly resulting in serial ordering errors.
However, some syllables transcribed as categoricalerrors appeared on the border between the clusters of theperceived and stimulus cluster, and some appeared nearestthe stimulus cluster despite being perceived as a cleanversion of a different syllable. To examine the kinematicrelationships between categorical errors and canonicalproductions further, we generated spider plots (see Figure 8),which illustrate the degree of (dis)similarity between eachproduction and the canonical (class centroid) version of eachof the six syllables used in the experiment. These examplespoint to the possibility that individual components of theproductions (i.e., movements of single articulators or coor-dinated articulatory gestures) might be in error, as has beenreported for slips of the tongue elicited in a speeded repetitiontask with normal feedback aimed to elicit slips (Goldsteinet al., 2007). In addition, examples with articulations withsimilarity to both the stimulus and perceived syllable couldrepresent simultaneous coproductions of more than oneplanned segment (Pouplier & Hardcastle, 2005). In general,the developed visualization methods provide intuitive tech-niques to determine relationships between individual produc-tions and to generate specific hypotheses that can be testeddirectly with the underlying EMA data.
We also summarized error profiles of categoricalerrors on the basis of classification analysis, across partici-pants. We found that many syllables were classified as the
r et al.: Speech Sound Sequencing Errors Induced by DAF 1707

4To help characterize the extent of this issue, the second transcriberperformed a blind transcription of one entire run. Of the 668 syllablesanalyzed, there was exact agreement on 615 (92%). Where there wasdisagreement, most were marked as distortions by one transcriberand not the other (7% of total), rather than disagreements about errortype (< 1% of total). Further, in nonerror syllables, the median jitterof the acoustically defined syllable boundary was less than 5% of thetemporal window used for analysis.
Complimentary Author PDF: Not for Broad Dissemination
perceived syllable only (43%), again consistent with thesebeing discrete phonemic sequencing errors. However, a rel-atively large fraction were classified both as the intendedstimulus and perceived syllables but not as any of the otherpossible syllables (20%; see Table 4). These results suggestthat, in fact, many errors represent blends of articulations ofthe stimulus and perceived sound. In addition to providinginformation about the interaction of DAF and articulatoryplanning, this result confirms that the articulation measuresemployed here add information about the nature of theseerrors that was not evident to listeners. One particularlycompelling example of a syllable transcribed as a categoricalerror was shown in Figure 9. This example shows strongevidence that, at least in this example, some articulatorsfollow trajectories consistent with the perceived syllable(see Figure 9A), while others combine trajectories of theperceived and stimulus syllable (see Figure 9B), and somearticulators follow neither expected trajectory (see Figure 9C).This result points to the complexity of the effects of DAF-induced errors and of interactions between altered feedbackand the speech controller. Although the effects of DAF havebeen studied for many decades, it is clear that they are stillpoorly understood.
Quantitative Measures for Kinematic Data SetsAlthough the number of participants in this study was
modest, the number of productions measured per partici-pant was quite large (M = 2,939 syllables). Constrainingthe stimulus set to six syllables resulted in many morenonerror utterances of each type than are typically analyzedby using measures of articulatory variability such as STI(e.g., 10–15 utterances; Smith et al., 2000) The type of datacollection, abbreviated transcription process and data pro-cessing approach, allows for comparison across many utter-ances and requires novel methods of visualization andanalysis. Here, we have presented a variety of measures (high-dimensional representation of kinematic data as a featurevector; Manhattan distance from mean nonerror productionas global measure of difference in articulation), associatedvisualizations (MDS and spider plots), and analyses (machinelearning for classifying errors into distinct profiles). WhileSTI is not typically used on errorful productions, the methodsdeveloped here can be directly employed to help characterizeerrors. Although the main aim of this study was to beginto determine how DAF affects syllable articulation, thesemethods could be applied to a variety of large kinematicdata sets. Further development could also enable analysisacross participants to characterize both group effects andindividual differences.
LimitationsA variety of factors could have affected the results
presented here in uncontrolled ways. Although participantsall reported no history of speech, language, or hearing dis-orders, they did not undergo a hearing screening prior toparticipating and thus may have had different sensitivities to
1708 Journal of Speech, Language, and Hearing Research • Vol. 60 •
feedback alterations. To produce large numbers of similarsyllables and elicited errors, the stimuli in this study consistedof repeating sequences of nonsense CV syllables. This wasparticularly necessary given the time constraints inherent inthe use of EMA sensors, which can detach after some time,particularly from lingual placements. However, it is unknownhow well these results would correlate to errors producedin conversational speech or how well they would generalizeto words and syllables with different segmental structures.The sensor locations were chosen a priori to maximally dif-ferentiate between the six phonemes. These locations weresimilar but not identical to those subsequently publishedby Wang, Samal, Rong, and Green (2016), which suggestedthat UL, LL, TT, and a sensor somewhat posterior to ourTD performed equivalently to a larger sensor set for classi-fying phrases, and thus may be preferable. In future studies,we plan to adopt these positions, in part to help stan-dardize EMA protocols and enable comparisons acrossexperiments.
The auditory-perceptual analysis presented hereenabled transcribing the large numbers of syllables requiredfor these analyses. However, this meant that productionslabeled as correct were only transcribed by one listener, whileproductions that differed from the stimulus were transcribedby two or three listeners. This suggests that although weare confident that the productions labeled here as errorsactually contained acoustically salient deviations from thetargets, a small fraction of syllables marked as nonerrorsmay have also contained some perceptually discernable dif-ferences.4 In addition, the kinematic measures presentedhere are intended to supplant the need to rely on auditoryperception, as indeed different listeners may have differentperceptual biases and thus may not identify the same setof errors. However, these kinematic measures still rely onmanual identification of the syllable onset through listeningto and viewing the recorded signal. Future developmentcould use kinematic rather than perceptual markers todetermine syllable boundaries. In a similar way, it is un-known to what degree the errors produced under DAFresemble those produced in typical speech or in studies eli-citing slips of the tongue via rapid speech or tongue twisterstimuli.
All analyses presented here were completed within-participant only, with the exception of the error profiles(see Table 4), which were calculated within participantbut summed across participants. This is primarily because,although our sample size is consistent with some of themost directly relevant EMA studies (e.g., Goldstein et al.,2007; Tilsen & Goldstein, 2012), the effects of DAF are
1695–1711 • June 2017

Complimentary Author PDF: Not for Broad Dissemination
in fact quite variable between participants. Therefore, theresults presented here may not be representative of the pop-ulation of typical speakers, and larger studies will ultimatelybe needed to assess individual variation of DAF effects onspeech kinematics. In addition, the measures, visualizationmethods, and machine learning analyses have not beenvalidated against other measures, with the exception ofthe presented STI comparison for nonerror data.
Future DirectionsThe complexity of this data set and of the methods
presented here warrant further analysis. In particular, fur-ther study could reveal what specific articulatory changesshift a syllable from being perceived as a nonerror to adistortion, as we have presented evidence that DAF inducessome changes in even clean productions in individuals mostaffected by feedback alterations. Further work could helpcollapse and compare data across participants, as most ofthe analyses presented here were within-participant only.The methods presented here were data driven, as variabilityin all sensors and dimensions were weighted equally; how-ever, kinematic variation in some sensors and dimensionswere almost certainly more critical than others for meetingphonetic goals. As the sensors and dimensions of importvary from phoneme to phoneme, the appropriate weightingof different sensors is not straightforward, and data-drivenmethods (e.g., on the basis of the Mahalanobis distance)may introduce circularity and/or biases in the analysis.However, future work should focus on weighting the differ-ent sensors and dimensions differentially on the basis of apriori knowledge of acoustic phonetics related to the spe-cific target sounds used.
Also, these data and results provide evidence thatcan be used to develop and test models of speech planningand serial speech production. Although models have beendeveloped that explicitly address the sequential representa-tion and production of an utterance (e.g., Bohland et al.,2010; Tilsen, 2013), they differ in terms of the proposedplanning units (i.e., abstract phonemes or articulatory ges-tures) and cannot currently explain how the mismatchedtiming of expected and received auditory feedback underDAF drives sequential production errors.
ConclusionIn this study, we examined the articulatory kinematics
of syllable productions recorded from eight typical adultspeakers with and without DAF. We show that analysis ofarticulatory kinematics can be informative in elucidating theprecise nature of the speech errors made under DAF, whichin many cases, differ from what is heard by listeners. Wefound that the kinematics of nonerror productions clusteredby perceived syllable class using a data-driven distance mea-sure operating on a global, high-dimensional representationof each production. Five participants had statistically sig-nificant differences in the variability of nonerror productionsmade with and without DAF, suggesting that kinematic
Cle
measures are sensitive to articulatory changes under delaythat are not evident to or not reported by listeners. Manydistortion errors were observed to be most similar to thestimulus syllable, but others were similar to other syllablesor alike no other syllables. Categorical errors were character-ized in four groups: those that were most similar to theperceived syllable (most common), those that were mostsimilar to the stimulus syllable, those that were a blendof the perceived and stimulus articulations, and those thatwere not similar to any of the six canonical syllables. Theerrors that are a blend of the perceived and stimulus articu-lations suggest that DAF may be interacting with the speechmotor sequencing controller at a subphonemic level. Thisstudy is one of the first to characterize articulatory kinematicchanges under DAF and provides initial results and a richdata set for testing future specific hypotheses and for con-straining and testing computational models of speech plan-ning and online control. In attempting to characterize thesespeech sequencing errors, we have developed and presenteda series of novel quantitative methods for analyzing andvisualizing large kinematic data sets.
AcknowledgmentsThe authors thank Mark Tiede for generously sharing his
scripts to filter and rereference electromagnetic articulographydata, Shanqing Cai and Joe Perkell for their consultation,Jessica Malloy for her work on previous related projects andearly help with this study, and Timothy Streeter for his expertisein sound calibration. This research was supported in part byNational Institutes of Health Grants: T90 DA032484 (fellowshipfor G. Cler, grant awarded to David Mountain from NIDA), F31DC014872 (awarded to G. Cler from NIDCD), R03 DC012651(awarded to C. Stepp from NIDCD), and P30 DC04663 (awardedto S. Colburn from NIDCD).
ReferencesBlack, J. W. (1951). The effect of delayed side-tone upon vocal
rate and intensity. Journal of Speech and Hearing Disorders,16, 56–60.
Boersma, P., & Weenink, D. (1996). Praat, a system for doingphonetics by computer (Version 3.4) [Computer software].Retreived from http://www.praat.org
Bohland, J. W., Bullock, D., & Guenther, F. H. (2010). Neuralrepresentations and mechanisms for the performance of sim-ple speech sequences. Journal of Cognitive Neuroscience, 22,1504–1529. https://doi.org/10.1162/jocn.2009.21306
Brainard, D. H. (1997). The psychophysics toolbox. Spatial Vision,10, 433–436.
Burke, B. D. (1975). Susceptibility to delayed auditory feedbackand dependence on auditory or oral sensory feedback. Journalof Communication Disorders, 8, 75–96.
Cai, S., Ghosh, S. S., Guenther, F. H., & Perkell, J. S. (2011).Focal manipulations of formant trajectories reveal a role ofauditory feedback in the online control of both within-syllableand between-syllable speech timing. The Journal of Neuro-science, 31, 16483–16490. https://doi.org/10.1523/JNEUR-OSCI.3653-11.2011
Chon, H., Kraft, S. J., Zhang, J., Loucks, T., & Ambrose, N. G.(2013). Individual variability in delayed auditory feedback
r et al.: Speech Sound Sequencing Errors Induced by DAF 1709

Complimentary Author PDF: Not for Broad Dissemination
effects on speech fluency and rate in normally fluent adults.Journal of Speech, Language, and Hearing Research, 56, 489–504.https://doi.org/10.1044/1092-4388(2012/11-0303)
Corey, D. M., & Cuddapah, V. A. (2008). Delayed auditory feed-back effects during reading and conversation tasks: Genderdifferences in fluent adults. Journal of Fluency Disorders,33(4), 291–305. https://doi.org/10.1016/j.jfludis.2008.12.001
Cornelisse, L. E., Gagne, J., & Seewald, R. C. (1991). Ear levelrecordings of the long-term average spectrum of speech. Earand Hearing, 12, 47–54. https://doi.org/10.1097/00003446-199102000-00006
Cutler, A. (1981). The reliability of speech error data. Linguistics,19, 561–582.
Dell, G. S. (1986). A spreading-activation theory of retrievalin sentence production. Psychological Review, 93, 283–321.https://doi.org/10.1037/0033-295X.93.3.283
Fairbanks, G. (1955). Selective vocal effects of delayed auditoryfeedback. Journal of Speech and Hearing Disorders, 20, 333–346.
Fairbanks, G., & Guttman, N. (1958). Effects of delayed auditoryfeedback upon articulation. Journal of Speech and HearingResearch, 1, 12–22. https://doi.org/10.1044/jshr.0101.12
Frisch, S. A., & Wright, R. (2002). The phonetics of phonologicalspeech errors: An acoustic analysis of slips of the tongue.Journal of Phonetics, 30, 139–162. https://doi.org/10.1006/jpho.2002.0176
Garnham, A., Shillcock, R. C., Brown, G. D. A., Mill, A. I. D.,& Cutler, A. (1981). Slips of the tongue in the London-Lundcorpus of spontaneous conversation. Linguistics, 19, 805–818.https://doi.org/10.1515/ling.1981.19.7-8.805
Goldstein, L., Pouplier, M., Chen, L., Saltzman, E., & Byrd, D.(2007). Dynamic action units slip in speech production errors.Cognition, 103, 386–412. https://doi.org/10.1016/j.cognition.2006.05.010
Guenther, F. H., Ghosh, S. S., & Tourville, J. A. (2006). Neuralmodeling and imaging of the cortical interactions underlyingsyllable production. Brain and Language, 96, 280–301. https://doi.org/10.1016/j.bandl.2005.06.001
Hartley, T., & Houghton, G. (1996). A linguistically constrainedmodel of short-term memory for nonwords. Journal of Memoryand Language, 35, 1–31. https://doi.org/10.1006/jmla.1996.0001
Hickok, G. (2012). Computational neuroanatomy of speech pro-duction. Nature Reviews Neuroscience, 13, 135–145. https://doi.org/10.1038/nrn3158
Hickok, G., Houde, J., & Rong, F. (2011, February). Sensorimotorintegration in speech processing: Computational basis andneural organization. Neuron, 69, 407–422. https://doi.org/10.1016/j.neuron.2011.01.019
Hixon, T., Weismer, G., & Hoit, J. (2008). Preclinical speechscience. San Diego, CA: Plural.
Hotopf, W. H. N. (1983). Lexical slips of the pen and tongue: Whatthey tell us about language production. In B. Butterworth (Ed.),Language production, vol. 2: Development, writing, and otherlanguage processes (pp. 147–199). London: Academic Press.
Houde, J. F., & Nagarajan, S. S. (2011). Speech production asstate feedback control. Frontiers in Human Neuroscience, 5,1–14. https://doi.org/10.3389/fnhum.2011.00082
Kruskal, J. B. (1964). Nonmetric multidimensional scaling: Anumerical method. Psychometrika, 29, 115–129. https://doi.org/10.1007/BF02289694
Lane, H., & Tranel, B. (1971). The Lombard sign and the roleof hearing in speech. Journal of Speech, Language, and Hear-ing Research, 14, 677–709. https://doi.org/10.1044/jshr.1404.677
1710 Journal of Speech, Language, and Hearing Research • Vol. 60 •
Levelt, W. J. M. (1983). Monitoring and self-repair in speech.Cognition, 14, 41–104. https://doi.org/10.1016/0010-0277(83)90026-4
Levelt, W. J. M., Roelofs, A., & Meyer, A. S. (1999). A theoryof lexical access in speech production. Behavioural and BrainSciences, 22, 1–38.
Malloy, J. R., Nistal, D., & Bohland, J. W. (2014). A study ofspeech sequencing errors due to delayed auditory feedback.Paper presented at the Motor Speech Conference. Sarasota, FL.
Nooteboom, S. G. (1973). The tongue slips into patterns. InV. A. Fromkin (Ed.), Speech Errors as Linguistic Evidence(pp. 144–156). The Hague, the Netherlands: Mouton.
Nooteboom, S. G. (1980). Speaking and unspeaking: Detectionand correction of phonological and lexical errors in spontane-ous speech. In V. A. Fromkin (Ed.), Errors in linguistic per-formance: Slips of the tongue, ear, pen, and hand (pp. 87–95),New York, NY: Academic Press.
Oller, D. K., & Eilers, R. E. (1988). The role of audition in infantbabbling. Child Development, 59(2), 441–449.
Perkell, J. S., Denny, M., Lane, H., Guenther, F., Matthies, M. L.,Tiede, M., . . . Burton, E. (2007). Effects of masking noise onvowel and sibilant contrasts in normal-hearing speakers andpostlingually deafened cochlear implant users. The Journal ofthe Acoustical Society of America, 121, 505–518. https://doi.org/10.1121/1.2384848
Perkell, J. S., Numa, W., Vick, J., Lane, H., Balkany, T.,& Gould, J. (2001). Language-specific, hearing-relatedchanges in vowel spaces: A preliminary study of English- andSpanish-speaking cochlear implant users. Ear and Hearing,22, 461–470.
Postma, A. (2000). Detection of errors during speech production:A review of speech monitoring models. Cognition, 77, 97–132.
Pouplier, M. (2007). Tongue kinematics during utterances elicitedwith the SLIP technique. Language and Speech, 50, 311–341.https://doi.org/10.1177/00238309070500030201
Pouplier, M., & Goldstein, L. (2005). Asymmetries in the percep-tion of synthesized speech. Journal of Phonetics, 33, 47–75.https://doi.org/doi:10.1016/j.wocn.2004.04.001
Pouplier, M., & Hardcastle, W. (2005). A re-evaluation of thenature of speech errors in normal and disordered speakers.Phonetica, 62, 227–243. https://doi.org/10.1159/000090100
Purcell, D. W., & Munhall, K. G. (2006). Compensation followingreal-time manipulation of formants in isolated vowels. TheJournal of the Acoustical Society of America, 119, 2288–2297.https://doi.org/10.1121/1.2173514
Saltzman, E. L., & Munhall, K. G. (1989). A dynamical approachto gestural patterning in speech production. Ecological Psychol-ogy, 1, 333–382. https://doi.org/10.1207/s15326969eco0104_2
Sasisekaran, J. (2012). Effects of delayed auditory feedback onspeech kinematics in fluent speakers. Perceptual and Motor Skills,115, 845–864. https://doi.org/10.2466/15.22.PMS.115.6.845-864
Shattuck-Hufnagel, S. (1983). Sublexical units and suprasegmentalstructure in speech production planning. In P. F. MacNeilage(Ed.), The production of speech (pp. 109–136). New York, NY:Springer-Verlag.
Shattuck-Hufnagel, S., & Klatt, D. H. (1979). The limited use ofdistinctive features and markedness in speech production:Evidence from speech error data. Journal of Verbal Learningand Verbal Behavior, 18, 41–55. https://doi.org/10.1016/S0022-5371(79)90554-1
Smith, A., Johnson, M., McGillem, C., & Goffman, L. (2000). Onthe assessment of stability and patterning of speech movements.Journal of Speech, Language, and Hearing Research, 43, 277–286.https://doi.org/10.1044/jslhr.4301.277
1695–1711 • June 2017

Complimentary Author PDF: Not for Broad Dissemination
Stuart, A., Kalinowski, J., Rastatter, M. P., & Lynch, K. (2002).Effect of delayed auditory feedback on normal speakers at twospeech rates. The Journal of the Acoustical Society of America,111, 2237–2241. https://doi.org/10.1121/1.1466868
Summers, W. V., Pisoni, D. B., Bernacki, R. H., Pedlow, R. I., &Stokes, M. A. (1988). Effects of noise on speech production:Acoustic and perceptual analyses. The Journal of the Acousti-cal Society of America, 84, 917–928. https://doi.org/10.1121/1.396660
Tiede, M., Bundgaard-Nielsen, R., Kroos, C., Gibert, G., Attina, V.,Kasisopa, B., . . . Best, C. (2010, 15–19 November). Speech artic-ulator movements recorded from facing talkers using two electro-magnetic articulometer systems simultaneously. Proceedingsof Meetings on Acoustics. Paper presented at 160th MeetingAcoustical Society of America, Cancun, Mexico. https://doi.org/10.1121/1.3508805
Tilsen, S. (2013). A dynamical model of hierarchical selectionand coordination in speech planning. PloS One, 8(4), e62800.https://doi.org/10.1371/journal.pone.0062800
Tilsen, S., & Goldstein, L. (2012). Articulatory gestures are individ-ually selected in production. Journal of Phonetics, 40, 764–779.https://doi.org/10.1016/j.wocn.2012.08.005
Cle
Tourville, J. A., Reilly, K. J., & Guenther, F. H. (2008). Neuralmechanisms underlying auditory feedback control of speech.NeuroImage, 39, 1429–1443. https://doi.org/10.1016/j.neuroimage.2007.09.054
Villacorta, V. M., Perkell, J. S., & Guenther, F. H. (2007). Sensori-motor adaptation to feedback perturbations of vowel acousticsand its relation to perception. The Journal of the Acoustical Soci-ety of America, 122, 2306–2319. https://doi.org/10.1121/1.2773966
Vousden, J. I., Brown, G. D., & Harley, T. A. (2000). Serial con-trol of phonology in speech production: A hierarchical model.Cognitive Psychology, 41, 101–175. https://doi.org/10.1006/cogp.2000.0739
Wang, J., Samal, A., Rong, P., & Green, J. R. (2016). An optimalset of flesh points on tongue and lips for speech-movement clas-sification. Journal of Speech, Language, and Hearing Research,59, 15–26. https://doi.org/10.1044/2015_JSLHR-S-14-0112
Xu, Y., Larson, C. R., Bauer, J. J., & Hain, T. C. (2004). Com-pensation for pitch-shifted auditory feedback during theproduction of Mandarin tone sequences. The Journal of theAcoustical Society of America, 116, 1168–1178.
Yates, A. J. (1963). Delayed auditory feedback. PsychologicalBulletin, 60, 213–232. https://doi.org/10.1037/h0044155
r et al.: Speech Sound Sequencing Errors Induced by DAF 1711