Kimi_thesis_2018_final_17_12_... - Discovery Research Portal
290
University of Dundee DOCTOR OF PHILOSOPHY Dual regulation of transcription factor Nrf2 by Keap1 and the beta-TrCP/GSK-3 in cancer Ebisine, Kimimuepigha Award date: 2019 Link to publication General rights Copyright and moral rights for the publications made accessible in the public portal are retained by the authors and/or other copyright owners and it is a condition of accessing publications that users recognise and abide by the legal requirements associated with these rights. • Users may download and print one copy of any publication from the public portal for the purpose of private study or research. • You may not further distribute the material or use it for any profit-making activity or commercial gain • You may freely distribute the URL identifying the publication in the public portal Take down policy If you believe that this document breaches copyright please contact us providing details, and we will remove access to the work immediately and investigate your claim. Download date: 22. Sep. 2022
-
Upload
khangminh22 -
Category
Documents
-
view
1 -
download
0
Transcript of Kimi_thesis_2018_final_17_12_... - Discovery Research Portal

University of Dundee
DOCTOR OF PHILOSOPHY
Dual regulation of transcription factor Nrf2 by Keap1 and the beta-TrCP/GSK-3 incancer
Ebisine, Kimimuepigha
Award date:2019
Link to publication
General rightsCopyright and moral rights for the publications made accessible in the public portal are retained by the authors and/or other copyright ownersand it is a condition of accessing publications that users recognise and abide by the legal requirements associated with these rights.
• Users may download and print one copy of any publication from the public portal for the purpose of private study or research. • You may not further distribute the material or use it for any profit-making activity or commercial gain • You may freely distribute the URL identifying the publication in the public portal
Take down policyIf you believe that this document breaches copyright please contact us providing details, and we will remove access to the work immediatelyand investigate your claim.
Download date: 22. Sep. 2022

Dual regulation of transcription factor Nrf2 by Keap1 and the
beta-TrCP/GSK-3 in cancer
Kimimuepigha Ebisine
A thesis submitted for the degree of Doctor of Philosophy, September 2018

i
Table of Contents Table of Contents .................................................................................................. i
List of Figures ..................................................................................................... ix
List of Tables ...................................................................................................... xii
Abbreviations .................................................................................................... xiii
Acknowledgements ........................................................................................... xx
Declaration ....................................................................................................... xxii
Abstract ........................................................................................................... xxiii
Chapter 1 .............................................................................................................. 1
1.0 General introduction................................................................................... 2
1.1 Molecular basis of cancer ........................................................................ 2
1.1.1 Metabolic changes in cancer ............................................................. 5
1.1.2 Anti-cancer therapies and drug resistance ........................................ 7
1.2 Oxidative stress and cancer .................................................................. 10
1.2.1 Reactive oxygen species ................................................................ 10
1.2.2 Chemical properties of ROS .......................................................... 11
1.2.3 Biological roles of ROS ................................................................... 12
1.2.4 ROS and cancer ............................................................................. 13
1.2.4.1 ROS and tumour cell death ......................................................... 17
ii
1.2.4.2 ROS and tumour cell proliferation ................................................ 18
1.3 Nrf2 and cytoprotection ......................................................................... 21
1.3.1 Nrf2 and redox homeostasis ........................................................... 21
1.3.2 Nrf2: Discovery, Structure and Function ......................................... 23
1.3.3 Nrf2 and its target genes ................................................................. 28
1.3.4 Nrf2 and intermediary metabolism .................................................. 31
1.4 Regulation of Nrf2 .................................................................................. 34
1.4.1 Mechanism of Nrf2 activation and repression ................................. 34
1.4.2 Regulation of Nrf2 by Keap1 ........................................................... 36
1.4.3 Regulation of Nrf2 by GSK-3 and β-TrCP ....................................... 41
1.4.4 Regulation of Nrf2 by phosphatidylinositol-3-kinase (PI3K)
pathway……………………………………………………………………………47
1.4.5 Regulation of Nrf2 by protein phosphorylation ................................ 47
1.5 Cancer chemoprevention....................................................................... 49
1.5.1 Role of Nrf2 ..................................................................................... 49
1.5.2 Upregulation of Nrf2 in cancer ........................................................ 52
1.5.3 Inducers of Nrf2 as anticancer agents ............................................ 55
1.5.4 Inhibitors of Nrf2 as anticancer therapy .......................................... 57
1.6 Aims of this thesis .................................................................................. 61
Chapter 2 ............................................................................................................ 63
2 Materials and methods ................................................................................. 64

iii
2.1 Materials ................................................................................................ 64
2.2 Mammalian cell culture .......................................................................... 65
2.2.1 Cell lines ......................................................................................... 65
2.2.2 Growth medium and cell culture conditions. .................................... 66
2.2.3 Passaging of cell lines .................................................................... 67
2.2.4 Seeding of cells ............................................................................... 67
2.2.5 Treatment of cells ........................................................................... 67
2.2.6 Preparation of frozen cell stocks ..................................................... 69
2.3 Preparation of stock solutions ................................................................ 69
2.3.1 Kinase lysis buffer ........................................................................... 69
2.3.2 RIPA lysis buffer ............................................................................. 69
2.3.3 5x Laemmeli protein sample loading buffer ..................................... 70
2.3.4 10x SDS-PAGE running buffer ........................................................ 70
2.3.5 10x SDS-PAGE transfer buffer ....................................................... 70
2.3.6 Tris-buffered saline tween-20 (TBST) washing buffer ..................... 70
2.3.7 Enhanced chemiluminescence (ECL) solution ................................ 70
2.4 Protein quantification ............................................................................. 70
2.5 Sample preparation for electrophoresis ................................................. 71
2.6 Western blotting ..................................................................................... 72
2.6.1 SDS-Polyacrylamide gel electrophoresis (PAGE) ........................... 72
2.6.1.1 Polyacrylamide-gel electrophoresis ............................................. 72

iv
2.6.1.2 NuPAGE gel electrophoresis ...................................................... 73
2.6.2 Wet transfer of electrophoretically resolved proteins ..................... 74
2.6.3 Immunoblotting ............................................................................... 74
2.7 shRNA knockdown ................................................................................ 75
2.7.1 Culturing Clonal Cells ..................................................................... 77
2.7.1.1 Transformation of E.coli cells with plasmid DNA.......................... 77
2.7.1.2 Preparation of frozen glycerol stock ............................................. 77
2.7.2 Purification of plasmid DNA ............................................................ 77
2.7.3 Quantification of plasmid DNA ........................................................ 78
2.7.4 DNA sequence analysis .................................................................. 78
2.7.5 Transfection of cells ............................................................................ 78
2.7.6 Kill curve.............................................................................................. 79
2.8 Colony formation assay ......................................................................... 79
2.9 Measurement of glutathione .................................................................. 80
2.9.1 Monochlorobimane-based assay to measure reduced glutathione . 80
2.9.2 Modified Tietze assay to measure total and reduced glutathione ... 80
2.10 Analysis of mRNA expression ............................................................... 82
2.10.1 Extraction of total RNA from cells ................................................... 82
2.10.2 Quantification of RNA ..................................................................... 83
2.10.3 Reverse-transcription of RNA ......................................................... 83
2.10.4 Quantitative real-time PCR (Taqman) ............................................. 83
v
2.11 Luciferase reporter assay ...................................................................... 84
2.11.1 Dual luciferase assay ...................................................................... 84
2.11.2 Single luciferase assay ................................................................... 85
2.12 β-Galactosidase (β-gal) activity assay ................................................... 85
2.13 Measurement of ROS ............................................................................ 87
2.14 Measurement of cytotoxicity .................................................................. 88
2.15 Measurement of cell Proliferation .......................................................... 88
2.16 Measurement of PTEN .......................................................................... 88
2.17 Measurement of glycogen synthase kinase-3 activity ............................ 89
2.18 Propidium Iodide staining for flow cytometry ......................................... 90
2.19 Polymerase chain reaction .................................................................... 91
2.20 Statistical analysis ................................................................................. 92
Chapter 3 ............................................................................................................ 93
3.0 Dual regulation of the Nrf2 by Keap1 and GSK-3 .......................................... 94
3.1 Introduction ............................................................................................... 94
3.1.1 Mechanism by which electrophiles induce the expression of Nrf2-
target genes via antagonism of CRLKeap1 ........................................................ 96
3.1.2 The PI3K/Akt pathway is required for induction of Nrf2-target genes by
many electrophiles .......................................................................................... 97
3.1.3 PTEN contributes to regulation of Nrf2 via the PI3K/Akt pathway ...... 99
3.2 Experimental result ................................................................................. 102

vi
3.2.1 Inducers can increase expression of Nrf2 target genes in a Keap1-
independent manner ..................................................................................... 102
3.2.2 Increase in mRNA for Hmox1 and Nqo1 by inducers is dependent on
Nrf2…….. ...................................................................................................... 106
3.2.3 Inducers that stimulate Nrf2-target gene expression in a Keap1-
independent manner inhibit GSK-3 ............................................................... 111
3.2.4 Inducers that antagonize GSK-3 function through the Neh6 domain of
Nrf2………………………………………………………………………………….117
3.2.5 Inhibition of PI3K suppresses Nrf2 activity ....................................... 121
3.2.6 Inhibition of PI3K leads to a decrease in Nrf2-target gene
expression………………………………………………………………………….124
3.2.7 Regulation of Nrf2 through the PI3K-AKT-GSK3 pathway is
independent of Keap1 ................................................................................... 128
3.2.8 Regulation of Nrf2 through the PI3K-AKT-GSK3 pathway is dependent
on GSK3 ........................................................................................................ 134
3.2.9 PTEN functions as a sensor protein for agents that induce Nrf2 ...... 137
3.3 Discussion .............................................................................................. 141
CHAPTER 4....................................................................................................... 146
4.0 Mechanism and therapeutic value of inhibition of Nrf2 CNC-bZIP
transcription factor in cancer. ............................................................................ 147
4.1 Introduction .............................................................................................. 147
4.1.1 Mutation frequencies of Keap1 and Nrf2 in cancer ....................... 148
4.1.2 Nrf2 and cell proliferation .............................................................. 149

vii
4.1.3 Nrf2 alters NADPH generation, pentose phosphate pathway and fatty
acid metabolism ......................................................................................... 150
4.2 Experimental results ............................................................................ 151
4.2.1 Effect of Nrf2 knockdown on anti-oxidant genes and reactive oxygen
species on tumour cells using shRNA. ....................................................... 151
4.2.2 Effect of Nrf2 knockdown on cell growth and proliferation in tumour
cells using shRNA. ..................................................................................... 158
4.2.3 Nrf2 regulates cellular glutathione ................................................. 162
4.2.4 Nrf2 controls cell proliferation by regulating the expression of
metabolic genes ......................................................................................... 165
4.2.5 Decreased cell proliferation is not as a result of cell death ........... 167
4.2.6 Nrf2 and cell cycle Protein ............................................................ 168
4.3 Discussion ........................................................................................... 173
CHAPTER 5....................................................................................................... 177
5.0 Discussion .............................................................................................. 178
5.1 Nrf2 activators function in both Keap1 and Keap1-independent
mechanism in Nrf2-target gene induction ...................................................... 178
5.2 Contribution of the PI3K-Akt/PKB signaling pathway to pharmacological
induction of Nrf2-target gene expression ....................................................... 181
5.3 Loss of Nrf2 in lung cancer cells causes reduced cell proliferation ...... 183
5.4 Conclusion and future work: chapter 3 ................................................ 186
5.5 Conclusion and future work: chapter 4 ................................................ 188
5.6 Limitations of study and future work .................................................... 190
viii
5.7 Conclusion .............................................................................................. 190
6 References ................................................................................................. 192
7 Appendices ................................................................................................ 262
7.1 Appendix I ............................................................................................... 262
7.2 Appendix II .............................................................................................. 263
7.3 Appendix III ............................................................................................. 264
ix
List of Figures
Figure 1.1: Metabolic reprogramming in tumours..................................................... 7
Figure 1.2: Dual role of ROS in cancer cell. ........................................................... 16
Figure 1.3: Relationship between ROS levels and cell fate ................................... 17
Figure 1. 4: Nrf2 regulates cellular homeostasis. ................................................... 23
Figure 1.5: Structure of Nrf2 protein ....................................................................... 28
Figure 1. 6: Structural domains of Keap1 protein with amino acid numbering. ...... 38
Figure 1.7: Diagram depicting the repression of Nrf2 by Keap1............................. 41
Figure 1. 8: Structure of the Neh6 domain of Nrf2 ................................................. 43
Figure 1. 9: structure of β-TCP protein ................................................................... 44
Figure 1. 10: Regulation of Nrf2 by Keap1 and GSK-3. ......................................... 44
Figure 1.11: Structures of Nrf2 inhibitors. .............................................................. 61
Figure 2.1: Thermo cycler settings for Real-time PCR ......................................... 84
Figure 2.2: Equation of reaction for β-galactosidase .............................................. 87
Figure 3.1: Regulation of Nrf2 by oxidative stress and growth stimuli. ................... 95
Figure 3.2: Nrf2 activators ...................................................................................... 99
Figure 3.3: Inhibitors of PI3K ............................................................................... 101
Figure 3.4: PTEN regulates the PI3K-Akt pathway. ............................................. 102
Figure 3.5: Effect of Nrf2 inducers on Keap1+/+ and Keap1-/- MEFs. .................... 104
Figure 3.6: Effect of Nrf2 inducers on ARE-driven gene expression .................... 108
x
Figure 3.7: Inducers increase the abundance of Nrf2 protein in Keap1-independent
system ................................................................................................................. 110
Figure 3.8: Inhibition of GSK-3 increases ARE-driven gene expression. ............. 111
Figure 3.9: Agents that induce Nrf2-target genes in a Keap1-independent manner
increases GSK-3 phosphorylation decreases the activity of GSK-3. .................... 115
Figure 3.10: Agents that induce Nrf2-target genes in a Keap1-independent manner
decreases the activity of GSK-3. .......................................................................... 117
Figure 3.11: Xenobiotics activate Nrf2 by preventing formation of the DSGIS-
containing phosphodegron in its Neh6 domain. ................................................... 120
Figure 3.12: The activity of Nrf2 is positively influenced by PI3K. ........................ 123
Figure 3.13: LY294002 and PI-103 represses Nrf2 gene expression in tBHQ
induced MCF7 cells. ............................................................................................ 125
Figure 3.14: LY294002 and PI-103 represses Nrf2 and inducible Nrf2-target gene
expression............................................................................................................ 128
Figure 3.15: Inhibition of PI3K suppresses Nrf2 activity in a Keap1 independent
manner. ................................................................................................................ 131
Figure 3.16: Blocking of Keap1 binding had no effect on PI3K. ........................... 133
Figure 3.17: Inhibition of kinase activity suppresses Nrf2 activity in a GSK-3-
dependent manner. .............................................................................................. 136
Figure 3.18: PTEN negatively controls Nrf2. ........................................................ 140
Figure 4.1: Knockdown of Nrf2 in A549 and H460 cells ....................................... 153
Figure 4.2: Knockdown of Nrf2 decreased Nrf2-target gene expression .............. 156

xi
Figure 4.3: Depletion of Nrf2 resulted in an increase in ROS in lung cancer cells
............................................................................................................................. 158
Figure 4.4: Nrf2 enhances cell proliferation and growth ....................................... 161
Figure 4.5: Cellular GSH reduction causes a decrease in A549 cell proliferation 164
Figure 4.6: Nrf2 knockdown alters the expression of genes involved in PPP,
NADPH production and fatty acid oxidation. ........................................................ 167
Figure 4.7: Loss of Nrf2 not associated with cell death ........................................ 168
Figure 4.8: Nrf2 knockdown caused a decrease in cell cycle protein ................... 172

xii
List of Tables Table 1.1: Sources of reactive oxygen species .................................................... 20
Table 1.2: Classical Nrf2 target genes and their function ..................................... 30
Table 1.3: Some mutations in Keap1 and NFE2L2 found in cancer..................... 54
Table 1.4: Examples of Nrf2 inhibitors. ................................................................ 58
Table 2.1: Plasmids used in thesis with their promoter and experimental application. ............................................................................................................. 65
Table 2. 2: List of drugs in experiment. .................................................................. 68
Table 2.3: Polyacrylamide gel composition. ........................................................... 73
Table 2.4: Mission shRNA plasmids. ..................................................................... 76
Table 2.5: PCR cycle conditions. ........................................................................... 92
Table 3.1: Expression of Hmox1 and Nqo1 in Keap1+/+ and Keap1-/- MEFs. .... 105
Table 7.1: Predesigned Taqman probes/primers (human) for gene expression
assay ................................................................................................................. 262
Table 7.2: Unmodified oligonucleotides used as Taqman probes and primers .. 263
Table 7.3: Antibodies used in PAGE-electrophoresis ........................................ 264

xiii
Abbreviations
2-ME: Beta-mercaptoethanol
ABI: Applied Biosystems
ABCB6: ATP-binding cassette subfamily B member 6
ACLY: ATP-citrate lyase
ACN: Acetonitrile
ADP: Adenosine diphosphate
AhR: Aryl-hydrocarbon receptor
AKR: Aldo-keto reductase
AKT: Protein Kinase B
AMP: Adenosine monophosphate
ANOVA: Analysis of variance
ARE: Antioxidant response element
ATP: Adenosine triphosphate
BACH: BTB and CNC homology
BSA: Bovine serum albumin
BSO: Buthionine sulfoximine
BTB: Broad complex, tramtrack and bric-a-brac
bZIP: basic region-leucine zipper
xiv
CDC2: cell cycle controlle
Cdk1 Cyclin-dependent kinase 1
cDNA: complementary deoxyribonucleic acid
CHD6: Chromodomain helicase DNA-binding protein 6
CNC: cap′n′collar
CoA: Coenzyme A
CRIF1: CR6-interacting factor 1
Cul: Cullin
CYP: Cytochrome P450
Cys: Cysteine
DAG: Diacylglycerol
DMSO: Dimethyl sulphoxide
DNA: Deoxyribonucleic acid
DTNB: 5’5-dithiobis-nitrobenzoic acid
ECL: Enhanced chemiluminescence
EDTA: Ethylenediaminetetraacetic acid
EpRE: Electrophile response element
ER: Endoplasmic reticulum
ERK: Extracellular signal-related kinase
FA: Fatty acid
FAD: Flavin adenine dinucleotide

xv
FAO: Fatty acid oxidation
FAS: Fatty acid synthesis
FASN: Fatty acid synthase
FECH’ Ferrochelatase
FFA: Free fatty acid
FOXQ1: Forkhead box Q1
G-6-P: Glucose-6-phosphate
G-6-P-D: Glucose-6-phosphate dehydrogenase
GAPDH: Glyceraldehyde 3-phosphate dehydrogenase
GCLC: Glutamate cysteine ligase catalytic subunit
GCLM: Glutamate cysteine ligase modulator subunit
GPX: Glutathione peroxidase
GR: Glutathione reductase
GSH: Glutathione (reduced)
GSK-3: Glycogen synthase kinase-3
GSS: Glutathione synthetase
GSSG: Glutathione (oxidised)
GST: Glutathione S-transferase
H2O2: Hydrogen peroxide
HCC: Hepatocellular carcinoma
HMOX: Haem oxygenase

xvi
HO•: Hydroxyl radical
hr: Hour
IVR: Intervening region
KD: Knock down
Keap1: Kelch-like ECH-associated protein 1
KLF5: Kruppel-like factor 5
KO: Knock out
KRD: Kelch repeat domain
LD50: Lethal dose (50%)
MAF: Musculoaponeurotic fibrosarcoma
MAG: Monoacylglycerol
MEF: Mouse embryonic fibroblast
min: Minutes
MRD: Multidrug resistance protein
MRP: Multidrug resistance-associated protein
mTOR: mechanistic target of rapamycin
mTORC: Mechanistic target of rapamycin complex
NAC: N-acetylcysteine
NADP+: Nicotinamide adenine dinucleotide phosphate (oxidised)
NADPH: Nicotinamide adenine dinucleotide phosphate (reduced)
Neh: Nrf2-ECH homology
xvii
NF-E2: Nuclear factor erythroid 2
NFκB: Nuclear factor κB
NOX: NADPH oxidase
NQO1: NAD(P)H quinone oxidoreductase 1
Nrf2: Nuclear factor erythroid 2-related factor 2
ns: not significant
NSCLC: Non-small cell lung carcinoma
O2•-: Superoxide
p63: Tumour protein 63
PAIP1: Polyadenylate-binding protein-interacting protein 1
PBS: Phosphate-buffered saline
PCR: Polymerase chain reaction
PDI: Protein disulphide isomerase
PEITC: Phenethyl isothiocyanate
PI3K: Phosphatidylinositol 3-kinase
PIG3: p53-induced gene 3
PKB: Protein kinase B
Pparα Peroxisome proliferator activated receptor alpha
Pparγ Peroxisome proliferator activated receptor gamma
PPAT: Phosphoribosyl pyrophosphate amidotransferase
PPP: Pentose phosphate pathway
xviii
PRDX: Peroxidoredoxin
PTEN: Phosphatase and tensin homolog
PVDF: Polyvinyllidene fluoride
RAR: Retinoic acid receptor
Rbx1: Ring-box protein 1
RHOB: Ras homology family member B
RNA: Ribonucleic acid
RNF4: RING finger protein 4
RNS: Reactive nitrogen species
ROS: Reactive oxygen species
RT-PCR: Real time PCR
RXR: Retinoid X receptor
RXRA: Retinoic acid receptor alpha
SCC: Squamous cell carcinomas
SCD1: stearoyl CoA desatuease 1
SCF: Skp1-Cul1-F-box protein complex
SCLC: Small cell lung cancer
SD: Standard deviation
SDS: Sodium dodecyl sulphate
SDS-PAGE: SDS polyacrylamide gel electrophoresis
SEM: Standard error of the mean

xix
SFN: Sulforophane
SH: Thiol
SILAC: Stable isotope labelling of amino acids in cell culture
Skp: S-phase kinase-assoicated protein 1
SRXN: Sulfiredoxin
TAG: Triacylglycerol
tBHQ: tert-butylhydroquinone
TEMED: Tetramethylethylenediamine
TG: Triglyceride
TNB: 5-thio-2-nitrobenzoic acid
TRE: TPA-response element
TSS: Transcription start site
TXN: Thioredoxin
TXNRD: Thioredoxin reductase
UGT: UDP-glucuronosyltransferases
UV: Ultra-violet
WT: Wild-type
XRE: Xenobiotic response element
β-TrCP: Beta-transducin repeat containing protein

xx
Acknowledgements I want to start by thanking the Almighty God for his grace, love and mercies
towards me throughout this study period. I dedicate this thesis to God Almighty for
He made a way.
I would like to express my deepest gratitude to my supervisor Prof. John D Hayes
for the utmost support, guidance, patience and encouragement throughout this
period. You have encouraged, criticized, corrected and have made yourself utterly
available to me any time I come knocking. I am indeed grateful and glad to be your
student. My special thanks to my second supervisor Prof. Albena D. Kostova for
guiding me and teaching me both theoretically and in the laboratory. Your smile
and encouragement have kept me going even in those tough days in the
laboratory.
I would like to acknowledge my family for always being there. Many thanks to my
husband Mr Gideon Ogunniye for your understanding even when I completely lose
myself in my experiments and forget about you. Thank you for those drive to the
laboratory at the middle of the night just to set up an experiment and waiting there
till I finish no matter how long I take. Thank you so much. My biggest thanks to my
father Dr S.S Ebisine for your love, support, vision and care. Without your support
this dream would not have been possible. Thank you for being a wonderful dad
and for supporting us both financially and otherwise. My mother, my pillar, I love
you so much. Thank you for the prayers, love and support. You are the best mum
ever. To my siblings, I love you all. My brother Ebi, you are just too much, you
made every day better than the last.
I would like to thank Dr Laureano De la Vega for your teaching, corrections during
lab meetings, for proving me with the CRISPR/CAS 9 Nrf2 knockdown cells and for
teaching me so many experimental techniques. You were like a third supervisor. I
am really grateful.

xxi
I would like to thank Dr Calum D. Sutherland for taking time to impart your
knowledge of GSK-3 on me. Thank you so much for providing CT99021 and for
teaching me on how best to do my experiments. I cannot overemphasize my
deepest appreciation for helping and doing the GSK-3 kinase activity assay. My
thesis would have been incomplete without it and you made such a difference to
my studies.
I would like to thank Dr Sudhir Chowdhry for teaching me every technique I know
today. Thank you for teaching me calculations in chemistry and I am indeed
grateful for that. Thank you for your time and knowledge passed on to me. I want to
say a big thank you to Dr Shubhra Rastogi for the cell cycle experiments and
setup. Thank you for providing antibodies and for explaining to me what
experiments were required. I also want to thank Dr Linda Smith for helping with
Flow cytometry.
I would like to thank my lab mates Dr Sharadha Dayalan Naidu, Dr Ritu Sharma,
Dr Lauren Tebay, Dr Elena Knatko, Dr Ying Zhang, Ms. Holly Robertson, Dr Laura
Torrente, Kevin Roth, Dr Dina Diokovskaya, Ms. Maureen Higgins, Ms. Aparajitha
Vaidyanathan, Dot Kisielewski, Diane Cassidy, Dr Gillian Smith, Lynne Sawers, for
always being there and assisting with several experiments. A big thank you to
everyone in Jacqui Wood cancer research centre, Dundee.

xxii
Declaration
I declare that this thesis is based on results obtained from investigations carried
out by me in the Division of Cancer Research, School of Medicine under the
supervision of Prof. John D Hayes. I declare that the entire thesis is my own
composition. Any work other than my own is clearly stated in the text and
acknowledged with reference to any relevant investigators or contributors. This
thesis has never been presented previously, in whole or in part, for the award of
any higher degree. I have consulted all the references cited within the text of this
thesis.
Signed …………………………………. Date ………………
I confirm that Kimimuepigha Ebisine is the author of this thesis and has spent the
equivalent of at least 9 terms in the Division of Cancer Research, School of
Medicine, University of Dundee, and that she has fulfilled the condition of the
University of Dundee, thereby qualifying her to submit this thesis in application for
the degree of Doctor of Philosophy.
Signed …………………………………. Date ………………
17/12/2018
17/12/2018

xxiii
Abstract
Cancer is one of the foremost causes of death worldwide with about 14.1 million
new incidences and 8.2 cancer related deaths occurring globally. NF-E2 p45-
related factor 2 (Nrf2), a cap-‘n’-collar basic leucine zipper (CNC-bZIP)
transcription factor, prevents carcinogenesis through expression of genes that
ensure the excretion, enzymatic modification, and repair of oxidative damage in
cells containing the antioxidant response element (ARE) in their promoter region.
Beyond providing cytoprotection against oxidative stress and xenobiotics, Nrf2
pays a role in maintaining basic physiological processes such as energy
metabolism and cell cycle regulation. Whilst Nrf2 plays a pivotal role in preventing
degenerative and inflammatory disease, upregulation of Nrf2 promotes
tumourigenesis in cancerous cells. Therefore, understanding the mechanisms
controlling Nrf2 activity is important in translational medicine.
Nrf2 is regulated by proteasomal degradation by Kelch-like ECH-associated protein
1 (Keap1) an E3 ubiquitin ligase substrate adaptor protein that recruits of cullin-3
(Cul3) to Nrf2 via its Neh2 domain. Nrf2 is also negatively regulated by
phosphorylation by glycogen synthase kinase-3 (GSK-3) causing β-transducin
repeat-containing protein (β-TrCP) to ubiquitinate Nrf2 by Skp1-Cul1-F-box (SCF)
ubiquitin ligase through the Neh6 domain of Nrf2. Several research groups have
shown that induction of ARE-driven genes can be regulated by phosphoinositide 3-
kinase- protein kinase B (PI3K-Akt/PKB) signalling pathway. The ability of tert-
butylhydroquinone (tBHQ), 1-[2-cyano-3,12-dioxooleana-1,9(11)-diene-28-
oyl]imidazole (CDDO-Im), diethyl maleate (DEM), curcumin, carnosol, ferulic acid
and sulforaphane (SFN) to activate Nrf2-target genes in a Keap1-dependent or
Keap1-independent manner was tested. It was discovered that all compounds,
except for SFN, activate Nrf2-target genes in a Keap1-independent manner,
inhibiting GSK-3 and functioning through the Neh6 domain of Nrf2. Analysis of the
involvement of PI3K-Akt/PKB pathway in Nrf2 activation revealed that regulation of
Nrf2 through the PI3K-Akt/PKB pathway is independent of Keap1 but dependent
on GSK-3. Also, it was shown that tBHQ, DEM, CDDO-Im, curcumin, ferulic acid

xxiv
directly decreased phosphatase and tensin homolog (PTEN) activity, thereby
preventing formation of the phosphodegron in the Neh6 domain of Nrf2.
With increased Nrf2 levels reported in various cancers including lung cancer,
leading to the progression of these cancers, Nrf2 can be seen as a double-edged
sword. Loss-of-function somatic mutations in KEAP1 as well as somatic mutation in
NFE2L2 has been reported in several human cancers playing a role in the
development of such cancer. Using short hairpin RNA (shRNA) and the
CRISPR/Cas9 system to generate stable Nrf2 knockdown A549 and H460 cells,
the second part of this thesis investigated biochemical and physiological changes
that occur, when the Nrf2 is genetically downregulated, and further on to determine
what mechanism(s) is responsible for decreased cell proliferation in tumours. The
findings obtained confirm that downregulation of Nrf2 from the human non-small
lung adenocarcinoma epithelial cell line A549 and H460, in which Nrf2 is
upregulated though somatic mutations in KEAP1, results in decreased cell
proliferation. Analysis of the genes involved in NADPH generation and pentose
phosphate pathway (PPP) show that decrease in Nrf2 caused a decrease in the
expression of genes involved in PPP. Although knockdown of Nrf2 resulted in a
decrease in cell proliferation, it was shown that this decrease was not as a result of
cell death. Nrf2 is able to control cell proliferation by induction of metabolic
reprogramming geared towards favoring anabolic pathways and influencing the
PPP as well as provide energy source required for cell proliferation.

1
Chapter 1
2
1.0 General introduction
1.1 Molecular basis of cancer One in eight deaths worldwide has been attributed to cancer (Stratton, Campbell
and Futreal, 2009). In developed countries, cancer is now recognized as the
second primary cause of death (Ren et al., 2011) next to heart disease, with an
increase in death rate despite the increased availability of chemotherapeutic
drugs (Knowles and Selby, 2005; Yu and Kensler, 2005; Ren et al., 2011;
Watson, 2013; Pandey et al., 2017). Research over the past 30 years has
revealed that cancer is associated with active changes in the genome (Hanahan
and Weinberg, 2000) that result in uncontrolled cell proliferation that is capable of
metastasizing into outlying organs beyond normal tissue (Stratton, Campbell and
Futreal, 2009). In humans, evidence indicates that tumourigenesis is a multistep
process reflecting genetic changes from normal human cells to highly malignant
cells (Hanahan and Weinberg, 2000, 2011). These changes in the genome of
cancer cells is attributed to intrinsic infidelity of DNA replication, exposure to
exogenous agents such as tobacco smoke, mycotoxins and ultraviolet radiation or
endogenous mutagens, defective DNA repair as well as enzymatic DNA
modification (Alexandrov et al., 2013).
Cancer arises as a consequence of continuous acquisition of (heritable) genetic
variations in individual cells by random mutation and by natural selection acting on
the resultant phenotypic diversity (Stratton, Campbell and Futreal, 2009).
Evidence suggests that human cancer arises from mutations in at least several
hundreds of the total 21000 genes that result in abnormal cell growth and division
(Watson, 2013). This mutagenetic process is divided into three major stages
known as initiation, promotion and progression that ultimately lead to metastasis
(Pitot, 1993; Vincent and Gatenby, 2008). Initiation is carried out by a driver
mutation that causes injury to cells resulting in a shift in the ratio of cell birth to cell
death (Tomasetti, Vogelstein and Parmigiani, 2013). Subsequent clonal
expansion arising from tumour promoters causes passenger mutations that lead

3
to formation of several benign tumours that progress to cancer (Hennings et al.,
1993; Tomasetti, Vogelstein and Parmigiani, 2013). Experimental models that are
capable of exhibiting cancer phenotype used in research showed the presence of
mutated oncogenes that are either tumour suppressor genes having recessive
loss of function or oncogenes with significant function gain (Hanahan and
Weinberg, 2000). Signal transduction pathways allow external signals such as
growth factors to move from cell surface receptor to key promoters, stimulating
the expression of genes required for cell growth and division as well as those
required for the evasion of programmed cell death (Watson, 2013). Cell growth
and proliferation arises through several molecular pathways each possessing its
own specific surface receptor, cytoplasmic transducers and gene promoters as
well as enhancers of gene expression. Cross-talk exists between these various
pathways that allows the generation of new pathways to cancer cells by novel
DNA mutations when pre-existing pathways are blocked (Lemmon and
Schlessinger, 2010; Watson, 2013).
On average, between 33 and 66 somatic gene mutations are observed in
common solid tumours such as breast, pancreas, brain and colon cancer. About
95% of these mutations correspond to single nucleotide base changes while
insertions and deletions of one or a few bases account for the remaining
percentage of gene mutations (Vogelstein et al., 2013). Some tumour types show
either greater or fewer mutations than other tumours, with melanomas and lung
tumours containing about 200 non-synonymous mutations per tumour while
pediatric tumours and leukemias show an average of about 10 mutations per
tumour. The participation of potent mutagens such as cigarette smoke, or
ultraviolet light has been linked to the high levels of mutations seen in melanomas
and lung cancer (Vogelstein et al., 2013). Govindan et al. (2012) reported a 10-
fold increase in point mutations in individuals with non-small cell lung carcinoma
(NSCLC) who smoked as opposed to those that had never smoked. A recent
study carried out by ‘The Cancer Genome Atlas (TCGA)’ on urothelial bladder
carcinoma reported slightly fewer DNA alteration in urothelial bladder carcinoma

4
than those with lung cancer and melanoma; an average of 302 exonic mutations,
204 segmental alterations in genomic copy number and 22 genomic
rearrangement in each sample analyzed as well as mutations in nine genes
(CDKN1A, ERCC2, RXRA, ELF3, KLF5, FOXQ1, RHOB, PAIP1, BTG2) that has
not been previously reported as significantly mutated in any cancer (TCGA, 2014).
The acquisition of additional mutations over time is required to transform a benign
tumour into a malignant lesion. A normal epithelial cell receives a growth
advantage from the first or driver mutation to outgrow its surrounding cells in order
for it to become a microscopic clone. Subsequent mutations may support a round
of clonal growth that permits an increase in cell number that eventually leads to
the formation of a malignant tumour that is capable of invading the underlying
basement membrane and metastasizing into outlying organs (Vogelstein et al.,
2013). A central step in tumour progression is its ability to invade other tissues
and this acts as a driving force for metastasis with the bulk of tumours displaying
characteristics of collective invasion cohesively as a multicellular unit (Friedl et al.,
2012; Cheung et al., 2013). Experiments carried out by Cheung et al. (2013) in
breast tumours using a three-dimensional (3D) organoid assay to identify invasive
cancer cells within a primary tumour in an unbiased fashion mimicking the
microenvironment surrounding invasive breast cancers, showed that the cells
leading to collective invasion are different from bulk tumor cells both molecularly
and behaviorally and display conserved, basal epithelial gene expression such as
cytokeratin-14 (K14) and p63 (Cheung et al., 2013).
Directly linked to age is the frequency of mutations found in some tumours of self-
renewing tissues. An evaluation of the linear regression in these tumours shows
that more than half of the somatic mutations identified occur during the
preneoplastic phase (Tomasetti, Vogelstein and Parmigiani, 2013; Vogelstein et
al., 2013). In a comparative lesion sequencing experiment, Jones et al. (2008)
showed that approximately 17 years is required for the advancement of a large
benign colorectal tumour into an advanced carcinoma whereas less than 2 years
is required for it to metastasize. These results suggest that practically all the

5
mutations required for metastasis are already present in all of the cells of the
antecedent carcinoma cells and that few, if not any, selective events are required
to transform an highly invasive cancer cell into one that can metastasize (Jones et
al., 2008).
1.1.1 Metabolic changes in cancer Cancer cells often exhibit characteristic changes in metabolism which differs from
that of normal cells (Currie et al., 2013). Reprogramming of metabolism in cancer
cells allows accumulation of intermediates as sources of cellular building blocks
required for abnormal cell growth and proliferation (Currie et al., 2013). One such
abnormality is the change in glucose metabolism from oxidative phosphorylation
employed by cells of normal tissues to the fermentation of glucose into lactate by
tumour cells even in the presence of high amount of oxygen known as the
Warburg effect (Warburg, 1956; Vander Heiden, Cantley and Thompson, 2009;
Currie et al., 2013). Oxidative phosphorylation is down regulated by mitochondria
of tumour cells (Gaude and Frezza, 2014). Activation of hypoxia inducible factor-1
(HIF-1) accompanies the warburg effect during normoxia (Sakamoto, Niiya and
Seiki, 2011). It is interesting to note that the distribution of oxygen within the
mitochondria is as low as 0.5 – 1 kPa and that cell culture conditions fall short of
replicating this in vitro (Keeley and Mann, 2018). Tumour growth beyond the
capacity of the pre-existing capillary network induces hypoxia within a tumour
mass which inturn leads to activation of HIF-1 switching cellular ATP production
system predominantly to anaerobic glycolysis (Sakamoto, Niiya and Seiki, 2011).
Other changes occur in cancer cells, including an increase in glutamine
metabolism that is required to fuel the tricarboxylic acid (TCA) cycle
(DeBerardinis, 2007; Mullen et al., 2012) and fatty acid metabolism (DeBerardinis
and Thompson, 2012; Santos and Schulze, 2012). Carbon molecules are
converted from energy production to fatty acid synthesis in cancer cells and are
used for the biosynthesis of membranes and production of signalling molecules
6
required for cell proliferation (Currie et al., 2013). Research has shown that the
metabolic reprogramming observed in cancer cells arises as a result of somatic
mutations in cancer-associated genes and alterations in cellular signalling
(Carracedo, Cantley and Pandolfi, 2013).
Most tumour suppressor genes and proto-oncogenes encode components of
signal transduction pathways and as such function in carcinogenesis by regulating
cell cycle and sustaining proliferative signaling as well as helping cells to evade
growth suppression and/or cell death (Ward and Thompson, 2012). The
phosphoinositide 3-kinase/protein kinase B/mammalian target of rapamycin
(PI3K/PKB/mTOR) pathway, along with p53, hypoxia inducible factor 1-alpha
(HIF-1α) and Myc have proven to promote the down regulation of oxidative
phosphorylation and increased utilization of both glutamine and glucose in tumour
cells (Figure 1.1) (Ward and Thompson, 2012; Kowalik et al., 2016). By enhancing
the expression of glutaminase (GLS), oncogenic Myc has been shown to
stimulate mitochondrial utilization of glutamine (Li et al., 2005a). HIF-1 blocks the
incorporation of glucose into mitochondrial citrate that is critical for lipid synthesis
by diverting pyruvate to lactate indicating a role for HIF-1 as a tumour suppressor
in some cancers (Lum et al., 2007). In a study using a rat model of
hepatocarcinogenesis, it was shown that early preneoplastic foci and nodules that
progress into hepatocellular carcinoma (HCC) are fueled by inhibition of oxidative
phosphorylation and by enhanced consumption of glucose to fuel the pentose
phosphate pathway (PPP) arising mostly from the increased expression of tumour
necrosis factor (TNF) receptor associated protein 1 (TRAP1) a mitochondrial
chaperone and Nuclear factor – (erythroid derived 2) p45- related factor 2 (Nrf2) a
transcription factor that induces the expression of glucose-6-phosphate
dehydrogenase (G6PD) a rate limiting enzyme in PPP following microRNA-1
(miRNA-1) inhibition (Kowalik et al., 2016). Nrf2 has been shown to bind to the
promoter region of several miRNAs regulating the transcription of these miRNAs
with miRNA-1 and miRNA-206 shown by Singh et al., 2013 to be indirectly
regulated by Nrf2 (Shah et al., 2013).

7
Figure 1.1: Metabolic reprogramming in tumours
Signaling molecules deregulated in tumours promote switch from oxidative phosphorylation to
promote biosynthesis of membranes taken from (Ward and Thompson, 2012).
1.1.2 Anti-cancer therapies and drug resistance The search to provide cures for cancer patients has progressed from the use of
general cytotoxic agents such as nitrogen mustards in the early 1940s, through to
the development of natural-product anti-cancer drugs such as vinca alkaloids and
anthracyclines in the 1960s, and onto the more recent development of specific
8
monoclonal antibodies and immunotoxins targeted at cell surface receptors as
well as specific agents targeted at inactivating kinases that promote growth
pathways. Furthermore, recent research has focused on exploiting molecular
targets based on tumour suppressors and oncogenes known to be involved in
tumor development. Although some of the newer therapies have reduced side
effects and increased cancer drug response rates than the older agents, none
have resulted in cure of patients with metastatic disease owing to innate drug
resistance of cancer cells (Gottesman, 2002). The resistance of cancer cells to
therapies often limits the successful treatment of cancer disease (Ren et al.,
2011). More than 90% of patients with metastatic disease experience failure in
treatment arising from resistance to therapeutic drugs that can ultimately lead to
death (Agarwal and Kaye, 2003). This resistance can be either in the form of
intrinsic resistance observed when cancer cells are inherently unresponsive to
drugs or acquired resistance where cancer cells after an initial response to drugs
develop resistance, probably due to the outgrowth of a few mutant cells within the
tumour, and results in reoccurrence of the disease (Hayes and Wolf, 1990; Ren et
al., 2011). Several studies on ovarian cancer show that many women who react
favorably to first line treatment subsequently relapse with onset of a
chemotherapeutic resistant form of the disease (Strathdee et al., 1999; Vaughan
et al., 2012).
Resistance of cancer cells to therapeutic drugs may result from several factors
that have been grouped into three main categories by (Agarwal and Kaye, 2003)
to include: pharmacokinetics, tumour microenvironment and cancer-cell specific
processes.
1. Pharmacokinetics: Factors such as drug delivery mechanism, poor
absorption of drug (depending on lipophilicity of drug and cell membrane
structure), low serum concentration of drugs arising from their rapid
metabolism or renal clearance of drugs and low tolerance to drug effect
arising from inter-patient differences play a role in drug resistance.
9
2. Tumour Microenvironment: Alterations affecting drug metabolism can also
initiate drug resistance as well as the manner of interaction of cancer cells
with each other and with host intestinal cells (Gottesman, 2002). A switch to
a hypoxic environment in cancer cells causes an epithelial-to-mesenchymal
cell transition that can result in changes in gene expression leading to
resistance to anti-cancer drugs (Agarwal and Kaye, 2003; Watson, 2013).
3. Cancer-cell specific: Different cancer cells from the same patients can
respond differently to therapeutic drugs and exhibit different mechanisms of
drug resistance because of variation in their genetic makeup, gene
expression profile, and mechanism of activation of oncogenes or inactivation
of tumour suppressor genes (Gottesman, 2002). Tumours are heterogenous
in nature. Genetic instability within a particular tumour is different as every
time a cell divides, variations across cells are bound to occur. It has been
reported that the resistance of cancer cells to therapeutic drugs may result
from acquired somatic mutations or epigenetic changes within the tumour
cells (Agarwal and Kaye, 2003), or over expression of the therapeutic drug
target and/or by increased inactivation of drugs arising from a decrease in
uptake or enhanced detoxification and drug removal (Ren et al., 2011). The
ability of tumour cells to repair damaged DNA may also cause drug
resistance both in-vitro and in-vivo. Several studies have shown that
resistance to cisplatin, a potent anticancer drug, is observed with enhanced
nucleotide excision repair (NER), a pathway with which DNA-platinum
adducts are removed and damaged DNA is repaired (Dabholkar et al., 1994;
Köberle et al., 1999; Agarwal and Kaye, 2003).
In the presence of an anticancer drug, genetic and epigenetic alterations in
cancer cells from a given patient can result in the development of new variants
that can tolerate therapeutic drugs leading to swift attainment of drug resistance
(Gottesman, 2002). One key point to consider is the fact that even in rapidly
proliferating tumours, a great proportion of cancer cells are in a quiescent state.
10
As most cytotoxic agents exert their actions against proliferating cells, quiescent
cells are relatively unharmed by anticancer drug relative to cycling cells (Agarwal
and Kaye, 2003). The low therapeutic index of many anticancer drugs means that
only a slight change in sensitivity of tumor cells to the agent can lead to drug
resistance (Agarwal and Kaye, 2003). Changes in cancer cells that promote drug
resistance act by either preventing programmed cell death activated by most
anticancer drugs, or by preventing the activation mechanisms that detoxify drugs
and repair DNA damage. It can also act by preventing cell cycle, and cell cycle
check points alterations (Gottesman, 2002).
1.2 Oxidative stress and cancer
1.2.1 Reactive oxygen species Energy generated by aerobic respiration in the mitochondria of eukaryotic cells
often results in the production of reactive oxygen species (ROS) such as the
superoxide anion radical (O2–), hydrogen peroxide (H2O2) and the hydroxyl
radical (HO) (Halliwell and Gutteridge, 2007). Some of these are beneficial to the
cell as they are involved in signalling processes; however at high intracellular
concentrations, less than 5% may be toxic to the cell causing several human
diseases (Poyton, Ball and Castello, 2009; Sosa et al., 2013). Continuous
exposure to chemically reactive species containing oxygen produced during
aerobic metabolism or as a result of extracellular insult beyond cell capacity leads
to a condition known as oxidative stress (Salazar et al., 2006). ROS are selective
and specific to their targets making the difference as to whether redox signaling
would occur in the cell or oxidative damage would occur (Schieber and Chandel,
2014). An imbalance between the generation of ROS and their rate of removal
that favours the former is called oxidative stress, which may result in damage to
important biomolecules such as DNA, RNA, lipids and proteins. If excessive, such
damage may produce lesions that lead to pathological conditions (Kensler,
Wakabayashi and Biswal, 2007; Niture et al., 2010; Reuter et al., 2010; Gupta et

11
al., 2012; Rotblat, Melino and Knight, 2012; Sosa et al., 2013). Hydroxyl radicals
that are generated from H2O2 through the Fenton reaction requiring iron or other
divalent metals such as copper and a source of reducing equivalents (NADH) to
generate metal is a major cause of the damage exerted by ROS (Cabiscol,
Tamarit and Ros, 2000). Polyunsaturated fatty acids in membranes are attacked
by free radicals to initiate lipid peroxidation that arises in a decrease in membrane
fluidity and disrupt membrane bound proteins (Humphries and Szweda, 1998).
The base and sugar moieties of DNA are also targeted by ROS causing single
and double stranded breaks in the backbone of DNA and also lesions that block
replication (Sies and Menck, 1992; Sies, 1993). The reaction between reactive
oxygen and nitrogen species with specific functional group of target protein results
in covalent modifications (Krumova and Cosa, 2016). Accumulation of ROS in
cells may contribute to several pathologies such as neurodegenerative disorders,
cancer, atherosclerosis, diabetes and aging (Salazar et al., 2006).
1.2.2 Chemical properties of ROS The frequent production of potentially damaging ROS is a disadvantage of
aerobic life and thus the intracellular ROS levels have to be tightly controlled in
order to prevent oxidative stress (Niture et al., 2010). Due to the function of single
electron transfer of oxygen, molecular oxygen reacts quickly with other radicals or
other species such as transition metals bearing unpaired electrons. Loss of one
electron in oxygen brings about the formation of O2●- that will subsequently lead to
generation of other ROS as more electrons are lost (Krumova and Cosa, 2016).
The reactivity of several ROS intermediates is dependent on their redox potential
with O2●- possessing a limited reactivity with electron rich centers due to its
anionic charge (Krumova and Cosa, 2016). The reactivity is based on ROS
operating either as one-electron oxidant (radical ROS species) or two-electron
oxidant (nonradical ROS species) (Halliwell, 2006). The level of ROS in the cell is
controlled by the actions of several ROS-scavenging systems such as glutathione

12
peroxidase, glutaredoxin, thioredoxin, catalase, superoxide dismutase (SOD) and
peroxiredoxin (Trachootham, Alexandre and Huang, 2009; Storr, Woolston and
Martin, 2012). In Escherichia coli (E.coli), an experimental result show that 87% of
the total H2O2 production is from the respiratory chain (Gonzalez-Flecha and
Demple, 1995). The impact of ROS on cells can be minimized by some
biochemical processes developed by cells themselves to combat this imbalance
such as (i) enzymes that inactivate ROS e.g SOD and catalase that function in
reduction of O2●- to H2O2 and subsequently to two molecules of water and oxygen
(Bauer, 2013, 2014) or (ii) antioxidants enzymes that directly or indirectly act
against ROS. Direct antioxidants that chemically scavenge ROS e.g glutathione,
tocopherol, thioredoxin (TXN) and indirect antioxidants that act by inducing
cytoprotective genes involved in the synthesis and regeneration of endogenous
direct antioxidants many of which can be found in the diet or (iii) drug metabolizing
enzymes, detoxification enzymes and drug efflux pump that function to eliminate
harmful xenobiotics (Tebay et al., 2015).
1.2.3 Biological roles of ROS The most common and well-studied ROS in cancer are H2O2, O2●-, OH●, and nitric
oxide (NO) (Gupta et al., 2012), ROS can be generated either internally or
externally (Table 1.1). pollutants, tobacco, smoke, drugs, xenobiotics or radiation
are common extracellular sources of ROS. While internally, ROS can be produced
through the action of several different sources such as mitochondria,
peroxisomes, endoplasmic reticulum and the NADPH oxidase (NOX) complex in
cell membrane (Table 1.1) (Gupta et al., 2012). The NOX isoenzymes and
mitochondria produce O2●-, which when acted upon by SOD1 and SOD2 in the
cell generates H2O2 (Schieber and Chandel, 2014). Different cellular
transformations can be triggered in cells depending on the specific NOX enzymes
expressed in the cell and can bring about different biological outcomes in cells
(Krumova and Cosa, 2016). Oxidation of cysteine residues in phosphatases

13
inhibits protein phosphorylation and cell proteome in general (Krumova and Cosa,
2016). The presence of oxidative stress in cell activates transcription factors such
as nuclear factor kappa-light-chain-enhancer of activated B cells (NF-κB),
activator protein-1 (AP-1), Nrf2, HIF-1α, and signal transducer and activator of
transcription 3 (STAT3) that control the expression of genes involved in
inflammation, cell transformation, tumour growth or survival, proliferation,
invasion, angiogenesis and metastasis (Brigelius-Flohé and Flohé, 2011; Gupta et
al., 2012). ROS influence several signal transduction pathways in the cell by
instigating a change in several cellular signaling molecules such as p53,
telomerase, phosphatidylinositol 3-kinase (PI3K), Ras, Raf, and HIF-1α (Gupta et
al., 2012). Several tyrosine kinase receptors employ ROS dependent
mechanisms in signalling (Schieber and Chandel, 2014). The generation of H2O2
has been shown to lead to the signalling of both the epidermal growth factor
receptor and the platelet-derived growth factor receptor (Sundaresan et al., 1995;
Bae et al., 1997). Signal transduction is modulated by H2O2 because it oxidizes
the catalytic cysteine of protein tyrosine phosphatase (PTEN), protein tyrosine
phosphatase 1B (PTP1B), inositol monophosphatase 1 (IMPA1), slingshot protein
phosphatase 3 (SSH3) and Src thereby preventing the inactivation of tyrosine
kinase signaling through AP-1 and protein kinase B (PKB/Akt) (Wang et al., 2000;
Leslie et al., 2003; Salmeen et al., 2003; Groen et al., 2005; Schieber and
Chandel, 2014). Lipo-polysaccharide (LPS) has been shown to activate apoptosis
signal regulating kinase 1 (ASK1) a member of the mitogen-activated protein
(MAP) kinase family in a ROS-dependent manner activating an innate immune
response (Matsuzawa et al., 2005; Matsuzawa and Ichijo, 2008).
1.2.4 ROS and cancer ROS in general are produced and eliminated constantly in the cell functioning in
driving normal cell processes and regulatory pathways including cell growth
through to apoptosis and cell death (Gupta et al., 2012; Schieber and Chandel,

14
2014). However, as mentioned earlier, an imbalance in the production of ROS
versus the elimination of ROS results in oxidative stress that can be detrimental to
cell. ROS plays a role in the initiation, progression and survival phenotype of
cancer cells; however, the role it plays whether good or bad is dependent on
factors such as type of tumour and tissue, the stage of the disease, the treatment
strategy, the levels, specificity and duration of ROS (Sabharwal and Schumacker,
2014; Okon and Zou, 2015). Several lines of evidence show that, unlike normal
cells, cancer cells exhibit high levels of ROS which in-turn leads to the activation
of transcriptional factors that control expression of genes involved in inflammation,
cell transformation, cell death or survival, cell proliferation, invasion, angiogenesis
and metastasis (Kawanishi et al., 2006; Szatrowski and Nathan, 1991;
Trachootham, Alexandre and Huang, 2009). Several risk factors linked to cancer
interact with cells via ROS generation (Figure 1.2). Although the exact pathway(s)
leading to elevation of ROS levels in cancer cells remains vague, several intrinsic
mechanisms such as mitochondrial dysfunction, aberrant metabolism, and loss of
functional p53 and activation of oncogenes are thought to account for the
increase in ROS levels during the development and progression of cancer
(Trachootham, Alexandre and Huang, 2009).
Tumor growth can be initiated by ROS through the induction of signaling
pathways required for cell growth and proliferation as well as stimulating DNA
damage that lead to mutations (Ray, Huang and Tsuji, 2012; Rotblat, Melino and
Knight, 2012). Increased levels of ROS were observed in the oncogenic
transformation of ovarian epithelial cells with H-RasV12 (Trachootham, Alexandre
and Huang, 2009; Gupta et al., 2012). In another similar study, high levels of O2●-
were seen when fibroblasts were constitutively transformed with active isoforms of
Rac and Ras (Irani et al., 1997).
The role of ROS in tumor development is uncertain. The levels of ROS present in
cell determines its effect on cell fate. Survival and proliferation of cells is driven by
low levels of ROS through post-translational modification of kinases and
phosphatases (Cairns, Harris and Mak, 2011). With mitochondria functioning as

15
the major source of ROS in majority of cell types, production of O2●- arising from
inefficiencies in oxidative phosphorylation accounts for 2% of the total oxygen
consumed by mitochondria (Orrenius,2007). The intracellular steady state levels
of O2●- is estimated to be very low, however its activity is spatially limited. To
promote cell proliferation in response to growth factors, production of H2O2 at
nanomolar levels have been estimated to be sufficient (Burch and Heintz, 2005).
NADPH and NADPH oxidase drive the production of this low levels of ROS and is
required for homeostatic signaling events. Moderate levels of ROS, however,
induces the expression of stress-responsive genes which in turn trigger the
expression of proteins providing pro-survival signals. However, high levels of ROS
causes damage to macromolecules, trigger senescence and apoptosis (Figure
1.3) (Cairns, Harris and Mak, 2011). High intracellular levels of ROS seem to play
an important role in the initiation and progression of cancer by promoting
oncogenic stimulation, increased metabolic activity and mitochondrial malfunction.
ROS also control the expression of several tumor suppressor genes such as p53.
Moreover, ROS activate the cell cycle inhibitor p21 that suppresses tumor growth,
as well as promoting the destruction of cancer cells by most chemotherapeutic
and radiotherapeutic agents (Gupta et al., 2012; Idelchik et al., 2017). Moderate
levels of ROS are required for tumor promotion whereas extremely high ROS
levels are required for tumor suppression (Wu and Hua, 2007; Gupta et al., 2012).
This dual role of ROS has been adopted by researchers as possible therapeutic
strategy in cancer, either by increasing ROS removal, and as such decreasing
H2O2 signaling and tumor growth, or by increasing the level of intracellular ROS,
and thus promoting apoptosis (Dolado et al., 2007; Fruehauf and Meyskens,
2007; Choudhary, Wang and Wang, 2011; Lee and Lee, 2011; Raj et al., 2011;
Gupta et al., 2012). This can be seen in the role played by ROS in the signalling
of the Ras-Raf-MEK1/2-ERK1/2 signalling pathway that is a key pathway in
oncogenesis and the signalling of p38 mitogen-activated protein kinases (MAPK)
pathway actively involved in tumor suppression (Dolado et al., 2007; Pan, Hong
and Ren, 2009; Dozio et al., 2010). Most therapeutic agents used in the treatment

16
of cancer cells function by either directly or indirectly stimulating the formation of
ROS that results in cell cycle arrest (Seok and Stockwell, 2008; Goga et al., 2007;
Watson, 2013).
Figure 1.2: Dual role of ROS in cancer cell.
Ros function to promote cancer cell formation, proliferation, survival, invasion and promote
metastasis of cancer cell as well as regulate inflammation and function in regulation cancer cell
death. (Gupta et al., 2012).

17
Figure 1.3: Relationship between ROS levels and cell fate
Low ROS levels promote cell proliferation and survival pathways. Moderate increase in ROS leads
to activation of various signalling pathway and activation of transcription factor that promote pro-
survival pathways. Increase in ROS levels beyond threshold that is specific to cell and stimulus,
cellular response shift to promote oxidative stress that can lead to cell death. Cells uses
antioxidants to counter the effect of high ROS levels.
1.2.4.1 ROS and tumour cell death
One key characteristics of cancer cell is their ability to survive and proliferate.
Most key intrinsic and extrinsic pathways that lead to induction of apoptosis in
cancer cells depend on high levels of ROS (Ozben, 2007). The tumor suppressor
p53 induces apoptosis by activating the expression of genes such as p53-induced
gene 3 (PIG3) which codes for quinine oxidoreductase that is required for ROS
synthesis (Wang et al., 2012). Raj et al. (2011) showed that cancer cells can be
selectively killed by piperlongumine because it increases ROS and binds to
proteins that reregulate oxidative stress through the generation of H2O2. Similar
work by Shaw et al. (2011) reported that Lanperisone induces non-apoptic cell
death in a cell cycle and translation-independent manner in K-ras mutant cancer
cells. It does this by inducing ROS that are inefficiently scavenged in K-ras mutant
cells leading to oxidative stress and cell death (Shaw et al., 2011). Increased ROS
18
production by HYD1 a 10 D-amino acid containing peptide previously known to
block cell adhesion was shown to necrotic cell death in multiple myeloma cells
(Nair et al., 2009). A similar study by Naito et al. (2004) showed that 8-nitrocaffine
and its analog, candidate radiosensitizer for cancer therapy induced necrotic cell
death in U937, HL-60, K562 and Jurkat cell lines in a ROS-dependent manner.
Depending on the ROS content, a switch from apoptosis to necrosis has also
been shown in prostate cancer cells (Garbarino et al., 2007). ROS has also been
shown to promote autophagy in cancer cells. Production of H2O2 by
organotelluride catalyst LAB027 in human colon cancer cells cause cell death via
autophagy (Coriat et al., 2011). Also, combination treatment of Gemcitabine and
cannabinoid in pancreatic cancer cell triggered a ROS dependent autoghagic cell
death (Donadelli et al., 2011). It is important however to emphasize that
modulation of ROS levels in cancer cells is unpredictable and may not always
lead to cancer cell death (Trachootham, Alexandre and Huang, 2009).
1.2.4.2 ROS and tumour cell proliferation
As stated earlier, one key feature of tumour cell is their ability to grow
uncontrollably. Proliferation of cancer cells is enhanced by intracellular ROS
produced by exogenous stimuli in cells and endogenous sources. Through
regulation of precise cell cycle regulators such as cyclins and cyclin dependent
kinases (CDKs), ROS is able to control cell proliferation. Low concentrations of
arsenite was shown to enhance cell proliferation in human breast cancer MCF7
cells by inducing ROS production and promoting the recruitment of cells into the S
phase of the cell cycle, enhancing the expression of c-Myc and heme oxygenase
1 (Hmox1) and increasing NF-кB activity (Ruiz-Ramos et al., 2009). Exogenous
administration of H2O2 caused an increase expression of PKB and extracellular
signal-regulated kinase (ERK) in hepatoma cells leading to increase cell
proliferation (Liu et al., 2002). ROS modulator 1 (Romo 1) a novel protein was
shown to endogenously induce ROS production in the mitochondria and was

19
required for the proliferation of lung cancer cells (Na et al., 2008). Reduction in the
antioxidant defense has been linked to increase in cell proliferation in breast and
ovarian cancer cells through increase in endogenous ROS (Hu et al., 2005; De
Luca et al., 2010).
(A) Intracellular sources of ROS
Intracellular sources Major ROS References
Mitochondria O2●-, H2O2, OH● (Balaban, Nemoto and
Finkel, 2005; Orient et al., 2007; Murphy and M, 2009; Turrens, 2003).
Endoplasmic reticulum H2O2, epoxide hydrolase 1.
(Balaban, Nemoto and Finkel, 2005; Orient et al., 2007; Cheong et al., 2009)
Peroxisomes O2●-, H2O2 (Corpas, Barroso and del
Rıo, 2001; Schrader and Fahimi, 2006)
Phagosome O2●-, H2O2 (Pan, Hong and Ren,
2009)
NOX RO2-, O2
●- (Bedard and Krause, 2007; Orient et al., 2007)

20
(B) External sources of ROS
External sources Major ROS References
Environmental pollutants such as transition metals, benzene, nitrogen oxides.
H2O2. OH●, ONOO●-, NO (Ahmad, 1995; Orient et al., 2007; Lodovici and Bigagli, 2011; Li et al., 2017)
Virus such as Hepatitis B, Hepatitis C.
H2O2 (Fruehauf and Meyskens, 2007).
Tobacco such as nicotine, polycyclic aromatic hydrocarbon (PAH), axaarenes.
NO, H2O2 (Huang, Lin and Ma, 2005; Tagawa et al., 2008; Valavanidis, Vlachogianni and Fiotakis, 2009)
Smoke such as particulate matter, organic carbon.
H2O2, O2●- (Tagawa et al., 2008)
Diet such as monosaturated fatty acid rich oils.
ONOO●- (Hoeks et al., 2008)
Radiation such as ozone, carbon monoxide, ultraviolet light.
H2O2, O2●-, RO2
●- (Tominaga et al., 2004; Riley, 1994)
Table 1.1: Sources of reactive oxygen species
A table describing the common sources of ROS and some examples of the type of ROS they
generate. (A) Intracellular sources of ROS (B) Extracellular sources of ROS.
Abbreviations: superoxide anion (O2●-), hydrogen peroxide (H2O2), hydroxyl ion (OH●), peroxyl
ion (RO2●-), peroxynitrite (ONOO●-), nitric oxide (NO).
21
1.3 Nrf2 and cytoprotection
1.3.1 Nrf2 and redox homeostasis In order to prevent ROS from accumulating within cells, and so maintain cellular
homeostasis, cells have developed several adaptive mechanisms. These include
induction of genes encoding antioxidant enzymes, phase I, II and III detoxification
proteins (Itoh et al., 1999; Kobayashi et al., 2004b; Bryan et al., 2013; Zhang et
al., 2013). In mammalian cells, 20 or more redox-sensitive transcription factors
have been identified (Zenkov, Menshchikova and Tkachev, 2013). Many of these
cytoprotective genes expressed in response to increases in ROS are regulated
through the Nrf2 antioxidant response pathway (Lau et al., 2008; Osburn et al.,
2008). The Nrf2 transcription factor also known as NF-E2-like 2 (NFE2L2)
maintains a balanced redox homeostasis by instigating the transcription of over
100 cytoprotective genes required for cellular adaptation (reviewed in Hayes and
Dinkova-Kostova, 2014). A common disadvantage that has been seen in cells
lacking Nrf2 is that they possess a compromised antioxidant system resulting in
an inability to scavenge ROS (Higgins et al., 2009). Reports from various research
groups states that the level of ROS in Nrf2-null cells is between 1.6-4.0-fold higher
than in wildtype (WT) cells having Nrf2, with loss of Nrf2 leading to depolarization
of mitochondria and reduced levels of ATP in cells (McDonald et al., 2010;
Holmstrom et al., 2013).
The genes transactivated by Nrf2 include those encoding antioxidant proteins,
phase II detoxifying enzymes, drug-efflux pumps, NADPH-regeneration enzymes,
heat shock proteins, 26S proteasomal subunits, growth factors, growth factors
receptors, and several transcriptional factors (Hayes and McMahon, 2009), which
play a role in maintaining a balanced redox homeostasis (Figure 1.4). Amongst
drug metabolizing and detoxifying proteins that are regulated by Nrf2, NAD(P)H:
quinine oxidoreductase 1 (NQO1) is highly induced by many redox stressors. It is
a widely distributed FAD-dependent flavoprotein involved in the reduction of
22
quinones, quinonemines, nitroaromatics and azo dyes using NADH, and thus
helps protect against the formation of ROS generated during oxidative cycling of
quinones (Nioi and Hayes, 2004; Ross and Zhou, 2010; Baird and Dinkova-
Kostova, 2011). The tumour suppressor p53 is protected against proteasomal
degradation by binding to NQO1 thereby aiding in p53 mediated apoptosis in
cancer cells (Asher et al., 2001). The glutamate-cysteine ligase modifier subunit
(GCLM) and glutamate-cysteine ligase catalytic unit (GCLC) subunits of
glutamate-cysteine ligase an enzyme that controls the rate-limiting step in the
synthesis of glutathione that helps in combating the effect of oxidative stress is
also regulated by Nrf2 (Mitsuishi et al., 2012). The expression of proteins such as
ferritin that acts as a blockage of free radicals through Fenton reaction is also
controlled by Nrf2 (Hayes and McMahon, 2009). Hmox1 a rate limiting enzymes in
the catabolism of heme to give biliverdin, ferrous iron (Fe2+) and carbon monoxide
(CO) in the presence of NADPH, cytochrome p450 and three molecules of oxygen
per heme molecule (Maines, 1997) is also regulated by Nrf2. Of the three
isoforms that has been described (Hmox1, Hmox2, Hmox3), Hmox1 a 32 kDa
protein is highly inducible by various stimuli while Hmox2 is constitutively
expressed in most tissues (Siow, Sato and Mann, 1999). Hmox1 functions by
maintaining redox homeostasis, prevention of vascular injury and has anti-
inflammatory and antiapoptic properties (Abraham and Kappas, 2008). Oxidative
and nitrosative stresses produced during inflammation induces the basal
expression of HO-1 gene (Alam et al., 2004). Genes involved in heme
biogeneration such as ATP binding cassette subfamily B member 6 (ABCB6) and
ferrochelatase (FECH) have been shown to be regulated by Nrf2 (Wu, Cui and
Klaassen, 2011; Campbell et al., 2013). The mobilization of iron from heme during
hemoglobin catabolism is regulated by Nrf2 (Kerins and Ooi, 2018). Thus, Nrf2
helps in the incorporation of iron back into heme and also in the destruction of
heme through the induction of Hmox-1, heme-responsive gene-1 (HRG1) and
biliverdin reductase A and B (BLVRs) (Kerins and Ooi, 2018).

23
Figure 1. 4: Nrf2 regulates cellular homeostasis.
In the presence of oxidative or electrophilic stresses, Nrf2 instigates the expression of genes
encoding the antioxidant response element (ARE) in their promoter region leading to a protection
against oxidative stress, inflammation and diseases associated with redox imbalance.
1.3.2 Nrf2: Discovery, Structure and Function Nrf2 was first cloned and characterized by (Moi et al., 1994) based on its ability to
bind to NF-E2/AP-1 repeat sequences (5ʹ-TGAC/GTCA-3ʹ) in the promoter region
of the β-globin gene. The Nrf2 protein is a member of a family of transcription
factors encoding a basic-region leucine zipper (bZip) DNA binding domain with a
cap‘n’collar (CNC) structure (Moi et al., 1994; Itoh et al., 1995; Lau et al., 2008).
The human Nrf2 protein is made up of 605 amino acids while that of mouse and
rat is made up of 597 amino acids (Tebay et al., 2015). Nrf2 possesses a
relatively short half-life in cells with a half-life of 13 min, 15 min, 7.5 min and 22
min in mouse hepatoma Hepa cells, Human HepG2 cells, African green monkey

24
COS7 cells and rat hepatocytes respectively (Nguyen et al., 2003; Stewart et al.,
2003; Smith et al., 2015; Kobayashi et al., 2004b).
Human Nrf2 contains seven highly conserved domains known as Nrf2-ECH
homology (Neh) domains (Figure 1.5) each with varying functions (Itoh et al.,
1995). The CNC-type basic-region leucine zipper required for DNA binding and
dimerization to other transcriptional factors is located in the Neh1 domain (Mohler
et al., 1991). In every seventh position of the “leucine zipper” region, a leucine
residue is located allowing for dimerization to form hydrophobic region (Zenkov et
al., 2017).
The Neh2 domain of Nrf2 allows binding via its N-terminal domain to the Kelch
domain of Kelch-like ECH- associated protein 1 (Keap1), a ubiquitin ligase
substrate adaptor that negatively regulates Nrf2 (Itoh et al., 1999). Contained in
the N-terminal Neh2 domain are two sequences, the high affinity ETGE motif (Ka =
20x107 M-1) and the low affinity DLG motif (Ka = 0.1x10⁷ M-1), to which the Keap1
dimer binds in order to allow cullin-3 (Cul3) to ubiquitylate Nrf2 and target it for
proteasomal degradation (McMahon et al., 2003; Katoh et al., 2005; McMahon et
al., 2006; Zenkov et al., 2017; Kobayashi et al., 2004b). Ubiquitination of Nrf2
within this domain is possible due to the presence of lysine residues between the
ETGE and DLG motif (Zenkov et al., 2017).
The Neh3 domain situated at the C-terminal region functions in Nrf2 stability and
transcriptional activation. Interaction of Nrf2 with chromodomain helicase DNA-
binding protein 6 has been shown to occur in this domain confirming its role in
transcriptional activation of Nrf2 (Nioi et al., 2005).
The acidic residue-rich Neh4 and 5 domains serve as transactivational domains,
and work synergistically interacting with cyclic adenosine monophosphate (cAMP)
response element-binding protein (CREB) and brahma-related gene-1 (BRG1) to

25
increase the rate of gene transcription by promoting interaction between RNA
polymerase complex and promoter regions of DNA due to histone proteins
acetylation and chromatin de-condensation (Katoh et al., 2001; Zhang et al.,
2006a).
The Neh6 domain contains numerous serine residues and a phospho-degron that
negatively regulates Nrf2 through its DSGIS and DSAPGS β-transducin repeat-
containing protein (β-Trcp) binding site in a redox independent manner.
Regulation of Nrf2 via this domain requires phosphorylation by glycogen synthase
kinase-3 (GSK-3) to the DSGIS motif (McMahon et al., 2004; Rada et al., 2011,
2012; Cuadrado, 2015; Chowdhry et al., 2013). Whereas very little is known about
the Neh7 domain, Wang et al. (2013) reported the repression of Nrf2 through its
Neh7 domain entailed an interaction between the 209-316 amino acid sequence
of Nrf2 and retinoic X receptor alpha (RXRα).
Contained in the Nrf2 protein are numerous nuclear localization signals (NLS) and
nuclear export signals (NES) that have been identified to allow the translocation of
transcription factors into nucleus or cytoplasm respectively. Among these is the
NES located in the leucine zipper domain of Nrf2 with a sequence of 537LKKQLSTLYL546 that is redox insensitive identified (Li et al., 2005). Subsequent
work by (Li, Yu and Kong, 2006) identified another functional NES 175LLSIPELQCLNI186 in the Neh5 transactivational domain of Nrf2 (Li et al., 2006).
Another study by Theodore and his colleagues identified two more NLS motifs in
murine Nrf2 one located near the N-terminal region (amino acid residue 42-53)
and the other (amino acid residue 587-593) located at the C-terminal region of
Nrf2 (Theodore et al., 2008). Research by Jain, Bloom and Jaiswal, 2005
identified a bipartite NLS at the C terminal region of Nrf2 located between amino
acids 495 and 511 and a NES between amino acids 545 and 554. Deletion of the
NLS prevented the nuclear localization of Nrf2 and a decrease in transcriptional
activity of the protein (Jain, Bloom and Jaiswal, 2005). Subsequent work by this
26
group reported that phosphorylation of Tyr-568 is required for Crm1-mediated
nuclear export and degradation of Nrf2 and that Fyn phosphorylated Nrf2 leading
to its nuclear export (Jain and Jaiswal, 2006). However, both papers have been
retracted. Fyn a tyrosine kinase has been reported to phosphorylate Nrf2 at Tyr-
568 leading to the nuclear export of the protein (Jain and Jaiswal, 2006). it has
been proposed that GSK-3β phosphorylates Fyn at Tyr-213 resulting in the
accumulation of Fyn in the nucleus which in turn phosphorylate mouse and rat
Nrf2 at Tyr-568 and human Nrf2 at Tyr-576 resulting in the nuclear export,
ubiquitination and degradation of Nrf2 (Jain and Jaiswal, 2007; Kaspar and
Jaiswal, 2011). The consensus is that tyrosine phosphorylation controls nuclear
export of Nrf2 (Kaspar and Jaiswal, 2011), however much research on this is still
required.
The other members of this CNC transcription factor family include nuclear factor-
erythroid 2 p45 (NF-E2 p45), NF-E2 p45-related factor 1 (Nrf1), Nrf3, BTB and
CNC homology 1 (Bach 1) and Bach 2 with Nrf2 having the highest
transactivational activity (Katoh et al., 2001; Hayes et al., 2015). Although the
expression of Nrf1 and Nrf2 are ubiquitous, the expression of NF-E2 p45 is limited
to hematopoietic tissues (Mignotte et al., 1989). Bach 1 and 2 mostly acts as
antagonists to Nrf2, competing for binding with the ARE with Bach 1
predominantly localized in the nucleus (Chapple et al., 2016). Bach 1 serves as a
heme-binding protein, involved in the cellular balance of heme, oxidative stress
response, and regulation of cell cycle progression (Davudian et al., 2016).
Interestingly, contrary to other CNC family members, Bach 1 and 2 acts as
transcription repressor, however, Bach 1 has been reported to act as a
transcriptional activator in erythroid cell line whereas Bach 2 acts as a
transcriptional repressor irrespective of the experimental system (Caterina et al.,
1994; Oyake et al., 1996; Davudian et al., 2016). Nrf1 is localized in the
endoplasmic reticulum and membrane targeting is mediated by its N-terminal
transmembrane domain which upon deletion results in nuclear localization of Nrf1
27
(Wang and Chan, 2006; Zhang et al., 2006). Nrf3 is also localized in the
endoplasmic reticulum and is not ubiquitously expressed but expressed in the
placenta, B cells and monocytes (Kobayashi et al., 1999; Zhang et al., 2009).
Nrf2 functions in various cellular processes to maintain cellular homeostasis by
controlling cellular responses to environmental and electrophilic stresses. Nrf2
also function in inhibition of inflammation and prevention of neurodegenerative
diseases. The significance of Nrf2 in promoting cellular processes was
demonstrated in a study, where the knockout of Nrf2 in mice caused the
development of complex disease manifestations, with a majority exhibiting a
lupus-like autoimmune syndrome characterized by multiorgan inflammatory
lesions and premature death arising from rapidly progressing glomerulonephritis
as opposed to wild type mice (Ma, Battelli and Hubbs, 2006). Other studies also
show that loss of Nrf2 causes increase susceptibility to several inflammatory
factors leading to increased production of proinflammatory cytokines (interleukin-
2, interleukin-6) and chemokines and increased progression of inflammatory
diseases as opposed to Nrf2+/+ Mice (Liu et al., 2009; Lau et al., 2015). Loss of
Nrf2 in mice increased the sensitivity to pulmonary inflammatory disease. The
disruption of Nrf2 in mice caused early onset and more aggressive form of
cigarette smoke-induced emphysema with pronounced bronchoalveolar
inflammation compared to wildtype mice (Rangasamy et al., 2004). The ability of
mice to withstand toxic xenobiotics is compromised in the absence of Nrf2.
Treatment of Nrf2-/- mice with 7,12-dimethylbenz(a)anthracene/12-O-
tetradecanoylphorbol-13 acetate to induce skin cancer resulted in increased
tumour burden that was not susceptible to sulforaphane treatment as opposed to
Nrf2+/+ mice (Xu et al., 2006). Overexpression of Nrf2 in astrocytes provided
protection against H2O2 treatment in neurons in culture (Kraft, 2004).

28
Figure 1.5: Structure of Nrf2 protein
Structure of human Nrf2 showing the different homology domains, function and amino acid
numbering. Mouse amino acid numbering is different. The Keap1 and β-TrCP domain required for
proteasomal degradation of Nrf2 are indicated below while the DLG and ETGE Keap1 binding
motifs and DSGIS and DSAPGS β-Trcp binding motifs shown above the domains.
1.3.3 Nrf2 and its target genes The promoter regions of all genes that are transcriptionally activated by Nrf2
possess an antioxidant response element/electrophile response element
(ARE/EpRE, 5ʹ-TGACNNNGCA-3ʹ) to which Nrf2 binds as a heterodimer with
small musculoaponeurotic fibrosarcoma (Maf) proteins; MafF, MafG and MafK (Itoh et
al., 1997; Toki et al., 1997; Osburn and Kensler, 2008). The ARE which was originally
defined as a DNA sequence within the regulatory region of rat and mouse
glutathione S-transferase (GST) class Alpha genes that allowed their induction by
oxidizable synthetic phenolic antioxidants (Rushmore and Pickett, 1990).
Subsequently, a Nrf2:small Maf heterodimer was shown to bind to ARE
sequences (Nioi et al. 2003). Depending on their ability to bind transcription
cofactors, all members of the bZIP family possess the ability to form active
regulatory dimers that can either stimulate or impede transcription of ARE-
dependent genes (Zenkov et al., 2017). Over 250 genes that contain an ARE
consensus sequence in their promoter regions has been identified using analysis
involving gene expression profiling and chromatin immunoprecipitation in mice
and humans to date (Thimmulappa et al., 2002; Malhotra et al., 2010; Chorley et
al., 2012). It is widely recognized that Nrf2 controls the expression of genes
involved in redox homeostasis, cytoprotection, transcription of genes, drug
29
metabolizing enzymes, lipid metabolism, glucose/glycogen metabolism, NADPH
production, growth factors and transport protein as listed in Table 1.2. Research
carried out by (Itoh et al., 1997) in Nrf2-/- mice to determine if induction of phase II
drug metabolizing enzymes GST and NQO1 is been regulated by Nrf2 showed
that induction of phase II enzymes by butylated hydroxyanisole (BHA) was greatly
abolished in liver and intestine of Nrf2-/- mice (Itoh et al., 1997).
Among the most highly induced Nrf2 genes in humans are the aldo-keto
reductase (AKR) isoenzymes as evident from experiments involving treatment of
HaCaT, MCF10A, IMR-32 neuroblastoma cells with Nrf2 inducers sulforaphane
(SFN) and tBHQ showing a significant increase in AKR1C1, AKR1B10, AKR1C2
and AKR1C3 (Agyeman et al., 2012; Jung et al., 2013). Alongside the control of
the expression of phase I and phase II drug-metabolizing enzymes, Nrf2 also
controls the expression of multi-drug resistance protein (MRP) transporters such
as MPP1, MRP2, MRP3, MRP4 and MRP5 (Maher et al., 2007) and the
antiapoptotic protein B-cell lymphoma 2 (Bcl2) contributing to the development of
multiple drug resistance in tumor cells and resistance to chemotherapy (Hur et al.,
2013; Zenkov, Menshchikova and Tkachev, 2013).
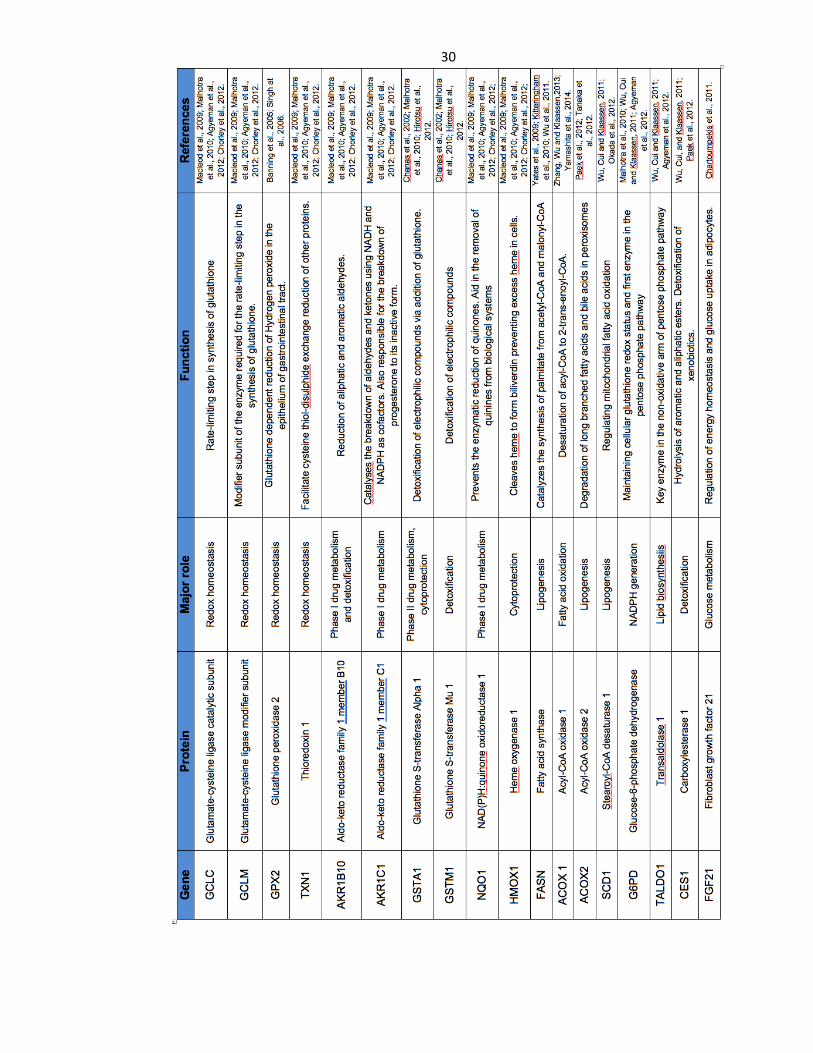
30

31
Nrf2 and intermediary metabolism Alongside directing cellular defenses, Nrf2 also plays a role in cell differentiation,
proliferation, hematopoiesis and more recently in regulation of fatty acid
metabolism (Shin et al., 2009; Kitteringham et al., 2010; Bryan et al., 2013). Nrf2
regulates many metabolic pathways such as glucose metabolism, pentose
phosphate pathway (PPP), lipid synthesis, purine synthesis and mitochondrial
function. It does this by either directly regulating key metabolic genes or by
indirectly regulating their expression through crosstalk with other transcription
factors involved in these pathways. Nrf2 has also been suggested to be involved
in diabetes mellitus and obesity as an increase in oxidative and nitrosative stress
levels were observed when Nrf2-null mice were treated with steptozotocin to
induce diabetes (Yoh et al., 2008). The fate of glucose in the body is dependent
on its availability with glucose being directed to anabolic reactions under
conditions of high glucose availability while under conditions of high energy
requirement; it is broken down to produce two molecules of pyruvate and ATP
(Voet and Voet, 2015). The levels of glucose in the blood is decreased with the
expression of Nrf2. Nrf2-null mice exhibit high blood glucose levels due to
increased expression of hepatic gluconeogenesis-related genes after
administration of a single intraperitoneal dose of streptozotocin to induce Type 1
diabetes (Aleksunes et al., 2010). Increased expression of Nrf2 in db/db Type 2
diabetes (T2D) mouse model caused the suppression of enzymes involved in
gluconeogenesis including glucose 6-phosphatase (G6pc), fructose-1,6-
bisphosphatase 1 (Fbp1), peroxisome proliferator-activated receptor γ coactivator
1-α (Ppargc1a) and nuclear receptor subfamily 4,group A member 2 (Nr4a2)
(Uruno et al., 2013). Similar work was reported by Slocum and his colleagues to
show that Nrf2 repress genes associated with gluconeogenesis and lipogenesis
through activation of AMP- activated protein kinase (AMPK) on mouse fed with a
high fat diet (60 kcal % fat) for 90 days (Slocum et al., 2016). Glucose uptake in
fasting alpha mouse liver (AML) hepatocytes was enhanced with knock down of
Nrf2 via siRNA and the gene expression levels of glucose transporter type 4,

32
insulin-like growth factor 1, forkhead box protein O1 that are involved in glucose
uptake and gluconeogenesis was altered also in these cells proving the role of
Nrf2 in the regulation of glucose metabolism (Yuan et al., 2017). Nrf2 has also
been shown to regulate glycogen metabolism by increasing the expression of
glycogen branching enzyme (Gbe1), muscle-type PhKα subunit (Phka1) in the
liver and skeletal muscle (Uruno et al., 2016).
Many genes encoding enzymes involved in lipid biosynthesis, fatty acid
metabolism are negatively regulated by Nrf2 (Mitsuishi et al., 2012). Research
carried out by Yates et al. (2009) showed that upregulation of Nrf2 either
genetically or pharmacologically causes changes in gene expression of genes
involved in lipid metabolism including sterol regulatory element-binding factor
(Srebf1), lipase endothelial (Lipg), fatty acid synthase (Fasn) and acetyl-
coenzyme A carboxylase alpha (Acaca). Subsequent studies also showed that
loss of Nrf2 in mice caused the development of fatty liver disease (liver steatosis)
in mice treated with a diet deficient in methionine and choline (Chowdhry et al.,
2010; Sugimoto et al., 2010; Zhang et al., 2010). H&E staining of liver sections in
experiments carried out by (Meakin et al., 2014) showed that Nrf2-/- mice fed
chronically with a high-fat diet developed significant microvesicular and
macrovesicular steatosis, neutrophil infiltration, apoptotic bodies, and disruption of
hepatic architecture that are consistent with NASH. By contrast, Nrf2+/+ mice fed a
high-fat diet that developed hepatic steatosis but showed no significant
inflammation or fibrosis that would be consistent with NASH. The livers of high-fat
fed Nrf2-/- mice also exhibited significant increase in expression of Srebf1, Srebf2,
peroxisome proliferator-activated receptor gamma (PPARγ) (Meakin et al., 2014).
It is important to note that high fat diet increased the expression of genes
associated with fatty acid uptake, fatty acid oxidation, fatty acid storage,
lipogenesis and inflammation in Nrf2-null animals as opposed to mice fed on a
regular chow diet (Meakin et al., 2014). Subsequent work also showed that
pharmacological activation of Nrf2 using TBE-31 failed to decrease liver steatosis,
ER stress, genes associated with lipogenesis, inflammation and fibrosis in livers
33
of high fat fructose fed Nrf2-null mice as opposed to high-fat high-fructose fed
wild-type mice indicating a role for Nrf2 in activation hepatic inflammation,
lipogenesis, and NASH (Sharma et al., 2018).
Glucose is redirected by Nrf2 into the anabolic pathway under sustained PI3K-Akt
signaling (Mitsuishi et al., 2012). The genes involved in the production of
nicotinamide adenine dinucleotide phosphate (NADPH) such as glucose-6-
phosphate dehydrogenase (G6PD), phosphogluconate dehydrogenase (PGD),
transketolase (TKT), transaldolase 1 (TALDO1) and malic enzyme 1 (ME1) are
activated by Nrf2 (Mitsuishi et al., 2012; Mitsuishi, Motohashi and Yamamoto,
2012). Decreases in NADPH levels were reported in Nrf2 knockdown experiments
in A549 cells whereas an increase in Nrf2 levels in Keap1 knockout mouse
embryonic fibroblast (MEFs) showed an increase in NADPH levels (Singh et al.,
2013). By regulating expression of NADPH genes, Nrf2 controls the oxidative and
non-oxidative arms of the PPP (Mitsuishi et al., 2012). Also, it has been seen that;
Nrf2 catalyses the expression of phosphoribosyl pyrophosphate amidotransferase
(PPAT), an enzyme required in the de-novo synthesis of purine nucleotides,
indicating a role for Nrf2 in production of cell building blocks and purine
biosynthesis. The role of Nrf2 in driving the PPP has linked Nrf2 and in vivo and in
vitro cell proliferation, ultimately leading to Nrf2 playing a role in increased tumour
growth (Mitsuishi et al., 2012; Singh et al., 2013). The levels of glutamine and
glutamate are also considerably increased in cells with Nrf2 deficiency leading to
increase production of GSH. Nrf2 also regulates the expression of genes for
nucleotide synthesis as knockdown of Nrf2 resulted in a significant increase in the
levels of glycolytic intermediates such as glucose 6 phosphate (G6P) and
fructose-6 phosphate (F6P) (Mitsuishi et al., 2012). Nrf2 controls the expression of
GCLC and GCLM, key enzymes that are required for glutathione synthesis. By
regulating the expression of SLC7A11, a subunit for cystine transporter, Nrf2 is
able to increase the supply of cysteine (Mitsuishi et al., 2012).

34
Also, mutant Nrf2 has been reported to alter mammalian target of rapamycin
(mTOR) signaling by regulating the expression of RagD, a member of the small G
protein family which encodes an mTOR pathway activator. Increased
phosphorylation of the ribosomal S6 protein, a downstream substrate for the
mTOR pathway and mild increase in AKT phosphorylation was observed in
mutant Nrf2 expressing cells (Shibata et al., 2010).
1.4 Regulation of Nrf2
1.4.1 Mechanism of Nrf2 activation and repression One key feature of Nrf2 protein is that it is normally maintained at low levels in
cells under normal homeostatic conditions possessing a relatively short half-life
but is seen to stabilize rapidly in response to either oxidative or electrophilic
stresses in the cell. Under normal unstressed conditions, Nrf2 is constantly
targeted for proteasomal degradation by Keap1. Disruption of the interaction
between Keap1 and Nrf2 by electrophiles and oxidants allows the CNC-bZIP
protein to accumulate, initiating adaptive response to stress (Hayes and Dinkova-
Kostova, 2014). The prevailing view for a really long time was that Nrf2 is
regulated solely at the level of protein stability by Keap1, however, recent
evidence shows that Nrf2 is also regulated by the combined action of glycogen
synthase kinase-3 (GSK3) and β-transducin repeat-containing protein (β-TrCP) in
both stressed and unstressed conditions. The C.elegans WDR-23, a substrate
receptor for Cul4-DDB1-ubiquitin ligase has been shown to regulate Nrf2 activity
independent of Keap1(Lo, Spatola and Curran, 2017). Increased expression of
WDR-23 in Keap1-/- cancer cells increases cellular sensitivity to cytotoxic
chemotherapeutic agents and suppresses Nrf2 activity (Lo, Spatola and Curran,
2017).
Nrf2 has also been shown to be negatively regulated by E3 ubiquitin-protein
ligase synoviolin (Hrd1) during liver cirrhosis. Activation of the XBP1-Hrd1 arm of
35
Endoplasmic reticulum (ER) stress in cirrhotic livers, led to enhanced Nrf2
ubiquitination and degradation and attenuation of the Nrf2 signalling pathway
arising from transcriptional upregulation of Hrd1 (Wu et al., 2014).
The regulation of Nrf2 occurs either at the transcriptional, translational or
posttranslational levels. Evidence of transcriptional variation in expression of
NFE2L2 was seen by occurrence of polymorphism at the promoter region at -336
bp from transcription start site (TSS) in mouse leading to variation in susceptibility
of mouse to develop acute lung injury (Cho et al., 2002). The presence of an
ARE-like sequence in Nrf2 gene suggests that it is able to autoregulate itself and
its downstream genes in the presence of electrophilic inducing agents (Kwak et
al., 2002). Xenobiotic response element (XRE)-like sequences found in promoter
region of Nrf2 causes the recruitment of the aryl hydrocarbon receptor (AhR) that
allows transcriptional activation of Nrf2 by polycyclic aromatic hydrocarbon (PAH)
compounds (Miao et al., 2005). Experiments involving HepG2-101L cells stably
transfected with a XRE-luciferase construct showed that aldo-keto reductases
(AKRs) generated planar PAH ortho-quinone activate CYP1A1 gene via AhR
binding in a XRE-dependent mechanism, indicating a cross talk between Nrf2
regulated genes and their metabolites (Burczynski and Penning, 2000).
Downstream of the TSS of Nrf2 contains a nuclear factor-кB (NF-кB) binding site
that allows lipopolysaccharide (LPS) to transcriptionally activation the CNC-bZIP
factor (Rushworth et al., 2012). LPS is able to upregulate Nrf2 transcription by
activating NF-кB ang inducing nuclear localization of Nrf2 and NF-кB (Rushworth
et al., 2012). It has also been reported that LPS is able to induce a cellular
response leading to increased ROS levels which would trigger Nrf2 activation and
drives the expression of Nrf2-regulated gene expression (Rushworth, MacEwan
and O’Connell, 2008).
Regulation of Nrf2 via a translational mechanism has also been examined by
Purdom-dickinson et al. (2007) who showed that H2O2 caused an increase in Nrf2
36
protein levels, but not Nrf2 mRNA in rat cardiomyocytes. By using incorporation of
[35S] methionine to measure new protein synthesis these workers demonstrated
that H2O2 increases Nrf2 protein synthesis in rat cardiomyocytes. Similar to the
functional internal ribosomal entry site (IRES) contained in yeast Yap1 gene, Nrf2
mRNA has also been seen to possess a redox sensitive IRES in its 5ʹ-UTR that
contains a putative 18S rRNA binding site (RBS) that is conserved across species
and is responsible for independent initiation of translation (Zhou, Edelman and
Mauro, 2001; Li et al., 2010; Shay et al., 2012). Located upstream of the RBS of
the Nrf2 IRES, is a hairpin structured inhibitory element (IE) which when deleted
remarkably improves translation (Li et al., 2010). It has also been shown that, the
IRESNrf2-driven translation is redox sensitive as treatment of cells with H2O2 and
sulforaphane, stimulated IRESNrf2-driven translation initiation (Li et al., 2010;
Huang et al., 2015).
Posttranslational regulation is one of the main mechanisms by which Nrf2 protein
level is regulated. Enzymatic ubiquitination of lysine residues in Nrf2 and
succeeding degradation of the 26S proteasome in the absence of activators
determines the stability of Nrf2 (Jaramillo and Zhang, 2013). Cell culture
experiments show that upon inhibition of proteasomal activity, concentrations of
Nrf2 in cells and nuclei increases (Kwak et al., 2002; McMahon et al., 2003;
Chowdhry et al., 2013).
1.4.2 Regulation of Nrf2 by Keap1 The cullin-3 (Cul3)- based E3 ubiquitin ligase substrate adaptor Keap1 is the
principal negative regulator of Nrf2 as it is responsible for the high turnover of Nrf2
protein in most cell types under non stressed conditions (Lau et al., 2008). Keap1,
which was first isolated by (Itoh et al., 1999) using the Neh2 domain of Nrf2 as
bait in a yeast two-hybrid system, has a relatively large number of cysteine
residues; 27 in the human protein and 25 in the mouse protein. It is dimeric,
containing three main domains (Figure 1.6); a broad complex, tramtrack and bric-
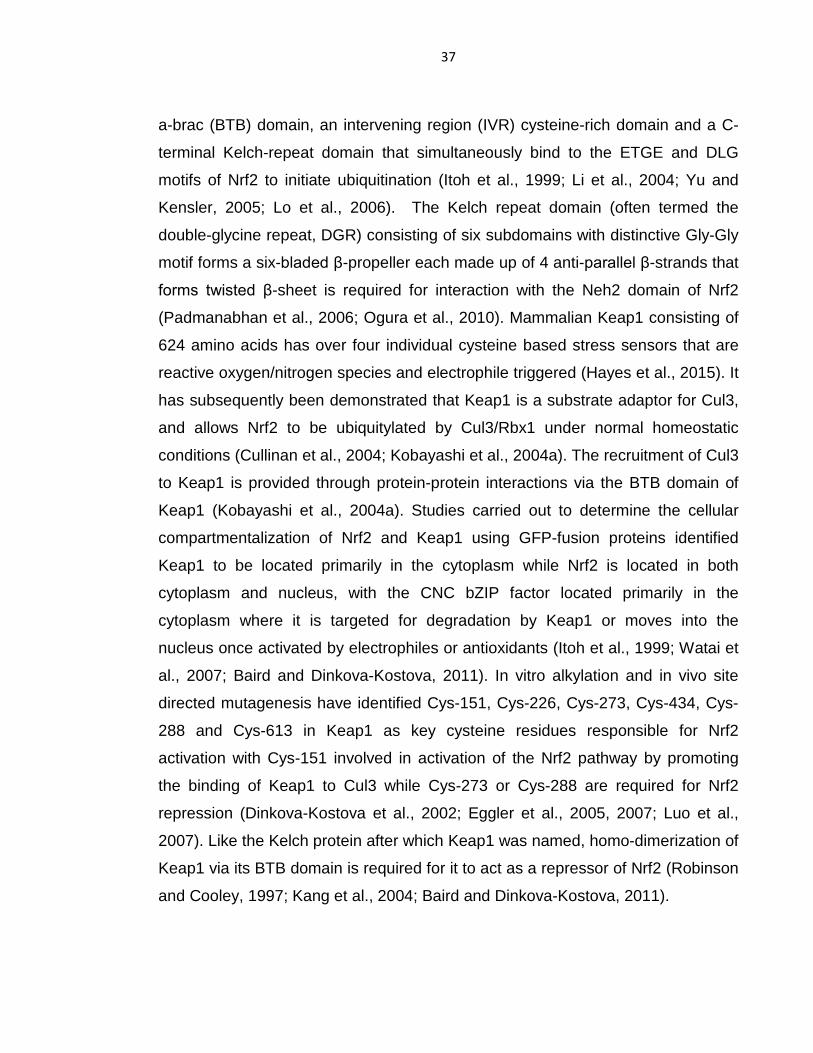
37
a-brac (BTB) domain, an intervening region (IVR) cysteine-rich domain and a C-
terminal Kelch-repeat domain that simultaneously bind to the ETGE and DLG
motifs of Nrf2 to initiate ubiquitination (Itoh et al., 1999; Li et al., 2004; Yu and
Kensler, 2005; Lo et al., 2006). The Kelch repeat domain (often termed the
double-glycine repeat, DGR) consisting of six subdomains with distinctive Gly-Gly
motif forms a six-bladed β-propeller each made up of 4 anti-parallel β-strands that
forms twisted β-sheet is required for interaction with the Neh2 domain of Nrf2
(Padmanabhan et al., 2006; Ogura et al., 2010). Mammalian Keap1 consisting of
624 amino acids has over four individual cysteine based stress sensors that are
reactive oxygen/nitrogen species and electrophile triggered (Hayes et al., 2015). It
has subsequently been demonstrated that Keap1 is a substrate adaptor for Cul3,
and allows Nrf2 to be ubiquitylated by Cul3/Rbx1 under normal homeostatic
conditions (Cullinan et al., 2004; Kobayashi et al., 2004a). The recruitment of Cul3
to Keap1 is provided through protein-protein interactions via the BTB domain of
Keap1 (Kobayashi et al., 2004a). Studies carried out to determine the cellular
compartmentalization of Nrf2 and Keap1 using GFP-fusion proteins identified
Keap1 to be located primarily in the cytoplasm while Nrf2 is located in both
cytoplasm and nucleus, with the CNC bZIP factor located primarily in the
cytoplasm where it is targeted for degradation by Keap1 or moves into the
nucleus once activated by electrophiles or antioxidants (Itoh et al., 1999; Watai et
al., 2007; Baird and Dinkova-Kostova, 2011). In vitro alkylation and in vivo site
directed mutagenesis have identified Cys-151, Cys-226, Cys-273, Cys-434, Cys-
288 and Cys-613 in Keap1 as key cysteine residues responsible for Nrf2
activation with Cys-151 involved in activation of the Nrf2 pathway by promoting
the binding of Keap1 to Cul3 while Cys-273 or Cys-288 are required for Nrf2
repression (Dinkova-Kostova et al., 2002; Eggler et al., 2005, 2007; Luo et al.,
2007). Like the Kelch protein after which Keap1 was named, homo-dimerization of
Keap1 via its BTB domain is required for it to act as a repressor of Nrf2 (Robinson
and Cooley, 1997; Kang et al., 2004; Baird and Dinkova-Kostova, 2011).
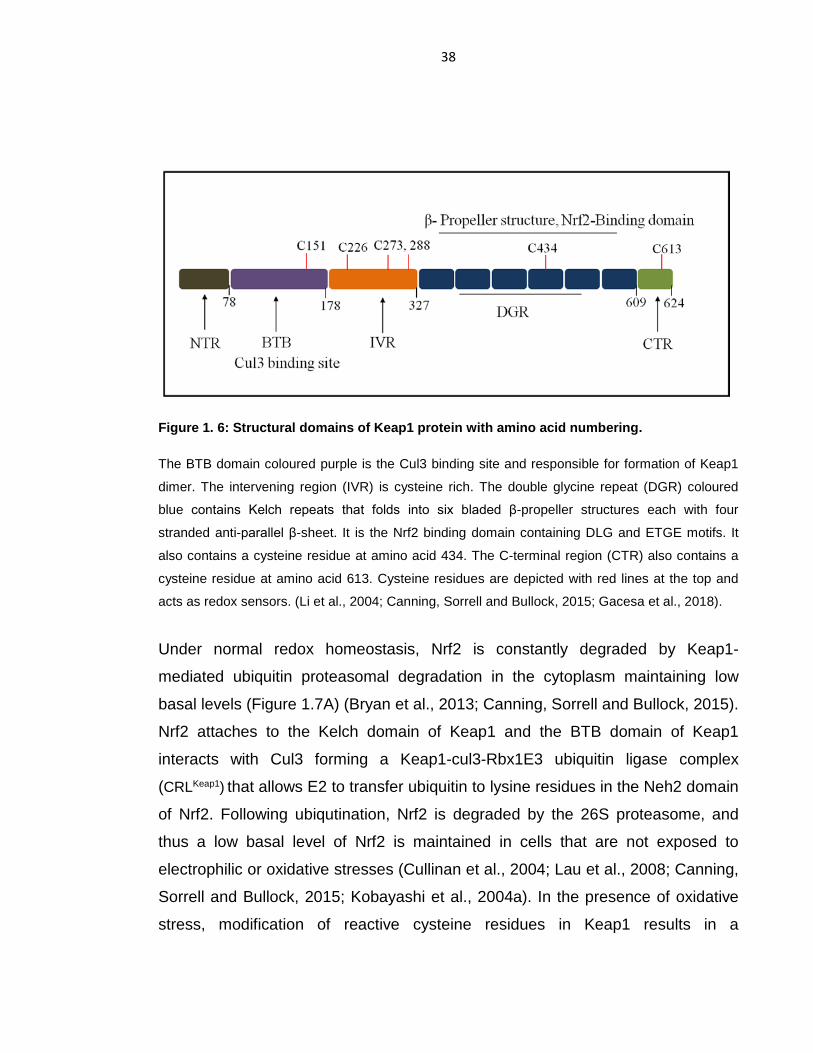
38
Figure 1. 6: Structural domains of Keap1 protein with amino acid numbering.
The BTB domain coloured purple is the Cul3 binding site and responsible for formation of Keap1
dimer. The intervening region (IVR) is cysteine rich. The double glycine repeat (DGR) coloured
blue contains Kelch repeats that folds into six bladed β-propeller structures each with four
stranded anti-parallel β-sheet. It is the Nrf2 binding domain containing DLG and ETGE motifs. It
also contains a cysteine residue at amino acid 434. The C-terminal region (CTR) also contains a
cysteine residue at amino acid 613. Cysteine residues are depicted with red lines at the top and
acts as redox sensors. (Li et al., 2004; Canning, Sorrell and Bullock, 2015; Gacesa et al., 2018).
Under normal redox homeostasis, Nrf2 is constantly degraded by Keap1-
mediated ubiquitin proteasomal degradation in the cytoplasm maintaining low
basal levels (Figure 1.7A) (Bryan et al., 2013; Canning, Sorrell and Bullock, 2015).
Nrf2 attaches to the Kelch domain of Keap1 and the BTB domain of Keap1
interacts with Cul3 forming a Keap1-cul3-Rbx1E3 ubiquitin ligase complex
(CRLKeap1) that allows E2 to transfer ubiquitin to lysine residues in the Neh2 domain
of Nrf2. Following ubiqutination, Nrf2 is degraded by the 26S proteasome, and
thus a low basal level of Nrf2 is maintained in cells that are not exposed to
electrophilic or oxidative stresses (Cullinan et al., 2004; Lau et al., 2008; Canning,
Sorrell and Bullock, 2015; Kobayashi et al., 2004a). In the presence of oxidative
stress, modification of reactive cysteine residues in Keap1 results in a

39
conformational change of the E3 ubiquitin ligase that prevents Keap1 from
degrading Nrf2. Subsequently synthesized Nrf2 translocates into the nucleus
where it heterodimerizes with a small Maf protein that ultimately leads to activation
of expression of ARE-dependent antioxidant genes (Zhang, 2006). On recovery of
cellular redox homeostasis by Nrf2 downstream genes, Nrf2 is either degraded in
the nucleus or transported back to the cytoplasm (Lau et al., 2008).
The earliest theory about Keap1-Nrf2 interaction proposed that Keap1 degrades
Nrf2 in the cytoplasm and that subsequent treatment with electrophiles or
oxidative stressors causes Nrf2 to be released from Keap1 where it becomes free
to move to the nucleus and initiate the expression of Nrf2 target genes (figure
1.7B) (Itoh et al., 1999). Another school of thought proposed that the release of
Nrf2 from Keap1 is triggered by phosphorylation of Nrf2 by protein kinase C (PKC)
at the Neh2 domain of Nrf2 (Huang, Nguyen and Pickett, 2002; Bloom and
Jaiswal, 2003; Numazawa et al., 2003). However live cell imaging experiments
revealed that the interaction between Nrf2 and Keap1 is such that one subunit of
Keap1 binds to the ETGE domain of Nrf2 forming an open conformation, followed
by the binding of the second subunit of Keap1 to the DLG domain of Nrf2 forming
a closed conformation allowing Nrf2 to be degraded and free Keap1 is then
available to interact with newly synthesized Nrf2 and the cycle continues (Baird et
al., 2013). Electrophiles and oxidative stressors however disrupt this cycle by
inducing conformational changes in Keap1 either by modification of the key
cysteine residues in Keap1 such that though Nrf2 is still bound to both dimers of
Keap1, its alignment to Keap1 is incorrect preventing the ubiquitination of Nrf2. As
such, Keap1 is not free to degrade Nrf2 and newly synthesized Nrf2 translocates
into the nucleus and induce the transcription of its downstream genes (figure
1.7C) (Padmanabhan et al., 2006; Hayes and Dinkova-Kostova, 2014; Baird et
al., 2013).

40
(A)
(B)

41
(C)
Figure 1.7: Diagram depicting the repression of Nrf2 by Keap1.
Nrf2 is constantly degraded by Keap1 in the cytosol under basal conditions. (B) Oxidative stress
condition causes Keap1 to dissociate from Nrf2 leading to accumulation of Nrf2 that is transported
to the nucleus where it binds with Maf and activates the expression of Nrf2 downstream genes. (C)
Oxidative stress causes conformational changes in Keap1 leading to improper alignment to Nrf2
and as such subsequently synthesized Nrf2 translocated to the nucleus and activates the
expression of Nrf2 downstream genes.
1.4.3 Regulation of Nrf2 by GSK-3 and β-TrCP Glycogen synthase kinase 3 (GSK-3) a member of the CMCG proline-directed
kinase family is a monomeric, second messenger-independent serine/threonine
protein kinase that was first discovered to activate the ATP-Mg-dependent form of
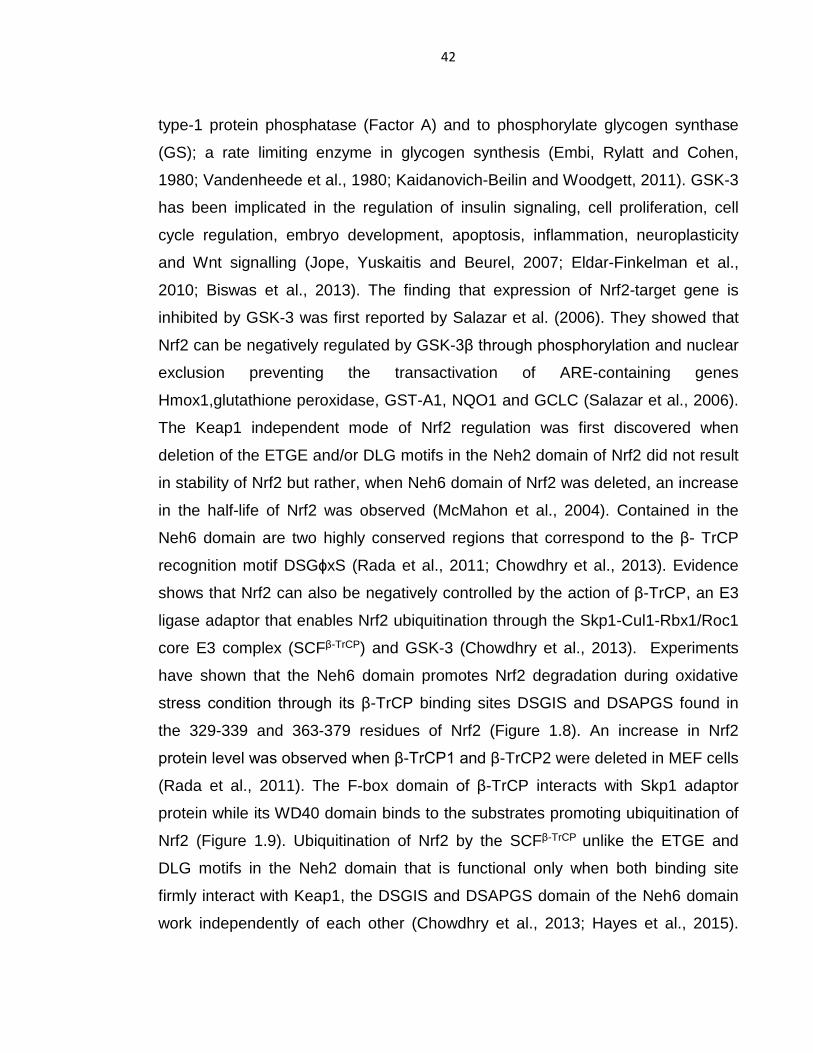
42
type-1 protein phosphatase (Factor A) and to phosphorylate glycogen synthase
(GS); a rate limiting enzyme in glycogen synthesis (Embi, Rylatt and Cohen,
1980; Vandenheede et al., 1980; Kaidanovich-Beilin and Woodgett, 2011). GSK-3
has been implicated in the regulation of insulin signaling, cell proliferation, cell
cycle regulation, embryo development, apoptosis, inflammation, neuroplasticity
and Wnt signalling (Jope, Yuskaitis and Beurel, 2007; Eldar-Finkelman et al.,
2010; Biswas et al., 2013). The finding that expression of Nrf2-target gene is
inhibited by GSK-3 was first reported by Salazar et al. (2006). They showed that
Nrf2 can be negatively regulated by GSK-3β through phosphorylation and nuclear
exclusion preventing the transactivation of ARE-containing genes
Hmox1,glutathione peroxidase, GST-A1, NQO1 and GCLC (Salazar et al., 2006).
The Keap1 independent mode of Nrf2 regulation was first discovered when
deletion of the ETGE and/or DLG motifs in the Neh2 domain of Nrf2 did not result
in stability of Nrf2 but rather, when Neh6 domain of Nrf2 was deleted, an increase
in the half-life of Nrf2 was observed (McMahon et al., 2004). Contained in the
Neh6 domain are two highly conserved regions that correspond to the β- TrCP
recognition motif DSGϕxS (Rada et al., 2011; Chowdhry et al., 2013). Evidence
shows that Nrf2 can also be negatively controlled by the action of β-TrCP, an E3
ligase adaptor that enables Nrf2 ubiquitination through the Skp1-Cul1-Rbx1/Roc1
core E3 complex (SCFβ-TrCP) and GSK-3 (Chowdhry et al., 2013). Experiments
have shown that the Neh6 domain promotes Nrf2 degradation during oxidative
stress condition through its β-TrCP binding sites DSGIS and DSAPGS found in
the 329-339 and 363-379 residues of Nrf2 (Figure 1.8). An increase in Nrf2
protein level was observed when β-TrCP1 and β-TrCP2 were deleted in MEF cells
(Rada et al., 2011). The F-box domain of β-TrCP interacts with Skp1 adaptor
protein while its WD40 domain binds to the substrates promoting ubiquitination of
Nrf2 (Figure 1.9). Ubiquitination of Nrf2 by the SCFβ-TrCP unlike the ETGE and
DLG motifs in the Neh2 domain that is functional only when both binding site
firmly interact with Keap1, the DSGIS and DSAPGS domain of the Neh6 domain
work independently of each other (Chowdhry et al., 2013; Hayes et al., 2015).
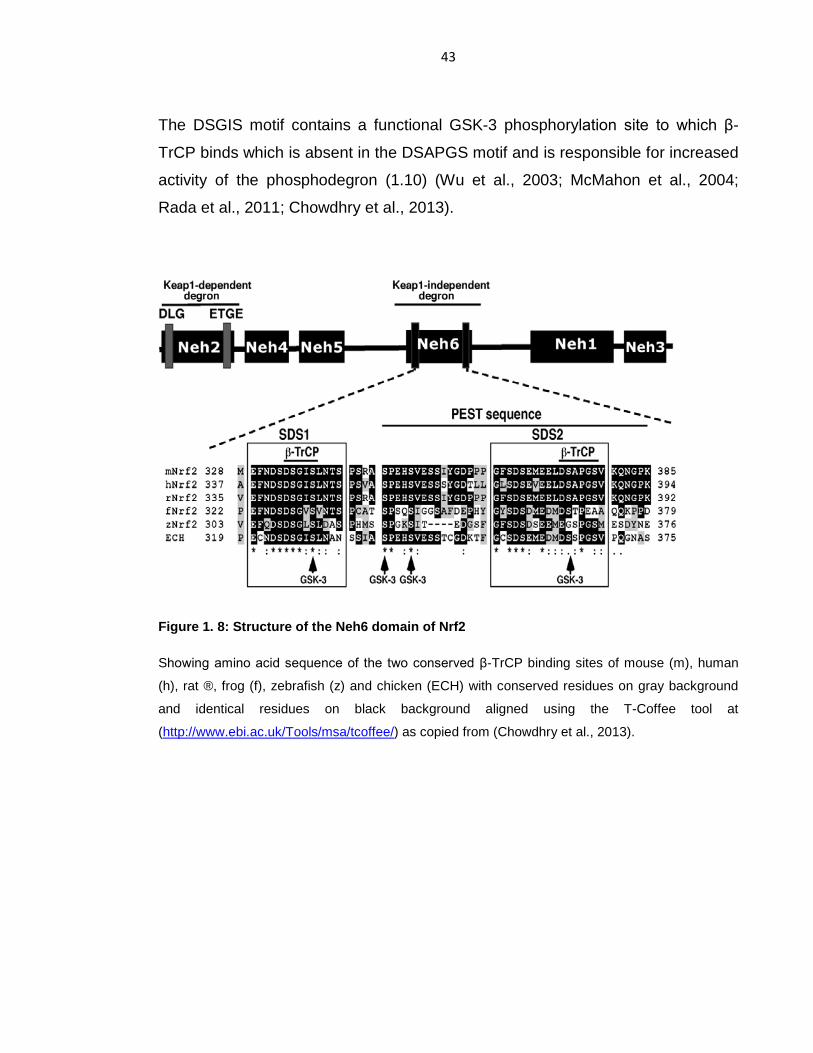
43
The DSGIS motif contains a functional GSK-3 phosphorylation site to which β-
TrCP binds which is absent in the DSAPGS motif and is responsible for increased
activity of the phosphodegron (1.10) (Wu et al., 2003; McMahon et al., 2004;
Rada et al., 2011; Chowdhry et al., 2013).
Figure 1. 8: Structure of the Neh6 domain of Nrf2
Showing amino acid sequence of the two conserved β-TrCP binding sites of mouse (m), human
(h), rat ®, frog (f), zebrafish (z) and chicken (ECH) with conserved residues on gray background
and identical residues on black background aligned using the T-Coffee tool at
(http://www.ebi.ac.uk/Tools/msa/tcoffee/) as copied from (Chowdhry et al., 2013).
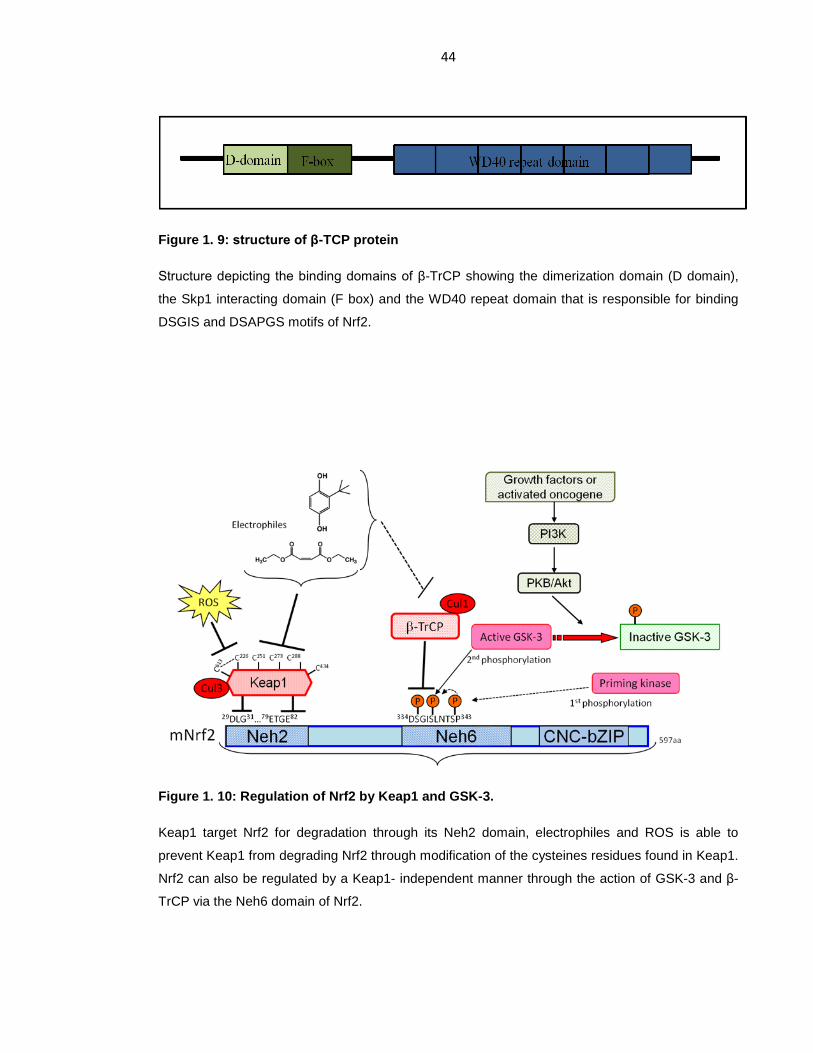
44
Figure 1. 9: structure of β-TCP protein
Structure depicting the binding domains of β-TrCP showing the dimerization domain (D domain),
the Skp1 interacting domain (F box) and the WD40 repeat domain that is responsible for binding
DSGIS and DSAPGS motifs of Nrf2.
Figure 1. 10: Regulation of Nrf2 by Keap1 and GSK-3.
Keap1 target Nrf2 for degradation through its Neh2 domain, electrophiles and ROS is able to
prevent Keap1 from degrading Nrf2 through modification of the cysteines residues found in Keap1.
Nrf2 can also be regulated by a Keap1- independent manner through the action of GSK-3 and β-
TrCP via the Neh6 domain of Nrf2.

45
Phosphorylation by GSK-3 is a common feature in proteins such as β-catenin,
Gli3, IκBα and securin that require degradation through the SCFβ-TrCP (Aberle et
al., 1997; Winston et al., 1999; Tempé et al., 2006; Limon-Mortes et al., 2008;
Hayes et al., 2015). GSK-3 is highly conserved and ubiquitously expressed having
two isoenzymes GSK-3α and GSK-3β with molecular weights of 51 kDa and 47
kDa respectively (Kaidanovich-Beilin and Woodgett, 2011). The two isoforms
though generated from distinct genes have similar catalytic domains with GSK3α
possessing a glycine rich N-terminus and are functionally different (Plattner and
Bibb, 2012; Pandey and DeGrado, 2016). Both isoforms of GSK-3 are
constitutively active in cell with the levels different in different tissues and an
abundance of GSK-3β found in the brain (Woodgett, 1990; Hernández et al.,
2010). GSK-3 controls a wide array of substrates including glycogen synthase,
beta-catenin, tau, PKA, c-Jun, c-Myc, ATP-citrate lyase etc. indicating a major role
in regulation of cellular processes (Ali, Hoeflich and Woodgett, 2001; Rayasam et
al., 2009). The activity of GSK-3 is highly controlled through four key mechanisms
that are specific to each substrate (Jope and Johnson, 2004). Of the four key
mechanisms of regulation of GSK-3, which include regulation by phosphorylation
of GSK-3, subcellular localization of GSK3, GSK-3 containing protein complexes
formation and regulation through phosphorylation of GSK-3 substrate; regulation
by inhibitory phosphorylation of a regulatory serine is the most characterized
(Woodgett, 1990; Jope, Yuskaitis and Beurel, 2007).
The N-terminal region of GSK-3 is required for phosphorylation by several kinases
such as Akt, protein kinase A (PKA), protein kinase C (PKC), and p90Rsk (Jope
and Johnson, 2004; Hernández et al., 2010). Phosphorylation of Ser-21 in GSK-
3α and Ser-9 in GSK-3β serves as inhibitory regulatory sites for GSK-3 whereas
its activity is positively regulated by phosphorylation at Tyr-279 and Tyr-216 for
GSK-3α and GSK-3β respectively (Jope and Johnson, 2004; Hernández et al.,
2010; Kaidanovich-Beilin and Woodgett, 2011; Pandey and DeGrado, 2016). The
β-strand and α-helical domains of GSK-3 must first align in a catalytically active

46
conformation before phosphorylation can occur for effective binding of the
substrate to GSK-3 (Pandey and DeGrado, 2016).
Most substrates that are phosphorylated by GSK-3 require pre-phosphorylation
(priming) by another kinase for them to be phosphorylated by GSK-3, thus
phosphorylation is through recognition of the S/TXXXS/T (P) consensus sequence
in certain proteins with priming occurring at a Ser residue that is located three or
four amino acid to the C-terminal GSK-3 phosphorylation site (Ali, Hoeflich and
Woodgett, 2001; Forde and Dale, 2007; Kaidanovich-Beilin and Woodgett, 2011).
The positively charged binding pocket of GSK-3 recognizes the primed
serine/threonine residue, enabling the correct alignment of substrates within the
active site of the kinase (Kaidanovich-Beilin and Woodgett, 2011). Some GSK-3
substrates, such as c-Jun, c-Myc, and MARK2/PAR-1, however do not require
priming in order for GSK-3 to phosphorylate them because the ‘priming’ site is
represented by an acidic residue or a peptide conformation (Kaidanovich-Beilin
and Woodgett, 2011). However, for those that requires prior phosphorylation,
GSK-3 phosphorylates serine/threonine residues N-terminal to the priming site
leading to multiple phosphorylation event (Boyle et al., 1991; Kaidanovich-Beilin
and Woodgett, 2011). Kinases that have been shown to prime for phosphorylation
of GSK-3 include cyclin-dependent kinase 5 (CDK-5), protease-activated
receptor-1 (PAR-1), casein kinase 1 (CK 1), casein kinase 2 (CK 2), protein
kinase C (PKC) and protein kinase A (PKA), however no specific kinase has been
recognized as a priming kinase for GSK-3 phosphorylation of Nrf2 (Amit et al.,
2002; Nishimura, Yang and Lu, 2004; Li et al., 2006; Kaidanovich-Beilin and
Woodgett, 2011).

47
1.4.4 Regulation of Nrf2 by phosphatidylinositol-3-kinase (PI3K) pathway The regulation of Nrf2 by GSK-3 has been largely overlooked over the years as
GSK-3 is inhibited under conventional cell culture by PI3K-protein kinase B
(PKB/Akt) pathway which lies upstream of GSK-3 (Hayes and Dinkova-Kostova,
2014; Tebay et al., 2015). PI3K is a serine/threonine lipid kinase involved in
regulation of cell growth, proliferation, survival, differentiation and changes in the
cytoskeleton due to generation of specific inositol lipids such as PKB or AKT
(Vanhaesebroeck and Alessi, 2000). Cell survival during oxidative stress is
regulated by the PI3K/AKT signalling pathway and offers protection against
oxidative-induced lung injury (Lu et al., 2001; Ahmad et al., 2006; Papaiahgari et
al., 2006; Manning BD, 2007). The evidence that PI3K plays a role in Nrf2
regulation was first demonstrated when the PI3K inhibitor LY294002 was used to
treat IMR-32 human neuroblastoma cells by Jeffery Johnson and colleagues.
Their result showed that treatment of IMR-32 cells diminished tBHQ-induced
NQO1 gene in these cells (Li, Lee and Johnson, 2002). Nrf2 activation in lung
epithelial cells is dependent on PI3K/AKT signalling as inhibition of PI3/AKT
caused inflammation and injury of the lungs (Papaiahgari et al., 2006; Reddy et
al., 2015).
1.4.5 Regulation of Nrf2 by protein phosphorylation Due to the relatively large amount of Ser, Thr and Tyr residues present in Nrf2
protein, several protein kinases including to PKC, c-Jun N-terminal kinase (JNK),
extracellular signal-regulated kinase (ERK), p38 MAPK, and PERK play roles in
regulating the stability of Nrf2 (Zenkov et al., 2017). Earlier work has shown that
phosphorylation of Nrf2 at Ser-40 by PKC weaken the binding of Keap1 to Nrf2
causing the stabilization of Nrf2 and increased transcription of Nrf2 downstream
genes (Huang, Nguyen and Pickett, 2000, 2002; Bloom and Jaiswal, 2003;
Numazawa et al., 2003). MAPK has also been demonstrated to regulate Nrf2 by
binding to ARE sequence. Inhibition of ERK and p38 MAPK was shown to result

48
in a 50% decrease in the induction of GCLC and GCLM while activation of these
genes by pyrrolidine dithiocarbamate resulted in the activation of ERK and p38
MAPK indicating that ERK and p38 MAPK play a role in the transcriptional
upregulation of these Nrf2 target genes (Zipper and Mulcahy, 2000, 2003).
Another study showed that the induction of glutathione and HO-1 by flavonoids
butein and phloretin is mediated by ERK1/2 signalling pathway resulting in
increased nuclear translocation of Nrf2 (Yang et al., 2011). The transcription start
site of the Nrf2 locus contains Jun and Myc binding sites and has been shown to
regulate Nrf2 in tumour cells (Denicola et al., 2011). Induction of Nrf2 target genes
by phenethyl isothiocyanate (PEITC) in PC-3 cells resulted in an increase in the
phosphorylation of ERK1/2 and JNK1/2 and this induced the nuclear translocation
of Nrf2 (Xu et al., 2006).
It is also important to note that Nrf2 can also be regulated by competitive protein
interactors such as p21, SQSTMI/p62, IκB kinase β (IKKβ) which competes with
Nrf2 for Keap1 binding thus increasing Nrf2 activity (Hayes et al., 2010).
Contained in the p62/SQSTM1 is an evolutionarily conserved Keap1 binding
region that has an STGE binding motif that is closely related to the ETGE motif of
Nrf2. This region causes p62/SQSTM1 to competitively bind to Nrf2 acting as an
activator of Nrf2 (Jain et al., 2010; Komatsu et al., 2010). The presence of an ARE
in the gene promoter region of p62/SQSTM1 indicates a possible mechanism by
which Nrf2 can regulate its own gene expression (Jain et al., 2010). The C-
terminal region of p21Cip1/WAF1 can associate with the DLG motif of Nrf2 blocking
Keap1 activity resulting in stabilization of Nrf2 thereby promoting cell survival in
response to oxidative stress (Taguchi, Motohashi and Yamamoto, 2011).
CR6-interacting factor 1 (CRIF1), a protein known to regulate the cell cycle and to
serve as a transcription cofactor, has also been reported to negatively regulate
Nrf2 by promoting its degradation in both oxidized and reduced stress conditions
(Kang et al., 2010). Seven in absentia homolog (Siah) 2, an E3 ubiquitin ligase
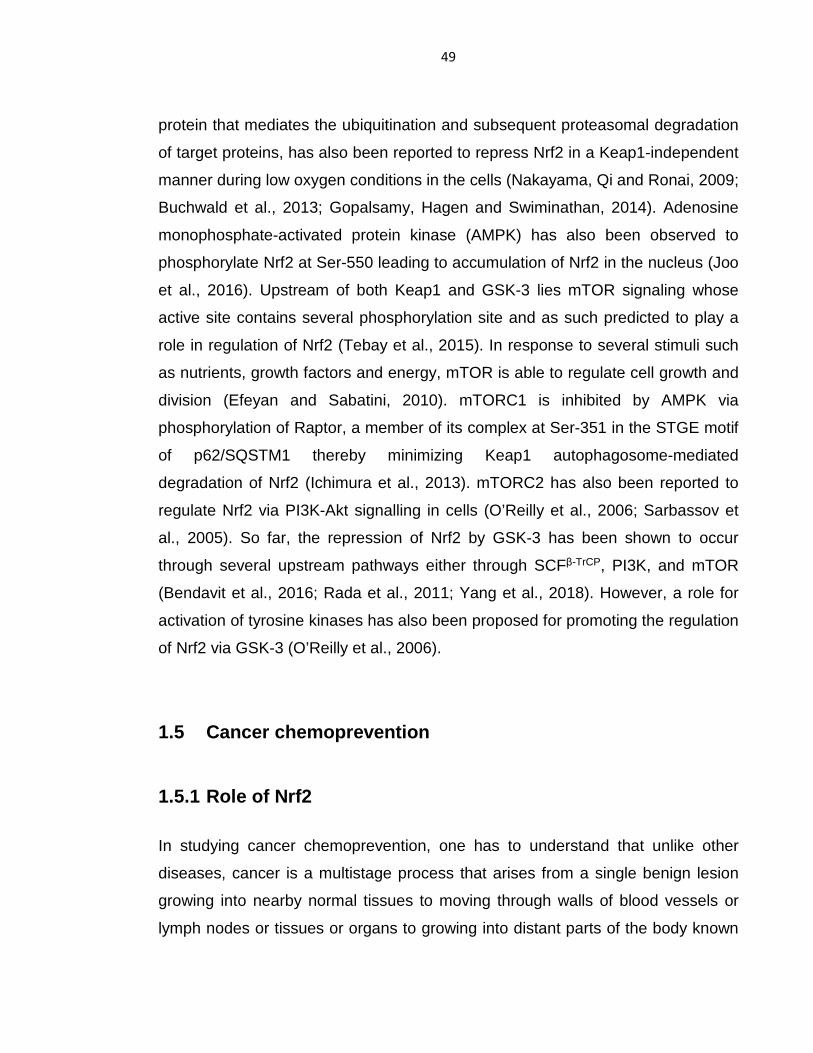
49
protein that mediates the ubiquitination and subsequent proteasomal degradation
of target proteins, has also been reported to repress Nrf2 in a Keap1-independent
manner during low oxygen conditions in the cells (Nakayama, Qi and Ronai, 2009;
Buchwald et al., 2013; Gopalsamy, Hagen and Swiminathan, 2014). Adenosine
monophosphate-activated protein kinase (AMPK) has also been observed to
phosphorylate Nrf2 at Ser-550 leading to accumulation of Nrf2 in the nucleus (Joo
et al., 2016). Upstream of both Keap1 and GSK-3 lies mTOR signaling whose
active site contains several phosphorylation site and as such predicted to play a
role in regulation of Nrf2 (Tebay et al., 2015). In response to several stimuli such
as nutrients, growth factors and energy, mTOR is able to regulate cell growth and
division (Efeyan and Sabatini, 2010). mTORC1 is inhibited by AMPK via
phosphorylation of Raptor, a member of its complex at Ser-351 in the STGE motif
of p62/SQSTM1 thereby minimizing Keap1 autophagosome-mediated
degradation of Nrf2 (Ichimura et al., 2013). mTORC2 has also been reported to
regulate Nrf2 via PI3K-Akt signalling in cells (O’Reilly et al., 2006; Sarbassov et
al., 2005). So far, the repression of Nrf2 by GSK-3 has been shown to occur
through several upstream pathways either through SCFβ-TrCP, PI3K, and mTOR
(Bendavit et al., 2016; Rada et al., 2011; Yang et al., 2018). However, a role for
activation of tyrosine kinases has also been proposed for promoting the regulation
of Nrf2 via GSK-3 (O’Reilly et al., 2006).
1.5 Cancer chemoprevention
1.5.1 Role of Nrf2
In studying cancer chemoprevention, one has to understand that unlike other
diseases, cancer is a multistage process that arises from a single benign lesion
growing into nearby normal tissues to moving through walls of blood vessels or
lymph nodes or tissues or organs to growing into distant parts of the body known
50
as stage IV (metastasis) cancer (Hanahan and Weinberg, 2000; Stratton,
Campbell and Futreal, 2009; Hanahan and Weinberg, 2011). The use of natural
or synthetic agents to impede, block or reverse the process of carcinogenesis is
the basis of cancer chemoprevention. Interference of carcinogen-cell interaction in
normal cells, alteration of proliferation rate in premalignant cells, modulation of
metabolism and disposition of endogenous and environmental carcinogens
through anti-mutagenic, antioxidative, anti-inflammatory and anti-hormonal
mechanism are effective strategies employed by these agents in cancer
prevention (Waun Ki Hong, 1997; Kwak, Wakabayashi and Kensler, 2004) Cancer
chemoprevention dates back to early 1950’s when decrease in cancer incidence
was observed in rats fed with high doses of carcinogenic azo dyes were prior fed
small quantities of 3-methylcholanthrene (Richardson and Cunningham, 1951;
Zhang, 2006). However, 3-methylcholanthrene is itself carcinogenic and thus
ensuing research over years established the effectiveness of non-carcinogenic
organic compounds to block carcinogenesis; some isolated from plants and others
as synthetic drugs as anti-carcinogens (Stutman, 1974; Henry et al., 1981; Zhang,
2006). The inhibition of chemical induced carcinogenesis using phenolic
antioxidants such as BHA has long been recognized to prevent cancer initiation
(Wattenberg, 1973; Benson et al., 1978). Some of the chemopreventive
mechanisms involve phase II drug metabolizing enzymes to facilitate
chemoprevention. Long et al., (2000) showed that loss of NQO1 in mice caused
susceptibility to benzo(a)pyrene induced carcinogenesis. Overexpression of
GSTP1 in human prostrate adenocarcinoma LNCaP cells containing a silenced
GSTP1 gene caused a decrease in cytotoxicity and DNA damage induced by an
heterocyclic amine carcinogen 2-amino-1-methyl-6-phenylimidazo [4,5-b]pyridine
(PhIP) (Nelson et al., 2001; Kwak, Wakabayashi and Kensler, 2004). Most of
these anticarcinogenic compounds induce cytoprotective genes through the Nrf2
antioxidant pathway suggesting a role for the CNC-bZIP protein in cancer
chemoprevention (Wang et al., 2007).
51
The binding of Nrf2 to the promoter region of cytoprotective genes in cells in
response to electrophiles and oxidants suggest a role for Nrf2 in mediating cellular
response (Baird and Dinkova-Kostova, 2011; Itoh et al., 1997). As discussed
earlier, the existence of several mutations in cells arising from exposure to
electrophiles and ROS may lead to initiation of carcinogenesis. As Nrf2 plays a
major role in combating electrophilic and redox stresses in cells, it is pertinent that
Nrf2 would play a major role in cancer chemoprevention. Nrf2 is able to prevent
carcinogenesis by either promoting the enzymatic breakdown and excretion of
chemical carcinogens, reduction of ROS or by promoting the repair of oxidative
damage through expression of Nrf2 downstream genes. Reduced Nrf2 activity
would mean loss of cytoprotection and thus increased risk of development of
carcinogenesis. Cancer cells attain malignancy by altering Nrf2 activity through
inactivation of Keap1 or gain-of-function mutation in NFE2L2 (Taguchi and
Yamamoto, 2017). Nrf2 inhibits the initiation of carcinogenesis because it induces
drug metabolizing enzymes and antioxidant enzymes that inactivate chemical
carcinogens (Yu and Kensler, 2005; Zhang, 2006). Mutant Nrf2-null mice
demonstrate that ARE-driven genes provide protection against oxidative stress
and reactive xenobiotics; Nrf2 knockout mice exhibit enhanced susceptibility to
carcinogenesis suggesting that Nrf2 can sometimes act as a tumour suppressor
known as the good side of Nrf2 (Rotblat, Melino and Knight, 2012). Low
expression of drug-metabolizing and antioxidative enzymes such as GST, NQO1
and peroxiredoxin 1 in liver, intestine and forestomach has been reported in Nrf2
knockout mice (Ramos-Gomez et al., 2001; S et al., 2002; Yu and Kensler, 2005)
showing that Nrf2 influences intrinsic resistance to carcinogenesis. The induction
of ARE-driven cytoprotective genes by cancer chemopreventive agents is also
attenuated in Nrf2-null mice (McMahon et al., 2001; S et al., 2002). Loss of Nrf2 in
mice results in increased susceptibility to toxicity evoked by environmental and
chemical stress due to 30-70% decrease in expression of NQO1 and GST in Nrf2
null mice as opposed to wild-type mice (Ramos-Gomez et al., 2001). Also,
hepatotoxicity induced by intake of acetaminophen was alleviated in mice

52
deficient in Nrf2 as opposed to wild-type mice (Ramos-Gomez et al., 2001; Fahey
et al., 2002). The presence of harmful DNA-damaging effects of estrogens was
reduced by pharmacological activation of Nrf2 using sulforaphane (SFN), or by
genetically knocking down Keap1 in MCF-10A cells (Yang et al., 2013). The
administration of chemical inducers of Nrf2 such as oltipraz, SFN, TBE-31 before
challenging with carcinogens has been shown to reduce the progression of
cancer (Hayes et al., 2000; Nioi and Hayes, 2004; Knatko et al., 2015).
The role of Nrf2 in the initiation, progression and growth of cancer cannot be
overemphasized. Decades of research on the induction of Nrf2 through
electrophiles that activate the gene using Nrf2-/- mice shows the protective role of
Nrf2 activation in the prevention of carcinogenesis. However, Nrf2 has also been
known to function as an oncogene as it is constitutively active in some cancers
and has led to favoring the progression of such cancers.
1.5.2 Upregulation of Nrf2 in cancer Nrf2 is upregulated in some carcinoma cells (Zhang, 2006). This observation
seems contradictory to the initial belief that the Keap1-Nrf2 system helps prevent
cancer. However, the knowledge that cancer cells often acquire increased
antioxidant and drug metabolizing activities possibly explains their acquirement of
malignancy and cytoprotective function (Taguchi and Yamamoto, 2017). The
upregulation of Nrf2 in cancer cells has been reported to arise either by: (i)
presence of somatic mutations within the genes encoding Nrf2, Keap1 or Cul3 ;
(ii) epigenetic silencing of Keap1; (iii) accumulation of proteins that interfere with
the binding of Nrf2 to Keap1 such as p62/Sqstm1 and p21; (iv) modification of
cysteine residues in Keap1 by oncometabolites (Taguchi, Motohashi and
Yamamoto, 2011; Menegon, Columbano and Giordano, 2016; Taguchi and
Yamamoto, 2017). The presence of high Nrf2 protein levels therefore increases
expression of genes that are required for cytoprotection, conferring resistance to
both chemotherapy and radiotherapy in such cancer cells (Ramos-Gomez et al.,

53
2003; Taguchi and Yamamoto, 2017). Sequence analysis of the Neh2 domain of
Nrf2 has revealed the presence of mutations around the DLG and ETGE motifs
that stops Keap1 from ubiquitinating Nrf2 (Zhang, 2010; Fukutomi et al., 2014).
Shibata et al. (2008b) reported the presence of somatic mutation in the DLG and
ETGE motif of patients with a history of smoking or suffering from squamous cell
carcinoma resulting in accumulation of Nrf2 and suppression of the transcription
factor using siRNA knockdown resulted in sensitizing the cells to
chemotherapeutic reagents. The loss of repression of Keap1 arising from either
somatic mutations of the ETGE and DLG motifs of Neh2 domain of Nrf2 or
epigenetic changes causes the up-regulation of Nrf2 in some tumor cells such as
lung, liver, ovary, stomach, head and neck (Singh et al., 2006; Ohta et al., 2008;
Shibata et al., 2008b; a). Missense mutations in the Keap1 gene in human lung
adenocarcinomas (Ohta et al., 2008; Shibata et al., 2008a) have been reported,
with mutations identified across the BTB, DGR, IVR, and NTR domains (Table
1.3) (Taguchi, Motohashi and Yamamoto, 2011). The cancer genome atlas
(TCGA) has documented a 25 -35% upregulation of Nrf2 in lung adenocarcinoma
(Collisson et al., 2014a), 8% in urothlial bladder carcinoma (TCGA, 2014), 5% in
head and neck squamous cell carcinoma (TCGA Network, 2015), with mutations
in Keap1 serving as second most genetic lesion in lung adenocarcinoma and
fourth most common in lung squamous cell carcinoma (Hammerman et al., 2012;
Lawrence et al., 2014). Mutations of Nrf2 and Keap1 genes that prevent Nrf2
degradation by CRLKeap1 are often seen in cancer cells leading to increased
expression of Nrf2-target genes. This can lead to increased cell proliferation of
cancer cells as well as resistance to therapeutic drugs through activation of drug
efflux systems (Ohta et al., 2008; Taguchi, Motohashi and Yamamoto, 2011).
Mutation in PTEN often leading to Nrf2 upregulation has also been reported in
cancer cells (Rojo et al., 2014).

54
Mutation Domain Tissue Reference
V167F BTB Lung (Singh et al., 2006)
C23Y NTR Breast (Nioi and Nguyen, 2007)
Q284L IVR Lung (Singh et al., 2006)
543insC IVR Gallbladder (Shibata et al., 2008a)
D77V Neh2 ETGE Lung (Shibata et al., 2008b)
D77A Neh2 ETGE Lung (Kim et al., 2010)
W24C Neh2 DLG Lung (Shibata et al., 2008b)
D29G Neh2 DLG Head and neck (Shibata et al., 2008a)
E79K Neh2 ETGE Lung (Shibata et al., 2008b)
Other mechanisms responsible for Nrf2 up regulation in cancer cells include: (i)
hypermethylated DNA at promoter region of Keap1; (ii) oncometabolites that
modify Keap1; (iii) competitive protein interactors that disrupt Keap1-Nrf2 binding;
(iv) transcriptional up regulation via oncogene-dependent signaling (Mitsuishi,
Motohashi and Yamamoto, 2012; Jaramillo and Zhang, 2013). The presence of
these various mutations either in Keap1 or Nrf2 that leads to activation of Nrf2 in
Table 1.3: Some mutations in Keap1 and NFE2L2 found in cancer
Examples of Keap1 and NFE2L2 mutations found in cancer cells. Point and mis-sense
mutations with the domain in Keap1 and Nrf2 as well as the tissue within which the mutations
have been reported to occur.
55
several human cancers has been seen to promote tumorigenesis and promote
chemoresistance by upregulation of glutathione, thioredoxin, and drug efflux
pathways (Singh et al., 2010; Shibata et al., 2011; Fukutomi et al., 2014; Rojo de
la Vega, Chapman and Zhang, 2018).
1.5.3 Inducers of Nrf2 as anticancer agents Several structurally diverse small molecules of endogenous and exogenous origin
upregulate the Keap1-Nrf2 pathway (Baird and Dinkova-Kostova, 2011). Inducers
of Nrf2 function by protecting the body from chemical carcinogens and by
promoting the detoxification of carcinogens arising from the environment (Taguchi
and Yamamoto, 2017). 4-methyl-5-(2-pyrazinyl)-1,2-dithiole-3-thione (oltipraz) a
dithiolethione has been shown to be a potent inducer of GST and other phase II
enzymes in cells (Kensler and Helzlsouer, 1995; Kwak, Wakabayashi and
Kensler, 2004) Administration of oltipraz caused significant reduction of gastric
tumour induced by benzo(a)pyrene in wild-type mice but had no effect when Nrf2
was lost in these cells (Ramos-Gomez et al., 2003). An earlier work reported a
daily dose of oltipraz administered in a two month clinical trial for hepatocellular
cancer resulted in significant increase in the level of aflatoxin-mercapturic acid
secreted into the urine (Wang et al., 1999). Acting as an effective
chemopreventive drug in an array of cancer including lung, bladder, colon, liver,
mammary gland and skin cancer models, oltipraz has passed in into phase II
clinical trial for the treatment of cancer and has shown to increase the expression
of phase II transcript levels and enzymes in humans (Kelloff et al. 1994; Kensler &
Helzlsouer 1995; Kwak et al. 2004; Taguchi & Yamamoto 2017).
SFN an isothiocyanate isolated from the cruciferous plant broccoli on the basis of
its ability to induce phase II drug metabolizing enzyme NQO1 has been used in
the treatment of cancer (Singletary and MacDonald, 2000; Fahey et al., 2002;
Kwak, Wakabayashi and Kensler, 2004; Yeh and Yen, 2009). Dopaminergic-like
neuroblastoma cell line SH-SY5Y treated with SFN resulted in significant increase

56
in total GSH, NQO1, GSH-transferase and GSH reductase leading to increase
resistance to H2O2 or 6-hydroxydopamine (6-OHDA) induced toxicity (Tarozzi et
al., 2009). Extract from SFN-enriched broccoli sprout used in treatment of mouse
and human keratinocytes resulted in increased expression of phase II enzymes
and glutathione resulting in decrease tumour burden in a dose dependent manner
(Dinkova-Kostova et al., 2006).
Synthetic triterpenoids that are potent inducers of cytoprotective enzymes and
inflammatory inhibitors have also been used as potent Nrf2 inducers (Yates et al.,
2007). The triterpenoids CDDO-ethyl amide and CDDO-methyl ester (CDDO-Me)
when fed to lung adenocarcinoma induced A/J mice resulted in an 86% to 92%
average tumour burden respectively (Liby et al., 2009). Subsequent work in VC1
lung cancer cells and A/J mung cancer mice using CDDO-imidazole (CDDO-Im)
and CDDO-Me and dimethyl fumarate (DMF) showed the triterpenoids activated
Nrf2 pathway and significantly reduced average tumour number, size and burden
as opposed to control group however, DMF though induced Nrf2 weakly was seen
to increase the severity of the tumour (To et al., 2015).
Another common inducer of Nrf2 is the tert-butylhydroquinone (tBHQ), an
aromatic organic compound that is a metabolite of BHA commonly used as a
synthetic food antioxidant (Gharavi, Haggarty and El-Kadi, 2007). tBHQ has been
shown to induce phase II enzymes via an Nrf2 dependent mechanism and also to
exhibit anti-carcinogenic ability (Gharavi, Haggarty and El-Kadi, 2007). In another
research conducted by Duan et al. (2014), it was seen that tBHQ suppressed
arsenic-induced hepatocellular toxicity in human hepatocytes via induction of Nrf2.
The FDA has approved the use of dimethyl fumarate; an Nrf2 inducer for the
treatment of multiple sclerosis and also, bardoxolone methyl (CDDO-Me or RTA
402) has also passed into phase II clinical trials for pulmonary hypertension and
chronic kidney disease (Taguchi and Yamamoto, 2017). Also, inducers such as
SFN, carnosol and curcumin are also in clinical trials and are been used as

57
dietary supplements for the treatment of cancer (Sporn and Liby, 2012; Taguchi
and Yamamoto, 2017).
1.5.4 Inhibitors of Nrf2 as anticancer therapy As Nrf2 is up regulated in tumors with mutant Keap1, there is a need to identify
chemicals that inhibit the transcription factor because they could be effective
anticancer drugs. The down-regulation of detoxification enzymes and drug
excretion transporters by inhibitors of Nrf2 might diminish cell proliferation and
would sensitize cancer cells to therapeutic drugs (Mitsuishi et al., 2012). Some
agents that have been proposed to inhibit Nrf2 include brusatol, retinoic acid
(Wang et al., 2007), luteolin (Tang et al., 2011), glucocorticoids (Kratschmar et al.,
2012), trigoneline (Boettler et al., 2011), ascorbic acid (Tarumoto et al., 2004),
wogonin (Zhong et al., 2013) and some ROS producing compounds (Shaw et al.,
2011) (Figure 1.11) (Table 1.4). Although, unlike Nrf2 inducers, inhibitors of Nrf2
have not been officially developed and would be a useful insight into the
mechanism by which Nrf2 activity is controlled.
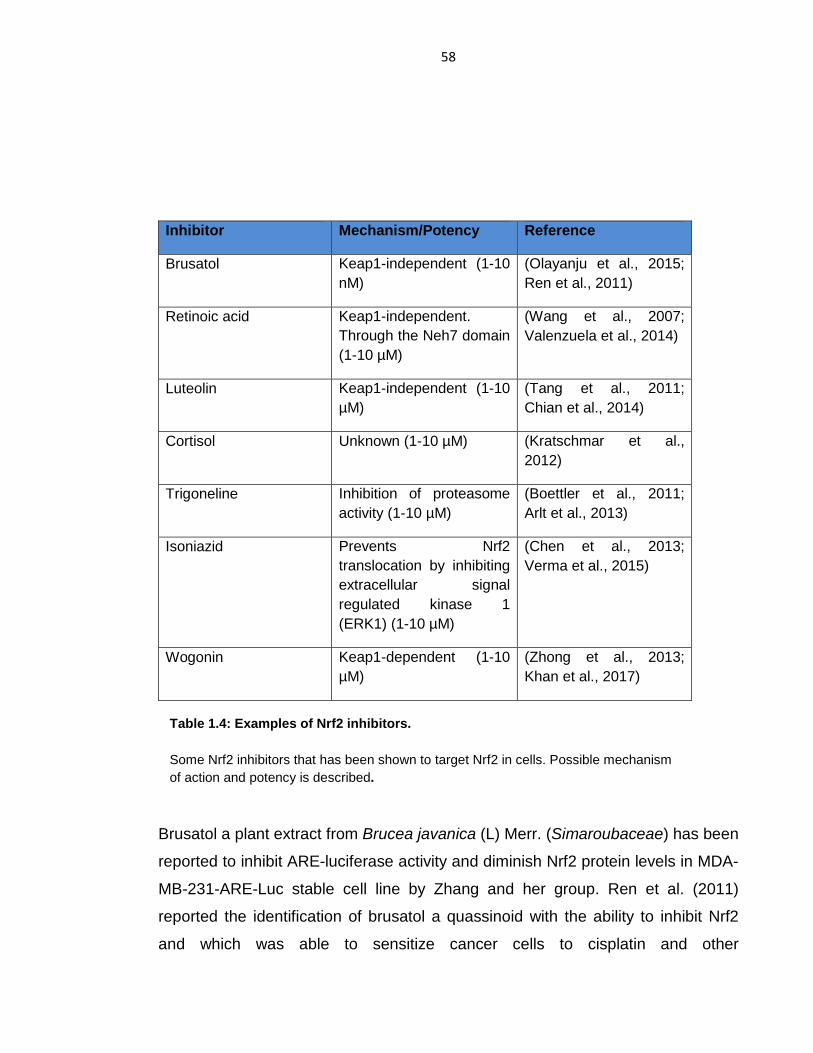
58
Inhibitor Mechanism/Potency Reference
Brusatol Keap1-independent (1-10 nM)
(Olayanju et al., 2015; Ren et al., 2011)
Retinoic acid Keap1-independent. Through the Neh7 domain (1-10 µM)
(Wang et al., 2007; Valenzuela et al., 2014)
Luteolin Keap1-independent (1-10 µM)
(Tang et al., 2011; Chian et al., 2014)
Cortisol Unknown (1-10 µM) (Kratschmar et al., 2012)
Trigoneline Inhibition of proteasome activity (1-10 µM)
(Boettler et al., 2011; Arlt et al., 2013)
Isoniazid Prevents Nrf2 translocation by inhibiting extracellular signal regulated kinase 1 (ERK1) (1-10 µM)
(Chen et al., 2013; Verma et al., 2015)
Wogonin Keap1-dependent (1-10 µM)
(Zhong et al., 2013; Khan et al., 2017)
Brusatol a plant extract from Brucea javanica (L) Merr. (Simaroubaceae) has been
reported to inhibit ARE-luciferase activity and diminish Nrf2 protein levels in MDA-
MB-231-ARE-Luc stable cell line by Zhang and her group. Ren et al. (2011)
reported the identification of brusatol a quassinoid with the ability to inhibit Nrf2
and which was able to sensitize cancer cells to cisplatin and other
Table 1.4: Examples of Nrf2 inhibitors.
Some Nrf2 inhibitors that has been shown to target Nrf2 in cells. Possible mechanism of action and potency is described.

59
chemotherapeutic drugs through reduction in Nrf2 protein expression.
Subsequent work by Olayanju et al. (2015) showed that brusatol inhibit Nrf2 in a
Keap1-independent manner.
Retinoic acid (RA), a derivative of vitamin A is involved in the regulation of cell
proliferation, differentiation and morphogenesis as well as promoting apoptosis
and inhibiting tumourigenesis via cell growth suppression and cellular
differentiation stimulation (Wang et al., 2007; Duester, 2008; Valenzuela et al.,
2014). RA acts via the retinoic acid receptors (RAR-α, -β, and –γ) and the retinoid
X receptors (RXR-α, -β, and –γ) to regulate gene expression functioning as
transcriptional regulator by forming a heterodimer between RXR and RAR
(Soprano, Qin and Soprano, 2004; Wang et al., 2007). Wang et al. (2013)
showed that RA antagonizes the expression of Nrf2 target genes by an interaction
between RXRα and Nrf2 through an RXRα binding region in Nrf2 designated as
the Neh7 domain. RXRα repression is likely due to inhibition of the recruitment of
Nrf2 coactivators. Although not much is known about what domain of RXRα is
responsible for its inhibitory action and calls for further investigation.
Another group of compounds that inhibit Nrf2 are the some flavonoids, which
exhibit high anti-proliferating activity and can sensitize cancer cells to anti-cancer
therapy (Kanadaswami et al., 2005). Epigallocatechin 3-gallate (EGCG) a
flavonoid found in green tea has been reported to inactivate Nrf2 in non-small-cell
lung cancer (NSCLC) A549 cells (Kweon et al., 2006). Furthermore 3᾿,4᾿,5,7-
tetrahydroxyflavone (also known as luteolin) was reported to act as a potent and
selective inhibitor of Nrf2 (Tang et al., 2011). Notably, inhibition of ARE-driven
gene expression in NSCLC A549 cells by luteolin was found to sensitize the cells
to treatment with several anticancer drugs such as oxaliplatin, bleomycin and
doxorubicin (Tang et al., 2011).
60
Also shown to inhibit Nrf2 activity in pancreatic adenocarcinoma (PDAC) cells is
trigonelline, a coffee alkaloid identified by (Boettler et al., 2011) to interfere with
Nrf2 activation by inhibiting the NMP-mediated induction of Nrf2 downstream
genes. (Arlt et al., 2013) went further to report the repression of Nrf2 activity in
PDAC cell lines and Human pancreatic duct cell line H6c7 by trigonelline as well
as decreasing proteasomal activity of Nrf2 resulting in cell apoptosis.
Isoniazid a widely used antitubercular drug has also been shown to inhibit ARE
activities in human and mouse cell lines. (Chen et al., 2013) reported the inhibition
of ARE-luciferase activity and mRNA expression levels of several ARE-dependent
antioxidant genes by isoniazid under both oxidative stressed and basal
conditions.
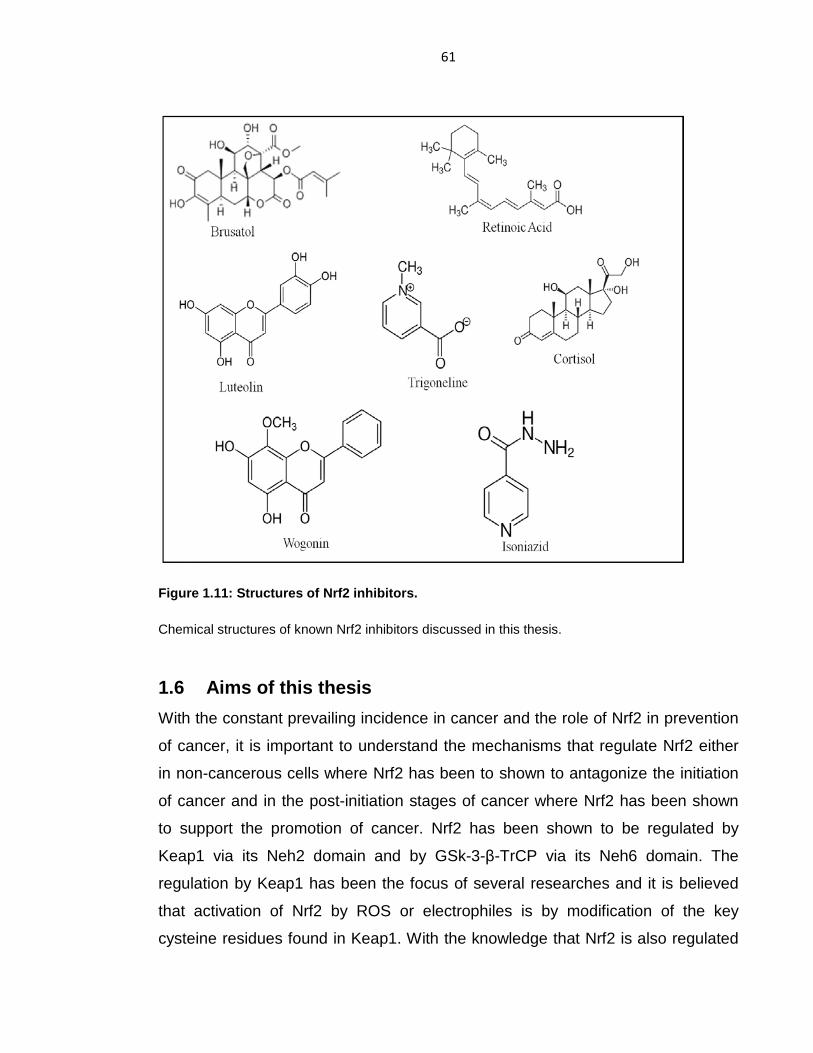
61
Figure 1.11: Structures of Nrf2 inhibitors.
Chemical structures of known Nrf2 inhibitors discussed in this thesis.
1.6 Aims of this thesis
With the constant prevailing incidence in cancer and the role of Nrf2 in prevention
of cancer, it is important to understand the mechanisms that regulate Nrf2 either
in non-cancerous cells where Nrf2 has been to shown to antagonize the initiation
of cancer and in the post-initiation stages of cancer where Nrf2 has been shown
to support the promotion of cancer. Nrf2 has been shown to be regulated by
Keap1 via its Neh2 domain and by GSk-3-β-TrCP via its Neh6 domain. The
regulation by Keap1 has been the focus of several researches and it is believed
that activation of Nrf2 by ROS or electrophiles is by modification of the key
cysteine residues found in Keap1. With the knowledge that Nrf2 is also regulated
62
by GSK-3, one question that came to mind was if electrophiles are able to activate
Nrf2 through the GSK-3-β-TrCP axis as opposed to modulating Keap1. This
question also comes with the revelation that PI3K inhibitors has been shown to
block the induction of Nrf2-target genes by several researches (Lee et al., 2001;
Nakaso et al., 2003). Upstream of GSK-3 is PI3K and so we aimed to see if
inducers of Nrf2 would regulate Nrf2 via Keap1 or through regulation of the GSK-
3-β-TrCP axis and what role those PI3K play in the induction of Nrf2 by Nrf2
activators and if it the role of PI3K is dependent on Keap1 or GSK-3 axis of Nrf2
regulation. The aims of the thesis are therefore:
1. To study the effect of several inducing agents that activate Nrf2 by inhibiting
Keap1 and/or the β-TrCP/GSK-3 axis;
2. To determine the role of PI3K in the induction of Nrf2-target genes;
3. To determine the mechanism by which chemical inhibitors of Nrf2 suppress its
activity;
4. To study the effect of Nrf2 repression on oxidative stress, metabolic pathways,
growth and proliferation of tumour cells expressing high Nrf2 levels.

63
Chapter 2
64
2 Materials and methods
2.1 Materials All chemicals and reagents were of high analytical standard and obtained as
stated in text. SFN was obtained from LKT laboratories (>98% pure) (St Paul,
Minnesota, USA). tBHQ (≥ 98% pure) was obtained from Sigma-Aldrich (Poole,
Dorset, UK). LY294002 (≥ 98% pure), MK2206 (≥ 98% pure), PI-103, ferulic acid,
and CT99021 were obtained from Selleckchem (Houston, USA). Curcumin,
carnosol and diethyl maleate (DEM) were obtained from Sigma-Aldrich. CDDO-Im
was obtained from Tocris Bioscience (Bristol, United Kingdom). PTEN inhibitor
bpv(HOPIC) was obtained from Sigma-Aldrich.
Dulbecco’s modified eagle medium (DMEM) containing 4.5 g/L glucose, L-
glutamine and pyruvate for cell culture were purchased from Life Technologies Ltd
(Paisley, Scotland, United Kingdom). Opti-MEM a reduced serum medium
containing L-glutamine, sodium pyruvate, HEPES and phenol red used for
transfection was obtained from GIBCO Thermofisher (Paisley, Scotland, United
Kingdom). Lipofectamine2000 used as transfection reagent was obtained from
Invitrogen Ltd (Paisley, Scotland, United Kingdom).
Pre-designed Taqman oligonucleotides containing probe primer set were
purchased from Applied Biosystems (ABI) Thermofisher. Unmodified
oligonucleotides used as Taqman primers and probes labeled with a 5ʹ
fluorescent reporter dye, 6-carboxy-fluorescein phospharamidite (FAM) and a 3ʹ
quenching dye, 6-carboxy-tetramethyl-rhodamine (TAMRA) designed in-house
were synthesized and purchased from Eurofins MWG Operon (Anzingerstr,
Germany). A list of oligonucleotides that have been used as Taqman probes and
primers are shown in Appendix I & II. Taqman master mix was obtained from ABI
while Omniscript RT kit used for reverse-transcription of RNA were purchased
from Qiagen (West Sussex, United Kingdom). Short hairpin RNA (shRNA) for Nrf2
was purchased from Sigma-Aldrich.

65
Reporter plasmids were designed in-house and are listed in Table 2.1, while
Mission shRNA used for knockdown experiments were purchased from Sigma-
Aldrich.
Plasmid DNA Promoter Experiment
pcDNA 3.1 V5 Nrf2 His A CMV Ectopic expression
pcDNA 3.1 Neh6+-LacZ-V5 His A
CMV β-Galactosidase activity
pRL-TK Renilla T7 Luciferase assay
-1016/nqo5ʹ-luc ARE pGL3 Luciferase assay
TRC2-pLKO-puro U6 shRNA knockdown
Nrf2∆ETGE pcDNA 3.1 V5 His A
CMV Ectopic expression
Nrf2∆DSGIS pcDNA 3.1 V5 His A
CMV Ectopic expression
2.2 Mammalian cell culture
2.2.1 Cell lines Rat liver RL-34 cells were purchased from the Japanese Cancer Research
Resources Bank, HSRRB (Sennan-shi, Japan). AREc32 a stable ARE-reporter
cell line containing a luciferase gene derived from MCF7 expressing the pGL-
8xARE was designed in-house (Wang, Hayes and Wolf, 2006). Immortalized wild-
type (WT) and Keap1 knockout (Keap1-/-) mouse embryonic fibroblast (MEF) cells
were generated in-house. Monkey kidney COS1, mouse hepatoma Hepa1c1c7,
human breast adenocarcinoma MCF7, non-small cell lung cancer (NSCLC) A549
Table 2.1: Plasmids used in thesis with their promoter and experimental application.

66
and human lung cancer H460 cells were obtained from American Type culture
collection (ATCC) (Teddington, Middlesex, UK). PTEN wild-type and PTEN
knockout embryonic stem (ES) cells were kindly donated by Prof Albena Dinkova-
Kostova (originally donated by Dr Nic Lesley).
2.2.2 Growth medium and cell culture conditions. AREc32 cells were maintained in DMEM, supplemented with 10% (v/v) fetal
bovine serum (FBS) (heat inactivated, Biosera), 1% (v/v) penicillin/streptomycin
(Pen Strep) (50U penicillin and 50 µg streptomycin) (Life technologies Ltd.) and
0.8 mg/ml G418 (Sigma-Aldrich).
WT and Keap1-/- MEF cells were maintained in DMEM supplemented with 10%
(v/v) FBS, 1% (v/v) Eagle’s minimum essential medium (MEM) non-essential
amino acids solution (Sigma-Aldrich) and 1% (v/v) Pen Strep.
COS1, Hepa1c1c7, MCF7, A549 and H460 cells were maintained in DMEM
supplemented with 10% (v/v) FBS and 1% (v/v) Pen Strep.
Rat liver RL-34 cells were maintained in DMEM media supplemented with 10%
(v/v) FBS and 1% (v/v) Pen Strep.
PTEN wild-type and PTEN knockout embryonic stem (ES) cells were maintained
in DMEM supplemented in 15% (v/v) pre-screened Hyclone FBS (VWR
International Ltd) (Hunter Boulevard, Leicestershire, United Kingdom), 1% (v/v)
100x non-essential amino acids (GIBCO), 1% (v/v) 100x sodium pyruvate
(GIBCO), 1% (v/v) 100x Glutamine (GIBCO), 1% (v/v) Pen strep, β-
mercaptoethanol (2-ME) (Sigma-Aldrich) and 1:10 of leukocyte inhibitory factor
(LIF) (Sigma-Aldrich) just before use.
All cells were cultured at 37oC, 95% air and 5% CO2 in a Heraeus incubator
routinely and passaged every 3 – 4 days.

67
2.2.3 Passaging of cell lines To keep cells alive and growing for extended period of cells, cells were passaged
when they are 80-90% confluent. The medium in which cells were grown was
removed and cells were washed with warm phosphate buffered saline (PBS) twice
after which cells were trypsinized with 1 ml or 3 ml of trypsin (0.05% (v/v)
(supplemented with ethylenediaminetetraacetic acid (EDTA) (0.05 mmol/l))
depending on flask size to allow dissociation of cell monolayer for effective cell
removal and incubated for 3 min in the incubator. Cells were then collected by
addition of ten volumes of complete growth media to flask to stop trypsin action
and transferred to 50 ml falcon tube and centrifuged at 16,000 x g for 3 min at
room temperature. The resulting pellet was then resuspended in fresh growth
medium and the cells split into new culture flasks at optimal split ratio that would
result in 98% growth in 3-4 days either at a ratio of 1:2 or 1:3 for MEF cells and
1:6 for COS1, RL-34, A549 and H460 cells.
2.2.4 Seeding of cells For experimental purpose, cells were seeded into either 6 cm dishes, 6-well plate,
12-well plate or 96-well plate. After the cells had been trypsinized and split into a
new flask, the cell number in the falcon tube was then counted using a
haemocytometer. Cells were then seeded either into 6-well plate or 60 mm petri-
dishes in complete growth media at a density that would result in ~80%
confluency approximately 24 hr after seeding, depending on the cell type
employed. The seeded cells were then grown in the incubator overnight at 37oC
(16-24 hr) prior to treatment.
2.2.5 Treatment of cells To check the effect of inducers or kinase inhibitors on cells, cells that had been
seeded as described in section 2.2.4 above were either replaced with fresh
complete growth media containing the desired xenobiotic or reduced serum media
(i.e. containing 1% FBS) for 16 hr for experiments involving GSK-3 and the Neh6
domain of Nrf2. After the 16 hr nutrient-depletion, the cells were treated with the

68
desired inducing agents, kinase inhibitors for the required time period depending
on the experiment. Drugs and dose used in experiments are listed in Table 2.2.
Drugs Manufacturer Catalogue number
Function Dose Used
SFN LKT laboratories S8044 Nrf2 activator 5 µM
tBHQ Sigma-Aldrich 8414240 Nrf2 activator 50 µM
Curcumin Sigma-Aldrich C1386 Nrf2 activator 15 µM
Carnosol Sigma-Aldrich 49702 Nrf2 activator 10 µM
DEM Sigma-Aldrich O7553 Nrf2 activator 100 µM
CDDO-Im Tocris Bioscience 4737/10 Nrf2 activator 100 nm
Ferulic acid Selleckchem S2300 Nrf2 activator 10 µM
LY294002 Selleckchem S1105 PI3K inhibitor 10 µM
PI-103 Selleckchem S1038 PI3K inhibitor 1 µM
MK2206 Selleckchem S1078 Akt inhibitor 5 µM
CT99021 Selleckchem S1263 GSk-3 inhibitor 5 µM
bpv(HOPIC) Sigma-Aldrich SML0-884 PTEN inhibitor 10 µM
GSK690693 Selleckchem S113 Akt inhibitor 1 µM
Table 2. 2: List of drugs in experiment.
Drugs used in treating cells during experiment is listed with manufacturer and catalogue number
described. Doses used were set from dose response treatment on cell line tested except
otherwise stated. Cells were treated with 50 µM as previous experiments in the laboratory showed
tBHQ gave the best activation of Nrf2 at this dose. Dose used for SFN was determined from
previous research published in the laboratory (Chowdhry et a., 2013). Drugs were made up in
DMSO and stored at -20oC.
69
2.2.6 Preparation of frozen cell stocks To store cells for future use and backup in case of contamination or loss of
supply, cells are cryopreserved when they are at their maximum growth rate. Cells
that had been trypsinized and pelleted, as described in section 2.2.3, were
resuspended in freezing media containing 90% (v/v) FBS and 10% (v/v) dimethyl
sulfoxide (DMSO) at a concentration of 1 x10⁶ cells/ml aliquots in cryotubes
(Nalgene Nunc International Corp, Naperville, USA) and stored at -80oC overnight
in a cryo-freezing container containing isopropanol to ensure slow freezing before
they were transferred to liquid nitrogen for long term storage.
2.3 Preparation of stock solutions Buffers used for preparation of samples for electrophoresis were made and stored
as described below.
2.3.1 Kinase lysis buffer Kinase lysis buffer used for lysing and breaking open cell membrane for extraction
of protein from cells was made following: 10% (w/v) sucrose, 50 mmol/l Tricine-
hydrochloride (Tris-HCl) pH 7.5, 1 mmol/l EDTA pH 8.0, 1 mmol/l ethylene glycol
tetraacetic acid (EGTA) pH 8.0, 2 mmol/l sodium vandate (Na2VO3), 10 mmol/l
glycerophosphate, 25 mmol/l sodium fluoride (NaF), 5 mmol/l sodium
pyrophosphate (NaP2O5), and 1% (v/v) nonidet P-40 (NP-40), made up to a total
volume of 100 ml.
2.3.2 RIPA lysis buffer RIPA lysis buffer used for lysing cell for GSK-3 catalytic activity assay was made
following: 50 mmol/l Tris-HCl pH 7.4, 150 mmol/l sodium chloride (NaCl), 1% (v/v)
NP-40, 0.5% (w/v) sodium deoxycholate, 0.1% (w/v) sodium dodecyl sulfate
(SDS) and 1 mmol/l EDTA, made up to a total volume of 100 ml.

70
2.3.3 5x Laemmeli protein sample loading buffer This comprised the following: 100 mmol/l Tris-HCl pH 6.8, 20% (v/v) glycerol, 4%
(w/v) SDS, 3.6 M β-mercaptoethanol, 0.05% (w/v) Bromophenol blue, made up to
a total volume of 9 ml. The buffer was stored at -20oC until required.
2.3.4 10x SDS-PAGE running buffer This comprised the following: 192 mmol/l glycine, 25 mmol/l Tris-HCl, 0.1% (w/v)
SDS, made up to a total volume of 1000 ml.
2.3.5 10x SDS-PAGE transfer buffer This comprised the following: 192 mmol/l glycine, 25 mmol/l Tris-HCl, 20% (v/v)
methanol (MeOH) and 0.01% (w/v) SDS, made up to a total volume of 1000 ml
and stored at 4oC prior to use.
2.3.6 Tris-buffered saline tween-20 (TBST) washing buffer This compromised the following: 50 mmol/l Tris-HCl, 150 mmol/l NaCl and 0.25%
(v/v) Tween-20.
2.3.7 Enhanced chemiluminescence (ECL) solution Detection of protein after electrophoretic separation and immunoblotting was
carried out using 1:1 dilution of ECL 1 and 2.
ECL solution 1: 100 mmol/l Tris-HCl pH 8.5, 2.5 mmol/l Luminol (Fischer
Scientific, Bishop Meadow road, Loughborough, United Kingdom), 0.4 mmol/l ρ-
coumaric acid (Sigma-Aldrich).
ECL solution 2: 100 mmol/l Tris-HCl pH 8.5, 0.02% (v/v) H2O2 (Sigma-Aldrich).
A final working solution of 1:1 ratio of ECL solution 1 and ECL solution 2 was
made just before use.
2.4 Protein quantification The amount of protein in cell lysates was quantified using the DC protein assay
(Bio-Rad, California, USA). The DC protein assay is a colorimetric based assay

71
that measures the interaction of protein in cell lysates with alkaline copper tartrate
solution (reagent A) and Folin reagent (reagent B) (Lowry, 1951; Lowry et al.,
1951). A standard working solution containing 20 µl of surfactant solution (reagent
S) in every 1 ml of reagent A was prepared according to the manufacturer’s
protocol. The mixture was vortexed and 100 µl aliquoted into a cuvette. Test
samples and standard (4 µl each) were added to it before addition of 800 µl of
reagent B and incubated in the dark for 15 min. The absorbance at 750 nm was
then read using a spectrophotometer. Concentration of test samples were
extrapolated from a set of standards containing known concentration of bovine
serum albumin (BSA): these are 0.125, 0.25, 0.5, 0.75, 1.0 and 2.0 µg/ml).
Samples and standards were analysed in triplicate.
2.5 Sample preparation for electrophoresis Cells that had been treated with xenobiotics were washed twice in ice-cold PBS
and lysed either in ice-cold RIPA buffer or kinase lysis buffer depending on the
downstream analysis containing protease inhibitor tablet (Sigma-Aldrich) per 10
ml of lysis buffer. The lysate was then centrifuged at 17,000 x g for 10 min at 4oC
to separate cell debris using the microCL 17R centrifuge (Thermoscientific). The
resulting clear supernatant was then transferred to 1.5 ml Eppendorf tubes and
either stored on ice for immediate analysis or flash freeze and stored at -80oC for
storage for later analysis. The concentration of protein in lysates was measured
using detergent compatible (DC) protein assay according to manufacturer’s
protocol. The samples were normalized to equal amount by diluting in 5x
Laemmeli protein sample loading buffer and 1:10 of lysis buffer before they were
run in sodium dodecyl sulphate (SDS) gels. For NuPAGE gels, samples were
normalized by diluting in 4x lithium dodecyl sulphate (LDS) buffer (Invitrogen), 10x
sample reducing agent (Invitrogen) and 1:10 of lysis buffer. Samples were boiled
for 10 min in 100oC heating block.

72
2.6 Western blotting
2.6.1 SDS-Polyacrylamide gel electrophoresis (PAGE) Proteins in cell lysates were separated electrophoretically by SDS-PAGE using
the Bio-Rad Mini-protein 11 cell electrophoresis system according to the Laemmli
discontinuous electrophoretic method (Laemmli, 1970). Using this method,
proteins are separated based on size with smaller sized proteins migrating faster
towards the anode with the aid of the denaturing properties of SDS (Peek and
Williams, 2001; Bonifacino, 2011; Gallagher, 2012; Madigan et al., 2012).
Separated proteins were transferred to a membrane that produces a band for
each protein which will be visualized by binding to antibody that is specific to the
protein of interest (Mahmood and Yang, 2012).
2.6.1.1 Polyacrylamide-gel electrophoresis
Polyacrylamide gels were made following the composition shown in Table 2.3 to
contain two different layers, a lower resolving gel containing 375 mmol/l Tris-HCl
pH 8.8 that allows separation of protein into different sizes and an upper stacking
gel containing 126 mmol/l Tris-HCl pH 6.8 that allows samples to stack into a
single sharp band. The percentage of the polyacrylamide stacking gel made was
always 5% (w/v), however, based on the molecular weight of the protein of
interest, different polyacrylamide percent gels were made for the resolving gel
with a high molecular weight protein ran in a lower percent gel and a lower
molecular weight protein ran in a higher percent gel. Polymerization of
polyacrylamide gels is based on copolymerization of acrylamide and bis-
acrylamide initiated by ammonium persulfate (APS) and
tetramethylethylenediamine (TEMED). All components of the gel solutions were
added first with the exception of TEMED that was added just before pouring into
glass plates (1.5 cm) and allowed to set. In this process, the rate of formation of
free radicals from persulfate is accelerated by TEMED that in turn catalyzes the
polymerization of the gel (Chrambach and Rodbard, 1971; Allison, Agrawal and
Moore, 1974; Chrambach et al., 1976).
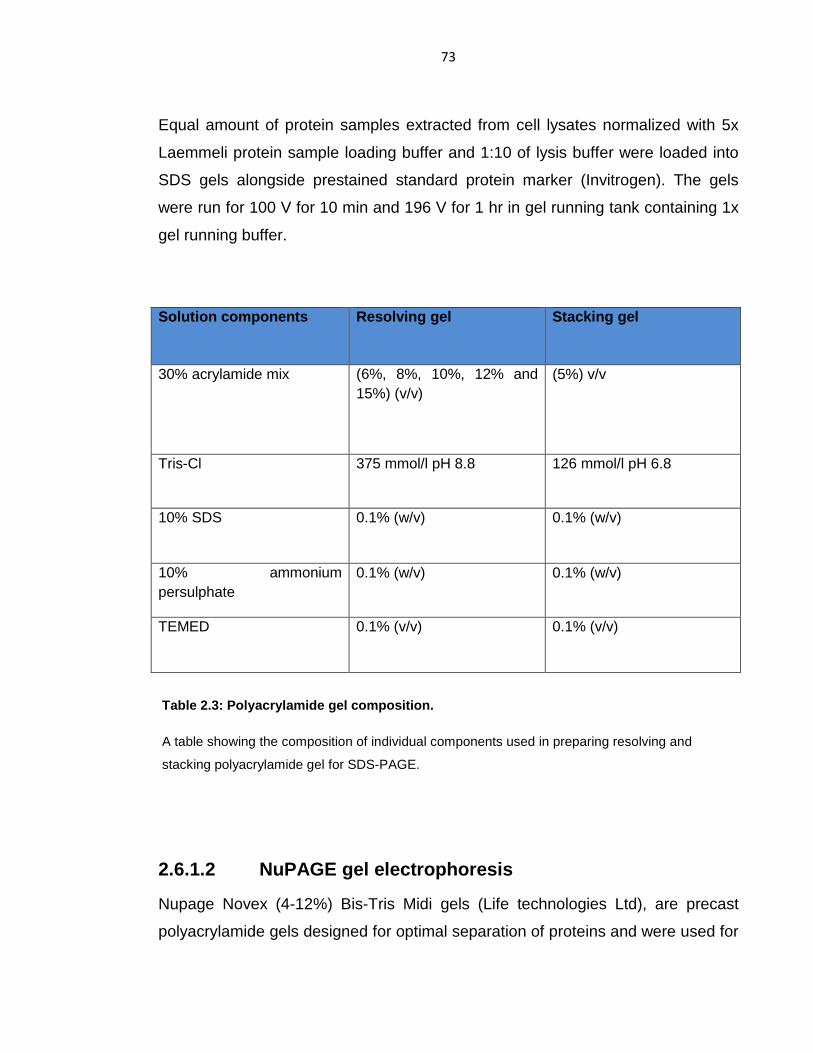
73
Equal amount of protein samples extracted from cell lysates normalized with 5x
Laemmeli protein sample loading buffer and 1:10 of lysis buffer were loaded into
SDS gels alongside prestained standard protein marker (Invitrogen). The gels
were run for 100 V for 10 min and 196 V for 1 hr in gel running tank containing 1x
gel running buffer.
Solution components Resolving gel Stacking gel
30% acrylamide mix (6%, 8%, 10%, 12% and 15%) (v/v)
(5%) v/v
Tris-Cl 375 mmol/l pH 8.8 126 mmol/l pH 6.8
10% SDS 0.1% (w/v) 0.1% (w/v)
10% ammonium persulphate
0.1% (w/v) 0.1% (w/v)
TEMED 0.1% (v/v) 0.1% (v/v)
2.6.1.2 NuPAGE gel electrophoresis
Nupage Novex (4-12%) Bis-Tris Midi gels (Life technologies Ltd), are precast
polyacrylamide gels designed for optimal separation of proteins and were used for
Table 2.3: Polyacrylamide gel composition.
A table showing the composition of individual components used in preparing resolving and
stacking polyacrylamide gel for SDS-PAGE.

74
examination of a larger number of samples in parallel using gels with 20 or 26
wells. Samples were normalized to approximately 1 µg protein/µl using 4x LDS
buffer, 10x sample reducing agent and 1:10 protein lysis buffer as outlined above.
An equal volume of each sample was then loaded into 4-12% precast gradient
gels alongside pre-stained protein marker and separated by electrophoresis using
1x MOPS (Invitrogen) buffer at 100 V for 1 hr.
2.6.2 Wet transfer of electrophoretically resolved proteins Resolved proteins in gels were transferred onto ImmobilonTM polyvinylidene
difluoride (PVDF) membranes (MerckMillipore, Watford, Hertfordshire, United
Kingdom) with a pore size of 0.45 µm that had been presoaked in methanol using
the Bio-Rad Mini trans-Blot system following manufacturer’s wet transfer protocol.
A transfer sandwich containing sponge, 3 filter papers, gel, PVDF membrane, and
another 3 filter papers locked within a transfer cassette was made and placed in
the transfer tanks. Transfer was carried out using 1x ice-cold transfer buffer at
100V for 45 min maintaining an even temperature throughout either by placing the
apparatus on ice or placing ice packs in the transfer tanks.
2.6.3 Immunoblotting Following transfer of protein, the PVDF membrane was immersed in blocking
buffer (5% (w/v) non-fat dry milk in TBST for regular antibodies, or 5% (w/v) of
BSA/TBST phosphoprotein antibodies) for 1 hr with continuous shaking to
saturate unbound membrane surface thereby preventing non-specific antibody
binding. Next, the membranes were incubated with a dilution of primary antibody
against the protein of interest overnight at 4oC. For experiments involving more
than one protein of interest, membrane is cut at band size corresponding to the
protein of interest before placing in appropriate primary antibody. After primary
antibody incubation, membranes were washed three times every 5 min with TBST
75
at room temperature to remove unbound primary antibody. Thereafter, the PVDF
membrane was incubated with a horseradish peroxidase (HRP)-conjugated
secondary antibody that recognizes immunoglobulin G (IgG) on the primary
antibody and binds to it for 1 hr at room temperature with continuous shaking.
This was followed by another TBST wash (3 times for 5 min and twice for 10 min)
at room temperature to remove any unbound secondary antibody. A list of
antibodies and their specificity is provided in Appendix III. Secondary antibody
was made up in 5% (w/v) dried skimmed milk in TBST in a 1: 3000 dilution.
Visualization of bound protein was carried out by exposure of membrane to 1:1
ratio of ECL solution and ECL solution 2 mixture evenly to cover entire surface of
the membrane for 30 seconds before exposure to autoradiograhic X-ray film
(Konica Minolta medical and Graphic, Inc, Banbury, United Kingdom) (in the dark)
and developed from the compact X4 Xograph. Films were scanned using the
Canon Inkjet MP980 series and protein bands edited using the Fotor and ImageJ.
2.7 shRNA knockdown Short hairpin RNA (shRNA) obtained from Sigma-Aldrich called mission shRNAs,
used to manipulate gene expression via RNA interference. Bacterial cultures were
amplified from glycerol stocks of five Mission shRNA bacterial glycerol stocks
harboring verified sequence (Table 2.4) for the human NFE2L2 gene cloned into
pLKO.1-puro vector used in purification of shRNA plasmid DNA. Subsequently,
A549 and H460 cells were transfected with purified plasmid to generate stable
shRNA Nrf2 knockdown (kd) cells following puromycin selection.

76
Clone ID Nrf2 Target Sequence Experimental Numbering
TRCN0000273494
5´-CCGGAGTTTGGGAGGAGCTATTATCCTCGAGGAT
AATAGCTCCTCCCAAACTTTTTTG-3´ A
TRCN0000007556
5´-CCGGGCACCTTATATCTCGAAGTTTCTCGAGAAAC
TTCGAGATATAAGGTGCTTTTT-3´ B
TRCN0000284999
5´-CCGGCCGGCATTTCACTAAACACAACTCGAGTTGT
GTTTAGTGAAATGCCGGTTTTTG-3´ C
TRCN0000007555
5´-CCGGGCTCCTACTGTGATGTGAAATCTCGAGATTT
CACATCACAGTAGGAGCTTTTT-3´ D
TRCN0000007558
5´-CCGGCCGGCATTTCACTAAACACAACTCGAGAGTT
GTGTTTAGTGAAATGCCGGTTTTT-3´ E
Table 2.4: Mission shRNA plasmids.
List of mission shRNA plasmids and their sequences used in generation of a stable Nrf2 knockdown in
A549 and H460 cells.

77
2.7.1 Culturing Clonal Cells Using a sterile loop, 100 µl of frozen Mission shRNA glycerol stock (Sigma-
Aldrich) was added to falcon tube containing 500 µl of Luria-Bertani (LB) broth
without antibiotics and incubated at 37oC with shaking for 30 min. A portion of the
culture (50 µl) was streaked onto LB agar plates containing 100 µg/ml carbenicillin
(Sigma-Aldrich) and incubated overnight at 37oC in a humidified incubator.
Individual colonies were then picked and purified according to section 2.6.2.
2.7.1.1 Transformation of E.coli cells with plasmid DNA
Supercompetent dH5α cells (Thermofisher) were used for transformation of
plasmid DNA. Purified plasmid DNA (2 µg) was transformed in 50 µl of E.coli cells
by incubation on ice for 30 min and then heat-shocked at 42oC for 45 sec and
incubated for an additional 2 min on ice. Next the cells were incubated at 37oC for
1 hr in an orbital shaker after addition of 500 µl of super optimal broth (SOC)
media before they were plated onto LB agar plates containing 50 µg/ml ampicillin
(Sigma-Aldrich) and grown overnight in a humidified incubator at 37oC.
2.7.1.2 Preparation of frozen glycerol stock
Bacterial culture grown overnight was aliquoted into a cryotube into which 50%
(v/v) glycerol was added and stored at -80oC.
2.7.2 Purification of plasmid DNA A single colony isolated from LB agar plates was picked and grown in LB medium
supplemented with appropriate antibiotic and incubated for 8 hr at 37oC in an
orbital shaker. The resulting bacterial broth (500 µl) was added to 300 ml of LB
broth containing appropriate antibiotic and incubated overnight at 37oC in an
orbital shaker. Next morning, bacterial cells were harvested by centrifugation at
6000 x g for 15 min at 4oC. The supernatant was then discarded and plasmid
DNA isolated from the pellet using the QIAfilter Maxiprep Kit (Qiagen Ltd)
following manufacturer’s protocol.
78
2.7.3 Quantification of plasmid DNA Isolated plasmid DNA was quantified using a spectrophotometer at 260 nm.
2.7.4 DNA sequence analysis DNA plasmid used as template alongside forward and reverse primers was used
for sequencing using capillary electrophoresis. Identification of the sequence of
isolated plasmid DNA was carried out in the DNA sequencing laboratory by Dr
Andrew Cassidy based in the Division of Molecular and Cellular Pathology,
Ninewells Hospital, UK using the 3500XL platform.
2.7.5 Transfection of cells Mission shRNA and other plasmid DNA used in manipulation of cells (Table 2.1)
were transfected using Lipofectamine2000® reagent (Invitrogen). Cells were
seeded into a 6-well plate at a concentration that would ensure 70-80%
confluency after overnight incubation in a humidified 37oC and 5% CO2 incubator.
Transfection was carried out by a two-step reaction in polystyrene tubes. The first
step reaction involved mixing 4 µl of Lipofectamine2000® in 100 µl of Opti-MEM
media for each well and incubated at room temperature for 12 min in the dark.
The next step reaction involved a mixture of 1- 3 µg of plasmid DNA in 100 µl of
Opti-MEM per well in a separate tube. Once incubation of the first reaction was
complete, 100 µl of it was added to the second reaction and incubated for 15 min
at room temperature in the dark. Next, growth media was removed from cells,
washed with 1x PBS before 800 µl of Opti-MEM was added to each well. Once
incubation of step 1 and 2 mixture was complete, 200 µl of it was added drop-wise
to cells and incubated in a humidified 37oC and 5% CO2 incubator for 4-5 hr.
Thereafter, cells were replaced with 2 ml of fresh 10% FBS DMEM media and
incubated for a further 24 hr in a humidified 37oC and 5% CO2 incubator until
further analysis.
For generation of stable shRNA Nrf2-knockdown cells, cells were trypsinized after
24 hr transfection and transferred to a 10 cm dish before 2 µg of puromycin was
added (a dose which had been shown to previously kill 100% of untransfected
79
cells). Transfected A549 and H460 cells were allowed to grow until colonies
began to form with constant changing of media and addition of fresh puromycin
every 48 hr. Once they are visible to the naked eye, colonies were picked using
cloning cylinder (Sigma-Aldrich) by drawing around each colony with a non-
permanent marker and aspirating off the media and replacing it with PBS to wash
colonies. Next a cloning cylinder was placed over each colony and 100 µl of
trypsin was added and incubated for approximately 1 min to loosen cells, before
they were transferred to a 24-well plate containing 1 ml of 10% FBS DMEM media
and adding 2 µg of puromycin and allowed to grow until they become confluent.
Once confluent, cells were moved up to a 6-well plate and subsequently to a small
flask. Success of knockdown was assayed by western blot and Taqman analysis.
2.7.6 Kill curve To determine an appropriate concentration of puromycin to be used during
generation of stable NRF2-knockdown cells, the parental A549 and H460 cells
were seeded into 6-well plates at a density of 4 x 10⁵ cells per well in 10% FBS
DMEM media and incubated overnight in a humidified 37oC and 5% CO2
incubator. The following day, a range of puromycin concentrations (i.e. 0 µg, 1 µg,
2 µg, 5 µg, 7 µg and 10 µg) was added and cells were allowed to grow for 10
days. Using the microscope, the minimum concentration of puromycin required to
kill off all the cells in the plate in a specific period of time was determined. The
ideal concentration required would be the lowest concentration of puromycin that
would kill off all the cells on the plate in the shortest possible time.
2.8 Colony formation assay A549 cells were seeded in a 10 cm dish at a seeding density of 250 cells/dish.
Cells were allowed to grow in 37oC, 5% CO2 incubator in 10% FBS DMEM media
for about 2- 3 weeks till individual colonies started to form. Cells were fed twice
every week with fresh 10% FBS DMEM media. Once individual colonies were
visible, cells were washed with ice-cold PBS twice and fixed with 3 ml of methanol
for 10 min in a rocker. After fixation was complete, cells were stained in 1:1

80
solution of 2% toludine blue O (Sigma-Aldrich) and 2% borax solution (sodium
tetraborate decahydrate, Sigma-Aldrich) for 5 min on a rocker before the stain
was washed off and the dish dried.
2.9 Measurement of glutathione
2.9.1 Monochlorobimane-based assay to measure reduced glutathione Monochlorobimane forms fluorometric reduced glutathione (GSH)-mCB adducts
from intracellular glutathione S-transferase that can be measured using a
microplate reader (Kamencic et al., 2000). After treatment with xenobiotics, cells
were washed with PBS twice to remove drugs that might interfere with the assay.
To measure GSH, a 240 μM stock solution of monochlorobimane (mCB, Sigma-
Aldrich) was prepared in sterile PBS and diluted to working solution of 40 μmol/l in
1 ml PBS. Cells were incubated at room temp for 10 min and the fluorescence
measured at 490 nm every 10 min for 40 min at excitation of 390 nm using the
SpectraMax M2 plate reader (Molecular Devices, San Jose, California, United
States).
2.9.2 Modified Tietze assay to measure total and reduced glutathione Total glutathione levels were measured by a method based on the Tietze assay
(Tietze, 1969) that has subsequently been modified by others. (Griffith, 1980;
Rahman, Kode and Biswas, 2007). The assay is based on the reaction between
oxidized glutathione (GSH) and 5,5′-dithio-bis(2 nitrobenzoic acid (DTNB) to
produce the yellow derivative 5′-thio-2-nitrobenzoic acid (TNB) at a peak
absorbance of 412 nm that is proportional to the concentration of GSH in the
samples (Rahman, Kode and Biswas, 2007). In the presence of NADPH,
glutathione adduct of GSH (GS-TNB) is reduced to GSH akin to oxidized
glutathione (GSSG) by glutathione reductase (GR). The GSSG formed is reduced
to 2GSH by GR and the amount of glutathione measured is equal to the sum of

81
reduced and oxidized glutathione in the sample (Rahman, Kode and Biswas,
2007).
[GSH]total = [GSH] + 2 x [GSSG].
Cells were seeded in 10 cm dish till they were about 60% confluent on the day of
assay and treated as described in section 2.2.5. Cells were washed with warm
PBS twice and trypsinised. The cell pellet was harvested by centrifuging for 3 min
at 1000 x g at 4oC. Resulting pellets were washed with 1 ml ice-cold PBS to
remove any remaining culture media and centrifuged again for 3 min at 1000 x g
at 4oC, before the final cell pellet was resuspended in 250 μl 0.25 M sucrose and
a 50 μl aliquot of the suspension was kept aside for protein estimation. A 200 μl of
2x extraction buffer (1.2% (w/v) 5-Sulfoslicyclic acid, 0.2% (v/v) Triton X-100,
0.2% (v/v) NP-40, 0.2 M potassium phosphate buffer pH 7.5, 10 mmol/l EDTA)
was added to the cell solution and centrifuged at 3000 x g for 4 min at 4oC. The
supernatant was removed and used to measure the ratio of reduced glutathione
(GSH) to oxidized glutathione (GSSG).
Samples for GSSG were prepared by adding 6 μl of 10% (v/v) 2-vinylpyridine/1 x
KPE buffer (0.1 M potassium phosphate, 5 mmol/l EDTA) to 250 μl samples and
incubated at room temperature for 1 hr. Thereafter, 18 μl of 16%
triethanolamine/1 x KPE buffer was added and incubated for 10 min at room
temperature to quench excess 2-vinylpyridine. Serial dilutions of a stock solution
of GSSG were made in standard buffer (0.125 M sucrose, 1 x extraction buffer,
0.2% 2-vinylpyridine, 1% triethanolamine) to give standards of 26.4, 13.2, 6.6, 3.3,
1.65, 0.825 and 0.4125 µmol/l GSSG to calibrate the assay. Into a sterile 96-well
plate, 50 μl of spiked GSSG standard and samples were added in triplicate to
wells and 40 μl of GSSG standard buffer was added to each well. A 20 μl portion
of the resulting sample mixture was then dispensed into a new 96-well plate in
triplicate to which were added 60 μl of DTNB (0.66 mg/ml stock solution) and 60
μl of glutathione reductase (GR) solution (3 units/ml). These mixtures were
incubated at room temperature for 2 min, after which, 60 μl of β-NADPH solution
82
(0.66 mg/ml) was added and the velocity (change in OD at 412/min) of the
reaction was measured immediately using the SpectraMax M2 plate reader
immediately.
Total GSH was measured by adding 50 μl of spiked GSH standard (26.4, 13.2,
6.6, 3.3, 1.65, 0.825 and 0.4125 µmol/l in GSH standard buffer (0.125 M sucrose,
1 x extraction buffer)) to 40 μl of GSH standard buffer and 10 μl GSH sample
lysates. A 20 μl portion of the resulting sample mixture was dispersed into sterile
96-well plate in triplicate. Thereafter, 60 μl of DTNB solution and 60 μl of GR
solution were added to it. Incubated at room temperature for 2 min, after which, 60
μl of β-NADPH solution was added and read immediately in the plate reader at
412 nm.
Protein concentration was measured for samples and the total GSH and GSSG
concentrations was calculated using Excel software using increment and slope
from standard curve, accounting for protein concentration.
2.10 Analysis of mRNA expression
2.10.1 Extraction of total RNA from cells Cell cultures treated with xenobiotics or gene knockdown were washed with ice-
cold PBS twice and 40 µl/cm2 of buffer RLT (guanidine thiocyanate) containing
1% (v/v) β-mercaptoethanol (2-Me) was added to cells and used to lyse and
homogenize cells before they were scraped into Qiashredder and placed in a 2 ml
collection tube and centrifuged at maximum speed for 3 min. Thereafter, 70%
(v/v) ethanol was added to the supernatant, mixed and transferred into RNeasy
mini spin column and centrifuged for 15 sec at 800 x g. The total RNA from cells
was extracted using the RNeasy Mini Kit (Qiagen) according to manufacturer’s
protocol. Isolated RNA was quantified and used for analysis or stored at -80oC for
further analysis.
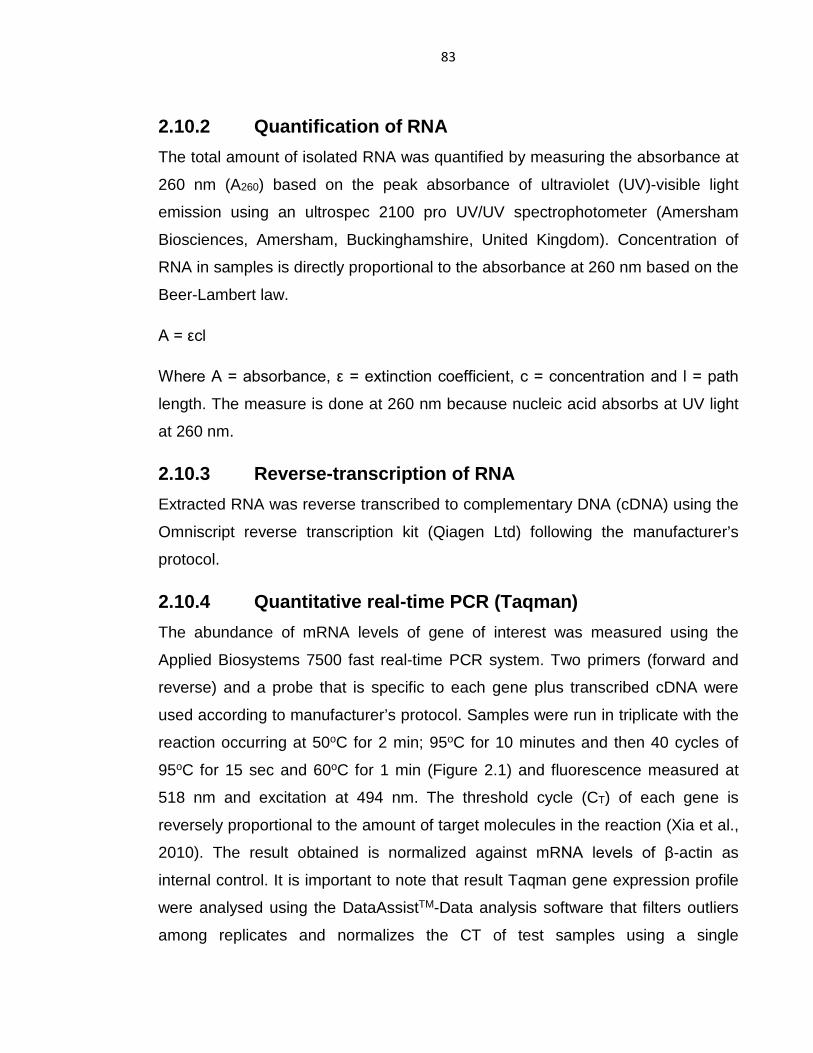
83
2.10.2 Quantification of RNA The total amount of isolated RNA was quantified by measuring the absorbance at
260 nm (A260) based on the peak absorbance of ultraviolet (UV)-visible light
emission using an ultrospec 2100 pro UV/UV spectrophotometer (Amersham
Biosciences, Amersham, Buckinghamshire, United Kingdom). Concentration of
RNA in samples is directly proportional to the absorbance at 260 nm based on the
Beer-Lambert law.
A = εcl
Where A = absorbance, ε = extinction coefficient, c = concentration and l = path
length. The measure is done at 260 nm because nucleic acid absorbs at UV light
at 260 nm.
2.10.3 Reverse-transcription of RNA Extracted RNA was reverse transcribed to complementary DNA (cDNA) using the
Omniscript reverse transcription kit (Qiagen Ltd) following the manufacturer’s
protocol.
2.10.4 Quantitative real-time PCR (Taqman) The abundance of mRNA levels of gene of interest was measured using the
Applied Biosystems 7500 fast real-time PCR system. Two primers (forward and
reverse) and a probe that is specific to each gene plus transcribed cDNA were
used according to manufacturer’s protocol. Samples were run in triplicate with the
reaction occurring at 50oC for 2 min; 95oC for 10 minutes and then 40 cycles of
95oC for 15 sec and 60oC for 1 min (Figure 2.1) and fluorescence measured at
518 nm and excitation at 494 nm. The threshold cycle (CT) of each gene is
reversely proportional to the amount of target molecules in the reaction (Xia et al.,
2010). The result obtained is normalized against mRNA levels of β-actin as
internal control. It is important to note that result Taqman gene expression profile
were analysed using the DataAssistTM-Data analysis software that filters outliers
among replicates and normalizes the CT of test samples using a single

84
endogenous control which in this case is the CT of control or WT samples, thus
control will always be set at zero and no error bars assigned.
Figure 2.1: Thermo cycler settings for Real-time PCR
Stages in the thermocycler for real-time PCR showing the different stages and their corresponding
temperature and time in each stage.
2.11 Luciferase reporter assay ARE reporter gene expression of RL-34 cells or cells transfected with -
1016/nqo5ʹ-luc reporter plasmid were analyzed using the luciferase reporter assay
system (Promega).
2.11.1 Dual luciferase assay COS1 or Keap1-/- MEF cells were seeded into 6-well plates and transiently
transfected with mouse Nqo1 luciferase plasmid cloned into pGL3-Basic
luciferase reporter vector (Nioi et al., 2003) and pRL-TK Renilla luciferase reporter
plasmid 24 hr after seeding. Following recovery from transfection, cells were

85
serum-deprived for 16 hr in 1% FBS media prior to treatment with xenobiotics for
18 hr. Cells were washed with ice-cold PBS twice, lysed with 1x passive lysis
buffer (Promega), vortexed briefly for 15 sec and centrifuged at 16,000 x g for 5
min at 4oC. The resulting supernatant was transferred to a new tube and placed
on ice for subsequent analysis using the Promega Dual-luciferase Reporter assay
system that measures the activities of firefly and Renilla luciferase sequentially
from a single sample (McNabb, Reed and Marciniak, 2005). The luciferase assay
was performed by aliquoting 20 µl of cell lysate into a 96-well flat bottom
microplate (Greiner bio-one, Stonehouse, Gloucestershire, United Kingdom) and
100 µl of luciferase assay reagent II (LAR II). Luciferase activity was measured
using the GloMax® 96 Microplate Luminometer with Dual injectors (Promega).
Injectors were set to dispense 100 µl of LAR II and stop & Glo® reagent
respectively with a 2 sec delay and a 10-sec read time. LAR II measures the firefly
luciferase while the stop & Glo® reagent quenches firefly luminescence while
activating Renilla luciferase. The activity of firefly luciferase is normalized to the
activity of the control Renilla luciferase.
2.11.2 Single luciferase assay For experiments with RL-34 cells expressing the pGL-8xARE, cells were seeded
into 6-well plates and allowed to grow overnight. Thereafter, cells were serum
deprived in 1% FBS DMEM media for 16 hr before treatment with xenobiotics for
18 hr. Cells were lysed using 1x passive lysis buffer and luciferase assay was
performed following a similar procedure as described in section 2.11.1 except a
single injector dispensing 100 µl of LAR II was used. Luciferase results were
normalized to protein concentration of samples determined by DC protein assay.
2.12 β-Galactosidase (β-gal) activity assay COS1 cells were seeded into 6-well plate and allowed to grow overnight. Cells
were then transfected with pcDNA3.1/Neh6+(lacZ)-V5 fusion protein and allowed
to grow overnight. Once cells had recovered from transfection, they were serum
depleted in 1% FBS DMEM media for 16 hr before treatment with different

86
inducers or inhibitors for 18 hr. Once treatment was complete, media was
removed from cells and washed with ice-cold PBS twice. Cells were lysed by
addition of 1x Reporter lysis buffer (RLB, Promega) to each well and incubated for
15 min at room temperature with constant rocking. Cells were then scraped and
transferred into labeled microcentrifuge tubes, vortexed briefly for 15 sec and
centrifuged at maximum speed for 5 min at 4oC. The resulting supernatant was
transferred into a fresh tube and assayed directly. β-gal assay was carried out
using the β-galactosidase enzyme assay system (Promega) that measures the
levels of active β-gal expressed in cells expressing the lacZ plasmid. β-
galactosidase assay is a colorimetric assay that is based on the hydrolysis of
ortho-nitrophenyl-β-D-galactopyranoside (ONPG) to ortho-nitrophenyl (ONP)
anion producing a bright yellow colour at 420 nm that can be quantified with a
spectrophotometer (Figure 2.2) (Held, 2007).
Lysates were diluted by addition of one part of 1x RLB to two part of lysates and
50 µl of diluted lysates were transferred to 96-well plate and 50 µl of 2x assay
buffer containing ONPG (Promega) was added to each well and incubated for 30
min at 37oC. Reactions were stopped by addition of 150 µl of 1 M sodium
carbonate, mixed carefully avoiding bubbles and read at 420 nm using the plate
reader (SpectraMax M2, Molecular Devices). A standard curve containing known
concentrations of β-gal (0, 1.0, 2.0, 3.0, 4.0, and 5.0 µmol/l) was obtained
alongside and the activity of β-gal in samples were extrapolated from it. As an
internal control, pRL-TK Renilla luciferase reporter plasmid was transfected
alongside Neh6+(lacZ)-V5 protein and luciferase activity measured as described in
section 2.11.
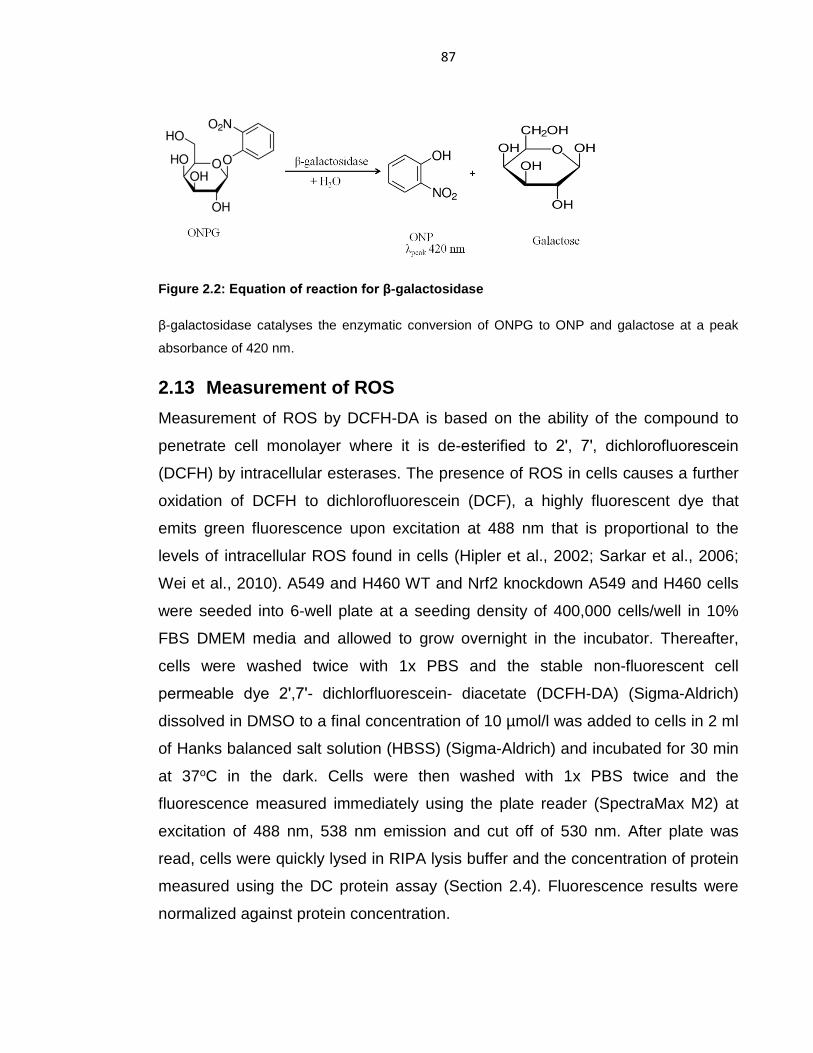
87
Figure 2.2: Equation of reaction for β-galactosidase
β-galactosidase catalyses the enzymatic conversion of ONPG to ONP and galactose at a peak
absorbance of 420 nm.
2.13 Measurement of ROS Measurement of ROS by DCFH-DA is based on the ability of the compound to
penetrate cell monolayer where it is de-esterified to 2ʹ, 7ʹ, dichlorofluorescein
(DCFH) by intracellular esterases. The presence of ROS in cells causes a further
oxidation of DCFH to dichlorofluorescein (DCF), a highly fluorescent dye that
emits green fluorescence upon excitation at 488 nm that is proportional to the
levels of intracellular ROS found in cells (Hipler et al., 2002; Sarkar et al., 2006;
Wei et al., 2010). A549 and H460 WT and Nrf2 knockdown A549 and H460 cells
were seeded into 6-well plate at a seeding density of 400,000 cells/well in 10%
FBS DMEM media and allowed to grow overnight in the incubator. Thereafter,
cells were washed twice with 1x PBS and the stable non-fluorescent cell
permeable dye 2ʹ,7ʹ- dichlorfluorescein- diacetate (DCFH-DA) (Sigma-Aldrich)
dissolved in DMSO to a final concentration of 10 µmol/l was added to cells in 2 ml
of Hanks balanced salt solution (HBSS) (Sigma-Aldrich) and incubated for 30 min
at 37oC in the dark. Cells were then washed with 1x PBS twice and the
fluorescence measured immediately using the plate reader (SpectraMax M2) at
excitation of 488 nm, 538 nm emission and cut off of 530 nm. After plate was
read, cells were quickly lysed in RIPA lysis buffer and the concentration of protein
measured using the DC protein assay (Section 2.4). Fluorescence results were
normalized against protein concentration.

88
2.14 Measurement of cytotoxicity Cytotoxicity in cell culture as a result of knockdown of Nrf2 was measured using
the CellToxTM Green cytotoxicity assay (Promega) that measures the change in
cell membrane integrity as cells begin to dye death using cyanine dye. The dye
binds to DNA in dead cells producing a fluorescence that is proportional to the
number of dead cells in cell culture and no fluorescence signal for cells that are
alive (Chiaraviglio and Kirby, 2014). A549 WT and shRNA Nrf2 knockdown A549
cells were seeded into 12-well plates in triplicate at a seeding density of 1 x10⁴
cells/well and incubated at 37oC, 5% CO2 incubator in 10% FBS DMEM media for
a period of 10 days. Next day, CellToxTM green dye was added to cell at a
concentration of 10 µl/5 ml (1:500) and incubated for 15 min in the dark and
fluorescence measured at 485 nm excitation, 520 nm emission using the Essen
Incucyte Zoom (Essen Bioscience). Fluorescence was measured every 48 hr with
fresh media containing CellToxTM green dye added.
2.15 Measurement of cell Proliferation Cell proliferation was measured using the Essen Incucyte Zoom (Essen
Bioscience) that allows time lapse live cell imaging. A549 and H460 WT and Nrf2
kd cells were seeded at 1 x 10⁴ cells/well into 12-well plate in triplicate and
incubated overnight at 37oC, 5% CO2 incubator. Plates were scanned in the
Incucyte Zoom and allowed to continue growing for another 10 days with
continuous scanning every 48 hr. The percentage confluency of cells as they
grow was recorded.
2.16 Measurement of PTEN Quantitative measurement of PTEN protein in cell was carried out by Simplestep
enzyme-linked immunosorbent assay (ELISA)® kit (Abcam) that employs an
affinity tag labeled capture antibody and a reporter conjugated detector antibody
which allows for immunocapture of sample analyte in solution (Abcam). The assay
directly the phosphoinositide product and the signal is inversely proportional to the
amount of phosphoinositide (4,5) phosphatase produced (Abcam). Keap1-/- MEFs
89
were seeded into 6 cm dishes and grown in 10% FBS DMEM media at 37oC, 5%
CO2 incubator for about 16 – 24 hr overnight. Cells were treated with electrophiles
for 18 hr. Growth media was removed and rinsed with chilled 1x PBS twice. Cells
were solubilized by addition of chilled 1x cell extraction buffer PTR directly to the
plates. Cells were scraped into a microfuge tube and incubated on ice for 15 min
followed by centrifugation at 18,000 x g for 20 min at 4oC. The resulting
supernatant was transferred into clean tubes and the pellets discarded. Samples
were either assayed directly or stored at -80oC for further use. The protein
concentrations of samples were quantified using DC protein assay (Section 2.4).
Samples were diluted 1: 10 in 1x cell extraction buffer PTR and assayed following
manufacturer’s protocol. 50 µl of samples and standards (human PTEN
recombinant protein 0, 0.125, 0.25, 0.5, 1, 2, 4, and 8 µg) into wells of antibody
coated microplate strips and 50 µl of antibody cocktail (1:1 mixture of PTEN
capture antibody and PTEN detector antibody) added to each well. Microplate
was sealed and incubated for 1 hr at room temperature on a plate shaker at 400
rpm. Wells were washed with 3 x 350 µl 1x wash buffer PT and 100 µl of TMB
substrate added to each well and incubated for 10 min in the dark on a plate
shaker at 400 rpm. Thereafter, 100 µl of stop solution was added to each well,
mixed for 1 min in a plate shaker and the optical density read at 450 nm on the
SpectraMax M2 plate reader.
2.17 Measurement of glycogen synthase kinase-3 activity GSK3 catalytic activity was measured by the incorporation of radioactive [γ-32P]-
MgATP into PGS2 peptide. Posttranslational modification (phosphorylation)
decreases the activity of GSK-3 in cells and can be measured directly by
immunoprecipitation of the total cellular GSK-3 of the various isoforms of the
kinase using phospho-specific antibodies that is relative to the amount of total
protein in the cell (Cole and Sutherland, 2008). Cells were washed once with 1x
PBS before lysed in lysis buffer (50 mM Tris-HCl pH7.4, 5 mM NaF, 1 mM Na-
pyrophosphate, 1 mM EDTA, 1 mM EGTA, 50 mM NaCl, 1% triton X-100, 0.27 M
sucrose, protease inhibitors, 0.1% β-mercaptoethanol, 1mM Na3VO4- 300 µl/10
90
cm dish). Protein lysates were spun at 16,000 x g at 4oC for 10 min to remove
insoluble material and protein concentration measured by DC assay. Next, an
immunoprecipitation (IP) assay for GSK3 was performed. 500 µl of Protein G
Sepharose beads (50% slurry in PBS) was split into two equal portions. Into one
portion 25 µg of anti-GSK3β antibody was added and to the other portion 25 µg of
anti-GSK3α antibody was added. Both were incubated at 4oC for 2 hr with mixing
then spun at 6000 x g for 5 min at 4oC and the supernatant removed. A 50%
slurry was made again with PBS. Cell lysates (200 µg at 1 mg/ml) were incubated
with 10 µl of the anti-GSK3β beads for 12 hr at 4oC with mixing. Then spun at
6000 x g for 5 min at 4oC and both supernatant was removed and kept. Anti-
GSK3α (10 µl) beads were added to each supernatant, incubated for 4 hr at 4oC
with mixing. Then spun at 6000 x g for 5 min at 4oC and the supernatant
discarded. Next, beads were washed once with 0.5 ml of cell lysis buffer mixed
and spun at 6000 x g for 5 min at 4oC and the supernatant discarded. Beads were
washed 1x with 1 ml of assay buffer containing 0.25 mol/l NaCl, mixed and kept
standing for 10 min at 4oC, then spun at 6000 x g for 5 min at 4oC and the
supernatant discarded. Beads were washed again 1x with 1 ml of assay buffer (25
mM Tris-HCL pH7.4, 0.1 mmol/l EDTA), mixed then spun at 6000 x g for 5 min at
4oC and the supernatant removed and discarded. GSK3 assay was then carried
out by addition of substrate (PGS2 peptide, 10 µM), assay buffer and radioactive
[γ-32P]-MgATP (10 mM/0.1 mM and around 0.5 x 10⁶ CPM/nmol) in a volume of
50 µl at 30oC for 20 min. Assay was stopped by spotting 40 µl of assay onto P81
paper (1x1 cm square) and dropping into 75 mM orthophosphoric acid. 5x 5 min
washes in the acid, 1x wash in acetone, air-dried, place in scintillation vial, and 1
ml of scintillation fluid was added and counted in TriCarb scintillation counter.
Blanks containing no cell lysate were added to experiment and a count generated
of the stock MgATP to have an accurate CPM/nmol.
2.18 Propidium Iodide staining for flow cytometry The population of cells found in the different cell cycle phases was identified using
flow cytometry to identify DNA content in cells. The proportion of cells in G1, G2

91
and S phases can be viewed via the relative content of the DNA. Flow cytometry
is used to purify cell population of interest by sorting cells based on the
fluorescent protein that it is expressing (Basu et al., 2010). Propidium Iodide (PI)
(Thermofisher) a specific fluorescent stain for DNA in flow cytometry to evaluate
DNA content in cell cycle analysis was used for this experiment (Deitch, Law and
White, 1982).
A549 and H460 WT and Nrf2-kd cells were seeded into a 6 cm dish at 6 x 10⁵
cells/dish in 10% FBS DMEM media and grown overnight. Media from adherent
cells was then removed next day into a 15 ml falcon tube. Cells were washed with
1x PBS and saved in the same tube. 1 ml of trypsin was then added to lose cells
and incubated at 37oC until cells become detached. 4 ml of 10% FBS DMEM
media was added to cells, mixed and added to tube and spun at 800 x g for 5 min
in the centrifuge. The supernatant was discarded, and the pellet resuspended in 1
ml of 1x PBS and spun again for 5 min at 800 x g. The resulting supernatant was
discarded, and 1 ml of 70% ice-cold ethanol was added to the pellet dropwise
while vortexing to prevent clumping of cells and fixed overnight at -20oC.
(Samples may be stored at these conditions for up to 4 weeks). Next, cells were
centrifuged and washed with ice-cold PBS twice and 1% (w/v) bovine serum
albumin (BSA). Cells were spun at 800 x g for 5 min and resuspended in 1 ml of
staining buffer (50 µg/ml PI (Sigma-Aldrich), 50 µg/ml ribonuclease A (RNAse A
(Sigma-Aldrich), 0.1% (v/v) triton x-100 in PBS). Transferred to FACS tubes and
incubated at room temperature for 30 min in the dark. Cells were analyzed using
flow cytometry detecting: Lin FSC-H, Log SSC-H, DNA as Lin FL2-H and using
FL2-W and FL2-A to distinguish single cells.
2.19 Polymerase chain reaction Plasmid DNA was amplified using the polymerase chain reaction (PCR). DNA
polymerase directs the synthesis of complementary sequence of DNA from a
small fragment (primer) that is connected to DNA strand in the 3′ end to generate
an extended region of double stranded DNA (Valones et al., 2009). A 50 µl

92
reaction mixture containing 20 ng template DNA, 1x reaction buffer, 0.5 µmol/l
forward and reverse primers (oligonucleotides), PCR master mix (Promega), 800
µmol/l dNTP, and 1 µl pfu Ultra II DNA polymerase (Agilient technologies, Santa
Clara, California, United States) was amplied using the Hybaid PCR sprint thermal
cycler (Hybaid Ltd, Ashford, Middlesex, United Kingdom). The PCR condition
used is described in Table 2.5 below.
Temperature Reaction stage Time Cycle
95oC Denaturation 2 min 1
95oC Denaturation 1 min
40 58oC Annealing 30 sec
68oC Extension 30 sec
68oC Final extension 5 min 1
2.20 Statistical analysis Results were analyzed using Graphpad Prism 6 software and Excel. Result are
expressed as mean ± standard deviation (SD) and analyzed either with student t-
test or two-way ANOVA. Statistical significance was based on either p < 0.05, P <
0.01 or p < 0.001. All data are a representation of two or three independent
experiments comprising of biological replicates each done in duplicates.
Table 2.5: PCR cycle conditions.

93
Chapter 3
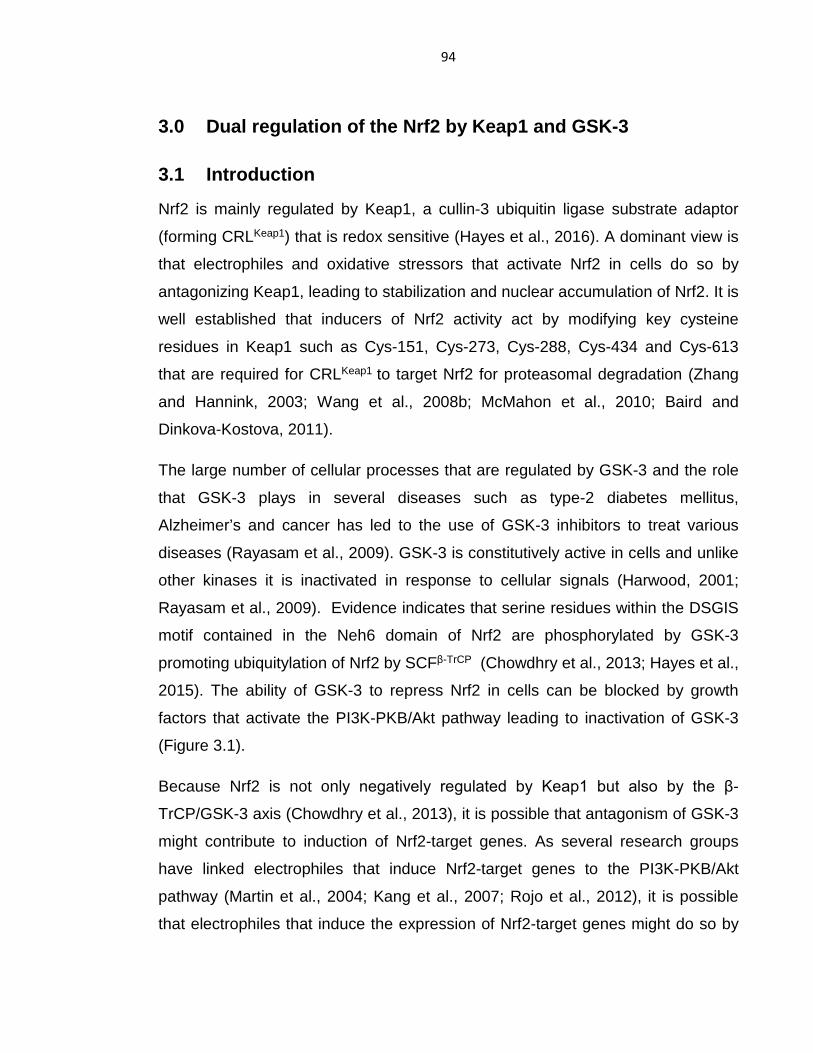
94
3.0 Dual regulation of the Nrf2 by Keap1 and GSK-3
3.1 Introduction Nrf2 is mainly regulated by Keap1, a cullin-3 ubiquitin ligase substrate adaptor
(forming CRLKeap1) that is redox sensitive (Hayes et al., 2016). A dominant view is
that electrophiles and oxidative stressors that activate Nrf2 in cells do so by
antagonizing Keap1, leading to stabilization and nuclear accumulation of Nrf2. It is
well established that inducers of Nrf2 activity act by modifying key cysteine
residues in Keap1 such as Cys-151, Cys-273, Cys-288, Cys-434 and Cys-613
that are required for CRLKeap1 to target Nrf2 for proteasomal degradation (Zhang
and Hannink, 2003; Wang et al., 2008b; McMahon et al., 2010; Baird and
Dinkova-Kostova, 2011).
The large number of cellular processes that are regulated by GSK-3 and the role
that GSK-3 plays in several diseases such as type-2 diabetes mellitus,
Alzheimer’s and cancer has led to the use of GSK-3 inhibitors to treat various
diseases (Rayasam et al., 2009). GSK-3 is constitutively active in cells and unlike
other kinases it is inactivated in response to cellular signals (Harwood, 2001;
Rayasam et al., 2009). Evidence indicates that serine residues within the DSGIS
motif contained in the Neh6 domain of Nrf2 are phosphorylated by GSK-3
promoting ubiquitylation of Nrf2 by SCFβ-TrCP (Chowdhry et al., 2013; Hayes et al.,
2015). The ability of GSK-3 to repress Nrf2 in cells can be blocked by growth
factors that activate the PI3K-PKB/Akt pathway leading to inactivation of GSK-3
(Figure 3.1).
Because Nrf2 is not only negatively regulated by Keap1 but also by the β-
TrCP/GSK-3 axis (Chowdhry et al., 2013), it is possible that antagonism of GSK-3
might contribute to induction of Nrf2-target genes. As several research groups
have linked electrophiles that induce Nrf2-target genes to the PI3K-PKB/Akt
pathway (Martin et al., 2004; Kang et al., 2007; Rojo et al., 2012), it is possible
that electrophiles that induce the expression of Nrf2-target genes might do so by
95
activating the PI3K-PKB/Akt pathway and preventing GSK-3 from phosphorylating
the DSGIS motif in the Neh6 domain of Nrf2 that is recognized by β-TrCP.
Figure 3.1: Regulation of Nrf2 by oxidative stress and growth stimuli.
(i) Reactive oxygen species and/or electrophiles regulate Nrf2 by modifying key cysteine residues
in Keap1 (ii) growth and/or metabolic stimuli promote the PI3K pathway that inhibits constitutively
active GSK-3 by activating PKB/Akt that leads to stabilization of Nrf2. The hypothesis is that
electrophiles positively regulate Nrf2 either by targeting Keap1 or by stimulating the PI3K-PKB/Akt
pathway either via inhibition of DJ-1 or PTEN (taken from Hayes et al., 2016).
96
3.1.1 Mechanism by which electrophiles induce the expression of Nrf2-target genes via antagonism of CRLKeap1
It is believed that the ability of electrophiles to induce Nrf2-target genes is based
on the “Hinge and latch” model of Keap1 binding to Nrf2 (Fukutomi et al., 2014;
Taguchi and Yamamoto, 2017). In this case, the physical complex formed
between Keap1 and Nrf2 is distorted by electrophilic inducing agents in a manner
that prevents ubiquitination of the transcription factor by CRLKeap1 (Baird et al.,
2013; Hayes et al., 2016). Many agents that activate Nrf2 have been reported to
form adducts with Cys-151, Cys-273, Cys-288, Cys-434 and Cys-613 of Keap1,
with the ability of CRLKeap1 to ubiquitylate Nrf2 inversely proportional to the ability
of the inducers to modify these cysteine residues (Zhang and Hannink, 2003;
McMahon et al., 2010; Hayes et al., 2016). Cys-278 and Cys-288 located in the
IVR of Keap1 have been linked to the Keap1-dependent ubiquitination of Nrf2 and
is required for Keap1-mediated repression of Nrf2-dependent transcription under
basal conditions (Zhang and Hannink, 2003). Mutation of this residue to alanine or
serine resulted in an inactive Keap1 mutant, however mutation of Cys-273 to Trp
or Cys-288 to Glu had no effect on Keap1’s ability to repress Nrf2 accumulation
(Saito et al., 2015). Cys-151 in the BTB domain of Keap1 has also been linked to
be critical for Nrf2 activation. Mutation of this residue results in decreased
expression of Nrf2-target genes in both basal conditions or in response to
electrophiles (Zhang and Hannink, 2003; Yamamoto et al., 2008; McMahon et al.,
2010). However, in 2006 Kobayashi et al, showed that treatment of cells with
electrophiles or mutation of Cys-273 and Cys-288 of Keap1 to alanine did not
affect the binding of Keap1 to Nrf2 but rather resulted in the impairment of Keap1-
mediated proteasomal degradation of Nrf2 (Kobayashi et al., 2006).
The ability of tBHQ or SFN to induce Nrf2-target genes was decreased when
amino acids Lys-131, Arg-135 and Lys-150 surrounding Cys-151 was replaced
with methionine residues (McMahon et al., 2010). Analysis of the various cysteine
residues of Keap1 also showed that Cys-151 is responsible for Nrf2 stabilization

97
in response to inducers such as tBHQ and SFN but not for arsenite-mediated Nrf2
activation, indicating a varying mechanism of action depending on the inducer
(Wang et al., 2008b).
3.1.2 The PI3K/Akt pathway is required for induction of Nrf2-target genes by many electrophiles
PI3K controls many biological functions including immune signaling due to the
lipid second messenger that it generates (Vanhaesebroeck and Alessi, 2000;
Vanhaesebroeck, Stephens and Hawkins, 2012). The 3ʹ-OH position of the
inositol ring in inositol phospholipid is phosphorylated by PI3K isoenzymes to
generate 3ʹ-PIs (Ptdlns3P, Ptdlns (3,4)P2 and Ptdlns (3,4,5)P3) that are crucial for
activation of PKB (Vanhaesebroeck and Alessi, 2000). Activation of Nrf2 by
hyperoxia in lung epithelial cells has been shown to be regulated by activation of
the PI3K/AKT pathway (Papaiahgari et al., 2006). The activation of PKB/Akt by
PI3K leads to phosphorylation of GSK-3 at Ser-9 and Ser-21 causing GSK-3 to be
inactive and Nrf2 to be upregulated in cells (Tebay et al., 2015; Hayes et al.,
2016).
Research carried out by Jeff Johnson in 2001 reported that the activation of the
human NQO1-ARE by tBHQ was mediated by PI3K as pretreatment of IMR-32
cells with LY294002 inhibited the hNQO1-ARE-luciferase expression (Lee et al.,
2001). Subsequent work by Nakaso et al. (2003) showed that inhibitors of PI3K
blocked induction of Nrf2 target genes. Similar work by Antonio Cuadrado and his
group in 2004 also showed a link between PI3K and Nrf2, using carnosol an Nrf2
inducer. They showed that the induction of Nrf2-target genes using carnosol was
significantly decreased when PI3K was inhibited in PC-12 pheochromocytoma
cells. Inhibition of PI3K however reduced the levels of both basal and induced
Nrf2 protein levels as well (Martin et al., 2004). Salazar et al. (2006) then showed
that Nrf2 activity was increased via PI3K directed inhibition of GSK-3 in cells.
98
Some inducers such as tBHQ, carnosol, curcumin, ferulic acid, 1[2-cyano-3,12-
dioxooleana-1,9(11)-diene-28-oyl]imidazole (CDDO-Im), 4,17(20)-(cis)-
pregnadiene-3,16-dione (E-guggulsterone) and nordihydroguaiaretic acid (Figure
3.2) induce Nrf2 downstream genes through a mechanism that is sensitive to
inhibition by the PI3K inhibitor LY294002, indicating an ability to stimulate Nrf2-
directed gene induction via inactivation of GSK-3 (Kang et al., 2007; Pitha-Rowe
et al., 2009; Ma et al., 2010; Almazari et al., 2012; Rojo et al., 2012; Hayes et al.,
2016). All these papers suggest that inducers of Nrf2-directed gene expression
work either by antagonizing Keap1 or through another mechanism of action that is
independent of Keap1. To examine the involvement of PI3K in activating Nrf2, two
PI3K inhibitors LY294002 (a flavonoid derivative that has been shown to
competitively and reversibly inhibit ATP binding site of PI3K and to inhibit ovarian
cancer cell growth (Hu et al., 2000) and PI-103 (a multi-targeted PI3K inhibitor
that has the ability to selectively block p110α and mTOR (Fan et al., 2006) were
used to inhibit PI3K in a Keap1-independent system and the expression of Nrf2-
target genes assayed with and without inhibition of PI3K; structures of LY294002
and PI-103 are shown in Figure 3.3.
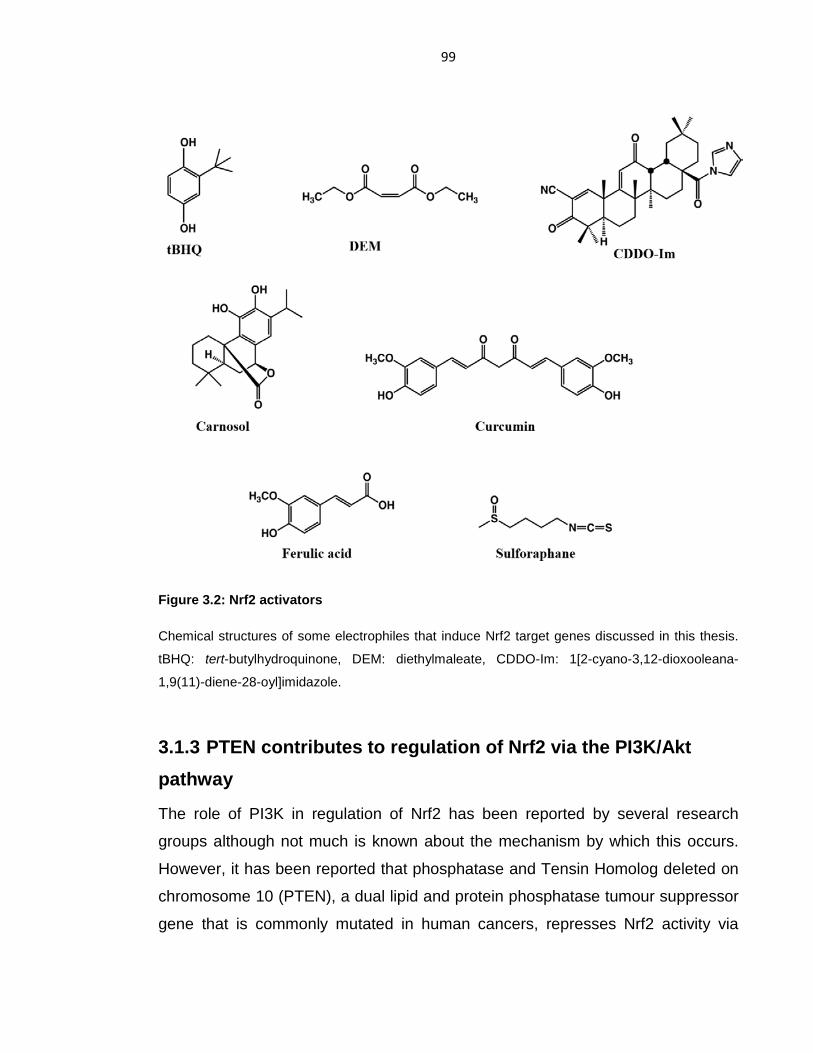
99
Figure 3.2: Nrf2 activators
Chemical structures of some electrophiles that induce Nrf2 target genes discussed in this thesis.
tBHQ: tert-butylhydroquinone, DEM: diethylmaleate, CDDO-Im: 1[2-cyano-3,12-dioxooleana-
1,9(11)-diene-28-oyl]imidazole.
3.1.3 PTEN contributes to regulation of Nrf2 via the PI3K/Akt pathway
The role of PI3K in regulation of Nrf2 has been reported by several research
groups although not much is known about the mechanism by which this occurs.
However, it has been reported that phosphatase and Tensin Homolog deleted on
chromosome 10 (PTEN), a dual lipid and protein phosphatase tumour suppressor
gene that is commonly mutated in human cancers, represses Nrf2 activity via

100
inhibition of formation of phosphatidylinositol 3,4,5-trisphosphate by PI3K
(Carnero and Paramio, 2014; Taguchi et al., 2014; Rojo et al., 2014). The C-
terminal domain of phosphoinositide-dependent protein kinase 1 (PDK1) contains
a pleckstrin homology domain (PHD) which binds to membrane bound
phosphatidylinositol (3,4,5)-triphosphate (PIP3) stimulating the activation of PDK1
which in turn phosphorylates Akt at Thr-308, priming it for subsequent
phosphorylation at Ser-473 by mammalian target of rapamycin complex 2
(mTORC2) leading to GSK-3 phosphorylation and Nrf2 activation (Figure 3.4)
(Carnero and Paramio, 2014). Biotinylated CDDO-Im analogue was seen to
activate the PI3K-PKB/Akt pathway through direct binding of Cys-124 in the active
center of PTEN thus inhibiting lipid phosphatase activity of PTEN in vitro (Pitha-
Rowe et al., 2009). Also over expression of the mutant PTENC124S in MCF-10A
cells caused the inhibition of E-guggulsterone induced expression of HMOX1
(Almazari et al., 2012). These studies suggest that the phosphatase activity of
PTEN is inhibited via modification of Cys-71 and Cys-124 acting as an indirect
sensor in regulating Nrf2 through PI3K in cells (Shearn et al., 2013; Rojo et al.,
2014).
How PTEN is regulated remains uncertain however, PTEN is negatively controlled
by a multifunctional parkinsonism-associated protein DJ-1 (Kim et al., 2005; Yang
et al., 2005). A gain-of-function screen to study the regulation of PTEN in
Drosophila melanogaster based on UAS-GAL4 system identified DJ-1 as one of
the genes responsible for regulation of PTEN (Brand and Perrimon, 1993; Kim et
al., 2005). Yokota et al. (2003) showed that knockdown of DJ-1 using small
interfering RNA (siRNA) induced cell death arising from oxidative stress,
endoplasmic reticulum stress and proteasomal inhibition in cells with a
corresponding reversal of phenotype when cells were rescued with over-
expression of wild-type DJ-1. Decrease phosphorylation of PKB/Akt was observed
in mammalian cells when DJ-1 was under-expressed while hyperphosphorylation
of PKB/Akt was observed when DJ-1 was over expressed (Kim et al., 2005).
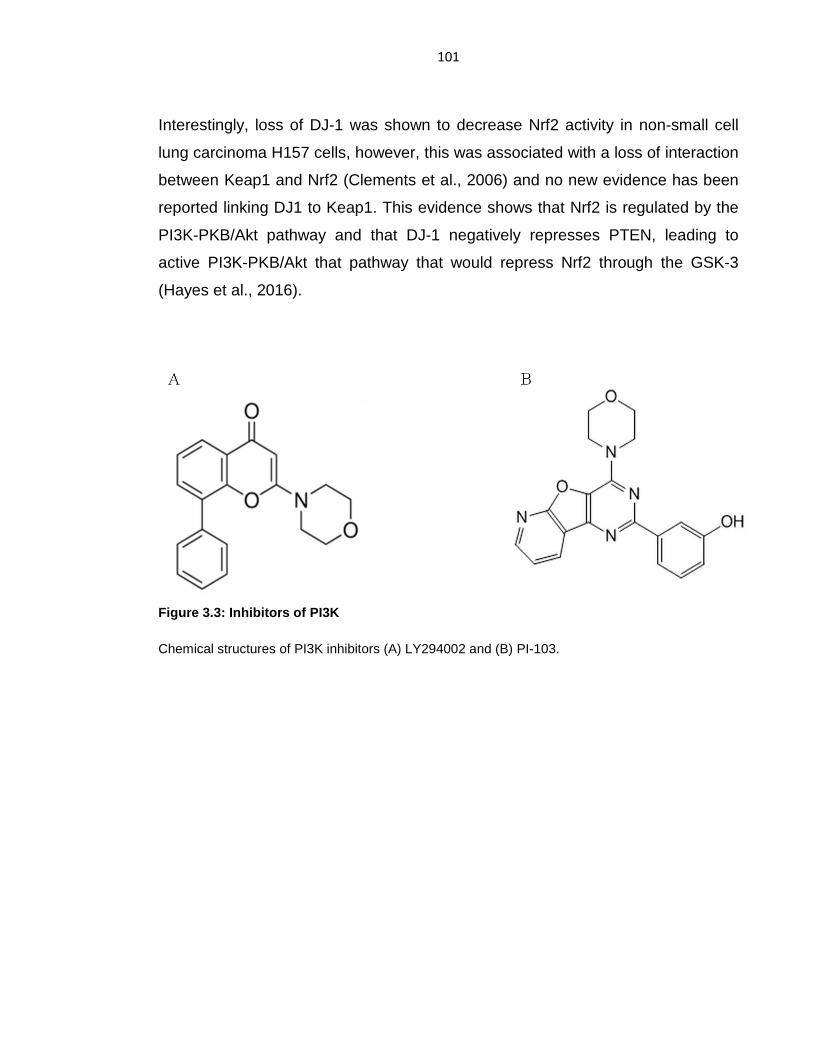
101
Interestingly, loss of DJ-1 was shown to decrease Nrf2 activity in non-small cell
lung carcinoma H157 cells, however, this was associated with a loss of interaction
between Keap1 and Nrf2 (Clements et al., 2006) and no new evidence has been
reported linking DJ1 to Keap1. This evidence shows that Nrf2 is regulated by the
PI3K-PKB/Akt pathway and that DJ-1 negatively represses PTEN, leading to
active PI3K-PKB/Akt that pathway that would repress Nrf2 through the GSK-3
(Hayes et al., 2016).
Figure 3.3: Inhibitors of PI3K
Chemical structures of PI3K inhibitors (A) LY294002 and (B) PI-103.

102
Figure 3.4: PTEN regulates the PI3K-Akt pathway.
PTEN inhibits the formation of PIP3 by PI3K. PDK1 binds to PIP3 leading to phosphorylation of
AKT at Thr-308 and a second phosphorylation at Ser-473 by mTORC2. This second
phosphorylation event will allow GSK-3 to be phosphorylated making GSK-3 inactive to trigger the
inhibition of Nrf2 via the Neh6 domain of Nrf2.
3.2 Experimental result
3.2.1 Inducers can increase expression of Nrf2 target genes in a Keap1-independent manner
It is well known that many thiol-reactive agents that induce Nrf2-target genes
expression inactivate the ubiquitin ligase activity of CRLKeap1 by modifying Cys
residues in Keap1. However, it is less clear whether such agents can induce Nrf2-
target genes in a Keap1-independent manner. To determine if Inducers can
activate Nrf2 via a Keap1-independent mechanism, Keap1-/- MEFs were treated
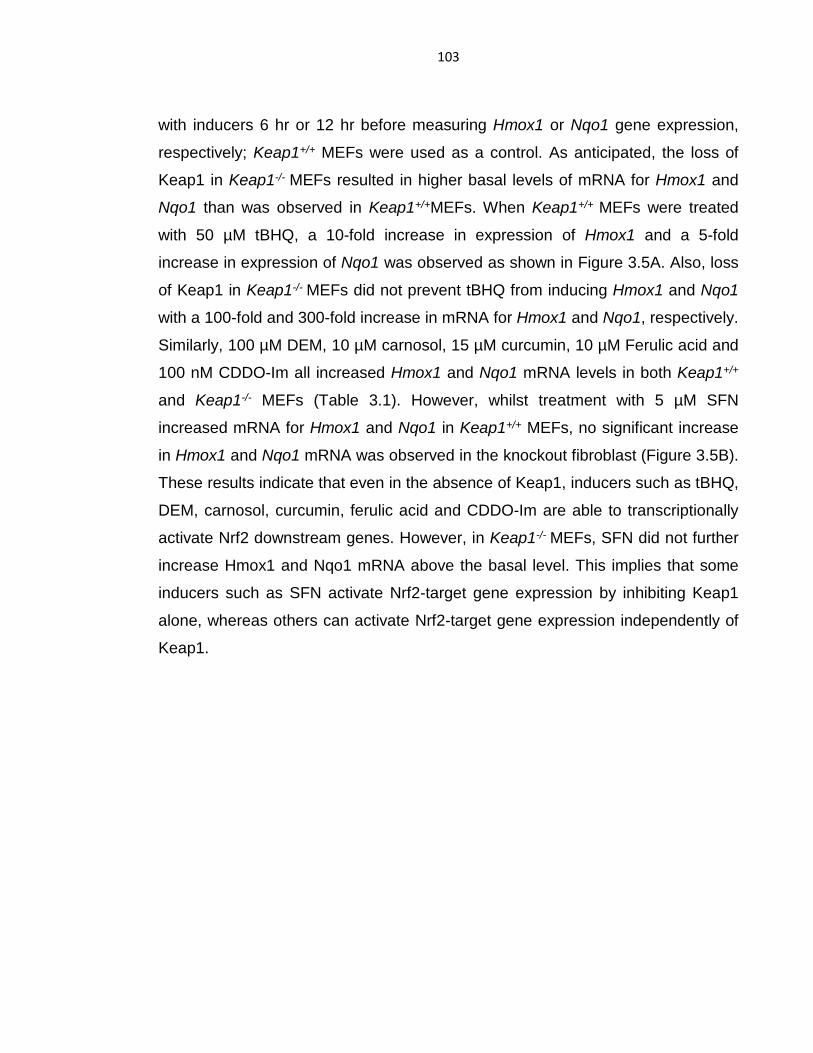
103
with inducers 6 hr or 12 hr before measuring Hmox1 or Nqo1 gene expression,
respectively; Keap1+/+ MEFs were used as a control. As anticipated, the loss of
Keap1 in Keap1-/- MEFs resulted in higher basal levels of mRNA for Hmox1 and
Nqo1 than was observed in Keap1+/+MEFs. When Keap1+/+ MEFs were treated
with 50 µM tBHQ, a 10-fold increase in expression of Hmox1 and a 5-fold
increase in expression of Nqo1 was observed as shown in Figure 3.5A. Also, loss
of Keap1 in Keap1-/- MEFs did not prevent tBHQ from inducing Hmox1 and Nqo1
with a 100-fold and 300-fold increase in mRNA for Hmox1 and Nqo1, respectively.
Similarly, 100 µM DEM, 10 µM carnosol, 15 µM curcumin, 10 µM Ferulic acid and
100 nM CDDO-Im all increased Hmox1 and Nqo1 mRNA levels in both Keap1+/+
and Keap1-/- MEFs (Table 3.1). However, whilst treatment with 5 µM SFN
increased mRNA for Hmox1 and Nqo1 in Keap1+/+ MEFs, no significant increase
in Hmox1 and Nqo1 mRNA was observed in the knockout fibroblast (Figure 3.5B).
These results indicate that even in the absence of Keap1, inducers such as tBHQ,
DEM, carnosol, curcumin, ferulic acid and CDDO-Im are able to transcriptionally
activate Nrf2 downstream genes. However, in Keap1-/- MEFs, SFN did not further
increase Hmox1 and Nqo1 mRNA above the basal level. This implies that some
inducers such as SFN activate Nrf2-target gene expression by inhibiting Keap1
alone, whereas others can activate Nrf2-target gene expression independently of
Keap1.

104
A
B
Figure 3.5: Effect of Nrf2 inducers on Keap1+/+ and Keap1-/- MEFs.
Keap1+/+ and Keap1-/- MEFs were seeded at 8 x 10⁶ cells/6 cm dish and grown in 10% FBS DMEM
media for 18 hr before they were transferred to reduced serum media (1% FBS DMEM) and left to
acclimatize for 16 hr before treatment with (A) 50 μM tBHQ, or (B) 5 µM SFN for either 6 hr or 12
hr to measure mRNA for Hmox1 or Nqo1, respectively. Relative levels of mRNA for Hmox1 and
Nqo1 were quantified by Taqman analysis. The graphs represent the mean values from three
independent experiments each done in duplicates. Levels of mRNA for Hmox1 and Nqo1 were
normalized against β-actin levels. Statistical analyses were performed using graphpad prism and
statistical significance assessed using unpaired t-test. Results significantly higher than DMSO
vehicle control with p-values <0.01 or <0.001 are indicated with double (**) or triple (***) asterisk
signs respectively and n.s = not significant.

105
Table 3.1: Expression of Hmox1 and Nqo1 in Keap1+/+ and Keap1-/- MEFs.
Table shows relative fold change plus/minus standard error of mean for mRNA for Hmox1 and
Nqo1. Keap1+/+ and Keap1-/- MEFs were treated with inducers for either 6 hr or 12 hr before mRNA
levels for Hmox1 or Nqo1 respectively, were measured. Treatment with inducers was done in
reduced serum 1% FBS DMEM media. Relative abundance of mRNA for Hmox1 and Nqo1 were
quantified by Taqman analysis. Levels of mRNA for Hmox1 and Nqo1 were normalized against β-
actin levels. The results are each a representation of three independent experiments each done in
duplicates.
Keap1+/+ Keap1-/-
Electrophiles Hmox1 Nqo1 Hmox1 Nqo1
tBHQ (50 µmol/l) 10 ± 1.0 5 ± 0.9 100 ± 11.4 300 ± 74.8
DEM (100 µmol/l) 60 ± 17.3 10 ± 2.1 300 ± 46.2 400 ± 91.0
carnosol (10 µmol/l) 12 ± 1.9 4 ± 0.6 100 ± 13.6 400 ± 54.5
curcumin (15 µmol/l) 29 ± 2.8 14 ± 1.0 60 ± 6.1 300 ±15.7
ferulic acid (10 µmol/l)
30 ± 5.4 14 ± 1.1 100 ± 8.4 200 ± 9.1
CDDO-Im (100 nmol/l)
22 ± 0.4 4 ± 0.2 60 ± 2.0 600 ± 100
SFN (5 µmol/l) 13 ± 0.2 13 ± 1.1 0 ± 1.2 0 ± 1.3

106
3.2.2 Increase in mRNA for Hmox1 and Nqo1 by inducers is dependent on Nrf2
To check if the ability of our panel of inducers to increase the expression of
Hmox1 and Nqo1 requires the presence of ARE sequences in their promoter
regions, and is thus probably mediated by Nrf2, their ability to increase ARE-
driven gene expression was assessed. Using a model reporter system, it was
found that treatment of AREc32 cells for 18 hr with 50 µM tBHQ, 100 µM DEM,
100 nM CDDO-Im, 15 µM curcumin, 10 µM carnosol, 10 µM ferulic acid and 5 µM
SFN increased the relative luciferase activity (Figure 3.6A). Keap1-/- MEFs, when
transfected with murine Nqo1 gene promoter (-1016/nqo5ʹ-luc luciferase reporter
plasmid) alongside pRL-TK Renilla Luciferase reporter plasmid also resulted in a
significant increase in relative luciferase activity when treated with tBHQ, DEM,
CDDO-Im, curcumin, carnosol, ferulic acid and SFN (Figure 3.6B). SFN is able to
activate the ARE-driven luciferase activity in AREc32 cells as these cells have a
functional Keap1 in them. It was interesting to note that SFN was still able to
induce the ARE-driven luciferase activity in AREc32 cells and in Keap1-/- MEFs as
well even though we propose that SFN requires Keap1 for activating Nrf2. This
might have been because these cells were transfected with the Nqo1 gene
promoter (-1016/nqo5ʹ-luc luciferase reporter plasmid).

107
A

108
B
Figure 3.6: Effect of Nrf2 inducers on ARE-driven gene expression
AREc32 reporter cells that contained a stably-transfected ARE reporter construct (A) or Keap1-/-
MEFs that were transiently transfected with an ARE-reporter plasmid (B) were treated with
inducing agents. In (A), the AREc32 cells were seeded at 4 x 10⁶ cells/6 well plate and grown in
10% FBS DMEM media for 18 hr before they were transferred to reduced serum media (1% FBS
DMEM) and left to acclimatize for 16 hr before they were treated with 50 μM tBHQ, 100 µM DEM,
100 nM CDDO-Im, 15 µM curcumin, 10 µM carnosol, 10 µM ferulic acid and 5 µM SFN for 18 hr.
In (B) the Keap1-/- MEFs were transfected with the mouse Nqo1-ARE reporter plasmid alongside
pRL-TK Renilla plasmid as internal control. Following transfection, cells were allowed to
acclimatize in 1% FBS DMEM media for 16 hr before they were treated with inducers for 18 hr.
Luciferase assay was measured using the Promega luciferase assay according to manufacturers’
protocol as described in chapter 2. Luciferase data were normalized against protein concentration.
Statistical analyses was done using graphpad prism and statistical significance assessed using
unpaired t-test. Results significantly higher than DMSO vehicle control with p-values <0.01,
<0.001, or <0.0001 are indicated with double (**), triple (***) or (****) asterisk signs respectively.
The results are each a representation of three independent experiments each done in triplicates.

109
To check whether the inducers increased the abundance of Nrf2 protein in a
Keap1-independent system, we examined their effects on Nrf2 in A549 cells, a
non-small lung cancer cell line containing inactive mutant Keap1. In this case,
A549 cells were treated with tBHQ, DEM, CDDO-Im, curcumin, carnosol, ferulic
acid and SFN for 2hr, after which the abundance of Nrf2 was measured by
western blotting. Treatment of A549 with inducers gave a 2-fold increase in the
abundance of Nrf2 protein by 50 µM tBHQ. By contrast, 100 µM DEM and 10 µM
ferulic acid gave a 10-fold increases in Nrf2 protein level, while 100 nM CDDO-Im
and 15 µM curcumin gave a 7-fold increase in the abundance of Nrf2 protein
level. However, SFN did not increase the levels of Nrf2 protein levels (Figure 3.7i
& ii). This result shows that inducers such as tBHQ, DEM, CDDO-Im, curcumin,
carnosol and ferulic acid is able to activate Nrf2 protein level in a Keap1-
independent manner, however, SFN will require Keap1 in modulating the activities
of Nrf2 and its target genes.
To investigate the involvement of GSK-3 in regulating Nrf2 in Keap1-/- MEFs,
CT99021 a small molecule inhibitor of GSK-3 was used to treat Keap1-/- MEFs
transfected with the reporter plasmid generated from the ARE-containing murine
Nqo1 gene promoter (-1016/nqo5ʹ-luc luciferase plasmid (Nioi et al. 2003))
alongside pRL-TK Renilla Luciferase reporter plasmid. Inhibition of GSK-3 using
CT99021 resulted in a dose-dependent increase in the ARE-driven gene
expression (Figure 3.8).
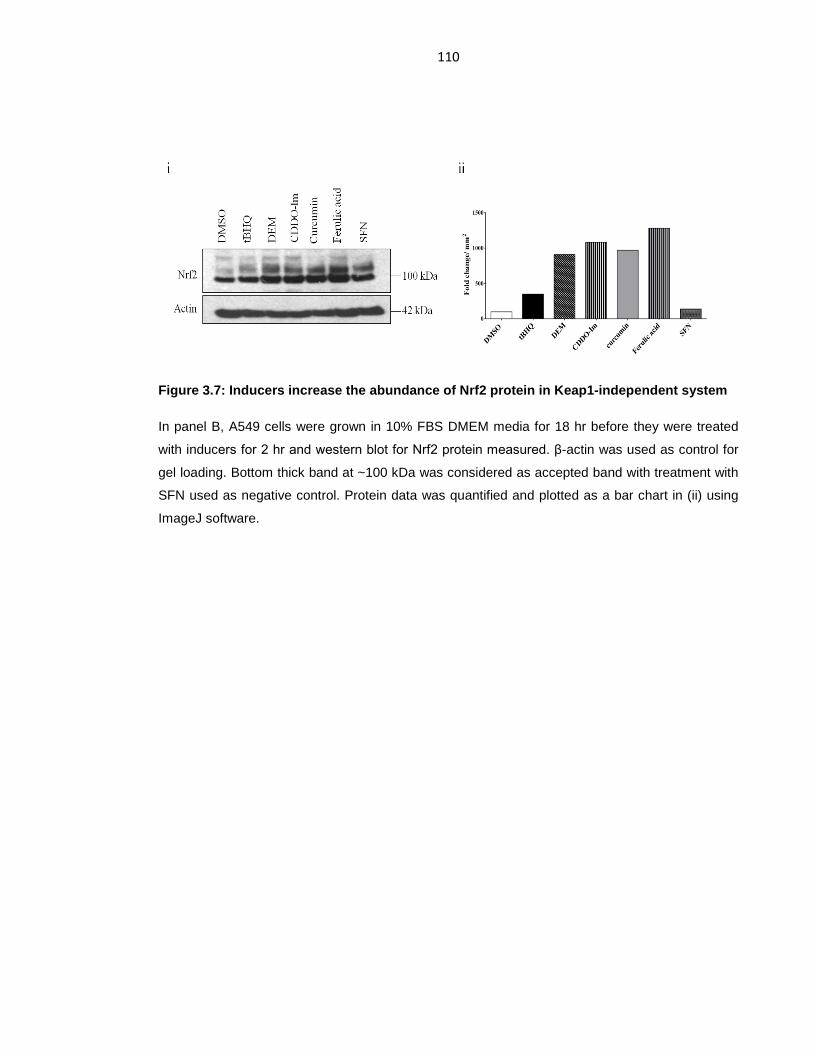
110
Figure 3.7: Inducers increase the abundance of Nrf2 protein in Keap1-independent system
In panel B, A549 cells were grown in 10% FBS DMEM media for 18 hr before they were treated
with inducers for 2 hr and western blot for Nrf2 protein measured. β-actin was used as control for
gel loading. Bottom thick band at ~100 kDa was considered as accepted band with treatment with
SFN used as negative control. Protein data was quantified and plotted as a bar chart in (ii) using
ImageJ software.

111
Figure 3.8: Inhibition of GSK-3 increases ARE-driven gene expression.
Keap1-/- MEFs were transfected with mouse Nqo1-ARE Plasmid alongside pRL- TK Renilla
plasmid as internal control and treated with increasing concentration of CT99021 for 18 hr.
Following transfection, cells were allowed to acclimatize in 1% FBS DMEM media for 16 hr.
Luciferase activity was measured using the Promega luciferase assay according to manufacturers’
protocol as described in chapter 2. Luciferase data were normalized against protein concentration.
Statistical analyses was done using graphpad prism and statistical significance assessed using
unpaired t-test. Results significantly higher than DMSO vehicle control with p-values <0.01 is
indicated with double (**) and n.s = not significant. The results are each a representation of three
independent experiments.
3.2.3 Inducers that stimulate Nrf2-target gene expression in a Keap1-independent manner inhibit GSK-3
Since Nrf2-directed gene expression can be increased in Keap1-null cells by
certain inducing agents, it was appropriate to test if they did so because they
blocked repression of Nrf2 via the β-TrCP/GSK-3 axis. To test this hypothesis,
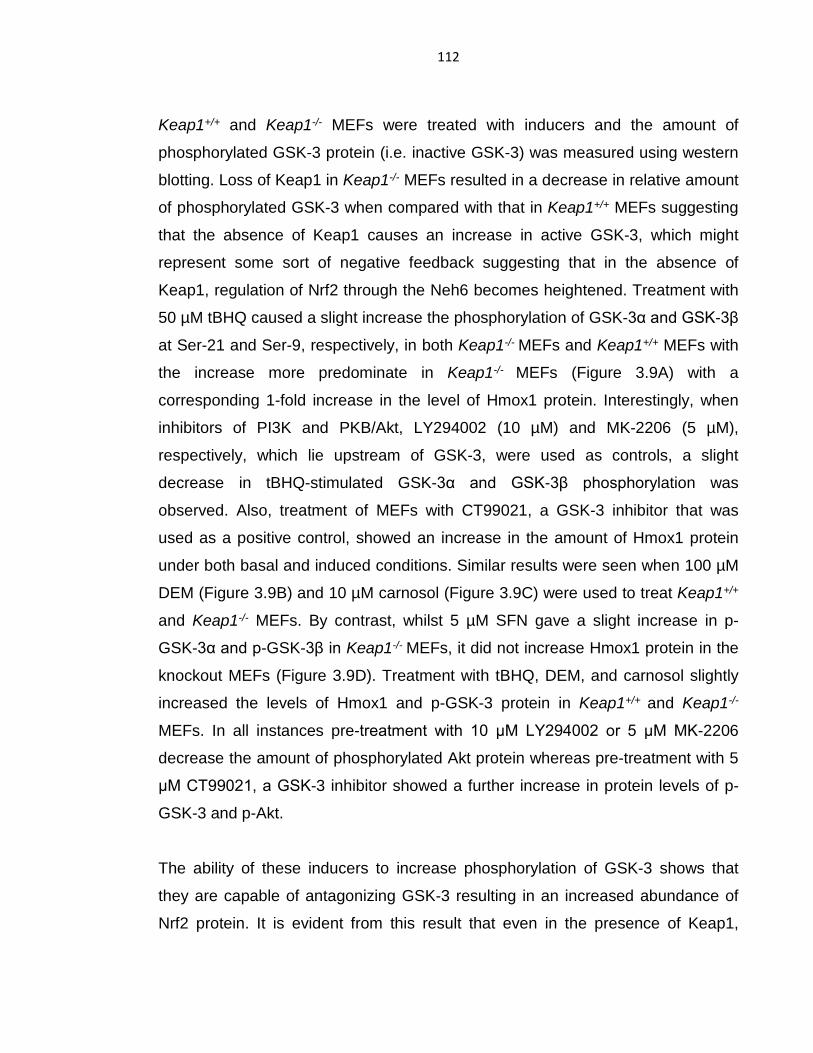
112
Keap1+/+ and Keap1-/- MEFs were treated with inducers and the amount of
phosphorylated GSK-3 protein (i.e. inactive GSK-3) was measured using western
blotting. Loss of Keap1 in Keap1-/- MEFs resulted in a decrease in relative amount
of phosphorylated GSK-3 when compared with that in Keap1+/+ MEFs suggesting
that the absence of Keap1 causes an increase in active GSK-3, which might
represent some sort of negative feedback suggesting that in the absence of
Keap1, regulation of Nrf2 through the Neh6 becomes heightened. Treatment with
50 µM tBHQ caused a slight increase the phosphorylation of GSK-3α and GSK-3β
at Ser-21 and Ser-9, respectively, in both Keap1-/- MEFs and Keap1+/+ MEFs with
the increase more predominate in Keap1-/- MEFs (Figure 3.9A) with a
corresponding 1-fold increase in the level of Hmox1 protein. Interestingly, when
inhibitors of PI3K and PKB/Akt, LY294002 (10 µM) and MK-2206 (5 µM),
respectively, which lie upstream of GSK-3, were used as controls, a slight
decrease in tBHQ-stimulated GSK-3α and GSK-3β phosphorylation was
observed. Also, treatment of MEFs with CT99021, a GSK-3 inhibitor that was
used as a positive control, showed an increase in the amount of Hmox1 protein
under both basal and induced conditions. Similar results were seen when 100 µM
DEM (Figure 3.9B) and 10 µM carnosol (Figure 3.9C) were used to treat Keap1+/+
and Keap1-/- MEFs. By contrast, whilst 5 µM SFN gave a slight increase in p-
GSK-3α and p-GSK-3β in Keap1-/- MEFs, it did not increase Hmox1 protein in the
knockout MEFs (Figure 3.9D). Treatment with tBHQ, DEM, and carnosol slightly
increased the levels of Hmox1 and p-GSK-3 protein in Keap1+/+ and Keap1-/-
MEFs. In all instances pre-treatment with 10 μM LY294002 or 5 μM MK-2206
decrease the amount of phosphorylated Akt protein whereas pre-treatment with 5
μM CT99021, a GSK-3 inhibitor showed a further increase in protein levels of p-
GSK-3 and p-Akt.
The ability of these inducers to increase phosphorylation of GSK-3 shows that
they are capable of antagonizing GSK-3 resulting in an increased abundance of
Nrf2 protein. It is evident from this result that even in the presence of Keap1,
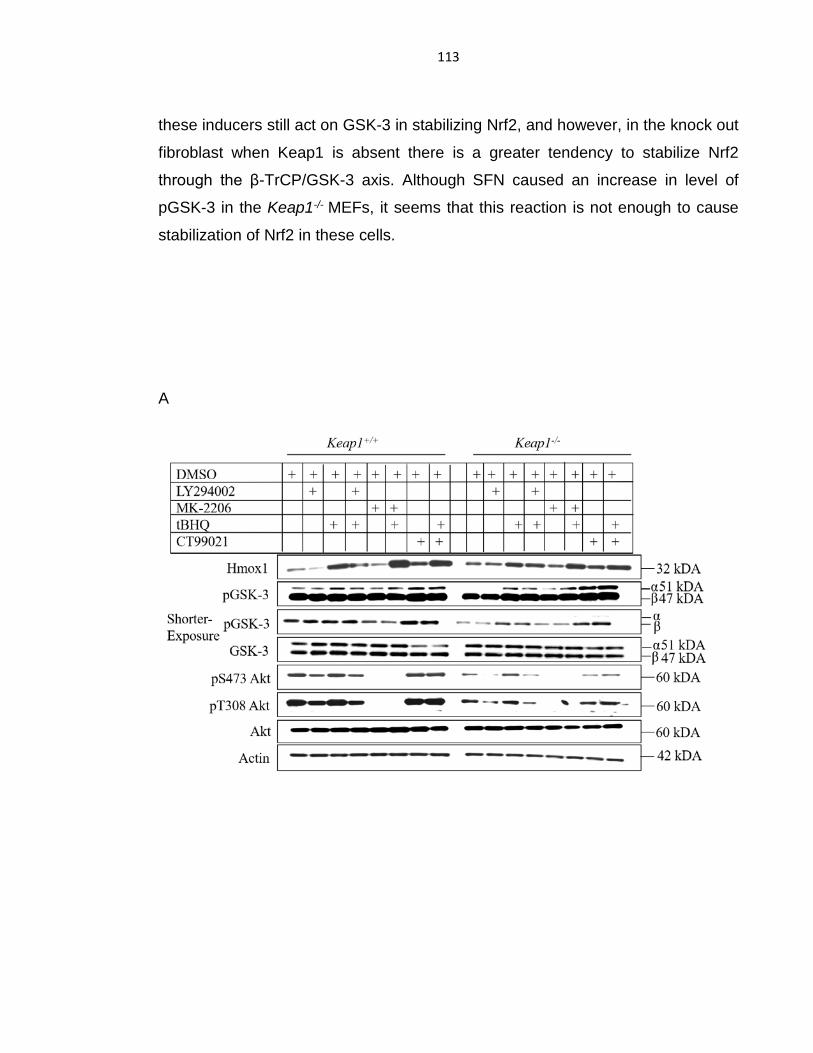
113
these inducers still act on GSK-3 in stabilizing Nrf2, and however, in the knock out
fibroblast when Keap1 is absent there is a greater tendency to stabilize Nrf2
through the β-TrCP/GSK-3 axis. Although SFN caused an increase in level of
pGSK-3 in the Keap1-/- MEFs, it seems that this reaction is not enough to cause
stabilization of Nrf2 in these cells.
A

114
B
C

115
D
Figure 3.9: Agents that induce Nrf2-target genes in a Keap1-independent manner increases GSK-3 phosphorylation decreases the activity of GSK-3.
Keap1+/+ and Keap1-/- MEFs were seeded at 8 x 10⁶ cells/6 cm dish and grown in 10% FBS DMEM
media for 18 hr before they were transferred to reduced serum media (1% FBS DMEM) and left to
acclimatize for 16 hr before treatment with 50 μM tBHQ (A), 100 μM DEM (B), 10 µM carnosol (C),
and 5 µM SFN (D) for either 2 hr for GSK-3 and Akt protein measurement or 8 hr to measure
Hmox1 protein using western blot. β-actin was used as control for gel loading. Pre-treatment with
LY294002, MK-2206 or CT99021 was done for 1 hr before treatment with inducers for either 2 hr
or 8 hr. The results are each a representation of three independent experiments. Proteins were
loaded into 26 well NuPAGE gels and membrane was cut and probed in different antibody
corresponding to sizes of protein of interest.
To examine whether these inducers can alter Nrf2 activity by inhibiting GSK-3,
and therefore presumably antagonizing the ability of the β-TrCP/GSK-3 axis to
repress Nrf2, the effect of the inducing agents on GSK-3 activity assay was

116
measured. The GSK-3 enzyme activity assay was carried out with the help of Dr
Calum Sutherland. The result showed that 50 µM tBHQ resulted in a slight
decrease in the activity of GSK-3α and GSK-3β in Keap1-/- MEFs. Similarly, 100
µM DEM, 100 nM CDDO-Im, 15 µM curcumin and 10 µM ferulic acid was able to
decrease the activity of GSK-3α (Figure 3.10A) and GSK-3β in Keap1-/- MEFs
(Figure3.10B). These results suggest that the inducers were able to inhibit GSK-3
activity and prevent the ubiquitination of Nrf2 by SCFβ-TrCP.
A
117
B
Figure 3.10: Agents that induce Nrf2-target genes in a Keap1-independent manner decreases the activity of GSK-3.
Keap1-/- MEFs were seeded at 8 x 10⁶ cells/6 cm dish and grown in 10% FBS DMEM media for 18
hr before they were transferred to reduced serum media (1% FBS DMEM) and left to acclimatize
for 16 hr before treatment with inducers for 2 hr. Immunoprecipitation (IP) of GSK-3 isoform and
GSK-3 activity assay was carried out from 200 µg of cell lysates as input sample. For assay, 10
µmol/l PGS2 peptide was used as substrate and around 0.5 x 10⁶ CPM/nmol radioactive [γ-32P]-
MgATP. Results were normalized blank GSK-3α and GSK-3β containing no cell lysates. The
results are each a representation of two independent experiments.
3.2.4 Inducers that antagonize GSK-3 function through the Neh6 domain of Nrf2
As previous research has shown that the β-TrCP/GSK-3 axis regulates Nrf2
through the Neh6 domain of the transcription factor, it was tested whether
inducers that antagonize GSK3 function increases the activity of Nrf2 through the
118
Neh6 domain. First, expression plasmids for wild-type Nrf2, Nrf2∆ETGE, or
Nrf2∆DSGIS were cotransfected with the ARE-containing murine Nqo1 gene
promoter (-1016/nqo5ʹ-luc luciferase reporter plasmid) alongside PRL as internal
control. Following recovery from transfection, the cells were treated with 50 µM
tBHQ, 100 µM DEM, 100 nM CDDO-Im, 15 µM curcumin or 5 µM SFN.
Subsequent measurement of luciferase activity revealed that tBHQ, DEM, CDDO-
Im, curcumin and SFN all increased ARE-driven luciferase activity in cells
expressing ectopic wild-type Nrf2. By contrast, when cells expressing ectopic
Nrf2∆ETGE were treated with the inducing agents, only tBHQ, DEM, CDDO-Im and
curcumin significantly increased ARE-driven luciferase activity; SFN had no effect
on luciferase activity in cells expressing ectopic Nrf2∆ETGE. When cells expressing
the Nrf2∆DSGIS were treated with inducers, a significant increase in luciferase
activity was observed for all inducers (Figure 3.11A). Collectively, these results
show that all inducers stimulate ARE-driven luciferase activity in wild-type Nrf2
with intact Neh2 and Neh6 domains. However, loss of Keap1-binding domain in
cells expressing ectopic Nrf2∆ETGE prevented SFN from stimulating Nrf2-directed
gene expression whereas tBHQ, DEM, CDDO-Im and curcumin were able to
increase the activity of Nrf2∆ETGE. By contrast, deletion of the β-TrCP binding
domain, did not affect the ability of any of the inducers to stimulate ARE-driven
luciferase activity. These data suggest SFN will only influence Nrf2 activity by
modulating Keap1 while others like tBHQ, DEM, CDDOIm, curcumin and ferulic
acid can modulate Keap1 or GSK-3 in regulating Nrf2-target gene induction.
To confirm that inducers can affect the activity of Nrf2 by attenuating the ability of
GSK-3 to modify its Neh6 domain, COS1 cells were transfected with a plasmid
encoding a fusion protein containing the Neh6 domain plus flanking residues (i.e.
amino acid 290-410 of mouse Nrf2) that was linked to β-gal, which was in turn V5-
tagged (designated Neh6+-LacZ-V5) and following recovery from transfection they
were treated with inducing agents. Measurement of β-gal activity showed that the
abundance of Neh6+-LacZ-V5 protein was significantly increased by 50 µM tBHQ,
100 µM DEM, 10 µM carnosol, 10 µM ferulic acid, 100 nM CDDO-Im, and 15 µM
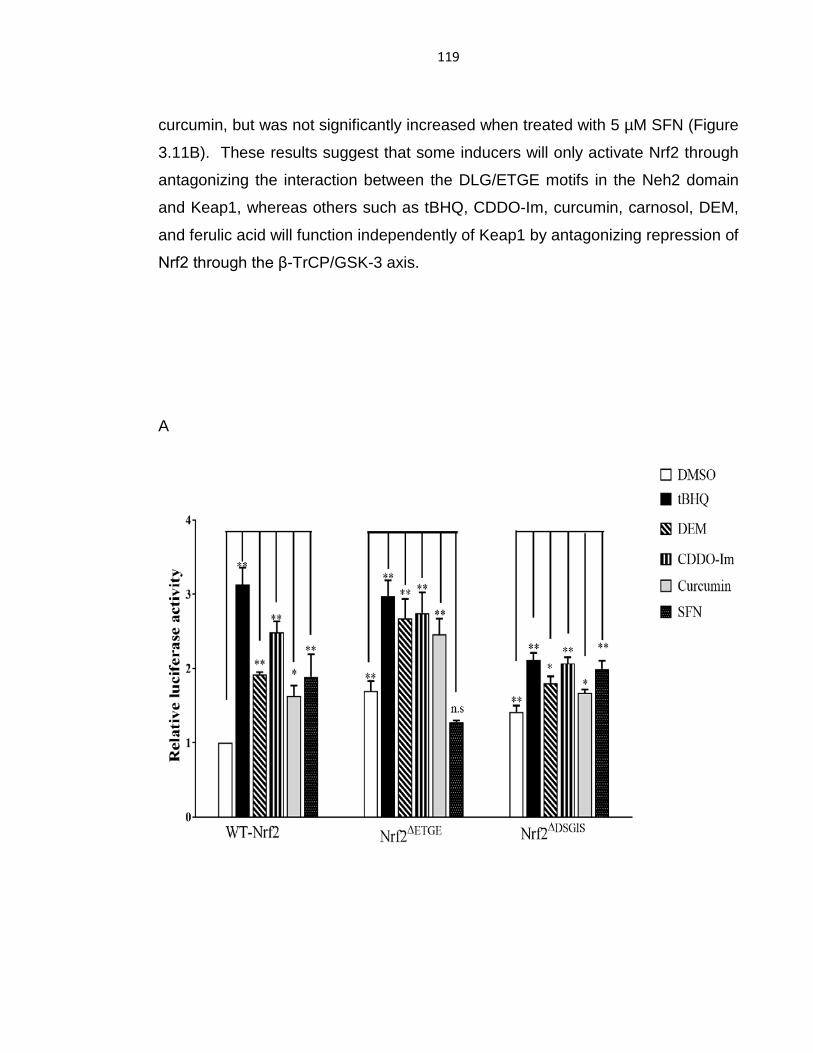
119
curcumin, but was not significantly increased when treated with 5 µM SFN (Figure
3.11B). These results suggest that some inducers will only activate Nrf2 through
antagonizing the interaction between the DLG/ETGE motifs in the Neh2 domain
and Keap1, whereas others such as tBHQ, CDDO-Im, curcumin, carnosol, DEM,
and ferulic acid will function independently of Keap1 by antagonizing repression of
Nrf2 through the β-TrCP/GSK-3 axis.
A

120
B
Figure 3.11: Xenobiotics activate Nrf2 by preventing formation of the DSGIS-containing phosphodegron in its Neh6 domain.
A. COS1 cells were co-transfected with 0.25 µg of pcDNA 3.1 full length mouse Nrf2-V5 or pcDNA
3.1 Nrf2-V5 ∆ETGE or pcDNA 3.1 Nrf2-V5 ∆DSGIS along with 0.25 ug of the -1016/nqo5ʹ-luc
reporter plasmid and 0.25 ug of pRL-TK Renilla plasmid for 24 hr before they were serum depleted
in 1% FBS DMEM media for 16 hr and treated with 50 µM tBHQ, 100 µM DEM, 100 nM CDDO-Im,
15 µM curcumin or 5 µM SFN for 18 hr after which luciferase activity was measured using
Promega Dual luciferase assay system. Results were normalized to Renilla luciferase used as
internal control and protein concentrations B. COS1 cells were transfected with Neh6+(lacZ)-V5
expression plasmid before treatment with 50 µM tBHQ, 100 nM CDDO-Im, 10 µM Carnosol, 15 µM
Curcumin, 10 µM Ferulic acid, 100 µM DEM or 5 µM SFN and β-galactosidase activity measured
using Promega β-galactosidase assay kit. Cells were co-transfected with pRL-TK Renilla plasmid
as transfection control and result was normalized against Renilla enzyme activity. Statistical
analyses was performed using graphpad prism and statistical significance assessed using
unpaired t-test. Results significantly higher than DMSO vehicle control with p-values <0.05, 0r
<0.01 are indicated with single (*), double (**) or asterisk signs respectively and n.s = not
significant. The graphs represent the mean ± standard error of mean from three independent
experiments each done in triplicates.

121
3.2.5 Inhibition of PI3K suppresses Nrf2 activity
To confirm reports that PI3K contributes to regulation of Nrf2 through stimulation
of PKB/Akt, which in turn phosphorylates GSK-3α and GSK-3β at Ser-21 and Ser-
9 respectively, leading to its inactivation, the MCF7-derived AREc32 reporter cells
were treated with the PI3K inhibitors LY294002 and PI-103. A time-course
analysis of AREc32 cells treated with LY294002 and PI-103 showed that
LY294002 caused a decrease in phosphorylation of p-GSK-3α/β from 15 min and
this lasted until 12 hr with a corresponding decrease in Nrf2 protein from 2 hr time
point and 8 hr compared to the DMSO control of each time point. PI-103 also
caused a decrease in p-GSK3α/β from 15 min until 8 hr but by 12 hr, the effect of
PI-103 seemed to be curtailed (Figure 3.12A). Also, treatment with PI-103
resulted in a decrease in Nrf2 protein from 2 hr and 8 hr time points. As a control,
phosphorylation of Akt at Ser-473 and Thr-308 was examined as a measure of the
effect of the inhibitors on PI3K. This showed that treatment with LY294002 and
PI-103 decreased phosphorylation of PKB/Akt at Ser-473 and Thr-308 at time
points measured. To assess if LY294002 can blunt activation of Nrf2 by inducing
agents, MCF7 cells were treated with 50 µM tBHQ with or without pretreatment
with 10 µM LY294002. This revealed that LY294002 decreased phosphorylation
of GSK-3α and GSK-3β at Ser-9 and Ser-21 under basal and inducible conditions
from 30 min until 12 hr (Figure 3.12B). This decrease in GSK-3 phosphorylation
was accompanied by a corresponding decrease in both the basal and induced
levels of Nrf2 protein level at 4 hr time point to 12 hr time point.
Following time-course experiments, the ability of LY294002 and PI-103 to inhibit
induction of ARE-driven gene expression by 50 µMtBHQ, 10 µM carnosol and 100
nM CDDO-Im was also assessed. The AREc32 reporter cell line was treated with
these inducers plus or minus pretreatment with LY294002 or PI-103 for 18 hr and
the relative luciferase activity measured. This revealed that LY294002 and PI-103
significantly decreased both basal and inducible ARE-driven luciferase activity
(Figure 3.12C).

122
A
B

123
C
Figure 3.12: The activity of Nrf2 is positively influenced by PI3K.
(A) AREc32 seeded at 8 x 10⁶ cells/ 6 cm dish were grown in 10% FBS DMEM media for 18 hr
before they were transferred to reduced serum media (1% FBS DMEM) and left to acclimatize for
16 hr. Cells were treated with the PI3K inhibitors LY294002 (at 10 µmol/l) and PI-103 (at 1 µmol/l)
over time interval spanning 0- 12 hr. AREc32 cells were then harvested and immunoblotted with
indicated antibodies. Actin was used as loading control. (B) Whole cell lysates from MCF7 cells
treated with (50 µmol/l) tBHQ plus/minus LY294002 (10µmol/l) over time interval spanning 0-12 hr
were resolved in Tris-Bis NuPAGE gels and immunoblotted with the indicated antibodies. Actin
was used as loading control. Prior to treatment with tBHQ, cells were serum depleted (1% FBS
DMEM media) for 16 hr. (C) AREc32 cells were treated with (50 µmol/l) tBHQ, (10 µmol/l)
carnosol, and (100 nmol/l) CDDO-Im for 18hrs, therafter luciferase reporter assay was carried out
and relative luciferase activity measured. Cells were serum depleted for 16 hr in 1% FBS DMEM
media and thereafter pretreated with 10 µM LY294002 or 1 µM PI-103 for 1 hr. before treatment
with inducers for 18 hr. Western blot for Nrf2 protein was carried out at 2 hr and 8 hr in a
complementary experiment to show that induction of the ARE-driven luciferase activity
corresponds to increased Nrf2 protein levels. Actin was used as loading control and DMSO was
used as vehicle control. Pretreatment with inhibitors was for 1 hr in all instances. The results are
each a representation of two independent experiments. Membranes were cut and multi-probed
with antibodies of interest.
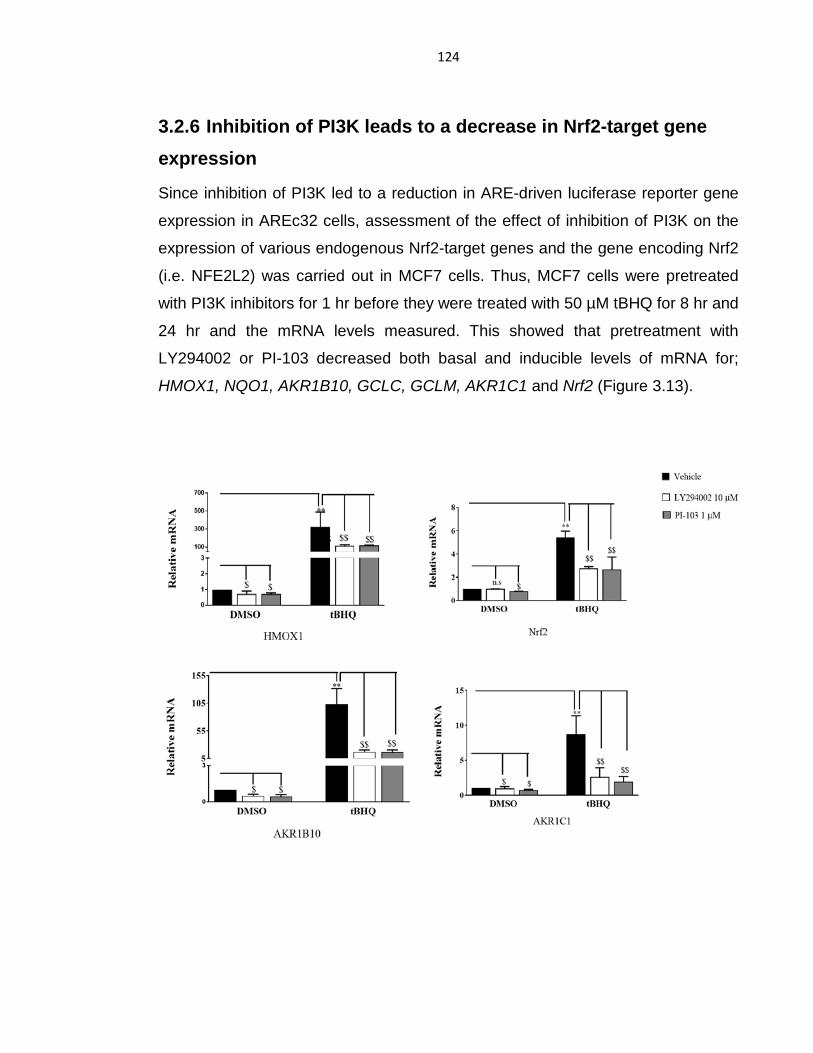
124
3.2.6 Inhibition of PI3K leads to a decrease in Nrf2-target gene expression
Since inhibition of PI3K led to a reduction in ARE-driven luciferase reporter gene
expression in AREc32 cells, assessment of the effect of inhibition of PI3K on the
expression of various endogenous Nrf2-target genes and the gene encoding Nrf2
(i.e. NFE2L2) was carried out in MCF7 cells. Thus, MCF7 cells were pretreated
with PI3K inhibitors for 1 hr before they were treated with 50 µM tBHQ for 8 hr and
24 hr and the mRNA levels measured. This showed that pretreatment with
LY294002 or PI-103 decreased both basal and inducible levels of mRNA for;
HMOX1, NQO1, AKR1B10, GCLC, GCLM, AKR1C1 and Nrf2 (Figure 3.13).
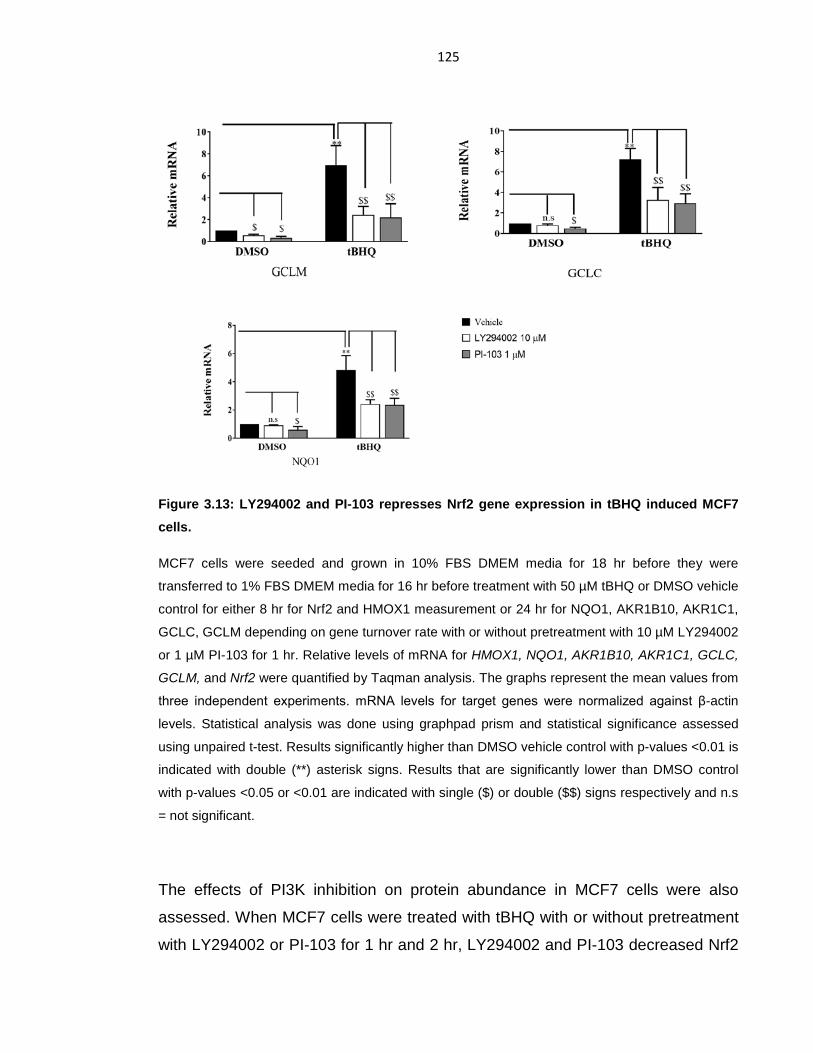
125
Figure 3.13: LY294002 and PI-103 represses Nrf2 gene expression in tBHQ induced MCF7 cells.
MCF7 cells were seeded and grown in 10% FBS DMEM media for 18 hr before they were
transferred to 1% FBS DMEM media for 16 hr before treatment with 50 µM tBHQ or DMSO vehicle
control for either 8 hr for Nrf2 and HMOX1 measurement or 24 hr for NQO1, AKR1B10, AKR1C1,
GCLC, GCLM depending on gene turnover rate with or without pretreatment with 10 µM LY294002
or 1 µM PI-103 for 1 hr. Relative levels of mRNA for HMOX1, NQO1, AKR1B10, AKR1C1, GCLC,
GCLM, and Nrf2 were quantified by Taqman analysis. The graphs represent the mean values from
three independent experiments. mRNA levels for target genes were normalized against β-actin
levels. Statistical analysis was done using graphpad prism and statistical significance assessed
using unpaired t-test. Results significantly higher than DMSO vehicle control with p-values <0.01 is
indicated with double (**) asterisk signs. Results that are significantly lower than DMSO control
with p-values <0.05 or <0.01 are indicated with single ($) or double ($$) signs respectively and n.s
= not significant.
The effects of PI3K inhibition on protein abundance in MCF7 cells were also
assessed. When MCF7 cells were treated with tBHQ with or without pretreatment
with LY294002 or PI-103 for 1 hr and 2 hr, LY294002 and PI-103 decreased Nrf2

126
protein levels under basal and tBHQ induced conditions with a corresponding
decrease in phosphorylation of GSK3α/β for both the 1 hr and 2 hr time points
(Figure 3.14A). Measurement of proteins encoded by Nrf2 also showed LY294002
and PI-103 repressed both basal and induced HMOX1, NQO1 (Figure 3.14B) and
AKR1B10 proteins (Figure 3.14C) at 8 hr, 18 hr and 24 hr. These results suggest
that Nrf2 activity can be regulated by inhibiting PI3K. Thus, electrophiles that
promote Nrf2 stability through the action of β-TrCP/GSK-3 do so by regulating the
PI3K-PKB/Akt pathway.
A

127
B

128
C
Figure 3.14: LY294002 and PI-103 represses Nrf2 and inducible Nrf2-target gene expression.
Human mammary MCF7 cells were seeded and grown in 10% FBS DMEM media containing 4.5
g/L glucose for 18 hr before they were transferred to 1% FBS reduced serum DMEM media (4.5
g/L glucose) for 16 hr before treatment with 50 µM tBHQ or DMSO vehicle control with or without
pretreatment with 10 µM LY294002 or 1 µM PI-103 for 1 hr. The proteins were resolved in SDS-
PAGE and immunoblotted with indicated antibodies. (A) protein levels of Nrf2, pGSK-3α/β, GSK-3,
pSer-473-AKT, pThr-308-AKT were measured by western blot for cells treated for 1 hr and 2 hr.
(B) protein levels of HMOX1 and NQO1 were measured for cells treated for 8 hr, 18 hr and 24 hr.
(C) protein levels of AKR1B10 were measured for cells treated for 24 hr. Actin was used as
loading control and the results is a representation of three independent experiments that are
biological replicates.
3.2.7 Regulation of Nrf2 through the PI3K-AKT-GSK3 pathway is independent of Keap1
To test if the ability of PI3K inhibitors to regulate Nrf2 requires Keap1, Keap1-/-
MEFs were treated with inducers plus or minus pretreatment with the PI3K
inhibitor LY294002 or the PKB/Akt inhibitor MK-2206 or the GSK-3 inhibitor

129
CT99021, and expression of Nrf2 downstream genes was measured using
Taqman RT-PCR; Keap1+/+ MEFs were used as a control. As anticipated, the
basal levels of Hmox1 and Nqo1 were higher in Keap1-/- MEFs than Keap1+/+
MEFs. Interestingly, LY294002 and MK-2206 decreased the high basal
expression of Hmox1 and Nqo1 in Keap1-/- MEFs. By contrast, CT99021
increased the basal expression levels of Hmox1 and Nqo1 in both Keap1+/+ and
Keap1-/- MEFs. When tBHQ was used to induce gene expression in MEFs,
LY294002 and MK-2206 was found to repress tBHQ induced Hmox1 and Nqo1
mRNA levels in both Keap1+/+ and Keap1-/- MEF cells (Figure 3.15A). Similarly,
LY294002 and MK-2206 inhibited induction of Hmox1 and Nqo1 mRNA by DEM
(Figure 3.15B), carnosol (Figure 3.15C), curcumin (Figure 3.15D), ferulic acid
(Figure 3.15E), and CDDO-Im (Figure 3.15F) indicating that LY294002 is still able
to regulate the activation of Nrf2 even in the absence of Keap1.
A

130
B
C
D

131
E
F
Figure 3.15: Inhibition of PI3K suppresses Nrf2 activity in a Keap1 independent manner.
(A-F) Keap1+/+ and Keap1-/- MEFs were seeded and grown in 10% FBS DMEM media (4.5 g/L
glucose) for 18 hr before they were transferred to reduced serum media (1% FBS DMEM) (4.5 g/L
glucose) for 16 hr before treatment with 50 μM tBHQ (A), 100 μM DEM (B), 10 µM Carnosol (C),
15 µM curcumin (D), 10 µM Ferulic acid (E), and 100 nM CDDO-Im (F) for either 6 hr or 12 hr to
measure Hmox1 or Nqo1 respectively. In all instances pre-treatment with 10 µM LY294002 or 5
µM MK-2206 or 5 µM CT99021was for 1 hr before treatment with inducers. Relative levels of
mRNA for Hmox1 and Nqo1 were quantified by Taqman analysis. The graphs represent the mean
values from three independent experiments each done in duplicates. Levels of mRNA for Hmox1
and Nqo1 were normalized against β-actin levels. Statistical analyses was done using graphpad
prism and statistical significance assessed using unpaired t-test. Results significantly higher than
DMSO vehicle control with p-values <0.01 or <0.001 are indicated with double (**) or triple (***)
asterisk signs respectively and results that are significantly lower than DMSO control with p-values
<0.01 are indicated with double ($$) signs: n.s= not significant.
132
To further investigate whether the PI3K inhibitors require Keap1 in order to
suppress ARE-regulated genes, a bis-sulfonamide NG284 that blocks the binding
of Keap1 to Nrf2 (Georgakopoulos et al., 2017) was used in the AREc32 reporter
cell line. AREc32 cells were treated with NG284 with or without pre-treatment with
LY294002 or PI-103 for 18 hr in 1% FBS reduced serum media. NG284 increased
ARE-driven luciferase activity in a dose dependent manner. However, when cells
were pretreated with either LY294002 or PI-103, this increase was suppressed
significantly (Figure 3.16). LY294002 and PI-103 were able to significantly
decrease ARE-driven luciferase activity at basal level and even when Keap1
interaction with Nrf2 is blocked by NG284. Measurement of Nrf2 protein level in
these cells showed a similar result. Together these results suggest that the kinase
inhibitors blunt Nrf2 activity via a Keap1-independent mechanism. The regulation
of Nrf2 through the PI3K-PKB/Akt pathway is independent of the Keap1 status of
the cell.

133
Figure 3.16: Blocking of Keap1 binding had no effect on PI3K.
AREc32 seeded at 8 x 10⁶ cells/ 6 cm dish were grown in 10% FBS DMEM media for 18 hr before
they were transferred to reduced serum media (1% FBS DMEM) and left to acclimatize for 16 hr.
Pretreatment with LY294002 or PI-103 were done for 1 hr before cells were treated with the bis-
sulfonamide NG284 for 18 hr. Thereafter, Luciferase assay was measured using the Promega
luciferase assay according to manufacturer’s protocol as described in section 2. Luciferase data
were normalized against protein concentration and corrected against vehicle-treated DMSO. 5 µM
SFN was used as positive control in this experiment. Western blot for Nrf2 protein abundance was
also measured. Protein levels of pSer-473-Akt were measured as control for P13K inhibitors. Actin
was used as loading control. Statistical analyses were done using graphpad prism and statistical
significance assessed using unpaired t-test. Results significantly higher than DMSO vehicle
control with p-values <0.01 are indicated with double (**) asterisk signs and results that are
significantly lower than DMSO control with p-values < 0.05 or <0.01 are indicated with single ($) or
double ($$) signs respectively, n.s= not significant. The results are a representation of three
independent experiments.
134
3.2.8 Regulation of Nrf2 through the PI3K-AKT-GSK3 pathway is dependent on GSK3
Since the above results show that PI3K inhibitors suppress Nrf2 activity in the
absence of Keap1, it was hypothesized that inhibitors suppress ARE-driven gene
expression by decreasing Akt activity which would in turn prevent inhibitory
phosphorylation of GSK-3 by Akt and so allow GSK-3 to create the DSGIS-
containing phosphodegron recognized by β-TrCP. To test if inhibition of basal
and/or inducible ARE-driven gene expression by kinase inhibitors requires GSK-3,
COS1 cells were transfected with the Neh6+-LacZ-V5 fusion protein and treated
with LY294002, the Akt inhibitor MK2206, the GSK-3 inhibitor CT99021 and
several inducing agents. In these experiments, LY294002 and MK2206 caused a
significant decrease in basal β-galactosidase activity and tBHQ- and ferulicacid-
inducible β-galactosidase activity. By contrast, inhibition of GSK-3 by CT99021
gave a significant increase in basal β-gal activity and an increase in tBHQ- and
ferulic acid-inducible β-galactosidase activity (Figure 3.17A).
Assessment of whether the ability of PI3K inhibitors to repress Nrf2 is abolished
by inhibition of GSK-3 was carried out by measuring the ARE-driven luciferase
activity in the AREc32 reporter cell line treated with increasing concentrations of
CT99021 plus/or minus LY294002 or PI-103. The results showed that CT99021
modestly increased luciferase activity in a dose-dependent manner. Importantly,
the increase in ARE-driven luciferase activity caused by CT99021 was not
prevented by LY294002, suggesting inhibition of GSK-3 is dominant over
inhibition of PI3K (Figure 3.17B). Similarly, the increase in ARE-driven luciferase
activity caused by CT99021 was not prevented by PI-103 at the lowest
concentration of CT99021 (Figure 3.17B). However, with increasing concentration
of CT99021, the increase in ARE-driven luciferase activity caused by CT99021
was blocked by PI-103. This may be because of the non-specificity of PI-103 or a
dose effect or that PI-103 can suppress Nrf2 activity via an alternative mechanism
not yet explored. PI-103 is a non-specific PI3K inhibitor, inhibiting both the PI3K
pathway and the mTOR pathway. These results therefore suggest that the ability

135
of PI3K to regulate Nrf2 is dependent on its regulation via the Neh6 domain of
Nrf2.
A

136
B
Figure 3.17: Inhibition of kinase activity suppresses Nrf2 activity in a GSK-3-dependent manner.
(A) COS1 cells were seeded at 6 x 10⁶ cells into 6-well plates and grown overnight until cells were
about 70% confluent before transfection. Cells were transfected with plasmid encoding the
Neh6+(lacZ)-V5 fusion protein, allowed to grow overnight before treatment with 50 µM tBHQ, 10
µM Ferulic acid, or DMSO control for 18 hr in 1% reduced serum media (1% FBS DMEM).
Pretreatment with 10 µM LY294002 or 5 µM Mk2206 or 5 µM CT99021 was done for 1 hr in 1&
FBS DMEM media. β-galactosidase activity was measured using the Promega β-galactosidase kit
according to manufacturer’s protocol using spectrophotometer. Cells were co-transfected with
pRL-TK Renilla plasmid as transfection control and result was normalized against Renilla enzyme
activity. (B) AREc32 cells were seeded at 5 x 10⁶ cells/ 6-well plate and grown in 10% FBS DMEM
overnight. Cells were treated with increasing concentration of CT99021 plus or minus 10 µM
LY294002 or 1µM PI-103 for 18 hr in 1% reduced serum media. Pretreatment with LY294002 or
PI-103 were done for 1 hr. Luciferase assay was measured using the Promega luciferase assay
according to manufacturers’ protocol as described in section 2. Luciferase data were normalized
against protein concentration. Statistical analyses were done using graphpad prism and statistical
significance assessed using unpaired t-test. Results significantly higher than DMSO vehicle
control with p-values <0.05 or <0.01 are indicated with single (*) or double (**) asterisk signs
respectively and results that are significantly lower than DMSO control with p-values <0.01 are
indicated with double ($$) signs: n.s= not significant.

137
3.2.9 PTEN functions as a sensor protein for agents that induce Nrf2
A biotinylated analogue of the Nrf2 activator CDDO-Im was shown by Mike Sporn
and colleagues to protect retinal cells from oxidant induced cell death through
activation of antioxidant genes in a manner that led to phosphorylation of Akt
through direct binding to Cys-124 in the active site of PTEN (Pitha-Rowe et al.,
2009). This led these authors to conclude that stimulation of the PI3K-Akt pathway
by electrophiles is mediated by inhibition of PTEN activity. Subsequent work by
Almazari et al. (2012) also indicated that the Nrf2 activator Guggulsterone
increased HMOX1 expression via modification of PTEN and subsequent
stimulation of phosphorylation of Akt. It is therefore possible that other Nrf2
inducers can similarly inhibit PTEN thereby promoting Nrf2 activation because
they activate the PI3K-PKB/Akt pathway and thus cause inhibitory
phosphorylation of GSK-3.
To assess the role of PTEN in inducing Nrf2-target genes, PTEN-wildtype and
PTEN-knockout embryonic stem (ES) cells were treated with increasing
concentrations of MK2206 and increasing concentrations of another Akt inhibitor
called GSK690693. The results showed that loss of PTEN in the knockout ES
cells caused an increase in Nrf2 protein levels. Treatment with Akt inhibitor
MK2206 resulted in a decrease in Nrf2 protein at the higher concentration of
MK2206 (10 µM) and treatment with GSK690693 resulted in a decrease in Nrf2
protein abundance at the lowest concentration (1 µM) of the inhibitor in PTEN-
wildtype ES cells, however, treatment with both Akt inhibitors resulted in a
decrease in Nrf2 protein levels in PTEN-knockout ES cells (Figure 3.18A). To
further assess the effect of PTEN on Nrf2, PTEN activity was inhibited using a
chemical inhibitor bpv(HOPIC). Inhibition of PTEN using bpv(HOPIC) in A549
cells resulted in an increase in Nrf2 protein levels (Figure 3.18B). Bpv(HOPIC)
caused a dose response increase in phosphorylation of Akt with 10 µM

138
bpv(HOPIC) giving the best corresponding increase in Nrf2 protein level. When 50
µM tBHQ was used to treat Keap1+/+ and Keap1-/- MEFs and the expression of
Hmox1 and Nqo1 assayed, it was observed that tBHQ caused an increase in the
induction of Hmox1 and Nqo1 genes with a further increase when cells were
treated with both bpv(HOPIC) and tBHQ (Figure 3.18C). A further question was to
assess if inducers can directly inhibit PTEN phosphatase activity. To do this,
Keap1-/- cells were treated with inducers for 18 hr and analysis of PTEN
phosphatase levels showed that inducers gave a significant decrease in PTEN
levels (Figure 3.18D). These results show that PTEN play a role in promoting Nrf2
induction through the PI3K-Akt-GSK3 pathway and that inducers such as tBHQ
would promote the induction of Nrf2 in the absence of Keap1 by directly
decreasing PTEN levels.
A

139
B
C
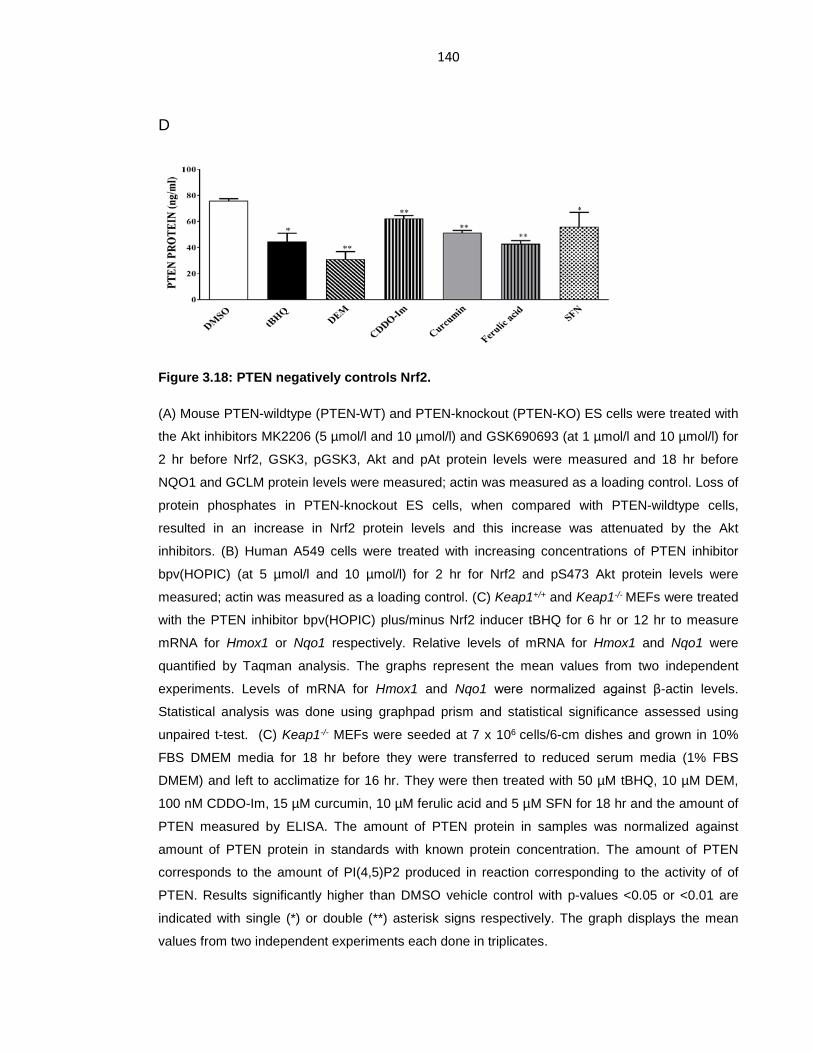
140
D
Figure 3.18: PTEN negatively controls Nrf2.
(A) Mouse PTEN-wildtype (PTEN-WT) and PTEN-knockout (PTEN-KO) ES cells were treated with
the Akt inhibitors MK2206 (5 µmol/l and 10 µmol/l) and GSK690693 (at 1 µmol/l and 10 µmol/l) for
2 hr before Nrf2, GSK3, pGSK3, Akt and pAt protein levels were measured and 18 hr before
NQO1 and GCLM protein levels were measured; actin was measured as a loading control. Loss of
protein phosphates in PTEN-knockout ES cells, when compared with PTEN-wildtype cells,
resulted in an increase in Nrf2 protein levels and this increase was attenuated by the Akt
inhibitors. (B) Human A549 cells were treated with increasing concentrations of PTEN inhibitor
bpv(HOPIC) (at 5 µmol/l and 10 µmol/l) for 2 hr for Nrf2 and pS473 Akt protein levels were
measured; actin was measured as a loading control. (C) Keap1+/+ and Keap1-/- MEFs were treated
with the PTEN inhibitor bpv(HOPIC) plus/minus Nrf2 inducer tBHQ for 6 hr or 12 hr to measure
mRNA for Hmox1 or Nqo1 respectively. Relative levels of mRNA for Hmox1 and Nqo1 were
quantified by Taqman analysis. The graphs represent the mean values from two independent
experiments. Levels of mRNA for Hmox1 and Nqo1 were normalized against β-actin levels.
Statistical analysis was done using graphpad prism and statistical significance assessed using
unpaired t-test. (C) Keap1-/- MEFs were seeded at 7 x 10⁶ cells/6-cm dishes and grown in 10%
FBS DMEM media for 18 hr before they were transferred to reduced serum media (1% FBS
DMEM) and left to acclimatize for 16 hr. They were then treated with 50 µM tBHQ, 10 µM DEM,
100 nM CDDO-Im, 15 µM curcumin, 10 µM ferulic acid and 5 µM SFN for 18 hr and the amount of
PTEN measured by ELISA. The amount of PTEN protein in samples was normalized against
amount of PTEN protein in standards with known protein concentration. The amount of PTEN
corresponds to the amount of PI(4,5)P2 produced in reaction corresponding to the activity of of
PTEN. Results significantly higher than DMSO vehicle control with p-values <0.05 or <0.01 are
indicated with single (*) or double (**) asterisk signs respectively. The graph displays the mean
values from two independent experiments each done in triplicates.

141
3.3 Discussion
Since Nrf2 regulates several aspects of cell physiologies going beyond its redox-
regulating capabilities, stringent control of this transcription factor is necessary.
Keap1 targets Nrf2 for degradation in the cytoplasm, maintaining a relatively high
turnover rate in the cytoplasm with Nrf2 possessing a short half-life of about 10-
20 min (Nguyen et al., 2003; Stewart et al., 2003; Kobayashi et al., 2004b; Smith
et al., 2015) . Activation of Nrf2 signalling and induction of Nrf2-target genes that
ensures the enzymatic detoxification and excretion of chemical carcinogens,
repair of oxidative damage or quenching of reactive oxygen species has ensured
that targeting of Nrf2 in cancer prevention a prime research interest. Several
studies on how Nrf2 is regulated in cancer prevention and treatment have been
extensively published but new insights to the context of each regulatory pathway
is still necessary. It has previously been shown that inducers of Nrf2 modulate the
binding of Keap1 to Nrf2, however several lines of evidence also point to the fact
that Nrf2 can be regulated in a Keap1-independent manner. This chapter exposes
a new mechanism by which inducers of the Nrf2 pathway increase the expression
of Nrf2-target genes through prevention of its degradation by the SCFβ-TrCP E3
ubiquitin ligase.
In this chapter, it is demonstrated that inducers of Nrf2 are able to regulate the
expression of its target genes in a Keap1-independent manner. It has been widely
demonstrated that many agents that induce Nrf2-target genes do so by modifying
key cysteine residues in Keap1 preventing Keap1-mediated Nrf2 turnover (Zhang
and Hannink, 2003; McMahon et al., 2003; Yamamoto et al., 2008). In a previous
study, nordihydroguaiaretic acid (NDGA) was shown to increase Nrf2 and Hmox1
protein levels in Keap1-/- MEFs(Rojo et al., 2012). Interestingly, this work has
found that other inducers such as tBHQ, DEM, carnosol, curcumin, ferulic acid
and CDDO-Im also activate Nrf2-target gene in Keap1-independent manner. This
is consistent with the work by Yamamoto et al. (2008) where mutation of Cys-151
to serine did not abolish the stabilization of Nrf2 and induction of reporter genes in
response to tBHQ. However, consistent with previous literature (Zhang and
142
Hannink, 2003; Yamamoto et al., 2008) that show that SFN modifies Cys-151 in
Keap1 for it to activate Nrf2, SFN was unable to induce Nrf2-target gene in Keap1-
/- MEFs.
As stated earlier, Nrf2 is also negatively regulated by GSK-3 signalling leading to
ubiquitylation through SCFβ-TrCP (Rojo, Sagarra and Cuadrado, 2008; McMahon et
al., 2004; Rada et al., 2011; Chowdhry et al., 2013). GSK-3 is constitutively active
in cell regulating just about 100 proteins involved in glycogen metabolism,
transcription, translation, cell cycle progression and apoptosis (Doble, 2003).
Phosphorylation of GSK-3α and GSK-3β at Ser-21 and Ser-9 respectively leads to
its deactivation (Doble, 2003). Consistent with this, the result obtained showed
that inducers that regulate Nrf2 independently of the Keap1 status of the cell do
so by increasing the phosphorylation of GSK-3 in Keap1-/- MEFs at Ser-21 and
Ser-9 of GSK-3α and GSK-3β respectively. Here it is reported for the first time
that tBHQ, CDDO-Im, DEM, and ferulic acid decrease the activity of GSK-3α and
GSK-3β in a ‘hot’ assay. One thing that is noticeable from the results obtained is
that inducers also phosphorylate GSK-3 even in the presence of Keap1. The
ARE-driven luciferase activity in cells expressing Nrf2∆ETGE show all inducers with
the exception of SFN increasing luciferase activity consistent with the hypothesis
that these inducers activate Nrf2 in a keap1-independent mechanism. However, in
cells expressing Nrf2∆DSGIS, the ability of these inducers to increase ARE-driven
luciferase activity was not aborted but instead promoted the increase in luciferase
activity. This indicates that these inducers target both the Neh6 domain and the
Neh2 domain. This is consistent with study by (Rojo et al., 2012) which show that
NDGA promoted longer half-life for protein fused to the Neh2 domain of Nrf2 and
protein fused to the Neh6 domain demonstrating that NDGA targets both the
Neh2 and the Neh6 degrons. This chapter therefore show that most inducers can
regulate Nrf2 through targeting of both the Neh2 domain and the Neh6 domain
depending on which domain is active in the cell and in different subcellular
compartment.

143
Several signal-transduction pathways such as PI3K-Akt/PKB, p90RSK MAPK, and
mTOR regulate GSK-3 through mediating phosphorylation of the kinase (Frame
and Cohen, 2001; Sutherland, 2011). Activation of PI3K-Akt by growth factor
stimulation inhibits GSK-3 through phosphorylation at Ser-21 in GSK-3α and Ser-
9 in GSK-3β (Van Weeren et al., 1998; Doble, 2003). Activation of Nrf2-target
genes by tBHQ, ferulic acid, CDDO-Im, 4-hydroxyl-2-nonenal (4-HNE), acrolein
and curcumin through PI3K/Akt signalling has been highlighted by several studies
in different cell systems (Lee et al., 2001; Martin et al., 2004; Li, Cha and Surh,
2006; Kang et al., 2007; Chen et al., 2009; Ma et al., 2010). Inhibition of PI3K was
also shown to block the induction of Nrf2-target genes in similar studies (Nakaso
et al., 2003; Martin et al., 2004; Salazar et al., 2006). Therefore, analysis of the
role played by PI3K in our panel of inducers using two PI3K inhibitors, LY294002
and PI-103. It is observed that inducers increased the phosphorylation of GSK-3α
and GSK-3β at Ser-21 and Ser-9 respectively and inhibition of PI3K blocked the
increased phosphorylation by tBHQ. Inhibition of PI3K also blocked the induction
of ARE-driven luciferase activity as well as Nrf2-target gene induction. This is
consistent to what other studies has found (Lee et al., 2001; Nakaso et al., 2003;
Martin et al., 2004; Salazar et al., 2006). Although all these different research
groups have outlined the involvement of PI3K-Akt signalling in activation of ARE-
driven genes and which this work have confirmed, they have however not
described if this induction mediated by PI3K is Keap1 dependent. The results
reported in this chapter show that the regulation of Nrf2 through the PI3K-PKB/Akt
signalling pathway is independent of Keap1. Inhibition of PI3K by LY294002 or
Akt by MK-2206 repressed Nrf2-target gene induction mediated by inducers in a
Keap1-/- MEFs. Blocking of Keap1-Nrf2 interaction using the bis-sulfonamide
NG284 did not stop the kinase inhibitors from decreasing ARE-driven luciferase
activity.
Several of the studies mentioned earlier have demonstrated that PI3K-Akt
signalling regulate GSK-3 through phosphorylation and other studies have linked
induction of Nrf2-target genes to be stimulated by PI3K, not much has been
144
shown to formally link the induction of Nrf2-target genes by inducers mediated
through the PI3K-Akt signalling pathway to the inhibition of GSK-3. Salazar et al.
(2006) came close when they identified that the cross-talk between the survival
signal elicited by PI3K-Akt and the induction of antioxidant genes was mediated
by GSK-3β. Therefore, the findings in this chapter show that inhibition of GSK-3
abolished the ability of PI3K inhibitor to repress Nrf2. Beside growth factors, the
PI3K signalling pathway is also regulated by PTEN via AKT phosphorylation at
Thr-308 and Ser-473 relaying signals to downstream target protein involved in cell
proliferation, survival, cell death and cell transformation (Bader et al., 2005; Cully
et al., 2006). Deficiency of PTEN arising as a consequence of mutation of the
gene leads to constitutive activation of PI3K-AKT signalling pathways (Wu et al.,
1998). A study by (Kensuke et al., 2009) showed that inhibition of PI3K-Akt/PKB
pathway by PTEN prevented the tBHQ-induced ARE-driven gene activation in
Jurkat human leukemia cells. Other studies also show that activation of PTEN
prevented induction of Nrf2 target genes (Pitha-Rowe et al., 2009; Almazari et al.,
2012). Cys-71 and Cys-124 in PTEN has been shown as sensor for Nrf2
regulation through PI3K in cells (Pitha-Rowe et al., 2009; Shearn et al., 2013;
Rojo et al., 2014). The hypothesis therefore was that inducers of Nrf2 that function
via the PI3K-Akt pathway will do so by inhibiting PTEN directly. The data reported
show that PTEN-knockout ES cells expresses increased levels of Nrf2 protein and
increased induction of Nrf2-target genes that is consistent with the literature.
Pharmacological inhibition of PTEN led to increase in expression of Nrf2-target
genes in a Keap1-independent manner and promoted tBHQ-induced expression
of Nrf2-target gene. Inhibition of PTEN in cells lacking Keap1 showed an increase
in Nrf2 protein levels and in expression of its target genes, showing that the role of
PTEN in regulation of Nrf2 is independent on Keap1. We show for the first time
that our panel of inducers directly decreased PTEN phosphatase activity in a
Keap1-independent manner.
This chapter sheds more light on the mechanism(s) by which pharmacological
inducers activate Nrf2. Thus, inducers of Nrf2-target gene expression can
145
increase Nrf2 activity both in the absence and presence of Keap1. Activation of
Nrf2 by electrophilic inducers in the absence of Keap1 arises by inhibitory
phosphorylation of GSK-3 resulting from activation of PKB/Akt and as a
consequence of direct inhibition of PTEN protein, thereby preventing the
formation of the phosphodegron in the Neh6 domain of Nrf2. It has also been
shown that compounds that steriochemically inhibit the activity of GSK-3, such as
CT99021, are a separate class of non-electrophilic inducers that work
independently of PTEN and Akt.

146
CHAPTER 4
147
4.0 Mechanism and therapeutic value of inhibition of Nrf2 CNC-bZIP transcription factor in cancer.
4.1 Introduction
In order to maintain cellular homeostasis arising from ROS imbalance, several
adaptive mechanisms are activated, including the induction of genes encoding
phase I, II and III detoxification proteins and antioxidant enzymes (Itoh et al.,
1997; Miao et al., 2005; Bryan et al., 2013). Within the heterodimer, Nrf2 is
responsible for gene transactivation and it maintains redox homeostasis by
inducing the expression of over 200 cytoprotective genes in response to redox
stressors (Hayes and Ashford, 2012). Alongside its role in cellular defense, Nrf2
also plays a role in cell differentiation, proliferation, hematopoiesis and the
regulation of fatty acid metabolism (Bryan et al., 2013).
Nrf2 functions to inhibit the initiation of carcinogenesis but recent evidence shows
that Nrf2 is also up-regulated in many types of cancer, and may play a significant
role in tumour growth and resistance to anti-cancer therapies (Ren et al., 2011).
The involvement of Nrf2 in cancer promotion was first observed when
hepatocellular carcinoma (HCC) was showed upregulation of Nrf2 and GSTP1
(Ikeda, Nishi and Sakai, 2004). More evidence of the role of Nrf2 in promoting
tumourigenesis and chemoresistance in cancer has surfaced. Many studies have
shown increased Nrf2 expression in many human cancers and that activation of
Nrf2 in cancer helps to promote the progression of cancer. Nrf2+/+ mice
administered with urethane to induce lung carcinoma developed higher number of
kRas-mutated adenocaninoma in the later tumorigenic stages, with 60% of mice
exhibiting large palpable nodules >5 mm as opposed to Nrf2-/- mice (Satoh et al.,
2013). In this study, Nrf2-/- though developed tumours faster at the early stage of
urethane administration, exhibited a markedly reduction in tumour number and
size at 24 weeks post urethane administration suggesting that the abundance of
148
Nrf2 in these mice is critical for the progression of lung cancer (Satoh et al.,
2013). In another study, A/J mice that were given vinyl carbamate to induce
carcinogenesis and treated with sulforaphane to activate Nrf2 or brusatol to inhibit
Nrf2 before and after tumour development showed that activation of Nrf2
prevented the initiation of cancer in mice group that were pretreated with
electrophiles but activation of Nrf2 promoted the progression of pre-existing
tumours and inhibition of Nrf2 with brusatol was able to stop the progression of
the tumours (Tao et al., 2018).
Suppression of expression of detoxification enzymes and drug efflux pumps by
inhibitors of Nrf2 might diminish cancer cell proliferation and sensitize tumours to
therapeutic drugs. There is therefore a need to inhibit Nrf2 activity in tumours in
which it is up-regulated. The aim of this chapter is to study what effect the
repression of Nrf2 has on oxidative stress, cell growth and proliferation in tumour
cells with high Nrf2 expression levels and also to understand what fuels the
increased proliferation exhibited by cancer cells having increased Nrf2.
4.1.1 Mutation frequencies of Keap1 and Nrf2 in cancer
The accumulation of Nrf2 in cancer cells has been attributed to either somatic
mutation of Keap1 and/or Nrf2 (Shibata et al., 2008b), or epigenetic modification
of Keap1 promoter region (Wang et al., 2008a; Satoh et al., 2013). The
identification of somatic mutation in the Kelch-like repeat domain of Keap1 in two
lung cancer cell lines was the first to be described in the Nrf2 pathway
(Padmanabhan et al., 2006). Mutation in Keap1 resulted in a significant
diminished binding to Nrf2 subsequently leading to increased expression of Nrf2-
target genes was reported in this study (Padmanabhan et al., 2006). In several
human cancers, gain of function mutations in Keap1 and Cul3 have also been
identified (Padmanabhan et al., 2006; Singh et al., 2006; Nioi and Nguyen, 2007;
Ohta et al., 2008; Shibata et al., 2008a).
149
Somatic mutation of NFE2L2 in 11 out of 103 patients a study in lung cancer cell
has been reported (Shibata et al., 2008b). Mutation in Nrf2 gene has also been
seen in several cancers including lung, head, esophagus and neck carcinoma
(Shibata et al., 2008b, 2011; Kim et al., 2010). High-resolution copy-number
analysis in 125 HCC and whole exome sequencing on 24 of these tumours
identified 6.4% mutation in NFE2L2 gene (Guichard et al., 2012). Similar studies
on 300 HCC from Japanese individuals identified 3.7% mutation in NFE2L2 gene
(Fujimoto et al., 2016). In another whole exome sequencing in 87 HCC patients,
reported 8% mutation in Keap1 gene (Cleary et al., 2013). 25 mutations in
NFE2L2 and 2 mutations in Keap1 were identified in 38 analyzed preneoplastic
lesions in rat HCC (Zavattari et al., 2015).
An analysis of tumour tissues from 1,391 patients with non-small cell lung cancer
(NSCLC) using next-generation sequencing (NGS) showed 11.3% and 3.5%
mutation frequency of Keap1 and NFE2L2 respectively and no patient with
mutation in Keap1 and Nrf2 responding to systemic first, second or third line of
treatment (Frank et al., 2018).
4.1.2 Nrf2 and cell proliferation
Imbalanced redox consumption and signalling and high proliferation are all
hallmark of cancer cells (Hanahan and Weinberg, 2011). The rate at which cancer
cells proliferate has been shown by several studies to be dependent on the status
of Nrf2 in cells. In a study to examine the effect of Nrf2 in three human lung
cancer cell lines with different degree of Nrf2 activation, knockdown of Nrf2 using
RNAi technique showed a significant decrease in cell proliferation rate in A549
cells with high levels of Nrf2 (Homma et al., 2009). However, the inhibitory effect
on cell proliferation by Nrf2 knockdown in this study was much lower in NCI-H292
cells having moderate levels of Nrf2 and no effect on LC-AI cells with low levels of
Nrf2. In a similar study in NSCLC A549 and H460 cells, depletion of Nrf2resulted
in a pronounced decrease in cellular proliferation (Singh et al., 2008). In another

150
study on patients with primary malignant brain tumours, upregulation of Nrf2
resulted in decreased survival and overall devastating outcome that was
associated with increased cell proliferation and oncogenic transformation (Fan et
al., 2017).
Genes associated with cell proliferation including Bmpr1a, Ifg1 and jag1 have
been identified as direct targets of Nrf2 by a genome-wide ChiP-sequencing
analyses (Malhotra et al., 2010). Other Nrf2 target genes Cdkn1a and Cdkn2b
have been shown to ack as cell cycle inhibitors (Malhotra et al., 2010). Through
regulation of ROS, Nrf2 is able to control cell proliferation. Loss of the CncC bZIP-
CNC transcription factor in drosophilia intestinal stem cells has been reported to
increase ROS and proliferative rate (Tsai et al., 2013). By regulating the enzymes
involved in synthesis and reduction of thioredoxin and glutathione, Nrf2 is able to
increase their cellular amount resulting in the elimination of ROS.
4.1.3 Nrf2 alters NADPH generation, pentose phosphate pathway and fatty acid metabolism
A switch in metabolism is one hall mark of cancer (Hanahan and Weinberg,
2011). Microarray and ChiP-sequencing analysis has revealed that by activating
the enzymes involved in metabolism and PPP, Nrf2 is able to regulate cell
proliferation (Mitsuishi et al., 2012; Malhotra et al., 2010; Hirotsu et al., 2012). The
regulation and consumption of the reducing agent NADPH used in anabolic
reactions has been linked to Nrf2 via regulation of enzymes involved in NADPH
generation (Wu, Cui and Klaassen, 2011; Mitsuishi et al., 2012; Thimmulappa et
al., 2002). Nrf2-/- MEFs exhibit lower levels of NADPH and the NADPH/NADP+
ratio compared to wild-type MEFs (Singh et al., 2013).
The major building block for the synthesis of triacylglycerides in the body is fatty
acids (Santos and Schulze, 2012). Functioning as second messengers, lipids play
a major role in signalling and as energy storage (Santos and Schulze, 2012).

151
Acetyl CoA serving as a precursor for fatty acid synthesis (FAS) is converted to
malonyl-CoA which is itself involved in the elongation of fatty acids via the action
of fatty-acid synthase (FASN) (Santos and Schulze, 2012). The role of Nrf2 in
regulating lipid metabolism was first observed when genetic or pharmacological
upregulation of Nrf2 caused change in expression of genes involved in lipid
metabolism (Yates et al., 2009). Genetic upregulation of Nrf2 in Keap1-/- MEFs
resulted in a decrease in the expression of genes involved in fatty acid synthesis
and an increase in the expression of genes involved in fatty acid oxidation (Paek
et al., 2012). The mRNA expression levels of Nrf2 and its target genes was shown
to be suppressed in wild-type MEFs fed with a high fat diet (HFD) (Tanaka et al.,
2008). Fumarate a metabolite in the Krebs cycle has been reported to activate
Nrf2 through succination of cysteine residues in Keap1 and fumarate hydratase
(FH) deficiency-induced type-2 papillary renal carcinoma (pRCC) shows elevated
Nrf2 expression (Adam et al., 2011).
4.2 Experimental results
4.2.1 Effect of Nrf2 knockdown on anti-oxidant genes and reactive oxygen species on tumour cells using shRNA.
To understand the effect of inhibition of Nrf2 in cancer cells, two human NSCLC
cell lines A549 and H460 having upregulated levels of Nrf2 due to somatic
mutations in KEAP1 gene were used. Nrf2 was knock down (Nrf2-kd) in A549 and
H460 cells using the mission shRNA and positive clones were picked, re-cultured
and probed for knockdown efficiency. Of the five shRNA plasmids used, western
blot analysis of each clone showed an 80% knockdown efficiency with plasmid E
(Table 2.1) in A549 Nrf2-kd cells with a corresponding decrease in mRNA gene
expression levels (Figure 4.1A&B) and a 70% knockdown efficiency for plasmid B
in H460 cells with a corresponding decrease in mRNA gene expression (Figure
4.1C&D).
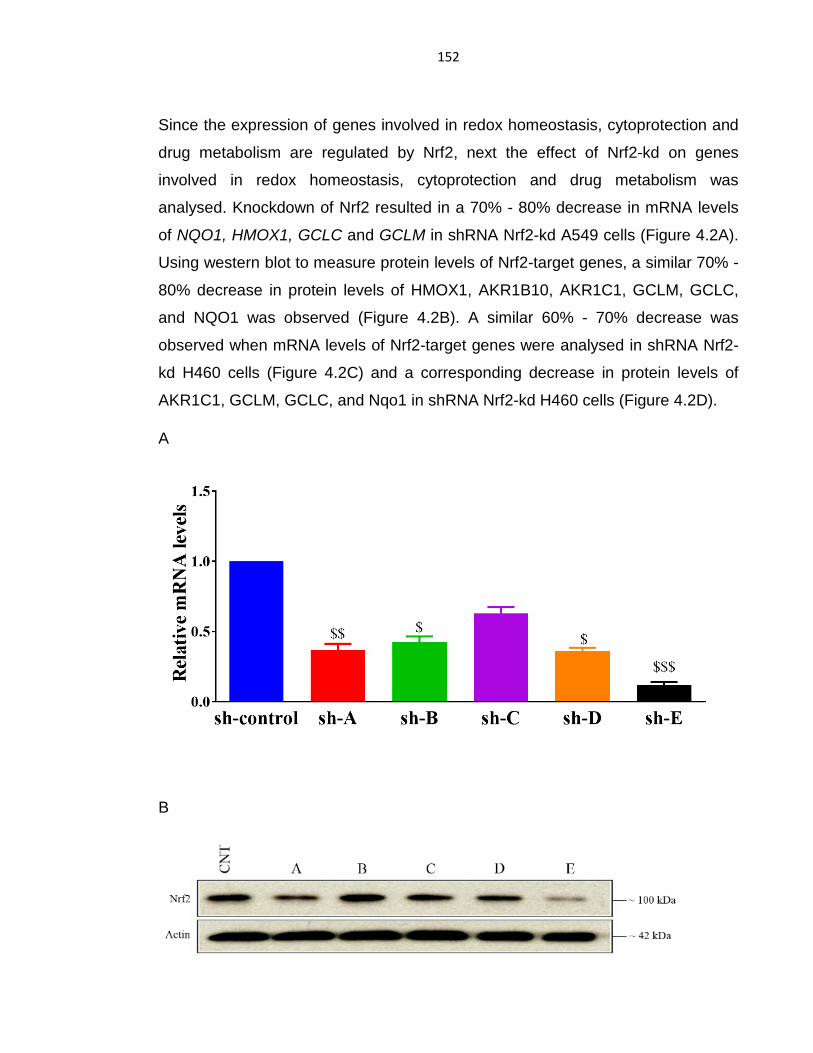
152
Since the expression of genes involved in redox homeostasis, cytoprotection and
drug metabolism are regulated by Nrf2, next the effect of Nrf2-kd on genes
involved in redox homeostasis, cytoprotection and drug metabolism was
analysed. Knockdown of Nrf2 resulted in a 70% - 80% decrease in mRNA levels
of NQO1, HMOX1, GCLC and GCLM in shRNA Nrf2-kd A549 cells (Figure 4.2A).
Using western blot to measure protein levels of Nrf2-target genes, a similar 70% -
80% decrease in protein levels of HMOX1, AKR1B10, AKR1C1, GCLM, GCLC,
and NQO1 was observed (Figure 4.2B). A similar 60% - 70% decrease was
observed when mRNA levels of Nrf2-target genes were analysed in shRNA Nrf2-
kd H460 cells (Figure 4.2C) and a corresponding decrease in protein levels of
AKR1C1, GCLM, GCLC, and Nqo1 in shRNA Nrf2-kd H460 cells (Figure 4.2D).
A
B

153
C
D
Figure 4.1: Knockdown of Nrf2 in A549 and H460 cells
A549 and H460 were seeded into 6-well plates at a density of 4 x10⁵ cells/well and grown
overnight in 10% FBS DMEM media. Cells were transfected with five Mission shRNA (A-E) and a
non-target shRNA control and allowed to grow in 10% FBS DMEM media following puromycin
selection, positive clones were selected and knockdown efficency measured by western blot and
taqman analysis. Panel A: Taqman NFE2L2 gene expression levels of A549 cells. Panel B:
western blot for A549 cells. Panel C: Taqman NFE2L2 gene expression for H460 cells. And panel
D: western blot for Nrf2 protein levels for H460 cells. Relative mRNA gene expression for NFE2L2
gene was performed using Taqman analysis and normalised against β-actin levels. Statistical
analyses were performed using graphpad prism and statistical significance assessed using
unpaired t-test. Results that are significantly lower than sh-control with p-values <0.05, <0.01 or
<0.001 are indicated with $, $$ or $$$ signs respectively. The graph represent the mean values
from 2 independent experiments and is relative to the CT values obtained for sh-control samples.
For western blot for protein samples, β-actin was used as a loading control. The result is a
representation of 2 independent experiments.
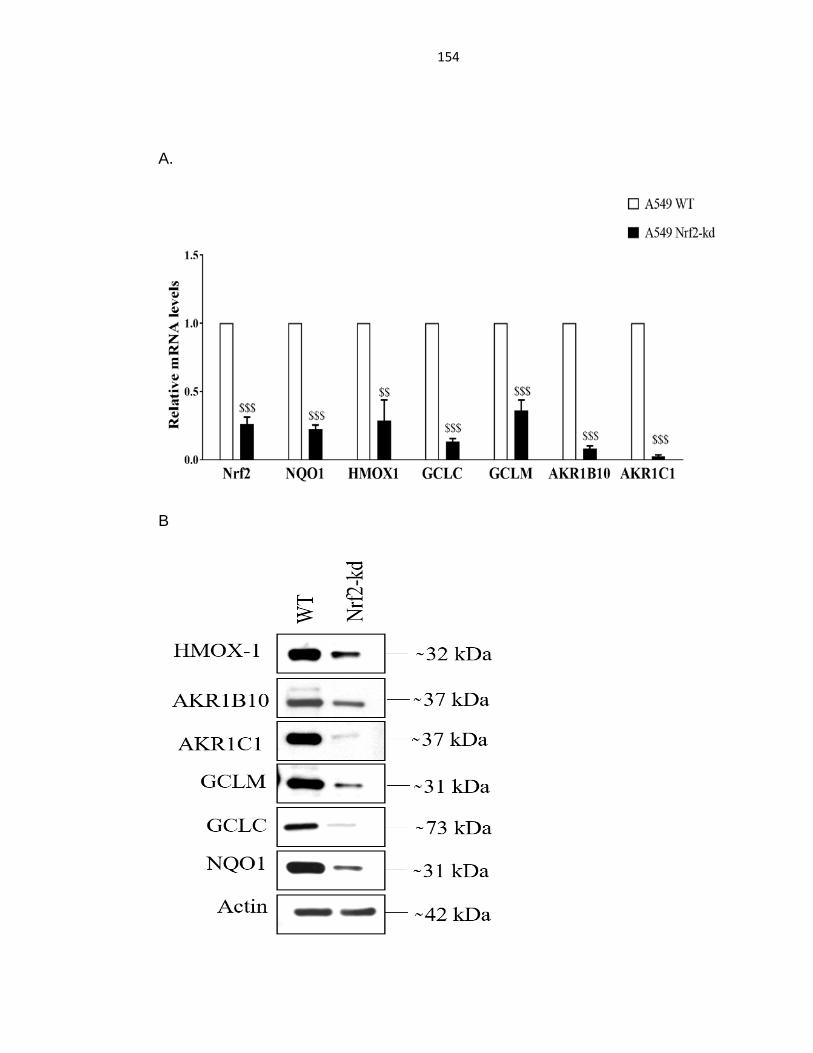
154
A.
B
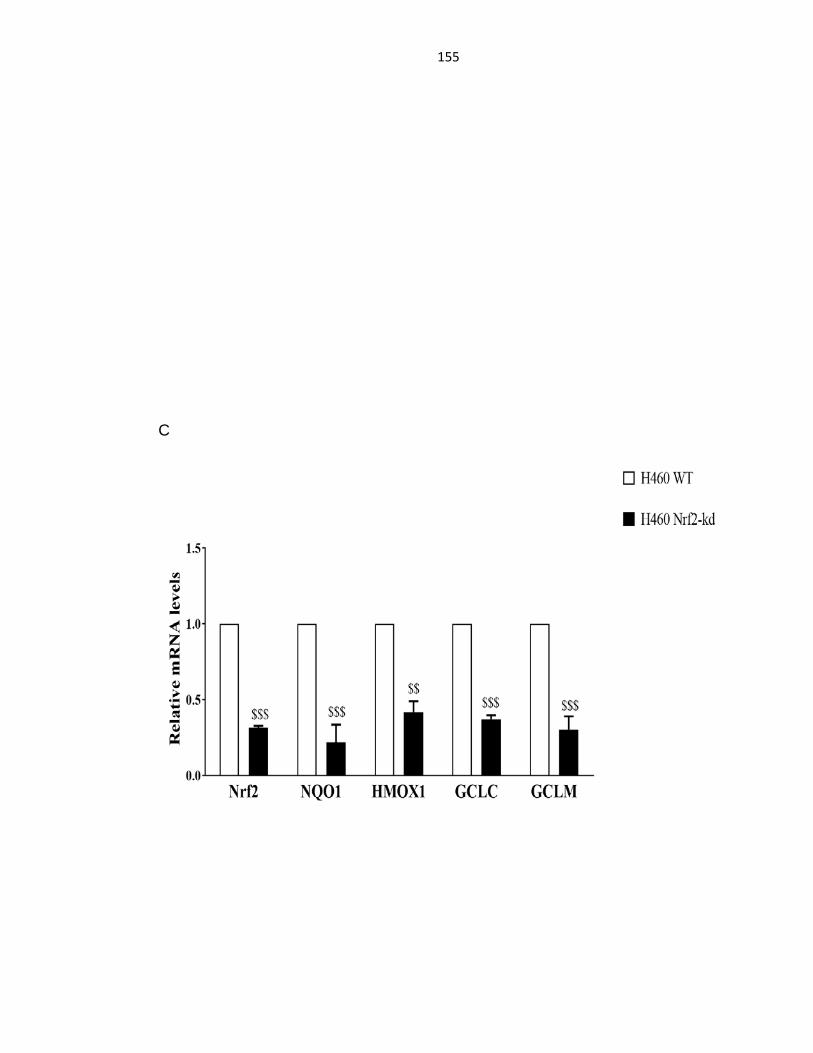
155
C
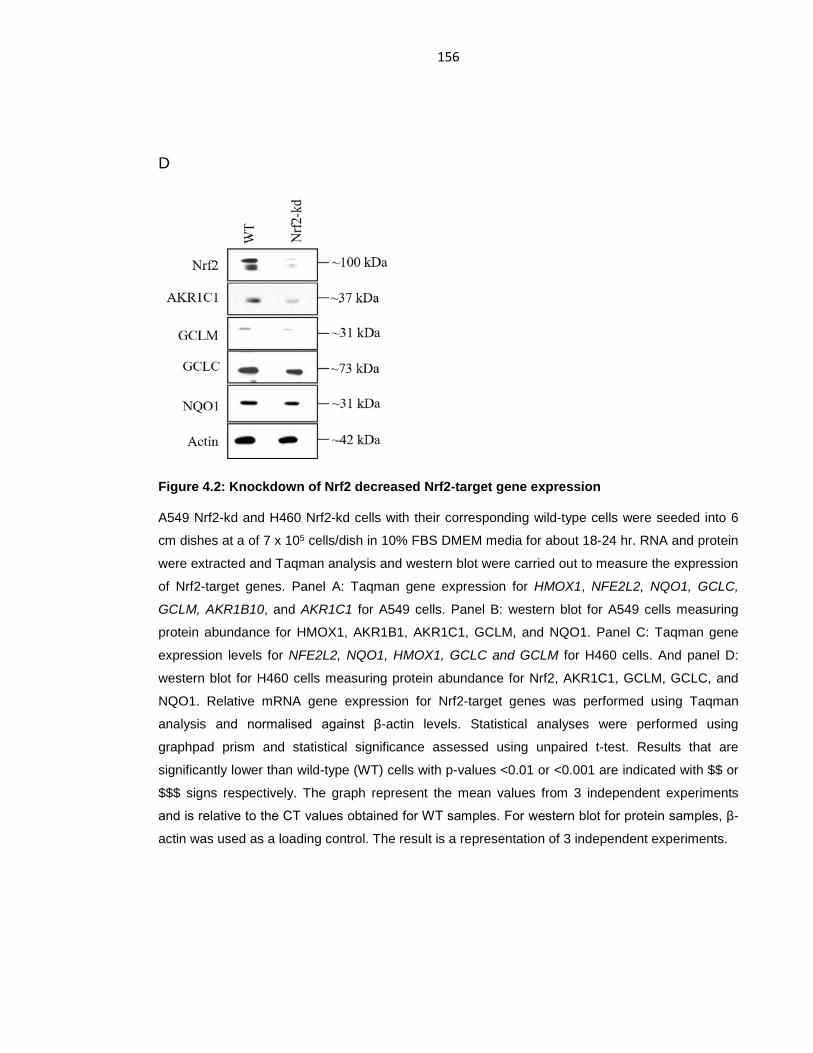
156
D
Figure 4.2: Knockdown of Nrf2 decreased Nrf2-target gene expression
A549 Nrf2-kd and H460 Nrf2-kd cells with their corresponding wild-type cells were seeded into 6
cm dishes at a of 7 x 10⁵ cells/dish in 10% FBS DMEM media for about 18-24 hr. RNA and protein
were extracted and Taqman analysis and western blot were carried out to measure the expression
of Nrf2-target genes. Panel A: Taqman gene expression for HMOX1, NFE2L2, NQO1, GCLC,
GCLM, AKR1B10, and AKR1C1 for A549 cells. Panel B: western blot for A549 cells measuring
protein abundance for HMOX1, AKR1B1, AKR1C1, GCLM, and NQO1. Panel C: Taqman gene
expression levels for NFE2L2, NQO1, HMOX1, GCLC and GCLM for H460 cells. And panel D:
western blot for H460 cells measuring protein abundance for Nrf2, AKR1C1, GCLM, GCLC, and
NQO1. Relative mRNA gene expression for Nrf2-target genes was performed using Taqman
analysis and normalised against β-actin levels. Statistical analyses were performed using
graphpad prism and statistical significance assessed using unpaired t-test. Results that are
significantly lower than wild-type (WT) cells with p-values <0.01 or <0.001 are indicated with $$ or
$$$ signs respectively. The graph represent the mean values from 3 independent experiments
and is relative to the CT values obtained for WT samples. For western blot for protein samples, β-
actin was used as a loading control. The result is a representation of 3 independent experiments.

157
The Keap1-Nrf2 pathway has been shown to regulate cytoprotective response
against endogenous and exogenous stress caused by ROS through regulating
the expression of proteins involved in scavenging ROS (Kovac et al., 2015).
Therefore, the level of ROS in these cells were analysed after knockdown of Nrf2.
A549 Nrf2-kd cells showed an increase in the levels of ROS when Nrf2 was
genetically knocked down (Figure 4.3A). Knockdown of Nrf2 in H460 cells caused
a similar increase in ROS levels (Figure 4.3B).
A

158
B
Figure 4.3: Depletion of Nrf2 resulted in an increase in ROS in lung cancer cells
To measure the level of ROS in A549 and H460 Nrf2 knocked down cells in comparison to
wildtype (WT), A549 and H460 cells were seeded in triplicate into 6-well plate at a density of 4 x
105 cells/well and grown overnight in 10% FBS DMEM media. The level of ROS is measured by
spectrophotometric analysis using the DCFH-DA dye. DCFH-DA measures the amount of reactive
oxygen species produced. The amount of DCF produced is normalised against the amount of
protein in cells after protein quantification. Results that are significantly higher than WT with p-
values <0.01 are indicated with double (**) asterisk signs. The results are a representation of three
independent experiments all including 3 technical replicates.
4.2.2 Effect of Nrf2 knockdown on cell growth and proliferation in tumour cells using shRNA.
One major characteristic of cancer cells is increased proliferation and an
imbalance in redox signalling (Fan et al., 2017). ROS has been shown act as
second messenger, driving cellular signalling (Liou and Storz, 2010). Cell growth,
proliferation and death is regulated and modulate by ROS status of the cell

159
environment (Sauer, Wartenberg and Hescheler, 2001; Day and Suzuki, 2006).
Lower levels of ROS especially hydrogen peroxide have been reported to induce
tumour growth (Day and Suzuki, 2006). Since Nrf2 is one of the major regulators
of ROS, it will therefore control the levels of cell proliferation. Fan et al. (2017)
showed that over-expression of Nrf2 in patients with malignant brain tumours
increased cell proliferation and oncogenic transformation. As knockdown of Nrf2
caused an increase in ROS levels in A549 and H460 cells, the effect of Nrf2
knockdown on cell growth and proliferation was next assayed. Cell proliferation
rate in A549 and H460 cells were measured using the Incucyte cell count
proliferation assay and showed that knockdown of Nrf2 caused a significant
decrease in cell proliferation rate in shRNA Nrf2-kd A549 cells (Figure 4.4A) and
shRNA Nrf2-kd H460 cells (Figure 4.4B). To confirm the effect of Nrf2 knockdown
on cell proliferation, colony formation assay was performed to show the number of
colonies formed when Nrf2 was knocked down in cancer cells. The result show
that knockdown of Nrf2 caused a significant decrease in the number of viable
colonies formed in A549 Nrf2-kd cells (Figure 4.4C) and in H460 Nrf2-kd cells as
opposed to wild-type. The results suggest that the elevated levels of Nrf2 in A549
and H460 cells promote the increased proliferative ability of these cancer cells.

160
A
B

161
C
D
Figure 4.4: Nrf2 enhances cell proliferation and growth
A549 (A) and H460 WT (B) and Nrf2-kd cells were seeded into 12-well plates at a density of
10,000 cells/well in 10% FBS DMEM media and incubated at 37oC 5% CO2 incubator overnight.
Next day, plates were scanned in the Incucyte Zoom and repeated every 48 hr over a period of 10
days. The media was changed every 48 hr and afterwards, the percentage of confluency obtained
on each day was plotted against time elapsed. For colony formation, A549 (C) and H460 WT (D)
and Nrf2- kd cells were seeded at 250 cells/10 cm dish in 10% FBS DMEM media for 18 days until
visible colonies begin to appear. Cells were then fixed and stained in a solution of 2% toludine
blue. The results are a representation of 2 independent experiments done in triplicate.

162
4.2.3 Nrf2 regulates cellular glutathione
By regulating the transcription of enzymes involved in glutathione synthesis, Nrf2
is able to regulate cellular levels of glutathione. Since knockdown of Nrf2 resulted
in a decrease in expression of the two subunits of glutamate-cysteine ligase:
GCLC and GCLM, a rate limiting enzyme required for synthesis of glutathione and
also an increase in ROS, the effect of Nrf2 knockdown on cellular glutathione
levels were ascertained. Knockdown of Nrf2 resulted in a 2-fold decrease in
cellular glutathione in A549 Nrf2-kd cells (Figure 4.5A) and H460 Nrf2-kd cells
(Figure 4.5B). An experiment by Reddy and His colleagues showed that Nrf2 is
able to regulate cell proliferation in pulmonary epithelial cells through regulating
cellular glutathione levels (Reddy et al., 2007a). As knockdown of Nrf2 resulted in
a decrease in cell proliferation and cellular glutathione levels, there was the need
to check if restoration of glutathione in A549 Nrf2-kd cells would result in
restoration of cell growth in comparison to the parental cell lines. To do this, A549
Nrf2-kd cells were treated with the antioxidant N-acetylcysteine (NAC), a prodrug
for L-cysteine used for production of glutathione in systems where it has been
depleted. The results showed that treatment of WT and Nrf2-kd A549 cells with
NAC caused an increase in the cellular glutathione in both A549 WT and A549
Nrf2-kd cells (Figure 4.5C). NAC caused a 5-fold increase in cellular glutathione in
A549 WT cells, and a 2-fold increase in A549 Nrf2-kd cells. When cells
proliferation rate was measured in A549 WT and A549 Nrf2-kd plus/minus NAC,
an increase in cell proliferation was observed in both A549 WT and A549 Nrf2-kd
cells with treatment with NAC (Figure 4.5D). The result therefore shows that
decrease cell proliferation is due to the decrease in glutathione levels as NAC
restored glutathione levels as well as increases cell proliferation.

163
A
B
C.
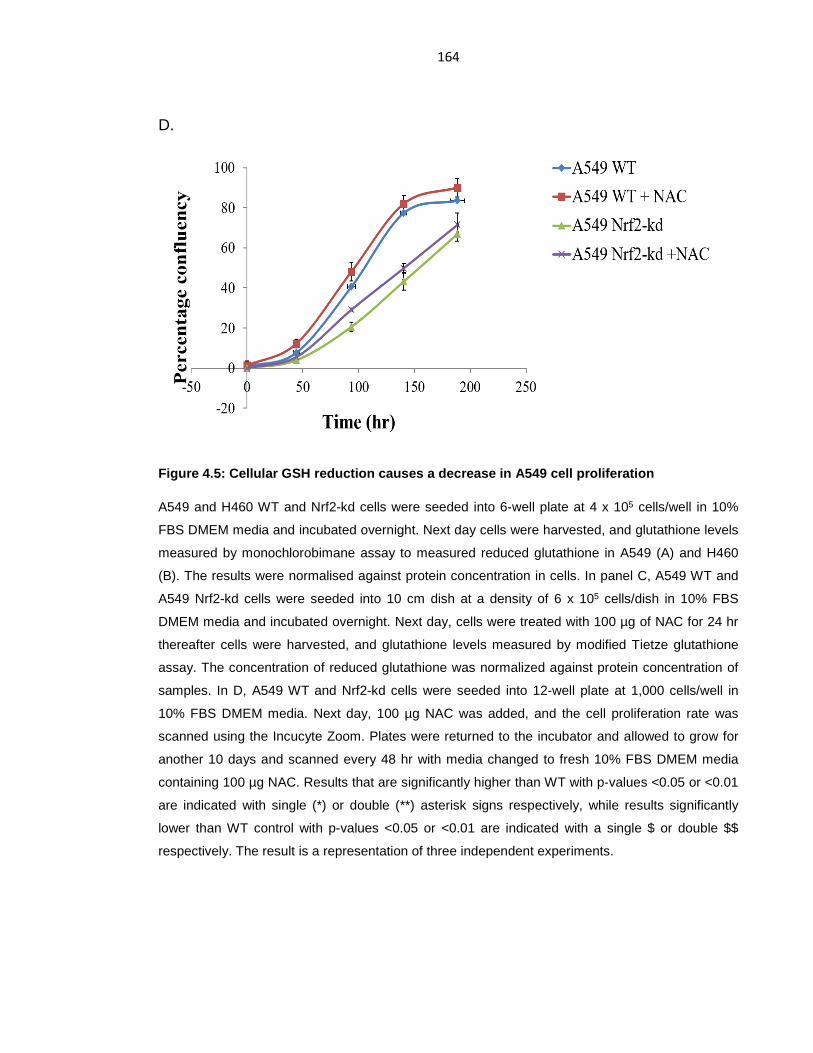
164
D.
Figure 4.5: Cellular GSH reduction causes a decrease in A549 cell proliferation
A549 and H460 WT and Nrf2-kd cells were seeded into 6-well plate at 4 x 10⁵ cells/well in 10%
FBS DMEM media and incubated overnight. Next day cells were harvested, and glutathione levels
measured by monochlorobimane assay to measured reduced glutathione in A549 (A) and H460
(B). The results were normalised against protein concentration in cells. In panel C, A549 WT and
A549 Nrf2-kd cells were seeded into 10 cm dish at a density of 6 x 10⁵ cells/dish in 10% FBS
DMEM media and incubated overnight. Next day, cells were treated with 100 µg of NAC for 24 hr
thereafter cells were harvested, and glutathione levels measured by modified Tietze glutathione
assay. The concentration of reduced glutathione was normalized against protein concentration of
samples. In D, A549 WT and Nrf2-kd cells were seeded into 12-well plate at 1,000 cells/well in
10% FBS DMEM media. Next day, 100 µg NAC was added, and the cell proliferation rate was
scanned using the Incucyte Zoom. Plates were returned to the incubator and allowed to grow for
another 10 days and scanned every 48 hr with media changed to fresh 10% FBS DMEM media
containing 100 µg NAC. Results that are significantly higher than WT with p-values <0.05 or <0.01
are indicated with single (*) or double (**) asterisk signs respectively, while results significantly
lower than WT control with p-values <0.05 or <0.01 are indicated with a single $ or double $$
respectively. The result is a representation of three independent experiments.

165
4.2.4 Nrf2 controls cell proliferation by regulating the expression of metabolic genes
Rapid tumour growth requires an adequate supply of nutrients and metabolic
intermediates to serves as building blocks (Mitsuishi et al., 2012; DeBerardinis et
al., 2008). Nrf2 has been shown to contribute to accelerated proliferation of
cancer cells and to redirect glucose and glutamine into anabolic pathways in
cancer cells (Mitsuishi et al., 2012). To understand how Nrf2 is controlling cell
proliferation in cancer cells, examination of what effect the disruption of Nrf2 has
on expression of genes involved in biosynthesis of macromolecules was carried
out. The mRNA levels of genes involved in PPP including glucose-6-phosphate
dehydrogenase (G6PD), phosphogluconate dehydrogenase (PGD), transaldolase
1 (TALDO1), was measured. Also, the genes required for NADPH synthesis
including malic enzyme 1 (ME1), pyruvate dehydrogenase lipoamide kinase 4
(PDK4) and isocitrate dehydrogenase 1 (IDH1) was measured by TAqman. The
results obtained showed that knockdown of Nrf2 in A549 cell resulted in an
approximate 70% decrease in G6PD, PGD1 and TALDO1 genes involved in
pentose phosphate pathway (Figure 4.6A). Similarly, knockdown of Nrf2 in A549
cells resulted in an approximate 50% decrease in ME1, IDH1, and PDK4 genes
involved in NADPH production and carbohydrate metabolism (Figure 4.6B).
Evidence has also shown that Nrf2 is involved in fatty acid metabolism. To check
this, mRNA levels of genes involved in fatty acid metabolism was analysed in
A549 WT and Nrf2-kd cells. Knockdown of Nrf2 resulted in a significant decrease
in expression level of the peroxisomal acyl-coenzyme A oxidase 1 (ACOX1), acyl-
coenzyme A oxidase 2 (ACOX2), carboxylesterase 1 (CES1) and carnitine
palmitoyltransferase 1(CPT1). However, Knockdown of Nrf2 caused a significant
increase in the expression of acetyl-coenzyme A acyltransferase 1 (ACAA1) and
stearoyl-CoA desaturase-1 (SCD1) (Figure 4.6C) consistent with the literature.

166
A
B
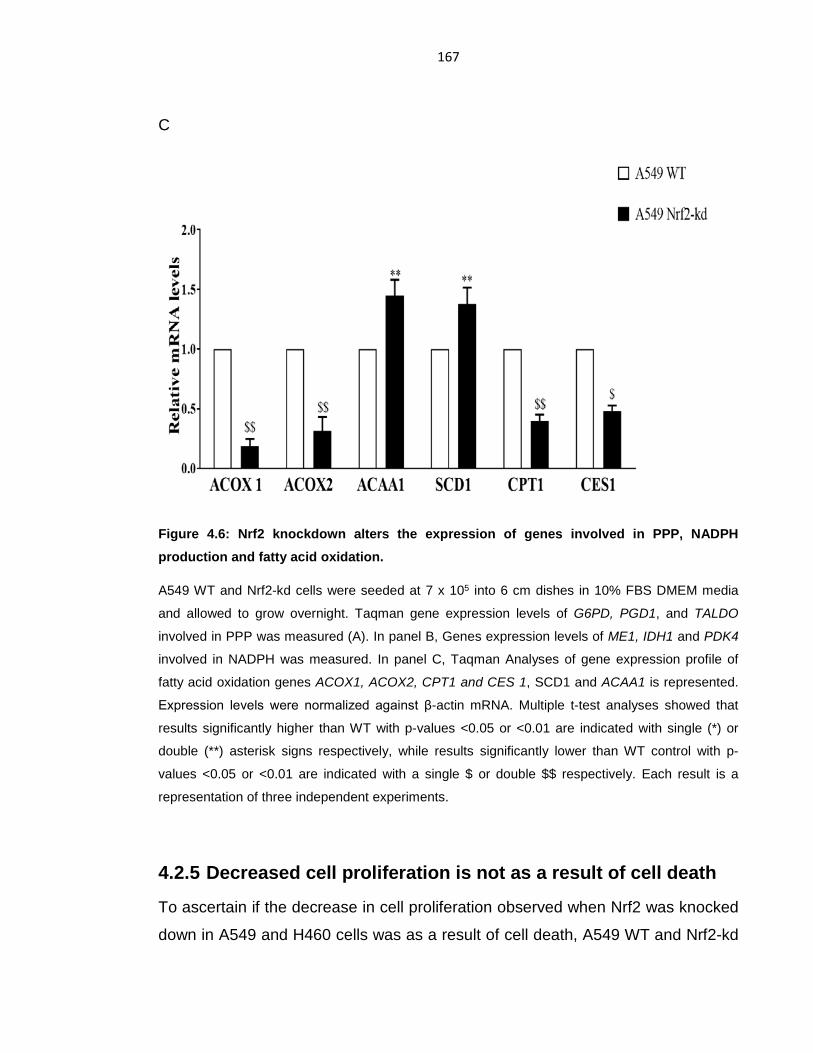
167
C
Figure 4.6: Nrf2 knockdown alters the expression of genes involved in PPP, NADPH production and fatty acid oxidation.
A549 WT and Nrf2-kd cells were seeded at 7 x 10⁵ into 6 cm dishes in 10% FBS DMEM media
and allowed to grow overnight. Taqman gene expression levels of G6PD, PGD1, and TALDO
involved in PPP was measured (A). In panel B, Genes expression levels of ME1, IDH1 and PDK4
involved in NADPH was measured. In panel C, Taqman Analyses of gene expression profile of
fatty acid oxidation genes ACOX1, ACOX2, CPT1 and CES 1, SCD1 and ACAA1 is represented.
Expression levels were normalized against β-actin mRNA. Multiple t-test analyses showed that
results significantly higher than WT with p-values <0.05 or <0.01 are indicated with single (*) or
double (**) asterisk signs respectively, while results significantly lower than WT control with p-
values <0.05 or <0.01 are indicated with a single $ or double $$ respectively. Each result is a
representation of three independent experiments.
4.2.5 Decreased cell proliferation is not as a result of cell death
To ascertain if the decrease in cell proliferation observed when Nrf2 was knocked
down in A549 and H460 cells was as a result of cell death, A549 WT and Nrf2-kd

168
cells were stained with celltox green dye that gives a fluorescence signal when
bound to dead cell that is proportional to the number of dead cells in a culture and
allowed to grow. Incucyte analysis of cell viability showed little or no cell death in
A549 Nrf2 kd cells even though cell proliferation is decreased as opposed to A549
WT (Figure 4.7). This suggests that the decrease in cell proliferation is not as a
result of the cells death.
Figure 4.7: Loss of Nrf2 not associated with cell death
A549 WT and Nrf2-kd cells were seeded into 12-well plate at 1,000 cells/well in 10% FBS DMEM
media. Celltox green dye was added next day and plate scanned using the Incucyte Zoom. Plates
were returned to incubator and allowed to grow for another 10 days and scanned every 48 hr with
media changed to fresh 10% FBS DMEM media containing celltox green dye. A549 WT cell is
shown in green line; A549 Nrf2-kd cell is grown as blue line while A549 Nrf2-kd cell expressing the
green dye is shown as red line.
4.2.6 Nrf2 and cell cycle Protein
As Nrf2 caused a decrease in cell proliferation, and this was not due to cell death,
next examination of cell cycle progression to verify if the decrease in cell
proliferation and growth was as a result of an arrest in the cell cycle. A previous
169
study using brusatol, an Nrf2 inhibitor in mouse reported that inhibition of Nrf2 was
associated with cell cycle arrest (Lin et al., 2018). An earlier study in Nrf2-/-
primary epithelial culture also reported that Nrf2 deficiency led to oxidative stress
and DNA lesions that was accompanied by impairment of the cell cycle (Reddy et
al., 2008). Several well characterized genes have been reported to be responsible
for cell cycle progression including the cyclins and cyclin-dependent kinases (Lin
et al., 2018). Western blot analysis of some cell cycle protein in A549 and H460
WT and Nrf2-kd cells showed that knockdown of Nrf2 caused a decrease in the
protein levels of cyclin A, cyclin B and p-CDC2 (Tyr15) in both A549 (Figure 4.8A)
and H460 Nrf2-kd cells (Figure 4.8B). Next, using FACS and staining with PI the
total amount of cell in the phases of the cell cycle was determined. Knockdown of
Nrf2 in A549 cells caused a decrease in number of cells entering the S phase
suggesting a G0/G1 phase arrest (Figure 4.8C). However, knockdown of Nrf2 in
H460 showed no significant change in the amount of cell entering the S phase
(Figure 4.8D).

170
A
B

171
C
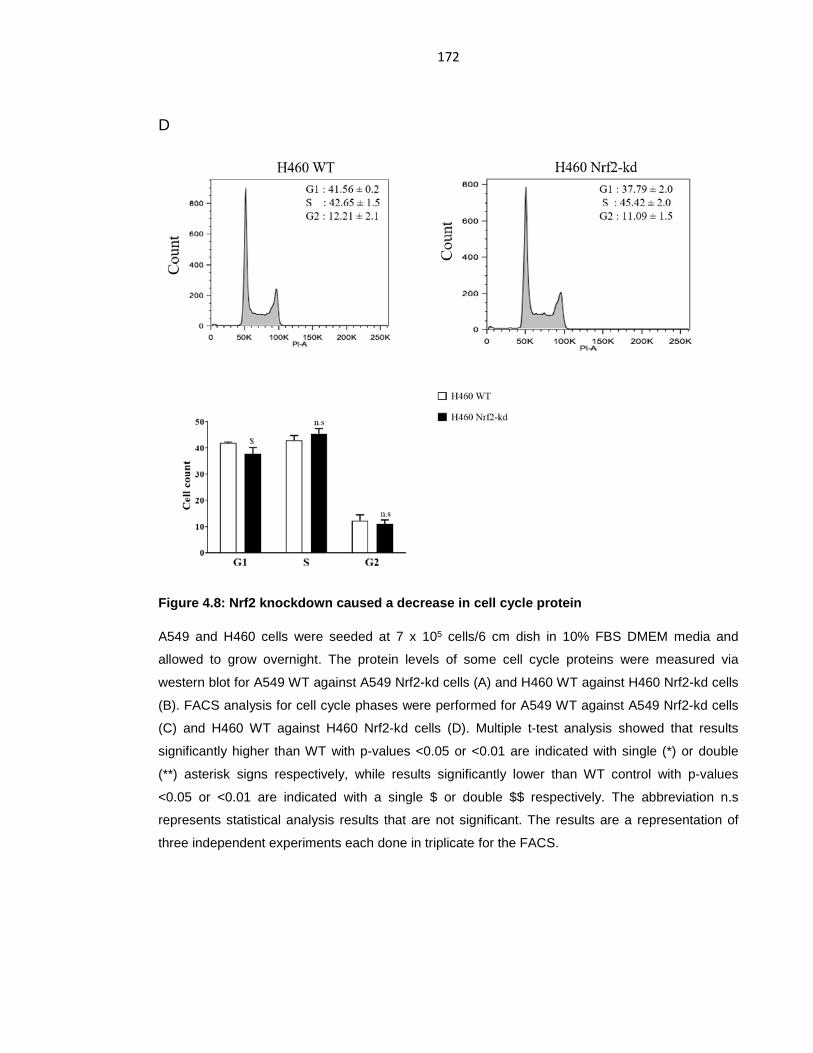
172
D
Figure 4.8: Nrf2 knockdown caused a decrease in cell cycle protein
A549 and H460 cells were seeded at 7 x 10⁵ cells/6 cm dish in 10% FBS DMEM media and
allowed to grow overnight. The protein levels of some cell cycle proteins were measured via
western blot for A549 WT against A549 Nrf2-kd cells (A) and H460 WT against H460 Nrf2-kd cells
(B). FACS analysis for cell cycle phases were performed for A549 WT against A549 Nrf2-kd cells
(C) and H460 WT against H460 Nrf2-kd cells (D). Multiple t-test analysis showed that results
significantly higher than WT with p-values <0.05 or <0.01 are indicated with single (*) or double
(**) asterisk signs respectively, while results significantly lower than WT control with p-values
<0.05 or <0.01 are indicated with a single $ or double $$ respectively. The abbreviation n.s
represents statistical analysis results that are not significant. The results are a representation of
three independent experiments each done in triplicate for the FACS.

173
4.3 Discussion
Lung cancer with a significantly lower survival rate than the majority of epithelial
malignancies is one of the leading cause of cancer-related death (Best et al.,
2018). Increased ROS has been reported in several cancer cell and are involved
in cell cycle progression and proliferation, cell survival and apoptosis, energy
metabolism, cell morphology, angiogenesis and maintenance of tumour stemness
(Liou and Storz, 2010). However, tumour cells also express increased levels of
antioxidant proteins to detoxify ROS creating a balance of the intracellular ROS
levels required for driving cancer cells (Liou and Storz, 2010). Nrf2 has been
reported to control the expression of antioxidant genes in response to ROS in
cells. This chapter confirms that knock down of Nrf2 in A549 and H460 caused a
significant increase in the level of intracellular ROS. This result is consistent with
that reported by Singh et al. (2011) were knockdown of Nrf2 was able to induce
the generation of ROS, suppress tumour growth and increased sensitivity to
chemotherapeutic drugs. Similar results were also reported by Shao et al. (2018).
High levels of Nrf2 in cancer cells correlate with poor prognosis due not only to
their resistance to chemo- and radio-therapy but also due to their increased
proliferative rate (McDonald et al., 2010; Solis et al., 2010; Bai et al., 2016). Cells
need to proliferate for proper functioning of tissues, embryo development and
death, however the rate of proliferation in tumour cells is heightened. A549 and
H460 cells had higher proliferative rate as opposed to A549 Nrf2-kd cells.
Knockdown of Nrf2 resulted in a decrease in cell proliferation and colony
formation in both A549 and H460 cells. This decrease in cell proliferation is
consistent with result shown by (Homma et al., 2009).
Proliferating cells use-up abundant nutrient including glutamine and glucose
(DeBerardinis et al., 2008). Studies have shown that glutathione is essential for
cells to proliferate effectively. By regulating the key enzymes required for
glutathione synthesis Nrf2 is able to regulate glutathione synthesis. The result
reported in this chapter shows that knockdown of Nrf2 caused a decrease in
174
GCLC and GCLM. Measurement of the total cellular glutathione revealed a high
level of glutathione in A549 and H460 which was decreased when Nrf2 was
genetically knockdown in these cells. To confirm if glutathione was indeed
required for the cells ability to proliferate, A549 Nrf2-kd cells were treated with
NAC. The result show that NAC increased cellular glutathione levels in both A549
WT and A549 Nrf2-kd cells. This increase also correlated with an increase in the
proliferative rate of the cells. A549 cells proliferated more on treatment with NAC
while A549 Nrf2-kd cells also expressed an increase in their rate of proliferation.
This confirms that the decrease in cell proliferation observed in Nrf2 knockdown
can be attributed to the glutathione levels in these cells.
Cells that are actively proliferating take up nutrients in excess beyond the
requirement for bioenergetic need and shunt metabolites into pathways that
promote biosynthesis (DeBerardinis et al., 2008). One hallmark of cancer cell is
the ability to switch metabolic pathway. Microarray and Chip sequencing data
reveal that by activating metabolic genes involved in pentose phosphate pathway,
Nrf2 is able to regulate cell proliferation (Malhotra et al., 2010; Mitsuishi et al.,
2012). By generating NADPH, the pentose phosphate pathway is able to prevent
oxidative stress (Moon and Giaccia, 2015). The flux of glucose either through the
glycolysis or PPP is controlled by G6PD. By controlling the expression of G6PD
Nrf2 is able to favour biosynthetic reactions (Wu, Cui and Klaassen, 2011). Also,
the non-oxidative phase of the PPP is also regulated by Nrf2. TALDO1 has been
reported to have a functional ARE sequence in its promoter and such is a direct
target for Nrf2 (Malhotra et al., 2010; Chorley et al., 2012). Consistent with
previous research, Nrf2 is able to upregulate G6PD, PGD, TALDO1, ME1 and
IDH1. Knockdown of Nrf2 showed a significant decrease in the expression of
these genes. By mediating the expression of these genes, Nrf2 is able to alter
glucose and glutamine metabolism to promote cancer cell proliferation. Proteomic
analysis of Nrf2 deficient mice has reported that Nrf2 controls lipid metabolism
(Kitteringham et al., 2010). Several lipases involved in the degradation of
triglycerides and phospholipids and fatty acid oxidation has been reported to be
175
reported by Nrf2. The results obtained in this chapter confirms that Nrf2 is able to
regulate lipid metabolism. Knockdown of Nrf2 caused an increase in SCD1 an
enzyme that catalyses the rate limiting step in unsaturated fatty acid synthesis.
Repression of SCD1 by Nrf2 reduces the biosynthesis of monounsaturated fatty
acid (Flowers and Ntambi, 2008). Nrf2 knockdown also caused a decrease in the
expression of ACOX1, ACOX2, CES1 and CPT1.
Based on the observation that impairment of Nrf2 compromises or delays entry to
the M-phase of the cell cycle, Nrf2 has been described to be required for the
transition from G2-phase to M-phase in the cell cycle (Reddy et al., 2008; Zou et
al., 2015). Activation of Cdk1/cyclin B1 pathway is required for G2/M transition.
Measurement of cdc2 and cyclin B1 protein abundance in A549 and H460 cells
shows that Nrf2 knockdown caused a decrease in cdc2 and cyclin B1 proteins
consistent with this observation. A member of the cyclin family functioning in the
regulation of cell cycle progression, cyclin A is able to activate two different cyclin-
dependent kinases (CDK), CDK1 and CDK 2 in both S phase and mitosis(Yam,
Fung and Poon, 2002). Western blot data of cyclin A showed a decrease in the
protein abundance of the cell when Nrf2 was knocked down. Consistent with this,
FACS analysis of A549 cells revealed a decrease in the number of cells in the S
phase suggesting a G0/G1 arrest in A549 Nrf2-kd cells as opposed to A549 cells.
This data is different from previous research that reported a G2/M phase arrest
(Reddy et al., 2008; LIN et al., 2018). However, both reports have not studied
human cancer cells but have looked at mouse. Further work to confirm this data is
advised.
Consistent with previous reports, the data presented in this chapter reveal that
knockdown of Nrf2 in cancer cells results in a decrease in the expression of Nrf2-
target genes encoding phase II drug-metabolising enzymes and enzymes
involved in the neo-synthesis of glutathione. The loss of Nrf2 also caused a
decrease in ROS levels in these cells consistent with the ability of Nrf2 to control
ROS imbalance. Nrf2 knockdown in these cancer cells caused a decrease in cell
proliferation and growth and this is due to a corresponding decrease in

176
glutathione synthesis as treatment with NAC resulted in a rescue of cell
proliferation rate. The decrease in cell proliferation was shown to be independent
of cell death but might be due to decrease in nutrient supply, impairment of
biosynthesis of macromolecules required for growth and decrease in
mitochondrial function and β- oxidation of fatty acid.

177
CHAPTER 5
178
5.0 Discussion
5.1 Nrf2 activators function in both Keap1 and Keap1-independent mechanism in Nrf2-target gene induction The ability of Nrf2 to transactivate genes encoding proteins involved in redox
homeostasis, stress response, drug metabolism, drug transport and intermediary
metabolism has made it a useful cytoprotective transcription factor in cancer
prevention. Controlled Nrf2 upregulation has been seen to protect cells against
the initiation of many types of cancer (auf dem Keller et al., 2006; Thimmulappa et
al., 2008). Nrf2-/- mice despite their normal embryonic development and lifespan,
readily develop tumours when exposed to chemical carcinogens, validating the
role of Nrf2 in cancer prevention (Ramos-Gomez et al., 2001). However, co-
administration of Nrf2 activators and a carcinogen results in reduced tumour
volume (Yates et al., 2006).
Recent research has focused on the ability of many foods and traditional
medicines to activate Nrf2 thus serve as therapeutic drugs. Natural electrophiles
contained in some of these food target Cys-151 in Keap1 leading to an increased
abundance of Nrf2 and subsequent induction of genes encoding antioxidants,
phase II detoxification enzymes and transporters, validating their use for
therapeutic benefit (Harder et al., 2015). The two most studied Nrf2 activators are
SFN generated from glucoraphanin within broccoli through the actions of
myrosinase (Zhang et al., 1992); and cinnamaldehyde isolated from cinnamon by
deamination of L-phenylalanine into cinnamic acid through the action of
phenylalanine lyase (PAL) (Singh et al., 2007; Gutzeit, and Ludwig-Muller, 2014.).
Administration of SFN to mice protected them against development of 7,12-
dimethylbezan(a)anthracene-induced skin tumour (Xu et al., 2006). Lung
179
carcinogenesis in A/J mice caused by tobacco was also seen to be suppressed by
treatment with SFN (Conaway et al., 2005). In humans, consumption of broccoli
has been linked with prevention of colon, lung, breast, liver and prostate cancer
(Spitz et al., 2000; Seow et al., 2002; Ambrosone et al., 2004; Joseph et al., 2004;
Kensler et al., 2005). Evaluation of the chemopreventive properties of broccoli
sprout in a phase II clinical trial in China revealed that SFN decreased aflatoxin-
DNA adducts in humans (Kensler et al., 2005). Cinnamaldehyde was shown to
decrease tumour in colorectal cancer by inducing Nrf2-target genes (Long et al.,
2015). Another well studied chemopreventive natural product capable of
activating Nrf2 is curcumin. Increased expression of Nrf2, and inhibition of
oxidative stress, inflammation and DNA adduct formation was seen in
benzo(a)pyrene-induced liver and lung carcinogenesis when curcumin was
administered in the diet (Garg, Gupta and Maru, 2008; Thimmulappa et al., 2008).
Bardoxolone-methyl (CDDO-Me) and dimethylfumarate (DMF), two other Nrf2
activators has passed into clinical trials and the clinic respectively. However, due
to safety issues, bardoxolone was retracted at phase III clinical trial. Increased
glomerular infiltration rate in patients with chronic kidney disease was ascribed to
prolong bardoxolone treatment in phase II clinical trials for the treatment of
diabetic nephropathy using bardoxolone (Pergola et al., 2011; Zhang, 2013; Chin
et al., 2018).
Due to the presence of the two degradation degrons within the Neh2 and Neh6
domains, Nrf2 is controlled primarily at the level of protein stability by Keap1 and
β-TrCP. Keap1 as the primary regulator of Nrf2 as discussed previously is subject
to oxidative and electrophilic modification. SFN present in cruciferous vegetables
such as broccoli has been shown to target the Keap1 at Cys-151 (Zhang and
Hannink, 2003). CDDO-Me has been reported to interact with Cys-151 in the BTB
domain of Keap1, interfering with the Keap1/cul3 interaction leading to Nrf2
activation (Cleasby et al., 2014). DMF has also been shown to alkylate cysteine
residues in Keap1 preventing ubiquitination and promoting stabilization and
subsequent activation of Nrf2-target genes (Phillips and Fox, 2013). Other than
180
sharing the ability to modify sulfhydryl groups of cysteines by oxidation and adduct
formation, xenobiotic compounds that activate Nrf2 are diverse in nature (Rojo et
al., 2012). Different electrophiles modify cysteine residues in Keap1 in their own
way in activation of Nrf2 displaying a unique pattern of cysteine modification
(Dinkova-Kostova et al., 2002; Eggler et al., 2005; Hong, Freeman and Liebler,
2005; Hong et al., 2005; Fujii et al., 2010) A recent study has shown that
nordihydroguaiaretic acid (NDGA) increased Nrf2 and Hmox1 levels through
inhibiting the phosphorylation the Neh6 domain in Nrf2 by GSK-3 (Rojo et al.,
2012). With the increased tendency for Nrf2 activators to target cysteines and
multiple signalling pathways, one major fear with the Nrf2 activators used as
pharmacological agents is occurrence of cytotoxicity arising as a result of off-
target effects. An understanding of the physiological or pathological state under
which a specific E3 ubiquitin ligase will play a dominant role in regulating Nrf2 is
required for effectively activating Nrf2 for disease prevention. Our result shows
that Nrf2 activators increase the expression of Nrf2 target gene in a Keap1-
independent manner. tBHQ, CDDO-Im, DEM, curcumin, carnosol, and ferulic acid
increased the expression of Nqo1 and Hmox1 genes in Keap1-/- MEFs.
The evidence that Nrf2 is inhibited by GSK-3 was first demonstrated in a study on
Skn-1, an orthologue of Nrf2 present in Caenorhabditis elegans. The result shows
that phosphorylation of Skn-1 protein mediated by GSK-3 prevented the nuclear
accumulation of Skn-1 and subsequent activation of phase II detoxification genes
(An et al., 2005). Earlier work by McMahon et al. (2004) revealed that Nrf2 is
negatively regulated by another domain other than Neh2 because when the
ETGE Keap1-binding motif in the Neh2 domain is deleted, the mutant Nrf2 protein
was still found to possess a short half-life. Specifically, examination of Nrf2
deletion mutants not targeted by Keap1 (e.g. including Nrf2∆116-131, Nrf2∆177-193,
Nrf2∆329-339, Nrf2∆329-379 and Nrf2∆363-379), revealed that only those that lack the
Neh6 domain (i.e. Nrf2∆329-339 and Nrf2∆363-379) exhibited increased stability
(McMahon et al., 2004). GSK-3 was subsequently identified to inhibit Nrf2 by
preventing the nuclear accumulation of the CNC-bZIP factor (Salazar et al., 2006;
181
Rojo, Sagarra and Cuadrado, 2008). The repression of Nrf2 by GSK-3 was found
to be independent of Keap1 and controlled by two β-TrCP recognition motif
(Chowdhry et al., 2013) through the Neh6 domain. In this thesis, treatment of
Keap1-/- MEFs with inducers of Nrf2 increased the phosphorylation of GSK-3 at
Ser-21 and Ser-9 moderately. Furthermore, use of a ‘Hot’ assay to measure GSK-
3 activity showed a slight decrease in the activity of GSK-3α and GSK-3β
following treatment with Nrf2 electrophilic activators. Collectively, the results
presented in this thesis revealed a Keap1-independent mechanism for induction
of Nrf2-target gene by electrophiles through prevention of GSK-3/β-TrCP-
dependent degradation of Nrf2 via its Neh6 domain.
5.2 Contribution of the PI3K-Akt/PKB signaling pathway to pharmacological induction of Nrf2-target gene expression PI3K mutation frequency has been observed in 11% of human lung
adenocarcinomas (Collisson et al., 2014b). There has been suggestion, that
activation of Akt/PKB is regulated by ROS (Ushio-Fukai et al., 1999) in a manner
in which inhibitors of the Akt/PKB signalling pathway would suppress Nrf2-target
gene while growth factor signalling would drive the activation of Nrf2-target gene
through inactivation of GSK-3. Another study also show that nerve growth factor
prevents the accumulation of ROS by a mechanism that is dependent on
PI3K/Akt-dependent induction of Hmox1 (Salinas et al., 2003). In a study to
understand how several stress proteins are upregulated by oxidative stress in
dopaminergic neurons in the pathogenesis of Parkinson’s disease, PI3K was
identified as important. In this study, PI3K-related signaling controlled the
activation of Nrf2 and inhibitors of PI3K signalling blocked nuclear translocation of
Nrf2 and its target protein (Nakaso et al., 2003). All of these studies therefore
show that the activation of PI3K-Akt/PKB kinase signalling pathway is required for
the induction of ARE-driven genes.
Several studies have shown that many xenobiotics stimulate cell signalling
cascades that participate in Nrf2 regulation. An initial study by the lab of Jeffery

182
Johnson reported that the activation of the human NQO1-ARE by tBHQ was
mediated by PI3K and not extracellular signal-related kinase (ERK 1/2) in IMR-32
cells (Lee et al., 2001). Antonio Cuadrado and his colleagues also showed that
the induction of ARE-driven genes by carnosol required the activation of the PI3K-
Akt/PKB kinase signalling pathway (Martin et al., 2004). Several studies also
highlighted the role of PI3k-Akt signalling in the induction of ARE-gene battery by
tBHQ (Kang et al., 2001, 2002; Zhang et al., 2015b). In addition, several studies
reported that inhibition of PI3K using LY294002 impairs the induction of ARE-
driven gene activation by tBHQ, 4-HNE, curcumin, ferulic acid and CDDO-Im
(Chen et al., 2009; Kang et al., 2007; Li, Lee and Johnson, 2002; Li, Cha and
Surh, 2006; Ma et al., 2010). In chapter 3 of this thesis, it was shown that
inhibition of PI3K by LY294002 and PI-103 caused a decrease in basal Nrf2
protein levels and in tBHQ, carnosol, and CDDO-Im ARE-driven and Nrf2-target
gene expression consistent with previous research (Lee et al., 2001; Nakaso et
al., 2003; Martin et al., 2004). Another key discovery was that regulation of Nrf2
through the PI3K-Akt/PKB signalling pathway is independent of Keap1 as
inhibition of PI3K repressed Nrf2-target gene induction in Keap1-/- MEFs.
As discussed earlier, the activity of PI3K-Akt is negatively regulated by PTEN
(Cantley and Neel, 1999; Gericke, Munson and Ross, 2006). PTEN has been
implicated as a tumour suppressor in lung cancer cells, with 27% of human
tumours harboring mutation in the PTEN gene (Best et al., 2018; Collisson et al.,
2014b). Mutation of the PTEN gene or genetic knockdown of PTEN activates Akt
(Salmena, Carracedo and Pandolfi, 2008). Results in chapter 3 of this thesis
confirm this as PTEN-knock-down ES cells, as well as pharmacological inhibition
of PTEN causes an increase in phosphorylation of Ser-473 in Akt. This activation
of Akt led to an increase in Nrf2 protein abundance. This is in accordance with the
study by Kensuke et al. (2009) that showed that mutation of PTEN in Jurkat
human leukemia cells led to tBHQ-induced expression of ARE-driven genes.
Analyses of the crystal structure of PTEN revealed that Cys-71 and Cys-124 form
disulphide bonds upon oxidation with ROS causing loss of phosphatase activity

183
(Lee et al., 2002; Cho et al., 2004; Seo et al., 2005). Consistent with the idea that
Cys-124 in PTEN is essential for the activity of PTEN (Kim et al., 2008a), E-
guggulsterone induced expression of Hmox1 was blocked when Cys-124 was
mutated confirming that this residue required for PTEN activity (Almazari et al.,
2012). Results presented in chapter 3 also show that inducers of Nrf2 decrease
the amount of PTEN protein. Nrf2 activators that target PI3K are able to do this by
inhibiting PTEN allowing inactivation of GSK-3 by phosphorylation of its N-
terminal Ser residue, preventing GSK-3 from negatively regulating Nrf2 by SCFβ-
TrCP.
5.3 Loss of Nrf2 in lung cancer cells causes reduced cell proliferation With a significantly lower survival rate, lung cancer is a major cause of cancer-
related death globally with an especially poor prognosis in advanced non-small-
cell lung cancer cases (Yamadori et al., 2012; Best et al., 2018). Mutations
resulting in dysregulation of the Keap1/Nrf2 stress response has been observed
in 23% of lung adenocarinomas (Govindan et al., 2012; Collisson et al., 2014b).
The major aim of improved anti-cancer drug over the last couple of years is to
prevent cancer cell growth and progression with as few side effects as possible.
High levels of Nrf2 in cancers has been linked with poor prognosis, due not only to
their ability to resist chemo and radio-therapy but also due to their robust
proliferation (McDonald et al., 2010; Solis et al., 2010; Bai et al., 2016; Best et al.,
2018). The proliferative rate of cells has been reported to depend on the status of
Nrf2 with cells expressing dominant negative Keap1 gene proliferating faster than
cells expressing wildtype Keap1 and this is in turn proliferates faster than cells
expressing a dominant negative NFE2L2 (Homma et al., 2009; Lister et al., 2011;
Zhang et al., 2015a, 2016). By maintaining the redox balance and generation of
antioxidants, Nrf2 is able to promote tumourigenesis and cancer cell proliferation.
Whilst high ROS may stimulate growth, high ROS may also cause apoptosis and

184
senescence. Thus, high Nrf2 levels may have different effect on cancer cells. In
the initiation, progression and survival phenotype of cancer, ROS has been
shown to play a major role. (Kwee, 2014; Okon and Zou, 2015; Poillet-Perez et
al., 2015). Since Nrf2 confers cytoprotection against oxidative stress, A549 and
H460 cells possess high ROS levels in them. Knockdown of NFE2L2 gene in
these cells resulted in decrease in ROS levels as well as decrease in cell
proliferation rate which is consistent with previous literature. Nrf2 makes use of
ROS as an arbitrator to pass on Nrf2-activating signals to cellular programs that
modify proliferation and differentiation (Murakami and Motohashi, 2015).
Liver regeneration is delayed in Nrf2-deficient mice after partial hepatectomy with
a decrease in number of proliferating hepatocytes and an increase in apoptotic
hepatocytes (Beyer et al., 2008). Activation of the PI3K-Akt signalling pathway
during liver regeneration has been reported to be attenuated in Nrf2-deficient
mice following partial hepatectomy suggesting a role for Nrf2 in the regulation of
growth factor signalling (Beyer et al., 2008). Another study described
accumulation of Nrf2 in livers of Keap1::PTEN double knockout mice causes
hepatomegaly promoting proliferation of liver cells (Taguchi et al., 2014). Thus, a
crosstalk between Nrf2 and the PI3K-Akt pathway would appear to support cell
growth and cell fate in various tissues (Murakami and Motohashi, 2015).
The cell cycle regulators Cdkn1a (p21) and Cdkn2b (p15) have been identified by
Chip-sequencing analyses to be novel Nrf2 target genes (Malhotra et al., 2010)
that may provoke stress-induce cell cycle arrest in response to oxidative stress.
Nrf2-deficient hepatocytes show accumulation of Wee1 and hyperphosphorylation
of cdk1 during liver degeneration causing a G2/M arrest (Zou et al., 2015).
Activation of Cdk1/cyclin B1 pathway drives the transition into G2/M phase. The
G2/M arrest caused by Nrf2 deficiency has been shown to be rescued by
supplementation with glutathione proposing that glutathione is a considerable
modifier of cell cycle status downstream of Nrf2 (Reddy et al., 2008).
185
The role of glutathione in promoting cell proliferation has been shown by many
studies (Reddy et al., 2007b; a; Ishimoto et al., 2011). Therefore, the ability of
Nrf2 to enhance glutathione synthesis in tumours is one-way Nrf2 promote cancer
cell proliferation. The result in chapter 4 showed that A549 and H460 cells
increase the expression of GCLC and GCLM and increase levels of GSH
explaining that Nrf2 may increase the synthesis of GSH. Knockdown of Nrf2 in
these cells caused a decrease expression of GCLC and GCLM and a decrease in
GSH leading to decreased cell proliferation. “Normal” non-cancer cells and
disease tissues utilizes metabolism in order to accomplish energy-dependent
processes. As opposed to quiescent cells, cancer cells possess different
metabolic activities as proliferating cells require abundant nutrients for the
synthesis of cellular components including lipids, proteins and nucleic acid. Nrf2
activates metabolic genes involved in glucose and glutamine metabolism,
contributing to reprogramming of cell proliferation (Mitsuishi et al., 2012).
Particularly, four key enzymes required for driving the PPP are regulated by Nrf2
including G6PD, PGD, TKT and TALDO1. Results in chapter 4 of this thesis show
that Nrf2 knockdown decreases the expression of G6PD, PGD, and TALDO
consistent with previous studies. Alteration in metabolic flux, shunting of glycolytic
intermediates into the PPP is mediated by activation of Nrf2 enhancing purine
nucleotide synthesis (Mitsuishi et al., 2012; Singh et al., 2013). Glutathione
synthesis and lactate production are also enhanced by Nrf2 through regulation of
glutamine metabolism. The major mechanism essential for the Nrf2-mediated
increase in cell proliferation is through facilitating the PPP.
Aside from controlling intracellular glutathione and ROS, Nrf2 also negatively
regulates lipid biosynthesis. Genetic (Keap1-KO) or pharmacological activation of
Nrf2 using CDDO-Im downregulated the expression of three critical enzymes
involved in fatty acid synthesis (FAS) including fatty acid synthase (FASN), ATP-
citrate lyase (ACLY) and stearoyl CoA desaturase (SCD) (Yates et al., 2009).
Accumulation of lipid was also observed in the livers of Nrf2-KO mice, in
comparison to wild-type mice in nutritional models of non-alcoholic steatohepatitis
186
(Chowdhry et al., 2010; Sugimoto et al., 2010). ACYL is the catalytic enzyme that
function as a precursor of acetyl CoA for FAS and has been shown by
immunoblotting and proteomics analysis to be significantly higher in Nrf2-KO mice
in comparison to their wild-type in a similar study (Kitteringham et al., 2010). The
reduced expression of SCD in the presence of constitutively active Nrf2 is
expected to lower FAS as SCD1 is involved in catalyzing mono-unsaturated fatty
acid biosynthesis giving rise to oleic acid and palmitoleic acid, key substrates for
the formation of phospholipids, triglycerides, cholesterol esters and alkyl-2,3-
diacylglycerols (Miyazaki and Ntambi, 2003; Flowers and Ntambi, 2008). Hepatic
expression of SCD1 in Nrf2-KO mice correlates to a higher triglycerides levels
compared to wild-type mice (Tanaka et al., 2012). In cancer, lipid metabolism is
altered (Santos and Schulze, 2012). The breakdown of beta-oxidation gives 17
molecules of ATP generating energy (Berg, L. and Stryer, 1988). By enhancing
beta-oxidation of fatty acids, Nrf2 upregulation is able to generate energy required
for building block of macromolecules.
5.4 Conclusion and future work: chapter 3 Study by Best et al. (2018) showed that loss of Keap1 alone caused no
morphological changes however, combined loss of Keap1 and PTEN resulted in
the formation of lung adenocarcinomas characterized by reprogramming of the
PPP. What remains unclear is what conditions favour induction of Nrf2 via Keap1-
Cul3-Rbx1 E3 ligase over GSK-3/β-TrCP E3 ubiquitin ligase.
With Nrf2 promoting cancer, one would wonder whether activation of Nrf2 can
lead to cancer and what importance is studying the mechanism of action of Nrf2
activators. To date, no evidence has been presented suggesting that Nrf2
activators increase the rate of tumour growth or even stimulate initiation of cancer.
For example, evaluation of the post-initiation effects of oltipraz, a known Nrf2
activator, on aflatoxin B1-induced preneoplastic foci in rat model of hepatic
tumourigenesis revealed that oltipraz neither inhibited nor enhanced tumour yield
187
or burden (Maxuitenko et al., 1993). Therefore, for the purpose of
chemoprevention, transient activation of Nrf2 in pre-cancerous cells by
pharmacological activators of Nrf2 is safe. An understanding of which E3 ubiquitin
ligase will play a dominant role in activation of Nrf2 by inducers is essential and
would help improve the specificity of Nrf2-based therapies. Most compounds are
able to activate more than one kinase cascade; however, they exhibit preference
to some.
The results outlined have therefore demonstrated that Cys-151, Cys-273 and Cys-
288 of Keap1 are not the sole sensor for Nrf2 inducers required for stabilizing and
transcriptionally activating Nrf2 but rather a Keap1-independent mechanism that is
based on phosphorylation via the PI3K and PTEN.
One thing that is clear is that Keap1-dependent regulation of Nrf2 is
predominantly in the cytoplasm and loss of Keap1 activity results in nuclear
accumulation of Nrf2. A good future experiment which this thesis has not covered
will be to analyze the effect of the inducers in activating Nrf2 in the subcellular
compartment within the cell. It has been reported that β-TrCP, the receptor
component of the SCF E3 ubiquitin ligase required for degradation of Nrf2 through
the Neh6 domain is localized in the nucleus (Lassot et al., 2001) as well as GSK-3
that can be found both in the nucleus and cytoplasm (Chiara and Rasola, 2013). It
would seem that the components required for ubiquitinating Nrf2 through the
Neh6 domain are located in the nucleus. Another experiment that could be done
is to find if inhibition of PI3K will alter nuclear localization of Nrf2 and if it does
require Keap1 or β-TrCP.
It has been proposed that GSK-3 phosphorylates Ser residues that overlap a
DSGIS338 destruction motif in the central Neh6 domain of Nrf2 (Rada et al., 2011).
When phosphorylated, DSGIS338 is recognized by β-TrCP and so allows the S-
phase kinase-associated protein-1 (Skp1)-cullen-1-F-box ubiquitin ligase to target
Nrf2 for proteasomal degradation (Rada et al., 2012; Chowdhry et al., 2013). Also,
a second recognition motif DSAPGS378 in the Neh6 domain of Nrf2 is recognized
188
by β-TrCP that contributes to the turnover of the transcription factor by SCFβ-TrCP
though it does not seem to be phosphorylated (Chowdhry et al., 2013). Although
we were able to show that the Neh6 is required for inducible Nrf2 activity by tBHQ,
DEM, CDDO-Im, carnosol, curcumin and ferulic acid, it would be interesting to
know whether inducers that inhibit PI3K require β-TrCP1 and/or β-TrCP2 in order
to activate Nrf2 activity. One thing we have shown is that regulation of Nrf2 by
inducers that target PI3K is independent of Keap1 and so it would be great to
establish if these are dependent on β-TrCP1 and/or β-TrCP2. Also, it would be
ideal to check the effect of inducers that inhibit PI3K result in inhibition by GSK-3
of phosphorylation of Nrf2 at both the Ser-342 and Ser-347 sites. This experiment
will prove that inducers that target the Neh6 domain as we saw in our experiment
is due to phosphorylation of these residues by GSK-3.
5.5 Conclusion and future work: chapter 4 With the insight that Nrf2 promotes the survival of cancer cells (referred to as the
“dark side of Nrf2”) studies on how to repress Nrf2 in cancer cells have been
underway. Several studies has indicated that Nrf2 is responsible for
chemoresistance (Cho et al., 2008; Kim et al., 2008; Tarumoto et al., 2004; Wang
et al., 2008). Many proteins that are now known to be encoded by Nrf2-target
genes, have been shown to contribute to the observed dependence of
chemoresistance and cancer promotion on Nrf2; these include genes for
antioxidants and detoxifying enzymes (Kim et al., 2007; Was et al., 2006; Black
and Wolf, 1991; Wang et al., 2008a; Schisselbauer et al., 1990). In chapter 4 of
this thesis, it was shown that non-small-cell lung cancer cell lines A549 and H460
express increased levels of HMOX1, NQO1, GCLC, GCLM and AKR1C1 and
Knockdown of Nrf2 in these cell lines decreased their basal expression level. By
contrast, increased expression of Nrf2 has been linked to promotion of cell
proliferation as observed by a decrease in cell proliferation when Nrf2 was
knocked down in A549 and H460 cells. Knockdown of Nrf2 also caused a
decrease in colony formation.
189
Rapid tumour growth requires an adequate supply of nutrients, metabolic
intermediates to serve as building blocks. Glucose and glutamine uptake is critical
in the metabolic shift observed in cancer cells. We have shown that decrease in
Nrf2 in A549 and H460 cells caused a decrease in cellular glutathione levels. As
Nrf2 controls the expression of glucose transporter, more work is needed to be
done to check the expression of glucose transporter gene.
Cancer cells utilizes large nutrient supply and maintains high levels of anabolism
(Mitsuishi et al., 2012). Nrf2 has been shown to redirect glucose and glutamine
into anabolic pathway (Mitsuishi et al., 2012). It was shown that loss of Nrf2
decrease the expression of G6PD, PGD1, TALDO, ME1, IDH1 and PDK4. It was
also show that Nrf2 regulates lipid metabolism providing energy source required
for cell proliferation.
The growth inhibition is likely attributed in part to its induction of cell cycle arrest at
the G1 phase in A549 Nrf2-kd cells. Further experiments to confirm this
hypothesis still need to be done.
Selective activation of glutathione rescues cell proliferation in A549 Nrf2-kd cells
indicating the major mechanism underlying accelerated cell proliferation in cancer
cell having high Nrf2 levels is by Nrf2 controlling the supply of nutrients and
generation of metabolites for building block and energy metabolism.
Future work that needs to be done to strengthen this work includes:
1. Analyze the effect of Nrf2 on more cell cycle proteins such as Cdkn1a
(p21), cdkn2b (p15), FOX3a, cyclin E and retinoblastoma (pRB)
2. We need to carry out Brdu staining to confirm S phase arrest.
3. Also, we need to test if loss of Nrf2 reduces glucose, cysteine and glycine
levels.
4. Test if loss of Nrf2 reduces autophagy that will cause a reduction in the
supply of metabolites requires for synthesis of macromolecules.
190
5.6 Limitations of study and future work Like with every research, there are some short comings and limitations to the
result shown. Some of the limitations presented include:
1. The N-number for sample size was small. Experiments were only set up
as duplicates and sometimes triplicates and only covered 3 biological replicates.
To effectively draw conclusions, more N-number would have been appropriate.
2. Blots were not always clear and inability to include densitometric analysis
of blots made conclusions difficult. It would have been better to include
densitometric data for blots shown to strengthen result.
3. This study covered both MEFs and human cancer cell lines to show that
results were not specific to only MEFs but also applicable in human cancer cell
line. However, using a large number of cell lines reduced scope for biological
replication.
5.7 Conclusion It has become progressively clear that Nrf2 promotes survival not only for normal
cells but for cancer cells functioning as a tumour suppressor and as an oncogene.
In normal cells, activation of Nrf2 using electrophiles that would induce the
expression of Nrf2-target gene has been and still being used as chemoprotective
drugs. The general consensus is that electrophiles that activate the Nrf2 pathway
do so by modifying cysteine residues in Keap1. This thesis shows that activators
of Nrf2 not only function through Keap1 but through a Keap1 independent
manner. The role of PI3K-Akt/PKB signalling pathway in regulating Nrf2 has also
been studied and showed that activators of Nrf2 that function independent of
Keap1 do so by activating the PI3K-Akt/PKB signaling pathway, through
decreasing PTEN and decreasing the activity of GSK-3 from promoting the
ubiquitylation of Nrf2. It is shown that activators that target the PI3K-Akt/PKB
pathway do this independently of Keap1. Nrf2 activators have also been shown to
target both the Neh2 domain and the Neh6 domain of Nrf2 indicating that both
191
domains of Nrf2 are indeed involved in stabilization of Nrf2 by inducers to activate
Nrf2.
In cancer cells having high Nrf2 level promoting the growth and resistance to
chemotherapy, knockdown of Nrf2 is able to decrease cell proliferation rate and
decrease colony formation. This thesis show that decrease in cell proliferation is
not due to cell death but due to regulation of metabolic genes required for
generation of NADPH, purine biosynthesis and lipid metabolism. The ability of
Nrf2 to control glutathione synthesis also has been shown to control cell
proliferation in these cells. Knockdown of Nrf2 in A549 and H460 resulted in a
decrease in GSH rate; and activation of glutathione using NAC rescued cell
proliferation.
Understanding of how Nrf2 can be activated in non-cancerous cells to promote
cell survival and prevention of cancer and how Nrf2 can be targeted for inhibition
in cancer cells having elevated levels of Nrf2 is very important for controlling
increased cell proliferation associated with cancer cells and subsequently
chemoresistance. As there are still no specific and effective Nrf2 inhibitors for
therapeutic purposes, pharmacological targeting of pathways involved in
metabolism will help in treatment of cancer.

192
6 References Aberle, H., Bauer, A., Stappert, J., Kispert, A. and Kemler, R., 1997. Beta-Catenin
Is a Target for the Ubiquitin-Proteasome Pathway. The EMBO journal, 16(13),
pp.3797–804.
Abraham, N.G. and Kappas, A., 2008. Pharmacological and clinical aspects of
heme oxygenase. Pharmacological reviews, 60(1), PP.79-127.
Adam, J., Hatipoglu, E., O’Flaherty, L., Ternette, N., Sahgal, N., Lockstone, H.,
Baban, D., Nye, E., Stamp, G.W., Wolhuter, K., Stevens, M., Fischer, R.,
Carmeliet, P., Maxwell, P.H., Pugh, C.W., Frizzell, N., Soga, T., Kessler, B.M., El-
Bahrawy, M., Ratcliffe, P.J. and Pollard, P.J., 2011. Renal Cyst Formation in Fh1-
Deficient Mice Is Independent of the Hif/Phd Pathway: Roles for Fumarate in
KEAP1 Succination and Nrf2 Signaling. Cancer Cell, 20(4), pp.524–537.
Agarwal, R. and Kaye, S.B., 2003. Ovarian cancer: strategies for overcoming
resistance to chemotherapy. Nature reviews. Cancer, 3(7), pp.502–16.
Agyeman, A.S., Chaerkady, R., Shaw, P.G., Davidson, N.E., Visvanathan, K.,
Pandey, A. and Kensler, T.W., 2012. Transcriptomic and proteomic profiling of
KEAP1 disrupted and sulforaphane-treated human breast epithelial cells reveals
common expression profiles. Breast Cancer Research and Treatment, 132(1),
pp.175–187.
Ahmad, A., Ahmad, S., Chang, L.Y., Schaack, J. and White, C.W., 2006.
Endothelial Akt activation by hyperoxia: Role in cell survival. Free Radical Biology
and Medicine, 40(7), PP.1108-1118.
Ahmad, S., 1995. Oxidative stress from environmental pollutants. Archives of
insect biochemistry and physiology, 29(2), pp.135–57.
Alam, J., Igarashi, K., Immenschuh, S., Shibahara, S. and Tyrrell, R.M., 2004.
Regulation of heme oxygenase-1 gene transcription: recent advances and
193
highlights from the International Conference (Uppsala, 2003) on Heme
Oxygenase. Antioxidants & redox signaling, 6(5), pp.924-933.
Aleksunes, L.M., Reisman, S.A., Yeager, R.L., Goedken, M.J. and Klaassen,
C.D., 2010. Nuclear factor erythroid 2-related factor 2 deletion impairs glucose
tolerance and exacerbates hyperglycemia in type 1 diabetic mice. The Journal of
pharmacology and experimental therapeutics, 333(1), pp.140-151.
Alexandrov, L.B. et al., 2013. Signatures of mutational processes in human
cancer. Nature, 500(7463), pp.415–21.
Ali, A., Hoeflich, K.P. and Woodgett, J.R., 2001. Glycogen synthase kinase-3:
Properties, functions, and regulation. Chemical Reviews, 101(8), pp.2527–2540.
Allison, J.H., Agrawal, H.C. and Moore, B.W., 1974. Effect of N,N,N′,N′-
tetramethylethylenediamine on the migration of proteins in SDS polyacrylamide
gels. Analytical Biochemistry, 58(2), pp.592-601.
Almazari, I., Park, J.M., Park, S.A., Suh, J.Y., Na, H.K., Cha, Y.N. and Surh, Y.J.,
2012. Guggulsterone induces heme oxygenase-1 expression through activation of
Nrf2 in human mammary epithelial cells: PTEN as a putative target.
Carcinogenesis, 33(2), pp.368–376.
Ambrosone, C.B., McCann, S.E., Freudenheim, J.L., Marshall, J.R., Zhang, Y.
and Shields, P.G., 2004. Breast Cancer Risk in Premenopausal Women Is
Inversely Associated with Consumption of Broccoli, a Source of Isothiocyanates,
but Is Not Modified by GST Genotype. The Journal of Nutrition, 134(5), pp.1134–
1138.
Amit, S., Hatzubai, A., Birman, Y., Andersen, J.S., Ben-Shushan, E., Mann, M.,
Ben-Neriah, Y. and Alkalay, I., 2002. Axin-mediated CKI phosphorylation of ??-
catenin at Ser 45: A molecular switch for the Wnt pathway. Genes and
Development, 16(9), pp.1066–1076.
An, J.H., Vranas, K., Lucke, M., Inoue, H., Hisamoto, N., Matsumoto, K. and
194
Blackwell, T.K., 2005. Regulation of the Caenorhabditis elegans oxidative stress
defense protein SKN-1 by glycogen synthase kinase-3. Proceedings of the
National Academy of Sciences, 102(45), pp.16275–16280.
Arlt, A., Sebens, S., Krebs, S., Geismann, C., Grossmann, M., Kruse, M.L.,
Schreiber, S. and Schäfer, H., 2013. Inhibition of the Nrf2 transcription factor by
the alkaloid trigonelline renders pancreatic cancer cells more susceptible to
apoptosis through decreased proteasomal gene expression and proteasome
activity. Oncogene, 32, pp.4825-4835.
Asher, G., Lotem, J., Cohen, B., Sachs, L. and Shaul, Y., 2001. Regulation of p53
stability and p53-dependent apoptosis by NADH quinone oxidoreductase 1.
Proceedings of the National Academy of Sciences of the United States of
America, 98, pp.1188–1193.
Auf dem Keller, U., Huber, M., Beyer, T.A., Kümin, A., Siemes, C., Braun, S.,
Bugnon, P., Mitropoulos, V., Johnson, D.A., Johnson, J.A., Hohl, D. and Werner,
S., 2006. Nrf transcription factors in keratinocytes are essential for skin tumor
prevention but not for wound healing. Molecular and cellular biology, 26(10),
pp.3773–3784.
Bader, A.G., Kang, S., Zhao, L. and Vogt, P.K., 2005. Oncogenic PI3K
deregulates transcription and translation. Nature Reviews Cancer, 5(12), pp.921-
929.
Bae, Y.S., Kang, S.W., Seo, M.S., Baines, I.C., Tckle, E., Chock, P.B. and Rhee,
S.G., 1997. Epidermal growth factor (EGF)-induced generation of hydrogen
peroxide. Role in EGF receptor-mediated tyrosine phosphorylation. Journal of
Biological Chemistry, 272,pp.217-221.
Bai, X., Chen, Y., Hou, X., Huang, M. and Jin, J., 2016. Emerging role of NRF2 in
chemoresistance by regulating drug-metabolizing enzymes and efflux
transporters. Drug Metabolism Reviews, 48(4), pp.541–567.
195
Baird, L. and Dinkova-Kostova, A.T., 2011. The cytoprotective role of the Keap1-
Nrf2 pathway. Archives of Toxicology, 85(4), pp.241–272.
Baird, L., Lleres, D., Swift, S., Dinkova-Kostova, A.T., Llères, D., Swift, S.,
Dinkova-Kostova, A.T., Lleres, D., Swift, S. and Dinkova-Kostova, A.T., 2013.
Regulatory flexibility in the Nrf2-mediated stress response is conferred by
conformational cycling of the Keap1-Nrf2 protein complex. Proceedings of the
National Academy of Sciences, 110(38), pp.15259–15264.
Balaban, R.S., Nemoto, S. and Finkel, T., 2005. Mitochondria, oxidants, and
aging. Cell, 120(4), pp.483–95.
Banning, A., Deubel, S., Kluth, D., Zhou, Z. and Brigelius-Flohé, R., 2005. The GI-
GPx gene is a target for Nrf2. Molecular Cell Biology, 25(12), pp.4914-4923.
Basu, S., Campbell, H.M., Dittel, B.N. and Ray, A., 2010. Purification of Specific
Cell Population by Fluorescence Activated Cell Sorting (FACS). Journal of
Visualized Experiments, 41, pp.1-4.
Bauer, G., 2013. HOCl-dependent singlet oxygen and hydroxyl radical generation
modulate and induce apoptosis of malignant cells. Anticancer Research, 33(9),
pp.3589-3602.
Bauer, G., 2014. Targeting extracellular ROS signaling of tumor cells. Anticancer
Research, 34(4), pp.1467-1482.
Bedard, K. and Krause, K., 2007. The NOX family of ROS-generating NADPH
oxidases: physiology and pathophysiology. Physiological reviews, 87(1), pp.245–
313.
Bendavit, G., Aboulkassim, T., Hilmi, K., Shah, S. and Batist, G., 2016. Nrf2
transcription factor can directly regulate MTOR: linking cytoprotective gene
expression to a major metabolic regulator that generates redox activity. The
Journal of biological chemistry, 291(49), pp.25476–25488.

196
Benson, A.M., Batzinger, R.P., Ou, S.Y., Bueding, E., Cha, Y.N. and Talalay, P.,
1978. Elevation of hepatic glutathione S-transferase activities and protection
against mutagenic metabolites of Benzo(a)pyrene by dietary antioxidants. Cancer
Research, 38(12), pp.4486-4495.
Berg, J.M., Tymoczko, J.L. and Stryer, L., 1988. Biochemistry. New York Press:
W H Freeman, 5th edition.
Best, S.A., De Souza, D.P., Kersbergen, A., Policheni, A.N., Dayalan, S., Tull, D.,
Rathi, V., Gray, D.H., Ritchie, M.E., McConville, M.J. and Sutherland, K.D., 2018.
Synergy between the KEAP1/NRF2 and PI3K Pathways Drives Non-Small-Cell
Lung Cancer with an Altered Immune Microenvironment. Cell Metabolism, 27(4),
pp.935–943.
Beyer, T.A., Xu, W., Teupser, D., auf dem Keller, U., Bugnon, P., Hildt, E., Thiery,
J., Kan, Y.W. and Werner, S., 2008. Impaired liver regeneration in Nrf2 knockout
mice: role of ROS-mediated insulin/IGF-1 resistance. The EMBO Journal, 27(1),
pp.212–223.
Biswas, M., Kwong, E.K., Park, E., Nagra, P. and Chan, J.Y., 2013. Glycogen
synthase kinase 3 regulates expression of nuclear factor-erythroid-2 related
transcription factor-1 (Nrf1) and inhibits pro-survival function of Nrf1. Experimental
Cell Research, 319(13), pp.1922–1931.
Black, S.M. and Wolf, C.R., 1991. The role of glutathione-dependent enzymes in
drug resistance. Pharmacology & therapeutics, 51(1), pp.139–54.
Bloom, D.A. and Jaiswal, A.K., 2003. Phosphorylation of Nrf2 at Ser40 by Protein
Kinase C in Response to Antioxidants Leads to the Release of Nrf2 from INrf2,
but Is Not Required for Nrf2 Stabilization/Accumulation in the Nucleus and
Transcriptional Activation of Antioxidant Response Element. Journal of Biological
Chemistry, 278(45), pp.44675–44682.
Boettler, U., Sommerfeld, K., Volz, N., Pahlke, G., Teller, N., Somoza, V., Lang,

197
R., Hofmann, T. and Marko, D., 2011. Coffee constituents as modulators of Nrf2
nuclear translocation and ARE (EpRE)-dependent gene expression. Journal of
Nutritional Biochemistry, 22, pp.426–440.
Bonifacino, J.S., 2011. Electrophoresis and Immunoblotting. Current Protocols in
Cell Biology, 52(1), pp.601-603.
Boyle, W.J., Smeal, T., Defize, L.H.K., Angel, P., Woodgett, J.R., Karin, M. and
Hunter, T., 1991. Activation of protein kinase C decreases phosphorylation of c-
Jun at sites that negatively regulate its DNA-binding activity. Cell, 64(3), pp.573–
584.
Brand, A.H. and Perrimon, N., 1993. Targeted gene expression as a means of
altering cell fates and generating dominant phenotypes. Development, 118(2),
pp.401–15.
Brigelius-Flohé, R. and Flohé, L., 2011. Basic principles and emerging concepts in
the redox control of transcription factors. Antioxidants & redox signaling, 15(8),
pp.2335–81.
Bryan, H.K., Olayanju, A., Goldring, C.E. and Park, B.K., 2013. The Nrf2 cell
defence pathway: Keap1-dependent and -independent mechanisms of regulation.
Biochemical pharmacology, 85(6), pp.705–17.
Buchwald, M., Pietschmann, K., Brand, P., Günther, A., Mahajan, N.P., Heinzel,
T. and Krämer, O.H., 2013. SIAH ubiquitin ligases target the nonreceptor tyrosine
kinase ACK1 for ubiquitinylation and proteasomal degradation. Oncogene, 32(41),
pp.4913–4920.
Burch, P.M. and Heintz, H.H., 2005. Redox regulation of cell-cycle re-entry: Cyclin
D1 as a primary target for the mitogenic effects of reactive oxygen and nitrogen
species. Antioxidants & Redox Signaling, 7(5-6), pp.741-751.
Burczynski, M.E. and Penning, T.M., 2000. Genotoxic polycyclic aromatic
hydrocarbon ortho-quinones generated by aldo-keto reductases induce CYP1A1
198
via nuclear translocation of the aryl hydrocarbon receptor. Cancer Research,
60(4), pp.908–915.
Cabiscol, E., Tamarit, J. and Ros, J., 2000. Oxidative stress in bacteria and
protein damage by reactive oxygen species. International Microbiology, 3(1),
pp.3–8.
Cairns, R., Harris, I. and Mak, T., 2011. Regulation of cancer cell metabolism.
Nature Reviews, 11(2), pp.85-95.
Campbell, M.R., Karaca, M., Adamski, K.N., Chorley, B.N., Wang, X. and Bell,
D.A., 2013. Novel hematopoietic target genes in the Nrf2-mediated transcriptional
pathway. Oxidative Medicine and Cellular Longetivity, 2013, pp.1-12.
Canning, P., Sorrell, F.J. and Bullock, A.N., 2015. Structural basis of Keap1
interactions with Nrf2. Free Radical Biology and Medicine, 88, pp.101-107.
Cantley, L.C. and Neel, B.G., 1999. New insights into tumor suppression: PTEN
suppresses tumor formation by restraining the phosphoinositide 3-kinase/AKT
pathway. Proceedings of the National Academy of Sciences of the United States
of America, 96(8), pp.4240–5.
Carnero, A. and Paramio, J.M., 2014. The PTEN/PI3K/AKT Pathway in vivo,
Cancer Mouse Models. Frontiers in Oncology, 4(252), pp.1-10.
Carracedo, A., Cantley, L. and Pandolfi, P., 2013. Cancer metabolism: fatty acid
oxidation in the limelight. Nature Reviews Cancer, 13(4), pp.227–232.
Caterina, J.J., Donze, D., Sun, C.-W., Ciavatta, D.J. and Townes, T.M., 1994.
Cloning and functional characterization of LCR-F1: a bZIP transcription factor that
activates erythroid-specific, human globin gene expression. Nucleic acid
Research, 22, 2383-2391.
Chanas, S., Jiang, Q., McMahon, M., McWalter, G.K., McLellan, L.I., Elcombe,
C.R., Henderson, C.J., Wolf, C.R., Moffat, G., Itoh, K., Yamamoto, M., and Hayes,

199
J.D., 2002. Loss of the Nrf2 transcription factor causes a marked reduction in
constitutive and inducible expression of the glutathione S-transferase Gsta1,
Gsta2, Gstm1, Gstm2, Gstm3 and Gstm4 genes in the livers of male and female
mice. Biochem. J., 365, pp.405–416.
Chapple, S.J., Keeley, T.P., Mastronicola, D., Arno, M., Vizcay-Barrena, G., Fleck,
R., Siow, R.C.M. and Mann, G.E., 2016. Bach1 differentially regulates distinct
Nrf2-dependent genes in human venous and coronary artery endothelial cells
adapted to physiological oxygen levels. Free Radical Biology and Medicine, 92,
pp.152-162.
Chartoumpekis, D.V., Ziros, P.G., Psyrogiannis, A.I., Papavassiliou. A.G.,
Kyriazopoulou, V.E., Sykiotis, G.P. and Habeos, I.G., 2011. Nrf2 represses
FGF21 during l;ong term high-fat diet-induced obesity in mice. Diabetes, 60(10),
pp. 2465-2473.
Chen, J., Wang, L., Chen, Y., Sternberg, P. and Cai, J., 2009.
Phosphatidylinositol 3 kinase pathway and 4-hydroxy-2-nonenal-induced oxidative
injury in the RPE. Investigative ophthalmology & visual science, 50(2), pp.936-
942.
Chen, Y., Xue, P., Hou, Y., Zhang, H., Zheng, H., Zhou, T., Qu, W., Teng, W.,
Zhang, Q., Andersen, M.E. and Pi, J., 2013. Isoniazid suppresses antioxidant
response element activities and impairs adipogenesis in mouse and human
preadipocytes. Toxicology and Applied Pharmacology, 273(3), pp.435-441.
Cheong, A.W.Y., Lee, Y.-L., Liu, W.-M., Yeung, W.S.B. and Lee, K.-F., 2009.
Oviductal microsomal epoxide hydrolase (EPHX1) reduces reactive oxygen
species (ROS) level and enhances preimplantation mouse embryo development.
Biology of reproduction, 81(1), pp.126-132.
Cheung, K.J., Gabrielson, E., Werb, Z. and Ewald, A.J., 2013. Collective invasion
in breast cancer requires a conserved Basal epithelial program. Cell, 155,
pp.1639–51.
200
Chian, S., Thapa, R., Chi, Z., Wang, X.J. and Tang, X., 2014. Luteolin inhibits the
Nrf2 signaling pathway and tumor growth in vivo. Biochemical and Biophysical
Research Communications, 447(4), pp.602-608.
Chiara, F. and Rasola, A., 2013. GSK-3 and mitochondria in cancer cells.
Frontiers in Oncology, 3, pp.16.
Chiaraviglio, L. and Kirby, J.E., 2014. Evaluation of Impermeant, DNA-Binding
Dye Fluorescence as a Real-Time Readout of Eukaryotic Cell Toxicity in a High
Throughput Screening Format. Assay and Drug Development Technologies,
12(4), pp.219-228.
Chin, M.P., Bakris, G.L., Block, G.A., Chertow, G.M., Goldsberry, A., Inker, L.A.,
Heerspink, H.J.L., O’Grady, M., Pergola, P.E., Wanner, C., Warnock, D.G. and
Meyer, C.J., 2018. Bardoxolone Methyl Improves Kidney Function in Patients with
Chronic Kidney Disease Stage 4 and Type 2 Diabetes: Post-Hoc Analyses from
Bardoxolone Methyl Evaluation in Patients with Chronic Kidney Disease and Type
2 Diabetes Study. American Journal of Nephrology, 47(1), pp.40–47.
Cho, H.Y., Jedlicka, A.E., Reddy, S.P.M., Zhang, L.Y., Kensler, T.W. and
Kleeberger, S.R., 2002. Linkage analysis of susceptibility to hyperoxia Nrf2 is a
candidate gene. American Journal of Respiratory Cell and Molecular Biology,
26(1), pp.42–51.
Cho, J.-M., Manandhar, S., Lee, H.-R., Park, H.-M. and Kwak, M.-K., 2008. Role
of the Nrf2-antioxidant system in cytotoxicity mediated by anticancer cisplatin:
Implication to cancer cell resistance. Cancer Letters, 260(1–2), pp.96–108.
Cho, S.-H., Lee, C.-H., Ahn, Y., Kim, H., Kim, H., Ahn, C.-Y., Yang, K.-S. and Lee,
S.-R., 2004. Redox regulation of PTEN and protein tyrosine phosphatases in
H(2)O(2) mediated cell signaling. FEBS letters, 560(1–3), pp.7–13.
Chorley, B.N., Campbell, M.R., Wang, X., Karaca, M., Sambandan, D., Bangura,
F., Xue, P., Pi, J., Kleeberger, S.R. and Bell, D.A., 2012. Identification of novel

201
NRF2-regulated genes by ChiP-Seq: Influence on retinoid X receptor alpha.
Nucleic Acids Research, 40(15), pp.7416-7429.
Choudhary, S., Wang, K.-K.A. and Wang, H.-C.R., 2011. Oncogenic H-Ras,
FK228, and exogenous H2O2 cooperatively activated the ERK pathway in
selective induction of human urinary bladder cancer J82 cell death. Molecular
carcinogenesis, 50, pp.215–219.
Chowdhry, S., Nazmy, M.H., Meakin, P.J., Dinkova-Kostova, A.T., Walsh, S. V.,
Tsujita, T., Dillon, J.F., Ashford, M.L.J. and Hayes, J.D., 2010. Loss of Nrf2
markedly exacerbates nonalcoholic steatohepatitis. Free Radical Biology and
Medicine, 48(2), pp.357–371.
Chowdhry, S., Zhang, Y., McMahon, M., Sutherland, C., Cuadrado, a and Hayes,
J.D., 2013. Nrf2 is controlled by two distinct β-TrCP recognition motifs in its Neh6
domain, one of which can be modulated by GSK-3 activity. Oncogene, 32(32),
pp.3765–81.
Chrambach, A. and Rodbard, D., 1971. Polyacrylamide Gel Electrophoresis.
Science, 172(3982), pp.440-451.
Chrambach, A., Rodbard, D., Jovin, T.M. and Svendsen, P.J., 1976. Analytical
and Preparative Polyacrylamide Gel Electrophoresis. Methods of Protein
Separation, Boston, MA: Springer US, pp.27–144.
Cleary, S.P., Jeck, W.R., Zhao, X., Chen, K., Selitsky, S.R., Savich, G.L., Tan, T.-
X., Wu, M.C., Getz, G., Lawrence, M.S., Parker, J.S., Li, J., Powers, S., Kim, H.,
Fischer, S., Guindi, M., Ghanekar, A. and Chiang, D.Y., 2013. Identification of
driver genes in hepatocellular carcinoma by exome sequencing. Hepatology,
58(5), pp.1693–1702.
Cleasby, A., Yon, J., Day, P.J., Richardson, C., Tickle, I.J., Williams, P.A.,
Callahan, J.F., Carr, R., Concha, N., Kerns, J.K., Qi, H., Sweitzer, T., Ward, P.
and Davies, T.G., 2014. Structure of the BTB Domain of Keap1 and Its Interaction

202
with the Triterpenoid Antagonist CDDO. PLoS ONE, 9(6), p.e98896.
Clements, C.M., McNally, R.S., Conti, B.J., Mak, T.W. and Ting, J.P.-Y., 2006.
DJ-1, a cancer- and Parkinson’s disease-associated protein, stabilizes the
antioxidant transcriptional master regulator Nrf2. Proceedings of the National
Academy of Sciences, 103(41), pp.15091–15096.
Cole, A.R. and Sutherland, C., 2008. Measuring GSK3 Expression and Activity in
Cells. In: Methods in molecular biology (Clifton, N.J.). pp.45–65.
Collisson, E.A. et al., 2014. Comprehensive molecular profiling of lung
adenocarcinoma. Nature, 511(7511), pp.543–550.
Conaway, C.C., Wang, C.-X., Pittman, B., Yang, Y.-M., Schwartz, J.E., Tian, D.,
McIntee, E.J., Hecht, S.S. and Chung, F.-L., 2005. Phenethyl Isothiocyanate and
Sulforaphane and their N -Acetylcysteine Conjugates Inhibit Malignant
Progression of Lung Adenomas Induced by Tobacco Carcinogens in A/J Mice.
Cancer Research, 65(18), pp.8548–8557.
Coriat, R., Marut, W., Leconte, M., Ba, L.B., Vienne, A., Chéreau, C., Alexandre,
J., Weill, B., Doering, M., Jacob, C., Nicco, C. and Batteux, F., 2011. The
organotelluride catalyst LAB027 prevents colon cancer growth in the mice. Cell
Death and Disease, 2(8), pp.e191.
Corpas, F.J., Barroso, J.B. and del Rıo, L.A., 2001. Peroxisomes as a source of
reactive oxygen species and nitric oxide signal molecules in plant cells. Trends in
Plant Science, 6(4), pp.145–150.
Cuadrado, A., 2015. Structural and functional characterization of Nrf2 degradation
by glycogen synthase kinase 3/β-TrCP. Free Radical Biology and Medicine.
88(B), pp.147-157.
Cullinan, S.B., Gordan, J.D., Jin, J., Harper, J.W. and Diehl, J.A., 2004. The
Keap1-BTB protein is an adaptor that bridges Nrf2 to a Cul3-based E3 ligase:
oxidative stress sensing by a Cul3-Keap1 ligase. Molecular and cellular biology,
203
24, pp.8477–8486.
Cully, M., You, H., Levine, A.J. and Mak, T.W., 2006. Beyond PTEN mutations:
The PI3K pathway as an integrator of multiple inputs during tumorigenesis. Nature
Reviews Cancer, 6(3), pp.184-192.
Currie, E., Schulze, A., Zechner, R., Walther, T.C. and Farese, R. V, 2013.
Cellular fatty acid metabolism and cancer. Cell metabolism, 18(2), pp.153–61.
Dabholkar, M., Vionnet, J., Bostick-Bruton, F., Yu, J.J. and Reed, E., 1994.
Messenger RNA levels of XPAC and ERCC1 in ovarian cancer tissue correlate
with response to platinum-based chemotherapy. The Journal of clinical
investigation, 94, pp.703–708.
Davudian, S., Mansoori, B., Shajari, N., Mohammadi, A. and Baradaran, B.,2016.
BACH1, the master regulator gene: A novel candidate target for cancer therapy.
Gene, 588(1), pp.30-37.
Day, R.M. and Suzuki, Y.J., 2006. Cell proliferation, reactive oxygen and cellular
glutathione. Dose-response : a publication of International Hormesis Society, 3(3),
pp.425–42.
DeBerardinis, R., Mancuso, A., Daikhin, E., Nissim, I., Yudkoff, M., Wehrli, S. and
Thompson, C., 2007. Beyond aerobic glycolysis: transformed cells can engage in
glutamine metabolism that exceeds the requirement for protein and nucleotide
synthesis. Proceedings of the Nathional Academy of Sciences of the United
States of America, 104(49), pp.19345–19350.
DeBerardinis, R.J., Lum, J.J., Hatzivassiliou, G. and Thompson, C.B., 2008. The
Biology of Cancer: Metabolic Reprogramming Fuels Cell Growth and Proliferation.
Cell Metabolism, 7(1), pp.11–20.
DeBerardinis, R.J. and Thompson, C.B., 2012. Cellular metabolism and disease:
what do metabolic outliers teach us? Cell, 148(6), pp.1132–44.

204
Deitch, A.D., Law, H. and White, R.D., 1982. A stable propidium iodide staining
procedure for flow cytometry. Journal of Histochemistry and Cytochemistry, 30(9),
pp.967-972.
Denicola, G.M., Karreth, F.A., Humpton, T.J., Gopinathan, A., Wei, C., Frese, K.,
Mangal, D., Yu, K.H., Yeo, C.J., Calhoun, E.S., Scrimieri, F., Winter, J.M.,
Hruban, R.H., Iacobuzio-Donahue, C., Kern, S.E., Blair, I.A. and Tuveson, D.A.,
2011. Oncogene-induced Nrf2 transcription promotes ROS detoxification and
tumorigenesis. Nature, 475(7354), pp.106-109.
Dinkova-Kostova, A.T., Holtzclaw, W.D., Cole, R.N., Itoh, K., Wakabayashi, N.,
Katoh, Y., Yamamoto, M. and Talalay, P., 2002. Dinkova-Kostova, A.T. et al.,
2002. Direct evidence that sulfhydryl groups of Keap1 are the sensors regulating
induction of phase 2 enzymes that protect against carcinogens and oxidants.
Proceedings of the National Academy of Sciences of the United States.
Proceedings of the National Academy of Sciences of the United States of
America, 99, pp.11908–11913.
Dinkova-Kostova, A.T., Jenkins, S.N., Fahey, J.W., Ye, L., Wehage, S.L., Liby,
K.T., Stephenson, K.K., Wade, K.L. and Talalay, P., 2006. Protection against UV-
light-induced skin carcinogenesis in SKH-1 high-risk mice by sulforaphane-
containing broccoli sprout extracts. Cancer Letters, 240(2), pp.243–252.
Doble, B.W., 2003. GSK-3: tricks of the trade for a multi-tasking kinase. Journal of
Cell Science, 116(7), pp. 1175-1186.
Dolado, I., Swat, A., Ajenjo, N., De Vita, G., Cuadrado, A. and Nebreda, A.R.,
2007. p38α MAP Kinase as a Sensor of Reactive Oxygen Species in
Tumorigenesis. Cancer Cell, 11(2), pp.191–205.
Donadelli, M., Dando, I., Zaniboni, T., Costanzo, C., Dalla Pozza, E., Scupoli,
M.T., Scarpa, A., Zappavigna, S., Marra, M., Abbruzzese, A., Bifulco, M.,
Caraglia, M. and Palmieri, M., 2011. Gemcitabine/cannabinoid combination
triggers autophagy in pancreatic cancer cells through a ROS-mediated

205
mechanism. Cell Death and Disease, 2(4), pp.e152.
Dozio, E., Ruscica, M., Passafaro, L., Dogliotti, G., Steffani, L., Marthyn, P.,
Pagani, A., Demartini, G., Esposti, D., Fraschini, F. and Magni, P., 2010. The
natural antioxidant alpha-lipoic acid induces p27(Kip1)-dependent cell cycle arrest
and apoptosis in MCF-7 human breast cancer cells. European journal of
pharmacology, 641(1), pp.29–34.
Duan, X., Liu, D., Xing, X., Li, J., Zhao, S., Nie, H., Zhang, Y., Sun, G. and Li, B.,
2014. Tert-butylhydroquinone as a phenolic activator of Nrf2 antagonizes arsenic-
induced oxidative cytotoxicity but promotes arsenic methylation and detoxication
in human hepatocyte cell line. Biological Trace Element Research, 160(2),
pp.294–302.
Duester, G., 2008. Retinoic Acid Synthesis and Signaling during Early
Organogenesis. Cell, 134(6), pp.921-931.
Efeyan, A. and Sabatini, D.M., 2010. MTOR and cancer: Many loops in one
pathway. Current Opinion in Cell Biology, 22(2), pp.169-176.
Eggler, A.L., Liu, G., Pezzuto, J.M., van Breemen, R.B. and Mesecar, A.D., 2005.
Modifying specific cysteines of the electrophile-sensing human Keap1 protein is
insufficient to disrupt binding to the Nrf2 domain Neh2. Proceedings of the
National Academy of Sciences of the United States of America, 102, pp.10070–
10075.
Eggler, A.L., Luo, Y., van Breemen, R.B. and Mesecar, A.D., 2007. Identification
of the highly reactive cysteine 151 in the chemopreventive agent-sensor Keap1
protein is method-dependent. Chemical research in toxicology, 20, pp.1878–1884.
Eldar-Finkelman, H., Licht-Murava, A., Pietrokovski, S. and Eisenstein, M., 2010.
Substrate Competitive GSK-3 Inhibitors- strategy and Implications. Biochimica et
Biophysica Acta - Proteins and Proteomics, 1804(3), pp.598-603.
Embi, N., Rylatt, D.B. and Cohen, P., 1980. Glycogen Synthase Kinase-3 from
206
Rabbit Skeletal Muscle. European Journal of Biochemistry, 107(2), pp.519–527.
Fahey, J.W., Haristoy, X., Dolan, P.M., Kensler, T.W., Scholtus, I., Stephenson,
K.K., Talalay, P. and Lozniewski, A., 2002. Sulforaphane inhibits extracellular,
intracellular, and antibiotic-resistant strains of Helicobacter pylori and prevents
benzo[a]pyrene-induced stomach tumors. Proceedings of the National Academy
of Sciences, 99(11), pp.7610–7615.
Fan, Q.W., Knight, Z.A., Goldenberg, D.D., Yu, W., Mostov, K.E., Stokoe, D.,
Shokat, K.M. and Weiss, W.A., 2006. A dual PI3 kinase/mTOR inhibitor reveals
emergent efficacy in glioma. Cancer Cell, 9(5), pp.341-349.
Fan, Z., Wirth, A.-K., Chen, D., Wruck, C.J., Rauh, M., Buchfelder, M. and
Savaskan, N., 2017. Nrf2-Keap1 pathway promotes cell proliferation and
diminishes ferroptosis. Oncogenesis, 6(8), p.e371.
Flowers, M.T. and Ntambi, J.M., 2008. Role of stearoyl-coenzyme A desaturase in
regulating lipid metabolism. Current opinion in lipidology, 19(3), pp.248–56.
Forde, J.E. and Dale, T.C., 2007. Glycogen synthase kinase 3: a key regulator of
cellular fate. Cellular and molecular life sciences : CMLS, 64(15), pp.1930–44.
Frame, S. and Cohen, P., 2001. GSK3 takes centre stage more than 20 years
after its discovery. The Biochemical journal, 359(1), pp.1-16.
Frank, R., Scheffler, M., Merkelbach-Bruse, S., Ihle, M.A., Kron, A., Rauer, M.,
Ueckeroth, F., Konig, K., Michels, S., Fischer, R., Eisert, A., Fassunke, J., Heydt,
C., Serke, M., Ko, Y.-D., Gerigk, U., Geist, T., Kaminsky, B., Heukamp, L.C.,
Clement-Ziza, M., Buttner, R. and Wolf, J., 2018. Clinical and pathological
characteristics of KEAP1- and NFE2L2-mutated Non–Small Cell Lung Carcinoma
(NSCLC). Clinical Cancer Research, 24(13), pp.1-11.
Friedl, P., Locker, J., Sahai, E. and Segall, J.E., 2012. Classifying collective
cancer cell invasion. Nature Cell Biology, 14(8), pp.777-783.
207
Fruehauf, J.P. and Meyskens, F.L., 2007. Reactive oxygen species: a breath of
life or death? Clinical cancer research : an official journal of the American
Association for Cancer Research, 13(3), pp.789–94.
Fujii, S., Sawa, T., Ihara, H., Tong, K.I., Ida, T., Okamoto, T., Ahtesham, A.K.,
Ishima, Y., Motohashi, H., Yamamoto, M. and Akaike, T., 2010. The Critical Role
of Nitric Oxide Signaling, via Protein S -Guanylation and Nitrated Cyclic GMP, in
the Antioxidant Adaptive Response. Journal of Biological Chemistry, 285(31),
pp.23970–23984.
Fujimoto, A. et al., 2016. Whole-genome mutational landscape and
characterization of noncoding and structural mutations in liver cancer. Nature
Genetics, 48(5), pp.500–509.
Fukutomi, T., Takagi, K., Mizushima, T., Ohuchi, N. and Yamamoto, M., 2014.
Kinetic, Thermodynamic, and Structural Characterizations of the Association
between Nrf2-DLGex Degron and Keap1. Molecular and Cellular Biology, 34(5),
pp.832–846.
Gacesa, R., Lawrence, K.P., Georgakopoulos, N.D., Yabe, K., Dunlap, W.C.,
Barlow, D.J., Wells, G., Young, A.R. and Long, P.F., 2018. The mycosporine-like
amino acids porphyra-334 and shinorine are antioxidants and direct antagonists
of Keap1-Nrf2 binding. Biochimie, 154, pp.35-44.
Gallagher, S.R., 2012. One-dimensional SDS gel electrophoresis of proteins.
Current Protocols in Protein Science, Chapter 10.
Garbarino, J.A., Cardile, V., Lombardo, L., Chamy, M.C., Piovano, M. and Russo,
A., 2007. Demalonyl thyrsiflorin A, a semisynthetic labdane-derived diterpenoid,
induces apoptosis and necrosis in human epithelial cancer cells. Chemico-
Biological Interactions, 169(3), pp.198-206.
Garg, R., Gupta, S. and Maru, G.B., 2008. Dietary curcumin modulates
transcriptional regulators of phase I and phase II enzymes in benzo[ a ]pyrene-
208
treated mice: mechanism of its anti-initiating action. Carcinogenesis, 29(5),
pp.1022–1032.
Gaude, E. and Frezza, C., 2014. Defects in mitochondrial metabolism and cancer.
Cancer & Metabolism, 2(1), p.10.
Georgakopoulos, N.D., Frison, M., Alvarez, M.S., Bertrand, H., Wells, G. and
Campanella, M., 2017. Reversible Keap1 inhibitors are preferential
pharmacological tools to modulate cellular mitophagy. Scientific Reports, 7(1),
pp.10303-10317.
Gericke, A., Munson, M. and Ross, A.H., 2006. Regulation of the PTEN
phosphatase. Gene, 374(7), pp.1-9.
Gharavi, N., Haggarty, S. and El-Kadi, A.O.S., 2007. Chemoprotective and
carcinogenic effects of tert-butylhydroquinone and its metabolites. Current drug
metabolism, 8(1), pp.1–7.
Goga, A., Yang, D., Tward, A.D., Morgan, D.O. and Bishop, J.M., 2007. Inhibition
of CDK1 as a potential therapy for tumors over-expressing MYC. Nature
Medicine, 13(7), pp.820-827.
Gonzalez-Flecha, B. and Demple, B., 1995. Metabolic sources of hydrogen
peroxide in aerobically growing Escherichia coli. Journal of Biological Chemistry,
270(23), pp.13681–13687.
Gopalsamy, A., Hagen, T. and Swiminathan, K., 2014. Investigating the molecular
basis of Siah1 and Siah2 E3 ubiquitin ligase substrate specificity. PlosOne, 9(9),
pp.e106547, 1-12.
Gottesman, M.M., 2002. Mechanisms of cancer drug resistance. Annual review of
medicine, 53, pp.615–27.
Govindan, R., Ding, L., Griffith, M., Subramanian, J., Dees, N.D.D., Kanchi, K.L.L.,
Maher, C.A.A., Fulton, R., Fulton, L., Wallis, J., Chen, K., Walker, J., McDonald,

209
S., Bose, R., Ornitz, D., Xiong, D., You, M., Dooling, D.J.J., Watson, M., Mardis,
E.R.R. and Wilson, R.K.K., 2012. Genomic Landscape of Non-Small Cell Lung
Cancer in Smokers and Never-Smokers. Cell, 150(6), pp.1121–1134.
Griffith, O.W., 1980. Determination of glutathione and glutathione disulfide using
glutathione reductase and 2-vinylpyridine. Analytical biochemistry, 106(1),
pp.207–12.
Groen, A., Lemeer, S., van der Wijk, T., Overvoorde, J., Heck, A.J.R., Ostman, A.,
Barford, D., Slijper, M. and den Hertog, J., 2005. Differential oxidation of protein-
tyrosine phosphatases. The Journal of biological chemistry, 280(11), pp.10298–
304.
Guichard, C., Amaddeo, G., Imbeaud, S., Ladeiro, Y., Pelletier, L., Maad, I. Ben,
Calderaro, J., Bioulac-Sage, P., Letexier, M., Degos, F., Clément, B., Balabaud,
C., Chevet, E., Laurent, A., Couchy, G., Letouzé, E., Calvo, F. and Zucman-Rossi,
J., 2012. Integrated analysis of somatic mutations and focal copy-number
changes identifies key genes and pathways in hepatocellular carcinoma. Nature
Genetics, 44(6), pp.694–698.
Gupta, S.C., Hevia, D., Patchva, S., Park, B., Koh, W. and Aggarwal, B.B., 2012.
Upsides and downsides of reactive oxygen species for cancer: the roles of
reactive oxygen species in tumorigenesis, prevention, and therapy. Antioxidants &
redox signaling, 16(11), pp.1295–322.
Gutzeit, H.O. and Ludwig-Müller, J., 2014. Plant natural products : synthesis,
biological functions and practical applications. Wiley-Blackwell.
Halliwell, B., 2006. Oxidative stress and neurodegeneration: where are we now? J
Neurochem, 97(6), pp.1634-58.
Halliwell, B. and Gutteridge, J.M.C., 2007. Cellular response to oxidative stress:
adaptation, damage, repair, senescence and death. Free Radicals in Biology and
Medicine, 4, pp.187-267.

210
Hammerman, P.S. et al., 2012. Comprehensive genomic characterization of
squamous cell lung cancers. Nature, 489, pp. 519-525.
Hanahan, D. and Weinberg, R.A., 2000. The Hallmarks of Cancer. Cell, 100,
pp.57–70.
Hanahan, D. and Weinberg, R.A., 2011. Hallmarks of cancer: The next
generation. Cell, 144(5), pp. 646-674.
Harder, B., Jiang, T., Wu, T., Tao, S., Rojo de la Vega, M., Tian, W., Chapman, E.
and Zhang, D.D., 2015. Molecular mechanisms of Nrf2 regulation and how these
influence chemical modulation for disease intervention. Biochemical Society
transactions, 43(4), pp.680–6.
Harwood, A.J., 2001. Regulation of GSK-3: A cellular multiprocessor. Cell, 105(7),
pp. 821-824.
Hayes, J.D. and Ashford, M.L.J., 2012. Nrf2 orchestrates fuel partitioning for cell
proliferation. Cell Metabolism, 16, pp.139–141.
Hayes, J.D., Chanas, S.A., Henderson, C.J., McMahon, M., Sun, C., Moffat, G.J.,
Wolf, C.R. and Yamamoto, M., 2000. The Nrf2 transcription factor contributes
both to the basal expression of glutathione S-transferases in mouse liver and to
their induction by the chemopreventive synthetic antioxidants, butylated
hydroxyanisole and ethoxyquin. Biochemical Society Transactions, 28(2), pp. 33-
41.
Hayes, J.D., Chowdhry, S., Dinkova-Kostova, A.T. and Sutherland, C., 2015. Dual
regulation of transcription factor Nrf2 by Keap1 and by the combined actions of β-
TrCP and GSK-3. Biochemical Society Transactions, 43(4), pp. 611-620.
Hayes, J.D. and Dinkova-Kostova, A.T., 2014. The Nrf2 regulatory network
provides an interface between redox and intermediary metabolism. Trends in
Biochemical Sciences, 39(4), pp. 199-218.
211
Hayes, J.D., Ebisine, K., Sharma, R.S., Chowdhry, S., Dinkova-Kostova, A.T. and
Sutherland, C., 2016. Regulation of the CNC-bZIP transcription factor Nrf2 by
Keap1 and the axis between GSK-3 and β-TrCP. Current Opinion in Toxicology,
1, pp. 92-103.
Hayes, J.D. and McMahon, M., 2009. NRF2 and KEAP1 mutations: permanent
activation of an adaptive response in cancer. Trends in biochemical sciences,]
34(4), pp.176–188.
Hayes, J.D. and Wolf, C.R., 1990. Molecular mechanisms of drug resistance. The
Biochemical journal, 272(2), pp.281–95.
Held, P., 2007. Kinetic Analysis of β-Galactosidase Activity using the PowerWave TM HT and Gen5 TM Data Analysis Software. Biotek, pp.1-5.
Hennings, H., Glick, A.B., Greenhalgh, D.A., Morgan, D.L., Strickland, J.E.,
Tennenbaum, T. and Yuspa, S.H., 1993. Critical aspects of initiation, promotion,
and progression in multistage epidermal carcinogenesis. Proceedings of the
Society for Experimental Biology and Medicine. Society for Experimental Biology
and Medicine, 202(1), pp.1–8.
Henry, C.J., Billups, L.H., Avery, M.D., Rude, T.H., Dansie, D.R., Lopez, A., Sass,
B., Whitmire, C.E. and Kouri, R.E., 1981. Lung cancer model system using 3-
methylcholanthrene in inbred strains of mice. Cancer research, 41, pp. 5027-
5032.
Hernández, F., Langa, E., Cuadros, R., Avila, J. and Villanueva, N., 2010.
Regulation of GSK3 isoforms by phosphatases PP1 and PP2A. Molecular and
Cellular Biochemistry, 344(1–2), pp.211–215.
Higgins, L.G., Kelleher, M.O., Eggleston, I.M., Itoh, K., Yamamoto, M. and Hayes,
J.D., 2009. Transcription factor Nrf2 mediates an adaptive response to
sulforaphane that protects fibroblasts in vitro against the cytotoxic effects of
electrophiles, peroxides and redox-cycling agents. Toxicology and Applied
212
Pharmacology, 237(3), pp.267-280.
Hipler, U.-C., Wollina, U., Denning, D. and Hipler, B., 2002. Fluorescence
Analysis of Reactive Oxygen Species ( ROS ) Generated by Six Isolates of
Aspergillus Fumigatus. BGM Labtechnologies, pp.1-2.
Hirotsu, Y., Katsuoka, F., Funayama, R., Nagashima, T., Nishida, Y., Nakayama,
K., Douglas Engel, J. and Yamamoto, M., 2012. Nrf2–MafG heterodimers
contribute globally to antioxidant and metabolic networks. Nucleic Acids
Research, 40(20), pp.10228–10239.
Hoeks, J., Briedé, J.J., de Vogel, J., Schaart, G., Nabben, M., Moonen-Kornips,
E., Hesselink, M.K.C. and Schrauwen, P., 2008. Mitochondrial function, content
and ROS production in rat skeletal muscle: effect of high-fat feeding. FEBS
letters, 582(4), pp.510–6.
Holmstrom, K.M., Baird, L., Zhang, Y., Hargreaves, I., Chalasani, A., Land, J.M.,
Stanyer, L., Yamamoto, M., Dinkova-Kostova, A.T. and Abramov, A.Y., 2013. Nrf2
impacts cellular bioenergetics by controlling substrate availability for mitochondrial
respiration. Biology Open, 2(8), pp.761-770.
Homma, S., Ishii, Y., Morishima, Y., Yamadori, T., Matsuno, Y., Haraguchi, N.,
Kikuchi, N., Satoh, H., Sakamoto, T., Hizawa, N., Itoh, K. and Yamamoto, M.,
2009. Nrf2 Enhances Cell Proliferation and Resistance to Anticancer Drugs in
Human Lung Cancer. Clinical Cancer Research, 15(10), pp.3423–3432.
Hong, F., Freeman, M.L. and Liebler, D.C., 2005. Identification of Sensor
Cysteines in Human Keap1 Modified by the Cancer Chemopreventive Agent
Sulforaphane. Chemical Research in Toxicology, 18(12), pp.1917–1926.
Hong, F., Sekhar, K.R., Freeman, M.L. and Liebler, D.C., 2005. Specific Patterns
of Electrophile Adduction Trigger Keap1 Ubiquitination and Nrf2 Activation.
Journal of Biological Chemistry, 280(36), pp.31768–31775.
Hu, L., Zaloudek, C., Mills, G.B., Gray, J. and Jaffe, R.B., 2000. In vivo and in vitro

213
ovarian carcinoma growth inhibition by a phosphatidylinositol 3-kinase inhibitor
(LY294002). Clinical cancer research : an official journal of the American
Association for Cancer Research, 6(3), pp.880-886.
Hu, Y., Rosen, D.G., Zhou, Y., Feng, L., Yang, G., Liu, J. and Huang, P., 2005.
Mitochondrial manganese-superoxide dismutase expression in ovarian cancer:
Role in cell proliferation and response to oxidative stress. Journal of Biological
Chemistry, 280, pp.39485-39492.
Huang, H.-C., Nguyen, T. and Pickett, C.B., 2000. Regulation of the antioxidant
response element by protein kinase C-mediated phosphorylation of NF-E2-related
factor 2. Proceedings of the National Academy of Sciences, 97(23), pp.12475–
12480.
Huang, H.C., Nguyen, T. and Pickett, C.B., 2002. Phosphorylation of Nrf2 at Ser-
40 by protein kinase C regulates antioxidant response element-mediated
transcription. Journal of Biological Chemistry, 277(45), pp.42769–42774.
Huang, M.-F., Lin, W.-L. and Ma, Y.-C., 2005. A study of reactive oxygen species
in mainstream of cigarette. Indoor air, 15(2), pp.135–40.
Huang, Y., Li, W., Su, Z. and Kong, A., 2015. The complexity of the nrf2 pathway:
Beyond the antioxidant response. Journal of Nutrition Biochemistry, 26(12), pp.
1401-1413.
Humphries, K.M. and Szweda, L.I., 1998. Selective inactivation of α-ketoglutarate
dehydrogenase and pyruvate dehydrogenase: Reaction of lipoic acid with 4-
hydroxy-2-nonenal. Biochemistry, 37(45), pp.15835–15841.
Hur, J., Pak, S.C., Koo, B.S. and Jeon, S., 2013. Borneol alleviates oxidative
stress via upregulation of Nrf2 and Bcl-2 in SH-SY5Y cells. Pharmaceutical
Biology, 51(1), pp.30-35.
Ichimura, Y., Waguri, S., Sou, Y. shin, Kageyama, S., Hasegawa, J., Ishimura, R.,
Saito, T., Yang, Y., Kouno, T., Fukutomi, T., Hoshii, T., Hirao, A., Takagi, K.,
214
Mizushima, T., Motohashi, H., Lee, M.S., Yoshimori, T., Tanaka, K., Yamamoto,
M. and Komatsu, M., 2013. Phosphorylation of p62 Activates the Keap1-Nrf2
Pathway during Selective Autophagy. Molecular Cell, 51(5), pp.618-631.
Idelchik, M. del P.S., Begley, U., Begley, T.J. and Melendez, J.A., 2017.
Mitochondrial ROS control of cancer. Seminars in Cancer Biology, 47, pp.57-66.
Ikeda, H., Nishi, S. and Sakai, M., 2004. Transcription factor Nrf2/MafK regulates
rat placental glutathione S-transferase gene during hepatocarcinogenesis. The
Biochemical journal, 380(Pt 2), pp.515–521.
Irani, K., Xia, Y., Zweier, J.L., Sollott, S.J., Der, C.J., Fearon, E.R., Sundaresan,
M., Finkel, T. and Goldschmidt-Clermont, P.J., 1997. Mitogenic signaling
mediated by oxidants in Ras-transformed fibroblasts. Science (New York, N.Y.),
275, pp.1649–1652.
Ishimoto, T., Nagano, O., Yae, T., Tamada, M., Motohara, T., Oshima, H.,
Oshima, M., Ikeda, T., Asaba, R., Yagi, H., Masuko, T., Shimizu, T., Ishikawa, T.,
Kai, K., Takahashi, E., Imamura, Y., Baba, Y., Ohmura, M., Suematsu, M., Baba,
H. and Saya, H., 2011. CD44 Variant Regulates Redox Status in Cancer Cells by
Stabilizing the xCT Subunit of System xc− and Thereby Promotes Tumor Growth.
Cancer Cell, 19(3), pp.387–400.
Itoh, K., Chiba, T., Takahashi, S., Ishii, T., Igarashi, K., Katoh, Y., Oyake, T.,
Hayashi, N., Satoh, K., Hatayama, I., Yamamoto, M. and Nabeshima, Y. ichi,
1997. An Nrf2/small Maf heterodimer mediates the induction of phase II
detoxifying enzyme genes through antioxidant response elements. Biochemical
and Biophysical Research Communications, 236(2), pp.313–322.
Itoh, K., Igarashi, K., Hayashi, N., Nishizawa, M. and Yamamoto, M., 1995.
Cloning and Characterization of a Novel Erythroid Cell-Derived CNC Family
Transcription Factor Heterodimerizing with the Small Maf Family Proteins.
Molecular and cellular biology, 15(8), pp.4184-4193.
215
Itoh, K., Wakabayashi, N., Katoh, Y., Ishii, T., Igarashi, K., Engel, J.D. and
Yamamoto, M., 1999. Keap1 represses nuclear activation of antioxidant
responsive elements by Nrf2 through binding to the amino-terminal Neh2 domain.
Genes & Development, 13(1), pp.76–86.
Jain, A.K., Bloom, D.A. and Jaiswal, A.K., 2005. Nuclear import and export signals
in control of Nrf2. The Journal of Biological Chemistry, 280, pp.29158-29168.
(Retracted).
Jain, A.K. and Jaiswal, A.K., 2006. Phosphorylation of Tyrosine 568 controls
Nuclear Export of Nrf2. The Journal of Biological Chemistry, 281, pp.12132-
12142. (Retracted).
Jain, A.K. and Jaiswal, A.K., 2007. GSK-3beta acts upstream of Fyn kinase in
regulation of nuclear export and degradation of NF-E2 related factor 2. The
Journal of Biological Chemistry, 282(22), pp.16502-16510.
Jain, A., Lamark, T., Sjøttem, E., Larsen, K.B., Awuh, J.A., Øvervatn, A.,
McMahon, M., Hayes, J.D. and Johansen, T., 2010. p62/SQSTM1 is a target gene
for transcription factor NRF2 and creates a positive feedback loop by inducing
antioxidant response element-driven gene transcription. Journal of Biological
Chemistry, 285(29), pp.22576–22591.
Jaramillo, M. and Zhang, D., 2013. The emerging role of the Nrf2–Keap1 signaling
pathway in cancer. Genes & development, 27, pp.2179–2191.
Jones, S., Chen, W.-D., Parmigiani, G., Diehl, F., Beerenwinkel, N., Antal, T.,
Traulsen, A., Nowak, M. a, Siegel, C., Velculescu, V.E., Kinzler, K.W., Vogelstein,
B., Willis, J. and Markowitz, S.D., 2008. Comparative lesion sequencing provides
insights into tumor evolution. Proceedings of the National Academy of Sciences of
the United States of America, 105(11), pp.4283–8.
Joo, M.S., Kim, W.D., Lee, K.Y., Kim, J.H., Koo, J.H. and Kim, S.G., 2016. AMPK
Facilitates Nuclear Accumulation of Nrf2 by Phosphorylating at Serine 550.

216
Molecular and cellular biology, 36(14), pp.1931–42.
Jope, R.S. and Johnson, G.V.W., 2004. The glamour and gloom of glycogen
synthase kinase-3. Trends in Biochemical Sciences, 29(2), pp.95-102.
Jope, R.S., Yuskaitis, C.J. and Beurel, E., 2007. Glycogen synthase kinase-3
(GSK3): Inflammation, diseases, and therapeutics. Neurochemical Research,
32(4-5), pp.577-595.
Joseph, M.A., Moysich, K.B., Freudenheim, J.L., Shields, P.G., Bowman, E.D.,
Zhang, Y., Marshall, J.R. and Ambrosone, C.B., 2004. Cruciferous Vegetables,
Genetic Polymorphisms in Glutathione S-Transferases M1 and T1, and Prostate
Cancer Risk. Nutrition and Cancer, 50(2), pp.206–213.
Jung, K.A., Choi, B. hyun, Nam, C.W., Song, M., Kim, S.T., Lee, J.Y. and Kwak,
M.K., 2013. Identification of aldo-keto reductases as NRF2-target marker genes in
human cells. Toxicology Letters, 218(1), pp.39–49.
Kaidanovich-Beilin, O. and Woodgett, J.R., 2011. GSK-3: Functional Insights from
Cell Biology and Animal Models. Frontiers in molecular neuroscience, 4(40), pp.1-
25.
Kamencic, H., Lyon, A., Paterson, P.G. and Juurlink, B.H.J., 2000.
Monochlorobimane Fluorometric Method to Measure Tissue Glutathione.
Analytical Biochemistry, 286(1), pp.35–37.
Kanadaswami, C., Lee, L.T., Lee, P.P.H., Hwang, J.J., Ke, F.C., Huang, Y.T. and
Lee, M.T., 2005. The antitumor activities of flavonoids. In Vivo, 19, pp.895-910.
Kang, E.S., Woo, I.S., Kim, H.J., Eun, S.Y., Paek, K.S., Kim, H.J., Chang, K.C.,
Lee, J.H., Lee, H.T., Kim, J.H., Nishinaka, T., Yabe-Nishimura, C. and Seo, H.G.,
2007. Up-regulation of aldose reductase expression mediated by
phosphatidylinositol 3-kinase/Akt and Nrf2 is involved in the protective effect of
curcumin against oxidative damage. Free Radical Biology and Medicine, 43(4),
pp. 535-545.
217
Kang, H.J., Hong, Y. Bin, Kim, H.J. and Bae, I., 2010. CR6-interacting factor 1
(CRIF1) regulates NF-E2-related factor 2 (NRF2) protein stability by proteasome-
mediated degradation. The Journal of biological chemistry, 285(28), pp.21258–68.
Kang, K.W., Cho, M.K., Lee, C.H. and Kim, S.G., 2001. Activation of
Phosphatidylinositol 3-Kinase and Akt by tert -Butylhydroquinone Is Responsible
for Antioxidant Response Element-Mediated rGSTA2 Induction in H4IIE Cells.
Molecular Pharmacology, 59(5), pp.1147–1156.
Kang, K.W., Lee, S.J., Park, J.W. and Kim, S.G., 2002. Phosphatidylinositol 3-
kinase regulates nuclear translocation of NF-E2-related factor 2 through actin
rearrangement in response to oxidative stress. Molecular pharmacology, 62(5),
pp.1001–10.
Kang, M.-I., Kobayashi, A., Wakabayashi, N., Kim, S.-G. and Yamamoto, M.,
2004. Scaffolding of Keap1 to the actin cytoskeleton controls the function of Nrf2
as key regulator of cytoprotective phase 2 genes. Proceedings of the National
Academy of Sciences, 101(7), pp.2046-2051.
Kasper, J.W. and Jaiswal, A.K., 2011. Tyrosine phosphorylation controls nuclear
export of Fyn, allowing Nrf2 activation of cytoprotective gene expression. The
Journal of the Federation of American Societies for Experimental Biology, 25(3),
pp.1076-1087.
Katoh, Y., Iida, K., Kang, M. Il, Kobayashi, A., Mizukami, M., Tong, K.I.,
McMahon, M., Hayes, J.D., Itoh, K. and Yamamoto, M., 2005. Evolutionary
conserved N-terminal domain of Nrf2 is essential for the Keap1-mediated
degradation of the protein by proteasome. In: Archives of Biochemistry and
Biophysics, 433(2), pp.342-350.
Katoh, Y., Itoh, K., Yoshida, E., Miyagishi, M., Fukamizu, A. and Yamamoto, M.,
2001. Two domains of Nrf2 cooperatively bind CBP, a CREB binding protein, and
synergistically activate transcription. Genes to Cells, 6(10), pp.857-868.

218
Kawanishi, S., Hiraku, Y., Pinlaor, S. and Ma, N., 2006. Oxidative and nitrative
DNA damage in animals and patients with inflammatory diseases in relation to
inflammation-related carcinogenesis. Biological chemistry, 387, pp.365–372.
Keeley, T.P. and Mann, G.E., 2018. Defining physiological normoxia for improved
translation of cell physiology to animal models and humans. Physiol Rev 99,
pp.161-234.
Kelloff GF, Crowell JA, Boone CW, Steele VE, Lubet RA, Greenwald P, et al,
1994. Clinical development plan:oltipraz. Journal of Biochem suppl, 20, pp.205–
18.
Kensler, T.W., Chen, J.-G., Egner, P.A., Fahey, J.W., Jacobson, L.P.,
Stephenson, K.K., Ye, L., Coady, J.L., Wang, J.-B., Wu, Y., Sun, Y., Zhang, Q.-N.,
Zhang, B.-C., Zhu, Y.-R., Qian, G.-S., Carmella, S.G., Hecht, S.S., Benning, L.,
Gange, S.J., Groopman, J.D. and Talalay, P., 2005. Effects of glucosinolate-rich
broccoli sprouts on urinary levels of aflatoxin-DNA adducts and phenanthrene
tetraols in a randomized clinical trial in He Zuo township, Qidong, People’s
Republic of China. Cancer Epidemiology Biomarkers & Prevention, 14(11),
pp.2605–2613.
Kensler, T.W., Wakabayashi, N. and Biswal, S., 2007. Cell survival responses to
environmental stresses via the Keap1-Nrf2-ARE pathway. Annual review of
pharmacology and toxicology, 47, pp.89–116.
Kensler TW and Helzlsouer KJ, 1995. Oltipraz: clinical opportunities for cancer
chemoprevention. Journal of Biochem suppl, 22, pp.101–7.
Kensuke, S., Kenta, I., Hiroyuki, S., Yoshiaki, T., Sakamoto, K., Iwasaki, K.,
Sugiyama, H. and Tsuji, Y., 2009. Role of the Tumor Suppressor PTEN in
Antioxidant Responsive Element-mediated Transcription and Associated Histone
Modifications. Molecular Biology of the Cell, 20(6), pp.1606–1617.
Kerins, M.J. and Ooi, A., 2018. The role of Nrf2 in modulating cellular iron

219
homeostasis. Antioxidant redox Signal, 29(17), pp.1756-1773.
Khan, N.M., Haseeb, A., Ansari, M.Y., Devarapalli, P., Haynie, S. and Haqqi,
T.M., 2017. Wogonin, a plant derived small molecule, exerts potent anti-
inflammatory and chondroprotective effects through the activation of
ROS/ERK/Nrf2 signaling pathways in human Osteoarthritis chondrocytes. Free
Radical Biology and Medicine, 106, pp.288-301.
Kim, J.-H., Na, H.-J., Kim, C.-K., Kim, J.-Y., Ha, K.-S., Lee, H., Chung, H.-T.,
Kwon, H.J., Kwon, Y.-G. and Kim, Y.-M., 2008a. The non-provitamin A carotenoid,
lutein, inhibits NF-κB-dependent gene expression through redox-based regulation
of the phosphatidylinositol 3-kinase/PTEN/Akt and NF-κB-inducing kinase
pathways: Role of H2O2 in NF-κB activation. Free Radical Biology and Medicine,
45(6), pp.885–896.
Kim, R.H., Peters, M., Jang, Y., Shi, W., Pintilie, M., Fletcher, G.C., DeLuca, C.,
Liepa, J., Zhou, L., Snow, B., Binari, R.C., Manoukian, A.S., Bray, M.R., Liu, F.F.,
Tsao, M.S. and Mak, T.W., 2005. DJ-1, a novel regulator of the tumor suppressor
PTEN. Cancer Cell, 7(3), pp.263–273.
Kim, S.K., Yang, J.W., Kim, M.R., Roh, S.H., Kim, H.G., Lee, K.Y., Jeong, H.G.
and Kang, K.W., 2008b. Increased expression of Nrf2/ARE-dependent anti-
oxidant proteins in tamoxifen-resistant breast cancer cells. Free Radical Biology
and Medicine, 45(4), pp.537–546.
Kim, Y.-J., Ahn, J.-Y., Liang, P., Ip, C., Zhang, Y. and Park, Y.-M., 2007. Human
prx1 Gene Is a Target of Nrf2 and Is Up-regulated by Hypoxia/Reoxygenation:
Implication to Tumor Biology. Cancer Research, 67(2), pp.546–554.
Kim, Y.R., Oh, J.E., Kim, M.S., Kang, M.R., Park, S.W., Han, J.Y., Eom, H.S.,
Yoo, N.J. and Lee, S.H., 2010. Oncogenic NRF2 mutations in squamous cell
carcinomas of oesophagus and skin. The Journal of pathology, 220, pp.446–451.
Kitteringham, N.R., Abdullah, A., Walsh, J., Randle, L., Jenkins, R.E., Sison, R.,
220
Goldring, C.E.P., Powell, H., Sanderson, C., Williams, S., Higgins, L., Yamamoto,
M., Hayes, J. and Park, B.K., 2010. Proteomic analysis of Nrf2 deficient
transgenic mice reveals cellular defence and lipid metabolism as primary Nrf2-
dependent pathways in the liver. Journal of Proteomics, 73, pp.1612–1631.
Knatko, E. V., Ibbotson, S.H., Zhang, Y., Higgins, M., Fahey, J.W., Talalay, P.,
Dawe, R.S., Ferguson, J., Huang, J.T.J., Clarke, R., Zheng, S., Saito, A., Kalra,
S., Benedict, A.L., Honda, T., Proby, C.M. and Dinkova-Kostova, A.T., 2015. Nrf2
activation protects against solar-simulated ultraviolet radiation in mice and
humans. Cancer Prevention Research, 8(6), pp.475–486.
Knowles, M.A. and Selby, P.J., 2005. Introduction to the Cellular and Molecular
Biology of Cancer, 4th Edition, Oxford University Press.
Kobayashi, A., Ito, E., Toki, T., Kogame, K., Takahashi, S., Igarashi, K., Hayashi,
N. and Yamamoto, M., 1999. Molecular cloning and functional characterization of
a new Cap’n’ collar family transcription factor Nrf3. The Journal of biological
chemistry, 274, pp.6443-6452.
Kobayashi, A., Kang, M.-I., Okawa, H., Ohtsuji, M., Zenke, Y., Chiba, T., Igarashi,
K. and Yamamoto, M., 2004a. Oxidative Stress Sensor Keap1 Functions as an
Adaptor for Cul3-Based E3 Ligase To Regulate Proteasomal Degradation of Nrf2.
Molecular and Cellular Biology, 24(16), pp.7130–7139.
Kobayashi, A., Kang, M.-I., Watai, Y., Tong, K.I., Shibata, T., Uchida, K. and
Yamamoto, M., 2006. Oxidative and electrophilic stresses activate Nrf2 through
inhibition of ubiquitination activity of Keap1. Molecular and cellular biology, 26(1),
pp.221–9.
Kobayashi, A., Kang, M.-I.M.-I.M.-I., Okawa, H., Ohtsuji, M., Zenke, Y., Chiba, T.,
Igarashi, K. and Yamamoto, M., 2004b. Oxidative Stress Sensor Keap1 Functions
as an Adaptor for Cul3-Based E3 Ligase To Regulate Proteasomal Degradation
of Nrf2. Molecular and Cellular Biology, 24(16), pp.7130–7139.
221
Köberle, B., Masters, J.R.W., Hartley, J.A. and Wood, R.D., 1999. Defective repair
of cisplatin-induced DNA damage caused by reduced XPA protein in testicular
germ cell tumours. Current Biology, 9, pp.273–276.
Komatsu, M., Kurokawa, H., Waguri, S., Taguchi, K., Kobayashi, A., Ichimura, Y.,
Sou, Y.-S., Ueno, I., Sakamoto, A., Tong, K.I., Kim, M., Nishito, Y., Iemura, S.,
Natsume, T., Ueno, T., Kominami, E., Motohashi, H., Tanaka, K. and Yamamoto,
M., 2010. The selective autophagy substrate p62 activates the stress responsive
transcription factor Nrf2 through inactivation of Keap1. Nature Cell Biology, 12(3),
pp.213-223.
Kowalik, M.A., Guzzo, G., Morandi, A., Perra, A., Menegon, S., Masgras, I.,
Trevisan, E., Angioni, M.M., Fornari, F., Quagliata, L., Ledda-Columbano, G.M.,
Gramantieri, L., Terracciano, L., Giordano, S., Chiarugi, P., Rasola, A. and
Columbano, A., 2016. Metabolic reprogramming identifies the most aggresive
lesions at early phases of hepatic carcinogenesis. Oncology Reports, pp.1–8.
Kraft, A.D., Johnson, D.A. and Johnson, J.A., 2004. Nuclear Factor E2-Related
Factor 2-Dependent Antioxidant Response Element Activation by tert-
Butylhydroquinone and Sulforaphane Occurring Preferentially in Astrocytes
Conditions Neurons against Oxidative Insult. Journal of Neuroscience, 24(5),
pp.1101-1112.
Kratschmar, D. V., Calabrese, D., Walsh, J., Lister, A., Birk, J., Appenzeller-
Herzog, C., Moulin, P., Goldring, C.E. and Odermatt, A., 2012. Suppression of the
Nrf2-dependent antioxidant response by glucocorticoids and 11β-HSD1-mediated
glucocorticoid activation in hepatic cells. PLoS ONE, 7(5), p.e36774.
Krumova, K. and Cosa, G., 2016. Chapter I: Overview of reactive oxygen species.
Singlet Oxygen : Applications in Biosciences and Nanosciences, Volume 1. pp.1-
21.
Kwak, M.-K., Itoh, K., Yamamoto, M. and Kensler, T.W., 2002. Enhanced
expression of the transcription factor Nrf2 by cancer chemopreventive agents: role
222
of antioxidant response element-like sequences in the nrf2 promoter. Molecular
and cellular biology, 22(9), pp.2883-2892.
Kwak, M.K., Wakabayashi, N. and Kensler, T.W., 2004. Chemoprevention through
the Keap1-Nrf2 signaling pathway by phase 2 enzyme inducers. Mutation
Research - Fundamental and Molecular Mechanisms of Mutagenesis, 555(1-2),
pp.133-148.
Kwee, J.K., 2014. A paradoxical chemoresistance and tumor suppressive role of
antioxidant in solid cancer cells: a strange case of Dr. Jekyll and Mr. Hyde.
BioMed research international, 2014, pp.1-9.
Kweon, M.-H., Adhami, V.M., Lee, J.-S. and Mukhtar, H., 2006. Constitutive
overexpression of Nrf2-dependent heme oxygenase-1 in A549 cells contributes to
resistance to apoptosis induced by epigallocatechin 3-gallate. The Journal of
biological chemistry, 281, pp.33761–33772.
Laemmli, U.K., 1970. Cleavage of structural proteins during the assembly of the
head of bacteriophage T4. Nature, 227, pp.680-685.
Lassot, I., Segeral, E., Berlioz-Torrent, C., Durand, H., Groussin, L., Hai, T.,
Benarous, R. and Margottin-Goguet, F., 2001. ATF4 Degradation Relies on a
Phosphorylation-Dependent Interaction with the SCF TrCP Ubiquitin Ligase.
Molecular and Cellular Biology, 21(6), pp.2192–2202.
Lau, A., Villeneuve, N.F., Sun, Z., Wong, P.K. and Zhang, D.D., 2008. Dual roles
of Nrf2 in cancer. Pharmacological research : the official journal of the Italian
Pharmacological Society, 58(5–6), pp.262–270.
Lau, W.L., Liu, S.M., Pahlevan, S., Yuan, J., Khazaeli, M., Ni, Z., Chan, J.Y. and
Vaziri, N.D., 2015. Role of Nrf2 Dysfunction in Uremia-Associated Intestinal
Inflammation and Epithelial Barrier Disruption. Digestive Diseases and Sciences,
60(5), pp.1215–1222.
Lawrence, M.S., Stojanov, P., Mermel, C.H., Robinson, J.T., Garraway, L.A.,

223
Golub, T.R., Meyerson, M., Gabriel, S.B., Lander, E.S. and Getz, G., 2014.
Discovery and saturation analysis of cancer genes across 21 tumour types.
Nature, 505(7484), pp.495–501.
Lee, J.M., Hanson, J.M., Chu, W.A. and Johnson, J.A., 2001. Phosphatidylinositol
3-Kinase, Not Extracellular Signal-regulated Kinase, Regulates Activation of the
Antioxidant-Responsive Element in IMR-32 Human Neuroblastoma Cells. Journal
of Biological Chemistry, 276(23), pp.20011-6.
Lee, S.-R., Yang, K.-S., Kwon, J., Lee, C., Jeong, W. and Rhee, S.G., 2002.
Reversible Inactivation of the Tumor Suppressor PTEN by H 2 O 2. Journal of
Biological Chemistry, 277(23), pp.20336–20342.
Lee, Y.-J. and Lee, S.-H., 2011. Sulforaphane induces antioxidative and
antiproliferative responses by generating reactive oxygen species in human
bronchial epithelial BEAS-2B cells. Journal of Korean medical science, 26(11),
pp.1474–82.
Lemmon, M.A. and Schlessinger, J., 2010. Cell signaling by receptor tyrosine
kinases. Cell, 141, pp.1117–1134.
Leslie, N.R., Bennett, D., Lindsay, Y.E., Stewart, H., Gray, A. and Downes, C.P.,
2003. Redox regulation of PI 3-kinase signalling via inactivation of PTEN. The
EMBO journal, 22(20), pp.5501–10.
Li, F., Wang, Y., Zeller, K.I., Potter, J.J., Wonsey, D.R., O’Donnell, K.A., Kim, J.-
W., Yustein, J.T., Lee, L.A. and Dang, C. V, 2005a. Myc stimulates nuclearly
encoded mitochondrial genes and mitochondrial biogenesis. Molecular and
cellular biology, 25(14), pp.6225–34.
Li, H., Li, X., Wu, X., Shi, W. and Ma, H., 2017. Observation of the Generation of
ONOO-in Mitochondria under Various Stimuli with a Sensitive Fluorescence
Probe. Analytical Chemistry, 89(10), pp.5519-5525.
Li, J., Lee, J.M. and Johnson, J.A., 2002. Microarray analysis reveals an

224
antioxidant responsive element-driven gene set involved in conferring protection
from an oxidative stress-induced apoptosis in IMR-32 cells. Journal of Biological
Chemistry, 277(1), pp.388–394.
Li, M.H., Cha, Y.N. and Surh, Y.J., 2006. Peroxynitrite induces HO-1 expression
via PI3K/Akt-dependent activation of NF-E2-related factor 2 in PC12 cells. Free
Radical Biology and Medicine, 41(7), pp.1079-1091.
Li, T., Hawkes, C., Qureshi, H.Y., Kar, S. and Paudel, H.K., 2006. Cyclin-
dependent protein kinase 5 primes microtubule-associated protein tau site-
specifically for glycogen synthase kinase 3beta. Biochemistry, 45(10), pp.3134–
45.
Li, W., Jain, M.R., Chen, C., Yue, X., Hebbar, V., Zhou, R. and Kong, A.N.T.,
2005b. Nrf2 possesses a redox-insensitive nuclear export signal overlapping with
the leucine zipper motif. Journal of Biological Chemistry, 280(3), pp. 28430-
28438.
Li, W., Thakor, N., Xu, E.Y., Huang, Y., Chen, C., Yu, R., Holcik, M. and Kong,
A.N., 2010. An internal ribosomal entry site mediates redox-sensitive translation of
Nrf2. Nucleic Acids Research, 38(3), pp.778–788.
Li, W., Yu, S.W. and Kong, A.N.T., 2006. Nrf2 possesses a redox-sensitive
nuclear exporting signal in the Neh5 transactivation domain. Journal of Biological
Chemistry, 281(37), pp.27251-63.
Li, X., Zhang, D., Hannink, M. and Beamer, L.J., 2004. Crystal structure of the
Kelch domain of human Keap1. Journal of Biological Chemistry, 279(52),
pp.54750-8.
Liby, K., Risingsong, R., Royce, D.B., Williams, C.R., Ma, T., Yore, M.M. and
Sporn, M.B., 2009. Triterpenoids CDDO-methyl ester or CDDO-ethyl amide and
rexinoids LG100268 or NRX194204 for prevention and treatment of lung cancer in
mice. Cancer Prevention Research, 2(12), pp.1050–1058.

225
Limon-Mortes, M.C., Mora-Santos, M., Espina, A., Pintor-Toro, J.A., Lopez-
Roman, A., Tortolero, M. and Romero, F., 2008. UV-induced degradation of
securin is mediated by SKP1-CUL1- TrCP E3 ubiquitin ligase. Journal of Cell
Science, 121(11), pp.1825–1831.
Lin, y., Sui, l.-c., Wu, r.-h., Ma, r.-j., Fu, h.-y., Xu, j.-j., Qiu, x.-h. and Chen, l.,
2018. Nrf2 inhibition affects cell cycle progression during early mouse embryo
development. Journal of Reproduction and Development, 64(1), pp.49–55.
Liou, G.-Y. and Storz, P., 2010. Reactive oxygen species in cancer. Free radical
research, 44(5), pp.479–96.
Lister, A., Nedjadi, T., Kitteringham, N.R., Campbell, F., Costello, E., Lloyd, B.,
Copple, I.M., Williams, S., Owen, A., Neoptolemos, J.P., Goldring, C.E. and Park,
B.K., 2011. Nrf2 is overexpressed in pancreatic cancer: implications for cell
proliferation and therapy. Molecular Cancer, 10(1), p.37.
Liu, M., Grigoryev, D.N., Crow, M.T., Haas, M., Yamamoto, M., Reddy, S.P. and
Rabb, H., 2009. Transcription factor Nrf2 is protective during ischemic and
nephrotoxic acute kidney injury in mice. Kidney International, 76(3), pp.277–285.
Liu, S.L., Lin, X., Shi, D.Y., Cheng, J., Wu, C.Q. and Zhang, Y.D., 2002. Reactive
oxygen species stimulated human hepatoma cell proliferation via cross-talk
between PI3-K/PKB and JNK signaling pathways. Arch Biochem Biophys, 406(2),
pp.173-182.
Lo, J.Y., Spatola, B.N. and Curran, S.P., 2017. WDR23 regulates NRF2
independently of KEAP1. PLoS Genetics, 13(4), pp1-26.
Lo, S.C., Li, X., Henzl, M.T., Beamer, L.J. and Hannink, M., 2006. Structure of the
Keap1:Nrf2 interface provides mechanistic insight into Nrf2 signaling. EMBO
Journal, 25(15), pp.3605-17.
Lodovici, M. and Bigagli, E., 2011. Oxidative stress and air pollution exposure.
Journal of toxicology, 2011, pp.487074, 1-9.
226
Long, D.J., Waikel, R.L., Wang, X.-J., Perlaky, L., Roop, D.R. and Jaiswal, A.K.,
2000. NAD(P)H:Quinone Oxidoreductase 1 Deficiency Increases Susceptibility to
Benzo(a)pyrene-induced Mouse Skin Carcinogenesis. Cancer Res, 60(21),
pp.5913-5.
Long, M., Tao, S., Rojo de la Vega, M., Jiang, T., Wen, Q., Park, S.L., Zhang,
D.D. and Wondrak, G.T., 2015. Nrf2-Dependent Suppression of
Azoxymethane/Dextran Sulfate Sodium-Induced Colon Carcinogenesis by the
Cinnamon-Derived Dietary Factor Cinnamaldehyde. Cancer Prevention Research,
8(5), pp.444–454.
Lowry, 1951. Lowry Protein Assay. Journal of Biological Chemistry, 193(1),
pp.265-75.
Lowry, O.H., Rosebrough, N.J., Farr, A.L. and Randall, R.J., 1951. Protein
measurement with the Folin phenol reagent. The Journal of biological chemistry,
193(1), pp.265-75.
Lu, Y., Parkyn, L., Otterbein, L.E., Kureishi, Y., Walsh, K., Ray, A. and Ray, P.,
2001. Activated Akt protects the lung from oxidant-induced injury and delays
death of mice. The Journal of experimental medicine, 193(4), pp.545-550.
De Luca, A., Sanna, F., Sallese, M., Ruggiero, C., Grossi, M., Sacchetta, P.,
Rossi, C., De Laurenzi, V., Di Ilio, C. and Favaloro, B., 2010. Methionine sulfoxide
reductase A down-regulation in human breast cancer cells results in a more
aggressive phenotype. Proceedings of the National Academy of Sciences of the
United States of America, 107(43), pp.18628-33.
Lum, J.J., Bui, T., Gruber, M., Gordan, J.D., DeBerardinis, R.J., Covello, K.L.,
Simon, M.C. and Thompson, C.B., 2007. The transcription factor HIF-1alpha plays
a critical role in the growth factor-dependent regulation of both aerobic and
anaerobic glycolysis. Genes & development, 21(9), pp.1037–49.
Luo, Y., Eggler, A.L., Liu, D., Liu, G., Mesecar, A.D. and van Breemen, R.B.,
227
2007. Sites of Alkylation of Human Keap1 by Natural Chemoprevention Agents.
Journal of the American Society for Mass Spectrometry, 18, pp.2226–2232.
Ma, Q., Battelli, L. and Hubbs, A.F., 2006. Multiorgan Autoimmune Inflammation,
Enhanced Lymphoproliferation, and Impaired Homeostasis of Reactive Oxygen
Species in Mice Lacking the Antioxidant-Activated Transcription Factor Nrf2. The
American Journal of Pathology, 168(6), pp.1960–1974.
Ma, Z.-C., Hong, Q., Wang, Y.-G., Tan, H.-L., Xiao, C.-R., Liang, Q.-D., Zhang,
B.-L. and Gao, Y., 2010. Ferulic Acid Protects Human Umbilical Vein Endothelial
Cells from Radiation Induced Oxidative Stress by Phosphatidylinositol 3-Kinase
and Extracellular Signal-Regulated Kinase Pathways. Biological & Pharmaceutical
Bulletin, 33(1), pp.29-34.
MacLeod, A.K., McMahon, M., Plummer, S.M., Higgins, L.G., Penning, T.M.,
Igarashi, K. and Hayes, J.D., 2009. Characterization ot the cancer
chemopreventive Nrf2-dependent gene bathery in human keratinocytes:
demonstration thet the Keap1-Nrf2 pathway, and not the BACH1-Nrf2 pathway,
controls cytoprotection against electrophiles as well as redox-cycling compounds.
Carcinogenesis, 30(9), pp.1571-1580.
Madigan, M.T., Martinko, J.M., Stahl, D.A. and Clark, D.P., 2012. Brock Biology of
Microorganisms, 13th Edition. International Microbiology.
Maher, J.M., Dieter, M.Z., Aleksunes, L.M., Slitt, A.L., Guo, G., Tanaka, Y.,
Scheffer, G.L., Chan, J.Y., Manautou, J.E., Chen, Y., Dalton, T.P., Yamamoto, M.
and Klaassen, C.D., 2007. Oxidative and electrophilic stress induces multidrug
resistance-associated protein transporters via the nuclear factor-E2-related factor-
2 transcriptional pathway. Hepatology, 46(5), pp.1597–1610.
Mahmood, T. and Yang, P.C., 2012. Western blot: Technique, theory, and trouble
shooting. North American Journal of Medical Sciences, 4(9), pp.429-434.
Maines, M.D., 1997. The heme oxigenase system: A regulator of second

228
messenger gases. Annual Review of Pharmacology and Toxicology, 37, pp.517-
554.
Malhotra, D., Portales-Casamar, E., Singh, A., Srivastava, S., Arenillas, D.,
Happel, C., Shyr, C., Wakabayashi, N., Kensler, T.W., Wasserman, W.W. and
Biswal, S., 2010. Global mapping of binding sites for Nrf2 identifies novel targets
in cell survival response through chip-seq profiling and network analysis. Nucleic
Acids Research, 38(17), pp.5718–5734.
Manning BD, C.L.C., 2007. AKTPKB signaling: navigating downstream. Cell,
129(7), pp.1261-1274.
Martin, D., Rojo, A.I., Salinas, M., Diaz, R., Gallardo, G., Alam, J., Ruiz De
Galarreta, C.M. and Cuadrado, A., 2004. Regulation of Heme Oxygenase-1
Expression through the Phosphatidylinositol 3-Kinase/Akt Pathway and the Nrf2
Transcription Factor in Response to the Antioxidant Phytochemical Carnosol.
Journal of Biological Chemistry, 279(10), pp.8919–8929.
Matsuzawa, A. and Ichijo, H., 2008. Redox control of cell fate by MAP kinase:
physiological roles of ASK1-MAP kinase pathway in stress signaling. Biochimica
et Biophysica Acta (BBA), 1780(11), pp.1325-36.
Matsuzawa, A., Saegusa, K., Noguchi, T., Sadamitsu, C., Nishitoh, H., Nagai, S.,
Koyasu, S., Matsumoto, K., Takeda, K. and Ichijo, H., 2005. ROS-dependent
activation of the TRAF6-ASK1-p38 pathway is selectively required for TLR4-
mediated innate immunity. Nature Immunology, 6(6), pp.587-592.
Maxuitenko, Y.Y., MacMillan, D.L., Kensler, T.W. and Roebuck, B.D., 1993.
Evaluation of the post-initiation effects of oltipraz on aflatoxin B1-induced
preneoplastic foci in a rat model of hepatic tumorigenesis. Carcinogenesis,
14(11), pp.2423–5.
McDonald, J.T., Kim, K., Norris, A.J., Vlashi, E., Phillips, T.M., Lagadec, C., Della
Donna, L., Ratikan, J., Szelag, H., Hlatky, L. and McBride, W.H., 2010. Ionizing

229
radiation activates the Nrf2 antioxidant response. Cancer Research, 70(21),
pp.8886–8895.
Mcmahon, M., Itoh, K., Yamamoto, M., Chanas, S.A., Henderson, C.J., Mclellan,
L.I., Wolf, C.R., Cavin, C. and Hayes, J.D., 2001. The Cap ’ n ’ Collar Basic
Leucine Zipper Transcription Factor Nrf2 ( NF-E2 p45-related Factor 2 ) Controls
Both Constitutive and Inducible Expression of Intestinal Detoxification and
Glutathione Biosynthetic Enzymes The Cap ‘ n ’ Collar Basic Leucine Zip. Cancer
research, 63(2), pp.3299–3307.
McMahon, M., Itoh, K., Yamamoto, M. and Hayes, J.D., 2003. Keap1-dependent
proteasomal degradation of transcription factor Nrf2 contributes to the negative
regulation of antioxidant response element-driven gene expression. Journal of
Biological Chemistry, 278(24), pp.21592-21600.
McMahon, M., Lamont, D.J., Beattie, K.A. and Hayes, J.D., 2010. Keap1
perceives stress via three sensors for the endogenous signaling molecules nitric
oxide, zinc, and alkenals. Proceedings of the National Academy of Sciences,
107(44), pp.18838–18843.
McMahon, M., Thomas, N., Itoh, K., Yamamoto, M. and Hayes, J.D., 2004.
Redox-regulated turnover of Nrf2 is determined by at least two separate protein
domains, the redox-sensitive Neh2 degron and the redox-insensitive Neh6
degron. The Journal of biological chemistry, 279(30), pp.31556–67.
McMahon, M., Thomas, N., Itoh, K., Yamamoto, M. and Hayes, J.D., 2006.
Dimerization of substrate adaptors can facilitate Cullin-mediated ubiquitylation of
proteins by a ‘tethering’ mechanism: A two-site interaction model for the Nrf2-
Keap1 complex. Journal of Biological Chemistry, 281(34), pp.24756-68.
McNabb, D.S., Reed, R. and Marciniak, R.A., 2005. Dual luciferase assay system
for rapid assessment of gene expression in Saccharomyces cerevisiae.
Eukaryotic Cell, 4(9), pp.1539-49.

230
Meakin, P.J., Chowdhry, S., Sharma, R.S., Ashford, F.B., Walsh, S. V.,
McCrimmon, R.J., Dinkova-Kostova, A.T., Dillon, J.F., Hayes, J.D. and Ashford,
M.L.J., 2014. Susceptibility of Nrf2-Null Mice to Steatohepatitis and Cirrhosis upon
Consumption of a High-Fat Diet Is Associated with Oxidative Stress, Perturbation
of the Unfolded Protein Response, and Disturbance in the Expression of
Metabolic Enzymes but Not with I. Molecular and Cellular Biology, 34(17),
pp.3305–3320.
Menegon, S., Columbano, A. and Giordano, S., 2016. The Dual Roles of NRF2 in
Cancer. Trends in Molecular Medicine, 22(7), pp.578-593.
Miao, W., Hu, L., Scrivens, P.J. and Batist, G., 2005. Transcriptional regulation of
NF-E2 p45-related factor (NRF2) expression by the aryl hydrocarbon receptor-
xenobiotic response element signaling pathway: Direct cross-talk between phase I
and II drug-metabolizing enzymes. Journal of Biological Chemistry, 280(21),
pp.20340–20348.
Mignotte, V., Wall, L., Deboer, E., Grosveld, F. and Romeo, P.H., 1989. Two
tissue-specific factors bind the erythroid promoter of the human porphobilinogen
deaminase gene. Nucleic Acids Research, 17(1), pp.37-54.
Mitsuishi, Y., Motohashi, H. and Yamamoto, M., 2012. The Keap1-Nrf2 system in
cancers: stress response and anabolic metabolism. Frontiers in oncology, 2(200),
pp.1-13.
Mitsuishi, Y., Taguchi, K., Kawatani, Y., Shibata, T., Nukiwa, T., Aburatani, H.,
Yamamoto, M. and Motohashi, H., 2012. Nrf2 Redirects Glucose and Glutamine
into Anabolic Pathways in Metabolic Reprogramming. Cancer Cell, 22(1), pp.66–
79.
Miyazaki, M. and Ntambi, J.M., 2003. Role of stearoyl-coenzyme A desaturase in
lipid metabolism. Prostaglandins, leukotrienes, and essential fatty acids, 68(2),
pp.113–21.
231
Mohler, J., Vani, K., Leung, S. and Epstein, A., 1991. Segmentally restricted,
cephalic expression of a leucine zipper gene during Drosophila embryogenesis.
Mechanisms of Development, 34(1), pp.3-9.
Moi, P., Chan, K., Asunis, I., Cao, A. and Kan, Y.W., 1994. Isolation of NF-E2-
related factor 2 (Nrf2), a NF-E2-like basic leucine zipper transcriptional activator
that binds to the tandem NF-E2/AP1 repeat of the beta-globin locus control
region. Proceedings of the National Academy of Sciences of the United States of
America, 91, pp.9926–9930.
Moon, E.J. and Giaccia, A., 2015. Dual roles of NRF2 in tumor prevention and
progression: Possible implications in cancer treatment. Free Radical Biology and
Medicine, 79, pp.292–299.
Mullen, A.R., Wheaton, W.W., Jin, E.S., Chen, P.-H., Sullivan, L.B., Cheng, T.,
Yang, Y., Linehan, W.M., Chandel, N.S. and DeBerardinis, R.J., 2012. Reductive
carboxylation supports growth in tumour cells with defective mitochondria. Nature,
481(7381), pp.385–8.
Murakami, S. and Motohashi, H., 2015. Roles of Nrf2 in cell proliferation and
differentiation. Free Radical Biology and Medicine, 88(Pt B), pp.168–178.
Murphy, M.P. and M, M., 2009. How mitochondria produce reactive oxygen
species. The Biochemical journal, 417(1), pp.1–13.
Na, A.R., Chung, Y.M., Lee, S.B., Park, S.H., Lee, M.S. and Yoo, Y. Do, 2008. A
critical role for Romo1-derived ROS in cell proliferation. Biochemical and
Biophysical Research Communications, 369(2), pp.672-8.
Nair, R.R., Emmons, M.F., Cress, A.E., Argilagos, R.F., Lam, K., Kerr, W.T.,
Wang, H.-G., Dalton, W.S. and Hazlehurst, L.A., 2009. HYD1-induced increase in
reactive oxygen species leads to autophagy and necrotic cell death in multiple
myeloma cells. Molecular Cancer Therapeutics, 8(8), pp.2441-51.
Naito, M., Hashimoto, C., Masui, S. and Tsuruo, T., 2004. Caspase-independent
232
necrotic cell death induced by a radiosensitizer, 8-nitrocaffeine. Cancer Science,
95(4), pp.361-366.
Nakaso, K., Yano, H., Fukuhara, Y., Takeshima, T., Wada-Isoe, K. and
Nakashima, K., 2003. PI3K is a key molecule in the Nrf2-mediated regulation of
antioxidative proteins by hemin in human neuroblastoma cells. FEBS Letters,
546(2–3), pp.181–184.
Nakayami, K., Qi, J. and Ronai, Z., 2009. The ubiquitin ligase Siah2 and the
hypoxia response. Molecular Cancer Research, 7(4), pp.443-51.
Nelson, C.P., La Kidd, C.R., Sauvageot, J., Isaacs, W.B., De Marzo, A.M.,
Groopman, J.D., Nelson, W.G. and Kensler, T.W., 2001. Protection against 2-
hydroxyamino-1-methyl-6-phenylimidazo[4,5-b]pyridine cytotoxicity and DNA
adduct formation in human prostate by Glutathione S-Transferase P1. Cancer
Research, 61(1), pp.103–109.
Nguyen, T., Sherratt, P.J., Huang, H.C., Yang, C.S. and Pickett, C.B., 2003.
Increased protein stability as a mechanism that enhances Nrf2-mediated
transcriptional activation of the antioxidant response element: Degradation of Nrf2
by the 26 S proteasome. Journal of Biological Chemistry, 278(7), pp.4536-4541.
Nioi, P. and Hayes, J.D., 2004. Contribution of NAD(P)H:quinone oxidoreductase
1 to protection against carcinogenesis, and regulation of its gene by the Nrf2
basic-region leucine zipper and the arylhydrocarbon receptor basic helix-loop-
helix transcription factors. Mutation research, 555(1–2), pp.149–171.
Nioi, P., McMahon, M., Itoh, K., Yamamoto, M. and Hayes, J.D., 2003.
Identification of a novel Nrf2-regulated antioxidant response element (ARE) in the
mouse NAD(P)H:quinone oxidoreductase 1 gene: reassessment of the ARE
consensus sequence. The Biochemical journal, 374(Pt 2), pp.337–48.
Nioi, P. and Nguyen, T., 2007. A mutation of Keap1 found in breast cancer
impairs its ability to repress Nrf2 activity. Biochemical and Biophysical Research

233
Communications, 362, pp.816–821.
Nioi, P., Nguyen, T., Sherratt, P.J. and Pickett, C.B., 2005. The carboxy-terminal
Neh3 domain of Nrf2 is required for transcriptional activation. Molecular and
cellular biology, 25(24), pp.10895-906.
Nishimura, I., Yang, Y. and Lu, B., 2004. PAR-1 kinase plays an initiator role in a
temporally ordered phosphorylation process that confers tau toxicity in Drosophila.
Cell, 116(5), pp.671–682.
Niture, S.K., Kaspar, J.W., Shen, J. and Jaiswal, A.K., 2010. Nrf2 signaling and
cell survival. Toxicology and Applied Pharmacology, 244, pp.37–42.
Numazawa, S., Ishikawa, M., Yoshida, A., Tanaka, S. and Yoshida, T., 2003.
Atypical protein kinase C mediates activation of NF-E2-related factor 2 in
response to oxidative stress. American journal of physiology. Cell physiology,
285(2), pp.C334-42.
O’Reilly, K.E., Rojo, F., She, Q.-B., Solit, D., Mills, G.B., Smith, D., Lane, H.,
Hofmann, F., Hicklin, D.J., Ludwig, D.L., Baselga, J. and Rosen, N., 2006. mTOR
Inhibition Induces Upstream Receptor Tyrosine Kinase Signaling and Activates
Akt. Cancer Research, 66(3), pp.1500–1508.
Ogura, T., Tong, K.I., Mio, K., Maruyama, Y., Kurokawa, H., Sato, C. and
Yamamoto, M., 2010. Keap1 is a forked-stem dimer structure with two large
spheres enclosing the intervening, double glycine repeat, and C-terminal
domains. Proceedings of the National Academy of Sciences, 107(7), pp.2842–
2847.
Ohta, T., Iijima, K., Miyamoto, M., Nakahara, I., Tanaka, H., Ohtsuji, M., Suzuki,
T., Kobayashi, A., Yokota, J., Sakiyama, T., Shibata, T., Yamamoto, M. and
Hirohashi, S., 2008. Loss of Keap1 function activates Nrf2 and provides
advantages for lung cancer cell growth. Cancer research, 68(5), pp.1303–9.
Okada, K., Warabi, E., Sugimoto, H., Horie, M., Gotoh, N., Tokushige, K.,

234
Hashimoto, E., Utsunomiya, H., Takahashi, H., Ishii, T., Yamamoto, M. and
Shoda, J., 2012. Deletion of Nrf2 leads to rapid progression of steatohepatitis in
mice fed atherogenic plus high-fat diet. Journal of Gastroenterology, 48(5),
pp.620-632.
Okon, I.S. and Zou, M.-H., 2015. Mitochondrial ROS and cancer drug resistance:
Implications for therapy. Pharmacological research, 100, pp.170–4.
Olayanju, A., Copple, I.M., Bryan, H.K., Edge, G.T., Sison, R.L., Wong, M.W., Lai,
Z.Q., Lin, Z.X., Dunn, K., Sanderson, C.M., Alghanem, A.F., Cross, M.J., Ellis,
E.C., Ingelman-Sundberg, M., Malik, H.Z., Kitteringham, N.R., Goldring, C.E. and
Park, B.K., 2015. Brusatol provokes a rapid and transient inhibition of Nrf2
signaling and sensitizes mammalian cells to chemical toxicity - Implications for
therapeutic targeting of Nrf2. Free Radical Biology and Medicine, 78, pp.202-212.
Orient, A., Donkó, A., Szabó, A., Leto, T.L. and Geiszt, M., 2007. Novel sources of
reactive oxygen species in the human body. Nephrology, dialysis, transplantation :
official publication of the European Dialysis and Transplant Association -
European Renal Association, 22(5), pp.1281–8.
Orrenius, S., 2007. Reactive oxygen species in mitochondria-mediated cell death.
Drug Metab Rev, 39, pp.443-445.
Osburn, W.O. and Kensler, T.W., 2008. Nrf2 signaling: An adaptive response
pathway for protection against environmental toxic insults. Mutation Research -
Reviews in Mutation Research, 659, pp.31–39.
Osburn, W.O., Yates, M.S., Dolan, P.D., Chen, S., Liby, K.T., Sporn, M.B.,
Taguchi, K., Yamamoto, M. and Kensler, T.W., 2008. Genetic or pharmacologic
amplification of nrf2 signaling inhibits acute inflammatory liver injury in mice.
Toxicological sciences : an official journal of the Society of Toxicology, 104(1),
pp.218–27.
Oyake, T., Itoh, K., Motohashi, N., Hayashi, H., Hoshino. M., Nishizawa, M.,

235
Yamamoto, M. and Igarashi, K., 1996. Bach proteins belong to a novel family of
BTB-basic leucine zipper transcription factors that interact with MafK and regulate
transcription through the NF-E2 site. Molecular and Cellular Biology, 16(11),
pp.6083-6095.
Ozben, T., 2007. Oxidative stress and apoptosis: Impact on cancer therapy.
Journal of Pharmaceutical Sciences, 96(9), pp.2181-2196.
Padmanabhan, B., Tong, K.I., Ohta, T., Nakamura, Y., Scharlock, M., Ohtsuji, M.,
Kang, M. Il, Kobayashi, A., Yokoyama, S. and Yamamoto, M., 2006. Structural
basis for defects of Keap1 activity provoked by its point mutations in lung cancer.
Molecular Cell, 21(5), pp.689–700.
Paek, J., Lo, J.Y., Narasimhan, S.D., Nguyen, T.N., Glover-Cutter, K., Robida-
Stubbs, S., Suzuki, T., Yamamoto, M., Blackwell, T.K. and Curran, S.P., 2012.
Mitochondrial SKN-1/Nrf mediates a conserved starvation response. Cell
metabolism, 16(4), pp.526–37.
Pan, J.-S., Hong, M.-Z. and Ren, J.-L., 2009. Reactive oxygen species: A double-
edged sword in oncogenesis. World Journal of Gastroenterology, 15, pp.1702–
1707.
Pandey, M.K. and DeGrado, T.R., 2016. Glycogen synthase kinase-3 (GSK-3)-
targeted therapy and imaging. Theranostics, 6(4), pp.571-593.
Pandey, P., Singh, A.K., Singh, M., Tewari, M., Shukla, H.S. and Gambhir, I.S.,
2017. The see-saw of Keap1-Nrf2 pathway in cancer. Critical Reviews in
Oncology/Hematology, 116, pp.89–98.
Papaiahgari, S., Zhang, Q., Kleeberger, S.R., Cho, H.-Y. and Reddy, S.P., 2006.
Hyperoxia Stimulates an Nrf2-ARE Transcriptional Response via ROS-EGFR-
PI3K-Akt/ERK MAP Kinase Signaling in Pulmonary Epithelial Cells. Antioxidants &
Redox Signaling, 8(1-2), pp.43-52.
Peek, M.E. and Williams, L., 2001. SDS Page Gel Electrophoresis. Georgia

236
Institute of Technology.
Pergola, P.E., Raskin, P., Toto, R.D., Meyer, C.J., Huff, J.W., Grossman, E.B.,
Krauth, M., Ruiz, S., Audhya, P., Christ-Schmidt, H., Wittes, J. and Warnock,
D.G., 2011. Bardoxolone Methyl and Kidney Function in CKD with Type 2
Diabetes. New England Journal of Medicine, 365(4), pp.327–336.
Phillips, J. and Fox, R., 2013. BG-12 in Multiple Sclerosis. Seminars in Neurology,
33(01), pp.056–065.
Pitha-Rowe, I., Liby, K., Royce, D. and Sporn, M., 2009. Synthetic triterpenoids
attenuate cytotoxic retinal injury: Cross-talk between Nrf2 and PI3K/AKT signaling
through inhibition of the lipid phosphatase PTEN. Investigative Ophthalmology
and Visual Science, 50(11), pp.5339–5347.
Pitot, H.C., 1993. The molecular biology of carcinogenesis. Cancer, 72(S3),
pp.962-970.
Plattner, F. and Bibb, J.A., 2012. Serine and Threonine Phosphorylation. In: Basic
Neurochemistry. pp.467–492.
Poillet-Perez, L., Despouy, G., Delage-Mourroux, R. and Boyer-Guittaut, M.,
2015. Interplay between ROS and autophagy in cancer cells, from tumor initiation
to cancer therapy. Redox Biology, 4, pp.184–192.
Poyton, R.O., Ball, K.A. and Castello, P.R., 2009. Mitochondrial generation of free
radicals and hypoxic signaling. Trends in endocrinology and metabolism, 20(7),
pp.332–40.
Purdom-dickinson, S.E., Sheveleva, E. V, Sun, H. and Chen, Q.M., 2007.
Translational control of nrf2 protein in activation of antioxidant response by
oxidants. Molecular pharmacology, 72(4), pp.1074–1081.
Rada, P., Rojo, A.I., Chowdhry, S., McMahon, M., Hayes, J.D. and Cuadrado, A.,
2011. SCF/{beta}-TrCP promotes glycogen synthase kinase 3-dependent

237
degradation of the Nrf2 transcription factor in a Keap1-independent manner.
Molecular and cellular biology, 31(6), pp.1121–33.
Rada, P., Rojo, A.I., Evrard-Todeschi, N., Innamorato, N.G., Cotte, A., Jaworski,
T., Tobón-Velasco, J.C., Devijver, H., García-Mayoral, M.F., Van Leuven, F.,
Hayes, J.D., Bertho, G., Cuadrado, A., Tobon-Velasco, J.C., Devijver, H., Garcia-
Mayoral, M.F., Van Leuven, F., Hayes, J.D., Bertho, G. and Cuadrado, A., 2012.
Structural and functional characterization of Nrf2 degradation by the glycogen
synthase kinase 3/β-TrCP axis. Molecular and cellular biology, 32(17), pp.3486-
3499.
Rahman, I., Kode, A. and Biswas, S.K., 2007. Assay for quantitative determination
of glutathione and glutathione disulfide levels using enzymatic recycling method.
Nature Protocols, 1(6), pp.3159–3165.
Raj, L., Ide, T., Gurkar, A.U., Foley, M., Schenone, M., Li, X., Tolliday, N.J.,
Golub, T.R., Carr, S.A., Shamji, A.F., Stern, A.M., Mandinova, A., Schreiber, S.L.
and Lee, S.W., 2011. Selective killing of cancer cells by a small molecule
targeting the stress response to ROS. Nature, 475, pp.231–234.
Ramos-Gomez, M., Dolan, P.M., Itoh, K., Yamamoto, M. and Kensler, T.W., 2003.
Interactive effects of Nrf2 genotype and oltipraz on benzo[a]pyrene-DNA adducts
and tumor yield in mice. Carcinogenesis, 24(3), pp.461-467.
Ramos-Gomez, M., Kwak, M.-K.K., Dolan, P.M., Itoh, K., Yamamoto, M., Talalay,
P. and Kensler, T.W., 2001. Sensitivity to carcinogenesis is increased and
chemoprotective efficacy of enzyme inducers is lost in nrf2 transcription factor-
deficient mice. Proceedings of the National Academy of Sciences of the United
States of America, 98(6), pp.3410–3415.
Rangasamy, T., Cho, C.Y., Thimmulappa, R.K., Zhen, L., Srisuma, S.S., Kensler,
T.W., Yamamoto, M., Petrache, I., Tuder, R.M. and Biswal, S., 2004. Genetic
ablation of Nrf2 enhances susceptibility to cigarette smoke-induced emphysema
in mice. Journal of Clinical Investigation, 114(9), pp.11248-1259.

238
Ray, P.D., Huang, B.-W. and Tsuji, Y., 2012. Reactive oxygen species (ROS)
homeostasis and redox regulation in cellular signaling. Cellular signalling, 24(5),
pp.981–90.
Rayasam, G.V., Tulasi, V.K., Sodhi, R., Davis, J.A. and Ray, A., 2009. Glycogen
synthase kinase 3: More than a namesake. British Journal of Pharmacology,
156(6), pp.885-895.
Reddy, N.M., Kleeberger, S.R., Bream, J.H., Fallon, P.G., Kensler, T.W.,
Yamamoto, M. and Reddy, S.P., 2008. Genetic disruption of the Nrf2
compromises cell-cycle progression by impairing GSH-induced redox signaling.
Oncogene, 27(44), pp.5821-32.
Reddy, N.M., Kleeberger, S.R., Cho, H.-Y., Yamamoto, M., Kensler, T.W., Biswal,
S. and Reddy, S.P., 2007a. Deficiency in Nrf2-GSH Signaling Impairs Type II Cell
Growth and Enhances Sensitivity to Oxidants. American Journal of Respiratory
Cell and Molecular Biology, 37(1), pp.3–8.
Reddy, N.M., Kleeberger, S.R., Yamamoto, M., Kensler, T.W., Scollick, C.,
Biswal, S. and Reddy, S.P., 2007b. Genetic dissection of the Nrf2-dependent
redox signaling-regulated transcriptional programs of cell proliferation and
cytoprotection. Physiological Genomics, 32(1), pp.74–81.
Reddy, N.M., Potteti, H.R., Vegiraju, S., Chen, H.J., Tamatam, C.M. and Reddy,
S.P., 2015. PI3K-AKT signaling via Nrf2 protects against hyperoxia-induced acute
lung injury, but promotes inflammation post-injury independent of Nrf2 in mice.
PLoS ONE, 10(6), pp.1-13.
Ren, D., Villeneuve, N.F., Jiang, T., Wu, T., Lau, A., Toppin, H.A. and Zhang,
D.D., 2011. Brusatol enhances the efficacy of chemotherapy by inhibiting the
Nrf2-mediated defense mechanism. Proceedings of the National Academy of
Sciences, 108(4), pp.1433–1438.
Reuter, S., Gupta, S.C., Chaturvedi, M.M. and Aggarwal, B.B., 2010. Oxidative

239
stress, inflammation, and cancer: how are they linked? Free radical biology &
medicine, 49(11), pp.1603–1616.
Richardson, H. and Cunningham, L., 1951. The inhibitory action of
methylcholanthrene on rats fed the azo dye 3’-methyl-4-
dimethylaminoazobenzene. Cancer Research 11, p.274.
Riley, P.A., 1994. Free Radicals in Biology: Oxidative Stress and the Effects of
Ionizing Radiation. International Journal of Radiation Biology, 65(1), pp.27–33.
Robinson, D.N. and Cooley, L., 1997. Drosophila kelch is an oligomeric ring canal
actin organizer. Journal of Cell Biology, 65(1), pp.27-33.
Rojo, A.I., Medina-Campos, O.N., Rada, P., Zúñiga-Toalá, A., López-Gazcón, A.,
Espada, S., Pedraza-Chaverri, J. and Cuadrado, A., 2012. Signaling pathways
activated by the phytochemical nordihydroguaiaretic acid contribute to a Keap1-
independent regulation of Nrf2 stability: Role of glycogen synthase kinase-3. Free
Radical Biology and Medicine, 52(2), pp.473–487.
Rojo, A.I., Rada, P., Mendiola, M., Ortega-Molina, A., Wojdyla, K., Rogowska-
Wrzesinska, A., Hardisson, D., Serrano, M. and Cuadrado, A., 2014. The
PTEN/NRF2 axis promotes human carcinogenesis. Antioxidants & redox
signaling, 21(18), pp.2498–2514.
Rojo, A.I., Sagarra, M.R. De and Cuadrado, A., 2008. GSK-3β down-regulates the
transcription factor Nrf2 after oxidant damage: Relevance to exposure of neuronal
cells to oxidative stress. Journal of Neurochemistry, 105(1), pp.192–202.
Rojo de la Vega, M., Chapman, E. and Zhang, D.D., 2018. NRF2 and the
Hallmarks of Cancer. Cancer Cell, 138(4), pp. 799-810.
Ross, D. and Zhou, H., 2010. Relationships between metabolic and non-metabolic
susceptibility factors in benzene toxicity. Chemico-Biological Interactions, 184,
pp.222–228.

240
Rotblat, B., Melino, G. and Knight, R.A., 2012. NRF2 and p53: Januses in cancer?
Oncotarget, 3(11), pp.1272–83.
Ruiz-Ramos, R., Lopez-Carrillo, L., Rios-Perez, A.D., De Vizcaya-Ruíz, A. and
Cebrian, M.E., 2009. Sodium arsenite induces ROS generation, DNA oxidative
damage, HO-1 and c-Myc proteins, NF-κB activation and cell proliferation in
human breast cancer MCF-7 cells. Mutation Research - Genetic Toxicology and
Environmental Mutagenesis, 674(1-2), pp.109-15.
Rushmore, T.H. and Pickett, C.B., 1990. Transcriptional regulation of the rat
glutathione S-transferase Ya subunit gene. Characterization of a xenobiotic-
responsive element controlling inducible expression by phenolic antioxidants.
Journal of Biological Chemistry, 265(24), pp.14648-53.
Rushworth, S.A., MacEwan, D.J. and O'Connell, M.A., 2008. Lipopolysaccharide-
induced expression of NAD-(P)H:quinone oxidoreductase 1 and heme
oxygenase-1 protects against excessive inflammatory responses in human
monocytes. Journal of Immunology, 181(10), pp.6730-6737.
Rushworth, S.A., Zaitseva, L., Murray, M.Y., Shah, N.M., Bowles, K.M. and
MacEwan, D.J., 2012. The high Nrf2 expression in human acute myeloid leukemia
is driven by NF-kappaB and underlies its chemo-resistance. Blood, 120(26),
pp.5188-5198.
Sabharwal, S.S. and Schumacker, P.T., 2014. Mitochondrial ROS in cancer:
Initiators, amplifiers or an Achilles’ heel? Nature Reviews Cancer, 14(11), pp. 709-
721.
Saito, R., Suzuki, T., Hiramoto, K., Asami, S., Naganuma, E., Suda, H., Iso, T.,
Yamamoto, H., Morita, M., Furusawa, Y., Negishi, T., Ichinose, M., Yamamoto, M.
and Yamamoto, M., 2015. Characterizations of Three Major Cysteine Sensors of
Keap1 in Stress Response. Molecular and Cellular Biology, 36(2), pp. 271-284.
Sakamoto, T., Niiya, D. and Seiki, M., 2011. Targeting the warburg effect that

241
arises in tumor cells expressing membrane Type-1 matrix metalloproteinase.
Journal of Biological Chemistry, 286(16), pp. 14691-14704.
Salazar, M., Rojo, A.I., Velasco, D., De Sagarra, R.M. and Cuadrado, A., 2006.
Glycogen synthase kinase-3β inhibits the xenobiotic and antioxidant cell response
by direct phosphorylation and nuclear exclusion of the transcription factor Nrf2.
Journal of Biological Chemistry, 281(21), pp.14841–14851.
Salinas, M., Diaz, R., Abraham, N.G., Ruiz de Galarreta, C.M. and Cuadrado, A.,
2003. Nerve Growth Factor Protects against 6-Hydroxydopamine-induced
Oxidative Stress by Increasing Expression of Heme Oxygenase-1 in a
Phosphatidylinositol 3-Kinase-dependent Manner. Journal of Biological Chemistry,
278(16), pp.13898–13904.
Salmeen, A., Andersen, J.N., Myers, M.P., Meng, T.C., Hinks, J.A., Tonks, N.K.
and Barford, D., 2003. Redox regulation of protein tyrosine phosphatase 1B
involves a sulphenyl-amide intermediate. Nature, 423(6941), pp. 769-773.
Salmena, L., Carracedo, A. and Pandolfi, P.P., 2008. Tenets of PTEN Tumor
Suppression. Cell, 133(3), pp.403–414.
Santos, C.R. and Schulze, A., 2012. Lipid metabolism in cancer. The FEBS
journal, 279(15), pp.2610–2623.
Sarbassov, D.D., Guertin, D.A., Ali, S.M. and Sabatini, D.M., 2005.
Phosphorylation and Regulation of Akt/PKB by the Rictor-mTOR Complex.
Science, 307(5712), pp.1098–1101.
Sarkar, M., Varshney, R., Chopra, M., Sekhri, T., Adhikari, J.S. and Dwarakanath,
B.S., 2006. Flow-cytometric analysis of reactive oxygen species in peripheral
blood mononuclear cells of patients with thyroid dysfunction. Cytometry Part B -
Clinical Cytometry, 70(1), pp.20-23.
Satoh, H., Moriguchi, T., Takai, J., Ebina, M. and Yamamoto, M., 2013. Nrf2
prevents initiation but accelerates progression through the kras signaling pathway

242
during lung carcinogenesis. Cancer Research, 73(13), pp. 158-168.
Sauer, H., Wartenberg, M. and Hescheler, J., 2001. Reactive Oxygen Species as
Intracellular Messengers During Cell Growth and Differentiation. Cellular
Physiology and Biochemistry, [online] 11(4), pp.173–186.
Schieber, M. and Chandel, N.S., 2014. ROS function in redox signaling and
oxidative stress. Current Biology, 24(10), pp.R453-R462.
Schisselbauer, J.C., Silber, R., Papadopoulos, E., Abrams, K., LaCreta, F.P. and
Tew, K.D., 1990. Characterization of glutathione S-transferase expression in
lymphocytes from chronic lymphocytic leukemia patients. Cancer research,
50(12), pp.3562–8.
Schrader, M. and Fahimi, H.D., 2006. Peroxisomes and oxidative stress.
Biochimica et biophysica acta, 1763(12), pp.1755–66.
Seo, J.H., Ahn, Y., Lee, S.-R., Yeo, C.Y. and Hur, K.C., 2005. The Major Target of
the Endogenously Generated Reactive Oxygen Species in Response to Insulin
Stimulation Is Phosphatase and Tensin Homolog and Not Phosphoinositide-3
Kinase (PI-3 Kinase) in the PI-3 Kinase/Akt Pathway. Molecular Biology of the
Cell, 16(1), pp.348–357.
Seok, W.S. and Stockwell, B.R., 2008. Inhibition of casein kinase 1-epsilon
induces cancer-cell-selective, PERIOD2-dependent growth arrest. Genome
Biology, 9(6), pp.R92.
Seow, A., Yuan, J.-M., Sun, C.-L., Van Den Berg, D., Lee, H.-P. and Yu, M.C.,
2002. Dietary isothiocyanates, glutathione S-transferase polymorphisms and
colorectal cancer risk in the Singapore Chinese Health Study. Carcinogenesis,
23(12), pp.2055–61.
Shah, N.J., Rushworth, S.A., Murray M.Y., Bowles, K.M. and MacEwan, D.J.,
2013. Understanding the role of NRF2-regulated miRNAs in human malignancies.
Oncotarget, 4(8), pp.1130-1142.
243
Shao, J., Glorieux, C., Liao, J., Chen, P., Lu, W., Liang, Z., Wen, S., Hu, Y. and
Huang, P., 2018. Impact of Nrf2 on tumour growth and drug sensitivity in
oncogenic K-ras-transformed cells in vitro and in vivo. Free Radical Research,
52(6), pp.661–671.
Sharma, R.S., Harrison, D.J., Kisielewski, D., Cassidy, D.M., McNeilly, A.D.,
Gallagher, J.R., Walsh, S. V., Honda, T., McCrimmon, R.J., Dinkova-Kostova,
A.T., Ashford, M.L.J., Dillon, J.F. and Hayes, J.D., 2018. Experimental
Nonalcoholic Steatohepatitis and Liver Fibrosis Are Ameliorated by
Pharmacologic Activation of Nrf2 (NF-E2 p45-Related Factor 2). CMGH. 5(3),
pp.367-398.
Shaw, A.T., Winslow, M.M., Magendantz, M., Ouyang, C., Dowdle, J.,
Subramanian, A., Lewis, T.A., Maglathin, R.L., Tolliday, N. and Jacks, T., 2011.
Selective killing of K-ras mutant cancer cells by small molecule inducers of
oxidative stress. Proceedings of the National Academy of Sciences of the United
States of America, 108(21), pp.8773–8778.
Shay, K.P., Michels, A.J., Li, W., Kong, A.T. and Hagen, T.M., 2012. Cap-
independent Nrf2 transaltion is a part of a lipoic acid-stimulated detoxification
stress response. Biochimica Biophysica Acta, 1823(6), pp.1102-1109.
Shearn, C.T., Smathers, R.L., Backos, D.S., Reigan, P., Orlicky, D.J. and
Petersen, D.R., 2013. Increased carbonylation of the lipid phosphatase PTEN
contributes to Akt2 activation in a murine model of early alcohol-induced steatosis.
Free Radical Biology and Medicine, 65, pp.680–692.
Shibata, T., Kokubu, A., Gotoh, M., Ojima, H., Ohta, T., Yamamoto, M. and
Hirohashi, S., 2008a. Genetic Alteration of Keap1 Confers Constitutive Nrf2
Activation and Resistance to Chemotherapy in Gallbladder Cancer.
Gastroenterology, 135(4), pp.1358-1368.
Shibata, T., Kokubu, A., Saito, S., Narisawa-Saito, M., Sasaki, H., Aoyagi, K.,
Yoshimatsu, Y., Tachimori, Y., Kushima, R., Kiyono, T. and Yamamoto, M., 2011.

244
NRF2 Mutation Confers Malignant Potential and Resistance to Chemoradiation
Therapy in Advanced Esophageal Squamous Cancer. Neoplasia, 13(9), pp.864-
873.
Shibata, T., Ohta, T., Tong, K.I., Kokubu, A., Odogawa, R., Tsuta, K., Asamura,
H., Yamamoto, M. and Hirohashi, S., 2008b. Cancer related mutations in NRF2
impair its recognition by Keap1-Cul3 E3 ligase and promote malignancy.
Proceedings of the National Academy of Sciences of the United States of
America, 105(36), pp.13568–13573.
Shin, S., Wakabayashi, J., Yates, M.S., Wakabayashi, N., Dolan, P.M., Aja, S.,
Liby, K.T., Sporn, M.B., Yamamoto, M. and Kensler, T.W., 2009. Role of Nrf2 in
prevention of high-fat diet-induced obesity by synthetic triterpenoid CDDO-
Imidazolide. European Journal of Pharmacology, 620, pp.138–144.
Sies, H., 1993. Damage to plasmid DNA by singlet oxygen and its protection.
Mutation Research/Genetic Toxicology, 299(3–4), pp.183–191.
Sies, H. and Menck, C.F.M.C., 1992. Singlet oxygen induced DNA damage.
Mutation Research/DNAging, 275(3–6), pp.367–375.
Singh, A., Bodas, M., Wakabayashi, N., Bunz, F. and Biswal, S., 2010. Gain of
Nrf2 function in non-small-cell lung cancer cells confers radioresistance.
Antioxidants & redox signaling, 13(11), pp.1627–37.
Singh, A., Boldin-Adamsky, S., Thimmulappa, R.K., Rath, S.K., Ashush, H.,
Coulter, J., Blackford, A., Goodman, S.N., Bunz, F., Watson, W.H., Gabrielson,
E., Feinstein, E. and Biswal, S., 2008. RNAi mediated silencing of Nrf2 gene
expression in non-small cell lung cancer inhibits tumor growth and increases
efficacy of chemotherapy. Cancer research, 68(19), p.7975-7984.
Singh, A., Happel, C., Manna, S.K., Acquaah-mensah, G., Carrerero, J., Kumar,
S., Nasipuri, P., Krausz, K.W., Wakabayashi, N., Dewi, R., Boros, L.G., Gonzalez,
F.J., Gabrielson, E., Wong, K.K., Girnun, G. and Biswal, S., 2013. Transcription

245
factor NRF2 regulates miR-1 and miR-206 to drive tumorigenesis. journal of
clinical investigation, 123(7), pp.2921–2934.
Singh, A., Misra, V., Thimmulappa, R.K., Lee, H., Ames, S., Hoque, M.O.,
Herman, J.G., Baylin, S.B., Sidransky, D., Gabrielson, E., Brock, M. V. and
Biswal, S., 2006. Dysfunctional KEAP1-NRF2 interaction in non-small-cell lung
cancer. PLoS Medicine, 3, pp.1865–1876.
Singh, G., Maurya, S., deLampasona, M.P. and Catalan, C.A.N., 2007. A
comparison of chemical, antioxidant and antimicrobial studies of cinnamon leaf
and bark volatile oils, oleoresins and their constituents. Food and Chemical
Toxicology, [online] 45(9), pp.1650–1661.
Singh, A., Rangasamy, T., Thimmulappa, R.K., Lee, H., Osburn, W.O., Brigelius-
Flohé, R., Kensler, T.W., Yamamoto, M. and Biswal, S., 2006. Glutathione
peroxidase 2, the major cigarette smoke-inducible isoform of GPX in lungs, is
regulated by Nrf2. American Journal of Respiratory Cell and molecular Biology,
35(6), pp. 639-650.
Singletary, K. and MacDonald, C., 2000. Inhibition of benzo[a]pyrene- and 1,6-
dinitropyrene-DNA adduct formation in human mammary epithelial cells
bydibenzoylmethane and sulforaphane. Cancer Letters, 155(1), pp.47–54.
Siow, R.C.M., Sato, H. and Mann, G.E., 1999. Heme oxygenase-carbon
monoxide signalling pathway in atherosclerosis: Anti-atherogenic actions of
bilirubin and carbon monoxide? Cardiovascular Research, 41(2), pp.385-94.
Slocum, S.L., Skoko, J.J., Wakabayashi, N., Aja, S., Yamamoto, M., Kensler,
T.W. and Chartoumpekis, D. V., 2016. Keap1/Nrf2 pathway activation leads to a
repressed hepatic gluconeogenic and lipogenic program in mice on a high-fat diet.
Archives of Biochemistry and Biophysics, 1(591), pp.57-65.
Smith, E.J., Shay, K.P., Thomas, N.O., Butler, J.A., Finlay, L.F. and Hagen, T.M.,
2015. Age-related loss of hepatic Nrf2 protein homeostasis: Potential role for

246
heightened expression of miR-146a. Free Radical Biology and Medicine, 89,
pp.1184–1191.
Solis, L.M., Behrens, C., Dong, W., Suraokar, M., Ozburn, N.C., Moran, C.A.,
Corvalan, A.H., Biswal, S., Swisher, S.G., Bekele, B.N., Minna, J.D., Stewart, D.J.
and Wistuba, I.I., 2010. Nrf2 and Keap1 abnormalities in non-small cell lung
carcinoma and association with clinicopathologic features. Clinical cancer
research : an official journal of the American Association for Cancer Research,
16(14), pp.3743–53.
Soprano, D.R., Qin, P. and Soprano, K.J., 2004. Retinoic acid receptors and
cancers. Annual review of nutrition, 24, pp.201–21.
Sosa, V., Moliné, T., Somoza, R., Paciucci, R., Kondoh, H. and LLeonart, M.E.,
2013. Oxidative stress and cancer: an overview. Ageing research reviews, 12(1),
pp.376–90.
Spitz, M.R., Duphorne, C.M., Detry, M.A., Pillow, P.C., Amos, C.I., Lei, L., de
Andrade, M., Gu, X., Hong, W.K. and Wu, X., 2000. Dietary intake of
isothiocyanates: evidence of a joint effect with glutathione S-transferase
polymorphisms in lung cancer risk. Cancer epidemiology, biomarkers &
prevention : a publication of the American Association for Cancer Research,
cosponsored by the American Society of Preventive Oncology, 9(10), pp.1017–
20.
Sporn, M.B. and Liby, K.T., 2012. NRF2 and cancer: The Good, the bad and the
importance of context. Nature Reviews Cancer, 12(8), pp.564-71.
Stewart, D., Killeen, E., Naquin, R., Alam, S. and Alam, J., 2003. Degradation of
transcription factor Nrf2 via the ubiquitin-proteasome pathway and stabilization by
cadmium. Journal of Biological Chemistry, 278(4), pp.2396-402.
Storr, S.J., Woolston, C.M. and Martin, S.G., 2012. Base excision repair, the
redox environment and therapeutic implications. Curr Mol Pharmacol, 5(1), pp.
247
88-101.
Strathdee, G., MacKean, M.J., Illand, M. and Brown, R., 1999. A role for
methylation of the hMLH1 promoter in loss of hMLH1 expression and drug
resistance in ovarian cancer. Oncogene, 18, pp.2335–2341.
Stratton, M., Campbell, P. and Futreal, P., 2009. The cancer genome. Nature,
458(7239), pp.719–724.
Stutman, O., 1974. Tumor development after 3-methylcholanthrene in
immunologically deficient athymic-nude mice. Science, 183(4124), pp.534-536.
Sugimoto, H., Okada, K., Shoda, J., Warabi, E., Ishige, K., Ueda, T., Taguchi, K.,
Yanagawa, T., Nakahara, A., Hyodo, I., Ishii, T. and Yamamoto, M., 2010.
Deletion of nuclear factor-E2-related factor-2 leads to rapid onset and progression
of nutritional steatohepatitis in mice. Am J Physiol-Gastr Liver, 298(2), pp.G283-
94.
Sundaresan, M., Yu, Z.-X., Ferrans, V.J., Irani, K. and Finkel, T., 1995.
Requirement for Generation of H(2)O(2) for Platelet-Derived Growth Factor Signal
Transduction. Science, 270(5234), pp.296-299.
Sutherland, C., 2011. What are the bona fide GSK3 substrates? International
Journal of Alzheimer’s Disease, 2011, pp1-23.
Szatrowski, T.P. and Nathan, C.F., 1991. Production of large amounts of
hydrogen peroxide by human tumor cells. Cancer research, 51, pp.794–798.
Tagawa, Y., Hiramatsu, N., Kasai, A., Hayakawa, K., Okamura, M., Yao, J. and
Kitamura, M., 2008. Induction of apoptosis by cigarette smoke via ROS-
dependent endoplasmic reticulum stress and CCAAT/enhancer-binding protein-
homologous protein (CHOP). Free radical biology & medicine, 45(1), pp.50–9.
Taguchi, K., Hirano, I., Itoh, T., Tanaka, M., Miyajima, A., Suzuki, A., Motohashi,
H. and Yamamoto, M., 2014. Nrf2 Enhances Cholangiocyte Expansion in Pten-

248
Deficient Livers. Molecular and Cellular Biology, 34(5), pp.900–913.
Taguchi, K., Motohashi, H. and Yamamoto, M., 2011. Molecular mechanisms of
the Keap1–Nrf2 pathway in stress response and cancer evolution. Genes to
cells : devoted to molecular & cellular mechanisms, 16, pp.123–140.
Taguchi, K. and Yamamoto, M., 2017. The KEAP1–NRF2 System in Cancer.
Frontiers in Oncology, 7(85), pp.1-11.
Tanaka, Y., Aleksunes, L.M., Yeager, R.L., Gyamfi, M.A., Esterly, N., Guo, G.L.
and Klaassen, C.D., 2008. NF-E2-Related Factor 2 Inhibits Lipid Accumulation
and Oxidative Stress in Mice Fed a High-Fat Diet. Journal of Pharmacology and
Experimental Therapeutics, 325(2), pp.655–664.
Tanaka, Y., Ikeda, T., Yamamoto, K., Ogawa, H. and Kamisako, T., 2012.
Dysregulated expression of fatty acid oxidation enzymes and iron-regulatory
genes in livers of Nrf2-null mice. Journal of Gastroenterology and Hepatology,
27(11), pp.1711–1717.
Tang, X., Wang, H., Fan, L., Wu, X., Xin, A., Ren, H. and Wang, X.J., 2011.
Luteolin inhibits Nrf2 leading to negative regulation of the Nrf2/ARE pathway and
sensitization of human lung carcinoma A549 cells to therapeutic drugs. Free
Radical Biology and Medicine, 50, pp.1599–1609.
Tao, S., Rojo de la Vega, M., Chapman, E., Ooi, A. and Zhang, D.D., 2018. The
effects of NRF2 modulation on the initiation and progression of chemically and
genetically induced lung cancer. Molecular Carcinogenesis, 57(2), pp.182-192.
Tarozzi, A., Morroni, F., Merlicco, A., Hrelia, S., Angeloni, C., Cantelli-Forti, G.
and Hrelia, P., 2009. Sulforaphane as an inducer of glutathione prevents oxidative
stress-induced cell death in a dopaminergic-like neuroblastoma cell line. Journal
of Neurochemistry, 111(5), pp.1161-1171.
Tarumoto, T., Nagai, T., Ohmine, K., Miyoshi, T., Nakamura, M., Kondo, T.,
Mitsugi, K., Nakano, S., Muroi, K., Komatsu, N. and Ozawa, K., 2004. Ascorbic

249
acid restores sensitivity to imatinib via suppression of Nrf2-dependent gene
expression in the imatinib-resistant cell line. Experimental Hematology, 32,
pp.375–381.
TCGA, 2014. Comprehensive molecular characterization of urothelial bladder
carcinoma. Nature, 507, pp.315-322.
TCGA Network, 2015. Comprehensive genomic characterization of head and
neck squamous cell carcinomas. Nature, 517(7536), pp.576–582.
Tebay, L.E., Robertson, H., Durant, S.T., Vitale, S.R., Penning, T.M., Dinkova-
Kostova, A.T. and Hayes, J.D., 2015. Mechanisms of activation of the
transcription factor Nrf2 by redox stressors, nutrient cues, and energy status and
the pathways through which it attenuates degenerative disease. Free Radical
Biology and Medicine, 88(Part B), pp.108–146.
Tempé, D., Casas, M., Karaz, S., Blanchet-Tournier, M.-F. and Concordet, J.-P.,
2006. Multisite protein kinase A and glycogen synthase kinase 3beta
phosphorylation leads to Gli3 ubiquitination by SCFbetaTrCP. Molecular and
cellular biology, 26(11), pp.4316–26.
Theodore, M., Kawai, Y., Yang, J., Kleshchenko, Y., Reddy, S.P., Villalta, F. and
Arinze, I.J., 2008. Multiple nuclear localization signals function in the nuclear
import of the transcription factor Nrf2. The Journal of biological chemistry,
283(14), pp.8984-94.
Thimmulappa, R.K., Mai, K.H., Srisuma, S., Kensler, T.W., Yamamoto, M. and
Biswal, S., 2002. Identification of Nrf2-regulated genes induced by the
chemopreventive agent sulforaphane by oligonucleotide microarray. Cancer
Research, 62(18), pp.5196-203.
Thimmulappa, R.K., Rangasamy, T., Alam, J. and Biswal, S., 2008.
Dibenzoylmethane activates Nrf2-dependent detoxification pathway and inhibits
benzo(a)pyrene induced DNA adducts in lungs. Medicinal chemistry (Shariqah
250
(United Arab Emirates)), 4(5), pp.473–81.
Tietze, F., 1969. Enzymic method for quantitative determination of nanogram
amounts of total and oxidized glutathione: applications to mammalian blood and
other tissues. Analytical biochemistry, 27(3), pp.502–22.
To, C., Ringelberg, C.S., Royce, D.B., Williams, C.R., Risingsong, R., Sporn, M.B.
and Liby, K.T., 2015. Dimethyl fumarate and the oleanane triterpenoids, CDDO-
imidazolide and CDDO-methyl ester, both activate the Nrf2 pathway but have
opposite effects in the A/J model of lung carcinogenesis. Carcinogenesis, 36(7),
pp.769–781.
Toki, T., Itoh, J., Kitazawa, J., Arai, K., Hatakeyama, K., Akasaka, J.I., Igarashi,
K., Nomura, N., Yokoyama, M., Yamamoto, M. and Ito, E., 1997. Human small
Maf proteins form heterodimers with CNC family transcription factors and
recognize the NF-E2 motif. Oncogene, 14(16), pp.1901-1910.
Tomasetti, C., Vogelstein, B. and Parmigiani, G., 2013. Half or more of the
somatic mutations in cancers of self-renewing tissues originate prior to tumor
initiation. Proceedings of the National Academy of Sciences of the United States
of America, 110(6), pp.1999–2004.
Tominaga, H., Kodama, S., Matsuda, N., Suzuki, K. and Watanabe, M., 2004.
Involvement of Reactive Oxygen Species (ROS) in the Induction of Genetic
Instability by Radiation. Journal of Radiation Research, 45(2), pp.181-188.
Trachootham, D., Alexandre, J. and Huang, P., 2009. Targeting cancer cells by
ROS-mediated mechanisms: a radical therapeutic approach? Nature reviews.
Drug discovery, 8(7), pp.579–91.
Tsai, J.J., Dudakov, J.A., Takahashi, K., Shieh, J.-H., Velardi, E., Holland, A.M.,
Singer, N. V., West, M.L., Smith, O.M., Young, L.F., Shono, Y., Ghosh, A.,
Hanash, A.M., Tran, H.T., Moore, M.A.S. and van den Brink, M.R.M., 2013. Nrf2
regulates haematopoietic stem cell function. Nature Cell Biology, 15(3), pp.309–
251
316.
Turrens, J.F., 2003. Mitochondrial formation of reactive oxygen species. The
Journal of Physiology, 552(2), pp.335–344.
Uruno, A., Furusawa, Y., Yagishita, Y., Fukutomi, T., Muramatsu, H., Negishi, T.,
Sugawara, A., Kensler, T.W. and Yamamoto, M., 2013. The Keap1-Nrf2 System
Prevents Onset of Diabetes Mellitus. Molecular and Cellular Biology, 33(15),
pp.2996-3010.
Uruno, A., Yagishita, Y., Katsuoka, F., Kitajima, Y., Nunomiya, A., Nagatomi, R.,
Pi, J., Biswal, S.S. and Yamamoto, M., 2016. Nrf2-Mediated Regulation of
Skeletal Muscle Glycogen Metabolism. Molecular and Cellular Biology, 36(11),
pp.1655-72.
Ushio-Fukai, M., Alexander, R.W., Akers, M., Yin, Q., Fujio, Y., Walsh, K. and
Griendling, K.K., 1999. Reactive oxygen species mediate the activation of
Akt/protein kinase B by angiotensin II in vascular smooth muscle cells. The
Journal of biological chemistry, 274(32), pp.22699–704.
Valavanidis, A., Vlachogianni, T. and Fiotakis, K., 2009. Tobacco smoke:
involvement of reactive oxygen species and stable free radicals in mechanisms of
oxidative damage, carcinogenesis and synergistic effects with other respirable
particles. International journal of environmental research and public health,] 6(2),
pp.445–62.
Valenzuela, M., Glorieux, C., Stockis, J., Sid, B., Sandoval, J.M., Felipe, K.B.,
Kviecinski, M.R., Verrax, J. and Calderon, P.B., 2014. Retinoic acid synergizes
ATO-mediated cytotoxicity by precluding Nrf2 activity in AML cells. British Journal
of Cancer, 111(5), pp.874-882.
Valones, M.A.A., Guimarães, R.L., Brandão, L.A.C., de Souza, P.R.E., de
Albuquerque Tavares Carvalho, A. and Crovela, S., 2009. Principles and
applications of polymerase chain reaction in medical diagnostic fields: a review.
252
Brazilian Journal of Microbiology, 40(1), pp.1–11.
Van Weeren, P.C., De Bruyn, K.M.T., De Vries-Smits, A.M.M., Van Lint, J. and
Burgering, B.M.T., 1998. Essential role for protein kinase B (PKB) in insulin-
induced glycogen synthase kinase 3 inactivation. Characterization of dominant-
negative mutant of PKB. Journal of Biological Chemistry, 273, pp.13150–13156.
Vandenheede, J.R., Yang, S.D., Goris, J. and Merlevede, W., 1980. ATP/Mg-
dependent protein phosphatase from rabbit skeletal muscle. II. Purification of the
activating factor and its characterization as a bifunctional protein also displaying
synthase kinase activity. Journal of Biological Chemistry, 255, pp.11768-11774.
Vander Heiden, M.G., Cantley, L.C. and Thompson, C.B., 2009. Understanding
the Warburg effect: the metabolic requirements of cell proliferation. Science,
324(5930), pp.1029–33.
Vanhaesebroeck, B. and Alessi, D.R., 2000. The PI3K-PDK1 connection: more
than just a road to PKB. The Biochemical journal, 346(3), pp.561–76.
Vanhaesebroeck, B., Stephens, L. and Hawkins, P., 2012. PI3K signalling: The
path to discovery and understanding. Nature Reviews Molecular Cell Biology, 13,
pp.195-203.
Vaughan, S., Road, C., Ka, L., Centre, S., Way, R. and Coukos, G., 2012. NIH
Public Access. Nature Reviews Cancer, 11(10), pp.719–725.
Verma, A.K., Yadav, A., Dewangan, J., Singh, S.V., Mishra, M., Singh, P.K. and
Rath, S.K., 2015. Isoniazid prevents Nrf2 translocation by inhibiting ERK1
phosphorylation and induces oxidative stress and apoptosis. Redox Biology, 6,
pp.80-92.
Vincent, T.L. and Gatenby, R.A., 2008. An evolutionary model for initiation,
promotion and progression in carcinogenesis. International Journal of Oncology,
32(4), pp.729-737.
253
Voet, D. and Voet, J. g, 2015. Biochemistry. John Wiley & Sons.
Vogelstein, B., Papadopoulos, N., Velculescu, V.E., Zhou, S., Diaz, L.A. and
Kinzler, K.W., 2013. Cancer genome landscapes. Science (New York, N.Y.),
339(6127), pp.1546–58.
Wang, H., Liu, K., Geng, M., Gao, P., Wu, X., Hai, Y., Li, Y., Li, Y., Luo, L., Hayes,
J.D., Wang, X.J. and Tang, X., 2013. RXRα inhibits the NRF2-ARE signaling
pathway through a direct interaction with the Neh7 domain of NRF2. Cancer
research, 73(10), pp.3097–108.
Wang, H., Luo, K., Tan, L.-Z., Ren, B.-G., Gu, L.-Q., Michalopoulos, G., Luo, J.-H.
and Yu, Y.P., 2012. p53-induced Gene 3 Mediates Cell Death Induced by
Glutathione Peroxidase 3. Journal of Biological Chemistry, 287(20), pp.16890-
902.
Wang, J.-S., Shen, X., He, X., Zhu, Y.-R., Zhang, B.-C., Wang, J.-B., Qian, G.-S.,
Kuang, S.-Y., Zarba, A., Egner, P.A., Jacobson, L.P., Muñoz, A., Helzlsouer, K.J.,
Groopman, J.D. and Kensler, T.W., 1999. Protective Alterations in Phase 1 and 2
Metabolism of Aflatoxin B 1 by Oltipraz in Residents of Qidong, People’s Republic
of China. Journal of the National Cancer Institute, 91, pp.347–354.
Wang, W. and Chan, J.Y., 2006. Nrf1 is targeted to the endoplasmic reticulum
membrane by an N-terminal transmembrane domain: Inhibition of nuclear
translocation and transacting function. Journal of Biological Chemistry, 281(28),
pp.19676-87.
Wang, X.-J.J., Sun, Z., Villeneuve, N.F., Zhang, S., Zhao, F., Li, Y., Chen, W., Yi,
X., Zheng, W., Wondrak, G.T., Wong, P.K. and Zhang, D.D., 2008a. Nrf2
enhances resistance of cancer cells to chemotherapeutic drugs, the dark side of
Nrf2. Carcinogenesis, 29(6), pp.1235–43.
Wang, X., McCullough, K.D., Franke, T.F. and Holbrook, N.J., 2000. Epidermal
growth factor receptor-dependent Akt activation by oxidative stress enhances cell

254
survival. The Journal of biological chemistry, 275(19), pp.14624–31.
Wang, X.J., Hayes, J.D., Henderson, C.J. and Wolf, C.R., 2007. Identification of
retinoic acid as an inhibitor of transcription factor Nrf2 through activation of
retinoic acid receptor alpha. Proceedings of the National Academy of Sciences of
the United States of America, 104, pp.19589–19594.
Wang, X.J., Hayes, J.D. and Wolf, C.R., 2006. Generation of a Stable Antioxidant
Response Element–Driven Reporter Gene Cell Line and Its Use to Show Redox-
Dependent Activation of Nrf2 by Cancer Chemotherapeutic Agents. Cancer
Research, 66(22), pp.10983-10994.
Wang, X.J., Sun, Z., Chen, W., Li, Y., Villeneuve, N.F. and Zhang, D.D., 2008b.
Activation of Nrf2 by arsenite and monomethylarsonous acid is independent of
Keap1-C151: enhanced Keap1-Cul3 interaction. Toxicology and Applied
Pharmacology, 230(3), pp.383–389.
Warburg, O., 1956. Origin of cancer cells. Oncologia, 9, pp.75–83.
Ward, P.S. and Thompson, C.B., 2012. Metabolic Reprogramming: A Cancer
Hallmark Even Warburg Did Not Anticipate. Cancer Cell, 21(3), pp.297-308.
Was, H., Cichon, T., Smolarczyk, R., Rudnicka, D., Stopa, M., Chevalier, C.,
Leger, J.J., Lackowska, B., Grochot, A., Bojkowska, K., Ratajska, A., Kieda, C.,
Szala, S., Dulak, J. and Jozkowicz, A., 2006. Overexpression of Heme
Oxygenase-1 in Murine Melanoma. The American Journal of Pathology, 169(6),
pp.2181–2198.
Watai, Y., Kobayashi, A., Nagase, H., Mizukami, M., Mcevoy, J., Singer, J.D.,
Itoh, K. and Yamamoto, M., 2007. Subcellular localization and cytoplasmic
complex status of endogenous Keap1. Genes to Cells, 12(10), pp.1163-78.
Watson, J., 2013. Oxidants , antioxidants and the current incurability of metastatic
cancers. Open Biology, 3(120144), pp.1–10.

255
Wattenberg, L.W., 1973. Inhibition of chemical carcinogen-induced pulmonary
neoplasia by butyl-ated hydroxyanisole. Journal of the National Cancer Institute,
50(6), pp.1541–1544.
Waun Ki Hong, M.B.S., 1997. Recent Advances in Chemoprevention of Cancer.
Science, 278, pp.1073–1078.
Wei, X., Guo, W., Wu, S., Wang, L., Huang, P., Liu, J. and Fang, B., 2010.
Oxidative stress in NSC-741909-induced apoptosis of cancer cells. Journal of
Translational Medicine, 8(37), pp.1-10.
Winston, J.T., Strack, P., Beer-Romero, P., Chu, C.Y., Elledge, S.J. and Harper,
J.W., 1999. The SCF(β-TRCP)-ubiquitin ligase complex associates specifically
with phosphorylated destruction motifs in IκBα and β-catenin and stimulates IκBα
ubiquitination in vitro. Genes and Development, 13(3), pp.270–283.
Woodgett, J.R., 1990. Molecular cloning and expression of glycogen synthase
kinase-3/factor A. The EMBO journal, 9(8), pp.2431–8.
Wu, G., Xu, G., Schulman, B.A., Jeffrey, P.D., Harper, J.W. and Pavletich, N.P.,
2003. Structure of a β-TrCP1-Skp1-β-catenin complex: Destruction motif binding
and lysine specificity of the SCFβ-TrCP1 ubiquitin ligase. Molecular Cell, 11,
pp.1445–1456.
Wu, K.C., Cui, J.Y. and Klaassen, C.D., 2011. Beneficial Role of Nrf2 in
Regulating NADPH Generation and Consumption. Toxicological Sciences, 123(2),
pp.590–600.
Wu, T., Zhao, F., Gao, B., Tan, C., Yagishita, N., Nakajima, T., Wong, P.K.,
Chapman, E., Fang, D. and Zhang, D.D., 2014. Hrd1 suppresses Nrf2-mediated
cellular protection during liver cirrhosis. Genes & development, 28(7), pp.708–22.
Wu, X. and Hua, X., 2007. Targeting ROS: selective killing of cancer cells by a
cruciferous vegetable derived pro-oxidant compound. Cancer biology & therapy,
6, pp.646–647.
256
Wu, X., Senechal, K., Neshat, M.S., Whang, Y.E. and Sawyers, C.L., 1998. The
PTEN/MMAC1 tumor suppressor phosphatase functions as a negative regulator
of the phosphoinositide 3-kinase/Akt pathway. Proceedings of the National
Academy of Sciences, 95(26), pp.15587-91.
Xia, M., Sherlock, J., Hegerich, P. and You, X., 2010. DataAssistTM–Data Analysis
Software for TaqMan® Real-Time PCR Data. Proceedings of the International
Multiconference of Engineers and computer Scientist, 1, pp.1-3.
Xu, C., Huang, M.T., Shen, G., Yuan, X., Lin, W., Khor, T.O., Conney, A.H. and
Kong, A.N.T., 2006. Inhibition of 7,12-dimethylbenz(a)anthracene-induced skin
tumorigenesis in C57BL/6 mice by sulforaphane is mediated by nuclear factor E2-
related factor 2. Cancer Research, 66(16), pp.8293-8296.
Yam, C.H., Fung, T.K. and Poon, R.Y.C., 2002. Cyclin A in cell cycle control and
cancer. Cellular and molecular life sciences : CMLS, 59(8), pp.1317–26.
Yamadori, T., Ishii, Y., Homma, S., Morishima, Y., Kurishima, K., Itoh, K.,
Yamamoto, M., Minami, Y., Noguchi, M. and Hizawa, N., 2012. Molecular
mechanisms for the regulation of Nrf2-mediated cell proliferation in non-small-cell
lung cancers. Oncogene, 31(45), pp.4768–4777.
Yamamoto, T., Suzuki, T., Kobayashi, A., Wakabayashi, J., Maher, J., Motohashi,
H. and Yamamoto, M., 2008. Physiological Significance of Reactive Cysteine
Residues of Keap1 in Determining Nrf2 Activity. Molecular and Cellular Biology,
28(8), pp.2758-70.
Yamashita, Y., Ueyama, T., Nishi, T., Yamamoto, Y., Kawakoshi, A., Sunami, S.,
Iguchi, M., Tamai, H., Ueda, K., Ito, T., Tsuruo, Y. and Ichinose, M., 2014. Nrf2-
inducing anti-oxidation strtess response in the rat liver-New beneficial effect of
Lansoprazole. Plos ONE, 9(5), e97419 pp. 1-12.
Yang, H., Hong, H., Luo, W., Dai, C., Chen, X., Wang, L., Li, Q., Li, Z., Liu, P. and
Li, Z., 2018. mTORC2 facilitates endothelial cell senescence by suppressing Nrf2

257
expression via the Akt/GSK-3β/C/EBPα signaling pathway. Acta Pharmacologica
Sinica, 39(12), pp.1837-1846.
Yang, L., Zahid, M., Liao, Y., Rogan, E.G., Cavalieri, E.L., Davidson, N.E., Yager,
J.D., Visvanathan, K., Groopman, J.D. and Kensler, T.W., 2013. Reduced
formation of depurinating estrogen-DNA adducts by sulforaphane or KEAP1
disruption in human mammary epithelial MCF-10A cells. Carcinogenesis, 34(11),
pp.2587–2592.
Yang, Y., Gehrke, S., Haque, M.E., Imai, Y., Kosek, J., Yang, L., Beal, M.F.,
Nishimura, I., Wakamatsu, K., Ito, S., Takahashi, R. and Lu, B., 2005. Inactivation
of Drosophila DJ-1 leads to impairments of oxidative stress response and
phosphatidylinositol 3-kinase/Akt signaling. Proceedings of the National Academy
of Sciences, 102(38), pp.13670-13675.
Yang, Y.C., Lii, C.K., Lin, A.H., Yeh, Y.W., Yao, H.T., Li, C.C., Liu, K.L. and Chen,
H.W., 2011. Induction of glutathione synthesis and heme oxygenase 1 by the
flavonoids butein and phloretin is mediated through the ERK/Nrf2 pathway and
protects against oxidative stress. Free Radical Biology and Medicine, 51911),
pp.2073-81.
Yates, M.S., Kwak, M.-K., Egner, P.A., Groopman, J.D., Bodreddigari, S., Sutter,
T.R., Baumgartner, K.J., Roebuck, B.D., Liby, K.T., Yore, M.M., Honda, T.,
Gribble, G.W., Sporn, M.B. and Kensler, T.W., 2006. Potent Protection against
Aflatoxin-Induced Tumorigenesis through Induction of Nrf2-Regulated Pathways
by the Triterpenoid 1-[2-Cyano-3-,12-Dioxooleana-1,9(11)-Dien-28-Oyl]Imidazole.
Cancer Research, 66(4), pp.2488–2494.
Yates, M.S., Tauchi, M., Katsuoka, F., Flanders, K.C., Liby, K.T., Honda, T.,
Gribble, G.W., Johnson, D.A., Johnson, J.A., Burton, N.C., Guilarte, T.R.,
Yamamoto, M., Sporn, M.B. and Kensler, T.W., 2007. Pharmacodynamic
characterization of chemopreventive triterpenoids as exceptionally potent inducers
of Nrf2-regulated genes. Molecular Cancer Therapeutics, 6(1), pp.154–162.

258
Yates, M.S., Tran, Q.T., Dolan, P.M., Osburn, W.O., Shin, S., McCulloch, C.C.,
Silkworth, J.B., Taguchi, K., Yamamoto, M., Williams, C.R., Liby, K.T., Sporn,
M.B., Sutter, T.R. and Kensler, T.W., 2009. Genetic versus chemoprotective
activation of Nrf2 signaling: Overlapping yet distinct gene expression profiles
between Keap1 knockout and triterpenoid-treated mice. Carcinogenesis, 30(6),
pp.1024–1031.
Yeh, C.T. and Yen, G.C., 2009. Chemopreventive functions of sulforaphane: A
potent inducer of antioxidant enzymes and apoptosis. Journal of Functional
Foods, 1(1), pp.23–32.
Yoh, K., Hirayama, A., Ishizaki, K., Yamada, A., Takeuchi, M., Yamagishi, S.I.,
Morito, N., Nakano, T., Ojima, M., Shimohata, H., Itoh, K., Takahashi, S. and
Yamamoto, M., 2008. Hyperglycemia induces oxidative and nitrosative stress and
increases renal functional impairment in Nrf2-deficient mice. Genes to Cells,
13(11), pp.1159-1170.
Yokota, T., Sugawara, K., Ito, K., Takahashi, R., Ariga, H. and Mizusawa, H.,
2003. Down regulation of DJ-1 enhances cell death by oxidative stress, ER stress,
and proteasome inhibition. Biochemical and Biophysical Research
Communications, 312(4), pp.1342–1348.
Yu, X. and Kensler, T., 2005. Nrf2 as a target for cancer chemoprevention.
Mutation research, 591(1–2), pp.93–102.
Yuan, X., Huang, H., Huang, Y., Wang, J., Yan, J., Ding, L., Zhang, C. and Zhang,
L., 2017. Nuclear factor E2-related factor 2 knockdown enhances glucose uptake
and alters glucose metabolism in AML12 hepatocytes. Experimental Biology and
Medicine, 242(9), pp.930-938.
Zavattari, P., Perra, A., Menegon, S., Kowalik, M.A., Petrelli, A., Angioni, M.M.,
Follenzi, A., Quagliata, L., Ledda-Columbano, G.M., Terracciano, L., Giordano, S.
and Columbano, A., 2015. Nrf2, but not β-catenin, mutation represents an early
event in rat hepatocarcinogenesis. Hepatology, 62(3), pp.851–862.
259
Zenkov, N.K., Kozhin, P.M., Chechushkov, A. V., Martinovich, G.G.,
Kandalintseva, N. V. and Menshchikova, E.B., 2017. Mazes of Nrf2 regulation.
Biochemistry, 82(5), pp.556–564.
Zenkov, N.K., Menshchikova, E.B. and Tkachev, V.O., 2013. Keap1/Nrf2/ARE
redox-sensitive signaling system as a pharmacological target. Biochemistry,
78(1), pp.19–36.
Zhang, C., Wang, H.J., Bao, Q.C., Wang, L., Guo, T.K., Chen, W.L., Xu, L.L.,
Zhou, H.S., Bian, J.L., Yang, Y.R., Sun, H.P., Xu, X.L. and You, Q.D., 2016.
NRF2 promotes breast cancer cell proliferation and metastasis by increasing
RhoA/ROCK pathway signal transduction. Oncotarget, 7(45), pp.73593–73606.
Zhang, D.D., 2006. Mechanistic studies of the Nrf2-Keap1 signaling pathway. In:
Drug metabolism reviews. pp.769–789.
Zhang, D.D., 2010. The Nrf2-Keap1-ARE signaling pathway: The regulation and
dual function of Nrf2 in cancer. Antioxidants & redox signaling, 13, pp.1623–1626.
Zhang, D.D., 2013. Bardoxolone brings Nrf2-based therapies to light. Antioxidants
& redox signaling, 19(5), pp.517–8.
Zhang, D.D. and Hannink, M., 2003. Distinct cysteine residues in Keap1 are
required for Keap1-dependent ubiquitination of Nrf2 and for stabilization of Nrf2 by
chemopreventive agents and oxidative stress. Molecular and cellular biology,
23(22), pp.8137–51.
Zhang, J., Ohta, T., Maruyama, A., Hosoya, T., Nishikawa, K., Maher, J.M.,
Shibahara, S., Itoh, K. and Yamamoto, M., 2006a. BRG1 Interacts with Nrf2 To
Selectively Mediate HO-1 Induction in Response to Oxidative Stress. Molecular
and Cellular Biology, 26(21), pp.7942-7952.
Zhang, J.Y., Wu, C.K. and Klaassen, C.D., 2013. Genetic activation of Nrf2
protects against fasting-induced oxidative stress in livers of mice. Plos ONE, 8(3),
e59122, pp. 1-10.

260
Zhang, M., An, C., Gao, Y., Leak, R.K., Chen, J. and Zhang, F., 2013. Emerging
roles of Nrf2 and phase II antioxidant enzymes in neuroprotection. Progress in
neurobiology, [online] 100, pp.30–47.
Zhang, M., Zhang, C., Zhang, L., Yang, Q., Zhou, S., Wen, Q. and Wang, J.,
2015a. Nrf2 is a potential prognostic marker and promotes proliferation and
invasion in human hepatocellular carcinoma. BMC Cancer, 15(1), p.531.
Zhang, Y., Crouch, D.H., Yamamoto, M. and Hayes, J.D., 2006b. Negative
regulation of the Nrf1 transcription factor by its N-terminal domain is independent
of Keap1: Nrf1, but not Nrf2, is targeted to the endoplasmic reticulum.
Biochemical Journal, 399(3), pp.373-385.
Zhang, Y., Fang Liu, F., Bi, X., Wang, S., Wu, X. and Jiang, F., 2015b. The
antioxidant compound tert-butylhydroquinone activates Akt in myocardium,
suppresses apoptosis and ameliorates pressure overload-induced cardiac
dysfunction. Scientific reports, 5(13005), pp.1-15.
Zhang, Y., Kobayashi, A., Yamamoto, M. and Hayes, J.D., 2009. The Nrf3
transcription factor is a membrane-bound glycoprotein targeted to the
endoplasmic reticulum through its N-terminal homology box 1 sequence. Journal
of Biological Chemistry, 284(5), pp.3195-3210.
Zhang, Y., Talalay, P., Cho, C.G. and Posner, G.H., 1992. A major inducer of
anticarcinogenic protective enzymes from broccoli: isolation and elucidation of
structure. Proceedings of the National Academy of Sciences of the United States
of America, 89(6), pp.2399–403.
Zhang, Y.K.J., Yeager, R.L., Tanaka, Y. and Klaassen, C.D., 2010. Enhanced
expression of Nrf2 in mice attenuates the fatty liver produced by a methionine-
and choline-deficient diet. Toxicology and Applied Pharmacology, 245(3), pp.326-
334.
Zhong, Y., Zhang, F., Sun, Z., Zhou, W., Li, Z.-Y., You, Q.-D., Guo, Q.-L. and Hu,
261
R., 2013. Drug resistance associates with activation of Nrf2 in MCF-7/DOX cells,
and wogonin reverses it by down-regulating Nrf2-mediated cellular defense
response. Molecular carcinogenesis, 52(10), pp.824–34.
Zhou, W., Edelman, G.M. and Mauro, V.P., 2001. Transcript leader regions of two
Saccharomyces cerevisiae mRNAs contain internal ribosome entry sites that
function in living cells. Proceedings of the National Academy of Sciences of the
United States of America, 98(4), pp.1531–6.
Zipper, L.M. and Mulcahy, R.T., 2000. Inhibition of ERK and p38 MAP Kinases
inhibits binding of Nrf2 and induction of GCS genes. Biochemical and Biophysical
Research Communications, 278(2), pp.484-492.
Zipper, L.M. and Mulcahy, R.T., 2003. Erk activation is required for Nrf2 nuclear
localization during pyrrolidine dithiocarbamate induction of glutamate cysteine
ligase modulatory gene expression in HepG2 cells. Toxicological Sciences, 73(1),
pp.124-134.
Zou, Y., Hu, M., Lee, J., Nambiar, S.M., Garcia, V., Bao, Q., Chan, J.Y. and Dai,
G., 2015. Nrf2 is essential for timely M phase entry of replicating hepatocytes
during liver regeneration. American Journal of Physiology-Gastrointestinal and
Liver Physiology, 308(4), pp.G262–G268.
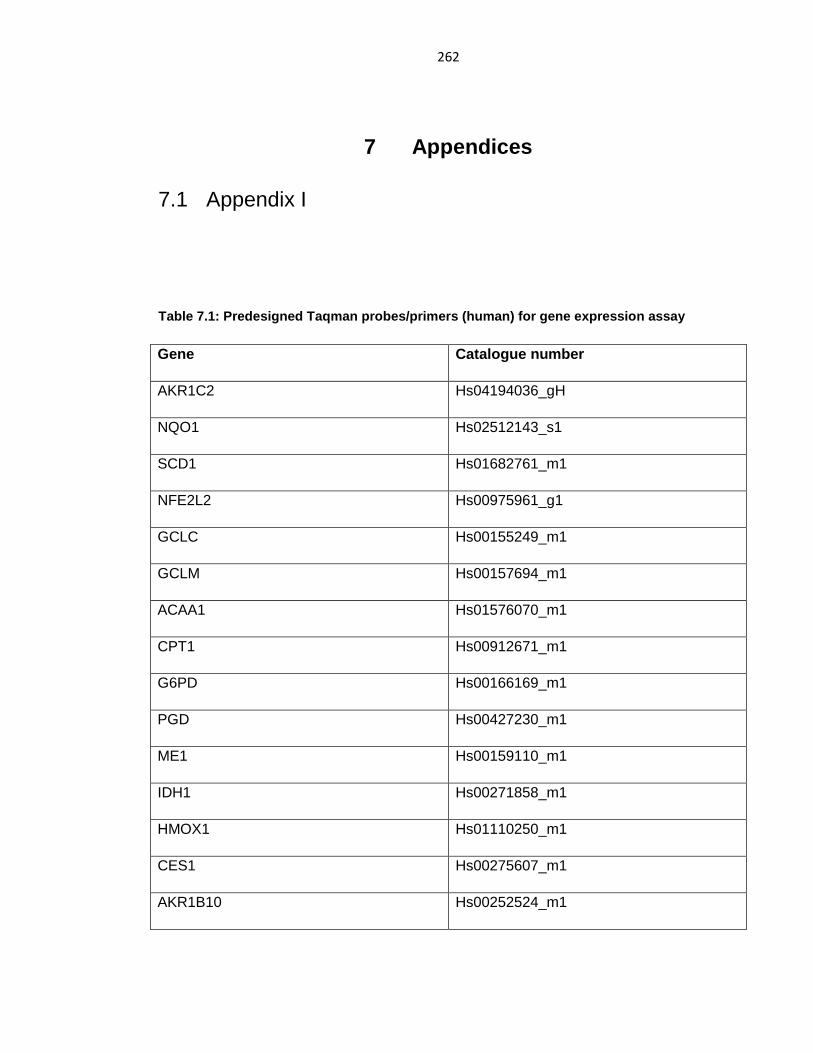
262
7 Appendices
7.1 Appendix I
Table 7.1: Predesigned Taqman probes/primers (human) for gene expression assay
Gene Catalogue number
AKR1C2 Hs04194036_gH
NQO1 Hs02512143_s1
SCD1 Hs01682761_m1
NFE2L2 Hs00975961_g1
GCLC Hs00155249_m1
GCLM Hs00157694_m1
ACAA1 Hs01576070_m1
CPT1 Hs00912671_m1
G6PD Hs00166169_m1
PGD Hs00427230_m1
ME1 Hs00159110_m1
IDH1 Hs00271858_m1
HMOX1 Hs01110250_m1
CES1 Hs00275607_m1
AKR1B10 Hs00252524_m1

263
AKR1C1 Hs04230636_Sh
PDK4 Hs01037712_m1
TALDO1 Hs00997203_m1
7.2 Appendix II
Table 7.2: Unmodified oligonucleotides used as Taqman probes and primers
Gene TaqMan primer probe sequences (5’-3’)
ACTIN FW primer
ACTIN RV primer
ACTIN probe
GCGCGGCTACAGCTTCA
TCTCCTTAATGTCACGCA
CACCACGGCCGAGCGGG
HMOX1 FW primer
HMOX1 RV primer
HMOX1 probe
AGTGCCACCAAGTTCAAGC
TATCACCCTCTGCCTGACTG
ACCGCTCCCGCATGAACTCC
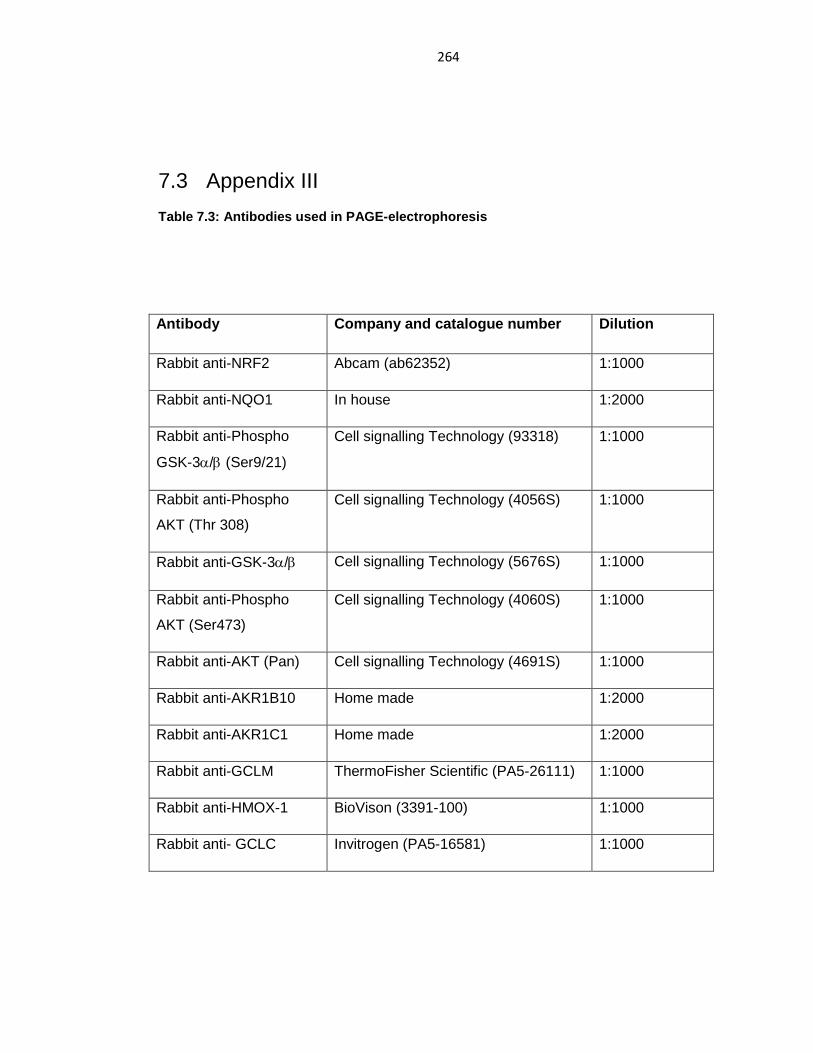
264
7.3 Appendix III Table 7.3: Antibodies used in PAGE-electrophoresis
Antibody Company and catalogue number Dilution
Rabbit anti-NRF2 Abcam (ab62352) 1:1000
Rabbit anti-NQO1 In house 1:2000
Rabbit anti-Phospho
GSK-3α/β (Ser9/21)
Cell signalling Technology (93318) 1:1000
Rabbit anti-Phospho
AKT (Thr 308)
Cell signalling Technology (4056S) 1:1000
Rabbit anti-GSK-3α/β Cell signalling Technology (5676S) 1:1000
Rabbit anti-Phospho
AKT (Ser473)
Cell signalling Technology (4060S) 1:1000
Rabbit anti-AKT (Pan) Cell signalling Technology (4691S) 1:1000
Rabbit anti-AKR1B10 Home made 1:2000
Rabbit anti-AKR1C1 Home made 1:2000
Rabbit anti-GCLM ThermoFisher Scientific (PA5-26111) 1:1000
Rabbit anti-HMOX-1 BioVison (3391-100) 1:1000
Rabbit anti- GCLC Invitrogen (PA5-16581) 1:1000