EuroCoalAsh2019Proceedings.pdf - Discovery Research Portal
507
Organised by: Supported by:
-
Upload
khangminh22 -
Category
Documents
-
view
0 -
download
0
Transcript of EuroCoalAsh2019Proceedings.pdf - Discovery Research Portal

Organised by:
Supported by:
i
EUROCOALASH 2019 10 - 12 June 2019 University of Dundee Dundee, Scotland, UK
Edited by
Michael J McCarthy Reader, Concrete Technology Unit University of Dundee
Moray D Newlands Senior Lecturer, Concrete Technology Unit University of Dundee
M Roderick Jones Professor and Director, Concrete Technology Unit University of Dundee
Thomas D Dyer Senior Lecturer, Concrete Technology Unit University of Dundee
Laszlo J Csetenyi Research/Teaching Fellow, Concrete Technology Unit University of Dundee
Li Zheng Research/Teaching Fellow, Concrete Technology Unit University of Dundee
ii
ABOUT THE EDITORS Dr Michael J McCarthy is a Reader in the Concrete Technology Unit at the University of Dundee. He has carried out research in the field of concrete technology for the last 20 years. Much of his work has been concerned with the use of fly ash in various construction applications, deterioration of concrete in various exposure conditions and aspects of concrete construction technology. He has been involved in many projects and has published widely. Dr Moray D Newlands is a Senior Lecturer within the Concrete Technology Unit at the University of Dundee. His research focusses on balancing sustainability and durability performance in concrete construction, as well as the use of novel materials and the development of test methods for assessing concrete. Professor M Roderick Jones is the Director of the Concrete Technology Unit at the University of Dundee. A renowned practitioner in the field of concrete technology, he is a member of numerous national and international technical committees and has published extensively on many aspects of concrete technology, cement science and sustainable construction. Dr Thomas D Dyer is a Lecturer in the Concrete Technology Unit at the University of Dundee. His research has primarily involved investigation of interactions of by-products with cement. He is also involved in applying life-cycle assessment techniques to construction. Recently his work has extended to include imprinting of biomimetic microstructures in construction materials, and interactions of brownfield contaminants with fresh concrete. Dr Laszlo J Csetenyi is a Research/Teaching Fellow in the Concrete Technology Unit at the University of Dundee. His main areas of interest include cement and concrete science and technology with emphasis on waste stabilisation/solidification and practical use of these materials in construction. Dr Li Zheng is a Research/Teaching Fellow within the Concrete Technology Unit at the University of Dundee. His current work is concerned with concrete durability, recycling aggregates, foamed concrete, fly ash recovery and beneficiation, cement hydration and temperature rise modelling and mix design/optimisation with novel cement combinations. Cover Photo: SEM photographs of fly ash from India and Japan Details of all publications from the University of Dundee - Concrete Technology Unit are available from: Concrete Technology Unit, University of Dundee, Dundee, DD1 4HN, UK Tel: 01382 384498, [email protected] Published by University of Dundee – Concrete Technology Unit, 2019 Requests to copy any part of this publication should be made to: Concrete Technology Unit, University of Dundee, Dundee, DD1 4HN, UK Tel: 01382 384498, [email protected] ISBN 978-0-9573263-2-3 © University of Dundee – Concrete Technology Unit, 2019 The views expressed in the papers in this volume of proceedings are those of the authors. The editors and University of Dundee – Concrete Technology Unit do not accept any responsibility for the contents of the papers or for any loss or damage which might occur as a result or following or using data or advice given in the papers.

iii
WELCOME TO EUROCOALASH2019 EUROCOALASH is an international conference, which is concerned with the use of Coal Combustion Products (CCPs) in the construction industry in Europe. The Conference takes place every two years, moving between different countries, and is co-organised by the European Coal Combustion Products Association (ECOBA) and a local institution in the particular country. In 2019, the sixth conference in the series - EuroCoalAsh 2019, was hosted by the Concrete Technology Unit, School of Science and Engineering, University of Dundee, Scotland, UK. The last few years have seen a number of challenges in the production and sourcing of CCPs. Coal combustion technology in electricity generation is changing, while coal-fired power stations are also gradually being taken out of service in many countries. These will affect the materials and their supply, with growth in international trading of CCPs likely. There is also an increasing interest in recovery and processing of material held in long-term deposits (e.g. stockpiles and lagoons) as an alternative source. Developments with CCPs in existing and novel applications, which look to exploit the unique properties and environmental benefits they offer, are on-going. At the same time, Standards and Regulations are being updated in support of their use in various aspects of construction. The 2019 Conference will bring together participants from industry, research and academic backgrounds to consider these and other issues. Over 50 presentations will be given with 43 papers published and authors and delegates attending from 18 countries. Dr Mike McCarthy Conference Chairman June 2019
iv
ORGANISING COMMITTEE
Dr M J McCarthy Conference Chairman
Dr M D Newlands Conference Secretary
Professor M R Jones
Dr T D Dyer
Dr L J Csetenyi
Dr L Zheng
Mr Raman Mangabhai Mangabhai Consulting, UK
Mrs Debbie Ree Dundee and Angus Convention Bureau, UK
SCIENTIFIC AND TECHNICAL COMMITTEE
Mr Nicolai Bech, StandardConsult ApS, Denmark
Dr Nigel Cooke,
UK Quality Ash Association, UK
Professor Urmil Dave, Nirma University, India
Professor Ravindra Dhir,
Applying Concrete Knowledge | University of Dundee, UK
Professor Andrew Dunster, Building Research Establishment | Coventry University, UK
Dr-Ing. Hans-Joachim Feuerborn,
ECOBA, Germany
Professor Tom Harrison, Independent Consultant | University of Dundee, UK
Professor Peter Hewlett,
David Ball Group | University of Dundee, UK
Dr Sivakumar Kandasami, L&T Construction, India
Dr Elizabet van der Merwe, University of Pretoria, South Africa
Dr Kevin Paine,
University of Bath, UK
Professor Ioanna Papayianni, Aristotle University of Thessaloniki, Greece
Professor John Provis,
University of Sheffield, UK
Professor Tom Robl, University of Kentucky, USA
Dr-Ing. Angelo Saraber, Vliegasunie, Netherlands
Mr Ivan Skidmore,
Power Minerals Ltd, UK
Professor Marios Soutsos, Queen’s University Belfast, UK
Professor Michael Thomas,
University of New Brunswick, Canada
SPONSORING AND SUPPORTING ORGANISATIONS
Dundee and Angus Convention Bureau
ECOBA/UKQAA
Atritor Ltd
Power Minerals Ltd
v
PROCEEDINGS CONTENTS
Page No
1
18
31
40
50
62
69
86
101
107
115
Opening Papes
Global Aspects on Coal Combustion Products Feuerborn, H-J, Harris, D, Heidrich, C
Developments in CCP Management in Europe Skidmore, I, Feuerborn, H-J
General Papers
Reporting and Verifying the Potential Release of Dangerous Substances from Concrete Containing Fly Ash Harrison, T A
Combined Effect of Polymeric Fibres and Superabsorbent Polymers (SAPs) on the Autogenous Shrinkage and Mechanical Properties of Fly Ash Cementitious Mortars Rostami R, Klemm, A J
Effect of Cracks on Alkalinity Level of Concrete Structures Exposed To Carbon Dioxide Environmental Condition Al-Ameeri, A, Rafiq, M I, Tsioulou, O
Application of Biomass Ashes in Construction Materials van Dijen, F
Biomass Ash and Options for Utilization: A European Perspective Bech, N, Sarabèr, A, Feuerborn, H-J
Biocoal Fly Ash: Ashes from Biomass and Coal: Properties and Regulatory Aspects Sarabèr, A, Haanappel, N
Comparison of EN 450 and ASTM 618 Specifications and Testing Procedures for Fly Ash Used in Concrete Robl, T, Oberlink, A, Jewell, R, Duvallet, T, Ladwig, K
Use of Fly Ash as a Proppant in Clean Fracking Unconventional Oil and Gas Wells Robl, T, Oberlink, A, Duvallet, T, Jewell, R,Ring, L, Cook, R L
Utilisation of Coal Combustion Products as a Ternary Binder in Shotcrete Šmilauer, V, Sovják R, Pešková, Š, Šulc, R, Škvára, F, Šídlová, M, Snop, R, Růžička, P
Can Czech Stockpiled Fly Ash be Used in the Production of Concrete? Peterová, A, Škvára, F, Šídlová, M, Šulc, R, Sokolová, K, Snop, R
123

vi
131
137
145
157
165
175
183
195
207
215
225
237
250
259
Mechanical and Some Durability Studies on Ambient Cured Fly ash Bottom Ash Alkali Activated Concrete Thakkar, S, Dave, U, Patel, D
Resistance of Non-cement Binder to Freezing and Thawing Cycles Šídlová, M, Škvára, F, Pulcová, K, Peterová, A, Šulc, R, Snop, R
A Review on the Development of Fly Ash-Based Geopolymer Materials Using Romanian Local Raw Materials Lăzărescu, A, Szilagyi, H, Baeră, C
Properties of High Temperature Fly Ashes After Application SNCR Technology from the Concrete Producers Point of View Hela, R, Ťažký, M, Osuska, L
Hydraulic Road Binders with High Content of Fly Ash: Czech Experience Kresta, F
Ternary Binders with Fly Ash after Denitrification Bílek, V, Bambuchová, M, Bulíková, L
Mechanical Properties of Calcareous Fly Ash Stabilized Soil Turan, C, Javadi, A, Vinai, R, Cuisinier, O, Russo, G, Consoli, N C
Study on Utilization of Fly Ash in Production of Lightweight Aggregate Sambuunyam, S, Pareek, S, Danzandorj, S, Purev-Erdene, B-E, Thombare, R
Use of Fly Ash in Production of Foam Glass Purev-Erdene, B-E, Pareek, S, Danzandorj, S, Sambuunyam, S, Thombare, R
Implementation of Basic Work Requirement 3 in Harmonized Product Standards: Update on CEN/TC 351 for Test Procedures and Status of Work in CEN/TC 104/WG4 for Implementation into EN 450-1 Wiens, U, Feuerborn, H-J, Saraber, A
Pore Structure and Properties of Aerogel-Cement Composites Lu, J, Jiang, J, Lu, Z Y, Li, J
Designing Durable Concrete for Constructability of the World's Tallest Statue Kandasami, S, Kannan, L S, Umamaheshwaran, V
Assessment of Durability of Alkali Activated Mortars Papayianni, I, Konopisi, S, Kesikidou, F
Performance of Dry and Moist Calcareous Fly Ash in Soil Stabilization Papayianni, I, Anastasiou, E, Papachristoforou, M, Kaplanidis, C, Bairaklili, P
Use of Calcareous Fly Ash in Grouting Slurry Walls in Underground Works Papayianni, I, Liapis, A, Anastasiou, E
267

vii
275
287
295
308
322
334
346
356
366
376
386
399
414
Investigation of Pore Structure and Properties of Lightweight Geopolymer based on Swelled Na-Bentonite Yang, Y, Jiang, J, Lu, Z Y, Li, J
A Novel Mechanically Robust Superhydrophobic Cement Foam Zheng, Z, She, W, Miao, C
Optimizing the Dosage of Leca and Fly Ash in Lightweight Concrete To Study the Peformance of Steel-Concrete Composite Slab Banupriya, R, Arul Mary, S
Study on Structural Grade Lightweight Concrete and Composite Concrete Structure Design Kalathingal, A, Desai, P, Shaikh, M T A
Lagoon Fly Ash: A Potential Source of the Precursor for Geopolymer Binders Kwasny, J, McGrath, T, Lawther, S, Correia, R, Soutsos, M, Sha, W, Cox, S, Chen, J F
Phase-Transition Conductometry to Study Pore Structure Evolution in Fly Ash Mortar Suryanto, B, Kim, J, McCarter, W J
Tailoring the Mechanical Properties of Landfilled Fly Ash Geopolymers by Grinding Ambrus, M, Szabó, R, Csőke, B, Mucsi, G
Use of Fly Ash in Concrete: Current Indian Scenario and a Case Study on HVFAC for Shear Wall Construction in India Kulkarni, V
Fly Ash as Alumina Resource Marko, M, Opravil, T, Šoukal, F, Pořízka, J
Fly Ash Reclamation and Beneficiation Using a Triboelectric Belt Separator Baker, L, Gupta A, Hrach, F
Mobility of Arsenic, Chromium and Copper Arising From Soil Application of Stabilised Aggregates Made From Contaminated Wood Ash Mitchell, K, Moreno-Jimenez, E, Jones, M R, Zheng, L, Trakal, L, Hough, R, Beesley, L
Influence of Heat and Chemical Activiation on Strength and Durability of High Strength High Volume Fly Ash Concrete Nwaubani, S, Hlabangana, M
Ca-rich Oil-shale Ash Waste as a Carbon Dioxide Sink: Stable Carbon and Oxygen Isotope Study Leben, K, Mõtlep, R, Kirsimäe, K
Examination of Particle Packing in Ternary Blends of Portland Cement, Fly Ash and Silica Fume Dyer, T, Csetenyi, L, Scobbie, K
420

viii
2020 to 2070 and Beyond: Transitioning from Production to Post-Production Coal Ash Use Sifton, B, Arato, C
442
Wet Stored Fly Ash: Processing for Use as an Addition in Concrete Hope, T A, McCarthy, M J, Csetenyi, L J
453
Alkali Activation of Ca-rich Oil Shale Ashes Paaver, P, Paiste, P, Kirsimäe, K
467
Ash Component Assemblies: Innovative Utilization of Fly ash for Building and Construction Panels Chiuta, S, Mdlamkomo, T, Payne, K Soutter, W
473
Abstract Summaries
A Report on Beneficial Use of Coal Combustion Products in the United States Adams, T
484
Outlook for Fly Ash in the UK Cooke, N
485
Fly Ash Drying Considerations Rigg, A, Coley, S
486
Cost-Effective, Environmentally-Friendly Ash Beneficiation Technology Sheikh, V
487
India as an Emerging Fly Ash Sourcing Hub Dalal, R
488
Radical Options For Non-Thermal Drying Zlatner, M, Every, C,
489
Potential Development of a PFA Landfill Site Crankshaw, J
490
Author Index
491
Keyword Index 493

Power Minerals sales desk: 01757 617415Email: [email protected] powerminerals.co.uk
Our core products are Pulverised Fuel Ash (PFA) and Furnace Bottom Ash (FBA) from the UK’s coal and biomass fired power stations.
For the civil engineering industry, our high-quality products deliver significant environmental benefits, reducing the need for virgin aggregates and cement.
With a network of partnerships at UK power stations, we’re perfectly placed to deliver our products nationwide, while our unique international links ensure unrivalled stability to our supply chain.
At Power Minerals Ltd, innovation is the foundation of all that we do.
Power Minerals Ltd are the UK’s leading independent provider of ash products from power stations across the country and via imports.
ASH SALES COVERING
THE UK
AWARDS IN 2018:Recognised for ‘Excellence in Industry’ at The Birmingham Post Business Awards
ATRITOR LIMITEDCoventry, United Kingdom
www.atritor.com
Atritor Limited has been designing and supplying plant and equipment to the world’s process industries for more than 90 years. Dry, fine powders, simultaneous milling and drying of powders and surface coating of powders are our speciality and we offer an extensive range of equipment for this purpose.
PULVERISING
DRYING
SEPARATION
Atritor Limited proudly serves many industries, including:
• chemicals
• minerals
• waste and recycling
• food
GLOBAL ASPECTS ON COAL COMBUSTION PRODUCTS
H-J Feuerborn
European Coal Combustion Products Association
Germany
D Harris
Asian Coal Ash Association
China
C Heidrich
Ash Development Association of Australia
Australia
ABSTRACT. As global energy demand and electrification rates increase, coal remains the most abundantly consumed fossil fuel for the production of electrical power. At the same time, international agreements and local policies are driving a transition towards alternative (nuclear, renewable, ..) energy sources, with a central focus on reducing CO2 emissions associated with fossil fuel combustion. In some countries, growth in renewable energy is resulting in coal-fired power operators losing base load supply agreements as they are forced to intermittent, lower volume production serving peak demand requirements that renewables are unable to meet. In addition, coal power operators face stricter emission controls from ‘Clean Air’ legislation that require retrofits of existing power stations and design changes for new plants. The shift away from base load power, introduction of retrofits and design changes all impact coal combustion product quality and supply consistency. Coal combustion by products are well established as valuable, high volume inputs for the manufacture of construction and building materials. They provide functional benefits in these applications and, as substitutes for energy intensive materials such as cement, sand and aggregates, they provide options for lower embedded carbon. With value as functional materials and recycled, low carbon inputs for the built environment CCP’s present a global opportunity for international trade. Factors inhibiting trade include regulatory constraints, limited export and import infrastructure, supply and demand imbalances in countries with CCP surpluses and – importantly – a lack of general consensus around product standards and limited supply-side knowledge of quality consistency. Due to the long history of using coal ash in construction materials, relevant standards exist for a range of applications. A compilation of national standards for use of fly ash in cement and concrete has been provided to demonstrate similarities and differences to be considered when ashes are used in other countries. The paper is jointly written by members of the World Wide Coal Combustion Products Network and is the result of an ongoing, international collaboration between respective country industry associations, being non-governmental organizations (NGO’s). Our collective mission is to inform the public, industry and governmental entities about the beneficial environmental, technical and commercial uses of CCPs.
Keywords: Energy, Production, Developments, Coal, Renewables, Coal combustion products (CCPs), Coal ash, Fly ash, Bottom ash, Global production, Legislation, Standards.
H-J Feuerborn is Secreatary General of ECOBA. David Harris is the founding director of the Asian Coal Ash Association. Craig Heidrich is Chief Executive Office of the Ash Development Association of Australia.
OPENING PAPER

2 Harris, Heidrich, Feuerborn
INTRODUCTION
CO2 emission concerns are creating regulatory and commercial incentives to reduce coal fired generation in many countries around the world. Despite this pressure, the share of coal in global power production remains above 38%, with coal consumption rising over the past few years after a short period of annual decreases. This recent rise in coal consumption is largely driven by economic growth in large developing countries such as China, India and parts of Southeast Asia.
In many developed economies a reduction of coal-fired power generation is underway, with some countries aiming at a total phase out of coal power over the next few decades. The shift away from coal in many countries is accompanied by increased use of fossil fuels such as natural gas, alternative fuels such as nuclear, biomass and increased use of renewables including wind, solar, hydro and geothermal. Energy production choices and the speed of transition to alternatives depend significantly on political, economic and geographical conditions.
Coal Combustion Product (CCPs) production volumes are directly correlated with the combustion of coal in thermal power stations. Their commercial and environmental value is well established as non-virgin, functional inputs in construction material manufacturing and geotechnical engineering applications. Management and utilization of CCP’s is similar in most countries, with policymakers encouraging producers and buyers to increase utilization in these applications.
To achieve maximum utilization, producers and policymakers must understand and address regulatory conditions, market demand, product quality and supply consistency. In some countries the majority of CCPs are already consumed in accordance with established product standards or technical guidelines. This has resulted in mature markets with steady demand for quality products used in construction materials and geotechnical applications. In other markets, lack of adequate standards, poor market education and regulatory barriers - such as designation of CCPs as wastes and not resources – are resulting in poor utilization rates with large volumes of CCPs landfilled.
Changing operating conditions of power plants leads to negative impacts on coal combustion product quality, consistency and availability. When the quality aspects are a continuous task of the power plant operators the availability is an issue of market partners with all tools from interim storage, re-use from stock, processing, beneficiation and also export/import for serving existing markets.
The members of the World-Wide CCP Network (WWCCPN) endeavor to continuously inform global stakeholders about developments in the production, utilization and trading of coal combustion products. The most recent data are provided with this paper.
ROLE OF COAL IN ENERGY PRODUCTION
As global supply of CCPs is tied directly to coal power production it is useful to understand the current state and outlook for global coal consumption and future demand.

Coal Combustion Products 3
At present, about 7,700 Mt of coal is used worldwide by a variety of sectors including power generation and other industries like iron and steel production, cement manufacturing etc. An overview of the coal recoverable resources is given in Figure 1 where recoverable means to be accessible under current local economic and technological conditions [1].
Figure 1 Coal recoverable resources by region [1]
Asia represents the biggest market for coal and currently accounts for 66% of global coal consumption [2]. After several years of declines, coal consumption rose by 1%, or 25 million tonnes of oil equivalent (mtoe), with India recording the fastest growth (4.8%, 18 mtoe). After three years of successive declines, China’s coal consumption also increased (0.5%, 4 mtoe) despite substantial coal-to-gas switching in the industrial and residential sectors, as increases in power demand in China consumed additional coal as the balancing fuel [3].
Interestingly, the increase in US production came despite a further fall in domestic consumption, with US coal producers increasing exports to Asia. The world top 10 coal producers are given in Table 1 [4] and TOP 10 coal exporter in Table 2 [5].
Table 1 Top 10 coal producers [4] Table 2 Top 10 coal exporter [5]
No COUNTRY AMOUNT
[million tonnes] No COUNTRY
AMOUNT [million tonnes]
1 China 3,874.0 1 Indonesia 467.7
2 United States 906.0 2 Australia 394.7
3 Australia 644.0 3 Russia 155.5
4 India 537.6 4 United States 112.7
5 Indonesia 458.0 5 Columbia 82.4
6 Russia 357.6 6 South Africa 82.2
7 South Africa 260.5 7 Canada 40.4
8 Germany 185.8 8 Kazakhstan 36.0
9 Poland 137.1 9 Mongolia 19.3
10 Kazakhstan 108.7 10 Korea 18.4

4 Harris, Heidrich, Feuerborn
The growth in coal demand in the near future is concentrated in India, Southeast Asia and a few other countries in Asia. Coal demand is expected to decline in Europe, Canada, the United States and China (see Figure 2). As a result of these contrasting trends, global coal demand will only slightly increase over the next decade. Although coal-fired power generation will increase in absolute terms, as a share of the energy mix it is expected to decrease due to growth of renewables and natural gas [6].
Figure 2 Coal demand in selected countries/regions in 2000, 2017 and 2023 [6]
World primary energy consumption grew by 2.2% in 2017, up from 1.2% in 2016 and the highest since 2013. All fuels except coal and hydroelectricity grew at above-average rates. Natural gas provided the largest increment to energy consumption at 83 (mtoe), followed by renewable power (69 mtoe) and oil (65 mtoe) (see Figure 3 [2]).
Figure 3 World primary energy consumption (in mt oil equivalent) [2]

Coal Combustion Products 5
The majority of coal is either utilised in power generation, using steam coal or lignite, or iron and steel production that uses coking coal. Coal still provides nearly 40% of the world’s electricity. The increase in world electricity consumption is closely linked with economic growth, and economic growth in turn relies upon dependable sources of power. While coal power can, in several geographies, provide reliable supply, demands for climate change mitigation, transition to renewable energy forms and increased competition from other resources are presenting challenges for the sector.
MAJOR AGREEMENTS IMPACTING COAL
Over the past few decades, national governments have required that coal combustion for energy production meet emissions standards for clean air. This has resulted in emissions reduction technologies for dust (fly ash), NOx and SOx and efforts to improve overall combustion efficiency. Along with these national regulations, global discussions on climate protection have led to international agreements with further regulations applying in signatory countries. The Climate Convention, Kyoto Protocol and Paris Agreement are all well known initiatives which aim at reducing CO2 emissions and mitigating risks of global warming.
UNFCCC The United Nations Framework Convention on Climate Change (UNFCCC) is the main international agreement on climate action. It was one of three conventions adopted at the Rio Earth Summit in 1992. Its sister Rio Conventions are the UN Convention on Biological Diversity and the Convention to Combat Desertification. The convention entered force on 21 March 1994. It started as a way for countries to work together to limit global temperature increases and climate change, and to cope with their impacts. The 197 countries that have ratified the Convention are called Parties to the Convention (CoP) [7].
The objective of the Convention is
The ultimate objective of this Convention and any related legal instruments that the Conference of the Parties may adopt is to achieve, in accordance with the relevant provisions of the Convention, stabilization of greenhouse gas concentrations in the atmosphere at a level that would prevent dangerous anthropogenic interference with the climate system. Such a level should be achieved within a time-frame sufficient to allow ecosystems to adapt naturally to climate change, to ensure that food production is not threatened and to enable economic development to proceed in a sustainable manner.
KYOTO PROTOCOL In the mid 1990’s, the UNFCCC realised that stronger provisions were needed to reduce emissions. In 1997, they agreed to the KYOTO PROTOCOL, which introduced legally binding emission reduction targets for developed countries. The participating countries have committed to reducing emissions by at least 18% below 1990 levels. The EU has committed to reducing emissions in this period to 20% below 1990 levels [7].
When the Convention encourage industrialised countries to stabilize GHG emissions, the Protocol only commits them to do so. Under the Protocol, countries must meet their targets primarily through national measures. However, the Protocol also offers them an additional
6 Harris, Heidrich, Feuerborn
means to meet their targets by way of three market-based mechanisms, such as International Emissions Trading Mechanism (ETM), Clean Development Mechanism (CDM) and Joint Implementation projects (JI).
The CDM, for example, allows emission-reduction projects in developing countries to earn Certified Emission Reduction (CER) credits, each equivalent to one tonne of CO2. These CERs can be traded and sold, and used by industrialized countries to a meet a part of their emission reduction targets under the Kyoto Protocol. The mechanism stimulates sustainable development and emission reductions, while giving industrialized countries some flexibility in how they meet their emission reduction limitation targets. Accepted CDM and JI projects are listed in the UNFCCC CDM data base [8]. One example of a JI project referring to the use of coal ash is the TEFRA project from Poland, involving three installations in different locations, where coal ash is used or planned to be used in the production of hydraulic binders [9, 10].
PARIS AGREEMENT On 12 December 2015, parties to the Paris Climate Conference reached a new global agreement on climate change. Article 2 of the Paris Agreement defines the three purposes of the instrument: to make mitigation effective by holding the increase of temperature well below 2°C, pursuing efforts to keep warming at 1.5°C above pre-industrial levels; to make adaptation possible for all parties; and to make finance available to fund low carbon development and build resilience to climate impacts. These three outcomes have an impact on energy developments, primarily through the adoption of commitments labelled as Nationally Determined Contributions (NDCs), which are only “intended” (hence INDCs) until the Agreement enters into force /11/. The Agreement entered into force 4 November 2016 after the conditions for ratification by at least 55 countries accounting for at least 55% of global greenhouse gas emissions were met. All EU Countries ratified the agreement [7]
The temperature target of Paris requires a profound transformation process and an inherently new understanding of our energy systems. Credible and effective national policies are crucial to translate the pledges made at Paris into domestic policy. To meet the Paris obligations, new policies will need to be put in place and old ones aggressively revisited:
• carbon emissions will need to be priced;• energy production and consumption technologies will be regulated;• funding for research and development will need to be made available;• and low carbon assets will need to be nurtured by financial markets.
Key market disruptions will be experienced by market participants and governments alike, including technology innovations and stranded assets [11].
The changing regulatory environments described above impact operating conditions for power plants which can lead to negative quality, consistency and availability impacts on CCPs for existing users. Power plant operators accordingly face difficulties maintaining reliable CCPs supply and quality consistency for served market partners. Significant research into harvesting of interim storage, recovery from stock, processing, beneficiation and also export/import for serving existing markets have become priorities.

Coal Combustion Products 7
BAT - BEST AVAILABLE TECHNOLOGIES
To ensure natural and economic ecosystems are sustainable it is necessary that we mitigate the negative impact of industrial activities on the environment. Emissions from industrial installations have therefore been subject to national legislation for many years. Clean air requirements for power plants have, inter alia, led to the collection and availability of CCPs. This has been a successful example of pollution reduction technology adoption around the world, with additional environmental benefits accrued through CCPs role as a substitute for natural, energy intensive resources.
There are several requirements for clean air which consider emission limit values round the world. Due to the ongoing information exchange the so-called Best Available Technologies (BAT) are partly referenced in laws and regulations.
The Organisation for Economic Co-operation and Development (OECD) has published a report on establishing BAT which describes activities in the different parts of the world [12].
The report presents a comprehensive analysis of approaches to establishing BAT and similar concepts to prevent and control industrial emissions in a wide range of countries, including examples from: the Russian Federation, Korea, the United States, the European Union, India, the People’s Republic of China and New Zealand. For each country, the report presents extensive information on the procedures for collection of data on techniques for control and prevention of industrial pollution, evaluation of the techniques and identification of BAT. In addition, the report covers international initiatives facilitating the application of BAT, including under the Minamata Convention on Mercury and the Stockholm Convention on Persistent Organic Pollutants. While acknowledging the inherent differences of the policy contexts in which BAT are applied, the report allows for a cross-country comparison of existing approaches to determine BAT.
The policies examined in the report use different terms and definitions to describe BAT. The European Union (EU) Industrial Emissions Directive [13] defines BAT as "the most effective and advanced stage in the development of activities and their methods of operation, indicating the practical suitability of particular techniques for providing the basis for emission limit values and other permit conditions designed to prevent and, where this is not practicable, to reduce emissions and the impact on the environment as a whole". However, some countries also include innovative and cutting-edge techniques amongst their BAT.
The BAT documents in the EU, the Russian Federation and Korea are called BAT reference documents, or BREFs, while they are named Guidelines on Available Techniques of Pollution Prevention and Control in China. All of the above present a list of techniques identified as BAT, while the Indian equivalent –Comprehensive Industry Documents Series (COINDS) – are rather guidelines highlighting the advantages and disadvantages of various available techniques to meet the Minimum National Standards (MINAS).
The revised EU Best Available Techniques (BAT) Reference Document for Large Combustion Plants (BREF LCP) was published in June 2017. The conclusions were published in the Official Journal and give bandwidths for emission limit values which have to be defined by the national regulators when implementing the new requirements. Besides dust, NOx and SOx, limit values for Hg will be defined. These limits may provide guidelines and regulatory certainty that may allow for further investment and effort to continue coal-fired generation in some regions.
8 Harris, Heidrich, Feuerborn
In Germany, producers formed the ‘Hgcapture Initiative’ to publicly inform about the success when using BAT as defined in the BREF [15]. This is of special importance as the CCPs from hard coal are used nearly completely in the construction industry and as changes in compositions may complicate continued use. The research work currently at lab and pilot scale demonstrate that the expected very low Hg emission values may not be reached with only one BAT. In addition, the systems have different effects in different power plants which has not been considered in the revision phase although commented several times.
COAL COMBUSTION PRODUCTS
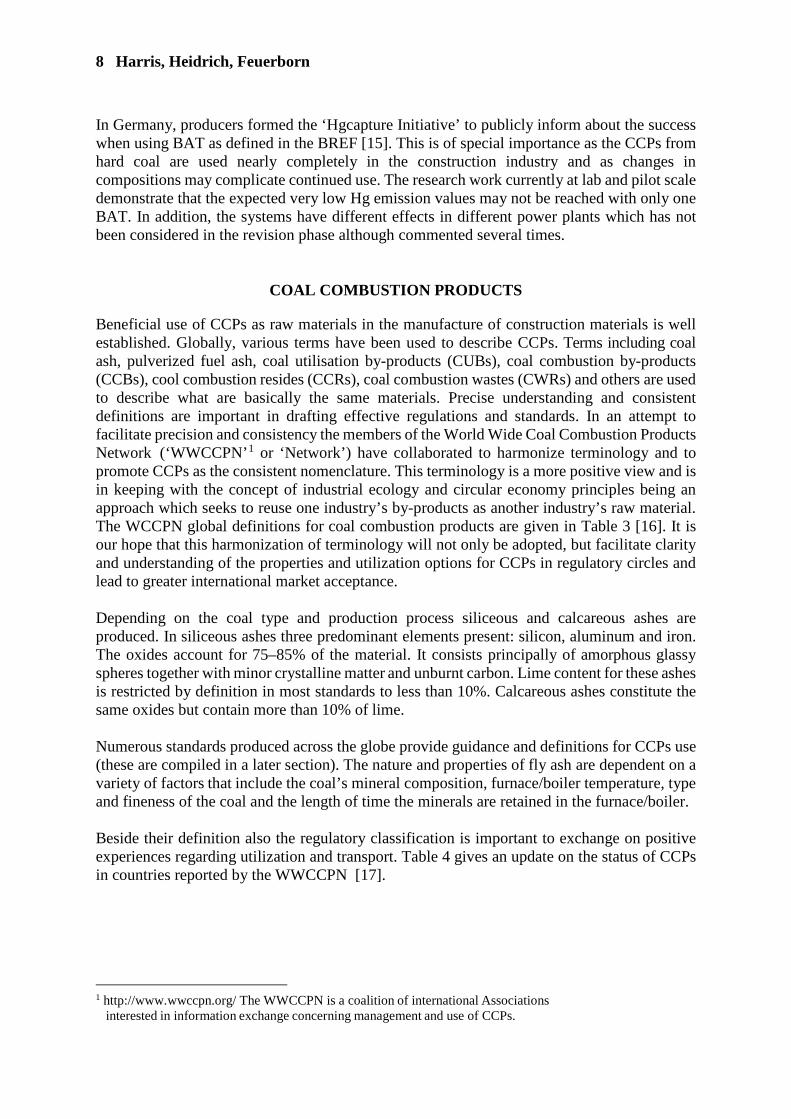
Beneficial use of CCPs as raw materials in the manufacture of construction materials is well established. Globally, various terms have been used to describe CCPs. Terms including coal ash, pulverized fuel ash, coal utilisation by-products (CUBs), coal combustion by-products (CCBs), cool combustion resides (CCRs), coal combustion wastes (CWRs) and others are used to describe what are basically the same materials. Precise understanding and consistent definitions are important in drafting effective regulations and standards. In an attempt to facilitate precision and consistency the members of the World Wide Coal Combustion Products Network (‘WWCCPN’1 or ‘Network’) have collaborated to harmonize terminology and to promote CCPs as the consistent nomenclature. This terminology is a more positive view and is in keeping with the concept of industrial ecology and circular economy principles being an approach which seeks to reuse one industry’s by-products as another industry’s raw material. The WCCPN global definitions for coal combustion products are given in Table 3 [16]. It is our hope that this harmonization of terminology will not only be adopted, but facilitate clarity and understanding of the properties and utilization options for CCPs in regulatory circles and lead to greater international market acceptance.
Depending on the coal type and production process siliceous and calcareous ashes are produced. In siliceous ashes three predominant elements present: silicon, aluminum and iron. The oxides account for 75–85% of the material. It consists principally of amorphous glassy spheres together with minor crystalline matter and unburnt carbon. Lime content for these ashes is restricted by definition in most standards to less than 10%. Calcareous ashes constitute the same oxides but contain more than 10% of lime.
Numerous standards produced across the globe provide guidance and definitions for CCPs use (these are compiled in a later section). The nature and properties of fly ash are dependent on a variety of factors that include the coal’s mineral composition, furnace/boiler temperature, type and fineness of the coal and the length of time the minerals are retained in the furnace/boiler.
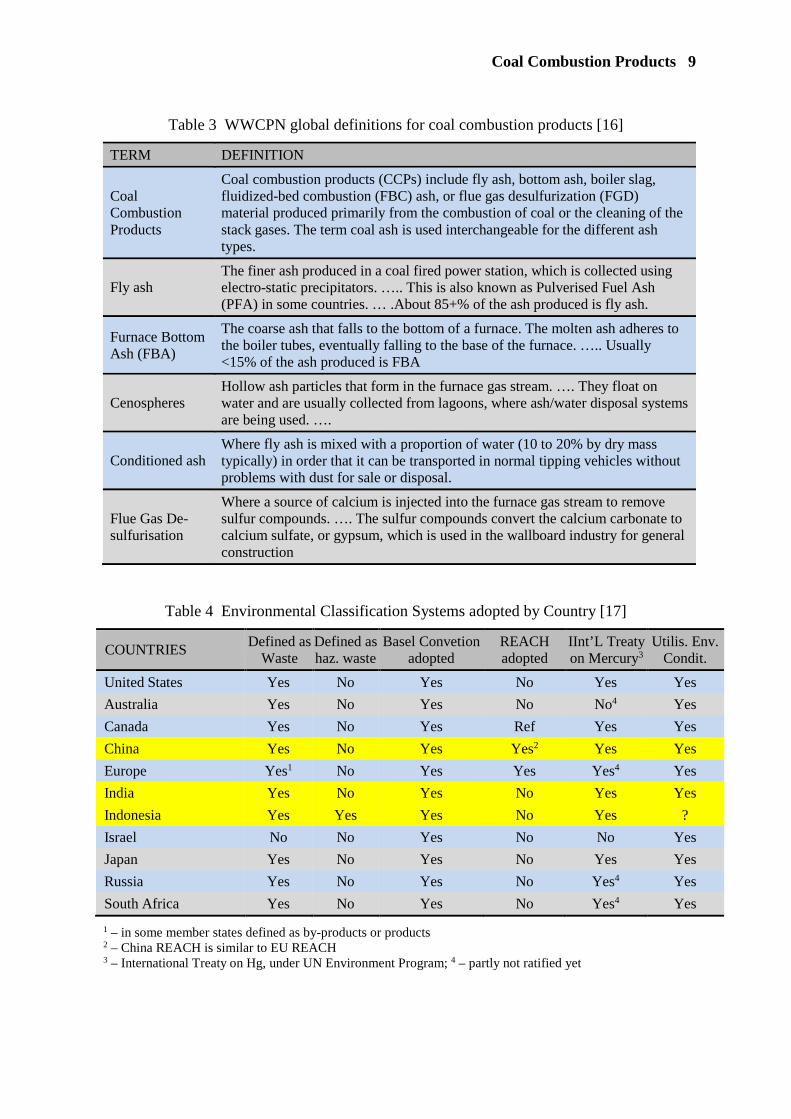
Beside their definition also the regulatory classification is important to exchange on positive experiences regarding utilization and transport. Table 4 gives an update on the status of CCPs in countries reported by the WWCCPN [17].
1 http://www.wwccpn.org/ The WWCCPN is a coalition of international Associations interested in information exchange concerning management and use of CCPs.
Coal Combustion Products 9
Table 3 WWCPN global definitions for coal combustion products [16]
TERM DEFINITION
Coal Combustion Products
Coal combustion products (CCPs) include fly ash, bottom ash, boiler slag, fluidized-bed combustion (FBC) ash, or flue gas desulfurization (FGD) material produced primarily from the combustion of coal or the cleaning of the stack gases. The term coal ash is used interchangeable for the different ash types.
Fly ash The finer ash produced in a coal fired power station, which is collected using electro-static precipitators. ….. This is also known as Pulverised Fuel Ash (PFA) in some countries. … .About 85+% of the ash produced is fly ash.
Furnace Bottom Ash (FBA)
The coarse ash that falls to the bottom of a furnace. The molten ash adheres to the boiler tubes, eventually falling to the base of the furnace. ….. Usually <15% of the ash produced is FBA
Cenospheres Hollow ash particles that form in the furnace gas stream. …. They float on water and are usually collected from lagoons, where ash/water disposal systems are being used. ….
Conditioned ash Where fly ash is mixed with a proportion of water (10 to 20% by dry mass typically) in order that it can be transported in normal tipping vehicles without problems with dust for sale or disposal.
Flue Gas De-sulfurisation
Where a source of calcium is injected into the furnace gas stream to remove sulfur compounds. …. The sulfur compounds convert the calcium carbonate to calcium sulfate, or gypsum, which is used in the wallboard industry for general construction
Table 4 Environmental Classification Systems adopted by Country [17]
COUNTRIES Defined as
Waste Defined as haz. waste
Basel Convetion adopted
REACH adopted
IInt’L Treaty on Mercury3
Utilis. Env. Condit.
United States Yes No Yes No Yes Yes
Australia Yes No Yes No No4 Yes
Canada Yes No Yes Ref Yes Yes
China Yes No Yes Yes2 Yes Yes
Europe Yes1 No Yes Yes Yes4 Yes
India Yes No Yes No Yes Yes
Indonesia Yes Yes Yes No Yes ?
Israel No No Yes No No Yes
Japan Yes No Yes No Yes Yes
Russia Yes No Yes No Yes4 Yes
South Africa Yes No Yes No Yes4 Yes
1 – in some member states defined as by-products or products 2 – China REACH is similar to EU REACH 3 – International Treaty on Hg, under UN Environment Program; 4 – partly not ratified yet

10 Harris, Heidrich, Feuerborn
PRODUCTION
During the course of 2012 the Network agreed to gather, collate and publish production and utilization data provided by members or from publically available and proven sources. The first worldwide compilation of the worldwide production of coal combustion products in 2010 resulted in approximately 780 Million metric tonnes (Mt) /18/, the update was given by Heidrich in 2017 resulting in 1.1 billion metric tonnes [19]. Table 5 reports on Annual Production, Utilization Rates by Country in 2016. The largest coal combustion product producing countries were China, India, Europe (total production of 140 Mt to be considered as utilization rates only available for EU15) and the USA. The total production estimate for the year totalled nearly 1.2 billion tonnes.
Table 5 2016 Annual Production and Utilisation Rates of CCPs by Country [17]
COUNTRY/REGION CCPs
PRODUCTION (Mt) CCPs UTILISATION
(Mt) UTILISATION
RATE %
Australia 12.3 5.4 43.5 Asia
- China 565 396 70.1 - Korea 10.3 8.8 85.4 -India 197 132 67.1 -Japan 12.3 12.3 99.3 - Other Asia 18.2 12.3 67.6 Europe 140
-EU15 (40.3) 38 94.3 Middle East & Africa 32.2 3.4 10.6 Israel 1.1 1 90.9 United States of America
107.4 60.1 56.0
Canada 4.8 2.6 54.2 Russian Federation 21.3 5.8 27.2
Total 1221.9 677.7 63.9
Utilization varies widely in the countries discussed in this paper. Japan had the highest reported effective utilization rate of 99.3% and Africa/Middle East (still) the lowest at 10.6%. Countries ranked with the highest coal combustion product utilization rates were; Japan 96.3%, Europe (EU15) 94.3%, Korea 85%, China 70% and Other Asia 67% or US 56%. The countries with a high utilization rate also demonstrate an existing market where CCPs are used regularly according to existing regulations and can easily be put into the market. Ashes are mostly used in cement and concrete applications, especially those with siliceous properties (or class F). Furthermore they are used in road construction, especially when stocks are available, and for filling applications. Calcareous ashes are mostly used for reclamation or, due to their hydraulic properties, as binders. FGD gypsum is predominantly used as raw material for the gypsum industry in different applications including manufacture of wallboard and plaster and in the cement industry as a setting regulator. There has been an increase in use of FGD gypsum as a substitute for natural gypsum in agricultural applications, particularly in the United States.

Coal Combustion Products 11
INTERNATIONAL TRADE
Unlike trade in coal, cement and other commodities there are no comparable figures or official statistics on the international trade of coal combustion products. Information collected from Network members and from import/export data resources provides some indication of trade activity.
Based on trade data provided by contributing network members, global trade for 2010 was more than 3.5 Mt of CCPs traded across borders worth over USD $101 million in transaction value. From the 6 countries reporting trade of CCPs during that year, only 4 countries were able to determine value attributable for these transactions. The compilation of CCP’s trade data for 2015 suggests global trade of more than 5 Mt [18]. With a very limited number of countries reporting trade data, the annual volumes and trade revenue generated by CCP’s is believed to highly underestimate actual volumes.
Figure 4 World traded coal flows in 2015 [20]
Despite having a designated HS code, coal combustion by products have not yet gained substantial trade volumes status from a global import/export perspective.
Given increased interest in global CCPs trading observed it is believed that volumes and value of global CCPs trade have increased substantially over the last decade /19/.The growth is driven by several market changes including changes in power production in the US with a switch to gas and in the Western part of Europe with a switch to increased production by renewables as well as in the middle east areas were the use of CCP’s has developed. In addition, the CO2 trading scheme for the industries led to increased requests by the cement industry as ashes and slags are accepted and long term established replacement materials as supplementary cementitious materials. In Europe, ECOBA reports on annual basis the cross border transport which since 2012 is on a constant level of nearly 3 million tonnes /21/.
Considering ship transports of the cement industry, ash transport into the US and cross Europe as well as those to the middle East, the trade volume of coal ash is estimated to be about 6 million tonnes annually and this figure is still seen as a minimum.
12 Harris, Heidrich, Feuerborn
Domestic market demand in countries with a net surplus of CCPs consumes much of the supply located closest to export facilities. This increases the total delivered cost of the products as supplies need to be transported from more distant production facilities. Accordingly, global trade in ashes and gypsum (FGD) is increasing slowly.
INTERNATIONAL STANDARDS
As the use of CCPs is either standard or project related the national regulations for the use in different applications have to be considered. The easiest way to serve existing markets is via product standards with definitions, properties and partly also use information for the materials. Therefore, a compilation of standards for the use of coal ash in cement and/or concrete of the most CCP producing countries is given in this report as this high value application may lead to increased international transport. Combustion of different types of coal in different types of boilers produces coal combustion products with different characteristics. The use of hard coal, bituminous and subbituminous coal in dry bottom boilers leads to siliceous fly ash with pozzolanic properties. In some countries this is referred to as Class F ash. When burning lignite coals with higher lime and sulfur content also ashes with hydraulic properties are produced. Due to the higher lime (calcium) content these are referred to as calcareous ashes or Class C ashes in some countries. The definitions and related properties are covered in standards and regulations governing and guiding utilization. The following international standards from Europe: EN 450-1 [22]; USA: ASTM C 618 [23]; Australia/New Zealand: AZ/NZS 3582 [24]; Japan: JIS 6201 [25]; India: IS 3812-1 [26]; China GB/T 1596 [27] and Russia: GOST 25818 [28] are compiled to avoid misunderstandings in cross border trade and to inform about options for increased utilisation through exchange of information on existing studies and long term experience. It has to be noted that the standards are used in combination with application standards and other regulations, including environmental requirements. Basically all standards deal with fly ash or pulverized fuel ash from coal (Europe, Australia/New Zealand and Japan), specifically anthracite, bituminuous, sub-bituminuous and lignite (USA, India and China) or also blended coal mixtures (Russia). These standards contain chemical and physical properties of the ash. Only the European Standards cover co-combustion of defined materials in specific amounts to ensure ashes characteristics are within a defined range. In addition, processing is covered for ashes which basically follow EN 450-1 standard except for fineness and LOI. Ashes can be processed in suitable production facilities through classification, selection, sieving, drying, blending, grinding or carbon reduction, or by a combination of these processes. Such processed fly ash may consist of fly ashes from different sources, each conforming to the basic definitions required to meet the criteria of the standard. South Africa uses the EN standard in full and Israel has implemented it with minor deviation by exclusion of co-combustion and quality control systems. The definitions all address the collection of fly ash from the flue gas by electrostatic precipitators or other collection methods. They address siliceous and/or calcareous ash (Europe, Japan, India, Russia) or Class F and Class C depending on the coal burned in the USA and China. Characterization of calcareous (class C) fly ash from siliceous (class F) requires
Coal Combustion Products 13
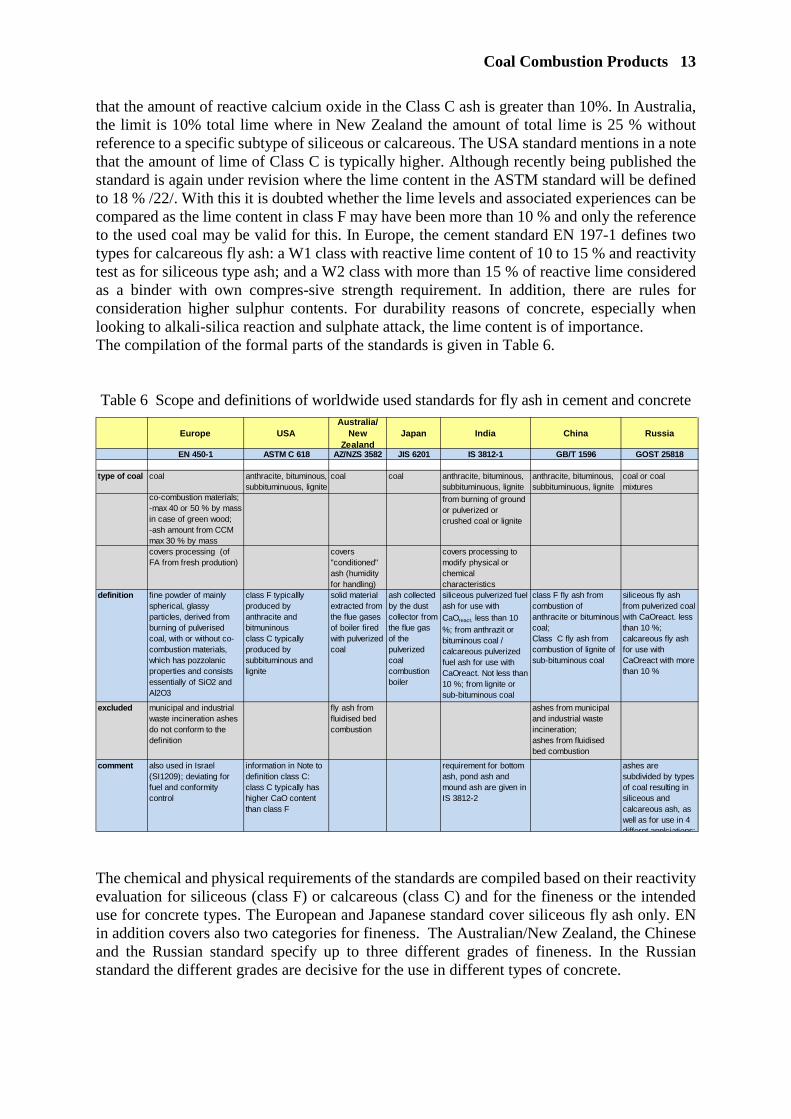
that the amount of reactive calcium oxide in the Class C ash is greater than 10%. In Australia, the limit is 10% total lime where in New Zealand the amount of total lime is 25 % without reference to a specific subtype of siliceous or calcareous. The USA standard mentions in a note that the amount of lime of Class C is typically higher. Although recently being published the standard is again under revision where the lime content in the ASTM standard will be defined to 18 % /22/. With this it is doubted whether the lime levels and associated experiences can be compared as the lime content in class F may have been more than 10 % and only the reference to the used coal may be valid for this. In Europe, the cement standard EN 197-1 defines two types for calcareous fly ash: a W1 class with reactive lime content of 10 to 15 % and reactivity test as for siliceous type ash; and a W2 class with more than 15 % of reactive lime considered as a binder with own compres-sive strength requirement. In addition, there are rules for consideration higher sulphur contents. For durability reasons of concrete, especially when looking to alkali-silica reaction and sulphate attack, the lime content is of importance. The compilation of the formal parts of the standards is given in Table 6.
Table 6 Scope and definitions of worldwide used standards for fly ash in cement and concrete
The chemical and physical requirements of the standards are compiled based on their reactivity evaluation for siliceous (class F) or calcareous (class C) and for the fineness or the intended use for concrete types. The European and Japanese standard cover siliceous fly ash only. EN in addition covers also two categories for fineness. The Australian/New Zealand, the Chinese and the Russian standard specify up to three different grades of fineness. In the Russian standard the different grades are decisive for the use in different types of concrete.
Europe USAAustralia/
New Zealand
Japan India China Russia
EN 450-1 ASTM C 618 AZ/NZS 3582 JIS 6201 IS 3812-1 GB/T 1596 GOST 25818
type of coal coal anthracite, bituminous, subbituminuous, lignite
coal coal anthracite, bituminous, subbituminuous, lignite
anthracite, bituminous, subbituminuous, lignite
coal or coal mixtures
co-combustion materials; -max 40 or 50 % by mass in case of green wood;-ash amount from CCM max 30 % by mass
from burning of ground or pulverized or crushed coal or lignite
covers processing (of FA from fresh prodution)
covers "conditioned" ash (humidity for handling)
covers processing to modify physical or chemical characteristics
definition fine powder of mainly spherical, glassy particles, derived from burning of pulverised coal, with or without co-combustion materials, which has pozzolanic properties and consists essentially of SiO2 and Al2O3
class F typicallly produced by anthracite and bitmuninousclass C typically produced by subbituminous and lignite
solid material extracted from the flue gases of boiler fired with pulverized coal
ash collected by the dust collector from the flue gas of the pulverized coal combustion boiler
siliceous pulverized fuel ash for use with CaOreact. less than 10 %; from anthrazit or bituminous coal / calcareous pulverized fuel ash for use with CaOreact. Not less than 10 %; from lignite or sub-bituminous coal
class F fly ash from combustion of anthracite or bituminous coal; Class C fly ash from combustion of lignite of sub-bituminous coal
siliceous fly ash from pulverized coal with CaOreact. less than 10 %;calcareous fly ash for use with CaOreact with more than 10 %
excluded municipal and industrial waste incineration ashes do not conform to the definition
fly ash from fluidised bed combustion
ashes from municipal and industrial waste incineration; ashes from fluidised bed combustion
comment also used in Israel (SI1209); deviating for fuel and conformity control
information in Note to definition class C: class C typically has higher CaO content than class F
requirement for bottom ash, pond ash and mound ash are given in IS 3812-2
ashes are subdivided by types of coal resulting in siliceous and calcareous ash, as well as for use in 4 differnt applciations:
14 Harris, Heidrich, Feuerborn
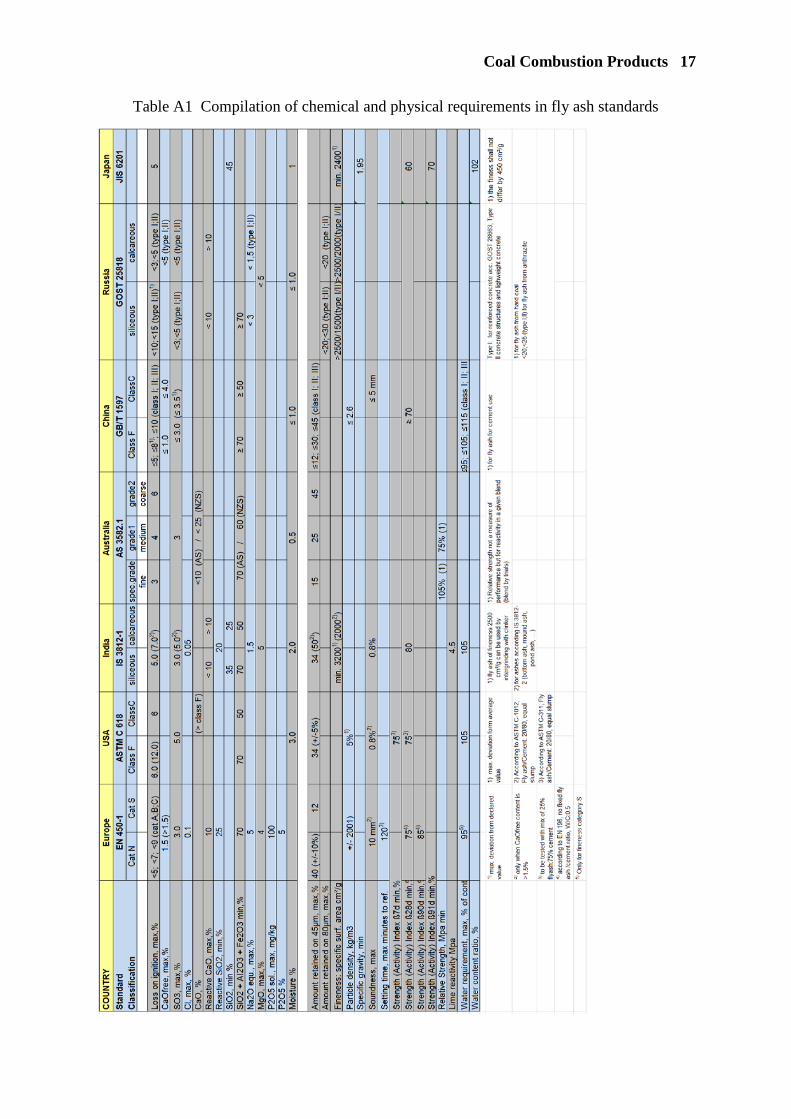
Beside fineness requirements for particle density, water demand, reactivity with lime or in mortars (activity index), setting time and for soundness are defined in most but not in all standards. Other chemical requirements include proportion of main oxides (SiO2, Al2O3 and Fe2O3), as well as sulphur content. Requirements for MgO have to be considered in Europe, India and Russia and for alkali-equivalence in Europe and India. In Europe, phosphate content must also be tested in cases of fly ash from co-combustion. The compilation of the chemical and physical requirements is given in Annex 1.
SUMMARY/OUTLOOK
Coal is used for energy and steam production all around the world. The natural resources, the global development as economic and population growth will lead to increased primary energy consumption which is also likely to be based on coal. In the near future, the use of coal is expected to grow in South-East Asia and India and to stabilize or slightly reduce in China, Japan and Korea and to be further reduced in America, Europe and Australia. Coal use in energy production is under considerable scrutiny using current combustion technology and resulting CO2 emissions with the main driver being climate change. New technologies such as High Efficiency Low Emissions (HELE) afford significant emission reductions, but the energy policy uncertainty across the globe continue to retard investment. Clean Air Acts and agreements for effective use of coal and requirements for flue gas cleaning exist for long time. Only few of them are cited given the worldwide framework as followed of the countries. The most important is the United Nations Framework Convention on Climate Change (UNFCCC) with more precise outcome CO2 reduction by the KYOTO protocol and a temperature limit of 1,5° for global warming by the Paris Agreement. Signatory countries informed about their approaches to reduce CO2 emission. Consequences are observed with construction of more efficient coal-fired power stations, retrofits with de-NOx and de-SOx installations as well in switches to other fossil fuels and phase-out of coal by replacing production capacities by other less CO2 emitting technologies, e.g. nuclear or renewables. New construction and retrofits as well as associated legal requirements for emissions are subject to state-of-the-art technologies which are used worldwide. However, the so-called Best Available Technologies phrased and used in different parts of the world are only partly comparable and the use has to be tested and adjusted in every single station. The worldwide production of coal combustions production is greater than 1.2 billion tonnes, almost doubling over the last 5 years. The utilization rates vary widely in the countries due to different regulatory environments, market education and market conditions. Due to existing markets with lower production and less developed markets with high production it was expected that the international trade will rise. The most recent evaluation considering ship transports of the cement industry, ash transports into the US, across Europe and into the middle East results in reported trade volume of 6 million tonnes. This is only moderately higher than reported in 2017 though nearly double when compared to the first evaluation in 2013.
Coal Combustion Products 15
Besides quality, established standards and a favorable regulatory regime the availability of material and export/import infrastructure has to be considered. To overcome some of the challenges of dealing with dust emissions at ports of loading and unloading, some importers have begun conditioning ash with 12-15% moisture. This allows geared ships or ports with grab bucket facilities to load and unload vessels with minimal environmental impact.
For the utilization of CCPs legal and technical requirements have to be considered. The dislocation between jurisdictions across the globe continues with some continuing to refer to CCPs either as waste, non-hazardous wastes, solid waste, inert waste, or resources, by-products or products and used widely in construction applications. Through the WWCCPN we continue to promote classify by-products of coal combustion as coal combustion ‘products’ (CCPs). This latter terminology is a more positive view and is in keeping with the concept of industrial ecology, an approach which seeks to reuse one industry’s by-products as another industry’s raw material. A compilation of the definitions and the physical and chemical requirements in standards for fly ash for concrete round the globe showed comparable definitions for siliceous or Class F and calcareous or Class C fly ashes. The differentiation is partly based on the reactive or the total lime content being 10 %. With this the use of fly ash in different countries is possible but national requirements for application have also to be considered.
The members of the World Wide Coal Combustion Products Network will continue to promote, coordinate and inform the public, industry and governmental entities about the beneficial environmental, technical and commercial uses of Coal Combustion Products.
REFERENCES
1 WORLD ENERGY COUNCIL: World Energy Resources 2016, https://www.worldenergy.org/data/resources/resource/coal/
2 BP Statistical Review of World Energy, 67th edition, June 2018
3 INTERNATIONAL ENERGY AGENCY: Statistics, http://energyatlas.iea.org/#!/tellmap/2020991907
4 WORLDATLAS: The Top 10 Coal Producers, www.worldatlas.com
5 INDEX MUNDI: Coal Export by country. https://www.indexmundi.com/energy/?product=coal&graph=exports&display=rank, status 04.2019
6 INTERNATIONAL ENERGY AGENCY, Coal 2018 - Analysis and forecasts to 2023, https://www.iea.org/coal2018/
7 United Nations Framework Convention on Climate Change, https://unfccc.int/bigpicture
8 UNFCCC CDM data base, https://cdm.unfccc.int/about/index.html
9 UNFCCC JI data base: PL1000546: TEFRA, https://ji.unfccc.int/JIITLProject/ DB/ NP2M39 PA4LLBN9BPEQD93530EGFO7S/details
10 SZCZYGIELSKI, K.: TEFRA®Project – the usage of the anthropogenic minerals as CO2 emission reduction materials, World of Coal Ash, May 5-7, 2017, Nashville/TN
16 Harris, Heidrich, Feuerborn
11 WORLD ENERGY COUNCIL: World Energy Resources 2016, p.12
12 OECD (Organisation for Economic Co-operation and Development): Report on Best Available Techniques for Preventing and Controlling Industrial Pollution Activity, Part 2: Approaches to establishing BAT around the world, June 2018
13 DIRECTIVE 2010/75/EU of the European Parliament and of the Council: Industrial emissions (integrated pollution prevention and control), November 2010
14 BREF-LCP: http://eippcb.jrc.ec.europa.eu/reference/lcp.html
15 VGB Power Tech: VGB Initiative “Hgcap”: Further reduction of mercury emissions from coal-fired power plants; https://www.vgb.org/en/hgcap.html
16 World-Wide CCP Network (WWCCPN): Glossary of terms, http://www.wwccpn.com/glossary.html
17 World-Wide CCP Network (WWCCPN): member information 2018/2019
18 HEIDRICH, C., FEUERBORN, J., WEIR, A.: Coal Combustion Products: a Global Perspective, World of Coal Ash, 2013
19 Heidrich, C., Feuerborn, J.: Global Operating Environment, World of Coal Ash, 2017
20 Verein deutscher Kohlenimporteure (Association of coal importer in Germany-VDKI): World traded coal flows 2015, from EURACOAL https://euracoal.eu/coal/international-coal-trade/
21 ECOBA: Statistics on cross border transport of ashes, http://www.ecoba.com/corss_border_transport.html
22 EN 450-1: Fly ash for concrete - Part 1: Definition, specifications and conformity criteria, 2012
23 ASTM C 618-171: Standard Specification for Coal Fly Ash and Raw or Calcined Natural Pozzolan for Use in Concrete, 2017
24 AS/NZS 3582.1: Supplementary cementitious materials, Part 1: Fly ash, 2016
25 JIS 6201: Fly ash, 1991
26 IS 3812-1: Pulverized Fuel Ash – Specification, Part 1 For use as Pozzolana in Cement, Cement Mortar and Concrete, 2003
27 GB/T 1596: Fly ash for cement and concrete, 2017
28 GOST 25818-91: Thermal plant fly-ashes for concrete, 1991 (in: Putilov,I. , Putilov, V.: Properties of coal ash in Russia, MPEI(TU))
29 ACAA: expert statement
Coal Combustion Products 17
Table A1 Compilation of chemical and physical requirements in fly ash standards

DEVELOPMENTS IN CCP MANAGEMENT IN IN EUROPE
I Skidmore
PowerMinerals Ltd
United Kingdom
H-J Feuerborn
ECOBA - European Coal Combustion Products Association
Germany
ABSTRACT. About half of the European energy production is based on fossil fuels. The production in these power plants is under continuous pressure to meet legal requirements for clean air and market requirements regarding availability and economic production. The installation of de-dusting, de-SOx and de-NOx systems in the past and in parts of Europe also today to meet always stringent emission limit values demonstrates the industry’s obligation. The revised BREF LCP with state-of-the-art technology and related possible emission limit values is synonym for the ongoing development. As a result several old boilers were retrofitted or closed and new power plants have to be constructed. The energy strategies of the European Commission require CO2 reduction, increased production by renewables and energy savings. Each member state has its own answer for CO2 savings due to dependencies in coal-fired generation from zero to about 85 %. Also energy security has to be considered starting with fuel availability, economics in production and grid stability. This results inter alia in increased production by imported coal due to closure of national mining and due to economic reasons. In a few countries the mandatory aims for CO2 reduction and increased production by renewable power resulted in a strong decrease in coal-fired power generation aiming in phasing out combined with increased imports or switch to biofuel or nuclear production in the long term. For grid stability coal-fired stations serve increasingly in non-continuous backup operation with economic risk in production and lifetime. In Europe, the energy production by coal still results in more than 140 million tonnes of Coal Combustion Products (CCPs) each year. Most of these CCPs are used as replacement for natural occurring raw and construction materials with environmental benefits in mining and production as well as increased durability of the constructions. The report gives an update on developments of regulations impacting the production of energy by coal-fired power plants and also quality and quantity of CCPs.
Keywords: Energy production, Coal-fired power generation, Clean air, Large Combustion Plant Directive (LCPD), BREF, BAT, CO2 reduction, Zero emission, Alternative production, renewables, Nuclear, Coal phase-out, CCPs, Production, Use, Standardisation, Legislation
Ivan Skidmore is Sales and Technical Director with Power Minerals Ltd and is currently President of ECOBA. H-J Feuerborn is Secretary General of European Coal Combustion Products Association (ECOBA).
OPENING PAPER
CCP Management in Europe 19
INTRODUCTION
The developments in power production in Europe, and by this also the production of coal combustion products (CCPs), are very much depending on national situations for a safe energy supply, environmental commitments for CO2 reduction and new emission limit values by the Large Combustion Plant Directive. About half of the European energy production is based on fossil fuels with single country production by coal from zero to about 80 %. Over the last decades coal-fired power plants were continuously equipped with state of the art technologies to follow the requirements for clean air acts. With the Large Combustion Plant Directive several boilers not meeting the emission limit values any longer and not being retrofitted for different reasons were shut down. The state-of-the art is given with a revised Best available techniques REFerence document - Large Combustion Plant (BREF LCP).
On top of the legal requirements on state-of-the-art technologies for coal power production the commitment on CO2 reduction has to be considered. The requirements on CO2 reduction are resulting in constructing of more effective coal-fired power plants, the increased use of biomass for co-combustion in coal-fired power plants, increased use of biomass in FBC- and dry-bottom boilers and increased production by renewables and also by nuclear. In countries with high installed renewable capacity coal-fired generation serves increasingly as backup resulting in non-continuous operation with economic risk in cost of production and maintenance and finally lifetime of the plant.
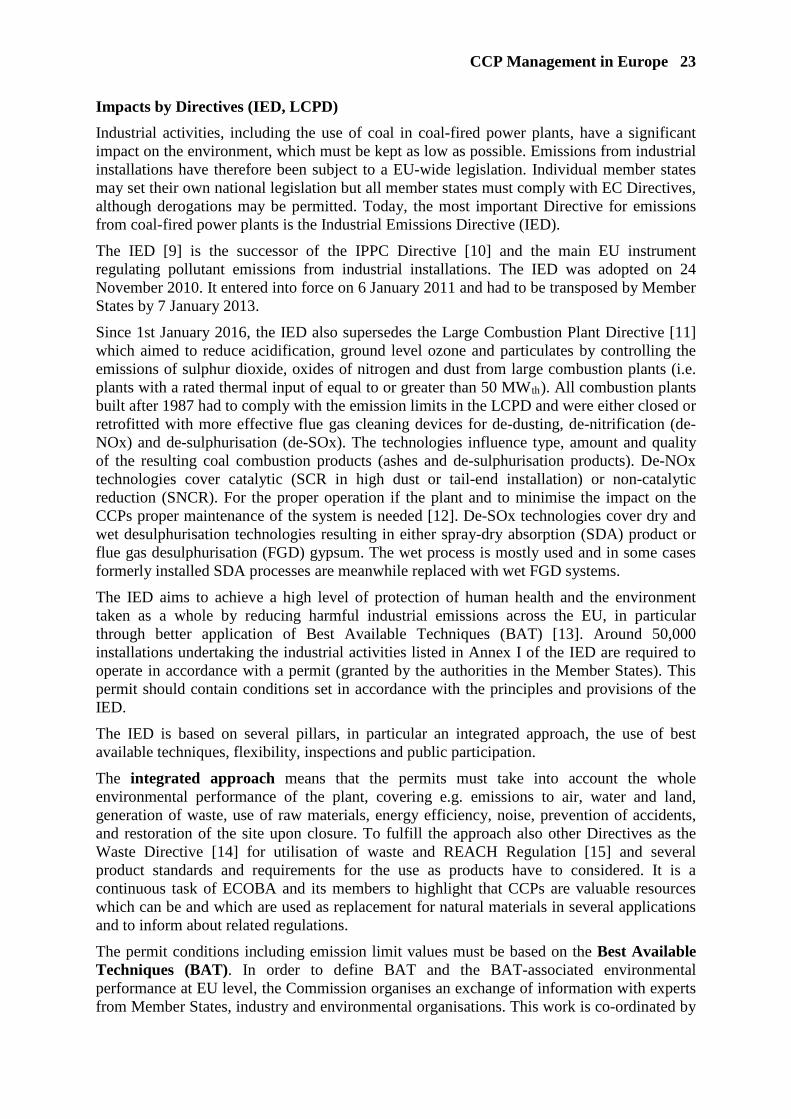
The CO2 commitment resulted in energy strategies for the transition to a competitive, secure and sustainable energy system and for reducing greenhouse gas emissions by at least 80% by 2050. Along with all scenarios on reduced power production and significant changes on power production in single member states the production of Coal Combustion Products in Europe still sums up to more than 140 million tons, about 40 million tonnes of this amount in EU15 member states in 2017 [1, 2]. CCPs are mainly utilised as a replacement for natural materials in the building material industry, in civil engineering, in road construction, for construction work in underground coal mining as well as for recultivation and restoration purposes in open cast mines. As the utilisation of CCPs is well established in some European countries, based on long-term experience and on technical as well as on environmental benefits, they are part of regular production and therefore requested on a regular base. Availability is becoming a major problem in some member states and the management of CCPs meeting market needs is a major task for power producers and marketers.
ENERGY PRODUCTION IN EUROPE
The European energy production is spread across a range of different energy sources: solid fuels (largely coal), natural gas, crude oil, nuclear energy and renewable energy (such as hydro, wind and solar energy).
In 2018, the largest contributing to energy production was by nuclear (29%) followed by renewables (28 %) and solid fuels (17 %), natural gas (14 %) and crude oil (10 %) (see Figure 1).

20 Skidmore, Feuerborn
Figure 1 Share of EU energy production by source in 2016 [3]
However, the production of energy is very different from one Member State to another. The significance of nuclear energy is particularly high in France (80 % of total national energy production), Belgium (75 %) and Slovakia (62 %). Renewable energy is the main source of energy produced in a number of Member States, with over 90 % (of the energy produced within the country) in Malta, Latvia, Portugal, Cyprus and Lithuania. Solid fuels have the highest importance in Poland (78 %), Estonia (67 %), Greece and Czechia (both 59 %), while natural gas is the main source of energy produced in the Netherlands (83 %). Crude oil is the major source of energy produced in Denmark (47 %) and the United Kingdom (41 %). [3]
Figure 2 Development of production of primary energy in EU 28 by source [4]
The development of primary energy production by source is given in Figure 2. Only the renewable energy showed a uniform increased by 66.5 %, replacing, to some degree, the production of other sources of energy. By contrast, the production levels for the other sources fell, the largest reductions being recorded for natural gas (-41.2 %), crude oil (-39.0 %) and solid fuels (-30.8 %), with a more modest fall of 15.2 % for nuclear energy.
CCP Management in Europe 21
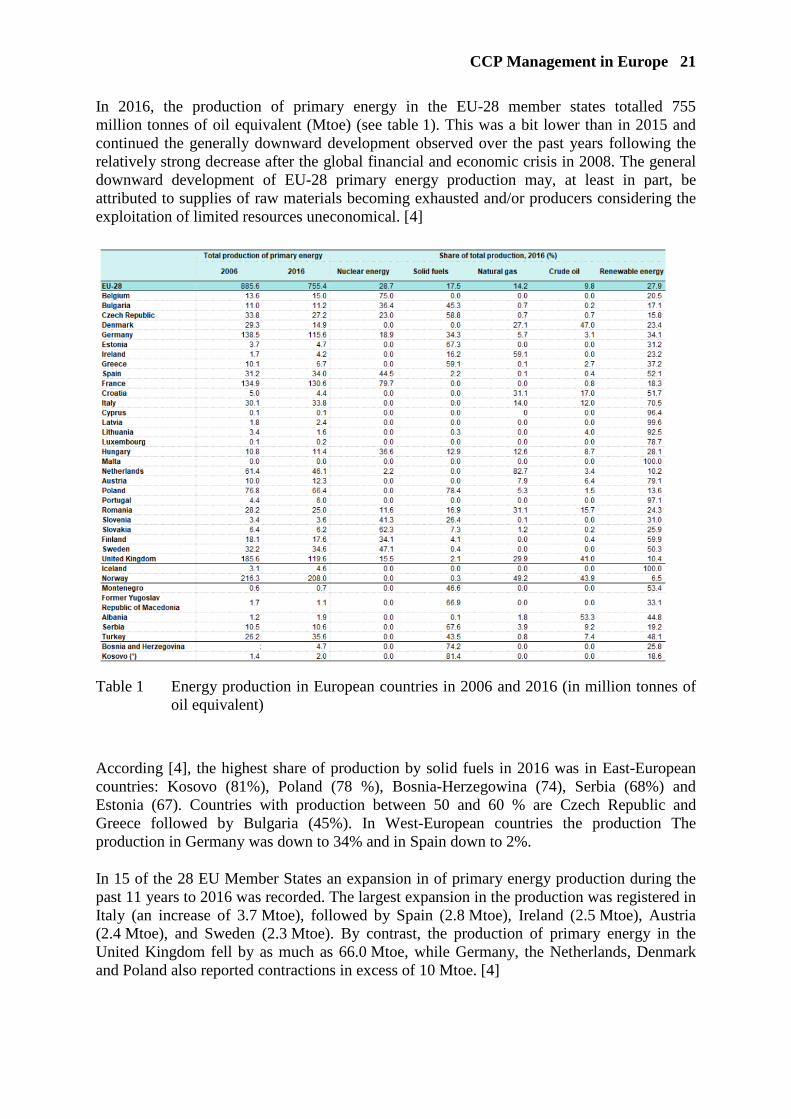
In 2016, the production of primary energy in the EU-28 member states totalled 755 million tonnes of oil equivalent (Mtoe) (see table 1). This was a bit lower than in 2015 and continued the generally downward development observed over the past years following the relatively strong decrease after the global financial and economic crisis in 2008. The general downward development of EU-28 primary energy production may, at least in part, be attributed to supplies of raw materials becoming exhausted and/or producers considering the exploitation of limited resources uneconomical. [4]
Table 1 Energy production in European countries in 2006 and 2016 (in million tonnes of oil equivalent)
According [4], the highest share of production by solid fuels in 2016 was in East-European countries: Kosovo (81%), Poland (78 %), Bosnia-Herzegowina (74), Serbia (68%) and Estonia (67). Countries with production between 50 and 60 % are Czech Republic and Greece followed by Bulgaria (45%). In West-European countries the production The production in Germany was down to 34% and in Spain down to 2%.
In 15 of the 28 EU Member States an expansion in of primary energy production during the past 11 years to 2016 was recorded. The largest expansion in the production was registered in Italy (an increase of 3.7 Mtoe), followed by Spain (2.8 Mtoe), Ireland (2.5 Mtoe), Austria (2.4 Mtoe), and Sweden (2.3 Mtoe). By contrast, the production of primary energy in the United Kingdom fell by as much as 66.0 Mtoe, while Germany, the Netherlands, Denmark and Poland also reported contractions in excess of 10 Mtoe. [4]

22 Skidmore, Feuerborn
Impacts by Energy Strategies
In December 2008, the European Parliament and the Council agreed upon the so-called “Climate and Energy Package”, which entered into force in 2009 [5]. The legislative package put in place what is collectively known as the EU-20-20-20 targets to be met by 2020:
- Reduction of greenhouse gas emissions of at least 20 % below 1990 level, - Increasing the share of renewable energy to 20% , and - Improving the EU’s energy efficiency by 20%.
With this package additional legislation was installed for promotion of the use of renewable energy (RES), geological storage of carbon dioxide and a revised Trading Scheme for greenhouse gases (GHG). From 2013, the system for allocating emission allowances changed significantly compared to the two previous trading periods (2005 to 2012). At first, the emission allowances were distributed according to fully harmonized and EU-wide rules. At second, auctioning became rule for the power industry, i.e. the allowances will not be allocated for free any longer. In 2013, over 40% of the allowances were auctioned. Over the period 2013-2020, the share auctioned will be higher: it is estimated that up to half of the allowances may be auctioned [6]. With the auctioning the polluter pays principle is practised resulting in higher cost for power production by coal.
EU countries have further agreed to meet at least a 40% reduction in greenhouse gas emissions, a binding target of at least 27% of renewable energy in the EU and an increase in energy efficiency increase of at least 27% by 2030. To reach this the completion of the internal energy market by reaching an electricity interconnection target of 15% between EU countries by 2030, and pushing forward important infrastructure projects have been agreed.
A first report from November 2015 showed that much progress has been made since the adoption of Energy Union in February 2015. The greenhouse gas emissions were cut by 18%, the share of renewable energy consumption is 15.3% and the energy efficiency is predicted to improve by 18% to 19% by 2020 – barely missing the 20% target.
On 30 November 2016, the Commission released draft legislative proposals designed to help achieve the set targets. The measures include draft proposals on electricity market design, renewables and energy efficiency. The EU aims to achieve an 80% to 95% reduction in greenhouse gasses compared to 1990 levels by 2050. Its Energy Roadmap 2050 analyses a series of scenarios on how to meet this target [7].
On 22 May, the Council of ministers of the EU formally adopted four new pieces of EU legislation that redesign the EU electricity market to make it fit for the future. This concludes the remaining elements of the “Clean energy for all Europeans package“ and represents a major step towards completing the Energy Union, delivering on the priorities of the Juncker Commission. The Clean energy for all Europeans package sets the right balance between making decisions at EU, national, and local level. Member States will continue to choose their own energy mix, but must meet new commitments to improve energy efficiency and the take-up of renewables in that mix by 2030. For example, the new rules on the electricity market, which have been adopted today, will make it easier for renewable energy to be integrated into the grid, encourage more inter-connections and cross-border trade, and ensure that the market provides reliable signals for future investment. Today’s rules also require Member State to draft plans to prevent, prepare for and manage possible crisis situations in the supply of electricity in coordination with neighbouring Member States, and to enhance the role of the Agency for the Cooperation of Energy Regulators (ACER) [8].
CCP Management in Europe 23
Impacts by Directives (IED, LCPD)
Industrial activities, including the use of coal in coal-fired power plants, have a significant impact on the environment, which must be kept as low as possible. Emissions from industrial installations have therefore been subject to a EU-wide legislation. Individual member states may set their own national legislation but all member states must comply with EC Directives, although derogations may be permitted. Today, the most important Directive for emissions from coal-fired power plants is the Industrial Emissions Directive (IED).
The IED [9] is the successor of the IPPC Directive [10] and the main EU instrument regulating pollutant emissions from industrial installations. The IED was adopted on 24 November 2010. It entered into force on 6 January 2011 and had to be transposed by Member States by 7 January 2013.
Since 1st January 2016, the IED also supersedes the Large Combustion Plant Directive [11] which aimed to reduce acidification, ground level ozone and particulates by controlling the emissions of sulphur dioxide, oxides of nitrogen and dust from large combustion plants (i.e. plants with a rated thermal input of equal to or greater than 50 MWth). All combustion plants built after 1987 had to comply with the emission limits in the LCPD and were either closed or retrofitted with more effective flue gas cleaning devices for de-dusting, de-nitrification (de-NOx) and de-sulphurisation (de-SOx). The technologies influence type, amount and quality of the resulting coal combustion products (ashes and de-sulphurisation products). De-NOx technologies cover catalytic (SCR in high dust or tail-end installation) or non-catalytic reduction (SNCR). For the proper operation if the plant and to minimise the impact on the CCPs proper maintenance of the system is needed [12]. De-SOx technologies cover dry and wet desulphurisation technologies resulting in either spray-dry absorption (SDA) product or flue gas desulphurisation (FGD) gypsum. The wet process is mostly used and in some cases formerly installed SDA processes are meanwhile replaced with wet FGD systems.
The IED aims to achieve a high level of protection of human health and the environment taken as a whole by reducing harmful industrial emissions across the EU, in particular through better application of Best Available Techniques (BAT) [13]. Around 50,000 installations undertaking the industrial activities listed in Annex I of the IED are required to operate in accordance with a permit (granted by the authorities in the Member States). This permit should contain conditions set in accordance with the principles and provisions of the IED.
The IED is based on several pillars, in particular an integrated approach, the use of best available techniques, flexibility, inspections and public participation.
The integrated approach means that the permits must take into account the whole environmental performance of the plant, covering e.g. emissions to air, water and land, generation of waste, use of raw materials, energy efficiency, noise, prevention of accidents, and restoration of the site upon closure. To fulfill the approach also other Directives as the Waste Directive [14] for utilisation of waste and REACH Regulation [15] and several product standards and requirements for the use as products have to considered. It is a continuous task of ECOBA and its members to highlight that CCPs are valuable resources which can be and which are used as replacement for natural materials in several applications and to inform about related regulations.
The permit conditions including emission limit values must be based on the Best Available Techniques (BAT). In order to define BAT and the BAT-associated environmental performance at EU level, the Commission organises an exchange of information with experts from Member States, industry and environmental organisations. This work is co-ordinated by

24 Skidmore, Feuerborn
the European IPPC Bureau of the Institute for Prospective Technology Studies at the EU Joint Research Centre in Seville (Spain). This process results in BAT Reference Documents (BREFs); the BAT conclusions contained are adopted by the Commission as Implementing Decisions. The IED requires that these BAT conclusions are the reference for setting permit conditions.
In 2011, the revision of the Best Available Techniques Reference Document for Large Combustion Plants (BREF LCP) BREF LCP was started and major commenting work via VGB and EURELECTRIC was organised in addition to meetings with the European Integrated Pollution Prevention and Control (IPPC) Bureau (EIPPCB) in Sevilla.
In June 2016, the EIPPC has published the final draft of the BREF LCP and the conclusions (chapter 10 of BREF LCP) [16]. The conclusions will provide stricter emission limit values for all existing parameters. In addition, requirements for Hg, HCl abd HF will be implemented. Early 2017, the Comitology procedure for the BREF LCP will be started. After acceptance of the BREF LCP it will be translated and published in the Official Journal of the EU. With that the revision may be concluded by midth of 2017. After publication in the Official Journal members states have to implement the conclusions within four years, e.g. by midth 2021.
In Germany, producers formed the ‘Hgcapture Initiative’ to publicly inform about the success when using BAT as defined in the BREF. This is of special importance as the CCPs from hard coal are used nearly completely in the construction industry and as changes in compositions may complicate continued use. The research work currently at lab and pilot scale demonstrate that the expected very low Hg emission values may not be reached with only one BAT. In addition, the systems has different effects in different power plants which has not been considered in the revision phase although commented several times [17].
Impact by markets
As coal-fired power plants do not only produce electricity and heat but also construction materials the market developments and demands for all markets have to be considered.
To achieve the aims in CO2 reduction the side conditions for the operation of coal-fired plants were modified. In addition to the legal framework described above also national incentives for renewable production were established aiming in "renewables first" and based on this changing the merit order (ranking of available sources of energy production). In addition several national energy markets are based on stock prices.
The merit order or ranking achieve that those with the lowest marginal costs are the first ones to be brought online to meet demand, and the plants with the highest marginal costs are the last to be brought on line. Dispatching generation in this way minimizes the cost of production of electricity. Sometimes generating units must be started out of merit order, due to transmission congestion, system reliability or other reasons driving costs.
Furthermore, the spot markets for electricity in Germany, Austria, Switzerland, Belgium, Netherlands and the United Kingdom are managed by EPEX Spot. The trade for the spot market is all year through for 24 h of the next day, consist of intraday (business the same day) and day-ahead business (for the next day) and are especially designed for integration of renewable power. Phelix - the reference price for the European trade market - is published on a daily base for energy in base and peak load [18]. In future, also power-to-purchase-agreements may be used. As long term direct marketing instruments they will influence also the existing market systems.

CCP Management in Europe 25
Impact on Coal Combustion Products
For the utilisation of CCPs quality and availability are important parameters for the construction market. The quality is defined by technical and environmental requirements in standards and regulations which have to be met all the time. A continuous quality management including auto and third party control is required. The standards and requirements are subject of regular updates to meet regulatory as well as market needs.
In addition to quality, availability is important to serve construction projects especially in member states with existing markets. Forecasting of production to serve market needs cause more efforts in CCP management. Stock management whether in silo or on site as well as beneficiation for fresh produced or stockpiled ash is being discussed together with cross border transport as options for safeguarding availability of CCPs.
The figures for production and use in EU15/EU28/EU are given in Table 2. The toal production of CCPs in the EU is calculated to more than 140 million tonnes, that in EU18 member states to more than 102 million tonnes. A regular statistics is compiled by ECOBA members annually and published as EU15 statistics. Beside the production also the utilization data for the coal combustion products are compiled. The utilization rate for CCPs used as or in raw material and construction materials and for reclamation is 92%.
Table 2 Production and utilisation of CCPs in Europe 2014 (EU15, EU28, EU) [1]
EU15 EU28* EU*
Production [mill.t]
CCPs total 40,4 >102 >140
Ashes 30,1 >84 >120
desulph. Products 10,3 >20 >21
utilisation rate
construction ind. 50% ** **
constr. + reclam. 92% ** ** * Estimate based on coal comsumption ** Information on utilisation only partly available
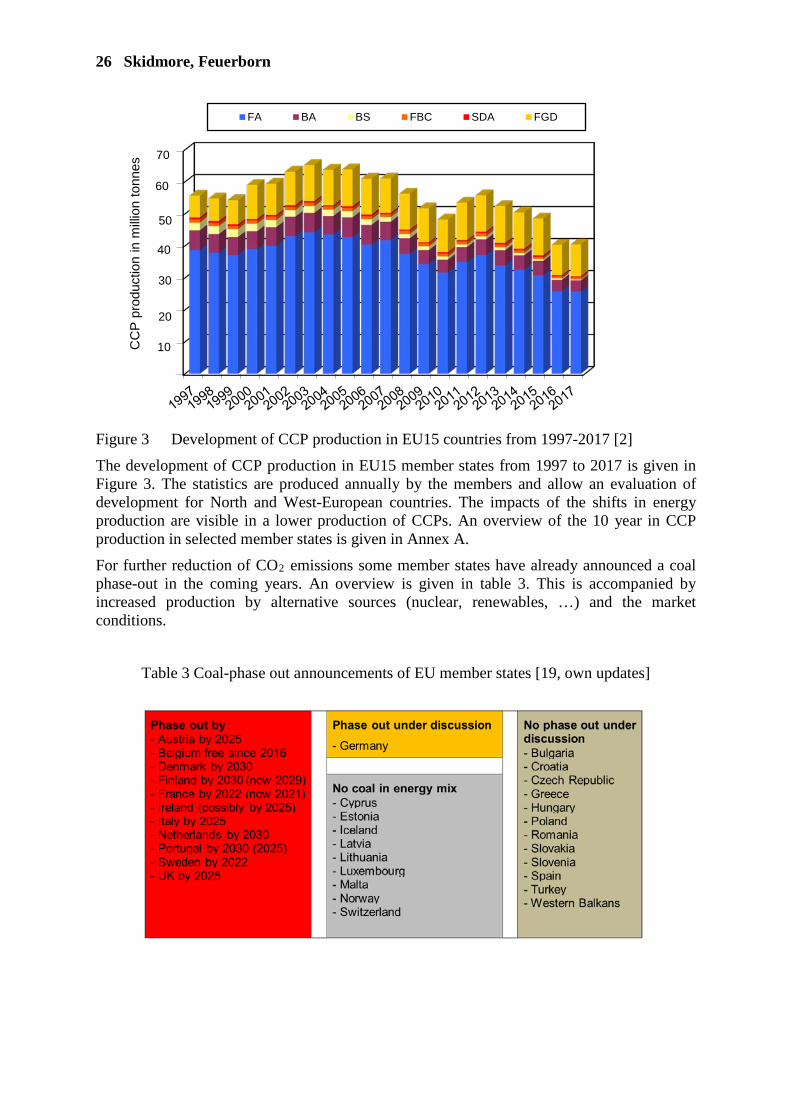
26 Skidmore, Feuerborn
Figure 3 Development of CCP production in EU15 countries from 1997-2017 [2]
The development of CCP production in EU15 member states from 1997 to 2017 is given in Figure 3. The statistics are produced annually by the members and allow an evaluation of development for North and West-European countries. The impacts of the shifts in energy production are visible in a lower production of CCPs. An overview of the 10 year in CCP production in selected member states is given in Annex A.
For further reduction of CO2 emissions some member states have already announced a coal phase-out in the coming years. An overview is given in table 3. This is accompanied by increased production by alternative sources (nuclear, renewables, …) and the market conditions.
Table 3 Coal-phase out announcements of EU member states [19, own updates]
FA BA BS FBC SDA FGDC
CP
prod
uctio
n in
milli
on to
nnes
60
50
40
30
20
10
70
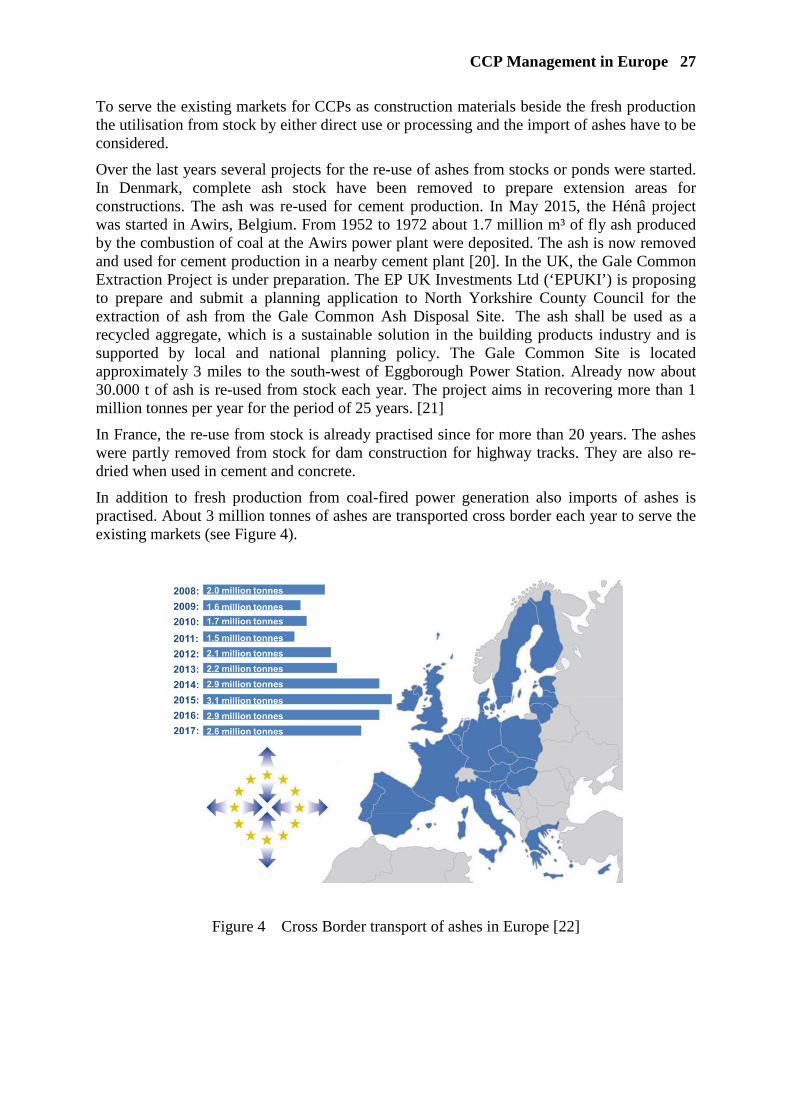
CCP Management in Europe 27
To serve the existing markets for CCPs as construction materials beside the fresh production the utilisation from stock by either direct use or processing and the import of ashes have to be considered.
Over the last years several projects for the re-use of ashes from stocks or ponds were started. In Denmark, complete ash stock have been removed to prepare extension areas for constructions. The ash was re-used for cement production. In May 2015, the Hénâ project was started in Awirs, Belgium. From 1952 to 1972 about 1.7 million m³ of fly ash produced by the combustion of coal at the Awirs power plant were deposited. The ash is now removed and used for cement production in a nearby cement plant [20]. In the UK, the Gale Common Extraction Project is under preparation. The EP UK Investments Ltd (‘EPUKI’) is proposing to prepare and submit a planning application to North Yorkshire County Council for the extraction of ash from the Gale Common Ash Disposal Site. The ash shall be used as a recycled aggregate, which is a sustainable solution in the building products industry and is supported by local and national planning policy. The Gale Common Site is located approximately 3 miles to the south-west of Eggborough Power Station. Already now about 30.000 t of ash is re-used from stock each year. The project aims in recovering more than 1 million tonnes per year for the period of 25 years. [21]
In France, the re-use from stock is already practised since for more than 20 years. The ashes were partly removed from stock for dam construction for highway tracks. They are also re-dried when used in cement and concrete.
In addition to fresh production from coal-fired power generation also imports of ashes is practised. About 3 million tonnes of ashes are transported cross border each year to serve the existing markets (see Figure 4).
Figure 4 Cross Border transport of ashes in Europe [22]

28 Skidmore, Feuerborn
CONCLUSIONS AND OUTLOOK
Environmental regulations and strict aims for CO2 reduction resulted in retrofits of coal-fired power plants, construction of new power plants and increased efforts for economic operation. With the revised reference document on best available technology new emission limit values have to be considered. Due to different situations in power production and agreements on reduced CO2 emission coal-fired power production was reduced over the years or a coal phase-out announced.
In existing markets the demand for CCPs as raw and construction is high as also the construction industry has to save CO2. Therefore, beside production in power plants also re-use from stock and imports from other countries are used to serve existing markets.
The operation of coal-fired power plants and the utilisation of CCPs as raw and construction materials is a continuous challenge!
REFERENCES
1. ECOBA Statistics on Production and Utilization of CCPs (EU/EU28/EU 15)
2. ECOBA Statistics on Production and Utilization of CCPs in Europe (EU 15), status 2017, draft
3. Eurostat: Energy – Overview, https://ec.europa.eu/eurostat/cache/infographs/ energy/bloc-2c.html
4. Eurostat: Energy production and imports, https://ec.europa.eu/eurostat/statistics-explained/index.php/Energy_production_and_imports
5. Climate an Energy Package: DECISION No 406/2009/EC, 23 April 2009, on the effort of Member States to reduce their greenhouse gas emissions to meet the Community’s greenhouse gas emission reduction commitments up to 2020
6. European Commission - Climate action – Auctioning (http://ec.europa.eu/clima /policies/ets/auctioning_en)
7. European Commission - Energie (https://ec.europa.eu/energy/en/topics/energy-strategy)
8. European Commission: News: https://ec.europa.eu/info/news/clean-energy-all-europeans-package-completed-good-consumers-good-growth-and-jobs-and-good-planet-2019-may-22_en
9. IED: Directive 2010/75/EU of the European Parliament and of the Council of 24 November 2010 on industrial emissions (integrated pollution prevention and control) (recast)
10. IPPC: Council Directive 96/61/EC of 24 September 1996 concerning integrated pollution prevention control
11. LCPD: Directive 2001/80/EC of the European Parliament and of the Coucil of 23 October 2001 on the limitation of emissions of certain pollutants into the air from Large Combustion Plants

CCP Management in Europe 29
12. Brandenstein, J.: Impact of SCR operation on the quality of fly ash, EUROCOALASH conference, 5-8.Oct. 2008, Warsaw
13. BAT: Best Available Techniques, Integrated Pollution Prevention and Control Reference Document, July 2006; http://eippcb.jrc.ec.europa.eu/reference/lcp.html
14. WD:Waste Directive (2008/98/EC) of the European Parliament and the Council of 19 Nov. 2008 on waste and repealing certain Directives, Official Journal of the European Union (L312/3), 22.11.2008
15. Regulation (EC) No 1907/2006 of the European Parliament and of the Council of 18 December 2006 concerning the Registration, Evaluation, Authorisation and Restriction of Chemicals (REACH), OJ L 396, 30.12.2006, p. 1
16. BREF-LCP: http://eippcb.jrc.ec.europa.eu/reference/lcp.html
17. VGB Power Tech: VGB Initiative “Hgcap”: Further reduction of mercury emissions from coal-fired power plants; https://www.vgb.org/en/hgcap.html
18. EEX: https://www.eex.com/de/produkte/strom/spotmarkt
19. Europe beyond coal: https://beyond-coal.eu/de/
20. ENGIE Electrabel: The Hena waste tip, https://corporate.engie-electrabel.be/energy-of-the-future/protecting-nature/the-hena-waste-tip/
21. EP UK Investments: Galecommon, https://www.galecommon.co.uk/
22. ECOBA: Cross border transport of ashes (http://www.ecoba.org/corss_border_ transport.html)

30 Skidmore, Feuerborn
Annex A
Annex A 10-year trend in CCP production in selected EU member states
REPORTING AND VERIFYING THE POTENTIAL RELEASE OF DANGEROUS SUBSTANCES FROM CONCRETE
CONTAINING FLY ASH
T A Harrison
University of Dundee
United Kingdom
ABSTRACT: Concrete containing fly ash is safe with respect to leaching into soil, groundwater or surface water meaning that concrete meets all notified regulations in Europe provided all the other constituents are on the proven list. Nevertheless in a few countries there are regulations on fly ash to be used in concrete and for these markets certain criteria have to be met. These involve a leaching test and measurements of the content of dangerous substances in the eluate. The producer may supply this information in the form of declared values, classes or categories. The pros and cons of each approach are identified. None of these approaches is ideal and a manufacturer’s declaration is proposed as the most helpful solution. In a few situations where the other constituents of concrete contribute a significant amount of ionizing radiations, information on the gamma radiation from fly ash will be needed if the producer selects to check the performance of concrete based on the contributions from each constituent. An introduction is given to the ways in which to validate the declaration of performance using procedures given in a CEN Technical Report 16797, which in turn is based on the approach used in the Netherlands. Keywords: Fly ash, Concrete, Dangerous substances, Regulations, Conformity. Professor Tom Harrison is an independent consultant and Visiting Industrial Professor at the University of Dundee, Scotland. He was chair of the BSI Concrete committee for 19 years and he is still the chair of CEN/TC104/WG14: Concrete and related materials WG14:Hygiene, health and the environment.
32 Harrison
INTRODUCTION In a few countries in Europe, manufacturers of construction products are required by law to comply with limits for the potential release of dangerous substances. Conformity to these limits is proven by testing and measuring the content of dangerous substances in the eluate or the emission into indoor air. In the past these few countries had different test procedures as well as different limits. As a step towards creating a free market for goods, CEN has developed (or are in the process of developing) common test methods. These test procedures will replace the national procedures. If a declaration of performance in a CEN standard includes potential release or emission of dangerous substances, the CEN standard is required to include a procedure for verifying that this declaration is valid. At present the procedures for verifying that any regulatory limits are achieved are set by national regulators and are part of the national law. The main purpose of European standards is to remove barriers to trade and different national procedures is a barrier to trade. Resolving this conundrum is not the task of the European Standardization Body (CEN), but it needs to be resolved before CEN product standards can sensible include procedures for declaring the potential release emission or content of dangerous substances. Limits on the potential release, content or emission of dangerous substances is a matter for the European Union (for example with respect to ionizing radiations, asbestos and mercury) and/or national authorities and they are not the concern of CEN. Nevertheless European product standards might be required to include a clause on dangerous substances and whether these clauses should contain the method for reporting the potential release of dangerous substances is an open question. Whether such a clause is required will be specified in the mandate for the products from the European Union to CEN. At present only a few mandates address dangerous substances although at national level environmental requirements exist. This paper describes the pros and cons of the different methods for giving information on the potential release of dangerous substances into soil, groundwater, surface water and emission into indoor air. Where potential release or emission cannot be determined, there may be alternative requirements in the form of content and the pros and cons of providing this information are also covered. This approach may be applicable to organic content. The Construction Products Regulation (CPR) [1] permits performance to be declared in terms of ‘declared values’ or ‘classes’, but both of these methods have disadvantages and so an alternative solution is proposed. If there are no notified regulations, the producer may use the ‘No performance declared’ (NPD) option. To give confidence in CE-marking, a product standard has to include a system for the verification of any declared performance such that the declaration of performance may be accepted without further testing.

Release of Dangerous Substances from Fly Ash Concrete 33
RELEVANT SCENARIOS To have the potential to release dangerous substances into soil, groundwater or surface water and indoor air, the tests have to be carried out taking into consideration relevant scenarios of release. The constituents of a product that is in contact with soil, water or indoor air, e.g. the cement, additions, admixtures and aggregates used to make concrete, should be covered by requirements taking into consideration the potential release from concrete. It is the release or emission from concrete that matters, but as the constituents of concrete may be used in many different products, it makes economic sense to test the constituent in, for example, a set concrete matrix and not the numerous concretes in which it will be used.
NO PERFORMANCE DECLARED OPTION As shown by a report instigated by the European Concrete Platform [2] concrete containing fly ash in accordance with EN 450-1 [3] is safe. Nevertheless there are a few national regulations on fly ash for concrete and producers are required to comply with the law. Where there are no notified regulations, the manufacturer is free to use the NPD option. This option will apply to most Members States of the European Union. While this remains an option for Member States with no notified regulations, manufactures may choose to provide information using one of the other options. Unfortunately there is in some places a distrust of industry and the NPD option might be taken as meaning that the producer is hiding a damaging environmental performance. Consequently a producer may opt to declare a performance even if there are no relevant national regulations. In the medium term it is hoped that the European concrete standard, EN 206 [4] will contain a statement saying concrete containing fly ash to EN 450-1 is safe.
DECLARED VALUES A declared value is a value that the manufacturer states as being unlikely to be exceeded and they are expected to have information to justify this claim. Where there are notified regulations, if the declared value is above the national limit value, this product cannot be legally placed on that market. Consequently declared values are unlikely to be above the limit values for the intended markets. The list of dangerous substances runs into thousands and for any one product, only a few of these substances may be relevant. The mandate will identify the dangerous substances to be declared, but the duty of care means that if the producer knows that the product contains other dangerous substances, these also have to be declared. These limits for release or emission for a specific substance are the same regardless of the product and therefore there is likely to be some substances to be declared that will always be well below the limit value and this gives the manufacturer the scope to declare values well below the limit values and use this information for marketing purposes.

34 Harrison
Having a potentially long list of declared values is not very helpful for almost all consumers and many consumers will not be able, or willing to determine if the product conforms to the legal requirements. As there is a legal requirement for the manufacturer to comply with the law, they will assume the manufacturer complies with their legal responsibilities. This becomes an issue if the product is placed on a market without any requirements and used in a market with requirements. For markets where there are no notified regulations, the manufacturer is free to select this approach as an alternative to the NPD option.
CLASSES Classes are created by regulation. Classes are only permitted in harmonised European standards if they have been instigated by the European Union in a product mandate or approved by them via a delegated act. At present there are no classes for potential release into soil groundwater or surface water and indoor air, but in the future there is likely to be classes for emission into indoor air. From a consumer or regulators viewpoint having classes or categories (see next section) that align with specific Member State requirements makes their life a lot simpler; however, the European Commission is reluctant to create classes as a Member State may change their requirements making the classification incorrect until the standard is amended. Another issue is that the European Commission do not like classes that identify a specific CEN Member e.g. for Germany, DS (DE) or for the Netherlands, DS (NL). They expect the classification of classes to be neutral, e.g. for Germany, DS (A) and for the Netherlands, DS (B). By making life difficult for users, it will only be a matter of time before the wrong classification is used. If classes are used in a product standard, the standard will have to include the list of dangerous substances covered by the classification and the limit values for the class. Classes are one of the options for declaring performance given in the CPR. As there are no classes for the potential release of dangerous substances into soil, groundwater or surface water and, at present, indoor air and as the European Commission is reluctance to issue delegated acts to introduce classes, the use classes is unlikely to be a realistic option.
CATEGORIES Categories are classes of convenience introduced by CEN Technical Committees to make life easier for the users of its standards. What comprises a category could be anything, but the most useful to consumers and regulators would be categories that align with national limit values, but this has the same issues as classes, see previous Section. Categories should be described in a way that clearly identified which national limit values they satisfy, but whether this will be permitted is an open question.

Release of Dangerous Substances from Fly Ash Concrete 35
Categories are not specifically identified in the CPR as a method for declaring performance, but using categories is a better solution for consumers and regulators than declared values. There remains the issue of categories in standards and regulations being out of alignment for periods of time. A solution would be to use a manufacturer’s statement of performance, see next Section.
MANUFACTURER’S STATEMENT Manufacturers have to comply with the national law. This includes any requirements for the potential release of dangerous substances into soil, groundwater or surface water and indoor air. As regulations have a higher status than standards, it can be argued that a statement stating in effect the product complies with the legal requirements for the market is unnecessary. Nevertheless the manufacturer may not know the market into which the product is eventually used and therefore some statement as to which European or national regulations the product complies with is useful for both consumers and regulations. The advantage of a manufacturer’s declaration over the use of categories, it that the statement should always be true as the manufacturer will have to achieve any new limit values the moment they become law. The manufacturer’s declaration should states the national requirements that are fulfilled. As this is a matter of trust a test report should be cited and provided on request.
VERIFICATION OF DECLARATION OF PERFORMANCE CEN Technical Report 16797 [5] provides guidance on the statistical assessment of declared values with respect to the release/emission/content of dangerous substances. This report provides statistically-based criteria for type-testing (TT), further-testing (FT) and where a product has been shown to be consistent with measured release/emission/content values that are significantly below the declared values, the point where no-further-testing (NFT) is permitted. A series of fundamental principles are defined in Part 1 and two statistical approaches are defined. The first approach is to use assessment by variables and this approach requires the data to be normally or log-normally distributed. This approach is recommended as the default option. The alternative approach based on assessment by attributes is appropriate for data sets that are not normally or log-normally distributed. The downside to this form of assessment is that more test data are needed for the same level of reliability. Part 1 introduces these assessment procedures and Part 2 provides more detail and the statistical proof that they satisfy the principles defined in Part 1. With both of these approaches the minimum frequency of testing is a function of the distance between the mean value and declared value and the variability of the data set, i.e. the sample standard deviation.
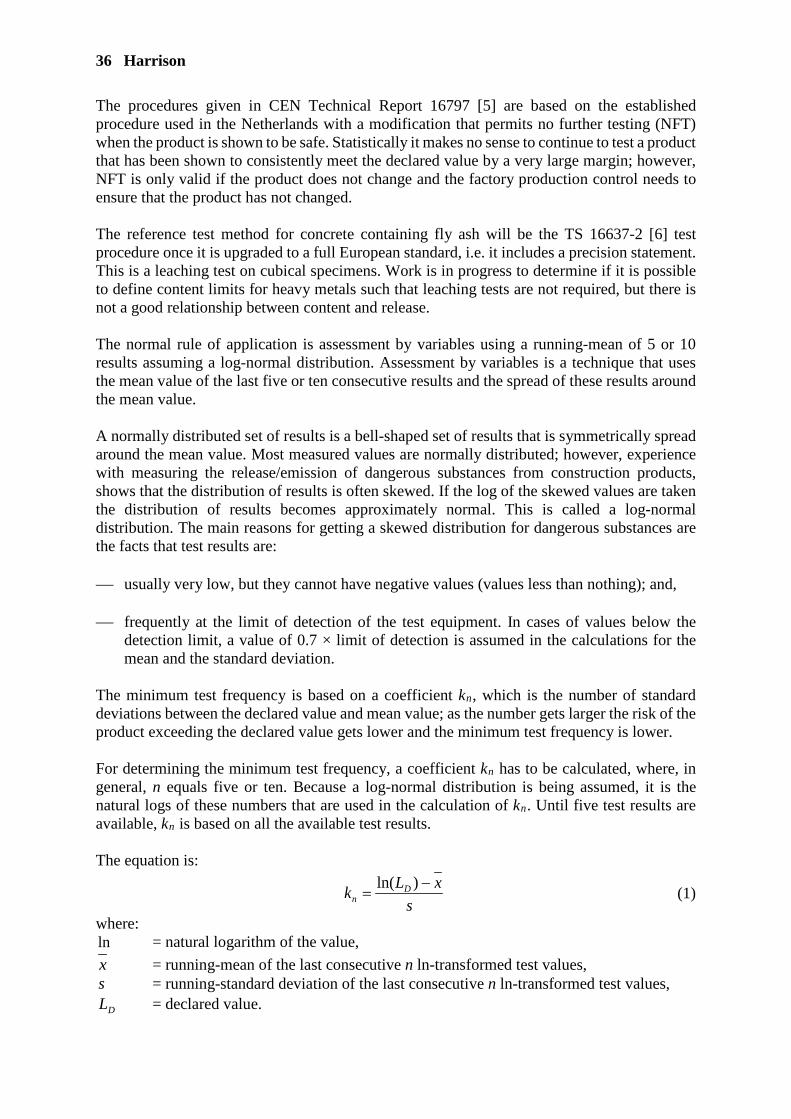
36 Harrison
The procedures given in CEN Technical Report 16797 [5] are based on the established procedure used in the Netherlands with a modification that permits no further testing (NFT) when the product is shown to be safe. Statistically it makes no sense to continue to test a product that has been shown to consistently meet the declared value by a very large margin; however, NFT is only valid if the product does not change and the factory production control needs to ensure that the product has not changed. The reference test method for concrete containing fly ash will be the TS 16637-2 [6] test procedure once it is upgraded to a full European standard, i.e. it includes a precision statement. This is a leaching test on cubical specimens. Work is in progress to determine if it is possible to define content limits for heavy metals such that leaching tests are not required, but there is not a good relationship between content and release. The normal rule of application is assessment by variables using a running-mean of 5 or 10 results assuming a log-normal distribution. Assessment by variables is a technique that uses the mean value of the last five or ten consecutive results and the spread of these results around the mean value. A normally distributed set of results is a bell-shaped set of results that is symmetrically spread around the mean value. Most measured values are normally distributed; however, experience with measuring the release/emission of dangerous substances from construction products, shows that the distribution of results is often skewed. If the log of the skewed values are taken the distribution of results becomes approximately normal. This is called a log-normal distribution. The main reasons for getting a skewed distribution for dangerous substances are the facts that test results are: usually very low, but they cannot have negative values (values less than nothing); and, frequently at the limit of detection of the test equipment. In cases of values below the
detection limit, a value of 0.7 × limit of detection is assumed in the calculations for the mean and the standard deviation.
The minimum test frequency is based on a coefficient kn, which is the number of standard deviations between the declared value and mean value; as the number gets larger the risk of the product exceeding the declared value gets lower and the minimum test frequency is lower. For determining the minimum test frequency, a coefficient kn has to be calculated, where, in general, n equals five or ten. Because a log-normal distribution is being assumed, it is the natural logs of these numbers that are used in the calculation of kn. Until five test results are available, kn is based on all the available test results. The equation is:
s
xLk Dn
−=
)ln( (1)
where: ln = natural logarithm of the value,
x = running-mean of the last consecutive n ln-transformed test values, s = running-standard deviation of the last consecutive n ln-transformed test values,
DL = declared value.
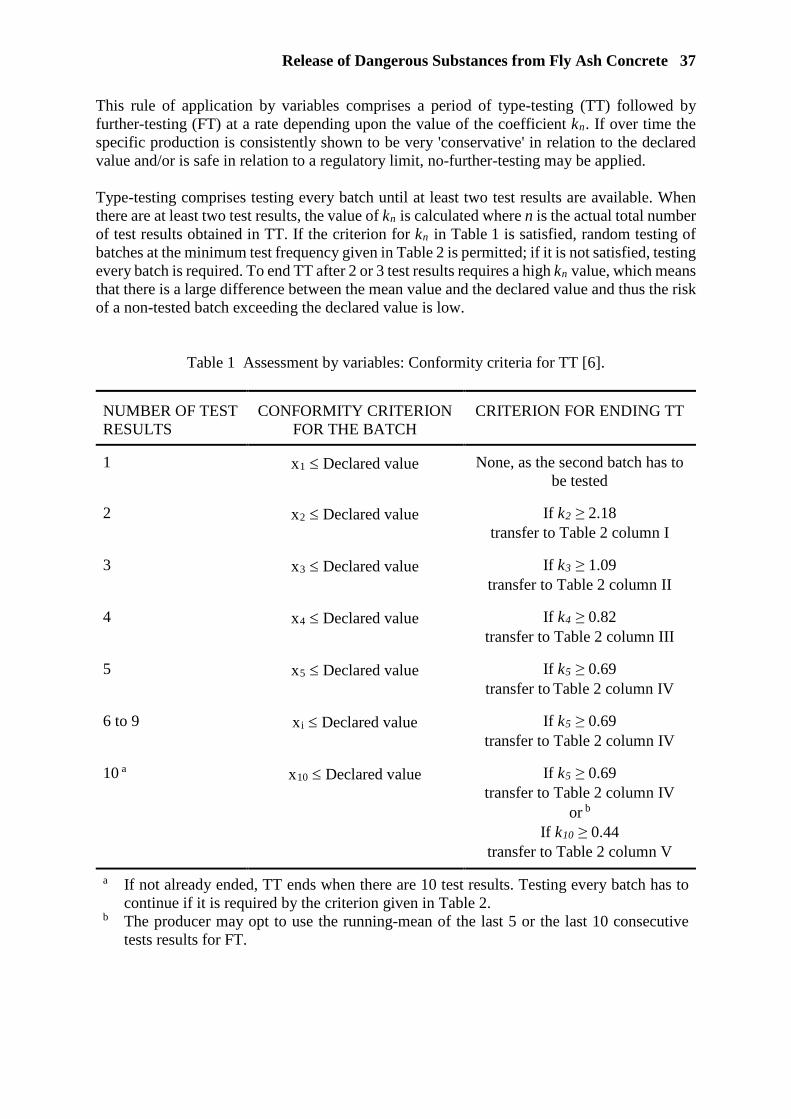
Release of Dangerous Substances from Fly Ash Concrete 37
This rule of application by variables comprises a period of type-testing (TT) followed by further-testing (FT) at a rate depending upon the value of the coefficient kn. If over time the specific production is consistently shown to be very 'conservative' in relation to the declared value and/or is safe in relation to a regulatory limit, no-further-testing may be applied. Type-testing comprises testing every batch until at least two test results are available. When there are at least two test results, the value of kn is calculated where n is the actual total number of test results obtained in TT. If the criterion for kn in Table 1 is satisfied, random testing of batches at the minimum test frequency given in Table 2 is permitted; if it is not satisfied, testing every batch is required. To end TT after 2 or 3 test results requires a high kn value, which means that there is a large difference between the mean value and the declared value and thus the risk of a non-tested batch exceeding the declared value is low.
Table 1 Assessment by variables: Conformity criteria for TT [6].
NUMBER OF TEST RESULTS
CONFORMITY CRITERION FOR THE BATCH
CRITERION FOR ENDING TT
1 x1 ≤ Declared value None, as the second batch has to be tested
2 x2 ≤ Declared value If k2 ≥ 2.18 transfer to Table 2 column I
3 x3 ≤ Declared value If k3 ≥ 1.09 transfer to Table 2 column II
4 x4 ≤ Declared value If k4 ≥ 0.82 transfer to Table 2 column III
5 x5 ≤ Declared value If k5 ≥ 0.69 transfer to Table 2 column IV
6 to 9 xi ≤ Declared value If k5 ≥ 0.69 transfer to Table 2 column IV
10 a x10 ≤ Declared value If k5 ≥ 0.69 transfer to Table 2 column IV
or b If k10 ≥ 0.44
transfer to Table 2 column V
a If not already ended, TT ends when there are 10 test results. Testing every batch has to continue if it is required by the criterion given in Table 2.
b The producer may opt to use the running-mean of the last 5 or the last 10 consecutive tests results for FT.

38 Harrison
The criteria given in Table 1 are used to determine the conformity of the batch and the criterion for continuing with batch testing. If not already ended, TT ends when there are 10 test results. Testing every batch has to continue if it is required by the criterion given in Table 2. Assessment by attributes is an alternative to using variables.
Table 2 Assessment by variables: Minimum test frequency for FT [6].
NUMBER OF TEST RESULTS MINIMUM TEST
FREQUENCY b 2 3 4 Last consecutive
5 a
Last consecutive
10 a
I II III IV V VI
k2 ≥ 24.58 k3 ≥ 9.65 k4 ≥ 7.13 k5 ≥ 6.11 k10 ≥ 4.63 1 batch per 3 year c, d, e
18.50 ≤ k2 < 24.58
7.34 ≤ k3 < 9.65
5.44 ≤ k4 < 7.13
4.67 ≤ k5 < 6.11
3.53 ≤ k10 < 4.63
1 batch per year d, e
10.25 ≤ k2 < 18.50
4.26 ≤ k3 < 7.34
3.19 ≤ k4 < 5.44
2.74 ≤ k5 < 4.67
2.07 ≤ k10 < 3.53
1:10 batches (≥ 5 batches per 3 years)
4.88 ≤ k2 < 10.25
2.23 ≤ k3 < 4.26
1.69 ≤ k4 < 3.19
1.46 ≤ k5 < 2.74
1.07 ≤ k10 < 2.07
1:4 batches (≥ 10 batches per 3 years)
2.18 ≤ k2 < 4.88
1.09 ≤ k3 < 2.23
0.82 ≤ k4 < 1.69
0.69 ≤ k5 < 1.46
0.44 ≤ k10 < 1.07
1:2 batches (≥ 5 batches per year)
k2 < 2.18 k3 < 1.09 k4 < 0.82 k5 < 0.69 k10 < 0.44 Test every batch f, g
a It is the producer’s choice to base the assessment on the running-mean of the last 5 or 10 consecutive test results.
b Where every batch is not being tested, the batch for testing is selected at random from within the period of production given in the last column.
c If the last consecutive 5 test values are lower than the limit of detection of the test method, the minimum test frequency is 1 batch per 3 years.
d If the last five consecutive test values are lower than 0.27 × declared value, the minimum test frequency is 1 batch per year; if they are lower than 0.17 × declared value, the minimum test frequency is 1 batch per three years.
e If the last ten consecutive test values are lower than 0.37 × declared value, the minimum test frequency is 1 batch per year; if they are lower than 0.23 × declared value, the minimum test frequency is 1 batch per three years.
f Any batch above the declared value is classified as non-conforming. g Where batch testing is required during continuous production, at least five new batches
have to be tested and the results give a k5 ≥ 0.69 and a k10 ≥ 0.44 before it is permitted to change from testing every batch.
Release of Dangerous Substances from Fly Ash Concrete 39
CONCLUSIONS
1. Until the European commission and the national regulators agree that the procedures validating the declaration of performance are in the relevant product standard and not in the national provisions, there is little point in including a declaration of performance with respect to dangerous substances in harmonised product standards.
2. A long list of declared values is not helpful to the consumer and in many cases not
understood by the consumer. At present there are no classes for dangerous substances and both classes and categories may have periods where they are out of line with regulations.
3. Declared values and declared classes have both pros and cons and neither easily satisfy the
needs of consumers or regulators. The use of a manufacture’s statement is a practical and effective solution for the declaration of performance with respect to release into soil, groundwater and surface water and indoor air.
4. CEN/TR 16797 provides statistically based methods for assessing the validity of the
declaration of performance based on the established method used in the Netherlands.
REFERENCES 1. EUROPEAN PARLIAMENT AND COUNCIL, Regulation (EU) No 305/2011 of
9 March 2011 laying down harmonised conditions for the marketing of construction products and repealing Council Directive 89/106/EEC.
2. DIJKSTRA J J AND VAN DER SLOOT H A, Dossier of information justifying that
concrete qualifies for the potential release of regulated dangerous substances without-further-testing (WFT) by the producer, March 2013. Report produced for the European Concrete Platform.
3. EN 450-1, Fly ash for concrete — Part 1: Definition, specifications and conformity criteria. 4. EN 206, Concrete — Specification, performance, production and conformity. 5. CEN/TR 16797, Construction products: Assessment of release of dangerous substances —
Guidance on the statistical assessment of declared values. 6. TS 16637-2: Horizontal dynamic surface leaching test.
COMBINED EFFECT OF POLYMERIC FIBRES AND SUPERABSORBENT POLYMERS (SAPS) ON THE
AUTOGENOUS SHRINKAGE AND MECHANICAL PROPERTIES OF FLY ASH CEMENTITIOUS MORTARS
R Rostami
A J Klemm
Glasgow Caledonian University
United Kingdom
ABSTRACT: Supplementary cementitious materials (SCMs), such as fly ash are commonly used in concrete in order to improve its sustainability and to reduce carbon dioxide emissions from the production of Portland cement clinker. The addition of Polymeric Fibres (PF) can enhance adhesive and frictional bond with a cementitious matrix and improve mechanical properties of composites. Despite these benefits self-desiccation processes and the following autogenous shrinkage may lead to formation of cracks and deterioration of cementitious materials. Polymeric fibres, commonly used to arrest crack propagation, are often insufficient and some form of internal curing is still required to provide water for continuous hydration. Superabsorbent polymers may provide a solution to this problem. However, their effectiveness in cementitious matrices depends on a number of parameters including water absorption/desorption kinetics and their particle sizes. This paper aim to evaluate the combined effect of PF and SAPs on the autogenous shrinkage and mechanical properties of PC-Fly Ash mortars. Two types of mortars reinforced by polymeric fibres (CEM I – PC Portland cement & CEM II – PC-Fly ash) modified by three types of SAPs were evaluated. Autogenous shrinkage and mechanical properties were analysed as a function of water absorption capacities of SAPs and their particle sizes. The experimental results show that addition of SAP to PC-FA fibre reinforced mortars has significant effect on the reduction of autogenous shrinkage. Although the mechanical properties of PC-FA mortars are temporarily reduced by SAP addition, this reduction diminishes with time due to progressive hydration facilitated by internal curing of SAP and pozzolanic action of FA. Keywords: Superabsorbent polymers (SAPs), Polymeric fibres (PF), Fly ash; Autogenous shrinkage, Mechanical properties. Professor Agnieszka Klemm is Professor in Construction Materials at the Department of Civil Engineering and Environmental Management in Glasgow Caledonian University. Her research interests cover different aspects of high performance cementitious materials; she is an active member of the RILEM Technical Committees. Rohollah Rostami is a PhD researcher in Construction Materials at the Department of Civil Engineering and Environmental Management in Glasgow Caledonian University.

Shrinkage of Mortars with Fibres 41
INTRODUCTION The appropriate use of fly ash (FA) have various beneficial effects on both fresh and hardened properties of mortars, including reduced water demand, improved workability, reduced permeability and improved long term strength and durability [1, 2]. FA properties can also contribute to improvement of sustainability of Portland cement-based materials. The use of Polymeric fibres (PF) in cementitious matrix can enhance adhesive and frictional bond [3], improve compressive and tensile strength, and increased ductility and toughness [4]. However, due to the complex hydration reactions early age shrinkage of cementitious systems make take place. Autogenous shrinkage (AS) occurs predominantly as a result of emptying of capillary pores due to insufficient supply of water during hydration process [5], decreases in internal relative humidity of cement paste and consequently self-desiccation [6]. This may lead to formation of cracks and deterioration of cementitious materials, which in turn impair strength, durability and aesthetics [5]. Although, as widely documented [7-8], PF can reduce autogenous deformation and crack formation, it is often insufficient and some form of internal curing is still required. Superabsorbent polymers (SAPs) as an internal curing agent may provide a solution to this problem by providing additional water for the hydration process. However, their effectiveness in cementitious matrices depends on a number of parameters including water absorption/desorption kinetics and their particle sizes. One the other hand, the pozzolanic reaction of fly ash, particularly at early age, may affect the mechanical properties [2]. Therefore, the main purpose of this study is to assess the combined effect of PF and SAPs on the autogenous shrinkage and mechanical properties of PC-Fly Ash mortars.
MATERIALS AND EXPERIMENTAL METHODS Two different binders were used in this study: Portland cement (CEM I, 52.5N (PC)), and Portland fly ash cement (CEM II/B-V 42.5N (PC-FA)). CEM I and II have been supplied by Hanson Cements (UK) and Lafarge (UK), respectively. Their chemical and physical characteristics are shown in Table 1.
Table 1 Chemical and physical characteristics of PC and PC-FA.
SiO2
(%)
Al2O3
(%)
Fe2O3
(%)
CaO
(%)
MgO
(%)
SO3
(%)
K2O
(%)
TiO2
(%)
ZnO
(%)
LOI
(%) PC 20.1 4.9 2.7 62.4 2.2 3.2 0.27 0.0 0.0 2.39
PC-FA 32.69 8.99 1.76 43.48 1.33 0.4 1.26 0.58 0.02 0.0 The micro polypropylene fibres used in this study (length of 6 mm, diameter 18 μm and density 0.91 kg/m³) were provided by ADFIL Construction Fibres (UK); (Figure 1). Three types of cross-linked Superabsorbent polymers (called here: A, C and E), provided by BASF Construction Chemicals GmbH, were used in the experiments. SAP A is copolymer of acrylamide and acrylic acid. SAP C and SAP E have the same chemical composition (modified polyacrylamide) but different particle grading (Figure 2.a).

42 Rostami, Klemm
Figure 1 The SEM micrographs of (a) fibre and (b) fibre in cement matrix. SAP Characterisation SAP particle sizes were determined by laser diffraction. Figure 2(a) shows the results of particle size distribution tests of SAPs. The water absorption capacity (WAC) of SAPs in DI water and in two cement paste solutions used in this study have been evaluated by the tea-bag method [9, 10] are presented in Figs. 2(b), 2(c) and 2(d), respectively. Shapes and size of SAPs have been characterized by the Scanning Electron Microscopy (SEM) techniques (Figure 3). The characteristics of used SAPs are summarised in Table 2.
Figure 2 (a) Particle size distribution of SAPs (b) Sorption behaviour of SAPs in DI water (c) Comparison of SAPs absorbency in deionised PC and (d) PC-FA solutions.
02468
101214161820
0 20 40 60 80 100 120 140 160 180 200 220 240 260 280
VO
LUM
E, %
(a) PARTICLE SIZE, µm
Particle Size Distribution
SAP A
SAP C
SAP E
050
100150200250300350400
0 180 360 540 720 900 1080 1260 1440
WAC
, g/g
(b) TIME, min
DI Water
SAP ASAP CSAP E
05
101520253035404550
0 180 360 540 720 900 1080 1260 1440
WAC
, g/g
(c) TIME, min
PC
SAP ASAP CSAP E
05
101520253035404550
0 180 360 540 720 900 1080 1260 1440
WAC
, g/g
(d) TIME, min
PC-FA
SAP ASAP CSAP E
a b

Shrinkage of Mortars with Fibres 43
Figure 3 The SEM micrographs of SAP A, C and E.
Table 2 SAP characteristics.
SAP TYPE PARTICLE SIZE, µm
WAC1, g/g Deionized water
WAC, g/g PC Solutions
WAC, g/g PC-FA Solutions
SAP A copolymer of acrylamide
and acrylic acid 30-140 340 35 32
SAP C modified polyacrylamide 30-140 290 38 35 SAP E modified polyacrylamide 10-110 340 40 45
1 WAC: water absorption capacity As seen in Table 2, different ionic concentrations in cement paste solution had a strong effect on SAPs absorption capacities. Mix Compositions Ten different compositions of mortar were designed to carry out research as shown in Table 3. All fibre reinforced mortars (FRM) were prepared with a binder to fine sand ratio of 1:2 (by weight). 90% of sand particles was smaller than 0.425 mm. Different water/binder ratios are explained by different amount of additional water absorbed by the SAPs [11]. Both SAPs and PF were added to mixtures in equal amounts of 0.25 % and 0.50 % by mass of cement, respectively.
SAP A SAP C
SAP E
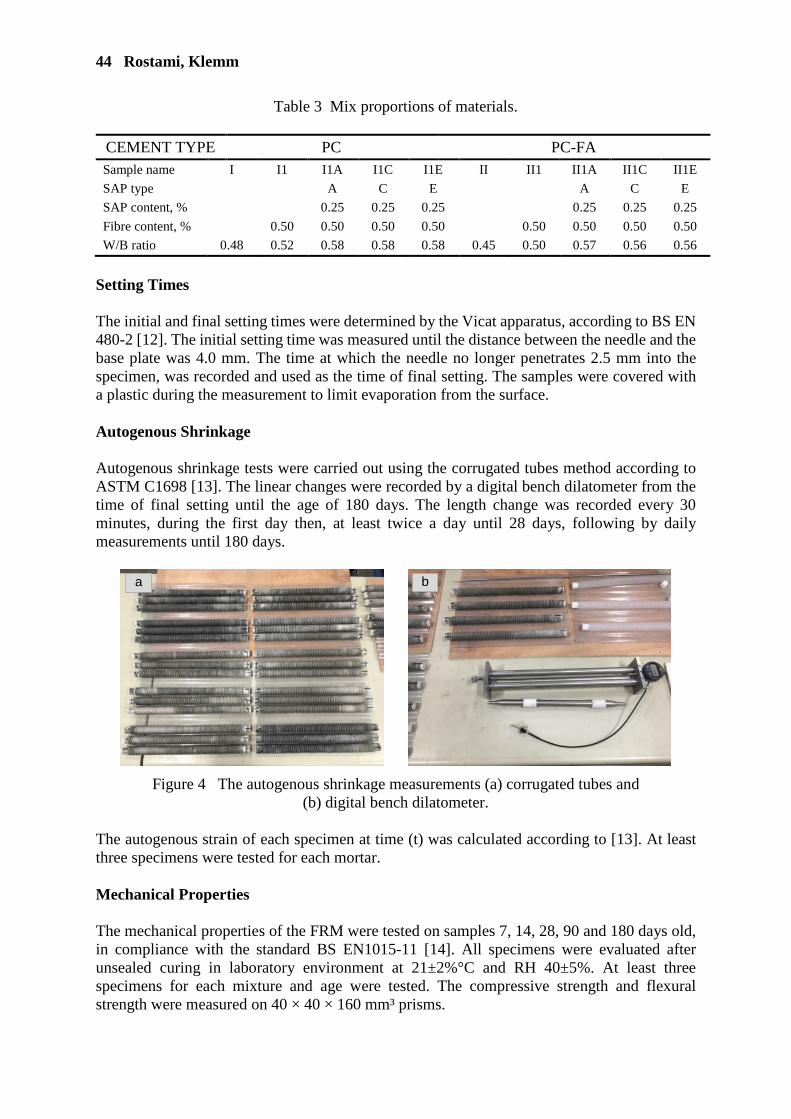
44 Rostami, Klemm
Table 3 Mix proportions of materials.
CEMENT TYPE PC PC-FA Sample name I I1 I1A I1C I1E II II1 II1A II1C II1E
SAP type A C E A C E
SAP content, % 0.25 0.25 0.25 0.25 0.25 0.25
Fibre content, % 0.50 0.50 0.50 0.50 0.50 0.50 0.50 0.50
W/B ratio 0.48 0.52 0.58 0.58 0.58 0.45 0.50 0.57 0.56 0.56
Setting Times The initial and final setting times were determined by the Vicat apparatus, according to BS EN 480-2 [12]. The initial setting time was measured until the distance between the needle and the base plate was 4.0 mm. The time at which the needle no longer penetrates 2.5 mm into the specimen, was recorded and used as the time of final setting. The samples were covered with a plastic during the measurement to limit evaporation from the surface. Autogenous Shrinkage Autogenous shrinkage tests were carried out using the corrugated tubes method according to ASTM C1698 [13]. The linear changes were recorded by a digital bench dilatometer from the time of final setting until the age of 180 days. The length change was recorded every 30 minutes, during the first day then, at least twice a day until 28 days, following by daily measurements until 180 days.
Figure 4 The autogenous shrinkage measurements (a) corrugated tubes and (b) digital bench dilatometer.
The autogenous strain of each specimen at time (t) was calculated according to [13]. At least three specimens were tested for each mortar. Mechanical Properties The mechanical properties of the FRM were tested on samples 7, 14, 28, 90 and 180 days old, in compliance with the standard BS EN1015-11 [14]. All specimens were evaluated after unsealed curing in laboratory environment at 21±2%°C and RH 40±5%. At least three specimens for each mixture and age were tested. The compressive strength and flexural strength were measured on 40 × 40 × 160 mm³ prisms.
a b
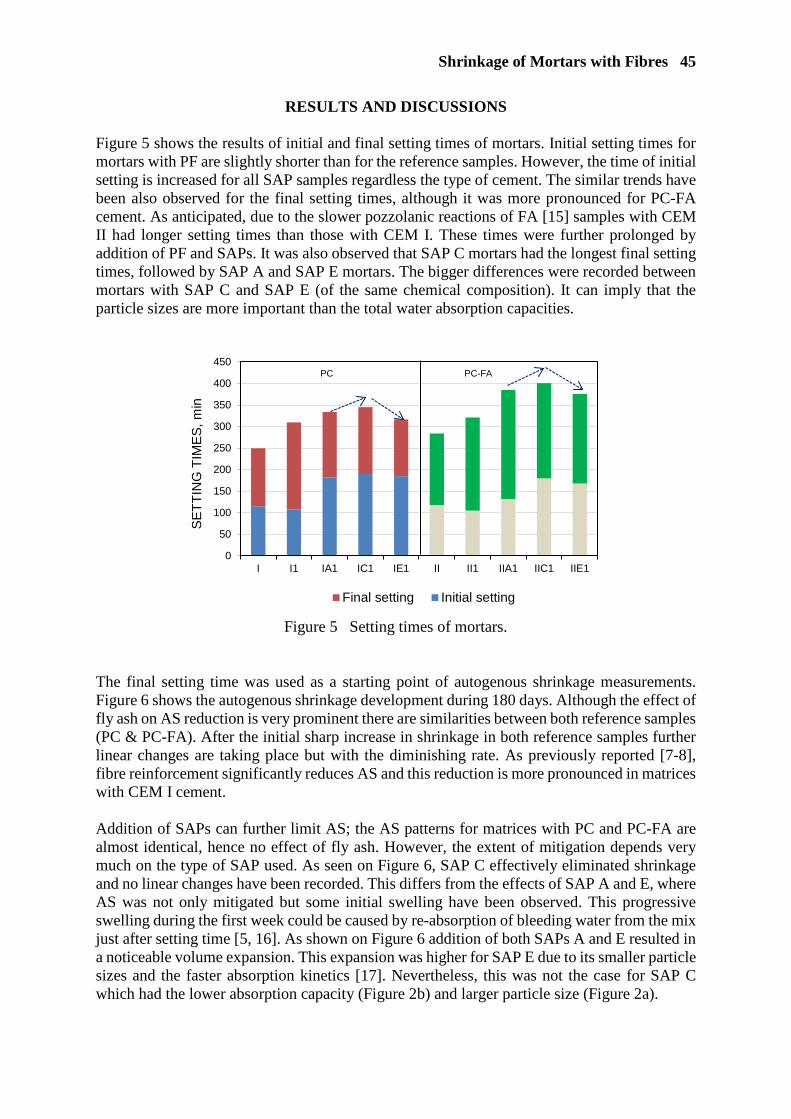
Shrinkage of Mortars with Fibres 45
RESULTS AND DISCUSSIONS Figure 5 shows the results of initial and final setting times of mortars. Initial setting times for mortars with PF are slightly shorter than for the reference samples. However, the time of initial setting is increased for all SAP samples regardless the type of cement. The similar trends have been also observed for the final setting times, although it was more pronounced for PC-FA cement. As anticipated, due to the slower pozzolanic reactions of FA [15] samples with CEM II had longer setting times than those with CEM I. These times were further prolonged by addition of PF and SAPs. It was also observed that SAP C mortars had the longest final setting times, followed by SAP A and SAP E mortars. The bigger differences were recorded between mortars with SAP C and SAP E (of the same chemical composition). It can imply that the particle sizes are more important than the total water absorption capacities.
Figure 5 Setting times of mortars.
The final setting time was used as a starting point of autogenous shrinkage measurements. Figure 6 shows the autogenous shrinkage development during 180 days. Although the effect of fly ash on AS reduction is very prominent there are similarities between both reference samples (PC & PC-FA). After the initial sharp increase in shrinkage in both reference samples further linear changes are taking place but with the diminishing rate. As previously reported [7-8], fibre reinforcement significantly reduces AS and this reduction is more pronounced in matrices with CEM I cement. Addition of SAPs can further limit AS; the AS patterns for matrices with PC and PC-FA are almost identical, hence no effect of fly ash. However, the extent of mitigation depends very much on the type of SAP used. As seen on Figure 6, SAP C effectively eliminated shrinkage and no linear changes have been recorded. This differs from the effects of SAP A and E, where AS was not only mitigated but some initial swelling have been observed. This progressive swelling during the first week could be caused by re-absorption of bleeding water from the mix just after setting time [5, 16]. As shown on Figure 6 addition of both SAPs A and E resulted in a noticeable volume expansion. This expansion was higher for SAP E due to its smaller particle sizes and the faster absorption kinetics [17]. Nevertheless, this was not the case for SAP C which had the lower absorption capacity (Figure 2b) and larger particle size (Figure 2a).
0
50
100
150
200
250
300
350
400
450
I I1 IA1 IC1 IE1 II II1 IIA1 IIC1 IIE1
SETT
ING
TIM
ES, m
in
Final setting Initial setting
PC PC-FA

46 Rostami, Klemm
Figure 6 Autogenous shrinkage (AS) development during 180 days. Figs. 7–8 show compressive and flexural strength developments as a function of mortars age. Figure 7 shows the similar trends of compressive strength development for all samples. However, the compressive strength of mortars with fly ash is lower than for mortars with Portland cement only; it may be related to the class and pozzolanic reactions of fly ash [2]. It is also evident that mortars with PF exhibited lower strengths than the reference samples because of increased porosity (compared to the reference). It was observed that all SAPs have a negative effect on strength development at early age because of the formation of pores after collapsing of SAP. However, this effect is reduced at later age due to further hydration facilitated by internal curing of SAP. Reduction of compressive strength by SAPs depends on their water absorption capacities. SAP A with lower WAC reduced the compressive strength less than SAP C and SAP E with maximum WAC respectively.
-500
-400
-300
-200
-100
0
100
200
0 30 60 90 120 150 180
AU
TOG
EN
OU
S S
HR
INK
AG
E, µ
m/m
(a) TIME, days
CEM I-PC
CI1E
CI1A
CI1C
CI1
CI
-500
-400
-300
-200
-100
0
100
200
0 30 60 90 120 150 180
AU
TOG
EN
OU
S S
HR
INK
AG
E, µ
m/m
(b) TIME, days
CEM II-PC-FA
CII1E
CII1A
CII1C
CII1
CII
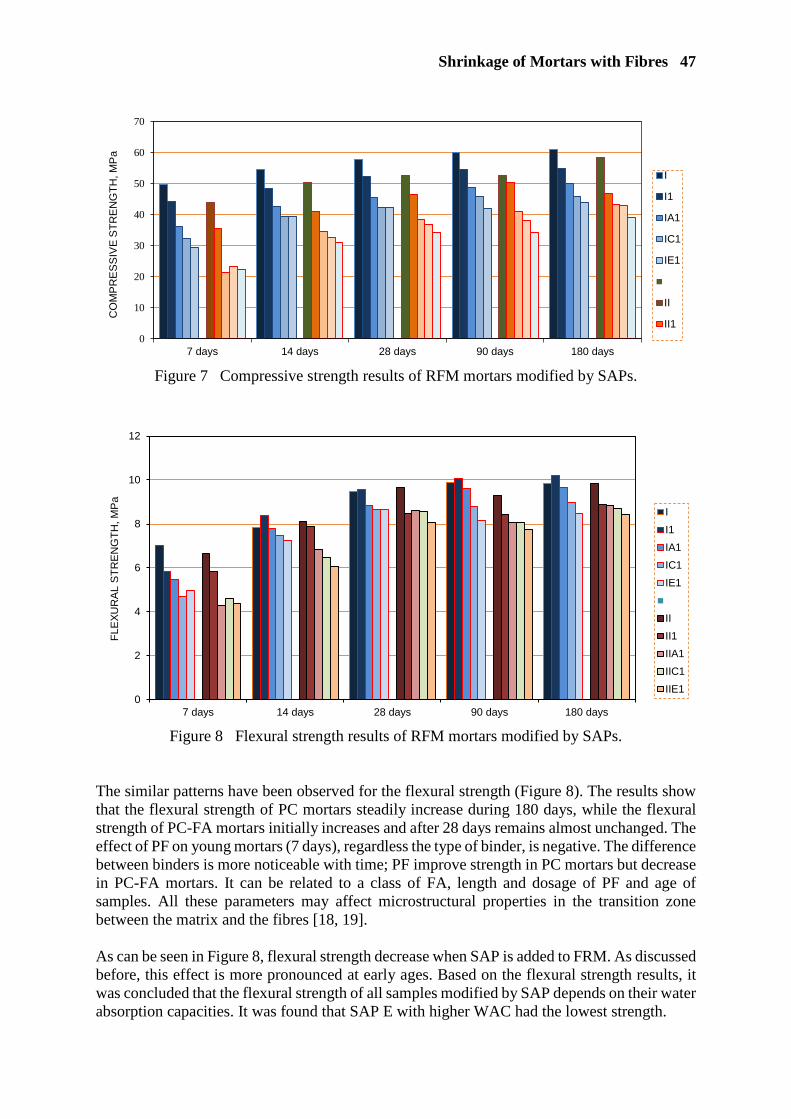
Shrinkage of Mortars with Fibres 47
Figure 7 Compressive strength results of RFM mortars modified by SAPs.
Figure 8 Flexural strength results of RFM mortars modified by SAPs.
The similar patterns have been observed for the flexural strength (Figure 8). The results show that the flexural strength of PC mortars steadily increase during 180 days, while the flexural strength of PC-FA mortars initially increases and after 28 days remains almost unchanged. The effect of PF on young mortars (7 days), regardless the type of binder, is negative. The difference between binders is more noticeable with time; PF improve strength in PC mortars but decrease in PC-FA mortars. It can be related to a class of FA, length and dosage of PF and age of samples. All these parameters may affect microstructural properties in the transition zone between the matrix and the fibres [18, 19]. As can be seen in Figure 8, flexural strength decrease when SAP is added to FRM. As discussed before, this effect is more pronounced at early ages. Based on the flexural strength results, it was concluded that the flexural strength of all samples modified by SAP depends on their water absorption capacities. It was found that SAP E with higher WAC had the lowest strength.
0
10
20
30
40
50
60
70
7 days 14 days 28 days 90 days 180 days
CO
MP
RE
SS
IVE
STR
EN
GTH
, MP
a
I
I1
IA1
IC1
IE1
II
II1
0
2
4
6
8
10
12
7 days 14 days 28 days 90 days 180 days
FLE
XUR
AL
STR
EN
GTH
, MP
a
II1IA1IC1IE1
IIII1IIA1IIC1IIE1

48 Rostami, Klemm
CONCLUSIONS Based on experimental results, the following can be concluded: Samples with PC-FA had longer setting times than with PC only due to slower
pozzolanic reactions. Addition of SAP retards both initial and final setting times of FRM. SAP C mortars had the longest final setting times, followed by SAP A and SAP E mortars. The bigger differences were observed between mortars with SAP C and SAP E with the same chemical composition but different particle gradings. It can be concluded that the particle sizes are more important than the water absorption capacities (WAC);
Autogenous shrinkage in FRM can be completely eliminated by addition of SAPs. The
effect of cement type is minimal; AS patterns for corresponding SAP mortars with different binders are almost identical. However, there are differences between individual polymers. SAP effectiveness depends on the particle sizes. The significant reduction of autogenous shrinkage was observed for mortars with SAP E with finer particle size. It can be concluded that the effect of WAC is of lesser importance;
SAP has a negative effect on compressive and flexural strength development of FRM, particularly at early ages. The gradual release of water for hydration by SAPs results in formation of pores (collapsed SAP) and in an inevitable loss of strength. Slow pozzolanic reactions in PC-FA cements also contribute to low early strength. However it should be noted that any initial differences in strength can be minimalised over longer period of time and the progress of hydration.
Although the presence of SAPs leads to increased porosity (collapsed SAP) and hence decreased strength at the early ages, the mitigation of AS outweigh this temporary problem.
REFERENCES 1. THOMAS M, Supplementary Cementing Materials in Concrete, 2013, Boca Raton: CRC
Press.
2. DE BELIE N, SOUTSOS M AND GRUYAERT E, Properties of fresh and hardened concrete containing supplementary cementitious materials, 2018, RILEM, 238-SCM.
3. PAKRAVAN H R, JAMSHIDI M, LATIFI M AND PACHECO-TORGAL F, Evaluation of adhesion in polymeric fibre reinforced cementitious composites, International Journal of Adhesion & Adhesives, 2011, doi:10.1016/j.ijadhadh.2011.08.009.
4. AFROUGHSABET V, BIOLZI L AND OZBAKKALOGLU T, High-performance fiber-reinforced concrete: a review. Journal of Materials Science, Vol. 51, 2016, pp. 6517-6551.
5. SNOECK D, JENSEN O M AND DE BELIE N, The influence of superabsorbent polymers on the autogenous shrinkage properties of cement pastes with supplementary cementitious materials. Cement and Concrete Research, Vol. 74, 2015, pp. 59-67.

Shrinkage of Mortars with Fibres 49
6. WYRZYKOWSKI M AND LURA P, Effect of relative humidity decrease due to self-desiccation on the hydration kinetics of cement, Cement and Concrete Research, Vol. 85, 2016, pp. 75-81.
7. GONG J, ZENG W AND ZHANG W, Influence of shrinkage-reducing agent and polypropylene fiber on shrinkage of ceramsite concrete. Construction and Building Materials, Vol. 159, 2018, pp. 155-163.
8. SAJE D, BANDELJ B, ŠUŠTERŠIČ J, LOPATIČ J AND SAJE F, Autogenous and Drying Shrinkage of Fibre Reinforced High-Performance Concrete, Journal of Advanced Concrete Technology, Vol. 10, 2012, pp. 59-73.
9. ALMEIDA F C R, ROSTAMI R AND KLEMM A J, Characterization of Polyacrylamide based Superabsorbent Polymers for potential use in PC Matrices with Supplementary Cementitious Materials, MATEC Web of Conferences, Vol. 199, 2018, 02023.
10. MECHTCHERINE V, SNOECK D, SCHRÖFL C, DE BELIE N, KLEMM A J, ICHIMIYA K, MOON J, WYRZYKOWSKI M, LURA P, TOROPOVS N, ASSMANN A, IGARASHI S-I, DE LA VARGA I, ALMEIDA F C R, ERK K, BETTENCOURT RIBEIRO A C, CUSTÓDIO J, REINHARDT H-W AND FALIKMAN V, Testing superabsorbent polymer (SAP) sorption properties prior to implementation in concrete: results of a RILEM Round-Robin Test. Materials and Structures, 2018, 51:28.
11. SNOECK D, SCHAUBROECK D, DUBRUEL P AND DE BELIE N, Effect of high amounts of superabsorbent polymers and additional water on the workability, microstructure and strength of mortars with a water-to-cement ratio of 0.50, Construction and Building Materials, Vol. 72, 2014, pp. 148-157.
12. BS EN 480-2, Admixtures for Concrete, Mortar and Grout — Test Methods — Part 2: Determination of Setting Time, 2006, British Standards Institution.
13. ASTM C1698-09, Standard Test Method for Autogenous Strain of Cement Paste and Mortars, ASTM International, 2009, American Society for Testing and Materials.
14. BS EN 1015-11, Methods of Test for Mortar for Masonry — Part 11: Determination of Flexural and Compressive Strength of Hardened Mortar, 2006, British Standards Institution.
15. SCRIVENER K L, LOTHENBACH B, DE BELIE N, GRUYAERT E, SKIBSTED J, SNELLINGS R AND VOLLPRACHT A, TC 238-SCM: hydration and microstructure of concrete with SCMs, Materials and Structures, Vol. 48, No. 4, 2015, pp. 835-862.
16. SANT G, LOTHENBACH B, JUILLAND P, LE SAOUT G, WEISS W J AND SCRIVENER K L, The origin of early age expansions induced in cementitious materials containing shrinkage reducing admixtures, Cement and Concrete Research, Vol. 41, 2011, pp. 218-229.
17. JUSTS J, WYRZYKOWSKI M, BAJARE D AND LURA P, Internal curing by superabsorbent polymers in ultra-high performance concrete, Cement and Concrete Research, Vol. 76, 2015, pp. 82-90.
18. GONCALVES J R A, BOLUK Y AND BINDIGANAVILE V, Crack growth resistance in fibre reinforced alkali-activated fly ash concrete exposed to extreme temperatures, Materials and Structures, 2018, 51:42.
19. KAYALI O, Effect of high volume fly ash on mechanical properties of fiber reinforced concrete, Materials and Structures, Vol. 37, 2004, pp. 318-327.
EFFECT OF CRACKS ON ALKALINITY LEVEL OF CONCRETE STRUCTURES EXPOSED TO CARBON DIOXIDE
ENVIRONMENT CONDITION
A Al-Ameeri
University of Brighton
United Kingdom
M I Rafiq O Tsioulou
University of Babylon
Iraq
ABSTRACT. Reduction of alkalinity of concrete due to the diffusivity of carbon dioxide and concrete carbonation is one of the major issues influencing the durability of reinforced concrete structures. Most of the previous studies have concentrated on the un-cracked / unloaded concrete although it has been acknowledged that structural cracks in concrete have an impact on the carbon dioxide diffusivity and carbonation - induced reinforcement corrosion as well as service life of concrete structures. Hence, this article aims to investigate the effect of cracks (produced by loading) in concrete exposed to the carbon dioxide environment condition, on the alkalinity level (apparent pH) and carbonation depth in concrete. Accelerated environmental test programme has been used on concrete prisms with four different crack widths. The depth of carbonation, apparent pH, and consumption of alkalinity (OH-) is investigated in accordance with the BS EN13295:2004 and the method proposed by Mc Polin et al.. The influence of replacing Portland Limestone cement (CEM II) by pulverized fuel ash and ground granulated blast furnace slag on the CO2 diffusivity in cracked concrete, is also analyzed and presented in this paper. The results have shown a strong relationship between depth of carbonation and the alkalinity level (consumed OH-) and pH of concrete structures. There is a considerable impact of crack width on the reduction in concrete alkalinity. The results also demonstrate a significant increase in consumption of OH- and reduction in pH owing to the addition of supplementary materials in the samples.
Keywords: Carbonation, Phenolphthalein indicator, pH, Consumed OH-, Crack width.
Abbas AL-Ameeri is Ph.D. student in University of Brighton. He has scholarship from Iraqi government, and he is a member staff in civil engineering department in University of Babylon-Iraq. He is a member of numerous national technical committees (Iraq) e.g. Code and standards and he has published extensively on many aspects of concrete technology, gypsum and cement science, and repair of damaged building. Dr M. Imran Rafiq is Deputy Head of School of Environment and Technology at the University of Brighton. His research focuses on quantifying deterioration in structures, and how this impacts on their performance, including the effects of climate changes. He is a member of numerous national and international groups within the area of asset management of deterioration prone structures and their health monitoring. Dr Orania Tsioulou is a Senior Lecturer in Civil Engineering at the University of Brighton, UK. Her main research interests are novel construction materials and concrete technology and she has published extensively in scientific journals and conferences.

Effect of Cracks on Alkalinity Level 51
INTRODUCTION Carbonation is the chemical reaction between carbonic acid (H2CO3), resulting from a combination of atmospheric carbon dioxide (CO2) with water, and calcium ion (Ca2+) from dissolution of hydrated cement products such as calcium hydroxyl Ca(OH)2, calcium silicate hydrates (C-S-H) and calcium aluminates hydrates (C-A-H). This reaction results in the formation of calcium carbonate (CaCO3), as shown in Equations. 1 to 4 [1, 2]. 𝐶𝐶𝐶𝐶2(𝑔𝑔𝑔𝑔𝑔𝑔) + 𝐻𝐻2𝐶𝐶 = 𝐻𝐻2𝐶𝐶𝐶𝐶3(𝑔𝑔𝑎𝑎) (1) 𝐶𝐶𝑔𝑔(𝐶𝐶𝐻𝐻)2 + 𝐻𝐻2𝐶𝐶𝐶𝐶3(𝑔𝑔𝑎𝑎) = 𝐶𝐶𝑔𝑔2𝐶𝐶𝐶𝐶3 + 𝐻𝐻2𝐶𝐶 (2) 3𝐶𝐶𝑔𝑔𝐶𝐶. 2𝑆𝑆𝑆𝑆𝐶𝐶2. 3𝐻𝐻2𝐶𝐶 + 3𝐻𝐻2𝐶𝐶𝐶𝐶3(𝑔𝑔𝑎𝑎) = 3𝐶𝐶𝑔𝑔𝐶𝐶𝐶𝐶3 + 2𝑆𝑆𝑆𝑆𝐶𝐶2 + 3𝐻𝐻2𝐶𝐶 (3) 4𝐶𝐶𝑔𝑔𝐶𝐶.𝐴𝐴𝐴𝐴2𝐶𝐶3. 13𝐻𝐻2𝐶𝐶 + 3𝐻𝐻2𝐶𝐶𝐶𝐶3(𝑔𝑔𝑎𝑎) = 4𝐶𝐶𝑔𝑔𝐶𝐶𝐶𝐶3 + 2𝐴𝐴𝐴𝐴(𝐶𝐶𝐻𝐻)3 + 10𝐻𝐻2𝐶𝐶 (4) The durability of concrete structures is controlled by their capacity to delay ion and fluid transport inside concrete. The transport properties of concrete are represented through permeability of concrete, which is likely to be significantly affected by the formation of cracks. Cracks in concrete structures are common due to its weakness in tension. Cracks maybe either non-structural or structural. Structural cracks have a tendency to be wider (> 0.1 mm), while, non-structural cracks are commonly finer. Structural cracks, or cracks due to stress, are typically produced due to excessive loading, low strength of concrete, inadequate reinforcement, impact loading, or movement of foundations, or a combination of these factors. On the other hand, non-structural cracks may occur due to plastic shrinkage, early-age thermal shrinkage, drying shrinkage and external chemical attack or carbonation shrinkage [3]. The carbon dioxide penetration and reaction with hydrated cement-based products often leads to carbonation shrinkage in concrete structures. It is a physio-chemical change in concrete that causes increment in weight and shrinking in volume (increment in density). This type of shrinkage is likely to generate shallow cracks on the concrete surface [3]. The cracks in concrete influence the diffusivity of aggressive species affecting durability. However, current modelling methods for durability assessment often exclude the effect of cracks, voids and defects in concrete, such as corrosion initiation, thereby reducing their effectiveness in predicting durability of concrete structures [4]. Therefore, it is important to study and consider how the presence of cracks may affect the rate of carbonation in concrete structures. Moreover, carbonation negatively affects the concrete alkalinity and reduces the pH of concrete pores solution from 13 to 9 [1], which is a considerable factor accelerating the chloride penetration as well as the corrosion of reinforced concrete structures [5, 6]. Some studies have examined diffusion of deleterious substances through cracked concrete [7, 8]. All of these studies have concluded that cracks increase the total molar flux of gases/fluids through concrete. However, there is no agreement on how to model the movement of the carbonation front in cracked concrete. The concept of effective diffusion of CO2 or carbonation front based on the penetration of CO2 through un-cracked and cracked concrete is proposed in this study. The CO2 first penetrates the cracks within concrete, and then diffuses outwards into the sound un-cracked concrete perpendicular to the face of cracked surface. The focus of this paper is to examine the effect of size of cracks in reinforced concrete samples on the penetration depth of carbonation and the alkalinity level in concrete. The impact of replacing Portland Limestone cement (CEM II/ A-LL 32,5R) cement by PFA and GGBS on the depth of carbonation (DoC) in cracked concrete has also been investigated.
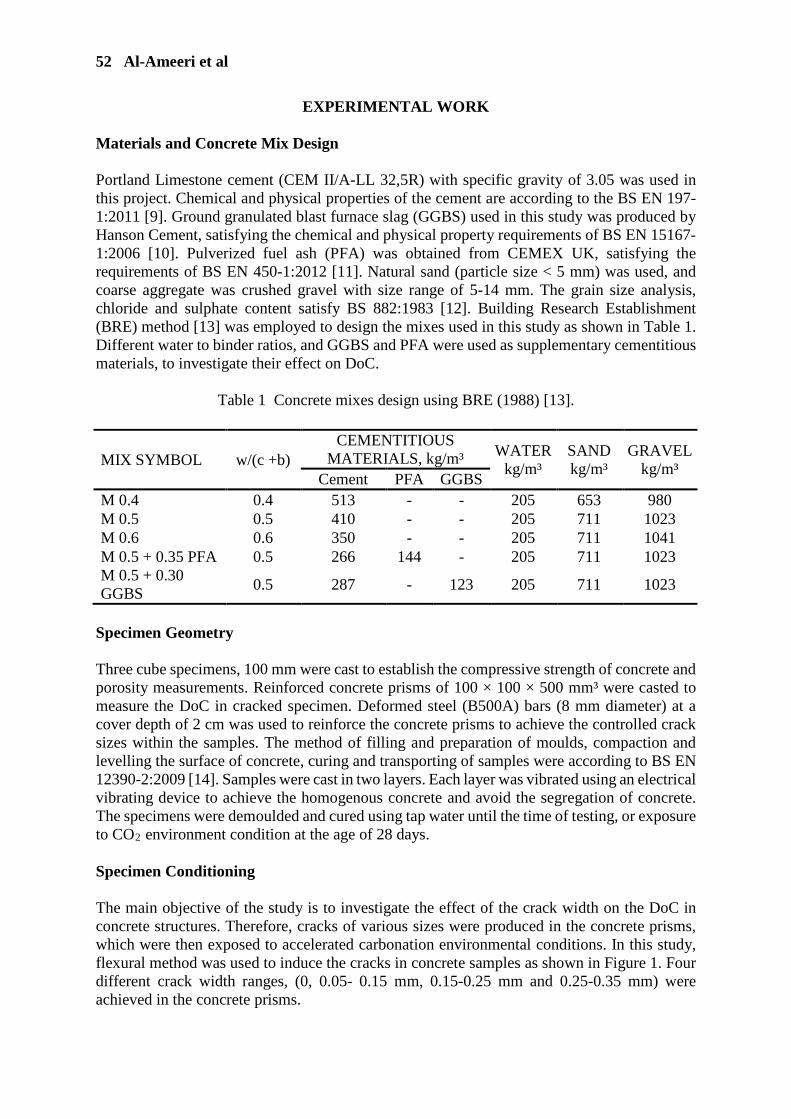
52 Al-Ameeri et al
EXPERIMENTAL WORK Materials and Concrete Mix Design Portland Limestone cement (CEM II/A-LL 32,5R) with specific gravity of 3.05 was used in this project. Chemical and physical properties of the cement are according to the BS EN 197- 1:2011 [9]. Ground granulated blast furnace slag (GGBS) used in this study was produced by Hanson Cement, satisfying the chemical and physical property requirements of BS EN 15167-1:2006 [10]. Pulverized fuel ash (PFA) was obtained from CEMEX UK, satisfying the requirements of BS EN 450-1:2012 [11]. Natural sand (particle size < 5 mm) was used, and coarse aggregate was crushed gravel with size range of 5-14 mm. The grain size analysis, chloride and sulphate content satisfy BS 882:1983 [12]. Building Research Establishment (BRE) method [13] was employed to design the mixes used in this study as shown in Table 1. Different water to binder ratios, and GGBS and PFA were used as supplementary cementitious materials, to investigate their effect on DoC.
Table 1 Concrete mixes design using BRE (1988) [13].
Specimen Geometry Three cube specimens, 100 mm were cast to establish the compressive strength of concrete and porosity measurements. Reinforced concrete prisms of 100 × 100 × 500 mm³ were casted to measure the DoC in cracked specimen. Deformed steel (B500A) bars (8 mm diameter) at a cover depth of 2 cm was used to reinforce the concrete prisms to achieve the controlled crack sizes within the samples. The method of filling and preparation of moulds, compaction and levelling the surface of concrete, curing and transporting of samples were according to BS EN 12390-2:2009 [14]. Samples were cast in two layers. Each layer was vibrated using an electrical vibrating device to achieve the homogenous concrete and avoid the segregation of concrete. The specimens were demoulded and cured using tap water until the time of testing, or exposure to CO2 environment condition at the age of 28 days. Specimen Conditioning The main objective of the study is to investigate the effect of the crack width on the DoC in concrete structures. Therefore, cracks of various sizes were produced in the concrete prisms, which were then exposed to accelerated carbonation environmental conditions. In this study, flexural method was used to induce the cracks in concrete samples as shown in Figure 1. Four different crack width ranges, (0, 0.05- 0.15 mm, 0.15-0.25 mm and 0.25-0.35 mm) were achieved in the concrete prisms.
MIX SYMBOL w/(c +b) CEMENTITIOUS
MATERIALS, kg/m³ WATER kg/m³
SAND kg/m³
GRAVEL kg/m³
Cement PFA GGBS M 0.4 0.4 513 - - 205 653 980 M 0.5 0.5 410 - - 205 711 1023 M 0.6 0.6 350 - - 205 711 1041 M 0.5 + 0.35 PFA 0.5 266 144 - 205 711 1023 M 0.5 + 0.30 GGBS
0.5 287 - 123 205 711 1023

Effect of Cracks on Alkalinity Level 53
Figure 1 Flexural method was used to create the crack in concrete sample.
The crack width was measured by microscope meter with accuracy 0.01 mm. The crack depth, Dcrack, was computed by measuring the time of pulse transfer using the ultrasonic pulse velocity device according to the Eq. 5 [15]. Figures 2 and 3 illustrate the methods for crack width and crack depth measurement respectively.
𝐷𝐷𝑐𝑐𝑐𝑐𝑐𝑐𝑐𝑐𝑐𝑐 = 𝑥𝑥𝑇𝑇𝑐𝑐2
𝑇𝑇𝑠𝑠2− 1 (5)
where: x is specific distance, Tc is the transfer time through cracked concrete distance (x) and Ts is transfer time through sound concrete distance (x).
Figure 2 Microscope meter used to
measure the cracks width.
Figure 3 Measuring the crack depth by pulse velocity of the ultrasonic device.
In this study, the one face of the specimens was exposed to accelerated environmental conditions (by sealing all other faces using isolated materials) in carbon dioxide incubator oven with CO2 concentration of 5%, temperature of 35°C and relative humidity of 65%, for 8 weeks [16]. Testing Methodologies Porosity and compressive strength test were performed on 100mm cube specimen in accordance with ASTM C642:2013 [17] and BS EN 12390-3:2000 [18] respectively. The test procedure given in BS EN13295:2004 [19] was used to determine the DoC using phenolphthalein indicator on the conditioned prism samples. The conditioned samples were split open into two parts as designated by Al-Amoudi et al. [20]. The first part was sprayed by phenolphthalein solution with one gram of phenolphthalein powder dissolved into a solution of 70 ml and 30 ml of ethanol and deionized water respectively according to CEN/TS 12390-10:2007 [21] to establish the DoC. The second part of sample was drilled (at the crack location) in order to collect concrete powder samples at eight different
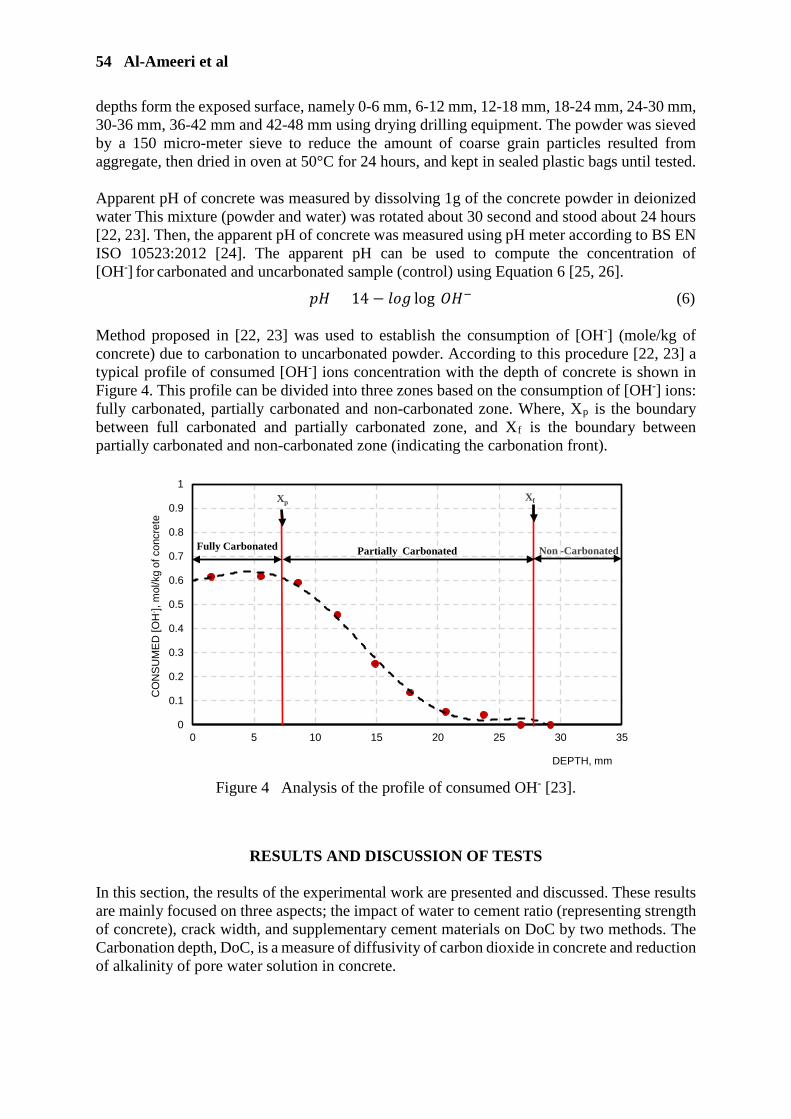
54 Al-Ameeri et al
depths form the exposed surface, namely 0-6 mm, 6-12 mm, 12-18 mm, 18-24 mm, 24-30 mm, 30-36 mm, 36-42 mm and 42-48 mm using drying drilling equipment. The powder was sieved by a 150 micro-meter sieve to reduce the amount of coarse grain particles resulted from aggregate, then dried in oven at 50°C for 24 hours, and kept in sealed plastic bags until tested. Apparent pH of concrete was measured by dissolving 1g of the concrete powder in deionized water This mixture (powder and water) was rotated about 30 second and stood about 24 hours [22, 23]. Then, the apparent pH of concrete was measured using pH meter according to BS EN ISO 10523:2012 [24]. The apparent pH can be used to compute the concentration of [OH-] for carbonated and uncarbonated sample (control) using Equation 6 [25, 26].
𝑝𝑝𝐻𝐻 = 14 − 𝐴𝐴𝑙𝑙𝑔𝑔 log[𝐶𝐶𝐻𝐻−] (6)
Method proposed in [22, 23] was used to establish the consumption of [OH-] (mole/kg of concrete) due to carbonation to uncarbonated powder. According to this procedure [22, 23] a typical profile of consumed [OH-] ions concentration with the depth of concrete is shown in Figure 4. This profile can be divided into three zones based on the consumption of [OH-] ions: fully carbonated, partially carbonated and non-carbonated zone. Where, Xp is the boundary between full carbonated and partially carbonated zone, and Xf is the boundary between partially carbonated and non-carbonated zone (indicating the carbonation front).
Figure 4 Analysis of the profile of consumed OH- [23].
RESULTS AND DISCUSSION OF TESTS In this section, the results of the experimental work are presented and discussed. These results are mainly focused on three aspects; the impact of water to cement ratio (representing strength of concrete), crack width, and supplementary cement materials on DoC by two methods. The Carbonation depth, DoC, is a measure of diffusivity of carbon dioxide in concrete and reduction of alkalinity of pore water solution in concrete.
Fully Carbonated Partially Carbonated Non -Carbonated
XpXf
0
0.1
0.2
0.3
0.4
0.5
0.6
0.7
0.8
0.9
1
0 5 10 15 20 25 30 35
CO
NS
UM
ED
[OH
- ], m
ol/k
g of
con
cret
e
DEPTH, mm

Effect of Cracks on Alkalinity Level 55
Carbonation Depth in Concrete Using Phenolphthalein Indicator The carbonation depths as a function of crack widths for the mixes used in this study are presented in Figures 5 and 6. The results illustrate that the penetration of CO2 from the exposed surface, reacts to form CaCO3, increases significantly with the increase in w/c ratio in concrete samples as shown in Figure 7. And the DoC is grown considerably with increasing crack width in concrete samples as shown in Figure 8. The percentage increases in DoC for samples having a crack with respect to the control concrete samples are presented in the Table 2.
Figure 2 Effect of w/c on carbonation
depth. Figure 3 Effect of supplementary
cementitious material on carbonation depth. On the other hand, partial replacement of Portland limestone cement (CEM II/A-LL 32,5R) with the supplementary cementitious materials (PFA and GGBS) increases the DoC when compared to concrete samples without any replacement (Figure 6).
Table 2 Percentage increase in carbonation depth for cracked samples with respect to un-cracked samples.
05
1015202530354045505560
0 0.1 0.2 0.3 0.4
CA
RB
ON
ATI
ON
DE
PTH
, mm
CRACK WIDTH, mm
M 0.4 M 0.5 M 0.6
05
1015202530354045505560
0 0.05 0.1 0.15 0.2 0.25 0.3 0.35 0.4
CA
RB
ON
ATI
ON
DE
PTH
, mm
CRACK WIDTH, mm
M 0.5 M 0.5+PFA M 0.5+GGBS
SAMPLE
INCREASE IN CARBONATION DEPTH (%) IN SAMPLES WITH CRACK WIDTH OF:
0.05 -0.15 mm 0.15-0.25 mm 0.25-0.35 mm
M 0.4 167 233 417 M 0.5 100 160 240 M 0.6 92 150 250 M 0.5 + 30% GGBS 109 200 264 M 0.5 + 35% PFA 114 186 214
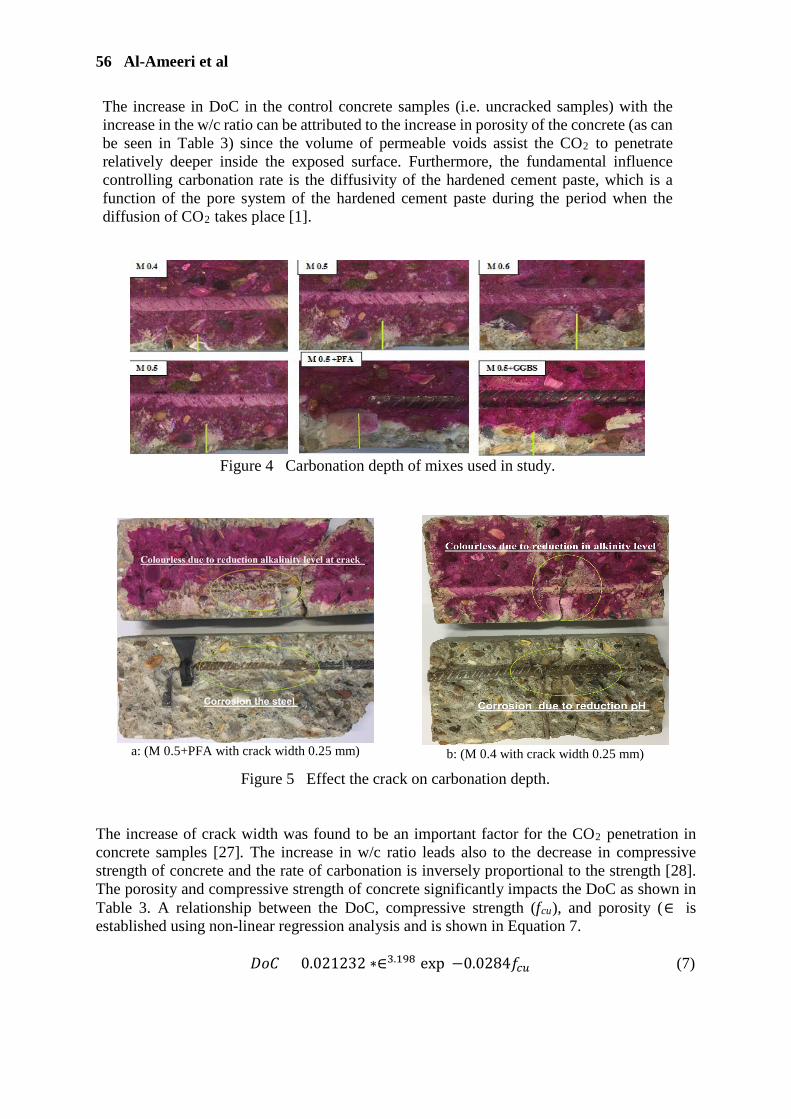
56 Al-Ameeri et al
The increase in DoC in the control concrete samples (i.e. uncracked samples) with the increase in the w/c ratio can be attributed to the increase in porosity of the concrete (as can be seen in Table 3) since the volume of permeable voids assist the CO2 to penetrate relatively deeper inside the exposed surface. Furthermore, the fundamental influence controlling carbonation rate is the diffusivity of the hardened cement paste, which is a function of the pore system of the hardened cement paste during the period when the diffusion of CO2 takes place [1].
Figure 4 Carbonation depth of mixes used in study.
a: (M 0.5+PFA with crack width 0.25 mm)
b: (M 0.4 with crack width 0.25 mm)
Figure 5 Effect the crack on carbonation depth. The increase of crack width was found to be an important factor for the CO2 penetration in concrete samples [27]. The increase in w/c ratio leads also to the decrease in compressive strength of concrete and the rate of carbonation is inversely proportional to the strength [28]. The porosity and compressive strength of concrete significantly impacts the DoC as shown in Table 3. A relationship between the DoC, compressive strength (fcu), and porosity (∈) is established using non-linear regression analysis and is shown in Equation 7. 𝐷𝐷𝑙𝑙𝐶𝐶 = 0.021232 ∗∈3.198 exp(−0.0284𝑓𝑓𝑐𝑐𝑐𝑐) (7)
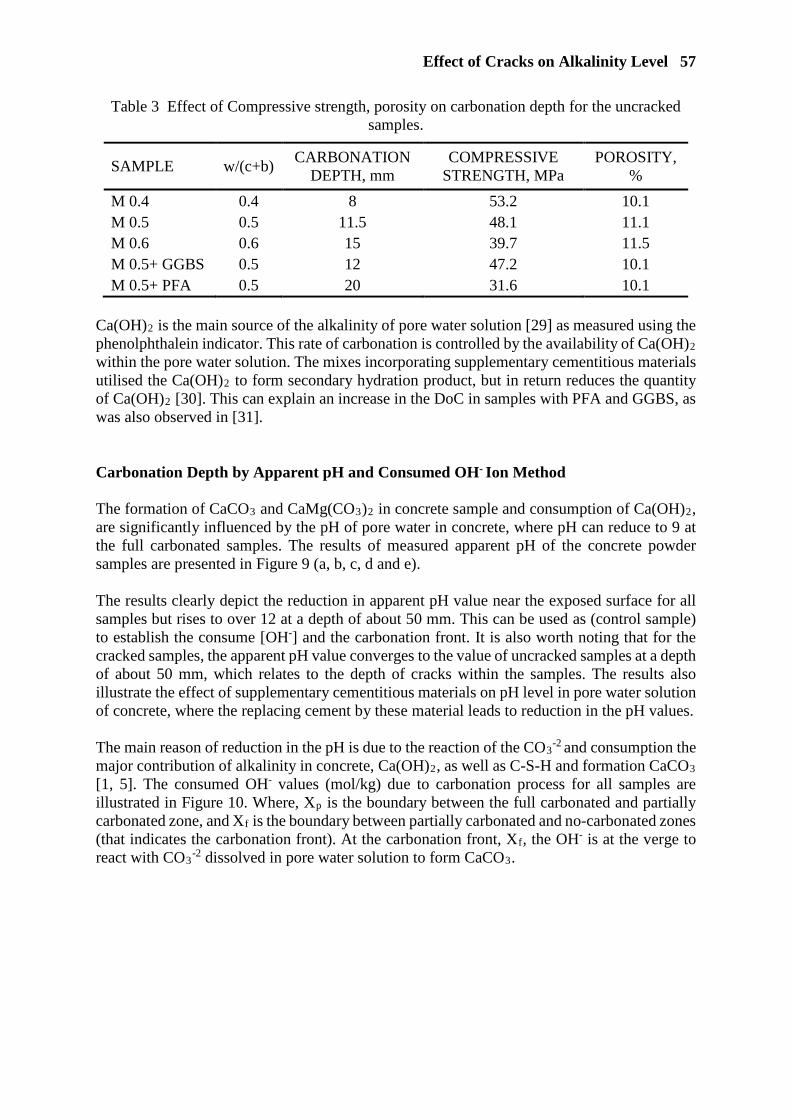
Effect of Cracks on Alkalinity Level 57
Table 3 Effect of Compressive strength, porosity on carbonation depth for the uncracked samples.
SAMPLE w/(c+b) CARBONATION
DEPTH, mm COMPRESSIVE
STRENGTH, MPa POROSITY,
%
M 0.4 0.4 8 53.2 10.1 M 0.5 0.5 11.5 48.1 11.1 M 0.6 0.6 15 39.7 11.5 M 0.5+ GGBS 0.5 12 47.2 10.1 M 0.5+ PFA 0.5 20 31.6 10.1
Ca(OH)2 is the main source of the alkalinity of pore water solution [29] as measured using the phenolphthalein indicator. This rate of carbonation is controlled by the availability of Ca(OH)2 within the pore water solution. The mixes incorporating supplementary cementitious materials utilised the Ca(OH)2 to form secondary hydration product, but in return reduces the quantity of Ca(OH)2 [30]. This can explain an increase in the DoC in samples with PFA and GGBS, as was also observed in [31]. Carbonation Depth by Apparent pH and Consumed OH- Ion Method The formation of CaCO3 and CaMg(CO3)2 in concrete sample and consumption of Ca(OH)2, are significantly influenced by the pH of pore water in concrete, where pH can reduce to 9 at the full carbonated samples. The results of measured apparent pH of the concrete powder samples are presented in Figure 9 (a, b, c, d and e). The results clearly depict the reduction in apparent pH value near the exposed surface for all samples but rises to over 12 at a depth of about 50 mm. This can be used as (control sample) to establish the consume [OH-] and the carbonation front. It is also worth noting that for the cracked samples, the apparent pH value converges to the value of uncracked samples at a depth of about 50 mm, which relates to the depth of cracks within the samples. The results also illustrate the effect of supplementary cementitious materials on pH level in pore water solution of concrete, where the replacing cement by these material leads to reduction in the pH values. The main reason of reduction in the pH is due to the reaction of the CO3
-2 and consumption the major contribution of alkalinity in concrete, Ca(OH)2, as well as C-S-H and formation CaCO3 [1, 5]. The consumed OH- values (mol/kg) due to carbonation process for all samples are illustrated in Figure 10. Where, Xp is the boundary between the full carbonated and partially carbonated zone, and Xf is the boundary between partially carbonated and no-carbonated zones (that indicates the carbonation front). At the carbonation front, Xf, the OH- is at the verge to react with CO3
-2 dissolved in pore water solution to form CaCO3.

58 Al-Ameeri et al
Figure 9 Effect of carbonation on pH level of concrete samples at (CO2=5%, T=35°C and
RH=65% for 8 weeks). The depth of Xp and Xf are summarized in Table 4. The results of consumed OH- shows a significant influence of w/c ratio, crack width and supplementary cementitious materials on consumption of OH- and reduce the alkalinity level in concrete. The increase in w/c ratio lead to increase of consumption of OH- and increase the depth of carbonation front. The results also indicates the carbonation front measured in the cracked specimen is always deeper than the carbonation front obtained in un-cracked specimens for all mixes. The reduction in pH level (and increase in the consumed OH-) with increase in w/b ratio and replacement of supplementary cementitious materials can be attributed to increased porosity and decrease the compressive strength (as previous discussed in relation to data presented in Table 3). Hence, the reduction in apparent pH (and increase the consumption OH-) in samples with PFA and GGBS are higher than CEM II based concrete samples.
11.0
11.3
11.5
11.8
12.0
12.3
12.5
12.8
13.0
0 5 10 15 20 25 30 35 40 45 50 55
pH
DEPTH, mma: M 0.4
M 0.4- UncrakedM 0.4- 0.1 mmM 0.4- 0.15 mmM 0.4- 0.3 mm
10.010.310.610.911.211.511.812.112.412.713.0
0 5 10 15 20 25 30 35 40 45 50 55
pH
DEPTH, mmb: M 0.5
M 0.5-uncrackedM 0.5 -0.1 mmM 0.5 -0.15 mmM 0.5-0.25mm
9.710.010.310.610.911.211.511.812.112.412.713.0
0 5 10 15 20 25 30 35 40 45 50 55
pH
DEPTH, mmc: M 0.6
M 0.6-uncrackedM 0.6-0.05mmM 0.6-0.1mmM 0.6-0.25mm
10.010.310.510.811.011.311.511.812.012.312.512.813.0
0 5 10 15 20 25 30 35 40 45 50 55
pH
DEPTH, mmd: M 0.5+GGBS
M 0.5+GGBS -uncrackedM 0.5+GGBS -0.1 mmM 0.5+GGBS -0.15 mmM 0.5+GGBS -0.25 mm
9.49.7
10.010.310.610.911.211.511.812.112.412.713.0
0 5 10 15 20 25 30 35 40 45 50 55
pH
DEPTH, mme:M 0.5+PFA
M 0.5+PFA uncrackedM 0.5+PFA-0.1mmM 0.5+PFA-0.15mmM 0.5+PFA- 0.25mm
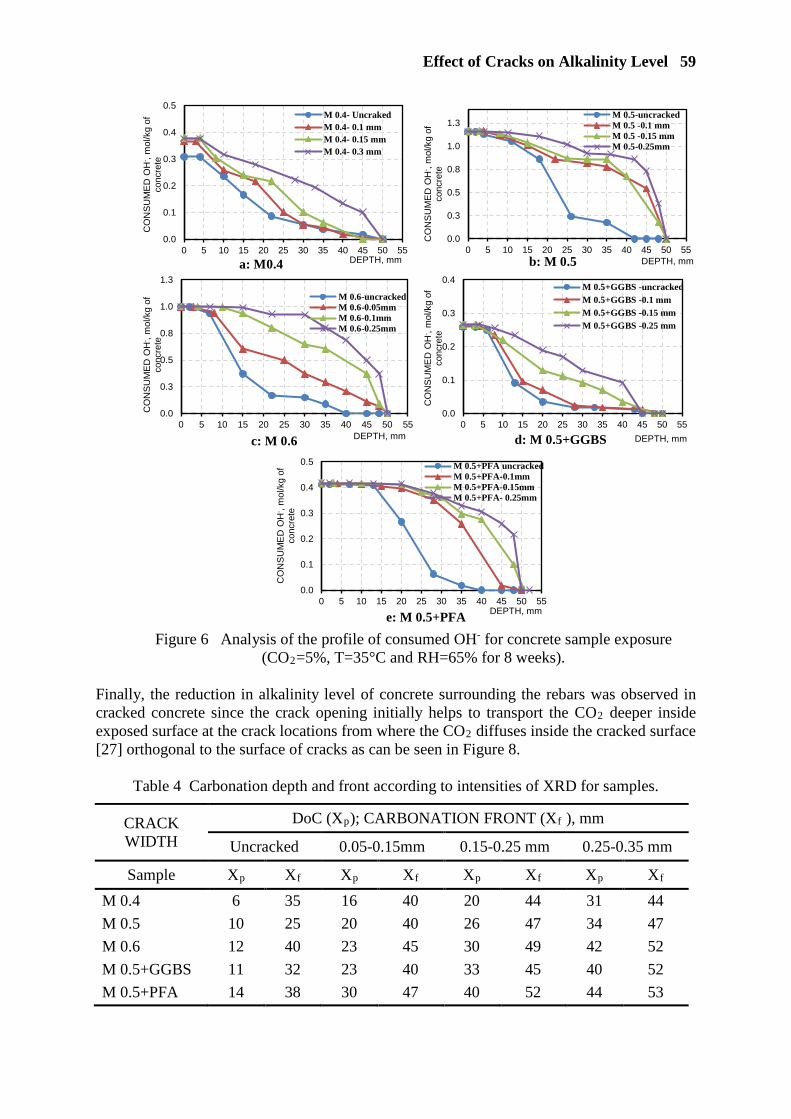
Effect of Cracks on Alkalinity Level 59
Figure 6 Analysis of the profile of consumed OH- for concrete sample exposure
(CO2=5%, T=35°C and RH=65% for 8 weeks). Finally, the reduction in alkalinity level of concrete surrounding the rebars was observed in cracked concrete since the crack opening initially helps to transport the CO2 deeper inside exposed surface at the crack locations from where the CO2 diffuses inside the cracked surface [27] orthogonal to the surface of cracks as can be seen in Figure 8.
Table 4 Carbonation depth and front according to intensities of XRD for samples.
CRACK WIDTH
DoC (Xp); CARBONATION FRONT (Xf ), mm
Uncracked 0.05-0.15mm 0.15-0.25 mm 0.25-0.35 mm
Sample Xp Xf Xp Xf Xp Xf Xp Xf
M 0.4 6 35 16 40 20 44 31 44
M 0.5 10 25 20 40 26 47 34 47
M 0.6 12 40 23 45 30 49 42 52
M 0.5+GGBS 11 32 23 40 33 45 40 52
M 0.5+PFA 14 38 30 47 40 52 44 53
0.0
0.1
0.2
0.3
0.4
0.5
0 5 10 15 20 25 30 35 40 45 50 55
CO
NS
UM
ED
OH
- , m
ol/k
g of
co
ncre
te
DEPTH, mma: M0.4
M 0.4- UncrakedM 0.4- 0.1 mmM 0.4- 0.15 mmM 0.4- 0.3 mm
0.0
0.3
0.5
0.8
1.0
1.3
0 5 10 15 20 25 30 35 40 45 50 55
CO
NS
UM
ED
OH
- , m
ol/k
g of
co
ncre
te
DEPTH, mmb: M 0.5
M 0.5-uncrackedM 0.5 -0.1 mmM 0.5 -0.15 mmM 0.5-0.25mm
0.0
0.3
0.5
0.8
1.0
1.3
0 5 10 15 20 25 30 35 40 45 50 55
CO
NS
UM
ED
OH
- , m
ol/k
g of
co
ncre
te
DEPTH, mmc: M 0.6
M 0.6-uncrackedM 0.6-0.05mmM 0.6-0.1mmM 0.6-0.25mm
0.0
0.1
0.2
0.3
0.4
0 5 10 15 20 25 30 35 40 45 50 55C
ON
SU
ME
D O
H- ,
mol
/kg
of
conc
rete
DEPTH, mmd: M 0.5+GGBS
M 0.5+GGBS -uncracked
M 0.5+GGBS -0.1 mm
M 0.5+GGBS -0.15 mm
M 0.5+GGBS -0.25 mm
0.0
0.1
0.2
0.3
0.4
0.5
0 5 10 15 20 25 30 35 40 45 50 55
CO
NS
UM
ED
OH
- , m
ol/k
g of
co
ncre
te
DEPTH, mme: M 0.5+PFA
M 0.5+PFA uncrackedM 0.5+PFA-0.1mmM 0.5+PFA-0.15mmM 0.5+PFA- 0.25mm
60 Al-Ameeri et al
CONCLUSIONS The influence of cracks caused by loading on the DoC was investigated in this study. Concrete samples were subjected to an accelerated environment test programme. DoC (Xp and Xf) has been obtained using Phenolphthalein Indicator, whilst the carbonation front has been obtained through apparent pH and consumed OH- technique. The effect of partially replacing CEM II cement by the PFA and GGBS on the carbonation depth in cracked concrete was also investigated. The following conclusions can be drawn from the results: 1 The crack width significantly increases the DoC and reduce alkalinity of concrete by
consuming the OH- ions, and reduces the pH level for all mixes used in the study. 2 DoC in the vicinity of the cracks are considerably higher due to relatively faster penetration
of CO2 into the crack followed by orthogonal outward diffusion into the un-cracked concrete surrounding the crack.
3 Results from the apparent pH and consumed OH- technique helps in identifying areas of fully carbonated and un-carbonated concrete in greater detail including the partially carbonated zones.
4 The type of binding materials have vital role on the carbonation penetration depth, whereby the replacement of CEM II cement by supplementary cementitious materials such as PFA and GGBS have significant increase in the DoC and reduce pH level and consumed alkalinity compounds in concrete.
5 The DoC, Xp and front Xf, are influenced by the material behaviours such as porosity, compressive strength and due to their impact of diffusivity of CO2.
REFERENCES 1. NEVILLE A M, Properties of concrete, 2011, (Five and Truly Final Edition) London:
Pearson Education Limited. 2. TARUN R AND RAKESH K, Global warming and cement-based materials, UWM Center
for By-Products Utilization, 2010, Milwaukee, Wisconsin, USA. 3. NEVILLE A M AND BROOKS J J, Concrete Technology, 2010, (Second Edition)
London: Pearson Education Limited. 4. PACHECO J AND POLDER R, Corrosion initiation and propagation in cracked concrete
– a literature review, Proceedings of the 4th International RILEM PhD Workshop, 2010, Madrid, Spain.
5. DYER T D, Concrete durability. New York, 2014, Taylor& Francis Group, LLC. 6. BROOMFIELD J P, Corrosion of steel in concrete. 2nd edition, 2007, London, Taylor
&Francis. 7. SONG H, KWON S, BYUN K AND PARK C, Predicting carbonation in early-aged
cracked concrete, Cement and Concrete Research, Vol. 36, No. 5, 2006, pp. 979-989. 8. JANG S Y, KIM B O AND OH B H, Effect of crack width on chloride diffusion
coefficients of concrete by steady-state migration tests, Cement and Concrete Research, Vol. 41, No. 1, 2011, pp. 9-19.
9. BS EN 197-1: 2011. Cement — Part 1: Composition, specifications and conformity criteria for common cements.
10. BS EN 15167-1: 2006. Ground granulated blast furnace slag for use in concrete, mortar and grout — Part 1: Definitions, specifications and conformity criteria. British Standard Institution.
Effect of Cracks on Alkalinity Level 61
11. BS EN 450-1: 2012. Fly ash for concrete — Part 1: Definition, specifications and conformity criteria.
12. BS 882-1983. Aggregate from natural sources for concrete. 13. TEYCHENNE D C, FRANKLIN R E AND ERNTROY H C, Design of normal concrete
mixes, Building Research Establishment, 1988, Second edition, Garston, Watford. 14. BS EN 12390-2:2009. Testing hardened concrete: Making and curing specimens for
strength tests. 15. AL-SAMARAAI M AND RAOUF Z, Non-destructive tests for concrete, 1999, University
of Sharqiyah, UEA. 16. CHI J M, HUANG R AND YANLG C, Effect of Carbonation on Mechanical Properties
and Durability of Concrete Using Accelerating Testing Method, Journal of Marine Science and Technology, Vol. 10, No. 1, 2002, pp. 14-20.
17. ASTM C642:2013, Density, Absorption, and Voids in Hardened Concrete. 18. BS EN 12390-3:2000. Testing hardened Concrete — Part 3: Compressive strength of test
specimens. 19. BS EN13295:2004. Products and systems for the protection and repair of concrete
structures — Test methods — Determination of resistance to carbonation. 20. AL-AMOUDI O, RASHEEDUZZAFAR A AND MASLEHUDDIN M, Carbonation and
corrosion of rebars in salt contaminated OPC/PFA concretes, Cement and Concrete Research, Vol. 21, 1991, pp. 38-50.
21- CEN/TS 12390-10:2007. Testing hardened concrete. Determination of the relative carbonation resistance of concrete.
22. McPOLIN D O, BASHEER P A, LONG A E, GRATTAN K T AND SUN T, New Test Method to Obtain pH Profiles due to Carbonation of Concretes Containing Supplementary Cementitious Materials, Journal of Materials in Civil Engineering, ASCE, Vol. 19, November 2007, pp. 936-946.
23. WANG Y C, BASHEER P A, NANUKUTTAN S V AND BAI Y, Progress of Carbonation in Chloride Contaminated Concretes, 5th International Conference on Durability of Concrete Structures Jun 30–Jul 1, 2016, Shenzhen University, Shenzhen, Guangdong Province, P. R. China, pp. 317-327.
24. BS EN ISO 10523:2012. Water quality — Determination of pH. British Standard Institution.
25. LI L, SAGÜÉS A A AND POOR N, In situ leaching investigation of pH and nitrite concentration in concrete pore solution, Cement and Concrete Research, Vol. 29, No.3, 1999, pp. 315-321.
26. SURYAVANSHI A AND NARAYAN SWAMY R, Stability of Friedel’s salt in carbonated concrete structural elements, Cement and Concrete Research, Vol. 26 No. 5, 1996, pp. 729-741.
27. AL-AMEERI A, RAFIQ M AND TSIOULOU O, Influence of cracks on the carbonation resistance of concrete structures, Sixth International Conference on the Durability of Concrete Structures, University of Leeds, 2018, pp. 358-367.
28. ROY S, POH K, NORTHWOOD D, Durability of concrete accelerated carbonation and weathering studies, Building and Environment, Vol. 34, No. 5, 1999, pp. 486-595.
29. CHANG C AND CHEN J, The experimental investigation of concrete carbonation depth, Cement and Concrete Research, Vol. 36, 2006, pp. 1760-1767.
30. ROY D M AND INDORN G M, Hydration, Structure and Properties of Blast Furnace Slag Cement, Mortar and Concrete, ACI Journal, Nov. - Dec. 1982, pp. 444-457.
31. LAGERBLAD B, Carbon dioxide uptake during concrete life cycle-state of the art, CBI Report 2:2005, Swedish Cement and Concrete Research Institute, SE-100 44, Stockholm.
APPLICATION OF BIOMASS ASHES IN CONSTRUCTION MATERIALS
F Van Dijen
ENGIE Laborelec
Belgium
ABSTRACT. ENGIE Laborelec investigated applications of ashes from the combustion of fresh wood and bark. These ashes can be used for making construction materials like fired bricks, calcium silicate blocks and geo-polymers. Water-leaching of the ashes, with recovery of potassium, prior to application in construction materials can be beneficial. With water-leaching especially salts, molybdenum and chromium-6 are removed from the ashes. The (water-leached) ashes can be used for replacing part of the clay with fired bricks. The ashes can replace hydrated lime with calcium silicate blocks. The ashes can be used as activator with geo-polymers. Here geo-polymers were based on the pozzolanic aluminium silicates ground granulated blast furnace slag (GGBFS) and bituminous coal fly ash. Excellent materials were obtained: high compressive strength, low water uptake and limited water-leaching. The term pozzolanic has similar meaning as (latent) hydraulic, as they all mean hardening with water [2]. Reference [1] includes dozens of relevant literature references. Keywords: Geo-polymers, Fired bricks, Calcium silicate blocks, Roman concrete, Activators, Wood fly ash, Bark fly ash, GGBFS, Blast furnace slag, Bituminous coal fly ash Frans van Dijen is consultant at ENGIE Laborelec. He works mainly in the fields of heat, power, fuels, flue gas cleaning, combustion, residues. He has published extensively on power generation aspects and technical ceramics.

Application of Biomass Ashes 63
INTRODUCTION
ENGIE Laborelec participates in the EU Biofficiency project, which is about drastically improving combustion of solid biomass fuels. Within this project, Laborelec is responsible for biomass ash analyses and valorisation of the biomass ashes. In agreement with EU policies and EU legislation, we look at applications of biomass ashes in top soils and in construction materials. We also consider the use of additives with fuel treatment, combustion and flue gas purification. We also consider pretreatment of biomass fuels and biomass ashes, especially water-leaching for removal of the elements K, Na, Cl and S from the biomass fuels, and salts containing K, Na, Cl and S from the biomass ashes. With water-leaching of biomass ashes, Cr-6 and Mo are removed as well. Water-leaching of biomass fuels and biomass ashes should at least be combined with recovery of potassium, also from a financial point of view. In this paper mainly ashes from bark and fresh wood are considered. Biomass fuels with a relatively high phosphorus content should be combusted in mono combustion, which allows for special application of the ashes and/or recovery of phosphate. The construction materials fired bricks, calcium silicate blocks and geo-polymers are considered in this paper. Here, geo-polymers are based on pozzolanic aluminium silicates. The main compounds of fly ash from fresh wood or bark are CaO, K2O and SiO2, according to XRF analyses. The CaO is also present as calcite. The potassium is also present as KCl, K2SO4 and K2CO3.
RAW MATERIALS AND ANALYSES
Most of the raw materials used, especially fly ashes of bituminous coal, wood and bark are not homogeneous on a microscopic scale. Simple analyses regarding the chemical composition is far from sufficient to characterise these raw materials. We applied XRF, XRD, ICP-AES, TGA & DSC, basic analyses and more [1, 3]. SEM & EDX is also applied for characterisation of fly ash [3]. Even this combination of analyses techniques proved not sufficient for complete characterisation of the fly ashes. The fly ash characteristics do not only depend on the fuel, like bituminous coal, wood or bark, but also on the type of combustion, like circulating fluidised bed combustion (CFBC) or pulverised fuel combustion (PFC), and on the fly ash treatment, like water-leaching. With combustion, especially the combustion temperature is important. This combustion temperature is about 900°C with CFBC and more than 1500°C with PFC. With water-leaching, some salts are removed, but there are also reactions, like:
CaO + H2O = Ca(OH)2 K2CO3 + Ca(OH)2 = CaCO3 + 2 KOH
K2SO4 + Ca(OH)2 + 2 H2O = CaSO4.2H2O + 2 KOH
KCl is completely dissolved and removed. Part of the potassium, part of the sodium, some of the calcium, part of the sulfate and almost all Cl are water-leached from the fly ashes of wood and bark. Mo and Cr-6 are also water-leached. From PFC wood fly ash some B is water-leached as well [1]. For some of the construction materials produced, we also applied SEM & EDX and TEM & EDX [1].
64 Van Dijen
CONSTRUCTION MATERIALS
Fired Bricks
Two Dutch river clays were mixed with respectively 0, 5 and 25 wt.% wood fly ash, from PFC. Small bars were made, dried and fired at 1080°C, for 6 hours and at oxidizing atmosphere. Both, wood fly ash and water-leached wood fly ash were tested. With water-leaching the salts are removed, especially K, Na, SO3 and Cl, but also molybdenum and chromium-6. The wood fly ash was obtained from a large-scale PFC power plant in Belgium. Due to the high calcium content of the wood fly ash, the fired bricks changed colour, from red to yellow. Due to mobile Ca(OH)2 present, which moves to the outside of the bricks on drying, a coloured coating appeared on the bricks. The water-leaching behaviour of the fired bricks, with and without (water-leached) wood fly ash, remained similar. Different leaching tests were applied, like EN 772-5, EN 772-21, NEN 7375 and NEN 6966 [1]. Adding a filler to clay for making fired bricks is state-of-the-art with very fine clays, as it improves extrusion and drying of the shaped clay. Producers of fired bricks prefer water-leached wood fly ash, as the presence of chloride and sulphate may cause problems regarding emissions with flue gases and corrosion of the ovens and dryers. They would also like to see the lime and hydrated lime of the wood fly ash reacted with CO2, for formation of calcium carbonate, which limits the mobility of calcium upon drying of the shaped bricks. Calcium Silicate Blocks
Here, we had the intention of replacing hydrated lime by (water-leached) fly ash from wood or bark. The quartz sand and hydrated lime or (water-leached) fly ash from wood or bark were dry mixed, using a zirconia ball mill, for 15 minutes. The bark fly ash was obtained from a large-scale CFBC cogeneration plant in Finland. After mixing / desagglomeration / milling, the mixture was screened over a 300 µm screen. After addition of about 10 g of water to 100 g of dry mixture, small tablets were pressed with a weight of about 1.1 g each. The tablets had a diameter of 13 mm and a pressure of 4 tons was applied. The tablets were heated in steam at about 180 to 200°C and 12 bars, for about 16 hours. Next, we measured compressive strength, bulk density, water uptake and water-leaching. The small samples size adds to obtaining a high compressive strength, according to Weibull statistics for ceramic materials. For water-leaching, the process was at room temperature, lasted at least 24 hours and the water to dry solids weight ratio was about 2. The small tablets were used for water-leaching. Some of the results obtained are presented in Table 1.
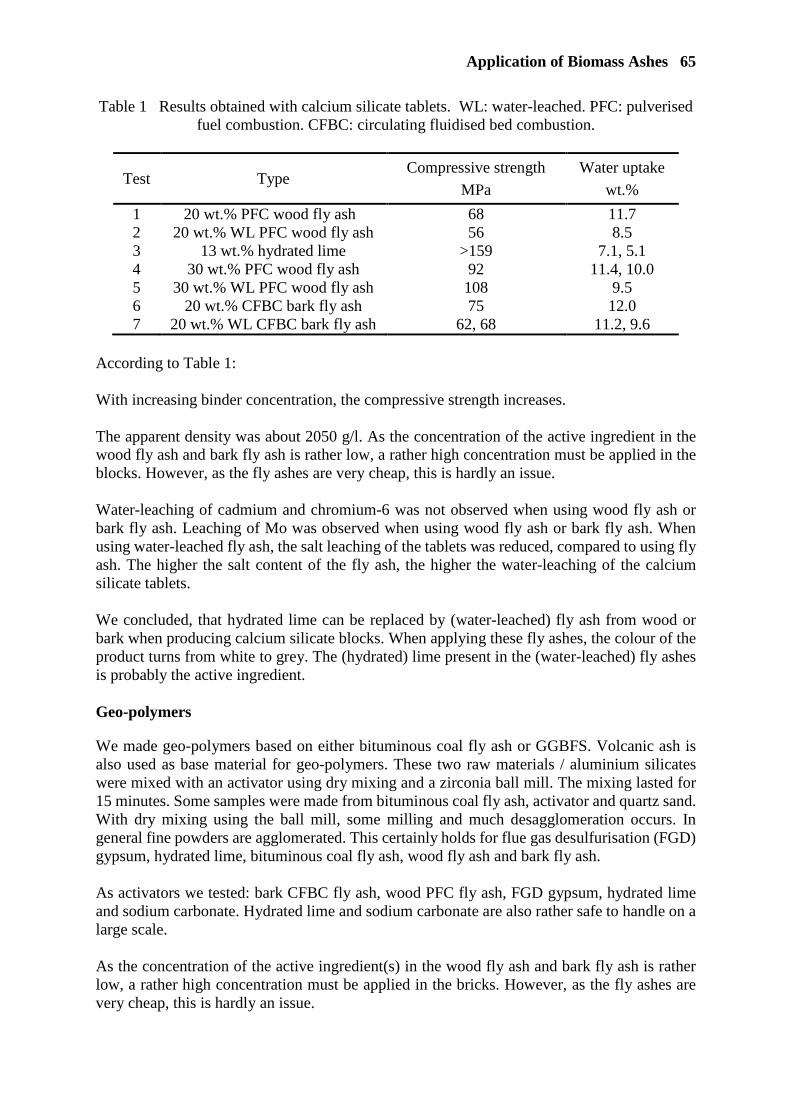
Application of Biomass Ashes 65
Table 1 Results obtained with calcium silicate tablets. WL: water-leached. PFC: pulverised fuel combustion. CFBC: circulating fluidised bed combustion.
Test Type Compressive strength
MPa
Water uptake
wt.%
1 2 3 4 5 6 7
20 wt.% PFC wood fly ash 20 wt.% WL PFC wood fly ash
13 wt.% hydrated lime 30 wt.% PFC wood fly ash
30 wt.% WL PFC wood fly ash 20 wt.% CFBC bark fly ash
20 wt.% WL CFBC bark fly ash
68 56
>159 92 108 75
62, 68
11.7 8.5
7.1, 5.1 11.4, 10.0
9.5 12.0
11.2, 9.6
According to Table 1: With increasing binder concentration, the compressive strength increases.
The apparent density was about 2050 g/l. As the concentration of the active ingredient in the wood fly ash and bark fly ash is rather low, a rather high concentration must be applied in the blocks. However, as the fly ashes are very cheap, this is hardly an issue. Water-leaching of cadmium and chromium-6 was not observed when using wood fly ash or bark fly ash. Leaching of Mo was observed when using wood fly ash or bark fly ash. When using water-leached fly ash, the salt leaching of the tablets was reduced, compared to using fly ash. The higher the salt content of the fly ash, the higher the water-leaching of the calcium silicate tablets. We concluded, that hydrated lime can be replaced by (water-leached) fly ash from wood or bark when producing calcium silicate blocks. When applying these fly ashes, the colour of the product turns from white to grey. The (hydrated) lime present in the (water-leached) fly ashes is probably the active ingredient. Geo-polymers
We made geo-polymers based on either bituminous coal fly ash or GGBFS. Volcanic ash is also used as base material for geo-polymers. These two raw materials / aluminium silicates were mixed with an activator using dry mixing and a zirconia ball mill. The mixing lasted for 15 minutes. Some samples were made from bituminous coal fly ash, activator and quartz sand. With dry mixing using the ball mill, some milling and much desagglomeration occurs. In general fine powders are agglomerated. This certainly holds for flue gas desulfurisation (FGD) gypsum, hydrated lime, bituminous coal fly ash, wood fly ash and bark fly ash. As activators we tested: bark CFBC fly ash, wood PFC fly ash, FGD gypsum, hydrated lime and sodium carbonate. Hydrated lime and sodium carbonate are also rather safe to handle on a large scale. As the concentration of the active ingredient(s) in the wood fly ash and bark fly ash is rather low, a rather high concentration must be applied in the bricks. However, as the fly ashes are very cheap, this is hardly an issue.

66 Van Dijen
After mixing / desagglomeration / milling, the mixture was screened over a 300 µm screen. Tablets were made from the mixtures, either by casting or by dry pressing. For casting, to 100 g of dry mixture 35 g of water was added (plus some soap in one case). For dry pressing, to 100 g of dry mixture about 15 g of water was added. With dry pressing, tablets with a diameter of 13 mm, a height of about 4 mm and a dry weight of about 1 g were made. A pressure of 4 tons was applied. With casting, tablets with a diameter of about 30 mm, a height of about 20 mm and a dry weight of about 20 g were made. The tablets were cured for 28 days at 35°C and 100% relative humidity, by placing them in sealed plastic pots with water. After curing, the density, water uptake, the compressive strength and water-leaching were determined. Some of the results obtained are presented in the tables 2 and 3. The small samples size adds to obtaining a high compressive strength, according to Weibull statistics for ceramic materials. For water-leaching, the process was at room temperature, lasted at least 24 hours and the water to dry solids weight ratio was about 2. The small, dry-pressed tablets and the bigger, cast tablets were used for water-leaching.
Table 2 Results obtained with GGBFS geo-polymers. C: cast. DP: dry pressed
TEST TYPE COMPRESSIVE
STRENGTH, MPa
WATER UPTAKE
wt.%
1 DP 1 C 2 C 3 C 4 C
5 DP 5 C
6 DP 6 C 7 C 8 C 9 C 10 C 11 C 12 C
10 wt.% sodium carbonate 10 wt.% sodium carbonate 10 wt.% PFC wood fly ash 20 wt.% PFC wood fly ash
20 wt.% WL PFC wood fly ash 10 wt.% gypsum 10 wt.% gypsum
10 wt.% hydrated lime 10 wt.% hydrated lime
30 wt.% PFC wood fly ash 30 wt.% WL PFC wood fly ash
30 wt.% CFBC bark fly ash 30 wt.% WL CFBC bark fly ash
15 wt.% hydrated lime 20 wt.% PFC wood fly ash, 10 wt.%
gypsum
153 129 16 29 43 125 81 108 28
38-44 50-64
62 61 52 44
3 8 15
14.5 12 7.5 8.5 6.5 14 24
18.5 15.5 14 19 16
According to Table 2:
• Better results are obtained with dry pressing, compared to casting • All materials tested act as activator: bark fly ash, wood fly ash, gypsum, hydrated lime
and sodium carbonate • With increasing activator concentration, the compressive strength increases • Gypsum is an excellent activator for GGBFS: a high compressive strength is obtained
and gypsum is cheap [3].
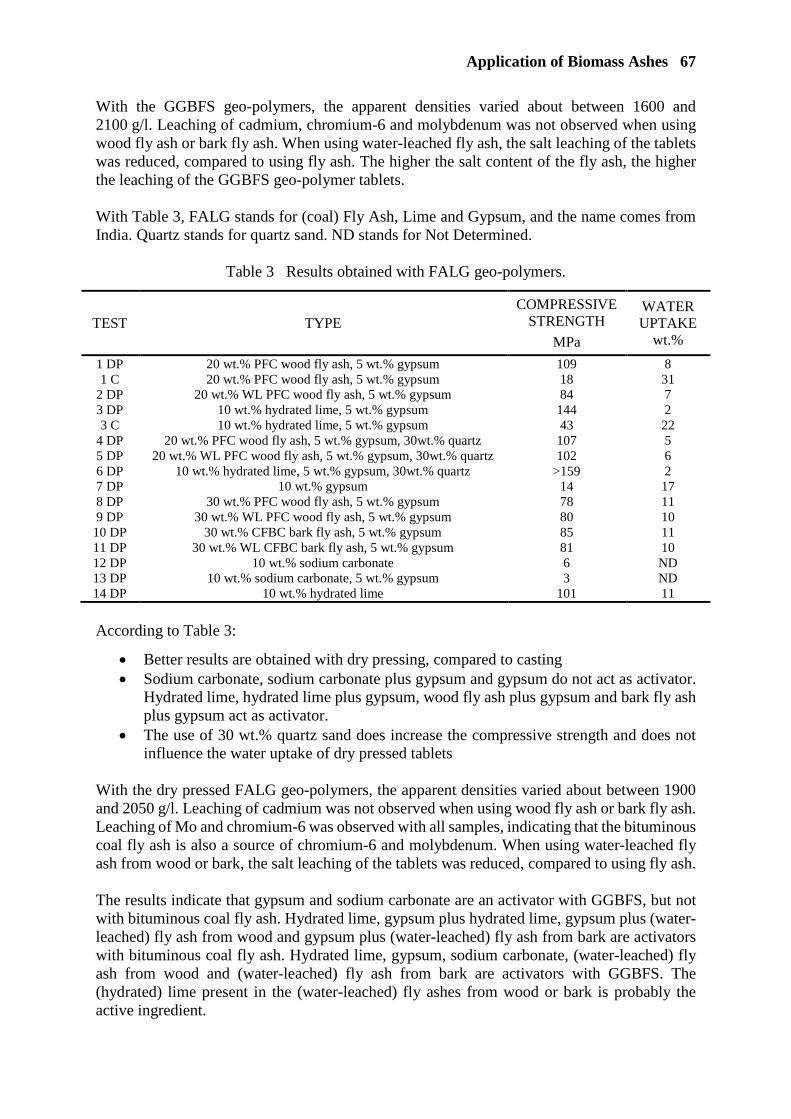
Application of Biomass Ashes 67
With the GGBFS geo-polymers, the apparent densities varied about between 1600 and 2100 g/l. Leaching of cadmium, chromium-6 and molybdenum was not observed when using wood fly ash or bark fly ash. When using water-leached fly ash, the salt leaching of the tablets was reduced, compared to using fly ash. The higher the salt content of the fly ash, the higher the leaching of the GGBFS geo-polymer tablets. With Table 3, FALG stands for (coal) Fly Ash, Lime and Gypsum, and the name comes from India. Quartz stands for quartz sand. ND stands for Not Determined.
Table 3 Results obtained with FALG geo-polymers.
TEST TYPE COMPRESSIVE
STRENGTH
MPa
WATER UPTAKE
wt.%
1 DP 1 C
2 DP 3 DP 3 C
4 DP 5 DP 6 DP 7 DP 8 DP 9 DP
10 DP 11 DP 12 DP 13 DP 14 DP
20 wt.% PFC wood fly ash, 5 wt.% gypsum 20 wt.% PFC wood fly ash, 5 wt.% gypsum
20 wt.% WL PFC wood fly ash, 5 wt.% gypsum 10 wt.% hydrated lime, 5 wt.% gypsum 10 wt.% hydrated lime, 5 wt.% gypsum
20 wt.% PFC wood fly ash, 5 wt.% gypsum, 30wt.% quartz 20 wt.% WL PFC wood fly ash, 5 wt.% gypsum, 30wt.% quartz
10 wt.% hydrated lime, 5 wt.% gypsum, 30wt.% quartz 10 wt.% gypsum
30 wt.% PFC wood fly ash, 5 wt.% gypsum 30 wt.% WL PFC wood fly ash, 5 wt.% gypsum
30 wt.% CFBC bark fly ash, 5 wt.% gypsum 30 wt.% WL CFBC bark fly ash, 5 wt.% gypsum
10 wt.% sodium carbonate 10 wt.% sodium carbonate, 5 wt.% gypsum
10 wt.% hydrated lime
109 18 84
144 43
107 102
>159 14 78 80 85 81 6 3
101
8 31 7 2 22 5 6 2 17 11 10 11 10 ND ND 11
According to Table 3:
• Better results are obtained with dry pressing, compared to casting • Sodium carbonate, sodium carbonate plus gypsum and gypsum do not act as activator.
Hydrated lime, hydrated lime plus gypsum, wood fly ash plus gypsum and bark fly ash plus gypsum act as activator.
• The use of 30 wt.% quartz sand does increase the compressive strength and does not influence the water uptake of dry pressed tablets
With the dry pressed FALG geo-polymers, the apparent densities varied about between 1900 and 2050 g/l. Leaching of cadmium was not observed when using wood fly ash or bark fly ash. Leaching of Mo and chromium-6 was observed with all samples, indicating that the bituminous coal fly ash is also a source of chromium-6 and molybdenum. When using water-leached fly ash from wood or bark, the salt leaching of the tablets was reduced, compared to using fly ash. The results indicate that gypsum and sodium carbonate are an activator with GGBFS, but not with bituminous coal fly ash. Hydrated lime, gypsum plus hydrated lime, gypsum plus (water-leached) fly ash from wood and gypsum plus (water-leached) fly ash from bark are activators with bituminous coal fly ash. Hydrated lime, gypsum, sodium carbonate, (water-leached) fly ash from wood and (water-leached) fly ash from bark are activators with GGBFS. The (hydrated) lime present in the (water-leached) fly ashes from wood or bark is probably the active ingredient.

68 Van Dijen
The results show that highest strengths are obtained by dry pressing, compared to casting. With dry pressing about 15 wt.% water is added to the mixture, compared to about 35 wt.% with casting. A low ratio of water/binder adds to a high compressive strength. Dry pressing also results in a high apparent density, compared to casting, which adds to a high compressive strength and a low water uptake. These results can amongst others be compared with those of reference [4], which used bituminous coal fly ash and sodium compounds for producing geo-polymers. These results can also be compared with those of reference [3], which used GGBFS and gypsum, amongst others. When water-leached fly ash is used, water-leaching of the geo-polymers is reduced as well.
CONCLUSIONS
In agreement with EU policies and EU legislation, ashes from biomass fuels, like wood and bark, can be used in construction materials, like fired bricks, calcium silicate blocks and geo-polymers. Water-leaching of ashes, combined with recovery of potassium salts, seems advantageous. With calcium silicate materials and geo-polymers, high compressive strength and low water uptake can be obtained. Leaching of salts and heavy metals can be limited indeed, including chromium-6, cadmium, and other toxic elements. Calcium silicate materials and geo-polymers with high compressive strengths of more than 50 MPa, even more than 100 MPa, are obtained by good processing, including dry pressing. The small samples size used adds to obtaining a high compressive strength, according to Weibull statistics for ceramic materials. It is also demonstrated that the different “aluminium silicates” can behave very different regarding the production of geo-polymers. With the production of construction materials, the water-leaching should be reduced due to the formation of a new chemical matrix and reduction of the specific surface area. By using residues for the production of geo-polymers, the costs of the feedstocks are low, the emissions of CO2 are low and energy consumption is low, especially when compared to using ordinary Portland cement (as binder). These results also offer a positive outlook for valorisation of ashes from lignites and from sub-bituminous coals.
REFERENCES
1. VAN DIJEN, F K, Bio-Efficiency, work package 6, analyses and utilisation of biomass ash (with additives), ENGIE Laborelec, 2019, to be published
2. LIVESEY, P, Hydraulicity, The building conservation directory, 2003, http://www.buildingconservation.com/articles/hydraulicity/hydraulicity.htm
3. SARABER, A, Ph. D. thesis, Fly ash from coal and biomass for use in concrete – Origin, properties and performance, Delft University of Technology, 2017
4. RANGAN, B V, Curtin University of Technology, Low-calcium fly ash-based geopolymer concrete, Research reports GC 1, GC 2 and GC 3, 2006; and GC 4, 2008

BIOMASS ASH AND OPTIONS FOR UTILIZATION: A EUROPEAN PERSPECTIVE
N Bech
Emineral A/S
Denmark
A Sarabèr
Vliegasunie
The Netherlands
H-J Feuerborn
VGB PowerTech
Germany
ABSTRACT. Biomass is increasingly used for power and heat production in a number of EU member states. On one hand it is an option for CO2-neutral production and on the other to serve for heat in the winter month. The situation in the member states differs for fuel and combustion technology and also for the utilization options of the resulting ashes. Biomass ash is produced by combustion by a wide variety of biomass types in different types of boilers for energy and heat production of different size. That leads to biomass ashes of different properties which are decisive for their (potential) use in the different applications. A survey has been performed of potential applications of biomass ashes and the status of these. However due to several reasons, only limited applications are implemented on a large scale and in specific countries due to different regulations. Biomass ashes are used in forestry, agriculture (fertilizer, soil liming), building materials (e.g. asphalt filler) and civil engineering (e.g. road construction). Applications are addressed in some fertilizer acts (mostly coarse fraction of wood ashes) and in aggregate standards. Beside the requirements in the acts and standards they also have to meet environmental criteria. Main conclusion is that on EU scale, utilization of biomass ashes is at the beginning of the transformation process from waste into a useful product. The experience with this process for coal fly ash and the experience with biomass ash utilization in countries like in Scandinavia may be very helpful to accelerate this process in the single member states. Keywords: Biomass ash, Ash utilization, European perspective, Dr Nicolai Bech, Emineral A/S, Denmark, is a chemical engineer with a PhD in coal combustion. Having pursued a career in various aspects of engineering until 30 years ago he entered the power industry becoming fully engaged in all aspects of ash, gypsum and other secondary materials from the power industry for 20 years. Dr. ing. Angelo Sarabèr MSc is senior product manager at Vliegasunie. He is convenor of CEN TC 104/WG 4 Fly ash a board member of ECOBA, the European Coal Combustion Products Association and a member of several Dutch committees regarding concrete. Dr.Ing Hans-Joachim Feuerborn VGB PowerTech, Germany, is the Secretary General for ECOBA, the European Coal Combustion Products Association. He is actively involved in several European and German standardisation committees.
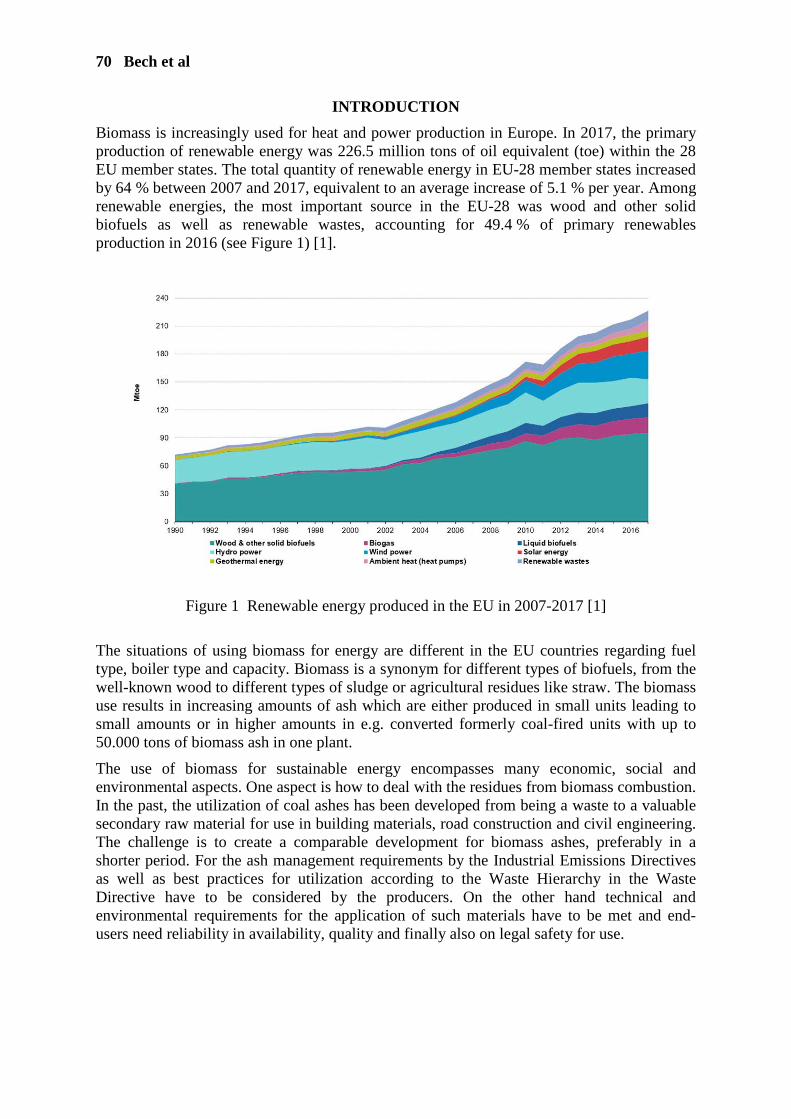
70 Bech et al
INTRODUCTION
Biomass is increasingly used for heat and power production in Europe. In 2017, the primary production of renewable energy was 226.5 million tons of oil equivalent (toe) within the 28 EU member states. The total quantity of renewable energy in EU-28 member states increased by 64 % between 2007 and 2017, equivalent to an average increase of 5.1 % per year. Among renewable energies, the most important source in the EU-28 was wood and other solid biofuels as well as renewable wastes, accounting for 49.4 % of primary renewables production in 2016 (see Figure 1) [1].
Figure 1 Renewable energy produced in the EU in 2007-2017 [1]
The situations of using biomass for energy are different in the EU countries regarding fuel type, boiler type and capacity. Biomass is a synonym for different types of biofuels, from the well-known wood to different types of sludge or agricultural residues like straw. The biomass use results in increasing amounts of ash which are either produced in small units leading to small amounts or in higher amounts in e.g. converted formerly coal-fired units with up to 50.000 tons of biomass ash in one plant.
The use of biomass for sustainable energy encompasses many economic, social and environmental aspects. One aspect is how to deal with the residues from biomass combustion. In the past, the utilization of coal ashes has been developed from being a waste to a valuable secondary raw material for use in building materials, road construction and civil engineering. The challenge is to create a comparable development for biomass ashes, preferably in a shorter period. For the ash management requirements by the Industrial Emissions Directives as well as best practices for utilization according to the Waste Hierarchy in the Waste Directive have to be considered by the producers. On the other hand technical and environmental requirements for the application of such materials have to be met and end-users need reliability in availability, quality and finally also on legal safety for use.
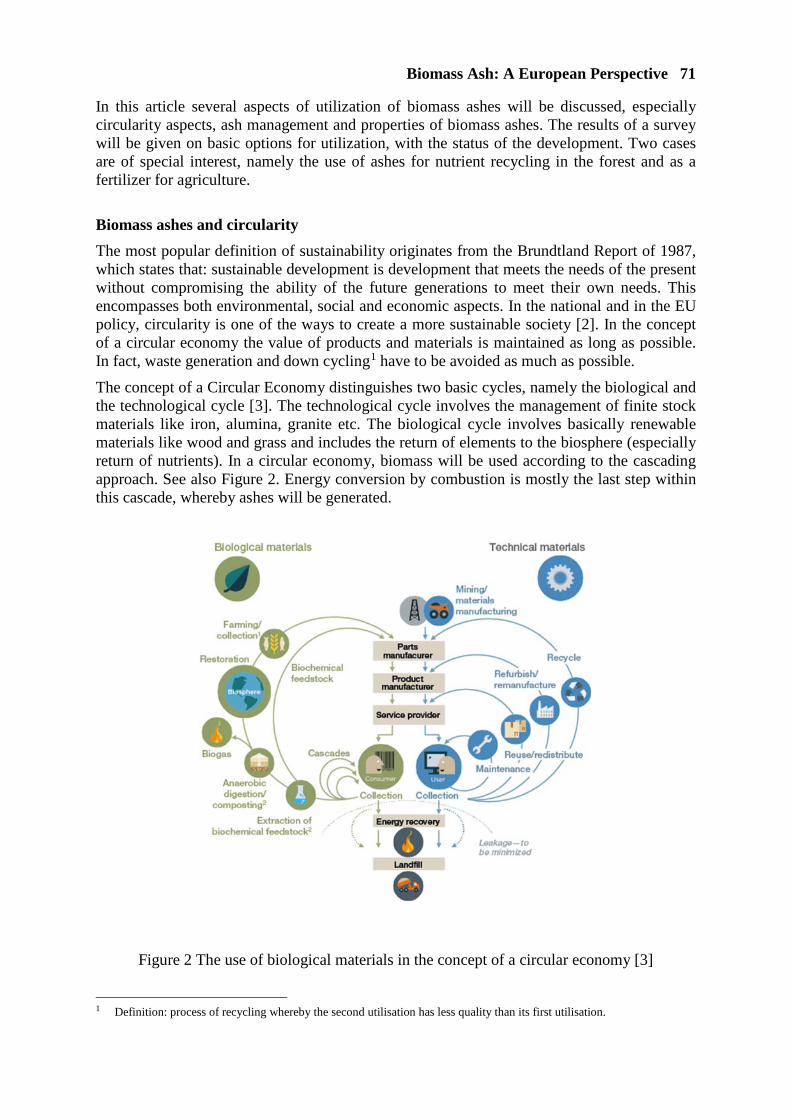
Biomass Ash: A European Perspective 71
In this article several aspects of utilization of biomass ashes will be discussed, especially circularity aspects, ash management and properties of biomass ashes. The results of a survey will be given on basic options for utilization, with the status of the development. Two cases are of special interest, namely the use of ashes for nutrient recycling in the forest and as a fertilizer for agriculture.
Biomass ashes and circularity
The most popular definition of sustainability originates from the Brundtland Report of 1987, which states that: sustainable development is development that meets the needs of the present without compromising the ability of the future generations to meet their own needs. This encompasses both environmental, social and economic aspects. In the national and in the EU policy, circularity is one of the ways to create a more sustainable society [2]. In the concept of a circular economy the value of products and materials is maintained as long as possible. In fact, waste generation and down cycling1 have to be avoided as much as possible.
The concept of a Circular Economy distinguishes two basic cycles, namely the biological and the technological cycle [3]. The technological cycle involves the management of finite stock materials like iron, alumina, granite etc. The biological cycle involves basically renewable materials like wood and grass and includes the return of elements to the biosphere (especially return of nutrients). In a circular economy, biomass will be used according to the cascading approach. See also Figure 2. Energy conversion by combustion is mostly the last step within this cascade, whereby ashes will be generated.
Figure 2 The use of biological materials in the concept of a circular economy [3]
1 Definition: process of recycling whereby the second utilisation has less quality than its first utilisation.
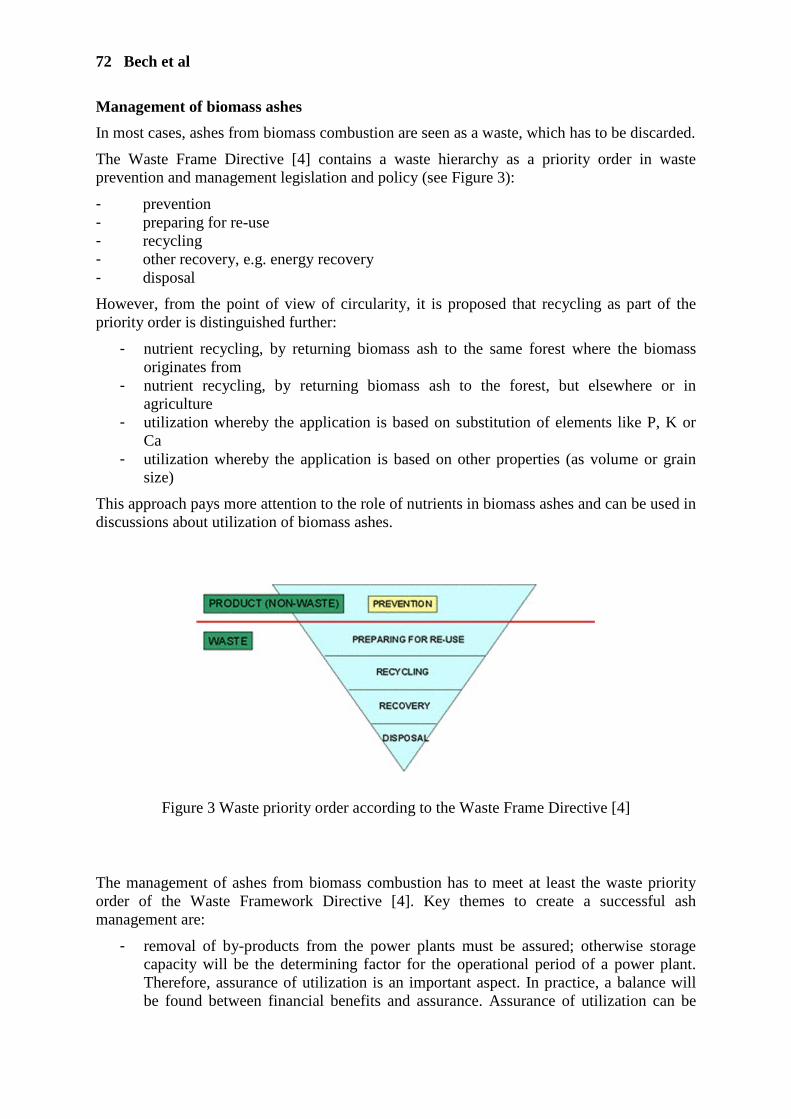
72 Bech et al
Management of biomass ashes
In most cases, ashes from biomass combustion are seen as a waste, which has to be discarded.
The Waste Frame Directive [4] contains a waste hierarchy as a priority order in waste prevention and management legislation and policy (see Figure 3):
- prevention - preparing for re-use - recycling - other recovery, e.g. energy recovery - disposal
However, from the point of view of circularity, it is proposed that recycling as part of the priority order is distinguished further:
- nutrient recycling, by returning biomass ash to the same forest where the biomass originates from
- nutrient recycling, by returning biomass ash to the forest, but elsewhere or in agriculture
- utilization whereby the application is based on substitution of elements like P, K or Ca
- utilization whereby the application is based on other properties (as volume or grain size)
This approach pays more attention to the role of nutrients in biomass ashes and can be used in discussions about utilization of biomass ashes.
Figure 3 Waste priority order according to the Waste Frame Directive [4]
The management of ashes from biomass combustion has to meet at least the waste priority order of the Waste Framework Directive [4]. Key themes to create a successful ash management are:
- removal of by-products from the power plants must be assured; otherwise storage capacity will be the determining factor for the operational period of a power plant. Therefore, assurance of utilization is an important aspect. In practice, a balance will be found between financial benefits and assurance. Assurance of utilization can be

Biomass Ash: A European Perspective 73
promoted by closing long-term contracts with customers and risk spreading by having different applications and/or customers.
- the by-product chain from generation at the power plant to end-user must comply with the current regulations. This applies to regulations concerning transport, waste legislation, health and safety, environment and technical aspects.
- utilisation must be sustainable.
- utilisation must generate maximum financial benefits (or minimum of costs).
- utilisation options must be accepted by society and must comply with the power brand (green power, grey power).
Properties of biomass ashes
The properties of biomass ashes depend on three factors: the origin of biomass, the combustion process and the ash removal system. Generally, the presence of ash forming matter in biomass is based on the uptake of inorganic elements by the plant due to its need for growth. There are fifteen inorganic elements which are essential for growth in higher plants. These can be divided (based on average concentration) in primary macro nutrients (N, P, K), secondary macro nutrients (Ca, Mg, S) and micronutrients (Fe, Mn, Zn, Cu, B, Mo, Cl, Ni, Co). The macronutrients are present in concentrations of 0.2-5 % or even higher, while micronutrient concentrations may be present at levels of 0.1-100 mg/kg [5]. The concentration of these elements in plants depends on several factors like the species, season of year, part of the plant and soil conditions. Furthermore, it is influenced by harvesting (contamination with soil minerals), processing and pre-treatment. Due to these influence factors biomass shows a wide range of compositions. When biomass is first used for other purposes (construction wood, paper), the ash forming matter is dominated by fillers and contaminations.
Ashes from wood combustion in large scale combustion plants contain high amounts of calcium, silicon and potassium (see Table 1). The living parts of the trees (leaves, needles, twigs) contain more potassium, phosphorus and magnesia than stem wood. Therefore, the way of harvesting (whole tree or conventional harvesting) influences the composition of the ashes (see chapter nutrient recycling in the forests). Also bark has a higher ash content and different ash composition compared to stem wood and the living parts of the trees. Ashes from combustion of agro-residues differs from wood by its very high potassium content, although specific residues like rice husks have very high silicon contents and low potassium contents. All these ashes have one parameter in common: the alumina content is very low compared to coal fly ashes. Higher alumina contents are mostly caused by contamination. Examples are contamination with soil minerals during harvesting or during first use (like waste wood and paper sludge).
A second important factor is the combustion process. The combustion temperature and residence time influences the ash formation. The higher the combustion temperature the more elements will be volatized and are able to react with other gaseous and non-gaseous components. The boiler type determines also the volume ratio fly ash/bottom ash. Grate-fired boilers and stoves generate relatively less fly ash and more bottom ash than fluidized bed boilers and pulverized fuel boilers. At the same time these fly ashes have higher concentrations of elements like potassium, arsenic, cadmium and zinc, which are volatilized during combustion and condensates before the fly ash is removed from the flue gases. A third factor is the ash removal system, included whether bottom ashes and fly ashes are mixed together.

74 Bech et al
It can be imagined that the chemical and physical properties of biomass ashes can be highly different from source to source. This is illustrated by table 1, which shows the concentration of macro elements and several trace elements in biomass fly ash and coal fly ash, and Figure 4, which shows the different morphology of fly ash particles from wood and coal combustion.
Figure 4 Morphology of coal fly ash (left) and wood fly ash (right). Both from pulverized fuel boilers (scanning electron photograph) [7].
Table 1 Concentration of macro elements and trace elements in biomass fly ashes [6] and coal fly ash.
FUEL UNIT WOOD WOOD RICE HUSKS MIXED
BIOMASS1 COAL3
Boiler type2 % m/m PFB GFB Stove FBB PFB Al2O3 % m/m 4,76 1,73 0.30 7,65 27 CaO % m/m 29,7 44,5 32,8 4.5 Cl % m/m 0,42 1,45 0,80 <0.01 Fe2O3 % m/m 2,45 8,41 0.52 2,04 7.3 K2O % m/m 12,3 16,5 3.29 2,05 1.6 MgO % m/m 5,65 3,93 1,71 1.5 Na2O % m/m 1,19 0,09 0,87 0.6 P2O5 % m/m 2,86 4,97 1,11 0.77 SO3 % m/m 5,78 18,2 0.47 2,70 0.7 SiO2 % m/m 29,7 12,9 88.0 36,4 55,0 TiO2 % m/m 0,32 0,09 0,93 Cu mg/kg 143 160 509 100 Mn mg/kg 11,000 1100 1160 630 Pb mg/kg 22.3 100 3150 54 Zn mg/kg 1040 5340 3180 190
1) mixed biomass is a mix of paper sludge, waste wood and green wood 2) boiler type:
PFB = pulverized fuel boiler FBB= fluidized bed combustion boiler GFB= grate fired boiler
3) average values of Dutch coal fly ashes
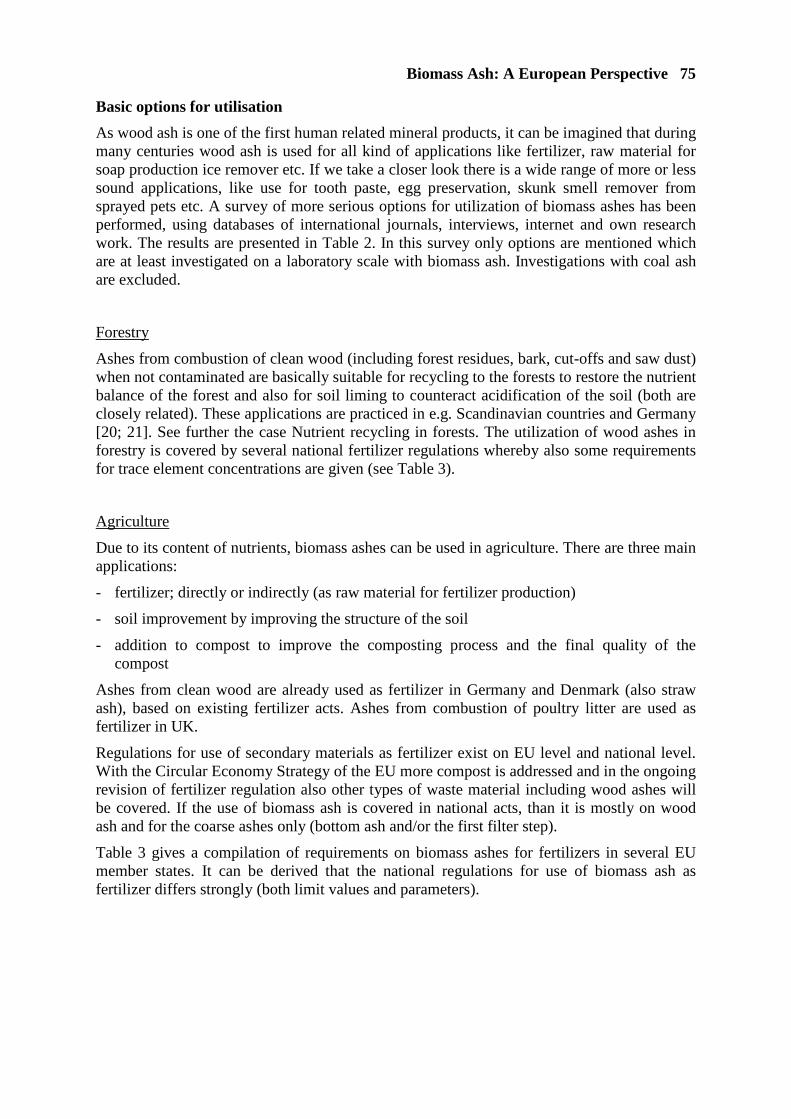
Biomass Ash: A European Perspective 75
Basic options for utilisation
As wood ash is one of the first human related mineral products, it can be imagined that during many centuries wood ash is used for all kind of applications like fertilizer, raw material for soap production ice remover etc. If we take a closer look there is a wide range of more or less sound applications, like use for tooth paste, egg preservation, skunk smell remover from sprayed pets etc. A survey of more serious options for utilization of biomass ashes has been performed, using databases of international journals, interviews, internet and own research work. The results are presented in Table 2. In this survey only options are mentioned which are at least investigated on a laboratory scale with biomass ash. Investigations with coal ash are excluded.
Forestry
Ashes from combustion of clean wood (including forest residues, bark, cut-offs and saw dust) when not contaminated are basically suitable for recycling to the forests to restore the nutrient balance of the forest and also for soil liming to counteract acidification of the soil (both are closely related). These applications are practiced in e.g. Scandinavian countries and Germany [20; 21]. See further the case Nutrient recycling in forests. The utilization of wood ashes in forestry is covered by several national fertilizer regulations whereby also some requirements for trace element concentrations are given (see Table 3).
Agriculture
Due to its content of nutrients, biomass ashes can be used in agriculture. There are three main applications:
- fertilizer; directly or indirectly (as raw material for fertilizer production)
- soil improvement by improving the structure of the soil
- addition to compost to improve the composting process and the final quality of the compost
Ashes from clean wood are already used as fertilizer in Germany and Denmark (also straw ash), based on existing fertilizer acts. Ashes from combustion of poultry litter are used as fertilizer in UK.
Regulations for use of secondary materials as fertilizer exist on EU level and national level. With the Circular Economy Strategy of the EU more compost is addressed and in the ongoing revision of fertilizer regulation also other types of waste material including wood ashes will be covered. If the use of biomass ash is covered in national acts, than it is mostly on wood ash and for the coarse ashes only (bottom ash and/or the first filter step).
Table 3 gives a compilation of requirements on biomass ashes for fertilizers in several EU member states. It can be derived that the national regulations for use of biomass ash as fertilizer differs strongly (both limit values and parameters).
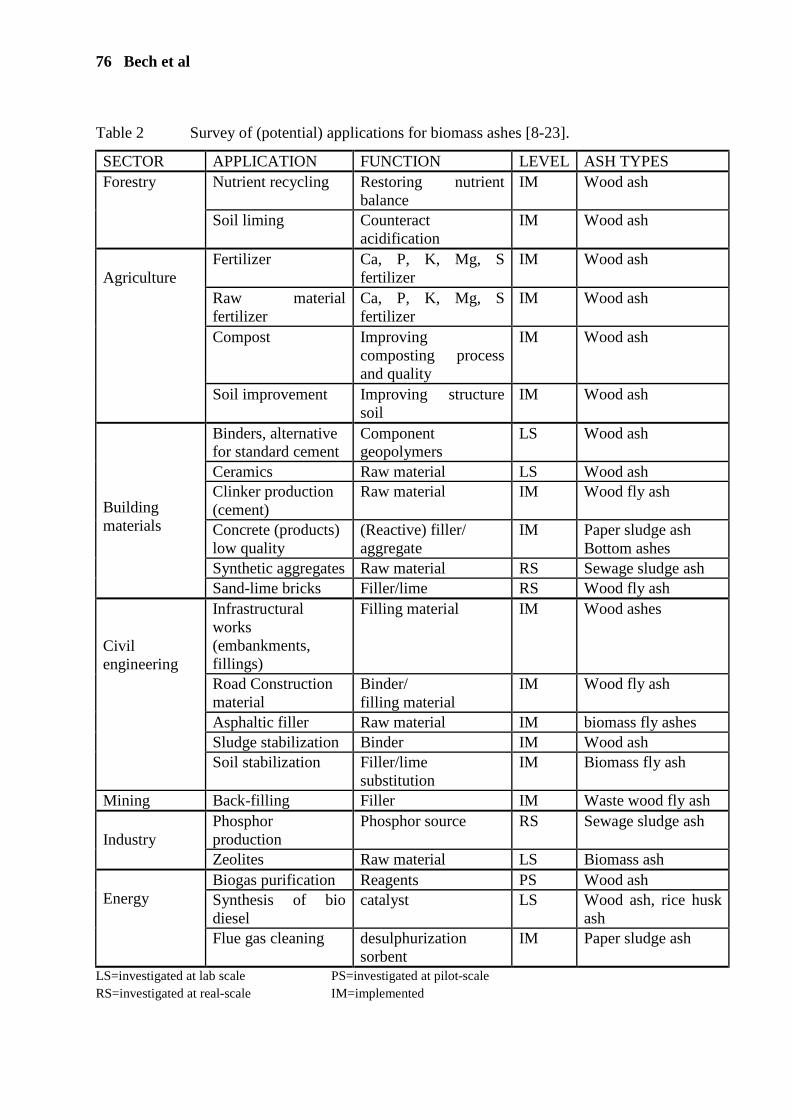
76 Bech et al
Table 2 Survey of (potential) applications for biomass ashes [8-23].
SECTOR APPLICATION FUNCTION LEVEL ASH TYPES Forestry Nutrient recycling Restoring nutrient
balance IM Wood ash
Soil liming Counteract acidification
IM Wood ash
Agriculture
Fertilizer Ca, P, K, Mg, S fertilizer
IM Wood ash
Raw material fertilizer
Ca, P, K, Mg, S fertilizer
IM Wood ash
Compost Improving composting process and quality
IM Wood ash
Soil improvement Improving structure soil
IM Wood ash
Building materials
Binders, alternative for standard cement
Component geopolymers
LS Wood ash
Ceramics Raw material LS Wood ash Clinker production (cement)
Raw material IM Wood fly ash
Concrete (products) low quality
(Reactive) filler/ aggregate
IM Paper sludge ash Bottom ashes
Synthetic aggregates Raw material RS Sewage sludge ash Sand-lime bricks Filler/lime RS Wood fly ash
Civil engineering
Infrastructural works (embankments, fillings)
Filling material IM Wood ashes
Road Construction material
Binder/ filling material
IM Wood fly ash
Asphaltic filler Raw material IM biomass fly ashes Sludge stabilization Binder IM Wood ash Soil stabilization Filler/lime
substitution IM Biomass fly ash
Mining Back-filling Filler IM Waste wood fly ash Industry
Phosphor production
Phosphor source RS Sewage sludge ash
Zeolites Raw material LS Biomass ash Energy
Biogas purification Reagents PS Wood ash Synthesis of bio diesel
catalyst LS Wood ash, rice husk ash
Flue gas cleaning desulphurization sorbent
IM Paper sludge ash
LS=investigated at lab scale PS=investigated at pilot-scale RS=investigated at real-scale IM=implemented
Biomass Ash: A European Perspective 77
Table 3 Compilation of requirements on biomass ashes for fertilizers and nutrient recycling in several EU member states [mg/kg] [22].
Unit CZ D NL Se DK (new) FIN fertilizer1 farming/forestry fertiliser/
agriculture forest
As mg/kg 10 40 75-375 30 25 40 B mg/kg 800 Ba mg/kg Cd mg/kg 2 1,5 6,3-31,3 30 5 straw
20 wood 5 mix
2,52 25
Cr mg/kg 100 375-1875 100 100 300 300 Cr VI mg/kg 2 Cu mg/kg 100 375-1875 400 600 700 Hg mg/kg 1,0 1,0 3,8-18,8 3 0,8 1 1 Mo mg/kg 50 Ni mg/kg 300 80 150-750 70 60 100 150 Pb mg/kg 100 150 333-2500 300 120
250 wood ash for forest
100 150
Tl mg/kg 1,0 V mg/kg 70 Zn mg/kg 1500-7500 7000 1500 4500 PFT mg/kg 0,1 Dioxins
ng/kg 30 3,8-19
PCB mg/kg 75-375 PAH mg/kg 2300-11500 1 the concentrations shall be calculated to the ‘value determining’ component of the
fertilizer/biomass ash like phosphorus, potassium or magnesium. The limit values itself depends also on the ‘value determining’ component.
2 Limit of Cd as application doses: 1,5 g Cd in hectar per year and 7,5 g Cd in hectar per 5 years in agriculture, 100g Cd per hectar Cd in 60 years in forestry
Building materials
Coal fly ash is widely used for the production of cement and concrete since decades. Also furnace bottom ash is used in concrete as a fine aggregate, especially in masonry blocks. Depending on properties and especially the chemical and mineralogical composition of the ashes, biomass ash can be used in building materials for production of cement, alternative binders and concrete. The technical suitability and feasibility depends highly on the properties of the ashes. Examples of applications which are at least investigated at real-scale are:
- bottom ash from biomass fired fluidized bed combustion boilers for concrete blocks, especially when quartz sand is used as bed material. The utilization of coarse and fine
78 Bech et al
biomass ashes as inert aggregate or filler is already covered by the aggregate standards for different applications (e.g. EN 12620 Aggregate for concrete).
- fly ash from paper sludge combustion as binder for non-structural concrete and sand-lime brick production. Important is to steer the combustion temperature to have a sufficient reactive lime.
- fly ash from wood combustion as raw material for clinker production. However, the addition is limited due to the content of undesired components, like alkalis and sulphur
- fly ash from wood combustion production of sand-lime bricks. Real-scale tests have been performed to use wood ash as partial replacement of lime and fine sand in sand-lime bricks. the addition was limited to less than 5% m/m. The implementation was put on hold due to the high transport costs.
Coal fly ash from co-combustion with biomass is used as reactive (pozzolanic) filler in concrete in several countries. The European technical standard EN 450-1 Fly ash for concrete [24] allows co-combustion up to 50% m/m fuel based for virgin wood only, whereby the ash amount of the co-combustion material does not exceed 30% m/m ash based. The latter is normally no bottle-neck due to the low ash content of wood pellets compared to coal. Co-combustion of other biomass is allowed up to 40% m/m (included mixes with virgin wood), if the biomass is listed in the EN 450 (see table 4) and all product requirements are met. Waste wood is excluded and thereby not allowed for certification according to EN 450-1.
Table 4 Types of co-combustion materials according to EN 450-1 [24]
1 Solid Bio Fuels conforming to EN 14588:2010 including animal husbandry residues and excluding waste wood
2 Animal meal (meat and bone meal) 3 Municipal sewage sludge 4 Paper sludge 5 Petroleum coke 6 Virtually ash free liquid and gaseous fuels A European Assessment Document (EAD) is in preparation to cover fly ash from combined firing of wood and biomass. Thereby 45% ash amount from the co-combustion material is allowed, with no limit value for co-combustion fuel based [25]. However, most of the chemical and physical parameters for the fly ash are the same. The EAD will be used to support the utilization of this so-called bio-coal fly ash in non-structural concrete. The chemical requirements, as set in the EN 450-1, together with the range for coal fly ash and wood fly ash are presented in Table 5. It shows that wood fly ash is unable to meet the criteria for coal fly ash in EN 450-1.
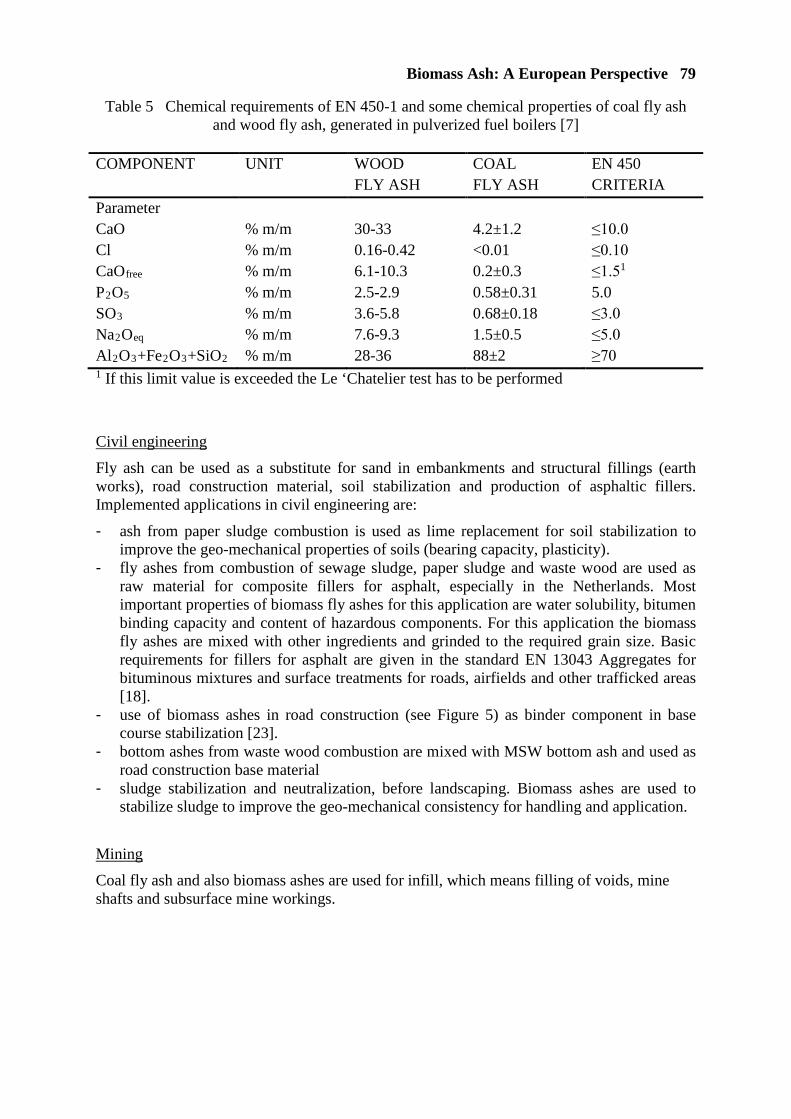
Biomass Ash: A European Perspective 79
Table 5 Chemical requirements of EN 450-1 and some chemical properties of coal fly ash and wood fly ash, generated in pulverized fuel boilers [7]
COMPONENT UNIT WOOD
FLY ASH COAL FLY ASH
EN 450 CRITERIA
Parameter CaO % m/m 30-33 4.2±1.2 ≤10.0 Cl % m/m 0.16-0.42 <0.01 ≤0.10 CaOfree % m/m 6.1-10.3 0.2±0.3 ≤1.51 P2O5 % m/m 2.5-2.9 0.58±0.31 5.0 SO3 % m/m 3.6-5.8 0.68±0.18 ≤3.0 Na2Oeq % m/m 7.6-9.3 1.5±0.5 ≤5.0 Al2O3+Fe2O3+SiO2 % m/m 28-36 88±2 ≥70 1 If this limit value is exceeded the Le ‘Chatelier test has to be performed
Civil engineering
Fly ash can be used as a substitute for sand in embankments and structural fillings (earth works), road construction material, soil stabilization and production of asphaltic fillers. Implemented applications in civil engineering are:
- ash from paper sludge combustion is used as lime replacement for soil stabilization to improve the geo-mechanical properties of soils (bearing capacity, plasticity).
- fly ashes from combustion of sewage sludge, paper sludge and waste wood are used as raw material for composite fillers for asphalt, especially in the Netherlands. Most important properties of biomass fly ashes for this application are water solubility, bitumen binding capacity and content of hazardous components. For this application the biomass fly ashes are mixed with other ingredients and grinded to the required grain size. Basic requirements for fillers for asphalt are given in the standard EN 13043 Aggregates for bituminous mixtures and surface treatments for roads, airfields and other trafficked areas [18].
- use of biomass ashes in road construction (see Figure 5) as binder component in base course stabilization [23].
- bottom ashes from waste wood combustion are mixed with MSW bottom ash and used as road construction base material
- sludge stabilization and neutralization, before landscaping. Biomass ashes are used to stabilize sludge to improve the geo-mechanical consistency for handling and application.
Mining
Coal fly ash and also biomass ashes are used for infill, which means filling of voids, mine shafts and subsurface mine workings.

80 Bech et al
Figure 5 Example of use of biomass ash in road construction [23]
Industry
Due to dependency of imports of phosphorus in most European countries there are several efforts and initiatives to satisfy the future use considering the processing of sewage sludge and also the reuse of ashes. Phosphorus is an essential element for today’s life. It is used in essential applications like fertilizers, steel production and pesticides.
In November 2013, the German Phosphorus Platform was found as a network of stakeholders from science, industry and public bodies to establish sustainable phosphorus management in Germany through a more efficient use of phosphorus as well as effective recycling and reprocessing. Core to the approach of DPP is identifying and implementing innovative technologies that allow economically feasible recycling of phosphorus on a broad scale but also through improved use of phosphorus in already existing manufacturing processes. This includes increases in production efficiency as well as re-using production waste as input material were possible [27].
In October 2017, Germany has release a new sewage act. By this, after an interim period, no sewage sludge from medium and big sewage plants are allowed for fertilisation and phosphorus has to be recycled from the sewage sludge [28].
Also in France it is expected that in 2020 100,000 tons/year of sewage sludge ash will be used to replace phosphate ore for the production of phosphorus [17].
In Japan the option of the application of biomass fly ash for the synthesis of zeolites was reported. Potassium was wet extracted from biomass fly ash and the aqueous solution was used for hydrothermal synthesis of K-zeolites [13]. Zeolites are used for many applications like absorption, in detergents, and for cracking of crude oil.
Energy
The use of biomass ash for energy production is very specific. A few studies have been reported about the use of wood ash and rice husk ash as a catalyst to produce biodiesel from Jatropha oil [16] or palm oil [11] respectively.
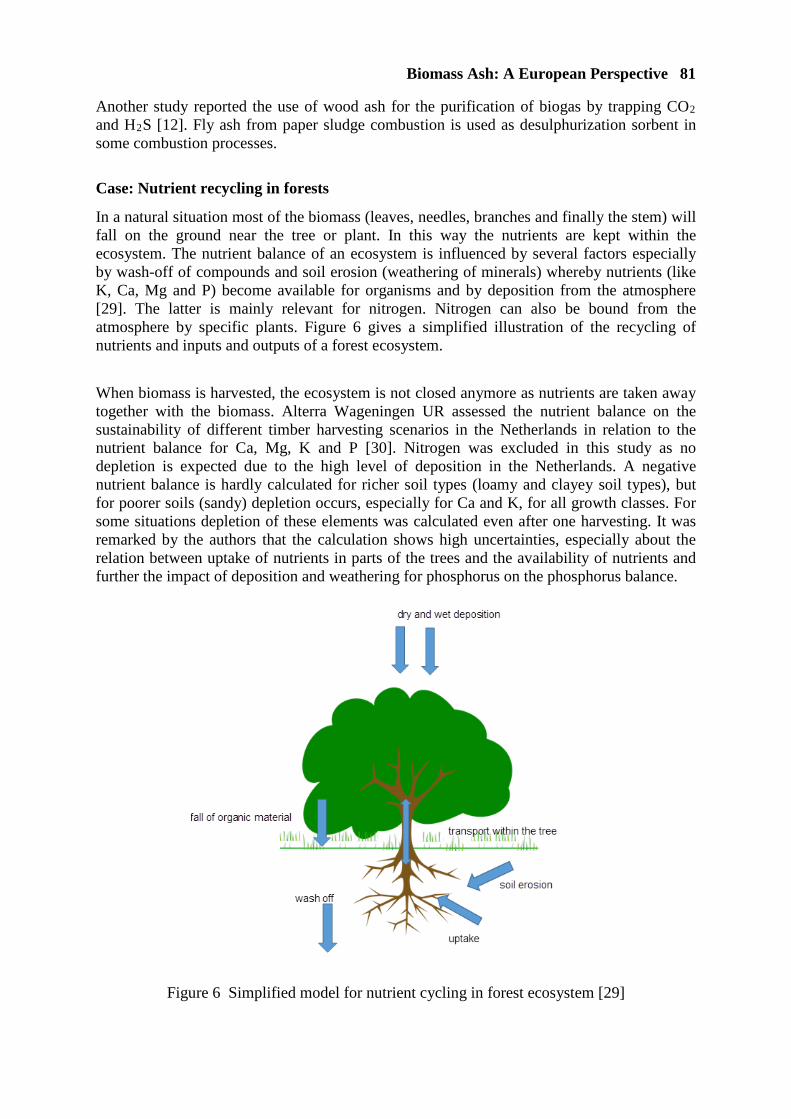
Biomass Ash: A European Perspective 81
Another study reported the use of wood ash for the purification of biogas by trapping CO2 and H2S [12]. Fly ash from paper sludge combustion is used as desulphurization sorbent in some combustion processes.
Case: Nutrient recycling in forests
In a natural situation most of the biomass (leaves, needles, branches and finally the stem) will fall on the ground near the tree or plant. In this way the nutrients are kept within the ecosystem. The nutrient balance of an ecosystem is influenced by several factors especially by wash-off of compounds and soil erosion (weathering of minerals) whereby nutrients (like K, Ca, Mg and P) become available for organisms and by deposition from the atmosphere [29]. The latter is mainly relevant for nitrogen. Nitrogen can also be bound from the atmosphere by specific plants. Figure 6 gives a simplified illustration of the recycling of nutrients and inputs and outputs of a forest ecosystem.
When biomass is harvested, the ecosystem is not closed anymore as nutrients are taken away together with the biomass. Alterra Wageningen UR assessed the nutrient balance on the sustainability of different timber harvesting scenarios in the Netherlands in relation to the nutrient balance for Ca, Mg, K and P [30]. Nitrogen was excluded in this study as no depletion is expected due to the high level of deposition in the Netherlands. A negative nutrient balance is hardly calculated for richer soil types (loamy and clayey soil types), but for poorer soils (sandy) depletion occurs, especially for Ca and K, for all growth classes. For some situations depletion of these elements was calculated even after one harvesting. It was remarked by the authors that the calculation shows high uncertainties, especially about the relation between uptake of nutrients in parts of the trees and the availability of nutrients and further the impact of deposition and weathering for phosphorus on the phosphorus balance.
Figure 6 Simplified model for nutrient cycling in forest ecosystem [29]

82 Bech et al
Table 6 gives an indication of the removal of macro-nutrients N, P, K and Ca (data about the other macro-nutrients Mg and S were not given) due to extraction of biomass in several forests in the United States [30]. Two types of harvesting were compared, namely conventional harvesting (stem only) and so-called ‘whole tree harvesting’, whereby the complete tree including branches, leaves etc. is removed from the forest. As most nutrients are present in the living parts of the tree, whole tree harvesting leads to considerably higher nutrient loss than conventional harvesting where just the stems are taken away [31-33].
Table 6 Removal of N, P, K and Ca due to whole tree harvesting and conventional harvesting in forests on poor (P) and rich (R) soils in the USA (harvested after 55 years of
growth) [31]
CONVENTIONAL HARVESTING WHOLE TREE HARVESTING
Tree EXT* N P K Ca EXT. N P K Ca ton/ha kg/h
a kg/h
a kg/h
a kg/h
a ton/ha kg/h
a kg/h
a kg/ha kg/ha
Douglass (R) 281 478 56 225 23 318 728 96 326 411 Douglas (P) 134 161 27 121 - 165 325 56 140 - High alder (R)
137 287 41 151 388 147 347 47 174 426
Low alder (P)
111 311 22 122 - 120 242 27 143 -
*EXT.=extraction of wood
In several countries, like Denmark, Sweden and Finland, spreading wood ash in the forests is practiced to recycle nutrients or as liming agent. In this way macro- and micronutrients are recycled, with exception of nitrogen as this compound is not bound in the fly ash during combustion. However in many regions in the developed countries there is significant contribution to the nutrient balance by atmospheric deposition.
Besides the nutrient balance, recycling of ashes in the forests encompasses many aspects to be taken into account, especially
- biomass fly ashes have a very high pH, which may influence the flora and fauna of the top soil in the forest. Pretreatment by carbonation in open air may reduce this effect.
- content and bio-availability of heavy metals. When the ashes are returned to the same area where the biomass originated from, the heavy metal burden is not influenced on a macro level. However, the bio availability may differ due to different speciation.
- legislation. The spreading of wood ash can be seen as dispersion of waste, which is not allowed
- contamination. If the biomass is first used for other applications according the cascade approach (which is the idea of a circular economy), the biomass may be contaminated
Biomass Ash: A European Perspective 83
with fillers, coating etc. These contaminations are also spread in the forest, which may have a negative impact on the ecosystem
- logistics. When the power plant is not situated near the forest it may not be efficient to recycle the ashes back to the forests.
The above mentioned aspects shows that the evaluation for an effective and/or efficient return of ashes to the forest is very complex and needs to be evaluated within the context of a circular economy.
EVALUATION AND CONCLUSIONS
Due to the increase of energy production from biomass, more biomass ashes are generated in the EU than recent decades. According to the EU policy, generation of waste has to be avoided. Therefore, utilization of biomass ashes has to be developed further as a significant part of the biomass ashes are disposed. The re-use of these biomass ashes is also relevant because biomass ashes contain nutrients, which are taken away with the biomass.
A lot of potential applications for biomass ashes have been identified. However, practice is stubborn and only a limited amount is implemented on a large scale. This can be attributed to several aspects as relatively small volumes per source, variations in (chemical) properties, lack of knowledge and the non-maturity of the market (not in all countries).
The logistic chain for biomass ashes is a very important aspect in the development of utilization due to the relatively small volumes per plant compared to coal ashes. This chain may also include stockpiling and processing before supply to end user.
Processing of biomass ash may help to improve specific properties and to create a more consistent and uniform quality. Examples are:
- carbonation to lower the pH by weathering - forced leaching to remove heavy metals and/or nutrients - granulation to get ashes which can be spread in the forests without dust and acts as a slow
release fertilizer - blending, which is performed on a routine base with coal fly ash - Milling to create a more reactive biomass ash.
Another positive influence to promote the utilization of biomass ashes is to share the existing knowledge and experience in different countries. Especially regarding the use of wood ashes for nutrient recycling and soil liming in the Scandinavian countries.
Main conclusion is that on EU scale, utilization of biomass ashes is at the beginning of the transformation process from waste into a useful product. The experience with this process for coal fly ash and the experience with biomass ash utilization in countries like in Scandinavia may be very helpful to accelerate this process in the single countries.
REFERENCES
1. EUROSTAT Renewables Energy statistics (https://ec.europa.eu/eurostat/statistics-
explained/index.php?title=File:Figure_3-Primary_production_of_energy_from_ renewable_ sources_EU-28_1990-2017.png)
84 Bech et al
2. EUROPEAN COMMISSION, 2015. Closing the loop; Commission adopts ambitious new Circular Economy Package to boost competiveness, create jobs and generate sustainable growth. Press Release December 2nd 2015.
3. ELLEN MACARTHUR FOUNDATION, 2015. Towards a circular economy: Business rationale for an accelerated transition.
4. WFD. Waste Framework Directive - Directive 2008/98/EC of the European Parliament and of the Council of 19 November 2008 on waste and repealing certain Directives
5. ALLEY M.M. AND VANLAUWE, B., 2009 The role of fertilizers in integrated plant nutrient management, International Fertilizer Industry Association. page 12.
6. SARABÈR, A.J. Suitability of biomass fly ash as binder in concrete (in Dutch). 2016. Final report. TKI-Project co-financed by Dutch Ministry of Economic Affairs.
7. SARABÈR, A.J., 2017. Fly ash from coal and biomass for use in concrete. PhD Dissertation Technical University Delft.
8. ASQUER, C. et al, 2017. Biomass ash reutilization as an additive in the composting process of organic fraction of municipal solid waste. In: Waste Management, Volume 69, November 2017, pp 127-135.
9. BAN, C. et al, 2015. The hybridization od coal fly ash and wood ash for the fabrication of low alkalinity geopolymer load bearing block cured at ambient temperatures. In: Construction and building materials, Volume 88, July 2015, pp 41-55.
10. BOUGNOM, B. P. et al, 2011. Possible use of wood ash and compost for improving acid tropical soils. In: Recycling of biomass ashes. Edited by Heribert Insam et al. Springer Verlag.
11. CHEN, G-Y, ET Al, 2015. Transesterification of palm oil to biodiesel using rice husk ash-based catalysts. In: Fuel Processing Technology, Volume 133, May 2015, pp 8-13.
12. FERNANDEZ-DELGADO JUAREZ, M. et al 2018. Biogas purification with biomass ash. In: Waste Management, Volume 71, January 2018, pp 224-232.
13. FUKASAWA, T. et al, 2017. Utilization of incinerator fly ash from biomass power plants for zeolite synthesis from coal fly ash by hydrothermal treatment. In: Fuel Processing Technology, Volume 167, December 2017, pp 92-98.
14. Havukainen, J. et al, 2016. Potential of phosphorus recovery from sewage sludge and manure ash by thermochemical treatment. In: Waste Management, Volume 49, March 2016, pp 221-229.
15. KIZINIEVIC, O. AND KIZINIEVIC, V., 2016. Utilisation of wood ash from biomass for the production of ceramic products. In: Construction and building materials. Volume 127, 30 November 2016, pp 264-273.
16. SHARMA, M. et al, 2012. Wood ash as a potential heterogeneous catalyst for biodiesel synthesis. In: Biomass and Bioenergy, Volume 41, June 2012, pp 94-106.
17. SNB, 2018. Oral information by Luc Sijstermans, July 17th 2018
18. SIBELCO, 2018. Oral information by Kees van der Plas, July 17th 2018
19. OTTOSEN, L.M. et al, 2016. Wood ash as partly sand and/or cement replacement in mortar. In: International Journal of Sustainable Development and Planning. 11(5), pp 781-791.
Biomass Ash: A European Perspective 85
20. SWEDISH FOREST AGENCY, 2006. International Handbook from Extraction of Forest Fuels to Ash Recycling.
21. WILPERT, K. VON, (FVA) 2015. RAL Quality mark for wood ash for forest fertilization. Presentation at VGB Biomass Ash Workshop, April 29th 2015.
22. VGB, 2017. Biomass ash (BMA) in Europe. A report on the situation of properties and use of Biomass Ash from power plants of different technology burning biomass only. draft – 23.05.2017. Not publicly available.
23. LAHTINEN, P., 2015. Utilization of biomass ashes in infrastructure construction in Finland. Presentation at VGB Biomass Ash Workshop, April 29th 2015.
24. EN 450-1:2012; Fly ash for concrete, Definition, requirements and conformity criteria
25. KIWA, 2018. European Assessment Document Bio-coal Fly ash for Concrete. EAD DP 17-26-0021-03.01. Fourth Draft version.
26. VGB, 2018 Report on the situation with biomass ash in Europe, draft (not publicly available).
27. DPP : https://www.deutsche-phosphor-plattform.de/english/
28. Verordnung über die Verwertung von Klärschlamm, Klärschlammgemisch und Klärschlamm-kompost (Klärschlammverordnung - AbfKlärV):09.2017 (Decree about the utilisation of sewage sludge, mixes of sewage sludge and mixes of sewage compost)
29. PARÉ D. AND THIFFAULT, E., 2016. Nutrient budgets in forests under increased biomass harvesting scenarios. In: Current Forestry Reports (2016) 2:pp 81-91.
30. ALTERRA, WAGENINGEN UR, 2015. Houtoogst en bodemvruchtbaarheid. Een modelstudie naar duurzaamheid op Nederlandse bosgroeiplaatsen
31. MANN L.K. ET al, 1998. Effects of Whole-Tree and Stem-only Clearcutting om postharvest Hydrologic Losses, Nutrient Capital and Regrowth. In: Forest Science, volume 34 Number 2, 1 june 1988 pp 412-418 (17).
32. DE SCHRIJVER A. et al, 2012. Koolstof- en nutriëntenkringlopen. In: Bosecologie en Bosbeheer, pp 167-175. Uitgeverij Acco, Leuven.
33. ALTERRA, WAGENINGEN UR, 2011. Effecten van de oogst van takhout op de voedingstoestand en bijgroei van het bos. Alterra-rapport 2202
BIOCOAL FLY ASH: FLY ASH FROM BIOMASS AND COAL PROPERTIES AND REGULATORY ASPECTS
A Sarabèr
N Haanappel
Vliegasunie
The Netherlands
ABSTRACT. In North-West Europe several coal-fired power plants are converted to biomass with co-firing coal or coal fly ash. This leads to fly ashes outside the European standard for fly ash in concrete (EN 450) as co-combustion is limited to 40% (fuel based) or 50% for virgin wood only. The results of this study show that it is possible to generate fly ash from high share of co-combustion of Fuller’s Earth in combination with wood that meet the basic requirements of the EN 450, with exception of MgO (occasionally). This is related by the co-combustion of specific Fuller’s Earth and to wood combustion. Additional testing shows that MgO is mainly in a harmless form and thereby not causing unsoundness. The performance requirements of EN 450 (setting time, soundness and activity index) are met in all cases. All requirements of EN 197 for siliceous fly ash are met for the fly ashes from the long-term co-combustion program. It was shown that even fly ash from 20% coal and 80% biomass combustion is able to meet these requirements. It all depends on the characteristics of the biomass and the coal. Keywords: Biocoal fly ash, Concrete, Biomass, Co-combustion, Wood Dr. ing. Angelo Sarabèr MSc is senior product manager at Vliegasunie. He is convenor of CEN TC 104/WG 4 “Fly ash” and board member of ECOBA, the European Coal Combustion Products Association. Further, he is member of several Dutch committees regarding concrete technology. ing. Nico Haanappel is product manager at Vliegasunie. He is member of several committees about power plant chemistry, REACh and radiation.
Biocoal Fly Ash 87
INTRODUCTION
The national and international policy is to reduce the emission of greenhouse gasses by society. The national power sector has challenging goals to reduce these emissions. The routes to achieve these goals are mainly by using renewable sources especially wind and biomass. Large scale use of biomass to substitute coal is a transition. One of the Dutch power stations has started to replace coal by biomass to an extent that requirements as prescribed in the European standard EN 450 [1] is sometimes exceeded by the co-combustion percentage or by the maximum content of MgO. Co-combustion is limited to 40% m/m of secondary fuels and 30% m/m ash-based or 50% m/m (fuel based) if only virgin wood is co-fired. The secondary fuels should be listed in the EN 450 (waste wood is not listed). The maximum MgO content is 4,0% m/m. However, the cement standard states that clinker may have up to 5.0 m/m [2]. An experimental study has been performed to the properties and to the regulatory aspects of fly ashes generated during a long-term co-combustion program with virgin wood and Fuller’s Earth and generated during a set of six co-combustion experiments with different combinations of these fuels. The fly ashes have been characterized and properties of paste and mortar have been assessed. The EN 450 and EN 197 were used as a starting point. Special attention was paid to the role of magnesium. The results of these tests are discussed and the regulatory aspects especially, technical standards and the Dutch Decree on soil quality (Besluit Bodemkwaliteit). Since a few months, fly ash from combined combustion of the above-mentioned biomass and coal is certified as filler aggregate according EN 12620 (type I filler) [3] and brought into the market using the trade name Biocoal fly ash. The fly ash fulfils most of the requirements of the EN 450 and all requirements of EN 197 (as main constituent). There is no limitation on the share of biomass if most of the ash is derived from coal and essential requirements are met.
MATERIALS AND METHODS Co-combustion program and co-combustion experiments A long-term co-combustion program (LCCP) of about four months and a set of six specific co-combustion experiments were performed at one of the Dutch power plants (pulverized fuel). This power plant has a capacity of about 600 MWe. Its boiler is tangentially fired and is equipped with low NOx burners and over-fire air supply. Fly ash was removed from the flue gas with an electrostatic precipitator. During the experiments, fly ashes were obtained from the electrostatic precipitator when the combustion process was reasonably stable, which was normally several hours after starting. An overview of the regular co-combustion and the set co-combustion experiments is given in Table 1. The coals that were fired by the power plant were blends from typically ‘world traded’ coals. Virgin wood (pellets) and so-called Fuller’s Earth was co-fired. The latter is a by-product from food-industry and consist of a mix of vegetable oil and clay minerals. Crude vegetable oil needs often to be processed before consumption. Processing is applied to improve colour, taste, odour and composition [4]. One of the process steps is called bleaching and is meant to remove colouring components, metals and oxidants. Raw materials for this bleaching process are clay minerals, active coal, alumina-oxide, silica gel, alumina silicates and magnesia silicates. Mostly 40% of the used Fuller’s earth consist of oil.

88 Sarabèr and Haanappel
As can be seen in Table 3, the different sources of Fuller’s Earths have different levels of magnesium contents. Co-firing was performed using 2:1 ratio low: high magnesium Fuller’s Earth. The set of co-combustion experiments was performed to obtain more knowledge about the relation between maximum biomass firing at one side and the combustion process and ash properties on the other side (see Table 2).
Table 1 Overview of long-term co-combustion program of wood and Fuller’s Earth
UNIT AVERAGE RANGE FUEL BASED
Wood pellets % m/m 24 16-37 Fuller’s Earth % m/m 4.5 0-7.4
ASH BASED Wood pellets % m/m 1.3 0.1-10.6 Fuller’s Earth % m/m 20 9-32.6
Table 2 Overview of six co-combustion experiments
UNIT C3/25* C6/24 C11/17 C19/16 C4/0 C21/0 FUEL BASED
coal % m/m 44 28 20 11 46 12 Wood pellets % m/m 53 70 79 88 54 88 Fuller’s Earth % m/m 2,8 1,8 0,9 0,5 0 0
ASH BASED coal % m/m 72 70 72 66 96 79 Wood pellets % m/m 3 6 11 19 4 21 Fuller’s Earth % m/m 25 24 27 16 0 0
*first figure stands for co-combustion percentage wood and second for Fuller’s Earth; ash based
Chemical analyses
The concentration of the main components Al, Ca, Fe, K, Mg, Na, P, S, Si and Ti in fly ashes was analysed with X-ray fluorescence. XRF is the standard analysis method used in quality control of coal fly ash in the Netherlands. The concentration of macro-elements (Al, Ca, Fe, K, Mg, Mn, Na, P, S, Si and Ti) in the fly ashes from the co-combustion experiments and the fuels were analysed after total digestion/destruction with Inductively Coupled Plasma (ICP-MS) by TLR.
The trace elements were also analysed with ICP-MS, after destruction with HF. Mercury was analysed with atomic fluorescent spectrometry (AFS). The concentration of free lime (CaO) in fly ash was determined in accordance with NEN-EN 451-1 [5]. The loss of ignition in fly ash was analysed in accordance with ISO 10694 by glowing at 950 or 975° C for 1 hour. The content of reactive SiO2 was analysed according EN 197-1 [2].

Biocoal Fly Ash 89
X-ray diffraction The X-ray diffraction analyses were performed with a Bruker D8 Advance, using a Cu LLF X-ray tube. Further details: scan range 10-61 2θ, scan range 0,02θ, count time/step 0,2 sec. Physical analyses of fly ashes The physical analyses of the fly ashes consist of particle size distribution, particle density and morphology. The particle size distribution is measured with laser diffraction (Malvern Mastersizer 2000). Before measuring, the particles are dispersed in ethanol. Ultrasonic energy is used to avoid agglomeration effects of particles. The morphology of the fly ashes was investigated using a scanning electron microscope (SEM). The SEM was a JEOL 6300. The pictures were taken with an acceleration voltage of 15 kV. The samples were sputtered with gold. Tests on cement paste The following characteristics were used to assess the performance of fly ash:
• Setting time was tested by Fugro in accordance with EN 450 [1]. This test is based on the penetration behaviour of a standard needle in a cement paste or cement fly ash paste. This cement fly ash paste consists of 75% cement and 25% fly ash. The amount of mixing water is adjusted to obtain a standard consistency.
• The soundness of cement fly ash paste was tested by Fugro in accordance with EN 450
using the LeChatelier test. This cement fly ash paste consists of 50% cement and 50% fly ash. The amount of mixing water is adjusted to obtain a standard consistency. This fresh cement paste is to fill a ring with two needles. After 24 hours of hardening, the distance between the tips of the needles is determined with a calliper. After that, the hardened cement paste together with the ring is stored in boiling water for a quarter of an hour. After that the distance between the tips of the needles is measured again. The increase of the distance before and after boiling is a measure for the unsoundness.
• The autoclave test according to ASTM C618 [66] was tested by SGS Intron. This test
is special developed for the assessment of soundness in relation to the presence of free MgO.
Tests on mortar The concept of the activity index is used in the European standard for fly ash in concrete (EN 450) for the assessment of the pozzolanic properties and is defined as the relative compressive strength (as percentage) of a fly ash cement mortar compared to the strength of standard cement mortar. In the fly ash cement mortar, 25% of the cement is replaced by fly ash. The activity index is normally measured after 28 and 91 days. The workability of the fresh mortar was assessed using the flow table test.
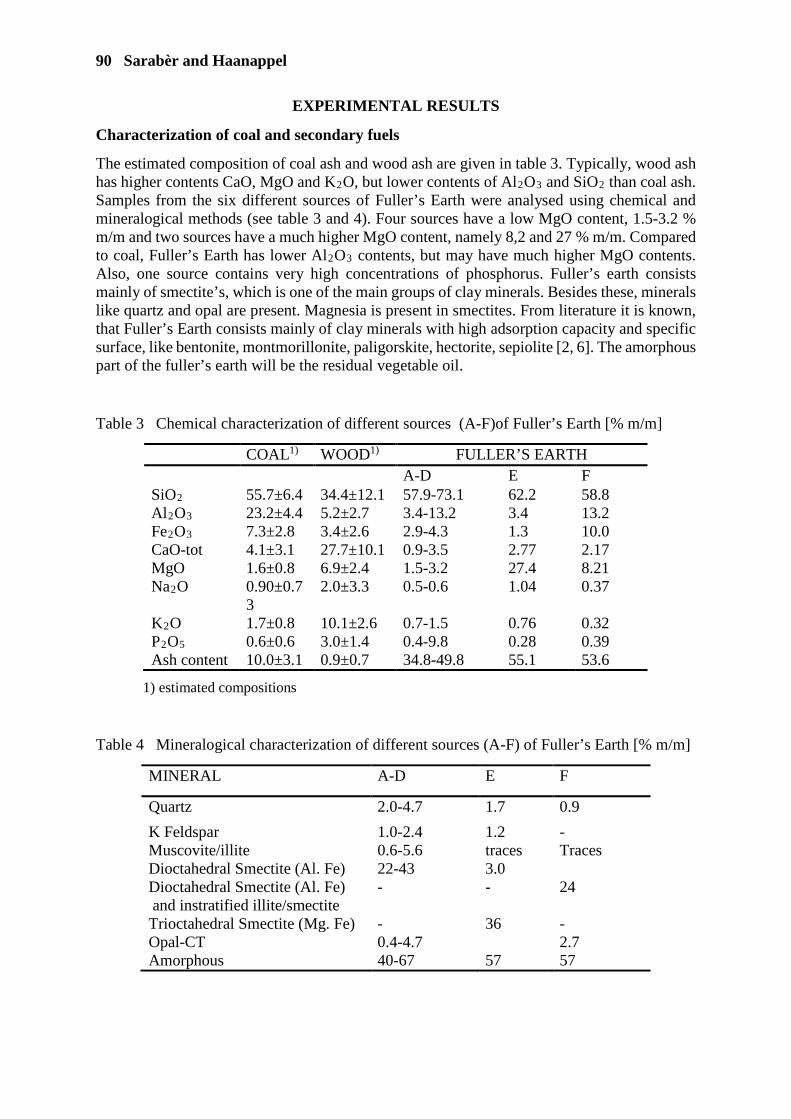
90 Sarabèr and Haanappel
EXPERIMENTAL RESULTS
Characterization of coal and secondary fuels
The estimated composition of coal ash and wood ash are given in table 3. Typically, wood ash has higher contents CaO, MgO and K2O, but lower contents of Al2O3 and SiO2 than coal ash. Samples from the six different sources of Fuller’s Earth were analysed using chemical and mineralogical methods (see table 3 and 4). Four sources have a low MgO content, 1.5-3.2 % m/m and two sources have a much higher MgO content, namely 8,2 and 27 % m/m. Compared to coal, Fuller’s Earth has lower Al2O3 contents, but may have much higher MgO contents. Also, one source contains very high concentrations of phosphorus. Fuller’s earth consists mainly of smectite’s, which is one of the main groups of clay minerals. Besides these, minerals like quartz and opal are present. Magnesia is present in smectites. From literature it is known, that Fuller’s Earth consists mainly of clay minerals with high adsorption capacity and specific surface, like bentonite, montmorillonite, paligorskite, hectorite, sepiolite [2, 6]. The amorphous part of the fuller’s earth will be the residual vegetable oil.
Table 3 Chemical characterization of different sources (A-F)of Fuller’s Earth [% m/m]
COAL1) WOOD1) FULLER’S EARTH A-D E F SiO2 55.7±6.4 34.4±12.1 57.9-73.1 62.2 58.8 Al2O3 23.2±4.4 5.2±2.7 3.4-13.2 3.4 13.2 Fe2O3 7.3±2.8 3.4±2.6 2.9-4.3 1.3 10.0 CaO-tot 4.1±3.1 27.7±10.1 0.9-3.5 2.77 2.17 MgO 1.6±0.8 6.9±2.4 1.5-3.2 27.4 8.21 Na2O 0.90±0.7
3 2.0±3.3 0.5-0.6 1.04 0.37
K2O 1.7±0.8 10.1±2.6 0.7-1.5 0.76 0.32 P2O5 0.6±0.6 3.0±1.4 0.4-9.8 0.28 0.39 Ash content 10.0±3.1 0.9±0.7 34.8-49.8 55.1 53.6
1) estimated compositions
Table 4 Mineralogical characterization of different sources (A-F) of Fuller’s Earth [% m/m]
MINERAL A-D E F
Quartz 2.0-4.7 1.7 0.9
K Feldspar 1.0-2.4 1.2 - Muscovite/illite 0.6-5.6 traces Traces Dioctahedral Smectite (Al. Fe) 22-43 3.0 Dioctahedral Smectite (Al. Fe) and instratified illite/smectite
- - 24
Trioctahedral Smectite (Mg. Fe) - 36 - Opal-CT 0.4-4.7 2.7 Amorphous 40-67 57 57

Biocoal Fly Ash 91
Chemical characterization of generated fly ashes
Table 5 provides an overview of the content of macro-elements (expressed as oxides), LOI, ammonium and chloride. The EN 450 prescribes several chemical requirements especially the content of sum SiO2+Al2O3+Fe2O3, CaO total, CaO free, MgO, Na2Oeq, Chlorides, Loss on Ignition (LOI), total and soluble phosphate:
• The sum SiO2+Al2O3+Fe2O3 should be at least 70% the sum of the LCCP fly ash varies between 87 and 93 % m/m. Also, fly ashes from the co-combustion experiments meet this requirement, but fly ash C19/16 and C21/0 have considerably lower contents. The EN 197 gives only a qualitative limit for siliceous fly ash, namely that it consists essentially of these compounds
• The amount of reactive CaO is maximum 10% m/m. Also, the EN 197-1 gives this requirement. This requirement is met by LCCP fly ashes and by the CCE fly ashes with exception of C19/16 and C21/0 (measured as total CaO).
• The amount of free lime should maximum 1.5%; above this value the requirement for soundness should be met (LeChatelier test). The EN 197 states that above 1.0 % m/m the requirement for soundness should be met, but he free lime content should remain below 2.5% m/m. The requirement of the EN 197 is not passed for fly ash C19/16 and C21/0
• The MgO content should be maximum 4% m/m. This limit value is in some cases exceeded by the fly ashes from the long-term co-combustion program (LLCP) and by fly ash C19/16.
• The alkali content is maximum 5,0% m/m. This requirement is met by all fly ashes
• Chloride content is maximum 0.1% m/m. This value is never exceeded by the investigated fly ashes.
• Loss on Ignition is maximum 5.0 % m/m for category A fly as, which value is met for both LCCP fly ashes and fly ashes from co-combustion experiments.
• The total amount of phosphate is 5.0% m/m. Also, this requirement is met.
• Soluble phosphate. Three random chosen LCCP fly ash samples were tested. The amount of soluble phosphate was <10 mg/kg.
The Dutch national guideline (BRL 2505) “KOMO product certificate coal fly ash for use in mortar and concrete” states that the average ammonium content should not exceed 75 mg/kg. An individual value may not exceed 100 mg/kg.
The measured values are far below these limit values. In general, it can be stated that all chemical requirements of the EN 450 are met by LCCP fly ashes, with exception of MgO. It should be remarked that the amount of MgO passes the requirement for clinker as given in the EN 197. Both MgO and CaO are components of special interest because their potential to cause unsoundness of concrete if they are present as periclase and slaked lime respectively.

92 Sarabèr and Haanappel
Table 5 Chemical composition (macro-elements) of fly ashes from long-term co-combustion program and fly ash from co-combustion experiments [% m/m].
LCCP1) C3/25 C6/24 C11/17 C19/16 C4/0 C21/0
Al2O3 24.7 (21.4-27.7) 27.1 23.9 23.7 19.5 25.2 22.0 CaO free 0.30 (0.07-0.64) 0.4 0.6 1.1 3.4 0.8 4.4 CaO-tot 4.06 (2.42-5.92) 4.72 5.5 6.61 12.0 5.4 12.3 Cl- 0.01 (0.00-0.01) 0.01 0.01 0.01 0.01 0.01 0.01 Fe2O3 4.8 (3.82-5.37) 5.01 4.93 4.83 3.93 4.79 4.36 K2O 1.96 (1.58-2.38) 1.66 1.86 2.19 4.65 2.08 5 LOI 3.40 (2.11-4.65) 2.62 2.50 2.13 0.45 3.28 0.58 MgO 3.55 (1.87-4.58) 1.48 2.35 2.22 4.07 1.45 2.44 Na2O 0.46 (0.31-0.62) 0.30 0.32 0.32 0.33 0.27 0.29 Na2O eq 1.75 (1.35-2.18) 1.40 1.50 1.80 3.40 1.60 3.60 NH3 13 (1-58)2) 5 5 5 5 5 5 P2O5 sol. <10 <10 <10 <10 <10 <10 <10 P2O5 total 1.10 (0.49-1.74) 0.88 1.07 1.25 1.48 0.99 1.49 SiO2 61.0 (56.7-66.4) 58.1 54.6 54.8 52.8 56.2 50.6 SiO2 reactive SO3 0.26 (0.06-0.99) 0.40 0.45 0.44 0.91 0.4 1.99 Sum Si+Al+Fe 90.4 (87.5-93.1) 90 84 83 76 86 77
Average value; between brackets minimum and maximum values.
Mineralogical characterization of generated fly ashes Table 6 provides an overview of the results of the X-ray diffraction analyses of the fly ashes:
• A limited part of the CaO is present as free lime and to a small extent as anhydrite and anorthite. This means that a significant part of CaO will be present in the amorphous phases of the fly ashes. It seems that the XRD-analyses gives a bit of an overestimation of the amount of free lime, compared to the titrimetric method of NEN-EN 451-1
• Only a limited part of the MgO is present as periclase. The major part will be present in the amorphous phase
• Silicon is present in quartz, mullite anorthite and the amorphous phase.
• Some metallic iron is present, which may be due to abrasion of milling and handling equipment for fuels
• Phosphorus may be present in Silicocarnotite (Ca5(PO4)2SiO4)
Physical characterization of generated fly ashes
The results of the physical characterization are given in table 7. The particle size distribution was analysed after 5 minutes of treatment with ultrasonic energy. This period was sufficient to get a constant particles size distribution (0-1-2-5 minutes were tested). The fineness, expressed as <45 µm, is as average 72% with a range 78-85%. In the past, the fineness of coal fly ash from the same power station was 75% with a declared range 65-85%. So, the LCCP fly ashes fits within this range.
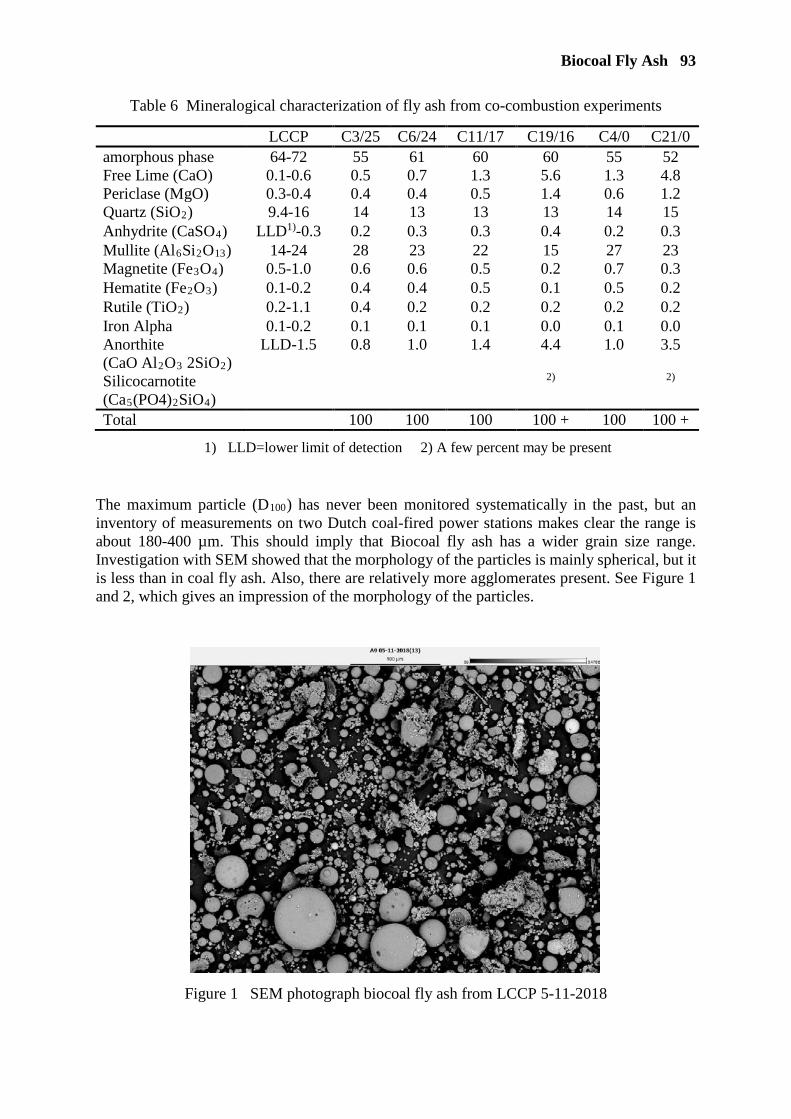
Biocoal Fly Ash 93
Table 6 Mineralogical characterization of fly ash from co-combustion experiments
LCCP C3/25 C6/24 C11/17 C19/16 C4/0 C21/0 amorphous phase 64-72 55 61 60 60 55 52 Free Lime (CaO) 0.1-0.6 0.5 0.7 1.3 5.6 1.3 4.8 Periclase (MgO) 0.3-0.4 0.4 0.4 0.5 1.4 0.6 1.2 Quartz (SiO2) 9.4-16 14 13 13 13 14 15 Anhydrite (CaSO4) LLD1)-0.3 0.2 0.3 0.3 0.4 0.2 0.3 Mullite (Al6Si2O13) 14-24 28 23 22 15 27 23 Magnetite (Fe3O4) 0.5-1.0 0.6 0.6 0.5 0.2 0.7 0.3 Hematite (Fe2O3) 0.1-0.2 0.4 0.4 0.5 0.1 0.5 0.2 Rutile (TiO2) 0.2-1.1 0.4 0.2 0.2 0.2 0.2 0.2 Iron Alpha 0.1-0.2 0.1 0.1 0.1 0.0 0.1 0.0 Anorthite (CaO Al2O3 2SiO2)
LLD-1.5 0.8 1.0 1.4 4.4 1.0 3.5
Silicocarnotite (Ca5(PO4)2SiO4)
2) 2)
Total 100 100 100 100 + 100 100 +
1) LLD=lower limit of detection 2) A few percent may be present
The maximum particle (D100) has never been monitored systematically in the past, but an inventory of measurements on two Dutch coal-fired power stations makes clear the range is about 180-400 µm. This should imply that Biocoal fly ash has a wider grain size range. Investigation with SEM showed that the morphology of the particles is mainly spherical, but it is less than in coal fly ash. Also, there are relatively more agglomerates present. See Figure 1 and 2, which gives an impression of the morphology of the particles.
Figure 1 SEM photograph biocoal fly ash from LCCP 5-11-2018

94 Sarabèr and Haanappel
Figure 2 SEM photograph biocoal fly ash from LCCP 4-12-2018
Table 7 Physical characterization of fly ash from co-combustion experiments and requirements EN 450
Unit LCCP C3/25 C6/24 C11/17 C19/16 C4/0 C21/0
< 45 mu % 72 (78-85) 78 77 76 61 78 68 D10 µm 3.1 (1.3-4.6) - 2,6 3,0 3,1 4,7 2,5 D50 µm 25 (10-29) - 19 21 37 34 25 D90 µm 106 (58-119) - 74 86 144 115 106
D100 µm 536 (420-597)
- 431 433 471 498 542
Particle density
kg/m3 2185 (2090-2310)
- 2200 - 2250 2150 2220
Properties of cement paste with fly ash
The results of the LeChatelier test and the setting time tests are presented in table 8. According to the EN450 initial setting time may be retarded up to twice the time of the initial setting time of the cement paste without fly ash. All fly ashes meet this requirement. Fly ash C4/0 causes an acceleration of initial binding. Setting time tests were repeated with a replacement of 5% cement instead of 25%, as the intention is to use the biocoal fly ash as minor constituent for cement (available samples were taken with different setting time behaviour). See table 9. There is only minor influence of biocoal fly ash on setting time behaviour at this replacement level.
The soundness as measured by the LeChatelier test is 0-2 mm, which is far below the limit value of 10 mm. Even fly ashes with free lime content of 3.4 and 4.4 % m/m have low expansion values. The autoclave expansion test shows also low values compared to the requirement of the ASTM 618-12a being 0.8%.
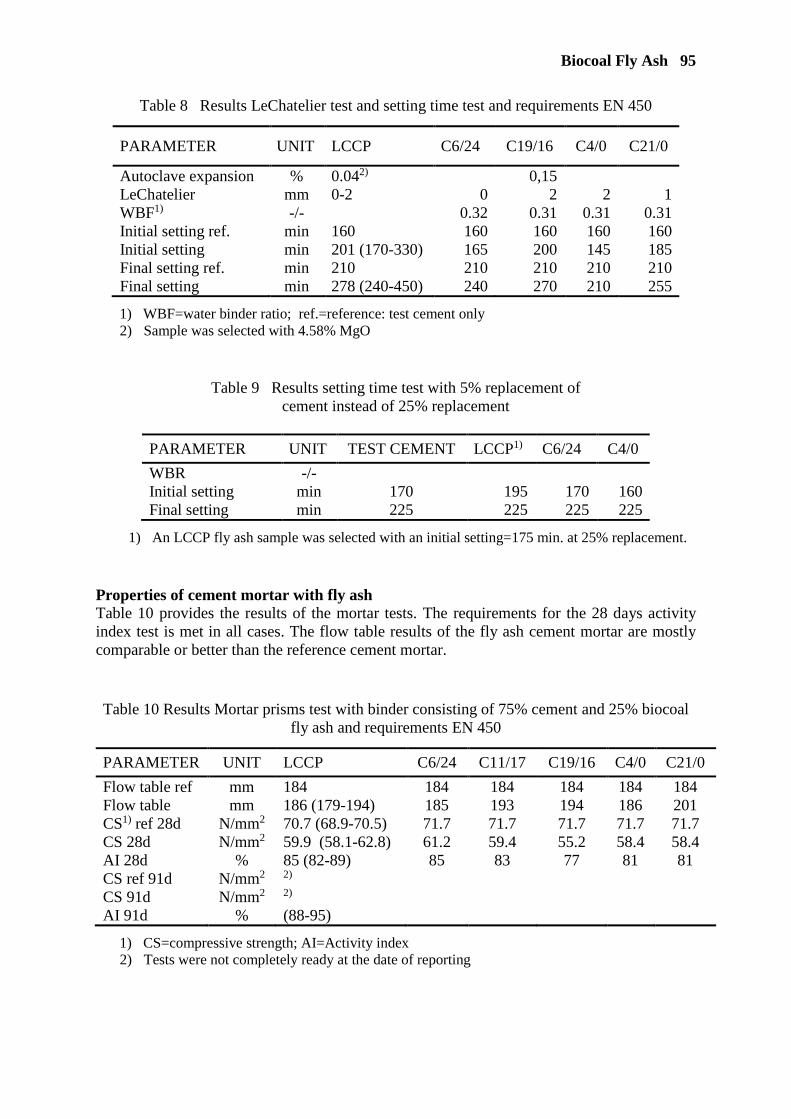
Biocoal Fly Ash 95
Table 8 Results LeChatelier test and setting time test and requirements EN 450
PARAMETER UNIT LCCP C6/24 C19/16 C4/0 C21/0
Autoclave expansion % 0.042) 0,15 LeChatelier mm 0-2 0 2 2 1 WBF1) -/- 0.32 0.31 0.31 0.31 Initial setting ref. min 160 160 160 160 160 Initial setting min 201 (170-330) 165 200 145 185 Final setting ref. min 210 210 210 210 210 Final setting min 278 (240-450) 240 270 210 255
1) WBF=water binder ratio; ref.=reference: test cement only 2) Sample was selected with 4.58% MgO
Table 9 Results setting time test with 5% replacement of cement instead of 25% replacement
PARAMETER UNIT TEST CEMENT LCCP1) C6/24 C4/0
WBR -/- Initial setting min 170 195 170 160 Final setting min 225 225 225 225
1) An LCCP fly ash sample was selected with an initial setting=175 min. at 25% replacement.
Properties of cement mortar with fly ash Table 10 provides the results of the mortar tests. The requirements for the 28 days activity index test is met in all cases. The flow table results of the fly ash cement mortar are mostly comparable or better than the reference cement mortar.
Table 10 Results Mortar prisms test with binder consisting of 75% cement and 25% biocoal fly ash and requirements EN 450
PARAMETER UNIT LCCP C6/24 C11/17 C19/16 C4/0 C21/0
Flow table ref mm 184 184 184 184 184 184 Flow table mm 186 (179-194) 185 193 194 186 201 CS1) ref 28d N/mm2 70.7 (68.9-70.5) 71.7 71.7 71.7 71.7 71.7 CS 28d N/mm2 59.9 (58.1-62.8) 61.2 59.4 55.2 58.4 58.4 AI 28d % 85 (82-89) 85 83 77 81 81 CS ref 91d N/mm2 2) CS 91d N/mm2 2) AI 91d % (88-95)
1) CS=compressive strength; AI=Activity index 2) Tests were not completely ready at the date of reporting
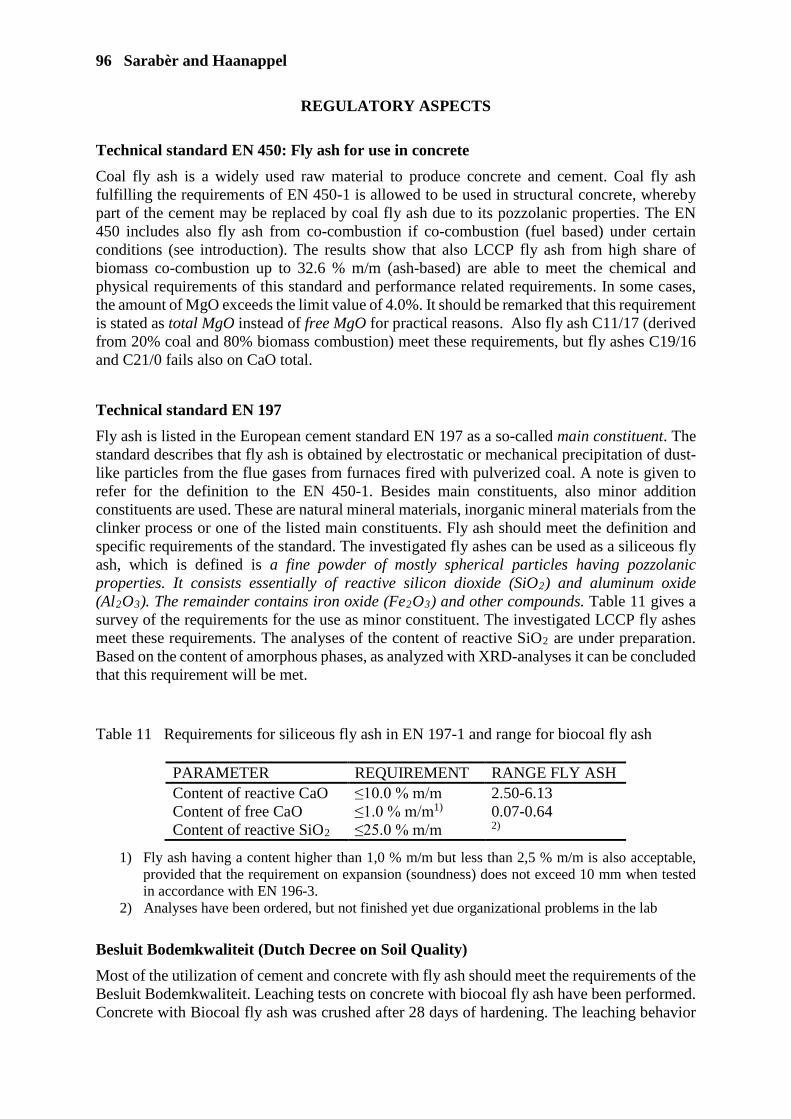
96 Sarabèr and Haanappel
REGULATORY ASPECTS
Technical standard EN 450: Fly ash for use in concrete
Coal fly ash is a widely used raw material to produce concrete and cement. Coal fly ash fulfilling the requirements of EN 450-1 is allowed to be used in structural concrete, whereby part of the cement may be replaced by coal fly ash due to its pozzolanic properties. The EN 450 includes also fly ash from co-combustion if co-combustion (fuel based) under certain conditions (see introduction). The results show that also LCCP fly ash from high share of biomass co-combustion up to 32.6 % m/m (ash-based) are able to meet the chemical and physical requirements of this standard and performance related requirements. In some cases, the amount of MgO exceeds the limit value of 4.0%. It should be remarked that this requirement is stated as total MgO instead of free MgO for practical reasons. Also fly ash C11/17 (derived from 20% coal and 80% biomass combustion) meet these requirements, but fly ashes C19/16 and C21/0 fails also on CaO total.
Technical standard EN 197
Fly ash is listed in the European cement standard EN 197 as a so-called main constituent. The standard describes that fly ash is obtained by electrostatic or mechanical precipitation of dust-like particles from the flue gases from furnaces fired with pulverized coal. A note is given to refer for the definition to the EN 450-1. Besides main constituents, also minor addition constituents are used. These are natural mineral materials, inorganic mineral materials from the clinker process or one of the listed main constituents. Fly ash should meet the definition and specific requirements of the standard. The investigated fly ashes can be used as a siliceous fly ash, which is defined is a fine powder of mostly spherical particles having pozzolanic properties. It consists essentially of reactive silicon dioxide (SiO2) and aluminum oxide (Al2O3). The remainder contains iron oxide (Fe2O3) and other compounds. Table 11 gives a survey of the requirements for the use as minor constituent. The investigated LCCP fly ashes meet these requirements. The analyses of the content of reactive SiO2 are under preparation. Based on the content of amorphous phases, as analyzed with XRD-analyses it can be concluded that this requirement will be met.
Table 11 Requirements for siliceous fly ash in EN 197-1 and range for biocoal fly ash
PARAMETER REQUIREMENT RANGE FLY ASH Content of reactive CaO ≤10.0 % m/m 2.50-6.13 Content of free CaO ≤1.0 % m/m1) 0.07-0.64 Content of reactive SiO2 ≤25.0 % m/m 2)
1) Fly ash having a content higher than 1,0 % m/m but less than 2,5 % m/m is also acceptable, provided that the requirement on expansion (soundness) does not exceed 10 mm when tested in accordance with EN 196-3.
2) Analyses have been ordered, but not finished yet due organizational problems in the lab
Besluit Bodemkwaliteit (Dutch Decree on Soil Quality)
Most of the utilization of cement and concrete with fly ash should meet the requirements of the Besluit Bodemkwaliteit. Leaching tests on concrete with biocoal fly ash have been performed. Concrete with Biocoal fly ash was crushed after 28 days of hardening. The leaching behavior
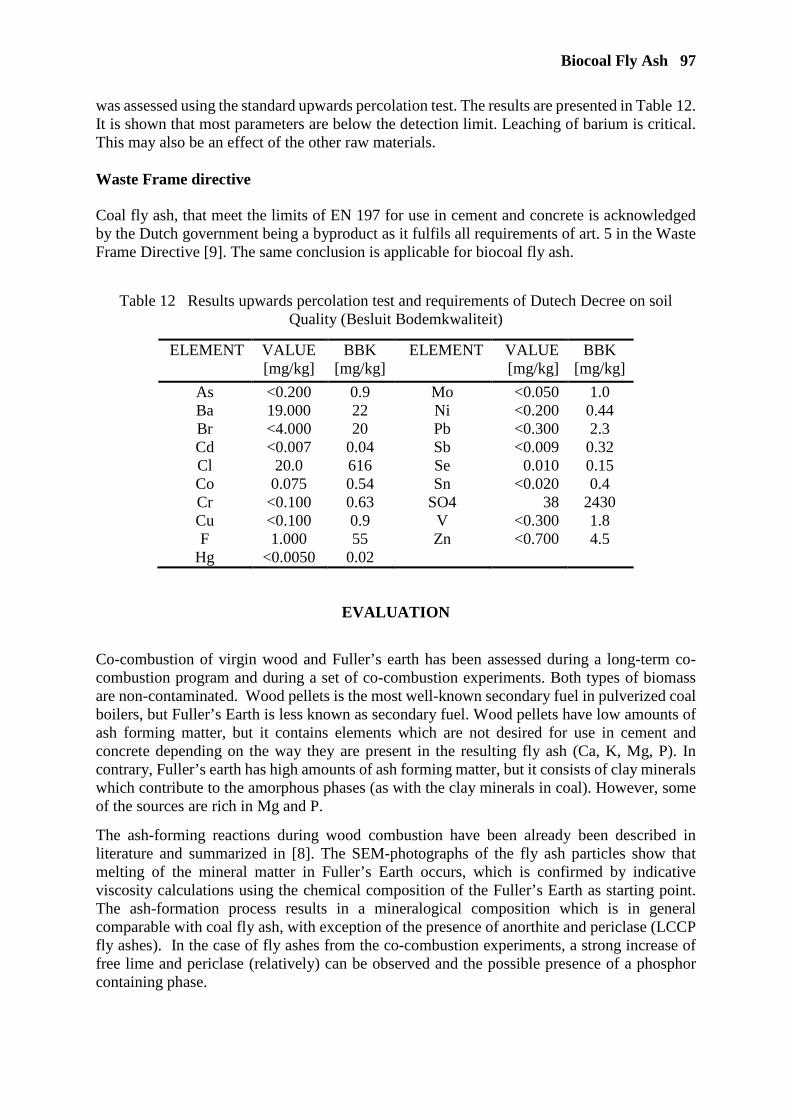
Biocoal Fly Ash 97
was assessed using the standard upwards percolation test. The results are presented in Table 12. It is shown that most parameters are below the detection limit. Leaching of barium is critical. This may also be an effect of the other raw materials. Waste Frame directive Coal fly ash, that meet the limits of EN 197 for use in cement and concrete is acknowledged by the Dutch government being a byproduct as it fulfils all requirements of art. 5 in the Waste Frame Directive [9]. The same conclusion is applicable for biocoal fly ash.
Table 12 Results upwards percolation test and requirements of Dutech Decree on soil Quality (Besluit Bodemkwaliteit)
ELEMENT VALUE [mg/kg]
BBK [mg/kg]
ELEMENT VALUE [mg/kg]
BBK [mg/kg]
As <0.200 0.9 Mo <0.050 1.0 Ba 19.000 22 Ni <0.200 0.44 Br <4.000 20 Pb <0.300 2.3 Cd <0.007 0.04 Sb <0.009 0.32 Cl 20.0 616 Se 0.010 0.15 Co 0.075 0.54 Sn <0.020 0.4 Cr <0.100 0.63 SO4 38 2430 Cu <0.100 0.9 V <0.300 1.8 F 1.000 55 Zn <0.700 4.5
Hg <0.0050 0.02
EVALUATION
Co-combustion of virgin wood and Fuller’s earth has been assessed during a long-term co-combustion program and during a set of co-combustion experiments. Both types of biomass are non-contaminated. Wood pellets is the most well-known secondary fuel in pulverized coal boilers, but Fuller’s Earth is less known as secondary fuel. Wood pellets have low amounts of ash forming matter, but it contains elements which are not desired for use in cement and concrete depending on the way they are present in the resulting fly ash (Ca, K, Mg, P). In contrary, Fuller’s earth has high amounts of ash forming matter, but it consists of clay minerals which contribute to the amorphous phases (as with the clay minerals in coal). However, some of the sources are rich in Mg and P.
The ash-forming reactions during wood combustion have been already been described in literature and summarized in [8]. The SEM-photographs of the fly ash particles show that melting of the mineral matter in Fuller’s Earth occurs, which is confirmed by indicative viscosity calculations using the chemical composition of the Fuller’s Earth as starting point. The ash-formation process results in a mineralogical composition which is in general comparable with coal fly ash, with exception of the presence of anorthite and periclase (LCCP fly ashes). In the case of fly ashes from the co-combustion experiments, a strong increase of free lime and periclase (relatively) can be observed and the possible presence of a phosphor containing phase.
98 Sarabèr and Haanappel
The fly ashes that were generated during the long-term co-combustion program (LCCP) meet the chemical requirements of EN 450-1 with exception of MgO (occasionally). If Mg is present as periclase it may cause unsoundness. Some of the fly ashes from co-combustion experiments do not meet the requirement for CaO total, CaO free and MgO.
Autoclave tests on two fly ashes with >4.0% MgO confirmed that no unsoundness occurred. Mg is mainly part of the clay mineral and will become part of the glass structure during the ash formation (network modifier). The LeChatelier test was performed on fly ashes with high amounts of free lime (3.4 and 4.4% m/m). The expansion remained far below the limit value. The amount of free lime, alkalis and phosphor depends mainly on the share of wood combustion.
Phosphor is a point of attention when it is present as a soluble phosphate because it may cause retardation of cement hydration. Therefore, EN 450 gives a requirement for soluble phosphate. The concentration of soluble phosphate is below the detection limit and also no retardation of setting time occurred.
The fineness and the morphology of fly ash is important for the behavior in (fresh) concrete. Both LCCP fly ashes as the fly ashes from the co-combustion experiments meet the requirement for fineness (>60% < 45µm) of EN 450. The EN 197 gives no physical requirement for siliceous fly ash as miner addition. The morphology of the particles is mainly spherical, but the amount is less than in coal fly ash. Also, there are relatively more agglomerates present.
The EN 450 gives requirements for setting time, soundness and pozzolanic behavior. The EN 197 gives only a requirement for soundness (only to be tested when the content of CaO free is above 1,5 and 1,0% respectively).
The setting time of the biocoal fly ashes fulfills the criterium of EN 450, but it is remarked that there is more deviation than with coal fly ashes. This may be due to the availability of compounds that influence cement hydration. The deviations are small at a 5% replacement level. The activity index does not seem to be influenced. Also, some concrete mixtures were prepared. The workability appears to be slightly reduced. The compressive strength is not negatively influenced, which confirms the mortar test results. Significant correlations are identified between co-combustion of wood, ash based and the amount of CaO total, CaO free, P2O5 and Na2Oeq and SO3 to a less extent (see also figure 3-4). No significant correlations could be derived for the physical and performance properties of the fly ashes. The alkali content shows a very good linear correlation with wood combustion but the best fit for the SO3 content seems to be an exponential correlation.
From literature it is known that in the case of biomass combustion potassium is volatilized during combustion (as potassium is mostly organically bound, in contrary to hard coal) and thereby able to react with SO3 and chlorine whereby potassium sulfate (arcanite) and to a less extent KCl is formed. This confirms the findings of [8]. It implies that with further increasing co-combustion, the content of SO3 may fail for the limit value for SO3 in the EN 450 (3.0% m/m).

Biocoal Fly Ash 99
Figure 3 Relation between CaO free in fly ash and co-combustion of wood (ash based)
Figure 4 Relation between the content of several compounds in fly ash and co-combustion of wood (ash based)
CONCLUSIONS
The results of this study show that it is possible to generate fly ash from high share of co-combustion of Fuller’s Earth in combination with wood, that meet the basic requirements of the EN 450, with exception of MgO (occasionally). This is related by the co-combustion of specific Fuller’s Earth and to wood combustion. Additional testing shows that MgO is mainly in a harmless form and thereby not causing unsoundness. The performance requirements of EN 450 (setting time, soundness and activity index) are met in all cases. All requirements of EN 197 for siliceous fly ash are met for the fly ashes from the long-term co-combustion program. It was shown that even fly ash from 20% coal and 80% biomass combustion was able to meet these requirements. It all depends on the characteristics of the biomass and the coal.
y = 0,3335e0,1209x
R² = 0,9512
00,5
11,5
22,5
33,5
44,5
5
0 5 10 15 20 25
CO
NTE
NT
OF
FRE
E L
IME
, % m
/m
CO-COMBUSTION OF WOOD, ASH BASED, % m/m
y = 0,276e0,076x
R² = 0,8249
y = 0,1252x + 0,881R² = 0,936
0,00
0,50
1,00
1,50
2,00
2,50
3,00
3,50
4,00
0 5 10 15 20 25
CO
NTE
NT,
% m
/m
CO-COMBUSTION OF WOOD, ASH BASED, % m/m
SO3
Na2Oeq
Exponentieel(SO3)Lineair (Na2Oeq)
100 Sarabèr and Haanappel
REFERENCES
1. NEN, 2012. Fly ash for concrete. NEN-EN 450-1. Fly ash for concrete - Part 1: Definition, specifications and conformity criteria.
2. NEN, 2011. Cement – Part 1: Composition, specifications and conformity for common cements. NEN-EN 197-1.
3. NEN, 2002. Aggregates for concrete. NEN-EN 12620.
4. COMMISSION DESKUNDIGEN MESTOFFENWET, 2014. Gebruikte bleekaarde met actieve koolstof. Geschiktheid als covergistingsmateriaal . Advies (Secondary Fuller’s Earth with active carbon. Suitability as co-digestion material. Advice).
5. NEN, 2003. NEN-EN451-1. Method of testing fly ash - Part 1: Determination of free calcium oxide content.
6. ASTM, 2015. Standard specification for Coal Fly As hand Raw or Calcined Natural Pozzolan for Use in Concrete. ASTM C618.
7. BRITISH GEOLOGICAL SUREVY, 2006. Fuller’s Earth. Mineral Planning Factsheet.
8. SARABÈR, A.J., 2017. Fly ash from coal and biomass for use in concrete. PhD dissertation TU Delft. Pp 22-24 and 129-136.
9. SARABÈR, A.J., 2014. Legal status of ashes and gypsum. International conference EuroCoalAsh 2014. Munich Germany 14/15 October 2014. Pp 183-191.

COMPARISON OF EN 450 AND ASTM 618 SPECIFICATIONS AND TESTING PROCEDURES FOR
FLY ASH USED IN CONCRETE
T Robl A Oberlink R Jewell T Duvallet
University of Kentucky Center for Applied Energy Research
K Ladwig
The Electric Power Research Institute2
United States of America
ABSTRACT. Multiple national standards exist for fly ash used in concrete including: the U.S. Standard, ASTM C-618, the Indian Standard, IS 3812-1, and IS 3812-2, the Chinese standard, GB/T 1596, the European Standard EN 450 as well as standards in Canadian, Australia, Japan and the Russian Federation. These standards include differences in both classification and test methodology. Unfortunately, due to the variations in test methodology, these data are not comparable among the various national standards. To illustrate; ASTM requires that a strength index of 75% be achieved as measured at 7 or 28 days. EN 450 prescribes an activity index of 75% be achieve at 28 days or 85% at 90 days. These requirements seem similar or at least comparable. This is not the case however as ASTM uses a flow table to set the water in the tests, i.e. the samples are prepared at constant flow, and the water variation is measured as water demand. EN 450 sets the test samples at constant water, and for Category S measures the flow separately to determine water demand. A standard series of tests were conducted using both ASTM and EU methods on a series of ash samples recovered from ponds and landfills. The results of these tests indicate that the ASTM methodology reflects early contributions to concrete such as improvements in rheology and particle packing, while the EN approach provides a measure of pozzolanic activity. Keywords: Ash standards, Strength activity testing, Fly ash, ASTM C-618, EN-450 Dr Thomas Robl, Ms Anne Oberlink, Dr Robert Jewell and Dr Tristana Duvallet are all research scientists in the Cementitious Division of the Materials Technologies Group at the Center for Applied Energy Research of the University of Kentucky. This group is focused on the development of new applications for coal combustion products as well as in the development of new, low energy cements and concretes. Mr Kenneth Ladwig, manages research related to coal combustion product disposal and use for the Electric Power Research Institute. He has been with EPRI for 16 years, and has more than 30 years’ experience in the electric utility industry. Prior to joining EPRI, Ken worked as an environmental consultant and managed environmental compliance for CCP issues at We Energies. Mr. Ladwig plays a key role with EPRI’s vast network of coal powered utilities with access to a wide array of production, ponded and landfilled ash sources.
102 Robl et al
INTRODUCTION Fly Ash Standards Fly ash is a product of coal combustion. Due to variations in power plant operations and coal sources it has variable quality for use in concrete. At its best, fly ash makes a significant contribution to the strength and durability of concrete. Poor quality ash can however be a detriment and for this reason many nations have adopted standards for ash in an attempt to assure performance. Fly ash use in concrete dates back almost 80 years, but became a widespread practice in the 1960’s. The earliest fly ash standards were the British BS3892, first published in 1965 and the ASTM C-618, which existed as a tentative specification in 1968 (ASTM C-618T), but was formally published as a standard in 1978. AASHTO M296-11 was based on the 1997 version of ASTM C-618. BS3892 was eventually divided into three parts. BS3892 Part 1 was published in 1982 and presented a standard for fly ash used in concrete as a cementitious addition. This has a stringent fineness criterion (12% retained on 325 mesh) that essentially required to the ash to be classified, a common practice in the UK [1]. This also guaranteed a high-quality product that commanded a premium price [2]. Part 2 of BS 3892 was published later and was intended for “run of plant” ash with up to 60% fineness [3]. The normalization of standards across the EU in the late 1990’s resulted in the development of EN-450. This was based in part on the British standards some elements of which are preserved within it. However, EN-450 allows the use of a broader range of ash with a fineness of up to 40% and differs significantly in some testing methodology. It is generally more complex in part due to provisions for ash that is derived from co-firing bio-mass and coal, and differences in marketing practices. Although others probably exist, a literature review found these ash standards currently in use: European standard EN-450 [4]; Japanese standard, JIS 6201 [5]; Australian standard, AS3582.1 [6]; Chinese standard, GB/T 1596 [7], (which is undergoing revision), Canadian standard, CSA A3000-13 [8]; Indian standards, IS.3812.1 [9] and IS.3812.2 [10] and Russian standard, GOST 25818-91 [11]. These standards vary from the relatively uncomplicated Australian standard with only 5 criteria, to the European standard which is the most complex of those examined. The Indian standard was the only one found to specifically address ash recovered from ponds and landfills (in part IS.3812.2) but only as an admix to concrete. In the U.S., ash quality criteria are determined by the American Society for Testing and Materials (ASTM) under its C-618 standard [12]. Although each national standard is different, many have similarities reflective of the original British Standard (i.e. India and Australia) or the ASTM approach (Canada and China). Other organizations may also be involved in specifying fly ash standards. For example, the America Association of State highway and Transportation Officials (AASHTO), publishes its own ash standard, M295 [13]. This standard was adapted from the 1996 version of ASTM C618 and, although minor revisions have been made since then, they remain very similar. In addition, state highway departments may have individualized requirements, such as lower LOI criteria than AASHTO or ASTM require [14].
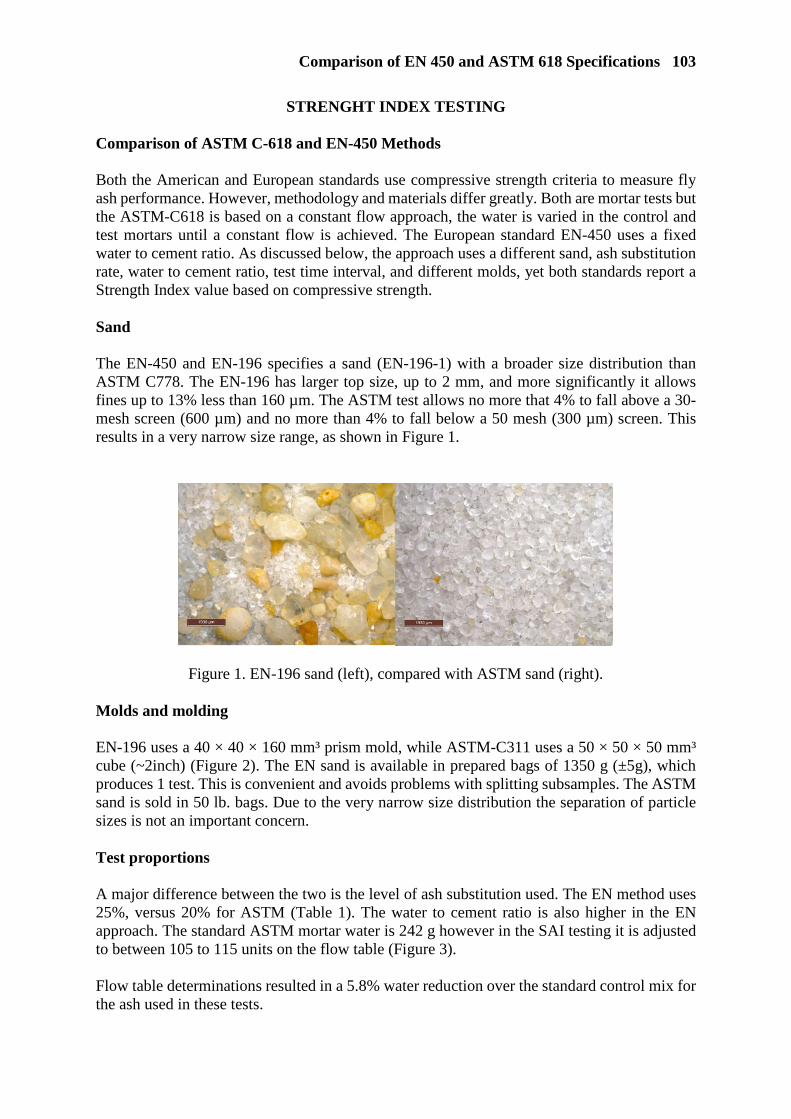
Comparison of EN 450 and ASTM 618 Specifications 103
STRENGHT INDEX TESTING Comparison of ASTM C-618 and EN-450 Methods Both the American and European standards use compressive strength criteria to measure fly ash performance. However, methodology and materials differ greatly. Both are mortar tests but the ASTM-C618 is based on a constant flow approach, the water is varied in the control and test mortars until a constant flow is achieved. The European standard EN-450 uses a fixed water to cement ratio. As discussed below, the approach uses a different sand, ash substitution rate, water to cement ratio, test time interval, and different molds, yet both standards report a Strength Index value based on compressive strength. Sand The EN-450 and EN-196 specifies a sand (EN-196-1) with a broader size distribution than ASTM C778. The EN-196 has larger top size, up to 2 mm, and more significantly it allows fines up to 13% less than 160 µm. The ASTM test allows no more that 4% to fall above a 30-mesh screen (600 µm) and no more than 4% to fall below a 50 mesh (300 µm) screen. This results in a very narrow size range, as shown in Figure 1.
Figure 1. EN-196 sand (left), compared with ASTM sand (right). Molds and molding EN-196 uses a 40 × 40 × 160 mm³ prism mold, while ASTM-C311 uses a 50 × 50 × 50 mm³ cube (~2inch) (Figure 2). The EN sand is available in prepared bags of 1350 g (±5g), which produces 1 test. This is convenient and avoids problems with splitting subsamples. The ASTM sand is sold in 50 lb. bags. Due to the very narrow size distribution the separation of particle sizes is not an important concern. Test proportions A major difference between the two is the level of ash substitution used. The EN method uses 25%, versus 20% for ASTM (Table 1). The water to cement ratio is also higher in the EN approach. The standard ASTM mortar water is 242 g however in the SAI testing it is adjusted to between 105 to 115 units on the flow table (Figure 3). Flow table determinations resulted in a 5.8% water reduction over the standard control mix for the ash used in these tests.

104 Robl et al
Figure 2 EN-196 prism mold (left), ASTM cube mold (right).
Figure 3 ASTM Flow Table.
Table 1 Comparison of Methods.
ASTM C-311 EN 196-1
Control Water, g 242 225 Sand, g 1375 1350 Cement, g 500 450 W/C 0.484 0.5 Fly Ash Test Mixes Rate, % 20 25 Ash, g 100 112.5 Cement, g 400 337.5 Sand, g 1375 1350 Water Fixed, g 225 Flow, mm 105 to 115
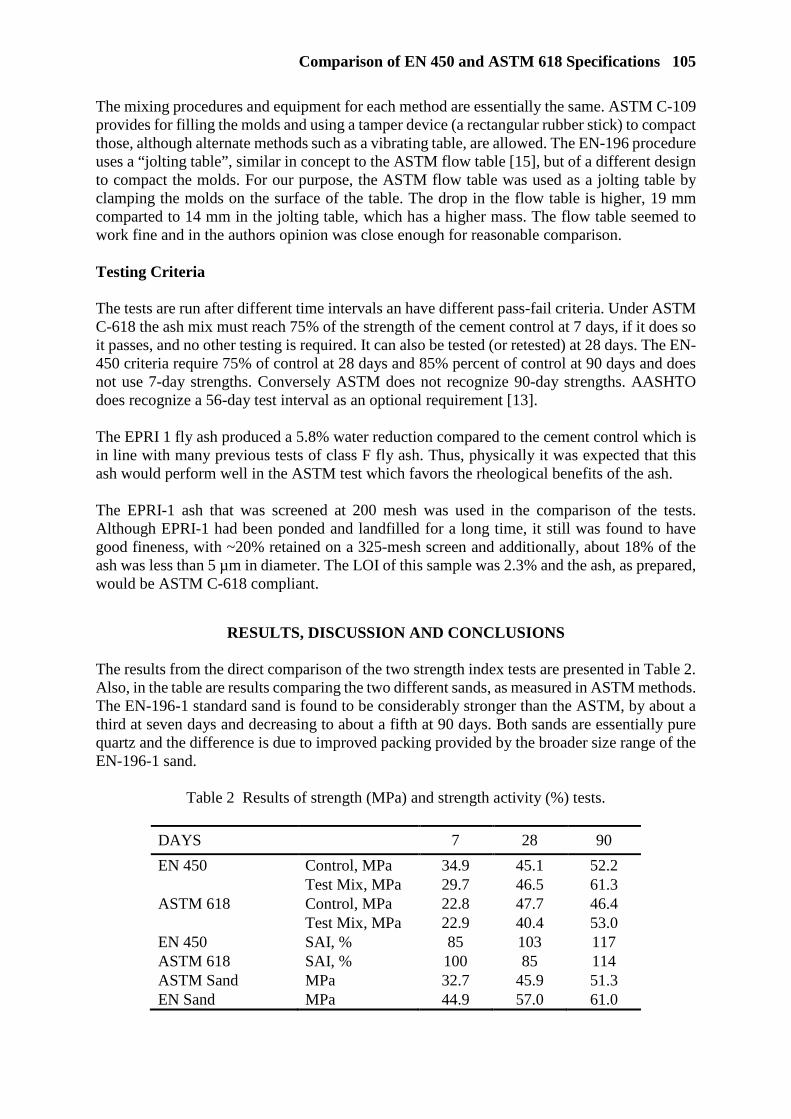
Comparison of EN 450 and ASTM 618 Specifications 105
The mixing procedures and equipment for each method are essentially the same. ASTM C-109 provides for filling the molds and using a tamper device (a rectangular rubber stick) to compact those, although alternate methods such as a vibrating table, are allowed. The EN-196 procedure uses a “jolting table”, similar in concept to the ASTM flow table [15], but of a different design to compact the molds. For our purpose, the ASTM flow table was used as a jolting table by clamping the molds on the surface of the table. The drop in the flow table is higher, 19 mm comparted to 14 mm in the jolting table, which has a higher mass. The flow table seemed to work fine and in the authors opinion was close enough for reasonable comparison. Testing Criteria The tests are run after different time intervals an have different pass-fail criteria. Under ASTM C-618 the ash mix must reach 75% of the strength of the cement control at 7 days, if it does so it passes, and no other testing is required. It can also be tested (or retested) at 28 days. The EN-450 criteria require 75% of control at 28 days and 85% percent of control at 90 days and does not use 7-day strengths. Conversely ASTM does not recognize 90-day strengths. AASHTO does recognize a 56-day test interval as an optional requirement [13]. The EPRI 1 fly ash produced a 5.8% water reduction compared to the cement control which is in line with many previous tests of class F fly ash. Thus, physically it was expected that this ash would perform well in the ASTM test which favors the rheological benefits of the ash. The EPRI-1 ash that was screened at 200 mesh was used in the comparison of the tests. Although EPRI-1 had been ponded and landfilled for a long time, it still was found to have good fineness, with ~20% retained on a 325-mesh screen and additionally, about 18% of the ash was less than 5 µm in diameter. The LOI of this sample was 2.3% and the ash, as prepared, would be ASTM C-618 compliant.
RESULTS, DISCUSSION AND CONCLUSIONS The results from the direct comparison of the two strength index tests are presented in Table 2. Also, in the table are results comparing the two different sands, as measured in ASTM methods. The EN-196-1 standard sand is found to be considerably stronger than the ASTM, by about a third at seven days and decreasing to about a fifth at 90 days. Both sands are essentially pure quartz and the difference is due to improved packing provided by the broader size range of the EN-196-1 sand.
Table 2 Results of strength (MPa) and strength activity (%) tests.
DAYS 7 28 90
EN 450 Control, MPa 34.9 45.1 52.2
Test Mix, MPa 29.7 46.5 61.3 ASTM 618 Control, MPa 22.8 47.7 46.4
Test Mix, MPa 22.9 40.4 53.0 EN 450 SAI, % 85 103 117 ASTM 618 SAI, % 100 85 114 ASTM Sand MPa 32.7 45.9 51.3 EN Sand MPa 44.9 57.0 61.0
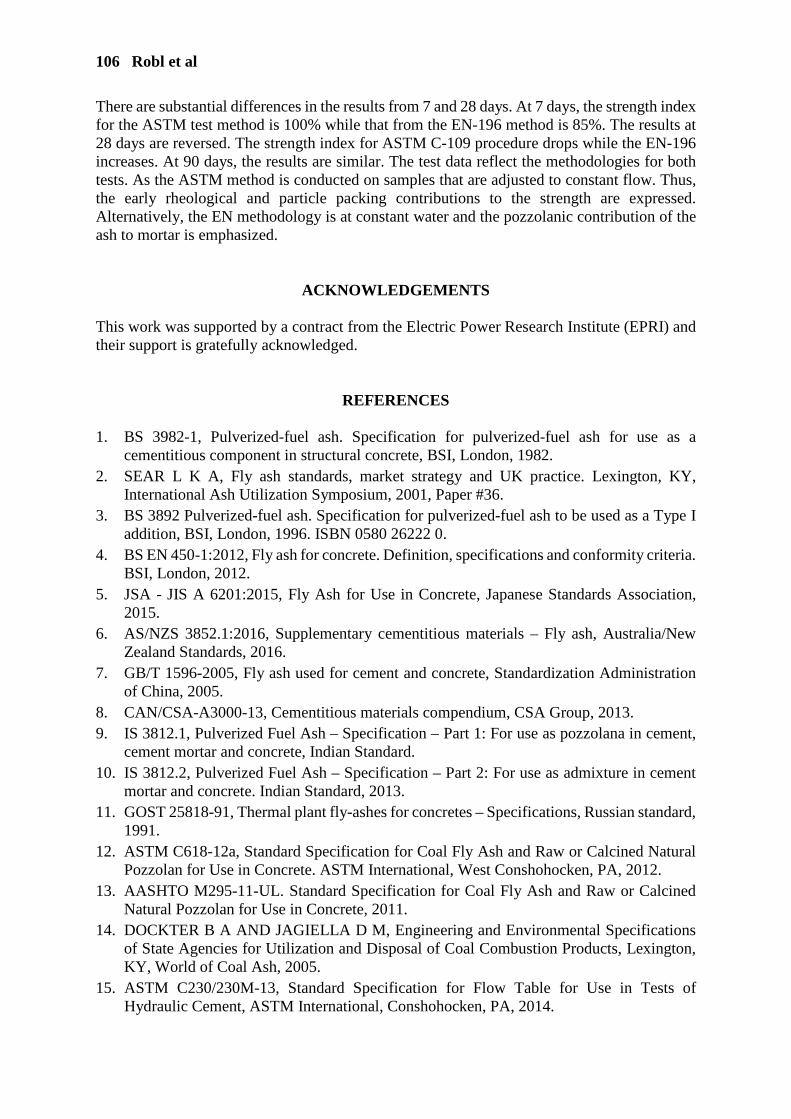
106 Robl et al
There are substantial differences in the results from 7 and 28 days. At 7 days, the strength index for the ASTM test method is 100% while that from the EN-196 method is 85%. The results at 28 days are reversed. The strength index for ASTM C-109 procedure drops while the EN-196 increases. At 90 days, the results are similar. The test data reflect the methodologies for both tests. As the ASTM method is conducted on samples that are adjusted to constant flow. Thus, the early rheological and particle packing contributions to the strength are expressed. Alternatively, the EN methodology is at constant water and the pozzolanic contribution of the ash to mortar is emphasized.
ACKNOWLEDGEMENTS This work was supported by a contract from the Electric Power Research Institute (EPRI) and their support is gratefully acknowledged.
REFERENCES 1. BS 3982-1, Pulverized-fuel ash. Specification for pulverized-fuel ash for use as a
cementitious component in structural concrete, BSI, London, 1982. 2. SEAR L K A, Fly ash standards, market strategy and UK practice. Lexington, KY,
International Ash Utilization Symposium, 2001, Paper #36. 3. BS 3892 Pulverized-fuel ash. Specification for pulverized-fuel ash to be used as a Type I
addition, BSI, London, 1996. ISBN 0580 26222 0. 4. BS EN 450-1:2012, Fly ash for concrete. Definition, specifications and conformity criteria.
BSI, London, 2012. 5. JSA - JIS A 6201:2015, Fly Ash for Use in Concrete, Japanese Standards Association,
2015. 6. AS/NZS 3852.1:2016, Supplementary cementitious materials – Fly ash, Australia/New
Zealand Standards, 2016. 7. GB/T 1596-2005, Fly ash used for cement and concrete, Standardization Administration
of China, 2005. 8. CAN/CSA-A3000-13, Cementitious materials compendium, CSA Group, 2013. 9. IS 3812.1, Pulverized Fuel Ash – Specification – Part 1: For use as pozzolana in cement,
cement mortar and concrete, Indian Standard. 10. IS 3812.2, Pulverized Fuel Ash – Specification – Part 2: For use as admixture in cement
mortar and concrete. Indian Standard, 2013. 11. GOST 25818-91, Thermal plant fly-ashes for concretes – Specifications, Russian standard,
1991. 12. ASTM C618-12a, Standard Specification for Coal Fly Ash and Raw or Calcined Natural
Pozzolan for Use in Concrete. ASTM International, West Conshohocken, PA, 2012. 13. AASHTO M295-11-UL. Standard Specification for Coal Fly Ash and Raw or Calcined
Natural Pozzolan for Use in Concrete, 2011. 14. DOCKTER B A AND JAGIELLA D M, Engineering and Environmental Specifications
of State Agencies for Utilization and Disposal of Coal Combustion Products, Lexington, KY, World of Coal Ash, 2005.
15. ASTM C230/230M-13, Standard Specification for Flow Table for Use in Tests of Hydraulic Cement, ASTM International, Conshohocken, PA, 2014.

USE OF FLY ASH AS A PROPPANT IN CLEAN FRACKING OF UNCONVENTIONAL OIL AND GAS WELLS
T Robl A Oberlink R Jewell T Duvallet
University of Kentucky Center for Applied Energy
L Ring R L Cook
WellsX Corp
United States of America
ABSTRACT. To produce oil and gas from tight, low permeable (unconventional) reservoirs, wells need not only to be drilled and completed, but formation also needs to be hydraulically fractured to create a network of conductive fractures with maximum possible surface area. This is typically achieved by pumping a slurry of natural or manufactured sand product suspended fracking fluid. Conventional proppant requires use of crosslinked polymers to suspend proppant, high pumping rates and huge horse power to deliver it into formation. The packed bed must maintain hydraulic conductivity to flow oil, gas, and water. Class F fly ash is an ideal candidate to be used as a proppant, as it is strong, smooth, round, relatively light weight and inert. With average particle size distribution round 50 micron, it can be suspended in pure or produced water and pumped without settling at very low rates and still deliver significant hydraulic conductivity. Ash is much finer than most other proppants and is thus capable of propping much smaller fractures. In the past few years, we have investigated fly ash recovered from ponds in Kentucky, Ohio, and Tennessee and have produced ash with hydraulic conductivity as high as 1.5 × 10⁻² cm/s, void volumes of over 50%, and bulk densities of less than 1.1 g/cm3. Void volumes equivalent to northern white quartz were produced at pressures up to 13,000 psi. Utilization of fly ash as proppant is big and attractive market for fly ash from ponds and landfills. WellsX, Inc. is a Texas based start-up that has initiated pioneering efforts to use fly ash as the only proppant during fracking operations. Using a patented approach, they have successfully rejuvenated old wells using a fly ash-based proppant. Although still in its infancy, successes to date indicate that fly ash with characteristics described above can be utilized as a proppant with no viscosity modifiers resulting in “greener” fracking operations with much smaller footprint and still yielding of oil and gas production equal to or greater than conventional approaches. Keywords: Fly ash, Fracking, Oil and gas recovery, Liquid frac. Dr Thomas Robl, Ms Anne Oberlink, Dr Robert Jewell and Dr Tristana Duvallet are all research scientists in the Cementitious Division of the Materials Technologies Group at the Center for Applied Energy Research, University of Kentucky. Dr Lev Ring has over 150 patents, over 30 publications, and multiple awards. He left his position Director of Technology Development at Weatherford to again team up with Lance Cook to establish WellsX. Dr Robert Lance Cook is a 36-year veteran of Shell Oil becoming VP of Technology in 2007 and Chief Scientist in 2012. He has been granted over 80 patents and is co-founder of WellsX..

108 Robl et al
INTRODUCTION Oil and gas production via fracking requires the fracturing of shale, siltstone, or limestone by various fracking methods, and the treatment of well to stabilize the fractures. This final step is typically accomplished by pumping a slurry of natural or manufactured sand product into the fractured zone to prop them open. Hence the term “proppant”. A trade-off exists for the smaller size range of proppants which are capable of stabilizing smaller fractures that generate a lot of the oil and gas, but may result in a lowered permeable packing, as a drawback. The development of proppants that are small enough to prevent the healing of micro fractures (i.e. “micro-proppants”), but still demonstrate acceptable hydraulic conductivity as well as strength, represents both a challenge and an opportunity. The typical characteristics of fly ash suggest that it is suitable as a high-performance micro proppant. Fly ash consists of round particles with a reasonably narrow size distribution that facilitates the development of void volume when packed. The smoothness of the particles prove for lowered resistance to flow (Figure 1). The small size of fly ash — typically in the silt and fine silt range — suggests an ability to prop micro fractures. Thus, fly ash appears to represent an ideal material to base a micro proppant on. This paper discusses lab work.
Figure 1 Comparison of surface properties of fly ash with clay minerals.
RESEARCH OBJECTIVES
The overall objective of this work is to examine the characteristics of coal-combustion fly ash as a fracking proppant from both laboratory testing and practical field trials. The laboratory work examined the effect of classification on the hydraulic conductivity of the ash. The proppant characteristics of fly ash materials was then determined using API and ISO methodology. This includes the determination of particle and packing density, void volume and crushing strength. Materials Class F fly ash, as defined by the ASTM C618 standard, were used in the lab work. Three different sources of ash were used, two from Kentucky and one from Ohio. The samples
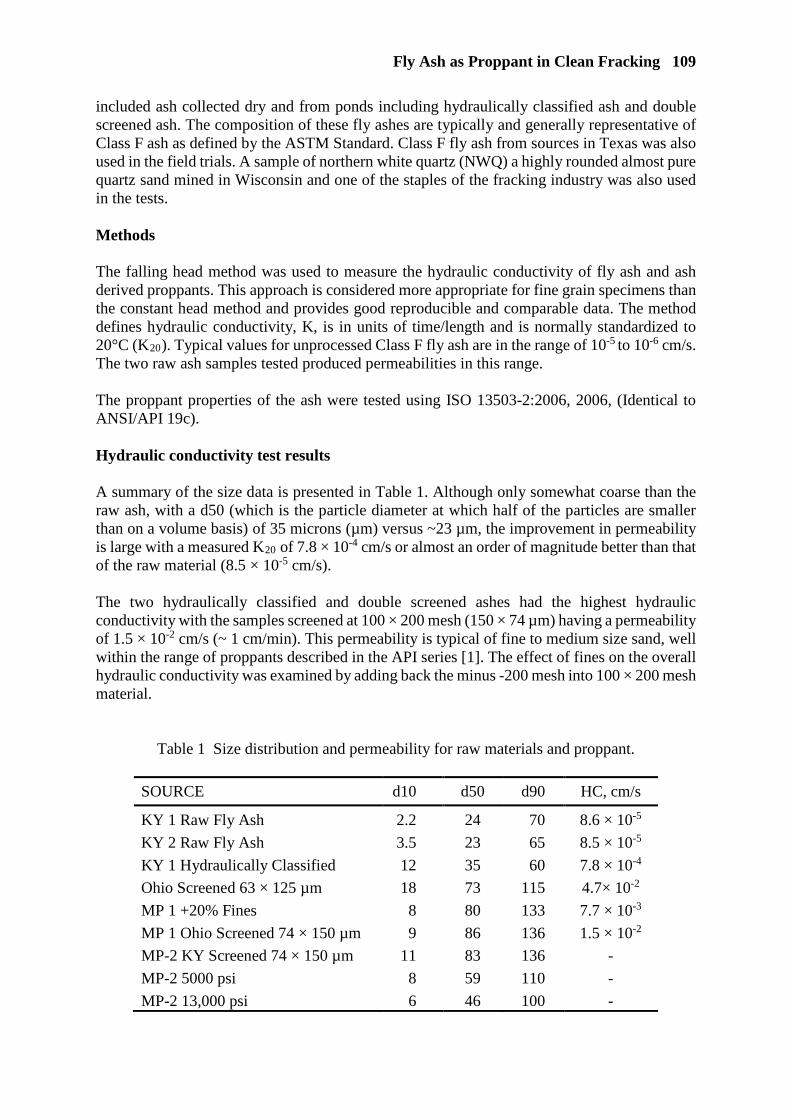
Fly Ash as Proppant in Clean Fracking 109
included ash collected dry and from ponds including hydraulically classified ash and double screened ash. The composition of these fly ashes are typically and generally representative of Class F ash as defined by the ASTM Standard. Class F fly ash from sources in Texas was also used in the field trials. A sample of northern white quartz (NWQ) a highly rounded almost pure quartz sand mined in Wisconsin and one of the staples of the fracking industry was also used in the tests. Methods The falling head method was used to measure the hydraulic conductivity of fly ash and ash derived proppants. This approach is considered more appropriate for fine grain specimens than the constant head method and provides good reproducible and comparable data. The method defines hydraulic conductivity, K, is in units of time/length and is normally standardized to 20°C (K20). Typical values for unprocessed Class F fly ash are in the range of 10-5 to 10-6 cm/s. The two raw ash samples tested produced permeabilities in this range. The proppant properties of the ash were tested using ISO 13503-2:2006, 2006, (Identical to ANSI/API 19c). Hydraulic conductivity test results A summary of the size data is presented in Table 1. Although only somewhat coarse than the raw ash, with a d50 (which is the particle diameter at which half of the particles are smaller than on a volume basis) of 35 microns (µm) versus ~23 µm, the improvement in permeability is large with a measured K20 of 7.8 × 10⁻⁴ cm/s or almost an order of magnitude better than that of the raw material (8.5 × 10⁻⁵ cm/s). The two hydraulically classified and double screened ashes had the highest hydraulic conductivity with the samples screened at 100 × 200 mesh (150 × 74 µm) having a permeability of 1.5 × 10⁻² cm/s (~ 1 cm/min). This permeability is typical of fine to medium size sand, well within the range of proppants described in the API series [1]. The effect of fines on the overall hydraulic conductivity was examined by adding back the minus -200 mesh into 100 × 200 mesh material.
Table 1 Size distribution and permeability for raw materials and proppant.
SOURCE d10 d50 d90 HC, cm/s
KY 1 Raw Fly Ash 2.2 24 70 8.6 × 10⁻⁵
KY 2 Raw Fly Ash 3.5 23 65 8.5 × 10⁻⁵
KY 1 Hydraulically Classified 12 35 60 7.8 × 10⁻⁴
Ohio Screened 63 × 125 µm 18 73 115 4.7× 10⁻²
MP 1 +20% Fines 8 80 133 7.7 × 10⁻³
MP 1 Ohio Screened 74 × 150 µm 9 86 136 1.5 × 10⁻²
MP-2 KY Screened 74 × 150 µm 11 83 136 -
MP-2 5000 psi 8 59 110 -
MP-2 13,000 psi 6 46 100 -
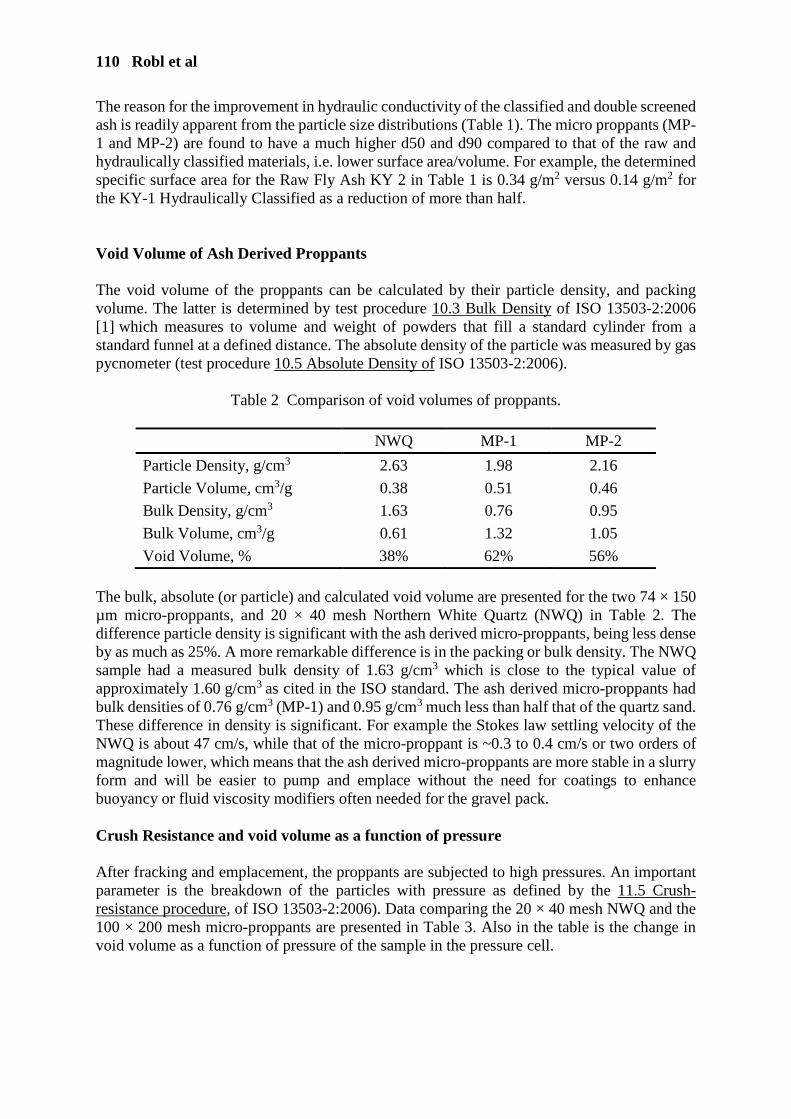
110 Robl et al
The reason for the improvement in hydraulic conductivity of the classified and double screened ash is readily apparent from the particle size distributions (Table 1). The micro proppants (MP-1 and MP-2) are found to have a much higher d50 and d90 compared to that of the raw and hydraulically classified materials, i.e. lower surface area/volume. For example, the determined specific surface area for the Raw Fly Ash KY 2 in Table 1 is 0.34 g/m2 versus 0.14 g/m2 for the KY-1 Hydraulically Classified as a reduction of more than half. Void Volume of Ash Derived Proppants The void volume of the proppants can be calculated by their particle density, and packing volume. The latter is determined by test procedure 10.3 Bulk Density of ISO 13503-2:2006 [1] which measures to volume and weight of powders that fill a standard cylinder from a standard funnel at a defined distance. The absolute density of the particle was measured by gas pycnometer (test procedure 10.5 Absolute Density of ISO 13503-2:2006).
Table 2 Comparison of void volumes of proppants.
NWQ MP-1 MP-2
Particle Density, g/cm3 2.63 1.98 2.16
Particle Volume, cm3/g 0.38 0.51 0.46
Bulk Density, g/cm3 1.63 0.76 0.95
Bulk Volume, cm3/g 0.61 1.32 1.05
Void Volume, % 38% 62% 56%
The bulk, absolute (or particle) and calculated void volume are presented for the two 74 × 150 µm micro-proppants, and 20 × 40 mesh Northern White Quartz (NWQ) in Table 2. The difference particle density is significant with the ash derived micro-proppants, being less dense by as much as 25%. A more remarkable difference is in the packing or bulk density. The NWQ sample had a measured bulk density of 1.63 g/cm3 which is close to the typical value of approximately 1.60 g/cm3 as cited in the ISO standard. The ash derived micro-proppants had bulk densities of 0.76 g/cm3 (MP-1) and 0.95 g/cm3 much less than half that of the quartz sand. These difference in density is significant. For example the Stokes law settling velocity of the NWQ is about 47 cm/s, while that of the micro-proppant is ~0.3 to 0.4 cm/s or two orders of magnitude lower, which means that the ash derived micro-proppants are more stable in a slurry form and will be easier to pump and emplace without the need for coatings to enhance buoyancy or fluid viscosity modifiers often needed for the gravel pack. Crush Resistance and void volume as a function of pressure After fracking and emplacement, the proppants are subjected to high pressures. An important parameter is the breakdown of the particles with pressure as defined by the 11.5 Crush-resistance procedure, of ISO 13503-2:2006). Data comparing the 20 × 40 mesh NWQ and the 100 × 200 mesh micro-proppants are presented in Table 3. Also in the table is the change in void volume as a function of pressure of the sample in the pressure cell.
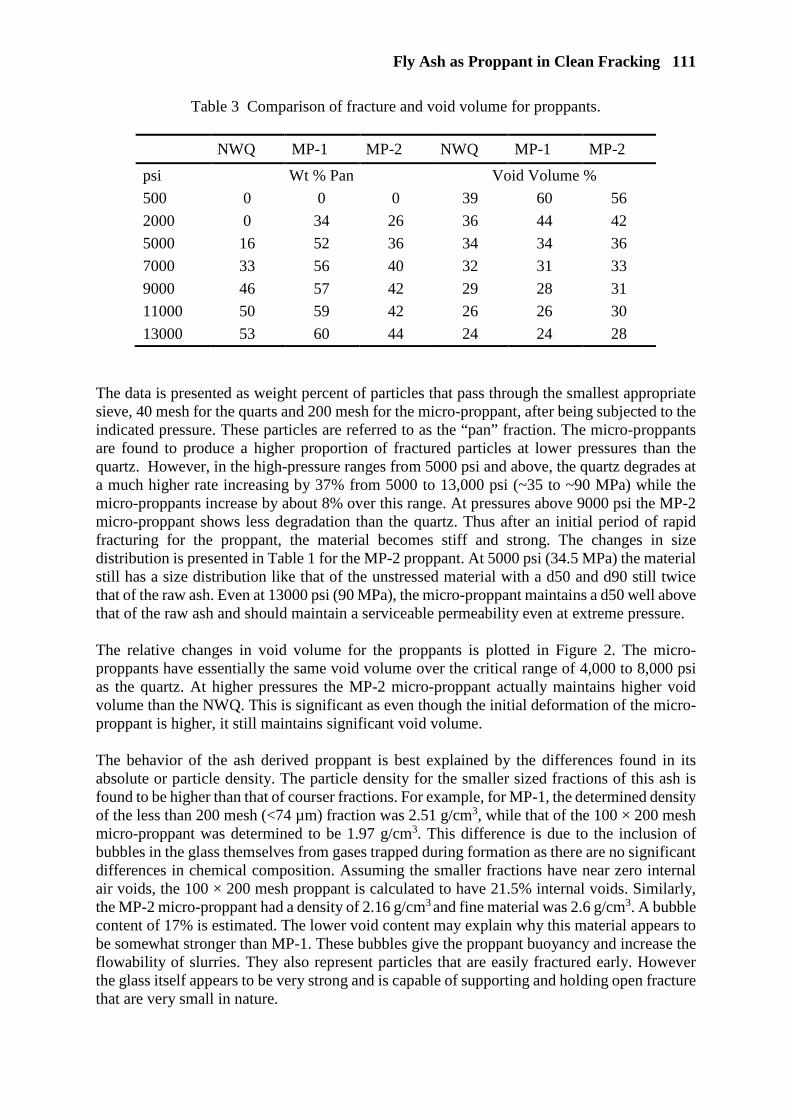
Fly Ash as Proppant in Clean Fracking 111
Table 3 Comparison of fracture and void volume for proppants.
NWQ MP-1 MP-2 NWQ MP-1 MP-2
psi Wt % Pan Void Volume %
500 0 0 0 39 60 56
2000 0 34 26 36 44 42
5000 16 52 36 34 34 36
7000 33 56 40 32 31 33
9000 46 57 42 29 28 31
11000 50 59 42 26 26 30
13000 53 60 44 24 24 28
The data is presented as weight percent of particles that pass through the smallest appropriate sieve, 40 mesh for the quarts and 200 mesh for the micro-proppant, after being subjected to the indicated pressure. These particles are referred to as the “pan” fraction. The micro-proppants are found to produce a higher proportion of fractured particles at lower pressures than the quartz. However, in the high-pressure ranges from 5000 psi and above, the quartz degrades at a much higher rate increasing by 37% from 5000 to 13,000 psi (~35 to ~90 MPa) while the micro-proppants increase by about 8% over this range. At pressures above 9000 psi the MP-2 micro-proppant shows less degradation than the quartz. Thus after an initial period of rapid fracturing for the proppant, the material becomes stiff and strong. The changes in size distribution is presented in Table 1 for the MP-2 proppant. At 5000 psi (34.5 MPa) the material still has a size distribution like that of the unstressed material with a d50 and d90 still twice that of the raw ash. Even at 13000 psi (90 MPa), the micro-proppant maintains a d50 well above that of the raw ash and should maintain a serviceable permeability even at extreme pressure. The relative changes in void volume for the proppants is plotted in Figure 2. The micro-proppants have essentially the same void volume over the critical range of 4,000 to 8,000 psi as the quartz. At higher pressures the MP-2 micro-proppant actually maintains higher void volume than the NWQ. This is significant as even though the initial deformation of the micro-proppant is higher, it still maintains significant void volume. The behavior of the ash derived proppant is best explained by the differences found in its absolute or particle density. The particle density for the smaller sized fractions of this ash is found to be higher than that of courser fractions. For example, for MP-1, the determined density of the less than 200 mesh (<74 µm) fraction was 2.51 g/cm3, while that of the 100 × 200 mesh micro-proppant was determined to be 1.97 g/cm3. This difference is due to the inclusion of bubbles in the glass themselves from gases trapped during formation as there are no significant differences in chemical composition. Assuming the smaller fractions have near zero internal air voids, the 100 × 200 mesh proppant is calculated to have 21.5% internal voids. Similarly, the MP-2 micro-proppant had a density of 2.16 g/cm3 and fine material was 2.6 g/cm3. A bubble content of 17% is estimated. The lower void content may explain why this material appears to be somewhat stronger than MP-1. These bubbles give the proppant buoyancy and increase the flowability of slurries. They also represent particles that are easily fractured early. However the glass itself appears to be very strong and is capable of supporting and holding open fracture that are very small in nature.
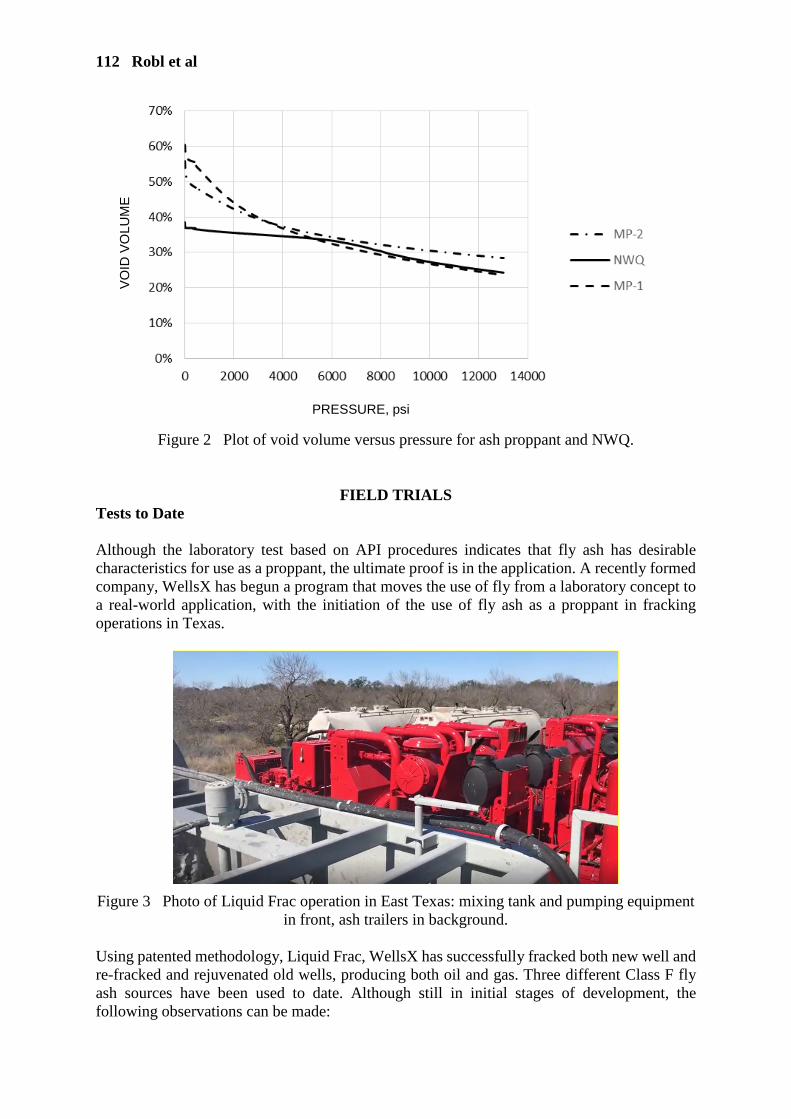
112 Robl et al
Figure 2 Plot of void volume versus pressure for ash proppant and NWQ.
FIELD TRIALS Tests to Date Although the laboratory test based on API procedures indicates that fly ash has desirable characteristics for use as a proppant, the ultimate proof is in the application. A recently formed company, WellsX has begun a program that moves the use of fly from a laboratory concept to a real-world application, with the initiation of the use of fly ash as a proppant in fracking operations in Texas.
Figure 3 Photo of Liquid Frac operation in East Texas: mixing tank and pumping equipment in front, ash trailers in background.
Using patented methodology, Liquid Frac, WellsX has successfully fracked both new well and re-fracked and rejuvenated old wells, producing both oil and gas. Three different Class F fly ash sources have been used to date. Although still in initial stages of development, the following observations can be made:
PRESSURE, psi
VOID
VO
LUM
E

Fly Ash as Proppant in Clean Fracking 113
• Field trials have shown that micro-proppants have impressive results on production and
ultimate recovery (both gas and oil). Although very early, there is some indication that the use of micro-proppants may increase and extend production.
• Liquid Frac requires much less hydraulic horsepower and much smaller foot print than conventional Frac
• Liquid Frac technology is very green and can use produced water for fracking jobs, without chemical additives.
• Liquid Frac jobs can be done through tubing which is perfect for re-fracking. • Technology is very forgiving, fracking can be restarted after a pause for several hours.
Summary, Advantages of Fly Ash Based Micro-Proppant
• Almost perfect spherical shape. The morphology of the material is derived from a suspended molten state producing perfectly round balls. The shape of these particles facilitates stabile flow with creating slurries that are pumpable long distances without settlement or phase separation issues.
• High hydraulic conductivity. Testing to date indicates that hydraulic conductivities of
ash derived proppants are relatively easy to modify using simple techniques hydraulic classification and screening. Conductivity of 10-2 cm/s was achieved in lab tests on double screened materials and thus a small silt size particle ash-based proppant (e.g. 70-90 µm d50) demonstrated the permeability of a much coarser sand sized material.
• Relatively low density. Ash derived proppant particle densities are in the range of 1.97
to 2.4 g/cm3. The small size and low density result in low settling velocities, e.g. 0.3-0.4 cm/s compared to 47 cm/s for 20 × 40 mesh quartz sand, for example. This allows the use of slurries without viscosity modifiers for transport with improved efficiency of placement and cleaner post fracking conditions, as demonstrated in the field trials.
• High strength. The fly ash proppant are composed of a strong ceramic glass. These materials show exceptional strength and stiffness at pressures in the 5,000 to 13,000 psi range.
• Very low surface area/volume ratio. Because of its origin, fly ash has one of the lowest
specific surface area to volume ratio. The low surface area results in greatly improved fluid flow in a packed bed.
• Simply modified surfaces. If needed, the fly ash based micro proppant has a glassy
surface that readily accepts low cost, environmentally friendly dispersants such as poly carboxylate, and sulfonates. The proppant also accepts silanes which can be used to enhance its hydrophobicity, further increasing hydraulic conductivity.
• Chemically inert. The Class F fly ash which the micro proppant is derived from is
essentially inert in a very broad pH range (~2 to ~12).
• Environmentally green material. The micro proppant is derived from ponded and landfilled Class F ash. There is somewhere between 1.5 and 1.8 billion tons of ash located in storage facilities (i.e. ponds and landfills) in the United States. The use of fly

114 Robl et al
ash as a source of micro-proppant, represents the recycling of what is currently an underutilized material. With a consumption rate of up to 2,000 lbs. per foot of fracked well, the potential utilization is on a par with that of construction materials.
REFERENCE
1. ISO 13503-2:2006, 2006, (Also as ANSI/API 19c) Petroleum and natural gas industries
Completion fluids and materials, Part 2: Measurement of properties of proppants used in hydraulic fracturing and gravel-packing operations. 28 p.
UTILIZATION OF COAL COMBUSTION PRODUCTS AS A TERNARY BINDER IN SHOTCRETE
V Šmilauer R Sovják Š Pešková R Šulc
Czech Technical University in Prague
F Škvára M Šídlová
University of Chemistry and Technology Prague
R Snop P Růžička
ČEZ Energetické produkty Hochtief CZ a.s.
Czech Republic
ABSTRACT. A hydraulic ternary binder was produced by intergrinding fly ash, CFBC fly ash and calcium hydroxide. The binder shows similar strength evolution as slow-hardening cements and can reach compressive strength over 40 MPa at 28 days without long-term detrimental expansion. The ternary binder can be blended with OPC which gives rise to eco-friendly concretes. Since the ternary binder generates large amount of ettringite during early hydration, the idea was to use this reaction for early-strength gain in shotcrete, in a similar way as reactions of alkali-free accelerators. A series of lab measurements showed that even 80% of OPC replacement by the ternary binder performs well for early strength gain. Based on those results, a full-scale mock-up experiment with 45% of OPC replacement proved to follow J2 strength curve for early-strength gain, using standard 7.5-8.5% alkali-free accelerator. Shotcrete of 4 m3 proved early strength gain, low fallout, good adhesion and workability, confirming lab results. Compressive strength of shotcrete reached over 30 MPa at 28 days, classifying shotcrete to C20/25 strength class. Keywords: Shotcrete, Ternary binder, Ettringite, CFBC Fly ash, Strength. Assoc. Prof. Vít Šmilauer works at Czech Technical University in Prague, faculty of Civil Engineering, Department of Mechanics. He focuses on alternative cementitious binders, long-term performance, microstructure characterization and micromechanical modelling. Assoc. Prof. Radoslav Sovják works at Czech Technical University in Prague, faculty of Civil Engineering, Experimental centre. He focuses on development and testing of Ultra-High-Performance Fibre-Reinforced Concrete. Dr. Šárka Pešková works at Czech Technical University in Prague, faculty of Civil Engineering, Experimental centre. She authored/co-authored over 15 journal papers focusing on high-temperature loading of concrete, spalling, tunnelling, recycled materials and CCPs. Dr. Rostislav Šulc works at Czech Technical University in Prague, faculty of Civil Engineering, Department of Technology. He focuses on characterization of basic physical, mechanical and chemical qualities of fly ash and synthesized activated-ash materials. Assoc. Professor František Škvára works at University of Chemistry and Technology Prague, Faculty of Chemical Technology. He is a leading research worker at the Institute of Glass and Ceramics in a group of inorganic binders. Dr. Martina Šídlová works at University of Chemistry and Technology Prague, Faculty of Chemical Technology. She is a research worker at the Institute of Glass and Ceramics in a group of inorganic binders. Dr. Roman Snop works at ČEZ Energetické produkty, s.r.o., which is part of the CEZ Group. Dr. Pavel Růžička works at Hochtief CZ a.s. as a Technical Director. Pavel is chartered engineer with more than 15 years experience in design, project management, site supervision and research on various tunnelling projects in Europe, Asia and USA.
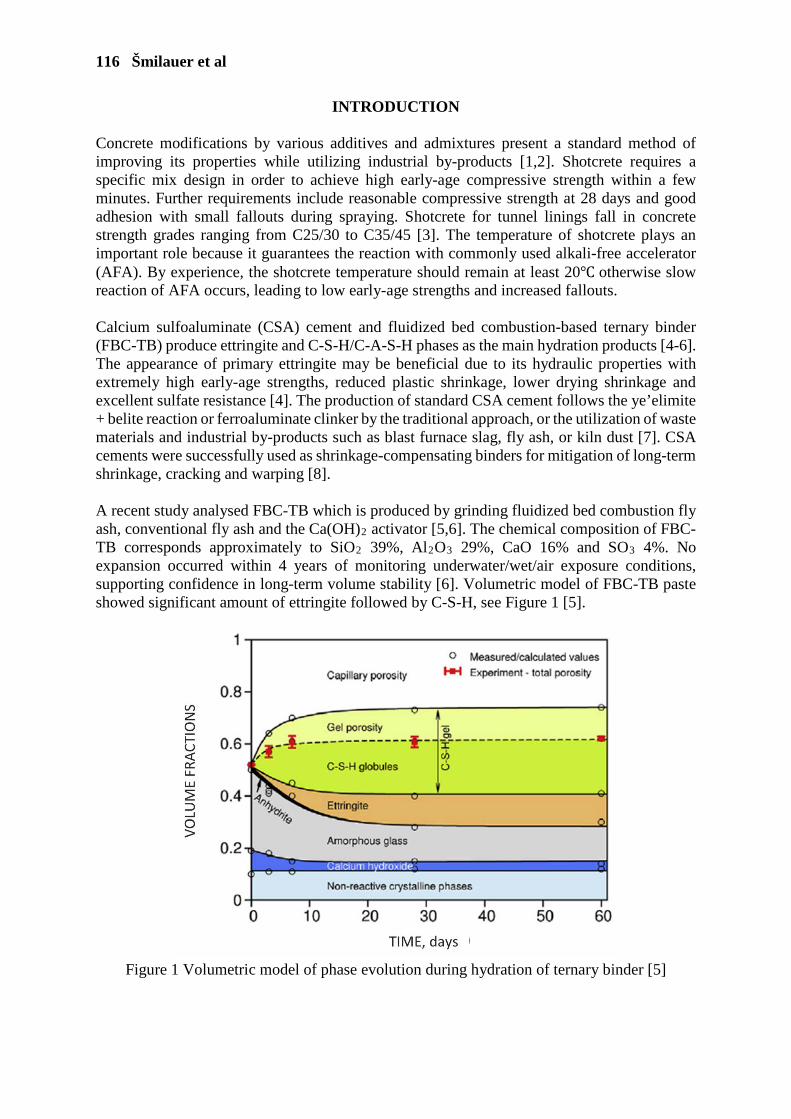
116 Šmilauer et al
INTRODUCTION
Concrete modifications by various additives and admixtures present a standard method of improving its properties while utilizing industrial by-products [1,2]. Shotcrete requires a specific mix design in order to achieve high early-age compressive strength within a few minutes. Further requirements include reasonable compressive strength at 28 days and good adhesion with small fallouts during spraying. Shotcrete for tunnel linings fall in concrete strength grades ranging from C25/30 to C35/45 [3]. The temperature of shotcrete plays an important role because it guarantees the reaction with commonly used alkali-free accelerator (AFA). By experience, the shotcrete temperature should remain at least 20 otherwise slow reaction of AFA occurs, leading to low early-age strengths and increased fallouts. Calcium sulfoaluminate (CSA) cement and fluidized bed combustion-based ternary binder (FBC-TB) produce ettringite and C-S-H/C-A-S-H phases as the main hydration products [4-6]. The appearance of primary ettringite may be beneficial due to its hydraulic properties with extremely high early-age strengths, reduced plastic shrinkage, lower drying shrinkage and excellent sulfate resistance [4]. The production of standard CSA cement follows the ye’elimite + belite reaction or ferroaluminate clinker by the traditional approach, or the utilization of waste materials and industrial by-products such as blast furnace slag, fly ash, or kiln dust [7]. CSA cements were successfully used as shrinkage-compensating binders for mitigation of long-term shrinkage, cracking and warping [8]. A recent study analysed FBC-TB which is produced by grinding fluidized bed combustion fly ash, conventional fly ash and the Ca(OH)2 activator [5,6]. The chemical composition of FBC-TB corresponds approximately to SiO2 39%, Al2O3 29%, CaO 16% and SO3 4%. No expansion occurred within 4 years of monitoring underwater/wet/air exposure conditions, supporting confidence in long-term volume stability [6]. Volumetric model of FBC-TB paste showed significant amount of ettringite followed by C-S-H, see Figure 1 [5].
Figure 1 Volumetric model of phase evolution during hydration of ternary binder [5]
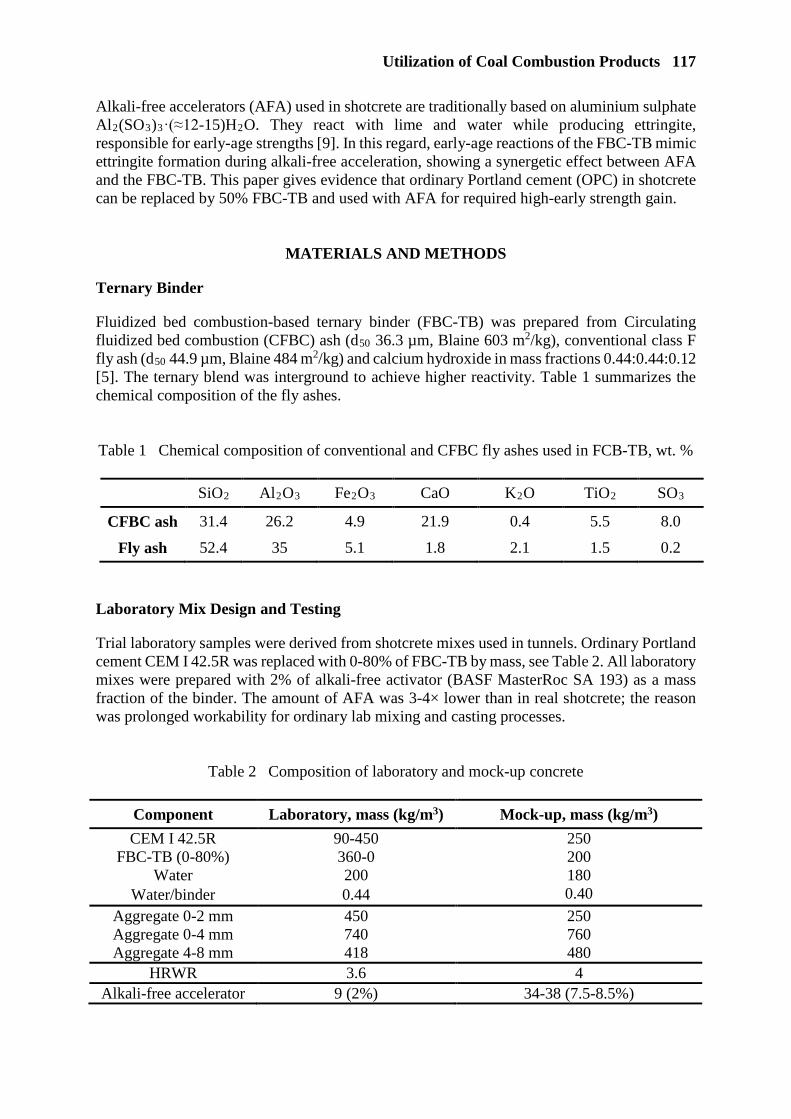
Utilization of Coal Combustion Products 117
Alkali-free accelerators (AFA) used in shotcrete are traditionally based on aluminium sulphate Al2(SO3)3·(≈12-15)H2O. They react with lime and water while producing ettringite, responsible for early-age strengths [9]. In this regard, early-age reactions of the FBC-TB mimic ettringite formation during alkali-free acceleration, showing a synergetic effect between AFA and the FBC-TB. This paper gives evidence that ordinary Portland cement (OPC) in shotcrete can be replaced by 50% FBC-TB and used with AFA for required high-early strength gain.
MATERIALS AND METHODS
Ternary Binder
Fluidized bed combustion-based ternary binder (FBC-TB) was prepared from Circulating fluidized bed combustion (CFBC) ash (d50 36.3 µm, Blaine 603 m2/kg), conventional class F fly ash (d50 44.9 µm, Blaine 484 m2/kg) and calcium hydroxide in mass fractions 0.44:0.44:0.12 [5]. The ternary blend was interground to achieve higher reactivity. Table 1 summarizes the chemical composition of the fly ashes. Table 1 Chemical composition of conventional and CFBC fly ashes used in FCB-TB, wt. %
SiO2 Al2O3 Fe2O3 CaO K2O TiO2 SO3
CFBC ash 31.4 26.2 4.9 21.9 0.4 5.5 8.0
Fly ash 52.4 35 5.1 1.8 2.1 1.5 0.2
Laboratory Mix Design and Testing
Trial laboratory samples were derived from shotcrete mixes used in tunnels. Ordinary Portland cement CEM I 42.5R was replaced with 0-80% of FBC-TB by mass, see Table 2. All laboratory mixes were prepared with 2% of alkali-free activator (BASF MasterRoc SA 193) as a mass fraction of the binder. The amount of AFA was 3-4× lower than in real shotcrete; the reason was prolonged workability for ordinary lab mixing and casting processes.
Table 2 Composition of laboratory and mock-up concrete
Component Laboratory, mass (kg/m3) Mock-up, mass (kg/m3)
CEM I 42.5R FBC-TB (0-80%)
Water
90-450 360-0 200
250 200 180
Water/binder 0.44 0.40
Aggregate 0-2 mm 450 250 Aggregate 0-4 mm 740 760 Aggregate 4-8 mm 418 480
HRWR 3.6 4 Alkali-free accelerator 9 (2%) 34-38 (7.5-8.5%)
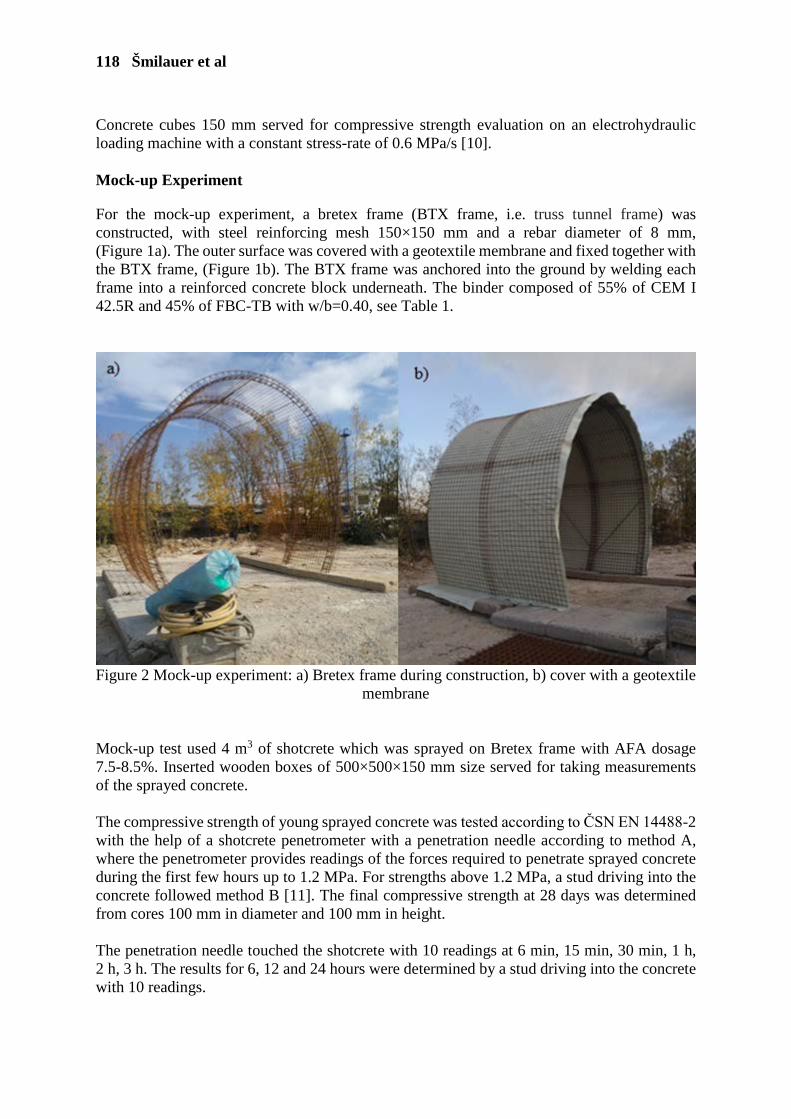
118 Šmilauer et al
Concrete cubes 150 mm served for compressive strength evaluation on an electrohydraulic loading machine with a constant stress-rate of 0.6 MPa/s [10]. Mock-up Experiment
For the mock-up experiment, a bretex frame (BTX frame, i.e. truss tunnel frame) was constructed, with steel reinforcing mesh 150×150 mm and a rebar diameter of 8 mm, (Figure 1a). The outer surface was covered with a geotextile membrane and fixed together with the BTX frame, (Figure 1b). The BTX frame was anchored into the ground by welding each frame into a reinforced concrete block underneath. The binder composed of 55% of CEM I 42.5R and 45% of FBC-TB with w/b=0.40, see Table 1.
Figure 2 Mock-up experiment: a) Bretex frame during construction, b) cover with a geotextile
membrane
Mock-up test used 4 m3 of shotcrete which was sprayed on Bretex frame with AFA dosage 7.5-8.5%. Inserted wooden boxes of 500×500×150 mm size served for taking measurements of the sprayed concrete. The compressive strength of young sprayed concrete was tested according to ČSN EN 14488-2 with the help of a shotcrete penetrometer with a penetration needle according to method A, where the penetrometer provides readings of the forces required to penetrate sprayed concrete during the first few hours up to 1.2 MPa. For strengths above 1.2 MPa, a stud driving into the concrete followed method B [11]. The final compressive strength at 28 days was determined from cores 100 mm in diameter and 100 mm in height. The penetration needle touched the shotcrete with 10 readings at 6 min, 15 min, 30 min, 1 h, 2 h, 3 h. The results for 6, 12 and 24 hours were determined by a stud driving into the concrete with 10 readings.
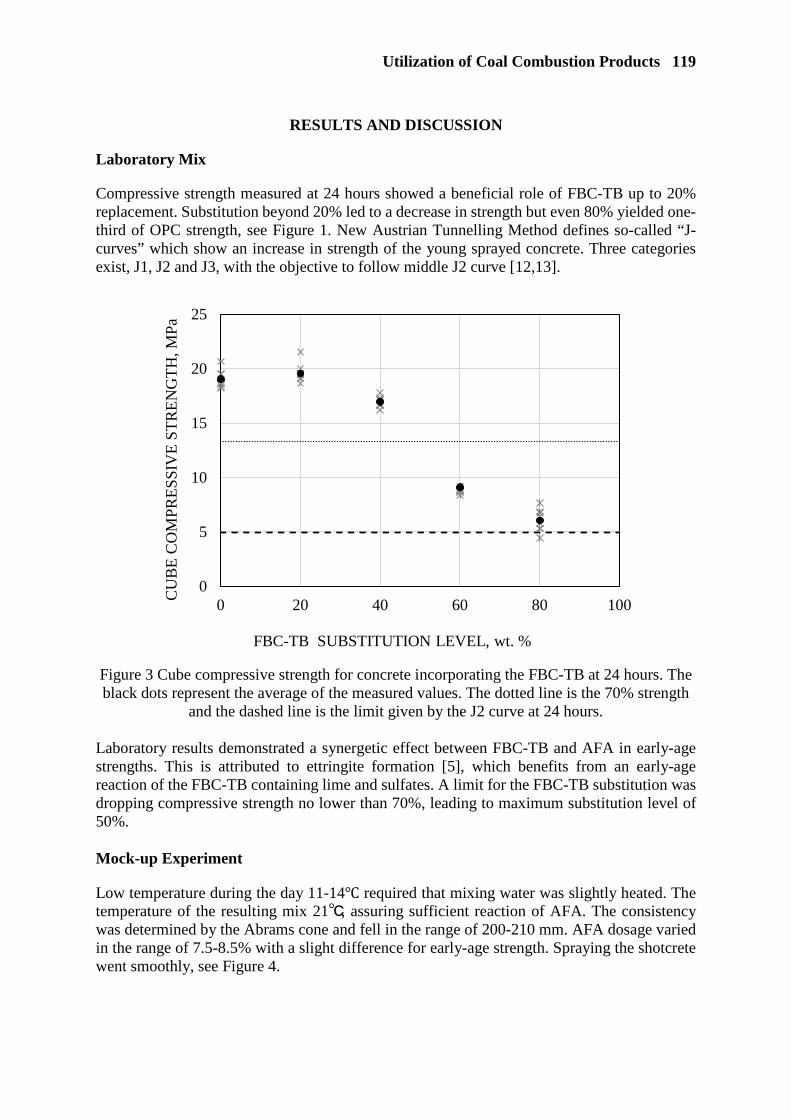
Utilization of Coal Combustion Products 119
RESULTS AND DISCUSSION
Laboratory Mix
Compressive strength measured at 24 hours showed a beneficial role of FBC-TB up to 20% replacement. Substitution beyond 20% led to a decrease in strength but even 80% yielded one-third of OPC strength, see Figure 1. New Austrian Tunnelling Method defines so-called “J-curves” which show an increase in strength of the young sprayed concrete. Three categories exist, J1, J2 and J3, with the objective to follow middle J2 curve [12,13].
Figure 3 Cube compressive strength for concrete incorporating the FBC-TB at 24 hours. The black dots represent the average of the measured values. The dotted line is the 70% strength
and the dashed line is the limit given by the J2 curve at 24 hours. Laboratory results demonstrated a synergetic effect between FBC-TB and AFA in early-age strengths. This is attributed to ettringite formation [5], which benefits from an early-age reaction of the FBC-TB containing lime and sulfates. A limit for the FBC-TB substitution was dropping compressive strength no lower than 70%, leading to maximum substitution level of 50%. Mock-up Experiment
Low temperature during the day 11-14 required that mixing water was slightly heated. The temperature of the resulting mix 21, assuring sufficient reaction of AFA. The consistency was determined by the Abrams cone and fell in the range of 200-210 mm. AFA dosage varied in the range of 7.5-8.5% with a slight difference for early-age strength. Spraying the shotcrete went smoothly, see Figure 4.
0
5
10
15
20
25
0 20 40 60 80 100
CU
BE
CO
MP
RE
SS
IVE
ST
RE
NG
TH
,MP
a
FBC-TB SUBSTITUTION LEVEL, wt. %
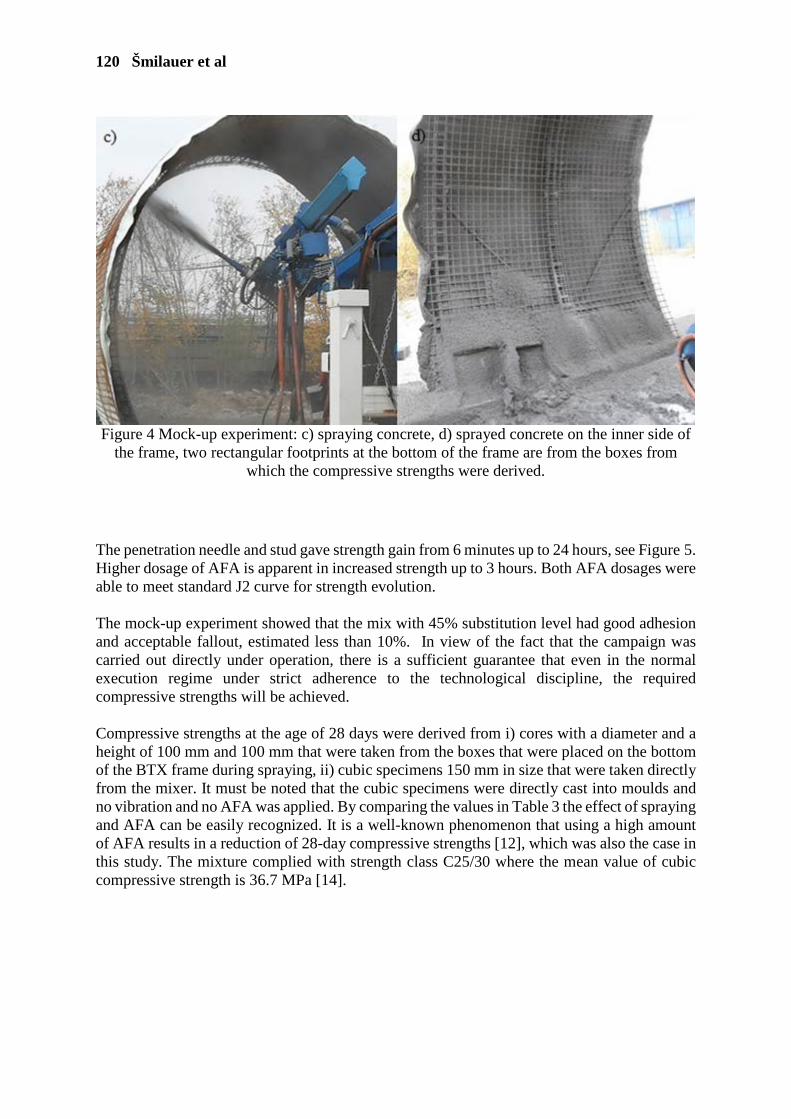
120 Šmilauer et al
Figure 4 Mock-up experiment: c) spraying concrete, d) sprayed concrete on the inner side of
the frame, two rectangular footprints at the bottom of the frame are from the boxes from which the compressive strengths were derived.
The penetration needle and stud gave strength gain from 6 minutes up to 24 hours, see Figure 5. Higher dosage of AFA is apparent in increased strength up to 3 hours. Both AFA dosages were able to meet standard J2 curve for strength evolution. The mock-up experiment showed that the mix with 45% substitution level had good adhesion and acceptable fallout, estimated less than 10%. In view of the fact that the campaign was carried out directly under operation, there is a sufficient guarantee that even in the normal execution regime under strict adherence to the technological discipline, the required compressive strengths will be achieved. Compressive strengths at the age of 28 days were derived from i) cores with a diameter and a height of 100 mm and 100 mm that were taken from the boxes that were placed on the bottom of the BTX frame during spraying, ii) cubic specimens 150 mm in size that were taken directly from the mixer. It must be noted that the cubic specimens were directly cast into moulds and no vibration and no AFA was applied. By comparing the values in Table 3 the effect of spraying and AFA can be easily recognized. It is a well-known phenomenon that using a high amount of AFA results in a reduction of 28-day compressive strengths [12], which was also the case in this study. The mixture complied with strength class C25/30 where the mean value of cubic compressive strength is 36.7 MPa [14].

Utilization of Coal Combustion Products 121
Figure 5 Compressive strength in mock-up experiment from 6 minutes up to 24 hours. J2 and
J3 curves define standardized shotcrete strength gain. Note two dosages of AFA.
Table 3 Average compressive strengths and bulk densities at the age of 28 days, AFA 7.5%
Core drilled from boxes of shotcrete Strength Bulk dens.
36.7±0.83 MPa 2245±15 kg/m3
Cubes taken directly from the mixer (not sprayed, not vibrated, no AFA)
Strength Bulk dens.
50.9±1.64 MPa 2107±0.8 kg/m3
CONSLUSIONS
The paper showed utilization of coal combustion products (FBC-TB) as a ternary binder for shotcrete mock-up test. The results demonstrated feasible replacement of 45% of CEM I with FBC-TB while maintaining early-age strength gain. Early-age ettringite formation in FBC-TB and AFA shows synergetic effect where FBC-TB provides sulphates and aluminates at much lower cost. The mock-up test proved low fallout, good adhesion and minimal technological adjustments with regards to standard shotcrete. Acknowledgements
This work was supported by the Technological Agency of the Czech Republic by projects TE01020168, TH02010206, TH02020163, TH03020404 and by Ministry of Industry and Trade under project FV30062.
0.1
1
10
6 60 600
COM
PRES
SIVE
STR
ENGT
H,M
Pa
TIME, min
J3
AFA 8.5%
AFA 7.5%
J2
122 Šmilauer et al
REFERENCES
1. IMBABI, M S, CARRIGAN C, MCKENNA S. Trends and developments in green cement
and concrete technology, Int. J. Sustain. Built Environ, Vol. 1, 2012, pp 194–216.
2. ZÁLESKÁ M, PAVLÍKOVÁ M, PAVLÍK Z, JANKOVSKÝ O, POKORNÝ J, TYDLITÁT V, SVORA P, ČERNÝ R. Physical and chemical characterization of technogenic pozzolans for the application in blended cements, Constr. Build. Mater., Vol. 160, 2018, pp 106–116. doi:10.1016/J.CONBUILDMAT.2017.11.021.
3. HILAR M et al. Shotcrete in underground civil engineering, Czech ITA-AITES, 2008
4. ADAMS L D. Ettringite, the positive side, in: 19th Int. Conf. Cem. Microsc., Ohio, 1997, pp 1–13.
5. HLAVÁČEK P, ŠULC R, ŠMILAUER V, RÖßLER C, SNOP R. Ternary binder made of CFBC fly ash, conventional fly ash, and calcium hydroxide: Phase and strength evolution, Cem. Concr. Compos, Vol. 90, 2018, pp 100–107
6. ŠKVÁRA F, ŠULC R, SNOP R, PETEROVÁ A, ŠÍDLOVÁ M. Hydraulic clinkerless binder on the fluid sulfocalcic fly ash basis, Cem. Concr. Compos., Vol. 93, 2018, pp 118–126
7. ARJUNAN P, SILSBEE M R, ROY D M. Sulfoaluminate-belite cement from low-calcium fly ash and sulfur-rich and other industrial by-products, Cem. Concr. Res., Vol. 29, 1999, pp 1305–1311
8. SHADRAVAN S, RAMSEYER C, KANG T H-K. A long term restrained shrinkage study of concrete slabs on ground, Eng. Struct., Vol. 102, 2015, pp 258–265
9. MYRDAL R. SINTEF REPORT: Advanced cementing materials - Controlling hydration development - Accelerating admixtures for concrete - State of the art, Trondheim, 2007
10. ČSN EN 12390-3, ČSN EN 12390-3 Testing hardened concrete - Part 3: Compressive strength of test specimens., 2009.
11. ČSN EN 14488-2, EN 14488-2 Testing sprayed concrete - Part 2: Compressive strength of young sprayed concrete, 2007.
12. PRUDÊNCIO L R. Accelerating admixtures for shotcrete, Cem. Concr. Compos., Vol. 20, 1998, pp 213–219
13. PATERNESI A, SCHWEIGER H F, RUGGERI P, FRUZZETTI V M E, SCARPELLI G. Comparisons of Eurocodes design approaches for numerical analysis of shallow tunnels, Tunn. Undergr. Sp. Technol., Vol. 62, 2017, pp115–125
14. ČSN EN 1992-1-1, Eurocode 2: Design of concrete structures - Part 1-1: General reles and rules for buildings, 2006.
CAN CZECH STOCKPILED FLY ASH BE USED IN THE PRODUCTION OF CONCRETE?
A Peterová, F Škvára M Šídlová
University of Chemistry and Technology
R Šulc K Sokolová
Czech Technical University in Prague
R Snop
CEZ Group
Czech Republic
ABSTRACT. Czech coal power plants produce around 8 million tons of high-temperature fly ash every year. A part of this ash is being stored together with slag in stockpiles or lagoons, turning into agglomerates. These deposits could, in fact, provide a source of valuable raw material for the construction industry. We compared the properties of agglomerates from stockpile Panský Les (Czech Republic), which was formed from the high-temperature fly ash from Mělník power plant (Czech Republic), with fresh fly ash from the same power plant. The comparison was done according to the European Standard EN 450-1 "Fly ash for concrete". Samples of agglomerates extracted from various depths of the stockpile complied with the requirements on chemical properties specified in the standard. To comply with physical requirements, the agglomerates must be dried, and coarse agglomerates removed. After such treatment, the agglomerates can be used in the production of concrete. Keywords: High temperature fly ash, Stockpile, Agglomerates, Deposited high temperature fly ash Dr. Adéla Peterová is a research worker at the Department of Glass and Ceramics at the University of Chemistry and Technology Prague. She is a part of a group of inorganic binders. Her research focuses on chemical, physical and mechanical properties of inorganic binders especially from ashes or alkali-activated materials. Assoc. Professor František Škvára is a leading research worker a group of inorganic binders at the Department of Glass and Ceramics at the University of Chemistry and Technology Prague. He focuses on chemical, physical and mechanical properties of inorganic binders and on development of building materials, including inorganic waste products. Dr. Martina Šídlová is a research worker at the Department of Glass and Ceramics at the University of Chemistry and Technology Prague. She is a part of a group of inorganic binders. Her research focuses on chemical, physical and mechanical properties of inorganic binders especially from alternative sources like fly ash or FBC ash. Dr. Rostislav Šulc is a research worker at the Department of Building Technology at the Czech Technical University in Prague. He focuses on chemical, physical and mechanical properties of inorganic binders and on development of building materials, including inorganic waste products. Kristýna Sokolová is a master student at the Department of Building Technology at the Czech Technical University in Prague. She focuses on chemical, physical and mechanical properties of Czech stockpiled fly ash. MSc. Roman Snop works at ČEZ Energetické produkty, s.r.o., which is a part of the CEZ Group. He is head of the R&D division of the company.

124 Peterová et al
INTRODUCTION
In 2016, the European (EU-15) power plants produced totals 40 million tonnes of coal combustion products. In the calculation for the European (EU-28) power plants produced totals more than 105 million tons [1]. The production of coal combustion products decreases year-by-year due to the gradual decline in combustion technology. Coal combustion products is synonymous of fly ash, bottom ash, slag, and flue-gas desulfurization gypsum from various types of burning process [2]. Among these coal combustion products, fly ash has the largest volume, with a broad range of properties that exhibits large variability from power plant to power plant, even in different batches from the same power plant. Around 42% of fly ash is successfully used in construction industry and other 52% is used for reclamation. Only 1–2% is temporary stockpiled [1]. The subject of global interest is the characterization of stored products and their use [3–7]. Our samples were from the stockpile Panský les (Czech Republic, Figure 1), which has been in operation since the early 1960s. There were stored productions of the secondary energy product from local power plant Mělník (Czech Republic). At the beginning, the fly ash was only float to the lagoons, then due to the draining and evaporation of water the solidification of the stored materials occurred over time, which were subsequently covered with soil and underwent biological reclamation. Nowadays the stockpile Panský les is used for the controlled storage of two secondary energy products from a nearby power plant - fly ash in a form of agglomerates and slag [8]. Agglomerate is a mixture of freshly produced fly ash, Elbe water and a small fraction of slag.
Figure 1 Location of borehole in stockpile Panský les (Czech Republic, map is from 2016)
The present study was focused on characterization of drilled samples from the stockpile Panský les (Czech Republic). The experimental study included determination of the chemical and physical properties in comparison to fresh produced fly ash (Table 1). Which can help as to answer a question: Can Czech stockpiled fly ash be used in the production of concrete?

Czech Stockpiled Fly Ash 125
Table 1 European Standard EN 450-1 specifications of fly ash for concrete [9]
PROPERTY STANDARD LIMITS
loss on ignition category A ≤ 5.0% category B ≤ 7.0% category C ≤ 9.0%
chloride Cl- content ≤ 0.10% sulphate content ≤ 3.0% free CaO ≤ 1.5% active CaO ≤ 10.0% active SiO2 ≥ 25.0% total SiO2, Al2O3 and Fe2O3 content
≥ 70.0%
total alkali content ≤ 5.0% MgO ≤ 4.0% particle density ± 200 kg/m3 from the declared value
MATERIALS AND METHODS
Fresh and Stockpiled Ash
The borehole was drilled at stockpile Panský les (Czech Republic). The samples were collected per meter vertically with B1A drilling rig on the T815 chassis. The drill was finished up to a final depth of 54 m. General geological profile of borehole was: 0.0–0.5 m soil cover, 0.5–47.0 m fly ash and 47.0–54.0 m underlying clay under the dimension of the current modified terrain. As a reference freshly produced fly ash from power plant Mělník (Czech Republic) was used. Methods
The physical characterization, which was conducted, included the determination of natural moisture content, particle density, loss on ignition and particle size distribution. The standard ČSN 72 2071 [10] method was used for determining natural moisture content and particle density in ashes. The natural moisture content determination was based on mass loss during drying at 110 °C to a constant mass. Particle density was based on determination the specific gravity of fly ash by the pycnometric method. The standard ČSN 72 0103 [11] method was used for determining loss on ignition, which was determinate as constant weight loss at 1 100 °C. A laser-light scattering analyser Mastersizer 2000 MU (Malvern Instruments Ltd., United Kingdom) was used to determine the particle size distribution. The chemical compositions were determined by X-ray fluorescence using a spectrometer ARL 9400 XP (Thermo ARL, Switzerland) with software Uniquant 4 for evaluation. A representative sample (about 100 g) of the dried material was taken for measurement, which was subsequently homogenized in a laboratory vibration mill BVM – 2 (BRIO Hranice, s. r. o., Czech Republic).
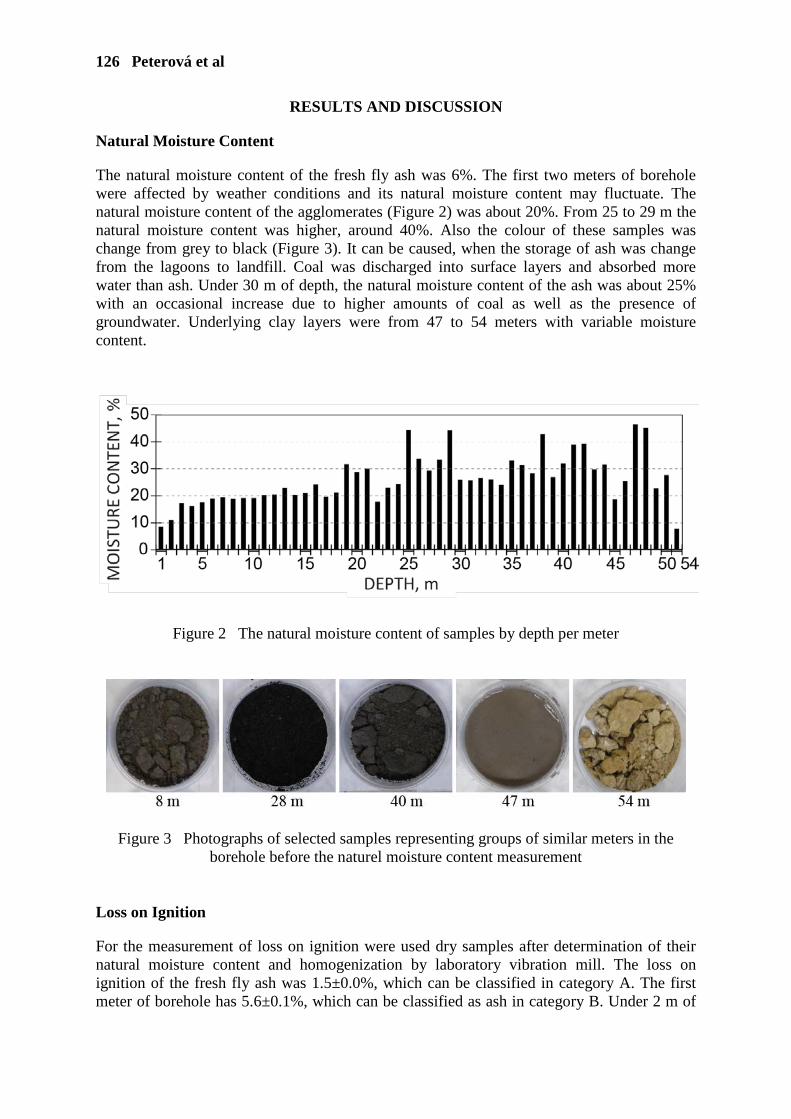
126 Peterová et al
RESULTS AND DISCUSSION
Natural Moisture Content
The natural moisture content of the fresh fly ash was 6%. The first two meters of borehole were affected by weather conditions and its natural moisture content may fluctuate. The natural moisture content of the agglomerates (Figure 2) was about 20%. From 25 to 29 m the natural moisture content was higher, around 40%. Also the colour of these samples was change from grey to black (Figure 3). It can be caused, when the storage of ash was change from the lagoons to landfill. Coal was discharged into surface layers and absorbed more water than ash. Under 30 m of depth, the natural moisture content of the ash was about 25% with an occasional increase due to higher amounts of coal as well as the presence of groundwater. Underlying clay layers were from 47 to 54 meters with variable moisture content.
Figure 2 The natural moisture content of samples by depth per meter
Figure 3 Photographs of selected samples representing groups of similar meters in the borehole before the naturel moisture content measurement
Loss on Ignition
For the measurement of loss on ignition were used dry samples after determination of their natural moisture content and homogenization by laboratory vibration mill. The loss on ignition of the fresh fly ash was 1.5±0.0%, which can be classified in category A. The first meter of borehole has 5.6±0.1%, which can be classified as ash in category B. Under 2 m of

Czech Stockpiled Fly Ash 127
depth, the loss on ignition of the agglomerates (Figure 4) was under 5.0% and it was in the same category A as fresh fly ash. From 26 to 29 m loss on ignition was higher, around 15%, which can be explained by increase amounts of coal in these meters. Under 30 m of depth, the loss on ignition of the ash was a little bit higher than in upper levels but still under 5.0%, with except on depth of 36 m, in which was again a higher amount of coal. The 54 m was loss on ignition higher due to the limestone used as a substrate for stockpile.
Figure 4 The loss on ignition of samples by depth per meter
Particle Density
For the measurement of particle density were used dry samples after determination of their natural moisture content. Because of the accuracy of the test method, the values were average of three independent measurements or more, if confirmation of the result was needed. The particle density of the fresh fly ash was 2 156±7 kg/m3. The range of particle density of the drilled samples was 2 019–2 639 kg/m3 with median in 2 152 kg/m3 (Figure 5). Median values of the density of drilled samples were comparable to the fresh fly ash. The drilled samples, which were secluded, were from the first two meters, meters in depth around 25 m and the under layer of stockpile. The differences around the depth 25 m could be cause by changing of storage technology and the necessary finding of new parameters in technology.
Figure 5 The particle density of samples by depth per meter
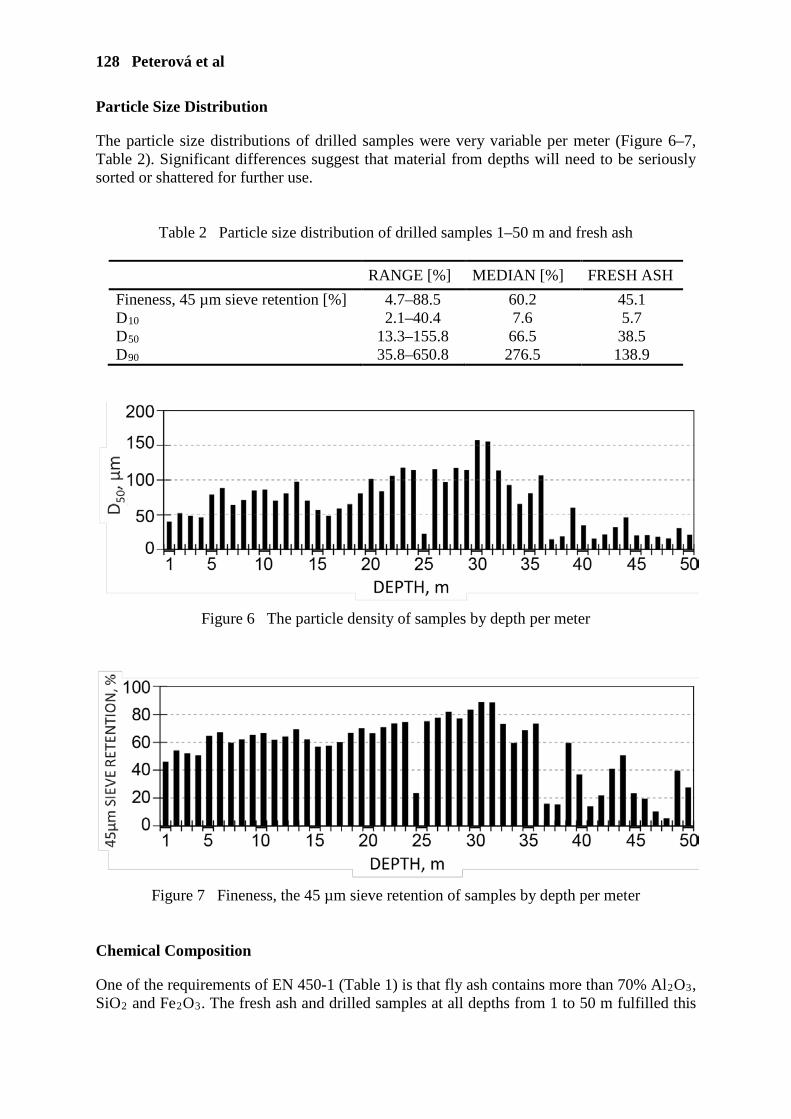
128 Peterová et al
Particle Size Distribution
The particle size distributions of drilled samples were very variable per meter (Figure 6–7, Table 2). Significant differences suggest that material from depths will need to be seriously sorted or shattered for further use.
Table 2 Particle size distribution of drilled samples 1–50 m and fresh ash
RANGE [%] MEDIAN [%] FRESH ASH
Fineness, 45 µm sieve retention [%] 4.7–88.5 60.2 45.1 D10 2.1–40.4 7.6 5.7 D50 13.3–155.8 66.5 38.5 D90 35.8–650.8 276.5 138.9
Figure 6 The particle density of samples by depth per meter
Figure 7 Fineness, the 45 µm sieve retention of samples by depth per meter
Chemical Composition
One of the requirements of EN 450-1 (Table 1) is that fly ash contains more than 70% Al2O3, SiO2 and Fe2O3. The fresh ash and drilled samples at all depths from 1 to 50 m fulfilled this
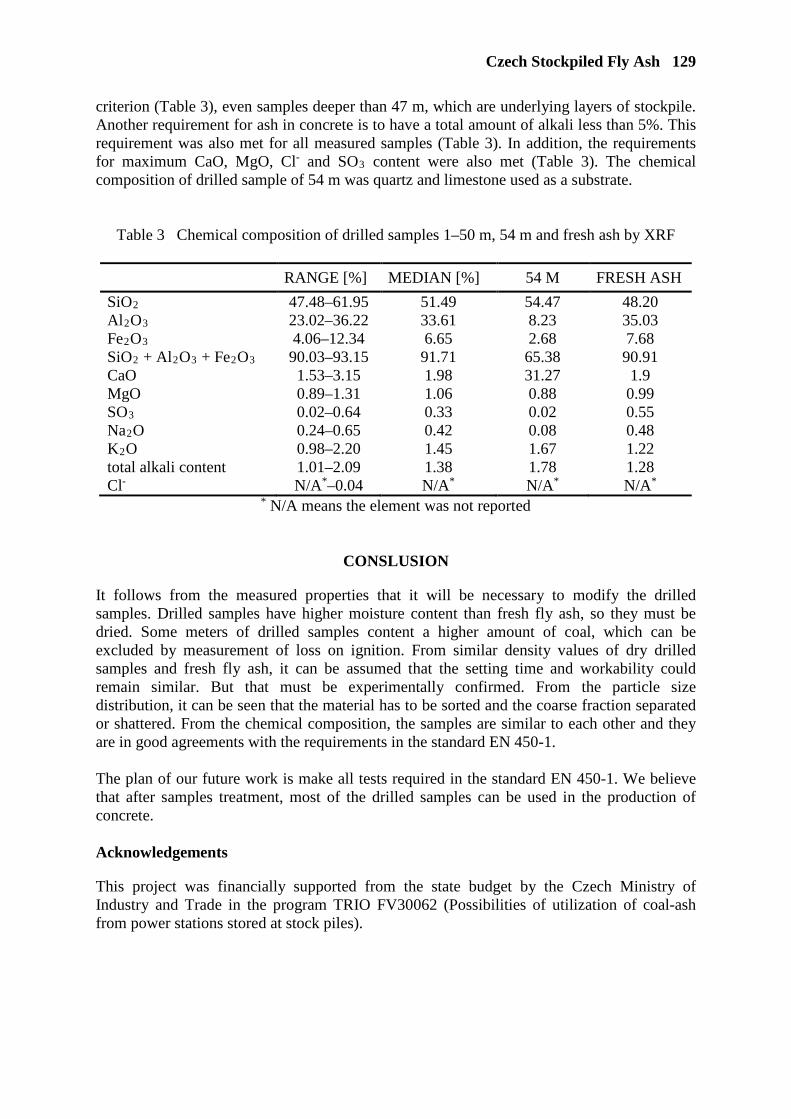
Czech Stockpiled Fly Ash 129
criterion (Table 3), even samples deeper than 47 m, which are underlying layers of stockpile. Another requirement for ash in concrete is to have a total amount of alkali less than 5%. This requirement was also met for all measured samples (Table 3). In addition, the requirements for maximum CaO, MgO, Cl- and SO3 content were also met (Table 3). The chemical composition of drilled sample of 54 m was quartz and limestone used as a substrate.
Table 3 Chemical composition of drilled samples 1–50 m, 54 m and fresh ash by XRF
RANGE [%] MEDIAN [%] 54 M FRESH ASH
SiO2 47.48–61.95 51.49 54.47 48.20 Al2O3 23.02–36.22 33.61 8.23 35.03 Fe2O3 4.06–12.34 6.65 2.68 7.68 SiO2 + Al2O3 + Fe2O3 90.03–93.15 91.71 65.38 90.91 CaO 1.53–3.15 1.98 31.27 1.9 MgO 0.89–1.31 1.06 0.88 0.99 SO3 0.02–0.64 0.33 0.02 0.55 Na2O 0.24–0.65 0.42 0.08 0.48 K2O 0.98–2.20 1.45 1.67 1.22 total alkali content 1.01–2.09 1.38 1.78 1.28 Cl- N/A*–0.04 N/A* N/A* N/A*
* N/A means the element was not reported
CONSLUSION
It follows from the measured properties that it will be necessary to modify the drilled samples. Drilled samples have higher moisture content than fresh fly ash, so they must be dried. Some meters of drilled samples content a higher amount of coal, which can be excluded by measurement of loss on ignition. From similar density values of dry drilled samples and fresh fly ash, it can be assumed that the setting time and workability could remain similar. But that must be experimentally confirmed. From the particle size distribution, it can be seen that the material has to be sorted and the coarse fraction separated or shattered. From the chemical composition, the samples are similar to each other and they are in good agreements with the requirements in the standard EN 450-1. The plan of our future work is make all tests required in the standard EN 450-1. We believe that after samples treatment, most of the drilled samples can be used in the production of concrete. Acknowledgements
This project was financially supported from the state budget by the Czech Ministry of Industry and Trade in the program TRIO FV30062 (Possibilities of utilization of coal-ash from power stations stored at stock piles).

130 Peterová et al
REFERENCES
1. ECOBA. CCPs Production <http://www.ecoba.com/ecobaccpprod.html> [accessed 13/03/19]
2. ROBL, T, OBERLINK, A, JONES, R. Coal Combustion Products (CCPs): Characteristics, Utilization and Beneficiation, 1st ed., 2017, Woodhead Publishing, p 107.
3. JONES, M R, MCCARTHY, M J, ZHENG, L, ROBL, T L, GROPPO, J. Experiences of Processing Fly Ashes Recovered from United Kingdom Stockpiles and Lagoons, their Characteristics and Potential End Uses, WOCA Conference – Proceedings: 3rd World of Coal Ash, Lexington, United States, 2009, 24 pp.
4. SHON, C-S, MUKHOPADHYAY, A K, SAYLAK, D, ZOLLINGER, D G, MEJEOUMOV, G G. Potential use of stockpiled circulating fluidized bed combustion ashes in controlled low strength material (CLSM) mixture, Construction and Building Materials, Vol. 24, No. 5, 2010, pp 839-847.
5. MEJEOUMOV, G G, SHON, C-S, SAYLAK, D, ESTAKHRI, C K. Beneficiation of stockpiled fluidized bed coal ash in road base course construction, Construction and Building Materials, Vol. 24, No. 11, 2010, pp 2072-2078.
6. MAHLABA, J S, KERSKLEY, E P, KRUGER R A. Physical, chemical and mineralogical characterisation of hydraulically disposed fine coal ash from SASOL Synfuels, Fuel, Vol. 90, No. 7, 2011, pp 2491-2500.
7. CARROLL, R A. Coal Combustion Products in the United Kingdom and the Potential of Stockpile Ash, WOCA Conference – Proceedings: 6th World of Coal Ash, Nasvhille, United States, 2015, 15 pp.
8. in PROJEKT LOUNY ENGINEERING s.r.o., Studie – Rekultivace odkaliště Panský les, 15-2112-01, 2015.
9. ČSN EN 450-1 Fly ash for concrete - Part 1: Definition, specifications and conformity criteria, Czech office for standards, metrology and testing, Prague, 2013, 28 pp.
10. ČSN 72 2071 Fly ash for building industry purposes - Common provisions, requirements and test methods, Czech office for standards, metrology and testing, Prague, 2011, 32 pp.
11. ČSN 72 0103 Basic analysis of silicates - Determination of loss on ignition, Czech office for standards, metrology and testing, Prague, 2009, 4 pp.
MECHANICAL AND SOME DURABILITY STUDIES ON AMBIENT CURED FLY ASH BOTTOM ASH
ALKALI ACTIVATED CONCRETE
S Thakkar
U Dave
D Patel
Nirma University
India
ABSTRACT. Bottom ash and fly ash are both waste residues from thermal power plants. While fly ash is widely accepted as a partial substitute of cement in concrete and for manufacturing of building blocks, bottom ash is not as effectually utilized and hence mainly serves as landfill, creating an environmental hazard. Since production of cement is environmentally hazardous and undesirable as it results in huge amounts of carbon dioxide, one of the methods to have a sustainable concrete by using the alkali activation method. In alkali activation, industrial waste and alkaline activators are reacted to produce a long chain of molecules which give strength by the process of the polymerisation. Two parameters play pivotal role in alkali activation, they are the choice of activators and temperature of alkali activation. Activators are generally expensive and play a vital role in strength development. The scope of the current study involves a combination of potassium hydroxide and sodium silicate as activators and alkali activation at ambient curing. The current study investigates process parameters affecting compressive strength, by varying the amount of source material, the molarity of potassium hydroxide and alkaline ratio. Durability studies were also undertaken, by evaluating resistance against acid and against corrosion for application in field. It was found that compared to Ordinary Portland cement concrete, alkali activated concrete had better resistance against acid attack, but lesser resistance in the accelerated corrosion test.
Keywords: Ambient curing, Alkaline activators, Fly ash, Bottom ash, Acid resistance, Corrosion resistance
Sonal Thakkar is the Research scholar and Assistant Professor in Civil Engineering Department, Institute of Technology, Nirma University. She is presently pursuing her Doctoral Studies in the area of alkali activated concrete. She has more than 20 years of experience in teaching and industry. Her research interest area includes advances in area of concrete technology, alkali activated concrete, repair materials and light weight concrete.
Dr Urmil Dave is a Professor of Civil Engineering at Institute of Technology, Nirma University, Ahmedabad, India. He received his PhD in Civil Engineering from the Indian Institute of Technology Bombay. He has more than 20 years of experience in teaching, research and consultancy. His current research interests include use of waste materials in concrete, repair and rehabilitation of structures. He has been invited by many industries and academic institutions to deliver the expert talks.
Daxesh Patel has done M.Tech (CASAD) from Civil Engineering Department and is currently practising as a structural engineer.
132 Thakkar et al
INTRODUCTION It is a well-known fact that cement is one of the most widely used building material after water due to its ease in availability, moulding ability and affordability. In real world, where development and sustainability should be together, one cannot ignore the facts about greenhouse gases emitted during the manufacturing process of cement and depletion of natural resources that will occur in the long run [1]. With rapid industrialisation, large amounts of industrial waste are produced which need judicious disposal. Thus, production of alternative concrete using these industrial wastes is an ideal solution for the modern world. One such technique is popularly known as geopolymer [2] or alkali activation. In developing countries, power production is mostly dependent on coal, which results in the production of a huge quantity of ashes [3]. These ashes are both fly ash and bottom ash. Fly ash being very fine and highly pozzolanic in nature is often used as a replacement of cement. Bottom ash, being coarser in nature is generally discarded along with other particles in the pond and therefore is also known as ‘pond ash’. Bottom ash as is very less reactive and coarser and has a lot of coarse fly ash particles and so is not used as pozzolanic material. It is generally discarded as land fill and leads to pollution of land and water. In this paper, an investigation was carried out on concrete using fly ash and bottom ash activated with a combination of potassium hydroxide and sodium silicate at ambient curing. Normally, elevated temperature curing is used in the process of alkali activation as it yields high early strength, but in the present work ambient curing was used i.e. samples were left in sunlight after preparation for curing. Generally, either combination of sodium hydroxide and silicate or potassium hydroxide and silicate are used, but here an attempt was made to use a combination of potassium hydroxide and sodium silicate and the parameters affecting strength were evaluated.
MATERIALS Low calcium fly ash and bottom ash were used which were procured from the local power station near Ahmedabad. Table 1 shows the properties of both fly ash and bottom ash used in this investigation. A combination of potassium hydroxide and sodium silicate was used as activator. Potassium hydroxide was in the form of flakes with 99% purity and was of industrial grade. Sodium silicate was in liquid form with Na2O (16.73%) and SiO2 (36.6%). River sand was used as fine aggregate with a fineness modulus of 3.1, while coarse aggregate was a combination of 20 mm and 10 mm size. Specific gravity of coarse aggregate was 2.65 while its fineness modulus was 7.8 and 6.35 for 20 mm and 10 mm size, respectively. Naphthalene base superplasticizer was used to increase the workability of concrete.
Table 1 Properties of fly ash and bottom ash.
PROPERTIES UNIT FLY ASH BOTTOM ASH
Colour - Light Grey Grey SiO2 % 61.44 60.48
Al2O3 % 31.80 32.16 CaO % 1.20 1.04
Loss on Ignition % 1.1 2.96
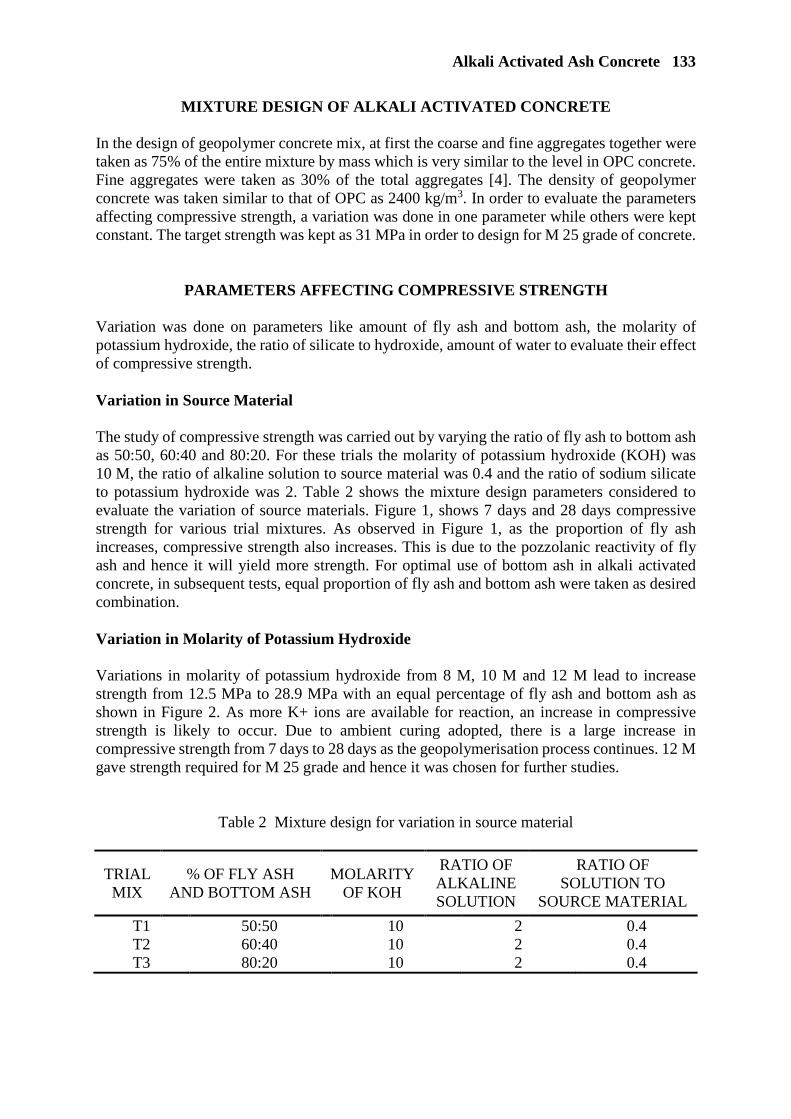
Alkali Activated Ash Concrete 133
MIXTURE DESIGN OF ALKALI ACTIVATED CONCRETE In the design of geopolymer concrete mix, at first the coarse and fine aggregates together were taken as 75% of the entire mixture by mass which is very similar to the level in OPC concrete. Fine aggregates were taken as 30% of the total aggregates [4]. The density of geopolymer concrete was taken similar to that of OPC as 2400 kg/m3. In order to evaluate the parameters affecting compressive strength, a variation was done in one parameter while others were kept constant. The target strength was kept as 31 MPa in order to design for M 25 grade of concrete.
PARAMETERS AFFECTING COMPRESSIVE STRENGTH Variation was done on parameters like amount of fly ash and bottom ash, the molarity of potassium hydroxide, the ratio of silicate to hydroxide, amount of water to evaluate their effect of compressive strength. Variation in Source Material The study of compressive strength was carried out by varying the ratio of fly ash to bottom ash as 50:50, 60:40 and 80:20. For these trials the molarity of potassium hydroxide (KOH) was 10 M, the ratio of alkaline solution to source material was 0.4 and the ratio of sodium silicate to potassium hydroxide was 2. Table 2 shows the mixture design parameters considered to evaluate the variation of source materials. Figure 1, shows 7 days and 28 days compressive strength for various trial mixtures. As observed in Figure 1, as the proportion of fly ash increases, compressive strength also increases. This is due to the pozzolanic reactivity of fly ash and hence it will yield more strength. For optimal use of bottom ash in alkali activated concrete, in subsequent tests, equal proportion of fly ash and bottom ash were taken as desired combination. Variation in Molarity of Potassium Hydroxide Variations in molarity of potassium hydroxide from 8 M, 10 M and 12 M lead to increase strength from 12.5 MPa to 28.9 MPa with an equal percentage of fly ash and bottom ash as shown in Figure 2. As more K+ ions are available for reaction, an increase in compressive strength is likely to occur. Due to ambient curing adopted, there is a large increase in compressive strength from 7 days to 28 days as the geopolymerisation process continues. 12 M gave strength required for M 25 grade and hence it was chosen for further studies.
Table 2 Mixture design for variation in source material
TRIAL MIX
% OF FLY ASH AND BOTTOM ASH
MOLARITY OF KOH
RATIO OF ALKALINE SOLUTION
RATIO OF SOLUTION TO
SOURCE MATERIAL
T1 T2 T3
50:50 60:40 80:20
10 10 10
2 2 2
0.4 0.4 0.4

134 Thakkar et al
Figure 1 Variation in compressive strength for different proportion of fly ash & bottom ash
Figure 2 Variation in the compressive strength for different molarity of
potassium hydroxide Variation in Ratio of Sodium Silicate to Potassium Hydroxide To study the effect of the ratio of alkaline solution, sodium silicate to sodium hydroxide was varied as 1.5, 2 and 2.5. An equal proportion of fly ash and bottom ash was used with the ratio of alkaline solution to the source material as 0.4. As observed in Figure 3, with the increase in the sodium silicate there increases the amount of Si++ ions which results in longer geopolymeric chains and gain in strength.
DURABILITY STUDIES Resistance against Sulphuric Acid Nine cube specimens of 150 mm were immersed in 5% sulphuric acid, three specimens each for 30 days, 60 days and 90 days exposure after 28 days of curing. Along with the visual observation, change in weight and change in compressive strength was measured. As shown in Figure 4, with the increase of exposure period there is increased loss of weight. Weight loss in ordinary Portland cement concrete was more compared to alkali activated concrete. Figure 5 shows a reduction in the compressive strength of alkali activated concrete and ordinary Portland cement concrete at different exposure periods. Due to inclusion of bottom ash, there is more loss in compressive strength in alkali activated concrete, but still it is lower than the loss of strength observed in ordinary Portland cement concrete at all ages.
14.1 14.5 15.4
21.723.8
25.4
0
5
10
15
20
25
30
35
T1 T2 T3
COM
PRES
SIVE
STR
ENGT
H, M
Pa
MIXTURE
7 day compressive strength 28 day compressive strength
12.514.1 15.6
20.4 21.7
28.9
0
5
10
15
20
25
30
35
T4 T1 T5
COM
PRES
SIVE
STR
ENGT
H, M
Pa
DIFFERENT MOLARITY OF KOH
7 day compressive strength 28 day compressive strength

Alkali Activated Ash Concrete 135
Figure 3 Variation in compressive strength for different ratio of sodium silicate to KOH
Figure 4 Percentage reduction in weight of OPC and alkali activated concrete at different exposure periods
Resistance against Corrosion Reduction of life of the structure occurs in concrete due to reinforcement corrosion, which causes spalling and cracking. For coastal and marine structures, resistance of corrosion is an important factor. The accelerated corrosion test was used to study the corrosion of alkali activated concrete and ordinary Portland cement concrete. Cylinders of 150 mm diameter and 300 mm height were prepared from both types of concrete. The cylinders embedded HYSD and stainless steel bars. These test specimen were then immersed in NaCl solution of 5% concentration up to 2/3 height after 28 days of curing. The steel bar was connected to the positive terminal to act as anode, the negative terminal was connected to the stainless steel bar which acted as cathode and these were connected to 60 Volt DC power supply. Cracks were initiated due to corrosion in the cylinders and the NaCl solution had free path to penetrate in the cylinder to the steel bar which then led to a sudden increase in current. This was recorded after different time intervals for the two concretes. It was observed that the first crack was initiated in the alkali activate concrete specimen after 130 hours of exposure, whereas in ordinary Portland cement concrete the crack developed at 216 hours, indicating that alkali activated concrete with fly ash and bottom ash is not suitable for reinforced concrete work, but can be effectively used for non-structural work.
13.615.6
17.6
26.028.9
32.1
0
5
10
15
20
25
30
35
40
T6 T5 T7
COM
PRES
SIVE
STR
ENGT
H, M
Pa
DIFFERENT RATIOS OF SODIUM SILICATE TO POTASSIUM HYDROXIDE
7 day compressive strength 28 day compressive strength
2.33.7
6.75.67
8.49
13.8
0
4
8
12
16
30 days 60 days 90 days
% R
EDU
CTIO
N IN
WEI
GHT
TIME, days
Reduction in weight in alkali activated concrete
Reduction in weight in Ordinary cement concrete
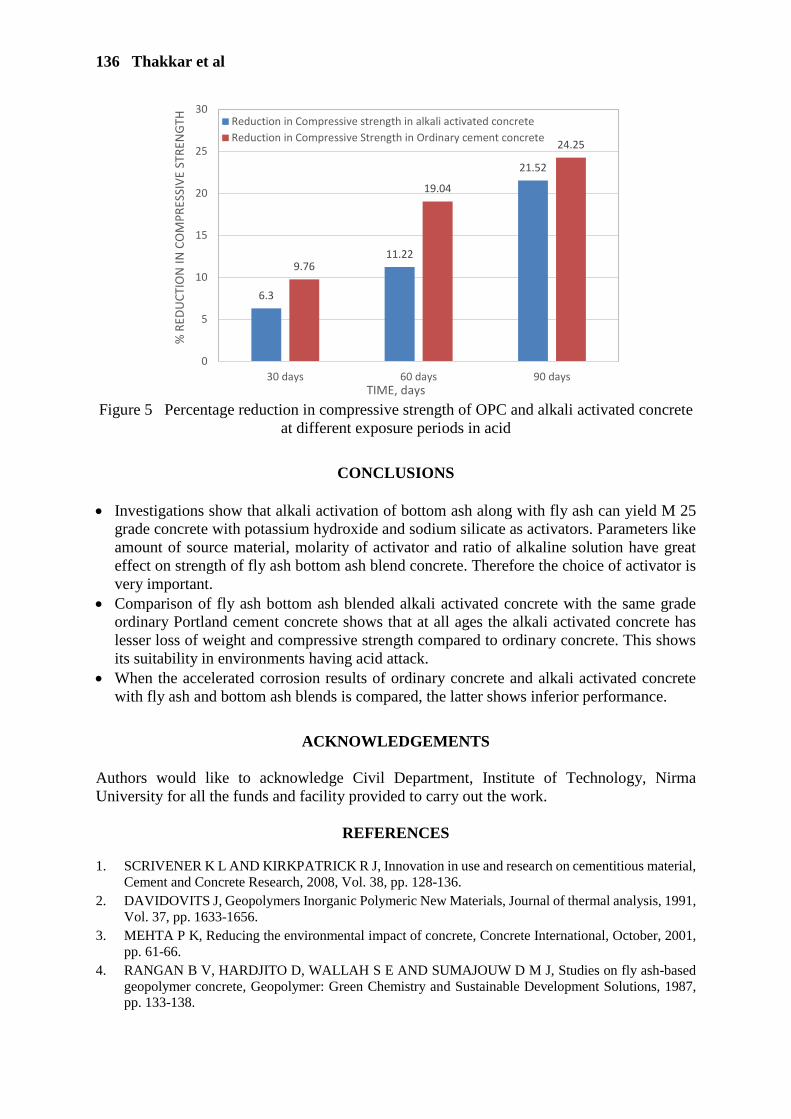
136 Thakkar et al
Figure 5 Percentage reduction in compressive strength of OPC and alkali activated concrete
at different exposure periods in acid
CONCLUSIONS • Investigations show that alkali activation of bottom ash along with fly ash can yield M 25
grade concrete with potassium hydroxide and sodium silicate as activators. Parameters like amount of source material, molarity of activator and ratio of alkaline solution have great effect on strength of fly ash bottom ash blend concrete. Therefore the choice of activator is very important.
• Comparison of fly ash bottom ash blended alkali activated concrete with the same grade ordinary Portland cement concrete shows that at all ages the alkali activated concrete has lesser loss of weight and compressive strength compared to ordinary concrete. This shows its suitability in environments having acid attack.
• When the accelerated corrosion results of ordinary concrete and alkali activated concrete with fly ash and bottom ash blends is compared, the latter shows inferior performance.
ACKNOWLEDGEMENTS Authors would like to acknowledge Civil Department, Institute of Technology, Nirma University for all the funds and facility provided to carry out the work.
REFERENCES
1. SCRIVENER K L AND KIRKPATRICK R J, Innovation in use and research on cementitious material, Cement and Concrete Research, 2008, Vol. 38, pp. 128-136.
2. DAVIDOVITS J, Geopolymers Inorganic Polymeric New Materials, Journal of thermal analysis, 1991, Vol. 37, pp. 1633-1656.
3. MEHTA P K, Reducing the environmental impact of concrete, Concrete International, October, 2001, pp. 61-66.
4. RANGAN B V, HARDJITO D, WALLAH S E AND SUMAJOUW D M J, Studies on fly ash-based geopolymer concrete, Geopolymer: Green Chemistry and Sustainable Development Solutions, 1987, pp. 133-138.
6.3
11.22
21.52
9.76
19.04
24.25
0
5
10
15
20
25
30
30 days 60 days 90 days
% R
EDU
CTIO
N IN
CO
MPR
ESSI
VE S
TREN
GTH
TIME, days
Reduction in Compressive strength in alkali activated concreteReduction in Compressive Strength in Ordinary cement concrete

RESISTANCE OF NON-CEMENT BINDER TO FREEZING AND THAWING CYCLES
M Šídlová F Škvára K Pulcová A Peterová
University of Chemistry and Technology Prague
R Šulc
Czech Technical University in Prague
R Snop
ČEZ Energetické produkty
Czech Republic
ABSTRACT. This study presents an investigation of a Sorfix (SFX) binder exposed to freezing and thawing cycles (FT) in water and in 3% NaCl solution. The Sorfix binder is a specific binder on the basis of selected mixture of sulphocalcic and high temperature fly ash modified by intergrinding and additivation similarly like hydraulic ternary binder system prepared previously. The Sorfix pastes and mortars were prepared by different conditions result in water to binder ratio ranged from 0.3 to 0.4 and 0.4 to 0.6, respectively. Freeze-thaw resistance to water and salt solution was evaluated for mass loss according to ČSN 73 1326 at every 25 freeze–thaw circulations. All the mixtures showed low mass loss after 100 FT cycles, except the mixtures without a superplasticizer. To identify the products formed by chloride attack, X-ray diffraction was performed on the selected samples after freeze–thaw circulation. The degradation material was found to consist of secondary ettringite (3CaO.Al2O3.3CaSO4.32H2O). The formation of the secondary ettringite was accelerated by chlorides attack trough a Friedel's salt (3CaO. Al2O3.CaCl2.10H2O). Keywords: Coal combustion products, FBC ash, SC ash, Freeze-thaw, Ettringite Dr Martina Šídlová is based at the Institute of Glass and Ceramics, Faculty of Chemical Technology, University of Chemistry and Technology Prague, working with inorganic binders. Assoc Professor František Škvára is a leading researcher at the University of Chemistry and Technology Prague. His work focuses on building materials incorporating waste products. Klára Pulcová is a bachelor student at the University of Chemistry and Technology Prague. She focuses on chemical, physical and mechanical properties of inorganic binders. Dr Adéla Peterová is based at the University of Chemistry and Technology Prague. Her research focuses on chemical, physical and mechanical properties of inorganic binders. Dr Rostislav Šulc is based at the Dept. of Building Technology at the Czech Technical University in Prague, focusing on chemical, physical and mechanical properties of binders. Dr Roman Snop. works at ČEZ Energetické produkty, s.r.o., which is part of the CEZ Group. He is Head of the R&D division of the company, and is focused on greening technologies.
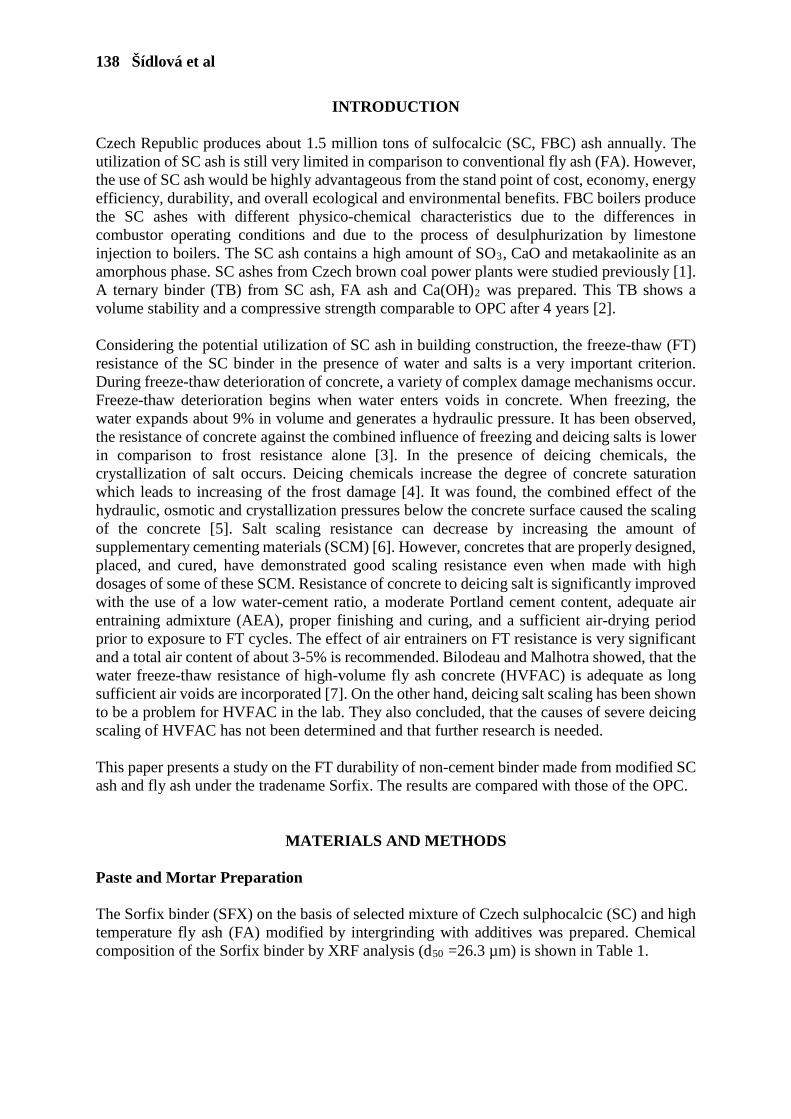
138 Šídlová et al
INTRODUCTION Czech Republic produces about 1.5 million tons of sulfocalcic (SC, FBC) ash annually. The utilization of SC ash is still very limited in comparison to conventional fly ash (FA). However, the use of SC ash would be highly advantageous from the stand point of cost, economy, energy efficiency, durability, and overall ecological and environmental benefits. FBC boilers produce the SC ashes with different physico-chemical characteristics due to the differences in combustor operating conditions and due to the process of desulphurization by limestone injection to boilers. The SC ash contains a high amount of SO3, CaO and metakaolinite as an amorphous phase. SC ashes from Czech brown coal power plants were studied previously [1]. A ternary binder (TB) from SC ash, FA ash and Ca(OH)2 was prepared. This TB shows a volume stability and a compressive strength comparable to OPC after 4 years [2]. Considering the potential utilization of SC ash in building construction, the freeze-thaw (FT) resistance of the SC binder in the presence of water and salts is a very important criterion. During freeze-thaw deterioration of concrete, a variety of complex damage mechanisms occur. Freeze-thaw deterioration begins when water enters voids in concrete. When freezing, the water expands about 9% in volume and generates a hydraulic pressure. It has been observed, the resistance of concrete against the combined influence of freezing and deicing salts is lower in comparison to frost resistance alone [3]. In the presence of deicing chemicals, the crystallization of salt occurs. Deicing chemicals increase the degree of concrete saturation which leads to increasing of the frost damage [4]. It was found, the combined effect of the hydraulic, osmotic and crystallization pressures below the concrete surface caused the scaling of the concrete [5]. Salt scaling resistance can decrease by increasing the amount of supplementary cementing materials (SCM) [6]. However, concretes that are properly designed, placed, and cured, have demonstrated good scaling resistance even when made with high dosages of some of these SCM. Resistance of concrete to deicing salt is significantly improved with the use of a low water-cement ratio, a moderate Portland cement content, adequate air entraining admixture (AEA), proper finishing and curing, and a sufficient air-drying period prior to exposure to FT cycles. The effect of air entrainers on FT resistance is very significant and a total air content of about 3-5% is recommended. Bilodeau and Malhotra showed, that the water freeze-thaw resistance of high-volume fly ash concrete (HVFAC) is adequate as long sufficient air voids are incorporated [7]. On the other hand, deicing salt scaling has been shown to be a problem for HVFAC in the lab. They also concluded, that the causes of severe deicing scaling of HVFAC has not been determined and that further research is needed. This paper presents a study on the FT durability of non-cement binder made from modified SC ash and fly ash under the tradename Sorfix. The results are compared with those of the OPC.
MATERIALS AND METHODS Paste and Mortar Preparation The Sorfix binder (SFX) on the basis of selected mixture of Czech sulphocalcic (SC) and high temperature fly ash (FA) modified by intergrinding with additives was prepared. Chemical composition of the Sorfix binder by XRF analysis (d50 =26.3 µm) is shown in Table 1.

Freeze Thaw Resistance 139
Table 1 Chemical composition of Sorfix binder (wt.%)
Sorfix SiO2 Al2O3 CaO SO3 Fe2O3 TiO2 OTHERS
37.0 28.8 18.2 6.7 4.8 2.5 2.0
Preparation of pastes and mortars from the Sorfix binder take place in a mixer with respect to the same workability. The mortars were prepared by using silica sand with continuing grainsize; the sand-to-binder ratio was 3:1. In addition, the cement CEM 42.5 R was used to prepare the reference paste and mortar specimens to be able to compare the results. A superplasticizer (on the basis of polycarboxylates) and an air-entraining admixture (AEA) were added in to selected mixtures. All the mixtures were put in moulds and were solidified in a humidity cabinet at the relative air humidity of 95%. The temperature of storage ranged from 20 to 23°C. The pastes and mortars were prepared according to the following Table 2.
Table 2 The composition of the Sorfix pastes (SFX P) and mortars (SFX M)
SPECIMEN w SUPERPLASTICIZER AIR
ENTRAINER
SFX P1 SFX P2 SFX P3
0.40 0.30 0.30
- x x
- - x
OPC P1 0.28 - - OPC P2 0.28 - x SFX M1 0.57 - - SFX M2 0.44 x - SFX M3 0.42 x x OPC M1 0.39 - -
Methods Freeze-Thaw The freeze-thaw cycling specimens were cured in a 100 mm wide plastic tube in humidity cabinet for 28 days to provide sufficient strength before the FT cycling. The water was poured onto the specimen surface for minimum of 24 hours before FT cycling. Then, the distilled water or 3% NaCl solution of about 20 mm thickness was poured onto the surface and placed into the FT chamber. Automatic cycling according to ČSN 73 1326, Z1, method C, took place in the environmental test chamber (Memmert CTC256) [8]. The temperature ranged from −18 ± 2 °C to 5 ± 2 °C with a residence time of 3 hours. The waste was filtered, washed by distilled water, dried and weighed after each 25 FT cycles. The FT cycling took place up to 100 cycles or up to the disintegration of the sample. Compressive Strength Compressive strength of Sorfix samples were measured at the ages of 7, 28 and 90 days on the 40x40x160 mm prism specimen according to ČSN EN 196-1 [9]. XRF and XRD Analyses ARL 9400 XP sequential WD-XRF spectrometer was used to perform XRF analysis. All peak intensity data were collected by software WinXRF in vacuum.
140 Šídlová et al
The diffraction patterns were collected at room temperature with an X'Pert3 Powder θ-θ powder diffractometer with parafocusing Bragg-Brentano geometry using Cu Kα radiation (λ = 1.5418 Å, Ni filter, generator setting: 40 kV, 30 mA). An ultrafast PIXCEL detector was employed to collect XRD data. The data were evaluated with software package HighScore Plus V4.6 (PANalytical, Almelo, Netherlands). Mercury Porosimetry A small fragments of Sorfix mortars were used for mercury intrusion porosimetry (Autopore 9500, Micromeritics, USA).
RESULTS AND DISCUSSION Sorfix Pastes The freezing and thawing resistance of the studied Sorfix pastes was evaluated for mass loss and the results are presented in graphs on Figures 1 and 2. Sorfix pastes showed a low mass loss after FT cycling in the presence of water, Figure 1. The highest mass loss values were obtained for the SFX P1 (218 g.m-2, 100cy), on the other hand the lowest value was achieved for SFX P3 (73 g.m-2) with a superplasticizer and air-entrainer. Mass loss of SFX P2 and P3 in the presence of water are comparable to OPC P1 (104 g.m-2, 100cy) and P2 (114 g.m-2, 100cy).
Figure 1 Freezing-thawing resistance of SFX pastes in water after 25, 50, 75 and 100 FT
cycles. As can be seen from Figure 2, mass loss of SFX P1 without superplasticizer was very high after the FT cycles in 3% NaCl solution. There is a significant increase in mass loss after each 25 FT cycles. After 100 FT cycles, the sample was highly disturbed (mass loss 5900 g.m-2). The lower strength of the SFX P1 binder after 28 days hydration, supplemented by the expansion reactions of secondary ettringite at FT, apparently caused binder destruction. Sofix mortars with superplasticizer SFX P2 and with air-entrainer SFX P3 showed a significant reduction in the mass loss up to the values 162 g.m-2 and 47 g.m-2, respectively. The mass loss values for SFX P3 are comparable to OPC P1 (56 g.m-2, 100cy) and OPC P2 (45 g.m-2, 100cy).
0
50
100
150
200
250
SFX P1CU
MU
LA
TIV
E M
AS
S L
OS
S, g
.m-2
.
25 50 75 100
0
20
40
60
80
100
120
SFX P2 SFX P3 OPC P1 OPC P2CU
MU
LA
TIV
E M
AS
S L
OS
S,
g.m
-2
25 50 75 100

Freeze Thaw Resistance 141
Figure 2 Freezing-thawing resistance of SFX paste in 3% solution of NaCl after 25, 50, 75
and 100 FT cycles. It is assumed, the higher mass loss of Sorfix binder in the presence of 3% NaCl during the FT cycling is due to the formation of a secondary ettringite (3CaO.Al2O3.3CaSO4.32H2O), which is accompanied by an volume expansion up to 270 vol.%. In the presence of chlorides, ettringite is more easily formed via Friedel's (3CaO.Al2O3.CaCl2.10H2O) and Kuzel's salt (3CaO·Al2O3·1/2CaSO4·1/2CaCl2·10H2O) [10]. The formation of Friedel's salt was confirmed by XRD analyses, Figure 3. The diffusion of the chloride ions is faster compared to the sulphate. This allows a faster transport of chlorides in to the binder structure followed by the reaction with the aluminium phase.
Figure 3 XRD analyses of Sorfix binder after 25 FT cycles.
0
1000
2000
3000
4000
5000
6000
7000
SFX P1
CU
MU
LA
TIV
E M
AS
S L
OS
S ,
g.m
-2 .
25 50 75 100
020406080
100120140160180
SFX P2 SFX P3 OPC P1 OPC P2C
UM
UL
AT
IVE
MA
SS
LO
SS
, g.m
-2
25 50 75 100
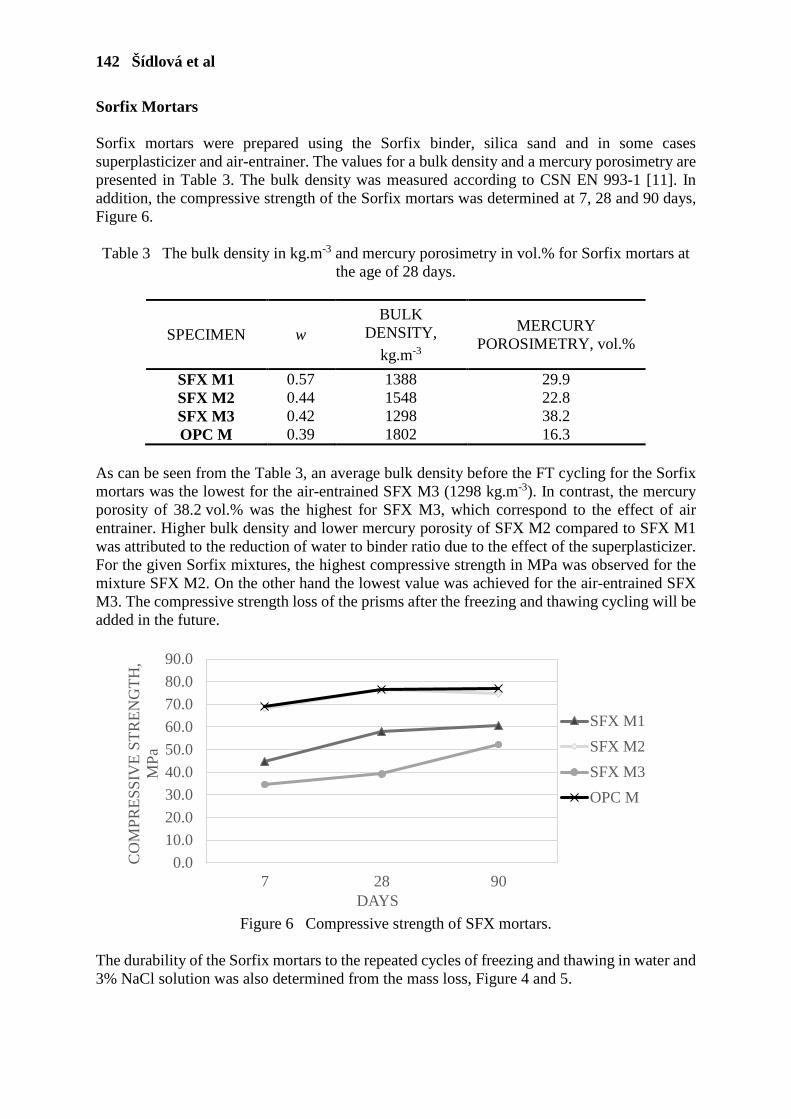
142 Šídlová et al
Sorfix Mortars Sorfix mortars were prepared using the Sorfix binder, silica sand and in some cases superplasticizer and air-entrainer. The values for a bulk density and a mercury porosimetry are presented in Table 3. The bulk density was measured according to CSN EN 993-1 [11]. In addition, the compressive strength of the Sorfix mortars was determined at 7, 28 and 90 days, Figure 6. Table 3 The bulk density in kg.m-3 and mercury porosimetry in vol.% for Sorfix mortars at
the age of 28 days.
SPECIMEN w BULK
DENSITY,
kg.m-3
MERCURY POROSIMETRY, vol.%
SFX M1 SFX M2 SFX M3
0.57 0.44 0.42
1388 1548 1298
29.9 22.8 38.2
OPC M 0.39 1802 16.3 As can be seen from the Table 3, an average bulk density before the FT cycling for the Sorfix mortars was the lowest for the air-entrained SFX M3 (1298 kg.m-3). In contrast, the mercury porosity of 38.2 vol.% was the highest for SFX M3, which correspond to the effect of air entrainer. Higher bulk density and lower mercury porosity of SFX M2 compared to SFX M1 was attributed to the reduction of water to binder ratio due to the effect of the superplasticizer. For the given Sorfix mixtures, the highest compressive strength in MPa was observed for the mixture SFX M2. On the other hand the lowest value was achieved for the air-entrained SFX M3. The compressive strength loss of the prisms after the freezing and thawing cycling will be added in the future.
Figure 6 Compressive strength of SFX mortars.
The durability of the Sorfix mortars to the repeated cycles of freezing and thawing in water and 3% NaCl solution was also determined from the mass loss, Figure 4 and 5.
0.0
10.0
20.0
30.0
40.0
50.0
60.0
70.0
80.0
90.0
7 28 90
CO
MP
RE
SS
IVE
ST
RE
NG
TH
, M
Pa
DAYS
SFX M1
SFX M2
SFX M3
OPC M
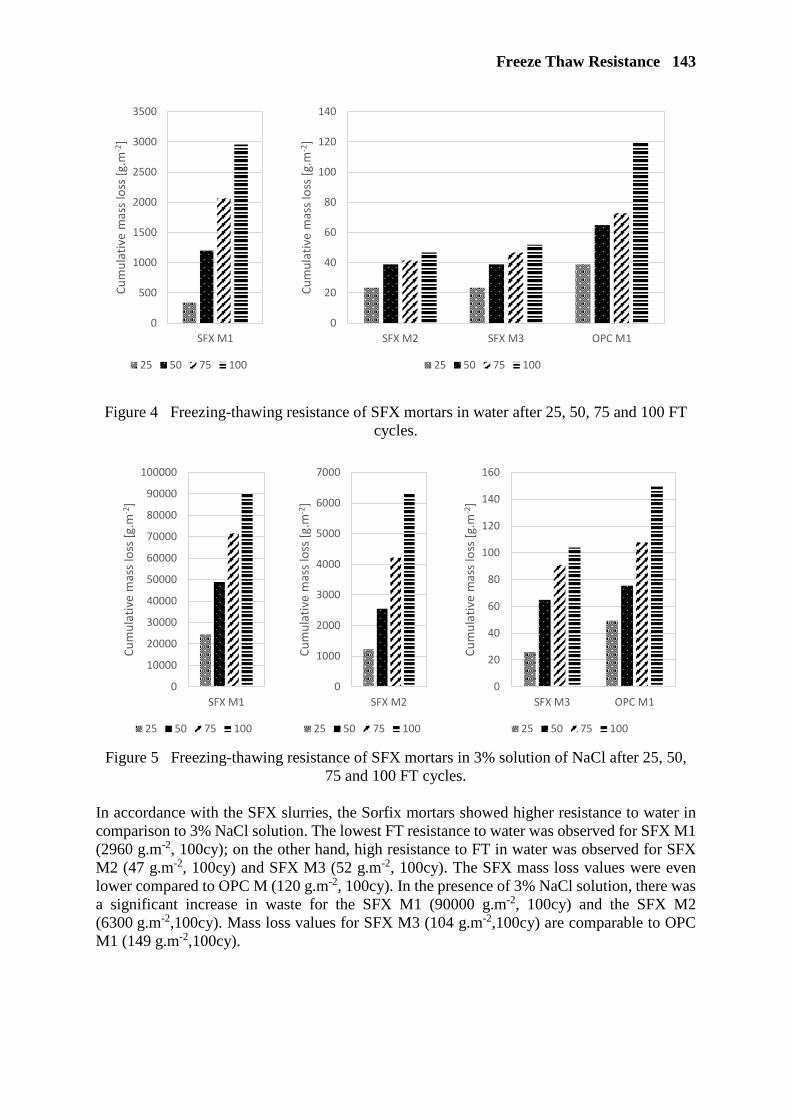
Freeze Thaw Resistance 143
Figure 4 Freezing-thawing resistance of SFX mortars in water after 25, 50, 75 and 100 FT cycles.
Figure 5 Freezing-thawing resistance of SFX mortars in 3% solution of NaCl after 25, 50,
75 and 100 FT cycles. In accordance with the SFX slurries, the Sorfix mortars showed higher resistance to water in comparison to 3% NaCl solution. The lowest FT resistance to water was observed for SFX M1 (2960 g.m-2, 100cy); on the other hand, high resistance to FT in water was observed for SFX M2 (47 g.m-2, 100cy) and SFX M3 (52 g.m-2, 100cy). The SFX mass loss values were even lower compared to OPC M (120 g.m-2, 100cy). In the presence of 3% NaCl solution, there was a significant increase in waste for the SFX M1 (90000 g.m-2, 100cy) and the SFX M2 (6300 g.m-2,100cy). Mass loss values for SFX M3 (104 g.m-2,100cy) are comparable to OPC M1 (149 g.m-2,100cy).
0
500
1000
1500
2000
2500
3000
3500
SFX M1
Cum
ulat
ive
mas
s los
s [g.
m-2
]
25 50 75 100
0
20
40
60
80
100
120
140
SFX M2 SFX M3 OPC M1
Cum
ulat
ive
mas
s los
s [g.
m-2
]
25 50 75 100
0
10000
20000
30000
40000
50000
60000
70000
80000
90000
100000
SFX M1
Cum
ulat
ive
mas
s los
s [g.
m-2
]
25 50 75 100
0
1000
2000
3000
4000
5000
6000
7000
SFX M2
Cum
ulat
ive
mas
s los
s [g.
m-2
]
25 50 75 100
0
20
40
60
80
100
120
140
160
SFX M3 OPC M1
Cum
ulat
ive
mas
s los
s [g.
m-2
]
25 50 75 100

144 Šídlová et al
CONCLUSIONS The specific binder under the trademark name Sorfix on the basis of selected mixture of sulphocalcic and high temperature fly ash modified by intergrinding with additives was prepared. The FT durability of the Sorfix was determined by the mass loss of Sorfix mixtures after the freeze-thaw circulation. It can be concluded, the selected Sorfix binders have a good FT durability both in water and in 3% NaCl solution after the 100 freeze-thaw cycles. The mass loss values of the Sorfix binder (SFX 3), that was prepared by using of superplasticizer and air-entrainer, were comparable to that of OPC. Acknowledgements This project was financially supported within the framework of the TA ČR project No. TH02020163 (Development and industrial optimisation of manufacturing process of construction materials from coal ash for transport construction).
REFERENCES 1. ŠKVÁRA, F, ŠULC, R, SNOP, R, ZLÁMALOVÁ-CÍLOVÁ, Z, PETEROVÁ, A, KOPECKÝ, L,
FORMÁČEK, P. Czech fluid sulfocalcic fly ash, Ceramics Silikaty, Vol. 60, No. 4, 2016, pp. 334-352. 2. ŠKVÁRA, F, ŠULC, R, SNOP, R, PETROVÁ, A, ŠÍDLOVÁ, M. Hydraulic clinkerless binder on the
fluid sulfocalcic fly ash basis, Cement and Concrete Composites, Vol. 93, 2018, pp. 118-126.
3. HARNICK, A B, MEIER, V, ROSLI, A. Combined influence of freezing and deicing salt on concrete: physical aspects, Durability of building materials and components, Eds. P J Sereda and G G Litvan. 1980, p. 474–484.
4. LITVAN, G G. Frost action in cement in the presence of deicers. Cement and Concrete Research, Vol.
6, No. 3, 1976, pp. 351-356.
5. WANG, K, NELSEN, D E, NIXON, W A. Damaging effects of deicing chemicals on concrete materials, Cement and Concrete Composites, Vol. 28, 2006, pp. 173-188.
6. KOSMATKA, S H, KERKHOFF, B, PANARESE, W C. Design and Control of Concrete Mixtures,
14th edition, Portland Cement Association, PCA R&D Serial Number SN2561, 2002.
7. BILODEAU, A, MALHOTRA, V. High-Volume Fly Ash System: The Concrete Solution for Sustainable Development, ACI Materials Journal Vol. 97, No. 1, 2000, pp. 41-48.
8. CSN 73 1326, Z1, method C, Resistance of cement concrete surface to water and defrosting chemicals, Czech office for standards, metrology and testing, Prague, 1985.
9. CSN EN 196-1, Methods of Testing Cement – Part 1: Determination of Strength, Czech office for
standards, metrology and testing, Prague, 2016, pp. 32. 10. GLASSER, F P, KINDNESS, A, STRONACH, S A. Stability and solubility relationships in AFm
phases Part I. Chloride, sulfate and hydroxide, Cement and Concrete Research, Vol. 29, 1999, pp. 861–866.
11. CSN EN 993-1, Methods of test for dense shaped refractory products - Part 1: Determination of bulk
density, apparent porosity and true porosity, Czech office for standards, metrology and testing, Prague, 1995.
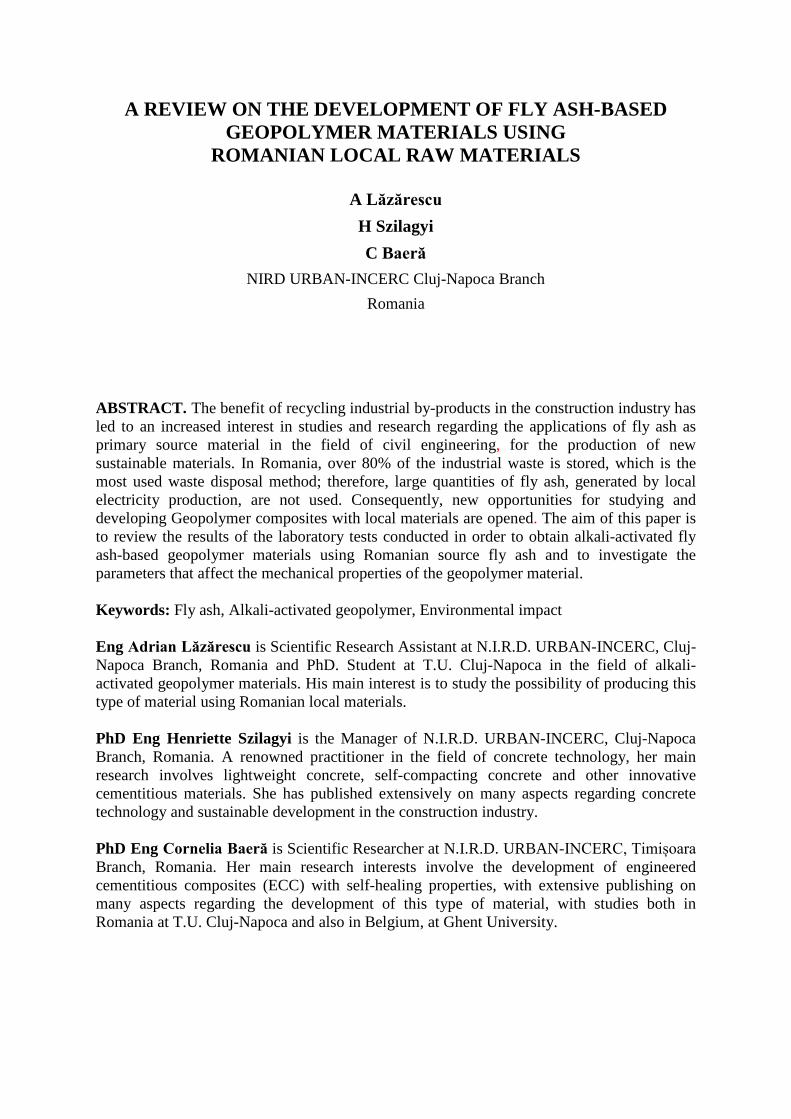
A REVIEW ON THE DEVELOPMENT OF FLY ASH-BASED GEOPOLYMER MATERIALS USING
ROMANIAN LOCAL RAW MATERIALS
A Lăzărescu
H Szilagyi
C Baeră
NIRD URBAN-INCERC Cluj-Napoca Branch
Romania
ABSTRACT. The benefit of recycling industrial by-products in the construction industry has led to an increased interest in studies and research regarding the applications of fly ash as primary source material in the field of civil engineering, for the production of new sustainable materials. In Romania, over 80% of the industrial waste is stored, which is the most used waste disposal method; therefore, large quantities of fly ash, generated by local electricity production, are not used. Consequently, new opportunities for studying and developing Geopolymer composites with local materials are opened. The aim of this paper is to review the results of the laboratory tests conducted in order to obtain alkali-activated fly ash-based geopolymer materials using Romanian source fly ash and to investigate the parameters that affect the mechanical properties of the geopolymer material. Keywords: Fly ash, Alkali-activated geopolymer, Environmental impact Eng Adrian Lăzărescu is Scientific Research Assistant at N.I.R.D. URBAN-INCERC, Cluj-Napoca Branch, Romania and PhD. Student at T.U. Cluj-Napoca in the field of alkali-activated geopolymer materials. His main interest is to study the possibility of producing this type of material using Romanian local materials. PhD Eng Henriette Szilagyi is the Manager of N.I.R.D. URBAN-INCERC, Cluj-Napoca Branch, Romania. A renowned practitioner in the field of concrete technology, her main research involves lightweight concrete, self-compacting concrete and other innovative cementitious materials. She has published extensively on many aspects regarding concrete technology and sustainable development in the construction industry. PhD Eng Cornelia Baeră is Scientific Researcher at N.I.R.D. URBAN-INCERC, Timișoara Branch, Romania. Her main research interests involve the development of engineered cementitious composites (ECC) with self-healing properties, with extensive publishing on many aspects regarding the development of this type of material, with studies both in Romania at T.U. Cluj-Napoca and also in Belgium, at Ghent University.
146 Lăzărescu et al
INTRODUCTION
Considered the most versatile, durable and reliable building material, concrete is the second most widely used material in the world, therefore the need to produce large quantities of Portland cement (PC) as binder for concrete are constantly increasing. The cement industry is considered to be the second carbon dioxide generator, being preceded only by the automotive industry. Each tonne of produced cement requires between 60 and 130 kg of liquid fuel or its equivalent, depending on the type of cement and the manufacturing process used, and approximately 110 KWh of electricity [1]. Also, one tonne of produced cement releases between 0.8 and 1.1 tonnes of CO2 into the atmosphere, as a consequence of combustion and calcareous calcination [2]. In 2014, the world cement production represented approximately 4.2 billion tonnes [3], indicating an obvious increase related to the previous years. Environmental problems associated with Portland cement production are well known and represent an issue which is worldwide carefully monitored. Alkaline activation of the fly ash represents a procedure able to generate the solidification of fly ash powder by mixing it with a certain type of alkaline activator, creating a new binding material and consequently a new building material when incorporating aggregate, as an alternative to traditional concrete and cement-based composites. The concept of Alkali Activated Materials (AAM) as an alternative to Portland cement has been known since the 1980s. Also, the sustainability of the materials obtained through this process has been demonstrated over the years in Belgium, Finland, Russia, China and recently, Australia. Since the 1990s, most research in the field of alkali-activated materials has focused on the microstructure of these materials and less on predictive studies on the possibility and exploitation of these types of materials, their durability and engineering properties [4-6]. Until recently, the field of activated alkali materials has been regarded as an academic curiosity, with potential niche applications, but never as a substitute for Portland cement in the construction industry. Any new and unconventional technology is difficult to be translated to the usual practice, as the existing standards and regulations established for concrete production and use do not cover the particular aspects for AAM materials regular production [7]. Standards usually regulate products that are already implemented in the industry, providing specific performance criteria which make them easy to evaluate, in terms of quality control and specific product characteristics [8]. When fly ash is used as a main binding material in the production of alkali activated geopolymer concrete, a careful consideration is needed when choosing the primary materials used for the mix. Certain chemical properties have to be taken into consideration so that the geopolymerisation reaction can properly occur [9]. The solid part (the alumino-silicate elements) and the liquid part (the alkaline activator) in alkali-activated systems should not be considered as additions, as they represent the main constituents of the geopolymer binder [10]. Fly ash resulting from the combustion of coal in the power plants has two main components: the fly ash (consisting of particles which are discharged together with combustion gases) and the slag which is collected in the boiler funnel (which becomes unusable and is stored in the dumps near the power plant, and represents a major concern for the environment). Fly ash is generally captured by the electrofilters before the combustion gases reach the basins of the power plants. Pollution control equipment owned by most of the power plants retain the fly ash before releasing the combustion gases into the atmosphere.
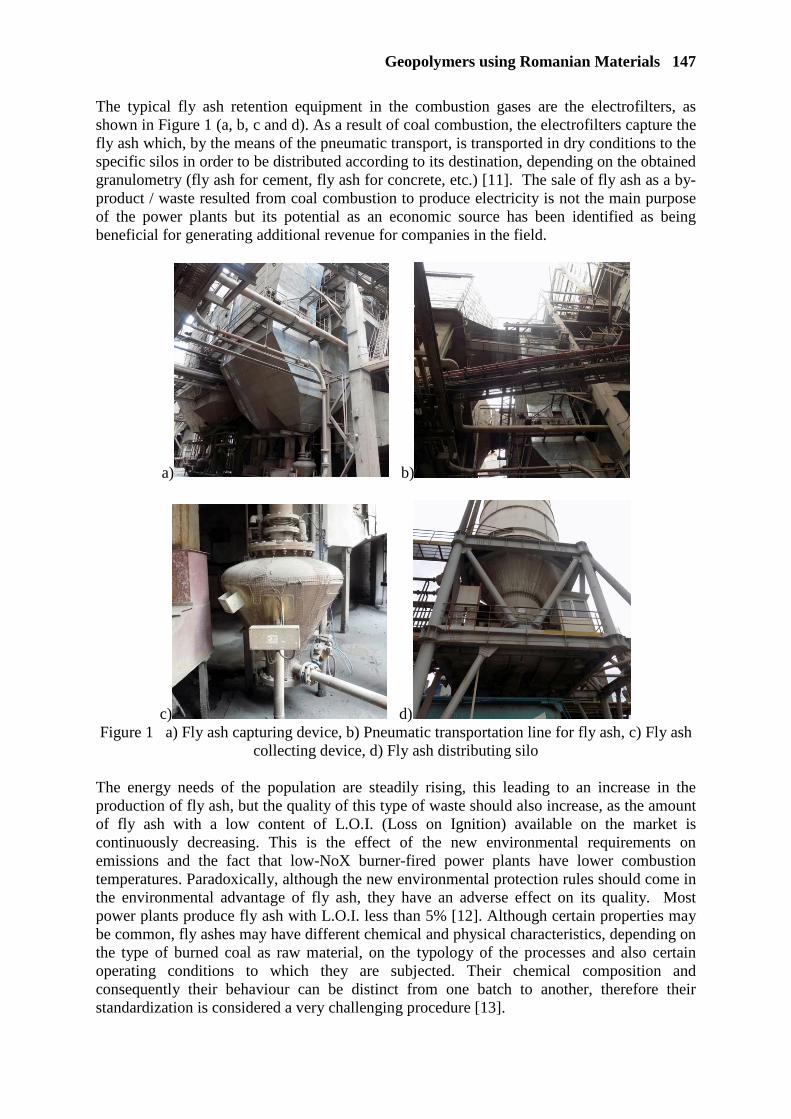
Geopolymers using Romanian Materials 147
The typical fly ash retention equipment in the combustion gases are the electrofilters, as shown in Figure 1 (a, b, c and d). As a result of coal combustion, the electrofilters capture the fly ash which, by the means of the pneumatic transport, is transported in dry conditions to the specific silos in order to be distributed according to its destination, depending on the obtained granulometry (fly ash for cement, fly ash for concrete, etc.) [11]. The sale of fly ash as a by-product / waste resulted from coal combustion to produce electricity is not the main purpose of the power plants but its potential as an economic source has been identified as being beneficial for generating additional revenue for companies in the field.
a) b)
c) d) Figure 1 a) Fly ash capturing device, b) Pneumatic transportation line for fly ash, c) Fly ash
collecting device, d) Fly ash distributing silo
The energy needs of the population are steadily rising, this leading to an increase in the production of fly ash, but the quality of this type of waste should also increase, as the amount of fly ash with a low content of L.O.I. (Loss on Ignition) available on the market is continuously decreasing. This is the effect of the new environmental requirements on emissions and the fact that low-NoX burner-fired power plants have lower combustion temperatures. Paradoxically, although the new environmental protection rules should come in the environmental advantage of fly ash, they have an adverse effect on its quality. Most power plants produce fly ash with L.O.I. less than 5% [12]. Although certain properties may be common, fly ashes may have different chemical and physical characteristics, depending on the type of burned coal as raw material, on the typology of the processes and also certain operating conditions to which they are subjected. Their chemical composition and consequently their behaviour can be distinct from one batch to another, therefore their standardization is considered a very challenging procedure [13].
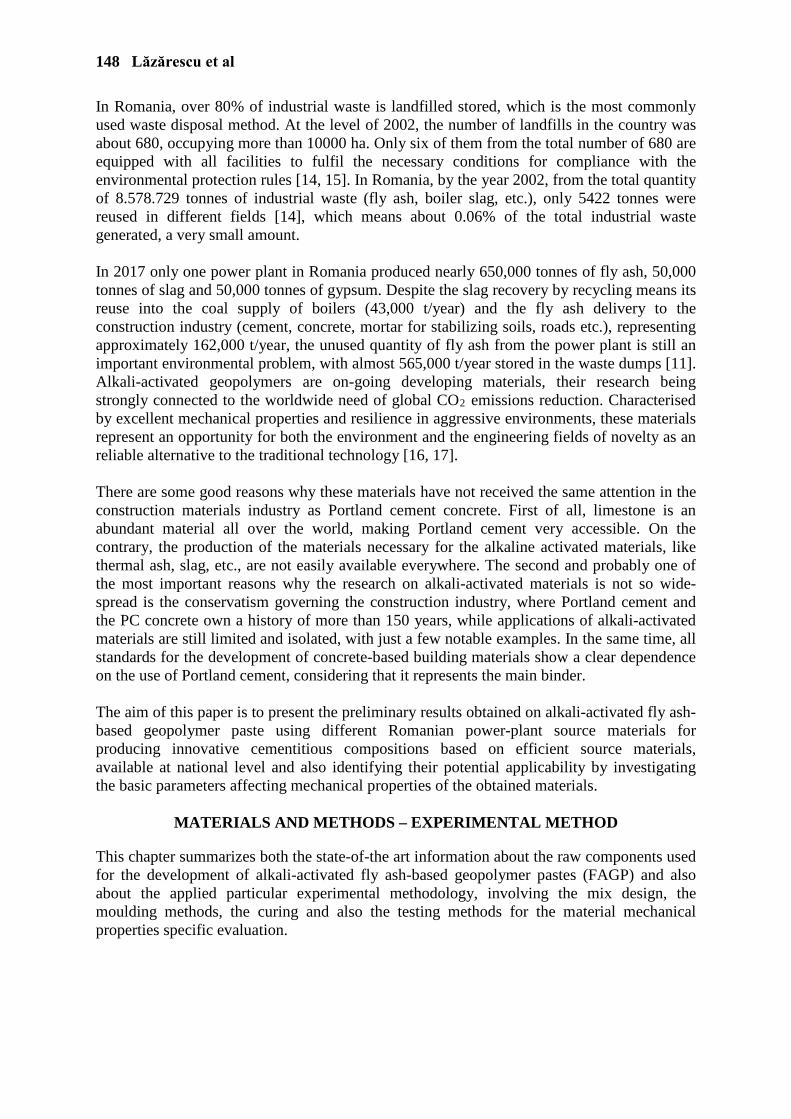
148 Lăzărescu et al
In Romania, over 80% of industrial waste is landfilled stored, which is the most commonly used waste disposal method. At the level of 2002, the number of landfills in the country was about 680, occupying more than 10000 ha. Only six of them from the total number of 680 are equipped with all facilities to fulfil the necessary conditions for compliance with the environmental protection rules [14, 15]. In Romania, by the year 2002, from the total quantity of 8.578.729 tonnes of industrial waste (fly ash, boiler slag, etc.), only 5422 tonnes were reused in different fields [14], which means about 0.06% of the total industrial waste generated, a very small amount. In 2017 only one power plant in Romania produced nearly 650,000 tonnes of fly ash, 50,000 tonnes of slag and 50,000 tonnes of gypsum. Despite the slag recovery by recycling means its reuse into the coal supply of boilers (43,000 t/year) and the fly ash delivery to the construction industry (cement, concrete, mortar for stabilizing soils, roads etc.), representing approximately 162,000 t/year, the unused quantity of fly ash from the power plant is still an important environmental problem, with almost 565,000 t/year stored in the waste dumps [11]. Alkali-activated geopolymers are on-going developing materials, their research being strongly connected to the worldwide need of global CO2 emissions reduction. Characterised by excellent mechanical properties and resilience in aggressive environments, these materials represent an opportunity for both the environment and the engineering fields of novelty as an reliable alternative to the traditional technology [16, 17]. There are some good reasons why these materials have not received the same attention in the construction materials industry as Portland cement concrete. First of all, limestone is an abundant material all over the world, making Portland cement very accessible. On the contrary, the production of the materials necessary for the alkaline activated materials, like thermal ash, slag, etc., are not easily available everywhere. The second and probably one of the most important reasons why the research on alkali-activated materials is not so wide-spread is the conservatism governing the construction industry, where Portland cement and the PC concrete own a history of more than 150 years, while applications of alkali-activated materials are still limited and isolated, with just a few notable examples. In the same time, all standards for the development of concrete-based building materials show a clear dependence on the use of Portland cement, considering that it represents the main binder. The aim of this paper is to present the preliminary results obtained on alkali-activated fly ash-based geopolymer paste using different Romanian power-plant source materials for producing innovative cementitious compositions based on efficient source materials, available at national level and also identifying their potential applicability by investigating the basic parameters affecting mechanical properties of the obtained materials.
MATERIALS AND METHODS – EXPERIMENTAL METHOD
This chapter summarizes both the state-of-the art information about the raw components used for the development of alkali-activated fly ash-based geopolymer pastes (FAGP) and also about the applied particular experimental methodology, involving the mix design, the moulding methods, the curing and also the testing methods for the material mechanical properties specific evaluation.

Geopolymers using Romanian Materials 149
MATERIALS
Fly ash
As a by-product, fly ash (FA) is obtained by electrostatic or mechanical precipitation of the pulverized particles resulting from the coal-fired combustion gases of the furnaces in power plants. It is a fine powder, consisting mainly of spherical shaped glass particles [18, 19]. Although some certain characteristics proved to be common for all fly ash types, due to factors like coal type as raw material for FA production and the burning process as well, fly ash powders show significant differences when coming to their chemical composition, sometimes even in the same production batch. The raised variation of the chemical composition, leading to different performance of FA as binding material, concrete addition or raw material for alkali-activated fly ash-based binding paste, represents an essential aspect for the general development of the concept [20]. Considering the differences in the FA chemical compositions, several FA classes were established. The Class F fly ash used for the present experimental study, is characterized as follows [21]: SiO2 + Al2O3 + Fe2O3> 70%, SO3 <5% and L.O.I. <6%. Figure 2a and Figure 2b present the low-calcium fly ashes (FA1 and FA2) used in the current research consisting in the development and implicit comparative analyses of fly ash-based geopolymer pastes [22]. FA1 and FA2 were delivered by two different Romanian power plants, and their chemical composition were established by X-ray fluorescence analysis (XRF analysis), presented in Table 1.
a) b) Figure 2 a) FA1, b) FA2
Alkaline liquid
When the reactive solids from the fly ash and the alkaline solution react, a hard, water-resistant material is generated due to formation of an alumino-silicate network [23]. The geopolymerisation occurs when the fly ash is mixed with the alkaline liquid, resulting the dissolution of the Si and Al compounds of the fly ash [24].

150 Lăzărescu et al
Table 1 XRF analysis data for the fly ash samples
XRF ANALYSIS
Oxides FA1 FA2
- % %
SiO2 53.61 54.32 Al2O3 26.16 22.04 Fe2O3 7.58 9.02 CaO 2.42 5.85 MgO 1.49 2.48 SO3 0.26 0.20
Na2O 0.59 0.54 K2O 2.60 2.23 P2O5 0.12 0.16 TiO2 1.04 0.86
Mn2O3 0.08 0.06 L.O.I. 3.57 3.05
The physical properties of the fly ash samples, namely the colour, the fineness (residue retained on the 45 μm sieve) and the moisture content, were also established (Table 2).
Table 2 Physical properties of fly ash samples
Properties FA1 FA2
Colour Light grey Grayish white Residue retained on 45 μm, % 37.6 59.4
Moisture content, % 0.5 0.6
The alkaline activator used for this experimental study (Figure 3a and Figure 3b), was a combination of sodium hydroxide solution (NaOH) and sodium silicate solution (Na2SiO3). The sodium silicate solution was purchased from the local market and its chemical composition was SiO2=30%, Na2O=14% and H2O=56%. The sodium hydroxide solution was prepared by dissolving the NaOH flakes into water until the desired concentration of the solution was achieved. Two distinct NaOH solutions, of 8M and respectively of 10M, were prepared for the alkali-activated fly ash-based geopolymer paste (FAGP) mixes. The 8M NaOH solution was prepared by dissolving 320g of NaOH flakes into water for 1 litre solution (40g x 8 = 320g NaOH/litre, where 40g is the molecular weight of NaOH). It was determined that for a mass of 1 kg of NaOH solution, the mass of NaOH flakes was 262 g, resulting the proper proportion: 1 kg of NaOH solution, 8M = 26.2% NaOH + 73.8% water. The same algorithm was used to obtain 10M NaOH solution for the mix design.
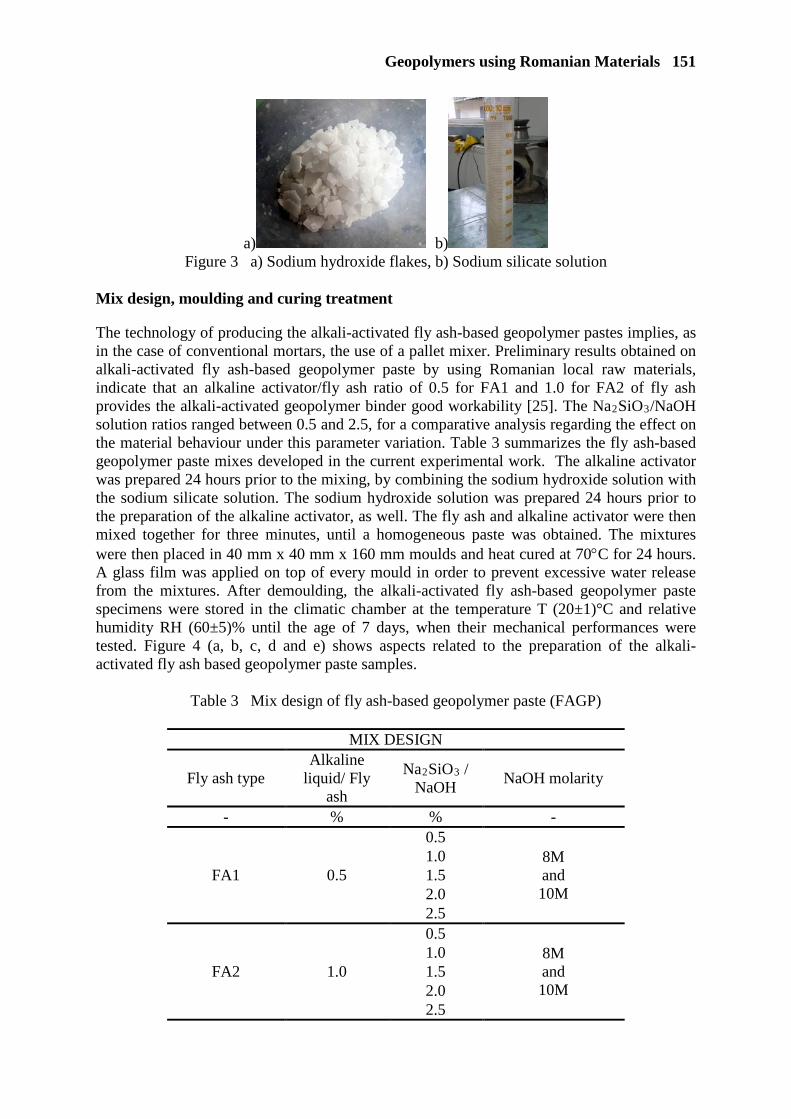
Geopolymers using Romanian Materials 151
a) b) Figure 3 a) Sodium hydroxide flakes, b) Sodium silicate solution
Mix design, moulding and curing treatment
The technology of producing the alkali-activated fly ash-based geopolymer pastes implies, as in the case of conventional mortars, the use of a pallet mixer. Preliminary results obtained on alkali-activated fly ash-based geopolymer paste by using Romanian local raw materials, indicate that an alkaline activator/fly ash ratio of 0.5 for FA1 and 1.0 for FA2 of fly ash provides the alkali-activated geopolymer binder good workability [25]. The Na2SiO3/NaOH solution ratios ranged between 0.5 and 2.5, for a comparative analysis regarding the effect on the material behaviour under this parameter variation. Table 3 summarizes the fly ash-based geopolymer paste mixes developed in the current experimental work. The alkaline activator was prepared 24 hours prior to the mixing, by combining the sodium hydroxide solution with the sodium silicate solution. The sodium hydroxide solution was prepared 24 hours prior to the preparation of the alkaline activator, as well. The fly ash and alkaline activator were then mixed together for three minutes, until a homogeneous paste was obtained. The mixtures were then placed in 40 mm x 40 mm x 160 mm moulds and heat cured at 70°C for 24 hours. A glass film was applied on top of every mould in order to prevent excessive water release from the mixtures. After demoulding, the alkali-activated fly ash-based geopolymer paste specimens were stored in the climatic chamber at the temperature T (20±1)°C and relative humidity RH (60±5)% until the age of 7 days, when their mechanical performances were tested. Figure 4 (a, b, c, d and e) shows aspects related to the preparation of the alkali-activated fly ash based geopolymer paste samples.
Table 3 Mix design of fly ash-based geopolymer paste (FAGP)
MIX DESIGN
Fly ash type Alkaline
liquid/ Fly ash
Na2SiO3 / NaOH
NaOH molarity
- % % -
FA1 0.5
0.5 8M and 10M
1.0 1.5 2.0 2.5
FA2 1.0
0.5 8M and 10M
1.0 1.5 2.0 2.5
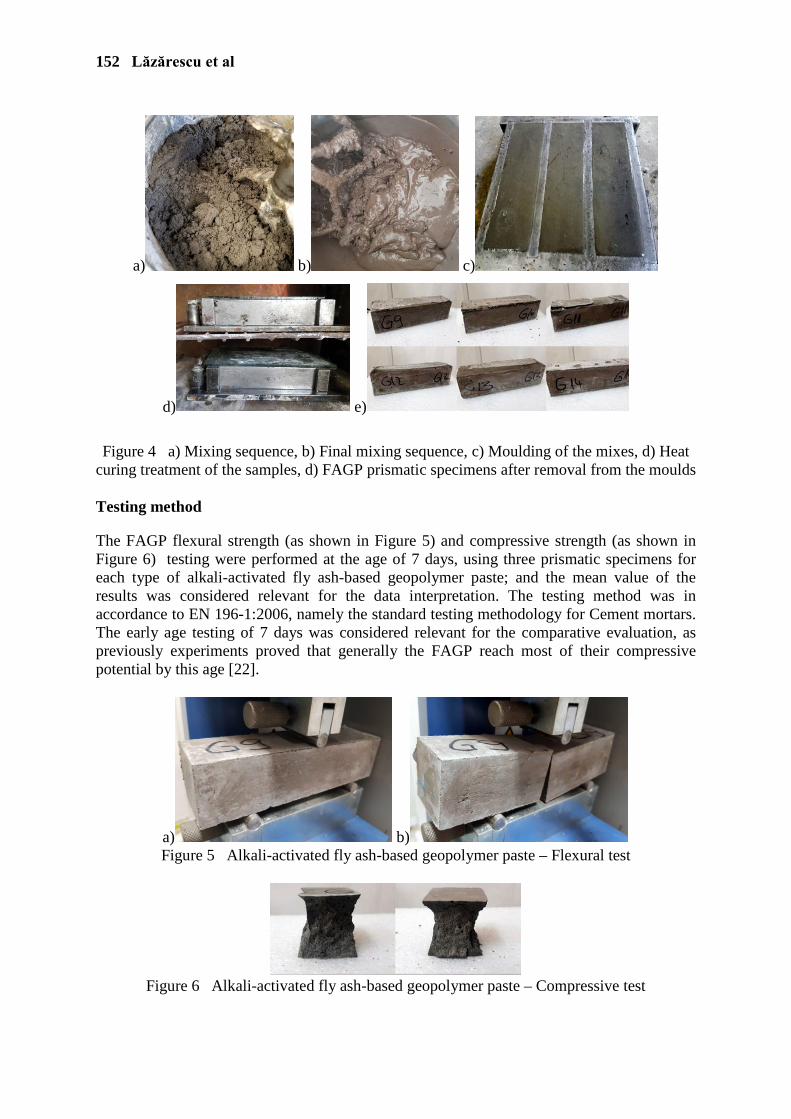
152 Lăzărescu et al
a) b) c)
d) e)
Figure 4 a) Mixing sequence, b) Final mixing sequence, c) Moulding of the mixes, d) Heat
curing treatment of the samples, d) FAGP prismatic specimens after removal from the moulds
Testing method
The FAGP flexural strength (as shown in Figure 5) and compressive strength (as shown in Figure 6) testing were performed at the age of 7 days, using three prismatic specimens for each type of alkali-activated fly ash-based geopolymer paste; and the mean value of the results was considered relevant for the data interpretation. The testing method was in accordance to EN 196-1:2006, namely the standard testing methodology for Cement mortars. The early age testing of 7 days was considered relevant for the comparative evaluation, as previously experiments proved that generally the FAGP reach most of their compressive potential by this age [22].
a) b) Figure 5 Alkali-activated fly ash-based geopolymer paste – Flexural test
Figure 6 Alkali-activated fly ash-based geopolymer paste – Compressive test

Geopolymers using Romanian Materials 153
RESULTS AND DISCUSSIONS
Alkali-activated fly ash-based geopolymer materials properties can be notably influenced by several important factors such as the source and quality of the fly ash used as the precursor material, the NaOH solution concentration and the Na2SiO3/NaOH solution ratio. The 7 days FAGP compressive strength was consider relevant for the comparative evaluation of the above nominated parameters. Fly Ash Influence on the FAGP Mix Design and Compressive Strength
The effect of fly ash type on the FAGP mix design, namely the fresh state workability, and its influence on the FAGP compressive strength was evaluated by the means of two samples of fly ash (FA1 and FA2), delivered by two different power plant stations in Romania. Their chemical composition was established by XRF analysis, as previously mentioned (Table 1). Since the burnt coal used in power plants to obtain energy is usually obtained from different quarries, the quality and the chemical composition of the fly ashes can varry significantly, therefore the fresh and hardened properties of the fly ash-based geopolymer materials are consequently affected. Although the chemical composition and the L.O.I. parameters of the used fly ash samples (FA1 and FA2), are only slightly different, as shown in Table 1, it can be easily noticed (Table 3) that the FAGP mix design for each FA sample is significantly different. In order to achieve the desired workability and to obtain a proper geopolymerisation process, the alkaline activator/fly ash ratio for FA1 was 0.5 and for FA2 was 1.0. The FAGP samples prepared with FA2 showed slightly lower compressive strength values for all the Na2SiO3/NaOH ratios and for both, 8M and 10M NaOH solution concentration. The fact that the fineness of the two fly ash samples are different (Table 2), shows that this paramater also plays an important role in the workability of the mix and, later, in the compressive strength development of the alkali activated material – the finer the fly ash, the better the workability of the mix, therefore, a lower alkaline activator/fly ash ratio. Influence of the Sodium Silicate Solution to Sodium Hydroxide Solution Ratio
The effect of sodium silicate solution to sodium hydroxide solution, by mass, on the compressive strength of the FAGPs specimens has been observed by analysing it for each of the molar concentration of the sodium hydroxide solution and for each fly ash sample, FA1 and FA2. The results are graphically presented in Figure 7 and Figure 8, both proving that the best compressive values were obtained for the Na2SiO3/NaOH ratio of 2.5 (for both samples of fly ash). For the mixtures prepared using FA1, the ratios that induced lower compressive strength were generally generated by a lower geopolymerisation reaction during the mixing of the components. The compressive strength evolution strongly depends the complexity of the geopolymerisation reaction and the concentration of the alkaline activator constituents. Influence of Sodium Hydroxide Solution Concentration
Figure 7 and Figure 8 also illustrate the effect of sodium hydroxide solution concentration on the compressive strength of the FAGP specimens. The compressive strength of the geopolymer binder increases with the increase in the concentration of the NaOH solution and is also significantly affecting the micro structure of the alkali-activated geopolymer binder in terms of geopolymer synthesis [24].

154 Lăzărescu et al
In the geopolymerical system’s aqueous phase, the sodium hydroxide solution is mainly involved in the dissolution process, but as well, it acts like a bonding agent for the solid particles in the final geopolymer matrix. A higher concentration of sodium hydroxide solution leads to a greater dissolution of precursor (fly ash), hence a higher compressive strength being achieved.
Figure 7 Effect of Na2SiO3/NaOH ratio on the FACP compressive strength (8M NaOH
solution)
Figure 8 Effect of Na2SiO3/NaOH ratio on the compressive strength (10M NaOH solution)
CONCLUSIONS
The experimental procedures for obtaining alkali-activated fly ash-based geopolymer paste (FAGP) using Romanian local raw materials were performed in controlled laboratory conditions, regarding the temperature, the relative humidity, the pressure and the air flow velocity, in order to collect proper data that would be used for future studies in the topic. Careful investigation of specific ratio variations within the paste when using fly ash from
10121416182022242628
0.5 1 1.5 2 2.5CO
MP
RE
SS
IVE
STR
EN
GTH
MP
a
Na2SiO3 / NaOH SOLUTION RATIO
FA1FA2
101214161820222426283032
0.5 1 1.5 2 2.5
CO
MP
RE
SS
IVE
STR
EN
GTH
MP
a
Na2SiO3 / NaOH SOLUTION RATIO
FA1FA2
Geopolymers using Romanian Materials 155
different sources provides important conclusions regarding further approaches of the mix design of the geopolymer material, namely the transition from the geopolimer paste (GP) to the geopolymer concrete (GC). Optimal dosage of the geopolymeric paste for superior compressive performance would be used in geopolymer mortar and concrete design. The best results were provided by the alkali-activated FAGP when using FA1, on mixes developed by using the 2.5 Na2SiO3/NaOH solution ratio and 8M NaOH concentration: 25.3 MPa, respectively 10M NaOH concentration: 29.2 MPa. The large variation, in terms of the physical and chemical properties of the fly ash obtained from different sources and the various sampling dates, namely different FA batches, may generate large variations in the fresh state behaviour and the compressive strength as well of the alkali-activated fly ash-based geopolymer materials. Fly ash FA1 provided both proper workability of the mixes and better compressive strength of the material. The presented results obtained on FAGP specimens contribute to the necessity of ongoing and up-to-date research on the identification and exploitation of the various Romanian sources of by-products, resulted both from secondary materials and as well as wastes from technological processes in various industries. Besides the economic advantages, an important aspect is the ecological one, namely the re-use of industrial wastes and by-products (sources of environmental pollution) into the economic circuit. Likewise, total replacement of cement in innovative, smart materials strongly contributes to the reduction of carbon dioxide emissions. Further similar studies will be performed using different types of fly ash, from different Romanian power-plants, in order to obtain the confirmation of present conclusion. The influence of fly ash chemical composition on geopolymer paste matrix, with respect to the evaluated NaOH concentration and the Na2SiO3/NaOH solution ratio and the optimization of the mix design, represent the near future challenges of the ongoing research. Acknowledgements
The current experimental program was carried out in the framework of the PhD. Research Program of the first author at the Technical University of Cluj-Napoca. All the experimental work has been carried out in the laboratory of N.I.R.D. URBAN-INCERC, Cluj-Napoca Branch, Romania and was supported by the Research Programmes for Smart Specialization, Sustainable Territorial Development, Environment Preservation and Resilience of Building Heritage – “CONCRET”, PN 18 35 04 03: “Research for valorising the inert, hydraulic late or pozzolanic mineral additions in innovative cementitious materials for resilient structures, in the context of implementing the “Circular Economy” concepts in Romania and PN 19 33 04 02: “Sustainable solutions to ensure health and safety of the population in the open innovation context and environmental protection”, financed by the Romanian Government.
REFERENCES
1. MALHOTRA, V M. Role of supplementary cementing materials in reducing greenhouse gas emissions. Infrastructure regeneration and rehabilitation improving the quality of life through better construction: a vision for the next millennium, Sheffield, 28 June - 2 July 1999.
2. INTERNATIONAL ENERGY AGENCY. Cement Technology Roadmap 2009, Carbon emissions reductions up to 2050, 2009.

156 Lăzărescu et al
3. CEMBUREAU,2017, https://cembureau.eu/media/1659/cimeurope_wsr_teaser_2017.pdf
4. DAVIDOVITS, J. Chemistry of Geopolymeric Systems. Terminology, International Conference on Geopolymer Concrete, 1999, France.
5. RANGAN, B V. Geopolymer Concrete for Environmental Protection, The Indian Concrete Journal, Special Issue – Future Concrete, 2014, pp. 41-59.
6. DAVIDOVITS, J. High-Alkali Cements for 21st Century Concretes. In Concrete Technology, Past, Present and Future, Proceedings of V. Mohan Malhotra Symposium, Editor P. Kumar Mehta, ACI, Vol. 144, pp 383-397.
7. HOOTON, R D. Bridging the gap between research and standards, Cem. Concr. Research, Vol. 38, No. 2, 2008, pp 247-258.
8. EUROPEAN COMMITTEE FOR STANDARDIZATION (CEN). Hands on Standardization – A Starter Guide to Standardization for Experts in CEN Technical Bodies, 2010.
9. BILODEAU, A, MALHOTRA, V M. High-volume fly ash system: Concrete solution for sustainable development, ACI Mater. J. Vol. 97, No. 1, 2000, pp 41-48.
10. PROVIS, J L, VAN DEVENTER, J S J. Alkali Activated Materials, State-of-the-Art Report, RILEM TC 224-AAM.
11. N.I.R.D. URBAN-INCERC. Research for valorising the inert, hydraulic late or pozzolanic mineral additions in innovative cementitious materials for resilient structures, in the context of implementing the “Circular Economy” concepts in Romania, National Programme 18 35 04 03, 2018, funded by the Romanian Government.
12. LEWANDOWSKI, W, FEUERBORN H J. Processing plants for fly ash in Europe, ECOBA, p.4
13. LĂZĂRESCU, A. Characteristics of the constituent materials of the geopolymer concrete, PhD. Research Report, Technical University of Cluj-Napoca, 2016.
14. CEPROCIM. Studies on the possibility of valorising of by-products from the industry (gypsum, calcium sulphite, fly ash etc.) in the Romanian economy, 2008, Romanian Ministry of Economy and Finances.
15. http://www.mmediu.ro
16. PALOMO, A, GRUTZEK, M W, BLANCO, M T. Alkali-activated fly ashes. A Cement for the future, Cem. Concr. Res., Vol. 29, 1999, pp. 1323-1329.
17. DUXON, P, PROVIS, J L,. LUKEY G C, VAN DEMETER, J S J. The role of inorganic polymer technology in the developent of ‘green concrete’, Cement Concr. Res, Vol. 37, 2007, pp. 1590-1597.
18. EN 450-1:2012 Fly ash for concrete. Definition, specifications and conformity criteria.
19. EN 197-1:2011 Cement. Composition, specifications and conformity criteria for common cements.
20. LĂZĂRESCU, A. Mix design and testing of the preliminary fly ash-based geopolymer mixes, PhD. Research Report, Technical University of Cluj-Napoca, 2017.
21. DAVIDOVITS, J. Properties of geopolymer cements, Alkaline Cements and Concretes, Kiev, Ukraine, 1994, pp.131-149.
22. LĂZĂRESCU, A, SZILAGYI, H, BAERĂ, C, IOANI, A. The Effect of Alkaline Activators Ratio on the Compressive Strength of Fly Ash-Based Geopolymer Paste, IOP Conf. Series: Materials Science and Engineering, 2017, doi: 10.1088/1757-899X/209/1/012064.
23. PACHECO-TORGAL, F, CASTRO-GOMEZ, J, JALALI, S. Alkali-activated binders: A review Part 1. Historical background terminology, reaction mechanisms and hydration products, J. Constr. Build. Mater, Vol. 22, 2008, pp. 1305-1314.
24. SOMNA, K, JATURAPITAKKUL, C, KAJITVICHYANUKUL, P, CHINDAPRASIRT, P. NaOH-activated ground fly ash geopolymer cured at ambient temperature, Fuel, Vol. 90, 2011, pp. 2118-2124.

PROPERTIES OF HIGH TEMPERATURE FLY ASHES AFTER APPLICATION SNCR TECHNOLOGY FROM
THE CONCRETE PRODUCERS POINT OF VIEW
R Hela
M Ťažký
L Osuska
Brno University of Technology
Czech Republic
ABSTRACT. This paper deals with the current issue of the usability of high-temperature power fly ash after the process of denitrification of flue gas through selective non-catalytic reduction of nitrogen oxides (SNCR). With the onset of new European legislation, nitrogen oxide emissions were severely reduced, which resulted in almost all power fly ash producers within the Czech Republic and neighbouring countries being introduced to the SNCR incineration process. The impact of the SNCR mechanism on the usability of fly ash for the production of concrete is the topic of many current research papers, which attempt to clarify the impact of SNCR on the properties of fly ash or the concrete produced from it. This paper summarises present knowledge and gives an overview of the production of concrete with this type of fly ash in the real conditions of the plant. It further measures and assesses its impact on air contamination by ammonia and groundwater contamination caused by concrete leachates with respect to safety limits. In addition, the results are supplemented by tests carried out in accordance with the EN 450-1 standard for fly ash used in concrete production. Keywords: Power fly ash, Denitrification, Ammonium salts, Efficiency index, Work safety Professor Rudolf Hela is the professor at the Brno University of Technology. He is a renowned practitioner in the field of concrete technology, he is a member of numerous national and international technical committees and has published extensively on many aspects of concrete technology, cement science and sustainable construction. Engineer Martin Ťažký in 2016 he graduated Brno University of Technology, Civil engineering - Institute of Technology and Buildings Materials and Composites and he get a title Ing. At the present time he continues a study as an Ph.D. candidate. At the present time he works at AdMas Center (Advanced Materials, Structures and Technologies Institute https://admas.eu/en/) as an researcher. His background is technology of concrete and silicates composites. His specialization is the use of secondary raw materials and the development of special concrete. Engineer Lucia Osuska is an absolvent Brno University of Technology. At the present time she continues a study as an Ph.D. candidate. She is engaged in the field of science and research of building materials. She has published extensively on many aspects of concrete technology, cement science and sustainable construction.
158 Hela et al
INTRODUCTION When high-temperature fly ash for concrete production is used in accordance with EN 206+A1 [1] as an active ingredient of Type II, it must meet the requirements of EN 450-1. [2] In previous experiments, it has been demonstrated that ash that has been through the SNCR mechanism can meet all the requirements of EN 450-1. Additionally, fly ash after SNCR may show slightly higher activity in the first days of maturation [3] due to the morphology of its grains, which are often disturbed after application of SNCR. These existing results show that, as far as physical-mechanical parameters and chemical composition are concerned, fly ash can be used in the production of concrete despite the introduction of SNCR. However, from the chemical point of view, after denitrification of exhaust gases fly ash also contains ammonium salts. Upon contact with the alkaline medium (cement) these begin to be released from the mixture in the form of gaseous ammonia. In general, the fly ash produced after SNCR at present contains 0 to 250 ppm of ammonia. Some research papers [4–6] show that ammonia from deNOx processes is bound to the fly ash surface in the form of ammonium salts (1, 2). The dominant reaction is the formation of ammonium sulphate ((NH4)2SO4) powder. On the other hand, the minority product, ammonium hydrogen sulphate (NH4HSO4), is sticky and partly liquid and adheres to the surface of the fly ash. However, the ratio of these two components is variable and depends on the composition of the exhaust gases and the temperatures at which the reaction takes place.
2 NH3 + H2O + SO3 → (NH4)2SO4 (1) NH3 + H2O + SO3 → NH4HSO4 (2)
Comparison of ammoniacal ash with model mixtures of uncontaminated fly ash with salt (NH4)2SO4 or NH4HSO4 shows that the ammoniacal ash from the selective non-catalytic reduction process predominantly contains (NH4)2SO4 [4]. The presence of ammonia in fly ash may cause problems in its storage and further use. The odour threshold of ammonia in the air is in the range of 1–50 ppm. [7] The permissible exposure limit for ammonia concentration in the air valid for the European Union is set at 14 mg/m3, i.e. at 20 ppm. The maximum allowable concentration in the working atmosphere is reported at 36 mg/m3, i.e. at 50 ppm [8]. The main potential problems with ammoniacal fly ash can be summarised in two basic points:
• development of ammonia during handling and transport, which creates odours for service personnel when dealing with alkalis;
• contamination of drinking water sources by ammonia, caused by leakage from landfills of ammonia fly ash.
Both of these parameters were monitored directly during the production of concrete in a real plant as well as over the long term after a concrete mixture was used in real construction.
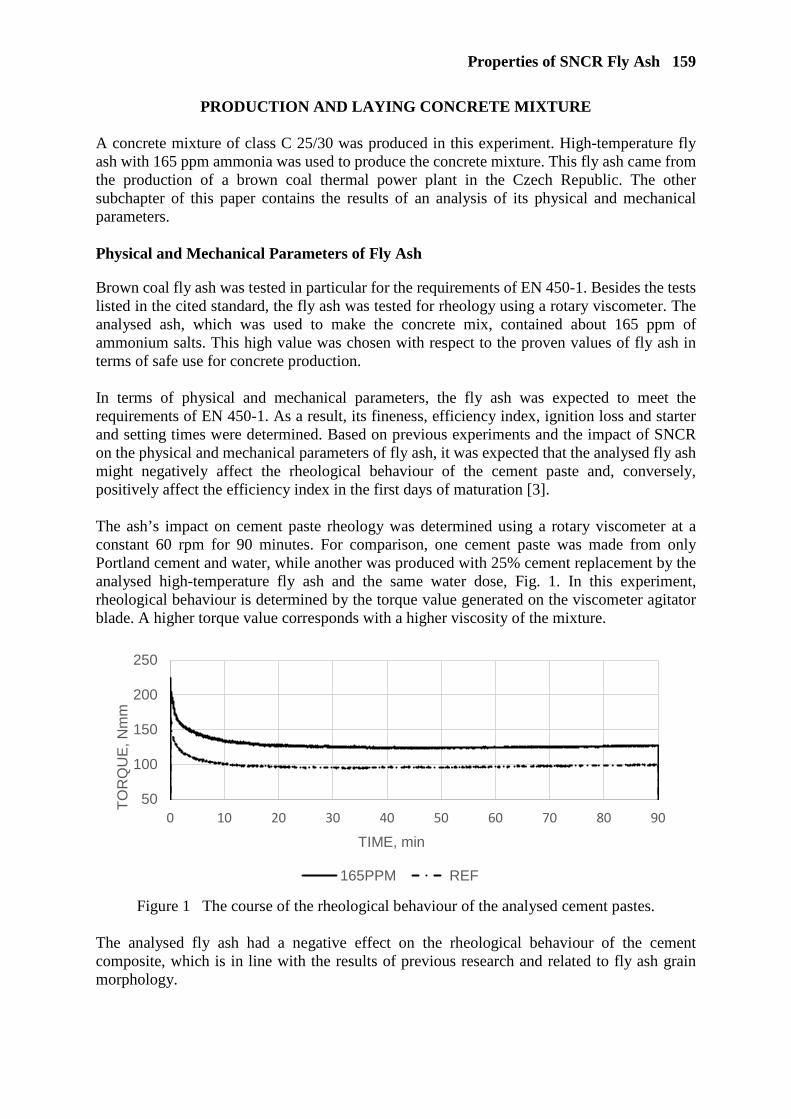
Properties of SNCR Fly Ash 159
PRODUCTION AND LAYING CONCRETE MIXTURE A concrete mixture of class C 25/30 was produced in this experiment. High-temperature fly ash with 165 ppm ammonia was used to produce the concrete mixture. This fly ash came from the production of a brown coal thermal power plant in the Czech Republic. The other subchapter of this paper contains the results of an analysis of its physical and mechanical parameters.
Physical and Mechanical Parameters of Fly Ash
Brown coal fly ash was tested in particular for the requirements of EN 450-1. Besides the tests listed in the cited standard, the fly ash was tested for rheology using a rotary viscometer. The analysed ash, which was used to make the concrete mix, contained about 165 ppm of ammonium salts. This high value was chosen with respect to the proven values of fly ash in terms of safe use for concrete production. In terms of physical and mechanical parameters, the fly ash was expected to meet the requirements of EN 450-1. As a result, its fineness, efficiency index, ignition loss and starter and setting times were determined. Based on previous experiments and the impact of SNCR on the physical and mechanical parameters of fly ash, it was expected that the analysed fly ash might negatively affect the rheological behaviour of the cement paste and, conversely, positively affect the efficiency index in the first days of maturation [3]. The ash’s impact on cement paste rheology was determined using a rotary viscometer at a constant 60 rpm for 90 minutes. For comparison, one cement paste was made from only Portland cement and water, while another was produced with 25% cement replacement by the analysed high-temperature fly ash and the same water dose, Fig. 1. In this experiment, rheological behaviour is determined by the torque value generated on the viscometer agitator blade. A higher torque value corresponds with a higher viscosity of the mixture.
Figure 1 The course of the rheological behaviour of the analysed cement pastes.
The analysed fly ash had a negative effect on the rheological behaviour of the cement composite, which is in line with the results of previous research and related to fly ash grain morphology.
50
100
150
200
250
0 10 20 30 40 50 60 70 80 90
TOR
QU
E,N
mm
TIME, min
165PPM REF

160 Hela et al
Further results of the tests carried out on the analysed fly ash are contained in Table 1.
Table 1 Physical and mechanical parameters of analysed high-temperature fly ash
PARAMETERS OF FLY ASH
Physical parameters Efficiency index, %
Fineness, %
Loss of ignition, %
Start of solidification,
min
Time of solidification,
min 7-days 28-days 90-days
38.9 0.8 255 360 80.8 76.5 88.7 All results in Table 1 show that the fly ash used, containing approximately 165 ppm ammonia, complies with the requirements of EN 450-1. The efficiency index after seven days of standard maturation also indicates good pozzolanic activity of the fly ash at the early stage of maturation of the composite. Production and Laying of Concrete Mixture
For the production of concrete mix of the C25/30 strength class, fly ash containing approximately 165 ppm of ammonia was used. Cement replacement with this fly ash was 35%. The concrete mixture was produced in a concrete plant under real-life conditions using an Ammann Elba mixer, type EMS 1000F. The produced concrete mixture was transported to the place of laying by the automix, where the concrete was used to create a floor in a closed room. During the production and subsequent laying of the concrete mixture, the level of ammonia leakage in the air was measured with the help of an accredited hygiene laboratory, the health institute. The measurements were carried out in the locations at which there was possible contact with the staff of the concrete plant, including automix as well as concrete workers. The limits were then set and compared with the guideline values of hygiene standards. A detailed description of the measurements and results are included in the following subchapter of this paper. Air Quality During Work with Ammoniacal Fly Ash
In the experiment, air quality was monitored during the work with ammoniacal fly ash with respect to the hygiene limits for substances contained in the working atmosphere and air quality in habitable rooms. The second named parameter was tracked at the place of concrete laying.
The air quality analysis and the subsequent evaluation and comparison with standard normative values were performed by the staff of the accredited testing hygiene laboratory. The analysis was carried out by means of these basic methods:
• Determination of ammonia concentration using a Casella CEL sampling apparatus with subsequent spectrophotometric analysis.
• Detection of ammonia by the Gatec suction with detection tubes.
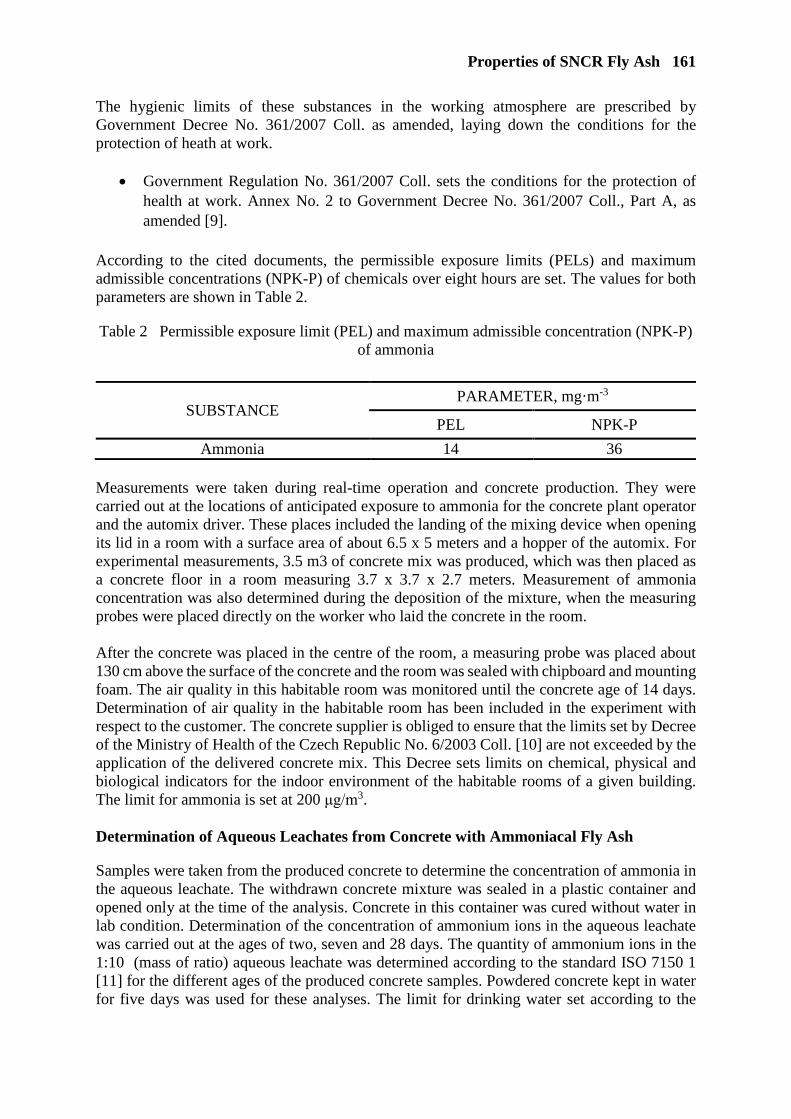
Properties of SNCR Fly Ash 161
The hygienic limits of these substances in the working atmosphere are prescribed by Government Decree No. 361/2007 Coll. as amended, laying down the conditions for the protection of heath at work.
• Government Regulation No. 361/2007 Coll. sets the conditions for the protection of health at work. Annex No. 2 to Government Decree No. 361/2007 Coll., Part A, as amended [9].
According to the cited documents, the permissible exposure limits (PELs) and maximum admissible concentrations (NPK-P) of chemicals over eight hours are set. The values for both parameters are shown in Table 2.
Table 2 Permissible exposure limit (PEL) and maximum admissible concentration (NPK-P) of ammonia
SUBSTANCE PARAMETER, mg·m-3
PEL NPK-P
Ammonia 14 36 Measurements were taken during real-time operation and concrete production. They were carried out at the locations of anticipated exposure to ammonia for the concrete plant operator and the automix driver. These places included the landing of the mixing device when opening its lid in a room with a surface area of about 6.5 x 5 meters and a hopper of the automix. For experimental measurements, 3.5 m3 of concrete mix was produced, which was then placed as a concrete floor in a room measuring 3.7 x 3.7 x 2.7 meters. Measurement of ammonia concentration was also determined during the deposition of the mixture, when the measuring probes were placed directly on the worker who laid the concrete in the room.
After the concrete was placed in the centre of the room, a measuring probe was placed about 130 cm above the surface of the concrete and the room was sealed with chipboard and mounting foam. The air quality in this habitable room was monitored until the concrete age of 14 days. Determination of air quality in the habitable room has been included in the experiment with respect to the customer. The concrete supplier is obliged to ensure that the limits set by Decree of the Ministry of Health of the Czech Republic No. 6/2003 Coll. [10] are not exceeded by the application of the delivered concrete mix. This Decree sets limits on chemical, physical and biological indicators for the indoor environment of the habitable rooms of a given building. The limit for ammonia is set at 200 μg/m3. Determination of Aqueous Leachates from Concrete with Ammoniacal Fly Ash
Samples were taken from the produced concrete to determine the concentration of ammonia in the aqueous leachate. The withdrawn concrete mixture was sealed in a plastic container and opened only at the time of the analysis. Concrete in this container was cured without water in lab condition. Determination of the concentration of ammonium ions in the aqueous leachate was carried out at the ages of two, seven and 28 days. The quantity of ammonium ions in the 1:10 (mass of ratio) aqueous leachate was determined according to the standard ISO 7150 1 [11] for the different ages of the produced concrete samples. Powdered concrete kept in water for five days was used for these analyses. The limit for drinking water set according to the
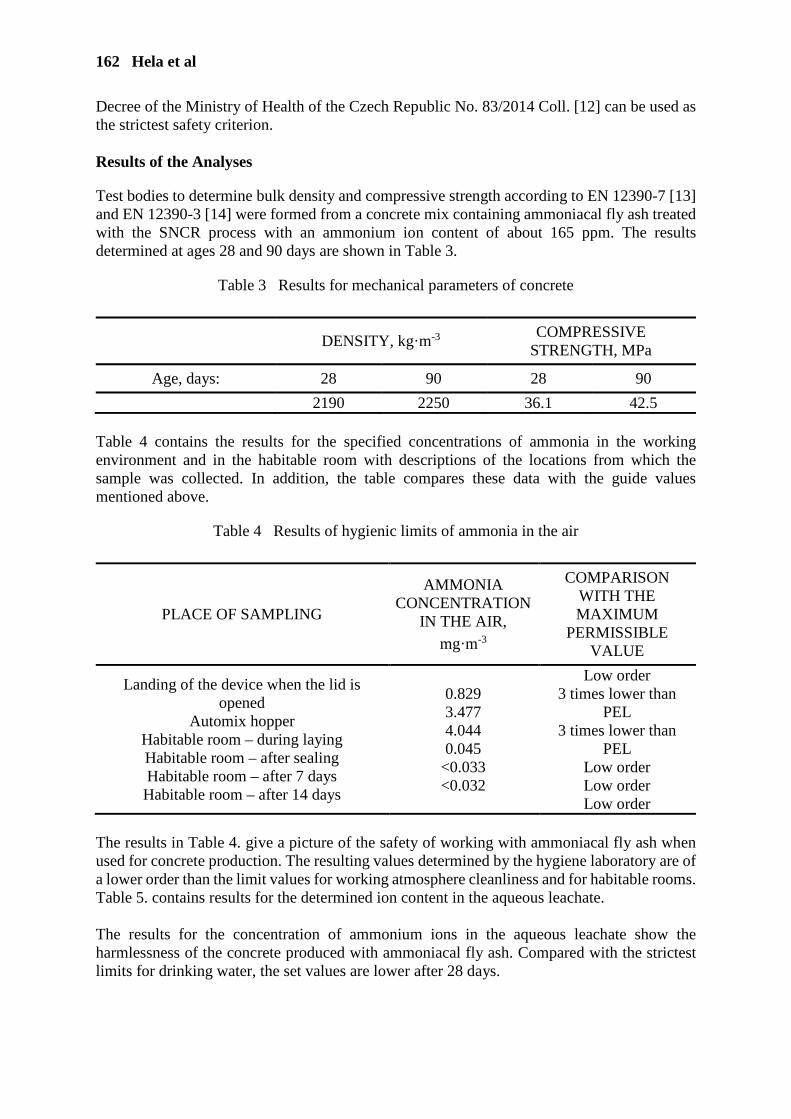
162 Hela et al
Decree of the Ministry of Health of the Czech Republic No. 83/2014 Coll. [12] can be used as the strictest safety criterion. Results of the Analyses
Test bodies to determine bulk density and compressive strength according to EN 12390-7 [13] and EN 12390-3 [14] were formed from a concrete mix containing ammoniacal fly ash treated with the SNCR process with an ammonium ion content of about 165 ppm. The results determined at ages 28 and 90 days are shown in Table 3.
Table 3 Results for mechanical parameters of concrete
DENSITY, kg·m-3 COMPRESSIVE
STRENGTH, MPa
Age, days: 28 90 28 90
2190 2250 36.1 42.5 Table 4 contains the results for the specified concentrations of ammonia in the working environment and in the habitable room with descriptions of the locations from which the sample was collected. In addition, the table compares these data with the guide values mentioned above.
Table 4 Results of hygienic limits of ammonia in the air
PLACE OF SAMPLING
AMMONIA CONCENTRATION
IN THE AIR,
mg·m-3
COMPARISON WITH THE MAXIMUM
PERMISSIBLE VALUE
Landing of the device when the lid is opened
Automix hopper Habitable room – during laying Habitable room – after sealing Habitable room – after 7 days Habitable room – after 14 days
0.829 3.477 4.044 0.045
<0.033 <0.032
Low order 3 times lower than
PEL 3 times lower than
PEL Low order Low order Low order
The results in Table 4. give a picture of the safety of working with ammoniacal fly ash when used for concrete production. The resulting values determined by the hygiene laboratory are of a lower order than the limit values for working atmosphere cleanliness and for habitable rooms. Table 5. contains results for the determined ion content in the aqueous leachate. The results for the concentration of ammonium ions in the aqueous leachate show the harmlessness of the concrete produced with ammoniacal fly ash. Compared with the strictest limits for drinking water, the set values are lower after 28 days.
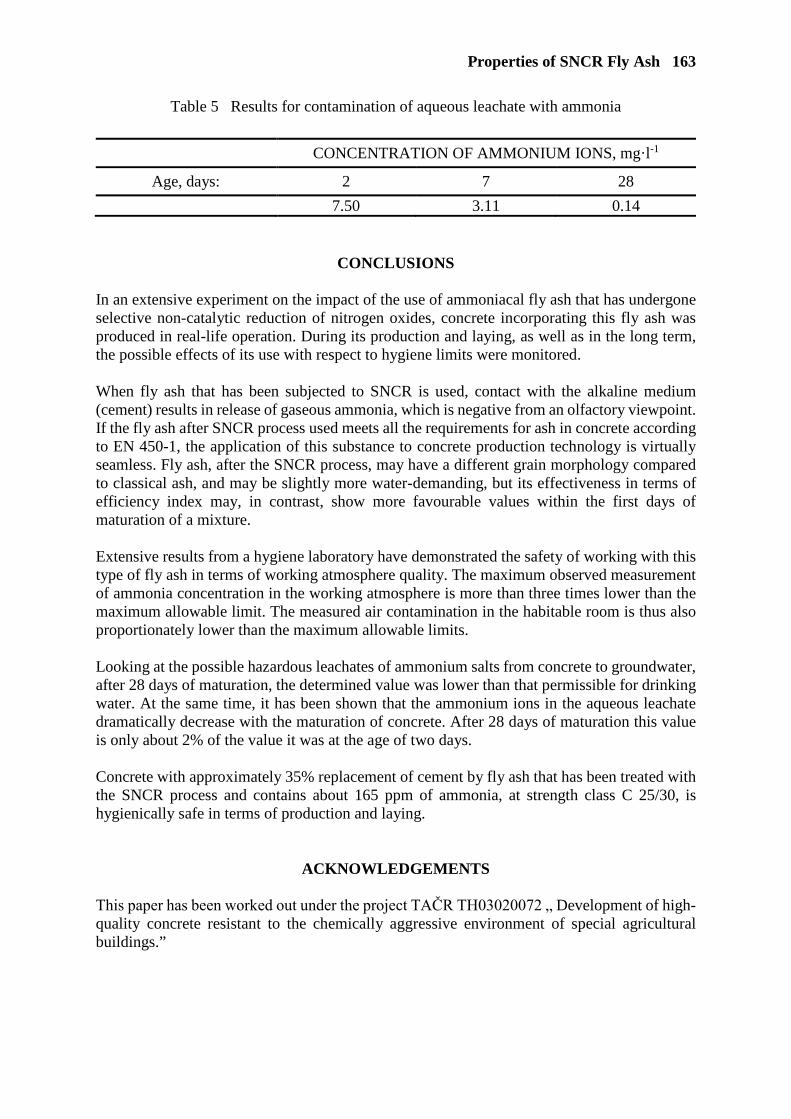
Properties of SNCR Fly Ash 163
Table 5 Results for contamination of aqueous leachate with ammonia
CONCENTRATION OF AMMONIUM IONS, mg·l-1
Age, days: 2 7 28
7.50 3.11 0.14
CONCLUSIONS In an extensive experiment on the impact of the use of ammoniacal fly ash that has undergone selective non-catalytic reduction of nitrogen oxides, concrete incorporating this fly ash was produced in real-life operation. During its production and laying, as well as in the long term, the possible effects of its use with respect to hygiene limits were monitored. When fly ash that has been subjected to SNCR is used, contact with the alkaline medium (cement) results in release of gaseous ammonia, which is negative from an olfactory viewpoint. If the fly ash after SNCR process used meets all the requirements for ash in concrete according to EN 450-1, the application of this substance to concrete production technology is virtually seamless. Fly ash, after the SNCR process, may have a different grain morphology compared to classical ash, and may be slightly more water-demanding, but its effectiveness in terms of efficiency index may, in contrast, show more favourable values within the first days of maturation of a mixture. Extensive results from a hygiene laboratory have demonstrated the safety of working with this type of fly ash in terms of working atmosphere quality. The maximum observed measurement of ammonia concentration in the working atmosphere is more than three times lower than the maximum allowable limit. The measured air contamination in the habitable room is thus also proportionately lower than the maximum allowable limits. Looking at the possible hazardous leachates of ammonium salts from concrete to groundwater, after 28 days of maturation, the determined value was lower than that permissible for drinking water. At the same time, it has been shown that the ammonium ions in the aqueous leachate dramatically decrease with the maturation of concrete. After 28 days of maturation this value is only about 2% of the value it was at the age of two days. Concrete with approximately 35% replacement of cement by fly ash that has been treated with the SNCR process and contains about 165 ppm of ammonia, at strength class C 25/30, is hygienically safe in terms of production and laying.
ACKNOWLEDGEMENTS This paper has been worked out under the project TAČR TH03020072 „ Development of high-quality concrete resistant to the chemically aggressive environment of special agricultural buildings.”
164 Hela et al
REFERENCES 1. EN 206+A1. Concrete: Specification performance, production and conformity, 2017.
2. EN 450-1. Fly ash for concrete - Part 1: Definition, specifications and conformity criteria, 2013.
3. HELA, R, ŤAŽKÝ, M. Effect of SNCR on the Properties of Fly Ash in Terms of its Applicability to Concrete, Solid State Phenomena, Vol. 272, pp. 107-114, 2018
4. RUBEL, A M. Forms of ammonia on SCR, SNCR, and FGC combustion ashes. Fuel Chemistry Division Preprints, 2002, 47 (2), 834–835.
5. BEHAVIOR OF AMMONIATED FLY ASH. Effects of Ammonia on Fly Ash Handling, Disposal, and End-Use, EPRI, Palo Alto, CA, 2002: 1003981.
6. EPRI, Impacts of Ammonia Contamination of Fly Ash on Disposal and Use, EPRI, Palo Alto, CA, 2001: 1004609.
7. MINISTERSTVO VNITRA – GENERÁLNÍ ŘEDITELSTVÍ HASIČSKÉHO ZÁCHRANNÉHO SBORU ČESKÉ REPUBLIKY. Bojový řád jednotek požární ochrany – taktické postupy zásahu: Zásahy s únikem amoniaku (čpavku), 2011.
8. SIGMA-ALDRICH. Bezpečnostní list – Ammonia, 2013.
9. NAŘÍZENÍ VLÁDY Č. 361/2007 SB., KTERÝM SE STANOVÍ PODMÍNKY OCHRANY ZDRAVÍ PŘI PRÁCI - ČÁST A Seznam chemických látek a jejich přípustné expoziční limity (PEL) a nejvyšší přípustné koncentrace (NPK-P)
10. VYHLÁŠKA Č. 6/2003 SB., Kterou se stanoví hygienické limity chemických, fyzikálních a biologických ukazatelů pro vnitřní prostředí pobytových místností a některých staveb, Ministerstvo Zdravotnictví ČR, 2003
11. ISO 7150-1. Water quality. Determination of ammonium - Part 1: Manual spectrometric method, 1994.
12. VYHLÁŠKA Č. 83/2014 SB., Kterou se mění vyhláška č. 252/2004 sb., Kterou se stanoví hygienické požadavky na pitnou a teplou vodu a četnost a rozsah kontroly pitné vody, Ve Znění Pozdějších Předpisů
13. EN 12390-7. Testing hardened concrete - Part 7: Density of hardened concrete, 2009.
14. EN 12390-3. Testing hardened concrete - Part 3: Compressive strength of test specimens, 2009.

HYDRAULIC ROAD BINDERS WITH HIGH CONTENT OF FLY ASH: CZECH EXPERIENCE
F Kresta
SG Geotechnika a.s.
Czech republic
ABSTRACT: Hydraulic road binders are very popular in soil treatment industry especially due to their low costs in comparison with traditional binders like lime or cement. Composition and main parameters of hydraulic road binders are summarized in EN 13282-1, - 2. Research on binders with high content of fly ash started in Czech Republic a long time before the finishing of EN standards. The RSS5 binder consisting of 80% of calcareous fly ash from fluid burning of black coal and 20% of quick lime has been used since 2010. It is a very good alternative for treatment of clays and sandy clays instead of lime. The ViaCalco binder is composed of fly ash and lime kiln dust. It is used for stabilisation especially of capping layers and pavements with high demands for their stiffness (e.g. airport runways). Finally, now under testing is a new hydraulic road binder consisting of siliceous fly ash after denitrification (SNCR) with max. 200 ppm of ammonia and cement kiln dust with high content of chlorine (max. 13%). Keywords: Hydraulic road binder, Fly ash, SNCR denitrification Assoc. Prof. František Kresta is the head of the branch Ostrava of SG Geotechnika a.s. company. He is also a lecturer in Faculty of civil engineering of Technical University in Ostrava. He is closely connected with practice in secondary materials utilisation in earthworks, including binders. He is a member of technical committee CEN 396 Earthworks.

166 Kresta
INTRODUCTION
Hydraulic road binders are very popular in soil treatment industry especially due to their low costs in comparison with traditional binders like lime or cement. Composition and main parameters of hydraulic road binders are summarized in EN 13282-1, - 2 [8], [9]. Hydraulic road binders can contain various components and admixtures. European standards EN 13282-1, - 2 only reacted on the situation on the market and tried to envelope as much as possible binders around the Europe. However, the way to these standards was very long. First attempts with rapid binders containing fly ash were tested during the Vietnam War at the beginning of 70 of 20th century. In Czech republic mixtures of fluidised fly ash and lime were used at the beginning of 90 of 20th century as fill, even in transition zones to bridges. Marginal conditions of their utilisation in earthworks were summarized in Technical specifications (TP) 93 firstly published in 1997 [12]. The stress was put on their strength parameters and their volumetric stability. First hydraulic road binders with some fly ash content were developed by foreign companies (Holcim, Carmeuse). The first Czech binder with high fly ash content was prepared in 2006 with 80% of fluidized ash and 20% of quick lime and named as RSS5 [2]. In 2012-2013 new binders containing fluidized ash and lime and/or cement kiln dusts from the Carmeuse company were prepared.
THE RSS5 HYDRAULIC ROAD BINDER
In the Czech Republic, laboratory and pilot tests were run in 2006 to verify the possibility of treating soils (medium-plasticity clays) with a mixture of fluidized fly ash (from Třinec Ironworks heat generating plant) and lime (the fly ash to lime ratio was 80:20). Laboratory tests were performed to check on a recipe for the content of mixed binder used in the treatment of clays of medium plasticity and of moisture w=wopt+3%. The results of the laboratory CBR tests are shown in Figures 1 and 2. During the course of curing the CBR bearing capacity increases, too; after no more than 7 days of curing and 4 days of soaking it has already passed the value of CBR>15% at all the binder concentrations tested, thus meeting the minimum requirements stipulated in the Czech standards and regulations for soils placed in the capping layer [11]. For the different binder concentrations, the shapes of the CBR curves for as-soaked samples were similar to one another. The growth of CBR values after 28 days of curing on the figure for 7 days of curing was no longer so distinct, yet the tendency of the CBR value to increase persisted. Binder material was applied under pilot-scale conditions and the potential for treatment of the medium-plasticity clays on the test sections was verified. The deformation modulus values (Edef2) obtained by measurements on the treated layer which remained unprotected in any way from inclement weather were 140 N.mm-2 and 150 N.mm-2 after 28 days and 60 days, respectively.

Hydraulic Road Binders 167
Figure 1 Values of soil CBR for soils treated with a binder mixture (fly ash/lime =80/20%)
as a function sample saturation, binder content and curing time
Figure 2 Results of the CBR (California bearing ratio) test for soil treated with a binder
mixture (fly ash/lime = 80/20%) as a function of sample saturation, binder content and curing time
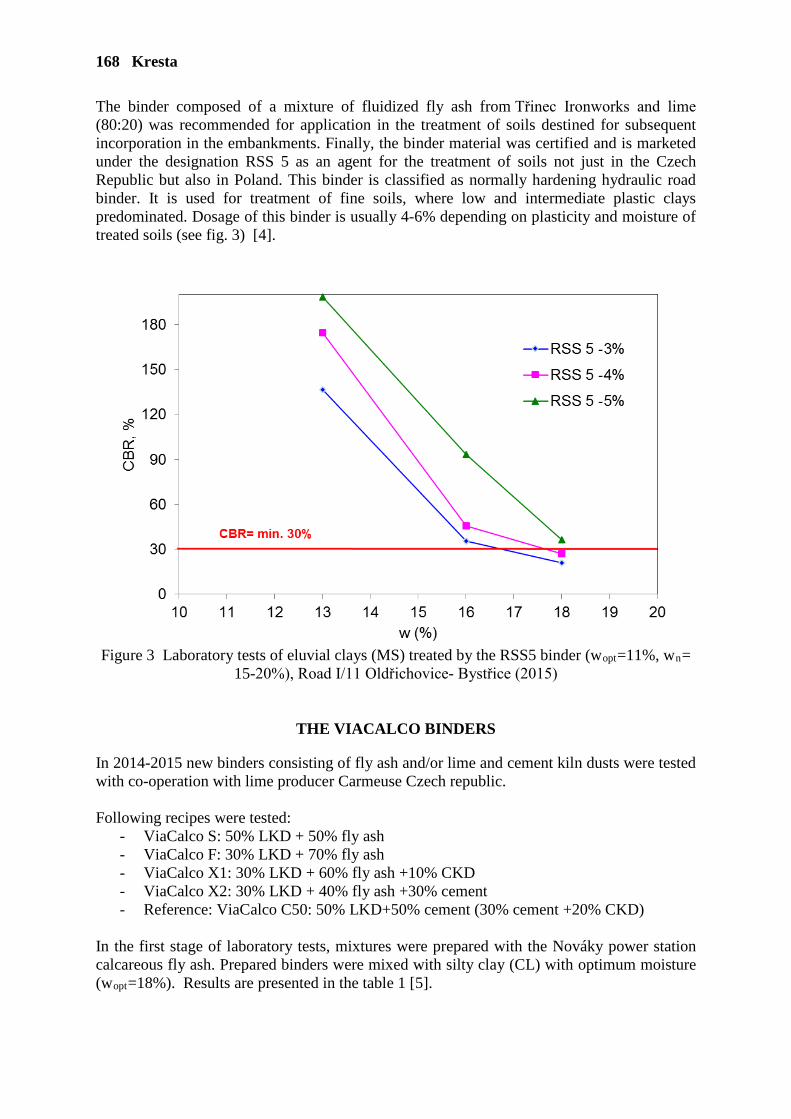
168 Kresta
The binder composed of a mixture of fluidized fly ash from Třinec Ironworks and lime (80:20) was recommended for application in the treatment of soils destined for subsequent incorporation in the embankments. Finally, the binder material was certified and is marketed under the designation RSS 5 as an agent for the treatment of soils not just in the Czech Republic but also in Poland. This binder is classified as normally hardening hydraulic road binder. It is used for treatment of fine soils, where low and intermediate plastic clays predominated. Dosage of this binder is usually 4-6% depending on plasticity and moisture of treated soils (see fig. 3) [4].
Figure 3 Laboratory tests of eluvial clays (MS) treated by the RSS5 binder (wopt=11%, wn=
15-20%), Road I/11 Oldřichovice- Bystřice (2015)
THE VIACALCO BINDERS
In 2014-2015 new binders consisting of fly ash and/or lime and cement kiln dusts were tested with co-operation with lime producer Carmeuse Czech republic. Following recipes were tested:
- ViaCalco S: 50% LKD + 50% fly ash - ViaCalco F: 30% LKD + 70% fly ash - ViaCalco X1: 30% LKD + 60% fly ash +10% CKD - ViaCalco X2: 30% LKD + 40% fly ash +30% cement - Reference: ViaCalco C50: 50% LKD+50% cement (30% cement +20% CKD)
In the first stage of laboratory tests, mixtures were prepared with the Nováky power station calcareous fly ash. Prepared binders were mixed with silty clay (CL) with optimum moisture (wopt=18%). Results are presented in the table 1 [5].

Hydraulic Road Binders 169
Table 1 Results of laboratory tests of mechanical properties of mixtures of binders with soil
(red values did not comply standard requirements)
Mixture IBI (%)
CBR after 7 days curing
and 96 hours
soaking (%)
CBR after 28 days
curing and 96 hours
soaking (%)
UCS after 7 days curing
(N.mm-2)
UCS after 28
days curing
(N.mm-2)
Swelling in the CBR
mould (%)
silty clay (without binder)
28,3 0,0
0,3
1,9
ViaCalco S (2%) 31,8 26,9 19,4 0,4 0,4 0,1 ViaCalco S (3%) 30,8 38,3 31,6 0,4 0,5 0,1 ViaCalco F (2%) 28,3 12,0 11,1 0,3 0,3 0,5 ViaCalco F (3%) 30,1 25,0 15,5 0,4 0,3 0,3
ViaCalco X1 (2%) 25,3 23,5 14,3 0,3 0,3 0,3 ViaCalco X1 (3%) 27,2 27,1 23,4 0,4 0,4 0,2 ViaCalco X2 (2%) 33,6 13,7 17,0 0,4 0,4 0,4 ViaCalco X2 (3%) 26,2 36,3 33,7 0,5 0,5 0,1 ViaCalco 50 (2%) 18,2 72,8 55,4 0,6 0,6 0,3 ViaCalco 50 (3%) 29,5 115,3 81,1 0,6 1,1 0,2
Results of laboratory tests of new binders prepared from fly ash, LKD, CKD and cement used for treatment of silty clay can be summarized in following points:
1) Regarding the IBI values all treated soils with 2% or 3% of new and reference binders comply demands of Czech standards and specifications (CSN 73 6133 [11], TP 94 [13]). An effect of new binders on the IBI values of treated soil (with optimum moisture) was small.
2) CBR values (after 96 hours soaking) of soils treated by new binders increase with dosage of binder. Expected dependence that with increasing time of curing CBR values increase was not observed in all cases (see fig. 4 and 5).
3) The lowest value of CBR of treated soils used in capping layer is 15% (roads with low traffic load). CBR values after 7 days treatment were in two cases (ViaCalco F – 2%, ViaCalco X2 – 2%) lower than 15%, after 28 days curing it was also in two cases (ViaCalco F – 2%, ViaCalco X1 – 2%).
4) UCS value of untreated silty clay was 0.3 N.mm-2. After treatment of new binders and 7 and 28 days curing UCS value increased maximally to 0.5 N.mm-2. A dosage of 2% of 3% of new binders does not influence UCS values of treated soils.
5) Treated soils by new and reference binders are stable without swelling. Addition of binders reduces swelling potential of untreated soils that show maximum swelling (1.9%). Swelling of treated soils was 0.1%-0.5%. Treated soils by new binders are volume stable [6].
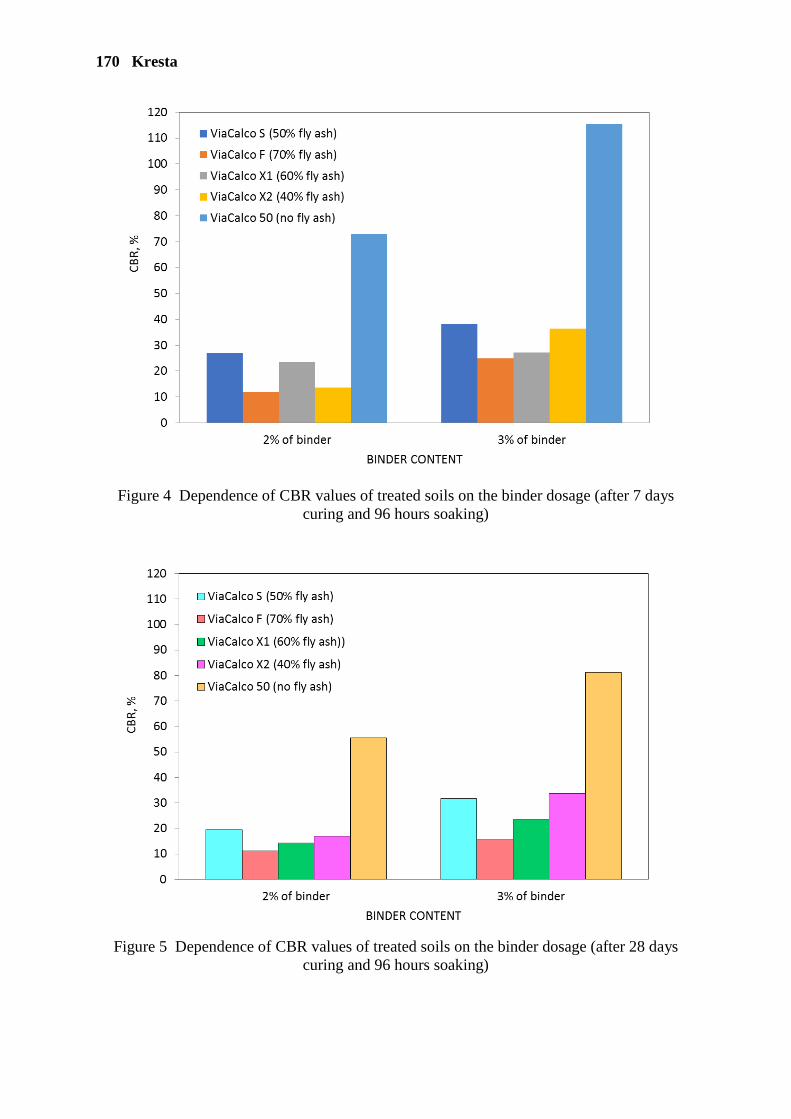
170 Kresta
Figure 4 Dependence of CBR values of treated soils on the binder dosage (after 7 days
curing and 96 hours soaking)
Figure 5 Dependence of CBR values of treated soils on the binder dosage (after 28 days
curing and 96 hours soaking)
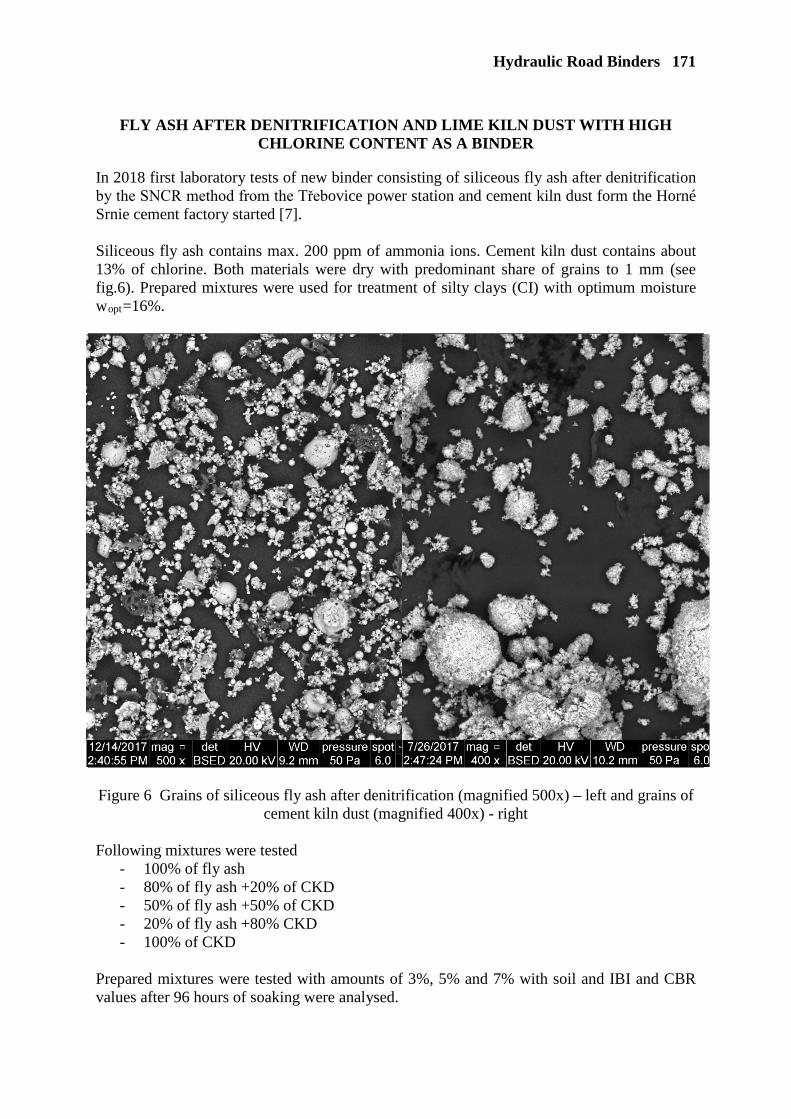
Hydraulic Road Binders 171
FLY ASH AFTER DENITRIFICATION AND LIME KILN DUST WITH HIGH
CHLORINE CONTENT AS A BINDER
In 2018 first laboratory tests of new binder consisting of siliceous fly ash after denitrification by the SNCR method from the Třebovice power station and cement kiln dust form the Horné Srnie cement factory started [7]. Siliceous fly ash contains max. 200 ppm of ammonia ions. Cement kiln dust contains about 13% of chlorine. Both materials were dry with predominant share of grains to 1 mm (see fig.6). Prepared mixtures were used for treatment of silty clays (CI) with optimum moisture wopt=16%.
Figure 6 Grains of siliceous fly ash after denitrification (magnified 500x) – left and grains of
cement kiln dust (magnified 400x) - right Following mixtures were tested
- 100% of fly ash - 80% of fly ash +20% of CKD - 50% of fly ash +50% of CKD - 20% of fly ash +80% CKD - 100% of CKD
Prepared mixtures were tested with amounts of 3%, 5% and 7% with soil and IBI and CBR values after 96 hours of soaking were analysed.

172 Kresta
IBI values increased with amount of mixture and the amount of CKD in the mixture (fig. 7). The same trend was obtained also in CBR values after 3 days and 28 days of curing and 96 hours soaking in both cases (fig. 8). However, tests with overwetted soils have not been carried out, yet.
Figure 7 Dependence of IBI value of soil treated by the fly ash after SNCR and CKD on the
amount of mixture
Figure 8 Dependence of CBR values after 3 days of curing and 96 hours of soaking of soil (CI) treated by mixture from fly ash after SNCR and CKD
0
5
10
15
20
25
30
0% 1% 2% 3% 4% 5% 6% 7% 8% 9% 10%
IBI,
%
MIXTURE CONTENT
100% fly ash
80% fly ash + 20% CKD
50% fly ash + 50% CKD
20% fly ash + 80% CKD
100% CKD
0102030405060708090
100110120
0% 1% 2% 3% 4% 5% 6% 7% 8% 9% 10%
CBR
,%
MIXTURE CONTENT
100% fly ash
80% fly ash + 20% CKD
50% fly ash + 50% CKD
20% fly ash + 80% CKD
100% CKD
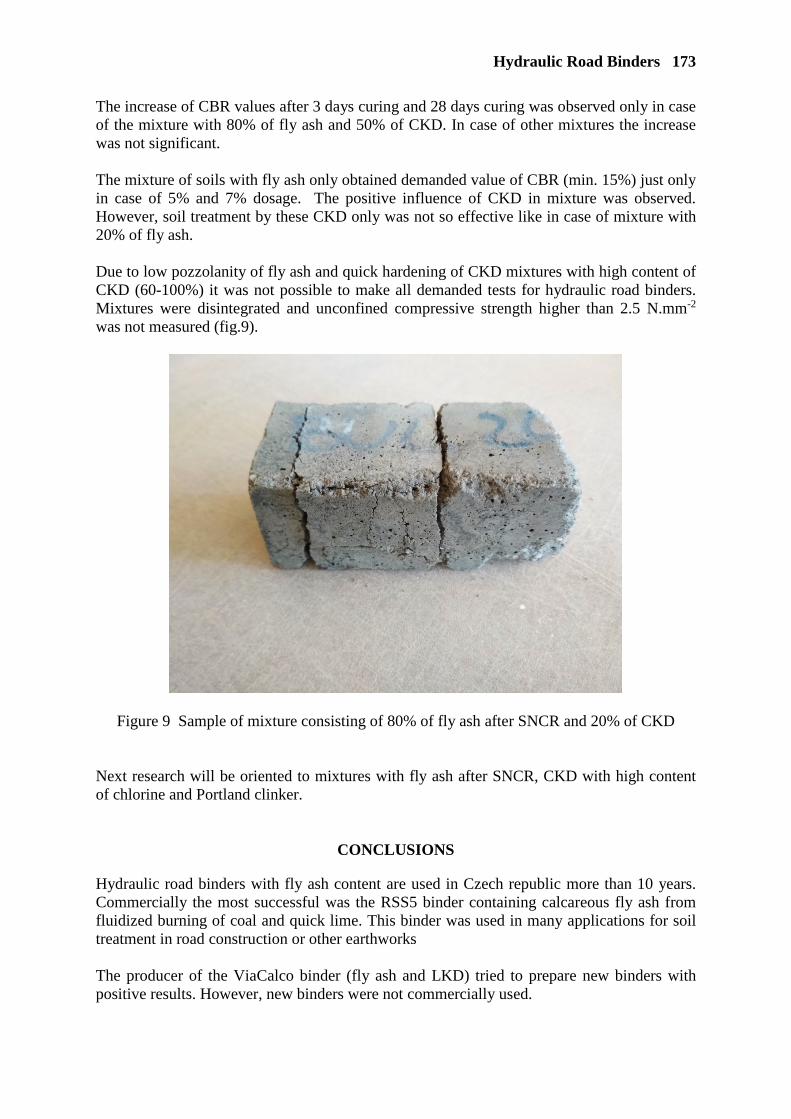
Hydraulic Road Binders 173
The increase of CBR values after 3 days curing and 28 days curing was observed only in case of the mixture with 80% of fly ash and 50% of CKD. In case of other mixtures the increase was not significant. The mixture of soils with fly ash only obtained demanded value of CBR (min. 15%) just only in case of 5% and 7% dosage. The positive influence of CKD in mixture was observed. However, soil treatment by these CKD only was not so effective like in case of mixture with 20% of fly ash. Due to low pozzolanity of fly ash and quick hardening of CKD mixtures with high content of CKD (60-100%) it was not possible to make all demanded tests for hydraulic road binders. Mixtures were disintegrated and unconfined compressive strength higher than 2.5 N.mm-2 was not measured (fig.9).
Figure 9 Sample of mixture consisting of 80% of fly ash after SNCR and 20% of CKD
Next research will be oriented to mixtures with fly ash after SNCR, CKD with high content of chlorine and Portland clinker.
CONCLUSIONS
Hydraulic road binders with fly ash content are used in Czech republic more than 10 years. Commercially the most successful was the RSS5 binder containing calcareous fly ash from fluidized burning of coal and quick lime. This binder was used in many applications for soil treatment in road construction or other earthworks The producer of the ViaCalco binder (fly ash and LKD) tried to prepare new binders with positive results. However, new binders were not commercially used.
174 Kresta
Finally, the last research was concentrated on preparing of a new binder consisting from fly ash after SNCR and CKD with high content of chlorine. This research has not been finished so far.
REFERENCES
1. KRESTA F.: Soils treated by binders with fly ash content. Seminar Construction layers and pavement subgrade., Brno, 2012 (in Czech).
2. KRESTA F.: Secondary materials in highway construction. VŠB TU Ostrava, 144 pp., 2012.
3. KRESTA F. Fly ash as a binder or binder component. Conference Fly ash in civil engineering. Brno, 2013. (in Czech)
4. KRESTA F.: Soil treatment by binders with fly ash content and existing results with RSS5 binder application. Silniční obzor, No.1, 2014, pp. 6-8 (in Czech).
5. KRESTA F.: Carmeuse – a new binder. Laboratory tests. Final report. ARCADIS CZ a.s. 06/2015.
6. KRESTA F.: Soil treatment by mixtures of fly ash and lime and cement kiln dusts. Conference Fly ash in civil engineering, 2017, Brno. (in Czech)
7. KRESTA F.: Fly ash after denitrification by the SNCR method and their utilisation in earthworks. Silniční obzor, Vol. 79, No.č.1, 2018, pp. 3-6. (in Czech)
8. EN 13282-1 Hydraulic road binders – Part 1: Rapid hardening hydraulic road binders – Composition, specifications and conformity criteria
9. EN 13282-2 Hydraulic road binders – Part 2: Normal hardening hydraulic road binders – Composition, specifications and conformity criteria
10. EN 16907-4 Earthworks – Part 4 Soil treatment by lime and/or hydraulic binders
11. ČSN 73 6133 Design and execution of road earthworks (in Czech)
12. TP 93 Design and execution of road earthworks with fly ash and ash (in Czech)
13. TP 94 Soil treatment (in Czech)
TERNARY BINDERS WITH FLY ASH AFTER DENITRIFICATION
V Bílek
ZPSV s.r.o., Uhersky Ostroh
M Bambuchová L Bulíková
VŠB – Technical University of Ostrava
Czech Republic
ABSTRACT. Present pressure on ecological behavior brings promising ternary blends into view. They can be prepared from Portland cement, limestone and other mineral admixtures which contain aluminate ions. The mineral admixture compound can be fly ash - collected from power and heating plants where selective non-catalytic reduction (SNCR) is installed. The paper deals with ternary blends with a high amount of ammonium salts in fly ash from power plants where SNCR method is used. Portland cement is the main component in this ternary blend system. Microsilica and metakaolin were used as further components. The compressive strength development of mixtures with a replacement of cement with SNCR-treated fly ash + limestone is presented and the results are compared with those with fly ash without the treatment. Keywords: Ternary binders, Fly ash, SNCR treatment, High performance concrete Associate Professor Vlastimil Bílek is Head of the Department of Building Materials and Diagnostics of Building at the Faculty of Civil Engineering, VSB – Technical University of Ostrava, Czech Republic. PhD student Markéta Bambuchová is currently a student of the Department of Building Materials and Diagnostics of Building at the Faculty of Civil Engineering, VSB – Technical University of Ostrava, Czech Republic. PhD student Lucia Bulíková is currently a student of the Department of Building Materials and Diagnostics of Building at the Faculty of Civil Engineering, VSB – Technical University of Ostrava, Czech Republic.
176 Bílek, Bambuchová, Bulíková
INTRODUCTION
Ternary binders are a promising way of decreasing the amount of global CO2 emissions. Given that environmentally friendly cement clinker manufacturing technologies that can reduce CO2 emissions cannot be expected in the near future, see [1], other actions need to take be taken, such as designing concrete with ternary binders. They are prepared from ordinary Portland cement (PC) and from two other well combined mineral admixtures. In particular, fly ash (FA) with an appropriate chemical and mineralogical composition is very popular as a promising mineral admixture. With ground limestone (LS), it can affect the increase of early strengths (and sometimes also late strengths) of concretes. This is caused by the reaction of calcium carbonate from LS and aluminate ions from FA or from other supplementary cementing materials. The strength increase reaction is explained in K. De Weerdt et al [2]. Calcium carbonate can also be found and used from recycled concrete filler and alumina from supplementary cementing materials such as ground granulated blast furnace slag (GBFS), bottom ash, metakaoline (MK) or other burned clays. As stated in Bílek [3], this combination of ground limestone LS and metakaoline MK or fly ash FA can bring a positive effect not only on strengths but also on durability – especially frost resistance and alkali-silica reaction resistance are enhanced. A method of inhibiting the alkali-silica reaction was also described by Kazim Turk et al [4]. When cement is partly replaced by two other mineral admixtures, a positive ecological impact is made. By producing one tonne of cement, approximately one tonne of CO2 is produced and with the risk of everyday global warming it is necessary to exploit all the possibilities to reduce the nasty impact on the world. However, our efforts to reduce the amount of emissions to the air also brings some negativity. These days, power and heating plants are installing so called selective non-catalytic reductions (SNCR) or selective catalytic reductions (SCR) to respond to the demand for the reduction of nitrogen oxide emissions (NOx). These requirements influence fly ash properties. The fly ash from these power and heating plants contains a higher amount of ammonium salts and its morphological structure may be damaged by thermal shock when the reducing agent is injected. This may cause worse workability, see Hela et al [5]. However, no positive or negative effect of ammonium salts in fly ash on the concrete strengths has been proved satisfactorily. Further research on this subject is necessary. High performance concretes (HPC) were designed for some subtle constructions. In these concretes FA was also used as a component of ternary binders together with LS. But formerly it was FA without any SNCR treatment. A big portion of PC in these HPC concretes was gradually replaced with (FA + LS). At the start it was only 75 kg/m3, later it was up to 225 kg/m3. The strengths of the concretes remained nearly the same. The reason is the low portion of hydrated cement grains as a consequence of low water/binder ratio which is approximately 0.20. In mixtures with a higher portion (FA+LS), which react slowly, there is more water available for hydration of cement grains. This means (FA+LS) is an important part of the binder. The target of this paper is to verify if FA can be replaced with SNCR treated fly ash (SNCR FA) and if the combination (SNCR FA+LS) has a similar influence as the (FA+LS) combination

Ternary Bindres with Fly Ash 177
MATERIALS AND EXPERIMENTAL PROCEDURE
SNCR-treated fly ash was obtained from the power plant in Opatovice (Czech Republic). Its basic properties are presented in Table 1 and a view of the fly ash is shown in Figure 1. There are hardly any perfectly smooth grains. Most of the grains show damaged morphology resulting from SNCR treatment. As mentioned above, this damaged morphology can worsen workability, but on the other hand – it may also affect the leaching of alumina from the grains of fly ash and affect the synergy in the ternary binder concept.
Table 1 SNCR FA properties
TEST STANDARD Loss on ignition EN 196-2 [%] 0,64 SO3 content EN 196-2 [%] 0,48 Cl- content EN 196-2 [%] 0,02 SiO2 content EN 196-2 [%] 53,04 Free lime content CaO EN 459-2 [%] 0,13 Specific surface area [m2/kg] 501,00
Figure 1 Grains of fly ash after SNCR method To prepare mortars, cement CEM I 42.5 R from CEMMAC Horné Srnie (Slovakia) was used. Metakaoline (MK) Metaver I (Newcem company) or Microsilica (CSF) from Chryso company were used to reduce the stickness of the mortars. Also, a combination of SNCR treated fly ash (SNCR FA) and ground limestone (LS) with specific surface area 360 m2/kg was used. CEM + SNCR FA + LS represents a ternary binder. Binder properties are affected by MK or CSF. It is necessary to use them to enhance of the workability of the mixture. Because MK contains aluminate ions, it can significantly affect synergy between ternary binders. Drinkable water, PCE superplasticizer, steel microfibers and sand were also used for the preparation of the mortars.
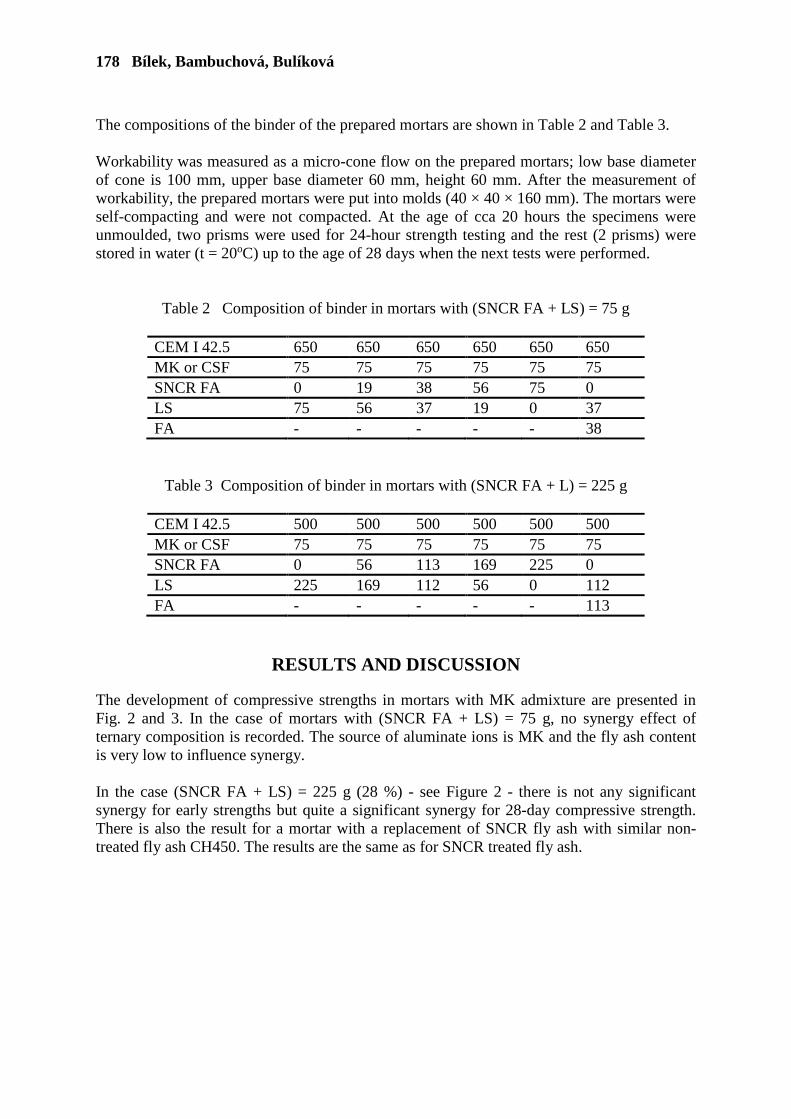
178 Bílek, Bambuchová, Bulíková
The compositions of the binder of the prepared mortars are shown in Table 2 and Table 3. Workability was measured as a micro-cone flow on the prepared mortars; low base diameter of cone is 100 mm, upper base diameter 60 mm, height 60 mm. After the measurement of workability, the prepared mortars were put into molds (40 × 40 × 160 mm). The mortars were self-compacting and were not compacted. At the age of cca 20 hours the specimens were unmoulded, two prisms were used for 24-hour strength testing and the rest (2 prisms) were stored in water (t = 20oC) up to the age of 28 days when the next tests were performed.
Table 2 Composition of binder in mortars with (SNCR FA + LS) = 75 g
CEM I 42.5 650 650 650 650 650 650 MK or CSF 75 75 75 75 75 75 SNCR FA 0 19 38 56 75 0 LS 75 56 37 19 0 37 FA - - - - - 38
Table 3 Composition of binder in mortars with (SNCR FA + L) = 225 g
CEM I 42.5 500 500 500 500 500 500 MK or CSF 75 75 75 75 75 75 SNCR FA 0 56 113 169 225 0 LS 225 169 112 56 0 112 FA - - - - - 113
RESULTS AND DISCUSSION
The development of compressive strengths in mortars with MK admixture are presented in Fig. 2 and 3. In the case of mortars with (SNCR FA + LS) = 75 g, no synergy effect of ternary composition is recorded. The source of aluminate ions is MK and the fly ash content is very low to influence synergy. In the case (SNCR FA + LS) = 225 g (28 %) - see Figure 2 - there is not any significant synergy for early strengths but quite a significant synergy for 28-day compressive strength. There is also the result for a mortar with a replacement of SNCR fly ash with similar non-treated fly ash CH450. The results are the same as for SNCR treated fly ash.
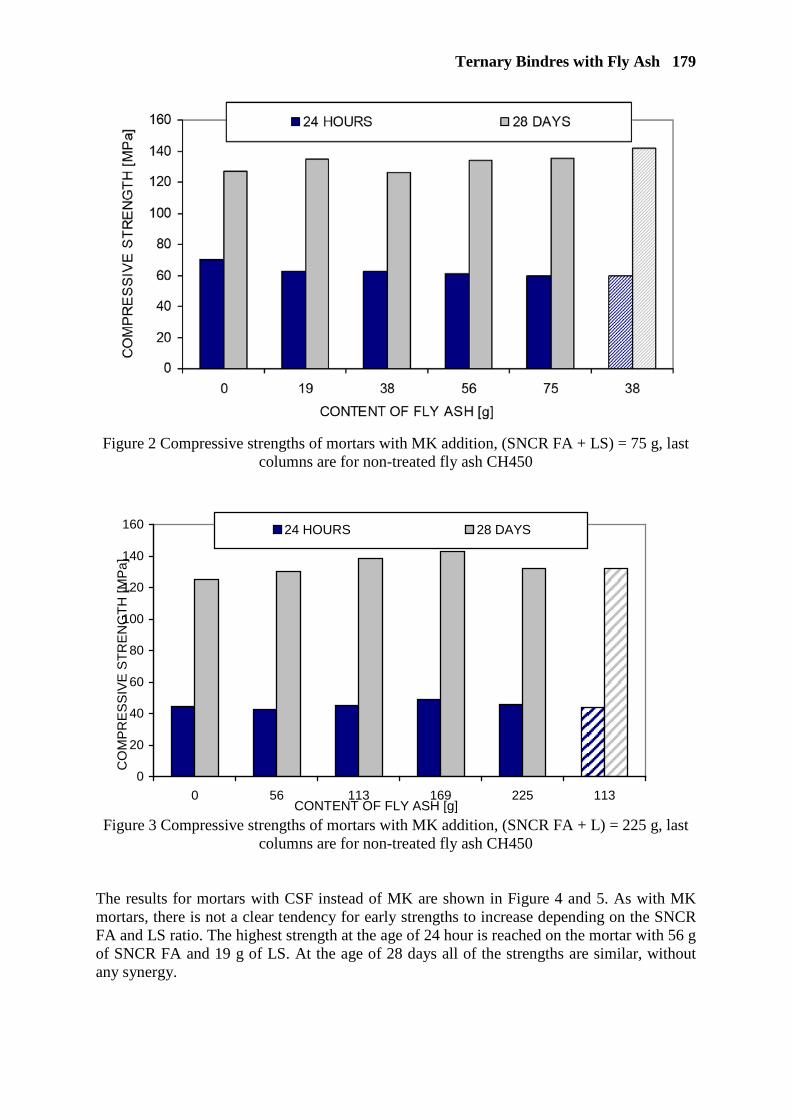
Ternary Bindres with Fly Ash 179
Figure 2 Compressive strengths of mortars with MK addition, (SNCR FA + LS) = 75 g, last
columns are for non-treated fly ash CH450
0
20
40
60
80
100
120
140
160
0 56 113 169 225 113
24 HOURS 28 DAYS
CO
MPR
ESSI
VE S
TREN
GTH
[MPa
]
CONTENT OF FLY ASH [g] Figure 3 Compressive strengths of mortars with MK addition, (SNCR FA + L) = 225 g, last
columns are for non-treated fly ash CH450 The results for mortars with CSF instead of MK are shown in Figure 4 and 5. As with MK mortars, there is not a clear tendency for early strengths to increase depending on the SNCR FA and LS ratio. The highest strength at the age of 24 hour is reached on the mortar with 56 g of SNCR FA and 19 g of LS. At the age of 28 days all of the strengths are similar, without any synergy.
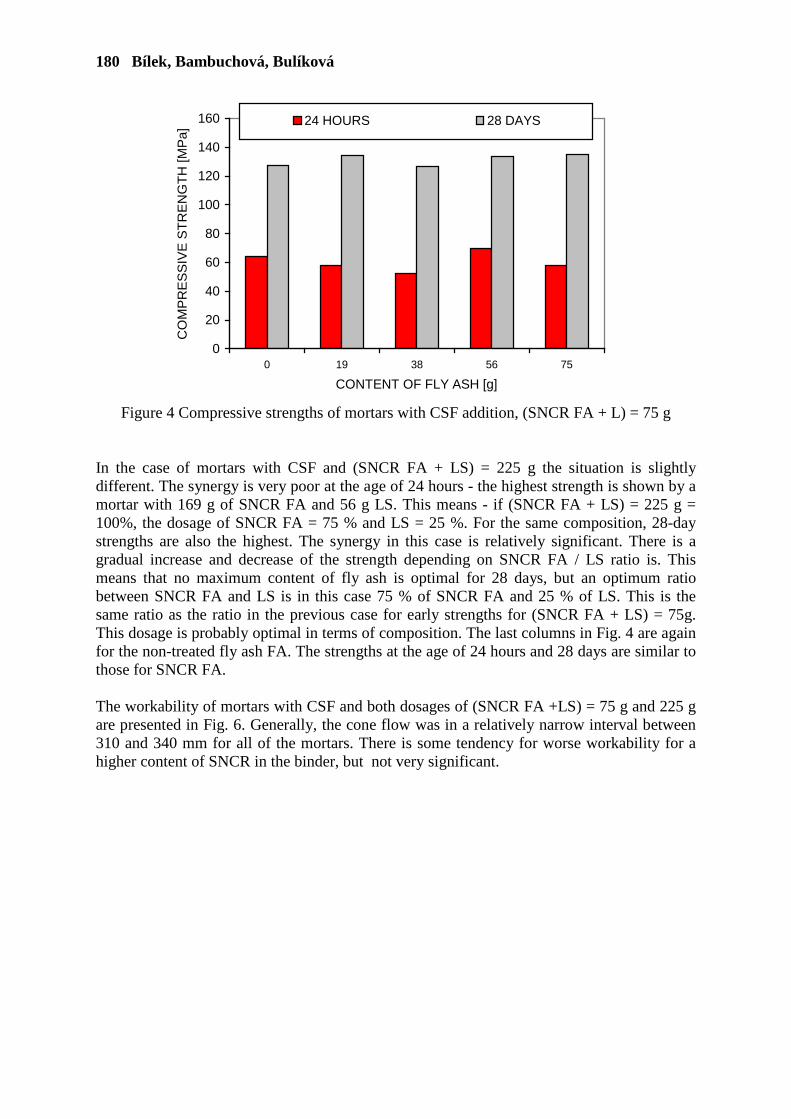
180 Bílek, Bambuchová, Bulíková
0
20
40
60
80
100
120
140
160
0 19 38 56 75
24 HOURS 28 DAYS
CO
MP
RE
SS
IVE
STR
EN
GTH
[MP
a]
CONTENT OF FLY ASH [g]
Figure 4 Compressive strengths of mortars with CSF addition, (SNCR FA + L) = 75 g In the case of mortars with CSF and (SNCR FA + LS) = 225 g the situation is slightly different. The synergy is very poor at the age of 24 hours - the highest strength is shown by a mortar with 169 g of SNCR FA and 56 g LS. This means - if (SNCR FA + LS) = 225 g = 100%, the dosage of SNCR FA = 75 % and LS = 25 %. For the same composition, 28-day strengths are also the highest. The synergy in this case is relatively significant. There is a gradual increase and decrease of the strength depending on SNCR FA / LS ratio is. This means that no maximum content of fly ash is optimal for 28 days, but an optimum ratio between SNCR FA and LS is in this case 75 % of SNCR FA and 25 % of LS. This is the same ratio as the ratio in the previous case for early strengths for (SNCR FA + LS) = 75g. This dosage is probably optimal in terms of composition. The last columns in Fig. 4 are again for the non-treated fly ash FA. The strengths at the age of 24 hours and 28 days are similar to those for SNCR FA. The workability of mortars with CSF and both dosages of (SNCR FA +LS) = 75 g and 225 g are presented in Fig. 6. Generally, the cone flow was in a relatively narrow interval between 310 and 340 mm for all of the mortars. There is some tendency for worse workability for a higher content of SNCR in the binder, but not very significant.

Ternary Bindres with Fly Ash 181
0
20
40
60
80
100
120
140
160
0 56 113 169 225 113
24 HOURS 28 DAYS
CO
MP
RE
SS
IVE
STR
EN
GTH
[MP
a]
CONTENT OF FLY ASH [g]
Figure 5 Compressive strengths of mortars with CSF addition, (SNCR FA + LS) = 225 g, last columns are for non-treated fly ash FA
300
310
320
330
340
350
0 25 50 75 100
CSF, (SNCR FA+L) = 75g CSF, (SNCR FA+L) = 225g
CO
NE
FLO
W [m
m]
PORTION FLY ASH IN (FA+L) [%]
Figure 6 Workability of mortars with CSF and different (SNCR FA + LS)
CONCLUSIONS
The aim of the paper is to verify that high performance concrete with ternary (or quarternary) binders containing ground limestone and SNCR treated fly ash shows similar properties to that with non-treated fly ash. The results show that: - compressive strength development of high performance mortars with SNCR FA and LS is similar or higher than that of non-treated fly ash and LS. This may be the result of the damaged surface of SNCR FA due to treatment.
182 Bílek, Bambuchová, Bulíková
- as expected - synergy between LS and fly ash occured in mortars with CSF; in blends with metakaoline the effect of fly ash is overcome by a more efficient source of aluminate ions - MK. - workability of mortars with an increasing content of SNCR FA generally decreases, but the decline is not strong. This means that SNCR treated fly ash does not pose any problems in terms of workability and strength development, and can be used to produce high performance concrete and mortars. Acknowledgements
This work was supported by the project TJ01000174 granted by TACR – Technology agency of the Czech Republic.
REFERENCES
1. MALHOTRA, V M. Global warning, sustainability issues and concrete technology, Advances in Science & Technology of Concrete, India, 2018, pp 2-14.
2. DE WEERDT, K, KJELLSEN, KO, SELLEVOLD, E, JUSTNES, H. Synergy between fly ash and limestone powder in ternary cements, Cement and Concrete Composites, Vol. 33, 2011, pp 30-38.
3. BÍLEK, V. Development and properties of concretes with ternary binders, Cement, Wapno, Beton, 2013, pp 343-352.
4. TURK, K, KINA, C, BAGDIKEN, M. Use of binary and ternary cementitious blends of
F-class fly-ash and limestone powder to mitigate alkali-silica reaction risk, Construction and Building Materials, Volume 151, 2017, pp 422-427.
5. HELA, R, ŤAŽKÝ, M. Influence of SNCR method to the fly ash properties and its
utility in concrete, Research and technologies, 24th Concrete Days, 2017, in Czech.

MECHANICAL PROPERTIES OF CALCAREOUS FLY ASH STABILIZED SOIL
C Turan A Javadi R Vinai
University of Exeter
United Kingdom
O Cuisinier G Russo N C Consoli
Université de Lorraine
France
University of Napoli Federico II
Italy
Universidade Federal
do Rio Grande do Sul
(UFRGS)
Brazil
ABSTRACT. Construction of any type of structure on clayey ground could be problematic due to the high swelling potential and/or low strength characteristics of the soil. This can lead to low stability or differential settlement of the ground. Many soil stabilization techniques have been proposed to prevent the uneven settlement and failure of the soil. Stabilization of soil with class C fly ash offers many advantages such as improving engineering characteristics, being cost-effective and being environmentally friendly. Class C fly ash chemically reacts with clay which results in a more durable and stronger soil. It has been shown by various researchers that fly ash-stabilized soil is typically stiff and strong even though there is no available standard or guidelines for the use of fly ash in construction industry. This paper presents the results from a program of experimental research on stabilization of a fine-grained soil with fly ash. Laboratory experiments, including Atterberg limits, compaction, uniaxial, and consolidation tests, were conducted on samples of a clay soil with different percentages of fly ash. The results show that adding fly ash decreased the plasticity index, increased compressive strength, and decreased the swelling and compressibility index. The maximum dry density increased and optimum moisture content decreased with addition of over 5 % fly ash by dry weight of the soil. Keywords: Class C fly ash, Clay, Soil stabilization, Laboratory tests Canan Turan is a PhD student, Department of Engineering, University of Exeter, Exeter, UK.
Professor Akbar Javadi is a Professor at Department of Engineering, University of Exeter, Exeter, UK.
Dr Raffaele Vinai, Department of Engineering, University of Exeter, Exeter, UK.
Professor Olivier Cuisinier, Université de Lorraine, CNRS, LEMTA – UMR 7563, Nancy, France.
Professor Giacomo Russo, Department of Earth Science, Environment and Resources University of Napoli Federico II, Napoli, Italy
Professor Nilo Cesar Consoli, Department of Civil Engineering, Universidade Federal do Rio Grande do Sul (UFRGS)
184 Turan et al
INTRODUCTION
Fine-grained soils are generally weak and their stability is low under heavy loading [1]. Traditionally, this type of soil is considered too incompetent for construction and in many cases is entirely replaced with soil with better properties. However, this solution is not only expensive and time-consuming but it is also a difficult task. Many soil stabilization techniques have been proposed to improve the characteristics of fine-grained soils. These techniques can be categorized into the 3 groups; mechanical stabilization, chemical stabilization, and geo-synthetic stabilization [2]. Several mechanical stabilization techniques have been proposed to improve the properties of fine-grained soils, especially problematic clayey soils. However, it has been found that there is also need to alter the physicochemical characteristics of clay to provide permanent stabilization [3]. Chemical stabilization involves the utilization of chemical binders to improve the properties of soils. Chemical stabilization is an effective method due to its ease of adaptability [4]. After the chemical reaction of soil particles and the chemical additives, strong bond is created between soil particles, improving the soil structure [5]. The most commonly used chemical binders in soil stabilization are lime and cement [6]. Many waste materials are also used as the alternative materials for the stabilization such as fly ash, bottom ash, and rice husk ash, owing to the many environmental benefits [3]. Fly ash is a waste material obtained from burning of coal and generated from thermal power plants [7]. The use of fly ash for soil stabilization is encouraged by many researchers based on understanding of its effective characteristics such as pozzolanic reactions, ease of adaptability and economic viability and many other benefits [8]. Fly ash has been generally utilized in subbase or base layers of road construction, railway or highway embankments, and as an aggregate or mineral filler in the construction industry [9]. The advantages of using fly ash are: • The amount of coal fly ash in the world is estimated at approximately 500 million tonnes
annually. At present, a large amount of ash is still discarded into landfills [9]. Thus, the use of fly ash in geotechnical projects can decrease the disposal costs of fly ash.
• The disposal of considerable amounts of fly ash creates huge environmental problems, such as, air, surface water and ground water pollution due to the leaching of its heavy metals to underground water, surface and deep soil. In addition, fly ash disposal in ponds or sea can create significant damage to aquatic life [10].
• The use of fly ash in soil stabilization can help to reduce CO2 emissions. If fly ash is used for soil stabilization instead of cement, CO2 emissions could be significantly reduced [11].
• Fly ash stabilized soil is an effective material for geotechnical applications [12]. From the geotechnical point of view, the advantages of using fly ash in construction industry are: • Significant decrease in swelling-shrinkage and plasticity potential of high plasticity soil
[13]. • Improvement in compressive and tensile strength, and bearing capacity of fine-grained
soils [7]. • Better performance under ‘wet and dry cycles’ based on durability tests [10]. • Decrease of permeability and improvement of transfer properties of soils [9].
Calcareous Fly Ash Stabilized Soil 185
In this paper, the effects of fly ash in improving the mechanical properties of a clayey soil is investigated through a program of laboratory tests. The liquid limit and plastic limit, compaction characteristics, and strength, and swelling behaviour are presented for different fly ash contents.
LITERATURE REVIEW
Laboratory and field studies have been carried out by many researchers to improve the understanding of the effects of fly ash in improving the properties of soils. Phani Kumar and Sharma [14] assessed plasticity, strength, swelling potential, hydraulic conductivity, and compaction characteristics of a clayey soil stabilized with 0 %, 5 %, 10 %, 15 %, and 20 % fly ash. It was revealed that both plasticity index and swelling characteristics of the stabilized soil decreased by about 50 % with addition of 20 % of fly ash. With fly ash content beyond 20 %, there was no significant decrease in swelling potential. In addition, undrained shear strength increased by approximately 27 % with inclusion of 20 % fly ash. Based on compaction test results, it was concluded that the optimum moisture content decreased by about 25 % and the maximum dry unit weight increased by about 5 % with 20 % fly ash inclusion. The results from variable-head permeability tests revealed that the hydraulic conductivity decreased with the inclusion of fly ash. Cokca [15] studied the effects of 3 stabilizers, including high calcium and low calcium class C fly ash, lime, and cement, on the swelling potential of an expansive soil. The amounts of lime and cement used were at 0 - 8 % while amount of fly ash used was between 0 - 25 %. Both fly ashes were cured for 7 and 28 days. It was concluded that the plasticity index and swelling potential of all the stabilized soils decreased significantly. Furthermore, there was a remarkable decrease in swelling potential of fly ash stabilized soil from 7 to 28 days curing times. Prabakar et al [4] conducted a number of experiments with addition of different percentages of fly ash from 9 % to 46 % on different soil types. Compaction, shear strength, CBR, and swelling characteristics were evaluated on CL (inorganic clay with low plasticity), OL (organic soil with low plasticity), and MH (inorganic silt with high plasticity) soils. Based on the experimental results, dry density of all soil types reduced by between 15 % and 20 % by addition of the fly ash. The shear strength of the soils increased non-linearly with the addition of fly ash. Another important finding was that the swelling behaviour of the soils decreased due to the particle size, shape, and non-expansive structures of fly ash. Moreover, the CBR values of the soils improved with the addition of fly ash in comparison with the pure soil. Brooks [16] investigated the impacts of class C fly ash and rice husk ash on high plasticity clayey soil by conducting unconfined compressive strength (UCS), California bearing ratio, compaction, and swell-shrinkage tests. According to the UCS tests results, the failure stress increased about 106 % with the addition of 25 % fly ash, although the stress decreased with adding over 25 % of fly ash. The swelling potential of the stabilized soil also decreased in consolidation tests. It was recommended that 12 % of rice husk ash or 25 % of fly ash are the best ratios for stabilization of the clayey soil. In general, there is some evidence from laboratory and field tests indicating that the use of fly ash can be effective in stabilization of soils. The main benefits of using fly ash for soil stabilization include improvement in compressibility and strength, and decrease in the swelling behaviour. This paper presents some results from a comprehensive program of experiments to study the effects of fly ash and alkali activators in improving the mechanical properties of a clay soil.

186 Turan et al
The experiments include Atterberg limits, compaction, uniaxial compressive strength, and consolidation/swelling tests on samples stabilized with different fly ash contents. In what follows the results from some of the experiments are presented and discussed. This is an ongoing project and more results will be available and presented at the conference.
MATERIALS AND METHODS
Soil
The soil used in this study was kaolinite, China clay. Its properties are presented in Table 1. Scanning electron microscopy (SEM) analysis was also carried out on pure kaolinite with different magnification factors (Figure 1). The results show that the kaolinite has a flat structure.
Table 1 Kaolinite clay properties
GEOTECHNICAL PROPERTIES OF KAOLINITE
Cone penetrometer Liquid limit (%) 54
Plastic limit (%) 27.15
Liquidity index (%) 26.85
Classification CI-CH Specific gravity (g/mL) 2.6
Maximum dry unit weight γdmax (kN/m3) 1.51
Optimum moisture content wopt (%) 21
Figure 1 SEM images of pure kaolinite with 50 µm and 10 µm magnification factors
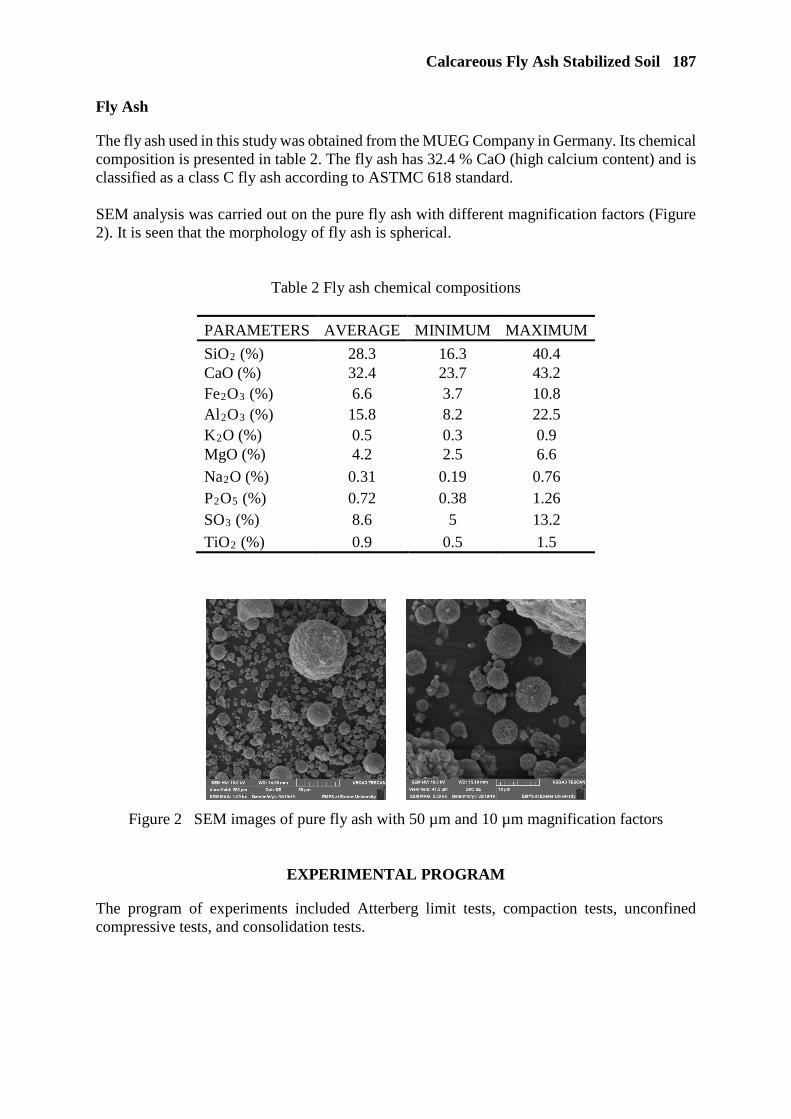
Calcareous Fly Ash Stabilized Soil 187
Fly Ash
The fly ash used in this study was obtained from the MUEG Company in Germany. Its chemical composition is presented in table 2. The fly ash has 32.4 % CaO (high calcium content) and is classified as a class C fly ash according to ASTMC 618 standard. SEM analysis was carried out on the pure fly ash with different magnification factors (Figure 2). It is seen that the morphology of fly ash is spherical.
Table 2 Fly ash chemical compositions
PARAMETERS AVERAGE MINIMUM MAXIMUM
SiO2 (%) 28.3 16.3 40.4 CaO (%) 32.4 23.7 43.2 Fe2O3 (%) 6.6 3.7 10.8 Al2O3 (%) 15.8 8.2 22.5 K2O (%) 0.5 0.3 0.9 MgO (%) 4.2 2.5 6.6
Na2O (%) 0.31 0.19 0.76 P2O5 (%) 0.72 0.38 1.26 SO3 (%) 8.6 5 13.2
TiO2 (%) 0.9 0.5 1.5
Figure 2 SEM images of pure fly ash with 50 µm and 10 µm magnification factors
EXPERIMENTAL PROGRAM
The program of experiments included Atterberg limit tests, compaction tests, unconfined compressive tests, and consolidation tests.
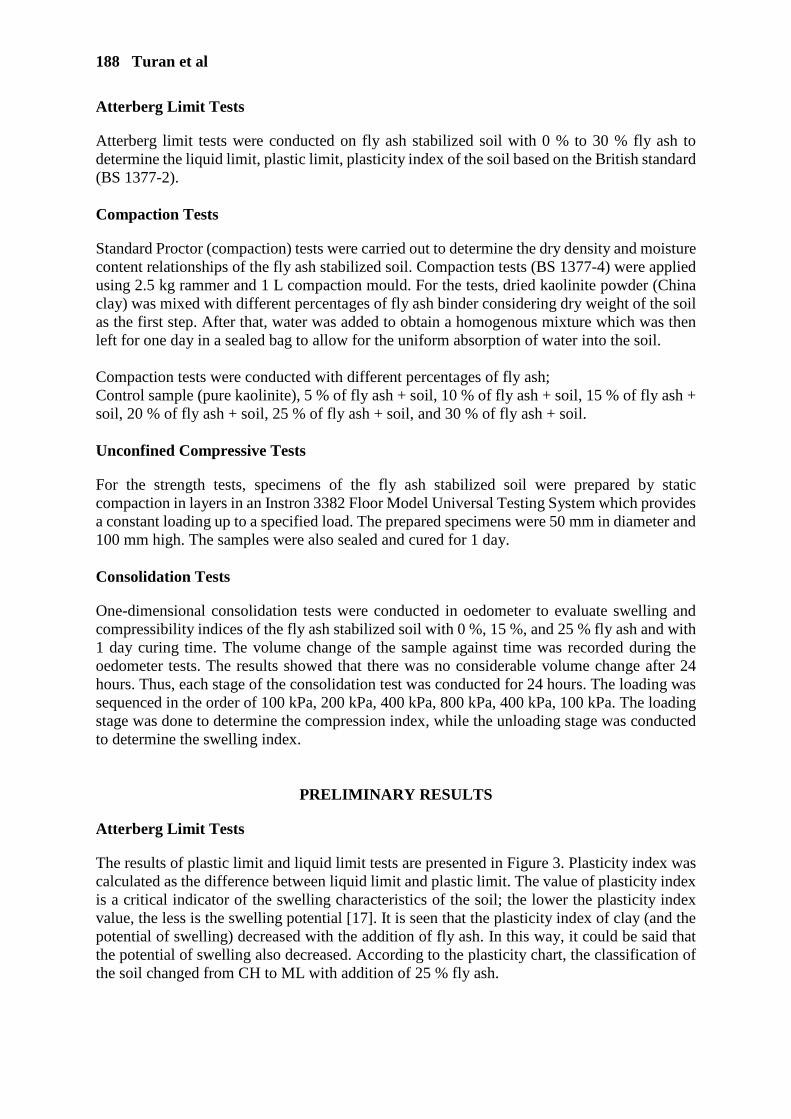
188 Turan et al
Atterberg Limit Tests
Atterberg limit tests were conducted on fly ash stabilized soil with 0 % to 30 % fly ash to determine the liquid limit, plastic limit, plasticity index of the soil based on the British standard (BS 1377-2). Compaction Tests
Standard Proctor (compaction) tests were carried out to determine the dry density and moisture content relationships of the fly ash stabilized soil. Compaction tests (BS 1377-4) were applied using 2.5 kg rammer and 1 L compaction mould. For the tests, dried kaolinite powder (China clay) was mixed with different percentages of fly ash binder considering dry weight of the soil as the first step. After that, water was added to obtain a homogenous mixture which was then left for one day in a sealed bag to allow for the uniform absorption of water into the soil. Compaction tests were conducted with different percentages of fly ash; Control sample (pure kaolinite), 5 % of fly ash + soil, 10 % of fly ash + soil, 15 % of fly ash + soil, 20 % of fly ash + soil, 25 % of fly ash + soil, and 30 % of fly ash + soil. Unconfined Compressive Tests
For the strength tests, specimens of the fly ash stabilized soil were prepared by static compaction in layers in an Instron 3382 Floor Model Universal Testing System which provides a constant loading up to a specified load. The prepared specimens were 50 mm in diameter and 100 mm high. The samples were also sealed and cured for 1 day. Consolidation Tests
One-dimensional consolidation tests were conducted in oedometer to evaluate swelling and compressibility indices of the fly ash stabilized soil with 0 %, 15 %, and 25 % fly ash and with 1 day curing time. The volume change of the sample against time was recorded during the oedometer tests. The results showed that there was no considerable volume change after 24 hours. Thus, each stage of the consolidation test was conducted for 24 hours. The loading was sequenced in the order of 100 kPa, 200 kPa, 400 kPa, 800 kPa, 400 kPa, 100 kPa. The loading stage was done to determine the compression index, while the unloading stage was conducted to determine the swelling index.
PRELIMINARY RESULTS
Atterberg Limit Tests
The results of plastic limit and liquid limit tests are presented in Figure 3. Plasticity index was calculated as the difference between liquid limit and plastic limit. The value of plasticity index is a critical indicator of the swelling characteristics of the soil; the lower the plasticity index value, the less is the swelling potential [17]. It is seen that the plasticity index of clay (and the potential of swelling) decreased with the addition of fly ash. In this way, it could be said that the potential of swelling also decreased. According to the plasticity chart, the classification of the soil changed from CH to ML with addition of 25 % fly ash.
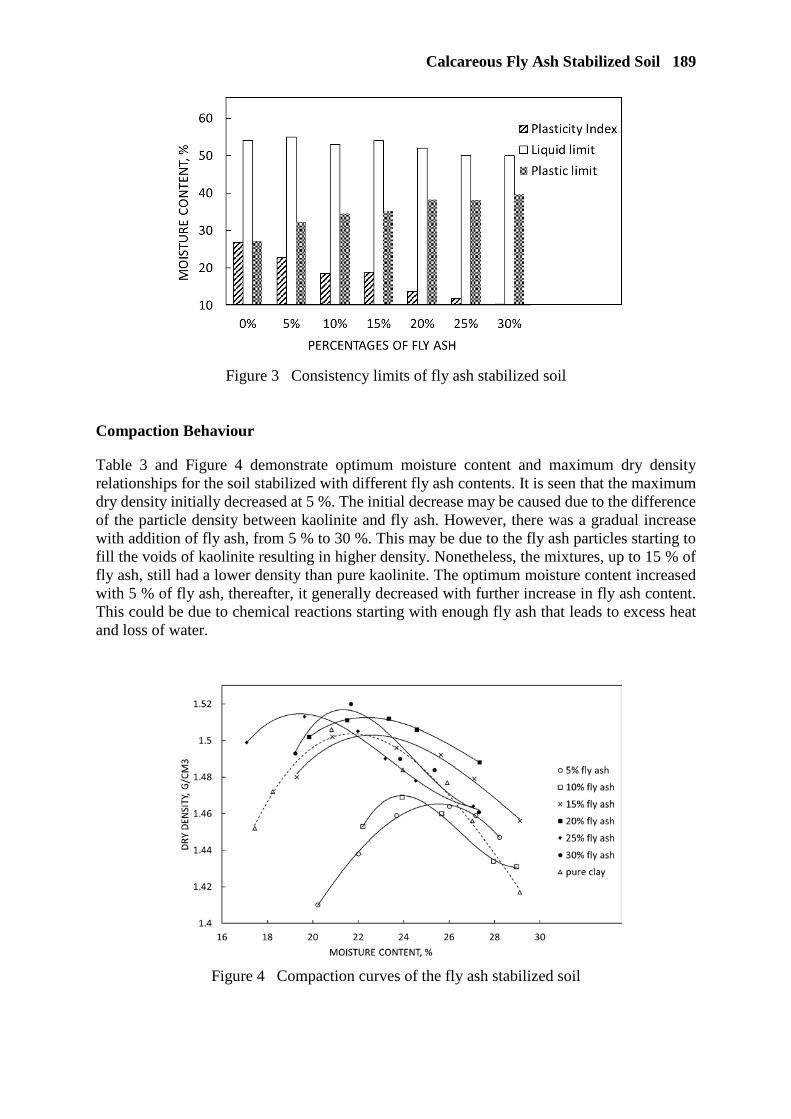
Calcareous Fly Ash Stabilized Soil 189
Figure 3 Consistency limits of fly ash stabilized soil
Compaction Behaviour
Table 3 and Figure 4 demonstrate optimum moisture content and maximum dry density relationships for the soil stabilized with different fly ash contents. It is seen that the maximum dry density initially decreased at 5 %. The initial decrease may be caused due to the difference of the particle density between kaolinite and fly ash. However, there was a gradual increase with addition of fly ash, from 5 % to 30 %. This may be due to the fly ash particles starting to fill the voids of kaolinite resulting in higher density. Nonetheless, the mixtures, up to 15 % of fly ash, still had a lower density than pure kaolinite. The optimum moisture content increased with 5 % of fly ash, thereafter, it generally decreased with further increase in fly ash content. This could be due to chemical reactions starting with enough fly ash that leads to excess heat and loss of water.
Figure 4 Compaction curves of the fly ash stabilized soil
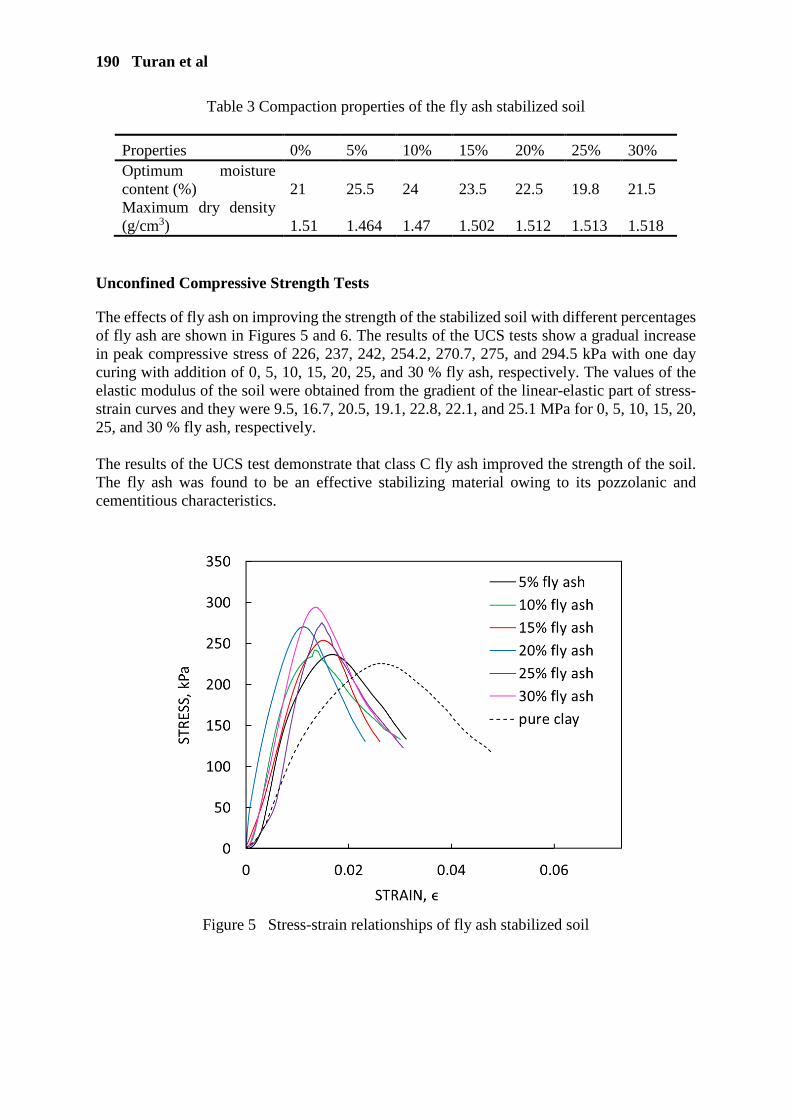
190 Turan et al
Table 3 Compaction properties of the fly ash stabilized soil
Properties 0% 5% 10% 15% 20% 25% 30% Optimum moisture content (%) 21 25.5 24 23.5 22.5 19.8 21.5 Maximum dry density (g/cm3) 1.51 1.464 1.47 1.502 1.512 1.513 1.518
Unconfined Compressive Strength Tests
The effects of fly ash on improving the strength of the stabilized soil with different percentages of fly ash are shown in Figures 5 and 6. The results of the UCS tests show a gradual increase in peak compressive stress of 226, 237, 242, 254.2, 270.7, 275, and 294.5 kPa with one day curing with addition of 0, 5, 10, 15, 20, 25, and 30 % fly ash, respectively. The values of the elastic modulus of the soil were obtained from the gradient of the linear-elastic part of stress-strain curves and they were 9.5, 16.7, 20.5, 19.1, 22.8, 22.1, and 25.1 MPa for 0, 5, 10, 15, 20, 25, and 30 % fly ash, respectively. The results of the UCS test demonstrate that class C fly ash improved the strength of the soil. The fly ash was found to be an effective stabilizing material owing to its pozzolanic and cementitious characteristics.
Figure 5 Stress-strain relationships of fly ash stabilized soil

Calcareous Fly Ash Stabilized Soil 191
Figure 6 Effects of fly ash content on unconfined compressive strength of the soil
Consolidation Tests
Stabilization of the soil with 15 % and 25 % fly ash showed a decrease in compressibility, indicating lower rate of settlement in the soil compared to the unstabilized soil (Figure 7). The reason of decrease in Cc and Cs values could be that the fly ash and soil particles compact well due to the morphology of the soil and fly ash.
Figure 7 Compression and swelling indices of pure clay and fly ash with 15 % and 25 %
192 Turan et al
CONCLUSIONS
In this paper, the effects of consistency, swelling and strength characteristics of class C fly ash with one day curing period were determined. The following conclusions can be drawn from the results:
• The values of the plasticity index decreased with inclusion of fly ash. • The maximum dry density of the soil decreased with addition of 5 % fly ash, and
thereafter increased. The optimum moisture content increased with 5 % of fly ash, and showed a decrease with further increase in the fly ash content.
• Unconfined compressive strength of fly ash stabilized soil with 1 day curing time increased gradually with increasing the fly ash content.
• Swelling and compressibility indices of fly ash stabilized soil generally decreased. These findings show that fly ash would be an effective method for decreasing swelling potential and increasing strength parameters of soils. The results presented here are part of a large program of research on the effects of fly ash and alkali activators on the mechanical behaviour of fine grained soils. Acknowledgements
The authors would like to thank the Turkish government for their financial support. This project has also received funding from the European Union’s Horizon 2020 research and innovation programme under the Marie Sklodowska-Curie grant agreement No 778120.
REFERENCES
1. RAMAJI, A. E. (2012). A review on the soil stabilization using low-cost methods. Journal
of Applied Sciences Research, 8(4), 2193-2196. Retrieved from: https://www.researchgate.net/profile/Amin_Ramaji2/publication/232322828_A_Review_on_the_Soil_Stabilization_Using_Low-Cost_Methods/links/09e4150838ff163c34000000.pdf
2. LAKHANPAL, A., & CHOPRA, A. (2018). A brief review on various methods and materials used for stabilization of soil. International Research Journal of Engineering and Technology (IRJET), 5(3), 682-684. Retrieved from: https://www.irjet.net/archives/V5/i3/IRJET-V5I3153.pdf
3. PETRY, T. M., & LITTLE, D. N. (2002). Review of stabilization of clays and expansive
soils in pavements and lightly loaded structures – History, Practice, and Future. Journal of Materials in Civil Engineering, 14(6), 447-460. Retrieved from: https://ascelibrary.org/doi/10.1061/%28ASCE%290899-1561%282002%2914%3A6%28447%29

Calcareous Fly Ash Stabilized Soil 193
4. PRABAKAR, J., DENDORKAR, N., & MORCHHALE, R. (2004). Influence of fly ash on strength behavior of typical soils. Construction And Building Materials, 18(4), 263-267. doi: 10.1016/j.conbuildmat.2003.11.003
5. MAHVASH, S., LÓPEZ-QUEROL, S., & BAHADORI-JAHROMI, A. (2018). Effect of
fly ash on the bearing capacity of stabilised fine sand. Proceedings Of The Institution Of Civil Engineers - Ground Improvement, 171(2), 82-95. doi: 10.1680/jgrim.17.00036
6. RAJ S., S., SHARMA, A., & ANAND, K. (2018). Performance appraisal of coal ash stabilized rammed earth. Journal Of Building Engineering, 18, 51-57. doi: 10.1016/j.jobe.2018.03.001
7. DAHALE, P., NAGARNAIK, P., & GAJBHIYE, A. (2017). Engineering Behavior of
Remolded Expansive Soil with Lime and Flyash. Materials Today: Proceedings, 4(9), 10581-10585. doi: 10.1016/j.matpr.2017.06.423
8. SHARMA, N., SWAIN, S., & SAHOO, U. (2012). Stabilization of a Clayey Soil with Fly
Ash and Lime: A Micro Level Investigation. Geotechnical And Geological Engineering, 30(5), 1197-1205. doi: 10.1007/s10706-012-9532-3
9. AHMARUZZAMAN, M. (2010). A review on the utilization of fly ash. Progress in
Energy and Combustion Science. 36 (3), 327-363. Retrieved from: https://doi.org/10.1016/j.pecs.2009.11.003
10. NAWAZ, I. (2013). Disposal and utilization of fly ash to protect the environment. International Journal of Innovative Research in Science, Engineering and Technology, 2(10), 5259-5266. Retrieved from: https://pdfs.semanticscholar.org/1052/fa86c95540c6d488a817e742ee66951e81b0.pdf
11. ASOKAN, P., SAXENA, M., & ASOLEKAR, S. R. (2005). Coal combustion residues-
environmental implications and recycling potentials. Resources, Conservations, and Recycling, 43, (3), 239-262. https://doi.org/10.1016/j.resconrec.2004.06.003
12. BIN-SHAFIQUE, S., EDIL, T., BENSON, C., & SENOL, A. (2004). Incorporating a fly-
ash stabilised layer into pavement design. Geotechnical Engineering, 157(4), 239-249. doi: 10.1680/geng.157.4.239.51822
13. BIN-SHAFIQUE, S., RAHMAN, K., YAYKIRAN, M., & AZFAR, I. (2009). The long-
term performance of two fly ash stabilized fine-grained soil subbases. Resources, Conservation And Recycling, 54(10), 666-672. doi: 10.1016/j.resconrec.2009.11.007
14. PHANI KUMAR, B. R., & SHARMA R. S. (2004). Effect of fly ash on engineering
properties of expansive soils. Journal of Geotechnical and Geoenvironmental Engineering, 130, 7. Retrieved from: https://ascelibrary.org/doi/abs/10.1061/(ASCE)1090-0241(2004)130:7(764)
15. ÇOKÇA, E. (2002). Closure to “Use of Class C Fly Ashes for the Stabilization of an
Expansive Soil” by Erdal Çokça. Journal Of Geotechnical And Geoenvironmental Engineering, 128(11), 966-966. doi: 10.1061/(asce)1090-0241(2002)128:11(966)

194 Turan et al
16. BROOKS, R. M., (2009). Soil stabilization with fly ash and rice husk ash. International
Journal of Research and Reviews in Applied Sciences, volume 1, issue 3. Retrieved from: http://citeseerx.ist.psu.edu/viewdoc/download?doi=10.1.1.303.978&rep=rep1&type=pdf
17. SEYREK, E. (2016). Engineering behaviour of clay soils stabilized with class C and class
F fly ashes. Science and Engineering of Composite Materials, 25(2), 273-287. https://doi.org/10.1515/secm-2016-0084
STUDY ON UTILIZATION OF FLY ASH IN PRODUCTION OF LIGHTWEIGHT AGGREGATE
S Sambuunyam S Pareek B-E Purev-Erdene R Thombare
Nihon University
Japan
S Danzandorj
Mongolian University of Science and Technology
Mongolia
ABSTRACT: Coal is one of the vastly used raw materials in electricity generating power plants. Approximately 300 million tons of fly ash is generated annually from thermal power plants in the world and only 10-30 percent of it is used in the construction industry and for various other purposes. Using fly ash as a raw material for lightweight aggregate helps removing fly ash from thermal power plants by large quantities and developing economic green technology. Substituting natural raw materials by reutilizing fly ash as by-product from power plants is the way of saving natural resources and reducing industrial waste. Lightweight aggregate is suitable for extreme climate conditions because of its superior insulation performance, eco-friendly character, variable particle size, deformation property and freeze/thaw resistance. In this research work, lightweight aggregate with fly ash which is acquired through heat treatment at high temperature was prepared and their physical and mechanical properties were studied. The Japanese fly ash with low calcium content was mixed with expandable clay as a binding agent and limestone was used for making fly ash lightweight aggregates by sintering at 1000-1150°C. The physical properties such as bulk density, specific gravity, porosity, water absorption of the lightweight aggregates were determined. Scanning electron micrograph has been taken to study the microstructure of the lightweight aggregates. The strength properties and porosity of the lightweight aggregates depend largely on the sintering temperature, bentonite content and agglomeration process.
Keywords: Fly ash, Lightweight aggregate, Coal ash, Bentonite, Specific gravity, Water absorption
Sunjidmaa Sambuunyam is a Masters Course student in the Department of Architecture at College of Engineering, Nihon University. She studied building materials made using coal ash. Dr.Eng., Sanjay Pareek is a Professor at the Department of Architecture at College of Engineering, Nihon University. Sunjidmaa Danzandorj is a lecturer, Mongolian University of Science and Technology. Purev-Erdene Bat-Erdene is a Masters Course student in the Department of Architecture at College of Engineering, Nihon University. Rucha Thombare is a visiting researcher at College of Engineering, Nihon University.

196 Sambuunyam et al
INTRODUCTION The production of lightweight aggregate with fly ash has the ability to consume waste ash in high amounts for the construction industry. Development of new techniques for managing wastes is one of the major areas of interest of researchers in recent days. This is due to the need for reusing the materials to avoid exhausting natural resources that are depleted abundantly with growing population. There are numerous lightweight aggregates available commercially which are obtained through expensive methods of manufacturing [1]. Also, these deplete natural resources for their raw materials. The best way to avoid this problem is to use the lightweight waste materials as raw material for aggregates in concrete. Beyond reducing the overall cost, this also finds a way to utilize this waste material that produces environmental problems. Dhir et al. [2] mention that the use of lightweight aggregate concrete in structures offers many advantages over the conventional normal-weight concrete, including an increased strength/weight ratio and improved thermal and sound insulation and fire resistance properties. Fly ash aggregates have been produced through palletization or compaction techniques. Various organic and inorganic binders or hardening methods such as cold-bonding (curing at room temperature), autoclaving or sintering have been further employed for enhancing its properties [3-9]. The choice of binders and hardening techniques was based on chemical composition of fly ash and performance requirement. The aggregate properties are substantially enhanced for temperature above 1000°C, which is attributed to the activation of liquid phase sintering [10]. Among the binders, aggregate with bentonite has a lower specific gravity compared to lime and cement. The addition of bentonite, which contains a high amount of very fine organic matter, increases the quantity of gases evolved during sintering, thereby reducing the density of the aggregates Ramamurthy and Harikrishnan [11] have reported that the significant improvement in strength and reduction in water absorption of sintered fly ash aggregate is observed when bentonite is added with fly ash. Various types of lightweight aggregates such as expanded clay and sintered fly ash can be produced through heat treatment from 1000 to 1200°C [12]. In general, when the Al2O3 + SiO2 content is high, the melting point and viscosity tend to be high. Thus, it is expected that the melting point of the fly ash would be higher than those of bentonite and glass powder. There are also fly ash aggregates that are produced using a 2 step thermal treatment where the first step is at 750°C for 10-15 minutes and second (the expansion) step is at 1150-1175°C for 10-15 minutes [13]. The present study is conducted on production of sintered fly ash lightweight aggregate with bentonite as a binder. Also, the properties of sintering fly ash lightweight aggregate as density, strength, water absorption, porosity, and morphology (by SEM analyses) were determined to study the characteristics of aggregates.
MATERIALS AND METHOD Class-F as a low calcium fly ash was obtained from Sakata thermal power plant and used as raw material with bentonite and powdered limestone as binder for the production of sintered fly ash lightweight aggregates (SFALWA). The physical and chemical properties of raw materials used for the production of lightweight aggregates are shown in Table 1.
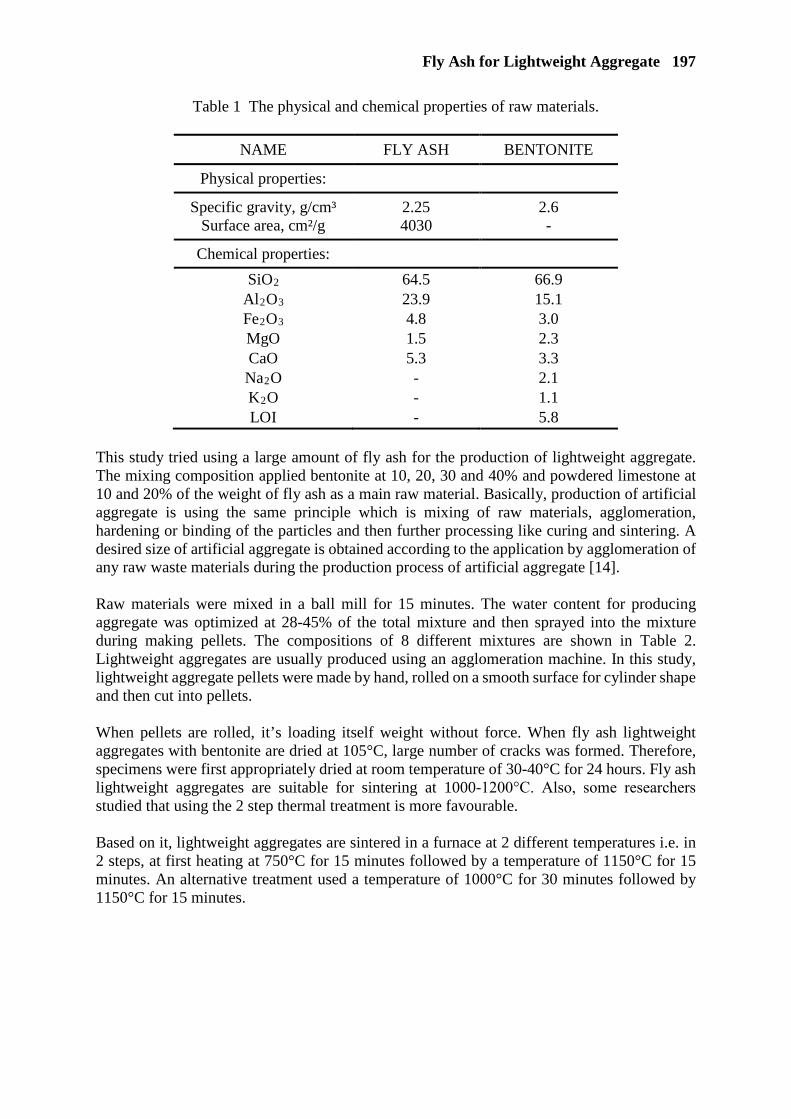
Fly Ash for Lightweight Aggregate 197
Table 1 The physical and chemical properties of raw materials.
NAME FLY ASH BENTONITE
Physical properties:
Specific gravity, g/cm³ Surface area, cm²/g
2.25 4030
2.6 -
Chemical properties:
SiO2 Al2O3 Fe2O3 MgO CaO Na2O K2O LOI
64.5 23.9 4.8 1.5 5.3 - - -
66.9 15.1 3.0 2.3 3.3 2.1 1.1 5.8
This study tried using a large amount of fly ash for the production of lightweight aggregate. The mixing composition applied bentonite at 10, 20, 30 and 40% and powdered limestone at 10 and 20% of the weight of fly ash as a main raw material. Basically, production of artificial aggregate is using the same principle which is mixing of raw materials, agglomeration, hardening or binding of the particles and then further processing like curing and sintering. A desired size of artificial aggregate is obtained according to the application by agglomeration of any raw waste materials during the production process of artificial aggregate [14]. Raw materials were mixed in a ball mill for 15 minutes. The water content for producing aggregate was optimized at 28-45% of the total mixture and then sprayed into the mixture during making pellets. The compositions of 8 different mixtures are shown in Table 2. Lightweight aggregates are usually produced using an agglomeration machine. In this study, lightweight aggregate pellets were made by hand, rolled on a smooth surface for cylinder shape and then cut into pellets. When pellets are rolled, it’s loading itself weight without force. When fly ash lightweight aggregates with bentonite are dried at 105°C, large number of cracks was formed. Therefore, specimens were first appropriately dried at room temperature of 30-40°C for 24 hours. Fly ash lightweight aggregates are suitable for sintering at 1000-1200°С. Also, some researchers studied that using the 2 step thermal treatment is more favourable. Based on it, lightweight aggregates are sintered in a furnace at 2 different temperatures i.e. in 2 steps, at first heating at 750°C for 15 minutes followed by a temperature of 1150°C for 15 minutes. An alternative treatment used a temperature of 1000°C for 30 minutes followed by 1150°C for 15 minutes.
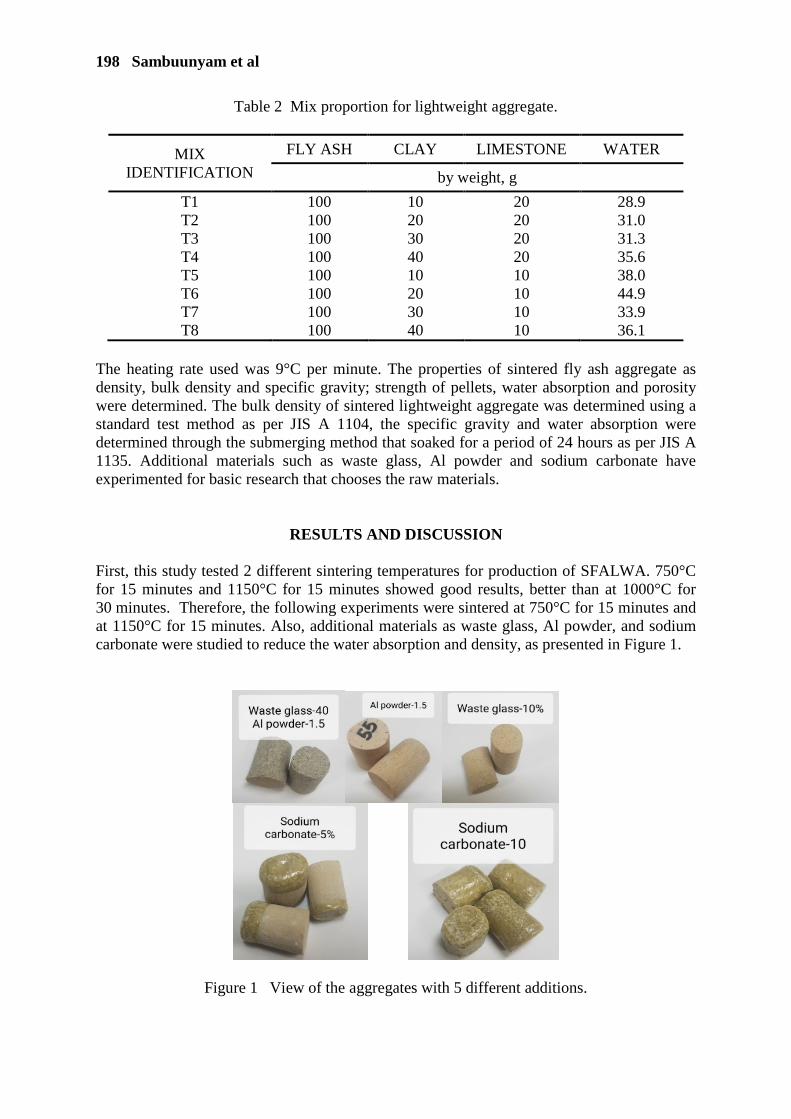
198 Sambuunyam et al
Table 2 Mix proportion for lightweight aggregate.
MIX IDENTIFICATION
FLY ASH CLAY LIMESTONE WATER
by weight, g
T1 T2 T3 T4 T5 T6 T7 T8
100 100 100 100 100 100 100 100
10 20 30 40 10 20 30 40
20 20 20 20 10 10 10 10
28.9 31.0 31.3 35.6 38.0 44.9 33.9 36.1
The heating rate used was 9°C per minute. The properties of sintered fly ash aggregate as density, bulk density and specific gravity; strength of pellets, water absorption and porosity were determined. The bulk density of sintered lightweight aggregate was determined using a standard test method as per JIS A 1104, the specific gravity and water absorption were determined through the submerging method that soaked for a period of 24 hours as per JIS A 1135. Additional materials such as waste glass, Al powder and sodium carbonate have experimented for basic research that chooses the raw materials.
RESULTS AND DISCUSSION First, this study tested 2 different sintering temperatures for production of SFALWA. 750°C for 15 minutes and 1150°C for 15 minutes showed good results, better than at 1000°C for 30 minutes. Therefore, the following experiments were sintered at 750°C for 15 minutes and at 1150°C for 15 minutes. Also, additional materials as waste glass, Al powder, and sodium carbonate were studied to reduce the water absorption and density, as presented in Figure 1.
Figure 1 View of the aggregates with 5 different additions.
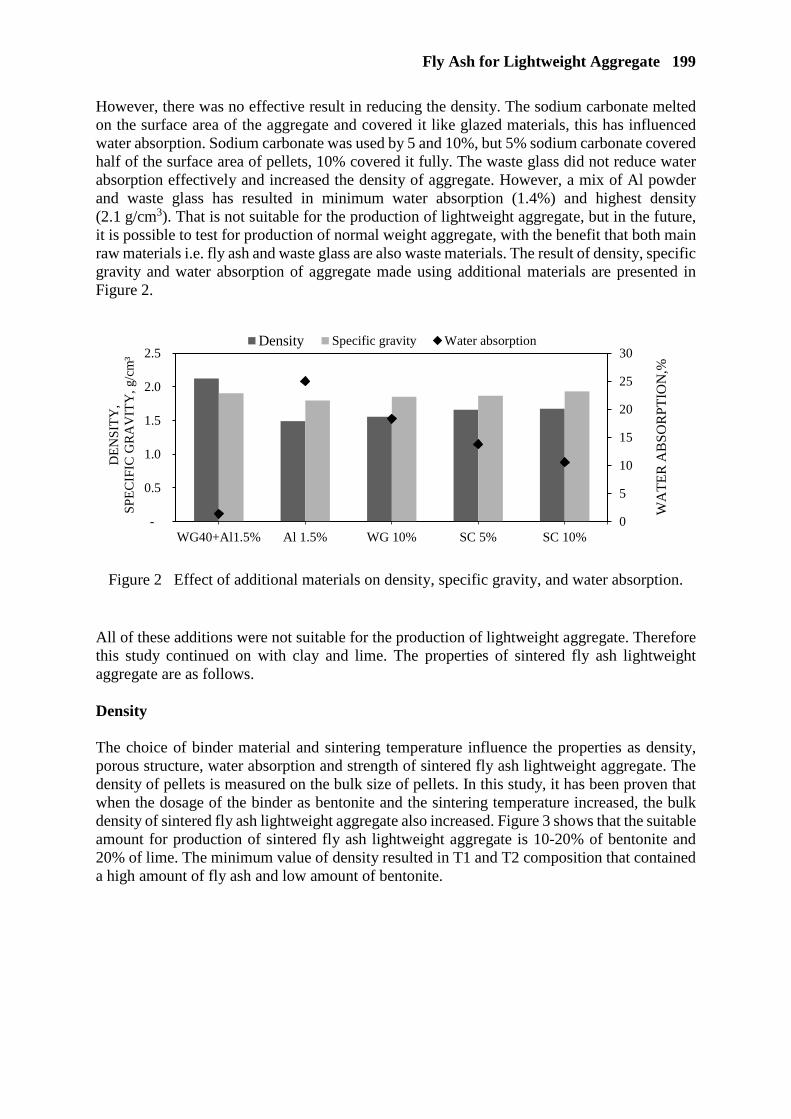
Fly Ash for Lightweight Aggregate 199
However, there was no effective result in reducing the density. The sodium carbonate melted on the surface area of the aggregate and covered it like glazed materials, this has influenced water absorption. Sodium carbonate was used by 5 and 10%, but 5% sodium carbonate covered half of the surface area of pellets, 10% covered it fully. The waste glass did not reduce water absorption effectively and increased the density of aggregate. However, a mix of Al powder and waste glass has resulted in minimum water absorption (1.4%) and highest density (2.1 g/cm3). That is not suitable for the production of lightweight aggregate, but in the future, it is possible to test for production of normal weight aggregate, with the benefit that both main raw materials i.e. fly ash and waste glass are also waste materials. The result of density, specific gravity and water absorption of aggregate made using additional materials are presented in Figure 2.
Figure 2 Effect of additional materials on density, specific gravity, and water absorption. All of these additions were not suitable for the production of lightweight aggregate. Therefore this study continued on with clay and lime. The properties of sintered fly ash lightweight aggregate are as follows. Density The choice of binder material and sintering temperature influence the properties as density, porous structure, water absorption and strength of sintered fly ash lightweight aggregate. The density of pellets is measured on the bulk size of pellets. In this study, it has been proven that when the dosage of the binder as bentonite and the sintering temperature increased, the bulk density of sintered fly ash lightweight aggregate also increased. Figure 3 shows that the suitable amount for production of sintered fly ash lightweight aggregate is 10-20% of bentonite and 20% of lime. The minimum value of density resulted in T1 and T2 composition that contained a high amount of fly ash and low amount of bentonite.
0
5
10
15
20
25
30
-
0.5
1.0
1.5
2.0
2.5
WG40+Al1.5% Al 1.5% WG 10% SC 5% SC 10%
DE
NS
ITY
,S
PE
CIF
IC G
RA
VIT
Y, g
/cm
³
Density Specific gravity Water absorption
WA
TE
R A
BS
OR
PT
ION
,%

200 Sambuunyam et al
Figure 3 Effect of addition content of clay on density.
Specific gravity The specific gravity of sintered fly ash aggregate is determined using formula
(𝐷𝐷𝑠𝑠 = 𝑊𝑊𝑠𝑠𝑊𝑊𝑠𝑠−𝑊𝑊𝑤𝑤
)
where WS is weight of sample in saturated surface-dry condition, WW is weight of sample in water. The porosity was determined by the formula
(Q= 𝑊𝑊𝑠𝑠−𝑊𝑊𝐷𝐷𝑊𝑊𝐷𝐷
× 100)
where WS is weight of sample in saturated surface-dry condition, WD is weight of sample after drying, after subjecting the aggregate samples inside Aspirator Gas-1N for 2 days as per to JIS A 1135. Figure 4 depicts the variation of specific gravity and porosity, and addition content of sintered fly ash lightweight aggregate. A mix of 20% bentonite and 10% lime has resulted in the minimum value of specific gravity (1.74), but when lime was changed to 20% this resulted in the highest value of specific gravity (1.87). Increasing content of bentonite and lime increased the specific gravity of aggregate.
Figure 4 Effect of clay content on specific gravity and porosity.
1.25
1.35
1.45
1.55
1.65
T 1 T 2 T 3 T 4 T 5 T 6 T 7 T 8D
EN
SIT
Y, g
/cm
³
COMPOSITIONS
1000°C
1150°C
1.65
1.70
1.75
1.80
1.85
1.90
Clay10 Clay20 Clay30 Clay40
PO
RO
SIT
Y, %
SP
EC
IFIC
GR
AV
ITY
,g/c
m³
Lime 20% Lime 10%
Lime 20% Lime 10%
Specific gravity Porosity
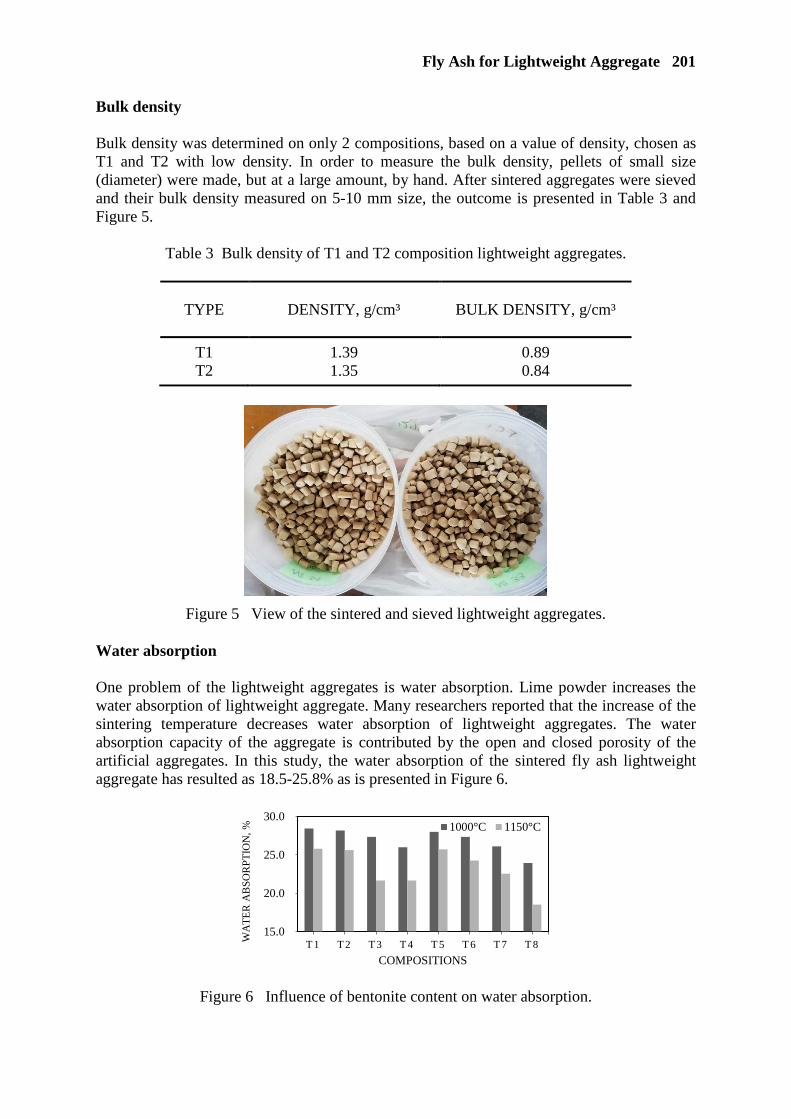
Fly Ash for Lightweight Aggregate 201
Bulk density Bulk density was determined on only 2 compositions, based on a value of density, chosen as T1 and T2 with low density. In order to measure the bulk density, pellets of small size (diameter) were made, but at a large amount, by hand. After sintered aggregates were sieved and their bulk density measured on 5-10 mm size, the outcome is presented in Table 3 and Figure 5.
Table 3 Bulk density of T1 and T2 composition lightweight aggregates.
TYPE DENSITY, g/cm³ BULK DENSITY, g/cm³
T1 T2
1.39 1.35
0.89 0.84
Figure 5 View of the sintered and sieved lightweight aggregates. Water absorption One problem of the lightweight aggregates is water absorption. Lime powder increases the water absorption of lightweight aggregate. Many researchers reported that the increase of the sintering temperature decreases water absorption of lightweight aggregates. The water absorption capacity of the aggregate is contributed by the open and closed porosity of the artificial aggregates. In this study, the water absorption of the sintered fly ash lightweight aggregate has resulted as 18.5-25.8% as is presented in Figure 6.
Figure 6 Influence of bentonite content on water absorption.
15.0
20.0
25.0
30.0
T 1 T 2 T 3 T 4 T 5 T 6 T 7 T 8WA
TE
R A
BSO
RPT
ION
, %
COMPOSITIONS
1000°C 1150°C

202 Sambuunyam et al
In the case of the main 8 compositions, an increase of bentonite content reduced the water absorption on both of the 2 different sintering temperatures. The minimum water absorption was observed in T8 which contained 40% bentonite and 10% lime, sintered at 1150°C. The highest sintering temperature is affected by the microstructure, due to reduce water absorption. Generally, the water absorption of lightweight aggregates sintered at 1000°C is a higher percentage. Strength The compressive strength of sintered fly ash lightweight aggregates was determined using Amsler Type Universal Testing Machine in chosen pellets from each composition. The highest crushing strength of 9.3 MPa was recorded for composition that contains Clay 40% and Lime 10% in Figure 7. When the high content of bentonite increasing, adhesiveness of aggregate is improved. All of the samples were no outward expanded porous structure like an expanded clay lightweight aggregate. Figure 7 shown the change of lime content is not influenced insufficient to the strength of SFALWA. One of the main factors that influence the strength is content of bentonite. When the content of bentonite is increased constantly, the composition with 40% bentonite and 10% lime (T8) resulted in a sharp increase in strength and had lowest water absorption. It’s demonstrated that bonding properties of bentonite to fly ash was improved and resulted fusion of particles at high temperature.
Figure 7 Effect of clay content on compressive strength of lightweight aggregate
SEM analysis The prepared sample with 6 mm × 6 mm dimensions was observed with a JEOL JSM 6500F Scanning Electron Microscope. The microstructure of sintered fly ash lightweight aggregate by 8 different compositions is seen in the SEM image of aggregates at 2500 times magnification, presented in Figure 8. The sintered fly ash lightweight aggregates are melted at high temperature and then interconnected due to the created fusion of particles. As the bentonite content is increased, the particles become connected to bentonite influencing the microstructure and developing fused particles at high temperature. Composition T8 shows a microstructure of high bentonite content like melted and developed by fusion. This kind of fusion of particles is to decrease the density and water absorption, and increase the strength. The low bentonite and lime content compositions as T1, T2, T5, and T5 developed an interconnected structure due to creating open and closed porosity. Therefore these compositions resulted in low density and high water absorption compared to other compositions. The fly ash is melted and changed shape above 1000°C.
23456789
10
1 0 2 0 3 0 4 0
CO
MP
RE
SS
IVE
S
TR
EN
GT
H, M
Pa
CLAY CONTENT,%
Lime 20%
Lime 10%

Fly Ash for Lightweight Aggregate 203
T1
T7 T8
T6 T5
T4 T3
T2
Fusion
Air void
Fusion
Air void
Air void
Air void
Air void
Air void
Fusion
Fusion
Fusion
Air void
+
+
Figure 8 SEM image of sintered lightweight fly ash aggregate.
Fusion
Fusion
Air void
Melted Fly ash
+
Fly ash
Fly ash
Fusion
+
+ Fly ash
+
Fusion
T4
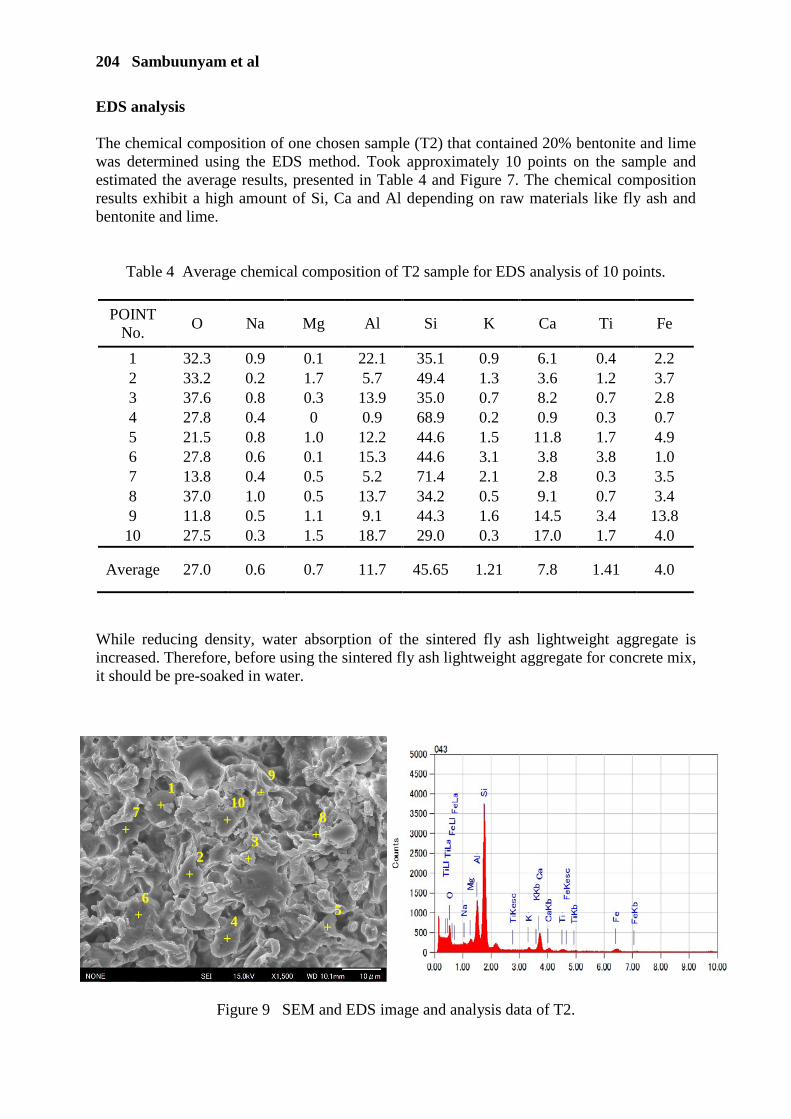
204 Sambuunyam et al
EDS analysis The chemical composition of one chosen sample (T2) that contained 20% bentonite and lime was determined using the EDS method. Took approximately 10 points on the sample and estimated the average results, presented in Table 4 and Figure 7. The chemical composition results exhibit a high amount of Si, Ca and Al depending on raw materials like fly ash and bentonite and lime.
Table 4 Average chemical composition of T2 sample for EDS analysis of 10 points.
POINT No.
O Na Mg Al Si K Ca Ti Fe
1 2 3 4 5 6 7 8 9 10
32.3 33.2 37.6 27.8 21.5 27.8 13.8 37.0 11.8 27.5
0.9 0.2 0.8 0.4 0.8 0.6 0.4 1.0 0.5 0.3
0.1 1.7 0.3 0
1.0 0.1 0.5 0.5 1.1 1.5
22.1 5.7 13.9 0.9 12.2 15.3 5.2 13.7 9.1 18.7
35.1 49.4 35.0 68.9 44.6 44.6 71.4 34.2 44.3 29.0
0.9 1.3 0.7 0.2 1.5 3.1 2.1 0.5 1.6 0.3
6.1 3.6 8.2 0.9 11.8 3.8 2.8 9.1 14.5 17.0
0.4 1.2 0.7 0.3 1.7 3.8 0.3 0.7 3.4 1.7
2.2 3.7 2.8 0.7 4.9 1.0 3.5 3.4 13.8 4.0
Average 27.0 0.6 0.7 11.7 45.65 1.21 7.8 1.41 4.0
While reducing density, water absorption of the sintered fly ash lightweight aggregate is increased. Therefore, before using the sintered fly ash lightweight aggregate for concrete mix, it should be pre-soaked in water.
Figure 9 SEM and EDS image and analysis data of T2.
7 +
5 +
1 +
2 +
3 +
4 +
6 +
8 +
9 +
10 +

Fly Ash for Lightweight Aggregate 205
CONCLUSIONS The composition with bulk density of 1.35 g/cm³ was sintered in a furnace at 750°C for 15 minutes and at 1150°C for 15 minutes. This study provided that high sintering temperature has resulted in good properties on the production of SFALWA. The experimental results exhibited that the type and content of the binders and sintering temperature influence the properties of the sintered fly ash lightweight aggregate. When the bentonite content is increased, water absorption reduces and density and strength both increase. The sintering temperature at more than 1000°C influences the properties of sintered lightweight aggregate effectively. The absorption of all of the compositions with addition as bentonite and lime is 18.5-25.8% in the 2 step heating process. The composition with 40% bentonite and 10% lime resulted in the maximum strength (9.3 MPa) and the minimum water absorption (18.5%). The minimum density (1.35 g/cm³) and bulk density (0.84 g/cm³) was obtained with the composition with 10% bentonite and 20% lime.
REFERENCES 1. MANIKANDAN R AND RAMAMURTHY K, Physical characteristics of sintered fly
ash aggregate containing clay binders, Material Cycles and Waste Management, 2012, Vol. 14, No. 2, pp. 120-131.
2. DHIR R K, MAYS R G C AND CHUA H C, Lightweight Structural concrete with Aglite aggregate: mix design and properties, The International Journal of Cement Composites and Lightweight Concrete, 1984, Vol. 6, No. 4, pp. 249-261.
3. NOR A M, YAHYA Z, ABDULLAH M M A B, ABDUL RAZAK R, JAYA EKAPUTRI J, FARIS M A AND NUR HAMZAH H, A Review on the Manufacturing of Lightweight, in MATEC Web of Conferences, 2016, 78, 01067.
4. MOHAN A B AND VASUDEV R, Artificial lightweight aggregate through cold bonding pelletization of fly ash: a review, International Research Journal of Engineering and Technology (IRJET), 2018, Vol. 5, No. 11, pp. 778-783.
5. AINETO M, ACOSTA A, RINCÓN J M AND ROMERO M, Production of lightweight aggregates from coal gasification Fly ash and Slag, World of Coal Ash (WOCA), 11-15 April, 2005.
6. ZHANG M H AND GJØRV O E, Characteristics of Lightweight Aggregates for High-Strength Concrete, ACI Materials Journal, 1991, Vol. 88, No. 2, pp. 150-158.
7. SRB J AND RÚŽIČKOVÁ Z, Pelletization of Fines, in series ‘Developments in Mineral Processing’, Vol. 7, Elsevier Science, 1988, 312 p.
8. PRIYADHARSHINI P, MOHAN GANESH G AND SANTHI A S, A Review on Artificial Aggregates, International Journal of Earth Sciences and Engineering, 2012, Vol. 5, No. 3, pp. 540-546.
9. BAYKAL G AND AND DÖVEN A G, Utilization of fly ash by pelletization process; theory, application areas and research result, Resources, Conservation and Recycling, 2000, Vol. 30, No. 1, pp. 59-77.

206 Sambuunyam et al
10. RANJITH BABU B AND THENMOZHI R, An Investigation of the Mechanical Properties of Sintered Fly Ash Lightweight Aggregate Concrete (SFLWAC) with Steel Fibers, Archives of Civil Engineering, 2018, Vol. 64, No. 1, pp. 73-85.
11. KOCKAL N U, Characteristics of lightweight fly ash aggregates produced with different binders and heat treatments, Cement & Concrete Composites, 2011, Vol. 33, pp. 61-67.
12. RAMAMURTHY K AND HARIKRISHNAN K I, Influence of binders on properties of sintered fly ash aggregate, Cement & Concrete Composites, 2006, Vol. 28, pp. 33-38.
13. RISDANARENI P, JAYA EKAPUTRI J, MAULIDIYAWATI I AND PUSPITASARI P, Mechanical properties of concrete composed of sintered fly ash lightweight aggregate, in MATEC Web of Conferences, 2018, 195, 01008.
14. BIJEN J M J M, Manufacturing processes of artificial, International Journal of Cement Composites and Lightweight Concrete, 1986, Vol. 8, No. 3, pp. 191-199.
USE OF FLY ASH IN PRODUCTION OF FOAM GLASS
B-E Purev-Erdene
S Pareek
S Danzandorj
S Sambuunyam
R Thombare
Nihon University
Japan
ABSTRACT. Development of the country can be demonstrated by its construction sector. In this sector, fast-growing globally, the quality of building materials is one of the most important factors. It is important to recycle waste materials to produce environmentally friendly construction materials. Widely used polystyrene boards as thermal insulation material have poor fire resistance and are difficult to recycle, making it harmful to the environment. In order to overcome these drawbacks, eco-friendly foam glass having superior fire resistance and recyclability has been proposed as insulation material using fly ash and waste glass. In this research work, the possibilities of producing such material was investigated. Fly ash foam glass with 20 to 40 wt.% fly ash was prepared using Type 2 Japanese fly ash, glass powder, sodium silicate and sodium carbonate as the foaming agent. The sample was given a heat treatment at 800 to 1000°C for 30 to 60 minutes as the foaming stage. The effect of the amount of glass powder and fly ash on the mechanical strength and apparent density, porosity, thermal conductivity, and microstructure was studied. Optimum fly ash content and foaming temperature for foam glass with superior mechanical, physical and thermal insulation properties have been proposed.
Keywords: Foam glass, Fly ash, Foaming agent, Foaming temperature, Waste glass, Recycling
B-E Purev-Erdene is a master course student of at the Department of Architecture, College of Engineering, Nihon University. Currently, he is doing research on constructional materials. Previously he obtained his bachelor degree of Civil Engineer, School on Construction, Mongolian University of Science and Technology.
Dr.Eng., Sanjay Pareek is the Professor of the Department of Architecture at the College of Engineering, Nihon University. A proficient professor in the field of concrete technology, he is a member of numerous national and international technical committees and has published extensively on many papers of concrete technology, cement science, and structural materials.
Sunjidmaa Danzandorj is a lecturer of the School of Civil Engineering and Architecture, Mongolian University of Science and Technology. A renowned professor in the field of the Mongolia building materials.
Sunjidmaa Sambuunyam is a student of postgraduate the Department of Architecture at the College of Engineering, Nihon University.
Rucha Thombare is a visiting researcher at the College of Engineering, Nihon University.
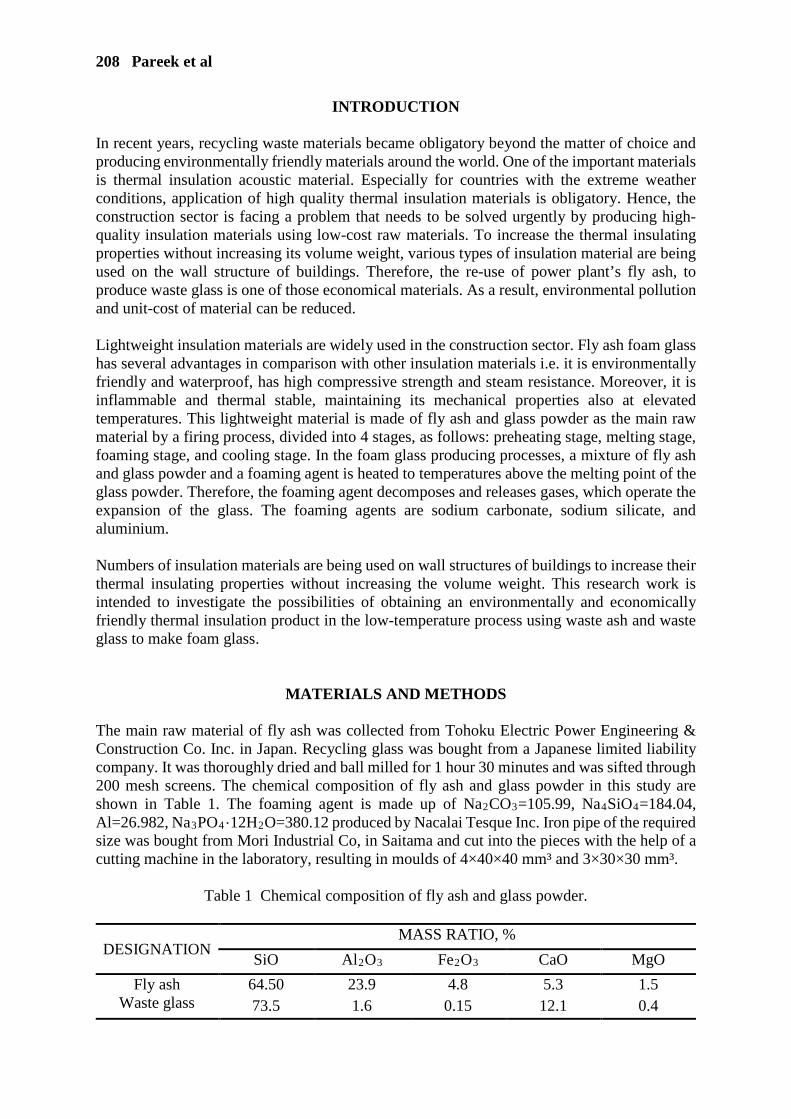
208 Pareek et al
INTRODUCTION In recent years, recycling waste materials became obligatory beyond the matter of choice and producing environmentally friendly materials around the world. One of the important materials is thermal insulation acoustic material. Especially for countries with the extreme weather conditions, application of high quality thermal insulation materials is obligatory. Hence, the construction sector is facing a problem that needs to be solved urgently by producing high-quality insulation materials using low-cost raw materials. To increase the thermal insulating properties without increasing its volume weight, various types of insulation material are being used on the wall structure of buildings. Therefore, the re-use of power plant’s fly ash, to produce waste glass is one of those economical materials. As a result, environmental pollution and unit-cost of material can be reduced. Lightweight insulation materials are widely used in the construction sector. Fly ash foam glass has several advantages in comparison with other insulation materials i.e. it is environmentally friendly and waterproof, has high compressive strength and steam resistance. Moreover, it is inflammable and thermal stable, maintaining its mechanical properties also at elevated temperatures. This lightweight material is made of fly ash and glass powder as the main raw material by a firing process, divided into 4 stages, as follows: preheating stage, melting stage, foaming stage, and cooling stage. In the foam glass producing processes, a mixture of fly ash and glass powder and a foaming agent is heated to temperatures above the melting point of the glass powder. Therefore, the foaming agent decomposes and releases gases, which operate the expansion of the glass. The foaming agents are sodium carbonate, sodium silicate, and aluminium. Numbers of insulation materials are being used on wall structures of buildings to increase their thermal insulating properties without increasing the volume weight. This research work is intended to investigate the possibilities of obtaining an environmentally and economically friendly thermal insulation product in the low-temperature process using waste ash and waste glass to make foam glass.
MATERIALS AND METHODS The main raw material of fly ash was collected from Tohoku Electric Power Engineering & Construction Co. Inc. in Japan. Recycling glass was bought from a Japanese limited liability company. It was thoroughly dried and ball milled for 1 hour 30 minutes and was sifted through 200 mesh screens. The chemical composition of fly ash and glass powder in this study are shown in Table 1. The foaming agent is made up of Na2CO3=105.99, Na4SiO4=184.04, Al=26.982, Na3PO4·12H2O=380.12 produced by Nacalai Tesque Inc. Iron pipe of the required size was bought from Mori Industrial Co, in Saitama and cut into the pieces with the help of a cutting machine in the laboratory, resulting in moulds of 4×40×40 mm³ and 3×30×30 mm³.
Table 1 Chemical composition of fly ash and glass powder.
DESIGNATION MASS RATIO, %
SiO Al2O3 Fe2O3 CaO MgO
Fly ash Waste glass
64.50 23.9 4.8 5.3 1.5 73.5 1.6 0.15 12.1 0.4

Foam Glass with Fly Ash 209
Firstly, fly ash and glass powder were sifted through 200 mesh screens of 0.074 mm aperture. The glass powder, fly ash and foaming agent were weighed according to a certain proportion, and then the mixture was put into the ball mill for 20 minutes. The compositions of foam glass in this study are shown in Table 2. The temperature control of the firing process was divided into 4 steps as follows. The first heating step was from room temperature to 400°C, during which the mixture of glass and fly ash foaming agent got dried. At the sintering stage, the temperature increased gradually from 400 to 600°C for 30 minutes. At the foaming stage, the temperature increased further from 600 to 900°C which caused the release of CO2 from decomposition, due to the high fluxing temperature of fly ash. At the pre-cooling stage, the temperature was dropped from 600 to 450°C, cooling relaxed at the annealing point for approximately 20-30 minutes. The bubbles formed a pore structure [1]. When the mill was turned off, the sample was naturally cooled to room temperature in the mill. Characterization techniques This part determined the mechanical-chemical composition of the sample. The apparent density of samples was determined by direct measurement of volume. The percentage of pores in the foam volume was calculated from the apparent and pycnometer densities of foam samples.
Table 2 Mix composition and curing conditions of foam glass.
TYPE COMPOSITION, wt.% FOAMING TEMPERATURE,
°C
FOAMING TIME,
min Foaming agent
Fly ash Glass
powder
1 2 20 78 800 30
2 4 30 66 850 30
3 6 40 54 900 30
G78F20 G66F30 G54F40
Figure1 Cut-section of foam glass samples made from glass and fly ash sintered at 900°C.
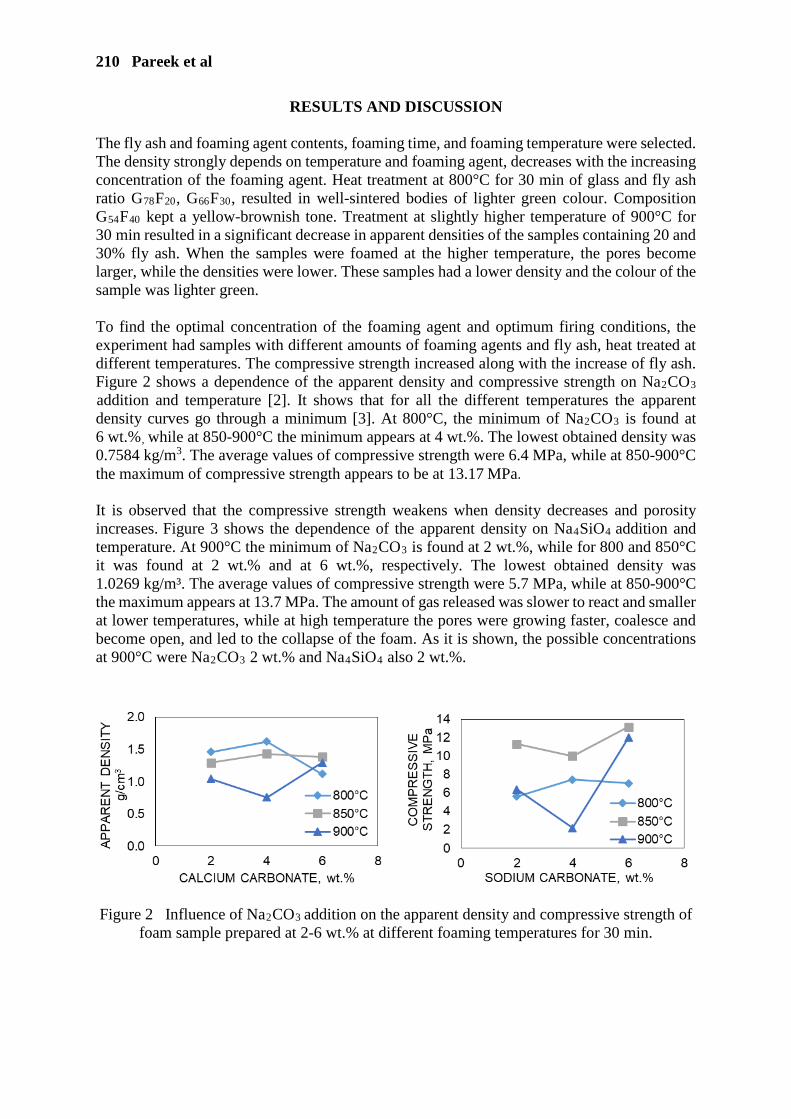
210 Pareek et al
RESULTS AND DISCUSSION The fly ash and foaming agent contents, foaming time, and foaming temperature were selected. The density strongly depends on temperature and foaming agent, decreases with the increasing concentration of the foaming agent. Heat treatment at 800°C for 30 min of glass and fly ash ratio G78F20, G66F30, resulted in well-sintered bodies of lighter green colour. Composition G54F40 kept a yellow-brownish tone. Treatment at slightly higher temperature of 900°C for 30 min resulted in a significant decrease in apparent densities of the samples containing 20 and 30% fly ash. When the samples were foamed at the higher temperature, the pores become larger, while the densities were lower. These samples had a lower density and the colour of the sample was lighter green. To find the optimal concentration of the foaming agent and optimum firing conditions, the experiment had samples with different amounts of foaming agents and fly ash, heat treated at different temperatures. The compressive strength increased along with the increase of fly ash. Figure 2 shows a dependence of the apparent density and compressive strength on Na2CO3
addition and temperature [2]. It shows that for all the different temperatures the apparent density curves go through a minimum [3]. At 800°C, the minimum of Na2CO3 is found at 6 wt.%, while at 850-900°C the minimum appears at 4 wt.%. The lowest obtained density was 0.7584 kg/m3. The average values of compressive strength were 6.4 MPa, while at 850-900°C the maximum of compressive strength appears to be at 13.17 MPa. It is observed that the compressive strength weakens when density decreases and porosity increases. Figure 3 shows the dependence of the apparent density on Na4SiO4 addition and temperature. At 900°C the minimum of Na2CO3 is found at 2 wt.%, while for 800 and 850°C it was found at 2 wt.% and at 6 wt.%, respectively. The lowest obtained density was 1.0269 kg/m³. The average values of compressive strength were 5.7 MPa, while at 850-900°C the maximum appears at 13.7 MPa. The amount of gas released was slower to react and smaller at lower temperatures, while at high temperature the pores were growing faster, coalesce and become open, and led to the collapse of the foam. As it is shown, the possible concentrations at 900°C were Na2CO3 2 wt.% and Na4SiO4 also 2 wt.%.
Figure 2 Influence of Na2CO3 addition on the apparent density and compressive strength of
foam sample prepared at 2-6 wt.% at different foaming temperatures for 30 min.
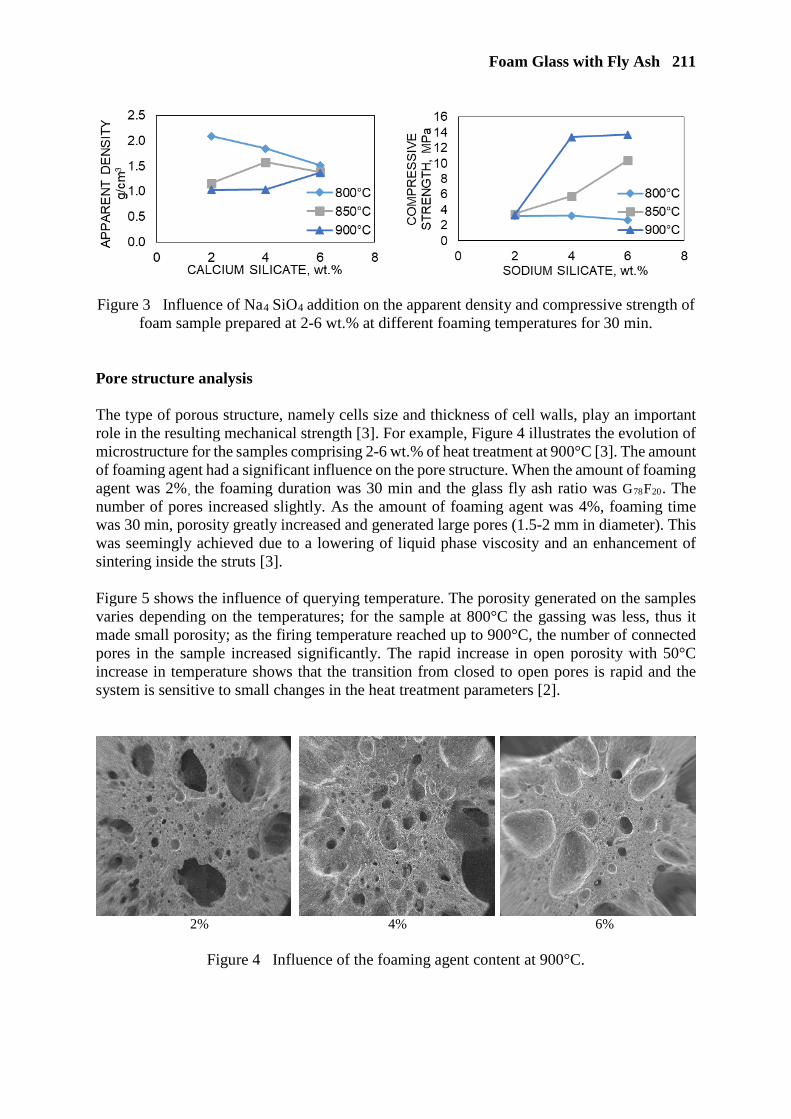
Foam Glass with Fly Ash 211
Figure 3 Influence of Na4 SiO4 addition on the apparent density and compressive strength of
foam sample prepared at 2-6 wt.% at different foaming temperatures for 30 min. Pore structure analysis The type of porous structure, namely cells size and thickness of cell walls, play an important role in the resulting mechanical strength [3]. For example, Figure 4 illustrates the evolution of microstructure for the samples comprising 2-6 wt.% of heat treatment at 900°C [3]. The amount of foaming agent had a significant influence on the pore structure. When the amount of foaming agent was 2%, the foaming duration was 30 min and the glass fly ash ratio was G78F20. The number of pores increased slightly. As the amount of foaming agent was 4%, foaming time was 30 min, porosity greatly increased and generated large pores (1.5-2 mm in diameter). This was seemingly achieved due to a lowering of liquid phase viscosity and an enhancement of sintering inside the struts [3]. Figure 5 shows the influence of querying temperature. The porosity generated on the samples varies depending on the temperatures; for the sample at 800°C the gassing was less, thus it made small porosity; as the firing temperature reached up to 900°C, the number of connected pores in the sample increased significantly. The rapid increase in open porosity with 50°C increase in temperature shows that the transition from closed to open pores is rapid and the system is sensitive to small changes in the heat treatment parameters [2].
2% 4% 6%
Figure 4 Influence of the foaming agent content at 900°C.
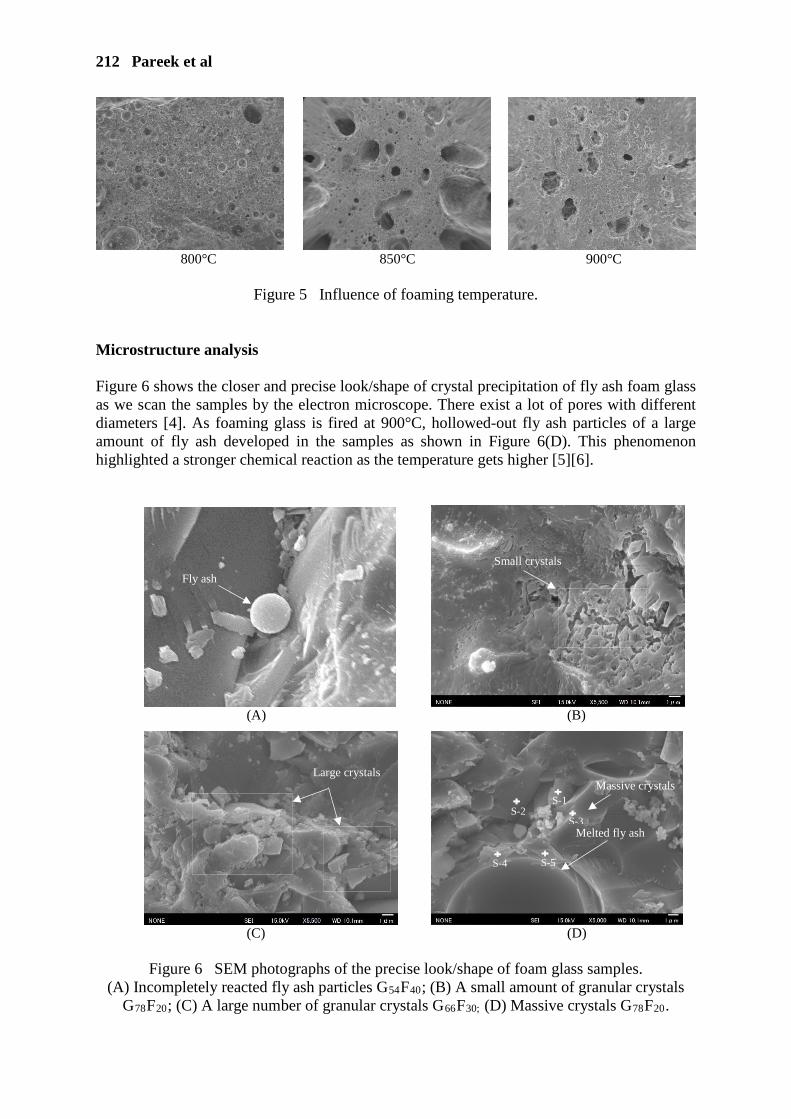
212 Pareek et al
800°C 850°C 900°C
Figure 5 Influence of foaming temperature.
Microstructure analysis Figure 6 shows the closer and precise look/shape of crystal precipitation of fly ash foam glass as we scan the samples by the electron microscope. There exist a lot of pores with different diameters [4]. As foaming glass is fired at 900°C, hollowed-out fly ash particles of a large amount of fly ash developed in the samples as shown in Figure 6(D). This phenomenon highlighted a stronger chemical reaction as the temperature gets higher [5][6].
(A) (B)
(C) (D)
Figure 6 SEM photographs of the precise look/shape of foam glass samples.
(A) Incompletely reacted fly ash particles G54F40; (B) A small amount of granular crystals G78F20; (C) A large number of granular crystals G66F30; (D) Massive crystals G78F20.
Fly ash
Massive crystals Large crystals
Small crystals
Melted fly ash
S-1 S-2
S-3
S-4 S-5

Foam Glass with Fly Ash 213
When foam glass was fired at 800°C, fly ash particles were found in the sample as shown Figure 6(A). The main chemical composition was SiO2 and Mg whose total amount was more than 80%. The querying temperature used in the experiment was 800-900°C, with solid state reaction occurring in the material at this temperature [4]. In Figure 6(B), only a small amount of granular crystals was observed in the sample, the small pieces of crystals were found 2% fly ash. The reaction between mullite and calcium carbonate in fly ash at moderate temperature produced nepheline, whose crystals were gathered together to form granules as shown in Figure 6(C) [7]. Figure 6(D) was obtained by scanning electron microscopy after corroding the sample with 2% G78F20. According to the above macro and microanalysis, the mechanical properties of foam glass could be improved remarkably by increasing the fly ash content. EDS analysis We chose the chemical composition sample (D) of Figure 6 that contained 20% fly ash and 78% glass powder using the EDS method. Then selected 5 points for point analysis and determined the chemical composition by their average. As pictured in Figure 7, EDS analysis showed that the sample mostly consisted of Si, and less of Fe, Ca, K and Mg.
Figure 7 SEM and EDS analysis data of (D).
CONCLUSION The result showed that the moderate foaming effect of the agent is greatly improved by the addition of Na2CO3 or Na4SiO4. With the addition of Na2CO3 or Na4 SiO4, an apparent density of 0.7584 kg/ m³ or 1.0269 kg/m³ could be achieved, respectively. The optimum concentration of foaming agent and Na2CO3, Na4 SiO4 were found to be 2 wt.%, respectively. On the other hand, foam glass is very sensitive to the foaming temperature and time. The optimum foaming condition was found at 800-900°C and 30 minutes which depends on the type. Assuming the maximum possible incorporation of ashes to form porous structures, the composition containing 80 wt.% of glass and 20 wt.% of fly ash was considered for foam production to
214 Pareek et al
which amounts foaming agents were added [3]. The influence of the amount of foaming agent is most important on generating the average pore size of the sample. The distribution of foaming agent particle size in the sample was random, and porosity and pore structure change were random as well. The randomness would be reflected in the physical and mechanical properties of the samples, which have a certain discreteness [8]. There was a certain amount of crystal precipitation in the process of firing. The increase in the amount of fly ash could increase the amount of crystal precipitation.
REFERENCES 1. LIA J, ZHUANG X, MONFORT E, QUEROL X, LLAUDIS A S, FONT O, MORENO
N, Ten F J G AND IZQUIERDO M, Utilization of coal fly ash from a Chinese power plant for manufacturing highly insulating foam glass: Implications of physical, mechanical properties and environmental features, Construction and Building Materials, Vol. 175, 2018, pp. 64-76.
2. STEINER A C, Foam glass production from vitrified municipal waste fly ashes, Thesis, Eindhoven Unversity of Technology, 2006.
3. FERNANDES H R, TULYAGANOV D U AND FERREIRA J M F, Preparation and characterization of foams from sheet glass and fly ash using carbonates as foaming agents, Ceramics International, Vol. 35, No. 1, 2009, pp. 229-235.
4. CHEN B, LUO Z AND LU A, Preparation of sintered foam glass with high fly ash content, Materials Letters, Vol. 65, No. 23–24, 2011, pp. 3555-3558.
5. ATTILA Y, GÜDEN M AND TAŞDEMIRCI A, Foam glass processing using a polishing glass powder residue, Ceramics International, Vol. 39, No. 5, 2013, pp. 5869-5877.
6. WANG H, SUN Y, LIU L, JI R AND WANG X, Integrated utilization of fly ash and waste glass for synthesis of foam/dense bi-layered insulation ceramic tile, Energy and Buildings, Vol. 168, 2018, pp. 67-75.
7. SASMAL N, GARAI M AND KARMAKAR B, Preparation and characterization of novel foamed porous glass-ceramics, Materials Characterization, Vol. 103, 2015, pp. 90-100.
8. QIN Z, LI G, TIAN Y, MA Y AND SHEN P, Optimization of preparation process and performance analysis of fly ash foam glass, Functional Materials, Vol. 25, No. 3, 2018, pp. 554-563.
IMPLEMENTATION OF BASIC WORK REQUIREMENT 3 IN HARMONIZED PRODUCT STANDARDS:
UPDATE ON CEN/TC 351 FOR TEST PROCEDURES AND STATUS OF WORK IN CEN/TC 104/WG4 FOR
IMPLEMENTATION INTO EN 450-1
U Wiens
German Committee for Structural Concrete (DAfStb)
H-J Feuerborn
VGB PowerTech,
Germany
A Saraber
Vliegasunie
Netherlands
ABSTRACT. The Construction Products Regulation (CPR) entered force in July 2013 and requires i. a. the implementation of Basic Work Requirements No 3 on "Hygiene, Health and the Environment" into harmonized product standards. A precondition for this work is the availability of horizontal test standards which are developed in CEN/TC 351. CEN/TC 351 „Construction products: Assessment of release of dangerous substances“ developed Technical Specifications for harmonized test methods over the past years, which are necessary for the implementation BWR 3 into harmonized product standards (e. g. EN 450 for fly ash for concrete or EN 13242 for aggregates for unbound and hydraulically bound materials). For the basic evaluation of bound and unbound products three technical specifications (TS) in series 16637 “Construction products - Assessment of release of dangerous substances are developed as Part 1: "Guidance for the determination of leaching tests and additional testing steps”; Part 2 “Horizontal dynamic surface leaching test” and Part 3: "Generic horizontal up-flow percolation test for determination of the release of substances from granular construction products” have been developed. Another method is for the release of volatile organic compounds into indoor air. Also for testing radioactivity a horizontal test procedure was developed. As the standards are available as CEN/TS the work for implementation of existing regulations for construction products can be started. TC 104/WG 4 "Fly ash for concrete" started the work on existing (notified) regulations and prepared a proposal for the implementation of BWR3 into EN 450-1 for fly ash for concrete. This contribution is an update of [1] and sums up the development in CEN/TC 351 and CEN/TC 104/WG4 taken place since 2017. Keywords: Construction Products Regulation, BWR 3, Mandate M/366, Fly ash, Concrete, Monolithic product, Percolation test, Release, Soil and ground water, Tank test. Udo Wiens is Convener of TC 351/WG1. Hans-Joachim Feuerborn is Convener of TC 104/WG4. Angelo Saraber is Convener of TC 104/WG43.
216 Wiens, Feuerborn, Saraber
INTRODUCTION
Since 1st July 2013, the Construction Products Regulation (CPR) is fully in force. The CPR requires implementation of basic requirements in harmonized product standards. The Basic Work Requirement No 3 on Health, Hygiene and Environment has to be implemented into harmonized product standards. The implementation is very much depending on horizontal European test standards, which are under development by TC 351. The test procedures for BWR 3 today are published as CEN/TSs. The final validation process resulting in figures on reproducibility and repeatability has been concluded in the beginning of 2019. The transfer from TSs to ENs is expected by the year 2020. Therefore, implementation has to be considered in the revision of harmonized product standards. TC 104/WG 4 for Fly ash for concrete already had an intensive discussion during the last two years on the implementation of existing notified regulations into EN 450-1.
CONSTRUCTION PRODUCT REGULATION - BASIC WORK REQUIREMENT 3
The Construction Products Regulation (CPR) [2] states about Basic Work Requirement 3 (BWR3): The construction works must be designed and built in such a way that they will, throughout their life cycle, not be a threat to the hygiene or health and safety of workers, occupants or neighbours, nor have an exceedingly high impact, over their entire life cycle, on the environmental quality or on the climate during their construction, use and demolition, in particular as a result of any of the following: (a) the giving-off of toxic gas; (b) the emissions of dangerous substances, volatile organic compounds (VOC), greenhouse
gases or dangerous particles into indoor or outdoor air; (c) the emission of dangerous radiation; (d) the release of dangerous substances into ground water, marine waters, surface waters or
soil; (e) the release of dangerous substances into drinking water or substances which have an
otherwise negative impact on drinking water; (f) faulty discharge of waste water, emission of flue gases or faulty disposal of solid or liquid
waste; (g) dampness in parts of the construction works or on surfaces within the construction works. The CPR states further that: the essential characteristics of construction products shall be laid down in harmonised technical specifications in relation to the basic requirements for construction works. By now, CEN/TS 15864 and CEN/TS 14405 are available or cited in standards, which describe test methods for leaching of monolithic and granular waste. For testing of products however, different test methods are used in the CEN Member States.
Implementation of Basic Work Requirement 3 217
Essential Requirement 3 / Basic Work Requirement 3 / Mandate M/366 Already in 2002, the Commission Services invited interested member states and stakeholder groups into an ad hoc working group on regulated dangerous substances and started preparing for a proper implementation of Essential Requirement 3 (ER3 according the Construction Products Directive (CPD) [3], now BWR3 according CPR [2]) on health, hygiene and environment. As best option for all construction products a horizontal approach was chosen meaning that test methods do not need to be developed for all different construction products separately. Instead, existing test methods are harmonised to cover the most relevant release scenarios for dangerous substances for most generic construction products [4]. The assignment for the development of horizontal test methods was elaborated in Mandate M/366 sent to CEN in 2005. The mandate gives the priority to release scenarios and not to individual substances. The test methods harmonised for the release scenarios emissions into indoor air, leaching into soil and water, radiation and for the supplementary scenario content analysis should be able to cover all relevant substances. Both CPD and CPR refer to dangerous substances. The broad understanding of the term is that all substances corresponding with the definition of the Dangerous Substances Directive of 1967 which have been repealed by the CLP Regulation in 2012 [5] and the term substituted through hazardous substances. In the context of CPD, CPR and this article the earlier established term dangerous substances is used further. The Commission Services, together with its Expert Group Dangerous Substances, gathered the substances and parameters explicitly covered in member states’ laws, regulations and administrative provisions for construction products into an “Indicative list” [6] which was given to CEN/TC 351 to elaborate which substances the harmonised test methods should cover. Additionally, the Commission Services decided to amend the already issued product mandates to include more precise details on dangerous substances. The first three mandate amendments for aggregates, floorings and thermal insulation products were sent to CEN in 2010. Several product mandates followed since that time, especially after a blockage of several years due to formal reasons. The mandate amendments for dangerous substances list for each mandated product standard the substances, the release scenarios and the member state provisions to be addressed. For example, fly ash according to EN 450 for the use in concrete is expected to be addressed in the described manner in the amendment to Mandate M/128 “Products related to concrete, mortar and grout”. Until the requirements from the amended mandates are implemented into product standards the CP-DS database remains in place. As the first round of mandate amendments does not necessarily cover all legitimate requirements of member states the CP DS database [7] can be used as a gap solution for the left over requirements still for a number of years. A detailed report about the development of test methods was published at the EUROCOALASH 2014 conference [8]. The information in this report serves as an update on TC 351 activities and the status of the developed test methods. CEN TC 351 In November 2005, CEN established a new Technical Committee CEN/TC 351 "Construction products: Assessment of release of dangerous substances" to development horizontal standardised assessment methods for harmonised approaches relating to the release (and/or the content when this is the only practicable or legally required solution) of regulated dangerous substances under the Construction Products Directive (CPD) [3] taking into account the intended conditions of use of the product. It addresses emission to indoor air, and release to
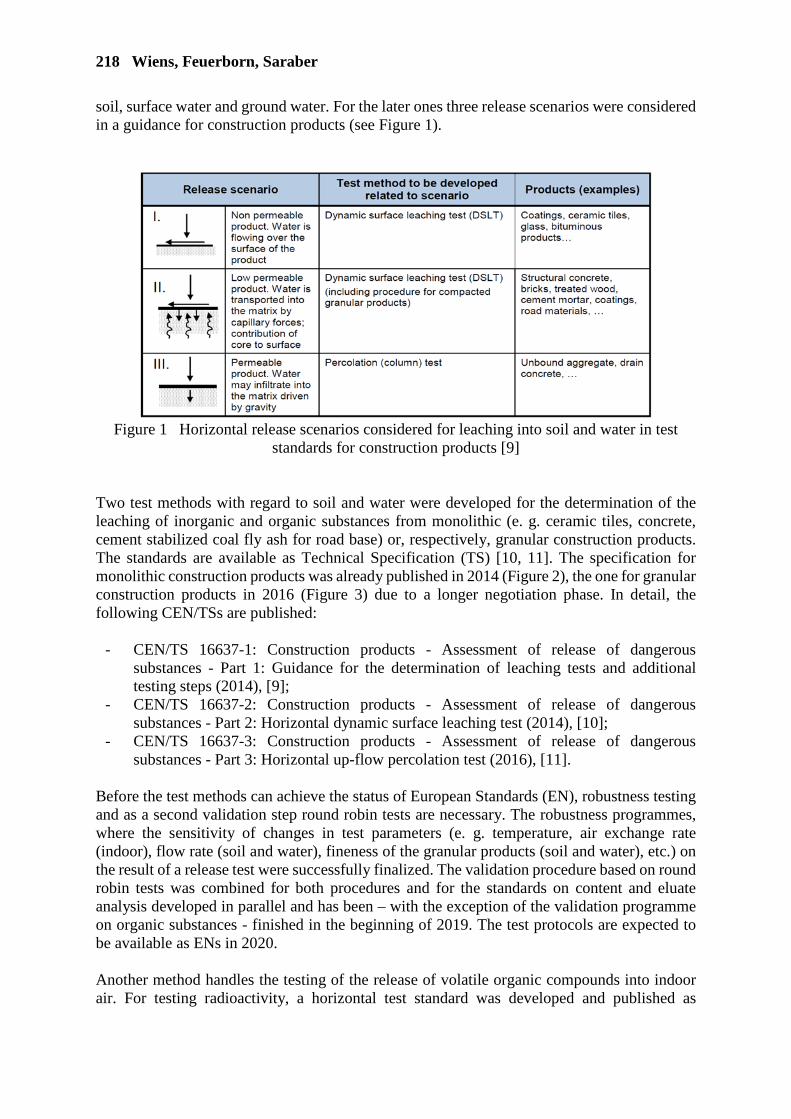
218 Wiens, Feuerborn, Saraber
soil, surface water and ground water. For the later ones three release scenarios were considered in a guidance for construction products (see Figure 1).
Figure 1 Horizontal release scenarios considered for leaching into soil and water in test
standards for construction products [9] Two test methods with regard to soil and water were developed for the determination of the leaching of inorganic and organic substances from monolithic (e. g. ceramic tiles, concrete, cement stabilized coal fly ash for road base) or, respectively, granular construction products. The standards are available as Technical Specification (TS) [10, 11]. The specification for monolithic construction products was already published in 2014 (Figure 2), the one for granular construction products in 2016 (Figure 3) due to a longer negotiation phase. In detail, the following CEN/TSs are published:
- CEN/TS 16637-1: Construction products - Assessment of release of dangerous substances - Part 1: Guidance for the determination of leaching tests and additional testing steps (2014), [9];
- CEN/TS 16637-2: Construction products - Assessment of release of dangerous substances - Part 2: Horizontal dynamic surface leaching test (2014), [10];
- CEN/TS 16637-3: Construction products - Assessment of release of dangerous substances - Part 3: Horizontal up-flow percolation test (2016), [11].
Before the test methods can achieve the status of European Standards (EN), robustness testing and as a second validation step round robin tests are necessary. The robustness programmes, where the sensitivity of changes in test parameters (e. g. temperature, air exchange rate (indoor), flow rate (soil and water), fineness of the granular products (soil and water), etc.) on the result of a release test were successfully finalized. The validation procedure based on round robin tests was combined for both procedures and for the standards on content and eluate analysis developed in parallel and has been – with the exception of the validation programme on organic substances - finished in the beginning of 2019. The test protocols are expected to be available as ENs in 2020. Another method handles the testing of the release of volatile organic compounds into indoor air. For testing radioactivity, a horizontal test standard was developed and published as
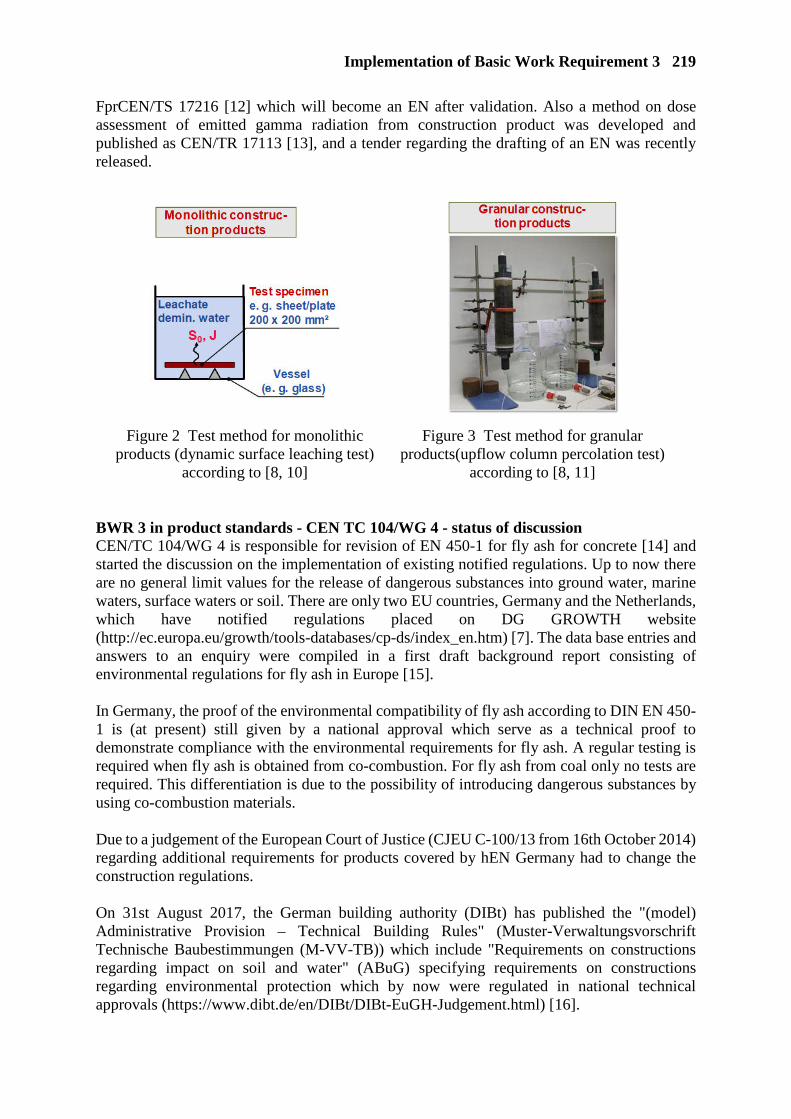
Implementation of Basic Work Requirement 3 219
FprCEN/TS 17216 [12] which will become an EN after validation. Also a method on dose assessment of emitted gamma radiation from construction product was developed and published as CEN/TR 17113 [13], and a tender regarding the drafting of an EN was recently released.
Figure 2 Test method for monolithic products (dynamic surface leaching test)
according to [8, 10]
Figure 3 Test method for granular products(upflow column percolation test)
according to [8, 11] BWR 3 in product standards - CEN TC 104/WG 4 - status of discussion CEN/TC 104/WG 4 is responsible for revision of EN 450-1 for fly ash for concrete [14] and started the discussion on the implementation of existing notified regulations. Up to now there are no general limit values for the release of dangerous substances into ground water, marine waters, surface waters or soil. There are only two EU countries, Germany and the Netherlands, which have notified regulations placed on DG GROWTH website (http://ec.europa.eu/growth/tools-databases/cp-ds/index_en.htm) [7]. The data base entries and answers to an enquiry were compiled in a first draft background report consisting of environmental regulations for fly ash in Europe [15]. In Germany, the proof of the environmental compatibility of fly ash according to DIN EN 450-1 is (at present) still given by a national approval which serve as a technical proof to demonstrate compliance with the environmental requirements for fly ash. A regular testing is required when fly ash is obtained from co-combustion. For fly ash from coal only no tests are required. This differentiation is due to the possibility of introducing dangerous substances by using co-combustion materials. Due to a judgement of the European Court of Justice (CJEU C-100/13 from 16th October 2014) regarding additional requirements for products covered by hEN Germany had to change the construction regulations. On 31st August 2017, the German building authority (DIBt) has published the "(model) Administrative Provision – Technical Building Rules" (Muster-Verwaltungsvorschrift Technische Baubestimmungen (M-VV-TB)) which include "Requirements on constructions regarding impact on soil and water" (ABuG) specifying requirements on constructions regarding environmental protection which by now were regulated in national technical approvals (https://www.dibt.de/en/DIBt/DIBt-EuGH-Judgement.html) [16].
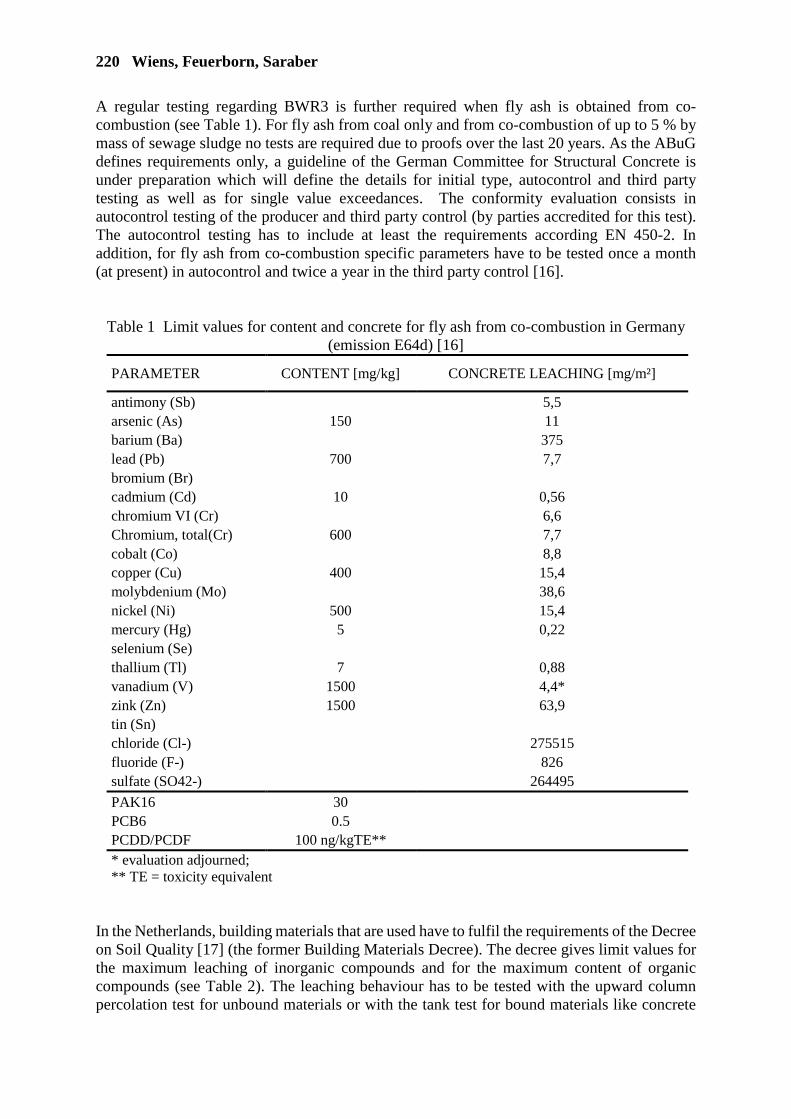
220 Wiens, Feuerborn, Saraber
A regular testing regarding BWR3 is further required when fly ash is obtained from co-combustion (see Table 1). For fly ash from coal only and from co-combustion of up to 5 % by mass of sewage sludge no tests are required due to proofs over the last 20 years. As the ABuG defines requirements only, a guideline of the German Committee for Structural Concrete is under preparation which will define the details for initial type, autocontrol and third party testing as well as for single value exceedances. The conformity evaluation consists in autocontrol testing of the producer and third party control (by parties accredited for this test). The autocontrol testing has to include at least the requirements according EN 450-2. In addition, for fly ash from co-combustion specific parameters have to be tested once a month (at present) in autocontrol and twice a year in the third party control [16].
Table 1 Limit values for content and concrete for fly ash from co-combustion in Germany (emission E64d) [16]
PARAMETER CONTENT [mg/kg] CONCRETE LEACHING [mg/m²]
antimony (Sb) 5,5 arsenic (As) 150 11 barium (Ba) 375 lead (Pb) 700 7,7 bromium (Br)
cadmium (Cd) 10 0,56 chromium VI (Cr) 6,6 Chromium, total(Cr) 600 7,7 cobalt (Co) 8,8 copper (Cu) 400 15,4 molybdenium (Mo) 38,6 nickel (Ni) 500 15,4 mercury (Hg) 5 0,22 selenium (Se)
thallium (Tl) 7 0,88 vanadium (V) 1500 4,4* zink (Zn) 1500 63,9 tin (Sn)
chloride (Cl-) 275515 fluoride (F-) 826 sulfate (SO42-) 264495 PAK16 30 PCB6 0.5 PCDD/PCDF 100 ng/kgTE** * evaluation adjourned; ** TE = toxicity equivalent
In the Netherlands, building materials that are used have to fulfil the requirements of the Decree on Soil Quality [17] (the former Building Materials Decree). The decree gives limit values for the maximum leaching of inorganic compounds and for the maximum content of organic compounds (see Table 2). The leaching behaviour has to be tested with the upward column percolation test for unbound materials or with the tank test for bound materials like concrete

Implementation of Basic Work Requirement 3 221
and bricks which in most cases is a surface-related diffusion process. Leaching of final products has to be tested on a regular base. So, in the case of fly ash for concrete, concrete has to be tested and not the constituent for producing concrete.
Table 2 Limit values maximum leaching inorganic compounds for bound applications in NL (emission E64d) [17]
PARAMETER CONCRETE LEACHING [mg/m²]
antimony (Sb) 8,7 arsenic (As) 260 barium (Ba) 1500 lead (Pb) 400 bromium (Br) 670 cadmium (Cd) 3,8 chromium VI (Cr)
Chromium, total(Cr) 120 cobalt (Co) 60 copper (Cu) 98 molybdenium (Mo) 144 nickel (Ni) 81 mercury (Hg) 1,4 selenium (Se) 4,8 thallium (Tl)
vanadium (V) 320 zink (Zn) 800 tin (Sn) 50 chloride (Cl-) 110.000 fluoride (F-) 2500 sulfate (SO42-) 165000
The so-called NL BSB Productcertificaat (Dutch Building materials Decree product certificate) is used in the market to prove that the requirements of the decree [16] are fulfilled. A product certificate can be declared for the product (group) of one company or for a cluster of companies with the same product (group). The minimum test frequency has to be derived based on the k-concept (different from the k-value for use of fly ash in concrete) or the gamma-scheme [17]. It is obvious from Table 1 and 2 that the limit values for leachates from concrete in the two countries are different. But also the evaluation systems are different as they were developed separately with different background consideration (place of evaluation, sorption capacity of soils, …). The implementation of BWR3 into harmonised product standards requires:
- Parameters, methods and limit values, - Evaluation scheme for auto control and third party control.
It further requires producers to declare the environmental performance of products according harmonized product standards. Based on the CPR [2], this can be done by declared values or
222 Wiens, Feuerborn, Saraber
by classes with the consequence that the customer finally has to decide whether the product can be used according national limit values. In both cases the required parameters have to be listed in the Declaration of Performance (DoP) and CE-mark. The EC and CEN prefer declared values or classes as required by the CPR. The use of declared values is also the easiest way to prepare a standard. But placing a product on the market is not the responsibility of the EC as free trade is the overall aim. Therefore, the consequences of such requirements regarding perception of customers for products on the existing and long term served market is not sufficiently considered by now. A list of trace parameter with maximum declared values or with classes based on minimum and maximum values in the DoP and/or CE-mark will result in confusion in the market, will not promote free movement of goods and use of secondary materials, and is finally against competition for materials with testing needs as not for all materials environmental requirements exist. It is obvious that a fly ash with a long list of environmental parameters like arsenic, cadmium, chromium, …. , will not be used when the competing material does not need such a declaration. The confusion or mistrust will further grow if such a fly ash has to place always NPD indicating that the producer may not be willing to declare the values or to perform such tests. Competing construction materials without testing needs will be preferred as causing no additional work for constructors regarding environmental requirements and work load to control whether declared values are meeting national requirements. Based on the requirements of existing environmental regulations WG4 has proposed a system of categories to allow neutral information on BWR3 in DoP and CE-mark [18]. By this, a “category” is defined as “a set or parameters, test procedures (as developed by TC 351) and limit values to be considered in a member state”. For each type of requirement (organics, content, leaching, concrete leaching) a category has to be defined for requirements in a member state leading to maximum three lines (organics, content, concrete leaching) for declaring environmental performance. In member states without respective environmental requirements NPD (no performance determined – or better: no test required) can be placed. This process however requires the preparation of a delegated act by the EC. As this is a time consuming process which will lead to a further postponement of the revision work of the standard, WG 4 has also proposed to consider the existing experience in the countries where requirements for either release into soil and ground or for radioactivity have to be provided in a test report which is considered “neutral”, and in case of radioactivity also to be declared by partly nuclide concentration or an index. At the last TC 104 meeting in June 2018, WG4 was ordered to update the discussion paper on pros and cons of the information systems by the systems existing in the place of use. The report is under discussion in WG4 and will be provided to TC 104 for the next meeting. It will also serve as a tool of information for all TCs dealing with the revision of harmonized product standard to develop a common view for an acceptable solution of environmental information in DoP and CE-mark for all construction products. Examples for the Declaration of Performance and/or CE marking by the four options “Declared values” , “Classes”, “Categories” and “Existing Systems” are given in Figure 4. It is obvious that the declaration via declared values and classes leads to a long list of parameters for environment which are predominant to the few technical parameters. The declaration via categories and by existing systems however, allow the information on environmental parameters by a few lines only.

Implementation of Basic Work Requirement 3 223
Declared values Categories
Classes Existing systems
Figure 4 Declaration of environmental performance of construction products (BWR3)
by Declared values, Classes, Categories and Existing systems
SUMMARY/OUTLOOK
The horizontal test procedure for leaching from concrete is available as Technical Specification and expected to be available as EN in 2020. CEN/TC 104/WG 4 discussed the implementation of the Basic Work Requirement 3 on Hygiene, Health and Environment. Beside parameters, test methods and limit values also the evaluation schemes for auto and third party control are of importance. The environmental performance has to be declared in the Declaration of Performance (DoP) by the producer. However, based on the Construction Products Regulation the declaration can be given by listing of Declared values or minimum and maximum values via classes. To avoid confusion to users and distortion of the market for construction products in competition a system for Categories being “a set or parameters, test procedures (as developed by TC 351) and limit values to be considered in a member state” have been proposed. In addition, the existing systems demonstrate that a free movement of goods is possible already now. A “neutral” information via Categories or Existing systems is seen the best way to avoid competition struggles for products on the market and to further allow the use of products with environmental testing needs.
224 Wiens, Feuerborn, Saraber
REFERENCES
1. SARABER, A.; WIENS, U.: Implementation of Basic Work Requirement 3 in harmonized product standards - update on CEN/TC 351 for test procedures and status of work in CEN/TC 104/WG4 for implementation into EN 450-1 – In: Proceeding of EUROCOALASH 2017, Brno, University of Technology, p. 65-72
2. Construction Products Regulation (CPR): Regulation (EU) No 305/2011 of the European Parliament and of the Council of 9 March 2011 laying down harmonised conditions for the marketing of construction products and repealing Council Directive 89/106/EEC, (https://eur-lex.europa.eu/legal-content/EN/TXT/?uri=CELEX:32011R0305)
3. Construction Products Directive (CPD): Council Directive 89/106/EEC of 21 December 1988 on the approximation of laws, regulations and administrative provisions of the Member States relating to construction products, OJ L 40, 11.2.1989, (https://eur-lex.europa.eu/legal-content/EN/TXT/?uri=CELEX:31989L0106)
4. PD CEN/TR 16098 − Construction products − Assessment of release of dangerous substances − Concept of horizontal testing procedures in support of requirements under the CPD. BSI; 2010
5. REGULATION (EC) No 1272/2008 of the European Parliament and of the Council of 16 December 2008 on classification, labelling and packaging of substances and mixtures, amending and repealing Directives 67/548/EEC and 1999/45/EC, and amending Regulation (EC). Official Journal of the European Union, Series L 31.12.2008; 353):1 –1355
6. Indicative List of Regulated Dangerous Substances possibly associated with Construction Products under the CPD. https://www.nen.nl/web/file?uuid=2b96de16-8512-416c-baba-6540d1850ce4&owner =39c5e2fc-6300-4bb7-af56-8aa934044ce4
7. CP-DS: Legislation on substances in construction products, https://ec.europa.eu/growth/tools-databases/cp-ds_en
8. WIENS. U., ILVONEN, O.: Release of dangerous substances from construction products into soil and water – A status report on test methods developed by CEN/TC 351/WG1, EUROCOALASH 2014, München, p. 193-208
9. CEN/TS 16637-1: Construction products – Assessment of release of dangerous substances – Part 1: Guidance for the determination of leaching tests and additional testing step (2014)
10. CEN/TS 16637-2: Construction products - Assessment of release of dangerous substances - Part 2: Horizontal dynamic surface leaching test (2014)
11. CEN/TS 16637-3: Construction products - Assessment of release of dangerous substances - Part 3: Horizontal up-flow percolation test (2016)
12. FprCEN/TS 17216: Construction products: Assessment of release of dangerous substances - Determination of activity concentrations of radium‐226, thorium‐232 and potassium‐40 in construction products using gamma‐ray spectrometry (2018)
13. CEN/TR 17113: Construction products. Assessment of release of dangerous substances. Radiation from construction products. Dose assessment of emitted gamma radiation (2018)
14. EN 450-1:2012 Fly ash for concrete – Part 1: Definitions, specifications and conformity criteria
15. CENT C 104/WG 4: (first draft) Background report on existing environmental regulations for fly ash for concrete, doc160-2016, WG 4 internal document
16. VV-TB/ABuG: Administrative Provision – Technical Building Rules (VVTB) and Requirements on constructions regarding impact on soil and water (ABuG); https://www.dibt.de/de/wir-bieten/technische-baubestimmungen/
17. Soil Quality Decree, Rijkswaterstaat, Ministry of Infrastructure and Environment (http://rwsenvironment.eu/subjects/soil/legislation-and/soil-quality-decree/)
18. CEN TC 104/WG4: Discussion paper implementation BWR3 in EN 450, doc 180/2017 (TC internal paper on CEN livelink)

PORE STRUCTURE AND PROPERTIES OF AEROGEL-CEMENT COMPOSITES
Jue Lu
Zhongyuan Lu Jun Li
Southwest University of Science and Technology
China
Jun Jiang
University of Dundee
United Kingdom
ABSTRACT: Commercial aerogel slurry was introduced into cement system to prepare thermal insulation materials by volume substitution method. Then the hardening properties and pore structure of the commercial aerogel-cement composites (CACCs) were investigated. The results indicate that aerogel slurry can achieve the preparation of homogeneous lightweight aerogel-cement composites. Composite with thermal conductivity as low as 0.0608 W/m K, compressive strength of 0.65 MPa and density of 280 kg/m3, was successfully prepared by 68vol% replacement of cement paste with aerogel slurry, indicating good thermal insulation property. In addition, the total pore volume and specific surface area of the composite are 0.2040 cc/g and 46.052 cm2/g, respectively.
Keywords: Aerogel slurry, Cement-based Composites, Hardening property, Pore structure
Jue Lu is a postgraduate of Southwest University of Science and Technology, specialized in industrial waste utilization and the design and preparation of green cement-based materials. Mr Jun Jiang is a visiting scholar of University of Dundee and Ph.D candidate of Southwest University of Science and Technology. He devotes himself in the theory study and application of functionalized and green cement-based materials. Professor Zhongyuan Lu is the Vice President of Southwest University of Science and Technology, Director of State Key Laboratory of Environment-friendly Energy Materials, member of MOE's Guiding Committee for Inorganic Non-metallic Materials and chairman of Cement Raw Materials & Waste Utilization Subcommittee in Chinese Ceramic Society. He has published extensively on many aspects of cement-based materials and sustainable construction, and completed more than 10 research projects supported by government bodies, research councils and industries in past 20 years. Associate Professor Jun Li is the vice Director of Engineering Laboratory of Green Cement-based Building Materials of Sichuan province. He has published extensively on many aspects of cement-based materials and waste utilization.
226 Lu et al
INTRODUCTION
Buildings account for over 30% of the world's total annual energy consumption[1, 2]. Using thermal insulation materials is the main method to reduce energy consumption of building. Compared with inorganic insulation materials, organic insulation materials are generally flammable. Among the numerous inorganic materials, cement products with realizable low thermal conductivity (lower than 0.1 W/m K) are considered as the most potential energy saving materials. Many methods can be used to develop cement-based materials for thermal insulation. Adding lightweight aggregates is the simplest and the most reliable approach to achieve the controllable preparation, which has been highly concerned. Expanded polystyrene (EPS) granules, hollow ceramic granules, expanded perlite are the most common lightweight aggregates to prepare cement-based materials for building insulation. However, their thermal conductivities are about 0.033-0.070 W/m K, showing poor thermal insulation performance [3-5].
Aerogel promotes to produce multifunctional thermal insulation materials. The unique structures of aerogel result in excellent thermal insulation property. Aerogel, especially silica-based aerogel, has attracted increasing attention in traditional building materials. The applications of silica-based aerogel to adding conventional construction materials, such as gypsum, slurry and concrete, have also been reported for improving thermal insulation properties [6]. In current researches, there are two main methods to prepare cement-based thermal insulation materials in combination with aerogel. Aerogel powders were dispersed to obtain gel-type aerogel, then mixed with cement paste to prepare mortar. The other is to incorporate block aerogels into the cement paste in the form of lightweight aggregates, then insulation cement-based material was prepared [7]. In 2010, Ratke proposed the preparation of aerogel concrete by incorporating silica aerogel particles as thermal insulation lightweight aggregates into the cement matrix [8]. Due to the poor mechanical properties of aerogel, the applications of aerogel in concrete are still in the pre-stage, basic mixture ratio design and performance optimization, thus Fickler and Ng recommended adopting HPC (high performance concrete) or UHPC (ultra-high performance concrete) to prepare aerogel-based concrete [9-11]. Some researchers tried to add aerogel to lightweight concrete (such as foam concrete) to improve the insulation property of the concrete [1, 12]. Júlio prepared amphiphilic aerogel instead of silica sand for light aggregate in concrete. The interface between aerogel and hydrated cement was greatly improved by adding trace amounts of anionic surfactant [13]. Júlio et al. also prepared thermal insulation slurry by using fly ash as binder, silica aerogel, softwood, expanded clay, and perlite as aggregates. The product had acceptable mechanical strength and good deformation with a thermal conductivity of 0.084 W/m K [14]. Jarosław et al. studied the effect of aerogel on the properties of lightweight concrete, when the sample contained 20vol% of aerogel, the thermal conductivity of the concrete was as low as 0.36~0.53 W/m K with the compressive strength of 6~13 MPa [15]. Besides, adding aerogel into cement-based materials can significantly reduce the thermal conductivity of the materials. By 60vol% replacement of the slurry mixture with aerogel particles, Stahl et al. had developed a commercialized thermal insulation slurry with the thermal conductivity as low as 0.025 W/m K [16]. In general, no matter what method uses to prepare cement-based materials, adding aerogel is an effective approach to achieve improvement of cement-based materials. However, aerogel floating and the frangibility of aerogel aggregates are the main problems currently. Introducing aerogel slurry into cement paste directly may be used to avoid the drawbacks.
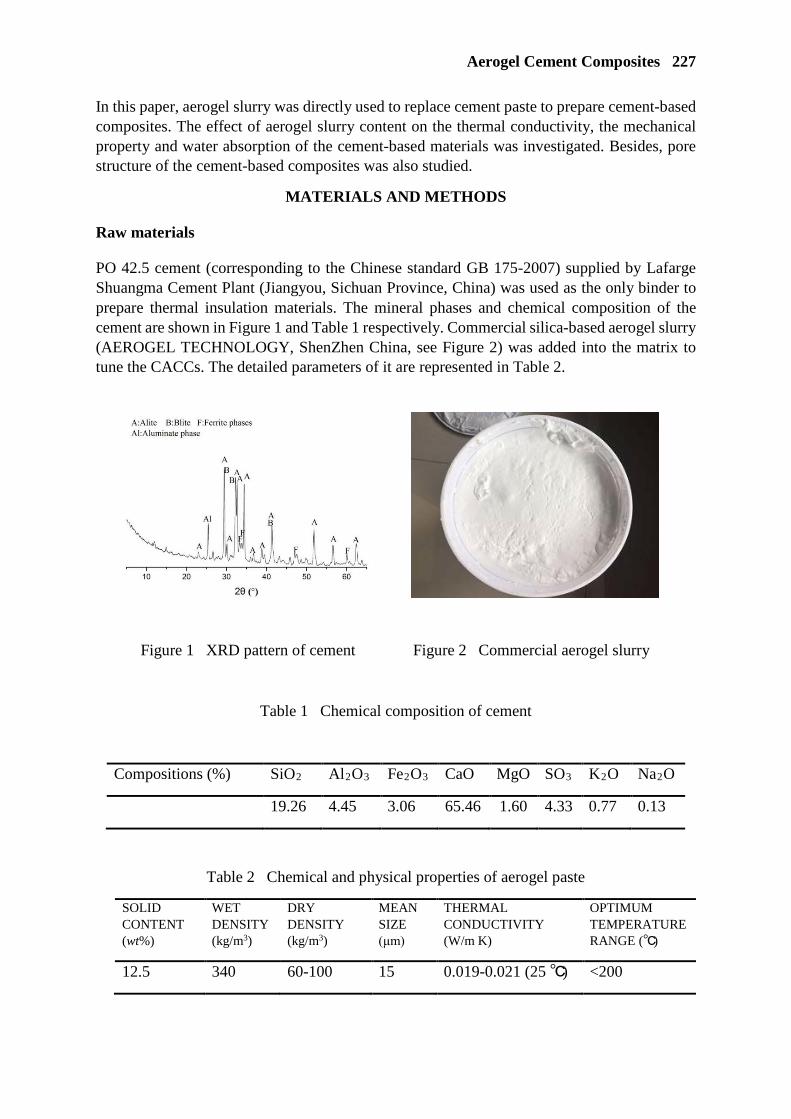
Aerogel Cement Composites 227
In this paper, aerogel slurry was directly used to replace cement paste to prepare cement-based composites. The effect of aerogel slurry content on the thermal conductivity, the mechanical property and water absorption of the cement-based materials was investigated. Besides, pore structure of the cement-based composites was also studied.
MATERIALS AND METHODS
Raw materials
PO 42.5 cement (corresponding to the Chinese standard GB 175-2007) supplied by Lafarge Shuangma Cement Plant (Jiangyou, Sichuan Province, China) was used as the only binder to prepare thermal insulation materials. The mineral phases and chemical composition of the cement are shown in Figure 1 and Table 1 respectively. Commercial silica-based aerogel slurry (AEROGEL TECHNOLOGY, ShenZhen China, see Figure 2) was added into the matrix to tune the CACCs. The detailed parameters of it are represented in Table 2.
Table 1 Chemical composition of cement
Compositions (%) SiO2 Al2O3 Fe2O3 CaO MgO SO3 K2O Na2O
19.26 4.45 3.06 65.46 1.60 4.33 0.77 0.13
Table 2 Chemical and physical properties of aerogel paste
SOLID CONTENT (wt%)
WET DENSITY (kg/m3)
DRY DENSITY (kg/m3)
MEAN SIZE (μm)
THERMAL CONDUCTIVITY (W/m K)
OPTIMUM TEMPERATURE RANGE ()
12.5 340 60-100 15 0.019-0.021 (25 ) <200
Figure 1 XRD pattern of cement Figure 2 Commercial aerogel slurry

228 Lu et al
Preparation of aerogel-cement composites
Commercial aerogel slurry (CA) was added into cement paste to prepare commercial aerogel-cement composites (CACCs). The mix parameters of CACCs are displayed in Table 3. Aerogel substitution (S) was determined by the target density (ρ). In formula (1)-(3), Va , Vc and VPaste stand for the volume of aerogel slurry, cement paste and the mixed paste, respectively. ma and mc stand for the quality of aerogel slurry and cement paste. When the water/cement ratio is 0.29, the corresponding density of cement paste is 2100 kg/m3. 340 refers to the density (kg/m3) of aerogel slurry. The empirical constant of cement hydration is 1.2, which stands for the ratio of the unevaporated solids and raw materials after curing. 12.5% is the solid content of CA.
Table 3 Mix parameters of CACCs
The cement, water and superplasticizer were mixed at low speed and high speed for 120 seconds in turn to obtain the net pulp with good workability. A variation of aerogel slurry was added into the paste and get different mixes. The introduction of aerogel slurrry can effectively avoid flying dust in mixing process, resulting in a gentle working environment. The aerogel and mixture were mixed for another 60 seconds to obtain mixed slurry. Due to the good dispersibility of CA, the mixture was homogeneous. Cubic specimens with the dimensions of 40×40×40 mm3 were prepared for the test of compressive strength, thermal conductivity and water absorption.
SN TARGET DRY
DENSITY (kg/m3)
COMPOSITION PER m3
AEROGEL SUBS (vol%)
WATER/CEMENT
RATIO (wt%)
SP/CEMENT RATIO (wt%) Cement
paste (m3) Aerogel
slurry (m3) CACC0 1950 1.00 0.00 0
0.29
0.3
CACC10 1500 0.90 0.10 10 CACC18 1300 0.82 0.18 18 CACC26 1100 0.74 0.26 26 CACC36 900 0.64 0.36 36 CACC44 700 0.56 0.44 44 CACC52 500 0.48 0.52 52 CACC60 400 0.40 0.60 60 CACC68 300 0.32 0.68 68
(1)
(2)
(3)
Paste
ac
Vmm ×+×
=%5.122.1ρ
%100×=Paste
a
VVS
3402100
29.1 acacPaste
mmVVV +×
=+=
Aerogel Cement Composites 229
Due to the presence of hydrophobic aerogel, the hydration and hardening process of cement-based composites was slowed down dramatically. Therefore, all samples were demoulded after 3 days curing. For 80 is the best curing temperature for cement-based aerogel insulation materials [11], the composites were steamed for 48 hours at 80 to obtain CCACs.
Test methods
The properties of the specimens were evaluated via compressive strength tests (TYE300, Wuxi Jianyi Instrument and Machinery Co., Ltd., Wuxi, China) performed at a loading rate of 2.4 kN/s and currency of ±1%, in accordance with ISO 679:1989. The thermal conductivity tests were based on Chinese standard GB/T32064-2015. The thermal conductivity was assessed by using the DRE-2C thermal conductivity measuring apparatus (Xiangtan instrument co. LTD, Xiangtan, China). The contact angles of CACCs were measured by using surface tension tester K100 (Kluz, Germany) to reflect the water repellency of the materials. The water absorption tests of the samples were measured in accordance with GB/T 11970-1997. Water absorption rate (W) is calculated according to formula (4). Mg stands for the quality of the sample after water absorption test and M0 stands for its drying quality.
Fourier transform infrared spectroscopy (FTIR, SPECTRUM ONE AUTOIMA, PerkinElmer, USA) analysis was performed. In FTIR analysis, the spectra was traced from 400 to 4000 cm-
1. Due to the fragile structure of aerogel, the technique of NAD was applied to explore the pore information in this paper via Nitrogen adsorption/desorption (NAD; NOVA 3000, Quantachrome, USA). The total pore volume is reflected under the relative pressure P/P0=0.99 according to the isothermal curve at 77K. When the value of parameter C is during the validity range (-5~300), surface area can be calculated from the low-pressure section (P/P0=0.05~0.3) of the BET isotherm. Using the Barrett-Joyner-Halenda (BJH) method, the corresponding pore size distributions were determined from the amount of adsorbed nitrogen.
Results and Discussion
Characterization of aerogel
The FIIR spectra of CA is shown in Figure 3. The band at 3434 cm-1 is assigined to the νO-H mode in aerogel. The most intense absorption band in CA, the νasSi-O-Si mode (at ~1081cm-
1), is related to the silica network. The band at 950 cm-1 is assigned to the νSi-OH mode. The νSi-O-Si mode is at 800 cm-1. The νC-H mode at 2971 cm-1, νC=C mode at 1647 cm-1, ωCH3
mode at 1257 cm-1, γCH3 mode at 840 cm-1 and ρCH3 mode at 757 cm-1 are related to the hydrophobic property of CA. This can be confirmed by the contact angle test and the contact angle of CA is 142.
%1000
0 ×−
=M
MMW g
(4)
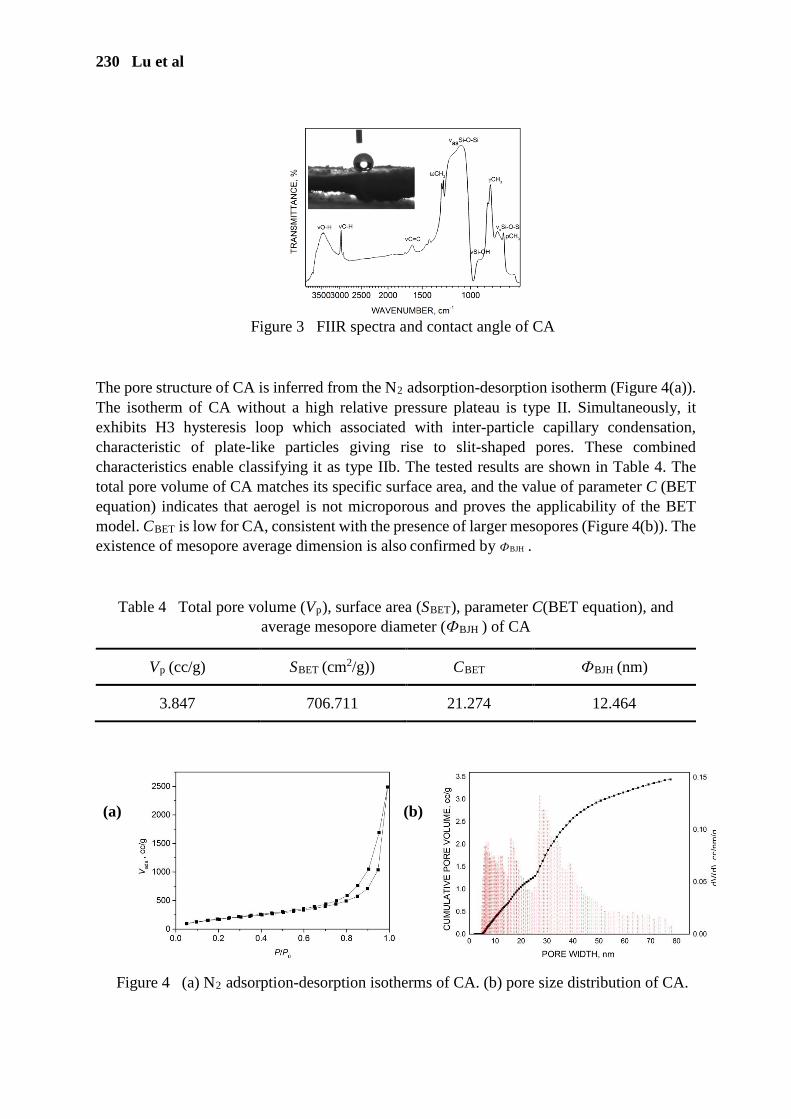
230 Lu et al
The pore structure of CA is inferred from the N2 adsorption-desorption isotherm (Figure 4(a)). The isotherm of CA without a high relative pressure plateau is type II. Simultaneously, it exhibits H3 hysteresis loop which associated with inter-particle capillary condensation, characteristic of plate-like particles giving rise to slit-shaped pores. These combined characteristics enable classifying it as type IIb. The tested results are shown in Table 4. The total pore volume of CA matches its specific surface area, and the value of parameter C (BET equation) indicates that aerogel is not microporous and proves the applicability of the BET model. CBET is low for CA, consistent with the presence of larger mesopores (Figure 4(b)). The existence of mesopore average dimension is also confirmed by ФBJH .
Table 4 Total pore volume (Vp), surface area (SBET), parameter C(BET equation), and average mesopore diameter (ФBJH ) of CA
Vp (cc/g) SBET (cm2/g)) CBET ФBJH (nm)
3.847 706.711 21.274 12.464
Figure 3 FIIR spectra and contact angle of CA
(a)
(b)
Figure 4 (a) N2 adsorption-desorption isotherms of CA. (b) pore size distribution of CA.
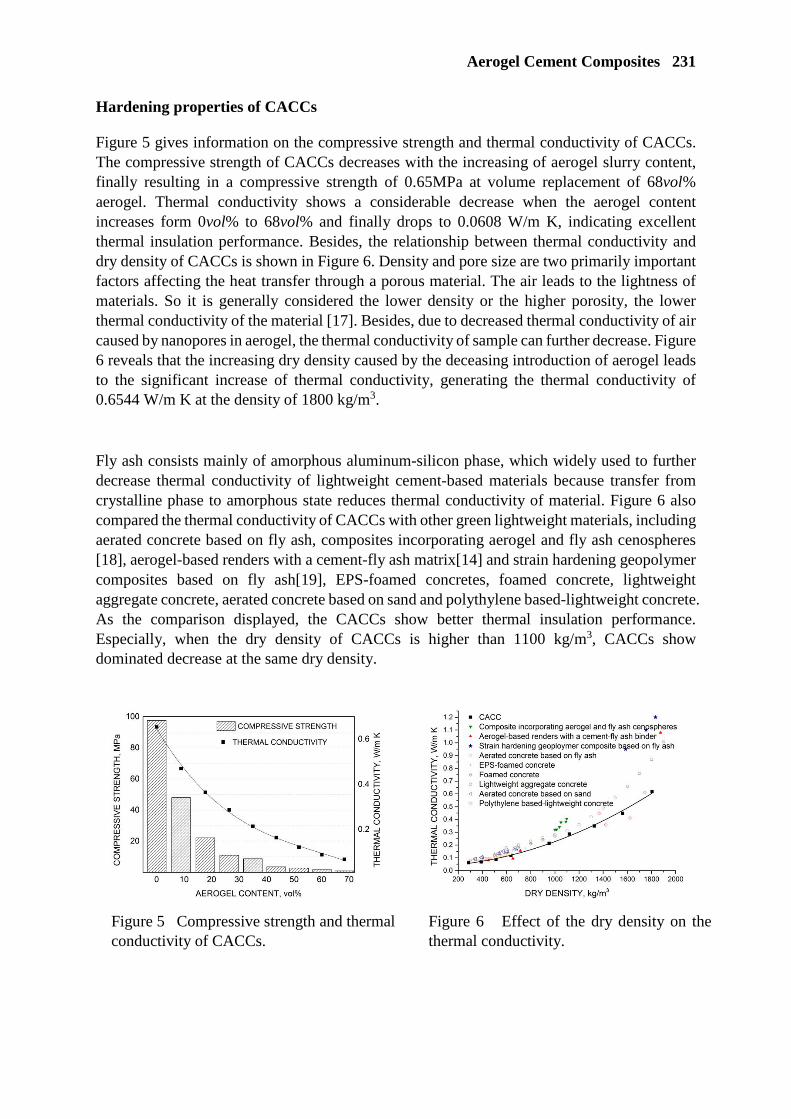
Aerogel Cement Composites 231
Hardening properties of CACCs
Figure 5 gives information on the compressive strength and thermal conductivity of CACCs. The compressive strength of CACCs decreases with the increasing of aerogel slurry content, finally resulting in a compressive strength of 0.65MPa at volume replacement of 68vol% aerogel. Thermal conductivity shows a considerable decrease when the aerogel content increases form 0vol% to 68vol% and finally drops to 0.0608 W/m K, indicating excellent thermal insulation performance. Besides, the relationship between thermal conductivity and dry density of CACCs is shown in Figure 6. Density and pore size are two primarily important factors affecting the heat transfer through a porous material. The air leads to the lightness of materials. So it is generally considered the lower density or the higher porosity, the lower thermal conductivity of the material [17]. Besides, due to decreased thermal conductivity of air caused by nanopores in aerogel, the thermal conductivity of sample can further decrease. Figure 6 reveals that the increasing dry density caused by the deceasing introduction of aerogel leads to the significant increase of thermal conductivity, generating the thermal conductivity of 0.6544 W/m K at the density of 1800 kg/m3.
Fly ash consists mainly of amorphous aluminum-silicon phase, which widely used to further decrease thermal conductivity of lightweight cement-based materials because transfer from crystalline phase to amorphous state reduces thermal conductivity of material. Figure 6 also compared the thermal conductivity of CACCs with other green lightweight materials, including aerated concrete based on fly ash, composites incorporating aerogel and fly ash cenospheres [18], aerogel-based renders with a cement-fly ash matrix[14] and strain hardening geopolymer composites based on fly ash[19], EPS-foamed concretes, foamed concrete, lightweight aggregate concrete, aerated concrete based on sand and polythylene based-lightweight concrete. As the comparison displayed, the CACCs show better thermal insulation performance. Especially, when the dry density of CACCs is higher than 1100 kg/m3, CACCs show dominated decrease at the same dry density.
Figure 5 Compressive strength and thermal conductivity of CACCs.
Figure 6 Effect of the dry density on the thermal conductivity.
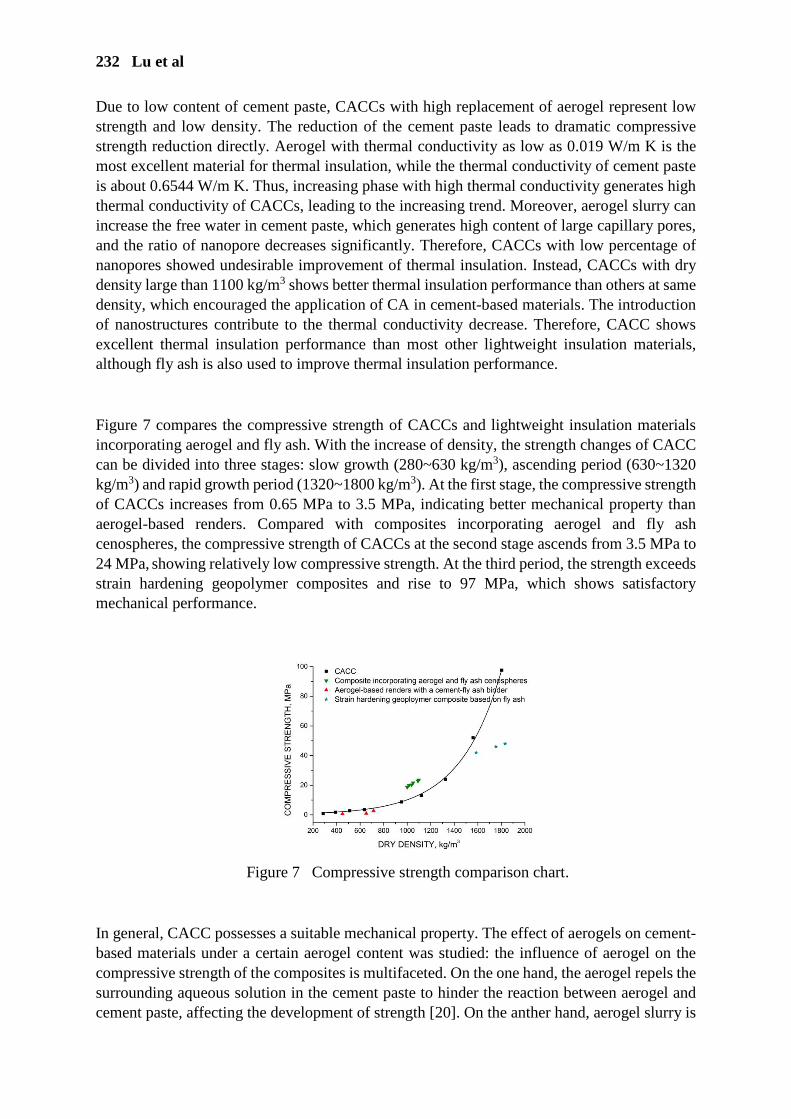
232 Lu et al
Due to low content of cement paste, CACCs with high replacement of aerogel represent low strength and low density. The reduction of the cement paste leads to dramatic compressive strength reduction directly. Aerogel with thermal conductivity as low as 0.019 W/m K is the most excellent material for thermal insulation, while the thermal conductivity of cement paste is about 0.6544 W/m K. Thus, increasing phase with high thermal conductivity generates high thermal conductivity of CACCs, leading to the increasing trend. Moreover, aerogel slurry can increase the free water in cement paste, which generates high content of large capillary pores, and the ratio of nanopore decreases significantly. Therefore, CACCs with low percentage of nanopores showed undesirable improvement of thermal insulation. Instead, CACCs with dry density large than 1100 kg/m3 shows better thermal insulation performance than others at same density, which encouraged the application of CA in cement-based materials. The introduction of nanostructures contribute to the thermal conductivity decrease. Therefore, CACC shows excellent thermal insulation performance than most other lightweight insulation materials, although fly ash is also used to improve thermal insulation performance.
Figure 7 compares the compressive strength of CACCs and lightweight insulation materials incorporating aerogel and fly ash. With the increase of density, the strength changes of CACC can be divided into three stages: slow growth (280~630 kg/m3), ascending period (630~1320 kg/m3) and rapid growth period (1320~1800 kg/m3). At the first stage, the compressive strength of CACCs increases from 0.65 MPa to 3.5 MPa, indicating better mechanical property than aerogel-based renders. Compared with composites incorporating aerogel and fly ash cenospheres, the compressive strength of CACCs at the second stage ascends from 3.5 MPa to 24 MPa, showing relatively low compressive strength. At the third period, the strength exceeds strain hardening geopolymer composites and rise to 97 MPa, which shows satisfactory mechanical performance.
In general, CACC possesses a suitable mechanical property. The effect of aerogels on cement-based materials under a certain aerogel content was studied: the influence of aerogel on the compressive strength of the composites is multifaceted. On the one hand, the aerogel repels the surrounding aqueous solution in the cement paste to hinder the reaction between aerogel and cement paste, affecting the development of strength [20]. On the anther hand, aerogel slurry is
Figure 7 Compressive strength comparison chart.
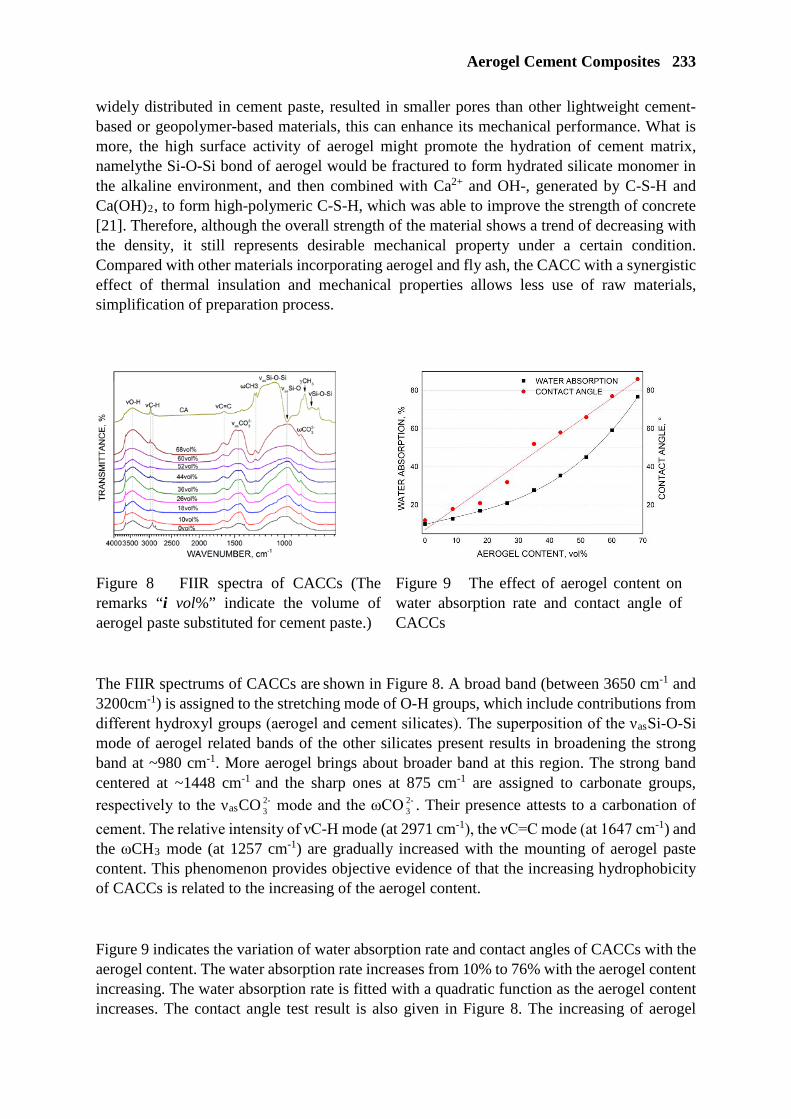
Aerogel Cement Composites 233
widely distributed in cement paste, resulted in smaller pores than other lightweight cement-based or geopolymer-based materials, this can enhance its mechanical performance. What is more, the high surface activity of aerogel might promote the hydration of cement matrix, namelythe Si-O-Si bond of aerogel would be fractured to form hydrated silicate monomer in the alkaline environment, and then combined with Ca2+ and OH-, generated by C-S-H and Ca(OH)2, to form high-polymeric C-S-H, which was able to improve the strength of concrete [21]. Therefore, although the overall strength of the material shows a trend of decreasing with the density, it still represents desirable mechanical property under a certain condition. Compared with other materials incorporating aerogel and fly ash, the CACC with a synergistic effect of thermal insulation and mechanical properties allows less use of raw materials, simplification of preparation process.
The FIIR spectrums of CACCs are shown in Figure 8. A broad band (between 3650 cm-1 and 3200cm-1) is assigned to the stretching mode of O-H groups, which include contributions from different hydroxyl groups (aerogel and cement silicates). The superposition of the νasSi-O-Si mode of aerogel related bands of the other silicates present results in broadening the strong band at ~980 cm-1. More aerogel brings about broader band at this region. The strong band centered at ~1448 cm-1 and the sharp ones at 875 cm-1 are assigned to carbonate groups,
respectively to the νasCO -23 mode and the ωCO -2
3 . Their presence attests to a carbonation of
cement. The relative intensity of νC-H mode (at 2971 cm-1), the νC=C mode (at 1647 cm-1) and the ωCH3 mode (at 1257 cm-1) are gradually increased with the mounting of aerogel paste content. This phenomenon provides objective evidence of that the increasing hydrophobicity of CACCs is related to the increasing of the aerogel content.
Figure 9 indicates the variation of water absorption rate and contact angles of CACCs with the aerogel content. The water absorption rate increases from 10% to 76% with the aerogel content increasing. The water absorption rate is fitted with a quadratic function as the aerogel content increases. The contact angle test result is also given in Figure 8. The increasing of aerogel
Figure 8 FIIR spectra of CACCs (The remarks “i vol%” indicate the volume of aerogel paste substituted for cement paste.)
Figure 9 The effect of aerogel content on water absorption rate and contact angle of CACCs
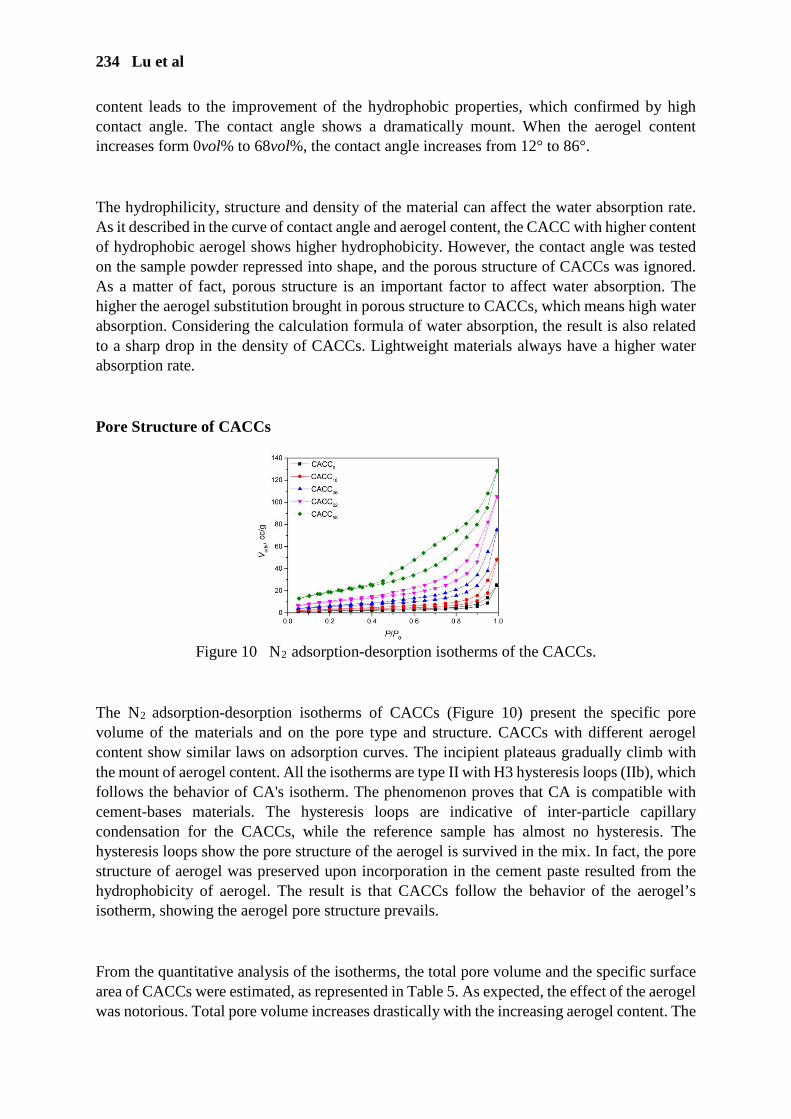
234 Lu et al
content leads to the improvement of the hydrophobic properties, which confirmed by high contact angle. The contact angle shows a dramatically mount. When the aerogel content increases form 0vol% to 68vol%, the contact angle increases from 12° to 86°.
The hydrophilicity, structure and density of the material can affect the water absorption rate. As it described in the curve of contact angle and aerogel content, the CACC with higher content of hydrophobic aerogel shows higher hydrophobicity. However, the contact angle was tested on the sample powder repressed into shape, and the porous structure of CACCs was ignored. As a matter of fact, porous structure is an important factor to affect water absorption. The higher the aerogel substitution brought in porous structure to CACCs, which means high water absorption. Considering the calculation formula of water absorption, the result is also related to a sharp drop in the density of CACCs. Lightweight materials always have a higher water absorption rate.
Pore Structure of CACCs
Figure 10 N2 adsorption-desorption isotherms of the CACCs.
The N2 adsorption-desorption isotherms of CACCs (Figure 10) present the specific pore volume of the materials and on the pore type and structure. CACCs with different aerogel content show similar laws on adsorption curves. The incipient plateaus gradually climb with the mount of aerogel content. All the isotherms are type II with H3 hysteresis loops (IIb), which follows the behavior of CA's isotherm. The phenomenon proves that CA is compatible with cement-bases materials. The hysteresis loops are indicative of inter-particle capillary condensation for the CACCs, while the reference sample has almost no hysteresis. The hysteresis loops show the pore structure of the aerogel is survived in the mix. In fact, the pore structure of aerogel was preserved upon incorporation in the cement paste resulted from the hydrophobicity of aerogel. The result is that CACCs follow the behavior of the aerogel’s isotherm, showing the aerogel pore structure prevails.
From the quantitative analysis of the isotherms, the total pore volume and the specific surface area of CACCs were estimated, as represented in Table 5. As expected, the effect of the aerogel was notorious. Total pore volume increases drastically with the increasing aerogel content. The

Aerogel Cement Composites 235
ФBJH does not be given in the table, for the BJH model is no longer applicable to the pore (non-cylindrical mesopores) in cement system. For CACC0, the index of CBET may be related to micropores, whereas the value is still in the valid range and fits BET mode. Lower CBET of CACCi (i≠0) refers to larger mesopores, which consistent with previous discussion.
Table 5 Total pore volume (Vp), specific surface area (SBET), parameter C(BET equation) of the CACCs.
SN Vp (cc/g) SBET (cm2/g) CBET
CACC0 0.039 6.209 82
CACC18 0.074 10.736 59
CACC36 0.116 21.352 45
CACC52 0.163 37.443 41
CACC68 0.204 46.052 46
CONCLUSIONS
High aerogel content that yield the lowest thermal conductivity is also responsible for very low mechanical strength. Fortunately, this phenomenon was better improved in this paper by introducing aerogel slurry. The aerogel in the form of slurry used in this paper can avoid flying dust in mixing process. The detailed characterization of the aerogel allows understanding the essential role of the aerogel nature and content on the final performances of the CACCs. Volume replacement of cement paste by aerogel slurry leaded to successfully produce lightweight (ρ=280 kg/m3) cement-based material with acceptable mechanical property (0.65 MPa) and excellent thermal insulation property (0.0608 W/m K).
REFERENCES
1. G. SAMSON, C. LANOS, A. PHELIPOT-MARDELE, A review of thermomechanical properties of lightweight concrete, Mag Concrete Res 69(4) (2017) 201-216.
2. D. URGE-VORSATZ, L. F. CABEZA, S. SERRANO, C. BARRENECHE, K. PETRICHENKO, Heating and cooling energy trends and drivers in buildings, Renew Sust Energ Rev 41 (2015) 85-98.
3. A. BRAS, M. LEAL, P. FARIA, Cement-cork mortars for thermal bridges correction. Comparison with cement-EPS mortars performance, Constr Build Mater 49 (2013) 315-327.
4. W. S. CHEN, H. HAO, D. HUGHES, Y. C. SHI, J. CUI, Z. X. LI, Static and dynamic mechanical properties of expanded polystyrene, Materials & Design 69 (2015) 170-180.
5. S. J. CHEN, L. F. TANG, X. X. TAO, L. CHEN, Z. YANG, L. L. LI, Effect of oxidation processing on the surface properties and floatability of Meizhiyou long-flame coal, Fuel 210 (2017) 177-186.
236 Lu et al
6. C. BURATTI, E. MORETTI, E. BELLONI, F. AGOSTI, Development of Innovative Aerogel Based Plasters: Preliminary Thermal and Acoustic Performance Evaluation, Sustainability-Basel 6(9) (2014) 5839-5852.
7. G. H. JIA, Z. LI, P. LIU, Q. S. JING, Applications of aerogel in cement-based thermal insulation materials: an overview, Mag Concrete Res 70(16) (2018) 822-837.
8. Lorenz RATKE, Herstellung und Eigenschaften eines neuen Leichtbetons: Aerogelbeton, Beton- und Stahlbetonbau 103(4) (2010) 236-243.
9. M. SCHNELLENBACH-HELD, T. WELSCH, S. FICKLER, B. MILOW, L. RATKE, Development of High Performance Aerogel Concrete, Beton- Und Stahlbetonbau 111(9) (2016) 555-563.
10. S. NG, B. P. JELLE, L. I. C. SANDBERG, T. GAO, O. H. WALLEVIK, Experimental investigations of aerogel-incorporated ultra-high performance concrete, Constr Build Mater 77 (2015) 307-316.
11. S. NG, B. P. JELLE, Y. P. ZHEN, O. H. WALLEVIK, Effect of storage and curing conditions at elevated temperatures on aerogel-incorporated mortar samples based on UHPC recipe, Constr Build Mater 106 (2016) 640-649.
12. M. K. WILLIAMS, Foam/aerogel composite materials for thermal and acoustic insulation and cryogen storage, 2011.
13. M. D. JULIO, A. SOARES, L. M. ILHARCO, I. FLORES-COLEN, J. DE BRITO, Silica-based aerogels as aggregates for cement-based thermal renders, Cement Concrete Comp 72 (2016) 309-318.
14. M. D. F. JULIO, A. SOARES, L. M. ILHARCO, I. FLORES-COLEN, J. DE BRITO, Aerogel-based renders with lightweight aggregates: Correlation between molecular/pore structure and performance, Constr Build Mater 124 (2016) 485-495.
15. J. STRZALKOWSKI, H. GARBALINSKA, Thermal and strength properties of lightweight concretes with the addition of aerogel particles, Adv Cem Res 28(9) (2016) 567-575.
16. T. STAHL, S. BRUNNER, M. ZIMMERMANN, K. GHAZI WAKILI, Thermo-hygric properties of a newly developed aerogel based insulation rendering for both exterior and interior applications, Energ Buildings 44 (2012) 114-117.
17. Q. ZENG, T. MAO, H. D. LI, Y. PENG, Thermally insulating lightweight cement-based composites incorporating glass beads and nano-silica aerogels for sustainably energy-saving buildings, Energ Buildings 174 (2018) 97-110.
18. A. HANIF, S. DIAO, Z. Y. LU, T. Y. FAN, Z. J. LI, Green lightweight cementitious composite incorporating aerogels and fly ash cenospheres - Mechanical and thermal insulating properties, Constr Build Mater 116 (2016) 422-430.
19. B. NEMATOLLAHI, R. RANADE, J. SANJAYAN, S. RAMAKRISHNAN, Thermal and mechanical properties of sustainable lightweight strain hardening geopolymer composites, Arch Civ Mech Eng 17(1) (2017) 55-64.
20. T. GAO, B. P. JELLE, A. GUSTAVSEN, S. JACOBSEN, Aerogel-incorporated concrete: An experimental study, Constr Build Mater 52 (2014) 130-136.
21. P. W. LI, H. J. WU, Experimental study on preparation and properties of low-density and low-thermal conductive aerogel foam concrete[J]. Bulletin of the Chinese Ceramic Society, 2018. (in Chinese).

DESIGNING DURABLE CONCRETE FOR CONSTRUCTABILITY OF THE WORLD'S TALLEST STATUE
S Kandasami
L S Kannan
V Umamaheshwaran
Larsen & Toubro
India
ABSTRACT. At 182 m the Statue of Unity is the tallest statue in the world and is located on the banks of the river Narmada in Gujarat, India. The statue is a structural system consisting of two reinforced concrete cores, a reinforced concrete podium and foundation resting on a solid rock in the middle of the river. Above the podium level, the statue clad in bronze is supported by structural steelwork fixed on to the concrete cores. This is the first major structure in India to have an intended service life of 100 years specified in the contract. Concrete durability design has been done on the lines of BS8500 for a service life of 100 years. In the absence of chlorides, carbonation-induced corrosion was identified as the predominant mechanism to induce corrosion of the reinforcement. This was mitigated in the design stage itself, by using concrete of low water-cement ratio, specifying concrete grade and providing adequate cover to reinforcement. This paper discusses the challenges in placing the concrete vertically, while simultaneously achieving faster cycle times and visual finish quality by appropriate choice of formwork system. Some of the site experiences in pumping concrete and control of the concrete properties in hot weather is highlighted. As this is a tall structure, long-term engineering properties such as creep and shrinkage of the concrete have also been tested conforming to current international best practice. Keywords: Concrete, Formwork, Durability, Carbonation, Corrosion, Statue, Service life Dr Sivakumar Kandasami obtained a PhD degree from the University of Dundee and is a concrete technologist with the Construction Division of Larsen & Toubro. His interests are in durability and service life design, and developing new innovations through R&D. He regularly reviews technical manuscripts for scholarly journals and serves on their editorial boards. Mr L S Kannan is Head of Concrete Management in Buildings & Factories Independent Company of Larsen & Toubro. He has got thirty years of experience in concrete mix design for various projects, expert trouble shooting in project sites and trainer for many institutions. Mr V Umamaheshwaran is a Post-graduate in Management and a concrete engineer in Buildings & Factories Independent Company of Larsen & Toubro. He has got seventeen years of experience in concrete mix design and ready-mixed concrete industry operations.

238 Kandasami et al
INTRODUCTION
The Statue of Unity is a 182-m tall statue located on the banks of the river Narmada in Gujarat, India. The statue is a structural system consisting of two semi-elliptical reinforced concrete cores, a reinforced concrete podium and foundation resting on a solid rock in the middle of the river. Above the podium level, the statue is clad in bronze supported by structural steelwork fixed on to the concrete cores. About 210000 m3 of concrete, 18500 tonnes of reinforcement, 6500 tonnes of structural steel and 1800 tonnes of bronze was used. The concrete used was produced onsite by captive batching plants. It took 13 months for the design process to be completed and the actual construction was completed in just 33 months.
STRUCTURAL SYSTEM
Statue
The primary gravity and lateral force resisting system comprises of two vertical reinforced concrete (RC) oval shaped cores up to 153 m height on top of raft foundation. The two core walls are enclosed by an outer oval concrete wall up to the podium roof at +83 m. These cores are buttressed with additional RC walls to the outer oval wall. Above the podium level, where the façade geometry of the statue permits, the cores are coupled together with two RC walls up to the entire height of core walls. The cores are designed with a self-compacting concrete (SCC) concrete of M65 grade. Structural steel is used to form the primary, secondary and tertiary structures that support the bronze façade off the RC cores. The floor system at viewing gallery level is made of composite deck slab on structural steel beams. Base of statue
The substructure of statue base is of shallow foundations i.e., isolated and combined footings either placed over the rock or structural fill. Grade level varies from +45 m level to +52.5 m level. The ground floor at +58 m level is made of structural slabs supported by columns and walls. Both concrete and steel are used extensively from +58 m level to +83 m Level. Vertical gravity loads are transferred by concrete columns whereas slabs at +78 m, +83 m and inclined roofs are made of composite deck slabs resting on structural beams/ trusses. The lateral stability is provided by RC walls and moment resisting frame.
CONCRETE DURABILITY DESIGN
This is the major structure in India to be built on the concept of durability for a service life design of 100 years. Since, the structure is located on the river bed there is no threat of attack from sulphates and chlorides to the reinforced concrete foundation. However, the foundation is expected to come in contact with water only during the annual monsoon flooding which is free of pollutants. The superstructure consisting of two reinforced concrete cores are clad in bronze which unintentionally acts as a primary shield and moreover, there is no source of airborne chlorides in the immediate vicinity since the site is far away from the coastline. The minimum acceptable performance parameters assumed are limited surface cracking, small areas of spalling and maintenance of minimum cover. For the durability considerations, the Indian Standard available i.e. IS456 [1] has no specific service life defined, though it is assumed
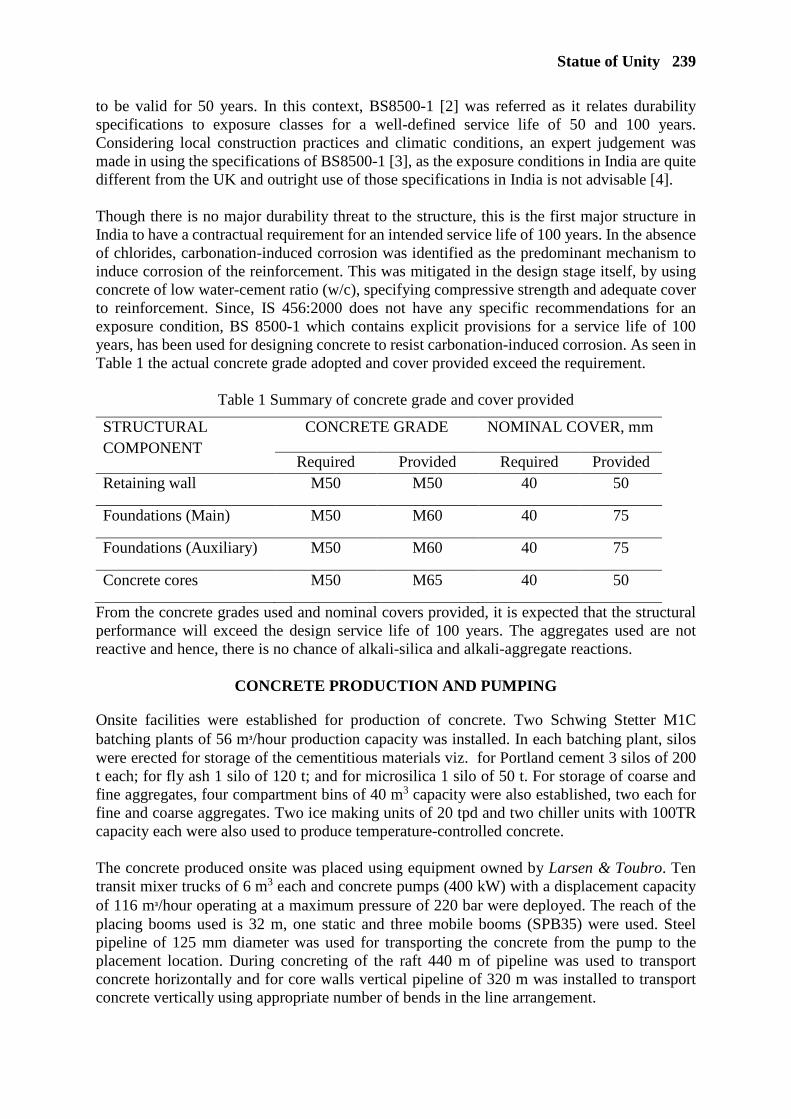
Statue of Unity 239
to be valid for 50 years. In this context, BS8500-1 [2] was referred as it relates durability specifications to exposure classes for a well-defined service life of 50 and 100 years. Considering local construction practices and climatic conditions, an expert judgement was made in using the specifications of BS8500-1 [3], as the exposure conditions in India are quite different from the UK and outright use of those specifications in India is not advisable [4]. Though there is no major durability threat to the structure, this is the first major structure in India to have a contractual requirement for an intended service life of 100 years. In the absence of chlorides, carbonation-induced corrosion was identified as the predominant mechanism to induce corrosion of the reinforcement. This was mitigated in the design stage itself, by using concrete of low water-cement ratio (w/c), specifying compressive strength and adequate cover to reinforcement. Since, IS 456:2000 does not have any specific recommendations for an exposure condition, BS 8500-1 which contains explicit provisions for a service life of 100 years, has been used for designing concrete to resist carbonation-induced corrosion. As seen in Table 1 the actual concrete grade adopted and cover provided exceed the requirement.
Table 1 Summary of concrete grade and cover provided
STRUCTURAL COMPONENT
CONCRETE GRADE NOMINAL COVER, mm
Required Provided Required Provided Retaining wall M50 M50 40 50
Foundations (Main) M50 M60 40 75
Foundations (Auxiliary) M50 M60 40 75
Concrete cores M50 M65 40 50
From the concrete grades used and nominal covers provided, it is expected that the structural performance will exceed the design service life of 100 years. The aggregates used are not reactive and hence, there is no chance of alkali-silica and alkali-aggregate reactions.
CONCRETE PRODUCTION AND PUMPING
Onsite facilities were established for production of concrete. Two Schwing Stetter M1C batching plants of 56 m₃/hour production capacity was installed. In each batching plant, silos were erected for storage of the cementitious materials viz. for Portland cement 3 silos of 200 t each; for fly ash 1 silo of 120 t; and for microsilica 1 silo of 50 t. For storage of coarse and fine aggregates, four compartment bins of 40 m3 capacity were also established, two each for fine and coarse aggregates. Two ice making units of 20 tpd and two chiller units with 100TR capacity each were also used to produce temperature-controlled concrete. The concrete produced onsite was placed using equipment owned by Larsen & Toubro. Ten transit mixer trucks of 6 m3 each and concrete pumps (400 kW) with a displacement capacity of 116 m₃/hour operating at a maximum pressure of 220 bar were deployed. The reach of the placing booms used is 32 m, one static and three mobile booms (SPB35) were used. Steel pipeline of 125 mm diameter was used for transporting the concrete from the pump to the placement location. During concreting of the raft 440 m of pipeline was used to transport concrete horizontally and for core walls vertical pipeline of 320 m was installed to transport concrete vertically using appropriate number of bends in the line arrangement.
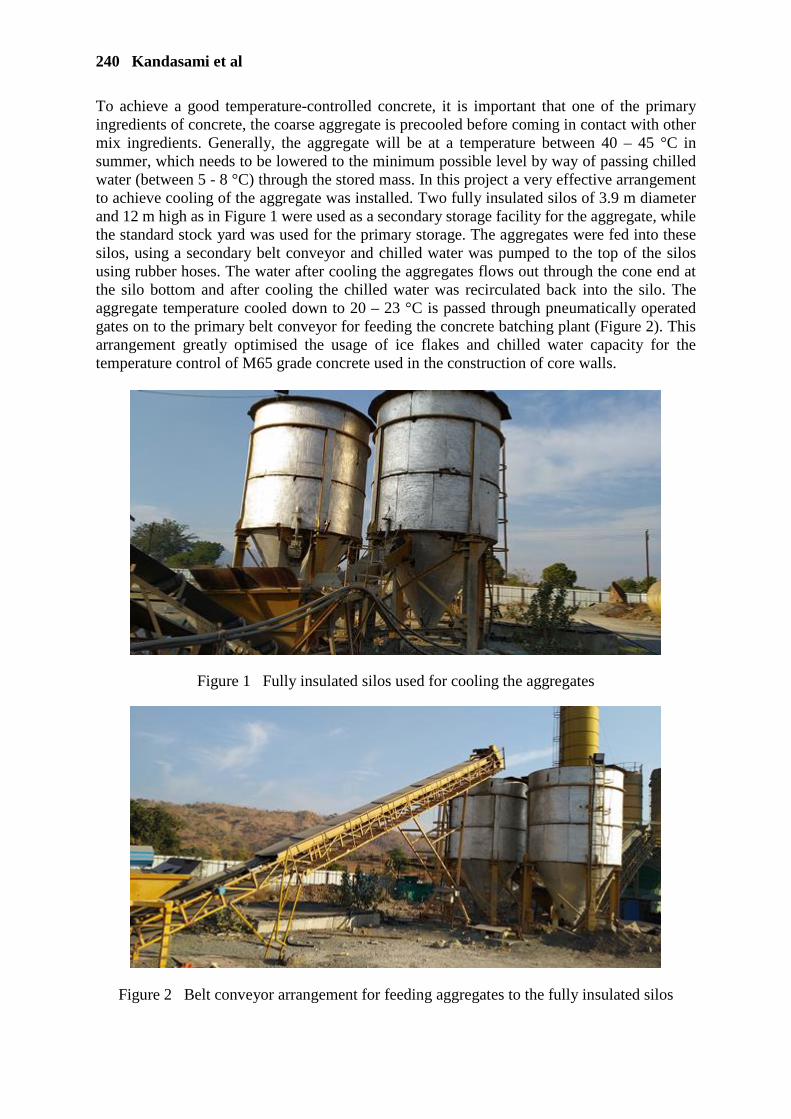
240 Kandasami et al
To achieve a good temperature-controlled concrete, it is important that one of the primary ingredients of concrete, the coarse aggregate is precooled before coming in contact with other mix ingredients. Generally, the aggregate will be at a temperature between 40 – 45 °C in summer, which needs to be lowered to the minimum possible level by way of passing chilled water (between 5 - 8 °C) through the stored mass. In this project a very effective arrangement to achieve cooling of the aggregate was installed. Two fully insulated silos of 3.9 m diameter and 12 m high as in Figure 1 were used as a secondary storage facility for the aggregate, while the standard stock yard was used for the primary storage. The aggregates were fed into these silos, using a secondary belt conveyor and chilled water was pumped to the top of the silos using rubber hoses. The water after cooling the aggregates flows out through the cone end at the silo bottom and after cooling the chilled water was recirculated back into the silo. The aggregate temperature cooled down to 20 – 23 °C is passed through pneumatically operated gates on to the primary belt conveyor for feeding the concrete batching plant (Figure 2). This arrangement greatly optimised the usage of ice flakes and chilled water capacity for the temperature control of M65 grade concrete used in the construction of core walls.
Figure 1 Fully insulated silos used for cooling the aggregates
Figure 2 Belt conveyor arrangement for feeding aggregates to the fully insulated silos
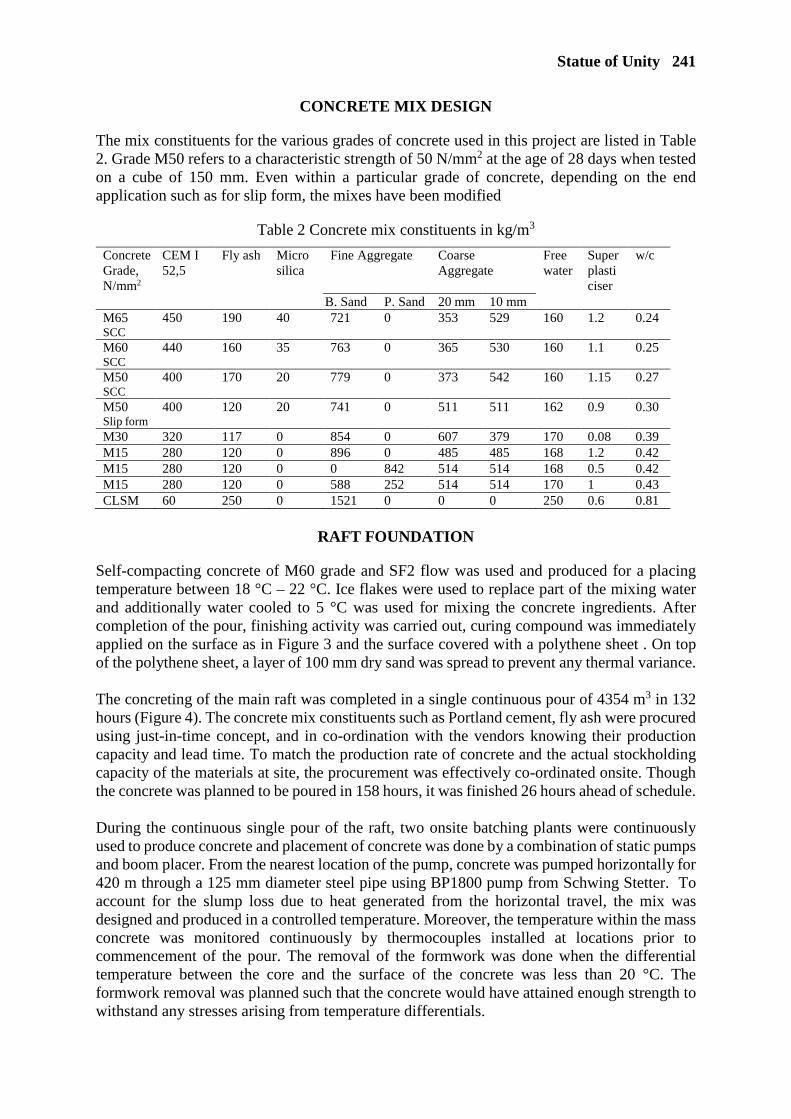
Statue of Unity 241
CONCRETE MIX DESIGN
The mix constituents for the various grades of concrete used in this project are listed in Table 2. Grade M50 refers to a characteristic strength of 50 N/mm2 at the age of 28 days when tested on a cube of 150 mm. Even within a particular grade of concrete, depending on the end application such as for slip form, the mixes have been modified
Table 2 Concrete mix constituents in kg/m3
Concrete Grade, N/mm2
CEM I 52,5
Fly ash Micro silica
Fine Aggregate Coarse Aggregate
Free water
Super plasticiser
w/c
B. Sand P. Sand 20 mm 10 mm M65 SCC
450 190 40 721 0 353 529 160 1.2 0.24
M60 SCC
440 160 35 763 0 365 530 160 1.1 0.25
M50 SCC
400 170 20 779 0 373 542 160 1.15 0.27
M50 Slip form
400 120 20 741 0 511 511 162 0.9 0.30
M30 320 117 0 854 0 607 379 170 0.08 0.39 M15 280 120 0 896 0 485 485 168 1.2 0.42 M15 280 120 0 0 842 514 514 168 0.5 0.42 M15 280 120 0 588 252 514 514 170 1 0.43 CLSM 60 250 0 1521 0 0 0 250 0.6 0.81
RAFT FOUNDATION
Self-compacting concrete of M60 grade and SF2 flow was used and produced for a placing temperature between 18 °C – 22 °C. Ice flakes were used to replace part of the mixing water and additionally water cooled to 5 °C was used for mixing the concrete ingredients. After completion of the pour, finishing activity was carried out, curing compound was immediately applied on the surface as in Figure 3 and the surface covered with a polythene sheet . On top of the polythene sheet, a layer of 100 mm dry sand was spread to prevent any thermal variance. The concreting of the main raft was completed in a single continuous pour of 4354 m3 in 132 hours (Figure 4). The concrete mix constituents such as Portland cement, fly ash were procured using just-in-time concept, and in co-ordination with the vendors knowing their production capacity and lead time. To match the production rate of concrete and the actual stockholding capacity of the materials at site, the procurement was effectively co-ordinated onsite. Though the concrete was planned to be poured in 158 hours, it was finished 26 hours ahead of schedule. During the continuous single pour of the raft, two onsite batching plants were continuously used to produce concrete and placement of concrete was done by a combination of static pumps and boom placer. From the nearest location of the pump, concrete was pumped horizontally for 420 m through a 125 mm diameter steel pipe using BP1800 pump from Schwing Stetter. To account for the slump loss due to heat generated from the horizontal travel, the mix was designed and produced in a controlled temperature. Moreover, the temperature within the mass concrete was monitored continuously by thermocouples installed at locations prior to commencement of the pour. The removal of the formwork was done when the differential temperature between the core and the surface of the concrete was less than 20 °C. The formwork removal was planned such that the concrete would have attained enough strength to withstand any stresses arising from temperature differentials.
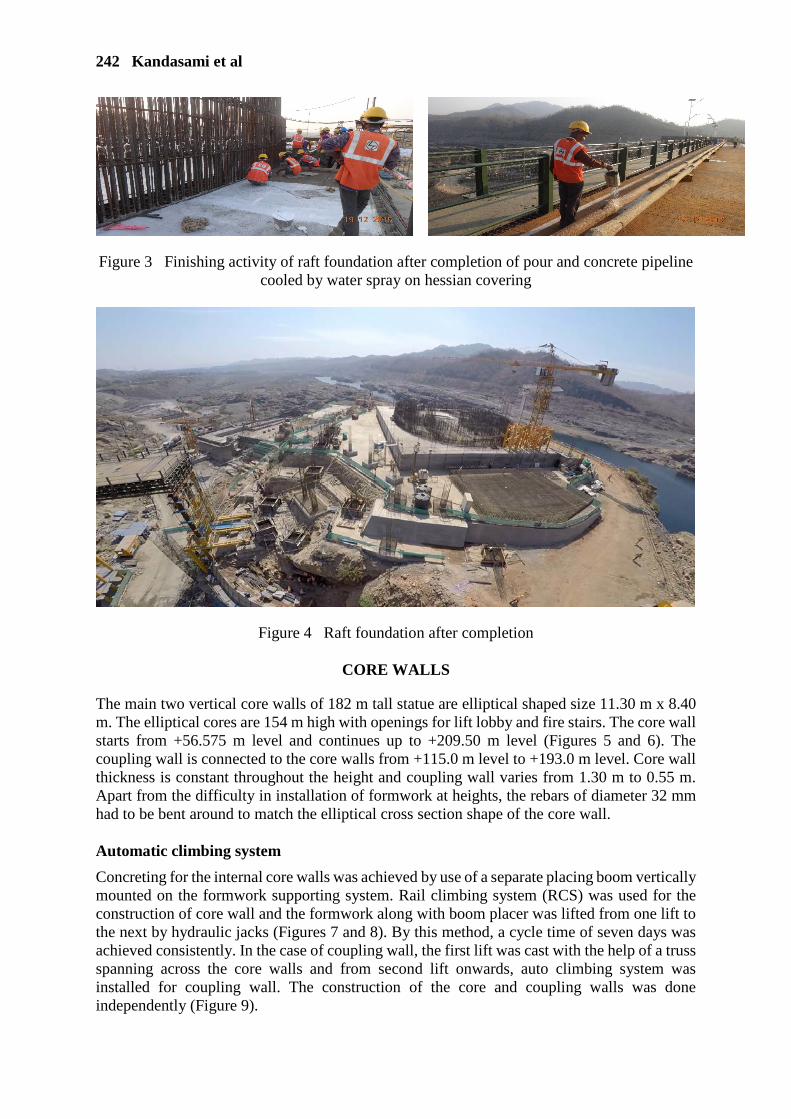
242 Kandasami et al
Figure 3 Finishing activity of raft foundation after completion of pour and concrete pipeline cooled by water spray on hessian covering
Figure 4 Raft foundation after completion
CORE WALLS
The main two vertical core walls of 182 m tall statue are elliptical shaped size 11.30 m x 8.40 m. The elliptical cores are 154 m high with openings for lift lobby and fire stairs. The core wall starts from +56.575 m level and continues up to +209.50 m level (Figures 5 and 6). The coupling wall is connected to the core walls from +115.0 m level to +193.0 m level. Core wall thickness is constant throughout the height and coupling wall varies from 1.30 m to 0.55 m. Apart from the difficulty in installation of formwork at heights, the rebars of diameter 32 mm had to be bent around to match the elliptical cross section shape of the core wall. Automatic climbing system
Concreting for the internal core walls was achieved by use of a separate placing boom vertically mounted on the formwork supporting system. Rail climbing system (RCS) was used for the construction of core wall and the formwork along with boom placer was lifted from one lift to the next by hydraulic jacks (Figures 7 and 8). By this method, a cycle time of seven days was achieved consistently. In the case of coupling wall, the first lift was cast with the help of a truss spanning across the core walls and from second lift onwards, auto climbing system was installed for coupling wall. The construction of the core and coupling walls was done independently (Figure 9).

Statue of Unity 243
Figure 5 Perspective view of core wall Figure 6 Typical cut section of core wall above 83 m
Figure 7 Rail climbing system section Figure 8 RCS in action
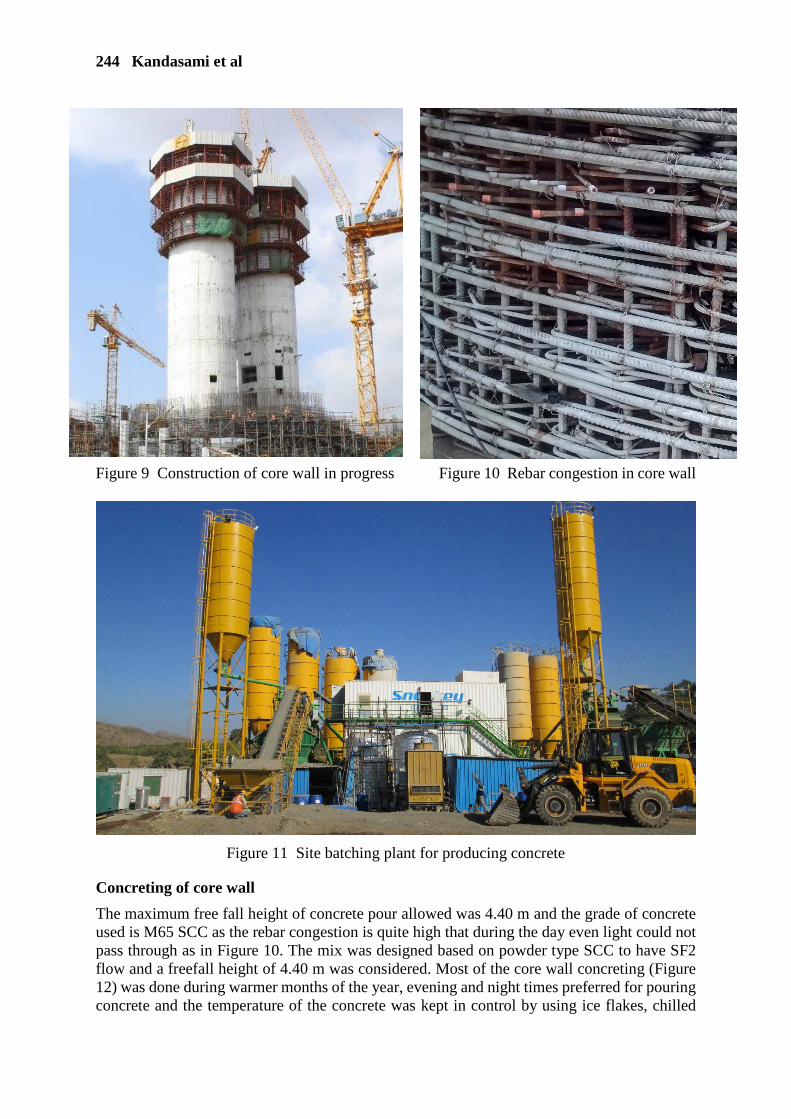
244 Kandasami et al
Figure 9 Construction of core wall in progress Figure 10 Rebar congestion in core wall
Figure 11 Site batching plant for producing concrete
Concreting of core wall
The maximum free fall height of concrete pour allowed was 4.40 m and the grade of concrete used is M65 SCC as the rebar congestion is quite high that during the day even light could not pass through as in Figure 10. The mix was designed based on powder type SCC to have SF2 flow and a freefall height of 4.40 m was considered. Most of the core wall concreting (Figure 12) was done during warmer months of the year, evening and night times preferred for pouring concrete and the temperature of the concrete was kept in control by using ice flakes, chilled
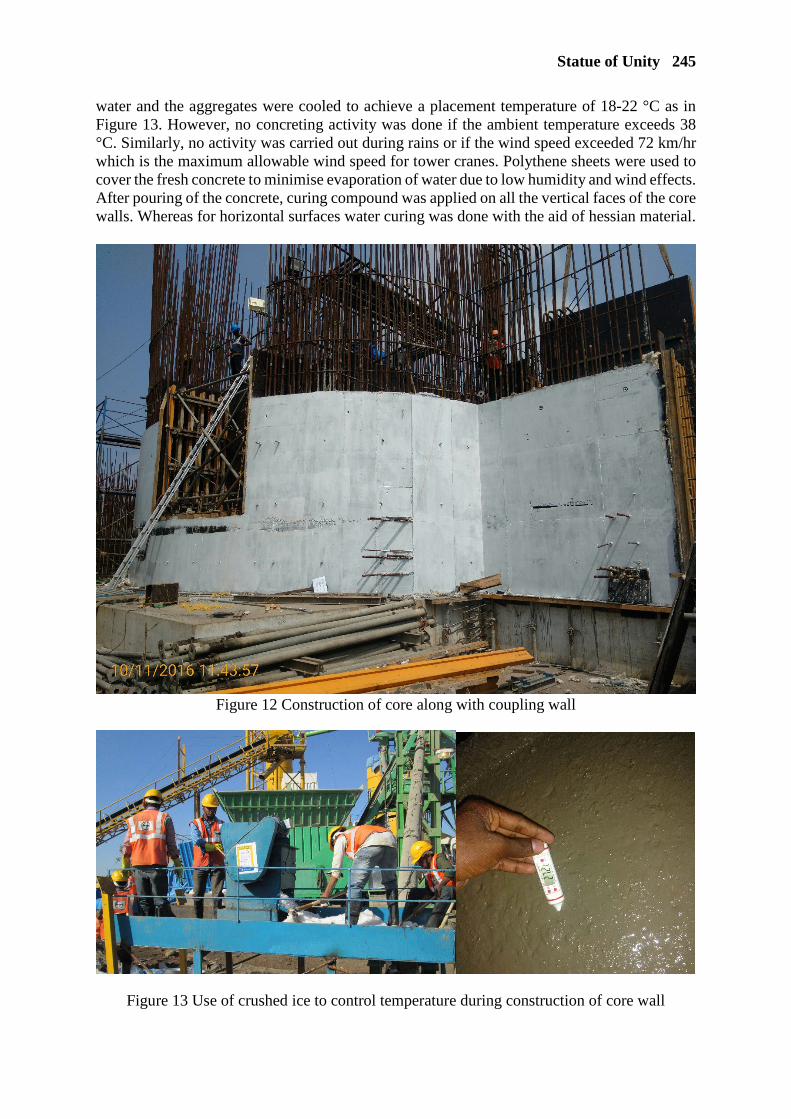
Statue of Unity 245
water and the aggregates were cooled to achieve a placement temperature of 18-22 °C as in Figure 13. However, no concreting activity was done if the ambient temperature exceeds 38 °C. Similarly, no activity was carried out during rains or if the wind speed exceeded 72 km/hr which is the maximum allowable wind speed for tower cranes. Polythene sheets were used to cover the fresh concrete to minimise evaporation of water due to low humidity and wind effects. After pouring of the concrete, curing compound was applied on all the vertical faces of the core walls. Whereas for horizontal surfaces water curing was done with the aid of hessian material.
Figure 12 Construction of core along with coupling wall
Figure 13 Use of crushed ice to control temperature during construction of core wall

246 Kandasami et al
Figure 14 Statue of Unity after completion

Statue of Unity 247
ENGINEERING PROPERTIES
Whilst everyday routine tests for fresh and hardened concrete properties such as slump-flow, cube strength were done at site, engineering properties of the concrete such as creep, shrinkage and modulus of elasticity for M50 and M65 were done in controlled conditions at the concrete laboratory in IIT Madras [5]. 150 mm cube and cylinder (150 mm Ø x 300 mm) specimens stored in water at the site for 7 days were transported to the laboratory in a carefully wrapped condition as in Figure 15. The specimens were placed under water curing in the laboratory until the test. Compressive strength of concrete was determined by testing on both cube and cylinder specimens. Variation in the compressive strength results is within acceptable limits (Table 3). Using cylinder specimens, elastic modulus was determined as per ASTM C469 and found to be within acceptable limits as well (Table 4). Compression creep test
To ensure surface planeness the two ends of the cylinder specimens were made even by grinding. After preparing the specimens, two reference pins were fixed using a reference gauge along three generatrices of the cylinder at 120° to each other. RILEM TC 107-CSP procedure was followed for doing the creep tests (drying and basic) under compression in a controlled environment of 25±1 °C and a RH of 65±3%. The set up consisting of a frame mounted on four springs at the corners is shown in Figure 16. Each frame consists of a load cell arrangement on top of two concrete cylinders stacked. The specimens were loaded axially by a 100 t capacity hydraulic jack and the bottom end of the specimen rests on a movable platen to eliminate eccentricity in loading. Prior to the loading, DEMEC readings were recorded for strain calculations. The maximum load applied was one-third of the compressive strength determined by testing specimens from the same concrete batch. To maintain the loading at a constant level, the frame was locked by tightening the screws of the horizontal plate above the load cell. The hydraulic jack was then removed and data from the load cell was recorded by a logger.
Figure 15 Typical storage of specimens Figure 16 Creep testing frame
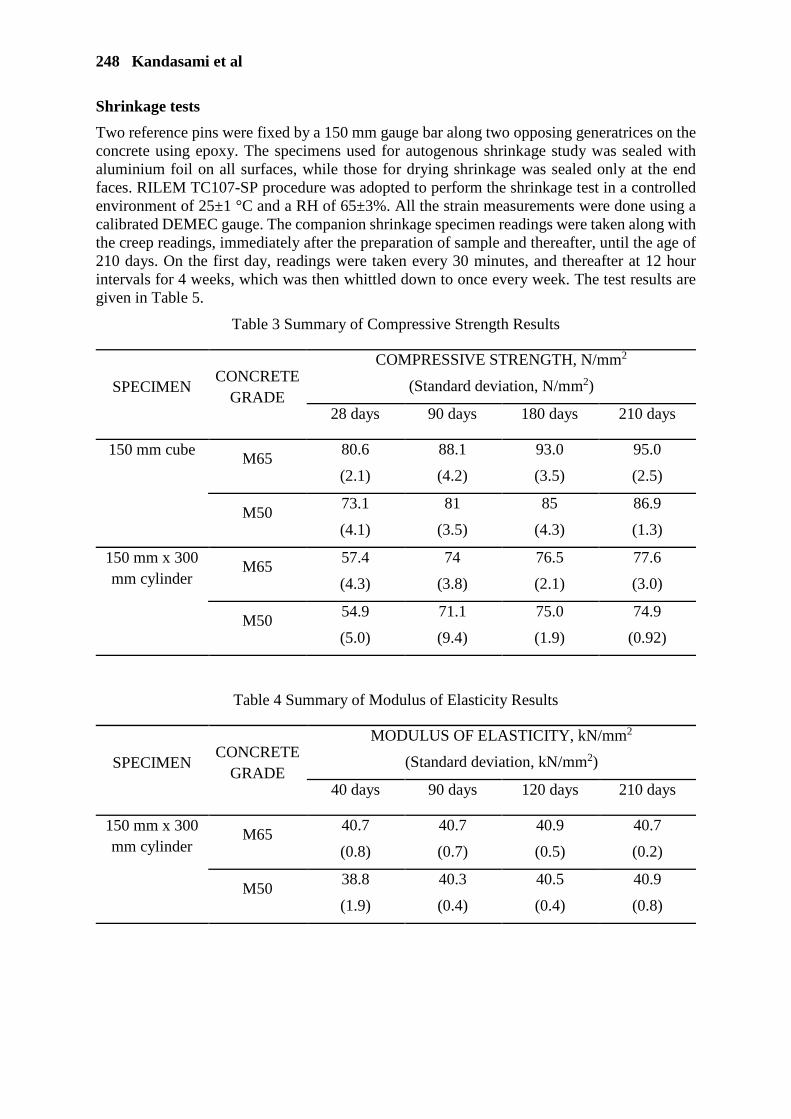
248 Kandasami et al
Shrinkage tests
Two reference pins were fixed by a 150 mm gauge bar along two opposing generatrices on the concrete using epoxy. The specimens used for autogenous shrinkage study was sealed with aluminium foil on all surfaces, while those for drying shrinkage was sealed only at the end faces. RILEM TC107-SP procedure was adopted to perform the shrinkage test in a controlled environment of 25±1 °C and a RH of 65±3%. All the strain measurements were done using a calibrated DEMEC gauge. The companion shrinkage specimen readings were taken along with the creep readings, immediately after the preparation of sample and thereafter, until the age of 210 days. On the first day, readings were taken every 30 minutes, and thereafter at 12 hour intervals for 4 weeks, which was then whittled down to once every week. The test results are given in Table 5.
Table 3 Summary of Compressive Strength Results
SPECIMEN CONCRETE
GRADE
COMPRESSIVE STRENGTH, N/mm2
(Standard deviation, N/mm2)
28 days 90 days 180 days 210 days
150 mm cube M65
80.6
(2.1)
88.1
(4.2)
93.0
(3.5)
95.0
(2.5)
M50 73.1
(4.1)
81
(3.5)
85
(4.3)
86.9
(1.3)
150 mm x 300 mm cylinder
M65 57.4
(4.3)
74
(3.8)
76.5
(2.1)
77.6
(3.0)
M50 54.9
(5.0)
71.1
(9.4)
75.0
(1.9)
74.9
(0.92)
Table 4 Summary of Modulus of Elasticity Results
SPECIMEN CONCRETE
GRADE
MODULUS OF ELASTICITY, kN/mm2
(Standard deviation, kN/mm2)
40 days 90 days 120 days 210 days
150 mm x 300 mm cylinder
M65 40.7
(0.8)
40.7
(0.7)
40.9
(0.5)
40.7
(0.2)
M50 38.8
(1.9)
40.3
(0.4)
40.5
(0.4)
40.9
(0.8)
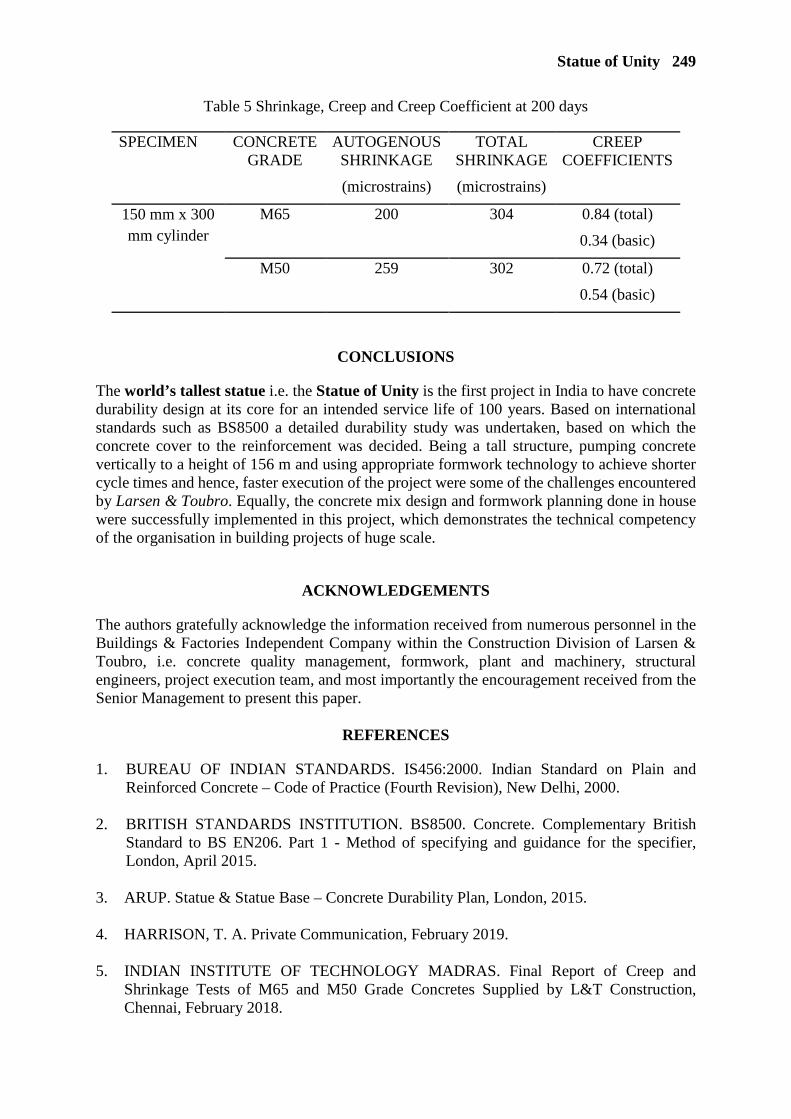
Statue of Unity 249
Table 5 Shrinkage, Creep and Creep Coefficient at 200 days
SPECIMEN CONCRETE GRADE
AUTOGENOUS SHRINKAGE
(microstrains)
TOTAL SHRINKAGE
(microstrains)
CREEP COEFFICIENTS
150 mm x 300 mm cylinder
M65 200 304 0.84 (total)
0.34 (basic)
M50 259 302 0.72 (total)
0.54 (basic)
CONCLUSIONS
The world’s tallest statue i.e. the Statue of Unity is the first project in India to have concrete durability design at its core for an intended service life of 100 years. Based on international standards such as BS8500 a detailed durability study was undertaken, based on which the concrete cover to the reinforcement was decided. Being a tall structure, pumping concrete vertically to a height of 156 m and using appropriate formwork technology to achieve shorter cycle times and hence, faster execution of the project were some of the challenges encountered by Larsen & Toubro. Equally, the concrete mix design and formwork planning done in house were successfully implemented in this project, which demonstrates the technical competency of the organisation in building projects of huge scale.
ACKNOWLEDGEMENTS
The authors gratefully acknowledge the information received from numerous personnel in the Buildings & Factories Independent Company within the Construction Division of Larsen & Toubro, i.e. concrete quality management, formwork, plant and machinery, structural engineers, project execution team, and most importantly the encouragement received from the Senior Management to present this paper.
REFERENCES
1. BUREAU OF INDIAN STANDARDS. IS456:2000. Indian Standard on Plain and Reinforced Concrete – Code of Practice (Fourth Revision), New Delhi, 2000.
2. BRITISH STANDARDS INSTITUTION. BS8500. Concrete. Complementary British Standard to BS EN206. Part 1 - Method of specifying and guidance for the specifier, London, April 2015.
3. ARUP. Statue & Statue Base – Concrete Durability Plan, London, 2015.
4. HARRISON, T. A. Private Communication, February 2019.
5. INDIAN INSTITUTE OF TECHNOLOGY MADRAS. Final Report of Creep and Shrinkage Tests of M65 and M50 Grade Concretes Supplied by L&T Construction, Chennai, February 2018.

ASSESSMENT OF DURABILITY OF ALKALI ACTIVATED MORTARS
I Papayianni
S Konopisi F Kesikidou
Aristotle University of Thessaloniki
Greece
ABSTRACT. One of the problems that hinder the widespread use of inorganic polymers in concrete is the lack of adequate durability tests and long term performance data. This paper contributes to durability issues of alkali activated mortars based on calcareous fly ash (CFA). Mixtures of CFA with steel Ladle Furnace Slag (LFS) and cement CEM II42.5 (C) at the following percentages by mass CFA 100%, CFA:LFS 80:20, CFA:LFS 50:50, CFA:C 80:20 were prepared. As aggregates glass cullet and sand (60:40 by mass) were used as well as a solution of NaOH 10M + Na2SiO3 as alkaline activator. The mortar samples were cured in the moulds at 25o C for 2 days and they were stored at an environment of 20o C and RH 95±5% up to 28-d age. Physico-mechanical properties were determined before mortars’ exposition to specific test conditions related to durability. The 28-d compressive strength of alkali activated fly ash based mortars ranged from 12-18MPa while at 90-d age the strength reached 16-25 MPa respectively. Previous investigation made by authors showed that in the case of calcareous fly ash two mechanisms proceed in parallel this of alkali activated polymerization contributing mainly to early strength development and that of pozzolanic reaction by which calcium silica hydrates enhance long term strength. The aforementioned mortars were tested in wet-dry cycling, freezing-thawing, chloride penetration and exposition to temperature and sulfuric acid attack by following existing standards or known from literature test methodologies. The resistance of mortars to wetting-drying was very good with very low mass loss 1-2% after 50 cycles and 4-5% after 100 cycles. Chloride penetration was measured by following wetting-drying cycles in sea water. After completion of 100 cycles the strength of mortars was not sensibly changed. In freeze-thaw cycling (ASTM C666) the tested mortar samples showed adequate performance up to 21-28 cycles by keeping their shape and losing only 0.35-1.06% of their mass but furthermore cycling resulted in significant mass loss and strength drop. The behaviour of the above mentioned mortars to exposure to high temperature (200, 400, 600, 800oC) was quite good taken into account that they contained glass cullet aggregate which are strongly influenced by temperature. Up to the temperature 400oC the residual strength of them after heating was ranged from 65-70% of their initial strength. After exposition to heating at 800oC of their strength they have lost around 80% of their strength. The tested mortars have also presented relatively good resistance to sulfuric acid. After one month immersion into solution of H2SO4 5% by mass a drop of strength around 50% was measured but after 90 days this drop was greater and deterioration of the specimen was obvious due to sulfuric acid reaction with crystallic calcitic phases as well as amorphous C-S-H and Al-Si based phases. Keywords: Fly ash, Ladle furnace slag, Alkali-activation, Durability Emeritus Professor Ioanna Papayianni, has served as Director of the Laboratory of Building Materials of the Aristotle University of Thessaloniki for several years. She is a member of numerous national and international technical committees and has published numerous papers on the properties of high calcium fly ash and its utilization in cement and concrete applications. Dr Stavroula Konopisi, Chemist, is a member of the teaching team in the Laboratory of Building Materials of the Aristotle University of Thessaloniki. Her research interests include chemical properties and geopolymerisation of industrial by-products. Ms Fotini Kesikidou, Civil Engineer, is a PhD Candidate in the Laboratory of Building Materials of the Aristotle University of Thessaloniki. Her research interests include mechanical characteristics of alkali-activated products.
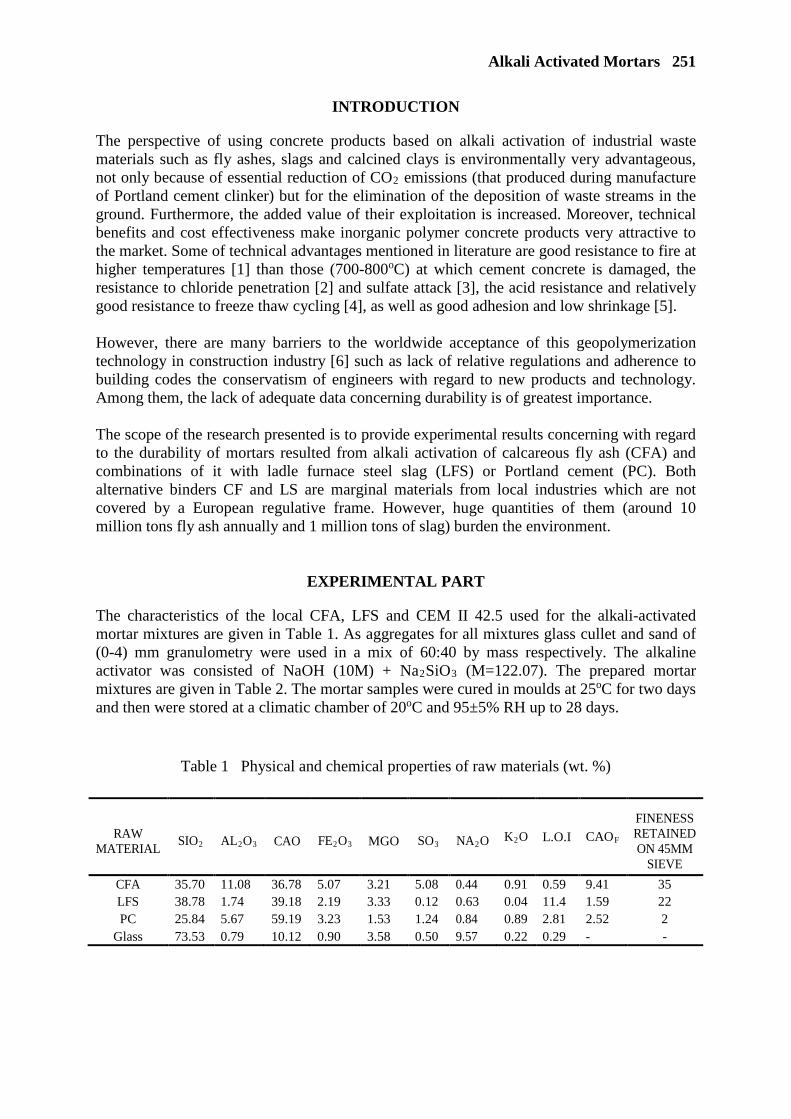
Alkali Activated Mortars 251
INTRODUCTION
The perspective of using concrete products based on alkali activation of industrial waste materials such as fly ashes, slags and calcined clays is environmentally very advantageous, not only because of essential reduction of CO2 emissions (that produced during manufacture of Portland cement clinker) but for the elimination of the deposition of waste streams in the ground. Furthermore, the added value of their exploitation is increased. Moreover, technical benefits and cost effectiveness make inorganic polymer concrete products very attractive to the market. Some of technical advantages mentioned in literature are good resistance to fire at higher temperatures [1] than those (700-800oC) at which cement concrete is damaged, the resistance to chloride penetration [2] and sulfate attack [3], the acid resistance and relatively good resistance to freeze thaw cycling [4], as well as good adhesion and low shrinkage [5]. However, there are many barriers to the worldwide acceptance of this geopolymerization technology in construction industry [6] such as lack of relative regulations and adherence to building codes the conservatism of engineers with regard to new products and technology. Among them, the lack of adequate data concerning durability is of greatest importance. The scope of the research presented is to provide experimental results concerning with regard to the durability of mortars resulted from alkali activation of calcareous fly ash (CFA) and combinations of it with ladle furnace steel slag (LFS) or Portland cement (PC). Both alternative binders CF and LS are marginal materials from local industries which are not covered by a European regulative frame. However, huge quantities of them (around 10 million tons fly ash annually and 1 million tons of slag) burden the environment.
EXPERIMENTAL PART
The characteristics of the local CFA, LFS and CEM II 42.5 used for the alkali-activated mortar mixtures are given in Table 1. As aggregates for all mixtures glass cullet and sand of (0-4) mm granulometry were used in a mix of 60:40 by mass respectively. The alkaline activator was consisted of NaOH (10M) + Na2SiO3 (M=122.07). The prepared mortar mixtures are given in Table 2. The mortar samples were cured in moulds at 25oC for two days and then were stored at a climatic chamber of 20oC and 95±5% RH up to 28 days.
Table 1 Physical and chemical properties of raw materials (wt. %)
RAW MATERIAL
SIO2 AL2O3 CAO FE2O3 MGO SO3 NA2O K2O L.O.I CAOF
FINENESS RETAINED ON 45ΜM
SIEVE
CFA 35.70 11.08 36.78 5.07 3.21 5.08 0.44 0.91 0.59 9.41 35 LFS 38.78 1.74 39.18 2.19 3.33 0.12 0.63 0.04 11.4 1.59 22 PC 25.84 5.67 59.19 3.23 1.53 1.24 0.84 0.89 2.81 2.52 2
Glass 73.53 0.79 10.12 0.90 3.58 0.50 9.57 0.22 0.29 - -
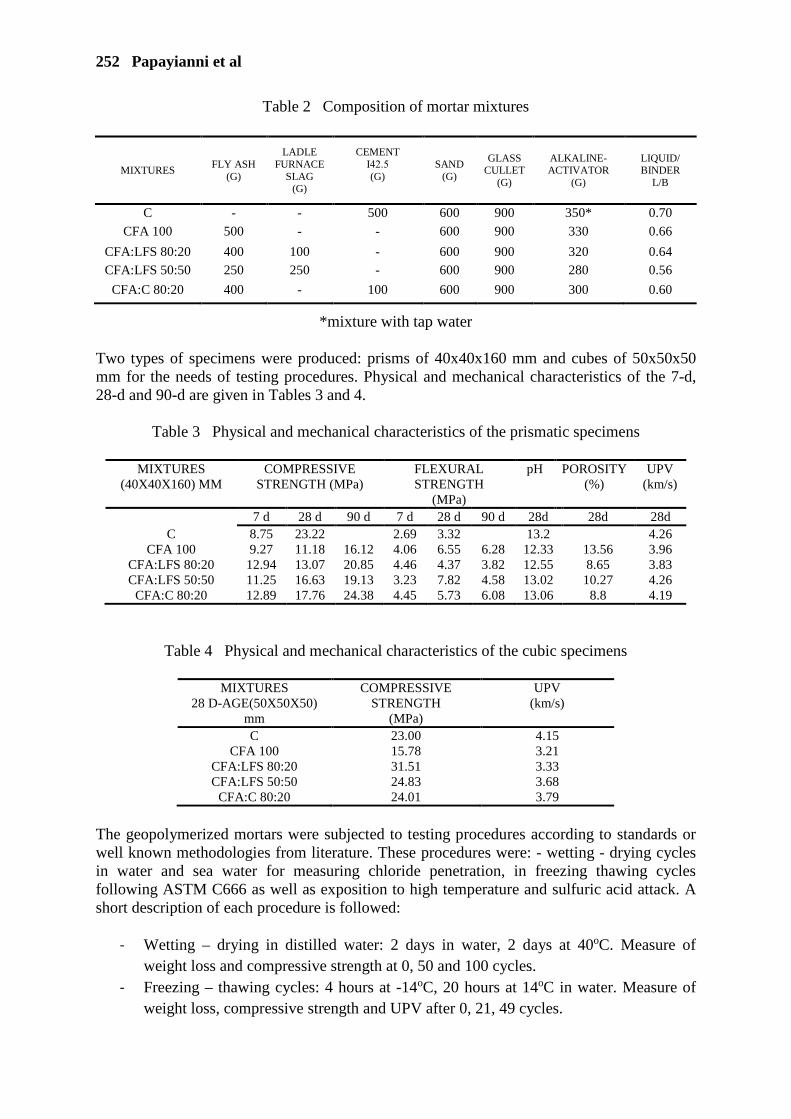
252 Papayianni et al
Table 2 Composition of mortar mixtures
*mixture with tap water Two types of specimens were produced: prisms of 40x40x160 mm and cubes of 50x50x50 mm for the needs of testing procedures. Physical and mechanical characteristics of the 7-d, 28-d and 90-d are given in Tables 3 and 4.
Table 3 Physical and mechanical characteristics of the prismatic specimens
MIXTURES (40X40X160) MM
COMPRESSIVE STRENGTH (MPa)
FLEXURAL STRENGTH
(MPa)
pH POROSITY (%)
UPV (km/s)
7 d 28 d 90 d 7 d 28 d 90 d 28d 28d 28d C 8.75 23.22 2.69 3.32 13.2 4.26
CFA 100 9.27 11.18 16.12 4.06 6.55 6.28 12.33 13.56 3.96 CFA:LFS 80:20 12.94 13.07 20.85 4.46 4.37 3.82 12.55 8.65 3.83 CFA:LFS 50:50 11.25 16.63 19.13 3.23 7.82 4.58 13.02 10.27 4.26
CFA:C 80:20 12.89 17.76 24.38 4.45 5.73 6.08 13.06 8.8 4.19
Table 4 Physical and mechanical characteristics of the cubic specimens
MIXTURES 28 D-AGE(50X50X50)
mm
COMPRESSIVE STRENGTH
(MPa)
UPV (km/s)
C 23.00 4.15 CFA 100 15.78 3.21
CFA:LFS 80:20 31.51 3.33 CFA:LFS 50:50 24.83 3.68
CFA:C 80:20 24.01 3.79
The geopolymerized mortars were subjected to testing procedures according to standards or well known methodologies from literature. These procedures were: - wetting - drying cycles in water and sea water for measuring chloride penetration, in freezing thawing cycles following ASTM C666 as well as exposition to high temperature and sulfuric acid attack. A short description of each procedure is followed:
- Wetting – drying in distilled water: 2 days in water, 2 days at 40oC. Measure of weight loss and compressive strength at 0, 50 and 100 cycles.
- Freezing – thawing cycles: 4 hours at -14oC, 20 hours at 14oC in water. Measure of weight loss, compressive strength and UPV after 0, 21, 49 cycles.
MIXTURES FLY ASH
(G)
LADLE FURNACE
SLAG (G)
CEMENT Ι42.5 (G)
SAND (G)
GLASS CULLET
(G)
ALKALINE-ACTIVATOR
(G)
LIQUID/ BINDER
L/B
C - - 500 600 900 350* 0.70
CFA 100 500 - - 600 900 330 0.66
CFA:LFS 80:20 400 100 - 600 900 320 0.64
CFA:LFS 50:50 250 250 - 600 900 280 0.56
CFA:C 80:20 400 - 100 600 900 300 0.60
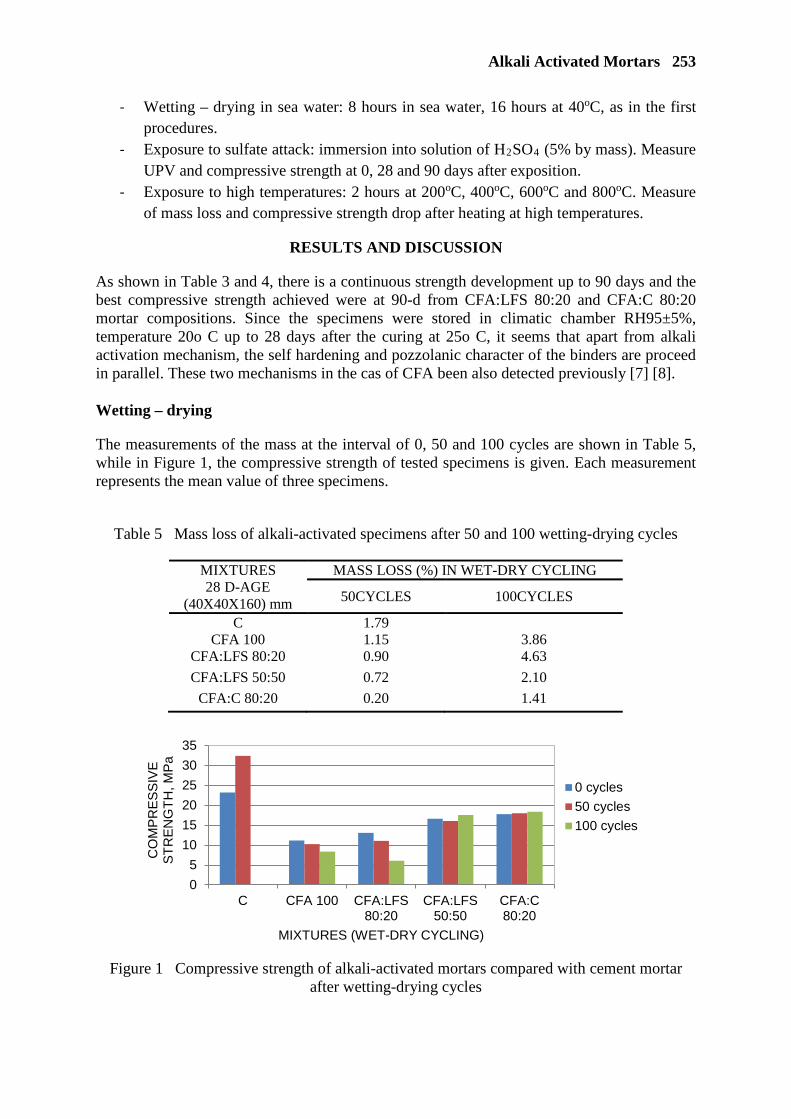
Alkali Activated Mortars 253
- Wetting – drying in sea water: 8 hours in sea water, 16 hours at 40oC, as in the first procedures.
- Exposure to sulfate attack: immersion into solution of H2SO4 (5% by mass). Measure UPV and compressive strength at 0, 28 and 90 days after exposition.
- Exposure to high temperatures: 2 hours at 200oC, 400oC, 600oC and 800oC. Measure of mass loss and compressive strength drop after heating at high temperatures.
RESULTS AND DISCUSSION
As shown in Table 3 and 4, there is a continuous strength development up to 90 days and the best compressive strength achieved were at 90-d from CFA:LFS 80:20 and CFA:C 80:20 mortar compositions. Since the specimens were stored in climatic chamber RH95±5%, temperature 20o C up to 28 days after the curing at 25o C, it seems that apart from alkali activation mechanism, the self hardening and pozzolanic character of the binders are proceed in parallel. These two mechanisms in the cas of CFA been also detected previously [7] [8]. Wetting – drying
The measurements of the mass at the interval of 0, 50 and 100 cycles are shown in Table 5, while in Figure 1, the compressive strength of tested specimens is given. Each measurement represents the mean value of three specimens.
Table 5 Mass loss of alkali-activated specimens after 50 and 100 wetting-drying cycles
MIXTURES 28 D-AGE
(40X40X160) mm
MASS LOSS (%) IN WET-DRY CYCLING
50CYCLES 100CYCLES
C 1.79 CFA 100 1.15 3.86
CFA:LFS 80:20 0.90 4.63
CFA:LFS 50:50 0.72 2.10
CFA:C 80:20 0.20 1.41
Figure 1 Compressive strength of alkali-activated mortars compared with cement mortar
after wetting-drying cycles
05
101520253035
C CFA 100 CFA:LFS80:20
CFA:LFS50:50
CFA:C80:20
CO
MPR
ESSI
VE
STR
ENG
TH,M
Pa
MIXTURES (WET-DRY CYCLING)
0 cycles50 cycles100 cycles
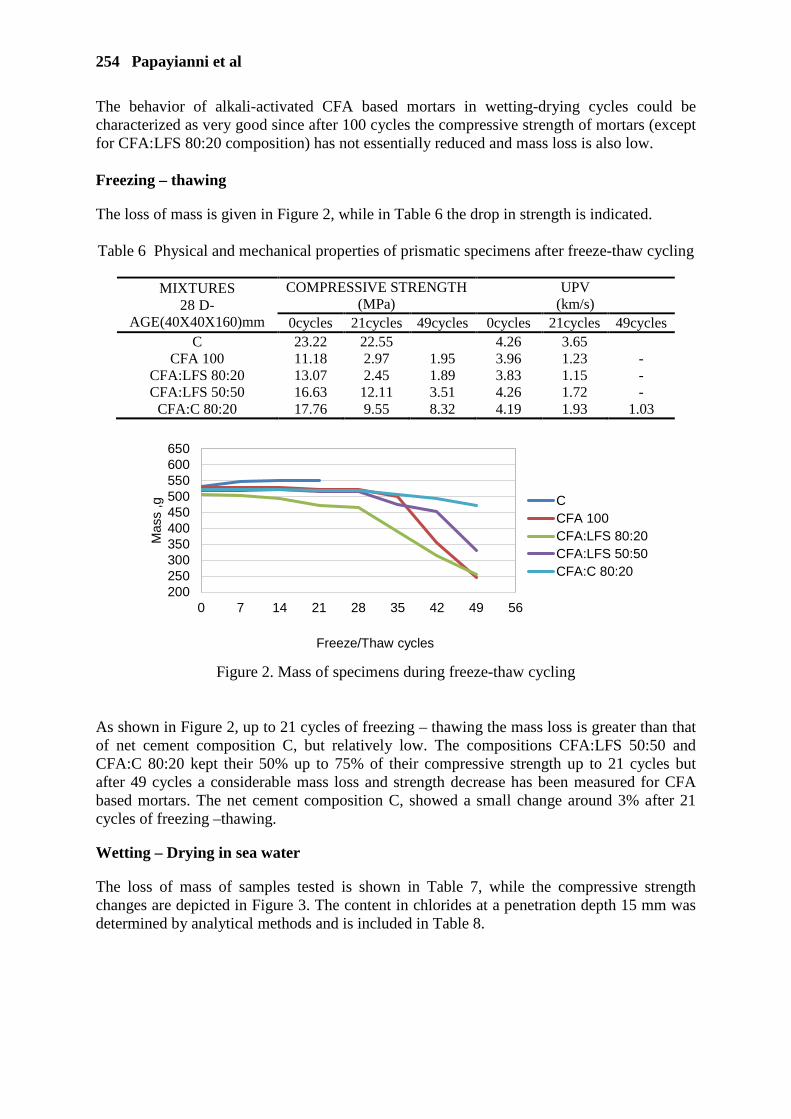
254 Papayianni et al
The behavior of alkali-activated CFA based mortars in wetting-drying cycles could be characterized as very good since after 100 cycles the compressive strength of mortars (except for CFA:LFS 80:20 composition) has not essentially reduced and mass loss is also low. Freezing – thawing
The loss of mass is given in Figure 2, while in Table 6 the drop in strength is indicated. Table 6 Physical and mechanical properties of prismatic specimens after freeze-thaw cycling
MIXTURES
28 D-AGE(40X40X160)mm
COMPRESSIVE STRENGTH (MPa)
UPV (km/s)
0cycles 21cycles 49cycles 0cycles 21cycles 49cycles C 23.22 22.55 4.26 3.65
CFA 100 11.18 2.97 1.95 3.96 1.23 - CFA:LFS 80:20 13.07 2.45 1.89 3.83 1.15 - CFA:LFS 50:50 16.63 12.11 3.51 4.26 1.72 -
CFA:C 80:20 17.76 9.55 8.32 4.19 1.93 1.03
Figure 2. Mass of specimens during freeze-thaw cycling
As shown in Figure 2, up to 21 cycles of freezing – thawing the mass loss is greater than that of net cement composition C, but relatively low. The compositions CFA:LFS 50:50 and CFA:C 80:20 kept their 50% up to 75% of their compressive strength up to 21 cycles but after 49 cycles a considerable mass loss and strength decrease has been measured for CFA based mortars. The net cement composition C, showed a small change around 3% after 21 cycles of freezing –thawing. Wetting – Drying in sea water
The loss of mass of samples tested is shown in Table 7, while the compressive strength changes are depicted in Figure 3. The content in chlorides at a penetration depth 15 mm was determined by analytical methods and is included in Table 8.
200250300350400450500550600650
0 7 14 21 28 35 42 49 56
Mas
s ,g
Freeze/Thaw cycles
CCFA 100CFA:LFS 80:20CFA:LFS 50:50CFA:C 80:20
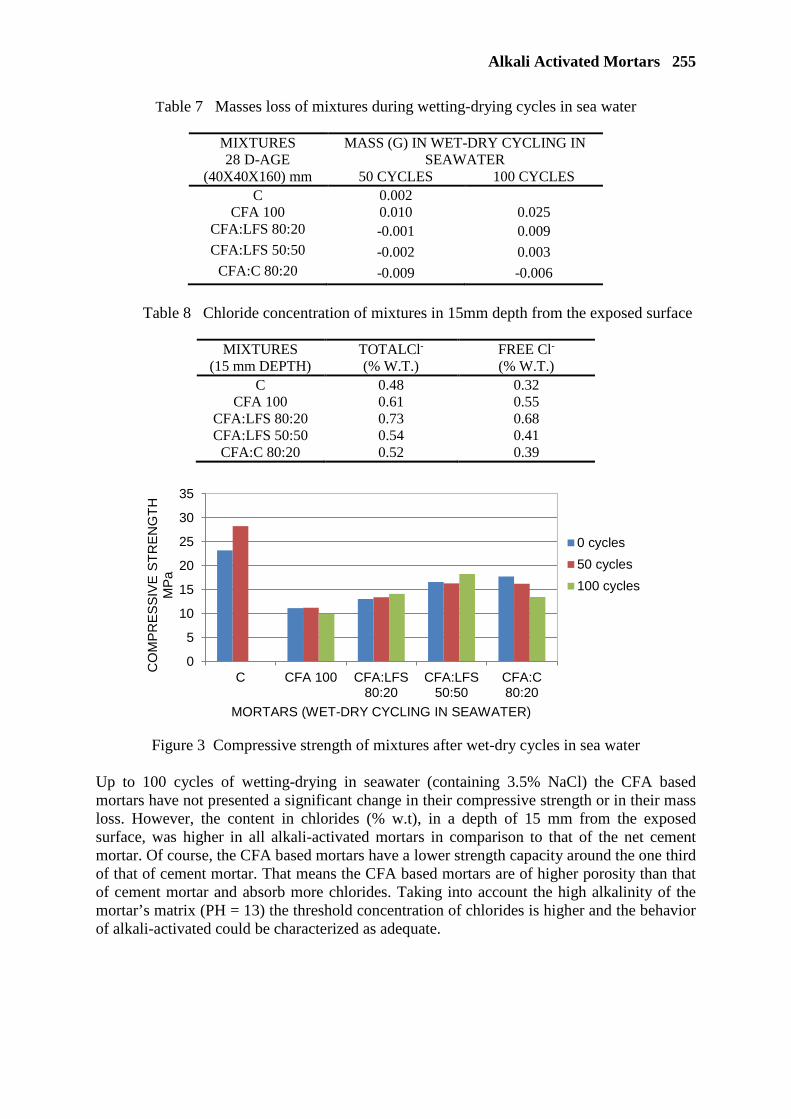
Alkali Activated Mortars 255
Table 7 Masses loss of mixtures during wetting-drying cycles in sea water
MIXTURES 28 D-AGE
(40X40X160) mm
MASS (G) IN WET-DRY CYCLING IN SEAWATER
50 CYCLES 100 CYCLES C 0.002
CFA 100 0.010 0.025 CFA:LFS 80:20 -0.001 0.009 CFA:LFS 50:50 -0.002 0.003
CFA:C 80:20 -0.009 -0.006
Table 8 Chloride concentration of mixtures in 15mm depth from the exposed surface
MIXTURES (15 mm DEPTH)
TOTALCl-
(% W.T.) FREE Cl-
(% W.T.) C 0.48 0.32
CFA 100 0.61 0.55 CFA:LFS 80:20 0.73 0.68 CFA:LFS 50:50 0.54 0.41
CFA:C 80:20 0.52 0.39
Figure 3 Compressive strength of mixtures after wet-dry cycles in sea water
Up to 100 cycles of wetting-drying in seawater (containing 3.5% NaCl) the CFA based mortars have not presented a significant change in their compressive strength or in their mass loss. However, the content in chlorides (% w.t), in a depth of 15 mm from the exposed surface, was higher in all alkali-activated mortars in comparison to that of the net cement mortar. Of course, the CFA based mortars have a lower strength capacity around the one third of that of cement mortar. That means the CFA based mortars are of higher porosity than that of cement mortar and absorb more chlorides. Taking into account the high alkalinity of the mortar’s matrix (PH = 13) the threshold concentration of chlorides is higher and the behavior of alkali-activated could be characterized as adequate.
0
5
10
15
20
25
30
35
C CFA 100 CFA:LFS80:20
CFA:LFS50:50
CFA:C80:20
CO
MPR
ESSI
VE S
TREN
GTH
M
Pa
MORTARS (WET-DRY CYCLING IN SEAWATER)
0 cycles50 cycles100 cycles
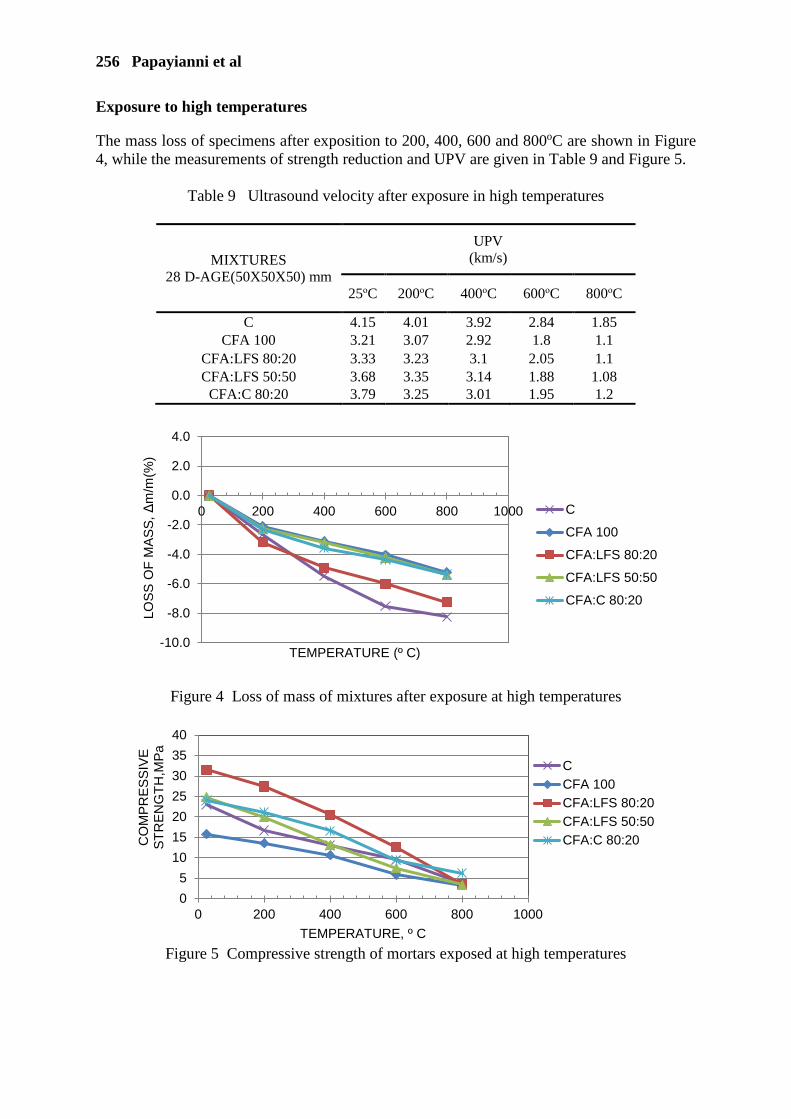
256 Papayianni et al
Exposure to high temperatures
The mass loss of specimens after exposition to 200, 400, 600 and 800oC are shown in Figure 4, while the measurements of strength reduction and UPV are given in Table 9 and Figure 5.
Table 9 Ultrasound velocity after exposure in high temperatures
MIXTURES 28 D-AGE(50X50X50) mm
UPV (km/s)
25οC 200οC 400οC 600οC 800οC
C 4.15 4.01 3.92 2.84 1.85 CFA 100 3.21 3.07 2.92 1.8 1.1
CFA:LFS 80:20 3.33 3.23 3.1 2.05 1.1 CFA:LFS 50:50 3.68 3.35 3.14 1.88 1.08
CFA:C 80:20 3.79 3.25 3.01 1.95 1.2
Figure 4 Loss of mass of mixtures after exposure at high temperatures
Figure 5 Compressive strength of mortars exposed at high temperatures
-10.0
-8.0
-6.0
-4.0
-2.0
0.0
2.0
4.0
0 200 400 600 800 1000
LOSS
OF
MAS
S, Δ
m/m
(%)
TEMPERATURE (º C)
C
CFA 100
CFA:LFS 80:20
CFA:LFS 50:50
CFA:C 80:20
05
10152025303540
0 200 400 600 800 1000
CO
MPR
ESSI
VE
STR
ENG
TH,M
Pa
TEMPERATURE, º C
CCFA 100CFA:LFS 80:20CFA:LFS 50:50CFA:C 80:20
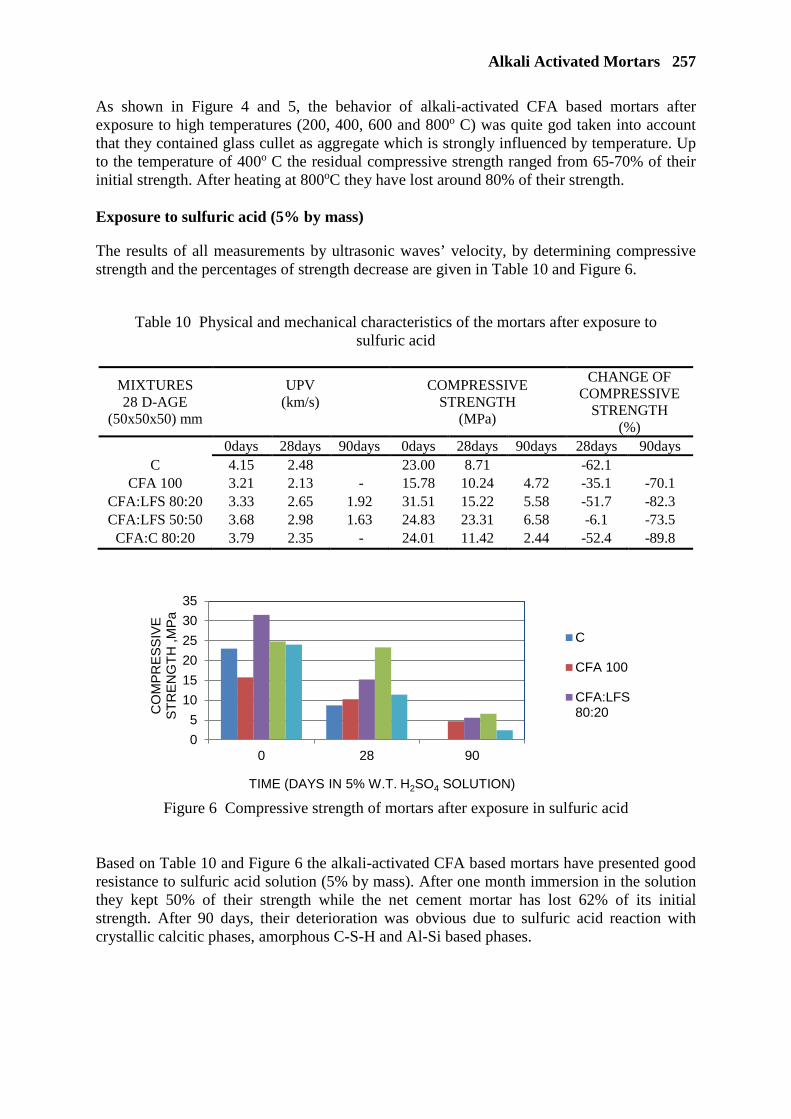
Alkali Activated Mortars 257
As shown in Figure 4 and 5, the behavior of alkali-activated CFA based mortars after exposure to high temperatures (200, 400, 600 and 800o C) was quite god taken into account that they contained glass cullet as aggregate which is strongly influenced by temperature. Up to the temperature of 400o C the residual compressive strength ranged from 65-70% of their initial strength. After heating at 800oC they have lost around 80% of their strength. Exposure to sulfuric acid (5% by mass)
The results of all measurements by ultrasonic waves’ velocity, by determining compressive strength and the percentages of strength decrease are given in Table 10 and Figure 6.
Table 10 Physical and mechanical characteristics of the mortars after exposure to sulfuric acid
MIXTURES 28 D-AGE
(50x50x50) mm
UPV (km/s)
COMPRESSIVE STRENGTH
(MPa)
CHANGE OF COMPRESSIVE
STRENGTH (%)
0days 28days 90days 0days 28days 90days 28days 90days C 4.15 2.48 23.00 8.71 -62.1
CFA 100 3.21 2.13 - 15.78 10.24 4.72 -35.1 -70.1 CFA:LFS 80:20 3.33 2.65 1.92 31.51 15.22 5.58 -51.7 -82.3 CFA:LFS 50:50 3.68 2.98 1.63 24.83 23.31 6.58 -6.1 -73.5
CFA:C 80:20 3.79 2.35 - 24.01 11.42 2.44 -52.4 -89.8
Figure 6 Compressive strength of mortars after exposure in sulfuric acid
Based on Table 10 and Figure 6 the alkali-activated CFA based mortars have presented good resistance to sulfuric acid solution (5% by mass). After one month immersion in the solution they kept 50% of their strength while the net cement mortar has lost 62% of its initial strength. After 90 days, their deterioration was obvious due to sulfuric acid reaction with crystallic calcitic phases, amorphous C-S-H and Al-Si based phases.
05
101520253035
0 28 90
CO
MPR
ESSI
VE
STR
ENG
TH,M
Pa
TIME (DAYS IN 5% W.T. H2SO4 SOLUTION)
C
CFA 100
CFA:LFS80:20
258 Papayianni et al
CONCLUSIONS
The alkali-activated mortars were exposed to a series of accelerated test methods commonly used for evaluating the durability of cement based mortars/concretes. Although, the 28-d strength of them was relatively low 12-18 MPa, their resistance to the repeated exposure to the very aggressive conditions of the applied test methods was very good. Furthermore, experimental work is needed to find limits in strength required for resistance to each specific class of exposure according to EN 206 Manual of Concrete. Based on this research work done as well as on literature it could be said that up to now the results are very encouraging.
REFERENCES
1. NATALI MURRI, A., RICKARD, W.D.A., BIGNOZZI, M.C. AND VAN RIESSEN, A. High temperature behaviour of ambient cured alkali-activated materials based on ladle slag, Cement and Concrete Research, Vol. 43, 2013, pp 51-61.
2. PUERTAS, F., MEJÍA DE GUTIERREZ, R., FERNÁNDEZ-JIMÉNEZ, A.,
DELVASTO, S. AND MALDONADO, J. Alkaline cement mortars. Chemical resistance to sulfate and seawater attack, Materiales de Construcción, Vol.52, (2002), pp 55-71.
3. MONTEIRO, P.J.M. Scaling and saturation laws for the expansion of concrete exposed
to sulfate attack, Proceedings of National Academy of Sciences of the USA, Vol. 103, No. 31, 2006, pp 11467-11472.
4. BILEK, V. AND SZKLORZOVA, H. Freezing and thawing resistance of alkali-activated
concretes for the production of building elements. In: Malhotra, V.M., (ed.) Proceedings of 10th CANMET/ACI Conference on Recent Advances in Concrete Technology, supplementary papers, Seville, Spain, 2009, pp. 661-670.
5. PROVIS, J. L. AND VAN DEVENTER, J. S. J. (Eds.) Alkali Activated Materials :
State-of-the-Art Report, RILEM TC 224-AAM, Springer, Netherlands, 2014. 6. DUXSON, P., PROVIS, J.L., LUKEY, G.C. AND VAN DEVENTER, J. S. J. The role
of inorganic polymer technology in the development of “green concrete. Cement and Concrete Research, Vol. 37, 2007, pp 1590-1597.
7. PAPAYIANNI, I. AND KONOPISI S. Study on Geopolymerization of High Lime Fly
Ashes, Proceedings of 8th Int. Conference Concrete in the Low Carbon Era, Dundee, UK. pp. 519-533.
8. PAPAYIANNI, I., KONOPISI S. AND KESIKIDOU F. Physico-mechanical properties
and durability aspects of alkali-activated calcareous fly ash/slag mortars. Key Engineering Materials, Vol. 761, 2018, pp 87-91.
PERFORMANCE OF DRY AND MOIST CALCAREOUS FLY ASH IN SOIL STABILIZATION
I Papayianni
E Anastasiou
M Papachristoforou C Kaplanidis P Bairaklili
Aristotle University of Thessaloniki
Greece
ABSTRACT. Calcareous Fly Ash (CFA) is produced at power plants by combustion of lignite or sub-bituminous coal. It constitutes more than half of the total fly ash output in Europe. It is selected dry for its use in cement/concrete industry, or it is sprayed with water (around 30% of its mass) and deposited in old lignite mines. In this paper, dry and moist CFA were tested as soil stabilizers. The common uses of CFA in this sector are for drying effect on moisture content of soils, limiting shrink-swell potential of clay soils, increasing strength properties of soils or stabilizing aggregate pavement bases. An adequate volume of soil was taken from excavations done for the construction of the subway in the area of Micra, in Thessaloniki, Greece. Properties of both (dry and moist) CFAs were also determined by chemical analysis, XRD diagrams and testing their pozzolanicity. Then, modified Proctor and CBR test methods were applied to plain soil and dry and moist CFAs and mixtures of soil. From the comparison of the CBR values, it seems that the CBR value of soil is 5% and increased up to 15% with the addition of 5% of moist CFA, and 35% with 10% addition of it to the soil. The CBR values for net dry and moist CFAs are 95% and 46% respectively. None of the tested samples presented unacceptable expansion (more than 2%) after water impregnation for 72 hours in CBR mould. It can be concluded that not only the dry CFA but even the moist one, which is deposited in lignite mines, can be used for soil stabilization. That is of great importance for reducing the accumulation of CFA as waste material in the basin of Ptolemaida area in Northern Greece, where most of the power plants are located. Keywords: Calcareous fly ash, Deposited fly ash, Soil stabilization, Modified Proctor, CBR Professor Emeritus Ioanna Papayianni is the former Director of the Laboratory of Building Materials at the Aristotle University of Thessaloniki (AUTH). She is a member of national and international scientific committees, the president of two non-profit organizations and has published extensively. Assistant Professor Eleftherios Anastasiou is a member of the Laboratory of Building Materials at the Aristotle University of Thessaloniki (AUTH). His main research interests include concrete techology, use of industrial by-products and other alternative materials in concrete. Dr. Michail Papachristoforou is a researcher civil engineer at the Laboratory of Building Materials of AUTH. Charalambos Kaplanidis and Polikseni Bairaklili are both civil engineers with research interests in the field of concrete applications and utilization of industrial by-products in construction.

260 Papayianni et al
INTRODUCTION
Main Fly ash is well-known by-product deriving from the burning of either lignite or sub-bituminous coal in power plants, for the production of energy. Due to the fineness of its particles, fly ash is collected by electrostatic filters and stored in piles or containers (Figs. 1 & 2). In order to avoid air contamination with high amount of very fine particles, fly ash is mixed with water before its storage and, typically, in the power plants of Northern Greece, the amount of water used to stabilize fly ash is 30% wt. This type of fly ash is called deposited or landfilled fly ash, in part of the literature,or ponded ash when deposited in ponds.
Figure 1 Conveyor belt for the deposition of CFA Figure 2 Deposited CFA in piles Calcareous fly ashes (CFA) are produced in vast amounts, in various areas of the world [1] and their utilization rate, despite considerable research efforts is still low [2;3]. Most of the literature available regards their use in engineering applications, as produced, in dry state [4; 5]. The unutilized fly ash, however, as stated above, is usually mixed with water and deposited as landfilling. The growing amount of this deposited moist fly ash has become an increasing environmental concern over the past years [6]. The problems associated with the use of landfilled fly ash are similar to those of dry fly ash, however, they are even more pronounced [7]. The chemical composition and physical properties of landfilled fly ash may vary significantly, including its self-cementing and pozzolanic properties. Compared to dry fly ash, deposited moist fly ash seems to have larger grain size and to be less reactive [8], however Cheerarot & Jaturapitakkul [9] found that the pozzolanic properties of disposed fly ash may be restored by grinding.Therefore, it seems that the common uses of CFA in thesoil stabilization sector could be performed with the deposited fly ash, as well. At the Laboratory of Building Materials of the Aristotle University of Thessaloniki, there is previous experience in improving soil bearing capacity by adding dry fly ash [10; 11]. The present research investigated the possibility of using deposited fly ash for the improvement of properties of unstabilized soils. Fly ash was tested, both in dry and in moist condition, for its chemical and physical properties, as well as its strength development (pozzolanicity). Then, it was used as an additive for improvement of a poor soil, regarding modified Proctor density and CBR value.The potential improvement of poor soils with the otherwise discarded fly ash would have considerable benefits regarding fly ash utilization, both financial, as deposited fly ash bears no cost, as well as environmental, since landfilling and raw material consumption would be reduced.
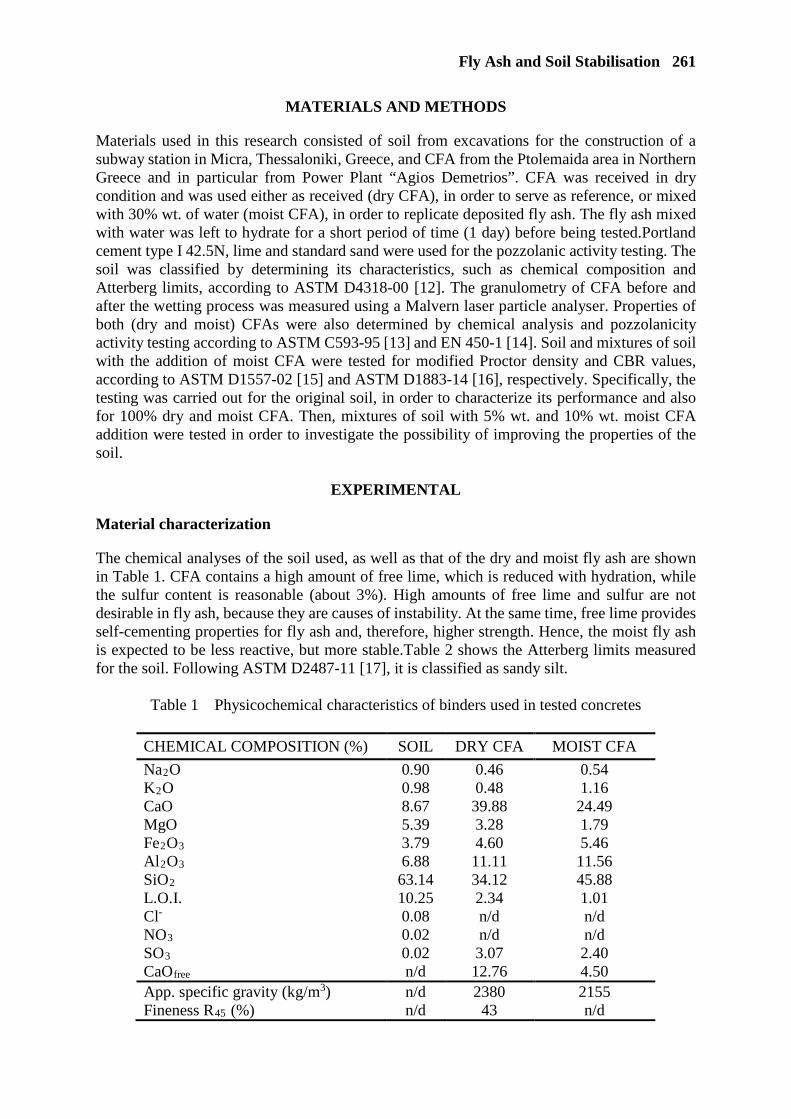
Fly Ash and Soil Stabilisation 261
MATERIALS AND METHODS
Materials used in this research consisted of soil from excavations for the construction of a subway station in Micra, Thessaloniki, Greece, and CFA from the Ptolemaida area in Northern Greece and in particular from Power Plant “Agios Demetrios”. CFA was received in dry condition and was used either as received (dry CFA), in order to serve as reference, or mixed with 30% wt. of water (moist CFA), in order to replicate deposited fly ash. The fly ash mixed with water was left to hydrate for a short period of time (1 day) before being tested.Portland cement type I 42.5N, lime and standard sand were used for the pozzolanic activity testing. The soil was classified by determining its characteristics, such as chemical composition and Atterberg limits, according to ASTM D4318-00 [12]. The granulometry of CFA before and after the wetting process was measured using a Malvern laser particle analyser. Properties of both (dry and moist) CFAs were also determined by chemical analysis and pozzolanicity activity testing according to ASTM C593-95 [13] and EN 450-1 [14]. Soil and mixtures of soil with the addition of moist CFA were tested for modified Proctor density and CBR values, according to ASTM D1557-02 [15] and ASTM D1883-14 [16], respectively. Specifically, the testing was carried out for the original soil, in order to characterize its performance and also for 100% dry and moist CFA. Then, mixtures of soil with 5% wt. and 10% wt. moist CFA addition were tested in order to investigate the possibility of improving the properties of the soil.
EXPERIMENTAL
Material characterization
The chemical analyses of the soil used, as well as that of the dry and moist fly ash are shown in Table 1. CFA contains a high amount of free lime, which is reduced with hydration, while the sulfur content is reasonable (about 3%). High amounts of free lime and sulfur are not desirable in fly ash, because they are causes of instability. At the same time, free lime provides self-cementing properties for fly ash and, therefore, higher strength. Hence, the moist fly ash is expected to be less reactive, but more stable.Table 2 shows the Atterberg limits measured for the soil. Following ASTM D2487-11 [17], it is classified as sandy silt.
Table 1 Physicochemical characteristics of binders used in tested concretes
CHEMICAL COMPOSITION (%) SOIL DRY CFA MOIST CFA
Na2O 0.90 0.46 0.54 K2O 0.98 0.48 1.16 CaO 8.67 39.88 24.49 MgO 5.39 3.28 1.79 Fe2O3 3.79 4.60 5.46 Al2O3 6.88 11.11 11.56 SiO2 63.14 34.12 45.88 L.O.I. 10.25 2.34 1.01 Cl- 0.08 n/d n/d NO3 0.02 n/d n/d SO3 0.02 3.07 2.40 CaOfree n/d 12.76 4.50 App. specific gravity (kg/m3) n/d 2380 2155 Fineness R45 (%) n/d 43 n/d
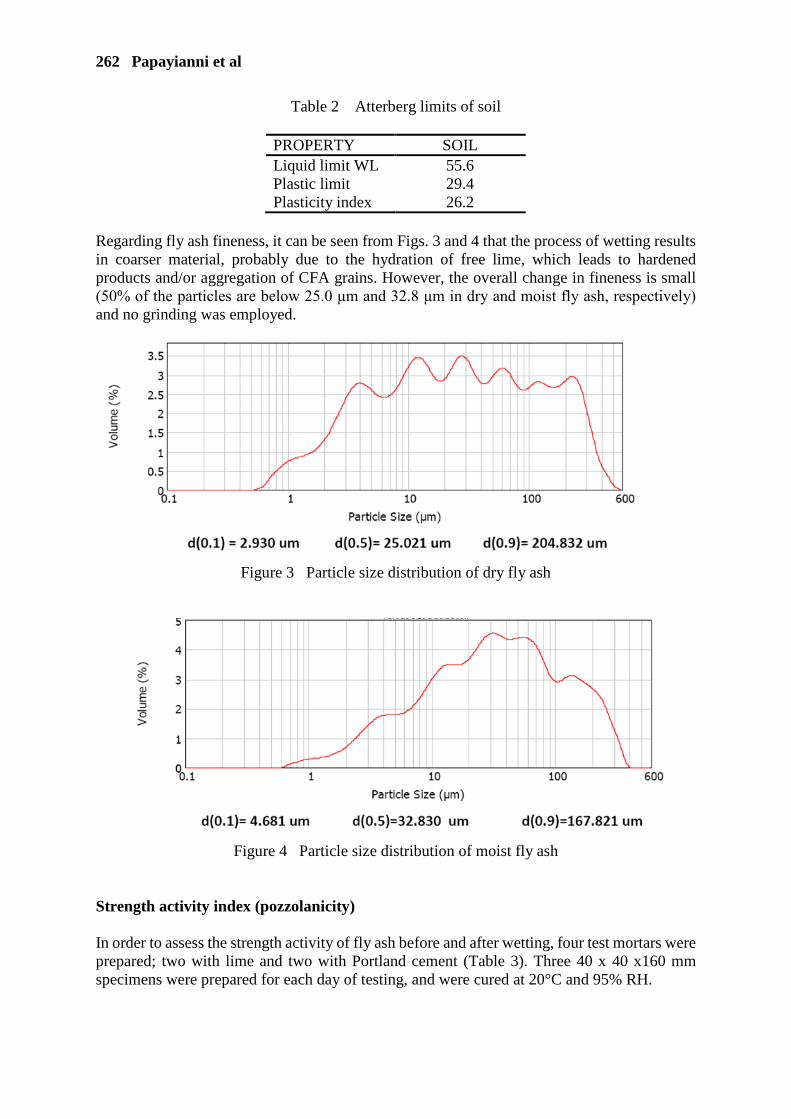
262 Papayianni et al
Table 2 Atterberg limits of soil
PROPERTY SOIL Liquid limit WL 55.6 Plastic limit 29.4 Plasticity index 26.2
Regarding fly ash fineness, it can be seen from Figs. 3 and 4 that the process of wetting results in coarser material, probably due to the hydration of free lime, which leads to hardened products and/or aggregation of CFA grains. However, the overall change in fineness is small (50% of the particles are below 25.0 μm and 32.8 μm in dry and moist fly ash, respectively) and no grinding was employed.
Figure 3 Particle size distribution of dry fly ash
Figure 4 Particle size distribution of moist fly ash
Strength activity index (pozzolanicity) In order to assess the strength activity of fly ash before and after wetting, four test mortars were prepared; two with lime and two with Portland cement (Table 3). Three 40 x 40 x160 mm specimens were prepared for each day of testing, and were cured at 20°C and 95% RH.

Fly Ash and Soil Stabilisation 263
Table 3. Strength activity of dry and moist CFA
MIXTURE NO. 1 2 3 4 Lime (g) 180 180 - - CEM I 42.5 (g) - - 315 315 Dry CFA (g) 360 - 135 - Wet CFA (g) - 360 - 135 Water (g) 1350 1350 1350 1350 Standard sand (g) 355 355 255 255 7-d flexural strength (MPa) 3.18 1.92 - - 7-d compressive strength (MPa) 8.31 3.80 - - 28-d flexural strength (MPa) 3.25 2.95 7.64 3.80 28-d compressive strength (MPa) 6.93 4.92 24.03 22.22 90-d flexural strength (MPa) - - 9.16 7.42 90-d compressive strength (MPa) - - 28.70 27.38
Each strength value in Table 3 is an average of three specimens tested regarding flexural strength tests and an average of six specimens regarding compressive strength tests. The results show that dry CFA shows very high pozzolanic activity (7 and 28 day compressive strength equal or higher than 7 MPa), while moist CFA shows considerable strength development although lower than that of dry CFA (7 and 28 day compressive strength between 4 and 5 MPa). Regarding strength activity with cement, it seems that 30% cement replacement with either dry or moist fly ash results in similar strength levels for 28 and 90 day compressive strength, with only a small reduction occurring due to the hydration of fly ash. Modified Proctor and CBR tests The modified Proctor and CBR tests are used to evaluate the properties of compacted soils. Maximum density, optimum moisture content, strength measured in terms of bearing ratio and swelling potential were the properties measured. Figure 5 shows the modified Proctor test and the results are presented in Table 4. Firstly, the test was carried out on the three materials separately (soil, dry CFA, moist CFA), in order to assess their properties. Then, two more tests were carried out with soil and an addition of 5% or 10% wt. of moist CFA, in order to assess its potential for soil improvement.
Figure 5 Particle size distribution of moist fly ash

264 Papayianni et al
Table 4 Modified Proctor test results
MATERIAL MAXIMUM DRY
PROCTOR DENSITY (kg/m3)
OPTIMUM MOISTURE CONTENT
(%) Soil 1730 14.8 Dry CFA 1110 38.0 Moist CFA 1110 37.2 Soil + 5% Moist CFA 1750 14.8 Soil + 10% Moist CFA 1620 15.8
The results show that fly ash (dry or moist) has a high water requirement and results in lower maximum density. Accordingly, its addition to the soil at a 5% rate does alter the density and optimum moisture content of the soil, but at 10% addition rate, a reduction of the maximum dry density and an increase of the optmimum content are observed. The results of the Proctor tests were used in order to prepare the specimens for the CBR test were strength-penetration tests were carried out in order to determine the maximum CBR value, while 72 hour swelling of specimens immersed in water was also recorded. The results of the CBR tests are presented in Table 5.
Table 5 CBR test results
MATERIAL CALIFORNIA BEARING
RATIO (CBR) (%)
MAXIMUM SWELLING AT 72h
(%) Soil 5 0.20 Dry CFA 95 1.32 Moist CFA 46 1.52 Soil + 5% Moist CFA 15 1.21 Soil + 10% Moist CFA 82 1.48
The results show that there is a significant improvement in the CBR values with the use of CFA. Moist CFA at 5% rate improves the CBR of the soil from 5% to 15%, but 10% rate further improves the CBR value to 82%. Swelling is generally increased when CFA is used, but in all cases it remained below the threshold of 2%.
DISCUSSION AND CONCLUSIONS
Regarding the tests for material characterization, the soil tested was classified as CH, or sandy silt, according to ASTM D2487-11. The dry fly ash had very high reactivity with lime (~7 MPa compressive strength at 28 days), which is a measure of strong pozzolanic activity. The moist CFA, which depicts the properties of the deposited fly ash had also considerable pozzolanic activity (~4 MPa compressive strength at 28 days). Reduction of free lime content was also observed after wetting the dry fly ash, while total sulfur content was reasonable (~3%) in both cases. Regarding the potential use of the deposited fly ash for soil stabilization, the following conclusions were drawn:
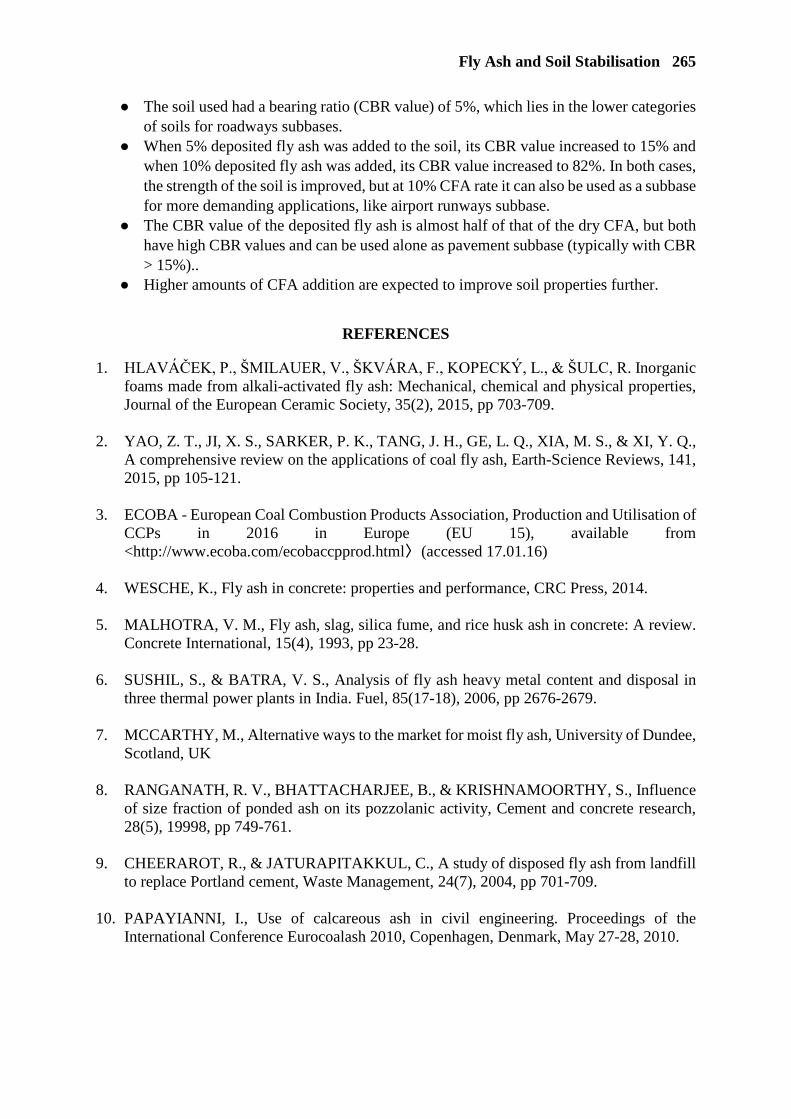
Fly Ash and Soil Stabilisation 265
The soil used had a bearing ratio (CBR value) of 5%, which lies in the lower categories of soils for roadways subbases.
When 5% deposited fly ash was added to the soil, its CBR value increased to 15% and when 10% deposited fly ash was added, its CBR value increased to 82%. In both cases, the strength of the soil is improved, but at 10% CFA rate it can also be used as a subbase for more demanding applications, like airport runways subbase.
The CBR value of the deposited fly ash is almost half of that of the dry CFA, but both have high CBR values and can be used alone as pavement subbase (typically with CBR > 15%)..
Higher amounts of CFA addition are expected to improve soil properties further.
REFERENCES
1. HLAVÁČEK, P., ŠMILAUER, V., ŠKVÁRA, F., KOPECKÝ, L., & ŠULC, R. Inorganic foams made from alkali-activated fly ash: Mechanical, chemical and physical properties, Journal of the European Ceramic Society, 35(2), 2015, pp 703-709.
2. YAO, Z. T., JI, X. S., SARKER, P. K., TANG, J. H., GE, L. Q., XIA, M. S., & XI, Y. Q., A comprehensive review on the applications of coal fly ash, Earth-Science Reviews, 141, 2015, pp 105-121.
3. ECOBA - European Coal Combustion Products Association, Production and Utilisation of CCPs in 2016 in Europe (EU 15), available from <http://www.ecoba.com/ecobaccpprod.html〉 (accessed 17.01.16)
4. WESCHE, K., Fly ash in concrete: properties and performance, CRC Press, 2014.
5. MALHOTRA, V. M., Fly ash, slag, silica fume, and rice husk ash in concrete: A review. Concrete International, 15(4), 1993, pp 23-28.
6. SUSHIL, S., & BATRA, V. S., Analysis of fly ash heavy metal content and disposal in three thermal power plants in India. Fuel, 85(17-18), 2006, pp 2676-2679.
7. MCCARTHY, M., Alternative ways to the market for moist fly ash, University of Dundee, Scotland, UK
8. RANGANATH, R. V., BHATTACHARJEE, B., & KRISHNAMOORTHY, S., Influence of size fraction of ponded ash on its pozzolanic activity, Cement and concrete research, 28(5), 19998, pp 749-761.
9. CHEERAROT, R., & JATURAPITAKKUL, C., A study of disposed fly ash from landfill to replace Portland cement, Waste Management, 24(7), 2004, pp 701-709.
10. PAPAYIANNI, I., Use of calcareous ash in civil engineering. Proceedings of the
International Conference Eurocoalash 2010, Copenhagen, Denmark, May 27-28, 2010.

266 Papayianni et al
11. PAPAYIANNI, I., PAPACHRISTOFOROU, M., & STAVRIDAKIS, E., Use of calcareous fly ash for improving mechanical and physical characteristics of soils.EUROCOALASH 2012 Conference, Thessaloniki September 25-27, 2012.
12. ASTM D4318-00: Standard Test Methods for Liquid Limit, Plastic Limit, and Plasticity Index of Soils.
13. ASTM C593-95: Standard Specification for Fly Ash and Other Pozzolans for Use with Lime
14. EN 450-1/2001: Fly ash concrete - Part 1, Definition, specifications and conformity criteria
15. ASTM D1557-02: Standard Test Methods for Laboratory Compaction Characteristics of Soil Using Modified Effort
16. ASTM D1883-14: Standard Test Method for California Bearing Ratio (CBR) of Laboratory-Compacted Soils
17. ASTM D 2487-17: Standard Practice for Classification of Soils for Engineering Purposes (Unified Soil Classification System)
USE OF CALCAREOUS FLY ASH IN GROUTING SLURRY WALLS IN UNDERGROUND WORKS
I Papayianni
A Liapis
E Anastasiou
Aristotle University of Thessaloniki
Greece
ABSTRACT. Most of calcareous fly ashes possess pozzolanic and also self-hardening properties, to be used for underground grouting, contributing to the economy and sustainability of the projects. Huge volumes of fly ash based grouts can be used for underpinning works, for protection of open excavations or deep foundations from large ground movements and groundwater, by strengthening the ground beneath or lowering the water table, affording an impervious substratum. In most cases of tunnel and dam construction, these underpinning works are necessary/common practice. The suitability of calcareous fly ash as alternative binder for grouts has been proved by research work by using local fly ash in two types as described in national specifications. The characteristics of both types were determined - especially the contents in free lime, sulfates and fineness. An adequate number of grout specimens was prepared by replacing Portland cement (CEM II 32.5) with 30, 50, 80 and 100% ratio by mass, of fly ash. Properties at fresh and hardened state (compressive and flexural strengths at 28 and 90 days) were measured. Grouts with 30% substitution of cement by fly ash had higher 28-day strength compared with net cement grout mixtures. Grouts with 30% fly ash had 28 day strength >2.5 MPa. Local fly ash was used in slurry walls for the construction of upper and down tunnels on the Hydroelectric Project of Ilarion. A limited experimental work was done onsite to conclude about the proportioning of the grout applied. The environmental and economical benefits have been estimated and presented in this paper. For the environmental impact the Life Cycle Assessment methodology has been implemented. The results have shown, as expected, an improvement, if the energy and emissions intensive cement is partially replaced by the fly ash. The pattern remains the same for the economic assessment.
Keywords: Calcareous fly ash, Grouts, Slurry walls, Underpinning works
Emeritus Professor Ioanna Papayianni, has served as Director of the Laboratory of Building Materials, in the Aristotle University of Thessaloniki for several years. She is a member of numerous national and international technical committees and has published numerous papers on the properties of high calcium fly ash and its utilization in cement and concrete applications. MSc Alexandros Liapis, is a PhD candidate in the Laboratory of Building Materials, in the Aristotle University of Thessaloniki, researching Environmental and Economical Assessment of building materials and structures; monitoring mechanical / physical properties of concrete. Assistant Professor Eleftherios K. Anastasiou is working in the Laboratory of Building Materials, in the Aristotle University of Thessaloniki. His main research interests include concrete technology, use of industrial by-products and other alternative materials in concrete and life cycle assessment, on which he published widely in international scientific journals.

268 Papayianni et al
INTRODUCTION Calcareous Fly Ashes (CFAs) constitute more than half of the coal fly ash output (88 million tons) produced in EU28 [1]. They are coming from the combustion of lignite or other sub-coal found mainly in south and southeastern Europe. The increased contribution of natural gas and renewable sources to energy production led to the decline of lignite usage in energy plants and consequently of the fly ash production although the cost of coal combustion energy remains the lowest of all other alternatives of energy production [2]. In Greece, one of the major producers of CFA in Europe, about 60% of consumed energy comes from lignite power plants and 9 to 10 million tons of CFA is produced annually. Almost 80% of it is co-deposited with other waste materials (bottom ash, FGD) for landfilling and less than 10% is used by cement industry for blended type cements manufacture. Most of CFAs possess pozzolanic and self-hardening properties [3] but they remain marginal materials since their use in the concrete industry is not covered by European standards, as in the case of siliceous fly ash for which EN 450-1 is valid. To overcome the need for a regulative frame about the use of CFA, National Technical Specifications were established in 2007 [4, 5] about the use of CFA in concrete mass construction, road pavements, grouts for underground works and precast concrete products. According to these Specifications, Greek CFA can be used in two types (EIT1, EIT2) for different applications as shown in Table 1.
Table 1 Categories of Hellenic fly ashes (values in %)
R45 SO3 CaOf EIT1 ≤45 ≤7 - EIT2 ≤30 ≤5 ≤3
In this paper the work done for justifying the use of CFA in grouts for underpinning projects is presented. It refers to experimental work about the performance of grouts in which Portland cement has been partially replaced by CFA, as well as the use of CFA in the Hydroelectrical Project of Ilarion for water-tightness of the Elati basin (a project of the Greek Public Power corporation) where CFA replaced 30% of Portland cement in grout mixtures of slurry walls of upper and down tunnels. In addition, to highlight the environmental and economic benefits, an assessment of both aspects has been conducted. For the environmental profile of the used mixtures (along with four other trial mixtures) the methodology of Life Cycle Assessment has been implemented, as it is described in ISO 14040 [6] and ISO 14044 [7].
SLURRY WALLS Grouts are used extensively in most underground works for stabilizing the ground in which they are injected to strengthen the ground beneath and reduce the risk of subsidence or other movements of the ground. The use of grouts in forming slurry walls / curtain walls is common practice in the construction of dams and tunnels, where there is need to lower the water table affording an impervious substratum or reduce seepage by filling and sealing spaces between tunnel lining and surrounding ground. In the last decades of the 20th century the most common grouting material for slurry walls was bentonite or soil-bentonite mixtures exploiting the formation of bentonite colloidal system in water and swelling properties of bentonite itself.
Calcareous Fly Ash Grouting Slurry 269
The soil-bentonite grouts were applied in two phases (first injecting the slurry and then backfill with excavated soil) and characterized by plastic and stress-dependent behavior, zero unconfined compressive strength and adequate hydraulic conductivity < 1×10⁻⁷ cm/s. Gradually, cementitious materials such as cement (C), blast furnace slags (S) were added to grouts that filled the trenches in one phase since the mixtures are hardened after the first day and serve as back fill while hardening is completed after 90 days [8, 9]. These type of grouts/slurries with cementitious materials are commonly used and characterized by their brittle behavior, achievement of designed strength and hydraulic conductivity (often lower than 1×10⁻⁷ cm/s). Which of the slurries composition is more effective in terms of environmental impact, can be estimated by following the Life Cycle Assessment methodology, along with a cost estimation for the most economy-efficient composition. For these assessments, all parameters involved must be considered, such as the local availability of cementitious materials. Most of Greek fly ash (only CFA is produced in Greece) is coming from West Greek-land, where the geomorphology and rivers allow the construction of dam or pumped reservoirs for storage energy from renewable resources. Although CFA is still a marginal by-product, it is well known [10, 11] that like blast furnace slag possesses self-hardening and pozzolanic capacity. Therefore, research has been oriented to the design of proper cement-CFA-bentonite grouts for slurry walls. The preliminary experimental work was to design grout mixtures of adequate fluidity, volume stability, strength development as well as low permeability < 1×10⁻⁷ cm/s. The perspective of using successfully CFA in slurry walls is of great importance since huge quantities of this by-product can be used beneficially. For example, for filling a trench of length 1000 m, depth 20 m and width 0.75 m, a volume of more than 15000 m3 is needed. Considering the continuously increased use of slurry walls as barriers to control the movement or migration of contaminant /waste constituents in remediation works of contaminated sites [12], this seems a much promising CFA application. Additional investigation is needed such as measurements of cracking tendency, resistance to wetting-drying cycles, other tests with triaxial apparatus including study of samples taken from real projects such as that of the Hydroelectrical Project of Ilarion, in the Elati basin.
EXPERIMENTAL DETAILS The characteristics of the materials used (Portland cement II 32.5N, fly ash CFA from the power plant of Agios Demetrius in Ptolemaida and sodium bentonite) are shown in Table 2 and composition of the grout mixtures (parts by weight) in Table 3. Bentonite was added to a stream of moving/agitated pre-weighted water to avoid formation of wetted lumps of colloid material. Fluidity was measured 1 hour after mixing according to ASTM C939-81. Bleeding and volume changes 24 hours after mixing were measured according to ASTM C940-81. The measurements are shown in Table 4. The compressive and flexural strength as well as the Dynamic Modulus of Elasticity were measured using specimens (40×40×160 mm³) according to BS 1881-203 at 28-d and 90-d ages. The results are depicted in Figure 1 and Figure 2.

270 Papayianni et al
Table 2 Chemical composition and some physical properties of Portland cement, fly ash and bentonite
CONSTITUENTS, % PORTLAND
CEMENT CEM II 32.5
PTOLEMAIDA FLY ASH
MEAN VALUE
SODIUM BENTONITE
(LOCAL) SiO2 20.10 26.00 62.48
Al2O3 5.46 10.60 14.45 Fe2O3 2.74 6.59 3.49 CaO 63.90 35.5 (free≈10) 4.21 MgO 1.50 1.48 2.65 SO3 2.55 5.57 -
Na2O 1.30 0.17 1.12 K2O 0.22 0.80 0.83 TiO2 0.25 0.90 0.22
Insoluble residue 15.5 21.50 - Loss of ignition 1.37 4.55 10.07
Fraction retained on 4900 mesh sieve
8 12 10
Dry specific gravity 3.17 2.56 > 2.2
Table 3 Mix proportions of grouts tested
CODE NO.
CEMENT HCFA % (w/w) OF CEMENT
W/C RATIO
BENTONITE % (w/w)
OF SOLIDS
SUPERPLASTICISER % (w/w)
OF CEMENT
C 1.0 - 2.0 2.5 - C-CFA 1 0.7 0.3 2.0 2.5 - C-CFA 2 0.5 0.5 2.0 2.5 - C-CFA 3 0.2 0.8 2.0 2.5 -
CFA 0.0 1.0 2.0 2.5 2.0
Table 4 Properties of fresh grouts tested
CODE NO. TIME OF EFFLUX 1h AFTER MIXING (s) (ASTM C 939-81)
FINAL BLEEDING (ASTM C 940-81)
1%
VOLUME CHANGE % 24h AFTER MIXING
C 8.5 6.03 9.17 C-CFA 1 8.0 7.15 10.05 C-CFA 2 9.5 5.24 6.08 C-CFA 3 13.5 0.0 3.15
CFA 14.8 0.0 3.95

Calcareous Fly Ash Grouting Slurry 271
Figure 1 Effect of CFA on strength of slurries (water/cement=2/1) at an age of 28 days
Figure 2 Effect of CFA on strength of slurries (water/cement=2/1) at an age of 90 days It seems that the three constituents (C + CFA + bentonite as well as CFA + bentonite) are compatible in slurry mixtures. A range of strength from <0.5 MPa up to 2.5 MPa has been developed at 28-d and from 0.5 MPa to 3.5 MPa at 90-d ages. Fluidity and volume stability seem to be benefited by CFA and bentonite although CFA in large percentages slightly increased flow times of the mixtures.
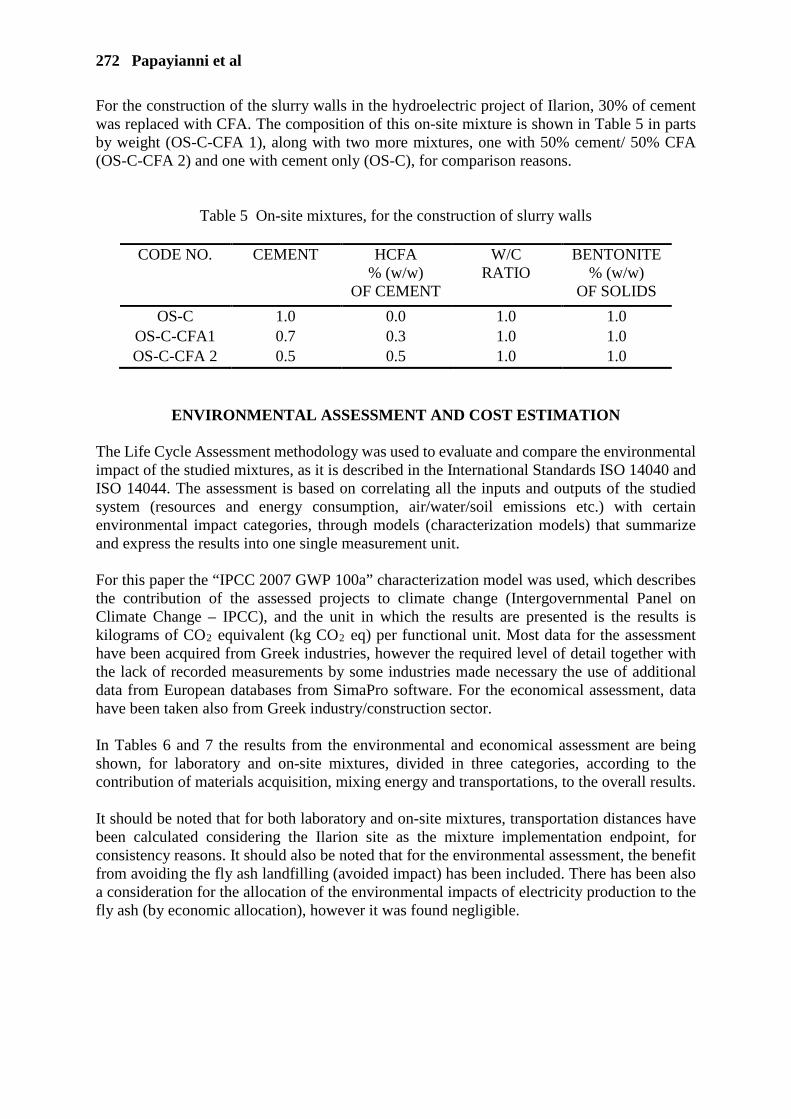
272 Papayianni et al
For the construction of the slurry walls in the hydroelectric project of Ilarion, 30% of cement was replaced with CFA. The composition of this on-site mixture is shown in Table 5 in parts by weight (OS-C-CFA 1), along with two more mixtures, one with 50% cement/ 50% CFA (OS-C-CFA 2) and one with cement only (OS-C), for comparison reasons.
Table 5 On-site mixtures, for the construction of slurry walls
CODE NO. CEMENT HCFA % (w/w)
OF CEMENT
W/C RATIO
BENTONITE % (w/w)
OF SOLIDS
OS-C 1.0 0.0 1.0 1.0 OS-C-CFA1 0.7 0.3 1.0 1.0 OS-C-CFA 2 0.5 0.5 1.0 1.0
ENVIRONMENTAL ASSESSMENT AND COST ESTIMATION The Life Cycle Assessment methodology was used to evaluate and compare the environmental impact of the studied mixtures, as it is described in the International Standards ISO 14040 and ISO 14044. The assessment is based on correlating all the inputs and outputs of the studied system (resources and energy consumption, air/water/soil emissions etc.) with certain environmental impact categories, through models (characterization models) that summarize and express the results into one single measurement unit. For this paper the “IPCC 2007 GWP 100a” characterization model was used, which describes the contribution of the assessed projects to climate change (Intergovernmental Panel on Climate Change – IPCC), and the unit in which the results are presented is the results is kilograms of CO2 equivalent (kg CO2 eq) per functional unit. Most data for the assessment have been acquired from Greek industries, however the required level of detail together with the lack of recorded measurements by some industries made necessary the use of additional data from European databases from SimaPro software. For the economical assessment, data have been taken also from Greek industry/construction sector. In Tables 6 and 7 the results from the environmental and economical assessment are being shown, for laboratory and on-site mixtures, divided in three categories, according to the contribution of materials acquisition, mixing energy and transportations, to the overall results. It should be noted that for both laboratory and on-site mixtures, transportation distances have been calculated considering the Ilarion site as the mixture implementation endpoint, for consistency reasons. It should also be noted that for the environmental assessment, the benefit from avoiding the fly ash landfilling (avoided impact) has been included. There has been also a consideration for the allocation of the environmental impacts of electricity production to the fly ash (by economic allocation), however it was found negligible.

Calcareous Fly Ash Grouting Slurry 273
Table 6 Environmental assessment of laboratory and on-site mixtures
MATERIALS ENERGY TRANSPORTATION TOTAL kg CO2 equivalent/m3
Laboratory mixtures C 416.35 2.33 11.50 430.18
C-CFA 1 299.91 2.33 9.24 311.48 C-CFA 2 222.65 2.33 7.70 232.68 C-CFA 3 106.35 2.33 5.40 114.08
CFA 40.75 2.33 3.86 46.94 On-site mixtures
OS-C 731.25 2.33 19.87 753.45 OS-C-CFA1 527.35 2.33 15.80 545.48 OS-C-CFA 2 39.35 2.33 13.11 54.79
Table 7 Cost estimation of laboratory and on-site mixtures
MATERIALS ENERGY TRANSPORTATION TOTAL €/m3
Laboratory mixtures C 40.6 0.362 4.69 45.652
C-CFA 1 31.0 0.362 3.74 35.102 C-CFA 2 24.6 0.362 3.10 28.062 C-CFA 3 15.0 0.362 2.15 17.512
CFA 25.7 0.362 1.52 27.582 On-site mixtures
OS-C 69.5 0.362 8.15 78.010 OS-C-CFA1 52.6 0.362 6.47 59.432 OS-C-CFA 2 41.4 0.362 5.36 47.122
DISCUSSION AND CONCLUSIONS The cement + CFA + bentonite slurries with a water/cementitious ratio 2:1 have shown good behavior at fresh state, in relation to their fluidity and volume stability. An increase to the replacement of cement by CFA, led lower measured volume changes after 24 hours. The addition -in proper way- of a quantity of bentonite during mixing, contributes to the reduction of volume loss and stabilization of the mixture. The curing at high RH (99%) for 28 days is essential for avoiding early cracking, from strength development point of view. The replacement of cement by CFA (30% and 50% by mass) seemed to be more advantageous since a strength level of 2.5 MPa at 28 days and 3.5 MPa at 90 days were achieved. Flexural strength values and Dynamic Modulus of Elasticity seem to follow compressive strength development and pozzolanic reactivity of CFA is obvious, since there is a significant strength increase from 28-d to 90-d age. Even CFA-bentonite slurries developed around 0.5 MPa, which is quite sufficient for many applications (trench backfilling) and presented adequate volume stability.

274 Papayianni et al
Regarding the environmental and economical profile of the studied and implemented mixtures, the improvement due to replacement of the emission-intensive and costly cement with CFA seems consistent throughout the whole mixture series. This is depicted more clearly when considering the contribution of the materials to the overall burden, compared to energy consumption for mixing or transportations. Regarding the increase in cost of Laboratory mixture CFA (100% fly ash) despite the total lack of cement it is attributed to the notable cost of superplasticizer which has been added only in this particular mixture. Although it exceeds the scope of this paper, however it would be interesting for future research to examine the sensitivity of the implementation location to the overall environmental and economical profile of the project and thus the correlation of transportations with mixture design.
ACKNOWLEDGEMENTS Part of the research was developed within a scholarship, funded by the Act “Support of research manpower, through the development of PhD research”, coming from resources of the OP “Human Resources Development. Education and Lifelong Learning”. 2014-2020 with support from the European Social Fund and the Greek Government.
REFERENCES 1. ECOBA, Statistics on Production and Utilization of CCPs in
Europe http://www.ecoba.com 2. MALHOTRA V M, Global warming and role of supplementary cementing materials and
superplasticizers in reducing Green house gas emissions from the manufacturing of Portland cement, Sustainability-Tomorrow, Vol. 2. Issue 2, April – June 2007, pp. 9-19.
3. PAPAYANNI I, An investigation of the pozzolanicity and hydraulic reactivity of a high lime fly ash, Magazine of Concrete Research. London, Vol. 39, No. 138, 1987, pp. 19-28.
4. PAPAYIANNI I, TSIMAS S, MOUTSATSOU A, Standardization aspects concerning High Calcium Fly Ashes, Proceedings of World of coal ash (WOCA) conference, May 4-7, 2009, Lexington, KY USA, p. 8.
5. FEK 551, Part B, National Technical Specifications, Hellenic Fly Ashes, Journal of Greek Government, Athens, April 18th, 2007.
6. ISO (2006a) Environmental management – life cycle assessment – principles and framework, ISO 14040, International Organization for Standardization (ISO), Geneva.
7. ISO (2006b) Environmental management – life cycle assessment – requirements and guidelines, ISO 14044, International Organization for Standardization (ISO), Geneva.
8. FILZ G M, EVANS J C, BRITTON J P, Soil-Bentonite hydraulic conductivity. Measurement and variability, Proceedings of 12th Pan-American Conference on Soil Mechanics and Geotechnical Engineering, Essen, Germany, June 2003, pp. 1323-1328.
9. EVANS, J C, DAWSON, A R, Slurry walls for control of contaminant migration. A comparison of UK and US practices, ASCE Specialty Conference on Geo-Engineering for Underground facilities, ASCE, Special Publ., No. 90, 1999, Reston, USA, pp. 105-120.
10. PAPAYIANNI, I, Performance of a high content in lime and sulfates fly ash in RCC, ACI SP-132, Ed. V. Malhotra, pp. 367-386.
11. PAPAYIANNI, I, Utilization of High Calcium Fly Ash in pavement construction, Ash-Tech Int., Ash Technology Conference, May 15-17, Birmingham, UK, CD edition, University of Kentucky.
12. PRIVETT, K D, MATTHEWS, S C, HEDGES, R A, Barriers. liners and cover systems for containment and control of land contamination, CIRIA Special Publication, No. 124, 278, 1996.

INVESTIGATION OF PORE STRUCTURE AND PROPERTIES OF LIGHTWEIGHT GEOPOLYMER
BASED ON SWELLED Na-BENTONITE
Ying Yang Zhongyuan Lu Ju Li
Southwest University of Science and Technology
China
Jun Jiang
University of Dundee
United Kingdom
ABSTRACT. Na-bentonite, metakaolin and sodium silicate were used as the main raw materials to prepare porous geopolymer, and the early-age properties, air-void structure and hardened state properties were studied in the paper. The results indicate that porous geopolymer can be prepared by incorporating the bentonite slurry into geopolymer pastes. Adding a certain volume of bentonite paste has a positive effect on the workability of fresh porous geopolymer. In addition, when the dry density is 766 kg/m3, the porosity of porous geopolymer can reach to 62.5%, whereas the compressive strength and thermal conductivity are 0.97 MPa and 0.104 W/(m·K), respectively. Keywords: Porous geopolymer, Bentonite, Thermal conductivity, Compressive strength, Pore structure Ying Yang is a postgraduate of Southwest University of Science and Technology, specialized in industrial waste utilization and the design and preparation of green geopolymer-based materials.
Mr Jun Jiang is a visiting scholar of University of Dundee and PhD candidate of Southwest University of Science and Technology, he devotes himself in the theory study and application of functionalized and green cement-based materials, and has many publications in the related field.
Professor Zhongyuan Lu is the Vice President of Southwest University of Science and Technology, Director of State Key Laboratory of Environment-friendly Energy Materials and member of MOE’s Guiding Committee for Inorganic Non-metallic Materials, and chairman of Cement Raw Materials & Waste Utilization Subcommittee in Chinese Ceramic Society. He has published extensively on many aspects of cement-based materials and sustainable construction, and completed more than 10 research projects supported by government bodies, research councils and industries in past 20 years.
Associate Professor Jun Li is the vice Director of Engineering Laboratory of Green Cement-based Building Materials of Sichuan province. He has published extensively on many aspects of cement-based materials and waste utilization.
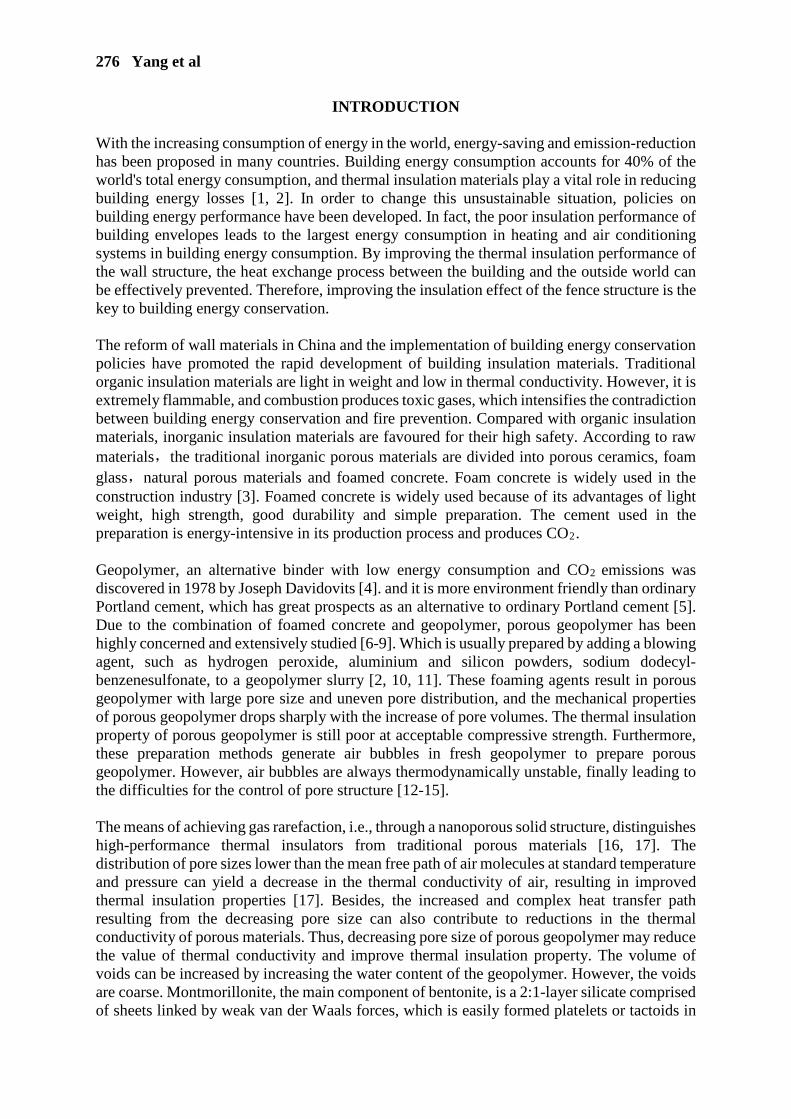
276 Yang et al
INTRODUCTION With the increasing consumption of energy in the world, energy-saving and emission-reduction has been proposed in many countries. Building energy consumption accounts for 40% of the world's total energy consumption, and thermal insulation materials play a vital role in reducing building energy losses [1, 2]. In order to change this unsustainable situation, policies on building energy performance have been developed. In fact, the poor insulation performance of building envelopes leads to the largest energy consumption in heating and air conditioning systems in building energy consumption. By improving the thermal insulation performance of the wall structure, the heat exchange process between the building and the outside world can be effectively prevented. Therefore, improving the insulation effect of the fence structure is the key to building energy conservation. The reform of wall materials in China and the implementation of building energy conservation policies have promoted the rapid development of building insulation materials. Traditional organic insulation materials are light in weight and low in thermal conductivity. However, it is extremely flammable, and combustion produces toxic gases, which intensifies the contradiction between building energy conservation and fire prevention. Compared with organic insulation materials, inorganic insulation materials are favoured for their high safety. According to raw materials,the traditional inorganic porous materials are divided into porous ceramics, foam glass,natural porous materials and foamed concrete. Foam concrete is widely used in the construction industry [3]. Foamed concrete is widely used because of its advantages of light weight, high strength, good durability and simple preparation. The cement used in the preparation is energy-intensive in its production process and produces CO2. Geopolymer, an alternative binder with low energy consumption and CO2 emissions was discovered in 1978 by Joseph Davidovits [4]. and it is more environment friendly than ordinary Portland cement, which has great prospects as an alternative to ordinary Portland cement [5]. Due to the combination of foamed concrete and geopolymer, porous geopolymer has been highly concerned and extensively studied [6-9]. Which is usually prepared by adding a blowing agent, such as hydrogen peroxide, aluminium and silicon powders, sodium dodecyl-benzenesulfonate, to a geopolymer slurry [2, 10, 11]. These foaming agents result in porous geopolymer with large pore size and uneven pore distribution, and the mechanical properties of porous geopolymer drops sharply with the increase of pore volumes. The thermal insulation property of porous geopolymer is still poor at acceptable compressive strength. Furthermore, these preparation methods generate air bubbles in fresh geopolymer to prepare porous geopolymer. However, air bubbles are always thermodynamically unstable, finally leading to the difficulties for the control of pore structure [12-15]. The means of achieving gas rarefaction, i.e., through a nanoporous solid structure, distinguishes high-performance thermal insulators from traditional porous materials [16, 17]. The distribution of pore sizes lower than the mean free path of air molecules at standard temperature and pressure can yield a decrease in the thermal conductivity of air, resulting in improved thermal insulation properties [17]. Besides, the increased and complex heat transfer path resulting from the decreasing pore size can also contribute to reductions in the thermal conductivity of porous materials. Thus, decreasing pore size of porous geopolymer may reduce the value of thermal conductivity and improve thermal insulation property. The volume of voids can be increased by increasing the water content of the geopolymer. However, the voids are coarse. Montmorillonite, the main component of bentonite, is a 2:1-layer silicate comprised of sheets linked by weak van der Waals forces, which is easily formed platelets or tactoids in

Swelled Na-Bentonite Geopolymer 277
pre-saturated situation. These presented in the voids may lead to void segmentation and, consequently, an increase in the volume of small voids. Hence, pre-statured bentonite may be used to form small voids in geopolymer, finally improving its thermal insulation property, and due to the potential of reaction between alkali and montmorillonite, severely weakened mechanical strength may be prevented. In this paper, porous geopolymer are prepared by adding bentonite slurry for formation small voids, and the fresh properties pore structure, thermal conductivity and hardened properties of porous geopolymer were investigated.
MATERIALS AND METHODS Materials Porous geopolymer were prepared using metakaolin, sodium silicate, sodium hydroxide, Na- bentonite and water. Metakaolin has high reactivity and purity compared to other raw materials such as fly ash and natural clay. Therefore, this paper selected metakaolin as the main precursor of the geopolymer matrix. Metakaolin supplied by Inner Mongolia Chaopai Kaolin Co., Ltd. (Inner Mongolia, China) was a starting material. Sodium bentonite was purchased from Junhui Bentonite Development Co., Ltd., Sichuan Province, China. The chemical compositions of the metakaolin and Na-bentonite were determined by X-ray fluorescence spectroscopy (PANalytical Axios X-ray fluorescence spectrometer, Netherlands) are presented in Table 1. The mineral phases and particle size distribution of raw material are shown in Figure 1and Figure 2. A scanning electron micrograph of bentonite is shown in Figure 3. The bentonite was uniformly dispersed with water using a power agitator, and then the bentonite paste was undisturbed for about 24 hours to form a water-rich slurry. The modulus of water glass was adjusted to 1.5 with sodium hydroxide. Sodium hydroxide (purity≥99.7) obtained from Chengdu Cologne Chemical Co., Ltd. (Sichuan Province, China). The water used in the experiment was tap water.
Table 1 Chemical composition of raw materials, %
COMPOSITION Na2O MgO Al2O3 SiO2 P2O5 SO3 K2O CaO TiO2 Fe2O3
Metakaolin 0.18 0.17 43.85 52.92 0.49 0.17 0.18 0.28 0.99 0.59 Na-bentonite 2.57 4.08 15.79 68.28 0.04 0.02 0.87 5.5 0.24 2.29
Figure 1 XRD patterns of raw materials. Figure 2 Particle size distribution of the raw materials.
ANGLE, 2θ°
INTE
NS
ITY
, cou
nts
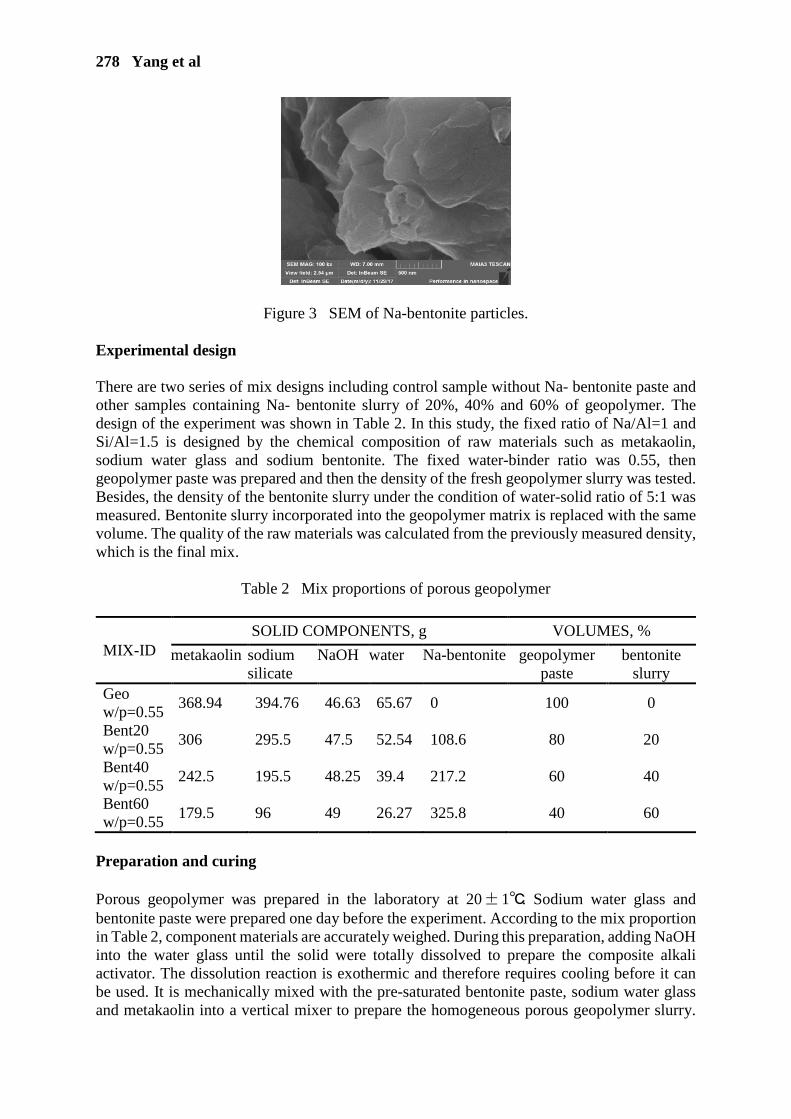
278 Yang et al
Figure 3 SEM of Na-bentonite particles. Experimental design There are two series of mix designs including control sample without Na- bentonite paste and other samples containing Na- bentonite slurry of 20%, 40% and 60% of geopolymer. The design of the experiment was shown in Table 2. In this study, the fixed ratio of Na/Al=1 and Si/Al=1.5 is designed by the chemical composition of raw materials such as metakaolin, sodium water glass and sodium bentonite. The fixed water-binder ratio was 0.55, then geopolymer paste was prepared and then the density of the fresh geopolymer slurry was tested. Besides, the density of the bentonite slurry under the condition of water-solid ratio of 5:1 was measured. Bentonite slurry incorporated into the geopolymer matrix is replaced with the same volume. The quality of the raw materials was calculated from the previously measured density, which is the final mix.
Table 2 Mix proportions of porous geopolymer
MIX-ID SOLID COMPONENTS, g VOLUMES, %
metakaolin sodium silicate
NaOH water Na-bentonite geopolymer paste
bentonite slurry
Geo w/p=0.55
368.94 394.76 46.63 65.67 0 100 0
Bent20 w/p=0.55
306 295.5 47.5 52.54 108.6 80 20
Bent40 w/p=0.55
242.5 195.5 48.25 39.4 217.2 60 40
Bent60 w/p=0.55
179.5 96 49 26.27 325.8 40 60
Preparation and curing Porous geopolymer was prepared in the laboratory at 20±1. Sodium water glass and bentonite paste were prepared one day before the experiment. According to the mix proportion in Table 2, component materials are accurately weighed. During this preparation, adding NaOH into the water glass until the solid were totally dissolved to prepare the composite alkali activator. The dissolution reaction is exothermic and therefore requires cooling before it can be used. It is mechanically mixed with the pre-saturated bentonite paste, sodium water glass and metakaolin into a vertical mixer to prepare the homogeneous porous geopolymer slurry.

Swelled Na-Bentonite Geopolymer 279
Then, the slurry was transferred to cubic steel moulds of 40 × 40 × 40 mm³, and sealed with clingfilm to prevent moisture release and stored in a 20 controlled room. The sample was removed from the mould and cured using a climatic chamber under controlled conditions of 20 ± 1°C and 90% relative humidity for 48 h. Finally, the test specimens were demoulded and stored in 90% relative humidity chamber at 20 ± 1 for 3, 7, 28 and 56 days. Test methods The workability of the porous geopolymer slurry was evaluated by testing the fluidity. The fluidity test of the porous geopolymer was tested by a truncated cone with a top surface diameter of 36 mm, a sub-face diameter of 60 mm, and a height of 60 mm. The test method was carried out according to GB/T 8077-2012. The fresh slurry is quickly poured into a Mini-cone geometry and the fluidity of the porous geopolymer is obtained by testing the diameter of expansion. The truncated cone was lifted in the vertical direction and the timing was started. After 30 seconds, the maximum diameter in both directions perpendicular to each other was measured with a ruler, and the average value was taken as the fluidity. The properties of the specimens were evaluated via compressive strength tests performed after 3, 7, 28 and 56 days of curing, in accordance with ISO 679:1989. For the estimation of compressive strength a destructive method using the loading press was used. The compression strength of geopolymer was tested using a universal material testing machine (TYE-300, Wuxi Jianyi Instrument & Machinery Co., Ltd., Jiangsu province, China) with a loading speed of 500 N/s. Three parallel test samples from each mixture were placed in the compression-testing machine, and the average compressive strength (in MPa) was recorded. The standard deviation of strength was less than 5%. Dry density was calculated using the estimated mass and volume of the test specimens. The samples (40 × 40 × 40 mm³) were transferred to an electric blast drying oven continuously dried at 60 until constant weight was achieved. The determination of dry density of porous geopolymer was done at the age of 28 days and the result was reported from the average of the three samples. The sample is stored in absolute ethanol to terminate the hydration. The results powders were tested by X-ray diffraction (XRD). A few specimens were grounded to powder and dry at 60 until the mass remained unchanged. Mineral phases of porous geopolymer were characterized via XRD measurements performed with a PANalytical X’PertPro diffractometer (copper target, step size: 0.03°). The chemical compositions of these materials were then determined by means of X ray fluorescence spectroscopy (Axios, PANalytical, The Netherlands). The micro-structures of the samples were examined via scanning electron microscopy (SEM; MAIA3LMU, Tescan, Czech Republic). MIP is a method for determining pore size distribution. Therefore, the pore volume of the corresponding pore size can be known by measuring the amount of mercury entering the pore at different external pressures. The capillary pore characteristics were represented by mercury intrusion porosimetry (MIP; AutoPore IV 9500, Micromeritics, USA). The applied intrusion pressure was increased from 0 to 30,000 psi. In general, pores are considered ideal cylindrical tubes with various diameters, and thus the intrusion pressure P can be related to the pore diameter 𝑑𝑑 via the Laplace equation, which is given as follows:
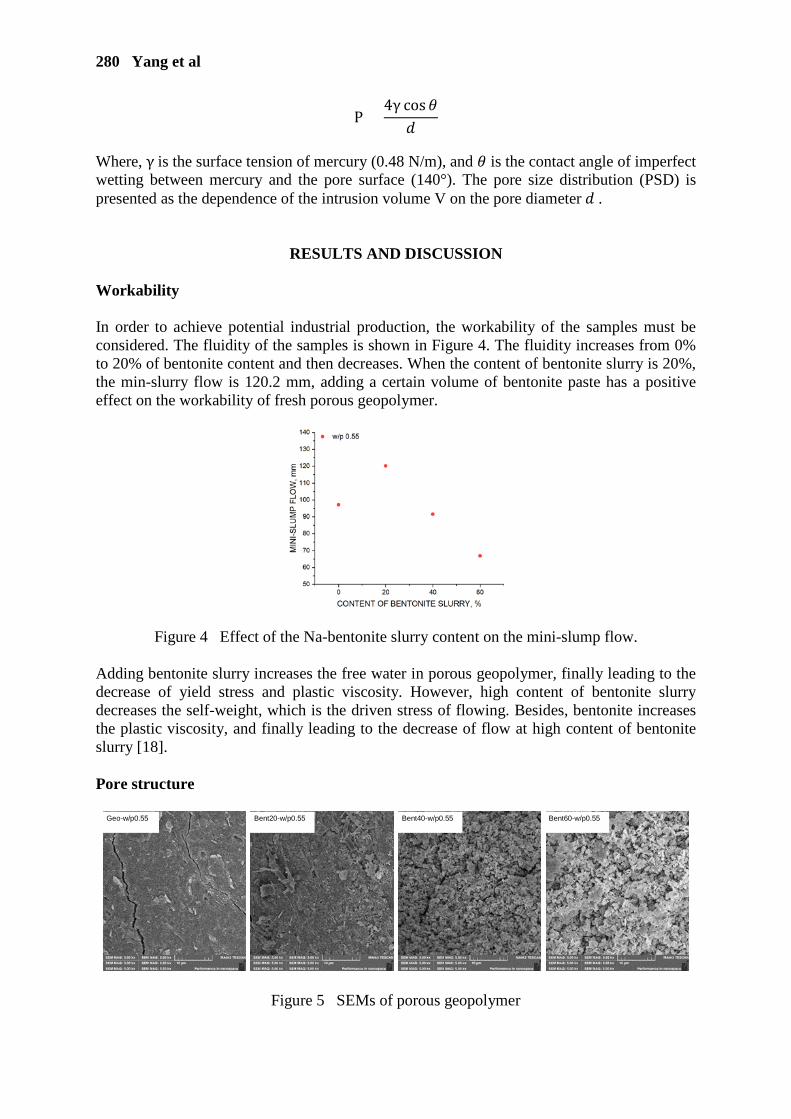
280 Yang et al
P =4γ cos𝜃𝜃
𝑑𝑑
Where, γ is the surface tension of mercury (0.48 N/m), and 𝜃𝜃 is the contact angle of imperfect wetting between mercury and the pore surface (140°). The pore size distribution (PSD) is presented as the dependence of the intrusion volume V on the pore diameter 𝑑𝑑 .
RESULTS AND DISCUSSION Workability In order to achieve potential industrial production, the workability of the samples must be considered. The fluidity of the samples is shown in Figure 4. The fluidity increases from 0% to 20% of bentonite content and then decreases. When the content of bentonite slurry is 20%, the min-slurry flow is 120.2 mm, adding a certain volume of bentonite paste has a positive effect on the workability of fresh porous geopolymer.
Figure 4 Effect of the Na-bentonite slurry content on the mini-slump flow.
Adding bentonite slurry increases the free water in porous geopolymer, finally leading to the decrease of yield stress and plastic viscosity. However, high content of bentonite slurry decreases the self-weight, which is the driven stress of flowing. Besides, bentonite increases the plastic viscosity, and finally leading to the decrease of flow at high content of bentonite slurry [18]. Pore structure
Figure 5 SEMs of porous geopolymer
Geo-w/p0.55 Bent20-w/p0.55 Bent40-w/p0.55 Bent60-w/p0.55
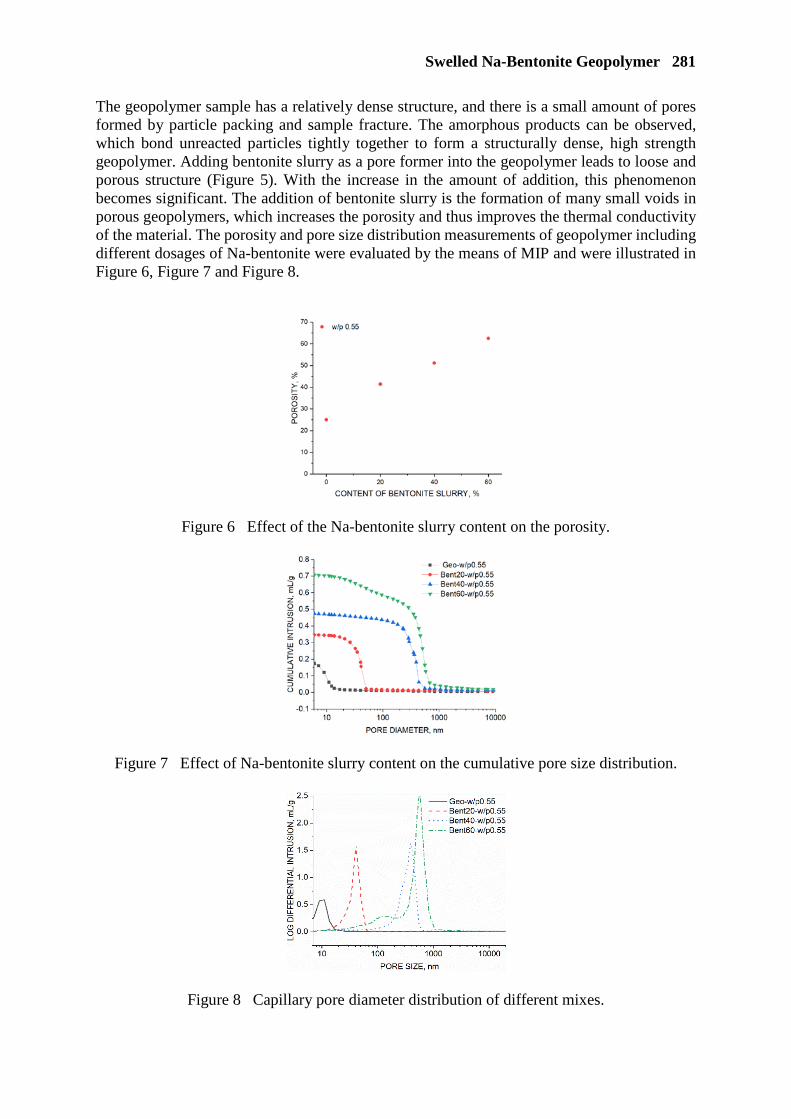
Swelled Na-Bentonite Geopolymer 281
The geopolymer sample has a relatively dense structure, and there is a small amount of pores formed by particle packing and sample fracture. The amorphous products can be observed, which bond unreacted particles tightly together to form a structurally dense, high strength geopolymer. Adding bentonite slurry as a pore former into the geopolymer leads to loose and porous structure (Figure 5). With the increase in the amount of addition, this phenomenon becomes significant. The addition of bentonite slurry is the formation of many small voids in porous geopolymers, which increases the porosity and thus improves the thermal conductivity of the material. The porosity and pore size distribution measurements of geopolymer including different dosages of Na-bentonite were evaluated by the means of MIP and were illustrated in Figure 6, Figure 7 and Figure 8.
Figure 6 Effect of the Na-bentonite slurry content on the porosity.
Figure 7 Effect of Na-bentonite slurry content on the cumulative pore size distribution.
Figure 8 Capillary pore diameter distribution of different mixes.

282 Yang et al
With the increase of bentonite slurry, the volume of mercury intrusion observably increased within 1000 nm of the pore diameter. Porosity of porous geopolymer increases with the increase of bentonite content. It can be observed that the cumulative intrusion volume corresponding to the porosity increases with addition of Na-bentonite paste. The cumulative pore volume increases from 0.175 ml/g to 0.708 ml/g, when the bentonite content increases from 0% to 60%. However, the percentage of smaller sized pores (sizes: < 100 nm) increased from 93.8% to 95.2% and decreased to 17%. This indicates that the addition of bentonite helps to form sub-micron pores, but due to the excessive water content in the bentonite slurry, the capillary pores larger than 100 nm increase from 0.017 ml/g to 0.588 ml/g. The pore size distribution is broadened and the total pore volume increases with increasing (from 0 to 60%) content. Montmorillonite, the main component of bentonite, is a 2:1-layer silicate comprised of sheets linked by weak van der Waals forces. The layer structure consists of two tetrahedral silica sheets with an octahedral alumina sheet sandwiched between two silica sheets [19]. Water in porous geopolymer, stemming from the bentonite slurry and the geopolymer paste, is unconsumed completely by geopolymer hydration, and gives rise to capillary voids. Pre-saturated bentonite consists of montmorillonite layers, which segregate to the large capillary voids. In porous geopolymer, montmorillonite may exist as platelets that divide the large capillary voids into smaller pores, resulting in the refinement of these voids and an increase in the content and percentage of small voids. However, in some cases, the water content is excessively high and the fraction of sufficiently large capillary voids is also high, while the segregation and refinement of large voids are highly limited by the content of plates or tactoids. Thus, a further increase in the small void fraction of the porous geopolymer is prevented for a given bentonite slurry content, which ultimately results in a decrease in this rate.
Figure 9 XRD patterns of porous geopolymer and bentonite. Pre-saturated bentonite consists of single layers or tactoids, which persist in porous geopolymer. Rearrangement of these layers into originally oriented stacks is prevented in the dried porous geopolymers, owing to the interaction between the alkaline environment and the montmorillonite layers, as confirmed by XRD patterns of the porous geopolymers and bentonite (Figure 9). The broad distribution peaks and the sharp 001 peaks correspond to porous geopolymers and montmorillonite, respectively [19]. This indicates that, in contrast to its form in the initial bentonite, montmorillonite in porous geopolymers exists as disordered single layers or few layers [20]. The samples overlap and interact, thereby preventing rearrangement of the layers, preserving single layers or few layers of montmorillonite, then dividing the large capillary voids into smaller pores and increasing the sub-micron pores content.
ANGLE, 2θ°
INTE
NS
ITY
, cou
nts
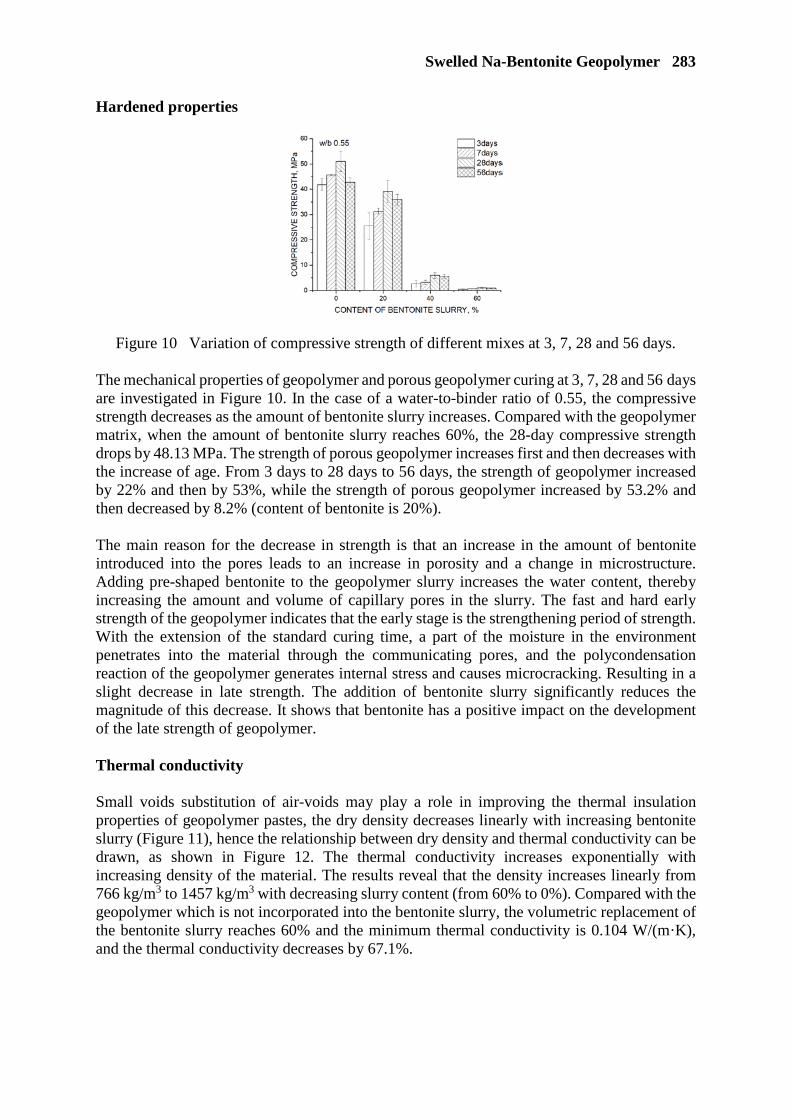
Swelled Na-Bentonite Geopolymer 283
Hardened properties
Figure 10 Variation of compressive strength of different mixes at 3, 7, 28 and 56 days.
The mechanical properties of geopolymer and porous geopolymer curing at 3, 7, 28 and 56 days are investigated in Figure 10. In the case of a water-to-binder ratio of 0.55, the compressive strength decreases as the amount of bentonite slurry increases. Compared with the geopolymer matrix, when the amount of bentonite slurry reaches 60%, the 28-day compressive strength drops by 48.13 MPa. The strength of porous geopolymer increases first and then decreases with the increase of age. From 3 days to 28 days to 56 days, the strength of geopolymer increased by 22% and then by 53%, while the strength of porous geopolymer increased by 53.2% and then decreased by 8.2% (content of bentonite is 20%). The main reason for the decrease in strength is that an increase in the amount of bentonite introduced into the pores leads to an increase in porosity and a change in microstructure. Adding pre-shaped bentonite to the geopolymer slurry increases the water content, thereby increasing the amount and volume of capillary pores in the slurry. The fast and hard early strength of the geopolymer indicates that the early stage is the strengthening period of strength. With the extension of the standard curing time, a part of the moisture in the environment penetrates into the material through the communicating pores, and the polycondensation reaction of the geopolymer generates internal stress and causes microcracking. Resulting in a slight decrease in late strength. The addition of bentonite slurry significantly reduces the magnitude of this decrease. It shows that bentonite has a positive impact on the development of the late strength of geopolymer. Thermal conductivity Small voids substitution of air-voids may play a role in improving the thermal insulation properties of geopolymer pastes, the dry density decreases linearly with increasing bentonite slurry (Figure 11), hence the relationship between dry density and thermal conductivity can be drawn, as shown in Figure 12. The thermal conductivity increases exponentially with increasing density of the material. The results reveal that the density increases linearly from 766 kg/m3 to 1457 kg/m3 with decreasing slurry content (from 60% to 0%). Compared with the geopolymer which is not incorporated into the bentonite slurry, the volumetric replacement of the bentonite slurry reaches 60% and the minimum thermal conductivity is 0.104 W/(m·K), and the thermal conductivity decreases by 67.1%.

284 Yang et al
Figure 11 Effect of the Na-bentonite slurry content on the dry density.
(a) (b)
Figure 12 Effect of the dry density on the thermal conductivity. The pore structure introduced by the addition of the bentonite paste is quite different from the conventional pore structure of the porous geopolymer prepared by foaming or the like. On the one hand, adding bentonite leads to an increase in porosity, which in turn reduces the thermal conductivity. On the other hand, the air pores introduced by using bentonite as a pore-forming agent are smaller in size and narrower in size distribution. Compared with other porous materials, porous geopolymer based on statured bentonite slurry can be attributed to the small voids, which increase the heat transfer path and decrease the thermal conductivity of air phase, finally showing excellent thermal insulation properties than others.
CONCLUSIONS In this study, porous geopolymers were successfully prepared by adding a pre-statured Na-bentonite slurry to geopolymer pastes. The main findings are summarized as follows: (1) Adding a certain volume of bentonite paste has a positive effect on the workability of fresh
porous geopolymer, when the content of bentonite reached 20, the flow diameter is 120.2 mm.
(2) The amount of montmorillonite layer of porous geopolymers is limited and it is not possible to refine all the pores, leading to low ratio of sub-micron pores, but it increases the content of small pores.
(3) When the amount of bentonite slurry reaches 60%, the dry density is 766 kg/m3, porosity is 62.6%.
(4) When the thermal conductivity is 0.104 W/(m·K), the strength can reach 0.97 MPa, which meets the requirements of thermal insulation materials.
Swelled Na-Bentonite Geopolymer 285
ACKNOWLEDGEMENTS This work was supported by the National Key Research and Development Plan (2016YFC0701004), Science and Technology Project of Sichuan (2018GZ0152, 18YYJC0904), Open Fund of State Key Laboratory Cultivation Base for Nonmetal Composites and Functional Materials (13zxfk04, 14tdfk01). The corresponding author would like to thank Southwest University of Science and Technology for providing the scholarship for this research in UK.
REFERENCES 1. NOVAIS R M, BURUBERRI L H, ASCENSÃO G, SEABRA M P AND LABRINCHA
J A, Porous biomass fly ash-based geopolymers with tailored thermal conductivity, Journal of Cleaner Production, Vol. 119, 2016, pp. 99-107.
2. BAI C Y, FRANCHIN G, ELSAYED H, CONTE A AND COLOMBO P, High strength metakaolin-based geopolymer foams with variable macroporous structure, Journal of the European Ceramic Society, Vol. 36, 2016, No. 16, pp. 4243-4249.
3. RAHMAN N A, JAINI Z M, RUM R H M, KHAIRUDDIN S A A AND ZAMRI M N, Effect of Span-to-Depth Ratio on the Fracture Energy of Foam Concrete, Key Engineering Materials, Vol. 730, 2017, pp. 440-444.
4. CHANG T P, SHIH J Y, YANG K M AND HSIAO T C, Material properties of portland cement paste with nano-montmorillonite, Journal of Materials Science, Vol. 42, 2007, No. 17, pp. 7478-7487.
5. HASSAN H S, ABDEL-GAWWAD H A, GARCIA S R V AND ISRADE-ALCANTARA I, Fabrication and characterization of thermally-insulating coconut ash-based geopolymer foam, Waste Management, Vol. 80, 2018, pp. 235-240.
6. FENG J J, ZHANG R F, GONG L L, YE L, WEI C AND CHENG X D, Development of porous fly ash-based geopolymer with low thermal conductivity, Materials & Design, Vol. 65, 2015, No. 3, pp. 529-533.
7. PEYNE J, GAUTRON J, DOUDEAU J AND ROSSIGNOL S, Development of low temperature lightweight geopolymer aggregate, from industrial Waste, in comparison with high temperature processed aggregates, Journal of Cleaner Production, Vol. 189, 2018, pp. 47-58.
8. SINGHAL A, GANGWAR B P AND GAYATHRY J M, CTAB modified large surface area nanoporous geopolymer with high adsorption capacity for copper ion removal, Applied Clay Science, Vol. 150, 2017, pp. 106-114.
9. ZHANG Y S, SUN W AND LI Z J, Composition design and microstructural characterization of calcined kaolin-based geopolymer cement, Applied Clay Science, Vol. 47, 2010, No. 3, pp. 271-275.

286 Yang et al
10. RICKARD W D A AND VAN RIESSEN A, Performance of solid and cellular structured fly ash geopolymers exposed to a simulated fire, Cement and Concrete Composites, Vol. 48, 2014, pp. 75-82.
11. VERDOLOTTI L, LIGUORI B, CAPASSO I, ERRICO A, CAPUTO D, LAVORGNA M AND IANNACE S, Synergistic effect of vegetable protein and silicon addition on geopolymeric foams properties, Journal of Materials Science, Vol. 50, 2015, No. 6, pp. 2459-2466.
12. ABDULLAH A, AL BAKRI A M M, KAMARUDIN H, RUZAIDI C M, YAHYA Z, MOHD SALLEH M A A, ZAKARIA N, MUHAMMAD FAHEEM M T, Compressive Strength and Morphology of Fly Ash Based Geopolymer as Artificial Aggregate with Different Curing Temperature, Key Engineering Materials, Vol. 594-595, 2013, pp. 151-155.
13. EMBONG R, KUSBIANTORO A, SHAFIQ N AND NURUDDIN M F, Strength and microstructural properties of fly ash based geopolymer concrete containing high-calcium and water-absorptive aggregate, Journal of Cleaner Production, Vol. 112, 2016, pp. 816-822.
14. JANG J G, AHN Y B, SOURI H, LEE H K, A novel eco-friendly porous concrete fabricated with coal ash and geopolymeric binder: Heavy metal leaching characteristics and compressive strength, Construction & Building Materials, Vol. 79, 2015, pp. 173-181.
15. BURCIAGADIAZ O AND ESCALANTEGARCIA J I, Strength and Durability in Acid Media of Alkali Silicate-Activated Metakaolin Geopolymers, Journal of the American Ceramic Society, Vol. 95, 2012, No. 7, pp. 2307-2313.
16. AKTHAR F K AND EVANS J R G, High porosity (> 90%) cementitious foams, Cement and Concrete Research, Vol. 40, 2010, No. 2, pp. 352-358.
17. BAETENS R, High performance thermal insulation materials for buildings, Chapter 9 in Nanotechnology in Eco-Efficient Construction, Woodhead Publishing, 2013, pp. 188-206.
18. MESBOUA N, BENYOUNES K AND BENMOUNAH A, Study of the impact of bentonite on the physico-mechanical and flow properties of cement grout, Cogent Engineering, Vol. 5, 2018, No. 1, pp. 1-12.
19. FU L H, CAO T H, LEI Z W, CHEN H, SHI Y G AND XU C H, Superabsorbent nanocomposite based on methyl acrylic acid-modified bentonite and sodium polyacrylate: Fabrication, structure and water uptake, Materials & Design, Vol. 94, 2016, pp. 322-329.
20. ZHANG G L, KE Y C, HE J, QIN M R, SHEN H, LU S C AND XU J S, Effects of organo-modified montmorillonite on the tribology performance of bismaleimide-based nanocomposites, Materials & Design, Vol. 86, 2015, pp. 138-145.
A NOVEL MECHANICALLY ROBUST SUPERHYDROPHOBIC CEMENT FOAM
Z Zheng
W She
C Miao
Southeast University
China
ABSTRACT: Here, we describe an ultra-lightweight, high strength and mechanically robust superhydrophobic cement foam for the first time, which was fabricated by simultaneously modifying the tomographic and chemical properties of cement paste border-air interfaces that were generated by H2O2 decomposition reaction in alkali environment. First, water repellent functional group was grafted onto the surface of nano-silica, the modified nano-silica will adsorb onto the surface of air- liquid interfaces and increase the viscosity of cement suspension, preventing the coalescence and coarsening process of bubbles with different size. The stability of cement foam was greatly increased, resulting in a more uniform and refined pore structure in hardened foam cement. Coupled with the reinforcing effect of nano-silica hydration on the strength of cement paste matrix, the aims of ultralight and high strength were thus achieved. Second, with the interfacial morphological modification by the functionalized nano-silica, a multi-scale hierarchical roughness was created on the interface of pores wall. The coupled effect of the physical and chemical interfacial modification results that a bulk superhydrophobic cement foam shows excellent mechanical robustness, which maintained the superhydrophobicity even upon major surface damage. Keywords: Foam cement, Robust superhydrophobic, Nanohybrid, Interfacial modification Professor Wei She is the Director of the Multi-functional Concrete at Southeast University. He has published extensively on many aspects of foam cement, superhydrophobic concrete and sustainable construction. Mr Z Zheng is a postgraduate student at Southeast University. His main research area is foam concrete. Professor Changwen Miao is the Director of High Performance Concrete and Admixture at Southeast University. He has undertaken and participated in a large number of national key projects.

288 She et al
INTRODUCTION
Since the concept of ‘sustainable development’ has been widely accepted in vary fields, reducing energy consumption and greenhouse gas emission during the whole service life of buildings has gain more and more attention. Therefore, thermal insulation materials are widely utilized in buildings. Compared with widely used organic heat insulating polymer materials, such as polystyrene board, polyurethane (PU) board and expanded polystyrene (EPS), lightweight concrete possesses advantages of superior fire-resistant, relatively inexpensive, less environmental impact and durability [1, 2, 3, 4]. Aqueous foam is thermodynamically unstable system by nature [5, 6]. When foam was generated in cement paste suspension, it will undergo continuously coalescence process. This phenomenon can be explained by ‘Ostwald ripening’ theory. The practical consequence of this phenomena is that larger bubbles grow at the expense of smaller ones, the drive force is Laplace pressure between bubbles with different sizes. This destabilization process results in larger bubbles and eventual collapse of the structure. Therefore, simultaneously realizing ultra-lightweight and high strength of foam cement is a big challenge [7, 8]. In addition, the hydrophilicity and porous structure of cement foam induce considerable water absorption [9, 10]. The ingress water will not only increase the bulk density and thermal conductivity, but also decrease the durability of cement-based material. Water is either be a transport medium of aggressive ions, e.g. chloride and sulfate ions, or be itself a reactant of a degradation agent (freezing expansion, ions leaching) [11]. In recent years, superhydrophobic techniques [12] have received much attention because of their large potential application in self-cleaning, anti-frost, anti-corrosion, oil/water separation and so on. Meanwhile, many methods have been reported for designing superhydrophobic surfaces [13] by mimicking several natural surfaces such as lotus leaves, pond skater legs, butterfly wings and so on, wherein super none-wetting property is achieved by design hierarchical surface roughness and low-surface-energy materials, including the fabrication of aligned microstructure by template method, coating preparation of fluoro-containing polymeric surfaces and the preparation of fluorinated micropatterned surface. However, large majority of superhydrophobic surfaces have very limited mechanical wear robustness and long-term durability [14]. This problem has restricted their utilization in commercial or industrial applications. The most common strategy for mechanical durability is to employ surfaces that can resist dynamic impact while retaining the geometric features associated with the surface topology and the hydrophobic composition associated with the surface chemistry. For example, good substrate adhesion, flexible organic coating and coatings including inorganic hard nanoparticles (TiO2, SiO2 and so on) [15]. Despite notable progress, all these methods are subject to certain disadvantages, such as complex and tedious fabrication, expensive materials. An obvious approach to avoid the top-coat problem is to employ homogeneous chemistry by use of hydrophobic bulk materials. However, bulk superhydrophobic materials with such characteristics have remained elusive. In this paper, we present a novel and feasible method for fabricating a durable superhydrophobic, ultra-lightweight foam cement. Small quantities of siloxane functionalized nano-silica were used to stabilize the cement foam and create a multi-scale hierarchical roughness by the interfacial morphological modification on the inner surface of pores wall of cement foam. Mechanically robust superhydrophobicity was simultaneously realized with superhydrophobic air voids distributed throughout the cementitious matrix to provide effective protection against water penetration as well as to improve the mechanical performance.

Superhydrophobic Cement Foam 289
EXPERIMENTAL PROCEDURES
Materials
White portland cement (P.W.52.5) was purchased from Yinshan, Jiangxi, China. A type of hydrophobic amorphous nano silica (NS; BET: 120 m2/g, average diameter: 30nm) and isobutyltriethoxysilane (IBTES) were obtained from Gelest. H2O2 (content: 30%) and calcium stearate (CS) obtained from Perfectly Advanced Material of Chemical Inc., were used as foaming agent and foam stabilizer respectively. MnO2 was used as the catalyzer for hydrogen peroxide decomposing which was purchased from Gelest. Polycarboxylic superplasticizer (water reducing efficiency: 40%) was obtained from Sobute New Materials Co., Ltd., China. Solution Preparation
Solution containing NS was first produced. Based on the weight of cement as 100%, 2% NS was dissolving in 55% water while using an ultrasonic dispersion machine with a maximum ultrasonic frequency of 40 kHz to avoid the aggregation of the NS particles. The ultrasonic treatment time was 20 min, during which the temperature was kept at 20 °C. Then, 4% IBTES was added into the suspension and then the surfactant solution was completed after stirring for 10 minutes. Foam Cement Preparation
White portland cement both with 1.5% CS and 0.5% MnO2 was first dry-mixed for 1min via a handheld mixer. Subsequently, the surfactant solution was added into the powders mixed before and mixing for 3min. In the stirring process, superplasticizer was used to adjust the viscosity of slurry. Finally, 7.5% H2O2 was fleetly added into the mixture and stirred for about 10s. After mixing, the foamed concrete paste was cast into molds and stood for 1h before moving to the standard maintenance room (20 °C, 100% relative humidity) until testing. Test Methods
WCA was performed by an instrument (OCA 15Pro contact angle meter) at ambient temperature. The volumes of probing liquids in the measurements were approximately 5 μL for the contact angle measurement. Each contact angle reported was an average value of at least five independent measurements on different spots. The images of liquid droplets on the surface were captured by a digital camera (EOS 5D II). A field emission scanning electron microscope (FESEM, Navo Nano SEM450) was used to analyze the morphological properties. The nano silica were characterized by transmission electron microscopy (TEM, JEM-3010). EDS analysis was performed over a microscopic area to confirm the nature of the specimens assembled with after coating. The FT-IR spectra were used to analyze the chemical bonding by a Thermo Nicolet 5700 spectrophotometer using KBr pellets. XRD was used to analyze the chemical components. The superhydrophobic property was characterized and analyzed by capillary water absorption test and immersion water absorption test.

290 She et al
RESULTS
Compressive Strength
The stability and reinforcement mechanism of nano silica in the system is multistage, from fresh stage to hardened stage. In fresh stage, the stability mechanism plays the dominant role while the reinforcement mechanism makes decision in hardened stage. First of all, compressive strength is analyzed. Samples with density of about 270 kg/m3 were selected for compressive strength testing for 3 days, 7 days and 28 days due to the test of samples with too low density will be inaccurate (Figure 1). For all samples, the strength increased with the increase of time. Compared with control group, the compressive strength increases with the adding of the calcium stearate (CS). When the content of CS is 1.5%, the compressive strength of foam cement (28 days) comes to the pinnacle (0.54 MPa) with a 44.74% improvement than control group. However, when the content is too high (according to the experiment, more than 1.5%), agglomeration may occur in the slurry and defects may generate, leading to a decrease in the strength. The second factor nano-silica (NS) content has the same trend. When adding no NS, 5.26% decline appears compared with the control group due to the 4% IBTES in the sample. The compressive strength increases rapidly due to the pozzolanic reaction of the NS with Ca(OH)2. Similarly with CS, a turning point appears around 2% content of NS due to the reunion of excessive NS producing defects. Excessive IBTES can not be combined with NS and may significantly affect compressive strength.
Figure 1 The influence of three components on compressive strength with the contents
increasing. Single factor horizontal experiment. Three factors: CS content(0.9%~1.8%), NS content(0 %~3%), IBTES content(3%~6%).
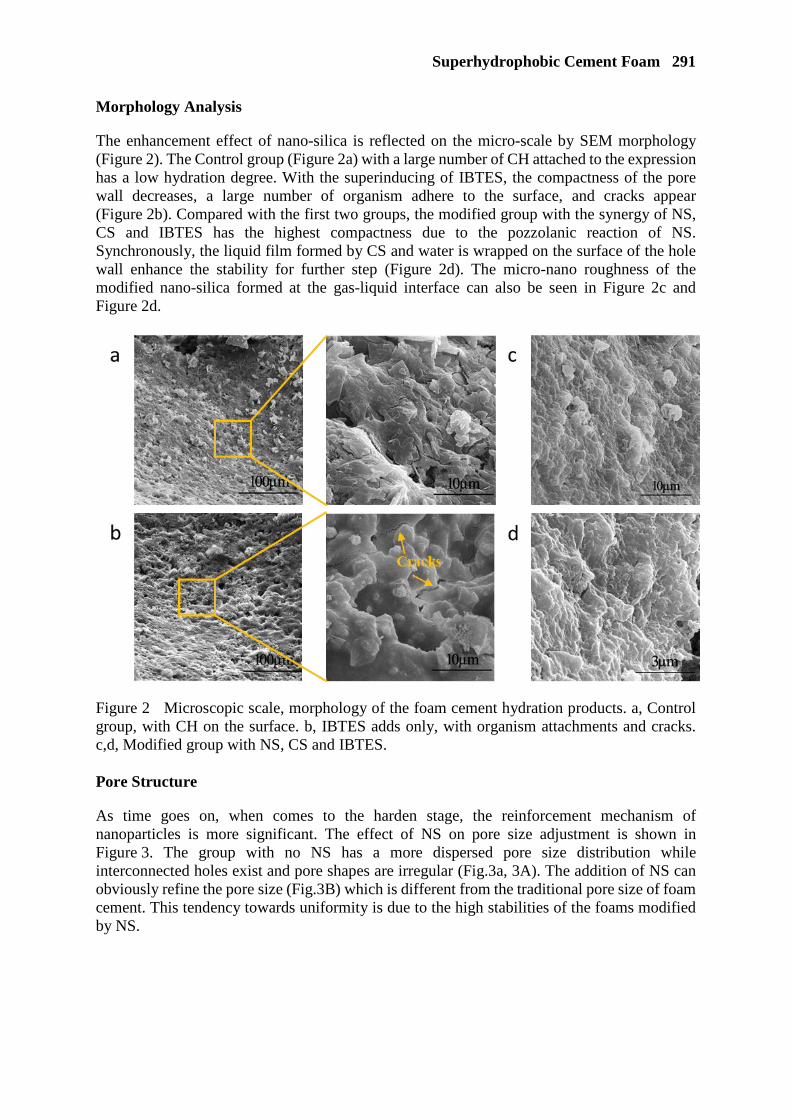
Superhydrophobic Cement Foam 291
Morphology Analysis
The enhancement effect of nano-silica is reflected on the micro-scale by SEM morphology (Figure 2). The Control group (Figure 2a) with a large number of CH attached to the expression has a low hydration degree. With the superinducing of IBTES, the compactness of the pore wall decreases, a large number of organism adhere to the surface, and cracks appear (Figure 2b). Compared with the first two groups, the modified group with the synergy of NS, CS and IBTES has the highest compactness due to the pozzolanic reaction of NS. Synchronously, the liquid film formed by CS and water is wrapped on the surface of the hole wall enhance the stability for further step (Figure 2d). The micro-nano roughness of the modified nano-silica formed at the gas-liquid interface can also be seen in Figure 2c and Figure 2d.
Figure 2 Microscopic scale, morphology of the foam cement hydration products. a, Control group, with CH on the surface. b, IBTES adds only, with organism attachments and cracks. c,d, Modified group with NS, CS and IBTES. Pore Structure
As time goes on, when comes to the harden stage, the reinforcement mechanism of nanoparticles is more significant. The effect of NS on pore size adjustment is shown in Figure 3. The group with no NS has a more dispersed pore size distribution while interconnected holes exist and pore shapes are irregular (Fig.3a, 3A). The addition of NS can obviously refine the pore size (Fig.3B) which is different from the traditional pore size of foam cement. This tendency towards uniformity is due to the high stabilities of the foams modified by NS.

292 She et al
Figure 3 Reinforcement stage, pore analysis. 3D images of foam cement and pore size distributions by X-ray computed tomography. a(A), 0%NS. b(B) 2%NS. Matrix Superhydrophobic
The matrix superhydrophobicity is shown in Figure 4. Both the surface and the internal matrix of the foam cement even powders are superhydrophobic while the water contact angles (WCA) of each one are beyond 150°. When superhydrophobic foam cement is immersed in water, mirror effect will appear on the surface due to the air layer. The matrix superhyphobicity is due to the functional interface modification.
Figure 4 Superhydrophobic surface, internal matrix and powders.

Superhydrophobic Cement Foam 293
CONCLUSIONS
In summary, we demonstrated a novel mechanically robust superhydrophobic cement foam with high specific strength via nanohybrid interfacial modification that sustained mechanical properties under a variety of harsh mechanical and chemical environments. The highlight significance of nanohybrid reinforcement can be presented in multiscale research and has an effect on physical roughness and chemical bonding enhancement at the same time. The nano-silica combined with isobutyltriethoxysilane makes macro performance changes mapped from micro changes. The superhydrophobic property is the synergistic result of micro-nano roughness and wettability modification. Through the results of single factor experiment, the ratio of NS to water repellent group is an extremely important variable for further research. Acknowledgements
Authors gratefully acknowledge the financial support from National Key R&D Program of China (2017YFB0309904), National Natural Science Fund of China (51508090), 973 Program (2015CB655100). State Key Laboratory of High Performance Civil Engineering Materials (2016CEM005).
REFERENCES
1. PADTURE, N. P., GELL, M., & JORDAN, E. H. (2002). Thermal barrier coatings for gas-turbine engine applications. Science, 296(5566), 280-284.
2. KORJENIC, A., & PETRÁNEK, V. (2011). Development and performance evaluation of natural thermal-insulation materials composed of renewable resources. Energy & Buildings, 43(9), 2518-2523.
3. OZEL, M. . (2011). Thermal performance and optimum insulation thickness of building walls with different structure materials. Applied Thermal Engineering, 31(17-18), 3854-3863.
4. MERIKALLIO, T., MANNONEN, R., & PENTTALA, V. (1996). Drying of lightweight concrete produced from crushed expanded clay aggregates. Cement & Concrete Research, 26(9), 1423-1433.
5. YI, L., TAO, W., MIN, P., & TIAN, Z. J. (2018). Preparation and high temperature resistance of a novel aqueous foam for fire extinguishing. Procedia Engineering, 211, 514-520.
6. WEI, S., YI, D., MIAO, C., LIU, J., ZHAO, G., & JIANG, J., ET AL. (2018). Application of organic- and nanoparticle-modified foams in foamed concrete: reinforcement and stabilization mechanisms. Cement & Concrete Research, 106, 12-22.
7. KRÄMER, C., KOWALD, T. L., & TRETTIN, R. H. F. (2015). Pozzolanic hardened three-phase-foams. Cement & Concrete Composites, 62, 44-51.
8. KRÄMER, C., SCHAUERTE, M., KOWALD, T. L., & TRETTIN, R. H. F. (2015). Three-phase-foams for foam concrete application. Materials Characterization, 102, 173-179.
9. KHATIB, J. M., & MANGAT, P. S. (1999). Influence of superplasticizer and curing on porosity and pore structure of cement paste. Cement & Concrete Composites, 21(5–6), 431-437.
294 She et al
10. TSIVILIS, S. , CHANIOTAKIS, E. , BATIS, G. , MELETIOU, C. , KASSELOURI, V. , & KAKALI, G. , ET AL. (1999). The effect of clinker and limestone quality on the gas permeability, water absorption and pore structure of limestone cement concrete. Cement & Concrete Composites, 21(2), 139-146.
11. LOTHENBACH, B., SCRIVENER, K., & HOOTON, R. D. (2011). Supplementary cementitious materials. Cement & Concrete Research, 41(3), 217-229.
12. ERBIL, H. Y., DEMIREL, A. L., AVCI, Y., & MERT, O. (2003). Transformation of a simple plastic into a superhydrophobic surface. Science, 299(5611), 1377-1380.
13. WANG, S., & JIANG, L. (2010). Definition of superhydrophobic states. Advanced Materials, 19(21), 3423-3424.
14. GENZER, J., & EFIMENKO, K. (2000). Creating long-lived superhydrophobic polymer surfaces through mechanically assembled monolayers. Science,290(5499), 2130-2133.
15. LU, Z., QIAO, W., RAN, Y., CHEN, B., & LI, Z. (2016). A novel tio TiO2 /foam cement composite with enhanced photodegradation of methyl blue. Construction & Building Materials, 129, 159-162.
OPTIMIZING THE DOSAGE OF LECA AND FLY ASH ON LIGHTWEIGHT CONCRETE TO STUDY THE PERFORMANCE
OF STEEL-CONCRETE COMPOSITE SLAB
R Banu Priya
P.S.R. Engineering College
S Arul Mary
Thiagarajar College Of Engineering
India
ABSTRACT. In concrete design philosophy there is always a demand to reduce the self-weight of structural members. Lightweight aggregate concrete substantially reduce the dead load of the structure. In this study there is a main focus on the design of M25 grade Light-Weight steel concrete composite slab with the appropriate apportioning of Light Expanded Clay Aggregates LECA and normal weight aggregates. The preliminary study also covers complete replacement of normal weight aggregates with light weight aggregates. The replacement of natural aggregate by means of LECA by 20, 40, 60 and 80 percentages in addition to partial replacement of cement through Fly Ash in percentages 15, 20 and 25 in the preparation of light weight concrete. Concrete performance analysis was done in fresh state as well as in hardened state to evaluate the physical and mechanical properties. This study assess the strength and durability of light weight concrete through the engineering parameters such as compressive strength, split tensile strength, flexural strength, young’s modulus, unit weight, durability studies on normal as well as Lightweight Aggregate Concrete. It was found that the density and the workability significantly decreased with increase in the percentage replacement of normal weight aggregate by Lightweight aggregate LECA. However, the strength and durability performance of optimal proportioned concrete mixtures were found to be equivalently better to normal weight concrete. From this study it was observed that the weight of lightweight concrete reduced significantly without compromising the strength performance. This study also aims to extend the application this light weight concrete to study the performance of steel concrete composite slab with decking sheet. The study reveals that the optimal dosage light weight concrete in steel concrete composite slab results in reduction of overall weight of slab when compared to conventional steel concrete slab. The performance parameters such as deflection and slip were also presented in this paper.
Keywords: Light Expanded Clay Aggregate (LECA), Fly ash, Steel Concrete Composite Slab, Lightweight concrete, Lightweight aggregate concrete, Embossment
Mrs R Banu Priya is the PhD Scholar in the field of light weight concrete and steel concrete composite structures. Dr S Arul Mary is the Professor of the Civil Engineering Department at the Thiagarajar College of Engineering, Madurai, India. A renowned practitioner in the field of Structural Engineering, she did extensively work on many aspects of non-destructive testing and in steel concrete composite structures.
296 Banu Priya, Arul Mary
INTRODUCTION
The most important and most frequently encountered combination of construction materials is that of steel and concrete. Composite construction integrates the structural properties of the two materials to produce stiffer, stronger and lighter members from the efficient connection between the two materials. In addition Light-weight concrete (LWC) is a type of concrete which includes an expanding agent. The damage caused in LWC is less significant than conventional concrete and therefore the maintenance cost is also reduced [1]. The Structural light weight concrete as we call is a concrete whose density varies from 1400 to 2000 kg/m3. The literatures have thrown a light on influence of palm oil clinker, coconut shell, ceramic waste, LECA concrete to reduce the density of structural concrete [2]. It reduces the weight of concrete and cost of concrete by reducing the aggregate cost and produces economic infrastructure system. Light-weight concrete cubes, cylinders, beams and steel concrete composite slab were cast and tested for determining compressive strength, split tensile strength, flexural strength, young’s modulus, load vs. deflection and slip of steel, concrete and the results obtained are compared with the control specimens.
LITERATURE REVIEW
It was seen that it is possible to produce high strength lightweight concrete using expanded clay aggregate; the cement content with 450 kg/m3; mechanical properties of concrete could be enhanced by using 10% fly ash; thus a saving in cement amount could be achieved by Serkan Suba [3]. Payam Shafigh et. al experimental results suggest that the ultimate moment of beams made with LECA lightweight concrete could be predicted satisfactorily using the equation provided by the ACI 318 building code [4]. Increasing utilization of lightweight materials in structural applications is making pumice stone a very popular raw material. More than the target means strength of M20 concrete is achieved with 20 percent replacement of natural coarse aggregate by pumice aggregate and with 1.5 percent of fibber. Also with 40% pumice and with 0.5% of fibers average target mean strength of M 20 concrete is achieved by SIVALINGA RAO et.al [5]. This paper investigates the mechanical properties of light weight Geo-polymer concrete produced by replacing normal coarse aggregate by Light weight expanded clay aggregates (LECA). Structural use was although limited to 60% replacement of coarse aggregate by LECA with a density of 1700kg/m3. On replacement of coarse aggregate by LECA by 40%, both split tensile strength and flexural strength decreased by about 35%, but still very much within structural limits [6]. To study the properties such as compressive strength and tensile strengths of lightweight concrete, Expanded Polystyrene (EPS) beads are used as partial replacement to coarse aggregates with 5,10,15,20,25 and 30% Increase in the EPS beads content in concrete mixes reduces the compressive and tensile strength of concrete. It is used for non-structural applications, like wall panels, partition walls, etc Thomas Tamu et-al [7]. Experimental investigation on concrete mix M20 is done by replacement of cement with fly ash, fine aggregate with bottom ash and coarse aggregate with LECA at the rate of 5%, 10%, 15%, 20%, 25%, 30% and 35% and The results shows that 5% replacement of cement with fly ash, fine aggregate with bottom ash and coarse aggregate with LECA was found to be good performance in compressive strength [8]. The Lightweight concrete density varies from 40% - 60% replacement of LECA as 1996kg/m3-1868kg/m3 suggesting for structural purpose. It reduces the weight of concrete and cost of concrete by reducing the aggregate cost and produces economical system [9]. Baskar R [10] studied the strength and behaviour of composite slabs both experimentally and analytically. The load carrying capacity of with embossments and end anchorages groups were found to be greater. Embossments play a vital role in increasing the longitudinal shear capacity of slabs.

Lightweight Concrete 297
Miquel Ferrer et al [11] concluded from the finite elemental analysis that 1.Minimum retention angle should be provided. 2. Alternate directions of embossments (inwards and outwards) tilting not effective 3.Too steep embossments are dangerous 4.Embossment length should be large and better if located near the edges 5. Minimise embossment spacing.
MIX PROPORTION
The procedures adopted for mix proportions are still experimental in spite of considerable work done on the theoretical aspects of mix proportioning of normal weight and lightweight concretes. Table 1 shows the properties of Fine aggregate, coarse aggregate and LECA. The mix design has been made for M25 grade conventional concrete (CC) as per recommended code IS 10262-2009, IS 456-2000. The water cement ratio (W/C) was kept constant at approximately 0.45 for all mixes. Four major groups of concrete mixes like Control specimen (M25 grade) concrete, Cement replaced by Fly Ash in 15%, 20%, 25% concrete, Coarse aggregate replaced by LECA in 20%, 40%, 60%, 80%, 100% concrete and optimal proportion of light weight aggregate concrete were prepared. IS code method is used for mix design, mix proportion obtained for M25 Grade of conventional concrete and light weight concrete mix ratio was 1:1.4:2.4 and 1:1.86:0.52. Table 2 shows the materials of per m3.
Table 1 Properties of Fine Aggregate, Coarse Aggregate and LECA.
PROPERTY FINE AGGREGATE COARSE AGGREGATE LECA
Specific gravity 2.65 2.68 0.44 Fineness modulus 2.83 7.04 5.99 Water absorption 1.5% 0.85% 10%
Bulk density(kg/m3) 1481 1659 357 Impact value - 29.41% 16.5%
Table 2 M25 grade Mix proportions for various mixes
Mixes(per m3) Cement (kg)
Fly Ash (kg)
Water (l)
FA (kg)
CA (kg)
LECA (l)
Super plasticizer
(l) CC 438 0 197 714 1082 0 0
CC with % of Fly Ash
(FC)
FC1 15% 376 66 197 714 1082 0 2.2 FC2 20% 350 88 197 714 1082 0 2.2 FC3 25% 328 110 197 714 1082 0 2.2
LECA (L) LM1 20% 438 0 197 714 854 43 2.2 LM2 40% 438 0 197 714 646 85 2.2 LM3 60% 438 0 197 714 427 128 2.2 LM4 80% 438 0 197 714 213 170 2.2 LM5 100% 438 0 197 714 0 213 2.2
Optimum Proportion
(LC)
FC1 + LM2 376 66 197 714 646 85 2.2 FC1 + LM3 376 66 197 714 427 128 2.2
Note: CC-Conventional Concrete, FA- Fine Aggregate, CA – Coarse Aggregate, LECA-Light Expanded Clay Aggregate, FC-Fly Ash Concrete, LM- LECA Mix
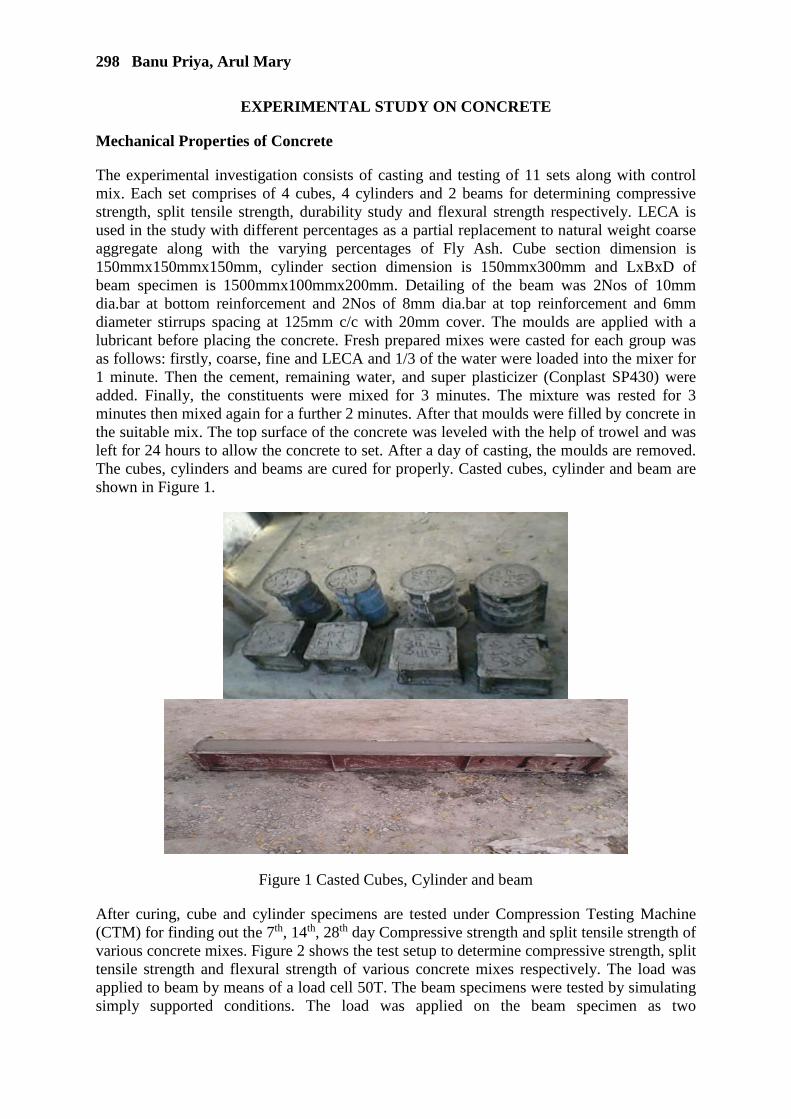
298 Banu Priya, Arul Mary
EXPERIMENTAL STUDY ON CONCRETE
Mechanical Properties of Concrete
The experimental investigation consists of casting and testing of 11 sets along with control mix. Each set comprises of 4 cubes, 4 cylinders and 2 beams for determining compressive strength, split tensile strength, durability study and flexural strength respectively. LECA is used in the study with different percentages as a partial replacement to natural weight coarse aggregate along with the varying percentages of Fly Ash. Cube section dimension is 150mmx150mmx150mm, cylinder section dimension is 150mmx300mm and LxBxD of beam specimen is 1500mmx100mmx200mm. Detailing of the beam was 2Nos of 10mm dia.bar at bottom reinforcement and 2Nos of 8mm dia.bar at top reinforcement and 6mm diameter stirrups spacing at 125mm c/c with 20mm cover. The moulds are applied with a lubricant before placing the concrete. Fresh prepared mixes were casted for each group was as follows: firstly, coarse, fine and LECA and 1/3 of the water were loaded into the mixer for 1 minute. Then the cement, remaining water, and super plasticizer (Conplast SP430) were added. Finally, the constituents were mixed for 3 minutes. The mixture was rested for 3 minutes then mixed again for a further 2 minutes. After that moulds were filled by concrete in the suitable mix. The top surface of the concrete was leveled with the help of trowel and was left for 24 hours to allow the concrete to set. After a day of casting, the moulds are removed. The cubes, cylinders and beams are cured for properly. Casted cubes, cylinder and beam are shown in Figure 1.
Figure 1 Casted Cubes, Cylinder and beam
After curing, cube and cylinder specimens are tested under Compression Testing Machine (CTM) for finding out the 7th, 14th, 28th day Compressive strength and split tensile strength of various concrete mixes. Figure 2 shows the test setup to determine compressive strength, split tensile strength and flexural strength of various concrete mixes respectively. The load was applied to beam by means of a load cell 50T. The beam specimens were tested by simulating simply supported conditions. The load was applied on the beam specimen as two

Lightweight Concrete 299
symmetrically arranged concentrated line loads. Loading was applied using a Hydraulic Jack and Linear Variable Differential Transformer (LVDT) was fixed at central bottom of the specimen to measure the mid span deflection.
Figure 2 Testing of cube and cylinder in CTM and beam specimen under loading frame
Durability Studies
Concrete is at risk to acid attack because of its alkaline nature. The components of the cement paste break down during contact with acids. The materials density and strengths are the most important properties in which studies are carried out. Figure 3, 4, 5, 6 and 7shows the physical appearance of concrete specimens after 28 days curing in sulphuric acid, hydrochloric acid, lactic acid, magnesium sulphate solution and also carbonation indication respectively.
`
Figure 3 The physical appearance of the cube specimens immersed 28 days in 5% H2SO4 solution
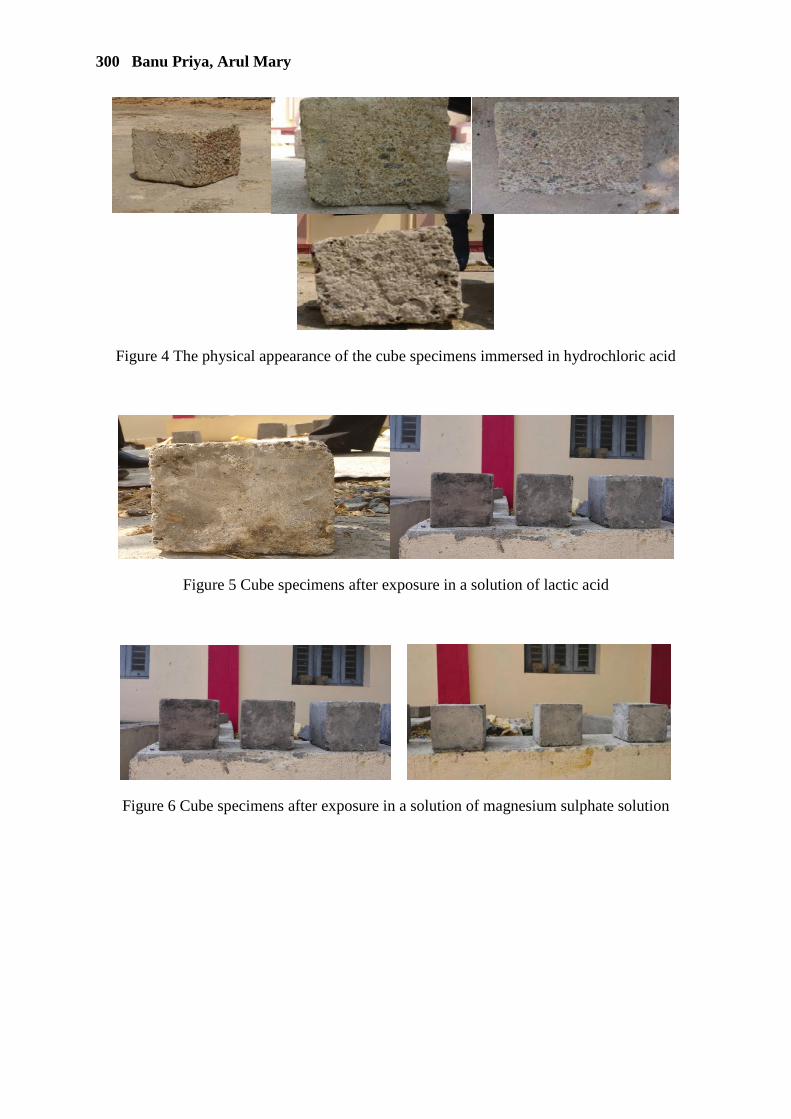
300 Banu Priya, Arul Mary
Figure 4 The physical appearance of the cube specimens immersed in hydrochloric acid
Figure 5 Cube specimens after exposure in a solution of lactic acid
Figure 6 Cube specimens after exposure in a solution of magnesium sulphate solution
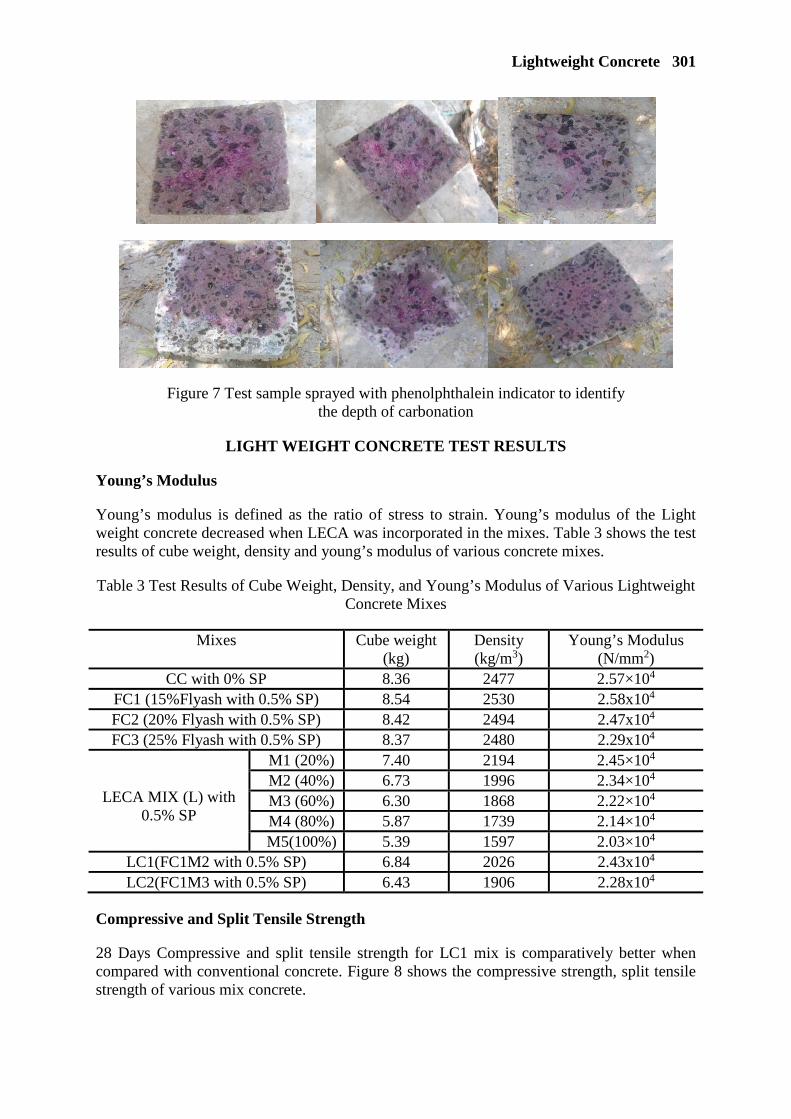
Lightweight Concrete 301
Figure 7 Test sample sprayed with phenolphthalein indicator to identify the depth of carbonation
LIGHT WEIGHT CONCRETE TEST RESULTS
Young’s Modulus
Young’s modulus is defined as the ratio of stress to strain. Young’s modulus of the Light weight concrete decreased when LECA was incorporated in the mixes. Table 3 shows the test results of cube weight, density and young’s modulus of various concrete mixes.
Table 3 Test Results of Cube Weight, Density, and Young’s Modulus of Various Lightweight Concrete Mixes
Mixes Cube weight (kg)
Density (kg/m3)
Young’s Modulus (N/mm2)
CC with 0% SP 8.36 2477 2.57×10⁴ FC1 (15%Flyash with 0.5% SP) 8.54 2530 2.58x10⁴ FC2 (20% Flyash with 0.5% SP) 8.42 2494 2.47x10⁴ FC3 (25% Flyash with 0.5% SP) 8.37 2480 2.29x10⁴
LECA MIX (L) with 0.5% SP
M1 (20%) 7.40 2194 2.45×10⁴ M2 (40%) 6.73 1996 2.34×10⁴ M3 (60%) 6.30 1868 2.22×10⁴ M4 (80%) 5.87 1739 2.14×10⁴ M5(100%) 5.39 1597 2.03×10⁴
LC1(FC1M2 with 0.5% SP) 6.84 2026 2.43x10⁴ LC2(FC1M3 with 0.5% SP) 6.43 1906 2.28x10⁴
Compressive and Split Tensile Strength
28 Days Compressive and split tensile strength for LC1 mix is comparatively better when compared with conventional concrete. Figure 8 shows the compressive strength, split tensile strength of various mix concrete.

302 Banu Priya, Arul Mary
Flexural Strength
Flexural strength of the concrete is usually found by testing plain concrete beams. Table 4 shows the flexural strength of various light-weight aggregate concrete mixes and conventional concrete.
Figure 8 28 days Compressive strength and split tensile strength of various Light-weight aggregate concrete
Table 4 Test Results of Various Mixes of Concrete Beams
Mixes Cracking Ultimate Failure Flexural strength (N/mm2)
Load (kN)
Deflection (mm)
Load (kN)
Deflection (mm)
Load (kN)
Deflection (mm)
CC 16.5 2.1 68.2 11.5 62.1 13.4 3.105 FC1 17.4 1.9 69.2 10.5 62.4 12.4 3.12 M2 14.7 2.0 62.0 9.0 55.6 14.6 2.78 M3 14.0 1.4 56.8 7.1 51.2 9.4 2.56 LC1 16.1 2.7 57.7 8.3 54.0 10.8 2.7 LC2 15.9 2.5 56.8 9.1 49.6 11.7 2.47
Durability Studies on concrete
Table 5 shows the test results of various concrete mixes after curing the specimen in sulphuric acid, hydrochloric acid solution, lactic acid solution and magnesium sulphate solution.
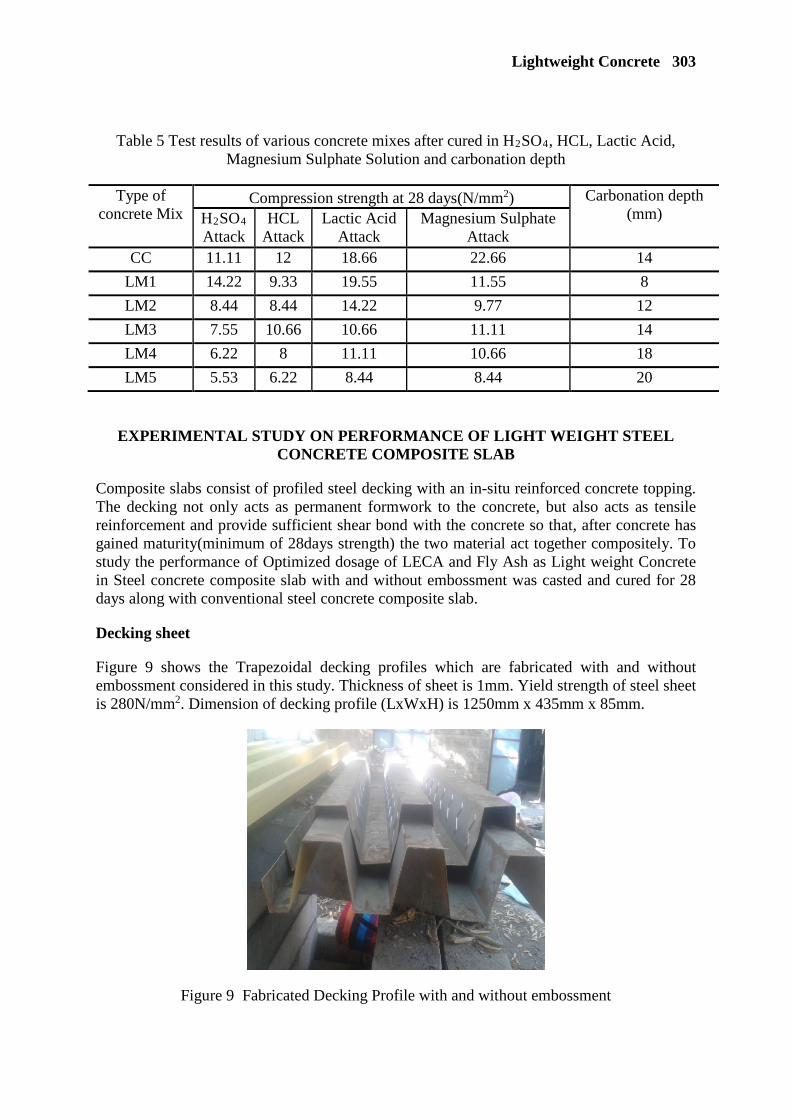
Lightweight Concrete 303
Table 5 Test results of various concrete mixes after cured in H2SO4, HCL, Lactic Acid, Magnesium Sulphate Solution and carbonation depth
Type of concrete Mix
Compression strength at 28 days(N/mm2) Carbonation depth (mm) H2SO4
Attack HCL
Attack Lactic Acid
Attack Magnesium Sulphate
Attack CC 11.11 12 18.66 22.66 14
LM1 14.22 9.33 19.55 11.55 8
LM2 8.44 8.44 14.22 9.77 12
LM3 7.55 10.66 10.66 11.11 14
LM4 6.22 8 11.11 10.66 18
LM5 5.53 6.22 8.44 8.44 20
EXPERIMENTAL STUDY ON PERFORMANCE OF LIGHT WEIGHT STEEL CONCRETE COMPOSITE SLAB
Composite slabs consist of profiled steel decking with an in-situ reinforced concrete topping. The decking not only acts as permanent formwork to the concrete, but also acts as tensile reinforcement and provide sufficient shear bond with the concrete so that, after concrete has gained maturity(minimum of 28days strength) the two material act together compositely. To study the performance of Optimized dosage of LECA and Fly Ash as Light weight Concrete in Steel concrete composite slab with and without embossment was casted and cured for 28 days along with conventional steel concrete composite slab.
Decking sheet
Figure 9 shows the Trapezoidal decking profiles which are fabricated with and without embossment considered in this study. Thickness of sheet is 1mm. Yield strength of steel sheet is 280N/mm2. Dimension of decking profile (LxWxH) is 1250mm x 435mm x 85mm.
Figure 9 Fabricated Decking Profile with and without embossment

304 Banu Priya, Arul Mary
Transverse reinforcement
This reinforcement is provided for temperature effects.The transverse reinforcement is provided at a clear cover of 20mm. Four numbers of 6mm diameter Fe 415 bars is provided in longitudinal direction with a spacing of 120 mm. Shuttering for casting of composite slab specimen and location of hooks for lifting as shown in the Figure 10.The specimens were casted in un-propped simply supported condition.
The experimental setup for the testing of composite slab specimens is as shown in the Figure 13. The mid-span deflection and the end slip in the concrete and steel part as shown in Figure 12. The LVDTs were connected to a computer, which automatically store the data for the given interval of time. The slip of the steel sheet and the concrete at the hinged support end were measured using electronic dial gauges, one in concrete and another in steel part as shown in Figure 10. The end slip after composite slab failed is shown in Figure 11.
Figure 10 Casted Composite slab specimen
The load was applied using 50T hydraulic jack and the corresponding deflection was measured using dial gauges and LVDTs. The loading history and the deformations were recorded automatically in the computer for the given interval of time. The load was applied as two line loads distributed across the width of the slab by transferring the actuator load through a distribution beam section (ISMB 150, I beam of depth 150 mm) to two smaller sections (ISMB 250, I beam of depth 250 mm) placed across the width of the slab. The dial gauges were also placed under loading beams to evaluate the deflections at L/3 spans as shown in the Figure 11.
Figure 11 LVDTs to measure slip at roller ends and at mid span, Dial gauges under loading span

Lightweight Concrete 305
Figure 12 Occurance of end slip at the time of failure
Figure 13 Composite slabs testing setup before and after two point loading
Load vs. deflection and slip on composite slab
Conventional steel concrete composite slab with and without embossment is denoted as NCS and NCES, Light weight steel concrete composite slab with and without embossment is denoted as LCS and LCES respectively. Simply supported span of 1.25m were tested to failure under static loading. At first the initial shear cracks are formed near the loading point. As the rate of loading is increased, flexural cracks are formed in between the loading point. At ultimate load the buckling of the sheet and vertical separation between two steel and concrete was also observed. Slip is one of the parameters to estimate the strength of the shear bond between concrete and deck sheet. Due the presence of embossment the load carrying capacity of the specimens were increased.

306 Banu Priya, Arul Mary
Also end slip as well as buckling of profile was observed in the slab and vertical separation between two materials was also observed before failure. Figure 14 shows the load vs. deflection and load vs. end slip of composite slabs.
Figure 14 Load vs. Deflection curve and Load vs. end slip graph
CONCLUSIONS
Based on the experimental results of this study the following conclusion can be drawn.
• The experimental work carried out to optimize the fly ash content in cement and from the results obtained, this study recommends the replacement of cement by 15% fly ash and LECA 40% shows better compressive strength, tensile strength, young’s modulus and flexural strength results with other mix proportion and hence it can be proposed for structural purposes.
• The unit weight of concrete is found to decrease with the increase in percentage replacement of normal aggregate by LECA. From the result obtained, in comparison with design mix concrete, replacing 40% coarse aggregate by LECA and 15% cement replaced by Fly ash concrete has reduction of 18% of self weight.
• Compressive Strength and split tensile strength of concrete is found to decrease from 34.60 to 29.33 N/mm2 and 3.20 to 2.62 N/mm2 respectively, when compared conventional concrete with 40% LECA a coarse aggregate and 15% Fly ash content in cement.
• In sulphuric acid attack, hydrochloric acid attack, lactic acid attack, sulphate attack, carbonation attack, the lightweight concrete was found to have equally good compressive strength as that of the normal weight concrete. Also the light weight concrete has the low % of weight loss at the age of 28 days than the normal weight concrete.
• Failure modes of all experimental slab specimens are determined in accordance with the Euro Code 4 (part 1.1) definition and exhibited a ductile failure.
Lightweight Concrete 307
• The future scope of this project is to change the admixtures and additives like % replacement of cement by silica fumes, addition of fibers and also to determine the optimum dosage of super plasticizer in LECA concrete to enhance the strength more and changing parameters in steel concrete composite slab like depth of slab, thickness of slab, end anchorages.
REFERENCES
1. PAVITHRA.A, JEROSIA DE ROSE D, Application of LECA a replacement of coarse aggregate in concrete pavements. International Journal of Engineering & Technology, Volume 7 (4.2), 2018 page1-4.
2. O. ARIOZ1, K.KILINC1, Et-al, A Preliminary Research on the Properties of Lightweight Expanded Clay Aggregate, J. Aust. Ceram. Soc. 44 [1] (2008) 23-30.
3. SERKAN SUBA, The effects of using fly ash on high strength lightweight concrete produced with expanded clay aggregate. Scientific Research and Essay Vol. 4 (4) pp. 275-288, April, 2009.
4. PAYAM SHAFIGH, S. VAHID RAZAVI AND MOHSEN KOBRAEI, An investigation of the flexural behaviour of reinforced lightweight concrete beams, International Journal of the Physical Sciences. 2414-2421, 18 May, 2011.
5. N. SIVALINGA RAO, Y.RADHA RATNA KUMARI, V. BHASKAR DESAI, B.L.P. SWAMI, Fibre Reinforced Light Weight Aggregate (Natural Pumice Stone) Concrete, International Journal of Scientific & Engineering Research, Volume 4, Issue 5, May-2013.
6. SACHIN PAUL, GANESH BABU, Mechanical Properties of Light Weight Aggregate Geopolymer Concrete Using Light Weight Expanded Clay Aggregate. Transactions on Engineering and Sciences, Vol.2, Issue 10, October 2014
7. THOMAS TAMU Et Al., Partial Replacement of Coarse Aggregates by Expanded Polystyrene Beads in Concrete. Construction and Building Materials, Vol-3, 2014.
8. S.SIVAKUMAR AND B. KAMESHWARI, Influence of Fly Ash, Bottom Ash and Light Expanded Clay Aggregate in Concrete, Advances in Materials Science and Engineering, Volume 2015, Article ID 849274.
9. T.SONIA, R.SUBAHINI, R. BANU PRIYA, “Experimental Investigation on Mechanical Properties of Light weight Concrete using LECA”, International Journal of Science and Research, Volume 5, Issue 11, Nov 2016.
10. BASKAR. R, “Experimental and Numerical Studies on Composite Deck Slabs”, International Journal of Engineering and Technology, Volume 2, No. 7, July, 2012, page 1116-1125.
11. MIQUEL FERRER, FREDERIC MARIMON, MICHEL CRISINEL “Designing cold-formed steel sheets for composite slabs: An experimentally validated FEM approach to slip failure mechanics”, Thin-Walled Structures, 44 (2006) pp. 1261–1271.

STUDY ON STRUCTURAL GRADE LIGHTWEIGHT CONCRETE AND COMPOSITE CONCRETE STRUCTURE DESIGN
Amith Kalathingal
Pranav Desai
Mohd. Tazir Asif Shaikh
Nuvoco Vistas Corp Ltd
India
ABSTRACT. Efficient strength to weight ratio of concrete plays a very critical role in design of structures. The major portion of load in a structure arises from the dead load of the structure primarily concrete. The paper studies fresh, mechanical and durability properties of structural grade light weight concrete and compare with M25 grade normal concrete. The results derived are used in building design comparison of normal and light weight concrete structures and a value engineering proposal is arrived for composite concrete structures using both normal and light weight concrete. For this purpose normal concrete mix of M25, M30, M40, M50, M60, M70, M80, and M90 grade were prepared and studied for workability and compressive strength for design of vertical structure elements. M25 grade normal concrete mix and three mixes of structural lightweight concrete grade using expanded clay aggregate with density 1400 kg/m3, 1600 kg/m3 and 1800 kg/m³ were prepared and studied for workability, density, compressive strength, flexural strength, split tensile strength, modulus of elasticity, water absorption and chloride ion penetration.
Keywords: Lightweight concrete, Expanded clay aggregate, Aggregate replacement, Value engineering Mr Amith Kalathingal is the Manager of Research and Development at Nuvoco Vistas Corp Ltd based out of Construction Development and Innovation Centre Mumbai. His current area of research involves light weight concrete, ultra-high performance fibre reinforced concrete and self-repair concrete. Mr Pranav Desai is the Vice President of Research and Development and Head of Construction Development and Innovation Centre at Nuvoco Vistas Corp Ltd, one of India’s leading construction materials Company focussing on cement, ready mix concrete and aggregates. He is a member of numerous national technical committees including Bureau of Indian Standards. Mr Mohd. Tazir Asif Shaikh is a Construction engineering and management student at Veermata Jijabai Technological Institute Mumbai and an intern at Construction Development and Innovation, Nuvoco Vistas Corp Ltd. His current area of research is light weight concrete.

Structural Lightweight Concrete 309
INTRODUCTION
Efficient strength to weight ratio of concrete is a major factor in design of high rise concrete structures. Conventionally weight of concrete is assumed a constant due to wide spread use of conventional concrete and efficiency in structure design is derived from concrete mixtures of high strength. As the major portion of load coming onto a structure is from the dead load of the structure itself and mostly from concrete, use of structural grade light weight concrete in either vertical or horizontal structural elements or both have high potential in total load reduction, design flexibility and substantial economical value generation. Structural grade light weight concrete utilizes light weight aggregates conforming to ASTM C 330 partially or completely in place of normal weight aggregate as a measure to reduce unit weight of concrete. Apart from replacing normal aggregate with light weight aggregate, air entrainment is also utilized for unit weight reduction, plastic properties enhancement and pump ability of light weight concrete. ACI 213 requires a minimum 28 day compressive strength of 17.2 MPa and air dried density ranging between 1440 - 1800 kg/m3 for concrete to be classified as structural light weight [5].
LITEATURE REVIEW OBJECTIVE OF RESEARCH
Hanamanth et al. (2015) made an attempt to replace coarse aggregate by 100% expanded clay aggregate (ECA) and achieved 34.2% reduction in overall cube density compared to normal concrete and a strength of 20.0 MPa at 28 days [1]. Serkan Subasi (2009) studied the effects of 0%, 10%, 20% and 30% fly ash up on ECA based light weight concrete and found that strength of lightweight concrete is enhanced at 10% fly-ash replacement of cement [2]. Mehrdad et al. (2016) studied structure design of a 11 floor building with 2400 kg/m3 normal weight concrete and compared with full replacement of 1900 kg/m3 light weight concrete and concluded that concrete and rebar volume reduces with use of light weight concrete. The reduction in size of beams and columns was also observed resulting in efficient interior space utilization [8].
OBJECTIVE OF RESEARCH
The research aims to study the significance of ECA proportioning in a triple binder blended mix of cement, fly ash and silica fume at a constant water binder ratio and study the plastic, hardened and durability properties of light weight concrete and compare the properties to M25 grade normal concrete. The lightweight concrete confirming to M25 grade is used in slab design as replacement to M25 normal concrete on G+5, G+15, G+25, G+35, G+45, G+55 and G+ 65 floor structures to study load reduction and other value engineering benefits.

310 Kalathingal et al
EXPERIMENTAL PROGRAM
MATERIALS
Cement, fly ash and silica fume
Ordinary Portland cement 53 Grade (OPC 53) confirming to IS 269, fly ash confirming to IS 3812 and silica fume confirming to IS 15388 were used throughout the study. The cement, fly ash and silica fume was stored in air tight containers during the entire duration of research. Table 1 shows the chemical composition and properties of cement, fly ash and silica fume used in the research.
Table 1 Chemical composition and physical properties of cement, fly ash and silica fume
CHEMICAL COMPOSITION PHYSICAL PROPERTIES Cement - OPC 53
Lime saturation factor 0.90 Standard consistency (%) 29 Al2O3 to Fe2O3 ratio 0.84 Blaine fineness (m2/kg) 278 Insoluble residue, % by mass 0.51 Initial setting time (minutes) 130 MgO, % by mass 2.18 Final setting time (minutes) 215 SO3, % by mass 2.04 Soundness – Lechatellier expansion (mm) 1 Loss of ignition, % by mass 2.52 Soundness – Autoclave expansion (%) 0.04 Cl, % by mass 0.017 Density (g/cc) 3.13 Na2O, % by mass 0.045 Compressive strength – 3 days (MPa) 36.5 C3A, % by mass 3.11 Compressive strength – 7 days (MPa) 45.5 Compressive strength – 28 days (MPa) 62.5
Fly ash SiO2+Al2O3+Fe2O3, % by mass 94.26 Blaine fineness (m2/kg) 335 SiO2, % by mass 60.2 45 micron retaining, % by mass 12.4 MgO, % by mass 1.2 Lime reactivity (MPa)) 4.82 SO3, % by mass 0.94 Soundness – Autoclave expansion (%) 0.04 Cl, % by mass 0.003 Density (g/cc) 2.22 Na2O, % by mass 0.24 Compressive strength – 28 days, % of
control (MPa) 88.7
Loss of ignition, % by mass 0.79
Silica fume Silica as SiO2, % 92 Density (g/cc) 2.2 Loss of ignition, % by mass 2.82 45 micron retaining, % by mass 8.1 Compressive strength – 7 days, % of
control (MPa) 86.5
Fine and coarse aggregates
Normal weight crushed stone sand (CSS), single sized 10mm and single sized 20mm confirming to IS 383 were used in the research. Crushed stone sand is gaining prominence as preferred fine aggregate in the Indian ready mix concrete industry due to mining bans on river sand. Aggregates of the same lot were used in the entire duration of the study. Table 2 shows the chemical and physical properties of the aggregates.
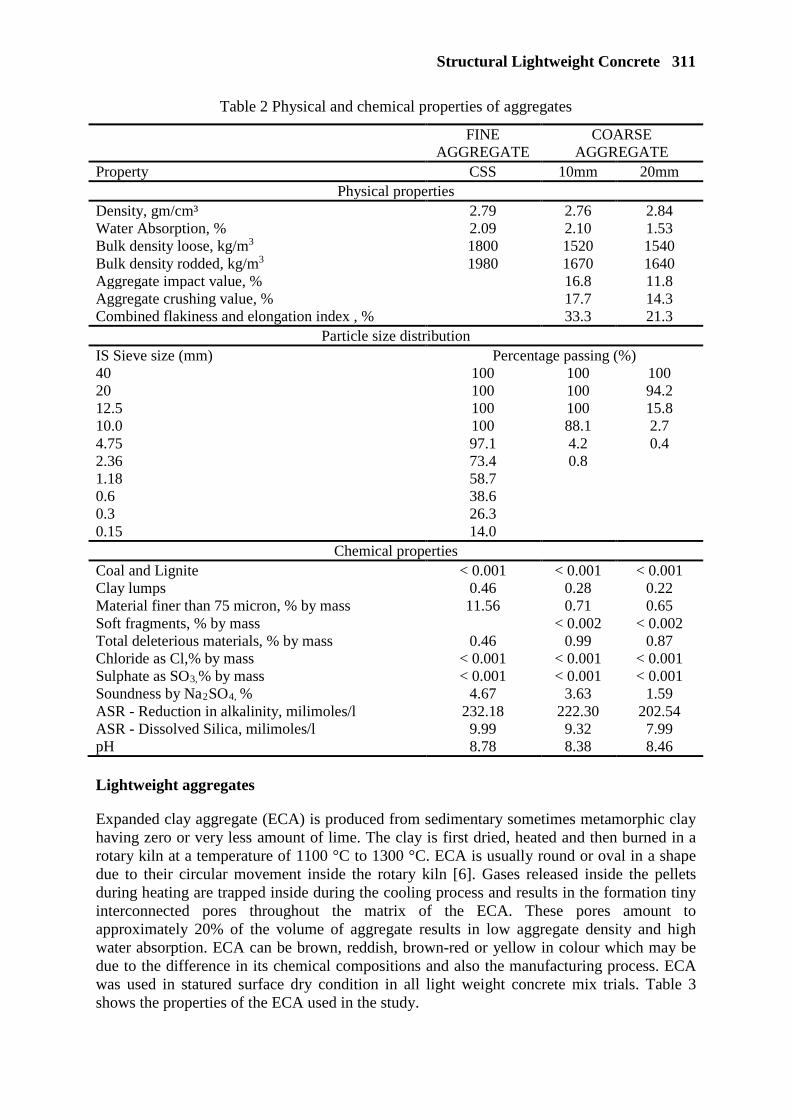
Structural Lightweight Concrete 311
Table 2 Physical and chemical properties of aggregates
FINE AGGREGATE
COARSE AGGREGATE
Property CSS 10mm 20mm Physical properties
Density, gm/cm³ 2.79 2.76 2.84 Water Absorption, % 2.09 2.10 1.53 Bulk density loose, kg/m3 1800 1520 1540 Bulk density rodded, kg/m3 1980 1670 1640 Aggregate impact value, % 16.8 11.8 Aggregate crushing value, % 17.7 14.3 Combined flakiness and elongation index , % 33.3 21.3
Particle size distribution IS Sieve size (mm) Percentage passing (%) 40 100 100 100 20 100 100 94.2 12.5 100 100 15.8 10.0 100 88.1 2.7 4.75 97.1 4.2 0.4 2.36 73.4 0.8 1.18 58.7 0.6 38.6 0.3 26.3 0.15 14.0
Chemical properties Coal and Lignite < 0.001 < 0.001 < 0.001 Clay lumps 0.46 0.28 0.22 Material finer than 75 micron, % by mass 11.56 0.71 0.65 Soft fragments, % by mass < 0.002 < 0.002 Total deleterious materials, % by mass 0.46 0.99 0.87 Chloride as Cl,% by mass < 0.001 < 0.001 < 0.001 Sulphate as SO3,% by mass < 0.001 < 0.001 < 0.001 Soundness by Na2SO4, % 4.67 3.63 1.59 ASR - Reduction in alkalinity, milimoles/l 232.18 222.30 202.54 ASR - Dissolved Silica, milimoles/l 9.99 9.32 7.99 pH 8.78 8.38 8.46
Lightweight aggregates
Expanded clay aggregate (ECA) is produced from sedimentary sometimes metamorphic clay having zero or very less amount of lime. The clay is first dried, heated and then burned in a rotary kiln at a temperature of 1100 °C to 1300 °C. ECA is usually round or oval in a shape due to their circular movement inside the rotary kiln [6]. Gases released inside the pellets during heating are trapped inside during the cooling process and results in the formation tiny interconnected pores throughout the matrix of the ECA. These pores amount to approximately 20% of the volume of aggregate results in low aggregate density and high water absorption. ECA can be brown, reddish, brown-red or yellow in colour which may be due to the difference in its chemical compositions and also the manufacturing process. ECA was used in statured surface dry condition in all light weight concrete mix trials. Table 3 shows the properties of the ECA used in the study.

312 Kalathingal et al
Table 3 Properties of ECA
PROPERTIES VALUES Particle Size 2 – 8 mm
Density 0.80 gm/cm³ Water Absorption 20%
Loose Bulk Density 530 kg/m³ Ph. Value 8.05
Crushing Strength 2.26 N/mm²
Thermal Conductivity 0.10 W/mK
Particle Size Distribution
IS Sieve Size (mm) Percentage Passing
12.5 100
10.0 100
4.75 34.5
2.36 11.6
Chemical Admixtures
Sulphonated naphthalene formaldehyde (SNF) or polycarbxylate ether (PCE) based water reducing super plasticizing admixture, set retarding admixture and air entraining admixture were used in the study. All admixture used were chloride free and complied to IS 9103.
CONCRETE MIXES
Normal concrete and light weight concrete mixes were designed as per IS 10262 and ACI 213 guidelines respectively for a volume of 1 m3. All concrete mixes were designed for high rise pump ability with Nuvoco Vistas Corp Ltd industry experience. Table 4 below shows the concrete mixes studied.
Table 4 Mix proportion of normal concrete and light weight concrete
GRADE OF CONCRETE
BINDER, kg/m3 AGGREGATE
PROPORTIONS, % WATER, kg
ADMIX. % Cement
Fly ash
Silica fume
10mm 20mm Sand ECA
M25 NC 330 110 0 30 25 45 0 165 1.75 M30 NC 340 120 0 25 28 47 0 160 1.20 M40 NC 380 120 0 32 25 43 0 160 2.05 M50 NC 440 110 15 26 32 42 0 160 2.05 M60 NC 440 120 25 28 25 47 0 160 2.15 M70 NC 450 150 50 32 26 42 0 155 2.35 M80 NC 475 150 50 33 23 44 0 155 2.25 M90 NC 500 150 65 50 0 50 0 155 2.55
D1400 LWC 450 200 50 0 0 36 64 180 1.25 D1600 LWC 450 200 50 0 0 65 35 180 1.45 D1800 LWC 450 200 50 0 0 81 19 180 0.95
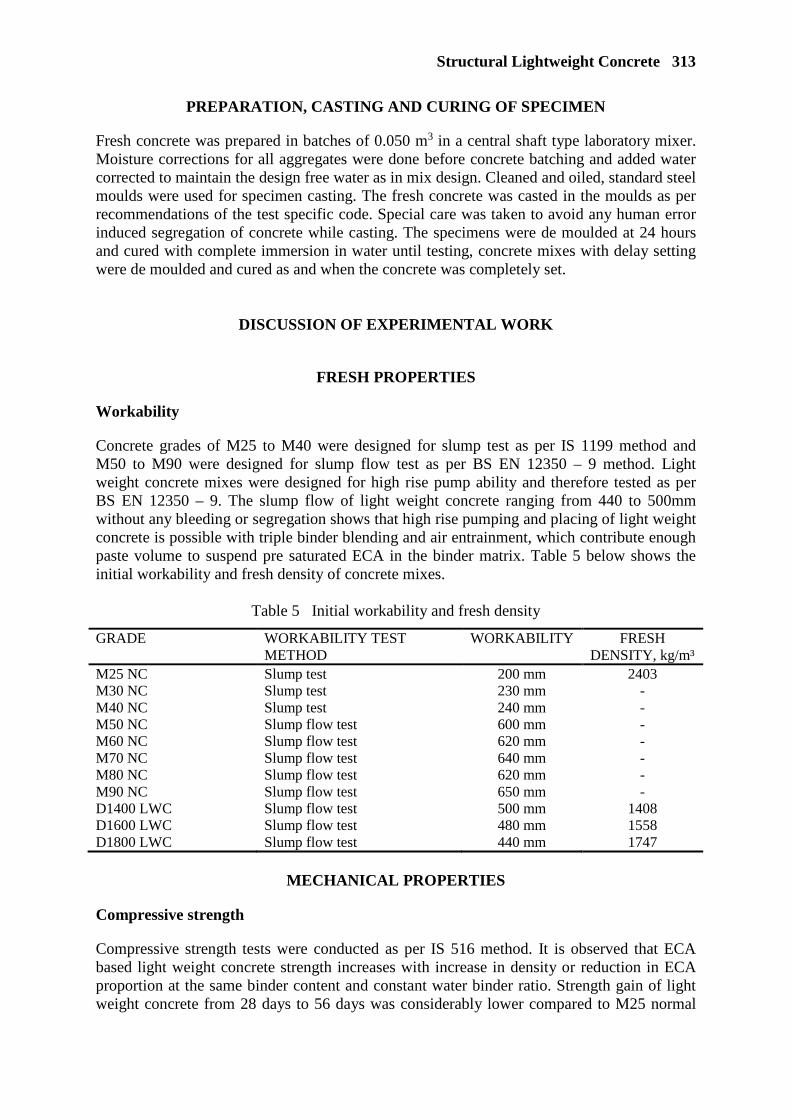
Structural Lightweight Concrete 313
PREPARATION, CASTING AND CURING OF SPECIMEN
Fresh concrete was prepared in batches of 0.050 m3 in a central shaft type laboratory mixer. Moisture corrections for all aggregates were done before concrete batching and added water corrected to maintain the design free water as in mix design. Cleaned and oiled, standard steel moulds were used for specimen casting. The fresh concrete was casted in the moulds as per recommendations of the test specific code. Special care was taken to avoid any human error induced segregation of concrete while casting. The specimens were de moulded at 24 hours and cured with complete immersion in water until testing, concrete mixes with delay setting were de moulded and cured as and when the concrete was completely set.
DISCUSSION OF EXPERIMENTAL WORK
FRESH PROPERTIES
Workability
Concrete grades of M25 to M40 were designed for slump test as per IS 1199 method and M50 to M90 were designed for slump flow test as per BS EN 12350 – 9 method. Light weight concrete mixes were designed for high rise pump ability and therefore tested as per BS EN 12350 – 9. The slump flow of light weight concrete ranging from 440 to 500mm without any bleeding or segregation shows that high rise pumping and placing of light weight concrete is possible with triple binder blending and air entrainment, which contribute enough paste volume to suspend pre saturated ECA in the binder matrix. Table 5 below shows the initial workability and fresh density of concrete mixes.
Table 5 Initial workability and fresh density
GRADE WORKABILITY TEST METHOD
WORKABILITY FRESH DENSITY, kg/m³
M25 NC Slump test 200 mm 2403 M30 NC Slump test 230 mm - M40 NC Slump test 240 mm - M50 NC Slump flow test 600 mm - M60 NC Slump flow test 620 mm - M70 NC Slump flow test 640 mm - M80 NC Slump flow test 620 mm - M90 NC Slump flow test 650 mm - D1400 LWC Slump flow test 500 mm 1408 D1600 LWC Slump flow test 480 mm 1558 D1800 LWC Slump flow test 440 mm 1747
MECHANICAL PROPERTIES
Compressive strength
Compressive strength tests were conducted as per IS 516 method. It is observed that ECA based light weight concrete strength increases with increase in density or reduction in ECA proportion at the same binder content and constant water binder ratio. Strength gain of light weight concrete from 28 days to 56 days was considerably lower compared to M25 normal
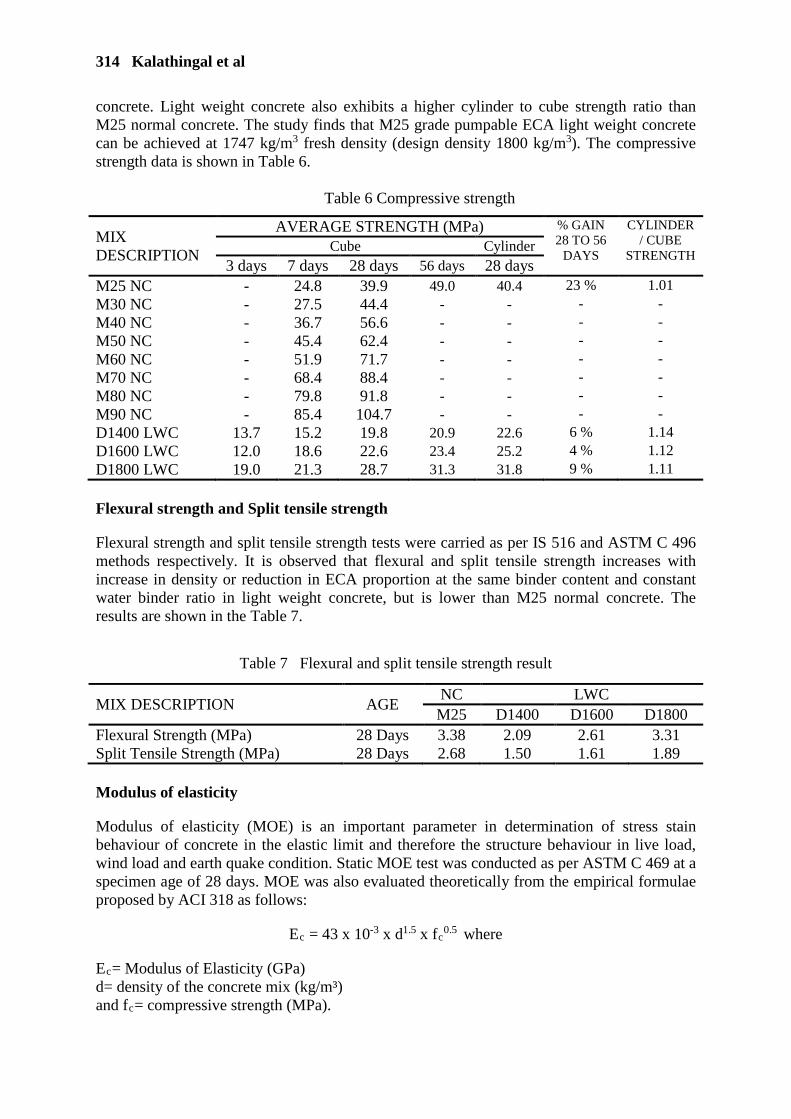
314 Kalathingal et al
concrete. Light weight concrete also exhibits a higher cylinder to cube strength ratio than M25 normal concrete. The study finds that M25 grade pumpable ECA light weight concrete can be achieved at 1747 kg/m3 fresh density (design density 1800 kg/m3). The compressive strength data is shown in Table 6.
Table 6 Compressive strength
MIX DESCRIPTION
AVERAGE STRENGTH (MPa) % GAIN 28 TO 56
DAYS
CYLINDER / CUBE
STRENGTH Cube Cylinder
3 days 7 days 28 days 56 days 28 days M25 NC - 24.8 39.9 49.0 40.4 23 % 1.01 M30 NC - 27.5 44.4 - - - - M40 NC - 36.7 56.6 - - - - M50 NC - 45.4 62.4 - - - - M60 NC - 51.9 71.7 - - - - M70 NC - 68.4 88.4 - - - - M80 NC - 79.8 91.8 - - - - M90 NC - 85.4 104.7 - - - - D1400 LWC 13.7 15.2 19.8 20.9 22.6 6 % 1.14 D1600 LWC 12.0 18.6 22.6 23.4 25.2 4 % 1.12 D1800 LWC 19.0 21.3 28.7 31.3 31.8 9 % 1.11
Flexural strength and Split tensile strength
Flexural strength and split tensile strength tests were carried as per IS 516 and ASTM C 496 methods respectively. It is observed that flexural and split tensile strength increases with increase in density or reduction in ECA proportion at the same binder content and constant water binder ratio in light weight concrete, but is lower than M25 normal concrete. The results are shown in the Table 7.
Table 7 Flexural and split tensile strength result
MIX DESCRIPTION AGE NC LWC M25 D1400 D1600 D1800
Flexural Strength (MPa) 28 Days 3.38 2.09 2.61 3.31 Split Tensile Strength (MPa) 28 Days 2.68 1.50 1.61 1.89 Modulus of elasticity
Modulus of elasticity (MOE) is an important parameter in determination of stress stain behaviour of concrete in the elastic limit and therefore the structure behaviour in live load, wind load and earth quake condition. Static MOE test was conducted as per ASTM C 469 at a specimen age of 28 days. MOE was also evaluated theoretically from the empirical formulae proposed by ACI 318 as follows:
Ec = 43 x 10-3 x d1.5 x fc0.5 where
Ec= Modulus of Elasticity (GPa) d= density of the concrete mix (kg/m³) and fc= compressive strength (MPa).

Structural Lightweight Concrete 315
It is observed that static MOE increases with increase in density or reduction in ECA proportion at the same binder content and constant water binder ratio in light weight concrete, but is considerably lower than M25 normal concrete. Empirical MOE derived from formulae exhibit a high variation with ECA light weight concrete actual static MOE tested. The table 8 below shows the actual and empirical MOE results.
Table 8 Modulus of elasticity
MIX DESCRIPTION NC LWC M25 D1400 D1600 D1800
Static MOE (GPa) 30.5 12.5 14.7 16.2 Empirical MOE (GPa) 32.8 11.4 12.7 16.5 % Variation – static to empirical MOE -8% 9% 14% -2%
DURABILITY PROPERTIES
Rapid chloride ion penetration test (RCPT)
RCPT test was performed as per ASTM C 1202 method. It is observed that the chloride ion penetration decreases with increase in density or reduction in ECA proportion at the same binder content and constant water binder ratio in light weight concrete and is considerably lower than M25 normal concrete. The following table 9 exhibits the results obtained.
Table 9 Rapid chloride ion penetration test results
MIX DESCRIPTION AGE NC LWC M25 D1400 D1600 D1800
Average RCPT Value (Coulombs) 28 Days 4364.2 1268.7 1250.6 657.9 Water absorption under submersion
The test was performed as per BS 1881: Part 122 method. It is observed that the Water absorption under submersion decreases with increase in density or reduction in ECA proportion at the same binder content and constant water binder ratio in light weight concrete and is considerably lower than M25 normal concrete for 1600kg/m3 and 1800kg/m3 light weight concrete.
Table 10 Water absorption under submersion test results
MIX DESCRIPTION AGE NC LWC M25 D1400 D1600 D1800
Average Water Absorption (%) 28 Days 3.2 3.28 2.72 2.14
Water absorption under low pressure
This test was performed as per Rilem 11.4 test method. The test method is an effective assessment of rain water absorption on a terrace slab or to a RCC wall under normal atmospheric pressure. It is observed that the water absorption under low pressure decreases
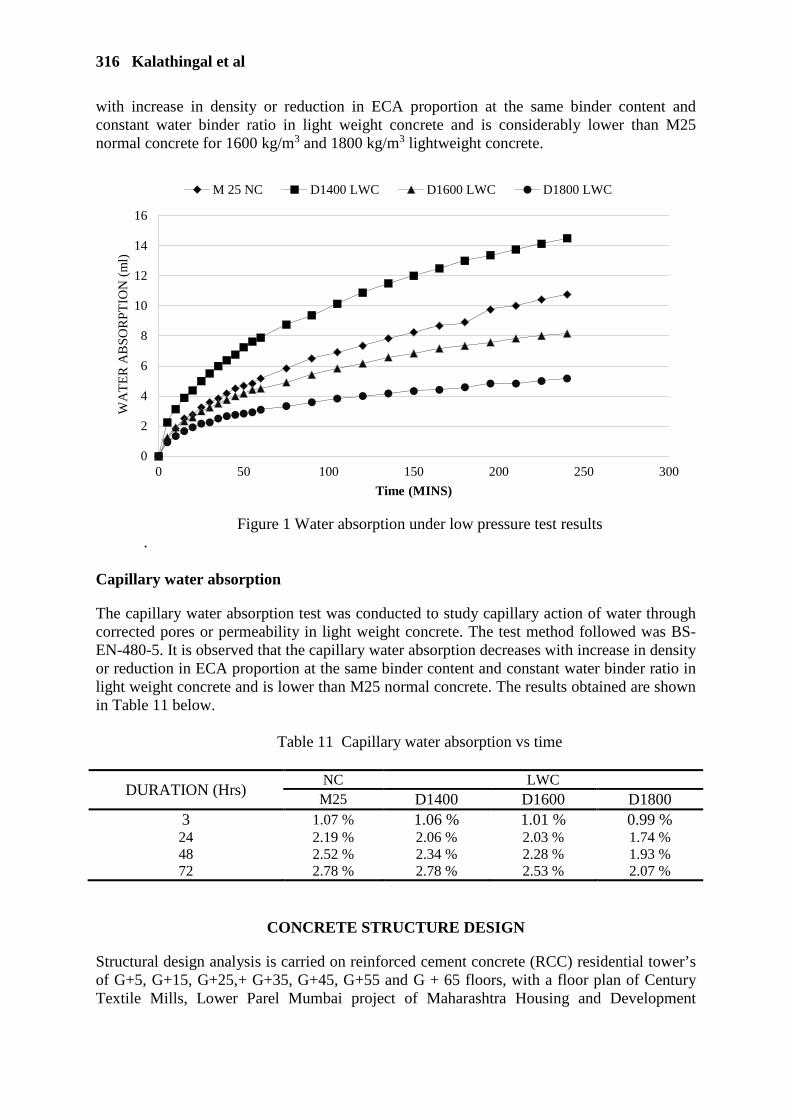
316 Kalathingal et al
with increase in density or reduction in ECA proportion at the same binder content and constant water binder ratio in light weight concrete and is considerably lower than M25 normal concrete for 1600 kg/m3 and 1800 kg/m3 lightweight concrete.
Figure 1 Water absorption under low pressure test results
. Capillary water absorption
The capillary water absorption test was conducted to study capillary action of water through corrected pores or permeability in light weight concrete. The test method followed was BS-EN-480-5. It is observed that the capillary water absorption decreases with increase in density or reduction in ECA proportion at the same binder content and constant water binder ratio in light weight concrete and is lower than M25 normal concrete. The results obtained are shown in Table 11 below.
Table 11 Capillary water absorption vs time
DURATION (Hrs) NC LWC
M25 D1400 D1600 D1800 3 1.07 % 1.06 % 1.01 % 0.99 % 24 2.19 % 2.06 % 2.03 % 1.74 % 48 2.52 % 2.34 % 2.28 % 1.93 % 72 2.78 % 2.78 % 2.53 % 2.07 %
CONCRETE STRUCTURE DESIGN
Structural design analysis is carried on reinforced cement concrete (RCC) residential tower’s of G+5, G+15, G+25,+ G+35, G+45, G+55 and G + 65 floors, with a floor plan of Century Textile Mills, Lower Parel Mumbai project of Maharashtra Housing and Development
0
2
4
6
8
10
12
14
16
0 50 100 150 200 250 300
WA
TE
R A
BS
OR
PT
ION
(m
l)
Time (MINS)
M 25 NC D1400 LWC D1600 LWC D1800 LWC

Structural Lightweight Concrete 317
Authority (MHADA) [4]. MHADA is a government body which offers low cost housing schemes in the state of Maharashtra – India. The floor plan of this project was selected for analysis as the real estate prices are one of the highest in India for this location [7]. Figure 2 shows the floor plan used for structural design and analysis.
Figure 2 Floor plan, dimensions in mm
Structural design and analysis were carried out in structural analysis and building design software ETABS. Only limit state conditions of live and dead load were considered for the design of structures. G+5, G+15, G+25, G+35, G+45, G+55 and G+65 structures were drafted and analyzed. Shear walls were introduced for structures of G+35 and above. The concrete grade for the vertical elements and beam were increased gradually from M25 NC to M90 NC for G+5 to G+65 for optimal structural design and all slabs are designed with M25 NC. Table 12 shows the concrete grade utilized for the design of structure. The total superstructure load was calculated for G+5, G+15, G+25, G+35, G+45, G+55 and G+65 structures with 2450 kg/m3 density normal concrete in column, shear walls, beam and slab. The total superstructure load was also calculated for G+5, G+15, G+25, G+35, G+45, G+55 and G+65 with composite concrete structural design of column, shear wall and beams casted with 2450 kg/m3 normal concrete and slabs casted with M25 grade LWC of 1800 kg/m3.
It is observed that with composite concrete design of normal concrete for vertical elements and light weight concrete for slab, 2.62% to 3.17% load reduction can be achieved in G+5 to G+65 floor structure.
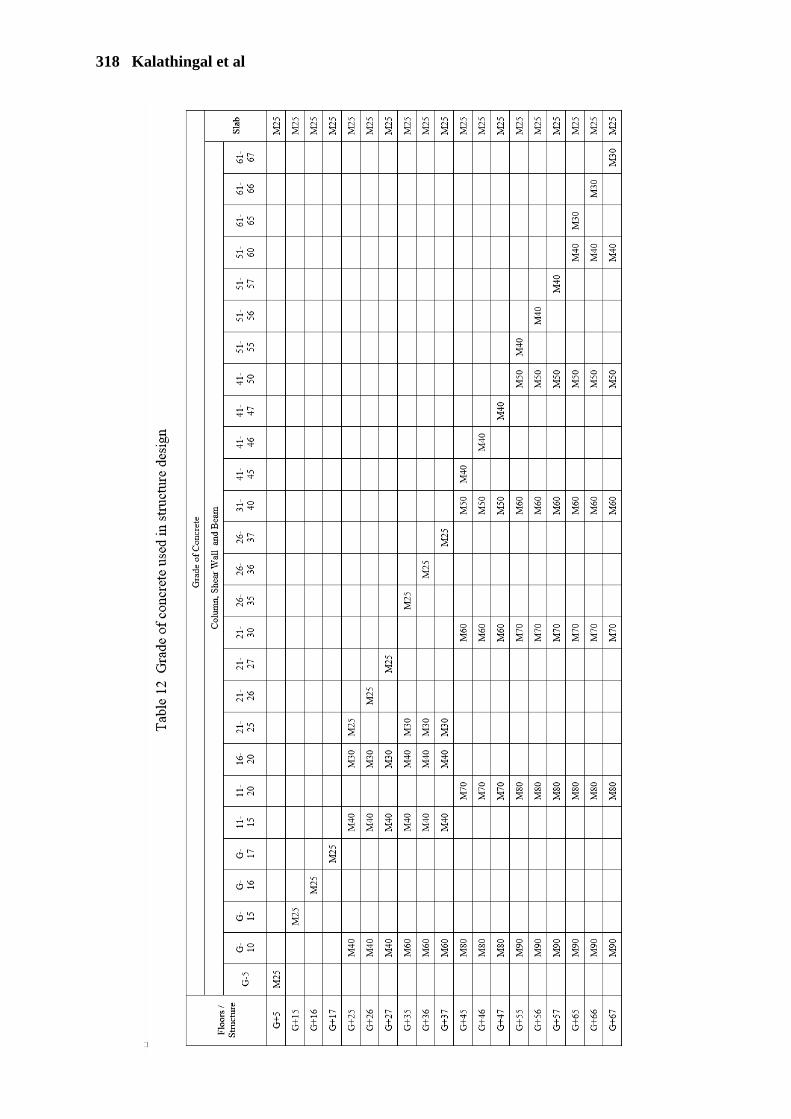
318 Kalathingal et al

Structural Lightweight Concrete 319
VALUE ENGINEERING
A study was done to make optimal utilisation of the total load reduction with composite concrete design on structures by calculating the additional floors that can be added to G+5, G+15, G+25, G+35, G+45, G+55 and G+65 structures. For the purpose composite concrete structure of additional one and two floors over the existing composite structures were analysed. Table 13 below shows the Total load of normal vs composite vs value engineered composite structure.
Table 13 Total load of normal (NC) vs composite (NC + LWC) vs value engineered composite structure
.
No of floor NC
Total load of the structure NC (kN)
No of floor – NC + LWC
Total load of the structure NC + LWC (kN)
NC+LWC / NC Total load ratio
G+5
10445.3
G+5 10171.7 0.97 G+6 10917.0 1.05 G+7 11326.4 1.08
G+15
24946.7
G+15 24217.2 0.97 G+16 25649.7 1.03 G+17 27082.2 1.09
G+25
44258.8
G+25 43073.3 0.97 G+26 44314.5 1.00 G+27 45746.9 1.03
G+35
57280.6
G+35 55639.9 0.97 G+36 56795.0 0.99 G+37 57518.1 1.00
G+45
69650.6
G+45 67518.7 0.97 G+46 68707.5 0.99 G+47 69993.5 1.00
G+55
82082.8
G+55 79314.0 0.97 G+56 80631.5 0.98 G+57 81885.2 1.00
G+65
94891.5
G+65 91882.3 0.97 G+66 93136.0 0.98 G+67 94401.8 0.99
It is observed that with composite concrete structure design an additional two floors can be added to an existing structure for designs above G+25 floors at the same total load of structure with normal concrete design.
CONCLUSIONS
• Compressive strength, flexural strength, split tensile strength and modulus of elasticity of ECA LWC increases with increase in density or reduction in ECA proportion at the same binder content and constant water binder ratio.
• M25 ECA LWC can be design at 1800 kg/m3 density.
320 Kalathingal et al
• Compressive strength, flexural strength, split tensile strength and modulus of elasticity of
M25 LWC is 28%, 2%, 30% and 47% lower than M25 NC respectively.
• Chloride ion penetration and water absorption of ECA LWC decreases with increase in density or reduction in ECA proportion at the same binder content and constant water binder ratio.
• Chloride ion penetration and water absorption of M25 LWC is 84% and 25% lower than
M25 NC respectively
• Composite concrete structure design with NC + LWC reduces total load of super structure by 3% for designs’ from G+5 to G+65 floors.
• Efficient composite concrete structure design with NC + LWC can be achieved from
G+25 floors, with the possibility of adding additional two floors from G+35 floors.
ACKNOWLEDGEMENTS
The Authors sincerely acknowledge the support provided by Dr. A.S. Wayal, Associate professor at Veermata Jijabai Technological Institute and Mr. Fakhruddin Vaglawala, Sr Manager Structural Systems at Nuvoco Vistas Corp Ltd and Mr Muralidharan N Govindarajulu, Head Quality Control at Nuvoco Vistas Corp Ltd.
REFERENCES
1. HANAMNATH SHEBANNAVAR, MANEETH P.D., BRIJBHUSHAN S. Comparative
study of LECA as a complete replacement as coarse aggregate by ACI methodwith equivalent likeness of strength of IS method, International Research Journal of Engineering and Technology (IRJET), Volume: 02 Issue: 08, 2015.
2. SERKAN SUBASI. The effects of using fly ash on high strength lightweight concrete produced with expanded clay aggregate, Scientific Research and Essay Vol. 4 (4) pp. 275-288, April, 2009.
3. GUIDE FOR STRUCTURAL LIGHTWEIGHT-AGGREGATE CONCRETE, (1987), Detroit, Mich.: American Concrete Institute 213.
4. CENTURY TEXTILE MILLS, Lower Parel, Mhada, 01-Aug-2018. Available:
https://www.mhada.gov.in/en/content/century-textile-mills-lower-parel.
5. AMERICAN SOCIETY FOR TESTING AND MATERIALS, Standard specification for lightweight aggregates for structural concrete, ASTM C330/C330M.
6. NEXUS BUILD SOLUTIONS, ECA, Expanded Clay Aggregate Manufacturer, Gujarat,
India, Expanded Clay Aggregate Manufacturer, Gujarat, India. Available: http://www.nexusbuildcon.com/eca.html.

Structural Lightweight Concrete 321
7. PROPERTY RATES IN MUMBAI, (2019). Available
at: https://www.magicbricks.com/Property-Rates-Trends/ALL-RESIDENTIAL-rates-in-Mumbai.
8. M. M. NEJAD, M.J.T AMIRI, M. MIRDOOST, H.DARVISHI AND J. BARFOROOSH.
Investigating and comparing the economic use of normal concrete and lightweight concrete in construction projects in iran, Journal of current research in science, S(1), pp. 560-564, 2016.
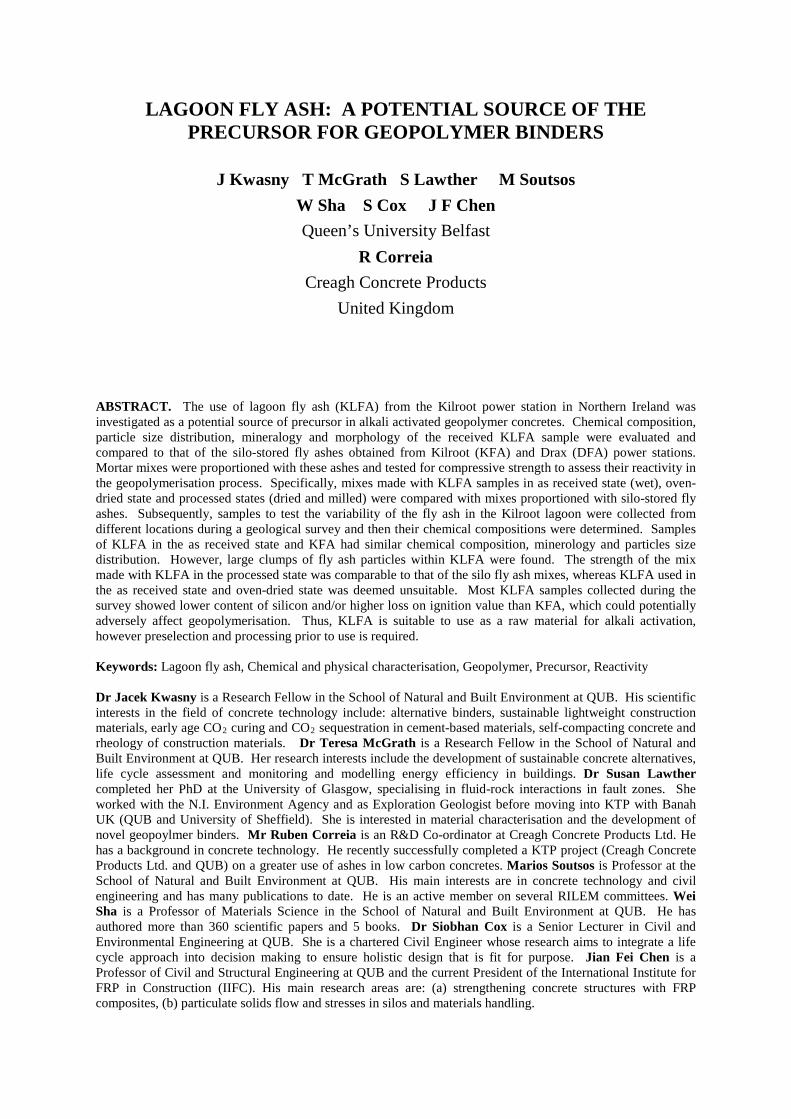
LAGOON FLY ASH: A POTENTIAL SOURCE OF THE PRECURSOR FOR GEOPOLYMER BINDERS
J Kwasny T McGrath S Lawther M Soutsos
W Sha S Cox J F Chen
Queen’s University Belfast
R Correia
Creagh Concrete Products
United Kingdom
ABSTRACT. The use of lagoon fly ash (KLFA) from the Kilroot power station in Northern Ireland was investigated as a potential source of precursor in alkali activated geopolymer concretes. Chemical composition, particle size distribution, mineralogy and morphology of the received KLFA sample were evaluated and compared to that of the silo-stored fly ashes obtained from Kilroot (KFA) and Drax (DFA) power stations. Mortar mixes were proportioned with these ashes and tested for compressive strength to assess their reactivity in the geopolymerisation process. Specifically, mixes made with KLFA samples in as received state (wet), oven-dried state and processed states (dried and milled) were compared with mixes proportioned with silo-stored fly ashes. Subsequently, samples to test the variability of the fly ash in the Kilroot lagoon were collected from different locations during a geological survey and then their chemical compositions were determined. Samples of KLFA in the as received state and KFA had similar chemical composition, minerology and particles size distribution. However, large clumps of fly ash particles within KLFA were found. The strength of the mix made with KLFA in the processed state was comparable to that of the silo fly ash mixes, whereas KLFA used in the as received state and oven-dried state was deemed unsuitable. Most KLFA samples collected during the survey showed lower content of silicon and/or higher loss on ignition value than KFA, which could potentially adversely affect geopolymerisation. Thus, KLFA is suitable to use as a raw material for alkali activation, however preselection and processing prior to use is required. Keywords: Lagoon fly ash, Chemical and physical characterisation, Geopolymer, Precursor, Reactivity Dr Jacek Kwasny is a Research Fellow in the School of Natural and Built Environment at QUB. His scientific interests in the field of concrete technology include: alternative binders, sustainable lightweight construction materials, early age CO2 curing and CO2 sequestration in cement-based materials, self-compacting concrete and rheology of construction materials. Dr Teresa McGrath is a Research Fellow in the School of Natural and Built Environment at QUB. Her research interests include the development of sustainable concrete alternatives, life cycle assessment and monitoring and modelling energy efficiency in buildings. Dr Susan Lawther completed her PhD at the University of Glasgow, specialising in fluid-rock interactions in fault zones. She worked with the N.I. Environment Agency and as Exploration Geologist before moving into KTP with Banah UK (QUB and University of Sheffield). She is interested in material characterisation and the development of novel geopoylmer binders. Mr Ruben Correia is an R&D Co-ordinator at Creagh Concrete Products Ltd. He has a background in concrete technology. He recently successfully completed a KTP project (Creagh Concrete Products Ltd. and QUB) on a greater use of ashes in low carbon concretes. Marios Soutsos is Professor at the School of Natural and Built Environment at QUB. His main interests are in concrete technology and civil engineering and has many publications to date. He is an active member on several RILEM committees. Wei Sha is a Professor of Materials Science in the School of Natural and Built Environment at QUB. He has authored more than 360 scientific papers and 5 books. Dr Siobhan Cox is a Senior Lecturer in Civil and Environmental Engineering at QUB. She is a chartered Civil Engineer whose research aims to integrate a life cycle approach into decision making to ensure holistic design that is fit for purpose. Jian Fei Chen is a Professor of Civil and Structural Engineering at QUB and the current President of the International Institute for FRP in Construction (IIFC). His main research areas are: (a) strengthening concrete structures with FRP composites, (b) particulate solids flow and stresses in silos and materials handling.
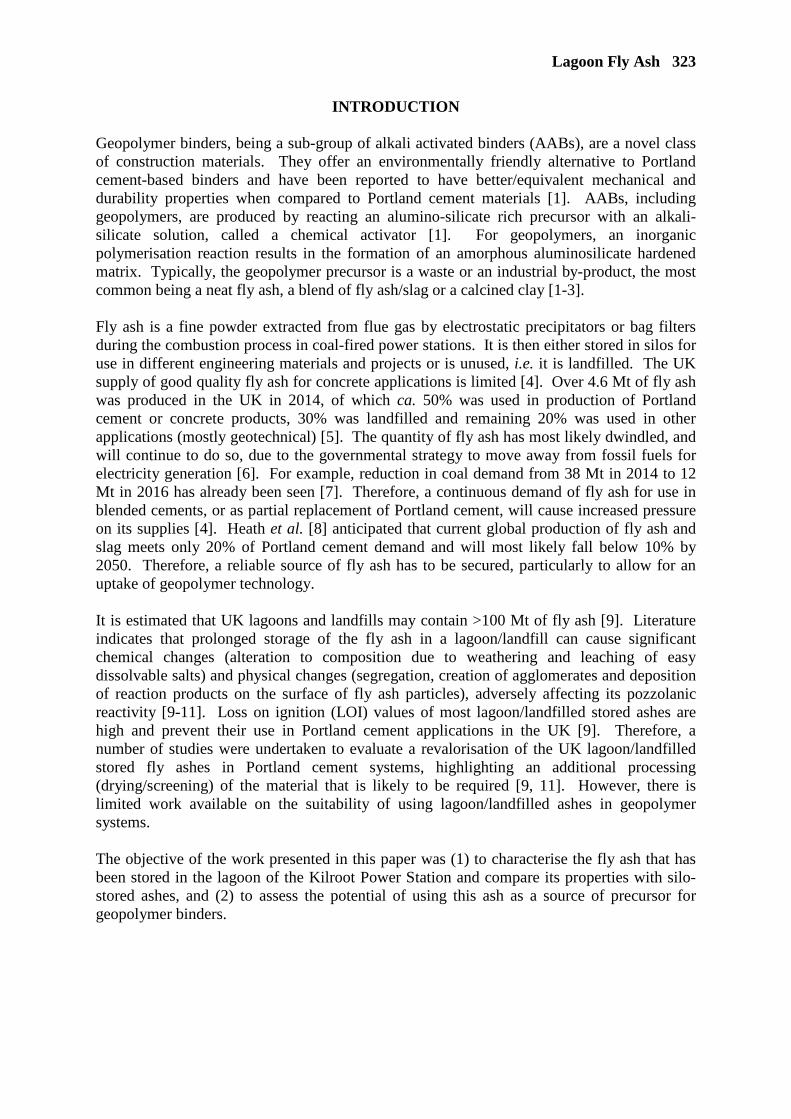
Lagoon Fly Ash 323
INTRODUCTION Geopolymer binders, being a sub-group of alkali activated binders (AABs), are a novel class of construction materials. They offer an environmentally friendly alternative to Portland cement-based binders and have been reported to have better/equivalent mechanical and durability properties when compared to Portland cement materials [1]. AABs, including geopolymers, are produced by reacting an alumino-silicate rich precursor with an alkali-silicate solution, called a chemical activator [1]. For geopolymers, an inorganic polymerisation reaction results in the formation of an amorphous aluminosilicate hardened matrix. Typically, the geopolymer precursor is a waste or an industrial by-product, the most common being a neat fly ash, a blend of fly ash/slag or a calcined clay [1-3]. Fly ash is a fine powder extracted from flue gas by electrostatic precipitators or bag filters during the combustion process in coal-fired power stations. It is then either stored in silos for use in different engineering materials and projects or is unused, i.e. it is landfilled. The UK supply of good quality fly ash for concrete applications is limited [4]. Over 4.6 Mt of fly ash was produced in the UK in 2014, of which ca. 50% was used in production of Portland cement or concrete products, 30% was landfilled and remaining 20% was used in other applications (mostly geotechnical) [5]. The quantity of fly ash has most likely dwindled, and will continue to do so, due to the governmental strategy to move away from fossil fuels for electricity generation [6]. For example, reduction in coal demand from 38 Mt in 2014 to 12 Mt in 2016 has already been seen [7]. Therefore, a continuous demand of fly ash for use in blended cements, or as partial replacement of Portland cement, will cause increased pressure on its supplies [4]. Heath et al. [8] anticipated that current global production of fly ash and slag meets only 20% of Portland cement demand and will most likely fall below 10% by 2050. Therefore, a reliable source of fly ash has to be secured, particularly to allow for an uptake of geopolymer technology. It is estimated that UK lagoons and landfills may contain >100 Mt of fly ash [9]. Literature indicates that prolonged storage of the fly ash in a lagoon/landfill can cause significant chemical changes (alteration to composition due to weathering and leaching of easy dissolvable salts) and physical changes (segregation, creation of agglomerates and deposition of reaction products on the surface of fly ash particles), adversely affecting its pozzolanic reactivity [9-11]. Loss on ignition (LOI) values of most lagoon/landfilled stored ashes are high and prevent their use in Portland cement applications in the UK [9]. Therefore, a number of studies were undertaken to evaluate a revalorisation of the UK lagoon/landfilled stored fly ashes in Portland cement systems, highlighting an additional processing (drying/screening) of the material that is likely to be required [9, 11]. However, there is limited work available on the suitability of using lagoon/landfilled ashes in geopolymer systems. The objective of the work presented in this paper was (1) to characterise the fly ash that has been stored in the lagoon of the Kilroot Power Station and compare its properties with silo-stored ashes, and (2) to assess the potential of using this ash as a source of precursor for geopolymer binders.

324 Kwasny et al
EXPERIMENTAL PROGRAMME Materials and Methods The work was divided into two phases. In the first phase, the activation potential of the Kilroot lagoon fly ash (KLFA) as precursor in geopolymer binders was assessed. The chemical composition, particle size distribution, mineralogy and morphology of KLFA were evaluated. Then, geopolymer mortar mixes were prepared to test compressive strength at 1-, 7- and 28-days (Table 1). Three mortar mixes were made with KLFA in as-received moist state (KLFA-W), oven-dried state (KLFA-D), and with a sample of KLFA which was oven-dried and then milled (KLFA-DM). Performance of the mortar made with KLFA was compared to mortars proportioned with silo-stored fly ashes obtained from Kilroot (KFA) and Drax (DFA) power stations. Geopolymer mixes were proportioned with a liquid chemical activator comprising a water solution of sodium hydroxide and a sodium silicate solution. The sodium hydroxide solution was produced by dissolving laboratory grade pellets of sodium hydroxide (NaOH) in water (30% by mass). A commercially available sodium silicate solution with the following mass percentage composition was used: 15% Na2O, 30% SiO2 and 55% water.
Table 1 Fly ash-based geopolymer mixes used to determine activation potential of KLFA
MIX CODE ASH SOURCE APPLIED TREATMENT GDFA DFA Used as received (dry) GKFA KFA Used as received (dry)
GKLFA-W KLFA-W Used as received (wet) and sieved on 2 mm sieve GKLFA-D KLFA-D Oven-dried# and sieved on 2 mm sieve
GKLFA-DM KLFA-DM Oven-dried# and milled## # – Dried at 105 °C to remove excess moisture ## – Milled in a Retsch PM400 Ball Mill at 300 rpm for 10 minutes Well-graded 0–5 mm concrete sand, with oven-dry particle density of 2695 kg/m3, was sourced locally in Northern Ireland (Creagh Concrete Products Ltd., Draperstown). Water absorption of sand at 1-hour and 24-hours was 0.92% and 1.1%, respectively. Both density and water absorption were determined according to BS 812-2:1995 [12]. In phase two, further 12 samples of KLFAs were collected during a pilot geological survey at Kilroot site to assess the variability in their chemical composition. Mix Composition All geopolymer mortar mixes were made with a chemical activator having the same composition: alkali dosage (M+) and alkali modulus (AM). The value of M+, i.e. the percentage mass ratio of total sodium oxide (Na2O) in the chemical activator to the precursor, was fixed at 7.5%. The value of AM, i.e. the mass ratio of sodium oxide to silica in the chemical activator, was set at 1.25. The water to solids (w/s) ratio of the geopolymer mortars was defined as the ratio between mass of the mixing water (i.e. mass of water in the chemical activator + mass of added water)

Lagoon Fly Ash 325
and mass of the solids (i.e. mass of the precursor + mass of solids in the chemical activator). This ratio was kept constant at 0.35. The sand to precursor mass ratio was fixed at 2.75. Sand was pre-saturated before mixing with extra water (quantity equal to the 1-hour water absorption of sand; this extra water was not included in w/s ratio calculations), to achieve its saturated-surface-dry state. Mix Preparation, Sample Casting, Demoulding and Conditioning To ensure that no other parameters influenced the results, all constituent materials were stored at room temperature (20 ±2 °C) prior to batching. Before mixing, sand was oven-dried (at 105 ±5 °C) until a constant mass was reached, subsequently cooled and stored in sealed plastic barrels. The mortar mixes were made in a Hobart mixer in 1 L batches. Pre-saturated sand (based on its 1-hour water absorption) and precursor were placed in the mixing bowl and mechanically homogenised for 1 minute. The designed quantities of the sodium hydroxide solution, sodium silicate solution and added water were mixed together and then added to the mixing bowl. The geopolymer mortar was mixed for a total of 6 minutes. All mortar specimens were cast in two layers. Each layer was compacted on a vibrating table. After casting, the moulds with samples were wrapped in polythene plastic sheets and placed in the oven at 70 °C. Samples were demoulded at 24 ±0.5 hours, counting from the casting time, and placed in plastic boxes on 15 mm plastic supports. Boxes were filled with water to the height of 5 mm, then covered with tightly fitting lids and stored in the conditioning room (20 ±1 °C). This procedure allowed the conditioning of the samples at relative humidity of >95% and prevented unintentional carbonation of the samples, and leaching of alkalis. Test Techniques Particle size distribution analysis of fly ashes was carried out using a Malvern Mastersizer in the 0–2000 µm range. Before testing all samples were oven-dried and sieved on 1 mm sieve. Samples for XRF and XRD spectroscopy analyses of ashes were transferred to a desiccator and stored for ca. 24 hours under vacuum at 40 ±1 °C to evaporate the moisture. Then, dried samples of KLFAs were powdered using mortar and pestle to pass a 63 µm sieve. Immediately after grinding, the powdered samples were placed in sealable plastic bags and stored in the desiccator under vacuum at 20 ±1 °C until testing. X-ray fluorescence (XRF) spectroscopy was used to determine the chemical composition of the ashes. Samples were analysed at the University of Leicester using PANalytical Axios Advanced XRF spectrometer. Powdered samples were analysed using powder XRD spectroscopy, with a PANalytical X’Pert PRO diffractometer, to identify the crystalline components of ashes. Diffraction patterns were collected between 2θ of 5 and 65° with a step size of 0.016°. PANalytical X’Pert Highscore software with the Powder Diffraction File database was used to identify the mineralogy of the samples based on the diffraction patterns.
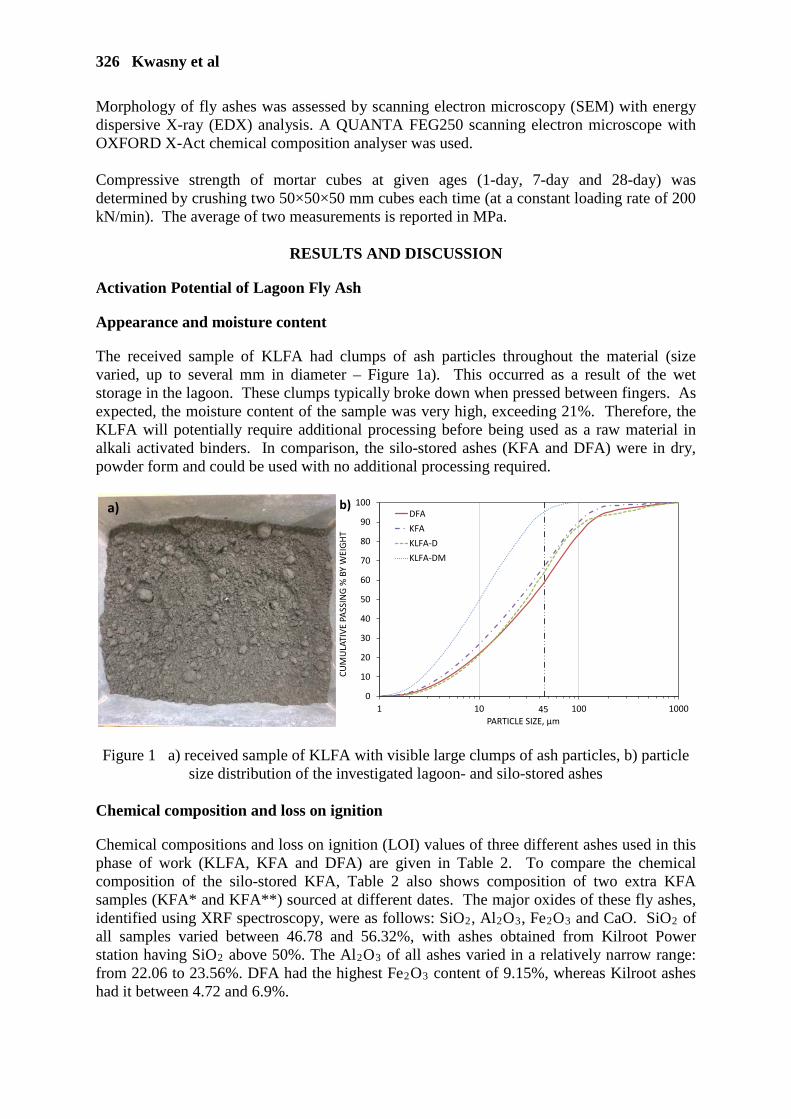
326 Kwasny et al
Morphology of fly ashes was assessed by scanning electron microscopy (SEM) with energy dispersive X-ray (EDX) analysis. A QUANTA FEG250 scanning electron microscope with OXFORD X-Act chemical composition analyser was used. Compressive strength of mortar cubes at given ages (1-day, 7-day and 28-day) was determined by crushing two 50×50×50 mm cubes each time (at a constant loading rate of 200 kN/min). The average of two measurements is reported in MPa.
RESULTS AND DISCUSSION
Activation Potential of Lagoon Fly Ash
Appearance and moisture content
The received sample of KLFA had clumps of ash particles throughout the material (size varied, up to several mm in diameter – Figure 1a). This occurred as a result of the wet storage in the lagoon. These clumps typically broke down when pressed between fingers. As expected, the moisture content of the sample was very high, exceeding 21%. Therefore, the KLFA will potentially require additional processing before being used as a raw material in alkali activated binders. In comparison, the silo-stored ashes (KFA and DFA) were in dry, powder form and could be used with no additional processing required.
a)
0
10
20
30
40
50
60
70
80
90
100
1 10 100 1000
CUM
ULA
TIVE
PAS
SIN
G %
BY
WEI
GHT
PARTICLE SIZE, µm
DFAKFAKLFA-DKLFA-DM
45
b)
Figure 1 a) received sample of KLFA with visible large clumps of ash particles, b) particle size distribution of the investigated lagoon- and silo-stored ashes
Chemical composition and loss on ignition
Chemical compositions and loss on ignition (LOI) values of three different ashes used in this phase of work (KLFA, KFA and DFA) are given in Table 2. To compare the chemical composition of the silo-stored KFA, Table 2 also shows composition of two extra KFA samples (KFA* and KFA**) sourced at different dates. The major oxides of these fly ashes, identified using XRF spectroscopy, were as follows: SiO2, Al2O3, Fe2O3 and CaO. SiO2 of all samples varied between 46.78 and 56.32%, with ashes obtained from Kilroot Power station having SiO2 above 50%. The Al2O3 of all ashes varied in a relatively narrow range: from 22.06 to 23.56%. DFA had the highest Fe2O3 content of 9.15%, whereas Kilroot ashes had it between 4.72 and 6.9%.
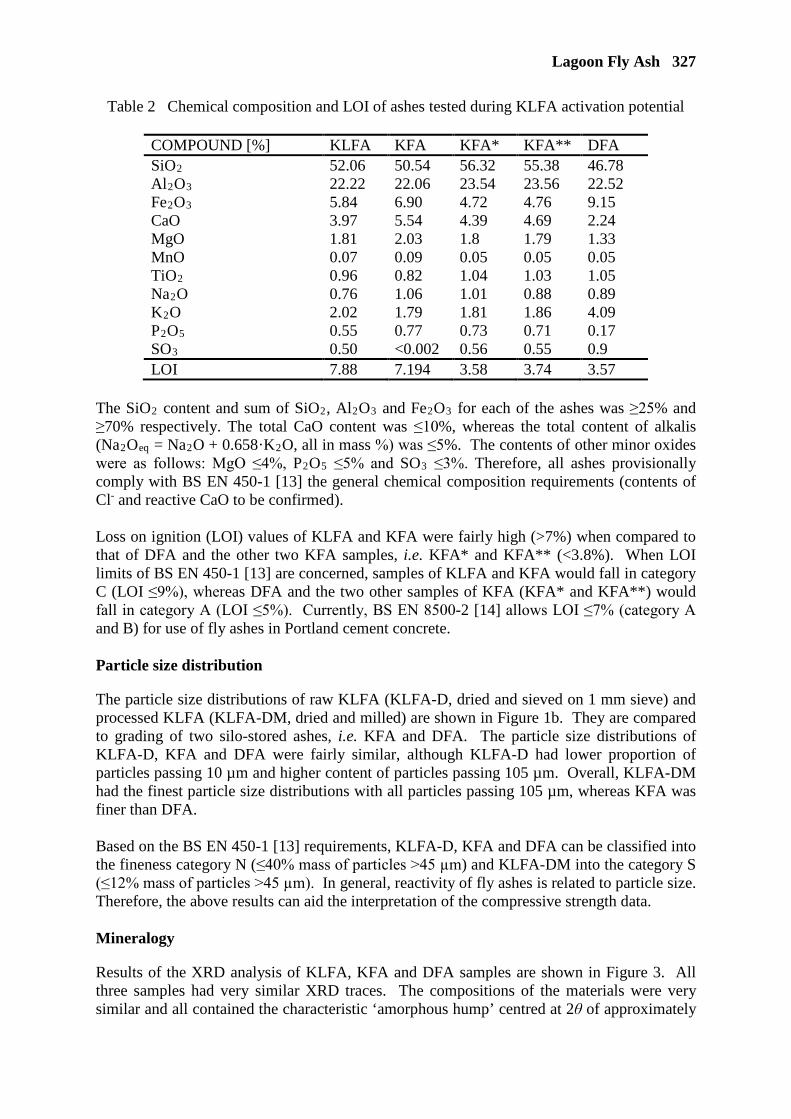
Lagoon Fly Ash 327
Table 2 Chemical composition and LOI of ashes tested during KLFA activation potential
COMPOUND [%] KLFA KFA KFA* KFA** DFA SiO2 52.06 50.54 56.32 55.38 46.78 Al2O3 22.22 22.06 23.54 23.56 22.52 Fe2O3 5.84 6.90 4.72 4.76 9.15 CaO 3.97 5.54 4.39 4.69 2.24 MgO 1.81 2.03 1.8 1.79 1.33 MnO 0.07 0.09 0.05 0.05 0.05 TiO2 0.96 0.82 1.04 1.03 1.05 Na2O 0.76 1.06 1.01 0.88 0.89 K2O 2.02 1.79 1.81 1.86 4.09 P2O5 0.55 0.77 0.73 0.71 0.17 SO3 0.50 <0.002 0.56 0.55 0.9 LOI 7.88 7.194 3.58 3.74 3.57
The SiO2 content and sum of SiO2, Al2O3 and Fe2O3 for each of the ashes was ≥25% and ≥70% respectively. The total CaO content was ≤10%, whereas the total content of alkalis (Na2Oeq = Na2O + 0.658·K2O, all in mass %) was ≤5%. The contents of other minor oxides were as follows: MgO ≤4%, P2O5 ≤5% and SO3 ≤3%. Therefore, all ashes provisionally comply with BS EN 450-1 [13] the general chemical composition requirements (contents of Cl- and reactive CaO to be confirmed). Loss on ignition (LOI) values of KLFA and KFA were fairly high (>7%) when compared to that of DFA and the other two KFA samples, i.e. KFA* and KFA** (<3.8%). When LOI limits of BS EN 450-1 [13] are concerned, samples of KLFA and KFA would fall in category C (LOI ≤9%), whereas DFA and the two other samples of KFA (KFA* and KFA**) would fall in category A (LOI ≤5%). Currently, BS EN 8500-2 [14] allows LOI ≤7% (category A and B) for use of fly ashes in Portland cement concrete. Particle size distribution
The particle size distributions of raw KLFA (KLFA-D, dried and sieved on 1 mm sieve) and processed KLFA (KLFA-DM, dried and milled) are shown in Figure 1b. They are compared to grading of two silo-stored ashes, i.e. KFA and DFA. The particle size distributions of KLFA-D, KFA and DFA were fairly similar, although KLFA-D had lower proportion of particles passing 10 µm and higher content of particles passing 105 µm. Overall, KLFA-DM had the finest particle size distributions with all particles passing 105 µm, whereas KFA was finer than DFA. Based on the BS EN 450-1 [13] requirements, KLFA-D, KFA and DFA can be classified into the fineness category N (≤40% mass of particles >45 µm) and KLFA-DM into the category S (≤12% mass of particles >45 µm). In general, reactivity of fly ashes is related to particle size. Therefore, the above results can aid the interpretation of the compressive strength data. Mineralogy
Results of the XRD analysis of KLFA, KFA and DFA samples are shown in Figure 3. All three samples had very similar XRD traces. The compositions of the materials were very similar and all contained the characteristic ‘amorphous hump’ centred at 2θ of approximately

328 Kwasny et al
25°. DFA shows traces of hematite that are not present in KLFA and KFA. Calcite (CaCO3) was present in KLFA. Given that calcite was not found in KFA, it is likely that it was formed within KLFA due to prolonged exposure to the atmospheric CO2 and weathering [15]. Morphology
SEM imaging was carried out on the ash samples of KLFA, KFA and DFA (Figure 2). All ashes were very similar in appearance, regardless of the source, primarily containing spherical fly ash particles. The spheres varied in size, from several to tens of microns, and some of the larger spheres were coated with smaller spheres. The surface of the spheres was typically smooth, but some spherical particles had pitted surface. Spot analysis of the spherical particles showed that they were primarily composed of Si and Al (in different particles the proportion of Si to Al varied, but Si was generally dominant). Within the KLFA the spheres often appear as clumps of particles (varying largely in their number) with no apparent material holding them together. This potentially may affect the reactivity of KLFA. All ashes contained irregularly shaped particles having numerous spheres attached to their surface. Spot analysis indicated that they were carbon-rich, thus likely to be unburnt carbon residue. There was also individual irregular shaped particles present, which were likely to be quartz or mullite.
0
2000
4000
6000
8000
10000
12000
14000
16000
18000
5 10 15 20 25 30 35 40 45 50 55 60 65
COUN
TS
2θ (°)
Mul
lite
Mul
lite
Mul
lite
Mul
lite
Mul
lite
Qua
rtz
Qua
rtz
Qua
rtz
Qua
rtz
Hem
atite
Cal
cium
Alu
min
ium
Oxi
de
Mul
lite
Mul
liteC
alci
te
Hem
atite
Mul
lite
Silic
on o
xide
Mul
lite
Qua
rtzQua
rtzC
alci
um A
lum
iniu
m O
xide
DFA
KFA
KLFA
Figure 2 XRD analysis of the KLFA, KFA and DFA samples
KLFA KFA DFA
Figure 3 SEM images of KLFA, KFA and DFA (circles – large clumps/agglomerates of fly
ash particles; arrows – carbon-rich particle with multiple spheres attached)

Lagoon Fly Ash 329
Compressive strength
Compressive strength results for the fly ash geopolymer mortars are shown in Figure 4. The control mix (GDFA), made with DFA, had compressive strengths of approximately 19, 24 and 24 MPa at 1, 7 and 28 days, respectively. The mix made with KFA (GKFA) had higher strength than the GDFA mix at each testing age, which can be related to the higher fineness of KFA (Figure 1b) [1]. When the KLFA was used in as received state, i.e. moist (KLFA-W), the recorded strength of the GKLFA-W mix at 1, 7 and 28 days was very low (below 3 MPa). This is obviously caused by the moisture present in the untreated KLFA-W (ca. 21% of the mass). Mix GKLFA-D (made with dried, as received state KLFA) was too dry during mixing process, hence it was not possible to cast samples (thus the strengths of this mix are reported as 0 MPa). This appears to be due to the lumpy nature of KLFA (resulting from the prolonged wet storage in the lagoon) and due to relatively high LOI (related to the content of unburnt carbon). Presumably, the KLFA lumps and unburnt carbon caused entrapment of the mixing water, which otherwise would be used for the lubrication of the solid particles in the mix. When KLFA was dried and milled (KLFA-DM), the compressive strength of the GKLFA-DM mix was slightly lower than that of the GKFA. The mechanical activation via reduction of the grain size is well known to increase the reactivity of fly ash [2, 16]. However, these results indicate that after mechanical activation KLFA was not as reactive as KFA. In summary, KLFA could be suitable to use as a raw material for the alkali activation, with prior processing.
0
5
10
15
20
25
30
35
40
0 7 14 21 28
COM
PRES
SIVE
STR
ENGT
H, M
Pa
TESTING AGE, DAYS
GDFA
GKFA
GKLFA-W
GKLFA-D
GKLFA-DM
Figure 4 Compressive strength development of fly ash geopolymer mortars Variability of Lagoon Fly Ash at Kilroot Power Station Sampling of Kilroot lagoon fly ashes A preliminary auger sampling program was organised to test the variability of KLFA. Samples were obtained from 12 different sites within the lagoon (Figure 5). The auger was capable of sampling to the depth of 2 m, hence the initial plan was to obtain samples from different height levels within the lagoon. This was considered useful, as if there would be variability across the site within the top 2 m, then it is likely that the variability would continue to the depth.

330 Kwasny et al
12s
1a
2a 3a4b
Sampling depth:a – 40 cmb – 50 cmc – 250 cmd – 30 cme – 20 cms – surface
5c
7c
6d
8e
9s10s
11s
100 m
Figure 5 Aerial photograph of Kilroot lagoon showing approximate sampling locations When sampling commenced it was clear that the ground was extremely compacted and that sampling would be problematic. Using the auger a maximum depth of 50 cm was achieved and at some sites sampling was from the top couple of centimetres as the ash could not be penetrated with the equipment at hand (Figure 5). For two sites samples were obtained using an excavator, which enabled sampling from the depth of approximately 2.5 m. Chemical composition of Kilroot lagoon fly ashes XRF analysis was carried out on 12 samples collected from the Kilroot lagoon. Selected XRF results are shown in Figure 6 (separated into two graphs for the ease of reading) and are compared to the ash samples listed in Table 2. The horizontal lines represent averages calculated for each elemental oxide/LOI for the silo-stored samples of KFA, KFA* and KFA** (Table 2), enabling easy comparison of Kilroot silo- and lagoon-stored ashes.
0
5
10
15
20
25
30
35
40
45
50
55
60
DFA
KFA
KFA*
KFA*
*
KLFA 1a 2a 3a 4b 5c 6d 7c 8e 9s 10
s
11s
12s
CON
TEN
T, %
Ash ID
Al2O3
a) SiO2
Fe2O3
LOI0
1
2
3
4
5
6
7
8
9
10
11
DFA
KFA
KFA*
KFA*
*
KLFA 1a 2a 3a 4b 5c 6d 7c 8e 9s 10
s
11s
12s
CON
TEN
T, %
Ash ID
CaO
MgOK2ONa2O
b)
Figure 6 XRF of selected oxides and LOI in ashes shown in Table 2 and 12 KLFA samples
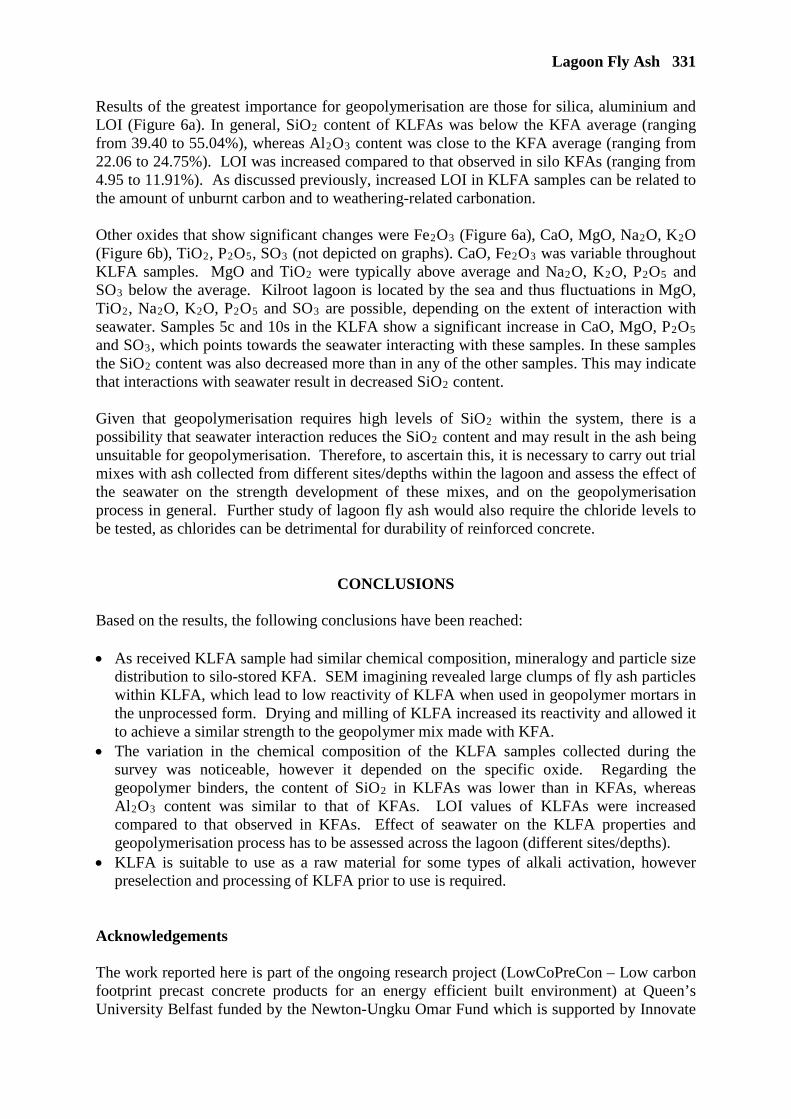
Lagoon Fly Ash 331
Results of the greatest importance for geopolymerisation are those for silica, aluminium and LOI (Figure 6a). In general, SiO2 content of KLFAs was below the KFA average (ranging from 39.40 to 55.04%), whereas Al2O3 content was close to the KFA average (ranging from 22.06 to 24.75%). LOI was increased compared to that observed in silo KFAs (ranging from 4.95 to 11.91%). As discussed previously, increased LOI in KLFA samples can be related to the amount of unburnt carbon and to weathering-related carbonation. Other oxides that show significant changes were Fe2O3 (Figure 6a), CaO, MgO, Na2O, K2O (Figure 6b), TiO2, P2O5, SO3 (not depicted on graphs). CaO, Fe2O3 was variable throughout KLFA samples. MgO and TiO2 were typically above average and Na2O, K2O, P2O5 and SO3 below the average. Kilroot lagoon is located by the sea and thus fluctuations in MgO, TiO2, Na2O, K2O, P2O5 and SO3 are possible, depending on the extent of interaction with seawater. Samples 5c and 10s in the KLFA show a significant increase in CaO, MgO, P2O5 and SO3, which points towards the seawater interacting with these samples. In these samples the SiO2 content was also decreased more than in any of the other samples. This may indicate that interactions with seawater result in decreased SiO2 content. Given that geopolymerisation requires high levels of SiO2 within the system, there is a possibility that seawater interaction reduces the SiO2 content and may result in the ash being unsuitable for geopolymerisation. Therefore, to ascertain this, it is necessary to carry out trial mixes with ash collected from different sites/depths within the lagoon and assess the effect of the seawater on the strength development of these mixes, and on the geopolymerisation process in general. Further study of lagoon fly ash would also require the chloride levels to be tested, as chlorides can be detrimental for durability of reinforced concrete.
CONCLUSIONS Based on the results, the following conclusions have been reached: • As received KLFA sample had similar chemical composition, mineralogy and particle size
distribution to silo-stored KFA. SEM imagining revealed large clumps of fly ash particles within KLFA, which lead to low reactivity of KLFA when used in geopolymer mortars in the unprocessed form. Drying and milling of KLFA increased its reactivity and allowed it to achieve a similar strength to the geopolymer mix made with KFA.
• The variation in the chemical composition of the KLFA samples collected during the survey was noticeable, however it depended on the specific oxide. Regarding the geopolymer binders, the content of SiO2 in KLFAs was lower than in KFAs, whereas Al2O3 content was similar to that of KFAs. LOI values of KLFAs were increased compared to that observed in KFAs. Effect of seawater on the KLFA properties and geopolymerisation process has to be assessed across the lagoon (different sites/depths).
• KLFA is suitable to use as a raw material for some types of alkali activation, however preselection and processing of KLFA prior to use is required.
Acknowledgements The work reported here is part of the ongoing research project (LowCoPreCon – Low carbon footprint precast concrete products for an energy efficient built environment) at Queen’s University Belfast funded by the Newton-Ungku Omar Fund which is supported by Innovate

332 Kwasny et al
UK and Malaysian Industry-Government Group for High Technology (MIGHT). The authors are grateful to the School of Natural and Built Environment for the facilities provided and to Innovate UK for the financial support.
REFERENCES
1. RILEM TC 224-AAM. Alkali-Activated Materials: State-of-the-Art Report, RILEM State-of-the-Art Reports Volume 13, Eds. J L PROVIS and J S J van DEVENTER, 2014, Springer/RILEM, Dordrecht.
2. SOUTSOS, M, BOYLE, A P, VINAI, R, HADJIERAKLEOUS, A, BARNETT, S J.
Factors influencing the compressive strength of fly ash based geopolymers, Construction and Building Materials, Vol. 110, 2016, pp. 355–368.
3. MCINTOSH, A, LAWTHER, S, KWASNY, J, SOUTSOS, M, CLELAND D J,
NANUKUTTAN S. Selection and characterisation of geological materials for use as geopolymer precursors, Advances in Applied Ceramics, 2015, DOI: 10.1179/1743676115Y.0000000055.
4. HEATH, A, PAINE, K, GOODHEW, S, RAMAGE, M, LAWRENCE, M. The
potential for using geopolymer concrete in the UK, Proceedings of the Institution of Civil Engineers - Construction Materials, Vol. 166, No. 4, 2013, pp. 195–203.
5. UK QUALITY ASH ASSOCIATION. UKQAA Ash Availability Report, UKQAA,
Wolverhampton, UK, January 2016. 6. DEPARTMENT FOR ENERGY AND CLIMATE CHANGE. Updated energy and
emissions projections 2016, DECC, London, UK, March 2017. 7. DEPARTMENT FOR BUSINESS, ENERGY & INDUSTRIAL STRATEGY. Fly ash
and blast furnace slag for cement manufacturing, BEIS research paper no. 19, September 2017.
8. HEATH, A, PAINE, K, MCMANUS, M. Minimising the global warming potential of
clay based geopolymers, Journal of Cleaner Production, Vol. 78, 2014, pp. 75–83. 9. MCCARTHY, M J, JONES, M R, ZHENG, L, ROBL, T L, GROPPO, J G.
Characterising long-term wet-stored fly ash following carbon and particle size separation, Fuel, Vol. 111, 2013, pp. 430–441.
10. CARROLL R A. Coal combustion products in the United Kingdom and the potential of
stockpile ash, 2015 World of Coal Ash Conference in Nashville, 5-7 May 2015. 11. MCCARTHY, M J, ZHENG, L, DHIR, R K, TELLA, G. Dry-processing of long-term
wet-stored fly ash for use as an addition in concrete, Cement and Concrete Composites, Vol. 92, 2018, pp. 205–215.
12. BRITISH STANDARDS INSTITUTION. BS 812-2:1995 – Testing aggregates.
Methods for determination of density, BSI, London, UK, 1995.
Lagoon Fly Ash 333
13. BRITISH STANDARDS INSTITUTION. BS EN 450-1:2012 Fly ash for concrete. Definition, specifications and conformity criteria, BSI, London, UK, 2012.
14. BRITISH STANDARDS INSTITUTION. BS 8500-2:2015 – Concrete.
Complementary British Standard to BS EN 206. Specification for constituent materials and concrete, BSI, London, UK, 2015.
15. HAYNES, R J. Reclamation and revegetation of fly ash disposal sites – Challenges and
research needs, Journal of Environmental Management, Vol. 90, No. 1, 2009, pp. 43–53.
16. KUMAR, R, KUMAR, S, MEHROTRA S P. Towards sustainable solutions for fly ash
through mechanical activation, Resources, Conservation and Recycling, Vol. 52, No. 2, 2007, pp. 157–179.
PHASE-TRANSITION CONDUCTOMETRY TO STUDY PORE STRUCTURE EVOLUTION IN FLY-ASH MORTAR
B Suryanto
J Kim
W J McCarter
Heriot-Watt University
United Kingdom
ABSTRACT. The durability of cement-based materials depends primarily on the environmental exposure conditions and micro-porous nature of the cementitious binder. In this paper, electrical impedance spectroscopy is exploited to study pore structure evolution in fly-ash mortars. To this end, mortar samples were exposed to a cyclic temperature regime over the temperature range 20oC -60oC to establish the relation between pore size and the freezing/melting point of pore-water. It is shown that when the bulk resistivity and thermal response of the mortars were presented in an Arrhenius format, hysteresis was evident over a significant portion of the plots. Depression in both the freezing and thawing temperatures was evident and used to estimate the radii of capillary pore necks and cavities. It is also shown that due to on-going hydration and pozzolanic activity, and resulting pore structure refinement, the bulk resistivity above the freezing point increases with curing time, while that below the freezing point exhibits an opposite trend and attributed to the reduction in pore-neck radius which has a governing role on ice formation. Keywords: Mortar, Freezing and thawing, Impedance, Arrhenius, Hysteresis, Pore radius, Ice formation Dr B Suryanto is an Associate Professor in the School of Energy, Geoscience, Infrastructure and Society at Heriot-Watt University in Edinburgh. His research interests are primarily concerned with the practical application of electrical property measurements and in the development and characterisation of multi-functional cementitious materials. Dr J Kim is a Postdoctoral Research Associate in the School of Energy, Geoscience, Infrastructure and Society at Heriot-Watt University in Edinburgh, specialising in the durability performance of concrete under aggressive environmental conditions such as high chloride environment, extreme heat and low temperatures. Professor W John McCarter is an Emeritus Professor in the School of Energy, Geoscience, Infrastructure and Society at Heriot-Watt University in Edinburgh. He has numerous research interests in the development and application of electrical property measurements for monitoring and characterisation of Civil Engineering materials, with particular focus on hydraulic cementitious materials and particulate system in general. He has published widely on the electrical properties of cement pastes, mortars, concretes and alkali activated materials.
Phase-Transition Conductometry 335
INTRODUCTION
Considerable advances have now been made in the use of electrical impedance spectroscopy (EIS) to study various physico-chemical processes in cement-based materials. The main advantage of EIS is that they are technically simple to perform allowing measurements to be obtained not only on Portland cement pastes, but also on mortars and concretes which have direct practical significance. The simplicity of the system also allows measurements to be taken continuously from casting through curing and long-term hardening under both laboratory [1-6] and field environments [7, 8]. These studies have shown that the impedance response of a cementitious system can be linked to the pore-water content, pore-water chemistry and the connectivity and tortuosity of the capillary pore network within the cementitious binder [9, 10], all of which have a direct influence on moisture and ionic transport and hence long-term durability [11]. Much of the work has, however, focused on the impedance response of cementitious systems at normal ambient temperatures (viz, between ~1oC and 40oC) [1-12]. In cold regions, the ambient temperature may drop below the freezing point and have implications on the durability of concrete. It has been recognised that concrete durability in this environment is intimately linked to the freezing point of the pore water within the cement binder, which is dependent upon the pore size and pore connectivity, and the volumetric ratio of frozen water within the pore network. In this work, we extend the application of EIS to lower temperature range and demonstrate its potential for characterising the micro porous nature of a cementitious system. A number of studies in this area have been reported [see, for example, 13-16]; however, they are limited with respect to the frequency and temperature range employed, in particular the low temperature limit. Extending the temperature to a lower range could establish an improved understanding of the process of ice formation, pore-size and pore connectivity. Here we present the application of EIS to study pore structure evolution in fly-ash mortars over a 28-day curing period within the temperature range 20oC/-60oC.
EXPERIMENTAL PROGRAMME
Materials and Sample Preparation The mix proportion for the mortar used in this programme is presented in Table 1. The binder comprised a blend of Portland cement CEM I 52.5N to BS EN197-1 [17] and fly-ash to BS EN450-1 [18], at a replacement ratio of 35%. The oxide composition of these materials is provided in Table 2. A relatively low water/binder ratio of 0.4 was used to minimise damage on the pore structure upon exposure to the low temperatures detailed below. To ensure adequate workability, a high-range water-reducing admixture was added into the mix at a fixed dosage rate of 0.5% by mass of binder. A total of fifteen fly-ash mortar samples were cast using a 10 litre Hobart planetary motion mixer: five were used for impedance tests and the remaining ten were used for compressive strength tests. Following mixing, the prepared mortar was compacted into standard three-gang 50mm steel moulds placed on a vibrating table; they were then covered with thick cling film to minimize water evaporation. All samples were demoulded after 24-hr and then placed in a curing tank at 20±1oC until required for testing, which, for the current work programme, at 3, 7, 14, 21 and 28 days. During this normal curing period, hydration is expected to have a significant influence on pore structure development.
336 Suryanto et al
Electrode Configuration and Calibration To enable electrical measurements, a pair of stainless steel (Grade 316L) pin-electrodes was positioned centrally within each of the five impedance samples at the time of casting (see Figure 1). Each electrode comprised a 2.4mm diameter stainless-steel (s/s) pin (approximately 60mm in length) which was sleeved with heat-shrink insulation to expose a 10mm length of tip at both ends, to allow electrical measurements. The pin-electrodes were then inserted to a depth of 30mm at a centre-to-centre spacing of 10mm and secured in position by means of a 0.3mm thick acrylic strip, which was fixed on the steel moulds prior to casting. In addition to the pin-electrodes, a 5kΩ thermistor was inserted to a depth of ~20mm at the centre of the pins to facilitate internal temperature measurements. When a cement-based sample placed between a pair of electrodes and subjected the action of a small amplitude, alternating current over a wide frequency range, the impedance response displayed in Figure 1(b) will result. Generally, the response comprises a spur at the right-hand (low frequency) side of the plot, which represents the polarization at the electrode/sample interface [19], and a semicircular arc whose centre depressed from the real axis at the left-hand (high frequency) side. The arc is associated with the bulk response of the test sample and the bulk resistance, R (Ω), can be obtained from the intercept of the low-frequency end of the arc with the real axis. This can be multiplied by the geometrical constant to obtain the bulk resistivity, ρ (Ωm), which is a fundamental electrical property and hence independent of the size and geometry of the sample. For a prismatic shape sample with two external plate-electrodes, this can be calculated by the relationship,
𝜌𝜌 = 𝑘𝑘 𝑅𝑅 Ωm (1) where 𝑘𝑘 is the geometrical constant (m) and, for a prismatic sample, equivalent to 𝐴𝐴 𝐿𝐿⁄ , with A being the cross-sectional area of the test sample (m2) and L the distance between the electrodes (m). Note that this equation is only valid when the electrical field between the electrodes is uniform. However, as the electrical field between the tips of the pin-electrodes is non-uniform, a priori calibration measurements is required to convert the measured resistance to resistivity. This was obtained by measuring the bulk resistance of solutions of known resistivity using a cell of similar internal dimensions and identical electrode arrangement.
Table 1 Mortar mix (w/b = 0.4). HRWR = high range water reducer.
Mix
designation
PC
(kg/m3)
Fly-ash
(kg/m3)
Water
(kg/m3)
Sand
(kg/m3)
HRWR
(kg/m3)
F28 (MPa)
CEM II/B-V 406 219 250 1375 3.1 44.5
Table 2 Typical oxide analysis of cement and fly-ash from the suppliers.
% by weight Cement Fly-ash
SiO2 Al2O3 Fe2O3 CaO MgO K2O Na2O
19.9 4.94 3.07 62.02 2.08 0.62 0.15
45-51 27-32 7-11 1-5 1-4 1-5
0.8-1.7
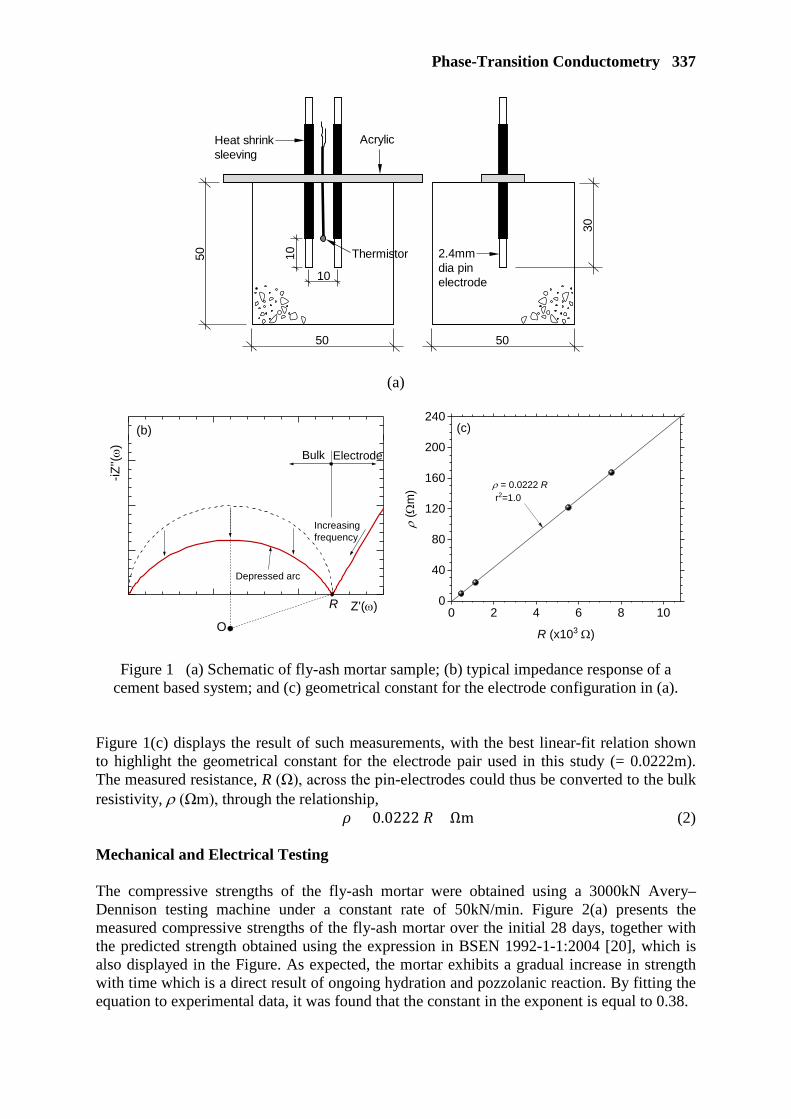
Phase-Transition Conductometry 337
(a)
Figure 1 (a) Schematic of fly-ash mortar sample; (b) typical impedance response of a cement based system; and (c) geometrical constant for the electrode configuration in (a).
Figure 1(c) displays the result of such measurements, with the best linear-fit relation shown to highlight the geometrical constant for the electrode pair used in this study (= 0.0222m). The measured resistance, R (Ω), across the pin-electrodes could thus be converted to the bulk resistivity, ρ (Ωm), through the relationship,
𝜌𝜌 = 0.0222 𝑅𝑅 Ωm (2) Mechanical and Electrical Testing The compressive strengths of the fly-ash mortar were obtained using a 3000kN Avery–Dennison testing machine under a constant rate of 50kN/min. Figure 2(a) presents the measured compressive strengths of the fly-ash mortar over the initial 28 days, together with the predicted strength obtained using the expression in BSEN 1992-1-1:2004 [20], which is also displayed in the Figure. As expected, the mortar exhibits a gradual increase in strength with time which is a direct result of ongoing hydration and pozzolanic reaction. By fitting the equation to experimental data, it was found that the constant in the exponent is equal to 0.38.
50
50
10
Acrylic
10
Heat shrinksleeving
50
30
2.4mmdia pinelectrode
Thermistor
Depressed arc
ElectrodeBulk
Increasingfrequency
Z'(ω)
-iZ''(ω
)
R
O
(b)
0 2 4 6 8 100
40
80
120
160
200
240ρ
(Ωm
)
R (x103 Ω)
(c)
ρ = 0.0222 R r2=1.0

338 Suryanto et al
Electrical measurements were undertaken using an E4980AL LCR meter operating in voltage drive mode at a signal amplitude of 350mV. The LCR meter was controlled by a desktop PC using custom-designed LabVIEW virtual instrument via a USB interface. Using this system, an automated frequency sweep measurement was undertaken over the frequency range 20Hz–1MHz at 20 frequency points per decade on a 2-min cycle. One sweep measurement took only ~25s and the LCR meter was placed in standby mode until the subsequent sweep. Temperature Measurements and Data Acquisition Temperature readings (chamber and sample) were undertaken using two thermistors which were connected to a resistance logger and operated at the same rate as above. These thermistor readings were converted to temperature using the Steinhart-Hart equation [7], 𝑇𝑇 = [𝐴𝐴 + 𝐵𝐵𝐵𝐵𝐵𝐵𝑅𝑅 + 𝐶𝐶(𝐵𝐵𝐵𝐵𝑅𝑅)3]−1 − 273.15 (1) where 𝑅𝑅 (Ω) is the measured thermistor resistance; 𝑇𝑇 is temperature (ºC±0.2°C); and A, B, and C are coefficients which depend on the type of the thermistor. For the thermistor used in the present study, the values of A, B, and C were 1.28×10⁻³, 2.36×10⁻⁴ and 9.31×10⁻⁸ K-1.
Figure 2 (a) Predicted and observed cube compressive strength; (b) measured internal sample (solid line) and chamber (dashed line) temperatures. Thermal Cycling Regime Prior to testing, one sample was removed from the curing tank, surface-dried and, to minimise water loss during testing, immediately wrapped with several layers of cling film before being placed in a climatic chamber and taken through the following thermal regime:
(I) isothermal hold at 20oC for 1-h to achieve thermal equilibrium; (II) temperature reduction from 20oC to -60oC at a rate of 10oC/h; (III) another isothermal hold for 3-h; (IV) temperature increase to 20oC at the same rate as (II); and (V) a final isothermal hold for 3-h.
At start, the thermistors were connected to the data logger, while the pin-electrodes to the LCR meter via four, individually screened coaxial leads which ducted out through a small cable entry port on the side of the chamber. The automated measurements were then triggered. Figure 2(b) presents the chamber (dashed line) and internal sample temperatures (solid line) during one full thermal cycle. It is apparent that the chamber temperatures during stages II and IV exhibit a linear relationship with time at a rate of 10oC/h, highlighting the
0 15 30 45 60 75 900
10
20
30
40
50
60
0.5
Cub
e co
mpr
essi
ve s
treng
th (M
Pa)
Time (days)
(a)
fc=45 e0.38(1-(28/t) )
0 3 6 9 12 15 18 21
-60
-40
-20
0
20
Tem
pera
ture
(o C)
Time (hours)
(b)
II III IV VI
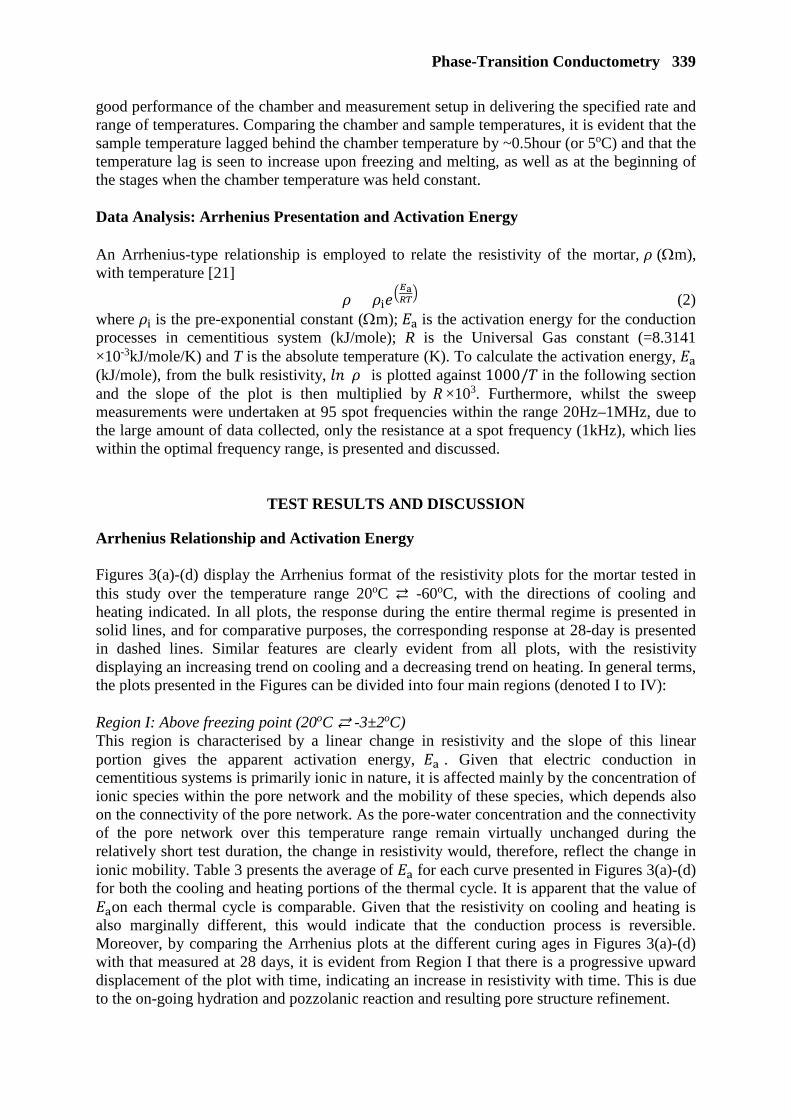
Phase-Transition Conductometry 339
good performance of the chamber and measurement setup in delivering the specified rate and range of temperatures. Comparing the chamber and sample temperatures, it is evident that the sample temperature lagged behind the chamber temperature by ~0.5hour (or 5oC) and that the temperature lag is seen to increase upon freezing and melting, as well as at the beginning of the stages when the chamber temperature was held constant. Data Analysis: Arrhenius Presentation and Activation Energy An Arrhenius-type relationship is employed to relate the resistivity of the mortar, 𝜌𝜌 (Ωm), with temperature [21]
𝜌𝜌 = 𝜌𝜌i𝑒𝑒𝐸𝐸a𝑅𝑅𝑅𝑅 (2)
where 𝜌𝜌i is the pre-exponential constant (Ωm); 𝐸𝐸a is the activation energy for the conduction processes in cementitious system (kJ/mole); R is the Universal Gas constant (=8.3141 ×10⁻³kJ/mole/K) and T is the absolute temperature (K). To calculate the activation energy, 𝐸𝐸a (kJ/mole), from the bulk resistivity, 𝐵𝐵𝐵𝐵(𝜌𝜌) is plotted against 1000/𝑇𝑇 in the following section and the slope of the plot is then multiplied by 𝑅𝑅 ×103. Furthermore, whilst the sweep measurements were undertaken at 95 spot frequencies within the range 20Hz–1MHz, due to the large amount of data collected, only the resistance at a spot frequency (1kHz), which lies within the optimal frequency range, is presented and discussed.
TEST RESULTS AND DISCUSSION
Arrhenius Relationship and Activation Energy Figures 3(a)-(d) display the Arrhenius format of the resistivity plots for the mortar tested in this study over the temperature range 20oC -60oC, with the directions of cooling and heating indicated. In all plots, the response during the entire thermal regime is presented in solid lines, and for comparative purposes, the corresponding response at 28-day is presented in dashed lines. Similar features are clearly evident from all plots, with the resistivity displaying an increasing trend on cooling and a decreasing trend on heating. In general terms, the plots presented in the Figures can be divided into four main regions (denoted I to IV): Region I: Above freezing point (20oC -3±2oC) This region is characterised by a linear change in resistivity and the slope of this linear portion gives the apparent activation energy, 𝐸𝐸a . Given that electric conduction in cementitious systems is primarily ionic in nature, it is affected mainly by the concentration of ionic species within the pore network and the mobility of these species, which depends also on the connectivity of the pore network. As the pore-water concentration and the connectivity of the pore network over this temperature range remain virtually unchanged during the relatively short test duration, the change in resistivity would, therefore, reflect the change in ionic mobility. Table 3 presents the average of 𝐸𝐸a for each curve presented in Figures 3(a)-(d) for both the cooling and heating portions of the thermal cycle. It is apparent that the value of 𝐸𝐸aon each thermal cycle is comparable. Given that the resistivity on cooling and heating is also marginally different, this would indicate that the conduction process is reversible. Moreover, by comparing the Arrhenius plots at the different curing ages in Figures 3(a)-(d) with that measured at 28 days, it is evident from Region I that there is a progressive upward displacement of the plot with time, indicating an increase in resistivity with time. This is due to the on-going hydration and pozzolanic reaction and resulting pore structure refinement.
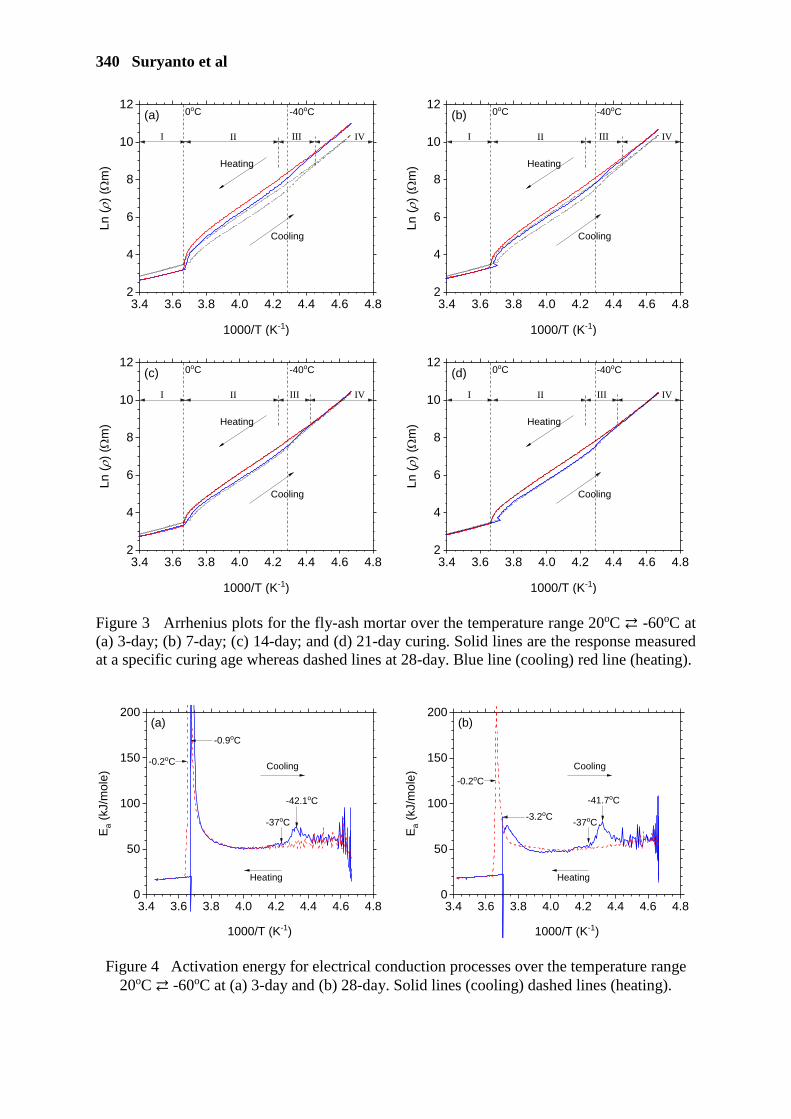
340 Suryanto et al
Figure 3 Arrhenius plots for the fly-ash mortar over the temperature range 20oC -60oC at (a) 3-day; (b) 7-day; (c) 14-day; and (d) 21-day curing. Solid lines are the response measured at a specific curing age whereas dashed lines at 28-day. Blue line (cooling) red line (heating).
Figure 4 Activation energy for electrical conduction processes over the temperature range 20oC -60oC at (a) 3-day and (b) 28-day. Solid lines (cooling) dashed lines (heating).
3.4 3.6 3.8 4.0 4.2 4.4 4.6 4.82
4
6
8
10
12Ln
(ρ) (Ω
m)
1000/T (K-1)
Cooling
Heating
0oC -40oC(a)
I II III IV
3.4 3.6 3.8 4.0 4.2 4.4 4.6 4.82
4
6
8
10
12
Ln (ρ
) (Ω
m)
1000/T (K-1)
Cooling
Heating
0oC -40oC(b)
I II III IV
3.4 3.6 3.8 4.0 4.2 4.4 4.6 4.82
4
6
8
10
12
Ln (ρ
) (Ω
m)
1000/T (K-1)
Cooling
Heating
0oC -40oC(c)
I II III IV
3.4 3.6 3.8 4.0 4.2 4.4 4.6 4.82
4
6
8
10
12
Ln (ρ
) (Ω
m)
1000/T (K-1)
Cooling
Heating
0oC -40oC(d)
I II III IV
3.4 3.6 3.8 4.0 4.2 4.4 4.6 4.80
50
100
150
200
E a (k
J/m
ole)
1000/T (K-1)
(a)
Cooling
Heating
-42.1oC
-37oC
-0.9oC
-0.2oC
3.4 3.6 3.8 4.0 4.2 4.4 4.6 4.80
50
100
150
200
E a (k
J/m
ole)
1000/T (K-1)
(b)
Cooling
Heating
-41.7oC
-37oC-3.2oC
-0.2oC
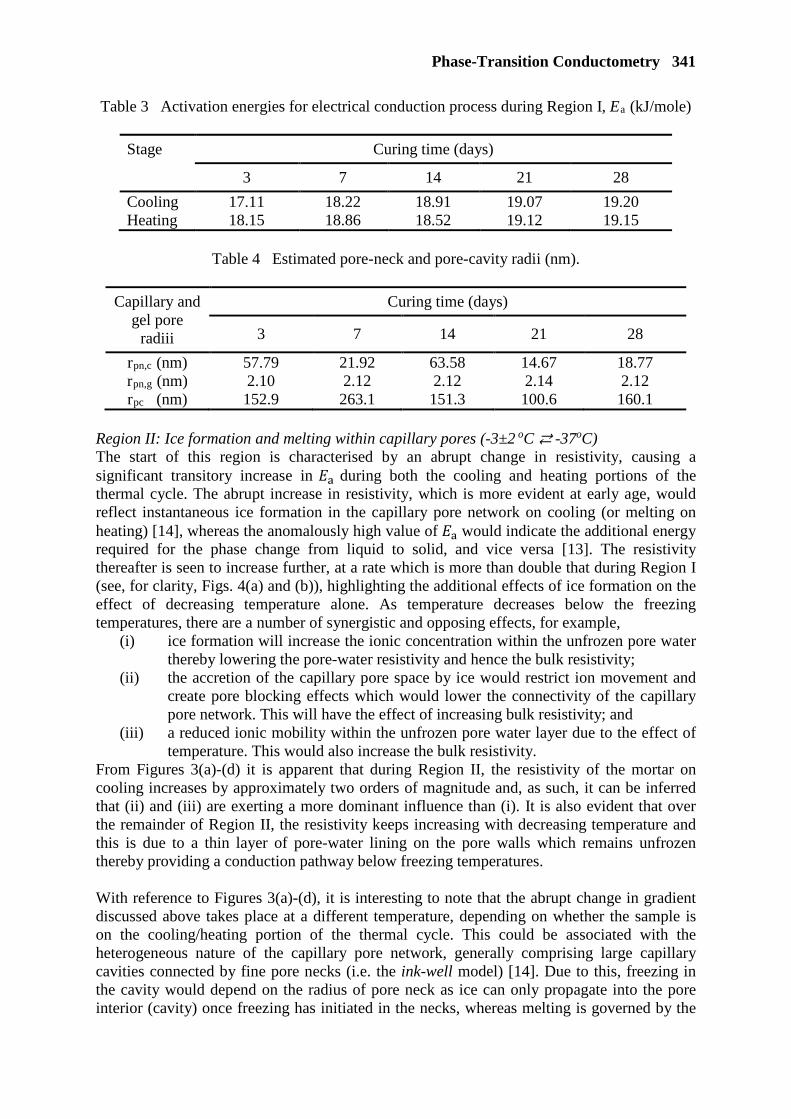
Phase-Transition Conductometry 341
Table 3 Activation energies for electrical conduction process during Region I, Ea (kJ/mole)
Stage Curing time (days)
3 7 14 21 28
Cooling Heating
17.11 18.15
18.22 18.86
18.91 18.52
19.07 19.12
19.20 19.15
Table 4 Estimated pore-neck and pore-cavity radii (nm).
Capillary and gel pore
radiii
Curing time (days)
3 7 14 21 28
rpn,c (nm) rpn,g (nm) rpc (nm)
57.79 2.10 152.9
21.92 2.12 263.1
63.58 2.12 151.3
14.67 2.14 100.6
18.77 2.12 160.1
Region II: Ice formation and melting within capillary pores (-3±2 oC -37oC) The start of this region is characterised by an abrupt change in resistivity, causing a significant transitory increase in 𝐸𝐸a during both the cooling and heating portions of the thermal cycle. The abrupt increase in resistivity, which is more evident at early age, would reflect instantaneous ice formation in the capillary pore network on cooling (or melting on heating) [14], whereas the anomalously high value of 𝐸𝐸a would indicate the additional energy required for the phase change from liquid to solid, and vice versa [13]. The resistivity thereafter is seen to increase further, at a rate which is more than double that during Region I (see, for clarity, Figs. 4(a) and (b)), highlighting the additional effects of ice formation on the effect of decreasing temperature alone. As temperature decreases below the freezing temperatures, there are a number of synergistic and opposing effects, for example,
(i) ice formation will increase the ionic concentration within the unfrozen pore water thereby lowering the pore-water resistivity and hence the bulk resistivity;
(ii) the accretion of the capillary pore space by ice would restrict ion movement and create pore blocking effects which would lower the connectivity of the capillary pore network. This will have the effect of increasing bulk resistivity; and
(iii) a reduced ionic mobility within the unfrozen pore water layer due to the effect of temperature. This would also increase the bulk resistivity.
From Figures 3(a)-(d) it is apparent that during Region II, the resistivity of the mortar on cooling increases by approximately two orders of magnitude and, as such, it can be inferred that (ii) and (iii) are exerting a more dominant influence than (i). It is also evident that over the remainder of Region II, the resistivity keeps increasing with decreasing temperature and this is due to a thin layer of pore-water lining on the pore walls which remains unfrozen thereby providing a conduction pathway below freezing temperatures. With reference to Figures 3(a)-(d), it is interesting to note that the abrupt change in gradient discussed above takes place at a different temperature, depending on whether the sample is on the cooling/heating portion of the thermal cycle. This could be associated with the heterogeneous nature of the capillary pore network, generally comprising large capillary cavities connected by fine pore necks (i.e. the ink-well model) [14]. Due to this, freezing in the cavity would depend on the radius of pore neck as ice can only propagate into the pore interior (cavity) once freezing has initiated in the necks, whereas melting is governed by the
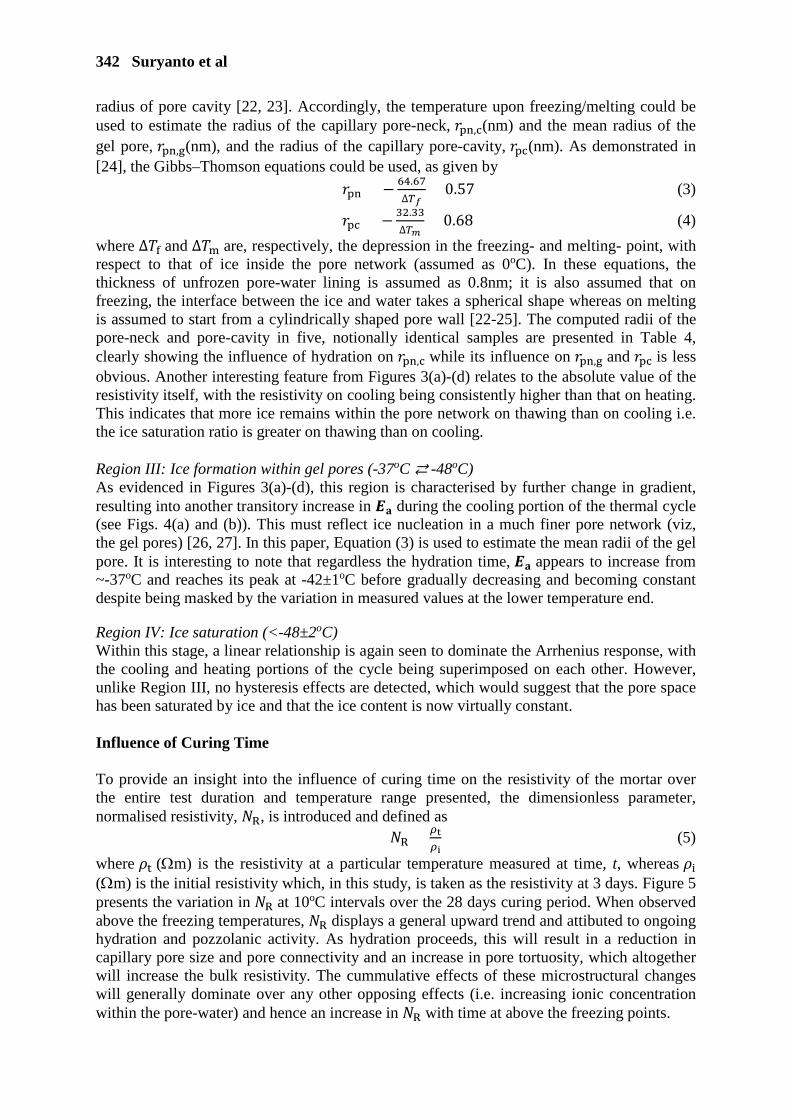
342 Suryanto et al
radius of pore cavity [22, 23]. Accordingly, the temperature upon freezing/melting could be used to estimate the radius of the capillary pore-neck, 𝑟𝑟pn,c(nm) and the mean radius of the gel pore, 𝑟𝑟pn,g(nm), and the radius of the capillary pore-cavity, 𝑟𝑟pc(nm). As demonstrated in [24], the Gibbs–Thomson equations could be used, as given by
𝑟𝑟pn = −64.67∆𝑇𝑇𝑓𝑓
+ 0.57 (3)
𝑟𝑟pc = −32.33∆𝑇𝑇𝑚𝑚
+ 0.68 (4)
where ∆𝑇𝑇f and ∆𝑇𝑇m are, respectively, the depression in the freezing- and melting- point, with respect to that of ice inside the pore network (assumed as 0oC). In these equations, the thickness of unfrozen pore-water lining is assumed as 0.8nm; it is also assumed that on freezing, the interface between the ice and water takes a spherical shape whereas on melting is assumed to start from a cylindrically shaped pore wall [22-25]. The computed radii of the pore-neck and pore-cavity in five, notionally identical samples are presented in Table 4, clearly showing the influence of hydration on 𝑟𝑟pn,c while its influence on 𝑟𝑟pn,g and 𝑟𝑟pc is less obvious. Another interesting feature from Figures 3(a)-(d) relates to the absolute value of the resistivity itself, with the resistivity on cooling being consistently higher than that on heating. This indicates that more ice remains within the pore network on thawing than on cooling i.e. the ice saturation ratio is greater on thawing than on cooling. Region III: Ice formation within gel pores (-37oC -48oC) As evidenced in Figures 3(a)-(d), this region is characterised by further change in gradient, resulting into another transitory increase in 𝑬𝑬𝐚𝐚 during the cooling portion of the thermal cycle (see Figs. 4(a) and (b)). This must reflect ice nucleation in a much finer pore network (viz, the gel pores) [26, 27]. In this paper, Equation (3) is used to estimate the mean radii of the gel pore. It is interesting to note that regardless the hydration time, 𝑬𝑬𝐚𝐚 appears to increase from ~-37oC and reaches its peak at -42±1oC before gradually decreasing and becoming constant despite being masked by the variation in measured values at the lower temperature end.
Region IV: Ice saturation (<-48±2oC) Within this stage, a linear relationship is again seen to dominate the Arrhenius response, with the cooling and heating portions of the cycle being superimposed on each other. However, unlike Region III, no hysteresis effects are detected, which would suggest that the pore space has been saturated by ice and that the ice content is now virtually constant. Influence of Curing Time To provide an insight into the influence of curing time on the resistivity of the mortar over the entire test duration and temperature range presented, the dimensionless parameter, normalised resistivity, 𝑁𝑁R, is introduced and defined as
𝑁𝑁R = 𝜌𝜌t𝜌𝜌i
(5)
where 𝜌𝜌t (Ωm) is the resistivity at a particular temperature measured at time, t, whereas 𝜌𝜌i (Ωm) is the initial resistivity which, in this study, is taken as the resistivity at 3 days. Figure 5 presents the variation in 𝑁𝑁R at 10oC intervals over the 28 days curing period. When observed above the freezing temperatures, 𝑁𝑁R displays a general upward trend and attibuted to ongoing hydration and pozzolanic activity. As hydration proceeds, this will result in a reduction in capillary pore size and pore connectivity and an increase in pore tortuosity, which altogether will increase the bulk resistivity. The cummulative effects of these microstructural changes will generally dominate over any other opposing effects (i.e. increasing ionic concentration within the pore-water) and hence an increase in 𝑁𝑁R with time at above the freezing points.
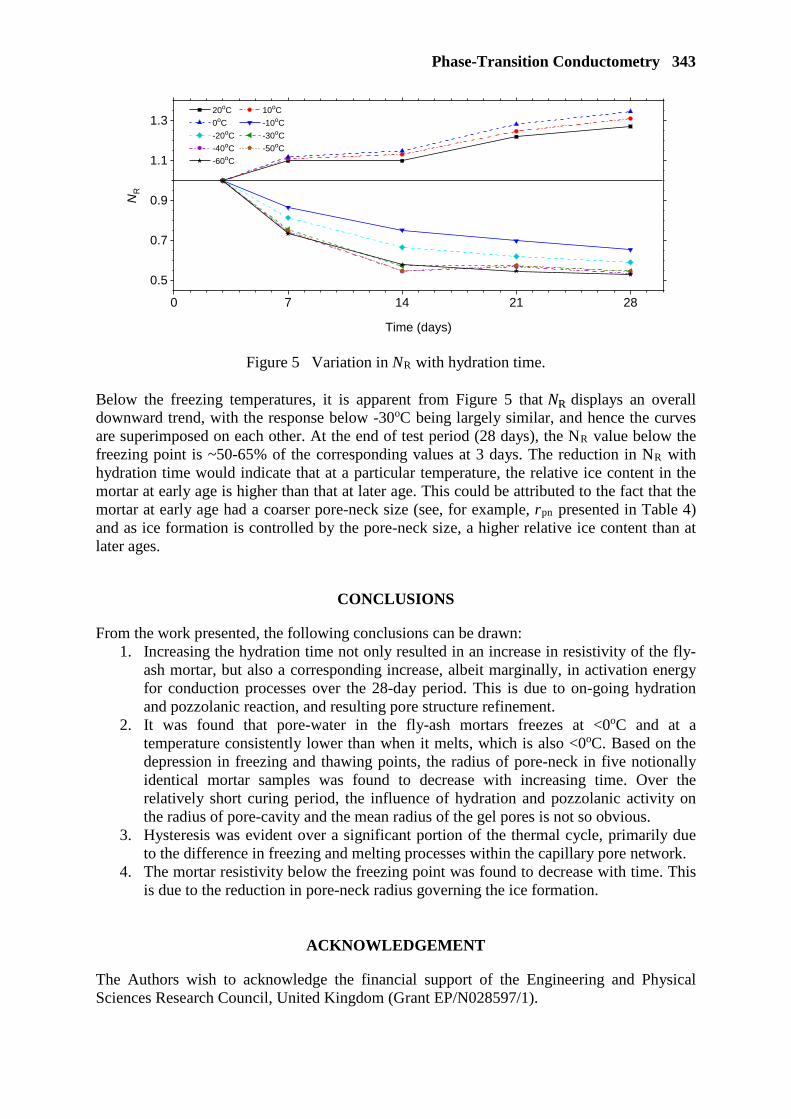
Phase-Transition Conductometry 343
Figure 5 Variation in NR with hydration time. Below the freezing temperatures, it is apparent from Figure 5 that 𝑁𝑁R displays an overall downward trend, with the response below -30oC being largely similar, and hence the curves are superimposed on each other. At the end of test period (28 days), the NR value below the freezing point is ~50-65% of the corresponding values at 3 days. The reduction in NR with hydration time would indicate that at a particular temperature, the relative ice content in the mortar at early age is higher than that at later age. This could be attributed to the fact that the mortar at early age had a coarser pore-neck size (see, for example, rpn presented in Table 4) and as ice formation is controlled by the pore-neck size, a higher relative ice content than at later ages.
CONCLUSIONS
From the work presented, the following conclusions can be drawn: 1. Increasing the hydration time not only resulted in an increase in resistivity of the fly-
ash mortar, but also a corresponding increase, albeit marginally, in activation energy for conduction processes over the 28-day period. This is due to on-going hydration and pozzolanic reaction, and resulting pore structure refinement.
2. It was found that pore-water in the fly-ash mortars freezes at <0oC and at a temperature consistently lower than when it melts, which is also <0oC. Based on the depression in freezing and thawing points, the radius of pore-neck in five notionally identical mortar samples was found to decrease with increasing time. Over the relatively short curing period, the influence of hydration and pozzolanic activity on the radius of pore-cavity and the mean radius of the gel pores is not so obvious.
3. Hysteresis was evident over a significant portion of the thermal cycle, primarily due to the difference in freezing and melting processes within the capillary pore network.
4. The mortar resistivity below the freezing point was found to decrease with time. This is due to the reduction in pore-neck radius governing the ice formation.
ACKNOWLEDGEMENT
The Authors wish to acknowledge the financial support of the Engineering and Physical Sciences Research Council, United Kingdom (Grant EP/N028597/1).
0 7 14 21 28
0.5
0.7
0.9
1.1
1.3 20oC 10oC 0oC -10oC -20oC -30oC -40oC -50oC -60oC
NR
Time (days)

344 Suryanto et al
REFERENCES
1. MCCARTER, W J, STARRS, G, ADAMSON, A, CHRISP, T M, BASHEER, P A M, NANUKUTTAN, S, SRINIVASAN, S, GREEN, C. Influence of different European cements on the hydration of cover-zone concrete during the curing and postcuring periods, Journal of Materials in Civil Engineering, Vol. 25, No. 9, 2012, pp 1335-1343.
2. SANISH, K B, NEITHALATH, N, SANTHANAM, M. Monitoring the evolution of
material structure in cement pastes and concretes using electrical property measurements, Construction and Building Materials, Vol. 49, 2013, pp 288-297.
3. RAJAMMA, R, SENFF, L, RIBEIRO, M J, LABRINCHA, J A, BALL, R J, ALLEN, G
C, FERREIRA, V M. Biomass fly ash effect on fresh and hardened state properties of cement based materials, Composites Part B: Engineering, Vol. 77, 2015, pp 1-9.
4. KURUMISAWA, K, NAWA, T. Electrical conductivity and chloride ingress in hardened
cement paste, Journal of Advanced Concrete Technology, Vol. 14, 2016, pp 87-94. 5. HOU, T C, SU, Y M, CHEN, Y R, CHEN, P J. Effects of coarse aggregates on the
electrical resistivity of Portland cement concrete, Construction and Building Materials, Vol. 133, 2017, pp 397-408.
6. HE, R, YE, H, MA, H, FU, C, JIN, X, LI, Z. Correlating the chloride diffusion
coefficient and pore structure of cement-based materials, Journal of Materials in Civil Engineering, Vol. 31, No. 3, 2019, pp 04019006.
7. MCCARTER, W J, CHRISP, T M, STARRS, G, ADAMSON, A, OWENS, E,
BASHEER, P A M, NANUKUTTAN, S V, SRINIVASAN, S, HOLMES, N. Developments in performance monitoring of concrete exposed to extreme environments, ASCE Journal of Infrastructure Systems, Vol. 18, No. 3, 2011, pp 167-175.
8. KIM, J, MCCARTER, W J, SURYANTO, B. Performance assessment of reinforced
concrete after long-term exposure to a marine environment, Construction and Building Materials, Vol. 192, 2018, pp 569-583.
9. HE, R, MA, H, HAFIZ, R B, FU, C, JIN, X, HE, J. Determining porosity and pore
network connectivity of cement-based materials by a modified non-contact electrical resistivity measurement, Materials & Design, Vol. 156, 2018, pp 82-92.
10. JAFARI AZAD, V, ERBEKTAS, A R, QIAO, C, ISGOR, O B, WEISS, W J. Relating
the formation factor and chloride binding parameters to the apparent chloride diffusion coefficient, Journal of Materials in Civil Engineering, Vol. 31, 2018, pp 04018392.
11. MCCARTER, W J, SURYANTO, B, TAHA, H M, NANUKUTTAN, S, BASHEER, P
A M. A testing methodology for performance-based specification, Journal of Structural Integrity and Maintenance, Vol. 2, No. 2, 2017, pp 78-88.
12. ALASWAD, G, MCCARTER, W J, SURYANTO, B. Moisture movement within
concrete exposed to simulated hot arid/semi-arid conditions, Proceedings of the Institution of Civil Engineers-Construction Materials, 2018, pp 1-15.
13. FARNAM, Y, TODAK, H, SPRAGG, R, WEISS, J. Electrical response of mortar with
Phase-Transition Conductometry 345
different degrees of saturation and deicing salt solutions during freezing and thawing, Cement and Concrete Composite, Vol. 59, 2015, pp 49-59.
14. MCCARTER, W J, STARRS, G, CHRISP, T M, BASHEER, P A M, NANUKUTTAN,
S V, SRINIVASAN, S. Conductivity/activation energy relationships for cement-based materials undergoing cyclic thermal excursions, Journal of Materials Science, Vol. 50, No. 12, 2015, pp 1129-1140.
15. WANG, Y, GONG, F, ZHANG, D, UEDA, T. Estimation of ice content in mortar based
on electrical measurements under freeze-thaw cycle, Journal of Advanced Concrete Technology, Vol. 14, No. 2, 2016, pp 35-46.
16. TOMLINSON, D, MORADI, F, HAJILOO, H, GHODS, P, ALIZADEH, A, GREEN,
M. Early age electrical resistivity behaviour of various concrete mixtures subject to low temperature cycling, Cement and Concrete Composite, Vol. 83, 2017, pp 323-334.
17. BRITISH STANDARDS INSTITUTION, BS EN 197-1:2011 Cement-Part 1:
Composition , specifications and conformity criteria for common cements, 2015. 18. BRITISH STANDARDS INSTITUTION, BS EN 450-1:2012 Fly ash for concrete - Part
1: Definition, specifications and conformity critera, 2012. 19. MCCARTER, W J, BROUSSEAU, R, The A.C. response of hardened cement paste,
Cement and Concrete Research, Vol. 20, No. 6, 1990, pp 891-900. 20. BRITISH STANDARDS INSTITUTION, BS EN 1992-1-1:2004+A1:2014 Eurocode 2 :
Design of concrete structures - Part 1-1:General rules and rules for buildings, 2014. 21. CHRISP, T M, STARRS, G, MCCARTER, W J, ROUCHOTAS, E, BLEWETT, J,
Temperature-conductivity relationships for concrete : An activation energy approach, Journal of Materials Science Letters, Vol. 20, No.12, 2001, pp 1085-1087.
22. SCHULSON, E M, SWAINSON, I P, HOLDEN, T M, KORHONEN, C J, Hexagonal
ice in hardened cement, Cement and Concrete Research, Vol. 30, 2000, pp 191-196. 23. SUN, Z, SCHERER, G W, Pore size and shape in mortar by thermoporometry, Cement
and Concrete Research, Vol. 40, No. 5, 2010, pp 740-751. 24. BRUN, M, LALLEMAND, A, QUINSON, J F, EYRAUD, C, A new method for the
simultaneous determination of the size and shape of pores: the thermoporometry, Thermochimca Acta, Vol. 21, No. 1, 1977, pp 59-88.
25. ZUBER, B, MARCHAND, J, Modeling the deterioration of hydrated cement systems
exposed to frost action: Part 1: Description of the mathematical model, Cement and Concrete Research, Vol. 30, No. 12, 2000, pp 1929-1939.
26. SCHERER, G W. Freezing gels, Journal of Non-Crystalline Solids, Vol. 155, No. 1,
1993, pp 1-25. 27. SANT, G, BENTZ, D, WEISS, J. Capillary porosity depercolation in cement-based
materials: Measurement techniques and factors which influence their interpretation, Cement and Concrete Research, Vol. 41, No. 8, 2011, pp 854-864.
TAILORING THE MECHANICAL PROPERTIES OF LANDFILLED FLY ASH GEOPOLYMERS BY GRINDING
M Ambrus
R Szabó
B Csőke
G Mucsi
University of Miskolc
Hungary
ABSTRACT. Due to the continuous shutdown of coal fired power plants, landfilled fly ash (FA) has become a substantial secondary resource for several branches of industry. The utilisation of FA as a raw material for geopolymerisation is becoming more and more widespread not only because of the appropriate reactivity of the base material, but also the environmentally benefits and good mechanical properties of the final products. Examination of the effect of mechanical activation of landfilled brown coal FA from Tatabánya (Hungary) on the mechanical properties of geopolymers was carried out. The FA was ground in a ball mill for 10, 20, 30, 60 and 120 minutes before geopolymer production. However, fluctuation was observed in the unconfined compressive strength results. Thus, comparison was made with previous data on geopolymers made from “fresh” FA to reveal possible reasons behind the inconsistency. Furthermore, both the raw materials and the geopolymers were examined (particle size analysis, FT-IR analysis, XRF, SEM) to investigate their geopolymerisation behaviour. Important conclusions can be drawn from the results about the effect of mechanical activation on the modification and reactivity of landfilled FA. Keywords: Compressive strength, Deposited fly ash, Geopolymerisation, Mechanical activation Mária Ambrus is an environmental engineering MSc student and research engineer at the Faculty of Earth Science and Engineering at the University of Miskolc, Hungary. Her research interests include the utilisation and management of wastes.
Roland Szabó is a PhD candidate of Mikoviny Sámuel Doctoral School of Earth Sciences from 2018 and assistant research fellow at University of Miskolc, Hungary. His current research is into the development of geopolymers with special properties using industrial wastes.
Professor Barnabás Csőke is a Professor Emeritus at the Faculty of Earth Science and Engineering, University of Miskolc, Hungary. He is one of the country’s pioneer researchers in waste preparation technologies, and has published extensively on many aspects of processing of secondary raw materials for industrial applications.
Assoc. Professor Gábor Mucsi is the Deputy Dean of the Faculty of Earth Science and Engineering at the University of Miskolc, Hungary. A renowned practitioner in the field of waste recycling technology, he is a member of many technical committees and has published extensively on material processing technology for concrete and cement.
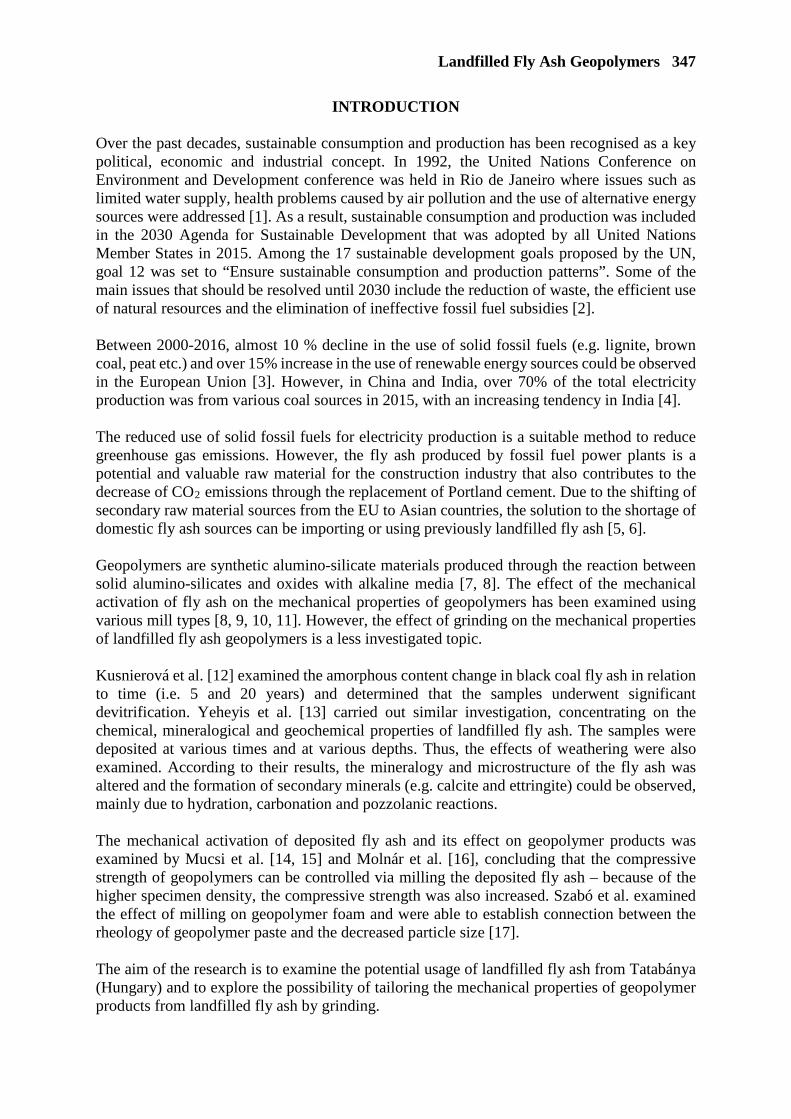
Landfilled Fly Ash Geopolymers 347
INTRODUCTION
Over the past decades, sustainable consumption and production has been recognised as a key political, economic and industrial concept. In 1992, the United Nations Conference on Environment and Development conference was held in Rio de Janeiro where issues such as limited water supply, health problems caused by air pollution and the use of alternative energy sources were addressed [1]. As a result, sustainable consumption and production was included in the 2030 Agenda for Sustainable Development that was adopted by all United Nations Member States in 2015. Among the 17 sustainable development goals proposed by the UN, goal 12 was set to “Ensure sustainable consumption and production patterns”. Some of the main issues that should be resolved until 2030 include the reduction of waste, the efficient use of natural resources and the elimination of ineffective fossil fuel subsidies [2]. Between 2000-2016, almost 10 % decline in the use of solid fossil fuels (e.g. lignite, brown coal, peat etc.) and over 15% increase in the use of renewable energy sources could be observed in the European Union [3]. However, in China and India, over 70% of the total electricity production was from various coal sources in 2015, with an increasing tendency in India [4]. The reduced use of solid fossil fuels for electricity production is a suitable method to reduce greenhouse gas emissions. However, the fly ash produced by fossil fuel power plants is a potential and valuable raw material for the construction industry that also contributes to the decrease of CO2 emissions through the replacement of Portland cement. Due to the shifting of secondary raw material sources from the EU to Asian countries, the solution to the shortage of domestic fly ash sources can be importing or using previously landfilled fly ash [5, 6]. Geopolymers are synthetic alumino-silicate materials produced through the reaction between solid alumino-silicates and oxides with alkaline media [7, 8]. The effect of the mechanical activation of fly ash on the mechanical properties of geopolymers has been examined using various mill types [8, 9, 10, 11]. However, the effect of grinding on the mechanical properties of landfilled fly ash geopolymers is a less investigated topic. Kusnierová et al. [12] examined the amorphous content change in black coal fly ash in relation to time (i.e. 5 and 20 years) and determined that the samples underwent significant devitrification. Yeheyis et al. [13] carried out similar investigation, concentrating on the chemical, mineralogical and geochemical properties of landfilled fly ash. The samples were deposited at various times and at various depths. Thus, the effects of weathering were also examined. According to their results, the mineralogy and microstructure of the fly ash was altered and the formation of secondary minerals (e.g. calcite and ettringite) could be observed, mainly due to hydration, carbonation and pozzolanic reactions. The mechanical activation of deposited fly ash and its effect on geopolymer products was examined by Mucsi et al. [14, 15] and Molnár et al. [16], concluding that the compressive strength of geopolymers can be controlled via milling the deposited fly ash – because of the higher specimen density, the compressive strength was also increased. Szabó et al. examined the effect of milling on geopolymer foam and were able to establish connection between the rheology of geopolymer paste and the decreased particle size [17]. The aim of the research is to examine the potential usage of landfilled fly ash from Tatabánya (Hungary) and to explore the possibility of tailoring the mechanical properties of geopolymer products from landfilled fly ash by grinding.

348 Ambrus et al
MATERIALS AND METHODS Landfilled brown coal fly ash (B-FA) from Tatabánya (Hungary) and fresh lignite fly ash (L-FA) from Mátra Power Station, Visonta (Hungary) were used for the experiments. The chemical composition of the FA samples was measured with Rigaku Supermini 200 type X-ray fluorescence spectrometer. The results of the XRF analysis are summarised in Table 1. The examination of the chemical compositions revealed that both samples are class F fly ash with rather similar SiO2 content. However, the B-FA contained higher wt.% Al2O3 which can have positive effect on the geopolymerisation process, while the L-FA had higher CaO content that can result in pozzolanic reactions beside geopolymerisation.
Table 1 The chemical composition of the FA samples.
B-FA L-FA
Chemical composition, wt.%
SiO2 46.40 48.10 Al2O3 27.40 14.42 CaO 7.04 11.76
Fe2O3 6.96 10.97 MgO 2.23 3.34 K2O 1.65 1.66 TiO2 0.941 0.492 Na2O 0.50 0.37 MnO 0.029 0.171 P2O5 0.117 0.264
Σ 93.27 91.55 The loss on ignition (LOI) was low for both samples: 0.75% for B-FA and 0.37% for L-FA. The mechanical activation of the fly ashes was carried out in a Ø305×305 mm size cylindrical ball mill with steel ball grinding media. The filling ratio of the grinding media was 30 V/V%, the material filling ratio was 110 V/V%. The time duration of mechanical activation was 5, 10, 20, 30, 60 and 120 minutes for B-FA and 5, 10, 20, 30 and 60 minutes for L-FA. The particle size distribution of the samples was examined with a Horiba LA950 V2 type laser particle size analyser. The specific surface areas (SSA) were calculated from the distributions, using shape factor 1.75. The microstructures of the raw fly ash samples were examined with a Phenom ProX EDX scanning electron microscope (SEM). The structure of the geopolymer products was investigated with a JASCO FT-IR 4200 type Fourier Transformed Infrared Spectrometer, equipped with a single-reflection diamond crystal.

Landfilled Fly Ash Geopolymers 349
RESULTS AND DISCUSSION For the B-FA geopolymer specimens 75 wt.% Betol SB type water glass (25.3% SiO2; 13.7% Na2O; 2.7% K2O) and 25 wt.% NaOH in 8M concentration was used as activator solution. The liquid-solid ratio of the geopolymers was 0.82. After moulding and a 24-hour holding time, the geopolymers were cured at 50 °C for 6 h, then the specimens were left to cool down. The uniaxial compressive strength tests were carried out after a five-day holding time. The effect of grinding time on the average uniaxial compressive strength and specimen density of landfilled B-FA geopolymers can be observed in Figure 1.
Figure 1 The average compressive strength and specimen density values of B-FA geopolymers.
Milling has been proven to be an appropriate process not only to modify the specific surface area and improve the reactivity of fly ash, but to drastically increase the mechanical strength of the resulted geopolymers as well [8, 10]. However, it has also been observed that the deposited fly ash has an optimal grinding time that can be observed as a maximum point in the compressive strength curve. After reaching the optimum, the compressive strength of the produced geopolymers starts to decrease with a close to linear trend. The occurrence of such decline might be due to the binding strength between the particles being higher than the strength of the particles itself [18]. The initial lack of reactivity is presumably due to the changes in the crystalline structure of fly ash (deamorphisation) during its stay in the deposit, but as it can be observed in Figure 1, the uniaxial compressive strength of the specimens could be improved with grinding the B-FA for 5 and 10 minutes. However, between 20-60 min grinding time, the mechanical activation had a negative effect on the compressive strength, which was reduced by more than half after 30- and 60-min grinding. Then, further mechanical activation had a positive effect on the compressive strength, reaching similar values achieved with shorter grinding time.
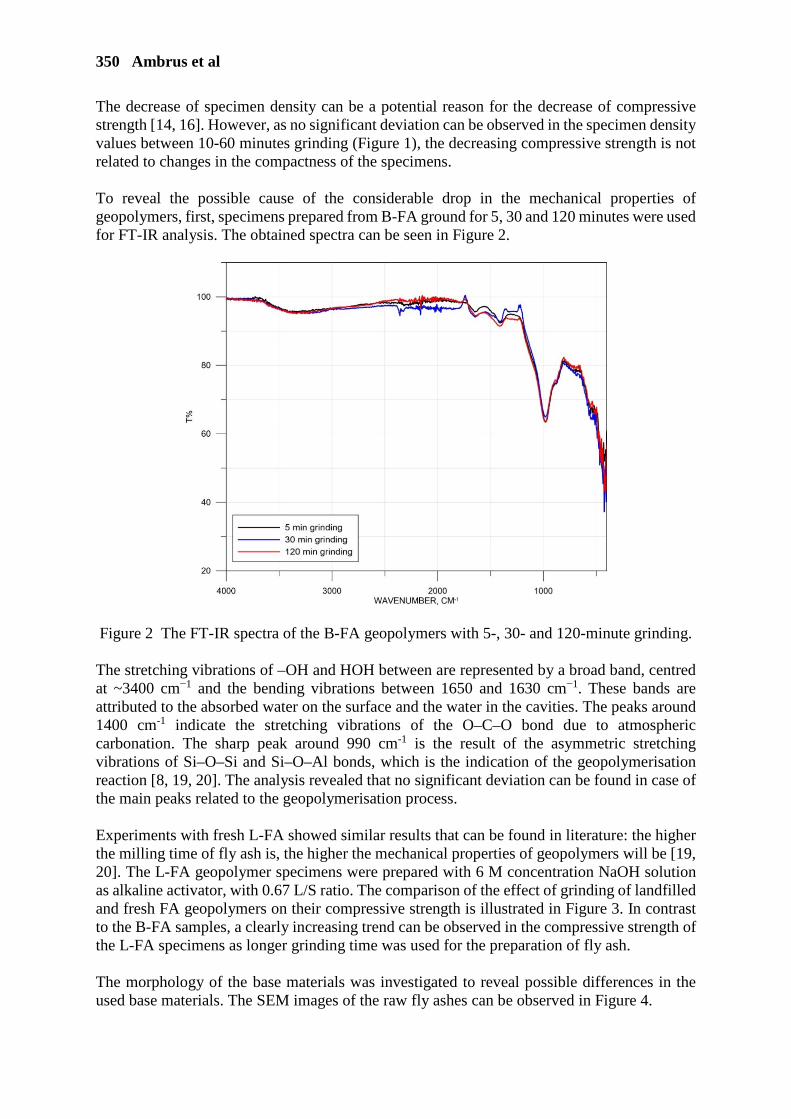
350 Ambrus et al
The decrease of specimen density can be a potential reason for the decrease of compressive strength [14, 16]. However, as no significant deviation can be observed in the specimen density values between 10-60 minutes grinding (Figure 1), the decreasing compressive strength is not related to changes in the compactness of the specimens. To reveal the possible cause of the considerable drop in the mechanical properties of geopolymers, first, specimens prepared from B-FA ground for 5, 30 and 120 minutes were used for FT-IR analysis. The obtained spectra can be seen in Figure 2.
Figure 2 The FT-IR spectra of the B-FA geopolymers with 5-, 30- and 120-minute grinding. The stretching vibrations of –OH and HOH between are represented by a broad band, centred at ~3400 cm−1 and the bending vibrations between 1650 and 1630 cm−1. These bands are attributed to the absorbed water on the surface and the water in the cavities. The peaks around 1400 cm-1 indicate the stretching vibrations of the O–C–O bond due to atmospheric carbonation. The sharp peak around 990 cm-1 is the result of the asymmetric stretching vibrations of Si–O–Si and Si–O–Al bonds, which is the indication of the geopolymerisation reaction [8, 19, 20]. The analysis revealed that no significant deviation can be found in case of the main peaks related to the geopolymerisation process. Experiments with fresh L-FA showed similar results that can be found in literature: the higher the milling time of fly ash is, the higher the mechanical properties of geopolymers will be [19, 20]. The L-FA geopolymer specimens were prepared with 6 M concentration NaOH solution as alkaline activator, with 0.67 L/S ratio. The comparison of the effect of grinding of landfilled and fresh FA geopolymers on their compressive strength is illustrated in Figure 3. In contrast to the B-FA samples, a clearly increasing trend can be observed in the compressive strength of the L-FA specimens as longer grinding time was used for the preparation of fly ash. The morphology of the base materials was investigated to reveal possible differences in the used base materials. The SEM images of the raw fly ashes can be observed in Figure 4.
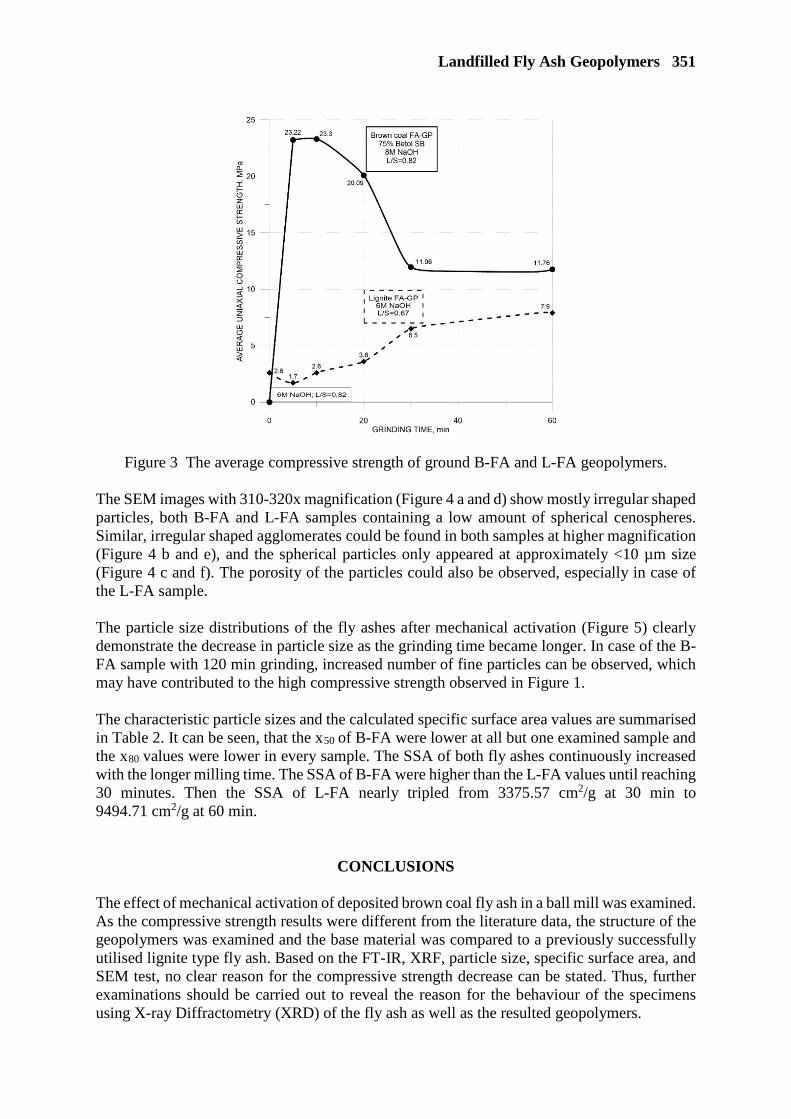
Landfilled Fly Ash Geopolymers 351
Figure 3 The average compressive strength of ground B-FA and L-FA geopolymers.
The SEM images with 310-320x magnification (Figure 4 a and d) show mostly irregular shaped particles, both B-FA and L-FA samples containing a low amount of spherical cenospheres. Similar, irregular shaped agglomerates could be found in both samples at higher magnification (Figure 4 b and e), and the spherical particles only appeared at approximately <10 µm size (Figure 4 c and f). The porosity of the particles could also be observed, especially in case of the L-FA sample. The particle size distributions of the fly ashes after mechanical activation (Figure 5) clearly demonstrate the decrease in particle size as the grinding time became longer. In case of the B-FA sample with 120 min grinding, increased number of fine particles can be observed, which may have contributed to the high compressive strength observed in Figure 1. The characteristic particle sizes and the calculated specific surface area values are summarised in Table 2. It can be seen, that the x50 of B-FA were lower at all but one examined sample and the x80 values were lower in every sample. The SSA of both fly ashes continuously increased with the longer milling time. The SSA of B-FA were higher than the L-FA values until reaching 30 minutes. Then the SSA of L-FA nearly tripled from 3375.57 cm2/g at 30 min to 9494.71 cm2/g at 60 min.
CONCLUSIONS The effect of mechanical activation of deposited brown coal fly ash in a ball mill was examined. As the compressive strength results were different from the literature data, the structure of the geopolymers was examined and the base material was compared to a previously successfully utilised lignite type fly ash. Based on the FT-IR, XRF, particle size, specific surface area, and SEM test, no clear reason for the compressive strength decrease can be stated. Thus, further examinations should be carried out to reveal the reason for the behaviour of the specimens using X-ray Diffractometry (XRD) of the fly ash as well as the resulted geopolymers.
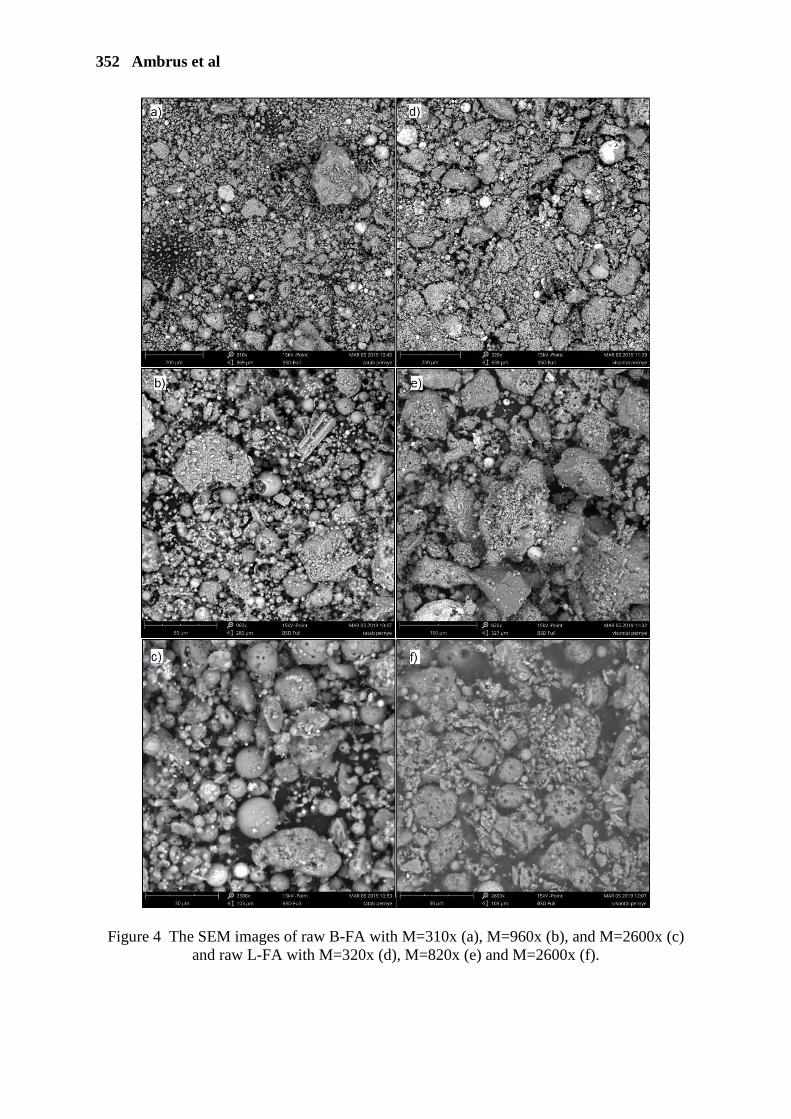
352 Ambrus et al
Figure 4 The SEM images of raw B-FA with M=310x (a), M=960x (b), and M=2600x (c) and raw L-FA with M=320x (d), M=820x (e) and M=2600x (f).

Landfilled Fly Ash Geopolymers 353
Figure 5 The particle size distribution of B-FA (left) and L-FA (right).
Table 2 The characteristic particle size and SSA values of the FA samples.
B-FA L-FA
Grinding time, min
x50, µm
x80, µm
SSA, cm2/g
x50, µm
x80, µm
SSA, cm2/g
0 51.12 113.35 2246.72 52.04 119.32 2016.12 5 31.62 82.78 2693.65 43.82 91.72 2133.77 10 24.28 67.17 2805.6 29.84 69.67 2625.51 20 17.50 43.82 3475.73 21.29 49.09 3042.25 30 15.40 34.58 4540.29 18.94 43.58 3375.57 60 12.21 23.66 7263.95 11.60 27.09 9494.71 120 9.29 18.26 15981.23 - - -
ACKNOWLEDGEMENTS The described work/article was carried out as part of the „Sustainable Raw Material Management Thematic Network – RING 2017”, EFOP-3.6.2-16-2017-00010 project in the framework of the Széchenyi 2020 Program. The realization of this project is supported by the European Union, co-financed by the European Social Fund. The authors are grateful for Nóra Pappné Halyag for the SEM and Ferenc Móricz for the XRF analysis.

354 Ambrus et al
REFERENCES 1. UN GENERAL ASSEMBLY. Report of the United Nations Conference on Environment
and Development, 3-14 June 1992, A/CONF.151/26 (Vol. I). Available at: https://www.un.org/documents/ga/conf151/aconf15126-1annex1.htm [accessed 21 February 2019].
2. UN GENERAL ASSEMBLY. Transforming our world: the 2030 Agenda for Sustainable Development, 21 October 2015, A/RES/70/1, pp 22-23. Available at: https://www.refworld.org/docid/57b6e3e44.html [accessed 18 February 2019].
3. EUROSTAT. Gross electricity production by fuel, GWh, EU-28, 2000-2016. Available at: https://ec.europa.eu/eurostat/statistics-explained/index.php?title=Electricity_and_heat_statistics [accessed 09 March 2019]
4. THE WORLD BANK GROUP. Electricity production from coal sources (% of total). Available at: https://data.worldbank.org/indicator/EG.ELC.COAL.ZS?locations=IN-CN&view=chart [accessed 02 March 2019]
5. UN Environment. Emissions Gap Report 2018. Available at: http://wedocs.unep.org/bitstream/handle/20.500.11822/26895/EGR2018_FullReport_EN.pdf [accessed 06 March 2019]
6. MILLWARD-HOPKINS, J, BUSCH, J, PURNELL, P, ZWIMER, O, VELIS, C A, BROWN, A, HAHLADAKIS, J, IACOVIDU, E. Fully integrated modelling for sustainability assessment of resource recovery from waste, Science of the Total Environment, Vol. 612, 2018, pp 613–624.
7. DAVIDOVITS, J. Geopolymers: Inorganic polymeric new materials, Journal of Thermal Analysis, Vol 37., 1991, pp. 1633-1656.
8. KUMAR, S, KUMAR, R. Mechanical activation of fly ash: Effect on reaction, structure and properties of resulting geopolymer, Ceramics International, Vol. 37, 2011, pp 533–541.
9. KUMAR, S, KUMAR, R, ALEX, T C, BANDOPADHYAY, A, MEHROTRA, S P. Influence of reactivity of fly ash on geopolymerisation, Adv. Appl. Ceram., Vol. 106, 2007, pp 120–127.
10. TEMUUJIN, J, WILLIAMS, R P, VAN RIESSEN, A. Effect of mechanical activation of fly ash on the properties of geopolymer cured at ambient temperature, J. Mater. Process. Technol., Vol. 209, 2009, pp 5276–5280.
11. RYU, G S, LEE, Y B, KOH, K T, CHUNG, Y S. The mechanical properties of fly ash-based geopolymer concrete with alkaline activators, Construction and Building Materials, Vol. 47, 2013, pp. 409–418.
12. KUSNIEROVÁ, M, SLESÁROVÁ, A, PRASCÁKOVÁ, M. The significance of fly ash for their processing and utilization. In. Proc. Waste Recycling – IX. Krakow, 17-19. November 2005.
13. YEHEYIS, M B, SHANG, J Q, YANFUL, E K. Chemical and Mineralogical Transformations of Coal Fly Ash after Landfilling, presentation, World of Coal Ash Conference (WOCA), May 4-7, 2009. Lexington, Kentucky, USA
Landfilled Fly Ash Geopolymers 355
14. MUCSI, G, GOMBKÖTŐ, I, MOLNÁR, Z, OSVÁTH, I, KUMAR, S. Effect of mechanical activation of fly ash on geopolymer properties, IMPC 2016: XXVIII International Mineral Processing Congress Proceedings, Eds. J Finch, C O'Connor, D Leroux, N Stubina and G Poling 2016, pp. 1-9.
15. MUCSI, G., KUMAR, S., CSŐKE, B., KUMAR, R., MOLNÁR, Z., RÁCZ, Á., MÁDAI F., DEBRECZENI, Á. Control of geopolymer properties by grinding of land filled fly ash. International Journal of Mineral Processing, Vol. 143, 2009, pp. 50 –58.
16. MOLNÁR, Z, KRISTÁLY, F, MUCSI, G. Mechanical activation of deposited brown coal fly ash in stirred media mill, Acta Physica Polonica A, Vol. 126, No. 4, 2014, pp. 988-993.
17. SZABÓ, R, GOMBKÖTŐ, I, SVÉDA, M, MUCSI, G. Effect of grinding fineness of fly ash on the properties of geopolymer foam, Arch. Metall. Mater, Vol. 62, No. 2B, 2017, pp. 1257-1231.
18. MUCSI, G, CSŐKE, B. Power Plant Fly Ash as a Valuable Raw Material, Geosciences and Engineering, Vol. 1, No. 1, 2012, 223-236.
19. HAMDI, N, MESSAOUD, B I, SRASRA, E. Production of geopolymer binders using clay minerals and industrial wastes. Comptes Rendus Chimie. 2018. doi:10.1016/j.crci.2018.11.010
20. YASERI, S, HAJIAGHAEI, G, MOHAMMADI, F, MAHDIKHANI, M, FAROKHZAD, R. The role of synthesis parameters on the workability, setting and strength properties of binary binder based geopolymer paste, Construction and Building Materials, 157, 2017, pp 534–545.

USE OF FLY ASH IN CONCRETE: CURRENT INDIAN SCENARIO AND A CASE STUDY ON HIGH VOLUME FLY ASH CONCRETE (HVFAC) FOR SHEAR WALL
CONSTRUCTION IN INDIA
V R Kulkarni
Midas Techfin Consultants LLP
India
ABSTRACT. Based on the available data, the paper presents a broad overview of current Indian scenario in the use of fly ash in concrete, highlighting the latest data on its production and utilization. In spite of some of strict regulatory measures enforced by the government agencies, nearly 33% of fly ash generated in India still remains unutilized. With the sustained growth of the ready-mixed concrete (RMC) industry in India in the past two decades - during which RMC’s footprints got expanded to more than 100 cities in the country - there has been a simultaneous increase in the use of fly ash through the RMC route. However, the utilization of fly ash in RMC has remained modest. The average percentage replacement of fly ash hovers around 15-20% by mass of cement. The paper discusses the reasons for this impasse. Brief mention is also made about the attempts to introduce technologies of high-volume fly ash (HVFA) concrete, and sintered fly ash aggregates in India. Finally, the paper describes a case study relating the use of 70-MPa self-compacting HVFA concrete for the shear wall having congested reinforcement. Keywords: CO2 emissions, Cement, Limestone reserves, Fly ash production and utilization, HVFA concrete, Processed fly ash, Sintered fly ash aggregates Er Vijay Kulkarni had been the Principal Consultant, Ready Mixed Concrete Manufacturers Association, and was the former President of the Indian Concrete Institute. He is the Chair of Durability Committee of ICI and Co-Chair of its Technical Board. He is also a member of cement and concrete committees of the Bureau of Indian Standards. Mr Kulkarni is the Head of Technical Committee of Greenpro Certification of RMC by CII. He is currently involved in consultancy work in the field of concrete technology. He was the erstwhile Editor of the Indian Concrete Journal.
High Volume Fly Ash Concrete 357
INTRODUCTION
Although India happens to be third largest CO2 emitting country in the world, her contribution to GHG emissions in per capita terms is not alarming [1, 2]. It is estimated that India’s per capita GHG emission in 2030-31 will vary from 2.77 tonnes to 5 tonnes of CO2e, which will be closer to or less than the world average per capita CHG value is 4.22 tonnes CO2e . Yet, considering the fact that there is no room for complacency, the Indian government has been taking laudatory steps in reducing CHG emissions. India has voluntarily pledged to cut GHG emissions intensity by 33 to 35 %, relative to 2005 levels, by 2030. It has also set a target to achieve about 40% cumulative electric power installed capacity from non-fossil-fuel energy resources by 2030 by installing 100 GW solar power and 60 GW wind power by 2022. In spite of all these efforts, coal is going to remain the major source of power in India. According to the projections made by Mckinsey, India’s power demand will be escalating to 3870 terawatt hours by 2030[3]. Further, based on the studies made by The Energy Research Institute (TERI), coal would account for about 45%–55% of India’s commercial energy mix throughout the modeling period up to 2030 in each of the four scenarios studied [4].
CONSTRUCTION INDUSTRY IN INDIA: BRIEF SCENARIO Concrete construction scenario in India has witnessed significant changes during the last two decades. While substantial volume of concrete produced in the country is still based on the labour-intensive, site-mixed and volume-batched practices, in recent years, the demand for higher speed of construction and improved quality necessitated adoption of mechanized and semi-mechanized techniques of construction in urban areas of India. This was conducive for the development of commercial ready-mixed concrete (RMC). The growth of RMC which started with metropolitan cities from mid-1990s onwards, has spread to other major cities, and has now trickled down to tier II and III cities. No authentic data is available on the RMC industry in India; however, it is unofficially reported that there are more than 100 cities having at least one or more commercial RMC plants. Further, thanks to the boost given the development of physical infrastructure in the form of roads, flyovers, metro rails as well as commercial housing, there is a steep rise in recent years in the captive RMC plants dedicated such projects. There seems to be a general agreement amongst industry experts that nearly 10-15 % of the cement produced in the country goes through the batch-plant concrete route. Thus, assuming an average cement content of 300 kg/m3 for the concrete produced from batch plants and an annual cement consumption of around 300 million tonnes, it can be estimated on a rough basis that a total of around 90-120 million m3 of concrete is currently being produced by the organized concrete sector using modern batch-plant concrete in India. Cement India has the distinction of being the second largest cement producer in the world, next to China. Based on the data from the Survey of Cement Industry, the Indian Cement Industry comprises of around 225 plants belonging to 84 companies, with an aggregate capacity of 444 million tonnes in 2014[5]. The recent estimate indicates that the production level of cement would reach 340 million tonnes in 2020[6]. Considering the huge expenditure being made on the development of highways, expressways, airports, metro rails, ports, etc., on the one hand and affordable housing on the other, the requirements for cement is bound to grow further beyond 2020.
358 Kulkarni
Limestone Reserves Limestone is the basic raw material required in the production of cement. Although India can boast of having one of the largest reserves of limestone in the world, the total cement-grade limestone reserves as classified based on United Nations Framework Classification (UNFC) system, are just 8,949 million tonnes, while the reserves under the “remaining resource” category are 115,591 million tonnes[7]. The remaining reserves are those which have not been found economically viable due to techno-economical, environmental, social and legal aspects. Further, limestone deposits located near human settlement are not available for mining. Considering these constraints, the report of the Working Group on Cement Industry states … “based on the expected growth and consumption pattern, the current reserves are expected to last only for another 35-41 years” [7]. From sustainability considerations, it is therefore prudent to use the limestone reserves sparingly, thus limiting the use of ordinary Portland cement. The limited future availability of limestone has already attracted attention towards alternative resources. These resources include a variety of supplementary cementitious materials (SCMs) such as fly ash, ground-granulated blast-furnace slag (GGBS), condensed silica fume, high reactive metakaolin, rice husk ash, etc. Amongst the various SCMs, fly ash and GGBS are available in large quantities for use in cement and concrete.
FLY ASH: AVAILABILITY AND UTILIZATION According to BP Statistical Energy Survey 2017, India has the fifth largest coal reserves in the world amounting to 190,514 million tonnes [8]. This would account for 9.4% of the total world reserves. The first thermal plant in independent India was started at Bokaro in 1952. Since then there has been a dramatic increase in the use of coal for the generation of electric power in India. Based on the data provided by the Ministry of Power, India’s total installed power capacity as on January 31st, 2019 was 349,288 MW [9]. Out of this the share of coal and lignite was as high as 56.5%. This is evident from Table 1, which provides the current Indian power scenario at a glance.
Table1 Power Sector in India at a Glance
POWER SECTOR SCENARIO
Type of Fuel Installed Capacity, MW % of Total Capacity
Coal 191,093 54.7 Lignite 63,60 1.8
Gas 24,937 7.2 Oil 638 0.2
Hydro (renewable) 45,399 13.0 Nuclear 6,780 1.9
Renewable Energy Sources*
74,082 21.2
*includes Small Hydro Project, Biomass Gasifier, Biomass Power, Urban & Industrial Waste Power, Solar and Wind Energy.

High Volume Fly Ash Concrete 359
As the power generation using coal grew, the fly ash generation also increased simultaneously. During the initial phase, both the awareness and regulations on the use of fly ash were lacking in India. As a result, the utilization of fly ash was abysmally low during the 1900s. The Central Electricity Authority (CEA) provides data on the progressive fly ash generation and its utilization during the period 1996-2018 [10]. Table 2 shows the summery the data. It can be seen that in 2016-17, thermal power plants generated a total of 169.25 million tonnes of fly ash. Out of this, only 63% of fly ash (107.1 million tonnes) was utilized fruitfully [10]. Table 2 Progressive Fly ash Generation and its Utilization during the Period 1996-2018
YEAR FLY ASH GENERATION
(MILLION-TON)
FLY ASH UTILIZATION
(MILLION-TON)
FLY ASH UTILIZATION
IN % 1996-97 68.88 6.64 9.63 1997-98 78.06 8.43 10.80 1998-99 78.99 9.22 11.68
1999-2000 74.03 8.91 12.03 2000-01 86.29 13.54 15.70 2001-02 82.81 15.57 18.80 2002-03 91.65 20.79 22.68 2003-04 96.28 28.29 29.39 2004-05 98.57 37.49 38.04 2005-06 98.97 45.22 45.69 2006-07 108.15 55.01 50.86 2007-08 116.94 61.98 53.00 2008-09 116.69 66.64 57.11 2009-10 123.54 77.33 62.60 2010-11 131.09 73.13 55.79 2011-12 145.41 85.05 58.48 2012-13 163.56 100.37 61.37 2013-14 172.87 99.62 57.63 2014-15 184.14 102.54 55.69 2015-16 176.74 107.77 60.97 2016-17 169.25 107.10 63.28 2017-18 196.44 131.87 67.13
Considering the slow pace of utilization of fly ash the country, the Ministry of Environment, Forest and Climate Change (MoEF&CC) commenced issuing stringent regulations on utilization of fly ash through various notifications. First notification was issued on November 14th, 1999 and was followed by amendments in the years 2003, 2009 and 2016. These amendments prescribe targets for fly ash utilization in a phased manner for all power stations in India. While the thermal power plants in operation prior to the year 2009 need to achieve fly ash utilization targets in successive 5 years (50% in the first year, 60% in second year, 75% in third year, 90% in 4th year and 100% in five years), those coming up after 2009 need to achieve the fly ash utilization targets in phased manner, reaching 100% utilization target in just 4 years. The CEA also provides data on major modes of fly ash utilization. Table 3 provides such data for the year 2017-18.

360 Kulkarni
Table 3 Major Modes of Fly ash Utilization during 2017-18
MODE OF UTILIZATION QUANTITY OF FLY ASH UTILIZED IN THE MODE OF
UTILIZATION, %
Million tonnes Percentage (%)
Cement 50.2909 25.60 Mine Filling 12.5159 6.37 Bricks & Tiles 17.6943 9.01 Reclamation of low lying area 20.5779 10.48 Ash Dyke Raising 13.5500 6.90 Roads & Flyovers 6.6733 3.40 Agriculture 0.5732 0.29 Concrete 1.2974 0.66 Hydro Power Sector 0.0077 0.004 Others 8.6857 4.42 Unutilized Fly Ash 64.5747 32.87
Total 196.4410 100.00
It can be seen from Table 3 that major consumption fly ash is occurring in cement, followed by reclamation of low-lying areas. The cement industry in India was quick to utilize the potential of fly ash. The percentage of Portland Pozzolana Cement (PPC) in the total cement produced in the country has gone up dramatically from 26.17 in 2000-01 to 43.17% in 2003-04 and then to 67.21% in 2009-10 [7]. However, during the later period, it had remained more or less stagnant around the latter figure. Jain has expressed the view that the PPC percentage to the total cement produced in India has now saturated and that the same may witness only marginal increase in coming years [11]. In the meantime, a new Indian Standard on Composite Cement, IS 16415, was published in 2015 by the Bureau of Indian Standards, permitting the use of both fly ash and granulated blast-furnace slag in cement, restricting the proportion of fly ash to 15-35, slag to 20-50% and Portland cement clinker/OPC to 35-65%[12]. This is supposed to provide further boost to the use of both fly ash and slag. Besides cement, concrete is another avenue where large proportion of fly ash can be utilized. Table 3 shows that only 0.66% of the total fly ash (i.e.1.3 million tonnes) got used through the concrete route during 2017-18. To the current author, this seems to be an underestimation. Although no authentic data on the use of fly ash consumed by the RMC sector is available, a very rough estimate indicates that nearly 2.5 to 3 million tonnes of fly ash would be getting used currently through the RMC route. Yet, there is a large potential to use higher volumes of fly ash in concrete. In the market place, there is a resistance from specifiers and consultants to use fly ash as a part replacement of cement in concrete. Many of them do not permit more than 15- 20% replacement of OPC by fly ash as against the code-permitted value of 35%. The main reason for this resistance can be attributed partly to the old mind set of specifiers and also on doubts about the quality of fly ash. Currently, only a handful of certified fly ash suppliers are available in India. Yet, there are few specifiers and designers, who have permitted 35% or even more replacement of OPC by fly ash in their concretes in actual practice.

High Volume Fly Ash Concrete 361
NEW AVENUES FOR FLY ASH UTILIZATION: SOME RECENT ATTEMPTS HVFA Concrete The technology of High Volume Fly Ash (HVFA) concrete was introduced in India through the efforts of the Canada Centre for Mineral and Energy Technology (CANMET) during the early 2010s. In 2001, CANMET initiated a project to implement high-volume fly ash concrete (HVFAC) technology in India under the sponsorship of the Canadian International Development Agency (CIDA). As part of this project, two Portland cements and 20 fly ash samples were collected from selected cement plants and thermal power plants in India, and then the physical and chemical properties of the fly ashes were first determined using conventional and advanced characterisations methods. The ashes were then used to evaluate their suitability for use in the manufacture of HVFAC. Detailed lab studies were conducted to evaluate the fresh and hardened properties of concrete. The high-performance concretes so produced had excellent mechanical properties and durability characteristics [13]. Attempts were made initially to introduce the HVFA concrete technology in the construction of roads. During the period 2002- 2005, small stretches of pavements were constructed using HVFA concrete for the PQC work at Ropar, Punjab; Ambujanagar, Gujarat; and Saurashtra University Campus in Rajkot[14]. In spite of these initial efforts, the use of HVFA concrete could not witness large applications in the roads sector in India, as the specifications of Indian Roads Congress restricted the fly ash replacement of OPC to 20% in DLC and PQC. However, the use of HVFA concrete picked up for mass concrete applications, basically for controlling the heat of hydration. First such use was for the around 2000m3 of 30-MPa concrete (cube compressive strength) for the tremie seal under pylon pile cap of the Bandra-Worli sea link project, Mumbai [15]. Later, the HVFA concrete witnessed growth in mass concrete applications of a number of raft foundations and basements of tall buildings in some of the major metropolitan cities in India. Here, structural consultants permitted the adoption of 56-day compressive strength criteria for the acceptance of of concrete. Some of them also specified the threshold limits for Rapid Chloride Ion Permeability (RCPT) test to ensure durability. Many structural consultants in India are not yet ready for the use of HVFA concrete in structural members. A bold attempt in this area is described in the later part of the paper in the form of a case study. Beneficiation of Fly Ash The physical properties of raw fly ash obtained from thermal power plants can be improved through beneficiation. Three beneficiation techniques that are in vogue include use of air classifiers, special grinding and a combination of air classifiers and grinding. It is well known that beneficiation helps in increasing in amorphous content leading to higher degree of pozzolanic/cementitious reactivity, enhancement in packing density of the cementitious system leading to improved pore refinement, improvements in compressive strength and durability properties of concrete, etc. In India, only a few entrepreneurs are beneficiating fly ash currently. They are using air classifier system for beneficiation. The use of beneficiated fly ash from select entrepreneurs is reported have the potential to produce high-strength, high-performance concrete.
362 Kulkarni
Incidentally, the present author reported encouraging results of laboratory investigations with the use of engineered microfine fly ash [16]. Unfortunately, such fly ash could not be commercialized in India. Sintered Fly Ash Aggregates The technology of structural lightweight concrete using sintered fly ash aggregate is well-established. Its many advantages are also well known - such as reduction in the dead weight to the tune around 30%, allowing reduction in section sizes and reinforcing steel, improved fire and thermal resistance, enhanced durability etc. After years of hesitation, two companies have started production of sintered fly ash aggregate in India. Simultaneously, the Bureau Indian Standard has brought out a draft standard on sintered fly ash aggregates, IS 9142-Part 2, and it is presently under circulation. The Indian Institute of Technology, Bhubaneshwar has been conducting R&D work on artificial aggregates which will be helpful to the concrete industry professionals [17].
CASE STUDY: SELF-COMPACTING HVFA CONCRETE FOR SHEAR WALL For the shear wall of a tall building in Mumbai the structural designer specified 70 MPa concrete. The shear wall had odd shape and the designer provided dense reinforcement. The contractor decided to construct the shear wall in different lift heights. The maximum pour size for non-stop concreting of the lift was 250 m3. For such a mass concrete, the designer specified that the peak temperature should not exceed 750C and the temperature differential should be less than 200C. Considering the stringent specifications, the concrete producer conducted a number of laboratory trials and finally decided to choose the option of self-compacting high-volume fly ash concrete. A mock-up trial casting a 1m x 1m x 1m block was also done to ensure that the specified temperature regime is achieved. The mixture proportions used and fresh and hardened properties of concrete obtained are listed in Tables 4 and 5.
Table 4 Mixture Proportions of 70-MPa HVFA Self-compacting Concrete
Characteristic cube compressive strength 70 MPa Ordinary Portland Cement (Conforming to IS 269) 350 kg/m3 Fly ash (ASTM Class F type) (Conforming to IS 3812)
350 kg/m3
Ultra-fine GGBS (Conforming to IS 16715)
055 kg/m3
Free water 145 lit. Coarse aggregate 888 kg/m3 Fine aggregate 758 kg/m3 Chemical Admixture (Polycarboxylate type)
0.9 % by weight of total cementitious materials
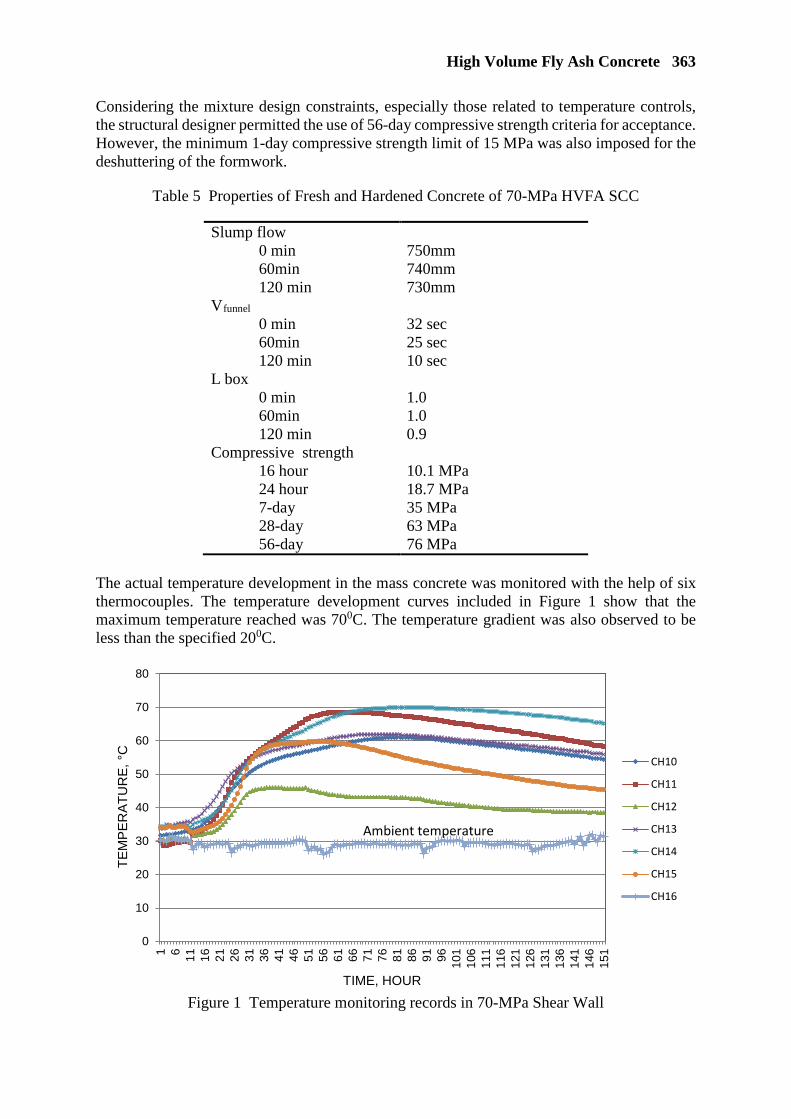
High Volume Fly Ash Concrete 363
Considering the mixture design constraints, especially those related to temperature controls, the structural designer permitted the use of 56-day compressive strength criteria for acceptance. However, the minimum 1-day compressive strength limit of 15 MPa was also imposed for the deshuttering of the formwork.
Table 5 Properties of Fresh and Hardened Concrete of 70-MPa HVFA SCC
Slump flow 0 min 60min 120 min
750mm 740mm 730mm
Vfunnel
0 min 60min 120 min
32 sec 25 sec 10 sec
L box 0 min 60min 120 min
1.0 1.0 0.9
Compressive strength 16 hour 10.1 MPa 24 hour 18.7 MPa 7-day 35 MPa 28-day 63 MPa 56-day 76 MPa
The actual temperature development in the mass concrete was monitored with the help of six thermocouples. The temperature development curves included in Figure 1 show that the maximum temperature reached was 700C. The temperature gradient was also observed to be less than the specified 200C.
Figure 1 Temperature monitoring records in 70-MPa Shear Wall
0
10
20
30
40
50
60
70
80
1 6 11 16 21 26 31 36 41 46 51 56 61 66 71 76 81 86 91 96 101
106
111
116
121
126
131
136
141
146
151
TEM
PER
ATU
RE,
°C
TIME, HOUR
CH10
CH11
CH12
CH13
CH14
CH15
CH16
Ambient temperature
364 Kulkarni
CONCLUSIONS Based on the above discussions, the following conclusions are drawn:
• In spite of the best efforts by the government regulatory authorities and the construction industry in India, nearly 33% of fly ash generated in the country is currently unutilized.
• Batch-plant concrete, the use of which is growing steadily in India, offers one of the best avenues to utilize higher proportions of fly ash in concrete.
• Entrepreneurs involved in fly ash production and supply should make efforts to get the quality their fly ash certified by the appropriate agencies so as to provide quality assurance to fly ash customers.
• Adequate awareness needs to be created amongst specifiers on the advantages of HVFA concrete so as to ensure higher utilization of fly ash.
• The use of structural lightweight concrete seems to be a promising alternative in the Indian context. This is because nearly 70% of the land mass in India is considered to be prone to moderate and heavy intensity of earthquakes, and hence it makes sense to reduce the deadweight of structures, especially for high-rise and long-span structures.
REFERENCES 1. INTERNATIONAL ENERGY AGENCY, CO2 Emissions from Fuel Combustion
Highlights 2016, France, 2016, p. 166.
2. MINISTRY OF ENVIRONMENT & FOREST, GOVERNMENT OF INDIA, India’s CHG Emission Profile: Results of Five Climate Modelling Studies, 2009, p. 60.
3. MCKINSEY & COMPANY, Executive Summary of Report on Environmental and Energy Sustainability: An Approach for India, http://www.mckinsey.com/clientservice/sustainability/pdf/India.
4. THE ENERGY RESEARCH INSTITUTE (TERI). Technology Vision 2030.
5. SURVEY OF CEMENT INDUSTRY AND DIRECTORY 2015, Glorious 100 years of cement industry 1914-2014, 4th edition, Industrial Chronicle, Hyderabad.
6. NIRMAL BANG INSTITUTIONAL EQUITIES, Report on Cement Sector, March 26, 2018.
7. WORKING GROUP ON CEMENT INDUSTRY FOR XII FIVE YEAR PLAN, Report of
Department of Industrial Policy and Promotion, Ministry of Commerce and Industry, December 2011.
8. BP STATISTICAL REVIEW OF WORLD ENERGY, 66th edition, June 2017.
9. MINITRY OF POWER, GOVERNMENT OF INDIA, Power Sector at a Glance-All
India, https://powermin.nic.in/en/content/power-sector-glance-all-india.
High Volume Fly Ash Concrete 365
10. CENTRAL ELECTRICITY AUTHORITY, Report on Fly Ash Generation and its Utilization in the Country for 2010-11, New Delhi, December 2011, p. 18.
11. JAIN A K, Fly ash utilization in Indian cement industry: Current status, future prospects,
Seminar on Concrete Sustainability, Indian Concrete Institute, 2010, pp.46-51.
12. COMPOSITE CEMENTS: SPECIFICATIONS, IS 16415, Bureau of Indian Standards, New Delhi, 2015.
13. SHIVSUNDARAM, V. and MALHOTRA, V M, High-performance high-volume fly ash
concrete, The Indian Concrete Journal, November 2004, pp. 13-21.
14. MALHOTRA V M, MEHTA, P K, High-performance, High-volume Fly Ash Concrete, for Building Durable and Sustainable Structures, Bharari Publication, Mumbai, pp. 137-139.
15. ASHRAF, M, SHARMA, A, MOKAL, M, HVFA concrete for tremie seal and pylon pile
cp of Bandra-Worli sea link project, The Indian Concrete Journal, November 2004, pp. 31-36.
16. KULKARNI, VIJAY, Processed fly ash for improving quality and sustainability of
concrete: Prospects for use in India, Paper no. 07-42, fib Congress 2014, Mumbai.
17. NADESAN, M S, DINKAR, P, Structural concrete using sintered fly ash lightweight aggregate: A Review, Construction and Building Materials, 154 (2017), pp. 928-944.
FLY ASH AS ALUMINA RESOURCE
M Marko
T Opravil F Šoukal J Pořízka
Brno University of Technology
Czech Republic
ABSTRACT. This paper responds to the worldwide problem concerning in the search of the new material resources for alumina production. Fly ash (FA), as a secondary product from power plant industry, could be one of the alternatives to the raw materials due to the chemical composition and Al2O3 content between 20–35 %. Chemical and phase composition of FA depend on a way of coal combustion. Classical high-temperature FA (HTFA) consists of typical phases such as mullite, quartz cristoballite, hematite or magnetite, while fluidised bed FA contains products of desulphurisation. Based on the FA chemical properties, various kinds of recovery processes could be applied. This paper summarises acid leaching methods applied on both HTFA and FFA and shows comparison of Al dissolution into sulphuric acid solutions at room temperature, reflux conditions and pre-leaching method. All subjected samples came from the Czech Republic production. According to the laboratory tests, especially leaching FFA under reflux conditions into sulphuric acid solution (5 wt. %) can reach Al dissolution up to 95 %. These terms are also very selective for Al recovery with dissolution only 17 % of Fe and minimum of other components. Keywords: Secondary raw material, Material base, Alumina recovery, Fly ash utilization, Fly ash leaching Ing. Michal Marko is a PhD student of Material Science and Technology program at Brno University of Technology, Faculty of Chemistry. He started working on the topic of using of fly ash as a resource since his Bc. thesis. Overall he participated several conferences presenting results on this topic. Doctor Tomáš Opravil is a director of Material Research Centre. His current teaching and research activities include chemistry, materials structure and chemistry, heat treatment of silicates, ceramics, refractory materials, special inorganic cements and binders, geopolymers, secondary energy products. Associated professor František Šoukal is a head of Materials Institute at Faculty of Chemistry, Brno University of Technology. His current teaching and research activities include chemistry, materials structure and chemistry, heat treatment of silicates, ceramics, refractory materials, special inorganic cements and binders, geopolymers, secondary energy products. Doctor Jaromír Pořízka is a member of Brno University of Technology, Faculty of Chemistry research team. His current teaching and research includes mainly chemistry and technology of food, contaminants, food authenticity and he also cooperates on determining of inorganic and organic compounds via ICP-OES, HPLC.

Fly Ash as an Alumina Resource 367
INTRODUCTION
Nowadays, the greatest attention is paid to high-volume produced waste and secondary materials, which also include solid residues from coal combustion. Coal belongs to a group of fossil fuels and can be described as a non-homogeneous, colloidal, solid natural rock material created due to the transformation of organic matter by biochemical decomposition. Already since the last century, fossil fuels have been burned in the power or thermal plants to produce electric and thermal energy. [1] Coal firing also produces some by-products (coal combustion products – CCPs). A solid, most produced CCP is fly ash (FA). Worldwide, a year production of FA reaches 500 mil tonnes and 280 mil tonnes of other CCPs, such as flue gas desulphurisation products, slag, etc. [2]
FA physical and chemical properties depend on a way of coal combustion. Classical high-temperature coal combustion is based on the firing lumpy or granulated fuels. The combustion process temperature reaches up to 1 600 °C in case of quality coal and 1 000–1 300 °C for alternative fuels and biomass. Typically, high-temperature fly ash (HTFA) forms spherical particles covered by glass phase. From the mineralogical point of view, the major phases contained in FA are quartz, cristobalite, hematite, magnetite and mullite. The second way of coal burning is more effective – fluidised bed combustion. This process is suitable for low quality fuels, alternative fuels and biomass. The combustion temperature is usually less than 1 000 °C. This way of burning is usually connected with solid state flue gas desulphurisation. Opposed to the classical FA, fluid ash typically forms groups of irregular shape particles containing quartz, hematite, magnetite, anhydrite, calcite and lime phases. Fluidised bed ash can be distinguished between two types – fluidised bed bottom ash (FBA) and fluidised bed filter/fly ash (FFA). [3, 4]
From a sustainability point of view, a great deal of emphasis is placed on the use of the maximum proportion of secondary raw materials. The ecological problem of FA is the content of undesirable and in some cases toxic substances, as well as in the way of its storage. This is done by a system of large-scale ponds that occupy large areas of soil and could cause land and water contamination. [5] Only less than a half ash production (up to 45 %) has been currently used. [6] The mainly applications of FA are in processes of some building and construction materials production, structural and waste stabilization, mining applications, agriculture, subbases and other. Because of the positive free-lime content, only HTFA could be utilised in cement and concrete production. [7]
Finding new areas for the utilization of solid residues after coal combustion is a very serious problem for all countries that run coal-firing power plants. The effort to find new possibilities of fly ash utilisation has been connected with another global problem of finding new material sources (material base) for future use because of the natural habitats depletion of certain commodities. Due to the FA chemical composition containing a range of minerals of silicon, calcium, iron, aluminium, titanium and others, it would be possible to use this CCP as a future feedstock in the certain material groups production. By using suitable, commercially and economically available reagents associated with subsequent conventional technological operations, it would be possible to prepare activated precursors for subsequent production or already finished products with very high purity. [8, 9]
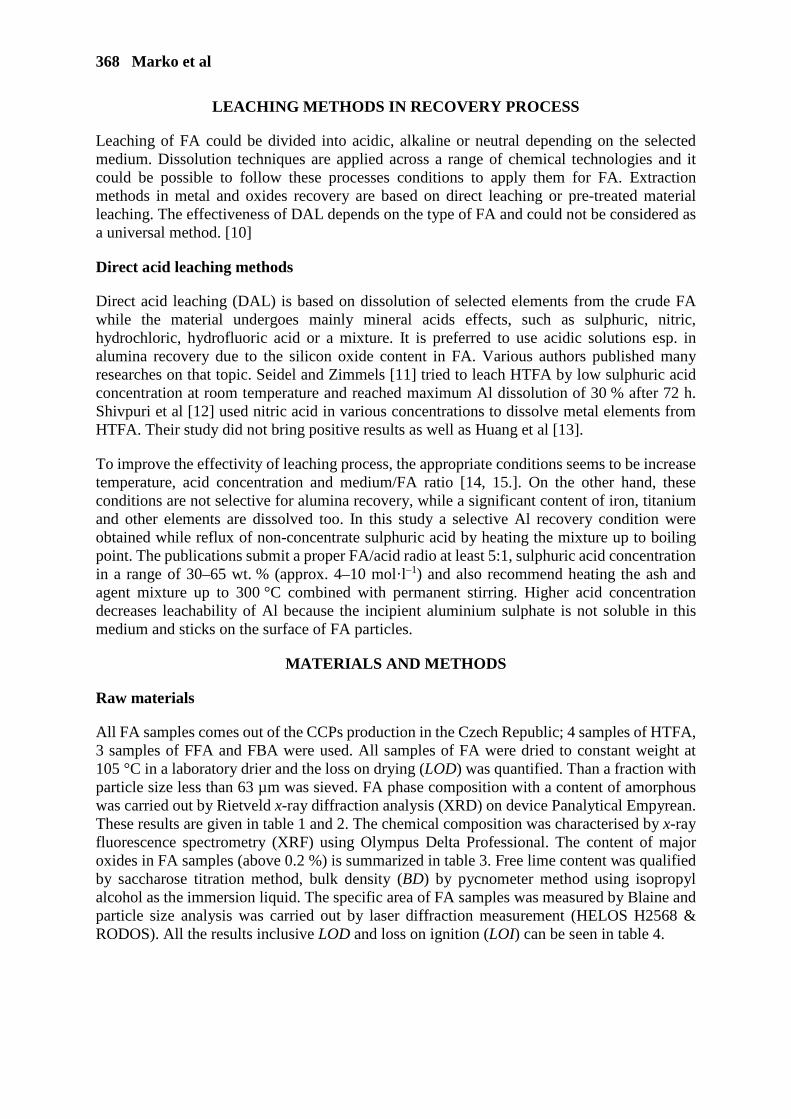
368 Marko et al
LEACHING METHODS IN RECOVERY PROCESS
Leaching of FA could be divided into acidic, alkaline or neutral depending on the selected medium. Dissolution techniques are applied across a range of chemical technologies and it could be possible to follow these processes conditions to apply them for FA. Extraction methods in metal and oxides recovery are based on direct leaching or pre-treated material leaching. The effectiveness of DAL depends on the type of FA and could not be considered as a universal method. [10]
Direct acid leaching methods
Direct acid leaching (DAL) is based on dissolution of selected elements from the crude FA while the material undergoes mainly mineral acids effects, such as sulphuric, nitric, hydrochloric, hydrofluoric acid or a mixture. It is preferred to use acidic solutions esp. in alumina recovery due to the silicon oxide content in FA. Various authors published many researches on that topic. Seidel and Zimmels [11] tried to leach HTFA by low sulphuric acid concentration at room temperature and reached maximum Al dissolution of 30 % after 72 h. Shivpuri et al [12] used nitric acid in various concentrations to dissolve metal elements from HTFA. Their study did not bring positive results as well as Huang et al [13].
To improve the effectivity of leaching process, the appropriate conditions seems to be increase temperature, acid concentration and medium/FA ratio [14, 15.]. On the other hand, these conditions are not selective for alumina recovery, while a significant content of iron, titanium and other elements are dissolved too. In this study a selective Al recovery condition were obtained while reflux of non-concentrate sulphuric acid by heating the mixture up to boiling point. The publications submit a proper FA/acid radio at least 5:1, sulphuric acid concentration in a range of 30–65 wt. % (approx. 4–10 mol·l–1) and also recommend heating the ash and agent mixture up to 300 °C combined with permanent stirring. Higher acid concentration decreases leachability of Al because the incipient aluminium sulphate is not soluble in this medium and sticks on the surface of FA particles.
MATERIALS AND METHODS
Raw materials
All FA samples comes out of the CCPs production in the Czech Republic; 4 samples of HTFA, 3 samples of FFA and FBA were used. All samples of FA were dried to constant weight at 105 °C in a laboratory drier and the loss on drying (LOD) was quantified. Than a fraction with particle size less than 63 µm was sieved. FA phase composition with a content of amorphous was carried out by Rietveld x-ray diffraction analysis (XRD) on device Panalytical Empyrean. These results are given in table 1 and 2. The chemical composition was characterised by x-ray fluorescence spectrometry (XRF) using Olympus Delta Professional. The content of major oxides in FA samples (above 0.2 %) is summarized in table 3. Free lime content was qualified by saccharose titration method, bulk density (BD) by pycnometer method using isopropyl alcohol as the immersion liquid. The specific area of FA samples was measured by Blaine and particle size analysis was carried out by laser diffraction measurement (HELOS H2568 & RODOS). All the results inclusive LOD and loss on ignition (LOI) can be seen in table 4.
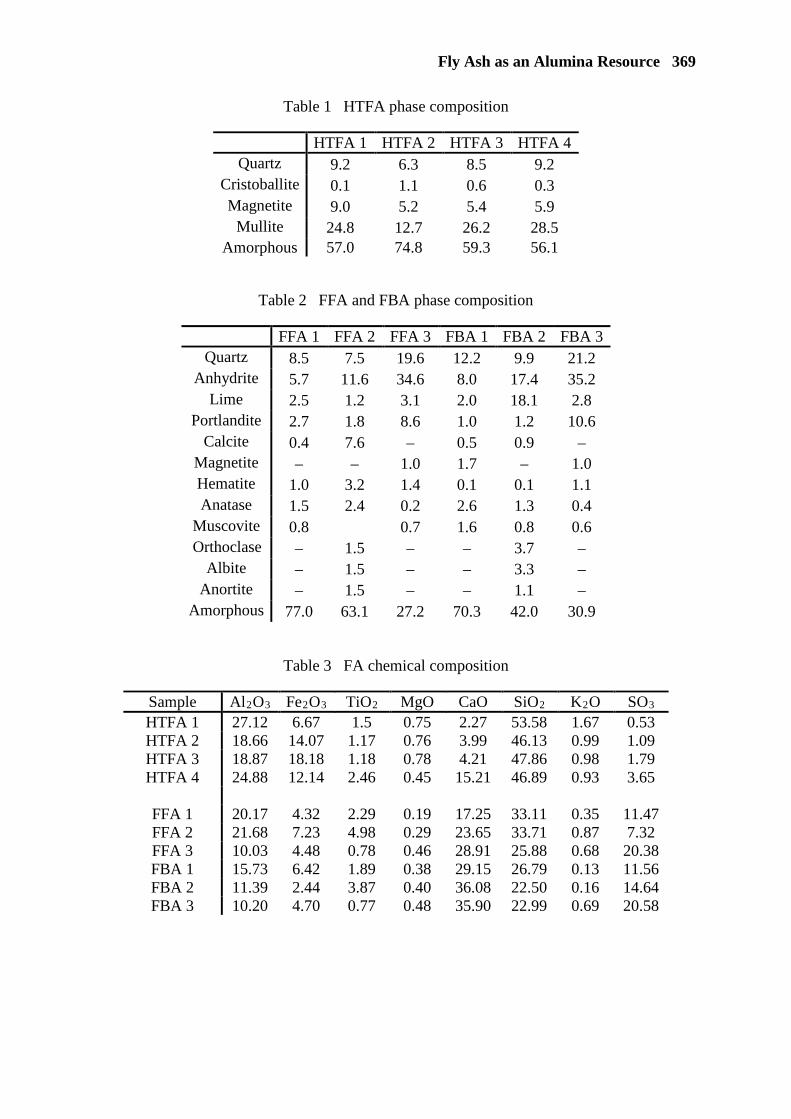
Fly Ash as an Alumina Resource 369
Table 1 HTFA phase composition
HTFA 1 HTFA 2 HTFA 3 HTFA 4 Quartz 9.2 6.3 8.5 9.2
Cristoballite 0.1 1.1 0.6 0.3 Magnetite 9.0 5.2 5.4 5.9
Mullite 24.8 12.7 26.2 28.5 Amorphous 57.0 74.8 59.3 56.1
Table 2 FFA and FBA phase composition
FFA 1 FFA 2 FFA 3 FBA 1 FBA 2 FBA 3 Quartz 8.5 7.5 19.6 12.2 9.9 21.2
Anhydrite 5.7 11.6 34.6 8.0 17.4 35.2 Lime 2.5 1.2 3.1 2.0 18.1 2.8
Portlandite 2.7 1.8 8.6 1.0 1.2 10.6 Calcite 0.4 7.6 – 0.5 0.9 –
Magnetite – – 1.0 1.7 – 1.0 Hematite 1.0 3.2 1.4 0.1 0.1 1.1 Anatase 1.5 2.4 0.2 2.6 1.3 0.4
Muscovite 0.8 0.7 1.6 0.8 0.6 Orthoclase – 1.5 – – 3.7 –
Albite – 1.5 – – 3.3 – Anortite – 1.5 – – 1.1 –
Amorphous 77.0 63.1 27.2 70.3 42.0 30.9
Table 3 FA chemical composition
Sample Al2O3 Fe2O3 TiO2 MgO CaO SiO2 K2O SO3 HTFA 1 27.12 6.67 1.5 0.75 2.27 53.58 1.67 0.53 HTFA 2 18.66 14.07 1.17 0.76 3.99 46.13 0.99 1.09 HTFA 3 18.87 18.18 1.18 0.78 4.21 47.86 0.98 1.79 HTFA 4 24.88 12.14 2.46 0.45 15.21 46.89 0.93 3.65
FFA 1 20.17 4.32 2.29 0.19 17.25 33.11 0.35 11.47 FFA 2 21.68 7.23 4.98 0.29 23.65 33.71 0.87 7.32 FFA 3 10.03 4.48 0.78 0.46 28.91 25.88 0.68 20.38 FBA 1 15.73 6.42 1.89 0.38 29.15 26.79 0.13 11.56 FBA 2 11.39 2.44 3.87 0.40 36.08 22.50 0.16 14.64 FBA 3 10.20 4.70 0.77 0.48 35.90 22.99 0.69 20.58
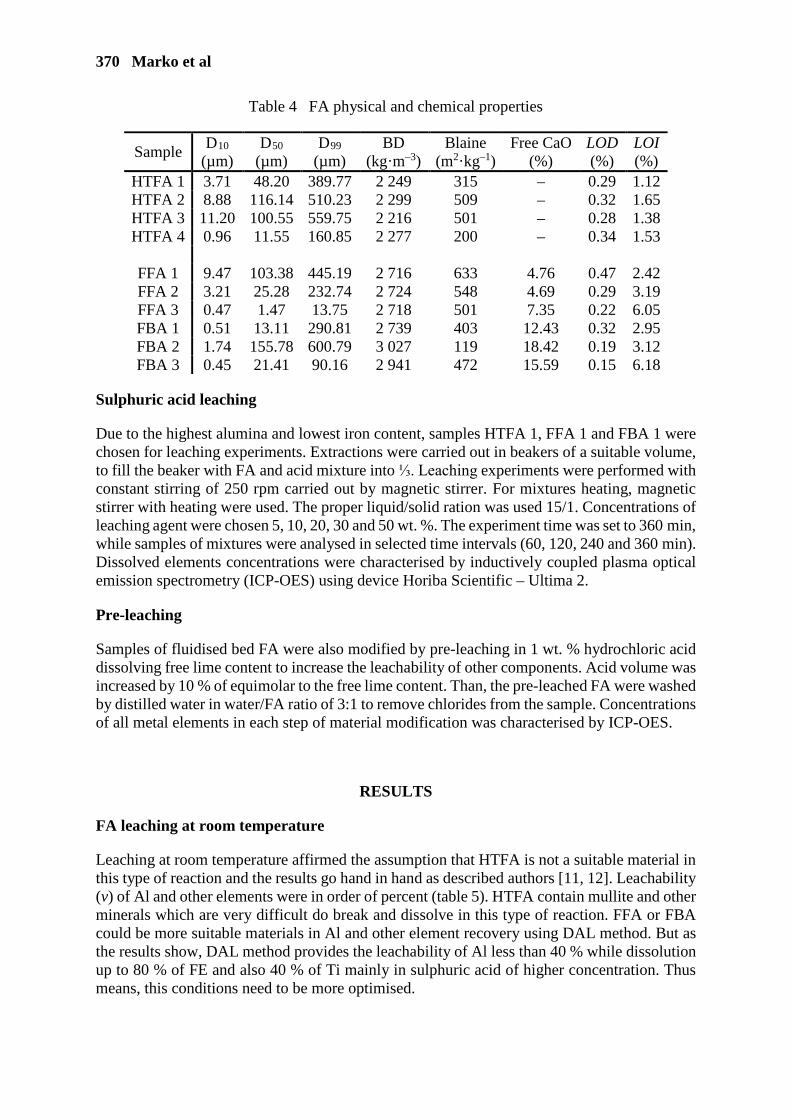
370 Marko et al
Table 4 FA physical and chemical properties
Sample D10
(µm) D50
(µm) D99
(µm) BD
(kg·m–3) Blaine
(m2·kg–1) Free CaO
(%) LOD (%)
LOI (%)
HTFA 1 3.71 48.20 389.77 2 249 315 – 0.29 1.12 HTFA 2 8.88 116.14 510.23 2 299 509 – 0.32 1.65 HTFA 3 11.20 100.55 559.75 2 216 501 – 0.28 1.38 HTFA 4 0.96 11.55 160.85 2 277 200 – 0.34 1.53
FFA 1 9.47 103.38 445.19 2 716 633 4.76 0.47 2.42 FFA 2 3.21 25.28 232.74 2 724 548 4.69 0.29 3.19 FFA 3 0.47 1.47 13.75 2 718 501 7.35 0.22 6.05 FBA 1 0.51 13.11 290.81 2 739 403 12.43 0.32 2.95 FBA 2 1.74 155.78 600.79 3 027 119 18.42 0.19 3.12 FBA 3 0.45 21.41 90.16 2 941 472 15.59 0.15 6.18
Sulphuric acid leaching
Due to the highest alumina and lowest iron content, samples HTFA 1, FFA 1 and FBA 1 were chosen for leaching experiments. Extractions were carried out in beakers of a suitable volume, to fill the beaker with FA and acid mixture into ⅓. Leaching experiments were performed with constant stirring of 250 rpm carried out by magnetic stirrer. For mixtures heating, magnetic stirrer with heating were used. The proper liquid/solid ration was used 15/1. Concentrations of leaching agent were chosen 5, 10, 20, 30 and 50 wt. %. The experiment time was set to 360 min, while samples of mixtures were analysed in selected time intervals (60, 120, 240 and 360 min). Dissolved elements concentrations were characterised by inductively coupled plasma optical emission spectrometry (ICP-OES) using device Horiba Scientific – Ultima 2.
Pre-leaching
Samples of fluidised bed FA were also modified by pre-leaching in 1 wt. % hydrochloric acid dissolving free lime content to increase the leachability of other components. Acid volume was increased by 10 % of equimolar to the free lime content. Than, the pre-leached FA were washed by distilled water in water/FA ratio of 3:1 to remove chlorides from the sample. Concentrations of all metal elements in each step of material modification was characterised by ICP-OES.
RESULTS
FA leaching at room temperature
Leaching at room temperature affirmed the assumption that HTFA is not a suitable material in this type of reaction and the results go hand in hand as described authors [11, 12]. Leachability (v) of Al and other elements were in order of percent (table 5). HTFA contain mullite and other minerals which are very difficult do break and dissolve in this type of reaction. FFA or FBA could be more suitable materials in Al and other element recovery using DAL method. But as the results show, DAL method provides the leachability of Al less than 40 % while dissolution up to 80 % of FE and also 40 % of Ti mainly in sulphuric acid of higher concentration. Thus means, this conditions need to be more optimised.

Fly Ash as an Alumina Resource 371
This could be done by dissolving maximum content of Fe in the first step and continue two or more step reaction to dissolve Al, Ti and other elements. Changes in the structure of used FA were observed by SEM (Zeiss Evo LS 10) and the images are given in figure 1. On the HTFA sample surface, a partial dissolution of the glass phase can be observed; in case of FFA, the formation of fine calcium sulphate particles.
Figure 1 Scans of HTFA up, FFA down; before acid leaching left and after leaching right
Table 5 Leachability of Al, Ti and Fe from FA, DAL after 360 min
HTFA FBA FFA
H2SO4 (wt. %)
v Fe v Al v Ti v Fe v Al v Ti v Fe v Al v Ti (%) (%) (%) (%) (%) (%) (%) (%) (%)
5 0.61 0.56 0.42 55.37 16.99 4.24 76.95 33.66 32.48 10 0.42 0.95 0.29 66.91 12.08 4.24 67.07 35.23 34.97 20 0.49 1.19 0.32 62.27 17.19 4.37 81.91 31.82 33.49 30 0.83 1.92 0.18 67.40 16.17 4.48 78.58 37.05 35.42 50 1.05 2.28 0.35 69.26 13.52 4.46 67.87 36.82 38.90
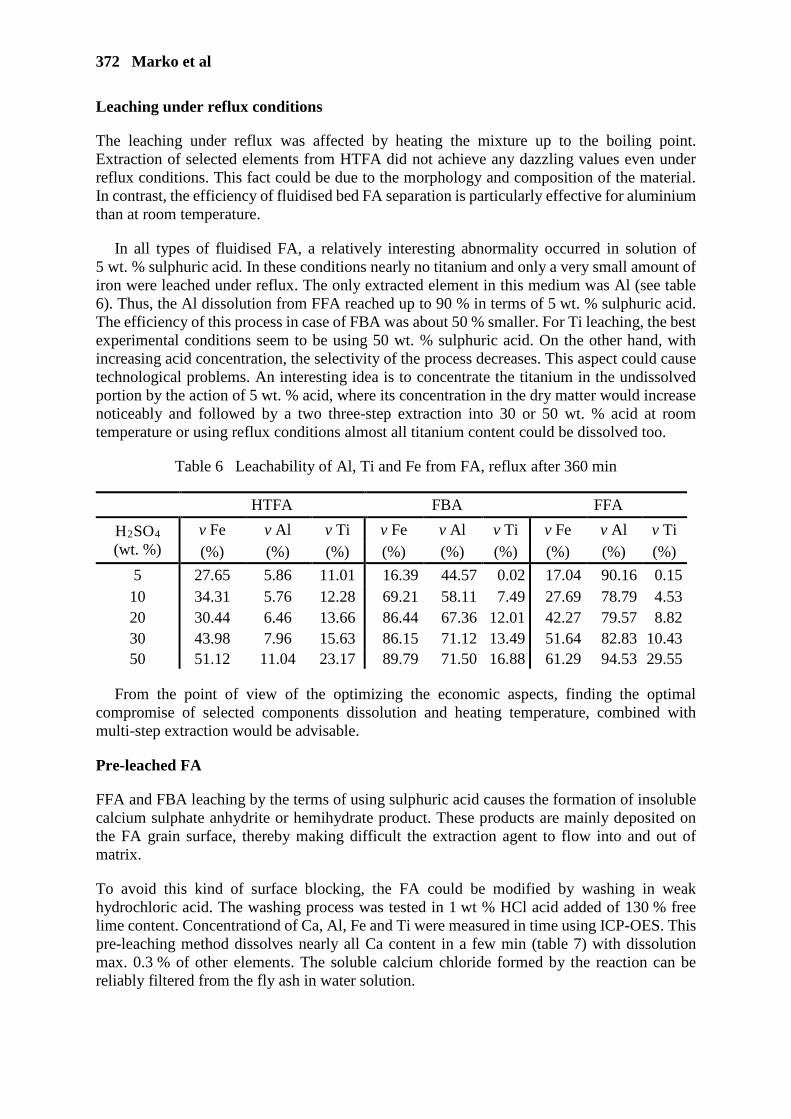
372 Marko et al
Leaching under reflux conditions
The leaching under reflux was affected by heating the mixture up to the boiling point. Extraction of selected elements from HTFA did not achieve any dazzling values even under reflux conditions. This fact could be due to the morphology and composition of the material. In contrast, the efficiency of fluidised bed FA separation is particularly effective for aluminium than at room temperature.
In all types of fluidised FA, a relatively interesting abnormality occurred in solution of 5 wt. % sulphuric acid. In these conditions nearly no titanium and only a very small amount of iron were leached under reflux. The only extracted element in this medium was Al (see table 6). Thus, the Al dissolution from FFA reached up to 90 % in terms of 5 wt. % sulphuric acid. The efficiency of this process in case of FBA was about 50 % smaller. For Ti leaching, the best experimental conditions seem to be using 50 wt. % sulphuric acid. On the other hand, with increasing acid concentration, the selectivity of the process decreases. This aspect could cause technological problems. An interesting idea is to concentrate the titanium in the undissolved portion by the action of 5 wt. % acid, where its concentration in the dry matter would increase noticeably and followed by a two three-step extraction into 30 or 50 wt. % acid at room temperature or using reflux conditions almost all titanium content could be dissolved too.
Table 6 Leachability of Al, Ti and Fe from FA, reflux after 360 min
HTFA FBA FFA
H2SO4 (wt. %)
v Fe v Al v Ti v Fe v Al v Ti v Fe v Al v Ti (%) (%) (%) (%) (%) (%) (%) (%) (%)
5 27.65 5.86 11.01 16.39 44.57 0.02 17.04 90.16 0.15 10 34.31 5.76 12.28 69.21 58.11 7.49 27.69 78.79 4.53 20 30.44 6.46 13.66 86.44 67.36 12.01 42.27 79.57 8.82 30 43.98 7.96 15.63 86.15 71.12 13.49 51.64 82.83 10.43 50 51.12 11.04 23.17 89.79 71.50 16.88 61.29 94.53 29.55
From the point of view of the optimizing the economic aspects, finding the optimal compromise of selected components dissolution and heating temperature, combined with multi-step extraction would be advisable.
Pre-leached FA
FFA and FBA leaching by the terms of using sulphuric acid causes the formation of insoluble calcium sulphate anhydrite or hemihydrate product. These products are mainly deposited on the FA grain surface, thereby making difficult the extraction agent to flow into and out of matrix.
To avoid this kind of surface blocking, the FA could be modified by washing in weak hydrochloric acid. The washing process was tested in 1 wt % HCl acid added of 130 % free lime content. Concentrationd of Ca, Al, Fe and Ti were measured in time using ICP-OES. This pre-leaching method dissolves nearly all Ca content in a few min (table 7) with dissolution max. 0.3 % of other elements. The soluble calcium chloride formed by the reaction can be reliably filtered from the fly ash in water solution.
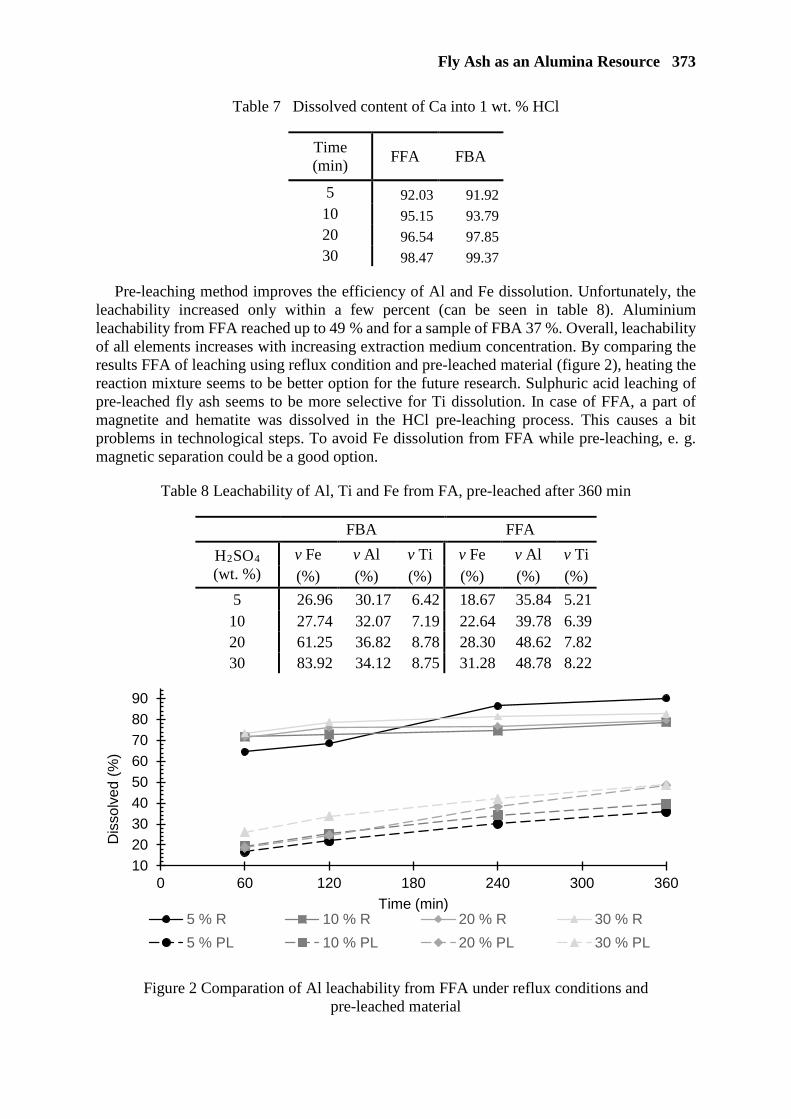
Fly Ash as an Alumina Resource 373
Table 7 Dissolved content of Ca into 1 wt. % HCl
Time (min) FFA FBA
5 92.03 91.92 10 95.15 93.79 20 96.54 97.85 30 98.47 99.37
Pre-leaching method improves the efficiency of Al and Fe dissolution. Unfortunately, the leachability increased only within a few percent (can be seen in table 8). Aluminium leachability from FFA reached up to 49 % and for a sample of FBA 37 %. Overall, leachability of all elements increases with increasing extraction medium concentration. By comparing the results FFA of leaching using reflux condition and pre-leached material (figure 2), heating the reaction mixture seems to be better option for the future research. Sulphuric acid leaching of pre-leached fly ash seems to be more selective for Ti dissolution. In case of FFA, a part of magnetite and hematite was dissolved in the HCl pre-leaching process. This causes a bit problems in technological steps. To avoid Fe dissolution from FFA while pre-leaching, e. g. magnetic separation could be a good option.
Table 8 Leachability of Al, Ti and Fe from FA, pre-leached after 360 min
FBA FFA
H2SO4 (wt. %)
v Fe v Al v Ti v Fe v Al v Ti (%) (%) (%) (%) (%) (%)
5 26.96 30.17 6.42 18.67 35.84 5.21 10 27.74 32.07 7.19 22.64 39.78 6.39 20 61.25 36.82 8.78 28.30 48.62 7.82 30 83.92 34.12 8.75 31.28 48.78 8.22
Figure 2 Comparation of Al leachability from FFA under reflux conditions and pre-leached material
102030405060708090
0 60 120 180 240 300 360
Dis
solv
ed (%
)
Time (min)5 % R 10 % R 20 % R 30 % R5 % PL 10 % PL 20 % PL 30 % PL
374 Marko et al
CONCLUSIONS
Based on the obtained results, it can be generally concluded that HTFA is not very suitable material for the separation of selected substances using sulphuric acid solutions, due to the combustion process, the shape and morphology of the grains. Conversely, FFA and FBA have very good potential for further research in this direction due to the large surface area and the absence of chemical resistant minerals like mullite. The most suitable FA type of fly ash for the Al separation was FFA, which reached leachability of Al 37 % at room temperature and using reflux conditions up to 95 %. It was also obtained, that using of 5 wt. % sulphuric acid combined with reflux heating dissolves Al very selectively with dissolution of max 17 % Fe. Pre-leaching of FFA in hydrochloric acid increased the efficiency of Al dissolution up to 49 %, while dissolving up to 80 % Fe. This method used to have such a good potential, but the results did not achieve interesting efficiency.
ACKNOWLEDGEMENTS
This outcome has been achieved with the financial support by the project of specific research FCH-S-18-5194.
REFERENCES
1 SHABTAI, Y, MUKMENEV, I. A combined chemical-biotechnological treatment of coal fly ash (CFA). Journal of Biotechnology. 1996, No. 51. pp 209–17.
2 JAMES, JIJO & PANDIAN, P. Soil Stabilization as an Avenue for Reuse of Solid Wastes: A Review. Civil Engineering and Architecture. 2016. No. 58. 50–76.
3 SCHEETZ, B E, EARLE, R. Utilization of fly ash Current Opinion in Solid State & Material Science. 1998, No. 3. pp 510–20.
4 AHMARUZZAMAN, M. A review on the utilization of fly ash. Progress in Energy and Combustion Science. 2009. No. 36. pp 327–63.
5 FERRAIOLO, G, ZILLI, M, CONVERTI, A. Fly ash disposal and utilization. Journal of Chemical Technology Biotechnology. 1990, No. 47. pp 281–305.
6 Production and Use of Coal Combustion Products in the U.S. 2015. American Coal Ash. [online].
7 EN 197-1 Cement – Part 1: Composition, specifications and conformity criteria for common cements. European Committee for Standardization, 2012.
8 SHEMI, A, MPANA, R N, NDLOVU, S, DYK VAN, L D, SIBANDA, V, SEEPE, L. Alternative techniques for extracting alumina from coal fly ash. Minerals Engineering. 2012. No. 34. pp 30–37.
9 MEAWAD, A S, BOJINOVA, D Y, PELOVSKI, Y G. An overview of metals recovery from thermal power plant solid wastes. Waste Management. 2010. No. 30. pp 2548–59.
10 KIM, A G, HESBACH, P. Comparison of fly ash leaching methods. Fuel. 2009. No. 88. pp 926–37.
Fly Ash as an Alumina Resource 375
11 SEIDEL, A, ZIMMELS, Y. Mechanism and kinetics of aluminium and iron leaching from coal fly ash by sulphuric acid. Chemical Engineering Science. 1998. No. 22. pp 3835–52.
12 SHIVPURI K, K, LOKESHAPPA, B, KULKARNI, D A, KUMAR, A D. Metal Leaching Potential in Coal Fly Ash. American Journal of Environmental Engineering. 2011. No. 1. pp 21–27.
13 HUANG, K, INOUE, K, HARADA, H, KAWAKITA, H, OHTO, K. Leaching behaviour of heavy metals with hydrochloric acid from fly ash generated in municipal waste incineration plants. Transactions of Nonferrous Metals Society of China. 2011. No. 21. pp 1422–27.
14 BLANCO, F, GARCIA, M P, AYALA, J. Variation in fly ash properties with milling and acid leaching. Fuel. 2005. No. 84. pp 89–96.
15 LAI-SHI ET AL. Extraction of Alumina from Coal Fly Ash with Sulfuric Acid Leaching Method. The Chinese Journal of Process Engineering. 2011. No. 2. pp 254–58.
FLY ASH RECLAMATION AND BENEFICIATION USING A TRIBOELECTRIC BELT SEPARATOR
L Baker
A Gupta
F Hrach
ST Equipment & Technology LLC
United States of America
ABSTRACT. Tribo-electrostatic separation has been used for the commercial beneficiation of coal combustion fly ash to produce a low carbon product for use as a cement replacement in concrete for over twenty years. With 24 separators installed in 17 locations across the world, ST Equipment & Technology LLC’s (STET) patented electrostatic separator has been used to produce over 17.5 Million tons of low carbon product that has been recycled for use in concrete or cement production. Commercial tribo-electrostatic beneficiation of fly ash has been performed primarily on dry “fresh” ash. Reductions in the quantity of dry fly ash generation and requirements to empty historical ash landfills and ponds has created the need to develop a process to reclaim and beneficiate landfilled or ponded ash. The authors have determined the effect of moisture exposure on separation efficiency of multiple ash samples that have been reclaimed from landfills and ponds at the pilot-scale. Test results have demonstrated that concrete performance for the low carbon fly ash product produced using tribo-electrostatic separation is equivalent for reclaimed fly ash and “fresh” fly ash produced from the same source. A technical and economic evaluation of tribo-electrostatic separation and combustion-based processes for beneficiation of reclaimed fly ash was performed. This study confirmed that the tribo-electric process is significantly lower total cost of operation and generates significantly lower air emissions than combustion-based processes for beneficiation of reclaimed fly ash. Keywords: Electrostatic, Beneficiation, Fly ash, Landfilled, Ponded Lewis Baker is the Senior Project Manager for ST Equipment & Technology (STET) based in the United Kingdom Abhishek Gupta is Manager, Process Engineer based at the Separation Technologies pilot plant and lab facility, STET Technical Center, USA.
Frank Hrach is Vice President of Process Engineering based at the Separation Technologies pilot plant and lab facility, STET Technical Center, USA.

Fly Ash Carbon Separation 377
INTRODUCTION
The American Coal Ash Association (ACAA) annual survey of production and use of coal fly ash reports that between 2000 and 2017, over 1.1 billion short tons of fly ash have been produced by coal-fired utility boilers in the United States.1 Of this amount, approximately 460 million tons have been beneficially used, mostly for cement and concrete production. However, the remaining 640 million tons are primarily found in landfills or filled ponded impoundments. While utilization rates for freshly generated fly ash have increased considerably over recent years, with current rates above 60%, approximately 14 million tons of fly ash continue to be disposed of annually. While utilization rates in Europe have been reported higher than in the US, considerable volumes of fly ash have still been stored in landfills and impoundments in some European countries.
Recently, interest in recovering this disposed material has increased, partially due to the demand for high-quality fly ash for concrete and cement production during a period of reduced production as coal-fired power generation has decreased in Europe and North America. Concerns about the long-term environmental impact of such impoundments are also prompting utilities to find beneficial use applications for this stored ash.
LAND FILLED ASH QUALITY AND REQUIRED BENEFICIATION While some of this stored fly ash may be suitable for beneficial use as initially excavated, the vast majority will require some processing to meet quality standards for cement or concrete production. Since the material has been typically wetted to enable handling and compaction while avoiding airborne dust generation, drying and deagglomeration is a necessary requirement. A greater challenge is assuring the chemical composition of the ash meets specifications, most notably the carbon content measured as loss-on-ignition (LOI). As fly ash utilization has increased in the last 20+ years, most “in-spec” ash has been beneficially used, and the off-quality ash disposed. Thus, LOI reduction will be a requirement for utilizing the vast majority of fly ash recoverable from utility impoundments.
LOI REDUCTION BY TRIBOELECTRIC SEPARATION
While other researchers have used combustion techniques and flotation processes for LOI reduction of recovered landfilled and ponded fly ash, STET has found that its unique tribo-electrostatic belt separation system, long used for beneficiation of freshly generated fly ash, is also effective on recovered ash after suitable drying and deagglomeration.
STET researchers have tested the tribo-electrostatic separation behavior of dried landfilled ash from several fly ash landfills in the Americas and Europe. This recovered ash separated very similarly to freshly generated ash with one surprising difference: the particle charging was reversed from that of fresh ash with the carbon charging negative in relation to the mineral.2 Other researchers of electrostatic separation of fly ash carbon have also observed this phenomena.3,4,5 The polarity of the STET tribo-electrostatic separator can easily be adjusted to allow rejection of negatively charged carbon from dried landfilled fly ash sources. No special modifications to the separator design or controls are necessary to accommodate this phenomena.
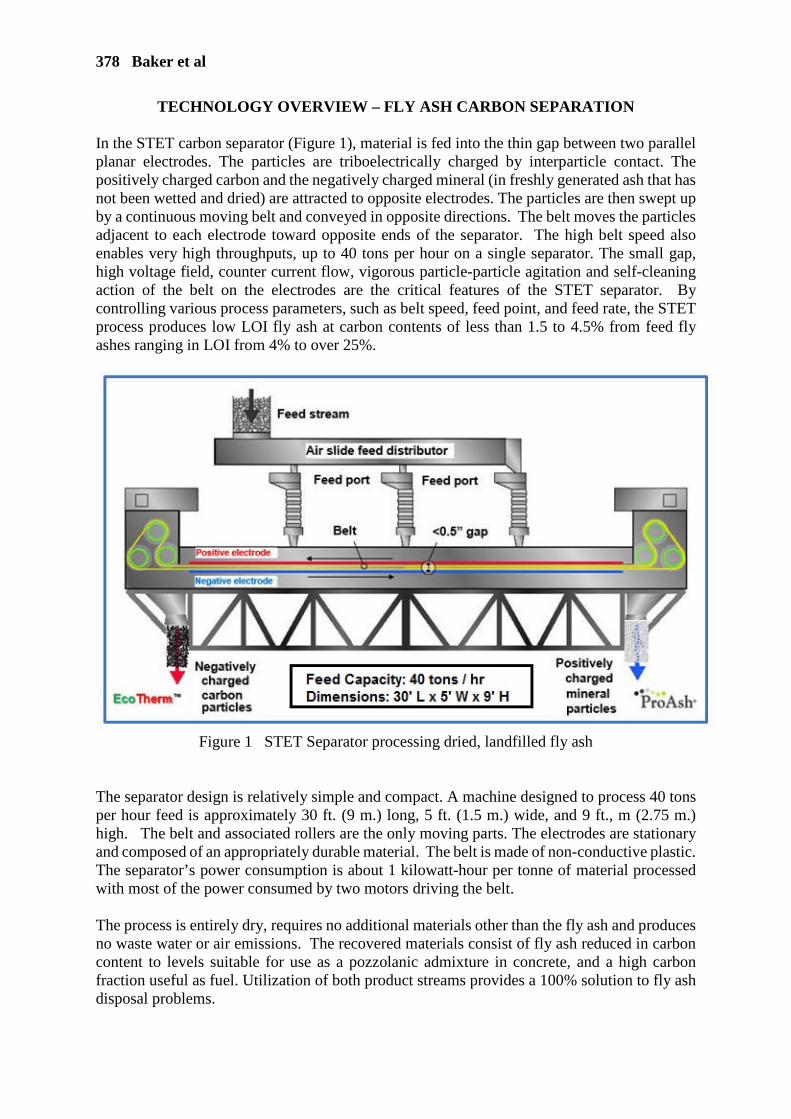
378 Baker et al
TECHNOLOGY OVERVIEW – FLY ASH CARBON SEPARATION In the STET carbon separator (Figure 1), material is fed into the thin gap between two parallel planar electrodes. The particles are triboelectrically charged by interparticle contact. The positively charged carbon and the negatively charged mineral (in freshly generated ash that has not been wetted and dried) are attracted to opposite electrodes. The particles are then swept up by a continuous moving belt and conveyed in opposite directions. The belt moves the particles adjacent to each electrode toward opposite ends of the separator. The high belt speed also enables very high throughputs, up to 40 tons per hour on a single separator. The small gap, high voltage field, counter current flow, vigorous particle-particle agitation and self-cleaning action of the belt on the electrodes are the critical features of the STET separator. By controlling various process parameters, such as belt speed, feed point, and feed rate, the STET process produces low LOI fly ash at carbon contents of less than 1.5 to 4.5% from feed fly ashes ranging in LOI from 4% to over 25%.
Figure 1 STET Separator processing dried, landfilled fly ash
The separator design is relatively simple and compact. A machine designed to process 40 tons per hour feed is approximately 30 ft. (9 m.) long, 5 ft. (1.5 m.) wide, and 9 ft., m (2.75 m.) high. The belt and associated rollers are the only moving parts. The electrodes are stationary and composed of an appropriately durable material. The belt is made of non-conductive plastic. The separator’s power consumption is about 1 kilowatt-hour per tonne of material processed with most of the power consumed by two motors driving the belt. The process is entirely dry, requires no additional materials other than the fly ash and produces no waste water or air emissions. The recovered materials consist of fly ash reduced in carbon content to levels suitable for use as a pozzolanic admixture in concrete, and a high carbon fraction useful as fuel. Utilization of both product streams provides a 100% solution to fly ash disposal problems.
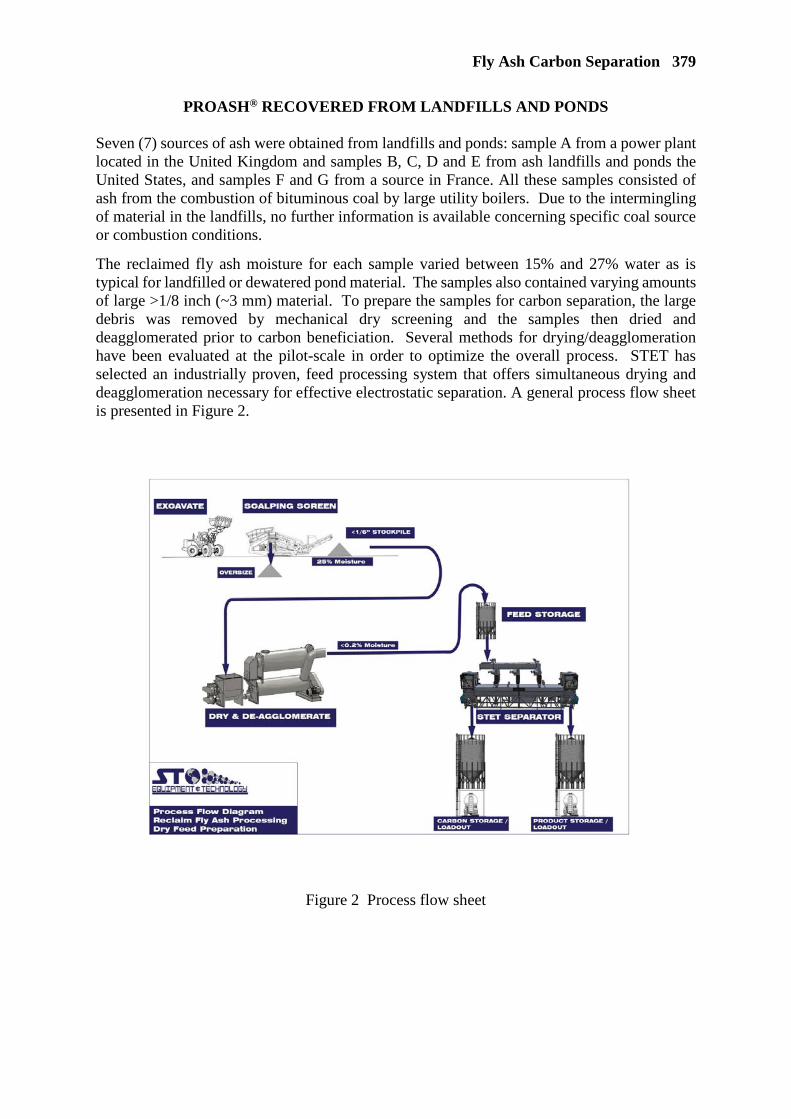
Fly Ash Carbon Separation 379
PROASH® RECOVERED FROM LANDFILLS AND PONDS Seven (7) sources of ash were obtained from landfills and ponds: sample A from a power plant located in the United Kingdom and samples B, C, D and E from ash landfills and ponds the United States, and samples F and G from a source in France. All these samples consisted of ash from the combustion of bituminous coal by large utility boilers. Due to the intermingling of material in the landfills, no further information is available concerning specific coal source or combustion conditions.
The reclaimed fly ash moisture for each sample varied between 15% and 27% water as is typical for landfilled or dewatered pond material. The samples also contained varying amounts of large >1/8 inch (~3 mm) material. To prepare the samples for carbon separation, the large debris was removed by mechanical dry screening and the samples then dried and deagglomerated prior to carbon beneficiation. Several methods for drying/deagglomeration have been evaluated at the pilot-scale in order to optimize the overall process. STET has selected an industrially proven, feed processing system that offers simultaneous drying and deagglomeration necessary for effective electrostatic separation. A general process flow sheet is presented in Figure 2.
Figure 2 Process flow sheet
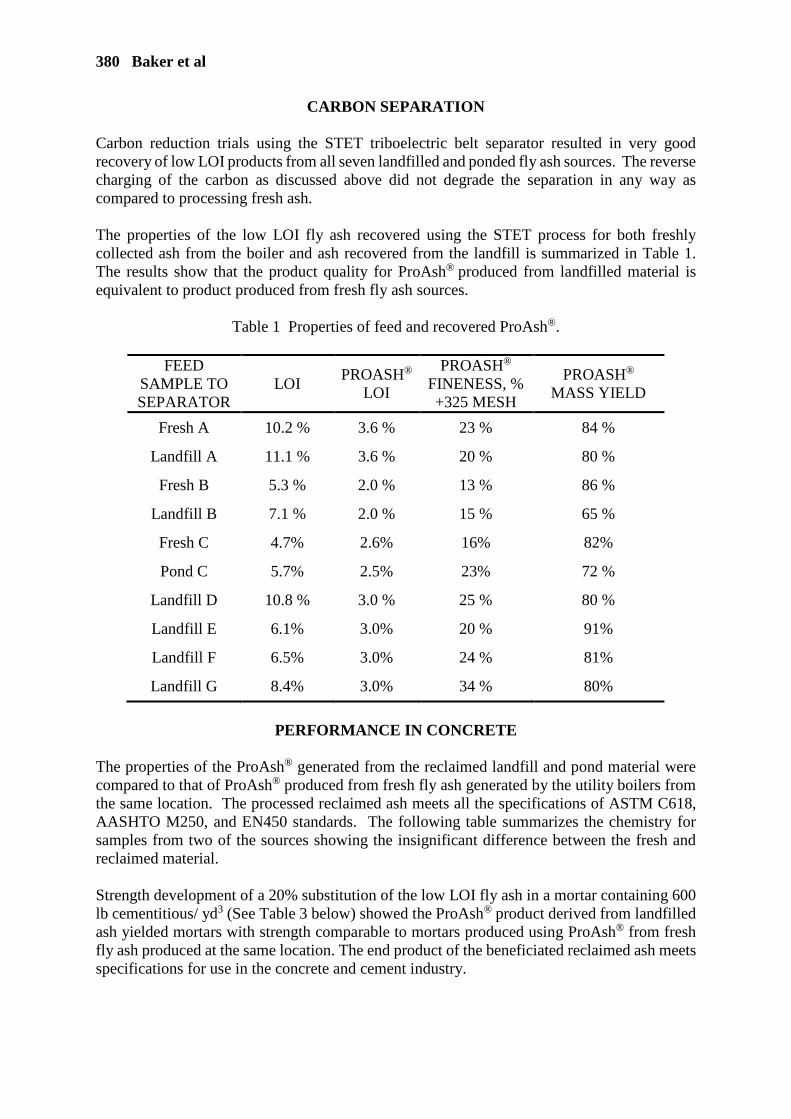
380 Baker et al
CARBON SEPARATION
Carbon reduction trials using the STET triboelectric belt separator resulted in very good recovery of low LOI products from all seven landfilled and ponded fly ash sources. The reverse charging of the carbon as discussed above did not degrade the separation in any way as compared to processing fresh ash. The properties of the low LOI fly ash recovered using the STET process for both freshly collected ash from the boiler and ash recovered from the landfill is summarized in Table 1. The results show that the product quality for ProAsh® produced from landfilled material is equivalent to product produced from fresh fly ash sources.
Table 1 Properties of feed and recovered ProAsh®.
FEED SAMPLE TO SEPARATOR
LOI PROASH®
LOI
PROASH® FINENESS, % +325 MESH
PROASH® MASS YIELD
Fresh A 10.2 % 3.6 % 23 % 84 %
Landfill A 11.1 % 3.6 % 20 % 80 %
Fresh B 5.3 % 2.0 % 13 % 86 %
Landfill B 7.1 % 2.0 % 15 % 65 %
Fresh C 4.7% 2.6% 16% 82%
Pond C 5.7% 2.5% 23% 72 %
Landfill D 10.8 % 3.0 % 25 % 80 %
Landfill E 6.1% 3.0% 20 % 91%
Landfill F 6.5% 3.0% 24 % 81%
Landfill G 8.4% 3.0% 34 % 80%
PERFORMANCE IN CONCRETE
The properties of the ProAsh® generated from the reclaimed landfill and pond material were compared to that of ProAsh® produced from fresh fly ash generated by the utility boilers from the same location. The processed reclaimed ash meets all the specifications of ASTM C618, AASHTO M250, and EN450 standards. The following table summarizes the chemistry for samples from two of the sources showing the insignificant difference between the fresh and reclaimed material. Strength development of a 20% substitution of the low LOI fly ash in a mortar containing 600 lb cementitious/ yd3 (See Table 3 below) showed the ProAsh® product derived from landfilled ash yielded mortars with strength comparable to mortars produced using ProAsh® from fresh fly ash produced at the same location. The end product of the beneficiated reclaimed ash meets specifications for use in the concrete and cement industry.

Fly Ash Carbon Separation 381
Table 2 Ash Chemistry of low LOI product ash (wt% as oxides for major elements)
MATERIAL SOURCE
LOI SiO2 Al2O3 Fe2O3 CaO K2O Na2O SO3
Fresh B 2.0 51.6 24.7 9.9 2.2 2.2 0.3 0.09 Landfill B 2.0 50.4 25.0 9.3 3.0 2.4 0.2 0.11 Fresh C 2.6 47.7 23.4 10.8 5.6 1.9 1.1 0.03 Pond C 2.5 48.5 26.5 11.5 1.8 2.4 0.2 0.02
Landfill D 3.0 49.8 25.7 16.6 1.6 1.25 0.1 0.03 Landfill E 3.0 63.0 21.3 6.5 0.7 2.4 0.5 0.05 Landfill F 3.0 52.5 25.9 6.7 4.5 2.0 0.8 0.6 Landfill G 2.9 53.9 28.2 5.2 1.7 4.2 0.8 0.1
Table 3 Compressive strength of mortar cylinders.
FLY ASH SOURCE
FRESH ASH RECLAIMED STET
PROCESS ASH
7 day (psi) 28 day (psi)
7 day (psi) 28 day (psi)
B 3948 5185 4254 5855 C 3860 5680 3750 5610 E 4040 4950
PROCESS ECONOMICS
The availability of low cost natural gas greatly enhances the economics of drying processes, including the drying of wetted fly ash from landfills and dewatered ash from ponds. Table 4 summarizes the energy costs for drying and deagglomerating feed ash for the STET separation process in the USA for 15%, 20%, and 25% moisture contents. The incremental costs for drying fly ash for STET tribo-electrostatic separation processing are relatively low.
Table 4 Drying costs on basis of dried mass.
MOISTURE CONTENT
FUEL COST/TON DRY FEED
POWER COST/TON DRY FEED
TOTAL ENERGY COST FOR FEED
PREP Nat. gas @ €0.03/KWhr Electricity @ €0.10/kWh
15 % €5.64 €3.06 €8.70
20 % €8.04 €3.06 €11.1
25 % €10.8 €3.06 €13.86
A technical and economic evaluation of tribo-electrostatic separation and combustion-based processes for beneficiation of reclaimed fly ash was performed. This comparison assumed a hypothetical installation designed to produce 300 ktpy of concrete quality fly ash product using (1) two STET model F42 tribo-electric fly ash separation systems, compared to (2) a combustion-based system (SEFA STAR or Boral CBO).
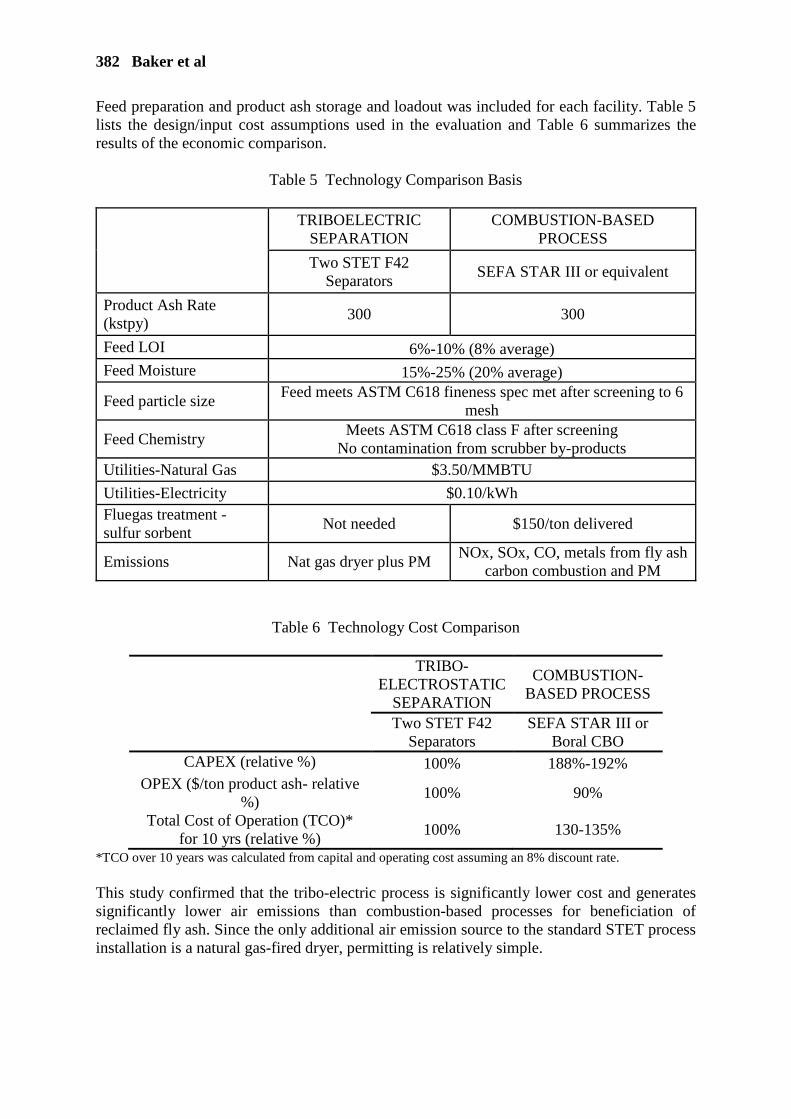
382 Baker et al
Feed preparation and product ash storage and loadout was included for each facility. Table 5 lists the design/input cost assumptions used in the evaluation and Table 6 summarizes the results of the economic comparison.
Table 5 Technology Comparison Basis
TRIBOELECTRIC SEPARATION
COMBUSTION-BASED PROCESS
Two STET F42 Separators
SEFA STAR III or equivalent
Product Ash Rate (kstpy)
300 300
Feed LOI 6%-10% (8% average) Feed Moisture 15%-25% (20% average)
Feed particle size Feed meets ASTM C618 fineness spec met after screening to 6
mesh
Feed Chemistry Meets ASTM C618 class F after screening
No contamination from scrubber by-products Utilities-Natural Gas $3.50/MMBTU
Utilities-Electricity $0.10/kWh Fluegas treatment -sulfur sorbent
Not needed $150/ton delivered
Emissions Nat gas dryer plus PM NOx, SOx, CO, metals from fly ash
carbon combustion and PM
Table 6 Technology Cost Comparison
TRIBO-ELECTROSTATIC
SEPARATION
COMBUSTION-BASED PROCESS
Two STET F42 Separators
SEFA STAR III or Boral CBO
CAPEX (relative %) 100% 188%-192% OPEX ($/ton product ash- relative
%) 100% 90%
Total Cost of Operation (TCO)* for 10 yrs (relative %)
100% 130-135%
*TCO over 10 years was calculated from capital and operating cost assuming an 8% discount rate. This study confirmed that the tribo-electric process is significantly lower cost and generates significantly lower air emissions than combustion-based processes for beneficiation of reclaimed fly ash. Since the only additional air emission source to the standard STET process installation is a natural gas-fired dryer, permitting is relatively simple.
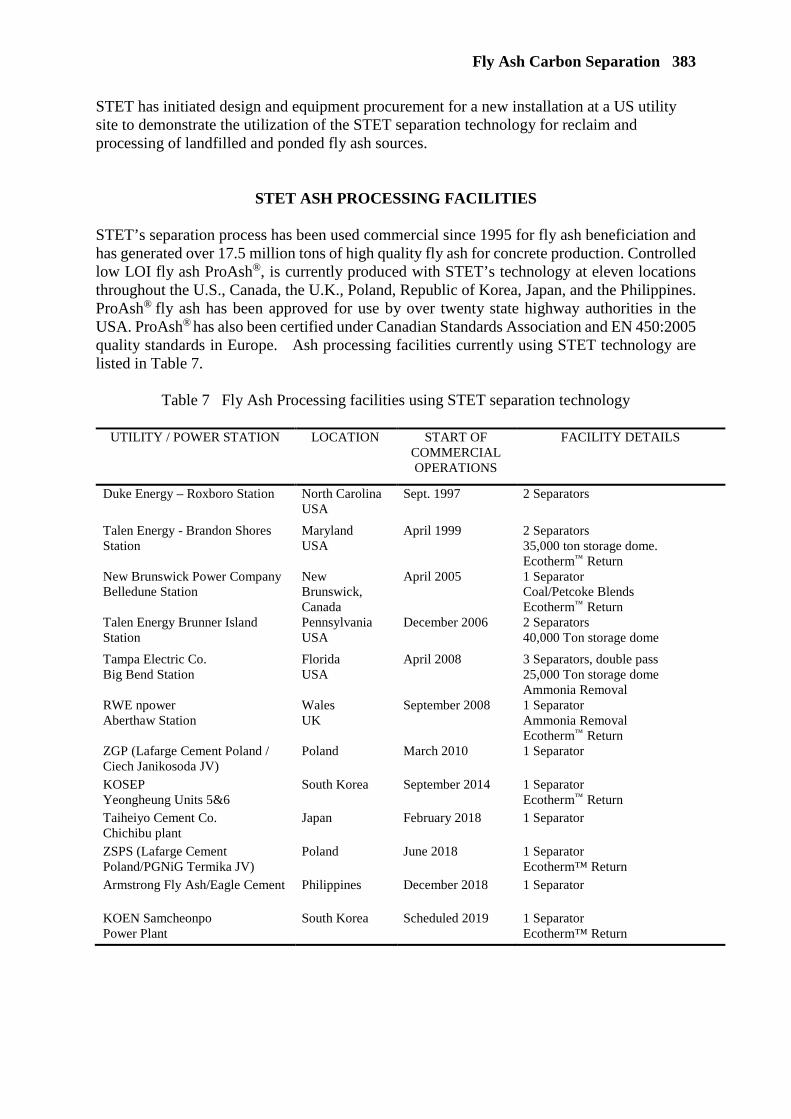
Fly Ash Carbon Separation 383
STET has initiated design and equipment procurement for a new installation at a US utility site to demonstrate the utilization of the STET separation technology for reclaim and processing of landfilled and ponded fly ash sources.
STET ASH PROCESSING FACILITIES STET’s separation process has been used commercial since 1995 for fly ash beneficiation and has generated over 17.5 million tons of high quality fly ash for concrete production. Controlled low LOI fly ash ProAsh®, is currently produced with STET’s technology at eleven locations throughout the U.S., Canada, the U.K., Poland, Republic of Korea, Japan, and the Philippines. ProAsh® fly ash has been approved for use by over twenty state highway authorities in the USA. ProAsh® has also been certified under Canadian Standards Association and EN 450:2005 quality standards in Europe. Ash processing facilities currently using STET technology are listed in Table 7.
Table 7 Fly Ash Processing facilities using STET separation technology
UTILITY / POWER STATION LOCATION START OF COMMERCIAL OPERATIONS
FACILITY DETAILS
Duke Energy – Roxboro Station North Carolina USA
Sept. 1997
2 Separators
Talen Energy - Brandon Shores Station
Maryland USA
April 1999 2 Separators 35,000 ton storage dome. Ecotherm™
Return New Brunswick Power Company Belledune Station
New Brunswick, Canada
April 2005 1 Separator Coal/Petcoke Blends Ecotherm™
Return Talen Energy Brunner Island Station
Pennsylvania USA
December 2006 2 Separators 40,000 Ton storage dome
Tampa Electric Co. Big Bend Station
Florida USA
April 2008 3 Separators, double pass 25,000 Ton storage dome Ammonia Removal
RWE npower Aberthaw Station
Wales UK
September 2008 1 Separator Ammonia Removal Ecotherm™
Return
ZGP (Lafarge Cement Poland / Ciech Janikosoda JV)
Poland March 2010 1 Separator
KOSEP Yeongheung Units 5&6
South Korea September 2014 1 Separator Ecotherm™
Return Taiheiyo Cement Co. Chichibu plant
Japan February 2018 1 Separator
ZSPS (Lafarge Cement Poland/PGNiG Termika JV)
Poland June 2018 1 Separator Ecotherm™ Return
Armstrong Fly Ash/Eagle Cement Philippines December 2018 1 Separator
KOEN Samcheonpo Power Plant
South Korea Scheduled 2019 1 Separator Ecotherm™ Return

384 Baker et al
RECOVERED FUEL VALUE OF HIGH-CARBON FLY ASH
In addition to the low carbon product for use in concrete, brand named ProAsh®, the STET separation process also recovers otherwise wasted unburned carbon in the form of carbon-rich fly ash, branded EcoTherm™. EcoTherm™ has significant fuel value and can easily be returned to the electric power plant using the STET EcoTherm™ Return system to reduce the coal use at the plant. When EcoTherm™ is burned in the utility boiler, the energy from combustion is converted to high pressure / high temperature steam and then to electricity at the same efficiency as coal,. The conversion of the recovered thermal energy to electricity in ST Equipment &Technology LLC EcoTherm™ Return system is two to three times higher than that of the competitive technology where the energy is recovered as low-grade heat in the form of hot water which is circulated to the boiler feed water system. EcoTherm™ is also used as a source of alumina in cement kilns, displacing the more expensive bauxite which is usually transported long distances. Utilizing the high carbon EcoTherm™ ash either at a power plant or a cement kiln, maximizes the energy recovery from the delivered coal, reducing the need to mine and transport additional fuel to the facilities. STET’s Talen Energy Brandon Shores, NBP Belledune, RWEnpower Aberthaw, and the two facilities in South Korea all include EcoTherm™ Return systems.
CONCLUSIONS ST Equipment & Technology (STET) offers a commercially proven processing technology for reducing the carbon (LOI) content of freshly generated dry fly ash. This proven tribo-electrostatic separation device has been used for the commercial beneficiation of coal combustion fly ash to produce a low carbon product for use as a cement replacement in concrete for over twenty years. Recent work by STET has demonstrated that this same commercially proven technology is suitable for processing recovered fly ash from ponds and landfills. After suitable scalping of large material, drying, and deagglomeration, fly ash recovered from utility plant landfills and ponds can be reduced in carbon content using the commercialized STET triboelectric belt separator. The quality of the fly ash product, ProAsh® using the STET system on reclaimed landfill material is equivalent to ProAsh® produced from fresh feed fly ash. The ProAsh® product is very well suited and proven in concrete production. The recovery and beneficiation of landfilled and ponded ash will provide a continuing supply of high quality ash for concrete producers in spite of the reduced production of “fresh” ash as coal-fired utilities reduce generation. Additionally, power plants that need to remove ash from landfills or ponds to meet changing environmental regulations will be able to utilize the process to alter a waste product liability into a valuable raw material for cement and concrete producers. The STET separation process with feed pre-processing equipment for drying and deagglomerating landfilled fly ash is an attractive option for ash beneficiation with significantly lower total cost and lower emissions compared to other combustion systems.
Fly Ash Carbon Separation 385
REFERENCES
1. American Coal Ash Association, CCP Production and Use Statistics, https://www.acaa-usa.org/publications/productionusereports.aspx
2. ST internal report, August 1995. 3. LI,T.X,. SCHAEFER, J.L., BAN, H., NEATHERY, J.K., AND STENCEL, J.M. Dry
Beneficiation Processing of Combustion Fly Ash, Proceedings of the DOE Conference on Unburned Carbon on Utility Fly Ash, May 19 20, Pittsburgh, PA, 1998.
4. BALTRUS, J.P., DIEHL, J.R., SOONG, Y., SANDS, W. Triboelectrostatic separation
of fly ash and charge reversal, Fuel 81, (2002) pp.757-762. 5. CANGIALOSI, F., NOTARNICOLA, M., LIBERTI, L, STENCEL, J. The role of
weathering on fly ash charge distribution during triboelectrostatic beneficiation, Journal of Hazardous Materials, 164 (2009) pp.683-688.

MOBILITY OF ARSENIC, CHROMIUM AND COPPER ARISING
FROM SOIL APPLICATION OF STABILISED AGGREGATES MADE FROM CONTAMINATED WOOD ASH
K Mitchell
St Georges University Grenada
West Indies
Eduardo Moreno-Jimenez
Universidad Autonoma de Madrid
Spain
M R Jones L Zheng
University of Dundee
United Kingdom
L Trakal
Czech University of Life Sciences Prague
Czech Republic
R Hough L Beesley
James Hutton Institute
United Kingdom
ABSTRACT. Excessive leaching of metal(loid)s from some waste-wood derived combustion ashes precludes their use as a soil amendment. Two stabilized soil-sized aggregates were produced from raw wood ashes with ~10000 mg kg-1 As, Cr and Cu, by a cementation process, and amended to two agricultural pasture soils. Column leaching and pot tests were employed to ascertain metal(loid) mobility and leaching and measure uptake to ryegrass, comparing raw ashes with CO2 strengthened (AG 2) and non-CO2 strengthened (AG 1) stabilized aggregates. Thereafter food-chain risk modeling was applied to selected data to indicate the relative risk of applying aggregates to these soils, compared to raw ashes. Under rapid leaching (7hrs) AG 2 generally outperformed AG 1 in terms of suppressed total soluble metal(loid) removal, though the extent was soil specific, as illustrated by the comparison to inert sand. However, during prolonged leaching (12d) both aggregates appeared at least partially susceptible to dissolution and release of metal(loid)s upon mild acidification. In both tested soils in pot conditions, raw wood ash application resulted in increased concentrations of As, Cr and Cu in soil pore water, commensurate with application dose. The highest application rate, 10% (vol) ash, resulted in complete lack of ryegrass growth in the pot experiment (9wks). In comparison the same application rate of both aggregates resulted in vigorous ryegrass growth in the pot test in both soils. Risk modelling of pot data demonstrated soil specific accumulation of As in beef muscle and milk, being furthest reduced (compared to the raw ash addition) by AG 2 in soil A, but increased in soil B by the same treatment. Therefore, the results of this study indicate that the stabilization of raw metal(loid) rich wood ashes by cementation processes results in an aggregate that, when added to two test soils, can result in reduced As, Cr and Cu in soil pore water compared to raw ash. However behavior was soil specific and, under continuous leaching conditions the CO2 strengthened aggregate appeared most stable, though not entirely resistant to mild acidification. Clearly therefore before the application of any such aggregate materials to soils in the field, pre-testing with local soils is required to ensure that metal(loid) mobility will remain suppressed. Keywords: Heavy metal leaching, Pore water, Bioavailability, Wood ash, Arsenic, Chromium

Wood Ash Aggregates 387
INTRODUCTION
The combustion of waste wood that has been treated with weatherproof protectants, paints and preservatives, such as chromated copper arsenate (CCA), can result in ashes entrained with high concentrations of metal(loid)s. Disposal of such materials to landfill is both expensive and wasteful because wood ashes have an intrinsic benefit to soils if applied circumspectly (e.g. liming effects, increase in available nutrient provision, etc.). Previous studies have found that As, Cr and Cu are highly mobile from wood ashes derived from waste wood sources, if applied untreated or together with organic amendments to soils (Mollon et al, 2016; Trakal et al, 2017; Mitchell et al, 2018). Furthermore, such application to soil has been demonstrated to have potential onward impacts with regards to food chain transfer risk from even small dosages in soils (Beesley et al; 2018), clearly indicating that it should not be applied to soils without further treatment. Physical stabilization of wood ashes, by the production of cementitious aggregates, to physically stabilize metal(loid)s and prevent their mobility, may be one method by which the application of contaminated ashes to soils may be acceptable in certain circumstances. However, this has, to the best of our knowledge, not been described or tested previously in soil conditions. The hypothesis of this study is that the production of stabilized aggregates from metal(loid) contaminated wood ash will result in reduced mobility of As, Cr and Cu when applied to soils, compared to the application of ‘raw’ wood ash. In turn this may allow for further experimental trials to determine the feasibility of producing stabilized aggregates from a range of contaminated ashes and facilitate testing of their impacts in soils. The following study aims to; 1) compare the mobility and plant uptake of As, Cr and Cu from ‘raw’ wood ash applied to soils, with that of stabilized aggregates made from the same wood ashes; 2) evaluate geo-chemical mechanisms impacting on the stability of As, Cr and Cu from the ash/aggregate applied soils; 3) subject the aggregates to chemical weathering within soils (acidification) to determine As, Cr and Cu release.
METHODS
Soils, ash and aggregate mixtures Two soils were used for this experimental work. Soil A was obtained from an upland farming estate in north-east Scotland (UK) stocked with cattle, sheep and deer. Soils on the farm are freely drained humus iron podzols (‘Entic podzol’ under WRB classification system; sandy loam texture, organic carbon (OC) contents of ~7% and nitrogen (N) contents of ~0.6%). Soil B was obtained from a lowland farming estate in central Scotland (UK) stocked with cattle and sheep. Soils on the farm are poorly drained gleys (‘Eutric Stagnosol’ under WRB classification system; sandy clay loam texture, organic carbon (OC) contents of ~5% and nitrogen (N) contents of ~0.5%). Ash was sourced from a 70kw biomass boiler that provides heat for the farm where soil A was sampled and is fueled by a mixture of farm-derived mixed waste wood, and virgin timber offcuts. Total metal(loid) concentrations of the soils and ash were determined by aqua-regia digestion, and analysis by ICP-MS. For the present experiment bulk ash samples were passed through a 2mm sieve in preparation for soil application (see Table 1).

388 Mitchell et al
Table 1 Concentrations of selected elements in test soils and ash, as determined by aqua-regia digestion (mg kg-1). For pH, organic carbon, and nitrogen information, see methods
above.
Al As Ca Cr Cu Fe K Mg Mn Pb Zn
Soil A
9240 4.00 647 19.0 16.0 14670 1100 2370 518 34.0 42.0
Soil B
8320 < 2.00 1600 31.0 17.0 18750 1830 1390 704 38.0 86.0
Ash 5195 9260 207200 9472 8790 8709 74800 36020 1934 3354 5004
Aggregates were produced by the method detailed in Jones, et al (2015). This method utilizes a foaming procedure to produce a lightweight technical material with a bulk density suitable for soils application (~1 g cm-3) and requiring low energy input to crush to a suitable particle size for soil application (e.g. < 2 mm). Briefly, two aggregates were prepared by mixtures of Portland cement and the metal(loid) rich wood ash detailed above (ratio 1:3 respectively). The second of the produced aggregates was further treated by carbon dioxide, as detailed in Jones et al (2015), in order to enhance mechanical strength and shrinkage properties of the finished material and promote the recalcitrance of metal(loid) in this material. Experimental soil plus ash/aggregate mixtures were prepared in bulk for use in the following experiments. Ash dosages of 0.1, 1.0 and 10% ash (vol.) and aggregate dosages of 10% (vol.) were mixed into soils using the end-over-end method, until a homogenous mixture was produced. Only one dosage of aggregate was provided, corresponding with the highest ash dosage. Previous experiments with this ash, reported in Mollon et al (2016), had demonstrated complete phyto-toxicity of ryegrass at an ash addition of 10% (vol.) in soil, so this was chosen as the threshold limit for ash and aggregate application in the present study. Controls without ash or aggregate were included for all experiments (see Figure 1).
Figure 1 Experimental set-up showing leaching column set-up, pot experimental set-up and
treatment details.

Wood Ash Aggregates 389
Column leaching tests Rapid assessment of cumulative removal of metal(loids) A leaching column tests was performed to determine the cumulative removal rate of As, Cr and Cu in the soils with the maximum ash/aggregate inclusion (10% vol.). As soil is a complex matrix, inert sand was also used by way of comparison to determine removal rates of metal(loid)s discounting sorption and other soil matrix effects. Identical plexiglass columns (Figure 1) of 20 cm length and 6 cm in internal diameter were filled with 100g of a) soil/sand only, b) soil/sand plus 10% (vol.) ash or c) soil/sand plus 10% (vol.) aggregates 1 or 2. After rapid saturation of soils from the base upwards, columns were inverted and gravitationally leached with deionized water from the top for 7 hours under a constant flow rate (1 ml min-1), which was maintained by a peristaltic pump, following the method detailed in Trakal et al (2017). The top of each column incorporated a shower type design together with a geotextile wicking to ensure homogenous irrigation over the surface of the soil. Pre-saturation from the base upwards before commencing the experiment was designed to minimize preferential moisture flow paths through the soil. Leachate samples were subsequently collected at the base of the column for 30 mins per hour (from the beginning of the experiment) resulting in 30ml of sample per fraction. Samples were analysed for metal(loid)s by ICP-MS. To determine total amounts of As, Cr and Cu removed from the tested soils the mass of soil and flow rate was accounted for to calculate cumulative removals (mg metal(loid) kg-1 soil). Prolonged leaching column test to establish aggregate stability Given the cementitious composition of the aggregates, a second leaching column test was set-up with a longer duration/slower flow rate and an acid dissolution phase incorporated, to determine resistance to physico-chemical weathering, and longevity in soils. The purpose of this test was to determine whether, under acidification, the aggregates were more stable, in terms of metal(loid) leaching, than the ash. The test was performed identically to that detailed above (2.1) except that the test was performed only on one test soil (Soil A) with AG1 & 2 and at a flow rate reduced to half that of the previous test (0.5ml min-1). As previously, after rapid saturation of soils from the base upwards, columns were inverted and gravitationally leached with deionized water from the top. The columns were subjected to 8 days continuous flow with de-ionised water only, during which time leachates were collected at the same time daily for 8 days (i.e. 24, 48, 72, …, 192 hours; T1-T8). Thereafter, without interruption to the flow, eluent was acidified with HCl (1%) pipetted into the eluent supply vessel until the pH of leachates from the control soil column was reduced by 1 unit. Conductivity was monitored to determine whether dissolution was occurring. The columns were run in this mode for a further 4 days (T9-T12). Leachate samples were analyzed for pH, conductivity, As, Cr and Cu concentrations by ICP-MS. Pot experimental set-up and risk assessment exercise Pore water sampling and analysis Soils A and B plus ash/aggregates were potted into triplicate 1L pots which were maintained at a controlled moisture and temperature for 9 weeks by determining mass of each pot and adjusting irrigation to maintain field capacity, whilst temperature was kept at 15oC under natural light in a glasshouse. Approximately one hundred ryegrass (Lolium perenne L.) seeds were dispersed uniformly over the soil surface in each pot, determined by mass. Thereafter soil
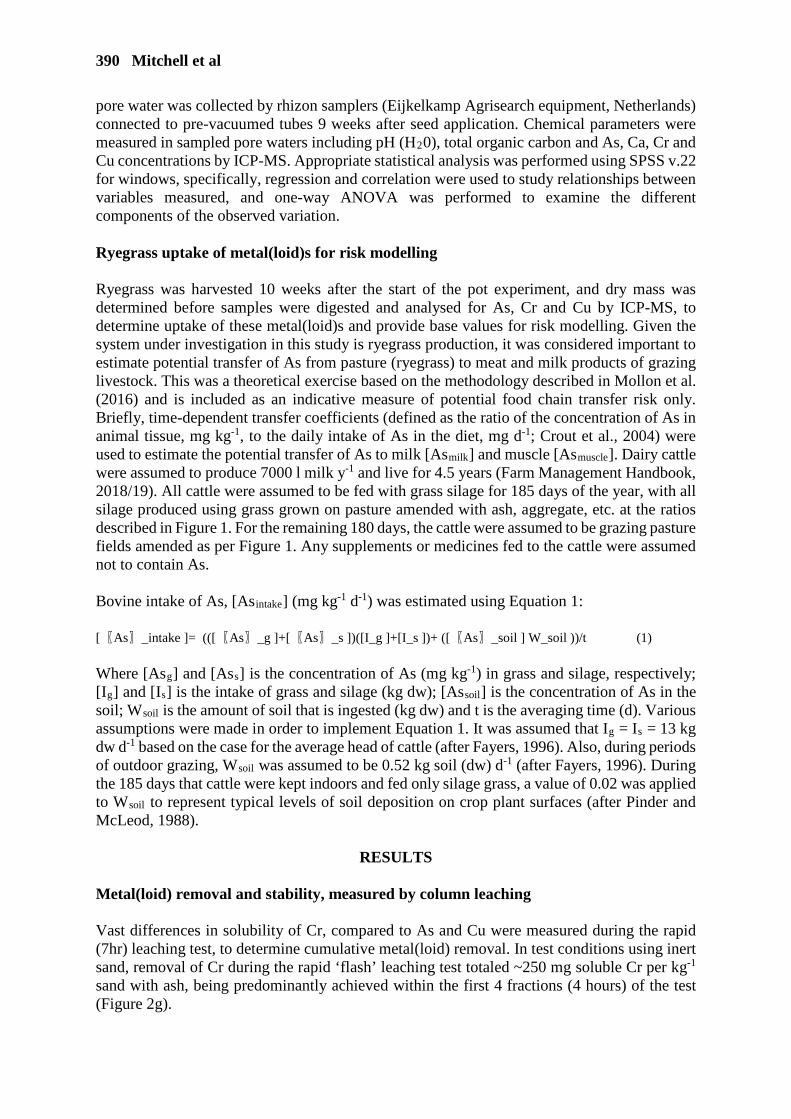
390 Mitchell et al
pore water was collected by rhizon samplers (Eijkelkamp Agrisearch equipment, Netherlands) connected to pre-vacuumed tubes 9 weeks after seed application. Chemical parameters were measured in sampled pore waters including pH (H20), total organic carbon and As, Ca, Cr and Cu concentrations by ICP-MS. Appropriate statistical analysis was performed using SPSS v.22 for windows, specifically, regression and correlation were used to study relationships between variables measured, and one-way ANOVA was performed to examine the different components of the observed variation. Ryegrass uptake of metal(loid)s for risk modelling Ryegrass was harvested 10 weeks after the start of the pot experiment, and dry mass was determined before samples were digested and analysed for As, Cr and Cu by ICP-MS, to determine uptake of these metal(loid)s and provide base values for risk modelling. Given the system under investigation in this study is ryegrass production, it was considered important to estimate potential transfer of As from pasture (ryegrass) to meat and milk products of grazing livestock. This was a theoretical exercise based on the methodology described in Mollon et al. (2016) and is included as an indicative measure of potential food chain transfer risk only. Briefly, time-dependent transfer coefficients (defined as the ratio of the concentration of As in animal tissue, mg kg-1, to the daily intake of As in the diet, mg d-1; Crout et al., 2004) were used to estimate the potential transfer of As to milk [Asmilk] and muscle [Asmuscle]. Dairy cattle were assumed to produce 7000 l milk y-1 and live for 4.5 years (Farm Management Handbook, 2018/19). All cattle were assumed to be fed with grass silage for 185 days of the year, with all silage produced using grass grown on pasture amended with ash, aggregate, etc. at the ratios described in Figure 1. For the remaining 180 days, the cattle were assumed to be grazing pasture fields amended as per Figure 1. Any supplements or medicines fed to the cattle were assumed not to contain As. Bovine intake of As, [Asintake] (mg kg-1 d-1) was estimated using Equation 1: [〖As〗_intake ]= (([〖As〗_g ]+[〖As〗_s ])([I_g ]+[I_s ])+ ([〖As〗_soil ] W_soil ))/t (1) Where [Asg] and [Ass] is the concentration of As (mg kg-1) in grass and silage, respectively; [Ig] and [Is] is the intake of grass and silage (kg dw); [Assoil] is the concentration of As in the soil; Wsoil is the amount of soil that is ingested (kg dw) and t is the averaging time (d). Various assumptions were made in order to implement Equation 1. It was assumed that Ig = Is = 13 kg dw d-1 based on the case for the average head of cattle (after Fayers, 1996). Also, during periods of outdoor grazing, Wsoil was assumed to be 0.52 kg soil (dw) d-1 (after Fayers, 1996). During the 185 days that cattle were kept indoors and fed only silage grass, a value of 0.02 was applied to Wsoil to represent typical levels of soil deposition on crop plant surfaces (after Pinder and McLeod, 1988).
RESULTS
Metal(loid) removal and stability, measured by column leaching Vast differences in solubility of Cr, compared to As and Cu were measured during the rapid (7hr) leaching test, to determine cumulative metal(loid) removal. In test conditions using inert sand, removal of Cr during the rapid ‘flash’ leaching test totaled ~250 mg soluble Cr per kg-1 sand with ash, being predominantly achieved within the first 4 fractions (4 hours) of the test (Figure 2g).

Wood Ash Aggregates 391
Figure 2 Leachate pH (a, b, c) and cumulative removal of As, Cr and Cu (d-l) from ash and
aggregates (10% vol.) in sand and soils A and B.
Cum
mul
ativ
e As
leac
hed
(mg
kg-1
)
0
10
20
30
40
d. e.
a. SandpH
4
6
8
10
12
14
16
b. Soil A c. Soil BControl + Ash + AG 1 + AG 2
Cum
mul
ativ
e C
r lea
ched
(mg
kg-1
)
0
50
100
150
200
250
300
Fraction
T0 T1 T2 T3 T4 T5 T6
Cum
mul
ativ
e C
u le
ache
d (m
g kg
-1)
0
5
10
15
20
25
30
Fraction
T0 T1 T2 T3 T4 T5 T6
Fraction
T0 T1 T2 T3 T4 T5 T6
f.
g. h. i.
j. k. l.

392 Mitchell et al
This contrasts with removals of ~30 mg soluble As and < 1 mg soluble Cu per kg-1 (Figure 2d & j). Reduced amounts of all measured metal(loid) were leached from aggregates in sand, being similar in the case of AG 1 and 2 for Cr (~100 mg kg-1), largely insoluble in the case of Cu, and variable in the case of As. Different leaching behaviors were observed when ash and aggregates were mixed with soils, compared to inert sand. For example, removal of As was greatly reduced for both ash and aggregates to < 20 mg soluble As kg-1 soil (Figure 2e & f). On the other hand, Cu removal appeared greatly increased in soils, compared to sand, especially so for AG 2 in soil A (Figure 2k). In the longer-term leaching column test, concentrations of metal(loid)s are reported rather than cumulative removal rates because pH modification is made to the eluent during the duration of the test to determine stability of the two aggregates. Concentrations of As, Cr and Cu measured in the leachates collected from the columns in this configuration demonstrated the depletion of the soluble pool [leaching] of these metal(loid)s over time (Figures 3a, b & c). During this phase of the test AG 2 appeared most stable, with reduced concentrations of leached As and Cr, especially during the first 3 days of the test (T1-T3; Figure 3a & b). Gradually concentrations of As and Cr converged during days 4-8 of the test. Copper leaching was more variable, fluctuating within the control soil and both aggregates (Figure 3c). Conductivity values were almost identical for both aggregates during the non-acidified leaching stage (Figure 3; A-T9 & A-T10 inset). Upon acidification conductivity increased rapidly (Figure 3c inset). Metal(loid) leaching appeared to respond, albeit more mutedly than conductivity (Figure 3; A-T9 & A-T10).
Figure 3 Concentrations of As, Cr, Cu (a, b, c) and conductivity (inset) as measured in leachates from the long-term column leaching column test; note that these data relate to Soil
A only. The vertical red dashed line indicates the initiation of acidification. Metal(loid)s in pore waters & their controlling factors Concentrations of As, Cr and Cu were close to or below the limit of detection in control soils A and B; the extent of the influence of ash addition was both metal(loid) and soil specific (Figure 4a, b & c). A 10% ash addition resulted in the highest concentrations of metal(loid)s, especially for Cr (~10 mg l-1 in Soil B; Figure 4b). Concentrations of As and Cu were, in general, much lower (0.1 and 1.0 mg l-1 respectively in soil plus 10% ash; Figure 2). Concentrations of As were significantly reduced by both aggregate additions in both soils, compared to 10% ash (P < 0.05). In the case of soil B this decrease in pore water As was greater than an order of magnitude. Chromium was significantly reduced only in soil B by AG 1 (P <
c. Cu
Fraction
T1 T2 T3 T4 T5 T6 T7 T8A-T9
A-T10A-T11
A-T120.0
0.5
1.0
1.5
2.0
b. Cr
Fraction
T1 T2 T3 T4 T5 T6 T7 T8A-T9
A-T10A-T11
A-T120.0
0.1
0.2
0.3
0.4
0.5
a. As
Fraction
T1 T2 T3 T4 T5 T6 T7 T8A-T9
A-T10A-T11
A-T12
Leac
hate
con
cent
ratio
n (m
g l-1
)
0.0
0.1
0.2
0.3
0.4
0.5Control (Soil A)+ AG1 + AG2
Conductivity
T1 T2 T3 T4 T5 T6 T7 T8A-T9
A-T10A-T11
A-T12
ms-1
0
200
400
600
800
1000
1200
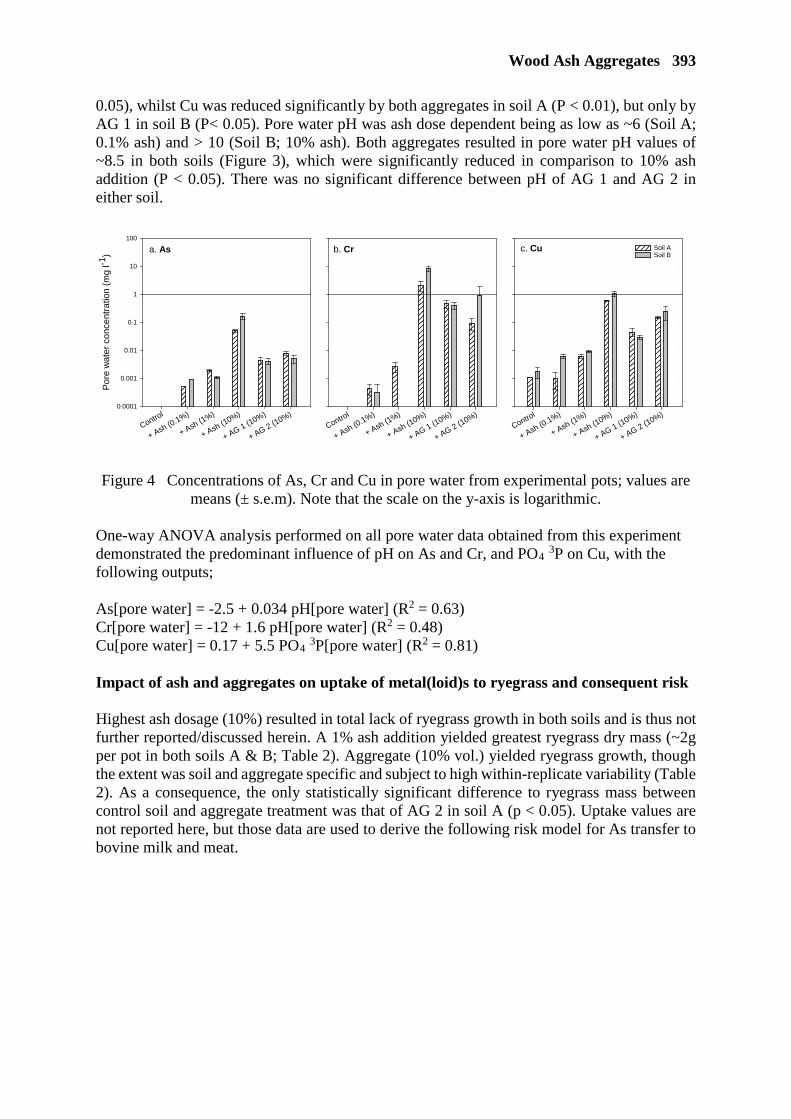
Wood Ash Aggregates 393
0.05), whilst Cu was reduced significantly by both aggregates in soil A (P < 0.01), but only by AG 1 in soil B (P< 0.05). Pore water pH was ash dose dependent being as low as ~6 (Soil A; 0.1% ash) and > 10 (Soil B; 10% ash). Both aggregates resulted in pore water pH values of ~8.5 in both soils (Figure 3), which were significantly reduced in comparison to 10% ash addition (P < 0.05). There was no significant difference between pH of AG 1 and AG 2 in either soil.
Figure 4 Concentrations of As, Cr and Cu in pore water from experimental pots; values are
means (± s.e.m). Note that the scale on the y-axis is logarithmic. One-way ANOVA analysis performed on all pore water data obtained from this experiment demonstrated the predominant influence of pH on As and Cr, and PO4 3P on Cu, with the following outputs; As[pore water] = -2.5 + 0.034 pH[pore water] (R2 = 0.63) Cr[pore water] = -12 + 1.6 pH[pore water] (R2 = 0.48) Cu[pore water] = 0.17 + 5.5 PO4 3P[pore water] (R2 = 0.81) Impact of ash and aggregates on uptake of metal(loid)s to ryegrass and consequent risk Highest ash dosage (10%) resulted in total lack of ryegrass growth in both soils and is thus not further reported/discussed herein. A 1% ash addition yielded greatest ryegrass dry mass (~2g per pot in both soils A & B; Table 2). Aggregate (10% vol.) yielded ryegrass growth, though the extent was soil and aggregate specific and subject to high within-replicate variability (Table 2). As a consequence, the only statistically significant difference to ryegrass mass between control soil and aggregate treatment was that of AG 2 in soil A (p < 0.05). Uptake values are not reported here, but those data are used to derive the following risk model for As transfer to bovine milk and meat.
c. Cu
Control
+ Ash (0.1%)
+ Ash (1%)
+ Ash (10%)
+ AG 1 (10%)
+ AG 2 (10%)
Soil ASoil B
b. Cr
Control
+ Ash (0.1%)
+ Ash (1%)
+ Ash (10%)
+ AG 1 (10%)
+ AG 2 (10%)
a. As
Control
+ Ash (0.1%)
+ Ash (1%)
+ Ash (10%)
+ AG 1 (10%)
+ AG 2 (10%)
Pore
wat
er c
once
ntra
tion
(mg
l-1)
0.0001
0.001
0.01
0.1
1
10
100

394 Mitchell et al
Table 2 Ryegrass yield (g dry weight) from pot experiment. *Note that ryegrass failed to germinate and grow in the 10% ash treatment
While maximum permissible levels of As have been established within the EU for rice and rice products (0.2 mg As kg-1), there are no similar regulatory limits for As in other foodstuffs such as meat or milk products. The USEPA has published a chronic reference dose (RfD, mg kg-1 d-
1) for inorganic As of 3.00x10⁻⁴ mg kg-1 d-1 which has been derived from a no-observed-adverse-effect-level (NOAEL) of 8.00x10⁻⁴ mg kg-1 d-1 for dermal effects in a Taiwanese agricultural community exposed to As via drinking water (Tseng, 1977; Tseng et al., 1968). Figure 5 shows the predicted time-dependent build-up of As in muscle and milk after 10, 100, and 1000 days grazing on pasture growing on Soils A & B with the amendment of ash and aggregates. For muscle, assuming a 1000 day production period, daily consumption would have to exceed 0.01 kg d-1 for a 70 kg body weight consumer to exceed the RfD for beef produced on non-amended (i.e. control) pasture. Given that the 95th%ile beef muscle consumer eats about 1.7x10⁻⁵ kg muscle d-1, a dietary risk is not implied. However, at the higher ash levels modelled here (1%) daily muscle consumption would need to exceed 6.03x10⁻³ kg d-1 (approximately the 25th%ile consumption rate) in order to exceed the RfD for As. Interestingly, lower application rates of ash (0.1%) or the application of aggregate 2 (10%) have a protective effect (ie lower risk than he control soil) reducing uptake of As to pasture and subsequent incorporation into meat products. For AG 2, daily beef muscle consumption would have to exceed 0.05 kg d-1 for a consumer exceed the RfD for As. Daily consumption of milk would have to exceed 0.1 l d-1 for As exposure to surpass the RfD from milk produced on un-amended pasture. The 95th%ile milk consumption rate is about 0.13 l d-1 therefore only those individuals who consume milk at the highest end of the distribution are likely to exceed the RfD. Once again, AG 2 demonstrates a protective effect with 0.44 L d-
1 required to exceed the RfD. Compared to an ash addition to soils of 1%, which brings this down to only 0.06 L d-1, close to the 50th%ile milk consumption rate. For Soil B, the pattern of relative toxicity is different to that of Soil A, with all soil amendments increasing the uptake of As into ryegrass and hence enhancing incorporation into meat and milk products. The relative pattern of toxicity is however the same across the milk and meat products produced on Soil B compared to Soil A, with AG 2 promoting the most elevated levels of As in milk and meat products (Figure 5). Following the same criteria as for Soil A, for beef muscle produced on un-amended pasture the consumer would need to exceed 0.07 kg muscle d-1 (far greater than the 95th%ile consumption rate) for an appreciable risk to be recognized. For beef muscle produced on aggregate-amended pasture (AG 2), the critical threshold is 9.7x10⁻³ kg muscle d-1 which still exceeds the 95th%ile consumption rate. For milk produced on unamended pasture, the critical consumption rate is 0.6 l milk d-1 (almost 5 times the 95th%ile consumption rate). This decreases to 0.09 l milk d-1 for AG 2 (roughly the 70th%ile milk consumer) indicating an appreciable dietary risk for about 1/3 of milk consumers.
Soil A Soil B Control 0.1 (0.05) 0.7 (0.03)
+ Ash (0.1%) 1.2 (0.06) 1.4 (0.05) + Ash (1%) 2.2 (0.17) 1.8 (0.1)
+ Ash (10%)* - - + AG 1 1.9 (0.55) 0.6 (0.22) + AG 2 1.3 (0.35) 1.0 (0.6)
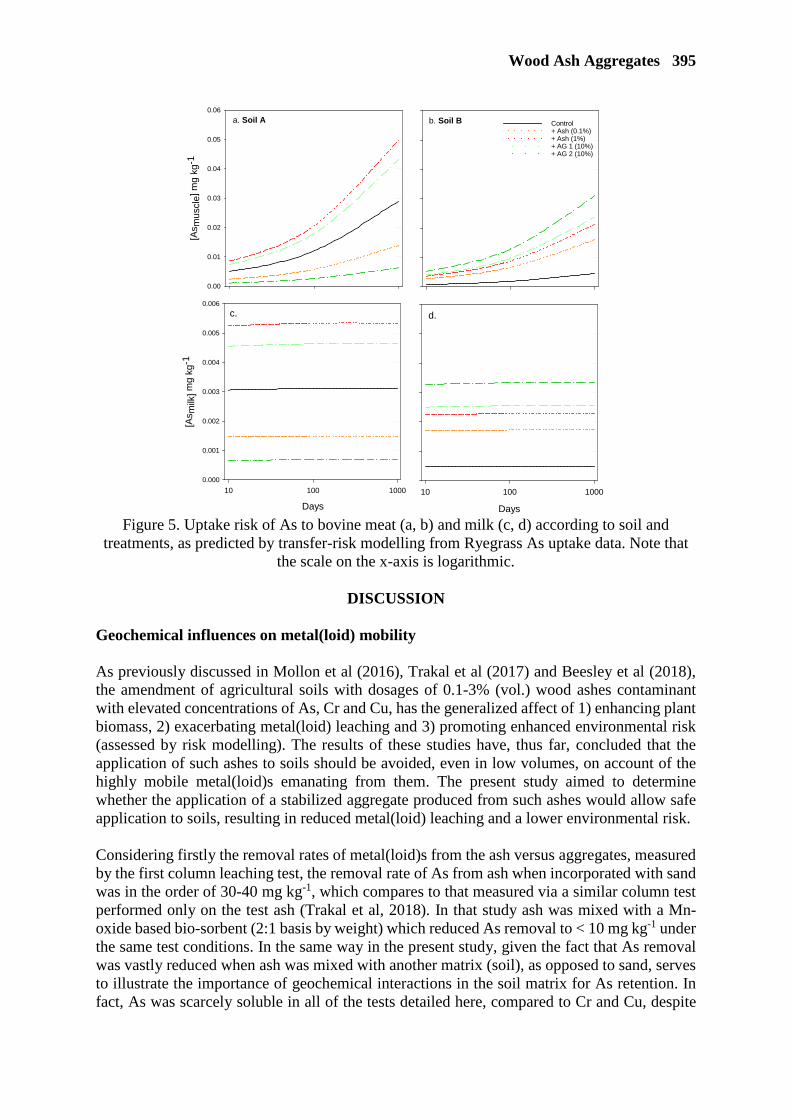
Wood Ash Aggregates 395
Figure 5. Uptake risk of As to bovine meat (a, b) and milk (c, d) according to soil and
treatments, as predicted by transfer-risk modelling from Ryegrass As uptake data. Note that the scale on the x-axis is logarithmic.
DISCUSSION
Geochemical influences on metal(loid) mobility As previously discussed in Mollon et al (2016), Trakal et al (2017) and Beesley et al (2018), the amendment of agricultural soils with dosages of 0.1-3% (vol.) wood ashes contaminant with elevated concentrations of As, Cr and Cu, has the generalized affect of 1) enhancing plant biomass, 2) exacerbating metal(loid) leaching and 3) promoting enhanced environmental risk (assessed by risk modelling). The results of these studies have, thus far, concluded that the application of such ashes to soils should be avoided, even in low volumes, on account of the highly mobile metal(loid)s emanating from them. The present study aimed to determine whether the application of a stabilized aggregate produced from such ashes would allow safe application to soils, resulting in reduced metal(loid) leaching and a lower environmental risk. Considering firstly the removal rates of metal(loid)s from the ash versus aggregates, measured by the first column leaching test, the removal rate of As from ash when incorporated with sand was in the order of 30-40 mg kg-1, which compares to that measured via a similar column test performed only on the test ash (Trakal et al, 2018). In that study ash was mixed with a Mn-oxide based bio-sorbent (2:1 basis by weight) which reduced As removal to < 10 mg kg-1 under the same test conditions. In the same way in the present study, given the fact that As removal was vastly reduced when ash was mixed with another matrix (soil), as opposed to sand, serves to illustrate the importance of geochemical interactions in the soil matrix for As retention. In fact, As was scarcely soluble in all of the tests detailed here, compared to Cr and Cu, despite
Days
10 100 1000
[As m
ilk] m
g kg
-1
0.000
0.001
0.002
0.003
0.004
0.005
0.006
a. Soil A
[As m
uscl
e] m
g kg
-1
0.00
0.01
0.02
0.03
0.04
0.05
0.06b. Soil B Control
+ Ash (0.1%) + Ash (1%) + AG 1 (10%) + AG 2 (10%)
Days
10 100 1000
c. d.

396 Mitchell et al
the similar pseudo-total concentrations (Table 1). A number of interacting factors could explain this. Arsenic is found in soils as an anion, either as arsenate or arsenite depending on the redox conditions, and these anionic forms are less strongly retained in soils as the pH rises (Moreno-Jiménez et al, 2012). In our experiments, we expected in both columns and pot conditions, that As is in the form of arsenate because no symptoms of reduction were observed. Arsenate has been consistently described to increase its mobility in soils as pH rises (Smith et al. 1999 ; Fitz and Wenzel 2002), especially in the pH range measured in the experiments described here. This explains the dominant affect of pH on As mobility in pore waters collected in pot conditions, in the presence of soils (as demonstrated by the equation in section 3.2). Therefore As mobility due to the pH of the ash and aggregate was expected. But this is complicated further by the presence of Ca, which has been reported to increase As retention in soils (Smith et al, 2002; Stachowicz et al, 2008). Therefore the treatments with more Ca, such as the cementitious aggregates, can partly counteract As mobilisation from the high pH. However, Wenzel (2013) comments on the lack of association of As with Ca minerals at pH of < 9.5 and it could thus prevail that the enhanced As retention afforded by soils A and B was due to formation of complexes with other soil components at pH > 9.5 (Fe oxide, organic matter etc). The formation of soluble organometallic complexes, for example with dissolved organic carbon is also a major controlling factor in metal(loid) mobility (Bernal et al., 2006; Beesley and Dickinson, 2010). Total lack of Cu removal from the ash and aggregates in test conditions when mixed only with sand can be explained by lack of solubility under alkaline conditions, without buffering from the inclusion of soils. Environmental risk factors associated with the tested materials The risk modelling approach used was very conservative, and as with all modelling approaches should be treated as providing an indication of potential risk, rather than a comprehensive assessment. Broadly speaking, the results of the modelling indicate that the application of un-treated ash derived from the burning of waste wood to agricultural soils may pose some risks to the food chain. More ‘extreme’ consumers are more likely to experience some form of adverse health outcomes attributable to the ash product, regardless of soil amendment or receiving soil. Having said this, consumers of this type may arguably experience other unwanted health outcomes associated with their dietary habits. More importantly, the magnitude of risk as well as the success of the stable aggregates to reduce that risk, was mediated by soil type. For Soil A, treatments AG2 and low (0.1%) ash both reduced potential food chain risks to below the level posed by the control treatment. Thus for this soil the use of AG2 enables a larger dose of ash to be applied whilst reducing the risk level associated with this amendment. However, for Soil B, all treatments elevated the potential food chain risk above the control treatment. Also, the use of the stabilized aggregates resulted in the highest levels of food chain risk. Thus knowledge of the receiving soil, and the biochemical conditions resulting from the addition of these treatments, are crucial to using these amendments effectively. Therefore it is not necessarily the case that testing the stability of aggregates under column conditions is directly transferrable to the assertion of risk.
CONCLUSIONS
Whilst the results of this study demonstrate the soil-specific nature of metal(loid) leaching, ryegrass uptake and associated risk when wood ashes and stabilized aggregates are added to two soils, it is possible to conclude that the formation of stabilized aggregates where metal(loid) rich wood ashes are a component may allow value to be derived from such ashes, in the context
Wood Ash Aggregates 397
of addition to soils. Whilst it is unlikely that wood ashes with high As, Cr and Cu concentrations would ever knowingly be applied to agricultural soils, it may be the case that the production of technical soils utilizing a proportion of their composition from stabilized aggregates could be suitable media for the growth of non-food crops, where leachates are closely monitored and captured to ensure that soluble metal(loid)s are not leaching in excessive concentrations to proximal waters. It remains for future research to determine whether further stabilization of As, Cr and Cu can be achieved through refining the method of aggregate production.
REFERENCES
Beesley, L., Dickinson, N. 2010. Carbon and trace element mobility in an urban soil amended with green waste compost. Journal of Soils and Sediments 10, 215-222 Beesley, L., Hough, R., Deacon, C. M., & Norton, G. J. (2018). The Impacts of Applying Metal(loid) Enriched Wood Ash to Soils on the Growth and Elemental Accumulation of Rice. Exposure and Health. https://doi.org/10.1007/s12403-018-0273-2 Beesley, L., Moreno-Jimenez, E., Clemente, R., Lepp, N. & Dickinson, N. 2010. Mobility of arsenic, cadmium and zinc in a multi-element contaminated soil profile assessed by in-situ soil pore water sampling, column leaching and sequential extraction. Environmental Pollution 158, 155-160. Bernal, M., Clemente, R. and Walker, D.J. 2007. The role of organic amendments in the bioremediation of heavy metal-polluted soils. In: Gore, R.W. (Ed.) Environmental Research at the Leading Edge. Nova Science. New York, pp. 1-58. Crout, N.M.J., Beresford, N.A., Dawson, J., Soar, J., Mayes, R.W. 2004. The transfer of 73As, 109Cd and 203Hg to the milk and tissues of dairy cattle. Journal of Agricultural Science 142:203-212. Fayers, C.A. 1996. Concentrations of elements in food and justification of the concentration ratios and transfer factors used in the NRPB Foodchain Model FARMLAND. NRPB Report No. M746. Chilton, Didcot, Oxon, UK. Fitz WJ, Wenzel WW (2002) Arsenic transformations in the soil-rhizophere-plant system: fundamentals and potential application to phytoremediation. J Biotechnol 99:259–278 Jones, M.R., Halliday, J.E., Csetenyi, L.J., Zheng, L., Strompinis, N. (2015). Feasibility of utilising quarry fines and waste silts to manufacture synthetic lightweight sand. Magazine of Concrete Research, 67(12): 656 –664 Mitchell, K., Trakal, L., Sillerova, H., Avelar-Gonzalez, F.J., Guerrero-Barrera, A.L., Hough, R., Beesley,L. (2018). Mobility of As, Cr and Cu in a contaminated grassland soil in response to diverse organic amendments; a sequential column leaching experiment. Applied Geochemistry, 88, 95-102 Mollon, L.C., Norton, G.J., Trakal, L., Moreno-Jimenez, E., Elouali, F.Z., Hough, R.L., Beesley, L. 2016 Mobility and toxicity of heavy metal(loid)s arising from contaminated wood ash application to a pasture grassland soil. Environmental Pollution, 218, 419-427
398 Mitchell et al
Moreno-Jiménez, E., Esteban, E., & Peñalosa, J. M. (2012). The fate of arsenic in soil-plant systems. In Reviews of environmental contamination and toxicology (pp. 1-37). Springer, New York, NY. Moreno-Jimenez, E., Beesley, L., Lepp, N.W., Dickinson, N.M., Hartley, W. & Clemente, R. 2011. Field sampling of soil pore water to evaluate trace element mobility and associated environmental risk. Environmental Pollution 159, 3078-3085 Pinder, J.E. & McLeod, K.W. 1988. Contaminant transport in agroecosystems through retention of soil particles on plant surfaces. Journal of Environmental Quality 17:602-607. Smith E, Naidu R, Alston AM (1999) Chemistry of arsenic in soils. I. Sorption of arsenate and arsenite by four Australian soils. J Environ Qual 28:1719–1726 Smith E, Naidu R, Alston AM (2002) Chemistry of inorganic arsenic in soils. II. Effect of phosphorous, sodium, and calcium on arsenic sorption. J Environ Qual 31:557–563 Stachowicz M, Hiemstra T, van Riemsdijk WH (2008) Multi-competitive interaction of As(III) and As(V) oxyanions with Ca 2+ , Mg 2+ , PO 4 3− , and CO 3 2− ions on goethite. J Colloid Interface Sci 320:400–414 The Farm Management Handbook. 2018/19. Editor Kara Craig, SAC Consulting. https://www.fas.scot/downloads/farm-management-handbook-2018-19/ Trakal, L., Raya-Moreno, I., Mitchell, K., Beesley, L. 2017. Stabilization of metal(loid)s in two contaminated agricultural soils: Comparing biochar to its non-pyrolysed source material. Chemosphere, 181, 150-159 Tseng, W.P., Chu, H.M., How, S.W., Fong, J.M., Lin, C.S. & Yen, S. 1968. Prevalence of skin cancer in an endemic area of chronic arsenicism in Taiwan. Journal of the National Cancer Institute 40:453-463. Tseng, W.P. 1977. Effects and dose-response relationships of skin cancer and Blackfoot disease with arsenic. Environmental Health Perspectives 19:109-119.
INFLUENCE OF HEAT AND CHEMICAL ACTIVATION ON STRENGTH AND DURABILITY OF HIGH STRENGTH HIGH
VOLUME FLY ASH CONCRETE
S Nwaubani
M Hlabangana
University of the Witwatersrand
South Africa
ABSTRACT. High volume fly ash (HVFA) concrete presents an alternative, sustainable, renewable and environmentally friendly approach to production of construction materials. However, it has not been fully embraced in high strength structural concrete applications due to the challenge of reduced early age compressive strength development. The study investigated the possibility of improving early age compressive strength of high-volume fly ash concrete. Concrete incorporating OPC and fly ash contents of 25%, 35% and 50% was subjected to heat and Ca(OH)2 activation in order to improve early age strength development and durability. Eight high strength concrete mixes with a w/c ratio of 0.45 were investigated for compressive strength development and chloride conductivity. Concrete cubes from each of the mixes were cast and cured in water at either 23⁰C or 40⁰C. Compressive strength tests were done after curing for 1, 3, 7, 28, 90 and 180 days. Chloride conductivity index tests were conducted at the age of 28days in accordance with the South African Standard. Compressive strength results showed that Ca(OH)2 and heat activation significantly improved the strength of HVFA concrete. Chloride conductivity index results indicate that the chloride conductivity index of OPC concrete was significantly higher than that of fly ash concrete. Fly ash concrete subjected to heat activation by curing at 40⁰C yielded much lower chloride conductivity index results compared to fly ash concrete cured at 23⁰C. Keywords: High Volume Fly Ash (HVFA), Ultra-fine fly ash, High Strength, Activation, Compressive Strength, Chloride Conductivity Professor Sunday Nwaubani is an academic at the School of Civil Engineering at University of the Witwatersrand, Johannesburg, in South Africa. Professor Nwaubani has been a Senior Lecturer in the United Kingdom for over 20 years aand is a Senior Fellow of the prestigious UK Higher Education Academy (SFHEA). His main research areas are concerned with the properties, durability and microstructure of construction materials, structural concrete, blended cements, clinckerless cements, polymer-concrete, use of waste materials in construction, sustainability, corrosion and corrosion mitigation issues. Mthulisi Hlabangana is an MSc student at the School of Civil Engineering at University of the Witwatersrand, Johannesburg, in South Africa.
400 Nwaubani and Hlabangana
INTRODUCTION
Concrete is one of the most extensively used construction material in the world, as a result it drives the demand of cement whose production is an energy intensive process with a high carbon footprint which contributes to climate change. Therefore, it is imperative to explore alternative approaches to utilisation of construction materials. Reducing cement used in concrete by incorporating high volume fly ash can go a long way in providing sustainable, cost effective and environmentally friendly solutions to developmental activities. In essence, high volume fly ash concrete is a tailor-made solution for sustainable use of concrete and for effective utilisation of fly ash. Mehta (2004) defines HVFA concrete as concrete with a minimum of 50% of fly ash by mass of the cementitious materials. High strength concrete can be defined as concrete with a compressive strength of 60MPa at 28 days (www.concrete.org.uk). High strength high volume fly ash concrete can be defined as concrete with at least 50% fly ash content which yields compressive strength of 60MPa and above at 28 days. However, the major challenge that limits the application of HVFA concrete in high strength concrete applications is the low early age strength development. This has resulted in authorities developing specifications that shun the use of high-volume fly ash as a cement extender. SANS 50197-1 standard limits fly ash content in blended cement manufacture to 35%. The use of HVFA has mainly been limited to mass concrete applications such as dam construction where it is primarily used for its ability to regulate the heat of hydration rather than for its strength. Applying activation techniques such as heat and alkaline activation can improve the early age strength of HVFA concrete and make it applicable for high strength concrete applications with high durability requirements. Temperature plays a vital role in concrete hydration and a number of previous work on the effect of high temperature on Fly Ash concrete reveal that compressive strength is greatly enhanced (Cabrera, et al (1993), Nwaubani and Khatib (2017)). It is important to point out that many of the previous investigations done on HVFA concrete has been concentrated on the ambient conditions in the temperate regions of the world, where the lower ambient temperatures result in slow hydration of the concrete. There is a need for more in-depth study of the influence of higher temperature on the early and long-term properties of HVFA concrete.
FLY ASH ACTIVATION
Activation of fly ash can be achieved through use of chemical and physical techniques. Owens et all. (2010), states that the two chemical methods commonly used to activate fly ash are alkali and sulphate activation. The alkali activators commonly used to activate fly ash pozzolanic reactions are sodium hydroxide and calcium hydroxide. Bao-min and Li-jiu (2004) allude to other activation techniques such as high molecular materials and special ion activators. Physical means of activating fly ash involves grinding of fly ash and heat activation. Addition of alkali into fly ash concrete creates an elevated alkaline pH environment which is conducive for the dissolution of fly ash glassy phases. Fly ash activation using alkali entails the breaking down of fly ash glassy phases such as alumina and silica in an elevated alkaline pH environment. Fraay et. al. (1989) investigated the solubility of the fly ash glass particles and reported that the glass structures of fly ash investigated were broken down substantially at a pH value of about 13.3 or higher. They further suggested that the rate of fly ash reaction is highly temperature dependent due to the fact that the solubility of the fly ash and the alkalinity of the concrete pore water are temperature dependent. This could be the explanation of why heat can be used to accelerate the fly ash pozzolanic
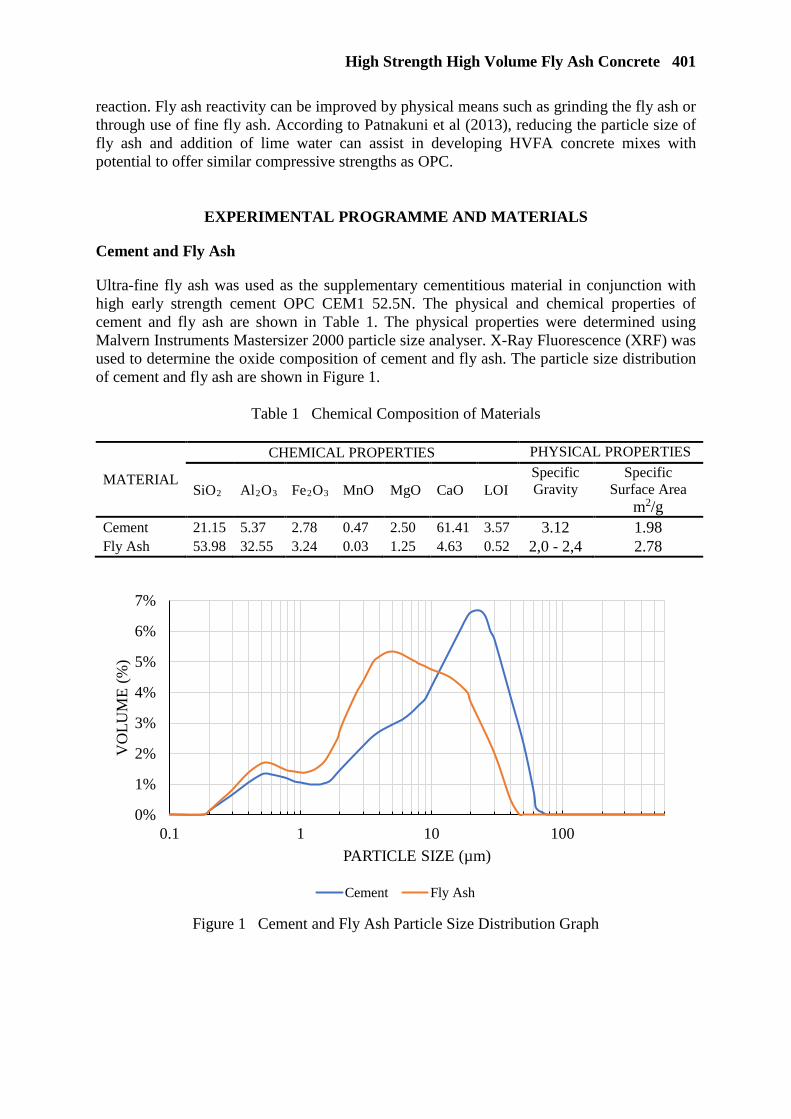
High Strength High Volume Fly Ash Concrete 401
reaction. Fly ash reactivity can be improved by physical means such as grinding the fly ash or through use of fine fly ash. According to Patnakuni et al (2013), reducing the particle size of fly ash and addition of lime water can assist in developing HVFA concrete mixes with potential to offer similar compressive strengths as OPC.
EXPERIMENTAL PROGRAMME AND MATERIALS
Cement and Fly Ash
Ultra-fine fly ash was used as the supplementary cementitious material in conjunction with high early strength cement OPC CEM1 52.5N. The physical and chemical properties of cement and fly ash are shown in Table 1. The physical properties were determined using Malvern Instruments Mastersizer 2000 particle size analyser. X-Ray Fluorescence (XRF) was used to determine the oxide composition of cement and fly ash. The particle size distribution of cement and fly ash are shown in Figure 1.
Table 1 Chemical Composition of Materials
MATERIAL
CHEMICAL PROPERTIES PHYSICAL PROPERTIES
SiO2 Al2O3 Fe2O3 MnO MgO CaO LOI Specific Gravity
Specific Surface Area
m2/g Cement 21.15 5.37 2.78 0.47 2.50 61.41 3.57 3.12 1.98 Fly Ash 53.98 32.55 3.24 0.03 1.25 4.63 0.52 2,0 - 2,4 2.78
Figure 1 Cement and Fly Ash Particle Size Distribution Graph
0%
1%
2%
3%
4%
5%
6%
7%
0.1 1 10 100
VO
LU
ME
(%
)
PARTICLE SIZE (µm)
Cement Fly Ash

402 Nwaubani and Hlabangana
Aggregates
The fine and coarse aggregates used consisted of crushed andesite rock particles. All the fine aggregates were sieved and separated according to standard sieve sizes and they were latter on mixed in desired proportions in order to achieve consistency of fine aggregates throughout the project. Water absorption tests for aggregates were used to determine the absorption water to be added to the mixing water. The coarse aggregate stone sizes used in the study were 6.7mm (20%), 9.5mm (30%) and 13.2mm (50%). The different coarse aggregate sizes were combined in order to improve particle packing. All the aggregates were oven dried to constant weight and stored in a dry airtight container. The aggregates had a relative density of 2.94. Admixtures
Sika Viscocrete 90HE with chemical base of modified polycarboxylic was used as a high range water reducing admixture. Activator
Calcium hydroxide was added to the concrete mixes in proportions shown in Table 2.
CONCRETE MIX DESIGN
Table 2 gives an outline of the concrete mixes investigated in the study.
Table 2 Concrete Mix Design (w/c=0.45)
MIX NO
CEMENT TOTAL WATER (L/m3)
OPC (kg/m3)
FA (kg/m3)
COARSE AGG (kg/m3)
FINE AGG (kg/m3)
POWDER CALCIUM
HYDROXIDE (% of OPC+FA)
1 OPC 180 400 0 1200 895 5 2 OPC 180 400 0 1200 895 0 3 OPC+25%FA 180 300 100 1200 895 5 4 OPC+25%FA 180 300 100 1200 895 0 5 OPC+35% FA 180 260 140 1200 895 5 6 OPC+35% FA 180 260 140 1200 895 0 7 OPC+50% FA 180 200 200 1200 895 5 8 OPC+50% FA 180 200 200 1200 895 0
CONCRETE MIXING, SPECIMEN PREPARATION AND CURING
A drum mixer was used for concrete mixing and the superplasticiser was added directly to the concrete during mixing at varying dosages. Consistency of concrete was checked by taking slump measurements. Concrete cubes of size 100mm were cast in accordance with SANS 5861-3:2006. The concrete cubes were cured in a water bath at either 23⁰C or 40⁰C. After casting, concrete moulds were covered with multiple water proof polythene bags and placed in the curing bath. The cubes were demoulded after 24 hours and returned to the curing baths.
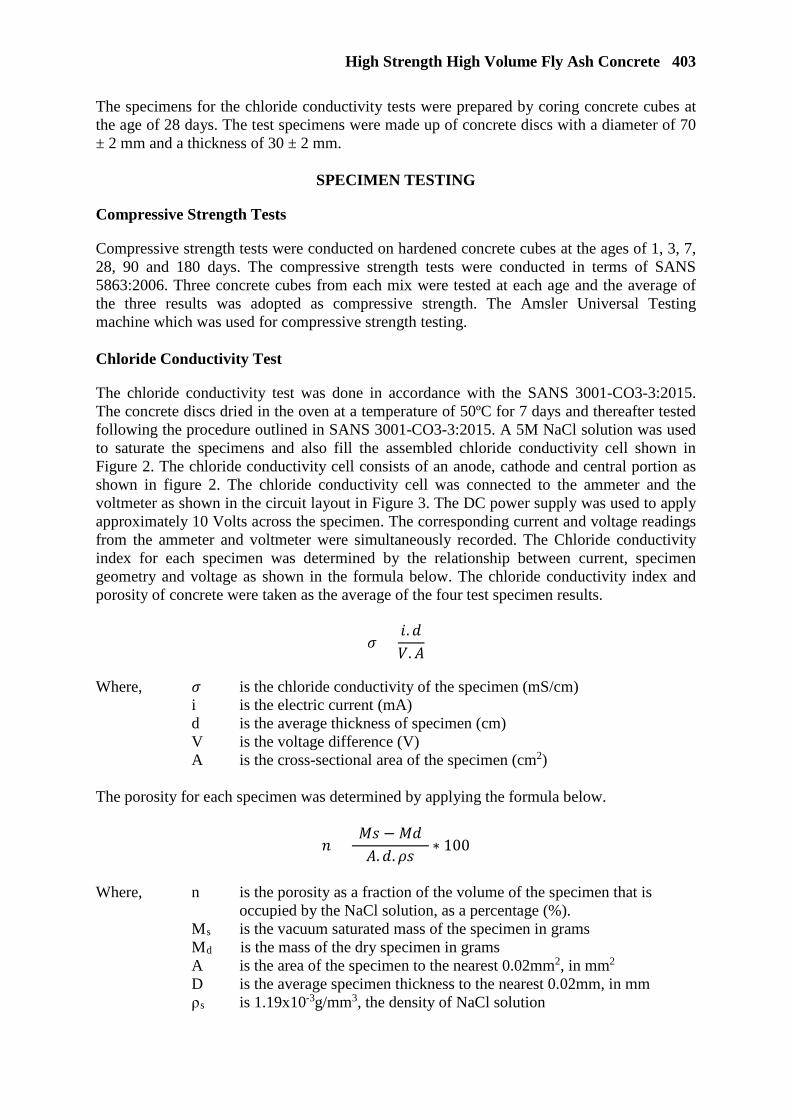
High Strength High Volume Fly Ash Concrete 403
The specimens for the chloride conductivity tests were prepared by coring concrete cubes at the age of 28 days. The test specimens were made up of concrete discs with a diameter of 70 ± 2 mm and a thickness of 30 ± 2 mm.
SPECIMEN TESTING
Compressive Strength Tests
Compressive strength tests were conducted on hardened concrete cubes at the ages of 1, 3, 7, 28, 90 and 180 days. The compressive strength tests were conducted in terms of SANS 5863:2006. Three concrete cubes from each mix were tested at each age and the average of the three results was adopted as compressive strength. The Amsler Universal Testing machine which was used for compressive strength testing. Chloride Conductivity Test
The chloride conductivity test was done in accordance with the SANS 3001-CO3-3:2015. The concrete discs dried in the oven at a temperature of 50ºC for 7 days and thereafter tested following the procedure outlined in SANS 3001-CO3-3:2015. A 5M NaCl solution was used to saturate the specimens and also fill the assembled chloride conductivity cell shown in Figure 2. The chloride conductivity cell consists of an anode, cathode and central portion as shown in figure 2. The chloride conductivity cell was connected to the ammeter and the voltmeter as shown in the circuit layout in Figure 3. The DC power supply was used to apply approximately 10 Volts across the specimen. The corresponding current and voltage readings from the ammeter and voltmeter were simultaneously recorded. The Chloride conductivity index for each specimen was determined by the relationship between current, specimen geometry and voltage as shown in the formula below. The chloride conductivity index and porosity of concrete were taken as the average of the four test specimen results.
𝜎𝜎 =𝑖𝑖.𝑑𝑑𝑉𝑉.𝐴𝐴
Where, 𝜎𝜎 is the chloride conductivity of the specimen (mS/cm)
i is the electric current (mA) d is the average thickness of specimen (cm) V is the voltage difference (V) A is the cross-sectional area of the specimen (cm2)
The porosity for each specimen was determined by applying the formula below.
𝑛𝑛 =(𝑀𝑀𝑀𝑀 −𝑀𝑀𝑑𝑑)𝐴𝐴.𝑑𝑑.𝜌𝜌𝑀𝑀
∗ 100
Where, n is the porosity as a fraction of the volume of the specimen that is
occupied by the NaCl solution, as a percentage (%). Ms is the vacuum saturated mass of the specimen in grams Md is the mass of the dry specimen in grams A is the area of the specimen to the nearest 0.02mm2, in mm2 D is the average specimen thickness to the nearest 0.02mm, in mm ρs is 1.19x10⁻³g/mm3, the density of NaCl solution

404 Nwaubani and Hlabangana
Figure 2 Chloride Conductivity Cell Assembly (Durability Index Testing Manual, 2017)
Figure 3 Chloride Conductivity Circuit Arrangement (Durability Index Testing Manual, 2017)
RESULTS AND DISCUSSIONS
Compressive Strength
The compressive strength tests were conducted at the ages of 1, 3, 7, 28, 90 and 180 days. The results presented in this section are the average of compressive strength results of three cubes. The discussion on compressive strength gives more emphasis on the comparison of strength results of concrete with 50% fly ash content and those of OPC concrete. The discussion gives insight on how compressive strength is influenced by fly ash content and activation.
A
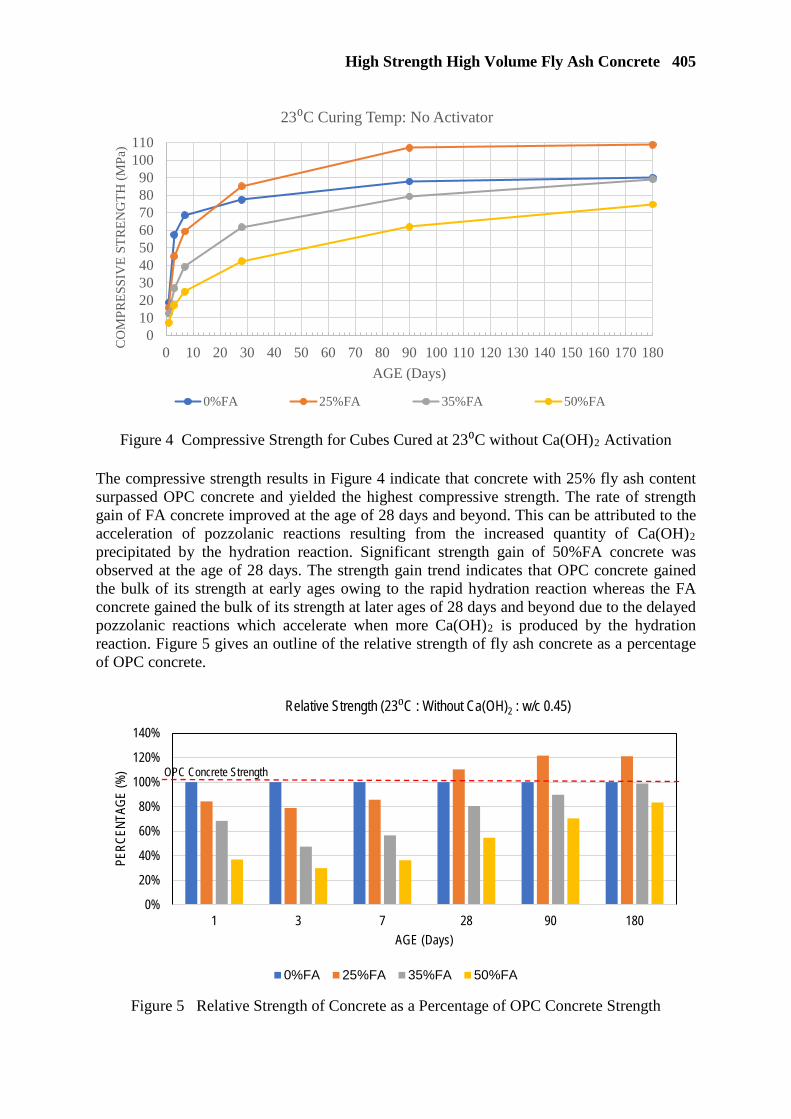
High Strength High Volume Fly Ash Concrete 405
Figure 4 Compressive Strength for Cubes Cured at 23⁰C without Ca(OH)2 Activation
The compressive strength results in Figure 4 indicate that concrete with 25% fly ash content surpassed OPC concrete and yielded the highest compressive strength. The rate of strength gain of FA concrete improved at the age of 28 days and beyond. This can be attributed to the acceleration of pozzolanic reactions resulting from the increased quantity of Ca(OH)2 precipitated by the hydration reaction. Significant strength gain of 50%FA concrete was observed at the age of 28 days. The strength gain trend indicates that OPC concrete gained the bulk of its strength at early ages owing to the rapid hydration reaction whereas the FA concrete gained the bulk of its strength at later ages of 28 days and beyond due to the delayed pozzolanic reactions which accelerate when more Ca(OH)2 is produced by the hydration reaction. Figure 5 gives an outline of the relative strength of fly ash concrete as a percentage of OPC concrete.
Figure 5 Relative Strength of Concrete as a Percentage of OPC Concrete Strength
0102030405060708090
100110
0 10 20 30 40 50 60 70 80 90 100 110 120 130 140 150 160 170 180
CO
MP
RE
SS
IVE
ST
RE
NG
TH
(M
Pa)
AGE (Days)
23⁰C Curing Temp: No Activator
0%FA 25%FA 35%FA 50%FA
0%
20%
40%
60%
80%
100%
120%
140%
1 3 7 28 90 180
PERC
ENTA
GE (%
)
AGE (Days)
Relative Strength (23⁰C : Without Ca(OH)2 : w/c 0.45)
0%FA 25%FA 35%FA 50%FA
OPC Concrete Strength
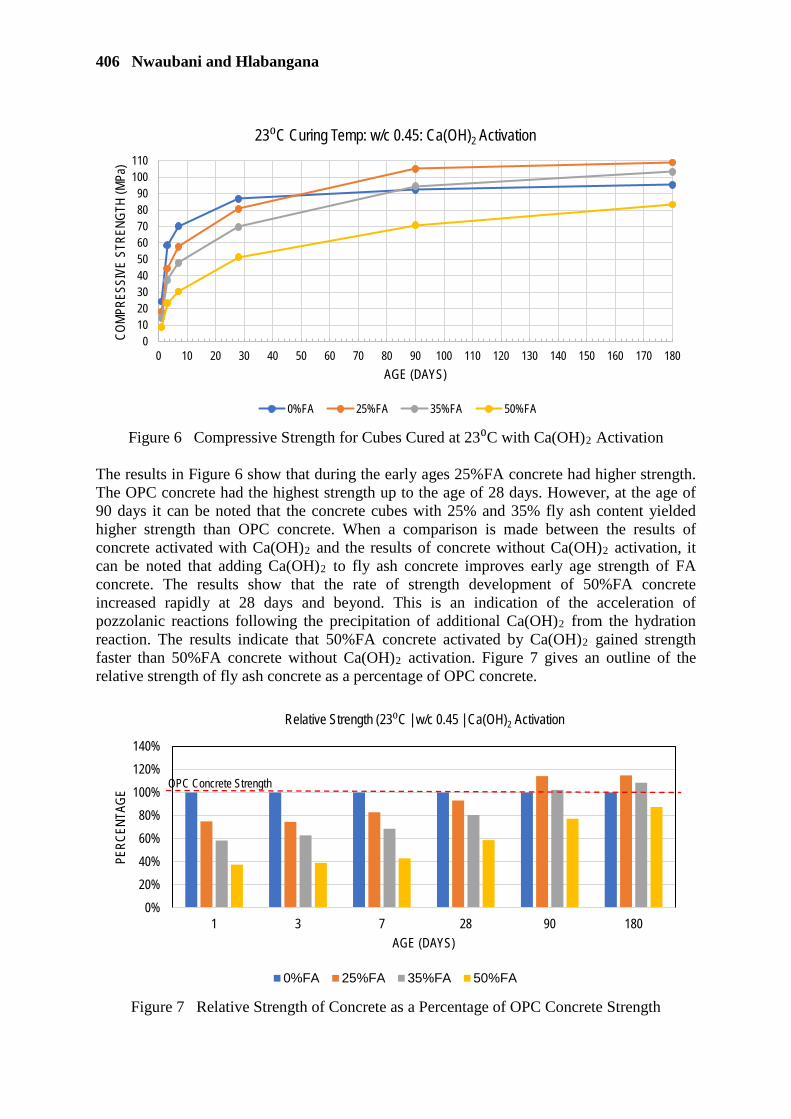
406 Nwaubani and Hlabangana
Figure 6 Compressive Strength for Cubes Cured at 23⁰C with Ca(OH)2 Activation
The results in Figure 6 show that during the early ages 25%FA concrete had higher strength. The OPC concrete had the highest strength up to the age of 28 days. However, at the age of 90 days it can be noted that the concrete cubes with 25% and 35% fly ash content yielded higher strength than OPC concrete. When a comparison is made between the results of concrete activated with Ca(OH)2 and the results of concrete without Ca(OH)2 activation, it can be noted that adding Ca(OH)2 to fly ash concrete improves early age strength of FA concrete. The results show that the rate of strength development of 50%FA concrete increased rapidly at 28 days and beyond. This is an indication of the acceleration of pozzolanic reactions following the precipitation of additional Ca(OH)2 from the hydration reaction. The results indicate that 50%FA concrete activated by Ca(OH)2 gained strength faster than 50%FA concrete without Ca(OH)2 activation. Figure 7 gives an outline of the relative strength of fly ash concrete as a percentage of OPC concrete.
Figure 7 Relative Strength of Concrete as a Percentage of OPC Concrete Strength
0102030405060708090
100110
0 10 20 30 40 50 60 70 80 90 100 110 120 130 140 150 160 170 180
COMP
RESS
IVE
STRE
NGTH
(MPa
)
AGE (DAYS)
23⁰C Curing Temp: w/c 0.45: Ca(OH)2 Activation
0%FA 25%FA 35%FA 50%FA
0%
20%
40%
60%
80%
100%
120%
140%
1 3 7 28 90 180
PERC
ENTA
GE
AGE (DAYS)
Relative Strength (23⁰C | w/c 0.45 | Ca(OH)2 Activation
0%FA 25%FA 35%FA 50%FA
OPC Concrete Strength
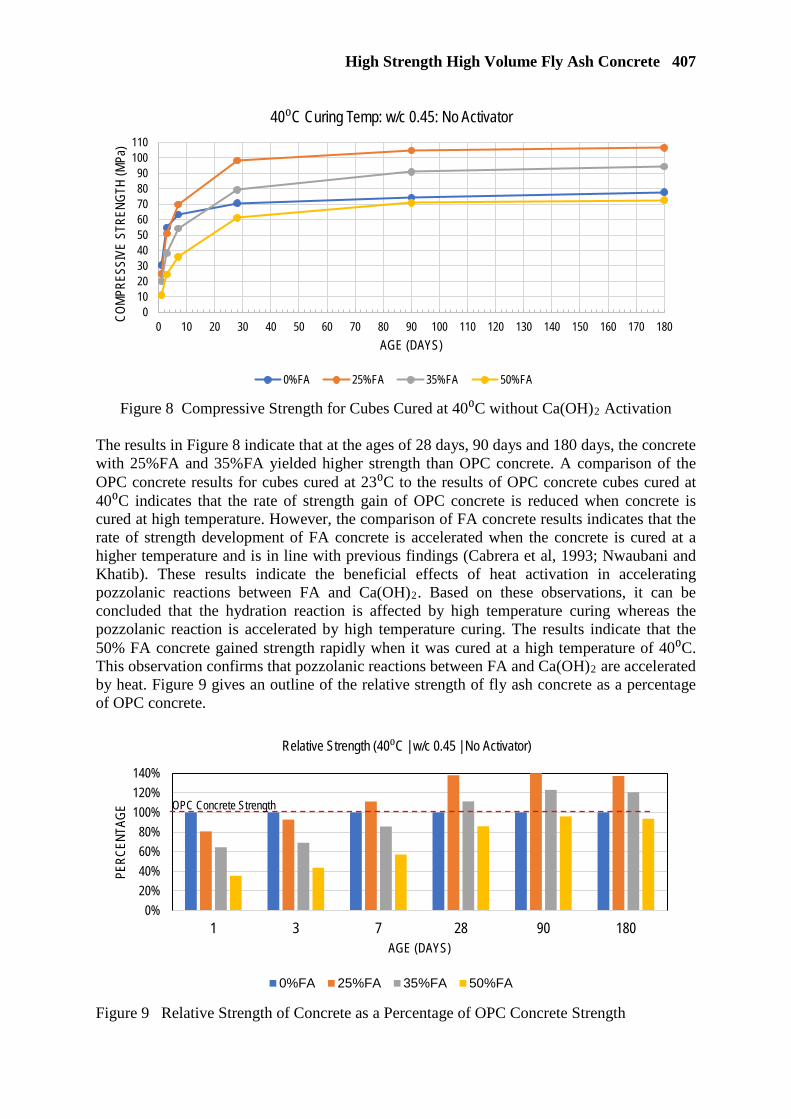
High Strength High Volume Fly Ash Concrete 407
Figure 8 Compressive Strength for Cubes Cured at 40⁰C without Ca(OH)2 Activation
The results in Figure 8 indicate that at the ages of 28 days, 90 days and 180 days, the concrete with 25%FA and 35%FA yielded higher strength than OPC concrete. A comparison of the OPC concrete results for cubes cured at 23⁰C to the results of OPC concrete cubes cured at 40⁰C indicates that the rate of strength gain of OPC concrete is reduced when concrete is cured at high temperature. However, the comparison of FA concrete results indicates that the rate of strength development of FA concrete is accelerated when the concrete is cured at a higher temperature and is in line with previous findings (Cabrera et al, 1993; Nwaubani and Khatib). These results indicate the beneficial effects of heat activation in accelerating pozzolanic reactions between FA and Ca(OH)2. Based on these observations, it can be concluded that the hydration reaction is affected by high temperature curing whereas the pozzolanic reaction is accelerated by high temperature curing. The results indicate that the 50% FA concrete gained strength rapidly when it was cured at a high temperature of 40⁰C. This observation confirms that pozzolanic reactions between FA and Ca(OH)2 are accelerated by heat. Figure 9 gives an outline of the relative strength of fly ash concrete as a percentage of OPC concrete.
Figure 9 Relative Strength of Concrete as a Percentage of OPC Concrete Strength
0102030405060708090
100110
0 10 20 30 40 50 60 70 80 90 100 110 120 130 140 150 160 170 180
COMP
RESS
IVE
STRE
NGTH
(MPa
)
AGE (DAYS)
40⁰C Curing Temp: w/c 0.45: No Activator
0%FA 25%FA 35%FA 50%FA
0%20%40%60%80%
100%120%140%
1 3 7 28 90 180
PERC
ENTA
GE
AGE (DAYS)
Relative Strength (40⁰C | w/c 0.45 | No Activator)
0%FA 25%FA 35%FA 50%FA
OPC Concrete Strength

408 Nwaubani and Hlabangana
Figure 10 Compressive Strength for Cubes Cured at 40⁰C with Ca(OH)2 Activation
The results in Figure 10, indicate that at the ages of 90 days and 180 days the strength of all concrete with fly ash surpassed the strength of OPC concrete. The strength development pattern of Ca(OH)2 activated concrete cured at 40⁰C indicates that the rate of strength gain of OPC concrete is reduced when concrete is cured at high temperature. However, the strength development patterns of FA concrete indicate that the rate of strength gain of FA concrete is accelerated when the concrete is cured at a higher temperature and activated with Ca(OH)2. This gives an indication of the influence of Ca(OH)2 activation and high temperature curing on accelerating pozzolanic reactions in fly ash concrete. The results indicate that the 50%FA concrete gained strength rapidly when it was subjected to both high temperature curing and Ca(OH)2 activation. Figure 11 gives an outline of the relative strength of fly ash concrete as a percentage of OPC concrete.
Figure 11 Relative Strength of Concrete as a Percentage of OPC Concrete Strength
0102030405060708090
100110
0 10 20 30 40 50 60 70 80 90 100 110 120 130 140 150 160 170 180
COMP
RESS
IVE
STRE
NGTH
(MPa
)
AGE (DAYS)
40⁰C Curing Temp: w/c 0.45: Ca(OH)2 Activation
0%FA 25%FA 35%FA 50%FA
0%
20%
40%
60%
80%
100%
120%
140%
1 3 7 28 90 180
PERC
ENTA
GE
AGE (DAYS)
Relative Strength (40⁰C | w/c 0.45 | Ca(OH)2 Activator)
0%FA 25%FA 35%FA 50%FA
OPC Concrete Strength
High Strength High Volume Fly Ash Concrete 409
CHLORIDE CONDUCTIVITY INDEX
The chloride conductivity index determined in terms of SANS 3001-CO3-3:2015 generally ranges from 3 mS/cm to 0.75 mS/cm. A low chloride conductivity index value depicts a concrete with good durability whereas a high value depicts concrete with poor durability (Alexander et al.,2001). The relationship between chloride conductivity index and fly ash content is shown by graphs in Figure 12. The results indicate that OPC concrete had the highest chloride conductivity index. This is consistent with the findings of Nath and Sarker (2011) who investigated chloride permeability of HVFA and concluded that fly ash concrete yielded better resistance to chloride ion penetration compared to OPC concrete. It can be observed that there was a significant reduction in chloride conductivity for concrete specimens with 25% FA and 35% FA. The results concur with the findings of a similar study conducted by Alexander et al. 2001 on FA and GGBS concretes in which they reported that there was a reduction in chloride conductivity index in concrete incorporating FA and GGBS. It can be noted that the chloride conductivity index was lowest in concrete with 35% fly ash content. The influence of curing temperature on chloride conductivity index was distinct and significant. It can be observed that concrete cured at 40⁰C had significantly lower chloride conductivity index compared to the concrete cured at 23⁰C. This can be attributed to the role played by heat in acceleration of pozzolanic reactions that increase the quantity of cementing compounds which fill the pore spaces and lead to the reduction of capillary pore sizes in the hardened cement paste. The results also indicate that the chloride conductivity index of 50%FA concrete slightly increased when compared to the chloride conductivity index of 25%FA and 35%FA concrete. This observation is consistent with the findings made by Dhir et al., (1997) in a study on chloride binding capacity of OPC/FA pastes. The study reported that up to 33% FA replacement level, the chloride binding capacity was the dominant factor in improving resistance to chloride ingress but beyond 33% FA level there was a decline in chloride binding capacity and a slight increase in intrinsic permeability that resulted in the reduction in concrete resistance to chloride ingress. The increase in chloride conductivity index for concrete with 50% FA can also be attributed to the fact that at the 28 day age of testing concrete with 50% FA, the quantity of pozzolanic reaction products had not yet risen to levels that could start significantly impacting on the porosity of concrete. A comparison of the results of concrete with Ca(OH)2 activation and those of concrete without Ca(OH)2 indicate that concrete with Ca(OH)2 activation had slightly lower chloride conductivity index. Table 4 shows the suggested durability index values developed by Alexander et al., (2001). A comparison of the chloride conductivity index (CCI) results with these suggested durability index values indicates that the bulk of the CCI results fall in the excellent category. Only CCI results for OPC concrete fall in the “Good” category. A similar comparison of the CCI results with the acceptance criterion detailed in Table 5 shows that the bulk of the CCI results fall within the acceptable criterion for laboratory and as-build concrete.
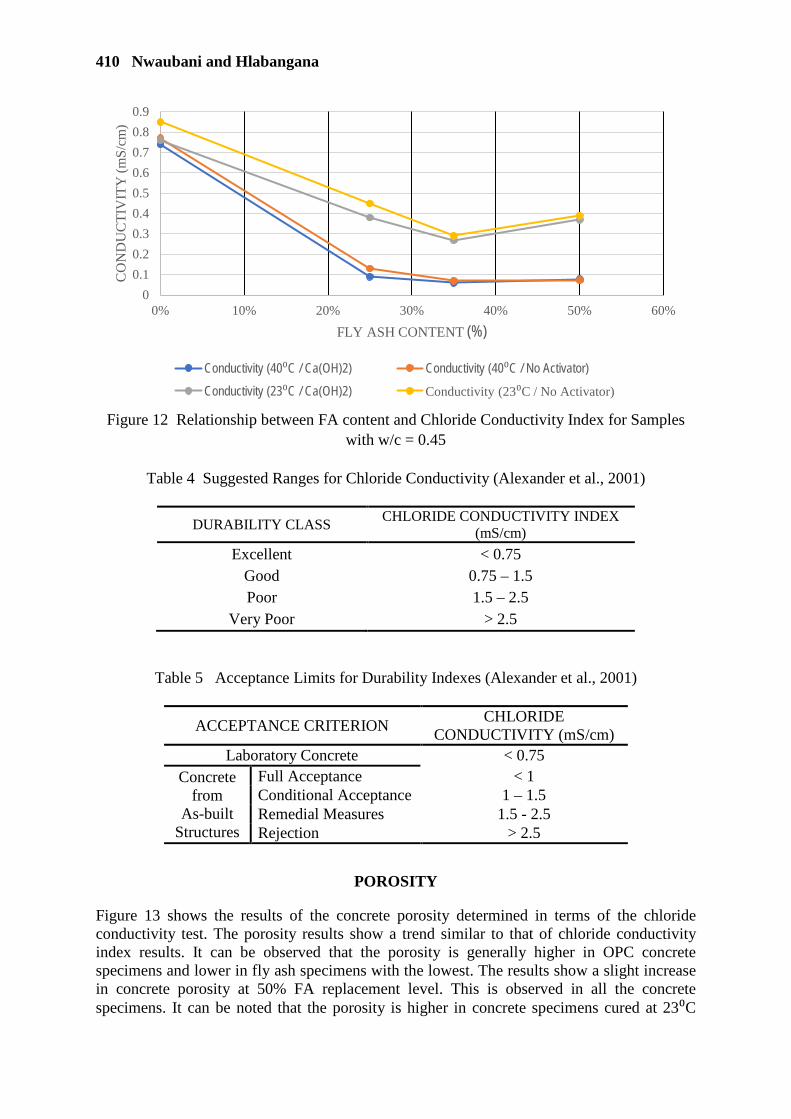
410 Nwaubani and Hlabangana
Figure 12 Relationship between FA content and Chloride Conductivity Index for Samples
with w/c = 0.45
Table 4 Suggested Ranges for Chloride Conductivity (Alexander et al., 2001)
DURABILITY CLASS CHLORIDE CONDUCTIVITY INDEX
(mS/cm)
Excellent < 0.75 Good 0.75 – 1.5 Poor 1.5 – 2.5
Very Poor > 2.5
Table 5 Acceptance Limits for Durability Indexes (Alexander et al., 2001)
ACCEPTANCE CRITERION CHLORIDE
CONDUCTIVITY (mS/cm) Laboratory Concrete < 0.75
Concrete from
As-built Structures
Full Acceptance < 1 Conditional Acceptance 1 – 1.5 Remedial Measures 1.5 - 2.5 Rejection > 2.5
POROSITY
Figure 13 shows the results of the concrete porosity determined in terms of the chloride conductivity test. The porosity results show a trend similar to that of chloride conductivity index results. It can be observed that the porosity is generally higher in OPC concrete specimens and lower in fly ash specimens with the lowest. The results show a slight increase in concrete porosity at 50% FA replacement level. This is observed in all the concrete specimens. It can be noted that the porosity is higher in concrete specimens cured at 23⁰C
0
0.1
0.2
0.3
0.4
0.5
0.6
0.7
0.8
0.9
0% 10% 20% 30% 40% 50% 60%
CO
ND
UC
TIV
ITY
(mS
/cm
)
FLY ASH CONTENT (%)
Conductivity (40⁰C / Ca(OH)2) Conductivity (40⁰C / No Activator)Conductivity (23⁰C / Ca(OH)2) Conductivity (23⁰C / No Activator)
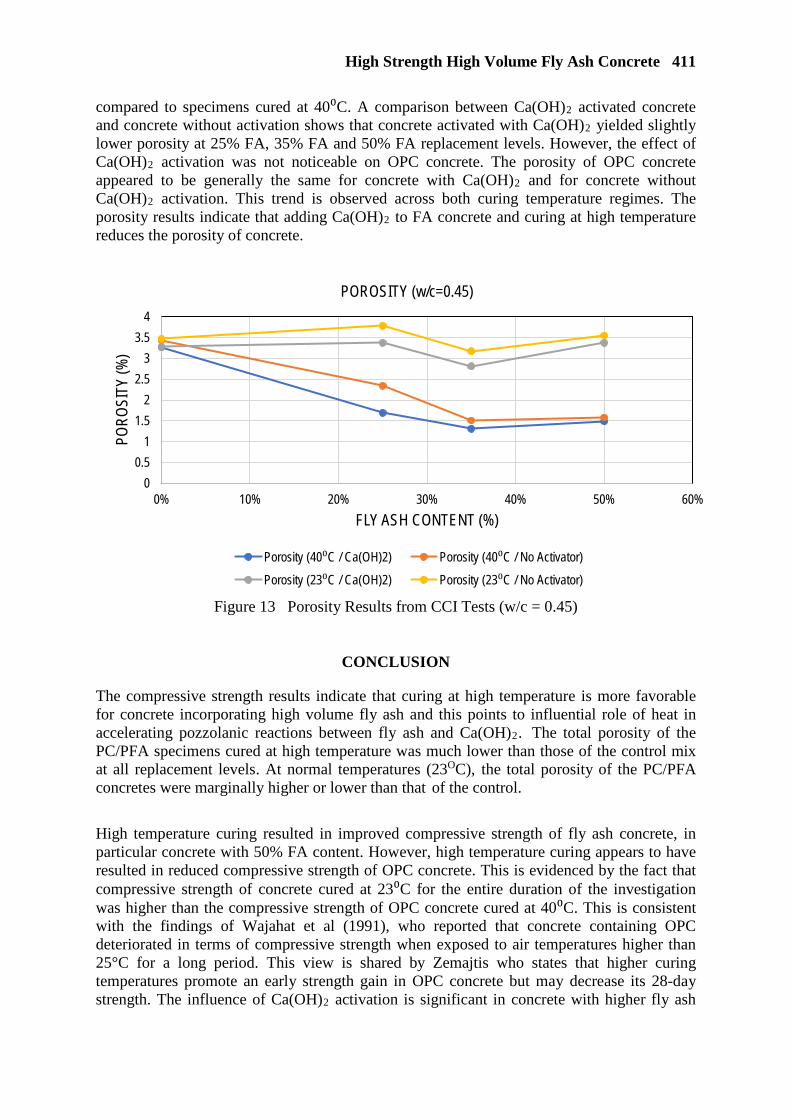
High Strength High Volume Fly Ash Concrete 411
compared to specimens cured at 40⁰C. A comparison between Ca(OH)2 activated concrete and concrete without activation shows that concrete activated with Ca(OH)2 yielded slightly lower porosity at 25% FA, 35% FA and 50% FA replacement levels. However, the effect of Ca(OH)2 activation was not noticeable on OPC concrete. The porosity of OPC concrete appeared to be generally the same for concrete with Ca(OH)2 and for concrete without Ca(OH)2 activation. This trend is observed across both curing temperature regimes. The porosity results indicate that adding Ca(OH)2 to FA concrete and curing at high temperature reduces the porosity of concrete.
Figure 13 Porosity Results from CCI Tests (w/c = 0.45)
CONCLUSION
The compressive strength results indicate that curing at high temperature is more favorable for concrete incorporating high volume fly ash and this points to influential role of heat in accelerating pozzolanic reactions between fly ash and Ca(OH)2. The total porosity of the PC/PFA specimens cured at high temperature was much lower than those of the control mix at all replacement levels. At normal temperatures (23OC), the total porosity of the PC/PFA concretes were marginally higher or lower than that of the control.
High temperature curing resulted in improved compressive strength of fly ash concrete, in particular concrete with 50% FA content. However, high temperature curing appears to have resulted in reduced compressive strength of OPC concrete. This is evidenced by the fact that compressive strength of concrete cured at 23⁰C for the entire duration of the investigation was higher than the compressive strength of OPC concrete cured at 40⁰C. This is consistent with the findings of Wajahat et al (1991), who reported that concrete containing OPC deteriorated in terms of compressive strength when exposed to air temperatures higher than 25°C for a long period. This view is shared by Zemajtis who states that higher curing temperatures promote an early strength gain in OPC concrete but may decrease its 28-day strength. The influence of Ca(OH)2 activation is significant in concrete with higher fly ash
00.5
11.5
22.5
33.5
4
0% 10% 20% 30% 40% 50% 60%
PORO
SITY
(%)
FLY ASH CONTENT (%)
POROSITY (w/c=0.45)
Porosity (40⁰C / Ca(OH)2) Porosity (40⁰C / No Activator)Porosity (23⁰C / Ca(OH)2) Porosity (23⁰C / No Activator)
412 Nwaubani and Hlabangana
content. Compressive strength results show that addition of Ca(OH)2 was capable of increasing compressive strengths of fly ash concrete. Based on Chloride conductivity results, it can be concluded that curing temperature has a significant influence in the durability of concrete with respect to the chloride ion diffusion.
REFERENCES
ALEXANDER, M.G., MACKECHNIE, J.R., BALLIM. Y., 2001, Use of durability indexes to achieve durable cover concrete in reinforced concrete structures. Materials Science of Concrete. J.P.Skalny & S.Mindess, Ed. Westerville: American Ceramic Soceity. 483-511. BAO-MIN W. AND LI-JIU W. 2004, Development of studies and applications of activation techniques of fly ash, Proceedings of the International Workshop on Sustainable Development and Concrete Technology, May 2004, Beijing, China, 159-169. CABRERA, J G, DODD, T. AND NWAUBANI, S. O. (1993), "The Effect of Curing Temperature on the Chloride Ion Diffusivity of Superplasticised Cements and Fly Ash Cement Pastes", in ACI Special Report, Sp-139, pp. 61-76, Detroit. [Library of Congress Catalogue nr: 93-72783]. DHIR, R. K., EL-MOHR, M. A. K., DYER, T. D., 1997, Developing Chloride Resisting Concrete Using PFA, Cement and Concrete Research, Vol 27, No. 11, pp 1633 -1639 1997. FRAAY, A.L.A., BEJEN, J.M., DE HAAN Y.M., The reaction of fly ash in concrete: A critical examination, Cement and Concrete Research, 19 (1989) 235-246 MEHTA, P. K., 2004, High-performance, high-volume fly ash concrete for sustainable development. Proceedings of the International Workshop on Sustainable Development and Concrete Technology, Beijing, China NATH P., SARKER P., 2011, Effect of Fly Ash on the Durability Properties of High Strength Concrete, Procedia Engineering 14 (2011) 1149–1156 NWAUBANI, S.O. AND KHATIB, J.M (2017), The influence of chemical and thermal activation on the strength of high volume fly ash concrete. Proc. 1st Int. Conf. Turkish World Engineering and Science Congress in Antalya, Turkey, pp. 500-506. ISBN 978-975-93505-7-4. http://teskongre.org/web2/ing/w/2017/index.php/onemli-tarihler OWENS, G., 2009, Fulton’s Concrete Technology, 9th Edition, Cement and Concrete Institute, Midrand, South Africa OWENS K. J., BAI Y., CLELAND D., BASHEER P.A.M., KWASNY J., SONEBI M., TAYLOR S., AND GUPTA A., 2010, Activation of High-Volume Fly Ash Pastes Using Chemical Activators, In. Proceedings of Second International Conference on Sustainable Construction Materials and Technologies, Ancona, Italy, 28–30 Jun 2010, vol. 3; 2010. p. 1759–770.
High Strength High Volume Fly Ash Concrete 413
PATNAIKUNI, I., SETUNGE, S. AND SOLIKIN, M., LING, X. AND BOINA, B., 2013, High Strength High Volume Fly Ash Concrete. In. Proceedings of The Seventh International Structural Engineering and Construction Conference, June 18-23, 2013 Honolulu, Hawaii, USA South African National Standard, 2013. Cement: Part 1: Composition, specifications and conformity criteria for common cements. (SANS 50197-1:2013). Pretoria: 2013 South African National Standard, 2006. Concrete tests Part 3: Making and curing of test specimens. (SANS 5861-3:2006). Pretoria: 2006 South African National Standard, 2015. Civil engineering test methods: Part CO3-3: Concrete durability index testing - Chloride conductivity test. (SANS 3001-CO3-3:2015). Pretoria: 2015. South African National Standard, 2006. Concrete Tests-Compressive Strength of Hardened Concrete. (SANS 5863:2006). Pretoria: SANS. University of Capetown and University of the Witwatersrand., 2017, Durability Index Testing Procedure Manual, Ver 4.2, July 2017, Capetown, South Africa. WAJAHAT H. M., SOLIMAN I. A., AL-BEDAWI W. H., (1991) Temperature effect on strength of mortars and concrete containing blended cements, Cement and Concrete Composites Volume 13, Issue 3, 1991, Pages 197-202. ZEMAJTIS J. Z., 2014, Role of Concrete Curing, [Online] https://www.cement.org/learn/concrete-technology/concrete-construction/curing-in-construction

Ca-RICH OIL-SHALE ASH WASTE AS A CARBON DIOXIDE SINK: STABLE CARBON AND OXYGEN ISOTOPE STUDY
K Leben
R Mõtlep
K Kirsimäe
University of Tartu
Estonia
ABSTRACT. The Estonian energetic industry uses local calcareous oil shale to produce the majority of the country’s electricity and is responsible for large CO2 emissions. The solid residues remaining after combustion are potentially capable for CO2 sequestration by carbonation of reactive Ca-phases. In this study we describe in detail the geochemical conditions in naturally alkaline Ca-rich ash waste deposits by characterizing drillcore material from the ash depository accumulated over nearly 50 years. We employ various methods including X-ray diffraction, X-ray fluorescence, and carbon and oxygen stable isotope composition. The results of the study show a highly depleted stable isotopic composition of the secondary carbonate phases characterized by δ13CVPDB values between -12 and -24‰ and δ18OVPDB between -8 and -15‰. The negative isotopic fractionation is caused by the highly alkaline conditions of the deposits and the results can be used to prove the atmospheric origin of bound CO2, derive environmental conditions during carbonation and exclude any significant microbiological activity in the ash sediments. Keywords: Oil shale ash, Mineralogy, Stable isotopes, CO2 sequestration, Ash utilisation Kristjan Leben is a doctoral student and a Junior Researcher at the Department of Geology at the University of Tartu. Dr Riho Mõtlep is a Researcher at the Department of Geology and the manager of the Earth Resources Centre at the University of Tartu. Professor Kalle Kirsimäe is the Head of the Department of Geology at the University of Tartu and a member of the Estonian Academy of Sciences.
Shale Ash Waste 415
INTRODUCTION
Kerogenous oil shales (OS) are exploited only in in a few countries. Mostly due to their low calorific value and high ash content. In Estonia over 15 Mt of calcareous OS is mined and about 6-8 Mt of alkaline Ca-rich ash waste is produced annually. Only a few percent of the ash is reused, mainly in cement production, the rest is hydraulically deposited into open ash depositories [1,2]. High free CaO content of the initial ash leads to the high alkalinity (pH ~12) of the deposited hydrated sediments. Over long periods of time the high alkalinity leads to the formation of different calcium silicate hydrate phases [3] but one of the main diagenetic alterations taking place shortly after hydration is natural carbonation [4].
However, on average it has been estimated that only about 4-5% of the CO2 emitted by oil-shale industry is sequestered by natural carbonation of oil shale ash [5]. In this contribution we study the mineral transformation and carbonation processes in naturally alkaline Ca-rich ash waste deposits at Eesti Power Plant (PP) accumulated over nearly 50 years. We focus on carbon and oxygen stable isotope composition of the authigenic carbonates in order to understand the carbonation process, isotope fractionation on alkaline environment and the origin of the CO2 bound in newly formed carbonate phases. The carbon and oxygen isotopic composition can be used to prove the atmospheric origin of the bound CO2, estimate the possibility of significant microbiological origin of the bound CO2, and also derive the environmental conditions during the carbonation of the sediments.
MATERIALS AND METHODS
The samples were taken from a drill core from the ash disposal site at Eesti PP, north-eastern Estonia. Total thickness of the deposit at the drilling site was 37.5 m. The groundwater level in the drill hole was measured at a depth of 6.6 m. The Eesti PP along with the ash waste deposit was commissioned around the year 1969. Until recently the oil shale ash from high-temperature pulverised fuel (PF) combustion boilers, along with smaller amounts of oil retorting ashes have been co-deposited in this site. From 2004 also ash from lower temperature circulating fluidised bed (CFB) combustion has been deposited. The ash containing mixture of all different sources composes only the upper few meters of the studied section. The deposit has been in continuous use and the composition of the used fuel (calcareous oil shale) has not significantly changed over the period.
Mineral and chemical composition of ash samples covering the full sequence of the ash deposits was analysed using X-ray diffraction and X-ray fluorescence spectroscopy and is reported in [3]. The C and O stable isotope composition (δ13C and δ18O) of carbonates was measured using Thermo Delta V Advantage isotope ratio mass spectrometer. The measured isotopic composition is presented as delta notation (δ) in relation to the Vienna Pee Dee Belemnite (V-PDB) standard and expressed in permil (‰).
RESULTS
The mineral composition of the ash sediments can be characterized by primary terrigenous phases composed mostly of quartz, K-feldspar with small amounts of mica, and secondary

416 Leben et al
phases formed during combustion and subsequent hydration, deposition and long-term recrystallisation. The secondary phases are composed of portlandite (Ca(OH)2) formed on hydration of lime (CaO), carbonates (calcite and traces of vaterite), Ca-silicates formed on thermal processing (belite, akermanite), various Ca-hydrate phases (ettringite, thaumasite, hydrocalumite, hydrogarnet), Calcium-(Aluminium)-Silicate-Hydrate phases formed by hydration of Ca-silicates and alkali activation (of glassy phases), and various other minor phases. Portlandite content shows significant cyclic variation in the studied material with its composition values ranging from undetected in some sections up to 21.4%. Calcite also shows high variability often displaying opposite trends with portlandite and with content values up to 25.5%. Traces of vaterite (γ-CaCO3 polymorph) were detected almost throughout the studied material but its content was not measured above 1.5%. The chemical composition of the ash sediment samples does not show significant variation and the trends of major elements generally follow the mineral composition with the variation of terrigenous and secondary phases reflecting in variation of SiO2, CaO and Al2O3 content. CaO content varies from 25.5 to 50.9% whereas the loss on ignition (LOI), mainly from the decomposition of secondary hydrate minerals and carbonates, ranges from 14.9 and 25.7%.
C and O isotope composition of the carbonate phases show strong depletion relative to the V-PDB standard. The δ13C values varied from -11.95 to -22.95‰ with a weighted average of -16.47‰. The variation in δ18O values was between -7.95 and -15.06‰ with a weighted average of -10.72‰ for the waste deposit sediments (Figure 1). There is a rough positive trend between the stable isotope values and more negative δ13C results tend to display also more negative δ18O values.
Figure 1 C and O stable isotope composition (δ13C and δ18O) of the ash sediment carbonates.

Shale Ash Waste 417
DISCUSSION
Due to different fractionation steps the Ca-carbonate (calcite) precipitating in saturated conditions in equilibrium with atmospheric CO2 should carry a δ13C value around zero. Highly depleted carbonate δ13C values are typically interpreted as indicating a 13C depleted carbon source – soil CO2 (including the microbial degradation of organic matter), oxidation of methane, etc. In this sense the negative δ13C values of calcite in ash deposits would indicate a depleted CO2 uptake. Principally, the oil shale ash deposit studied here is a mixture ash of three ash types: pulverised fuel combustion and circulating fluidised bed combustion ashes, and oil retorting ashes. The last contain a small amount of up to 1-3% unburnt organic carbon. It is therefore possible, that degradation/oxidation of this reduced carbon source controls the isotopic composition of the available carbonate ion in the system and causes highly depleted isotopic composition of secondary Ca-carbonate precipitates.
However, several studies of both natural sedimentary systems, waste deposits, concrete and lime based mortars have shown that carbonates formed in alkaline environments often display a significant depletion of heavier 13C and also 18O stable isotopes [6–9]. In alkaline environments with a prevailing inorganic or atmospheric carbon source, hydration-hydroxylation reactions or a kinetic fractionation effect during diffusion and dissolution of CO2 determine the trends in stable isotope composition [8–10].
Clark et al. [7] suggested that the highly negative non-equilibrium fractionation of stable isotopes in carbonates formed in hyperalkaline conditions is controlled by aqueous kinetic effects. Subsequently, a 13C depletion of 15.5‰ in the formed carbonate phases was determined to be the result of the lower activation energy of 12C-O bonding (compared to 13C-O) on the reaction of CO2 with OH-. Leleu et al. [9], however, argues that the reported depletions in 13C of carbonates are due to kinetic effects caused by the different diffusion rates of 13CO2 and 12CO2 as previously described by Dietzel et al. [10]. These conditions are very similar to those of oil shale ash deposition. The water-ash slurry, initially depleted in dissolved carbon and enriched in Ca due to the fast exothermic slaking of free CaO and subsequent dissolution of portlandite, on diffusion of atmospheric CO2 starts rapidly precipitating calcite. Therefore, if the carbonate precipitation did not occur under isotopic equilibrium conditions then kinetic fractionation, ranging from -11.3 to -10% should occur by interaction of CO2 with hyper-alkaline waters [11]. Consequently, if the atmospheric CO2 has a δ13C value between -7 to -8‰, then the δ13C of the carbonates should be between -19.3 and -18‰. This agrees in general with the observed range of the δ13C values in studied ash plateau sediments and suggest atmospheric origin of the carbon dioxide without the need for highly depleted organic carbon source.
Variation of the δ13C values from the expected values can on the one hand be explained by incorporation of residual carbonate (calcite) potentially present in bottom ash fraction or by the carbonate precipitation at the later stages of the carbonation when pH values are dropping below 9, approaching thus the equilibrium status during carbonate precipitation. On the other hand, the more negative values hint on additional fractionation in different kinetic steps [7,12] resulting in total maximum fractionation of -15.5±1.5%, and final carbonate δ13C value of -23‰. This agrees with the minimum measured values of up to -22.95‰ measured in oil shale ash deposits.
Oxygen isotopic composition of carbonate can be used to derive the equilibrium temperature of the carbonate precipitation [9,13]. Using the monthly weighted mean Estonian rainfall
418 Leben et al
oxygen isotopic composition of -10.4‰ (relative to Vienna Standard Mean Ocean Water) [14], the calculated temperatures for the ash deposit sediments range from 5.7 to 27.6 °C (with one outlier at 22 m depth showing a temperature of 38.7 °C) that roughly agrees with the mean annual temperature. However, the non-equilibrium effects can be present in oxygen isotopic system as well and these results are possibly not reliable.
CONCLUSIONS
Geochemical properties of oil shale ash waste sediments deposited over nearly 50 years at an open deposit were studied. The highly-alkaline environment of the oil shale ash deposits leads to a depleted stable carbon isotope composition due to kinetic effects on diffusion of CO2. Molecules of CO2 containing lighter 12C isotopes are preferred on diffusion into the water film surrounding Ca(OH)2. Previously reported fractionation of stable carbon isotopes in a highly-alkaline environment combined with the negative atmospheric signal roughly agrees with the measured weighted average δ13C value of -16.47‰, likely confirming the atmospheric origin of bound CO2. The wide range of the obtained δ13C values can possibly be explained variations in the solution pH and additional occurring kinetic fractionation steps. Equilibrium temperatures of carbonate precipitation calculated using the oxygen stable isotope composition of the ash carbonate approximately fit the mean annual temperature. However, due to non-equilibrium effects in the oxygen isotopic system, the results may not be reliable.
REFERENCES
1. A. KONIST, B. MAATEN, L. LOO, D. NESHUMAYEV AND T. PIHU, Mineral sequestration of CO2 by carbonation of Ca-rich oil shale ash in natural conditions, Oil Shale 33, 2016, pp. 248.
2. R. MÕTLEP, T. SILD, E. PUURA AND K. KIRSIMÄE, Composition, diagenetic transformation and alkalinity potential of oil shale ash sediments, J. Hazard. Mater. 184, 2010, pp. 567–573.
3. K. LEBEN, R. MÕTLEP, P. PAAVER, A. KONIST, T. PIHU, P. PAISTE et al., Long-term mineral transformation of Ca-rich oil shale ash waste, Sci. Total Environ. 658, 2019, pp. 1404–1415.
4. M. LIIRA, K. KIRSIMÄE, R. KUUSIK AND R. MÕTLEP, Transformation of calcareous oil-shale circulating fluidized-bed combustion boiler ashes under wet conditions, Fuel 88, 2009, pp. 712–718.
5. R. KUUSIK, H. VESKIMÄE, T. KALJUVEE AND O. PARTS, Carbon dioxide binding in the heterogeneous systems formed by combustion of oil shale. 1. Carbon dioxide binding at oil shale ash deposits, Oil Shale 18, 2001, pp. 109–122.
Shale Ash Waste 419
6. G. ARP, B.T. HANSEN, A. PACK, A. REIMER, B.C. SCHMIDT, K. SIMON et al., The soda lake—mesosaline halite lake transition in the Ries impact crater basin (drilling Löpsingen 2012, Miocene, southern Germany), Facies 63, 2016, pp. 20.
7. I.D. CLARK, J.-C. FONTES AND P. FRITZ, Stable isotope disequilibria in travertine from high pH waters: Laboratory investigations and field observations from Oman, Geochim. Cosmochim. Acta 56, 1992, pp. 2041–2050.
8. C. FLÉHOC, J.-P. GIRARD, P. PIANTONE AND F. BODÉNAN, Stable isotope evidence for the atmospheric origin of CO2 involved in carbonation of MSWI bottom ash, Appl. Geochem. 21, 2006, pp. 2037–2048.
9. T. LELEU, V. CHAVAGNAC, A. DELACOUR, C. NOIRIEL, G. CEULENEER, M. ARETZ et al., Travertines Associated With Hyperalkaline Springs: Evaluation As A Proxy For Paleoenvironmental Conditions And Sequestration of Atmospheric CO 2, J. Sediment. Res. 86, 2016, pp. 1328–1343.
10. M. DIETZEL, E. USDOWSKI AND J. HOEFS, Chemical and 13C/12C- and 18O/16O-isotope evolution of alkaline drainage waters and the precipitation of calcite, Appl. Geochem. 7, 1992, pp. 177–184.
11. J. O’NEIL AND I. BARNES, C13 and O18 compositions in some fresh-water carbonates associated with ultramafic rocks and serpentinites: Western United States, Geochim. Cosmochim. Acta 35, 1971, pp. 687–697.
12. R. LÉTOLLE, P. GÉGOUT, N. RAFAI AND E. REVERTEGAT, Stable isotopes of carbon and oxygen for the study of carbonation/decarbonation processes in concretes, Cem. Concr. Res. 22, 1992, pp. 235–240.
13. E.L. GROSSMAN, Applying Oxygen Isotope Paleothermometry in Deep Time, Paleontol. Soc. Pap. 18, 2012, pp. 39–68.
14. J.-M. PUNNING, M. TOOTS AND R. VAIKMÄE, Oxygen-18 in Estonian Natural Waters, Isot. Isot. Environ. Health Stud. 23, 1987, pp. 232–234.
EXAMINATION OF PARTICLE PACKING IN TERNARY BLENDS OF PORTLAND CEMENT,
FLY ASH AND SILICA FUME
T Dyer
L Csetenyi
K Scobbie
University of Dundee
United Kingdom
ABSTRACT. With the ultimate aim of developing low plastic shrinkage concrete mixes, the Portland cement – fly ash – silica fume ternary system has been characterised in terms of viscosity in the fresh state, and hydration chemistry and porosity in the hardened state. Whilst these characteristics were examined to identify boundaries within which practical blends could be formulated, measuring them also permitted the effects of particle packing on viscosity and porosity to be examined. Two methods for optimising particle packing are evaluated – one established and the other more experimental. A means of modifying one particle packing method to allow minimisation of viscosity with water / solid ratios typical of cement pastes is devised. Using a novel approach to translating particle size distribution into pore size distribution, the effectiveness of both packing methods is demonstrated. The approach suggests a possible means of predicting performance of pastes from particle size distributions, but further development is required. For the specific materials investigated, compositional boundaries are established. Keywords: Fly ash, Portland cement, Silica fume, Ternary blends, Viscosity, Hydration chemistry, Porosity. Dr Thomas Dyer is a Senior Lecturer in the Concrete Technology Unit at the University of Dundee. His research covers a number of aspects of concrete technology, ultimately with the objective of optimising performance. Dr Laszlo Csetenyi is a Research Fellow in the Concrete Technology Unit at the University of Dundee. His research interests include supplementary cementitious materials and enhancing the resulting concrete with particular attention paid to sustainability and environmental issues. Mr Kurt Scobbie is studying towards an MSc in Civil Engineering at the University of Dundee. The results presented in this paper derive from his MSc project which is currently underway.

Particle Packing in Ternary Blends 421
INTRODUCTION Optimizing the packing of particles finds application in a wide range of fields. In the case of concrete technology, efficient packing has the potential to minimise viscosity and plastic shrinkage, and optimise strength and elastic modulus. Focussing solely on the cement component of concrete, whilst particle size can be manipulated using just two cement components, considerably greater flexibility is realised through the use of ternary blends. Such an approach also potentially affords greater control over both the amount of Portland cement used and the chemical composition of the ternary system. The need for more sustainable cements has placed emphasis on using ternary blends to reduce the level of Portland cement clinker to produce low carbon cements. This is because ternary blends potentially allow the manipulation of hydration chemistry and particle packing in a way that optimises performance at lower clinker levels. An example of this is the new CEM-VI group [1] in EN197-1 [2] which combines Portland clinker, slag and either fly ash or limestone powder to obtain low-clinker cements suitable for use in concrete. However, whilst minimising Portland clinker content is a route towards formulating low carbon ternary blends, compositional limits are placed on such systems by hydration chemistry and viscosity requirements. Firstly, limits will be reached where insufficient calcium hydroxide is available for pozzolanic and / or latent hydraulic reactions of the non-PC constituents. Secondly, it is unlikely that ternary blends whose viscosity at a given water content is higher than that of PC alone would be considered desirable. This paper explores the Portland cement (PC) – fly ash (FA) – silica fume (SF) ternary system. The basis for the study is the development of ternary blend cements with low plastic shrinkage. It represents an interim report at the stage where viscosity, pore size distribution and hydration chemistry characterisation has been conducted to identify compositional limits. However, it was recognised that these measurements would also provide insight into the effect of particle packing on viscosity, porosity and pore size. Fundamental to the production of low plastic shrinkage cement blends, is a need to design mixes which have optimal particle packing. Techniques for achieving this are already established [3]. However, such methods usually require correction or additional materials characterisation to be used reliably. The approach taken in this study was to focus on relatively simple methods for optimising particle packing which could be easily achieved using conventional spreadsheet software. This paper, therefore, explores both an established method and a possible alternative route towards blend design which has the potential of being easily implemented. To understand the two methods it is first necessary to briefly examine some aspects of particle packing. Particle Packing The manner in which a system of spherical particles of the same diameter - ‘monodisperse’ - pack together defines the packing fraction: the fraction of the resulting volume occupied by solid material. The most efficient packing configurations are the hexagonal close packed and face-centred cubic arrangements, which give a packing fraction of 0.740 [4]. However, experiments show that, in reality, loose particles tend to pack in what is known as a random close packed arrangement, which yields a packing fraction of around 0.64.
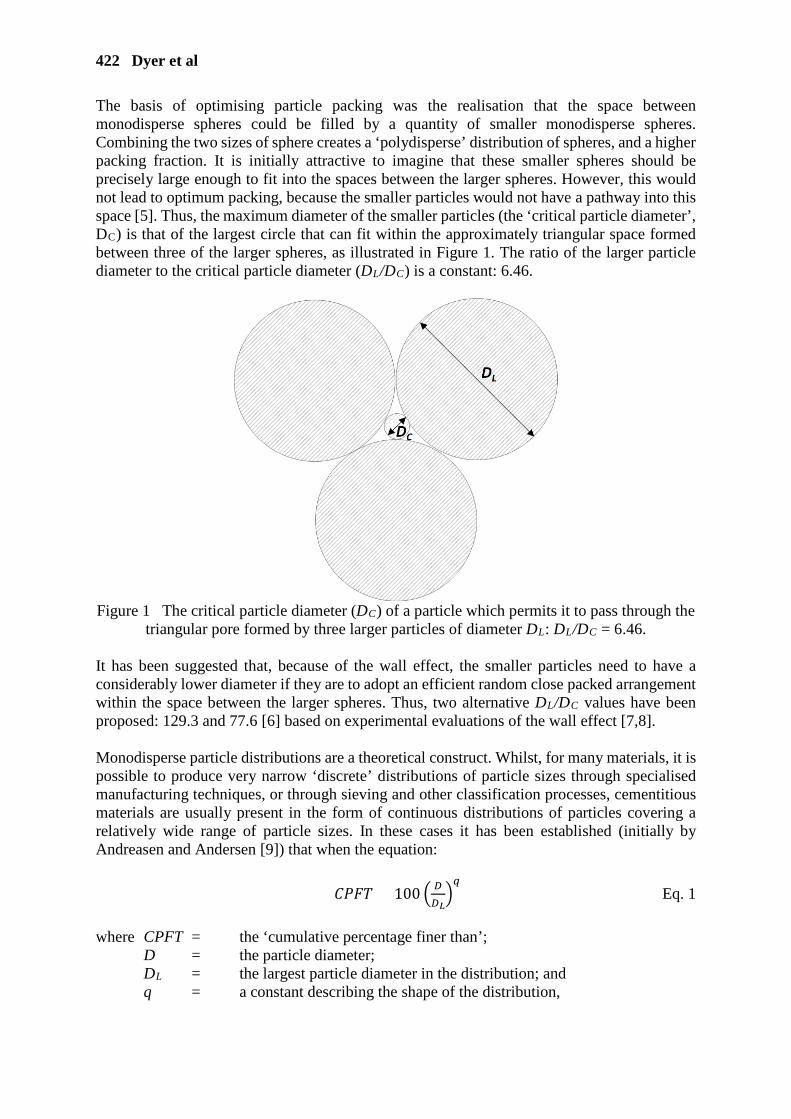
422 Dyer et al
The basis of optimising particle packing was the realisation that the space between monodisperse spheres could be filled by a quantity of smaller monodisperse spheres. Combining the two sizes of sphere creates a ‘polydisperse’ distribution of spheres, and a higher packing fraction. It is initially attractive to imagine that these smaller spheres should be precisely large enough to fit into the spaces between the larger spheres. However, this would not lead to optimum packing, because the smaller particles would not have a pathway into this space [5]. Thus, the maximum diameter of the smaller particles (the ‘critical particle diameter’, DC) is that of the largest circle that can fit within the approximately triangular space formed between three of the larger spheres, as illustrated in Figure 1. The ratio of the larger particle diameter to the critical particle diameter (DL/DC) is a constant: 6.46.
Figure 1 The critical particle diameter (DC) of a particle which permits it to pass through the
triangular pore formed by three larger particles of diameter DL: DL/DC = 6.46. It has been suggested that, because of the wall effect, the smaller particles need to have a considerably lower diameter if they are to adopt an efficient random close packed arrangement within the space between the larger spheres. Thus, two alternative DL/DC values have been proposed: 129.3 and 77.6 [6] based on experimental evaluations of the wall effect [7,8]. Monodisperse particle distributions are a theoretical construct. Whilst, for many materials, it is possible to produce very narrow ‘discrete’ distributions of particle sizes through specialised manufacturing techniques, or through sieving and other classification processes, cementitious materials are usually present in the form of continuous distributions of particles covering a relatively wide range of particle sizes. In these cases it has been established (initially by Andreasen and Andersen [9]) that when the equation:
𝐶𝐶𝐶𝐶𝐶𝐶𝐶𝐶 = 100 𝐷𝐷𝐷𝐷𝐿𝐿𝑞𝑞 Eq. 1
where CPFT = the ‘cumulative percentage finer than’;
D = the particle diameter; DL = the largest particle diameter in the distribution; and q = a constant describing the shape of the distribution,
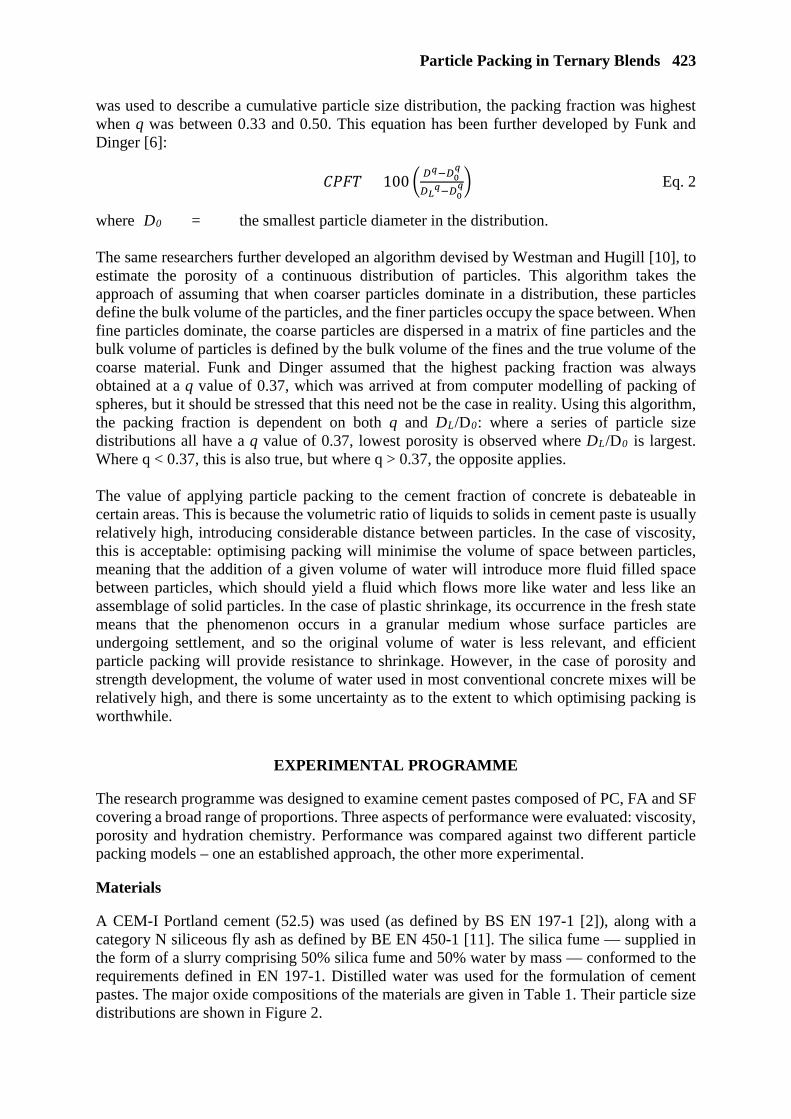
Particle Packing in Ternary Blends 423
was used to describe a cumulative particle size distribution, the packing fraction was highest when q was between 0.33 and 0.50. This equation has been further developed by Funk and Dinger [6]:
𝐶𝐶𝐶𝐶𝐶𝐶𝐶𝐶 = 100 𝐷𝐷𝑞𝑞−𝐷𝐷0
𝑞𝑞
𝐷𝐷𝐿𝐿𝑞𝑞−𝐷𝐷0𝑞𝑞 Eq. 2
where D0 = the smallest particle diameter in the distribution. The same researchers further developed an algorithm devised by Westman and Hugill [10], to estimate the porosity of a continuous distribution of particles. This algorithm takes the approach of assuming that when coarser particles dominate in a distribution, these particles define the bulk volume of the particles, and the finer particles occupy the space between. When fine particles dominate, the coarse particles are dispersed in a matrix of fine particles and the bulk volume of particles is defined by the bulk volume of the fines and the true volume of the coarse material. Funk and Dinger assumed that the highest packing fraction was always obtained at a q value of 0.37, which was arrived at from computer modelling of packing of spheres, but it should be stressed that this need not be the case in reality. Using this algorithm, the packing fraction is dependent on both q and DL/D0: where a series of particle size distributions all have a q value of 0.37, lowest porosity is observed where DL/D0 is largest. Where q < 0.37, this is also true, but where q > 0.37, the opposite applies. The value of applying particle packing to the cement fraction of concrete is debateable in certain areas. This is because the volumetric ratio of liquids to solids in cement paste is usually relatively high, introducing considerable distance between particles. In the case of viscosity, this is acceptable: optimising packing will minimise the volume of space between particles, meaning that the addition of a given volume of water will introduce more fluid filled space between particles, which should yield a fluid which flows more like water and less like an assemblage of solid particles. In the case of plastic shrinkage, its occurrence in the fresh state means that the phenomenon occurs in a granular medium whose surface particles are undergoing settlement, and so the original volume of water is less relevant, and efficient particle packing will provide resistance to shrinkage. However, in the case of porosity and strength development, the volume of water used in most conventional concrete mixes will be relatively high, and there is some uncertainty as to the extent to which optimising packing is worthwhile.
EXPERIMENTAL PROGRAMME The research programme was designed to examine cement pastes composed of PC, FA and SF covering a broad range of proportions. Three aspects of performance were evaluated: viscosity, porosity and hydration chemistry. Performance was compared against two different particle packing models – one an established approach, the other more experimental. Materials A CEM-I Portland cement (52.5) was used (as defined by BS EN 197-1 [2]), along with a category N siliceous fly ash as defined by BE EN 450-1 [11]. The silica fume — supplied in the form of a slurry comprising 50% silica fume and 50% water by mass — conformed to the requirements defined in EN 197-1. Distilled water was used for the formulation of cement pastes. The major oxide compositions of the materials are given in Table 1. Their particle size distributions are shown in Figure 2.
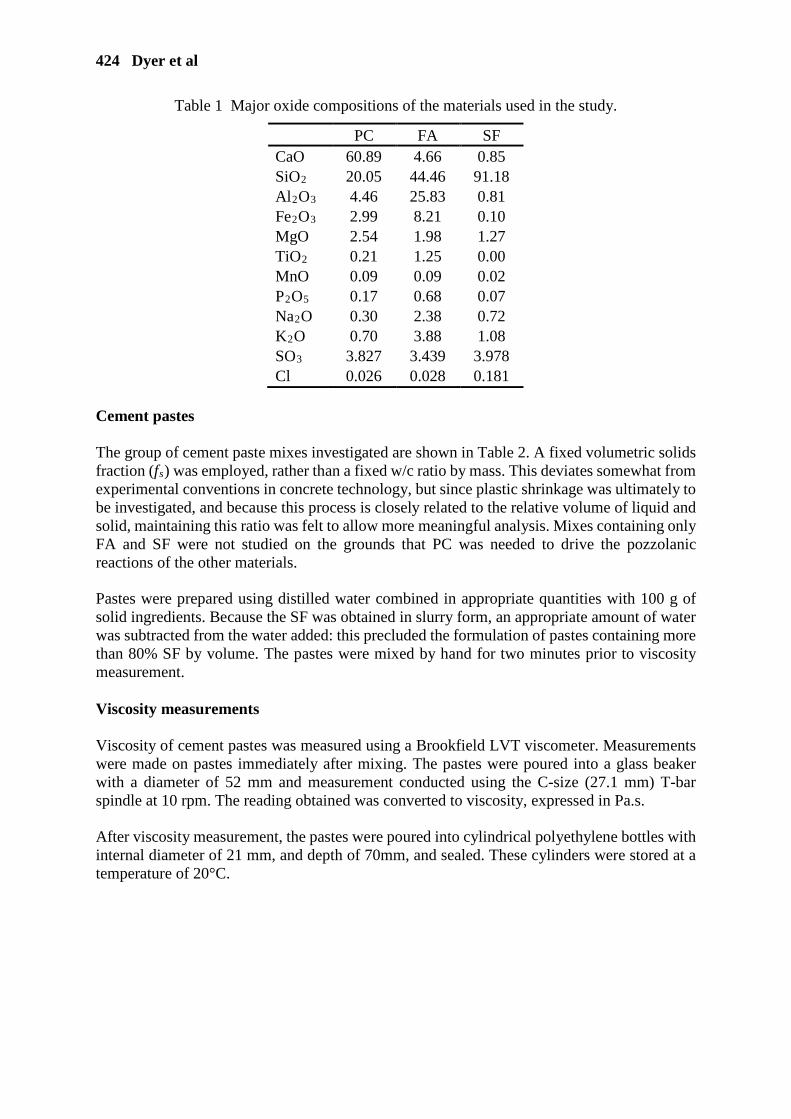
424 Dyer et al
Table 1 Major oxide compositions of the materials used in the study.
PC FA SF CaO 60.89 4.66 0.85 SiO2 20.05 44.46 91.18 Al2O3 4.46 25.83 0.81 Fe2O3 2.99 8.21 0.10 MgO 2.54 1.98 1.27 TiO2 0.21 1.25 0.00 MnO 0.09 0.09 0.02 P2O5 0.17 0.68 0.07 Na2O 0.30 2.38 0.72 K2O 0.70 3.88 1.08 SO3 3.827 3.439 3.978 Cl 0.026 0.028 0.181
Cement pastes The group of cement paste mixes investigated are shown in Table 2. A fixed volumetric solids fraction (fs) was employed, rather than a fixed w/c ratio by mass. This deviates somewhat from experimental conventions in concrete technology, but since plastic shrinkage was ultimately to be investigated, and because this process is closely related to the relative volume of liquid and solid, maintaining this ratio was felt to allow more meaningful analysis. Mixes containing only FA and SF were not studied on the grounds that PC was needed to drive the pozzolanic reactions of the other materials. Pastes were prepared using distilled water combined in appropriate quantities with 100 g of solid ingredients. Because the SF was obtained in slurry form, an appropriate amount of water was subtracted from the water added: this precluded the formulation of pastes containing more than 80% SF by volume. The pastes were mixed by hand for two minutes prior to viscosity measurement. Viscosity measurements Viscosity of cement pastes was measured using a Brookfield LVT viscometer. Measurements were made on pastes immediately after mixing. The pastes were poured into a glass beaker with a diameter of 52 mm and measurement conducted using the C-size (27.1 mm) T-bar spindle at 10 rpm. The reading obtained was converted to viscosity, expressed in Pa.s. After viscosity measurement, the pastes were poured into cylindrical polyethylene bottles with internal diameter of 21 mm, and depth of 70mm, and sealed. These cylinders were stored at a temperature of 20°C.

Particle Packing in Ternary Blends 425
APERTURE SIZE, µm
10x10-3 100x10-3 1x100 10x100 100x100 1x10³ 10x103
% V
OLU
ME
PASS
ING
0
20
40
60
80
100
PCFASF
Figure 2 Particle size distributions of the materials used in the study.
Table 2 Paste mixes investigated during the study.
% BY VOLUME % BY MASS PC FA SF PC FA SF w/c fs DL/D0 q 20 20 60 26 19 55 0.643 0.388 0.0016 0.000 20 40 40 26 38 36 0.638 0.388 0.0007 0.082 20 60 20 25 57 18 0.633 0.388 0.0008 0.313 20 80 0 25 75 0 0.627 0.388 0.0120 0.370 40 0 60 48 0 52 0.603 0.388 0.0009 0.000 40 20 40 48 18 34 0.599 0.388 0.0008 0.107 40 40 20 48 35 17 0.594 0.388 0.0008 0.347 40 60 0 47 53 0 0.590 0.388 0.0138 0.416 60 0 40 68 0 32 0.565 0.388 0.0008 0.134 60 20 20 67 17 16 0.560 0.388 0.0008 0.367 60 40 0 67 33 0 0.557 0.388 0.0157 0.470 80 0 20 85 0 15 0.530 0.388 0.0007 0.404 80 20 0 84 16 0 0.527 0.388 0.0210 0.448 90 0 10 93 0 7 0.513 0.388 0.0009 0.571
100 0 0 100 0 0 0.500 0.388 0.0235 0.510 Thermogravimetry At an age of 90 days quantities of the paste specimens were ground using a mortar and pestle, and dispersed in acetone for a period of 30 minutes before being filtered and dried in a vacuum oven at 45°C for around 16 hours. Samples were stored in a desiccator at 20 °C until analysis was conducted.

426 Dyer et al
Thermogravimetry (TG) was conducted on the dried paste samples with a Netzsch STA 409 instrument. A heating rate of 10°C/minute was used from ambient temperature to 1000°C, whilst nitrogen was passed through the furnace at a rate of 125 ml/min. Mercury porosimetry Porosity of the mortars was measured by mercury intrusion porosimetry (MIP), using fragments taken from the 90-day paste cylinders using a hammer and chisel. These were dried in a vacuum oven at 45°C to constant mass. Mercury intrusion porosimetry of the samples at variable pressure rates up to 230 MPa was then carried out, with pores above 0.0065 µm being measured. Paste density measurements Hydrated paste density measurements were conducted on the powdered materials prepared for TG analysis using a 25 ml pycnometer and methanol as the fluid. Approximately 5g masses of sample were used. Predicting particle packing Two methods for identifying theoretically optimally-packed mixtures were used. In the first, the approach described by Funk and Dinger [6] was followed. A series of ‘composite’ particle size distributions were calculated by summing the particle size distributions from the PC, FA and SF constituents weighted in accordance with the volume fractions present. Thus, for a given size class used in the measurement of particle size distribution:
𝜐𝜐𝐷𝐷𝑢𝑢
𝐷𝐷𝑙𝑙(𝐷𝐷)𝑑𝑑𝐷𝐷 = 𝑎𝑎 𝜐𝜐𝑃𝑃𝑃𝑃
𝐷𝐷𝑢𝑢
𝐷𝐷𝑙𝑙(𝐷𝐷)𝑑𝑑𝐷𝐷 + 𝑏𝑏 𝜐𝜐𝐹𝐹𝐹𝐹
𝐷𝐷𝑢𝑢
𝐷𝐷𝑙𝑙(𝐷𝐷)𝑑𝑑𝐷𝐷 + (1 − (𝑎𝑎 + 𝑏𝑏)) 𝜐𝜐𝑆𝑆𝐹𝐹
𝐷𝐷𝑢𝑢
𝐷𝐷𝑙𝑙(𝐷𝐷)𝑑𝑑𝐷𝐷
Eq. 3 where a = the volume fraction of PC; b = the volume fraction of FA; D = the particle diameter; Du/l = the upper and lower limits of a size class; ν(D) = the volume of particles of diameter D in the mixture of materials; and ν x(D) = the volume of particles of diameter D in material x. Values of a covered the range 0.1 – 1.0 and values of b covered the range 0 – 0.9, and were changed in increments of 0.1. The theoretical porosity was then calculated for each composite distribution using the modified Westman-Hugill algorithm discussed above. The second approach was more experimental in that it was based solely on the premise that obtaining a continuous particle size distribution from a given set of real materials that most closely fits a multimodal distribution formulated to theoretically optimise packing, should achieve optimal packing for those specific materials. In this case, an ideal ‘multimodal’ cumulative distribution theoretically capable of yielding the highest packing density was generated. This was initially calculated using the ideal diameter ratio of 6.46, as discussed previously, and a packing fraction of monodisperse particles of 0.63. The resulting distribution (using a maximum particle size of 25 mm) is shown in Figure 3.

Particle Packing in Ternary Blends 427
APERTURE SIZE, µm
1x10⁻³ 10x10-3 100x10-3 1x100 10x100 100x100 1x10³ 10x103 100x103
% P
ASSI
NG
0
20
40
60
80
100
Ideal distributionReal distribution
Figure 3 A composite particle size distribution obtained from combining the PC, FA and SF
PSDs (dashed line) to yield the closest fit to an ideal multimodal distribution (solid line). The fit to this distribution obtainable using the materials under investigation was then found by using an optimisation algorithm to modify the values of a and b in Equation 3, as well as the maximum particle size of the ideal distribution to yield a composite particle size distribution which most closely fit the ideal distribution. χ2 was used as the means of measuring goodness of fit. This approach to optimising packing will be referred to as ‘multimodal approximation’ throughout the rest of the paper.
RESULTS Predictions of optimum packing The results from the Westman-Hugill algorithm for the system under investigation are shown in Figure 4, in the form of a ternary diagram showing the theoretical porosity across the full system. A band of low porosity is seen running close to the PC-FA edge of the diagram. When probed in more detail, this band has its lowest point at a SF content of around 15% by volume. Figure 5 show the results of the multimodal approximation approach to predicting optimum packing, which plots the square root of the χ2 values obtained. Square roots are shown to allow clearer definition of the regions on the ternary diagram where the fit of the distributions was closest. It should be stressed that the shapes of the ternary diagrams in Figures 4 and 5 should not be compared directly, since the χ2 values are not a measure of porosity, just of the goodness of fit between the multimodal and continuous distributions. What is important is the location of the band where the lowest values of χ2 are obtained, which is similar. Further investigation established that best fits were obtained at SF contents of around 11% by volume.
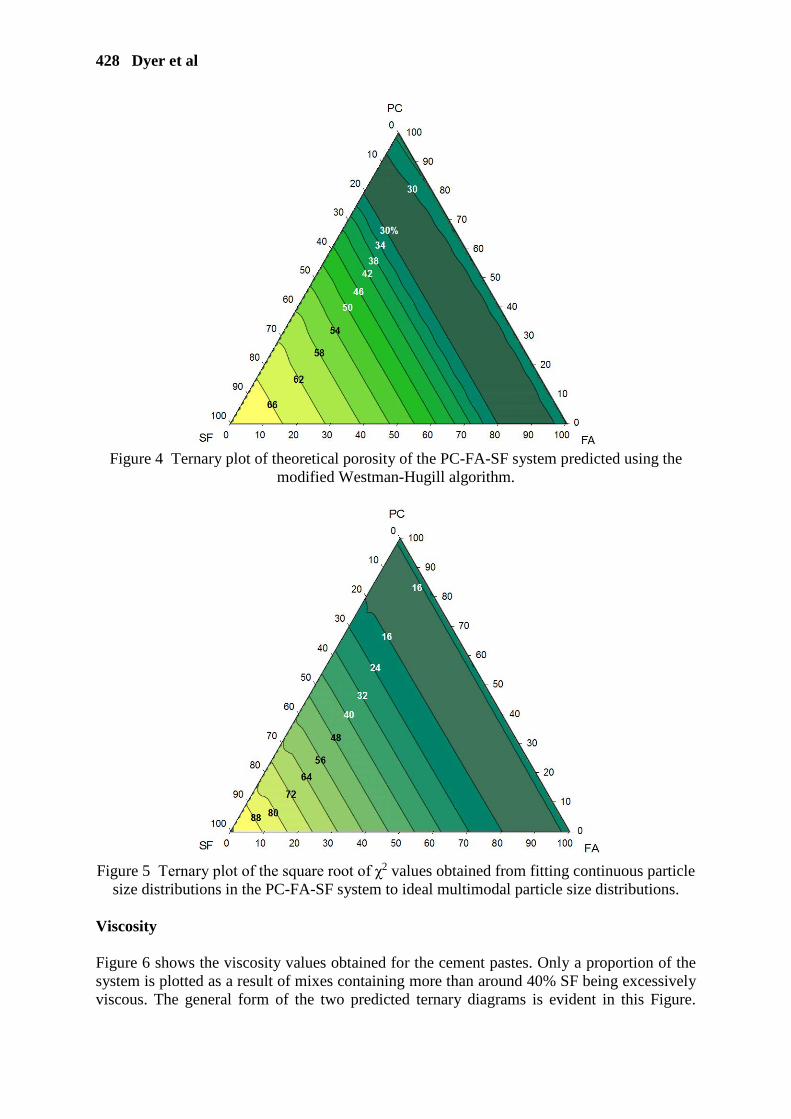
428 Dyer et al
Figure 4 Ternary plot of theoretical porosity of the PC-FA-SF system predicted using the
modified Westman-Hugill algorithm.
Figure 5 Ternary plot of the square root of χ2 values obtained from fitting continuous particle
size distributions in the PC-FA-SF system to ideal multimodal particle size distributions. Viscosity Figure 6 shows the viscosity values obtained for the cement pastes. Only a proportion of the system is plotted as a result of mixes containing more than around 40% SF being excessively viscous. The general form of the two predicted ternary diagrams is evident in this Figure.
Particle Packing in Ternary Blends 429
There are, however, differences: whilst the predictions indicated optimum packing for a given PC content at a composition some distance away from the PC – FA edge of the ternary diagram, the actual viscosity results were lowest directly along this edge. In other words, for a given PC content, the lowest viscosity is apparently observed in pastes containing only PC and FA. Whilst the compositional increments used in the experiments means that there exists the possibility that a band of minimum viscosity exists slightly off-set from the edge, it is unlikely that it is located far from this edge. Additionally, the experimental results are somewhat uneven in comparison to the predicted packing values. Some of this is likely to be the result of experimental error, but it must also be stressed that particle packing is far from being the only parameter influencing viscosity, with differences in the nature of particle interactions (van der Waals forces, friction etc.) at different compositions being an important factor.
Figure 6 Results of viscosity measurements plotted as a ternary diagram.
Porosity Figure 7 shows the cumulative pore size distributions of the pastes of equivalent PC content at 90 days. Additionally, Figure 8 plots the total porosities of the pastes on a ternary diagram. It should be noted that the distributions are relatively similar, although certain distributions are notable in being coarser or finer than distributions of the same PC content. Porosity above 0.2 μm in diameter (0.4 μm in the case of the 20% PC / 80% FA paste) is likely to be the result of air bubbles and, possibly, cracks, and is not included in subsequent analysis of distribution shapes. The total porosity value obtained for the paste containing 60% PC, 20% FA and 20% SF was deemed disproportionately high (44.5%) compared to its neighbouring results, and so has been omitted from the ternary plot. The FA / SF ratio which gives the lowest porosity at a given PC level shifts with PC content. At a PC content of 20%, the lowest porosity occurs at a FA / SF ratio of around 3, whereas at 40% PC the minimum is at around a ratio of 2. At a PC level of 60% the supposed erroneous result makes judgement of where minimal porosity occurs
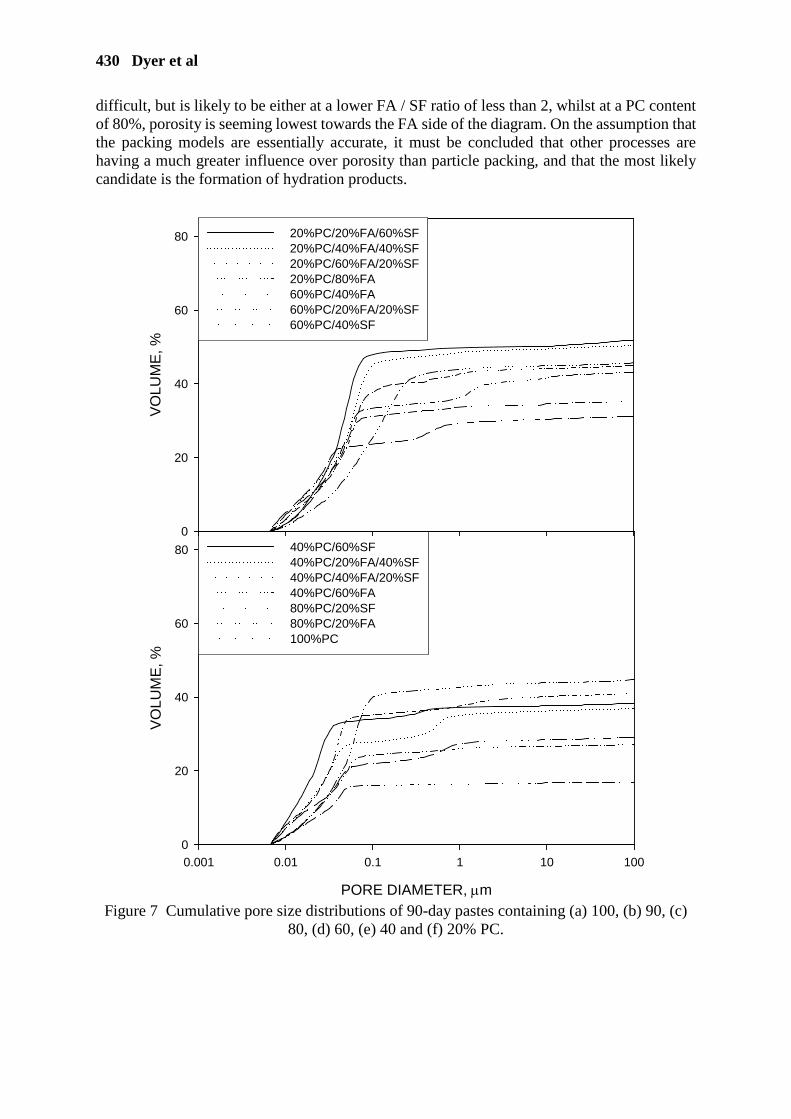
430 Dyer et al
difficult, but is likely to be either at a lower FA / SF ratio of less than 2, whilst at a PC content of 80%, porosity is seeming lowest towards the FA side of the diagram. On the assumption that the packing models are essentially accurate, it must be concluded that other processes are having a much greater influence over porosity than particle packing, and that the most likely candidate is the formation of hydration products.
PORE DIAMETER, µm
0.001 0.01 0.1 1 10 100
VOLU
ME,
%
0
20
40
60
80 40%PC/60%SF40%PC/20%FA/40%SF40%PC/40%FA/20%SF40%PC/60%FA80%PC/20%SF80%PC/20%FA100%PC
VOLU
ME,
%
0
20
40
60
80 20%PC/20%FA/60%SF20%PC/40%FA/40%SF20%PC/60%FA/20%SF20%PC/80%FA60%PC/40%FA60%PC/20%FA/20%SF60%PC/40%SF
Figure 7 Cumulative pore size distributions of 90-day pastes containing (a) 100, (b) 90, (c)
80, (d) 60, (e) 40 and (f) 20% PC.

Particle Packing in Ternary Blends 431
Figure 8 Total porosities of the 90-day pastes.
Hydration The quantities of CH present were determined from the thermogravimetry traces — indicated by a relatively abrupt drop in mass at a temperature of around 450°C – and are shown in a ternary diagram in Figure 9. It would be expected for the level of CH present to decline with decreasing PC content, since this will be the sole source of this hydration product in the blends investigated, and this is indeed seen in the results. Additionally, for a given PC content, there is less CH present in pastes containing more SF than FA. This is presumably for two reasons. Firstly, silica fume is composed of much finer particles, giving a higher initial surface area, and hence a higher rate of pozzolanic reaction. Secondly, a proportion of the fly ash is composed of mineral phases unavailable for reaction – in particular much of the iron oxide and SiO2 are present as crystalline minerals which are unlikely to take part to any significant extent in pozzolanic reaction. A greater degree of pozzolanic reaction is likely to yield a higher quantity of hydration products. This is supported by Figure 10, which plots total bound water in the pastes — measured as total mass loss up to a temperature of 650°C — as a ternary diagram. Some caution must be exercised when interpreting such data, since the water associated with different hydration products varies, and the water content of the calcium silicate hydrate (CSH) phases can vary considerably. However, as an indication of the overall quantity of hydration products formed, it is a useful parameter. Thus, the figure indicates that, for a given PC content, a higher quantity of bound water is present in the pastes containing a higher proportion of SF and, hence, a higher degree of pozzolanic reaction had occurred. The formation of hydration products will lead to a decrease in porosity, and so bound water and porosity are compared in Figure 11 (including the rejected porosity data point) showing a reasonably good correlation between the two values. This indicates that (a) the reduction in porosity is strongly influenced by the quantity of hydration products formed (and that bound
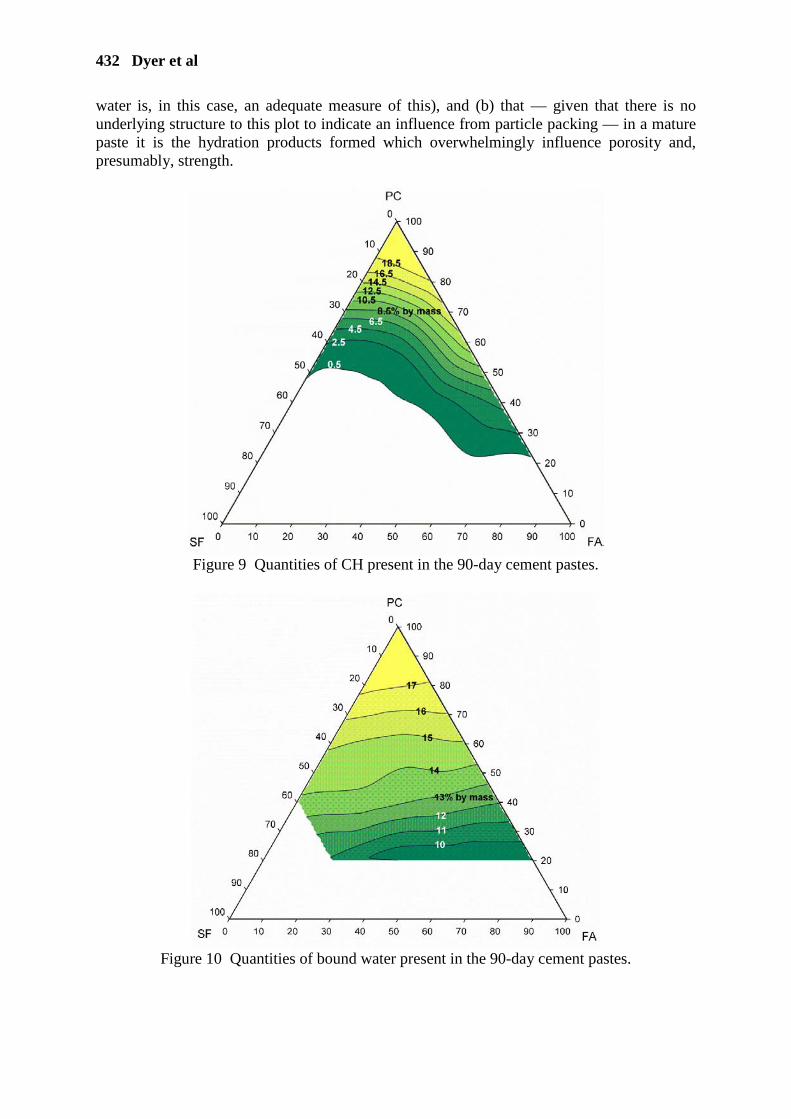
432 Dyer et al
water is, in this case, an adequate measure of this), and (b) that — given that there is no underlying structure to this plot to indicate an influence from particle packing — in a mature paste it is the hydration products formed which overwhelmingly influence porosity and, presumably, strength.
Figure 9 Quantities of CH present in the 90-day cement pastes.
Figure 10 Quantities of bound water present in the 90-day cement pastes.

Particle Packing in Ternary Blends 433
BOUND WATER, % by mass
8 10 12 14 16 18
POR
OSI
TY, %
0
20
40
60
80
100
Figure 11 Porosity versus bound water in the 90-day cement pastes.
It is desirable to retain a residual quantity of CH in the mature cement paste. This is for two reasons. Firstly, where CH is exhausted, it can be concluded that pozzolanic reactions have been arrested, and thus the full potential of the cementitious materials is not realised. Secondly, the durability of concrete is influenced by the pH of the cement matrix and, where CH is absent, it is likely to be compromised. For instance, the surface of steel reinforcement may not be passified, the capacity of concrete to bind chloride ions will be limited, and resistance to carbonation will be lowered.
DISCUSSION The Particle Packing Models Two approaches to optimisation were explored: one based on a modification of the Westman-Hugill algorithm, and the more experimental multimodal approximation method. Both methods appear effective at predicting optimum packing. Discussion of computational efficiency is of limited relevance for tasks of this nature, since they require periods of only fractions of a second using contemporary computer technology. However, it should be noted that the second of these approaches requires fewer optimisation procedures. The Westman-Hugill algorithm not only requires optimisation for adjusting the proportions of constituents to obtain the desired q value, but also to obtain the q value for each curve generated. In contrast the multimodal approximation method requires a single optimisation process to fit the constituent curves to the idealised distribution. Thus, the multimodal approximation approach is more amenable to use within conventional spreadsheet software. It is evident that both the modified Westman-Hugill and multimodal approximation techniques were not wholly adequate at predicting compositions at which minimum viscosity for a given PC content is observed. The most likely reason is the presence of a volume of water exceeding the volume of theoretical space between the particles when packed.

434 Dyer et al
In the case of the multimodal approximation method, this introduction of additional space between particles will manifest itself as a decrease in DL/DC. Random close packing has a packing fraction comparable to orthorhombic packing [4], and so some parallels can be drawn between the two configurations. To establish the manner in which the presence of water is likely to influence the critical diameter in the ternary blends under investigation, an orthorhombic configuration is used. One close packed layer within an orthorhombic unit cell is shown in Figure 12. As water is introduced, it initially fills the porosity between the particles. At the point where the porosity is just filled with water, the volume fraction of solids (Vs) in the orthorhombic unit cell is given by the equation:
𝑉𝑉𝑠𝑠 =43𝜋𝜋
𝐷𝐷𝐿𝐿2
3
𝐷𝐷𝐿𝐿3sin (60)
Eq. 4
Where the upper term is the volume of one sphere (i.e. the total volume of spheres in the unit cell), and the lower term is the volume of an orthorhombic unit cell. If any further water is introduced, the spheres will move apart to accommodate the additional volume. Taking this into account in the solids fraction equation:
𝑉𝑉𝑠𝑠 =43𝜋𝜋
𝐷𝐷𝐿𝐿2
3
(𝐷𝐷𝐿𝐿+s)3sin (60°) Eq. 5
Figure 12 Diagram illustrating the generation of an interparticle spacing, s, between the close packed layer of a group of orthorhombically packed spheres resulting from the introduction
of water into the pores, and the effect on the critical pore diameter.
However, this is independent of the size of the larger spheres, and so it is useful to make DL equal to one:
𝑉𝑉𝑠𝑠 =43𝜋𝜋
123
(1+s)3sin (60°)= 0.605
(1+𝑠𝑠)3 Eq. 6

Particle Packing in Ternary Blends 435
Rearranging:
𝑠𝑠 = 0.605𝑉𝑉𝑠𝑠
3 − 1 Eq. 7
The diameter of the smallest sphere that will pass through this arrangement of larger spheres, DC, is:
𝐷𝐷𝑃𝑃 = 𝐷𝐷𝐿𝐿+𝑠𝑠sin (60°)
−𝐷𝐷𝐿𝐿 = 0.154𝐷𝐷𝐿𝐿 + 1.154𝑠𝑠 Eq. 8
Therefore, and, again, assuming a value of DL of one:
𝐷𝐷𝐿𝐿𝐷𝐷𝐶𝐶
= 1
0.154−1+1.154 0.605𝑉𝑉𝑠𝑠
3= 1
0.976𝑉𝑉𝑠𝑠3 −0.846
Eq. 9
Making this adjustment yields a shift in the optimal packed region over to the PC-FA axis, as shown in Figure 13.
Figure 13 Ternary plot of the square root of χ2 values obtained from fitting continuous
particle size distributions in the PC-FA-SF system to ideal multimodal particle size distributions with correction for the presence of water.
We have previously seen that researchers have proposed that DL/DC should, in fact, be higher, to account for the theoretical value of Dc only just fitting the space between larger particles. However, the fact that a lower value of DL/DC yields an improved prediction indicates that the effect of an additional volume of water is more important than a more realistic consideration of what size particles will fit between the larger particles. In reality, it is likely that the actual value of DL/DC lies somewhere between the theoretical value without water (6.46) and the value obtained by the method described above (2.03, for the solids fraction used in this study).
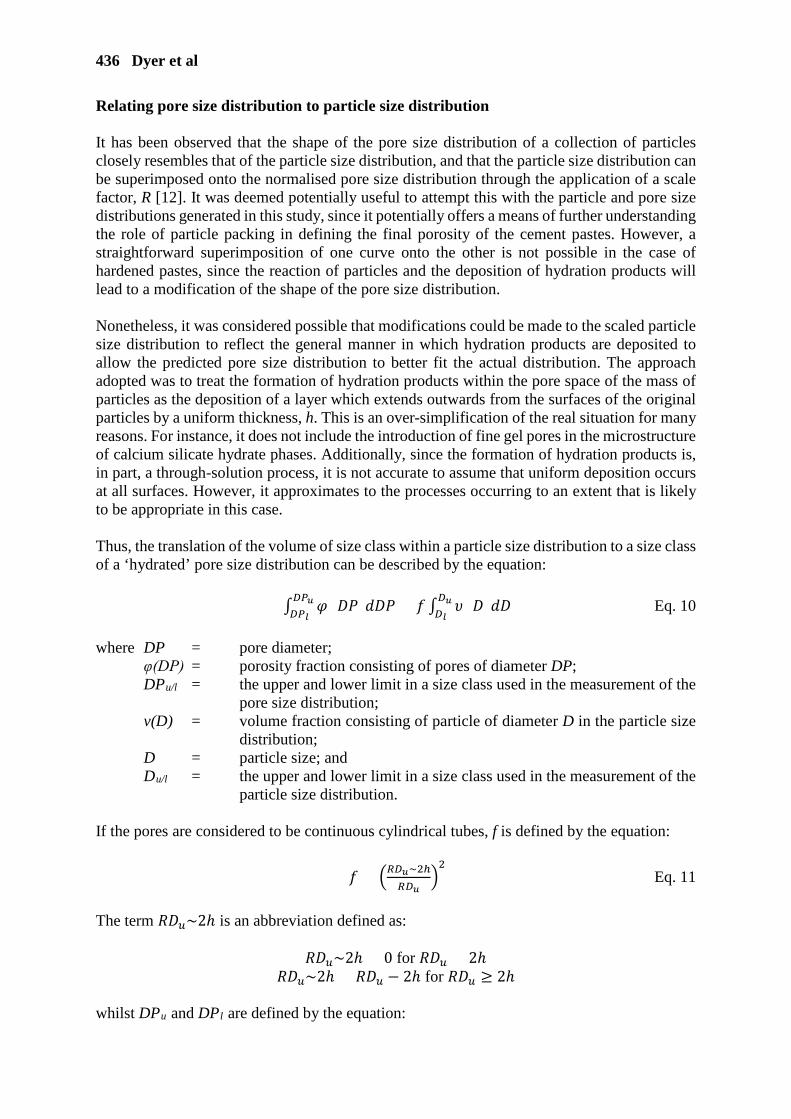
436 Dyer et al
Relating pore size distribution to particle size distribution It has been observed that the shape of the pore size distribution of a collection of particles closely resembles that of the particle size distribution, and that the particle size distribution can be superimposed onto the normalised pore size distribution through the application of a scale factor, R [12]. It was deemed potentially useful to attempt this with the particle and pore size distributions generated in this study, since it potentially offers a means of further understanding the role of particle packing in defining the final porosity of the cement pastes. However, a straightforward superimposition of one curve onto the other is not possible in the case of hardened pastes, since the reaction of particles and the deposition of hydration products will lead to a modification of the shape of the pore size distribution. Nonetheless, it was considered possible that modifications could be made to the scaled particle size distribution to reflect the general manner in which hydration products are deposited to allow the predicted pore size distribution to better fit the actual distribution. The approach adopted was to treat the formation of hydration products within the pore space of the mass of particles as the deposition of a layer which extends outwards from the surfaces of the original particles by a uniform thickness, h. This is an over-simplification of the real situation for many reasons. For instance, it does not include the introduction of fine gel pores in the microstructure of calcium silicate hydrate phases. Additionally, since the formation of hydration products is, in part, a through-solution process, it is not accurate to assume that uniform deposition occurs at all surfaces. However, it approximates to the processes occurring to an extent that is likely to be appropriate in this case. Thus, the translation of the volume of size class within a particle size distribution to a size class of a ‘hydrated’ pore size distribution can be described by the equation:
∫ 𝜑𝜑𝐷𝐷𝑃𝑃𝑢𝑢𝐷𝐷𝑃𝑃𝑙𝑙
(𝐷𝐷𝐶𝐶)𝑑𝑑𝐷𝐷𝐶𝐶 = 𝑓𝑓 ∫ 𝜐𝜐𝐷𝐷𝑢𝑢𝐷𝐷𝑙𝑙
(𝐷𝐷)𝑑𝑑𝐷𝐷 Eq. 10
where DP = pore diameter; φ(DP) = porosity fraction consisting of pores of diameter DP;
DPu/l = the upper and lower limit in a size class used in the measurement of the pore size distribution;
v(D) = volume fraction consisting of particle of diameter D in the particle size distribution;
D = particle size; and Du/l = the upper and lower limit in a size class used in the measurement of the
particle size distribution. If the pores are considered to be continuous cylindrical tubes, f is defined by the equation:
𝑓𝑓 = 𝑅𝑅𝐷𝐷𝑢𝑢~2ℎ𝑅𝑅𝐷𝐷𝑢𝑢
2 Eq. 11
The term 𝑅𝑅𝐷𝐷𝑢𝑢~2ℎ is an abbreviation defined as:
𝑅𝑅𝐷𝐷𝑢𝑢~2ℎ = 0 for 𝑅𝑅𝐷𝐷𝑢𝑢 < 2ℎ 𝑅𝑅𝐷𝐷𝑢𝑢~2ℎ = 𝑅𝑅𝐷𝐷𝑢𝑢 − 2ℎ for 𝑅𝑅𝐷𝐷𝑢𝑢 ≥ 2ℎ
whilst DPu and DPl are defined by the equation:

Particle Packing in Ternary Blends 437
𝐷𝐷𝐶𝐶𝑥𝑥 = 𝑅𝑅𝐷𝐷𝑥𝑥~2ℎ Eq. 12 where x is either l or u, and ~ serves a similar purpose as before. Theoretical composite cumulative particle size distributions for the pastes investigated were calculated from the PSDs of the component materials, and the cumulative pore size distributions from mercury porosimetry measurements normalised to 100. 4-parameter logistics curves were then fitted to the normalised pore size distributions, and the particle size distributions scaled and modified to fit these curves by refining h and R. Values of h and R from the pastes are presented in Table 3. R is effectively an indicator of how well packed the particles are (although it is also dependent on the upper particle size). Thus, a lower value signifies more efficient packing. A feature of the lower PC blends is a minimum in R at a SF level of around 20% (Figure 14). This implies that particle packing was initially most efficient in the zone predicted by both packing optimisation methods. The volume of water in the fresh pastes (just over 72% at a solids fraction of 0.388) was in excess of even the highest porosity predicted by the Westman-Hugill algorithm. Thus, it might be expected that packing (and hence R) would be equal for all mixes. Given that R reflects the efficiency of packing prior to any cement reaction having occurred, the apparent presence of a minimum in this value at certain SF / FA ratios suggests that some settling of the pastes had occurred. Thus, it can be concluded that both approaches to predicting packing are appropriate for the ternary blends studied in this paper, albeit with the caveat — in accordance with observations made above — that it will have limited influence on the performance of mature cement blends. Table 3 Values of h and R obtained through adapting particle size distributions to pore size
distributions.
% BY VOLUME h, μm R PC FA SF 20 20 60 0.0006 0.00266 20 40 40 0.0012 0.00158 20 60 20 0.0034 0.00131 20 80 0 0.0058 0.00201 40 0 60 0.0005 0.00113 40 20 40 0.0012 0.00104 40 40 20 0.0020 0.00099 40 60 0 0.0039 0.00137 60 0 40 0.0014 0.00190 60 20 20 0.0025 0.00127 60 40 0 0.0031 0.00108 80 0 20 0.0022 0.00115 80 20 0 0.0034 0.00127 90 0 10 0.0028 0.00123 100 0 0 0.0042 0.00106
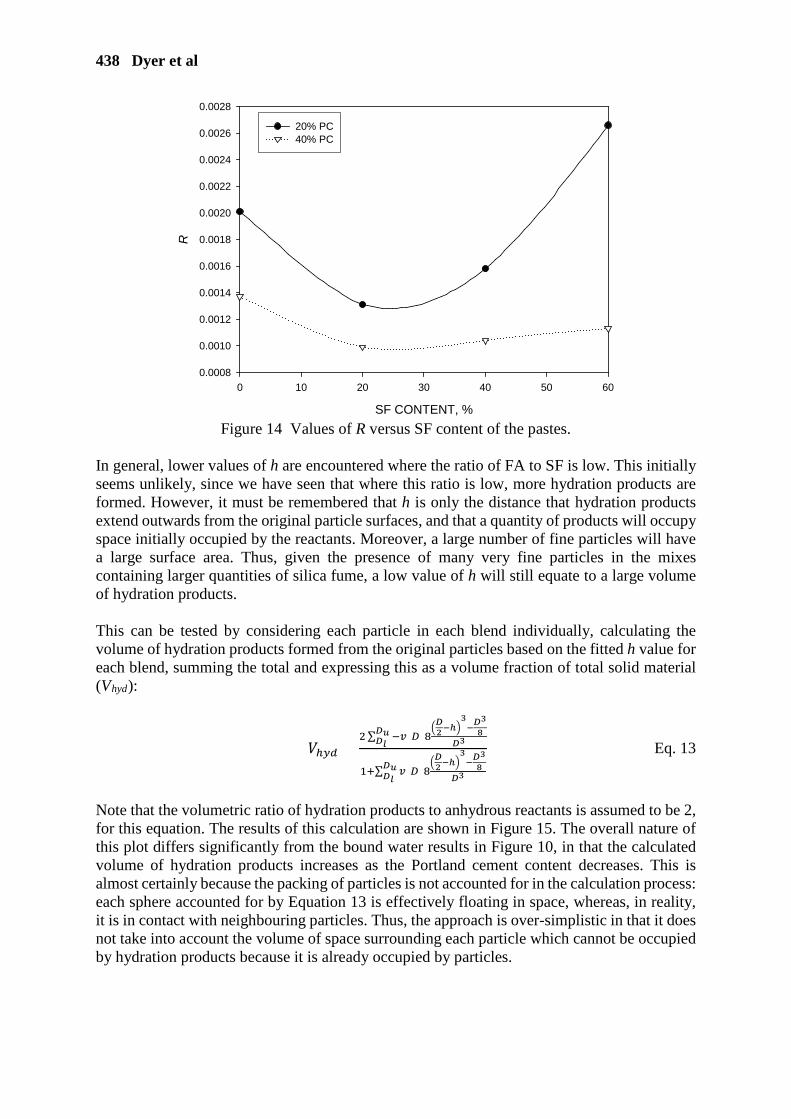
438 Dyer et al
SF CONTENT, %
0 10 20 30 40 50 60
R
0.0008
0.0010
0.0012
0.0014
0.0016
0.0018
0.0020
0.0022
0.0024
0.0026
0.0028
20% PC40% PC
Figure 14 Values of R versus SF content of the pastes.
In general, lower values of h are encountered where the ratio of FA to SF is low. This initially seems unlikely, since we have seen that where this ratio is low, more hydration products are formed. However, it must be remembered that h is only the distance that hydration products extend outwards from the original particle surfaces, and that a quantity of products will occupy space initially occupied by the reactants. Moreover, a large number of fine particles will have a large surface area. Thus, given the presence of many very fine particles in the mixes containing larger quantities of silica fume, a low value of h will still equate to a large volume of hydration products. This can be tested by considering each particle in each blend individually, calculating the volume of hydration products formed from the original particles based on the fitted h value for each blend, summing the total and expressing this as a volume fraction of total solid material (Vhyd):
𝑉𝑉ℎ𝑦𝑦𝑦𝑦 =2∑ −𝑣𝑣(𝐷𝐷)8
𝐷𝐷2−ℎ3−𝐷𝐷
38
𝐷𝐷3𝐷𝐷𝑢𝑢𝐷𝐷𝑙𝑙
1+∑ 𝑣𝑣(𝐷𝐷)8𝐷𝐷2−ℎ
3−𝐷𝐷
38
𝐷𝐷3𝐷𝐷𝑢𝑢𝐷𝐷𝑙𝑙
Eq. 13
Note that the volumetric ratio of hydration products to anhydrous reactants is assumed to be 2, for this equation. The results of this calculation are shown in Figure 15. The overall nature of this plot differs significantly from the bound water results in Figure 10, in that the calculated volume of hydration products increases as the Portland cement content decreases. This is almost certainly because the packing of particles is not accounted for in the calculation process: each sphere accounted for by Equation 13 is effectively floating in space, whereas, in reality, it is in contact with neighbouring particles. Thus, the approach is over-simplistic in that it does not take into account the volume of space surrounding each particle which cannot be occupied by hydration products because it is already occupied by particles.
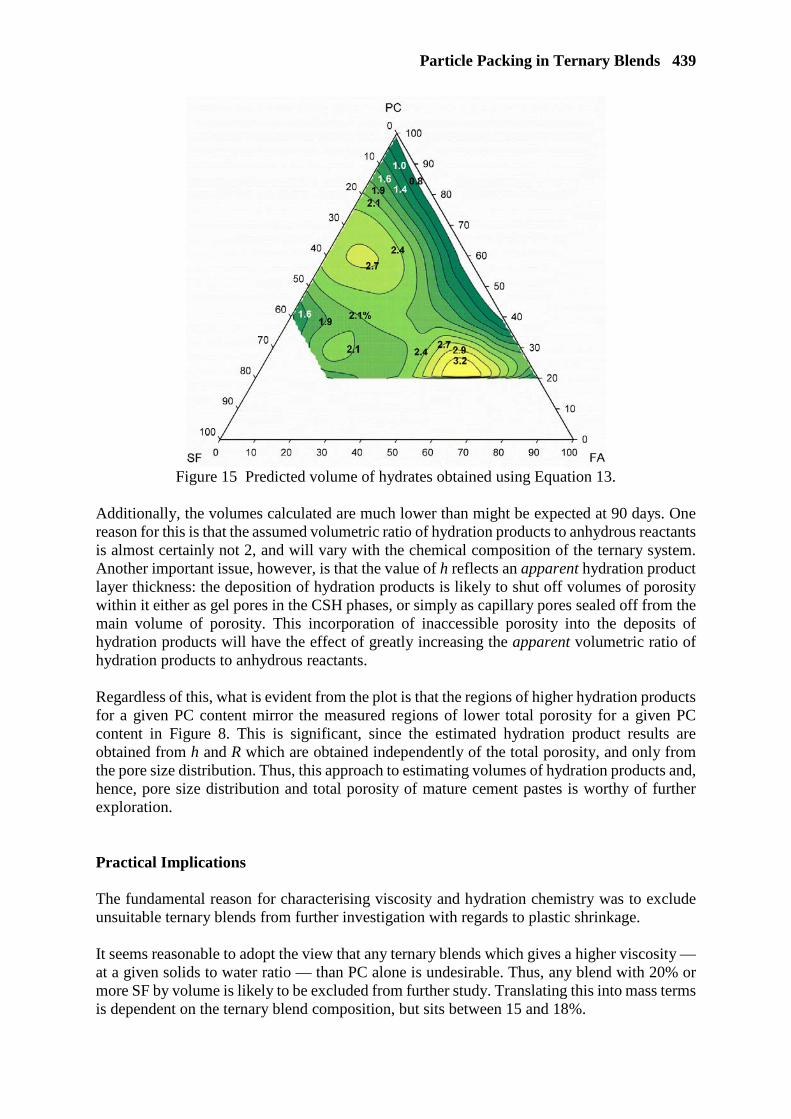
Particle Packing in Ternary Blends 439
Figure 15 Predicted volume of hydrates obtained using Equation 13.
Additionally, the volumes calculated are much lower than might be expected at 90 days. One reason for this is that the assumed volumetric ratio of hydration products to anhydrous reactants is almost certainly not 2, and will vary with the chemical composition of the ternary system. Another important issue, however, is that the value of h reflects an apparent hydration product layer thickness: the deposition of hydration products is likely to shut off volumes of porosity within it either as gel pores in the CSH phases, or simply as capillary pores sealed off from the main volume of porosity. This incorporation of inaccessible porosity into the deposits of hydration products will have the effect of greatly increasing the apparent volumetric ratio of hydration products to anhydrous reactants. Regardless of this, what is evident from the plot is that the regions of higher hydration products for a given PC content mirror the measured regions of lower total porosity for a given PC content in Figure 8. This is significant, since the estimated hydration product results are obtained from h and R which are obtained independently of the total porosity, and only from the pore size distribution. Thus, this approach to estimating volumes of hydration products and, hence, pore size distribution and total porosity of mature cement pastes is worthy of further exploration. Practical Implications The fundamental reason for characterising viscosity and hydration chemistry was to exclude unsuitable ternary blends from further investigation with regards to plastic shrinkage. It seems reasonable to adopt the view that any ternary blends which gives a higher viscosity — at a given solids to water ratio — than PC alone is undesirable. Thus, any blend with 20% or more SF by volume is likely to be excluded from further study. Translating this into mass terms is dependent on the ternary blend composition, but sits between 15 and 18%.
440 Dyer et al
Furthermore, blends where CH is completely exhausted should also be excluded. Limiting our search to regions permitted by the previous viscosity criterion, the requirement is simply that only blends with a PC content exceeding 20% by volume are studied further (which translates to between 25 and 26% by mass). Some caution needs to be applied here – the pastes were cured in a sealed condition for 90 days, and it is conceivable that a longer curing period and the presence of additional water might allow the pozzolanic reaction to proceed further, thus raising this limit. CONCLUSIONS The paper reports on interim results from a study whose ultimate aim is to develop low plastic shrinkage cement pastes containing PC, FA and SF with the ultimate aim of extending this to concrete mixes. It examines viscosity, hydration and porosity characteristics partly to eliminate unsuitable mixes for further study. However, such measurements also offer the opportunity to establish other effects of optimising particle packing. The findings can be summarised as follows:
• Two approaches to optimisation were explored: one based on a modification of the Westman-Hugill algorithm, and a more experimental approach based on obtaining an approximate fit of a continuous particle size distribution to an idealised multimodal distribution. Both methods appear to function similarly in predicting optimum packing, although the multimodal approximation approach is more amenable to being implemented using conventional spreadsheet software.
• Both optimisation methods fall short when predicting optimum viscosity. An attempt
has been made to address this in the case of the multimodal approximation approach — seemingly successfully. This requires further validation using a range of water / cement ratios and by application to other ternary systems.
• A novel approach to analysing the relationships between particle size distribution and
pore size distribution of the ternary blends indicates that both models predict packing well. A possible approach to predicting porosity and pore size distributions in mature pastes from particle size distributions of constituent materials is tentatively suggested. This method requires considerable development.
• The compositional limits of the PC – FA – SF ternary blends have been identified for
the materials studied as <20% SF and >20% PC by volume of solids.
REFERENCES 1. KUTERASIŃSKA J AND KRÓL A, New types of low-carbon cements with reduced
Portland clinker content as a result of ecological actions of cement industry towards sustainable development. Economic and Environmental Studies, Vol. 16, 2016, pp. 403-419.
2. BRITISH STANDARDS INSTITUTION, BS EN 197-1: Cement. Composition, specifications and conformity criteria for common cements, BSI, London, 2011.
Particle Packing in Ternary Blends 441
3. JONES MR, ZHENG L AND NEWLANDS MD, Comparison of particle packing models for proportioning concrete constituents for minimum voids ratio, Materials and Structures, Vol. 35, 2002, pp. 301-309.
4. DULLIEN FAL, Porous Media: Fluid Transport and Pore Structure (2nd ed.), Academic Press, New York, 1992.
5. GREENWOOD R, LUCKHAM PF AND GREGORY T, The effect of diameter ratio and volume ratio on the viscosity of bimodal suspensions of polymer lattices. Journal of Colloid and Interface Science, Vol. 191, 1997, pp. 11-21.
6. FUNK JE AND DINGER DR, Predictive Process Control of Crowded Particulate Suspensions. Springer, New York, 1994.
7. MCGEARY RK, Mechanical packing of spherical particles. Journal of the American Ceramic Society, Vol. 44, 1961, pp. 513-522.
8. AYER JE AND SOPPETT FE, Vibratory compaction: I – Compaction of spherical shapes, Journal of the American Ceramic Society, Vol. 48, 1965, pp. 180-183.
9. ANDREASEN AHM AND ANDERSEN J, Über die Beziehung zwischen Kornabstufung und Zwischenraum in Produkten aus losen Körnern (mit einigen Experimenten). Kolloid-Zeitschrift, Vol. 50, 1930, pp. 217-228.
10. WESTMAN AER AND HUGILL HR, The packing of particles. Journal of the American Ceramic Society, Vol. 13, 1930, pp. 767-779.
11. BRITISH STANDARDS INSTITUTION, BS EN 450-1: Fly ash for concrete. Definition, specifications and conformity criteria, BSI, London, 2012.
12. WU L, VOMOCIL JA AND CHILDS SW, Pore size, particle size, aggregate size, and water retention. Soil Science Society of America Journal, Vol. 45, 1990, pp. 952-956.
2020 TO 2070 AND BEYOND: TRANSITIONING FROM PRODUCTION TO POST-PRODUCTION COAL ASH USE
J B Sifton
C Arato
SonoAsh Engineered Materials Ltd
Canada
ABSTRACT. Over the last 50 years, production coal ash, in various global markets, has successfully transitioned from a "resisted use" product to a "specified component" in cement mixtures to be used in infrastructure projects. The next 50 years will require an extension of that effort. It will necessitate the product and quality specification of coal ash to include the use of post-production coal ash from the vast reserves stored in impounded coal ash sites around the world. To initiate this transition, a new approach is needed to create a fungible market for this 21st century material through the development of broad product matrix that takes into account local ash and market development opportunities. Keywords: CCR, REE, Green cement, Proppant, Beneficiation, Waste, Value J Bruce Sifton, P. Eng., is the President and Founder of SonoAsh Engineered Materiels Ltd., based in Vancouver, B.C. He has a proven track record in creating value around diverse opportunities such as urban mining from electronic waste, carbon-based nanochemistry in power and metal applications, basalt fibre composites for military applications, and specialty paints and coatings. Bruce holds a BSc. (Chemistry) and Master of Engineering (Chemical) from the University of New Brunswick. He is a registered Professional Engineer in British Columbia and Saskatchewan. Claudio Arato, P.Eng., is the Principal Engineer and inventor behind the SonoAsh concept, the Research & Development and all ash beneficiation patent procurement. Claudio’s decade long development of commercialized applications for the low frequency acoustic technology is the heart of SonoAsh IP. He holds degrees in Chemistry and Chemical Engineering from the University of British Columbia (UBC) and is an Engineers Canada Fellow. He is a registered Professional Engineer in British Columbia and Saskatchewan. He is the recipient of the UBC 2018 Alumni Builders Award, 2016 Faculty of Applied Science Dean’s Medal of Distinction, the 2014 Engineers Canada Meritorious Achievement Award for Professional Service and the author of numerous additional patents.
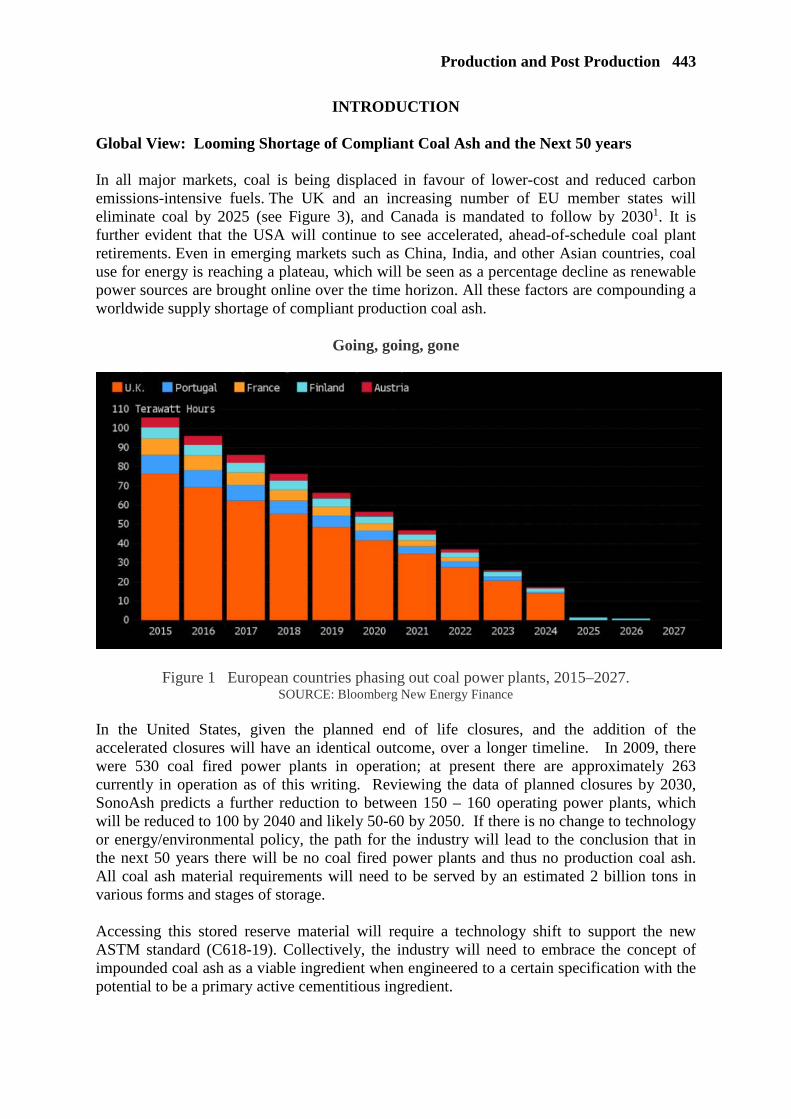
Production and Post Production 443
INTRODUCTION Global View: Looming Shortage of Compliant Coal Ash and the Next 50 years In all major markets, coal is being displaced in favour of lower-cost and reduced carbon emissions-intensive fuels. The UK and an increasing number of EU member states will eliminate coal by 2025 (see Figure 3), and Canada is mandated to follow by 20301. It is further evident that the USA will continue to see accelerated, ahead-of-schedule coal plant retirements. Even in emerging markets such as China, India, and other Asian countries, coal use for energy is reaching a plateau, which will be seen as a percentage decline as renewable power sources are brought online over the time horizon. All these factors are compounding a worldwide supply shortage of compliant production coal ash.
Going, going, gone
Figure 1 European countries phasing out coal power plants, 2015–2027. SOURCE: Bloomberg New Energy Finance
In the United States, given the planned end of life closures, and the addition of the accelerated closures will have an identical outcome, over a longer timeline. In 2009, there were 530 coal fired power plants in operation; at present there are approximately 263 currently in operation as of this writing. Reviewing the data of planned closures by 2030, SonoAsh predicts a further reduction to between 150 – 160 operating power plants, which will be reduced to 100 by 2040 and likely 50-60 by 2050. If there is no change to technology or energy/environmental policy, the path for the industry will lead to the conclusion that in the next 50 years there will be no coal fired power plants and thus no production coal ash. All coal ash material requirements will need to be served by an estimated 2 billion tons in various forms and stages of storage. Accessing this stored reserve material will require a technology shift to support the new ASTM standard (C618-19). Collectively, the industry will need to embrace the concept of impounded coal ash as a viable ingredient when engineered to a certain specification with the potential to be a primary active cementitious ingredient.

444 Sifton and Arato
Additionally, many jurisdictions around the world are implementing some version of carbon pricing, either through a tax or cap-and-trade system or some other as-yet-to-be determined mechanism. Carbon policies focused on coal power generation and the cement industry require a reduction of carbon emissions. The impact of these policies on power generation is reducing the use of coal as a fuel. The result impacts cement producers and requires process adjustments and new cement formulas. Impounded Coal Ash Is Key to Inevitable Shortages Resource optimization means understanding our building history. What is old becomes new again. As with the formulas developed during the Roman Empire circa 312 BC to 500 AD (see Figure 2)—which used volcanic ash as a natural pozzolan in the construction of some of its most durable structures—new formulas will need to be considered in the search for a low-carbon reality for 21st century infrastructure buildout and revitalization.
2000 years and counting
Figure 2 The Pantheon in Rome is an example of Roman concrete construction built in 113–125 AD.
SOURCE: Jean-Christophe BENOIST, CC BY 2.5, ttps://commons.wikimedia.org/w/index.php?curid=2532901 John Ward, Chairman of the American Coal Ash Association's Government Relations Committee, stated: "However…if you want to invent the machine/pixie dust that eliminates performance variability among ash types and sources, that would be a true breakthrough—enabling the CCP world to shift from a series of local markets to a single fungible commodity market."2 The authors agree completely with this statement; it is the key to unlocking the 21st century opportunities. The SonoAsh approach enables a consistent product to be manufactured from an inconsistent supply for a complete product matrix solution.
Production and Post Production 445
Applying this new thinking together with the appropriate innovative technology converts coal ash impoundments to resource-rich above ground ore bodies. The opportunity paradigm in this new reality is the additional high-value multi-product matrix available in coal ash impoundments. This multi-product matrix includes engineered pozzolanic material (high-performance green cement), cenospheres, silica flour, rare earth elements, strategic metals, carbon offsets, and proppants. The coal power industry and related associations have made excellent progress in quantifying and mitigating the perception of risk associated with production coal ash as a high-quality pozzolanic material. This can be seen in the dramatic rise in the use of production coal ash in North America, as the product application utilization rate has nearly doubled over the last decade to nearly 45% even while the share of coal in the global energy mix has declined. The decline in coal use has reduced the volumes of reliable, uniform high-quality production coal ash available to the concrete and construction industries, as measured by consistent loss on ignition (LOI) and impurities (such as sulphur, chlorides and nuisance heavy metals). Key cement parameters, like workability and ASTM C-618-19 (EN 450)-grade material particle size, are often assumed to be consistent in the marketplace but are not. Both LOI and particle size of production coal ash have highly empirical correlations with one another relating to high-performance and LEED-eligible applications, where reuse has significant value-add upside. Ensuring both workability and uniform particle size will be essential to making reclaimed coal ash a fungible market material in the 21st century marketplace and useful for future cement applications.
A CASE STUDY: THE UNITED KINGDOM AND THE END OF COAL POWER Nowhere is the problem of coal ash more acute than in the United Kingdom. The UK's situation represents the ‘canary in the coal mine’ for the industry structure around the world. The UK leads the global charge toward zero-coal power generation, with plans to close all remaining coal plants by 2025 (see Figures 1 and 3). To put this action in context, as recently as 2012, the UK generated more than 6 million tons of fly ash. In 2018, that figure dropped to roughly 1.6 million tons3 following further reductions in the use of coal. These trends foreshadow a new era in the domestic cement markets. Coal: Turned Off The historic supply of readily available, and compliant production coal ash will end with the production of coal power generation. For the UK, the timing could not be worse. The complication of Brexit is causing cost uncertainty on materials historically imported from Europe. As a result, the domestic building products industry is now faced with a significant problem: Where will it source new EN 450 (European ASTM C-618 equivalent) compliant materials?

446 Sifton and Arato
Figure 3 Historical and projected UK electricity generation by fuel type, 2008–2025 (TWh).
SOURCE: 2008–2016 actuals from BEIS (the UK Department of Business, Energy & Industrial Strategy) 2018
forecast https://www.gov.uk/government/organisations/department-for-business-energy-and-industrial-
strategy/about/statistics
The Second End of Coal
Figure 4. United Kingdom coal consumption, 1920–2017 (MMst). SOURCE: U.S. Energy Information Administration. (www.eia.gov)

Production and Post Production 447
The answer to the supply question will be realized in the country’s vast supplies of post-production ash. Both impounded and landfilled coal ash. The United Kingdom Quality Ash Association (UKQAA) has been studying this issue since 2014. The UKQAA has stated that the country's stockpiled ash, estimated at 50 million tons,3 should be designated as future “pozzolanic” reserves. However, this sort of initiative will require multi-level government support. In the meantime, the UK will have to continue to import its coal ash from Europe. While that might be a solution for the short term, Europe is also moving away from coal as a fuel. Therefore, whatever relief the industry can gain through those imports will only delay the inevitable. The second end of coal energy parallels the first, separated by 100 years, as seen in Figure 4. Coal generated electrical power displaced historic direct burn of coal and coal fired steam power as the “green technology” of the early 20th century. Renewable sources of power (solar, wind, geothermal) are now displacing electrical coal power generation as the “green technology” of the 21st century. The implications on the 21st century will have a greater impact than those of the technology shift of the 20th century.
SONOASH APPROACH Any fiscally responsible, data driven technology approach must apply a series of systematic evaluations to develop a robust process toward maximizing the value of coal, and especially, its by-products as a vital aspect of the ultimate objective of closed loop coal. Global social, technological and political drivers are well publicized toward the prediction that thermal coal power as a fuel source will soon disappear. Depending on where you live, that disappearance will occur at different rates. The developing world will see coal used for decades to come and contribute to the energy grid for the foreseeable future. However, the clock is ticking in Europe and North America and we can expect to see 80% of coal power to go offline by 2050.4
How will the increasing demand for viable coal ash be met for global infrastructure demands? Very clearly, the efficient review of the billions of tonnes of impounded coal ash will need to be revisited. Many such impoundments have been stabilized and remediated in such a way that they would clearly not be early candidates for the recovery of coal ash. However, it is long documented by the American Coal Ash Association (ACAA) that there is in excess of 1,100 coal ash impounds in North American alone containing billions of tons of waste coal ash.5 Of those, there are many high risk locations subject to leaking or impoundment rupture or unusually high profile situations that will need to be removed in the near term. Thus presenting the natural opening for an ore body characterization and beneficial use recovery plan to be deployed, opening the door to a financially sustainable path to closed loop coal as outlined in Figure 5.
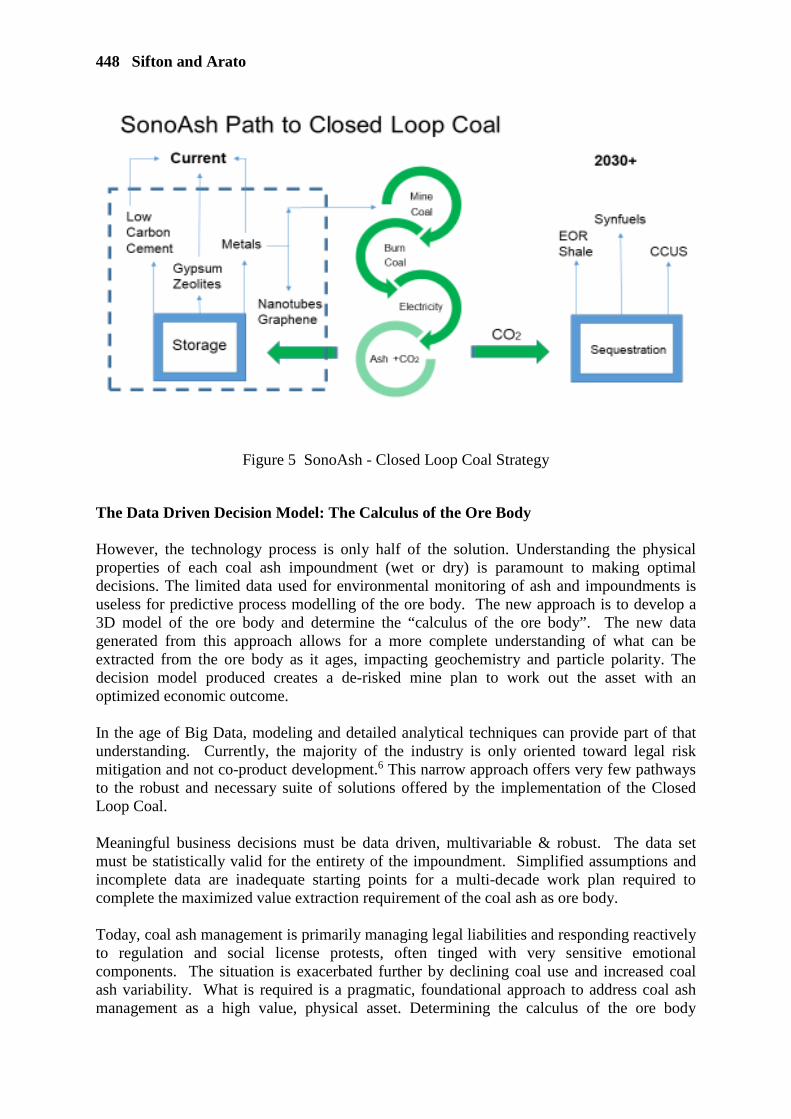
448 Sifton and Arato
Figure 5 SonoAsh - Closed Loop Coal Strategy
The Data Driven Decision Model: The Calculus of the Ore Body However, the technology process is only half of the solution. Understanding the physical properties of each coal ash impoundment (wet or dry) is paramount to making optimal decisions. The limited data used for environmental monitoring of ash and impoundments is useless for predictive process modelling of the ore body. The new approach is to develop a 3D model of the ore body and determine the “calculus of the ore body”. The new data generated from this approach allows for a more complete understanding of what can be extracted from the ore body as it ages, impacting geochemistry and particle polarity. The decision model produced creates a de-risked mine plan to work out the asset with an optimized economic outcome. In the age of Big Data, modeling and detailed analytical techniques can provide part of that understanding. Currently, the majority of the industry is only oriented toward legal risk mitigation and not co-product development.6 This narrow approach offers very few pathways to the robust and necessary suite of solutions offered by the implementation of the Closed Loop Coal. Meaningful business decisions must be data driven, multivariable & robust. The data set must be statistically valid for the entirety of the impoundment. Simplified assumptions and incomplete data are inadequate starting points for a multi-decade work plan required to complete the maximized value extraction requirement of the coal ash as ore body. Today, coal ash management is primarily managing legal liabilities and responding reactively to regulation and social license protests, often tinged with very sensitive emotional components. The situation is exacerbated further by declining coal use and increased coal ash variability. What is required is a pragmatic, foundational approach to address coal ash management as a high value, physical asset. Determining the calculus of the ore body
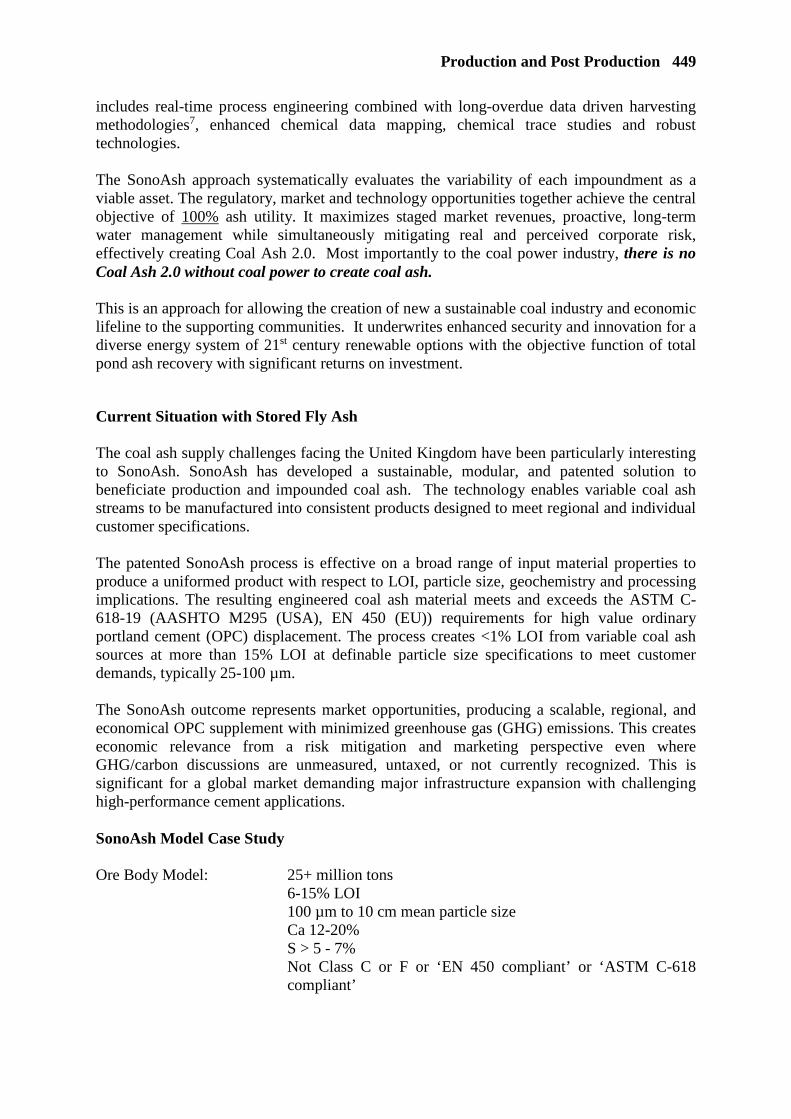
Production and Post Production 449
includes real-time process engineering combined with long-overdue data driven harvesting methodologies7, enhanced chemical data mapping, chemical trace studies and robust technologies. The SonoAsh approach systematically evaluates the variability of each impoundment as a viable asset. The regulatory, market and technology opportunities together achieve the central objective of 100% ash utility. It maximizes staged market revenues, proactive, long-term water management while simultaneously mitigating real and perceived corporate risk, effectively creating Coal Ash 2.0. Most importantly to the coal power industry, there is no Coal Ash 2.0 without coal power to create coal ash. This is an approach for allowing the creation of new a sustainable coal industry and economic lifeline to the supporting communities. It underwrites enhanced security and innovation for a diverse energy system of 21st century renewable options with the objective function of total pond ash recovery with significant returns on investment.
Current Situation with Stored Fly Ash The coal ash supply challenges facing the United Kingdom have been particularly interesting to SonoAsh. SonoAsh has developed a sustainable, modular, and patented solution to beneficiate production and impounded coal ash. The technology enables variable coal ash streams to be manufactured into consistent products designed to meet regional and individual customer specifications. The patented SonoAsh process is effective on a broad range of input material properties to produce a uniformed product with respect to LOI, particle size, geochemistry and processing implications. The resulting engineered coal ash material meets and exceeds the ASTM C-618-19 (AASHTO M295 (USA), EN 450 (EU)) requirements for high value ordinary portland cement (OPC) displacement. The process creates <1% LOI from variable coal ash sources at more than 15% LOI at definable particle size specifications to meet customer demands, typically 25-100 µm. The SonoAsh outcome represents market opportunities, producing a scalable, regional, and economical OPC supplement with minimized greenhouse gas (GHG) emissions. This creates economic relevance from a risk mitigation and marketing perspective even where GHG/carbon discussions are unmeasured, untaxed, or not currently recognized. This is significant for a global market demanding major infrastructure expansion with challenging high-performance cement applications. SonoAsh Model Case Study Ore Body Model: 25+ million tons 6-15% LOI 100 µm to 10 cm mean particle size Ca 12-20% S > 5 - 7%
Not Class C or F or ‘EN 450 compliant’ or ‘ASTM C-618 compliant’

450 Sifton and Arato
Production Input: 400,000 – 500,000 tons annual process facility Revenue Model Matrix: Low Carbon Cement material Cenospheres Silica Flour
Rare Earth Elements (REE) Proppants (Fracking Sand Material) Additional Benefits: Social License
Generational Employment – 120 FTE/yr over 50 years (6,000-person years)
Reduction of Environmental Liability 20+ million tons CO2 offset TBD – International Transferrable Mitigating Outcomes Production Output: 400,000 – 500,000 tons Sub-1% LOI 25 – 75 micron specification required mean particle size Calcium (Ca) ~ 10 % Sulphur (S) < 5 % Engineered to end use requirement Total Project Potential: $1 billion to $2 billion over the life of the project A New Multi-Billion Dollar Industry in the Making As noted above, a new industry structure is required. The demand for the products that can be produced from beneficiated coal ash will be measured in the billions of dollars over the next 50 years. As the market conditions evolve, some of the existing industry players will survive and some will not. The opportunity exists therefore for both existing players and new entrants to seize the opportunity to realize increased margins that attend technological breakthrough. As a proforma example the following chart shows representative and prospective value that will come from a single 25 million ton ore body. The indicative value shown in the following is to a degree a function of the product mix and the regional value creation but in total over the economic life of the ore body, not discounted for present value, a total measured in the billions of dollars of value creation. By adopting a product matrix approach, allows for maximum revenue generation, with minimum non-revenue generating material produced.
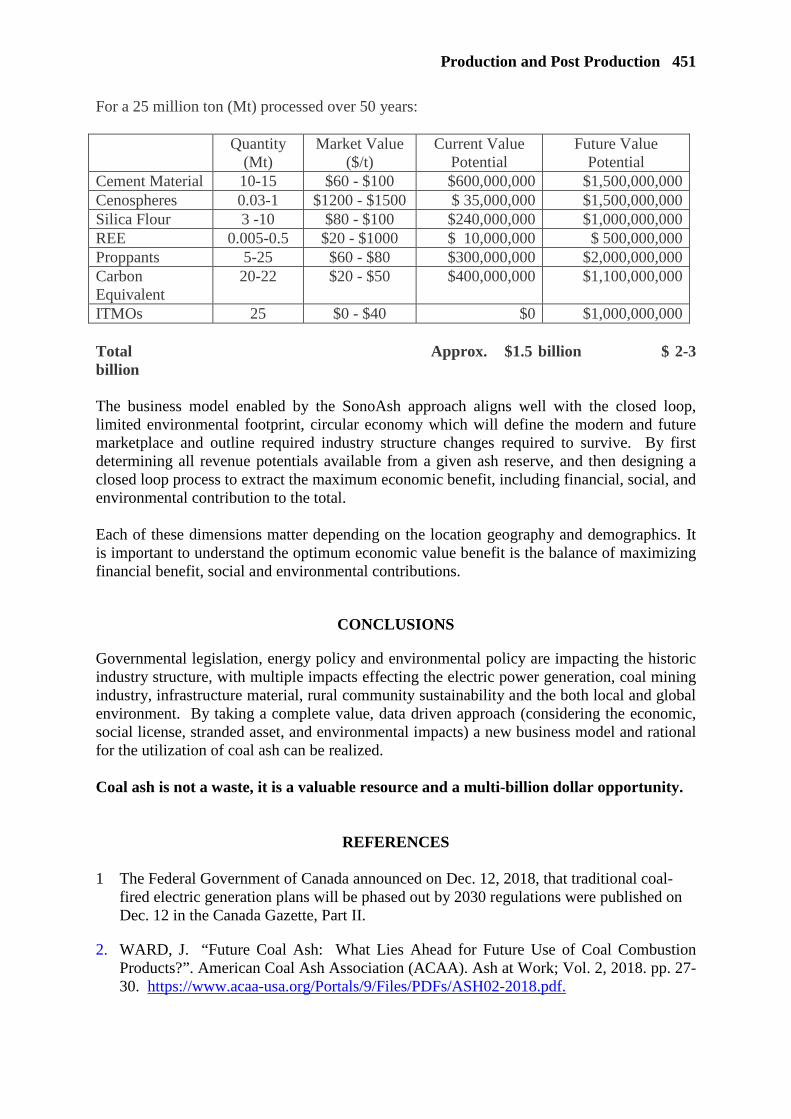
Production and Post Production 451
For a 25 million ton (Mt) processed over 50 years: Quantity
(Mt) Market Value
($/t) Current Value
Potential Future Value
Potential Cement Material 10-15 $60 - $100 $600,000,000 $1,500,000,000 Cenospheres 0.03-1 $1200 - $1500 $ 35,000,000 $1,500,000,000 Silica Flour 3 -10 $80 - $100 $240,000,000 $1,000,000,000 REE 0.005-0.5 $20 - $1000 $ 10,000,000 $ 500,000,000 Proppants 5-25 $60 - $80 $300,000,000 $2,000,000,000 Carbon Equivalent
20-22 $20 - $50 $400,000,000 $1,100,000,000
ITMOs 25 $0 - $40 $0 $1,000,000,000 Total Approx. $1.5 billion $ 2-3 billion The business model enabled by the SonoAsh approach aligns well with the closed loop, limited environmental footprint, circular economy which will define the modern and future marketplace and outline required industry structure changes required to survive. By first determining all revenue potentials available from a given ash reserve, and then designing a closed loop process to extract the maximum economic benefit, including financial, social, and environmental contribution to the total. Each of these dimensions matter depending on the location geography and demographics. It is important to understand the optimum economic value benefit is the balance of maximizing financial benefit, social and environmental contributions.
CONCLUSIONS
Governmental legislation, energy policy and environmental policy are impacting the historic industry structure, with multiple impacts effecting the electric power generation, coal mining industry, infrastructure material, rural community sustainability and the both local and global environment. By taking a complete value, data driven approach (considering the economic, social license, stranded asset, and environmental impacts) a new business model and rational for the utilization of coal ash can be realized. Coal ash is not a waste, it is a valuable resource and a multi-billion dollar opportunity.
REFERENCES 1 The Federal Government of Canada announced on Dec. 12, 2018, that traditional coal-
fired electric generation plans will be phased out by 2030 regulations were published on Dec. 12 in the Canada Gazette, Part II.
2. WARD, J. “Future Coal Ash: What Lies Ahead for Future Use of Coal Combustion Products?”. American Coal Ash Association (ACAA). Ash at Work; Vol. 2, 2018. pp. 27-30. https://www.acaa-usa.org/Portals/9/Files/PDFs/ASH02-2018.pdf.
452 Sifton and Arato
3. COOKE, N. "Utilizing the UK’s Vast Landfilled Fly Ash Deposits." ACAA. Ash at Work; Vol. 1, 2018. pp. 8-9. https://www.acaa-usa.org/Portals/9/Files/PDFs/ASH01-2018.pdf
4. US Energy Information Administration (EIA). Annual Energy Outlook 2019. January 24, 2019. https://www.eia.gov/outlooks/aeo/
5. WARD, J. “Future Coal Ash: What Lies Ahead for Future Use of Coal Combustion Products?”. American Coal Ash Association (ACAA). Ash at Work; Vol. 2, 2018. pp. 27-30. https://www.acaa-usa.org/Portals/9/Files/PDFs/ASH02-2018.pdf
6. HANLEY, S. “Coal Ash Pollution Contaminates Ground Water at Hundreds of Locations”. https://cleantechnica.com/2019/03/04/coal-ash-pollution-contaminates-ground-water-at-hundreds-of-locations/. 2019.
7. ASTM E3183-18. Standard Guide for Harvesting Coal Combustion Products Stored in Active and Inactive Storage Areas for Beneficial Use. https://www.astm.org/Standards/E3183.htm. 2018.

WET STORED FLY ASH: PROCESSING FOR USE AS AN ADDITION IN CONCRETE
T A Hope
M J McCarthy
L J Csetenyi
University of Dundee
United Kingdom
ABSTRACT: With changes in electricity generation, increasing attention is being given to the supply of fly ash for the future. In the UK, alternative means of sourcing material are being considered, with fly ash in external holding areas (stockpiles or lagoons) providing an option. This wet stored material exists since historically there have often been differences in quantities produced and used. Surveys of fly ash from these areas suggest that it may be variable and undergo physico-chemical changes. A study was, therefore, set up to establish the potential for recovery/processing of the material for use as an addition in concrete. Processing at laboratory-scale considered drying (to recover handling properties) and particle separation (sieving), size reduction (grinding) and carbon removal (burn-off). This showed that fly ash fineness and loss-on-ignition requirements to EN 450-1 could be achieved. Some benefits were found for water requirement and reactivity, although not all met Standard requirements. In concrete, reduced superplasticizer dose to achieve a target slump was noted with increasing fineness (following processing) up to a point, beyond which increases occurred. Compressive strength tended to follow the volume of < 10 µm particles in fly ash, with increases becoming noticeable when this exceeded about 50%. A pilot-scale trial was carried out and generally confirmed these effects. Keywords: Fly ash, Wet storage, Recovery, Drying, Processing, EN 450-1, Concrete Mr Thomas A. Hope is a Postgraduate Researcher in the School of Science and Engineering at the University of Dundee. He is currently working in the area of recovery and processing of stockpile fly ash for use in concrete construction. Dr Michael J. McCarthy is a Reader in the School of Science and Engineering at the University of Dundee. He has carried out research on a range of topics in concrete materials, including fly ash, for the past 25 years. Dr Laszlo J. Csetenyi is a Research Fellow in the School of Science and Engineering at the University of Dundee. His research interests include supplementary cementing materials and their influence on concrete, with particular focus on sustainability and environmental issues.
454 Hope et al
INTRODUCTION
Fly ash brings many benefits as an addition/supplementary cementing material to concrete, ranging from improved fresh properties and reduced heat development, through to long-term strength development and enhancements to aspects of durability [1]. Historically, in the UK, with the number and distribution of power stations, the material could be readily sourced. However, with reductions in coal-firing in electricity generation, including the use of alternative fuels and technologies, the supply of material has been affected. The impact of this is likely to increase with plans to take the remaining coal-fired power station stock out of service by 2025 [2]. A recent report examining availability [3] indicates that one of the routes for fly ash sourcing in future is likely to be through recovery and processing of wet stored material. This exists because supply of fly ash has often exceeded demand and much of the surplus has been kept in holding areas, i.e. stockpiles or lagoons. Research on material under this type of storage in the UK, suggests that it may be prone to (i) variability (e.g. fineness and loss-on-ignition (LOI)) [4] and (ii) agglomeration due to physico-chemical effects, and reductions in reactivity [5, 6]. As a result, to achieve Standard-compliant material for use in concrete, processing may be necessary [7]. Given the situation referred to above and effects occurring under wet storage, the paper reports on research that was mainly concerned with fly ash recovered from stockpiles. This was dried to recover handling properties and then processed by various means to establish what properties could be achieved and whether Standard (EN 450-1) [8] requirements could be met. This was then extended to investigate processing at pilot scale.
MATERIALS AND TEST METHODS
A range of materials both dry and those from wet holding areas were considered during the research described. The characteristics of fly ash (physical, chemical and reaction) and properties of concrete (fresh and compressive strength) were evaluated using European Standard (EN) or in-house test methods, as described previously [9]. An example showing the appearance of dry, stockpile and lagoon fly ash from different sources is given in Figure 1. These highlight the particulate nature of dry fly ash, and how agglomerates form with wet storage. In the image, stockpile fly ash appears to have fewer large particles than that from the lagoon. Other work [10] examining the same material at different moisture levels and in an excess of water suggests that agglomeration tends to be greater in the former. The main physical and chemical properties of the fly ashes considered are given in Table 1. As indicated, all dry materials were within the EN 450-1 fineness range, while the wet stored materials tended to be coarser. This may, in part, correspond to the wet storage conditions, given the coarsening and agglomeration effects noted above. The LOIs of the dry and stockpile fly ashes had similar ranges, with the higher values up to around 15%, while those from lagoons were between 9 and 10%. These are likely to reflect power station operations, rather than effects of wet storage, although slight increases under these conditions may occur [5].
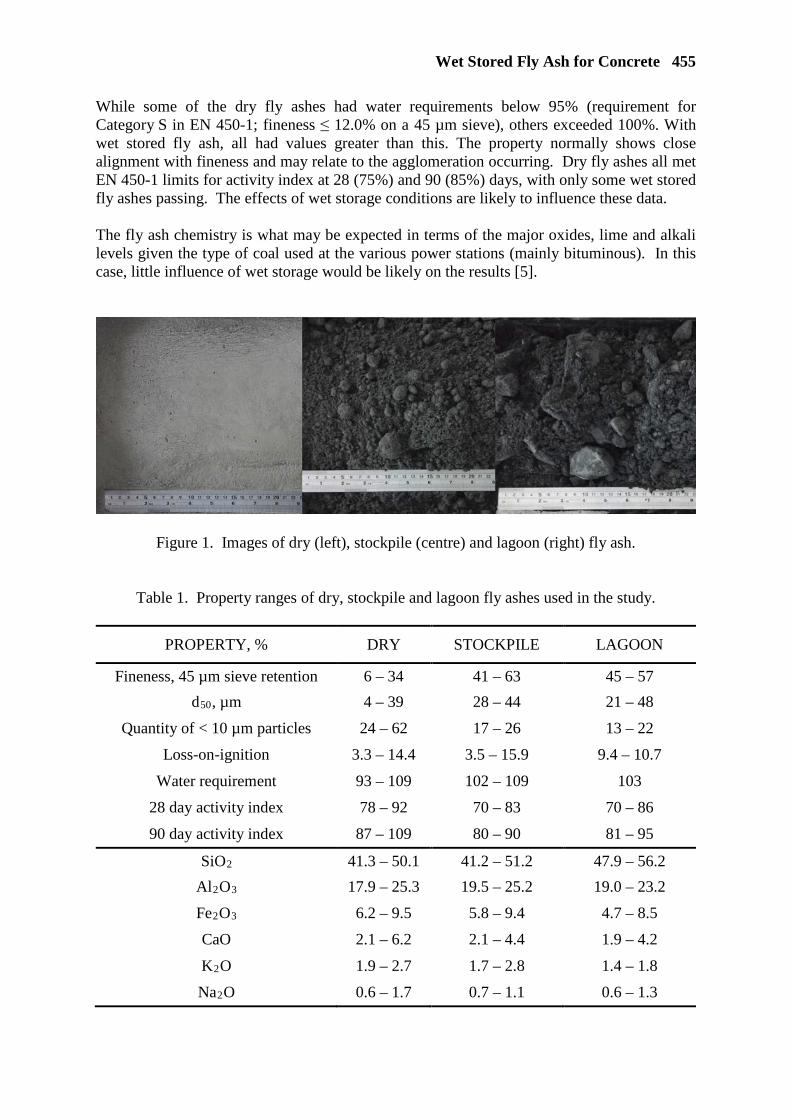
Wet Stored Fly Ash for Concrete 455
While some of the dry fly ashes had water requirements below 95% (requirement for Category S in EN 450-1; fineness ≤ 12.0% on a 45 µm sieve), others exceeded 100%. With wet stored fly ash, all had values greater than this. The property normally shows close alignment with fineness and may relate to the agglomeration occurring. Dry fly ashes all met EN 450-1 limits for activity index at 28 (75%) and 90 (85%) days, with only some wet stored fly ashes passing. The effects of wet storage conditions are likely to influence these data. The fly ash chemistry is what may be expected in terms of the major oxides, lime and alkali levels given the type of coal used at the various power stations (mainly bituminous). In this case, little influence of wet storage would be likely on the results [5].
Figure 1. Images of dry (left), stockpile (centre) and lagoon (right) fly ash.
Table 1. Property ranges of dry, stockpile and lagoon fly ashes used in the study.
PROPERTY, % DRY STOCKPILE LAGOON
Fineness, 45 µm sieve retention 6 – 34 41 – 63 45 – 57
d50, µm 4 – 39 28 – 44 21 – 48
Quantity of < 10 µm particles 24 – 62 17 – 26 13 – 22
Loss-on-ignition 3.3 – 14.4 3.5 – 15.9 9.4 – 10.7
Water requirement 93 – 109 102 – 109 103
28 day activity index 78 – 92 70 – 83 70 – 86
90 day activity index 87 – 109 80 – 90 81 – 95
SiO2 41.3 – 50.1 41.2 – 51.2 47.9 – 56.2
Al2O3 17.9 – 25.3 19.5 – 25.2 19.0 – 23.2
Fe2O3 6.2 – 9.5 5.8 – 9.4 4.7 – 8.5
CaO 2.1 – 6.2 2.1 – 4.4 1.9 – 4.2
K2O 1.9 – 2.7 1.7 – 2.8 1.4 – 1.8
Na2O 0.6 – 1.7 0.7 – 1.1 0.6 – 1.3
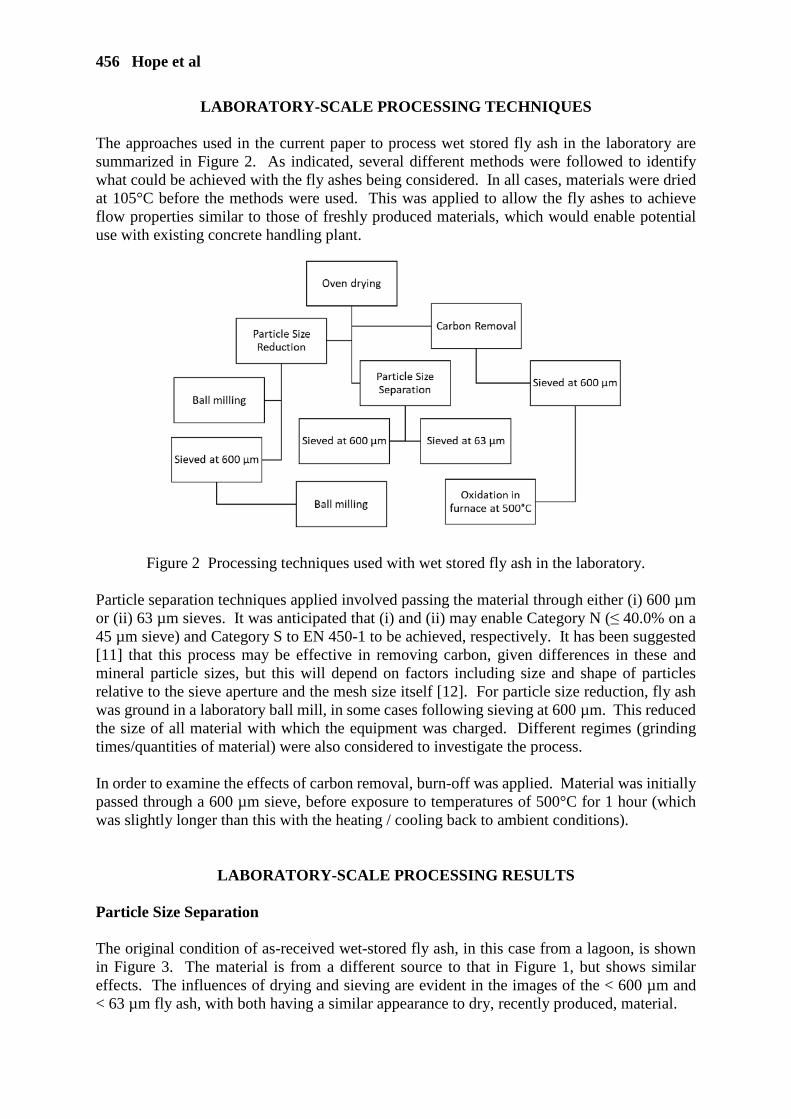
456 Hope et al
LABORATORY-SCALE PROCESSING TECHNIQUES The approaches used in the current paper to process wet stored fly ash in the laboratory are summarized in Figure 2. As indicated, several different methods were followed to identify what could be achieved with the fly ashes being considered. In all cases, materials were dried at 105°C before the methods were used. This was applied to allow the fly ashes to achieve flow properties similar to those of freshly produced materials, which would enable potential use with existing concrete handling plant.
Figure 2 Processing techniques used with wet stored fly ash in the laboratory. Particle separation techniques applied involved passing the material through either (i) 600 µm or (ii) 63 µm sieves. It was anticipated that (i) and (ii) may enable Category N (≤ 40.0% on a 45 µm sieve) and Category S to EN 450-1 to be achieved, respectively. It has been suggested [11] that this process may be effective in removing carbon, given differences in these and mineral particle sizes, but this will depend on factors including size and shape of particles relative to the sieve aperture and the mesh size itself [12]. For particle size reduction, fly ash was ground in a laboratory ball mill, in some cases following sieving at 600 µm. This reduced the size of all material with which the equipment was charged. Different regimes (grinding times/quantities of material) were also considered to investigate the process. In order to examine the effects of carbon removal, burn-off was applied. Material was initially passed through a 600 µm sieve, before exposure to temperatures of 500°C for 1 hour (which was slightly longer than this with the heating / cooling back to ambient conditions).
LABORATORY-SCALE PROCESSING RESULTS Particle Size Separation The original condition of as-received wet-stored fly ash, in this case from a lagoon, is shown in Figure 3. The material is from a different source to that in Figure 1, but shows similar effects. The influences of drying and sieving are evident in the images of the < 600 µm and < 63 µm fly ash, with both having a similar appearance to dry, recently produced, material.
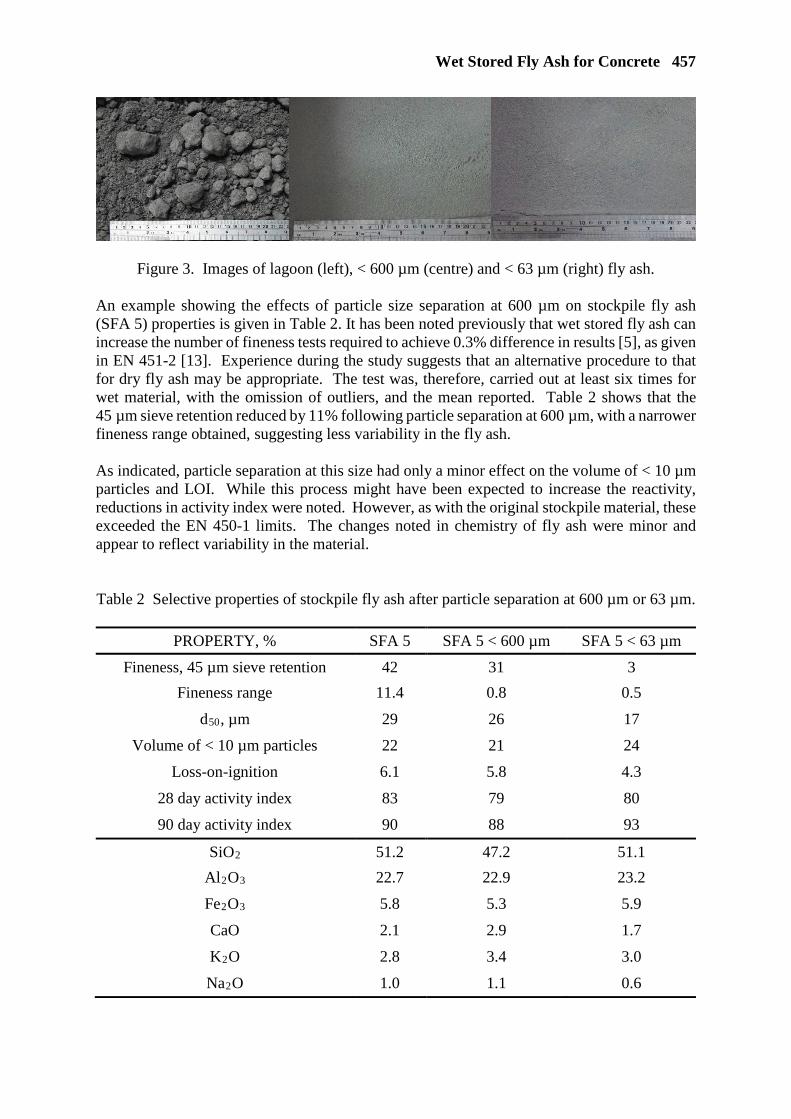
Wet Stored Fly Ash for Concrete 457
Figure 3. Images of lagoon (left), < 600 µm (centre) and < 63 µm (right) fly ash. An example showing the effects of particle size separation at 600 µm on stockpile fly ash (SFA 5) properties is given in Table 2. It has been noted previously that wet stored fly ash can increase the number of fineness tests required to achieve 0.3% difference in results [5], as given in EN 451-2 [13]. Experience during the study suggests that an alternative procedure to that for dry fly ash may be appropriate. The test was, therefore, carried out at least six times for wet material, with the omission of outliers, and the mean reported. Table 2 shows that the 45 µm sieve retention reduced by 11% following particle separation at 600 µm, with a narrower fineness range obtained, suggesting less variability in the fly ash. As indicated, particle separation at this size had only a minor effect on the volume of < 10 µm particles and LOI. While this process might have been expected to increase the reactivity, reductions in activity index were noted. However, as with the original stockpile material, these exceeded the EN 450-1 limits. The changes noted in chemistry of fly ash were minor and appear to reflect variability in the material. Table 2 Selective properties of stockpile fly ash after particle separation at 600 µm or 63 µm.
PROPERTY, % SFA 5 SFA 5 < 600 µm SFA 5 < 63 µm
Fineness, 45 µm sieve retention 42 31 3
Fineness range 11.4 0.8 0.5
d50, µm 29 26 17
Volume of < 10 µm particles 22 21 24
Loss-on-ignition 6.1 5.8 4.3
28 day activity index 83 79 80
90 day activity index 90 88 93
SiO2 51.2 47.2 51.1
Al2O3 22.7 22.9 23.2
Fe2O3 5.8 5.3 5.9
CaO 2.1 2.9 1.7
K2O 2.8 3.4 3.0
Na2O 1.0 1.1 0.6
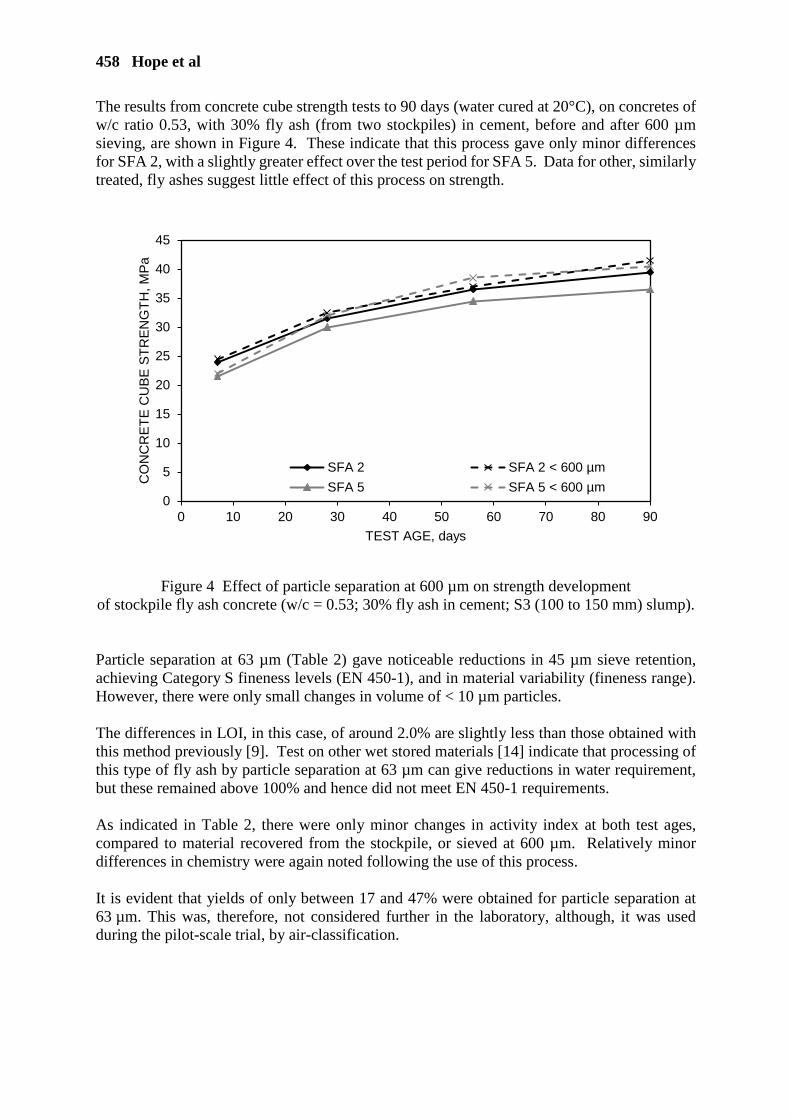
458 Hope et al
The results from concrete cube strength tests to 90 days (water cured at 20°C), on concretes of w/c ratio 0.53, with 30% fly ash (from two stockpiles) in cement, before and after 600 µm sieving, are shown in Figure 4. These indicate that this process gave only minor differences for SFA 2, with a slightly greater effect over the test period for SFA 5. Data for other, similarly treated, fly ashes suggest little effect of this process on strength.
Figure 4 Effect of particle separation at 600 µm on strength development of stockpile fly ash concrete (w/c = 0.53; 30% fly ash in cement; S3 (100 to 150 mm) slump). Particle separation at 63 µm (Table 2) gave noticeable reductions in 45 µm sieve retention, achieving Category S fineness levels (EN 450-1), and in material variability (fineness range). However, there were only small changes in volume of < 10 µm particles. The differences in LOI, in this case, of around 2.0% are slightly less than those obtained with this method previously [9]. Test on other wet stored materials [14] indicate that processing of this type of fly ash by particle separation at 63 µm can give reductions in water requirement, but these remained above 100% and hence did not meet EN 450-1 requirements. As indicated in Table 2, there were only minor changes in activity index at both test ages, compared to material recovered from the stockpile, or sieved at 600 µm. Relatively minor differences in chemistry were again noted following the use of this process. It is evident that yields of only between 17 and 47% were obtained for particle separation at 63 µm. This was, therefore, not considered further in the laboratory, although, it was used during the pilot-scale trial, by air-classification.
0
5
10
15
20
25
30
35
40
45
0 10 20 30 40 50 60 70 80 90
CO
NC
RET
E C
UBE
STR
ENG
TH, M
Pa
TEST AGE, days
SFA 2 SFA 2 < 600 µmSFA 5 SFA 5 < 600 µm
Wet Stored Fly Ash for Concrete 459
Particle Size Reduction
Particle size reduction used a laboratory ball mill (Fritsch Pulverisette, 250 ml capacity, 6 × 30 mm steel balls). Trials with the system suggest that while continued reductions in particle size are possible, there were diminishing benefits with increased grinding times. An example of typical results for stockpile fly ash (SFA 2) before and after grinding for (i) 20 minutes (BM20) in 125 g batches and (ii) 120 minutes (BM120) in 50 g batches is given in Table 3. Grinding for 20 minutes was found to reduce particle size of wet stored materials to < 12.0%, meeting EN 450-1 Category S requirements, and increased the volume of < 10 µm particles. A reduction in water requirement with BM20 of 9% to 100%, i.e. the same as the PC reference, was achieved. Results from tests for the same property on several stockpile fly ashes are shown against fineness in Figure 5(a). As indicated, these were similar to the data in Table 2 and while Category S fineness levels were achieved in some cases, their water requirement exceeded the EN 450-1 limit.
Table 3 Selective properties of stockpile fly ash before and after grinding.
PROPERTY, % SFA 2 SFA 2 BM20
(125g) SFA 2
< 600 µm SFA 2 < 600 µm
BM120 (50g)
Fineness, 45 µm sieve retention 48 7 36 1
d50, µm 44 15 37 5
Volume of < 10 µm particles 20 35 22 74
Loss-on-ignition 8.9 8.9 9.2 9.7
Water requirement 109 100 104 -
28 day activity index 71 78 80 91
90 day activity index 86 97 85 121
SiO2 43.7 42.4 47.0 49.4
Al2O3 22.9 23.4 25.0 24.8
Fe2O3 9.4 8.3 8.6 9.4
CaO 2.3 3.5 2.5 2.6
K2O 2.4 2.9 2.5 2.5
Na2O 0.7 0.9 0.9 0.9
The activity index values increased for ground materials, as shown in Table 3, most notably at 90 days. Results from tests on several stockpile fly ashes are shown in Figure 5(b) against volume of < 10 µm particles, which was used given its sensitivity in providing a measure of particle size following grinding. As indicated, the activity index was closely related to the volume of < 10 µm particles in fly ash and appears to reflect the increased exposure of surfaces with processing. The results show that all material following this achieved EN 450-1 activity index requirements and there was a consistent increase in the property between 28 and 90 days.
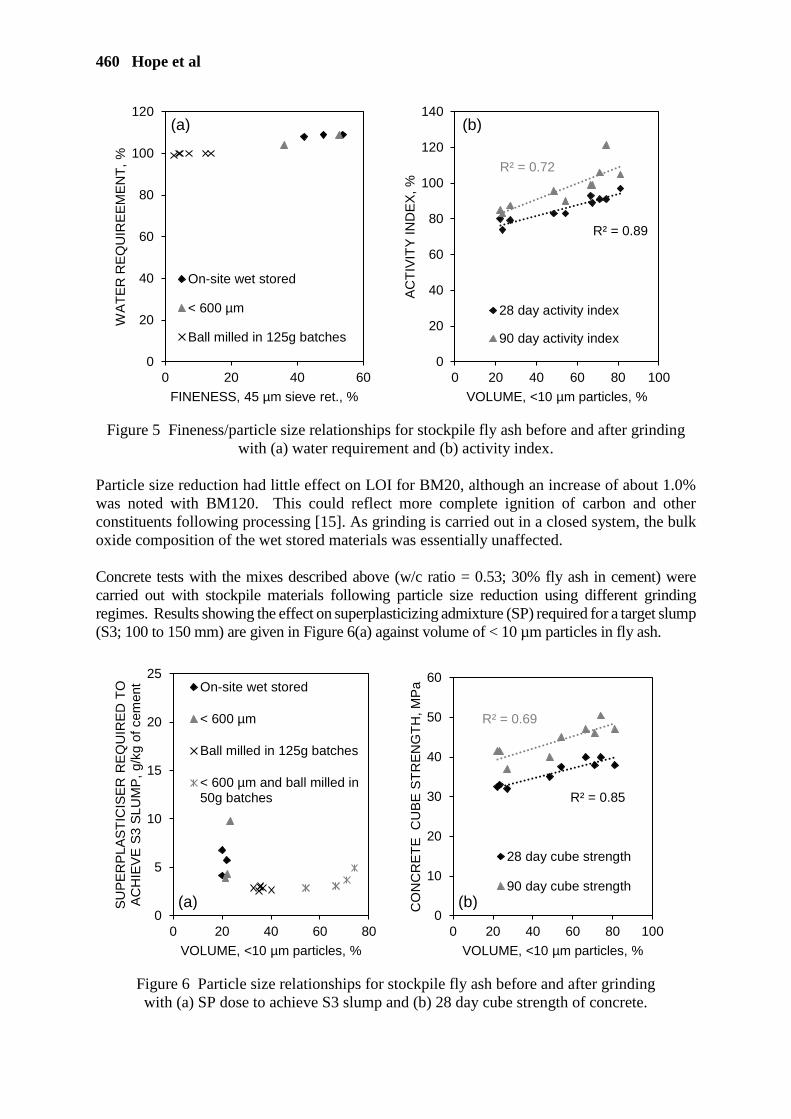
460 Hope et al
Figure 5 Fineness/particle size relationships for stockpile fly ash before and after grinding
with (a) water requirement and (b) activity index. Particle size reduction had little effect on LOI for BM20, although an increase of about 1.0% was noted with BM120. This could reflect more complete ignition of carbon and other constituents following processing [15]. As grinding is carried out in a closed system, the bulk oxide composition of the wet stored materials was essentially unaffected. Concrete tests with the mixes described above (w/c ratio = 0.53; 30% fly ash in cement) were carried out with stockpile materials following particle size reduction using different grinding regimes. Results showing the effect on superplasticizing admixture (SP) required for a target slump (S3; 100 to 150 mm) are given in Figure 6(a) against volume of < 10 µm particles in fly ash.
Figure 6 Particle size relationships for stockpile fly ash before and after grinding with (a) SP dose to achieve S3 slump and (b) 28 day cube strength of concrete.
0
20
40
60
80
100
120
0 20 40 60
WAT
ER R
EQU
IREE
MEN
T, %
FINENESS, 45 µm sieve ret., %
On-site wet stored
< 600 µm
Ball milled in 125g batches
R² = 0.89
R² = 0.72
0
20
40
60
80
100
120
140
0 20 40 60 80 100
ACTI
VITY
IND
EX, %
VOLUME, <10 µm particles, %
28 day activity index
90 day activity index
0
5
10
15
20
25
0 20 40 60 80
SUPE
RPL
ASTI
CIS
ER R
EQU
IRED
TO
AC
HIE
VE S
3 SL
UM
P, g
/kg
of c
emen
t
VOLUME, <10 µm particles, %
On-site wet stored
< 600 µm
Ball milled in 125g batches
< 600 µm and ball milled in50g batches R² = 0.85
R² = 0.69
0
10
20
30
40
50
60
0 20 40 60 80 100
CO
NC
RET
E C
UBE
STR
ENG
TH, M
Pa
VOLUME, <10 µm particles, %
28 day cube strength
90 day cube strength
(a) (b)
(a) (b)
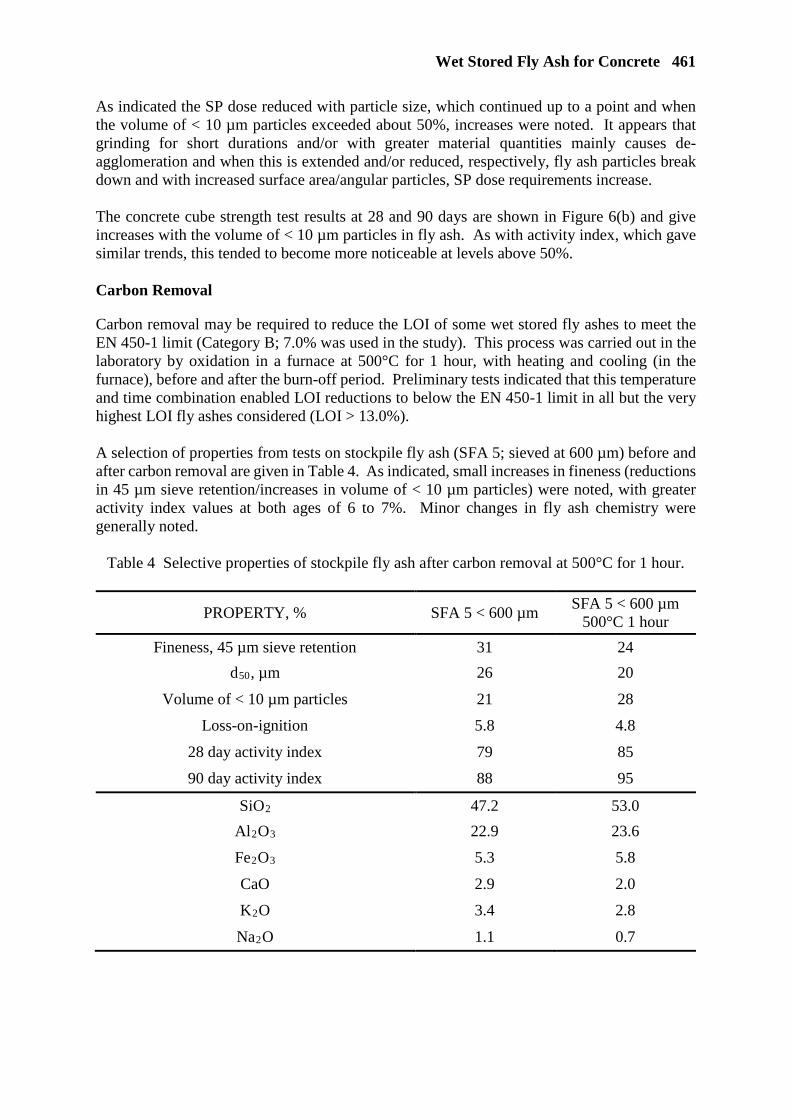
Wet Stored Fly Ash for Concrete 461
As indicated the SP dose reduced with particle size, which continued up to a point and when the volume of < 10 µm particles exceeded about 50%, increases were noted. It appears that grinding for short durations and/or with greater material quantities mainly causes de-agglomeration and when this is extended and/or reduced, respectively, fly ash particles break down and with increased surface area/angular particles, SP dose requirements increase. The concrete cube strength test results at 28 and 90 days are shown in Figure 6(b) and give increases with the volume of < 10 µm particles in fly ash. As with activity index, which gave similar trends, this tended to become more noticeable at levels above 50%. Carbon Removal
Carbon removal may be required to reduce the LOI of some wet stored fly ashes to meet the EN 450-1 limit (Category B; 7.0% was used in the study). This process was carried out in the laboratory by oxidation in a furnace at 500°C for 1 hour, with heating and cooling (in the furnace), before and after the burn-off period. Preliminary tests indicated that this temperature and time combination enabled LOI reductions to below the EN 450-1 limit in all but the very highest LOI fly ashes considered (LOI > 13.0%). A selection of properties from tests on stockpile fly ash (SFA 5; sieved at 600 µm) before and after carbon removal are given in Table 4. As indicated, small increases in fineness (reductions in 45 µm sieve retention/increases in volume of < 10 µm particles) were noted, with greater activity index values at both ages of 6 to 7%. Minor changes in fly ash chemistry were generally noted.
Table 4 Selective properties of stockpile fly ash after carbon removal at 500°C for 1 hour.
PROPERTY, % SFA 5 < 600 µm SFA 5 < 600 µm
500°C 1 hour
Fineness, 45 µm sieve retention 31 24
d50, µm 26 20
Volume of < 10 µm particles 21 28
Loss-on-ignition 5.8 4.8
28 day activity index 79 85
90 day activity index 88 95
SiO2 47.2 53.0
Al2O3 22.9 23.6
Fe2O3 5.3 5.8
CaO 2.9 2.0
K2O 3.4 2.8
Na2O 1.1 0.7

462 Hope et al
The effects on LOI after oxidation in the laboratory furnace for 1 hour at 500°C are shown for selected stockpile materials (SFA 2, SFA 5 and SFA 7) in Figure 7(a). Carbon removal reduced LOI by 1.0 to 3.4 %, tending to be greater when values were initially higher. This also gave small reductions in SP dose required to achieve S3 slump and minor increases in concrete cube strength of 1.5 to 3.0 MPa at 28 days, as shown in Figure 7(b).
Figure 7 Effect of carbon removal from stockpile fly ash at 500°C for 1 hour on (a) loss-on-
ignition and (b) 28 day concrete cube strength (w/c = 0.50; 30% fly ash in cement).
PILOT-SCALE TRIAL
The research described above identified what is possible for processing of wet stored fly ash under laboratory conditions. The next stage was to determine if these applied on a larger scale, with available plant, and to evaluate fly ash properties and effect that these have on concrete. This work used mineral processing plant with a company providing this type of service. Several tonnes of relatively low LOI material were obtained from a UK stockpile, such that only particle size separation or reduction would be required to achieve properties to EN 450-1. The processing used for the material is shown in Figure 8. As indicated, the feed material was initially dried and de-agglomerated in a flash dryer and pulverizing mill (PFA 2), before smaller samples were air-classified to achieve a Category S fineness material (PFA 3), or ground in a micronizing mill to give high fineness (PFA 4). Electrostatic separation was also carried out on selective materials to remove carbon. A selection of properties for materials from the pilot-scale trial is given in Table 5. Drying and de-agglomeration reduced 45 µm sieve retention by around 50%. The material following this process achieved Category N fineness to EN 450-1, however, there was a marginal decrease in the volume of < 10 µm particles, possibly due to some fines loss. The air-classified and micronized materials were much finer with retention values of 2 and 1% respectively, however, the latter had a noticeably greater volume of fine particles of 72%, compared to 36%. The water requirement gave reductions of a few percent, following de-agglomeration, air classifying and micronizing, however, these were greater than EN 450-1 requirements for Category S fly ash.
0123456789
10
SFA 2 SFA 5 SFA 7
LOSS
-ON
-IGN
ITIO
N, %
< 600 µm< 600 µm 500°C for 1 hour
0
5
10
15
20
25
30
35
40
45
SFA 2 SFA 5 SFA 7
28 D
AY C
ON
CR
ETE
CU
BE
STR
ENG
TH, M
Pa
< 600 µm< 600 µm 500°C for 1 hour
(a) (b)

Wet Stored Fly Ash for Concrete 463
Figure 8 Processing techniques used with wet stored fly ash in pilot-scale trial.
The activity index was mainly found to increase with the various forms of processing and gave general agreement with fly ash fineness. In addition, these materials went from failing the test at both ages for the feed (SFA 8) and de-agglomerated materials to passing following air classifying and micronizing.
Table 5 Selective material properties from the pilot-scale trial.
PROPERTY, % SFA 8 PFA 2 PFA 3 PFA 4
Fineness, 45 µm sieve retention 62 31 2 1
d50, µm 33 33 14 7
Volume of < 10 µm particles 22 20 37 72
Loss-on-ignition 6.3 6.1 6.3 6.6
Water requirement 103 100 98 100
28 day activity index 70 70 75 80
90 day activity index 80 83 88 103
SiO2 46.5 46.5 45.3 46.9
Al2O3 24.5 23.5 24.4 23.6
Fe2O3 8.4 9.1 8.3 10.0
CaO 2.8 3.0 2.5 2.6
K2O 2.5 2.7 2.5 2.4
Na2O 0.9 1.0 0.8 0.7

464 Hope et al
In concretes with equal mix proportions (w/c ratio = 0.53; 30% fly ash in cement), a linear relationship was found between fly ash fineness and SP dose required to achieve S3 slump, Figure 9(a). Tests for concrete strength, at equal w/c ratio, indicate that there were only minor benefits for the materials following processing, i.e. little difference in 28 day strength observed between SFA 8, PFA 2 and PFA 3, with PFA 4 only achieving an increase of 3.0 MPa. However, given the lower SP dose requirements, the w/c ratio of these mixes could be adjusted, at fixed SP dose, while still achieving S3 slump. Figure 9(b) demonstrates the strength development for these concretes. At 28 days, concrete cube strength of the adjusted mixes (compared to SFA 8 (0.53 w/c ratio)) gave increases of 2.5 MPa in PFA 2 at 0.51 w/c, an increase of 5.0 MPa in PFA 3 at 0.51 w/c and a large increase of 10.0 MPa for PFA 4 at 0.49 w/c ratio. Electrostatic carbon removal was also carried out on PFA 2 and PFA 4. This reduced the LOI to levels of 3.0%, but generally gave minor changes to the other fly ash properties examined. In this case, concrete was not tested.
Figure 9 (a) Relationships between fineness and SP dose for S3 slump and (b) strength development of processed fly ashes for the pilot scale materials.
CONCLUDING REMARKS
With changes in electricity generation from coal-firing to alternative fuels and new technologies, different methods of sourcing fly ash will be required. One of the options for this is the surplus that has been deposited in stockpiles or lagoons near power stations. However, fly ash in these areas can be prone to variability and can undergo changes with the wet conditions and hence processing is likely to be required. The paper initially considered what can be achieved with different processing techniques at laboratory scale, which were applied after the material had been dried (to allow recovery of handling properties). The methods considered included particle size separation, size reduction and carbon removal.
SFA 8
PFA 2
PFA 3
PFA 4R² = 1.00
0
1
2
3
4
5
6
0 20 40 60 80
SUPE
RPL
ASTI
CIS
ER R
EQ. T
O
ACH
IEVE
S3
SLU
MP,
g/k
g of
cem
ent
FINENESS, 45 µm sieve retention, %
0
10
20
30
40
50
60
0 20 40 60 80 100
CO
NC
RET
E C
UBE
STR
ENG
TH, M
Pa
TEST AGE, days
SFA 8 0.53 w/cPFA 2 0.51 w/cPFA 3 0.51 w/cPFA 4 0.49 w/c
(a) (b)
Wet Stored Fly Ash for Concrete 465
The tests showed that these methods could achieve fineness and LOI requirements for fly ash to EN 450-1. Some benefits were generally found for water requirement and activity index, although not all met the limits in the Standard. Minor changes to fly ash chemistry were generally found. In concrete, reduced SP dose was noted with increasing fineness to achieve a target slump (following processing) up to a point, beyond which increases occurred. Compressive strength tended to follow < 10 µm content in fly ash, with increases becoming noticeable when this exceeded about 50% in the material. The pilot-scale trial carried out, which involved air classifying or micronizing following drying/de-agglomeration of material generally confirmed these effects. Further research is needed to consider the use of the recovered/processed materials in different concretes and with regard to other aspects of performance, e.g. durability. It is also important to recognise that there are energy requirements (and costs) associated with processing (which will depend on the method used) and balancing these against what the resulting material can achieve will be important [9]. Although these issues remain, the research has demonstrated that wet stored material has potential as an option for sourcing fly ash in future.
ACKNOWLEDGEMENTS The Authors would like to acknowledge the EPSRC Doctoral Training Award and UK Quality Ash Association and its members for supporting the research described. Thanks are also given to Dr Robert Carroll and Dr Nigel Cooke for their technical input and assistance during the running of the project.
REFERENCES
1 CONCRETE SOCIETY, Cementitious materials: the effect of GGBS, fly ash, silica fume and limestone fines on the properties of concrete. Technical Report 74. Concrete Society, Camberley, Surrey, UK, 2011, 70 pp.
2 DEPARTMENT OF ENERGY & CLIMATE CHANGE, Government announces plans to close coal power stations by 2025. November 2015. https://www.gov.uk/government/news/government-announces-plans-to-close-coalpower-stations-by-2025
3 DEPARTMENT FOR BUSINESS, ENERGY AND INDUSTRIAL STRATEGY, Fly ash and blast furnace slag for cement manufacturing. BEIS research paper, No. 19, 2017, Crown copyright, 33 p.
4 McCARTHY M J, JONES M R, ZHENG L, ROBL T L AND GROPPO J G, Characterizing long-term wet-stored fly ash following carbon and particle size separation. Fuel Journal, Vol. 111, 2013, pp. 430-430.
5 McCARTHY M J, TITTLE P A J AND DHIR R K, Characterisation of conditioned PFA for use as a cement component in concrete, Magazine of Concrete Research, Vol. 51, No. 3, 1999, pp. 191-206.
6 McCARTHY M J, TITTLE P A J AND DHIR R K, Influences of conditioned PFA as a cement component in concrete, Magazine of Concrete Research, Vol. 52, No. 5, 2000, pp. 329-343.

466 Hope et al
7 McCARTHY M J, ROBL T L AND CSETENYI L J, Recovery, processing, and usage of wet stored fly ash, in: Robl, Oberlink, Jones (Eds.), Chapter 14, Coal Combustion Products (CCP's) - Characteristics, Utilization and Beneficiation, Elsevier, Oxford, UK, 2017, pp. 343-368.
8 BS EN 450-1, Fly Ash for concrete: Definition, Specifications and Conformity Criteria, British Standards Institution, London, UK, 2012.
9 McCARTHY M J, ZHENG L, DHIR R K AND TELLA G, Dry processing of long-term wet-stored fly ash for use as an addition in concrete, Cement and Concrete Composites, Vol. 92, 2018, pp. 205-215.
10 DHIR R K, McCARTHY M J AND TITTLE P A J, Developing applications for conditioned and lagoon PFA in concrete construction, Concrete, Vol. 33, No. 10, 1999, pp. 34-38.
11 SOONG Y, SCHOFFSTALL M R, GRAY M L AND KNOER J P, Dry beneficiation of high loss-on- ignition fly ash, Separation and Purification Technology, Vol. 26, 2002, pp. 177-184.
12 LUI K S, Some factors affecting sieve performance and efficiency, Power Technology, Vol. 109, 2009, pp 208-213.
13 BS EN 451-2, Method of Testing Fly Ash. Determination of Fineness by Wet Sieving, British Standards Institution, London, UK, 1995.
14 HOPE T A, McCARTHY M J AND CARROLL R A, Recovery and processing of wet-stored fly ash for use in concrete construction, EuroCoalAsh2017, Brno, Czech Republic, 2017, pp. 31-38.
15 MALHOTRA V M AND RAMEZANIANPOUR A A, Fly Ash in Concrete, CANMET, 2nd Edition, 1994, pp. 13.
ALKALI ACTIVATION POTENTIAL OF ESTONIAN Ca-RICH OIL SHALE ASHES
P Paaver
P Paiste
K Kirsimäe
University of Tartu
Estonia
ABSTRACT. This contribution reviews the geopolymeric potential of Ca-rich oil shale processing residues and aims at the characterization of the effects of different alkaline activator solutions on the polymerization of oil shale residues. Alkali activation of Estonian oil shale solid wastes is controlled by the presence and dissolution of reactive Ca-bearing phases. However, the geopolymeric potential of oil shale ashes is limited by the amount of available reactive Si and Al in the source material. Excess Ca in activated samples is precipitated as Ca-hydroxide showing Si deficiency in the system. Keywords: Activation, Geopolymer, Oil shale ash, Solid heat carrier retorting ash. Peeter Paaver is a PhD student at the University of Tartu, Estonia. Päärn Paiste is a Research Fellow at the University of Tartu, Estonia. Kalle Kirsimäe is a Professor of Mineralogy at the University of Tartu, Estonia.
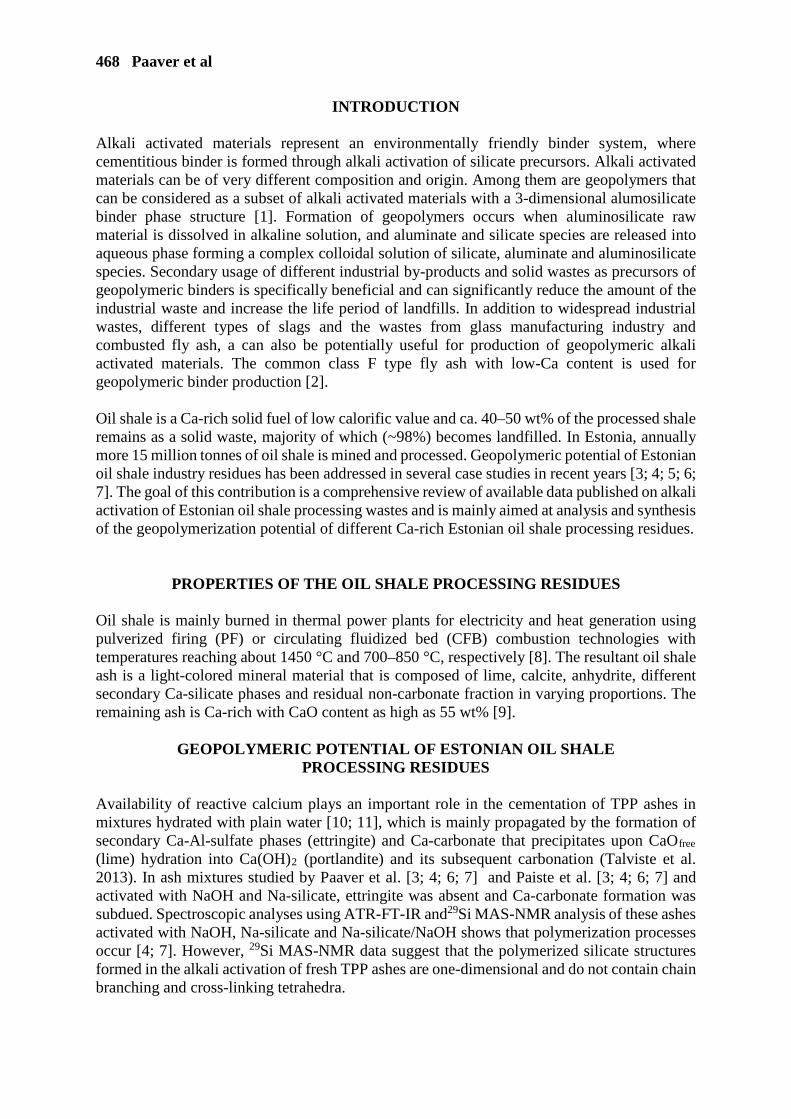
468 Paaver et al
INTRODUCTION Alkali activated materials represent an environmentally friendly binder system, where cementitious binder is formed through alkali activation of silicate precursors. Alkali activated materials can be of very different composition and origin. Among them are geopolymers that can be considered as a subset of alkali activated materials with a 3-dimensional alumosilicate binder phase structure [1]. Formation of geopolymers occurs when aluminosilicate raw material is dissolved in alkaline solution, and aluminate and silicate species are released into aqueous phase forming a complex colloidal solution of silicate, aluminate and aluminosilicate species. Secondary usage of different industrial by-products and solid wastes as precursors of geopolymeric binders is specifically beneficial and can significantly reduce the amount of the industrial waste and increase the life period of landfills. In addition to widespread industrial wastes, different types of slags and the wastes from glass manufacturing industry and combusted fly ash, a can also be potentially useful for production of geopolymeric alkali activated materials. The common class F type fly ash with low-Ca content is used for geopolymeric binder production [2]. Oil shale is a Ca-rich solid fuel of low calorific value and ca. 40–50 wt% of the processed shale remains as a solid waste, majority of which (~98%) becomes landfilled. In Estonia, annually more 15 million tonnes of oil shale is mined and processed. Geopolymeric potential of Estonian oil shale industry residues has been addressed in several case studies in recent years [3; 4; 5; 6; 7]. The goal of this contribution is a comprehensive review of available data published on alkali activation of Estonian oil shale processing wastes and is mainly aimed at analysis and synthesis of the geopolymerization potential of different Ca-rich Estonian oil shale processing residues.
PROPERTIES OF THE OIL SHALE PROCESSING RESIDUES
Oil shale is mainly burned in thermal power plants for electricity and heat generation using pulverized firing (PF) or circulating fluidized bed (CFB) combustion technologies with temperatures reaching about 1450 °C and 700–850 °C, respectively [8]. The resultant oil shale ash is a light-colored mineral material that is composed of lime, calcite, anhydrite, different secondary Ca-silicate phases and residual non-carbonate fraction in varying proportions. The remaining ash is Ca-rich with CaO content as high as 55 wt% [9].
GEOPOLYMERIC POTENTIAL OF ESTONIAN OIL SHALE PROCESSING RESIDUES
Availability of reactive calcium plays an important role in the cementation of TPP ashes in mixtures hydrated with plain water [10; 11], which is mainly propagated by the formation of secondary Ca-Al-sulfate phases (ettringite) and Ca-carbonate that precipitates upon CaOfree (lime) hydration into Ca(OH)2 (portlandite) and its subsequent carbonation (Talviste et al. 2013). In ash mixtures studied by Paaver et al. [3; 4; 6; 7] and Paiste et al. [3; 4; 6; 7] and activated with NaOH and Na-silicate, ettringite was absent and Ca-carbonate formation was subdued. Spectroscopic analyses using ATR-FT-IR and29Si MAS-NMR analysis of these ashes activated with NaOH, Na-silicate and Na-silicate/NaOH shows that polymerization processes occur [4; 7]. However, 29Si MAS-NMR data suggest that the polymerized silicate structures formed in the alkali activation of fresh TPP ashes are one-dimensional and do not contain chain branching and cross-linking tetrahedra.

Ca-Rich Oil Shale Ashes 469
Yip et al. [13] have proposed that in the presence of elevated calcium concentrations in geopolymeric system the C–S–H based cementitious material forms. Indeed, as mentioned above, the 29Si MAS-NMR analyses of studied TPP ash mixtures show that a C–(A)–S–H phase with a chemical shift typical to a system saturated with Na+ has formed, which is further supported by behaviour of Si–O(–Si/Al) stretching bands in ATR-FT-IR spectra of activated materials [4;7]. Several earlier studies [13; 14; 15] have shown that the CaO in source material used for geopolymerization appears to strengthen the geopolymer by the decrease of microstructural porosity and formation of amorphous Ca–Al–Si gel. The elevated calcium content in the solid raw materials affects the process of geopolymerization by providing extra nucleation sites for precipitation of dissolved species [16]. Our studies, however, show that excessive calcium and high pH (activity of hydroxide ions) in initial synthesising solution causes precipitation of Ca(OH)2 (portlandite), which later reacts with CO2 in the atmosphere forming calcite, resulting in deterioration of the polymeric product. This feature is evident in all experimental mixtures based on 5M NaOH [7]. Portlandite also appears in mixtures of TTP ashes prepared with Na-silicate containing activators. The initial compressive strengths achieved with sodium silicate based mixtures (>10 MPa in 7 days) agree well with the formation of polymeric structures apparent from 29Si MAS-NMR and ATR-FT-IR data reported in [6; 7]. However, though the polycondensation in Na-silicate and Na-silicate/NaOH activated mixtures was found to progress with aging and the polymerized chains were growing in length, the measured compressive strength values are lower in aged samples (7 days of curing vs. 28 to 90 days of curing) was evidently due to strong dry shrinkage and formation of abundant micro-cracks observed by [3; 4] in the polymerized samples. Although longer curing times lead to formation of structurally longer and more polymerized aluminosilicate binder phase and this trend can be expected to continue with time then the coherence of the sample is lost [3; 4; 6]. Shrinkage and creep are a typical processes observed in systems based on cement and geopolymer binders [17] which results mainly from drying shrinkage that can be controlled by selecting optimum curing temperature and liquid-to-ash ratio. Overall, these experimental studies [3; 4; 6; 7] suggest that Estonian oil shale ashes does not show very good geopolymerization properties, which is evidently related to the characteristics and the content of potentially reactive phases/components. In general, the composition of the Estonian oil shale ash produced either in thermal power plants or in shale oil retorting processes is considerably different from the raw materials typically used for producing geopolymeric binders [3; 4; 6; 7]. By its composition oil shale ash could be considered a class C fly ash that is a Ca-rich ash (CaO content >20 wt%), that can be and are used to produce geopolymers with considerable final strength [18; 19]. At the same time, peculiarity of Estonian oil shale ashes is, compared with other raw materials, consistently lower proportion of Al2O3 (typically <10 wt%). This compositional characteristic by itself dictates that formation of strong aluminosilicate polymer networks does not contribute or is subdued in development of uniaxial strength. This means that for production of geopolymeric materials from oil shale processing wastes, the mix design must include a source of available Si and Al in combination with an appropriate activator mixed at an optimum ratio to induce a sufficient degree of depolymerization-repolymerization reactions.

470 Paaver et al
Figure 1 Classification of potential raw materials used for geopolymers on CaO-SiO2-Al2O3 ternary plot. Modified after Buchwald et al. [21]. Data for Petroter ash from Paaver et al. [3], data for Enefit ash from Paaver et al [5] and oil shale CFB ashes from Bityukova et al. [9].
Figure 2 Ternary plot showing the relationship between geopolymer compressive strength
and fly ash oxide composition. Modified after Aughenbaugh et al. [20]. Data for Petroter ash from Paaver et al. [3], data for Enefit ash from Paaver et al [5] and oil shale CFB ashes from
Bityukova et al. [9].
Ca-Rich Oil Shale Ashes 471
.
Figure 3 SEM picture of (Na)-Ca-Al-Si gel-matrix formed in Petroter black ash activated with Na-silicate/NaOH dilution
REFERENCES
1. DAVIDOVITS, J. 2011. Geopolymer Chemistry and Applications. Institut Géopolymère, Saint-Quentin.
2. ZHANG, Z. H., WANG, H., ZHU, Y. C., REID, A., PROVIS, J. L. & BULLEN, F. 2014. Using fly ash to partially substitute metakaolin in geopolymer synthesis. Applied Clay Science, 88-89, 194-201.
3. PAAVER, P., PAISTE, P. & KIRSIMAE, K. 2016. Geopolymeric Potential of the Estonian Oil Shale Solid Residues: Petroter Solid Heat Carrier Retorting Ash. Oil Shale, 33(4), 373-392.
4. PAAVER, P., PAISTE, P. & KIRSIMAE, K. 2019. Alkali activation of Estonian Ca-rich oil shale ashes. Oil Shale, Joranian oil shale conference special issue.
5. PAAVER, P., PAISTE, P., MOTLEP, R. & KIRSIMAE, K. 2017. Self-Cementing Properties and Alkali Activation of Enefit280 Solid Heat Carrier Retorting Ash. Oil Shale, 34(3), 263-278.
6. PAISTE, P., KÜLAVIIR, M., PAAVER, P., HEINMAA, I., VAHUR, S. & KIRSIMÄE, K. 2017. Beneficiation of Oil Shale Processing Waste: Secondary Binder Phases in Alkali Activated Composites. Waste and Biomass Valorization.
7. PAISTE, P., LIIRA, M., HEINMAA, I., VAHUR, S. & KIRSIMAE, K. 2016. Alkali activated construction materials: Assessing the alternative use for oil shale processing solid wastes. Construction and Building Materials, 122, 458-464.
472 Paaver et al
8. OTS, A. 2006. Oil shale fuel combustion, 833 pp. Tallinna Raamatutrükikoda, Tallinn.
9. BITYUKOVA, L., MÕTLEP, R. & KIRSIMÄE, K. 2010. Composition of Oil Shale Ashes from Pulverized Firing and Circulating Fluidized-Bed Boiler in Narva Thermal Power Plants, Estonia. Oil Shale, 27(4), 339-353.
10. KUUSIK, R., UIBU, M., KIRSIMAE, K., MOTLEP, R. & MERISTE, T. 2012. Open-Air Deposition of Estonian Oil Shale Ash: Formation, State of Art, Problems and Prospects for the Abatement of Environmental Impact. Oil Shale, 29(4), 376-403.
11. SEDMAN, A., TALVISTE, P. & KIRSIMÄE, K. 2012. The Study of Hydration and Carbonation Reactions and Corresponding Changes in the Physical Properties of Co-Deposited Oil Shale Ash and Semicoke Wastes in a Small-Scale Field Experiment. Oil Shale, 29(3), 279-294.
12. TALVISTE, P., SEDMAN, A., MÕTLEP, R. & KIRSIMÄE, K. 2013. Self-cementing properties of oil shale solid heat carrier retorting residue. Waste Management & Research, 31(6), 641-647.
13. YIP, C. K., LUKEY, G. C. & VAN DEVENTER, J. S. J. 2005. The coexistence of geopolymeric gel and calcium silicate hydrate at the early stage of alkaline activation. Cement and Concrete Research, 35(9), 1688-1697.
14. KOMNITSAS, K. A. 2011. Potential of geopolymer technology towards green buildings and sustainable cities. 2011 International Conference on Green Buildings and Sustainable Cities, 21, 1023-1032.
15. XU, H. & VAN DEVENTER, J. S. J. 2000. The geopolymerisation of alumino-silicate minerals. International Journal of Mineral Processing, 59(3), 247-266.
16. VAN DEVENTER, J. S. J., PROVIS, J. L., DUXSON, P. & LUKEY, G. C. 2007. Reaction mechanisms in the geopolymeric conversion of inorganic waste to useful products. Journal of Hazardous Materials, 139(3), 506-513.
17. CASTEL, A., FOSTER, S. J., NG, T., SANJAYAN, J. G. & GILBERT, R. I. 2015. Creep and drying shrinkage of a blended slag and low calcium fly ash geopolymer Concrete. Materials and Structures, 1-10.
18. GUO, X. L., SHI, H. S. & DICK, W. A. 2010b. Compressive strength and microstructural characteristics of class C fly ash geopolymer. Cement & Concrete Composites, 32(2), 142-147.
19. MIJARSH, M. J. A., JOHARI, M. A. M. & AHMAD, Z. A. 2015. Effect of delay time and Na2SiO3 concentrations on compressive strength development of geopolymer mortar synthesized from TPOFA. Construction and Building Materials, 86, 64-74.
20. AUGHENBAUGH, K.L., WILLIAMSON, T. AND JUENGER. 2015. Critical evaluation of strength prediction methods for alkali-activated fly ash. Materials and Structures, 48(3): 607-620.
21. BUCHWALD, A., DOMBROWSKI, K. AND WEIL, M., 2005. The influence of calcium content on the perfomance of geopolymeric binder especially the resistance against acids, 4th International Conference on Geopolymers, St. Quentin, France, pp. 35-39.
ASH COMPONENT ASSEMBLIES: INNOVATIVE UTILIZATION OF FLY ASH FOR BUILDING AND CONSTRUCTION PRODUCTS
S Chiuta T Mdlamkomo
K Payne W Soutter
Zetland Technologies ZA (PTY) Ltd
South Africa
ABSTRACT: Fibre cement is a popular construction material due to its versatility and myriad advantages. It is used for roofing, wall claddings and internal linings in both domestic and commercial buildings. The Hatschek process is widely used in the manufacture of fibre cement boards, where vacuum filtration of a dilute slurry mixture of fibres, sand and cement, produce a thin film (typically around 0.25 to 0.40 mm thick). Each fibre cement sheet comprises a stack of these films. At Zetland Technologies, we have developed an innovative alternative to the 100-year-old Hatschek process to obtain fibre cement panels that look and feel the same as the conventional. The method is unique in that it is amenable to using abundant industrial waste materials such as fly ash, bagasse ash and mineral slags. Zetland Technologies’ method involves granulation of a slurry mixture comprised of cement, fly ash, cellulose or synthetic fibres among other additives. The granulation is achieved by complexing the slurry mixture in a high-shear mixing device to obtain free-flowing and friable micro-granules that instantly coalesce upon cold pressing to form a fibre-cement panel. This process has paved way to production of fibre cement panels exceeding the current threshold thickness of 19mm. Because of this possibility, we further developed an alternative building technology, where two 30-mm-thick fibre cement panels sandwich an 80-mm-thick fly ash foam insulation core to produce a building block of high insulation value. This paper presents unique strategies for value addition of fly ash to produce innovative building and construction products namely fibre cement panels, fibre cement extrusion bodies, lightweight foamed insulation panels, and ultimately an alternative building system.
Keywords: Fly ash, Pressed fibre cement, Fibre cement extrusion, Lightweight panels, Zetland Building System
Dr S Chiuta is the Technical General Manager of Zetland Technologies ZA (Pty) Ltd. He leads the development of licensable innovations for the building, construction, and mining industries. Mrs Tebogo Mdlamkomo is the Materials Scientist at Zetland Technologies ZA (Pty) Ltd responsible for developing binder chemistry within the group. Mr Kyle Payne is the Sales and Business Development Manager at Zetland Technologies. He has over 15 years’ experience in the construction industry. Mr Wesley Soutter is the Manging Director of Zetland Technologies ZA (Pty) Ltd responsible for management oversight, marketing, and legal execution of intellectual property licensing. He is a qualified attorney with over 13 years’ experience in business negotiation and litigation, mainly in the construction and mining industries.
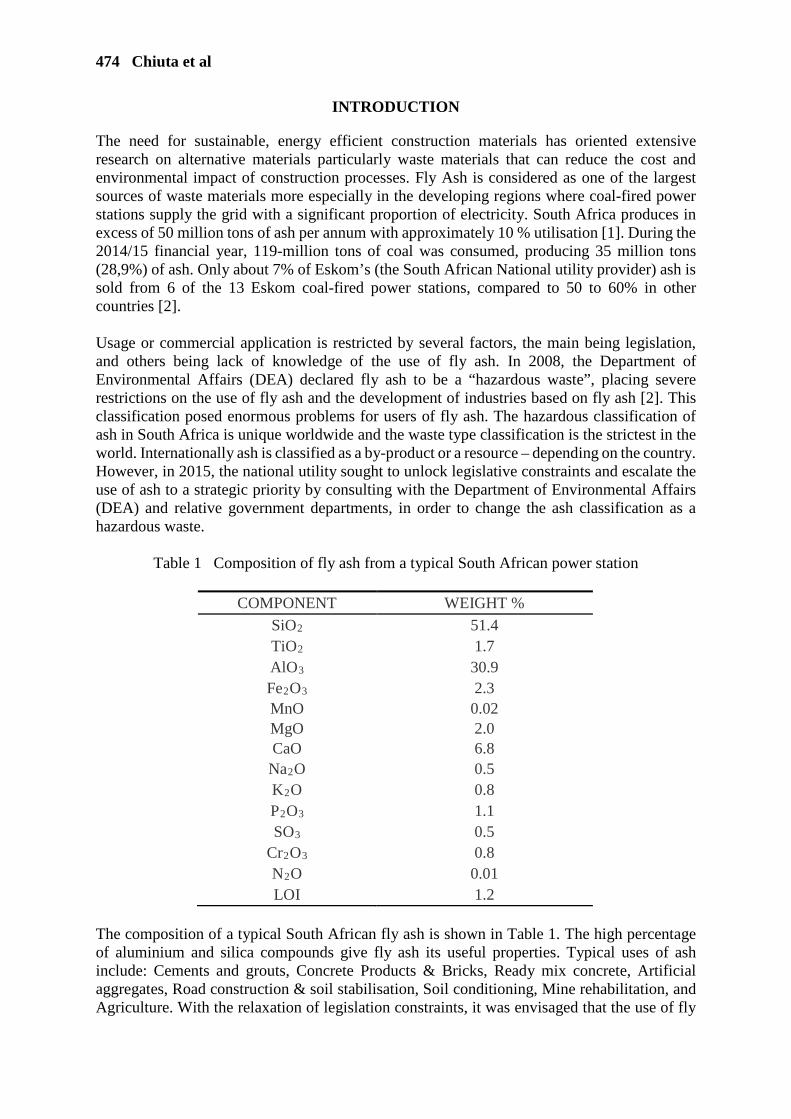
474 Chiuta et al
INTRODUCTION
The need for sustainable, energy efficient construction materials has oriented extensive research on alternative materials particularly waste materials that can reduce the cost and environmental impact of construction processes. Fly Ash is considered as one of the largest sources of waste materials more especially in the developing regions where coal-fired power stations supply the grid with a significant proportion of electricity. South Africa produces in excess of 50 million tons of ash per annum with approximately 10 % utilisation [1]. During the 2014/15 financial year, 119-million tons of coal was consumed, producing 35 million tons (28,9%) of ash. Only about 7% of Eskom’s (the South African National utility provider) ash is sold from 6 of the 13 Eskom coal-fired power stations, compared to 50 to 60% in other countries [2]. Usage or commercial application is restricted by several factors, the main being legislation, and others being lack of knowledge of the use of fly ash. In 2008, the Department of Environmental Affairs (DEA) declared fly ash to be a “hazardous waste”, placing severe restrictions on the use of fly ash and the development of industries based on fly ash [2]. This classification posed enormous problems for users of fly ash. The hazardous classification of ash in South Africa is unique worldwide and the waste type classification is the strictest in the world. Internationally ash is classified as a by-product or a resource – depending on the country. However, in 2015, the national utility sought to unlock legislative constraints and escalate the use of ash to a strategic priority by consulting with the Department of Environmental Affairs (DEA) and relative government departments, in order to change the ash classification as a hazardous waste.
Table 1 Composition of fly ash from a typical South African power station
The composition of a typical South African fly ash is shown in Table 1. The high percentage of aluminium and silica compounds give fly ash its useful properties. Typical uses of ash include: Cements and grouts, Concrete Products & Bricks, Ready mix concrete, Artificial aggregates, Road construction & soil stabilisation, Soil conditioning, Mine rehabilitation, and Agriculture. With the relaxation of legislation constraints, it was envisaged that the use of fly
COMPONENT WEIGHT %
SiO2 51.4 TiO2 1.7 AlO3 30.9 Fe2O3 2.3 MnO 0.02 MgO 2.0 CaO 6.8 Na2O 0.5 K2O 0.8 P2O3 1.1 SO3 0.5
Cr2O3 0.8 N2O 0.01 LOI 1.2

Ash Component Assemblies 475
ash could allow for improved business development, increased infrastructure development, job creation, create social uplift and allow for skills development. However, the expected growth has been painstakingly slow in part due to lack of buy in and competition from cheap conventional products such as bricks. On the contrary, the development of high-value niche product market can overturn this status quo and propel the beneficial utilization of fly ash to meet the intended socio-economic objectives. To this end, Zetland Technologies has developed various ‘green’ technologies utilizing fly ash. In this paper, we review the different building and construction products that we have developed using fly ash namely fibre cement panels/boards, fibre cement extrusion products, lightweight foamed insulation panels, alternative building system, fly ash dry walling, and fly ash poles products – ash component assemblies.
ASH COMPONENT ASSEMBLY 1: FIBER CEMENT PANELS Fibre cement boards are one of the famous construction products that can be used as an internal/external wall as well as materials for roofing and cladding. It is a great substitute to gypsum boards in certain applications due to its moisture resistance, quality and superior strength. Fibre cement panels are highly suitable and recommended for high moisture areas including, bathrooms and kitchens as well as drywalls in service areas such as corridors, car parks, hospitality kitchens and control rooms where a high level of impact resistance is required. The superior thermal insulation properties of these boards make them ideal for extreme climatic conditions.
FIBER CEMENT PRODUCTION VIA THE HATSCHEK PROCESS Fibre cement was invented in the 1890's by Ludwig Hatschek who mixed asbestos fibre directly with Portland cement using a modification of the vat/cylinder paper machine. Since that time, the Hatschek process has largely improved, but the fundamentals remain virtually unchanged. In this process, vacuum filtration of a dilute slurry mixture of fibres, silica sand and cement produce paper thin films (typically around 0.25 to 0.40 mm thick) placed one on the other until the desired sheet thickness is reached. Cooke [3] has reviewed extensively the mechanisms on the Hatschek Machine, and point out the formation of sheets occurs in 4 stages; 1) Initial formation of a filter layer on the surface of the sieve, 2) Building of a very watery layer of fibre cement over the filter layer as the sieve rotates in
contact with the slurry in the vat, 3) Low intensity dewatering of the wet film as it transfers to the felt, and 4) High intensity dewatering of the film as it passes through the nip of the accumulator roller. Clearly, the Hatschek process is a very wet process that produces large volumes of contaminated wastewater that requires expensive treatment. Due to this, the board thickness from the Hatschek process is limited to 20 millimetre owing largely to the springback phenomenon which occurs with thicker board panels. In addition, the process is limited to cellulosic fibres, and to a large extent use of synthetic fibres is avoided as they tend to float on top of the wet slurry and exhibit poor dispersion. Furthermore, the wet sheets from the Hatschek machine need to be autoclaved at high temperature and pressure in order to promote free lime-silica reactions and increase productivity. Against this background, Zetland Technologies patented an alternative process to produce fibre cement panels with thickness greater than 20 millimetres.

476 Chiuta et al
Figure 1 A 30-mm-thick fly ash-based fibre cement board sample produced using Zetland
Technologies proprietary method
FIBRE CEMENT PRODUCTION WITH ZETLAND TECHNOLOGIES
GRANULATION OF A SLURRY Traditional methods of making fibre cement boards were limited to a maximum thickness of 20 mm, yet the Zetland process has pressed boards up to 100mm. Figure 1 shows a fibre cement panel sample of size 480 mm x 258 mm x 30 mm produced using Zetland’s patented technology. The crux of the technology involves the granulation of a slurry [4], where cement, fly ash or sugarcane bagasse ash or mineral slag, cellulosic or synthetic fibre, are homogenised and kneaded together with a liquid polymeric binder (which can be a fully hydrolysed polyvinyl alcohol) to a thick paste that transforms into non-sticky microgranules upon addition of a complexation additive to the paste. The Figure 2 shows the dry, fluffy consistency of the fibre cement mix at the end of a mixing cycle.
Figure 2 Fly ash-based fibre cement mix at the end of a 3 ½-minute mixing cycle The mixing of the solids and liquid additives is achieved using a high shear device such as an Eirich-type mixer. Several experiments were conducted at Machinefabriek Gustav Eirich GmBH (Hardheim, Germany) to ascertain the suitability of Eirich mixer towards producing

Ash Component Assemblies 477
fibre cement mixes using Zetland’s technology. In these experiments, an EL-10 lab mixer with a volume capacity of 10 litres was used for the initial tests aimed at optimising the amount of liquid additive, mixing cycle time, and rotor/pan rotational speeds. Scale up effects were also investigated using an R-08 production mixer with a volume capacity of 75 litres (Figure 3). Both the initial and dynamic upscale tests were successful and produced a consistent mix as shown in Figure 2. The optimal mixing cycle lasted 3 ½ minutes and included process steps of solids homogenization, liquid binder addition, kneading, complexing agent addition, and final homogenization. Variable rotor speed was required starting off at 6m/s and ending off the cycle at 18m/s. The mixer needs a star type rotor working in counter-current mode with vessel speed remaining unchanged at 1 m/s.
Figure 3 The R-08W production mixer showing star-type rotor and fixed scraper at Machinefabriek Gustav Eirich GmBH
Because this is essentially a ‘dry’ process, the range of additives that can be added to the board to reduce its weight or improve its strength or other qualities is unlimited. Hi-tech fibres, lightweight extenders to reduce the density, and other additives that would not normally be considered in very wet processes, can now be used. In addition, this process uses only the required amount of liquid to hydrate the cement and so, there is no wastewater emissions from the plant. These process advantages cannot be derived from the Hatschek process.

478 Chiuta et al
The non-sticky, homogenous microgranules produced from the mixer can be spread onto a platen, in a manner very similar to existing particleboard production. The scattering of the fibre cement mix is crucial aspect which ensures uniform spatial density across the finished panel. To this end, experiments were performed to assess the scattering of Zetland’s fibre cement mix at IPCO (formerly Sandvik TPS, Goppingen, Germany). Figure 4 shows the scattering machine used for these tests.
Figure 4 Type F IPCO GmBH scattering machine and scattered fibre cement granules at 20kg/m2
The scattering machine (Figure 4: left) consists of a hopper, scattering roller, doctor blade, and brush-off roller. The scattering roller picks up the material to be scattered. A rigid doctor blade runs the material into the “pockets” of the roller surface. The scattering material will be brushed off by a rotary brush and falls through a gap between the rotary brush and the scattering roll onto the underneath travelling substrate. The quantity of scattering material is determined by the speed of the scattering roll. For instance, roller and belt speeds of 7.6 rpm and 2 m/min were required to dispense material at 20 kg/m2. Figure 4 (right) shows the uniformly scattered fibre cement mix obtained during these tests.
Figure 5 A double belt press used to produce a 12-mm-thick fibre cement panel at the IPCO GmBH pilot testing centre in Goppingen, Germany
The microgranules are pressed at ambient temperature at specific pressures between 200 to 250 N/cm2, and instantly coalesce to produce a panel of predetermined density. Experiments
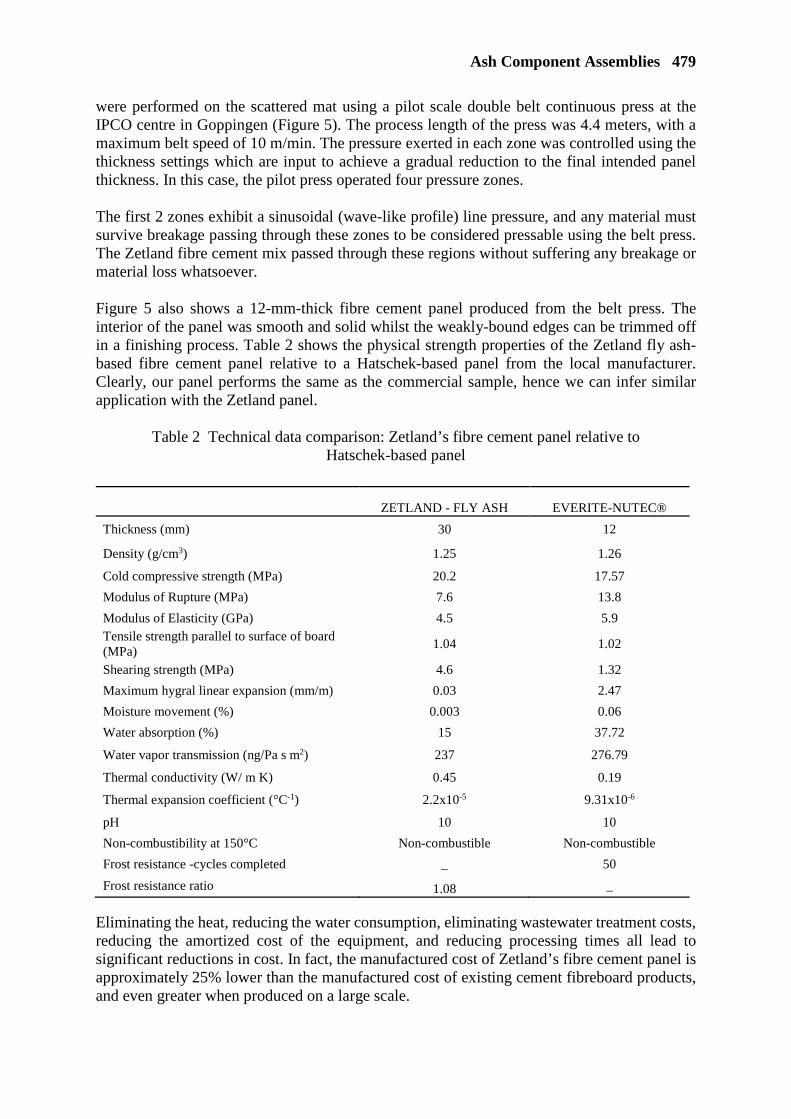
Ash Component Assemblies 479
were performed on the scattered mat using a pilot scale double belt continuous press at the IPCO centre in Goppingen (Figure 5). The process length of the press was 4.4 meters, with a maximum belt speed of 10 m/min. The pressure exerted in each zone was controlled using the thickness settings which are input to achieve a gradual reduction to the final intended panel thickness. In this case, the pilot press operated four pressure zones. The first 2 zones exhibit a sinusoidal (wave-like profile) line pressure, and any material must survive breakage passing through these zones to be considered pressable using the belt press. The Zetland fibre cement mix passed through these regions without suffering any breakage or material loss whatsoever. Figure 5 also shows a 12-mm-thick fibre cement panel produced from the belt press. The interior of the panel was smooth and solid whilst the weakly-bound edges can be trimmed off in a finishing process. Table 2 shows the physical strength properties of the Zetland fly ash-based fibre cement panel relative to a Hatschek-based panel from the local manufacturer. Clearly, our panel performs the same as the commercial sample, hence we can infer similar application with the Zetland panel.
Table 2 Technical data comparison: Zetland’s fibre cement panel relative to Hatschek-based panel
ZETLAND - FLY ASH EVERITE-NUTEC®
Thickness (mm) 30 12
Density (g/cm3) 1.25 1.26
Cold compressive strength (MPa) 20.2 17.57
Modulus of Rupture (MPa) 7.6 13.8
Modulus of Elasticity (GPa) 4.5 5.9 Tensile strength parallel to surface of board (MPa)
1.04 1.02
Shearing strength (MPa) 4.6 1.32
Maximum hygral linear expansion (mm/m) 0.03 2.47
Moisture movement (%) 0.003 0.06
Water absorption (%) 15 37.72
Water vapor transmission (ng/Pa s m2) 237 276.79
Thermal conductivity (W/ m K) 0.45 0.19
Thermal expansion coefficient (°C-1) 2.2x10⁻⁵ 9.31x10⁻⁶
pH 10 10
Non-combustibility at 150°C Non-combustible Non-combustible
Frost resistance -cycles completed _ 50
Frost resistance ratio 1.08 _
Eliminating the heat, reducing the water consumption, eliminating wastewater treatment costs, reducing the amortized cost of the equipment, and reducing processing times all lead to significant reductions in cost. In fact, the manufactured cost of Zetland’s fibre cement panel is approximately 25% lower than the manufactured cost of existing cement fibreboard products, and even greater when produced on a large scale.

480 Chiuta et al
EXTRUSION OF FIBRE CEMENT PRODUCTS: FORMULATION OPTIMIZATION
The basic formulation for Zetland’s fibre cement was also extended to extrusion products. However, the fibre cement mix as formulated for board panels could not be extruded successfully, and some recipe adjustments were made specifically targeting water retention of the mix, plasticity of the mix, and extrudate profile stability. Overall, the changes reduced fibres, complexing agent, and density modifiers to leading to improved stiffness of the extrusion bodies. Experimental investigations were carried out at Händle GmbH Maschinen und Anlagenbau (Mühlacker, Germany) and, both solid and hollow profile bodies were extruded successfully as shown in Figure 6. Clearly, the mix consistency for extrusion differs considerably from mix design for pressed panel.
Figure 6 (a) Good, homogenous fibre cement mix for extrusion. (b) Consistent perforated profile from extruder die. (c) Solid column and 4-channel perforated extrusion bodies. ASH COMPONENT ASSEMBLY 2: LIGHTWEIGHT ASH INSULATION PANELS
The Zetland lightweight fly ash insulation panels have been designed to have variable density and strength properties specifically for non-structural applications such as insulation, acoustics, thermal, and infills. Very low densities in the order of 230 kg/m3 have been obtained. The insitu airborne sound insulation of 47 dB, thermal R-value of 1.8 m2 K/W, and fire rating resistance of 120 minutes have been achieved with these panels.
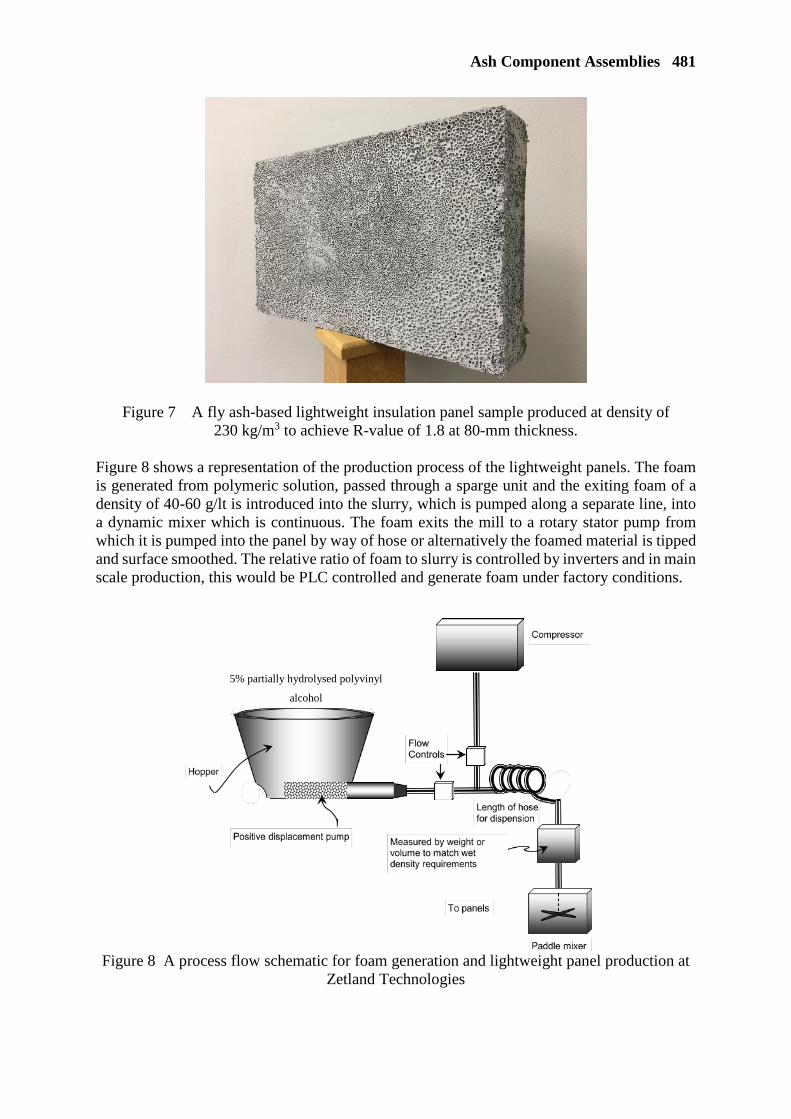
Ash Component Assemblies 481
Figure 7 A fly ash-based lightweight insulation panel sample produced at density of 230 kg/m3 to achieve R-value of 1.8 at 80-mm thickness.
Figure 8 shows a representation of the production process of the lightweight panels. The foam is generated from polymeric solution, passed through a sparge unit and the exiting foam of a density of 40-60 g/lt is introduced into the slurry, which is pumped along a separate line, into a dynamic mixer which is continuous. The foam exits the mill to a rotary stator pump from which it is pumped into the panel by way of hose or alternatively the foamed material is tipped and surface smoothed. The relative ratio of foam to slurry is controlled by inverters and in main scale production, this would be PLC controlled and generate foam under factory conditions.
Figure 8 A process flow schematic for foam generation and lightweight panel production at
Zetland Technologies
5% partially hydrolysed polyvinyl
alcohol

482 Chiuta et al
ASH COMPONENT ASSEMBLY 3: ZETLAND BUILDING SYSTEM The Zetland Building System evolved from the innovation on fibre cement panels which allowed ‘pressed’ panels in excess of 20 mm-thickness. Seizing on this opportunity, Zetland set about designing an Alternative Building System that met the insulating requirements of the most recent South African design regulations as specified in the SANS10400 [5]. The Zetland Building System is in principle an interlocking block design where 2 30-mm-thick fibre cement panels sandwich an 80-mm-thick lightweight fly ash insulation core. The blocks have a spline along 2 edges (top and side) so that they slot into a base plate (keeping them perfectly straight) and into one another (so they can only be built perfectly perpendicular). 1 block has a size equivalent of 12 standard bricks on a double-sided wall. Figure 9 shows detailed sectional views of the interlocking block unit for the Zetland Building System.
Figure 9 Sectional drawing of the insulated interlocking building block unit for the
Zetland Building System There are many benefits for using the Zetland building system. The splines mean that the blocks do not have to be laid in a staggered profile and no mortar is required. This means that 6 or more workers can start constructing the walls of a building at the same time to the truss level. A block layer can place the same wall area in an hour that a skilled bricklayer can normally lay in a day. In brick and mortar construction, such activity is not possible, and the mortar needs to set at each metre, meaning the bricklayer has to come back to the project over 3 days to complete it.

Ash Component Assemblies 483
In addition, a high-tech cement adhesive resin is used to bond the building blocks together, eliminating the cost and waste issues related to mortar that is otherwise used in traditional brick walls. The blocks have a spline along 2 edges so that they slot into a base plate (keeping them perfectly straight) and into one another (so they can only be built perfectly perpendicular). This means that unskilled and semi-skilled labour can be used to construct the walls. These factors, coupled with the fact that there is no time wasted waiting for mortar and plaster to be applied or dried, means that a house’s construction period is cut by at least 5 days. For the developer, be it private or government, this means that cash payments are only made when the house has reached the final stages. There is less chance that builders will run out of cash because the whole schedule is considerably tighter, giving the developer much-needed control. Further benefits include:
• Manufacturers benefit from lower costs, no wastage, no emissions and economies of scale.
• Builders and developers benefit from shorter construction times and tighter cash flow control.
• Contractors benefit from a cleaner, safer, easier work environment that will make them more productive and hence able to generate more income.
• Home owners benefit from a cooler house in summer, a warmer house in winter, lower energy bills and the knowledge that they have a house made of world class advanced building materials.
• The government benefits through significant job creation for unskilled male and female labour and lower cost, faster construction.
Finally, the Zetland Building System is just as suited to high-end housing as it is to community housing. Further, it presents a sustainable strategy to utilizing the abundant fly ash from the national utility’s coal-fired power stations. Mass balance calculations have shown that 1 plant producing blocks to build 20,000 small houses of 40 m2 floor area per year consumes over 70,000 tons of fly ash per year.
REFERENCES 1. KRUGER, R A. Coal Ash in South Africa, World of Coal Ash 2015. 2. REYNOLDS-CLAUSEN K, SINGH N. South Africa’s power producer’s revised coal
ash strategy and implementation progress, World of Coal Ash 2017, May 9 11, 2017, Lexington, KY.
3. COOKE T, MOSLEMI A. Formation of Films on Hatschek Machines, 8th Conference
Inorganic-bonded wood and fiber composite materials, pp 231246, Sun Valley, ID. 4. SYMONS M W. A hydraulic binder product. European Patent Application Number
10185595, Application Date: 27.07.2005 5. SANS 10400 – Building Regulations South Africa. https://sans10400.co.za/sans10400/
A REPORT ON BENEFICIAL USE OF COAL COMBUSTION PRODUCTS IN THE UNITED STATES
T H Adams
American Coal Ash Association
United States of America
ABSTRACT. The American Coal Ash Association (ACAA) has conducted a survey of the production and use of coal combustion products (CCP) since 1970. The most current data available is for 2017. While the data show the highest rate of beneficial use in the history of the survey, the nature of the uses is showing some unique activity. In addition, the U.S. is seeing the beginning of harvesting of CCP from surface impoundments and landfills. Harvesting has been a very limited part of CCP beneficial use for some time. Large scale activities are getting underway. Demand for concrete-grade fly ash has been growing for several years. Today demand is outstripping supply with regional supply shortages in regional markets. It is estimated that the gap between supply and demand is as much as 30%. Concerns regarding the supply of fly ash and other supplementary cementitious materials is motivating consideration of revisions to existing specifications as well as creation of new specifications to allow for increased quantities of materials to come to the market. This presentation will discuss the current survey data on beneficial use, harvesting activities, and CCP import activity. It will also provide a summary of activity in specifications for supplementary cementitious materials. Keywords: Ash, CCP, USA, Demand Thomas H Adams was appointed executive director of the American Coal Ash Association (ACAA) in 2009. In his role as chief operating officer he serves as the voice of the beneficial use industry.Mr. Adams' 30 years in the concrete industry prepared him well for the challenges he faces as ACAA Executive Director. He has held key leadership posts for the American Concrete Institute, American Shotcrete Association, ASTM International, National Ready Mixed Concrete Association, and Michigan Concrete Association. He is a native of Detroit and attended Michigan's Wayne State University and Aquinas College studying Business Administration
OUTLOOK FOR FLY ASH IN THE UK
Nigel Cooke
United Kingdom Quality Ash Association
United Kingdom
ABSTRACT. It is well known that all coal fired power production in the UK is expected to cease by 2025. Indeed, most stations will be closed well before this date. This has meant that both suppliers and users of fly ash are currently evaluating their future strategy and options. Options which include imports and developing landfilled ash deposits. The UKQAA has also had to adapt and redefine itself for its members. In the past, the primary objective was promoting the use of fly ash and providing technical support to users and suppliers. Over the past 2 years the emphasis has changed and is now fully focussed on assisting members identify future sourcing options as well as highlighting best practices and technologies that may facilitate this. The UKQAA feels that the answer may well be in the development of landfilled fly ashes from pulverised coal fired power stations. The UKQAA estimates that there are well over 100 million tonnes of landfilled fly ash located at currently operating or recently closed power stations. Subject to being defined as future mineral or pozzolanic reserves, these single source deposits of alumino silicates in closely defined boundaries can be beneficially used by the construction industry for generations to come. The paper aims to describe how the UKQAA is working with key stakeholders including the Environment Agency and Planners to safeguard these strategic reserves. This will provide a background to more focussed papers on the performance of landfill fly ashes and technologies used to beneficiate them including the case study for Gale Common by EPUKI. Keywords: Fly ash, United Kingdom, EPUKI Dr Nigel Cooke is Director of the United Kingdom Quality Ash Association. Nigel has more than 30 years’ experience of working within the building materials sector, including time spent at Blue Circle Industries and Lafarge. He also has global experience, including involvement in a number of cementitious initiatives across Europe, Russia, South East Asia and Japan. During his time with Blue Circle/Lafarge in the UK, he was responsible for setting up ash beneficiation projects and logistics facilities with ScottishPower, EDF Energy, RWE nPower and Drax Power.
FLY ASH DRYING CONSIDERATIONS
A Rigg
S Coley
Atritor Limited
United Kingdom
ABSTRACT. This presentation investigates the process of drying fly ash coming from alternative sources such as stockpiles and ponds, highlighting the possibilities, whilst addressing the implications involved. With the future of ash supplies from traditional sources in doubt, fly ash from stockpiles and ponds has the potential to be used in many existing applications, particularly in the construction industry where it is already established as a filler and or product property enhancer. Other examples include within fields such as carbon recovery. The possibility to dry and grind the fly ash simultaneously in an Atritor Dryer-Pulveriser air-swept mill not only simplifies the plant to process plant, but also offers great flexibility in creating bespoke product characteristics required for different applications. A typical ‘fly ash from landfill’ drying plant duty is mainly to de-agglomerate and surface dry the product. For example, a finished product specification of < 25% retained on a 45-micron mesh and some 0.5% moisture. There are a number of important factors to consider when evaluating such a process. A good understanding of moisture content of the landfill ash is critical. Total cost of ownership is addressed, in particular with regards to wear and the associated energy costs. Keywords: Flash drying, Grinding processes Scott Coley and Andrew Rigg work with with Atritor Limited, UK
COST-EFFECTIVE, ENVIRONMENTALLY-FRIENDLY ASH BENEFICIATION TECHNOLOGY
Vassiem Sheikh
Charah Solutions
United Kingdom
ABSTRACT. Currently, coal fly ash with a loss on ignition (LOI) above 6% does not meet ASTM C-618 specification. Additionally, coal fly ash with ammonia content above 100 ppm can cause health concerns for concrete workers due to off-gassing of the ammonia when mixed with alkaline materials. Also, many cement kilns have stringent guidelines on total mercury input, sometimes limiting the beneficial use of fly ash. To increase supply of marketable fly ash to concrete producers nationwide, the MP618™ Multi-Process fly ash thermal beneficiation technology can reliably and continuously process fly ash to:
‐ Reduce LOI to < 3% ‐ Reduce ammonia content to < 60 ppm ‐ Reduce mercury to < 100 ppb ‐ Reduce activated carbon and moisture
Charah Solutions’ proven MP618 technology allows for beneficiation of both wet and dry fly ash and offers important advantages over competing technologies. Specifically, it has a significantly lower cost profile, an efficient footprint with self-contained environmental controls that can be deployed in months versus years and a modular design that can be scaled up or down to increase production based on market demand. With the functionality to process both wet and dry fly ash, the MP618 technology can be installed at both operating and non-operating power plants, regardless of whether the fly ash is current production or legacy ash stored in ponds or landfills. The technology also allows for the processing of kiln dust to remove mercury for emissions regulations compliance. In addition, the MP618 process delivers a marketable concrete grade or cement kiln-friendly product from existing coal fly ash streams as a stand-alone process not required to be placed at a host utility. Finally, the MP618 system separates and isolates heavy metals, such as mercury and arsenic, particularly for cement kilns, which other technologies fail to do. The MP618 ash beneficiation system can be delivered as a portable or stationary system depending on client requirements. Charah Solutions’ recently completed unit operating in Louisiana processes utility generated ash and can be used to test site-specific fly ash, allowing for a complete analysis of material both pre and post processing. The MP618 technology enhances Charah Solutions’ MultiSource® materials network, a unique distribution system of more than 30 nationwide sourcing locations, and improves the company’s ability to provide a continuous and reliable supply of supplementary cementitious materials for ready-mix concrete producers and other customers throughout the U.S. Keywords: Beneficiation, LOI, Ammonia, Mercury, Carbon Dr Vassiem Sheikh works with Charah Solutions.
INDIA AS AN EMERGING FLY ASH SOURCING HUB
Rishit Dalal
Jaycee Buildcorp LLP
India
ABSTRACT. Coal will remain the predominant source of electricity in India in the near future with approx. 600 million tons of coal being consumed per annum. Consequently, there is 200 million tons of Fly Ash produced yearly. However, only 65-70% of Fly Ash is gainfully utilized. Power plants liberally use pond dumping for disposal of unutilized ash and more than 350 million tons has accumulated only in the past 5 years, resulting in significant economic, environmental and social consequences. The construction industry remains the major consumer of Fly Ash with majority going into cement and concrete. The Government of India has seeded research institutes that are working on new-age Fly Ash applications such as geo-polymers, zeolites, plasters as well as fertilizers. Fly Ash beneficiation and exports is a ‘sunrise’ sector. Ash produced from domestic Indian coal is high quality, with low LOI and high pozzolanic content. Processing makes it consistent. However, serious investments have been deterred due to short-term contracts by power plants, demand-supply imbalance and absence of government incentives/ regulations. The industry remains highly disorganized with many fragmented, fly-by-night operators but there emerging organized players producing classified, consistent quality ash (as per international standards) that is exported across Asia Pacific, Middle East and Africa. Europe and America could be the next big importer of such ash. Opportunities in the Fly Ash industry include downstream value added product manufacturing, exports of classified ash, transfer of technological solutions, and partnerships with international universities for research and development. Keywords: Sourcing, India, Fly ash Rishit Dalal is Director of Projects and International Business at JAYCEE, a 30-year old business in building materials and the market leader for ash exports from India. The company exports to over 10 countries worldwide, with industry experts on its board. It has recently set up South-Asia’s largest ash processing project in India with a capacity of 1 million tons/ annum, and is the only player with CE-Marking on Fly Ash. Rishit is an engineer, and an alumnus of London Business School. He is a Director with the “Asian Coal Ash Association” and drives several initiatives to increase ash utilization internationally.
RADICAL OPTIONS FOR NON-THERMAL DRYING
C Every M ZlatnerCoomtech Ltd
United Kingdom
ABSTRACT. In the UK, Europe and the USA the once prolific supply of ash from coal fired power generation has faltered or ceased in many territories. Consequences for the traditional users of Powdered Fuel Ash in the construction products and cement industries in particular have been especially badly affected by this change in the supply chain. There have been two major consequences of these changes. Shortages of PFA have forced prices to rise in the market and the migration to alternatives where they can be found and are effective as replacement materials. Meanwhile, the inevitable follow-on of the “clean up” of the coal fired power industry has also led to changing legislation. Many US States, for example, are responding to the national EA and public awareness and are now enforcing the clean-up of old stockpiles and lagoons where excess ash has been stored historically. The recovery of that portion of stockpiled ash, still reactive and suitable for the construction and cement industries, has become a real option provided the material quality and condition meets required standards at commercially viable costs while also meeting the cement/concrete industries drive around the world to become greener too. Radical technology options such as non-thermal drying can come into their own in the current marketplace, positively impacting both cost and clean technology benefits. The presentation will address how the Coomtech SMR (Surface Moisture Removal), a non-thermal technology, can play a significant part in this situation. It will address how Coomtech SMR can strategically fit in the marketplace alongside traditional processes of recovery and handling of ash, while creating financial and green benefits to the users over traditional thermal processing technologies.
Keywords: Ash, Thermal drying, Surface moisture removal
Chris Every is a Commercial Director with Coomtech Ltd, United Kingdom.

POTENTIAL DEVELOPMENT OF A PFA LANDFILL SITE
J Crankshaw
EP (UK) Investments
United Kingdom
ABSTRACT. Gale Common is a closed PFA disposal site located in North Yorkshire. The site received ash from both Ferrybridge C and Eggborough coal fired power stations for nearly 50 years. EPUKI are in the process of expanding current ash exports significantly by obtaining the relevant planning permissions from the local authority. The presentation will review the challenges and learning points from the planning application process. Keywords: PFA, Planning consent James Crankshaw is the Head of Engineering for EP (UK) Investments. Over the last 2 years his team have delivered successful planning consents for a 2,500MW CCGT power station in North Yorkshire (Development Consent Order), a 1,700MW CCGT power station in Norfolk (Section 36 variation) and a 640 ktpa Energy from Waste plant in North East Lincolnshire (Town and Country Planning Act).
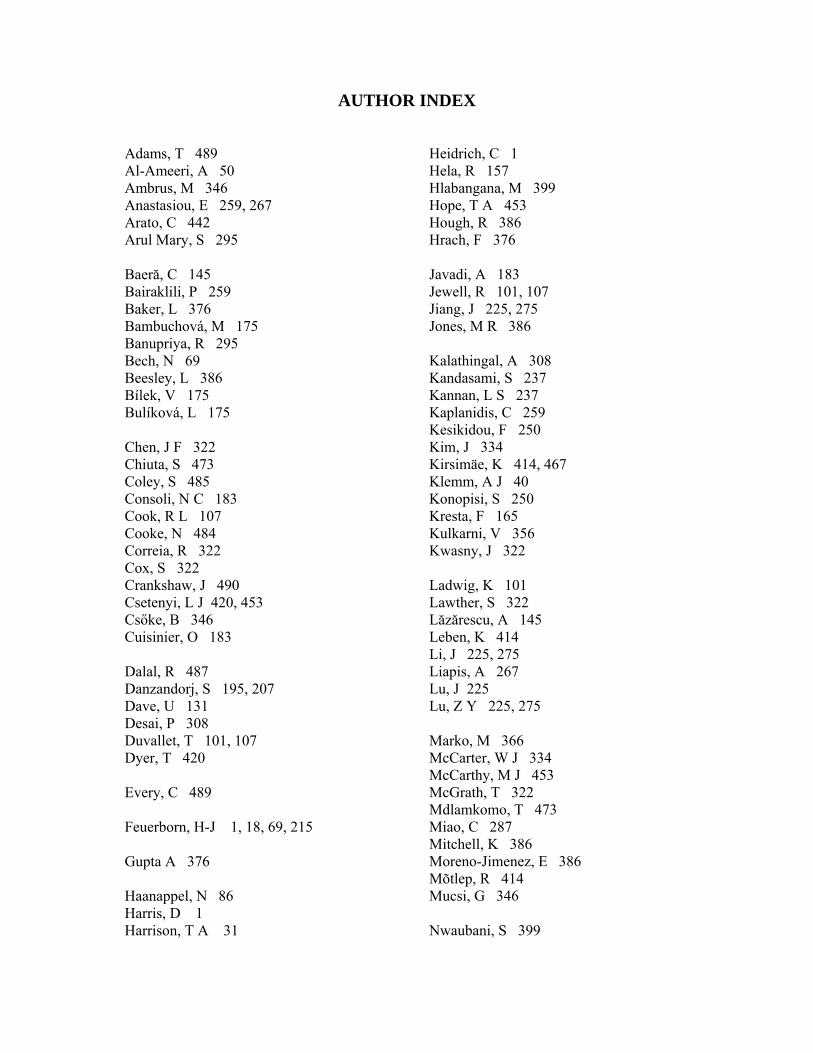
AUTHOR INDEX
Adams, T 489 Al-Ameeri, A 50 Ambrus, M 346 Anastasiou, E 259, 267 Arato, C 442 Arul Mary, S 295
Baeră, C 145 Bairaklili, P 259 Baker, L 376 Bambuchová, M 175 Banupriya, R 295 Bech, N 69 Beesley, L 386 Bílek, V 175 Bulíková, L 175
Chen, J F 322 Chiuta, S 473 Coley, S 485 Consoli, N C 183 Cook, R L 107 Cooke, N 484 Correia, R 322 Cox, S 322 Crankshaw, J 490 Csetenyi, L J 420, 453 Csőke, B 346 Cuisinier, O 183
Dalal, R 487 Danzandorj, S 195, 207 Dave, U 131 Desai, P 308 Duvallet, T 101, 107 Dyer, T 420
Every, C 489
Feuerborn, H-J 1, 18, 69, 215
Gupta A 376
Haanappel, N 86 Harris, D 1 Harrison, T A 31
Heidrich, C 1 Hela, R 157 Hlabangana, M 399 Hope, T A 453 Hough, R 386 Hrach, F 376
Javadi, A 183 Jewell, R 101, 107 Jiang, J 225, 275 Jones, M R 386
Kalathingal, A 308 Kandasami, S 237 Kannan, L S 237 Kaplanidis, C 259 Kesikidou, F 250 Kim, J 334 Kirsimäe, K 414, 467 Klemm, A J 40 Konopisi, S 250 Kresta, F 165 Kulkarni, V 356 Kwasny, J 322
Ladwig, K 101 Lawther, S 322 Lăzărescu, A 145 Leben, K 414 Li, J 225, 275 Liapis, A 267Lu, J 225 Lu, Z Y 225, 275
Marko, M 366 McCarter, W J 334 McCarthy, M J 453 McGrath, T 322 Mdlamkomo, T 473 Miao, C 287 Mitchell, K 386 Moreno-Jimenez, E 386 Mõtlep, R 414 Mucsi, G 346
Nwaubani, S 399

Oberlink, A 101, 107 Opravil, T 366 Osuska, L 157
Paaver, P 467 Paiste, P 467 Papachristoforou, M 259 Papayianni, I 250, 259, 267 Pareek, S 195, 207 Patel, D 131 Payne, K 473 Pešková, Š 115 Peterová, A 123, 137 Pořízka, J 366 Pulcová, K 137 Purev-Erdene, B-E 195, 207
Rafiq, M I 50 Rigg, A 485 Ring, L 107 Robl, T 101, 107 Rostami R 40 Russo, G 183 Růžička, P 115
Sambuunyam, S 195, 207 Sarabèr, A 69, 86, 215 Scobbie, K 420 Sha, W 322 Shaikh, M T A 308 She, W 287 Sheikh, V 486 Šídlová, M 115, 123, 137 Sifton, B 442 Skidmore, I 18 Škvára, F 115, 123, 137 Šmilauer, V 115 Snop, R 115, 123, 137 Sokolová, K 123 Šoukal, F 366 Soutsos, M 322 Soutter, W 473 Sovják R 115 Šulc, R 115, 123, 137 Suryanto, B 334 Szabó, R 346 Szilagyi, H 145
Ťažký, M 157 Thakkar, S 131
Thombare, R 195, 207 Trakal, L 386 Tsioulou, O 50 Turan, C 183
Umamaheshwaran, V 237
van Dijen, F 62 Vinai, R 183
Wiens, U 215
Yang, Y 275
Zheng, L 386 Zheng, Z 287 Zlatner, M 489
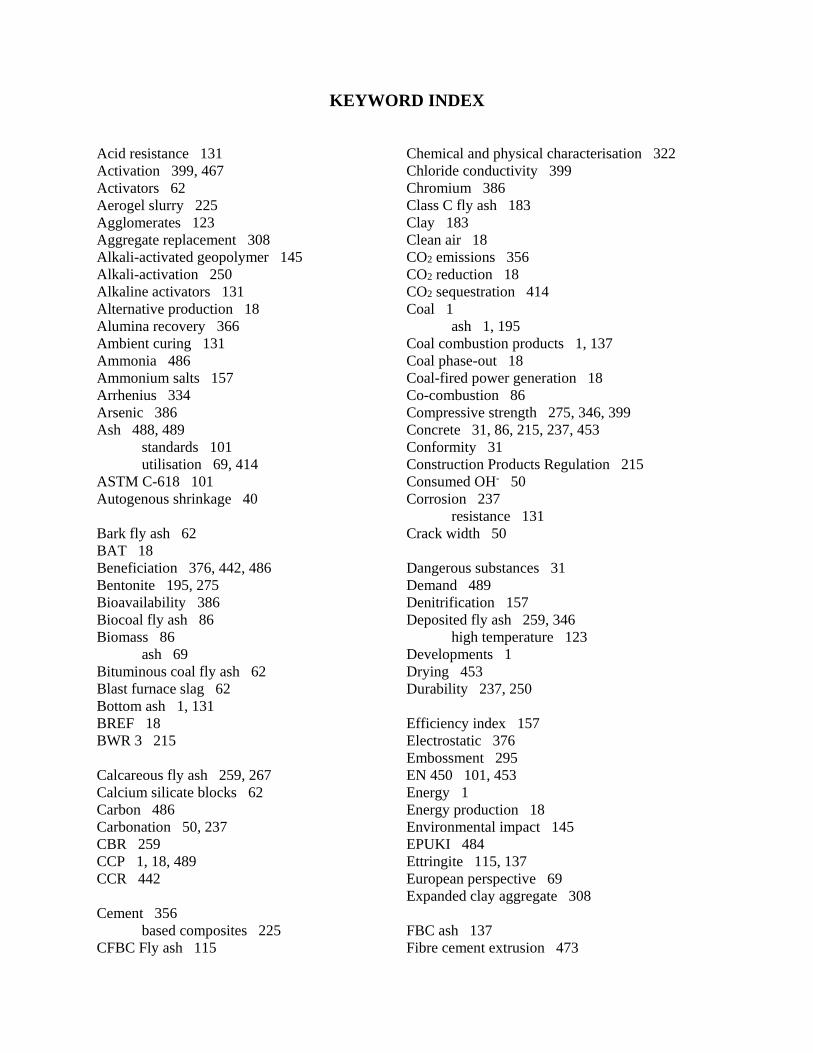
KEYWORD INDEX
Acid resistance 131 Activation 399, 467 Activators 62 Aerogel slurry 225 Agglomerates 123 Aggregate replacement 308 Alkali-activated geopolymer 145 Alkali-activation 250 Alkaline activators 131 Alternative production 18 Alumina recovery 366 Ambient curing 131 Ammonia 486 Ammonium salts 157 Arrhenius 334 Arsenic 386 Ash 488, 489
standards 101 utilisation 69, 414
ASTM C-618 101 Autogenous shrinkage 40
Bark fly ash 62 BAT 18 Beneficiation 376, 442, 486 Bentonite 195, 275 Bioavailability 386 Biocoal fly ash 86 Biomass 86
ash 69 Bituminous coal fly ash 62 Blast furnace slag 62 Bottom ash 1, 131 BREF 18 BWR 3 215
Calcareous fly ash 259, 267 Calcium silicate blocks 62 Carbon 486 Carbonation 50, 237 CBR 259 CCP 1, 18, 489 CCR 442
Cement 356 based composites 225
CFBC Fly ash 115
Chemical and physical characterisation 322 Chloride conductivity 399 Chromium 386 Class C fly ash 183 Clay 183 Clean air 18 CO2 emissions 356 CO2 reduction 18 CO2 sequestration 414 Coal 1
ash 1, 195 Coal combustion products 1, 137 Coal phase-out 18 Coal-fired power generation 18 Co-combustion 86 Compressive strength 275, 346, 399 Concrete 31, 86, 215, 237, 453 Conformity 31 Construction Products Regulation 215 Consumed OH- 50 Corrosion 237
resistance 131 Crack width 50
Dangerous substances 31 Demand 489 Denitrification 157 Deposited fly ash 259, 346
high temperature 123 Developments 1 Drying 453 Durability 237, 250
Efficiency index 157 Electrostatic 376 Embossment 295 EN 450 101, 453 Energy 1 Energy production 18 Environmental impact 145 EPUKI 484 Ettringite 115, 137 European perspective 69 Expanded clay aggregate 308
FBC ash 137 Fibre cement extrusion 473
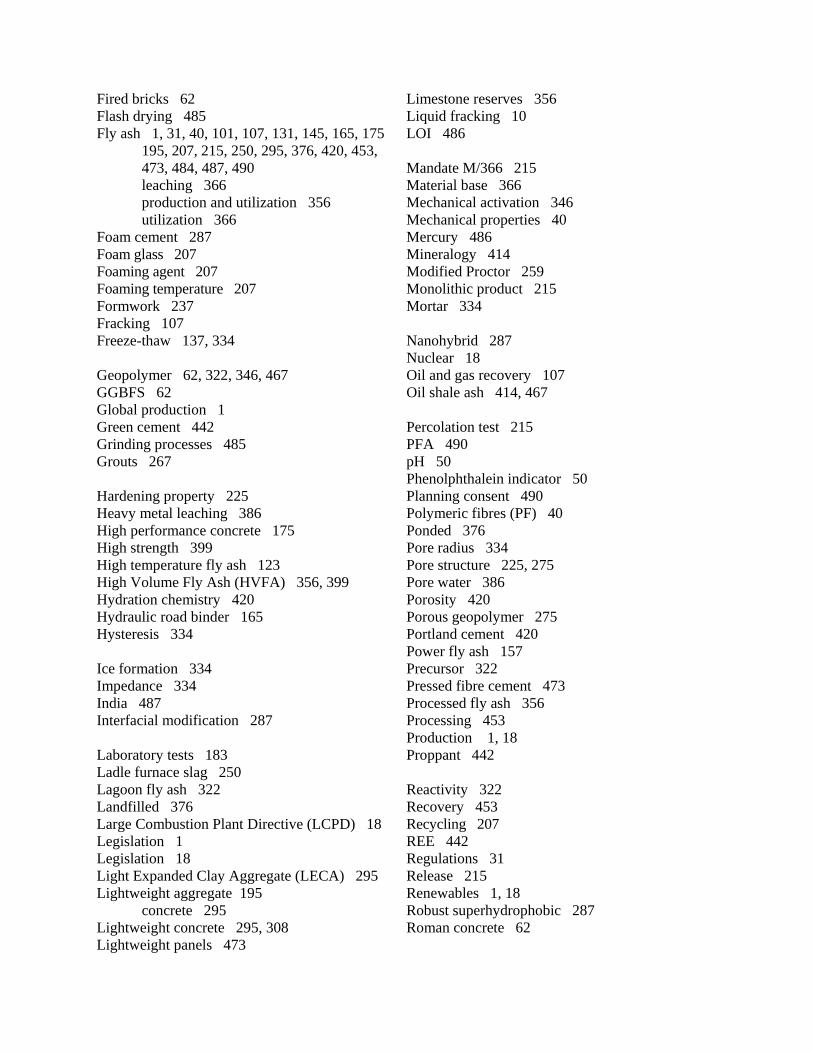
Fired bricks 62 Flash drying 485 Fly ash 1, 31, 40, 101, 107, 131, 145, 165, 175
195, 207, 215, 250, 295, 376, 420, 453, 473, 484, 487, 490 leaching 366 production and utilization 356 utilization 366
Foam cement 287 Foam glass 207 Foaming agent 207 Foaming temperature 207 Formwork 237 Fracking 107 Freeze-thaw 137, 334 Geopolymer 62, 322, 346, 467 GGBFS 62 Global production 1 Green cement 442 Grinding processes 485 Grouts 267 Hardening property 225 Heavy metal leaching 386 High performance concrete 175 High strength 399 High temperature fly ash 123 High Volume Fly Ash (HVFA) 356, 399 Hydration chemistry 420 Hydraulic road binder 165 Hysteresis 334 Ice formation 334 Impedance 334 India 487 Interfacial modification 287 Laboratory tests 183 Ladle furnace slag 250 Lagoon fly ash 322 Landfilled 376 Large Combustion Plant Directive (LCPD) 18 Legislation 1 Legislation 18 Light Expanded Clay Aggregate (LECA) 295 Lightweight aggregate 195
concrete 295 Lightweight concrete 295, 308 Lightweight panels 473
Limestone reserves 356 Liquid fracking 10 LOI 486 Mandate M/366 215 Material base 366 Mechanical activation 346 Mechanical properties 40 Mercury 486 Mineralogy 414 Modified Proctor 259 Monolithic product 215 Mortar 334 Nanohybrid 287 Nuclear 18 Oil and gas recovery 107 Oil shale ash 414, 467 Percolation test 215 PFA 490 pH 50 Phenolphthalein indicator 50 Planning consent 490 Polymeric fibres (PF) 40 Ponded 376 Pore radius 334 Pore structure 225, 275 Pore water 386 Porosity 420 Porous geopolymer 275 Portland cement 420 Power fly ash 157 Precursor 322 Pressed fibre cement 473 Processed fly ash 356 Processing 453 Production 1, 18 Proppant 442 Reactivity 322 Recovery 453 Recycling 207 REE 442 Regulations 31 Release 215 Renewables 1, 18 Robust superhydrophobic 287 Roman concrete 62
SC ash 137 Secondary raw material 366 Service life 237 Shotcrete 115 Silica fume 420 Sintered fly ash aggregates 356 Slurry walls 267 SNCR denitrification 165 SNCR treatment 175 Soil and ground water 215 Soil stabilization 183, 259 Solid heat carrier retorting ash 467 Sourcing 487 Specific gravity 195 Stable isotopes 414 Standardisation 18 Standards 1 Statue 237 Steel Concrete Composite Slab 295 Stockpile 123 Strength 115 Strength activity testing 101 Superabsorbent polymers (SAPs) 40 Surface moisture removal 489
Tank test 215 Ternary binder 115, 175, 420 Thermal conductivity 275 Thermal drying 489
Ultra-fine fly ash 399 Underpinning works 267 United Kingdom 484 USA 489 Use 18
Value 442 Value engineering 308 Viscosity 420
Waste 442 Waste glass 207 Water absorption 195 Wet storage 453 Wood 86 Wood ash 62, 386 Work safety 157
Zero emission 18 Zetland Building System 473