504870.pdf - King's Research Portal
254
This electronic thesis or dissertation has been downloaded from the King’s Research Portal at https://kclpure.kcl.ac.uk/portal/ Take down policy If you believe that this document breaches copyright please contact [email protected] providing details, and we will remove access to the work immediately and investigate your claim. END USER LICENCE AGREEMENT Unless another licence is stated on the immediately following page this work is licensed under a Creative Commons Attribution-NonCommercial-NoDerivatives 4.0 International licence. https://creativecommons.org/licenses/by-nc-nd/4.0/ You are free to copy, distribute and transmit the work Under the following conditions: Attribution: You must attribute the work in the manner specified by the author (but not in any way that suggests that they endorse you or your use of the work). Non Commercial: You may not use this work for commercial purposes. No Derivative Works - You may not alter, transform, or build upon this work. Any of these conditions can be waived if you receive permission from the author. Your fair dealings and other rights are in no way affected by the above. The copyright of this thesis rests with the author and no quotation from it or information derived from it may be published without proper acknowledgement. Cystinosis : the diagnosis and treatment Van't Hoff, W. G Download date: 24. Jan. 2022
-
Upload
khangminh22 -
Category
Documents
-
view
1 -
download
0
Transcript of 504870.pdf - King's Research Portal

This electronic thesis or dissertation has been
downloaded from the King’s Research Portal at
https://kclpure.kcl.ac.uk/portal/
Take down policy
If you believe that this document breaches copyright please contact [email protected] providing
details, and we will remove access to the work immediately and investigate your claim.
END USER LICENCE AGREEMENT
Unless another licence is stated on the immediately following page this work is licensed
under a Creative Commons Attribution-NonCommercial-NoDerivatives 4.0 International
licence. https://creativecommons.org/licenses/by-nc-nd/4.0/
You are free to copy, distribute and transmit the work
Under the following conditions:
Attribution: You must attribute the work in the manner specified by the author (but not in anyway that suggests that they endorse you or your use of the work).
Non Commercial: You may not use this work for commercial purposes.
No Derivative Works - You may not alter, transform, or build upon this work.
Any of these conditions can be waived if you receive permission from the author. Your fair dealings and
other rights are in no way affected by the above.
The copyright of this thesis rests with the author and no quotation from it or information derived from it
may be published without proper acknowledgement.
Cystinosis : the diagnosis and treatment
Van't Hoff, W. G
Download date: 24. Jan. 2022

Cystinosis: the diagnosis and treatment
Submission for MD thesis bY:
Dr William Gordon van't Hoff,
United Medical and Dental Schools
of Guy's and St Thomas's, Guy's Hospital.
pI
IV ONDON
IV UU
B'BL I L
nN

Abstmet
The use of a cystine binding protein assay to establish the diagnosis of cystinosis was investigated. The assay has a lower limit of detection of 0.0314mol/l, is linear to a
concentration of 1.5, umol/I and has a coefficient of variation of 1.7 and 15.0%
between 0.05 and 0.614mol/l. In 32 patients the mean ± SD pre-treatment leucocyte
cystine concentration was 5.78 ± 2.49 nmol 1/2 cystine per mg protein (controls 0.10
± 0.05). The median polymorphonuclear leucocyte cystine concentration in a group
of 24 obligate heterozygotes was 0.55 (range 0.23 - 1.79) nmol 1/2 cystine per mg
protein (controls 0.10, range 0.04 - 0.38).
The effects of single doses of phosphocysteamine solution, rectal cysteamine gel, intravenous cysteamine and a cysteamine capsule were studied in 10 patients with
cystinosis. No significant diurnal variation in leucocyte cystine was found. Compared
with the intravenous dose, cysteamine was poorly absorbed from rectal gel (21 %
bioavailability) but well absorbed after administration of either oral
phosphocysteamine solution (73% bioavaflability) or a cysteamine capsule (50%
bioavailability). oral phosphocysteamine (10mg/kg cysteamine base), intravenous
cysteamine (5mg/kg) and cysteamine capsule (15mg/kg) significantly reduced the
mean leucocyte cystine with maximal depletion 1-3 hours after the dose. At 12 hours
the mean leucocyte cystine was significantly lower than the pre-treatment level in each
of these studies. Rectal cysteamine did not significantly reduce the mean leucocyte
cystine concentration. In conclusion, phosphocysteamine suspension may be
administered 12 hourly. Rectal cysteamine administration is feasible but higher doses
are required before efficacy can be judged. A cysteamine capsule may prove to be a
viable alternative to oral phosphocysteamine.
59 patients have received cysteamine and/or phosphocysteamine in the UK up to May 1990. In the 44 pre-transplant patients, cysteamine did not prevent a decline in
glomerular renal function but a normal growth rate was maintained. The inability to demonstrate a significant reduction in leucocyte cystine concentrations suggests that monitoring of therapy needs to be improved.
P2

Errata
Page 32: MgCL should be MgC12,
Page 33: Units of hexosaminidase activity should be per minute per unit
hexosaminidase. Page 103: Structures of cystine and cysteine are incorrect. See page 25 for correct
versions. Page 108: Units for PRCIO should be (mg/dl)-'. Page 115: Data are shown as mean ± SEM. Page 120: Figure 6.1 refers to data from 34 patients (and not 36 as stated).
The regression equation should read: y= -0.0018x + 0.019.
Page 137: A blood sample was taken at 20.00h and not 22.00h as stated. Page 187: Duration of therapy was incorrectly calculated in one patient, giving the
impression that she started therapy at 9 months. This does not affect the
statistical analysis. Page 192: The data for PMN leucocyte cystine concentrations are not normally
distributed and should be log transformed. The means for the log
transformed PMN cystines in the normal controls and obligate heterozygotes are 0.13 and 0.57nmol 1/2 cys/mg protein respectively.

Table of Contents
Abstract .................................., **, *, P2
Table of Contents ...................................... P3
List of tables ................................... ***... P 12
List of rigures ................................ *,, **p
Acknowledgments ..................................... p 18
Chapter 1: Introduction ................................. P 21
Chapter 2: Biochemical aspects of cystinosis .................... P 24
Description of cystine ............................... P 24
Chemistry ...................................... P 25
Metabolism of cysteine .............................. P 25
Synthesis: trans-sulphuration pathway ................. P 25
Dezradation ................................. P 26
Conversion to cystine ........................... P 26
Metabolic defect in cystinosis .......................... P 26
Cystine metabolism ............................ P 26
Site of cystine accumulation ....................... P 27
Plasma cystine concentrations ...................... P 27
Intracellular cystine concentrations ................... P 27
Morphological evidence of cystine compartmentalisation ..... P 28
Source of cystine ................... 6. *. 0*-- P 28
Studies of lysosomal transport ................ 0... P 29
Demonstration of a defect in lysosomal cystine transport ..... P 30
Specificity of lysosomal cystine counter-transport .......... P 31
P3

Lysosomal cystine concentrations and transport in the variant
forms of cystinosis ........................ P 32
Further characterisation of lysosomal cystine transport ....... P 33
Other species ........................... P 33
1. Mouse ......................... P 33
2. Bacteria ........................ P 34
3. Yeast .......................... P 34
The effect of altered incubation temperature on cystine transport
in vitro ............................... P 35
Cystine accumulation and transport in other lysosomal diseases . P 35
The Renal Fanconi Syndrome .......................... P 37
Pathogenesis of the Fanconi syndrome ................ P 37
Mechanisms of cystine toxicity in cystinosis ............. P 38
Chapter 3: The determination of cystine and cysteamine ............ P 40
The determination of cystine in biological samples .............. P 40
Introduction ................................. P 40
Studies on the measurement of cystine ................ P 42
1. Lower limit of detection ................... P 42
2. Linearity ............................ P 42
3. Specificity ........................... P 44
4. Coefficient of variation .................... P 46
a. Cysfine binding protein assay ........... P 46
Protein assay ......... b P 46 ............ .
c. -Mixed leucocyte cystine preparation ....... P 46
d. Polymorphonuclear leucocyte cystine
re aration P 47 p .................... p 5. Comparison of two different forms of leucocyte pellet
..................... preparation P 47 ...
6. Composition of mixed and polymorphonuclear leucocyte pellets ..................... P 49
7. Effect of storage of the blood sample on leucocyte
cystine concentration .................. P 50
Discussion of determination of leucocyte cystine concentration .. P 53
P4

Determination of plasma cysteamine ...................... P 55
Introduction ................................. P 55
Studies on the measurement of plasma cysteamine ......... P 55
1. Recovery of cysteamine following reduction ....... P 55
2. Determination of the optimal worldng and screen
potentials ......................... P 56
3. Lower limit of detection, linearity and coefficient of
variation .......................... P 60
Discussion of determination of plasma cysteamine ......... P 60
Chapter 4: Clinical features of cystinosis ....................... P 63
Introduction ..................................... P 63
Historical perspective ............................... P 63
Presentation of early-onset (infantile) cystinosis ............... P 65
Symptoms .................................. P 65
Examination ................................ P 66
Skeletal changes ..................... 0.0...... P 67
Ocular manifestations .. o........................ P 67
Plasma and urine biochemistry ...... o.............. P 68
Urine ................................ P 68
Blood ................................ P 68
Glomerular filtration rate at diagnosis ................. P 69
Metabolic bone disease and mineral homeostasis .......... P 70
Haematology ................. o .............. P 71
Thyroid function- tests ................ 0.000.00. P 71
Urinary excretion of low molecular weight proteins ........ P 71
U i iti i P 73 r nary carn ne excret on .................... 0.. C fi i f th di i P 73 on rmat on o e agnos s ............ o.............
Pre-symptomatic diagnosis ........................ P 75
Clinical course and longterm manifestations of cystinosis .......... P 76
Introduction ................................. P 76
Kidney .................................... P 76
Change in glomerular filtration rate .............. P 76 Renal histology ...... o................... P 78
P5

Other factors leading to deterioration in renal function P 78
.......... Growth P 79 .........................
Endocrine function in cystinosis .................... P 83
1. Thyroid ............................. P 83
2. Growth hormone ....................... P 83
3. Pancreas ............................ P 86
4. Gonadotrophins, puberty and pregnancy ......... P 86
Neurological manifestations ....................... P 87
Longterm ocular manifestations ..................... P 88
Gastrointestinal and hepatic manifestations .............. P 89
Miscellaneous findings .......................... P 89
Late-onset cystinosis ................................ P 90
Chapter 5: The treatment of cystinosis ........................ P 92
Introduction and historical perspective ..................... P 92
General measures in the management of cystinosis .............. P 93
........... Introduction P 93 .... o .................
id th Fl P 94 erapy ................................ u Correction of acidosis and electrolyte disturbance ..... o.. P 94
Treatment of hypophosphataernia and rickets ............. P 95
Other thera ies P 96 ........................... 09.. 0.00 p
.......... Use of thiazide diuretics and indomethacin P 96 ....
Carnitine thera P 97 py .......... o.................. Hormone replacement in cystinosis .......................
P 97
i P 97 ne ............................ 0*0. 1. Thyrox
Insulin 2 P 97 .................................. .
Growth Hormone 3 P 97 ........................... . .
i if h S P 99 es ................................. pec ic t erap . Dietary thera 1 P 99 py ........................ 0.0. . *
............... o....... .. . 2. Drug therapy .P 1W . . .
......... .. Penicillamine .P 100 . ..............
............ Dithiothreitol . .P 100 ...... .......
.............. Ascorbic acid .... .P 101 ...... ..
Other agents used to deplete cystine ............ .P 101
P6

Renal transplantation ................................ P 102
The use of cysteamine and phosphocysteamine ................ P 103
Introduction ................................. P 103
The occurrence of cysteamine in the body .............. P 103
Mechanism of action of cysteamine .................. P 104
Phosphocysteamine ............................ P 105
Clinical studies ............................... P 106
Use of cysteamine and phosphocysteamine in pre-symptomatic patients ...............................
P 111
Adverse effects of cysteamine ...................... P 112
Hyperphosphataemia ....................... P 114
Other effects of cysteamine ....................... P 114
Further developments in cysteamine therapy ............. P 116
Chapter 6: Experience with cysteamine in the UK and Eire .......... P 117
Introduction ..................................... P 117
Methods .......................................
P 117
Patients ................................... P 117
Data collection ............................... P 117
Data analysis ................................ P 118
Results ........................................ P 118
Patients ................................... P 118
Other medical history and medication ................. P 120
Cysteamine and phosphocysteamine treatment ............ P 122
Adverse events and discontinuation of treatment ........... P 124
Efficacy ................................... P 126
Renal function ........................... P 126
Growth ............................... P 126
Leucocyte cystine concentrations ............... P 131
Discussion ...................................... P 132
Chapter 7: The pharmacokinetics of cysteamine and phosphocysteamine .. P 135
Introduction ..................................... P 135
Methods ....................................... P 135
P7

Patients ................................... P 135
St d P t l P 136 u y ro oco s.................... .......... Blood sampling ..................... ..........
P 136
.. Pharmacokinetic and statistical methods .......... P 136
.... A study of the effects of a single oral dose of phosphocysteamine
l i P 137 on ......................... so ut .......... Pilot study ........................ ..........
P 137
Methods .................... .......... P 137
Results ....... P 137
..................... ... Discussion .......
P 140 ................... ...
Conclusions .................. .......... P 140
Methods ........................ ........... P 141
Results ......................... ........... P 141
Drug administration and adverse effects . .......... P 141
Diurnal variation in leucocyte cystine ............. P 141
Plasma cysteamine concentrations ............... P 141
Leucocyte cystine concentrations ............... P 145
Pharmacoldnefic parameters ....... ........... P 145
. Discussion ........... P 148
...................... A study of the effects of rectal cystearnine gel ..... ...........
P 149
t d tion I P 149 ...................... ro n uc ...........
Methods .......... P 149
........................ . Rectal administration and sampling times ..........
P 149
Results .......... P 150
......................... . Plasma cysteamine concentrations .. 0.00000.0P
150 .... Leucocyte cystine concentrations ...........
P 150 ....
Pharmacoldnetic parameters ...... *0. P 150 . ....... . Discussion .......
P 155 ....................... ....
A trial of longterm rectal cysteamine ...... ........... P 156
A trial of a new formulation of cysteamine in capsules ........... P 158
i I d P 158 on ..................... uct ntro ............ Methods ........ P 159
....................... .... Patients ........ P 159
................... .... Blood sampling .............. ............ P 159
P8

Results .................................... P 159
Plasma cysteamine concentraflons ............... P 159
Leucocyte cystine concentrations ............... P 159
Pharmacokinetic parameters .................. P 164
Discussion .................................. P 164
A study of the effects of a single dose of intravenous cysteamine ..... p 165
Introduction ................................. P 165
Pilot study .................................. P 166
Methods .............................. P 166
Results ............................... P 167
Methods ................................... P 170
Patients ............................... P 170
Blood sampling .......................... P 170
Results .................................... P 170
Plasma cysteamine concentrations ............... P 170
Leucocyte cystine concentrations ............... P 170
Pharmacokinetic parameters .................. P 175
Discussion .................................. P 175
Discussion of the pharmacokinetics of cystearnine and
phosphocysteamine ............................ P 176
Chapter 8: Personal experience and recommendations for treatment ..... P 183
Management of newly-diagnosed child ..................... P 183
Clinical use of cysteamine and phosphocysteamine .............. P 185
Introduction ................................. P 185
Dosage and frequency of administration ................ P 185
Monitoring of leucocyte cystine concentrations ........... P 186
Care of the cystinosis patient in the outpatient clinic ............ P 188
Treatment during dialysis and after renal transplantation .......... P 189
Chapter 9: The genetics of cystinosis ......................... P 190
Incidence ....................................... p 190 Gene frequency ................................... P 191 Sex mtio ....................................... p 191
p9

Inheritance ...................................... p 191
Heterozygote diagnosis ................... ........... P 192
Prenatal diagnosis ...................... ........... P 196
The cystinosis gene ...................... ........... P 198
Introduction ...................... ........... P 198
Strategy for determining the location ...... ........... P 198
Methods ........................ ........... P 201
Clinical material .............. ........... P 201
Heterozygote determination ........ ........... P 201
Linkage studies ............... ........... P 201
Interim Results ................... ........ o. P 202
Chapter 10: Conclusions ............................ *,, **P 203
Diagnosis and therapeutic monitoring ...................... P 203
Use of cysteamine and phosphocystearnine .................. P 204
Growth in children with cystinosis ....................... P 205
Genetics of cystinosis ............................... P 206
References .......................................... P 207
Appendix 1: Analytical methods ...................... ,, *... P 230
Mixed leucocyte cell pellet preparation ..................... P 230
Chemicals .................................. P 230
Procedure .................................. P 230
Polymorphonuclear leucocyte cell pellet preparation ............. P 232
......... Chemicals P 232 .........................
........ Procedure P 232 ..........................
Blood sampling .......................... P 233
Gradient preparation ....................... P 233
......... P 233 Cell wash .....................
Hypotonic red cell lysis ..................... P 233
........... Cell wash .P 234 ..................
Polymorphonuclear leucocyte cell lysis ............ P 234
Determination of cystine in cultured cells and tissue specimens ...... P 235
P 10

Chemicals .................................. P 235
Procedure .................................. P 235
Preparation of the sample for determination of the cystine and protein
contents ................................... P 236
Chemicals ................................. P 236
Method ................................... P 236
Determination of the protein concentration .................. P 237
Introduction ................................. P 237
Chemicals .................................. P 237
Methods ................................... P 237
Determination of the cystine concentration using the cystine binding
protein assay ................................ P 240
Chemicals .................................. P 240
CYstine binding protein "cocktail .................... P 240
Cystine standards ............................. P 241
Methods ................................... P 242
Calculation of the leucocyte cystine concentrations ......... P 244
Appendix 2: Determination of plasma cysteamine ................. P 245
Reduction of plasma cystearnine ......................... P 245
Chemicals .................................. P 245
Methods ................................... P 245
Preparation of mobile phase for high pressure liquid chromatography .. P 246
Chemicals .................................. P 246
Methods ................................... P 246
High pressure liquid chromatography ...................... P 246
Principles of electrochemical detection ................ P 246
Procedure .................................. P 248
Appendix 3: Cystinosis pedigrees ............................ P 249
P11

List of tables
Chapter 2: Biochemical aspects of cystinosis
Table 2.1: Causes of the Renal Fanconi Syndrome
Chapter 3: The determination of eystine and cysteamine
Table 3.1: Specificity of cystine binding protein Table 3.2: Coefficient of variation of cystine binding protein assay Table 3.3: Coefficient of variation of the determination of mixed leucocyte cystine
concentration Table 3.4: Composition of mixed and polymorphonuclear leucocyte pellets Table 3.5: Comparison of mixed and polymorphonuclear leucocyte cystine
concentrations Table 3.6: Effect of storage of blood sample for 4 hours on leucocyte cystine
concentration Table 3.7: Effect of storage of blood sample for 24 and 48 hours on leucocyte
cystine concentration Table 3.8: Recovery of cysteamine following reduction Table 3.9: Coefficient of variation of cysteamine assay
Chapter 4: Ctinical features of cystinosis
Table 4.1: Glomerular filtration rate in newly-diagnosed patients Table 4.2: Urinary excretion of low molecular weight proteins in newly-diagnosed
patients Table 4.3: Tissue cystine concentrations
Chapter 5: The treatment of eystinosis
Table S. 1: Results of US collaborative cysteamine study, 1987 Table 5.2: Results of NIH experience of cystearnine, 1993
P 12

Chapter 6: Experience with cysteamine in the UK and Eire
Table 6.1: Patient details
Table 6.2: Duration of cysteamine treatment
Table 6.3: Adverse events Table 6.4: Data on leucocyte cystine concentrations
Chapter 7: The pharmacokinetics of cysteamine and phosphocysteamine
Table 7.1: Patient details
Table 7.2: Pharmacokinetic parameters for oral phosphocystearnine solution Table 7.3: Pharmacokinetic parameters for rectal cysteamine gel Table 7.5: Pharmacokinetic parameters for oral cysteamine capsule Table 7.6: Pharmacokinetic parameters for intravenous cysteamine Table 7.7: Summary of pharmacokinetic, parameters Table 7.8: Bioavailability of cysteamine and phosphocysteamine
Chapter 8: Personal experience and recommendations for treatment
Table 8.1: Doses of electrolyte and vitamin D supplements Table 8.2: Summary of leucocyte cystine concentrations during cysteamine
treatment
Chapter 9: The genetics of cystinosis
Table 9.1: Incidence of cystinosis in Europe Table 9.2: Polymorphonuclear leucocyte cystine concentrations in obligate
heterozygotes and normal individuals Table 9.3: Effect of a "cut-off" value of 0.28nmol 1/2 cystine per mg
protein on the results of the heterozygote assay Table 9.4: Prenatal diagnosis results from Smith et al. Table 9.5: Prenatal diagnosis results from Guy's Hospital Table 9.6: Consanguinous and multiple affected families
P 13

Table 9.7: Logarithm of the odds (LOD) scores and number of meioses for
pedigrees A, B and C
Appx 1: Analytical methods
Table A l: Dilution of cystine binding protein Table A2: Composition of cystine standards
P 14

List of figures
Chapter 3: The determination of cystine and eysteamine Figure 3.1: Cystine standard curve Figure 3.2: Saturation of cystine binding protein Figure 3.3: Comparison of two methods of leucocyte pellet preparation on
cystine concentration (units: nmol 1/2 cystine/mg protein) Figure 3A Effect of storage of blood sample for 24 and 48 hours on
leucocyte cystine concentration Figure 3.5: Hydrodynamic voltammogram, Figure 3.6: Effect of increasing working potential on background current Figure 3.7: Effect of screen potential on peak response Figure 3.8: Cysteamine standard curve
Chapter 4: CHnical features of eystinosis Figure 4.1: Mixed leucocyte cystine concentrations in patients and controls Figure 4.2: Growth of 5 pre-transplant boys at Guy's Hospital Figure 4.3: Growth of 4 pre-transplant girls at Guy's Hospital Figure 4.4: Height standard deviation scores for 9 pre-transplant children at Guy's
Hospital
Figure 4.5: Overnight growth hormone secretion in 4 pre-pubertal children (study
commenced at 20.00h)
Figure 4.6: Growth hormone secretion after an arginine infusion (0 - 30mins)
Chapter 5: The treatment of cystinosis Figure 5.1: Effect of a single dose of phosphocysteamine on plasma phosphate
concentration
Chapter 6: Experience with cysteamine in the UK and Eire Figure 6.1: Cross sectional analysis of reciprocal plasma creatinine concentration at
start of treatment vs. age Figure 6.2: Duration of treatment Figure 6.3: Change in plasma creatinine concentration in 31 pre-transplant patients
receiving cystearnine (hatched area shows "untreated" controls)
P 15

Figure 6.4: Height standard deviation scores in 34 pre-transplant patients receiving
cysteamine Figure 6.5: Growth of 17 pre-transplant boys receiving cysteamine Figure 6.6: Growth of 17 pre-transplant girls receiving cysteamine
Chapter 7: The pharmacokinetics of cysteamine and phosphocysteamine Figure 7.1: Plasma cysteamine concentrations after a single oral dose of
cystearnine solution (20mg/kg) in Pt. 8
Figure 7.2: Leucocyte cystine concentrations before and after a single oral dose of
cystearnine solution (20mg/kg, given at 24h) in Pt. 8
Figure 7.3: Diurnal variation in leucocyte cystine concentrations Figure 7.4: Individual plasma cysteamine concentrations after a single dose of oral
phosphocystearnine solution (10mg/kg cystearnine base)
Figure 7.5: Mean plasma cysteamine concentrations after a single dose of oral
phosphocystearnine solution (10mg/kg cystearnine base)
Figure 7.6: Individual leucocyte cystine concentrations after a single dose of oral
phosphocysteamine solution (10mg/kg cysteamine base) Figure 7.7: Mean leucocyte cystine concentrations after a single dose of oral
phosphocystearnine solution (10mg/kg cystearnine base)
Figure 7.8: Individual plasma cysteamine concentrations after a single dose of rectal
cysteamine gel (10mg/kg cysteamine base)
Figure 7.9: Mean plasma cysteamine concentrations after a single dose of rectal
cysteamine gel (10mg/kg cysteamine base) Figure 7.10: Individual leucocyte cystine concentrations after a single dose of rectal
cysteamine gel (10mg/kg cysteamine base) Figure 7.11: Mean leucocyte cystine concentrations after a single dose of rectal
cysteamine gel (10mg/kg cysteamine base) Figure 7.12: Longterm rectal cysteamine therapy in 3 patients Figure 7.13: Individual plasma cysteamine concentrations after a single dose of
cysteamine capsules (15mg/kg cysteamine base) Figure 7.14: Mean plasma cysteamine concentrations after a single dose of
cysteamine capsules (15mg/kg cysteamine base) Figure 7.15: Individual leucocyte cystine concentrations after a single dose of
cysteamine capsules (15mg/kg cysteamine base)
P 16

Figure 7.16: Mean leucocyte cystine concentrations after a single dose of cysteamine
capsules (15mg/kg cysteamine base) Figure 7.17: Plasma cysteamine concentrations after an intravenous infusion of
cystearnine (2.5mg/kg cystearnine base) in Pt. 5
Figure 7.18: Leucocyte cystine concentrations after an intravenous infusion of
cystearnine ( . 5mg/kg cystearnine base) in Pt. 5 Figure 7.19: Individual plasma cysteamine concentrations after an intravenous
infusion of cystearnine (5mg/kg cystearnine base)
Figure 7.20: Mean plasma cysteamine concentrations after an intravenous infusion of
cysteamine (5mg/kg cysteamine base)
Figure 7.21: Individual leucocyte cystine concentrations after an intravenous infusion
of cysteamine (5mg/kg cysteamine base)
Figure 7.22: Mean leucocyte cystine concentrations after an intravenous infusion of
cysteamine (5mg/kg cysteamine base) Figure 7.23: Effects of different formulations and doses of cysteamine on leucocyte
cystine concentration
Chapter 8: Personal experience and recommendations for treatment Figure 8.1: Effect of longterm cysteamine therapy on leucocyte cystine
concentration
Chapter 9: The genetics of cystinosis Figure 9.1: Polymorphonuclear leucocyte cystine concentrations in obligate
heterozygotes and controls Figure 9.2: Probability density curves derived from PMN cystine distributions in
controls and heterozygotes
P 17

Acknowledgments
I am indebted to Professor Cyril Chantler, Principal of the United Medical and Dental
Schools of Guy's and St Thomas's, who saw a need to pursue research in cystinosis
and appointed me to work in this field. During this time I was employed as a Lecturer
in Paediatrics at Guy's Hospital and I am therefore also indebted to the trustees of
Children Nationwide Medical Research for endowing the post. I am grateful to
Professor George Haycock, Professor of Paediatrics at Guy's Hospital, for his support
and help.
The laboratory work was undertaken in the Children Nationwide Kidney Research
Laboratory at Guy's Hospital, under the supervision of Dr. Neil Dalton, Senior
Lecturer in Paediatric Biochemistry. I am enormously grateful to him for his help,
inspiration and support. Ms. Tina Baker was employed as a medical laboratory
scientific officer to support the research. She was responsible for all the assays of
tubular proteins and for assistance with the determination of leucocyte cystine and
plasma cysteamine concentrations. I am very grateful to her for her superb work and
to the National Kidney Research Fund and the Research Trust for Metabolic Diseases
in Children who contributed towards her salary. I am grateful to Mr. Charles Turner,
Senior Biochemist, for his technical assistance. The cystinosis clinic at Guy's Hospital
is organised by Sister Moira Clarke and supervised by Dr. Sue Rigden. I am grateful
to them for their tremendous help. Ms. Leonie Duke, paediatric pharmacist at Guy's
Hospital, has provided enormous assistance with the provision of cysteamine in
different formulations and Dr. Steven Smith, research pharmacist, has also helped in
this work. The clinical studies were undertaken on Dickens Ward at Guy's Hospital
and I am grateful to the nursing staff for allowing me to use beds on their ward. I
would like to thank Dr. Joanne Lim and Ms. Fiona Arnold who assisted me with
some of the blood sampling in two of the studies. I am grateful to Dr Paul Tomlinson,
Consultant Paediatrician, who as a research fellow in the Department of Paediatrics at
Guy's Hospital, undertook research into tubular proteinuria and thus stimulated and
established the basis for my interest in this field.
I am very grateful to Dr. Malcolm Coulthard for establishing a research interest in
pharmaceutical formulation of cysteamine capsules, principally at the University of
P 18

Sunderland. Ms. Fiona Dixon, Dr. Geoff Rowley and Mr. Ian Sharkey have all
participated in this research and I am grateful to them for asking for my assistance in
developing and testing the capsule.
The leucocyte cystine assay used in this project was developed by Professor Jerry
Schneider's research group in University of California, San Diego. During a visit to
Europe in 1988, he spent one month at Guy's Hospital introducing the methods to us. Since then he has been a constant source of information, expertise and guidance. I am
also very grateful to him for inviting me to visit his department in 1990 and 1993 and
for asking me to undertake the review of the UK experience of cysteamine. That study
was supported by Warner-Lambert Pharmaceuticals who, at that time, had an interest
in applying for a license to produce cysteamine under the United States Food and Drug Administration Orphan Drug Program. I received further advice in that project from Drs. Bill Gahl, National Institutes of Health, Bethesda and Jess Thoene,
University of Michigan, Ann Arbor.
I am also grateful to Dr. Gahl for collaborating in the study to find the location of the
gene for cystinosis. I am grateful to the Medical Research Council for supporting this
study over a three year period. Their sponsorship has enabled us to employ Dr.
Margaret Town to undertake the DNA laboratory work under the guidance of Dr. Chris Mathew and Professor Martin Bobrow, Division of Medical and Molecular
Genetics, United Medical and Dental Schools of Guy's and St Thomas's, at Guy's
Hospital.
Many paediatric nephrologists throughout the UK have contributed data and provided help for the research (especially during the review of the UK experience of cysteamine). Collectively, the British Association of Paediatric Nephrologists has
given enormous support. In particular, however, I wish to pay tribute to the late Dr. Michael Winterborn. At the Children's Hospital in Birmingham, he established a particular expertise in the use of cysteamine and phosphocysteamine and thus gathered a large group of cystinosis patients. He made an enormous contribution to the care of children with cystinosis and to our research. Dr Anne Green, Director of Clinical Chemistry at the Children's Hospital, Birmingham, Icindly allowed me to visit and use their facilities. I am grateful to Professors Cyril Chantler and Jerry Schneider and to
p 19

Dr. Jane Collins all of whom carefully reviewed and criticised this thesis.
My greatest thanks are due to the children and parents who participated in this
research. Many gave up weekends and endured discomfort and inconvenience to take
part in the work. I hope that the results of these studies contribute towards an improvement in care both for themselves and for other children with cystinosis.
P 20

Chapter 1: Introduction
Cystinosis is a rare metabolic disorder inherited in an autosomal recessive manner. It
causes renal dysfunction and growth failure in early childhood. The underlying biochemical abnormality is a defect in lysosomal cystine transport which leads to
intracellular cystine accumulation. The proximal renal tubule appears to be
particularly sensitive to cystine toxicity.
Children present with features of the renal Fanconi syndrome (polyuria, polydipsia,
poor growth and rickets). Without specific treatment, patients progress into end-stage
renal failure by the end of the first decade of life. With the advent of successful renal
transplantation, patients are now able to survive into adulthood. However, although
the donor kidney does not develop features of cystinosis, widespread cystine
accumulation in other organs leads to multisystem disease. Thus older transplanted
patients can develop endocrine, visual and neurological dysfunction. Despite
transplantation, growth continues to be poor and short stature is universal in adults.
Cystinosis has an approximate incidence of 1/175,000 births in Europe but there
remain cases who are not diagnosed until after their death. Older methods of diagnosis
relied on the demonstration of cystine crystals in biopsy specimens. This invasive and
specialised procedure meant that confirmation of the diagnosis was difficult and
restricted to centres of excellence. In the 1960's Schneider et al. demonstrated that the
cystine content of leucocytes was increased in children with cystinosis (Schneider et
al., 1967). Determination of the leucocyte cystine concentration became the most convenient biochemical method- of diagnosis. In the UK, leucocyte cystine concentrations have traditionally been measured on an amino acid analyzer. However
this method is relatively slow, insensitive and expensive. Oshima et al. described an
assay for measuring cystine in a variety of biological specimens, utilising a specific bacterial cystine, binding protein (Oshima et al., 1974). This method was in
widespread use in North America but there was no clinical experience of the technique in the United Kingdom. Thus the first step in this research project on cystinosis was to set up and further characterise this assay. Once in place, cystine levels were determined in leucocytes, chorion villous samples, amniocytes and tissue samples. Determination of the cystine content of a purified polymorphonuclear leucocyte pellet
P 21

led to the ability to distinguish heterozygotes for cystinosis from normal individuals
(Smolin et al., 1987).
The treatment of cystinosis involves replacement of fluid and electrolyte losses, good
nutrition and vitamin D supplements. The discovery of cysteamine, an agent that
depletes cystine both in vitro and in vivo, led to a new era in the management of the
condition. Cysteamine acts by reacting with cystine to form a mixed disulphide which is transported out of the lYsosome. Cysteamine treatment slows the progression of
renal glomerular disease and improves growth. However, the drug has a foul taste,
frequently causes nausea & vomiting and leads to the unpleasant smell of free
sulphides on the breath. Despite the use of cysteamine and its pro-drug,
phosphocysteamine, for over 14 years, the pharmacokinetics and pharmacodynamics
of the drugs have not been reported. The second aim of this project was to undertake
such studies in an effort to improve the efficacy and tolerability of these compounds.
As part of this investigation, new routes and formulations of the drug were studied.
A postal survey of paediatric nephrologists in the UK revealed that there are
approximately 80 patients with cysfinosis in this country. Many of these have received
cysteamine in the last 14 years but there has been no formal review of the efficacy of their therapy. A retrospective study of the experience of cysteamine treatment in the
UK was therefore undertaken. These data have formed part of an application by North
American paediatricians to the United States Government Food and Drug Administration to produce cysteamine under the Orphan Drug Program.
Although cysteamine has made-a ma or impact on the course of cystinosis, a greater understanding of the molecular basis of the condition is still required. The site of the
cystinosis gene is not known, indeed there is not yet chromosomal localisation. There is marked clinical heterogeneity in cystinosis. In addition, there are rarer late-onset
and adult (benign) forms of the disorder. Identification of the gene will lead to a better understanding of the pathogenesis of cystinosis and mutation analysis will help
to explain the heterogeneity of patients. Ultimately there will be the prospect of gene therapy.
The search for the cystinosis gene is a major undertaking. The first steps have been
P 22

addressed in this project. Other groups have tried to isolate the human cystine binding
protein. These efforts have, so far, been unsuccessful. A group has therefore been
established at Guy's Hospital to undertake a search of every autosome to look for
linkage between markers and the cystinosis gene. A reliable method of determining
heterozygote status greatly increases the linkage content of each family.. A number of highly informative families in the UK, with 2 affected children and/or consanguinity, have been studied.
P 23

Chapter 2: Biochemical aspects of cystinosis
Description of cystine The first description of cystine was made by William Hyde Wollaston in a paper read
on July 5th, 1810 and subsequently published in the Philosophical Transactions of the
Royal Society (Wollaston WH, 1810). Wollaston trained as a physician but later
became more famous for his contribution to physical chemistry and optics. He had
developed an interest and expertise in the study of urinary calculi.
As a result of this interest, he received from Dr. Reeve in Norwich, a portion of
calculus removed from Dr. Reeve's brother at the age of 5 years. Another calculus of
the same nature was sent to him by Mr. Lucas, a surgeon at Guy's Hospital, who had
removed it from the bladder of a 36 year old man called William Small (Wollaston
WH, 1810). This latter calculus can still be viewed in the Gordon Museum at Guy's
Hospital. It is likely that both these patients suffered from cystinuria. Wollaston
performed various physical and chemical analyses upon these two calculi: "Under the
blow-Pipe it may be distinguished ftom uric acid by the smell, which at no period
resembles that ofprussic acid; but in addition to the usual smell of burned animal
substances, there is a peculiarfoetor, of which I cannot give a correct idea, as I know
of no smell which it can be said to resemble".
He described the characteristic hexagonal crystals of cystine and attempted to dissolve
portions of the calculi in several fluids including water, alcohol, various acids and
alkalies: " 7he combination of this substance with acids, may be made to crystallize
without difficulty, and they form*slender spicula radiatingfrom a center [sic] ....... Wollaston's Test, as performed in laboratories today, involves adding hydrochloric
acid to a tissue sample in which there are suspected crystals of cystine. Wollaston
concludes: "From the ready disposition of this substance to unite with both acids and
alkalies, it would appear to be an oxide ..... and since both calculi that have yet been
observed have been takenfirom the bladder, it may be convenient to give it the name of cystic oxide... ". Although Wollaston himself expressed the hope that the name would not be altered, it has come to be shortened to cystine.
P 24

Chemistry
Cystine is a dibasic amino acid with a molecular weight of 240.3. It is the disulphide
of cysteine, particiPating in a reversible oxidation-reduction reaction:
Cysteine:
NH2-CH-COOH I
CH2 I
SH
Cystine:
NH2-CH-COOH I CH2 I s I s I CH2 I
NH2-Ukl-UUUH
Cystine is very insoluble in water but the addition of weak acid or alkali increases
solubility. It is insoluble in alcohol, a property used diagnostically in the histochemical preparation of tissue to demonstrate cystine crystals.
Metabotism of cysteine
Synthesis: trans-sulphuration pathway Cysteine results firstly from hydrolysis of protein and secondly, from de novo,
synthesis via the metabolism of methionine in the trans-sulphuration pathway. This pathway describes the conversion of methionine, an essential amino acid, to
cysteine. A full description of the pathway has been published elsewhere (Mudd et al., 1989).
S-adenosylmethionine (SAM) is formed by the transfer of an adenosyl moiety of ATP
to methionine, catalysed. by methionine adenosyl transferase. The adenosyl moiety is linked via a sulphonium bond, making S-adenosylmethionine a "high energy" compound, ie. each substituent is capable of participating in transfer reactions. This
allows SAM to act as a methyl donor in many reactions, yielding the next compound in the pathway, S-adenosylhomocysteine (SAH). SAH is cleaved by a hydrolase enzyme to hornocysteine and adenosine.
P 25

Homocysteine may be methylated to methionine either with betaine, catalysed by
betaine-homocysteine methyltransferase or using 5-methyltetrahydrofolate as a methyl donor. Alternatively homocysteine may condense with serine to form cystathionine, catalysed by cystathionine B synthetase. Cystathionine is then cleaved to cysteine and ketobutyrate by cystathionase.
Whilst cysteine is not normally an essential amino acid, deficiencies of the enzymes
converting homocysteine to cysteine will make it an obligatory requirement. Thus a deficiency of cystathionine 8 synthetase (in cases of homocystinuria) or of
cystathionase (deficient in foetal tissue and in cases of cystathionuria) will make
cysteine an essential amino acid.
Degradation
Approximately two-thirds of ingested cysteine is oxidised, mainly to inorganic
sulphate and to taurine. Oxidation of the sulphur atom gives cysteinesulphinic acid,
which is metabolised to sulphite either directly yielding alanine or after transamination, yielding pyruvate. Sulphite is converted by sulphite oxidase to
sulphate which is excreted in the urine. Decarboxylation of cysteinesulphinic acid
gives hypotaurine which is further oxidised to taurine, both steps being pyridoxine dependent.
Conversion to cystine Cysteine spontaneously oxidises to the disulphide form, cystine, in aerobic and alkaline conditions. An acid pH slows but does not prevent oxidation. In the cytosol, the presence of glutathione and-reductases maintain cystine in its reduced state. Most
reactions of cysteine occur when it is in its reduced state.
Metabolic defect in cystinosis
Cystine metabolism No defect in cystine reduction or cysteine metabolism has been consistently demonstrated in cystinosis (Gahl et al., 1989). The enzyme systems described in the preceding sections exist outside the lysosome (which is the major site of cystine storage, see "Site of cystine accumulation"). Since there are multiple pathways by
P 26

which cysteine may be metabolised, a single enzyme block would be unlikely to
account for significant cystine accumulation.
Site of cystine accumulation Cystine crystals have been demonstrated in many tissues from patients with cystinosis
(see Gahl et al., 1989 for review). Cystine concentrations in many cystinotic tissues
are markedly elevated compared with normals (Gahl et al., 1989; see also chapter 4,
"Clinical course and longterm manifestations").
Early workers suggested that phagocytosis led to the occurrence of cystine crystals
within reticuloendothelial cells. Baar and Bickel presented evidence that cystine
crystallisation occurred intracellularly in reticuloendothelial cells (Baar and Bickel,
1952). They found similarities between the storage of cystine in cystinosis and the
accumulation of storage material in Gaucher's and in Niemann-Pick diseases (which
were subsequently shown to be lysosomal storage disorders). Although they
incorrectly attributed cystine accumulation to a disorder of protein metabolism, it took
a further 15 years to improve on their knowledge of the site of cystine storage.
Plasma cystine concentrations Crawhall et al. measured plasma cystine concentrations in 6 children with cystinosis
and 4 healthy children (Crawhall et al., 1968). They found no significant difference in
either the cystine concentrations or the plasma cystine/cysteine ratios. Since previous
workers had demonstrated high cystine concentrations in tissues (Patrick, 1965),
Crawhall et al. concluded that the tissue cystine could not be in equilibrium with the
extracellular fluid and plasma. This was supported by the finding that a reduction in
plasma cystine (achieved by treatment with penicillamine or a low cystine diet) had no
effect on cystine storage (Crawhall et al., 1968). Cystinosis is therefore due to intracellular accumulation of cystine.
Intracellular cystine concentrations The increased concentration of free cystine in leucocytes was first demonstrated by Schneider et al. (Schneider et al., 1967). The mean leucocyte cystine concentration in 9 cystinosis children was 6.44 ± 2.76 Amol 1/2 cystine per gm protein, compared with 0.08 ± 0.06 in controls. Heterozygotes were found to have an intermediate level of
P 27

0.49 ± 0.28. N-ethylmaleimide was used to trap free cysteine during the assay, but
Schneider et al. were unable to detect any cysteine-NEM in normal, cystinotic or heterozygote leucocyte preparations. This suggested that cystine might be localised in
subcellular compartments, inaccessible to the cellular reduction systems. Sub-cellular
fractionation of normal and cystinotic leucocytes was performed and the majority (75%) of the intracellular cystine was found to be in the granular fraction (as
demonstrated by acid-phosphatase activity). Addition of a detergent (Triton X-100) to disrupt lipid membranes, led to an increase in cystine content of the granular fractions. This further suggested that the cystine storage was compartmentalised within the granular fraction.
Morphological evidence of cystine compartmentatisation Patrick and Lake examined a lymph node taken from a5 year old boy with cystinosis (Patrick and Lake, 1968). Using electron microscopy, they demonstrated that the
intracellular cystine crystals were delineated by intact membranes and that acid-
phosphatase reactivity was localised. to the periphery of the cystine crystals.
Schulman et al. treated tissue from 2 conjunctival biopsies (one from a cystinosis
patient and one control) with ferritin (Schulman et al., 1970a). Ferritin is readily phagocytosed and concentrated in lysosomes. Electron microcopy revealed negative images of the cystine crystals surrounded by a dense accumulation of ferritin. This
work demonstrated the presence of crystals in conjunctiva and also provided further
evidence that lysosomes are the site of cystine accumulation. Hummeler et al. demonstrated cystine crystals in the lamina propria cells of rectal biopsies from two
cystinotic patients (Hummeler et al., 1970). Cells that were stained for acid phosphatase showed enzyme activity around the crystal inclusions.
Soume of cystine Oshima et al. studied IIS-Cystine incorporation in cystinotic and normal fibroblasts (Oshima et al., 1976). Following treatment with cysteamine (a cystine depleting agent, see chapter 5: "Mechanism of action of cysteamine") cystinotic fibroblasts
reaccumulated 30 to 50% of the original cystine after 24 hours in a cystine-free medium. Cystine therefore accumulates from an intracellular source, even in the absence of extracellular free cystine. Further work investigated whether cystine
P 28

reaccumulated in this model in the presence of labelled methionine, cystathionine or
serine-enriched medium. In no case did cystine reaccumulate suggesting that these
extracellular thiols were not the source of cystine (Crawhall et al., 1977; Thoene et
al., 1977). Thoene et al. also demonstrated that glutathione was not a source of
cystine reaccumulation (Thoene et al., 1977).
Evidence that cystine was derived from protein came from the observation that
cysteamine-treated cystinotic fibroblasts did not reaccumulate cystine in the presence
of cycloheximide (an inhibitor of protein synthesis) or chloroquine (an inhibitor of
protein degradation) (Thoene et al., 1977). Subsequent work has shown that cellular
protein degradation involves both cytoplasmic and lysosomal systems. Extracellular
protein and "long-lived" cellular proteins are degraded within lysosomes, and serve as
a source of cystine (Thoene et al., 1985).
Free extracellular cystine (as opposed to that associated with protein) may also serve
as a source of intralysosomal cystine accumulation (Thoene and Lemons, 1982).
Thoene and Lemons presented evidence suggesting that pinocytosis of free cystine or incorporation of cystine into "short-lived" cellular proteins were unlikely to be the
major mechanisms of entry of cystine into the lysosome. Forster et al. examined the
effects of colchicine (an inhibitor of pinocytosis) and glutamate (a competitive inhibitor of plasma membrane cystine transport), on cystine reaccumulation (Forster et
al., 1990). Glutamate but not colchicine inhibited cystine reaccumulation suggesting that cystine can enter cells by transport across the plasma membrane. Forster et al.
concluded that cytosolic cystine is reduced by glutathione to cysteine in which form it
enters the lysosome (Forster et-al., 1990). The cystine that accumulates in cystinotic lysosomes is cystine therefore derived either from the degradation of protein or from
transport of extracellular free cystine.
Studies of lysosomal transport The evidence described so far suggested that the lysosome is the site of cystine accumulation and that there is no defect in cystine metabolism. An alternative explanation was that there was a defect in lysosomal, cystine transport.
Schulman and Bradley demonstrated that the concentrations of amino acids (other than
P 29

cystine) were normal in preparations of cystinotic lysosomal fractions (for review, see Schulman and Bradley, 1972). These workers investigated the effects of incubating
human fibroblasts with D-isomers of various amino acids and with a series of mixed disulphides. The test compound enters the lysosome by endocytosis and is then
available to be metabolised or to cross the lysosomal membrane. If the * substance is
not cleared it accumulates within the lysosome leading to osmotic swelling and
vacuolation. Schulman and Bradley observed that the lysosomal membrane seemed to
have an apparent impermeability to molecules with a molecular weight greater than
220-230. Cystinotic but not normal cells underwent vacuolation when incubated with
cysteine-penicillamine disulphide (MW 269 similar to cystine, MW 240). This
suggested that the cystinotic lysosomes could not clear cystine.
There remained difficulties in studying lysosomal cystine transport. Firstly, cystinotic
cells contained a large amount of cystine within the lysosomal membrane. Secondly,
any cystine that was transported out of the lysosome would immediately be reduced to
cysteine. Reeves reported a method for studying amino acid efflux from lysosomes
(Reeves, 1979). Amino acid methyl esters diffuse passively into the lysosome where they are hydrolysed to the free amino acid. Lysosomal amino acid accumulation could be induced against a concentration gradient. The rate of efflux of the amino acid from
the pre-accumulated lysosome could then be studied.
Demonstmtion of a defect in lysosomal cystine tmnsport
Steinherz et al. loaded isolated lysosomes from normal and cystinotic cells with
cystine and leucine methylesters (Steinherz et al., 1982a). Whereas the rate of efflux
of leucine was normal in cystino*tic lysosomes, the rate of cystine efflux was much
slower in both cystinotic and normal preparations (Steinherz et al., 1982a). The same
workers repeated the work with in= leucocytes and with much lower concentrations
of radioactive cystine dimethyl ester (CDME) (Steinherz et al., 1982b). Using this
method, normal and cystinotic leucocytes accumulated cystine to high but non-toxic
concentrations. Cystine loading did not affect lysosomal membrane integrity or alter
the intracellular concentration of other amino acids. Fractionation experiments and
electron microscopy demonstrated that the cystine loading had occurred within the lysosomal fmction. The cystinotic cells lost radioactive cystine more slowly than the
normal cells. The work was repeated and confirmed with nonradioactive CDME.
P 30

Jonas et al. incubated normal, heterozygous and cystinotic fibroblasts with 30mM
cysteine-glutathione mixed disulphide and achieved modestly elevated lysosomal
cystine accumulation. When placed in cystine-free medium, there was rapid loss of the
accumulated cystine from the normal and heterozygote but not from the cystinotic fibroblasts (Jonas et al., 1982a).
Gahl et al. confirmed that cystine exodus from cystinotic lysosomes pre-loaded with "S-Cystine or nonradioactive cystine was markedly slower than in normal preparations
and was intermediate in heterozygotes (Gahl et al., 1982a; Gahl et al., 1982b).
Cystinotic lysosomes showed no abnormality in the transport of methionine or
tryptophan. These workers also demonstrated that cystine recovery inside and outside
the lysosomes was unaffected by the addition of N-ethylmaleimide (which traps
cysteine) to the medium. This suggested that cystine was lost from the lysosome in the
disulphide form and not first reduced to cysteine. Gahl et al. studied the kinetics of
cystine efflux in normal, heterozygote and cystinotic lysosomal fractions (Gahl et al.,
1982b). They found that the velocity of cystine efflux was zero in cystinotic
preparations, saturable in normal cells and approximately half normal in
heterozygotes.
Another series of experiments demonstrated that lysosomal cystine transport was
carrier-mediated (Gahl et al., 1983b). The occurrence of counter-transport (or trans-
stimulation) constitutes classical proof that a transmembrane movement is mediated by
a carrier. Counter-transport exists if tracer quantities of a radioactive substance cross
a membrane at an increased rate in the presence of a substantial concentration of the
non-radioactive substance on the opposite side of the membrane (Gahl et al., 1983b).
Normal leucocyte granular fractions pre-loaded with cystine (by CDME) demonstrated
increased uptake of IH-cystine compared to those that had not been loaded. The rate
of uptake was proportional to the intralysosomal cystine load. Cystinotic fractions
showed no uptake and heterozygote fractions half the normal counter-transport. This
work proved conclusively that lysosomal cystine transport was carrier-mediated. -
Speciricity of lysosomal cystine counter-transport Studies of counter-transport also provided infomation on the specificity of the lysosomal cystine transporter (Gahl et al., 1983b). The results showed that the carrier
P 31

is stereospecific to L-cysfine and does not transport other amino acids such as arginine
or glutamate. This suggested that the lysosomal carrier is distinct from the plasma
membrane cystine transporter which can also carry arginine (in intestinal and renal tubular cells) and glutamate (in fibroblasts).
Many workers have investigated the effects of nucleotides, lysosomal acidification, potassium, magnesium and altered temperature on cystine lysosomal transport (ATP, Mg, KCI in leucocytes: Gahl et al., 1982b; ATP, protonisation in lymphoblasts: Jonas
et al., 1982b and Jonas et al., 1983; acidification of leucocyte lysosomes: Gahl and Tietze, 1985a; effects of pH and cations in rat liver lysosomes: Jonas, 1986; effects of Mg and NEM on leucocytes: Greene et al., 1987). Variable results were obtained in
these studies, partly because of methodological differences (Greene et al., 1987). Further, the addition of a substance can have more than one effect, eg. ATP provides energy but also affects lysosomal acidification (Gahl and Tietze, 1985a). Finally, Ebstein-Barr transformed lymphoblasts and rat liver lysosomes behaved differently from polymorphonuclear leucocytes (Gahl et al., 1982b; Jonas et al., 1982b; Jonas, 1986). In leucocytes, normal cystine transport was stimulated by the addition of ATP (in the presence of MgCl and KCI) (Gahl et al., 1982b). The presence of a proton translocator, an alkalinising agent, an inhibitor of ATP-dependent acidification or an anion transport inhibitor (all of which reduce the proton gradient across the lysosomal
membrane) had no effect on cystine transport (Gahl and Tietze, 1985a). In lymphoblasts the addition of a proton translocator or an ATP analogue inhibited
normal cystine transport (Jonas et al., 1982b). Jonas et al. went on to demonstrate that there is no abnormality of ATP-dependent acidification and ATP-ase activity in
cystinotic lysosomes (Jonas et al., 1983).
Lysosomal cystine concentrations and transport In the variant forms of cystinosis Schneider et al. demonstrated that the leucocyte cystine concentrations were generally higher in patients with infantile nephropathic cystinosis (range 4-14 umol 1h cystine per gni protein) compared to those with the adult ("benign") form (range 1-4 jimol 1/2
cystine per gni protein), (Schneider et al., 1968).
Goldman et al. found that mean cystine concentrations in fibroblasts from infantile and adolescent patients were 10.8 and 6.6 pmol/gm protein respectively (compared to 0.2
P 32

in normal cells), (Goldman et al., 1971). They also found that leucocyte cystine
concentrations in the adolescent-type patients were intermediate between those from
the adult and those from the infantile forms of cystinosis. Smolin et al. confirmed
some of these findings in preparations of both mixed leucocytes and polymorphonuclear leucocytes (Smolin et al., 1987).
Gahl and Tietze studied lysosomal cystine efflux and counter-transport in variant forms of cystinosis (Gahl and Tietze, 1987b). A patient with intermediate
("adolescent") cystinosis was found to have a cystine concentration in his cultured fibroblasts of 14 nmol 1/2 cystine per mg protein (within the range for the infantile
form). The mean velocity of cystine efflux from his cells was 0.2 pmol 1/2 cystine per
minute unit of hexosaminidase, compared to normal cells (4.8 ± SEM 1.0) and infantile cystinotic cells (I. I±0.3). A second boy, with benign ("adult") cystinosis had a leucocyte cystine concentration of 2.85 nmol 1/2 cystine per mg protein and between 9 and 29% of the normal amount of cystine counter-transport (compared to 0-
5% in the infantile form). These data suggested that the variant forms for cystinosis
were also due to a defect in lysosomal cystine transport, although not so severe as in
the infantile form. .
Further characterisation of lysosomal cystine transport
There is no animal model of cystinosis; however various workers have studied cystine
transport in other species in an attempt to further characterise the lysosomal carrier. One of the aims of these studies was to identify substances that might bind to the
cystine carrier and thus be used to differentiate cystinotic and normal cells.
Other species 1. Mouse
Mouse L-929 fibroblasts have a specific lysosomal carrier for cystine which, like the human transporter, exhibits counter-transport (Greene et al., 1990). Greene et al. measured rates of counter-transport at different external substrate concentrations. Kinetic modelling suggested that the results could best be fitted to a model containing a saturable and a second, non-saturable component. The authors speculated that the
second component might well have been saturable at higher cystine concentrations in
the external medium. The presence of two lysosomal transport systems for cystine
P 33

could explain the observation that cystinotic cells do not accumulate cystine indefinitely.
A variety of substances were tested for competitive inhibition of cystine counter-
transport in the mouse model. Greene et al. found that the mouse lysosomal
transporter exhibited specificity for L-isomers and could be best inhibited by DL-
selenocystine, LL-lanthionine and L(+)-cystathionine. Comparing these results with
those for other potential inhibitors, they deduced that the presence of a amino groups
was more important than carboxyl groups in terms of binding. Substitution of the
sulphur atom for a carbon or selenium atom had little effect on binding inhibition.
2. Bacteria
A bacterial cystine binding protein (CBP) can be isolated from Escherichia coli by an
osmotic shock and purification procedure (Berger and Heppel, 1972). Two transport
systems exist. A specific system recognises cystine, selenocystine and cystathionine. A
general system is also inhibited by lanthionine, diaminopimelate, 3-hydroxy and 4-
methyl-diaminopiMelate. Oshima et al. studied this further by incubating a range of
potential inhibitors with 14 C-Cystine and CBP. The mixture was then filtered and the
percentage of bound radioactivity determined. DL-Lanthionine (9% radioactivity bound), DL-Diaminopimelic acid (23%) and cystathionine were all potent inhibitors at
a concentration of 91umol/l. No significant inhibition was found for cysteic acid,
carboxymethylcysteine, cysteine-N-ethylmaleimide, methionine, taurine and
glutathione.
The patterns of inhibition of the bacterial general cystine transport system and the
mouse fibroblast system are thus very similar, suggesting that there may be homology for the binding site between the two species.
3. Yeast
Idriss and Jonas described a cystine transport system in the yeast acidic vacuole (prepared from Saccharomyces cerevisiae), analogous to the mammalian lysosome (Idriss and Jonas, 1990). Cystine uptake had a pH optimum of 7.5, was dependent on ATP and Mg and was highly specific. Study of this transport system may provide evidence of homology of the cystine transporter and aid in its identification.
P 34

The effect of altered incubation temperature on cystine transport in vitro Lemons et al. have investigated the effects of increasing the incubation temperature on
the cystine content of cystinotic fibroblasts (Lemons et al., 1986). When cells were
cultured at 40*C or 43"C for 48 hours, the cystine contents were reduced to 40% and 20%, respectively, of the control cells, without any change in cell viability. These
results were unexpected since the rate of proteolysis increases with temperature. The
authors speculated that the increased temperature might alter the structural specificity of the cystine transporter, thereby allowing cystine efflux. Forster et al. performed the
opposite experiment (Forster et al., 1989). They hypothesised that the increased incubation temperature could increase in vitro activity of the lysosomal cystine transporter by improving membrane fluidity. They demonstrated that a reduction in
incubation temperature from 37'C to 28*C led to a reversible further accumulation of
cystine in cystinotic fibroblasts. A second alternative is that a'second lysosomal
cystine transporter might exist which is responsible for the presumed efflux of cystine from cystinotic cells. Forster. et al argued that the effects of temperature alteration on
cystine content demonstrated in their paper might be explained by altered membrane fluidity in this second transport system.
Cystine accumulation and transport in other lysosomal diseases
Lysosomal cystine transport studies have been undertaken in two other lysosomal
diseases, mucoliPidosis type II (ML-II, I-cell disease) and Salla disease (Greene et al., 1985; Tietze et al., 1986; Renlund et al., 1986). Greene et al. demonstrated increased
cystine levels in cultured fibroblasts but not leucocytes nor liver tissue from 4 patients
with ML-II. As with cystinotic cells, the cystine was localised in the lysosomes.
Cystine efflux from ML-II cells *was slower than from normal cells but not to the degree seen in cystinotic lysosomes. Tietze et al. reported similar results.
ML-II is caused by a reduced activity of N-acetylglucosamine I-phosphotransferase
which catalyses the addition of a mannose-6-phosphate marker to enzymes targeted for
the lysosomes. The abnormality of cystine transport in ML-II may be due to the cystine transporter also lacking a mannose-6-phosphate residue or may be a secondary phenomenon of impaired lysosomal proteinase function (Tietze et al., 1986).
Renlund et al. studied the lysosomal efflux of sialic acid in Salla disease. Fibroblasts
P 35

from normal and Salla disease individuals were loaded with sialic acid by incubating
them with N-acetylmannosamine (the precursor of N-acetyl neuraminic acid, NANA,
which accumulates to abnormal amounts in this disorder). Whereas normal cells
cleared NANA, the rate of NANA efflux from Salla cells was minimal, suggesting that the disorder is due to an abnormality of lysosomal NANA transport. Salla
fibroblasts were then loaded with cystine using CDME (see "Studies of lysosomal
transport"). There was no abnormality of cystine efflux from Salla fibroblasts
indicating that the defect in Salla disease is restricted to NANA rather than being a
generalised lysosomal transport disorder.
P 36

The Renal Fanconi Syndrome
The renal Fanconi syndrome consists of generalised proximal tubular dysfunction and
rickets. The proximal tubular dysfunction leads to a reduced reabsorption of amino
acids, glucose, phosphate, bicarbonate, urate, sodium and thus water. There are also
excessive losses of other substances including potassium, calcium, magnesiumo low
molecular weight proteins and enzymes. The syndrome may be an isolated
phenomenon, occur as part of an inherited metabolic disorder or be secondary to
toxins or disease (see table 2.1 below):
Table 2.1: Causes of the Renal Fanconi Syndrome
Idiopathic: Sporadic or familial Inherited: Cystinosis
Lowe's syndrome Hereditary fructose intolerance Tyrosinaemia type I Galactosaernia Wilson's disease Glycogen storage disease (some forms) Mitochondrial disorders (some)
Acquired: Drugs: 6-mercaptopurine Aminoglycosides Outdated tetracyclines
Toxins: Heavy metals (Cd, Hg, Pb, PI) Paraquat, toluene
Renal: Nephrotic syndrome Renal transplantation Interstitial nephritis (antiTBM Ab) Multiple myeloma/ dysproteinaemias
Pathogenesis of the Fanconi syndrome The mechanisms whereby the conditions listed above lead to the Fanconi syndrome are not yet clear. Since there are multiple carriers for active transport of amino acids, glucose, phosphate etc., it is unlikely that genetic mutations will separately affect each carrier. It is more likely that the mutation or disorder causes a defect in a process common to all of the carrier systems. Such a defect might involve inhibition of NaK ATPase or a reduction in cellular ATP. Alternatively or in addition, there might be an increase in the efflux of molecules from the tubular cell to the lumen, perhaps as a
P 37

result of an increased permeability of the brush border membrane. Detailed reviews of
experimental models and mechanisms of the Fanconi syndrome have been published (Bergeron and GouGoux, 1989; Gonick and Buckalew, 1985).
MechanLqm of cystine toxicity in cystinosis
There is no animal model of cystinosis and the exact mechanism whereby cystine
accumulation leads to cellular dysfunction remains unknown. The effects of cystine
toxicity have been best studied in the kidney. Foreman et al. created a mild
experimental Fanconi syndrome by administering a course of intraperitoneal CDME to
rats. Treated rats showed an increase in urine volume, excretion of phosphate, glucose
and amino acids compared with untreated rats (Foreman et al., 1987). The creatinine
clearance was unaffected. They also demonstrated that in vitro incubation of renal
cortical tubule suspensions with CDME led to intracellular cystine concentrations
comparable to those found in renal tissue removed from patients with cystinosis. Such
cystine-loaded tubules showed a reduction in solute uptake. In later experiments, rat
brush border membrane vesicles isolated from cystine-loaded cells showed identical
uptake of proline compared with non-loaded controls (Foreman and Benson, 1990).
Thus cystine loading did not affect the transport of proline across the brush border.
These results suggested that the abnormality in renal tubular function induced by
cystine loading, was not due to a direct effect on apical membrane transporters.
Salmon and Baum set up in vitro microperfusion studies in isolated rabbit proximal
convoluted tubules loaded with cystine by incubation with CDME (Salmon and Baum, 1990). Cystine loading led to a dramatic reduction in volume absorption, glucose and bicarbonate transport. There was no change in the permeability of the tubules to
mannitol or to bicarbonate, suggesting that the decrease in transport was due to inhibition of active transport. These effects were not seen with methyl esters of leucine or tryptophan. Since CDME loading had led to an increase in intracellular
cysteine concentration, the effect of cysteine methyl ester was also studied. At higher
concentrations than the cystine dimethyl ester (2mM vs 0.5mM), the cysteine loading
also had inhibitory effects on tubular transport.
These workers then studied the effects of CDME loading on ATP and NaK ATPase
activity in the same in vitro model (Coor et al., 1991). Cystine loading led to a 60%
P 38

reduction in intracellular ATP. In addition, the reduction in volume absorption could
be partly negated by the addition of exogenous ATP to the culture medium. However
cystine loading had no effect on the Idnetics of NaK ATPase even at twice the normal CDME concentration.
Sakarcan et al. found that basal oxygen consumption in isolated cystine-loaded
proximal tubules was significantly decreased compared with control tubules (12.1
0.6 vs. 20.6 ± 0.5 nmol oxygen per min per mg protein), (Sakarcan et al., 1992).
When the cystine-loaded and control tubular preparations were incubated with ouabain
which inhibits NaK ATPase activity, oxygen consumption was reduced to 11.4 ± 1.0
and 10.2 ± 0.7 nmol oxygen per min per mg protein respectively. Thus inhibition of
NaK ATPase accounts for virtually all of the decrease in oxygen consumption seen
when tubules are loaded with cystine. The results of these studies suggest that
increased intracellular cystine concentrations do not affect membrane permeability but
lead to a fall in intracellular ATP and to inhibition of NaK ATPase. Both these
mechanisms would lead to a reduction in active transport processes and therefore a net increase in excretion of solute and water.
P 39

Chapter 3: The determination of cystine and cysteamine
The determination of cystine in biological samples Introduction
Cystinosis results from the intra-lysosomal accumulation of the disulphide, cystine.
The plasma cystine concentration is normal in patients with cystinosis (see chapter 2:
"Plasma cystine concentrations"). An assay for intracellular cystine is therefore
required for biochemical confirmation of the diagnosis.
The traditional method of determining cystine in biological samples relies on
colorimetric analysis after reaction with ninhydrin, using an amino acid analyser. This
method is relatively slow, with a capacity of between 5-8 samples per day (RN
Dalton, personal communication). Many methods exist for the determination of thiols.
These can be used to measure total cyst(e)ine, however they are subject to interference
from the many other compounds containing sulphydryl groups (eg. glutathione).
Oshima et al. developed an assay for cystine in physiological samples, utilising a cystine binding protein derived from Escherichia coli (Oshima et al., 1974). The
cystine binding protein (CBP) can be isolated from Escherichia coli by an osmotic shock and purification procedure (Berger and Heppel, 1972; Willis et al., 1974). CBP is stable and its binding interaction remains relatively constant over a range of ionic
strength and ph (Oshima et al., 1974). Berger and Heppel investigated the binding and found there to be general specificity for a, a'- diamino-dicarboxylic acids with a3 to 4 carbon atom chain length between the 2 a-carbon atoms (Berger and Heppel, 1972).
Oshima et al. studied this further by incubating a range of potential inhibitors with "C-Cystine and CBP. The mixture was then filtered and the percentage of bound
radioactivity determined. DL-lanthionine (9% radioactivity bound), DL- diaminopimelic acid (23%) and cystathionine were all potent inhibitors at 9lumol/l
concentration. No significant inhibition was found for cysteic acid, carboxymethyl- cysteine, cysteine-N-ethylmaleimide, methionine, taurine and glutathione. Cystinotic fibroblasts, treated with lmM dithiothreitol (DM to reduce cystine to cysteine and then reacted with N-ethylmaleimide to trap cysteine and free DIT, showed no detectable cystine. This demonstrated that there were no other interfering compounds
P 40

present in any significant quantity in the cystinotic samples (Oshima et al., 1974).
Since the defect in cystinosis is an intraceflular accumulation of cystine, and leucocytes derived from a peripheral blood sample are the most accessible source of
cells, the measurement of leucocyte cystine is the most practical means of confirming
the diagnosis biochemically.
A mixed leucocyte cell preparation can be made by allowing whole blood to separate in an acid citrate dextrose - dextran (ACD) mixture (Smolin et al., 1987).
Measurement of the cystine concentration within such a cell preparation provides an
excellent separation between patients affected with cystinosis and normal people (see
chapter 4: "Confirmation of the diagnosis" for results). The effects of treatment with the cystine depleting agents, cystearnine and phosphocysteamine, can also be
accurately followed with mixed leucocyte cystine concentrations (see chapter 8:
"Monitoring of leucocyte cystine concentrations" for results).
The establishment of a method for determining the leucocyte cystine concentration
using the cystine binding protein assay, was clearly necessary prior to starting
research in cystinosis. Professor Schneider, during a visit to Europe in 1988, spent one month at Guy's Hospital introducing the methodology.
Although the mean mixed leucocyte cystine concentration in a group of heterozygotes is elevated by a factor of six compared with normal people (Schneider et al., 1967)o individual results show some overlap. It is not possible to distinguish any individual as normal or heterozygous by this*method. Schulman et al. reported that the cystine in
cystinotic leucocytes is primarily located in polymorphonuclear leucocytes rather than in lymphocytes (Schulman et al., 1970b). Smolin et al. measured the cystine concentrations in polymorphonuclear leucocyte pellets prepared from a group of 29
parents of children with cysfinosis (ie. obligate heterozygotes) (Smolin et al., 1987). This group reported no overlap between the heterozygote cystine concentrations and those in a group of normal people.
The determination of cystine therefore requires several steps: L Isolation, purification and lysis of a cell pellet of the tissue to be studied (eg.
P 41

leucocytes).
2. Deproteinisation and separation of the protein-free supernatant. 3. Determination of the protein-free cystine concentration. 4. Determination of the protein content of the pellet to
account for variation in cell recovery. These steps are detailed in appendix 1.
The assay can be used to determine the cystine concentration not only in leucocytes
but also a variety of other tissues including the following:
- cultured skin fibroblasts and amniocytes,
- chorion villous biopsy or placental tissue,
- post mortem or tissue biopsy specimens.
Although the methods were in use in several North American laboratories, there
remained unanswered questions about the assay. It was important to establish the
sensitivity, specificity, linearity and coefficient of variation of the assay in our own laboratory. Secondly, the effect of storing the blood sample prior to preparation of the leucocyte pellet had not been studied. This is of importance since many nephrology centres do not have on-site facilities for the cell preparation. Studies on the
characteristics of the assay were therefore undertaken.
Studies on the measurement of cystine 1. Lower timit of detection The lower limit of detection of the cystine binding protein assay was determined by
running 6 blank ("0") standards and calculating the mean and standard deviation of the
results. The lower limit of detection is generally taken as 3 standard deviations of the
mean of the zero result. In this assay the lower limit of detection was calculated to be
0.03 jAmol/l.
2. Linearity
A standard curve over the range 0-0.6, umol/I was performed for each assay. A typical curve, with the calculated line of regression of CpNý.. /CPM,,, b. on Standard cystine concentration, is shown in figure 3.1. To establish the linear range of the assay, cystine standards were measured in duplicate over the concentration range 0-
P 42

Figure 3.1: Cystine standard curve
(0
cs
U)
C;
a 0
C, r) C5
W
0 0 (D
C*j V)
C)
TOM d
7ý0
sqoV4dO/x'BwV4dO P 43
0 LO 0 LO 0 LO 0 LO 0 LO Lr; qi 4 C6 Cfi Cý Cý r-: r-: C5

5.014mol/I (see figure 3.2). A line of regression of the data between 0 and 0.6ptmol/l
was plotted. At cystine concentrations of > 1.5, umol/l, values of CPM=x/CPM,, b, fall
away from this line indicating saturation of binding (see figure 3.2). Thus to ensure that clinical samples fell within the linear range, they were diluted to fall between
0.2 - OAAmol/l.
3. Specificity
Specificity was assessed by running cystine standards of 0.2 and 0.5 /Amol/I to which had been added Amino Acid Calibration Standards (containing 39 components) diluted
to 25 14mol/l, with cystine standards to which water had been added as a control. Table 3.1 shows the mean (SD) results of 4 samples:
Table 3.1: Specificity of cystine binding protein
Concentration
(. umo]Vl)
Amino acid
standard
Cystine standard
0.20 0.20(0.01) 0.20(0.01)
0.50 0.48(0.02) 0.49(0.02)
CBP specifically binds cystine. Oshima et al. advocated the use of N-ethylmaleimide (NEM) to trap free thiol groups and thus prevent them from cross-reacting with CBP, during the leucocyte pellet preparation (Oshima et al., 1974). To investigate whether free thiols did affect cystine binding, a 40ml blood sample was taken from an adult cystinosis patient who was on phosphocysteamine treatment. From this sample, 6 leucocyte pellets were prepared with the addition of lOmM NEM in dipotassium hydrogen phosphate buffer and, as a control, 6 pellets were prepared with the addition of distilled water. The mean (SD) leucocyte cystine concentration for the 6 pellets prepared with NEM was 0.45 (0.11) nmol 1/2 cystine per mg protein compared with a value of 0.48 (0.08) for the pellets prepared with water.
P 44

Figure 3.2: Saturation of cystine binding to cystine protein
10%
t
a
0
16m
a Ono Cl)
Tý
0
sqoV4dO/x9wNdO p 45
0 LO 0 LO 0 C*j Tý Tý

4. Coefficient of variation
a. Cystine binding protein assay The coefficient of variation (CoV) was assessed by assaying 6 spiked cystine standards
at each of the following concentrations: 0,0.05,0.1,0.2,0.3,0.4,0.5 and
0.6jAmol/l. The results (mean ± SD) are shown in table 3.2 below:
Table 3.2: Coefficient of variation of cystine binding protein assay
Spiked conen. (JAMOI/1)
Measured concn. (igmolll)
cov M
0 -0.02 0.01 35.3
0.05 0.05 0.01 15.0
0.1 0.10 0.00 2.7
0.2 0.22 0.01 5.0
0.3 0.32 0.02 5.6
0.4 0.42 0.01 2.3
0.5 0.46 0.01 2.9
0.6 0.61 0.01 1.7
b. Protein assay The coefficient of variation was assessed by determining, in duplicate, the protein
concentration of 10 aliquots of a protein standard (Sigma, 1mg/ml) using the methods in appendix I ("Detemination of the protein concentration"). The result is factored so
that lmg/mI gives a result of 50OAg in the cuvette. The mean (SD) protein content
was 500.7 (5.1) pg per cuvette, giving a coefficient of variation of 1.0 %-
c. Mixed leucocyte cystine preparation The coefficient of variation for the mixed leucocyte cystine preparation was assessed by taking a 15-18ml blood sample from each of 4 individuals (3 cystinosis patients, two of whom were receiving cysteamine and one unaffected healthy adult). Mixed
P 46

leucocyte cystine concentrations were determined as detailed in appendix 1.
Table 3.3: Coefficient of variation of the determination of mixed leucocyte cystine
concentration
Concentration
(nmol 'A cys/mg protein)
Number of
samples
Coefficient of
variation M
0.06 6 24.7
1.30 5 8.1
3.54 6 6.0
8.47 6 15.2
d. Polymorphonuclear leucocyte cystine preparation The coefficient of variation was assessed by preparing 6 polymorphonuclear leucocyte
cystine pellets from a 30ml blood sample taken from a healthy volunteer. The mean (SD) leucocyte cystine concentration was 0.10 (0.03) nmol Ih cystine per mg protein. The coefficient of variation at this concentration is 33%.
5. Comparison of two different forms of leucocyte peHet preparation LeucoPREP cell separation tubes (Becton Dickinson Labware) have been designed to
provide a convenient separation of mononuclear cells from whole blood. The tubes contain a gel layer through which neutrophils, red cells and platelets but not mononuclear cells pass during centrifugation. Since this system is much more convenient, a comparison of leucocyte cystine concentrations obtained from blood
processed by the LeucoPREP and standard ACD methods was made. Blood samples from two healthy adults and nine cystinosis patients (receiving various doses of phosphocysteamine) were simultaneously prepared by the two methods. (After cells were obtained from the LeucoPREP tube the pellet preparation was by standard methods). The results (see figure 3.3, overleaf) indicate that there is no correlation between cystine concentrations obtained by standard methods and those derived from LeucoPREP cell separation. The LeucoPREP system cannot therefore be utilised in the determination of leucocyte cystine concentration.
P 47
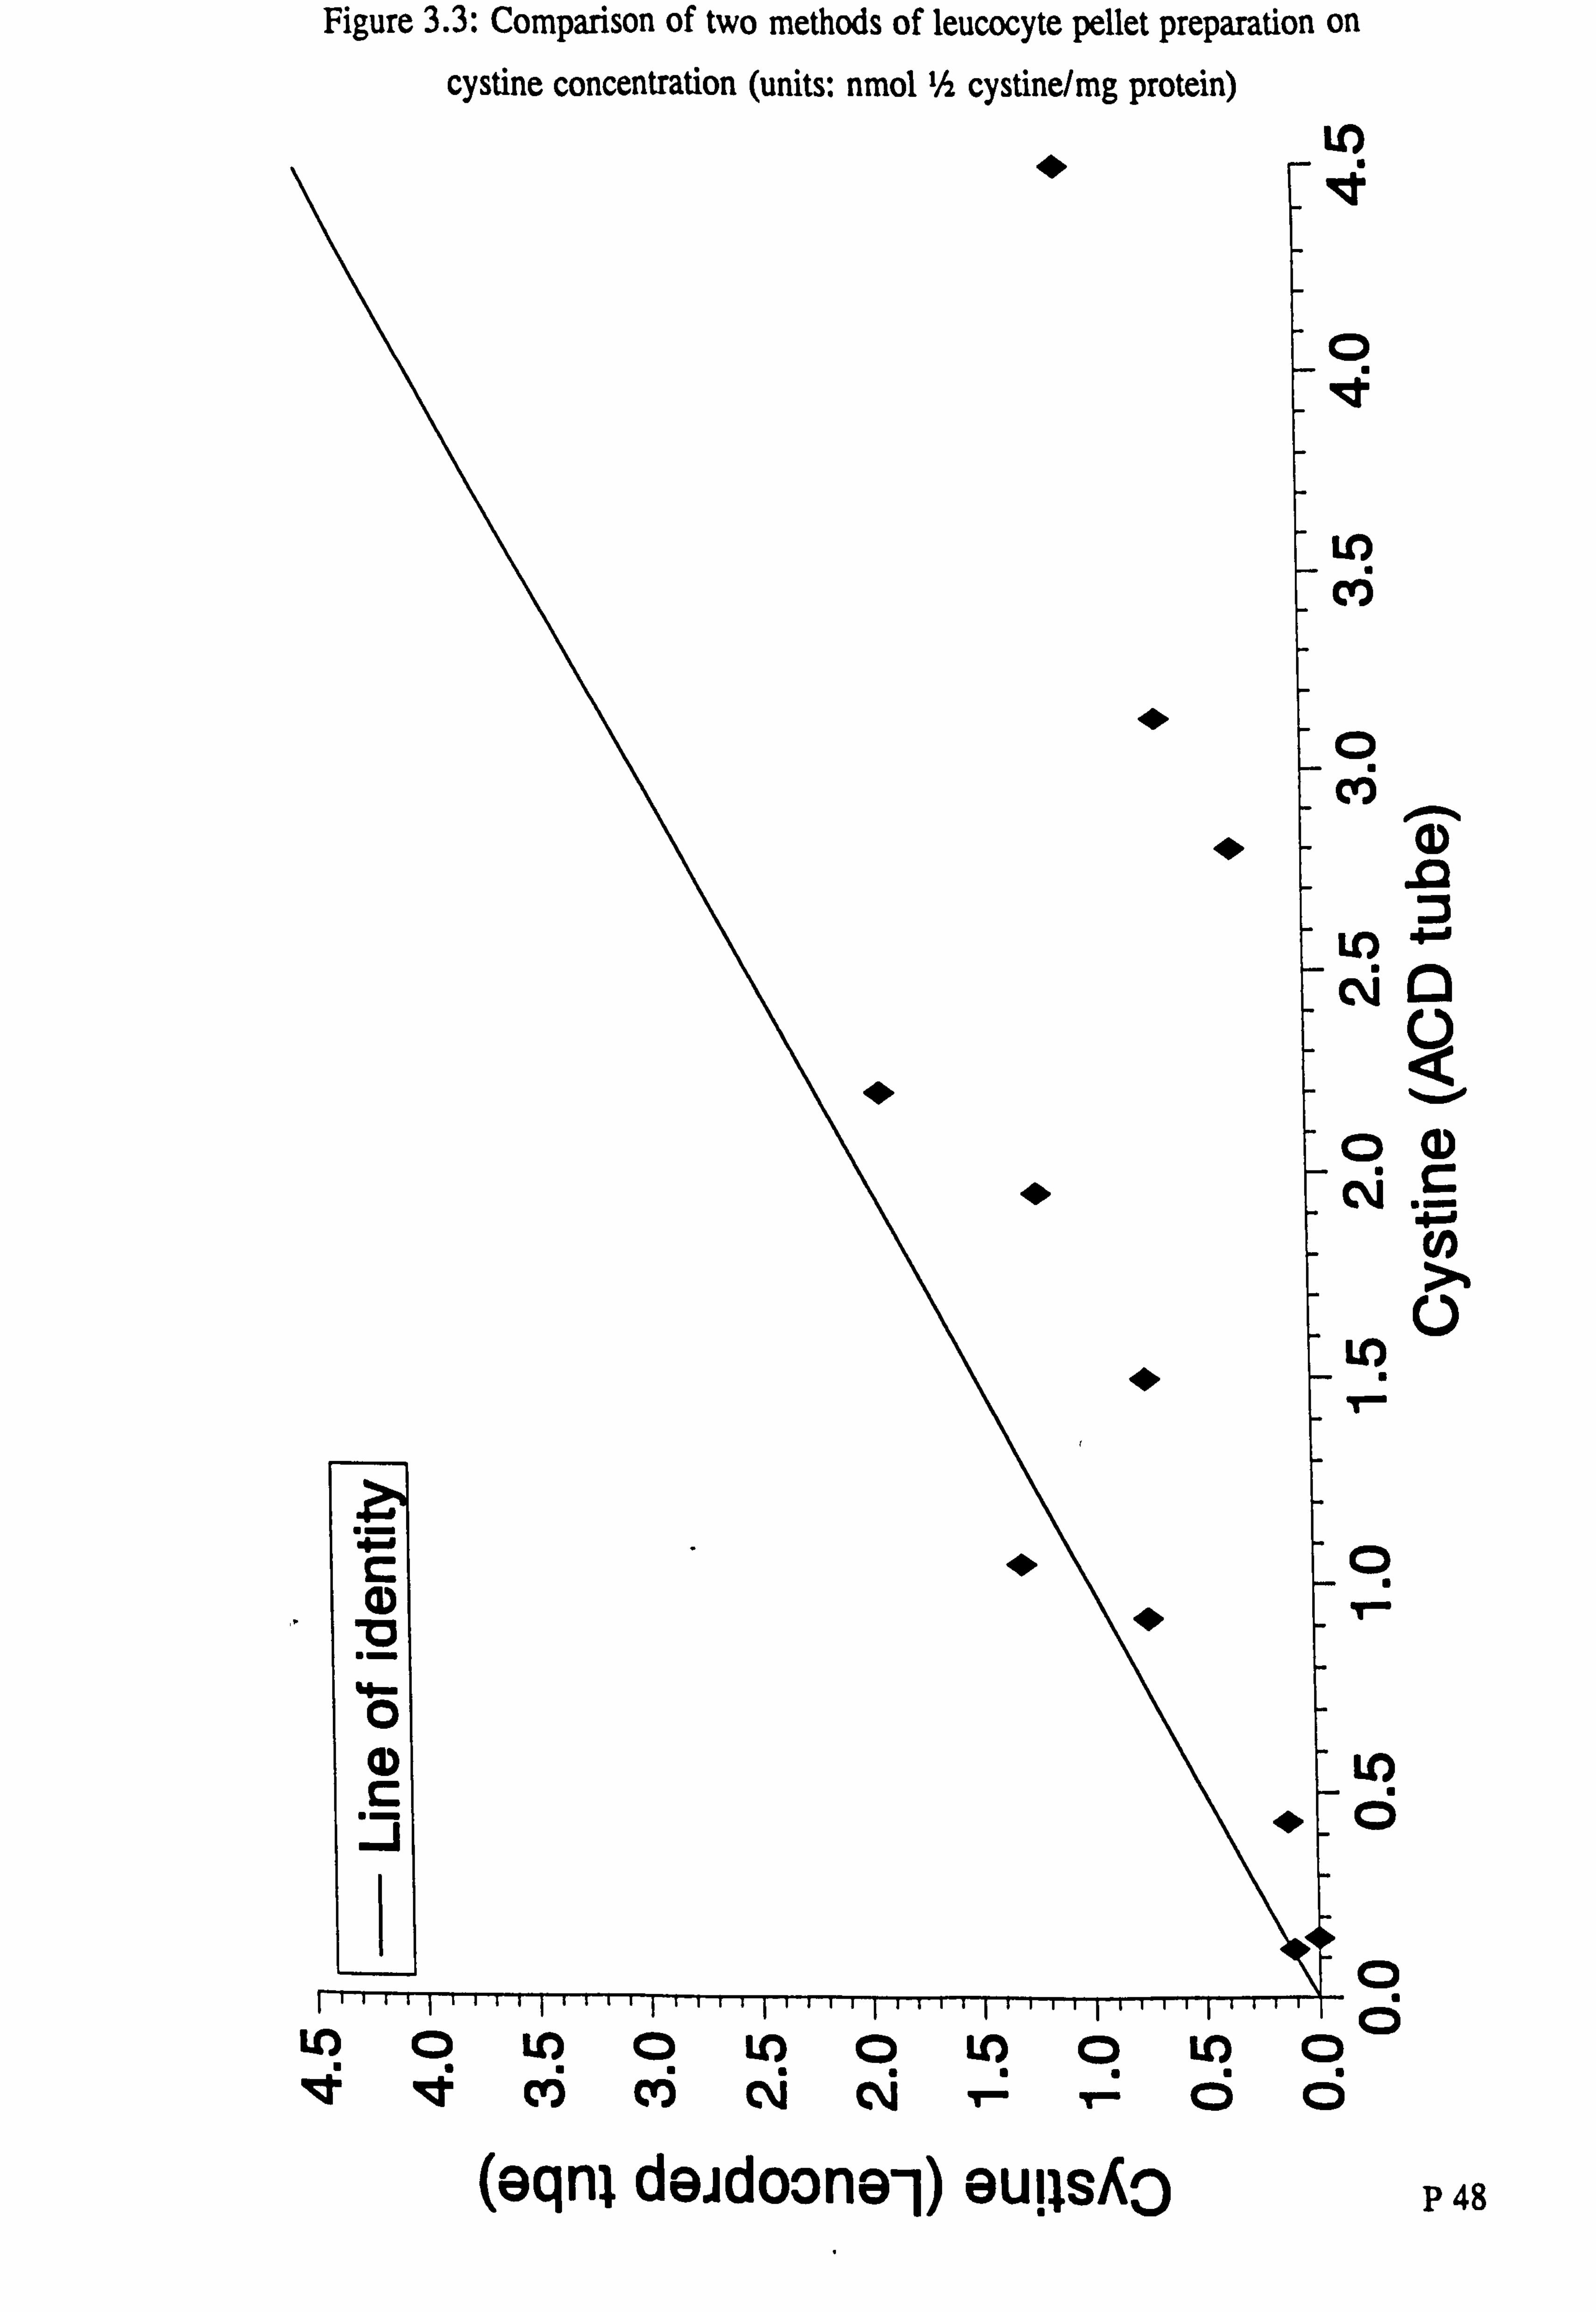
Figure 3-3: Comparison of two methods of leucocyte pellet preparation on
cystine concentration (units: nmol Ih cystine/mg protein) Lf)
D
1)
Lo CQ
04) Cý G-
LO 14
q
LO
ci
0
c;
(eqnl deidoone-1) euils, &o P 48
LO 0 L-0 0 LO 0 LO 0 LO m0 v. qq cti cti Cý Cý ci

6. Composition of mixed and polymorphonuclear leucocyte peUets
Blood samples (40mls) were taken from two healthy adult volunteers for leucocyte
pellet preparation and for whole blood leucocyte differential count. Six mixed
leucocyte pellets were prepared from one volunteer and six polymorphonuclear (PMN)
leucocyte pellets from the other. After the last cell wash in each preparation, 0.25mls
were removed for differential leucocyte count using a Coulter counter. The remainder
of the specimen was prepared in the usual way. Differential counting was possible in
every mixed leucocyte preparation and in 4 of the 6 polymorphonuclear specimens.
No red blood cells were detected in any of the leucocyte preparations. Table 3.4
shows the whole blood leucocyte counts and the mean (SD) from each preparation.
Table 3.4: Composition of mixed and polymorphonuclear leucocyte pellets
Total leucocyte Lymphocytes Neutrophils
count M M
I (X 1000/, Ul) I I
Whole blood 8.6 28 62
(Subject 1)
Mixed leucocyte pellet 2.5(0.7) 23(2) 51 (4)
(Subject 1)
Whole blood 7.6 31 64
(Subject 2)
PMN leucocyte pellet 3.3(0.8) 4(l) 91 (2)
(Subject 2) 1 - 1
Fractionation of blood on acid citrate dextran solution leads to a mixed leucocyte
preparation with a differential count similar to that in whole blood. When blood is
added to Ficoll Hypaque gradients a highly purified polymorphonuclear leucocyte
pellet is obtained. To determine whether the different leucocyte count in each preparation affected the leucocyte cystine concentration, mixed leucocyte and
polymorphonuclear leucocyte cystine concentrations were simultaneously determined in 5 healthy adults (see table 3.5, below):
nP 49 BIBL
LONDON (U)NIV
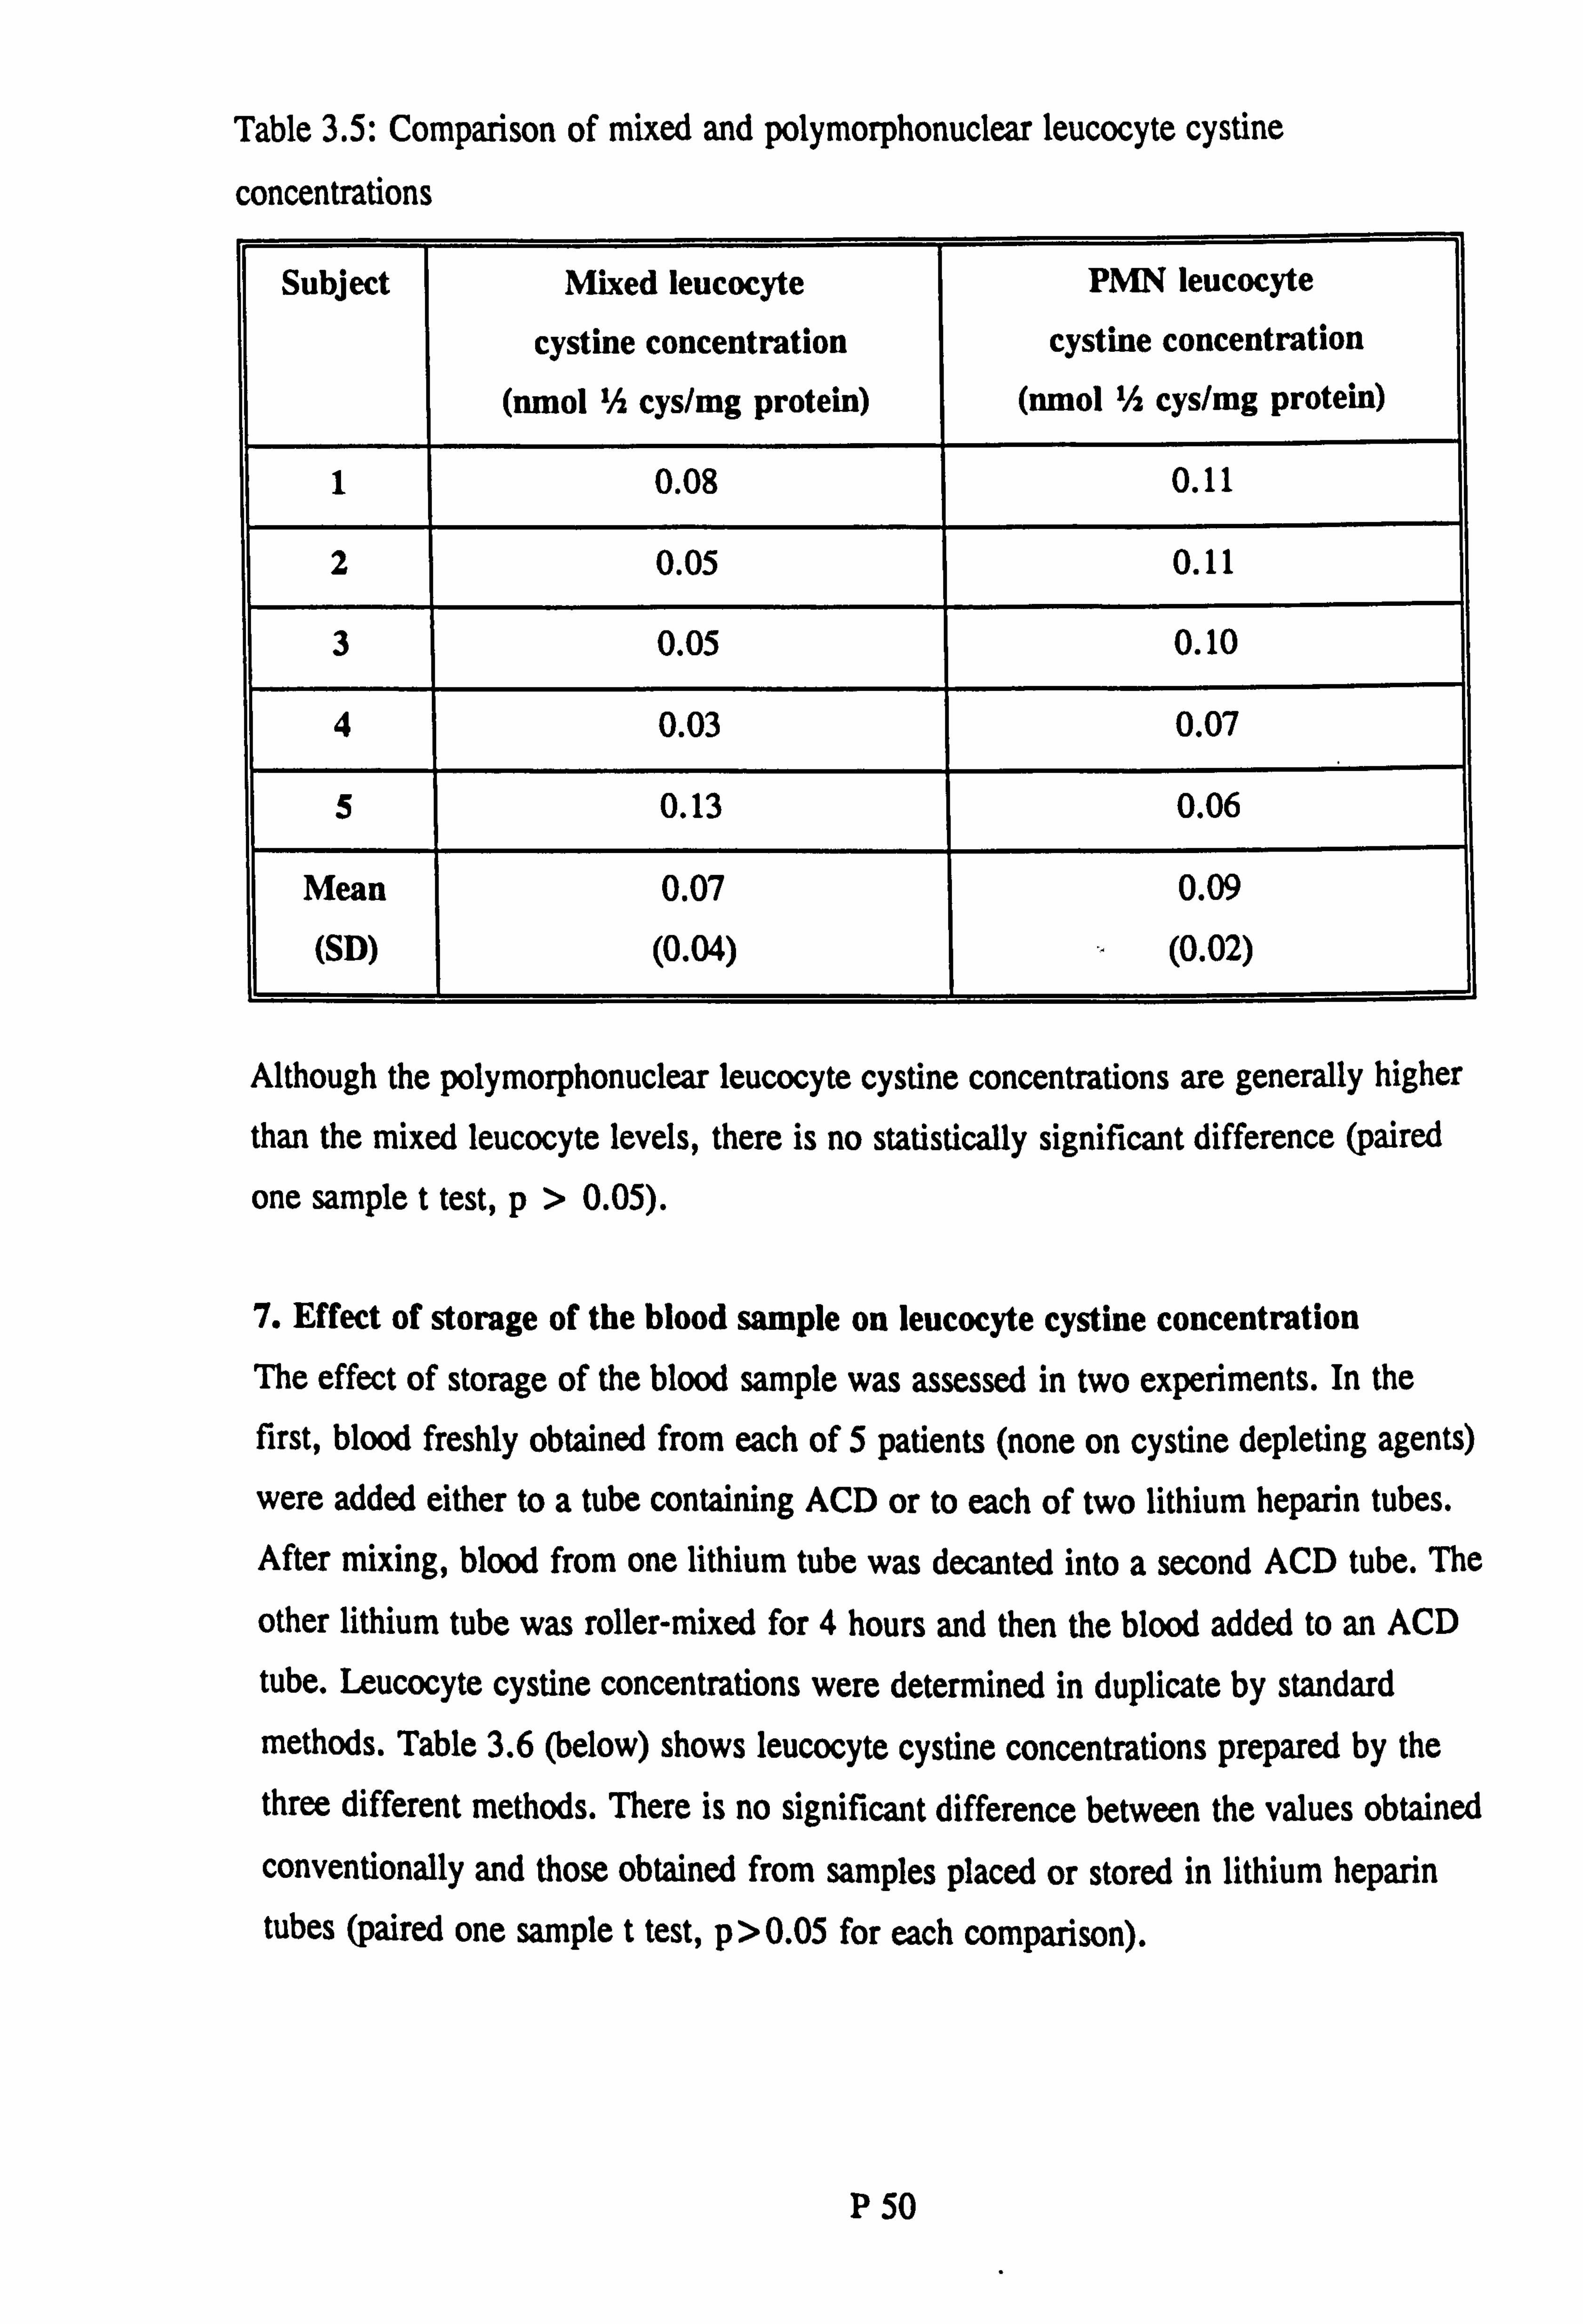
Table 3.5: Comparison of mixed and polymorphonuclear leucocyte cystine
concentraflons
Subject Mixed leucocyte
cystine concentration (nmol Ih cys/mg protein)
PMN leucocyte
cystine concentration (nmol 'A cys/mg protein)
1 0.08 0.11
2 0.05 0.11
3 0.05 0.10
4 0.03 0.07
5 0.13 0.06
Mean
(SD)
0.07
(0.04)
0.09
(0.02)
Although the polymorphonuclear leucocyte cystine concentrations are generally higher
than the mixed leucocyte levels, there is no statistically significant difference (paired
one sample t test, p>0.05).
7. Effect of storage of the blood sample on leucocyte cystine concentration The effect of storage of the blood sample was assessed in two experiments. In the first, blood freshly obtained from each of 5 patients (none on cystine depleting agents)
were added either to a tube containing ACD or to each of two lithium heparin tubes. After mixing, blood from one lithium tube was decanted into a second ACD tube. The
other lithium tube was roller-mixed for 4 hours and then the blood added to an ACD
tube. Leucocyte cystine concentrations were determined in duplicate by standard methods. Table 3.6 (below) shows leucocyte cystine concentrations prepared by the three different methods. There is no significant difference between the values obtained conventionally and those obtained from samples placed or stored in lithium heparin
tubes (paired one sample t test, p>0.05 for each comparison).
P 50

Table 3.6: Effect of storage of blood sample for 4 hours on leucocyte cystine
concentration
Patient Standard ACD Lithium heparin 4h lithium heparin
1 4.34 5.05 4.11
2 7.80 7.95 7.09
3 9.06 9.79 10.03
4 6.55 4.04 3.89
5 5.61 8.35 3.86
Mean
(SD)
6.67
(1.84)
7.04
(2.40)
5.80
(2.73)
The effects of storage were further investigated by comparing the mixed leucocyte
cystine concentration from 6 samples prepared immediately after venepuncture with 6
samples left in either acid citrate dextran or in a lithium heparin tube at room temperature for 24h, 48h or 7 days. Leucocyte pellets could not be prepared from any
of the samples that had stood for 7 days. Figure 3.4 shows the results of the 24 and 48 hour studies. The mean (SD) values are shown in table 3.7.
Table 3.7: Effect of storage of blood sample for 24 and 48 hours on leucocyte cystine
concentration
Control ACD
tube rin Lithium heparin
tube
[F24
hour study 2.35(1.45) 2.62(1.43)
]
2.23(1.13)
48 48 hour study 2.17(1.72) 2.34(0.96) 2.47(0.80)
P 51

Figure 3.4: Effect of storage of blood sample for 24 and 48 hours on leucocyte
cystine concentration
Co
0
C . i= cc CL (D
m
E
0
-c
75
IIIIIi Ln IV m cm T- 0 (ulejoid Ow/sAoZ/ý lowu) eupsAo
CO)
10 0
m cm 0 (ulejoid Bw/sAo?, /L lowu) euqsA3
IIIIII U) le C#) cm V- 0
(ulejoid Bw/sAoz/L lowu) euRSAO
4
'a
0
4
0
C 0 0
IaIII LO 11 Ct) CM T- r"P 52 (uleioid Bw/sha/L lowu) GURSAo

There were no statistically significant differences between the control values and those
obtained after storage for 24 or 48 hours (paired one sample t test, p>0.05 for each
comparison). There were some technical difficulties (mainly poorer fractionation) in
preparing pellets from some of the samples stored for such long periods. Blood
samples should not therefore be routinely stored prior to leucocyte pellet preparation. However, centres unable to prepare leucocyte pellets could send blood in a lithium
heparin tube through the post to a specialised centre without undue loss of accuracy.
Discussion of determination of leucocyte cystine concentration Determination of leucocyte cystine concentration using the methods described, has
proven to be feasible and reliable. The cystine binding protein assay is sensitive,
specific, reproducible and versatile. The assay has a lower limit of detection of 0.03jAmol/1 cystine and is linear to a concentration of 1.5/Amol/l. No interference was found after the addition of Amino Acid Calibration Standards, demonstrating the
specificity of binding to cystine binding protein. Incubation with n-ethylmaleimide also had no effect on the results thus indicating that cysteine and other free thiols do not bind to CBP.
The differential leucocyte count in mixed leucocyte pellets is broadly similar to that in
the whole blood from which the pellets were prepared. In contrast, the purified polymorphonuclear (PMN) leucocyte pellets contained a mean of 91 % neutrophils compared with a value of 64% neutrophils in the whole blood sample. The double Ficoll gradient preparation of PMN pellets is therefore very effective. However, in
normal subjects, the PMN leucbcyte cystine is not significantly different to the mixed leucocyte value.
The preparation of a mixed leucocyte pellet takes approximately 11/2 hours from the time of venepuncture. Experience has shown that up to 6 samples can be prepared at any one time. However, laboratories at hospitals with only one or two cystinosis patients may not be able to direct resources to such a time consuming method. For this reason, the effect of storage of blood samples on leucocyte cystine concentration was studied. No significant difference was found between samples prepared immediately and those stored for up to 48 hours in either acid citrate dextrose-dextran
P 53

solution or in lithium heparin tubes. However pellet preparation was more difficult in
samples stored for 48 hours and such storage cannot normally be recommended. Shorter durations of storage have not been associated with such problems. Therefore smaller laboratories can send the blood sample to a specialised centre to be prepared. It is hoped that such work will make the diagnosis and therapeutic monitoring of cystinosis more accessible. This is of importance since the prognosis is clearly related to the age at which treatment is started.
P 54

Determination of plasma cysteamine
Introduction
The determination of plasma cysteamine was based on the methods of Smolin and
Schneider (Smolin and Schneider, 1988). Plasma was first reduced with sodium borohydride to convert disulphides to thiols. The samples were then applied to a high-
performance liquid chromatography system and the analytes detected
electrochemically. The method was modified for use on a Coulochern electrochemical detection system. This required the determination of the optimal conditions for the
new system (specifically, pH of the mobile phase, operating potentials and the effect
of a screen electrode).
The methods and principles of electrochemical detection are detailed in appendix 2.
Studies on the measurement of plasma cysteamine
1. Recovery of cysteamine foHowing reduction The recovery of cysteamine was studied by reducing cysteamine standards prepared in
water, 1.4% bovine albumin solution and plasma taken from a healthy adult volunteer. These were compared with freshly prepared cystearnine standards that were not reduced. Recovery was assessed at 1,10,50 and 1001M cysteamine. The results are shown in table 3.8.
Table 3.8: Recovery of cysteamine following reduction
Concentration Recovery in
Water
Recovery in
Albumin
Recovery in
Plasma M
0 121 60
10 61 108 94
so 43 86 81
100 47 90 83
P 55

These results demonstrate that protein is required as some form of supporting matrix during derivatisation. In subsequent patient studies, cystearnine standards were
prepared in an aliquot of the patient's pre-dose plasma.
2. Determination of the optimal working and screen potentials Since the combination of analyte, mobile phase and electrochemical cell was new, it
was necessary to define the optimal working potential for the two electrodes. Electrode I was set at 0. IOV and electrode 2 at OV. The mean background current
and response obtained after duplicate injections of 100, umol/I Cysteamine standard
were noted. The potential applied to electrode 1 was increased by 0.05V and the injections repeated. A hydrodynamic voltammogram was constructed by continuing this process until the response had levelled out (see figure 3.5). Likewise a hydrodynamic voltammogram was constructed for electrode 2 (with electrode 1 set at OV), see figure 3.5. Although the response from electrode I is far superior to that from electrode 2, the resulting background current is also much greater and becomes
prohibitively high. The maximal response from electrode 2 was seen at an applied
potential of 0.60V and at this setting there was negligible increase in background
current (see figure 3.6).
The two electrodes in the Coulochem cell allow the first to be set in a Screen mode. In order to define the best combination of electrode potentials in this mode, the
response obtained after injecting the 10014mol/I Cysteamine standard was assessed with electrode 2 set at 0.60V and the potential applied to the Screen electrode, varied. The
results of duplicate injections are shown in figure 3.7. These data suggest that there is
negligible loss of response when the Screen electrode is set at 0.1 OV. Background
current was however, markedly reduced by the use of the Screen mode.
P 56

Figure 3.5: Hydrodynamic voltammogram
N c;
ö
LO
C;
E Nt cz c;
CD 4-8 0
CL Iffia Ci d)
0 0- CL
C\l
cs
lvý
C;
esuodsejýB9d
III10
P 57
04 co CD

Figure 3.6: Effect of increasing working potential on background current
(vd) iuaiino-
N
r D
E D
as
(D 4-0 0 C2.
C*j
c;
1
d
0 ö
I'D
58
LO a LO 0 LO 0 LO cf) CIO 04 C\l Tý T-

Figure 3.7: Effect of screen potential on peak response
esuods9jNB9d
U)
c;
q* C;
ooýN
Cf) ýý> as
0 CL
C\j (D 6 In. C')
CD
d
0 d
p 59
CD LO qqt C, 0 C\l

3. Lower limit of detection, linearity and coefficient of variation Cysteamine standards were prepared in bovine serum albumin at 0,1,5,20 and 100jimol/I and derivatised as detailed in the methods. Samples were injected 6 times
and the mean response calculated. The results (see figure 3.8) demonstrate that the
assay is linear over this range of concentrations. The lower limit of detection is
generally taken as 3 standard deviations of the mean of the zero result. In this assay
the lower limit of detection is therefore 0.42 ; tmol/l. The coefficient of variation at
each concentration is shown in table 3.9 (see below).
Table 3.9: Coefficient of variation of cysteamine assay
Concentration (jumol/l)
Coefficient of
variation
0 29.0
1 39.0
5 12.0
20 4.7
100 4.7
Discussion of determination of plasma cysteamine The development of an assay for plasma cysteamine led to the ability to study the pharmacoldnetics of cysteamine and phosphocysteamine. The methodology of the assay described in this thesis is based on that developed by Smolin and Schneider, 1988. However, since a different electrode was used, new operating potentials needed to be ascertained. In addition the recovery of cysteamine standard from water, albumin and plasma was studied. These results suggested that the presence of protein in the sample acted as a support matrix for cysteamine. The cysteamine assay was found to have a lower limit of detection of 0.42timol/I and was linear over a concentration range of I- 10014moVI.
P 60

Figure 3.8: Cysteamine standard curve
0
0 Co
oooft%
am
=L
esuodsell
0(1) cDE.
cu 0 4-0 Co
(: > (Z
ge E Co Co CL
0
C\l
0
61
0 Co Co qe CM

Samples were batched for analysis of plasma cysteamine. Prior to running each batch,
there were commonly difficulties in re-establishing the optimal working conditions of
the system. These are difficulties common to most electrochemical detection systems. Further work is required to improve the determination of cysteamine in biological
samples so that new formulations of the drug can be studied.
P 62

Chapter 4: CHnical features of cystinosis
Introduction
Children with early onset cystinosis present with manifestations of the renal Fanconi
syndrome usually in the second half of infancy (Gahl et al., 1989). Without specific
treatment to reduce the toxic effects of cystine accumulation, patients develop
progressive renal glomerular failure and require renal replacement therapy (usually a
renal transplant) at the end of their first decade. Even if this is successful, the
metabolic defect remains in non-renal tissues and longterm manifestations of cystinosis
supervene.
Patients with the rarer late-onset (or intermediate) form of cystinosis present after 18
months of age, usually with proteinuria and chronic renal impairment (Goldman et al., 1971). Benign cystinosis is extremely rare and is diagnosed in individuals who have
no renal pathology but have corneal crystal deposition seen on slit lamp examination (Cogan et al., 1957). Such individuals are entirely asymptomatic.
Historical perspective
Abderhalden is credited with the first description of a patient with cystinosis (see
McCune et al., 1943, for review). Abderhalden described a boy of 21 months who had died of "inanition", whose kidneys, intestines, liver, spleen and mesenteric glands contained "chalky foci" in which he identified cystine crystals. This boy, two brothers, the father and the grandfather were all described as having "cystinuria".
Several independent authors (including Lignac, Fanconi, de Toni and Debrd) reported the association of severe rickets, dwarfism, glycosuria and albuminuria. (see McCune
et al., 1943, for review). Fanconi suggested the concept of tubular damage as opposed to glomerular dysfunction and gave this the name of "nephrotic-glycosuric dwarfism
with hypophosphataemic rickets. " The authors mentioned above were credited with the
eponym but McCune et al. shortened it to the now familiar "Fanconi syndrome".
The association between cystine storage and the Fanconi syndrome was seen in II of 39 children with rickets and glycosuria, reviewed by McCune et al., (McCune et al., 1943). Freudenberg reviewed 17 previously published cases of cystinosis and noted
P 63

the similarities between this disorder and the Fanconi syndrome (Freudenberg, 1949).
Cystinosis remains the commonest inherited cause of the Fanconi syndrome although there are many other causes (see chapter 2: "The renal Fanconi syndrome").
The demonstration of cystine in the urine and tissues of Abderhalden's patient led
workers to believe that cystinuria and cystine storage disease were due to the same basic abnormality of cystine metabolism. Lignac described a boy of 3 years age with rickets, glycosuria and cystine deposits in the renal cortex (McCune et al., 1943). Russell and Barrie described 3 children with renal failure, two of whom had cystine crystals in the liver, the third having cystinuria (Russell and Barrie, 1936). The first
child had polyuria, glycosuria, severe renal rickets and was extremely small (height 91cms, weight 18.49kg at 12 years). She died from the complications of renal failure
at 12 years of age. The second child was described as having rickets as a young child (but had no skeletal abnormality at the time of his death at 16 years), polyuria, glycosuria and again died in renal failure. The last child had had 2 operations to
remove cystine calculi from the bladder and right ureter. He also died from terminal
renal failure at the age of 13 years. With hindsight, it would seem that the first of Russell and Barrie's cases had infantile cystinosis and followed a typical course. Their
second case did not have severe rickets and there is no comment on whether his
stature was small. Noting also that he died of renal failure at 16 years (considerably later than at 10 years, the mean age of onset of end-stage renal failure for infantile
cystinosis) it is possible he might have had "late onset" cystinosis. Russell and Barrie,
considering all the above cases, conclude: "there can be little doubt that cystinuria and cystinosis are due to one and the same disturbance ofprotein metabolism". They
argued that renal rickets in thege cases could be explained by damage to the kidney by
continued excessive excretion of cystine in the urine and speculated that "the deposition of cystine in tissues might be regarded as a secondary retention phenomenon".
This confusion between cystinuria and cystinosis may be explained in two ways. Firstly, children with cystinosis have a generalised aminoaciduria, of which cYstine is one part. The excessive excretion of dibasic amino acids (cystine, lysine, ornithine and arginine) seen in cystinuria, was not however, observed. Secondly, children with cystinuria in whom calculus formation leads to urinary obstruction and infection, will
P 64

suffer progressive renal damage unless the condition is treated. It is thus not
surprising that early workers reported children with cystinuria, dying from renal failure.
Major advances in the description and understanding of the pathogenesis of cystinosis
were made by Bickel et al. in a review of the clinical, biochemical and pathological features of 14 cases (Bickel et al., 1952). These workers found that the arninoaciduria in cystinosis was generalised and therefore different to that in cystinuria. Bickel
stated: "cystine storage in Lignac-Fancon! disease is the result neither of renal damage nor of cystinuria alone. " Secondly, Bickel's group correctly surmised that
cystine accumulated at the site of its production from protein hydrolysis: "7he
intracellular localisation of cystine crystals is stressed, and histopathological and
experimental evidence is given for the assumption that cystine storage is not due to
phagocytosis, but that cystine crystallizes at the site of its formation, namely in a
certain part of the reticuloendothelial system. "
Subsequently the site of cystine storage was found to be the lysosome and the
underlying biochemical abnormality a defect in cystine transport (see chapter 2: "Demonstration of a defect in lysosomal cystine transport"). Coincident with these
advances were improved methods of diagnosis. Traditional methods relied on the demonstration of cystine crystals in fissue biopsies, usually from conjunctiva or lymph
node. Schneider et al. published evidence that the leucocyte cystine concentrations were significantly elevated in patients with cystinosis (Schneider et al., 1967). This
allowed easy diagnosis and provided a means of therapeutic monitoring when cysfine- depleting agents were discoverea.
Presentation of early-onset (infantile) cystinosis Symptoms
Patients with cystinosis appear normal at birth (Gahl et al., 1989) and grow well for the first few months of life. Symptoms usually become prominent in the second half
of infancy although some parents note abnormal symptoms at a much earlier age. In a recent review of 59 patients with cystinosis in the UK, the median age of onset of symptoms was II months (range 4- 176), (see chapter 6: "Results: patients") .
P 65

Typical symptoms include poor weight gain or weight loss, inadequate and fussy
feeding, vomiting, constipation, lethargy, weakness, excessive thirst, polydipsia and
polyuria. Direct questioning may reveal that the child has a dislike of bright light as a
result of corneal cystine deposition (see below). Large quantities of dilute urine are
passed each day and parents may comment on the need for "double nappies" or on the fact that bedclothes are dripping wet from urine. A history of the child drinking two
to three 500ml. bottles of water at night is not uncommon. Recurrent episodes of fever and dehydration may occur (see chapter 4: "Miscellaneous findings"). The
weakness may be profound and can lead to an inability to bear weight or walk. One
child under the care of Guy's Hospital, presented having "gone off his feet". A
common finding is that children with cystinosis like salty and spicy foods even whilst still in infancy (Gahl et al., 1989). Two of the children recently referred to Guy's Hospital had a habit of dipping their fingers into salt pots or jars of Marmite. Such behaviour led in one case to the family being referred for psychiatric counselling before the diagnosis of cystinosis was made. Another child at Guy's Hospital
presented to their local hospital at the age of 18 months with a femur fractured after a minor injury and was subsequently found to have rickets secondary to cystinosis.
Some children die before a diagnosis can be made. In one case a child presented to a paediatric department in a state of collapse at the age of 16 months (N Mann, personal communication). She was extremely small (weight and length << 3rd centile) and in
a state of cardiovascular collapse. Despite aggressive treatment she died 5 hours after admission. Urinalysis had shown proteinuria and ketonuria, radiographs showed florid rickets and post mortem histology demonstrated crystalline deposits in lymph
node, spleen and liver. These wire subsequently shown to be cystine crystals, confirming the diagnosis of cystinosis. Early reviews of cystinosis contained many reports of such cases, diagnosed only at post mortem examination (Worthen and Good, 1958).
Examination
The most striking feature on examination of children with cystinosis is their short stature and wasting. The mean height standard deviation score of 6 children aged 0.67
- 1-94y) presenting to Guy's Hospital since 1989, was -3.10 (range -2.09 to -3.9 1). Thus normal growth parameters in a newly presenting case make the diagnosis of
P 66

infantile cystinosis unlikely.
Cystinosis is not associated with dysmorphic features although the patient's appearance
can be characteristic. Typically, there is frontal bossing, blond hair and a protuberant
abdomen. Most Caucasian patients have a fair complexion and light or blond hair
although the presence of dark hair does not exclude the diagnosis. A cause for the
paler skin and hair has yet to be found, although Gahl et al. has speculated that it may be related to impaired melanosome function since melanosomes are the melanocyte
counterparts of lysosomes (Gahl et al., 1989). At the time of diagnosis, hair may be
sparse and thin. Following rehydration, electrolyte replacement and treatment with
cysteamine, parents often comment that hair growth improves and that it also darkens.
Children of other racial groups (eg. African, Middle Eastern, Pakistani) have a
complexion identical to their unaffected siblings.
Skeletal changes Head circumference is not affected by the growth failure. Frontal bossing secondary to rickets is commonly seen and may persist throughout childhood. Other more
marked signs of rickets may be noted, including swelling of the wrists (due to
metaphyseal widening), "rachitic rosary" (swelling of the costo-chondral junctions)
and genu valgum. As noted above one patient presented after sustaining a fractured femur.
Radiological changes, best seen in the rapidly growing distal ends of the ulna and radius, include rarefaction, fraying of the provisional zone of calcification and
widening and concavity of the metaphyses. Cupping of the end of the shaft is an advanced feature. In the longterm, angulation deformities (eg. genu valgum/varum) can occur due to displacement of the epiphyseal cartilage during the active growth stage (Silverman, 1993). The bone age is delayed with respect to chronological age. In the above series of 6 patients presenting to Guy's Hospital, the mean bone age delay was 0.76y (range 0.17 to 1.11 y).
Ocular manifestations Photophobia is the earliest symptom of ocular involvement and is due to deposition of cystine crystals within the cornea. Demonstration of corneal crystals requires slit lamp
P 67

examination by an experienced ophthalmologist. Crystals are not present in the
neonatal period but can usually be seen by one year of age (Wong, 1972). Thus the
inability to see corneal crystals does not exclude the diagnosis of cystinosis in an infant whilst their demonstration is virtually pathognomonic. The crystals are fusiform
or needle-shaped and are found in the stroma beneath the epithelium. In adults a
similar appearance is seen in patients with myeloma (Wong, 1972). Slit-lamp
examination of the conjunctiva reveals a ground-glass appearance, again due to crystal deposition.
Fundoscopy may reveal a patchy depigmentation of the retina with peripheral clumps
of pigment. The retinal changes may precede the corneal features and have been
observed as early as 5 weeks of age (Wong, 1972). In addition the retina may be
generally hypopigmented (the "blond fundus"). Longterm ocular manifestations of
cystinosis are described later in this chapter.
Plasma and urine biochemistry
In most newly-presenting patients the abnormalities on routine urinalysis and/or
plasma biochemistry provide the first clues to the diagnosis since they will reveal features of the renal Fanconi syndrome. The results from a nine month old child who
recently presented to Guy's Hospital illustrate the abnormalities:
Urine:
pH 6, glycosuria, trace proteinuria Blood:
Sodium 132mmol/l, potassium 1.7mmol/l, chloride 107mmol/l, urea 2.1 mmol/l, creatinine 50, umol/l, calcium 2.63mmol/l, phosphate 0.61mmol/l, magnesium 0.96mmol/l, albumin 51g/l, total bilirubin lOjAmol/l, aspartate transaminase 17iu/1,
alkaline phosphatase 711 iu/1.
pH 7.49, PaC02 2.64kPa, Standard bicarbonate 15.3mmol/l, base deficit - 9. Ommol/l.
This patient therefore had hyponatraemia (with vascular contraction suggested by the increased albumin level), severe hypokalaemia and hypophosphataemia. Such volume contraction would lead to secondary hyperaldosteronism causing further urine loss of potassium. The standard bicarbonate was low, compensated by a low PaCO2but the
P 68

degree of hyponatracmia, volume contraction and hypokalaernia was so severe that the
pH was elevated, reflecting a metabolic alkalosis.
Urinary pH is often paradoxically high unless the depletion of bicarbonate is so severe
as to reduce the tubular luminal bicarbonate concentration below the threshold for
reabsorption. In this case urinary pH may be less than 5. Urinary osmolality is low
(< 300 mosmol/1), (Gahl et al., 1989). There is a generalised aminoaciduria, contrasting with cystinuria in which only the dibasic amino acids (cystine, lysine,
ornithine and arginine) are excreted in excess.
Rarely cystinosis can present with features of Bartter's syndrome (Lemire et al., 1978), nephropathic diabetes insipidus or pseudohypoaldosteronism (Lemire and
Kaplan, 1984).
There are no abnormalities of plasma bilirubin or transaminases in cystinosis children
presenting in infancy. Abnormal biochemical indices of hepatic function would suggest
an alternative cause of the Fanconi syndrome (eg. tyrosinaemia or fructosaemia).
Glomerular filtration rate at diagnosis
The plasma creatinine is often within the normal range at the time of diagnosis (unless
the diagnosis is either very late, eg. over 3-4 years of age, or the child has "late-
onset" cystinosis - see below). However if the child is very dehydrated, there may be
a fall in plasma creatinine concentration with fluid and electrolyte therapy.
Formal measurement of glomerular filtration rate, using a single injection inulin
clearance method, was therefore undertaken in 6 children, mean age 15.3months (range 8- 23), newly-presenting to Guy's Hospital (for methods, see Montini et al., 1989). All the children were in a stable state of hydration and the test was performed after an overnight fast. Table 4.1 shows the results of these studies:
P 69

Table 4.1: Glornerular filtration rate in newly-diagno patients
Patient Inutest GFR
(mls/min/1.73m)
Estimated GFR (Schwartz et
al., 1976)
MD 95 55
DC 34 38
RH 63 54
LE 46 43
Rj 60 51
I OB 1 112 1 80 1
Mean ± SD 68 ± 30 1 54 ± 15
Metabolic bone disease and mineral homeostasis
In the 9 month old newly-presenting patient whose results are detailed above, the
parathyroid hormone (iPTH) concentration was below the limit of detection (< I
ng/1). Presumably the severe hypophosphatemia (0.61mmol/1) led to an increase in 25-
(OH)DO-a-hydroxylation, increasing bone resorption and intestinal calcium
absorption. The slightly increased plasma calcium (2.63mmol/1) would serve to
suppress PTH secretion.
Correction of the acidosis with sodium bicarbonate and of the hypophosphataemia with
phosphate supplements, led to this child developing frank tetany approximately 1-2
weeks after admission. This sequence of events was seen in five of the last eight
children admitted in a state of dehydration. Hypomagnesaemia can also contribute to
the occurrence of tetany.
The serum alkaline phosphatase is usually raised at the time of diagnosis, reflecting active rickets. Vitamin D metabolism has been studied in a group of 10 cystinosis patients with varying degrees of renal impairment (Steinherz et al., 1983). None were
P 70

receiving cysteamine or phosphocysteamine but they were all talcing bicarbonate and Vitamin D supplements. No evidence of total calcidiol (25-hydroxyvitamin D)
deficiency was found although levels of 24,25-dihydroxyvitamin D and 1,25- dihydroxyvitamin D were low in some patients, in proportion to their renal parenchymal damage. Deficient 25-(OH)D3-1-a-hydroxylation is also a potential cause
of reduced 1,25-dihydroxyvitamin D levels.
Haematology
Haematological indices may be normal or may show a mild anaemia, variable leucocyte count and high platelet count (Gahl, 1986a). The anaemia may initially be
due to iron deficiency but in an older child with cystinosis, may have a variety of
causes (Gahl et al., 1989). The erythrocyte sedimentation rate and platelet count can be high and remain so, although no explanation has been given for these findings
(Gahl, 1986a).
Thyroid function tests
Thyroid function tests are usually normal at the time of presentation (Gahl, 1986a)
although one patient presenting at Guy's Hospital at the age of 9 months already had
an abnormally high TSH level with a free T4 concentration at the lower limit of the
normal range. In the second and third decades of life, abnormalities of thyroid
function become increasingly common (see below "Endocrine function in cystinosis").
Urinary excretion of low molecular weight proteins The excretion of low molecular weight (LMW) proteins and tubular enzymes are increased in cystinosis. LMW proteins such as retinol. binding protein (RBP) and 82,
microglobulin 02-M), are freely filtered through the glomerulus, reabsorbed by
endocytosis in the proximal tubule and catabolised in the tubular cell lysosomes. In healthy Iddneys, the reabsorption of LMW proteins is estimated to be 99.9% complete (Tomlinson, 1992). Even minor degrees of proximal tubular dysfunction may therefore be associated with an increased LMW protein excretion.
Random urine samples from 10 newly-diagnosed patients, aged 8-25 months, were collected prior to cysteamine therapy. The mean glomerular filtration rate, estimated in 7 patients, either using the Inutest (n = 6) or chromium-EDTA (n = 1) single
P 71

injection method, was 68 mis/min/1.73e.
The concentrations of retinol binding protein (RBP), B2-microglobulin 02-M), albumin (Alb), N-acetylglucosaminidase (NAG) and alanine aminopeptidase (AAP) were determined using standard methods (Tomlinson et al., 1990; Marulin, 1976; Jung and Scholz, 1980). 82-microglobulin is unstable in acid urine, however all the samples in
the above series had a pH > 7. Table 4.2 shows the median results and ranges, with
normal geometric mean values (Tomlinson et al., 1990; Tomlinson et al., in press):
Table 4.2: Urinary excretion of low molecular weight proteins in newly-diagnosed
patients
Protein/enzyme Normal range Cystinosis
RBP (n=8) 8.1 84,586
(mg/mol creat) (< 1-24.5) (54,289-136,904)
82-m (n=3) 9.8 90,642
(mg/mol creat) (6-40.7) (71,651-97,424)
Alb (n = 8) 0.52 143
(g/mol creat) (0.014-1.17) (89-231)
NAG (n=10) 6.8 3460
(mmol. /pNP/h/mol creat) (1.8-25) (831-6618)
AAP (n=5) 0.94 19.1
(u/mol creat) (0.17-1.62) (8.4-36.7)
Note: n= number of patients analysed for each urine marker
These data confirm the grossly elevated excretion of LMW proteins and tubular enzymes in cystinosis (for review, see Waldmann et al., 1972). Data on the increased
excretion of alanine aminopeptidase in cystinosis have not previously been reported. The excretion of albumin was also increased, but to a lesser extent.
P 72

Urinary camitine excretion
The reabsorption of carnitine from the proximal tubule is also impaired. Bernadini et
al found that the fractional excretion of free and acyl carnitine in children with
cystinosis was increased (32 and 27% respectively) compared to normal controls (2.8
and 5.3% respectively) (Bernadini et al., 1985). This led to a deficiency of plasma
free carnitine. In two cystinosis patients who underwent muscle biopsies, the levels of
total and free carnitine were reduced compared to normal controls.
Confirmation of the diagnosis
There is often a substantial delay between the onset of symptoms and confirmation of
the diagnosis of cystinosis. In a recent review of 58 patients in the UK (see chapter
6), the median age at which the diagnosis was made was 19.6 months (range 0-100)
giving a median delay between onset of symptoms and diagnosis of 6 months (0-100).
There is evidence in North America that paediatricians have an increased awareness of
the condition, based on a reduction in the age of diagnosis from 51.3 ± 12.3 (SEM)
months for children born between 1958 and 1964, to 27.6 ± 4.1 months for those
born between 1970 and 1974 (Gahl et al., 1986b).
The best method of confirming the diagnosis clinically is by the demonstration of
corneal cystine crystals using a slit-lamp. This requires an experienced
ophthalmologist but is non-invasive and diagnostic. However crystals may not be
apparent in infancy and can easily be missed (see above: "Ocular manifestations"). Failure to demonstrate crystals in an infant does not therefore exclude the diagnosis.
All children in whom the diagnosis is suspected should therefore have the leucocyte
cystine concentration determined. This requires a 3ml venous blood sample, processed
according to the methods detailed in appendix I ("Mixed leucocyte cell pellet
preparation; Determination of the cystine concentration"). When necessary a result can be given within 24 hours. For centres unable to prepare a leucocyte pellet, blood can be sent by courier to the appropriate laboratory. Figure 4.1 shows the leucocyte
cystine concentrations in 32 patients (prior to treatment with cysteamine) either
P 73

Figure 4.1: Mixed leucocyte cystine concentrations in patients and controls
OOOMR% C\l CIO 11 a %humoo
* All-40*410 * 4mmow 40* 404w (1)
a.
000,00%
a
U) 0 LM
IIIIIIIIIIIII co co qq C\j
(uielojd 6wl sAo Z/L lowu) euilsAC) P 74

referred to Guy's Hospital or for whom a leucocyte pellet/blood was sent for this
assay, compared with those of 14 controls (healthy volunteers or patients with other diagnoses). The mean (SD) leucocyte cystine concentration in this group was 5.78 ± 2.49 nmol Ih cystine per mg protein (median 5.62, range 1.57-11.84). For the control
group the mean value was 0.10 ± 0.05 nmol 1/2 cystine per mg protein (median 0.10,
range 0.03-0.18). An elevated cystine concentration can also be found in skin fibroblasts. This is, however, an inconvenient method of diagnosis since it is more invasive and requires several weeks of cell culture before the assay can be performed.
Prior to the advent of a reliable assay for leucocyte cystine concentration, a variety of
other methods were used to confirm the diagnosis. Cystine is found in abundance in
hair in normal and in cystinosis patients. Analysis of hair amino acids after acid hydrolysis showed no differences between samples from children with cystinosis and
those from normals (Vellan et al., 1969). In contrast, infra-red spectroscopy of
cystinosis hair samples gives a spectrum sufficiently different from normals for the
method to be used as a means of diagnosis (Lubec et al., 1983).
Demonstration of cystine crystals in biopsy tissue was a frequent method of diagnosis. Crystals can be seen in biopsies of the kidney (see below), lymph node (Patrick and Lake, 1968), conjunctiva (Schulman et al., 1970c), rectum (Holtzapple et al., 1969)
and in bone marrow aspirates (Schneider et al., 1969).
Pre-symptomatic diagnosis With the advent of cysteamine therapy, many North American parents with an affected child no longer wish to have prenatal diagnosis for subsequent pregnancies (Schneider JA, personal communication). For such couples, pre-symptomatic diagnosis of the newborn baby is possible using either umbilical cord blood or samples of the placenta (Smith et al., 1989).
P 75

Clinical course and longterm manifestations of cystinosis Introduction
Although children with cystinosis present with features of renal tubular dysfunction,
cystinosis is a multisystem disorder. An illustration of this is given by the cystine
concentrations determined in post mortem tissue samples taken from a9 year old child
(SM) with cystinosis who died from fungal septicaernia during intensive
immunosuppression after renal transplantation. Samples were analysed as described in
appendix 1 and the results (in nmot 1h cystine per mg wet weight) are shown together
with results from other groups, in table 4.3 below. Published values are mainly from
post mortern studies of a 25 year old woman with cystinosis (Jonas et al., 1987).
Kidney
Change in glomerular filtration rate Without treatment glomerular damage progresses inexorably but at a variable rate.
The plasma creatinine concentration may remain stable for several years but will then
increase exponentially as the child develops chronic glomerular failure. Plasma
creatinine concentration may not however be as good a guide to glomerular filtration
rate as in other some renal conditions since children with cystinosis often have severe
muscle wasting. Progression to end-stage renal failure has been observed to occur as
early as 30 months (Schnaper et al., 1992) but usually occurs at the end of the first
decade. In a review of 205 patients with cystinosis, studied before the advent of
cysteamine, the mean age of renal death was 9.2 years (Gretz et al., 1982). In a
review of British children with cystinosis, cross-sectional analysis of the patients'
reciprocal creatinine concentrations at the start of cysteamine therapy plotted against
age revealed a linear relationship with a calculated age of renal death of approximately
. 10 years (see chapter 6: "Results"). A similar age of renal death was calculated in an
earlier North American review (Gahl et al., 1990).
As the child's glomerular filtration rate falls so the urinary fluid and electrolyte losses
are also reduced. Less electrolyte supplements are required and the child appears to be
"getting better". As chronic renal impairment progresses, salt, water, potassium and phosphate restriction is required. Renal transplantation is discussed in chapter 5.
P 76

Table 4.3: Tissue cystine concentrations
Tissue Patient SM Other groups Normal values
Cerebral cortex 1.1 10 0.25
Cerebellum 0.6 11 0.38
Pituitary 135 154 0.19
Thyroid 105
Parathyroid 88
Adrenal 1210 137
Pancreas 1080 102 0.37
Ovary 225 47 0.54
Uterus 97 60 0.10
Heart muscle 23 50 0.02
Skeletal muscle 15 11 0.02
Aorta 48 100 0.31
Skin 135 65 1.3
Liver 413 537 0.43
Spleen 191 0 427
Kidney 820 124 0.25
Lymph node 900 62 0.33
(Units: nmol 1/2 cystine per mg protein)
P 77

The mechanism whereby cystine accumulation leads to tubular damage is discussed in
chapter 2 ("Mechanisms of cystine toxicity in cystinosis"). The cause of progressive
glomerular failure in cystinosis is not known. There is increasing evidence that early
and aggressive use of cysteamine leads to slower progression of glomerular renal dysfunction (see chapter 5: "The use of cysteamine and phosphocysteamine"). Since
cysteamine reduces the lysosomal cystine content, it is likely that the accumulation of
cystine is involved in the glomerular toxicity. This does not preclude cysteamine having another as yet undefined, therapeutic action.
Renal histology
Renal biopsy is not routinely undertaken in children with cystinosis. Renal histology
varies between relatively minor changes and "end-stage" kidneys (Spear, 1974). The
proximal tubule is involved by epithelial degeneration with characteristic "ballooning
out" of the cytoplasm. Microdissection may reveal a "swan-neck" thinning and
shortening of the proximal tubule, a feature seen in many causes of the Fanconi
syndrome and one that makes distinction between different segments of the nephron difficult. Cystine crystals are not always seen but, if visualised, are present in the interstitum.
Changes in the glomeruli are also variable. There may be multinucleate giant cell transformation of podocytes (visceral epithelium). The distribution of this change does
not parallel the site of cystine crystal deposition. There is mesangial cell proliferation and changes of hyalWsation may be seen. The basement membrane may be normal, thick or split. Interstitial tissue shows fibrosis and Spear reported the presence of dark bodies mainly in macrophages but also at other sites (Spear, 1972). These dark inclusion bodies were further studied and found to contain an elevated content of cystine. They have also been described in biopsies from kidneys transplanted into
children with cystinosis (Spear et al., 1989). These authors have speculated that cystine accumulation may not be localised to the lysosome.
Other factors leading to deterioration in renal function Saleem et al. found that out of 22 children studied, 17 had an increased urinary calcium/creatinine ratio and all 22 had features of nephrocalcinosis on ultrasound (Saleem et al., 1992). Strife et al. reported the development of gross structural
P 78
q

abnormalities of the genitourinary tract in two children with cystinosis (Strife et al., 199 1). An 11 year old boy was found to have megacystis, grossly dilated ureters and hydronephrosis in the absence of bladder outlet obstruction. He had had a normal intravenous urogram at 2 years of age. A vesicostomy led to his renal function, which had been deteriorating rapidly, returning to a stable state. A 16 year old girl was found on ultrasound examination, to have extensive renal cysts which the authors postulated might have been related to longstanding hypokalaemia. These reports serve to highlight that children with cystinosis require intensive follow-up to minimise the progression of their disease.
Growth
Short stature is an almost universal feature of patients with cystinosis. Figures 4.2 and 4.3 demonstrate the growth of 9 pre-transplant children (5 boys, 4 girls) at Guy's
Hospital (normal data are taken from Tanner et al., 1966). The effects of recombinant human growth hormone treatment are shown by the "hatched" lines (for further
details, see chapter 5: "Hormone replacement in cystinosis"). Figure 4.4 shows the
same data converted to height standard deviation scores. Most children are growing at
an approximately normal rate but remain 3 standard deviations below the mean. The
degree of growth retardation is out of proportion to the extent of renal damage. Chronic acidosis, loss of electrolytes as a result of the Fanconi syndrome, rickets and the effects of cystine accumulation in bone and other organs (eg. thyroid) may all
contribute to the poor growth. Nutritional intake is also poor in most children with cystinosis. Endocrine abnormalities in cystinosis are discussed below.
Growth is improved by treatment with cystine-depleting agents (see section on treatment). Final height, however, remains short even after renal transplantation. In a European review of 123 patients with cysfinosis receiving renal replacement therapy, only 8 patients had heights above the third centile for age (Ehrich et al., 1992). Bone age was severely retarded in almost all patients. Only 19% of these patients received cysteamine or phosphocysteamine and no data on dosage or cystine concentrations were reported. In transplanted patients, immunosuppression with steroids is an additional factor leading to growth retardation.
P 79

Figure 4.2: Growth Of 5 pre-transplant bOYs at GuY's Hospital
N
0
00
25 a) C)
r CD Co r=
8 (SWO) 14619H
co
q*
CM
0
P 80
0
co

Figure 4.3: Growth of 4 pre-transplant girls at Guy's Hospital
(SWO) 146109H
1
cm
Tý
0
00
(D
q*
C\l
0
P 81
0000000000
co CD q* CM 0 co co lq; t C\j 7ý Tý Tý Tý lrý

Figure 4.4: Height standard deviation scores for 9 pre-transplant children at Guy's
Hospital
CM Tý
0 1
co
0 ý-
co
q*
C\l
0
SOS 146169H P 82
CM m M* LO

Endocrine function in cystinosis 1. Thyroid
Abnormalities of thyroid function are common in cystinosis and are unrelated to renal dysfunction. These may vary from mild elevation of thyroid stimulating hormone
(TSH) to frank clinical hypothyroidism. Pathologically there is thyroid follicular cell
atrophy with collapse and condensation of the connective tissue framework (Chan et
al., 1970). Burke et al. found an exaggerated response of TSH to thyrotropin releasing hormone (TRH), suggesting impaired thyroid reserve compared to control children
with chronic renal failure (Burke et al., 1978).
The frequency of hypothyroidism increases with age but elevation of the TSH
concentration has been seen as early as 9 months of age (van't Hoff W, personal
communication). Fifty-two percent of 123 European children with cystinosis on renal
replacement therapy (aged 7-25 years) had hypothyroidism (Ehrich et al., 1992). In
two French reviews, 56% of patients aged 8-16 years and 79% of patients aged 15-26
years were hypothyroid (Broyer et al., 1981; Broyer et al., 1987). Similar figures
have been reported in a North American review (Gahl et al., 1986b).
2. Growth hormone
Preliminary reports suggest normal growth hormone (GH) secretion in cystinosis. Wilson et al. studied physiological and pharmacologically-induced GH secretion in 2
children (Wilson et al., 1989). GH secretion was stimulated to normal levels after
glucagon but not arginine. The frequency and maximum peak concentrations of
spontaneous GH secretion were also normal but the mean integrated concentration was
slightly lower than normal. In an initial report of the European multicentre study of
growth hormone treatment in cystinosis, overnight GH concentration profiles in 8
patients were not statistically different from controls with chronic renal failure (van't
Hoff et al., 1993).
Overnight GH profiles have been measured in 4 prepubertal (pre-transplant) patients, aged 5-12 years, at Guy's Hospital (see figure 4.5). All 4 patients achieved a peak GH concentration of > 20mu/I and the profiles can therefore be regarded as "normal". However, the GH level should become virtually undetectable between peaks, and this is seen in only one patient (SV) on one occasion (Stanhope R, personal
P 83
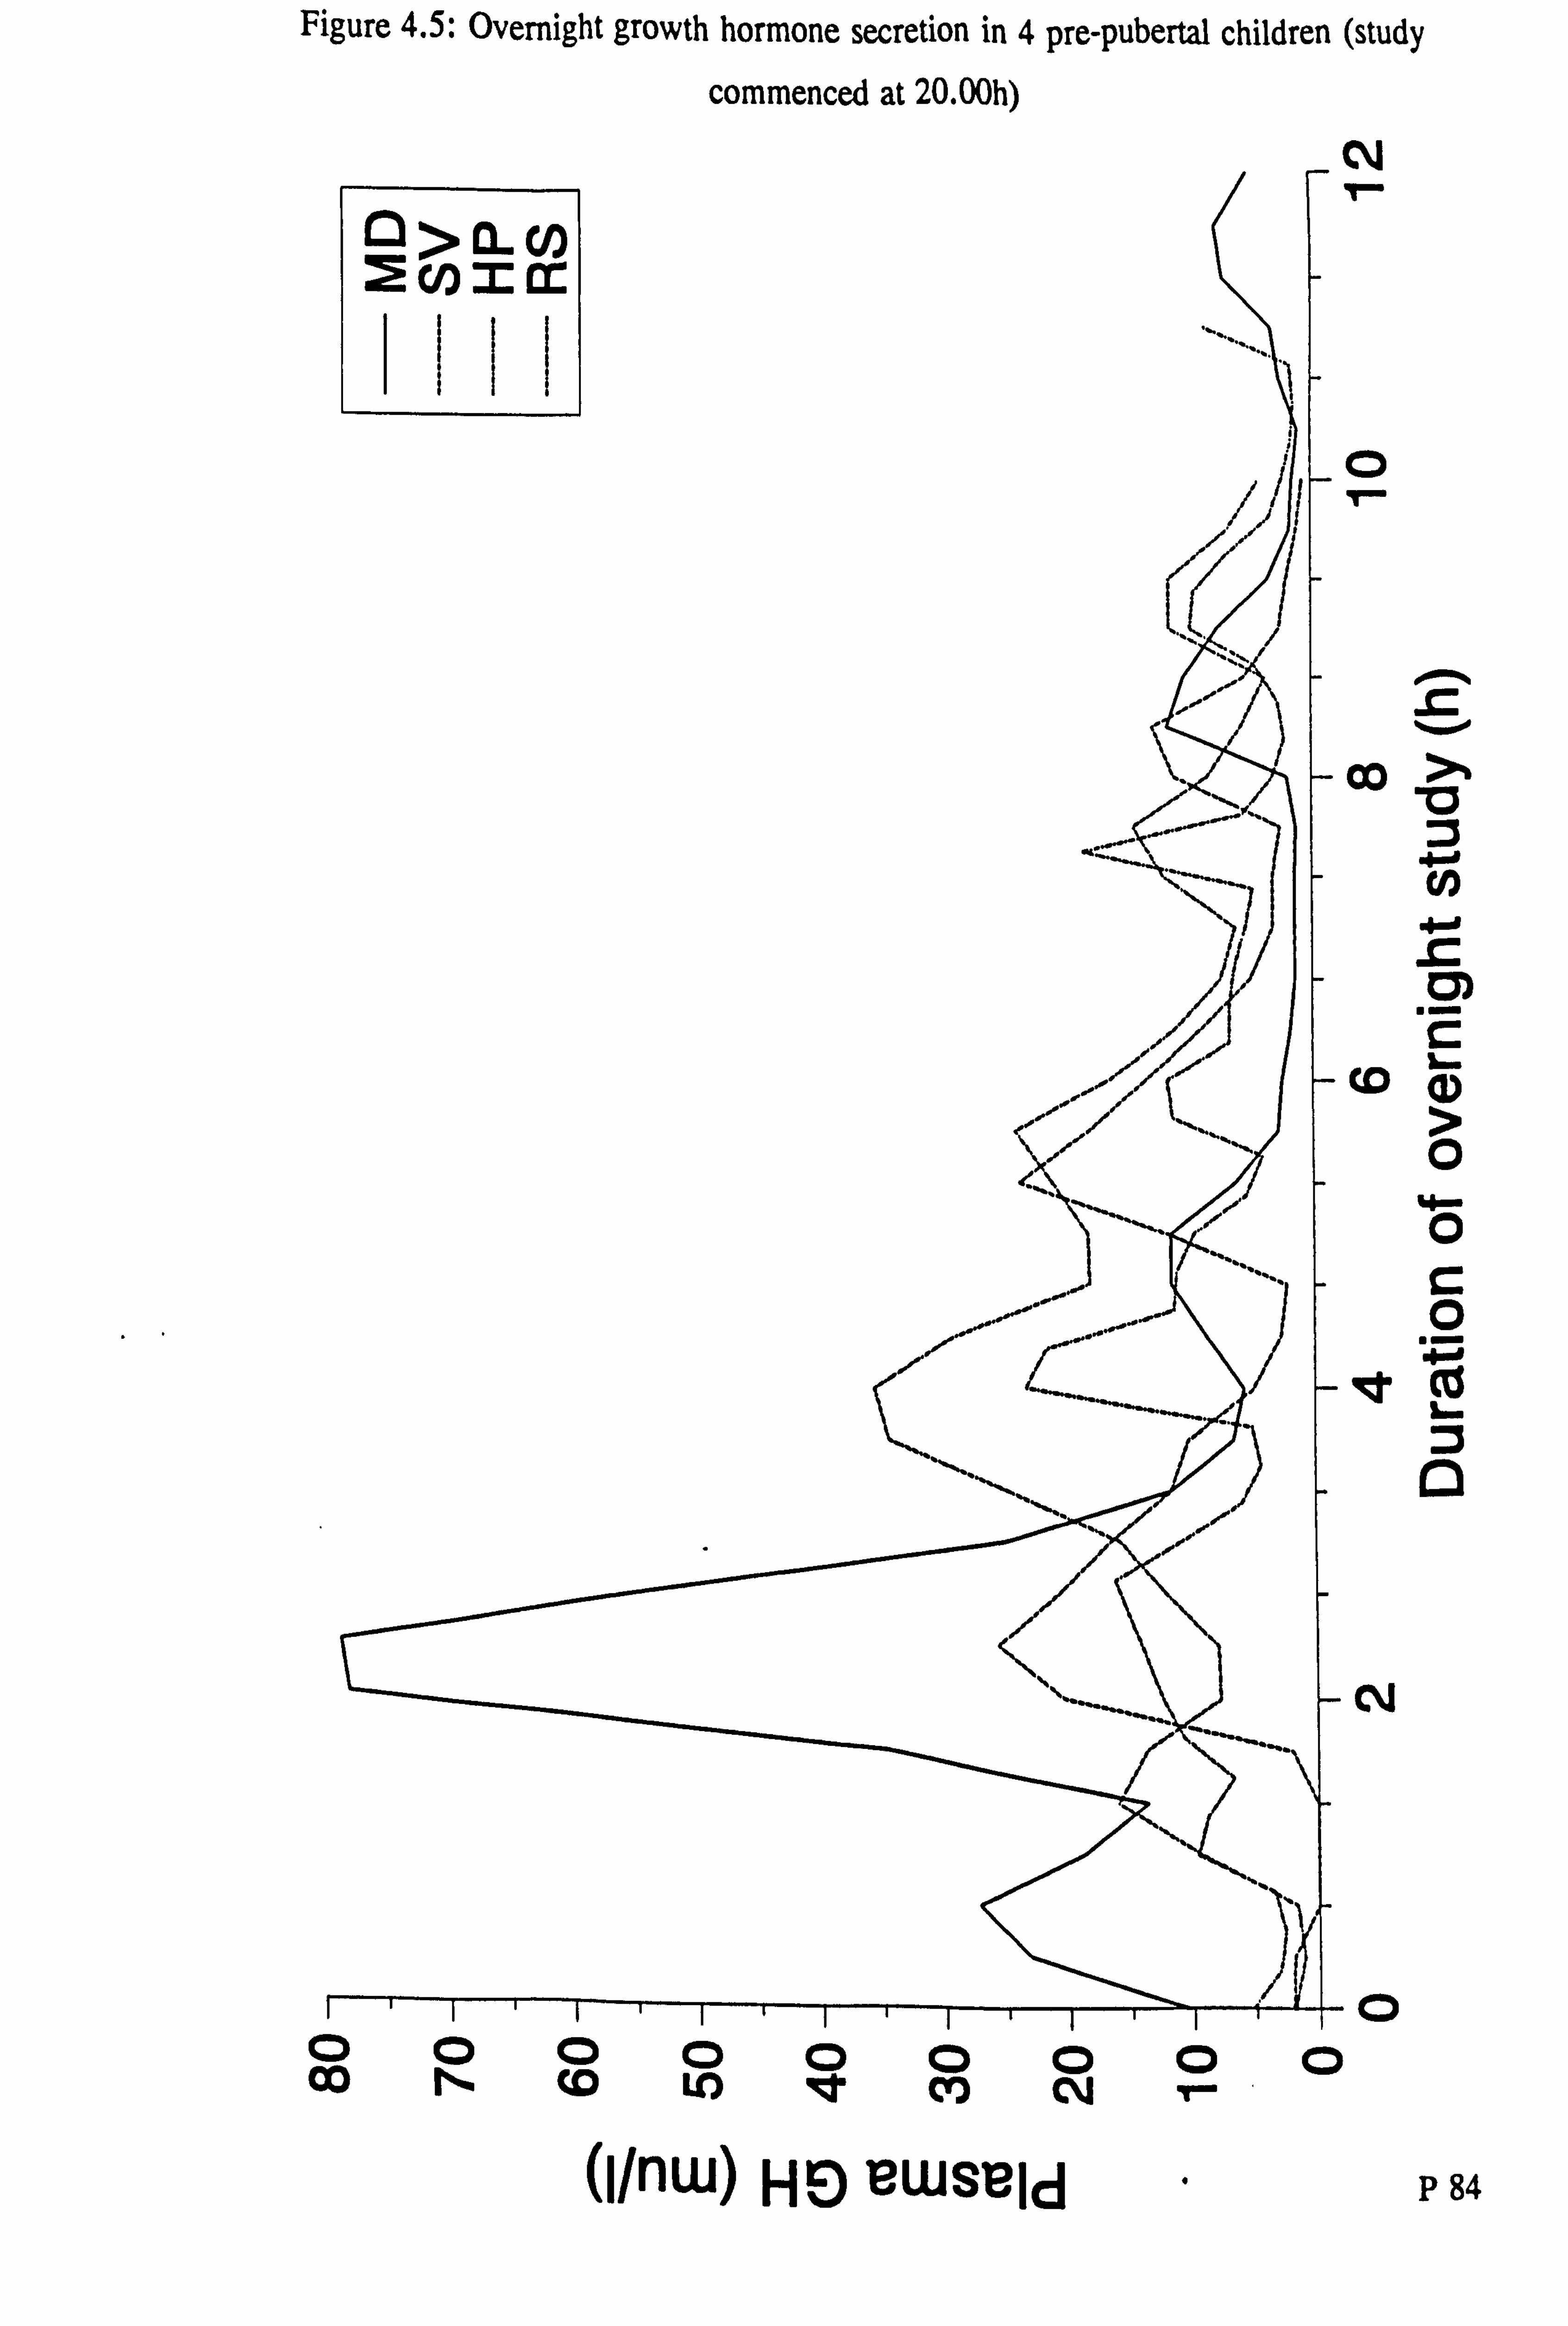
Figure 4.5: Overnight growth hormone secretion in 4 pre-pubertal children (study
commenced at 20-00h)
C\l 1ý
0 1
Co
CD
qt
C*j
0
040mm m
>
Cl) 4-'
.2 C
a, > 0
0 C 0
a
(1/nw) HE) BwsBld P 84
000000000
Co N (D LO 4t CIO C\j T- ý

Hgure 4.6: Growth hormone secretion after an arginine infusion
(between 0- 30 mins) a
F)
D 0
C
I D CY)
0
0
CIO I
(1/nw) HE) LIWSBid P 85
0000000 (0 LO Igt CO CM Tý

communication). Growth hormone secretion following an infusion of arginine (a
pharmacological stimulant of GH secretion) has been measured in 3 of these patients (see figure 4.6). Plasma GH should rise above 20mu/I after the arginine dose. Two of the three patients tested showed such a normal response whilst the other, RS, had a suboptimal profile.
3. Pancreas
Hyperglycaemia and diabetes mellitus may occur in the older (transplanted) cystinosis
patients. There were 7 patients with diabetes mellitus in the European review of 123
patients on renal replacement therapy (Ehrich et al., 1992). Fivush et al. reported 5
such patients with insulin levels which were inappropriately low when compared with the glucose concentration at the time of the sample suggesting inadequate insulin
secretion (Fivush et al., 1987). This finding contrasts with the observation of B-cell
hyperplasia in post-mortem pancreatic tissue from 8 cystinosis patients (Milner and Wirdnam, 1982). There has been one case report of a young child of 13 months with insulin dependent diabetes mellitus who also had cystinosis (Ammenti et al., 1986).
4. Gonadotrophins, puberty and pregnancy Pubertal development is generally delayed (Gahl and Kaiser-Kupfer, 1987; Winkler et al., 1993). In one study of 17 patients, the mean onset of puberty was 15.5y (range 12-18) in males and 15y (12-18) in females (Winkler et al., 1993). Bone age at the
onset of puberty was delayed by a mean of approximately 4.5 years in both sexes. Females established stable menstrual cycles 2 years after menarche and had
appropriate cyclical fluctuations in gonadotrophin and oestradiol levels. In males, gonadotrophin levels are increased above the normal range. Luck et al. found an inappropriately high LH level in an 8 year old boy with cystinosis (Luck et al., 1977). Winkler et al. found abnormally high LH and FSH levels but low testosterone levels in post-pubertal males (Winkler et al., 1993). The results of these and HCG stimulation tests led the authors to conclude that the hypergonadotrophic hypogonadism might be due to progressive testicular damage secondary to cystine accumulation.
Reiss et al. reported a successful pregnancy in a woman with cystinosis and a renal transplant (Reiss et al., 1988). The patient had developed chronic renal failure at 8
P 86

years, was transplanted at 9 years and had never received cystine-depleting drugs. She
had her menarche at 15 years, menstruated regularly thereafter and became pregnant
at 20 years of age. She developed hypertension, proteinuria and oedema at 35 weeks
of gestation and on account of cephalo-pelvic disproportion as well as these problems,
underwent elective caesarian section at 36 weeks. A healthy male infant weighing 2.79kg was delivered and he remained well at I year of age. His leucocyte cystine
concentration was 0.95 nmol 1/2 cystine per mg protein, consistent with his expected heterozygote status. This report suggests that gonadotrophin and ovarian function in
adult women with cystinosis may be adequate to allow conception and support a
pregnancy.
Neurological manifestations Early neurological development and function appears to be normal in cystinosis. However in the second and third decades of life, the frequency of neurological
manifestations of cystine accumulation increase. Ehrich et al. described three children
aged 9-11 years with seizures in whom computerised tomography (CT) of the brain
demonstrated generalised cerebral atrophy (Ehrich et al., 1977). The degree of
cerebral atrophy experienced by patients with cystinosis is greater than that which can
occur in other patients with renal disease. Cochat et al. demonstrated significantly
greater cerebral atrophy on CT scans from 10 children with cystinosis compared with
a similarly aged control group with other renal diseases (Cochat et al., 1986). Nichols
et al. demonstrated cortical atrophy with magnetic resonance imaging in 10 of II
patients aged 5-19 years (Nichols et al., 1990). Cognitive test scores were poorer in
children with the greatest degree of atrophy but the relationship did not reach
statistical significance (Nichols -et al., 1990).
In older patients neurological symptoms may include bradykinesia, tremort memory loss, dementia, rigidity, weakness, paraesthesiae, dysarthria and dysphagia (Fink et
al., 1989; Vogel et al., 1990). Neurological examination may be normal or may reveal a generalised myopathy (Gahl et al., 1988a), tremor, spasticity and an abnormal gait (Fink et al., 1989; Vogel et al., 1990).
Swallowing dysfunction is a late but serious complication and can lead to fatal
aspiration (Sonies et al., 1990; Gahl et al, 1988a). In a review of 43 patients, Sonies
P 87

et al. found that oral motor and swallowing dysfunction increased with age but that there were severely affected younger patients. The dysfunction appears to be related to impaired neuromuscular activity rather than to neurological damage. Both dry and wet swallowing times are prolonged in cystinosis, but the greater differences are seen with dry swallows which require more muscular effort (Sonies et al., 1990).
Neuropathological findings include gyral atrophy, dilated ventricles, cystic necrosis of the globus pallidus and lentiform nuclei, patchy demyelination, calcification and
spongiform changes in cerebral cortex and white matter (Vogel et al., 1990). Cystine
crystals can be demonstrated in basal ganglia, cortex, thalamus, cerebellum and
pituitary gland (Fink et al., 1989; Vogel et al., 1990). Gahl et al. described the histological changes in muscle in a patient with a striking myopathy (Gahl et al., 1988a). Frozen sections of skeletal muscle revealed variation in fibre size, selective
atrophy of type I fibres, presence of ring fibres, absence of inflammatory changes and
only slight lipid accumulation. Cystine crystals were present in the perimysial and
endomysial spaces. Several groups have determined cystine concentrations in post-
mortem brain and muscle tissue (see table 4.3 and Jonas et al., 1987; Gahl et al., 1988a; Vogel et al., 1990).
Longitudinal psychometric testing has shown that children with cystinosis usually have
a normal intelligence quotient (IQ) and can attend normal school (Wolff et al., 1982).
However other workers have found that whilst overall IQ scores are normal, patients with cystinosis had significantly poorer scores in tests of short-term visual memory and that this deficit was not due to ocular disease (Trauner et al., 1988).
Longterm ocular manifestations Although the effects of cystine deposition in the eye can be detected early in life (see
above), visual acuity remains good in childhood. However the longterm prognosis for
normal vision is poor (Kaiser-Kupfer et al., 1986). Corneal cystine crystal deposition
progresses with age leading to haziness or clouding in the second decade of life. The
photophobia increases in severity and corneal erosions develop. Crystal deposition in the iris may lead to an inflammatory reaction causing posterior synechiae and glaucoma. Crystals may also be seen on the lens surface. Retinal dysfunction also occurs. In older patients colour vision may be defective, the dark-adaptation
P 88

thresholds are increased and electro-refinograms become abnormal. A haemorrhagic
refinopathy can occur leading to retinal detachment, scarring and angle-closure glaucoma (Schneider et al., 1990).
Gastrointestinal and hepatic manifestations Cystine crystals may be found in intestinal mucosa, confined to cells of the lamina
propria but gastrointestinal function appears to be normal (Morecki et al., 1968). Poor
feeding is however a frequent complaint and is perhaps related to a feeling of gastric fullness due to the large quantities of fluid that the child is obliged to drink. Vomiting
may be related to chronic acidosis and is exacerbated by medications especially
cysteamine. Alteration of bowel habit is unusual, if anything there is a tendency to
constipation as a result of dehydration. One child developed chronic diarrhoea and
colonoscopy demonstrated features of ulcerative colitis (Treem et al., 1988).
Pancreatic dysfunction may lead to diabetes mellitus (see above) and malabsorption. Fivush et al. reported a 17 year old post-transplant female who developed bulky,
offensive stools and lost weight (Fivush et al., 1988). Hypoalbuminaemia, excessive stool fat excretion and a very low serum trypsinogen all suggested exocrine pancreatic dysfunction. The serum amylase remained normal and ultrasound of the pancreas showed a marked increase in echogenicity, consistent with chronic pancreatitis. Treatment with pancreatic enzyme replacement led to resolution of the symptoms and
weight gain.
Hepatomegaly may occur even in young children. Approximately 30% of patients under 5 years have hepatornegaly or splenomegaly (Gahl, 1986a). This number rises to 42% in patients over 10 years of age (Gahl et al., 1986b). However, biochemical
tests of liver function are generally normal. Portal hypertension is rare but has been
reported in French patients with cystinosis, occurring approximately 5 years after transplantation and, in 2 cases, requiring a porto-caval shunt operation (Broyer et al., 1987). Liver biopsy may show normal hepatocytes and portal spaces filled with enlarged Kupffer cells containing cystine crystals (Broyer et al., 1987).
MisceHaneous rmdi gs Gahl et al. demonstrated that children with cystinosis have an impairment of sweat
P 89

production when tested by pilocarpine iontophoresis (Gahl et al., 1984). The
concentration of sweat chloride was similar to that in normals. Impaired sweat
production renders cystinosis patients intolerant to prolonged heat exposure.
Pintos-Morell et al. demonstrated impaired neutrophil migration and adhesiveness in
cystinotic cells (Pintos-Morell et al., 1985). The authors note that these properties are
essential for leucocyte-endothelial interactions such as may occur in allograft rejection. These workers later reported a decreased production of Ig-containing cells and of Ig in
stimulated monocytes from cystinosis children (Pintos-Morell et al., 1991). This effect
was not seen in monocyte-depleted preparations. However no in vivo clinical immunological alteration has been described in cystinosis (Pintos-Morell et al., 1991)
and there is no evidence of increased susceptibilty to infection (Schneider and Schulman, 1986).
Hypercholesterolaemia has been demonstrated in boys but not girls with cystinosis (Murphy and Papathalds, 1993). The serum cholesterol concentration was elevated in boys by ly of age and the rise was progressive. Renal transplantation led to some improvement in cholesterol level.
There has been a single case report of a patient, transplanted on account of cystinosis, who died in respiratory fOure from pulmonary fibrosis (Almond et al., 1993). No details of post mortem findings were given. Cystine crystals have been observed in interstitial tissue of the lung in one other patient but in this case there were no fibrotic
changes (van't Hoff W, personal communication).
Late-onset cystinosis In 1971, Goldman et al. described two brothers aged 14 and 15 years, with cystinosis (Goldman et al., 1971). The elder brother had a history of polyuria and polydipsia from early childhood and had been found to have proteinuria at the age of 4 years. At 11 years of age cystine crystals were demonstrated in the cornea and conjunctiva. His
younger brother did not suffer from polyuria but was diagnosed at the age of 10 years when his elder sibling was admitted for investigation. Both brothers had a generalised aminoaciduria, glycosuria and rickets. This was the first description of what was called "adolescent cystinosis" (Goldman et al., 1971). Subsequently there have been
P 90

further reports of cases of nephropathic cystinosis presenting after infancy, the oldest
new diagnosis being made in a woman of 26 years of age (Schneider JA, personal
communication). Patients with intermediate or late-onset cystinosis may develop the typical features of the renal Fanconi syndrome or may present with symptoms and signs of chronic renal impairment. A 12 year old asymtomatic girl, electively admitted for excision of osteochondromata, was found to have glycosuria, proteinuria and a
plasma creatinine concentration of 265[imol/I (van't Hoff WG, personal communication). There had been no history of polyuria or polydipsia. Slit-lamp
examination of her cornea revealed crystal deposition and her leucocyte cystine concentration was 6.92 nmol 1/2 cystine per mg protein. She required haemodialysis from the age of 14 years and subsequently received a renal transplant. Cysteamine treatment was given from the age of 16 years.
In general, patients with late-onset cystinosis have a slower progression of renal glomerular damage than do infantile-onset patients (Gahl et al., 1989). The degree of growth retardation is also less severe than the younger-onset children. These features
may be related to the findings that the untreated leucocyte cystine concentrations are generally lower and fibroblast lysosomal cystine transport generally greater in late-
onset patients than in the infantile group (Gahl et al., 1989). There is however no clear separation between the two groups and it is likely that molecular genetic techniques will reveal a continuum of severity related to different gene mutations.
p 91

Chapter 5: The treatment of cystinosis
Introduction and historical perspective The treatment of cystinosis can be divided into two broad categories: general and
specific. General measures are those that aim to correct and maintain biochemical
homeostasis. These include a high fluid intake, electrolyte and alkali supplements and
Vitamin D. Specific therapies are those that aim to reduce the cystine toxicity in
tissues. Such measures have included dietary therapy, penicillamine, dithiothreitol,
ascorbic acid and more recently, cysteamine and phosphocysteamine.
Renal replacement therapy (dialysis or transplantation) is required for patients in end-
stage renal failure. In contrast to the use of liver transplantation to correct enzyme deficiencies in some other metabolic disorders, neither dialysis nor transplantation
affect the accumulation of cystine in non-renal tissues.
Discussion of treatment options formed a small part of the early reports of cystinosis. Russell and Barrie describe the therapy given to their first case as "a course of ultra-
violet light together with vitamin D. " (Russell and Barrie, 1936). McCune et al.
reviewed the 39 reported cases of the Fanconi syndrome including some with
cystinosis (McCune et al., 1943). Various therapies had been employed. Insulin had
been used without benefit. Many workers had given alkali therapy but the results
seemed disappointing. In contrast, Goldmann and Ekstein reported great benefit from
a diet rich in potassium (Goldmann and Ekstein, 1939). Vitamin D in conventional doses had little effect on the rickets but much higher doses had been beneficial
(McCune et al., 1943).
Bickel et al. reviewed the management of 10 cases of cystinosis (Bickel et al., 1952).
Albright's solution containing sodium citrate 100gms, citric acid 140gms and water to 1 litre, was used to correct the acidosis. Potassium was given as the chloride salt or as
part of a modified Albright's solution (substituting 50gms potassium citrate for 50gms
of the sodium citrate). Very large doses of calciferol (50,000 to 500,000 units daily)
were given to treat the rickets. The authors wrote "our patients show such obvious improvement that we cannot avoid an attitude of cautious optimism".
P 92

Dietary therapy consisting of a protein intake low in cystine and methionine was
attempted in the 1940's and remained the only potential specific therapy for three decades (Bickel et al., 1972). In the 1960's penicillamine and dimercaprol were tried
with conflicting but generally ineffective results (Hambraeus and Broberger, 1967). The discovery of agents capable of depleting the cystine content of cystinotic fibroblasts in vitro led to a new era of therapy. Dithiothreitol was the first of these
agents and had a beneficial effect on leucocyte cystine concentration but no clinical benefit (DePape-Brigger et al., 1977). Ascorbic acid was useful in vitro but not in
vivo. In 1976, cysteamine was found to be a very effective cystine depleting agent (Thoene et al., 1976). This compound together with the derivative,
phosphocysteamine, are currently the drugs of choice for the treatment of cystinosis.
General measures in the management of cystinosis Introduction
General measures are those that aim to correct and maintain biochemical homeostasis. Most children with cystinosis present in late infancy with features of dehydration,
potassium and mineral deficiency leading to weakness and rickets., Thus the most important aims in early management are adequate replacement of fluids, correction of hypokalaemia, acidosis, hypophosphataemia and treatment of rickets. Once these
measures are underway, attention can be directed towards nutrition and to reducing the intracellular cystine concentrations (see below).
The management of cystinosis requires a multi-disciplinary approach. Close liaison between physician, nurse, biochemist, pharmacist and dietician is needed. Specialist
support is required with ophthalmological, neurodevelopmental, psychological and radiological reviews. When there are a sufficient number of patients, these services are best coordinated within a specialist, dedicated clinic. As in many genetic and chronic conditions, there is a great burden on the family of the affected child. Feelings of guilt in relation to passing on a "defective gene" to the child are compounded by the child's poor growth, anorexia, nausea and as a result of treatment, breath smell. Families find both the "nature" and "nurture" difficult. Growth failure becomes an especial problem at school. Children are teased about their height, their smell and their need to pass urine frequently. Older children experience difficulties with peer relationships and attitudes. Although transplantation has led to longer
P 93

survival, cystinosis remains a fatal disease. However, there is the hope that the
current generation of well-treated patients will have a longer lifespan. For these
reasons, all families should be offered the support of the Research Trust for Metabolic Diseases in Children (RTMDC), a parents and professionals group dedicated to all metabolic disorders. In addition, supportive counselling is frequently helpful.
Fluid therapy
Children with cystinosis may have an obligatory urine output of 2-6 litres per day
(Gahl et al., 1989). Free access to fluid is therefore required day and night. It is a
common experience that rehydration of the newly diagnosed patient leads to increased
urine output and electrolyte losses (see below). The initial therapy will usually need to
take place in hospital and may take several weeks.
Illnesses which compromise the child's ability to absorb these volumes, eg. vomiting, diarrhoea, or which are associated with further fluid loss, eg. fever, sunstroke, require urgent and aggressive intravenous therapy. The calculation of intravenous fluid
requirements should take into account the "normal" daily urine output for the child. Thus a 10kg cystinosis child may require a maintenence volume of 100ml/kg/day (1,000ml) plus 2,500ml per day.
The experience at Guy's Hospital is that most children will only drink water, rejecting more nutritious fluids such as milk or carbohydrate drinks. However, much of the daily electrolyte requirement can be safely added to bottles of water which can be
taken over several hours. Children should be encouraged to drink as much as they
want. It is important to correct -ihe misapprehension that the child is passing a, lot of urine because he is drinking so much, rather than the other way round. This becomes
a particular problem during nursery and schooling.
Correction of acidosis and electrolyte disturbance Correction of acidosis -will lead to massive bicarbonate loss in the urine in the form of NaHC03 or KHC03 which leads to further electrolyte deficiencies. Sodium and potassium are therefore given with an anion such as bicarbonate or citrate (which is
metabolised in the liver consuming hydrogen ions) so that both electrolyte disturbance
and acidosis is corrected. In the UK, potassium is usually given as potassium citrate
P 94

or chloride and sodium as sodium bicarbonate or citrate. A modified Albright's
solution (containing sodium citrate, potassium citrate and citric acid) is used in some
centres. This has the advantage of replacing 3 electrolytes in one concentrated solution. Some patients however do not tolerate the taste of citrate formulations. Prediction of the doses required for each patient is difficult as they vary enormously. Initial doses might be sodium bicarbonate 5-10mmol/kg/day and potassium chloride 4- 5 mmol/kg/day (or equivalent for compound solutions). Doses are titrated against plasma electrolytes, aiming to maintain plasma potassium above 3.5mmol/l (although 3.0-3.5 is often the best that can be achieved) and the bicarbonate level at approximately 22-24mmol/l.
Treatment of hypophosphataemia and rickets Hypophosphataemia is seen in all newly diagnosed children with cystinosis. A variety
of phosphate supplements are available for use. At Guy's Hospital, neutral sodium
phosphate, 1.8mmol sodium and I. Ommol phosphate per ml, is used to maintain the
plasma phosphate concentration within the normal range. This is associated with healing of the rickets and a return of the serum alkaline phosphatase level towards the
normal range. Diarrhoea is a potential side-effect of phosphate therapy but does not
appear to be a major problem in practice.
Hypocalcaemia is not a common problem when the child first presents. There is
however a very significant risk of profound hypocalcaemia leading to tetany following
correction of the acidosis and hypophosphataemia (see chapter 4: "Metabolic bone disease and mineral homeostasis"). This requires correction with oral or intravenous
calcium and magnesium supplenientation may also be necessary. Some patients require longterm calcium supplements.
Treatment of the rickets also involves the use of vitamin D supplements and these are used routinely at Guy's Hospital. 1-ci-hydroxycholecalciferol (Alfacalcidol) is used, usually starting at a dose of 25-50 nanogram/kg/day. Very careful monitoring of plasma calcium and phosphate together with the serum alkaline phosphatase and parathyroid hormone concentrations are required during this therapy. Treatment will lead to healing of rickets over several months but there is a risk of hypercalcaemia with subsequent renal damage. Hypercalciuria is a feature of the Fanconi syndome and
P 95

and nephrocalcinosis has recently been described in cystinotic children (Saleem et al., 1992).
Other therapies
Use of thiazide diuretics and indomethacin
Treatment of the fluid and electrolyte abnormalities in cystinosis can lead to an increase in vascular volume, glomerular filtration and thus a further increase in
urinary salt, bicarbonate and phosphate losses. Some patients have extreme difficulty
tolerating the volumes of alkali required to correct their acidosis and in these cases,
additional measures are justified. Thiazide diuretics reduce extracellular volume but
will cause increased loss of sodium and potassium.
Indomethacin, a prostaglandin synthetase inhibitor, is a useful adjunct to conventional therapy. It can reduce the polyuria and polydipsia thereby reducing the requirement for electrolyte replacements. This often has the effect of making the child feel better
and improving appetite. In some patients indomethacin therapy can improve growth
rate dramatically even in those who have been well treated with cysteamine (M
Broyer, personal communication). It acts by reducing renal blood flow with a
consequent fall in glomerular filtration rate (Haycock et al., 1982). Indomethacin also has the effect of increasing tubular sodium reabsorption thereby reducing potassium
wastage (Haycock et al., 1982). Indomethacin therapy is however potentially dangerous. Firstly it causes reduction, albeit reversible over the short term, in
glomerular filtration rate in a disease characterised by progressive glomerular dysfunction (Lemire and Kaplan, 1981). Secondly one patient suffered a duodenal
perforation during indomethacin therapy (Haycock et al., 1982).
Indomethacin is not used in the management of cystinosis in North America (JA Schneider, personal communication) but is commonly prescribed in European centres (Broyer and Tete, 1990). At Guy's Hospital, indomethacin is used in patients in whom conventional electrolyte and alkali therapy fails to achieve an adequate biochemical
response. In June 1993,6 of the 10 pre-transplant patients cared for in the Cystinosis Clinic at Guy's Hospital were receiving indomethacin.
P 96

Camitine therapy
Bernadini et al. demonstrated that patients with cystinosis have an increased urinary
excretion of free and acyl carnifine leading to a deficiency of plasma and muscle free
carnitine (Bernadini et al., 1985). Gahl et al. undertook a trial of L-carnitine
supplements (25mg/kg every 6 hours) to children with cystinosis (Gahl et al., 1988b).
This dose of carnitine rapidly corrected the plasma deficiency but within the time of the study (up to 18 months therapy) did not correct the muscle deficiency. In a recent
report, Gahl et al. reported that longterm (approximately 5 years) supplementation increased muscle carnitine levels to within the normal range (Gahl et al., 1993). It
remains unclear whether carnitine treatment has any symptomatic benefits.
Hormone replacement in cystinosis 1. Thyroxine
The need for thyroid replacement therapy increases with age. In one survey, 63% of
patients aged 10-13 years and 80% of those aged 19-26 years, required thyroxine
replacement (Gahl et al., 1986b). Following renal transplantation, abnormalities in
thyroid function can resolve spontaneously (Ehrich et al., 1991).
2. Imufin
Patients with cystinosis who develop diabetes mellitus require insulin in standard doses. However some patients who have developed diabetes shortly after transplantation, only require insulin for a short time (Broyer et al., 1987). Oral hypoglycaemic agents have also been used in the management of cystinosis patients with diabetes (Almond et al., 1993).
3. Growth Hormone
Wilson et al. reported the effect of recombinant human growth hormone (rhGH) treatment in two children aged 10 and II years with cystinosis (Wilson et al., 1989). Both responded with an increase in growth velocity from approximately 3cm/year to 8 and 9cm/year respectively. The authors stated that the rate of decline of renal function did not appear to be altered by rhGH treatment.
Andersson et al. reported on the effects of 18-24 months treatment with rhGH in 3 children with cystinosis, aged 6.6 - 14 years (Andersson et al., 1992). All three
P 97

showed an increase in growth velocity but also a sharp increase in plasma creatinine
concentration. One patient required a renal transplant and the authors cautioned that
rhGH treatment might increase the rate of progression of renal failure.
Rees et al. studied two prepubertal children with cystinosis who had been
transplanted, among a series of children with renal disease given rhGH (Rees et al., 1990). Both children increased their growth velocities, one suffered a decline in renal function (as estimated by plot of reciprocal plasma creatinine concentration) but there
was no significant change in height standard deviation score (HtSDS) for bone age in
the group, suggesting that final height would be unaffected.
A European multicentre trial of rhGH in children with cystinosis is in progress. As of August 1993,55 patients have been enroled, 30 have completed 1 year and 12 have
completed 2 years of therapy (van't Hoff et al., 1993, in press). The median results are shown in table 5.1, below.
Table 5.1: Interim results of rhGH therapy in pre-terminal renal failure (n = 16)
Baseline 1 year rhGH 2 years rhGH
Height velocity (cm/y) 3.5 9.0 7.0
Height SDS (chron. age) -4.5 -3.7 n/a
Height SDS (bone age) -2.1 -1.6 n/a
These results suggest that shorrierm, rhGH therapy improves growth. There are potential technical inaccuracies in the estimation of bone age in children with rickets, however the increase in height SDS when corrected for bone age suggests that final
height may be improved. No change in the progression of renal disease was observed, nor was there any deterioration in the results of serial oral glucose tolerance tests.
The longterm effects of growth hormone therapy on renal function will take several years to evaluate. Its effect on final height can only be judged when the children participating in the trial have finished their growth period, 10-15 years from now.
P 98

Speciric therapies
1. Dietary therapy
Dietary manipulation was the first specific therapy used in cystinosis. Freudenberg in
an early review, noted that some patients were given a diet based on proteins with a low cystine content (eg. lentil preparations), (Freudenberg, 1949). Subsequently some groups used an amino acid mixture free of methionine and cystine as the main protein source together with a small amount of natural protein. Seip et al. found an improvement in "well-being" and a reduction in the polyuria and polydipsia in two brothers treated with a lentil diet (Seip et al., 1968). Christensen et al. reported some symptomatic improvement in one of two children treated with a similar diet (Christensen et al., 1970).
Crawhall et al. reported that plasma cystine concentrations in children with cystinosis were not significantly different to those in controls (Crawhall et al., 1968). These
workers found that although dietary restriction of cystine and methionine could lead to
a substantial reduction in the plasma cystine level, there was no concomitant reduction in the quantity of cystine crystals seen in the cornea or bone marrow. This work led to the realisation that intracellular cystine was not in free equilibrium with extracellular fluid and plasma cystine.
Dietary therapy was unpleasant and associated with serious side-effects. In an extensive review of 21 patients receiving dietary therapy, Bickel et al. reported four deaths of young children from liver cirrhosis associated with severe methionine deficiency (Bickel et al., 1972). No beneficial effect on growth, renal function or cystine storage could be demonstrated and the authors concluded that dietary measures had no effect on the course of the disease (Bickel et al., 1972). Subsequently, Thoene
et al. demonstrated that the major source of intralysosomal cystine was from the breakdown of endogenous protein (Thoene et al., 1977). Attempts to reduce intracellular cYstine by reduction of the extracellular and plasma cystine were therefore likely to be in vain.
p 99

2. Drug therapy
Peniciflamine
Penicillamine was used in the treatment of cystinosis initially "in the hope of reactivating or maintaining thiol-dependent systems" which were thought to be deficient in cystinosis (Clayton and Patrick, 1961). Clayton and Patrick reported a
reduction in acidosis, aminoaciduria and symptomatic improvement in three children treated with penicillamine and dimercaprol (Clayton and Patrick, 1961). Hambraeus
and Broberger gave penicillamine to one 17 month old child with cystinosis in the belief that it might undergo disulphide exchange with cystine (Hambraeus and Broberger, 1967) However, there was no clinical improvement nor any change in
aminoaciduria (Hambraeus and Broberger, 1967). Other groups confirmed the ineffectiveness of penicillamine treatment (Crawhall et al., 1968; Bickel et al., 1972). Thoene et al. later demonstrated that there was no appreciable cystine depletion when cystinotic fibroblasts were incubated in vitro with penicillamine (Thoene et al., 1976).
Dithiothreitol
Dithiothreitol (2,3-dihydroxy-1,4-dithiobutane) is a powerful reducing agent capable of reacting with disulphides to form an oxidised cyclic derivative. Goldman et al. demonstrated that incubation of cystinotic fibroblasts in vitro with ImM dithiothreitol led to a marked reduction in the cystine content of the cells (Goldman et al., 1970; Aaron et al., 1971). These workers treated one patient in end-stage renal failure for
two weeks with daily intravenous infusions of dithiothreitol and found a 65% fall in
cystine content between pre and post-treatment rectal mucosal biopsies. However such a fall could be accounted for by sampling error. The child died of terminal uraemia one month after the trial of dithiothreitol (Aaron et al., 1971).
DePape-Brigger et al. gave courses of dithiothreitol in capsule form (at a dose of up to 25mg/kg three times a day) to two boys for up to 8 months (DePape-Brigger et al., 1977). They demonstrated a marked fall in leucocyte cystine concentration during treatment. Both children had significant renal impairment prior to dithiothreitol and treatment did not appear to affect renal function. One boy died during the study but the authors felt that this was not attributable to the drug and there were no other serious side-effects (Depape-Brigger et al., 1977). More recently the use of other, more effective cystine-depleting agents (cysteamine and phosphocysteamine) has meant
P 100

that dithiothreitol is no longer widely used.
Ascorbic acid Kroll and Schneider reported that cystinotic fibroblasts were partly depleted of their
cystine content when incubated in a medium containing high concentrations of
ascorbic acid (Kroll and Schneider, 1974). A multicentre double-blind clinical trial of
ascorbic acid (200mg/kg/day) versus placebo was then undertaken in 64 patients (Schneider et al., 1979). Both the placebo and ascorbic acid groups were well matched
prior to treatment. The mean age of both groups was 4y, mean GFR approximately 39ml/min/1.73M2 and there was no statistically significant difference between the two
groups in their pre-treatment leucocyte cystine concentrations. After two years the
study was terminated when there was sufficient evidence that ascorbic acid treatment
might be harmful. Eight of the eleven patients who left the study on account of death,
dialysis or transplantation were in the ascorbic acid group. The mean (SD) increase in
plasma creatinine in the ascorbic acid treated group, 0.52 (0.75) mg/dl, was over
twice that of the placebo group, 0.24 (0.29), although this difference was not
statistically significant. No data on the effects of ascorbic acid on leucocyte cystine
were reported.
Other agents used to deplete cystine Following the report in 1976 of the cystine-depleting property of cysteamine, this drug
became the treatment of choice in cystinosis. Cysteamine and phosphocysteamine are discussed in the next section.
Nevertheless, other compounds- have been studied. Pantethine is the disulphide of
pantetheine a naturally occurring precursor of cysteamine (see below: "The occurrence of cystearnine in the body"). Pantethine, when incubated with cystinotic fibroblasts in
vitro, leads to cystine depletion (Butler and Zatz, 1984). It is likely that pantethine is
reduced to pantetheine once it has entered the cell and that cleavage of pantetheine to
cystearnine and pantothenic acid occurs by the action of pantetheinase. The cystine depletion induced by pantethine is probably mediated by the cystearnine so formed (Butler and Zatz, 1984).
Butler reported that homocysteine had a cystine-depleting effect on cystinotic
P 101

fibroblasts in vitro (Butler, 1990). Furthermore the addition of cysteamine and homocysteine to the culture medium led to a synergistic cystine-depleting effect. This finding may lead to new strategies of treatment.
Renal transplantation
Prior to the advent of successful renal replacement therapyt children with cystinosis died from renal failure. Haemodialysis and subsequently renal transplantation were first undertaken in the late 1960's (Mahoney et al., 1970; Goodman et al., 1972).
There were no technical difficulties specific to children with cystinosis and the results
were very encouraging. Patients no longer required electrolyte and alkali replacement, felt better and in some cases, grew better (Mahoney et al., 1970).
Broyer et al. commented on the favourable outcome of renal transplantation in
children with cystinosis compared to those with other causes of renal failure (Broyer
et al., 1981, Broyer et al., 1987). Graft survival was 86% at 6 years and 76% at 10
years compared to 58% and 40% for the whole group of paediatric renal transplant
patients in the H6pital des Enfants Malades, Paris. Other groups in North America
and Germany have not found a difference in rejection episodes and graft survival between cystinosis and non-cystinosis patients (Gahl and Kaiser-Kupffer, 1987b;
Ehrich et al., 1991).
Renal transplantation does not correct the metabolic abnormality in cystinosis but the
grafted kidney does not develop features of cystine toxicity (Goodman et al., 1972). Some features of the Fanconi syndrome can occur in transplanted kidneys, probably related to episodes of rejection -ýEhrich et al., 1991). Cystine crystals may be seen in
transplant biopsies but are found in mesangial or interstitial tissue and not (as in the
native cystinotic Iddney) in the cytoplasm of the renal tubular epithelium (Malekzadeh
et al., 1977). Such interstitial cystine deposition is consistent with host mononuclear cell infiltration.
There are theoretical risks to the use of live-related donors some of whom, as heterozygotes, have impaired lysosomal cystine transport. However the results from a live-related donor graft may be better than from a cadaveric graft and the cystine content in the two types is similar (Malekzadeh et al., 1977; Gahl and Kaiser-Kupffer,
P 102

1987).
Initial impressions of improved growth after renal transplantation have not been
confirmed and as survival has increased, the spectrum of multisystern failure due to
cystine accumulation in non-renal tissues has become apparent (see chapter 4:
"Clinical course and longterm manifestations of cystinosis", also Gahl and Kaiser-
Kupffer, 1987; Ehrich et al., 1991).
The use of cysteamine and phosphocysteamine Introduction
The discovery that cysteamine, a naturally occurring compound, was a powerful
cystine-depleting agent led to a new era in the treatment of cystinosis. It became an
extremely useful compound for studying cystinotic cells in vitro but, more importantly, cysteamine had a dramatic effect on leucocyte cystine concentrations in
vivo. A series of clinical studies has subsequently demonstrated its potential benefits
although there are significant problems with administration of the drug. The pro-drug
phosphocysteamine is better tolerated and is now widely used.
The occurrence of cysteamine in the body Cysteamine is a naturally occurring sulphydryl compound. it is formed by the action
of pantetheinase on pantetheine, in the formation of coenzyme A (Orloff et al., 1981).
H2N-CH-COOH H2N-CH-COOH H2N
CH2 CH2
CH2 Uki2 CH2
s SH SH
s Cysteine Cysteamine
CH2
CH2+
H3N-CH-COOH
Cystine
P 103

Orloff et al. confirmed that there was no defect in pantetheinase activity in cystinotic
cells and hence no deficiency of cysteamine to account for cystine accumulation in the
disorder (Orloff et al., 1981).
Mechanism of action of cysteamine Thoene et al. first demonstrated the depletion of cystine that occurs when cystinotic
fibroblasts are incubated in a medium containing cysteamine (Thoene et al., 1976). A
range of other compounds were tested for cystine-depleting activity. Thoene et al.
found that optimal depletion occurred with unsubstituted aminothiols and that the
presence of an amine group was essential, possibly because it enables passage of the
molecule through the plasma and lysosomal membranes (Thoene et al., 1976). The
disulphide cystamine was also effective but is probably reduced to cysteamine prior to
lysosomal entry and is therefore no betterthan cysteamine itself.
Thoene et al. postulated that cysteamine reacted with cystine inside the lysosome to
form the mixed disulphide and cysteine. The mixed disulPhide was then thought to
either diffuse out of the lysosome on account of its molecular weight (196) being less
than 200-230 daltons, above which compounds were thought not to be able to diffuse
out of the lysosome (Thoene et al., 1976). Alternatively, they suggested that the
mixed disulphide might react with cysteamine to form cystamine and cysteine. Cysteine can leave the lysosome freely and cystamine could be converted back to
cysteamine.
Subsequent work demonstrated that when lysosome-rich granular fractions of
cystinotic leucocytes were loaded with labelled cystine and treated with cysteamine, high concentrations of the labelled mixed disulphide were recovered (Gahl et al., 1985b). This work suggested that the mixed disulphide of cysteamine and cysteine left
the lysosome intact. Work by Pisoni et al. on lysosomal amino acid transport led to a better understanding of the mechanism of cysteamine action (Pisoni et al., 1985).
Granular fractions enriched in lysosomes were loaded with lysine by incubation with L-["C]lysine methyl ester (see chapter 2: "Studies of lysosomal transport"). Once loaded the lysosomal preparations were incubated in various media and aliquots removed at set intervals for determination of radioactivity (and hence lysine efflux). The addition of 2mM lysine to the medium led to a 50% reduction in the half-time of
P 104

lysine exodus -a phenomenon known as counter-transport (or trans-stimulation) and
accepted as evidence of a carrier-mediated transport system. The lysine carrier was found to be specific for cationic amino acids and stereospecific to the L-isomers.
When either the mixed disulphide of cysteamine and cysteine or 2-aminoethyl-L-
cysteine (see below for structures) were incubated in the medium, the efflux of lysine
was greatly increased (Pisoni et al., 1985).
H3N'-CH-COO- H3N'-CH-COO- H3N+-CH-COO-
11712
ss (ý112
s UkI2 L; k12
CH2 L; kl2 L; k12
III
CH2 H3N+ H3N+
H31'4
Mixed disulphide 2-aminoethyl L-lysine of cysteamine -L-cysteine and cysteine
This work therefore demonstrated that cystine, converted into the mixed disulphide by
the action of cysteamine, can be transported across the lysosomal membrane on the
lysine carrier. Once in the cytosol the disulphide is available for reduction. Cysteine
so formed can participate in protein synthesis or be further degraded to sulphate and
taurine (see chapter 2: "Degradation"). The other component of the reduced disulphide, cysteamine, may be able to re-enter the lysosome and further reduce the
cystine content.
Phosphocysteamine
Thoene and Lemons demonstrated that phosphocysteamine, a phosphothioester of
cysteamine, was extremely effective in depleting cystinotic fibroblasts of cystine (Thoene and Lemons, 1980). Since phosphocysteamine lacks much of the odour of
cystearnine, it was suggested that it might be a preferable agent for the treatment of
cystinosis.
P 105

Smolin et al. confirmed the bioequivalence of cysteamine and phosphocysteamine in
vivo (Smolin et al., 1988). Equimolar doses of cysteamine and phosphocysteamine
were given to 6 children with cystinosis. The mean peak plasma cysteamine concentration and degree of leucocyte cystine depletion one hour after the dose, were not significantly different after cysteamine or phosphocysteamine administration.
Cluinical studies In their paper describing the cystine-depleting action of cysteamine, Thoene et al. reported their experience of treating a7 year old girl in end-stage renal failure due to
cystinosis (Thoene et al., 1976). She was treated for 2 months with increasing doses
of cysteamine given orally in gelatin capsules. At a dose of 90mg/kg/day she suffered generalised seizures for which no obvious cause could be found. These responded to
anticonvulsant medication and the cysteamine was stopped. Serial measurements of her
leucocyte cystine concentrations (taken 3 hours after a dose) showed a dose-response
effect with levels within the. heterozygote range when she was on 90mg/kg/day.
Thoene et al. also tried an intravenous dose of 10mg/kg cysteamine given over 5
minutes. Leucocyte cystine concentrations remained suppressed for 48 hours. Neither
of these trials had any effect on the patient's condition.
Early clinical experiences were published in the form of case reports (Roy and Pollard, 1978; Girardin et al., 1979). Roy and Pollard described the effect of cystearnine in reducing leucocyte cystine concentrations in vivo in a5 year old girl. However, her plasma creatinine concentration rose from 86/Amol/I to 122JAmol/I over the 9 month study period (Roy and Pollard, 1978). Girardin et al. treated a 14 month old boy with cysteamine and reýorted an improvement in creatinine clearance. Unfortunately he then suffered an episode of severe pyelonephrifis which led to further renal damage (Girardin et al., 1979).
Yudkoff et al. reported their experience of treating 5 cystinosis patients with cysteamine for periods of up to 30 months (Yudkoff et al., 1985). The 5 boys, aged 30-81 months, received increasing doses (up to 90mg/kg/day) of cystearnine as a 5%
solution. After 30 months therapy, renal function, estimated by creatinine clearanceg had stabilised in two of the children and deteriorated in the others. There was no effect on renal tubular function nor growth. The mean (SD) leucocyte cystine
P 106

concentrations decreased from 7.9 (0.9) to 0.7 (0.4) nmol 1/2 cystine per mg protein
with treatment.
In 1978 a multicentre, collaborative trial of cystearnine therapy was initiated in North
America (Gahl et al., 1987c). 93 children were treated with cysteamine (mean dose
51.3 mg/kg/day in 6 hourly doses) for up to 73 months. Since cysteamine has a foul
smell and taste, a placebo group was felt to be unacceptable. Instead the treated group
were compared with 55 historical controls who had participated in the ascorbic acid
trial (see above: "Specific therapies: Ascorbic acid"). Summary data (mean ± SEM)
from the trial are shown in table 5.2.
Table 5.2: Results of US collaborative cysteamine study, 1987
I Cysteamine group Control group
Age at start (y) 3.89 0.25 4.05 0.26
Age at finish (y) 6.79 0.27 5.40 0.28
Creatinine clearance
at start (ml/min/1.73m')
38.4 2.0 34.9 1.8
Creatinine clearance
at finish (ml/niin/1.73m)
38.5 2.5 29.7 2.0
*§*
Growth velocity in first year
of trial (% normal)
73.5 3.4 59.2 3.7
(*§*: significant difference between groups, p=0.015)
The mean leucocyte cystine concentration in patients treated for more than one year was reduced from 9.3 ± 1.0 to 1.7 ± 0.2 nmol 1h cystine per mg protein. Although the use of historical controls is contentious (especially since renal function in the
group treated with ascorbic acid was worse, albeit not to a significant level, than the
untreated patients), this study provided further evidence of the efficacy of cysteamine. It suggested that longterm cysteamine therapy could reduce the progression of renal glomerular disease and improve growth.
P 107

No effect was seen on tubular function in the small number of patients studied in this
respect. The only side-effects of note were the foul taste, nausea and vomiting (these led to 14% patients becoming non-compliant).
Gahl et al. re-analysed the data on renal function from this study using a parameter they called the "predicted reciprocal creatinine at age 10y (PRCIO)" (Gahl et al., 1990). Cross-sectional analysis of the patients' reciprocal creatinine concentrations at the start of cysteamine therapy plotted against age revealed a linear relationship with
an intercept on the x axis (ie. equivalent to no renal function or l/creat = co) of 10.5
years. By analysing each patient's reciprocal creatinine data longitudinally, an
extrapolated value at age 10 (PRCIO) could be calculated. Values over I would suggest
excellent renal function (plasma creatinine lmg/dl w 88 timol/1) and values less than 0.1 would mean terminal renal failure. Patients who had been treated with cysteamine had a significantly greater PRCIO than those in the control group (mean values 0.62 vs 0.33mg/dl respectively, p =. 0.02). Further analyses showed that PRCIO increased
with the duration of cysteamine therapy and the extent of leucocyte cystine depletion
(Gahl et al., 1990). This method of analysis has been criticised on the basis that it is
unreasonable to perform statistical calculations on such extrapolated data (N Gretz,
personal communication).
Proesmans et al. reported their experience of treating 3 children with cysteamine and
phosphocysteamine (Proesmans et al., 1987). The three children aged 2-3 years
received cysteamine (and later phosphocysteamine) for up to 6 years in a dose of 60mg/kg/day as a syrup, also containing ascorbic acid and electrolyte solution. All
three progressed to end-stage renal failure by 10 years. Growth rate remained stable or decreased. These results were disappointing but the patients were not monitored with serial leucocyte cystine concentrations. These serve not only as an index of cystine depletion but also of compliance. Efficacy cannot be judged without this information.
French experience with cysteamine was reported by Broyer and Tete (Broyer and Tete, 1990). Eighteen children mean age 3y 4mos (range l0mos-7y) received a mean dose of 50mg/kg/day of cysteamine for a mean duration of 4y 8mos (range 6mos-8y). As well as conventional alkali and vitamin D therapy, most received indomethacin.
P 108

Compared with historical controls cared for at the same centre, 65 % of whom developed terminal renal failure by 10 years of age, the cysteamine group fared better. Only 3 of the patients (all of whom started the drug after 41h years of age) required dialysis by 10 years. Children treated before 26 months were 2 standard deviations taller than historical controls at age 5 years.
Clark et al. reported a study of the effects of high dose (1.95g cysteamine free base/m'/day) vs low dose (1.30g free base/M2/day), (Clark et al., 1992). (A dose of 1.30g free base/m2/day is approximately equivalent to 50mg/kg/day). 95 patients were studied and data were presented after 2 years of treatment. There was no significant difference between the admission and 2 year creatinine clearances (mean ± SEM 63.3
± 2.3 and 67.7 ± 2.8mls/min/1.73m' respectively). In addition, there was no difference in the results between the high and the low dose treatment groups. Compared with the previous multicentre trial (see above), both the admission and follow-up creatinine clearances were much higher, possibly because the mean age at admission in this study was 28 ± 2.1 months compared with 46.7 ± 3.0 in the older study. Height standard deviation. score remained stable during the study. The mean leucocyte cystine concentrations were 1.7 and 1.3 nmol 1/2 cystine per mg protein in
the low and high dose groups.
The most compelling evidence of the efficacy of cysteamine treatment was presented in a review of 32 years' experience of the care of children with cystinosis at the National Institutes of Health (Markello et al., 1993). In this review, 24-hour
creatinine clearances were determined in 1217 admissions of 76 children (each
admitted on at least 2 occasions). Twenty-seven patients were seen prior to the use of cysteamine (no treatment group), 32 were considered partly treated (poor compliance, cysteamine started after 2 years of age or median leucocyte cystine concentration > 2nmol 1h cystine per mg protein) and 17 were adequately treated (median leucocyte
cystine < 2nmol 1h cystine per mg protein and cysteamine started before 2 years Of age). The age at diagnosis was significantly less for the adequately treated group compared with the untreated group (mean ages 1.0 ± 0.5 vs. 2.2 ± 2. ly, p<0.01). The results are summarised in the table 5.3 (below).
P 109

Table 5.3: Results of NIH experience of cysteamine, 1993
No treatment Partial
treatment
Adequate
treatment
Duration of treatment (y) 4.5 7.1
Age at follow-up (y) 8.3±1.9 10.5±2.7 8.3±3.8
Clcmt (ml/min/1.73m) 8.0±4.8 12.4±7.7 57±20
Leucocyte cystine (nmol cys/mg protein)
8.8±5.5 1.7±2.1 1.1±0.7
The mean creatinine clearance for the well treated group was significantly greater and the leucocyte cystine concentration significantly less than corresponding values for the
untreated group (p < 0.001). Creatinine clearances were also analysed by averaging the results for each group at yearly age intervals. Partially and well treated children demonstrated some increase in creatinine clearance in the first three years of life
whereas clearance continued to fall in the untreated group. After this age, creatinine clearance fell but the slope of this line was the same for the well treated group as that for normal unaffected children. The authors extrapolated these data to predict the ages at which creatinine clearance would fall to zero. These were calculated as 9.5,20.0
and 74.3 years respectively, for the untreated, partially and adequately treated groups. They further estimated that every one month of adequate cysteamine treatment would allow 14 extra months of kidney survival. However, these predictions are based on data in children up to the age of 12 years and only time will tell whether they are accurate.
Although there is now overwhelming evidence that cysteamine reduces the progression of renal damage there has been concern that the drug would not affect cystine- mediated damage to non-renal fissues. Topical cysteamine treatment can prevent or reverse corneal cystine crystal deposition (Kaiser-Kupfer et al., 1987; Kaiser-Kupfer et al., 1990). Gahl et al. have shown that cysteamine therapy reduces the cystine
P 110

content in skeletal muscle (Gahl et al., 1988a). These workers have recently found
that the muscle cystine content in untreated patients increases with age (Gahl et al., 1992). In contrast the muscle cystine content remained relatively constant in 15
patients treated with cysteamine for approximately 7 years (Gahl et al., 1992). No
cystine crystals were seen in a post-mortem study of liver and kidney tissue from a9
year old boy who had received cysteamine for 8 years (Gahl et al., 1992). This work
suggests that cysteamine may help to prevent the non-renal manifestations of cystinosis and provides support for the contention that treatment should be offered to transplanted patients.
Use of cysteandne and phosphocysteamine in pre-symptomatic patients The advent of a treatment for cystinosis led families who had already had an affected
child, to consider pre-symptomatic treatment. There is clear evidence from the studies
reviewed above that early treatment is a critical factor in the success of therapy. It
was therefore very important to study the drug's effect in pre-symptomatic children
with cystinosis. Siblings affected with cystinosis tend to follow the same clinical
course and therefore the first child can act as a control for the newly treated patient (Gahl et al., 1989).
Da Silva et al. reported the use of cysteamine in a pre-symptomatic child with cystinosis (da Silva et al., 1985). The patient's elder brother was diagnosed as having
cysfinosis at 16 months of age and at 10 years was in terminal renal failure. The
patient was born at this time and although clinical examination was normal, leucocyte
and skin fibroblast cystine concentrations were within the affected range. At 4 weeks he was started on cysteamine solution and except for two brief intervals, the leucocyte
cystine concentration was maintained at < 0.5 nmol 1/2 cystine per mg protein. At the
age of 4 years, his height was on the 50th centile, creatinine clearance was 75ml/min/1.73m2and he had no features of the Fanconi syndrome. This report therefore provided dramatic evidence of the efficacy of cysteamine if started early and maintained at sufficient dosage. In two updates at 5 and 8 years of age, he was reported as remaining well with no features of the Fanconi syndrome although he has developed corneal cystine crystals (da Silva et al., 1985; Schneider JA, personal communication).
ill,

This very encouraging evidence is in contrast to other reports of the treatment of pre-
symptomatic children (Gradus et al., 1985; Reznik et al., 1991). Gradus et al. treated
a girl with cystinosis from the age of 9 weeks starting with a dose of 10mg/kg/day
and increasing to 58mg/kg/day by approximately 15 weeks. At this age despite good cystine depletion (0.8 nmol 1/2 cystine per mg protein) she had developed glycosuria and a metabolic acidosis. All the features of the Fanconi syndrome subsequently occurred although at the time of the report (aged 1 year) her glomerular function was good and her growth was normal.
Reznik et al. described three children treated from 12 hours, 9 days and 3 weeks of
age respectively (Reznik et al., 1991). When re-evaluated at 6 to 8 months old, all three had good cystine depletion but all had developed biochemical evidence of the Fanconi syndrome (aminoaciduria and reduced phosphate reabsorption) and two of the
three needed alkali therapy. Compared with their elder affected siblings, their growth had been better and their clinical course had been less severe. This may be due to the
early use of cysteamine or to more aggressive general medical care.
There may be several reasons for the differences between the first report of pre- symptomatic treatment and subsequent cases. Firstly there may be genetic heterogeneity between the cases although 0 would be classified as having infantile
nephropathic cystinosis. Secondly compliance with therapy may be a factor. Thirdly there may be differences in the rearing of these infants (eg. nutrition and environmental factors) that are as yet of unrealised significance.
Adverse effects of cysteamine- The most common side-effects of cysteamine and phosphocysteamine are nausea and vomiting. In the large multicentre trial, 14% of patients became non-compliant on account of the foul taste and nausea (Gahl et al., 1987c). However, it must be
remembered that cystinosis patients are prone to nausea and vomiting, even without the addition of cysteamine.
Corden et al. reported adverse reactions in 3 children treated with cysteamine in
whom the dose was being rapidly increased (Corden et al., 1981). A 10 year old boy developed fever, abdominal pain, headache and a maculopapular eruption after 9 days
P 112

of cysteamine treatment at which time he was taking 53mg/kg/day. After stopping the drug the symptoms resolved over 48 hours. A5 year old girl developed fever,
vomiting and a rash 8-10 days after starting the drug having reached a dose of 67mg/kg/day. She became lethargic, an EEG was reported as consistent with a "toxic
encephalopathy" and she developed neutropaenia. One to two days after stopping the drug, she recovered completely. A third child aged 7 years developed fever and a rash 12 days after starting cysteamine at a dose of 75mg/kg/day. Again all the symptoms resolved one day after stopping therapy.
All three children restarted cysteamine after an interval, built up to a dose of 50-
60mg/kg/day over a longer interval and remained free of their previous symptoms. In
retrospect all three cases could easily have suffered a viral illness to account for the
side-effects. Although rashes and fever can occur with penicillamine treatment (a drug
structurally similar to cysteamine), the time course of recovery is evidence against
such allergic phenomena.
Avner et al. reported a potentially much more serious adverse event during cysteamine therapy (Avner et al., 1983). An 8 year old boy developed hepatomegaly 15 months after starting cysteamine. Two months later he presented with a severe haematemesis, hepatosplenornegaly, ascites and prominent abdominal wall venous distension. After
recovering from surgery (gastric devascuMsation), he underwent a liver biopsy
which showed marked sinusoidal fibrosis, most apparent in the centrolobular areas. There was severe fibrosis around central veins. Numerous cystine crystals and some fatty infiltration characteristic of cystinosis were seen. The authors felt that this patient's liver disease was not the same as the hepatic dysfunction sometimes seen in (untreated) cystinosis and was therefore likely to be associated with cysteamine. This
view has been disputed by Gahl et al. who felt that the hepatic damage was a manifestation of the disease rather than the treatment (Gahl et al., 1983b).
The first patient treated with cysteamine developed seizures whist on a dose of 90mg/kg/day (Thoene et al., 1976). These responded to anticonvulsant medication and cessation of cysteamine. Subsequently, cysteamine was reintroduced without ill-effect.
P 113

Hyperphosphataemia
Phosphocysteamine is rapidly hydrolysed to cysteamine in the stomach. The phosphate released during this process is available for absorption. Changes in plasma phosphate were studied in 4 of the 6 patients at Guy's Hospital, undergoing a trial of oral phosphocysteamine suspension (see chapter 7: "A study of the effects of a single oral dose of phosphocysteamine solution"). Plasma phosphate was determined by standard methods in samples taken over a 24 hour period prior to phosphocysteamine and for a further 12 hours after a dose of 10mg/kg cysteamine base equivalent. Diet and fluid intake was identical on both days. The results, shown in figure 5.1, demonstrate an increase in plasma phosphate for several hours after the dose. The small number of subjects precludes statistical analysis of this change.
Clinical experience has confirmed these findings. Patients in end-stage renal failure have hyperphosphataemia and require phosphate binding medication. Phospho-
cysteamine treatment can lead to a substantial additional phosphate load and this has led on several occasions to hyperphosphataemia, especially in patients on dialysis. For this reason, cysteamine is the preferred formulation for patients in end-stage renal failure.
Other effects of cysteamine Cysteamine is used to produce an experimental model of duodenal ulceration in rats, although this effect has not been seen in humans (Selye and Szabo, 1973). High doses (100mg for a 100grn rat) were used to achieve this effect. This dose is approximately 20 times higher than the average daily dose in the US multicentre trial. Administration of smaller doses (30mg/kg) to rats led to a marked fall in somatostatin in the stomach and duodenum, probably by reducing its synthesis or increasing its breakdown at a cellular level (Szabo and Reichlin, 1981).
Tannenbaum et al. demonstrated that administration of cysteamine to rats depleted hypothalamic somatostatin concentrations and suppressed pulsatile growth hormone
release (Tannenbaum et al., 1990). Growth hormone-releasing factor immunoreactivity in some tissues was increased but the plasma levels decreased, suggesting that cysteamine led to an overall decrease in GRF secretion.
P 114

Figure 5.1: Effect of a single dose of phosphocysteamine on plasma phosphate
concentration
CM
Tý lrý
0
CY)
co
N OOOMW*4
(9) (D E P
LO
ql
CIO
Tý
0
(1/loww) 91LDqdsoqd P 115
0 Co (D qe cm Co a09a CM ly- 94 94

Gahl and Bercu studied prolactin secretion in cystinosis patients before and after cystearnine therapy (Gahl and Bercu, 1985c). Chronic cysteamine therapy led to a lower basal prolactin level and to a blunted prolactin response, abnormalities not seen in 12 cystinosis patients who had not received the drug. There was no effect of cysteamine on thyroid stimulating hormone.
Jeitner and Oliver determined the effect of cysteamine on lysosomal enzymes of the hyperprolactinaemic rat pituitary (Jeitner and Oliver, 1990). They demonstrated that the prolactin-depleting effect of cysteamine was due not to increased prolactin protease activity but possibly due to an alterion in the structure of the prolactin molecule.
Thus cysteamine has marked effects on hormonal secretion in animals and humans. It is not clear, however, what the significance of these many actions are in the patient
with cystinosis.
Further developments in cysteamine therapy
Cysteamine or phosphocysteamine remain the specific treatments of choice for
cystinosis. Research into alternative and improved methods of delivery is in progress. Unfortunately, the breath smell occurs even after intravenous dosage suggesting pulmonary excretion of sulphides (see chapter 7: "A study of the effects of a single dose of intravenous cysteamine"). Cysteamine is very hygroscopic and therefore difficult to formulate into capsules. Bergonzi et al. reported on the use of a capsule prepared with 2% silicic acid (Bergonzi et al., 1981). Cysteamine has been prepared in capsules with a polyethylene glycol base (see chapter 7: "A trial of a new formulation of cysteamine in capsules") and these have shown prolonged efficacy and stability. Other groups have formulated cysteamine bitartrate and found this to be
stable and easy to use in capsule form (Schneider JA, personal communication).
P 116

Chapter 6: Experience with cysteamine in the UK and Eire
Introduction Although there is extensive experience of the use of cysteamine and
phosphocysteamine reported in the literature, there are no data available from the
many patients treated in the UK. The objective of this study was to evaluate through
retrospective data collection, the efficacy of cysteamine and phosphocysteamine in the
treatment of cystinosis in the UK and Eire.
Methods
Patients
A postal survey was sent to every paediatric nephrologist and those adult nephrologists
who participate in the care of children with renal disease, in the United Kingdom and
Eire in February, 1990. The survey asked for the names of every cysfinosis patient
who had ever received cysteamine or phosphocysteamine.
Data coUection Data were collected retrospectively from the patient records. The data collection form
was adapted from that used in the United States for patients participating in the US
National Collaborative Study of Cysteamine (Gahl et al., 1987c). To ensure
consistency, data were only entered by either myself or by a fellow researcher (Miss
A Comber). Baseline data included a brief medical history and pre-treatment laboratory results. Subsequently, follow-up data were collected as near to 4-monthly
intervals as possible up to a cut-off date of May 31st 1990. Follow-up data included
dose information, occurrence of adverse effects or changes in medical condition,
growth parameters and routine laboratory determinations.
The data collection forms specifically asked about the occurrence of certain adverse
effects: vomiting temporally related to cysteamine or phosphocystearnine (occurring
within one hour of the dose), vomiting unrelated to medication, anorexia, diarrhoea,
jaundice, rash and fever. For transplanted patients there were questions designed to highlight episodes of graft rejection, infection or hypertension. The medical records were also scrutinised for other adverse events.
P 117

Data analysis Data were entered into a customised database using SmartwareII (Informix). At the
start of cysteamine/ phosphocysteamine treatment, results from the preceding clinic
were used to give the baseline data providing the clinic date was less than 30 days
beforehand.
The main parameters of efficacy were renal function and growth. Plasma creatinine
and hence estimated glomerular filtration rate (Schwartz et al., 1976) were chosen as indices of renal function since these measurements were made at most clinic
attendances. There were few data on formal assessments of glomerular filtration rate
and these were therefore not used. Growth was assessed by height standard deviation
score (HtSDS) based on Tanner and Whitehouse standards (Tanner et al., 1966).
Leucocyte cystine concentration was chosen as a biochemical parameter of efficacy of
cystine depletion.
Covariate analysis was used to study whether there were significant differences
between the pre-treatment and the final values of plasma creatinine, estimated glomerular filtration rate (estGFR) and height standard deviation score (HtSDS). This
allowed the effect of age on renal function and gro wth to be taken into account. Since
indomethacin affects renal function and may affect growth, 7 patients who received indomethacin were excluded at the point that the drug was started. One pre-transplant
patient treated with recombinant human growth hormone was excluded from the
analysis. Six patients were excluded from the analysis on account of missing data.
(Some patients were excluded on more than one count).
The leucocyte cystine concentration is not affected by age or by renal transplantation. All patients in the study were therefore eligible to be included in analysis of cystine depletion. The student's paired one sample t test was used to compare these data with Bonferroni's correction for multiple analyses. For the purposes of analysis of efficacy,
cystearnine (C) and phosphocystearnine (PC) were considered as equivalent.
Results
Patients
Fifty-nine patients received C/PC treatment in the UK and Eire. There were 30
P 118

females and 29 males, studied over a total of 563 clinic attendances. The ethnic origin
was Caucasian in 45 (76 %), Asian in 12 (20 %) , Middle Eastern in 1 (2 %) and mixed (Asian/Caucasian) in I patient (2%). Forty-four (75%) of the patients had been treated
at either Birmingham Children's Hospital (24 patients) or Guy's Hospital (20
patients). The number of patients, n, with completed data is given in all further
analyses. Ages are given as the median value with the range in parentheses. "Renal
death" is defined as the need for renal replacement therapy in the form of dialysis or transplantation. Table 6.1 shows the patient details.
Table 6.1: Patient details
All patients (n=59)
Age of onset of symptoms 11.0 mos (4-176)
(n =5 1)
Sex: NVF 30/29
Age at diagnosis 19.6 mos (5-276)
(n=58)
Symptom to diagnosis duration 6.0 mos (0-100)
(n=51)
"Renal death" 15
prior to C/PC (n=59)
Age at "renal death" 8.62 y (5.31-21.39)
prior to C/PC (n = 15)
Information on the mode of diagnosis was available for 55 (93%) patients. More than one method was used in some patients. The diagnosis was confirmed in 38 (69%) by the observation of cystine crystals in the cornea, in 13 (24%) by demonstration of cystine in a bone marrow aspirate and in 25 (45%) by an elevated leucocyte cystine concentration.
Forty eight of the patients for whom data were available, developed symptoms under
p 119

3 years of age. Three patients developed symptoms after 3 years of age (at 3.5,12.5
and 14.7y). The older two might be considered as having "late-onset" cystinosis (Goldman et al., 1971). At the start of cysteamine or phosphocysteamine therapy 15
(25%) had had a renal transplant.
Figure 6.1 shows a cross-sectional analysis of reciprocal creatinine concentration of
each of 36 of the pre-transplant patients (for whom data were available) at the start of cysteamine treatment. A line of regression drawn through these values can be
represented by the equation:
y= -0.0018x + 0.0019 (r=0.37),
where y is the reciprocal creatinine and x is age in years. The intercept ot is ine on
the x axis gives the age of renal death, in this study 10.6 years.
Other medical history and medication Several patients had other medical conditions requiring treatment. Three patients had
orthopaedic deformities secondary to rickets. Four transplanted patients had developed
non-renal complications of cystinosis (including diabetes mellitus and cerebral degeneration) prior to starting treatment. One transplanted boy had had a parvovirus infection 3 months prior to starting phosphocysteamine. This had led to hepatitis and bone marrow suppression, but his liver function tests and blood count had returned to
normal at the start of treatment.
The pre-transplant patients (n=44) commonly received electrolyte replacements (n=31), alkalinising agents (n=32), vitamin D supplements (n=36) or indomethacin
(n=7). Immunosuppressive ageiýs used after transplantation included prednisolone (n = 13), azathioprine (n = 12) and cyclosporin A (n = 8). Thyroxine supplements were
given to 14 transplanted patients but only one pre-transplant patient. Nine transplanted
patients were receiving anti-hypertensive agents (including frusemide in 4, atenolol in
4, hydralazine in 3). Two patients (both transplanted) were receiving growth hormone.
P 120

Figure 6.1: Cross sectional analysis of reciprocal plasma creatinine concentration at start of cysteamine treatment vs. age in 36 pre-transplant patients
CM Tý
0
Co
O-Oft
q*
C\j
0
000,
L/ L (1/lowd/L) gululluen/L P 121 a8
00000
qrt cr) C14 rý

Cysteamine and phosphocysteamine treatment Twenty-nine patients were treated with cystearnine and 30 with phosphocysteamine. 40
patients started treatment with cysteamine, 18 of these changed to phosphocysteamine and I changed back. Twenty-two patients started treatment before the age of 2 years. The median ages at which C/PC were started and the durations of treatment for the different patient groups are shown in table 6.2 and figure 6.2.
Table 6.2: Duration of cysteamine treatment
All Pre-transplant Transplant
patients (n=44) (n = 15)
(n=59)
Age at start 3.2y 2.2y 16.3y (Y) (0.6-24.8) (0.6-9) (8-24.8)
Duration (y) 3. Oy 3.6y 0.6y
(0.01-11.2) (0.01-11.2) (0.2-4.1)
Four patients had received oral cysteamine prior to entering the study. One patient had
received cysteamine for several months whilst in Australia but had stopped due to lack
of improvement. No data were available from that treatment episode. Two patients received courses of cysteamine for 5 and 4 months respectively, before stopping. They
resumed treatment 26 and 32 months later and continued until the cut-off date. Data
were therefore collected from their second courses of treatment. No baseline data for the first cysteamine treatment episode were available for one patient.
Details of the final doses taken at the cut-off date were available for 38 of the 44 pre- transplant patients. Fourteen were receiving cysteamine at a mean dose of 33mg/kg/day. Twenty-four were taking phosphocysteamine at mean a dose of 84
mg/kg/day (equivalent to 37mg/kg/day cysteamine base).
P 122

Figure 6.2: Duration of treatment
0 1
A
0 1
C)
co
: 23 I%ft
E C5
CD 4-0
%6- 0
r. 0 U)
:3
ql
CIO
N
Tý
sweiled jo jeqwnN 8P 123
LO 0 Lf) 0 LO 0 U) 0 LO 0 IT 4T M (Y) C\l C\l T-- T-

Adverse events and discontinuation of treatment
Adverse events were recorded in 54 (92%) of the patient's records and were noted in
280 (50%) of all clinic attendances assessed. Many (such as an episode of rhinitis,
gastroenteritis, respiratory infection) occurred once only for any patient and might be
expected in any longterm study of a paediatric population. Table 6.3 summarises the
important adverse events, by treatment group for the pre-transplant patients. Data
refer to the number of patients in whom an adverse effect was noted.
Other adverse events noted in the pre-transplant patients related to progression of their
renal disease eg. anaemia, hypertension, fluid overload, rather than to the drugs. Two
patients developed seizures, one at a time of severe hypertension and the other during
a high fever. In neither case were cysteamine or phosphocysteamine felt to have
contributed to the events.
Table 6.3: Adverse events
Adverse event Total
(n=44)
Cysteamine
(n=26)
Phosphocysteamine
(n = 18)
Vomiting related to C/PC
27(61%) 14(54%) 13(72%)
Vomiting not related to C/pc
31(70%) 18(69%) 13 (72%)
Breath smell 4(9%) 4(15%) 0
Anorexia 28 ý64%) 18(69%) 10(56%)
Diarrhoea 11 (25%) 8(31%) 3(17%)
Fever 23(52%) 16(62%) 7(39%)
Rash 7(16%) 6(23%) 1 (6%)
Convulsions 2(5%) 1(4%) 1(6%)
P 124
Two pre-transplant patients treated at the same centre, developed urticaria and facial
oedema after starting phosphocysteamine, formulated into capsules at their local hospital pharmacy. The symptoms resolved 48 hours after the drugs were Stopped. The allergic reaction may have been due to the drug or to an excipient added to the preparation.
In the transplanted patients, 3 of 12 (25 %) receiving phosphocysteamine had vomiting related to the medication and many had episodes of fever, headache or hypertension
which seemed related to problems with their transplant.
At the end of the study period, 46 (78%) of all the patients were continuing cysteamine or phosphocysteamine. Six patients (three pre-transplant) died during the
period studied. One, aged 2 years, was admitted during a severe infection, 15 months after starting cysteamine 10mg/kg/day. Cysteamine was stopped during this episode and she died four days later. One girl who had been on cysteamine for one month,
was noted to have developed features of athetoid cerebral palsy and although it was felt that this was probably related to pre- or perinatal events, cysteamine was stopped. Her neurological features remained unchanged after treatment was withdrawn and she died five years later. One other pre-transplant patient died as a result of acute renal failure.
One patient who had received three Iddney transplants within a period of 12 months, died from disseminated fungal infection probably related to immunosuppression. She had stopped cysteamine treatment 2 months before her death because of ill health and had only ever tolerated a low dose (200mg b. d. ). Two patients died of cerebral manifestations of cystinosis. Both had received phosphocysteamine at a late stage in their illnesses and treatment had had no appreciable effect on their outcome.
Three patients participated in a trial of rectal cysteamine (see chapter 7: "A trial of longterm rectal cysteamine"). Data from that trial are not included in the present analysis. Two of these patients had developed severe nausea on oral cysteamine and would have stopped treatment were it not for the rectal preparation. One other child stopped on account of nausea and vomiting. Only one patient developed end-stage renal failure requiring dialysis, during the study period. Phosphocystearnine was
P 125

stopped at that point.
Seven patients experienced a decrease in haemoglobin concentration, associated in six
of these, by a rise in plasma creatinine concentration. In the other patient the low
haemoglobin concentration resolved. Two patients were noted to have a fall in total leucocyte count during cysteamine therapy but in neither case was this significant. There were many changes in plasma electrolyte concentrations during the study period but these are expected in children with cystinosis.
Efficacy
The main parameters of efficacy (changes in renal function and growth) were assessed
only in the 44 pre-transplant patients. A number of patients were excluded from the
analysis, specifically those receiving indomethacin or growth hormone (see "Data
analysis" for details). The number of remaining (evaluable) patients is given in all
further analyses. For the purposes of analysis of efficacy, cysteamine (C) and
phosphocysteamine (PC) were considered as equivalent.
Renal function (number of evaluable patients: 3 1) Figure 6.3 shows individual longitudinal plots of plasma creatinine concentration
against age for these patients (the hatched area represents longitudinal plasma
creatinine concentrations in untreated patients (Broyer et al., 1981). Using covariate
analysis to compare pre-treatment and final values, there was a significant increase in
plasma creatinine concentration (p < 0.001) and a significant decrease in estimated GFR (p < 0.02).
Growth (number of evaluable patients: 34)
Figures 6.4 and 6.5 show the growth of boys and girls respectively, plotted with
centiles from healthy children (Tanner et al., 1966). Figure 6.6 shows individual longitudinal plots of HtSDS against age. There was no significant difference between
the pre-treatment and final values of HtSDS (p > 0.20).
P 126

Figure 6-3: Change in plasma creatinine concentration in 31 pre-transplant patients
receiving cysteamine (hatched area shows data from to untreated" controls, see text)
HC'J I'-
0
Co
loý
0)
1 ---7 -T---T -- TTT-ITT -T- -I IT --' -I- - -, C) C) C) C) C) C) 0
LO Iq (Y) C\j IT-
(Illowd) gululliegio
co
41
C\j
0
P 127

Figure 6.4: Height standard deviation scores in 34 pre-transplant patients receiving
cysteamine
IRT Tý
N F-
I-
00
a) co
1q: r
C4J
0
SGS 146-IIBH P 128
04 c1r) LO co

is-- - 0% - . ý- ". ji - __ --.
Figure 6.5: Growth of 17 pre-transplant boys receiving cystearnine
1
CIO Tý
04 T-
1
0
0)
0000ft% 00 0 16m as
LO
Nt
111111 -T-7- ,i, -= i (D CD 000000000
(D Igt CM CD Co (D qe CM
(Wo) 101B9H
CQ
Tý
P 129

Figure 6.6: Growth of 17 pre-transplant girls receiving cystearnine
1
Co
C\l Tý
1 1
0
CY)
otomw% 00 Co km (Z
CO (0
4e 000 CD Cm CD Co (D
(WO) lqß@IGH
LO
cr)
CM
qe clq
P 130

Leucocyte cystine concentrations (number of evaluable patients: 34)
Data on pre-treatment and final values of leucocyte cystine concentration were only
available in 34 (26 pre-transplant) patients. Table 6.4 summarises the data on mean (SD) leucocyte cystine concentrations for the different patient groups.
Table 6.4: Data on leucocyte cystine concentrations
All patients Renal function Growth
n 34 21 22
Durn. (y) 3.06 3.97 3.87
Pre-Rx
cystine
6.98(4.65) 6.65(5.52) 6.64(5.38)
Post-Rx
cystine
4.79(5.52) 5.58(6.52) 5.39(6.72)
t statistic 2.01 o. 64 0.78
p value > 0.2 > 0.2 > 0.2
Confidence
interval -0.02 to 4.39 -2.43 to 4.55 -2.08 to 4.60
(units of leucocyte cysfine: nmol 1/2 cystine per mg protein)
In no group was there a significant difference between pre-treatment and final value of leucocyte cystine concentration. The leucocyte cystine concentration was less than the
accepted upper limit of the treatment range (I nmol 1/2 cystine per mg protein) in only 21 % of all post-treatment determinations. There were very little data on the timing of
the sample with respect to the last dose of cysteamine.
P 131

Discussion
This is the first study of the UK experience with cysteamine and phosphocysteamine in the treatment of cystinosis. The presentation and clinical features of cystinosis are
sufficiently rare and distinct that it is likely that most patients will be known to a
paediatric nephrologist. Not all UK patients have been treated with cysteamine or
phospho-cysteamine. Cysteamine was first used in the UK by Dr Michael Winterborn
at the Birmingham Children's Hospital. As a result of his subsequent experience and
more recently of a research interest in cystinosis at Guy's Hospital, these two centres
cared for 44 of the 79 cystinosis patients in the UK in 1989 (personal
communications, BAPN survey 1989). In the present study, 75 % of the patients were treated at one of these two centres. Experience with cysteamine and phospho-
cysteamine was much more limited elsewhere. It is therefore likely that the data
accurately reflect the UK experience with these drugs.
Data from patients with typical early onset cystinosis were pooled with those whose
onset of symptoms was later. The division between infantile and late-onset cystinosis is not clear cut and the quality of data on age of onset of symptoms in this study was too poor to make a qualified classification. Although the study group is very heterogeneous, cross-sectional analysis of reciprocal creatinine concentration at the
start of cysteamine therapy, reveals that the course of the untreated disease in UK
patients was very similar to that in the rest of Europe and North America. The
equation of the line of regression for this data closely resembles those published in the
small study by Yudkoff et al. (Yudkoff et al., 1985) and in the large multicentre trial
(Gahl et al., 1990). In addition the mean age of renal death of the 15 patients who had
received a transplant prior to cjiteamine therapy, was 8.6 years, similar to the figure
of 9.2 years reported from a review of 205 patients with cystinosis, studied before the
advent of cystearnine (Gretz et al., 1982).
The occurrence of side effects of cysteamine treatment was difficult to determine. Although adverse events were recorded in 54 (92%) of the patient's records, many
such as fever, vomiting and diarrhoea occur in unaffected young children. Vomiting
related to the drugs was noted in (61 %) of pre-transplant patients and with a similar frequency for cysteamine and phosphocysteamine (see table 6.3). Children with cystinosis are prone to vomiting even without cysteamine treatment (Gahl et al.,
P 132
1989). In this study, 70% of pre-transplant patients were noted to suffer from
vomiting unrelated to the drug treatment. However, the decision to attribute or not to
attribute vomiting to cysteamine is a subjective one. Prior to the study, the design of the data collection form was discussed with the investigators of the US trial. All
agreed that vomiting that occurred more than one hour after the drug was unlikely to be due to the drug.
One child withdrew on account of nausea although two others would have done so
were it not for a rectal preparation. Thus 3 of 44 (7%) pre-transplant children stopped
through an inability to tolerate the medication. However the mean final doses of
cysteamine and phosphocystearnine are much lower than in the US multicentre trial.
One explanation might be that UK patients could not tolerate a higher dose.
Comparison of compliance rates with the US multicentre trial is therefore difficult.
Retrospective data collection is an imperfect means of acquiring information, since it
relies on a good standard of clinical note-keeping and is prone to observer bias. In this
study, only objective data (plasma creatinine, height and leucocyte cystine
concentration) were used to assess efficacy. The most important criterion of efficacy
of cysteamine treatment is the effect on renal function. Data on individual changes in
plasma creatinine for the 205 patients reported in 1982 have yet not been published (Gretz, personal communication). Broyer et al. presented data on evolution of plasma
creatinine with age in 35 French cystinosis patients, none of whom had received
cysteamine (Broyer et al., 1981). It was not possible to extrapolate these data to the
present study to act as a control group. In addition, the French study group reported
children treated between 1959 and 1979, many years before the present study. The
methods of data collection in the present study precluded analysis of the changes in
renal function at set intervals after the start of treatment. Therefore analysis of the
change between pre-treatment and final values of plasma creatinine concentration and
estimated GFR was undertaken in the pre-transplant children. There was a significant increase in plasma creatinine concentration and a significant decrease in estimated GFR, despite treatment and this effect could not be accounted for by the effect of age
on plasma creatinine concentration. Although some patients had only had a short duration of treatment (4 patients were treated for <I year) their inclusion in the data
analysis would be expected to reduce the chance of finding a significant change in
P 133

plasma creatinine. In this study therefore, cysteamine and phosphocystearnine did not
prevent the progression of glomerular deterioration. It is not possible to say whether
treatment affected the rate of deterioration of renal function but some individuals did
seem to have relatively stable plasma creatinine even after 10 years (see figure 6.3).
Conversely the lack of significant difference between the pre-treatment and final
values of HtSDS in the showed that growth rate was maintained although there was no "catch-up". There are many factors determining the growth of children with cystinosis. These include poor nutrition, frequent episodes of vomiting, electrolyte disturbance (including chronic metabolic acidosis and hyponatraemia) and the effects
of tissue cystine accumulation (eg. in bone and endocrine tissue). Cysteamine
treatment is therefore only one variable in this equation. Nevertheless, the
maintenance of a normal growth rate is in contrast to previous experience with
untreated controls (Broyer et al., 1981).
The leucocyte cystine concentration is the "gold standard" of biochemical response to
cysteamine treatment. The results showed that the cystine concentration was less than
the accepted upper limit of the treatment range (1 nmol 1/2 cystine per mg protein) in
21 % of determinations. There was no significant difference between pre-treatment and final values of leucocyte cystine concentration. Therefore, in this study, there is clear
evidence that cysteamine treatment did not adequately reduce the leucocyte cystine
concentration in many patients. It is likely that the poor cystine depletion is related to
the fact that the mean final doses of cysteamine (33mg/kg/day) and phosphocysteamine (37mg/kg/day base equivalent) in this study, are much less than
the average dose used in the US multicentre trial (51mg/kg/day) (Gahl et al., 1987c).
These data contrast with the outstanding results of cystearnine therapy at the National
Institutes of Health, recently presented by Markello et al., see chapter 5: "Clinical
studies", (Markello et al., 1993). Since the ability of these drugs to deplete cystine and reduce the progression of renal disease are now proven, these results suggest that
cysteamine and phosphocysteamine have not been adequately used in the UK.
P 134

Chapter 7: The pharmacokinetics of cysteamine and phosphocYsteamine
Introduction Despite their use for over 14 years, the pharmacokinetics, optimal route and frequency of administration of cysteamine and phosphocysteamine have yet to be
determined. Single dose studies of the pharmacokinefics and pharmacodynarnics of
these drugs were therefore undertaken.
Methods
Patients
Ten patients participated in the pharmacoldnetic studies (see table 7.1).
Table 7.1: Patient details
Patient
No.
Age
(y)
Sex Renal
transplant
Plasma creatibruine (umol/1)
1 1.8 M No 79
2 2.0 F No 40
3 4.5 F No 79
4 7.5 F No 132
5 10.2 M No 186
6 10.6 M Yes 68
7 13.9 M Yes 54
8 14.0 M Yes 131
9 16.1 F Yes 59
10 16.5 F Yes 192
Renal function, assessed by plasma creatinine concentration, was stable at the time of
studies. None had biochemical evidence of liver disease (plasma bilirubin, aspartate transaminase and alkaline phosphatase within normal limits).
P 135

Study Protocols
Patients who were already on cystearnine or phospho-cysteamine treatment stopped the
drug 7 days before each study began to allow an adequate "wash-out" period. Other
drug therapy was not altered during the study periods because of the hazards of
withdrawing indomethacin in the pre-transplant group and immunosuppression in the
transplanted children. Food was withheld for 8 hours before and for the first 3 hours
of each study but free access to clear fluids was allowed in view of their obligatory
polyuria.
Informed, written consent was obtained from the parents and from the older children. The study protocols were all approved by the Guy's Hospital ethical review
committee.
Blood sampling An intravenous cannula was inserted and patency maintained with intermittent bolus
injections of 2mls heparinised saline (Heplok, lOu/ml). Serial blood samples were
taken for leucocyte cystine concentration (3mls) and for plasma cysteamine (lml) at
varying time points after the dose. Leucocyte cystine concentrations were determined
using the methods in appendix 1. The blood sample for cysteamine determination was
taken into a lithium heparin tube and placed in wet ice. Plasma was separated immediately and frozen at -70T pending derivatisation and analysis by the methods detailed in appendix 2.
Pharmacokinetic and statistical methods Pharmacoldnetic parameters were estimated from standard formulae using the BIOPAK software package. For each plasma cysteamine profile, the maximum cysteamine concentration (C., ) and time at which this occurred (T. ), were noted. The area under the plasma concentration time curve (AUCO. ) was determined by the linear trapezoidal method. Individual semilog plots of plasma concentration versus time were inspected to determine the appropriate data points from which to calculate the elimination half-life (to. Statistical analyses were performed using a two tailed Student's paired West with Bonferroni's correction for multiple analyses (Altman, 1991). Significance was assumed if p<0.05.
P 136

A study of the effects of a single oral dose of phosphocysteamine solution
Pilot study Methods
A pilot study of the effects of a single oral dose of cysteamine was undertaken in
patient number 8. He had not previously been treated with cysteamine or phospho-
cysteamine. As a control, serial blood samples were taken after an overnight fast, at 08.00,09.00,11.00,14.00,22.00 and 08.00hrs. for determination of any diurnal
variation in leucocyte cystine concentration. Water was freely allowed at any time of
the study and food was given after 3 hours. A dietary record of all oral intake was kept. After a second overnight fast, he received 20mg/kg of cysteamine base in
solution. 50mls of water were allowed to "wash down" the drug. Concomitant drug
therapy (including immunosuppression for his renal transplant) was continued during
the study. Serial blood samples were taken for measurement of plasma cysteamine at
0,20,30,40,60,90mins., 2,3,4,6 and 12h and for leucocyte cystine determination
at 0,1,3,6,12 and 24h after the dose. Intake of diet, fluids and other drugs was
similar on both the pre-dose (diurnal variation) and oral dose days.
Results
The cysteamine dose was poorly tolerated and the patient started vomiting I hour after the dose. He vomited a further 5 times during the next 12 hours and required intravenous rehydration. Oral fluids were reintroduced after 24 hours and he was discharged from hospital 3 days after the study. The plasma cysteamine concentration
rose sharply (see figure 7.1) reaching a maximum concentration of 92pmol/l, 30
minutes after the dose. Elimination of the drug was rapid and plasma cysteamine was
virtually undetectable by 8 hours. Figure 7.2 shows the variation in leucocyte cystine
concentration during the pre-dose and dosage days. After the dose, the leucocyte
cystine concentration fell from 6.06nmol Ih cystine per mg protein to 3.37 at I hour
and 2.07 at 3 hours. Although plasma cysteamine was undetectable after 8 hours, the leucocyte cystine concentration remained suppressed during the study period. At the
end of the study, 24 hours after the dose, the leucocyte cystine concentration was 4.42nmol Ih cystine per mg protein (73% of the pre-dose value).
P 137

Figure 7.1: Plasma cysteamine concentrations after a single oral dose of cysteamine
solution (20mg/kg) in Pt. 8 rk I
0
LM
0
0
E P
qt
CNJ
0
9UIGWBIBISAO BWSBld P 138
000000 0 Co Co qe CNJ
Irm

Figure 7.2: Leucocyte cystine concentrations before and after a single oral dose of cysteamine solution (20mg/kg, given at 24 hours) in Pt. 8
0
LO
1) It
C)
um :3 0
LO M c\I
0 E
cm
LO Tý
0
71"
LO
0
(uielojd 6w/sAo 2; /L lowu) euilsAC) P 139 60
0 Co (D qe CM 0 T-

Discussion
The administration of an oral dose of 20mg/kg cysteamine solution to this patient (who had not had previous experience of the drug) was associated with severe vomiting. Intravenous rehydration prevented any deterioration in renal transplant function (there was no change in his plasma creatinine).
The plasma cysteamine concentrations achieved in this patient (9211mol/I at 30 minutes
and 71, umol/I at 1 hour after the dose) were substantially higher than expected from
reports of previous studies. Jonas and Schneider gave a single oral dose (mean 14
mg/kg) of cysteamine solution to 5 cystinosis children (Jonas and Schneider, 1982c).
The mean plasma cysteamine concentration 1 hour after the dose was 34Amol/l.
Smolin et al. administered equimolar doses of cysteamine (equivalent to 18mg/kg) and
phosphocysteamine to 6 children with cystinosis (Smolin et al., 1988). The peak
plasma cysteamine concentrations obtained between 30 mins and I hour, were 49Amol/I and 54t&mol/I respectively.
There was no consistent pattern of variation in leucocyte cystine concentration during
the control (pre-dose) day. After the dose, there was a rapid and sustained reduction in cystine concentration over the study period.
Conclusions
The results of the pilot study demonstrated that a 20mg/kg oral dose of cysteamine solution in a patient with no previous exposure to the drug, leads to very high (and
toxic) concentrations of cysteamine. Although the plasma is cleared of cysteamine by 8 hours, the reduction in leucocyte cystine was more prolonged. As a result of this
pilot study, it was decided to use phosphocysteamine for subsequent patients since this form of the drug is generally better tolerated. In addition, the dose was reduced to 23
mg/kg phosphocysteamine (equivalent to 10mg/kg cysteamine base).
P 140

A study of a single oral dose of phosphocysteamine: Methods In order to study any diurnal variation in leucocyte cystine concentration (and to act as a control), six patients (subjects 3,5,6,7,9 and 10) had serial blood samples taken for leucocyte cystine determination over a 24 hour period (at 08.00,09.00,11.00, 14.00 20.00 and 08.00hours). Seven patients (subjects 2,3,5,6,7,9 and 10)
received a 23mg/kg single oral dose of phosphocysteamine, given as a suspension in 50 mls water in the morning (07.30-08.30h). Because of the unpalatability of the drug, 50 mls of either juice or milk, were allowed immediately after the drug. Serial blood samples were taken for leucocyte cystine concentration at 0,1,3,6 and 12 hours and for plasma cysteamine at 0,20,30,40mins, 1,1.5,2,3,4,6,8,12 hours. Intake of diet, fluids and other drugs was similar on both the pre-dose (diurnal
variation) and oral dose days.
Results
Drug administration and adverse effects All the patients in the oral dose study successfully swallowed the phosphocysteamine suspension. Patients 5 and 10 suffered vomiting, starting approximately I hour after the dose. Patient 10, who vomited 3 times, had the highest peak cysteamine concentration (C,,,: 61.4 gmol/1) and largest "area under curve" (AUCo,: 120.1
14mol. h/1). All the patients were noted to have the characteristic breath smell oi cysteamine but there were no other adverse effects. No patient required intravenous fluids and there were no changes in plasma creatinine concentration during the study (data not shown).
Diurnal variation in leucocyte7 eystine Figure 7.3 shows the mean leucocyte cystine concentrations in the 6 patients in whom diurnal variation was studied. There was a trend for the leucocyte cystine to fall during the morning but there was no significant change from the baseline
concentration at time Oh (p>0.3 at all time points). Inspection of diet and drug sheets revealed no trend between intake and leucocyte cystine concentration.
Plasma cysteamine concentrations Individual plasma cysteamine profiles after oral phosphocysteamine are shown in figure 7.4 and the mean profiles in figure 7.5.
P 141

Figure 7.3: Diurnal variation in leucocyte cystine concentration
q* C\l
CD r4
00"'" to V) W4
16- :3 0
%-ýOoo
C\j
0
c 0
as
:3 coo
q*
0
(ulejoid 6w/sAo 3/ý lowu) eullsAC) P 142 6a
le CM 0 Co (D qe CM 0

Figure 7.4: Individual plasma cysteamine concentrations after a single dose of oral
phosphocystearnine solution (10mg/kg cystearnine base)
04
D
m
OOMW% CO)
Co %.. -. 0
0
E
11
C4
0
(1110WO) 9U§IWBGIS/%O BWSBld P 143
000a0000
1%% (D LO IT Cf) CM Tý

Figure 7.5: Mean plasma cysteamine concentrations after a single dose of oral
phosphocysteamine soludon (10mg/kg cysteamine base)
CJ
D
x>
16m Z 0
CD -C %-. 00
0
E
q*
C\l
0
0/10LUO) 9ul§w89lsAO BWSBld P 144
000000 LO Me Cf) C\l Tý

Leucocyte cystine concentrations
Individual variation and mean changes in leucocyte cystine concentration after oral phosphocysteamine are shown in figures 7.6 and 7.7. After oral phosphocysteamine, the mean leucocyte cystine concentration was significantly reduced (p=0.005) to a minimum of 40% of the pre-treatment concentration at 3h. The mean leucocyte cystine concentration had only reaccumulated to 61 % of the pre-treatment level at 12 hours after the dose (p=0.032).
Pharmacokinetic parameters Individual derived values of peak concentration (C., J, time to peak concentration (T. J, area under the curve from Oh to 8h (AUCo. ) and terminal half-life (t. j are shown in table 7.2.
Table 7.2: Pharmacokinetic parameters for oral phosphocysteamine solution
Patient
No. ctn"
(jumol/1) TIO&I
(min) AUC"
(; tmol. h/1) tý4 (h)
2 17.5 40 25.1 1.63
3 46.5 30 44.5 1.00
5 28.0 30 44.1 1.90
6 46.8 40 88.0 4.71
7 26.5 40 54.3 0.76
9 29.2 40 39.3 0.24
10 61.4 40 120.1 0.87
Mean
(SD)
36.4
(15.5) 59.4
(33.1)
1.59
(1.48)
P 145

Figure 7-6: Individual leucocyte cystine concentrations after a single dose of oral
phosphocysteamine soludon (10mg/kg cysteamine base)
Z) rmm
30
OOM*N 0 16»
0
_c CD %. -00 0
E P
q4T
cq
0
(ulejoid 6wjsAOU/Ljowu)eullsAo P 146 a0
C*J co co qe oj 0

Figure 7.7: Mean leucocyte cystine concentrations after a single dose of oral phosphocystearnine solution (lOmg/kg cystearnine base)
C*j Tý
0
CO
km :3 0
m (D %--4 0
E
qe
N
0
(ulleoid 6w/sAo Z; /ý lowu) eulisAC) P 147 2a
CM 0 co C\l Tý Tý
Discussion
The single doses of oral phosphocysteamine solution were generally well tolerated.
Only one patient vomited more than once and she had the highest peak cysteamine
concentration and area under the curve. There was no difference in patient tolerance between those who had received the drug on a longterm basis and those for whom this
was the first exposure to the drug.
Since the accumulation of cystine within lysosomes is derived from protein catabolism (Thoene et al., 1977), it might be expected that leucocyte cystine concentration would
vary with diet and time of day. The results show that there is no significant diurnal
variation in leucocyte cystine levels.
Cysteamine was rapidly absorbed into the circulation after oral administration of a
suspension of phosphocysteamine. Pharmacokinetic parameters for cysteamine have
not previously been described. There was considerable individual variation in C.,
AUCO, and t% but in all cases plasma cysteamine was virtually undetectable after 6h.
In the absence of data of plasma cysteamine concentrations after intravenous
administration, it is not possible to calculate the extent of cysteamine absorption after
an oral dose of phosphocysteamine. However, the rapid absorption and short time to
peak concentration, are consistent with a high site of gastrointestinal absorption (eg.
stomach and duodenum). These data are also in keeping with rapid hydrolysis of
phosphocysteamine to cysteamine in vitro, as suggested by Smolin et al. (Smolin et
al., 1988). Cysteamine has been prescribed in a6 hourly regimen for two reasons. Firstly, Thoene et al. reported that cystine reaccumulated over this period (Thoene et
al., 1976) and secondly Jonas and Schneider demonstrated that cysteamine was
undetectable in plasma 6 hours after a dose (Jonas and Schneider, 1982c). The results in this study demonstrate that the effect of the drug is more prolonged since the mean leucocyte cystine concentration had only risen to 61 % of the pre-treatment level 12h
after the oral dose.
P 148

A study of the effects of rectal cysteamine gel
Introduction
Cysteamine has an unpleasant taste and following an oral dose, the patient's breath
smells of free sulphides. A second common side effect is vomiting, typically occurring
approximately 1/2 hour after the dose. In an attempt to circumvent these problems, an investigation of the feasibility and efficacy of rectal administration of cystearnine was
undertaken. Since palatability was not a concern for the rectal study, and there is no information on rectal hydrolysis of phosphocystearnine, cysteamine was used for this
route.
Methods
Six patients (subjects 1,2,3,5,6 and 7) received a dose (10mg/kg) of cysteamine,
given rectally as a gel. Cysteamine gel was prepared in the Department of Pharmacy,
Guy's Hospital, with the following constituents:
- 2-94g cysteamine hydrochloride powder (Idis Ltd. ),
- 0. Ig disodium edetate,
- 10mls water,
- 9% methylcellulose. Preliminary dose formulations were prepared with a variety of methylcellulose concentrations, from which 9% methyl-cellulose was judged the most suitable. The
dose of cysteamine was calculated for each patient and dissolved in 9% methyl-
cellulose gel to a final volume of between 2.5 and 5mls so that the dose volume was
approximately similar for all patients. The gel was tested for stability and kept at 4T.
Rectal administration and sampling thnes Prior to administration the rectal cysteamine gel was allowed to stand at room temperature for 30mins. Get was administered to the patients in either the left lateral
or supine position, over 2 minutes, using a 5ml syringe (Steriseal) and a fine soft
plastic quill (Avon Medicals). The children remained supine for 15 minutes after the dose. Serial blood samples were taken for leucocyte cystine concentration at 0,1,3,6
and 12 hours and for plasma cysteamine at 0,20,30,40mins, 1,1.5,2,3,4,6,8, 12 hours.
P 149

Results
Administration of the rectal cysteamine gel was well tolerated in the younger 3
children. The older 3 children expressed a desire to expel the dose approximately 15
minutes after administration, but were able to retain the gel for a further 15 minutes. No child in the rectal study suffered vomiting, diarrhoea nor rectal bleeding. The
smell of cysteamine on the breath was minimal or not apparent after rectal dosage.
Plasma cysteamine concentrations Individual plasma cysteamine, profiles after rectal cysteamine are shown in figure 7.8
and the mean plasma cysteamine profile is shown in figure 7.9. The 3 children who
retained the rectal dose had a higher mean peak plasma cysteamine concentration than
those who expelled the dose (20.1 vs. 14.3gmol/1). Statistical comparison of these
groups is not possible because of the small numbers.
Leucocyte cystine concentrations Individual and mean leucocyte cystine profiles after rectal cysteamine are shown in
figures 7.10 and 7.11. There was no significant reduction in mean leucocyte cystine
concentration at any time point after the rectal dose (p > 0.1 at all time points). Those
children who had retained the rectal dose had a lower pre-treatment mean leucocyte
cystine concentration (6.65 vs. 10.23nmol 1h cystine per mg protein) but a greater
reduction at A (41 % vs. 14 %) than those who expelled the dose.
Pharmacokinetic parameters Individual derived values of peak concentration (C. J, time to peak concentration (T., J, area under the curve from Oh to 8h (AUCOJ and terminal half-life (t. h) are
shown in table 7.3. (Inspection of the plasma cysteamine profile for patient I showed
a slight rise in cysteamine concentration at 8h, making calculation of pharmacokinetic parameters impossible).
P 150

Figure 7.8: Individual plasma cysteamine concentrations after a single dose of rectal
cysteamine gel (10mg/kg cysteamine base)
CM
Z) rý
00
0*OM%% to 16m :3 0
m Co Nb-.. 90
a) E P
lit
CM
0
9UIWBIBISAO IBWS*eld P 151
0 LO 0 LO LO 0 CO cm CM Ir-

Figure 7.9: Mean plasma cysteamine concentrations after a single dose of rectal
cysteamine gel (10mg/kg cysteamine base)
04
D
z
km Z 0
to m
0
E
qe
cJ
0
v9ul@WBv9lsA0 BWSBld P 152
0 Lf) 0 LO 0 U) Cf) CM CM r- Ir"

Figure 7.10: Individual leucocyte cystine concentrations after a single dose of rectal
cystearnine gel (10mg/kg cysteamine base)
C\l
OOMM CO)
rD m
4) E F-
41
C\l
0
(Uielojd 6w jed sAC) Z; / ý lowu) oullsAC) P 153
co lqt C*j 0 00 co Nt Tý Tý Tý I-

Figure 7.11: Mean leucocyte cystine concentrations after a single dose of rectal
cysteamine gel (10mg/kg cysteamine base)
C\l
D
00
OOMW%
0
E P
wl
cm
0
(ulejoid Bw/Ao Z/ý lowu) eullsAC) P 154 aa
CM

Table 7.3: Pharmacoldnetic parameters for rectal cystearnine gel
Patient
No.
cinax
GIM01/0 Tlnsx
(min)
AUCO,
(; tmol. h/1)
t4 (h)
1 15.4 40 See note See note
2 17.5 40 27 0.73
3 27.6 30 45 1.46
5 10.0 20 9 0.45
6 20.6 20 15 0.29
7 12.3 30 15 0.98
Mean (SD) 17.2(6.3) 22.3 (14.3) 0.78(0.46)
Discussion
The 3 younger patients who received rectal cysteamine, tolerated the dose without any
problems. Halitosis was noted in 2 but was minimal compared with that after oral dosage. There was marked individual variation in the plasma cysteamine and leucocyte
cystine profiles after rectal dosage. Although cysteamine was rapidly absorbed from
the rectum, the extent of absorption was low (table 7.3). There was no significant
effect on the mean leucocyte cystine concentrations (see figure 7.11) and this is
probably because the older 3 patients expelled the dose 30 minutes after
administration. One patient in particular had a marked fall in leucocyte cystine that
persisted for the study period (see figure 7.10).
P 155
A trial of longterm rectal cysteamine
Three young children (patients 1,2 and 3) who became intolerant of oral phosphocysteamine were treated for up to 12 months with a once or twice daily
regimen of rectal cysteamine gel. The gel was formulated and prescribed as in the single dose study. The doses were steadily increased according to firstly the effect on leucocyte cystine concentration and secondly patient tolerability. The volume of gel administered was maintained at approximately 5mls per dose by increasing the concentration of cysteamine within the gel. The final rectal doses varied considerably. One patient (number 1) required only 20mg/kg/day whereas the other two needed higher doses of 50 and 70mg/kg/day respectively.
Compliance improved not only with the drug but also with their electrolyte replacements and dietary intake. Leucocyte cystine concentrations fell to more
acceptable levels (see figure 7.12), (van't Hoff et al., 1991). Diaries of adverse
events during therapy revealed that the children tended to defaecate 1/2h after the dose in approximately 30% of administrations. Their parents noted that the breath smell and nausea were much reduced compared with oral dosage.
Rectal administration in the three patients was discontinued after 6,8 and 11 months respectively. Two stopped on account of side-effects (diarrhoea and minor rectal bleeding respectively) and the third wanted to recommence oral dosage. All three
were able to recommence oral phosphocysteamine without difficulty. For these patients rectal cysteamine acted as a "stop-gap" treatment, covering a period of complete intolerance to oral therapy.
P 156

Figure 7.12: Longterm rectal cysteamine therapy in 3 patients
04
D -
Cl)
0
m
41
C*j
0
hm
a
(uleloid ßw jed sÄ0 Z/ ý lowu) eullsÄ0 P 157 00
N (D LO qe cr) cm 0

A trial of a new formulation of eysteamine in capsules
Introduction
Cysteamine hydrochloride is very hydroscopic, tending to oxidise, to the disulphide,
cystarnine, in the presence of moisture. It has therefore always been prescribed as a
solution, formulated with a reducing agent, as follows:
- Cysteamine hydrochloride 142.25g
- Disodium edetate 100mg
- Water to I litre. This produces a solution of 100mg cysteamine base per mi of solution.
Nausea, vomiting and breath smell are common side-effects of cysteamine solution. The pro-drug, phosphocysteamine, was developedlo counter these adverse effects. Most patients prefer phosphocysteamine to cysteamine. It is prescribed as a powder,
either in sachets or in capsules which can be dissolved in water just prior to ingestion.
The Pharmacy Departments of Birmingham Children's Hospital and Guy's Hospital
have in the past, hand-packed capsules of phosphocysteamine. Although this is very time and labour-consuming, the older patients prefer encapsulated drug.
Phosphocystearnine is obtained in the UK from Idis Ltd, who import the powder from
Medea Research Laboratories in Westhampton Beach, New York State, USA. This is
the only commercial source of the drug in the World and is relatively expensive (018.35 per 500g, 1989 price).
For these reasons, research into new formulations of cysteamine has been undertaken. Bergonzi et al. reported on the -use of a capsule prepared with 2% silicic acid but no
pharmacokinetic or pharmacodynamic data were given (Bergonzi et al., 1981). Dr G
Rowley and colleagues at Sunderland Polytechnic have developed a capsule of
cystearnine by formulating it in polyethylene glycol. A trial of these capsules was
undertaken in cystinosis patients since this would give not only pharmacokinetic data
but also information about the effect of the capsule on leucocyte cystine concentrations.
P 158

Methods
Patients
After an overnight fast, 4 patients (subjects 4,5,6 and 7) received a dose (15mg/kg)
of cysteamine base in capsule form. The capsules were individually prepared for each patient by Dr Rowley and Miss Dixon at Sunderland Polytechnic. The patients swallowed the capsules over 1-2 minutes with 50mls water.
Blood sampling Serial blood samples were taken for leucocyte cystine at 0,1,3,6,12 and 24hours
and for plasma cysteamine at 0,20,30,40,60,75,90mins., 2,3,4,6,8,12 and 24
hours.
Results
All the patients were able to swallow the capsules without difficulty and none experienced nausea or vomiting. However the characteristic breath smell was noted in
all patients.
Plasma cysteamine concentrations The individual and mean plasma cysteamine profiles after the oral cysteamine capsule dose are shown in figures 7.13 and 7.14 respectively. The small number of subjects precludes statistical analysis but there appears to be a biphasic absorption profile, with a secondary peak at 90 minutes.
Leucocyte cystine concentrations The individual and mean leucocyte cystine profiles are shown in figures 7.15 and 7.16
respectively. Although statistical analysis has not been performed, all the subjects demonstrated a marked reduction in leucocyte cystine concentration. One hour after the dose, the mean cystine concentration was 47% of the pre-dose level. The greatest reduction in mean leucocyte cystine concentration (to 27% of the pre-dose level) occurred 3 hours after the dose. At 24 hours after the dose, the mean leucocyte cystine concentration had only risen to 51 % of the baseline value.
p 159

Figure 7.13: Individual plasma cysteamine concentrations after a single dose of cysteamine capsules (15mg/kg cysteamine base)
C*j Tý
0
00
(D %. -0 0
E P
Mt
CM
0
0/10WO)"s P 160 lw'e9lsA3'BWSl8ld
0 LO 0 LO 0 LO 0 LO 0 44* Cf) Cf) C-4 04 T- T-

Figure 7.14: Mean plasma cysteamine concentrations after a single dose of cysteamine
capsules (15mg/kg cysteamine base)
CM qpý
30
OOOMN (4
CD %b- 0
E r-
q*
C\l
0
(I/IOWH) 9UIIWBIBISAO BWSBld P 161
Lf) 0 LO 0 LO 0 U) 0 Lo IT qq V) Ct) C\l C\l T- T-

Figure 7.15: Individual leucocyte cystine concentrations after a single dose of
cysteamine capsules (15mg/kg cysteamine base)
ql C\l
X) r«w
OOMWN Co
0 CM m rm %NMOOO
E
C)
co
Cf)
0
(uielojd 6w/euilsAo Z; /L lowu), guilsAC) 948P 162
Co r*-. Co LO qe CY) CM 1- 0

Figure 7.16: Mean leucocyte cystine concentrations after a single dose of cysteamine
capsules (15mg/kg cysteamine base) 41
CM
\1
0
1)
:3 0
rý %mmloo (D
E
0)
co
m
0
(ulejoid 6w/eullsAo Z/ý lowu) gullsAC) P 163 aaa
Co r*. % Co LO qe CO CM T- 0

Pharmacokinetic parameters Individual derived values of peak concentration (C.., ), time to peak concentration (T. J, area under the curve from Oh to 8h (AUC04) and terminal half-life (tj) are
shown in table 7.5.
Table 7.5: Pharmacoldnetic parameters for oral cysteamine capsule
Patient
No.
cluax
(UM01/1)
Tmax
(min)
AUCO-t
(umol. h/1) W
4 30.6 30 30.0 0.35
5 23.6 30 28.4 0.80
6 42.2 90 92.5 0.77
7 38.3 75 92.9 0.64
Mean
(SD)
30.6
(8.42)
61.0
(36.7)
0.70
(0.23)
Discussion
The manufacture of a readily available and stable form of cysteamine capsule would be a major practical advance in the treatment of cystinosis. The results of this small
and preliminary study indicate that the formulation of cysteamine in a capsule with
polyethylene glycol, is both safe and very effective.
As in previous pharmacoldnetic studies on cysteamine, there was wide variation in
plasma cysteamine concentrations achieved after an identical (weight-based) dose.
There was a suggestion of a biphasic absorption profile with an initial mean peak of 28.9jAmol/I at 30 minutes and a secondary peak (mean 23.31zmol/1) at 90 minutes. The
secondary peak may indicate absorption of the drug from the small intestine since it
occurs too early to be due to enterohepatic circulation.
All the subjects showed a marked and sustained reduction in leucocyte cystine concentration. Despite the slower absorption of cysteamine, the profile of leucocyte
P 164

cystine depletion was similar to that seen after administration of oral
phosphocysteamine solution. This suggests that total area under the plasma cysteamine
vs. time curve might be as important a factor in efficacy as peak plasma cysteamine
concentration. If this is correct, it would allow the development of slower release formulations of cysteamine.
A study of the effects of a single dose of intmvenous cysteamine
Introduction Intravenous cysteamine has been administered to one patient with cystinosis (Thoene
et al., 1976). In that study, plasma cysteamine was not measured but there was a
profound reduction in leucocyte cystine that was maintained for 48 hours. No details
of adverse effects were reported.
There is much wider experience of intravenous cysteamine in the treatment of severe
paracetamol poisoning (Prescott et al., 1976; Hughes et al., 1977). Glutathione
precursors and thiols such as L-cysteine, L-methionine and cysteamine were found to
be protective against hepatic necrosis in acute paracetamol poisoning. Prescott et al.
gave intravenous cysteamine to 30 of 121 patients with severe paracetamol poisoning (Prescott et al., 1976). The dose regimen was 2g cysteamine base infused over 10
minutes, followed by a further 1.6g over the next 20 hours. Details of the patients'
ages were not given, but if an average weight of 70kg is assumed, the initial loading
dose is approximately 29mg/kg. Early cysteamine treatment (within 10 hours of ingestion) was found to be very* effective in preventing severe liver damage, renal failure and death when compared with a control group. Cystearnine "regularly" (sic)
caused flushing, nausea, vomiting, drowsiness and misery. In a further trial , Hughes
et al. gave intravenous cystearnine to 26 patients after a paracetamol overdose (Hughes et al., 1977). The dose used was 2g cystearnine hydrochloride over 10
minutes with a further 1.2g over 20 hours. The doses in this study are lower than
those in the study of Prescott et al., since the latter used doses based on cysteamine hydrochloride rather than cystearnine base. All 26 patients treated with cysteamine in
the study of Hughes et al. developed severe nausea and vomiting (Hughes et al., 1977). Six became drowsy and one developed meningism (although examination of
P 165

spinal fluid was normal). None had any longterm sequelae of treatment. No mention
was made in either study of whether the patients had the characteristic smell of
cysteamine on their breath. In addition in neither study were plasma cysteamine
concentrations measured. Subsequently, other thiol derivatives such as methionine and N-acetylcysteine have replaced cysteamine as protective agents in the treatment of
severe paracetamol poisoning.
The assessment of the systemic bioavailability of a drug requires information on the
plasma concentrations achieved after intravenous dosage in which it is assumed that
absorption is complete. Comparison of the areas under the curve after enteral and intravenous doses allows the bioavailability (F) to be calculated as follows (Rogers et
al., 1981):
F =(AUCa / AUCi, ) / (Dosei, x Dose. )
where AUCw = area under curve after oral dose
AUCj, area under curve after iv dose
Dose,, w oral dose
Dosei., = iv dose.
A study of the effects of a single intravenous dose of cysteamine was undertaken to
provide data on which to calculate systemic bioavailability of the drug and also to investigate the suggestion of prolonged cystine depletion after intravenous dosage
(Thoene et al., 1976).
Pilot study Methods
After an overnight fast, patient number 5 (see table 7.1) received an infusion of 2. Smg/kg cysteamine base made up in 50mls of 0.9% Normal saline, given over 30
minutes. At the end of the infusion, the intravenous line was flushed with 5 mls of 0.9% Normal saline to ensure that the entire dose of cysteamine was administered. Administration by infusion over this time period was designed to mimic the time course of the plasma cysteamine profile after oral phosphocysteamine (see figure 7.5). It was therefore hoped to avoid very high peak concentrations that might have arisen
P 166

if the intravenous dose had been given by bolus and thereby reduce the incidence of
nausea and vornifing.
Serial blood samples were taken from a second intravenous line placed in the
contralateral arm, for leucocyte cystine at 0,1,3,6,12,24 hours and for plasma
cysteamine at 0,10,20,30,40,45,50,60,75,90,105 mins., 2,3,4,6,8,12 and
24 hours. Pulse and blood pressure were monitored at 30 minute intervals over the
first 4 hours of the study.
Results
The intravenous dose was very well tolerated and there were no adverse effects. The
characteristic smell of cysteamine was not noted on the patient's breath. There were
no consistent changes in pulse or blood pressure.
The plasma cysteamine profile after intravenous infusion of cysteamine is shown in
figure 7.17. The peak concentration of 20, umol/I was reached at 20 minutes although the drug was infused over 30 minutes. Elimination of the drug was rapid and it was
undetectable in plasma after 3 hours. The leucocyte cystine concentrations are shown in figure 7.18. There is no consistent pattern in the cystine results.
In summary, an intravenous dose of 2.5mg/kg was safely administered by infusion
over 30 minutes. However, the resulting plasma cysteamine concentrations were low
and were not associated with any change in leucocyte cystine concentration. The
absence of halitosis might also be explained by the low plasma concentrations of
cystearnine. A larger dose would be needed for subsequent studies of the effects of intravenous cYsteamine.
P 167

Figure 7.17: Plasma cysteamine concentrations after an intravenous infusion of
cystearnine (2.5mg/kg cystearnine base) in patient No. 5
CM
D -
x3
N%Noo
qe
0
(I/IOWH) 9UI@WBGlsf%O 1OWS91d P 168
C\j 0 co (D Mt CM 0 co co Mt C*j 0 CM CM T- T- T- T- T-

Figure 7.18: Leucocyte cystine concentrations after an intravenous infusion of
cystearnine (2.5mg/kg cystearnine base) in patient No. 5
Iq C\j
D
I-
%wmwgo
Co
qqt
0
(u! glojd Bw /sAo Z; /ý lowu) eullsAo P 169 9a
CNJ 0 00 CD qt CM 0 Tý T-

A study of the effects of a single dose of intmvenous; cysteamine
Methods Patients
After an overnight fast, 4 patients (subjects 2,3,4 and 6), received a 5mg/kg dose of
cysteamine, given by intravenous infusion in 50mls of 0.9% Normal Saline over 30
minutes. At the end of the infusion, the intravenous line was flushed with 5 mls of
0.9% Normal saline to ensure that the entire dose of cysteamine was administered.
Blood sampling Serial blood samples were taken from a second intravenous line placed in the
contralateral arm, for leucocyte cystine at 0,1,3,6,12,24 hours and for plasma
cysteamine at 0,10,20,309 40,45,50,60,75,90,105 mins., 2,3,4,6,8,12 and
24 hours. Pulse and blood pressure were monitored at 30 minute intervals over the
first 4 hours of the study.
Results
As in the pilot study, the intravenous dose was very well tolerated and there were no
adverse effects. The characteristic smell of cysteamine was noted on the breath of all
patients but was less noticeable than in the oral study. There were no consistent
changes in pulse or blood pressure.
Plasma cysteamine concentrations
The individual and mean plasma cysteamine profiles after intravenous dosage are
shown in figures 7.19 and 7.20 respectively.
Leucocyte cystine concentmflons The individual and mean leucocyte cystine profiles after intravenous cysteamine are
shown in figures 7.21 and 7.22 respectively. Two subjects showed marked and
sustained reductions in leucocyte cystine concentration following intravenous dosage.
The other two subjects had no consistent change in cystine concentration. Overall the
mean leucocyte cystine concentration was reduced to 55% of the mean pre-dose level
at I hour and had only reaccumulated to 72% of the baseline concentration after 24
hours. The small number of subjects precludes statistical analysis.
P 170

Figure 7.19: Individual plasma cysteamine concentrations after an intravenous infusion
of cysteamine (5mg/kg cysteamine base)
D
30
km
:3
0
E P
, it
C\l
0
! BUGIWBGISAO L'WsBld P 171
00000000
r*-. co LO v Ct) C\j lrý

Figure 7.20: Mean plasma cysteamine concentrations, after an intravenous infusion of cysteamine (5mg/kg cysteamine base)
CM Tý
0
00
**IM%
16m :3 0
Co C
%--. 0
(D E P
q*
C*j
0
9UIWB9ISA0 lewsuld P 172
0000000
(D LO le cr) CM Tý

Figure 7.21: Individual leucocyte cystine concentrations after an intravenous infusion
of cysteamine (5mg/kg cysteamine base) IP40
)
0 -
LM :3
E P
Co
lqt
0
(ulejoid 6wjsAo Z/ý lowu) 9UIISAO P 173 aa
0 Co qe CM 0

Figure 7.22: Mean leucocyte cystine concentrations after an intravenous infusion of cysteamine (5mg/kg cysteamine base)
q* CM
0 cm
CD
:3 0
C\l = %"moo
(D E P
co
41
0
(ulejoid Bw /sAo Z/L lowu), gullsAo P 174 aa
co CM 0

Pharmacokinetic parameters Individual derived values of peak concentration (C,. ), time to peak concentration
(r. j, area under the curve from Oh to 8h (AUCo-) and terminal half-life (tj) are
shown in table 7.6.
Table 7.6: Pharmacokinetic parameters for intravenous cysteamine
Patient
No.
cinal
(14mol/1)
Twal
(min)
AUCOt
(/AMOI. h/1)
týj
(h)
2 29.7 20 43 1.45
3 37.7 30 29 1.89
4 34.1 20 25 2.45
6 64.0 20 67 1.90
Mean
(SD)
41.4
(15.4)
40.9
(19.2)
1.79
(0.35)
- 11
Discussion
Administration of an intravenous dose of cysteamine in the form of a short infusion,
proved to be safe and in some patients, effective in reducing the leucocyte cystine
concentration. Since the primary aim of this study was to enable the calculation of
systemic bioavailability of cysteamine, a low and non-toxic dose was chosen. The
presence of halitosis suggests that the characteristic breath smell is due to pulmonary
excretion of free sulphides. As in previous studies, there was marked variation in the
plasma cysteamine concentrations achieved after an identical (weight-based) dosage.
There were no technical problems with the intravenous infusions so that delivery of the dose can be assumed to be complete. The patient with the highest peak plasma cysteamine concentration and area under the curve (subject 6) did not have the
greatest reduction in leucocyte cystine, as might have been expected. All the intravenous studies were completed within a4 week period, a time over which the formulation had been shown to be stable (data not shown).
P 175

The reduction in mean leucocyte cystine concentration was sustained for the 24 hour
duration of the study. Without data on leucocyte cystine concentrations more than 24
hours after an intravenous dose, it is not possible to say how long the reduction in
cystine would last. As was observed in the oral dose study, the duration of leucocyte
cystine depletion (24h) far outlasted the presence of cysteamine in the plasma
compartment (8h).
Discussion of the pharmacokinetics of cysteamine and phosphocysteamine There has been little work on the pharmacokinetics and administration of cysteamine
and phosphocysteamine. Such information will almost certainly increase efficacy,
reduce side effects and thereby improve compliance. This investigation is the first
formal study of the pharmacokinetics of cysteamine and phosphocysteamine in patients
with cystinosis.
All the pharmacokinetic studies were undertaken in patients with cysfinosis rather than in animals or healthy human volunteers. Animals were not used mainly because
pharmacokinetic data are often species-dependent. Patients were studied in preference to healthy volunteers since this provided data not only on the pharmacoldnetics but
also on the pharmacological response (ie. a change in leucocyte cystine). The leucocyte cystine concentration in a normal healthy person is less than 0.3nmol 1/2
cystine per mg protein. This level approaches the lower limit of detection of the
assay. Thus it would not be feasible to measure an effect of cysteamine on the leucocyte cystine concentration in healthy volunteers.
Since cystinosis is a very rare condition, the number of patients at any one centre is
relatively small. From this point of view, it was fortunate that there were a group of patients at Guy's Hospital who felt able to participate in these studies. Inevitably the
number of subjects in any one trial was small. Many patients underwent several studies, although none took part in more than one in every six months. Each study involved stopping longterm phosphocystearnine treatment for 7 days and entailed a two day hospital admission (generally arranged in school holidays or at weekends). Practical and ethical considerations therefore limited the research.
Preliminary data on the metabolism of cysteamine came from the studies of its
P 176

radioprotective effects. Eldjarn and Nygaard studied the distribution of cysteamine and cystamine after administering S35 -labelled capsules of each compound to 2 healthy human volunteers (Eldjarn and Nygaard, 1954). Peak serum radioactivity occurred between 30 and 60 minutes after the doses, with rapid fall-off thereafter. Urinary
excretion of radioactive products demonstrated that very little cystamine or cysteamine was excreted in unchanged form. Most of the S35 -labelled products were in the form
of sulphate and taurine. Further animal work from the same group demonstrated that in mice, cystamine and cysteamine are extensively protein bound in the form of mixed disulphides (Eldjarn and Pihl, 1956).
At the time of the first description of the depletion of cystine by cysteamine, a clinically applicable assay for cysteamine was not available (Thoene et al., 1976). There were therefore no data on plasma cystearnine concentrations after the oral and intravenous doses in the first treated patient. Jonas and Schneider measured plasma cystearnine concentrations after an oral dose (mean 14 mg/kg) of cysteamine solution in 5 cystinosis children on longterm treatment (Jonas and Schneider, 1982c). The
mean plasma cysteamine concentration I hour after the dose was 34, umol/l. Urinary
cysteamine excretion was also measured and was found to vary between 0.3 and 1.7%
of the total daily dose.
Smolin et al. compared equimolar doses of cysteamine (equivalent to 18mg/kg) and phosphocysteamine in 6 children with cystinosis (Smolin et al., 1988). These children were on longterm treatment although it had been stopped for I day (in 2 patients) and 7 days (in 4 patients). The peak plasma cysteamine concentrations obtained between 30 mins and 1 hour, were 49pthiol/i and 5414mol/I after cysteamine and phospho- cystearnine, respectively. In their study, plasma cysteamine concentrations and leucocyte cystine levels were not reported more than 6 hours after the dose. In all cases cysteamine had been virtually cleared from the plasma by this time. In the 2 patients in their study who had stopped longterm cysteamine treatment 7 days beforehand, the leucocyte cystine concentrations 6 hours after the dose remained lower than the pre-dose levels. -
Cysteamine is prescribed in a6 hourly regimen since, in vitro, cystine reaccumulated over this period (Thoene et al., 1976). In addition Jonas and Schneider demonstrated
P 177

that cysteamine was undetectable in plasma 6 hours after a dose (Jonas and Schneider,
1982c). The results of the oral phosphocysteamine study demonstrate that the effect of
the drug is more prolonged since the mean leucocyte cystine concentration had only
risen to 61 % of the pre-treatment level 12h after the oral dose. Since this was a single dose study, undertaken in patients with "untreated" cystine levels, it is not surprising that the cystine level remained well above the upper limit of the therapeutic range (lnmol 1/2 cystine per mg protein). Whilst some patients in the UK can tolerate 6
hourly dosage, many can only manage to take the drug twice a day (Winterborn M,
van't Hoff W, personal communications). The demonstration that 12 hourly dosage is
efficacious is of great importance to these patients. It is not possible to say from these
results whether the rate of cystine re-accumulation will be the same after multiple doses. Longterm therapeutic monitoring will provide information in this respect (see
chapter 8: "Monitoring of leucocyte cystine concentrations").
Even with such a reduction in the frequency of dosage, there remain patients who are
unable to tolerate therapy. This is a particular problem in the youngest children since they usually require larger quantities of electrolyte supplements at this time. These
young, recently diagnosed cystinosis children are prone to vomiting, even before
cysteamine is started (Gahl et al., 1989). It can therefore be difficult to introduce
cysteamine or phosphocysteamine therapy with the expectation of nausea and vomiting
as common side effects. For these reasons, alternative routes of administration of these drugs have been studied.
Rectal administration of cysteamine in the form of a gel, proved to be feasible and
safe. Although some individuals showed a reduction in cystine concentration, the low
dose used and the fact that 3 subjects expelled the dose after 30 minutes, resulted in
there being no significant reduction in mean leucocyte cystine. There was no significant difference between the mean elimination half lives, t1/2, in the oral and rectal dose studies (p > 0.2), see table 7.7, below.
As a result of this preliminary study, the 3 younger subjects participated in a study of longterm rectal cysteamine treatment (see chapter 7: "A trial of longterm rectal cysteamine"). For these three patients, rectal cysteamine proved to be a "stop-gap" treatment, covering a period in which they were completely intolerant of the oral
P 178

medication.
For the older patient, new formulations of oral cystearnine are required. Although a
cystearnine capsule has been prepared and used in clinical practice (Bergonzi et al., 1981), there has been no previous description of the pharmacokinetics and
pharmacodynamics of a capsule formulation. Although the number of patients was
small, all showed a marked and sustained reduction in leucocyte cystine concentration. There was a suggestion of a biphasic absorption profile after administration of the
cysteamine capsule. After the capsule dose the mean peak cysteamine concentration
was less than that after the oral phosphocysteamine suspension, although the AUCO,
was comparable, see table 7.7.
Table 7.7: Summary of pharmacoldnetic parameters
Drug (dose) Cmax AUCO., t4
(UM01/1) (; tmol. h/1) (h)
Phosphocysteamine 36.4 59.4 1.59
soln., 10mg/kg
Rectal cysteamine 17.2 22.3 0.78
gel, 10mg/kg
Intravenous 41.4 40.9 1.79
cysteamine, 5mg/kg
Cysteamine 30.6 61.0 0.70
capsule, 15mg/kg
Notes:
1. Doses are given as the equimolar dose of cysteamine base. 2. A secondary peak plasma cysteamine concentration occurred after the capsule dosage.
Administration of the intravenous (IV) dose was designed to mimic the plasma cysteamine profile after oral phosphocysteamine. After IV dosage, three of the
P 179

subjects had a peak concentration at 20 minutes, the fourth occurring at 30 minutes.
This suggests rapid distribution of the drug out of the vascular compartment. The
results of the single dose intravenous cysteamine study enabled calculation of the
bioavailability of these drugs when administered in different formulations and by
alternative routes. The systemic bioavailability of a drug is that amount of the
compound reaching the vascular compartment. For orally administered drugs, a low
bioavailability may reflect either poor absorption from the gastrointestinal tract or an
extensive first-pass extraction by the liver. A drug given by the rectal route should
avoid the first-pass effect, since there is a porto-systemic anastomosis with the inferior
rectal vein. The systemic bioavailabilities of cystearnine after oral and rectal
administration, corrected for the different doses used, are shown in table 7.8 (see
below):
Table 7.8: Bioavailability of. cysteamine and phosphocysteamine
Route of administration E Bioavailability
Intravenous cysteamine 100
Oral phosphocysteamine
solution
73
Rectal cysteamine
gel
21
Oral cysteamine cmafleL 50
The calculation of bioavailability requires a number of assumptions (Rogers et al., 1981):
1. that the apparent volume of distribution M and elimination rate constant (k) of the drug are independent of the route of administration, 2. that the principle of superposition applies, ie. that the phamacoldnetics of
P 180

Figure 7.23: Effect of different formulations and doses of cystearnine on leucocyte
cystine concentration C\l
D
30
CD
q*
C*j
0
(u! elojd Bw jed sAo Z/L lowu) eullsAo aa
C» X
"6w5
E
75 Co c2. cu 0
CO Lf)
%NUOOO
(1) E
r. D E
cts LM
CD
Jýd , "a E
ca
181
0 00 (D qe CINJ 0
cysteamine may be described by a first-order model. The values of systemic bioavailability, F, in table 7.8 above, show that cysteamine is absorbed very well from a dose of phosphocysteamine solution and rather poorly from rectal gel. Poor
rectal absorption is in part explained by the elimination of the dose in three cases. The
high bioavailability of oral phosphocysteamine suggests that first-pass extraction of
cysteamine must be relatively minor. Cysteamine is moderately well absorbed from
the capsule formulation in comparison to the oral phosphocysteamine solution.
Despite the greater absorption of cysteamine from oral phosphocysteamine solution,
the leucocyte cystine depletion was greater 3 hours after the capsule dose (27% of
pre-dose level) than after the suspension (40% of pre-dose level), see figure 7.23
(above). The small numbers and marked variability preclude statistical analysis of this
difference. It is possible that cystine depletion depends as much on the area under the
curve as on the peak concentration achieved after cysteamine administration. Since
there is a suggestion that the peak concentration is a major factor in determining
toxicity (Schneider JA, personal communication), further work is required to investigate whether cysteamine could be formulated into slow-release preparations.
It has been estimated that the manufacture of a cysteamine capsule is five times
cheaper than the equivalent dose of phosphocysteamine (M Coulthard, personal communication). Furthermore cysteamine is widely available whereas phosphocysteamine is supplied by only one source in the world. As a result of this
pharmacoldnetic study, a trial is being prepared by the British Association of Paediatric Nephrologists, comparing the acceptability and efficacy of cysteamine versus
phosphocysteamine capsules in -cystinosis patients.
P 182

Chapter 8: Personal experience and recommendations for treatment
At Guy's Hospital, children are seen in a specialist cystinosis clinic, held fortnightly
and supported by a senior liason nursing sister. As of August 1993, there are 10 pre-
transplant children were attending the clinic. A protocol for their care has been
developed with the benefit of 5 years of experience in the clinic and based on the
results of the studies described in chapter 7:
Management of newly-diagnosed child - 1. Newly-diagnosed children require admission to hospital, usually for a period of 2
weeks, to correct the biochemical abnormalities, start cysteamine treatment and to
allow detailed discussions with the parents. 2. In addition to the standard clinical history and examination, the following details
are recorded:
- detailed family tree
- height, weight and head circumference
- blood pressure
- formal dietary assessment. 3. Initial investigations should include:
- urea, creatinine and electrolytes, acid base
- calcium, magnesium, phosphate, albumin
- liver function tests
- haematology (including differential leucocyte count)
- urine biochemistry, pH
- urine tubular proteins and enzymes
- thyroid function tests
- parathyroid hormone level
- bone age
- Inutest 5-point single injection estimation of GFR
- blood for subsequent DNA analysis
- plasma quantitative amino acids, trace elements and vitamins (as from September 1993)
P 183

4. Management of fluid and electrolyte imbalance varies between patients but the
following guidelines are helpful:
- allow free access to fluid, day and night
- vomiting or fluid refusal are indications for nasogastric or intravenous therapy
- most patients require nasogastric feeds or oral calorie supplementsin the first few
months after diagnosis
- initial doses are in the range shown in table 8.1:
- aggressive correction of the acidosis and hypophosphataemia can lead to tetany
secondary to hypocalcaemia and/or hypomagnesaemia
- phosphocysteamine is started according to the guidelines detailed in the section "Clinical use of cystearnine and phosphocystearnine"
Table 8.1: Doses of electrolyte and vitamin D supplements
Drug Initial dose
Sodium bicarbonate 5- 10 mmol/kglday
Potassium chloride 4-5 mmol/kg/day
Phosphate Sandoz 1/2 tab (8mmol) twice a day
Neutral sodium phosphate 5 -10 mmol/day
1-ot calcidol 200 nanograms once a day
P 184

ClWcal use of cysteamine and phosphocysteamine
Introduction
There is now therefore overwhelming evidence of the efficacy of cysteamine treatment
in cystinosis. Therapy should be started as soon as possible since longterm outcome is
directly related to the age at which cysteamine is introduced. There is not yet evidence
that renal tubular dysfunction can be corrected but early treatment may lead to an improvement in glomerular filtration rate (Markello et al., 1993). It follows that early diagnosis is of paramount importance if therapy is to be successful.
Dosage and frequency of administration My practice is to start at a dose of approximately 10mg/kg/day cysteamine base.
(10mg/kg cysteamine base is approximately equivalent to 23mg/kg
phosphocysteamine). Phosphocysteamine is generally preferred to cysteamine. The
dose is increased steadily over a period of weeks aiming for a pre-dose leucocyte
cystine concentration of <I nmol Ih cystine per mg protein. The dose needed to
achieve this level of cystine depletion varies considerably. Some need as little as 20mg/kg/day whereas others need 75mg/kg/day. The dose should not normally exceed
90mg/kg/day.
In the UK, phosphocysteamine is prescribed in 200mg capsules (equivalent to 87mg
cysteamine base). The phosphocysteamine powder can be dissolved in a small volume
of water or juice, so that small children can take it in liquid form (orally or via a
nasogastric tube). Older children can swallow the capsules. At each dose increase, a
re-emergence of nausea and vomiting can be expected but tolerance usually develops
after one week. In North America, the drug is usually given in divided doses every 6
hours. This is a reasonable method of administration if the child is able to tolerate it.
The results of the pharmacoldnetic and pharmacodynamic studies suggest that 12
hourly dosage is probably as efficacious (van't Hoff et al., 1991). Clinical experience suggests that these results can be extrapolated to chronic therapy thus allowing 12
hourly administration. This frequency of dosage is often better tolerated especially in
those patients who find the breath smell socially disadvantageous (eg. at school or work).
P 185

Monitoring of leucocyte cystine concentrations Whatever the formulation, route and frequency of dosage, careful monitoring of the
leucocyte cystine concentration is essential since the response to cysteamine is
unpredictable. Leucocyte cystine concentrations should be determined just prior to the
next dose. Patients receiving 12 hourly doses are advised that on the night before their
clinic appointment, they should take a dose as late as possible. At the clinic, a pre-
dose level is measured in the morning, approximately 12 hours after the last dose.
Figure 8.1 shows the results of 179 leucocyte cystine determinations in 18 patients (mainly at Guy's Hospital) treated for up to 44 months. Only leucocyte cystine levels
measured 9- 15 hours after the last dose are shown. These data demonstrate that
effective cystine depletion can take at least 12 months to achieve and that good control
can be interrupted by high results. Table 8.2 (below) summarises the leucocyte cystine
concentrations (n = 109) in 14 of these patients, taken after at least 12 months of
therapy.
Table 8.2: Summary of leucocyte cystine concentrations during cysteamine treatment
Cystine concentration (mol 1/2cystine per mg protein)
Mean ± SD 1.69 ± 1.25
Median 1.28
Inter-quartile range 0.82-2.20
Range 0.16-6.66
72% of these concentrations were < 2nmol 1/2 cystine per mg protein, a value considered to reflect good control (Markello et al., 1993) and 33% were < Inmol 1/2
cystine per mg protein. However unexplained high cystine concentrations in seemingly well controlled patients are a common phenomenon. There may be several explanations including poor compliance, intercurrent illness and batch-to-batch
variation in the medication.
P 186

Figure 8.1: Effect of longterm cystearnine therapy on leucocyte cystine concentration
U) IRT
D 1"
1)
00=0% Cl)
0
E
LO CM E Cý (D
0 c 0
LO
a
0 1
Lf)
0
(uleloid 6w/sAo 3/L lowu) eullsAo P 187 6a
CM 0 Co (D qe CM 0 Tý Tý

Care of the cystinosis patient in the outpatient cl*uu*c
The following protocol has been formulated:
Each visit: Height and weight Plasma electrolytes, Ca, P04, Astrup
FBC including differential leucocyte count Spot urine for tubular proteins Other tests as indicated, eg. CyA if renal Tx
Leucocyte cystine concentration (monthly until stable) Dietary assessment
3 monthly: PTH
Leucocyte cystine concentration Liver function tests Thyroid function tests
6 monthly: 3-day dietary assessment (sent by parent) Random blood glucose
Pubertal assessment Ophthalmology review
12 monthly: Plasma amino acids, trace elements and vitamins* Bone age
Neurological review - IQ/Developmental scale & psychometric tests* Inutest 5-point single injection estimation of GFR
Ultrasound of liver, spleen and pancreas*
' To be considered as part of a prospective study
P 188

Treatment during dialysis and after renal transplantation
Whereas there are clear parameters by which to judge the efficacy of treatment prior
to end-stage renal failure, it is much more difficult to determine whether cysteamine treatment after renal transplantation is successful. In a recent European review, only 19% of post-transplant patients were treated with cysteamine (Ehrich et al., 1992).
My practice is to continue therapy during dialysis and after transplantation. Care is
needed with phosphocysteamine treatment when the patient is in end-stage renal failure since this drug provides a considerable phosphate load (see chapter 4:
"Adverse effects"). During the immediate post-transplantation period, cysteamine
therapy is often witheld. At this time there are more immediate concerns of graft
rejection, infection and recovery from surgery. Once stable, the patient can
recommence cysteamine. There are clear theoretical benefits to continuation of therapy
after transplantation, but only time will tell whether this approach is correct. The
possibility of teratogenic effýcts preclude its use in pregnancy.
P 189

Chapter 9: The genetics of cystinosis
Incidence
Nephropathic cystinosis is an extremely rare condition but has been reported throughout the World. The true incidence varies according to the community studied. Studies of incidence have relied on retrospective surveys of paediatric admissions. This method is fraught with problems. Firstly, since no evidence of a systematic database of cases has been presented, it relies on the recall of the paediatricians studied. Secondly there is evidence that children with cystinosis die prior to the diagnosis being confirmed (see chapter 4: "Clinical features"). Thirdly, although most
patients are followed in a paediatric nephrology centre, some remain in the care of the local hospital. Surveys of paediatric nephrology centres alone may therefore miss cases (Bois et al., 1976). However, accepting all these reservations, the incidence of
cystinosis varies between 1 in 26,000 and 1 in 326,000 as shown in table 9.1 (see
below).
The highest incidence described so far occurred in 3 Departments of France (Finist6re, Morbihan, C6tes-du-Nord). This area has a high consanguinity rate but
Bois et al. found no such marriages in the Breton families studied. However they did
find that the distance between the parental birthplaces was considerably smaller for the Breton families than for the rest of France (mean 84km vs 146km). This may be
indirect evidence of inbreeding. Manz and Gretz found an increased incidence in
isolated rural communities with low populations (5.9 patients per million population) compared to the rest of Germany (0.9 patients per million), (Manz and Gretz, 1985).
There is also a cluster of cystinosis families in the region of Saint-Jean Lake in
Quebec, whose ancestry can be traced to Brittany and Normandy (Bois et al., 1976).
In a survey of UK paediatric nephrologists, undertaken in 1989,1 found 79 cases of
cystinosis. In view of the reservations detailed above, I have not presented an estimate of the incidence. Combining the incidence figures from the three national surveys of France, Germany and Denmark and assuming these to be representative of the rest of Europe, the incidence of cystinosis in this area is approximately 1/175,000 births.
P 190

Table 9.1: Incidence of cystinosis in Europe
Area Incidence 6: 9 Reference
Nfidlands, England 1 in 40,000 1: 1 Bickel et al. 1952
West Brittany I in 26,000 Bois et al. 1976
Rest of France I in 326,000 1.2: 1 Bois et al. 1976
France (overall) I in 230,000 Bois et al. 1976
West Germany 1 in 179,000 1.4: 1 Manz & Gretz 1985
Denmark I in 115,000 1.75: 1 Ebbesen et al. 1976
Gene frequency
The gene frequency for cystinosis can be calculated from the Hardy-Weinberg
equation:
pý + 2pq + q2 =1
where: p= frequency of the normal allele q= frequency of the cystinosis allele.
Since cystinosis is an autosomal recessive disorder, qý is equal to the disease
frequency, approximately 1/175,000 births. The gene frequency (q) is therefore 0.00239 and the carrier frequency (2pq) approximately 0.00478 (equivalent to 1/210).
Sex mtio The sex ratio for cystinosis shows a slight preponderance of males (see table 9.1).
There is no obvious explanation for this finding but Bois et al. noted that the male
preponderance was no different than that of the general population (Bois et al., 1976).
Inheritance
Cystinosis is inherited in an autosomal recessive manner. Evidence for this conclusion comes from the following observations: I. Cystinosis can occur in more than one family member, but always in a sibling and never in more than one generation.
p 191

2. The incidence of consanguinity and possibly of inbreeding, is raised in cystinosis families. 3. Both males and females are affected. Parents of cystinosis patients are obligate heterozygotes and are entirely
asymptomatic. However, studies of lysosomal cystine transport have shown that the
rate of efflux of cystine is 0% for affected patients and 50% for heterozygotes (Gahl
et al., 1982b). This gene dose effect is further evidence of recessive inheritance.
Heterozygote diagnosis
The impaired rate of cystine transport and subsequent moderate lysosomal cystine
accumulation in heterozygotes permits carrier diagnosis. Studies of cystine transport
can distinguish heterozygotes from normals but are difficult to perform (Steinherz et,
al., 1982c). The most convenient method of heterozygote detection is to determine the
cystine concentration in a polymorphonuclear (PMN) cell preparation (Smolin et al., 1987). Using this method, Smolin et al. found no overlap between the values in 29
obligate heterozygotes and those in 18 individuals, presumed to be normal (Smolin et
al., 1987). Subsequently, many more individuals have been tested and some overlap has been seen (Schneider JA, personal communication). The measurement of PMN
cell cystine concentration is described in appendix 1. Using this assay, the cystine concentrations were measured in 24 obligate heterozygotes (ie. parents of cystinosis patients) and 33 healthy individuals. The results, expressed as nmol Ih cystine per mg
protein, are shown in figure 9.1 and summarised in table 9.2 below.
Table 9.2: Polymorphonuclear leucocyte cystine concentrations in obligate heterozygotes and nomal individuals
Obligate heterozygotes
(n=24)
Normals
(n=33)
Mean 0.67 0.12
SD 0.41 0.08
Median 0.55 0.10
Range 0.23-1.79 0.04-0.38
P 192

Figure 9.1: Polymorphonuclear leucocyte cystine concentrations in obligate heterozygotes and controls
OONM%%
Nq C\l *e Lem 16. C13 0
co
0 LM m 0 .
000% Cf) CIO
0
Co (D oj 0 co CD cm 00 C) 0
(ulejoid Bw/ sAo Z/ý lowu) vgu! IsAo P 193 aa

Smolin et al. calculated a cut-off value of 0.30 nmol Ih cystine per mg protein, between normal and heterozygote cystine concentrations (Smolin et al., 1987). From
the results above, the upper limit of the normal range could be defined as 0.28 (mean
+ 2SD). Using this value, the results can be further analysed to calculate the
following parameters (Altman, 1991):
a. sensitivity (the proportion of true positives that are correctly identified by the test),
b. specificity (the proportion of true negatives that are correctly identified by the test),
c. positive predictive value (the proportion of individuals with a positive test who are
correctly diagnosed),
d. negative predictive value (the proportion of individuals with a negative test who are
correctly diagnosed).
Table 9.3: Effect of a "cut-off' value of 0.28nmol 1/2 cystine per mg protein on the
results of the heterozygote assay
Obligate
heterozygotes
Normals Totals:
Carrier 21 2 23
Non-carrier 3 31 34
Totals: 24 33 57
Sensifivity = 21/24 * 100% = 88%
Specificity = 31/33 * 100% = 94%
Positive predictive value = 21/23 * 100 %= 91 %
Negative predictive value = 31/34 * 100 %= 91
The 3 obligate heterozygotes with low PMN cystine concentrations (0.23,0.23 and 0.24 respectively) fall into the "normal range", but were all mothers, thus eliminating the question of "non-paternity". Figure 9.2 shows the PMN cystine concentrations for
controls and carriers transformed into probability density curves (Dennis and Carter, 1978; Altman, 1991).
P 194

Figure 9.2: Probability density curves derived from PMN leucocyte cystine
concentrations in controls and heterozygotes
Aouenbei-4
0
Cý 00
r:
N
C\l CD
0
E CO
CD >% , ci
0 z 2
qq CL ci
C\l
C;
0
6
p 195
0 0) Co 'N (0 LO qe Cr) N T7 ö cs

Prenatal diagnosis
Prenatal diagnosis was initially performed with a pulse-labelling technique (Schulman
et al., 1970d). Schneider et al. confimed the diagnosis of cystinosis following
amniocentesis in an 18 week old foetus using this technique (Schneider et al., 1974).
Prenatal diagnosis using chorionic villous sampling was reported simultaneously by
two groups (Smith et al., 1987; Patrick et al., 1987). Patrick et al. incubated the
chorion sample with IIS-cystine, separated the products with thin-layer
chromatography and assessed the uptake by autoradiography. Smith et al. determined
the cystine content of chorionic villi using the cystine binding protein (CBP) assay and
reported one positive (affected) case (Smith et al., 1987). Their group have performed
a number of prenatal diagnoses on chorionic villous (by direct assay and in cultured
cells) or amniotic fluid samples and the cystine contents (in nmol 1/2 cystine per mg
protein) are shown below (Smith ML, personal communication):
Table 9.4: Prenatal diagnosis results from Smith et al.
CVS (direct) CVS (culture) Amniocyte
Cystinosis 9.5 3.9
34.7 9.7
17.9 7.3
Unaffected 0.11-0.64 0.12-0.24 0.10 0.04
(n = 4) (n = 4) (n 8)
Control 0.09-0.70 0.04-0.26
(n = 9) (n = 8)
Only one amniocentesis test has given a positive (affected) diagnosis of 3.9 nmol 1/2
cystine per mg protein, measured (in 1974) by a radio-labelling technique.
In view of our experience with the CBP assay, this method was chosen as the
preferred method at Guy's Hospital (see appendix I for methods). Prenatal diagnosis has been undertaken in 7 pregnancies from 6 at-risk couples, 4 by chorion villous sampling (CVS), 2 by amniocentesis (Amnio) and I by foetal blood sampling (FBS). Foetal blood sampling was undertaken at 20 weeks gestation because an amnio-
P 196
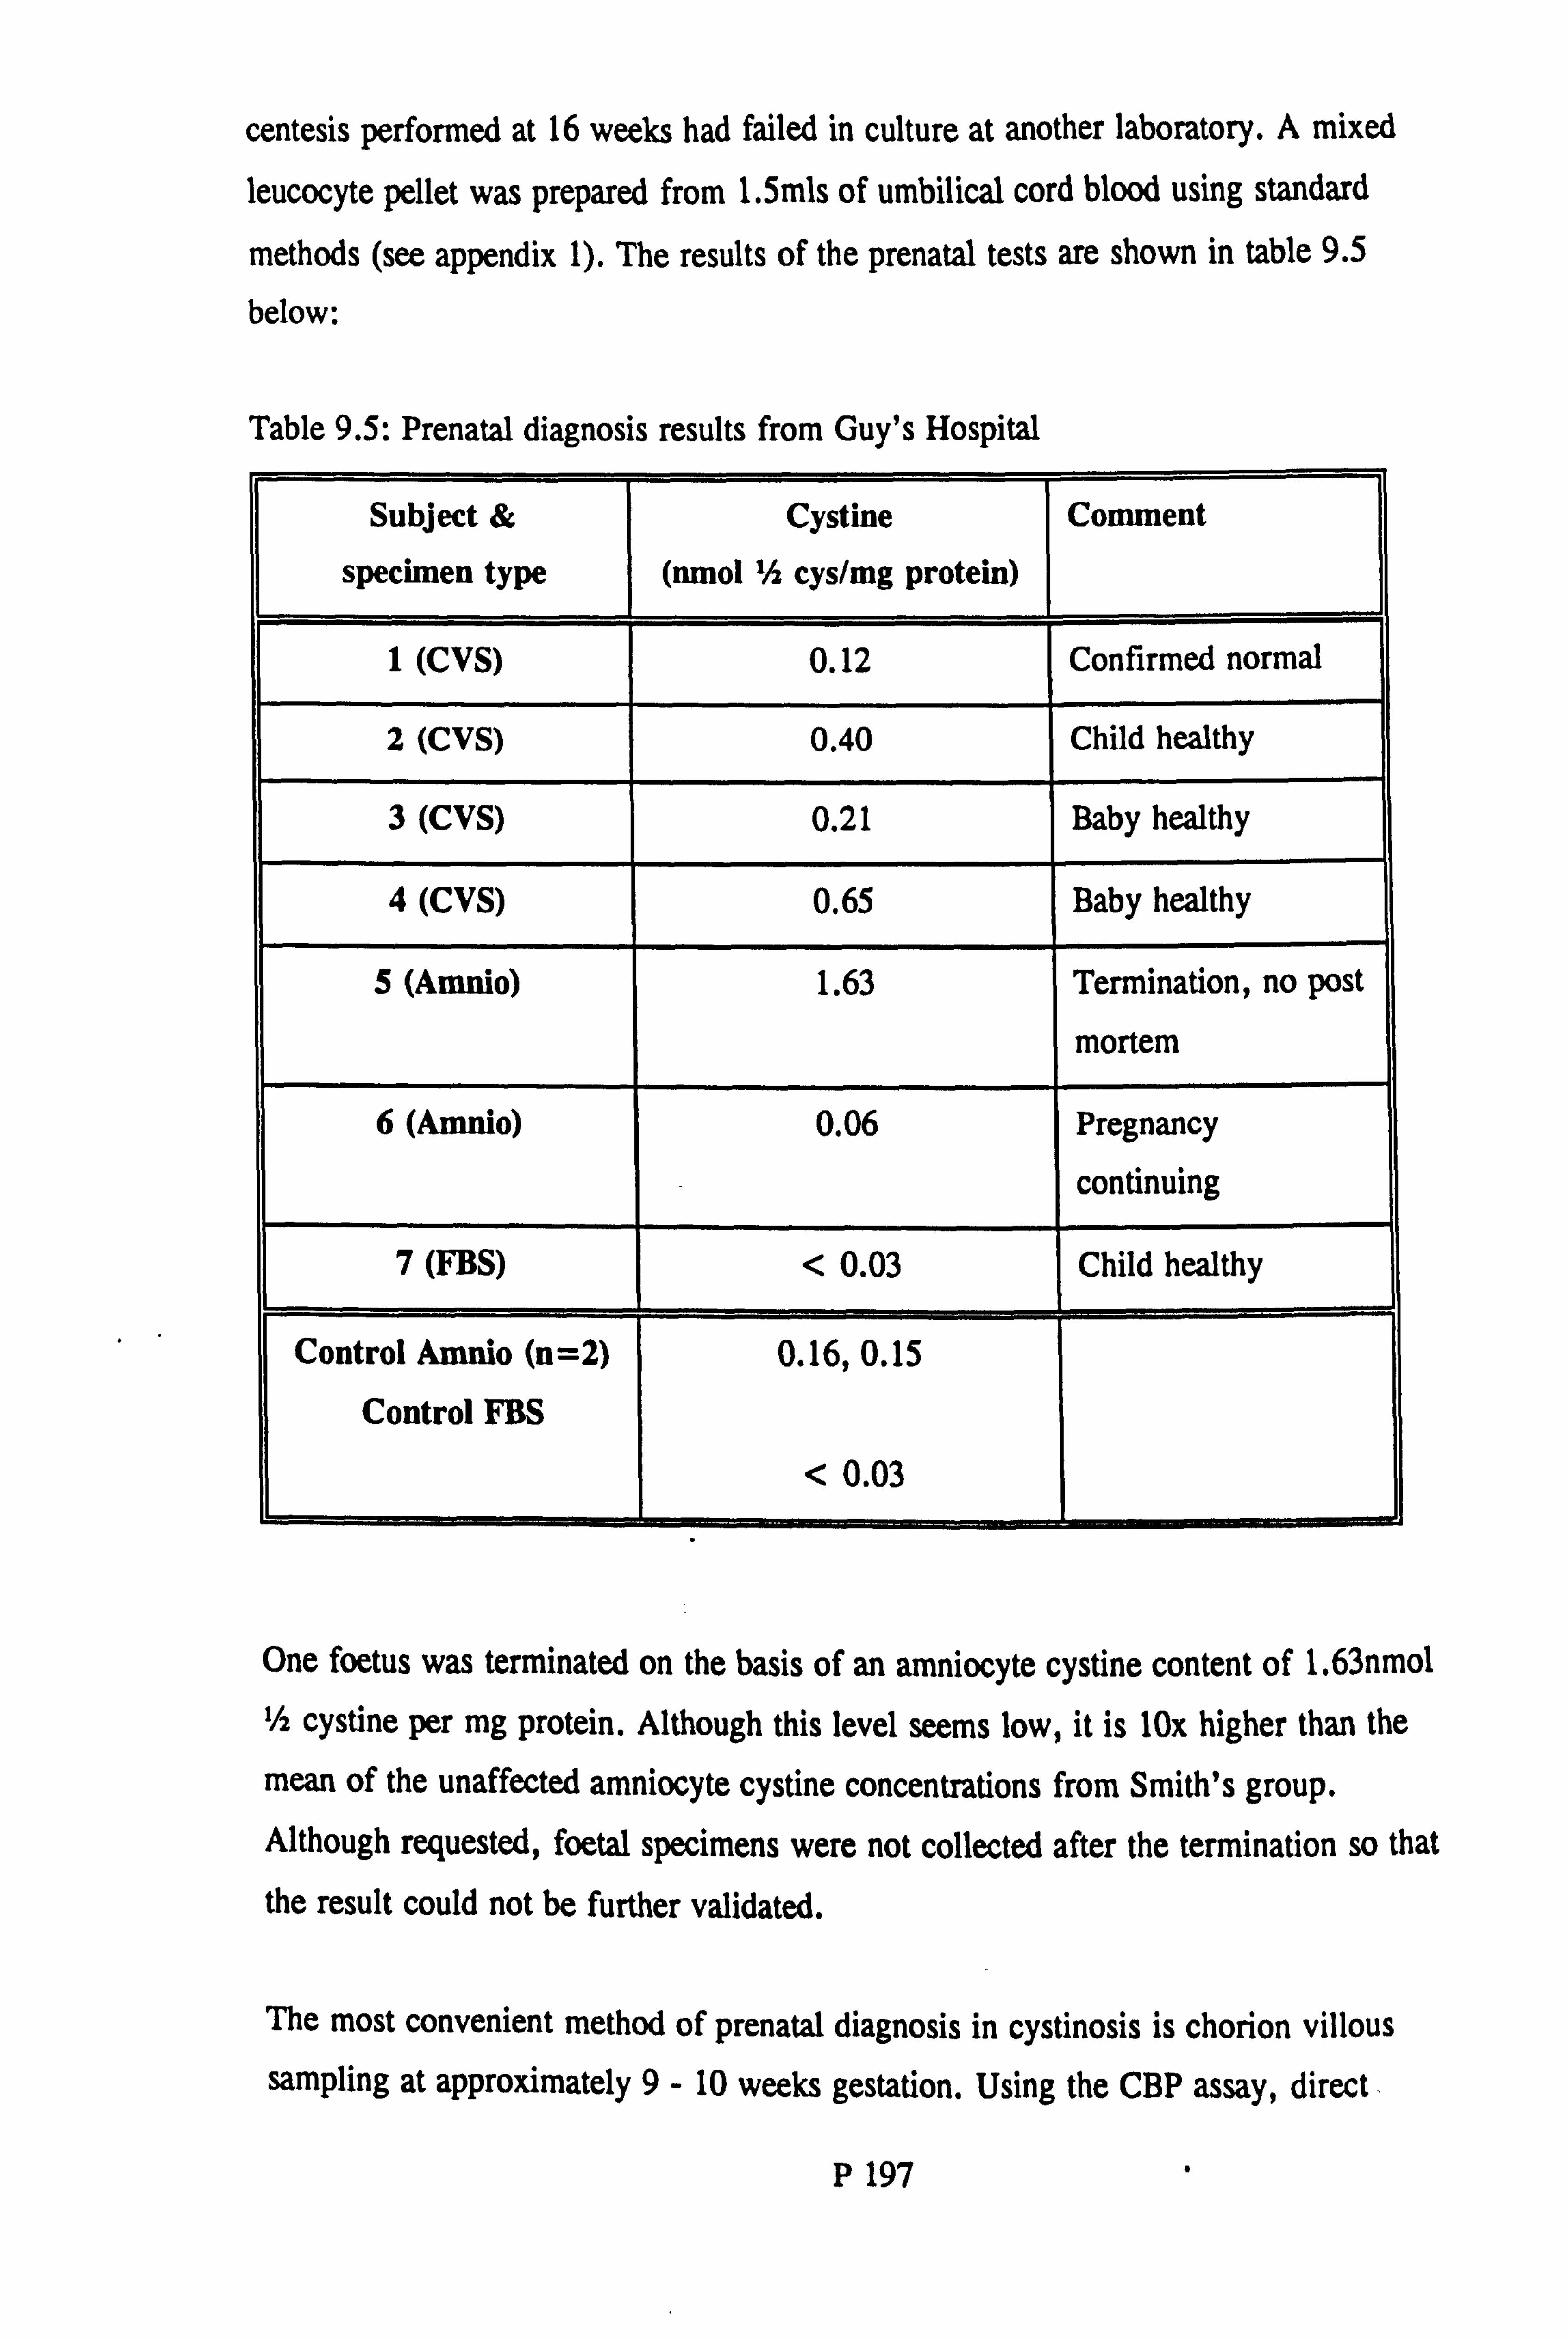
centesis performed at 16 weeks had failed in culture at another laboratory. A mixed leucocyte pellet was prepared from 1.5mls of umbilical cord blood using standard
methods (see appendix 1). The results of the prenatal tests are shown in table 9.5
below:
Table 9.5: Prenatal diagnosis results from Guy's Hospital
Subject &
specimen type
Cystine
(nmol Ih cys/mg protein)
Comment
I (CVS) 0.12 Confirmed normal
2 (CVS) 0.40 Child healthy
3 (CVS) 0.21 Baby healthy
4 (CVS) 0.65 Baby healthy
5 (Amnio) 1.63 Termination, no post
mortem
6 (Amneo) 0.06 Pregnancy
continuing
7 (FBS) < 0.03 Child healthy
Control AmWo (n=2)
Control FM
0.16,0.15
< 0.03
One foetus was terminated on the basis of an amniocyte cystine content of 1.63nmol 1/2 cystine per mg protein. Although this level seems low, it is IN higher than the
mean of the unaffected amniocyte cystine concentrations from Smith's group. Although requested, foetal specimens were not collected after the termination so that
the result could not be further validated.
The most convenient method of prenatal diagnosis in cystinosis is chorion villous sampling at approximately 9- 10 weeks gestation. Using the CBP assay, direct .
P 197

measurement of the cystine content in the sample is straightforward and accurate. It is
possible to provide an answer within 24 - 48h of receiving the sample. Wherever
possible, a control CVS should be analysed at the same time and it is advisable to set
up half of the CVS for culture. This allows a second (fafl-back) specimen to analyse
and will also provide material for chromosome analysis if needed.
The eystinosis gene
Introduction
The location of the gene responsible for cystinosis is unknown and attempts to isolate
the human cystine transport protein have so far been unsuccessful. Using somatic cell hybrids between cells from patients with the different clinical variants of the disorder
(infantile, late-onset and benign), Pellet et al. found that no complementation occurred
(Pellett et al., 1988). This strongly suggests that the three forms of cystinosis are
allelic.
Very rarely, children with cystinosis have had an additional genetic disorder raising the potential of linkage between the two disorders. However, molecular genetic
analysis of a pedigree containing a child with both cystic fibrosis (CF) and cystinosis
showed no linkage between the CF gene and the proband (Smith et at., 1991). There
has been no report of a child with cystinosis who also has a chromosomal disorder
(deletion, translocation etc. ). Thus there are no candidate chromosomes for the
cystinosis gene.
A project group has therefore býen set up to determine the site of the cystinosis gene. The project has received a grant from the Medical Research Council to fund the work. Formal collaboration has been established with Dr. Gahl, National Institutes of Health, Bethesda, Dr. Taylor (previously the late Dr. Winterborn), Birmingham Children's Hospital and Dr. Schneider, University of California, San Diego.
Strategy for determining the location of the cystinosis gene Since the chromosomal location of the cystinosis gene or genes is unknown, a systematic search of all autosomes for a linked marker will have to be carried out. Although this seems a formidable task, several groups have shown that it is feasible
p 198

(for example, Mathew et al., 1987). Furthermore, several major recent advances have
facilitated this approach. First, a substantial number of probes for variable numbers of tandem repeats (VNTRs) or minisatellite type sequences are now available (Nakamura
et al., 1987; Wong et al.; 1987). Microsatellites are di- or trinucleotide repeats which
are very abundant and widely distributed throughout the genome. The lengths of individual microsatellite loci are highly polymorphic and therefore much more informative for linkage analysis than restriction fragment length polymorphisms (RFLP). Secondly, the polymerase chain reaction (PCR) can be used to amplify
polymorphic loci from genomic DNA, so that large numbers of samples can be
amplified in a single day (White et al., 1989). Thirdly, detailed linkage maps of all human chromosomes have now been established, such that a set of probes spaced at
20 centiMorgan intervals along a chromosome can be used to test whether a
disease locus lies within a particular interval (White et al., 1985; Lander and Botstein,
1986; Weissenbach et al., 1992).
In 1990 a postal survey of all the paediatric nephrologists in the UK and Eire, identified 79 patients from 66 families. Thirteen of the families are particularly suitable for linkage analysis (9 families with 2 affected children and 4 with a
consanguinous marriage). Details of some of the most informative families are given in table 9.6. Two pedigrees, B and C, contain more than one nuclear family; details
of the pedigrees of families A, B and C are shown in appendix 3.
Table 9.6: Consanguinous and multiple affected families
Pedigree Affected
siblings
Consanguinity Generations
A 2 Yes 3
B 2 Yes 3
C 3 Yes 3
D I Yes 3
&J 2 No 3
p 199

Two factors significantly increase the linkage information content of these families:
1. Several families contain a consanguinous marriage. Lander and Botstein have
shown that since each offspring from such a marriage will be homozygous by descent
around the disease locus, they provide the same linkage information as a nuclear
family with 3 affected siblings (Lander and Botstein, 1987).
2. The ability to distinguish heterozygotes from normal individuals significantly increases the linkage content of each pedigree. Although there is some overlap between normal and heterozygote cystine concentrations, a probability of an individual
being heterozygous can be calculated (see above "Heterozygote diagnosis"). This
probability will then be incorporated into the linkage calculations.
Heterozygote detection can be used to establish whether the cystinosis gene is of
grandpaternal or grandmaternal origin, and hence the phase in the parents. Furthermore, unaffected siblings yield significant information. Dr. Farrell (Clinical
Research Centre, Northwick Park) has calculated maximal LOD scores and equivalent
number of meioses, for the 3 most informative families (pedigrees A, B and
assuming a highly polymorphic marker which is perfectly linked (see table 9.7 below).
Calculations have been performed for both "completely recessive" (non-carriers and
carriers indistinguishable) and "carrier detection" situations.
Table 9.7: Logarithm of the odds (LOD) scores and number of meioses for pedigrees A, B and C
No beterozygote
detection
FuH heterozygote
detection
Pedigree zam No.
meioses
zmx No.
meioses
A 1.9 6.2 4.2 14.0
B 1.4 4.5 5.8 19.4
C 3.1 10.0 3.9 13.0
TOTAL: :- . 01 6.4 20.7
1
=.
j 13.9
_--
46.4 I
P 200

Methods
Clinical material The genetically most informative families have been approached through the paediatric
nephrologist loolcing after them. Families A, B and C have been extensively studied. A further 70 DNA samples have been obtained from UK families and DNA from 12
North American pedigrees has been sent from Bethesda.
Heterozygote determination
Heterozygote determination has been performed on members of pedigrees A, B and C
according to the methods detailed in appendix I (see appendix 3 for results). Some
members of family C also suffer from an inherited haemolytic anaemia which led to
difficulties in the preparation of PMN leucocyte pellets. Many members of family C
have been studied twice. Individual PMN leucocyte cystine concentrations were
similar on each occasion and the phenotypic status was confirmed. Borderline PMN
cystine concentrations (ie. between 0.25 - 0.35 nmol 1/2 cystine per mg protein) were
found in 3 members of the family on both occasions. These results serve to underline
the reproducibility of the method.
LUkage studies A systematic search for co-segregation of polymorphic DNA markers with the
cystinosis phenotype is in process. The linkage search is based on a set of markers from every autosome, which are spaced at intervals of approximately 20
centiMorgans. Probes which detect highly polymorphic sequences and PCR systems
which detect simple tandem repeats are used wherever possible.
DNA segments are amplified by PCR, detected using a fluorescent labelling system
and separated by polyacrylamide gel electrophoresis (PAGE). This is a more rapid
process than Southern blotting. Fluorescent labelling is used rather than a radiolabelling technique for the following reasons: 1. No exposure to radioactivity 2. Fluorescent labels are available in 4 colours so that many more markers can be run than with monochrome autoradiographs. 3. A molecular size standard can be labelled with a different colour and thus run with each track, reducing sizing errors.
P 201

4. Fluorescent labels are stable in contrast to the short half-life of P" primers. 5. Data-analysis is aided by a computerised laser system that rapidly analyses the gels directly (without the need for making an autoradiograph). 6. Since the computer can distinguish different colours even when they overlap,
several markers can be run in the same track.
Interim Results
As of August 1993, The research group has established sets of fluorescently labelled
primers to microsatellite markers from chromosomes 5 (primers kindly supplied by
June Davies, John Radcliffe Hospital), 6q, 9,10 and 20. Using the fluorescent
detection system, 112 microsatellite markers have been analysed in 13 cystinosis families but no significantly positive LOD scores have been found.
P 202

Chapter 10: Conclusions
Diagnosis and therapeutic monitoring The determination of cystine in biological samples using a cystine binding protein
assay (CBP), (Oshima et al., 1974), has been further studied. The method has been
improved by the development of a semi-automated assay for protein, using a Cobas-
Mira autoanalyser. The cystine assay has a lower limit of detection of 0.0314mol/I
cystine and is linear to a concentration of 1.5/4mol/l. Binding is highly specific and no interference is found ftom free thiols or other amino acids. The differential leucocyte
count in mixed leucocyte pellets is broadly similar to that in the whole blood from
which the pellets were prepared.
Clinical applications of this assay have been described. Determination of the leucocyte
cystine concentration is the most appropriate method of biochemically confirming the
diagnosis of cystinosis. In a series of 32 patients (not receiving cystine-depleting drugs) the mean ± SD leucocyte cystine concentration was 5.78 ± 2.49 nmol 1/2
cystine per mg protein (controls 0.10 ± 0.05). Besides confirmation of the diagnosis,
the leucocyte cystine concentration is used to monitor the efficacy of cysteamine and
phosphocysteamine treatment. As of May 1993, over 700 leucocyte cystine samples have been processed. Data on 109 samples from 14 patients treated for at least 12
months have been presented. The median leucocyte cystine concentration in this group
was 1.28 (range 0.16 - 6.66) nmol 1/2 cystine per mg protein. Seventy-two percent of these concentrations were < 2nmol 1/2 cystine per mg protein, a value considered to
reflect good control (Markello et al., 1993) and 33% were < Inmol 1/2 cystine per
mg protein. The CBP assay has also been used to determine the cystine concentration in post-mortem tissue samples, amniocytes and chorion villous material.
In recognition of the practical difficulties of determining leucocyte cystine concentration in other laboratories, the effect of storage of blood samples on leucocyte
cystine concentration was studied. Although pellet preparation of samples stored for
48 hours was technically more difficult, no significant difference was found between the results from samples prepared immediately and those stored for up to 48 hours in
either acid citrate dextrose-dextran solution or in lithium heparin tubes. Ideally, a leucocyte pellet should be prepared immediately and storage of the blood sample
P 203

cannot normally be recommended. However, there is negligible loss of accuracy when
samples are sent to a specialised centre and prepared within 48 hours. It is hoped that
such work will make the diagnosis and therapeutic monitoring of cystinosis more
accessible. This is of importance since the prognosis is clearly related to the age at
which treatment is started.
A study of tubular proteinuria in 10 newly-diagnosed cystinosis patients was
undertaken prior to their starting cysteamine. The grossly elevated excretion of retinol binding protein, 82-microglobulin and N-acetylglucos-amininidase in these patients was
confirmed. In 5 patients, the excretion of the tubular brush border enzyme, alanine
aminopeptidase, was also determined and was found to be markedly elevated. Low
molecular weight proteinuria is considered to be a very early marker of the renal Fanconi syndrome (Tomlinson, 1992). These urine markers are relatively easy to
determine in random urine samples and could be used to screen children suspected of
having a renal tubular disorder, prior to the more complicated measurement of
leucocyte cystine concentration. With the development of urine testing strips for
NAG, tubular dysfunction could be diagnosed at the bedside or in the clinic.
Use of cysteamine and phosphocysteamine Single dose studies of the pharmacoldnetics and pharmacodynamics of cysteamine and
phosphocysteamine in patients with cystinosis have been undertaken. The results have
led to the development of rational and proven dosage guidelines. There is no
appreciable diurnal variation in leucocyte cystine concentration so that therapeutic
monitoring is not dependent on the time of day that the sample is taken. Oral
cysteamine and phosphocysteamine are prescribed on a 12 hourly basis. Different
routes of administration and formulations of cysteamine have been studied. The data
show that rectal administration with higher doses may be a feasible alternative for
patients unable to tolerate the oral route. It is hoped that a suppository of cysteamine will be developed as a more convenient form of administration. This may be a more
acceptable alternative to older children and adults. The intravenous study has yielded essential pharmacoldnetic data on the bioavailability of cysteamine and phosphocysteamine. Finally, the development of a cysteamine capsule has led to a viable oral alternative to phosphocysteamine. Cysteamine was moderately well absorbed from the capsule and led to'substantial cystine depletion. Further studies of
P 204

the pharmacokinetics of new formulations can be expected to improve efficacy, reduce
side-effects and improve compliance.
Fifty nine patients with cystinosis have received cysteamine and/or phosphocysteamine
in the UK and Eire in the period up to May 1990. In the 44 pre-transplant patients,
the median age at start of treatment was 2.2 years (range 0.6 - 9) and the median
duration of treatment was 3.6 years (range 0.01 - 11.2). Nausea and vomiting were
frequent side-effects. There was no difference in this respect between cysteamine and
phosphocysteamine. There were no serious adverse events that could be attributed to
these drugs. The mean dose of cysteamine used was much lower than that reported in
the US multicentre trial (Gahl et al., 1987c). Cysteamine treatment did not prevent a
progressive decline in glomerular renal function. However in the absence of control data, it is not possible to prove whether cysteamine treatment affected the rate of
progression of renal damage. The mean height SDS remained stable during treatment
indicating that a normal growth rate was maintained. The inability to demonstrate a
significant reduction in leucocyte cystine concentrations suggests that monitoring of
therapy needs to be improved. These data contrast with the excellent results being
achieved in North America (Markello et al., 1993), and highlight the need for more
aggressive use of cysteamine in the UK.
Growth in children with cystinosis Data on growth in children with cystinosis at Guy's Hospital have been presented. In
a group of 6 newly-diagnosed patients, whose mean age was 15.3 months, the mean height standard deviation score was -3.1. Growth remains poor throughout childhood
although some have responded well to cysteamine treatment. Growth hormone
secretion as measured by overnight profile, was normal in 4 prepubertal children. When maximal growth hormone secretion was determined following an infusion of
arginine, one of three patients had a sub-optimal response. It is likely that growth failure in cystinosis is primarily related to the severity of the renal disorder rather than to deficient growth hormone secretion.
A trial of high dose recombinant human growth hormone (rhGH) therapy in cystinosis has been described. In the short-term, rhGH treatment has led to an improvement in height velocity and height standard deviation score (HtSDS), without any significant
P 205

effect on renal function or glucose tolerance. Longterm data are required to establish
the role of rhGH treatment in cystinosis.
Genetics of cystinosis A strategy for determining the cystinosis gene by linkage analysis has been described.
The most genetically informative cystinosis families in the UK have been identified.
Determination of the polymorphonuclear leucocyte cystine concentration enabled heterozygotes for cystinosis to be distinguished from normal individuals in
approximately 90% cases. The median polymorphonuclear leucocyte cystine
concentration in a group of 24 obligate heterozygotes was 0.55 (range 0.23 - 1.79)
nmol 1/2 cystine, per mg protein (controls 0.10, range 0.04 - 0.38). A method for
searching the genome using a fluorescent labelling technique has been described and a
collaborative study is now in progress. Interim results have been presented. It is
hoped that the location of the cystinosis gene will be found within the next few years. This will lead to a study of the gene mutations in cystinosis, an attempt to isolate the
gene product and perhaps ultimately a possibility of gene therapy.
Although cystinosis is extremely rare, prompt diagnosis and early treatment with cysteamine or phosphocysteamine are required to ensure a good prognosis. Even in
the 1990s, children have died prior to the diagnosis being made and there are children in the UK who still do not receive cysteamine treatment. It is to be hoped that the
work in this thesis will contribute towards an improvement in the diagnosis, treatment
and future for children with cystinosis.
P 206

References
Aaron K, Goldman H and Scriver CR (1971). Cystinosis - new observations. 1.
Adolescent (Type III) form. 2. Correction of phenotypes in vitro with dithiothreitol.
ppl. 51-160, in Carson NAJ, Raine DN (eds. ) Inherited disorders of sulphur
metabolism. Churchill Livingstone, London.
Almond PS, Matas AJ, Nakhleh RE, Morel P, Troppmann C, Najarian JS and
Chavers B (1993). Renal transplantation for infantile cystinosis: long-term follow-up.
J Pediatr Surg 28: 232-238.
Altman DG (1991). Practical statisticsfor medical research. Chapman and Hall,
London.
Arnmenti A, Grossi A and Bernasconi S (1986). Infantile cystinosis and insulin-
dependent diabetes mellitus. Eur J Pediatr 145: 548-549
Andersson HC, Markello T, Schneider JA and Gahl WA (1992). Effect of growth
hormone treatment on serum creatinine concentration in children with cystinosis and
chronic renal disease. J Pediatr 120: 716-720
Avner ED, Ellis D and Jaffe R (1983). Veno-occlusive disease of the liver associated
with cysteamine treatment of nephropathic cystinosis. J Pediatr 102: 793-795
Raar HS and Bickel H (1952). Morbid anatomy, histology and pathogeneisis of Lignac-Fanconi disease. Part 8, ppl7l-232, in Bickel H, Baar HS, Astley R, Douglas
AA, Finch E, Harris H, Harvey CC, Hickmans EM, Philpott MG, Smallwood WC,
Smellie JM, Teall CG (eds. ) Cystine storage disease with aminoaciduria and dwarfism
(Lignac-Fanconi disease). Acta Paediatr 42 (Supp 90)
Berger EA and Heppel LA (1972). A binding protein involved in the transport of cystine, and diaminopimelic acid in Escherichia coli. J Biol Chem 247: 7684-7693.
P 207

Bergeron M and GouGoux A (1989). The Renal Fanconi Syndrome. Chapter 104, pp
2569-2580, in Scriver CR, Beaudet AL, Sly WS, Valle D (eds. ) The Metabolic Basis
of Inhefited Disease, 6th edition, McGraw-Hill, Inc.
Bergonzi E, Herren A, Lavanchy P, Buhlman Chr, Wyss SR, Luthy C and Oetliker 0
(1981). Treatment of cystinosis with cysteamine: a pilot study determining dose and form of application. Helv Paediatr Acta 36: 437-443
Bemadini I, Rizzo WB, Dalakas M, Bemard J and Gahl WA (1985). Plasma and
muscle free carnitine deficiency due to renal Fanconi syndrome. J Clin Invest
75: 1124-1130
Bickel H, Baar HS, Astley R, Douglas AA, Finch E, Harris CC, Hickmans EM,
Philpott MG, Smallwood WC, Smellie JM and Teall CG (1952). qstine storage disease with aminvaciduria and dwarfism (Lignac-Fanconi syndrome). Acta Paediatr
42: Suppl. 90
Bickel H, Lutz P and Schmidt H (1972). The treatment of cystinosis with diet or drugs. Chapter 10, pp 199-223, in Schulman JD (ed. ), qstinosis. US Dept of Health, Education and Welfare Publication No. (NIH) 72-249, Washington DC.
Bois E, Feingold J, Frenay P and Briard M-L (1976). Infantile cystinosis in France:
genetics, incidence, geographic distribution. J Med Genet 13: 434-438
BroYer M, Guillot M, Gubler MC and Habib R (1981). Infantile cystinosis.. a reappraisal of early and late symptoms, ppl37-166, in Hamburger J, Crosnier J,
Griinfeld J-P, Maxwell MH (eds. ): Advances in Nephrology. Chicago, Year Book.
Broyer M, Tete M-J and Gubler MC (1987). Late symptoms in infantile cystinosis. Pediatr Nephrol 1: 519-524
Broyer M and Tete MJ (1990). Traitement de la cystinose par la cystdamine. Ann Pddiatr (Paris) 37: 91-93
P 208

Burke JR, EI-Bishti MM, Maisey MN and Chantler C (1978). Hypothyoidism in
children with cYstinosis. Arch Dis Child 53: 947-951
Butler J and Zatz M (1984). Pantethine and cystamine deplete cystine from cystinotic
fibroblasts via efflux of cysteamine-cysteine mixed disulphide. J Clin Invest 74: 411 - 416
Butler J (1990). Depletion of cystine in cystinotic fibroblasts by homocysteine.
Biochem Pharmacol 40: 879-885
Chan AM, Lynch MJG, Bailey JD, Ezrin C and Fraser D (1970). Hypothyoidism in
cystinosis: a clinical, endocrinologic and histologic study involving sixteen patients
with cystinosis. Am J Med 48: 678-692
Christensen MF, Nielsen JA and Henriksen 0 (1970). Treatment of cystinosis wit a diet poor in cystine and methionine. Acta Paediatr Scand 59: 613-620
Clark KF, Franklin PS, Reisch JS, Hoffman HJ, Gahl WA, Thoene JG and Schneider
JA (1992). Effect of cysteamine-HCL and phosphocysteamine dosage on renal function and growth in nephropathic cystinosis. Clin Res 40: 113A
Clayton BE and Patrick AD (1961). Use of dimercaprol or penicillamine in the
treatment of cystinosis. Lancet ii: 909-910
Clifton PM, Chang L and Mackinnon AM (1988). Development of an automated Lowry protein assay for the Cobas-Bio Centrifugal analyser. Anal Biochem 172: 165-
168
Cochat P, Drachman R, Ganadoux M-F, Pariente D and Broyer M (1986). Cerebral
atrophy and nephropathic cysfinosis. Arch Dis Child 61: 401-403
Cogan DG, Kuwabara T, Kinoshita J, Sheehan L and Merola L (1957). Cystinosis in
an adult. JAMA 164: 394-386
P 209

Coor C, Salmon RF, Quigley R, Marver D and Baum M (1991). Role of Adenosine
Triphosphate (ATP) and NaK ATPase in the inhibition of proximal tubule transport
after intracellular cystine loading. J Clin Invest 87: 955-961
Corden BJ, Schulman JD, Schneider JA and Thoene JG (1981). Adverse reactions to
oral cystearnine use in nephropathic cystinosis. Dev Pharmacol Ther 3: 25-30
Crawhall JC, Lietman PS, Schneider JA and Seegmiller JE (1968). Cystinosis. Plasma
cystine and cysteine concentrations and the effect of D-penicillamine and dietary
treatment. Am J Med 44: 330-339
Crawhall IC, Oshima RG and Schneider JA (1977). Factors controlling the non
protein cystine content of cystinotic fibroblasts. Pediatr Res 11: 41-45
DePape-Brigger D, Goldman HY, Scriver CR, Delvin E and Marner 0 (1977). The
use of dithiothreitol in cystinosis. Pediatr Res 11: 124-131
Dalton RN and Turner C (1987). A sensitive and specific method for the measurement
of inulin. Ann Clin Biochern 24: S231
Dennis NR and Carter CO (1978). Use of overlapping normal distributions in genetic
counselling. J Med Genet 15: 106-108
Ebbesen F, Mygind KI and Holck F (1976). Infantile nephropathic cystinosis in
Denmark. Dan Med Bull 23: 216-222
Ehrich JHH, Stoeepler L, Offner G and Brodehl J (1977). Evidence of cerebral involvement in nephropathic cystinosis. Neuro-pediatrics 10: 128-137
Ehrich JH, Brodehl J, Byrd DI, Hossfeld S, Hoyer PF, Leipert KP, Offner G and Wolff G (1991). Renal transplantation in 22 children with nephropathic cystinosis. Pediatr Nephrol 5: 708-714
P 210

Ehrich JHH, Loirat C, Brunner FP, Geerlings W, Undais P, Mallick NP, Margreiter
R, Raine AEG, Selwood NH, Tufveson G and VaIderrabano F (1992). Report on
management of renal failure in children in Europe, XXII, 1991. Nephrol Dial
Transplant Suppl. 2: 36-48
Eldjam L and Nygaard 0 (1954). Cysteamine-cystarnine: intestinal absorptiong distribution among various organs and axcretion. Archives Internationales de
Physiologie (Paris) 62: 476-486
Eldjam L and Pihl A (1956). On the mode of action of X-ray protective agents. I.
The fixation in vivo of cystamine and cysteamine to proteins. J Biol Chem 223: 341-
352
Fink JF, Brouwers P, Barton N, Malekzadeh MH, Sato S, Hill S, Cohen WE, Fivush
B and Gahl WA (1989). Neurologic complications in long-standing nephropathic cystinosis. Arch Neurol 46: 543-548
Fivush B, Green OC, Porter CC, Balfe JW, O'Regan S and Gahl WA (1987). Pancreatic endocrine insufficiency in post-transplant cystinosis. Am J Dis Child 141: 1087-1089
Fivush B, Flick JA and Gahl WA (1988). Pancreatic exocrine insufficiency in a patient with nephropathic cystinosis. J Pediatr 112: 49-51
Foreman JW, Bowring MA, Lee J, States B and Segal S (1987). Effect of cystine dimethylester on renal solute handling and isolated renal tubule transport in the rat: a new model of the Fanconi syndrome. Metabolism 36: 1185-1191
Foreman JW and Benson L (1990). Effect of cystine loading and cystine dimethylester on renal brush border membrane transport. Biosc Rep 10: 455-459
Forster S, Scarlett L and Lloyd JB (1989). The effects of decreased growth temperature on the cystine content of cysfinofic fibroblasts. Biochim Biophys Acta 1013: 7-10
P 211

Forster S, Scarlett L and Lloyd JB (1990). Mechanism of cystine reaccumulation by
cystinotic fibroblasts in vitro. Biosc Rep 10: 225-229
Freudenberg E (1949). Cystinosis: Cystine disease (Lignac's disease) in children. Adv
Pediatr 4: 265-292
Gahl WA, Tietze F, Bashan N, Steinherz R and Schulman JD (1982a). De ective
cystine exodus from isolated lysosome-rich fractions of cystinotic leucocytes. J Biol
Chem 257: 9570-9575
Gahl WA, Bashan N, Tietze F, Bernadini I and Schulman JD (1982b). Cystine
transport is defective in isolated leucocyte lysosomes from patients with cystinosis. Science 217: 1263-1265
Gahl WA, Tietze F, Bashan N, Bernadini I, Raiford D and Schulman JD (1983a).
Characteristics of cystine counter-transport in normal and cystinotic lysosome-rich leucocyte granular fractions. Biochem J 216: 393-400
Gahl WA, Schulman JD, Thoene JG and Schneider JA (1983b). Hepatotoxicity of cysteamine? (letter). J Pediatr 103: 1008-1009
Gahl WA, Hubbard VS and Orloff S (1984). Decreased sweat production in
cystinosis. J Pediatr 104: 904-905
Gahl WA and Tietze F (1985aý. *pH effects on cystine transport in lysosome-rich leucocyte granular fracdons. Biochem J 228: 263-267
Gahl WA, Tietze F, Butler J and Schulman JD (1985b). Cysteamine depletes
cystinotic granular fractions of cystine by the mechanism of disulphide exchange. Biochem J 228: 545-550
Gahl WA and Bercu B (1985c). Blunted prolactin response to thyrotropin-releasing hormone stimulation in cystinotic children receiving cystearnine. J Endocrin and Metab 60: 793-796
P 212

Gahl WA (1986a). Cystinosis coming of age. Adv Pediatr 33: 95-126
Gahl WA, Schneider JA, Thoene JG and Chesney R (1986b). Course of nephropathic
cystinosis after age 10 years. J Pediatr 109: 605-608
Gahl WA and Tietze F (1987a). Lysosomal cystine transport in cystinosis variants and
their parents. Pediatr Res 21: 193-196
Gahl WA and Kaiser-Kupffer MI (1987b). Complications of nephropathic cystinosis
after renal failure. Pediatr Nephrol 1: 260-268
Gahl WA, Reed GF, Thoene JG, Schulman JD, Rizzo WB, Jonas AJ, Denman DW,
Schlesselman JJ, Corden BJ and Schneider JA (1987c). Cysteamine therapy for
children with nephropathic cystinosis. N Engl J Med 316: 971-977
Gahl WA, Dalakas MC, Chamas L, Chen KTK, Pezeshkpour GH, Kuwabara T,
Davis SL, Chesney RW, Fink J and Hutchinson HT (1988a). Myopathy and cystine
storage in a patient with nephropathic cystinosis. N Engl J Med 319: 1461-1464
Gahl WA, Bemadini I, Dalakas M, Rizzo WB, Harper GS, Hoeg JM, Hurko 0 and Bernar J (1988b). Oral camitine therapy in children with cystinosis and renal Fanconi
syndrome. J Clin Invest 81: 549-560
Gahl WA, Renlund M and Thoene JG (1989). Disorders of Lysosomal Transport: Cystinosis and Sialic Acid Storage Disorders. Chapter 107, pp 2619-2647, in Scriver CR, Beaudet AL, Sly WS, Valle D. 7he Metabolic Basis of Inherited Disease, 6th
edition, McGraw-Hill, Inc., 1989
Gahl WA, Schneider JA, Schulman JD, Thoene JG and Reed GF (1990). Predicted
reciprocal creatinine at age 10 years as a measure of renal function in children with nephropathic cysfinosis treated with oral cysteamine. Pediatr Nephrol 4: 129-135
P 213

Gahl WA, Chamas L, Markello TC, Bemadini 1, Ishak KG and Dalakas MC (1992).
Parenchymal organ cystine depletion with long-term cystearnine therapy. Biochem
Med Metab Biol 48: 275-285
Girardin EP, DeWolfe MS and Crocker JFS (1979). Treatment of cystinosis with
cysteamine. J Pediatr 94: 838-840
Goldman H, Scriver CR and Aaron K (1970). Use of dithiothreitol to correct cystine
storage in cultured cystinotic fibroblasts. Lancet i: 811-812
Goldman H, Scriver CR, Aaron K, Delvin E and Canlas Z (1971). Adolescent
cystinosis: comparisons with infantile and adult forms. Pediatrics 47: 979-988
Goldmann F and Ekstein G (1939). Renal dwarfism due to tubular dysfunction:
Clinical and metabolic studies of a case. J Pediatr 15: 53-63
Gonick HC and Kramer HJ (1985). Pathogenesis of the Fanconi Syndrome. Chapter
15, pp 545-595, in Gonick HC, Buckalew VM (eds. ) Renal Tubular Disorders.
Marcel Dekker, Inc.
Goodman SI, Hambridge KM, Mahoney CP and Striker GE (1972). Renal
homotransplantation in the treatment of cystinosis. Chapter 11, pp225-232, in
Schulman JD (ed. ) qvinosis. US Dept of Health, Education and Welfare Publication
No. (NIH) 72-249, Washington DC.
Gradus DB, Carmi R, Potashnik R, Moses S and Bahan N (1985). Treatment of infantile cystinosis with cysteamine (letter). N Engl J Med 314: 1319-1320
Greene AA, Jonas AJ, Harms E, Smith ML, Pellett OL, Bump EA, Miller AL and Schneider JA (1985). Lysosomal cystine storage in cystinosis and mucolipidosis type 11. Pediatr Res 19: 1170-1174
Greene AA, Clark KF, Smith ML and Schneider JA (1987). Cystine exodus from
normal leucocytes is stimulated by MgATP. Biochem J 246: 547-549
P 214

Greene AA, Marcusson EG, Morell GP and Schneider JA (1990). Characterization of
the lysosomal cystine transport system in mouse L-929 fibroblasts. J Biol Chem
256: 9888-9895
Gretz N, Manz F, Augustine R, Barratt TM, Bender-G6tze C, Brandis M, Bremer
HJ, Brodehl J, Broyer M, Bulla M, Callis L, Chantler C, Diekmann L, Dillon MJ,
Egli F, Ehrich JHH, Endress W, Fanconi A, Feldhoff C, Geisert J, Gekle D,
Gesch6ll-Bauer B, Grote K, Grfittner R, Hagge W, Haycock GB, Hennemann H,
Klare B, Leupold D, L6hr H, Miehalk D, Oliveira A, Ott F, Pistor K, Ran J, Schlrer
K, Schindera F, Schmidt H, Schulte-Wissermann H, Verrier-Jones K, Weber HP,
Willenbockel U and Wolf H (1982). Survival time in cystinosis. A collaborative
study. Proceedings EDTA 19: 582-589
Hambraeus L and Broberger 0 (1967). Penicillamine treatment of cystinosis. Acta
Paediatr Scand 56: 243-248
Haycock GB, AI-Dahhan J, Mak RHK and Chantler C (1982). Effect of indomethacin
on clinical progress and renal function in cystinosis. Arch Dis Child 57: 934-939
Hearse DJ (1984). Microbiopsy metabolite and paired flow analysis: a new rapid
procedure for homogenisation, extraction and analysis of high energy phosphates and
other intermediates without any errors from tissue loss. Cardiovasc Res 18: 384-390
van't Hoff WG, Baker T, Dalton RN, Duke LC, Smith SP, Chantler C and Haycock GB (1991). The effects of oral phosphocystearnine and rectal cysteamine in cystinosis. Arch Dis Child 66: 1434-1437
van't Hoff WG, WOM E, Offner G, Broyer M, Mehls 0 (1993). Growth in children with nephropathic cystinosis. Pediatr Nephrol 7 (suppl) C7
Holtzapple PG, Yakovac WC, Hummeler K and Segal S (1969). Diagnosis of cystinosis by rectal biopsy. N Engl J Med 281: 143-145
Hughes RD, Gazzard BG, Hanid MA, Trewby PN, Murray-Lyon IM, Davis M,
P 215

Williams R and Bennett JR (1977). Controlled trial of cysteamine and dimercaprol
after paracetarnol overdose. Brit Med J 2: 1395
Hurnmeler K, Zajac BA, Genel M, Holtzapple PG and Segal S (1970). Human
cystinosis: Intracellular deposition of cystine. Science 168: 859-860
ldriss JM and Jonas AJ (1990). Cysfine transport in yeast acidic vacuoles. W18.3
Abstract, Proceedings of the Vth International Congress of Inborn Errors of Metabolism, Asilomar.
Jeitner TM and Oliver JR (1990). Effect of cysteamine on the lysosomal enzymes of
the hyperprolactinaemic rat pituitary. J Endocrin 125: 75-80
Jonas AJ, Greene AA, Smith ML and Schneider JA (1982a). Cystine accumulation
and loss in normal, heterozygous, and cystinotic fibroblasts. Proc Natl Acad Sci USA 79: 4442-4425
Jonas AJ, Smith ML and Schneider JA (1982b). ATP-dependent lysosomal cystine
efflux is defective in cystinosis. J Biol Chem 257: 13185-13188
Jonas AJ and Schneider JA (1982c). Plasma cysteamine concentrations in children treated for cystinosis. J Pediatr 100: 321-323
Jonas AJ, Smith ML, Allison WS, Laildnd PK, Greene AA and Schneider JA (1983).
Proton-translocating ATP-ase and lysosomal cystine transport. J Biol Chem 258: 11727-11730
Jonas AJ (1986). Cystine transport in purified rat liver lysosomes. Biochem J 236: 671-677
Jonas AJ, Conley SB, Marshall R, Johnson RA, Marks M and Rosenberg H (1987). Nephropathic cystinosis with central nervous system involvement. Am J Med 83: 966- 970
P 216

Jung K and Scholz D (1980). An optimized assay for alanine aminopeptidase activity
in urine. Clin Chem 26: 1251-1254
Kaiser-Kupfer MI, Caruso RC, Minkler DS and Gahl WA (1986). Long-term ocular
manifestations in nephropathic cystinosis. Arch Ophthalmol 104: 706-711
Kaiser-Kupfer MI, Fujikawa L, Kuwabara T, Jain S and Gahl WA (1987). Removal
of comeal crystals by topical cysteamine in nephropathic cystinosis. N Engl J Med
316: 775-779
Kaiser-Kupfer MI, Gazzo MA, Datiles MB, Caruso RC, Kuehl EM and Gahl WA
(1990). A randomized placebo-controlled trial of cysteamine eye drops in nephropathic
cystinosis. Arch Ophthalmol 108: 689-693
Kroll WA and Schneider JA (1974). Decrease in free cystine content of cultured
cystinotic fibroblasts by ascorbic acid. Science 186: 1040-1042
Lander ES and Botstein D (1986). Strategies for studying heterogeneous traits in
humans by using a linkage map of restriction fragment length polymorphisms. Proc
Natl Acad Sci USA 83: 7353-7357
Lander ES and Botstein D (1987). Homozygosity mapping: A way to map human
recessive traits with the DNA of inbred children. Science 236: 1567-1570
Lemire J, Kaplan BS and Scriver CR (1978). Presentation of cystinosis as Bartter's
syndrome and conversion to Fanconi syndrome on indomethacin treatment. Pediatr
Res 12: 544A
Lemire J and Kaplan B (1981). Prolonged use of indomethacin in cystinosis. Pediatr Res 15: 696A
Lemire J and Kaplan BS (1984). The various renal manifestations of the nephropathic form of cystinosis. Am J Nephrol 4: 81-85
P 217

Lemons RM, Pisoni RL, Christensen HN and Thoene JG (1986). Elevated
temperature produces cystine depletion in cystinotic fibroblasts. Biochim Biophys Acta
884: 429-434
Lowry OH, Rosebrough NJ, Farr AL and Randell RJ (1951). Protein measurement
with the Folin Phenol reagent. J Biol Chem 193: 265-275
Lubec G, Nauer G and Pollack A (1983). Non-invasive diagnosis of cystinosis by
infra-red spectroscopy of hair (letter). Lancet ii: 623
Luck AW, Howley PM, Megyesi K, Spielberg SP and Schulman JD (1977).
Endocrine studies in cystinosis: compensated primary hypothyroidism. J Pediatr
91: 204-210
Mahoney CP, Striker GE, Hickman RO, Manning GB and Marchioro TL (1970).
Renal transplantation for childhood cystinosis. N Engl I Med 283: 397-402
Malekzadeh MH, Neustein HB, Schneider JA, Pennisi AJ, Ettenger RB, Uittenbogaart
CH, Kogut M and Fine RN (1977). Cadaver renal transplantation in children with
cysfinosis. Am J Med 63: 525-533
Manz F and Gretz N (1985). Cystinosis in the Federal Republic of Germany.
Coordination and analysis of data. J Inherit Metabol Dis 8: 2-4
Markello TC, Bernadini IM and Gahl WA (1993). Improved renal function in children
with cystinosis treated with cysteamine. N Engl J Med 328: 1157-1162
Marulin D (1976). Rapid colorimetric assay of B-D-galactosidase and N-acetyl-B-D
glucosaminidase in human urine. Clin Chim Acta 73: 453-461
Mathew CG, Chin KS, Easton DF, Thorpe K, Carter C, Liou GI, Fong S-L, Bridges
CD, Haak H, Nieuwenhuijzen Kruseman AC, Schifter S, Hansen HH, Telenius H, Telenius-Berg and Pounder BA (1987). A linked genetic marker for multiple endocrine neoplasia type 2A on chromosome 10. Nature 327: 528-529
P 218
McCune DJ, Mason HH and Clarke HT (1943). Intractable hypophosphataernic rickets
with renal glycosuria and acidosis (the Fanconi syndrome). Am J Dis Child 65: 81-146
Milner RDG and Wirdnam PK (1982). The pancreatic B cell fraction in children with
errors of amino acid metabolism. Pediatr Res 16: 213-216
Montini G, Dalton RN, Tomlinson PA, Allen SJ and Chantler C (1989). The
estimation of glomerular filtration rate from single injection inulin measurements using
numerical analysis. Pediatr Nephrol 3: A2.001
Morec1d R, Paunier L and Hamilton JR (1968). Intestinal mucosa. in cystinosis. A fine
structure study. Arch Path 86: 297-307
Mudd SH, Levy HL, Skovby F (1989). Disorders of Transsulfuration. Chapter 23, pp 693-734, in Scriver CR, Beaudet AL, Sly WS, Valle D (eds. ) 7he Metabolic Basis of
Inherited Disease, 6th edition, McGraw-Hill, Inc., 1989
Murphy JL and Papathakis PC (1993). Hypercholesterolemia in children with
cysfinosis. Pediatr Nephrol 7: 159-162
Nakamura Y, Leppert M, O'Connell P, Wolff R, Holm T, Culver M, Martin C,
Fujimoto E, Hoff M, Kumlin E and White R (1987). Variable number of tandem
repeat (VTNR) markers for human gene mapping. Science 235: 1616-1622
Nichols SL, Press GA, Schneider JA and Trauner DA (1990). Cortical atrophy and
cognitive performance in infantile nephropathic cystinosis. Pediatr Neurol 6: 379-381
Orloff S, Butler J, Towne D, Mukheýee A and Schulman JD (1981). Pantetheinase
activity and cysteamine content in cystinotic and normal fibroblasts and leukocytes. Pediatr Res 15: 1063-1067
P 219

Oshima RG, Willis RC, Furlong CE and Schneider JA (1974). Binding assays for
amino acids. The utilization of a cystine binding protein from Escherichia coli for the
determination of aci-soluble cystine, in small physiological samples. J Biol Chem
249: 6033-6039
Oshima RG, Rhead WJ, Thoene JG and Schneider JA (1976). Cystine metabolism in
human fibroblasts. Comparison of normal, cystinotic and glutamylcysteine synthetase deficient cells. J Biol Chem 251: 4287-4293
Patrick AD (1965). Deficiencies of -SH-dependent enzymes in cystinosis. Clin Sci
28: 427-443
Patrick AD and Lake BD (1968). Cystinosis: electron microscope evidence of lysosomal storage of cystine in lymph node. J Clin Path 21: 571-575
Patrick AD, Young EP, Mossman J, Warren R, Kearney L and Rodeck CH (1987).
First trimester diagnosis of cystinosis using intact chorionic villi. Prenat Diagn 7: 71-
74
Pellett OL, Smith ML, Greene AA and Schneider JA (1988). Lack of
complementation in somatic sell hybrids between fibroblasts from patients with different forms of cystinosis. Proc Natl Acad Sci USA 85: 3531-3534
Pintos-Morell G, Niaudet P, Jean G and Descamps-Latscha B (1985). Altered
oxidative metabolism, motility and adherence in phagocytic cells from cystinosis children. Pediatr Res 19: 1318-1321
Pintos-Morell G, Jean G, Dechaux M and Niuadet P (1991). Increased monocyte- dependent suppression of polyclonal activation of B-lymphocytes from cystinotic children. Pediatr Nephrol 5: 597-602
Pisoni RL, Thoene JG and Christensen HN (1985). Detection and characterisation of carrier-mediated cationic amino acid transport in lysosomes of normal and cystinotic human fibroblasts. J Biol Chem 260: 4791-4798
P 220

Pisoni R, Acker TL and Thoene JG (1989). A highly specific lysosomal cysteine transport system provides a major route for the delivery of reductant to the lysosomal
compartment. Pediatr Res 25: 144A
Prescott LF, Sutherland GR, Park J, Smith U and Proudfoot AT (1976). Cysteamine,
methionine, and penicillarnine in the treament of paracetamol poisoning. Lancet
2: 109-113
Proesmans W, Baten E, Hoogmartens J and Bruynell P (1987). Nephropathie
cystinosis: effect of long-term cysteamine therapy. Clin Nephrol 27: 309-312
Rees L, Rigden SP, Ward G and Preece MA (1990). Treatment of short stature in
renal disease with recombinant human growth hormone. Arch Dis Child 65: 856-860
Reeves JP (1979). Accumulation of amino acids by lysosomes incubated with amino acid methyl esters. J Biol Chem 254: 8914-8921
Reiss RE, Kuwabara T, Smith ML and Gahl WA (1988). Successful pregnancy despite placental cystine crystals in a woman with nephropathic cystinosis. N Engl J
Med 319: 223-226
Renlund M, Tietze F and Gahl, WA (1986). Defective sialic acid egress from isolated
fibroblast lysosomes of patients with Salla disease. Science 232: 759-762
Reznik VM, Adamson M, Adelman RD, Murphy JL, Gahl. WA, Clark KF and Schneider JA (1991). Treatment of cystinosis with cysteamine from early infancy. J
Pediatr 119: 491-493
Rogers HJ, Spector RG and Trounce JR (1981). Drug Absorption and Bioavailabilityt Chapter 2, pp5O-77, in Rogers HJ, Spector RG, Trounce JR (eds. ) A Textbook of Clinical Pharmacology. Hodder and Stoughton Ltd.
Roy LP and Pollard AC (1978). Cysteamine. therapy for cystinosis (letter). Lancet ii: 729-730
P 221

Russefl DS and Barrie HJ (1936). Storage of cystine in the reficulo-endothelial system
and its association with chronic nephritis and renal rickets. Lancet ii: 899-905
Sakarcan A, Arichetta R and Baum M (1992). Intracellular cystine loading causes
proximal tubule respiratory dysfunction: effect of glycine. Pediatr Res 32: 710-713
Saleem M, Milford DV and Winterbom MH (1992). Nephrocalcinosis in children
with cystinosis. Pediatr Nephrol 6: CI59
Salmon RF and Baum M (1990). Intracellular cystine loading inhibits transport in the
rabbit proximal convoluted tubule. J Clin Invest 85: 340-344
Schnaper HW, Cottel J, Merrill S, Marcusson E, Kissane JM, Shackelford GD, So
SKS, Nelson R, Cole BR, Smith ML and Schneider JA (1992). Early occurrence of
end-stage renal disease in a patient with infantile nephropathic cystinosis. J Pediatr
120: 575-578
Schneider JA, Bradley K and Seegmiller JE (1967). Increased cystine in leukocytes
from individuals homozygous and heterozygous for cystinosis. Science 157: 1321-1322
Schneider JA, Wong V, Bradley K and Seegmiller JE (1968). Biochemical
comparisons of the adult and childhood forms of cystinosis. N Engl J Med 279: 1253-
1257
Schneider JA, Wong V and Seegmiller JE (1969). The early diagnosis of cystinosis. J
Pediatr 74: 114-116
Schneider JA, Verroust FM, Kroll WA, Garvin AJ, Horger 3rd EO, Wong VG, Spear GS, Jacobson C, Pellet 0 and Becker FL (1974). Prenatal diagnosis of cystinosis. N Engl J Med 290: 878-882
Schneider JA, Schlesselman JJ, Mendoza SA, Orloff S, Thoene. JG, Kroll WA, Godfrey AD and Schulman JD (1979). Ineffectiveness of ascorbic acid therapy in
nephropathic cysfinosis. N Engl J Med 300: 756-759
P 222

Schneider J and Schulman JD (1986). Cystinosis and the Fanconi Syndrome, Chapter
54, pp985-997, in Andreoli TE, Hoffman JF, Fanestil DD and Schultz SG (eds. )
Physiology of Membrane Disorders. Plenum Publishing Corporation
Schneider JA, Katz B and Melles RB (1990). Update on nephropathic cystinosis. Pediatr Nephrol 4: 645-653
Schulman JD, Wong V, Olson V and Seegmiller JE (1970a). Lysosomal site of
crystalline deposits in cystinosis as shown by ferritin uptake. Arch Pathol 90: 259-264
Schulman JD, Wong VG, Kuwabara T, Bradley KH and Seegmiller JE (1970b).
Intracellular cystine content of leukocyte populations in cystinosis. Arch Int Med
125: 660-664
Schulman JD, Wong VG, Bradley KH and Seegmiller JE (1970c). A simple technique
for the biochemical diagnosis of cystinosis. J Pediatr 76: 289-292
Schulman JD, Fujimoto WY, Bradley KH and Seegmeiller JE (1970d). Identification
of heterozygous genotype for cystinosis in utero by a new pulse-labelling technique: a
preliminary report. J Pediatr 77: 468-470
Schulman JD and Bradley KH (1972). In vitro studies on cystinosis. Chapter 8, pp, 111- 1145, in Schulman JD (ed. ), Cystinosis. US Dept of Health, Education and Welfare Publication No. (NIH) 72-249, Washington DC.
Schwartz GJ, Haycock GB, Edelman CM and Spitzer A (1976). A simple estimate of glomerular filtration rate in children derived from body length and plasma creatinine. Pediatrics 58: 259-263
Seip M, Steen-Johnson J, Vellan JE and Gjessing LR (1968). Dietary treatment of cystinosis. Acta Paediatr Seand 57: 409-416
Selye H and Szabo S (1973). Experimental model for production of perforating duodenal ulcers by cysteamine in rats. Nature 244: 458-459
P 223

da Silva VA, Zurbr-agg RP, Lavanchy P, Blumberg A, Suter H, Wyss SR, Lathy CM
and Oetliker OH (1985). Long-term treatment of infantile cystinosis with cysteamine. N Engl J Med 313: 1460-1463
da Silva VA, ZurbrOgg RP, Lavanchy P, Blumberg A, Suter H, Wyss SR, Lfithy CM
and Oetliker OH (1985). Treatment of infantile nephropathic cystinosis with
cysteamine (letter). N Engl J Med 314: 1320-1321
Silverman FN (1993). The Limbs. Part VI, section 44, pp 1715-1784, in Silverman
FN, Kuhn JP (eds. ) Caffey's Pediat? ic X-ray diagnosis: an integrated imaging
approach. 9th edition, Mosby.
Smith ML, Pellett OL, Cass MMJ, Kennaway NG, Buist NRM, Buckmaster J,
Golbus M, Spear GS and Schneider JA (1987). Prenatal diagnosis of cystinosis
utilizing chorionic villus sampling. Prenat Diagn 7: 23-26
Smith ML, Clark KF, Davis S, Greene AA, Marcusson EG, Chen Y-j and Schneider JA (1989). Diagnosis of cystinosis with use of placenta. N Engl J Med 321: 397-398
Smith ML, Pellet OL, Cahill TC, David DN, Kaskel FJ, Smolin LA, Greene AA,
Weissbecker K, Dean M and Schneider JA (1991). Biochemical and genetic analysis of a child with cystic fibrosis and cystinosis. Am J Med Genet 39: 84-90
Smolin LA, Clark KF and Schneider JA (1987). An improved method for heterozygote detection of cystinosis, using polymorphonuclear leucocytes. Am J Hum Genet 41: 266-275
Smolin LA, Clark KF, Thoene JG, Gahl WA and Schneider JA (1988). A comparison of cysteamine and phosphocysteamine in elevating plasma cysteamine concentration and decreasing leukocyte free cystine in nephropathic cystinosis. Pediatr Res 23: 616- 620
P 224

Smolin LA and Schneider JA (1988). Measurement of total plasma cysteamine using high-performance liquid chromatography with electrochemical detection. Anal
Biochem 168: 374-379
Sonies BC, Ekman EF, Andersson HC, Adamson MD, Kaler SG, Markello TC and
Gahl WA (1990). Swallowing dysfunction in nephropathic cystinosis. N Engl J Med
323: 565-570
Spear GS (1972). The pathology of the kidney. Chapter 4, pp 37-53, in Schulman JD
(ed. ), Cýstinosis. US Dept of Health, Education and Welfare Publication No. (NIH)
72-249, Washington DC.
Spear GS (1974). Pathology of the kidney in cystinosis. In Sommers SC (ed. )
Pathology Annual, Appleton-Century-Crofts, New York
Spear GS, Gubler MC, Habib R and Broyer M (1989). Dark cells of cystinosis. Hum
Pathol 20: 472-476
Steinherz R, Tietze F, Raiford D, Gahl WA and Schulman JD (1982a). Patterns of
amino acid efflux from isolated normal and cystinotic leucocyte lysosomes. J Biol
Chem 257: 6041-6049
Steinherz R, Tietze F, Gahl WA, Triche TJ, Chiang H, Modesti A and Schulman JD
(1982b). Cystine accumulation and clearance by normal and cysfinofic leucocytes
exposed to cystine, dimethyl. estir. Proc Nad Acad Sci USA 79: 4446-4450
Steinherz R, Tietze F, Triche T, Modesti A, Gahl WA and Schulman JD (1982c). Heterozygote detection in cystinosis, using leukocytes exposed to dimethyl ester. N Engl J Med 306: 1468-1470
Steinherz R, Chesney RW, Schulman JD, DeLuca HF and Phelps M (1983). Circulating vitamin D metabolites in nephropathic cystinosis. J Pediatr 102: 592-594
P 225

Strife CF, Strife JL and Wacksman J (1991). Acquired structural genitourinary
abnormalities contributing to deterioration of renal function in older patients with
nephropathic cystinosis. Pediatrics 88: 1238-1241
Szabo S and Reichlin S (1981). Sornatostatin in rat tissues is depleted by cysteamine administration. Endocrinology 109: 2255-2257
Tannenbaum GS, McCarthy GF, Zeitler P and Beaudet A (1990). Cysteamine-induced
enhancement of growth hormone-releasing factor (GRF) immunoreactivity in arcuate
neurons: morphological evidence for putative somatostatin/GRF interactions within hypothalamus. Endocrinology 127: 2551-2560
Tanner JM, Whitehouse RH and Takaishi M (1966). Standards from birth to maturity for height, weight, height velocity, and weight velocity: British children, 1965, Part
II. Arch Dis Child 41: 613-635
Thoene JG, Oshima RG, Crawhall JC, Olson DL and Schneider JA (1976).
Cystinosis. Intracellular cystine depletion by aminothiols in vitro and in vivo. J Clin
Invest 58: 180-189
Thoene JG, Oshima RG, Ritchie DG and Schneider JA (1977). Cystinotic fibroblasts
accumulate cystine from intracellular protein degradation. Proc Natl Acad Sci USA 74: 4505-4507
Thoene JG and Lemons R (1980). Cysfine depleflon of cysfinofic fissues by
phosphocysteamine (WR638). J Pediatr 96: 1043-1044
Thoene JG and Lemons RM (1982). Cysfine accumulation in cystinotic fibroblasts from free and protein-linked cystine but not cysteine. Biochem J 208: 823-830
Thoene JG, Lemons, R, Boskovich S and Borysko K (1985). Inhibitors of protein synthesis also inhibit lysosomal proteolysis. J Clin Invest 75: 370-376.
P 226

Tietze F, Rome LH, Butler J, Harper GS and Gahl WA (1986). Impaired clearance of free cystine from lysosome-enriched granular, fractions of I-cell disease fibroblasts.
Biochem J 237: 9-15
Tomlinson PA, Dalton RN, Turner C and Chantler C (1990). Measurement of 82-
microglobulin, retinol-binding protein, a, -microglobulin and urine protein 1 in healthy
children using enzyme-linked immunosorbent assay. Clin Chim Acta 192: 99-106
Tomlinson PA (1992). Low molecular weight proteins in children with renal disease.
Pediatr Nephrol 6: 565-571.
Tomlinson PA, Smellie JM, Prescod, N, Dalton RN and Chantler C (1993, in press). Differential excretion of urinary proteins in vesico-ureteric reflux and reflux
nephropathy. Pediatr Nephrol
T6nshoff B, Haffner D, van't Hoff WG, Broyer M and Mehls 0 (1992). European
multicentre study for growth hormone treatment of children with nephropathic cystinosis. Pediatr Nephrol 6: C102
Trauner DA, Chase C, Scheller J, Katz B and Schneider JA (1988). Neurologic and
cognitive deficits in children with cystinosis. J Pediatr 112: 912-914
Treem WR, Rusnack EJ, Ragsdale BD, Seikaly MG and DiPalma JS (1988). Inflammatory bowel disease in a patient with nephropathic cystinosis. Pediatrics 81: 584-587
Vellan EJ, Gjessing LR and Seip M (1969). Hair amino acids in cystinosis, homocystinuria, F611ing's disease and tyrosinosis. Acta Paediatr Scand 58: 287-289
Vogel DG, Malekzadeh MH, Comford. ME, Schneider JA, Shields WD and Vinters HV (1990). Central nervous system involvement in nephropathic cystinosis. J Neuropath Exp Neurol 49: 591-599
P 227

Waldmann TA, MogielnicId RP and Strober W (1972). The proteinuria of cystinosis: its pattern and pathogenesis. Chapter 5, pp 55-66, in Schulman JD (ed. ) Cystinosis.
US Dept of Health, Education and Welfare Publication No. (NIH) 72-249,
Washington DC.
Weissenbach J, Gyapay G, Dib C, Vignal A, Morissette J, Millasseau P, Vaysseix G
and Lathrop M (1992). A second-generation linkage map of the human genome. Nature 359: 794-801
White R, Leppert M, Bishop T, Barker D, Berkowitz J, Brown C, Callahan P, Holm
T and Jermonski L (1985). Construction of linkage maps with DNA markers for
human chromosomes. Nature 315 : 101-105
White TJ, Arnheim N and Erlich HA (1989). The polymerase chain reaction. Trends
Genet 5: 185-189
Willis RC, Morris RG, Cirakoglu C, Schellenberg GD, Gerber NH and Furlong CE
(1974). Preparation of the periplasmic binding proteins from Salmonella typhimurium
and Escherichia coli. Arch Biochem Biophys 161: 64-75
Wilson DP, Jelley D, Stratton R and Coldwell JG (1989). Nephropathic cystinosis: improved linear growth after treatment with recombinant human growth hormone. J
Pediatr 115: 758-761
Winkler L, Offner G, Krull F and Brodehl J (1993). Growth and pubertal developmental in nephropathic cystinosis. Eur J Pediatr 152: 244-249
Wolff G, Ehrich JHH, Offner G and Brodehl J (1982). Psychological and intellectual development in 12 patients with infantile nephropathic cystinosis. Acta Paediatr Scand 71: 1007-1011
Wollaston WH (1810). On cystic oxide, a new species of urinary calculus. Philos Trans Roy Soc Lond Biol XIII, pp 223-230
P 228

Wong V (1972). The eye and cystinosis. Chapter 3, pp23-35, in Schulman JD (ed. )
Cystinosis. US Dept of Health, Education and Welfare Publication No. (NIH) 72-249,
Washington DC.
Wong Z, Wilson V, Patel 1, Povey S and Jeffreys AJ (1987). Characterization of a
panel of highly variable minisatellites cloned from human DNA. Ann Hum Genet
51: 269-288
Worthen HG and Good RA (1958). The de Toni-Fanconi syndrome with cystinosis. Am J Dis Child 95: 653-688
Yudkoff M, Foreman JW and Segal S (1985). Effects of cysteamine therapy in
nephropathic cystinosis. N Engl J Med 304: 141-145
P 229

Appendix 1: Analytical methods
Mixed leucocyte cell pellet preparation Chenfleals required:
a) ACD-Dextran solution: 3g Dextran (Sigma D-7265, MW2xlOl' - 2.75xl0l),
2.1 g Dextrose,
0.33g Sodium Citrate,
O. llg anhydrous Citric Acid
made up to 100ml of 0.9% Sodium Chloride.
b) 0.9% Sodium Chloride
c) 3.6% Sodium Chloride
d) Distilled water
e) 12% 5-Sulphosalicylic Acid
(All solutions were filtered through a 0.22liM Millipore filter in a vacuum flask prior
to use and were kept at 40C between assays) f) Wet Ice
Procedure
1.3mls of ACD-Dextran solution in a 15ml. test tube (Elkay Products, Inc. 000-2087-
000) were allowed to stand at room temperature prior to use. Other solutions were kept on wet ice.
2.3mls. venous blood were taken into a syringe primed with a small amount of heparin (1000iu/ml).
3. The blood was immediately added to the ACD-Dextran solution and inverted gently
until well mixed. The tube was stood in ice for 45 minutes to allow the red cells to
precipitate. 4. After 45 minutes the supernatant was transferred to another 15ml test tube. The
tube was spun in a pre-chilled centrifuge at 50C, at 450 xg for 10 minutes to
precipitate the leucocytes.
5. The supernatant was discarded using a water vacuum aspirator, leaving a red pellet. 6.0.8 mls. of 0.9% sodium chloride were added and the tube held on a vortex mixer
until the pellet was resuspended. 2.4 mls. of distilled water were added and the tube
was vortexed continuously for 90 seconds. 0.8 mls. of 3.6% sodium chloride were
P 230

then added to restore the suspension to isotonicity and briefly vortexed to ensure
mixing. The tube was centrifuged at 450 xg for 3 minutes at 5*C. 7. The supernatant was discarded using a water vacuum aspirator and the hypotonic
lysis step was repeated, usually once but twice if the resulting pellet remained
contaminated with red cells. 8. After the supernatant had been discarded the pellet was washed by adding 3-OmIs
of 0.9% sodium chloride and briefly vortexed to resuspend the leucocytes. The pellet
was precipitated by centrifugation at 450 xg at 5C for 3 mins. 9. The supernatant was discarded and the pellet taken to dryness with a water vacuum
aspirator. 150, ul of distilled water were added and the tube was vortexed briefly.
10. The leucocYte suspension was lysed by ultrasonication using a Sonipen High
Power Cell Disrupter (Technic International, Inc. ). 5 short (I second) bursts of
sonication were used to disrupt the leucocyte cell membranes. 11. The suspension was transferred to an Eppendorf/Microfuge tube to which has
been added 501AI 12% 5-sulphosalicylic acid to precipitate the protein fraction. The
tube was vortexed briefly to ensure mixing. 12. The pellets were stored at -7OoC pending determination of the cystine and protein
contents.
P 231

Polymorphonuclear leucocyte cell pellet preparation Chemicals required: a) 0.9% Sodium Chloride in 5mM EDTA
b) 0.9% Sodium Chloride
c) 3.6% Sodium Chloride
d) Distilled water
e) Phosphate buffered Saline (PBS): 800mg sodium chloride, 200mg potassium chloride, 1.15gm di-sodium hydrogen phosphate
made up to I litre with distilled water and buffered to pH7.2. f) 12% 5-Sulphosalicylic Acid
g) 0.2 M Sodium EDTA
h) lOmM Potassium phosphate buffer
(All solutions were filtered through a 0.2214M Millipore filter in a vacuum flask prior
to use and were kept at 4"C between assays) i) N-Ethylmaleimide (Sigma E-3876)
2.6mg NEM in 4. Omls of potassium phosphate buffer was prepared on the day
of the assay. j) Histopaque-1077 (Sigma 1077-1)
k) Histopaque-1119 (Sigma 1119-1)
All solutions (except the Histopaque gradients) were kept at VC between assays or on
wet ice during the pellet preparation. The Histopaque gradients were kept at VC
between assays but were allowed to stand at room temperature for I hour prior to use.
Procedure
1. Three 15 ml test tubes (Elkay Products, Inc. 000-2087-OW) were marked for each
patient. The first (gradient tube) was marked at 3,4.5 & 6mls. The second (blood
collection tube) was marked at 4.5 &9 mls. The third tube was marked at 12mls.
2. A Pasteur pipette was used to carefully add 3 mls. of Histopaque- 1119 to the
bottom of the first 15ml test tube, ensuring that there were no splashes on the side of the tube.
P 232

Blood smpting 3.0.25mls of 0.2M sodium EDTA were added to the second (blood collection tube).
4.5 - 5mls of venous blood were taken into a heparinized syringe and immediately
added to the blood collection tube. The tube was gently inverted several times to mix
and placed on ice until all the blood samples had been taken. 4.4.5mls PBS were added to the blood and the tube mixed by inverting several times.
Gradient preparation 5. A Pasteur pipette was used to very slowly (over 3-5 mins) add 3mls of Histopaque-
1077 to the gradient tube. The two layers of Histopaque were seen to be separated by
a meniscus.
6. A Pasteur pipette was used to very gently pipette the blood onto the Histopaque
gradient.
Isolation of polymorphonuclear cell: 7. The tube was spun at 450 xg for 20 mins at room temperature (20*C), and
allowed to decelerate without any centrifuge brake so as not to disturb the gradient layers.
8. The centrifuge was run at 450 xg at 5*C for 10 minutes to chill it in preparation for the next stage. 9. A vacuum aspirator was used to carefully discard the supernatant down to the
4.5ml mark, removing at the same time the lymphocyte layer.
10. A Pasteur pipette was used to transfer the layer containing the polymorphonuclear leucocyte cells to the third test tube, being careful not to take up any red cells.
CeH wash 11. The polymorphonuclear leucocyte cells were diluted with 0.9 % sodium chloride containing 5mM EDTA up to the 12ml mark. The tube was spun at 450 xg at VC for 10 minutes and allowed to decelerate with the centrifuge brake in the off position.
Hypotonic red cell lysis
12. A vacuum aspirator was used to remove the supernatant down to the pellet. 0.8mls. of 0.9% sodium chloride were added to gently resuspend the pellet. 2-4mls-
of distilled water were added and the tube vortexed briefly. After 90 seconds 0.8mls.
P 233

of 3.6% sodium chloride were added to restore isotonicity. The pellet was precipitated by centrifugation at 450 xg for 3 minutes at 50C.
CeU wash 13. A vacuum aspirator was used to remove the supernatant down to the pellet. Occasionally, if the pellet still appeared to be contaminated with red cells, the hypotonic red cell lysis step was repeated. 4. Omls. of 0.9% sodium chloride containing 5mM EDTA were added and the pellet resuspended and centrifuged as before.
Polymorphonudear leucocyte cell lysis
14. A vacuum aspirator was used to remove the supernatant and dry the leucocyte
pellet. 150jul of the N-ethylmaleimide solution were added and the pellet resuspended by briefly vortex mixing. 15. The leucocyte suspension was lysed by ultrasonication using a Sonipen High
Power Cell Disrupter (Technic International, Inc. ). 5 short (I second) bursts of
sonication were used to disrupt the leucocyte cell membranes. 16. The suspension was transferred to an Eppendorf/Microfuge tube to which has
been added 50, ul 12% 5-sulphosalicylic acid to precipitate the protein fraction. The
tube was vortexed briefly to ensure mixing. 17. The pellets were stored at -70oC pending determination of the cYstine and protein
contents.
P 234

Determination of cystine in cultured cells and tissue specimens
Chemicals required:
a) 0.9% Sodium Chloride
b) Distilled water
c) 12% 5-Sulphosalicylic Acid
(All solutions were filtered through a 0.22, uM Millipore filter in a vacuum flask prior
to use and were kept at 4oC between assays) f) Wet Ice
Procedure
1. The sample was washed to remove blood (and in the case of cultured cells,
extraneous cystine in the medium) in 0.9% sodium chloride by vigorous pipetting
using a wide mouth pipette. 2. The tissue was pelleted by centrifugation at 450 x, g for 5mins at VC and the
supernatant discarded.
3. The tissue was disrupted in a centrifugal micro-homogeniser system (Hearse,
1984).
4.200til of dH20 were added and the suspension was lysed by ultrasonication using a
Sonipen High Power Cell Disrupter (Technic International, Inc. ). 5 short (I second)
bursts of sonication were used to disrupt the leucocyte cell membranes.
5.67AI 12% 5-sulphosalicylic acid were added to precipitate the protein fraction. The
tube was vortexed briefly to ensure mixing. 6. The supernatants and protein pellets were stored at -700C pending determination of
the cystine and protein contentg respectively.
P 235

Preparation of the sample for determination of the cystine and protein contents
0 Chemicals required:
a) 1.66M Sodium hydroxide
b) 1M Sodium acetate, pH5
c) O. lM Sodium hydroxide
(All solutions were filtered through a 0.22jim Millipore filter in a vacuum flask prior
to use and kept at 4"C between assays)
Method
1. The samples were thawed on a rollermixer and the protein fraction pelleted by
centrifuging the sample in a microcentrifuge for 2 mins. 2. Using a 200jil pipette and noting the exact volume, the protein free supernatant was
removed into a microfuge tube for cystine determination.
3.5001410. IM Sodium hydroxide were added to the protein pellet and the tube
vortexed over 2-3 mins. The protein sample was then frozen at -70*C pending determination of the protein concentration. 4.25141 1.66M Sodium hydroxide and 25jul 1M Sodium acetate were added to the
cystine sample tube and the mixture briefly vortexed. 5. The pH of the sample was measured by testing a 3-5, ul aliquot on a pH paper strip. 51A aliquots of either 1.66M Sodium hydroxide or 25, ul IM Sodium acetate were
added to the cystine sample tube until the sample measured pH 5. The volume of buffer added was noted. Samples were either used directly or frozen at -70*C pending determination of the cystine concentration.
P 236

Determination of the protein concentration
Introduction
The protein concentration was determined by the method of Lowry et al., modified
for use on a Cobas-Mira autoanalyser (Lowry et al., 1951). The Lowry method uses
two steps, firstly the protein sample is incubated with alkaline copper solution.
Secondly, Folin-Ciocalteu reagent is added and the sample incubated for 30 minutes,
after which the resulting colour change is determined by a spectrophotometer. Clifton
et al. described a modification of the Lowry assay for use on a Cobas-Bio centrifugal
analyser allowing rapid multiple analyses (Clifton et al., 1988). Clifton et al. found
that the colour reaction was accelerated threefold at 37*C compared with 25*C,
allowing a reduction in the time of the second incubation. Further they found a linear
relationship between the time of the first incubation and final absorbance values, so
that the first incubation could be reduced to 60 seconds without any detriment in
accuracy.
The methods of Clifton et al. were adapted to a Cobas-Mira Centrifugal analyser.
Chemicals required:
a) 2% Cupric sulphate (CuS04.51120), (BDH Analar)
b) 3% Anhydrous sodium carbonate (BDH Analar) in OAM sodium hydroxide,
containing 8AI Sodium dodecyl sulphate (BDH Prod-44215) per 100mls
c) 4% Sodium tartrate dihydrate (Sigma S8640)
d) 2M Folin Ciocalteu phenol reagent (Sigma F2952)
e) lmg/mI Protein standards (Sigma P0914)
Methods:
1. The protein pellet samples were thawed on a rollermixer, spun briefly in a microcentrifuge and inspected to ensure that the pellet had dissolved in the sodium hydroxide. (Occasionally, more than 500, ul of 0. IM sodium hydroxide were added to the protein sample to dissolve the pellet. The exact volume of sodium hydroxide
required was noted). 2.501AI protein sample were pipetted into a Cobas-Mira sample cup. 3. The sample cups were placed in a rack, interspersed every 5 samples, with 2
P 237

sample cups containing 501AI dH20 and 50/Al protein standard (Img/ml) respectively. 4. Lowry reagent C was prepared by mixing 20mls 3% Sodium carbonate, 200AI 4% Sodium tartrate and 200til 2% Copper sulphate. 5. Main reagent (Lowry reagent Q and start reagent (2mls Folin Ciocalteu reagent) were placed in cups in the appropriate positions in a rack "5". 6. A sample needle dedicated to the protein assay was used. Prior to starting, the needle was primed for 30 seconds. 7. The Cobas Mira settings were as shown on the menu (enclosed). Samples were run in duplicate and the blank and standard results reviewed to check for drift during the assay run.
P 238

Menu for Protein Determination on COBAS MIRA
General Measurement Mode Reaction Mode Calibration mode Reagent mode Cleaner Wavelength Decimal position Unit Analysis Sample Dil. Name Post Dil. Factor
Conc. Factor Sample Vol: 3 jil Reagent Vol: 200, ul Start Reagent 1 Vol: I 01AI
Calculation Sample Limit Reac. Direction Check Convers. Factor Offset Test Range
Norm. Range
Number of steps Calc. Step A Readings Calibmtion Calib. Interval Reagent Blank Reag. Range
Blank Range
Calibrator
Replicate Deviation Control CSI Pos: No CS2 Pos: No CS3 Pos: No
: Absorb : R-S-SRI : Calibrator : Reag/Sol No : 600 nm :2
: H20 No No Cycle 1 Dil: 7 141 Cycle I
Cycle 4 DR: 5, ul
Wo Jncrease
: Off : 1.00000
: 0.00000 Low 5.00 High : 5000.00 Low No High No
:1 : Endpoint
First :3
: Each run Sol-Pos: 8
Low No High -. No LOW No High No
Cup-Pos: 7 Cal-I : 500.00
: Dupl : 10.0%
Last: 8
P 239

Determination of the cystine concentration using the cystine binding protein assay
(Based on the methods of Oshima et al., 1974)
Chemicals required:
a) 100mM Sodium acetate, pH5 b) Cystine binding protein "cocktail" (see below for composition)
c) Cystine standards (see below for composition) d) Scintillation fluid (0.5% Butyl PBD, (Sigma B 8378), in toluene)
Cystine binding protein "cocktail"
Chemicals required: Bovine serum albumin (Sigma A 7888)
Cystine binding protein (CBP), (Riverside Scientific Enterprises, Bainbridge Island,
WA 98110, USA)o
"C-Cystine (65jAM, NEN Research Products NEC-465)
IM Sodium acetate pH 5.0
lOOmM Sodium acetate pH 5.0
(The sodium acetate solutions were filtered through a 0.22ym Millipore filter in a
vacuum flask prior to use and kept at OC between assays)
1.6514M "C-Cystine was diluted to a final concentration of MkM with 100mM
sodium acetate (typical volumes used were 251A 14C_Cystine with 4.19mls of acetate). 20141 of the 0.4; tM 14 C-Cystine were spotted onto 2 nitrocellulose filters (24mm
diameter, Schleicher and Schueft BA 80,0.45, um, Ref No 401104) and dried under a heat lamp. The dry filters were placed in 6mls of scintillation fluid and the counts
measured over 10 minutes in a liquid scintillation counter (Beckman LS 1800). The
counts needed to be between 4100 and 5000 to ensure an appropriate slope for the
standards in the cystine assay (see below). The diluted 0.4, UM 14C_Cystine was frozen in aliquots at -70*C until required. Each dilution of 65juM 14 C-Cysfine was checked in
this way. 2.10mls of a solution of 0.4mg/ml BSA in lOOmM sodium acetate were prepared and filtered through a 0.221&m Millipore filter. The CBP was diluted I in 6 with 0.4mg/ml BSA in sodium acetate solution by adding 1.2ml CBP to 6. Omls of BSA solution. The
P 240

albumin acts as a stabiliser to the CBP. The CBP in albumin was divided into aliquots
and frozen at -70*C until required. 3. Cystine binding protein "cocktail" was prepared prior to the assay by adding 0.4, uM 14C_Cystine and 1M sodium acetate to the diluted CBP according to the
volumes given in table Al. I below:
Table Al. 1: Dilution of cystine binding protein
0.4, uM "C-
Cystine (mls)
IM sodium
acetate (mls)
Volume of CBP (mls)
Maximum number
of samples
0.4 0.16 0.4 12
0.8 0.32 0.8 28
1.2 0.48 1.2 41
1.6 . 0.64 1.6 60
The cocktail was used directly or kept frozen for a maximum of 2 weeks.
Cystine standards
Stock solution of 50014M Cystine in 0.1 M Hydrochloric acid was kept in aliquots, at - 70"C. Standards were prepared as follows: 1.50jul of 500juM Cystine in 0. IM Hydrochloric acid were added to 4950jul of 100mM sodium acetate, pH5 giving a 514M Cystine solution. 2. Standards were prepared in 100mM Sodium acetate, pH5, as detailed in table Al. 2 below:
P 241

Table AI. 2: Composition of cystine standards
Cystine
standard CuM)
Volume of 100mM
Sodium acetate Ws)
Volume of 514M
Cystine solution
0 1.00 0
0.05 0.99 10
0.1 0.98 20
02 0.96 40
0.3 0.94 60
0.4 0.92 80
0.5 0.90 100
0.6 0.88 120
The cystine standards were kept at -70"C between assays.
Methods
1. The samples were thawed to room temperature on a rollermixer and centrifuged in
a microcentrifuge for 1-2 mins. 2. The samples were diluted to fall within the worldng range for the cystine binding
protein assay using 100mM Sodium acetate, pH5. The dilutions used were determined
by the following factors:
a. whether the patient is on cysteamine or phosphocysteamine treatment (and if so, the
time of the sample in relation to the last dose),
b. the size of the sample pellet as judged by the protein concentration and
c. the dilutions used for that patient in previous assays. For samples from individuals suspected of having cystinosis, initial dilutions were as follows: neat, I in 2,1 in 20 and I in 50.
3. Using forceps one nitrocellulose filter (24mm diameter, Schleicher and Schuell BA
80,0.45jAm, Ref No 401104) for each sample and standard were placed in a petri dish
containing lOmM Sodium acetate to ensure hydration.
P 242

4.501AI of the standards and diluted samples were pipetted into microfuge tubes.
5.60,41 of CBP cocktail were added to each sample tube at 20 second intervals and
the tube vortexed briefly to ensure mixing. When CBP cocktail had been added to all
the tubes, they were briefly spun in a microcentrifuge and incubated at room
temperature for 30 minutes. 6. The "wash" syringe was primed with lOmM Sodium acetate and a vacuum pressure
of 5 inches Hg maintained by a water vacuum aspirator. 7. Following incubation, a nitrocellulose filter was carefully placed on the filter holder
causing the vacuum pressure to increase to 10 inches Hg. At this pressure, 1001AI of
the incubated sample were carefully pipetted onto the centre of the filter.
8. The filter was immediately washed with 6001A lOmM Sodium acetate, delivered by
the "wash" syringe. The filter was then taken off and placed on a clean piece of
aluminium foil in a tray. 9. When all the samples had been pipetted, the filters were dried under an infra-red
heat lamp for 45 minutes. 10. The filters were then placed in 20ml scintillation vials to which were added 6mls
scintillation fluid.
11. The radioactivity remaining on the filters was determined by using a Beckman LS
1800 liquid scintillation counter. Counts were accumulated over 10 minutes or until 10,000cpm.
P 243

Calculation of the leucocyte cystine concentrations Taking the counts for the zero standard as CPM.., the ratio CPM..
. i.. /CPM,, b,,,,,, was calculated for each standard and sample. A linear
regression of CPM.,,, /CPM,, b, on standard cystine concentration was performed. The
slope of this regression line was normally 4.5 - 5.0 and the y intercept approximately 1.0 ± 0.1. If the values of slope and intercept fell outside these ranges, the assay
was repeated with a fresh CBP cocktail. The values of CPM. /CPM,, b. were plotted against cystine standard concentration as a visual check on the assay. "Raw" cystine concentrations in each sample were calculated from the regression curve. These values were then adjusted to take into account the volume of supernatant in the sample, the
volume of buffers added and the dilution performed. The adjusted values were factored by the mean protein concentration for the pellet to account for cell recovery and expressed in nanomoles 1h cystine per milligram protein.
These calculations were incorporated into a spreadsheet using SmartWare II (Informix Software, Inc. ), allowing rapid generation of the regression plot and providing a hardcopy of the data.
P 244

Appendix 2: Determination of plasma cyst ie
Reduction of plasma cysteamine Chemicals required:
a) 7M Urea in water (Sigma U-1250)
b) 100mg/ml Sodium borohydride (Sigma S-9125) in 0.1M sodium hydroxide
c) 10% Trichloroacetic acid (Sigma T-4885)
Methods
1. Plasma samples were thawed on a rollermixer and briefly microcentrifuged.
2. Cysteamine standards were freshly prepared as follows:
50AI of lmM cysteamine in OAM HCI (stock solution stored at -70*C) were added to
150, ul dH20 to give a 2501AM solution. 501AI of the 250, uM cysteamine solution were
added to 200jAI dH20 to give a 501AM solution. 201AI of the 501AM cysteamine solution
were added to 180, ul of dH20 to give a solution of 5jAM cysteamine.
3.10141 of dH20,5,50 or 250, uM cysteamine were added to one of four 15ml
polypropylene test tubes containing 40, ul of the patient's pre-drug plasma to give
standards of 0,2,20 and 100AM cysteamine respectively. 2.40AI patient plasma were pipetted into a 15ml polypropylene test tube, to which
were added IOAI dH20.
3.250, ul 7M Urea and I drop Octanol (Sigma 0-4500) were added and the tube
vortexed briefly.
4.25/Al Sodium borohydride solution were added to each tube which was then covered
with Parafilm and briefly vortexed. 5. The tubes were incubated and agitated at 50*C in a water bath for 30 minutes. 6. The reduction was stopped by the addition of 2501AI of cold 10% trichloroacetic
acid.
7. The tubes were centrifuged at 3000 xg for 15 minutes at room temperature to
precipitate the protein fmction.
8. The supernatant was transferred to a 22tiM filter cup in a microfuge tube (Millipore Ultrafree-MC, UFM OGV 00) and centrifuged for 5 mins. 9. The filtered protein-free samples were frozen at -70*C pending analysis.
P 245

Preparation of mobile phase for high pressure liquid chromatography
Chemicals required:
a) Monochloroacetic acid (Sigma C-0266)
b) Ethylamine (70%, w/v), (Sigma E-3754)
c) Octyl sulphate (Sigma 0-4003)
Methods 1.4.73g of monochloroacetic acid (MCA) were made up to 1 litre with dH20 to form
a solution of 0.05M MCA. 2.3mls of Ethylamine (70%, w/v aqueous) and 60mg Octyl sulphate, were added. 3. The solution was buffered to pH 3.10 by the addition of further monochloroacetic
acid or IM Acetic acid. 4. The mobile phase was filtered through a 22tiM filter on a vacuum flask prior to
use. 5. A Waters 501 HPLC pump set at Iml/hr was used to recycle mobile phase for 7
days prior to use to reduce the effect of impurities on the analyte response.
High pressure liquid chromatography
Principles of electrochemical detection
Electrochemical detection (ECD) is based on the measurement of a current generated by the oxidation or reduction of the analyte when it is exposed to a voltage applied to
an electrolysis cell, as a function of elution time. The electrolysis cell consists of a test electrode at which the electrolysis of the analyte occurs, an auxillary cell at which the complimentary electrolytic reaction occurs and a reference electrode which provides a constant potential used in measuring the potential at the test electrode. Amperometric measurement requires both an electrolysis cell and a potentiostat which adjusts the voltage of the control amplifier until the signal potential and the difference in potential between the test and reference electrodes are equal. The potential applied to the test electrode will affect sensitivity and background noise (due to electrolysis of other components and contaminants in the eluent). The optimal test potential must therefore be individually derived for the mobile phase and substance being analysed.
An amperometric detector produces a current signal proportional to the analyte
P 246

concentration. In most systems between I and 5% of the analyte is electrolysed. When
the proportion of analyte being electrolysed approaches 100%, the detector is said to
be coulometric and the response is directly proportional to the analyte concentration. The advantages of coulometric detectors are: 1. Enhanced signal stability (since impurities on the electrode surface will not affect
response until > 95% area is covered) 2. The signal due to analyte electrolysis is maximised 3. Dual electrodes in series can further enhance selectivity.
The ECD used in this work was the ESA Model 5100A Coulochem. The electrolysis
cell has two electrodes in series. The second (downstream) electrode is used as the
test electrode. The first (upstream) electrode can be used in "screen" or in "redox"
mode. Once the optimal working potential to apply to the test electrode is known, a
second potential selected from the lower end of the response vs. test potential curve,
can be applied to the screen electrode. This will serve to reduce background current
and prevent unwanted peaks from impurities that are electrolysed at potentials lower
than the working potential. Redox mode is used when the electrolysis of the substance being analysed can be reversed. For instance, reduction is caused at the first electrode
and then oxidation at the second electrode (set at an opposite polarity to the first). Use
of the redox mode can improve selectivity and reduce noise.
The mobile phase serves to maintain conductivity of the solution, controls the pH and minimises ionic migration of the analYte. Purity of the mobile phase is of paramount importance since the current created by analyte electrolysis will be significantly affected by electrolysis of contaminants. The noise thus created can be reduced by
using only "high grade" purity components and organic solvents, by filtering the
mobile phase prior to use and by recycling it prior to use. Recycling allows impurities to be electrolysed sequentially as they pass through the cell so that after some time, the mobile phase is "purer".
P 247

Procedure
1. Reduced plasma samples were thawed and microcentrifuged prior to use. 2. Nitrogen was bubbled through each sample for 1 min. to maintain cystearnine in its
reduced state. 3.60, ul were injected via an injection port onto a Hichrorn S50DS2 -2879 column. 4. The chromatography of cysteamine varied from run to run but generally eluted at
approximately 5 minutes. 5. The analytes were detected using an ESA Model 5011 Analytical cell, controlled by
the ESA Coulochern 5100A electrochemical detector.
6. Typical operating settings were as follows:
Electrode 1: Operating potential +0.10V
Electrode 2: Operating potential +0.60V Gain xIO Response time 0.4s
7. The output from the Coulochem detector was integrated using a Spectra Physics
SP4270 integrator.
8. Samples were run in duplicate and as far as possible, in ascending concentration
order.
P 248

Appendix 3: Cystinosis pedigrees
EI II
Key to pedigrees
: Homozygous affected
: Heterozygous
: Hornozygous unaffected
rmm LA : Borderline result
Mn : Not tested
P 249

Pedigree A
P 250

Pedigree
r.
c 1ýý c
c
c
P 251

Pedigree C
P 252
IBIBL LDONDON
NIV UNIV