Kidney involvement in a nongenetic rat model of type 2 diabetes
10
Kidney International, Vol. 68 (2005), pp. 2562–2571 Kidney involvement in a nongenetic rat model of type 2 diabetes RATNA S. DANDA,NUSRATH M. HABIBA,HERNAN RINCON-CHOLES,BASANT K. BHANDARI, J EFFREY L. BARNES,HANNA E. ABBOUD, and PABLO E. PERGOLA Department of Medicine, University of Texas Health Science Center at San Antonio, San Antonio, Texas; and South Texas Veterans Health Care System, Audie L. Murphy Division, San Antonio, Texas Kidney involvement in a nongenetic rat model of type 2 diabetes. Background. Rats fed a high fat diet and given a low dose of streptozotocin (STZ) (35 mg/kg) develop type 2 diabetes with insulin resistance, hyperinsulinemia, moderate hyperglycemia, hyperlipidemia, and salt-sensitive hypertension. We postulated that rats with noninsulinopenic (type 2) diabetes develop le- sions of diabetic nephropathy significantly more prominent than those seen in classic insulinopenic (type 1) diabetic rats. Methods. Rats were fed regular chow or high fat diet (60% calories from fat and 70% animal fat). After 5 weeks, rats fed regular chow received vehicle (controls) or 55 mg/kg STZ (type 1 diabetes mellitus). Rats fed high fat diet received vehicle (high fat) or low dose STZ, 35 mg/kg (type 2 diabetes mellitus). Rats were sacrificed 14 weeks after STZ/vehicle injection. Results. Blood glucose, systolic blood pressure, and uri- nary protein excretion were significantly higher in both dia- betes groups than in controls. Serum insulin levels (ng/mL) were higher in type 2 diabetes than in type 1 diabetes groups (0.49 ± 0.12 vs. 0.07 ± 0.07) (P = 0.01). Percentage of sclerosed glomeruli was significantly higher in type 2 diabetes group than in control and type 1 diabetes groups. Fibronectin expression was significantly increased in high fat, type 1 and type 2 diabetes groups compared to controls. The expression of type IV colla- gen, connective tissue growth factor (CTGF), and transforming growth factor-b (TGF-b ) was significantly increased in high fat and type 2 diabetes groups compared to controls. Conclusion. Rats fed a high fat diet and given a low dose of STZ developed diabetes (with normal/high insulin levels), hypertension, and proteinuria. Kidney lesions in this type 2 model appear to be more pronounced than in type 1 diabetic rats despite lower blood glucose levels and proteinuria. We present a nongenetic rat model of type 2 diabetes mellitus and nephropathy. Diabetic nephropathy is the major cause of end-stage renal disease (ESRD) in the United States. The majority of these patients are affected by type 2 diabetes. Ani- Key words: nephropathy, insulin, streptozotocin, obesity, high fat diet, type 2 diabetes. Received for publication August 5, 2004 and in revised form April 28, 2005 Accepted for publication July 7, 2005 C 2005 by the International Society of Nephrology mal models of type 2 diabetes allow performing detailed and mechanistic testing, including direct examination of tissue to assess pathology that is difficult or impossible to perform in clinical studies. At the present time there are no nongenetic animal models of type 2 diabetes and nephropathy. Rat strains with defects causing type 2 di- abetes are expensive, difficult to obtain, and in most of these the genetic defect has not been well characterized yet [1, 2]. For example, metabolic abnormalities in the Zucker diabetic fatty rat (ZDF/Drt-fa) closely mimics those found in patients with type 2 diabetes. These rats develop obesity, hyperlipidemia, insulin resistance, hy- perinsulinemia (and eventual hypoinsulinemia), hyper- glycemia, spontaneous proteinuria, and renal lesions of focal segmental glomerulosclerosis (FSGS) leading to renal failure. Unfortunately, the presence of significant nondiabetic renal lesions like hydronephrosis, renal ab- scesses, pyelonephritis and granulomas limits the util- ity of this model to study diabetic nephropathy [2, 3]. The widely accepted rat model of type 1 diabetes (in- sulinopenic model) induced with high dose STZ has a number of limitations when used to study diabetes. First, animals are insulinopenic and require insulin replace- ment. Because there is no agreement between investi- gators on the regimen of insulin used (if used at all) and the level of glycemic control achieved, there is a lot of heterogeneity in the results reported using this model. Second, animals are hypercatabolic if not treated with insulin (different from the obesity seen in type 2 dia- betes). Third, animals require administration of single high dose of streptozotocin (STZ) (55 to 65 mg/kg) which is associated with known nephrotoxic effects [4–6]. Fi- nally, although these rats develop thickening of glomeru- lar basement membrane (GBM), modest expansion of mesangial matrix in the long term and variable tubuloin- terstitial histopathology depending on rat species used, they do not develop the typical diffuse and/or nodular glomerulosclerosis seen in human diabetic nephropathy [7, 8]. The epidemic of type 2 diabetes warrants an animal model that more closely mimics the human pathophysiol- ogy and kidney disease. A nongenetic model of type 2 dia- betes has been described that involves feeding rats a high 2562
Transcript of Kidney involvement in a nongenetic rat model of type 2 diabetes

Kidney International, Vol. 68 (2005), pp. 2562–2571
Kidney involvement in a nongenetic rat model of type 2 diabetes
RATNA S. DANDA, NUSRATH M. HABIBA, HERNAN RINCON-CHOLES, BASANT K. BHANDARI,JEFFREY L. BARNES, HANNA E. ABBOUD, and PABLO E. PERGOLA
Department of Medicine, University of Texas Health Science Center at San Antonio, San Antonio, Texas; and South Texas VeteransHealth Care System, Audie L. Murphy Division, San Antonio, Texas
Kidney involvement in a nongenetic rat model of type 2diabetes.
Background. Rats fed a high fat diet and given a low dose ofstreptozotocin (STZ) (35 mg/kg) develop type 2 diabetes withinsulin resistance, hyperinsulinemia, moderate hyperglycemia,hyperlipidemia, and salt-sensitive hypertension. We postulatedthat rats with noninsulinopenic (type 2) diabetes develop le-sions of diabetic nephropathy significantly more prominent thanthose seen in classic insulinopenic (type 1) diabetic rats.
Methods. Rats were fed regular chow or high fat diet (60%calories from fat and 70% animal fat). After 5 weeks, ratsfed regular chow received vehicle (controls) or 55 mg/kg STZ(type 1 diabetes mellitus). Rats fed high fat diet received vehicle(high fat) or low dose STZ, 35 mg/kg (type 2 diabetes mellitus).Rats were sacrificed 14 weeks after STZ/vehicle injection.
Results. Blood glucose, systolic blood pressure, and uri-nary protein excretion were significantly higher in both dia-betes groups than in controls. Serum insulin levels (ng/mL)were higher in type 2 diabetes than in type 1 diabetes groups(0.49 ± 0.12 vs. 0.07 ± 0.07) (P = 0.01). Percentage of sclerosedglomeruli was significantly higher in type 2 diabetes group thanin control and type 1 diabetes groups. Fibronectin expressionwas significantly increased in high fat, type 1 and type 2 diabetesgroups compared to controls. The expression of type IV colla-gen, connective tissue growth factor (CTGF), and transforminggrowth factor-b (TGF-b) was significantly increased in high fatand type 2 diabetes groups compared to controls.
Conclusion. Rats fed a high fat diet and given a low doseof STZ developed diabetes (with normal/high insulin levels),hypertension, and proteinuria. Kidney lesions in this type 2model appear to be more pronounced than in type 1 diabeticrats despite lower blood glucose levels and proteinuria. Wepresent a nongenetic rat model of type 2 diabetes mellitus andnephropathy.
Diabetic nephropathy is the major cause of end-stagerenal disease (ESRD) in the United States. The majorityof these patients are affected by type 2 diabetes. Ani-
Key words: nephropathy, insulin, streptozotocin, obesity, high fat diet,type 2 diabetes.
Received for publication August 5, 2004and in revised form April 28, 2005Accepted for publication July 7, 2005
C© 2005 by the International Society of Nephrology
mal models of type 2 diabetes allow performing detailedand mechanistic testing, including direct examination oftissue to assess pathology that is difficult or impossibleto perform in clinical studies. At the present time thereare no nongenetic animal models of type 2 diabetes andnephropathy. Rat strains with defects causing type 2 di-abetes are expensive, difficult to obtain, and in most ofthese the genetic defect has not been well characterizedyet [1, 2]. For example, metabolic abnormalities in theZucker diabetic fatty rat (ZDF/Drt-fa) closely mimicsthose found in patients with type 2 diabetes. These ratsdevelop obesity, hyperlipidemia, insulin resistance, hy-perinsulinemia (and eventual hypoinsulinemia), hyper-glycemia, spontaneous proteinuria, and renal lesions offocal segmental glomerulosclerosis (FSGS) leading torenal failure. Unfortunately, the presence of significantnondiabetic renal lesions like hydronephrosis, renal ab-scesses, pyelonephritis and granulomas limits the util-ity of this model to study diabetic nephropathy [2, 3].The widely accepted rat model of type 1 diabetes (in-sulinopenic model) induced with high dose STZ has anumber of limitations when used to study diabetes. First,animals are insulinopenic and require insulin replace-ment. Because there is no agreement between investi-gators on the regimen of insulin used (if used at all) andthe level of glycemic control achieved, there is a lot ofheterogeneity in the results reported using this model.Second, animals are hypercatabolic if not treated withinsulin (different from the obesity seen in type 2 dia-betes). Third, animals require administration of singlehigh dose of streptozotocin (STZ) (55 to 65 mg/kg) whichis associated with known nephrotoxic effects [4–6]. Fi-nally, although these rats develop thickening of glomeru-lar basement membrane (GBM), modest expansion ofmesangial matrix in the long term and variable tubuloin-terstitial histopathology depending on rat species used,they do not develop the typical diffuse and/or nodularglomerulosclerosis seen in human diabetic nephropathy[7, 8]. The epidemic of type 2 diabetes warrants an animalmodel that more closely mimics the human pathophysiol-ogy and kidney disease. A nongenetic model of type 2 dia-betes has been described that involves feeding rats a high
2562

Danda et al: Animal model of type 2 diabetes and nephropathy 2563
fat diet and administering a low dose of STZ [9]. Rats de-velop diabetes with the following characteristics: (1) theyare insulin resistant; (2) they have measurable serum in-sulin concentrations typically at or above normal levels;(3) they have moderately elevated blood glucose levels(about 300 mg/dL) without insulin treatment; (4) theyhave increased levels of cholesterol, triglycerides, freefatty acids, and lipoproteins; and (5) they are salt-sensitiveand hypertension-prone [10, 11]. These metabolic abnor-malities are very similar to those seen in human type 2 di-abetes which is associated with obesity, insulin resistance,hyperlipidemia, and in a majority of cases salt-sensitivehypertension [12]. Although this type 2 model of diabeteswas originally described in the mouse in 1998 [13], it is stillunknown whether the kidney pathology observed in thistype 2 model of diabetes will compare to that observedin the established type 1 model.
HYPOTHESIS
Rats with diabetes induced by a combination of highfat diet and low dose STZ will develop kidney lesionssignificantly more severe than those seen in rats with theclassical high dose STZ-induced diabetes.
METHODS
Experimental design
All protocols were conducted in accordance with theInstitutional Animal Care and Use Committee of ourinstitution. Thirty-one age- and weight-matched maleSprague-Dawley rats weighing 175 to 200 g (Harlan,Indianapolis, IN, USA) were used for the studies. Ratswere housed in individual cages in a temperature con-trolled room with a 14/10-hour light-dark cycle (startingat 07:00 A.M.) and allowed to acclimate to the environ-ment for 1 week before dietary intervention was initiated.
Diet and induction of diabetes
Rats were randomly assigned to either regular rat chow(N = 16) or high fat diet (N = 15) (60% calories from fatand 70% animal fat) (TD97201; Harlan Teklad, Madison,WI, USA). All rats were given food and water ad libitum.After 5 weeks on their respective diets, rats fed regularchow were divided into three groups: controls (N = 5),low dose (35 mg/kg) (N = 5), or high dose STZ (55 mg/kg)(N = 6) (type 1 diabetes mellitus). A low dose of STZ,regular rat chow, control group was included to compareto the percentage of animals that develop diabetes withthe low dose of STZ given to the high fat diet–fed animals.Rats fed high fat diet received either vehicle (N = 5) (highfat) or low dose STZ (N = 10) (type 2 diabetes mellitus).STZ was dissolved in citrate buffer (0.01 mol/L, pH 4.5)and given by a single tail vein injection. For STZ injection,
animals were anesthetized using isofluorane inhalationanesthesia. Control animals received intravenous citratebuffer alone.
Noninvasive blood pressure measurement
Blood pressure and heart rate were measured us-ing the noninvasive tail cuff plethysmography method(IITC Inc., Life Science Instruments, Woodland Hills,CA, USA). Blood pressure was measured under resting,conscious condition in a climate-controlled room (23◦C).Rats were trained to sit in Plexiglass restrainers placedover a warming pad (29◦C) for 30 minutes each day for5 consecutive days before blood pressure was measured.During this acclimation period, the cuff was inflated anddeflated several times to condition the animals to the pro-cedure. Five consecutive systolic blood pressure and si-multaneous heart rate measurements were recorded andthe three readings in the median range used for analysis.
Determination of urine protein and creatinineconcentrations
Rats were placed in metabolic cages and urine col-lected for 24 hours every 4 weeks for determination ofprotein and creatinine excretion. Total protein excretionwas determined using the colorimetric assay Biuret pro-tein assay (KNaC4H4O.4H2O and CuSO4.5H2O) [14,15]. Urine creatinine was determined using an Olympusauto analyzer (AU640) (Olympus Corp., Melville, NY,USA) utilizing a kinetic modification of the Jaffe reac-tion. Protein to creatinine ratio was then calculated. Uri-nary albumin excretion was determined by western blotanalysis of the urine with affinity purified rabbit anti ratalbumin antibody (Immunology Consultants Laboratory,Newberg, OR, USA).
Collection and storage of blood samples
Prior to STZ injection, blood was obtained from the tailvein in tubes with 10 lL of 0.5 mol/L ethylenediaminete-traacetic acid (EDTA). Samples were centrifuged at10,000 rpm for 10 minutes and the supernatant plasmaseparated, aliquoted, and immediately stored at −80◦C.At the time of sacrifice, blood was also collected from theaorta and plasma separated and stored as above.
Determination of blood glucose and hemoglobinA1c (HbA1c)
Random, nonfasting, morning blood glucose concen-tration was determined at 1- to 2-week intervals inall groups by glucometer (Bayer Elite XL) (Bayer,Pittsburgh, PA, USA) on blood samples obtained fromtail veins. HbA1c was determined on blood samples ob-tained at the end of the 14-week study period using aDCA 2000 analyzer (Bayer).

2564 Danda et al: Animal model of type 2 diabetes and nephropathy
Determination of serum insulin, creatinine,and lipid profile
Serum insulin, creatinine, and lipid levels were deter-mined from the blood samples obtained at the end of the14-week study period. Serum insulin levels were deter-mined using a sensitive rat antibody radioimmunoassay(Linco Diagnostics, St. Charles, MO, USA). Serum crea-tinine and serum lipid profile were determined using anOlympus auto analyzer (AU640) (Olympus Corp.).
Routine histology
Rats were sacrificed 14 weeks after induction of dia-betes to determine the morphologic changes in the kid-ney. At sacrifice, kidneys were excised, cortical tissuesliced, and portions fixed in neutral buffered formalin forroutine paraffin embedment and subsequent tissue stain-ing by hematoxylin and eosin and Jones periodic acid-Schiff (PAS) for bright-field microscopic evaluation. Theremaining cortex was sliced and frozen by immersion inliquid nitrogen for subsequent detection of fibronectinby Western blot analysis and immunoperoxidase histo-chemistry as described below. The number of scleroticglomeruli were determined in Jones PAS-stained sectionsby counting obsolescent glomeruli by a semiquantitativescoring technique and reported as a percent of approxi-mately 100 glomeruli examined in each slide.
Immunohistochemistry for cellular fibronectin
Localization of cellular fibronectin was assessed by im-munoperoxidase histochemistry using the avidin-biotin-complex (Vector Laboratories, Burlingame, CA, USA)technique for immunoperoxidase as previously de-scribed.[16] Acetone fixed frozen sections (6 lm) wereincubated with nonimmune donkey IgG to block non-specific binding, then sections were incubated with 0.6%hydrogen peroxide in methanol, to block nonspecific per-oxidase activity and 0.01% avidin and 0.001% biotin toblock endogenous biotin activity. A mouse monoclonalantibody specific for the alternatively spliced extra do-main (ED-A) of cellular fibronectin (IST-9) (Serotec,Harlan Bioproducts for Science, Indianapolis, IN, USA)was used as the primary followed by biotin-labeleddonkey antimouse IgG (Chemicon International, Inc.,Temecula, CA, USA). Signal was detected using the ABCmethod with diaminobenzidine (DAB) substrate and de-veloped according to the manufacturer’s instructions. Allincubations of primary and secondary antibodies were for30 minutes with three washes with phosphate-bufferedsaline (PBS) containing 0.1% bovine serum albumin(BSA), 5 minutes each between steps. Controls consistedof non-immune mouse IgG or PBS/BSA in place of pri-mary antibody followed by detection procedures as out-lined above.
The extent of DAB reaction product was measured us-ing the segmentation tool of Image-Pro Plus 4.5 (MediaCybernetics, Silverspring, MD, USA). Digital imageswere taken of 40 randomly selected glomeruli in tissueslides derived from each experiment. All images weretaken using a 20× objective and computer assisted imageanalysis was used to measure area of DAB staining in eachglomerulus. The color of staining product was extractedfrom the image by selecting a lower and upper range ofgray scale within the limits of background and the highestintensity of staining. The circumference of the glomeruluswas outlined utilizing the polygonal tracing tool of Image-Pro Plus; then the image data were masked and pseudo-colored for measurement of total staining area relativeto the area of interest, set to encompass the glomeru-lar capillary tuft. All images were calibrated to a stagemicrometer.
Determination of glomerular size by image analysis
The image analysis method used was similar to thatused for determination of area of glomerular fibronectinstaining. Digital images were taken of randomly se-lected glomeruli in hematoxylin and eosin–stained sec-tions. The circumference of each glomerulus was outlinedas above using the polygonal tracing tool of Image-ProPlus. Glomerular area was computed utilizing the spatialmeasurement tool calibrated to a stage micrometer.
Western blot analysis
Kidney tissue was homogenized in RIPA buffer[20 mmol/L Tris-HCl, pH 7.5, 150 mmol/L NaCl,5 mmol/L EDTA, 1 mmol/L Na3VO4, 1 mmol/L phenyl-methylsulfonyl fluoride (PMSF), 20 lg/mL aprotinin,20 lg/mL leupeptin, and 1% NP-40) for 30 minutes.Whole kidney lysates were centrifuged at 10,000g for30 minutes at 4◦C. Protein concentration was determinedin the cleared supernatant using the Bio-Rad method(Bio-Rad, Hercules, CA, USA). For immunoblotting,equal amounts of protein per lane were loaded andelectrophoresed under reducing conditions on polyacry-lamide gels, and then transferred to nitrocellulose mem-branes. The membranes were rinsed twice with TBSTbuffer (150 mmol/L NaCl, 10 mmol/L Tris-HCl, and 0.1%Tween 20) followed by incubation for 1 hour at room tem-perature with TBST buffer with 2% nonfat milk powder.This was followed by overnight incubation at 4◦C withantibodies to fibronectin, type IV collagen, or transform-ing growth factor-b (TGF-b). Horseradish peroxidase–conjugated anti-IgG was used as a secondary antibody.Membranes were then washed, and the reactive bandswere detected by chemiluminescence using the enhancedchemiluminescence (ECL) system (Amersham, Bucking-hamshire, UK). Primary antibodies used were (1) mousemonoclonal antibody to a region in the ED-A domain

Danda et al: Animal model of type 2 diabetes and nephropathy 2565
600
500
400
300
200
100
0
Blo
od g
luco
se (
mg/
dL)
1 2 4 6 10 14Weeks after STZ/vehicle
Type 2 DMType 1 DM
ControlHigh fat diet
*†
*†‡
Fig. 1. Blood glucose levels (mg/dL) obtained by tail vein punctureduring the study period at 2-week intervals. Rats with diabetes hadelevated blood glucose levels throughout the study compared to controland high fat diet groups. High fat diet alone did not cause hyperglycemia.DM is diabetes mellitus and STZ is streptozotocin. Data are mean ±SE. ∗P < 0.05 vs. control; †P < 0.05 vs. high fat diet; ‡P < 0.05 vs. type 1diabetes.
of human cellular fibronectin which crossreacts with hu-man, mouse, rat, dog, and monkey (Abcam, Cambridge,MA, USA), 1:5000 dilution; (2) polyclonal antibody to achains of type IV collagen which reacts with human, mon-key, and rat (Chemicon International), 1:1000 dilution;(3) rabbit polyclonal antibody to TGF-b detects TGF-b1,TGF-b2, and TGF-b3 of mouse, rat, and human origin,1:1000 dilution (Santa Cruz Biotechnology, Santa Cruz,CA, USA); and (4) rabbit polyclonal antibody to recom-binant fragment of mouse connective tissue growth fac-tor (CTGF), 1:1000 dilution (Abcam), crossreacts withhuman, mouse, and rat.
Statistical analysis
Significance of differences was determined by mul-tiple sample comparison methods analysis of variance(ANOVA) using Statview software (SAS Institute Inc.,Cary, NC, USA). Differences were considered significantif P < 0.05. Data are presented as mean ± SE.
RESULTS
Changes in blood glucose and HbA1c concentrations
Blood glucose levels are shown in Figure 1. All the ani-mals in the type 1 diabetes mellitus group (high dose STZ)became diabetic after injection of STZ (sustained bloodglucose levels >250 mg/dL). Low dose STZ (35 mg/kg)induced diabetes mellitus in 70% (seven out of ten) ofthe rats fed high fat diet but in only 40% (two out offive) of those fed regular rat chow. Rats that did not de-velop hyperglycemia in the type 2 diabetes mellitus groupwere excluded from the study. Data from animals in thelow dose STZ regular rat chow group are not reported.
HbA1c concentrations in the four study groups are shownin Table 1. Neither the controls on regular chow nor therats on high fat diet alone developed hyperglycemia bythe end of the study period.
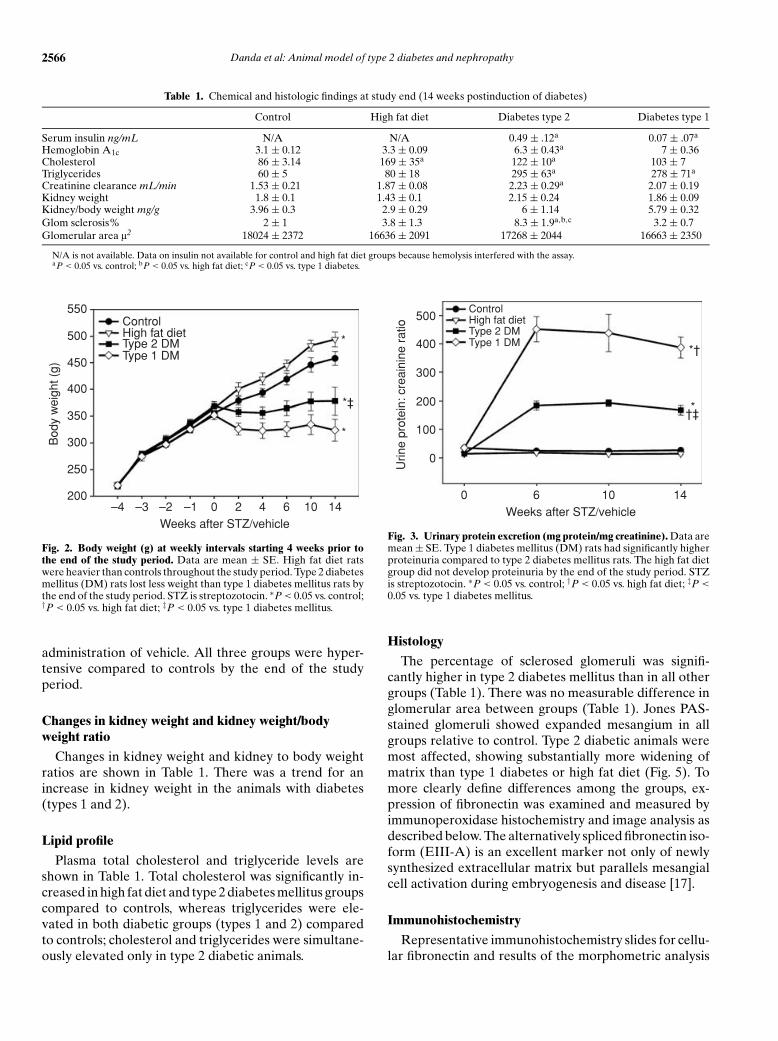
Changes in body weight
Body weights during the observation period are shownin Figure 2. At the time of STZ/vehicle injection animalsfed a high fat diet for the prior 5 weeks were heavier thanthe animals in the regular rat chow group. Animals inthe high fat diet group continued to gain weight and wereheavier than control animals throughout the study period(high fat diet 494 ± 14 g and control 458 ± 13 g). Ratswith type 2 diabetes mellitus had regained their pre-STZinjection weight at the time of sacrifice (378 ± 26 g). Incontrast animals in the type 1 diabetes mellitus group con-tinued to lose weight during the follow-up period (324 ±20 g).
Changes in serum insulin levels
Serum insulin levels at the end of the study period areshown in Table 1. Before injection of STZ, rats fed ahigh fat diet had significantly higher insulin levels thanrats fed regular rat chow (0.67 ± 0.05 ng/mL and 0.39 ±0.086 ng/mL, respectively). At the end of the study period,insulin levels in the type 2 diabetes mellitus group weresimilar to the controls prior to STZ injection, whereasinsulin levels in the type 1 diabetes mellitus group werealmost undetectable (Table 1). Insulin levels for controlsand high fat diet group at the end of the study could notbe determined as hemolysis interfered with the assay.
Proteinuria and renal function
Protein to creatinine ratios are shown in Figure 3.Creatinine clearances calculated from a 24-hour urinecollection are shown in Table 1. Animals in both the dia-betic groups had significant proteinuria by 6 weeks com-pared to control and high fat diet animals. There was noincrease in protein excretion noted in the high fat dietgroup by the end of the study period. Creatinine clear-ance tended to increase in all the three groups comparedto controls but was significantly elevated only in the type 2diabetes mellitus group (Table 1). There was no signifi-cant difference in albumin excretion rates between highfat diet rats and controls as measured by Western blotanalysis (data not shown).
Changes in blood pressure
Systolic blood pressure in the different groups is shownin Figure 4. Systolic blood pressure was significantly el-evated in both diabetic groups compared to controlsby 4 weeks after induction of diabetes. Systolic bloodpressure in the high fat diet group was also signifi-cantly elevated compared to controls by 6 weeks after
2566 Danda et al: Animal model of type 2 diabetes and nephropathy
Table 1. Chemical and histologic findings at study end (14 weeks postinduction of diabetes)
Control High fat diet Diabetes type 2 Diabetes type 1
Serum insulin ng/mL N/A N/A 0.49 ± .12a 0.07 ± .07a
Hemoglobin A1c 3.1 ± 0.12 3.3 ± 0.09 6.3 ± 0.43a 7 ± 0.36Cholesterol 86 ± 3.14 169 ± 35a 122 ± 10a 103 ± 7Triglycerides 60 ± 5 80 ± 18 295 ± 63a 278 ± 71a
Creatinine clearance mL/min 1.53 ± 0.21 1.87 ± 0.08 2.23 ± 0.29a 2.07 ± 0.19Kidney weight 1.8 ± 0.1 1.43 ± 0.1 2.15 ± 0.24 1.86 ± 0.09Kidney/body weight mg/g 3.96 ± 0.3 2.9 ± 0.29 6 ± 1.14 5.79 ± 0.32Glom sclerosis% 2 ± 1 3.8 ± 1.3 8.3 ± 1.9a,b,c 3.2 ± 0.7Glomerular area l2 18024 ± 2372 16636 ± 2091 17268 ± 2044 16663 ± 2350
N/A is not available. Data on insulin not available for control and high fat diet groups because hemolysis interfered with the assay.aP < 0.05 vs. control; bP < 0.05 vs. high fat diet; cP < 0.05 vs. type 1 diabetes.
550
500
450
400
350
300
250
200
Bod
y w
eigh
t (g)
–4 –3 –2 –1 0 2 4 6 10 14Weeks after STZ/vehicle
*
*
ControlHigh fat dietType 2 DMType 1 DM
*‡
Fig. 2. Body weight (g) at weekly intervals starting 4 weeks prior tothe end of the study period. Data are mean ± SE. High fat diet ratswere heavier than controls throughout the study period. Type 2 diabetesmellitus (DM) rats lost less weight than type 1 diabetes mellitus rats bythe end of the study period. STZ is streptozotocin. ∗P < 0.05 vs. control;†P < 0.05 vs. high fat diet; ‡P < 0.05 vs. type 1 diabetes mellitus.
administration of vehicle. All three groups were hyper-tensive compared to controls by the end of the studyperiod.
Changes in kidney weight and kidney weight/bodyweight ratio
Changes in kidney weight and kidney to body weightratios are shown in Table 1. There was a trend for anincrease in kidney weight in the animals with diabetes(types 1 and 2).
Lipid profile
Plasma total cholesterol and triglyceride levels areshown in Table 1. Total cholesterol was significantly in-creased in high fat diet and type 2 diabetes mellitus groupscompared to controls, whereas triglycerides were ele-vated in both diabetic groups (types 1 and 2) comparedto controls; cholesterol and triglycerides were simultane-ously elevated only in type 2 diabetic animals.
500
400
300
200
100
0
Urin
e pr
otei
n: c
reai
nine
rat
io
0 6 10 14Weeks after STZ/vehicle
ControlHigh fat dietType 2 DMType 1 DM
*†
*†‡
Fig. 3. Urinary protein excretion (mg protein/mg creatinine). Data aremean ± SE. Type 1 diabetes mellitus (DM) rats had significantly higherproteinuria compared to type 2 diabetes mellitus rats. The high fat dietgroup did not develop proteinuria by the end of the study period. STZis streptozotocin. ∗P < 0.05 vs. control; †P < 0.05 vs. high fat diet; ‡P <
0.05 vs. type 1 diabetes mellitus.
Histology
The percentage of sclerosed glomeruli was signifi-cantly higher in type 2 diabetes mellitus than in all othergroups (Table 1). There was no measurable difference inglomerular area between groups (Table 1). Jones PAS-stained glomeruli showed expanded mesangium in allgroups relative to control. Type 2 diabetic animals weremost affected, showing substantially more widening ofmatrix than type 1 diabetes or high fat diet (Fig. 5). Tomore clearly define differences among the groups, ex-pression of fibronectin was examined and measured byimmunoperoxidase histochemistry and image analysis asdescribed below. The alternatively spliced fibronectin iso-form (EIII-A) is an excellent marker not only of newlysynthesized extracellular matrix but parallels mesangialcell activation during embryogenesis and disease [17].
Immunohistochemistry
Representative immunohistochemistry slides for cellu-lar fibronectin and results of the morphometric analysis

Danda et al: Animal model of type 2 diabetes and nephropathy 2567
150
140
130
120
110
100
Sys
tolic
blo
od p
ress
ure
(mm
Hg)
0 2 4 6 10 14Weeks after STZ/vehicle
Type 1 DMType 2 DM
ControlHigh fat diet
*
Fig. 4. Systolic blood pressure (mm Hg) measured by noninvasive tailcuff plethysmography at 2-week interval during the study period. Dataare mean ± SE. Systolic blood pressure in type 2 diabetes mellitus (DM)group was higher at baseline compared to high fat diet since rats wererandomized based on their body weight and not their blood pressure.Systolic blood pressure was high in all experimental groups comparedto control at the end of the study. There was no difference in systolicblood pressure between high fat diet, type 1 and type 2 diabetes mellitusgroups at the end of the study period. ∗P < 0.05 vs. control; †P < 0.05vs. high fat diet; ‡P < 0.05 vs. type 1 diabetes mellitus.
are shown in Figure 6. There was light staining seen in thecontrol, modestly increased staining in the type 1 diabeticgroup but significantly more in the type 2 diabetic group.The high fat diet group was not evaluated because thetissue was not suitable for immunohistochemistry. Mor-phometric analysis of glomerular fibronectin stain arearevealed that compared to the control group there wasa significant increase in both diabetic groups. Staining offibronectin in type 2 diabetes was significantly increased(fourfold) over control, whereas type 1 diabetes showedless of an increase (threefold over control). Moreover,the increase in fibronectin staining in type 2 diabetes wassignificantly higher than in type 1 diabetes (P < 0.05).
Whole kidney levels of fibronectin on type IV collagen,TGF-b, and CTGF
Immunoblot analyses demonstrated that fibronectinexpression was significantly increased in all three groupscompared to control (Fig. 7). The expression of type IVcollagen, TGF-b , and CTGF was significantly increasedonly in high fat diet and type 2 diabetes groups (Figs. 7and 8).
DISCUSSION
We show that rats with type 2 diabetes develop morepronounced kidney lesions than type 1 diabetic rats de-spite having lower urinary protein excretion rates andlower serum glucose levels. We also show that high fatdiet alone causes significant kidney damage in the ab-sence of proteinuria or hyperglycemia.
Data from animal experiments as well as human stud-ies suggest a direct association between obesity, insulinresistance, and hypertension and kidney disease. In fe-male Fischer rats, a high fat and refined carbohydrate dietinduces insulin resistance that precedes other aspects ofthe metabolic syndrome [18]. Sprague-Dawley rats feda high fat diet develop hypertension and morphologicchanges in the kidney suggestive of glomerulosclerosis by10 weeks [10]. In our study, high fat diet alone was associ-ated with hypertension and structural changes in the kid-ney despite no evidence of proteinuria or hyperglycemia.Although there is conclusive evidence in animal models,as well as human studies, that lipids play an important rolein the pathogenesis of progressive renal injury, the exactmechanism by which this occurs is still not clear. A pro-posed mechanism for lipid-induced glomerular injury isthe increase in glomerular macrophages with release of anumber of chemical mediators and oxidized low-densitylipoprotein (LDL)–dependent oxidative stress [19, 20].These mechanisms are analogous to the pathogenesisof systemic atherosclerosis [21, 22]. Hyperfiltration andglomerular hypertension secondary to efferent arterio-lar vasoconstriction may also play an important role inhypercholesterolemia mediated glomerular injury [23].
Our findings suggest that at least in rats, the degree ofproteinuria may be an inadequate marker of early kid-ney disease. This suggests it is possible for patients withmetabolic syndrome (not commonly associated with ab-normal urine protein excretion rates) to have significantkidney damage by the time they develop diabetes basedon our observation of significant pathology in the highfat diet group [24]. Despite the presence of significantglomerular lesions, there was no proteinuria evident inthe animals fed a high fat diet as measured by the sensitiveBiuret protein assay. There was no microalbuminuria ev-ident in these animals either. Hyperglycemia appears tobe a major factor in determining the presence and degreeof proteinuria. In the high fat diet group, blood glucoseand urinary protein excretion remained normal. In con-trast, animals with type 2 diabetes had hyperglycemia andabnormal urinary protein excretion. The degree of pro-teinuria appears related to the degree of hyperglycemia asanimals with type 1 diabetes had higher average glucoselevels and significantly higher protein excretion rates.However, neither proteinuria nor hyperglycemia aloneappears to correlate well with the extent of structuraldamage in the kidney. Other modifying factors like hy-pertension, hypercholesterolemia, and/or hyperinsuline-mia seem to play an important role in the developmentof kidney lesions. This is exemplified by the severity ofthe histologic lesions seen in type 2 diabetic rats whichwere more prominent than those seen in type 1 diabeticanimals despite lower urine protein excretion rates, lowerblood glucose levels, similar degree of hypertension, andhaving received a lower dose of STZ. This suggests that

2568 Danda et al: Animal model of type 2 diabetes and nephropathy
Control
Type 2 DM Type 1 DM
High fat diet
Fig. 5. Histology [Jones periodic acid-Schiffstain (PAS)] of representative glomeruli at20× magnification from control, high fatdiet, type 1 and 2 diabetes mellitus (DM)groups 14 weeks postinduction of diabetes.Jones PAS-stained glomeruli showed ex-panded mesangium in all experimental groupsrelative to control. Type 2 diabetic animalswere most affected, showing substantiallymore widening of matrix than type 1 diabetsor high fat diet.
Control Type 2 DM Type 1 DM
30
25
20
15
10
5
0% F
ibro
nect
in s
tain
are
a
ControlType 2 DMType 1 DM
Fig. 6. Immunohistochemical staining of glomeruli for cellular fibronectin in frozen kidney sections (20× magnification, upper three panels).Quantification of the% glomerular fibronectin stain area is shown in the lower panel. Fibronectin stain area was greater in both diabetes mellitus(DM) groups compared to control but greatest in the type 2 diabetic group. Data are not available for the high fat diet group because tissue wasunsuitable for histochemistry due to technical problems (related to the processing of the tissue). ∗P < 0.05 vs. control; ‡P < 0.05 vs. type 1 diabetesmellitus.
hyperglycemia acts synergistically with other factors likeinsulin, hypertension, and hyperlipidemia to alter thecourse of kidney disease.
Deregulation of growth factors appears critical inmediating glomerular extracellular mesangial matrixaccumulation. In vitro studies have shown that high glu-
cose concentrations stimulate the expression of platelet-derived growth factor (PDGF), CTGF, TGF-b , fibroblastgrowth factor (FGF), and vascular endothelial growthfactor (VEGF) [25]. TGF-b , in particular, stimulates theexpression of fibronectin, laminin, collagen IV, and otherextracellular matrix proteins [25–27]. During the course

Danda et al: Animal model of type 2 diabetes and nephropathy 2569
Control HFD DM 2 DM 1
Fibronectin
Collagen IV
Actin
500
400
300
200
100
0
Fib
rone
ctin
exp
ress
ion Control
High fat dietType 2 DMType 1 DM
*
*
*
ControlHigh fat dietType 2 DMType 1 DM
*
*1000
800
600
400
200
0Ty
pe IV
col
lage
n ex
pres
sion
Fig. 7. Immunoblot analysis of fibronectin and type IV collagen. Data are mean ± SE. Fibronectin expression in whole kidney lysates wassignificantly increased in all three groups compared to controls. Type IV collagen was increased only in high fat diet (HFD) and type 2 diabetesmellitus (DM) groups. ∗P < 0.05 vs. control.
Control HFD DM 2 DM 1
TGF β
Actin
1 2 3 4 5 6 7 8
Control HFD DM 2 DM 1
CTGF
Actin
1 2 3 4 5 6 7 8
ControlHigh fat dietType 2 DMType 1 DM
600
500
400
300
200
100
0
CT
GF
exp
ress
ion
*
*500
400
300
200
100
0
ControlHigh fat dietType 2 DMType 1 DM *
*
TG
F-b
eta
expr
essi
on
Fig. 8. Immunoblot analysis for transforming growth factor-b (TGF-b) and connective tissue growth factor (CTGF). Data are mean ± SE. TGF-band CTGF expression in whole kidney lysates was significantly increased only in high fat diet (HFD) and type 2 diabetes mellitus (DM) groups.∗P < 0.05 vs. control.
of diabetic nephropathy, abnormal production and disor-dered incorporation of extracellular matrix results in thetypical findings of thickening of the GBM and increaseddeposition of mesangial matrix leading to glomeruloscle-rosis and ultimately kidney failure. Different proteins
are deposited at different stages of diabetic nephropa-thy. For example, fibronectin and collagen type IV in-crease in the expanding mesangium throughout the wholecourse of the disease. In contrast, collagen type I appearspredominantly late in the disease process. Oncofetal

2570 Danda et al: Animal model of type 2 diabetes and nephropathy
isoforms of fibronectin (ED-A and ED-B) are onlypresent in glomerulosclerosis but not in normal kidney[28]. In the present study, immunoblots of whole kidneylysates revealed significantly increased growth factor lev-els and matrix protein expression in the high fat diet andtype 2 diabetes mellitus groups. Fibronectin was also in-creased in the type 1 diabetes mellitus group. The reasonfor the lack of change in type IV collagen and TGF-bin type 1 diabetes mellitus observed in this study is notclear. One possible explanation may be that whole kidneylysates were used which could have diluted the subtle in-creases in matrix proteins and growth factors usually seenin glomerular extracts. For example, in a detailed analy-sis using kidney cortex of rats with STZ-induced diabetes(type I diabetes mellitus), Hill et al [29] demonstrated in-creases in TGF-b isoforms and its receptors that peakedat 3 months postinduction of diabetes and returned tobaseline level by 6 months. These results were confirmedby Makino et al [30] who in addition to TGF-b isoformsalso investigated the time course of CTGF induction inrats with STZ-induced diabetes. CTGF mRNA expres-sion in glomeruli was maximal 28 days postinductionof diabetes returning toward baseline at 3 months [30].Therefore, in the case of CTGF, the timing of the mea-surement could have contributed to the observed resultsin type 1 rats. Nonetheless, although more sensitive stud-ies using kidney cortex or immunohistochemistry wouldlikely show an increase in TGF-b in tissues from type 1diabetic rats, the lack of change in these growth factorsand type IV collagen are in obvious contrast with the sig-nificant increases observed in the type 2 diabetes and highfat diet groups, the focus of our research.
Glomerular and systemic hemodynamics likely play animportant role in the development of the glomerular le-sions we observed in the high fat diet and type 2 diabeticrats. For example, in Dahl rats, hyperlipidemia enhancesglomerular injury through systemic and intraglomerularhypertension. Diet-induced hypercholesterolemia wors-ened the kidney pathology produced by hypertension inDahl-sensitive rats compared to rats fed a regular ratchow low in cholesterol [31]. In contrast, in Dahl-resistantrats (that do not develop hypertension) diet-induced hy-percholesterolemia did not result in glomerular injurysuggesting that changes in glomerular hemodynamicswere necessary to unmask an adverse effect of hyper-lipidemia on the kidney [31]. Similarly, in patients withtype 2 diabetes, elevated plasma cholesterol levels, bloodglucose levels, and mean blood pressure are major de-terminants of the subsequent renal outcome [32]. Ourstudy also supports these findings. For a similar degree ofhypertension, kidney pathology was worse in the groupsthat received a high fat diet (e.g., type 2 diabetes melli-tus groups) compared to type 1 diabetic rats. Therefore,hypertension alone does not seem to be the only deter-minant of kidney pathology in these animals. The combi-
nation of hypertension and high fat diet appears to havea synergistic effect in causing the kidney lesions in thehigh fat diet group. Furthermore, the combination of hy-perglycemia, hypertension, and dyslipidemia appears tobe significantly more detrimental to the kidney as seen inthe type 2 diabetic rats.
In obesity-prone male Sprague-Dawley rats, a moder-ately high fat (32% of calories from fat) and high saltdiet (4% NaCl) accelerated the development of hyper-tension and kidney sclerosis and vascular and renal ox-idative stress compared to rats on the high fat diet but onlow salt diet instead (0.8% NaCl) [11]. In humans withtype 2 diabetes, hypertension accelerates the decline inrenal function [33]. The effect of a high salt diet in accel-erating the hypertension and kidney lesions in this type 2model of diabetes needs further investigation.
One of the possible drawbacks of this model is that thepotential nephrotoxic effect of STZ cannot be eliminated.Rats still received a significant dose of STZ (35 mg/kg)that was sufficient to induce diabetes in 40% of the ratson a regular rat chow. The fact that type 1 diabetic ratshad less significant kidney lesions at 14 weeks despite re-ceiving a higher dose of STZ suggests that STZ-inducednephrotoxicity did not account for the kidney pathol-ogy observed. The nephrotoxicity of high fat diet doesnot appear to be specifically related to the particularformulation of the diet used as other investigators haveshown similar kidney pathology with different formula-tions of high fat diet [10, 19, 31, 34]. Also, not antici-pating that protein excretion rates did not correlate wellwith the severity of kidney pathology, rats were sacri-ficed 14 weeks after induction of diabetes based on asignificant increase in urine protein excretion. Longerstudies are needed to determine if these animals woulddevelop nodular glomerulosclerosis, the hallmark of di-abetic nephropathy in humans. For example, it was re-cently shown in a genetic model of diabetes and kidneydisease (T2DN/Mcwi strain) that glomerular nodular le-sions and diffuse glomerulosclerosis were apparent onlyat 18 months of age but not earlier [1].
This nongenetic rat model of type 2 diabetes has sev-eral differences and potential advantages over the con-ventional type 1 diabetes model: (1) moderately elevatedand constant blood glucose levels without insulin admin-istration; (2) need for insulin treatment is avoided po-tentially rendering more homogeneous results using thismodel; (3) less expensive than genetic models; (4) kid-ney effects of hyperinsulinemia and mild hypertensioncan be determined independently of hyperglycemia; and(5) presence of prominent glomerular lesions associatedwith significant increases in growth factor expression andaccumulation of extracellular matrix proteins.
The effect of dyslipidemia on the kidney in the pres-ence or absence of hyperglycemia and proteinuria can bedetermined by comparing high fat diet vs. type 2 diabetes

Danda et al: Animal model of type 2 diabetes and nephropathy 2571
groups. The effect of hyperglycemia on the kidney in thepresence or absence of dyslipidemia and hyperinsuline-mia can be determined by comparing type 1 and type 2diabetes groups. In this rat model of type 2 diabetes thecombination of hyperglycemia, hypertension, and dys-lipidemia appears to be detrimental to the kidney, similarto human type 2 diabetes and nephropathy where mul-tiple factors appear to act synergistically to acceleratekidney damage. Hence, we believe this is an appropriatemodel to examine the effects of type 2 diabetes with as-sociated hypertension on structural abnormalities in thekidney.
ACKNOWLEDGMENTS
We would like to thank Sergio Garcia for his assistance with the an-imal work and Fredyne Springer for her help with processing tissuesfor histology. This study was supported in part by a training grant fromNIH, T32 HL07446 (Ratna Danda), NIDDK (George O’Brien Kid-ney Research Center Grant), Grant in Aid from the American HeartAssociation Texas Affiliate, Research Enhancement Award Program(REAP) from the Veterans Administration and Research Career De-velopment Award, South Texas Veterans Health Care System (HernanRincon-Choles).
Reprint requests to Pablo E. Pergola, M.D., Ph.D., The Universityof Texas Health Science Center at San Antonio, Department ofMedicine/Division of Nephrology, Mail Code 7882, 7703 Floyd CurlDrive, San Antonio, TX 78229-3900.E-mail: [email protected]
REFERENCES
1. NOBREGA M, FLEMING S, ROMAN R, et al: Initial characteriza-tion of a rat model of diabetic nephropathy. Diabetes 53:735–742,2004
2. JANSSEN U, PHILLIPS AO, FLOEGE J: Rodent models of nephropathyassociated with type II diabetes. J Nephrol 12:159–172, 1999
3. VORA J, ZIMSEN S, HOUGHTON D, ANDERSON S: Evolution ofmetabolic and renal changes in the ZDF/Drt-fa rat model of typeII diabetes. J Am Soc Nephrol 7:113–117, 1996
4. BENNETT RA, PEGG AE: Alkylation of DNA in rat tissues followingadministration of streptozotocin. Cancer Res 41:2786–2790, 1981
5. BOLZAN AD, BIANCHI MS: Genotoxicity of streptozotocin. MutationRes 512:121–134, 2002
6. KRAYNAK A, STORER R, JENSEN R, et al: Extent and persistence ofstreptozotocin-induced DNA damage and cell proliferation in ratkidney as determined by in vivo alkaline elution and BrdUrd label-ing assays. Toxicol Appl Pharmacol 135:279–286, 1995
7. GROSS M, RITZ E, SCHOOF A, et al: Comparison of renal morphologyin the Streptozotocin and the SHR/N-cp models of diabetes. LabInvest 84:452–464, 2004
8. SHARMA K: Structural and functional consequences ofstreptozotocin-induced diabetes on the kidney, in Experimen-tal Models of Diabetes, edited by McNeill JH, Boca Raton, Florida,CRC Press LLC, 1999
9. LIN KY, ITO A, ASAGAMI T, et al: Impaired nitric oxide synthasepathway in diabetes mellitus: Role of asymmetric dimethylargi-nine and dimethylarginine dimethylaminohydrolase. Circulation106:987–992, 2002
10. DOBRIAN AD, DAVIES MJ, PREWITT RL, LAUTERIO TJ: Developmentof hypertension in a rat model of diet-induced obesity. Hypertension35:1009–1015, 2000
11. DOBRIAN AD, SCHRIVER SD, LYNCH T, PREWITT RL: Effect of salt
on hypertension and oxidative stress in a rat model of diet-inducedobesity. Am J Physiol Renal Physiol 285:F619–F628, 2003
12. FELDSTEIN C: Salt intake, hypertension and diabetes mellitus. J HumHypertens 16:S48–S51, 2002
13. LUO J, QUAN J, TSAI J, et al: Nongenetic mouse models of non–insulin-dependent diabetes mellitus. Metabolism 47:663–668, 1998
14. GREIVE KA, BALAZS ND, COMPER WD: Protein fragments in urinehave been considerably underestimated by various protein assays.Clin Chem 47:1717–1719, 2001
15. EPPEL GA, NAGY S, JENKINS MA, et al: Variability of standard clini-cal protein assays in the analysis of a model urine solution of frag-mented albumin. Clin Biochem 33:487–494, 2000
16. BARNES J, MITCHELL R, KANALAS J, BARNES VL: Differential expres-sion of thrombospondin and cellular fibronectin during remodelingin proliferative glomerulonephritis. J Histochem Cytochem 47:533–544, 1999
17. BARNES VL, MUSA J, MITCHELL R, BARNES J: Expression of em-bryonic fibronectin isoform EIIIA parallels smooth muscle actin inmaturing and diseased kidney. J Histochem Cytochem 47:787–797,1999
18. BARNARD RJ, ROBERTS CK, VARON SM, BERGER JJ: Diet-inducedinsulin resistance precedes other aspects of the metabolic syndrome.J Appl Physiol 84:1311–1315, 1998
19. DOMINGUEZ JH, TANG N, XU W, et al: Studies of renal injury III:Lipid-induced nephropathy in type II diabetes. Kidney Int 57:92–104, 2000
20. KASISKE BL, O’DONNELL MP, SCHMITZ PG, et al: Renal injury ofdiet-induced hypercholesterolemia in rats. Kidney Int 37:880–891,1990
21. MOORE S: Pathogenesis of atherosclerosis. Metabolism 34:13–16,1985
22. ROSS R: The pathogenesis of atherosclerosis—An update. N Engl JMed 314:488–500, 1986
23. ANDERSON S, KING AJ, BRENNER BM: Hyperlipidemia and glomeru-lar sclerosis: An alternative viewpoint. Am J Med 87:34N–38N, 1989
24. DE JONG P, VERHAVE J, PINTO-SIETSMA S, HILLEGE H: Obesity andtarget organ damage: The kidney. Int J Obesity 26 (Suppl 4):S21–S24, 2002
25. ABBOUD H: Growth factors and diabetic nephrology: an overview.Kidney Int (Suppl) 60:S3–S6, 1997
26. PARK I, KIYOMOTO H, ABBOUD S, ABBOUD H: Expression oftransforming growth factor-beta and type IV collagen in earlystreptozotocin-induced diabetes. Diabetes 46:473–480, 1997
27. GILBERT R, WILKINSON-BERKA J, JOHNSON D, et al: Renal expressionof transforming growth factor-beta inducible gene-h3 (beta ig-h3)in normal and diabetic rats. Kidney Int 54:1052–1062, 1998
28. MASON RM, WAHAB NA: Extracellular matrix metabolism in dia-betic nephropathy. J Am Soc Nephrol 14:1358–1373, 2003
29. HILL C, FLYVBJERG A, GRøNBÆK H, et al: The renal expression oftransforming growth factor-b isoforms and their receptors in acuteand chronic experimental diabetes in rats. Endocrinology 141:1196–1208, 2000
30. MAKINO H, MUKOYAMA M, SUGAWARA A, et al: Roles of connec-tive tissue growth factor and prostanoids in early streptozotocin-induced diabetic rat kidney: The effect of aspirin treatment. ClinExp Nephrol 7:33–40, 2003
31. TOLINS JP, STONE BG, RAIJ L: Interactions of hypercholesterolemiaand hypertension in initiation of glomerular injury. Kidney Int41:1254–1261, 1992
32. RAVID M, BROSH D, RAVID-SAFRAN D, et al: Main risk factors fornephropathy in type 2 diabetes mellitus are plasma cholesterollevels, mean blood pressure, and hyperglycemia. Arch Intern Med158:998–1004, 1998
33. BAKRIS G, WEIR M, SHANIFER S, et al: Effects of blood pressure levelon progression of diabetic nephropathy: Results from the RENAALstudy. Arch Intern Med 163:1555–1565, 2003
34. ROBERTS CK, VAZIRI ND, WANG XQ, BARNARD RJ: EnhancedNO inactivation and hypertension induced by a high-fat, refined-carbohydrate diet. Hypertension 36:423–429, 2000