Key Trends in Tracking Supply of and Demand for Oncologists
40
Key Trends in Tracking Supply of and Demand for Oncologists March 2015
-
Upload
khangminh22 -
Category
Documents
-
view
0 -
download
0
Transcript of Key Trends in Tracking Supply of and Demand for Oncologists

Key Trends in Tracking Supply of and Demand for OncologistsMarch 2015
Key Trends in Tracking Supply of and Demand for Oncologists
Table of Contents
Introduction . . . . . . . . . . . . . . . . . . . . . . . . . . . . . . . . . . . . . . . . . . . . . . . . . . . . . . . . . . . . . . . . . . . . . . . . . . . . . . . . . . 3
Limitations of the Data . . . . . . . . . . . . . . . . . . . . . . . . . . . . . . . . . . . . . . . . . . . . . . . . . . . . . . . . . . . . . . . . . . . . 6
Section 1 - Supply . . . . . . . . . . . . . . . . . . . . . . . . . . . . . . . . . . . . . . . . . . . . . . . . . . . . . . . . . . . . . . . . . . . 7
Number of Oncologists (MDs and DOs) . . . . . . . . . . . . . . . . . . . . . . . . . . . . . . . . . . . . . . . . . . . . . . . . . . . . . . . . . . . . . . . . . . . . . . . 7
Percentage of Oncologists Who Are Female . . . . . . . . . . . . . . . . . . . . . . . . . . . . . . . . . . . . . . . . . . . . . 10
Percentage of Oncologists Who Are MDs . . . . . . . . . . . . . . . . . . . . . . . . . . . . . . . . . . . . . . . . . . . . . . . . 11
Percentage of Oncologists Who Are DOs . . . . . . . . . . . . . . . . . . . . . . . . . . . . . . . . . . . . . . . . . . . . . . . . 12
Percentage of Oncologists Who Are IMGs . . . . . . . . . . . . . . . . . . . . . . . . . . . . . . . . . . . . . . . . . . . . . . . . 13
Percentage of Oncologists Who Are Active in Direct Patient Care . . . . . . . . . . . . . . . . . . . . . . . . . . . . . . . . . . . . . . . . . . . .14
Percentage of Oncologists Engaged in Patient Care by Employment Setting . . . . . . . . . . . . . . . . . . . . . . . . . . . . . . . . . . . . . . . . . . . . . . . . . . . . .15
Percentage of Oncologists by Age Group . . . . . . . . . . . . . . . . . . . . . . . . . . . . . . . . . . . . . . . . . . . . . . . . . . . . . . . . . . . . . . . . . . 16
Median Age of Oncologists . . . . . . . . . . . . . . . . . . . . . . . . . . . . . . . . . . . . . . . . . . . . . . . . . . . . . . . . . . . . . . . . . .17
Number of Oncologists by State . . . . . . . . . . . . . . . . . . . . . . . . . . . . . . . . . . . . . . . . . . . . . . . . . . . . . . . . . 18
Oncologists Per 100,000 Residents Age 55 Years and Older by State . . . . . . . . . . . . . . . . . . . . . . . . . . . . . . . . . . . . . . . . . . . . . . . . . . . . . . . . .19
Geographic Distribution of Oncologists . . . . . . . . . . . . . . . . . . . . . . . . . . . . . . . . . . . . . . . . . . . . . . . . . . . . . . . . .20
Rural and Urban Oncology Practice Location . . . . . . . . . . . . . . . . . . . . . . . . . . . . . . . . . . . . . . . . . . . . . . . . . . . . . . . . .21
Section 2 - New Entrants . . . . . . . . . . . . . . . . . . . . . . . . . . . . . . . . . . . . . . . . . . . . . . . . . . . . . . . . . . . . . . . . . . . . . . . . . . . . . . . . . . . . . . . . . . . . .22
Residents in Oncology Pipeline Programs . . . . . . . . . . . . . . . . . . . . . . . . . . . . . . . . . . . . . . . . . . . . . . . . . . . . . . . . .22
Percentage of Residents in Oncology Pipeline Programs Who Are Female . . . . . . . . . . . . . . . . . . . . . . . . . . . . . . . . . . . . . . . . . . . . . . . . . . . . .23
Percentage of Residents in Oncology Pipeline Programs Who Are USMDs . . . . . . . . . . . . . . . . . . . . . . . . . . . . . . . . . . . . . . . . . . . . . . . . . . . . .24
Number of Physicians Who Completed an Oncology Pipeline Program . . . . . . . . . . . . . . . . . . . . . . . . . . . . . . . . . . . . . . . . . . . . . . . . . . . . .25
Number of Physicians Who Applied for an Internal Medicine Subspecialty Fellowship . . . . . . . . . . . . . . . . . . . . . . . . . . . . . . . . . . . . . . . . . . . . . . . . . . . . .26
Number and Percentage of USMD Oncology Fellowship Applicants Who Matched to an Oncology
Fellowship . . . . . . . . . . . . . . . . . . . . . . . . . . . . . . . . . . . . . . . . . . . . . . . . . . . . . . . . . . . . . . . . . . . . . . . . . . . .27
Number of First Year Fellows in Internal Medicine Subspecialties . . . . . . . . . . . . . . . . . . . . . . . . . . . . . . . . . . . . . . . . . . . . . . . . . . . . .28
Percentage of First Year Fellows in Internal Medicine Subspecialties by Subspecialty . . . . . . . . . . . . . . . . . . . . . . . . . . . . . . . . . . . . . . . . . . . . . . . . . . . . .29
Estimated Percentage of Residents Completing Internal Medicine Entering IM Subspecialty
Fellowships . . . . . . . . . . . . . . . . . . . . . . . . . . . . . . . . . . . . . . . . . . . . . . . . . . . . . . . . . . . . . . . . . . . . . . . . . . . .30
Percentage of Fellows in Internal Medicine Subspecialties Who Are Female . . . . . . . . . . . . . . . . . . . . . . . . . . . . . . . . . . . . . . . . . . . . . . . . . . . . .31
Percentage of Fellows in Internal Medicine Subspecialties Who Are IMGs . . . . . . . . . . . . . . . . . . . . . . . . . . . . . . . . . . . . . . . . . . . . . . . . . . . . .32
Percentage of Fellows in Internal Medicine Subspecialties Who Are Black or African American . . . . . . . 33
Percentage of Residents/Fellows Who Are Black or African American . . . . . . . . . . . . . . . . . . . . . . . . . . . . . . . . . . . . . . . . . . . . . . . . . . . . . .34
Percentage of Fellows in Internal Medicine Subspecialties Who Are Hispanic or Latino. . . . . . . . . 35
Percentage of Residents/Fellows Who Are Hispanic or Latino. . . . . . . . . . . . . . . . . . . . . . . . . . . . . . . . . . . . . . . . . . . . . . . . . .36
New Entrants to the Oncology Workforce (Fellows Completing GME and Board Exam Test
Takers) . . . . . . . . . . . . . . . . . . . . . . . . . . . . . . . . . . . . . . . . . . . . . . . . . . . . . . . . . . . . . . . . . . . . . . . . . . . . 37
Section 3 - Cancer Incidence and Prevalence . . . . . . . . . . . . . . . . . . . . . . . . . . . . . . . . . . . . . . . . . . . . . . . . . . . .38
Estimated Number of New Cancer Cases (in 1000s) by Sex . . . . . . . . . . . . . . . . . . . . . . . . . . . . . . . . . . . . . . . . . . . . . . . . . . . . .38
Five-Year Relative Cancer Survival Rates by Year of Diagnosis . . . . . . . . . . . . . . . . . . . . . . . . . . . . . . . . . . . . . . . . . . . . . . . . . . . . .39
Number of People With a History of Cancer (in 1000s) . . . . . . . . . . . . . . . . . . . . . . . . . . . . . . . . . . . . . . . . . . . . . . . . . . . . .40
- 2 -
Key Trends in Tracking Supply of and Demand for Oncologists
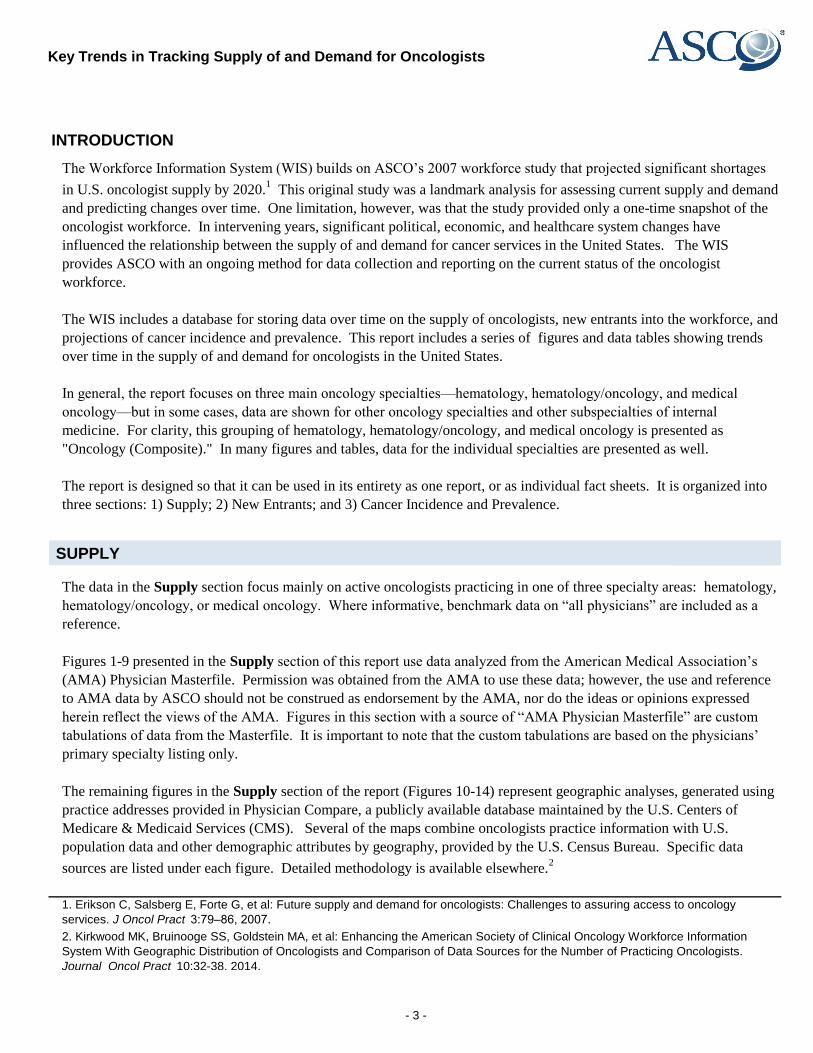
INTRODUCTION
SUPPLY
The Workforce Information System (WIS) builds on ASCO’s 2007 workforce study that projected significant shortages
in U.S. oncologist supply by 2020.1 This original study was a landmark analysis for assessing current supply and demand
and predicting changes over time. One limitation, however, was that the study provided only a one-time snapshot of the
oncologist workforce. In intervening years, significant political, economic, and healthcare system changes have
influenced the relationship between the supply of and demand for cancer services in the United States. The WIS
provides ASCO with an ongoing method for data collection and reporting on the current status of the oncologist
workforce.
The WIS includes a database for storing data over time on the supply of oncologists, new entrants into the workforce, and
projections of cancer incidence and prevalence. This report includes a series of figures and data tables showing trends
over time in the supply of and demand for oncologists in the United States.
In general, the report focuses on three main oncology specialties—hematology, hematology/oncology, and medical
oncology—but in some cases, data are shown for other oncology specialties and other subspecialties of internal
medicine. For clarity, this grouping of hematology, hematology/oncology, and medical oncology is presented as
"Oncology (Composite)." In many figures and tables, data for the individual specialties are presented as well.
The report is designed so that it can be used in its entirety as one report, or as individual fact sheets. It is organized into
three sections: 1) Supply; 2) New Entrants; and 3) Cancer Incidence and Prevalence.
The data in the Supply section focus mainly on active oncologists practicing in one of three specialty areas: hematology,
hematology/oncology, or medical oncology. Where informative, benchmark data on “all physicians” are included as a
reference.
Figures 1-9 presented in the Supply section of this report use data analyzed from the American Medical Association’s
(AMA) Physician Masterfile. Permission was obtained from the AMA to use these data; however, the use and reference
to AMA data by ASCO should not be construed as endorsement by the AMA, nor do the ideas or opinions expressed
herein reflect the views of the AMA. Figures in this section with a source of “AMA Physician Masterfile” are custom
tabulations of data from the Masterfile. It is important to note that the custom tabulations are based on the physicians’
primary specialty listing only.
The remaining figures in the Supply section of the report (Figures 10-14) represent geographic analyses, generated using
practice addresses provided in Physician Compare, a publicly available database maintained by the U.S. Centers of
Medicare & Medicaid Services (CMS). Several of the maps combine oncologists practice information with U.S.
population data and other demographic attributes by geography, provided by the U.S. Census Bureau. Specific data
sources are listed under each figure. Detailed methodology is available elsewhere.2
1. Erikson C, Salsberg E, Forte G, et al: Future supply and demand for oncologists: Challenges to assuring access to oncology
services. J Oncol Pract 3:79–86, 2007.
2. Kirkwood MK, Bruinooge SS, Goldstein MA, et al: Enhancing the American Society of Clinical Oncology Workforce Information
System With Geographic Distribution of Oncologists and Comparison of Data Sources for the Number of Practicing Oncologists.
Journal Oncol Pract 10:32-38, 2014.
- 3 -
Key Trends in Tracking Supply of and Demand for Oncologists
NEW ENTRANTS
The figures and data tables in the New Entrants section include data on:
• Residents in pipeline programs
• Percentage of residents in pipeline programs who are female
• Percentage of residents in pipeline programs who are USMD
• Residents completing pipeline programs
• Applicants to an IM subspecialty fellowship
• USMD applicants to an IM subspecialty fellowship
• First year IM subspecialty fellows
• Percentage of IM subspecialty fellows who are female
• Percentage of IM subspecialty fellows who are IMG
• Percentage of oncology fellows who are Black or African American
• Percentage of oncology fellows who are Hispanic
• Fellows who complete oncology training and first-time board test-takers
The figures and data tables in the Supply section include data on:
• The total number of active oncologists by specialty
• Percentage female
• Percentage medical doctors (MDs)
• Percentage doctors of osteopathy (DOs)
• Percentage international medical graduates (IMGs)
• Percentage active in direct patient care
• Percentage patient care oncologists by employment setting
• Percentage under age 40 and age 64 or older
• Number of oncologists by state
• Oncologists per 100,000 residents 55 years and older by state
• Geographic distribution of oncology practices
• Rural and urban oncology practice locations
This section focuses on physicians in training, starting with the pipeline of residents who are eligible to enter training in
hematology, hematology/oncology, medical oncology, gynecologic oncology, and pediatric hematology/oncology
fellowship programs (i.e., residents who completed an internal medicine, obstetric/gynecology, or pediatric residency
program) and continuing through to the number completing training in oncology fellowship programs. In addition to
demographic comparisons (such as gender, race, and ethnicity), we provide data on the competitiveness of oncology
fellowships relative to other internal medicine fellowship programs. Where appropriate, we have included benchmark
references of all residents, internal medicine residents, and/or select internal medicine subspecialties.
Data from this section come from three primary sources: 1) the Journal of the American Medical Association ’s
(JAMA's ) Medical Education issues (published annually), 2) annual publications on the National Residency Match
Program, and 3) data on first time board test-takers as published on the American Board of Internal Medicine (ABIM)
website.
- 4 -
Key Trends in Tracking Supply of and Demand for Oncologists
CANCER INCIDENCE AND PREVALENCE
The Cancer Incidence and Prevalence section presents the latest available data on cancer incidence and prevalence,
showing the trends in the number of new cases and number of survivors. Survivor data is presented in terms of five-year
survival rates as well as anyone with a history of cancer.
Data for the Cancer Incidence and Prevalence section come primarily from two sources: 1) National Cancer Institute
(NCI) publications focusing on analysis of the Surveillance Epidemiology and End Results Cancer Statistics Review, and
2) the American Cancer Society’s annual publication, Cancer Facts and Figures, which is jointly prepared with the NCI.
The figures and data tables in this section include data on:
• New cancer cases
• 5-year relative survival rates
• Population with a history of cancer
- 5 -
Key Trends in Tracking Supply of and Demand for Oncologists
LIMITATIONS OF THE DATA
Yang W, Williams JH, Hogan PF, et al: Projected supply of and demand for oncologists and radiation oncologists through 2025: an aging, better-
insured population will result in shortage. J Oncol Pract 10:39-45, 2014.
Much of the data from the Supply section of this report come from the AMA Physician Masterfile. Although the
Masterfile was not designed for workforce analysis, it is commonly used because it captures detailed demographic and
practice information for AMA member and nonmember physicians. The AMA makes available to ASCO and other
researchers the full Masterfile on an annual basis. The advantage to this is researchers are afforded the flexibility to
create custom tabulations of the data. For instance, data on the percentage of oncologists who are age 64 or older are
only obtainable by using the Masterfile itself.
Despite the flexibility of using the full Masterfile, there are disadvantages to using it as a source of data on oncologists.
A physician's activity status comes from the AMA's Census of Physicians. A physician typically receives the AMA's
Census every three to four years, which may result in a lag in changing a physician's status from active to inactive.
Because much of the information is self-reported through the AMA Census, there are also issues with interpretation (e.g.,
which specialty field a physician chooses as his/her primary specialty) and with missing fields. In addition, physician
board certification information is not available through the Masterfile.
In order to assess the geographic distribution of oncologists, we used a second data source for the Supply section: the
CMS Physician Compare database. Physician Compare is a publicly available data set that stores information on U.S.
healthcare providers, specifically those who have billed for Medicare reimbursement within the prior 12 months. The
data are the most up-to-date available, to our knowledge, and provide individual-level addresses for physician practice
locations (and secondary practice locations, where applicable). Physician Compare does not provide demographic and
practice information important for workforce montoring (e.g., age and employment setting), so cannot replace the AMA
Masterfile as a the primary Supply data source.
Much of the data from the New Entrant section come from JAMA . The published data in JAMA are derived from the
AAMC/AMA National GME Census and represent an undercount of residents and fellows, as they do not account for
late reporting. Furthermore, the GME Census represents ACGME programs only. However, there are less than 10
osteopathic GME programs in hematology and oncology, with fewer than 30 positions.
For purposes of annual tracking in the WIS, ASCO uses high-level data from the National Cancer Institute and the
American Cancer Society for the Cancer Incidence and Prevalence section. ASCO acknowledges that these statistics
do not adequately represent demand for cancer care services in the United States and is pursuing separate initiatives
towords this end. In 2014, ASCO published an updated demand methodology and projections.3
- 6 -
Key Trends in Tracking Supply of and Demand for Oncologists
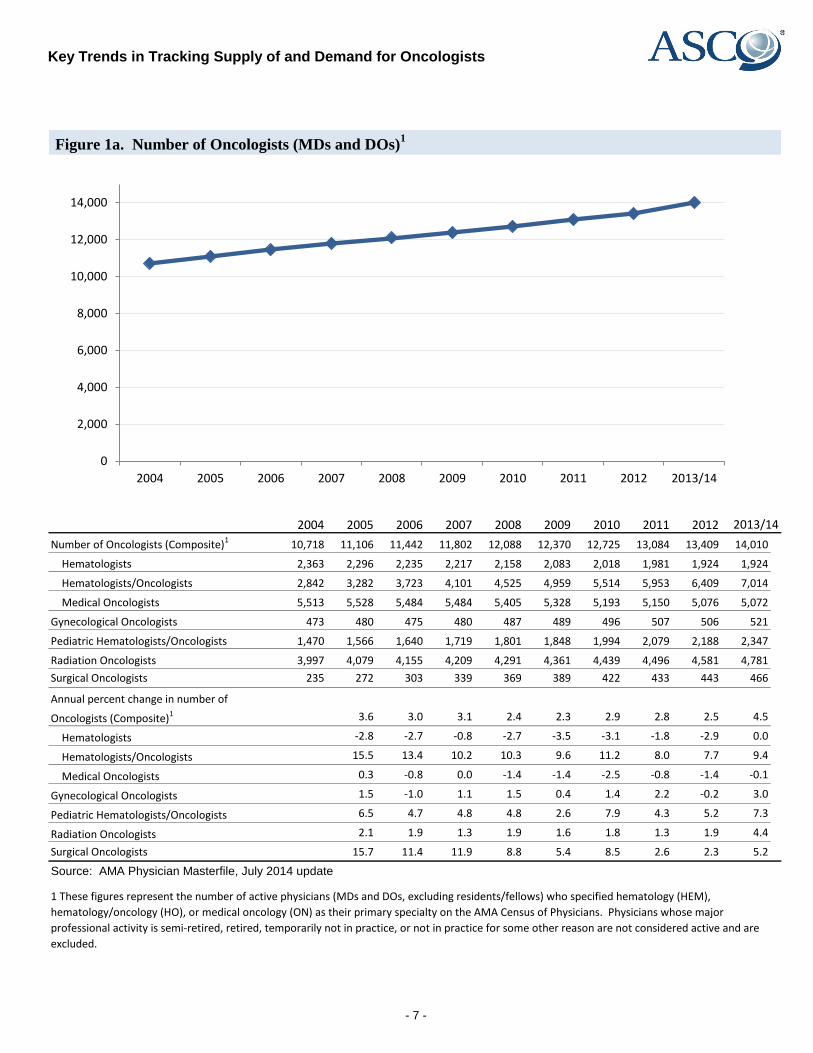
Figure 1a. Number of Oncologists (MDs and DOs)1
2004 2005 2006 2007 2008 2009 2010 2011 2012
Number of Oncologists (Composite)1 10,718 11,106 11,442 11,802 12,088 12,370 12,725 13,084 13,409 14,010
Hematologists 2,363 2,296 2,235 2,217 2,158 2,083 2,018 1,981 1,924 1,924
Hematologists/Oncologists 2,842 3,282 3,723 4,101 4,525 4,959 5,514 5,953 6,409 7,014
Medical Oncologists 5,513 5,528 5,484 5,484 5,405 5,328 5,193 5,150 5,076 5,072
Gynecological Oncologists 473 480 475 480 487 489 496 507 506 521
Pediatric Hematologists/Oncologists 1,470 1,566 1,640 1,719 1,801 1,848 1,994 2,079 2,188 2,347
Radiation Oncologists 3,997 4,079 4,155 4,209 4,291 4,361 4,439 4,496 4,581 4,781
Surgical Oncologists 235 272 303 339 369 389 422 433 443 466
Annual percent change in number of
Oncologists (Composite)1 3.6 3.0 3.1 2.4 2.3 2.9 2.8 2.5 4.5
Hematologists -2.8 -2.7 -0.8 -2.7 -3.5 -3.1 -1.8 -2.9 0.0
Hematologists/Oncologists 15.5 13.4 10.2 10.3 9.6 11.2 8.0 7.7 9.4
Medical Oncologists 0.3 -0.8 0.0 -1.4 -1.4 -2.5 -0.8 -1.4 -0.1
Gynecological Oncologists 1.5 -1.0 1.1 1.5 0.4 1.4 2.2 -0.2 3.0
Pediatric Hematologists/Oncologists 6.5 4.7 4.8 4.8 2.6 7.9 4.3 5.2 7.3
Radiation Oncologists 2.1 1.9 1.3 1.9 1.6 1.8 1.3 1.9 4.4
Surgical Oncologists 15.7 11.4 11.9 8.8 5.4 8.5 2.6 2.3 5.2
Source: AMA Physician Masterfile, July 2014 update
1 These figures represent the number of active physicians (MDs and DOs, excluding residents/fellows) who specified hematology (HEM),
hematology/oncology (HO), or medical oncology (ON) as their primary specialty on the AMA Census of Physicians. Physicians whose major
professional activity is semi-retired, retired, temporarily not in practice, or not in practice for some other reason are not considered active and are
excluded.
2013/14
0
2,000
4,000
6,000
8,000
10,000
12,000
14,000
2004 2005 2006 2007 2008 2009 2010 2011 2012 2013/14
- 7 -
Key Trends in Tracking Supply of and Demand for Oncologists
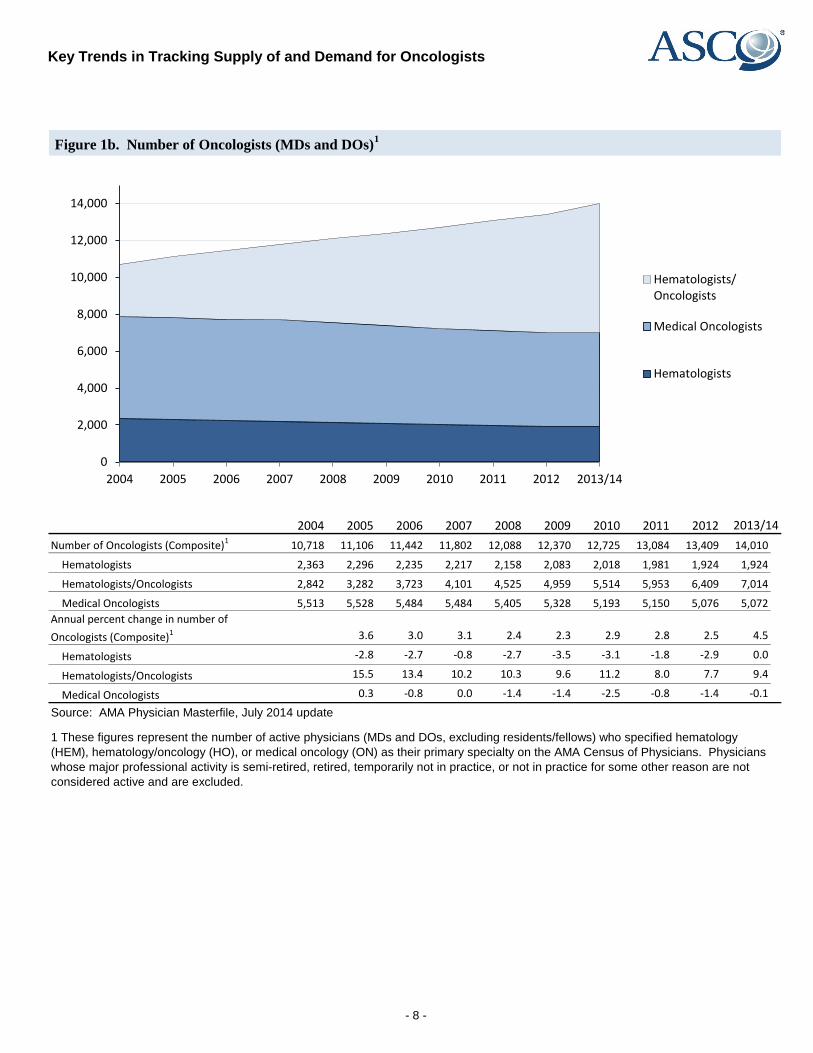
Figure 1b. Number of Oncologists (MDs and DOs)1
2004 2005 2006 2007 2008 2009 2010 2011 2012
Number of Oncologists (Composite)1 10,718 11,106 11,442 11,802 12,088 12,370 12,725 13,084 13,409 14,010
Hematologists 2,363 2,296 2,235 2,217 2,158 2,083 2,018 1,981 1,924 1,924
Hematologists/Oncologists 2,842 3,282 3,723 4,101 4,525 4,959 5,514 5,953 6,409 7,014
Medical Oncologists 5,513 5,528 5,484 5,484 5,405 5,328 5,193 5,150 5,076 5,072
3.6 3.0 3.1 2.4 2.3 2.9 2.8 2.5 4.5
Hematologists -2.8 -2.7 -0.8 -2.7 -3.5 -3.1 -1.8 -2.9 0.0
Hematologists/Oncologists 15.5 13.4 10.2 10.3 9.6 11.2 8.0 7.7 9.4
Medical Oncologists 0.3 -0.8 0.0 -1.4 -1.4 -2.5 -0.8 -1.4 -0.1
Source: AMA Physician Masterfile, July 2014 update
1 These figures represent the number of active physicians (MDs and DOs, excluding residents/fellows) who specified hematology
(HEM), hematology/oncology (HO), or medical oncology (ON) as their primary specialty on the AMA Census of Physicians. Physicians
whose major professional activity is semi-retired, retired, temporarily not in practice, or not in practice for some other reason are not
considered active and are excluded.
2013/14
Annual percent change in number of
Oncologists (Composite)1
0
2,000
4,000
6,000
8,000
10,000
12,000
14,000
2004 2005 2006 2007 2008 2009 2010 2011 2012 2013/14
Hematologists/Oncologists
Medical Oncologists
Hematologists
- 8 -
Key Trends in Tracking Supply of and Demand for Oncologists
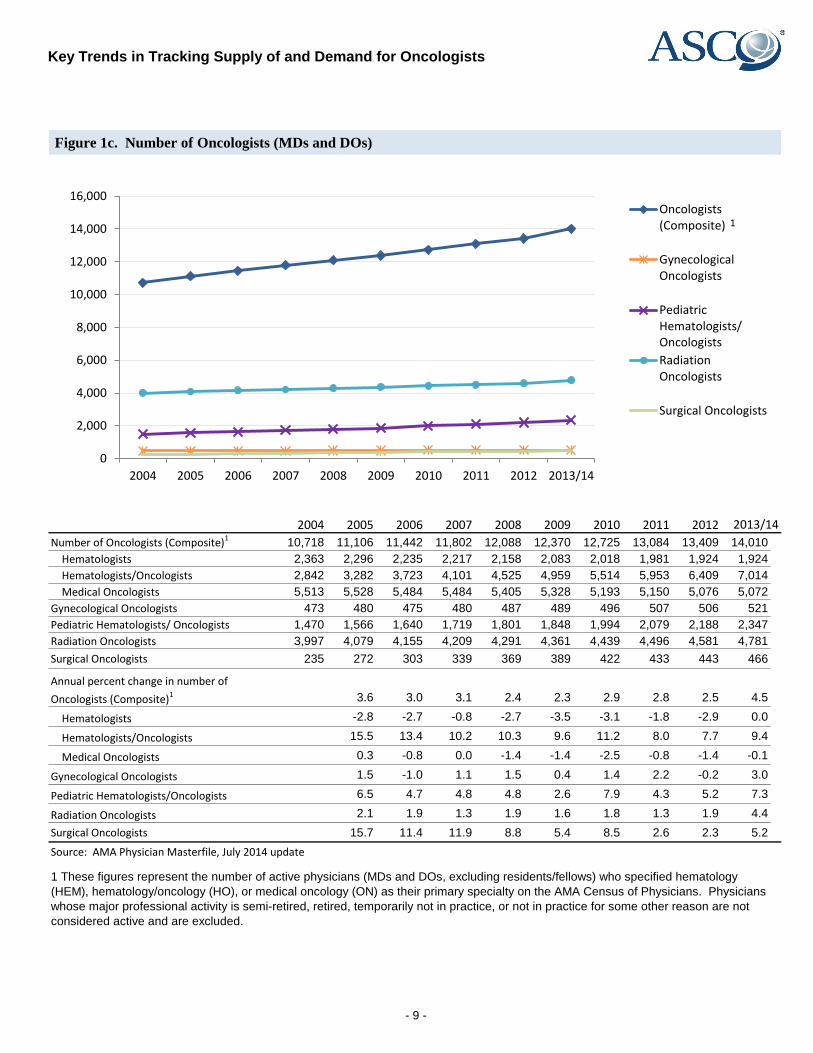
Figure 1c. Number of Oncologists (MDs and DOs)
2004 2005 2006 2007 2008 2009 2010 2011 2012
Number of Oncologists (Composite)110,718 11,106 11,442 11,802 12,088 12,370 12,725 13,084 13,409 14,010
Hematologists 2,363 2,296 2,235 2,217 2,158 2,083 2,018 1,981 1,924 1,924
Hematologists/Oncologists 2,842 3,282 3,723 4,101 4,525 4,959 5,514 5,953 6,409 7,014
Medical Oncologists 5,513 5,528 5,484 5,484 5,405 5,328 5,193 5,150 5,076 5,072
Gynecological Oncologists 473 480 475 480 487 489 496 507 506 521
Pediatric Hematologists/ Oncologists 1,470 1,566 1,640 1,719 1,801 1,848 1,994 2,079 2,188 2,347
Radiation Oncologists 3,997 4,079 4,155 4,209 4,291 4,361 4,439 4,496 4,581 4,781
Surgical Oncologists 235 272 303 339 369 389 422 433 443 466
3.6 3.0 3.1 2.4 2.3 2.9 2.8 2.5 4.5
Hematologists -2.8 -2.7 -0.8 -2.7 -3.5 -3.1 -1.8 -2.9 0.0
Hematologists/Oncologists 15.5 13.4 10.2 10.3 9.6 11.2 8.0 7.7 9.4
Medical Oncologists 0.3 -0.8 0.0 -1.4 -1.4 -2.5 -0.8 -1.4 -0.1
Gynecological Oncologists 1.5 -1.0 1.1 1.5 0.4 1.4 2.2 -0.2 3.0
Pediatric Hematologists/Oncologists 6.5 4.7 4.8 4.8 2.6 7.9 4.3 5.2 7.3
Radiation Oncologists 2.1 1.9 1.3 1.9 1.6 1.8 1.3 1.9 4.4
Surgical Oncologists 15.7 11.4 11.9 8.8 5.4 8.5 2.6 2.3 5.2
Source: AMA Physician Masterfile, July 2014 update
1 These figures represent the number of active physicians (MDs and DOs, excluding residents/fellows) who specified hematology
(HEM), hematology/oncology (HO), or medical oncology (ON) as their primary specialty on the AMA Census of Physicians. Physicians
whose major professional activity is semi-retired, retired, temporarily not in practice, or not in practice for some other reason are not
considered active and are excluded.
Annual percent change in number of
Oncologists (Composite)1
2013/14
0
2,000
4,000
6,000
8,000
10,000
12,000
14,000
16,000
2004 2005 2006 2007 2008 2009 2010 2011 2012 2013/14
Oncologists(Composite)
GynecologicalOncologists
PediatricHematologists/Oncologists
RadiationOncologists
Surgical Oncologists
1
- 9 -
Key Trends in Tracking Supply of and Demand for Oncologists
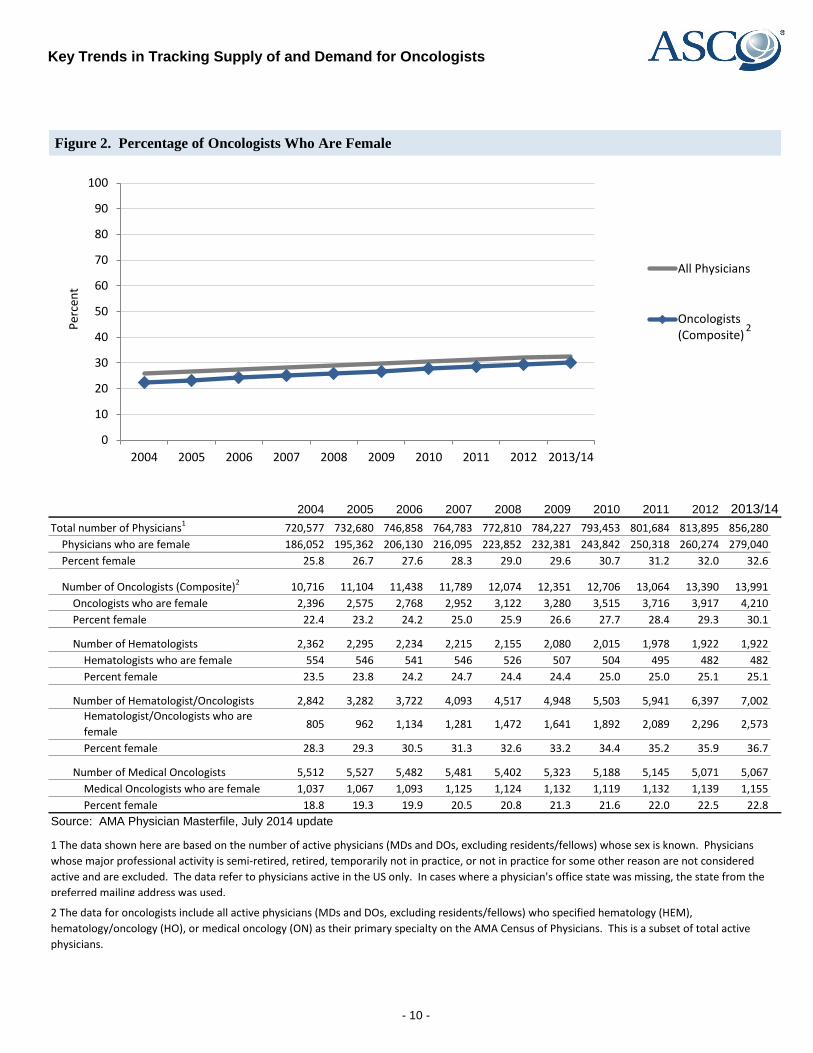
Figure 2. Percentage of Oncologists Who Are Female
2004 2005 2006 2007 2008 2009 2010 2011 2012
Total number of Physicians1 720,577 732,680 746,858 764,783 772,810 784,227 793,453 801,684 813,895 856,280
Physicians who are female 186,052 195,362 206,130 216,095 223,852 232,381 243,842 250,318 260,274 279,040
Percent female 25.8 26.7 27.6 28.3 29.0 29.6 30.7 31.2 32.0 32.6
Number of Oncologists (Composite)2 10,716 11,104 11,438 11,789 12,074 12,351 12,706 13,064 13,390 13,991
Oncologists who are female 2,396 2,575 2,768 2,952 3,122 3,280 3,515 3,716 3,917 4,210
Percent female 22.4 23.2 24.2 25.0 25.9 26.6 27.7 28.4 29.3 30.1
Number of Hematologists 2,362 2,295 2,234 2,215 2,155 2,080 2,015 1,978 1,922 1,922
Hematologists who are female 554 546 541 546 526 507 504 495 482 482
Percent female 23.5 23.8 24.2 24.7 24.4 24.4 25.0 25.0 25.1 25.1
Number of Hematologist/Oncologists 2,842 3,282 3,722 4,093 4,517 4,948 5,503 5,941 6,397 7,002
Hematologist/Oncologists who are
female805 962 1,134 1,281 1,472 1,641 1,892 2,089 2,296 2,573
Percent female 28.3 29.3 30.5 31.3 32.6 33.2 34.4 35.2 35.9 36.7
Number of Medical Oncologists 5,512 5,527 5,482 5,481 5,402 5,323 5,188 5,145 5,071 5,067
Medical Oncologists who are female 1,037 1,067 1,093 1,125 1,124 1,132 1,119 1,132 1,139 1,155
Percent female 18.8 19.3 19.9 20.5 20.8 21.3 21.6 22.0 22.5 22.8
Source: AMA Physician Masterfile, July 2014 update
2 The data for oncologists include all active physicians (MDs and DOs, excluding residents/fellows) who specified hematology (HEM),
hematology/oncology (HO), or medical oncology (ON) as their primary specialty on the AMA Census of Physicians. This is a subset of total active
physicians.
2013/14
1 The data shown here are based on the number of active physicians (MDs and DOs, excluding residents/fellows) whose sex is known. Physicians
whose major professional activity is semi-retired, retired, temporarily not in practice, or not in practice for some other reason are not considered
active and are excluded. The data refer to physicians active in the US only. In cases where a physician's office state was missing, the state from the
preferred mailing address was used.
0
10
20
30
40
50
60
70
80
90
100
2004 2005 2006 2007 2008 2009 2010 2011 2012 2013/14
Per
cen
t
All Physicians
Oncologists(Composite)
2
- 10 -
Key Trends in Tracking Supply of and Demand for Oncologists
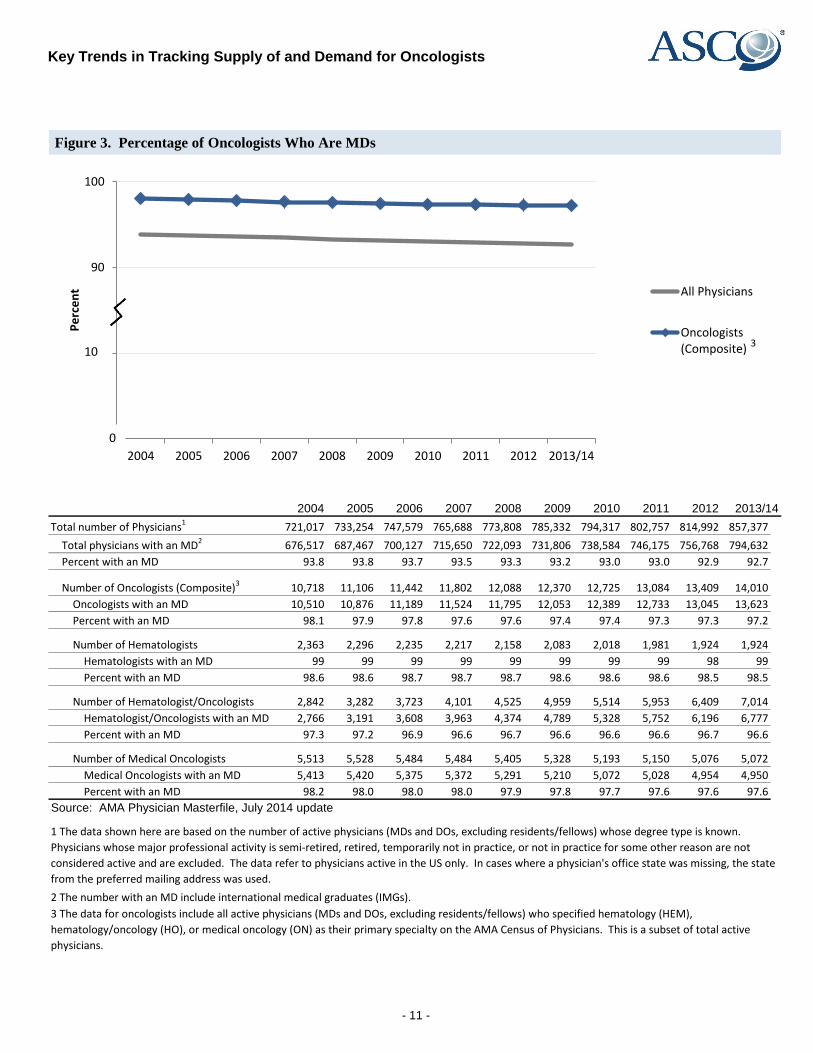
Figure 3. Percentage of Oncologists Who Are MDs
2004 2005 2006 2007 2008 2009 2010 2011 2012
Total number of Physicians1 721,017 733,254 747,579 765,688 773,808 785,332 794,317 802,757 814,992 857,377
Total physicians with an MD2 676,517 687,467 700,127 715,650 722,093 731,806 738,584 746,175 756,768 794,632
Percent with an MD 93.8 93.8 93.7 93.5 93.3 93.2 93.0 93.0 92.9 92.7
Number of Oncologists (Composite)3 10,718 11,106 11,442 11,802 12,088 12,370 12,725 13,084 13,409 14,010
Oncologists with an MD 10,510 10,876 11,189 11,524 11,795 12,053 12,389 12,733 13,045 13,623
Percent with an MD 98.1 97.9 97.8 97.6 97.6 97.4 97.4 97.3 97.3 97.2
Number of Hematologists 2,363 2,296 2,235 2,217 2,158 2,083 2,018 1,981 1,924 1,924
Hematologists with an MD 99 99 99 99 99 99 99 99 98 99
Percent with an MD 98.6 98.6 98.7 98.7 98.7 98.6 98.6 98.6 98.5 98.5
Number of Hematologist/Oncologists 2,842 3,282 3,723 4,101 4,525 4,959 5,514 5,953 6,409 7,014
Hematologist/Oncologists with an MD 2,766 3,191 3,608 3,963 4,374 4,789 5,328 5,752 6,196 6,777
Percent with an MD 97.3 97.2 96.9 96.6 96.7 96.6 96.6 96.6 96.7 96.6
Number of Medical Oncologists 5,513 5,528 5,484 5,484 5,405 5,328 5,193 5,150 5,076 5,072
Medical Oncologists with an MD 5,413 5,420 5,375 5,372 5,291 5,210 5,072 5,028 4,954 4,950
Percent with an MD 98.2 98.0 98.0 98.0 97.9 97.8 97.7 97.6 97.6 97.6
Source: AMA Physician Masterfile, July 2014 update
1 The data shown here are based on the number of active physicians (MDs and DOs, excluding residents/fellows) whose degree type is known.
Physicians whose major professional activity is semi-retired, retired, temporarily not in practice, or not in practice for some other reason are not
considered active and are excluded. The data refer to physicians active in the US only. In cases where a physician's office state was missing, the state
from the preferred mailing address was used.
2 The number with an MD include international medical graduates (IMGs).
3 The data for oncologists include all active physicians (MDs and DOs, excluding residents/fellows) who specified hematology (HEM),
hematology/oncology (HO), or medical oncology (ON) as their primary specialty on the AMA Census of Physicians. This is a subset of total active
physicians.
2013/14
70
80
90
100
2004 2005 2006 2007 2008 2009 2010 2011 2012 2013/14
Pe
rce
nt All Physicians
Oncologists(Composite)10
3
0
- 11 -
Key Trends in Tracking Supply of and Demand for Oncologists
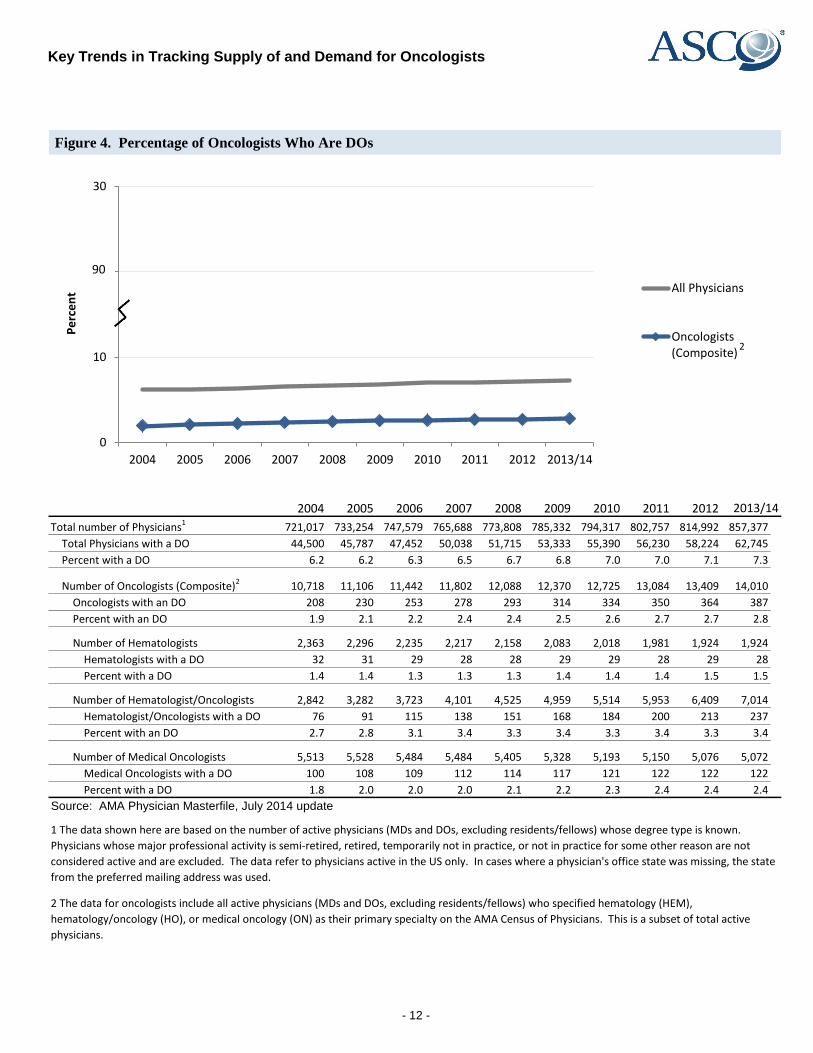
Figure 4. Percentage of Oncologists Who Are DOs
2004 2005 2006 2007 2008 2009 2010 2011 2012
Total number of Physicians1 721,017 733,254 747,579 765,688 773,808 785,332 794,317 802,757 814,992 857,377
Total Physicians with a DO 44,500 45,787 47,452 50,038 51,715 53,333 55,390 56,230 58,224 62,745
Percent with a DO 6.2 6.2 6.3 6.5 6.7 6.8 7.0 7.0 7.1 7.3
Number of Oncologists (Composite)2 10,718 11,106 11,442 11,802 12,088 12,370 12,725 13,084 13,409 14,010
Oncologists with an DO 208 230 253 278 293 314 334 350 364 387
Percent with an DO 1.9 2.1 2.2 2.4 2.4 2.5 2.6 2.7 2.7 2.8
Number of Hematologists 2,363 2,296 2,235 2,217 2,158 2,083 2,018 1,981 1,924 1,924
Hematologists with a DO 32 31 29 28 28 29 29 28 29 28
Percent with a DO 1.4 1.4 1.3 1.3 1.3 1.4 1.4 1.4 1.5 1.5
Number of Hematologist/Oncologists 2,842 3,282 3,723 4,101 4,525 4,959 5,514 5,953 6,409 7,014
Hematologist/Oncologists with a DO 76 91 115 138 151 168 184 200 213 237
Percent with an DO 2.7 2.8 3.1 3.4 3.3 3.4 3.3 3.4 3.3 3.4
Number of Medical Oncologists 5,513 5,528 5,484 5,484 5,405 5,328 5,193 5,150 5,076 5,072
Medical Oncologists with a DO 100 108 109 112 114 117 121 122 122 122
Percent with a DO 1.8 2.0 2.0 2.0 2.1 2.2 2.3 2.4 2.4 2.4
Source: AMA Physician Masterfile, July 2014 update
2013/14
1 The data shown here are based on the number of active physicians (MDs and DOs, excluding residents/fellows) whose degree type is known.
Physicians whose major professional activity is semi-retired, retired, temporarily not in practice, or not in practice for some other reason are not
considered active and are excluded. The data refer to physicians active in the US only. In cases where a physician's office state was missing, the state
from the preferred mailing address was used.
2 The data for oncologists include all active physicians (MDs and DOs, excluding residents/fellows) who specified hematology (HEM),
hematology/oncology (HO), or medical oncology (ON) as their primary specialty on the AMA Census of Physicians. This is a subset of total active
physicians.
0
10
20
30
2004 2005 2006 2007 2008 2009 2010 2011 2012 2013/14
Pe
rce
nt All Physicians
Oncologists(Composite)
2
90
- 12 -
Key Trends in Tracking Supply of and Demand for Oncologists
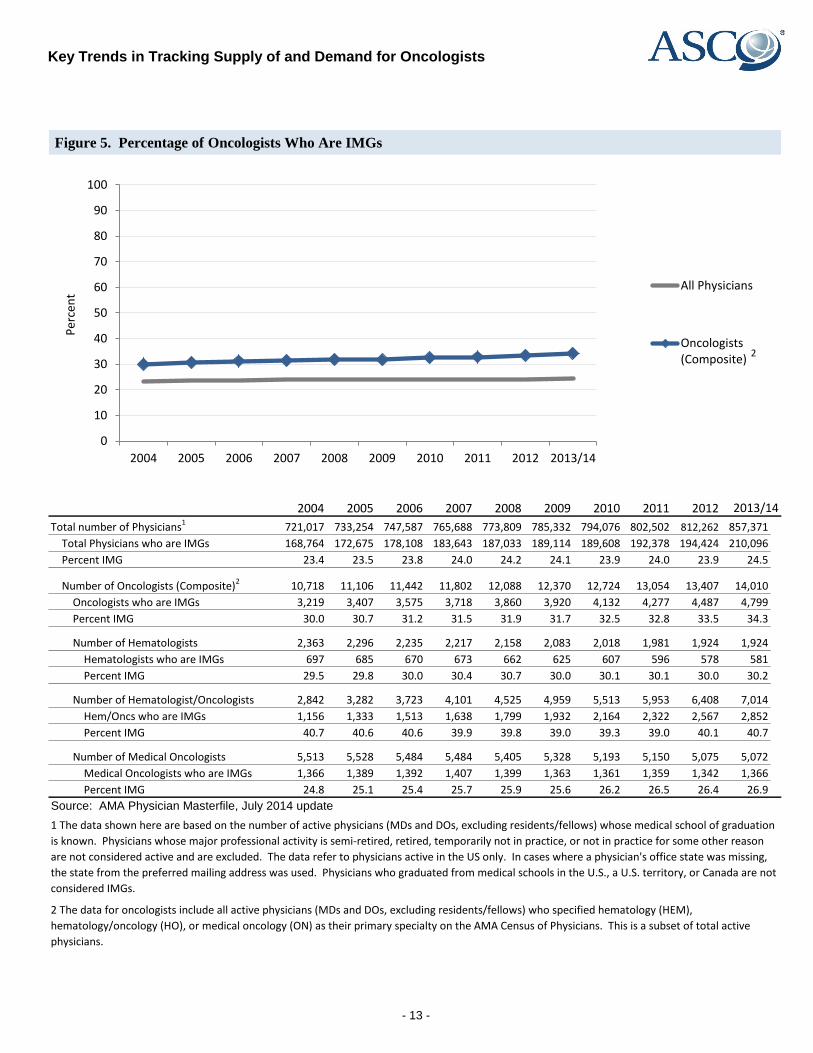
Figure 5. Percentage of Oncologists Who Are IMGs
2004 2005 2006 2007 2008 2009 2010 2011 2012
Total number of Physicians1 721,017 733,254 747,587 765,688 773,809 785,332 794,076 802,502 812,262 857,371
Total Physicians who are IMGs 168,764 172,675 178,108 183,643 187,033 189,114 189,608 192,378 194,424 210,096
Percent IMG 23.4 23.5 23.8 24.0 24.2 24.1 23.9 24.0 23.9 24.5
Number of Oncologists (Composite)2 10,718 11,106 11,442 11,802 12,088 12,370 12,724 13,054 13,407 14,010
Oncologists who are IMGs 3,219 3,407 3,575 3,718 3,860 3,920 4,132 4,277 4,487 4,799
Percent IMG 30.0 30.7 31.2 31.5 31.9 31.7 32.5 32.8 33.5 34.3
Number of Hematologists 2,363 2,296 2,235 2,217 2,158 2,083 2,018 1,981 1,924 1,924
Hematologists who are IMGs 697 685 670 673 662 625 607 596 578 581
Percent IMG 29.5 29.8 30.0 30.4 30.7 30.0 30.1 30.1 30.0 30.2
Number of Hematologist/Oncologists 2,842 3,282 3,723 4,101 4,525 4,959 5,513 5,953 6,408 7,014
Hem/Oncs who are IMGs 1,156 1,333 1,513 1,638 1,799 1,932 2,164 2,322 2,567 2,852
Percent IMG 40.7 40.6 40.6 39.9 39.8 39.0 39.3 39.0 40.1 40.7
Number of Medical Oncologists 5,513 5,528 5,484 5,484 5,405 5,328 5,193 5,150 5,075 5,072
Medical Oncologists who are IMGs 1,366 1,389 1,392 1,407 1,399 1,363 1,361 1,359 1,342 1,366
Percent IMG 24.8 25.1 25.4 25.7 25.9 25.6 26.2 26.5 26.4 26.9
Source: AMA Physician Masterfile, July 2014 update
1 The data shown here are based on the number of active physicians (MDs and DOs, excluding residents/fellows) whose medical school of graduation
is known. Physicians whose major professional activity is semi-retired, retired, temporarily not in practice, or not in practice for some other reason
are not considered active and are excluded. The data refer to physicians active in the US only. In cases where a physician's office state was missing,
the state from the preferred mailing address was used. Physicians who graduated from medical schools in the U.S., a U.S. territory, or Canada are not
considered IMGs.
2013/14
2 The data for oncologists include all active physicians (MDs and DOs, excluding residents/fellows) who specified hematology (HEM),
hematology/oncology (HO), or medical oncology (ON) as their primary specialty on the AMA Census of Physicians. This is a subset of total active
physicians.
0
10
20
30
40
50
60
70
80
90
100
2004 2005 2006 2007 2008 2009 2010 2011 2012 2013/14
Per
cen
t
All Physicians
Oncologists(Composite)
2
- 13 -
Key Trends in Tracking Supply of and Demand for Oncologists
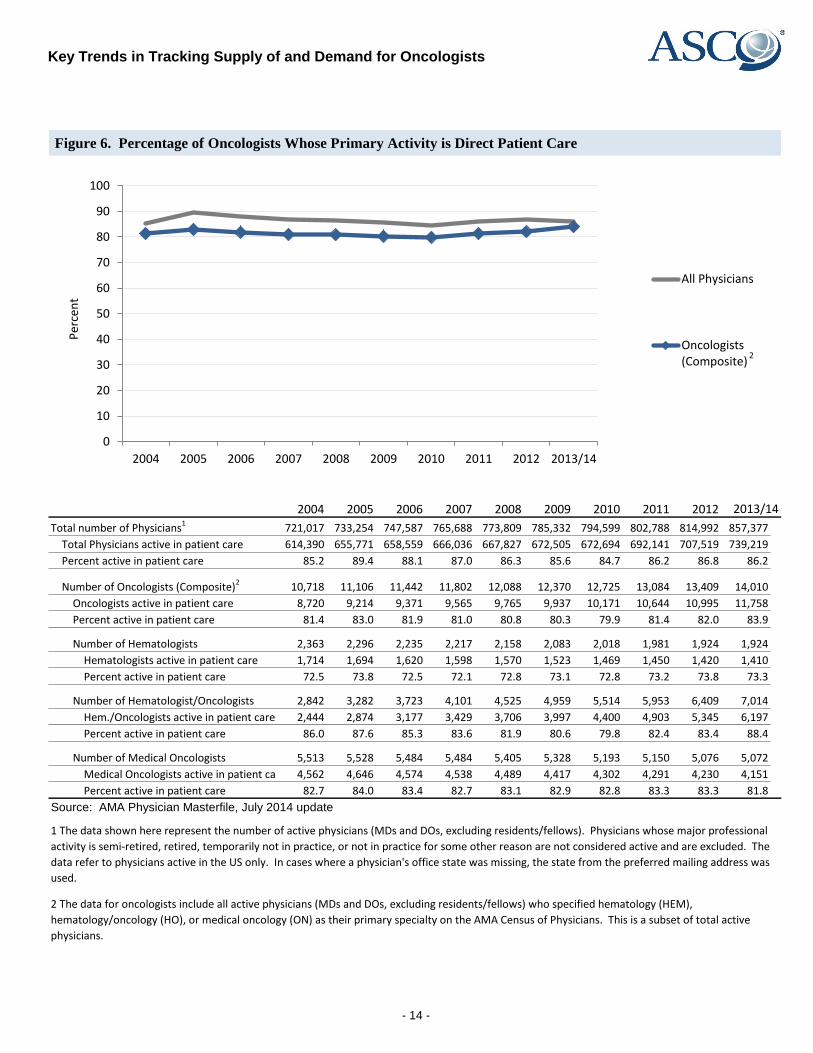
Figure 6. Percentage of Oncologists Whose Primary Activity is Direct Patient Care
2004 2005 2006 2007 2008 2009 2010 2011 2012
Total number of Physicians1 721,017 733,254 747,587 765,688 773,809 785,332 794,599 802,788 814,992 857,377
Total Physicians active in patient care 614,390 655,771 658,559 666,036 667,827 672,505 672,694 692,141 707,519 739,219
Percent active in patient care 85.2 89.4 88.1 87.0 86.3 85.6 84.7 86.2 86.8 86.2
Number of Oncologists (Composite)2 10,718 11,106 11,442 11,802 12,088 12,370 12,725 13,084 13,409 14,010
Oncologists active in patient care 8,720 9,214 9,371 9,565 9,765 9,937 10,171 10,644 10,995 11,758
Percent active in patient care 81.4 83.0 81.9 81.0 80.8 80.3 79.9 81.4 82.0 83.9
Number of Hematologists 2,363 2,296 2,235 2,217 2,158 2,083 2,018 1,981 1,924 1,924
Hematologists active in patient care 1,714 1,694 1,620 1,598 1,570 1,523 1,469 1,450 1,420 1,410
Percent active in patient care 72.5 73.8 72.5 72.1 72.8 73.1 72.8 73.2 73.8 73.3
Number of Hematologist/Oncologists 2,842 3,282 3,723 4,101 4,525 4,959 5,514 5,953 6,409 7,014
Hem./Oncologists active in patient care 2,444 2,874 3,177 3,429 3,706 3,997 4,400 4,903 5,345 6,197
Percent active in patient care 86.0 87.6 85.3 83.6 81.9 80.6 79.8 82.4 83.4 88.4
Number of Medical Oncologists 5,513 5,528 5,484 5,484 5,405 5,328 5,193 5,150 5,076 5,072
Medical Oncologists active in patient care 4,562 4,646 4,574 4,538 4,489 4,417 4,302 4,291 4,230 4,151
Percent active in patient care 82.7 84.0 83.4 82.7 83.1 82.9 82.8 83.3 83.3 81.8
Source: AMA Physician Masterfile, July 2014 update
2013/14
1 The data shown here represent the number of active physicians (MDs and DOs, excluding residents/fellows). Physicians whose major professional
activity is semi-retired, retired, temporarily not in practice, or not in practice for some other reason are not considered active and are excluded. The
data refer to physicians active in the US only. In cases where a physician's office state was missing, the state from the preferred mailing address was
used.
2 The data for oncologists include all active physicians (MDs and DOs, excluding residents/fellows) who specified hematology (HEM),
hematology/oncology (HO), or medical oncology (ON) as their primary specialty on the AMA Census of Physicians. This is a subset of total active
physicians.
0
10
20
30
40
50
60
70
80
90
100
2004 2005 2006 2007 2008 2009 2010 2011 2012 2013/14
Per
cen
t
All Physicians
Oncologists(Composite)
2
- 14 -
Key Trends in Tracking Supply of and Demand for Oncologists
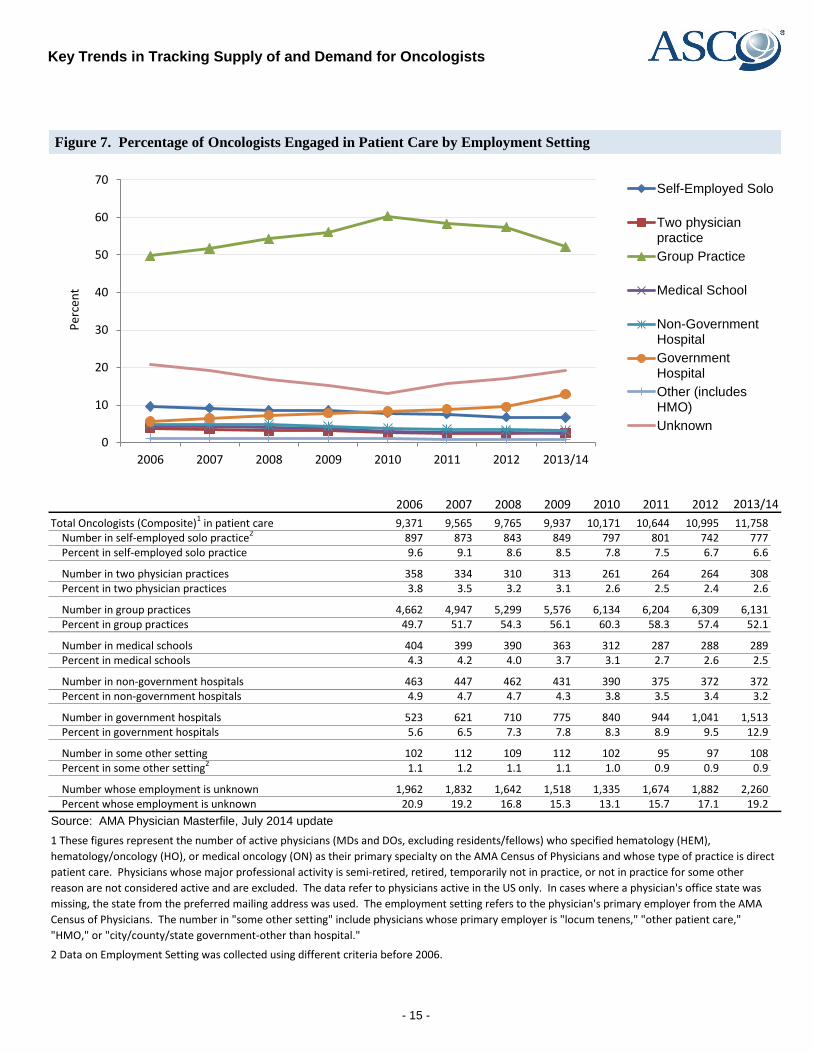
Figure 7. Percentage of Oncologists Engaged in Patient Care by Employment Setting
2006 2007 2008 2009 2010 2011 2012
Total Oncologists (Composite)1 in patient care 9,371 9,565 9,765 9,937 10,171 10,644 10,995 11,758Number in self-employed solo practice2 897 873 843 849 797 801 742 777Percent in self-employed solo practice 9.6 9.1 8.6 8.5 7.8 7.5 6.7 6.6
Number in two physician practices 358 334 310 313 261 264 264 308Percent in two physician practices 3.8 3.5 3.2 3.1 2.6 2.5 2.4 2.6
Number in group practices 4,662 4,947 5,299 5,576 6,134 6,204 6,309 6,131Percent in group practices 49.7 51.7 54.3 56.1 60.3 58.3 57.4 52.1
Number in medical schools 404 399 390 363 312 287 288 289Percent in medical schools 4.3 4.2 4.0 3.7 3.1 2.7 2.6 2.5
Number in non-government hospitals 463 447 462 431 390 375 372 372Percent in non-government hospitals 4.9 4.7 4.7 4.3 3.8 3.5 3.4 3.2
Number in government hospitals 523 621 710 775 840 944 1,041 1,513Percent in government hospitals 5.6 6.5 7.3 7.8 8.3 8.9 9.5 12.9
Number in some other setting 102 112 109 112 102 95 97 108Percent in some other setting2 1.1 1.2 1.1 1.1 1.0 0.9 0.9 0.9
Number whose employment is unknown 1,962 1,832 1,642 1,518 1,335 1,674 1,882 2,260Percent whose employment is unknown 20.9 19.2 16.8 15.3 13.1 15.7 17.1 19.2
Source: AMA Physician Masterfile, July 2014 update
2 Data on Employment Setting was collected using different criteria before 2006.
1 These figures represent the number of active physicians (MDs and DOs, excluding residents/fellows) who specified hematology (HEM),
hematology/oncology (HO), or medical oncology (ON) as their primary specialty on the AMA Census of Physicians and whose type of practice is direct
patient care. Physicians whose major professional activity is semi-retired, retired, temporarily not in practice, or not in practice for some other
reason are not considered active and are excluded. The data refer to physicians active in the US only. In cases where a physician's office state was
missing, the state from the preferred mailing address was used. The employment setting refers to the physician's primary employer from the AMA
Census of Physicians. The number in "some other setting" include physicians whose primary employer is "locum tenens," "other patient care,"
"HMO," or "city/county/state government-other than hospital."
2013/14
0
10
20
30
40
50
60
70
2006 2007 2008 2009 2010 2011 2012 2013/14
Per
cen
t
Self-Employed Solo
Two physicianpractice
Group Practice
Medical School
Non-GovernmentHospital
GovernmentHospital
Other (includesHMO)
Unknown
- 15 -
Key Trends in Tracking Supply of and Demand for Oncologists
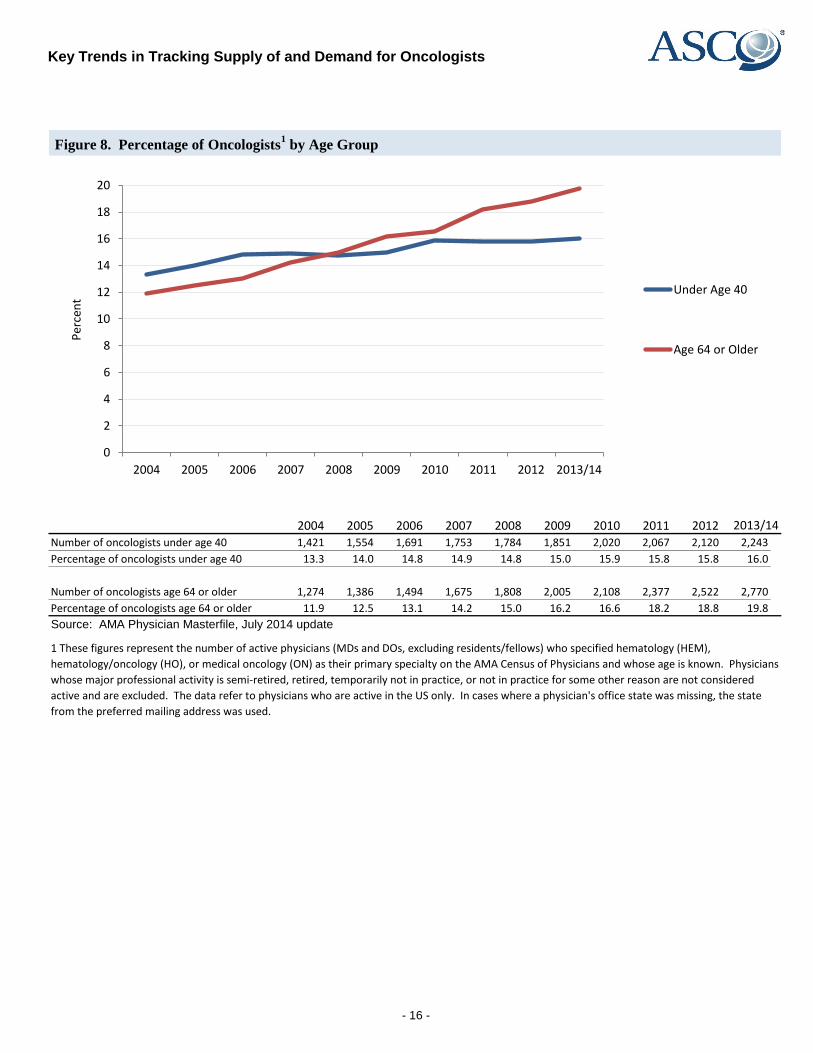
Figure 8. Percentage of Oncologists1 by Age Group
2004 2005 2006 2007 2008 2009 2010 2011 2012Number of oncologists under age 40 1,421 1,554 1,691 1,753 1,784 1,851 2,020 2,067 2,120 2,243
Percentage of oncologists under age 40 13.3 14.0 14.8 14.9 14.8 15.0 15.9 15.8 15.8 16.0
Number of oncologists age 64 or older 1,274 1,386 1,494 1,675 1,808 2,005 2,108 2,377 2,522 2,770
Percentage of oncologists age 64 or older 11.9 12.5 13.1 14.2 15.0 16.2 16.6 18.2 18.8 19.8
Source: AMA Physician Masterfile, July 2014 update
2013/14
1 These figures represent the number of active physicians (MDs and DOs, excluding residents/fellows) who specified hematology (HEM),
hematology/oncology (HO), or medical oncology (ON) as their primary specialty on the AMA Census of Physicians and whose age is known. Physicians
whose major professional activity is semi-retired, retired, temporarily not in practice, or not in practice for some other reason are not considered
active and are excluded. The data refer to physicians who are active in the US only. In cases where a physician's office state was missing, the state
from the preferred mailing address was used.
0
2
4
6
8
10
12
14
16
18
20
2004 2005 2006 2007 2008 2009 2010 2011 2012 2013/14
Per
cen
t
Under Age 40
Age 64 or Older
- 16 -
Key Trends in Tracking Supply of and Demand for Oncologists
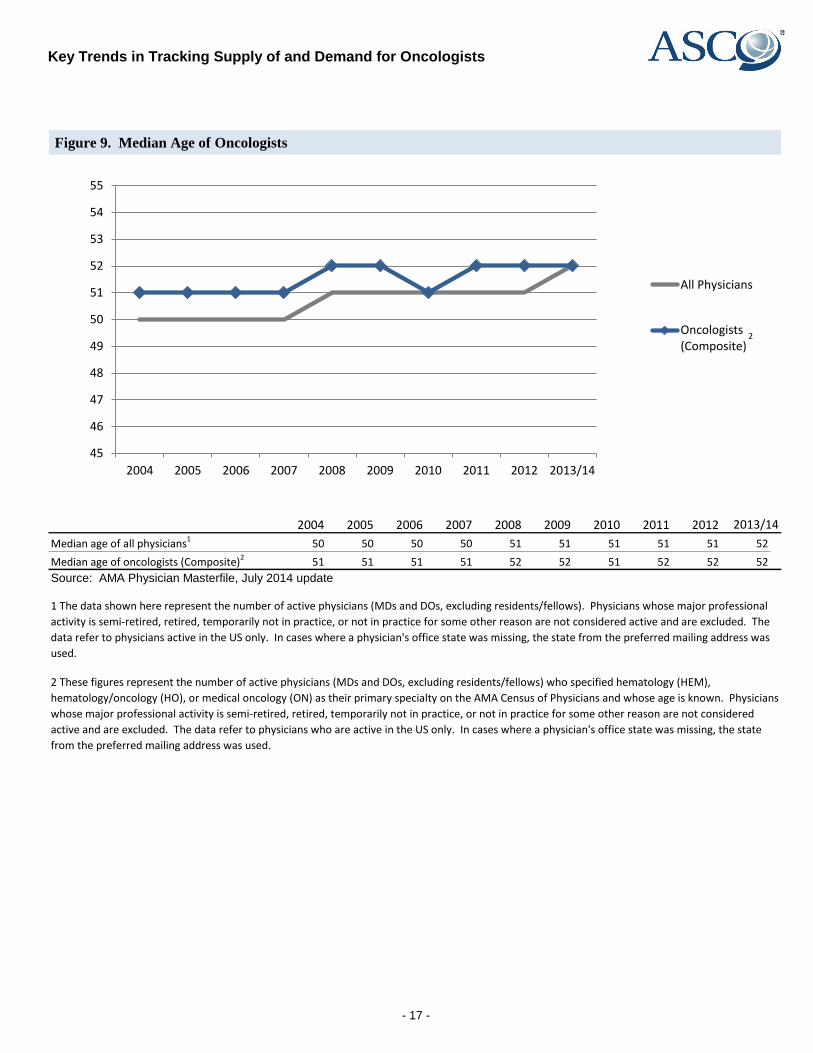
Figure 9. Median Age of Oncologists
2004 2005 2006 2007 2008 2009 2010 2011 2012
Median age of all physicians1 50 50 50 50 51 51 51 51 51 52
Median age of oncologists (Composite)2 51 51 51 51 52 52 51 52 52 52
Source: AMA Physician Masterfile, July 2014 update
1 The data shown here represent the number of active physicians (MDs and DOs, excluding residents/fellows). Physicians whose major professional
activity is semi-retired, retired, temporarily not in practice, or not in practice for some other reason are not considered active and are excluded. The
data refer to physicians active in the US only. In cases where a physician's office state was missing, the state from the preferred mailing address was
used.
2 These figures represent the number of active physicians (MDs and DOs, excluding residents/fellows) who specified hematology (HEM),
hematology/oncology (HO), or medical oncology (ON) as their primary specialty on the AMA Census of Physicians and whose age is known. Physicians
whose major professional activity is semi-retired, retired, temporarily not in practice, or not in practice for some other reason are not considered
active and are excluded. The data refer to physicians who are active in the US only. In cases where a physician's office state was missing, the state
from the preferred mailing address was used.
2013/14
45
46
47
48
49
50
51
52
53
54
55
2004 2005 2006 2007 2008 2009 2010 2011 2012 2013/14
All Physicians
Oncologists(Composite)
2
- 17 -
Key Trends in Tracking Supply of and Demand for Oncologists
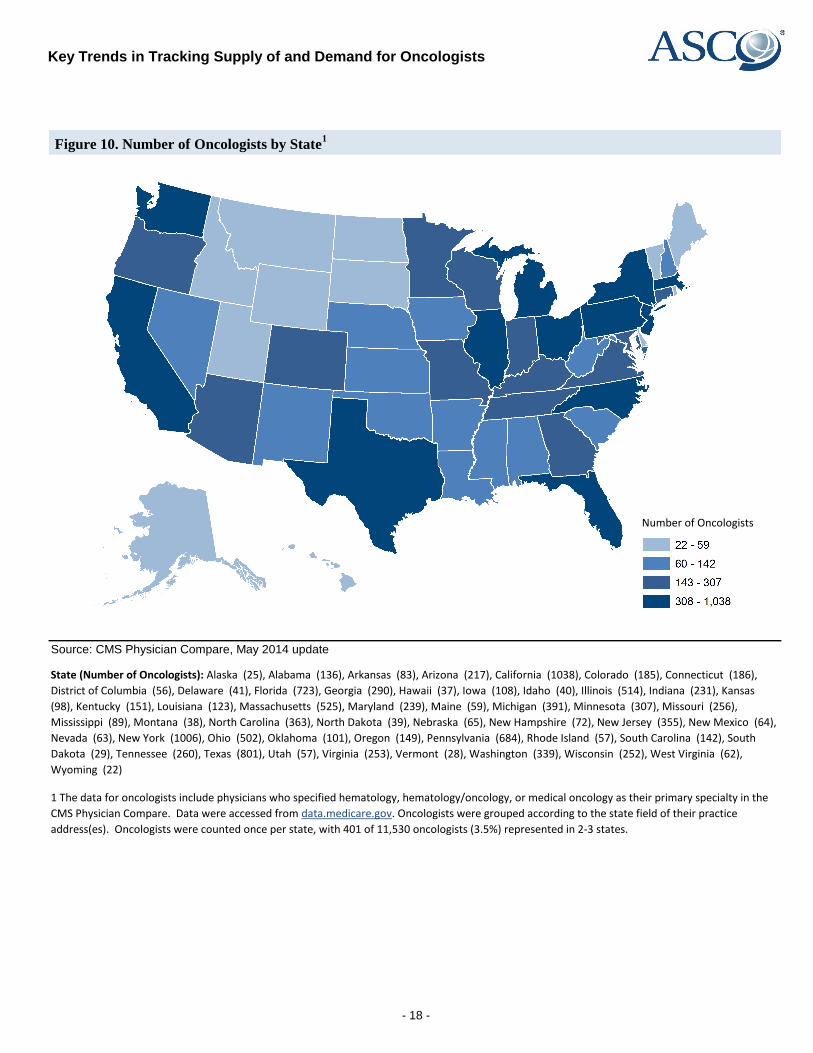
Figure 10. Number of Oncologists by State1
Source: CMS Physician Compare, May 2014 update
1 The data for oncologists include physicians who specified hematology, hematology/oncology, or medical oncology as their primary specialty in the
CMS Physician Compare. Data were accessed from data.medicare.gov. Oncologists were grouped according to the state field of their practice
address(es). Oncologists were counted once per state, with 401 of 11,530 oncologists (3.5%) represented in 2-3 states.
State (Number of Oncologists): Alaska (25), Alabama (136), Arkansas (83), Arizona (217), California (1038), Colorado (185), Connecticut (186),
District of Columbia (56), Delaware (41), Florida (723), Georgia (290), Hawaii (37), Iowa (108), Idaho (40), Illinois (514), Indiana (231), Kansas
(98), Kentucky (151), Louisiana (123), Massachusetts (525), Maryland (239), Maine (59), Michigan (391), Minnesota (307), Missouri (256),
Mississippi (89), Montana (38), North Carolina (363), North Dakota (39), Nebraska (65), New Hampshire (72), New Jersey (355), New Mexico (64),
Nevada (63), New York (1006), Ohio (502), Oklahoma (101), Oregon (149), Pennsylvania (684), Rhode Island (57), South Carolina (142), South
Dakota (29), Tennessee (260), Texas (801), Utah (57), Virginia (253), Vermont (28), Washington (339), Wisconsin (252), West Virginia (62),
Wyoming (22)
- 18 -
Number of Oncologists

Key Trends in Tracking Supply of and Demand for Oncologists
Figure 11. Oncologists per 100,000 Residents Age 55 Years and Older1,2
Sources: CMS Physician Compare (May 2014 update), U.S. Census Bureau TIGER/Line® Shapefiles
1 The data for oncologists include physicians who specified hematology, hematology/oncology, or medical oncology as their primary specialty in the
CMS Physician Compare. Data were accessed from data.medicare.gov. Oncologists were grouped according to the state field of their practice
address(es). Oncologists were counted once per state, with 401 of 11,530 oncologists (3.5%) represented in 2-3 states.
2 The data were normalized using population statitics from the 2010 Decenniel Census administered by the U.S. Census Bureau. Geographic shapefiles
of these data were accessed from census.gov/geo/maps-data/data/tiger-line.html. Residents age 55 years and older were chosen for normalization
because they account for more than 75% of new cancer cases (see seer.cancer.gov/statfacts/html/all.html).
- 19 -
Oncologists per 100,000Residents 55 and Older
Key Trends in Tracking Supply of and Demand for Oncologists
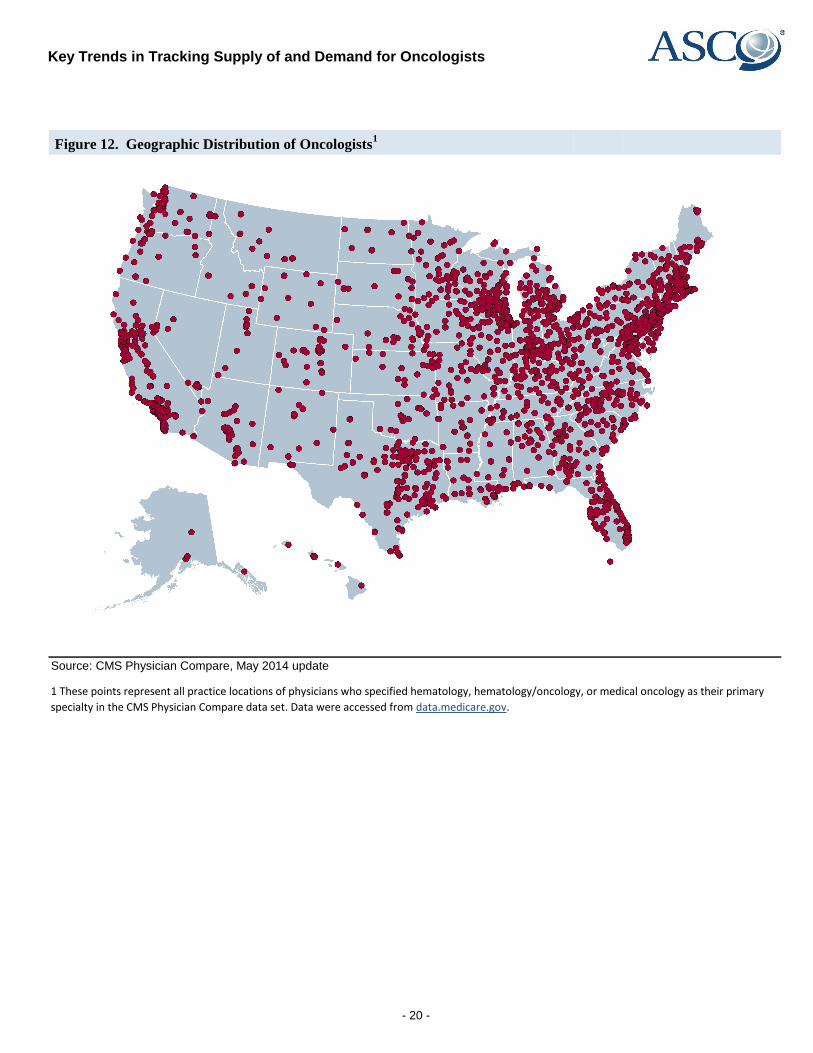
Figure 12. Geographic Distribution of Oncologists1
Source: CMS Physician Compare, May 2014 update
1 These points represent all practice locations of physicians who specified hematology, hematology/oncology, or medical oncology as their primary
specialty in the CMS Physician Compare data set. Data were accessed from data.medicare.gov.
- 20 -
Key Trends in Tracking Supply of and Demand for Oncologists
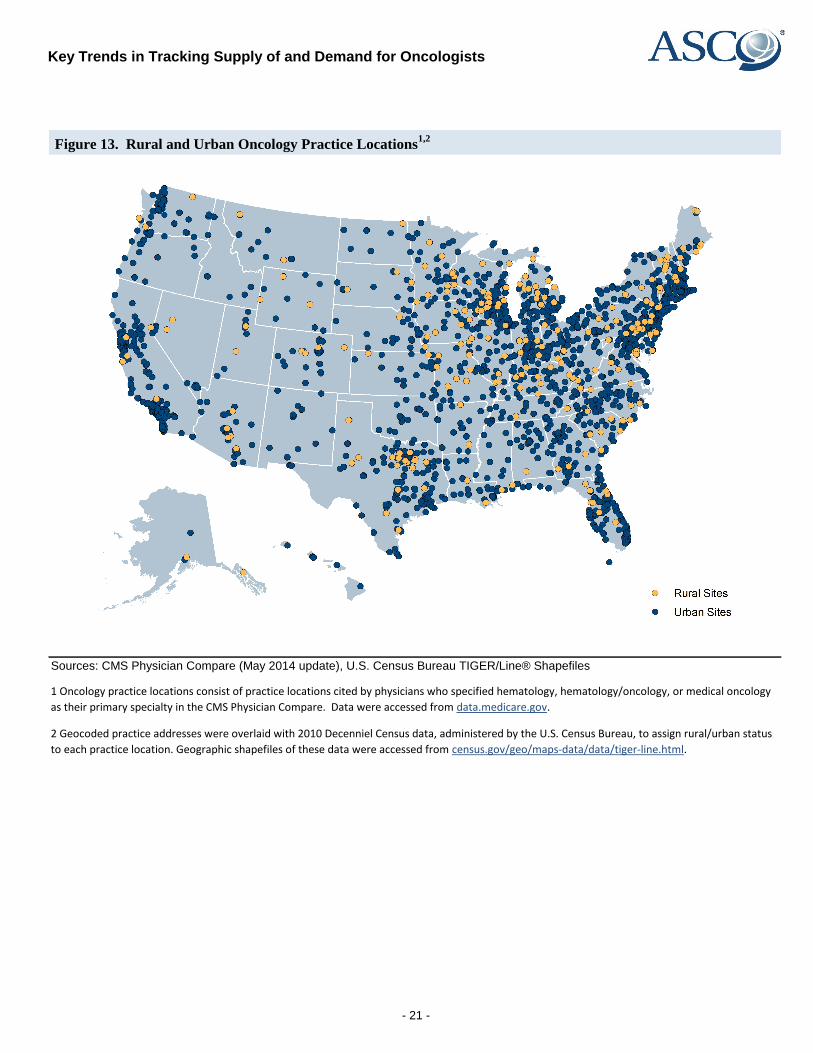
Figure 13. Rural and Urban Oncology Practice Locations1,2
Sources: CMS Physician Compare (May 2014 update), U.S. Census Bureau TIGER/Line® Shapefiles
1 Oncology practice locations consist of practice locations cited by physicians who specified hematology, hematology/oncology, or medical oncology
as their primary specialty in the CMS Physician Compare. Data were accessed from data.medicare.gov.
2 Geocoded practice addresses were overlaid with 2010 Decenniel Census data, administered by the U.S. Census Bureau, to assign rural/urban status
to each practice location. Geographic shapefiles of these data were accessed from census.gov/geo/maps-data/data/tiger-line.html.
- 21 -
Key Trends in Tracking Supply of and Demand for Oncologists
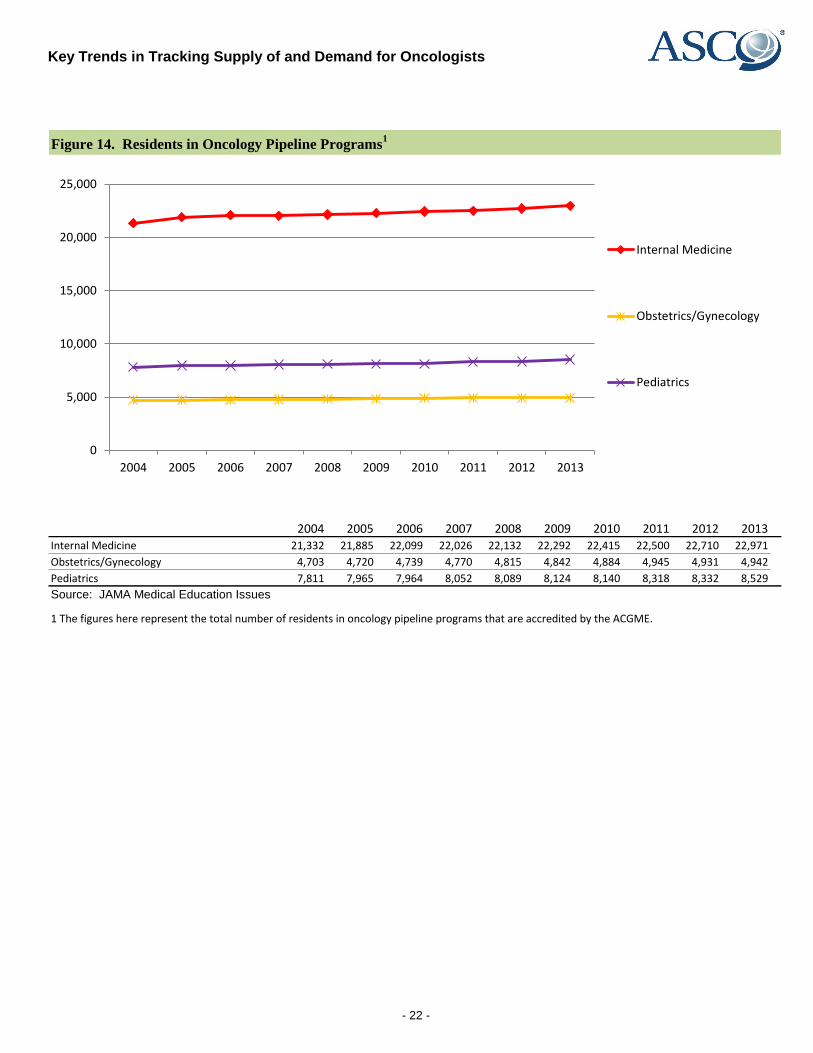
Figure 14. Residents in Oncology Pipeline Programs1
2004 2005 2006 2007 2008 2009 2010 2011 2012 2013Internal Medicine 21,332 21,885 22,099 22,026 22,132 22,292 22,415 22,500 22,710 22,971
Obstetrics/Gynecology 4,703 4,720 4,739 4,770 4,815 4,842 4,884 4,945 4,931 4,942
Pediatrics 7,811 7,965 7,964 8,052 8,089 8,124 8,140 8,318 8,332 8,529
Source: JAMA Medical Education Issues
1 The figures here represent the total number of residents in oncology pipeline programs that are accredited by the ACGME.
0
5,000
10,000
15,000
20,000
25,000
2004 2005 2006 2007 2008 2009 2010 2011 2012 2013
Internal Medicine
Obstetrics/Gynecology
Pediatrics
- 22 -
Key Trends in Tracking Supply of and Demand for Oncologists
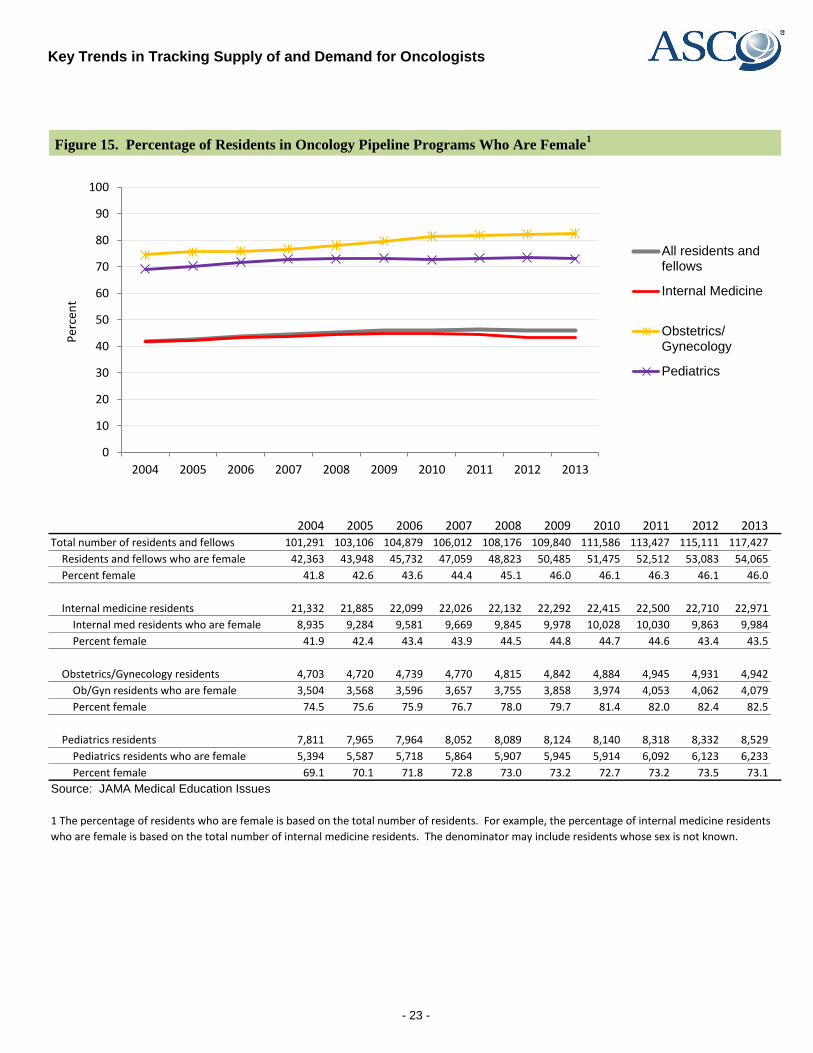
Figure 15. Percentage of Residents in Oncology Pipeline Programs Who Are Female1
2004 2005 2006 2007 2008 2009 2010 2011 2012 2013Total number of residents and fellows 101,291 103,106 104,879 106,012 108,176 109,840 111,586 113,427 115,111 117,427
Residents and fellows who are female 42,363 43,948 45,732 47,059 48,823 50,485 51,475 52,512 53,083 54,065
Percent female 41.8 42.6 43.6 44.4 45.1 46.0 46.1 46.3 46.1 46.0
Internal medicine residents 21,332 21,885 22,099 22,026 22,132 22,292 22,415 22,500 22,710 22,971
Internal med residents who are female 8,935 9,284 9,581 9,669 9,845 9,978 10,028 10,030 9,863 9,984
Percent female 41.9 42.4 43.4 43.9 44.5 44.8 44.7 44.6 43.4 43.5
Obstetrics/Gynecology residents 4,703 4,720 4,739 4,770 4,815 4,842 4,884 4,945 4,931 4,942
Ob/Gyn residents who are female 3,504 3,568 3,596 3,657 3,755 3,858 3,974 4,053 4,062 4,079
Percent female 74.5 75.6 75.9 76.7 78.0 79.7 81.4 82.0 82.4 82.5
Pediatrics residents 7,811 7,965 7,964 8,052 8,089 8,124 8,140 8,318 8,332 8,529
Pediatrics residents who are female 5,394 5,587 5,718 5,864 5,907 5,945 5,914 6,092 6,123 6,233
Percent female 69.1 70.1 71.8 72.8 73.0 73.2 72.7 73.2 73.5 73.1
Source: JAMA Medical Education Issues
1 The percentage of residents who are female is based on the total number of residents. For example, the percentage of internal medicine residents
who are female is based on the total number of internal medicine residents. The denominator may include residents whose sex is not known.
0
10
20
30
40
50
60
70
80
90
100
2004 2005 2006 2007 2008 2009 2010 2011 2012 2013
Per
cen
t
All residents andfellows
Internal Medicine
Obstetrics/Gynecology
Pediatrics
- 23 -
Key Trends in Tracking Supply of and Demand for Oncologists
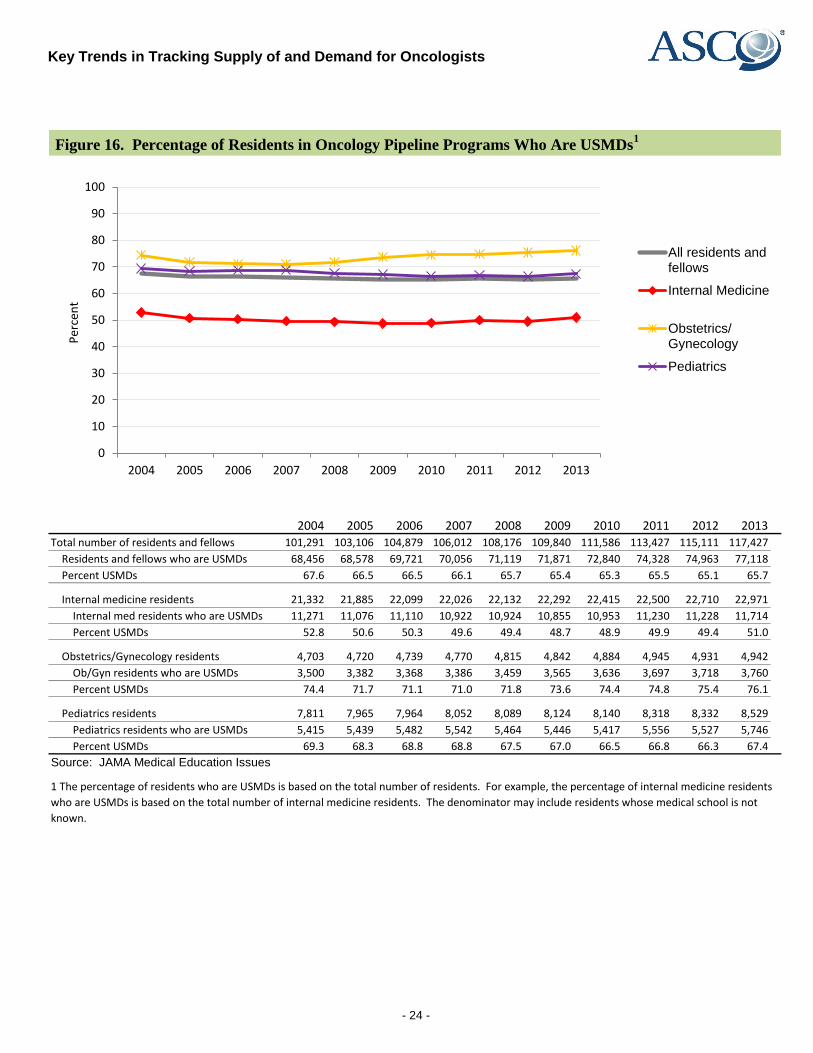
Figure 16. Percentage of Residents in Oncology Pipeline Programs Who Are USMDs1
2004 2005 2006 2007 2008 2009 2010 2011 2012 2013Total number of residents and fellows 101,291 103,106 104,879 106,012 108,176 109,840 111,586 113,427 115,111 117,427
Residents and fellows who are USMDs 68,456 68,578 69,721 70,056 71,119 71,871 72,840 74,328 74,963 77,118
Percent USMDs 67.6 66.5 66.5 66.1 65.7 65.4 65.3 65.5 65.1 65.7
Internal medicine residents 21,332 21,885 22,099 22,026 22,132 22,292 22,415 22,500 22,710 22,971
Internal med residents who are USMDs 11,271 11,076 11,110 10,922 10,924 10,855 10,953 11,230 11,228 11,714
Percent USMDs 52.8 50.6 50.3 49.6 49.4 48.7 48.9 49.9 49.4 51.0
Obstetrics/Gynecology residents 4,703 4,720 4,739 4,770 4,815 4,842 4,884 4,945 4,931 4,942
Ob/Gyn residents who are USMDs 3,500 3,382 3,368 3,386 3,459 3,565 3,636 3,697 3,718 3,760
Percent USMDs 74.4 71.7 71.1 71.0 71.8 73.6 74.4 74.8 75.4 76.1
Pediatrics residents 7,811 7,965 7,964 8,052 8,089 8,124 8,140 8,318 8,332 8,529
Pediatrics residents who are USMDs 5,415 5,439 5,482 5,542 5,464 5,446 5,417 5,556 5,527 5,746
Percent USMDs 69.3 68.3 68.8 68.8 67.5 67.0 66.5 66.8 66.3 67.4
Source: JAMA Medical Education Issues
1 The percentage of residents who are USMDs is based on the total number of residents. For example, the percentage of internal medicine residents
who are USMDs is based on the total number of internal medicine residents. The denominator may include residents whose medical school is not
known.
0
10
20
30
40
50
60
70
80
90
100
2004 2005 2006 2007 2008 2009 2010 2011 2012 2013
Per
cen
t
All residents andfellows
Internal Medicine
Obstetrics/Gynecology
Pediatrics
- 24 -
Key Trends in Tracking Supply of and Demand for Oncologists
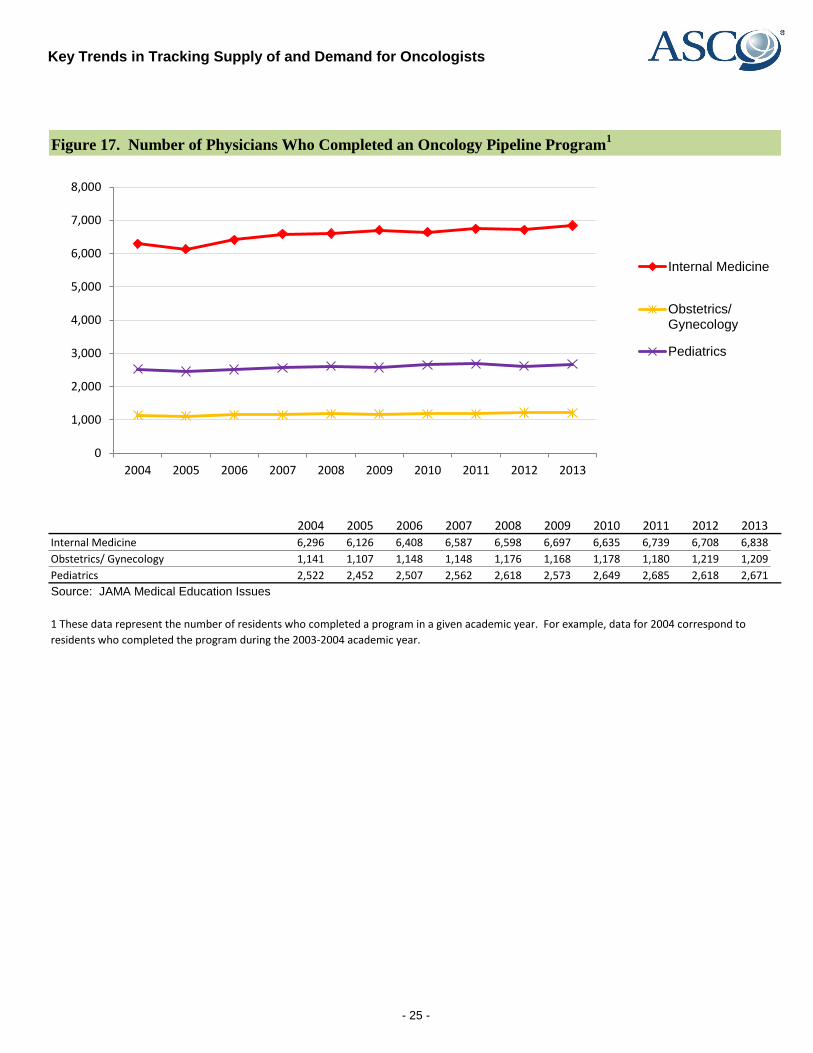
Figure 17. Number of Physicians Who Completed an Oncology Pipeline Program1
2004 2005 2006 2007 2008 2009 2010 2011 2012 2013Internal Medicine 6,296 6,126 6,408 6,587 6,598 6,697 6,635 6,739 6,708 6,838
Obstetrics/ Gynecology 1,141 1,107 1,148 1,148 1,176 1,168 1,178 1,180 1,219 1,209
Pediatrics 2,522 2,452 2,507 2,562 2,618 2,573 2,649 2,685 2,618 2,671
Source: JAMA Medical Education Issues
1 These data represent the number of residents who completed a program in a given academic year. For example, data for 2004 correspond to
residents who completed the program during the 2003-2004 academic year.
0
1,000
2,000
3,000
4,000
5,000
6,000
7,000
8,000
2004 2005 2006 2007 2008 2009 2010 2011 2012 2013
Internal Medicine
Obstetrics/Gynecology
Pediatrics
- 25 -
Key Trends in Tracking Supply of and Demand for Oncologists
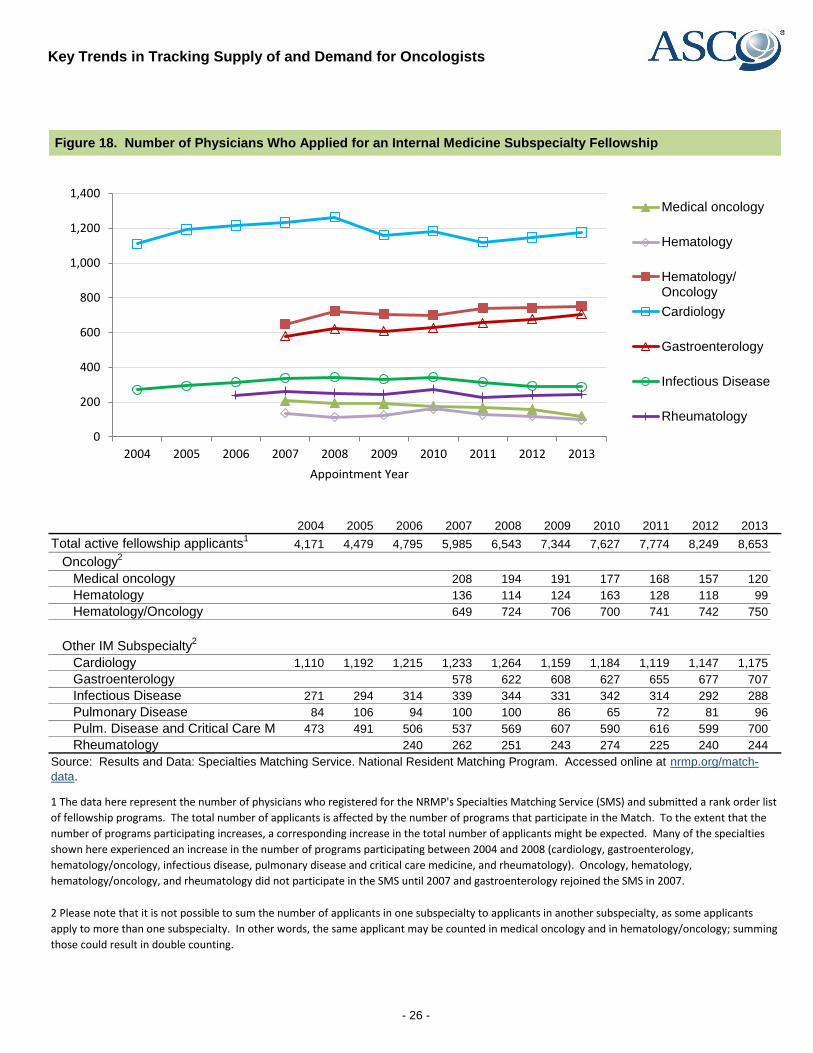
Figure 18. Number of Physicians Who Applied for an Internal Medicine Subspecialty Fellowship
2004 2005 2006 2007 2008 2009 2010 2011 2012 2013
Total active fellowship applicants1
4,171 4,479 4,795 5,985 6,543 7,344 7,627 7,774 8,249 8,653
Oncology2
Medical oncology 208 194 191 177 168 157 120
Hematology 136 114 124 163 128 118 99
Hematology/Oncology 649 724 706 700 741 742 750
Other IM Subspecialty2
Cardiology 1,110 1,192 1,215 1,233 1,264 1,159 1,184 1,119 1,147 1,175
Gastroenterology 578 622 608 627 655 677 707
Infectious Disease 271 294 314 339 344 331 342 314 292 288
Pulmonary Disease 84 106 94 100 100 86 65 72 81 96
Pulm. Disease and Critical Care Med. 473 491 506 537 569 607 590 616 599 700
Rheumatology 240 262 251 243 274 225 240 244
1 The data here represent the number of physicians who registered for the NRMP's Specialties Matching Service (SMS) and submitted a rank order list
of fellowship programs. The total number of applicants is affected by the number of programs that participate in the Match. To the extent that the
number of programs participating increases, a corresponding increase in the total number of applicants might be expected. Many of the specialties
shown here experienced an increase in the number of programs participating between 2004 and 2008 (cardiology, gastroenterology,
hematology/oncology, infectious disease, pulmonary disease and critical care medicine, and rheumatology). Oncology, hematology,
hematology/oncology, and rheumatology did not participate in the SMS until 2007 and gastroenterology rejoined the SMS in 2007.
2 Please note that it is not possible to sum the number of applicants in one subspecialty to applicants in another subspecialty, as some applicants
apply to more than one subspecialty. In other words, the same applicant may be counted in medical oncology and in hematology/oncology; summing
those could result in double counting.
Source: Results and Data: Specialties Matching Service. National Resident Matching Program. Accessed online at nrmp.org/match-
data.
0
200
400
600
800
1,000
1,200
1,400
2004 2005 2006 2007 2008 2009 2010 2011 2012 2013
Appointment Year
Medical oncology
Hematology
Hematology/Oncology
Cardiology
Gastroenterology
Infectious Disease
Rheumatology
- 26 -
Key Trends in Tracking Supply of and Demand for Oncologists
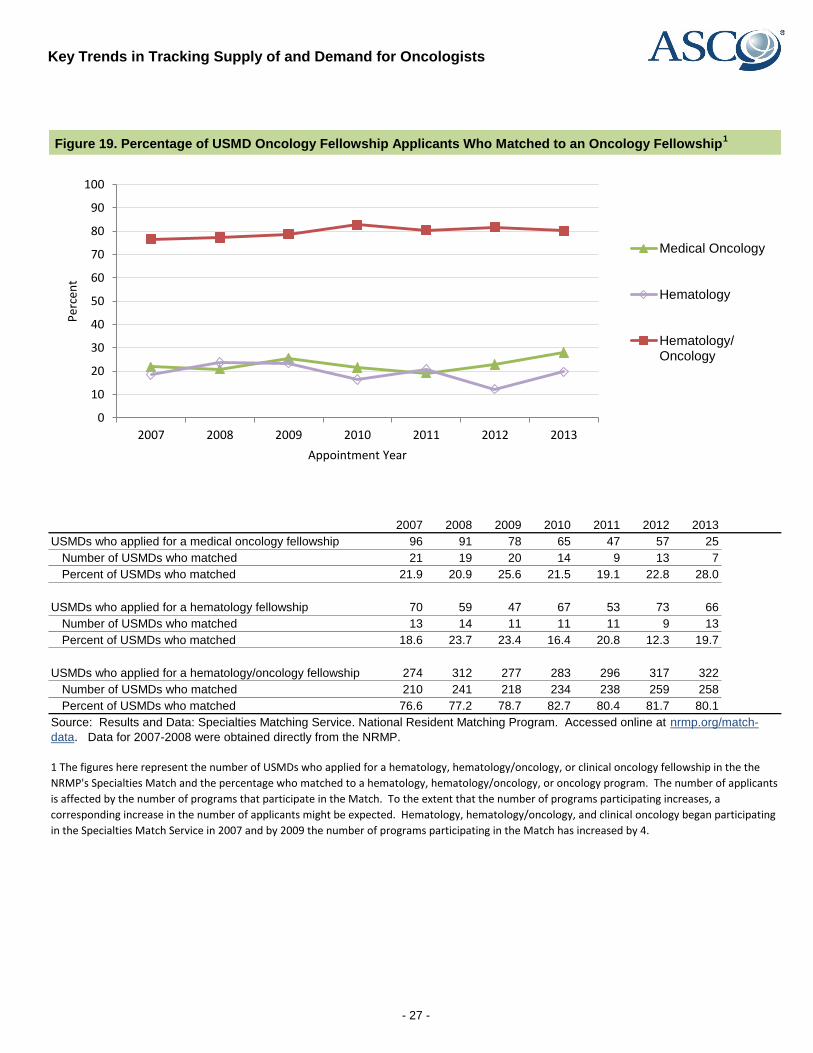
Figure 19. Percentage of USMD Oncology Fellowship Applicants Who Matched to an Oncology Fellowship1
2007 2008 2009 2010 2011 2012 2013
USMDs who applied for a medical oncology fellowship 96 91 78 65 47 57 25
Number of USMDs who matched 21 19 20 14 9 13 7
Percent of USMDs who matched 21.9 20.9 25.6 21.5 19.1 22.8 28.0
USMDs who applied for a hematology fellowship 70 59 47 67 53 73 66
Number of USMDs who matched 13 14 11 11 11 9 13
Percent of USMDs who matched 18.6 23.7 23.4 16.4 20.8 12.3 19.7
USMDs who applied for a hematology/oncology fellowship 274 312 277 283 296 317 322
Number of USMDs who matched 210 241 218 234 238 259 258
Percent of USMDs who matched 76.6 77.2 78.7 82.7 80.4 81.7 80.1
Source: Results and Data: Specialties Matching Service. National Resident Matching Program. Accessed online at nrmp.org/match-
data. Data for 2007-2008 were obtained directly from the NRMP.
1 The figures here represent the number of USMDs who applied for a hematology, hematology/oncology, or clinical oncology fellowship in the the
NRMP's Specialties Match and the percentage who matched to a hematology, hematology/oncology, or oncology program. The number of applicants
is affected by the number of programs that participate in the Match. To the extent that the number of programs participating increases, a
corresponding increase in the number of applicants might be expected. Hematology, hematology/oncology, and clinical oncology began participating
in the Specialties Match Service in 2007 and by 2009 the number of programs participating in the Match has increased by 4.
0
10
20
30
40
50
60
70
80
90
100
2007 2008 2009 2010 2011 2012 2013
Per
cen
t
Appointment Year
Medical Oncology
Hematology
Hematology/Oncology
- 27 -
Key Trends in Tracking Supply of and Demand for Oncologists
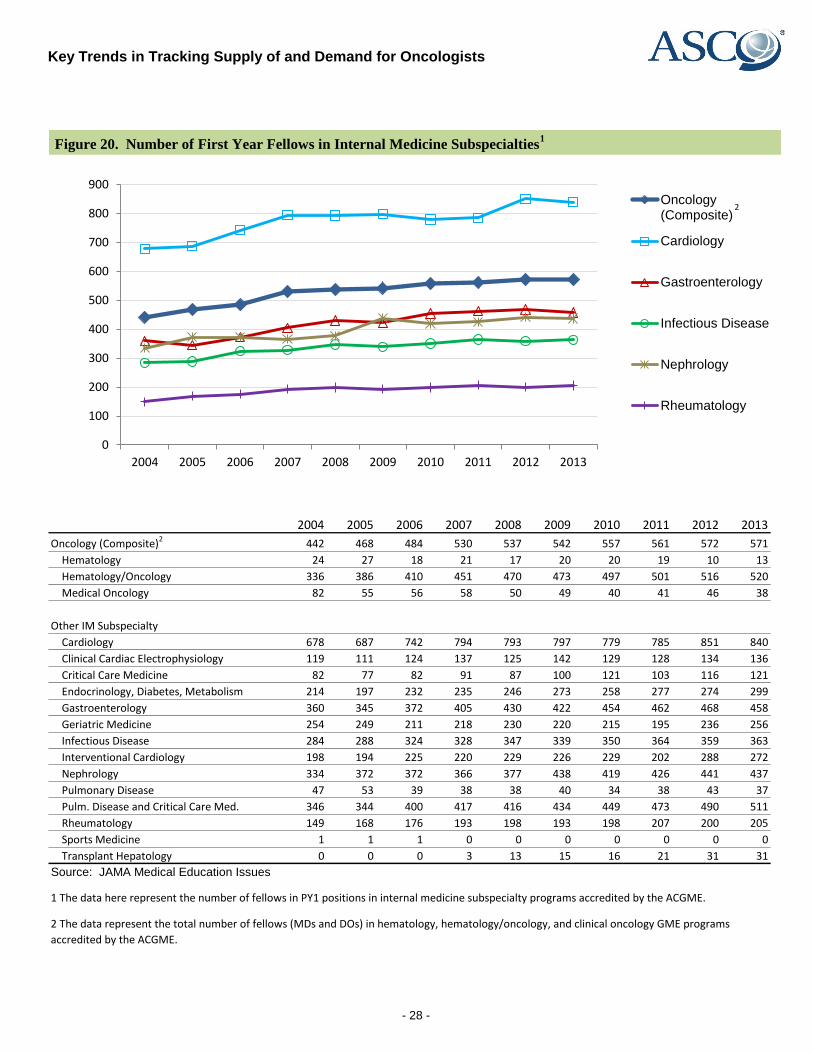
Figure 20. Number of First Year Fellows in Internal Medicine Subspecialties1
2004 2005 2006 2007 2008 2009 2010 2011 2012 2013
Oncology (Composite)2 442 468 484 530 537 542 557 561 572 571
Hematology 24 27 18 21 17 20 20 19 10 13
Hematology/Oncology 336 386 410 451 470 473 497 501 516 520
Medical Oncology 82 55 56 58 50 49 40 41 46 38
Other IM Subspecialty
Cardiology 678 687 742 794 793 797 779 785 851 840
Clinical Cardiac Electrophysiology 119 111 124 137 125 142 129 128 134 136
Critical Care Medicine 82 77 82 91 87 100 121 103 116 121
Endocrinology, Diabetes, Metabolism 214 197 232 235 246 273 258 277 274 299
Gastroenterology 360 345 372 405 430 422 454 462 468 458
Geriatric Medicine 254 249 211 218 230 220 215 195 236 256
Infectious Disease 284 288 324 328 347 339 350 364 359 363
Interventional Cardiology 198 194 225 220 229 226 229 202 288 272
Nephrology 334 372 372 366 377 438 419 426 441 437
Pulmonary Disease 47 53 39 38 38 40 34 38 43 37
Pulm. Disease and Critical Care Med. 346 344 400 417 416 434 449 473 490 511
Rheumatology 149 168 176 193 198 193 198 207 200 205
Sports Medicine 1 1 1 0 0 0 0 0 0 0
Transplant Hepatology 0 0 0 3 13 15 16 21 31 31
Source: JAMA Medical Education Issues
2 The data represent the total number of fellows (MDs and DOs) in hematology, hematology/oncology, and clinical oncology GME programs
accredited by the ACGME.
1 The data here represent the number of fellows in PY1 positions in internal medicine subspecialty programs accredited by the ACGME.
0
100
200
300
400
500
600
700
800
900
2004 2005 2006 2007 2008 2009 2010 2011 2012 2013
Oncology(Composite)
Cardiology
Gastroenterology
Infectious Disease
Nephrology
Rheumatology
2
- 28 -
Key Trends in Tracking Supply of and Demand for Oncologists
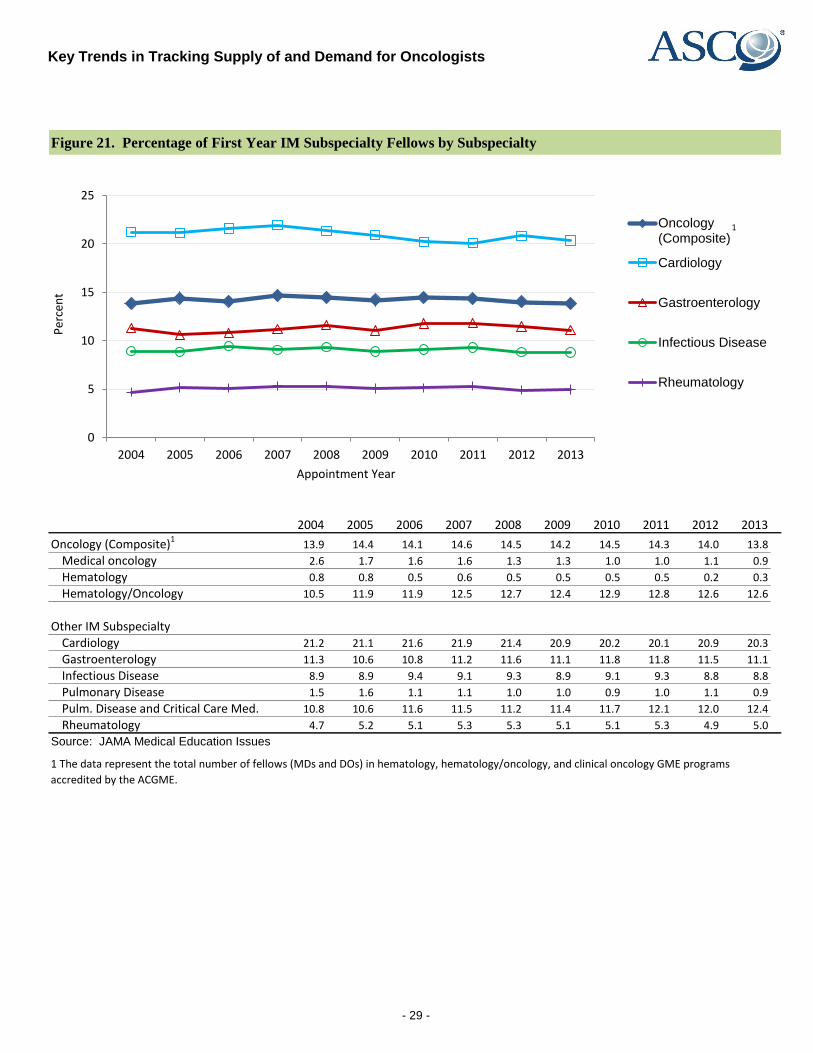
Figure 21. Percentage of First Year IM Subspecialty Fellows by Subspecialty
2004 2005 2006 2007 2008 2009 2010 2011 2012 2013
Oncology (Composite)113.9 14.4 14.1 14.6 14.5 14.2 14.5 14.3 14.0 13.8
Medical oncology 2.6 1.7 1.6 1.6 1.3 1.3 1.0 1.0 1.1 0.9
Hematology 0.8 0.8 0.5 0.6 0.5 0.5 0.5 0.5 0.2 0.3
Hematology/Oncology 10.5 11.9 11.9 12.5 12.7 12.4 12.9 12.8 12.6 12.6
Other IM SubspecialtyCardiology 21.2 21.1 21.6 21.9 21.4 20.9 20.2 20.1 20.9 20.3
Gastroenterology 11.3 10.6 10.8 11.2 11.6 11.1 11.8 11.8 11.5 11.1
Infectious Disease 8.9 8.9 9.4 9.1 9.3 8.9 9.1 9.3 8.8 8.8
Pulmonary Disease 1.5 1.6 1.1 1.1 1.0 1.0 0.9 1.0 1.1 0.9
Pulm. Disease and Critical Care Med. 10.8 10.6 11.6 11.5 11.2 11.4 11.7 12.1 12.0 12.4
Rheumatology 4.7 5.2 5.1 5.3 5.3 5.1 5.1 5.3 4.9 5.0
Source: JAMA Medical Education Issues
1 The data represent the total number of fellows (MDs and DOs) in hematology, hematology/oncology, and clinical oncology GME programs
accredited by the ACGME.
0
5
10
15
20
25
2004 2005 2006 2007 2008 2009 2010 2011 2012 2013
Per
cen
t
Appointment Year
Oncology(Composite)
Cardiology
Gastroenterology
Infectious Disease
Rheumatology
1
- 29 -
Key Trends in Tracking Supply of and Demand for Oncologists
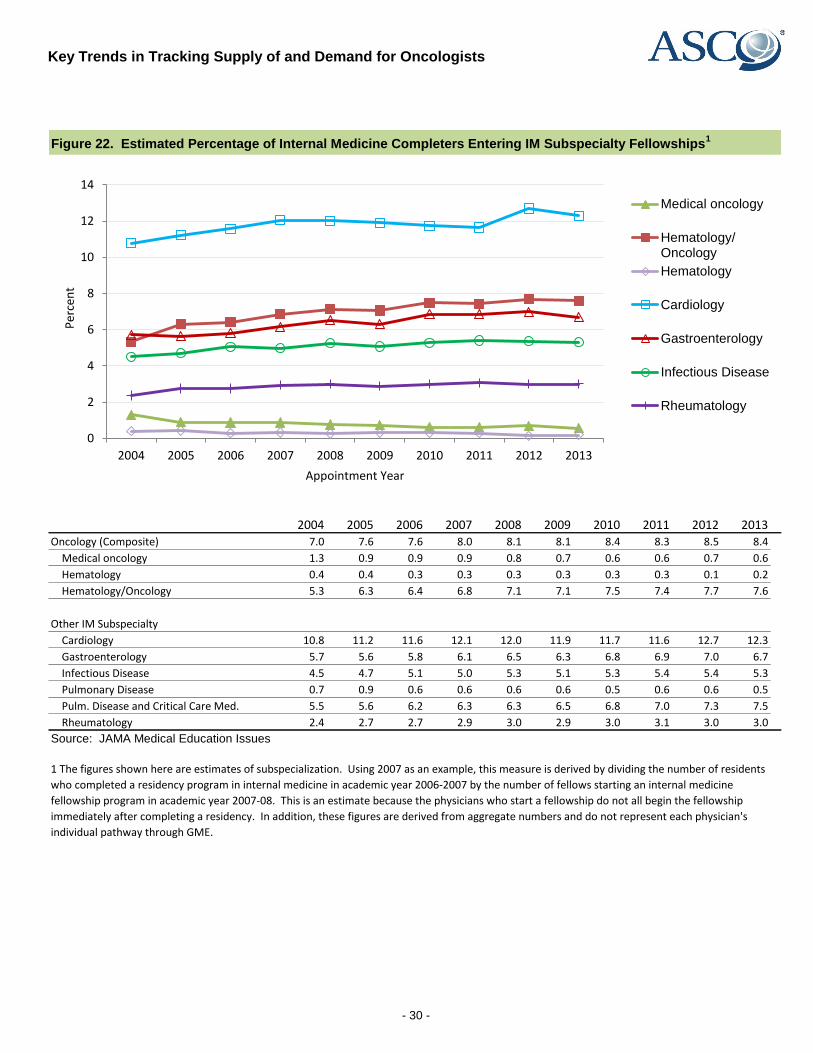
Figure 22. Estimated Percentage of Internal Medicine Completers Entering IM Subspecialty Fellowships1
2004 2005 2006 2007 2008 2009 2010 2011 2012 2013Oncology (Composite) 7.0 7.6 7.6 8.0 8.1 8.1 8.4 8.3 8.5 8.4
Medical oncology 1.3 0.9 0.9 0.9 0.8 0.7 0.6 0.6 0.7 0.6
Hematology 0.4 0.4 0.3 0.3 0.3 0.3 0.3 0.3 0.1 0.2
Hematology/Oncology 5.3 6.3 6.4 6.8 7.1 7.1 7.5 7.4 7.7 7.6
Other IM Subspecialty
Cardiology 10.8 11.2 11.6 12.1 12.0 11.9 11.7 11.6 12.7 12.3
Gastroenterology 5.7 5.6 5.8 6.1 6.5 6.3 6.8 6.9 7.0 6.7
Infectious Disease 4.5 4.7 5.1 5.0 5.3 5.1 5.3 5.4 5.4 5.3
Pulmonary Disease 0.7 0.9 0.6 0.6 0.6 0.6 0.5 0.6 0.6 0.5
Pulm. Disease and Critical Care Med. 5.5 5.6 6.2 6.3 6.3 6.5 6.8 7.0 7.3 7.5
Rheumatology 2.4 2.7 2.7 2.9 3.0 2.9 3.0 3.1 3.0 3.0
Source: JAMA Medical Education Issues
1 The figures shown here are estimates of subspecialization. Using 2007 as an example, this measure is derived by dividing the number of residents
who completed a residency program in internal medicine in academic year 2006-2007 by the number of fellows starting an internal medicine
fellowship program in academic year 2007-08. This is an estimate because the physicians who start a fellowship do not all begin the fellowship
immediately after completing a residency. In addition, these figures are derived from aggregate numbers and do not represent each physician's
individual pathway through GME.
0
2
4
6
8
10
12
14
2004 2005 2006 2007 2008 2009 2010 2011 2012 2013
Per
cen
t
Appointment Year
Medical oncology
Hematology/Oncology
Hematology
Cardiology
Gastroenterology
Infectious Disease
Rheumatology
- 30 -
Key Trends in Tracking Supply of and Demand for Oncologists
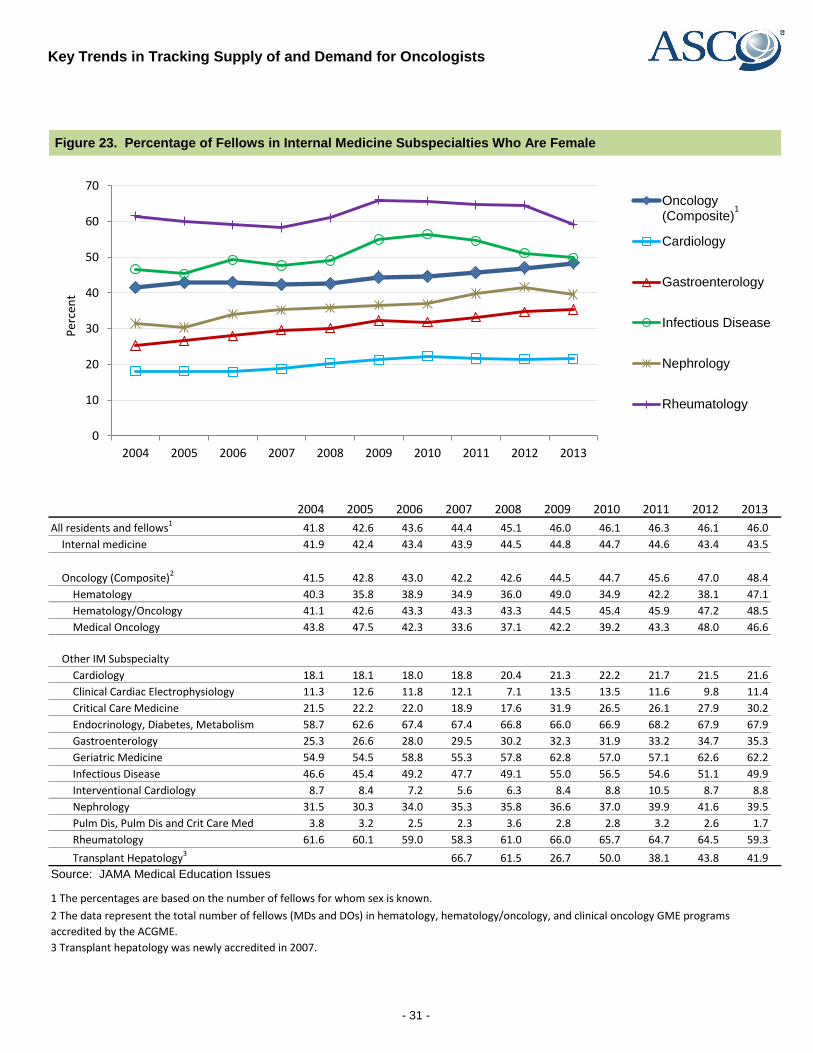
Figure 23. Percentage of Fellows in Internal Medicine Subspecialties Who Are Female
2004 2005 2006 2007 2008 2009 2010 2011 2012 2013
All residents and fellows1 41.8 42.6 43.6 44.4 45.1 46.0 46.1 46.3 46.1 46.0
Internal medicine 41.9 42.4 43.4 43.9 44.5 44.8 44.7 44.6 43.4 43.5
Oncology (Composite)2 41.5 42.8 43.0 42.2 42.6 44.5 44.7 45.6 47.0 48.4
Hematology 40.3 35.8 38.9 34.9 36.0 49.0 34.9 42.2 38.1 47.1
Hematology/Oncology 41.1 42.6 43.3 43.3 43.3 44.5 45.4 45.9 47.2 48.5
Medical Oncology 43.8 47.5 42.3 33.6 37.1 42.2 39.2 43.3 48.0 46.6
Other IM Subspecialty
Cardiology 18.1 18.1 18.0 18.8 20.4 21.3 22.2 21.7 21.5 21.6
Clinical Cardiac Electrophysiology 11.3 12.6 11.8 12.1 7.1 13.5 13.5 11.6 9.8 11.4
Critical Care Medicine 21.5 22.2 22.0 18.9 17.6 31.9 26.5 26.1 27.9 30.2
Endocrinology, Diabetes, Metabolism 58.7 62.6 67.4 67.4 66.8 66.0 66.9 68.2 67.9 67.9
Gastroenterology 25.3 26.6 28.0 29.5 30.2 32.3 31.9 33.2 34.7 35.3
Geriatric Medicine 54.9 54.5 58.8 55.3 57.8 62.8 57.0 57.1 62.6 62.2
Infectious Disease 46.6 45.4 49.2 47.7 49.1 55.0 56.5 54.6 51.1 49.9
Interventional Cardiology 8.7 8.4 7.2 5.6 6.3 8.4 8.8 10.5 8.7 8.8
Nephrology 31.5 30.3 34.0 35.3 35.8 36.6 37.0 39.9 41.6 39.5
Pulm Dis, Pulm Dis and Crit Care Med 3.8 3.2 2.5 2.3 3.6 2.8 2.8 3.2 2.6 1.7
Rheumatology 61.6 60.1 59.0 58.3 61.0 66.0 65.7 64.7 64.5 59.3
Transplant Hepatology3 66.7 61.5 26.7 50.0 38.1 43.8 41.9
Source: JAMA Medical Education Issues
1 The percentages are based on the number of fellows for whom sex is known.
3 Transplant hepatology was newly accredited in 2007.
2 The data represent the total number of fellows (MDs and DOs) in hematology, hematology/oncology, and clinical oncology GME programs
accredited by the ACGME.
0
10
20
30
40
50
60
70
2004 2005 2006 2007 2008 2009 2010 2011 2012 2013
Per
cen
t
Oncology(Composite)
Cardiology
Gastroenterology
Infectious Disease
Nephrology
Rheumatology
1
- 31 -
Key Trends in Tracking Supply of and Demand for Oncologists
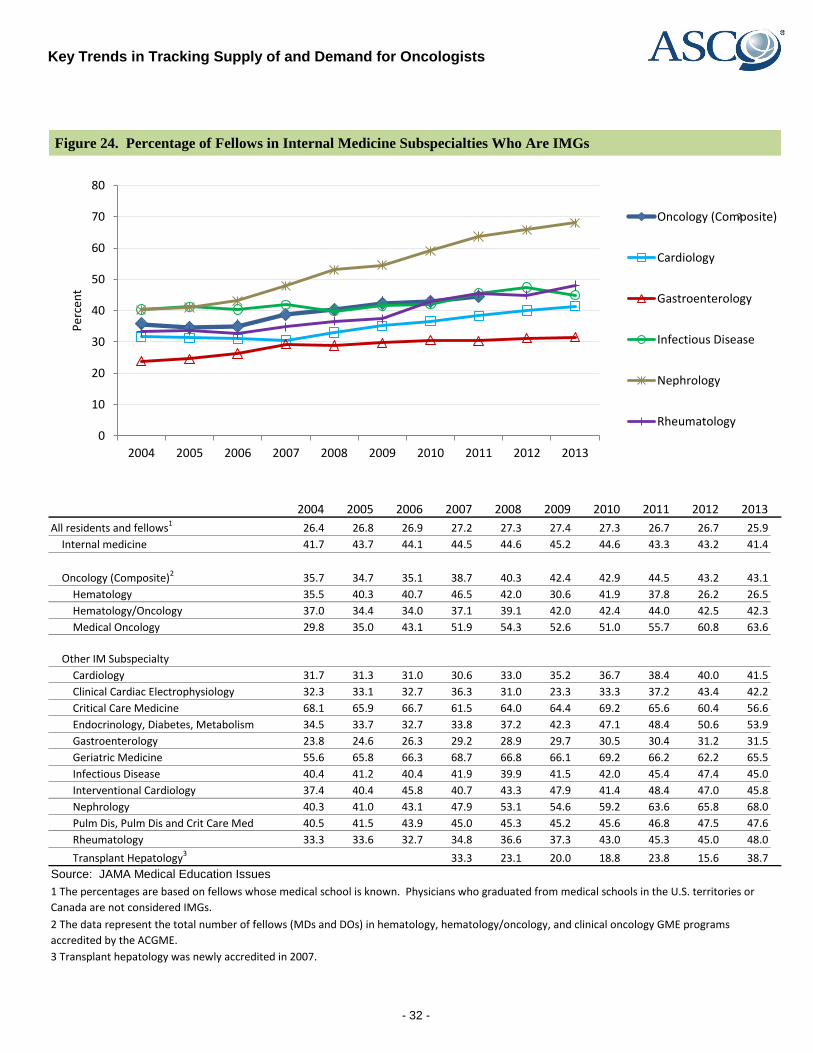
Figure 24. Percentage of Fellows in Internal Medicine Subspecialties Who Are IMGs
2004 2005 2006 2007 2008 2009 2010 2011 2012 2013
All residents and fellows1 26.4 26.8 26.9 27.2 27.3 27.4 27.3 26.7 26.7 25.9
Internal medicine 41.7 43.7 44.1 44.5 44.6 45.2 44.6 43.3 43.2 41.4
Oncology (Composite)2 35.7 34.7 35.1 38.7 40.3 42.4 42.9 44.5 43.2 43.1
Hematology 35.5 40.3 40.7 46.5 42.0 30.6 41.9 37.8 26.2 26.5
Hematology/Oncology 37.0 34.4 34.0 37.1 39.1 42.0 42.4 44.0 42.5 42.3
Medical Oncology 29.8 35.0 43.1 51.9 54.3 52.6 51.0 55.7 60.8 63.6
Other IM Subspecialty
Cardiology 31.7 31.3 31.0 30.6 33.0 35.2 36.7 38.4 40.0 41.5
Clinical Cardiac Electrophysiology 32.3 33.1 32.7 36.3 31.0 23.3 33.3 37.2 43.4 42.2
Critical Care Medicine 68.1 65.9 66.7 61.5 64.0 64.4 69.2 65.6 60.4 56.6
Endocrinology, Diabetes, Metabolism 34.5 33.7 32.7 33.8 37.2 42.3 47.1 48.4 50.6 53.9
Gastroenterology 23.8 24.6 26.3 29.2 28.9 29.7 30.5 30.4 31.2 31.5
Geriatric Medicine 55.6 65.8 66.3 68.7 66.8 66.1 69.2 66.2 62.2 65.5
Infectious Disease 40.4 41.2 40.4 41.9 39.9 41.5 42.0 45.4 47.4 45.0
Interventional Cardiology 37.4 40.4 45.8 40.7 43.3 47.9 41.4 48.4 47.0 45.8
Nephrology 40.3 41.0 43.1 47.9 53.1 54.6 59.2 63.6 65.8 68.0
Pulm Dis, Pulm Dis and Crit Care Med 40.5 41.5 43.9 45.0 45.3 45.2 45.6 46.8 47.5 47.6
Rheumatology 33.3 33.6 32.7 34.8 36.6 37.3 43.0 45.3 45.0 48.0
Transplant Hepatology3 33.3 23.1 20.0 18.8 23.8 15.6 38.7
Source: JAMA Medical Education Issues
3 Transplant hepatology was newly accredited in 2007.
1 The percentages are based on fellows whose medical school is known. Physicians who graduated from medical schools in the U.S. territories or
Canada are not considered IMGs.
2 The data represent the total number of fellows (MDs and DOs) in hematology, hematology/oncology, and clinical oncology GME programs
accredited by the ACGME.
0
10
20
30
40
50
60
70
80
2004 2005 2006 2007 2008 2009 2010 2011 2012 2013
Per
cen
t
Oncology (Composite)
Cardiology
Gastroenterology
Infectious Disease
Nephrology
Rheumatology
2
- 32 -
Key Trends in Tracking Supply of and Demand for Oncologists
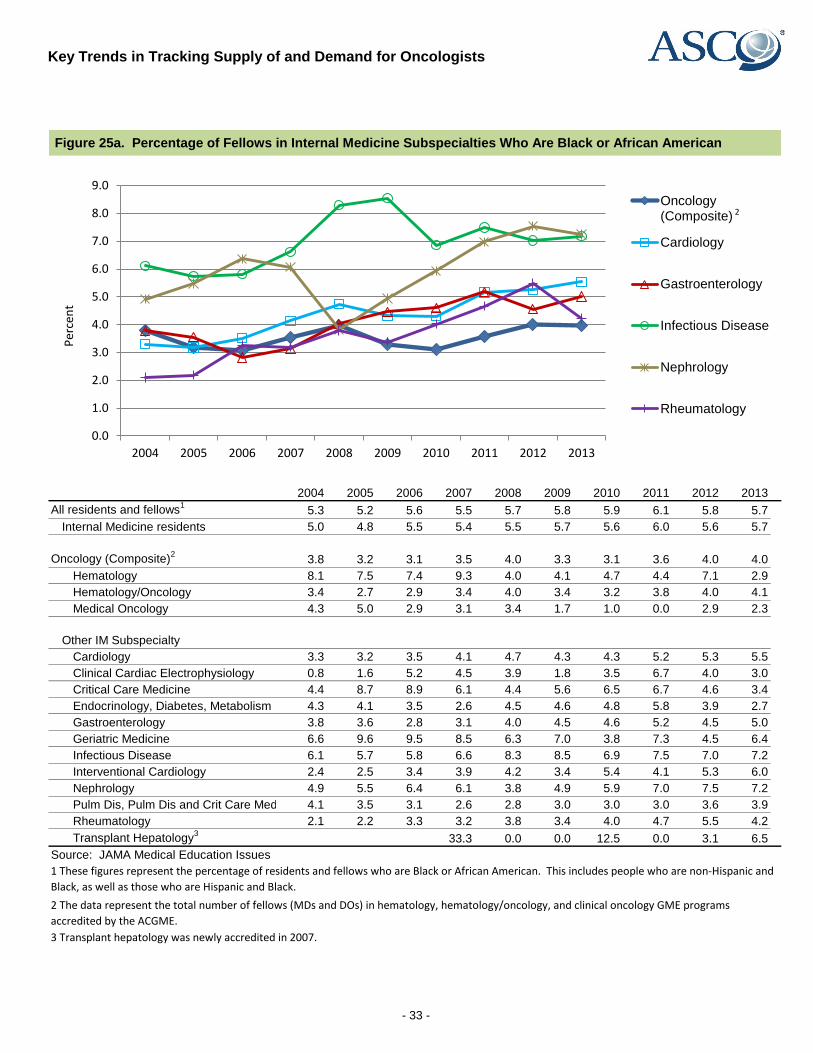
Figure 25a. Percentage of Fellows in Internal Medicine Subspecialties Who Are Black or African American
2004 2005 2006 2007 2008 2009 2010 2011 2012 2013
All residents and fellows1
5.3 5.2 5.6 5.5 5.7 5.8 5.9 6.1 5.8 5.7
Internal Medicine residents 5.0 4.8 5.5 5.4 5.5 5.7 5.6 6.0 5.6 5.7
Oncology (Composite)2
3.8 3.2 3.1 3.5 4.0 3.3 3.1 3.6 4.0 4.0
Hematology 8.1 7.5 7.4 9.3 4.0 4.1 4.7 4.4 7.1 2.9
Hematology/Oncology 3.4 2.7 2.9 3.4 4.0 3.4 3.2 3.8 4.0 4.1
Medical Oncology 4.3 5.0 2.9 3.1 3.4 1.7 1.0 0.0 2.9 2.3
Other IM Subspecialty
Cardiology 3.3 3.2 3.5 4.1 4.7 4.3 4.3 5.2 5.3 5.5
Clinical Cardiac Electrophysiology 0.8 1.6 5.2 4.5 3.9 1.8 3.5 6.7 4.0 3.0
Critical Care Medicine 4.4 8.7 8.9 6.1 4.4 5.6 6.5 6.7 4.6 3.4
Endocrinology, Diabetes, Metabolism 4.3 4.1 3.5 2.6 4.5 4.6 4.8 5.8 3.9 2.7
Gastroenterology 3.8 3.6 2.8 3.1 4.0 4.5 4.6 5.2 4.5 5.0
Geriatric Medicine 6.6 9.6 9.5 8.5 6.3 7.0 3.8 7.3 4.5 6.4
Infectious Disease 6.1 5.7 5.8 6.6 8.3 8.5 6.9 7.5 7.0 7.2
Interventional Cardiology 2.4 2.5 3.4 3.9 4.2 3.4 5.4 4.1 5.3 6.0
Nephrology 4.9 5.5 6.4 6.1 3.8 4.9 5.9 7.0 7.5 7.2
Pulm Dis, Pulm Dis and Crit Care Med 4.1 3.5 3.1 2.6 2.8 3.0 3.0 3.0 3.6 3.9
Rheumatology 2.1 2.2 3.3 3.2 3.8 3.4 4.0 4.7 5.5 4.2
Transplant Hepatology3
33.3 0.0 0.0 12.5 0.0 3.1 6.5
Source: JAMA Medical Education Issues
3 Transplant hepatology was newly accredited in 2007.
1 These figures represent the percentage of residents and fellows who are Black or African American. This includes people who are non-Hispanic and
Black, as well as those who are Hispanic and Black.
2 The data represent the total number of fellows (MDs and DOs) in hematology, hematology/oncology, and clinical oncology GME programs
accredited by the ACGME.
0.0
1.0
2.0
3.0
4.0
5.0
6.0
7.0
8.0
9.0
2004 2005 2006 2007 2008 2009 2010 2011 2012 2013
Per
cen
t
Oncology(Composite)
Cardiology
Gastroenterology
Infectious Disease
Nephrology
Rheumatology
2
- 33 -

Key Trends in Tracking Supply of and Demand for Oncologists
Figure 25b. Percentage of Residents/Fellows Who Are Black or African American
2004 2005 2006 2007 2008 2009 2010 2011 2012 2013Total residents and fellows 101,291 103,106 104,879 106,012 108,176 109,840 111,586 113,427 115,111 117,427
Residents and fellows who are Black1 5,330 5,371 5,855 5,823 6,172 6,345 6,533 6,908 6,626 6,685
Percent Black 5.3 5.2 5.6 5.5 5.7 5.8 5.9 6.1 5.8 5.7
14,676 17,029 13,464 16,037 13,889 11,258 10,617 6,544 10,490 9,595
Percent "Other/Unknown" 5.5 7.0 7.0 11.3 6.5 5.1 6.3 3.3 0.0 3.3
Internal Medicine residents 21,332 21,885 22,099 22,026 22,132 22,292 22,415 22,500 22,710 22,971
IM residents who are Black 1,066 1,055 1,215 1,182 1,219 1,264 1,250 1,339 1,278 1,304
Percent Black 5.0 4.8 5.5 5.4 5.5 5.7 5.6 6.0 5.6 5.7
Oncology fellows (Composite)2 1,290 1,391 1,434 1,503 1,559 1,577 1,607 1,622 1,675 1,688
Oncology fellows who are Black 49 44 44 53 62 52 50 58 67 67
Percent Black 3.8 3.2 3.1 3.5 4.0 3.3 3.1 3.6 4.0 4.0
Hematology fellows 62 67 54 43 50 49 43 45 42 34
Hematology fellows who are Black 5 5 4 4 2 2 2 2 3 1
Percent Black 8.1 7.5 7.4 9.3 4.0 4.1 4.7 4.4 7.1 2.9
Hematology/Oncology fellows 1,020 1,164 1,243 1,329 1,393 1,412 1,462 1,480 1,531 1,566
Hem/Onc fellows who are Black 35 31 36 45 56 48 47 56 61 64
Percent Black 3.4 2.7 2.9 3.4 4.0 3.4 3.2 3.8 4.0 4.1
Medical Oncology fellows 208 160 137 131 116 116 102 97 102 88
Medical Onc. fellows who are Black 9 8 4 4 4 2 1 0 3 2
Percent Black 4.3 5.0 2.9 3.1 3.4 1.7 1.0 0.0 2.9 2.3
Source: JAMA Medical Education Issues
1 These figures represent the percentage of residents and fellows who are Black or African American. This includes people who are non-Hispanic and
Black, as well as those who are Hispanic and Black.2 The data represent the total number of fellows (MDs and DOs) in hematology, hematology/oncology, and clinical oncology GME programs
accredited by the ACGME.
Residents and fellows whose race/ethnicity is
"Other/Unknown"
0
1
2
3
4
5
6
7
8
9
10
2004 2005 2006 2007 2008 2009 2010 2011 2012 2013
Per
cen
t
All residents andfellows
Internal medicineresidents
Oncology fellows(Composite) 2
- 34 -
Key Trends in Tracking Supply of and Demand for Oncologists
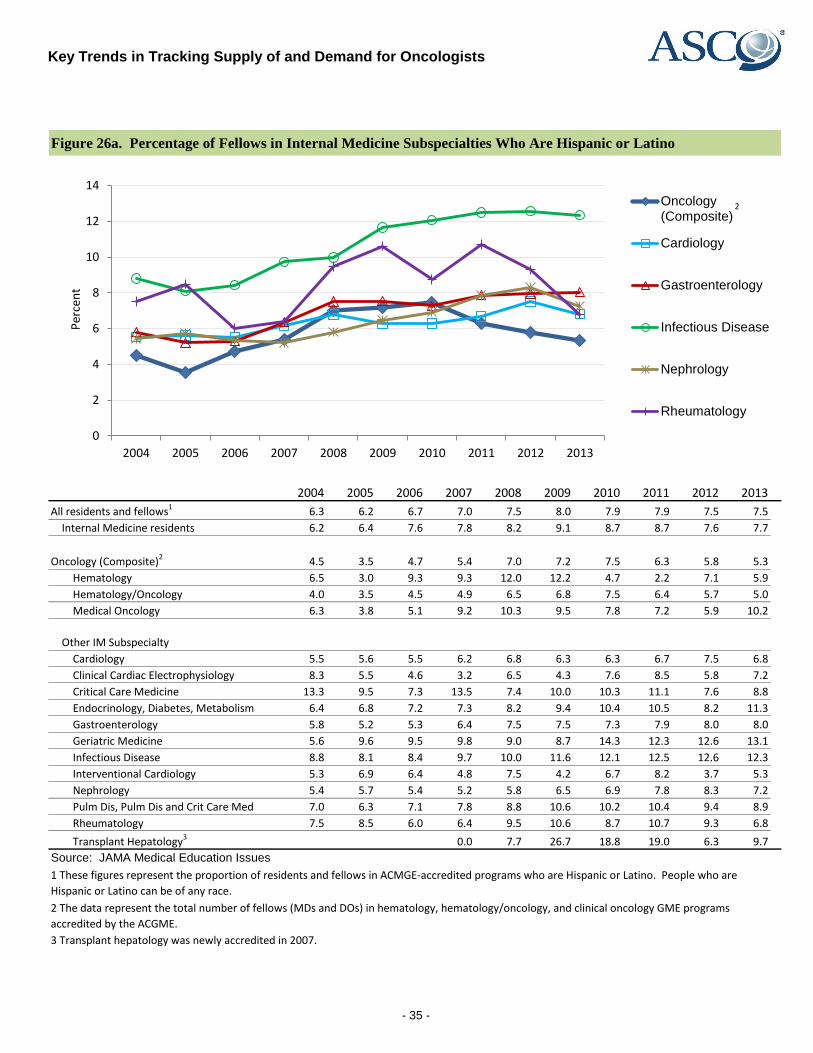
Figure 26a. Percentage of Fellows in Internal Medicine Subspecialties Who Are Hispanic or Latino
2004 2005 2006 2007 2008 2009 2010 2011 2012 2013
All residents and fellows1 6.3 6.2 6.7 7.0 7.5 8.0 7.9 7.9 7.5 7.5
Internal Medicine residents 6.2 6.4 7.6 7.8 8.2 9.1 8.7 8.7 7.6 7.7
Oncology (Composite)2 4.5 3.5 4.7 5.4 7.0 7.2 7.5 6.3 5.8 5.3
Hematology 6.5 3.0 9.3 9.3 12.0 12.2 4.7 2.2 7.1 5.9
Hematology/Oncology 4.0 3.5 4.5 4.9 6.5 6.8 7.5 6.4 5.7 5.0
Medical Oncology 6.3 3.8 5.1 9.2 10.3 9.5 7.8 7.2 5.9 10.2
Other IM Subspecialty
Cardiology 5.5 5.6 5.5 6.2 6.8 6.3 6.3 6.7 7.5 6.8
Clinical Cardiac Electrophysiology 8.3 5.5 4.6 3.2 6.5 4.3 7.6 8.5 5.8 7.2
Critical Care Medicine 13.3 9.5 7.3 13.5 7.4 10.0 10.3 11.1 7.6 8.8
Endocrinology, Diabetes, Metabolism 6.4 6.8 7.2 7.3 8.2 9.4 10.4 10.5 8.2 11.3
Gastroenterology 5.8 5.2 5.3 6.4 7.5 7.5 7.3 7.9 8.0 8.0
Geriatric Medicine 5.6 9.6 9.5 9.8 9.0 8.7 14.3 12.3 12.6 13.1
Infectious Disease 8.8 8.1 8.4 9.7 10.0 11.6 12.1 12.5 12.6 12.3
Interventional Cardiology 5.3 6.9 6.4 4.8 7.5 4.2 6.7 8.2 3.7 5.3
Nephrology 5.4 5.7 5.4 5.2 5.8 6.5 6.9 7.8 8.3 7.2
Pulm Dis, Pulm Dis and Crit Care Med 7.0 6.3 7.1 7.8 8.8 10.6 10.2 10.4 9.4 8.9
Rheumatology 7.5 8.5 6.0 6.4 9.5 10.6 8.7 10.7 9.3 6.8
Transplant Hepatology3 0.0 7.7 26.7 18.8 19.0 6.3 9.7
Source: JAMA Medical Education Issues
3 Transplant hepatology was newly accredited in 2007.
1 These figures represent the proportion of residents and fellows in ACMGE-accredited programs who are Hispanic or Latino. People who are
Hispanic or Latino can be of any race.
2 The data represent the total number of fellows (MDs and DOs) in hematology, hematology/oncology, and clinical oncology GME programs
accredited by the ACGME.
0
2
4
6
8
10
12
14
2004 2005 2006 2007 2008 2009 2010 2011 2012 2013
Per
cen
t
Oncology(Composite)
Cardiology
Gastroenterology
Infectious Disease
Nephrology
Rheumatology
2
- 35 -
Key Trends in Tracking Supply of and Demand for Oncologists
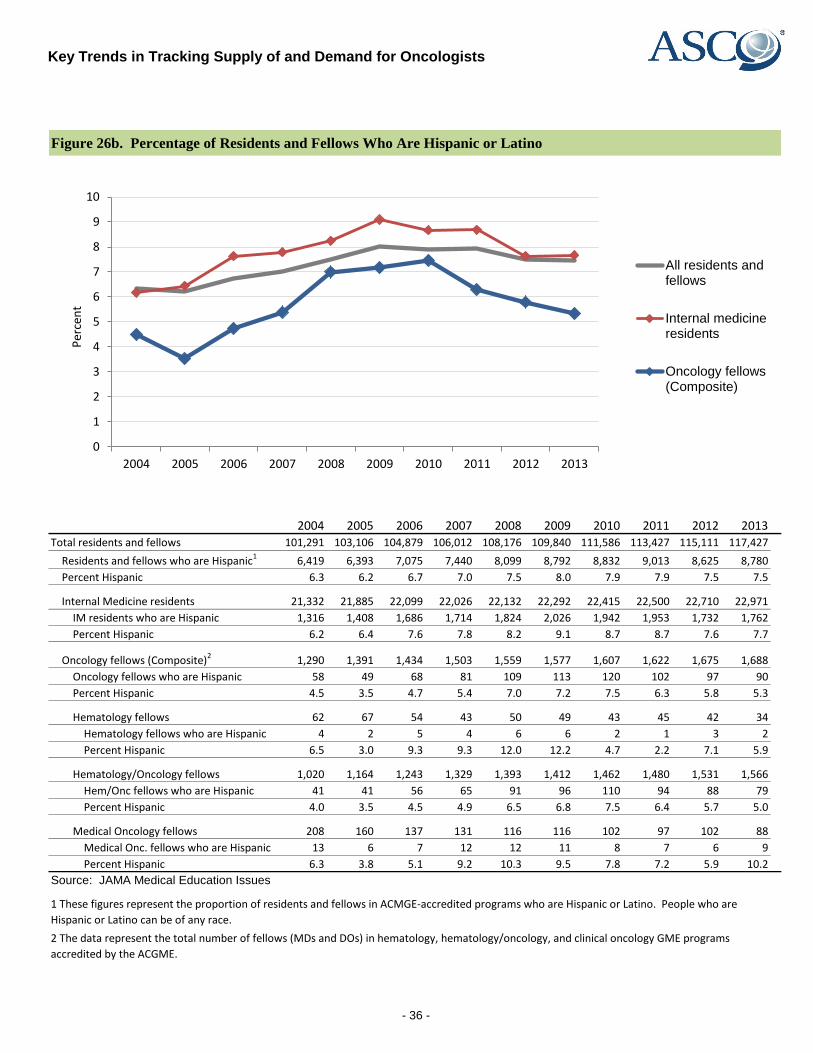
Figure 26b. Percentage of Residents and Fellows Who Are Hispanic or Latino
2004 2005 2006 2007 2008 2009 2010 2011 2012 2013Total residents and fellows 101,291 103,106 104,879 106,012 108,176 109,840 111,586 113,427 115,111 117,427
Residents and fellows who are Hispanic1 6,419 6,393 7,075 7,440 8,099 8,792 8,832 9,013 8,625 8,780
Percent Hispanic 6.3 6.2 6.7 7.0 7.5 8.0 7.9 7.9 7.5 7.5
Internal Medicine residents 21,332 21,885 22,099 22,026 22,132 22,292 22,415 22,500 22,710 22,971
IM residents who are Hispanic 1,316 1,408 1,686 1,714 1,824 2,026 1,942 1,953 1,732 1,762
Percent Hispanic 6.2 6.4 7.6 7.8 8.2 9.1 8.7 8.7 7.6 7.7
Oncology fellows (Composite)2 1,290 1,391 1,434 1,503 1,559 1,577 1,607 1,622 1,675 1,688
Oncology fellows who are Hispanic 58 49 68 81 109 113 120 102 97 90
Percent Hispanic 4.5 3.5 4.7 5.4 7.0 7.2 7.5 6.3 5.8 5.3
Hematology fellows 62 67 54 43 50 49 43 45 42 34
Hematology fellows who are Hispanic 4 2 5 4 6 6 2 1 3 2
Percent Hispanic 6.5 3.0 9.3 9.3 12.0 12.2 4.7 2.2 7.1 5.9
Hematology/Oncology fellows 1,020 1,164 1,243 1,329 1,393 1,412 1,462 1,480 1,531 1,566
Hem/Onc fellows who are Hispanic 41 41 56 65 91 96 110 94 88 79
Percent Hispanic 4.0 3.5 4.5 4.9 6.5 6.8 7.5 6.4 5.7 5.0
Medical Oncology fellows 208 160 137 131 116 116 102 97 102 88
Medical Onc. fellows who are Hispanic 13 6 7 12 12 11 8 7 6 9
Percent Hispanic 6.3 3.8 5.1 9.2 10.3 9.5 7.8 7.2 5.9 10.2
Source: JAMA Medical Education Issues
1 These figures represent the proportion of residents and fellows in ACMGE-accredited programs who are Hispanic or Latino. People who are
Hispanic or Latino can be of any race.
2 The data represent the total number of fellows (MDs and DOs) in hematology, hematology/oncology, and clinical oncology GME programs
accredited by the ACGME.
0
1
2
3
4
5
6
7
8
9
10
2004 2005 2006 2007 2008 2009 2010 2011 2012 2013
Per
cen
t
All residents andfellows
Internal medicineresidents
Oncology fellows(Composite)
- 36 -
Key Trends in Tracking Supply of and Demand for Oncologists
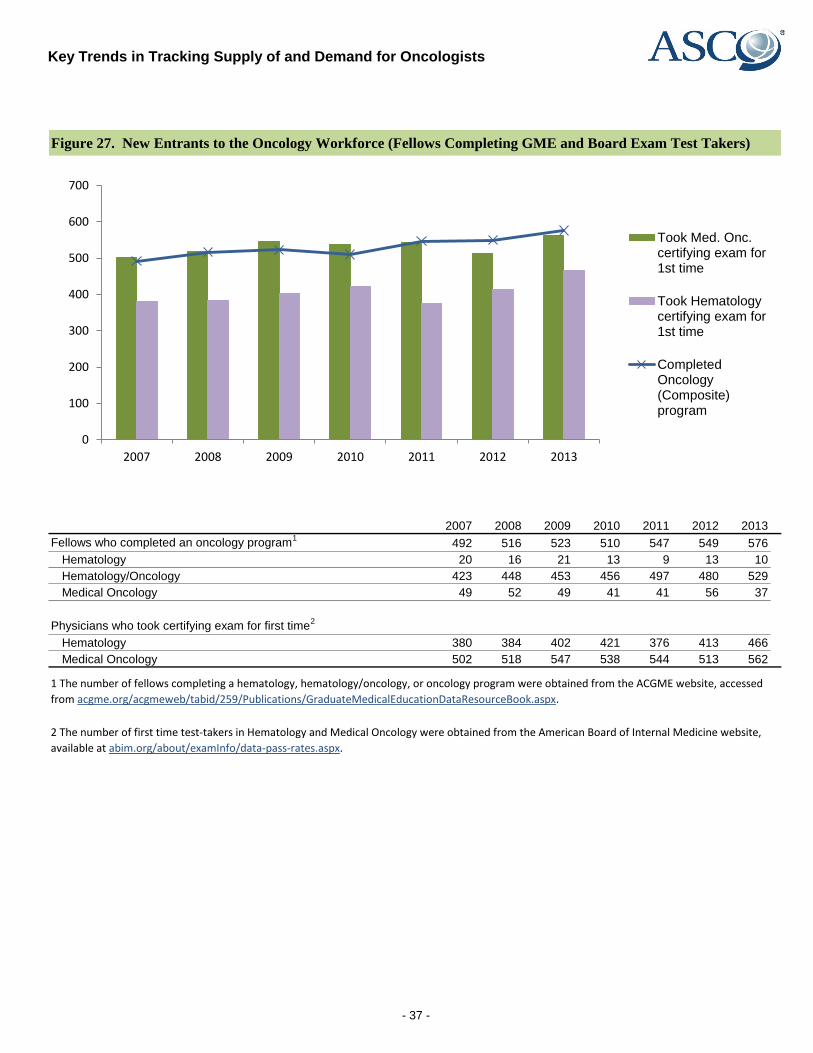
Figure 27. New Entrants to the Oncology Workforce (Fellows Completing GME and Board Exam Test Takers)
2007 2008 2009 2010 2011 2012 2013
Fellows who completed an oncology program1
492 516 523 510 547 549 576
Hematology 20 16 21 13 9 13 10
Hematology/Oncology 423 448 453 456 497 480 529
Medical Oncology 49 52 49 41 41 56 37
Physicians who took certifying exam for first time2
Hematology 380 384 402 421 376 413 466
Medical Oncology 502 518 547 538 544 513 562
1 The number of fellows completing a hematology, hematology/oncology, or oncology program were obtained from the ACGME website, accessed
from acgme.org/acgmeweb/tabid/259/Publications/GraduateMedicalEducationDataResourceBook.aspx.
2 The number of first time test-takers in Hematology and Medical Oncology were obtained from the American Board of Internal Medicine website,
available at abim.org/about/examInfo/data-pass-rates.aspx.
0
100
200
300
400
500
600
700
2007 2008 2009 2010 2011 2012 2013
Took Med. Onc.certifying exam for1st time
Took Hematologycertifying exam for1st time
CompletedOncology(Composite)program
- 37 -
Key Trends in Tracking Supply of and Demand for Oncologists
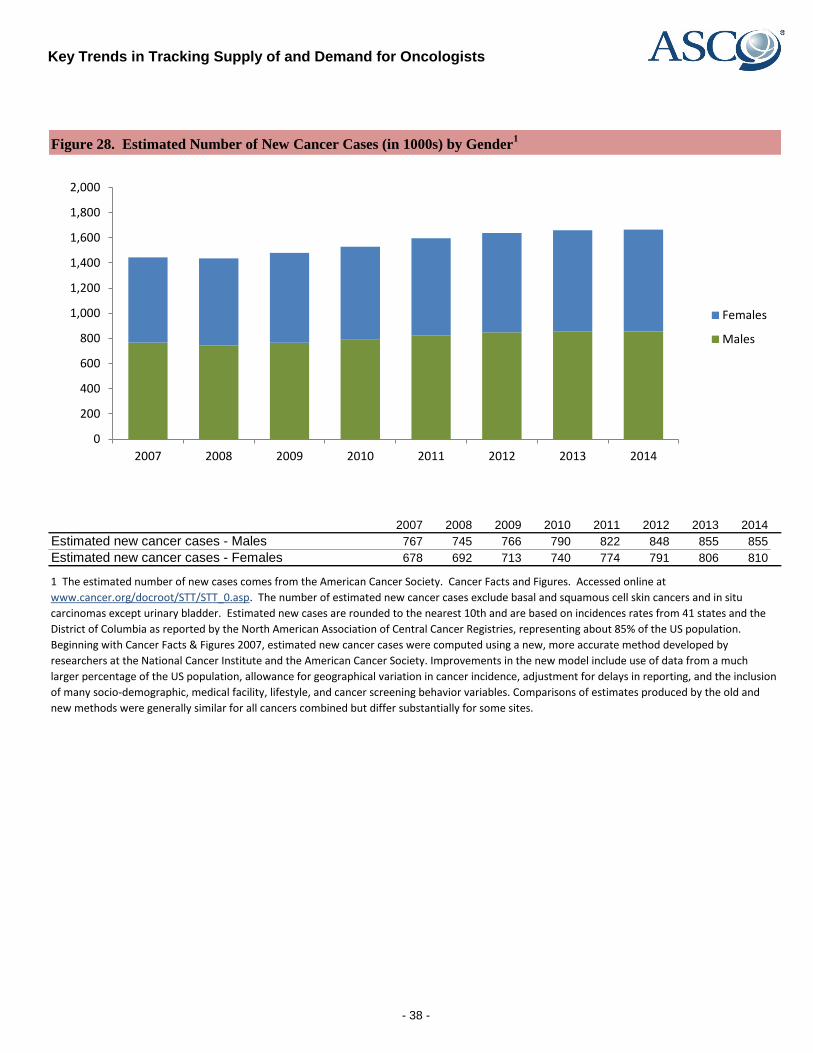
Figure 28. Estimated Number of New Cancer Cases (in 1000s) by Gender1
2007 2008 2009 2010 2011 2012 2013 2014
Estimated new cancer cases - Males 767 745 766 790 822 848 855 855
Estimated new cancer cases - Females 678 692 713 740 774 791 806 810
1 The estimated number of new cases comes from the American Cancer Society. Cancer Facts and Figures. Accessed online at
www.cancer.org/docroot/STT/STT_0.asp. The number of estimated new cancer cases exclude basal and squamous cell skin cancers and in situ
carcinomas except urinary bladder. Estimated new cases are rounded to the nearest 10th and are based on incidences rates from 41 states and the
District of Columbia as reported by the North American Association of Central Cancer Registries, representing about 85% of the US population.
Beginning with Cancer Facts & Figures 2007, estimated new cancer cases were computed using a new, more accurate method developed by
researchers at the National Cancer Institute and the American Cancer Society. Improvements in the new model include use of data from a much
larger percentage of the US population, allowance for geographical variation in cancer incidence, adjustment for delays in reporting, and the inclusion
of many socio-demographic, medical facility, lifestyle, and cancer screening behavior variables. Comparisons of estimates produced by the old and
new methods were generally similar for all cancers combined but differ substantially for some sites.
0
200
400
600
800
1,000
1,200
1,400
1,600
1,800
2,000
2007 2008 2009 2010 2011 2012 2013 2014
Females
Males
- 38 -
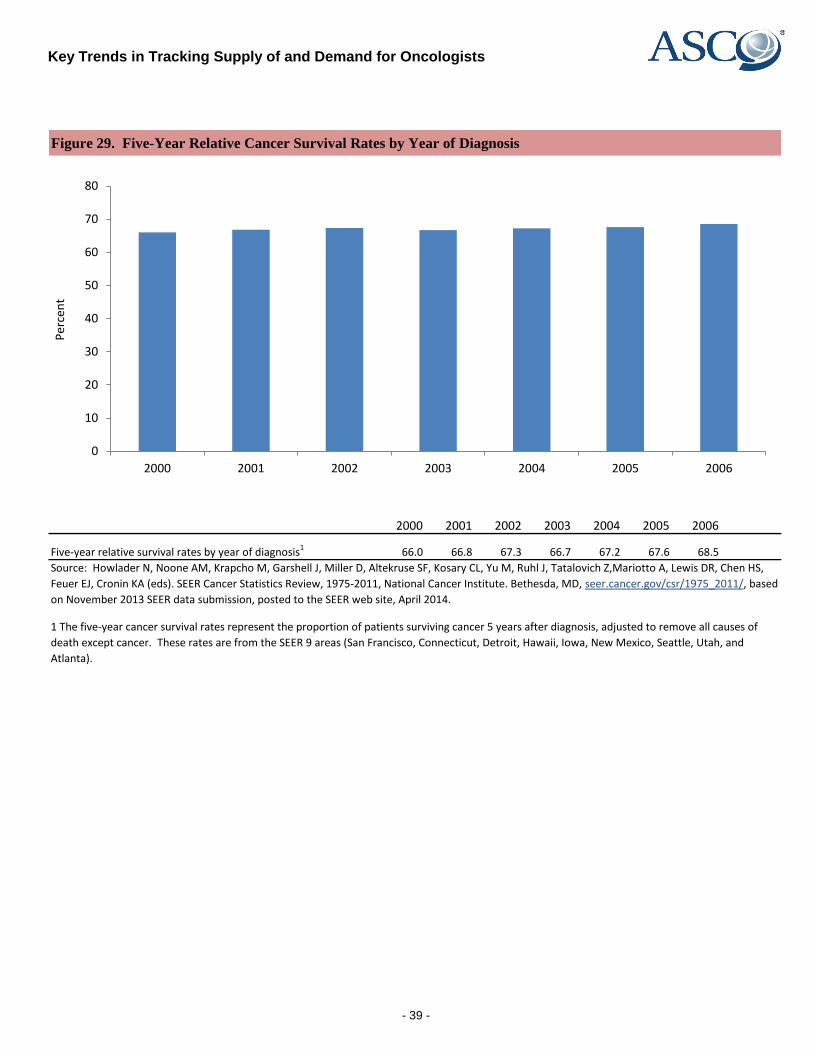
Key Trends in Tracking Supply of and Demand for Oncologists
Figure 29. Five-Year Relative Cancer Survival Rates by Year of Diagnosis
2000 2001 2002 2003 2004 2005 2006
Five-year relative survival rates by year of diagnosis1 66.0 66.8 67.3 66.7 67.2 67.6 68.5
Source: Howlader N, Noone AM, Krapcho M, Garshell J, Miller D, Altekruse SF, Kosary CL, Yu M, Ruhl J, Tatalovich Z,Mariotto A, Lewis DR, Chen HS,
Feuer EJ, Cronin KA (eds). SEER Cancer Statistics Review, 1975-2011, National Cancer Institute. Bethesda, MD, seer.cancer.gov/csr/1975_2011/, based
on November 2013 SEER data submission, posted to the SEER web site, April 2014.
1 The five-year cancer survival rates represent the proportion of patients surviving cancer 5 years after diagnosis, adjusted to remove all causes of
death except cancer. These rates are from the SEER 9 areas (San Francisco, Connecticut, Detroit, Hawaii, Iowa, New Mexico, Seattle, Utah, and
Atlanta).
0
10
20
30
40
50
60
70
80
2000 2001 2002 2003 2004 2005 2006
Per
cen
t
- 39 -
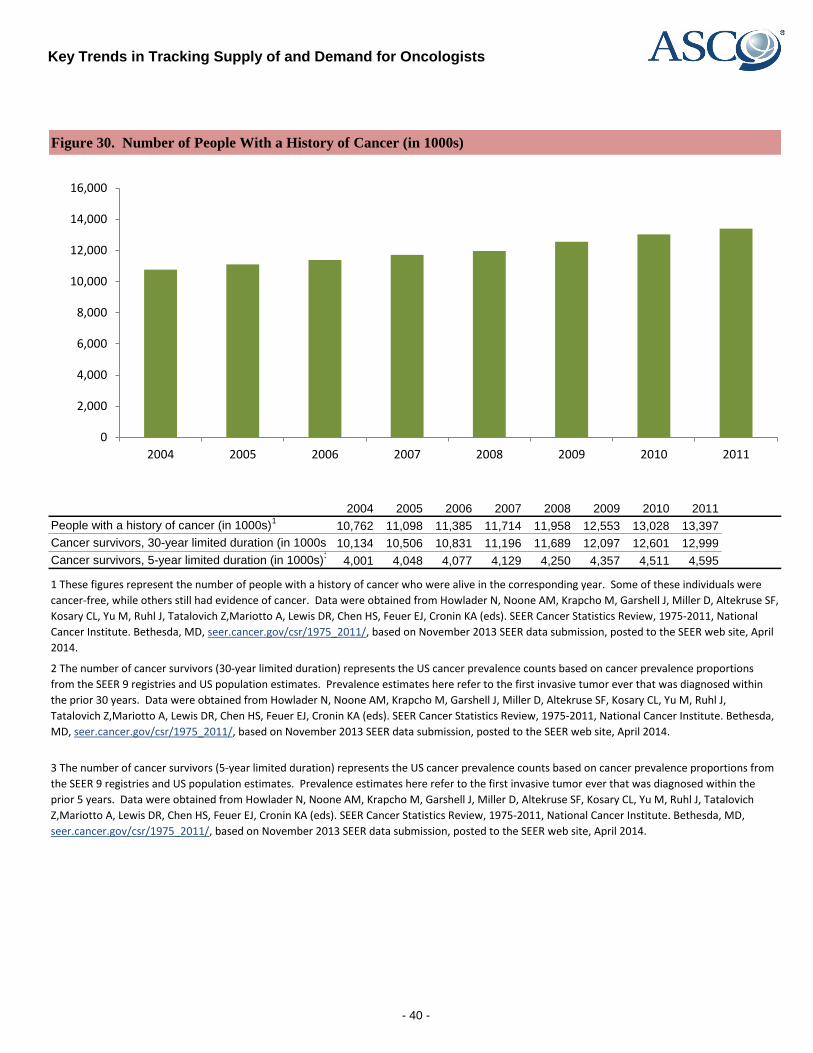
Key Trends in Tracking Supply of and Demand for Oncologists
Figure 30. Number of People With a History of Cancer (in 1000s)
2004 2005 2006 2007 2008 2009 2010 2011
People with a history of cancer (in 1000s)1
10,762 11,098 11,385 11,714 11,958 12,553 13,028 13,397
Cancer survivors, 30-year limited duration (in 1000s)210,134 10,506 10,831 11,196 11,689 12,097 12,601 12,999
Cancer survivors, 5-year limited duration (in 1000s)3
4,001 4,048 4,077 4,129 4,250 4,357 4,511 4,595
1 These figures represent the number of people with a history of cancer who were alive in the corresponding year. Some of these individuals were
cancer-free, while others still had evidence of cancer. Data were obtained from Howlader N, Noone AM, Krapcho M, Garshell J, Miller D, Altekruse SF,
Kosary CL, Yu M, Ruhl J, Tatalovich Z,Mariotto A, Lewis DR, Chen HS, Feuer EJ, Cronin KA (eds). SEER Cancer Statistics Review, 1975-2011, National
Cancer Institute. Bethesda, MD, seer.cancer.gov/csr/1975_2011/, based on November 2013 SEER data submission, posted to the SEER web site, April
2014.
2 The number of cancer survivors (30-year limited duration) represents the US cancer prevalence counts based on cancer prevalence proportions
from the SEER 9 registries and US population estimates. Prevalence estimates here refer to the first invasive tumor ever that was diagnosed within
the prior 30 years. Data were obtained from Howlader N, Noone AM, Krapcho M, Garshell J, Miller D, Altekruse SF, Kosary CL, Yu M, Ruhl J,
Tatalovich Z,Mariotto A, Lewis DR, Chen HS, Feuer EJ, Cronin KA (eds). SEER Cancer Statistics Review, 1975-2011, National Cancer Institute. Bethesda,
MD, seer.cancer.gov/csr/1975_2011/, based on November 2013 SEER data submission, posted to the SEER web site, April 2014.
3 The number of cancer survivors (5-year limited duration) represents the US cancer prevalence counts based on cancer prevalence proportions from
the SEER 9 registries and US population estimates. Prevalence estimates here refer to the first invasive tumor ever that was diagnosed within the
prior 5 years. Data were obtained from Howlader N, Noone AM, Krapcho M, Garshell J, Miller D, Altekruse SF, Kosary CL, Yu M, Ruhl J, Tatalovich
Z,Mariotto A, Lewis DR, Chen HS, Feuer EJ, Cronin KA (eds). SEER Cancer Statistics Review, 1975-2011, National Cancer Institute. Bethesda, MD,
seer.cancer.gov/csr/1975_2011/, based on November 2013 SEER data submission, posted to the SEER web site, April 2014.
0
2,000
4,000
6,000
8,000
10,000
12,000
14,000
16,000
2004 2005 2006 2007 2008 2009 2010 2011
- 40 -