KAKUMA & KALOBEYEI SPATIAL PROFILE - UN-Habitat
132
KAKUMA & KALOBEYEI SPATIAL PROFILE June 2021 Funded by
-
Upload
khangminh22 -
Category
Documents
-
view
0 -
download
0
Transcript of KAKUMA & KALOBEYEI SPATIAL PROFILE - UN-Habitat
KAKUMA & KALOBEYEI SPATIAL PROFILE
June 2021
Funded by

2
Acknowledgments:
This project is funded by: European Union Trust Fund
The spatial and narrative analysis has been developed by UN-Habitat’s Urban Practices Branch, Urban Planning, Finance and Economy Section, under the Planning for Humanitarian and Development Practice Programme.
Project Supervison: Yuka TeradaProject Coordination: Jonathan Weaver
Contributors HQ: Lucy Donnelly, Sammy Muinde, Martin Murithi, Helen Yu, Risper Talai, Ting Zhang, Mariana PinheiroField Support: Wilson Karanja, Winston Njuguna, Bernard Heng, David Kitenge, Eric Muchunku, Cover Photo: UNHCR drone image of Kakuma Camp (2019).
Disclaimer:The designations employed and the presentation of material in this report do not imply the expression of any opinion whatsoever on the part of the Secretariat of the United Nations concerning the legal status of any country, territory, city or area or of its authorities, or concerning the delimitation of its frontiers or boundaries, or regarding its economic system or degree of development. The analysis conclusions and recommendations of this publication do not necessarily reflect the views of the United Nations Human Settlements Programme or its Governing Council or its member states.
Reference of this publication of any specific commercial products, brand names, processes, or services, or the use of any trade, firm, or corporation name does not constitute endorsement, recommendation, or favouring by UN-Habitat or its officers, nor does such a reference constitute an endorsement of UN-Habitat.

PO Box 30030, GPONairobi, 00100
Kenya
Programme delivered under by Humanitarian and Development
Practicehttps://unhabitat.org/programme/
planning-for-humanitarian-development-practice-connecting-
normative-to-operations
P.O. Box 11-30500, LodwarKenya
With the kind collaboration of the Turkana County Government
Dunhill Towers 19th Floor 115 Waiyaki Way,
Nairobi, Kenya
Funded under the T05-EUTF-HOA-KE-69-02 Enhancing Self-Reliance
For Refugees And Hostcommunities In Kenya
U N - H A B I TAT I K A K U M A A N D K A L O B E Y E I S PAT I A L P R O F I L E 3

ASAL - Arid and Semi Arid LandsCIDP - County Integrated Development PlanCRRF - Comprehensive Refugee Response FrameworkESA - East and Southern AfricaGCP - Gross County ProductGCR - Global Compact on RefugeesGNI - Gross National IncomeHH - HouseholdHLP - Housing Land and PropertyIRC - International Rescue CommitteeISUD - Integrated Sustainable Urban DevelopmentKRC - Kenya Red CrossKISEDP - Kakuma/Kalobeyei Integrated Socio Economic Development PlanKNBS - Kenya National Bureau of StatisticsLAPSSET - Lamu Port South Sudan Ethiopia TransportLWF - Lutheran World FederationMCA - Member of County AssemblyNCAP - National Climate Adaptation PlanNCCK - National Council of Churches KenyaNCCRS - National Climate Change Response StrategyNRC - Norwegian Refugee CouncilOSR - Own Source RevenuePWJ - Peace Winds JapanPoC - People of ConcernRAS - Refugee Affairs SecretariatSDGs - Sustainable Development GoalsSWOT - Strength Weakness Opportunity ThreatUNHCR - United Nations High Commissioner for RefugeesWASH - Water Sanitation and HygieneWTK - Windle Trust Kenya
4
Abbreviations

U N - H A B I TAT I K A K U M A A N D K A L O B E Y E I S PAT I A L P R O F I L E 5
Maps
Map 1: Current (2019) and Projected (2030) Population Figures in Kenya 13Map 2: National Major Growth and Infrastructure Priorities 19Map 3: National Climate Vulnerability and Flood plain 21Map 4: Migration of Refugees into Kenya by country of orgin 2020 23Map 5: Population density per sub-county in Turkana County. 31Map 6: Connectivity and access from Kakuma and Lodwar. 33Map 7: Land use in Turkana County. 35Map 8: Drought and flood prone areas in Turkana County. 37Map 9: Livelihood zoning and livestock trade corridors in Turkana County. 39Map 10: Turkana West administrative boundaries. 49Map 11: Administrative boudaries. 53Map 12: Kakuma-Kalobeyei area accessibility analysis. 55Map 13: Kakuma-Kalobeyei area market accessibilty analysis. 57Map 14: Kakuma-Kalobeyei market snapshots. 59Map 15: Kakuma-Kalobeyei land use and planning areas. 61Map 16: Kalobeyei Settlement land use and planning areas. 62Map 17: Kalobeyei Town land use and planning areas. 62Map 18: Kakuma Town and camp land use and planning areas.. 63Map 19: Kakuma-Kalobeyei basic services 65Map 20: Kalobeyei Settlement basic services. 66Map 21: Kalobeyei Town basic services. 66Map 22: Kakuma Town and camp basic services 67Map 23: Kakuma-Kalobeyei public facilities. 69Map 24: Kalobeyei Settlement public facilities. 70Map 25: Kalobeyei Town public facilities. 70Map 26: Kakuma Town and Camp public Facilities. 71Map 27: Kakuma and Kalobeyei planning constraints 73Map 28: Kakuma-Kalobeyei population density. 75Map 29: Kalobeyei Settlement population density. 76Map 30: Kalobeyei Town population density. 76Map 31: Kakuma Town and camp population density. 77Map 32: Kakuma-Kalobeyei area opportunity index. 79Map 33: Kalobeyei Settlement opportunity index. 80Map 34: Kalobeyei Town popportunity index. 80Map 35: KakumaTown and camp opportunity index. 81Map 36: Kalobeyei Settlement opportunity index. 100Map 37: Kalobeyei Town popportunity index. 100Map 38: KakumaTown and camp opportunity index. 101Map 39: Scenario A Map 117Map 40: Scenario B Map 119Map 41: Scenario C Map 121

6
Table of Contents
Abbreviations 4Maps 5Table of Contents 6Foreword 8Introduction 10
NATIONAL CONTEXT 13National & International Setting 14Demographic Dividend in Kenya 16Governance & Administration System 18Relevant Planning Frameworks 20Climate Risk Context 22Displacement Dynamics in Kenya 24Displacement Dynamics - The Role of Kakuma 26
TURKANA COUNTY CONTEXT 28Turkana County Planning Context 30Social & Demographic Context 32Location and Connectivity 34Land Use & Ecological Framework 36Climate Context & Natural Hazards 38Urban & Rural Economy 40Financial Context 44Housing Land & Property 46
KAKUMA & KALOBEYEI CONTEXT 49Turkana West Sub-County Context 50Spatial Impact of Influx 52Turkana West Governance Context 54Kakuma & Kalobeyei Accessibility 56Kakuma & Kalobeyei Local Economic Activity & Markets 58Kakuma & Kalobeyei Land Use & Natural Hazards 62Kalobeyei Land Use & Natural Hazards 64Kakuma Land Use & Natural Hazards 65Kakuma & Kalobeyei Basic Services 66Kalobeyei Basic Services 68Kakuma Basic Services 69Kakuma & Kalobeyei Public Facilities 70Kalobeyei Public Facilities 72Kakuma Public Facilities 73Planning boundaries 74Kakuma & Kalobeyei Population Distribution & Growth 76Kalobeyei Population Density 78Kakuma Population Density 79Kakuma & Kalobeyei Opportunity Index 80

U N - H A B I TAT I K A K U M A A N D K A L O B E Y E I S PAT I A L P R O F I L E 7
Kalobeyei Service Provision Opportunity Index 82Kakuma Service Provision Opportunity Index 83Settlement Structure - Block Structures 84
STAKEHOLDER WORKSHOP 86Stakeholder Engagement Workshop 88Strengths, Weaknesses, Opportunities, Threats 90
LOOKING FORWARD 92Development Challenges 94Development Opportunities 98Kakuma & Kalobeyei Planned and Recently Completed Infrastructure 100Kalobeyei Planned and Recently Completed Infrastructure 102Kakuma Planned and Recently Completed Infrastructure 103
SCENARIO BUILDING 104Scenario Building 106Variable: Population Growth & Decline 108Variable: Urban Footprint 110Variable: Planned Develeopment Projects 112Variable: Climate Risk & Natural Hazards 114Variable: Local Economic Development 116Scenario A - Business as Usual 118Scenario B - Planning for Growth and Resilient Development 120Scenario C - Unplanned Large Scale Growth without Major Investment 122Leveraging KISEDP & Supporting a Kakuma-Kalobeyei Municipality 124Appendix 1 - Data Availability 130

Foreword
Kakuma Refugee Camp and Kalobeyei Settlement combined are home to over 200,000 refugees from over 9 different countries, many who have lived in the area for more than 25 years. Both settlements are managed by the Refugee Affairs Secretariat from the Kenyan Government together with UNHCR and their partners.
In March 2021, the Government of Kenya announced that all refugee camps in Kenya are to be closed, with a road map developed in association with UNHCR aiming for closure by June 2022. This includes both Kakuma Camp and Kalobeyei Settlement in addition to Dadaab refugee camps in north-eastern Kenya. UNHCR has prepared a roadmap for the Government of Kenya on the closure of Kenya’s refugee camps. Having been prepared over the course of 2020 and early 2021, the announcement of the closure of Kenya’s refugee camps came after this Spatial Profile was prepared and finalised.
A substantial amount of ambiguity remains regarding what the future holds particularly for theKakuma Camp and Kalobeyei Settlement and the hosting communities who live in the area and rely on the infrastructure and services as well as the economic vibrancy provided by the camps . For example, it has also been proposed that Kakuma Camp may be converted into a settlement for those refugees who have originated from theEast African Community (EAC) as they may be given permission to reside in Kenya. This however is yet to be confirmed. As of June 2021, UNHCR is preparing to undertake surveys for all current refugees to understand their intention and willingness to voluntarily repatriate to their country of origin, or to a third country The results of this survey will not be known until late 2021 but it is anticipated that a number of refugees will need to remain in Kenya under the protection of UNHCR.
In light of this announcement, consideration must be given to a potential drastic reduction in refugee presence in Turkana County over the coming years.This will have flow-on effects for the host community in Kakuma Town and Kalobeyei Town, as well as impacting the wider region. If members of the EAC community are given residency, for example, this could result in large-scale migration away from Kakuma and Kalobeyei to large urban centres in Kenya. In addition to reduced refugee numbers, consideration must also be given to a likely reduction in humanitarian aid in the near future, as this would be expected to be rolled back with reduced caseloads alongside donor uncertainty. At the same time, the discussions to confer municipality status upon Kakuma is ongoing and may yet provide a solid base for a sustainable urban settlement in the future.
In light of these changing circumstances however, UN-Habitat advocates that the role of this study remains unchanged. The spatial profile provides a solid understanding of the current context of the area and provides a useful baseline for the future planning of Kakuma-Kalobeyei and will assist decision-makers in prioritizing funding and implementation modalities. The profile also supports the gazettement of the Kakuma-Kalobeyei Municipality, as it will support in the preparation of the Inclusive Sustainable Urban Development (ISUD) Plan that is required for this process.
8 C H A P T E R 1 | I N T R O D U C T I O N

Refugees living in Kakuma Camp (UN-Habitat 2020)
U N - H A B I TAT I K A K U M A A N D K A L O B E Y E I S PA T I A L P R O F I L E 9

Introduction
Purpose
The human settlements that make up the area of Kakuma and Kalobeyei are the largest agglomeration of population in Turkana County as well as its neighbours. They are situated in Turkana West Sub-County which is unique due to its historical role in hosting refugees and humanitarian organizations since the early 1990s.
This spatial profile aims to provide a succinct overview of the area and is part of a wider set of project initiatives that examines how the socio-economic development of the area can be enhanced, holistically to benefit both refugees and host communities living in the area. In order to design interventions of that nature, it is critical to begin with comprehending the socio-conditions related to the area. This is important given that Turkana West is part of Turkana County, a historically marginalized region of Kenya, with high poverty levels and poorly developed infrastructure, alongside decades of hosting refugees. This in combination with other factors have left households in the area to experience unique development challenges, which can now be responded to in new ways since Kenya’s Devolution including a focus upon linking humanitarian and development approaches. A strong focus upon refugee integration in the County Integrated Development Plan II 2018-2022 (CIDP II) as well as initiatives such as the Kalobeyei Integrated Socio Economic Development Programme (KISEDP) are key foundations to shifting the agenda and providing a base from which sustainable and concrete interventions can begin to take place.
The broad intention of this spatial profile is in support of this process, and aims to prepare a multi-scalar and multi-dimensional set of maps and supporting narrative which serve as a basis for informing further study and future development scenarios for the area. The document should be seen as a “snapshot” which can be developed upon, updated and improved as situations change and as new data becomes available. The spatial analysis data developed as part of this profile will also be shared with the Turkana County government for their own use.
Beginning with an analysis of the National context with relevance to Kakuma and Kalobeyei and the relevant plans, policies and trends that may influence the areas’ development this then progressively zooms into the County Context followed by spatial analysis of the Settlement Context and its more local considerations. The
profile provides a framework for spatially and strategically analyzing the settlement from a development perspective which aligns with National and County level priorities. By both collating data and observations from primary sources and field operations (including the UN-Habitat / Turkana West Survey 2021) and synthesizing narratives and opportunities for tangible development and potential integration, humanitarian actors, development agencies, local and national governments as well as other relevant stakeholders can be brought onto the same page.
This unified Spatial Profile should thus help serve decision-makers in prioritizing and streamlining funding and implementation modalities, benefiting not only PoC, but also host populations and coordination amongst international governments and partners.
Methodology
The methodology comprised primary and secondary data collection, field visits, alongside key informant interviews, consultations with local and national government actors as well as three focus group discussions. A desktop review of grey and academic literature was undertaken to triangulate information from the primary data collection methods. Practice based toolkits, reports, guidance notes and case studies comprised the majority of the literature reviewed. This was then supported by detailed GIS analysis at national, district and settlement scale to synthesise and distil information into graphics and maps with a supporting narrative. The information was finally reviewed and validated by specialist field and headquarter teams in both UN-Habitat and the Turkana County Government.
Target Audience
The profile should provide entry points for country-level/settlement-level practitioners to feed into both the profiles and longer term development process. The analysis aims to consider the various scales of work and the relevant outcomes, e.g strategic and country level information for senior humanitarian and development decision makers as well as settlement technical information to support the operational teams. It is envisioned that this could also be used as a basis for open and informed decisions with local government and community members. This profile will also aim to continue to support activities under the KISEDP framework.
1 0 C H A P T E R 1 | I N T R O D U C T I O N

Gathering of women and children in Kakuma Camp (UN-Habitat 2018)
U N - H A B I TAT I K A K U M A A N D K A L O B E Y E I S PA T I A L P R O F I L E 1 1
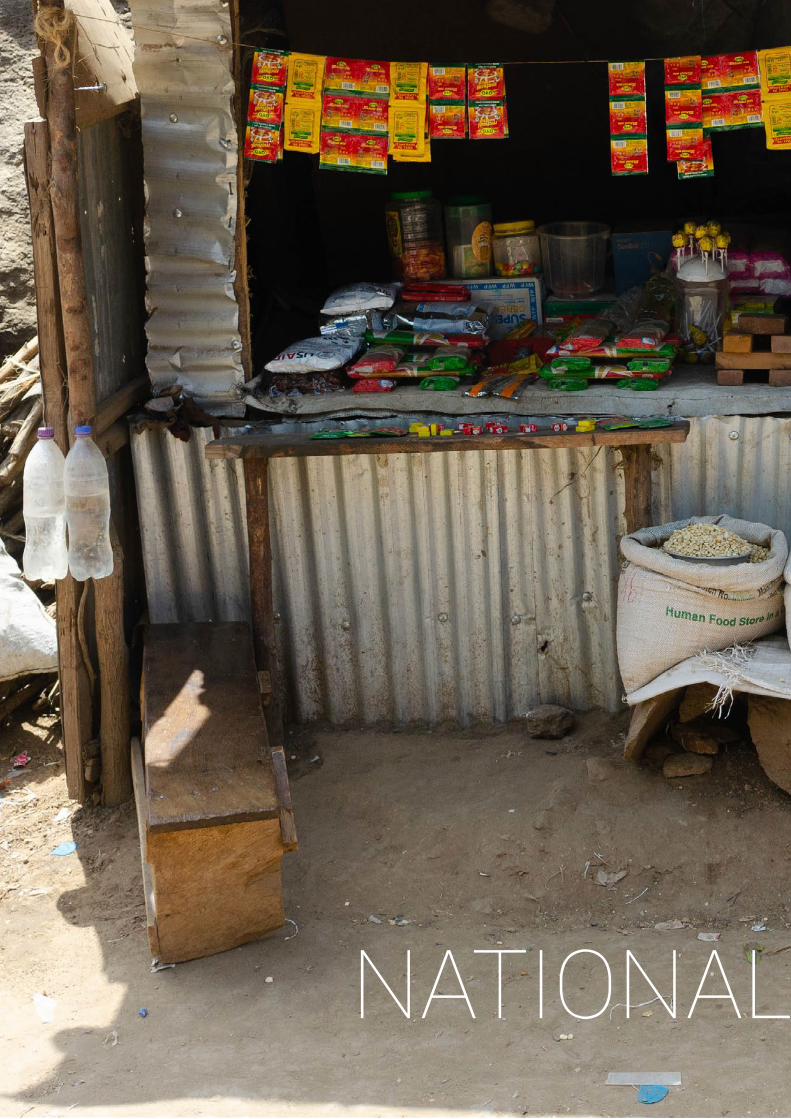
NATIONAL CONTEXT

NATIONAL CONTEXTKakuma shop (UN-Habitat 2020)

The Republic of Kenya is the economic, financial and transport hub of Eastern Africa and is bordered by Somalia, Ethiopia, South Sudan, Uganda and Tanzania. It has a population of 51.4 million1 (2019) which is heavily concentrated in and around the capital city of Nairobi (population 4.4 million2), in the west of the country along Lake Victoria and along the coast around Mombasa. Apart from these areas, Kenya is relatively sparsely populated, in particular in the northern regions of the country.
Kenya’s pattern of population distribution reflects an uneven distribution of agricultural potential and employment opportunities, with most of the infrastructure and services being concentrated in the highly populated centres leaving the sparsely populated areas of the country lacking in basic services. Kenya has a GNI (Gross National Income) per capita, PPP (purchasing power parity) (current international $) of $4,230 USD (2018)3. This is above the average for Sub-Saharan Africa which is $ 3,6674 and Kenya’s major neighbouring countries of Ethiopia ($2,140), Uganda ($1,780), Tanzania ($3,140) and Somalia ($860).
Kenya became classified by the World Bank as a lower-middle income country in 2015 based on the country’s GNI per capita which has been growing steadily since 2010. Kenya is one of the fastest growing economies in Sub-Saharan Africa. Agriculture and horticulture remains the backbone of the Kenyan economy, in particular the production and exporting of tea and coffee. Tourism also plays a major role and the ICT and communications sectors are expanding rapidly in addition to transport, medicine, education and financial services5. Kenya has a Human Development Index (HDI) of 147 out of 189 (2019)6 which has been increasing since the 1990’s due to increased life expectancy, increased expected years of schooling and increased GNI per capita.
Kenya is one the fastest growing economies in Africa, however the wealth generated from this growth is not evenly distributed, with over 40% of Kenyans living on less than a dollar a day7. In addition the majority of Kenya’s poor live in rural areas, with 90% of Kenyans who fall into the bottom 40% of the income distribution living in rural areas8
Urbanization
Like most African countries, Kenya is characterized by rapid urbanization and urban growth, with a current annual population growth rate of 2.3% (2018)9. Kenya’s population is 73% rural and 27% urban (2018)10, with the rural population increasing at a rate of 1.7% per annum11 and the urban population increasing more rapidly at 4% per annum12.
Kenya is the 19th most rapidly urbanizing country in the world13 and by 2050 it is predicted that approximately half of Kenya’s population will be living in cities14. Whilst Kenya is urbanizing at a rapid rate, it is currently under-urbanized, meaning that it still has the opportunity to leverage the benefits of urbanization. The rapid rates of urbanization mean that connectivity between rural and urban areas is increasingly important as both people and goods travel between these areas. Greater focus and investment will need to be given to Kenya’s urban-rural linkages to accommodate the levels of urbanization predicted to occur.
Drivers of the rapid urbanization occurring in Kenya are varied. Historical drivers include the colonial impact of establishing centres of administrative, cultural, economic and recreational life in a small number of easily accessible centres. There are also economic, employment, and educational opportunities available in cities that rural areas simply can not provide. This leads to high rates of rural-urban migration as Kenyans move to cities in pursuit of these opportunities.
The pattern of urban areas in Kenya follows various urbanization drivers, some of which include transport infrastructure corridors, dominant economic activities and economic potential (e.g. agriculture, mining, pastoralism etc.), presence of natural resources (e.g. oil, minerals, water bodies etc.) and administrative functions. Historically, the majority of Kenya’s urbanization has happened along the Southern Transport Corridor, which connects Kenya’s port city of Mombasa in the south-east to Malaba and Uganda in the west. Based on a 2016 Urbanization Review by the World Bank, about 85% of all urban dwellers in Kenya lived within 35 kilometers of the southern corridor, while 75% of the total urban population lived within just 15 kilometers of the corridor15.
National & International Setting
Urban (red) and rural (green) population as percentage of total (1950 - 2050)
1 4 C H A P T E R 2 | N AT I O N A L S C A L E
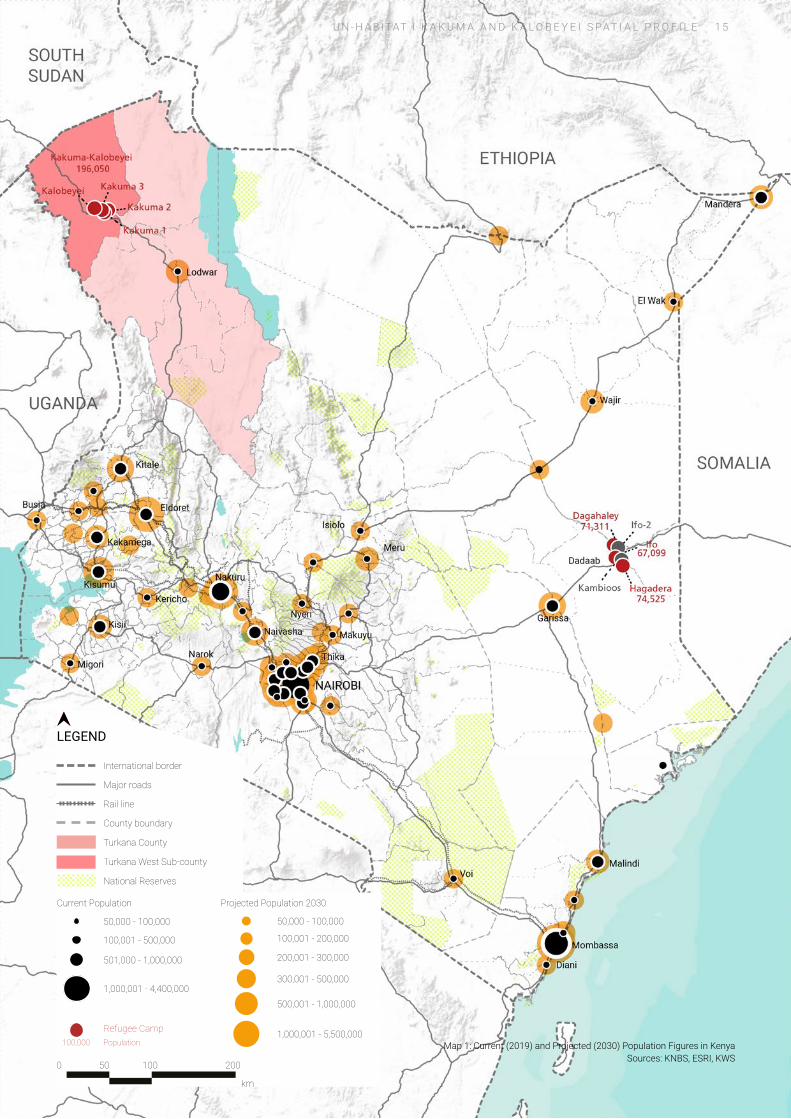
Map 1: Current (2019) and Projected (2030) Population Figures in Kenya Sources: KNBS, ESRI, KWS
0 50 100 200
km
LEGEND
International border
Major roads
County boundary
Turkana County
50,000 - 100,000
100,001 - 200,000
200,001 - 300,000
300,001 - 500,000
500,001 - 1,000,000
Current Population Projected Population 2030
Refugee Camp
Turkana West Sub-county
100,000 Population
National Reserves
Rail line
1,000,001 - 5,500,000
50,000 - 100,000
100,001 - 500,000
501,000 - 1,000,000
1,000,001 - 4,400,000
U N - H A B I TAT I K A K U M A A N D K A L O B E Y E I S PA T I A L P R O F I L E 1 5

Demographic Dividend in Kenya
Demographic dividend is the economic growth potential resulting from a shift in a country’s age structure, to when the working-age proportion of the population (15 - 64 years) is larger than the total non-working age population (younger than 15 and over 65). There is great potential for economic gain at this time due to the potential productivity of the young labor force who have a decreasing number of dependent children. In order to harness this economic potential however, the young population must have access to a variety of facilities including education, nutrition and reproductive health.
Over the past 20 years Kenya’s population has doubled and at a current annual growth rate of 2.28%, is expected to exceed 100 million by the end of 2058. Kenya’s population growth rate is decreasing however due to falling fertility rates16 in addition to Kenyan life expectancy increasing. This decline in fertility rates and increase in life expectancy is lowering the dependency ratio and contributing to what is known as a demographic dividend.
The first graph illustrates the current and projected dependency ratio of Eastern and Southern Africa (ESA) up until 2100. The graph illustrates how family sizes are continuing to shrink as life expectancy extends, which is causing the dependency ratio to fall in ESA. The ratio topped out at 96% in the late 1980s (i.e. there were 96 dependents for every 100 potential workers); the ratio is currently at 78%, which is expected to bottom out around 54% in the 2060s before reversing course. However, since the rate of change will begin to slow down significantly in the 2050s, ESA has approximately 30 years to take advantage of the favorable demographic conditions that are being propelled by the rising share of working age persons in the population. To offer a comparison, this trend is inverted in high income countries, with the dependency ratio currently at 54%, on average, and expected to exceed 70% in 205017.
The second graph illustrates Kenya’s dependency ratio compared to the changing pattern of youth, working-age and aged population up until 2019 (based on 2019 Census data). If the graph was to project the next 50-80 years, it would follow the trend of the graph above, and show that there is approximately a 30 year window to take advantage of the young workforce.
What this means for Kenya, is that there is a likely 30 year time period to by which to take advantage of this opportunity to accelerate economic development and unlock wider sustainable socio-economic opportunities for more people. In order to enable the full advantages of this to be realised, investment in key infrastructure is critical.
Children carrying plastic water containers in Kakuma Camp (UN-Habitat 2018)
1 6 C H A P T E R 2 | N AT I O N A L S C A L E

Population ages 65+
Population ages 15 - 64
Population ages 0 - 14
Age dependency ratio (% of working-age population)
Demograpghic Dividend Phase
Current and projected dependency ratio of Eastern and Southern Africa 1950-2100 (Population Dynamics and the Demographic Dividend Potential of Eastern and Southern Africa, UNICEF and ESARO 2019)
Child Dependents (0-11)
Elderly Dependents (65+)
0
20
40
60
80
100
120
0
1960
1961
1962
1963
1964
1965
1966
1967
1968
1969
1970
1971
1972
1973
1974
1975
1976
1977
1978
1979
1980
1981
1982
1983
1984
1985
1986
1987
1988
1989
1990
1991
1992
1993
1994
1995
1996
1997
1998
1999
2000
2001
2002
2003
2004
2005
2006
2007
2008
2009
2010
2011
2012
2013
2014
2015
2016
2017
2018
2019
100
12060 million
50 million
20 million
30 million
40 million
10 million
Kenya population structure and dependency ratio (World Bank 2020)
Young and old dependency ratio projections in East and Southern Africa 1950 - 2100(Children & Elderly as % of working age population)
U N - H A B I TAT I K A K U M A A N D K A L O B E Y E I S PA T I A L P R O F I L E 1 7

Governance & Administration System
Kenya is politically structured as a Democratic Republic with two tiers of government, National and County, formed from a period of political reform which replaced the 1963 Independence Constitution with the Constitution of Kenya 201018.
The County Government Act (2012) and devolution in general brings development and investment resources closer to the local communities and presents a unique opportunity for a balanced urban structure throughout Kenya. This opportunity, which is driven by decentralization of administrative functions has already resulted in a rapid growth of the county headquarters throughout Kenya and is projected to significantly shape the future of Kenya’s urban structure. This is particularly key in the ASAL counties, where marginalization has for decades contributed to the area and its populations slow rate of development. By assigning urban management duties to county governments, the county government act equally presents opportunities for urban planning as well as enhanced public participation in urban planning processes at the local level.
The introduced system of devolution gave greater power to the 47 newly created county governments, aiming to give counties the ability to manage their own affairs and development, give citizens a sense of identity and self-empowerment and protect minorities and marginalized communities19. The 47 counties consisted of three main arms - the Executive, Legislative (Assembly) and Judiciary branches.
The County Assembly, which makes up the legislative branch, is composed of members elected at the ward level. The County Executive is responsible for facilitating access to financial resources, human capital and the facilities and equipment needed by County Departments (designated as planning authorities in counties under the County Governments Act) to enact plans20.
Kenya's 47 counties are then further subdivided into 290 sub-counties, which are broken up into departments that mirror departs and committee functions at the county level.
With regard to planning, regional development authorities can also draft plans at a multi-county level. Such plans typically focus mainly on land use and resource management, as is the case with the Tana and Athi Rivers Development Authority21. Plans prepared in respective county departments are submitted by the County Executive Committee of the Ministry to the Governor who then table them to the County Assemby for approval.
Central Government
County
Urban DistrictVillage
Regional
National Level AuthoritiesNational Government Line Ministries
County ExecutiveOffice of the Governor
County Committees / Departments
Village Administrator
County Assembly
County Assembly Members elected at Ward Level
urban
rural
Municipality
City / Town ManagerCity / Town Board (6 members)
City / Utility Agencies
Ward Administrator
Sub-County Administrator (manages sub-county departments)Sub-County Committee / Department Representatives
Ward
Sub-County
1 8 C H A P T E R 2 | N AT I O N A L S C A L E

Existing
Missing
National boundary
Counties
Sub-County
Wards
Turkana County Integrated Development Plan (2018-2022)
Kenya National Spatial Plan (2015 - 2045)
Kenya Vision 2030
Sub-County Strategic Development Plan
Kenya National Adaptation Plan 2015-2030
Turkana County Spatial Plan
Kakuma Tow
n Spatial Plan
Kalobeyei Local Physical Plan
Organigram of governance structure in Kenya
Turkana County
Turkana West Sub-County
Kalobeyei Ward
Letea Ward
Kakuma Ward
U N - H A B I TAT I K A K U M A A N D K A L O B E Y E I S PA T I A L P R O F I L E 1 9

Relevant Planning Frameworks
Kenya Vision 2030
Kenya Vision 2030 is the country’s long-term development blueprint. Its objective is to transform Kenya into a “newly industrializing, middle-income country providing a high quality of life to all its citizens by 2030 in a clean and secure environment.” The vision identifies the role of urbanization in the attainment of its objectives and creates special growth areas and a strategy to develop the infrastructure necessary for accelerated and sustainable urbanization22. Anchoring the Vision’s 3 pillars, land reform is a key issue raised in the document that also plays a major role in Turkana’s path to development (in this context, for community land). Emphasis is also placed on water harvesting, management, supply and sanitation, particularly in ASAL areas, which is crucial for diversifying Turkana County’s economy.
National Spatial Plan (2015 - 2045)
The Plan catalogues Zone 1, “the North West23” including the centres of Lodwar, Kakuma and Lokichoggio and key spatial growth zones with specific potentials, policies and strategies to be set out for the areas development. These are outlined broadly to support Lodwar, the county capital as Future Growth Area as well as new potential resort cities in Turkana to capitalise on domestic and international tourism. Policies to encourage increased livestock production and associated industries within the ASAL regions and in particular within Turkana as well as promotion of the Turkana Basin oil fields as a concentration node and the Lake Turkana Wind Power Project are key elements to support economic development. In addition, the exploration of water resources, fisheries and culture and tourism are listed as areas worth pursuing due to their development potential in north-western Kenya.
In general, policies such as the sustainable use and exploitation of natural resources, environmental conservation, balanced growth and increased investment in social and physical infrastructure are underscored in support of the proposed potential areas of growth. The strategies that could then bolster such areas and policies include: selective development concentration; construction of key infrastructure to support resource exploitation and urban development; mineral mapping and exploitation; environmental protection of sensitive areas and mining zones and utilization of water resources for agriculture and food production.
Kenya National Climate Adaptation Plan (2015-2030)
The 2015 - 2030 National Climate Adaptation Plan is Kenya’s first plan to centre on the issue of climate adaptation. It builds on foundations laid by the National Climate Change Response Strategy (NCCRS, 2010) and the National Climate Change Action Plan (NCCAP 2013-2017) and is aligned with Vision 2030 in support of the Paris Agreement, integrating climate change scenarios into spatial planning through resilience strategies.
LAPSSET
As part of a major transportation and investment corridor running through northern Kenya, the Lamu Port-South Sudan-Ethiopia Transport (LAPSSET) Corridor proposal envisages a new road network, rail line and oil pipeline as well as a new international airport in Turkana. The full corridor is designed to move oil from South Sudan to a new refinery in Lamu, increase cross-border trade with South Sudan and Ethiopia, and provide “the backbone for opening up Northern Kenya and integrating it into the national economy”24. While uncertainties remain about some aspects of the project, LAPSSET could deliver an estimated USD 25-30 billion in infrastructure investment across the region in coming years. This would be a remarkable turn of events for northern Kenya, and counties such as Turkana which has previously attracted very limited no government investment in its infrastructure. This infrastructure would be a major game changer for the county given its poor connectivity infrastructure which currently limits market integration into the wider country and region.
2 0 C H A P T E R 2 | N AT I O N A L S C A L E

Map 2: National Major Growth and Infrastructure Priorities Sources: KNBS, ESRI, Kenya National Spatial Plan, LCDA
0 50 100 200
km
Regional Highway Corridor
Other Corridor
National Growth Area
Regional Growth Area
Future Growth Area
LAPSSET Corridor
Turkana County
Turkana West Sub-county
National Highway Corridor
Airport
Port
LEGEND
International border
County boundary
Rail line
Current Population
Refugee Camp100,000 Population
50,000 - 100,000
100,001 - 500,000
501,000 - 1,000,000
1,000,001 - 4,400,000
Potential wind energy areas
Potenntial solar insolation areas
Growth Areas
U N - H A B I TAT I K A K U M A A N D K A L O B E Y E I S PA T I A L P R O F I L E 2 1

Climate Risk Context
In 2010, Kenya developed a National Climate Change Response Strategy (NCCRS) which recognized the importance of climate change impacts for the country’s development. This was followed by the development of the National Climate Change Action Plan (NCCAP) in 2012.
The high vulnerability score and low readiness score (the measurement of a “country’s ability to leverage investments and convert them to adaptation actions” as measured by economic, governance and social readiness) of Kenya highlights that it has both a great need for investment and innovations to improve readiness and a great urgency for action. Kenya is the 32nd most vulnerable country and the 40th least ready country.
Climate risks pose serious threats to Kenya’s attainment of the UN’s Sustainable Development Goals (SDGs). With the largest economy in East Africa and a population of 48.5 million, Kenya serves as the regions’ financial, trade and communications hub. The country’s economy is largely dependent on rainfed agriculture and tourism, each susceptible to climate variability and change and extreme weather events. Increasing interseasonal variability and declining rainfall in the main rainy season have impacted cereal production in recent years. Recurrent droughts25 and floods—likely to be exacerbated by increasing temperatures, heavy rainfall events and sea level rise— lead to severe crop and livestock losses, famine and displacement.
Climate issues have caused severe crop and livestock losses, famine and population displacement. Climate change introduces an additional uncertainty into existing vulnerabilities, particularly in the Arid and Semi-Arid Lands
(ASALs) which cover over 80 per cent of the country. Increased temperatures in the future are likely to exacerbate the drought conditions and may have a significant impact on water availability and general well-being.
Excessive flooding in Kenya occurs relatively frequently (on average every three to four years) and is linked to El Niño or La Niña episodes that can lead to extreme weather in the country and region. Annual rainy seasons in Kenya are becoming progressively wetter, with sudden and/or late onsets bringing with them floods and inundation26. Major floods periodically afflict the Winam Gulf of Lake Victoria, Lower Tana basin and the coastal regions. Geographically, the western, northern, eastern, central and southeastern parts of the country are quite susceptible to seasonal floods in the wet seasons of March - May and October - December. Riverine floods are the most dominant floods in Kenya, although the ASALs are also particularly vulnerable to flash flooding. The economic costs of flooding to the country are very high, resulting in losses of 5.5 percent of GDP every seven years.
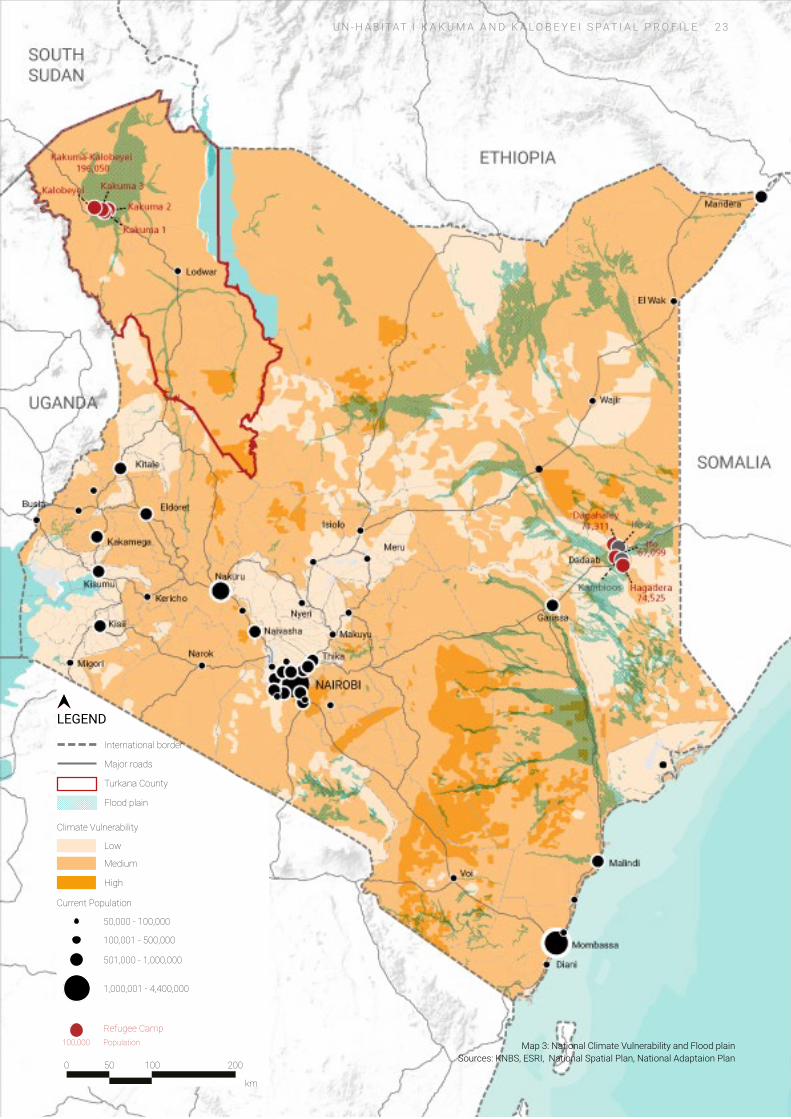
Current impacts of climate change may be exacerbated by climate vulnerability in the surrounding region (Somalia, Ethiopia), potentially sparking conflict over resources and further contributing to climate-induced displacement and migration trends towards urban centres.
This is particularly felt in Turkana as it suffers from medium-high climate vulnerability, flood risk and locust influxes.
JANJUL
APROCT
FEBAUG
MAYNOV
MARSEP
JUNDEC
DROUGHTFLOOD
19801990
20002010
2020
short rains harvest
livestock migration to dry season grazing areas
livestock migration to dry season grazing areas short rainslong rains
long rains harvestplanting planting
lean season
Years of Severe Drought and Flood in Kenya (1980 - 2020)
Typical Seasonal Calendar for Eastern and Northern Kenya
2 2 C H A P T E R 2 | N AT I O N A L S C A L E
151 out of 181Kenya’s ND-GAIN Matrix
(Vulnerability rank)2017
0 50 100 200
km
Turkana County
Low
Flood plain
Medium
Climate Vulnerability
High
Current Population
Refugee Camp100,000 Population
50,000 - 100,000
100,001 - 500,000
501,000 - 1,000,000
1,000,001 - 4,400,000
LEGEND
International border
Major roads
U N - H A B I TAT I K A K U M A A N D K A L O B E Y E I S PA T I A L P R O F I L E 2 3
Map 3: National Climate Vulnerability and Flood plainSources: KNBS, ESRI, National Spatial Plan, National Adaptaion Plan

Displacement Dynamics in Kenya
Kenya is a hub in Eastern Africa, acting as a destination, origin and transit country. The vast majority of immigrants into Kenya are from other African countries, in particular from other East African countries. Kenya has provided asylum to influxes of refugees since the 1980’s and is currently host to several large refugee camps and approximately 494,300 refugees (July 2020)27. Besides Nairobi, the two major areas where refugees have been settled are Kakuma-Kalobeyei in the north-west of the country near the South Sudan-Uganda border and Dadaab in the west of the country near the Somali border28.
Prior to the 1990s, no large-scale camps had come into existence in Kenya, and limited support was provided from the national government. Refugee policy was mainly dealt with at the local level in the country, and churches and aid organizations were the predominant groups concerned with integration. However when hundreds of thousands of refugees fleeing conflict and insecurity in Somalia, Ethiopia, Sudan, Burundi, Rwanda and the DRC arrived in Kenya, locally-led integration policies were reversed.
By the end of 1992, Kenya hosted the first mass influx of refugees in the country’s history - almost 300,000 refugees from Somalia (Abuya, 2007). Almost 70,000 Ethiopians added to the huge number of Somalis seeking refuge in Kenya after conflict broke out in Ethiopia towards the end of 1992. An additional 22,000 Sudanese, half of whom are believed to have been unaccompanied minors, also added to the large influx. Throughout the 1990s, as tensions led to the Second Congo War in the DRC, refugees from the large land-locked country also started fleeing for Kenya. Whereas before 1990, refugee populations were estimated at between 12,000 and 15,000, in 1991 that figure rose to 120,000, reaching over 400,000 in 1992.
The unprecedented number and profiles of new arrivals to Kenya shifted refugee policy from integration to a primarily encampment-centred approach. In 1998, most refugees in the country were transferred to the relatively isolated and low density camps in Dadaab and Kakuma, locations for which are reported to have been chosen in order to minimise the potential for conflict with Kenya, where the largest number of refugees remain today.
Turkana County Government, together with humanitarian partners has been providing protection and assistance to refugees since 1992 when the camps in Kakuma were first established. Whilst the refugee population has fluctuated over the years, in particular immediately after the Comprehensive Peace Agreement (CPA 2006), since 2013 Turkana County has witnessed a major influx of refugees as more than 90,00029 fled and sought asylum
in Kenya. Despite the long existence of Kakuma refugee camps, 67 percent of its population arrived within the last five years resulting in significant growth in the adjacent Kakuma Town both in terms of population, geographic size and economic opportunities, and resulting in a 50 percent increase in Turkana West’s population since 201330.
Kenya refugee policy
Kenya is party to the 1951 United Nations Convention relating to the Status of Refugees and the 1967 Protocol, as well as the 1969 Organization of African Unity Convention. The Refugees Bill 2019 - published through the Kenya Gazette Supplement No 126 (National Assembly Bills No. 62). The second reading of the bill was in July 2020.
The bill outlines the rights and duties of asylum seekers in Kenya and states that no person shall be refused entry into Kenya, expelled, extradited or returned to any other country and that refugees shall be enabled to contribute to the economic and social development of Kenya by facilitating access to, and issuance of, the required government documentation.
Furthermore, Part 28.4 states that “Refugees shall be enabled to contribute to the economic and social development of Kenya by facilitating access to, and issuance of, the required documentation at both levels of Government”. There is no mention of an issuance of work permits for those who have obtained refugee status, nor are rights given regarding self-employment or social security31.
Somalia
Refugee Population
2020
Refugee Population in Kenya by Country of Origin 2020 (UNHCR 2020)
South Sudan
DR Congo
Ethiopia
Brundi
Sudan
Uganda
Rwanda
Other
2 4 C H A P T E R 2 | N AT I O N A L S C A L E

Map 4: Migration of Refugees into Kenya by country of orgin 2020Sources: KNBS, ESRI, UNHCR
0 50 100 200
km
Turkana County
Refugee Camp
Turkana West Sub-county
100,000 Population
3%Percentage of Kenya's
refugees
0 50 100 200
km
Refugee Camp
Decommissioned Camps (pre-1998)
LEGEND
International border
Major roads
County boundary
Rail line
Current Population
50,000 - 100,000
100,001 - 500,000
501,000 - 1,000,000
1,000,001 - 4,400,000
U N - H A B I TAT I K A K U M A A N D K A L O B E Y E I S PA T I A L P R O F I L E 2 5
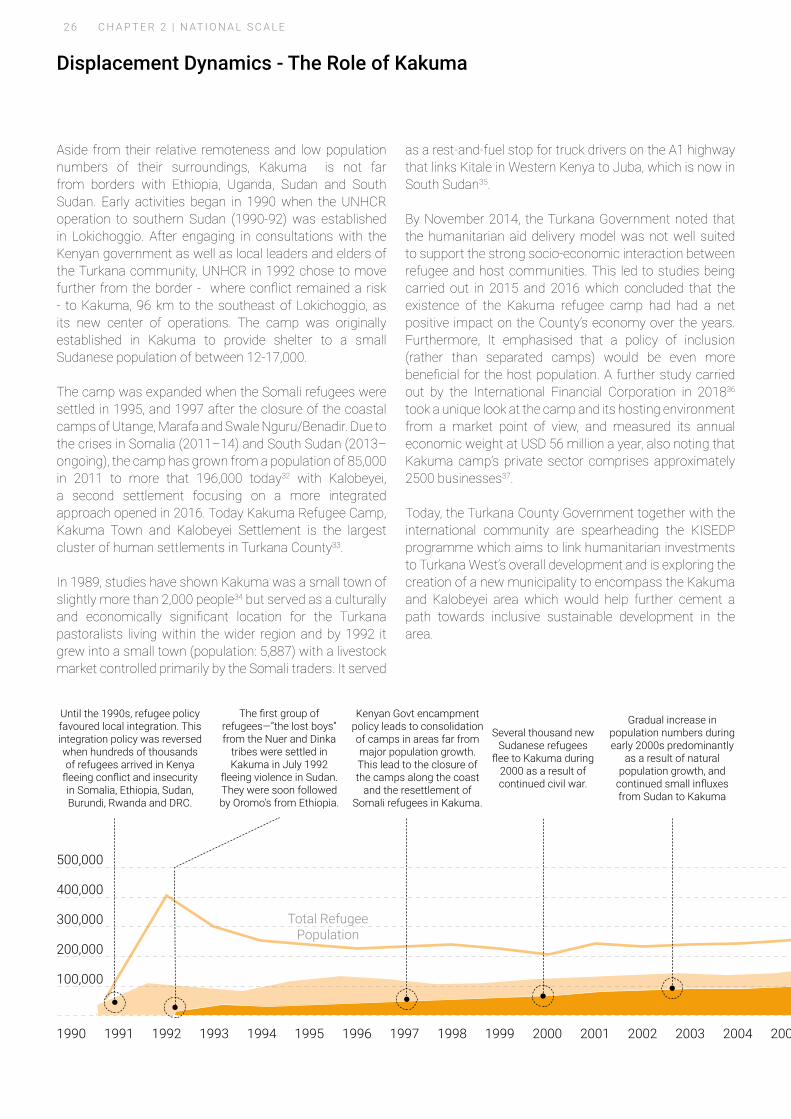
Aside from their relative remoteness and low population numbers of their surroundings, Kakuma is not far from borders with Ethiopia, Uganda, Sudan and South Sudan. Early activities began in 1990 when the UNHCR operation to southern Sudan (1990-92) was established in Lokichoggio. After engaging in consultations with the Kenyan government as well as local leaders and elders of the Turkana community, UNHCR in 1992 chose to move further from the border - where conflict remained a risk - to Kakuma, 96 km to the southeast of Lokichoggio, as its new center of operations. The camp was originally established in Kakuma to provide shelter to a small Sudanese population of between 12-17,000.
The camp was expanded when the Somali refugees were settled in 1995, and 1997 after the closure of the coastal camps of Utange, Marafa and Swale Nguru/Benadir. Due to the crises in Somalia (2011–14) and South Sudan (2013–ongoing), the camp has grown from a population of 85,000 in 2011 to more that 196,000 today32 with Kalobeyei, a second settlement focusing on a more integrated approach opened in 2016. Today Kakuma Refugee Camp, Kakuma Town and Kalobeyei Settlement is the largest cluster of human settlements in Turkana County33.
In 1989, studies have shown Kakuma was a small town of slightly more than 2,000 people34 but served as a culturally and economically significant location for the Turkana pastoralists living within the wider region and by 1992 it grew into a small town (population: 5,887) with a livestock market controlled primarily by the Somali traders. It served
as a rest-and-fuel stop for truck drivers on the A1 highway that links Kitale in Western Kenya to Juba, which is now in South Sudan35.
By November 2014, the Turkana Government noted that the humanitarian aid delivery model was not well suited to support the strong socio-economic interaction between refugee and host communities. This led to studies being carried out in 2015 and 2016 which concluded that the existence of the Kakuma refugee camp had had a net positive impact on the County’s economy over the years. Furthermore, It emphasised that a policy of inclusion (rather than separated camps) would be even more beneficial for the host population. A further study carried out by the International Financial Corporation in 201836 took a unique look at the camp and its hosting environment from a market point of view, and measured its annual economic weight at USD 56 million a year, also noting that Kakuma camp’s private sector comprises approximately 2500 businesses37.
Today, the Turkana County Government together with the international community are spearheading the KISEDP programme which aims to link humanitarian investments to Turkana West’s overall development and is exploring the creation of a new municipality to encompass the Kakuma and Kalobeyei area which would help further cement a path towards inclusive sustainable development in the area.
1990 1991 1992 1993 1994 1995 1996 1997 1998 1999 2000 2001 2002 2003 2004
Kenyan Govt encampment policy leads to consolidation of camps in areas far from major population growth. This lead to the closure of the camps along the coast
and the resettlement of Somali refugees in Kakuma.
Until the 1990s, refugee policy favoured local integration. This integration policy was reversed when hundreds of thousands of refugees arrived in Kenya
fleeing conflict and insecurity in Somalia, Ethiopia, Sudan, Burundi, Rwanda and DRC.
Gradual increase in population numbers during early 2000s predominantly
as a result of natural population growth, and
continued small influxes from Sudan to Kakuma
Total Refugee Population
100,000
200,000
300,000
400,000
500,000
Several thousand new Sudanese refugees
flee to Kakuma during 2000 as a result of continued civil war.
The first group of refugees—”the lost boys” from the Nuer and Dinka
tribes were settled in Kakuma in July 1992
fleeing violence in Sudan. They were soon followed by Oromo’s from Ethiopia.
Displacement Dynamics - The Role of Kakuma
2005
2 6 C H A P T E R 2 | N AT I O N A L S C A L E

2006 2007 2008 2009 2010 2011 2012 2013 2014 2015 2016 2017 2018 2019 2020
Despite Kenya’s encampment policy, 75,000 refugees are registered as urban
refugees outside the camps, with their
presence implicitly endorsed by the Kenyan
authorities
Refugee Act 2006 is passed,
recognising statutory and prima facie refugees.
Dadaab Refugee Population
Kakuma Refugee Population
Comprehensive Peace Agreement signed in Naivasha in January
2005 paving the way for large scale repatriation
of Sudanese refugees in Kakuma
Between 2006 & 2008, large scale repatriation
of Sudanese refugees took place,
substantially reducing the population
numbers in Kakuma
South Sudan gains independence in 2011
but suffers from sporadic violence as well as poor
infrastructure and service access leading to gradual return of South Sudanese
refugees to Kakuma
Conflict breaks out in South Sudan in December 2013 leading to renewed
large scale influx into Kakuma over the following 3 years.
The Turkana Round table on the Integration of Refugees and Host
Community Economies in November 2014 agreed a clear consensus on a
more sustainable approach to refugee assistance
programming
In June 2015, the Turkana County
Government, at the request of the Central Government, allocates
15km2 in Kalobeyei Ward NW of Kakuma, for a new integrated
settlement
Kenyan National Government
announces plans to close the all
Refugee Camps disbands the
Department of Refugee Affairs
By mid 2018, Kalobeyei Integrated Settlement adjacent to Kakuma
houses 35,000 refugees, and awaits approval
from the County Government as a formal
planned area
Kakuma 1 in 1993 (©UNHCR/Panos Moumtzis)
2005
Refugee population growth in Kenya 1990-2020 (UNHCR, World Bank, Ohta 2005, USAID)
U N - H A B I TAT I K A K U M A A N D K A L O B E Y E I S PA T I A L P R O F I L E 2 7

TURKANA COUNTY CONTEXT

TURKANA COUNTY CONTEXTMarkets in Kakuma (UN-Habitat 2020
Turkana County Planning Context
Turkana County Government is led by the Governor which comprises three Arms. They are the County Executive (Committee), the Legislature (County Assembly), and the Public Service (County Public Service Board). The Members of the County Assembly (MCA’s) are the elected officials and represent their constituencies at Ward Level. The last election was in 2017 with the next one scheduled for 2021.
With regard to planning, counties are tasked with articulating and implementing the physical planning policies outlined in the National Spatial Plan. This is meant to be carried out through 5 key plans at the county level: The County Integrated Development Plan (CIDP), County Sectorial Pans, County Spatial Plans, County Urban Areas and CIties Plans, and County Performance Management Plans. These plans, in addition to humanitarian and development initiatives such as KISEDP, help set a baseline for county assemblies’ structuring of annual budgets.
County Integrated Development Plan (CIDP)
CIDPs allow county governments to set a development agenda and articulate priority areas. They are also meant to provide a means for the active inclusion of public voices within that process.
The priorities for the Turkana CIDP II (2018-2022)38 are summarised in Governor H.E. Hon. Josphat Koli Nanok’s 10 point agenda:
1. Land management and environmental conservation2. Oil and Gas3. Peace Building and Conflict Management4. Water development and exploitation5. Transformative Flagship Projects6. Food Security7. Youth, Women, minority and People with Disability
Empowerment8. Pastoral Economy 9. Partnerships and private Sector investment10. Scaling up investments in the social sectors
CIDP II recognises that it is vital for the County and all actors involved to acknowledge the enduring presence and to maximise the positive impact of refugees within the County.
Kalobeyei Integrated Socio-Economic Development Plan (KISEDP)
Under the CIDP II, and focusing on Turkana West Sub-County, KISEDP is a collaboration of various stakeholders,
including the National and County Governments39, UN agencies, development actors, bilateral donors, civil society, and the private sector, actively working and investing in the area. It is a framework and tool to manage the presence of the refugees in a manner that is of benefit to all – both the refugees and their hosts.
KISEDP comprises four thematic components; Social Services Delivery (Health, Education and Protection), Spatial Planning and Infrastructure Development, Agriculture and Livestock and Private Sector Entrepreneurship. These thematic components are anchored in the CIDP II as well as Kenya Vision 2030 and national priorities as outlined in the Medium-Term Plan III, ‘Big Four Agenda’ along with international and regional commitments like the Global Compact on Refugees (GCR), the Sustainable Development Goals (SDGs) and Nairobi, Djibouti and Kampala Declarations. It aims to enhance the socio-economic conditions of both refugees and host communities with the intention of reducing over-dependence on humanitarian aid.
The KISEDP structure includes an overall objective/goal, four strategic objectives, eight sectoral components and the required financial resources for implementation.
The strategic objectives of KISEDP are:
1. Create a conducive environment that attracts investment from the private sector and financial service providers to promote the local economy
2. Invest in basic socio-economic infrastructure, introduce sustainable models and strengthen capacities for enhanced and inclusive national service delivery
3. Enhance innovative aid delivery and increase financial inclusion for refugees and host communities to increase self-reliance and reduce poverty
4. Increase access to higher and specialised education and support market-driven skills and capabilities of refugees and host communities to take part in the local economy.
This spatial profile is fundamentally linked to both of these initiatives, ensuring that the future of the Kakuma and Kalobeyei area is fully understood and that future planning initiatives such as the creation of a new municipality is informed by a comprehensive spatial understanding and recommendations are coordinated and support government led multi-stakeholder programming for sustainable development to be achieved.
3 0 C H A P T E R 3 | C O U N T Y S C A L E
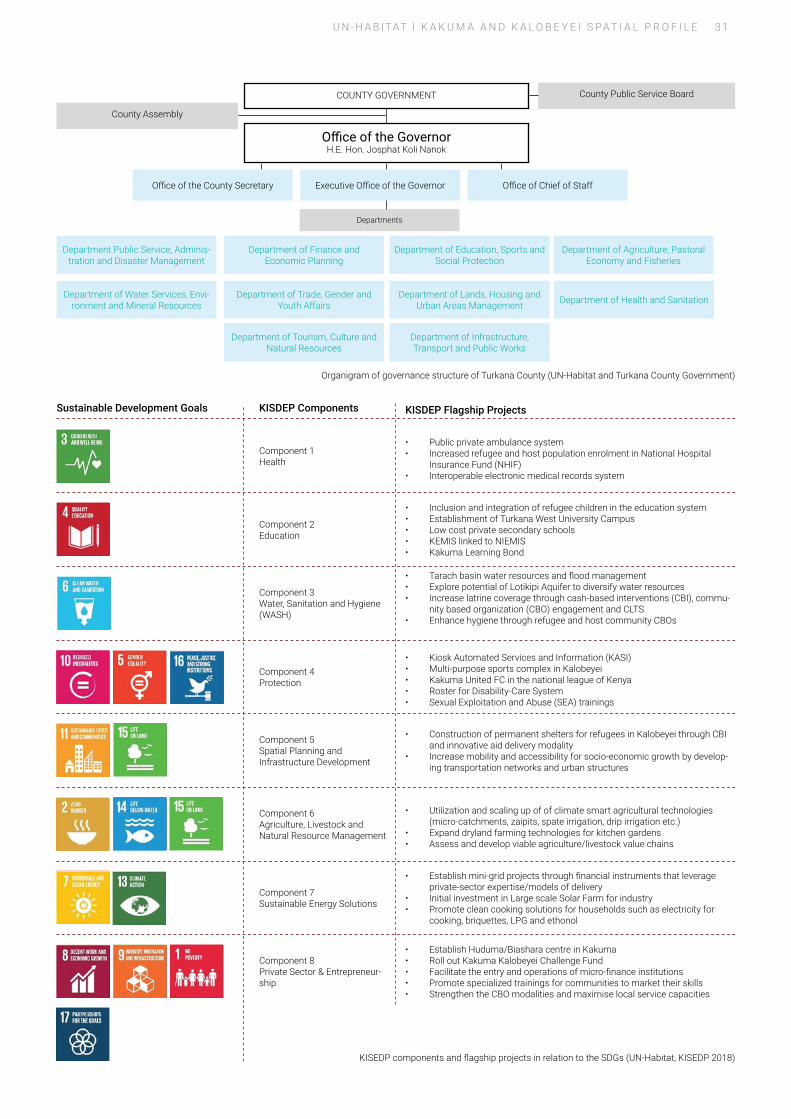
Organigram of governance structure of Turkana County (UN-Habitat and Turkana County Government)
KISEDP components and flagship projects in relation to the SDGs (UN-Habitat, KISEDP 2018)
Component 1 Health
• Public private ambulance system• Increased refugee and host population enrolment in National Hospital
Insurance Fund (NHIF)• Interoperable electronic medical records system
Component 2Education
• Inclusion and integration of refugee children in the education system• Establishment of Turkana West University Campus• Low cost private secondary schools• KEMIS linked to NIEMIS• Kakuma Learning Bond
Component 4 Protection
• Kiosk Automated Services and Information (KASI)• Multi-purpose sports complex in Kalobeyei• Kakuma United FC in the national league of Kenya• Roster for Disability-Care System• Sexual Exploitation and Abuse (SEA) trainings
Component 5Spatial Planning and Infrastructure Development
• Construction of permanent shelters for refugees in Kalobeyei through CBI and innovative aid delivery modality
• Increase mobility and accessibility for socio-economic growth by develop-ing transportation networks and urban structures
Component 8Private Sector & Entrepreneur-ship
• Establish Huduma/Biashara centre in Kakuma• Roll out Kakuma Kalobeyei Challenge Fund• Facilitate the entry and operations of micro-finance institutions• Promote specialized trainings for communities to market their skills• Strengthen the CBO modalities and maximise local service capacities
Component 7Sustainable Energy Solutions
• Establish mini-grid projects through financial instruments that leverage private-sector expertise/models of delivery
• Initial investment in Large scale Solar Farm for industry• Promote clean cooking solutions for households such as electricity for
cooking, briquettes, LPG and ethonol
Component 6Agriculture, Livestock and Natural Resource Management
• Utilization and scaling up of of climate smart agricultural technologies (micro-catchments, zaipits, spate irrigation, drip irrigation etc.)
• Expand dryland farming technologies for kitchen gardens• Assess and develop viable agriculture/livestock value chains
KISDEP Flagship Projects
Component 3Water, Sanitation and Hygiene (WASH)
• Tarach basin water resources and flood management• Explore potential of Lotikipi Aquifer to diversify water resources• Increase latrine coverage through cash-based interventions (CBI), commu-
nity based organization (CBO) engagement and CLTS• Enhance hygiene through refugee and host community CBOs
KISDEP Components
Office of the Governor H.E. Hon. Josphat Koli Nanok
Executive Office of the GovernorOffice of the County Secretary Office of Chief of Staff
County Public Service Board
County Assembly
Department of Finance and Economic Planning
Department of Agriculture, Pastoral Economy and Fisheries
Department of Water Services, Envi-ronment and Mineral Resources
Department of Education, Sports and Social Protection
Department of Trade, Gender and Youth Affairs
Department of Lands, Housing and Urban Areas Management Department of Health and Sanitation
Department Public Service, Adminis-tration and Disaster Management
Department of Infrastructure, Transport and Public Works
Department of Tourism, Culture and Natural Resources
Sustainable Development Goals
Departments
COUNTY GOVERNMENT
U N - H A B I TAT I K A K U M A A N D K A L O B E Y E I S PA T I A L P R O F I L E 3 1

Social & Demographic Context
Turkana County is the second largest of Kenya’s 47 counties, covering an area of 68,233 km2 (13.5% of Kenya’s total land area). The county is arid and semi-arid in nature, with approximately 65% of ethnic Turkana relying on a nomadic pastoralist livelihood, made difficult in recent years by drought, climate change, population growth, and environmental degradation40.
The major population centres in Turkana County are concentrated along the main transport route (A1 Highway), which enters Turkana County at Kitale and West Pokot and connects the principal market towns of Lokichar, Lodwar, Kakuma and Lokichogio, and along the Turkwel River.
Turkana County has a total population of 926,000, 196,000 (21%) of which are refugees41. Turkana West Sub-County has the second-highest population density of all the sub-counties, due to the inclusion of Kakuma and Kalobeyei refugee camps, which comprise 45% of the sub county’s population. The prevalence of pastoralism means the population distribution throughout the county changes between the wet and dry seasons. This emphasises the need to ensure that service provision is designed to respond to the shifting population in any planning considerations going forward.
The average household size for the host community is 4.6, and 5.9 for refugees in Kakuma (UNHCR, 2016). However, the 2019 census reported a higher household size, of 5.3 for Turkana West - based on a population of 239,627 people and 45,451 households (KNBS, 2020b). In general household sizes for the refugee community tend to be larger than the host community.
Over the past 40 years, Turkana County has experienced high rates of population growth, however the KNBS 2019 census data suggests that this growth rate has slowed substantially. As such, current figures show that the county has a population growth rate of 0.8% per annum42,
compared to Kenya’s average population growth rate of 2.15% per annum43. This low growth is complex to fully understand, particularly as it is at odds with historical growth trends, but may be due to internal migration of younger people to larger urban areas in search of education and employment opportunities as well as climate induced migration of pastoralist clans to surrounding counties in search of food and water for thei livestock.
The legacy of historic rapid population growth has however resulted in Turkana County having a particularly young population profile. The population of Turkana County below the age of 19 is 60%44., and for Turkana-West Sub-county it is 68%45. This particularly young population leads to concerns in the provision of education and training opportunities.
A dependency ratio measures the population not in the workforce (age 0-14 and 65+) who are dependent on those of working-age (between 15 to 65 years). Turkana County’s dependency ratio has been decreasing since 2009 and is currently estimated to be 0.78%46, meaning that there are fewer dependents that rely on and are an economic burden to the labor force. A decreasing dependency ratio leads to an increase in productivity as the labor force now has fewer people to support, freeing up resources that can be invested to accelerate a country’s economic development.
There needs to be the infrastructure available however to capitalise on this low dependency ratio, as the young workforce of a county such as Turkana will leave for cities with more employment and education opportunities such as Nairobi. This migration is accelerated by issues of climate change and the decreasing viability of pastoralism as a common livelihood. It is critical therefore to consider the opportunity of investments in Turkana West as something to take hold of and leverage for the wider social benefits for all.
Breakdown of Population, Area and Density by Subcounty. The boundaries for Kibish Sub-county are unclear and vary and therefore are not shown on the map (KNBS 2019 , UNHCR 2020)
Subcounty
Kibish 36,769 10,466 4Loima 107,795 9,120 12
Turkana Central 185,305 6,415 29Turkana East 138,526 11,396 12
Turkana North 65,218 7,012 9Turkana South 153,736 7,045 22Turkana West 239,627 + 196,000 refugees 16,779 14 > 26 (inc. refugees)
Total Population 2019 Area (km2) Density 2019 (p/km2)
Total Population 201947
1,123,026 786,185 140,791 196,050
Rural Population Urban Population Refugee Population
3 2 C H A P T E R 3 | C O U N T Y S C A L E

Turkana North - 9 p/km2
Village
Population Density
Refugee Camp
0 12.5 50
km
25
Turkana Central - 29 p/km2
Turkana West - 26 p/km2
Turkana South - 22 p/km2
Turkana East + Loima - 12 p/km2
Turkana Trading Centres
County boundary
LEGEND
International border
Major roads
Major rivers
Airport
Major Town
LAPSSET Corridor
U N - H A B I TAT I K A K U M A A N D K A L O B E Y E I S PA T I A L P R O F I L E 3 3
Map 5: Population density per sub-county in Turkana County.Sources: KNBS, ESRI, LCDA , UN-Habitat
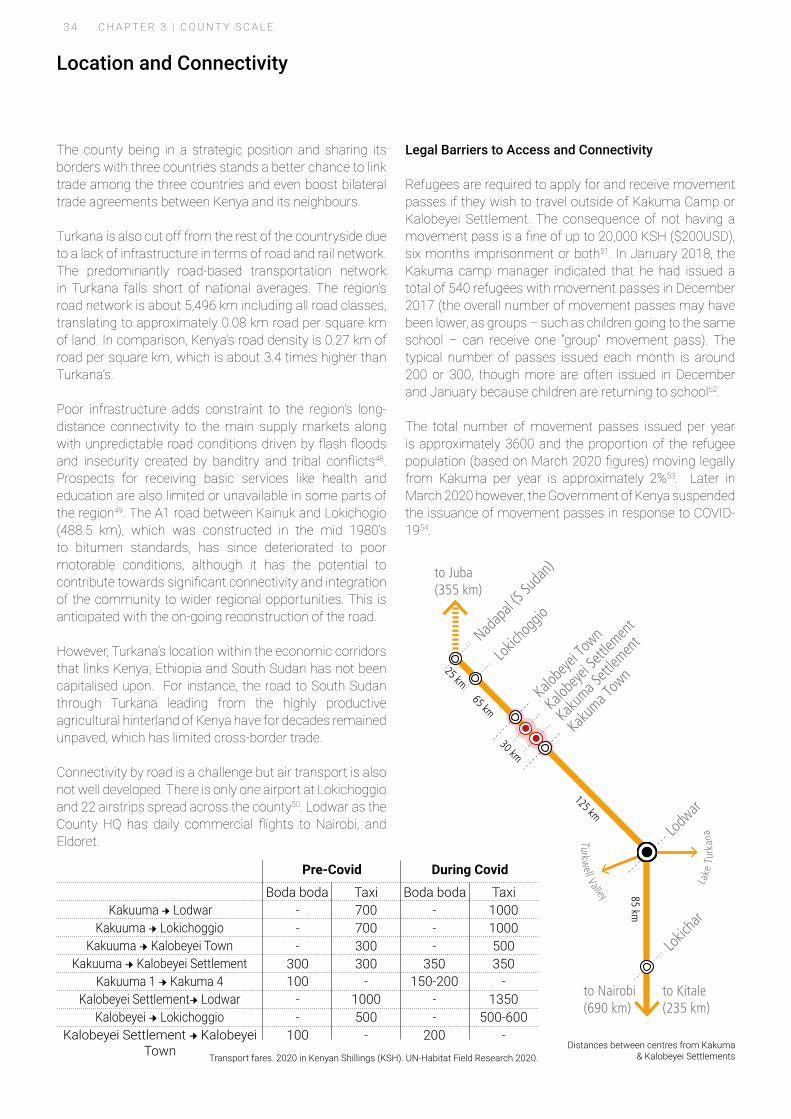
Transport fares. 2020 in Kenyan Shillings (KSH). UN-Habitat Field Research 2020.
Kakuuma → Lodwar -Kakuuma → Lokichoggio
Kakuuma → Kalobeyei TownKakuuma → Kalobeyei Settlement
Kakuuma 1 → Kakuma 4Kalobeyei Settlement→ Lodwar
Kalobeyei → Lokichoggio
During Covid
Kalobeyei Settlement → Kalobeyei Town
Pre-Covid
--
300100
--
100
700700300300
-1000500
-
10001000500350
-1350
500-600-
---
350150-200
--
200
Boda boda Taxi Boda boda Taxi
Location and Connectivity
The county being in a strategic position and sharing its borders with three countries stands a better chance to link trade among the three countries and even boost bilateral trade agreements between Kenya and its neighbours.
Turkana is also cut off from the rest of the countryside due to a lack of infrastructure in terms of road and rail network. The predominantly road-based transportation network in Turkana falls short of national averages. The region’s road network is about 5,496 km including all road classes, translating to approximately 0.08 km road per square km of land. In comparison, Kenya’s road density is 0.27 km of road per square km, which is about 3.4 times higher than Turkana’s.
Poor infrastructure adds constraint to the region’s long-distance connectivity to the main supply markets along with unpredictable road conditions driven by flash floods and insecurity created by banditry and tribal conflicts48. Prospects for receiving basic services like health and education are also limited or unavailable in some parts of the region49. The A1 road between Kainuk and Lokichogio (488.5 km), which was constructed in the mid 1980’s to bitumen standards, has since deteriorated to poor motorable conditions, although it has the potential to contribute towards significant connectivity and integration of the community to wider regional opportunities. This is anticipated with the on-going reconstruction of the road.
However, Turkana’s location within the economic corridors that links Kenya, Ethiopia and South Sudan has not been capitalised upon. For instance, the road to South Sudan through Turkana leading from the highly productive agricultural hinterland of Kenya have for decades remained unpaved, which has limited cross-border trade.
Connectivity by road is a challenge but air transport is also not well developed. There is only one airport at Lokichoggio and 22 airstrips spread across the county50. Lodwar as the County HQ has daily commercial flights to Nairobi, and Eldoret.
Legal Barriers to Access and Connectivity
Refugees are required to apply for and receive movement passes if they wish to travel outside of Kakuma Camp or Kalobeyei Settlement. The consequence of not having a movement pass is a fine of up to 20,000 KSH ($200USD), six months imprisonment or both51. In January 2018, the Kakuma camp manager indicated that he had issued a total of 540 refugees with movement passes in December 2017 (the overall number of movement passes may have been lower, as groups – such as children going to the same school – can receive one “group” movement pass). The typical number of passes issued each month is around 200 or 300, though more are often issued in December and January because children are returning to school52.
The total number of movement passes issued per year is approximately 3600 and the proportion of the refugee population (based on March 2020 figures) moving legally from Kakuma per year is approximately 2%53. Later in March 2020 however, the Government of Kenya suspended the issuance of movement passes in response to COVID-1954.
Lodw
ar
Lokic
har
Kaku
ma Tow
nLo
kicho
ggio
Nadap
al (S
Suda
n)
125 km
Kalob
eyei T
own
Kaku
ma Sett
lemen
t
Kalob
eyei S
ettlem
ent
Lake
Tur
kanaTurkw
ell Valley
to Kitale(235 km)
to Nairobi(690 km)
to Juba(355 km)
85 km
65 km
25 km
30 km
Distances between centres from Kakuma & Kalobeyei Settlements
3 4 C H A P T E R 3 | C O U N T Y S C A L E

0 12.5 50
km
25
15 minutes
30 minutes
1 hour
Access: Drive 50km/hr
1 hour travel distance radius
Village
Refugee Camp
International border
Major roads
Major rivers
Airport
Turkana Trading Centres
LAPSSET Corridor
LEGEND
County boundary
U N - H A B I TAT I K A K U M A A N D K A L O B E Y E I S PA T I A L P R O F I L E 3 5
Map 6: Connectivity and access from Kakuma and Lodwar.Sources: KNBS, ESRI, LCDA , UN-Habitat spatial analysis

Land Use & Ecological Framework
Turkana County is classified as part of the arid and semi-arid (ASAL) region of Kenya; as such, it is characterized by a lack of water and predominantly pastoralist land as a source of livelihood for the local residents.
Turkana County has inadequate water for domestic use, livestock rearing and crop irrigation. Rainfall is inadequate and unreliable, amounting to an average of 200mm of rainfall per annum. About 88 percent of the country’s residents depend on surface and subsurface dams for water, which often do not hold sufficient water due to high evaporation rates during the dry seasons55.
The main water sources in the County are boreholes, piped water and river water. Other sources include springs, rock catchments and wells. Currently, there are 1,267 boreholes, 531 shallow wells, 129 water pans, 35 unprotected springs, 10 protected springs and 6,819 roof catchments. The number of households accessing safe and clean water is 66,085. Out of this, 18% have access to piped water. The mean distance to the nearest water point is 10 km against the minimum requirement of 0.5 km56.
Shallow river aquifers often yield very high quality groundwater due to its rapid recharge by chemically good surface water and its short retention time within the aquifer, however the recently discovered deep water aquifers of Lodwar (Napuu) and Lotikipi have significant amounts of salts and will require desalination before human consumption57.
Reports note that authorities are in talks with a Saudi investor to build a desalination plant on top of the Lotikipi aquifer, in the village of Nanam, at an expected cost of 5–10bn Kenyan shillings (£37.5–75m)58. The desalination
plant would benefit Turkana greatly by providing such a scarce resource and allowing this basic need to be met. The high energy requirements of the desalination plant could capitalize on the county’s wind and solar renewable energy generation potential.
Ethiopia has embarked on a massive plan for dams, water-intensive irrigated cotton and sugar plantations, irrigation canals and other infrastructure in Ethiopia’s Omo River Basin, which provides 90 percent of the water in Lake Turkana. These developments are predicted to dramatically reduce the water supply of Lake Turkana with the planned irrigation projects alone possibly reducing Omo River’s total flow by up to 50 percent59.
Pastoralism
The predominant land use as pastoral grazing land is the traditional means of livelihood for the host community; This is an adaptation to the majority of Turkana County being either bushland (sparse) (51.7%) or barren land (rocky) (24.9%). Livestock are an essential source of food, nutrition and financial security for the host community.
Turkana suffers from increasingly unpredictable and extreme climatic conditions, with droughts and floods resulting in economic losses, loss of life and social disruption. Pastoralism as a livelihood is under threat and will need to be adapted to increasingly unpredictable and extreme climate conditions. Diversification of livelihoods is needed as a response to the impacts of climate change.
0.2%
24.9%
4.1%
10.9%51.7%
0.4%2.9%
0.1% 1%3.8%
Breakdown of land-use in Turkana County
Agriculture (sparse)
Barren land (rocky)
Barren land (sand and gravel)
Bushland (dense)
Bushland (sparse)
Grassland
Swamp
Urban
Waterbody
Woodland
3 6 C H A P T E R 3 | C O U N T Y S C A L E

Map 7: Land use in Turkana County.Sources: KNBS, ESRI, LCDA , KWS, OXfam GB, Turkana County Government, UN-Habitat research, UNESCO
0 12.5 50
km
25
Grassland
Swamp
Urban
Waterbody
Woodland
Bushland (sparse)
Landuse
Conservation Area
Aquifers
!!!!
Bushland (dense)
Barren land (rocky)
Agriculture (sparse)
Barren land (sand/gravel)
Propsoed desalination plant
Village
Refugee Camp
International border
Major roads
Major rivers
Airport
Turkana Trading Centres
LAPSSET Corridor
County boundary
LEGEND
Livestock routes
Major Town
U N - H A B I TAT I K A K U M A A N D K A L O B E Y E I S PA T I A L P R O F I L E 3 7

Climate Context & Natural Hazards
Arid and Semi-Arid Land(ASAL)
Turkana County is arid and semi-arid, characterised by a hot climate ranging between 20ºC to 41ºC. While global mean temperatures are estimated to have increased by 0.8°C (1.5°F) in the past century, in Turkana County minimum and maximum air temperatures have increased by between 2 and 3°C (3.5 and 5.5°F) between 1967 and 201260. On average, Turkana County receives 200mm of rain per year, mostly during one of the two rainy seasons. The long rains usually occur between April and July and the short rains between October and November. These rainfall patterns are erratic and unreliable however with the short rainy season becoming longer and wetter and the long rainy season becoming shorter and dryer61.
Where drought was a relatively predictable phenomenon that occurred once every 5-10 years, providing adequate time for households and communities to recover their assets and livelihoods, drought now occurs every 1 to 3 years. Overall annual rainfall in Turkana remains at low levels, with repeated intense droughts across Northern Kenya.
While climate change has exacerbated the effects of droughts and floods, key causes arise from a lack of resilience of the landscape. This stems from unsustainable land and water management practices that leave the land and water resources unable to recover. Degraded and reduced natural resources often exacerbate conflict. Disaster risk affects the majority of the population of Turkana County.
Drying of Lake Turkana
According to numerous reports, Turkana Lake which untill recently extended to Ethiopia, has shrunk to within Kenya. Its increased salinity has resulted in reduced fish stocks, even as growing numbers of local Turkana people turn to fishing as drought has killed off their herds. The shrinking of Lake Turkana is attributed to the construction of the Gibe
II dam on the Omo River in Ethiopia in 2006. In addition, in early 2011 Ethiopia commenced a large-scale irrigation project for water-intensive sugar-cane plantation in the Lower Omo. Lake Turkana’s water levels have dropped by approximately 1.5 meters since January 201562. The drop is already affecting the shoreline of the lake, which has receded as much as 1.7 kilometers in Ferguson Gulf since November 2014. Ferguson Gulf is a critical fish breeding area, and a key fishing ground for the indigenous Turkana people 63.
Changes to Lake Turkana will impact the surrounding environment far beyond its shores. The lake has a significant cooling effect on the region, regulating temperatures and precipitation, preventing desertification. Ethiopia’s development projects, in conjunction with climate change, could also have an impact on some large non-renewable energy projects that utilize the current climatic conditions, such as the wind farm recently completed southeast of Lake Turkana64 in Marsabit County.
Locusts
Kenya is experiencing its worst locust invasion in 70 years. Turkana South, Turkana West, Turkana Central and Loima have all been affected by locust infestations65. The locust infestation, coupled with the COVID-19 pandemic and recent flooding has exacerbated existing food insecurity in Turkana County.
Adapting to Climate Change
Diversifying livelihoods (away from predominantly pastoralism) is one way of addressing the impacts of climate change in Turkana County. Extending services for skills development is one way of helping build peoples’ capacity to adapt to climate change. Access to not only education and training, but also local financial and institutional resources, including basic services (potable water, electricity, education) will also be critical for responding to shocks and stressors.
Drought magnitude in Lodwar, Turkana. World Bank, UNHCR & University of Notre Dame (2016).
1952 Lotiira (1952-57) 611960 Namotor 551971 Kimududu/ Kibekbek 541976 Kibekbek 541980 Kiyoto Atang’aa/Lapiar (1980-87) 651986 Lopiar (1986-87) 531990 Lokwakoyo/Akalkal (1990-95) 53
Year Name of Famine/Drought Mortality Rate Among Livestock
1999 Logara/Epomopo (1999-2001) 63
3 8 C H A P T E R 3 | C O U N T Y S C A L E

Map 8: Drought and flood prone areas in Turkana County.Sources: KNBS, ESRI, LCDA , KWS, RCMRD, National Spatial Plan, UNESCO, UN-Habitat
0 12.5 50
km
25
Very high
High
Medium
Drought Prone Area Severity
Low
Very high flood risk
High flood risk
Flood Risk
Medium flood risk
Low flood risk
Village
Refugee Camp
International border
Major roads
Major rivers
Airport
Turkana Trading Centres
LAPSSET Corridor
County boundary
LEGEND
Major Town
Conservation Area
Flood plain
U N - H A B I TAT I K A K U M A A N D K A L O B E Y E I S PA T I A L P R O F I L E 3 9
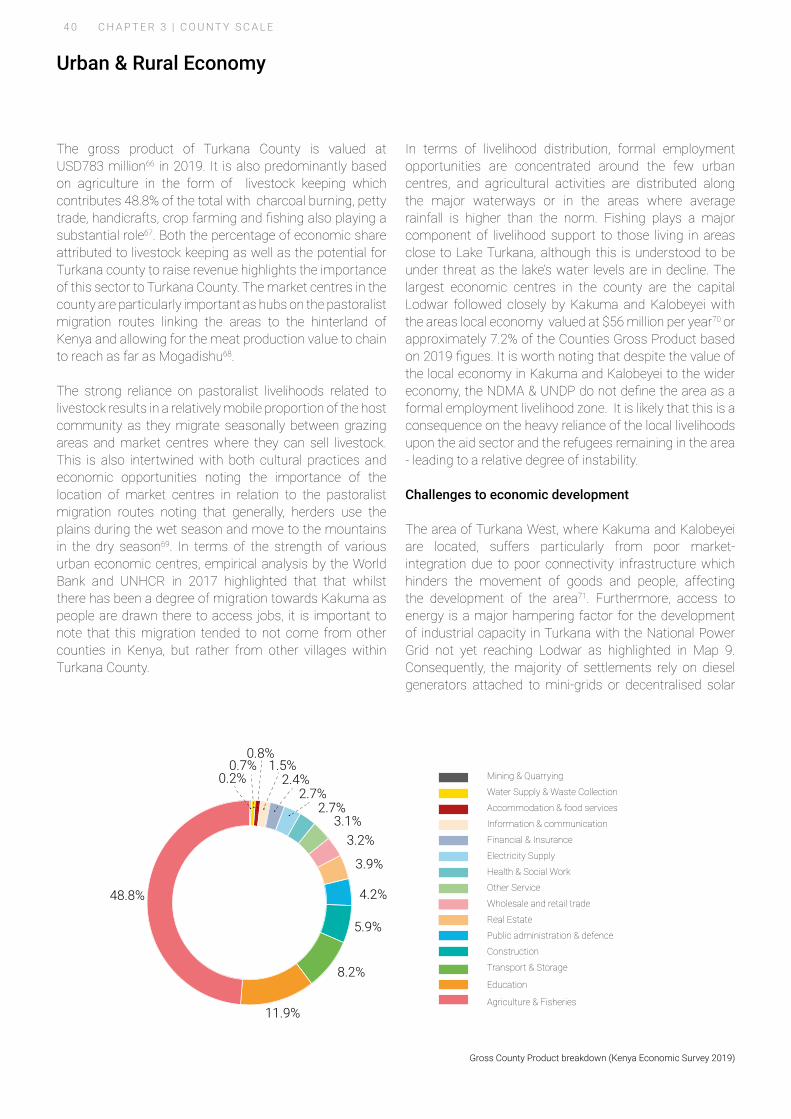
The gross product of Turkana County is valued at USD783 million66 in 2019. It is also predominantly based on agriculture in the form of livestock keeping which contributes 48.8% of the total with charcoal burning, petty trade, handicrafts, crop farming and fishing also playing a substantial role67. Both the percentage of economic share attributed to livestock keeping as well as the potential for Turkana county to raise revenue highlights the importance of this sector to Turkana County. The market centres in the county are particularly important as hubs on the pastoralist migration routes linking the areas to the hinterland of Kenya and allowing for the meat production value to chain to reach as far as Mogadishu68.
The strong reliance on pastoralist livelihoods related to livestock results in a relatively mobile proportion of the host community as they migrate seasonally between grazing areas and market centres where they can sell livestock.This is also intertwined with both cultural practices and economic opportunities noting the importance of the location of market centres in relation to the pastoralist migration routes noting that generally, herders use the plains during the wet season and move to the mountains in the dry season69. In terms of the strength of various urban economic centres, empirical analysis by the World Bank and UNHCR in 2017 highlighted that that whilst there has been a degree of migration towards Kakuma as people are drawn there to access jobs, it is important to note that this migration tended to not come from other counties in Kenya, but rather from other villages within Turkana County.
In terms of livelihood distribution, formal employment opportunities are concentrated around the few urban centres, and agricultural activities are distributed along the major waterways or in the areas where average rainfall is higher than the norm. Fishing plays a major component of livelihood support to those living in areas close to Lake Turkana, although this is understood to be under threat as the lake’s water levels are in decline. The largest economic centres in the county are the capital Lodwar followed closely by Kakuma and Kalobeyei with the areas local economy valued at $56 million per year70 or approximately 7.2% of the Counties Gross Product based on 2019 figues. It is worth noting that despite the value of the local economy in Kakuma and Kalobeyei to the wider economy, the NDMA & UNDP do not define the area as a formal employment livelihood zone. It is likely that this is a consequence on the heavy reliance of the local livelihoods upon the aid sector and the refugees remaining in the area - leading to a relative degree of instability.
Challenges to economic development
The area of Turkana West, where Kakuma and Kalobeyei are located, suffers particularly from poor market-integration due to poor connectivity infrastructure which hinders the movement of goods and people, affecting the development of the area71. Furthermore, access to energy is a major hampering factor for the development of industrial capacity in Turkana with the National Power Grid not yet reaching Lodwar as highlighted in Map 9. Consequently, the majority of settlements rely on diesel generators attached to mini-grids or decentralised solar
Urban & Rural Economy
48.8%
11.9%
8.2%
5.9%
4.2%
3.9%
3.2%3.1%
2.7%
1.5%0.8%
0.7%0.2%
2.7%2.4% Mining & Quarrying
Water Supply & Waste Collection
Accommodation & food services
Information & communication
Financial & Insurance
Electricity Supply
Health & Social Work
Other Service
Wholesale and retail trade
Real Estate
Public administration & defence
Construction
Transport & Storage
Education
Agriculture & Fisheries
Gross County Product breakdown (Kenya Economic Survey 2019)
4 0 C H A P T E R 3 | C O U N T Y S C A L E

Existing National Grid
Proposed National Grid
((
0 12.5 50
km
25
Agro pastoral
Livelihood zoning
Pastoral (all species)
Pastoral (cattle, sheep, goats)
Trade Business & Employment Centres
Pastoral (goats, sheep)
Oil wells
Village
Refugee Camp
International border
Major roads
Major rivers
Airport
Turkana Trading Centres
LAPSSET Corridor
County boundary
LEGEND
Livestock routes
Major Town
AquifersMap 9: Livelihood zoning and livestock trade corridors in Turkana County.
Sources: KNBS, ESRI, LCDA, OXfam GB, Turkana County Government, GoK, UN-Habitat research
U N - H A B I TAT I K A K U M A A N D K A L O B E Y E I S PA T I A L P R O F I L E 4 1
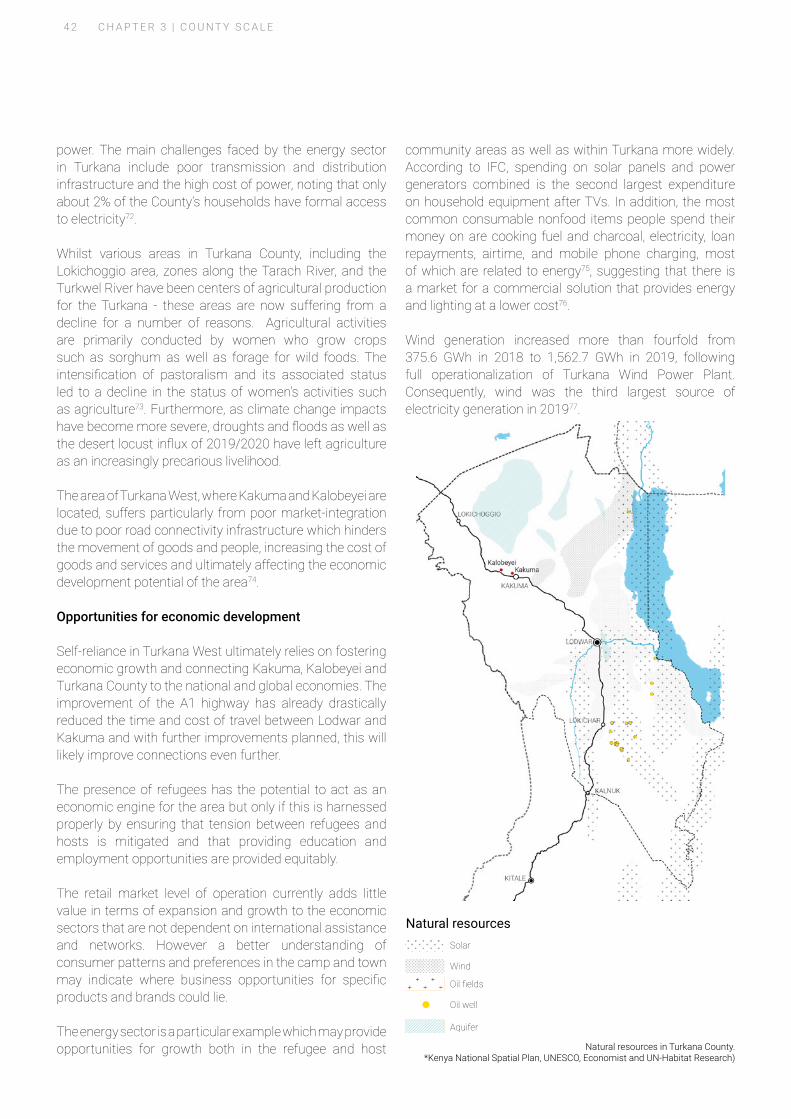
power. The main challenges faced by the energy sector in Turkana include poor transmission and distribution infrastructure and the high cost of power, noting that only about 2% of the County’s households have formal access to electricity72.
Whilst various areas in Turkana County, including the Lokichoggio area, zones along the Tarach River, and the Turkwel River have been centers of agricultural production for the Turkana - these areas are now suffering from a decline for a number of reasons. Agricultural activities are primarily conducted by women who grow crops such as sorghum as well as forage for wild foods. The intensification of pastoralism and its associated status led to a decline in the status of women’s activities such as agriculture73. Furthermore, as climate change impacts have become more severe, droughts and floods as well as the desert locust influx of 2019/2020 have left agriculture as an increasingly precarious livelihood.
The area of Turkana West, where Kakuma and Kalobeyei are located, suffers particularly from poor market-integration due to poor road connectivity infrastructure which hinders the movement of goods and people, increasing the cost of goods and services and ultimately affecting the economic development potential of the area74.
Opportunities for economic development
Self-reliance in Turkana West ultimately relies on fostering economic growth and connecting Kakuma, Kalobeyei and Turkana County to the national and global economies. The improvement of the A1 highway has already drastically reduced the time and cost of travel between Lodwar and Kakuma and with further improvements planned, this will likely improve connections even further.
The presence of refugees has the potential to act as an economic engine for the area but only if this is harnessed properly by ensuring that tension between refugees and hosts is mitigated and that providing education and employment opportunities are provided equitably.
The retail market level of operation currently adds little value in terms of expansion and growth to the economic sectors that are not dependent on international assistance and networks. However a better understanding of consumer patterns and preferences in the camp and town may indicate where business opportunities for specific products and brands could lie.
The energy sector is a particular example which may provide opportunities for growth both in the refugee and host
community areas as well as within Turkana more widely. According to IFC, spending on solar panels and power generators combined is the second largest expenditure on household equipment after TVs. In addition, the most common consumable nonfood items people spend their money on are cooking fuel and charcoal, electricity, loan repayments, airtime, and mobile phone charging, most of which are related to energy75, suggesting that there is a market for a commercial solution that provides energy and lighting at a lower cost76.
Wind generation increased more than fourfold from 375.6 GWh in 2018 to 1,562.7 GWh in 2019, following full operationalization of Turkana Wind Power Plant. Consequently, wind was the third largest source of electricity generation in 201977.
Natural resources in Turkana County.*Kenya National Spatial Plan, UNESCO, Economist and UN-Habitat Research)
Oil fields
Oil well
Aquifer
Natural resourcesSolar
Wind
((
4 2 C H A P T E R 3 | C O U N T Y S C A L E

Marketplace in Kakuma UN-Habitat 2020)
U N - H A B I TAT I K A K U M A A N D K A L O B E Y E I S PA T I A L P R O F I L E 4 3

Financial Context
Overview
Public finance and sound fiscal management are key to supporting local development goals and establishing a solid financial base that strengthens the public sector’s role in supporting local economic development.
County governments receiving funding from two sources: transfers, and own source revenues. Transfers are of three kinds. Unconditional equitable share transfers, which allocate the county share of revenue (determined by the Division of Revenue Act) according to a formula agreed by Parliament and set out in the County Allocation of Revenue Act. The Constitution provides that counties receive a minimum of 15 percent of national revenues of the last audited financial year. The Equitable Share is then distributed among the counties via a progressive formula that gives historically marginalized counties a larger per capita transfer than historically privileged counties. As a result of the Equitable Share Formula, historically marginalized counties like Turkana have significant discretionary budget resources. The Constitution also provides for an Equalization Fund amounting to 0.5 % of total nationally generated revenues.
Conditional transfers which are of two types:• Conditional grants included in the County Allocation
of Revenue Act, which cover devolved donor projects and funding for level 5 hospitals
• Conditional grants embedded in the national budget, which include grants for the operation and maintenance of health facilities, and funding to compensate them for loss of revenue from the free maternity and free primary health care policies of the national government.
The Constitution grants limited revenue-raising powers to counties (the largest being property rates and single business permits), thus most counties remain highly transfer-dependent.
Expenditure Breakdown
In terms of budgeting, the largest share (36%) of the county expenditure is allocated to the running of the public service and administration of the County itself. In terms of other service provision, Healthcare is second with 8.7% and with education at 6.7% and infrastructure in general receiving only 5.3%.
The Ministry of Lands is only allocated 4% despite the complex community land and fragile environment context.
Revenue Breakdown
At this point in time, no actual reports of Own Source Revenue (OSR) for the county was available for analysis. As such, the analysis for OSR was taken from forecasts in the Turkana County 2019/2020 annual budget.
The two largest sectors for own source revenue are forecast to come from livestock levies and healthcare related fees at 21% and 20% respectively. The next two largest sector are royalties on resources at 17%, and business permits at 13%. The income from fees and hides is also forecast to be significant with 11% of the total. In total, livestock related fees generate 33% of forecast income for the county, emphasising the significant relevance of this sector to not only the economy but to the ability of the county to raise revenue to support improved service delivery.
Utility fees, which is often a major component of municipal income is not shown in the forecast for Turkana County makes up less than 1% of the own source revenue - which reveals a potential opportunity. This is necessary to be considered as part of any sustainable investment in water, waste and public works (including roads) infrastrastructure going forward.
Potential for Local Economic Development
Given the particularly low own source revenue (OSR) collected in Turkana, it is very difficult for the County Government to invest in improvements to infrastructure and service provision. It also implies that the cost of maintenance of infrastructure will be particularly burdensome and risk rapid deterioration. It is crucial therefore for improvements in OSR to be prioritised in tandem with infrastructure investment and associated development projects to have any potential for sustainability.
4 4 C H A P T E R 3 | C O U N T Y S C A L E
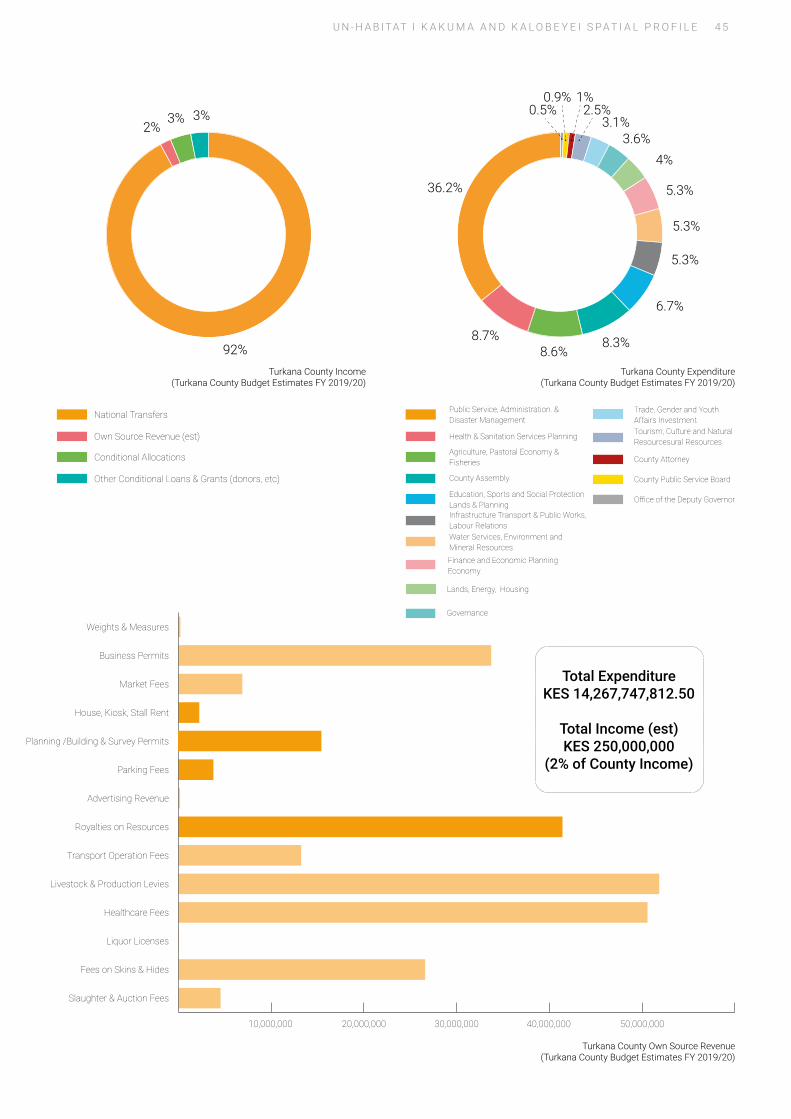
36.2%
8.7%8.6%
8.3%
6.7%
5.3%
5.3%
5.3%
4%3.6%
3.1%2.5%
1%0.9%0.5%
Public Service, Administration. & Disaster ManagementNational Transfers
Own Source Revenue (est)
Conditional Allocations
Other Conditional Loans & Grants (donors, etc)
Health & Sanitation Services Planning
Agriculture, Pastoral Economy & Fisheries
County Assembly
Education, Sports and Social Protection Lands & PlanningInfrastructure Transport & Public Works, Labour RelationsWater Services, Environment and Mineral ResourcesFinance and Economic Planning Economy
Lands, Energy, Housing
Governance
Trade, Gender and Youth Affairs InvestmentTourism, Culture and Natural Resourcesural Resources
County Attorney
92%
2%3% 3%
County Public Service Board
Office of the Deputy Governor
Weights & Measures
Business Permits
Market Fees
House, Kiosk, Stall Rent
Planning /Building & Survey Permits
Parking Fees
Advertising Revenue
Royalties on Resources
Transport Operation Fees
Livestock & Production Levies
Healthcare Fees
Liquor Licenses
Fees on Skins & Hides
Slaughter & Auction Fees
10,000,000 20,000,000 30,000,000
Total ExpenditureKES 14,267,747,812.50
Total Income (est)KES 250,000,000
(2% of County Income)
40,000,000 50,000,000
Turkana County Income(Turkana County Budget Estimates FY 2019/20)
Turkana County Expenditure(Turkana County Budget Estimates FY 2019/20)
Turkana County Own Source Revenue(Turkana County Budget Estimates FY 2019/20)
U N - H A B I TAT I K A K U M A A N D K A L O B E Y E I S PA T I A L P R O F I L E 4 5
Housing Land & Property
Land Ownership Types in Kenya
The Kenyan Government has instigated land reforms to improve tenure security in the past decade. A key approach is the adoption of the National Land Policy in 2009 and the passage of the 2010 Constitution simplifying land laws and land management systems in the country and the Community Land Act of 2016 which is of particular importance to Turkana County,
The three forms of Land ownership in Kenya are as follows:
1. Public land – reserved for public use or environmental protection. It is administered and managed by the National Land Commission (NLC) on behalf of the people of Kenya.
2. Community land – held by communities on basis of ethnicity, culture or similar community interest. It is administered under the Community Land Act No. 27 of 2016. Any unregistered land that is community land is held in trust by the county governments for the community.
3. Private land – held by natural or legal persons. The Ministry of Lands is tasked with the registration of any interest in private land. This can be under the Freehold or Leasehold land tenure system which gives the holder absolute ownership of the land for life.
Community Land in Turkana
The land in Turkana County is generally designated as Community Land. It is not understood however the proportion of land that has been allocated titles or is under the status of private or public land.
The status of the land where the Kakuma Camps sit was not able to be clarified by this study, but are presumed to designated as Public Land held by the County based on other camp contexts in Kenya
Kalobeyei Settlement is Community Land allocated to UNHCR for the purposes of hosting refugees under a terms of engagement signed between the County Government, Representatives of the community and UNHCR in 2015.21
According to the 2016 Act, Community Land in Kenya shall vest in the Community. In this respect, the term “Community” has been defined to mean a consciously distinct and organised group of users of community land who are citizens of Kenya and share any of the following attributes: common ancestry, similar culture or unique mode of livelihood; socioeconomic or other similar common interest; geographical space; ecological space;
or ethnicity. The constitution of a community is therefore not limited to ethnic lines. The Act requires a community claiming an interest in or right over community land to be registered, the process outlined in the figure adjacent
The main role of the County Government under the Act is to hold in trust on behalf of a community unregistered community land and any monies payable as compensation for compulsory acquisition of any such unregistered community land. Any such monies shall be deposited in a special interest earning account by the County Government and shall be released to the community upon registration of the community land.
A County Government is prohibited from selling, disposing, transferring, and converting for private purposes or in any other way disposing of any unregistered community land that it is holding in trust on behalf of a community.
Community Land Ownership and Pastoralism
The importance of managing community land in Turkana cannot be overstated, The livestock sector on which this land relies contributes an estimated 12 percent to the countries GDP and 47 percent to agricultural GDP. The livestock population is concentrated in the Arid and Semi-Arid Lands (ASALs) (75 percent of total surface area) where the livestock sector accounts for 90 percent of employment and more than 95 percent of family incomes. These areas have the highest incidence of poverty and very low access to basic social services (FAO 2005).
Pastoralists in Boran, Gabra and Garri in the border areas of northern Kenya and southern Ethiopia have long relied on moving herds between dry and wet season pastures based on primary and secondary rights of use negotiated with different pastoral groups in order to regulate sharing of water and pasture. The viability of these systems has been historically weakened by state policies that have failed to recognize the legitimate right of pastoralists to rangeland resources. Conflict has escalated, traditional rules and practices have eroded and pastoral livelihoods have been weakened as a result. Kenya’s Community Land Bill offers a new approach to securing the rights of pastoralists to land, grazing and water through devolved governance and greater influence over decisions affecting their livelihood.
4 6 C H A P T E R 3 | C O U N T Y S C A L E

Land Tenure Options ExploredREGISTERED COMMUNITY LAND
COMPONENT 1 - REGISTRATION OF COMMUNITIES
A community claiming an interest in or
right over community land must register
its rights under the Land Registration Act.
They must have a plausible justification for
why they are registering the community
land as a collective, e.g. common ancestry,
similar culture, etc.
Community Land Registrar (CLR) invites community members to a public meeting
Community Assembly elects members of the Community Land Management Committees (CLMC)
The CLMC submits to the CLR the community name, registered members and minutes of meeting registration
1
2
3
COMPONENT 2 - REGISTRATION OF LAND
Using a general map of the area from the Survey of Kenya Folio Register (FR), a licensed surveyor must provide ground coordinates, with beacons placed to mark the area. Using the deed plan that shows the reference point, the new points, and the resultant maps, this must be verified by the land control board. Once the process is verified and submitted to Survey of Kenya for confirmation, the parcel is given a parcel number. At that point the registrar can submit register the ownership of the land and issue a title to the relevant community.
The Cabinet Secretary (CS) issues a gazette notice of the adjudication programme
The CS appoints an adjudication officer (AO)
The CS issues a public notice valid for 60 days of intention to survey land
The AO facilitates the demarcation of the land and delineation of the boundaries
The AO submits the cadastral map to CLR for registration
Certificate of title issued by CLR
1
2
3
4
5
6
Process for registering Community Land (UN-Habitat Governance & Legislation Unit 2017)
U N - H A B I TAT I K A K U M A A N D K A L O B E Y E I S PA T I A L P R O F I L E 4 7

KAKUMA & KALOBEYEI CONTEXT

KAKUMA & KALOBEYEI CONTEXT
Kalobeyei Integrated Settlement (UNHCR)

The few settlements which could be termed as urban within Turkana West Sub-County include the town of Lokichoggio and particularly Kakuma which both sit along the A1 highway which forms the infrastructure backbone of the area. Kakuma sits at the entry point to the sub-county coming from Lodwar and hosts the majority of the total sub-counties host community population as well as more than 200,000 refugees in the Kakuma camps as well as the adjacent Kalobeyei refugee camp.The landscape is predominantly characterized by a sparsely populated arid landscape inhabited by nomadic pastoralists who depend mainly on livestock for survival.
The sub-county is one of the most impoverished and marginalized areas in the region and the obstacles facing the Turkana community, in terms of climate change, limited local resources and access to socio-economic opportunities are significant. These obstacles are often exacerbated due to the pressure of hosting refugees for almost three decades, which has led to integrated scale development programming targeting both hosts and refugees (such as KISEDP) to help ease the pressures and support improved cohesion between the groups.
The Kakuma area was formerly a watering and meeting hole for Turkana pastoralists from surrounding areas which prior to1992, Kakuma was a culturally and economically significant location, with a livestock market, primarily controlled by the Somali traders. In 1992, after consulting with the Kenyan Government as well as local leaders and elders of the Turkana community, UNHCR chose Kakuma, 96 km to the southeast of Lokichoggio, as its new center of operations. By the end of 1992 and 1993, the first group of refugees—the Nuer—reached Kakuma, followed in 1993 and 1994 by the Dinka, Ethiopian Amhara, Ethiopian Oromo, and some Somalis78.
Refugee and Host Community Relationship
The relationship between the host and refugee communities are complex. Since the initial phase of the camp’s establishment, the host community has recognised the economic benefits of the flow of humanitarian aid into the refugee community, which to some extent flows on into the host community in the form of infrastructure, employment opportunities, social programmes and economic potential79.
These benefits are tempered however by conflicts which have arisen over the years regarding access to the limited resources of water and firewood, environmental degradation caused by the presence of the camps, land ownership and encroachment disputes and over access to infrastructure and facilities80. These conflicts are seen
Turkana West Sub-County Context
Turkana County Male Population
Turkana County Female Population
Turkana West Male Population
Turkana West Female Population
0-9
10-19
20 - 59
>60
Demographic breakdown of Turkana County and Turkana West sub-county (KNBS 2019)
to be heightened during the dry seasons, when access to resources is especially constrained81.
Kalobeyei Settlement was envisioned to encourage integration between host and refugee communities through having them live side-by-side and having equal access to shared health, education and recreation facilities. Social integration in Kalobeyei Settlement however has been found to be only minimal and partial, with most residents of the new settlement being refugees82. Additional barriers to full integration of the host and refugee communities include unbalanced assistance by humanitarian organisations in favour of refugees, socio-cultural differences between the communities and a lack of deliberate programming to mainstream realistic integration os issues in KISEDP83.
The already fraught relationship between the Turkana host community and the refugees are being tested by the changing demographics of the refugee settlement at Kakuma with regard to its scale and the cultural origins of the refugees in addition to coping with large influxes within the last decade. This can be clearly demonstrated by the fact that Kakuma camp was originally planned built for around 80,000 Sudanese refugees, the population of Kakuma Refugee Camp has fluctuated from 35,000 at its establishment to 80,000 in 2009 and over 160,000 in 201684 and almost 200,000 since the development of Kalobeyei Integrated Settlement. As of July 2020, refugees make up 45% of the sub-county’s population, almost outnumbering the host community.
The challenge for the future is to ensure that the nuances of this relationship is considered within municipal systems and sound urban management processes and concretely unlocks pathways for inclusive sustainable development.
5% 5%10% 10%15% 15% 20%20%
5 0 C H A P T E R 4 | S E T T L E M E N T S C A L E

LEGEND
International border
Major roads
County boundary
Village
Administration Boundary
Refugee Camp
0 12.5 50
km
25
Kakuma + Letea Wards
Turkana West Sub-county
Major rivers
Airport
Major Town
LAPSSET Corridor
Map 10: Turkana West administrative boundaries.Sources: KNBS, ESRI, LCDA
Turkana County population breakdown (KNBS 2019)
36%
34%
6.4%
6.2%
8.8%
8.2%
Male Population - Rural
Male Population - Urban
Female Population - Rural
Refugees Male
Female Population - Urban
Refugees - Female
U N - H A B I TAT I K A K U M A A N D K A L O B E Y E I S PA T I A L P R O F I L E 5 1

Spatial Impact of Influx
1989 1990 1991 1992 1993 1994 1995 1996 1997 1998 1999 2000 2001 2002 2003 2004
The first group of refugees —”the lost boys” from the Nuer and Dinka
tribes were settled in Kaku-ma in July 1992 following the closure of the refugee
camp in Lokichoggio
KAKUMA 3
50,000
100,000150,000
200,000
250,000
Gradual increase in population numbers during early 2000s predominantly
as a result of natural population growth, and
continued small influxes from Sudan to Kakuma,
lead to the development of Kakuma 3
Following closure of the coastal camps of Utange, Marafa and Swale Nguru/
Benadi, Somali refugees re-settled in Kakuma, leading
to the opening of Kakuma 2
Kakuma 1 is expanded to accommodate additional
Oromo and Amhara Ethiopi-an refugees fleeing conflict.
The camp was expanded to house approximately
35,000 people
1995Developed Area: 3.79 km2Population: 41,000 approx
Density: 10801 person/km2
2007Developed Area: 13.9 km2
Population: 93,610Density: 6713 person/km2
Kakuma 1
Kakuma Town
Kakuma 1
Kakuma Town
Kakuma 2/3
KAKUMA 2
KAKUMA 1
Host community
Refugee camps
5 2 C H A P T E R 4 | S E T T L E M E N T S C A L E

KAKUMA 3
2005 2006 2007 2008 2009 2010 2011 2012 2013 2014 2015 2016 2017 2018 2019 2020
KALOBEYEI
KAKUMA 4
KAKUMA 2
KAKUMA 1
KAKUMA 3
Comprehensive Peace Agreement for Sudan signed in 2005 paving the way for large scale
repatriation of Sudanese refugees in Kakuma, leading to the semi-
abandonment of Kakuma 3
Sporadic violence, poor infrastructure and service
delivery in Sudan lead to the gradual return of refugees to Kakuma. In addition, the relocation of 15,000 Somali
refugees from Dadaab to Kakuma led to the re-
development of Kakuma 3
In June 2015, the Turkana County
Government, at the request of the Central Government, allocates
15km2 in Kalobeyei Ward NW of Kakuma, for a new integrated
settlement
Further conflict in South Sudan leads to the
development of Kakuma 4 to house the increased
influx of refugees
In April 2017, an advisory plan for
the development of Kalobeyei Integrated
Settlement is submitted to Turkana County
Government for approval as formal urban settlement
2015Developed Area: 24.4 km2
Population: 222,401Density: 9121 person/km2
2020Developed Area: 41.55km2
Population: 242,527Density: 5837 person/km2
To Kalobeyei
Kakuma 1
Kakuma Town
Kakuma 2/3
Kakuma 4
Kakuma 1
Kakuma Town
Kakuma 2/3
Kakuma 4
Kalobeyei
Built-up footprint of Kakuma-Kalobeyei over time (UN-Habitat research)
Population growth of Kakuma-Kalobeyei over time(UNHCR, World Bank, Ohta 2005, KNBS 2009, KNBS 2019)
U N - H A B I TAT I K A K U M A A N D K A L O B E Y E I S PA T I A L P R O F I L E 5 3

Turkana West Governance Context
Sectoral ResponsibilitiesKalobeyei Settlement and Kakuma Refugee Camps
Kakuma Town, Kalobeyei Town, Villages
Settlement Management
Health
Education
Water
Waste Management
Urban Roads
Energy & Environment
Security
UNHCR and RAS
UNHCR/AIC/IRC/KRC
UNHCR/LWF/WIK
UNHCR/NRC
UNHCR/NRC/PWJ
UNHCR
UNHCR/Lokado/GIZ
National Government, RAS & Police
Turkana County Government
Turkana County Government
Turkana County Government
Turkana County Government
Turkana County Government
Turkana County Government
Turkana County Government
National Government & Police
On behalf of the National Government at the county level, Turkana West Sub-county is led by a Deputy Commissioner who reports to the County Commissioner. The Deputy County Commissioner oversees 4 divisions in Turkana West, which are headed by Assistant county commissioners. The divisions contain several locations that are headed by Chiefs. The Locations are further broken down into sub-locations (as shown in the map by white lines) which are headed by Sub-Chiefs. It is at this level which the communities most easily engage with National Government Institutions. On behalf of the County Government85, Turkana West is administered by a sub-county administrator who is appointed by the County Public service Board and is responsible for the management of the administrative functions in the sub-county. They oversee representatives/professionals of all ministries that exist within the county at the headquarters level whose role is to implement plans in the wards within the sub-county.
Turkana West sub-county has 7 wards. Each ward unit is headed by the ward administrator who is appointed by the County Public Service Board. He/she carries out similar duties as the sub-county administrator but at the ward level. In carrying out the functions and duties the ward administrator is supervised by the sub-county administrator. Each village unit within a ward establishes a village council that includes the village administrator and village elders (between 3 and 5) who are approved by the County Assembly. The team ensures and coordinates the participation of the village unit in governance, monitoring, and implementation of policies and advises the ward administrator and sub-county administrators on matters related to the village.
The Turkana County government is proposing to confer municipality status upon Kakuma town and its surrounding areas as per section 9 of the Urban Areas and Cities
Act. It will therefore acquire new authority to empower the area’s new leaders to work directly with the various departments of the county government for the successful implementation of projects and delivery of services. The municipality’s management will be under the municipal board (11 members) appointed by the governor with approval by the County Assembly. The Municipality will be headed by the Municipal manager who is competitively recruited and appointed by the County Public Service Board. The manager will be able to implement decisions and functions of the board and answers to the board.
One major issue that currently occurs as a result of this dual structure of government administration is the number of institutional actors that must be engaged in any future development for the Kakuma and Kalobeyei areas which is also exacerbated by the overlap of administrative boundaries. The implications of this mean that the built-up area of Kalobeyei Settlement sits across two sub-locations of Kalobeyei and Lopur but is fully within the ward of Letea. The settled area of Kakuma town and camp sits across 3 wards, namely Letea, Lopur, and Kakuma as well as 4 sublocations including Lopur, Nadapal, Morungole, and Lokore.
The intergovernmental relationship challenges arise due to overlapping responsibilities and therefore opportunity for potential ambiguity leading to lack of impactful land administration and service provision. In addition to the existing national and county levels of governance, the ongoing humanitarian and development actors in the county have added to the various governance structures. Most prominent of which is the KISEDP programme which aims to link National and Government planning priorities with specific programming. The conferment of Municipality status for Kakuma once completed will allow for a much more streamlined administrative system of service and land management and ideally enable more impactful and efficient service delivery.
Requires attentionPartially functionalFunctional (UN-Habitat Field Interviews 2020)
5 4 C H A P T E R 4 | S E T T L E M E N T S C A L E

Map 11: Administrative boudaries.Sources: KNBS, ESRI , UN-Habitat
LEGENDSub-County Boundary
Sublocation Boundary
Ward Boundary
Refugee Camp
0 2.51.25
km
5
Waterway
Built-Up Area
Major RoadAirport
Village
U N - H A B I TAT I K A K U M A A N D K A L O B E Y E I S PA T I A L P R O F I L E 5 5

Kakuma & Kalobeyei Accessibility
Kakuma Town is the economic centre of the district, growing from being a small trading centre for pastoralists to the major marketplace it is today along with being a base for UNHCR and other agencies working in the area.
Kalobeyei Town, Kalobeyei Settlement, Kakuma Camp and Kakuma Town are all located along the A1 highway, which is a major road and transport corridor in Kenya and has been recently upgraded between Lodwar and Kalobeyei Town. Kalobeyei Settlement is just over a 15 minute taxi drive from Kakuma (approximate cost 350 KSH) and Kalobeyei Town is a further 15-20 minute drive by taxi (approximate cost 500 KSH).
While the A1 highway is in good condition and suitable for cars, other roads within the settlements are less formalised and suitable for only boda boda or foot travel. The road between Kalobeyei Settlement and Kakuma Camps exists as an official county road and the fastest connection between these settlements, however the quality is very poor and it is only suitable for walking or boda boda. There is another informal road between Kakuma 4 and the A1 which also is only suitable for walking or boda boda.
Floods pose a seasonal risk to accessibility, in particular the connection between Kakuma 1 and Kakuma 2, 3 and 4. The road connecting Kakuma 1 to the other camps often becomes impassable during the rainy seasons, isolating the camps and preventing refugees accessing facilities in these isolated sections.
Refugees in Kakuma Camps and Kalobeyei are afforded freedom of movement within Kenya with the appropriate movement pass. The total number of passes issued per year is approximately 3,600 and the proportion of the refugee population (based on March 2020 figures) moving legally from Kakuma Camps per year is 2%.
In terms of wider connectivity, there are buses from Lodwar to Nairobi and there is a small airport at Kakuma which has regional flights available.
Transport fares in Kenyan Shillings (KSH). UN-Habitat Field Research 2020.
Kakuuma → Kalobeyei TownKakuuma → Kalobeyei Settlement
Kakuuma 1 → Kakuma 4
During Covid
Kalobeyei Settlement → Kalobeyei Town
Pre-Covid
-300100100
300300
--
500350
--
-350
150-200200
Boda boda Taxi Boda boda Taxi
Roads in Kakuma Camp after rain (UN-Habitat 2020)
5 6 C H A P T E R 4 | S E T T L E M E N T S C A L E

Map 12: Kakuma-Kalobeyei area accessibility analysis.Sources: KNBS, ESRI, UN-Habitat researchLEGEND
Sub-County Boundary
Ward Boundary
Refugee Camp
0 2.51.25
km
5
Waterway Built-Up Area
Major Road Airport
Village 15 minutes
30 minutes
1 hour
Access: Drive 50km/hr 15 minutes
Travel Distance Radius
30 minutes
Travel Distance Radius
Bushland
U N - H A B I TAT I K A K U M A A N D K A L O B E Y E I S PA T I A L P R O F I L E 5 7

Kakuma & Kalobeyei Local Economic Activity & Markets
The value of the local economy in the Kakuma and Kalobeyei area is valued at $56 million per year based on the IFC study in 201886. The market places here are the most diverse in this part of Turkana and despite the legal and practical limitations for the refugees living in the area (such as the inability to gain formal employment, move, or own property), a thriving informal economy has evolved. These informal markets see both men and women actively involved and they play a critical role in food security and social integration between refugees and the host community. It is in some respects due to the economic vibrancy that a long term solution for economic development in the area is viewed as important to ensure resilience in the long term in case the refugees begin to return home. Both Lokichoggio after the closure of Operation Lifeline as well as Kakuma in 2008 after the peace accord was signed suffered major economic shocks due to the reduction in refugee and international NGO/agency presence.
Kakuma camp and town can therefore be seen as one economic area made up of several markets including the town itself which has 232 shops along the main road and adjacent alleys87 as well as four major markets in Kakuma one, and Kakuma three, and with one in Kakuma four. Given the length of time that the refugees have been present, the camp and the town have become socio-economically interdependent with refugees hiring, trading, and working with town residents and vice versa. A World Bank Study in 2016 identified more than 2,746 shops (all business types), in Kakuma (both the town and the camp), including 14 wholesalers88. It is well reported for example that refugees hire Turkana locals as porters, shopkeepers, security guards, or casual labor (to help with housework); shop in town; and open businesses with residents. At the same time, Kakuma town residents buy goods in the camps, particularly the markets closest to the host community settlement as well as sell livestock and charcoal to refugees, whose access to
these resources is limited89. Sales and profits appear to be slightly higher in dense markets, but the variety of goods sold is slightly lower.
In terms of land use allocation - generally this has been ad hoc especially in Kakuma and Kalobeyei towns. The spatial plans for Kalobeyei Settlement and Kakuma allocate specific land for commercial uses within their planning areas, but there is limited enforcement. WFP has supported shopkeepers who set up Bamba Chakula shops within the commercially zoned areas in Kalobeyei settlement. Previous research in Kakuma camp has suggested that business owners can choose their location through an informal ‘real estate’ market, although the lack of formal registration leaves many open to exploitation90.
A challenge to growth of the economy in the area is the lack of skilled labour. Before arriving in Kakuma, most refugees were farmers or reared livestock. Only 7 percent had a business before they arrived at the camp. Given the harsh climate, scarcity of water, and constraints to livestock ownership for refugees, farming or livestock rearing is not a viable option for refugees, making it difficult for them to earn money from traditional occupations or to leverage their skills in a new and unfamiliar job market91.
In terms of the legal enabling environment for the local economy, According to Kenyan legislation, refugees can register their business as a limited liability company or as a single business name with the national registrar and receive a single business permit from the county government based on national registration. Further information on the business environment in the area as well as a better impression of the actual scale of tax revenue generated from this will be collected as part of the detailed socio-economic survey currently being carried out by UN-Habitat.
455
397
Som
ali M
arke
t
Ethi
opia
n M
arke
t
Hon
g Ko
ng
Fuji M
arke
t
Gam
bella
Mar
ket
Kaku
ma
3 M
arke
t
Kism
ayo
Mar
ket
Liz
Ahua
Mar
ket
Kaku
ma
4 M
arke
t
?
Loki
tang
Mar
ket
Kaku
na T
own
Mar
ket
?
Kalo
beye
i Tow
n
Mar
ket
?
Kalo
beye
i Mar
ket
?
Kalo
beye
i Tow
n
287
195
143 135
183 182
118
232
Number of Business in each market centre.Compiled from Vermuru et al (2016) and UN-Habitat field research (2020)
5 8 C H A P T E R 4 | S E T T L E M E N T S C A L E

Map
Map 13: Kakuma-Kalobeyei area market accessibilty analysis.Sources: KNBS, ESRI, UN-Habitat researchLEGEND
Sub-County Boundary
Ward Boundary
Refugee Camp
0 2.51.25
km
5
Waterway
Built-Up Area
Bushland
Transit Corridor
Major Road
Minor Road
Airport
Market
Village 15 minutes
30 minutes
60 minutes
Access: Walk 3 km/hr
!!
U N - H A B I TAT I K A K U M A A N D K A L O B E Y E I S PA T I A L P R O F I L E 5 9

LEGENDPrimary Road
Secondary Road
Business Location
0 50
Shop Building
Building
Market AreaTertiary Road
Track
l
m
100
Residential Block
Waterway
6 0 C H A P T E R 4 | S E T T L E M E N T S C A L E

Map 14: Kakuma-Kalobeyei market snapshots.Sources: KNBS, UN-Habitat research
U N - H A B I TAT I K A K U M A A N D K A L O B E Y E I S PA T I A L P R O F I L E 6 1

Kakuma & Kalobeyei Land Use & Natural Hazards
The climatic characteristics of the Kakuma & Kalobeyei areas are typical of semi-arid desert with an annual mean temperature of 27.6 °C and a total annual rainfall of 321 mm. Whilst the driest month is typically January, with 6 mm of rain, the most precipitation falls in April with an average of 76 mm meaning that water scarcity is an ongoing and regular challenge92.
The topography of the area is mainly flat with no perennial rivers in the area. The area bounded by the two seasonal rivers makes up the geographical area where the largest proportion of population dwell. The land generally drains to the north from the slightly higher ground to the south with the A1 highway forming an approximate edge between this and the extremely flat area of land where Kalobeyei and Kakuma settlements sit.
The ASAL nature of the region has meant that in terms of land cover, it is predominantly open low shrubs such as the Prosopis plant common with most rangelands in the region which is typically used by pastoralists for grazing their livestock. Along the intermittent waterways, and slightly less dry areas there is limited herbaceous vegetation which has also tended to correlate with pockets of agricultural land. The most vegetated zones with the wider areas are situated mainly along the Tarach River which divides Kakuma camp from Kakuma town, and where small household agriculture is carried out.
The Kakuma-Kalobeyei region is susceptible to both flooding and drought. Heavy rains cause seasonal flooding of Tarach River, blocking roads and leading to loss of agriculture, infrastructure and human life. Protracted droughts impact on the ability of refugees to farm, increasing reliance on humanitarian aid. Most water is taken from boreholes, with there being 81 boreholes located throughout the Kakuma-Kalobeyei region. Access to water resources must be carefully managed, especially between host and refugee communities.
The predominant land classification is bushland (sparse), reflective of the pastoralist based economy, and bushland (dense) along the riverbanks, which have a higher agricultural potential.
Kakuma Town’s land use is predominantly residential (51%) and agricultural (41%). Education facilities makeup 2.6% of Kakuma Town, institutional facilities (including government offices and health facilities) makeup 1.6% and police stations are 6%. Kakuma Camp has an even greater share of residential land-use (76%), most of which is mixed residential (58%). Kakuma Camp also has a significant proportion of agriculture (18%) and education facilities (3%).
Kalobeyei Settlement has a much finer-grain land-use pattern and Kalobeyei Town is mostly agriculture (30%), residential (25%), bushland within the settlement (22%) and waterways within the settlement (11%). All types of education facilities (from kindergarten to secondary and vocational studies) makeup 4.4% of the settlement, health facilities make up 1.2% and NGO and other agencies facilities (2.3%).
Water and Food Security
Water and food security is an ongoing and critical issue for Kakuma-Kalobeyei. No strategic and reliable water supply exists in Kakuma-Kalobeyei, with 66% of refugees and 52.8% of host community reporting seasonal water scarcity93. Investing in a long-term strategic water supply, instead of the current heavy dependency on boreholes, will be needed. According to a survey conducted by UN-Habitat in 2021, 58% of respondents in Kakuma were found to be moderately or severely food insecure and 32% of Kalobeyei respondents were found to be so. A coping mechanism for the host community is to exchange firewood for food with refugees who receive humanitarian assistance with food.
Bushland (sparse)
Bushland (dense)
Barren land (rocky)
Urban
Barren land (sand and gravel)
Waterway
Agriculture
NGO’s and other agencies
Airstrip
Woodland
Kakuma-Kalobeyei land-use breakdown.
76.6%
10.3%
8.7%1.4% 1%
1%
0.01%0.02%
0.4%0.6%
6 2 C H A P T E R 1 | I N T R O D U C T I O N

Map 15: Kakuma-Kalobeyei land use and planning areas.Sources: KNBS, ESRI, Kakuma ISUD Plan, LCDA , UN-Habitat researchLEGEND
Sub-County Boundary
Ward Boundary
Refugee Camp
0 2.51.25
km
5
Waterway Bushland (Sparse)
Built-Up Area Barren Land (Rocky)
WoodlandConservation Area
Bushland (Dense)Flood zone
Barren Land (Sand and Gravel)
Major Road
Minor Road
Planning Boundaries
Airport
Village
Land Use
U N - H A B I TAT I K A K U M A A N D K A L O B E Y E I S PA T I A L P R O F I L E 6 3

Kalobeyei Land Use & Natural Hazards
0 0.75 1.5
kmMap 16: Kalobeyei Settlement land use and planning areas.
Sources: KNBS, ESRI, UN-Habitat analysis
Map 17: Kalobeyei Town land use and planning areas.Sources: KNBS, ESRI, UN-Habitat analysis
Flood zone
Flood zone
LEGEND
Waterway
Retail
Health Facility
Institutional
Education Facility
Agriculture
Police Station
Light Industry
Mixed Residential
Planning areas
Land Use
Ward Boundary
Primary Road
Secondary Road
Tertiary Road
LEGEND
Waterway
Retail
Education Facility
Public Purpose
Mixed Residential
Planning areas
Land Use
Ward Boundary
Primary Road
Secondary Road
Tertiary Road
0 10.5 2
km
6 4 C H A P T E R 4 | S E T T L E M E N T S C A L E

Kakuma Land Use & Natural Hazards
Map 18: Kakuma Town and camp land use and planning areas..Sources: KNBS, ESRI, UN-Habitat analysis
LEGEND
Waterway
High Density Residential
Religious Facility
Retail
Market
Health Facility
Woodland
Medium Density Residential
Institutional
Education Facility
Recreation Facility
Bushland (Dense)
Agriculture
Low Density Residential
Police Station
Light Industry
Mixed Residential
Airstrip
Planning areas
Land Use
Ward Boundary
Primary Road
Secondary Road
Tertiary Road
0 0.75 1.5
km
Flood zone
U N - H A B I TAT I K A K U M A A N D K A L O B E Y E I S PA T I A L P R O F I L E 6 5

Kakuma & Kalobeyei Basic Services
The data displayed in the maps has been compiled from UNHCR and UN-Habitat field research, however is incomplete. There are gaps in the data, in particular in regards to electricity infrastructure coverage. Further infrastructure profiling is required to illustrate the complete infrastructure provision of Kakuma-Kalobeyei. The data displayed also does not indicate the condition of the infrastructure, such as either functional, non-functional or damaged.
WASH
WASH infrastructure is any infrastructure that relates to water, sanitation or hygiene and includes water taps, water tanks, boreholes, water kiosks (where water is sold), latrines or dump sites. The maps indicate wide coverage of latrines and water taps throughout Kakuma Camp and Kalobeyei Settlement however latrine and water tap data is not available for Kakuma Town or Kalobeyei Town. Based on a UNHCR survey, approximately 77% of refugees in Kakuma and Kalobeyei had latrines in proximity to their shelters and 89% had access to household latrines, as opposed to communal latrines94. Despite this, open defecation is still a significant problem, with a UN-Habitat survey indicating that 7.3% of refugees still practice open defecation despite having toilets within their compounds95.
The majority of boreholes are either located along the Tarach River in Kakuma or near the river in Kalobeyei Town and most boreholes run on diesel generated water pumping systems96. All shallow wells, water kiosks and windmill water are located in Kakuma town and there are no water kiosks in Kakuma Camp, Kalobeyei Settlement and Kalobeyei Town. Water tanks are located throughout Kakuma Town, Kakuma Camp, Kalobeyei Settlement and Kalobeyei Town.
Two water pans (which are a type of reservoir to collect water for irrigation during dry periods) are located in Kalobeyei Settlement. These water pans were constructed by the WFP and are shared by both refugees and the host community for cultivation of small plots of land to grow vegetables. The water pans were constructed because of Turkana County’s harsh climate, recurrent droughts and lack of stable water supply throughout the year, impacting on food security. One water pan has a capacity of 30 million litres and if filled to capacity can hold sufficient water for six months97. The water pan between Village 1 and Village 2 has been fitted with a solar powered pump and is able to pump around 150,000 litres of water daily98. There is an additional water pan in Kalobeyei Settlement constructed by UN-Habitat for the use of the host community in the area.
Burning is the most common method of solid waste disposal reported by 70% of households responding to a UN-Habitat survey99. Another common method by refugees was burying.
Energy
Kalobeyei Settlement has a 60 kWp mini-grid that only serves a section of Village 1, leaving Village 2 and Village 3 completely off-grid and without access to sustainable energy, as seen in the map. UNHCR currently states that the current capacity of the mini-grid cannot meet the energy demand of Kalobeyei Settlement leaving most refugee households, businesses and institutions without access to reliable and sustainable energy100. GIZ is planning to expand the electrical grid to Villages 2 and 3, however construction is yet to start.There is also a solar mini-grid located south of Kalobeyei Town providing power to the town.
Kakuma Camp remains completely off grid with access to electricity from independently operated diesel-powered generators (gensets)101, with the operators informally selling power to neighbouring markets and households. Household solar systems and solar lanterns are also prevalent throughout Kakuma Camp, although there is only piecemeal coverage.
The main cooking energy used by both host and refugees in Kakuma-Kalobeyei is wood and charcoal102. This has a great health impact associated with indoor pollution and environmental impact associated with unsustainable production.
Telecommunications
Telecom coverage indicates that Safaricom coverage extends from Kakuma town to Kalobeyei Settlement however it does not reach Kalobeyei Town. Telecom coverage is considered basic infrastructure due to the necessity of mobile phones for mobile banking such as M-pesa and digital cash-assistance programmes like Bamba Chakula which was introduced in Kakuma Camp in 2015103. In 2019, 95% of food assistance was provided through Bamba Chakula in Kalobeyei and only about 30% was provided through Bamba Chakula in Kakuma104. According to a UN-Habitat Survey, 80% of respondents in Kalobeyei Settlement and 82% of respondents in Kakuma had a mobile phone105. There is a cell tower located in Kalobeyei Village 1.
6 6 C H A P T E R 4 | S E T T L E M E N T S C A L E

Map 19: Kakuma-Kalobeyei basic servicesSources: KNBS, ESRI, WFP, FAO, UN-Habitat research
Network Coverage
LEGENDSub-County Boundary
Ward Boundary
0 2.51.25
km
5
Dumping site Borehole
Windmill water Waterpan
Shallow well
Water kiosk
Water tank
Major Road
Minor Road
Basic Services
Solar Mini-grid
Water tap
Latrine
Electricity lines
Earthdamn
U N - H A B I TAT I K A K U M A A N D K A L O B E Y E I S PA T I A L P R O F I L E 6 7

Kalobeyei Basic Services
0 0.75 1.5
kmMap 20: Kalobeyei Settlement basic services.
Sources: KNBS, ESRI, WFP, FAO, UN-Habitat analysis
Map 21: Kalobeyei Town basic services.Sources: KNBS, ESRI, WFP, FAO, UN-Habitat analysis
0 10.5 2
km
LEGEND
Sub-County Boundary
Borehole
Waterpan
Water tank
Basic Services
Solar Mini-grid
Ward Boundary
Primary Road
Secondary Road
Tertiary Road
LEGEND
Waterpan
Water tank
Basic Services
Solar mini-grid
Water tap
Latrine
Electricity lines Network Coverage
Primary Road
Secondary Road
Tertiary Road
6 8 C H A P T E R 4 | S E T T L E M E N T S C A L E

Map 22: Kakuma Town and camp basic servicesSources: KNBS, ESRI, WFP, FAO, UN-Habitat analysis
0 0.75 1.5
km
Kakuma Basic Services
LEGEND
Sub-County Boundary
Dumping site
Borehole
Windmill water
Waterpan
Shallow well
Water kiosk
Water tank
Basic Services
Water tap
Latrine
Network Coverage
Ward Boundary
Primary Road
Secondary Road
Tertiary Road
U N - H A B I TAT I K A K U M A A N D K A L O B E Y E I S PA T I A L P R O F I L E 6 9

Kakuma & Kalobeyei Public Facilities
Overall the greatest concentration of public facilities is in Kakuma Camp, particularly Kakuma 1 and 2. This is likely due to Kakuma 1 being the first camp established, leading to an agglomeration of facilities over time
Health Facilities
There is a mixed spread of health facilities throughout Kakuma-Kalobeyei with the greatest concentration in Kakuma Town. UNHCR found that almost all persons of concern (97%) rely on health services from NGO run health facilities in Kakuma and Kalobeyei106. UNHCR also found that refugees in Kalobeyei Settlement continue to report a lack of clinics, long queues to receive basic health care and inadequately stocked dispensaries107. Health care is free for refugees and the host community in Kakuma-Kalobeyei under the umbrella of Kenya’s Universal Health Care (UHC) Scheme108.
Education
Approximately 78% of children in Kakuma-Kalobeyei attend school. There is a concentration of education facilities in Kakuma Town near the A1 road and in Kakuma Camp, specifically Kakuma 1. Kakuma Camp has the highest concentration of primary and secondary schools in Turkana County and there is an emerging tertiary education system in Kakuma with the Masinde Muliro University opening a Kakuma branch in 2016 and Jesuit World Learning starting a Bachelor’s Degree programme in 2017109. Overall, refugees report better access to education and training in Kakuma compared with Kalobeyei and refugees in Kakuma are more likely to be in formal education than those in Kalobeyei110. It is also reported that the schools in Kalobeyei are severely congested111.
According to a UN-Habitat survey, for all of Turkana-West Sub-county, 69% had never been to school112. This
is attributed to the nomadic life of the host community. In Kakuma-Kalobeyei 33% of respondents surveyed by UNHCR have not received any form of formal education, with women accounting for 69% of those with no formal education113. There are particularly low transition rates among female students which disadvantages girls and hinders the availability of local skilled and trained labor114.
Security
Security facilities are predominantly police stations and police posts. Overall 59% of community members feel safe in Kakuma Camp however 49% of respondents feel unsafe between midnight and 0600 hours. The three main sources of insecurity are burglary/theft, community disputes and gang activity115.
Recreational
Recreational facilities include football fields, volleyball pitches, netball pitches, basketball courts and playfields and playgrounds. There are a small number of recreational facilities located throughout Kakuma, particularly the northern section of Kakuma 3. Participation of refugees in sports activities is much higher in Kakuma rather than Kalobeyei116, likely due to the higher proportion of sports facilities (both formal and informal) that have been developed across the sprawling camp area over time. The provision of recreational facilities is not sufficient however, with a UN-Habitat survey indicating that 71% of host and 74% of refugees said their household does not have access to playgrounds117.
Distribution Centres
There are distribution centres located throughout Kakuma Camp and Kalobeyei Settlement. These are where UNHCR and WFP distributes food and items to the refugees.
Refugees at distribution centre in Kakuma (UN-Habitat 2020)
7 0 C H A P T E R 4 | S E T T L E M E N T S C A L E
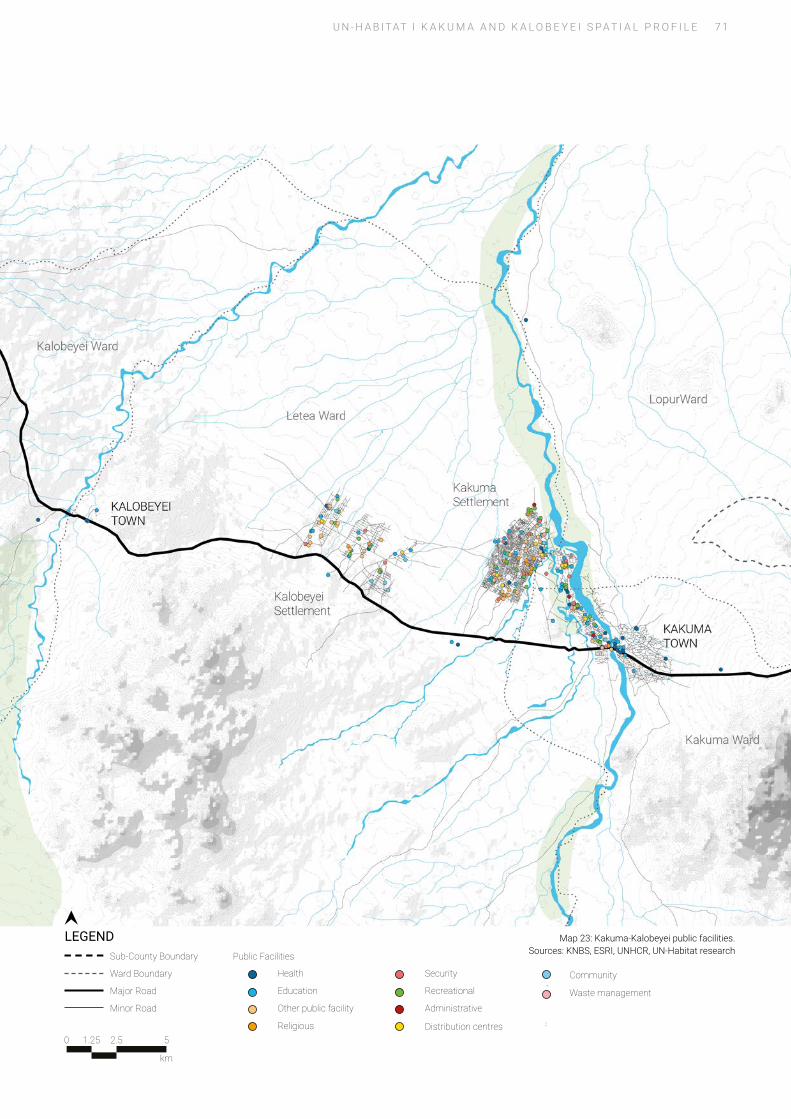
LEGENDSub-County Boundary
Ward Boundary
0 2.51.25
km
5
Health Security
Education Recreational
Other public facility
Religious
Administrative
Major Road
Minor Road
Public Facilities
Distribution centres
Community
Waste management
Map 23: Kakuma-Kalobeyei public facilities.Sources: KNBS, ESRI, UNHCR, UN-Habitat research
U N - H A B I TAT I K A K U M A A N D K A L O B E Y E I S PA T I A L P R O F I L E 7 1

Kalobeyei Public Facilities
0 0.75 1.5
kmMap 24: Kalobeyei Settlement public facilities.
Sources: KNBS, ESRI, UNHCR, UN-Habitat analysis
Map 25: Kalobeyei Town public facilities.Sources: KNBS, ESRI, UNHCR, UN-Habitat analysis
0 10.5 2
km
Health
Education
Public Facilities
LEGEND
Sub-County Boundary
Ward Boundary
Primary Road
Secondary Road
Tertiary Road
Health
Security
Education
Recreational
Other public facility
Religious
Public Facilities
Distribution centres
Community
LEGEND
Primary Road
Secondary Road
Tertiary Road
7 2 C H A P T E R 4 | S E T T L E M E N T S C A L E

Map 26: Kakuma Town and Camp public Facilities.Sources: KNBS, ESRI, UNHCR, UN-Habitat analysis
0 0.75 1.5
km
Kakuma Public Facilities
Health
Security
Education
Recreational
Other public facility
Religious
Administrative
Public Facilities
Distribution centres
Community
Waste management
LEGEND
Sub-County Boundary
Ward Boundary
Primary Road
Secondary Road
Tertiary Road
U N - H A B I TAT I K A K U M A A N D K A L O B E Y E I S PA T I A L P R O F I L E 7 3

Planning boundaries
Kakuma ISUD 2015-2035
Kakuma ISUD (Integrated Strategic Urban Development) Plan (2015-2035) was prepared in 2015-2016 and has not yet been approved. Kakuma ISUD Plan is a long-term plan for Kakuma town, recommending a spatial framework to guide and control development for 20 years. The plan does not propose anything for the area currently occupied by Kakuma Camp. The plan also does not propose any growth boundary or recommended development areas specifically limiting the potential for clear implementation steps to be taken. Unfortunately, the plan does not accurately survey any of the existing municipal infrastructure within Kakuma, which is a weakness. As it has now been over 4 years, the plan is likely to require review in 2021 before final approval.
LAPSSET Corridor
The LAPSSET (Lamu Port, South Sudan, Ethiopia) Corridor project is intended to provide seamless infrastructure connectivity, by enhancing trade and logistics within the region by providing an additional corridor to the Northern Corridor that links Mombasa Port and Central African Countries. LAPSSET is a strategic corridor that will connect the landlocked neighbouring countries of Ethiopia and South Sudan, with Lamu Port in Kenya. Turkana County is among the counties with the longest stretch of this corridor.
The Corridor is designed to be 500-meters wide, including a highway, the railway, the oil pipelines, airports and utilities. Furthermore, 50 kilometres on either side of the corridor has been mapped as the outer economic corridor. This economic corridor will include urban development – such as new and existing towns, Special Economic Zones, as well as Agricultural and Irrigation schemes. The master planning of the outer economic corridor is being developed in partnership with the World Wildlife Fund (WWF) and in consultation with the County Governments and relevant partners. The construction of LAPSSET’s main components is currently ongoing.
Kalobeyei Settlement Plan
In a bid to depart from the way refugee camps were developed and managed traditionally, the Kenya National Government, together with the County Government of Turkana, allocated 1500 hectares of land to UNHCR and the Refugee Affairs Secretariat (RAS) in Kalobeyei ward for the establishment of a new refugee settlement. This was after an agreement to develop KISEDP, an initiative to promote the socioeconomic integration of refugees and the host community by leveraging on the opportunities
emanating from the refugee settlements. This was proposed through the ability to stimulate economic growth through the formation of ‘urban-like’ conditions – and associated benefits of agglomeration
The initial Kalobeyei Settlement Plan envisioned land development in the area surrounding Kalobeyei Settlement. The planning area has been identified as the section that is near the southern part of the settlement, along the LAPSSET corridor. Part of the site is settled by the host community in three villages: Esikiriait, Elelea and Ayanae-Angidapala Villages. The site is located along the A1 road approximately 15 km from Kakuma Town, and 15 km from Kalobeyei Town.
Kalobeyei Infrastructure Corridor Development Plan
The aim of Kalobeyei Infrastructure Corridor Development Plan is to prevent unplanned development near Kalobeyei Settlement and promote local economic development in proximity to the LAPSSET corridor route.The corridor is intended to have an Industrial Area (with local markets for agriculture, pastoralism and food processing), a Logistics Area (with warehouses, a Logistics Hub and service area) and an Enterprise Area (with offices, educational and medical facilities.
7 4 C H A P T E R 4 | S E T T L E M E N T S C A L E

Map 27: Kakuma and Kalobeyei planning constraintsSources: KNBS, ESRI, Kakuma ISUD Plan, LCDALEGEND
Sub-County Boundary
Ward Boundary
Refugee Camp
0 2.51.25
km
5
Kakuma ISUD Plan
LAPSSET Corridor
Kalobeyei Infrastructure Corridor Development Plan
Kalobeyei Settlement Plan
Major Road
Minor Road
Airport
Market
Village
!!
U N - H A B I TAT I K A K U M A A N D K A L O B E Y E I S PA T I A L P R O F I L E 7 5

Kakuma & Kalobeyei Population Distribution & Growth
Turkana West sub-county has a population of 239,627, not including refugees (2019 Census). Both Kakuma Camp (population 157,718) and Kalobeyei Settlement (population 39,632) combined make up approximately 45.7% of the total population of the sub-county. Kakuma Town (population 45,882) makes up approximately 11% of the sub-county’s population. Kalobeyei Town is much smaller (population of less than 2,000), making up less than 1% of the sub-county’s population. The total population therefore in the Kakuma and Kalobeyei area (both hosts and refugees) is estimated to be 245,223.
Subcamps and demographics
Whilst Kakuma and Kalobeyei towns are relatively homogenous in their population demographics being essentially Turkana with a few Somali traders the Kakuma camp in particular is a melting pot of nationalities and ethnicities. Its demographic breakdown shows that most of the residents are South Sudanese (55 percent) and Somali (26 percent). There are also refugees from Burundi, the Democratic Republic of the Congo, Ethiopia, and Sudan, among others. The distribution of nationalities differs greatly among Kakuma’s four subcamps. Subcamps one, two, and three have diverse populations, while subcamp four, hosting the newest arrivals, is primarily South Sudanese118.
Kalobeyei Settlement is predominantly inhabited by new arrivals from South Sudan, Burundi, and Ethiopia, who have arrived since 2016 as well as and a small number of transfers from the Dadaab refugees camps. Hosts have since been encouraged to move into the settlement, a key component of the settlements planning initiative, however to date - majority of residents remain refugees.
Population Density
Kakuma Town and the refugee settlements are significant urban centres in Turkana West, and so have demonstrated
higher population densities than the average for Turkana West.
The average population density of Turkana West sub-county is 14 p/km2. contrasted with the population density of Kakuma Camp of 11,580 p/km2, Kakuma Town at 3,549 p/km2, Kalobeyei Town at 3,333 p/km2 and Kalobeyei Settlement at 3,770 p/km2. The spatial analysis carried out for the purposes of this study demonstrates that the most densely populated areas are typically within the refugee camps, particularly Kakuma 1, and Kakuma Town in general has a much lower population density. This is likely in part due to the host communities tendency to have much larger plot sizes, and the refugee camp being constrained in terms of growth both due to land access as well as their allocated plot sizes.
The areas of highest population density in Kakuma camp have tended to cluster around the market centres which are central to informal livelihoods and thus are areas where there is high demand to live. Kalobeyei settlement has a generally lower density than Kakuma camp, but still remains on average higher than the Kakuma or Kalobeyei towns.
This has implications in terms of urban growth as the towns may therefore be prone to sprawl. The table below provides two urban growth scenarios, one based on the average population growth of Kenya (2.15% per annum) and the other on the population growth of Turkana County (3.35% per annum). Based on the higher growth rate scenario, and assuming that each settlement will retain its current density, by 2030 Kalobeyei Settlement will expand by 4.1 km2, Kakuma Camp by 5.3 km2, Kakuma Town by 5 km2 and Kalobeyei Town by 0.23 km2. In total across all settlements, there is a forecast maximum growth of 95,708 people in the next 10 years with a required expansion of 14.7 km2 to accommodate.
Urban Extent 2020 (km2)
Population 2020 (est)
Population Density (p/km2)
Population 2030 (est)
Urban Extent 2030 (km2)
Population 2030 (est)
Urban Extent 2030 (km2)
Kakuma Town
12.93
45,882
3,549
56,758
16
63,789
17.98
Kakuma Camp
13.62
157,718
11,580
195,103
16.85
219,274
18.94
Kalobeyei Town
0.6
2,000
3,333
2,474
0.74
2,781
0.83
Kalobeyei Settlement
10.51
39,623
3770
49,015
13
55,087
14.61
TOTAL
37.66
245,223
303,351
46.59
340,901
52.63
Current and future population estimates, urban extents and densities (based on UNHCR September 2020 Camp figures)
Kenya Growth Rate
(+2.15%)
Turkana County Growth Rate
(+3.35%)
7 6 C H A P T E R 4 | S E T T L E M E N T S C A L E

Map 28: Kakuma-Kalobeyei population density.Sources: KNBS, ESRI, UN-Habitat analysis
LEGENDSub-County Boundary
Ward Boundary
0 2.51.25
km
5
Waterway
Built-Up Area
BushlandMajor Road
Minor Road Village Medium
Medium-high
High
Population Density
Low
Very low
U N - H A B I TAT I K A K U M A A N D K A L O B E Y E I S PA T I A L P R O F I L E 7 7

Kalobeyei Population Density
Kalobeyei Town Centre
Map 29: Kalobeyei Settlement population density.Sources: KNBS, ESRI, UN-Habitat analysis
Map 30: Kalobeyei Town population density.Sources: KNBS, ESRI, UN-Habitat analysis
LEGENDWard Boundary
Waterway
Primary Road
Secondary Road
Tertiary Road
Education
Market
Health
Facility
!!
!!
!!
Medium
Medium-high
High
Population Density
Low
Very low
0 10.5 2
km
0 0.75 1.5
km
7 8 C H A P T E R 4 | S E T T L E M E N T S C A L E

Kakuma Population Density
Kakuma 1 Centre (Somali Market) Kakuma Town Centre
Kakuma 1 Centre (Hong Kong)
Map 31: Kakuma Town and camp population density.Sources: KNBS, ESRI, UN-Habitat analysis
0 0.75 1.5
km
LEGEND
Building
Road
U N - H A B I TAT I K A K U M A A N D K A L O B E Y E I S PA T I A L P R O F I L E 7 9

Kakuma & Kalobeyei Opportunity Index
An analysis of composite accessibility was carried out for the wider Kakuma and Kalobeyei study area to support in understanding the areas of human settlement that have the most and least access to various forms of public facility or service. For the purposes of this study, the data used included health facilities, education facilities and market places (noting that this data still needs to be field verified and validated). These facilities were then analysed against the catchment area of a 15 minute walking distance with a 1 hectare hexagon overlaid to allow for comparable areas to be measured against other indicators such as land use, population density and various natural hazards. The more facilities that overlay within a 15 minute catchment area of each other, the higher the index is within those specific areas - meaning that these areas offer inhabitants a comparatively higher opportunity to access facilities.
This assessment therefore reveals some interesting findings across the settlement areas. Clear hotspots of opportunity are highlighted particularly in the camps, particularly in the older section of Kakuma 1, as well as village 1 in Kalobeyei. This can be attributed in the case of Kakuma 1, a long history of humanitarian service delivery in the area which has led to a diversity of service facilities being developed in the area, and in Kalobeyei - a response to proactive planning which set out a spatial hierarchy of land use to support efficient targeting of public infrastructure investment. What is also notable (and needs to be field verified) is that Kakuma town does not well demonstrate strong access to opportunities with only a small proportion of the town being within 15 minutes walking distance of 3 types of facilities and a large proportion of the town being more than 15 mins walk.
This needs to be assessed in more detail based on the service potential of the facilities and population density which in Kakuma town is generally much lower than in the refugee settlements and therefore time travelled to access services may represent a “pay off” against having larger plot sizes. It is important to note however that a higher
density may allow for improved service delivery per capita and in future development plans for Kakuma, including its potential to become a formal municipality - this should be addressed.
These findings would recommend a detailed georeferenced family counting process to be carried out, with anonymised but disaggregated data to allow for a clear assessment of the various population density breakdowns to be more accurately mapped. This would therefore nuance the findings further to reveal the areas which demonstrate the most amount of people who have either the least or most amount of access to opportunities and therefore can spatially target where to intervene in terms of improving or shifting services.
It is important to note, that this analysis does not cover qualitative analysis of the services provided.
3 Types of Facility
2 Types of Facility
1Types of Facility
Access to FacilitiesEstimated Catchment
Population
112,250
159,835
25,410
% of Total Area Population
37 %
54 %
9 %
Kakuma Town and camp population density.
8 0 C H A P T E R 4 | S E T T L E M E N T S C A L E

Map 32: Kakuma-Kalobeyei area opportunity index.Sources: KNBS, ESRI, UNHCR, UN-Habitat analysisLEGEND
Sub-County Boundary
Ward Boundary
0 2.51.25
km
5
Waterway
Built-Up Area
BushlandMajor Road
Minor Road
Village
Education
Market
Health
Access to 1 Kinds of Facilities
Access to 2 Kinds of Facilities
Access to 3 Kinds of Facilities
Opportunity IndexFacilityAccess to 3 Kinds of Facilities (Educational, Market & Health within 15 minutes Walk - 3km/hr!!
!!
!!
Refugee Camp
U N - H A B I TAT I K A K U M A A N D K A L O B E Y E I S PA T I A L P R O F I L E 8 1

Kalobeyei Service Provision Opportunity Index
Map 33: Kalobeyei Settlement opportunity index.Sources: KNBS, ESRI, UNHC, UN-Habitat analysis
Map 34: Kalobeyei Town popportunity index.Sources: KNBS, ESRI, UNHCR, UN-Habitat analysis
LEGENDWard Boundary
Waterway
Primary Road
Secondary Road
Tertiary Road
Education
Market
Health
Facility
!!
!!
!!
Access to 1 Kinds of Facilities
Access to 2 Kinds of Facilities
Access to 3 Kinds of Facilities
Opportunity Index
0 10.5 2
km
0 0.75 1.5
km
8 2 C H A P T E R 4 | S E T T L E M E N T S C A L E

Kakuma Service Provision Opportunity Index
Map 35: KakumaTown and camp opportunity index.Sources: KNBS, ESRI, UNHCR, UN-Habitat analysis
0 0.75 1.5
km
U N - H A B I TAT I K A K U M A A N D K A L O B E Y E I S PA T I A L P R O F I L E 8 3

Settlement Structure - Block Structures
LEGEND
Building
Open Area
Road
Typical Block Area (ha):
Typical Block Length (m):
Typical Block Width (m):
Typical Block Density (HH/ha):
Typical Major Road Width (m):
Typical Shelter Area (m²):
Typical FAR:
1 Kakuma Town
2.02
250
85
9
5
150
0.13
Typical Block Area (ha):
Typical Block Length (m):
Typical Block Width (m):
Typical Block Density (HH/ha):
Typical Major Road Width (m):
Typical Shelter Area (m²):
Typical FAR:
2 Kakuma Settlement
2.25
150
150
18
5
35
0.27
Typical Block Area (ha):
Typical Block Length (m):
Typical Block Width (m):
Typical Block Density (HH/ha):
Typical Major Road Width (m):
Typical Shelter Area (m²):
Typical FAR:
3 Kakuma Settlement
2.70
200
140
18
5
30
0.19
8 4 C H A P T E R 4 | S E T T L E M E N T S C A L E

Typical Block Area (ha):
Typical Block Length (m):
Typical Block Width (m):
Typical Block Density (HH/ha):
Typical Major Road Width (m):
Typical Shelter Area (m²):
Typical FAR:
4 Kakuma Settlement
0.09
56
16
22
7
50
0.31
Typical Block Area (ha):
Typical Block Length (m):
Typical Block Width (m):
Typical Block Density (HH/ha):
Typical Major Road Width (m):
Typical Shelter Area (m²):
Typical FAR:
5 Kalobeyei Town
0.95
120
80
8.4
5
50
0.08
Typical Block Area (ha):
Typical Block Length (m):
Typical Block Width (m):
Typical Block Density (HH/ha):
Typical Major Road Width (m):
Typical Shelter Area (m²):
Typical FAR:
6 Kalobeyei Settlement
0.55
90
60
25
6
40
0.10
U N - H A B I TAT I K A K U M A A N D K A L O B E Y E I S PA T I A L P R O F I L E 8 5

STAKEHOLDER WORKSHOP
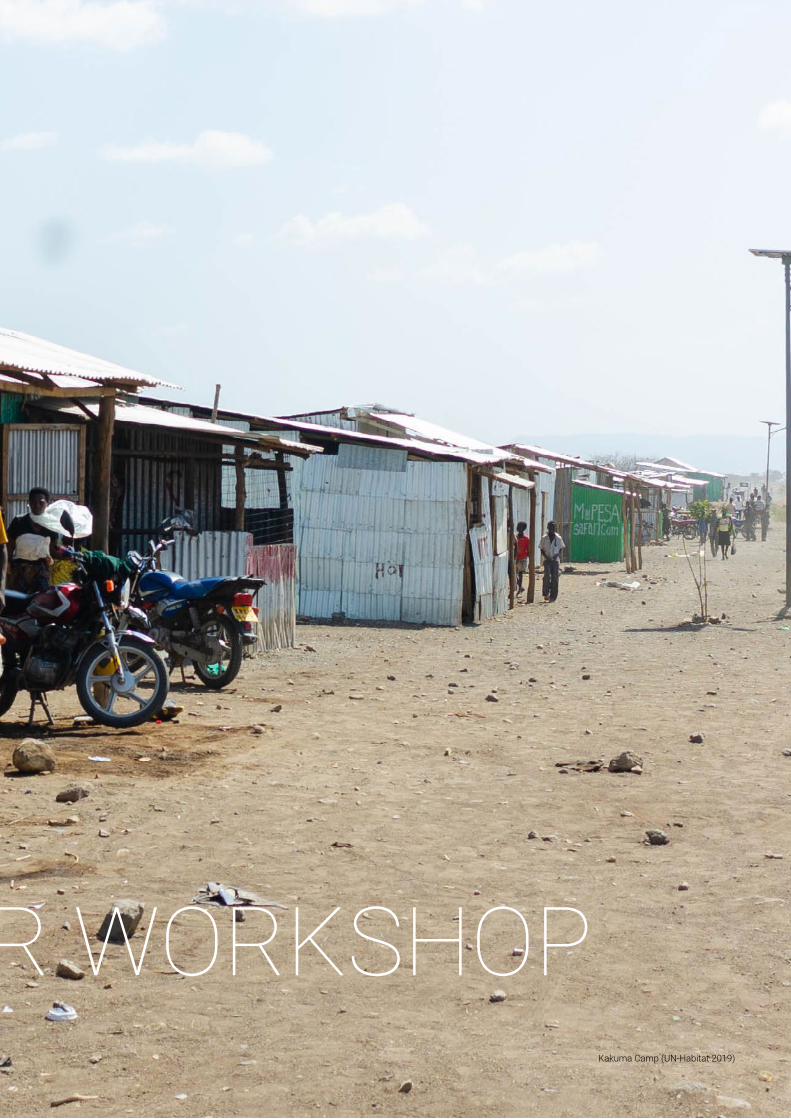
STAKEHOLDER WORKSHOPKakuma Camp (UN-Habitat 2019)

On 28 and 29 September 2020, UN-Habitat and Turkana County Government hosted a two-day semi-virtual workshop, The purpose of the workshop was to receive feedback and facilitate discussions with Turkana County officials on the potential land-use proposals based on the existing situational analysis as well as proposals provided by the community, private sector, National and County Government Ministries and agencies from previous multi-level and multi-sector meetings. This plan would also support the County Government in having the plans needed for the conferment of the proposed Kakuma-Kalobeyei Municipality.
Day one of the workshop began with an overview of urban development in Turkana County followed by UN-Habitat’s presentation of the Spatial Profiling of Kakuma & Kalobeyei. The Spatial Profile is a multi-sectoral assessment of Kakuma & Kalobeyei, collating and creating spatial data to help inform decision making, specifically regarding the location of the Kakuma-Kalobeyei Municipality. Discussions of the Spatial Profiling was guided by a SWOT (strengths, weaknesses, opportunities, threats) analysis of Kakuma and Kalobeyei, with the aim of clarifying,
verifying and identifying gaps in the research that has been conducted so far. This analysis was able to confirm some of the major findings of the profile while also adding new perspectives to topics such as the tourism potential of Kakuma-Kalobeyei, changing political dynamics, the green energy potential of Turkana County and environmental conservation.
During the workshop Chief Officer of Turkana County Government Ministry of Lands, Housing, Energy and Urban Areas Management highlighted that “the planning of the Kalobeyei Infrastructure corridor and the spatial profiling work will significantly contribute to the process of attaining the municipality status for Kakuma and Kalobeyei”. The Director in charge of Physical Planning from Turkana County Government Ministry of Lands, Housing, Energy and Urban Areas Management added that “the next phase of the planning process of the Kalobeyei corridor plan will focus on completing the development of the final land use proposals and probably have the plan submitted to the County Government before the end of the year 2020”.
Stakeholder Engagement Workshop
Participants from Turkana County at the Kalobeyei Infrastructure Corridor Technical Meeting (UN-Habitat 2020)
8 8 C H A P T E R 5 | W O R K S H O P

STRENGTHS WEAKNESSES
OPPORTUNITIES THREATS
Kakuma
• Large population, which has created a vibrant economy and market availability
• Strategic geographical location along A1, LAPSSET Corridor and international boarders
• Political goodwill from local leadership• Presence of Kakuma Refugee Camp• Sufficient land available for future development• Availability of existing plans (Kakuma, Kalobeyei and
Corridor Plan)• Favourable climate of the region
Kalobeyei
• Enough land for expansion of housing and infrastructure
• Availability of sources of green energy (ie. solar)• Geographical location both on A1 Highway and close
to South Sudan and Lokichoggio• High population density• Livestock market and business hub
Kakuma
• Fragile ecosystem• Prone to soil erosion• Lack of proper waste management system. Solid and
liquid waste systems are not in place and the ones that are are not legally licensed
• Lack of an Urban Governance Institution for proposed municipality
• Lacked of skilled labor • Improper water and sanitation
Kalobeyei
• High transport cost to other local towns eg. Kakuma• No waste management system• Improper WATSAN facilities• Improper transport facilities leading to high transport
costs• Poor land tenure system not suitable for investors
Kakuma
• Proposed municipality • Proposed Lotikipi game reserve. Kakuma and
Kalobeyei could become a possible tourism hub• Availability of Lotikipi water aquifer to provide water in
a large scale support agricultural activitties• LAPSSET corridor which will bring opportunities and
boost communication• Presense of Prosopis juliflora to provide fuel• The availability of new skills from rural-urban coming
looking for employment
Kalobeyei
• Availability of low cost materials• Cultural diversity - good interaction between refugees
and host community• Cross border trade opportunities with Sudan• Access to educational facilities in Kalobeyei town (eg.
technical schools)
Kakuma
• Presence of Prosopis juliflora having a negative impact on pastures and supressing indigenous tree
• Overreliance of humanitarian actors and NGO support• Changing political dynamics with the upcoming
election• Erosion of the Tarach River bank which can cause
massive flooding and destroy property and life• Deforestation for charcoal production + building
materials due to population growth• Rural-urban migration overpowering ability of
government to provide infrastructure
Kalobeyei
• Cattle rustling with pastoralists• Operlap on policy and regulatory frameworks - urban
areas and cities act and refugee act• Internal migration - locals moving to Kalobeyei hence
overdependence on social amenities• Concentration of resources on one area leads to
inaequate distribution of resources
U N - H A B I TAT I K A K U M A A N D K A L O B E Y E I S PA T I A L P R O F I L E 8 9

Strengths, Weaknesses, Opportunities, Threats
Availability of sources of green energy eg. solar
SWOT Analysis
Strength
Weakness
Opportunity
Threat
Livestock market and business hub
Cultural diversity
No waste management system
Cattle rustling
Strategic geographic location
High population density
Improper WASH facilities
High transport costs
Poor land tenure system
Availability of educational facilities in Kalobeyei Town
Overlap on policy and regulatory frameworks
9 0 C H A P T E R 5 | W O R K S H O P

Improper WASH facilities
Vibrant economy
Local leadership and political goodwill
Presence of prosopis juliflora to provide fuel
Lotikipi water aquifer to support agriculture
Strategic geographic location
Overreliance on humanitarian community
Changing political dynamics with upcoming election
Presence of prosopis juliflora impacting on pastures
High transport costs
Large population
No waste management system
U N - H A B I TAT I K A K U M A A N D K A L O B E Y E I S PA T I A L P R O F I L E 9 1

LOOKING FORWARD

LOOKING FORWARDChildren in Kakuma Camp (UN-Habitat 2019)

Development Challenges
Strategic Challenges
Unequal Urbanisation• Kenya is one the fastest growing economies in Africa,
however the wealth generated from this growth is not evenly distributed, with counties such as Turkana suffering from long term marginalisation. The poor infrastructure and sheer distance from large urban centres have placed limits on access to opportunities for the local community who have simultaneously been generously sharing the increasingly pressured resources with more than 200,000 refugees living in the county.
Demographic Profile• Kenya has a rapidly growing population, with a growth
rate of 2.15% and it is the 19th most rapidly urbanizing country in the world. This can be seen clearly in the local context as the total projected population growth of Kakuma-Kalobeyei is estimated to be between 58,000 (24% increase) - 95,000 people (39% increase) by 2030. The difference in population projections is according to either Kenya’s average growth rate (+2.15%) or Turkana County average growth rate (+3.35%). This will require an additional 10.2km2 - 16.5km2 of land to accommodate this population growth at current density levels. In addition to land requirements for urban growth, additional provision of basic service and public facilities will need to accompany this. Provision of basic service is a problem within the current settlements, with villages of Kalobeyei Settlement and Kakuma Camp not yet being connected to an electrical grid. Schools in Kalobeyei Settlement are also reported to be over-capacity.
• Turkana County has a younger population profile compared to much of Kenya with approximately 60% of the population being under 19. This poses a challenge in terms of provision of sufficient education facilities (primary, secondary and tertiary). There is also the challenge of providing sufficient employment opportunities for the young workforce, otherwise many may relocate to larger employment centres such as Nairobi in search of employment opportunities.
Cliamte Change• The current impacts of climate change may be
exacerbated by the fact that the region suffers particularly from climate vulnerability both in Kenya as well as in neighbouring South Sudan and Ethiopia. This can lead to potential conflict over resources and
further contributing to climate-induced displacement and migration trends towards urban centres.
• An increasingly unpredictable climate in combination with high population growth also impacts the viability of pastoralism as a livelihood for a large proportion of the host community. More resilient livelihoods need to be explored to support resilience to droughts and floods which affect food security and result in an increasing reliance on aid.
• Planning proactively to prepare for this is particularly important as Turkana as it is already itself highly vulnerable to climate change and therefore needs active measures and to ensure that urban areas can become and remain inclusive, prosperous and sustainable.
Governance, Land Management & Planning Challenges
Refugee Policy• Despite Kenya being designated as a country that
complies with the Comprehensive Refugee Response Framework, there is a fracture in the policy perspectives between the national and local government when it comes to hosting refugees. Whilst the the Refugee Bill of 2019 states that “Refugees shall be enabled to contribute to the economic and social development of Kenya by facilitating access to, and issuance of, the required documentation at both levels of Government”, there is no mention of an issuance of work permits for those who have obtained refugee status, nor are rights given regarding self-employment or social security, which limit potential for refugee inclusion and for local communities to benefit fully from hosting refugees.
Land Management & Planning Boundaries• There is an overlap over land management and
administrative boundaries which come under the purview of both county and national government, which leads to cases of potential ambiguity and thus gaps in actualising responsibilities impacting service delivery. This is clearly demonstrated in that Kakuma-Kalobeyei spans Letea, Kakuma, Kalobeyei and Lopur Wards and that Kalobeyei Settlement is split across Kalobeyei and Lopur Sub-locations.
• There is general uncertainty over land status and land tenure within Turkana-West. There is a need for clarity regarding the delineation between community land and public land, for future planning purposes.
• Furthermore, due to the refugee settlements there is an extensive range of actors that work across both
9 4 C H A P T E R 6 | LO O K I N G F O R W A R D

the camps/settlements as well as with the host community.These actors including UNHCR, RAS, AIC, IRC, KRC, LWF, WIK, NRC, PWJ, Lokado, GIZ, UNICEF and UN-Habitat. This can lead to further overlapping responsibilities, which when combined with limited coordination can result in inefficient distribution of resources and service delivery.
• Many of the planning initiatives for Kakuma-Kalobeyei are not coordinated or integrated. For example, the current proposed location of the LAPSSET corridor bisects Kalobeyei Settlement and, if it were to go ahead, would require the demolition of many existing shelters, infrastructure and facilities within Kalobeyei Settlement.
Environmental and Natural Hazard Challenges
• Water scarcity throughout Turkana County impacts on livestock rearing, which is a major source of livelihood in the county, as well as the growth of the agricultural sector. This can be exacerbated by the drought prone nature of the area which risks livestock loss and agriculture failure and thus food insecurity, greater reliance on aid agencies and ultimately potential conflict between host and refugee communities.
• Seasonal flooding of Tarach River threatens houses, infrastructure and lives on a yearly basis.
• The sharing of water sources between livestock and humans is common and has the potential to lead to cross-infection of diseases between animals and humans.
• Energy access is a major challenge with the majority of the refugee settlements relying on firewood or charcoal for cooking purposes. There is however a severe lack of firewood that can be used for charcoal production due to the arid conditions of the environment which is likely to be as a result of deforestation that has been occurring as larger populations (both host and refugees) have been settling in the area.
• The proliferation of invasive species Prosopis Juliflora in Turkana County has resulted in the species colonising pasturelands and farmland, preventing the growth of native species
• Along with many other counties, Turkana County was affected by a locust infestation in early 2020. This infestation compounded the threat of food security throughout the county. While the infestation was able to be contained through surveillance and aerial and ground spraying, there is the risk of locust infestations recurring.
Socio-economic Challenges
Economy and Jobs• There is a lack of skilled labor within both the host
and refugee population, and at the same time limited formal livelihood opportunities in the area beyond petty trade activities, which has led to poor employment opportunities for all.
• Investors are not incentivised to develop large businesses in the area despite the potential large consumer market due to the high cost of commodities due to relative isolation from major production centres as well as poor transport and energy infrastructure
• Unemployment levels are very high and those who have a job are usually hired by the international agencies & NGOs. The strong reliance on aid/UN/NGOs from refugees (lack of self-sufficiency) alone with little private sector business development has lead to a trend of educated and skilled labour to migrate to Nairobi or other major centres for better employment opportunities
• COVID-19 has impacted a large number of host community households (loss of jobs/income, low business) compared to refugees who continue to get regular support from humanitarian organizations
Facilities and Infrastructure• There is a lack of solid and liquid waste management
systems throughout Kakuma Camp and Kalobeyei Settlement. Priority should be given to engineered landfill and an efficient system of collection.
• Unequal distribution of education/market/health infrastructure throughout the settlements. The majority of facilities are located in Kakuma Camp (especially Kakuma 1) due to the age of the camp.
• Poor transmission and distribution infrastructure leading to extremely low household access to energy and high cost of energy when it is provided (often through informal sources)
Conflict between Host and Refugee Communities• There is ongoing conflict between host and refugee
communities due to unequal access to facilities and resources as well as job opportunities. This has been ongoing since the construction of the camps and is often exacerbated due to food insecurity competition over the limited resources as well as a predominant
U N - H A B I TAT I K A K U M A A N D K A L O B E Y E I S PA T I A L P R O F I L E 9 5
focus from the international community on the refugees.
Spatial Challenges
Sprawling Development and Population Density• Land density varies substantially between host
communities and refugees. Whilst the host communities are used to large plots to host livestock etc, as the population grows this is leading to rapid growth in the town footprint which increases the cost of service provision, as well as risking poor land use efficiency.
• As a result of the sprawling nature of development as well as the low population density and high population growth, the projected future land demand could be up to:• Kalobeyei Settlement +4.1km2
• Kakuma Camp +5.3km2
• Kakuma Town +5km2
• Kalobeyei Town +0.23km2
• The disparate nature of the settlements makes infrastructure investment expensive both in terms of capital investment, maintenance and ensuring basic service delivery into the long term.
Accessibility and Connectivity• Generally Turkana County suffers from poor transport
connectivity with only 5% of the county roads being sealed with tarmac.
• All roads other than the A1 highway are unsealed or poor quality. Especially during the rainy season, this renders many roads almost impassable such as the existing road between Kakuma Camp 1 and 2, the link to the A1 from Kakuma 4 as well as the link to Kalobeyei Settlement which is only suitable for motorcycles and foot traffic.
• There is poor market integration in the surrounding region and hinterland, with the exception of the pastoralist livestock owners, it is difficult to travel any significant distance away from the A1 corridor.
9 6 C H A P T E R 6 | LO O K I N G F O R W A R D

Children playing in Kalobeyei (UN-Habitat 2019).
U N - H A B I TAT I K A K U M A A N D K A L O B E Y E I S PA T I A L P R O F I L E 9 7

Development Opportunities
Strategic Opportunities
• Despite Turkana’s historic marginalisation in Kenya, the country is now benefiting from higher than average national transfers to support accelerated development in the county.
• Furthermore, due to the high proportion of young population in the county as well as reducing dependency ratio, there is a strong potential to spur multidimensional development in the county as the labour force grows and the dependent population shrinks.
• Kenya is a signatory to the CRRF and the 2018-2022 Turkana County Integrated Development plan specifically includes Refugees, and notes the positive contributions to local economic development. As such, there is a major opportunity to leverage the county government support and positive enabling environment to seek sustainable medium to long term interventions in infrastructure and service delivery that equitably support both host and refugee communities and promote integration.
• The endorsement of KISEDP as a joint Turkana County Government and international agency framework for integrated programming around complementary and mutually reinforcing components provides a unique basis for investors and government agencies to build upon and utilise as a platform for identifying sustainable interventions.
• The proposal to confer municipality status on the area around Kakuma-Kalobeyei if implemented will allow for more efficient delivery of urban services and give the Kakuma-Kalobeyei area greater leverage to lobby for funding and service provision for its resident communities.
• The LAPSSET Corridor (when completed) will potentially create trade and investment opportunities for Kauma-Kalobeyei as the travel times to the hinterland of kenya will be reduced, and transport of goods and services will becoming easier and more affordable.
Environmental Opportunities
• There is the opportunity to use Prosopis Juliflora for firewood. This is beneficial as it provides a source of fuel for firewood and charcoal creation as well as
controlling the spread of an invasive species. This should not be the only source of fuel however and renewable fuel sources should continue to be invested in and expanded.
• As such, there is an opportunity for increased investment in green energy in both wind and solar power generation. The county in general is stated to be able to draw on large areas of land which benefit from solar radiation as well as potential wind energy.Small scale solar plants and mini-grids have been developed already and could be explored for potential expansion.
• As further investigations are carried out on the Lotikipi Aquifer, alongside potential for a desalination plant to be implemented, this should be monitored to ensure opportunities for clean water provision can be maximised. Furthermore, there already exists the opportunity to invest in small scale water and irrigation infrastructure such as water pans and rain water harvesting to expand the agricultural sector of Kakuma-Kalobeyei, benefiting both refugee and host communities.
• The land within the Kakuma area that is particularly flood prone along Tarach river, should be restricted in terms of development, with potential for small scale agriculture to be explored instead. The large land supply in the area should be captured as an opportunity to focus development on non flood-prone land.
Socio-economic Opportunities
Economy and Jobs• The value of the local economy in Kakuma and
Kalobeyei is already worth more than USD 56 million per year, and more than 2100 businesses exist in the area. This is a strong basis from which to build if infrastructure and the business environment can be improved as well as opening up potential for both leveraging and diversifying the local pastoralist economy, reducing the over-reliance on pastoralism and improving resilience.
• There are large numbers of adults enrolled in education programmes across Kakuma and Kalobeyei, highlighting the ambitions of the local communities as well as the potential for a growing skilled workforce to be leveraged. When taken together with the positive demographic dividend it offers an opportunity for
9 8 C H A P T E R 6 | LO O K I N G F O R W A R D

a growing skilled workforce to also become more productive and support local economic development if other enabling factors are put in place.
• Recent studies specify activities such as investing in entrepreneurship, shifting to cash assistance, improving access to finance and banking, diversifying supply chains including by improving refugee participation within value-chains using temporary forms of protection for small start-ups in infant industries like the food sector, and minimising market concentration as potential avenues for programming.
• As improvement of transport infrastructure takes place, there is also the opportunity to investigate international trade opportunities in the future, especially with South Sudan due to its close proximity.
Facilities and Infrastructure• Provision and investment in energy, transport,
connectivity and education infrastructure will provide the young population with skills and access to opportunities to be able to contribute to the local economy both as a skilled workforce as well as making the area more conducive to local investors wishing to start businesses in the area. The potential creation of a Kakuma municipality will also allow for more resources for improved infrastructure to be targeted in this area and can help to stimulate self-reliance and reduce reliance on aid/NGOs in the long-term
Spatial Opportunities
Land Availability• Although there are areas of high population density,
in particular in Kakuma 1, the majority of Kalobeyei Settlement and Kakuma Town are characterised by relatively low density. This presents an opportunity to increase the population density in certain areas and consolidation specific development areas in order to plan effectively for the projected population growth. Consolidation allows for resources to be targeted better and could also increase the amount of people within 15 minute walking proximity of basic services and public facilities.
• If necessary. there is land available for the expansion of the settlements to accommodate projected population growth. In particular, there is undevelopment land between Kakuma Camp and Kalobeyei Settlement that could accommodate population growth. Although there is the land available for expansion, unplanned urban sprawl must be avoided as it would compound issues of basic service and infrastructure provision and accessibility.
Accessibility and Connectivity• Upgrading the link road between Kakuma and
Kalobeyei as well as key access roads within Kakuma Camp will reduce travel time between the settlements, allow for faster transport of goods and services and help integrate the settlements and reduce reliance on the A1 highway
• Upgrading of the A1 Highway between Kainuk and Lokichogio and Lodwar and Kakuma will improve the transport of goods and reduce the cost of commodities in Kakuma-Kalobeyei for both host and refugee communities.
U N - H A B I TAT I K A K U M A A N D K A L O B E Y E I S PA T I A L P R O F I L E 9 9

Kakuma & Kalobeyei Planned and Recently Completed Infrastructure
Category Project Description Organisation Responsible Projected
completion date
Basic
Services
Water 1 Water tank 2 steel water tanks are bring built in Kalobeyei Settlement
in Villages 2 and 3.
UNHCR and NRC -
Somali Market’s water tank was replaced in 2019. UNHCR and NRC 2019
2 Water pan Kangura water pan holds 100,000 m3 of water. FAO, WFP & Turkana County
Govt
-
Water pan between Village 1 & 2 in Kalobeyei Settlement. FAO, WFP & Turkana County
Govt
2019
Water pan between Village 2 & 3 in Kalobeyei Settlement. FAO, WFP & Turkana County
Govt
2020
Roof water harvesting. UN-Habitat -
Proposed water pan near Kakuma Town, Kangitesiroi. WTF. AAHI -
3 Borehole 5 additional boreholes are currently being built. -
Rehabilitation of existing boreholes -
Pipeline 13km water pipeline proposed from Lopur to Kalobeyei
Settlement.
PWJ -
Waste
Management
1 Dumping Site Waste management site proposed by Turkana County
Government, comprising both of solid and liquid waste.
Ministry of Lands, Energy,
Housing and Urban Areas
Management and UN-Habitat
-
2 Pits Estimated 16 pits to be constructed in accordance with
Kalobeyei Settlement Advisory Development Plan.
UN-Habitat, UNHCR and
PWJ.
-
Energy 1 Solar power plant Kalobeyei Village 1 solar power plant and mini-grid. UNHCR, GIZ and Renewvia
Energy
2019
2 Mini-grid Kalobeyei Town mini-grid. UNHCR, GIZ and Renewvia
Energy
2019
Public
Facilities
Commercial 1 Marketplace In 2019, WFP constructed sheltered marketplaces in
Kalobeyei Village 1.
WFP 2019/2020
Markplace in Kalobeyei Village 3. WFP 2019/2020
Marketpalce in Kakuma Town. WFP 2019/2020
2 Banking Equity Bank constructed and completed a bank in
Kalobeyei Settlement Village 1, in 2020.
Equity Bank 2020
3 Entrepreneurship
centre
A Youth Entrepreneurship centre was constructed in
Kalobeyei Settlement Village 1.
DRC -
4 Model cottage
industry unit
Installation of pilot model cottage industry units in
Kalobeyei Settlement.
Estimated
completion date:
May 2021
5 Biashara/Huduma
Business Centre
Centre proposed in Kakuma Town IFC -
Consultations with UNHCR, FAO, WFP and Turkana County Government were undertaken with the aim to cross-reference, verify and update UN-Habitat’s existing database of planned and recently completed infrastructure in Kakuma-Kalobeyei. Partners were requested to share information and data they had regarding planned projects within the camps or throughout the host community. The table below and following maps summarize the known
recent and future infrastructure projects throughout Kakuma-Kalobeyei. The process of data gathering and updating is ongoing and further consultations are expected to take place in 2021.
1 0 0 C H A P T E R 6 | LO O K I N G F O R W A R D

Agriculture 1 Demonstration
plot
Establishment of demonstration plots for production
of nutrient dense foods in selected health facilities in
Turkana West Sub County.
FAO Estimated
completion date:
March 2022
2 Horticultural farm 4 agricultural farms that will be seved by the 3 irrigation
water pans
WFP October 2020
Community 1 Multi-purpose/
community center
Community Centre in Kalobeyei Village 2. DRC -
DRC Women and Girls Empowerment Centre in Kalobeyei
Village 3
UN Women, PWJ, DRC 2020
2 Sports complex Sports complex started construction in 2020. UNHCR -
Education 1 Primary school Bright Primary School, 12 classrooms, latrines for boys
and girls, and a kitchen, constructed in Kalobeyei Village 3.
FCA and UNICEF, in
partnership with Kingdom of
Netherlands
-
Bright ECD in Kalobeyei Village 3. -
A primary school is constructed near Kakuma Town for
the host community, completed in 2020.
Welthungerhilfe 2020
New classrooms for Elliye Primary School are being built
in Kakuma Refugee Camp 4.
LWF -
2 Secondary school Construction of 8 classrooms and 4 latrines in Greenlight
Secondary School in Kakuma.
AAR 2019
Construction of boys dormitory and teachers quarter at
Kalobeyei Secondary School in Kalobeyei Town.
2020
3 University/Tertiary University construction ongoing since 2019. UNHCR and Masinde Muliro
University
Proposed to
end in 2020, but
construction
was stalled by
COVID-19 until
further notice.
Don Bosco are expanding their school in Kakuma Town. -
Health 1 Hospital Hospital in Village 2 in Kalobeyei, AIC, completed in 2019 AIC, UNHCR 2019
Public Space Public Space Basketball pitch in Kalobeyei Village 1 UN-Habitat, AAR 2019
Public space in Kalobeyei Village 2 UN-Habitat,, PWJ, GIZ -
U N - H A B I TAT I K A K U M A A N D K A L O B E Y E I S PA T I A L P R O F I L E 1 0 1

Kalobeyei Planned and Recently Completed Infrastructure
Map 37: Kalobeyei Town popportunity index.Sources: KNBS, ESRI, UNHCR, WFP, FAO, UN-Habitat analysis
0 10.5 2
km
Map 36: Kalobeyei Settlement opportunity index.Sources: KNBS, ESRI, UNHCR, WFP, FAO, UN-Habitat analysis
0 0.75 1.5
km
LEGEND
Primary Road
Secondary Road
Tertiary Road
Water
Agriculture
Waste Management
Community
Energy
Commercial
Education
Facilities
Health
Public Space
Kalobeyei Economic Corridor
Public Facilities
LEGEND
Sub-County Boundary
Ward Boundary
Primary Road
Secondary Road
Tertiary Road
Energy
Education
1 0 2 C H A P T E R 6 | LO O K I N G F O R W A R D

Kakuma Planned and Recently Completed Infrastructure
Map 38: KakumaTown and camp opportunity index.Sources: KNBS, ESRI, UNHCR, WFP, FAO, UN-Habitat analysis
0 0.75 1.5
km
Public Facilities
LEGEND
Sub-County Boundary
Ward Boundary
Primary Road
Secondary Road
Tertiary Road
Education
Water
Commercial
Road Upgrades
U N - H A B I TAT I K A K U M A A N D K A L O B E Y E I S PA T I A L P R O F I L E 1 0 3

SCENARIO BUILDING

SCENARIO BUILDINGShops on main street in Kakuma (UN-Habitat 2019)

1 0 6 C H A P T E R 7 | S C E N A R I O S
Scenario Building
Moving from Assessment to Scenario Building
The spatial profile so far has established and summarized the challenges and opportunities that impact Kakuma-Kalobeyei. Understanding these challenges and opportunities, which span categories of demographics, climate change, economics, refugee policy and land management, provides a contextual framework to the current status of Kakuma-Kalobeyei. These challenges and opportunities have been verified by the stakeholder engagement session that was undertaken and aligned against the SDGs.
The framework of challenges and opportunities forms a basis from which the most important trends affecting the area’s future trajectory are established. These trends, or variables, are used to develop different future scenarios for Kakuma-Kalobeyei up to 2030. The complex interrelationships between trends, priorities and realities have been simplified in this section of the profile to provide three scenarios of what Kakuma-Kalobeyei could look like in 2030, along with the factors that determined that outcome.
Scenario A - ‘Business as Usual’ and Scenario C - ‘Unplanned large scale growth without major investment’ demonstrate scenarios where Kakuma-Kalobeyei does not undergo
adequate planning nor receive necessary investment and suffers because of this. Scenario B - ‘Planning for Growth and Resilient Development’ demonstrates the scenario where Kakuma-Kalobeyei is able to reach its full potential while also enabling the implementation of KISEDP and CIDP.
Development Scenarios - Methodology
A typical scenario building approach for contexts experiencing forced displacement is the chain of plausibility approach, which includes a detailed review of all possible events and developments. Scenario building, using this approach, starts with identifying variables that are likely to spark a chain of events resulting in a series of potential impacts. Informed assumptions are then made on the most important variables and the direction of these variables. The Variable is a development or event that has the potential to cause a change in a humanitarian situation and Outcomes are directions that a variable can take (e.g. increase, decrease). The impacts of each isolated variable outcomes are broadly outlined, but are explored in a more composite manner when combined together as part of the potential scenario.
In the report, the research question for scenario building is “Given the context of the imminent conferment of
What are the key variables that affect both sustainable development and urban planning considerations in the area?
What are the scenarios that the combination of the variables could result in?
• Will they positively, negatively or marginally affect the study area?• How probable is it that this scenario (or similar) may occur?• What is the impact both spatially as well as socio-economically on the area?
What are the overall assumptions?
What are the outcomes which would influence the direction of the area's
future development?
What are the actions that enable this (if relevant)
What are the impact upon the area as a result of the
identified outcome

Construction of water pan in Kalobeyei (UN-Habitat 2019)
U N - H A B I TAT I K A K U M A A N D K A L O B E Y E I S PA T I A L P R O F I L E 1 0 7
municipality status of Kakuma and Kalobeyei, how could the area be developed to support more inclusive and resilient communities?” and “Which events would lead to large changes in the built environment, what is the expected impact and likelihood?”. Below, the selected variables are explained more broadly and their interlinkages are analysed.
Overall Assumptions
1. There is continued political stability in Kenya and refugee policy does not change
2. There is continued support of the Turkana County Government to work towards durable solutions for the hosts and refugees in the Kakuma and Kalobeyei area.
3. Plans to confer Municipality status upon the Kakuma-Kalobeyei area will be realised.
4. The demographic trend of Kenya and East Africa as a whole will continue to occur, shifting the population breakdown to one dominated by economically productive working adults.

1 0 8 C H A P T E R 7 | S C E N A R I O S
57%18%
7%
5%
6%
5% 1%
2020 2022 2024 2026 20282021 2023 2025 2027 2029 2030
50,000
0
100,000
150,000
200,000
250,000
300,000
350,000
400,000
South Sudan
Democratic Republic of the Congo
Somalia
Sudan
Burundi
Ethiopia
Other
High Growth Rate at 3.35%
Low Growth Rate at 1%
Medium Growth Rate at 2.15%
Host Community Population Decline
Refugee Population Decline
Variable: Population Growth & Decline
Context
Unplanned urbanization leads to increased pressure on basic services, environmental degradation and inefficient use of resources. A major variable that will impact on the future growth of Kakuma-Kalobeyei is population growth, as this will determine future infrastructure provision and potential economic growth. The growth of both the host and refugee communities will impact on the ideal development scenarios of the settlements.
Population Growth
Three different growth rates have been projected for Kakuma-Kalobeyei, representing high, medium and low growth scenarios. While in reality the exact growth rate of the host and refugee communities are likely to differ to some degree due to varying influences, they have been combined for the purposes of these projections. It should also be noted that of the total population of Kakuma-Kalobeyei, the host community represents approximately 20% of the population while the remaining 80% are refugees.
The projected growth outcomes are shown in the graph,
illustrating high, medium and low growth scenarios. If Kakuma-Kalobeyei were to have a growth rate of 3.35% per annum, which is the projected growth rate of Turkana County, this would add an additional 95,000 people by 2030, a 39% increase of the current population. If Kakuma-Kalobeyei were to grow at Kenya’s average growth rate of 2.15%, this would project an additional 58,000 residents by 2030, a 25% increase of the current population. Finally, if Kakuma-Kalobeyei was to only have a population growth rate of 1% per annum, this would still result in an additional 25,000 residents by 2030, an 11% increase of the current population.
In addition to these projected growth rates, refugee surges may occur within the next 10 years which could cause a sudden spike in population. Refugee surges like this however are difficult to predict. The predominant countries of origin of refugees in Kakuma-Kalobeyei are South Sudan (57%), Somalia (18%) and the Democratic Republic of the Congo (7%). Numbers of South Sudanese refugees have been growing steadily since 2017 and Somali refugee numbers have been growing since 2018 without any major influxes. Therefore, the proposed population growth outcomes will focus on the natural growth of the existing population without proposing any major refugee influxes.
Projected Population Growth of Kakuma-Kalobeyei Ethnicities of Refugees in Kakuma Camp and Kalobeyei Settlement

U N - H A B I TAT I K A K U M A A N D K A L O B E Y E I S PA T I A L P R O F I L E 1 0 9
Population Decline
While population growth, to some extent, of both the host and refugee communities is the most likely outcome over the next 10 years, there is also the possibility of population decline of both these communities.
Host community decline:
Population decline of the host community could occur due to migration of location away from Kakuma-Kalobeyei. Migration to neighbouring counties with more water and vegetation resources could be seen as a necessary option for many of the predominantly pastoralist host community who rely on their livestock. Members of the host community may also relocate to other urban centres if sufficient employment and livelihood opportunities are not made available in Kakuma-Kalobeyei.
Refugee population decline:
Voluntary repatriation is an option for refugees, and significant repatriation of the refugee population would impact on the growth rate of Kakuma-Kalobeyei. However, based on the main countries of origin of the refugees in
Kakuma-Kalobeyei, significant repatriation is not expected to occur within the next 10 years.
Since 2009, only 757 refugees have been repatriated to South Sudan from Kenya. This is likely due to the continuation of issues that caused the refugees to initially leave South Sudan, which are mostly communal clashes, civil war and natural disasters. While larger numbers have been repatriated to Somalia from Kenya (85,060 since 2009), the majority of this occurred in 2016 and repatriation numbers to Somalia have been decreasing every year since. In addition, many refugees have lived in Kakuma since the 1990’s and have built their lives there for 30 years. Voluntary repatriation is even more unlikely in these circumstances. Resettlement of refugees to other countries is another pathway of migration however historic rates of resettlement are too low to significantly impact on future growth.
Outcome 1: Large population growth of Kakuma-KalobeyeiIf Kakuma-Kalobeyei were to grow at Turkana County’s projected annual growth rate of 3.35% per annum, this would project an additional 95,000 people by 2030, a 39% increase of the current population.
+39%increase of the current
population
Outcome 2: Medium population growth of Kakuma-Kalobeyei If Kakuma-Kalobeyei were to grow by only 2.15%, this would result in an additional 58,000 by 2030, which would represent an 24% increase of the current population.
+24%increase of the current
population
Outcome 3: Population declinePopulation decline of refugee population due to repatriation and/or population decline of host community from migration due to employment opportunities and maintaining pastoralist livelihoods.
-xx%decrease of the current
population

1 1 0 C H A P T E R 7 | S C E N A R I O S
Variable: Urban Footprint
Context
Natural population growth, as discussed previously, has the potential to affect the expansion of the urban footprint of Kakuma-Kalobeyei. This in conjunction with the density of the built areas will define how much more land needs to be developed to accommodate various potential outcomes of projected population growth.
Based on the population growth projections of the previous variable, Kakuma-Kalobeyei could grow between 26,000 - 95,000 additional residents by 2030 (inclusive of both host and refugee communities). Analysis of the existing settlements demonstrate different densities as shown in the table below:
• Kakuma Camp has the highest density of all the settlements in Kakuma-Kalobeyei, approximately 11,400p/km2. This is mainly due to the length of time the Camp has been open in conjunction as a result of multiple influxes of refugees as well as the fact that the amount of land allocated to housing refugees has been restricted. Whilst the camp demonstrates high density, in this case it could be considered as over-crowded due to the comparatively poor infrastructure and service provision.
• Kalobeyei Settlement currently has a built up area density of 3,800p/km2. This density whilst low in comparison to typical urban areas, is in part due to the fact that the settlement is not at full capacity. According to the development plan, the settlement has room to support another 20,000 people and is also the only settlement where the density relates to an environment which was proactively planned. As such, looking to the future, it could be assumed that the settlement could support a density of up to 5,700p/km2 if a sustainable water solution can be found.
• Kakuma Town has a population density of 3,600p/
km2, the dense centre along the A1 highway being offset by the large areas of unplanned sprawl on the town’s periphery.
• Kalobeyei Town has the lowest population density estimated to be up to 3,300p/km2 but likely to be lower. This is due to the very small population size of the town and there being no constraints on the land that is able to be developed.
Whilst the higher the density of any proposed growth, the less land will be required, this is only preferable if the investment in supporting infrastructure follows. However in relation to urban footprint alone, the highest population projection of an additional 95,000 by 2030 would only require an additional 9.2km2 of land if all this land was built to the same density as Kakuma Camp. This is approximately 60% of the total current area of Kalobeyei Settlement (eg. Village 1 and Village 2).
Conversely, to accommodate 95,000 additional residents at the planned density of Kalobeyei Settlement, this will require an additional 36.5km2. This is 250% the current size of Kalobeyei Settlement.
An opportunity of Kakuma-Kalobeyei is that there is much undeveloped land between the settlements which could accommodate significant population growth. Growth at the density of Kalobeyei Settlement however would not be cost effective and would require very heavy infrastructure investment. Infrastructure networks in particular (such as electricity grids, water pipelines and sewage lines) are very expensive when required to service a large area. Generally, it is cheaper and more efficient to provide infrastructure for a smaller area with a higher density. This also applies to non-network types of infrastructure such as schools and health facilities. The lower the density of the growth, the longer the walking distance to the nearest facility. Higher density of dwellings allows for a higher opportunity index.
Kalobeyei Settlement
Kakuma Camp
Kalobeyei Town
Kakuma Town
Area - Built-up (km²) 10.51 13.62 0.6 12.93
Population (2020)
39,623 (60,000 Planned Capacity)
155,685 2000 45,882
Population Density (p/km²)
3770.03(5,708 density at planned capacity)
11430.62 3333.33 3548.49
Population IncreaseLow Density3,300 p/km²
Medium Density 5,700 p/km²
High Density11,600 p/km²
Low - 25,000 7.6 km² 4.4 km² 2.2 km²
Medium - 58,000 17.6 km² 10.2 km² 5 km²
High - 95,000 28.8 km² 16.7 km² 9.2 km²
Population Densities of Kakuma-Kalobeyei Settlements.
Additional Area Required (km²) Depending on Density

U N - H A B I TAT I K A K U M A A N D K A L O B E Y E I S PA T I A L P R O F I L E 1 1 1
Sub-Variable: Location of growth
While the projected growth of Kakuma-Kalobeyei and its impact on the associated land requirement is itself a variable, a key sub-variable relates to where the projected expansion takes place and good decision making on this is essential to the sustainable growth of the area as a whole.
Kakuma Town, Kakuma Camp, Kalobeyei Settlement and Kalobeyei Town could grow in different ways and the options of growth are summarised in the table to the right.
Outcome 1: Planned development based on medium growth at medium density
This outcome is based on the assumption that moderate population growth across both hosts and refugees will continue, and the land to support this will be proactively planned and developed in a way that utilizes infill land between the settlements requiring 24% more land than today.
The impact of this will be that large investment will be required up front, but improved infrastructure and services can be provided to more of the community in a cost effective and sustainable manner, limiting further impact on the surrounding environment and avoiding development on risk prone areas.
+26%more land required
Outcome 2: Unplanned development based on medium growth at low density
This outcome is based on the assumption that moderate population growth based on Kenya average growth rates across both hosts and refugees will continue, but that the land to support this will not necessarily be developed in a way that is particularly efficient i.e. following the spontaneously settled pattern of Kalobeyei town. This may mean that sprawling growth continues, and the settlements expand in all directions
The impact of this will be that very large and unsustainable investments will be required to provide services to everyone, and the maintenance of this infrastructure is likely to prove unaffordable. As such, it is likely limited improvement in service delivery will take place, potential for increased access to opportunities for all will be limited and further environmental degradation may continue.
+45%more land required
Outcome 3: Unplanned development based on high growth at low density
If the population of Kakuma and Kalobeyei grows as the same average historical growth rate as Turkana county as a whole (3.35%), and no further planning takes place leading to a low density development pattern, a vast additional area of land may be needed by 2030.
The impact of this will be predominantly negative with infrastructure unable to be implemented in a way that responds to the growth, severely impeding service delivery to all as well as creating increased competition over the limited resources. This in turn may lead to increased risk of conflict between various groups as well as increasing vulnerability to those unable to easily access the limited services and infrastructure.
+67%more land required
New SettlementIn a similar plan as to how Kalobeyei was developed, one option could be to select a new site, separate from both Kakuma Town and Kalobeyei Settlement, could be selected for a new planned settlement. This could be a self-contained camp.
Urban Expansion of Existing SettlementsThis option would involve the expansion of the existing settlements, requiring additional land for growth.
InfillThe final option is to increase the density of existing developed areas within Kakuma-Kalobeyei. This has the benefit of being able to utilise existing infrastructure
+10.2 km²
+17.6 km²
+28.8 km²

1 1 2 C H A P T E R 7 | S C E N A R I O S
Variable: Planned Develeopment Projects
Context
Three catalytic projects have been identified which, if implemented, would transform Kakuma-Kalobeyei into a strategic location. These projects will increase the economic development potential of Kakuma-Kalobeyei, increase demand to live and work in this location and allow for greater investor confidence. Each of the catalytic projects will involve multiple stages over many years, with specific timeframes currently undetermined.
While there are other infrastructure projects planned for in and around Kakuma-Kalobeyei, these three have been identified as being particularly impactful to the future growth of the area. Each project on it’s own will yield specific benefits to Kakuma-Kalobeyei over time, however the combined impact of all three catalytic projects will be significant as they are mutually beneficial. Investment in these infrastructure projects will have a powerful multiplier effect as their implementation will spur additional investment and infrastructure projects.
Catalytic Project 1: LAPSSET Corridor
• The LAPSSET Corridor comprises a highway, railway and oil pipeline, currently planned to run adjacent and through Kakuma-Kalobeyei.
• The aspects of the project which will have the greatest impact on Kakuma-Kalobeyei are the highway and railway, in particular if a railway station is located in Kakuma Town. In addition to being able to transport people and resources in and out of Kakuma-Kalobeyei, there is the potential for Kakuma to become a transit hub in the region.
• This infrastructure will catalyze economic development, access to opportunities, security of livelihoods and lower the cost of goods and services.
• While the wider LAPSSET Corridor project already has significant investment and planning behind it, the exact location of the corridor when it travels through Kakuma-Kalobeyei has not yet been finalised.
Highway
Railway
Oil Pipeline
Manufacture
ICT
Security of livelihoods
Employment Investment Enterprise
Lower cost of goods and services
Catalytic Project 2: Kalobeyei Economic Enterprise Zone (EEZ)
• The Kalobeyei Economic Corridor development plan proposes an Economic Enterprise Zone (EEZ) in the southern section of Kalobeyei Settlement, along the A1 Highway. The objective of the EEZ is to enhance the local economy and maximise the impact of the LAPSSET Corridor. The EEZ aims to benefit both host and refugee communities by creating an environment for the growth of new industries such as manufacturing and ICT.
• The growth of this corridor, in coordination with the development of the LAPSSET corridor, will put Kalobeyei Settlement on the map as a strategic location for employment, investment and enterprise.

U N - H A B I TAT I K A K U M A A N D K A L O B E Y E I S PA T I A L P R O F I L E 1 1 3
Outcome 1: No projects implemented
If neither of the three catalytic projects are developed, this will prevent any viable growth of Kakuma-Kalobeyei’s economy. Kakuma-Kalobeyei will likely struggle to provide new employment opportunities and many residents may choose to move to other urban centres, resulting in an even greater decline.For all three projects to not eventaure would be somewhat unlikely however due to the momentum and political interest in both the LAPSSET Corridor and Kalobeyei EEZ.
0/3catalytic projects
implemented
Outcome 2: 2 projects implemented
The development and implementation of the LAPSSET Corridor and Kalobeyei EEZ will allow for the potential economic growth of Kakuma-Kalobeyei to be realized. The LAPSSET Corridor will directly support the growth of the Kalobeyei EEZ as it provides the transport infrastructure necessary to integrate Kalobeyei into the wider economy.
2/3catalytic projects
implemented
Outcome 3: All projects implemented
The optimal scenario would be for all three catalytic projects to be implemented. All three projects would be able to strengthen the others, such as the water resources from Lotikipi Aquifer providing greater food security for Kakuma-Kalobeyei, allowing for the expansion and even commercialization of the agricultural sector. While there are existing plans for LAPSSET Corridor and the Kalobeyei EEZ, there are currently no plans in place regarding the utilisation, desalination and distribution of water resources from the Lotikipi Aquifer.
3/3catalytic projects
implemented
Lotikipi Aquifer
Agricultural Production Food Security
Catalytic Project 3: Utilization of the Lotikipi Aquifer
• The Lotikipi Aquifer is located over 70 kilometres from Kakuma-Kalobeyei. While it was only discovered in 2013, it is nine times the size of any aquifer in Kenya. The water from Lotikipi aquifer was predicted to be able to meet Kenya’s water needs for several years, however testing revealed that the water will require desalination prior to human consumption. The isolated location of the aquifer indicates that extensive infrastructure will be required to distribute the water from the desalination plant so any major location throughout Kenya.
• While there are reports of Saudi interest in investing in a desalination plant for Lotikipi Aquifer, there is yet to be any agreement made with the Turkana County government or any official plans made. Desalination and distribution of Lotikipi Aquifer’s water will take many years to be realised.
• While both the desalination plant and the distribution infrastructure will require significant investment over many years, utilization of the aquifer has the potential to alleviate Turkana County’s ongoing struggle with water scarcity. Water scarcity is one of the major issues restricting the growth of Kalobeyei Settlement and this issue will only be compounded by climate change over the next decade. With the water from the aquifer, the agriculture sector of Kakuma-Kalobeyei could be greatly expanded, improving long-term issues of food security for both host and refugee communities.

1 1 4 C H A P T E R 7 | S C E N A R I O S
Climate Risk
AdaptationFlood Barrier
AdaptationWater Transportation
AdaptationPlant Vegetation
MitigationCharcoal Alternatives
Variable: Climate Risk & Natural Hazards
Context
Climate change is a reality that poses a very significant threat to Kakuma-Kalobeyei, with impacts already becoming evident in recent years. Climate change impacts Kakuma-Kalobeyei in multiple ways, predominantly through the increasing severity and frequency of droughts and flooding.
While climate change needs to be addressed and mitigated at both national and global scales, the future planning of Kakuma-Kalobeyei can be done in such a way to either exacerbate, stabilize or reduce the impacts of climate change on the settlements.
Adaptation refers to the process of adjusting to the actual or expected effects of climate change. For Kakuma-Kalobeyei, short-term adaptation would take the form of flood barriers to reduce the impact of the seasonal flooding of Tarach River or transporting in water from outside Kakuma-Kalobeyei to combat water scarcity caused by drought. More medium-term adaptation interventions could include the planting vegetation along Tarach River to minimise flooding as well as the diversification of livelihoods away from predominantly pastoralism which is heavily impacted by both droughts and flooding.
Mitigation of climate change refers to interventions that reduce the sources of greenhouse gases. For Kakuma-Kalobeyei these could for example include interventions to switch from charcoal burning stoves to cleaner alternatives.
The combination of both adaptation and mitigation interventions is the most effective way to combat the short and medium term impacts of climate change, as well as contributing to long term climate change reduction goals

U N - H A B I TAT I K A K U M A A N D K A L O B E Y E I S PA T I A L P R O F I L E 1 1 5
Outcome 1: No specific climate change mitigation or adaptation actions are taken leading to increasing vulnerability for local communities
If no actions are taken, the impacts of climate change are going to continue to worsen for the foreseeable future. Flood events will increase in severity and frequency, causing increasing levels of damage to housing and infrastructure and causing greater numbers of injuries and deaths. Land that has been identified as being particularly flood prone, in particular Kakuma 1, may eventually have to be abandoned due to the imwpact of constant severe flooding. Outbreaks of waterborne diseases are also likely. In addition, longer and more frequent droughts will impact directly on water and food security of both the host and refugee communities. Loss of livestock and widespread famine is a likely outcome.
None
Outcome 2: Climate change adaptation actions are taken leading to reduced vulnerability for local communities
While these adaptation actions are able to protect the local communities from some of the impacts of climate change, ie. move people from flood prone areas and improve flood protection in vulnerable areas, they do not fully result in an overall improved outcome. These actions will not have any impact upon the wider climate change impacts such as reducing overall greenhouse gas emissions, which is necessary to slow climate change on a global level.As such, the impacts are likely to continue to worsen, for example in the form of increased droughts, potential outbreaks of desert locusts etc which impact food security and livelihoods reliant on agriculture and livestock.
Adaptation measures
Outcome 3: Both mitigation and adaptation strategies are taken leading to reduced vulnerability and improve resilience of local communities
In addition to stabilizing the current situation, the above activities will contribute to the potential reduction of detrimental impact of climate change on the communities who live in the Kakuma-Kalobeyei area. This assumes that this will happen in conjunction with both national actions as highlighted above as well as global efforts. Adaptation measures will result in both a better understanding of the most risk affected communities as well as the targeting of more resilient housing and infrastructure to protect vulnerable groups from flooding, and to introduce livelihoods that are more resilient to the impacts of climate change. The mitigation measures will help to reduce the impact the communities are already having on the environment, for example through the reduction of use of charcoal cooking fuels to green energy sources such as solar and wind. This will both result in a reduction in environmental degradation and potential increased desertification as well as providing a more reliable and sustainable energy source which will enable the communities to spend their time on more productive activities. Overall this outcome will help to support an increasingly resilient place for the communities to live, with reduced insecurity around natural resources and natural hazards.
Adaptation +
Mitigation measures

1 1 6 C H A P T E R 7 | S C E N A R I O S
Variable: Local Economic Development
Context
A key factor in promoting solutions that integrate refugees with host communities in a planned and coordinated way is to leverage the potential inclusive economic benefit that the investments in the area can have for all. This is also premised on the basis that the scale of population in Kakuma-Kalobeyei has great potential for economic development. This is due in part to a combination of factors including the significant young working-age population, the strategic location of the settlements and the catalytic projects of the LAPSSET Corridor and Kalobeyei EEZ which provide platforms for local economic development.
Evidencing this fact are a number of well publicised studies including the International Finance Corporation’s (IFC) study in 2018. They point out that Kakuma-Kalobeyei has a vibrant informal economy with more than 2,000 businesses and its multitude of shops, traders and daily economic activity indicate a significant market. The study estimated the total household consumption to be conservatively worth $56.2 million (KES 5.8 billion) annually. This economic value is well understood by the county government as well as humanitarian and development actors. As such, it is therefore a strategic objective of KISEDP to increase the self-resilience of refugees and the host population by promoting the local economy with a range of innovative, market-based approaches other than the conventional aid model as well as investment in basic socio-economic infrastructure.
However when considering the potential for how this could impact the future economic development of the area, there are various outcomes that are possible to consider that are tied to spatial dynamics. These are generally based on both policy measures as well as infrastructure investments and land usage strategies that would help enable (if implemented) or continue to constraint (if not implemented) the economic vibrancy and development potential in the area.
Retail businesses by type in Kakuma camp
Total annual household consumption, in KES millions
Source: IFC
Source: IFC
Cosm
etic
s/sa
lon
Oth
er
Barb
er
Clot
hing
/sho
es
Phot
o
Tailo
ring
Elec
troni
cs/p
hone
Hot
el/ r
esta
uran
t
Vege
tabl
es
Duka
Mec
hani
c
Coffe
e/te
a
Har
dwar
e
Frui
t
Butc
hery
566
3342455263829199134141
329
413
55
5,810
702
2,663
863
174
59
170
293
389
496
TOTAL
Clothing
Education
Consumer goods
Health
Equipment & electronics
Entertainment
Communication
Transportation
Housing & lighting
1,697
4,113
36
75
206
1,619
560
111
142
752
34 355
1,044
87
140 356
Kakuma Camp Kakuma Town

U N - H A B I TAT I K A K U M A A N D K A L O B E Y E I S PA T I A L P R O F I L E 1 1 7
Outcome 1: Economic decline resulting in significantly reduced access to opportunities for all
There is large scale refugee repatriation due to significant improvement in conditions for return to the various countries of origin leading to a large scale reduction in humanitarian presence and major reduction in both the aid driven economy as well as the market demand. This is however viewed to be unlikely in the short to medium term.
There are policy measures put in place that may further prevent the refugee population from taking part as active members of the workforce in the Kakuma-Kalobeyei area, or inhibit the legal and regulatory access to refugees’ free movement and ability to grow businesses.
The impact of this on the Kakuma Kalobeyei area would result in a severe deterioration of the situation. Turkana county witnessed the impact of this on Lokichoggio when the humanitarian activities due to the refugee presence as well as activities in South Sudan moved away. This led to large scale loss of livelihoods. In the case of Kakuma and Kalobeyei, the few formal jobs in the area are generally all tied to the aid sector and therefore would likely be lost and the vast numbers of traders and local businesses would lose a huge customer base, harming local host businesses as well as the informal employees and supply chains that they rely upon. It is important to emphasise that the situation would impact the host communities predominantly as they rely upon the aid driven economy for their livelihoods. The few refugees who may remain would suffer from drastic cuts in service provision and similar impacts upon their access to socio-economic opportunities.
Outcome 2: Economic stability/small growth resulting in marginally improved access to opportunities
The few activities that may continue to occur may include improvement to future infrastructure development but at a slow pace and there is limited concrete improvement to refugee rights enacted in line with the draft refugee bill.
Practical limits to refugee movement due to the need to acquire written authorization from the Kenyan government to legally leave the camp would likely remain in place affecting consumers, producers, and suppliers since refugees cannot usually travel outside the camp to acquire the goods or materials needed for shops or construction. The reliance therefore on middlemen to negotiate results in significant inefficiencies for business owners and higher prices for consumers. This negatively affects both hosts and refugees, reducing their productivity and placing limits upon growth potential.
The constraints facing freedom of movement also have implications upon the ability of refugees to apply for the work permits that they are entitled to as they are practically often unable to visit the necessary offices in Nairobi to obtain a work permit. This restricts them to a much smaller pool of livelihood opportunities.
Furthermore, as refugees do not have access to property rights therefore limiting potential for a large proportion of the local areas inhabitants to invest in their homes and businesses. Furthermore,banks will remain hesitant to provide credit to individuals or businesses as a lack of ownership means a lack of collateral, limiting the potential for business to grow.
Outcome 3: Significant economic growth resulting in substantially improved access to opportunities for both hosts and refugees
The expediting of the implementation of the various infrastructure interventions associated with LAPSSET Corridor including high speed internet, road and railway alongside the development of the Kalobeyei EEZ implementation. These pieces of infrastructure will also result in multiplier effects each leveraging the next.
Improving the regulatory environment to mitigate challenges to freedom of movement and potential for refugees to obtain work permits. Improve access to formal education and business training.
The IFC study findings show that education is positively correlated with employment status, business ownership, and income.
The RSC data shows that access to business training in general is correlated with improved business performance.
Investment in the road infrastructure and construction of a commercial airport can improve people’s access to markets, help build the logistics system in the area and connect local business to larger wholesalers. Currently Kakuma struggles with market integration because poor road conditions hinder the movement of goods and people.Easing the legal and regulatory limitations for refugees to work, move, own and operate property will support sustainable business growth in grocery markets and the current informal real estate markets. This will be achieved by reducing the time and money consumed in the business chain and increasing people’s access to financial services with property ownership.
Action in attracting the private sector and social enterprises to the Kakuma area and supporting local and refugee entrepreneurs has the potential to expand job opportunities, improve services, provide more choice, and reduce prices. In turn, this could enhance the self-reliance of both communities and their socioeconomic integration, while contributing to the development of the hosting region.Ensuring people’s access to financial services built on the existing mobile money system and supporting financial literacy campaigns to raise awareness will equip refugees and host community members with ability to set up a business.

1 1 8 C H A P T E R 7 | S C E N A R I O S
Scenario A - Business as Usual
Variables Population Urban footprint Climate change Catalytic projects Local economic development
Host community population
Refugee population Additional land (based on med
density)
Type of expansion
Outcomes
Large Increase (39% increase by 2030)
Natural population growth
Large Increase (39% increase by 2030)
Natural population growth
10.2km² - based on medium growth at medium density
Planned expansion and Infill
Reduced vulnerability and increased resilience
Significant Improvement in infrastructure
LAPSSET, EEZ and Aquifer implemented
Significant growth
Rights for work, movement, business
Medium increase (25% increase by 2030)
Natural population growth
Medium increase (25% increase by 2030)
Natural population growth
18km2 - based on medium growth at low density
Planned urban expansion
Kalobeyei planned settlement
Reduced vulnerability LAPSSET and EEZ implemented
Stable / small growth
Decline
Decrease due to migration for employment/ livelihoods
Decline
Decline due to repatriation
28.8km2 - based on high growth at low density
Uncontrolled sprawl
Uncontrolled sprawl in Kakuma
Increase vulnerability to the climate change events and death/injury/loss of property
None implemented Decline
Growth offset by other factors
Scenario
If natural population growth continues at 2.15% amongst host and refugee communities, LAPSSET Corridor and Kalobeyei EEZ are implemented however no concerted actions taken to combat the impacts of climate change...
Impact
The urban footprint will expand approximately 18km2 as a combination of both planned expansion and sprawl. The planned urban expansion will be focused within the Kalobeyei EEZ and will be a continuation of the planning that is already underway for this zone. The majority of growth however will be low-density sprawl, likely extending Kakuma 4 towards the highway and continuing the sprawl of Kakuma Town that is already evident. This sprawl will cause environmental degradation and put pressure on existing infrastructure.
Floods and drought will become more frequent because no actions to adapt to the impacts of or mitigate the causes of climate change have been taken. The vulnerable land in Kakuma 1 and Kakuma 2 will continue to be impacted by seasonal flooding, resulting in loss of housing, infrastructure and lives.
In addition to failing to address climate disasters, this scenario would put Kakuma-Kalobeyei in a situation where it would struggle to respond to and absorb any unexpected refugee surges. Any surges would put additional strain on resources and infrastructure, which are already put under strain by the sprawl.
As the projects are already underway, it is likely that the LAPSSET Corridor and Kalobeyei EEZ will continue development and implementation. Unfortunately, the economic growth that these projects are likely to generate will be offset by the worsening floods and droughts and the unplanned sprawl. This will result in overall economic stagnation.
This situation represents the business as usual scenario for the growth of Kakuma-Kalobeyei. While this is not the most negative outcome, in this scenario Kakuma-Kalobeyei will not reach its full potential. Kakuma-Kalobeyei will not develop into a strategic location of enterprise, employment and economic growth.
Probability Highly unlikely Unlikely Marginal Likely Highly likely
Impact Significant deteroiration Slight Deterioration Marginal Slight improvement Significant improvement

Map 39: Scenario A Map
U N - H A B I TAT I K A K U M A A N D K A L O B E Y E I S PA T I A L P R O F I L E 1 1 9
+45%more land required
+24%increase of the current
population
+17.6 km²
LEGENDSub-County BoundaryWard Boundary
0 2.51.25
km
5
Waterway Flood Vulnerable AreaFlood ZoneBuilt-Up Area Urban Expansion / SprawlBushland
Major RoadMinor Road
LAPSSET CorridorEEZ
Expansion Direction

1 2 0 C H A P T E R 7 | S C E N A R I O S
Scenario B - Planning for Growth and Resilient Development
Variables Population Urban footprint Climate change Catalytic projects Local economic development
Host community population
Refugee population Additional land (based on med density)
Type of expansion
Outcomes Large Increase (39% increase by 2030)
Natural population growth
Large Increase (39% increase by 2030)
Natural population growth
10.2km² - based on medium growth at medium density
Planned expansion and Infill
Reduced vulnerability and increased resilience
Significant Improvement in infrastructure
LAPSSET, EEZ and Aquifer implemented
Significant growth
Rights for work, movement, business
Medium increase (25% increase by 2030)
Natural population growth
Medium increase (25% increase by 2030)
Natural population growth
18km2 - based on medium growth at low density
Planned urban expansion
Kalobeyei planned settlement
Reduced vulnerability LAPSSET and EEZ implemented
Stable / small growth
Decline
Decrease due to migration for employment/ livelihoods
Decline
Decline due to repatriation
28.8km2 - based on high growth at low density
Uncontrolled sprawl
Uncontrolled sprawl in Kakuma
Increase vulnerability to the climate change events and death/injury/loss of property
None implemented Decline
Growth offset by other factors
Probability Highly unlikely Unlikely Marginal Likely Highly likely
Impact Significant deteroiration Slight Deterioration Marginal Slight improvement Significant improvement
Scenario
If natural population growth remains at 2.15% for host and refugee communities and all growth is accommodated within infill and planned extensions in conjunction with interventions to directly minimise the impacts of climate change...
Impact
The combination of planned infill and expansion, where necessary, will only require 10.8km2 (26%) of additional land to support a 25% population increase. Infill will support in consolidating existing clusters of infrastructure and create a more compact urban form while the areas of expansion will be located strategically to minimise exposure to natural hazards, minimise environmental degradation and be developed in conjunction with necessary infrastructure provision. Equitable provision and access to infrastructure will minimise conflict between host and refugee communities, with access to education infrastructure being crucial to economic advancement.
Both the LAPSSET Corridor and Kalobeyei EEZ will be implemented, creating employment and enterprise opportunities. The demographic dividend of Kakuma-Kalobeyei’s workforce will be capitalised upon to spur growth and further investment. Highway and railway upgrades as part of LAPSSET will decrease the cost of goods in Kakuma-Kalobeyei and provide expanded trade opportunities. As Kakuma-Kalobeyei grows as a strategic location, it becomes more integrated into surrounding markets including the markets of neighbouring countries such as South Sudan, Uganda and Ethiopia.
In addition to the LAPSSET Corridor and Kalobeyei EEZ continuing development, there is potential for the Lotikipi Aquifer desalination plant and distribution infrastructure to be implemented. Water resources from the aquifer (if managed effectively and combined with localised sources) would reduce water scarcity for Kakuma-Kalobeyei and allow for expansion of the agricultural sector. The multiplier effect would be evident in this scenario, as initial levels of investment would attract further investment. This would spur job creation and enterprise opportunities.
Not only could climate change adaptation measures be taken in this scenario, such as flood prevention infrastructure along the Tarach River and diversification of livelihoods, but long-term climate change mitigation strategies would be adopted such as investment in clean energy for which the area is ripe.
This planned growth scenario would put Kakuma-Kalobeyei in a position to more effectively respond to any unexpected refugee surges that may occur as the efficient utilization of land and infrastructure gives scope for additional planned growth.
This scenario represents an ideal scenario for Kakuma-Kalobeyei, building on the current trajectory and momentum of LAPSSET and Kalobeyei EEZ while addressing the impacts of climate change to allow for the full benefits of these projects to be realised. The strong economic growth this scenario is likely to result in if supported by the relevant policy measures will benefit both the host and refugee communities.
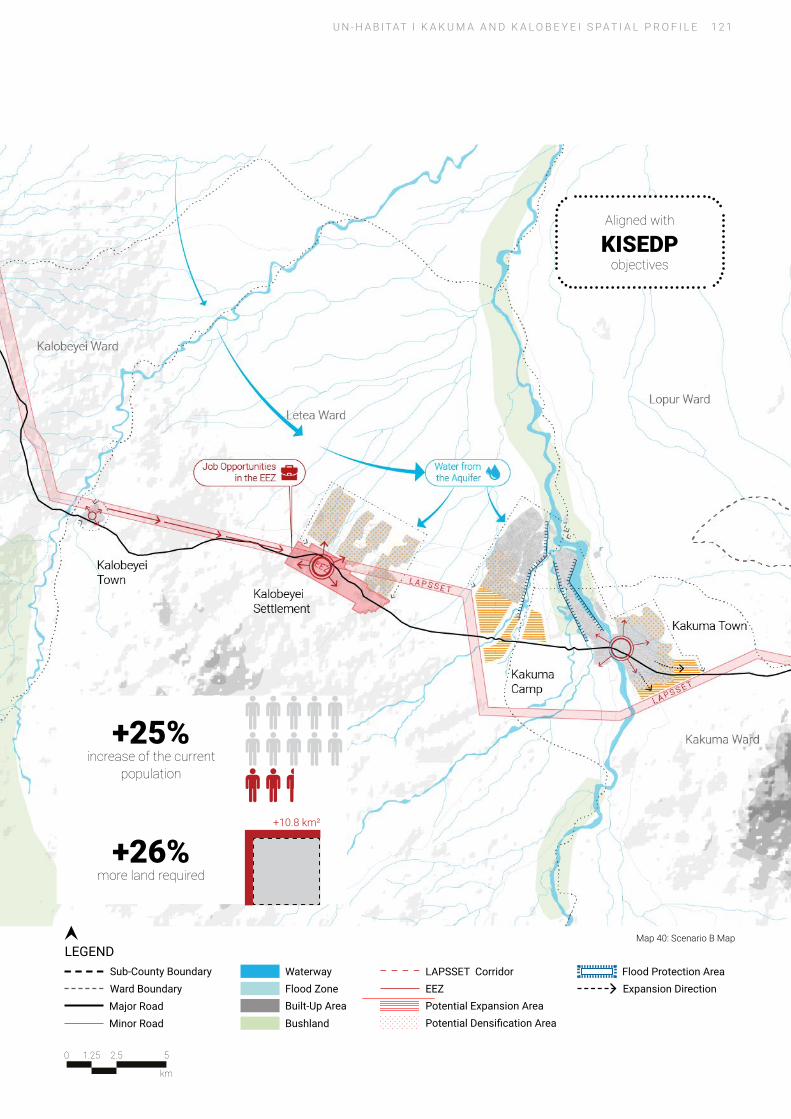
Map 40: Scenario B Map
U N - H A B I TAT I K A K U M A A N D K A L O B E Y E I S PA T I A L P R O F I L E 1 2 1
+26%more land required
+25%increase of the current
population
+10.8 km²
Aligned with
KISEDPobjectives
LEGENDSub-County BoundaryWard Boundary
0 2.51.25
km
5
Waterway Flood Protection AreaFlood ZoneBuilt-Up Area Potential Expansion Area
Potential Densification AreaBushlandMajor RoadMinor Road
LAPSSET CorridorEEZ Expansion Direction

1 2 2 C H A P T E R 7 | S C E N A R I O S
Scenario C - Unplanned Large Scale Growth without Major Investment
Variables Population Urban footprint Climate change Catalytic projects Local economic development
Host community population
Refugee population Additional land (based on med density)
Type of expansion
Outcomes Large Increase (39% increase by 2030)
Natural population growth
Large Increase (39% increase by 2030)
Natural population growth
10.2km² - based on medium growth at medium density
Planned expansion and Infill
Reduced vulnerability and increased resilience
Significant Improvement in infrastructure
LAPSSET, EEZ and Aquifer implemented
Significant growth
Rights for work, movement, business
Medium increase (25% increase by 2030)
Natural population growth
Medium increase (25% increase by 2030)
Natural population growth
18km2 - based on medium growth at low density
Planned urban expansion
Kalobeyei planned settlement
Reduced vulnerability LAPSSET and EEZ implemented
Stable / small growth
Decline
Decrease due to migration for employment/ livelihoods
Decline
Decline due to repatriation
28.8km2 - based on high growth at low density
Uncontrolled sprawl
Uncontrolled sprawl in Kakuma
Increase vulnerability to the climate change events and death/injury/loss of property
None implemented Decline
Growth offset by other factors
Probability Highly unlikely Unlikely Marginal Likely Highly likely
Impact Significant deteroiration Slight Deterioration Marginal Slight improvement Significant improvement
Scenario
If growth amongst host and refugee communities surges to 3.35% and all three catalytic projects fail to eventuate while no action is taken to address the impacts of climate change...
Impact
If there is large natural growth among both host and refugee communities and no settlement planning, population growth will sprawl over an estimated 28.8km2 of land. The sprawl over this large amount of land will be disconnected and lacking in basic infrastructure especially water and sanitation. This uncontrolled sprawl will likely extend along the A1 highway and the lack of basic sanitation infrastructure may lead to the spread of disease and environmental degradation. Competition for limited natural resources such as firewood will heighten tensions between host and refugee communities, likely resulting in conflict.
The impacts of climate change will become more pronounced if no action is taken. Seasonal flooding of the Tarach river will frequently destroy houses, infrastructure and cause loss of human life. Flooding will also severely impact the weak sanitation systems and result in spread of waterborne diseases throughout both the refugee and host communities.
If all three of the catalytic projects fail to eventuate, either due to lack of investment or political constraints, Kakuma-Kalobeyei will have lost a major opportunity to stimulate
economic growth. Not only is Kakuma-Kalobeyei likely not to grow, it may decline substantially due to the lack of employment and livelihood opportunities. Lack of transport infrastructure will likely result in Kakuma-Kalobeyei failing to integrate market systems and impact potential to streamline value chains. Members of the host community may decide to migrate to larger urban centres in this scenario, due to the lack of opportunities in Kakuma-Kalobeyei, and limiting potential to leverage the demographic dividend.
This scenario represents a worst case scenario for Kakuma-Kalobeyei. The combination of variables would likely lead to a crisis situation as the basic needs of both host and refugees are unable to be met. Famine, disease outbreaks and escalating conflict between refugee and host communities would be expected. This would be further compounded by the impacts of climate change. This would leave Kakuma-Kalobeyei in a position completely unable to respond to any unexpected refugee surges. Any refugee surge could result in a major humanitarian crisis, impacting both host and refugee communities.
Fortunately, this scenario is not viewed as particularly likely due to the progress that has been made with LAPSSET and Kalobeyei EEZ and the ongoing political goodwill of the County Government. That being said, this momentum could easily be lost due to complacency.

Map 41: Scenario C Map
U N - H A B I TAT I K A K U M A A N D K A L O B E Y E I S PA T I A L P R O F I L E 1 2 3
LEGENDSub-County BoundaryWard Boundary
0 2.51.25
km
5
Waterway Flood Protection AreaFlood ZoneBuilt-Up Area Potential Expansion Area
Potential Densification AreaBushlandMajor RoadMinor Road
LAPSSET CorridorEEZ Expansion Direction
+67%more land required
+39%increase of the current
population
+28.8 km²

1 2 4 C H A P T E R 7 | S C E N A R I O S
Leveraging KISEDP & Supporting a Kakuma-Kalobeyei Municipality
KISEDP is a critical vehicle for action where the concerns identified in the Spatial Profile can be addressed and the platform on which the proposed sustainable development initiatives can be launched. The KISEDP is a comprehensive programme that takes an inclusive approach to the needs of both the refugee and host communities with the aim of promoting inclusive economic growth, political stability, social cohesion, and sustainability, led by Turkana County Government and supported by the various humanitarian and development actors active in the county. It is designed to achieve these goals through a coordinated government-led multi-sector effort involving participation by multiple stakeholders from the public, non-profit, private, development, and humanitarian sectors.
A key principle of KISEDP is the recognition that the protracted presence of those compelled to flee war and persecution can represent an opportunity, rather than a burden. Studies119 have empirically demonstrated that the economic impact of refugees in the county has been largely positive (although with negative impact upon the local ecological system which needs to be mitigated), creating a stimulus and opening the region to development opportunities. Including the refugee community in the long-term planning of the area, in line with local, county and national priorities can help unlock these benefits as well as prevent aid dependence and increased reliance on negative coping mechanisms.
The Spatial Profile for Kadaab area delivers the following.
1. Support to the development of a spatialised data set alongside a deeper baseline of analysis for decision making and to ensure that the physical context of the refugee hosting areas in Turkana West Sub-counties are fully understood by all stakeholders.
2. Contributing to future planning and investment initiatives that are informed by a comprehensive spatial understanding to allow for coordination of investments and to enable sustainable growth that is resilient, green, inclusive and equitable.
3. Support to the Turkana County Government as a tool to enhance advocacy for a new municipality in the Kakuma-Kalobeyei area.
Next steps in the planning process
In addition to supporting the wider KISDEP framework, the spatial profile is the first step in formulating the regeneration strategy for key sections of Kakuma Camp as well as formation of the new municipality. These activities will take place in collaboration with the Turkana County Government Ministry of Lands and the various
agency and community stakeholders between 2021 & 2022. The project will continue to build on the work that was undertaken in 2020, and strengthen relationships with the Turkana County Government, partners and host and refugee communities.
Activities Q1 2021:
• Finalization and validation of the socio-economic survey and integration of the survey findings into the Spatial Profile,
• Dissemination of the Spatial Profile to local government, partners and stakeholders for validation and feedback. After the Spatial Profile has been validated and finalized, the visioning for the regeneration of Kakuma Camp will commence,
• Consolidation of the Infrastructure Mapping Database of existing and planned infrastructure in Kakuma-Kalobeyei,
• In partnership with local actors, form community planning group to engage in the planning process
• Acceleration the Social Tenure Domain Model (STDM) work in Kakuma; and
• Overall alignment of activities with existing public space, corridor planning and field operations carried out by UN-Habitat as well as other ongoing Humanitarian and Development activities.
Activities for Q2-Q4 2021:
• The initial visioning for Kakuma Camp will result in a final vision for Kakuma Camp. This vision will lead into the concept planning preparation for Kakuma Camp,
• Formulation of spatial regeneration strategies for Kakuma Camp in order to realize the vision,
• Preparation of financing and legal considerations in support of regeneration strategies, and
• Ongoing stakeholder engagement process including Turkana County Government, host and refugee communities and as operational actors.
Activities for 2022:
• Finalisation of the spatial planning proposals in partnership with the Turkana County Government will be followed by validation of the spatial regeneration strategies through stakeholder participation and feedback.
All throughout the planned programme activities and milestones, UN-Habitat will be providing ongoing support to Turkana County Government in the following capacities:
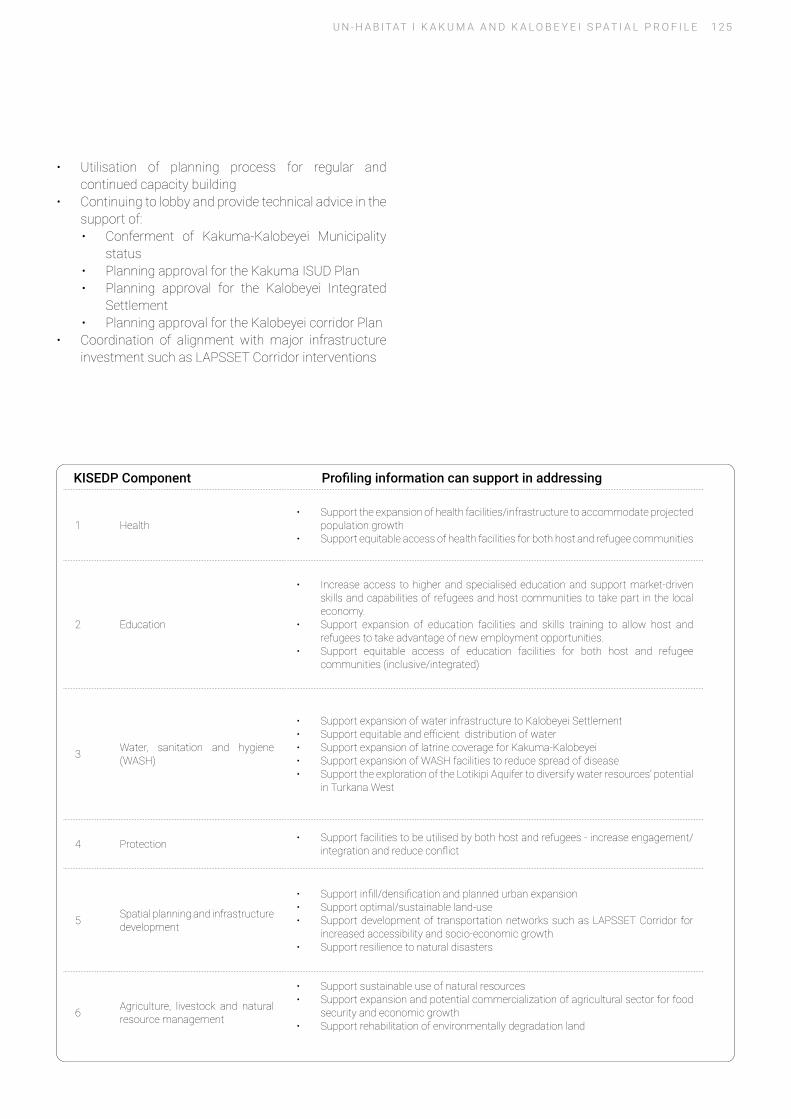
U N - H A B I TAT I K A K U M A A N D K A L O B E Y E I S PA T I A L P R O F I L E 1 2 5
• Utilisation of planning process for regular and continued capacity building
• Continuing to lobby and provide technical advice in the support of:• Conferment of Kakuma-Kalobeyei Municipality
status• Planning approval for the Kakuma ISUD Plan• Planning approval for the Kalobeyei Integrated
Settlement• Planning approval for the Kalobeyei corridor Plan
• Coordination of alignment with major infrastructure investment such as LAPSSET Corridor interventions
KISEDP Component Profiling information can support in addressing
1 Health• Support the expansion of health facilities/infrastructure to accommodate projected
population growth • Support equitable access of health facilities for both host and refugee communities
2 Education
• Increase access to higher and specialised education and support market-driven skills and capabilities of refugees and host communities to take part in the local economy.
• Support expansion of education facilities and skills training to allow host and refugees to take advantage of new employment opportunities.
• Support equitable access of education facilities for both host and refugee communities (inclusive/integrated)
3 Water, sanitation and hygiene (WASH)
• Support expansion of water infrastructure to Kalobeyei Settlement • Support equitable and efficient distribution of water• Support expansion of latrine coverage for Kakuma-Kalobeyei• Support expansion of WASH facilities to reduce spread of disease • Support the exploration of the Lotikipi Aquifer to diversify water resources’ potential
in Turkana West
4 Protection • Support facilities to be utilised by both host and refugees - increase engagement/integration and reduce conflict
5 Spatial planning and infrastructure development
• Support infill/densification and planned urban expansion• Support optimal/sustainable land-use• Support development of transportation networks such as LAPSSET Corridor for
increased accessibility and socio-economic growth• Support resilience to natural disasters
6 Agriculture, livestock and natural resource management
• Support sustainable use of natural resources• Support expansion and potential commercialization of agricultural sector for food
security and economic growth• Support rehabilitation of environmentally degradation land

Endnotes
1 https://data.worldbank.org/country/kenya2 https://www.citypopulation.de/en/kenya/admin/nairobi/47__nairobi/3 https://databank.worldbank.org/views/reports/reportwidget.aspx?Report_
Name=CountryProfile&Id=b450fd57&tbar=y&dd=y&inf=n&zm=n&country=KEN4 https://data.worldbank.org/indicator/NY.GNP.PCAP.PP.CD?locations=ZG-KE5 https://www.nordeatrade.com/dk/explore-new-market/kenya/economical-context6 http://hdr.undp.org/en/countries/profiles/KEN7 https://www.usaid.gov/sites/default/files/documents/1865/Kenya_Economic_Growth_February_2020.pdf8 Republic of Kenya Urbanization Review, World Bank, 2016, p.29 https://databank.worldbank.org/views/reports/reportwidget.aspx?Report_
Name=CountryProfile&Id=b450fd57&tbar=y&dd=y&inf=n&zm=n&country=KEN10 https://data.worldbank.org/indicator/SP.RUR.TOTL.ZS?locations=KE11 https://data.worldbank.org/indicator/SP.RUR.TOTL.ZG?end=2018&locations=KE&start=1960&view=chart12 https://data.worldbank.org/indicator/SP.URB.GROW?locations=KE13 https://www.cia.gov/library/publications/the-world-factbook/fields/349.html#:~:text=rate%20of%20
urbanization%3A%202.06%25%20annual,(2015%2D20%20est.)&text=total%20population%20(2020)-,rate%20of%20urbanization%3A%201.66%25%20annual%20rate%20of%20change,(2015%2D20%20est.)&text=rate%20of%20urbanization%3A%201.86%25%20annual,(2015%2D20%20est.)&text=rate%20of%20urbanization%3A%201.57%25%20annual,(2015%2D20%20est.)
14 Republic of Kenya Urbanization Review, World Bank, 2016, p.315 World Bank (2016). Kenya Urbanization Review. World Bank, Washington D.C. Accessed on 10 July 2020 at:
http://documents1.worldbank.org/curated/en/639231468043512906/pdf/AUS8099-WP-P148360-PUBLIC-KE-Urbanization-ACS.pdf
16 https://worldpopulationreview.com/countries/kenya-population17 https://www.unicef.org/esa/sites/unicef.org.esa/files/2019-11/UNICEF-ESA-Population-Dynamics-
Demographic-Dividend-Potential-Nov-2019.pdf18 https://www.worldbank.org/en/country/kenya/overview19 https://www.dandc.eu/en/article/kenyas-new-counties-give-people-more-say-local-level-governance-challenges-
persist20 https://unhabitat.org/urban-planning-for-city-leaders-a-handbook-for-kenya21 https://unhabitat.org/urban-planning-for-city-leaders-a-handbook-for-kenya22 World Bank (2016)23 National Spatial Plan, 2015-2045, Ministry of Lands and Physical Planning - Department of Physical Planning, 24 http://habitat3.org/wp-content/uploads/Kenya-National-Report.pdf25 https://publications.iom.int/system/files/pdf/kenya_meclep_survey.pdf26 https://www4.unfccc.int/sites/NAPC/Documents%20NAP/Kenya_NAP_Final.pdf27 https://www.unhcr.org/ke/figures-at-a-glance#:~:text=Currently%2C%20Kenya%20continues%20to%20
be,refugee%20hosting%20countries%20in%20Africa.&text=In%20addition%2C%2076%20Ethiopian%20refugees,28%2C500%20Ethiopian%20refugees%20in%20Kenya.
28 UNHCR Data 202029 UNHCR Data 201830 Kalobeyei Integrated Socio-Economic Development Plan in Turkana West, 201931 Recognising Nairobi’s Refugees, NRC & IHCR, 2017.32 UNHCR Data 202033 http://documents1.worldbank.org/curated/en/359161482490953624/pdf/111309-REVISED-PUBLIC-Turkana-
Social-Impact-Analysis-December-2016.pdf34 https://www.researchgate.net/publication/237630636_Coexisting_with_Cultural_Others_Social_Relationships_
between_the_Turka35 http://documents.worldbank.org/curated/en/359161482490953624/pdf/111309-REVISED-PUBLIC-Turkana-
Social-Impact-Analysis-December-2016.pdf36 Kakuma as a Marketplace, IFC, 201837 Kalobeyei Integrated Socio-Economic Development Plan in Turkana West, 201938 Turkana County Integrated Development Plan, CIDP II 2018-202239 https://www.unhcr.org/ke/wp-content/uploads/sites/2/2018/12/KISEDP-Strategic-Overview.pdf40 Turkana County Integrated Development Plan, CIDP II 2018-2022, p1141 UN-Habitat / Turkana West Survey 2021

42 Based on 2009-2019 average43 Based on 2009-2019 average44 Turkana County Integrated Development Plan, CIDP II 2018-2022, p.945 UN-Habitat / Turkana West Survey 202146 Turkana County Integrated Development Plan, CIDP II 2018-2022, p. 8 47 https://www.knbs.or.ke/?wpdmpro=2019-kenya-population-and-housing-census-volume-ii-distribution-of-
population-by-administrative-units48 The Economics of Hosting Refugees. A Host Community Perspective from Turkana, World Bank & UNHCR,
2017 49 Silale, J. & Nyambegera, S.M. (2014). The Influence of Socio-Economic Factors in the Transformation of Rural
Economies in Arid and Semi-Arid Areas: Lessons from Turkana County in Northern Kenya. http://erepo.usiu.ac.ke/bitstream/handle/11732/751/369-963-2-PB.pdf?sequence=4&isAllowed=y
50 https://turkana.go.ke/wp-content/uploads/2016/10/Annual-Development-Plan-2015-2016.pdf51 https://hrp.law.harvard.edu/wp-content/uploads/2018/09/Movement-Briefing-NRC-IHRC-1.pdf52 https://hrp.law.harvard.edu/wp-content/uploads/2018/09/Movement-Briefing-NRC-IHRC-1.pdf53 https://hrp.law.harvard.edu/wp-content/uploads/2018/09/Movement-Briefing-NRC-IHRC-1.pdf54 https://www.unhcr.org/ke/wp-content/uploads/sites/2/2020/03/English-25-March-2020-IMPORTANT-NOTICE.
pdf 55 https://turkana.go.ke/wp-content/uploads/2016/10/Annual-Development-Plan-2015-2016.pdf56 Turkana County Integrated Development Plan, CIDP II 2018-202257 Turkana County Integrated Development Plan, CIDP II 2018-202258 https://www.theguardian.com/global-development/2019/oct/28/kenya-turns-to-saudi-investor-to-make-water-
drinkable-in-arid-turkana-region-kenya59 Sean Avery, “What Future for Lake Turkana? The impact of hydropower and irrigation development on the
world’s largest desert lake,” African Studies Centre, 2012,60 There is No Time Left, HRW 201561 Sean Avery, “What Future for Lake Turkana? The impact of hydropower and irrigation development on the
world’s largest desert lake,” African Studies Centre, 2012,62 Sean Avery, “What Future for Lake Turkana? The impact of hydropower and irrigation development on the
world’s largest desert lake,” African Studies Centre, 2012,63 https://www.hrw.org/news/2017/02/14/ethiopia-dams-plantations-threat-kenyans64 The windfarm is expected to contribute 300 MW of much-needed renewable energy to Kenya’s national power
grid, see http://www.evwind.es/2015/03/04/lake-turkana-wind-power-project/50789 (accessed March 15, 2015). The project summary asserts that “the site has a unique geographical phenomenon whereby daily temperature fluctuations generate strong predictable wind streams between Lake Turkana (with relatively constant temperature) and the desert hinterland (with steep temperature fluctuations)
65 https://reliefweb.int/report/kenya/kenya-intensifies-desert-locust-control-measures-turkana-county66 KNBS Gross County Product Report 201967 Turkana County Integrated Development Plan, CIDP II 2018-202268 Business and Local Economic Development in Turkana West69 UN-Habitat Socio-Economic Survey, UN-Habitat, 201670 Kakuma as a Marketplace, IFC, 201871 Kakuma as a Marketplace, IFC, 201872 Turkana County Integrated Development Plan, CIDP II 2018-2022 73 http://documents1.worldbank.org/curated/en/359161482490953624/pdf/111309-REVISED-PUBLIC-Turkana-
Social-Impact-Analysis-December-2016.pdf74 Kakuma as a Marketplace, IFC, 201875 Kimetrica, UNHCR, and World Food Programme, 2016.76 Kakuma as a Marketplace, IFC, 201877 Economic Survey 2020, KNBS, 202078 http://documents1.worldbank.org/curated/en/359161482490953624/pdf/111309-REVISED-PUBLIC-Turkana-
Social-Impact-Analysis-December-2016.pdf79 UN-Habitat / Turkana West Survey 202180 Refugee Impacts on Turkana Hosts, A Social Impact Analysis for Kakuma Town and Refugee Camp Turkana
County, Kenya, World Bank, 201681 UN-Habitat / Turkana West Survey 202182 UN-Habitat / Turkana West Survey 202183 UN-Habitat / Turkana West Survey 2021
84 http://documents1.worldbank.org/curated/en/359161482490953624/pdf/111309-REVISED-PUBLIC-Turkana-Social-Impact-Analysis-December-2016.pdf
85 Powers of the county are provided in Article 191 and 192 and the Fourth Schedule of the Constitution of Kenya and the County Government Act 2012. Functions and duties not assigned by the Constitution to the County automatically becomes the National government responsibility.
86 Kakuma as a Marketplace, IFC, 201887 Refugee Impacts on Turkana Hosts, A Social Impact Analysis for Kakuma Town and Refugee Camp Turkana
County, Kenya, World Bank, 201688 Doing Business in Kakuma: Refugees, Entrepreneurship, and the Food Market, Refugee Studies Centre, 201989 Kakuma as a Marketplace, IFC, 201890 Doing Business in Kakuma: Refugees, Entrepreneurship, and the Food Market, Refugee Studies Centre, 201991 Kakuma as a Marketplace, IFC, 201892 Kakuma Integrated Strategic Urban Development Plan, Turkana County Government, 2016 93 UN-Habitat / Tuakana West Survey 202194 UNHCR, 2020 Participatory Assessment Report, p. 2995 UN-Habitat / Tuakana West Survey 202196 UNHCR, 2020 Participatory Assessment Report, p. 2697 https://insight.wfp.org/the-game-changing-water-reservoirs-of-kalobeyei-cb614ba3fa6298 https://insight.wfp.org/the-game-changing-water-reservoirs-of-kalobeyei-cb614ba3fa6299 UN-Habitat / Turkana West Survey 2021100 2020 Participatory Assessment Report, UNHCR, p. 27101 2020 Participatory Assessment Report, UNHCR, p. 26102 UN-Habitat / Turkana West Survey 2021103 https://ec.europa.eu/echo/field-blogs/stories/kenya-introducing-digital-cash-dadaab-worlds-biggest-refugee-
settlement_en#:~:text=The%20cash%20transfers%20are%20dubbed,used%20in%20selected%20food%20shops.
104 The Kalobeyei Model: Towards Self-reliance for Refugees? 2019 p.25105 UN-Habitat / Turkana West Survey 2021106 2020 Participatory Assessment Report, UNHCR, p. 35107 The Kalobeyei Model: Towards Self-reliance for Refugees?, Refugee Studies Centre, 2019, p.23108 The Kalobeyei Model: Towards Self-reliance for Refugees?, Refugee Studies Centre, 2019, p.23109 The Kalobeyei Model: Towards Self-reliance for Refugees? 2019 p 21110 Self-Reliance in Kalobeyei? 2018, p. 20111 Self-Reliance in Kalobeyei? 2018, p. 22112 UN-Habitat / Turkana West Survey 2021113 UNHCR, 2020 Participatory Assessment Report, p. 50114 UN-Habitat / Turkana West Survey 2021115 2020 Participatory Assessment Report, UNHCR, p. 19116 The Kalobeyei Model: Towards Self-reliance for Refugees? 2019 p 14117 UN-Habitat / Turkana West Survey 2021118 Kakuma as a Marketplace, IFC, 2018119 “Yes” in My Backyard? : The Economics of Refugees and Their Social Dynamics in Kakuma, Kenya, UNHCR and
World Bank Group, 2016


Appendix 1 - Data Availability
Kakuma town Kakuma Camp Kalobeyei Settlement Kalobeyei town
Toilet facilities/latrines No data Up to date Up to date No DataSewage management facilities No data No data No data No data
Waste management facilities Present - Main and planned (Need Updating)
No data Missing and need updating
Missing and need updating
Landfill/dumping sites
Water taps No data, though Water Kiosks exists (Need Updating)
Outdated - gap in Kakuma 3
Fairly updated Need Updating
Water pipeline No data No data No data No Data
Water supply pumping stations No data No data No data No Data
Boreholes Up to date Up to date up to date Present(Update needed for new boreholes)
Windmill water Good Good Good GoodWater Pans Fairly good Fairly good Good Good
Water Tanks Fairly good Fairly good Fairly good - some updates needed
Good
Water Kiosk Fairly good No data No data No dataPower Generators (check with Wilson)
No data No data No data No data
Power Grid Present(Update needed) No data Present(Update needed) No data
Solar Power Plant/Minigrid Good Good Good Good
Solar Street lighting No data, some mapping is required
No data No data No data
Telecommunication 3G/4G Mobile Masts No data No data No data No data
Geography Environment Flood Areas Present(Update needed) Present(Update needed) Present(Update needed) No data
Health Health Facilities Fairly good Need to be looked at Need to be looked at Fairly goodRecreational Public Spaces Good Good Good Good
Education facilities (Primary schools, secondary schools, tertiary schools)
Fairly good Up to date Up to date Fairly good
University
Education
Public Facilities
Waste management facilities
Energy facilities
Basic Services
StatusSector Category Type
Water Facilities
With the aim to gain a clear picture of the existing infrastructure in the area, consultations with UNHCR, FAO, WFP and Turkana County Government were undertaken with the aim to cross-reference, verify and update UN-Habitat’s existing database throughout Kakuma-Kalobeyei. Based on UN-Habitat’s current database, existing infrastructure maps were shared with the partners and they were , requested to identify any gaps, inconsistencies or errors and were then requested to provide updated infrastructure data if available. The table below summarizes the status of UN-Habitat’s infrastructure database as of December 2020. The process of data gathering and updating is ongoing and further consultations are expected to take place in 2021.


Funded by