Dammam City Profile - UN-Habitat
162
-
Upload
khangminh22 -
Category
Documents
-
view
0 -
download
0
Transcript of Dammam City Profile - UN-Habitat


Future Saudi Cities ProgrammeCity Profiles Series: Dammam
© 2019. Ministry of Municipal and Rural AffairsKing Fahd National Library Cataloging-in-publication Data
Ministry of Municipal and Rural AffairsDammam City Profile./ Ministry of Municipal and Rural AffairsRiyadh, 2019..p ; ..cm
ISBN: 978-603-8279-01-4
1-Dammam (Saudi Arabia) - History I-Title915.313 dc 1440/8074
L.D. no. 1440/8074ISBN: 978-603-8279-01-4
© 2019. Ministry of Municipal and Rural Affairs and United Nations Human Settlements ProgrammeAll rights reserved.
Ministry of Municipal and Rural Affairs P.O. Box : 935 - King Fahd, Riyadh, 11136Tel: 00966114569999www.momra.gov.sa
United Nations Human Settlements Programme (UN-Habitat)P.O. Box 30030, 00100 Nairobi GPO KENYATel: 254-020-7623120 (Central Office)www.unhabitat.org
DisclaimerThe designations employed and the presentation of the material in this publication do not imply the expression of any opinion whatsoever on the part of the Secretariat of the United Nations concerning the legal status of any country, territory, city or area or of its authorities, or concerning the delimitation of its frontiers or boundaries. Views expressed in this publication do not necessarily reflect those of the Ministry of Municipal and Rural Affairs, the United Nations Human Settlements Programme, the United Nations or its Member States. Excerpts may be reproduced without authorisation, on condition that the source is indicated.
ACKNOWLEDGEMENTS
City Profiles Series Editors:Herman PienaarSalvatore FundaròCostanza La Mantia
Contributing Authors:Luis Angel Del Llano Gilio (urban planning & design)Jonathan Weaver (urban planning & design)Costanza La Mantia (content editor)Rama Nimri (regional planning)Anne Klen-Amin (legal & governance)Samuel Njuguna (legal & governance)Ayman El-Hefnawi (legal & governance)Giuseppe Tesoriere (economy & finance)Elizabeth Glass (economy & finance)Abdulkarim Alhowaish (economy & finance)Mario Tavera (GIS)Carmelo Ignaccolo (GIS)Antara Tandon (GIS)Solomon Karani (GIS)
Layout Design:Hai Anh Nguyen
Cover Page:UN-Habitat
The Future Saudi Cities Programme is a jointly implemented project managed by the Deputyship of Town Planning of the Ministry of Municipality and Rural Affairs of the Government of the Kingdom of Saudi Arabia and the United Nations Human Settlements Programme (UN-Habitat).
For UN-Habitat:Mr. Robert Lewis-LettingtonMr. Ayman El-HefnawiMs. Manka Bajaj
DAMMAMالدمام
FUTURE SAUDI CITIES PROGRAMMECITY PROFILE

Dammam waterfront

© FSCP

CONTENTS
4
Contents
1 INTRODUCTION .................................................................................................................. 9
1.1 About the Future Saudi Cities Programme ...................................................................................................................10
1.2 Saudi Initiatives for Sustainable Urban Development ....................................................................................................10
1.3 Objectives of the City Profile Report .............................................................................................................................10
1.3.1 Scope of the city profile .............................................................................................................................................10
1.3.2 Objectives of the city profile ......................................................................................................................................10
1.4 City Profile Methodology .............................................................................................................................................12
1.4.1 Evidence-based input approach ..................................................................................................................................12
1.4.2 The reviews ................................................................................................................................................................13
1.4.3 The City Prosperity Index assessment report ................................................................................................................13
1.4.4 The GIS spatial analysis ...............................................................................................................................................13
2 NATIONAL AND REGIONAL SPATIAL CONTEXT .............................................................. 15
2.1 The Region’s Role in the KSA .......................................................................................................................................16
2.1.1 Historical background ...............................................................................................................................................16
2.1.2 Geography and location .............................................................................................................................................16
2.1.3 Demographic background ..........................................................................................................................................16
2.1.4 Socio-economic background ......................................................................................................................................16
2.1.5 National connectivity ..................................................................................................................................................18
2.2 Regional Development Patterns and Dynamics .............................................................................................................20
2.2.1 Regional organisation .................................................................................................................................................20
2.2.2 Regional Structure and Resources ...............................................................................................................................24
2.3 City-region Structure and Dynamics .............................................................................................................................27
2.3.1 Functional connectivity ...............................................................................................................................................27
2.3.2 City-region environmental and climate change risks ...................................................................................................28
CONTENTS
5
3 GOVERNANCE AND FINANCIAL FRAMEWORK ............................................................... 31
3.1 Dammam Legal and Institutional Frameworks ..............................................................................................................32
3.1.1 Legal and institutional context ....................................................................................................................................32
3.2 Planning Instruments and Procedures ..........................................................................................................................33
3.2.1 Hierarchy of plans ......................................................................................................................................................33
3.2.2 Strategic Regional Plan for Eastern Region ..................................................................................................................33
3.2.3 The Dammam Plan .....................................................................................................................................................36
3.2.4 The Dammam Urban Growth and Development Protection Boundaries ......................................................................40
3.2.5 Land Subdivision Plans ...............................................................................................................................................44
3.3 The Insitutional Context ...............................................................................................................................................44
3.3.1 Urban institutions in KSA ...........................................................................................................................................44
3.3.2 Regional context: Eastern Region ...............................................................................................................................44
3.3.3 Local context: Dammam .............................................................................................................................................45
3.3.4 Legal and institutional implications for Dammam .......................................................................................................46
3.4 Financial Context .........................................................................................................................................................46
3.4.1 Financial system ........................................................................................................................................................46
3.4.2 Municipal revenue ......................................................................................................................................................46
3.4.3 Financing municipal operating costs ...........................................................................................................................47
3.4.4 Capital financing for municipal development ..............................................................................................................48
3.4.5 Financial sustainability ................................................................................................................................................50
4 THE CURRENT CITY ........................................................................................................... 53
4.1 Urbanisation Patterns ..................................................................................................................................................54
4.1.1 The city’s development patterns .................................................................................................................................54
4.1.2 Administrative boundaries ..........................................................................................................................................58
4.1.3 Urban density .............................................................................................................................................................59
4.1.4 Density / income correlations ......................................................................................................................................60

CONTENTS
6
4.2 Structuring Elements ...................................................................................................................................................62
4.2.1 Natural and topographic elements .............................................................................................................................62
4.2.2 Movement infrastructure ............................................................................................................................................62
4.2.3 Existing and proposed land use patterns .....................................................................................................................64
4.2.4 Vacant land ................................................................................................................................................................66
4.2.5 Public transport accessibility .......................................................................................................................................68
4.3 Environmental and Climate Change Risk Implications ..................................................................................................70
4.3.1 Water scarcity and desertification ...............................................................................................................................70
4.3.2 Coastal degradation ...................................................................................................................................................72
4.3.3 Green networks vs. ARAMCO ....................................................................................................................................74
5 STRATEGIC DIAGNOSIS .................................................................................................... 77
5.1 Identifying and Defining Main Strategic Issues .............................................................................................................78
5.1.1 Unbalanced growth and development patterns ..........................................................................................................78
5.1.2 Divisions and lack of cohesion in city structure ...........................................................................................................78
5.1.3 Monofunctional and polarised development ...............................................................................................................79
5.1.4 Socio-ecological and economic imbalance .................................................................................................................79
5.2 Analysing Dammam’s Four Issues in Depth ..................................................................................................................80
5.2.1 Dammam’s unbalanced growth and development patterns ........................................................................................80
5.2.2 Divisions and lack of cohesion in Dammam’s urban fabric ..........................................................................................82
5.2.3 Dammam’s monofunctional and polarised development ............................................................................................86
5.2.4 Socio-ecological and economic imbalance in Dammam ..............................................................................................90
6 THE FUTURE CITY ............................................................................................................. 95
6.1 Strategic Responses .....................................................................................................................................................96
6.1.1 The Compact City .......................................................................................................................................................96
6.1.2 The Connected City ....................................................................................................................................................96
6.1.3 The Inclusive City ........................................................................................................................................................97
6.1.4 The Resilient City ........................................................................................................................................................97

CONTENTS
7
6.2 Appropiate Models for Dammam’s Urban Development ..............................................................................................98
6.2.1 The Compact City: Consolidating development and densifying centres in Dammam ...................................................98
6.2.2 The Connected City: From a system of urban islands to a systemic archipielago ........................................................100
6.2.3 The Inclusive City: Equalising access to public facilities and economic opportunities in Dammam ..............................102
6.2.4 The Resilient City: Rebalancing socio-ecological and economic systems .....................................................................104
6.3 Vision for a Sustainable Dammam .............................................................................................................................106
6.4 Strategic Impact of the Vision on Urban Patterns .......................................................................................................108
7 ACTION PLAN ................................................................................................................ 121
7.1 From Strategy to Action ............................................................................................................................................122
7.1.1 Action 1: Implement a multi-modal transportation network .....................................................................................124
7.1.2 Action 2: Relink the natural systems to a rich and diversified coastal development ....................................................128
7.1.3 Action 3: Create a new “Waterfront City” ................................................................................................................130
7.1.4 Action 4: Rethink the development model for Half Moon Bay as a socio-ecological hub ...........................................136
7.2 Four Systemic Actions for Structural Change ..............................................................................................................136
8 FINAL RECOMMENDATIONS: THE THREE-PRONGED APPROACH ............................... 139
8.1 Spatial Recommendations .........................................................................................................................................140
8.1.1 A strategic view on the Eastern Region spatial development .....................................................................................140
8.1.2 Towards Greater Dammam, An Eco-coastal City .......................................................................................................142
8.2 Institutional and Legal Recommendations ..................................................................................................................144
8.3 Financial Recommendations ......................................................................................................................................146
8.3.1 Own-source revenue instruments .............................................................................................................................146
8.3.2 Leveraging urban productivity .................................................................................................................................150
9 ANNEX ........................................................................................................................... 153
9.1 Picture Credits ...........................................................................................................................................................154
9.2 List of Figures ............................................................................................................................................................156
9.3 Notes and References ................................................................................................................................................158

88

1 1
INTR
OD
UCT
ION
© FSCP

INTRODUCTION
10
1.1 About the Future Saudi Cities Programme
The Future Saudi Cities Programme is a joint programme developed by the Saudi Ministry of Municipal and Rural Affairs (MoMRA) and UN-Habitat, implemented in close cooperation with the municipalities of 17 major Saudi cities. The cities have been selected based on their different population sizes, geographic distribution, and a range of criteria based on capacities and economic potential to create a more balanced regional development among the cities of Saudi Arabia. The chosen cities include Riyadh, Makkah, Jeddah, Taif, Madinah, Tabuk, Dammam, Qatif, Al-Ahsa, Abha, Najran, Jazan, Hael, Arar, Al-Baha, Buraidah, and Skaka.
After undertaking city-level reviews in the 17 cities, five cities were chosen as a representative cross-section, for in-depth analysis. The city-level reviews considered the linkages between urban and territorial planning by examining the city within the relational context of its sub-region and exploring specific issues at the neighbourhood level. These reviews, when referenced with City Prosperity Index reports and validation processes in the Rapid Planning Studio workshops, were used to extrapolate strong, evidence-based conclusions that relate to the planning system as a whole.
Applied research, with a strong focus on action-oriented conclusions, was used to collect evidence to diagnose the strengths and weaknesses of the planning system and local planning practices in each city. The methodology utilised design tests and demonstration projects as avenues to apply and analyse potential solutions, before concluding on policy recommendations.
UN-Habitat’s three-pronged approach considers spatial planning in relation to legal and institutional frameworks, in addition to financial mechanisms. In this way, success criteria for the sustainable implementation of a spatial plan should include flexible but enforceable rules and regulations, in addition to a financing strategy and projections.
As a pragmatic explication of this approach, three local demonstration projects, representing essential elements of a strengthened and improved planning system, have been developed. These were elaborated to include schematic designs and feasibility studies, that can later be transformed into implementation plans. Such implementation plans are projected to be undertaken by MoMRA, in collaboration with other partners in the Kingdom.
In order to facilitate this process, a joint “FSCP Urban Lab” was created as a vehicle to strengthen endogenous capacities and to develop tailored tools, and instruments. The Lab, composed of international expertise from the planning, legal and economy branches of UN-Habitat Nairobi office, has been working with Saudi-based staff in the UN-Habitat Riyadh office (selected by MoMRA), to enhance knowledge exchange and to apply a learning-by-doing method to the programme.
As such, all 17 cities have been simultaneously engaged in a capacity-building strategy that included foundational learning, and ‘on the job’ training, culminating in Saudi-specific advanced training. This training was based on the planning-system conclusions and recommendations, that the FSCP produced. Thus, the Urban Lab functions as a tool to generate evidence whilst additionally strengthening capacities through a process of learning-by-doing.
1.2 Saudi Initiatives for Sustainable Urban Development
The Saudi Government, along with the respective Ministries, and in line with a larger country-wide transformation process, has made several efforts aimed at the sustainable development of its growing cities. These contributions vary from plans at the national level, like the National Spatial Strategy (NSS), to strategies and plans at the regional level, cutting across various sectors towards realising Vision 2030. The FSCP recognises these efforts as positive, supporting Vision 2030 goals to realise a sustainable urban environment for the Kingdom of Saudi Arabia. The FSCP acknowledges and builds upon the current tools, plans, and strategies as part of a comprehensive assessment and suggests variations and improvements where appropriate.
1.3 Objectives of the City Profile Report
1.3.1 Scope of the city profile
The city-profile combines MoMRA’s new strategy, with a review of existing studies, plans, and strategic documents, such as the review of the Kingdom of Saudi Arabia (KSA) National Spatial Strategy (NSS) to identify and address the root causes of problematic conditions outlined in the preliminary findings. The report acknowledged low uptake of the NSS by regions, utilities and ministries, as a key weakness. The issue of horizontal (sectors) and vertical (scales) integration is thus a key challenge that the FSCP aims to address going forward.
Policy recommendations for improving urban planning frameworks and practice shall be structured through a multi-scalar lens, considering the city as a continuum in the urban fabric, that should grow from the neighbourhood to the wider city-region, whilst influenced by dynamics and regulations at the national and supranational levels. This ensures that policy recommendations for these cities do not operate in isolation from the city’s envisioned role in the administrative region and the national system of cities.
1.3.2 Objectives of the city profile
The City Profile Report brings together diagnostic urban analysis and aligns that analysis with the UN-Habitat sustainable development framework and the Saudi Vision

11
Public space in Dammam
© FSCP

INTRODUCTION
12
2030. It performs as a thinking tool that constitutes together an assessment tool and guidance for the current and future planning of the city, whilst defining a clear strategy for sustainable development.
The definition of an ad-hoc strategy is rooted in an evidence-based approach to the issues, building upon both primary and secondary data collection and analysis. The profile, as well as the Programme as a whole, uses the data collected by the City Prosperity Initiative (CPI), to identify significant trends and challenges at the city level. This evidence is then combined with reviews of existing planning documents, and cross-referenced with multi-scalar GIS spatial analysis, to define the above-mentioned ad-hoc strategy.
1.4 City Profile Methodology
1.4.1 Evidence-based input approach
The evidence-based planning approach creates a deeper understanding of the spatial dynamics of the urban area, by combining and comparing urban datasets such as demographics, density, land use, natural features, and accessibility analysis.
The evidence (data) is reflected in the form of indicators that can be compared with best practice standards and benchmarks
for sustainable urban development. Not only does this provide a clear perspective on the main developmental issues, but it also quantifies the projected effect of future development proposals on the indicators applied in the analysis.
The programme recognises that the methodology, on which policy recommendations guiding improvements and adjustments in the planning system are based, needs to be evidence-based. For this purpose, different methods were integrated to first provide the necessary body of evidence on which to build an understanding, and full assessment of issues before making recommendations for the respective cities.
The elements constituting the evidence-based approach are primarily constituted of the following:
• Reviews of existing policy documents and plans;• CPI index;• GIS spatial analysis.
All of these elements are utilised in a cross-scalar diagnostic methodology that incorporates quantitative and qualitative evidence. The method used to generate evidence-based policy recommendations, which develops capacities and engages stakeholders in all 17 cities, provides conclusions derived from both top-down and bottom-up approaches, cross-cutting all scales of planning.
FSCP workshop with local authorities and stakeholders
© FSCP

INTRODUCTION
13
By analysing how the structures of spatial, socio-environmental and economic issues interact at different scales of influence, the diagnostic methodology moves from the national to the neighbourhood scale, tracking the interdependencies within the city’s physical development patterns, and seeking to decrypt the reasons behind them.
1.4.2 The reviews
Several reviews of existing policy documents and plans were undertaken with the purpose of a) extracting information useful to the understanding of the context, and the city itself, and b) assessing their contents based on three criteria: content relevance, process integration, and effectiveness. The reviews focused on assessing the:
• National Spatial Strategy; • Strategic Regional Plan for Eastern Region;• Structural Plan of Dammam Metropolitan;• Dammam Local Plan.
1.4.3 The City Prosperity Index assessment report
The City Prosperity Index is made up of six dimensions that serve to define targets and goals that can support the formulation of evidence-based policies. These include the definition of city-visions and long-term plans that are both ambitious and measurable. The six dimensions are:
• Productivity;• Infrastructure;• Quality of life;• Equity and inclusion;• Environmental sustainability;• Governance and legislation.
These dimensions have been assumed as guiding principles in the spatial assessment of Dammam. There are ten detailed spatial indicators at the FSCP city profile level that link into the 72 flexible indicators of the CPI assessment.
1.4.4 The GIS spatial analysis
The spatial reflection of the above indicators highlights detailed patterns of development and the interactions and dynamics associated with movement, densities, and land use within the urban system.
This process enables a dynamic understanding of the physical expressions of weaknesses and strengths in the urban system and the main issues to be addressed. The effect of proposals for future development can also be assessed by use of the same indicators.
National Scale
Eastern Region
DammamCity-region
DammamMetropolitan Area
DammamCity
DammamNeighbourhoods
CROSS SCALAR DIAGNOSTIC METHODOLOGY

14

2 2
NAT
ION
AL
AN
D R
EGIO
NA
L SP
ATIA
L CO
NTE
XT
© NasserAlnacer

NATIONAL AND REGIONAL SPATIAL CONTEXT
16
2.1 The Region’s Role in the KSA
2.1.1 Historical background
Dammam area was consisted of several hamlets that rely on fishing and pearls for their survival. Over a span of a little more than half a century, the area has developed into a thriving hub of industries, commerce and science, and home to over 1.7 million people. A complete transformation of Dammam occurred after the discovery of oil in 1938, and it was in Dammam that ARAMCO dug the famous Dammam No. 7 well that supplied the Kingdom with a large quantity of hydrocarbons. The discovery of the new oil fields to the South, West and North of Dammam in the 1940’s and 1950’s, accounted for a quarter of the world’s proven oil reserves, thus triggered a building and construction boom in the city. Within just few decades, the little fishing settlement grew into the capital of the Eastern Region, and a worldwide oil-shipping hub.
2.1.2 Geography and location
The city is located in Eastern Saudi Arabia, on the Arabian Gulf just 10 metres above sea level. It is about 400 kilometres East of the capital city Riyadh, and about 1,230 kilometres East of Jeddah. It has a hot and dry desert climate, with an average low temperature of about 20°C, and an average high of around 34°C. Rainfall in Dammam is generally sparse, and usually occurs in small amounts, especially between
December and April, and the annual average rainfall is about 86 millimetres. The city has a geographical area of about 800 square kilometres; the boundaries of Dammam Metropolitan Area extend and cover two other cities Dhahran and Al Khobar.
2.1.3 Demographic background
Dammam City is the fifth largest city in the Kingdom of Saudi Arabia, the city population was 903,313 in 2010, and is estimated to have grown to approximately 1.7 million inhabitants currently. The geographical land area of the city is about 562 square kilometres, with a population density of about 20 inhabitants per hectares. The population of Dammam City alone is about 46% of the population in the Eastern Region. The average household size is 6.2 persons per household, which is the same as the regional average.
2.1.4 Socio-economic background
Dammam City, is the capital or the seat of administration of Ash Sharqiyah (Eastern) Region, located to the far Eastern side of the Kingdom on the Arabian Gulf. The Eastern Region of KSA is the heart of the Saudi oil production and processing industry. The Saudi ARAMCO runs the oil and gas sector as
Fig. 1. Population distribution, growth rate and urban areas within the Kingdom of Saudi Arabia
Population (2010)Area (km2)Growth rate / yearRate of
Urbanisation
15.1%
84.9%
Population Rest of KSA
Population Eastern Region
Percentage of the region compare to the total KSA
population in 2014
17
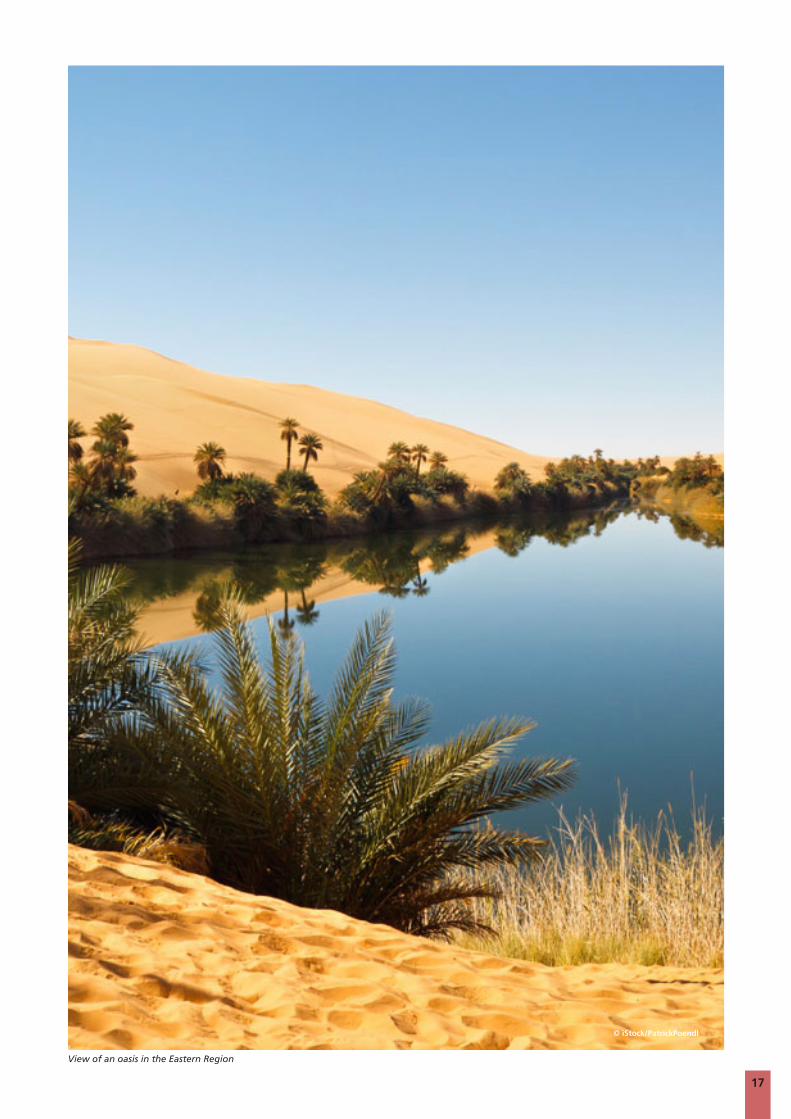
View of an oasis in the Eastern Region
© iStock/PatrickPoendl
NATIONAL AND REGIONAL SPATIAL CONTEXT
18
a whole, from prospecting, exploring, and extracting as well as collecting, processing, refining, and finally distributing, shipping, and exporting. Consequently, the economy and physical development of the city is mainly dependent on the petroleum industry. A large proportion of the population in the entire metropolitan area works at Saudi ARAMCO, or other petroleum-related business activities. The average household income in the city is estimated at about USD 4,000 per month. The city also has a thriving manufacturing industry; by the end of 2013 the Eastern Region had 1,492 productive factories, representing about 23.4% of the total number in the Kingdom, 6,364. The number of factory workers in the Eastern Region is about 214,000, representing around 25.8% of the total industrial manpower in the Kingdom.
Gross Domestic ProductThe total GDP of the Eastern Region amounted to 1,646 billion Riyals in 2012, accounting for 60% of the total GDP of the Kingdom. The GDP of the region, without the crude oil and natural gas, was 344 billion Riyals, representing 24% of the total GDP of the Kingdom.The annual average GDP growth rate of the region, without the crude oil and gas was 24.8% from 2009 to 2012. The industrial sector ranks first due to their contribution to the Eastern Region GDP (without crude oil) with 43.4%, followed by the trade sector with 11.1%, and real estate and financial services with 10.8%, and finally the construction and communication sector with 5.7%
2.1.5 National connectivity
Air TransportThe city’s main airport, King Fahd International Airport, is the third biggest in the country in terms of traffic, after Riyadh and Jeddah, and is the largest in terms of area. Located about 22 kilometres Northwest of Dammam, the airport is well connected by Dammam-Riyadh Highway, and Abu Hadriyah Highway, while SAPTCO offers bus services from the airport to their main stations in Dammam, Khubar, and Jubail. International routes with the highest traffic flow include Dubai, Cairo, Doha, and Bahrain. And domestic routes with the highest traffic flow include Jeddah, Riyadh, Madinah, and Abha.
Railways TransportSaudi Railways Organisations, operates a network of railways with a total length of approximately 1,380 kilometres, extending from King Abdulaziz Port in Dammam and the city of Dammam to Riyadh, passing Abqaiq, Al Hofuf, Haradh, Al- Tawdhihiyah, and Al-Kharj. In addition, some auxiliary lines branch from SRO’s main lines to connect some of the industrial and agricultural areas, and military sites with export ports and residential areas. Railroads operated by SRO include:
• The Passenger Line: A 449 kilometres line that connects Riyadh to Dammam, through Al-Ahsa and Abqaiq.
• The Cargo Line: A 556 kilometres line starting at King Abdulaziz Port in Dammam and ending in Riyadh.
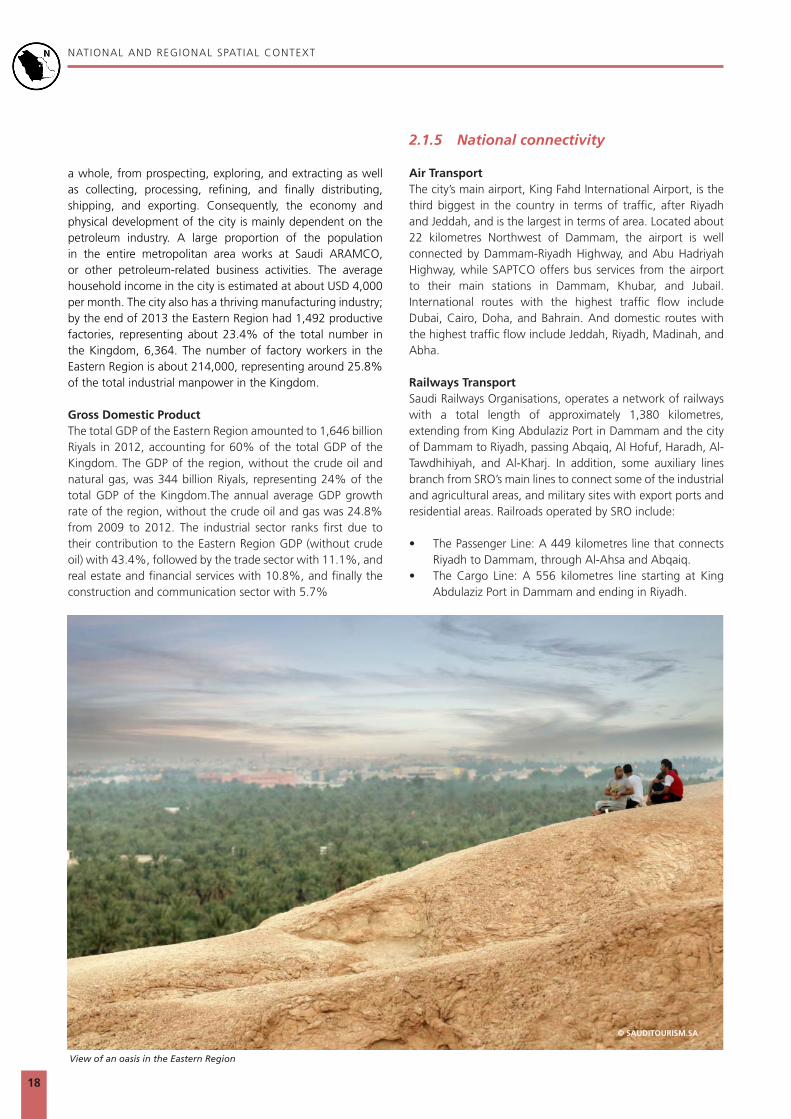
View of an oasis in the Eastern Region
© SAUDITOURISM.SA

NATIONAL AND REGIONAL SPATIAL CONTEXT
19
Fig. 2. Regional Gross Domestic Product and economic sectors contribution
Fig. 3. Transport connectivity between Saudi cities
Industry
Finance, real estate
Government services
Agriculture
Trade
Energy (electricity)
Transport
Social services
Mining
Construction
Dammam: King Fahd
International Airport
(Passengers 9,567,000);
Jeddah: King Abdulaziz
International Airport
(Passengers 30,000,000);
Riyadh: King Khalid
International Airport
(Passengers 22,300,000);
Madinah: Prince
Mohammad Bin Abdulaziz
International Airport
(Passengers 6,500,000);
Buraidah: Prince Nayef
Bin Abdulaziz International Airport
(Capacity 550,000).
Dammam-Abqaiq-Riyadh
Al Qassim-Majma’a-Riyadh
Makkah-Jeddah-Madinah
Arabian Gulf Ports:
King Abdulaziz Port, Dammam
King Fahd Industrial Port, Jubail
Jubail Commercial Port
Ras Al Khair Port
Ras Tanura Port
Red Sea Ports:
Jeddah Islamic Port
King Fahd Industrial Port
Yanbu Commercial Port
Economic sector contribution to GDP in Eastern Region (2012)
NATIONAL AND REGIONAL SPATIAL CONTEXT
20
• Branch lines: A total length of 373 kilometres, connecting industrial and agricultural production sites, and some military sites with export ports and some residential areas.
Sea TransportThe Saudi Ports on the Arab Gulf are fully managed and operated by the private sector on a commercial basis whilst the Ports Authority of KSA still retains a supervisory role. Four major ports are found in the vicinity of the Dammam City-region:
1. King Fahd Industrial Port (Jubail); 2. Jubail Commercial Port; 3. Ras Tanura Port; 4. King Abdulaziz Port (Dammam).
Dammam Port is the largest port in the Arabian Gulf, and the second largest and busiest port in the Middle East and North Africa region, after the Jeddah Islamic Port. The King Abdulaziz Port is a major export centre for the oil industry, and also a key distribution centre for major landlocked cities in the country, particularly the capital cities of regions, such as Riyadh which is linked to Dammam by a railway line.
2.2 Regional Development Patterns and Dynamics
2.2.1 Regional organisation
Among the five large metropolises, the hierarchy has been stable for decades, and is not expected to change in the near future. Over the period 1985 and 2025, Riyadh has been the largest urban agglomeration followed by Jeddah, Makkah, Madinah and Dammam. Over the next two decades, Dammam (albeit much smaller) is predicted to grow faster than Jeddah. The decadal growth rate on average for the five big metropolises has slowed down from 82% (1985-1995), to 41% (2000-2010), 18% (2015-2025), which follows a more general trend observed also in the secondary cities. In the early 1980’s Dammam was a separate city despite being so close to Al Khobar and Dhahran that, after years of rapid urban expansions witnessed across the Kingdom, the three towns inevitably merged into one, creating a single urban continuum known as the Dammam Metropolitan Area.
Dammam City is part of the Dammam Metropolitan Area (DMA), which is the largest urban agglomeration in the Eastern Region, and one of the largest in the Kingdom of Saudi Arabia. Urban growth in the DMA has been particularly rapid, with a population increase from 365,000 inhabitants in 1974, to about 1.7 million people today, and expecting a further
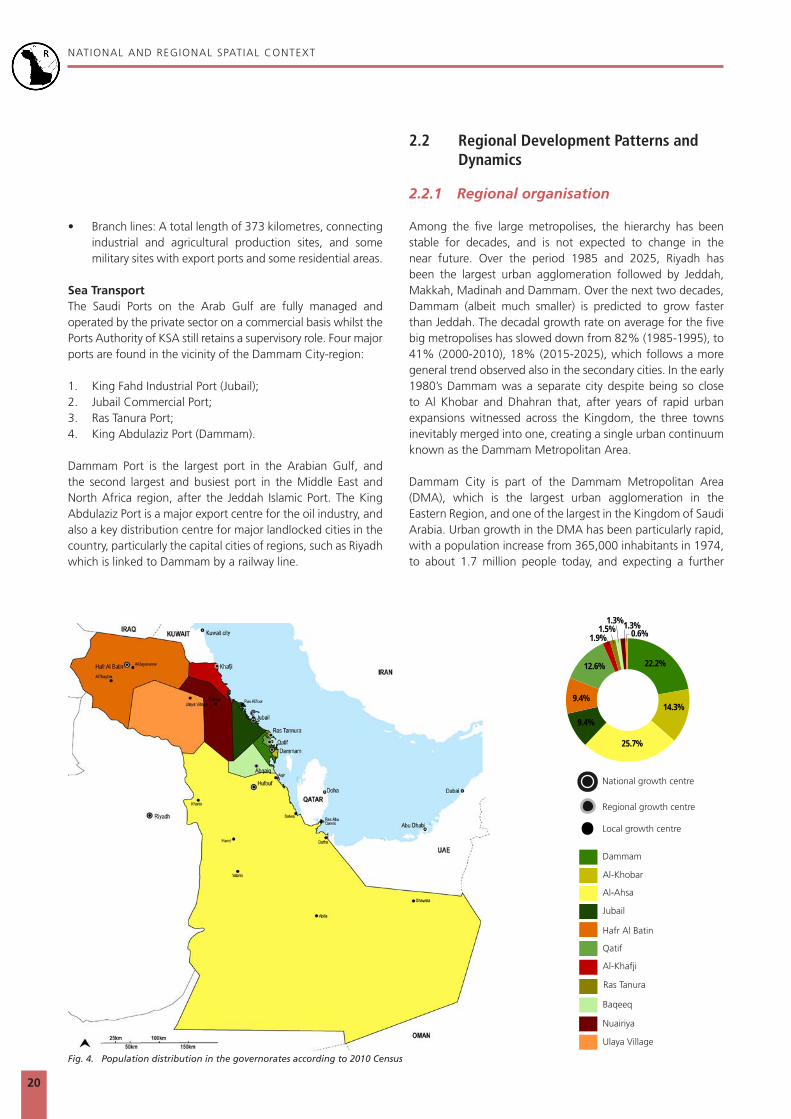
Fig. 4. Population distribution in the governorates according to 2010 Census
22.2%
14.3%
25.7%
9.4%
12.6%
0.6%1.3%
1.9%1.5%
9.4%
1.3%
Al-Khafji
Qatif
Hafr Al Batin
Al-Ahsa
Al-Khobar
Dammam
Jubail
Baqeeq
Nuairiya
Ulaya Village
Ras Tanura
National growth centre
Regional growth centre
Local growth centre

21
Dammam coastline
© FSCP

NATIONAL AND REGIONAL SPATIAL CONTEXT
22
increase to 3.62 million people by 2040. The rapid growth has led to the formation of an agglomerated urban mass in the DMA. Most of this growth was unplanned and happened beyond urban limits set by MoMRA. Due to limited alternative options for investment by the ordinary citizens, investing in housing has become the preferred option for many of them. Private sector companies have followed the same trend and are investing heavily in the housing sector. Urban sprawl is a major problem associated with the rapid development of the DMA. The contiguous spatial expansion of the DMA has been extensive, outpacing the growth of population, and resulting in sprawling, low density development.
In 2003, 8,900 out of 25,618 hectares of land within the urban growth boundary (approx. 35%) were developed, leaving 16,700 hectare of land vacant. The three main factors that are promoting this growth can be identified as: the rapid expansion of the economy; the speculative real-estate market, and the limited capacity of the Eastern Province Urban Planning Department (EPUPD), in devising and imposing urban regulations.
Administrative Boundaries Dammam is the capital of the Eastern Region (one of 13 regions of KSA), and its region is subdivided into 11 governorates and the governorates are further subdivided into sub-governorates. The governorates of the Eastern Region are; Al Khobar, Abqaiq, Nariyah, Qaryat Al-Ulya, Hafr Al Batin,
Dhahran, Jubail, Ras Tanura, Qatif, Khafji, Al-Ahsa. Al-Ahsa Governorate, which includes the traditional oasis of Al-Ahsa and the Empty Quarter Desert, is the largest governorate in Saudi Arabia in terms of area. Similar to the other 12 regions of KSA, Dammam is governed by a “municipality” (Arabic: Amanah) and is headed by a Mayor. Dammam is specially characterised by its unique and strategic location; it has sea ports at the Arabian Gulf and shares borders with several Gulf States thus making it open to the outside world facilitating commercial, industrial, and cultural exchange as well as a link between the Kingdom and other states of the Gulf Cooperation Council (GCC), and Southeast Asian countries. It is the largest region in the Kingdom, and is located between longitudes (44 and 56), and latitudes (19 and 29) North.
Dammam lies within the “Coastline Sector” as per the Regional Plan of the Eastern Region. This sector includes the governorates of Qatif, Jubail, Ras Tanura, Dammam, Al Khobar and Abqaiq, which accommodate about 65% of the total population of the region, and has about 24% of the total number of urban clusters in the region. The main economic activity of this sector includes administrative, service, industrial, and touristic activity.
In general, Dammam City and the Eastern Region are considered the main economic base in the Kingdom, where it is the main location for production of petroleum in the Kingdom, and the direct link to the GCC, and East Gate of the Kingdom.
Coastline (Dammam sector): About 24% of the total number of urban clusters in the region. It has been targeted that the main economic activity of this sector to be an administrative, service, industrial and touristic activity.
Al-Ahsa: Agricultural, tourism and manufacturing activities are considered the focus of the region in addition to commercial activity.
Empty Quarter: Reserves of petroleum and gas in it and the ongoing research and excavation. However, it is lacking a developed urban centre to carry out a service role in this sector.
Adeed: Security sector and the Southeastern entrance to the region and to the kingdom as well, activating the exchange between the region and the Gulf Countries in trade, tourism and service activities, and due to the existence of a proposed economic city in Abu Gamees this shall establish a commercial industrial activity for the sector.
Hafr Al Batin: Limited medium economies sectors with simple herding and agricultural activities though it includes some arable lands. However, pastoral activities are overshadowing the sector in addition to security, as the region is linked to surrounding countries through several outlets.
Fig. 5. Development sectors according to the Regional Plan for Eastern Region
23
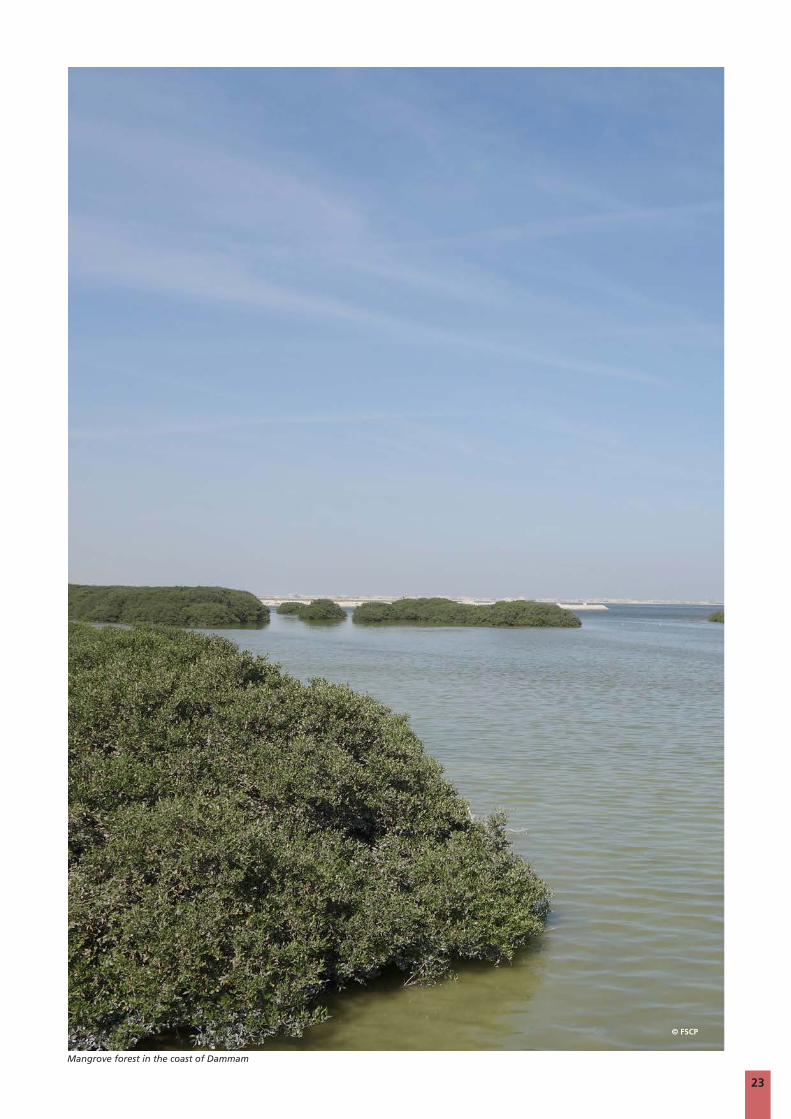
Mangrove forest in the coast of Dammam
© FSCP

NATIONAL AND REGIONAL SPATIAL CONTEXT
24
Development Corridors85% of the total regional population resides in the Coastline Sector, where Dammam is located. Dammam is the major urban centre, and it has a strong system of functional and economic relations with other significant urban centres surrounding it. Within these urban centres in the region, there are three main axis that can be observed, two of which lie on two main highways cutting through the region:
1. An institutional corridor is identified along Highway 40, which is the most important highway of Saudi Arabia, linking the largest cities by crossing the entire country, and the Arabian Peninsula. The 1,359 kilometres long highway connects Jeddah and Makkah on the West Coast to Dammam on the East Coast, passing through the capital of Riyadh.
2. The second corridor runs along Highway 95, and is also known as Abu Haidriyah Highway and begins from the King Fahd Causeway. The highway links Bahrain to Saudi Arabia, and extends to the Kuwaiti border, serving major cities such as Dammam and Jubail. The highway is over 300 kilometres long and is a main path for the movement of trucks and goods in the area. It runs parallel to the Dhahran – Jubail Highway, a substitute for each other when either of them is undergoing maintenance or reconstruction. The highway also serves as an Eastern border for King Fahd International Airport in Dammam.
3. The third axis is along Highway 75, which connects Dammam to Al Hofuf. Along this highway runs the railway, connecting
Dammam Port, Dammam city centre, and Al Hofuf to Riyadh. This railway branches into farms and agricultural land in Al-Ahsa Oasis, the largest producer of dates in the region. Interestingly enough, Highway 75 Southern terminus is in a remote area in the Rub’ Al Khali and the road ends in the desert, not near a town or village as would be expected.Quite possible, it was intended to extend to Oman, but realised it passes through 600 kilometres of barren land consisting only of shifting sand dunes.
2.2.2 Regional Structure and Resources
Movement InfrastructureCharacterised by its strategic location, Dammam and its city-region are well connected on the regional, national and supra-national scale. With one international airport, one regional airport, four ports, a railway line, and frequent inter-city bus services, the Eastern Region has one of the highest movement densities in the Kingdom.
Dammam is linked to cities within its city-region context through the various highways. It connects to Abqaiq, Dhahran, Al Hofuf, and Jubail via the Dhahran – Jubail Highway, to Khafji, and Al Khobar via the Dammam – Khobar Highway, and to Ras Tanura, Sihat, and Qatif via the Gulf Road (Saudi Arabia), as well as many cities in other parts of the Kingdom by eight lane highways. Dammam is connected to the Saudi capital, Riyadh and Jeddah on the West Coast by Highway 40 and is also linked to Bahrain by the 28 kilometres long King Fahd Causeway. The Dhahran–Jubail Highway connects Dhahran in
King Abdulaziz Port
© FSCP

NATIONAL AND REGIONAL SPATIAL CONTEXT
25
National growth centre
Proposed regional double road
Highway
Major single road
Regional double road
Regional growth centre
Proposed highway
Local growth centre
Drive Time Popula on % of Total15 Min 581,503 83.4%30 Min 601,122 86.6%60 Min 624,159 89.9%120 Min 693,699 99.9%Inaccessable 605 0.1%
Fig. 6. Development corridors according to the Regional Plan of Eastern Region
Fig. 7. Access and connectivity in the Eastern Region
Local growth centre
Development corridor
National growth centre
Regional growth centre
National growth centre
Regional growth centre
Local growth centre

NATIONAL AND REGIONAL SPATIAL CONTEXT
26
the South and Jubail in the North. With two roads connecting it with King Fahd International Airport, which is 15 kilometres to the West, the speed limit is 120 km/hour. The region this highway serves has a total population of approximately 2.5 million and is in constant traffic jam.
The highway is 165 kilometres long (previously 100 kilometres), after its extension further to the North serving the new industrial areas North of Jubail such as Khurasaniyah, and Ras Al-Khair. It has three lanes and two shoulders for each of the two sides, (a current project is undergoing to add a fourth lane for each direction), a three-lane service road is available only for the 38 kilometres part that crosses Dammam and Qatif. Saudi Public Transport Co. Inter-city bus services are operated from Dammam by the Saudi Arabian Public Transport Company (SAPTCO). Domestic routes with the highest traffic flow include Hafr Al Batin, Riyadh, Jubail, Al-Ahsa, and Abqaiq. SAPTCO also operates direct international routes from Dammam to UAE, Bahrain, Qatar, Kuwait, Egypt, and Jordan. Additionally, SAPTCO provides services to Egypt and Sudan via connecting ferries.
Economic ResourcesThe oil and gas sector is the largest and most important economic activity in the Eastern Region, where all productive oil and gas fields of the Kingdom are found. These include Dammam Field, the first field discovered in the Kingdom; Ghawar Field, the largest oil field in the world; Savanya; Al-Wafra; Al-Shaibah in the Empty Quarter, which is one of the
latest discovered fields and contains huge oil and gas reserves; as well as other fields.
The oil reserves in the Eastern Region rose to 265.9 billion barrels in 2012, equaling 25% of the world’s reserves of crude oil. Additionally, they have the necessary infrastructure in place to stabilise, transport, and refine large volumes of crude, and easy export access to the East and the West. The Saudi ARAMCO, with its headquarters in Dammam runs this sector as a whole, from prospecting, exploring, and extracting as well as collecting, processing, refining, and finally distributing, shipping, and exporting.
Dammam is the starting point of the East-West pipeline, which runs from the port of Yanbu on the Red Sea to Abqaiq in Eastern Saudi Arabia (a total of 1200 kilometres). Refining and processing takes place in Abqaiq, Saudi ARAMCO’s processing, and stabilisation plant (the world’s largest), with a capacity of over seven MBOD. Saudi ARAMCO operates many refineries in the country and is currently producing than 10 million barrels a day.
In regards to export, Saudi Arabia’s crude and refined exports exit the country through major oil ports on the Arabian Gulf, (notably the Ras al Ju‘aymah Oil Terminal and the port city of Ras Tanura) and on the Red Sea (Yanbu). Saudi Arabia’s access to Eastern markets through the Arabian Gulf, and Western markets through the Red Sea are a tremendous asset, particularly during times of regional unrest, and in tough
Fig. 8. Oil and gas reserves
anbu on the
through major oil ports on the Persian Gulf (notably the Ras al Ju‘aymah Oil Terminal and the port city of Ras Tanura) and on the Red Sea (Yanbu). Saudi Arabia’s access to eastern markets through the Persian Gulf, and western markets through the Red Sea are a tremendous asset, particularly during times of regional unrest – if things get hot in the Persian Gulf like during the 80s Iran-Iraq Tanker War, Saudi Arabia still has a pathway to market.
Oil fieldGas FieldGas pipelineOil pipeline
Oil Refinery
Oil Processing Complex
Oil Export Terminal
Oil Field
Gas Field
Gas Pipeline
Oil Pipeline
Oil Refinery
Oil Processing Complex
Oil Export Terminal
NATIONAL AND REGIONAL SPATIAL CONTEXT
27
situations in the Arabian Gulf as they did during the 80’s Iran-Iraq Tanker War, Saudi Arabia still has a pathway to market.
Following oil and gas, the next most important industry is the manufacturing sector in the Eastern Region as the Eastern Region hosts the largest number of industrial cities in the Kingdom, and the largest industrial city in the Middle East, Jubail, which is expanding and growing exponentially. Three of these plants are in Dammam, one in Al-Ahsa, and the other in Hafr Al Batin. The infamous large petrochemical industries complexes located in Jubail Industrial City are among the most important industries in the Kingdom due to their large production capacities of such industries, most of which are exported.
Agriculture is also one of the important economic sectors in the Eastern Region. In 2011, the total area for cultivation of crops cultivated was 56,000 hectares, representing about 7.1% of the total crops cultivated area in the Kingdom, (788,000 hectares).
The information and figures used in the Dammam National and Regional Spatial Context were extracted from the following resources:
• Eastern Region Economic Report, 1434/1435, SAGIA 2014
• Review of Regional Planning in Saudi Arabia - The Case of The Eastern Region, FSCP
• Dammam City Review Report, FSCP• National Spatial Strategy Review, FSCP
2.3 City-region Structure and Dynamics
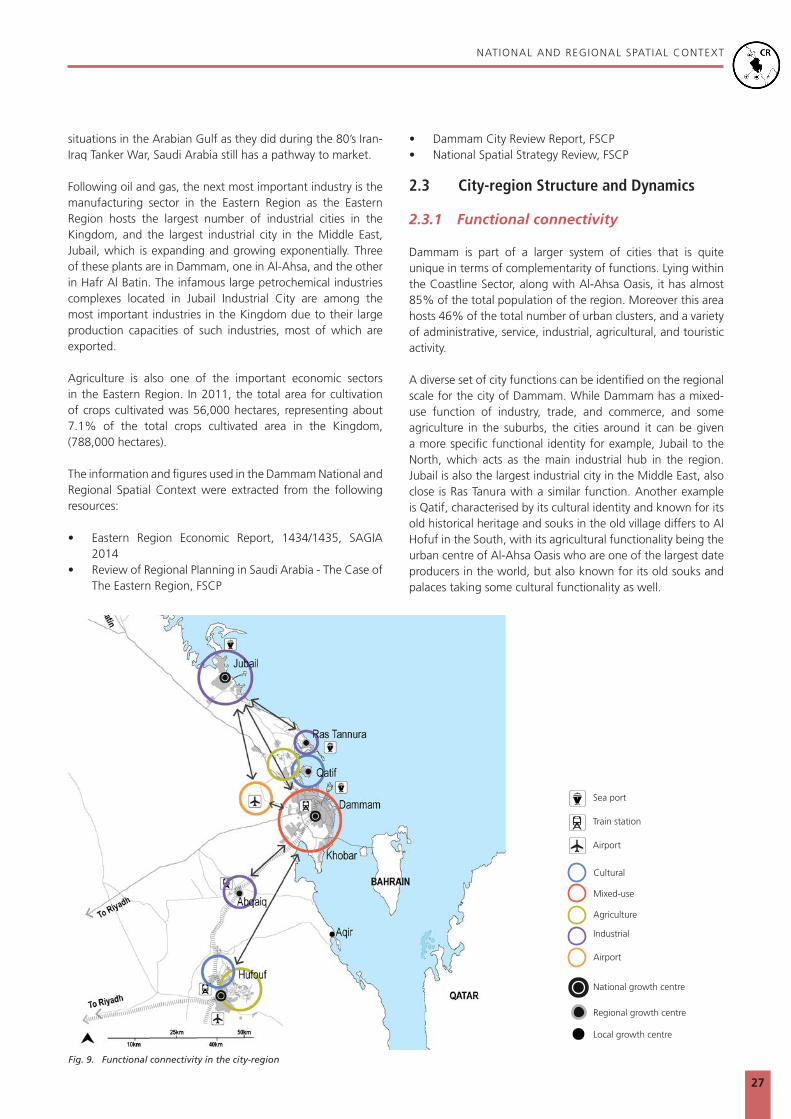
2.3.1 Functional connectivity
Dammam is part of a larger system of cities that is quite unique in terms of complementarity of functions. Lying within the Coastline Sector, along with Al-Ahsa Oasis, it has almost 85% of the total population of the region. Moreover this area hosts 46% of the total number of urban clusters, and a variety of administrative, service, industrial, agricultural, and touristic activity.
A diverse set of city functions can be identified on the regional scale for the city of Dammam. While Dammam has a mixed-use function of industry, trade, and commerce, and some agriculture in the suburbs, the cities around it can be given a more specific functional identity for example, Jubail to the North, which acts as the main industrial hub in the region. Jubail is also the largest industrial city in the Middle East, also close is Ras Tanura with a similar function. Another example is Qatif, characterised by its cultural identity and known for its old historical heritage and souks in the old village differs to Al Hofuf in the South, with its agricultural functionality being the urban centre of Al-Ahsa Oasis who are one of the largest date producers in the world, but also known for its old souks and palaces taking some cultural functionality as well.
A diverse set of city functions can be identified on the re-gional scale for the city of Dammam, While Dammam has a mixed use function of industry, trade and commerce, and some agriculture in the suburbs, the cities around can be given a more specific functional identity. From Jubeil to the north which acts as the main industrial hub in the region, that has the largest industrial city in the middle east, also close is Ras Tanura with a similar function. To Qatif, which is characterized with a cultural identity known for its old historical heritage and souks in the old village. To hufoof in the south with a n agricultural functionality being the urban center of Al-Ahsa Oasis one of the largest date producers in the world, also known for its old souks and palaces taking some cultural functionality as well.
Cultural
Mixed Use
Agricultural
Industrial
Airport
Cultural
Mixed-use
Agriculture
Industrial
Airport
National growth centre
Regional growth centre
Local growth centre
Sea port
Train station
Airport
Fig. 9. Functional connectivity in the city-region
NATIONAL AND REGIONAL SPATIAL CONTEXT
28
2.3.2 City-region environmental and climate change risks
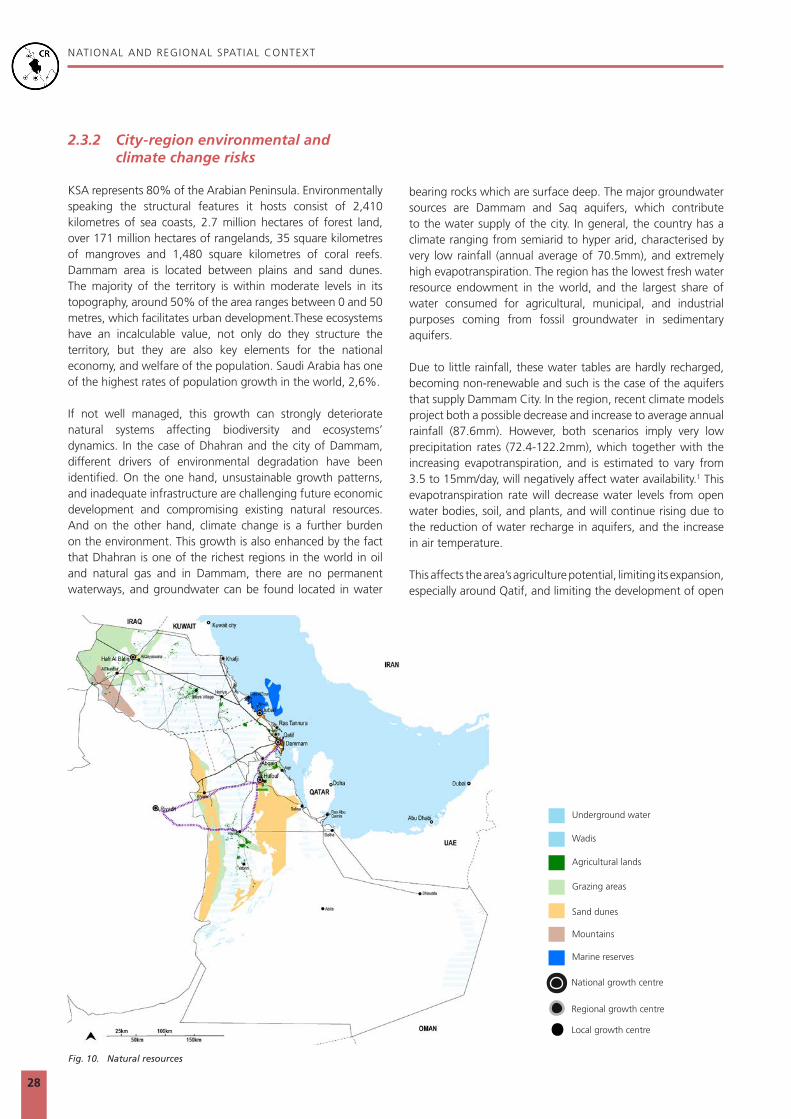
KSA represents 80% of the Arabian Peninsula. Environmentally speaking the structural features it hosts consist of 2,410 kilometres of sea coasts, 2.7 million hectares of forest land, over 171 million hectares of rangelands, 35 square kilometres of mangroves and 1,480 square kilometres of coral reefs. Dammam area is located between plains and sand dunes. The majority of the territory is within moderate levels in its topography, around 50% of the area ranges between 0 and 50 metres, which facilitates urban development.These ecosystems have an incalculable value, not only do they structure the territory, but they are also key elements for the national economy, and welfare of the population. Saudi Arabia has one of the highest rates of population growth in the world, 2,6%.
If not well managed, this growth can strongly deteriorate natural systems affecting biodiversity and ecosystems’ dynamics. In the case of Dhahran and the city of Dammam, different drivers of environmental degradation have been identified. On the one hand, unsustainable growth patterns, and inadequate infrastructure are challenging future economic development and compromising existing natural resources. And on the other hand, climate change is a further burden on the environment. This growth is also enhanced by the fact that Dhahran is one of the richest regions in the world in oil and natural gas and in Dammam, there are no permanent waterways, and groundwater can be found located in water
bearing rocks which are surface deep. The major groundwater sources are Dammam and Saq aquifers, which contribute to the water supply of the city. In general, the country has a climate ranging from semiarid to hyper arid, characterised by very low rainfall (annual average of 70.5mm), and extremely high evapotranspiration. The region has the lowest fresh water resource endowment in the world, and the largest share of water consumed for agricultural, municipal, and industrial purposes coming from fossil groundwater in sedimentary aquifers.
Due to little rainfall, these water tables are hardly recharged, becoming non-renewable and such is the case of the aquifers that supply Dammam City. In the region, recent climate models project both a possible decrease and increase to average annual rainfall (87.6mm). However, both scenarios imply very low precipitation rates (72.4-122.2mm), which together with the increasing evapotranspiration, and is estimated to vary from 3.5 to 15mm/day, will negatively affect water availability.1 This evapotranspiration rate will decrease water levels from open water bodies, soil, and plants, and will continue rising due to the reduction of water recharge in aquifers, and the increase in air temperature.
This affects the area’s agriculture potential, limiting its expansion, especially around Qatif, and limiting the development of open
Fig. 10. Natural resources
Marine reserves
Mountains
Sand dunes
Agricultural lands
Wadis
Underground water
Grazing areas
National growth centre
Regional growth centre
Local growth centre

NATIONAL AND REGIONAL SPATIAL CONTEXT
29
Fig. 11. Pollution and other environmental conditions
Pollution Generating Facility
Coastal Pollution
Air Pollution
green spaces across the city. In Dammam, agricultural land has decreased at a rate of 23ha/year,2 since 1981, and currently only 9% of the city is green space. Overall, the few green spaces configure a discontinuous green system that does not contribute to protecting and replenishing water-tables, nor does it mitigate the urban heat islands effect. In addition, at the national level, trends indicate that average temperature has been increasing by about 0.2°C to 0.3°C per decade3 due to climate change, which negatively impacts water, and green infrastructure, in Dhahran, with the current trend in annual temperature increase, the average is expected to raise from 3.4°C to 3.6°C by 2080.
Heat waves are more frequent and extreme, and records (up to 2013) show how peak temperatures have increased from 13 events (1978-1995), to 57 events (1996-2003),4 due to its hyper-arid climate, the aridity index in the region is lower than 0.05. Another factor affecting these higher temperatures are the significantly frequent sand storms coming from the Northwest into the city, which have increased to 88%.5 However, being on the coastline, Dammam City enjoys major coastal winds from the East, which could potentially reduce the UHI effect in the urban area. Coastal areas, such as Dammam, are specially affected by climate change and an estimated 401-1,726 hectares are
expected to be lost by the year 2100, along the Arabian Gulf.6 This will impact a significant portion of Saudi’s population, as around 12% resides in urban coastal zones with low elevation, and 50% live within 100 kilometres of the coast.7 It will also disturb natural habitats, such as coral reefs, which represent the most significant habitat found along the Arabian Gulf. These reefs, as well as the mangrove forests provide shelter and food for a wide array of marine life, and are likely to be negatively impacted by global warming and by rises in sea-level.8
In Dammam, there are areas that can already be identified as vulnerable. This is the case of Tarut Bay, which has been defined by the Saudi Wildlife Commission as a Resource Use Reserve, equivalent to a protected seascape. The degradation of marine environment has already been noticed, and it is estimated that around 485 hectares of mangroves has been lost and that 3,810 hectares of landfill development has encroached into the marine environment of Tarut Bay.
Landfills
Underground Water

30
3 3
GO
VERN
AN
CE A
ND
FI
NA
NCI
AL
FRA
MEW
ORK
© FSCP

32
GOVERNANCE AND FINANCIAL FRAMEWORK
3.1 Dammam Legal and Institutional Frameworks
3.1.1 Legal and institutional context
Islamic Sharia Law shapes the Dammam’s planning legal framework and the law-making authority is vested in four entities; the King, the Shura Council, the Council of Ministers, and the Ministerial departments. Consequently, there are five legislative instruments (Royal Order, Royal Decree, Supreme Order, Council of Ministers Resolution, and Ministerial Decree), that function in a hierarchical order, underpinning their authority and validity. Due to this non-centralised law-making process, the city of Dammam is guided by over 500 existing urban planning related instruments with most of these having been promulgated at the lowest administrative level (circulars)9 lacking authoritative legal force.
The Ministry of Municipal and Rural Affairs (MoMRA), plays a significant role in Dammam’s growth and development patterns, because it is legally entrusted with the task of conducting urban planning in the Kingdom’s cities, including the issuance of all types of construction permits. Consequently, the Municipality of the Eastern Region (Amanah), as the local level actor for Dammam, merely acts as an implementing arm for MoMRA.
The institutional budgetary system is also centralised, meaning that Dammam’s development intervention is reliant on funds allocated from MoMRA, through an annual line item budget, which is the sole fiscal means available to them.
Given the rich oil reserves, the private sector plays a key role in the economic development of Dammam. However, their construction and land filling activities along ecologically sensitive areas have engendered indiscriminate land development, raising the cost of housing, speculative land markets, and urban sprawl.
The Kingdom’s planning system, which follows a hierarchy of spatial levels and is predominantly top-down, influences the spatial system of Dammam. The National Spatial Strategy (NSS) of 2001, is the guiding plan for the Kingdom. The Strategic Urban Eastern Regional Plan 2005, highlights the pivotal role
that Dammam, as the regional capital, can play as the economic engine of the Eastern Region.
The Dammam Plan which is composed of a strategic component (the Structural Plan), supported by a regulatory document (the Local Plan), identifies strategic land uses and infrastructure networks within the metropolitan area, and it applies urban controls to urban land use and building regulations, within the municipal boundary. The Urban Growth Boundary aims to prevent urban sprawl in the outskirts of cities without adequate urban infrastructure, while the Land Subdivision Plans are the basic building blocks that guide the development of Dammam.
Apart from NSS, these planning instruments are defined by procedural manuals within MoMRA, rather than by Law, thus they lack legitimacy. By their nature, these instruments cannot construct a system of legal accountability and transparency of the relevant actors. Moreover, there is evidence10 to suggest that land use and building control regulations have facilitated urban sprawl within Dammam. For example, 92.5% of areas have been approved for low-density detached houses with a height limit of two floors, which has resulted in large amounts of land used for residential purposes.
Despite the high level of household income in Dammam, the price of these villas has excluded a large section of the population, particularly the poor and the youth. It has also been suggested11 that regulations have been waived to allow for development activities that are incompatible with the zoning requirements, which have contributed to significant social, economic, and environmental unsustainability. In terms of reform, Dammam would benefit from both fiscal and jurisdictional decentralisation to facilitate independent and innovative solutions to urban social problems at the Amanah level. This should entail:
• The transfer of local planning power, authority and function from MoMRA to the Amanah with provision for independent action, without recourse to effectively address community needs. This is supported by the New Urban Agenda, which specifies that territorial urban design and planning processes should be led by sub-national and local levels, but their implementation will require coordination with all spheres of governments as well as participation of the civil society, the public sector and other relevant stakeholders.
• Fiscal decentralisation, which gives autonomy to the Amanah to source funds to finance development activities. Revenue generation activities in cities may also include taxes and levies. Urban areas should be allowed to collect some form of property taxes to fund development activities. The recent White Lands Act that imposes fees on undeveloped plots in urban areas to tackle land speculation, housing shortage
Fig. 12. Number of urban laws in KSA based on the Main Themes of
Urban Planning Legislation (UN-Habitat)
Land management
Public space
Plots and blocks
Building regulations
Financing
Building & development rights
2 %
41 %
23 %
16%
16 %
3 %

33
GOVERNANCE AND FINANCIAL FRAMEWORK
and indiscriminate land development shows that regulatory mechanisms can be leveraged to generate revenue while fostering an efficient development framework.
• Opening of avenues for actors, including the private and voluntary sector and the general community, to participate in decisions regarding projects that affect them.
The legal framework also needs to enshrine an acceptable mode of public participation in public decision making, to foster equality and inclusion. The consolidation of the urban legislation would also give legitimacy to the plans that Dammam relies on. Revising the Urban Growth Boundary Law to include clear criteria on how it is set would enhance technical and vertical accountability.
This would also guide policy formulation designed to make the city more compact and dense. Moreover, a post-legislative scrutiny of the Urban Growth Boundary Law should be done to assess if it has met its policy objectives. This could in turn inform the legal reform process as well as the planning policy options.
3.2 Planning Instruments and Procedures
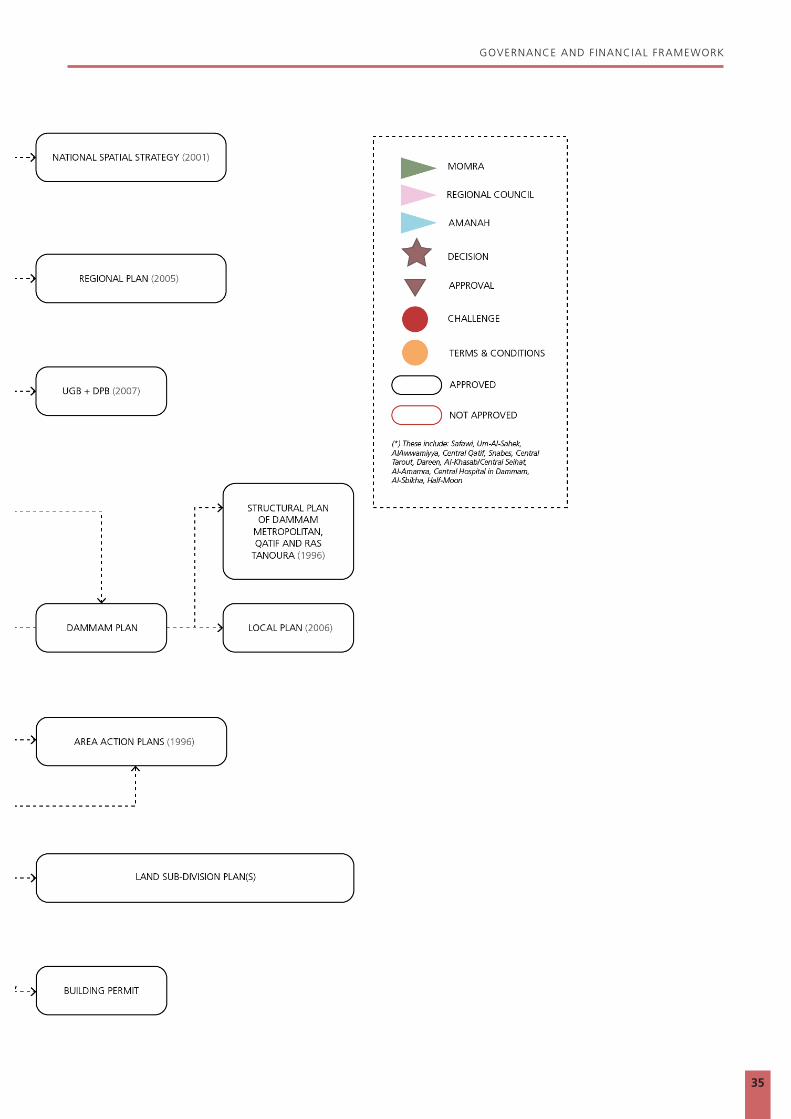
3.2.1 Hierarchy of plans
The planning system of Dammam is derived from the de facto planning hierarchy of the Kingdom. In this framework, there are four different levels of spatial plans: national, regional, local and district. Figure 14 highlights the planning instruments in force in Dammam.
3.2.2 Strategic Regional Plan for Eastern Region
Regional planning represents the second-tier of spatial planning in KSA, which aims to address the natural, urban, social, and economic regional development aspects. The Strategic Regional Plan for Eastern Region of 2005 was prepared and approved by MoMRA. The Plan aims to:
• Take advantage of the region’s strategic location at the Arabian Gulf as a link between the Kingdom and the other states of Gulf Cooperation Council and Southeast Asian countries;
• Enhance the contribution of the region’s non-petroleum resources in national development to achieve balanced growth;
• Exert expansion in projects in diverse industries, which are particularly dependent on the region’s non-petroleum resources;
FSCP workshop with stakeholders
© FSCP

34
GOVERNANCE AND FINANCIAL FRAMEWORK
Fig. 13. FSCP simplified representation of hierarchy of plans and the planning instruments for the city of Dammam
35
GOVERNANCE AND FINANCIAL FRAMEWORK
Fig. 13. FSCP simplified representation of hierarchy of plans and the planning instruments for the city of Dammam

36
GOVERNANCE AND FINANCIAL FRAMEWORK
• Enhance the participation of the private sector in the provision of education and training across the region;
• Address the developmental concentration on the coastal strip to achieve a balanced urban development in the region. Support a balanced pattern of cities in the region that confirms the hierarchy of functions and population sizes.
3.2.3 The Dammam Plan
The Dammam Plan is a planning tool composed of a strategic component (the Structural Plan), supported by a regulatory document (the Local Plan), and 12 detailed plans and schemes12 for selected areas within the city. The scope of these plans includes:
• Long term strategy for the city;• Identification of relevant development areas;• Identification of urban/non-urban land;• Main mobility system;• Environmental protection;• Infrastructure provision;• Detailed land use;• Urban regulations; and• Detailed proposals for selected areas.
Structural Plan of Dammam Metropolitan, Qatif, and Ras TanuraThe Structural Plan aims to identify key spatial structures as those provided for in the Regional Spatial Strategy. The Dammam Structural Plan (1996-2030) was prepared by the Amanah. This plan, in line with the Regional Plan, highlights different objectives for the different cities that are located within Greater Dammam Metropolitan Area. For instance, the city of Dammam remains the administrative and services centre with an improved future focus on strengthening tourism along the Corniche area. However, this Plan differs with NSS by proposing axial development along main corridors (Dammam - Dhahran – Khobar).
In terms of land use, this Plan identifies strategic land uses and infrastructure networks within the metropolitan area of the 2030 / 1450 Urban Growth Boundary (UGB). Within this growth boundary, 18% of land,13 is allocated for residential land uses, whereas 25% of the urban area is preserved for oil pipelines. The area allocated for residential purposes can hold double the projected population, because the plan promotes a low density residential typology.
Moreover, the area preserved as buffers for the oil and gas pipelines should be used instead for a green network of open spaces that connect to a hierarchy of parks (city-district-neighbourhood), with a link to the waterfront recreational strip.This Plan does not promote a clear mixed land use strategy as it encourages a mono land use typology instead. Mixed land uses (commercial to residential) are only proposed along the major corridors. The plan engenders incompatible
building forms by introducing industrial land pockets in the urban cluster. The Industrial City site is an example; where the plan suggests moving these uses using centric land in the Western areas leaving the central cluster for other uses more compatible with the residential and service oriented nature of the Dammam centre. The net effect of such zoning requirements is incompatible land use zones, which will have adverse environmental effects in Dammam.
Local PlanThe Local Plan represents the third level of the urban planning system in KSA, and is largely focused on those areas of a municipality which are contained within the Urban Growth Boundary with a special focus on housing.
The Local Plan contains the Urban Atlas which details the allowed land uses for every part of the city. It is complemented by a regulations report, which contains specifications on the permissible development rights, such as floor area ratio, street dynamics, building heights, and areas of special building regulations, etc. The aim of the local plan is to a) apply urban controls to urban land use and building regulations; b) to provide public services and infrastructure in a cost effective and integrated manner; c) set basic requirements for proposed road networks; and d) help facilitate the development of public and private sector housing.
The Local Plan is prepared by various consultants following the “Booklet of the Terms of Reference for the Preparation of the Local Plan”, which is formulated by MoMRA. This booklet was updated in 2015 and one key technical change is the requirement that the lifespan of new plans should be 14 years (2015-2029). The development of the Local Plan is complicated as there are parallel structures set up by MoMRA and the Ministry of the Interior. Whilst the legal mandate for planning clearly lies in the Municipalities (under MoMRA), there are jurisdictional overlaps with the newly established Eastern Region Development Authority (ERDA)14, while MoMRA is the central spatial planning institution, but there is no clear coordination mechanism. This frequently leads to decision-making impasse which affects the delivery of technical standards within municipalities such as Dammam.
The Dammam Local Plan was approved in 2006 by MoMRA. This Plan has no real mixed land use strategy, even though such characteristics are still present in a few parts of the city, for example in the city centre. However, the Plan does not spread commercial activities along the urban tissue, and mixed-uses are proposed along main roads to preserve privacy in residential areas. This is one of the factors that engender car dependency and poor quality public spaces. The Plan is not only obsolete and does not reflect current urban dynamics, but also includes massive expansion areas (between city footprint and urban boundary), which encourage urban sprawl.
37
GOVERNANCE AND FINANCIAL FRAMEWORK
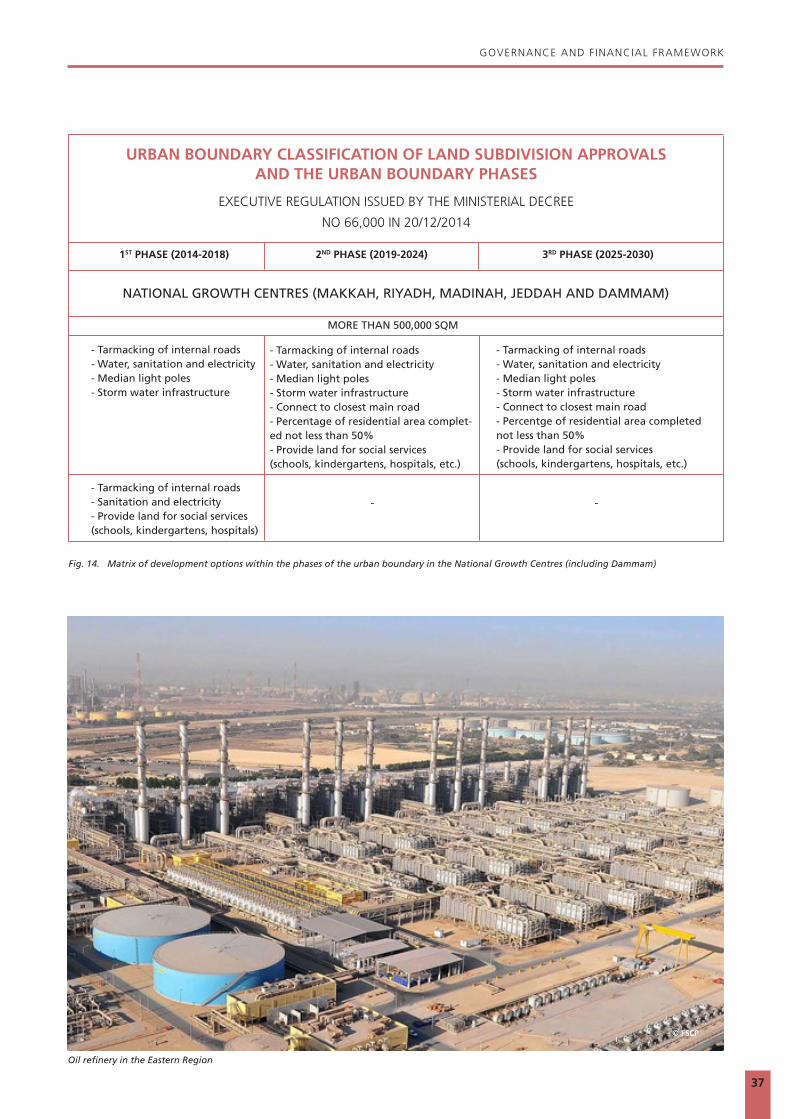
Fig. 14. Matrix of development options within the phases of the urban boundary in the National Growth Centres (including Dammam)
URBAN BOUNDARY CLASSIFICATION OF LAND SUBDIVISION APPROVALS AND THE URBAN BOUNDARY PHASES
EXECUTIVE REGULATION ISSUED BY THE MINISTERIAL DECREE
NO 66,000 IN 20/12/2014
1ST PHASE (2014-2018) 2ND PHASE (2019-2024) 3RD PHASE (2025-2030)
NATIONAL GROWTH CENTRES (MAKKAH, RIYADH, MADINAH, JEDDAH AND DAMMAM)
MORE THAN 500,000 SQM
- Tarmacking of internal roads - Water, sanitation and electricity - Median light poles - Storm water infrastructure
- Tarmacking of internal roads - Sanitation and electricity - Provide land for social services (schools, kindergartens, hospitals)
- Tarmacking of internal roads - Water, sanitation and electricity - Median light poles - Storm water infrastructure - Connect to closest main road - Percentage of residential area complet-ed not less than 50% - Provide land for social services (schools, kindergartens, hospitals, etc.)
- Tarmacking of internal roads - Water, sanitation and electricity - Median light poles - Storm water infrastructure - Connect to closest main road - Percentge of residential area completed not less than 50% - Provide land for social services (schools, kindergartens, hospitals, etc.)
- -
Oil refinery in the Eastern Region
© FSCP

38
GOVERNANCE AND FINANCIAL FRAMEWORK
Fig. 15. FSCP simplified representation of Planning Process and Actors involved in the preparation of the Dammam Local Plan
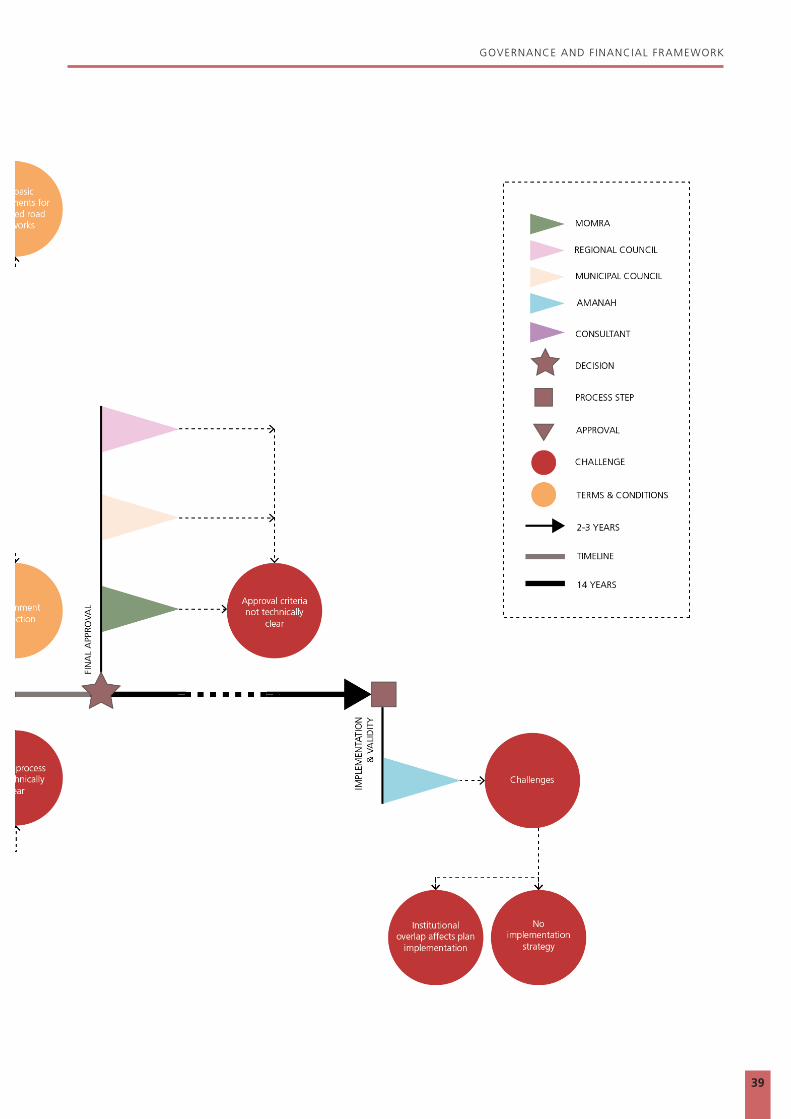
39
GOVERNANCE AND FINANCIAL FRAMEWORK
Fig. 15. FSCP simplified representation of Planning Process and Actors involved in the preparation of the Dammam Local Plan

40
GOVERNANCE AND FINANCIAL FRAMEWORK
3.2.4 The Dammam Urban Growth and Development Protection Boundaries
Legal FrameworkIn 2008, the Prime Minister issued decree No. 157, which sets the overall regulations for both the Urban Growth Boundary (until 2030) and the Development Protection Boundary. The executive regulations were issued in 2010 by the MoMRA Ministerial Decree No. 11769 followed by the current revision (MoMRA Ministerial Decree No. 66000) which was enacted in 2014. The Urban Growth Boundary is meant to control urban expansion, whereas the Development Protection Boundary is meant to prevent urban sprawl in the outskirts of cities without adequate infrastructure, by demarcating a no-development zone. This boundary has the function of preserving land for future urban development beyond the 2030 Urban Growth Boundary, while supporting the role of the urban growth boundary in preventing sprawl. The 2014 Decree stipulates several general development principles including:• Strategic development projects that are part of the spatial
strategies, including major road and railway networks passing through private lands, should be prioritised over any other development projects;
• Development projects outside of the boundary are only permitted with the approval of MoMRA; and
• Large-scale development projects should follow specified detailed standards.
The Law also defines development standards that a developer is obliged to comply with based on strategic categories of national, regional and local centres, and the size of the lot. Dammam is categorised as a national growth centre. Legally, the area between the Development Protection Boundary and the 1450 (2030) Urban Growth Boundary is protected and not earmarked for development but the law also outlines mechanisms for building mega or national-regional economic projects therein. For instance, in the case of the Eastern Region, industrial projects by ARAMCO have been approved by MoMRA.
Moreover, given the law, certain agencies have rights to lands situated in such areas, where approval of development projects is routinely controlled by a set of regulations in this regard. Additionally, given the legal flexibility around the definition of “mega” or “strategic” projects, private residential developments exist outside the 1450 (2030) Urban Growth Boundary. These factors have undermined the functional effectiveness of the regulations, the rule of law as well as compact development of urban areas such as Dammam.
Setting the BoundaryThe Urban Growth Boundary for Dammam, along with other cities, was set simultaneously by MoMRA through a Committee under the Unit of Coordination and Projects. The composition of the committee is not clear but, for instance, it did not involve the municipality of Eastern Region, which is responsible for planning at city level. There is an understanding
that the calculations were based on some factors, such as historical growth and expected population growth in the city; however, there are no accurate published criteria on how the size of the boundary was calculated. Spatially, the Committee was not guided by existing infrastructure and services, as the boundary was set symmetrically so that “all sides of the city” can benefit.
Challenges Although the growth boundary regulations set very clear rules for development not to occur outside the boundaries, there are some exceptions, such as housing projects which undermine the effectiveness of the law. For example, in Dammam, there is evidence to suggest that a city was constructed outside the Urban Growth Boundary (in a location between Dammam, Begig, and Al-Ahsa).15 This has caused socio-ecological and economic imbalance (incompatible land uses & land speculation), as well as unbalanced growth and development patterns (sprawl).
Disparity between the size of the boundary and the demographic dynamics of Dammam based on the Committee’s calculations, undermines densification. In other words, based on current population growth projections, the 2030 density will be 6.42 p/ha, which is well below any recommended target, including UN-Habitat’s recommendation of 150 p/ha.
Permitting Development within the Urban Growth Boundary is closely linked to permitting and development control. The process in Dammam is as follows:
• A developer submits a land subdivision plan, including detailed implementation plans for the instalment of the requisite infrastructure to the Amanah (Eastern Region);
• The Amanah assesses application in accordance with the provisions of the Law on Urban Growth Boundary; except those cases defined by MoMRA Ministerial Decree No 17777. This Decree delegates certain roles for the mayors for approving land subdivision solely in relation to the size of residential projects. The Mayor of Eastern Region is an approval authority under this Law;

41
New development next to Dammam’s coast
© FSCP

42
GOVERNANCE AND FINANCIAL FRAMEWORK
White Lands ActThe percentage of undeveloped land (“white lands”) in Dammam is high given that 21% of total land available for urbanisation (see figure 16). The existence of white lands has been a major contributor to a growing housing shortage, particularly for the youth and the growing population as owners choose to hoard property to maximise value, rather than develop it. The Government recently issued the White Lands Tax Law that imposes an annual land tax of 2.5% of its value on ‘white land’, which is defined as vacant land located in ‘populated areas’, zoned for residential or for dual residential and commercial use. The aim of this Law is to:
• Increase the supply of developed land to better address housing shortages;
• Make residential land available at reasonable prices; and • Combat monopolistic practices.
The Ministry of Housing, which is the implementing authority, will implement the Law in phases, starting with Dammam as one of the initial cities.
3.2.5 Land Subdivision Plans
The land subdivision plans are the basic building blocks for KSA cities’ growth and development. The Mayor of the Eastern Region has the power to approve land subdivision in accordance with the following criteria (Ministerial Decree No. 17777 of 2010):
• The land must be within the approved urban boundaries;• The land use specified for the land is consistent with the
instructions and regulations governing it;• The subdivision will not result in cancellation or modification
of an approved regulation, planning or authorised land use; and
• All necessary planning procedures have been completed and the Deputy Ministry for Town Planning (DMTP) has been issued with a certified copy of the plan after its approval.
The Amanah has approved 18 residential land subdivisions between January-December 2017.16
3.3 The Insitutional Context
3.3.1 Urban institutions in KSA
The Deputy Ministry of Town Planning under MoMRA and its departments such as Local Planning, Studies & Research, Projects Coordination and Urban Planning & Design, is mandated to coordinate with all “concerned bodies” in charge of planning to achieve comprehensive urban development.17 In practice, there is little coordination between these departments and the Amanah and this affects service delivery and project implementation.
3.3.2 Regional context: Eastern Region
According to the Ministry of Interior administrative classification, the Eastern Region is divided into 11 governorates, (6 are class A and 5 are class B) and 107 centres (71 are class A, while 36 are class B). Dammam, being the regional capital, is not included in this classification, but instead is governed through a “municipality” (Amanah) headed by a Mayor. This delineation is provided for by MoMRA with Dammams actual status being a 1st class Amanah.18 Given this structure, the Amanah has been allocated funds by MoMRA for development action and municipal services through an annual line item budgeting19 which is the sole fiscal means available to Dammam.20
There are additional institutions in the Eastern Region that manage and regulate the development process: the Amarah and the newly established Eastern Region Development Authority (ERDA). The Amarah of the Region, headed by the Regional Prince who, pursuant to the Regional Law,21 reports to the Ministry of Interior.
The Regional Council,22 is based in the Amarah and is required to,23 :
• Identify the needs of the region and propose their inclusion in the National Development Plan;
• Identify beneficial projects for the Region and submit these as activities requiring funding. These requests are vetted, and viable projects selected for funding. Funding is provided as part of the National Development Plans and yearly budget of the country which is the sole means available to municipalities;
• Study the organisational arrangement of the regional administrative centres, follow up implementation of any modifications; and
• Implement the provisions of the development and budget plan and carry out the needed coordination.
The Municipal Council, also located in the Amanah, with two-thirds of its members appointed by citizen’s votes, while the rest are appointed by MoMRA, supervises the activities of the Amanah and municipalities to make sure that they conform to the Local Plan, as well as meet the current needs of the region. It approves:
Riyadh
Jeddah
Dammam
Others
47 %
27%
7 %
21%
Fig. 16. Percentage of white lands

43
GOVERNANCE AND FINANCIAL FRAMEWORK
• The municipal budget sourced from the cash allocation from national Government. This is constantly subject to revision as it is based on the agreed priorities between the Council and the Mayor;
• Examines the residential plans focussing on whether any procedural violation occurred;
• The scope of municipal services; and• Expropriation projects based on the priorities of the city. The High Commission for the Development of the Eastern Region (HCDER) was established in 2015 to contribute to the comprehensive development of the region (Resolution of the Council of Ministers No. 64 of 2015).
The same law establishes a Council composed of 14 members that should, inter alia, draw up general policies for projects within the region and follow-up their implementation in coordination with the Regional Council and the Amanah.
However, more recently, a decree defining a new authority, named Eastern Region Development Authority (ERDA), was issued.
3.3.3 Local context: Dammam
The Eastern Region is composed of several cities including Dammam, which is the capital and largest city. As earlier mentioned, the city is managed by the Amanah which is headed by a mayor. The mayor is appointed by the Minister of MoMRA and the rest of the Amanah’s executive members are appointed by the Civil Service Bureau based on their professional qualifications. Dammam Urban Planning Department (DUPD),24 ensures compliance with MoMRA’s outline for the Kingdom’s cities, rural areas, streets and construction designs.
The DUPD has roughly 30-40 planners and architects,25 distributed in four units: a) urban planning; b) project management; c) development control; and d) land survey. However, it is difficult to ascertain the role and functions of these units, as well as the manner these units link with other authorities since the internal structure constantly changes with no technical accountability. The Amanah established a Local Urban Observatory, which is monitored by the National Urban Observatory,26 (MoMRA Ministerial Decree No. 1280 of 2007). This observatory supports DUDP by measuring, every three years, the progress of:
• Achieving Vision 2030;
Presentation of the Future Saudi Cities Program
© FSCP

44
GOVERNANCE AND FINANCIAL FRAMEWORK
3.4.2 Municipal revenue
Currently, Amanahs have few sources of revenue and limited authority to collect fees. MoMRA’s recently introduced municipal fees, which expanded their own-source revenue base, but local revenues continue to be insufficient. Consequently, Amanahs continue to be reliant on support from teh central budget.
The central Government finances a large share of the public services and infrastructure at the local level. Baladiyahs prepare project proposals and submit them to municipal Governments to prepare for the budget proposals. Municipalities send these proposals to MoMRA and the Ministry of Finance (MoF). The MoF allocates funds to ministries and agencies (e.g., Amir, regional councils) taking into account additional factors such as population.
Municipalities spend the amount received on the activities included in the line-item budget proposal. MoMRA introduced new municipal fees to increase municipality’s own sources of revenue. In 2016, Dammam generated 19% own-source revenue. Fines, leasing of Government land, and advertisements are the primary contributors to own-source revenues. The gap between own-source revenue and the municipal budgets is usually filled by intergovernmental transfers, leaving municipal Governments reliant on financial resources from the central Government.
Every year the MoF solicits budget proposals from each ministry. Ministries are then responsible for drafting budgets that are compliant with budgetary guidelines. Although the final decision is a top-down process, within MoMRA, the proposal process tends to be bottom-up wherein lower levels of Government submit projects for the next budgetary cycle.
For example, Amanahs aggregate project proposals from Baladiyahs, which are then submitted to MoMRA. Following budget evaluations and revisions, the approved projects are included for review by the MoF. After review and approval, MoF allocates funding accordingly.29
• Achieving Goal 11 of the SDGs; and• City Prosperity Index indicators and other contextualised
urban indicators.
The private sector also plays a vital role in Dammams land development projects. For instance, the Saudi Arabian Oil Company (ARAMCO), while functionally independent from the Ministry of Energy, Industry and Mineral Resources, is directly overseen by the highest levels of Government (the Ministers of Energy, Finance, Communication and Information Technology are on the Board).27
Such large corporations have been criticised for indiscriminate land development, rising cost of housing, speculative land market and urban sprawl due to their construction and land filling activities along ecologically sensitive areas and areas beyond the urban limit.28
3.3.4 Legal and institutional implications for Dammam
Most of the technical decisions and approvals in the local governance system (Amanah), including planning decisions are made on a discretionary basis based on the priorities set fot the city. Therefore, the system lacks technical accountability, predictability, and practical clarity.
3.4 Financial Context
3.4.1 Financial system
Public finance and sound fiscal management are key to supporting local development goals and establishing a solid financial base that strengthens the public sector’s role in supporting local economic development. This chapter examines the financial system in Saudi Arabia and Dammam, in particular.
The financial system mirrors the degree of centralisation observed in overall governance system in the Kingdom of Saudi Arabia (KSA). The Ministry of Municipal and Rural Affairs (MoMRA), via Amanahs, is responsible for financing municipal service activities such as city planning, building licensing, road maintenance, etc.
In addition to MoMRA, a number of other specialised agencies (e.g., the Amir, regional councils, national level ministries) fund and implement projects at the local level. For instance, the Ministry of Education funds city schools directly, as opposed to funding them through Amanahs.
In case of Dammam and the Eastern Region, the presence of ARAMCO plays a significant role in financing and urban development projects both directly and indirectly.
Fig. 17. Budget process at Eastern Region
Ministry of Finance
Ministry of Municipal and Rural Affairs(MoMRA)
Municipal government(Amanah)
Municipal government(Amanah)
Baladiyah Baladiyah Baladiyah Baladiyah
Villages
Villages Villages Villages Villages Villages VillagesVillages
Source: Ministry of Finance, Kingdom of Saudi Arabia

45
GOVERNANCE AND FINANCIAL FRAMEWORK
3.4.3 Financing municipal operating costs
Although, Dammam is one of the highest-ranking cities in KSA, in terms of own-source revenue generation, only 19% of the Amanah’s budget in 2016 was own-source revenue while the rest came from intergovernmental transfers and grants,30. As a result, Dammam/Eastern Region is heavily reliant on the central Government. While the budgeting process takes objective indicators such as population into account, the process is highly political wherein powerful governors influence the how the budget is allocated. With that in mind, the Eastern Region has an advantage with high profile members such as the ARAMCO and Minister of Energy representatives on municipal board.31
Despite minor setbacks between 2015 and 2016, data reports a general growth trend in own-source revenue mobilisation, which increased from SAR 246 million to SAR 299 million between 2012 and 2016. A more detailed breakdown of Dammams own-source revenue (see figure 20) shows the largest own-source revenue contributions come from the revenue collected from government land.
Dammams budget followed by operation and maintenance/programs and contracts, salaries, and operation expenses.While own-source revenues have increased over the last
View of one of the main arteries in the city
Fig. 18. Amanah revenue 2016
2012 2013 2014 20160
50
100
150
200
250
300
350
2015Notes: Revenue is the sum of intergovernmental transfers and own-source revenue
Source: Ministry of Finance, Saudi Arabia, 2016
Fig. 19. Own-source revenue breakdown for Dammam, 2016
Source: Ministry of Finance, Kingdom of Saudi Arabia
0% 10% 20% 30% 40% 50% 60% 70% 80% 90% 100%
Subscription fees Other systems & papers/Terms of
specifications & competitionDifferent income from the activity
Penalties and fine imposedRent of commercial buildings
Land leasingIllustrative fees
Transfer of ownershipHealth certificates
Building, demolition & restorationlicenses
Fee boardsFees for shop boards Fees resulting fromunclassified activity
Advertising spot feesShop licenses
Sales resulting fromactivities not classified
Power supply fees
Rental of facilities
© SAUDITOURISM.SA
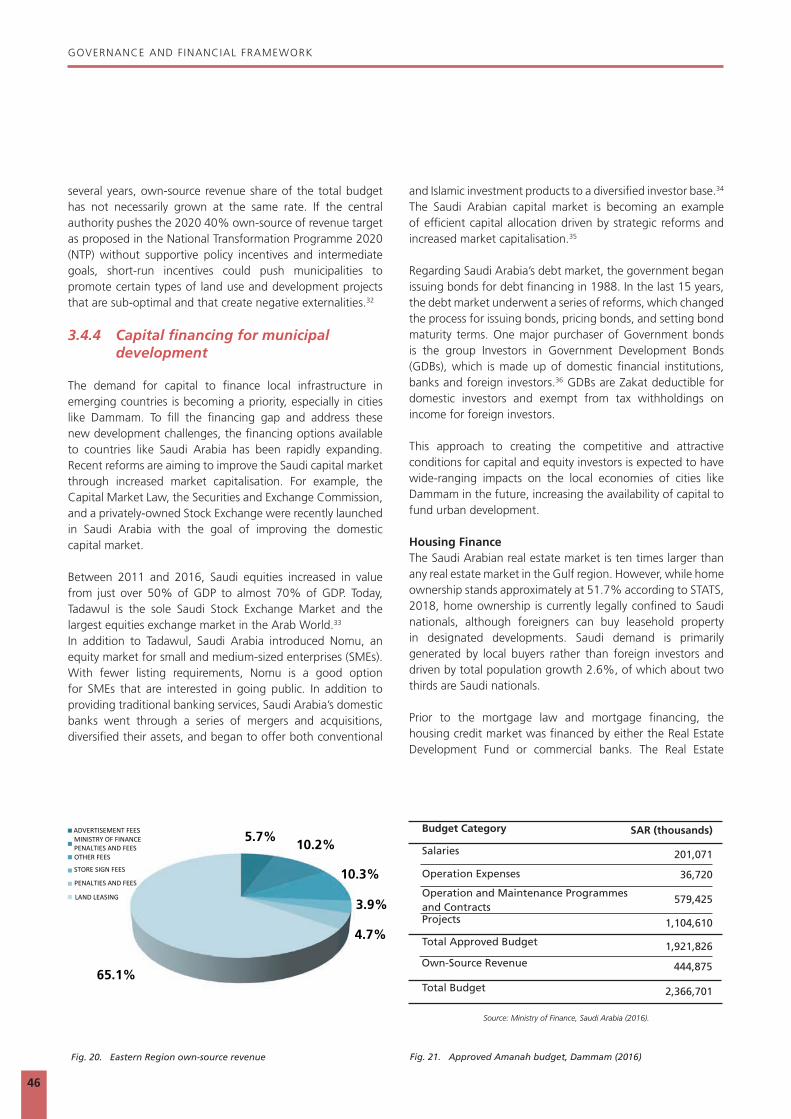
46
GOVERNANCE AND FINANCIAL FRAMEWORK
several years, own-source revenue share of the total budget has not necessarily grown at the same rate. If the central authority pushes the 2020 40% own-source of revenue target as proposed in the National Transformation Programme 2020 (NTP) without supportive policy incentives and intermediate goals, short-run incentives could push municipalities to promote certain types of land use and development projects that are sub-optimal and that create negative externalities.32
3.4.4 Capital financing for municipal development
The demand for capital to finance local infrastructure in emerging countries is becoming a priority, especially in cities like Dammam. To fill the financing gap and address these new development challenges, the financing options available to countries like Saudi Arabia has been rapidly expanding. Recent reforms are aiming to improve the Saudi capital market through increased market capitalisation. For example, the Capital Market Law, the Securities and Exchange Commission, and a privately-owned Stock Exchange were recently launched in Saudi Arabia with the goal of improving the domestic capital market.
Between 2011 and 2016, Saudi equities increased in value from just over 50% of GDP to almost 70% of GDP. Today, Tadawul is the sole Saudi Stock Exchange Market and the largest equities exchange market in the Arab World.33
In addition to Tadawul, Saudi Arabia introduced Nomu, an equity market for small and medium-sized enterprises (SMEs). With fewer listing requirements, Nomu is a good option for SMEs that are interested in going public. In addition to providing traditional banking services, Saudi Arabia’s domestic banks went through a series of mergers and acquisitions, diversified their assets, and began to offer both conventional
and Islamic investment products to a diversified investor base.34 The Saudi Arabian capital market is becoming an example of efficient capital allocation driven by strategic reforms and increased market capitalisation.35
Regarding Saudi Arabia’s debt market, the government began issuing bonds for debt financing in 1988. In the last 15 years, the debt market underwent a series of reforms, which changed the process for issuing bonds, pricing bonds, and setting bond maturity terms. One major purchaser of Government bonds is the group Investors in Government Development Bonds (GDBs), which is made up of domestic financial institutions, banks and foreign investors.36 GDBs are Zakat deductible for domestic investors and exempt from tax withholdings on income for foreign investors.
This approach to creating the competitive and attractive conditions for capital and equity investors is expected to have wide-ranging impacts on the local economies of cities like Dammam in the future, increasing the availability of capital to fund urban development.
Housing FinanceThe Saudi Arabian real estate market is ten times larger than any real estate market in the Gulf region. However, while home ownership stands approximately at 51.7% according to STATS, 2018, home ownership is currently legally confined to Saudi nationals, although foreigners can buy leasehold property in designated developments. Saudi demand is primarily generated by local buyers rather than foreign investors and driven by total population growth 2.6%, of which about two thirds are Saudi nationals. Prior to the mortgage law and mortgage financing, the housing credit market was financed by either the Real Estate Development Fund or commercial banks. The Real Estate
Fig. 20. Eastern Region own-source revenue
Budget Category SAR (thousands)
Salaries
Operation Expenses
Operation and Maintenance Programmes and ContractsProjects
Total Approved Budget
201,071
36,720
579,425
1,104,610
1,921,826
Source: Ministry of Finance, Saudi Arabia (2016).
Own-Source Revenue 444,875
Total Budget 2,366,701
5.7%
4.7%
3.9%
10.2%
10.3%
ADVERTISEMENT FEESMINISTRY OF FINANCEPENALTIES AND FEESOTHER FEES
STORE SIGN FEES
LAND LEASING
PENALTIES AND FEES
65.1%
Fig. 21. Approved Amanah budget, Dammam (2016)
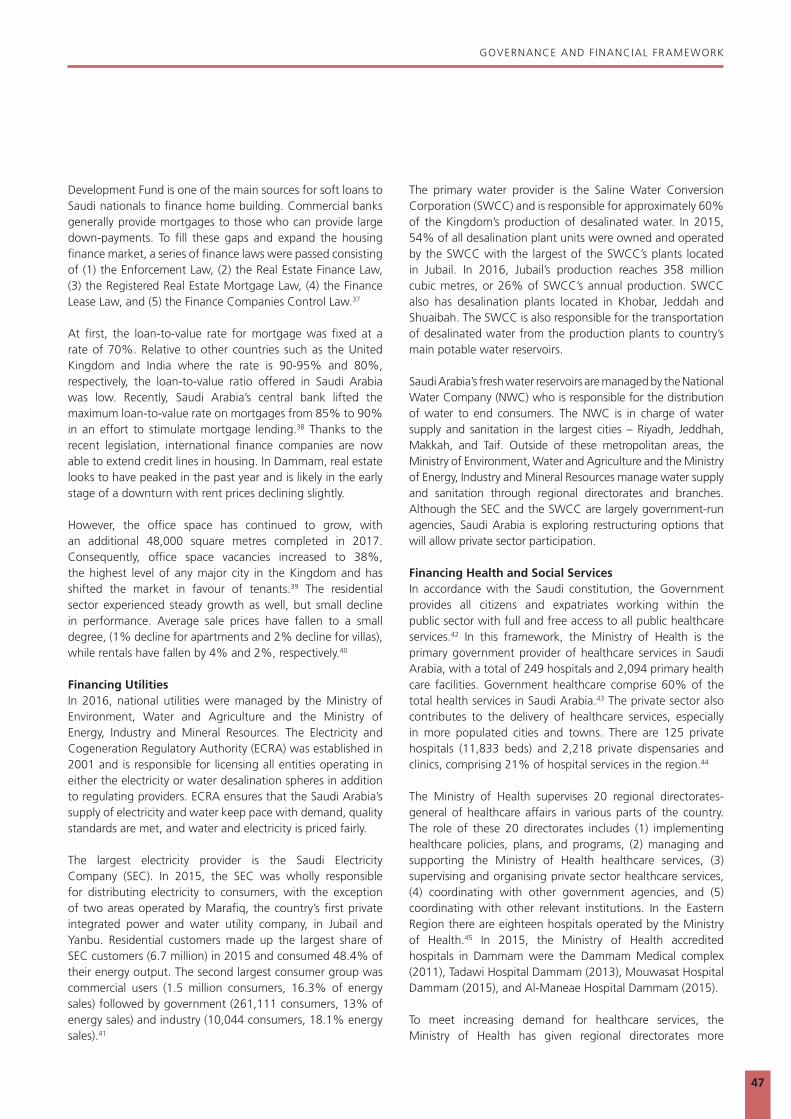
47
GOVERNANCE AND FINANCIAL FRAMEWORK
Development Fund is one of the main sources for soft loans to Saudi nationals to finance home building. Commercial banks generally provide mortgages to those who can provide large down-payments. To fill these gaps and expand the housing finance market, a series of finance laws were passed consisting of (1) the Enforcement Law, (2) the Real Estate Finance Law, (3) the Registered Real Estate Mortgage Law, (4) the Finance Lease Law, and (5) the Finance Companies Control Law.37 At first, the loan-to-value rate for mortgage was fixed at a rate of 70%. Relative to other countries such as the United Kingdom and India where the rate is 90-95% and 80%, respectively, the loan-to-value ratio offered in Saudi Arabia was low. Recently, Saudi Arabia’s central bank lifted the maximum loan-to-value rate on mortgages from 85% to 90% in an effort to stimulate mortgage lending.38 Thanks to the recent legislation, international finance companies are now able to extend credit lines in housing. In Dammam, real estate looks to have peaked in the past year and is likely in the early stage of a downturn with rent prices declining slightly. However, the office space has continued to grow, with an additional 48,000 square metres completed in 2017. Consequently, office space vacancies increased to 38%, the highest level of any major city in the Kingdom and has shifted the market in favour of tenants.39 The residential sector experienced steady growth as well, but small decline in performance. Average sale prices have fallen to a small degree, (1% decline for apartments and 2% decline for villas), while rentals have fallen by 4% and 2%, respectively.40
Financing UtilitiesIn 2016, national utilities were managed by the Ministry of Environment, Water and Agriculture and the Ministry of Energy, Industry and Mineral Resources. The Electricity and Cogeneration Regulatory Authority (ECRA) was established in 2001 and is responsible for licensing all entities operating in either the electricity or water desalination spheres in addition to regulating providers. ECRA ensures that the Saudi Arabia’s supply of electricity and water keep pace with demand, quality standards are met, and water and electricity is priced fairly.
The largest electricity provider is the Saudi Electricity Company (SEC). In 2015, the SEC was wholly responsible for distributing electricity to consumers, with the exception of two areas operated by Marafiq, the country’s first private integrated power and water utility company, in Jubail and Yanbu. Residential customers made up the largest share of SEC customers (6.7 million) in 2015 and consumed 48.4% of their energy output. The second largest consumer group was commercial users (1.5 million consumers, 16.3% of energy sales) followed by government (261,111 consumers, 13% of energy sales) and industry (10,044 consumers, 18.1% energy sales).41
The primary water provider is the Saline Water Conversion Corporation (SWCC) and is responsible for approximately 60% of the Kingdom’s production of desalinated water. In 2015, 54% of all desalination plant units were owned and operated by the SWCC with the largest of the SWCC’s plants located in Jubail. In 2016, Jubail’s production reaches 358 million cubic metres, or 26% of SWCC’s annual production. SWCC also has desalination plants located in Khobar, Jeddah and Shuaibah. The SWCC is also responsible for the transportation of desalinated water from the production plants to country’s main potable water reservoirs. Saudi Arabia’s fresh water reservoirs are managed by the National Water Company (NWC) who is responsible for the distribution of water to end consumers. The NWC is in charge of water supply and sanitation in the largest cities – Riyadh, Jeddhah, Makkah, and Taif. Outside of these metropolitan areas, the Ministry of Environment, Water and Agriculture and the Ministry of Energy, Industry and Mineral Resources manage water supply and sanitation through regional directorates and branches. Although the SEC and the SWCC are largely government-run agencies, Saudi Arabia is exploring restructuring options that will allow private sector participation.
Financing Health and Social ServicesIn accordance with the Saudi constitution, the Government provides all citizens and expatriates working within the public sector with full and free access to all public healthcare services.42 In this framework, the Ministry of Health is the primary government provider of healthcare services in Saudi Arabia, with a total of 249 hospitals and 2,094 primary health care facilities. Government healthcare comprise 60% of the total health services in Saudi Arabia.43 The private sector also contributes to the delivery of healthcare services, especially in more populated cities and towns. There are 125 private hospitals (11,833 beds) and 2,218 private dispensaries and clinics, comprising 21% of hospital services in the region.44
The Ministry of Health supervises 20 regional directorates-general of healthcare affairs in various parts of the country. The role of these 20 directorates includes (1) implementing healthcare policies, plans, and programs, (2) managing and supporting the Ministry of Health healthcare services, (3) supervising and organising private sector healthcare services, (4) coordinating with other government agencies, and (5)coordinating with other relevant institutions. In the Eastern Region there are eighteen hospitals operated by the Ministry of Health.45 In 2015, the Ministry of Health accredited hospitals in Dammam were the Dammam Medical complex (2011), Tadawi Hospital Dammam (2013), Mouwasat Hospital Dammam (2015), and Al-Maneae Hospital Dammam (2015). To meet increasing demand for healthcare services, the Ministry of Health has given regional directorates more
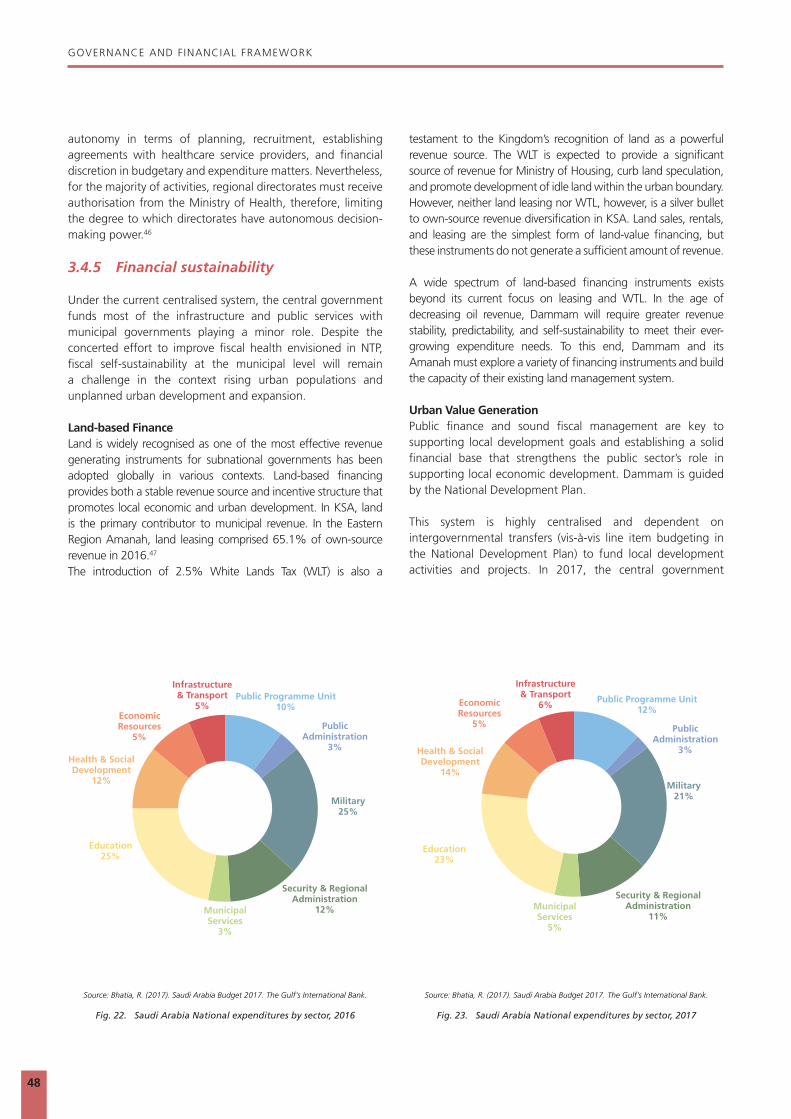
48
GOVERNANCE AND FINANCIAL FRAMEWORK
autonomy in terms of planning, recruitment, establishing agreements with healthcare service providers, and financial discretion in budgetary and expenditure matters. Nevertheless, for the majority of activities, regional directorates must receive authorisation from the Ministry of Health, therefore, limiting the degree to which directorates have autonomous decision-making power.46
3.4.5 Financial sustainability
Under the current centralised system, the central government funds most of the infrastructure and public services with municipal governments playing a minor role. Despite the concerted effort to improve fiscal health envisioned in NTP, fiscal self-sustainability at the municipal level will remain a challenge in the context rising urban populations and unplanned urban development and expansion.
Land-based FinanceLand is widely recognised as one of the most effective revenue generating instruments for subnational governments has been adopted globally in various contexts. Land-based financing provides both a stable revenue source and incentive structure that promotes local economic and urban development. In KSA, land is the primary contributor to municipal revenue. In the Eastern Region Amanah, land leasing comprised 65.1% of own-source revenue in 2016.47 The introduction of 2.5% White Lands Tax (WLT) is also a
testament to the Kingdom’s recognition of land as a powerful revenue source. The WLT is expected to provide a significant source of revenue for Ministry of Housing, curb land speculation, and promote development of idle land within the urban boundary. However, neither land leasing nor WTL, however, is a silver bullet to own-source revenue diversification in KSA. Land sales, rentals, and leasing are the simplest form of land-value financing, but these instruments do not generate a sufficient amount of revenue.
A wide spectrum of land-based financing instruments exists beyond its current focus on leasing and WTL. In the age of decreasing oil revenue, Dammam will require greater revenue stability, predictability, and self-sustainability to meet their ever-growing expenditure needs. To this end, Dammam and its Amanah must explore a variety of financing instruments and build the capacity of their existing land management system.
Urban Value GenerationPublic finance and sound fiscal management are key to supporting local development goals and establishing a solid financial base that strengthens the public sector’s role in supporting local economic development. Dammam is guided by the National Development Plan.
This system is highly centralised and dependent on intergovernmental transfers (vis-à-vis line item budgeting in the National Development Plan) to fund local development activities and projects. In 2017, the central government
Fig. 22. Saudi Arabia National expenditures by sector, 2016
Infrastructure& Transport
6%Public Programme Unit
12%
Public Administration
3%
Military21%
Security & Regional Administration
11%Municipal Services
5%
Education23%
Health & Social Development
14%
Economic Resources
5%
Infrastructure& Transport
5%Public Programme Unit
10%
Public Administration
3%
Military25%
Security & Regional Administration
12%Municipal Services
3%
Education25%
Health & Social Development
12%
Economic Resources
5%
Source: Bhatia, R. (2017). Saudi Arabia Budget 2017. The Gulf’s International Bank. Source: Bhatia, R. (2017). Saudi Arabia Budget 2017. The Gulf’s International Bank.
Fig. 23. Saudi Arabia National expenditures by sector, 2017

49
GOVERNANCE AND FINANCIAL FRAMEWORK
allocated 5% of the total budget to municipal services, which also covered projects and programs managed by MoMRA (see figure 23). To reduce dependence on intergovernmental transfers and increase the performance of municipal services and activities, the government is exploring alternative means of generating revenue to support their development activities and improve services.
A few public services that could be privatised include public transportation, tax administration and collection, waste management services, and municipal property management. On the basis of these premises, the development of Dammam and its capacity to generate value are strongly correlated to planning, finance and governance. Land management and urban planning can support the transformation of municipal finance by improving local capacity to generate revenue.
The funding capacity of municipal governments depends on the local finance mechanisms in use. Moreover, the attractiveness of municipal investment opportunities is influenced by local governance structures. Therefore, municipal capacity building should be a priority for municipalities especially for those interested in public private partnerships (PPPs).
Good governance is also key to increasing land-value, boosting local revenue, privatising public services, and attracting local and foreign investment. Consequently, local governance structures that adopt a holistic approach will be
Understanding Dammam’s legal and financial dynamics
key in maximising urban value in terms of project productivity, efficiency, and effectiveness.
© FSCP

50

4 4
TH
E CU
RREN
T CI
TY
© FSCP

52
THE CURRENT CITY
4.1 Urbanisation Patterns
4.1.1 The city’s development patterns
In the past few years, Saudi Arabian cities experienced rapid urbanisation phenomena. In early 1957, the Dammam Metropolitan Area (DMA) had a population of approximately 70,000, and since then, the Greater Dammam Metropolitan Area (GDMA) witnessed the highest rates in urban development compared to other cities in the Kingdom of Saudi Arabia. Despite the short age of modern urban development, the urban growth has been very rapid. This is evident in the population growth of the GDMA which has increased from 0.365 million inhabitants (1974), to 1.3 million (1993), to 1.75 million (2004), and to most recently, 1.8 million (2010). The population of the DMA has doubled five times in the last 35 years, from 1975 to 2005. Under current population growth rates, the DMA population is expected to reach 3.25 - 3.62 million people in 2040, with an increase of about 1.5 - 1.9 million people in next 25 years.48
The three main factors that have provoked this rapid urbanisation include; the accelerated development of the economy, due to the petroleum reserves and ARAMCO National Oil Company (with their main headquarters in Dammam); secondly, the speculation with land and real estate and third, the slow process to activate legal mechanisms, and urban regulations for establishing a better controlled city expansion. The current DMA population is 1,800,172 people, of which 76% are Saudi Nationality and 24% are non-Saudis; a high number of non-Saudi residents for the city. Additionally, 26.8% of the total population is below 15 years old, and about 50% is below 30 years old, depicting a quite young population. Subsequently, the necessity of provision for enough residential units, education, parks, services, and public infrastructure is also high.
Low density and urban sprawl are two of the main issues of Dammam. The DMA population density in 2003 was 64 p/ha and since then, Dammam density has decreased by 46%. This trend is expected to continue and the density in the DMA is expected to precipitate to a level of 35 p/ha by 2030, if the actual policies and legal measures do not re-address this trend (MoMRA, 2007).
The expansion of the city, at an annual 3% population growth rate, does not align with the growth rate of the city’s area, which has grown by 600% since 1982, mainly due to land speculations indicating that the city’s rapid horizontal expansion, and dispersal of population is defining unbalanced growth patterns.This phenomenon affects the correct functioning of the city and its sustainability, manifesting in the many monofunctional areas: as developers continue creating new gated residential areas without adopting mixed-use models.
POPULATION
2,250,000
POPULATION DENSITY on built-up area
20.13 p/ha
AGE PROFILE
50% < 30
POPULATION GROWTH RATE
3%3,127,500 Expected Population by 2030
Population: 8,5 millionArea: 1,572 km2
Density: 50.51 p/ha
GREATER DAMMAM COMPARED TO GREATER LONDON
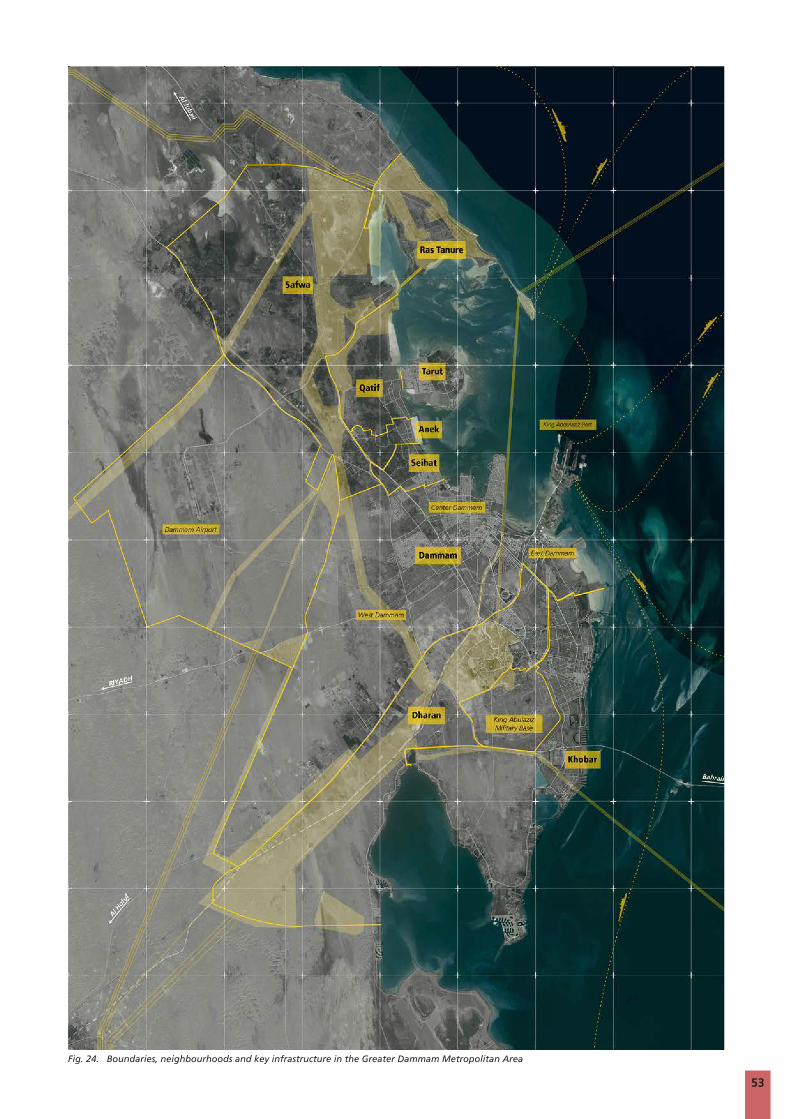
53
Fig. 24. Boundaries, neighbourhoods and key infrastructure in the Greater Dammam Metropolitan Area

54
THE CURRENT CITY
1957Area: 964 haPopulation: 70,000
1934Area: 435 haPopulation: 30,000
Fig. 25. Land allocated per capita
464 sqm/capita in Dammam

THE CURRENT CITY
55
1982Area: 10,000 haPopulation: 490,000
Fig. 26. Urban growth stages
2004
2017
Area: 25,929 haPopulation: 1,202,213
Area: 105,00 haPopulation: 2,250,000

56
THE CURRENT CITY
DEVELOPMENT PROTECTION BOUNDARY
FSCP STUDY AREA
1450 URBAN GROWTH BOUNDARY
484,200 HA
200,200 HA
139,5OO HA
Fig. 27. Administrative boundaries in the Greater Dammam Metropolitan Area
As mentioned above, Dammam City has a strategic geopolitical location within the Eastern Region: it has a seaport opening to the Arabian Gulf, establishing a direct relation to other Gulf States, close to the largest petroleum reserves in the world, and with direct connection to Riyadh, the capital city of the KSA.
The city is amongst the most developed and prosperous within the region, and it relies on a dynamic exchange of goods, people, and resources with the surroundings cities as Dhahran, Khobar, Qatif, Safwa, and Ras Tanura. This has determined important infrastructure investments and development, in particular areas of the Metropolitan Region. Nonetheless Dammam is a city with important spatial, environmental, economic, and social dysfunctionalities.
4.1.2 Administrative boundaries
The Eastern Region is characterised by an extended geographical area. It is the largest region of the Kingdom in terms of area with the “Empty Quarter Desert” occupying more than half of it. The populated part of the region is located in the Northern sector along the Arabian Gulf coast, where Dammam lies. The DMA is surrounded by a Development Protection Boundary and as such, the Dammam Development Protection Boundary (set by the City Planning Department at the Ministry of Municipalities and Rural Affairs (MoMRA) and Amanah). This includes the cities of Dammam, Dhahran,
Khobar, Qatif, Safwa, and Ras Tanura. The boundary includes a variety of natural landscapes, parks, desert, dunes, and beaches with a recreational coastline to the Arabian Gulf. It is considered to be the largest metropolitan extent with an area of 484,200 hectares, and an estimated population of 4,140,000 (2012).
The Dammam Metropolitan Area and the identifies the territory under the direct authority of the Amanah, and it includes Dammam, Dharan, and Al Khobar.It has an area of 139,500 hectares and its spatial extension outpaces the growth of population, resulting in sprawling and low-density development. In 2003, only 8,900 out of 25,618 hectares of land within the urban boundary (35%) was developed, leaving 16,700 hectares of vacant land, with a density of population of 64 p/ha. The high pressure of private sector, with its speculative land market, has played a dominant role in both the economy and the definition of new development boundaries by the Eastern Region, Amanah.
The regulatory laws and initiatives by the Municipality are a slow process compared to the speed of development through which private companies are developing, and dividing large pieces of land in the peripheries of the city, promoting urban sprawl, as well as ignoring the UN-Habitat recommended design principles, and international standard guidelines to promote integrated communities and efficient cities.
105,616 HA

THE CURRENT CITY
57
Fig. 28. Current distribution of population density in the Greater Dammam Metropolitan Area
This indiscriminate land development is a threat to sustainable urban development and creates a big pressure on the municipal economy, undermining its ability and efficiency to supply/grant accessibility to water, electricity, sewage, education, hospitals, and public spaces.
Another relevant issue impacting urban sprawl is the low rate of land that is being developed outside of the consolidated city. Evidently, a high percentage of available land within the city boundary is still vacant, referring to subdivisions located away from city centres. In 2003, about 50% of land allocated for urban activities within the Dammam Metropolitan Area, was still vacant. If these approved subdivisions are not redeveloped and redesigned according to an integrated and comprehensive vision of the metropolitan territory and its system of cities, it will constitute a major development constraint in formulating efficient future urban development plans, by creating consistent pockets of urban voids undermining the continuity, and integration of the urban fabric.
To counteract this recurring tendency, UN-Habitat proposes to redefine the limits of the current Development Protection Boundary, and create an amended Dammam Metropolitan Area Boundary, which reduces the area for urban expansion from 484,200 hectares to 200,200 hectares. This would be less than half of the current area, pushing for consolidation over the existing urban footprint, and establishing almost
280,000 hectares as preservation land, to margin the sprawling development. The area between the existing Development Protection Boundary. and the proposed amended Dammam Metropolitan Area Boundary would therefore be considered a no-development buffer zone for at least the next 50-60 years.
4.1.3 Urban density Dammam geographical location close to the sea and to the desert, have shaped the way the city expanded and where population have decided to settle since the foundation of the city. Most of the development was established in the old city centre of Dammam and Al-Khobar. It is in this two urban cores where the ciy reaches the highest densities from 80 to 120 p/ha.The average density is 20.13 p/ha. In the built-up area, which can be considered a low/middle figure compared to the Saudi Arabian urban context. Is not a dramatic number but it means that there are still areas of Dammam where densities number can be higher, with the possibility of allocating more inhabitants. With the fast development of land speculation at the city’s outskirts, the density numbers continue decreasing. The urban area of DMA has rapidly grown from just 2,096 hectares in 1973, to 8762 hectares in 1982, to 16,148 hectares In 2004, and is expected to reach 20,368 hectares in 2015, doubling 10 times in 40 years. To keep the current density number and increasing it, it is one of the city’s challenges for the next 15-30 years.
1 - 22.0 p/ha22.0 - 48.5 p/ha
48.5 - 68.5 p/ha
68.5- 80 p/ha
80 - 100 p/ha
100 - 120 p/ha
120 - 140 p/ha
Average population density:
Residents:
20.13 p/ha
2, 250,000

THE CURRENT CITY
58
4.1.4 Density / income correlations
The results of the analysis performed reveal that in the GDMA, the areas with the highest density have the people with the lower income, and vice versa.Few areas present mixed income, and high density depicting a scenario where wealthier citizen often live far from the centre and from the better performing areas.
The city centre of Dammam is characterised for presenting a high density but mostly from people with low income, while at the city’s outskirts the poeple with the higher income have decided to live, creating a strong social division and economic polarisation, that it is reflected in spatial terms as well.
This trend has a high impact for the city in terms of economic inefficiency, poor accessibility, low sustainability, and low quality of life. Having higher densities provide the preconditions for an efficient public transport, accessibility to urban opportunities, connectivity, and walkability to urban services, and an overall better quality of life, contrasting the negative impacts of overcrowding, stress, and pollution.
The city needs to balance its actual conditions and promote a more integrated society where people with high and low income can share the same living space, having access to the same public infrastructure and public transport. This creates more equal cities in terms of space and economy.
Fig. 29. Income and density distribution in Greater Dammam Metropolitan Area
1
2 3
4
1 QATIF CITY CENTRE Medium income with high density
2 DAMMAM CITY CENTRE low income with high density
3 DAMMAM PERIPHERY high income with low density
4 AL KHOBAR CITY CENTRE high income with high density
People
2,500-5,000 dlls (high income)
1,000-2,500 dlls (medium income)
0-1,000 dlls (low income)
......

THE CURRENT CITY
59
Fig. 30. Population distribution within Dammam Metropolitan Area
Fig. 31. Work division in Dammam Metropolitan Area
48%
16%
36%
Land Distribution
77 neighbourhoodsMaximum size 35.87km2
Minimum size 0.36km2
Average size 4.01km2
13 neighbourhoodsMaximum size 43.93km2
Minimum size 0.70km2
Average size 8.61km2
44 neighbourhoodsMaximum size 10.70km2
Minimum size 0.42km2
Average size 3.47km2
62%30%
8%
Population Distribution
18%SOCIAL SERVICES [STATE]
21%PETROCHEMICALS
15%TRANSPORT
37%OTHER
DAMMAMDAMMAM
DAMMAMDAMMAM
DHAHRANDHAHRAN
DHAHRANDHAHRAN
AL KHOBARAL KHOBAR
AL KHOBAR
AL KHOBAR
16%TRANSPORT
33%SOCIAL SERVICES [STATE]
50%OTHER
20%SOCIAL SERVICES [STATE]
20%PETROCHEMICALS
22%OTHER
11%CONSTRUCTION
11%WATER AND ENERGY

THE CURRENT CITY
60
Roads infrastructure at the city centre
4.2 Structuring Elements
4.2.1 Natural and topographic elements
Dammam is a coastal city, located between the sea, desert plains and sand dunes. The majority of the territory showcases low-lying elevation topography, as about 50% of the city’s area currently lying between 0 and 10 metres above the sea level. In particular, ARAMCO infrastructure, and industrial areas are located on low-lying grounds to facilitates urban development.
Though in Dammam there are no permanent waterways, groundwater can be found in water bearing rocks-surfaces developing at underground depth. The major ground water sources are the Dammam and Saq aquifers, which used to contribute to the water supply of the city until a recent Royal decree instructed cities not to keep using fossil water tables, preventing further groundwater extraction.
The coast, although heavily polluted and damaged by anthropic activities - from land reclamation to oil-related production and transportation - is undoubtedly Dammam prevalent natural feature. Once characterised by rich water-related ecosystems and rich biodiversity, the degraded coastline is in dire need of attention and ad-hoc rehabilitation programmes.
Furter to be considered, coastal areas such as Dammam, are heavily affected by climate change through rising sea-levels.
Based on a current rate of 1% increase in coastal development per year, and considering the projected 1 metre sea-level rise estimated by the IPCC scenarios, various portions of territory - ranging from 401 to 1,726 hectares are expected to be lost by the year 2100 along the entire Arabian Gulf. This will impact a significant portion of Saudi’s population, as about 12% resides in urban coastal zones characterised by low elevation, and about 50% live within 100 kilometres of the coast. Coastal erosion and sea-level rising, will also disrupt natural habitats, such as coral reefs and mangrove forests, which represent the most significant natural habitat found along the Arabian Gulf.
4.2.2 Movement infrastructure
The Eastern Region is considered the pillar of industry in the Kingdom due to the availability of raw materials, of petroleum, oil reserves, and natural gas. Therefore, Dammam enjoys a high level of infrastructure development that well-connects the city both at the national and regional level.
The development era started when ARAMCO began operating in the city, and needed a port, staff housing, trains, as well as roads. A major port and an international airport also reinforce Dammam’s infrastructure allocation.The King Fahd International Airport, with its 780 square kilometres, is the biggest airport in
© FSCP

THE CURRENT CITY
61
Fig. 32. Natural and topographic elements
Fig. 33. Proposed and existing movement infrastructure according to the Dammam Plan (2006)
1 Proposed high speed rail
1
2
3
4
5
3 Proposed light train
4 Proposed public transit
2 Proposed high speed rail station
5 Existing military base
Train station
Sea port
Airport
Main roads
Public transport
Existing railwayProposed railway
Existing green areas
Topography
Agriculture
Mangroves
Aquifer
Streams

THE CURRENT CITY
62
Vacant land at the city’s outskirts
the world area-wise, and has a transit of 9,570,000 passengers per year, making it the third busiest airport in the KSA. The King Abdulaziz Port, located in Dammam City covers an area of over 19,000 hectares, and is considered the largest port of the Arabian Gulf, and the second busiest port in the Middle East and North Africa, after the Jeddah Islamic Port.
DMA is also directly connected to the Kingdom of Bahrain with a 25 kilometres long King Fahd Causeway. Jubail Industrial City is located in close proximity, less than 80 kilometres to the North of Dammam. The capital Riyadh is some 400 kilometres to the West. Express highways connect DMA to Riyadh and other Saudi cities and neighboring states of Kuwait, UAE and Oman. It is connected by a railroad to the capital Riyadh.
4.2.3 Existing and proposed land use patterns
Land uses is categorised to the different socio-economic activities occurring in a particular area, the human behavior patterns they create, and their effects on the environment. Land use usually provides direction and guidance in structuring the ways that a city functions. Land use planning refers to the process by which institutions decide where, within their territory, different socio-economic activities such as agriculture, housing, industry, recreation, and commerce should take place. However, in the analysis of Dammam carried out by comparing existing and proposed land use plans, it appears that the proposed land uses for the development of Dammam
are dangerously increasing some of the current issues for Dammam urban structure. Overall, the proposed land use presents an important increase in the land use percentage destined to (exclusively) residential areas, increasing from 28% to a 55% of the total urban area, which is almost double. This figure speaks to an increased urban sprawl, especially because of the spatial distribution of these new residential areas, together with exacerbating the tendency to expand the city following monofunctional areas planning.
Currently, Dammam only has a very small area designated to mixed-use, representing barely a 1% of the city’s area. The proposed land use does not provide an increment to this figure. This lack of consistent and diffused mixed land use, risks are mainly toward the overall socio-economic performance of the city. According to UN-Habitats international standards, a prosperous city has to allocate at least 40% of the floor space for economic and commercial uses, including residential areas.This stimulates local jobs, promotes local economic opportunities, and helps to reduce social gaps.
Furthermore, in the proposed land use plan, the land designated as environmental areas dramatically switches from being 19% to just 2% of the total area of the city. Not preserving more land as an ecological buffer to the current natural assets, and not limiting development in ecologically sensitive areas, will have strong consequences in relation to water quality, air pollution, urban heat island effect, and coastal degradation.
© FSCP

THE CURRENT CITY
63
Fig. 34. Existing land use
Fig. 35. Proposed land use according to the Dammam Plan (2006)
Residential
Residential
Industrial
Industrial
Commercial
Commercial
Agriculture
Agriculture
Public facilities
Public facilities
Warehouses
Warehouses
Parking area
Parking area
Open spaces
Open spaces
63.7 %
61.4 %
0.42%
5%
0.74%
4.1%
23.2%
19.8%
1.76%
0.57%
9.2%
7.3%
0.1%
0.22%
0.78%
0.1%
0.75%
Mixed-use
Mixed-use
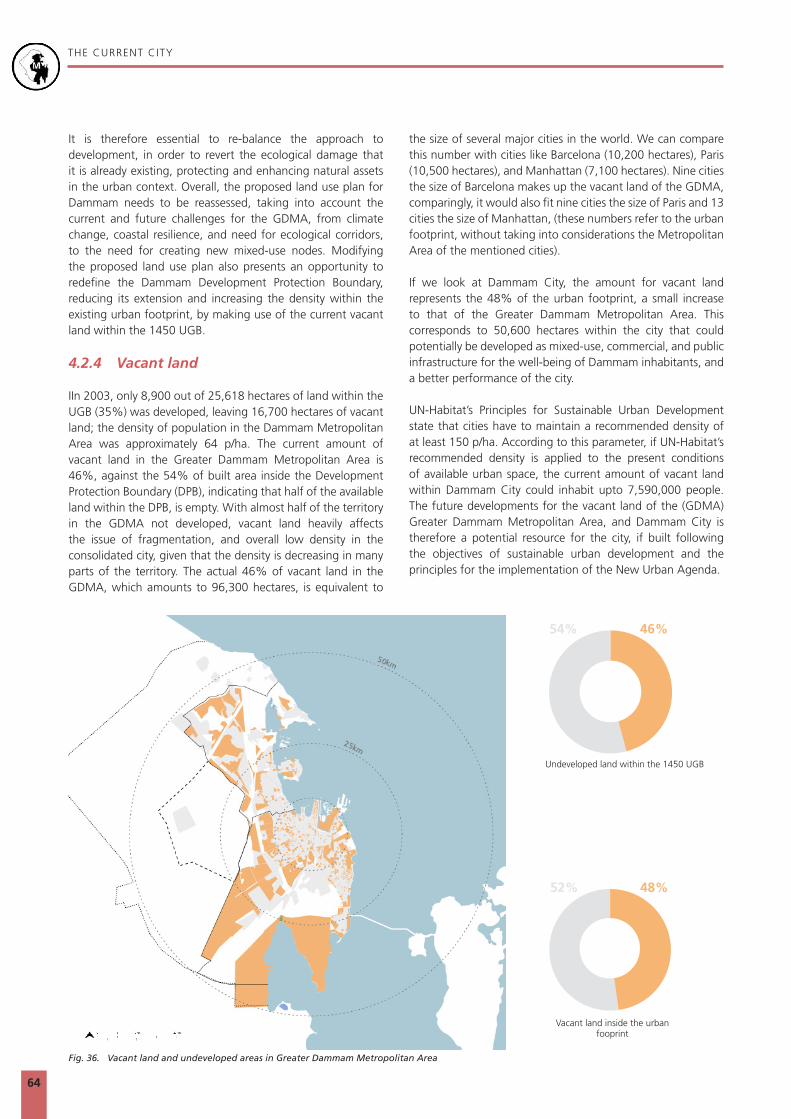
THE CURRENT CITY
64
46%
48%
54%
52%
Undeveloped land within the 1450 UGB
Vacant land inside the urban fooprint
Fig. 36. Vacant land and undeveloped areas in Greater Dammam Metropolitan Area
It is therefore essential to re-balance the approach to development, in order to revert the ecological damage that it is already existing, protecting and enhancing natural assets in the urban context. Overall, the proposed land use plan for Dammam needs to be reassessed, taking into account the current and future challenges for the GDMA, from climate change, coastal resilience, and need for ecological corridors, to the need for creating new mixed-use nodes. Modifying the proposed land use plan also presents an opportunity to redefine the Dammam Development Protection Boundary, reducing its extension and increasing the density within the existing urban footprint, by making use of the current vacant land within the 1450 UGB.
4.2.4 Vacant land
IIn 2003, only 8,900 out of 25,618 hectares of land within the UGB (35%) was developed, leaving 16,700 hectares of vacant land; the density of population in the Dammam Metropolitan Area was approximately 64 p/ha. The current amount of vacant land in the Greater Dammam Metropolitan Area is 46%, against the 54% of built area inside the Development Protection Boundary (DPB), indicating that half of the available land within the DPB, is empty. With almost half of the territory in the GDMA not developed, vacant land heavily affects the issue of fragmentation, and overall low density in the consolidated city, given that the density is decreasing in many parts of the territory. The actual 46% of vacant land in the GDMA, which amounts to 96,300 hectares, is equivalent to
the size of several major cities in the world. We can compare this number with cities like Barcelona (10,200 hectares), Paris (10,500 hectares), and Manhattan (7,100 hectares). Nine cities the size of Barcelona makes up the vacant land of the GDMA, comparingly, it would also fit nine cities the size of Paris and 13 cities the size of Manhattan, (these numbers refer to the urban footprint, without taking into considerations the Metropolitan Area of the mentioned cities).
If we look at Dammam City, the amount for vacant land represents the 48% of the urban footprint, a small increase to that of the Greater Dammam Metropolitan Area. This corresponds to 50,600 hectares within the city that could potentially be developed as mixed-use, commercial, and public infrastructure for the well-being of Dammam inhabitants, and a better performance of the city.
UN-Habitat’s Principles for Sustainable Urban Development state that cities have to maintain a recommended density of at least 150 p/ha. According to this parameter, if UN-Habitat’s recommended density is applied to the present conditions of available urban space, the current amount of vacant land within Dammam City could inhabit upto 7,590,000 people. The future developments for the vacant land of the (GDMA) Greater Dammam Metropolitan Area, and Dammam City is therefore a potential resource for the city, if built following the objectives of sustainable urban development and the principles for the implementation of the New Urban Agenda.

65
Desert land outside the urban footprint
© FSCP

THE CURRENT CITY
66
Automobile oriented infrastructure in Dammam
PHASE 1 (BRT Line I: 50 km) 4.2.5 Public transport accessibility
Dammam City proposed an Integrated Public Transport Network Plan (IPTNP) in order to create a more accessible city. The project includes 50 kilometres of Light Rail (LRT), 110 kilometres of Bus Rapid Transit (BRT), and 350 kilometres of Feeder Buses. The main goal of this plan is to connect the city from the South to the North. The first line would run from Tarot Island via Al Qatif, Dammam, and Dhahran, to Al Khobar. The second line would run along on King Fahd Road in Dammam Northwest, towards King Fahd International Airport. The IPTNP is expected to be completed by 2021, and it will be developed as a Public Private Partnership. According to the analysis performed by UN-Habitat on the proposed Public Transport Master Plan, the LRT in the Phase One will grant accessibility within 10-minute walking distance from each stop to 17% of the total population of Dammam. For Phase Two, the proposed Light Rail Transport - Line 2 - will give accessibility within 10-minute walking from a LRT stop to 27% of the total population. A total of 615,495 people will be therefore served by an easily accessible public transport system at walkable distance once the two main light rail lines are set in place. For the BRT proposed plan, with the completion of the first line, the network will be serving complessively 37% of the total population of the city within a 10-minute walking distance. With the completion of the second line of the BRT, the entire Public Transport system will be granting overall accessibility to about 47% of the total population, (1.043.507 inhabitants of GDMA), and, most importantly, provide a linkage to the Dammam International airport.
© FSCP
253,354 - 18.5 %
383,449 - 28 %
PEOPLE SERVED BY PHASE I
5-minute walking distance
10-minute walking distance
City wide accessibility to public transport
28 %
72 %
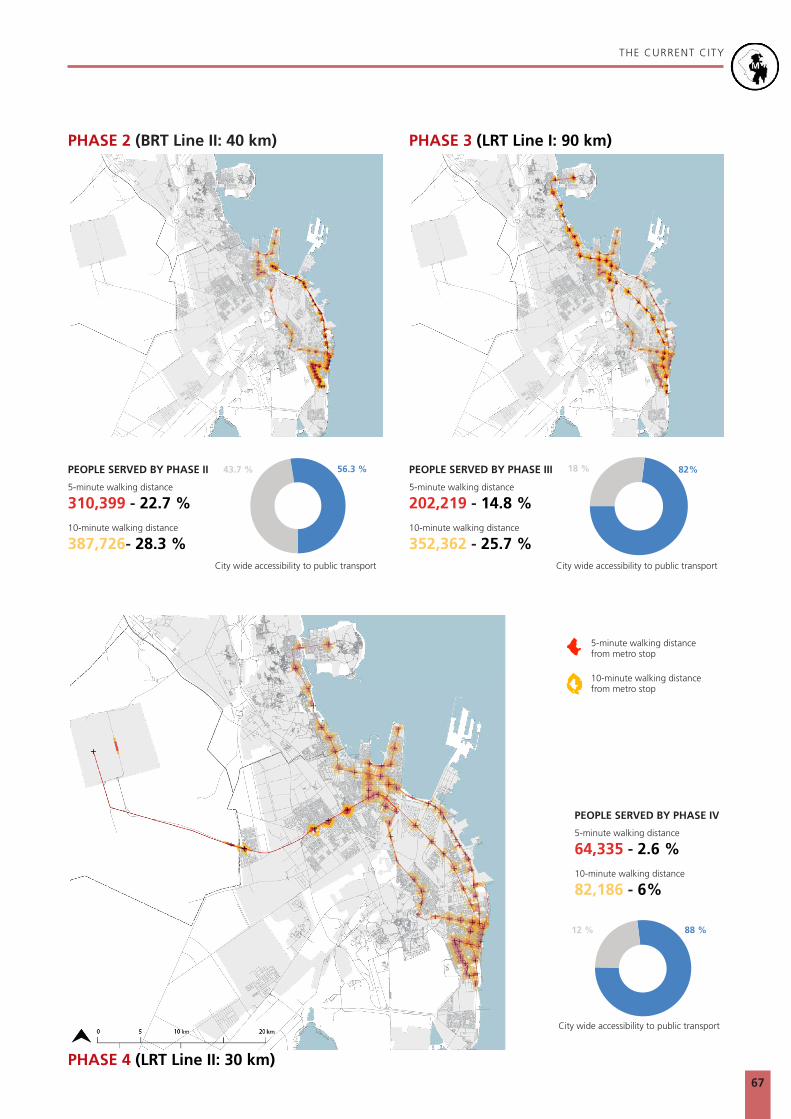
THE CURRENT CITY
67
PHASE 2 (BRT Line II: 40 km) PHASE 3 (LRT Line I: 90 km)
PHASE 4 (LRT Line II: 30 km)
5-minute walking distance from metro stop
10-minute walking distance from metro stop
City wide accessibility to public transport City wide accessibility to public transport
310,399 - 22.7 % 202,219 - 14.8 %
387,726- 28.3 % 352,362 - 25.7 %
PEOPLE SERVED BY PHASE II PEOPLE SERVED BY PHASE III
5-minute walking distance 5-minute walking distance
10-minute walking distance 10-minute walking distance
56.3 % 82%43.7 % 18 %
City wide accessibility to public transport
64,335 - 2.6 %
82,186 - 6%
PEOPLE SERVED BY PHASE IV
5-minute walking distance
10-minute walking distance
88 %12 %

THE CURRENT CITY
68
Land reclamation in Dammam
4.3 Environmental and Climate Change Risk Implications
4.3.1 Water scarcity and desertification
The climate condition in Saudi Arabia results in water scarcity, less than 1,000 cubic metres of water per person per year, and reduced green cover. The environmental features previously described coupled with the unsustainable urbanisation and inadequate infrastructure, puts increased pressure on the use of its limited water. Though a percentage of consumption water comes from desalination plants, it is important to notice that this process is a big source of greenhouse gas emissions, and needs major investments.
Shifting current growth trends to incorporate natural features, and the ecosystems dynamics into the planning processes is paramount to better use of existing resources, and pollution prevention. Current patterns are affecting renewable water resources per capita, which are dropping at an annual rate of 2%. In Dammam City, though no permanent water bodies exist, integrated water streams into the urban realm, has the potential to replenish water into the aquifers. On the contrary, the urban area has been waterproofed through impermeable surfaces and canalisations that direct the water out of the city. In this process, water is usually polluted having a negative impact on the soil, and the sea it flows to. The lack and misuse of water prevents green infrastructure growth,
such as parks, tree canopies, green plazas, etc. In the Eastern Region, overgrazing has reduced vegetation cover to such an extent that previously stable fossil dunes have once again become active, having a negative effect on sand balance, and increasing sand storms towards the Dammam area.
Increasing and incorporating green infrastructure will help protection, and reduction of sand storms, and it will ameliorate the high temperatures that climate change, and concrete development have increased. Simultaneously, these green spaces could become the infrastructure through which rainfall water is better managed, being used for irrigation whilst also enabling water to filter back to the soil. For this purpose, the waterways in the city have been identified and correlated to the limited green spaces and water tables. Similarly, an estimation of areas in the city with the highest risk of UHI effect has been mapped together with the existing wind patterns, and the green spaces.
The mapping helped to identify the current development boundaries of the city, that are mainly growing to the Northwest direction, and are increasingly distant from the sea. Reconsideration is highly recommended, taking into account
© FSCP
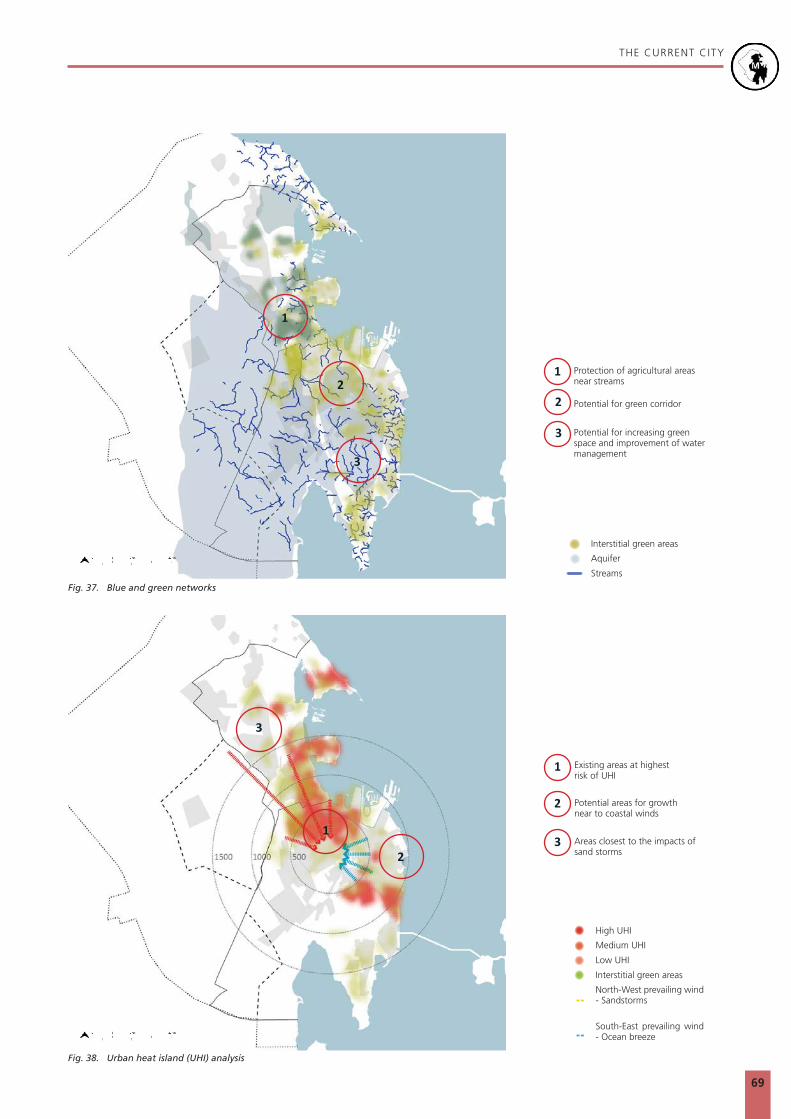
THE CURRENT CITY
69
Protection of agricultural areas near streams
Existing areas at highest risk of UHI
Potential for green corridor
Potential areas for growth near to coastal winds
Potential for increasing green space and improvement of water management
Areas closest to the impacts of sand storms
Interstitial green areas
High UHI
Interstitial green areas
Aquifer
Medium UHI
North-West prevailing wind - Sandstorms
Streams
Low UHI
South-East prevailing wind - Ocean breeze
Fig. 37. Blue and green networks
Fig. 38. Urban heat island (UHI) analysis
1
1
2
2
3
31
2
3
1
3
2

THE CURRENT CITY
70
Destruction of mangrove forests and land reclamation at the coast of Dammam
that the source of cooling breeze that is so needed in the city comes from the sea, and that the sand storms, and hotter winds come from the Northwest. Mapping the mentioned features also helped in recognising that, many of the areas with the highest impact of sand storms are under agricultural use. If this is to be changed as per current trends, the exposure level of this area, and the rest of the city will increase.
Protecting the remaining agricultural land, and promoting the development of a green space strategy, can support the current challenges the city faces with solutions towards the increasing urban temperature, that generates thermal discomfort and threatens urban health.
Potential areas for green infrastructure are identified through the seasonal streams within the built-up form (wadis), which represent the natural flow of rainfall water. This, overlaid with the water tables, helps to diagnose areas along the coast where water management should focus on irrigation of public spaces, and areas where there is also potential for aquifer recharge.
Another potential input increasing the sustainability of public spaces concerns the reuse of grey waters from residential consumption. It is important to notice that around 28% of Dammam, (includes Al Khobar, Qatif,and Seihat) rely on septic tanks where disposal is a big source of environmental pollution. Decentralising water treatment, and recycling at the neighbourhood level could help to reduce water consumption, while supporting the creation of consistent green networks across the city.
Ultimately, public spaces should become a network that supports a better urban environment by protecting natural assets, and enhancing continuity of vegetation, supporting provision of better services related to public spaces, such as sustainable mobility.
4.3.2 Coastal degradation
As previously described, the rise in sea level due to climate change, is a major threat to natural and urban assets at the coast. Sea level rise modelling, particularly in Dammam was developed for scenarios of 0-2 metres, in order to have a rough estimation of affected areas.49 Under this scenario, large coastline areas were identified as vulnerable to the sea-level rise, dangerously impacting national and local economy.
Contrastingly, key infrastructure such as ports, airports, and trains are at risk, affecting the flow of products, and people whilst reclaimed areas are also highly exposed, compromising great investments that have been put on infringement. Therefore, major efforts need to be deployed in order to develop mitigation strategies along the coastline that will reduce their exposure, and vulnerability.
Through reclamation of land towards the Gulf, development is strongly polluting the coastal ecosystems. Since 1955, approximately 14,000 hectares of coastal land have been encroached through backfill operations, leading to water stagnation and threatening marine wildlife. And yet, this
© FSCP
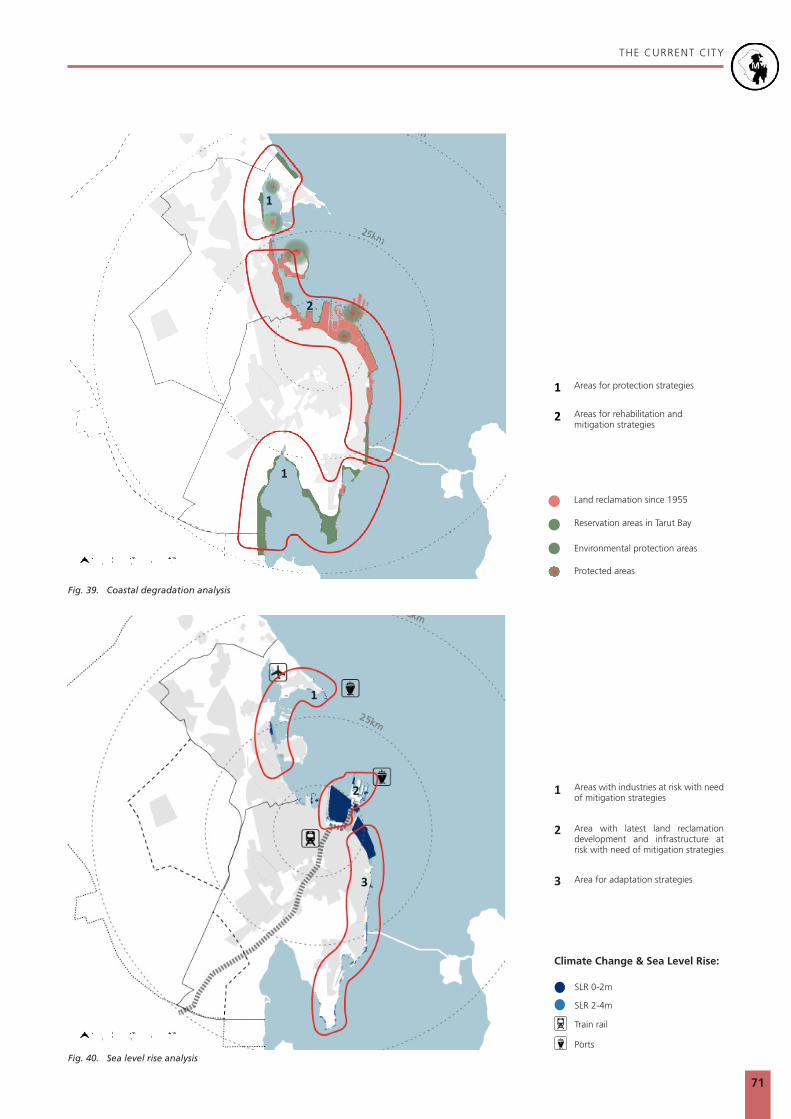
THE CURRENT CITY
71
Areas for protection strategies
Areas with industries at risk with need of mitigation strategies
Area with latest land reclamation development and infrastructure at risk with need of mitigation strategies
Areas for rehabilitation and mitigation strategies
Land reclamation since 1955
SLR 0-2m
Area for adaptation strategies
SLR 2-4m
Reservation areas in Tarut Bay
Environmental protection areas
Protected areas
Train rail
Ports
Fig. 39. Coastal degradation analysis
Climate Change & Sea Level Rise:
Fig. 40. Sea level rise analysis
1
1
2
2
3
1
1
2
2
3
1
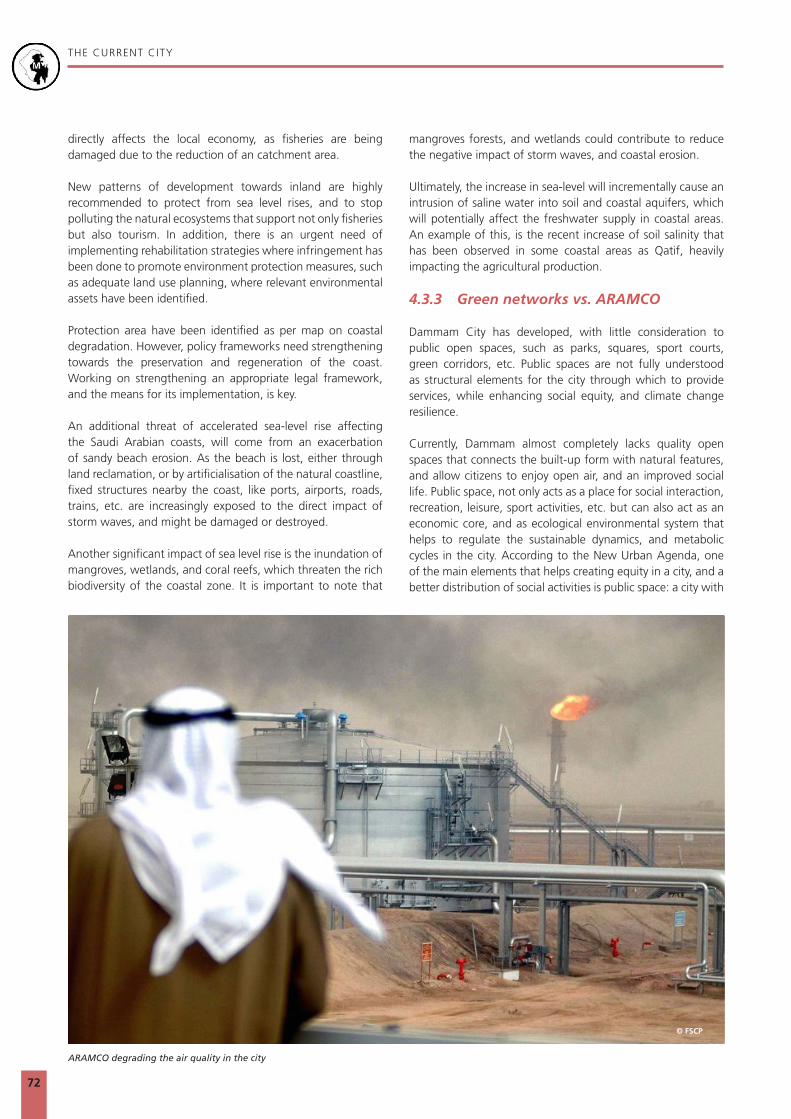
72
THE CURRENT CITY
ARAMCO degrading the air quality in the city
directly affects the local economy, as fisheries are being damaged due to the reduction of an catchment area.
New patterns of development towards inland are highly recommended to protect from sea level rises, and to stop polluting the natural ecosystems that support not only fisheries but also tourism. In addition, there is an urgent need of implementing rehabilitation strategies where infringement has been done to promote environment protection measures, such as adequate land use planning, where relevant environmental assets have been identified.
Protection area have been identified as per map on coastal degradation. However, policy frameworks need strengthening towards the preservation and regeneration of the coast. Working on strengthening an appropriate legal framework, and the means for its implementation, is key.
An additional threat of accelerated sea-level rise affecting the Saudi Arabian coasts, will come from an exacerbation of sandy beach erosion. As the beach is lost, either through land reclamation, or by artificialisation of the natural coastline, fixed structures nearby the coast, like ports, airports, roads, trains, etc. are increasingly exposed to the direct impact of storm waves, and might be damaged or destroyed.
Another significant impact of sea level rise is the inundation of mangroves, wetlands, and coral reefs, which threaten the rich biodiversity of the coastal zone. It is important to note that
© FSCP
mangroves forests, and wetlands could contribute to reduce the negative impact of storm waves, and coastal erosion.
Ultimately, the increase in sea-level will incrementally cause an intrusion of saline water into soil and coastal aquifers, which will potentially affect the freshwater supply in coastal areas. An example of this, is the recent increase of soil salinity that has been observed in some coastal areas as Qatif, heavily impacting the agricultural production.
4.3.3 Green networks vs. ARAMCO
Dammam City has developed, with little consideration to public open spaces, such as parks, squares, sport courts, green corridors, etc. Public spaces are not fully understood as structural elements for the city through which to provide services, while enhancing social equity, and climate change resilience.
Currently, Dammam almost completely lacks quality open spaces that connects the built-up form with natural features, and allow citizens to enjoy open air, and an improved social life. Public space, not only acts as a place for social interaction, recreation, leisure, sport activities, etc. but can also act as an economic core, and as ecological environmental system that helps to regulate the sustainable dynamics, and metabolic cycles in the city. According to the New Urban Agenda, one of the main elements that helps creating equity in a city, and a better distribution of social activities is public space: a city with

THE CURRENT CITY
73
1%
21.6%69.4%
4%4%
Fig. 41. ARAMCO owned land vs. the green network in the Greater Dammam Metropolitan Area
Public space
Interstitial green spaces
Agricultural land
ARAMCO owned land
a poor standard in green areas is therefore a city with a poor social equity as well.
According to the spatial analysis, ARAMCO pipelines occupy 21% of the total Greater Dammam Metropolitan Area, affecting aspects related to urban fragmentation and discontinuity of the city’s fabric. The quantity of outdoor activities and the quality of public life in Greater Dammam Metropolitan Area, can be considered very low, with public space barely covering 1% of the total urban area within the Development Protection Boundary.
Following UN-Habitat parameters, Dammam needs to increase the amount of public space, to at least a 15% or 20% of its area dedicated exclusively to parks, and green open spaces. This will help control the Urban Heat Island effects, and increase economic prosperity in degraded areas. The New Urban Agenda states that inclusive, and accessible cities are committed to create a strong public space network, including streets, sidewalks, and cycling lanes, squares, waterfronts areas, gardens, and parks.
These spaces have a purpose to be multifunctional areas for social interaction and inclusion, human health and well being, economic exchange and cultural expression and to create dialogue among a wide range of diverse people and cultures, designed and managed to ensure human development and build peaceful inclusive and participatory societies, as well as to promote living together, connectivity and social inclusion.
An integrated network of green, public, open spaces needs to be set in place, complementing and linking the current disaggregated and disconnected one. In this scenario, the existing, and quite extensive open spaces, currently labeled as ARAMCO reserves and pipelines buffer areas, could play a key role in creating, connecting, and expanding public open spaces and green infrastructures in Dammam.

74

5 5
STR
ATEG
IC D
IAG
NO
SIS
© FSCP

STRATEGIC DIAGNOSIS
76
5.1 Identifying and Defining Main Strategic Issues
The in-depth, evidence-based analysis brought to light four main strategic, interrelated issues highlighting Dammam’s performance in relation to the principles of sustainable urban development. These issues represent the strategic framing of a complex diagnosis, synthesised through four conceptual lenses. The lenses, once defined in their conceptual nature, were then contextualised by examining how they manifest spatially in Dammam, at different scales. They are synthesised as follows:
5.1.1 Unbalanced growth and development patterns
Spatial patterns are defined by structural elements, fabric morphology, and density distribution, and are highly influenced by land use policy. Inherently, a coherent land use policy influences spatial patterns by determining the appropriate amount of land needed to accommodate future growth and by distributing urban functions and densities accordingly. The combination of these attributes can either generate urban quality or create and increase urban issues such as sprawl. This often happens when a city grows rapidly, presenting an extended sprawl phenomenon, and inharmoniously manifesting unbalanced developments across its territorial extension. Dysfunctionalities emerge in appropriate urban management and citizens experience. In this scenario, the city showcases low density and does not perform effectively, its services and facilities are not well balanced in distribution and accessibility, and therefore citizens do not equally benefit from the advantages of urban life. Additionally, it is costly and difficult for the municipality to provide and maintain basic servicesor efficient and sustainable infrastructure, such as public transport. This is an inherent issue in conditions of sprawl and low density as water, sewage, electricity and transport infrastructures require extension over longer distances to reach relatively fewer people. As such, the significant amounts of land per capita that urban sprawl tends to consume, requires larger capital investments for infrastructure installation and increasing maintenance costs.
The current development trends in Dammam tend to reproduce disperse patterns of low-density and monofunctional land use, with scarce provisions for social activities and both empty interstitial spaces and large areas of vacant land between existing portions of the consolidated city. The tendency toward sprawl in requires urgent address in order to halt progression of the condition, which is heavily affecting the city’s functionality by reproducing unsustainable development patterns of unbalanced growth at low-densities.
DIVISIONS AND LACK OF COHESION IN THE CITY STRUCTURE[ FRAGMENTATION ]
UNBALANCED GROWTH AND DEVELOPMENT PATTERN[ SPRAWL ]
21
Unbalanced Growth and Developmet Patterns Division and Fragmentation
5.1.2 Divisions and lack of cohesion in city structure
In cases of unbalanced growth, sprawl, and inharmonious development, forms of non-contiguous and non-cohesive city structures tend to co-exist without integration. Pockets of leapfrog development are far and widespread. Undeveloped land, over-dimensioned infrastructures and/or large extensions of monofunctional developments, hinder the continuity of the city’s fabric, and therefore, its social, economic, and ecological performance. As in cases of sprawl, this renders the equal provision of infrastructure and services to the entire city difficult and costly. The fragmentation phenomenon also spatially affects the social dimension of sustainability, creating urban inequalities and segregation in areas that lie at a distance to the largest hubs and become isolated by a discontinuous urban landscape. Fragmented cities tend to exhibit a presence of residential estates in the city outskirts, either as high income gated communities or as low-cost housing enclaves, built separately and far from shopping and commercial facilities, industrial, business, and directional centres, and recreational areas. This adds to fragmentation and unsustainable urban patterns, as large highways are often the only viable means of connectivity over such long distances, resulting in car-dependency and high mobility costs.
As such, a city’s spatial patterns influence socio-spatial connectivity and increases travel times and congestion. People’s ability to move from their homes to their workplace, shops, school, and health centres is essential for a city’s performance, and needs to be considered both in terms of distance and comprehensive fabric connectivity. If there are many physical barriers to walk and traverse the city, the city becomes inaccessible to its inhabitants. A well connected urban fabric supports public transport and decreases congestion by increasing the overall accessibility. In well articulated, dense and cohesive urban areas, congestion is reduced, while social and economic vibrancy is increased.

STRATEGIC DIAGNOSIS
77
SOCIO-ECOLOGICAL AND ECONOMIC IMBALANCE[ LACK OF RESILIENCE ]
MONOFUNCTIONAL AND POLARISED DEVELOPMENT[ SPATIAL INEQUALITY ]
3 4
Unbalanced Socio-Ecologocal and Economic Systems
Mono-functional Clusters
5.1.3 Monofunctional and polarised development
When a city showcases a predominance of extended monofunctional zones and lacks in mixed-use areas, this implies a polarised development. This is particularly acute in cases in which monofunctional developments are distantly scattered and isolated from the rest of the city. In Dammam, the urban structure is characterised by monofunctional clusters of economic or social activity that amounts to socio-spatial polarisation, creating inequality with highly variable levels of access between different urban areas. Overall, various forms of polarised development result in inequality in a city, the most obvious example of which can be characterised by socio-economic segregations such as private compounds and gated communities, with high quantity and quality of services when compared to the majority of the consolidated city, in which they are lacking.
Monofunctional land use is a symptom of polarised development, which intrinsically induces socio-spatial inequality. This is demonstrated in reduced opportunities for lower income groups and limited possibilities of social interaction and integration. Monofunctional land use, particularly when coupled with low densities, encourages the use of individual mobility, increasing car dependency and eroding the viability of public transport networks. These conditions further reinforces the exclusion of less privileged social groups in the city. This kind of development hinders economic opportunities, as it precludes synergies and mutual stimulation amongst productive activities.
5.1.4 Socio-ecological and economic imbalance
Each city is formed by complex social, economic and ecological systems. In a sustainable city, the balance between these three interrelated systems is maintained and enhanced over time. If any one system is given continued preference over the others, over time, a structural imbalance will emerge that alters the sustainable trajectory of the city’s growth and development. A socio-ecological and economic imbalance is also created when planning decisions for the city fail to consider preservation and management of existing natural resources, or the functional value of natural assets and their territorial continuity. Planning processes and spatial development practices that incorporate, for instance, integrated water-resource management, natural cycles, and more broadly, functional ecosystem services, are often undervalued by local municipalities all over the world. Socio-ecologically unbalanced urban systems result in a number of threats to the environment, to overall urban quality, and to the health of citizens. Unsustainable consumption patterns, pollution, loss of biodiversity and of agricultural soil, pressure on ecosystems, as well as increased subjection to natural and manmade disasters, are examples of these. All of these conditions additionally carries heavy effect on the economic performances of a city, that can become increasingly clear over long-term observation.
A good example in Dammam, is the case of the oil industry, whereas an economic urban system grows and brings prosperity to its city and citizens, but at the same time destroys natural resources and heavily impacts other socio-spatial aspects of the city’s and the citizens’ health.
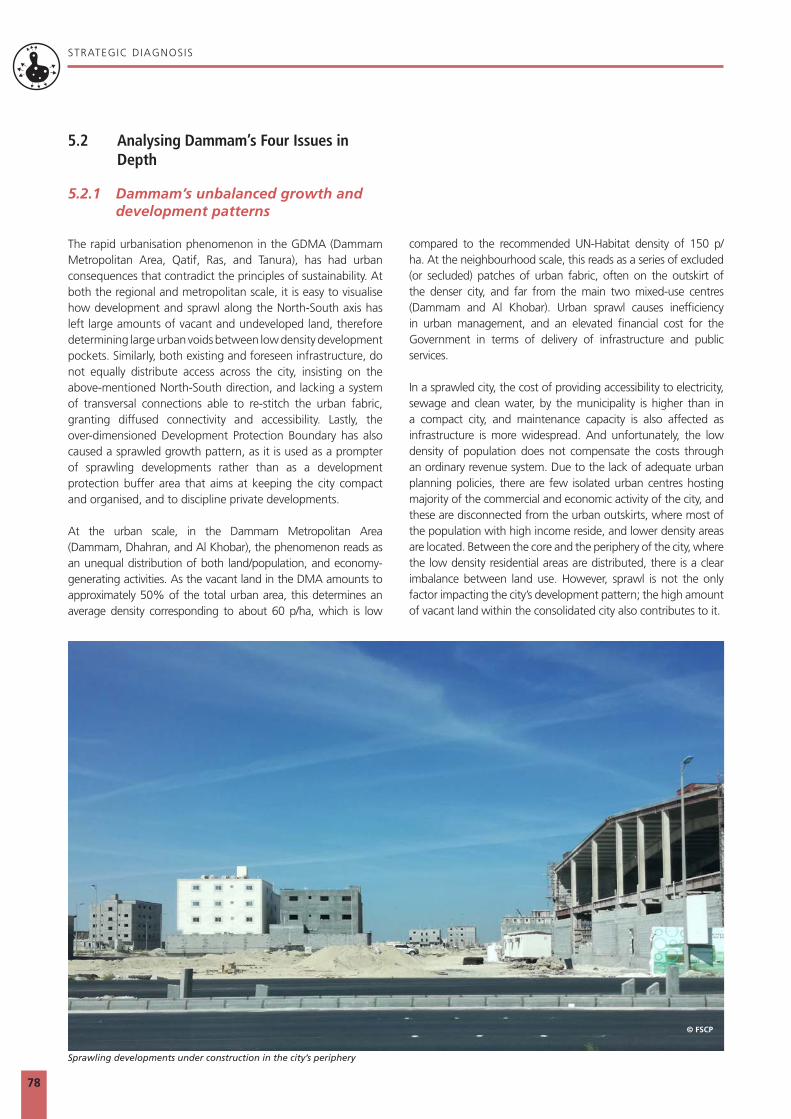
STRATEGIC DIAGNOSIS
78
5.2 Analysing Dammam’s Four Issues in Depth
5.2.1 Dammam’s unbalanced growth and development patterns
The rapid urbanisation phenomenon in the GDMA (Dammam Metropolitan Area, Qatif, Ras, and Tanura), has had urban consequences that contradict the principles of sustainability. At both the regional and metropolitan scale, it is easy to visualise how development and sprawl along the North-South axis has left large amounts of vacant and undeveloped land, therefore determining large urban voids between low density development pockets. Similarly, both existing and foreseen infrastructure, do not equally distribute access across the city, insisting on the above-mentioned North-South direction, and lacking a system of transversal connections able to re-stitch the urban fabric, granting diffused connectivity and accessibility. Lastly, the over-dimensioned Development Protection Boundary has also caused a sprawled growth pattern, as it is used as a prompter of sprawling developments rather than as a development protection buffer area that aims at keeping the city compact and organised, and to discipline private developments.
At the urban scale, in the Dammam Metropolitan Area (Dammam, Dhahran, and Al Khobar), the phenomenon reads as an unequal distribution of both land/population, and economy-generating activities. As the vacant land in the DMA amounts to approximately 50% of the total urban area, this determines an average density corresponding to about 60 p/ha, which is low
Unbalanced Growth and Developmet Patterns
Sprawling developments under construction in the city’s periphery
© FSCP
compared to the recommended UN-Habitat density of 150 p/ha. At the neighbourhood scale, this reads as a series of excluded (or secluded) patches of urban fabric, often on the outskirt of the denser city, and far from the main two mixed-use centres (Dammam and Al Khobar). Urban sprawl causes inefficiency in urban management, and an elevated financial cost for the Government in terms of delivery of infrastructure and public services.
In a sprawled city, the cost of providing accessibility to electricity, sewage and clean water, by the municipality is higher than in a compact city, and maintenance capacity is also affected as infrastructure is more widespread. And unfortunately, the low density of population does not compensate the costs through an ordinary revenue system. Due to the lack of adequate urban planning policies, there are few isolated urban centres hosting majority of the commercial and economic activity of the city, and these are disconnected from the urban outskirts, where most of the population with high income reside, and lower density areas are located. Between the core and the periphery of the city, where the low density residential areas are distributed, there is a clear imbalance between land use. However, sprawl is not the only factor impacting the city’s development pattern; the high amount of vacant land within the consolidated city also contributes to it.

STRATEGIC DIAGNOSIS
79
Fig. 42. Dammam’s unbalanced growth and development patterns
Urban centres
Vacant land
Light rail
Bus route
Bus route
Light rail-airport shuttle
Lack of radial transport routesPlanned ring road extensions
GDMA boundary
Study area boundary
Unbalanced Growth and Developmet Patterns

STRATEGIC DIAGNOSIS
80
Division and Fragmentation
Automobile oriented infrastructure dividing the city
© FSCP
5.2.2 Divisions and lack of cohesion in Dammam’s urban fabric
The divisions and lack of cohesion in the Dammam City structure are defined by various elements, and are observable at different scales. At the scale of the Greater Dammam Metropolitan Area, this is represented by ARAMCO owned land, oversized roads infrastructures, the military base, and the extended industrial areas, all of which define huge cuts and discontinuity in the urban fabric. Also at the scale of the Dammam Metropolitan Area there is a consistent lack of cohesion in the general urban structure, and the urban fabric appears as a series of patches, divided by huge infrastructure, and large amounts of ARAMCO reserve land.
Greater Dammam Metropolitan Area, in particular, presents a fragmented structure due to the presence of industrial complexes, and military areas, pipelines, and large-scale road infrastructure signifying disconnected islands of land. Additional to this, is the scarcity of mixed-use development, extensive amounts of highly monofunctional land use, and a high polarisation in terms of accessibility to services, commercial areas, and public space between rich and poor areas. Contrastingly, and with a very specialised land use zoning, the two main mixed-use centres of old Dammam and old Al Khobar (representing only 2.9% of the entire urban area) are isolated and non easily accessible for most of the city.
At the neighbourhood level, this manifests as a series of neighbourhoods characterised by the disconnected fabric, where either large ARAMCO land reserves, overdimensioned infrastructure, or large parts of hyper-specialised land uses crosscut the neighbourhoods. Thus creating a discontinuous urban fabric with no or very poor mixed-use development, and a lack of human scale in the landscape.
In the rare occasion in which one of these neighbourhoods has a good ratio of space dedicated to streets and public space, the urban environment does not support the principles of walkable, human scale and a sustainable city. This is because this ratio manifests in large scale highways that usually hinders the pedestrian connectivity, and creates low quality public space, that do not translate into an incentive towards walkability.
The resulting density of the built fabric, the overdimensioned infrastructure, and the lack of adequate quality public space, depict neighbourhoods characterised by divisions and emptiness, therefore unable to perform as a unified and connected system within the city at large.

STRATEGIC DIAGNOSIS
81
Fig. 43. Divisions and lack of cohesion in Dammam’s urban fabric
ARAMCO owned land
Divided areas
Division and Fragmentation

STRATEGIC DIAGNOSIS
82
Fig. 44. Spatial obstacles dividing the city
Fig. 45. Fragmentation of the city structure
DHAHRAN
AL KHOBAR
DAMMAM
1
2
3
Divided areas
62.5%GREATER DAMMAM METROPOLITAN AREA
22.3% ARAMCO
OWNED LAND
11.3%INDUSTRIAL LAND
3.9%MILITARY LAND
Military land
Industrial land
ARAMCO owned land
1. ARAMCO RESERVE & INFRASTRUCTURE - Creating a division between the centre of Dammam and Al Khobar
2. MILITARY BASE AND ARAMCO RESERVE - Constraining development of Al Khobar and limiting integration with Dhahran
3. INDUSTRIAL AREA & ARAMCO RESERVE - Creating a large “hole” in the city limiting cohesive urban fabric
Division and Fragmentation

83
ARAMCO fenced land dividing the city
© FSCP

STRATEGIC DIAGNOSIS
84
Mono-functional Clusters
Neighbourhood without mixed-use in the ground floor at the periphery
© FSCP
5.2.3 Dammam’s monofunctional and polarised development
Looking at the functionality of the Greater Dammam Metropolitan Area, it is clear how the overall urban structure is characterised by a series of specialised monofunctional clusters. This highly specialised mono-functionality, directly related to the above-mentioned division and lack of cohesion in the urban fabric, defines an unbalanced urban system and enhances spatial inequality. Thus, Dammam is shaped as a city of cities: industrial city, port city, airport city, shopping city, dormitory city, tourist city, etc.
At the urban scale this is represented by an extremely limited portion of the population, who enjoy easy access to shopping facilities, jobs, and various urban services. Only 31% of the population resides within accessible distance from the two densely mixed-use urban centres, and less than 6% of the population of the DMA resides within 10-minute walking distance from the Dammam, and Al Khobar mixed-use areas.
This lack of diffused mixed-use areas has greatly increased the level of inequality between different urban areas. Whilst more recent developments tend to emphasise, and increase spatial inequality, when looking at some of Dammam oldest neighbourhoods, (Al Dawasir, An Nakhil and Qazaz), surprisingly used to perform well. The older neighbourhoods present high density developments, linked to an efficient
street hierarchy, and supported by a well-balanced mixed-use, favouring high connectivity and equal access to services, and opportunities.
Segregation, in its broadest sense, refers to a situation where the elements of a system are not well mixed and adequately balanced in distribution, and therefore tend to disintegrate and polarise the entire system structure with elements of one nature in one area, and elements with other features in another area.
Transferred to populations, the concept is indicative of a specific group of people characterised by a certain economic and/or social status living in one area with a high levels of services and facilities, whilst people of another socio-economic group live in areas that are far and deprived of the same kind of services.
Segregation is caused by economic, social, and political structures operating on both lower and higher scales. At the local level, it appears as a result of locational choices; where people choose to reside, or are forced to. These locational decisions are taken within the social, demographic, economic, and political context of their country and regions, that primarily affect the housing markets. The unequal distribution

STRATEGIC DIAGNOSIS
85
Mono-functional Clusters
Fig. 46. Dammam’s monofunctional and polarised development
Train stationSea port
Agricultural cityIndustrial city
Mixed-use cityAirport city
Tourism city
Restricted Access City

STRATEGIC DIAGNOSIS
86
Mono-functional Clusters
Major artery with mixed-use at the ground floor
© FSCP
of a population across space can be observed in various ways in the GDMA, particularly in the city centre and the urban outskirts, that have developed in total different directions and functions. Hence, specialised sectors and monofunctional uses are found, which contradicts the UN-Habitat principles of having mixed-use in 40% of the total area of land.
In Dammam, the distribution of activities across the entire urban system are negatively influenced due to the lack of a hierarchy between urban cores and neighbourhoods within the city, the resulting effect is that Dammam appears to be a fragmented city, lacking social richness and vibrant street life, with areas characterised by absence or poor economic activity, and prosperity. Only a 35% of the total population in the city has accessibility to public facilities as schools, hospitals, parks, shops, etc. The other 75%, a total of 513,000 inhabitants, suffers from spatial injustice and inequality.
At the neighbourhood scale, the effect of this polarisation is visible in the new peripheral neighbourhood’s developments. These peripheral neighbourhoods are characterised by fewer connections, scarce accessibility to the rest of the city, and very low-density developments. Although the plans for these neighbourhoods foresee the construction of services and facilities, often enough these structures do not get built
because of their isolated location, and the low density of the neighbourhoods in question make the construction extremely expensive and inefficient. Notwithstanding the planning, the resulting implementation of these developments is poor and creates inequality across the various neighbourhoods, in regards to access to facilities, services, and infrastructure.

STRATEGIC DIAGNOSIS
87
Fig. 47. Mixed land use intensity
Zoom 2The historic neighbourhood demonstrates a high intensity of land mixed-use with both residential and commercial, having more than 32% of the area of economic activity.
ZOOM
Mono-functional Clusters
Zoom 3This district at the coast of the city, presents a medium land mixed-use performance, with only 12% of space for economic activity. However, due to the proximity to the sea-front it has almost 11% public space.
Zoom 1The neighbourhood with a poor mixed-use performance and with none of the area allocating economic activity. The pipeline reserve offers an opportunity to re-stitch the neighbourhood.
Fig. 48. Mixed land use analysis in neighbourhoods
Major roads
Medium mixed-use
Low mixed-use
High mixed-use
There is only a 2.5% of Dammam Metropolitan Area of high mixed-use
2.9%
HIGH MIXED-USE
22.6%
PARTIAL
MIXED-USE
74.5%
LIMITED OR NOMIXED-USE
1
3
2

STRATEGIC DIAGNOSIS
88
Unbalanced Socio-Ecologocal and Economic Systems
Coastal pollution and mangrove forest destruction in the city
© FSCP
5.2.4 Socio-ecological and economic imbalance in Dammam
As mentioned above, the GDMA is located between plains, sand dunes, and the coast of the Arabian Gulf. Majority of the territory is within moderate levels of topography, as about 50% of the urban area ranges between 0 and 50 metres above the sea level, which eases urban development.
Dammam development has mainly been shaped by the oil boom, being the main ARAMCO site, and this has heavily impacted the urban development in both quantity and quality. It is clear how the economic development and the city’s ecosystems functioning are set on divergent paths, defining a scenario where the city’s economy is highly detrimental to the city’s ecology. The result is a deep disconnection and imbalance amongst the social, the ecological, and the economic dimensions of the city.
These three systems have grown and developed in opposing directions, with no emphasis on how they impact the function of each other’s. Delicate ecosystems have been disrupted or eradicated to make room for pipelines, refineries, coastal residential developments, and industrial ports. Additionally, the underlying hydrogeological structure of the city, with its delicate ecological habitats, are left ignored and damaged. Due to a generally inconsistent green network, fragmented by
the pipelines, the ARAMCO reserve, and the over dimensioned infrastructure, there is no connection between the green network and the natural water systems (blue network). The blue network is also fragmented and obstructed, therefore decreasing the resilience to floods, and increasing the reliance on other sources of water for the city (e.g., desalination).
The inconsistent green system and its lack of linkage with the blue network need to be addressed as, if the two systems were linked, it could reduce the evapotranspiration factors and contribute to replenishment of underground water tables.
At the regional scale, the discontinuity of green networks and the lack of green spaces in the urban areas contribute to an increased Urban Heat Islands effect, exacerbated by the limited and disconnected green networks at the citywide scale, and worsening the climatic performance of the city. Likewise, at the scale of Greater Dammam, public open space is not distributed equally, as wealthy coastal areas with relatively low population density have more access to public open space than highly populated areas.

STRATEGIC DIAGNOSIS
89
Fig. 49. Socio-ecological and economic imbalance in Dammam
Mangrove at risk
Reclaimed land
Agricultural land
Interstitial green space
ARAMCO
Urban heat island risk area
Negative environmental impact
Unbalanced Socio-Ecologocal and Economic Systems

STRATEGIC DIAGNOSIS
90
Unbalanced Socio-Ecologocal and Economic Systems
Mangrove forest at Dammam’s coast
© FSCP
For instance, while there is an average of 15.08 square metres of public space per capita, the ratio gets down to 1.06 square metres per capita when looking at the central parts of the city. However, both values reflect a scarce quantity of green public open space, as the recommended UN-Habitat reference value is 30 square metres per capita, which should amount to 15% of the total built-up area.
Furthermore, from a social point of view, the aspect related to the discontinuity of green open spaces networks, highlights an uneven allocation, and therefore an unequal distribution of green infrastructure across the urban areas, reflecting a scarce accessibility of most citizens to open public and green spaces. Whilst vacant land is abundant within both the Greater Dammam Metropolitan Area and the Dammam Metropolitan Area, a dangerous tendency to reclaim land on the coast has altered the natural coastline, emphasising the risks of sea level rising for these new waterfront developments.
Dammam coastline does present a better value for public open space, however it is an area that is at maximum environmental risk due to land reclamation resulting in biodiversity loss. The result is that the compromised coastline, with its large-scale land reclamation developments, and a poor relationship or complete destruction of natural coastline ecosystems, presents high environmental risks, and an urgent need for ecological rehabilitation.
This is all clearly visible at the neighbourhood scale. For instance, by looking at a typified coastal condition in Al Khobar, where new development has taken place close to the existing mixed-use centre, it appears that more than 95% of this neighbourhood has been built on reclaimed land, with up to 10% of the area at risk of sea level rise (2 metres max.).
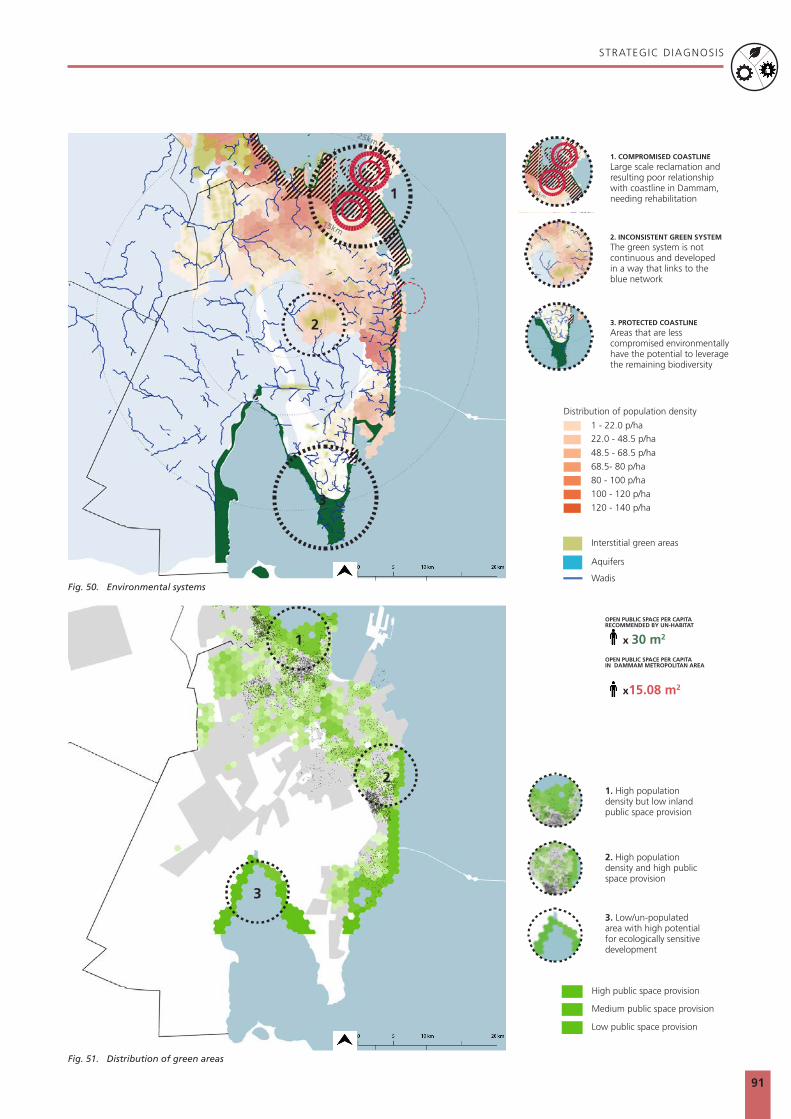
STRATEGIC DIAGNOSIS
91
Fig. 50. Environmental systems
1
2
3
Wadis
Aquifers
Interstitial green areas
Distribution of population density
1. COMPROMISED COASTLINE
Large scale reclamation and resulting poor relationship with coastline in Dammam, needing rehabilitation
2. INCONSISTENT GREEN SYSTEM
The green system is not continuous and developed in a way that links to the blue network
3. PROTECTED COASTLINE
Areas that are less compromised environmentally have the potential to leverage the remaining biodiversity
Fig. 51. Distribution of green areas
1
2
3
Medium public space provision
Low public space provision
High public space provision
1. High population density but low inland public space provision
2. High population density and high public space provision
3. Low/un-populated area with high potential for ecologically sensitive development
OPEN PUBLIC SPACE PER CAPITARECOMMENDED BY UN-HABITAT
OPEN PUBLIC SPACE PER CAPITA IN DAMMAM METROPOLITAN AREA
x 30 m2
x15.08 m2
1 - 22.0 p/ha22.0 - 48.5 p/ha
48.5 - 68.5 p/ha
68.5- 80 p/ha
80 - 100 p/ha
100 - 120 p/ha
120 - 140 p/ha
Unbalanced Socio-Ecologocal and Economic Systems

92
6 6
TH
E FU
TURE
CIT
Y
© FSCP

THE FUTURE CITY
94
THE CONNECTED CITY[ RE-STITCH ]
THE COMPACT CITY[ CONSOLIDATE ] 21
6.1 Strategic Responses
After performing a strategic diagnosis, and identifying four main issues affecting the urban development of Dammam, four strategic recommendations were identified in response. Akin to the four strategic issues, the above-mentioned four strategic recommendations define the conceptual framing for a systemic and strategic level of solutions. Once defined in their conceptual nature, they are developed into a more detailed description, spatially interpreted and contextualised in Dammam, at the various scales. This is followed by a roadmap to implementation, in the form of an articulated Action Plan.
6.1.2 The Connected City
The New Urban Agenda asks cities to commit to creating access to public spaces, public transport, housing, education and health facilities, public information, and communication. The Connected City is envisaged as a continuous, well-connected and well-balanced network of neighbourhoods, each with parks and public spaces, and accommodating a diversity of overlapping private and public activities, shaping a healthy and vital urban environment. The street network has a major role in shaping the urban structure which, in turn, sets the development patterns and scales for blocks, connective nodes, buildings, open spaces, and landscape. This involves development of a well-organised street hierarchy with arterial routes and local streets that is based on different modes of transport and traffic speeds, acting as connectors that should be considered both in terms of accessibility and of social interactions.
In this scenario, public transport can provide fast cross-town connections linking public areas and functional cores of the city to the surrounding neighbourhoods. Most importantly, these neighbourhoods in turn, should provide opportunities and conveniently located facilities that are accessible locally by the community, which in turn reduces the dependency on private vehicles. In large cities, mass transit systems can provide high-speed, cross-town travel by linking one neighbourhood centre with another, leaving local distribution to local systems and foot traffic. This reduces the volume and impact of traffic, which can be calmed and controlled, particularly around the public cores of neighbourhoods. Local trains, light railway systems, and electric buses become more effective, and as a result, cycling and walking more pleasant. Moreover, congestion and pollution are drastically reduced, and a sense of security and conviviality in public space is increased.
6.1.1 The Compact City
According to the UN-Habitat principles, cities need to encourage spatial development strategies that take into account, as appropriate, the need to guide urban extension, prioritising renewal by planning for the provision of accessible and well-connected infrastructure and services, sustainable population densities, and compact design. They must consider integration of new neighbourhoods into the urban fabric, in order to prevent urban sprawl and marginalisation. UN-Habitat principles emphasise the relationship between urban form and sustainability, asserting that the shape and density of cities have implications for the sustainable use of resources into the future, and quality of life for citizens. Strong arguments have emerged to promote the Compact City as the most sustainable urban form. A Compact City is envisioned as a high-density urban settlement, characterised by mixed-use development, recognisable, dense, and revitalised central areas, with well-distributed services and facilities (hospitals, parks, schools, leisure, and entertainment).
Establishing spatial and legal mechanisms to consolidate a Compact City should increase accessibility and walkability, therefore increasing use of public transport and public space, reducing congestion, boosting the local economy and increasing interactions across society. Policies to promote urban compaction involve the promotion of urban regeneration, the revitalisation of town centres, restraint on development in rural and peripheral areas, promotion of higher densities and mixed-use development, promotion of public transport, and the concentration of urban development at public transport nodes. In this scenario, a vibrant street life encourages people to walk or cycle more, and the high-density and mixed-land use developments will, in a sensible way, encourage a social mix who will enjoy close proximities to work, home, and services. Walkability helps to reduce automobile reliance, thus alleviating congestion, air pollution, and unnecessary use of available natural and financial resources.. In addition, compact urban development aims to preserve land resources and natural assets, while increasing the efficiency of public infrastructure and transportation services. A compact built form, supported by an efficient public transport backbone, offers opportunities to increase densities, protect environmental resources, and enhance accessibility to the central area for all residents.

THE FUTURE CITY
95
THE INCLUSIVE CITY[ REBALANCE ]
THE RESILIENT CITY[ PROTECT & IMPROVE ]3 4
6.1.3 The Inclusive City
The New Urban Agenda (NUA) requests commitment from cities in the promotion of diversity in cities and human settlements, to strengthen social cohesion, intercultural dialogue, understanding, tolerance, mutual respect, gender equality, innovation, entrepreneurship, inclusion, identity, safety, and the dignity of all people, while fostering liveability and a vibrant urban economy. However, while urbanisation is moving the global economy forward, rising inequality and exclusion within cities can derail development progress. The concept of an Inclusive City helps to guide urban development towards a model in which people can reap the benefits of urbanisation by ensuring that the local institutions promote pluralism and peaceful coexistence, within increasingly heterogeneous and multicultural societies. The concept of an Inclusive City is structured around:• a vibrant, sustainable, and inclusive urban economy;• building on endogenous potentials, competitive advantages,
cultural heritage, and local resources;• resource-efficient and resilient infrastructure; promoting
sustainable and inclusive industrial development, • sustainable consumption and production patterns; fostering an
enabling environment for businesses, innovation and livelihoods.
This means that for cities to provide opportunities and better living conditions for all, it is essential to understand that the concept of inclusive cities involves a complex web of multiple spatial, social, and economic factors:• Spatial inclusion: urban inclusion requires access to affordable
necessities such as housing, water, and sanitation. Lack of access to essential infrastructure and services is a daily struggle for many disadvantaged households;
• Social inclusion: an Inclusive City needs to guarantee equal rights and participation for all, including the most marginalised. Recently, the lack of opportunities for the urban poor and greater demand for a voice from the socially excluded, has exacerbated incidents of social upheaval in cities;
• Economic inclusion: creating jobs and providing urban residents with the opportunity to enjoy the benefits of economic growth is a critical component of urban inclusion.
The spatial, social, and economic dimensions of urban inclusion are tightly intertwined and tend to reinforce each other. On a negative path, these factors interact to trap people in poverty and marginalisation. When acknowledged and integrated effectively, they can lift people out of exclusion and improve lives.
6.1.4 The Resilient City
A Resilient City takes into consideration appropriate built form and physical infrastructure to increase resilience to the physical, social, and economic challenges that arise from depleting carbon-based fuels and climate change. As such, a Resilient City can be defined as a sustainable network of physical systems and communities in which physical systems consist of both the constructed and environmental components of the city.
They include roads, buildings, physical infrastructure, communication facilities, soils, topography, physical features, geology, waterways, population density, etc. In sum, the physical systems act as the body of the city, its bones, arteries, and muscles. Resilient cities as explained by Godschalk (2003)50 are cities which are capable of withstanding severe shock and stress without either immediate chaos/damage or permanent deformation or rupture. These cities are designed in advance to anticipate and recover from the impacts of natural or technological hazards.
According to the New Urban Agenda (NUA), cities need to ensure environmental sustainability by promoting clean energy and sustainable use of land and resources, protecting ecosystems and biodiversity, promoting sustainable consumption and production patterns, reducing disaster risks, as well as mitigating and adapting to climate change. These elements amount to resilience. The NUA states that cities need to invest in the generation and use of renewable and affordable energy, and sustainable and efficient transport infrastructure and services. This will provide benefits of connectivity and reduce the financial, environmental, and public health cost of inefficient mobility, congestion, air pollution, noise and urban heat island effects. Alongside this, a Resilient City also supports and is mutually supported by its territorial ecosystems, activating positive urban metabolism mechanisms, ensuring a reliable resource supply and balanced value chains.

THE FUTURE CITY
96
New urban cores
6.2 Appropiate Models for Dammam’s Urban Development
6.2.1 The Compact City: Consolidating development and densifying centres in Dammam
There are several perceived benefits of the Compact City over urban sprawl, which include:
• Less car dependency thus lower emissions, • Reduced energy consumption;• Better public transport services;• Increased overall accessibility; • The re-use of infrastructure and previously developed land;• A regeneration of existing urban areas;• The preservation of green space bringing a higher quality
of life, and;• The creation of a milieu for enhanced business and
trading activities. As such, the first strategy concentrates on the importance of limiting the urban sprawl in Dammam, by focusing on the extension and function of the current DPB.
By establishing a strong boundary that limits the extension and consolidates the size of the city, it is possible to increase the density within the built-up areas and in parallel, push for developing the empty plots within existing the urban fabric. This measure will encourage developers to build on the existing vacant land, hence boosting the financial and economic activities related to the construction sector in Dammam. This will also release some pressure from the municipality in supplying basic infrastructure such as sewerage, electricity, and clean water distribution networks, by making their provision economically more viable. In turn, this will also increase the energetic efficiency in the city without necessarily requiring a high cost.
Overall, the provision of more efficient and capillary infrastructure, especially by complementing the existing road system and by providing public transport, will increase accessibility, and support the creation of new centres, envisaged as new mixed-use cores. The proposed public transport network should be optimised, giving access to the current urban peripheries of the city that lack a good connection to the city centres, as well as accessibility to public infrastructure such as schools, hospitals, libraries, and parks. This will increase access to opportunities, as a new integrated multimodal public transport will offer diversified and capillary access to the city, and limit necessity for long distance commuting. Complementing this scenario, a push to infill vacant land will provide new urban services, and convert unused land into productive landscapes, thus contributing to the city’s economy and health.
Densification along the major arteries
Regeneration of existing urban areas
© ONEWORKS
© ONEWORKS
© ONEWORKS
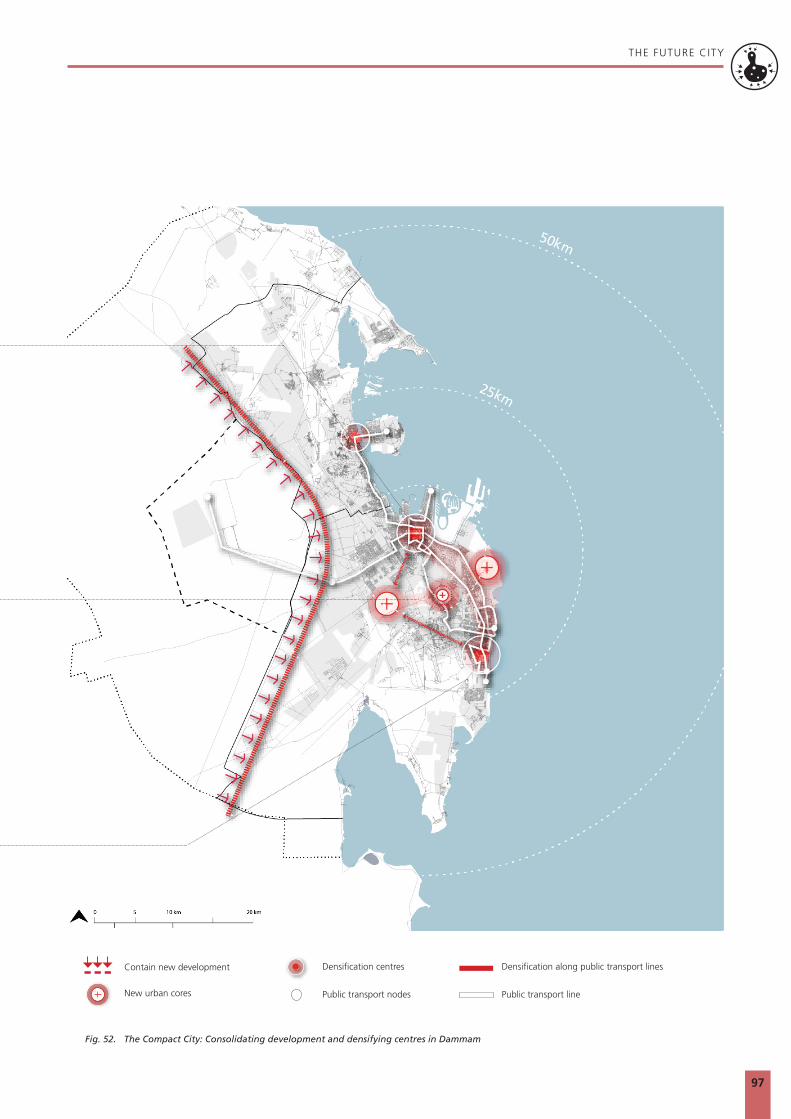
THE FUTURE CITY
97
Fig. 52. The Compact City: Consolidating development and densifying centres in Dammam
Contain new development
New urban cores
Densification centres Densification along public transport lines
Public transport nodes Public transport line
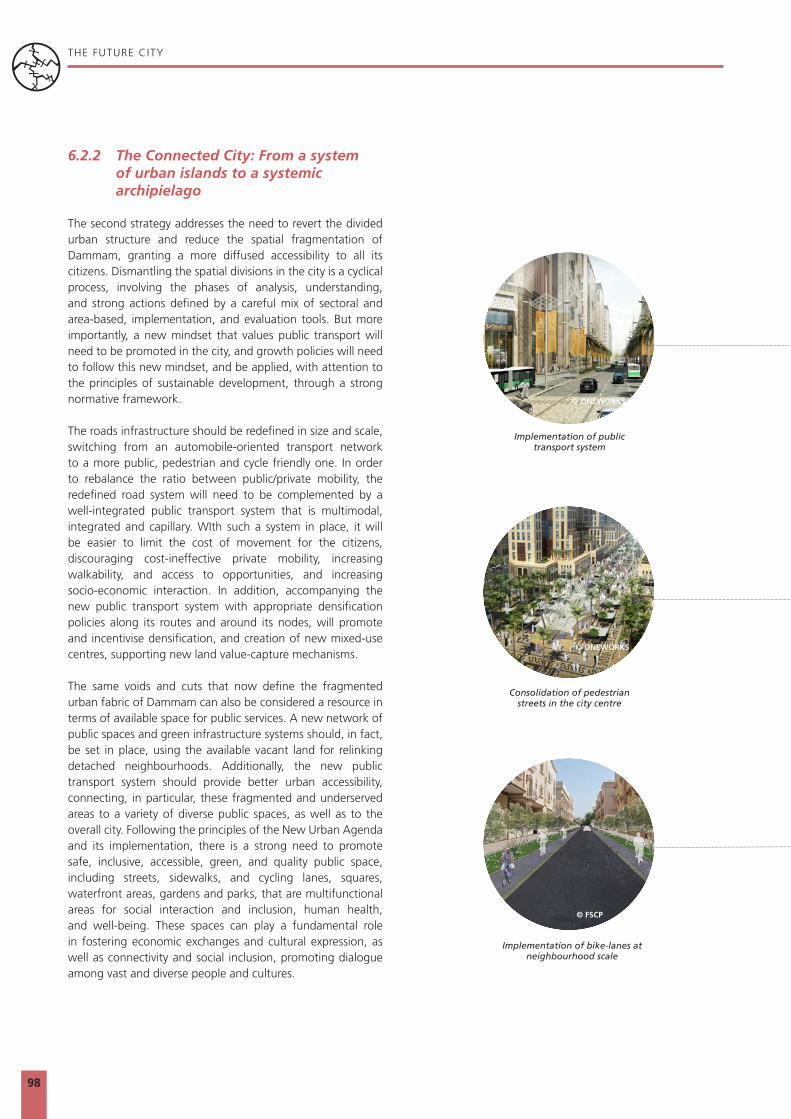
THE FUTURE CITY
98
6.2.2 The Connected City: From a system of urban islands to a systemic archipielago
The second strategy addresses the need to revert the divided urban structure and reduce the spatial fragmentation of Dammam, granting a more diffused accessibility to all its citizens. Dismantling the spatial divisions in the city is a cyclical process, involving the phases of analysis, understanding, and strong actions defined by a careful mix of sectoral and area-based, implementation, and evaluation tools. But more importantly, a new mindset that values public transport will need to be promoted in the city, and growth policies will need to follow this new mindset, and be applied, with attention to the principles of sustainable development, through a strong normative framework.
The roads infrastructure should be redefined in size and scale, switching from an automobile-oriented transport network to a more public, pedestrian and cycle friendly one. In order to rebalance the ratio between public/private mobility, the redefined road system will need to be complemented by a well-integrated public transport system that is multimodal, integrated and capillary. WIth such a system in place, it will be easier to limit the cost of movement for the citizens, discouraging cost-ineffective private mobility, increasing walkability, and access to opportunities, and increasing socio-economic interaction. In addition, accompanying the new public transport system with appropriate densification policies along its routes and around its nodes, will promote and incentivise densification, and creation of new mixed-use centres, supporting new land value-capture mechanisms.
The same voids and cuts that now define the fragmented urban fabric of Dammam can also be considered a resource in terms of available space for public services. A new network of public spaces and green infrastructure systems should, in fact, be set in place, using the available vacant land for relinking detached neighbourhoods. Additionally, the new public transport system should provide better urban accessibility, connecting, in particular, these fragmented and underserved areas to a variety of diverse public spaces, as well as to the overall city. Following the principles of the New Urban Agenda and its implementation, there is a strong need to promote safe, inclusive, accessible, green, and quality public space, including streets, sidewalks, and cycling lanes, squares, waterfront areas, gardens and parks, that are multifunctional areas for social interaction and inclusion, human health, and well-being. These spaces can play a fundamental role in fostering economic exchanges and cultural expression, as well as connectivity and social inclusion, promoting dialogue among vast and diverse people and cultures.
Implementation of bike-lanes at neighbourhood scale
Implementation of public transport system
Consolidation of pedestrian streets in the city centre
© ONEWORKS
© ONEWORKS
© FSCP

THE FUTURE CITY
99
Fig. 53. The Connected City: From a system of urban islands to a systemic archipielago
ARAMCO owned land proposed as green corridor
Existing urban cores
Capillar street structure
Public transport network Public transport network
Sea bus service Sea bus stops

THE FUTURE CITY
100
6.2.3 The Inclusive City: Equalising access to public facilities and economic oppor-tunities in Dammam
The third strategy builds on the previous one and aims at shaping a more inclusive and equal city, increasing the accessibility to public facilities and economic opportunities.
The approach should build on the previous strategy, aiming at utilising the vacant land for service provision, stimulating investments in public space, leisure/green spaces, public services, and facilities to gradually restructure the urban form. This can be achieved, for instance, by strategically positioning major urban attractions in underdeveloped areas, and by linking these new attractions, as well as new public spaces and services, to the rest of the city through an efficient public transport system. Such an operation would maximise accessibility for all citizens and urban users, bringing more people, services, and amenities together in close proximity, and promoting well-distributed high-density mixed-use areas across the city.
There is much evidence to show the adverse side-effects of segregation, and they differ according to the type of segregation. Self-chosen segregation in upmarket gated communities has a different negative effect than other forms, based on lack of choice, although it is as visible and does impact the overall city’s structure. While the residents of the more impoverished areas have fewer opportunities for higher education, better jobs, or upward social mobility, higher-income residents manage to access all of these benefits because of their economic status. What tends to happen is that these upmarket neighbourhoods are often able to lobby towards their interests and influence urban decision-making mechanisms in their favour, while the interests of deprived communities tend to be underrepresented in local political decision-making structures.
Decreasing the fragmentation and the uneven access to opportunities will offer an indirect stimulus for the rebalancing of structural socio-economic dynamics in the city, bringing about positive trade-offs, such as equalising wealth distribution, triggering economic exchange and dialogue amongst a greater diversity of people and social classes. Through integrated legal, financial, and spatial policies, a gradual redistribution of both urban quality and accessibility to services can be achieved in those areas currently characterised by less socio-economic interaction and inclusion.
Public spaces promoting social interaction
Public facilities linked to the sea bus stops
New public infrastructure at the existing urban footprint
©FSCP
© HOLCIM
© FSCP

THE FUTURE CITY
101
Fig. 54. The Inclusive City: Equalising access to public facilities and economic opportunities in Dammam
ARAMCO owned land proposed as green corridor
Public transport network
Connections between urban cores
New urban cores
Existing urban cores
Public transport network

THE FUTURE CITY
102
6.2.4 The Resilient City: Rebalancing socio-ecological and economic systems
Dammam needs to be understood as a complex system of spatial and functional relations amongst its economic productivity (as related to the urban infrastructure), its social systems, and its environmental resources and natural ecosystems. As such, the fourth strategy aims at promoting the development of urban spatial frameworks that support sustainable management in the use of natural resources and land, encouraging appropriate compactness and density, polycentrism, and mixed-uses, and progressively resetting Dammams economic systems towards a more sustainable trajectory. In this scenario, the coastline, the agricultural, and the public green space networks represent a potential source of economic growth and social development that can also be directed to regenerate the health of damaged urban ecosystems.
This should be achieved through urban planning and design instruments that promote viable solutions aimed at re-balancing these systems. An example of this approach, are strategic infill or planned urban extension strategies, as applicable on case-by-case criteria, which can trigger economies of scale and agglomeration, parallel strengthening, and enhance resource efficiency, economic redistribution, urban resilience, and environmental sustainability. In this approach, quality of the urban form, infrastructure, and building design are some of the most important drivers of cost and resource efficiencies, enacting benefits of economy of scale and agglomeration, fostering energy efficiency and productivity, and favouring sustainable growth in the urban economy. A green and circular economy approach, for instance, can provide a reference framework whereby decisions and actions can promote resource efficiency, effective environmental management, and a better standard of living for the residents. Such a framework that aims at balancing aggregated demand for the economic, the social, and the institutional spheres needs to incorporate:
• The ecological dimension-to provide a healthy and natural productive environment;
• The economic dimension-to contribute to economic progress in the sense of prosperity and sustainable resource management;
• The social dimension-to provide for prosperity and equitable social opportunities; and,
• The institutional dimension-to contribute to conducting socio-ecological systems towards sustainability through participatory governance (IRF 2015, 2013).
At the same time, each dimension related to a production system should contribute, at different degrees, to the human development and well-being of the citizens. Human development does not need to be promoted at the cost of ecological preservation and sustainable growth. The necessity of improving urban metabolism and moving towards a
more sustainable city, should be considered and enforced in any new development, by establishing closed loops for production/consumption cycles. There are many examples of such an approach, for instance, integrating public transport and renewable energy generation optimises both the ecological and economic benefits of investments. Another good example for Dammam is the possibility of changing sewage and stormwater-management systems, towards a more decentralised nature-based-solution approach, in order to decrease pollution of both aquifers and the coastline, while reducing the cost of service delivery. Also, ecological remediation can be used and promoted as an economic engine, by developing new opportunities and new markets, from environmental and cultural tourism to fisheries, urban farming, etc. In Dammam, for instance, using the wadis as new green public spaces, and at the same time reframing ARAMCO / vacant land as spaces for reconnection between green and blue networks, could help to redefine new socio-ecological infrastructure for the city, decreasing the water evapotranspiration factors, and increasing the amount of natural resources and open spaces to better connect the city while providing environmental benefits.
Sustainable developments in the coastline
Eco-tourism projects at Half Moon Bay

THE FUTURE CITY
103
Fig. 55. The Resilient City: Rebalancing socio-ecological and economic systems
Connecting green corridors
Public transport network
WadisCoastal revitallisation
Sea public transport nodes linked to green network
ARAMCO owned land proposed as green corridor
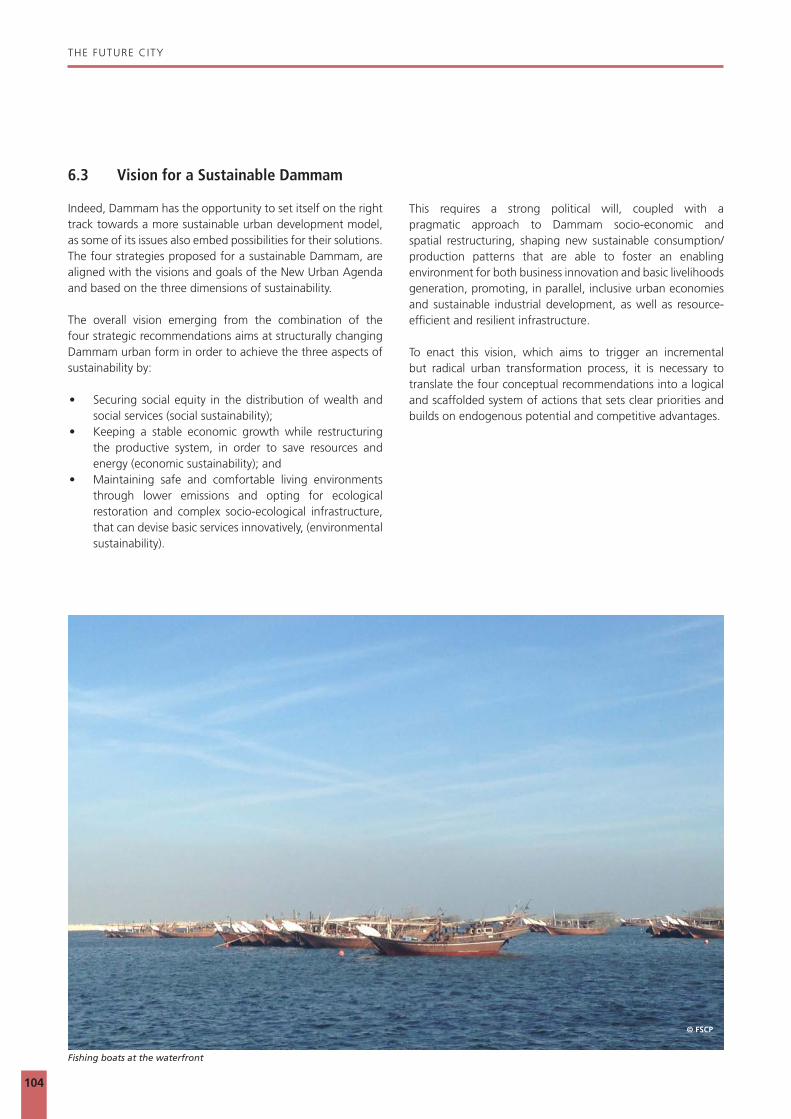
THE FUTURE CITY
104
6.3 Vision for a Sustainable Dammam
Indeed, Dammam has the opportunity to set itself on the right track towards a more sustainable urban development model, as some of its issues also embed possibilities for their solutions. The four strategies proposed for a sustainable Dammam, are aligned with the visions and goals of the New Urban Agenda and based on the three dimensions of sustainability.
The overall vision emerging from the combination of the four strategic recommendations aims at structurally changing Dammam urban form in order to achieve the three aspects of sustainability by:
• Securing social equity in the distribution of wealth and social services (social sustainability);
• Keeping a stable economic growth while restructuring the productive system, in order to save resources and energy (economic sustainability); and
• Maintaining safe and comfortable living environments through lower emissions and opting for ecological restoration and complex socio-ecological infrastructure, that can devise basic services innovatively, (environmental sustainability).
This requires a strong political will, coupled with a pragmatic approach to Dammam socio-economic and spatial restructuring, shaping new sustainable consumption/production patterns that are able to foster an enabling environment for both business innovation and basic livelihoods generation, promoting, in parallel, inclusive urban economies and sustainable industrial development, as well as resource-efficient and resilient infrastructure.
To enact this vision, which aims to trigger an incremental but radical urban transformation process, it is necessary to translate the four conceptual recommendations into a logical and scaffolded system of actions that sets clear priorities and builds on endogenous potential and competitive advantages.
Fishing boats at the waterfront
© FSCP

105
Vibrant corniche at Dammam’s coastline
© FSCP

THE FUTURE CITY
106
6.4 Strategic Impact of the Vision on Urban Patterns
The vision laid out for Dammam in the preceding text has direct and tangible impacts on the spatial organisation of the city. The outcome of the strategic recommendations based on transit-oriented development principles can be assessed using the same methodology that was used to analyse the current conditions. The text and maps discussed in the sections below illustrate the impact of this vision on the density, land use, productivity, and accessibility of Dammam.
Land UseThe spatial patterns of a city are defined by structural elements, fabric morphology, and density distribution. This means that spatial planning and land use are linked to a city’s performance by defining the social, economic, and environmental fabric of our cities. In turn, spatial patterns determine the amount of
land supply that the city would need to accommodate future growth, according to a coherent land use policy.
In the case of Dammam, the identified priority is to infill the interstitial spaces and vacant land existing within the current built-up area. As such, the densification strategy for Dammam prioritises the increase of density around the two existing urban cores, as well as focusing on the new proposed third one, the New Waterfront City. In addition, a general densification strategy, based on the Transit Oriented Development principles, foresees and proposes to incrementally densify along the main axis and nodes of the public transport system.
Creating intensification in certain areas would also help to trigger both spatial synergies amongst diverse parts of the
Fig. 56. Current land use
Residential
Industrial
Commercial
Agriculture
Public facilities
Governmental
Military land
Open spaces
Mixed-use
34.7 %7.3%
2.8%
10.1%
1.5%
5.7%

THE FUTURE CITY
107
city and economies of scale, which, in turn, would create opportunities for different economic strata of society. Accordingly, the proposed Vision for Dammam establishes an increase in mixed-use up to 60%, and a 40% increase for residential areas within the New Waterfront City (NWC).
This operation would dramatically increase Dammam’s current proportion of 1.5% mixed land use, to 8% allocation for mixed land use within the urban area. Following the vision, Dammam would consolidate a more continuous fabric along the main axis and next to the waterfront, reducing the tendency to sprawl by prioritising urban renewal and infill approaches, rather than promoting urban expansions. As an overall effect, the densification strategy for Dammam would incrementally consolidate and compact the urban form, creating a more
efficient use of land and developing the different parts of the city in line with their socio-spatial characteristics. The emerging urban pattern, based on a polycentric and more balanced model, would redefine a coherent and homogenous city, reducing fragmentation and reconnecting small and intermediate neighbourhoods, strengthening their role within the urban system.
Fig. 57. FSCP proposal for new land use
Residential
Industrial
Commercial
Agriculture
Public facilities
Governmental
Military land
Open spaces
Mixed-use
32.7 %6.5%
2.5%
9.3%
8.3%
6.4%

THE FUTURE CITY
108
DensityAccording to the current growth rate for Dammam, by the year 2030, there will be 493,200 new inhabitants in the city. The FSCP Vision for Dammam proposes to allocate most of the new population within the New Waterfront City, rather than to expand the city, to avoid sprawling patterns.
In line with this scenario and implementing the suggested strategic densification and intensification process over the two existing cores of Al Khobar and Old Dammam would enable Dammam to achieve both, a well-distributed density increase and widespread accessibility to social infrastructure and services (e.g., shops, restaurants, hospitals, schools), as well as to business opportunities, for a much larger portion of the population. Following an estimate based on UN-Habitat recommended density, the densification around all the three cores would have the capacity to allocate a total of 1,064,929
new residents, achieving a density ranging between 150 p/ha to 250 p/ha, and achieving the population growth projections for Dammam over the next 30 years.
1 - 22.0 p/ha22.0 - 48.5 p/ha
48.5 - 68.5 p/ha
68.5- 80 p/ha
80 - 100 p/ha
100 - 149 p/ha
150 - 250 p/ha
Average population density in Dammam City Centre:
Current Population:
125-150 p/ha
1,368,617
Fig. 58. Current population density

THE FUTURE CITY
109
Current Population:
125-150 p/ha
1 - 22.0 p/ha22.0 - 48.5 p/ha
48.5 - 68.5 p/ha
68.5- 80 p/ha
80 - 100 p/ha
100 - 149 p/ha
150 - 250 p/ha
Average population density in New Urban Core:
Proposed population:
150-250 p/ha
2,433,546
Fig. 59. FSCP proposal for population density

THE FUTURE CITY
110
ProductivityAccess to jobs is a pivotal factor in the future growth and economic development of a city. The current land use allotment and the population distribution across the city of Dammam can help estimate the number of jobs, which is a critical indicator of the spatial representation of economic opportunities. With greater access to jobs within close distances, the productivity of residents increases, as they spend less time on daily commutes and more time in productive work. Economic opportunities attract businesses and talent, which contribute to the competitive advantage of the city.
The productivity analysis is based on a few assumptions, which assign a certain number of jobs per square metre of built-up area for each land use. While this assumption is broad and an approximation, it helps to understand the trends of job distribution in the city and reveals the inequities and gaps in their spatial distribution and access. The total jobs in the
city at present is at 46 jobs per 100 residents. This number increases to 59 jobs per 100 residents in the proposed scenario by simply densifying land use and building heights within a 10-minute walk corridor along the public transport lines. Thus, for twice the increase in population, the estimated increase in jobs is 2.5 times.
4000 - 15000
JOBS
2000 - 4000
1000 - 2000
400 - 1000
200 - 400
0 - 200
Fig. 60. Current job accessibility within a 10-minute walking distance
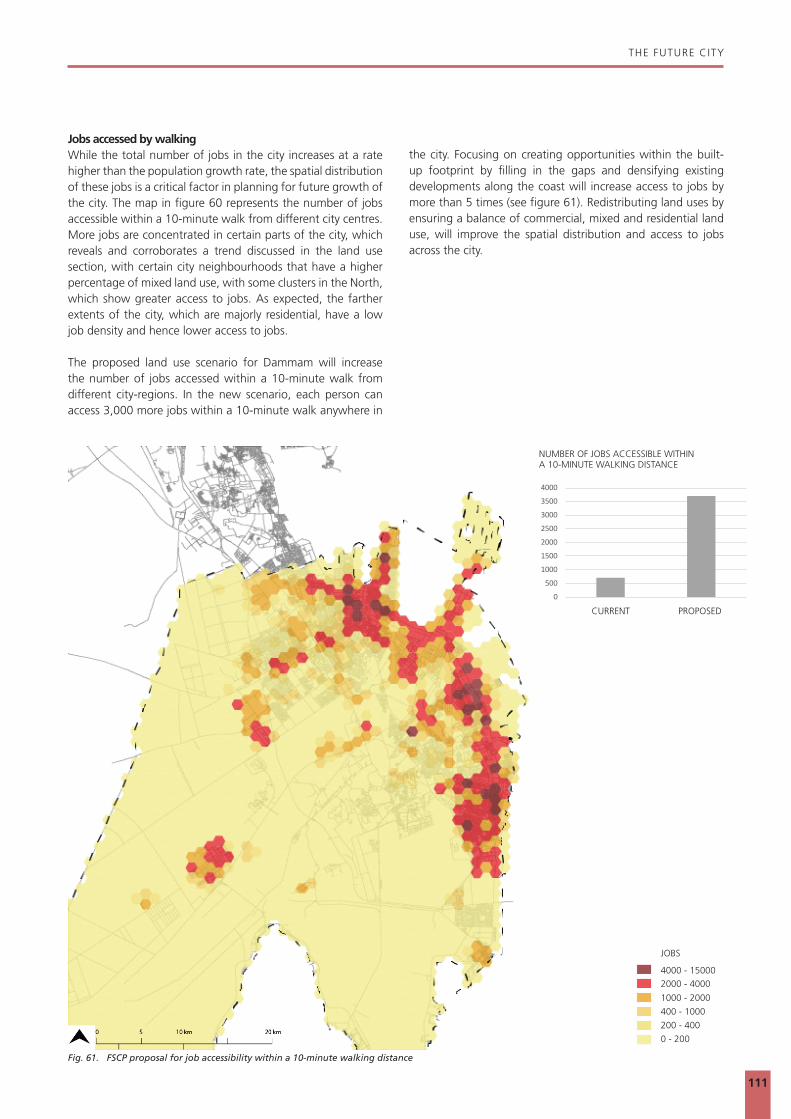
THE FUTURE CITY
111
4000 - 15000
JOBS
2000 - 4000
1000 - 2000
400 - 1000
200 - 400
0 - 200
Jobs accessed by walkingWhile the total number of jobs in the city increases at a rate higher than the population growth rate, the spatial distribution of these jobs is a critical factor in planning for future growth of the city. The map in figure 60 represents the number of jobs accessible within a 10-minute walk from different city centres. More jobs are concentrated in certain parts of the city, which reveals and corroborates a trend discussed in the land use section, with certain city neighbourhoods that have a higher percentage of mixed land use, with some clusters in the North, which show greater access to jobs. As expected, the farther extents of the city, which are majorly residential, have a low job density and hence lower access to jobs.
The proposed land use scenario for Dammam will increase the number of jobs accessed within a 10-minute walk from different city-regions. In the new scenario, each person can access 3,000 more jobs within a 10-minute walk anywhere in
the city. Focusing on creating opportunities within the built-up footprint by filling in the gaps and densifying existing developments along the coast will increase access to jobs by more than 5 times (see figure 61). Redistributing land uses by ensuring a balance of commercial, mixed and residential land use, will improve the spatial distribution and access to jobs across the city.
0
500
1000
1500
2000
2500
3000
3500
4000
1 2
Number of jobs accessible within a 10 minute walk
JOBS
CURRENT
NUMBER OF JOBS ACCESSIBLE WITHIN A 10-MINUTE WALKING DISTANCE
PROPOSED
4000 - 150002000 - 4000
1000 - 2000
400 - 1000
200 - 400
0 - 200
Fig. 61. FSCP proposal for job accessibility within a 10-minute walking distance

THE FUTURE CITY
112
Jobs accessed by public transportThe proposed public transport lines, which includes BRT and LRT, with the current land use pattern and distribution, give access to 22% of all jobs in the city to people residing and working within a 10-minute walk buffer and assuming a 20-minute ride. With the current density and distribution of land use, the public transportation system will not be successful as it would struggle to serve a large percentage of the population.
Densifying and changing land use along the 10-minute walk catchment area from the BRT and LRT stations while retaining the alignment of the lines along the coast of the city, significantly increases the number of jobs accessed, increasing access to 57% of all jobs within the city. The exact proportion of jobs added along these corridors will vary based on the density and distribution of land uses during implementation.
However, developing along the guidelines mentioned in this document will ensure that the city benefits from the economic advantages of bringing people together and connecting them via public transport.
22%
78%
Fig. 62. Current job accessibility from public transport stations
8000 - 50000
JOBS
4000 - 8000
2000 - 4000
1000 - 2000
500 - 1000
0 - 500

THE FUTURE CITY
113
8000 - 50000
JOBS
4000 - 8000
2000 - 4000
1000 - 2000
500 - 1000
0 - 500
57%
43%
Fig. 63. FSCP proposal for job accessibility from public transport stations
8000 - 50000
JOBS
4000 - 8000
2000 - 4000
1000 - 2000
500 - 1000
0 - 500

THE FUTURE CITY
114
Jobs accessed by drivingJob distribution is calculated by estimating a certain number of jobs per square metre of the built-up area for each land use. As shown in figure 64, about 38% of all current jobs in the city can be accessed within a 20-minute drive from anywhere in the city, which is quite reasonable compared to other cities in the Kingdom. This analysis is dependent on the even distribution of land use and the road network itself. This means that central locations have a greater reach to jobs within the city.
Dammam is well-connected by roads, but poorly connected by public transit in the current state. As the population increases and with a denser distribution in the city centre, the access to jobs by road should increase. However, with an increase in the number of people on the current road network, the travel speeds would reduce due to congestion. This is a fair assumption, as trends worldwide indicate that growing cities
witness increased congestion and an overall reduction in travel speeds. Hence, the number of jobs accessed by car within 20-minute will reduce to 26%, (see figure 65). This statistic endorses the need to supplement this reduction in the number of jobs accessible by car by putting a public transportation system in place as the city grows. The public transportation system will increase the total number of jobs accessed when all modes of transport are considered together.
80 - 100%60 - 80%
40 - 60%
20 - 40%
10 - 20%
0 - 10%
38%
62%
Fig. 64. Current job accessibility within a 20-minute driving distance
PERCENTAGE OF JOBS ACCESSIBLEWITHIN A 20-MINUTE DRIVE

THE FUTURE CITY
115
80 - 100%60 - 80%
40 - 60%
20 - 40%
10 - 20%
0 - 10%
26%
74%
Fig. 65. FSCP proposal for job accessibility within a 20-minute driving distance
PERCENTAGE OF JOBS ACCESSIBLEWITHIN A 20-MINUTE DRIVE

THE FUTURE CITY
116
5-minute walking distance from metro stop
10-minute walking distance from metro stop
AccessibilitySpatial planning, land use, and urban density impact the overall effectiveness of a public transport system, in terms of the number of users, travel-time, and distances. In a city with a balanced mixed land use and characterised by compactness and good accessibility to services and facilities, can generate strong local economic dynamics and trigger social integration through public transport.
Implementing the vision for Dammam will have a great impact on the number of people accessing public transportation, therefore, the city and its opportunities. In respect of the foreseen public transport system, the number of users for the LRT Line II and the BRT Line I - connecting the metropolitan area formed by Al-Khobar, Dammam, and Qatif from the South to North - will increase substantially, therefore, justifying the large investment needed. These two lines will be crossing
the area of intervention for the New Waterfront City (NWC). Without the densification strategy accompanying the creation of the NWF, these two lines would serve 387,726 people, but according to the proposed densification strategy, the overall impact of the public transport system would increase dramatically, serving more than one million people. This means that the proposed intervention will more than double the capacity and impact on the foreseen public transport network, with an increase of 635,540 in the number of possible users.
Fig. 66. Current accessibility within 10-minute walking distance from metro stops
65.2%
34.8%

THE FUTURE CITY
117
5-minute walking distance from metro stop
10-minute walking distance from metro stop
Fig. 67. FSCP proposal for accessibility within a 10-minute walking distance from metro stops
74.8%
25.2%

118

7 7
ACT
ION
PLA
N
© FSCP

Act ion P lan
120
7.1 From Strategy to Action
Transforming conceptual recommendations into concrete and implementable strategies through both punctual and diffused interventions requires detailed systemic and scaffolded actions that can incrementally trigger the envisaged spatial, economic, and social transformations. Intrinsically, an action plan that is rooted in the four strategic recommendations and grounded in a series of systematically scaffolded interventions for Dammam serves as a guide towards building a more vibrant and prosperous city. Overall, the action plan aims to generate impact at three scales: Greater Dammam Metropolitan Region, Dammam Metropolitan Area, and the neighbourhood scale. It supports the construction of new infrastructure, rebuilding the relations between the city, its waterfront and its other natural resources, while boosting integration of the urban outskirts to the rest of the city, by improving transport and mobility networks, and, in parallel, developing and expanding financing and legal instruments needed to support all of these transformations. The action plan outlines four systemic actions, envisaged for the Dammam context, in the form of four strategic actions. Although all the strategic actions target specific interventions able to trigger a structural change in Dammams development trajectory, there is a conceptual difference in the way that they were conceived.
The four actions are defined as:
• ACTION 1: Implement a multi-modal transportation network.
• ACTION 2: Relink the natural systems to a rich and diversified coastal development.
• ACTION 3: Create a new “Waterfront City”.
• ACTION 4: Rethink the development model for Half Moon Bay as a socio-ecological hub.
Actions 1 and 2 address the need for a system of diffused interventions acting at the scale of the metropolitan region (Greater Dammam Metropolitan Area), aiming to re-balancing ecosystem services and infrastructural development, building the broad conditions for a socio-ecological rehabilitation of the whole metropolitan system.
Simultaneously, Actions 1 and 2 will begin to change and diversify the economies at the metropolitan region scale. Actions 3 and 4 focus on the urban level, (Dammam Metropolitan Area), showing how Dammam new development model needs to be spatialised at the neighbourhood/settlement scale.
Vibrant public space at the waterfront
© FSCP

Act ion P lan
121
1. Implement a multi-modal transportation network
Fig. 68. Four integrated actions for a sustainable Dammam
2. Relink the natural systems to a rich and diversified coastal development
3. Create a New “Waterfront City”
4. Rethink the development model for Half Moon Bay as a socio-ecological hub.
2
31
4

Act ion P lan
122
These new acupunctural green interventions will start to create a networked system of green infrastructure. Over time, with the increasing decline in the oil industry, and the necessary conversion of ARAMCO’s activities in other economic sectors, vast extensions of land currently labelled as ARAMCO’s reserve, will be available for the city to link and extend this network of green infrastructure, and for ARAMCO to explore new and more sustainable investment possibilities. In this scenario, the vision is that the vast linear urban territories will become new linear productive landscapes, functioning as socio-ecological infrastructure, and creating new green systems across the city by merging ecological and social functions, to economic ones. The first action comprehensively targets the implementation of integrated, polycentric, and balanced territorial development policies and plans, encouraging cooperation and mutual support among the different cities constituting the GDMA (Dammam, Al Khobar, Dhahran, and Qatif). This, in turn, provides access to sustainable, affordable, adequate, resilient infrastructure and services to the entire urban system. From an economic point of view, the goal is to facilitate effective trade-links across the sea and the city continuum, ensuring that small-scale farmers and fishers are linked to local chains and markets. In parallel, providing better connectivity based on development nodes linked to the public transport system grants a generally better accessibility and integration, therefore more economic opportunities, to the entire population.
7.1.1 Action 1: Implement a multi-modal transportation network
This action intends on using the foreseen new public transport system for Dammam to advocate for new concepts of conceiving infrastructural development. As such, one of its premise is to reduce the size and quantity of roads, especially in regards to construction halts for a new ring-road linking the coastal parts of the city with bridges on the seafront, in both Qatif and Half Moon Bay. If built, this would heavily impact the health of the coastline, keeping the inflection on private mobility. Action 1, embracing the TOD principles, envisages an integrated and inter-modal public transport system and includes a proposal to complement the foreseen public transport system on land (BRT, Light Rail, and trams), with an integrated system of sea-taxis. Building on this, the next step would be to establish mixed-use, pedestrian-only, and pedestrian-priority areas, to promote walkability, and to create pocket public spaces that are well connected to the rest of the city through the improved public transport, starting with Old Dammam.
Parallel to this, Action 1 advises toward investment in green infrastructure and sustainable economies, (e.g. green energy production, the establishment of ecological tourism destinations, and support for sustainable fishery). This redefinition of a system of urban and green infrastructure should begin by establishing mangrove forest parks on the coastline, by focusing first on the small residual patches still existing in Qatif, Dammam, and Ras Tanura. Mangrove forests are important for sustaining a variety of species such as fish, crab, shrimp, and mollusk species. As fisheries form an essential source of livelihood for coastal communities such as Qatif, this will also support the sustainable economic development and food security, which helps to create economic value around the preservation of the existing marine biodiversity - such as coral reefs and mangrove forests. In addition, the dense root systems of mangrove forests trap sediments flowing down rivers and off the land, which helps stabilise the coastline and prevent erosion from waves and storms. In areas where mangroves have been cleared, coastal damage from sea level rise, windstorm, and typhoons are more severe. By filtering out sediments, the forests also protect coral reefs, and seagrass meadows from being smothered in sediment.
The new mangrove parks will be connected to the new multi-modal transport system by a sea transport network (sea taxis), replacing the foreseen ring road extension on the sea, and supporting the establishment of new relationships between the urban waterfront, and the coastal ecosystems. This will make it more accessible, richer in ecological and social functions, and supported by small commercial and leisure activities. Additionally, the action calls for various small and consistent interventions in the Old Khobar small fabric, making the and streets sections more walkable and green, and opening them towards the sea to improve the overall connection between the inner parts of the city, and the coast.
A
B
C
D
Define new green infrastructure by establishing mangrove forest parks connected with multi-modal transport systems, including sea taxi replacing the foreseen ring road extension on the sea.
Establish mixed-use pedestrian-only and pedestrian priority areas by promoting walkability and creating pocket public spaces in Old Dammam.
Establish a new relation between the urban waterfront and the coastal ecosystems making it more accessible, richer in ecologocal and social functions, and supported by small commercial and leisure activities.
Small consistent interventions on the section of Old Khobar streets fabric by making them walkable, green and opening them to the sea.

Act ion P lan
123
Fig. 69. Action 1: Implement a multi-modal transportation network
B
C
D
A
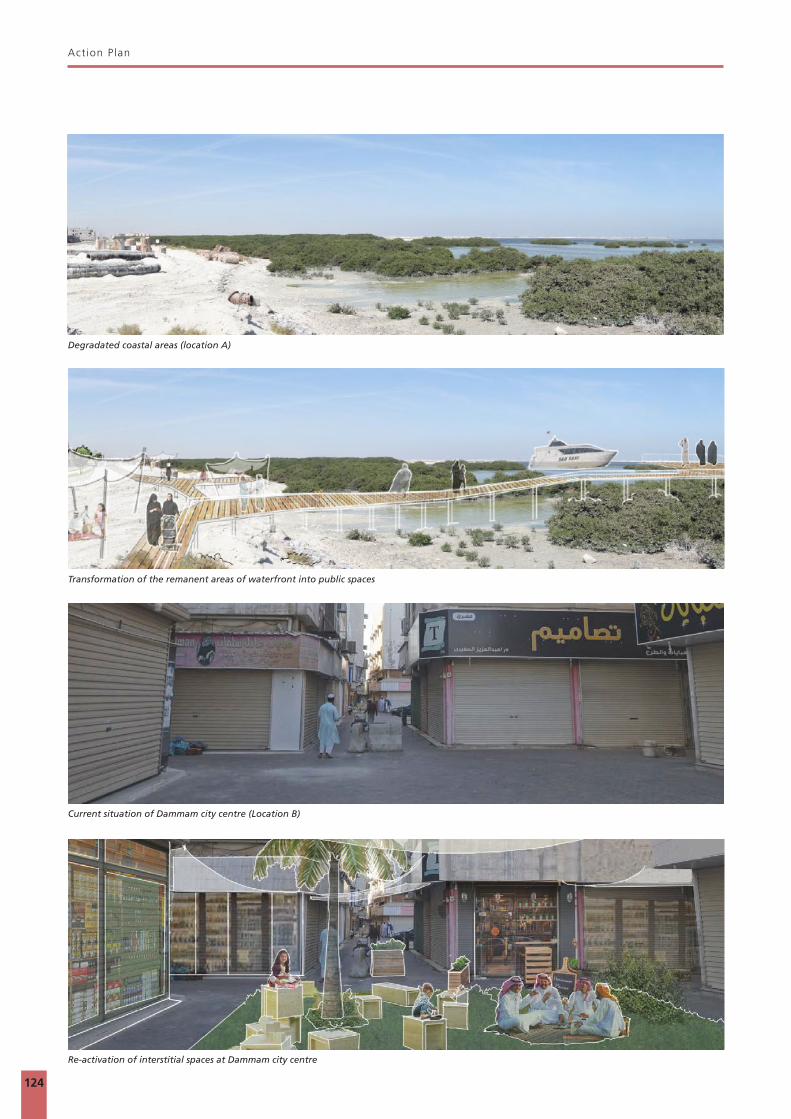
Act ion P lan
124
Re-activation of interstitial spaces at Dammam city centre
Current situation of Dammam city centre (Location B)
Degradated coastal areas (location A)
Transformation of the remanent areas of waterfront into public spaces

Act ion P lan
125
Re-activation of the coastline with new activities for families and accessibility to water transport network (Location C)
Proposed bikelines in the old urban fabric of Al Khobar (Location D)
Current situation of the waterfront next to the port (Location C)

Act ion P lan
126
7.1.2 Action 2: Relink the natural systems to a rich and diversified coastal development
Dammam currently seems to turn its back on its coastal nature. Considering it is a waterfront city the sea is rarely perceivable from the inland parts of the city, and there is hardly any activity on the urban waterfront, concerning both economic and social activities. As such, action 2 focuses on reverting this attitude and defining an entirely new relationship between the city and its coastal nature. Building on action 1, action 2 focuses on a comprehensive rehabilitation of the urban waterfront from a social, ecological, and economic point of view. Again, targeting the GDMA scale, action 2 is composed of a systematic series of interventions along the coastline, (Qatif, Dammam, Al Khobar, and Ras Tanura).
The envisaged interventions should be oriented to rehabilitate the coastline, diversify the current activities offered, and boost the economy of the urban waterfront. Apart from the creation of mangrove parks along the coast in Qatif, Dammam, and Ras Tanura. Action 2 aims at ecologically rehabilitating the entire urban coastline for social, economic, and ecological development. This will be done through tourism, nature trails, ecological and bio-diverse marine parks, low-impact leisure activities and water sports, etc. Along with this new coastline, leisure and culture-based economies should cohabitate with high-tech and service-economies, together with socially-mixed residential development, and a high concentration of ecologically-sound and water-sensitive public spaces, and public services.
According to action 2, the new urban waterfront should be clearly composed of a diversified, well-connected and well-distributed network of open, green, safe, inclusive, multi-functional and accessible, high-quality public spaces. This new system of revitalised coastal green public spaces would make the waterfront more lively and vibrant, while at the same time improving the resilience of the city to disasters and climate change, including floods, drought risks, and heat waves. These interventions should help to re-balance the social, ecological, and economic functioning of the city, integrating disaster risk reduction, climate change adaptation, and mitigation considerations, (including greenhouse gas emissions) into resilience-based, and climate effective design of spaces, buildings, services, and infrastructure, while widely promoting nature-based solutions where possible.
Interventions have not been detailed in this phase. The accompanying image gathers references from other cities and images of projects that visually interpret the approach described here, representing an abacus of ideas on how to spatialise such an ecologically balanced, vibrant, and diversified new relationship with coastal development in Dammam, addressing potential impacts from climate change whilst boosting its social and economic vibrancy.
Amongst the proposed interventions are wetlands and mangrove parks, (preserving the existing and creating new ones), new small tourist ports, water-based innovation hubs, marine transport infrastructure linked to terrestrial ones, low-impact entertainment centres, and various forms of public spaces, (including urban beaches). In line with the Sustainable Development Goals, this systematic reshaping of the urban waterfront will redefine it as a strong new infrastructure that functions as a device for increasing coastal resilience in the GDMA, as well as performing as social infrastructure, and establishing new economic systems related to the marine nature of the territory.
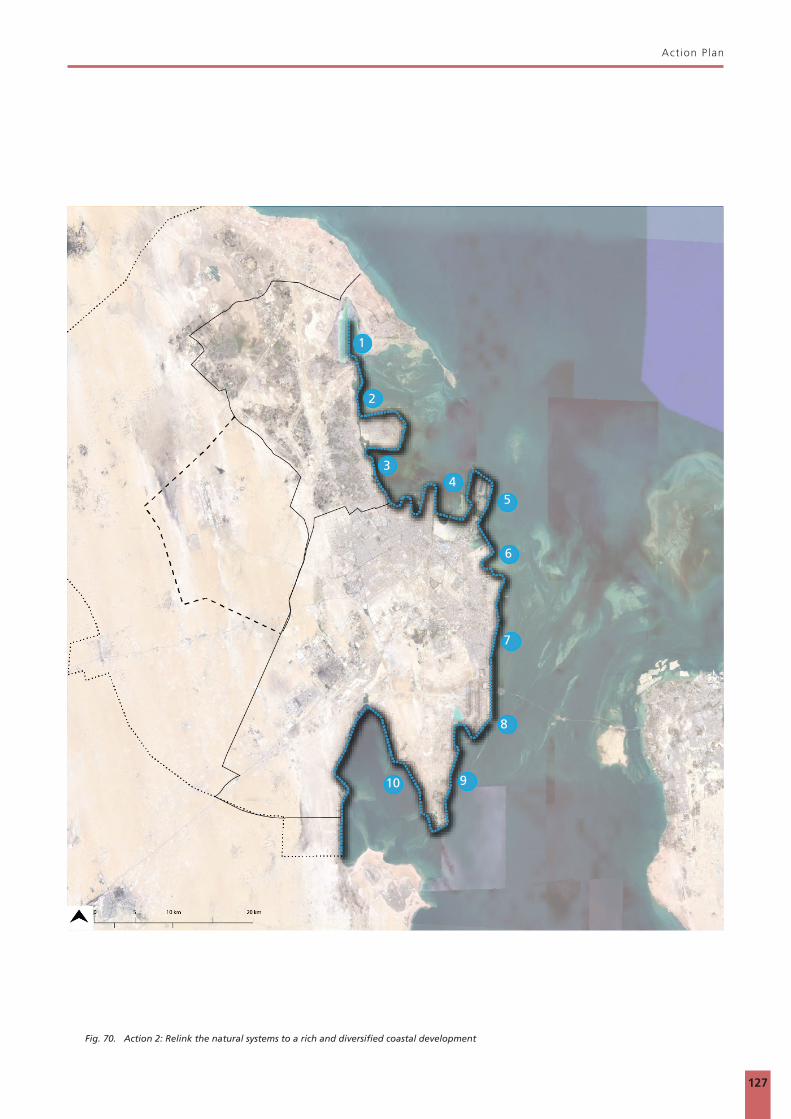
Act ion P lan
127
Fig. 70. Action 2: Relink the natural systems to a rich and diversified coastal development
1
3
7
5
2
4
6
8
10 9
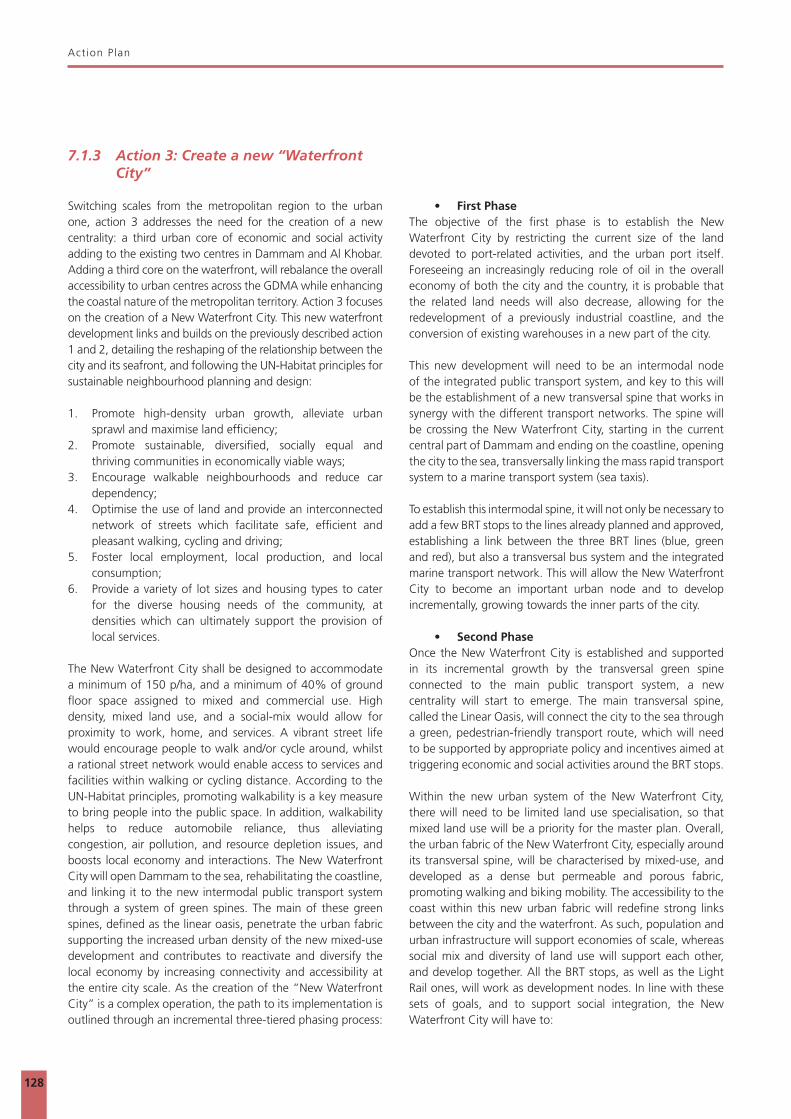
Act ion P lan
128
7.1.3 Action 3: Create a new “Waterfront City”
Switching scales from the metropolitan region to the urban one, action 3 addresses the need for the creation of a new centrality: a third urban core of economic and social activity adding to the existing two centres in Dammam and Al Khobar. Adding a third core on the waterfront, will rebalance the overall accessibility to urban centres across the GDMA while enhancing the coastal nature of the metropolitan territory. Action 3 focuses on the creation of a New Waterfront City. This new waterfront development links and builds on the previously described action 1 and 2, detailing the reshaping of the relationship between the city and its seafront, and following the UN-Habitat principles for sustainable neighbourhood planning and design:
1. Promote high-density urban growth, alleviate urban sprawl and maximise land efficiency;
2. Promote sustainable, diversified, socially equal and thriving communities in economically viable ways;
3. Encourage walkable neighbourhoods and reduce car dependency;
4. Optimise the use of land and provide an interconnected network of streets which facilitate safe, efficient and pleasant walking, cycling and driving;
5. Foster local employment, local production, and local consumption;
6. Provide a variety of lot sizes and housing types to cater for the diverse housing needs of the community, at densities which can ultimately support the provision of local services.
The New Waterfront City shall be designed to accommodate a minimum of 150 p/ha, and a minimum of 40% of ground floor space assigned to mixed and commercial use. High density, mixed land use, and a social-mix would allow for proximity to work, home, and services. A vibrant street life would encourage people to walk and/or cycle around, whilst a rational street network would enable access to services and facilities within walking or cycling distance. According to the UN-Habitat principles, promoting walkability is a key measure to bring people into the public space. In addition, walkability helps to reduce automobile reliance, thus alleviating congestion, air pollution, and resource depletion issues, and boosts local economy and interactions. The New Waterfront City will open Dammam to the sea, rehabilitating the coastline, and linking it to the new intermodal public transport system through a system of green spines. The main of these green spines, defined as the linear oasis, penetrate the urban fabric supporting the increased urban density of the new mixed-use development and contributes to reactivate and diversify the local economy by increasing connectivity and accessibility at the entire city scale. As the creation of the “New Waterfront City” is a complex operation, the path to its implementation is outlined through an incremental three-tiered phasing process:
• First PhaseThe objective of the first phase is to establish the New Waterfront City by restricting the current size of the land devoted to port-related activities, and the urban port itself. Foreseeing an increasingly reducing role of oil in the overall economy of both the city and the country, it is probable that the related land needs will also decrease, allowing for the redevelopment of a previously industrial coastline, and the conversion of existing warehouses in a new part of the city.
This new development will need to be an intermodal node of the integrated public transport system, and key to this will be the establishment of a new transversal spine that works in synergy with the different transport networks. The spine will be crossing the New Waterfront City, starting in the current central part of Dammam and ending on the coastline, opening the city to the sea, transversally linking the mass rapid transport system to a marine transport system (sea taxis).
To establish this intermodal spine, it will not only be necessary to add a few BRT stops to the lines already planned and approved, establishing a link between the three BRT lines (blue, green and red), but also a transversal bus system and the integrated marine transport network. This will allow the New Waterfront City to become an important urban node and to develop incrementally, growing towards the inner parts of the city.
• Second PhaseOnce the New Waterfront City is established and supported in its incremental growth by the transversal green spine connected to the main public transport system, a new centrality will start to emerge. The main transversal spine, called the Linear Oasis, will connect the city to the sea through a green, pedestrian-friendly transport route, which will need to be supported by appropriate policy and incentives aimed at triggering economic and social activities around the BRT stops.
Within the new urban system of the New Waterfront City, there will need to be limited land use specialisation, so that mixed land use will be a priority for the master plan. Overall, the urban fabric of the New Waterfront City, especially around its transversal spine, will be characterised by mixed-use, and developed as a dense but permeable and porous fabric, promoting walking and biking mobility. The accessibility to the coast within this new urban fabric will redefine strong links between the city and the waterfront. As such, population and urban infrastructure will support economies of scale, whereas social mix and diversity of land use will support each other, and develop together. All the BRT stops, as well as the Light Rail ones, will work as development nodes. In line with these sets of goals, and to support social integration, the New Waterfront City will have to:

Act ion P lan
129
Fig. 71. Opening the city to the waterfront (phase 1)
Fig. 72. Consolidating the two urban cores (phase 2)
Coastal areas
Coastal areas
BRT stops
BRT stops
New urban cores
New urban cores
Link to the coast

Act ion P lan
130
• Achieve a social mix, through allocation policies and the spatial distribution of poor households;
• Achieve a social-mix and mixed-use development by appropriately devising urban and housing design;
• Invest in and improve public housing; • Providing plots of different sizes and with different
regulations, to increase the diversity of housing options; • Work with private developers to increase public housing
supply; and• Promote employment within the community.
• Third PhaseIn the third phase, the completed Linear Oasis and the two existing cores of activity in Dammam and Al Khobar will be consolidated together with the new core formed by the New Waterfront City and its activities. All of the three cores will be highly connected through the BRT and LRT networks, as well as through the marine transport system. Incrementally, other green spines will be opened, linking the public transport to the sea and the rehabilitated coastline.
This approach will progressively support the increase of density and encourage mixed land use along public transport system across the entire urban system, supporting economic vibrancy and boosting a lively street life. High population density generates higher industrial and commercial services demand, while mixed land use provides adequate manufacturing and service space for fostering diversity of economic activities,
linking (spatially) demand with supply, thus stimulating a prosperous urban street life. In addition, linking the high density and mixed-use development to an efficient, capillary and intermodal public transport system, supports affordability of transactions and economic activities, as well as of infrastructure and services delivery, by promoting proximity and reducing costs. Proximity, in turn, helps to reduce time and resources wastage in travel time (home to work, home to shopping, etc.), as well as in infrastructure provision and maintenance, reducing general service costs.
The “Waterfront City” and the “Linear Oasis “A conceptual master plan for the “Waterfront City”, developed by following the UN-Habitat Five Principles for Sustainable Neighbourhood Planning,51 shows that the New Waterfront City, should proportionally dedicate 1,45 hectares to streets and public open spaces (30% of the total), 483.9 hectares should be considered for public infrastructure and services (representing 10% of the total area), and 2,418 hectares considered for mixed-use development (representing 50% of the total area), while only 483,9 hectares is considered for residential use (representing 10% of the total area). Furthermore, social-mix principles should be promoted through a rational distribution of urban public resources and the provision of adequate housing for different revenue groups by city planning regulations; promoting socio-economic integration across diverse groups of citizens. At the urban scale, the structuring of the “Linear Oasis” will form a
Fig. 73. Linking the three urban cores (phase 3)
Coastal areas
BRT stops
New urban cores
Three major urban cores

Act ion P lan
131
Residential area
Mixed-use area
High density buildings
Green spaces
Public transport stops
New urban fabric
Fig. 74. Action 3: Create a new “Waterfront City”

Act ion P lan
132
FRIENDLY PEDESTRIAN STREET
OPEN TERRACES
TWO LINE BIKEPATHS PROTECTED BY VEGETATION
BRT NETWORK
BRT NETWORK
TWO LINE BIKEPATHS PROTECTED BY VEGETATION
FLEXIBLE PUBLIC SPACE
OPEN TERRACE
PLAYGROUND
FRIENDLY PEDESTRIAN
TOURISTIC VIEWPOINT
WATER ACTIVITIES
FRIENDLY PEDESTRIAN STREET
OPEN TERRACES TWO LINE BIKEPATHS PROTECTED BY VEGETATION
PUBLIC TRANSPORT NETWORK PUBLIC TRANSPORT NETWORK
TWO LINE BIKEPATHS PROTECTED BY VEGETATION
PLAYGROUNDS
MULTI-FUNCTIONALPUBLIC SPACE
OPEN TERRACES
MULTI-FUNCTIONALPUBLIC SPACE
TOURISTIC VIEWPOINTS
SEA TRANSPORTATIONNETWORK
FRIENDLY PEDESTRIAN STREET
OPEN TERRACES TWO LINE BIKEPATHS PROTECTED BY VEGETATION
PUBLIC TRANSPORT NETWORK PUBLIC TRANSPORT NETWORK PLAYGROUNDS
MULTI-FUNCTIONALPUBLIC SPACE
TOURISTIC VIEWPOINTS
WATER ACTIVITIESFRIENDLY PEDESTRIAN STREET
FRIENDLY PEDESTRIAN STREET
TWO LINE BIKEPATHS PROTECTED
Section of the proposed waterfront with small pocket public spaces and public transport access
Section of the proposed waterfront with commercial activity in the ground floor and accessibility to water public transport
Section of the proposed waterfront with public transport network and two different levels of activity

Act ion P lan
133
FRIENDLY PEDESTRIAN STREET
OPEN TERRACES
TWO LINE BIKEPATHS PROTECTED BY VEGETATION
OPEN TERRACE
FLEXIBLE PUBLIC SPACE
PLAYGROUND
PUBLIC TRANSPORT NETWORK PUBLIC TRANSPORT NETWORK
FRIENDLY PEDESTRIAN STREET
OPEN TERRACES
LRT NETWORK SYSTEM
FLEXIBLE PUBLIC SPACE
PLAYGROUNDOPEN TERRACES TWO LINE BIKEPATHS PROTECTED BY VEGETATION
Section of the “Linear Oasis” with commercial activity at the ground floor and bikelines in the centre along public transport
Transversal section of a street with elevated BRT system
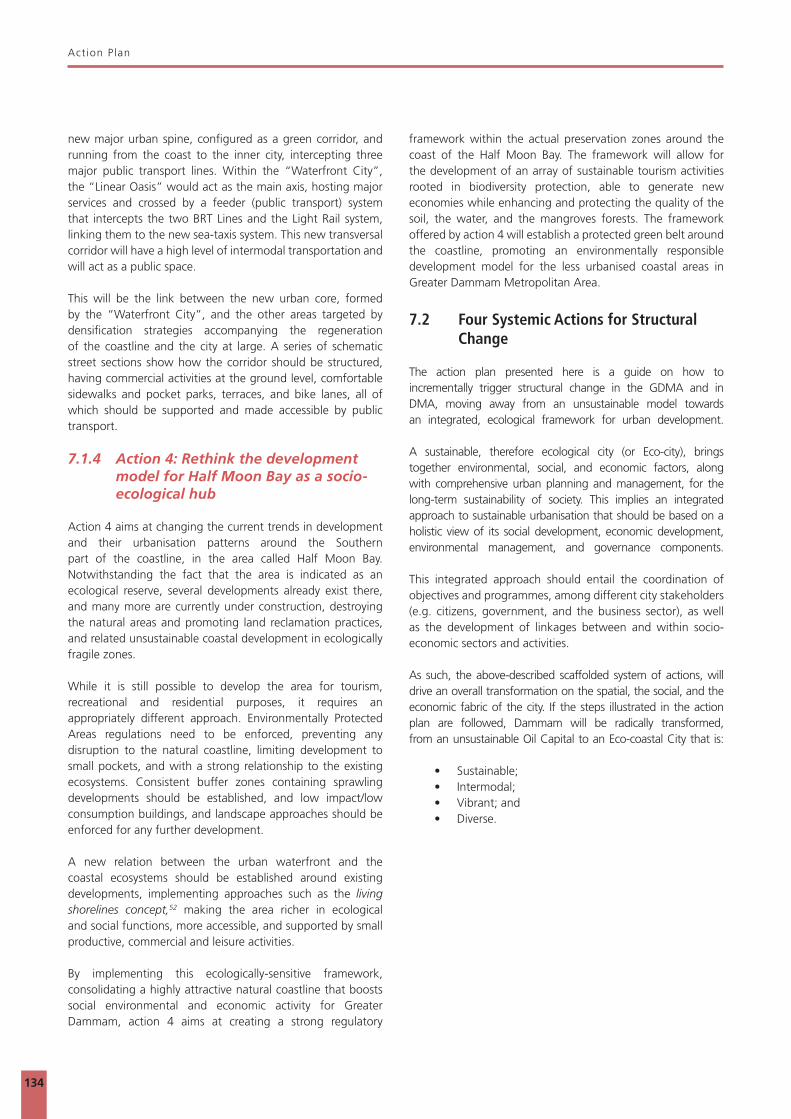
Act ion P lan
134
framework within the actual preservation zones around the coast of the Half Moon Bay. The framework will allow for the development of an array of sustainable tourism activities rooted in biodiversity protection, able to generate new economies while enhancing and protecting the quality of the soil, the water, and the mangroves forests. The framework offered by action 4 will establish a protected green belt around the coastline, promoting an environmentally responsible development model for the less urbanised coastal areas in Greater Dammam Metropolitan Area.
7.2 Four Systemic Actions for Structural Change
The action plan presented here is a guide on how to incrementally trigger structural change in the GDMA and in DMA, moving away from an unsustainable model towards an integrated, ecological framework for urban development.
A sustainable, therefore ecological city (or Eco-city), brings together environmental, social, and economic factors, along with comprehensive urban planning and management, for the long-term sustainability of society. This implies an integrated approach to sustainable urbanisation that should be based on a holistic view of its social development, economic development, environmental management, and governance components.
This integrated approach should entail the coordination of objectives and programmes, among different city stakeholders (e.g. citizens, government, and the business sector), as well as the development of linkages between and within socio-economic sectors and activities.
As such, the above-described scaffolded system of actions, will drive an overall transformation on the spatial, the social, and the economic fabric of the city. If the steps illustrated in the action plan are followed, Dammam will be radically transformed, from an unsustainable Oil Capital to an Eco-coastal City that is:
• Sustainable; • Intermodal; • Vibrant; and• Diverse.
new major urban spine, configured as a green corridor, and running from the coast to the inner city, intercepting three major public transport lines. Within the “Waterfront City”, the “Linear Oasis” would act as the main axis, hosting major services and crossed by a feeder (public transport) system that intercepts the two BRT Lines and the Light Rail system, linking them to the new sea-taxis system. This new transversal corridor will have a high level of intermodal transportation and will act as a public space.
This will be the link between the new urban core, formed by the “Waterfront City”, and the other areas targeted by densification strategies accompanying the regeneration of the coastline and the city at large. A series of schematic street sections show how the corridor should be structured, having commercial activities at the ground level, comfortable sidewalks and pocket parks, terraces, and bike lanes, all of which should be supported and made accessible by public transport.
7.1.4 Action 4: Rethink the development model for Half Moon Bay as a socio-ecological hub
Action 4 aims at changing the current trends in development and their urbanisation patterns around the Southern part of the coastline, in the area called Half Moon Bay. Notwithstanding the fact that the area is indicated as an ecological reserve, several developments already exist there, and many more are currently under construction, destroying the natural areas and promoting land reclamation practices, and related unsustainable coastal development in ecologically fragile zones.
While it is still possible to develop the area for tourism, recreational and residential purposes, it requires an appropriately different approach. Environmentally Protected Areas regulations need to be enforced, preventing any disruption to the natural coastline, limiting development to small pockets, and with a strong relationship to the existing ecosystems. Consistent buffer zones containing sprawling developments should be established, and low impact/low consumption buildings, and landscape approaches should be enforced for any further development.
A new relation between the urban waterfront and the coastal ecosystems should be established around existing developments, implementing approaches such as the living shorelines concept,52 making the area richer in ecological and social functions, more accessible, and supported by small productive, commercial and leisure activities.
By implementing this ecologically-sensitive framework, consolidating a highly attractive natural coastline that boosts social environmental and economic activity for Greater Dammam, action 4 aims at creating a strong regulatory

Act ion P lan
135
Fig. 75. Environmental strategy for Half Moon Bay
Fig. 77. Visualisation of environmental sensitive coastal development for Half Moon Bay
Fig. 76. Four systemic actions

136
8 8
FIN
AL
RECO
MM
ENDA
TIO
NS:
TH
E TH
REE-
PRO
NG
ED A
PPRO
ACH
© FSCP

138
The Three-pronged Approach
8.1 Spatial Recommendations
8.1.1 A strategic view on the Eastern Region spatial development
The Eastern Region is the Eastern Gate of the Kingdom, connecting it to the other GCC countries. In these terms, its strategic location should be better utilised, as there are hardly any strategies leveraging on spatial synergy in the GCC area, where there is high competition but lack of strategic cooperation. The region is the largest in the Kingdom in terms of area, but despite the significant extension, the population concentration is limited to the few major cities along the coastal strip, including Dammam, Dhahran, Al Khobar, Jubail, and Hafr Al Batin. Currently, and in comparison to the main urban centres on the coastline, public service provisions lack in medium and small cities, from the lack of infrastructure networks to scarcity of basic education, and health services, which is one of the main reasons for migration from rural areas to coastal cities, such as Dammam and Jubail. This uneven access to services and opportunities, together with the unbalanced population distribution, clearly shows the need for a territorial rebalancing strategy. This strategy should aim at redefining a hierarchical system for the cities of the region, building opportunities for secondary cities to contribute to the diversification of the economy in the region, progressively rebalancing the population distribution, and capitalising
on the potential role of these secondary cities. From an economic point of view, the Eastern Region is considered to be the main economic engine for the Kingdom, as it is the main location for petroleum production. Over 86% of the Kingdom’s basic industries are located in this region. However, the expansion and diversification of the economic base in the region is a necessity in any long-term plan. While, industrial areas in Dammam and Jubail show significant achievements and unique developments in the entire region, there is a need for expansion in other sectors, capitalising on the non-oil resources of the region. As such, a diversification strategy should support the emergence of new economic sectors by leveraging other regional and territorial resources. One of the possible sectors that hold great potential towards achieving this goal is cultural and ecological tourism. A regional strategy for economic diversification should, therefore, aim to develop tourism activities through the preservation of monuments and cultural heritage in the region, as well as to support marine tourism, and in parallel, develop the agricultural and fisheries sector. Almost 6.5% of the total area of the region is agricultural land/suitable for agricultural use, because of the presence of underground water reserves, especially in the
FSCP workshop in Dammam with stakeholders
© FSCP
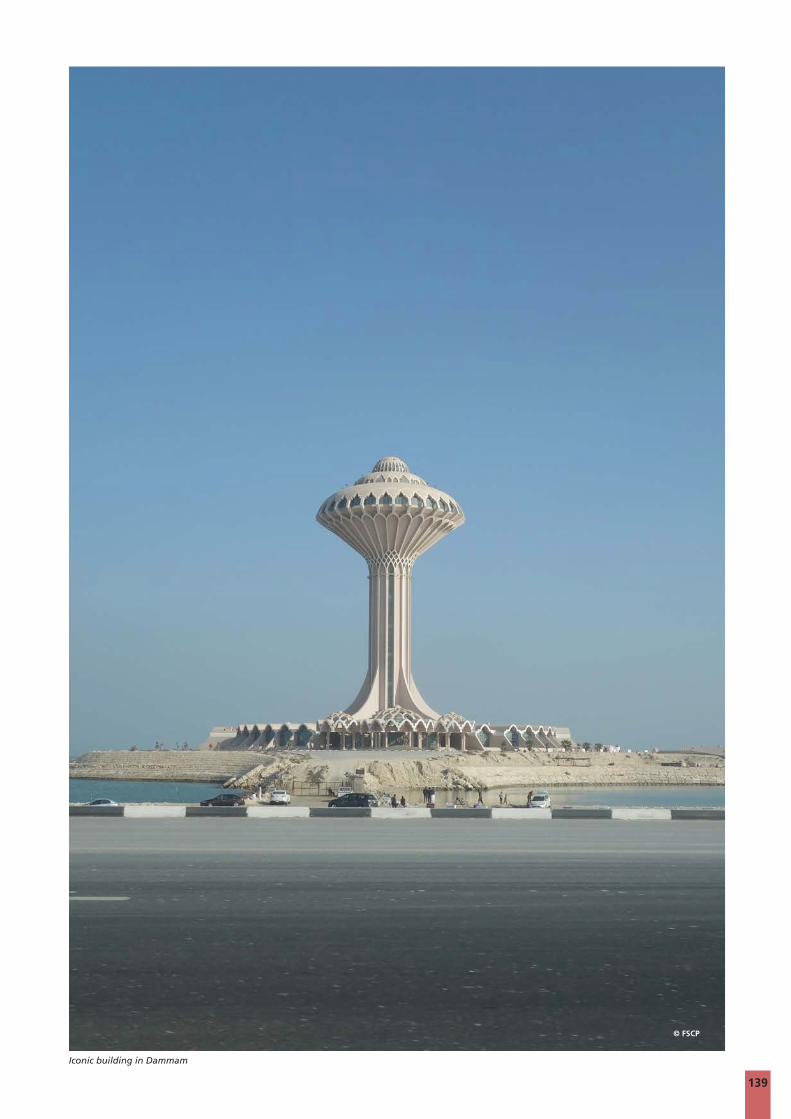
139
Iconic building in Dammam
© FSCP

140
The Three-pronged Approach
area of Al-Ahsa, which includes the largest oasis in the region, and is one of the most fertile areas in the entire country. In addition, there are various archaeological sites and tourist attractions, which could add value through both preservation efforts, and by providing the necessary services to attract and revitalise the tourism industry in the region. It is crucial to point out that there are many sites along the coastline of the region that are environmentally sensitive, such as the coastal strip from Safaniya to Manifa Bay, and Tarot Bay, as well as a group of marine islands. An environmental protection strategy at the regional level needs to be put in place and implemented coherently, and be strongly interlinked and considered central in any tourism plan in the region.
8.1.2 Towards Greater Dammam, An Eco-coastal City
There are many challenges, but also many opportunities associated with urbanisation, and, specifically for Dammam, these entail a much-needed economic transformation, ongoing societal changes, and climate change threats. If they are not addressed, the number of social, economic, and ecological issues affecting the city, will increase year after year. However, if correctly responded to, these issues can trigger a structural transformation that can help the city transition from a city known and characterised by a heavily oil-based urban economy, to a city characterised by a diversified economy, and from an unsustainable urban form to a dense, compact,
and socio-ecologically balanced one. To prepare for future challenges, such as the declining oil economy, climate change, societal transformation, etc., Dammam will need to redefine its identity, from being the current Oil Capital to becoming a future Eco-coastal City. Therefore, the action plan for Dammam, with its four actions, illustrates the basic steps to trigger structural change, activating an incremental system of spatial modifications to the fabric of the city, which will also modify its social, economic, and environmental structure. By enacting the systemic transformations depicted in the action plan, Dammam will become more sustainable, intermodal, vibrant, and diverse.
• Dammam Sustainable CityA sustainable city is where social, ecological, and economic systems are well balanced and mutually supportive of each other. In addition, ecological resources and preservation of ecosystems become central in any development strategy guiding urban transformations. In Dammam, the different actions proposed along the coastline, and on the vacant land, will contribute in many ways to its journey towards sustainable development, as it will reinforce the natural coastal ecosystems, and link it with new green infrastructures on land. Establishing a positive relationship with natural resources will translate into new economies. For instance, having a healthy coastal ecosystem will be reflected in sustaining fisheries, triggering an increase of local income for coastal communities by providing more economic-related activities. Additionally,
Mangrove forest at the coast of Dammam
© FSCP

141
Fig. 78. Strategic spatial recommendations for Dammam
Contain new development Densification along public transport lines
Capillar street structure
Public transport network
Public transport network Connecting green corridors
Wadis
Coastal revitallisation
Water public transport nodes linked to green network
ARAMCO owned land proposed as green corridor

142
The Three-pronged Approach
with more tourists visiting the natural areas and reserves proposed on the coast, the local communities will benefit with new employment opportunities. Lastly, protection of biodiversity, and in particular, the protection and increase of mangrove forests, and the creation of a buffering, re-naturalised urban waterfront, will contribute to the prevention of floods and associated risks, protecting the city from tide variations, storms, and waves, while naturally controlling the regulation of the water quality and sediments.
• Dammam Intermodal CityIntermodality, is the coordination and integration of more than one mode of transport, creating a connected and compact city with wide and easy access to most of its functional cores and areas. Public transport plays a central role concerning intermodal urban mobility, but it is necessary to improve the connection amongst different transport modes and to private mobility (such as cars or bicycles), around public transport stations. In addition, the connection across local/regional/national/international transport systems should also be taken into account in order to maximise economic opportunities, which are linked to easy access and improved connectivity at all scales. Linking the proposed Public Transport Network with a marine transport system through the transversal linear corridors will allow improved and intermodal connection throughout the city. Implementing the Public Transport Network will also contribute to an overall reduction of traffic, and provide a safer transport environment for drivers, pedestrians, and cyclists. Another positive trade-off will be the reduction of air pollution, as currently, the air quality in Dammam is one of the most polluted and toxic in the entire Kingdom of Saudi Arabia, and negatively impacts the quality of life of its residents.
• Dammam Vibrant CityAround the world, cities seek for the economic success recipe in a rapidly changing global marketplace. Indispensable assets in a post-industrial economy include well-educated people, the ability to generate new ideas and to turn those ideas into commercial realities. Specifically, in Dammam, by building on multi-modal transportation infrastructure system and connecting local and global markets. A vibrant city is a city characterised by life, movements, and diverse activities, where continuous economic development results in the prosperity of its citizens, defined as a lively and healthy environment, and characterised by a variety of social and cultural activities. In these terms, the creation of a third urban core of economic and social activities will promote a more vibrant and integrated urban environment. With the creation of this third centre, the city should aim at directing most of its development energies towards the coastline, in order to prevent/reduce urban sprawl. As such, the creation of the New Waterfront City entails a well planned urban extension, based on the principles of equitable, efficient, and sustainable use of land and natural resources. The New Waterfront City showcases how to implement compactness, appropriate density, polycentrism, and connectivity, as well as mixed social
and economic uses. High density combined with mixed land use will create efficient and vibrant communities, reducing mobility challenges and lowering service delivery costs per capita. In addition, connecting the new third core to the intermodal transport system, linking it to the reactivation of existing patches of vacant land in other areas of the city centre with new activities and increased density, will support the overall creation of a more vibrant and prosperous city.
• Dammam Diverse CityDiversity represents a guiding principle for city planners. It constitutes an antithesis to previous orientations in which segregation of homogeneous districts was the orthodox approach. A diverse city has several meanings: a varied physical design, mix of uses, diversified urban economies, diverse urban ecosystems, an expanded public realm, and multiple social groupings exercising their “right to the city.” In these terms, the four actions aim at transforming the GDMA into a diverse city, in regards to the ecology, economy, and society. While Dammam has a strong industrial specialisation around the oil industry and oil-related activities, it is fundamental to start diversifying the urban economy and creating an urban economic system that is less dependent on the declining oil sector, in order to help businesses adapt to the ever-changing trends and seize new opportunities that enhance all pillars of sustainability. For this purpose, the overall action plan for Dammam creates the pre-conditions to invest in increasing its diversity by pursuing economic diversification, sustaining social diversity, and enhancing the ecological one (biodiversity). This approach includes the promotion of cultural, social and natural assets by investing in activities that support innovation and creativity, generating opportunities for citizens to obtain the majority of their goods and services within the city. Additionally, in promoting a sustainable agri-food sector by protecting agricultural resources, retaining and enhancing natural assets and the variety of ecosystems, and finally, providing diverse urban environments that respond to diverse categories of citizens.
8.2 Institutional and Legal Recommendations
With regards to legal reform, Dammam would benefit from both fiscal and jurisdictional decentralisation to facilitate independent and innovative solutions to spatial and social problems, at the Amanah level. This should entail: • The transfer of planning power, authority, and function,
from MoMRA to the local Amanah with provision for independent action without recourse, to effectively address community needs. This is supported by the New Urban Agenda, which specifies that territorial urban design and planning processes should be led by sub-national and municipal governments, but their implementation will require coordination with all spheres of governments as well as the participation of the civil society, the public sector, and other relevant stakeholders;

143
Validation process with local stakeholders
© FSCP

144
The Three-pronged Approach
• Fiscal decentralisation, which gives autonomy to the Amanah to source funds from finance development activities. Revenue generation activities in cities may also include taxes and levies, and urban areas should be allowed to collect some form of property taxes to fund development activities. The recent White Lands Act that imposes fees on undeveloped plots in urban areas to tackle land speculation, housing shortage, and indiscriminate land development shows that regulatory mechanisms can be leveraged to generate revenue while fostering an efficient development framework;
• Opening of avenues for actors, including the private and voluntary sector and the general community, to participate in decisions regarding projects that affect them.
Consolidation of the legal planning instruments would also support development intervention in Dammam, along with the review, update, and modernisation of these laws to make them relevant to the current development situation. This should also entail re-thinking the lawmaking process to limit the number of actors. The mere existence of the laws in KSA will not guarantee sustainable urban development as they must be functionally effective, i.e., precise in achieving their intended results, clear, consistent, and simple to understand. There is a need for a functionally effective urban planning law that, inter alia:
• Introduces incentives/requirements that will enable more compact city growth;
• Defines clear institutional roles and responsibilities at each level;
• Enforces linkage between all levels of plans (national, regional, local);
• Provides effective coordination and monitoring mechanisms; and
• Increases meaningful public participation and engagement in planning.
The legal framework also needs to preserve an acceptable mode of public participation in public decision making, to foster equality and inclusion. The consolidation of the urban legislation would also give legitimacy to the plans that Dammam relies on. Revising the Urban Growth Boundary Law to include clear criteria on how the growth boundary is set would enhance technical and vertical accountability.
The UGB law also needs to place more emphasis on establishing the Development Protection Boundary as a no-development zone to not only prevent haphazard development but also avert private interests from taking advantage of the laxity in the legal text. These initiatives will strengthen policy formulation designed to make the city more sustainable, compact and dense.
8.3 Financial Recommendations
8.3.1 Own-source revenue instruments
In 2015, KSA began implementing a series of reforms meant to strengthen public finance by diversifying public revenue, introducing new tax mechanisms, improving tax administration, and attracting private investment. In addition to improving local finance and economic dynamism, the reforms were also meant to support the implementation of the New Urban Agenda (NUA) by fostering inclusive, sustainable, and equitable local financial and economic frameworks through progressive tax policies and revenue generation. The introduction of the White Lands Tax (WLT) in 2015 and Value Added Tax (VAT) in 2018 are evidence of the Saudi Arabia’s commitment to fostering a more sustainable and diversified economy, and public finance system. The geographic, cultural, social, demographic, and economic advantages of the Kingdom of Saudi Arabia (KSA) have made KSA a key international player and economic world power. Historically, oil and gas have been the country’s primary exports, but KSA has begun investing in other strategic sectors of the economy. This push towards economic diversification is supported by Saudi Arabia’s Vision 2030, which was adopted as a development roadmap for the Kingdom of Saudi Arabia,53 in its aim is to facilitate economic development in new industries, and foster innovation, and competitiveness in other sectors. In order to build the institutional capacity and capabilities needed to achieve Vision 2030, the National Transformation Programme 2020 (NTP) was launched. NTP utilises innovative methods to identify challenges, seize opportunities, adopt effective planning tools, engage with the private sector, implement reforms, and evaluate performance. The objective of the Saudi reforms proposed in the NTP is to support economic growth and diversification. The reforms are aimed at strengthening public finance, introducing new tax mechanisms, and attracting private investment into strategic economic sectors. One example of these reforms is the White Lands Tax, introduced in 2015, which aims to create a more stable, diversified, and sustainable public finance base. The White Lands Tax requires owners of empty urban plots designated for residential or commercial use to pay an annual tax of 2.5% of the land value. The land tax is levied on 10,000 square metres of urban land. The tax has been adopted in the cities of Riyadh, Jeddah, and Dammam. In addition to improving the own-source revenue base of municipal Governments, these reforms also support the New Urban Agenda (NUA), a framework for sustainable urbanisation.54 The new land tax aims to: • Promote real estate development that addresses supply
shortages in the region;• Increase the availability of land for affordable housing
development;• Safeguard competitive markets and minimise
monopolistic practices; and• Increase local revenue generation.

145
View from Half Moon Bay
© FSCP

146
The Three-pronged Approach
International experience and case studies from other countries and cities, including OECD countries, Hong Kong, Taiwan, and Colombia, provide valuable insight and a framework for introducing land-based taxes that support own-source revenue generation, and local economic development. In the case of Dammam, a policy aimed at increasing revenue sources should take into account socio-economic and demographic factors, such as the population growth rate, population density, and urban sprawl. Taking these factors into consideration, new financing instruments that mobilise adequate local revenues and take into account future expenditures levels will be needed to support local finance and sustainable urban development. Hence, exploring own-source tax instruments, such as land-based financing mechanisms, will be a crucial part of reaching the goals outlined in the NTP.Experiences from other countries suggest that this mechanism can stimulate urban development, local economic growth, and incentivise efficient land use. On average, the potential revenue contribution through immovable property is 2.1% of the GDP in high-income countries, while in middle-income countries, it contributes an additional 0.6% to GDP,55. Evidence from a diverse set of countries supports the use of land-value capture as a mechanism for capturing the value created by new infrastructure projects, zoning changes, and/or infrastructure upgrades.
Land-based finance is particularly well suited to Dammam. Increasing infrastructure investment demands, transportation system, and the FSCP proposal for waterfront development are opportunities to introduce land-based taxation tools. One land-based tax mechanism is betterment levies.56
Betterment levies are effective financing instruments that contribute greatly to large capital investment cost recovery. In addition, betterment levies are tailored for transportation infrastructure, and changes in land use planning, therefore, making them a good candidate for the infrastructure projects planned in Dammam.
Betterment levies are also an important source of own-source
THE IMPACT OF INFRASTRUCTURE
DEVELOPMENT ON LAND VALUE
Case examples Key findings
London, England
The Crossrail Property Impact Study (2012) estimated that
capital values in the areas around central London Crossrail
stations would rise by 35% for residential properties and
27.5% for office properties; outperforming the baseline
projections.
Source: GVA (2018); Mohammad et al. (2017); Colliers International (2017); Rodríguez
and Targa (2004).
Dubai, United Arab
Emirates
The impact of public transportation on property values
for dwellings and commercial properties is about 13%
and 76%, respectively, within an area of 1.5 kilometres.
Cairo, Egypt
• Urban development that included retail facilities
resulted in a price premium of 15 – 20%.
• Schools increased residential land prices by
approximately 13%.
• Walkability within a residential community increases
home values by up to 9%.
Bogotá, Colombia Research suggests that for every additional 5 minutes of
walking time to a public transportation station, rental
prices fell by 6.8 - 9.3%.
Fig. 79. The impact of infrastructure development on land value
KEY FACTORS IN DESIGNING
BETTERMENT LEVIES
Determining land value capture objectives
Revenue targets based on either
(a) a percent of infrastructure cots
or (b) a percent of the increase in
land value
• Betterment levies are a good option for scenarios involving
public transportation and waterfront development
• Data on changes in land value and efficient tax administration
are critical success factors
Timing and collection of payments
Payments collected:
• Upfront, as with developer
contributions made before the
infrastructure is built
• Annually, as with an increment to
municipal rates
• At the time the property is sold
• Consideration should be given to whether there are negative
financial consequences for landowners who may not have the
capacity to pay a levy or who are asset rich, but income poor
• The government might consider only requiring the levy to be
paid when a property is sold or transferred
Application of the Levy by Land Use Groups
• Real estate developers
• Commercial landowners
• Residential landowners
• Application of the levy should be determined using the
beneficiary-pays principle
• If it can be demonstrated that benefits will flow to specific
types of property owners, then there is a strong case to include
them in the land value mechanism design
Source: Youngman, J.M. (1996). Tax on land and buildings. In Thuronyi, V., (Eds.) Tax
law design and drafting. International Monetary Fund. Washington, DC.
Application and Boundaries of Levy
Levies can be structured to have a
broad based (e.g. city-wide) or time/
distance based
• In Dammam, land value benefits are maximized for a
1.5 kilometres area with a walking catchment for public
transportation.
• This benchmark is given supported by other cases (e.g. Dubai,
London, Bogotá) and will require additional analysis focused
on project specifics
Setting the Rate
The rate structure is variable and is
determined on a case-by-case basis
• The choice of rate structure will need to reflect the choice of
who to tax and the revenue base selected.
• In Dammam, the base is related to the percent of land value
increase
Governance structures for Land Value Capture
• Various existing legal instruments that could be used for the purpose of supporting value capture tools
• Regulation of new area-specific levies associated with infrastructure projects or urban planning
• Selecting the right legal instrument reduces the potential for unintended consequences
• KSA and, specifically, Dammam currently use land value capture mechanisms
• Lessons learned from current instruments (e.g. White Lands Tax) can inform the selection and
implementation of appropriate legal instruments that support land value capture instruments
Fig. 80. Key factors in designing betterment levies
147
Public space in the waterfront of Dammam
© FSCP
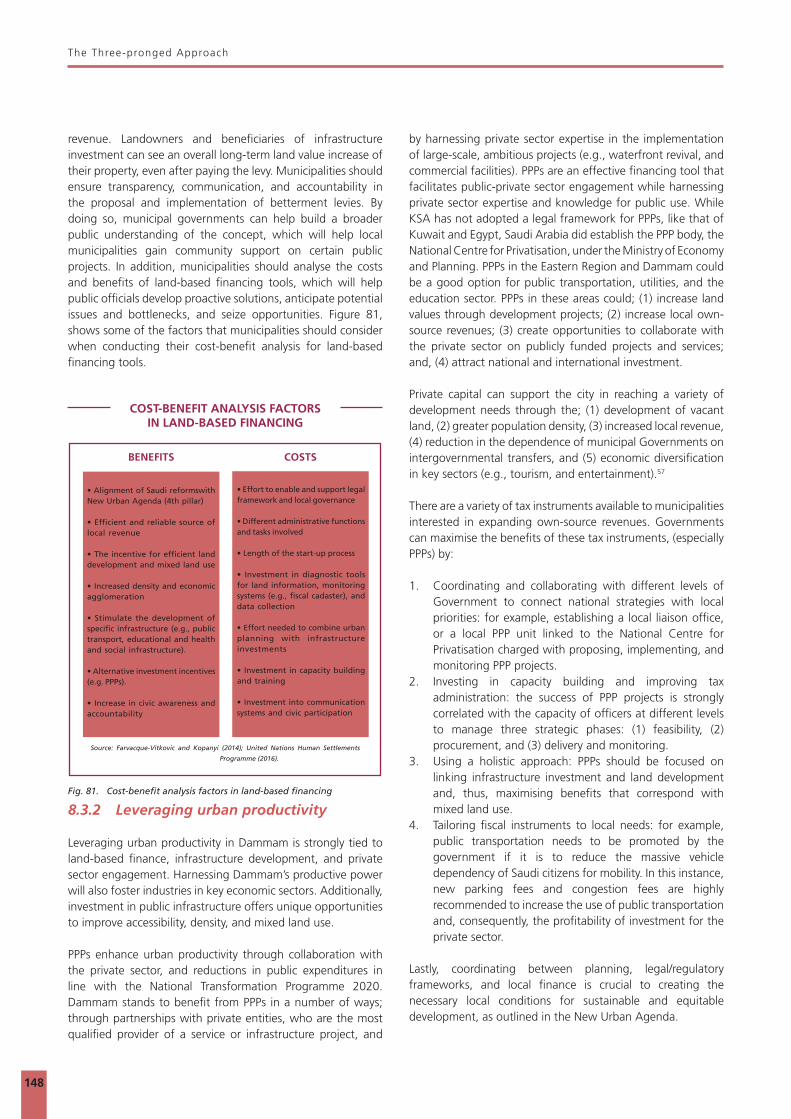
148
The Three-pronged Approach
revenue. Landowners and beneficiaries of infrastructure investment can see an overall long-term land value increase of their property, even after paying the levy. Municipalities should ensure transparency, communication, and accountability in the proposal and implementation of betterment levies. By doing so, municipal governments can help build a broader public understanding of the concept, which will help local municipalities gain community support on certain public projects. In addition, municipalities should analyse the costs and benefits of land-based financing tools, which will help public officials develop proactive solutions, anticipate potential issues and bottlenecks, and seize opportunities. Figure 81, shows some of the factors that municipalities should consider when conducting their cost-benefit analysis for land-based financing tools.
8.3.2 Leveraging urban productivity
Leveraging urban productivity in Dammam is strongly tied to land-based finance, infrastructure development, and private sector engagement. Harnessing Dammam’s productive power will also foster industries in key economic sectors. Additionally, investment in public infrastructure offers unique opportunities to improve accessibility, density, and mixed land use. PPPs enhance urban productivity through collaboration with the private sector, and reductions in public expenditures in line with the National Transformation Programme 2020. Dammam stands to benefit from PPPs in a number of ways; through partnerships with private entities, who are the most qualified provider of a service or infrastructure project, and
by harnessing private sector expertise in the implementation of large-scale, ambitious projects (e.g., waterfront revival, and commercial facilities). PPPs are an effective financing tool that facilitates public-private sector engagement while harnessing private sector expertise and knowledge for public use. While KSA has not adopted a legal framework for PPPs, like that of Kuwait and Egypt, Saudi Arabia did establish the PPP body, the National Centre for Privatisation, under the Ministry of Economy and Planning. PPPs in the Eastern Region and Dammam could be a good option for public transportation, utilities, and the education sector. PPPs in these areas could; (1) increase land values through development projects; (2) increase local own-source revenues; (3) create opportunities to collaborate with the private sector on publicly funded projects and services; and, (4) attract national and international investment. Private capital can support the city in reaching a variety of development needs through the; (1) development of vacant land, (2) greater population density, (3) increased local revenue, (4) reduction in the dependence of municipal Governments on intergovernmental transfers, and (5) economic diversification in key sectors (e.g., tourism, and entertainment).57
There are a variety of tax instruments available to municipalities interested in expanding own-source revenues. Governments can maximise the benefits of these tax instruments, (especially PPPs) by: 1. Coordinating and collaborating with different levels of
Government to connect national strategies with local priorities: for example, establishing a local liaison office, or a local PPP unit linked to the National Centre for Privatisation charged with proposing, implementing, and monitoring PPP projects.
2. Investing in capacity building and improving tax administration: the success of PPP projects is strongly correlated with the capacity of officers at different levels to manage three strategic phases: (1) feasibility, (2) procurement, and (3) delivery and monitoring.
3. Using a holistic approach: PPPs should be focused on linking infrastructure investment and land development and, thus, maximising benefits that correspond with mixed land use.
4. Tailoring fiscal instruments to local needs: for example, public transportation needs to be promoted by the government if it is to reduce the massive vehicle dependency of Saudi citizens for mobility. In this instance, new parking fees and congestion fees are highly recommended to increase the use of public transportation and, consequently, the profitability of investment for the private sector.
Lastly, coordinating between planning, legal/regulatory frameworks, and local finance is crucial to creating the necessary local conditions for sustainable and equitable development, as outlined in the New Urban Agenda.
COST-BENEFIT ANALYSIS FACTORS IN LAND-BASED FINANCING
BENEFITS COSTS
• Alignment of Saudi reformswith New Urban Agenda (4th pillar)
• Efficient and reliable source oflocal revenue
• The incentive for efficient landdevelopment and mixed land use
• Increased density and economicagglomeration
• Stimulate the development of specific infrastructure (e.g., public transport, educational and healthand social infrastructure).
• Alternative investment incentives(e.g. PPPs).
• Increase in civic awareness andaccountability
• Effort to enable and support legalframework and local governance
• Different administrative functionsand tasks involved
• Length of the start-up process
• Investment in diagnostic tools for land information, monitoring systems (e.g., fiscal cadaster), anddata collection
• Effort needed to combine urban planning with infrastructureinvestments
• Investment in capacity buildingand training
• Investment into communicationsystems and civic participation
Source: Farvacque-Vitkovic and Kopanyi (2014); United Nations Human Settlements
Programme (2016).
Fig. 81. Cost-benefit analysis factors in land-based financing
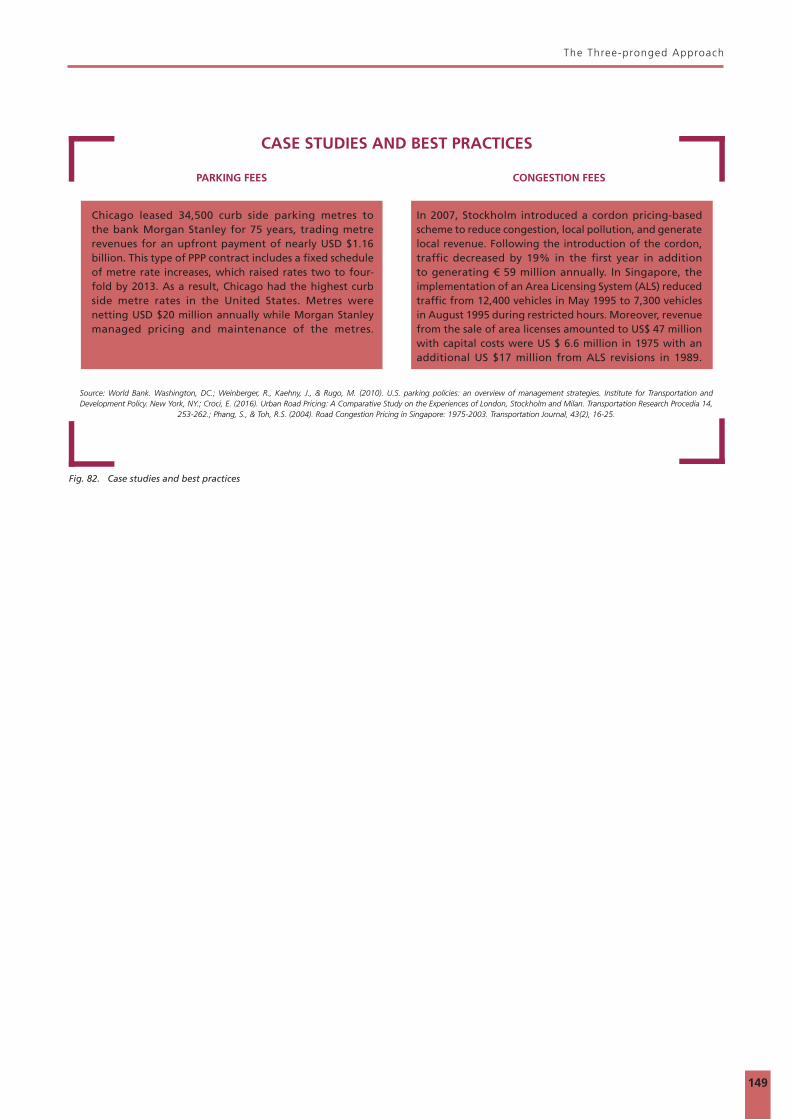
149
The Three-pronged Approach
Chicago leased 34,500 curb side parking metres to the bank Morgan Stanley for 75 years, trading metre revenues for an upfront payment of nearly USD $1.16 billion. This type of PPP contract includes a fixed scheduleof metre rate increases, which raised rates two to four- fold by 2013. As a result, Chicago had the highest curb side metre rates in the United States. Metres were netting USD $20 million annually while Morgan Stanley managed pricing and maintenance of the metres.
In 2007, Stockholm introduced a cordon pricing-based scheme to reduce congestion, local pollution, and generate local revenue. Following the introduction of the cordon, traffic decreased by 19% in the first year in addition to generating € 59 million annually. In Singapore, the implementation of an Area Licensing System (ALS) reduced traffic from 12,400 vehicles in May 1995 to 7,300 vehicles in August 1995 during restricted hours. Moreover, revenue from the sale of area licenses amounted to US$ 47 million with capital costs were US $ 6.6 million in 1975 with an additional US $17 million from ALS revisions in 1989.
Source: World Bank. Washington, DC.; Weinberger, R., Kaehny, J., & Rugo, M. (2010). U.S. parking policies: an overview of management strategies. Institute for Transportation and Development Policy. New York, NY.; Croci, E. (2016). Urban Road Pricing: A Comparative Study on the Experiences of London, Stockholm and Milan. Transportation Research Procedia 14,
253-262.; Phang, S., & Toh, R.S. (2004). Road Congestion Pricing in Singapore: 1975-2003. Transportation Journal, 43(2), 16-25.
PARKING FEES CONGESTION FEES
CASE STUDIES AND BEST PRACTICES
Fig. 82. Case studies and best practices

150

9 9
A
NN
EX
© FSCP

152
Annexures
9.1 Picture Credits
© FSCP ............................................................................................................................................................................................................................................... 5
© FSCP ............................................................................................................................................................................................................................................... 9
© FSCP ............................................................................................................................................................................................................................................. 11
© FSCP ............................................................................................................................................................................................................................................. 12
© NasserAlnacer ............................................................................................................................................................................................................................. 15
© iStock/PatrickPoendl ................................................................................................................................................................................................................... 17
© SAUDITOURISM.SA ..................................................................................................................................................................................................................... 18
© FSCP ............................................................................................................................................................................................................................................. 21
© FSCP ............................................................................................................................................................................................................................................. 23
© FSCP ............................................................................................................................................................................................................................................. 24
© FSCP ............................................................................................................................................................................................................................................. 31
© FSCP ............................................................................................................................................................................................................................................. 33
© FSCP ............................................................................................................................................................................................................................................. 37
© FSCP ............................................................................................................................................................................................................................................. 41
© FSCP ............................................................................................................................................................................................................................................. 45
© SAUDITOURISM.SA ..................................................................................................................................................................................................................... 47
© FSCP ............................................................................................................................................................................................................................................. 51
© FSCP ............................................................................................................................................................................................................................................. 53
© FSCP ............................................................................................................................................................................................................................................. 62
© FSCP ............................................................................................................................................................................................................................................. 64
© FSCP ............................................................................................................................................................................................................................................. 67
© FSCP ............................................................................................................................................................................................................................................. 68
© FSCP ............................................................................................................................................................................................................................................. 70
© FSCP ............................................................................................................................................................................................................................................. 72
© FSCP ............................................................................................................................................................................................................................................. 74
© FSCP ............................................................................................................................................................................................................................................. 77
© FSCP ............................................................................................................................................................................................................................................. 80
© FSCP ............................................................................................................................................................................................................................................. 82
© FSCP ............................................................................................................................................................................................................................................. 85
© FSCP ............................................................................................................................................................................................................................................. 86
© FSCP ............................................................................................................................................................................................................................................. 88
© FSCP ............................................................................................................................................................................................................................................. 90
© FSCP ............................................................................................................................................................................................................................................. 92
© FSCP ............................................................................................................................................................................................................................................. 95
© ONEWORKS ................................................................................................................................................................................................................................ 98
© ONEWORKS ................................................................................................................................................................................................................................ 98
© ONEWORKS ................................................................................................................................................................................................................................ 98
© FSCP ........................................................................................................................................................................................................................................... 100
© ONEWORKS .............................................................................................................................................................................................................................. 100
© ONEWORKS .............................................................................................................................................................................................................................. 100
©FSCP ............................................................................................................................................................................................................................................ 102
© HOLCIM ..................................................................................................................................................................................................................................... 102
© FSCP ........................................................................................................................................................................................................................................... 102
© FSCP ........................................................................................................................................................................................................................................... 106
© FSCP ........................................................................................................................................................................................................................................... 107
153
Annexures
© FSCP ........................................................................................................................................................................................................................................... 121
© FSCP ........................................................................................................................................................................................................................................... 122
© FSCP ........................................................................................................................................................................................................................................... 139
© FSCP ........................................................................................................................................................................................................................................... 140
© FSCP ........................................................................................................................................................................................................................................... 141
© FSCP ........................................................................................................................................................................................................................................... 142
© FSCP ........................................................................................................................................................................................................................................... 145
© FSCP ........................................................................................................................................................................................................................................... 147
© FSCP ........................................................................................................................................................................................................................................... 149
© FSCP ........................................................................................................................................................................................................................................... 153
154
Annexures
9.2 List of Figures
Fig. 1. Population distribution, growth rate and urban areas within the Kingdom of Saudi Arabia ...................................................................................16
Fig. 2. Regional Gross Domestic Product and economic sectors contribution ........................................................................................................................19
Fig. 3. Transport connectivity between Saudi cities ..................................................................................................................................................................19
Fig. 4. Population distribution in the governorates according to 2010 Census ......................................................................................................................20
Fig. 5. Development sectors according to the Regional Plan for Eastern Region ...................................................................................................................22
Fig. 6. Development corridors according to the Regional Plan of Eastern Region .................................................................................................................25
Fig. 7. Access and connectivity in the Eastern Region ..............................................................................................................................................................25
Fig. 8. Oil and gas reserves .........................................................................................................................................................................................................26
Fig. 9. Functional connectivity in the city-region ......................................................................................................................................................................27
Fig. 10. Natural resources ...........................................................................................................................................................................................................28
Fig. 11. Pollution and other environmental conditions ............................................................................................................................................................29
Fig. 12. Number of urban laws in KSA based on the Main Themes of Urban Planning Legislation (UN-Habitat) ...............................................................32
Fig. 13. FSCP simplified representation of hierarchy of plans and the planning instruments for the city of Dammam ......................................................34
Fig. 14. Matrix of development options within the phases of the urban boundary in the National Growth Centres (including Dammam) ....................37
Fig. 15. FSCP simplified representation of Planning Process and Actors involved in the preparation of the Dammam Local Plan ....................................38
Fig. 16. Percentage of white lands .............................................................................................................................................................................................42
Fig. 17. Budget process at Eastern Region .................................................................................................................................................................................44
Fig. 18. Amanah revenue 2016 ...................................................................................................................................................................................................45
Fig. 19. Own-source revenue breakdown for Dammam, 2016 ................................................................................................................................................45
Fig. 20. Eastern Region own-source revenue ............................................................................................................................................................................46
Fig. 21. Approved Amanah budget, Dammam (2016) ..............................................................................................................................................................46
Fig. 22. Saudi Arabia National expenditures by sector, 2016 ...................................................................................................................................................48
Fig. 23. Saudi Arabia National expenditures by sector, 2017 ...................................................................................................................................................48
Fig. 24. Boundaries, neighbourhoods and key infrastructure in the Greater Dammam Metropolitan Area ........................................................................53
Fig. 25. Land allocated per capita ..............................................................................................................................................................................................54
Fig. 26. Urban growth stages .....................................................................................................................................................................................................55
Fig. 27. Administrative boundaries in the Greater Dammam Metropolitan Area ..................................................................................................................56
Fig. 28. Current distribution of population density in the Greater Dammam Metropolitan Area ........................................................................................57
Fig. 29. Income and density distribution in Greater Dammam Metropolitan Area ................................................................................................................58
Fig. 30. Population distribution within Dammam Metropolitan Area ....................................................................................................................................59
Fig. 31. Work division in Dammam Metropolitan Area ............................................................................................................................................................59
Fig. 32. Natural and topographic elements ...............................................................................................................................................................................61
Fig. 33. Proposed and existing movement infrastructure according to the Dammam Plan (2006) .......................................................................................61
Fig. 34. Existing land use .............................................................................................................................................................................................................63
Fig. 35. Proposed land use according to the Dammam Plan (2006) .........................................................................................................................................63
Fig. 36. Vacant land and undeveloped areas in Greater Dammam Metropolitan Area .........................................................................................................64
Fig. 37. Blue and green networks ..............................................................................................................................................................................................69
Fig. 38. Urban heat island (UHI) analysis ...................................................................................................................................................................................69
Fig. 39. Coastal degradation analysis .........................................................................................................................................................................................71
Fig. 40. Sea level rise analysis .....................................................................................................................................................................................................71
Fig. 41. ARAMCO owned land vs. the green network in the Greater Dammam Metropolitan Area ....................................................................................73
Fig. 42. Dammam’s unbalanced growth and development patterns .......................................................................................................................................79

155
Annexures
Fig. 43. Divisions and lack of cohesion in Dammam’s urban fabric .........................................................................................................................................81
Fig. 44. Spatial obstacles dividing the city .................................................................................................................................................................................82
Fig. 45. Fragmentation of the city structure ..............................................................................................................................................................................82
Fig. 46. Dammam’s monofunctional and polarised development ...........................................................................................................................................85
Fig. 47. Mixed land use intensity ................................................................................................................................................................................................87
Fig. 48. Mixed land use analysis in neighbourhoods ................................................................................................................................................................87
Fig. 49. Socio-ecological and economic imbalance in Dammam ..............................................................................................................................................89
Fig. 50. Environmental systems .................................................................................................................................................................................................91
Fig. 51. Distribution of green areas ...........................................................................................................................................................................................91
Fig. 52. The Compact City: Consolidating development and densifying centres in Dammam ...............................................................................................97
Fig. 53. The Connected City: From a system of urban islands to a systemic archipielago ......................................................................................................99
Fig. 54. The Inclusive City: Equalising access to public facilities and economic opportunities in Dammam .......................................................................101
Fig. 55. The Resilient City: Rebalancing socio-ecological and economic systems ..................................................................................................................103
Fig. 56. Current land use ...........................................................................................................................................................................................................106
Fig. 57. FSCP proposal for new land use ..................................................................................................................................................................................107
Fig. 58. Current population density .........................................................................................................................................................................................108
Fig. 59. FSCP proposal for population density .........................................................................................................................................................................109
Fig. 60. Current job accessibility within a 10-minute walking distance .................................................................................................................................110
Fig. 61. FSCP proposal for job accessibility within a 10-minute walking distance ................................................................................................................111
Fig. 62. Current job accessibility from public transport stations ............................................................................................................................................112
Fig. 63. FSCP proposal for job accessibility from public transport stations ...........................................................................................................................113
Fig. 64. Current job accessibility within a 20-minute driving distance ..................................................................................................................................114
Fig. 65. FSCP proposal for job accessibility within a 20-minute driving distance ..................................................................................................................115
Fig. 66. Current accessibility within 10-minute walking distance from metro stops ............................................................................................................116
Fig. 67. FSCP proposal for accessibility within a 10-minute walking distance from metro stops .........................................................................................117
Fig. 68. Four integrated actions for a sustainable Dammam .................................................................................................................................................121
Fig. 69. Action 1: Implement a multi-modal transportation network ...................................................................................................................................123
Fig. 70. Action 2: Relink the natural systems to a rich and diversified coastal development ..............................................................................................127
Fig. 71. Opening the city to the waterfront (phase 1) ............................................................................................................................................................129
Fig. 72. Consolidating the two urban cores (phase 2) ............................................................................................................................................................129
Fig. 73. Linking the three urban cores (phase 3) .....................................................................................................................................................................130
Fig. 74. Action 3: Create a new “Waterfront City” .................................................................................................................................................................131
Fig. 75. Environmental strategy for Half Moon Bay ...............................................................................................................................................................135
Fig. 77. Visualisation of environmental sensitive coastal development for Half Moon Bay ................................................................................................135
Fig. 76. Four systemic actions ..................................................................................................................................................................................................135
Fig. 78. Strategic spatial recommendations for Dammam .....................................................................................................................................................141
Fig. 79. The impact of infrastructure development on land value ........................................................................................................................................146
Fig. 80. Key factors in designing betterment levies ...............................................................................................................................................................146
Fig. 81. Cost-benefit analysis factors in land-based financing ...............................................................................................................................................148
Fig. 82. Case studies and best practices ...................................................................................................................................................................................149

156
Annexures
9.3 Notes and References
1. UNFCCC Designated Authority in Saudi Arabia. 2016. Third National Communication to UNFCCC
2. Structural Plan for Dammam Metropolitan, Qatif and Ras Tanura
3. The World Bank. 2012. Adaptation to a Changing Climate in the Arab Countries
4. UNFCCC Designated Authority in Saudi Arabia.2016.Third National Communication to UNFCCC.
5. UNFCCC Designated Authority in Saudi Arabia.2016.Third National Communication to UNFCCC.
6. FAO-RNE. Response to Climate Change in the Kingdom of Saudi Arabia.
7. UNFCCC Designated Authority in Saudi Arabia.2016.Third National Communication to UNFCCC.
8. FAO-RNE. Response to Climate Change in the Kingdom of Saudi Arabia.
9. Represent the instructions issued by a Minister, his representative or any official of the Ministry to announce new regulations and updates regarding
any intent or action to be undertaken.
10. Antar Abou-Korin and Faez Al-Shihri, ‘Rapid Urbanization and Sustainability in Saudi Arabia: The Case of Dammam Metropolitan Area’ (2015) 8 (9)
Journal of Sustainable Development pg. 59 <http://www.ccsenet.org/journal/index.php/jsd/article/view/51957/28913> accessed 09 February 2018.
11. Ibid pg. 60. These incompatible land uses include the Dhahran military base, oil pipelines, high-tension power lines, animal markets, garbage
disposal and treatment facilities etc. (MoMRA-KSA, 2007).
12. MoMRA and the National Habitat Consultation Group in Saudi Arabia, ‘The National Report for the Third UN Conference on Housing and Sustainable
Urban Development (Habitat III) for the Kingdom of Saudi Arabia’ (2016) <http://habitat3.org/wp-content/uploads/Saudi-Arabia-National-Report.
pdf> accessed 14 February 2018. [2] Royal Decree No M/4 dated 24 November 2015 (the “Law”) and Council of Ministers Decision No. 377 dated 13
June 2016 (the “Regulations”).
13. Infographic for the land subdivision plans
14. 14. According to Article 7 and 8 of Regional Law, the Minister of Interior chairs the meeting with all regional Amirs to discuss issues affecting each
region and the general services required.
15. These include: Safawi, Um-Al-Sahek, AlAwwamiyya, Central Qatif, Snabes, Central Tarout, Dareen, Al-Khasab/Central Seihat, Al-Amamra, Central
Hospital in Dammam, Al-Sbikha, Half-Moon.
16. Dammam workshop, December 201716. .
17. See Royal Decree No. (1663) of 1976.
18. The other big four regional capitals (Riyadh, Jeddah, Madinah and Makkah) are also 1st Class Amanahs.
19. 19. A line-item budget lists, in vertical columns, each of the city’s revenue sources and each of the types of items such as capital outlays, contractual
services, personal services etc. the city will purchase during the fiscal year.
20. Chapter 5 of the State of Saudi Cities Report, “Managing Urban Transformation in Saudi Arabia - The Role of Urban Governance (2018)” pg. 16.
21. See Article 5 of the Law of Regions to Royal Order No. A/92 (1993).
22. It consists of a) the Prince/Governor of the Region as president; b) Deputy Governor of the region as the vice president; c) Deputy Mayor of the
AMARAH; d) Heads of government authorities in the Region who are determined pursuant to a decision issued by the Prime Minister according
to the directives of the Minister of Interior; and e) Ten citizens who are scholars, experts and specialists and are appointed by order of the Prime
Minister based on the nomination of the Prince of the Region and the approval of the Minister of the Interior, for a renewable four year term.
23. See ibid n.15, Article 23.
24. This department is supported by the City Planning Department at MoMRA.
25. FSCP workshop in Dammam 2017.
26. The National Urban Observatory is situated in the Department of Urban Studies, MoMRA.
27. Shearman and Sterling LLP, ‘Understanding the Key Government Institutions and Ministries in the Kingdom of Saudi Arabia’ (2016) <https://www.
shearman.com/~/media/Files/NewsInsights/Publications/2016/09/Saudi-Arabia-Publications/Understanding-the-Key-Government-Institutions-and-
Ministries-in-the-Kingdom-of-Saudi-Arabia.pdf> accessed 09 February 2018.
28. See supra footnote 3. From a FSCP workshop, it emerged that there was a city constructed by ARAMCO outside the urban boundary (in a location
between Dammam, Begig and Ihsaa). The location suitability was not decided by the regional plan; rather it was a decision by ARAMCO to carry
out that development.
29. Baladiyahs are administrative subdivisions. It is used to indicate the Municipalities.
157
Annexures
30. Ministry of Finance, Kingdom of Saudi Arabia (2016).
31. ARAMCO is Saudi Arabia’s state-run oil company.
32. NTP goal is to increase own-source revenue to 40% of municipal budgets by 2020.
33. Jadwa Investment. (2016). The Saudi Stock Exchange.
34. Saudi banking system is supervised by Saudi Arabian Monetary Authority (SAMA), which includes 12 licensed local banks and 12 branches of
licensed foreign banks. Saudi Arabia Monetary Authority http://www.sama.gov.sa/en-US/Pages/default.aspx
35. The Capital Market Law, formation of the Securities and Exchange Commission, and creation of a privately-owned stock exchange were launched
with the aim of improving the domestic capital market. Saudi Arabian Monetary Authority. Retrieved from http://www.sama.gov.sa/en-US/Pages/
default.aspx
36. Hentov, E., Kassam, A., Kumar, A., Petrov, A. (2017). Transforming Saudi Arabia’s Capital Markets, Strengthening the Financial Triad. State Street
Global Advisors.
37. Deloitte Transaction Services LLC. (2013). Saudi mortgage laws: a formula for a well-functioning market? Deloitte Corporate Finance Limited. Dubai
International Finance Centre & Deloitte LLP. United Kingdom.
38. Saudi Arabian Monetary Agency (2015).
39. JLL. 2017. Dammam Metropolitan Area Real Estate Market Overview.
40. JLL. 2017. Dammam Metropolitan Area Real Estate Market Overview.
41. Energy and Cogeneration Regulatory Authority (2016).
42. Colliers International. (2012). Kingdom of Saudi Arabia health care overview. Retrieved from http://www.colliers.com/~/media/files/emea/emea/
research/speciality/2012q1-saudi-arabia-healthcare-overview.ashx
43. Ministry of Health. (2015). Health statistical book. Retrieved from https://www.moh.gov.sa/en/Ministry/Statistics/book/Pages/default.aspx
44. Ministry of Health. (2015). Health statistical book. Retrieved from https://www.moh.gov.sa/en/Ministry/Statistics/book/Pages/default.aspx
45. Ministry of Health. (2015). Health statistical book. Retrieved from https://www.moh.gov.sa/en/Ministry/Statistics/book/Pages/default.aspx
46. Almalki, M., Fitzgerald, G., & Clark, M. Health care system in Saudi Arabia: an overview. Eastern Mediterranean Health Journal, 17(10), 784-793.
47. Ministry of Finance, Kingdom of Saudi Arabia
48. Antar A. Abou-Korin & Faez Saad Al-Shihri, 2015
49. A more detailed modeling is needed in order to achieve more accurate results
50. Godschalk, D. R. (2003). Urban Hazard Mitigation Creating Resilient Cities. Natural Hazards Review, 4, 136-143.
51. A New Strategy of Sustainable Neighbourhood Planning: Five principles - Urban Planning Discussion Note 3, UN-Habitat, 2014
52. Jeffrey E. Huber, Keith Van de Riet, John Sandell, Lawrence Scarpa, 2017 , “Salty Urbanism: Towards an Adaptive Coastal Design Framework to
Address Sea Level Rise”, The Plan Journal, 2 (2): 389-414,
53. Vision 2030. (2018). Kingdom of Saudi Arabia. Retrieved from http://vision2030.gov.sa
54. United Nations. (2017). New Urban Agenda. United Nations Human Settlements Programme, Nairobi, Kenya.
55. Norregaard, J. (2013). Taxing immovable property: revenue potential and implementation challenges. International Monetary Fund, Working Paper
WP/13/129, Washington, DC.
56. This instrument has “a long tradition of being implemented in Colombia” going back to the passage of Act 25 in 1921. Medellin was one of the first
cities to use this funding instrument. It is estimated that more than 50% of Medellín’s street grid was paid by betterment levies.; Walters, L. (2016).
Leveraging land: land-based finance for local governments. United Nations Human Settlements Programme. Nairobi, Kenya.
57. Ministry of Finance, Kingdom of Saudi Arabia (2016). In 2016, intergovernmental transfers represented 85% of the municipal budget.

158
Annexures


ISBN: 978-603-8279-01-4